
Evaluating the User Experience of Interactive Systems ... - Trepo
257
Tuuli Keskinen Evaluating the User Experience of Interactive Systems in Challenging Circumstances ACADEMIC DISSERTATION To be presented with the permission of the School of Information Sciences of the University of Tampere, for public discussion in the Pinni auditorium B1100 on November 28, 2015, at noon. School of Information Sciences University of Tampere Dissertations in Interactive Technology, Number 22 Tampere 2015
-
Upload
khangminh22 -
Category
Documents
-
view
2 -
download
0
Transcript of Evaluating the User Experience of Interactive Systems ... - Trepo
Tuuli Keskinen
Evaluating the User Experience of Interactive Systems
in Challenging Circumstances
ACADEMIC DISSERTATION To be presented with the permission of the School of Information Sciences of the
University of Tampere, for public discussion in the Pinni auditorium B1100 on November 28, 2015, at noon.
School of Information Sciences
University of Tampere
Dissertations in Interactive Technology, Number 22 Tampere 2015
ACADEMIC DISSERTATION IN INTERACTIVE TECHNOLOGY Supervisor: Professor Markku Turunen, Ph.D.
School of Information Sciences, University of Tampere, Finland
Opponent: Senior Associate Professor Eva-Lotta Sallnäs Pysander, Ph.D. School of Computer Science and Communication, KTH Royal Institute of Technology, Sweden
Reviewers: Professor Anirudha Joshi, Ph.D. Industrial Design Centre, Indian Institute of Technology Bombay, India
Adjunct Professor Thomas Olsson, D.Sc. (Tech.) Department of Pervasive Computing, Tampere University of Technology, Finland
The originality of this thesis has been checked using the Turnitin OriginalityCheck service in accordance with the quality management system of the University of Tampere.
Dissertations in Interactive Technology, Number 22
School of Information Sciences FIN-33014 University of Tampere FINLAND
ISBN 978-951-44-9958-6 ISSN 1795-9489
Juvenes Print ‒ Suomen Yliopistopaino Oy Tampere 2015
Acta Electronica Universitatis Tamperensis 1611ISBN 978-951-44-9972-2 (pdf)ISSN 1456-954Xhttp://tampub.uta.fi

……
……
…
iii
Abstract
“User experience” is the word of the day in human-technology interaction. One should design and aim for a good user experience, although there is not even a unanimously approved definition of the term. This dissertation takes a practical perspective to the issue. The focus is on evaluating the user experience of interactive systems in challenging circumstances outside of laboratories, and thus, aiming to fulfill the research gap of how to evaluate user experience in practice.
The questions answered through this dissertation are how to evaluate the user experience of interactive systems in challenging circumstances and how to apply known methods to create an appropriate evaluation approach for a specific user experience evaluation case. This is done by presenting seven interactive systems and their eight user experience evaluations in which the challenges have arisen either from the context or the user group(s). The case studies demonstrate evaluations beyond merely traditional user experience evaluations, as they have been conducted outside of laboratories and the systems have included new interaction techniques still not consistently used in interactive systems.
The case studies presented in this dissertation are MediaCenter (I): a multimodal media center for visually impaired users; DrillSimulator (II): haptic feedback for drill rig simulator users; SymbolChat (III): a symbol-based chat application for users with intellectual disabilities; EventExplorer (IV): an experiential program guide for cultural events; EnergySolutions (V): a playful system for raising awareness of energy consumption; Dictator (VI): a dictation application with automatic speech recognition for healthcare purposes; and LightGame (VII): a lighting-based exercise game for schoolchildren that consists of two evaluations. The evaluation cases and the selected evaluation approaches are introduced, and the outcomes are analyzed and discussed from the user experience point of view. The basis for the evaluations has been to focus on taking into account the context, user group(s), and interaction technique(s).
As a result of this work, I present a process model on how to evaluate the user experience of interactive systems in practice. The model comprises the whole life cycle of user evaluations, including practical considerations on what issues need to be taken into account in specific phases. The model can be utilized as a guideline for designing and conducting user evaluations, the focus being strongly on the design phase and how to address the challenges raised by evaluation circumstances.
……
……
…
iv
Acknowledgements
Others gone through this know it: there were times when I seriously thought this day will never come. Yet, here it is. Although this thesis as the final effort of the process was obviously mine to push through, it would not have been possible without significant people supporting my work in various ways over the years.
First of all, my supervisor Professor Markku Turunen, thank you for believing in me and providing me with the possibility to work in a wide range of projects. Sometimes it has been hectic, but never boring. I also wish to thank Senior Associate Professor Eva-Lotta Sallnäs Pysander for agreeing to act as my opponent in the public defense. Professor Anirudha Joshi and Adjunct Professor Thomas Olsson, thank you for reviewing my thesis.
I have been working in the Tampere Unit for Computer-Human Interaction (TAUCHI) for seven years now, and I have to say I have enjoyed it. The members of our research group, and other colleagues, thank you for the atmosphere. Special thanks go to Dr. Tomi Heimonen and Dr. Jaakko Hakulinen: You have been like academic big brothers to me, you have always had the time to advise me. I hope I will be able to provide something similar to younger academics during the years to come. I would also like to thank all of the co-authors, and project partners involved. The differing projects that have enabled my work have been funded by TEKES—the Finnish Funding Agency for Technology and Innovation, the European Institute of Innovation & Technology (EIT ICT Labs), and the European Commission. Thank you also to the Anu Kirra Fund for supporting my thesis work.
Rakkaat Äiti ja Iskä, en osaa kuvitella lasta, joka tuntisi itsensä rakastetummaksi. Kiitos kaikesta tuestanne! (Dear Mom and Dad, I cannot imagine a child who would feel oneself more loved. Thank you for all your support!) My darling big sister Meri, I believe we have always unconsciously set high standards for each other. Look where it took us both! My lovely niece Taimi, I am eager to follow your newly began path of life, and I will support you in achieving your standards, whatever they will be.
Most importantly, my dearest husband Sami, thank you for being my best friend and the Sun of my life. I love you beyond words!
Tampere, October 22, 2015
Tuuli Keskinen

……
……
…
v
Contents
1 INTRODUCTION ........................................................................... 1 1.1 Objective ............................................................................................................. 3 1.2 Context of Research .......................................................................................... 4 1.3 Methodology ..................................................................................................... 5 1.4 Results ................................................................................................................ 6 1.5 Structure of the Thesis ...................................................................................... 6
2 USER EXPERIENCE EVALUATION .......................................................... 9 2.1 User Experience ................................................................................................ 9 2.2 Evaluation methods ........................................................................................ 12
3 CASE STUDIES ........................................................................... 25 3.1 MediaCenter (I) ............................................................................................... 29 3.2 DrillSimulator (II) ........................................................................................... 37 3.3 SymbolChat (III) .............................................................................................. 43 3.4 EventExplorer (IV) .......................................................................................... 55 3.5 EnergySolutions (V) ....................................................................................... 65 3.6 Dictator (VI) ..................................................................................................... 74 3.7 LightGame (VII) .............................................................................................. 82
3.7.4 Evaluation I ................................................................................................ 84 3.7.5 Evaluation II ............................................................................................... 88
4 THE PROCESS OF USER EXPERIENCE EVALUATION .................................... 101 4.1 Before the Evaluation ................................................................................... 102 4.2 (During) the Evaluation ............................................................................... 115 4.3 After the Evaluation ..................................................................................... 118 4.4 Summary ........................................................................................................ 121
5 CONCLUSIONS ......................................................................... 125
6 REFERENCES .......................................................................... 131
APPENDICES .............................................................................. 141
……
……
…
vi
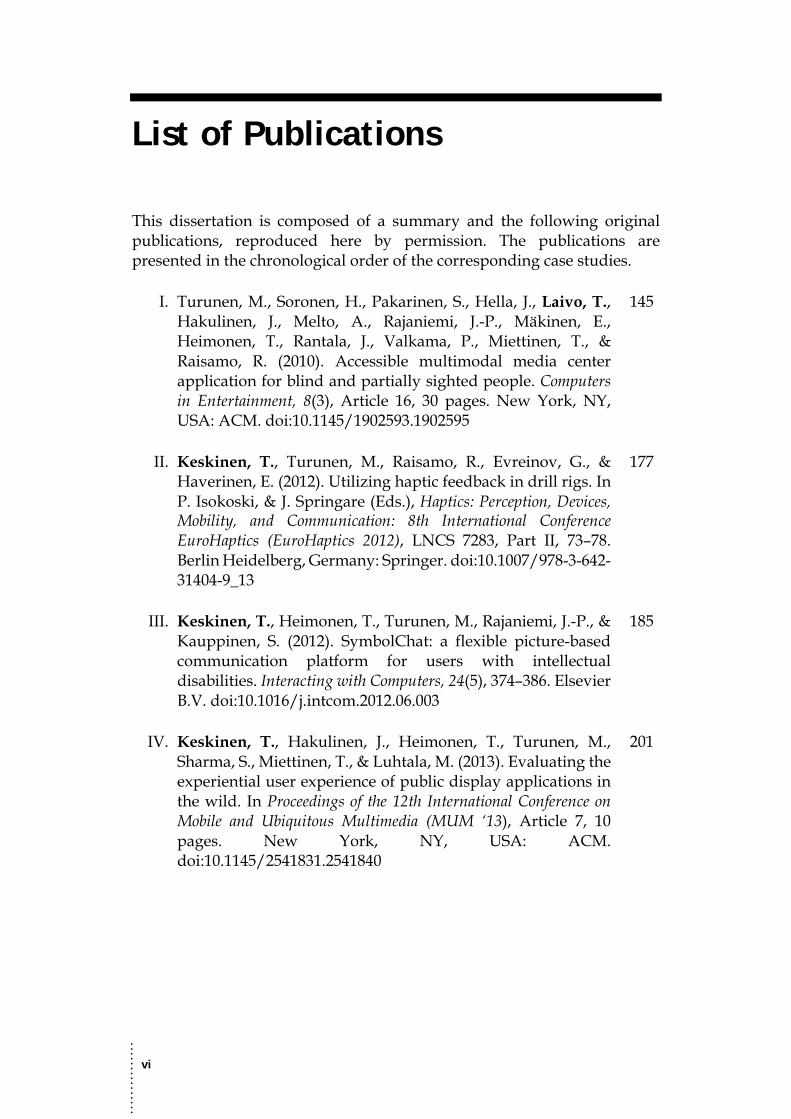
List of Publications
This dissertation is composed of a summary and the following original publications, reproduced here by permission. The publications are presented in the chronological order of the corresponding case studies.
I. Turunen, M., Soronen, H., Pakarinen, S., Hella, J., Laivo, T., Hakulinen, J., Melto, A., Rajaniemi, J.-P., Mäkinen, E., Heimonen, T., Rantala, J., Valkama, P., Miettinen, T., & Raisamo, R. (2010). Accessible multimodal media center application for blind and partially sighted people. Computers in Entertainment, 8(3), Article 16, 30 pages. New York, NY, USA: ACM. doi:10.1145/1902593.1902595
145
II. Keskinen, T., Turunen, M., Raisamo, R., Evreinov, G., & Haverinen, E. (2012). Utilizing haptic feedback in drill rigs. In P. Isokoski, & J. Springare (Eds.), Haptics: Perception, Devices, Mobility, and Communication: 8th International Conference EuroHaptics (EuroHaptics 2012), LNCS 7283, Part II, 73–78. Berlin Heidelberg, Germany: Springer. doi:10.1007/978-3-642-31404-9_13
177
III. Keskinen, T., Heimonen, T., Turunen, M., Rajaniemi, J.-P., & Kauppinen, S. (2012). SymbolChat: a flexible picture-based communication platform for users with intellectual disabilities. Interacting with Computers, 24(5), 374–386. Elsevier B.V. doi:10.1016/j.intcom.2012.06.003
185
IV. Keskinen, T., Hakulinen, J., Heimonen, T., Turunen, M., Sharma, S., Miettinen, T., & Luhtala, M. (2013). Evaluating the experiential user experience of public display applications in the wild. In Proceedings of the 12th International Conference on Mobile and Ubiquitous Multimedia (MUM ‘13), Article 7, 10 pages. New York, NY, USA: ACM. doi:10.1145/2541831.2541840
201
……
……
…
vii
V. Keskinen, T., Melto, A., Hakulinen, J. Turunen, M., Saarinen, S., Pallos, T., Danielsson-Ojala, R., & Salanterä, S. (2013). Mobile dictation with automatic speech recognition for healthcare purposes. In Proceedings of the 8th MobileHCI Workshop on Speech in Mobile and Pervasive Environments (SiMPE 2013), Article 6. Available at http://tinyurl.com/Simpe13.
213
VI. Hakulinen, J., Turunen, M., Heimonen, T., Keskinen, T., Sand, A., Paavilainen, J., Parviainen, J., Yrjänäinen, S., Mäyrä, F., Okkonen, J., & Raisamo, R. (2013). Creating immersive audio and lighting based physical exercise games for schoolchildren. In D. Reidsma, N. Katayose, & A. Nijholt (Eds.), Advances in Computer Entertainment: 10th International Conference (ACE 2013), LNCS 8253, 308-319. Springer International Publishing. doi:10.1007/978-3-319-03161-3_22
221
VII. Keskinen, T., Hakulinen, J., Turunen, M., Heimonen, T., Sand, A., Paavilainen, J., Parviainen, J., Yrjänäinen, S., Mäyrä, F., Okkonen, J., & Raisamo, R. (2014). Schoolchildren’s user experiences on a physical exercise game utilizing audio and lighting. Entertainment Computing, 5(4), 475–484. doi:10.1016/j.entcom.2014.08.009
235

……
……
…
viii
The Author’s Contribution to the Publications
This work was done as a part of several research projects and would not have been possible without my project colleagues. All of the seven publications included in this dissertation were co-authored. The technical design and implementation of the systems have been done by others in each study. I have been responsible for designing the user evaluations, including user experience data collection, and analyzing the results. Considering the actual publications, my contributions have concentrated on presenting all aspects of the user evaluations, i.e., context, participants, procedure, data collection methods, and results. Publication-specific responsibilities and contributions are listed below.
Publication I: ”MediaCenter” (I) This article describes an accessible multimodal media center for blind and partially sighted people, and its evaluation with representatives of the target user group in their homes. I (Tuuli Keskinen, nee Laivo) was responsible for designing the evaluation questionnaires for the visually impaired participants, creating the web forms for data collection, and ensuring their accessibility.
Publication II: ”DrillSimulator” (II) This article describes a haptic user interface for a drill rig simulator and its evaluation with representatives from the industry. I was responsible for designing the evaluation, i.e., the methods and content of gathering subjective data, gathering the subjective data during evaluations, and analyzing the results. I was also the main contributor to the publication.
Publication III: ”SymbolChat” (III) This article describes a case study in which a symbol-based instant messaging tool for people with intellectual disabilities was designed, implemented, and evaluated. I was responsible for designing the evaluation in collaboration with other stakeholders, i.e., the methods and content of gathering subjective data, and analyzing the results. In addition, I negotiated the symbols to be used for research purposes and designed the final symbol set with our project partner representatives with a professional background considering the target user group. I was mainly responsible for the publication.
……
……
…
ix
Publication IV: “EventExplorer” (IV) and “EnergySolutions” (V) This article introduces a new method for evaluating the experiential user experience of interactive systems in the wild and its utilization in two case studies concerning public displays. I was responsible for creating the method, designing the evaluations, and analyzing the results. I was the main person responsible for the publication.
Publication V: ”Dictator” (VI) This article describes a mobile dictation application for healthcare professionals and its evaluation with nurses. I was responsible for designing the evaluation, i.e., the methods and content of gathering subjective data, creating the web forms for data collection, and analyzing the results. Apart from the technical description of the system, I was the main contributor to the publication itself.
Publication VI: “LightGame” (VII) Evaluation I This article introduces a physical exercise game, the “LightGame,” which utilizes light and sound and is targeted toward schoolchildren. In the article, an initial and extended version of the system, their evaluations, and a co-creation workshop are described. I was responsible for designing the evaluation of the extended version in collaboration with other stakeholders, i.e., the methods and content of gathering subjective questionnaire data, and analyzing the results.
Publication VII: “LightGame” (VII) Evaluation II This article is an extended version of the previous publication, introducing another user experience evaluation of the LightGame system. I was responsible for designing the evaluation in collaboration with other stakeholders, i.e., the methods and content of gathering subjective questionnaire data, and analyzing the quantitative results. I was the main person responsible for the publication, and apart from the technical description of the system, I was the main contributor to the publication.

……
……
…
x

……
……
…
1
1 Introduction
The literature and discussion in the field of human-technology interaction (HTI) bristles with the term “user experience” today—and has for a while. There is debate on the definition of the term, and several definitions have been presented originating from different perspectives (see, e.g., All about UX—definitions, 2014). There also seems to be an idealistic pursuit or need to determine user experience from, or based on, a theoretical ground (e.g., Obrist et al., 2011; Kuutti, 2010). However, academic user experience research often seems treated like a monolith and is not divided into, e.g., user experience design and user experience evaluation. For example, Väänänen-Vainio-Mattila, Roto, and Hassenzahl (2008a; 2008b) talk about academic user experience research in a way that almost implies practical user experience evaluation not being a part of it.
They (Väänänen-Vainio-Mattila et al., 2008b) introduce a figure presenting a gap between academic user experience research and industrial user experience development, in which the academic research side includes only theories, models, and frameworks. Practical user experience work is mentioned only on the industry side. Without taking a stance on experience-driven design or designing for user experience in academia, I would assume theories and such might be more relevant considering those topics. However, I argue that grounding practical user experience evaluations conducted in varying academic research projects directly in readily available theories, or methodology even, appears to be far from the reality. Although the research conducted within our research group does not deal with product development as such, it does deal with evaluating the user experience of functional prototypes of interactive systems and their iterative development. Thus, my work is highly practical, yet academic, user experience research.
……
……
…
2
There is a need to change the atmosphere in the field, i.e., abandon the stereotypical division between academia and practitioners. In fact, Hassenzahl and Tractinsky (2006) state that the lack of empirical user experience research also interferes with theoretical progress. The need to increase empirical user experience research, and report it openly, has been acknowledged for quite some time (e.g., Hassenzahl & Tractinsky, 2006; Vermeeren et al., 2010; Bargas-Avila & Hornbæk, 2011). Although there are numerous studies and articles on user experience (e.g., Forlizzi & Battarbee, 2004; Battarbee & Koskinen, 2005; Jetter & Gerken, 2006; Hassenzahl, 2008; Law, Roto, Vermeeren, Kort, & Hassenzahl, 2008; Law, Roto, Hassenzahl, Vermeeren, & Kort, 2009), the focus usually is more on the discussion of what constitutes user experience, how it is understood, what characteristics it has, and so forth. Despite some effort (e.g., Obrist, Roto, & Väänänen-Vainio-Mattila, 2009), amazingly little detailed information still is available on how to actually evaluate user experience in practice. This thesis demonstrates a different direction by transparently disseminating information, and thus, it aims to promote the development of user experience evaluation research.
In this dissertation, I present practical, academic user experience evaluations of interactive systems, including new interaction techniques in challenging circumstances outside of laboratories, and I contribute to the field by presenting a process model for user experience evaluation. User experience is understood widely here: In brief, it is a user’s subjective view on a specific property of an object in a certain context at that specific moment. New interaction techniques include novel input and output modalities or techniques that differ from traditional techniques, such as mouse and keyboard interaction or using a button-based interface. Circumstances here refer primarily to either context or user group. However, circumstances can be understood more widely as well, referring to basically any characteristics that may induce challenges, limitations, or even possibilities for an evaluation. To avoid restricting the applicability of the current work to such properties as context or user group only, the rather loose term “circumstances” is used. What is meant by challenging circumstances here is that they were somehow extraordinary: An ordinary user evaluation might occur in a laboratory setting with non-disabled adults testing a smart phone meant primarily for personal, leisure-time usage, for instance. Here, however, the circumstances involved special characteristics that needed attention. For example, a work environment or industrial domain as the evaluation context, or intellectually disabled people as the user group, bring extra challenges to the evaluation setting and require additional consideration when making evaluation approach decisions.
……
……
…
3
1.1 OBJECTIVE The objective of this dissertation is to provide an approach to fill the research gap of how to evaluate user experience in practice. This is done by answering the following research questions:
• How to evaluate the user experience of interactive systems in challenging circumstances, i.e., context or user groups?
• How to apply known methods to create an appropriate evaluation approach for a specific user experience evaluation case?
These questions are considered by presenting concrete examples of applying evaluation methods in seven case studies and eight evaluation cases, including different interactive systems, different interaction techniques, contexts, and user groups. The ultimate goal of this dissertation is to provide practical guidelines for using, applying, and creating evaluation approaches taking into account these circumstances. Each case study has characteristics that made the user experience evaluation somehow challenging: In some cases, the challenges arose from the context (environment or domain), and in some, from the user group.
The challenges in the cases were different, as were the cases themselves. Some of the challenges were more practical, such as getting ideal participants, while some were more serious, such as how to evaluate a system with intellectually disabled people. The challenges in each case are explained in the detailed descriptions of the case studies in Chapter 3. Already involving new interaction techniques made the evaluations demanding, as those have not yet been widely studied. In addition, a common challenge for all the case studies presented here is the fact that the evaluations were conducted in real-world environments, outside of laboratories. Laboratory studies are inevitably somewhat artificial, and it is important to evaluate systems in real-world settings, e.g., to determine their true commercial success (Väänänen-Vainio-Mattila, Olsson, & Häkkilä, 2015). A real-world environment, however, poses extra challenges to evaluations and analyses, as there are several factors that cannot be controlled. Conducting user evaluations in real-world environments limits, or even eliminates, the researcher’s possibilities of controlling what happens in the surroundings, e.g., in a public environment: How will the participants react or communicate with others, i.e., will they direct their focus on the couple nearby arguing about cleaning or keep their focus on the system and its evaluation? Will they chit-chat with their friend and base their feedback on commonly agreed-upon opinions? At the other extreme, evaluations conducted in real-world environments may concern “closed” environments, such as home or restricted work environments, where the researcher may not, or is not allowed to, stay during the usage or evaluation and have any control over events. Thus, conducting evaluations outside of laboratory settings, and interpreting the data gathered from these real-
……
……
…
4
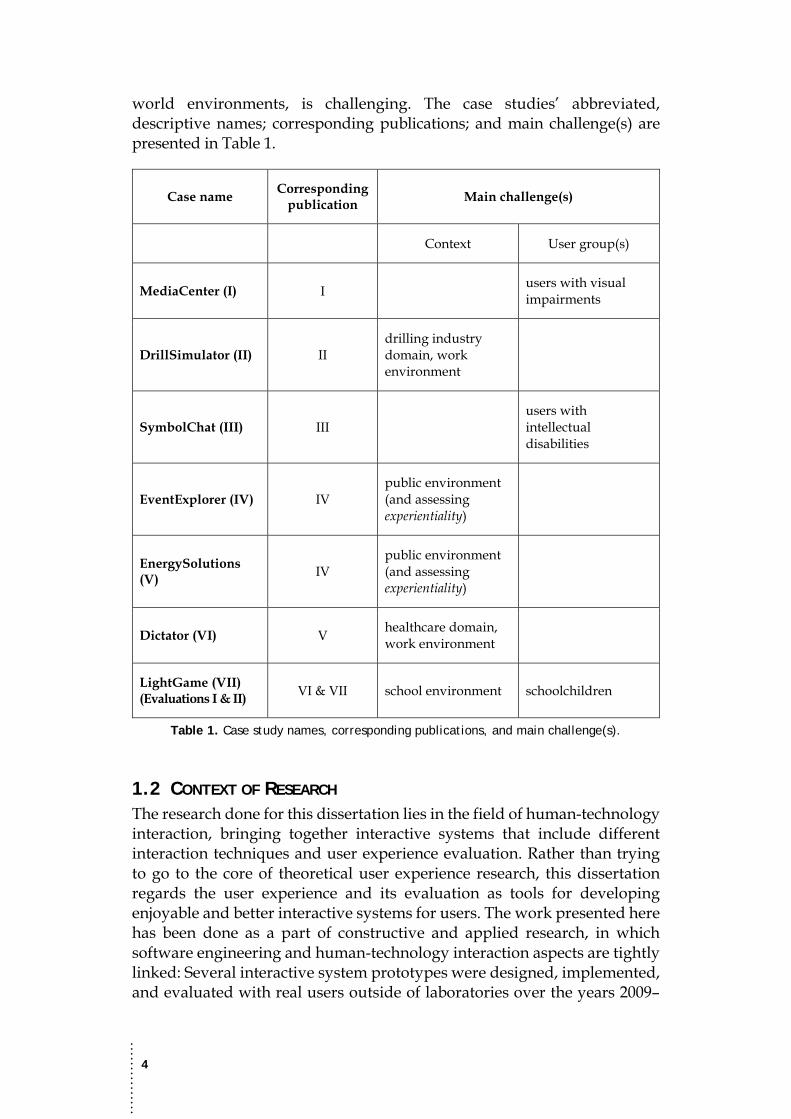
world environments, is challenging. The case studies’ abbreviated, descriptive names; corresponding publications; and main challenge(s) are presented in Table 1.
Case name Corresponding publication Main challenge(s)
Context User group(s)
MediaCenter (I) I users with visual impairments
DrillSimulator (II) II drilling industry domain, work environment
SymbolChat (III) III users with intellectual disabilities
EventExplorer (IV) IV public environment (and assessing experientiality)
EnergySolutions (V) IV
public environment (and assessing experientiality)
Dictator (VI) V healthcare domain, work environment
LightGame (VII) (Evaluations I & II) VI & VII school environment schoolchildren
Table 1. Case study names, corresponding publications, and main challenge(s).
1.2 CONTEXT OF RESEARCH The research done for this dissertation lies in the field of human-technology interaction, bringing together interactive systems that include different interaction techniques and user experience evaluation. Rather than trying to go to the core of theoretical user experience research, this dissertation regards the user experience and its evaluation as tools for developing enjoyable and better interactive systems for users. The work presented here has been done as a part of constructive and applied research, in which software engineering and human-technology interaction aspects are tightly linked: Several interactive system prototypes were designed, implemented, and evaluated with real users outside of laboratories over the years 2009–

……
……
…
5
2014. This dissertation is meant to provide practical examples and guidelines for considering user experience in, and as an essential part of, software development, rather than trying to tell ultimate truths about user experience or its evaluation methods. Although the cases presented here cover mainly only the first implementation-evaluation iteration, the methods and guidelines are suitable to be used in iterative software assessment and development as well. However, the chosen user experience evaluation approach then should also be adapted iteratively as necessary.
1.3 METHODOLOGY The case studies presented in this dissertation have mainly followed the same pattern: First, an interactive system, or a functional prototype at least, has been designed and implemented based on user and other requirements and higher-level goals of a specific project. Then, the system has been evaluated with a varying number of participants in real-world settings, outside of laboratories. Preceding the evaluations, the data collection and other content of the evaluation have been carefully designed to find out how well the developed system fulfills the aims of the project and the evaluation case. The systems, aims, contexts of use, and user groups differing substantially between the cases, it has been necessary to design the user experience evaluations case by case. Existing evaluation methods have been utilized whenever possible. Often, existing methods have required some modifications, or elements from them have been combined with newly created elements.
Usually, user experience goals, as such, have not been defined in the beginnings of the projects or cases. Thus, when designing the evaluation contents, the questions or statements meant to be asked from the participants have mostly been constructed based on the objectives of the project, case, or system, and general research interests regarding users’ experiences with human-technology interactions. The design processes in the case studies cannot be described as designing for user experience. Although more general goals in many cases may have been rather close to user experience goals, this term has not been explicitly used in the discussions. Thus, the user experience component in the case studies has dealt with designing a user experience evaluation given the circumstances (i.e., aims, system, context, user group); conducting the evaluation; collecting the predefined data; and finally, based on the received data from different sources, describing user experiences. In other words, how did the users feel about utilizing the system?
The fundamental principle in all evaluations presented in this dissertation has been that the ultimate truth about user experience lies within the user himself or herself. As a consequence, the subjective data—and particularly the quantitative, mainly statement-based data gathered from the

……
……
…
6
participants themselves—have the primary role in this dissertation. Because these data are for the most part of ordinal scale and the numbers of participants per evaluation case are small, the analysis and discussion mainly focus on dealing with median values and the statistical analysis suitable for these kinds of data. Data from other sources, such as subjective interview data or objective observation data, have been used to support the quantitative subjective data and to understand possible reasons for specific experiences. The majority of the evaluations presented in this dissertation have also included gathering user expectations about the system before its usage—something rarely seen in field studies of user experiences (Bargas-Avila & Hornbæk, 2011).
1.4 RESULTS This dissertation demonstrates how to measure or otherwise evaluate the users’ subjective experiences of interactive systems in a way that suits the specific circumstances of an evaluation case. The evaluations have been conducted in real-world situations or environments, not artificially in laboratories, unlike some user studies within the field of human-technology interaction (e.g., Wechsung, 2014). The true contribution of this dissertation is a step-by-step process model for evaluating the user experience of interactive systems considering the evaluation circumstances. The actual user experience results are not the core here. The process model for the user experience evaluation has been created based on the findings of the individual evaluation cases, and it is meant to act as a guideline for people designing and conducting practical user experience evaluations. In addition, two evaluation methods are discussed that are used in the research conducted within our research group (see sections 2.2.2 and 2.2.3): SUXES (Turunen, Hakulinen, Melto, et al., 2009), an earlier method for evaluating user expectations and experiences of multimodal systems, and the Experiential User Experience Evaluation Method (Publication IV), which I created as part of the research done for this dissertation, and which combines elements from SUXES and the Experience Pyramid (Tarssanen & Kylänen, 2006), a theoretical model for tourist products.
1.5 STRUCTURE OF THE THESIS This dissertation is a compound thesis comprising seven original publications and their summary. This summary part is structured as follows. First, I briefly introduce background on user experience and its evaluation methods, focusing on two methods created within our own research. Then, I present the seven case studies and eight evaluation cases in detail, concentrating on the user experience evaluation per se, i.e., data collection methods and the discussion of the outcomes. Finally, I summarize the findings of the individual cases by proposing a process model for

……
……
…
7
evaluating the user experience of interactive systems and discuss the issues that need to be considered during the evaluation process. As a conclusion, I sum up the contribution of the current work and outline the possibilities for future work.

……
……
…
8

……
……
…
9
2 User Experience Evaluation
This chapter introduces background on user experience and its evaluation. My work has a highly practical emphasis instead of a strong theoretical basis. Thus, this background description is kept compact, and its main idea is to present the stance taken regarding the topics. As user experience is defined and understood in varying ways, here I explain what I mean by the term. Then, I briefly discuss existing methods for user experience evaluations. Finally, I describe two methods, the SUXES (Turunen, Hakulinen, Melto, et al., 2009) and the Experiential User Experience Evaluation Method (Publication IV), which have been utilized in the case studies presented later in Chapter 3.
2.1 USER EXPERIENCE There are numerous definitions for the term user experience. According to the ISO (2010), it is “a person’s perceptions and responses that result from the use or anticipated use of a product, system or service.” This definition takes into account user and system, but ignores context, which is seen as one of the three main factors that user experience is built from by Hassenzahl and Tractinsky (2006) and by Roto, Law, Vermeeren, and Hoonhout (2011). In this respect, the ISO (1998) definition for usability would be more suitable, as it says, "the extent to which a product can be used by specified users to achieve specified goals with effectiveness, efficiency, and satisfaction in a specified context of use.” This definition, however, disregards more or less the subjectivity of the matter and also highlights effectiveness needlessly.
Unlike the more traditional usability, user experience is something purely subjective and thus cannot be evaluated by observation or expert evaluation alone. “Usability” and “user experience” are still used almost synonymously surprisingly often, especially in industry (Hassenzahl, 2008).
……
……
…
10
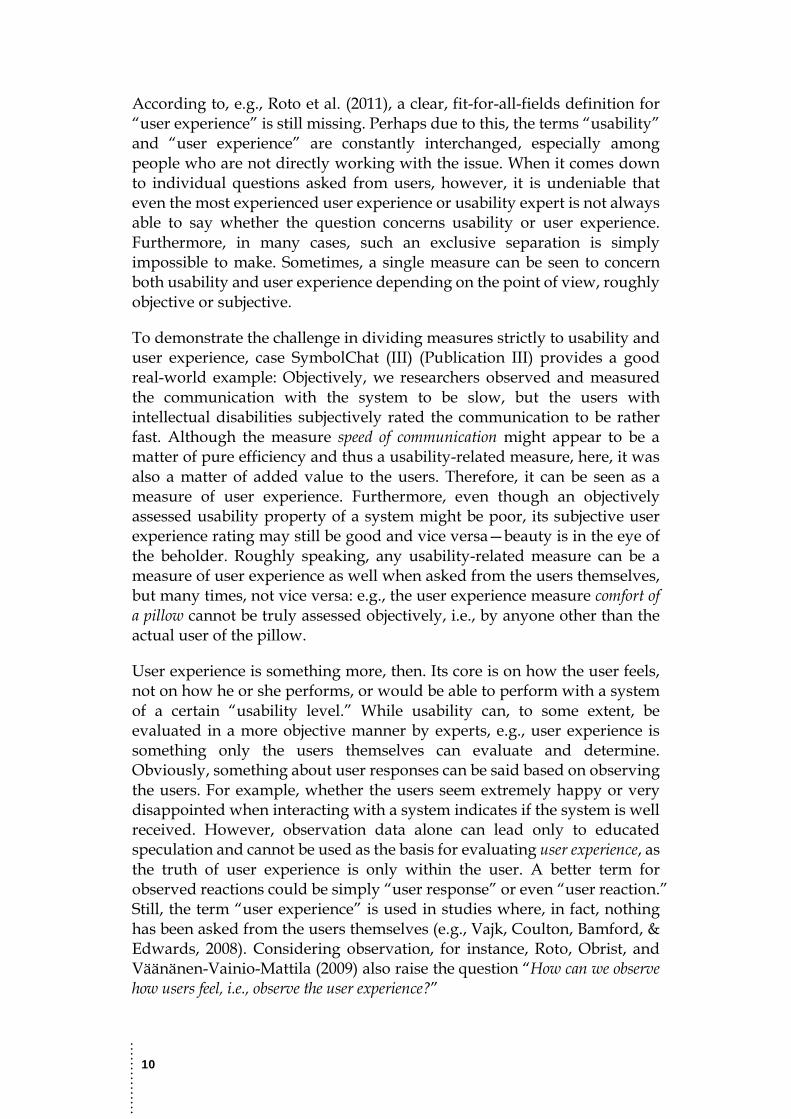
According to, e.g., Roto et al. (2011), a clear, fit-for-all-fields definition for “user experience” is still missing. Perhaps due to this, the terms “usability” and “user experience” are constantly interchanged, especially among people who are not directly working with the issue. When it comes down to individual questions asked from users, however, it is undeniable that even the most experienced user experience or usability expert is not always able to say whether the question concerns usability or user experience. Furthermore, in many cases, such an exclusive separation is simply impossible to make. Sometimes, a single measure can be seen to concern both usability and user experience depending on the point of view, roughly objective or subjective.
To demonstrate the challenge in dividing measures strictly to usability and user experience, case SymbolChat (III) (Publication III) provides a good real-world example: Objectively, we researchers observed and measured the communication with the system to be slow, but the users with intellectual disabilities subjectively rated the communication to be rather fast. Although the measure speed of communication might appear to be a matter of pure efficiency and thus a usability-related measure, here, it was also a matter of added value to the users. Therefore, it can be seen as a measure of user experience. Furthermore, even though an objectively assessed usability property of a system might be poor, its subjective user experience rating may still be good and vice versa—beauty is in the eye of the beholder. Roughly speaking, any usability-related measure can be a measure of user experience as well when asked from the users themselves, but many times, not vice versa: e.g., the user experience measure comfort of a pillow cannot be truly assessed objectively, i.e., by anyone other than the actual user of the pillow.
User experience is something more, then. Its core is on how the user feels, not on how he or she performs, or would be able to perform with a system of a certain “usability level.” While usability can, to some extent, be evaluated in a more objective manner by experts, e.g., user experience is something only the users themselves can evaluate and determine. Obviously, something about user responses can be said based on observing the users. For example, whether the users seem extremely happy or very disappointed when interacting with a system indicates if the system is well received. However, observation data alone can lead only to educated speculation and cannot be used as the basis for evaluating user experience, as the truth of user experience is only within the user. A better term for observed reactions could be simply “user response” or even “user reaction.” Still, the term “user experience” is used in studies where, in fact, nothing has been asked from the users themselves (e.g., Vajk, Coulton, Bamford, & Edwards, 2008). Considering observation, for instance, Roto, Obrist, and Väänänen-Vainio-Mattila (2009) also raise the question “How can we observe how users feel, i.e., observe the user experience?”
……
……
…
11
Alongside several models describing user experience, a number of definitions for the term have been constructed, many of them trying to define almost exactly the same thing with only slight differences in, e.g., wordings and emphasis. Merely to point out a few definitions, Alben (1996), e.g., refers to experience and quality of experience in the context of the ACM/interactions Design Award as “all the aspects of how people use an interactive product: the way it feels in their hands, how well they understand how it works, how they feel about it while they’re using it, how well it serves their purposes, and how well it fits into the entire context in which they are using it.” Without her explicitly stating this to be a definition for user experience per se, it can, and also has been, interpreted as such (e.g., All about UX—definitions, 2014). Hassenzahl and Tractinsky (2006), conversely, define “user experience” as “a consequence of a user’s internal state (…), the characteristics of the designed system (…) and the context (…) within which the interaction occurs (…).” This definition highlights the three core elements affecting user experience—user, system, and context. According to Mahlke (2008), the influence of the user and the context—in addition to the system only—have been recognized as an influential part of usability already by Shackel (1991), for example. The idea of all three components—user, system, and context—having an effect on user experience is highly relevant for my research and this dissertation: User experience evaluation cannot be designed disregarding any of these factors.
Hassenzahl (2008) later states simply that user experience is “a momentary, primarily evaluative feeling (good–bad) while interacting with a product or service,” but restricts his flexible definition by continuing: “Good UX is the consequence of fulfilling the human needs for autonomy, competency, stimulation (self-oriented), relatedness, and popularity (others-oriented) through interacting with the product or service (i.e., hedonic quality). Pragmatic quality facilitates the potential fulfilment of” these ”be-goals.” The second part of the definition suggests that all of the listed human needs demand to be fulfilled to achieve good user experience, and thus, sets high standards for user experience. From the viewpoint of the practical evaluation work done for this dissertation, Hassenzahl’s (2008) definition is overly complex and perhaps too accurate. Furthermore, this definition overlooks context.
As this dissertation is not attempting to solve theoretical issues in user experience research, but instead has a highly practical perspective, the definition for user experience is kept simple and flexible. Here, “user experience” means:
A user’s subjective opinion about (or answer to) a certain statement (or question) about the system (or modality, interaction, or any other specified target) in a certain context at that time.
I kept the definition loose so it will not restrict the kinds of users, opinions, statements, questions, systems, or contexts it can deal with. The definition
……
……
…
12
may be used with a range of agendas, be it user experience, usability, or consumer satisfaction. In fact, this definition does not exclude non-interactive or even non-computer-based “objects,” but instead, can be used concerning anything that can have a user in the first place—be it an interactive public display or a watering can. Furthermore, to maintain simplicity, the abbreviation UX is not used in this dissertation. The complexity around the term and its definition seen in literature is probably only increased by using the buzzword-like abbreviation “UX.” Thus, the term “user experience” is interpreted literally here: an individual using an object (user) + his or her feeling about the object (experience) = user experience.
Furthermore, the concept of user experience comprises different aspects or focus areas. For example, Wright, Wallace, and McCarthy (2008) talk about aesthetic (user) experience, and they identify several aspects of experience: sensual, emotional, spatio-temporal, and compositional. While specified aspects of user experiences may be particularly relevant for certain studies, such special nuances of user experience are out of the scope of this dissertation. Here, the core is on how to evaluate user experience, not specifically what to evaluate. Apart from some exceptions, the focus here is mainly on short-term user experiences. The user experiences gathered are rather general-level experiences, one might say even usability-like aspects, such as pleasantness or easiness to learn. However, each case study has its own characteristics—more detail can be found in Chapter 3.
2.2 EVALUATION METHODS The subjective nature of user experience makes measuring or otherwise evaluating it extremely challenging. Not only are situations experienced and questions interpreted differently, but the personal scales of users are also different. Therefore, comparing subjective user experiences is hard, and drawing comprehensive conclusions, even more difficult. In addition, there is the issue of having no common definition for user experience. As a result of the challenges related to the topic, several methods for measuring or otherwise evaluating user experience have been developed to fit various contexts and research areas (see, e.g., All about UX—methods, 2014). The differences between evaluation cases, i.e., the objectives, system, and its features, context, user group, and so forth, have most probably contributed to the creation of such a large number of methods as well. Many times, readily available methods that would suit the evaluation case as such are difficult or impossible to find. Thus, researchers have been forced to create new methods or questionnaires, or at least variations of existing methods (Keskinen, Hakulinen, et al., 2013). One obstruction in the evolution of the evaluation questionnaires, for example, is that often the content of self-created questionnaires remains unrevealed, as found by Bargas-Avila and Hornbæk (2011) in their review of empirical user experience studies from
……
……
…
13
2005–2009. This secrecy probably goes partly hand-in-hand with the lack of transparent literature on how to evaluate user experience in practice.
Probably one of the best-known user experience evaluation methods is the AttrakDiff questionnaire developed by Hassenzahl, Burmester, and Koller (2003). It consists of 28 adjective pairs representing the dimensions of pragmatic quality, hedonic quality–stimulation, hedonic quality–identity, and attractiveness. The positive side of the method is that it is available as an online tool (AttrakDiff, 2014), and it produces a report of the results. The downsides, considering the research done for this dissertation, e.g., are that it is many times too generic compared to the aims of specific cases and it is not “openly” available, i.e., available for modifications. Nor can the data be obtained for one’s own further analyses or storage. The official tool is also available only in the German and English languages.
Another example of a user experience evaluation method relying on self-reporting is the User Experience Questionnaire (UEQ) by Laugwitz, Held, and Schrepp (2008). It includes 26 items, also represented as opposite adjective pairs having a seven-step rating scale in between. The questionnaire and ready spreadsheets for data entry and analysis are freely downloadable online (UEQ, 2014). Although the questionnaire is available in several languages, again, the Finnish version is missing: the importance of having the questionnaire in respondents’ native language is acknowledged on the website as well. Above all, however, the biggest downside of this method is that it is too generic, like AttrakDiff, considering the aims and requirements of the case studies reported in this dissertation.
Moreover, user experience has different time frames, simply, user experiences based on short-term usage and long-term usage. For example, Karapanos, Martens, and Hassenzahl (2012) talk about the different time frames of user experience evaluations, and state that longitudinal evaluations are rare because they consume many resources. As a natural consequence, many user experience evaluation methods are not tailored for long-term evaluations. Examples of methods specifically designed for long-term evaluations are iScale (Karapanos, Martens, & Hassenzahl, 2012), UX Curve (Kujala, Roto, Väänänen-Vainio-Mattila, Karapanos, & Sinnelä, 2011), and the Day Reconstruction Method (Kahneman, Krueger, Schkade, Schwarz, & Stone, 2004).
While many user experience evaluation methods include self-reported quantitative ratings, i.e., namely data gathered with questionnaires, user experience can be evaluated, or at least has been, or the more subjective data can be enhanced with, e.g., the following data collection methods: interviews, observation, focus groups, diaries, and probes (e.g., Bargas-Avila & Hornbæk, 2011). A rather wide, although not exhaustive, list of existing methods for evaluating user experience can be found through All about UX—methods (2014). Despite the many methods already created, it
……
……
…
14
is not unusual that none of the methods is suitable as such for a specific evaluation case due to various reasons.
2.2.1 User expectations
Roto (2006, p. 76) underscores the role of understanding “whether the product met the expectations that the user had before starting to use it,” but states that research utilizing user expectations in interpreting the actual experiences is rather rare. For example, in their analysis of 66 empirical studies of user experience in the field of human-computer interaction, Bargas-Avila and Hornbæk (2011, p. 2694) identified only five studies (7.6%) where the assessments made before the usage concerned the expectations about the studied product itself. Yogasara, Popovic, Kraal, and Chamorro-Koc (2011), however, discuss anticipated user experience and highlight the significance of somehow evaluating a product during the very early stages of product development, i.e., before a working prototype is available. They state that this is important, to be able to produce an end product that corresponds with the users’ wishes and needs as well as possible. Anticipated use is actually something that is equated with the use of a product even in the ISO definition for user experience (2010). User expectations are also addressed by Olsson (2012), who later expands the discussion even further to expectations of future technologies (2014).
Agreeing more with Roto’s (2006) comment on understanding whether the users’ expectations are met, rather than the idea of anticipated user experience, user expectation data are something we have found extremely important and useful when interpreting users’ experiences of specific systems. Thus, we enforce the practice of also gathering user expectations whenever possible in our evaluations. In four of the eight user evaluations discussed in this dissertation, expectations per se were gathered. In an additional two evaluations, very preliminary first-impression experiences were gathered and then compared with the user experiences collected after the usage, and thus, can be seen as an adaption of gathering expectations.
The effect of expectations on experiences has been discussed especially outside of HTI, but for instance, Raita and Oulasvirta (2011) report a study in which the role of expectations in usability ratings of a mobile phone was examined. However, they manipulated the information given to the participants before the usage, i.e., the participants read a positive or a negative product review, or no review at all. These “primes” are referred to as expectations by the authors, as they were meant to evoke positive or negative expectations, or no special expectations for the control group, which received no prior information. The actual expectations of the participants were not inquired about, and thus, this approach is far from what I mean by “user expectations,” i.e., subjective user expectations. These expectations pre-exist within the user when he or she arrives to the evaluation situation, or in some cases, expectations are awakened by a short,

……
……
…
15
but objective, introduction to the system, e.g., which is the same for all participants.
In earlier studies of mobile services, Tähti, Väinämö, Vanninen, and Isomursu (2004) gathered user expectations with Emocards (Desmet, Overbeeke, & Tax, 2001) before the usage and compared these with the experiences gathered after the usage. However, they focused heavily on investigating the suitability of the Emocards in collecting emotional responses to mobile services in general, and the analysis between expectations and experiences received only a little attention. Jokinen and Hurtig (2006), conversely, analyze in more detail the relationship of user expectations and experiences in their study of a multimodal navigation system. They discuss the differences between age groups, e.g., and the “modality groups,” i.e., whether the participant told that he or she uses a speech interface with tactile features or a tactile interface that also has speech-based features. More importantly, they also discuss whether the expectations of the system were fulfilled—something invited also by Roto (2006).
Gathering user expectations explicitly can be criticized with the argument that it may affect the reported expectations, the usage itself, or the user experiences gathered after the usage. However, we justify the approach with the value of the expectation ratings when interpreting the user experiences, and finding possible reasons for experiences as well as the differences between the expectations and experiences, i.e., what affected the actual experiences so they were worse or better than the expectations. Like user experience, expectations are subjective: It is impossible to know users’ subjective expectations without asking the users themselves (Keskinen, Hakulinen, et al., 2013).
Next, two evaluation methods used in the research within our research group will be described. As a demonstration of the differences between evaluation cases and aims, neither one of these methods is included in the All about UX—methods (2014) listing—although they have been found very applicable to our user experience studies. Both methods also include the gathering of user expectations by default.
……
……
…
16
2.2.2 SUXES Method
The basis for measuring user experience in many of our case studies has been SUXES (Turunen, Hakulinen, Melto, et al., 2009), a method also developed in our research group. It is based on a framework originating from the field of marketing, the SERVQUAL framework for service quality (Zeithaml, Parasuraman, & Berry, 1990). SUXES is an evaluation method for multimodal interaction, and its essence is the measurement of both user expectations and user experiences on certain statements. The statements are the same both before and after the usage, and thus, the method enables the comparison of pre-usage expectations and post-usage experiences.
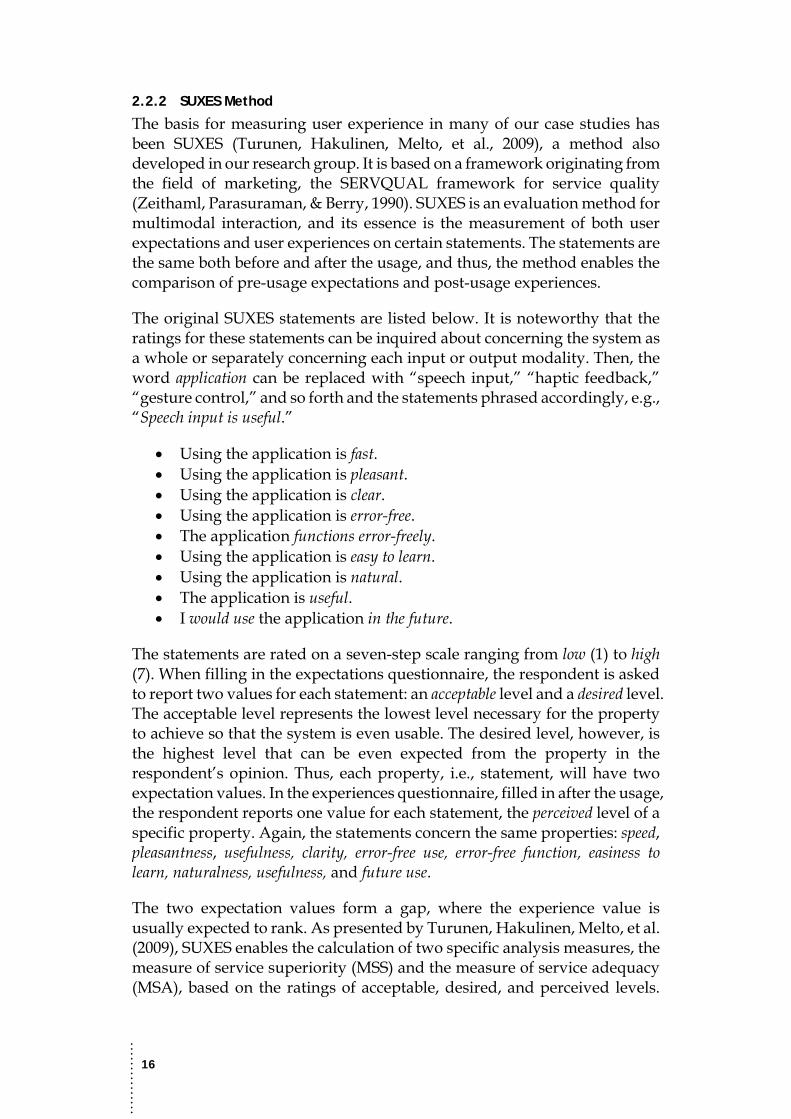
The original SUXES statements are listed below. It is noteworthy that the ratings for these statements can be inquired about concerning the system as a whole or separately concerning each input or output modality. Then, the word application can be replaced with “speech input,” “haptic feedback,” “gesture control,” and so forth and the statements phrased accordingly, e.g., “Speech input is useful.”
• Using the application is fast. • Using the application is pleasant. • Using the application is clear. • Using the application is error-free. • The application functions error-freely. • Using the application is easy to learn. • Using the application is natural. • The application is useful. • I would use the application in the future.
The statements are rated on a seven-step scale ranging from low (1) to high (7). When filling in the expectations questionnaire, the respondent is asked to report two values for each statement: an acceptable level and a desired level. The acceptable level represents the lowest level necessary for the property to achieve so that the system is even usable. The desired level, however, is the highest level that can be even expected from the property in the respondent’s opinion. Thus, each property, i.e., statement, will have two expectation values. In the experiences questionnaire, filled in after the usage, the respondent reports one value for each statement, the perceived level of a specific property. Again, the statements concern the same properties: speed, pleasantness, usefulness, clarity, error-free use, error-free function, easiness to learn, naturalness, usefulness, and future use.
The two expectation values form a gap, where the experience value is usually expected to rank. As presented by Turunen, Hakulinen, Melto, et al. (2009), SUXES enables the calculation of two specific analysis measures, the measure of service superiority (MSS) and the measure of service adequacy (MSA), based on the ratings of acceptable, desired, and perceived levels.

……
……
…
17
However, these measures were not used in the work done for this dissertation, because their practical usefulness in interpreting the results of the case studies covered here seemed minimal. Further information on MSS and MSA can be found in the original article describing the method (Turunen, Hakulinen, Melto, et al., 2009).
Figure 1 demonstrates the answering scales and answers given by a fictional respondent. The example expectation ratings can be interpreted as “It is acceptable that using the phone is rather slow, but I don’t expect it to be especially slow or fast.” The respondent experienced the phone use to be faster than expected, and thus, the perceived experience level does not rank in the gap formed by the expectation values. In general, in the comparison of expectations and experiences, exceeding expectations is a very positive result. Here, the experienced level is only slightly above the neutral level of the scale and cannot be straightforwardly considered a huge success on its own. However, comparing expectations and experiences reveals that, considering this individual respondent, the speed of using the phone is a success, as expectations are exceeded.
Figure 1. An example of a SUXES statement, a respondent’s expectations and experience, and the comparison between these. In the comparison, the grey area represents the gap
formed by the expectation values, and the black circle is the experienced level.
SUXES in its original form (Turunen, Hakulinen, Melto, et al., 2009), i.e., using two values for expectation ratings and one value for experiences, and furthermore, inquiring ratings for each statement on separate modalities in addition to the whole system, was used in the MediaCenter case (I) (Publication I) reported in this dissertation (Section 3.1). In other case studies, the ideas or statements of SUXES were utilized to varying extents. For example, we have found dividing the expectation rating into two values somewhat problematic for participants, and thus, we have asked for only one value in our recent evaluations. Although this procedure does not form the range of expectation values of an individual statement, it does not prevent the comparison of expectations and experiences altogether. Moreover, rather than covering the whole methodology presented in the original article, by SUXES, we have recently referred mainly to the idea of
EXPECTATIONS
EXPERIENCES
COMPARISON
Using the phone is fast.
Low High
x x
Using the phone is fast. x
Using the phone is fast.
……
……
…
18
gathering both user expectations and experiences, and inquiring about these considering the specific properties.
Utilizing SUXES in user evaluation data collection results in quantitative data consisting of user expectations and experiences regarding certain statements. The data are of ordinal scale, and the main analysis and interpretation approach has been to calculate the median values for each variable, and then compare these. These data are often supported by other subjective feedback, such as responses to open questions or interview data. Moreover, objective data can be used to support the interpretation and understanding of the SUXES results.
In addition to the case studies discussed here, SUXES has been utilized in other studies of human-technology interaction (e.g., Turunen, Melto, et al., 2009; Turunen et al., 2013; Heimonen et al., 2013; Kallioniemi et al., 2013). Furthermore, the method has been applied in brain-computer interface (BCI) evaluation, and more specifically in the evaluation of BCI games, e.g., by Gürkök, Hakvoort, and Poel (2011; Gürkök, Hakvoort, Poel, & Nijholt, 2011; Gürkök, 2012).
2.2.3 Experiential User Experience Evaluation Method
In the EventExplorer case study (Section 3.4), we encountered the need to somehow assess the experiential user experience of the interactive system under evaluation. “Experiential” here means more than the English term: “By experiential we refer to experiences evoked through discovery and adventure, such as a tour in the jungle or one’s first bungee jump—something truly amazing and even an once-in-a-lifetime type of experience” (Keskinen, Hakulinen, et al., 2013). Unfortunately, there is no specific English word for what Finnish speakers, e.g., mean by the term “experiential.” The relationship between “experience” and the “more special experience” would be kokemus–elämys in Finnish, something like erfarenhet–upplevelse in Swedish, and Erfahrung–Erlebnis in German. In English, the pair would be undistinguishingly experience–experience or perhaps experience–thrill.
Because I was unable to find a readily available method that would take into account the experiential side of user experience and otherwise suit the evaluation case, I created a method of my own. Although the method was originally designed for a public, real-world context, reasons for not using it in other kinds of evaluation environments are not apparent. The Experiential User Experience Evaluation Method builds from two separate approaches. For measuring the user experience of an interactive system on a more general level, the SUXES method described above was chosen. To address the experiential aspects, I turned to experience production research and discovered the Experience Pyramid model by Tarssanen and Kylänen (2006). It is not a readily available tool or method of any kind; instead, it is a theoretical framework to be utilized for designing, analyzing, and developing particularly tourism products emphasizing the experiential
……
……
…
19
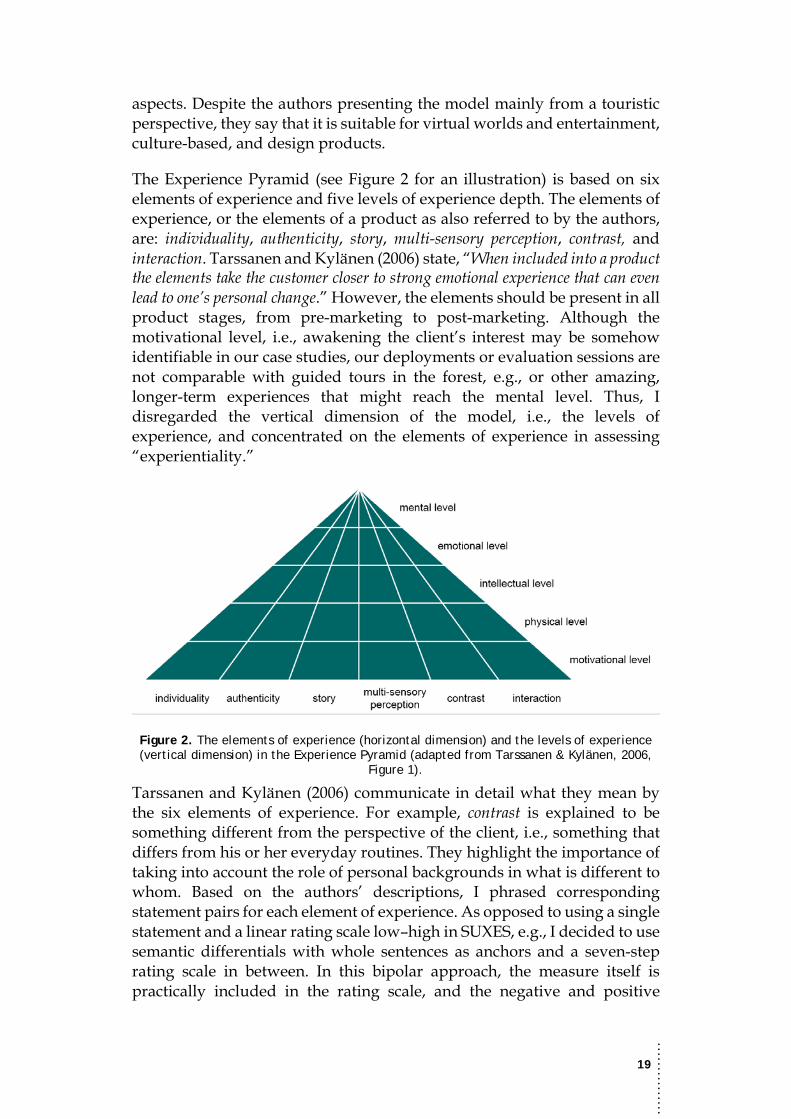
aspects. Despite the authors presenting the model mainly from a touristic perspective, they say that it is suitable for virtual worlds and entertainment, culture-based, and design products.
The Experience Pyramid (see Figure 2 for an illustration) is based on six elements of experience and five levels of experience depth. The elements of experience, or the elements of a product as also referred to by the authors, are: individuality, authenticity, story, multi-sensory perception, contrast, and interaction. Tarssanen and Kylänen (2006) state, “When included into a product the elements take the customer closer to strong emotional experience that can even lead to one’s personal change.” However, the elements should be present in all product stages, from pre-marketing to post-marketing. Although the motivational level, i.e., awakening the client’s interest may be somehow identifiable in our case studies, our deployments or evaluation sessions are not comparable with guided tours in the forest, e.g., or other amazing, longer-term experiences that might reach the mental level. Thus, I disregarded the vertical dimension of the model, i.e., the levels of experience, and concentrated on the elements of experience in assessing “experientiality.”
Figure 2. The elements of experience (horizontal dimension) and the levels of experience (vertical dimension) in the Experience Pyramid (adapted from Tarssanen & Kylänen, 2006,
Figure 1).
Tarssanen and Kylänen (2006) communicate in detail what they mean by the six elements of experience. For example, contrast is explained to be something different from the perspective of the client, i.e., something that differs from his or her everyday routines. They highlight the importance of taking into account the role of personal backgrounds in what is different to whom. Based on the authors’ descriptions, I phrased corresponding statement pairs for each element of experience. As opposed to using a single statement and a linear rating scale low–high in SUXES, e.g., I decided to use semantic differentials with whole sentences as anchors and a seven-step rating scale in between. In this bipolar approach, the measure itself is practically included in the rating scale, and the negative and positive
……
……
…
20
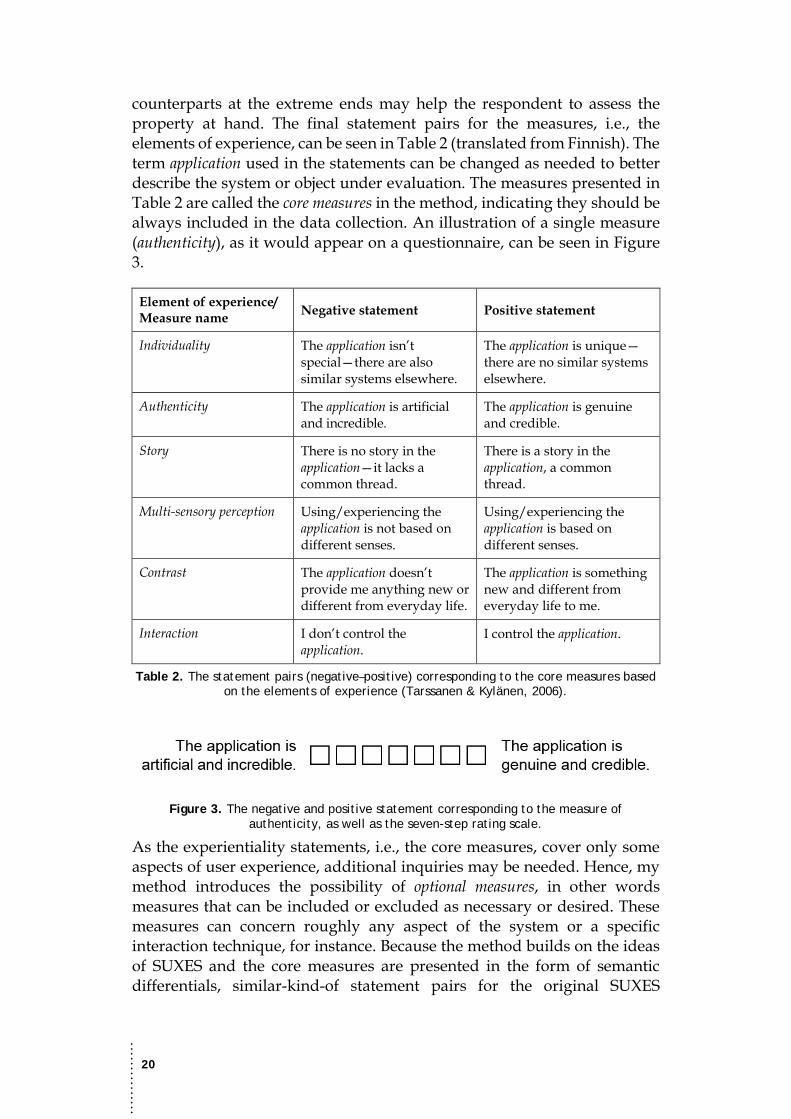
counterparts at the extreme ends may help the respondent to assess the property at hand. The final statement pairs for the measures, i.e., the elements of experience, can be seen in Table 2 (translated from Finnish). The term application used in the statements can be changed as needed to better describe the system or object under evaluation. The measures presented in Table 2 are called the core measures in the method, indicating they should be always included in the data collection. An illustration of a single measure (authenticity), as it would appear on a questionnaire, can be seen in Figure 3.
Element of experience/ Measure name Negative statement Positive statement
Individuality The application isn’t special—there are also similar systems elsewhere.
The application is unique—there are no similar systems elsewhere.
Authenticity The application is artificial and incredible.
The application is genuine and credible.
Story There is no story in the application—it lacks a common thread.
There is a story in the application, a common thread.
Multi-sensory perception Using/experiencing the application is not based on different senses.
Using/experiencing the application is based on different senses.
Contrast The application doesn’t provide me anything new or different from everyday life.
The application is something new and different from everyday life to me.
Interaction I don’t control the application.
I control the application.
Table 2. The statement pairs (negative–positive) corresponding to the core measures based on the elements of experience (Tarssanen & Kylänen, 2006).
Figure 3. The negative and positive statement corresponding to the measure of authenticity, as well as the seven-step rating scale.
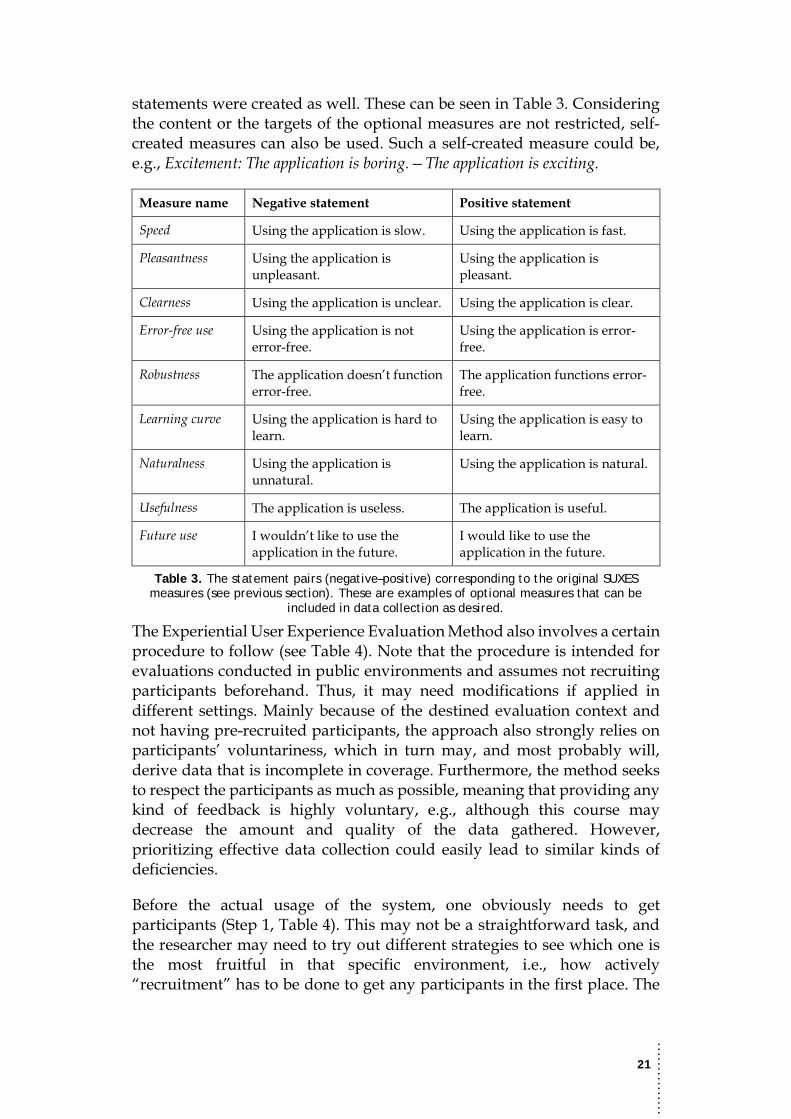
As the experientiality statements, i.e., the core measures, cover only some aspects of user experience, additional inquiries may be needed. Hence, my method introduces the possibility of optional measures, in other words measures that can be included or excluded as necessary or desired. These measures can concern roughly any aspect of the system or a specific interaction technique, for instance. Because the method builds on the ideas of SUXES and the core measures are presented in the form of semantic differentials, similar-kind-of statement pairs for the original SUXES
……
……
…
21
statements were created as well. These can be seen in Table 3. Considering the content or the targets of the optional measures are not restricted, self-created measures can also be used. Such a self-created measure could be, e.g., Excitement: The application is boring.—The application is exciting.
Measure name Negative statement Positive statement
Speed Using the application is slow. Using the application is fast.
Pleasantness Using the application is unpleasant.
Using the application is pleasant.
Clearness Using the application is unclear. Using the application is clear.
Error-free use Using the application is not error-free.
Using the application is error-free.
Robustness The application doesn’t function error-free.
The application functions error-free.
Learning curve Using the application is hard to learn.
Using the application is easy to learn.
Naturalness Using the application is unnatural.
Using the application is natural.
Usefulness The application is useless. The application is useful.
Future use I wouldn’t like to use the application in the future.
I would like to use the application in the future.
Table 3. The statement pairs (negative–positive) corresponding to the original SUXES measures (see previous section). These are examples of optional measures that can be
included in data collection as desired.
The Experiential User Experience Evaluation Method also involves a certain procedure to follow (see Table 4). Note that the procedure is intended for evaluations conducted in public environments and assumes not recruiting participants beforehand. Thus, it may need modifications if applied in different settings. Mainly because of the destined evaluation context and not having pre-recruited participants, the approach also strongly relies on participants’ voluntariness, which in turn may, and most probably will, derive data that is incomplete in coverage. Furthermore, the method seeks to respect the participants as much as possible, meaning that providing any kind of feedback is highly voluntary, e.g., although this course may decrease the amount and quality of the data gathered. However, prioritizing effective data collection could easily lead to similar kinds of deficiencies.
Before the actual usage of the system, one obviously needs to get participants (Step 1, Table 4). This may not be a straightforward task, and the researcher may need to try out different strategies to see which one is the most fruitful in that specific environment, i.e., how actively “recruitment” has to be done to get any participants in the first place. The

……
……
…
22
researcher may try to, for instance, stay to the side first and approach a person not until he or she has clearly “entered” the scene. Alternatively, the researcher might approach passersby more actively and invite them to get involved in a friendly, low-key manner. In addition, inviting elements, such as posters or signs, may be utilized.
Evaluation phase Content
Before the usage 1. Getting participants
2. Introduction and gathering the user expectations
Usage 3. Providing instructions (incl. possible tasks) and the usage of the system
During the usage 4. Gathering the supportive, objective data
After the usage 5. Gathering the user experiences and other feedback (e.g.,
with an interview) and other information (e.g., background information)
Table 4. The evaluation procedure per participant in the Experiential User Experience Evaluation Method.
After a person has shown interest in participating, the system is introduced to him or her (Step 2a): with a short verbal description, a picture or video, or anything deemed suitable by the research team. Considering comparability between participants, though, an important detail here is that the introduction should be as similar as possible for all participants. Still before the usage of the system, the participant is asked to fill in the expectations questionnaire (Step 2b). It consists of the core measures at least and a selection of eligible optional measures. Unlike the original form of SUXES, the participant is asked to mark only one value per measure, i.e., simply what level he or she expects that specific property to be in the system or the usage.
Next, the participant is given necessary instructions (Step 3a), if any, and for instance, possible tasks are revealed. Then the participant actually uses the system (Step 3b) freely or according to the given instructions, i.e., limitations, tasks, and so forth. During the usage, supportive, objective data are gathered (Step 4). This can contain anything from log and observation data to videorecordings. The purpose of the supportive data is to have objective information about the participant’s behavior and reactions, and help to interpret the user experiences as well as to find possible reasons for them.
Finally, after the usage, the most essential part of user experience evaluation occurs: Subjective feedback is gathered (Step 5). The participant is asked to fill in the experiences questionnaire. The questionnaire should contain the same statements that were included in the expectations questionnaire at the minimum. However, additional statements or other kinds of inquiries can be included as well. For example, properties that are of interest but would
……
……
…
23
have been challenging to rate regarding expectation value can be covered in the experiences questionnaire. Open questions are very worthwhile to include in the experiences questionnaire to collect qualitative data in case there will not be any kind of interview, for instance. The items in the experiences questionnaire are presented in past tense so they are easier for the participant to comprehend: Was is advised to be used instead of is in the statements, e.g., although the whole content would be otherwise similar to the expectations questionnaire. Background information is also requested as part of the experiences questionnaire. This information may consist of very basic data such as gender and age, but previous experience with similar kinds of systems and interaction techniques should be inquired about as well. The final set of items to be asked needs to be designed depending on the individual study and its aims, however. To conclude the evaluation session, an interview, e.g., can be conducted. It can deal with the responses given by the participant or other predefined questions. Here, as well as in other communication between the researcher and the participant, the researcher needs to pay attention to objectivity, i.e., aim for similar questions, wordings, and so forth, between the participants. This way, the data considering different participants stay as comparable as possible.
The Experiential User Experience Evaluation Method results at least in quantitative data consisting of comparable user expectations and experiences regarding specific statements, similar to SUXES. Again, the data are of ordinal scale, and analysis and interpretation of the results rely on examining median values. Furthermore, all other data collected, i.e., subjective feedback and comments, observation data, and so on, can be used to understand the experiences per se and possible reasons for them. Unlike the SUXES method, the Experiential User Experience Evaluation Method has been utilized only in two evaluation cases so far. Both of them are discussed in this dissertation, the EventExplorer case (IV) in Section 3.4 and the EnergySolutions (V) in Section 3.5, as well as in the original publication describing the method (Keskinen, Hakulinen, et al., 2013).

……
……
…
24

……
……
…
25
3 Case Studies
This chapter presents the seven case studies and altogether eight user experience evaluations included in the publications:
(I) MediaCenter: multimodal media center for visually impaired users (II) DrillSimulator: haptic feedback for drill rig simulator users
(III) SymbolChat: symbol-based chat application for users with intellectual disabilities
(IV) EventExplorer: experiential program guide for cultural events (V) EnergySolutions: playful system for raising awareness of energy
consumption (VI) Dictator: dictation application with ASR for healthcare purposes
(VII) LightGame: lighting-based exercise game for schoolchildren o Evaluation I o Evaluation II
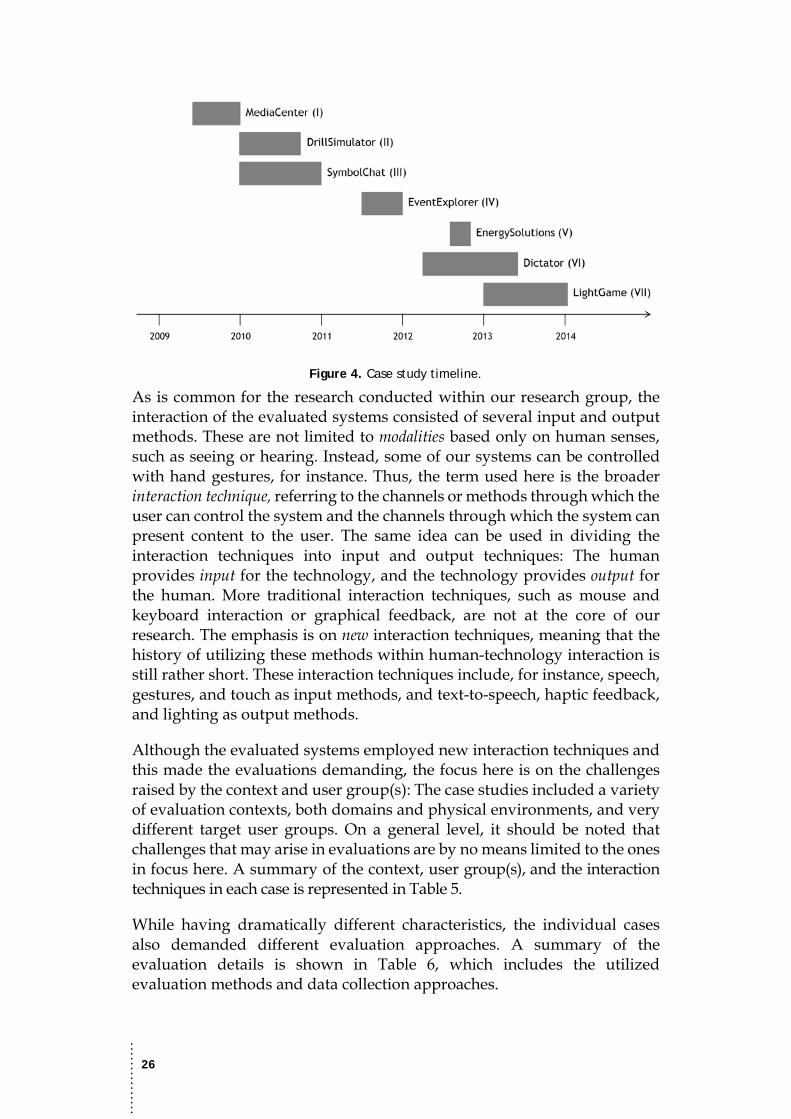
The case studies were conducted as parts of larger research projects in 2009–2014. The times and relative order of the studies can be seen in the timeline represented in Figure 4.
……
……
…
26
Figure 4. Case study timeline.
As is common for the research conducted within our research group, the interaction of the evaluated systems consisted of several input and output methods. These are not limited to modalities based only on human senses, such as seeing or hearing. Instead, some of our systems can be controlled with hand gestures, for instance. Thus, the term used here is the broader interaction technique, referring to the channels or methods through which the user can control the system and the channels through which the system can present content to the user. The same idea can be used in dividing the interaction techniques into input and output techniques: The human provides input for the technology, and the technology provides output for the human. More traditional interaction techniques, such as mouse and keyboard interaction or graphical feedback, are not at the core of our research. The emphasis is on new interaction techniques, meaning that the history of utilizing these methods within human-technology interaction is still rather short. These interaction techniques include, for instance, speech, gestures, and touch as input methods, and text-to-speech, haptic feedback, and lighting as output methods.
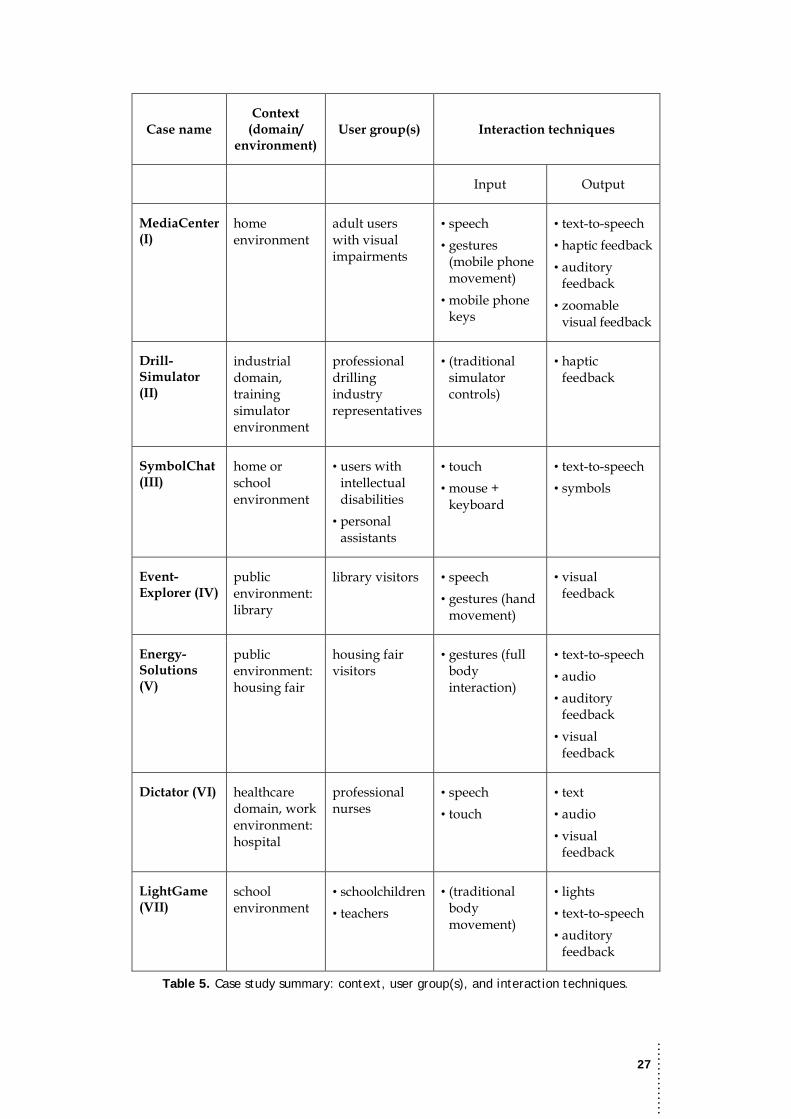
Although the evaluated systems employed new interaction techniques and this made the evaluations demanding, the focus here is on the challenges raised by the context and user group(s): The case studies included a variety of evaluation contexts, both domains and physical environments, and very different target user groups. On a general level, it should be noted that challenges that may arise in evaluations are by no means limited to the ones in focus here. A summary of the context, user group(s), and the interaction techniques in each case is represented in Table 5.
While having dramatically different characteristics, the individual cases also demanded different evaluation approaches. A summary of the evaluation details is shown in Table 6, which includes the utilized evaluation methods and data collection approaches.
……
……
…
27
Case name Context
(domain/ environment)
User group(s) Interaction techniques
Input Output
MediaCenter (I)
home environment
adult users with visual impairments
• speech • gestures
(mobile phone movement)
• mobile phone keys
• text-to-speech • haptic feedback • auditory
feedback • zoomable
visual feedback
Drill-Simulator (II)
industrial domain, training simulator environment
professional drilling industry representatives
• (traditional simulator controls)
• haptic feedback
SymbolChat (III)
home or school environment
• users with intellectual disabilities
• personal assistants
• touch • mouse +
keyboard
• text-to-speech • symbols
Event-Explorer (IV)
public environment: library
library visitors • speech • gestures (hand
movement)
• visual feedback
Energy-Solutions (V)
public environment: housing fair
housing fair visitors
• gestures (full body interaction)
• text-to-speech • audio • auditory
feedback • visual
feedback
Dictator (VI) healthcare domain, work environment: hospital
professional nurses
• speech • touch
• text • audio • visual
feedback
LightGame (VII)
school environment
• schoolchildren • teachers
• (traditional body movement)
• lights • text-to-speech • auditory
feedback
Table 5. Case study summary: context, user group(s), and interaction techniques.

……
……
…
28
Case name Applied method(s) Subjective data collection
Supportive, objective data
collection
Pre-
usag
e us
er
expe
ctat
ions
Post
-usa
ge u
ser
expe
rien
ces
Inte
rvie
w
Obs
erva
tion
Vid
eore
cord
ing
Log
data
MediaCenter (I) SUXES
DrillSimulator (II) SUXES
SymbolChat (III) • SUXES • Smileyometer
EventExplorer (IV) Experiential User Experience Evaluation Method
EnergySolutions (V)
Experiential User Experience Evaluation Method
Dictator (VI) SUXES
LightGame (VII)
Table 6. Case study summary: user experience evaluation details. The symbol indicates that the data collection method was used in the evaluation, and further symbols highlight the methods that I was mainly responsible for and that are discussed thoroughly in this dissertation.
Next, the case studies included in the publications will be presented separately. Each case study’s objectives, system, and main challenges are described shortly, after which the evaluation approaches are demonstrated. Each case study introduction is concluded with a discussion of the outcomes and implications for evaluations in similar circumstances. Note that the participants were Finnish and all material presented here is translated from the original Finnish. The introductions here focus on the user experience evaluation point of view. Thus, e.g., system descriptions and other details are kept to the minimum as they can be found in the corresponding publications. Furthermore, the results are not treated as the “results” here, although presenting them in a coherent way clearly contributes to comprehending the relationship between the evaluation approaches and outcomes. The ultimate purpose of this chapter is to provide an understanding of what was done in the user experience evaluation, how it was done, and how successful the outcome was.
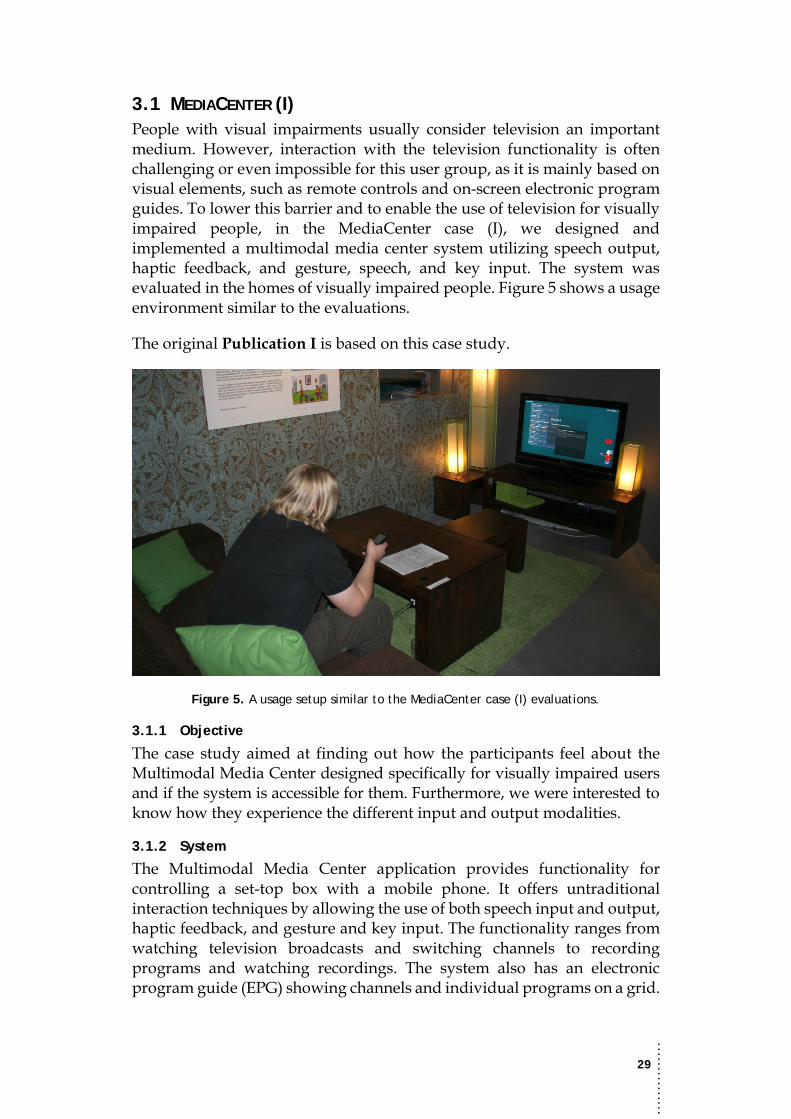
……
……
…
29
3.1 MEDIACENTER (I) People with visual impairments usually consider television an important medium. However, interaction with the television functionality is often challenging or even impossible for this user group, as it is mainly based on visual elements, such as remote controls and on-screen electronic program guides. To lower this barrier and to enable the use of television for visually impaired people, in the MediaCenter case (I), we designed and implemented a multimodal media center system utilizing speech output, haptic feedback, and gesture, speech, and key input. The system was evaluated in the homes of visually impaired people. Figure 5 shows a usage environment similar to the evaluations.
The original Publication I is based on this case study.
Figure 5. A usage setup similar to the MediaCenter case (I) evaluations.
3.1.1 Objective
The case study aimed at finding out how the participants feel about the Multimodal Media Center designed specifically for visually impaired users and if the system is accessible for them. Furthermore, we were interested to know how they experience the different input and output modalities.
3.1.2 System
The Multimodal Media Center application provides functionality for controlling a set-top box with a mobile phone. It offers untraditional interaction techniques by allowing the use of both speech input and output, haptic feedback, and gesture and key input. The functionality ranges from watching television broadcasts and switching channels to recording programs and watching recordings. The system also has an electronic program guide (EPG) showing channels and individual programs on a grid.

……
……
…
30
Based on our previous versions for non-disabled users (Turunen, Hakulinen, Hella, et al., 2009), users with physical disabilities (Turunen et al., 2010), and the received feedback, we modified the system to address the special needs of users with visual impairments.
The key characteristics in the current version are speech output, a specialized EPG, and the ability to change user interface settings. Especially regarding users with very low or no vision, the user interface elements, e.g., menus, and the content of the EPG are read out loud concentrating on the relevant information first to allow fast browsing of the EPG. To support users with partial sight, the EPG includes only relevant and simplified information and is fully zoomable. Speech synthesis settings, i.e., rate and loudness, and font color can be adjusted.
The use of the system is also supported by speech input, i.e., giving specific commands without the need to see what is available for selection or memorize the functionality of certain buttons in certain situations or views. With speech commands, it is possible to switch the channel or start recording, as examples. Gesture input, i.e., moving the mobile phone in a certain way, allows possibilities similar to speech input but can be utilized for fewer commands due to the limitations in the number of feasible and robust commands in sensor-based recognition. In the media center designed for users with visual impairments, the key gesture input function activates speech recognition by raising the phone in front of the user’s mouth, but the gesture functionality also allows altering the functions of the keypad by changing the phone’s orientation. The operation is further enhanced with haptic and auditory feedback, which are used to give simpler feedback compared to speech output, such as indicating that a command has been received successfully by triggering the vibration in the phone and playing a corresponding audio signal simultaneously.
3.1.3 Challenges
The challenges in this user experience evaluation case arose from the target user group, but the home environment also needed attention. Because of the participants’ visual impairments, evaluation material, e.g., questionnaires, had to be made accessible: Considering blind participants, the ability to perceive the whole material through the sense of hearing (or touch) is a necessity. To support partially sighted participants, the material can be enhanced with visual choices, such as color combinations and font sizes. Evaluating in one’s home, however, requires discretion and respect. Furthermore, as is the case with most marginal user groups, suitable participants are not easy to find. The evaluation taking place in users’ homes also makes it difficult to reach people willing to let researchers in their private surroundings. Thus, getting participants was also a challenge in this case study.
……
……
…
31
3.1.4 Evaluation
The user experience evaluation was conducted with three visually impaired male participants in their homes. User expectations and experiences were gathered with electronic forms suitable to be filled in utilizing a screen reader.
Context
This user experience evaluation study was conducted in the homes of the participants in its entirety, and thus, the environment differed among the participants. The usage took place in participants’ living rooms, where we took a high-definition television, a PC, and a mobile phone to run the system.
Participants
With help from the Finnish Federation of the Visually Impaired (FFVI) (Näkövammaisten Keskusliitto), we got three male participants (47–58 years old, mean=51.33, SD=5.86). The participants did not get any compensation for their participation. According to the five-step categorization used by the FFVI (e.g., FFVI, 2012, Table 4) (based on the World Health Organization’s definition), one of the participants had low vision (Category 2, severe low vision), and two were blind (categories 3, profound low vision, and 5, total blindness). The totally blind participant had the visual impairment since birth, and the two other participants, for 10 to 14 years. The blind participants reported that they use separately installed applications (such as WidGets or Google Maps) on their mobile phones daily, while the participant with low vision never used such applications. Speech input, i.e., speech recognition, was used only by the participant with profound low vision: daily on the mobile phone and monthly elsewhere, e.g., in phone services. Haptic feedback on the mobile phone was used only by the totally blind participant, and he used it daily. Elsewhere, haptic feedback or gesture input was not used by any of our participants.
Procedure
The user evaluation was conducted in periods lasting four, seven, or ten days, depending on the participants’ personal schedules. The procedure of the evaluation periods is presented in Table 7.
After providing their background information, the participants were provided with a brief textual description of the system: “In the Media center system, a set-top box can be controlled with a mobile phone. This is done by giving speech commands, by performing gestures by moving the phone, or by using the mobile phone’s keys. The purpose of the system is to apply new modes of operation in parallel to traditional remote control and thus ease the usage.” In addition, the key characteristics of the system—speech input, gesture input, electronic program guide, and haptic feedback—were described by a few sentences. Based on this knowledge, the participants reported their expectations before going deeper into the functionality of the system, which was done afterwards. Particularly to enable the usage of a screen reader, all of the
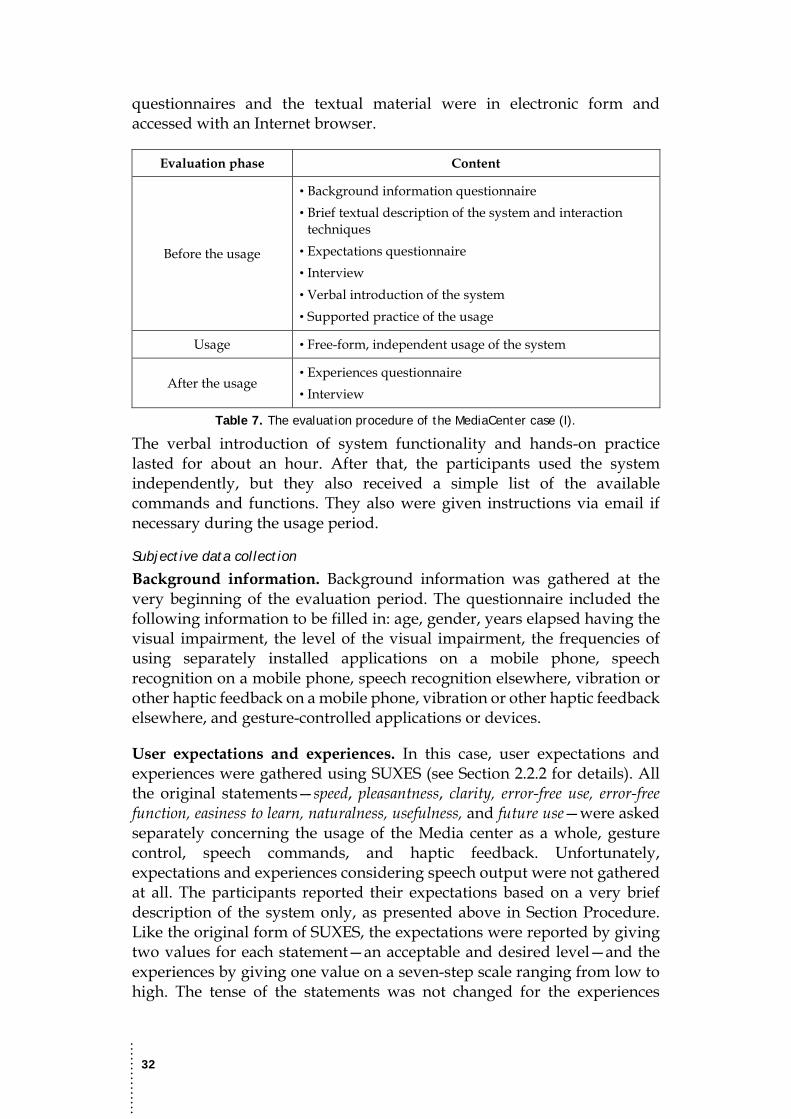
……
……
…
32
questionnaires and the textual material were in electronic form and accessed with an Internet browser.
Evaluation phase Content
Before the usage
• Background information questionnaire • Brief textual description of the system and interaction
techniques • Expectations questionnaire • Interview • Verbal introduction of the system • Supported practice of the usage
Usage • Free-form, independent usage of the system
After the usage • Experiences questionnaire • Interview
Table 7. The evaluation procedure of the MediaCenter case (I).
The verbal introduction of system functionality and hands-on practice lasted for about an hour. After that, the participants used the system independently, but they also received a simple list of the available commands and functions. They also were given instructions via email if necessary during the usage period.
Subjective data collection
Background information. Background information was gathered at the very beginning of the evaluation period. The questionnaire included the following information to be filled in: age, gender, years elapsed having the visual impairment, the level of the visual impairment, the frequencies of using separately installed applications on a mobile phone, speech recognition on a mobile phone, speech recognition elsewhere, vibration or other haptic feedback on a mobile phone, vibration or other haptic feedback elsewhere, and gesture-controlled applications or devices.
User expectations and experiences. In this case, user expectations and experiences were gathered using SUXES (see Section 2.2.2 for details). All the original statements—speed, pleasantness, clarity, error-free use, error-free function, easiness to learn, naturalness, usefulness, and future use—were asked separately concerning the usage of the Media center as a whole, gesture control, speech commands, and haptic feedback. Unfortunately, expectations and experiences considering speech output were not gathered at all. The participants reported their expectations based on a very brief description of the system only, as presented above in Section Procedure. Like the original form of SUXES, the expectations were reported by giving two values for each statement—an acceptable and desired level—and the experiences by giving one value on a seven-step scale ranging from low to high. The tense of the statements was not changed for the experiences

……
……
…
33
questionnaire. Instead, the wording of the statements followed the pattern “Using the speech commands is pleasant” throughout the evaluation.
A more considerable issue than the content of the user experience evaluation was the representation of the material in this evaluation case. To ensure accessibility for visually impaired participants, the questionnaires were in electronic form, and they were designed for and tested with a screen-reader application. Normally, the seven-step scales for SUXES statements are represented as sequential check boxes for expectations and radio buttons for experiences. As there were 4*9 statements and, e.g., expectations were given with two values, i.e., each statement would have had 2*7 check boxes, the participants would have heard the screen reader saying “check box” 504 times in addition to the other content. Obviously, this would have been totally inappropriate and taken the focus away from the purpose. Thus, the scales were replaced with text fields. This narrowed the number of read-aloud input elements to 72 in the expectations questionnaire and to 36 in the experiences questionnaire. Although still somewhat laborious, we could not devise a better solution for gathering data.
In addition to the screen-reader compatibility, we supported the partially sighted participants by providing special material for them. According to our knowledge, the individual differences in perceiving color combination contrasts are great. Thus, we offered the questionnaires and other electronic material in four color combinations: yellow or white text on a black background and black text on a yellow or white background. Another version without the irrelevant content of choosing the color combination was available for the totally blind participants.
Interviews. Semi-structured interviews were conducted both before and after the actual usage period by our project partners. The interview before the usage period lasted about 45 minutes and included topics such as the current usage of television and its functionality and expectations considering the new system, its functionality, and modalities. The interview after the usage period lasted about an hour and included wide discussion of the experiences about the system, its functionality, and modalities, as well as areas for development.
Supportive, objective data collection
Log data were collected from interaction events and the usage of modalities. However, recordings of audio or video were not made because of privacy reasons. Log data without any connection to real-world events, such as a true problem with the system or a poorly given speech command, cannot provide insights into user experiences or support the findings in this respect. Thus, the log data were not analyzed as part of the user experience evaluation in this case.
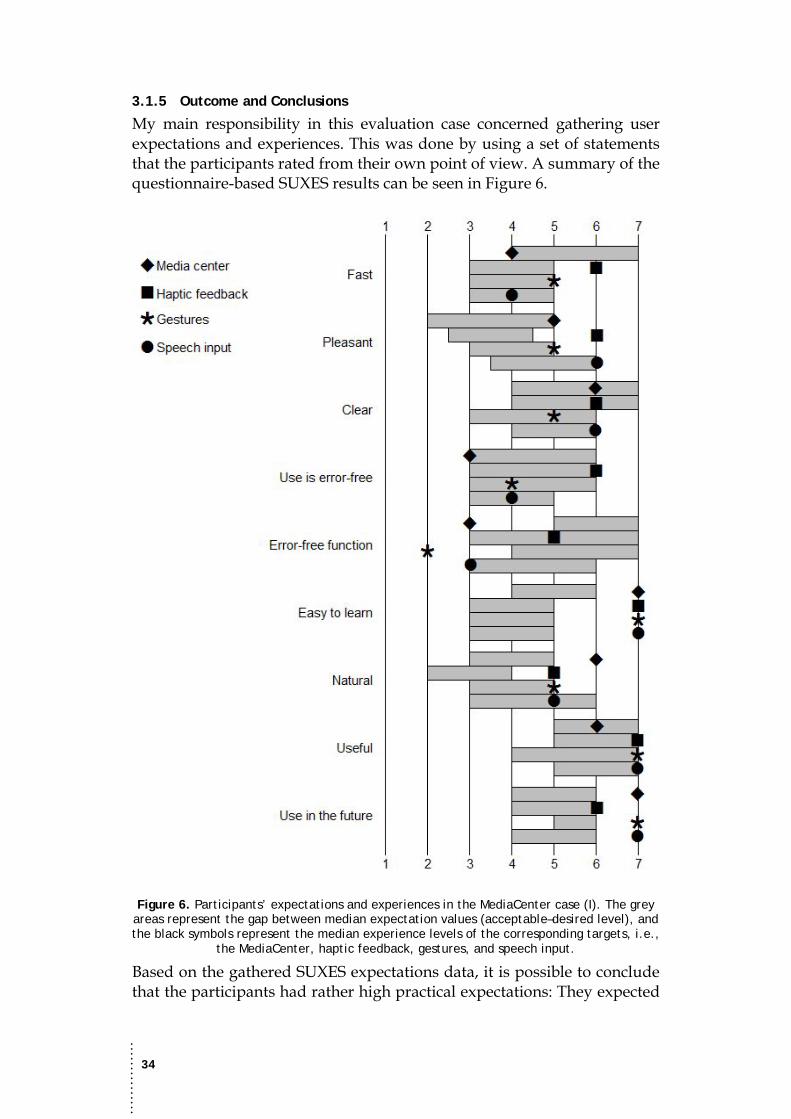
……
……
…
34
3.1.5 Outcome and Conclusions
My main responsibility in this evaluation case concerned gathering user expectations and experiences. This was done by using a set of statements that the participants rated from their own point of view. A summary of the questionnaire-based SUXES results can be seen in Figure 6.
Figure 6. Participants’ expectations and experiences in the MediaCenter case (I). The grey areas represent the gap between median expectation values (acceptable–desired level), and the black symbols represent the median experience levels of the corresponding targets, i.e.,
the MediaCenter, haptic feedback, gestures, and speech input.
Based on the gathered SUXES expectations data, it is possible to conclude that the participants had rather high practical expectations: They expected

……
……
…
35
the system and the modalities to be clear and function without errors, but more than anything, they expected usefulness. Apart from some exceptions, the expectations were met, but some were even clearly surpassed. For example, the system as a whole and the modalities—haptic feedback, gesture input, and speech input—were experienced as easy to learn, the corresponding statement reaching a median of seven out of seven considering each assessed target aspect.
Based on the SUXES results, it is fairly straightforward to spot which properties of the evaluated system were successful. Considering iterative system development, these positively experienced properties do not require further development efforts. Properties that were experienced worse, i.e., did not meet expectations at all or barely met the acceptable expectation level, can be discovered as well. These properties are the critical ones from a system development point of view. However, to make something better, one has to know exactly what is the problem and how to make it better—the simple idea of “Let’s improve it” alone is not enough.
The power of the SUXES method is quickly detecting which properties or elements of a system succeeded or failed by comparing the user expectations and the actual experiences. However, it does not provide direct and detailed information on what the property succeeded or failed on. Thus, additional methods for finding out reasons for the user experiences and receiving development ideas from the users themselves are needed. In this evaluation case, such an insight was achieved through the interviews, i.e., reflecting the user experience measures’ data with the issues raised in the discussions with participants. For example, the median experience of error-free function of speech input was only three, and the interviews revealed that at least some participants had experienced misinterpreted and unrecognized commands, system crashes due to speech commands, as well as some delay in the recognition process. Conversely, the participants stated that the speech commands were logical and intuitive, which can be seen as the high experience ratings of easiness to learn concerning speech input.
Through the interviews, we were able to find out that speech output was highly appreciated by the participants: They saw it as the most important feature of the system. Because speech output minimizes the need for visual interaction, it supported the use of the electronic program guide enormously: It allowed the users to browse the EPG from a distance for the partially sighted participants, e.g., while making the use of a magnifier unnecessary. For our totally blind participant, the speech output enabled him to make recordings—something that had been long impossible. These positive experiences would have been interesting to capture with the SUXES ratings, as well as the expectations regarding speech input, which were unfortunately not included in the expectations questionnaire.

……
……
…
36
The interviews conducted by our project partners turned out to be an essential part of the evaluation and provided reasons for and insights into user experiences that could not have been derived from the SUXES data alone. Without using interviews or another method for free-form feedback, the statements would have to be unrealistically specific. In addition, ideas for development areas are not received when gathering subjective data based on statements only. For example, in this case, we received several development ideas through the verbal discussions with the participants.
Considering addressing the challenges in this evaluation case, mainly the participants’ visual impairments, our solutions were suitable. Providing the evaluation material in electronic, screen-reader compatible form and allowing four color combinations enabled all participants to provide their user expectations and experiences. Although the evaluation was conducted in an intimate environment in the homes of the participants, the participants were enthusiastic and co-operative. We believe they did not feel intruded upon because of our friendly, respectful way of communicating with them.
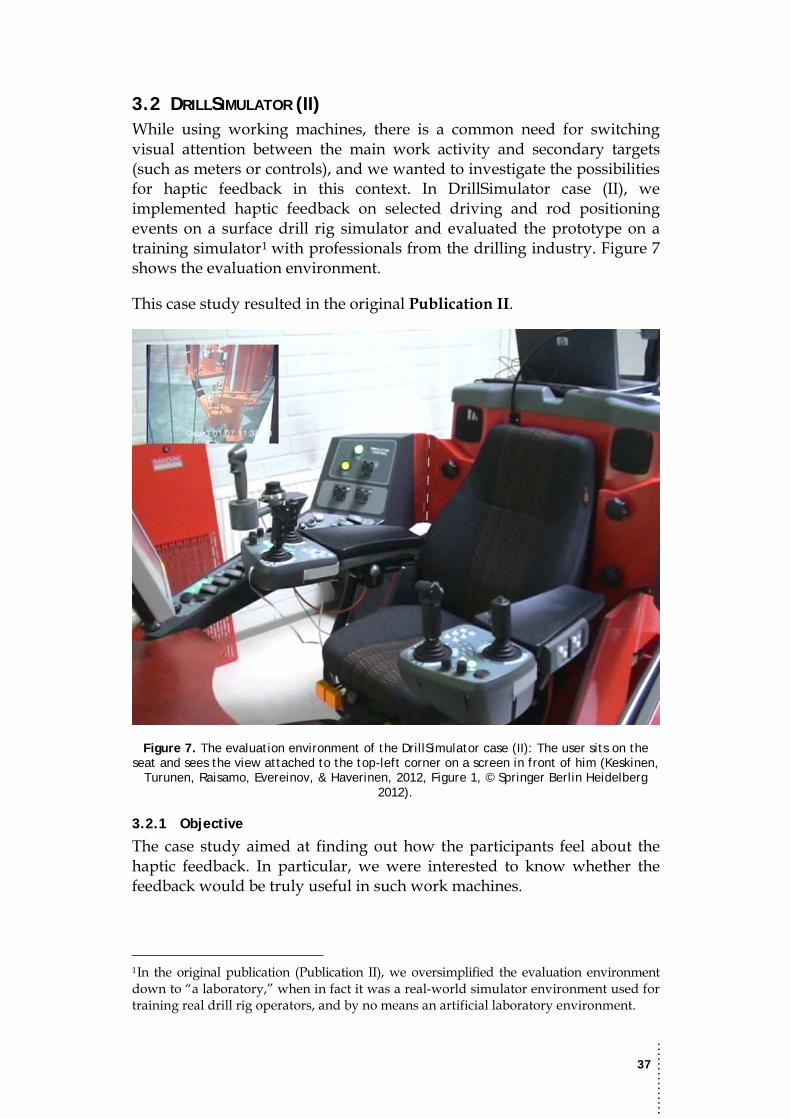
……
……
…
37
3.2 DRILLSIMULATOR (II) While using working machines, there is a common need for switching visual attention between the main work activity and secondary targets (such as meters or controls), and we wanted to investigate the possibilities for haptic feedback in this context. In DrillSimulator case (II), we implemented haptic feedback on selected driving and rod positioning events on a surface drill rig simulator and evaluated the prototype on a training simulator1 with professionals from the drilling industry. Figure 7 shows the evaluation environment.
This case study resulted in the original Publication II.
Figure 7. The evaluation environment of the DrillSimulator case (II): The user sits on the seat and sees the view attached to the top-left corner on a screen in front of him (Keskinen,
Turunen, Raisamo, Evereinov, & Haverinen, 2012, Figure 1, © Springer Berlin Heidelberg 2012).
3.2.1 Objective
The case study aimed at finding out how the participants feel about the haptic feedback. In particular, we were interested to know whether the feedback would be truly useful in such work machines.
1In the original publication (Publication II), we oversimplified the evaluation environment down to “a laboratory,” when in fact it was a real-world simulator environment used for training real drill rig operators, and by no means an artificial laboratory environment.
……
……
…
38
3.2.2 System
Generally, surface drill rigs are used to drill blast holes. In the training simulator used in our evaluation, the driving and the drill rod positioning are executed with four joysticks, two for both hands. We integrated vibrating motors into the right hand’s joysticks and implemented functionality to produce tactile feedback from selected events related to driving the rig and positioning the drill rod. When a person drove the rig, warning-like feedback was given regarding the danger of falling over and locked the crawler oscillation. For positioning the drill rod, we created two opposite feedbacks: A) increasing (amplitude and frequency) pulse-like feedback when approaching the correct drilling hole point, which stops at the exact point, and B) decreasing (amplitude and frequency) feedback when approaching the correct drilling hole point, which also stops completely on the exactly correct point.
3.2.3 Challenges
The challenges in this user experience evaluation case concerned the context: The industrial setting alone raises challenges and requirements not existing in leisure-related evaluations. Furthermore, the very narrow and specific industry area of drilling made it practically impossible to find readily existing and suitable methods, questions, and user experience measures for this case. Thus, the user experience evaluation was heavily case-oriented. An additional challenge also related to the narrow target domain was the lack of suitable and available participants.
3.2.4 Evaluation
This user experience evaluation was conducted in a drill rig simulator environment with five male participants from the drilling industry. User expectations and experiences were gathered with (mainly) electronic forms. In addition, interview questions were asked.
Context
The study concerned the domain of work machines and, more specifically, the drilling industry. The physical environment for the evaluation was a drill rig simulator used for training drilling personnel, i.e., drill masters. The simulator consisted of an operator seat, drill rig controls (monitors, joysticks, etc.), and a large projection screen in front of the user (see Figure 7). As mentioned above, the joysticks for the right hand were replaced with ones having vibrating motors.
Participants
We had five male participants (29–50 years old, mean=39.2, SD=9.26), who were all professionals from the drilling industry (drill masters, product development, or training simulator personnel). All participants were recruited from the company where the evaluation was conducted, and they did not receive any compensation for their participation. The frequencies of using either a real drill rig or a drill rig simulator varied between the
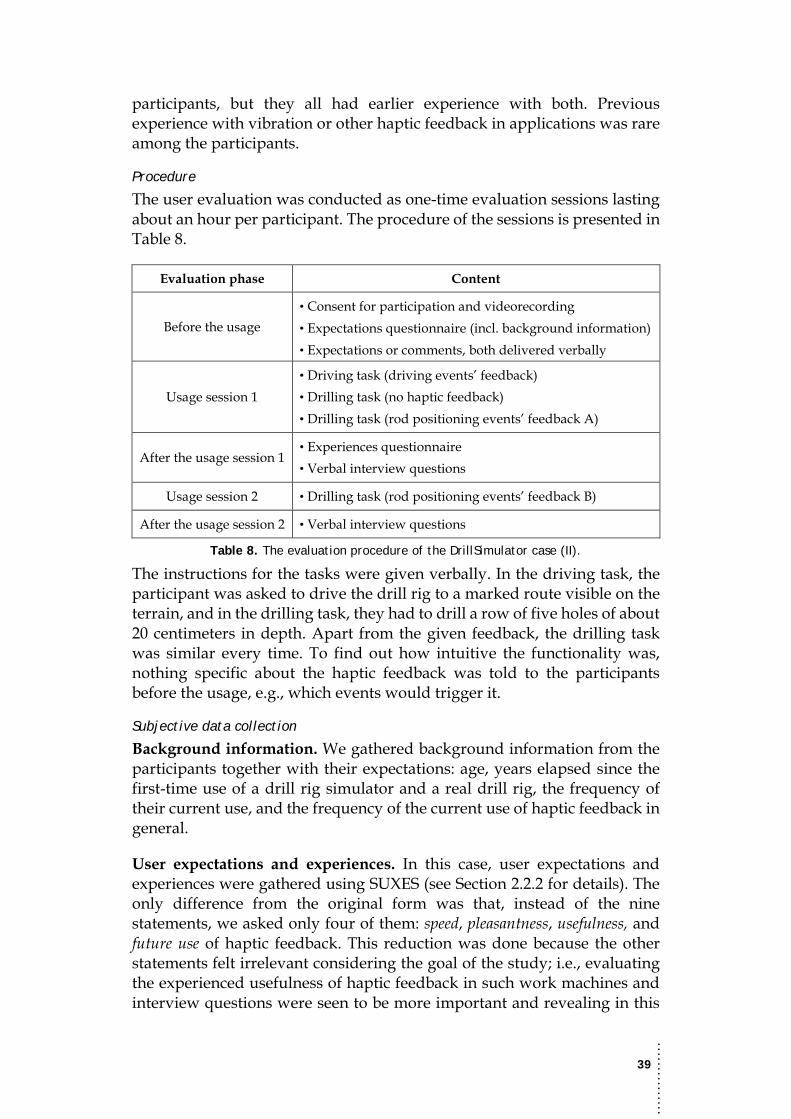
……
……
…
39
participants, but they all had earlier experience with both. Previous experience with vibration or other haptic feedback in applications was rare among the participants.
Procedure
The user evaluation was conducted as one-time evaluation sessions lasting about an hour per participant. The procedure of the sessions is presented in Table 8.
Evaluation phase Content
Before the usage • Consent for participation and videorecording • Expectations questionnaire (incl. background information) • Expectations or comments, both delivered verbally
Usage session 1 • Driving task (driving events’ feedback) • Drilling task (no haptic feedback) • Drilling task (rod positioning events’ feedback A)
After the usage session 1 • Experiences questionnaire • Verbal interview questions
Usage session 2 • Drilling task (rod positioning events’ feedback B)
After the usage session 2 • Verbal interview questions
Table 8. The evaluation procedure of the DrillSimulator case (II).
The instructions for the tasks were given verbally. In the driving task, the participant was asked to drive the drill rig to a marked route visible on the terrain, and in the drilling task, they had to drill a row of five holes of about 20 centimeters in depth. Apart from the given feedback, the drilling task was similar every time. To find out how intuitive the functionality was, nothing specific about the haptic feedback was told to the participants before the usage, e.g., which events would trigger it.
Subjective data collection
Background information. We gathered background information from the participants together with their expectations: age, years elapsed since the first-time use of a drill rig simulator and a real drill rig, the frequency of their current use, and the frequency of the current use of haptic feedback in general.
User expectations and experiences. In this case, user expectations and experiences were gathered using SUXES (see Section 2.2.2 for details). The only difference from the original form was that, instead of the nine statements, we asked only four of them: speed, pleasantness, usefulness, and future use of haptic feedback. This reduction was done because the other statements felt irrelevant considering the goal of the study; i.e., evaluating the experienced usefulness of haptic feedback in such work machines and interview questions were seen to be more important and revealing in this

……
……
…
40
case. In addition, the fact that only a feedback modality, not a whole system, was under evaluation might have made assessing statements like “Haptic feedback is easy to learn” quite difficult to conceptualize.
There was no introduction of the haptic interface or possibility to try it out before the participants filled in their expectations. Based on the text on the consent for participation and videorecording, they only knew that the test was about new properties of the drill rig simulator. Consequently, the expectations they provided were based on their previous experiences or conceptions about haptic feedback. The experiences questionnaire was filled in after usage session 1, meaning it did not cover the rod positioning events’ feedback B. This approach was used to ensure the quantitative data would have been as pure as possible, i.e., not affected by the verbal interviews and discussion. Both user expectations and experiences questionnaires were in electronic form.
Interviews. The interview questions asked verbally after the first usage session and experiences questionnaire were:
1. About which functions or events was haptic feedback given? 2. How useful do you feel haptic feedback is, related to these functions
or events? 3. What kind of feelings do you have about haptic feedback at the
moment? 4. Did the haptic feedback reduce the need to look at the simulator's
screen? 5. Was the haptic feedback annoying? 6. Should the haptic feedback be modified somehow? How?
After the second usage session, i.e., at the end of the evaluation session, the following summarizing questions were asked verbally:
7. Which positioning feedback was better? Why? 8. How could the haptic feedback be developed? 9. In what other situations could it be used? 10. Do you have other comments/ideas?
Supportive, objective data collection
We have no objective data that would support interpreting the subjective user experience data. The sessions were videorecorded (both the participant and the simulator screen), but this data did not provide useful insights. We also used an Eyebox22 device by Xuuk Inc. to capture participants’ eyes to find out whether the haptic feedback would decrease the need to look at the simulator’s control display. Because of the limited space, the device had to be placed rather near the participants, about one meter away. However,
2 http://www.xuuk.com/eyebox2/
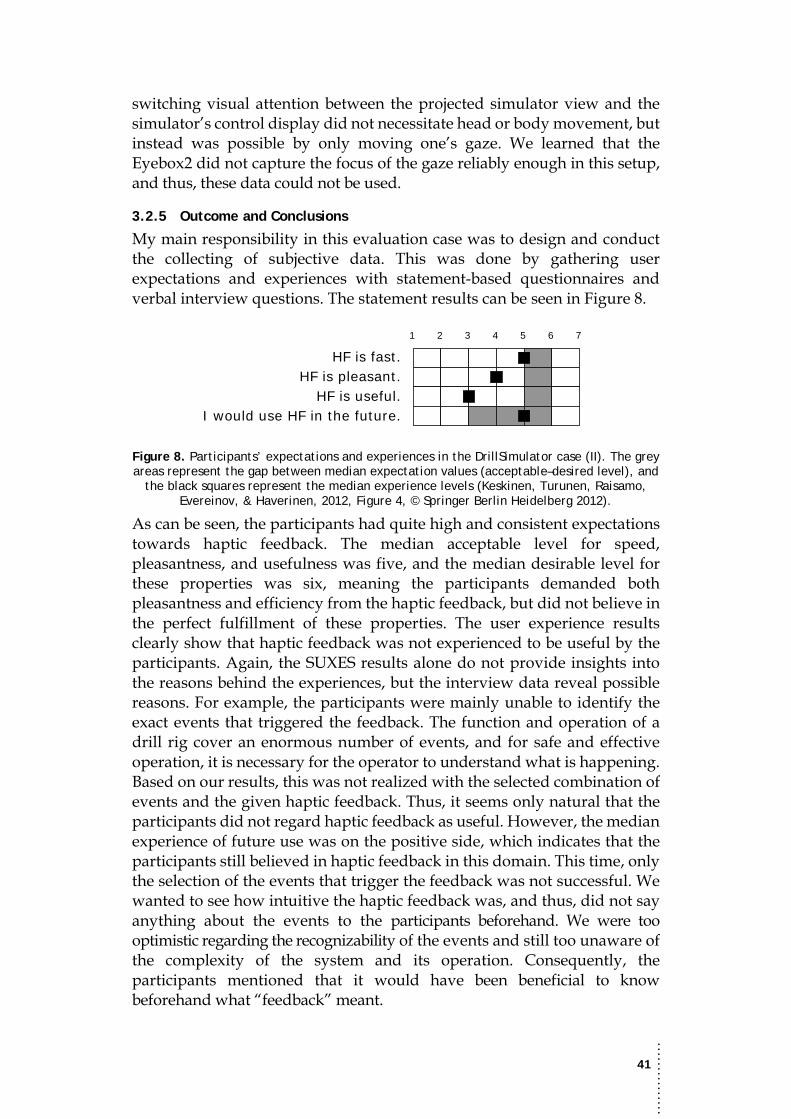
……
……
…
41
switching visual attention between the projected simulator view and the simulator’s control display did not necessitate head or body movement, but instead was possible by only moving one’s gaze. We learned that the Eyebox2 did not capture the focus of the gaze reliably enough in this setup, and thus, these data could not be used.
3.2.5 Outcome and Conclusions
My main responsibility in this evaluation case was to design and conduct the collecting of subjective data. This was done by gathering user expectations and experiences with statement-based questionnaires and verbal interview questions. The statement results can be seen in Figure 8.
Figure 8. Participants’ expectations and experiences in the DrillSimulator case (II). The grey areas represent the gap between median expectation values (acceptable–desired level), and
the black squares represent the median experience levels (Keskinen, Turunen, Raisamo, Evereinov, & Haverinen, 2012, Figure 4, © Springer Berlin Heidelberg 2012).
As can be seen, the participants had quite high and consistent expectations towards haptic feedback. The median acceptable level for speed, pleasantness, and usefulness was five, and the median desirable level for these properties was six, meaning the participants demanded both pleasantness and efficiency from the haptic feedback, but did not believe in the perfect fulfillment of these properties. The user experience results clearly show that haptic feedback was not experienced to be useful by the participants. Again, the SUXES results alone do not provide insights into the reasons behind the experiences, but the interview data reveal possible reasons. For example, the participants were mainly unable to identify the exact events that triggered the feedback. The function and operation of a drill rig cover an enormous number of events, and for safe and effective operation, it is necessary for the operator to understand what is happening. Based on our results, this was not realized with the selected combination of events and the given haptic feedback. Thus, it seems only natural that the participants did not regard haptic feedback as useful. However, the median experience of future use was on the positive side, which indicates that the participants still believed in haptic feedback in this domain. This time, only the selection of the events that trigger the feedback was not successful. We wanted to see how intuitive the haptic feedback was, and thus, did not say anything about the events to the participants beforehand. We were too optimistic regarding the recognizability of the events and still too unaware of the complexity of the system and its operation. Consequently, the participants mentioned that it would have been beneficial to know beforehand what “feedback” meant.
1 2 3 4 5 6 7
HF is fast.HF is pleasant.
HF is useful.I would use HF in the future.

……
……
…
42
The main challenges in this evaluation case arose from the context: the industrial setting in general, the specific area of drilling, and thus, the non-existence of readily suitable user experience evaluation methods. With the selected methods, i.e., gathering user expectations and experiences with a selection of SUXES statements and interview questions, we were able to find out that the participants did not gain added value through the haptic feedback with the selected events. However, this does not mean that haptic feedback would not be useful in such work machines at all. The participants acknowledged the potential of haptic feedback in case the correct and most beneficial events would be found. Based on this evaluation, it is not possible to say what these events would be, though. In this study, the haptic feedback was integrated into an existing user interface that was somewhat familiar to the participants. Thus, they were able to utilize the graphical elements quite effectively. Consequently, the integrated haptic feedback was insufficient to provide additional value to them. When enhancing traditional interfaces with additional modalities, it would be better to redesign the whole system. Obviously, this was out of the scope and resources of our research project.
When evaluating the user experience of work machines in very specific domains, one needs to thoroughly familiarize oneself with the work tasks, equipment, and routines. Pragmatically, this means communicating with the representatives of the final target user group to understand the context from the final user’s point of view. In contexts that are not at the core of the researchers’ expertise, this is the only way to identify the elements or properties that are even worth evaluation. As is common in our research, this case also included the design and implementation of the system. At this point, it would have been extremely important to communicate with the true target users, i.e., drill masters, so we could have designed the whole functionality and chosen the appropriate events based on the actual needs.
Although a lot of resources and thought were put into the design, we as HTI researchers and a product development representative from the target field were not able to understand the actual work routines and the workers’ needs well enough. Afterwards, it seems clear that input from the actual users would have been very valuable as early as the design phase. This does not concern the user experience evaluation directly, but more appropriate design choices would have made the evaluation more worthwhile as well, because then we could have evaluated functionality that arose from needs, not educated guesses. Moreover, if we would have already known what the target users need or wish for, and thus could have designed the functionality better, we could have also evaluated user experience on a more detailed level and gained insights of utilizing haptic feedback in such surface drill rig equipment. Gaining insights into user experience requires using the correct measures and asking the correct questions, which further requires profound understanding of the context and users.

……
……
…
43
3.3 SYMBOLCHAT (III) Unfortunately, people with intellectual disabilities easily remain outside the modern digital world. Although there are numerous applications for real-time remote communication available, they are mainly inaccessible for people with intellectual disabilities, as they require reading and writing skills, or are otherwise simply too complicated for this user group. Furthermore, special applications for real-time communication for this user group are available, but apart from very few examples, they are meant for face-to-face communication and do not support remote social communication. To promote the inclusion of people with intellectual disabilities, we designed and implemented a symbol-based instant communication application, the SymbolChat, utilizing touch-screen input and speech output.
Knowledge about this specific user group was provided by our project partners from the Rinnekoti Foundation, which is a rehabilitation center providing services for special user groups. The system was evaluated with the representatives of the target user group in a classroom and home environment. Figure 9 shows a sample usage situation and environment.
The original Publication III is the outcome of this case study.
Figure 9. A usage situation similar to the SymbolChat case (III) evaluations.
3.3.1 Objective
In the SymbolChat case (III), we wanted to investigate the potential of a picture-based communication tool allowing real-time, remote communication for users with intellectual disabilities. Particularly, we were interested in studying how the users themselves feel about the system and how these experiences relate to the views of the assistants. “Assistant” here refers to a
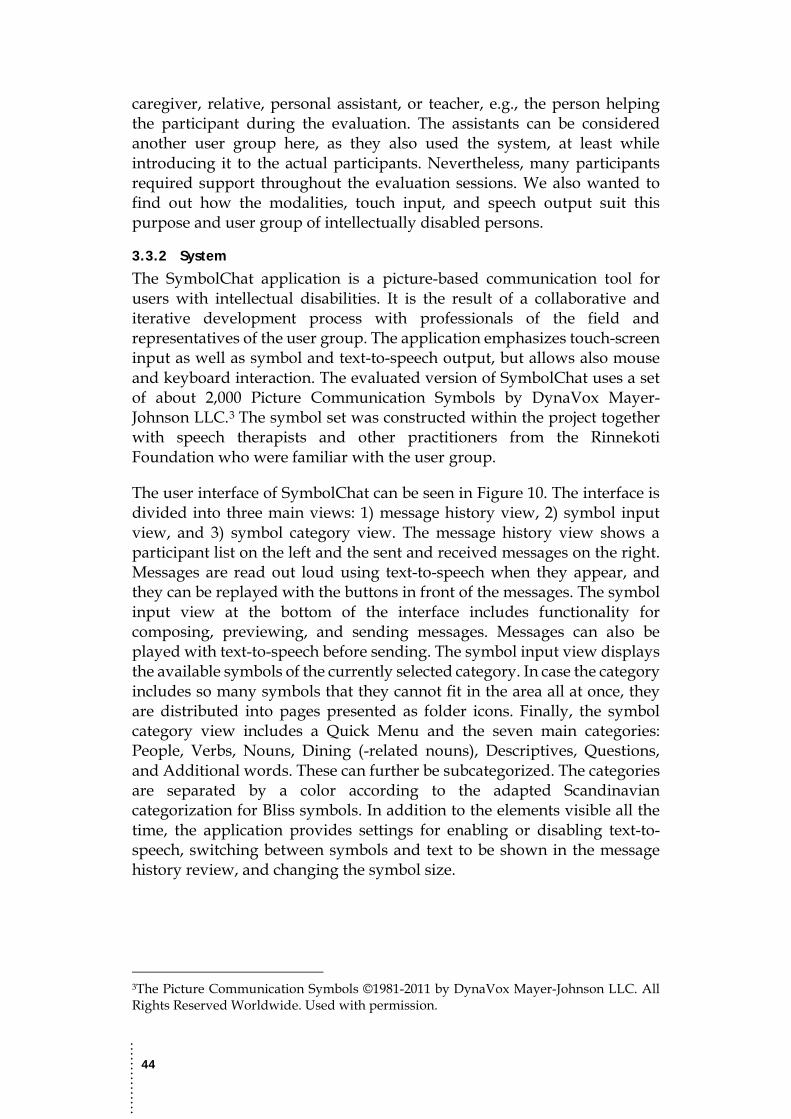
……
……
…
44
caregiver, relative, personal assistant, or teacher, e.g., the person helping the participant during the evaluation. The assistants can be considered another user group here, as they also used the system, at least while introducing it to the actual participants. Nevertheless, many participants required support throughout the evaluation sessions. We also wanted to find out how the modalities, touch input, and speech output suit this purpose and user group of intellectually disabled persons.
3.3.2 System
The SymbolChat application is a picture-based communication tool for users with intellectual disabilities. It is the result of a collaborative and iterative development process with professionals of the field and representatives of the user group. The application emphasizes touch-screen input as well as symbol and text-to-speech output, but allows also mouse and keyboard interaction. The evaluated version of SymbolChat uses a set of about 2,000 Picture Communication Symbols by DynaVox Mayer-Johnson LLC.3 The symbol set was constructed within the project together with speech therapists and other practitioners from the Rinnekoti Foundation who were familiar with the user group.
The user interface of SymbolChat can be seen in Figure 10. The interface is divided into three main views: 1) message history view, 2) symbol input view, and 3) symbol category view. The message history view shows a participant list on the left and the sent and received messages on the right. Messages are read out loud using text-to-speech when they appear, and they can be replayed with the buttons in front of the messages. The symbol input view at the bottom of the interface includes functionality for composing, previewing, and sending messages. Messages can also be played with text-to-speech before sending. The symbol input view displays the available symbols of the currently selected category. In case the category includes so many symbols that they cannot fit in the area all at once, they are distributed into pages presented as folder icons. Finally, the symbol category view includes a Quick Menu and the seven main categories: People, Verbs, Nouns, Dining (-related nouns), Descriptives, Questions, and Additional words. These can further be subcategorized. The categories are separated by a color according to the adapted Scandinavian categorization for Bliss symbols. In addition to the elements visible all the time, the application provides settings for enabling or disabling text-to-speech, switching between symbols and text to be shown in the message history review, and changing the symbol size.
3The Picture Communication Symbols ©1981-2011 by DynaVox Mayer-Johnson LLC. All Rights Reserved Worldwide. Used with permission.
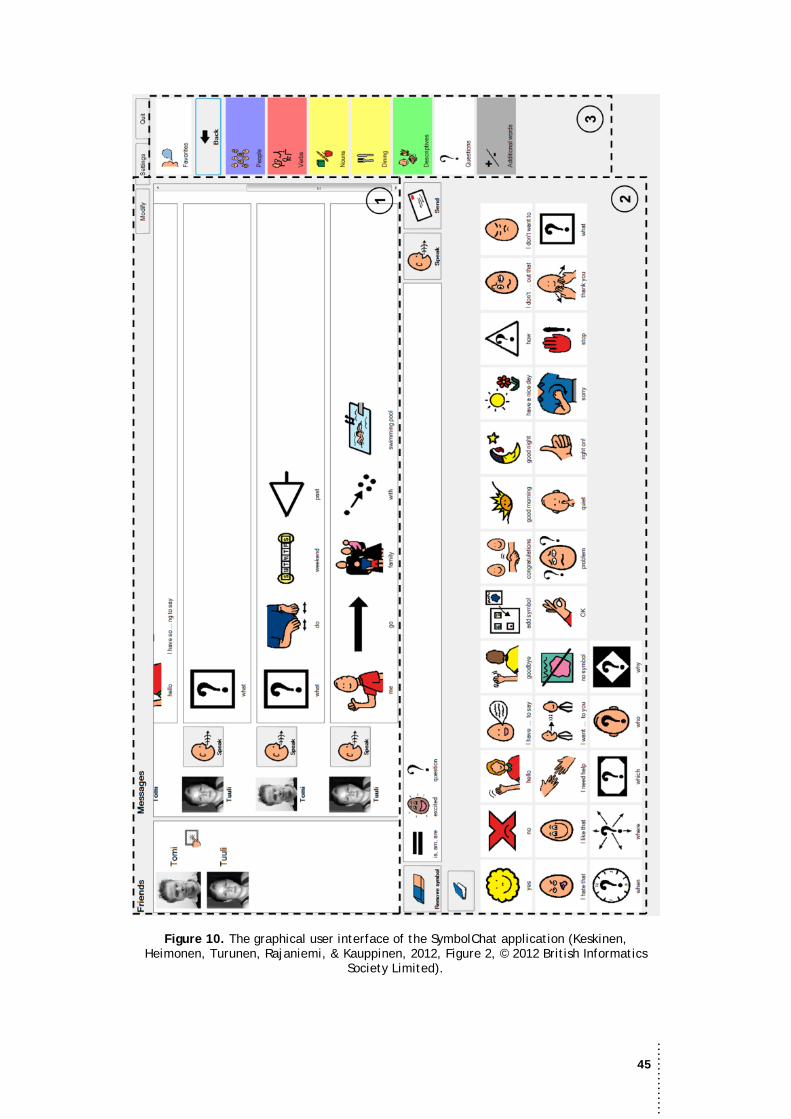
……
……
…
45
Figure 10. The graphical user interface of the SymbolChat application (Keskinen, Heimonen, Turunen, Rajaniemi, & Kauppinen, 2012, Figure 2, © 2012 British Informatics
Society Limited).

……
……
…
46
In practice, the interaction with the application follows this simplified pattern: The user selects a main category from the symbol category view, which updates the symbol input view accordingly, and selects a symbol from the symbol input view. The user then presses the Send message button, after which the message appears in the message history view and is read out loud.
3.3.3 Challenges
From an evaluation point of view, the fundamental challenge here was the target user group. Intellectual disabilities may affect the ability to read and write, but more importantly, the ability to comprehend things of varying complexities. Thus, the user experience evaluation could not be based on traditional questionnaires requiring reading and writing skills. As the difficulties among this user group are extremely individual, the evaluation material content had to be designed so it would be suitable for all participants, but the data would be as comparable as possible. Like comprehension and communication skills, the motivational and behavioral characteristics of individuals vary greatly among people with intellectual disabilities. Therefore, keeping the participants motivated and feeling as comfortable as possible was an issue that needed attention.
Because we wanted to study topics obviously too difficult for the end-users to understand or give feedback on, the familiar assistants of the users were included in the user experience evaluation. This raised further challenges in the evaluation design: how to mimic the subjective data gathering when, in fact, the collection is rather objective. Although we worked in close collaboration with professionals from the field of special needs care, getting suitable and available participants was hard. Furthermore, as the conducting of the evaluation did not involve only participants and researchers, space, time, and other resources also limited the evaluation.
3.3.4 Evaluation
This user experience evaluation was conducted with nine male participants with intellectual or other disabilities. Statement-based user experiences were gathered utilizing smiley face cards and open questions from the participants themselves as well as expectations and experiences with statements from their assistants.
Context
The evaluation sessions took place in a classroom or home environment, and thus, the physical context varied between evaluation groups and sessions. The participants were either in separate physical locations or in the same space. Each participant used the system with a computer enabling touch input, i.e., having a touch screen. At least a participant, an assistant, and a researcher or a representative from the Rinnekoti Foundation was present at the evaluation scene.

……
……
…
47
Participants
We had nine male participants (14–37 years old, mean=25.89, SD=8.78), of which eight had an intellectual disability. Many of the participants had multiple disabilities of varying severities, e.g., physical, visual, hearing, or speech disability; autism; or behavioral disorder. All participants communicated with speech, utterances, or single words, and three used additional communication methods, i.e., symbol language, gestures or facial expressions, signing, physical communication, or a communication binder. It is noteworthy that only two participants used symbols, and only one of them was familiar with the Picture Communication Symbols, the symbols utilized in the SymbolChat application. Except for one participant, everyone used a computer at least on a weekly basis. The level of the participants’ reading or writing skills is unfortunately unknown, but at least some participants were able to read and write. The participants were recruited by the Rinnekoti Foundation, and they did not receive any compensation for their participation.
Procedure
The user evaluation was conducted for four weeks. Each week, a group of two or three participants had three evaluation sessions lasting about 1 to 1.5 hours. The procedure and content of the evaluation sessions are presented in Table 9.
Evaluation phase Content
Session 1 • Introduction of the system (by the assistants) • Using the system, i.e., communicating with other
participants
Session 2
• Interview (led by the assistants) • Expectations questionnaire (filled in by the assistants from
the participants’ point of view) • Using the system
Session 3
• Using the system • Interview + user experiences (led by the assistants) • Experiences questionnaire (filled in by the assistants from
the participants’ point of view)
After the usage sessions • Textual feedback from the assistants
Table 9. The evaluation procedure of the SymbolChat case (III).
Because of different evaluation groups, locations, and individual characteristics of the participants, executing the procedure consistently throughout the evaluation was not realistic in this case. However, the procedure followed the content presented in Table 9 quite well. A significant feature in the whole evaluation case was that the sessions were led and practically all communication with the participants was done by the
……
……
…
48
familiar assistants, not by us researchers. This approach was selected to make the participants feel as comfortable and natural as possible.
The assistants were given brief written instructions about the system, and in the beginning of the first evaluation session, the assistants introduced the system and its functionality to the participants. After the introduction, the participants communicated with each other by using the SymbolChat application. The assistants had a list of possible discussion topics to refer to if the communication seemed to stop at any point of the evaluation.
In the beginning of the second session, the participants were interviewed by the assistants about their current communication ways and routines. The assistants also filled in an expectations questionnaire from the point of view of the participant and based on the first impressions received in the first session. For the rest of the second session, the participants communicated with each other.
The third session consisted of using the system and providing feedback. After communicating with each other, the participants were interviewed by the assistants. In addition to open questions, user experiences were gathered with statements ranked on a smiley face scale. Finally, the assistants filled in an experiences questionnaire again from the point of view of the participant, similar to the expectations. After the evaluation, the assistants were asked to provide feedback on certain questions through email. A participant-specific background information questionnaire was also filled in by the assistants at some point of the evaluation or outside the actual evaluation sessions.
Subjective data collection
Background information. The background information questionnaire included the following information: age, gender, participants’ disabilities and their severities, disability-related aids in use, communication methods used, the frequency of using a computer, computer usage purposes, aids in information technology devices, and the motivation to participate in the study. The paper questionnaire was filled in by the participant’s assistant.
Interviews and smiley face scale user experiences. The interviews, as well as other communication with participants, were led by the assistants whenever possible. They were instructed to modify and adapt the questions given by us to suit the participants’ limitations and abilities. This was obviously something we would not have been able to do very successfully being unfamiliar with the participants and their individual characteristics.
The interview held at the second session was a rather general discussion about the participant’s current communication ways, hopes, and needs. The planned structure of the interview included the following questions:

……
……
…
49
• Do you communicate with your friends or family using a computer? Who would you like to communicate with using a computer?
• Would you like to communicate more with your friends and family? • Would you like to communicate using a computer, or do you prefer
some other way? • Is there something especially easy or hard in communicating
currently? • Is there something especially fun or unpleasant in communicating
currently? • Would you like to have some properties in your current
communication tools that they do not have now? • Are there properties that should definitely be there?
The final interview, held on the third session, included the following questions considering the experiences of the communication:
• What was fun in the communication? • What was unpleasant in the communication? • What was hard in the communication? • What was easy in the communication? • What properties should the application have had? • What did you think about the pictures (symbols)?
During the final interview, user experiences from the participants themselves were gathered with smiley face cards. The Smileyometer method by Read, MacFarlane, and Casey (2002) was originally designed to be used with children. We believed this fun approach would be suitable for people with intellectual disabilities, as traditional scales might be hard to understand for them. The scale ranges from “extremely sad” to “extremely happy,” and the actual cards I constructed are represented in Figure 11. As can be seen, we did not use any textual labels, unlike Read et al. (2002), because we figured this would have only confused the participants unable to read.
Figure 11. The smiley face cards used in the SymbolChat case’s (III) evaluation.
For each question, the concrete cardboard cards were placed in front of the participant, and the assistant presented the question verbally, after which the participant selected the card best corresponding to his opinion. The assistant marked down the answer on the interview form along with the other answers. The questions answered with the smiley face cards were:
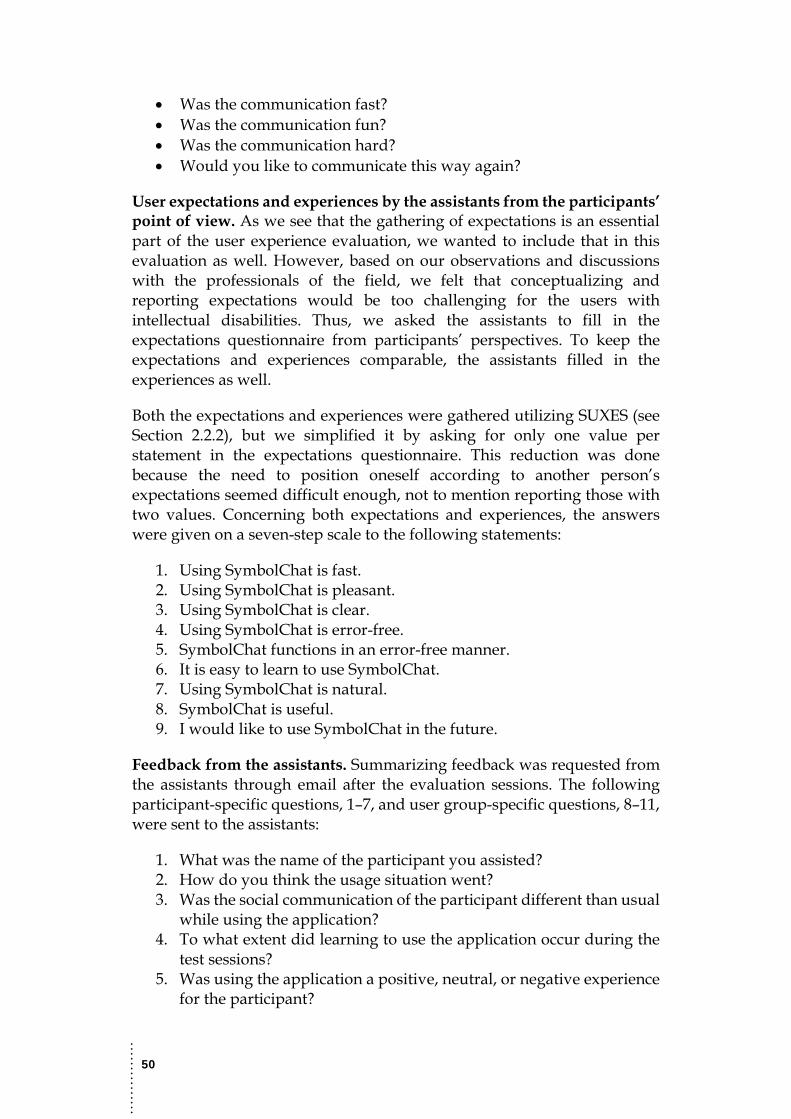
……
……
…
50
• Was the communication fast? • Was the communication fun? • Was the communication hard? • Would you like to communicate this way again?
User expectations and experiences by the assistants from the participants’ point of view. As we see that the gathering of expectations is an essential part of the user experience evaluation, we wanted to include that in this evaluation as well. However, based on our observations and discussions with the professionals of the field, we felt that conceptualizing and reporting expectations would be too challenging for the users with intellectual disabilities. Thus, we asked the assistants to fill in the expectations questionnaire from participants’ perspectives. To keep the expectations and experiences comparable, the assistants filled in the experiences as well.
Both the expectations and experiences were gathered utilizing SUXES (see Section 2.2.2), but we simplified it by asking for only one value per statement in the expectations questionnaire. This reduction was done because the need to position oneself according to another person’s expectations seemed difficult enough, not to mention reporting those with two values. Concerning both expectations and experiences, the answers were given on a seven-step scale to the following statements:
1. Using SymbolChat is fast. 2. Using SymbolChat is pleasant. 3. Using SymbolChat is clear. 4. Using SymbolChat is error-free. 5. SymbolChat functions in an error-free manner. 6. It is easy to learn to use SymbolChat. 7. Using SymbolChat is natural. 8. SymbolChat is useful. 9. I would like to use SymbolChat in the future.
Feedback from the assistants. Summarizing feedback was requested from the assistants through email after the evaluation sessions. The following participant-specific questions, 1–7, and user group-specific questions, 8–11, were sent to the assistants:
1. What was the name of the participant you assisted? 2. How do you think the usage situation went? 3. Was the social communication of the participant different than usual
while using the application? 4. To what extent did learning to use the application occur during the
test sessions? 5. Was using the application a positive, neutral, or negative experience
for the participant?

……
……
…
51
6. How realistic do you think independent usage would be, and how long or how many supported usage times would this take?
7. Free-form participant-specific comments? 8. In your opinion, what worked well in the application, considering
this user group? 9. In your opinion, what worked badly in the application, considering
this user group? 10. Can you think of properties that should be added to the application,
considering this user group? 11. Any other comments?
Supportive, objective data collection
We collected objective data mainly with the informal walkthrough (Riihiaho, 2009), but we also logged communication event data and did some videorecordings. Regarding the informal walkthrough used in the second and third session, we had an observation sheet, which included the application features and information about whether they were found and used independently, with help or not at all by the participant. The features included, e.g., selecting different main symbol categories or subcategories, adding or erasing symbols, and sending or replaying messages. The researcher observed the communication and filled in the sheet accordingly.
The log data included basic information about the communication, such as adding or erasing symbols, or sending messages. We did not record data about the content of the messages or the meanings of added symbols, because we wanted to respect the privacy of the participants. Thus, the log data do not provide insights into the content of the communication or its meaningfulness.
Some of the evaluation sessions were also videorecorded. Mainly to find obvious problems in the usage, about an hour of this material was analyzed with project partner representatives by adapting the Interaction Analysis Lab method (Jordan & Henderson, 1995).
3.3.5 Outcome and Conclusions
My main responsibility in this evaluation case was to design the collecting of subjective data, both from the participants and the assistants. The data from the participants were collected with a combination of interview questions and scale-based statement-like ratings. The interview regarding the current communication habits was conducted with five participants. Only two of the respondents stated they use a computer when communicating with their friends and family. Four participants speculated that the computer might be the best tool for communicating, while one participant preferred calling because the phone is easier and more fun to use. The user experience results received with the smiley face cards can be seen in Figure 12.
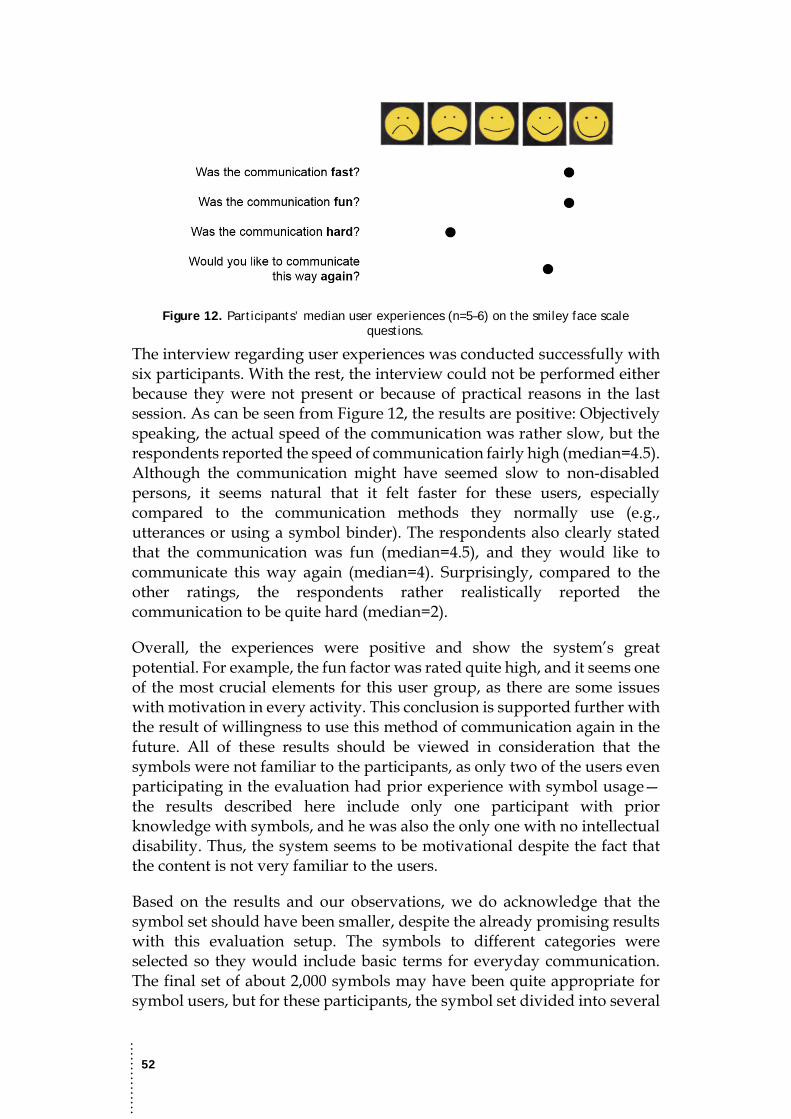
……
……
…
52
Figure 12. Participants’ median user experiences (n=5–6) on the smiley face scale questions.
The interview regarding user experiences was conducted successfully with six participants. With the rest, the interview could not be performed either because they were not present or because of practical reasons in the last session. As can be seen from Figure 12, the results are positive: Objectively speaking, the actual speed of the communication was rather slow, but the respondents reported the speed of communication fairly high (median=4.5). Although the communication might have seemed slow to non-disabled persons, it seems natural that it felt faster for these users, especially compared to the communication methods they normally use (e.g., utterances or using a symbol binder). The respondents also clearly stated that the communication was fun (median=4.5), and they would like to communicate this way again (median=4). Surprisingly, compared to the other ratings, the respondents rather realistically reported the communication to be quite hard (median=2).
Overall, the experiences were positive and show the system’s great potential. For example, the fun factor was rated quite high, and it seems one of the most crucial elements for this user group, as there are some issues with motivation in every activity. This conclusion is supported further with the result of willingness to use this method of communication again in the future. All of these results should be viewed in consideration that the symbols were not familiar to the participants, as only two of the users even participating in the evaluation had prior experience with symbol usage—the results described here include only one participant with prior knowledge with symbols, and he was also the only one with no intellectual disability. Thus, the system seems to be motivational despite the fact that the content is not very familiar to the users.
Based on the results and our observations, we do acknowledge that the symbol set should have been smaller, despite the already promising results with this evaluation setup. The symbols to different categories were selected so they would include basic terms for everyday communication. The final set of about 2,000 symbols may have been quite appropriate for symbol users, but for these participants, the symbol set divided into several

……
……
…
53
categories seemed to be too challenging to manage and utilize. For people not familiar with symbols or little children just learning to communicate, the symbol set should be very narrow in the beginning, and then it can be gradually grown. All in all, a communication tool for this user group should be highly customizable because of the significantly different abilities among individuals.
Figure 13. The median expectations (n=6) and experiences (n=7) reported by the assistants from the participants’ point of view. White circles represent expectations, and black circles
represent experiences.
Both the expectations and experiences reported by the assistants from the participants’ point of view were received considering six participants (and only the experiences considering a seventh participant). The results are shown in Figure 13. There were no statistically significant differences between expectations and experiences. However, considering the median responses, pleasantness and easiness to learn the system barely missed meeting the expectations. The experiences considering the other statements were either fulfilled or exceeded.
This evaluation case was extremely challenging, and not all of the practical issues could be addressed optimally. Obviously, one reason behind these shortcomings is the challenging user group. Moreover, somewhat as a consequence of the user group, there were many stakeholders involved, which in turn decreased the control over the performance of the evaluation executors. Analyzing the evaluation, the practical shortcomings include that interviews were conducted about the participants’ current communication ways, hopes, and needs only for the two first weeks of evaluation, i.e., for the two first groups. The final interview regarding experiences took place only for six participants. Furthermore, there were issues with the assistance of the participants: Sometimes the researchers had to communicate with the participants because there were no familiar assistants available. As a more
……
……
…
54
notable issue, the person assisting a specific participant was not always the same for all sessions. As a result, the interviews and questionnaires concerning a specific participant were not conducted or filled in by the same person by default.
Unfortunately, due to reasons out of our control, we were not able to get fully representative participants for the evaluation. The current participants were not symbol users, and only a few of them had any kind of experience with symbols. However, some of the participants had either too severe or different kinds of disabilities, so they clearly were not potential target users for the system as such. At least two participants could not touch the screen and select symbols independently. Especially considering the participant without any intellectual disability, observing the usage was painful for his sake as the input method he used was extremely slow and incompatible with the system and its functionality at that time. The application could go through the categories and symbols automatically, e.g., and the user could select a symbol when it was in focus. Accordingly, the application might benefit this participant by speeding up his communication, compared to constructing words letter by letter, for instance.
From a user experience point of view, the evaluation approaches provided a lot of helpful information about the experiences of the users. Already as such, the system showed great potential within this user group—even for individuals without prior experience with symbols. Considering the participants represented symbol users, though, the possibilities of the application as a true enabler of independent communication could have been better investigated.

……
……
…
55
3.4 EVENTEXPLORER (IV) Public displays are a rather new and popular way to provide information to people visiting public environments, e.g., shopping centers and museums. They can include useful information about bus schedules or locations of shops, for instance. To utilize the idea of public displays in an amusing way, we developed a multimodal public display application for exploring cultural events. The Experiential Program Guide is operated with gesture and speech input. The user experience of the system was evaluated with library visitors, and an example usage situation can be seen in Figure 14.
This case study is the first of the two studies presented in the original Publication IV.
Figure 14. An evaluation situation in the EventExplorer case (IV) where I am observing the usage and filling in the observation form (© Marja Laivo).
3.4.1 Objective
In the EventExplorer case (IV), we wanted to provide an unusual and fun way to browse information; we wanted to provide something experiential (see Section 2.2.3, p. 18, for definition). The objective of the evaluation was to measure the experientiality level of the system and the pleasantness of the input techniques, speech, and gestures.

……
……
…
56
3.4.2 System
The Experiential Program Guide consists of two interface views, the Word Cloud and the Metro Map. The Word Cloud (Figure 15) presents words on an invisible globe, which can be moved with one’s hands. The words visible in the cloud can be selected by moving them into the middle or by speaking them out loud, making the interaction a combined usage of modalities. This step is repeated three times until a sequence of adjective/noun/verb is constructed. Each word represented in the cloud is linked to at least one cultural event, but the words are not traditional keywords describing the events. Based on the selected words, unexpected “metro routes” are created and represented in the Metro Map view (Figure 16). Each route corresponds to an event category, such as art exhibitions or musical events, and each stop includes the co-located events. The routes can be selected by pointing or speaking out loud the category name on top of the screen. Each time a route is selected, the view moves to the next stop of the route, and details of the corresponding event(s) are shown. The user can move back to the map overview or to the Word Cloud by pointing the “Back” (Takaisin in Finnish) item or saying it out loud.
Figure 15. The Word Cloud view showing the selectable adjective keywords. Visible here are, e.g., “absurdi,” which is “absurd” in English; “luvaton,” meaning “unauthorized”; and
“vaarallinen,” meaning “dangerous” (Keskinen, Hakulinen, et al., 2013, Figure 2, © ACM 2013).
3.4.3 Challenges
The challenges in this case study rose from, first, the public environment, and second, the measurement of experientiality. Having a public environment as the physical evaluation context brings up many challenges to be solved. For example, one has to be able to attract people to participate and gather enough information to gain insights in a way that still is not too demanding for the participants. Furthermore, because the participants cannot be recruited beforehand for this kind of evaluation, everything has
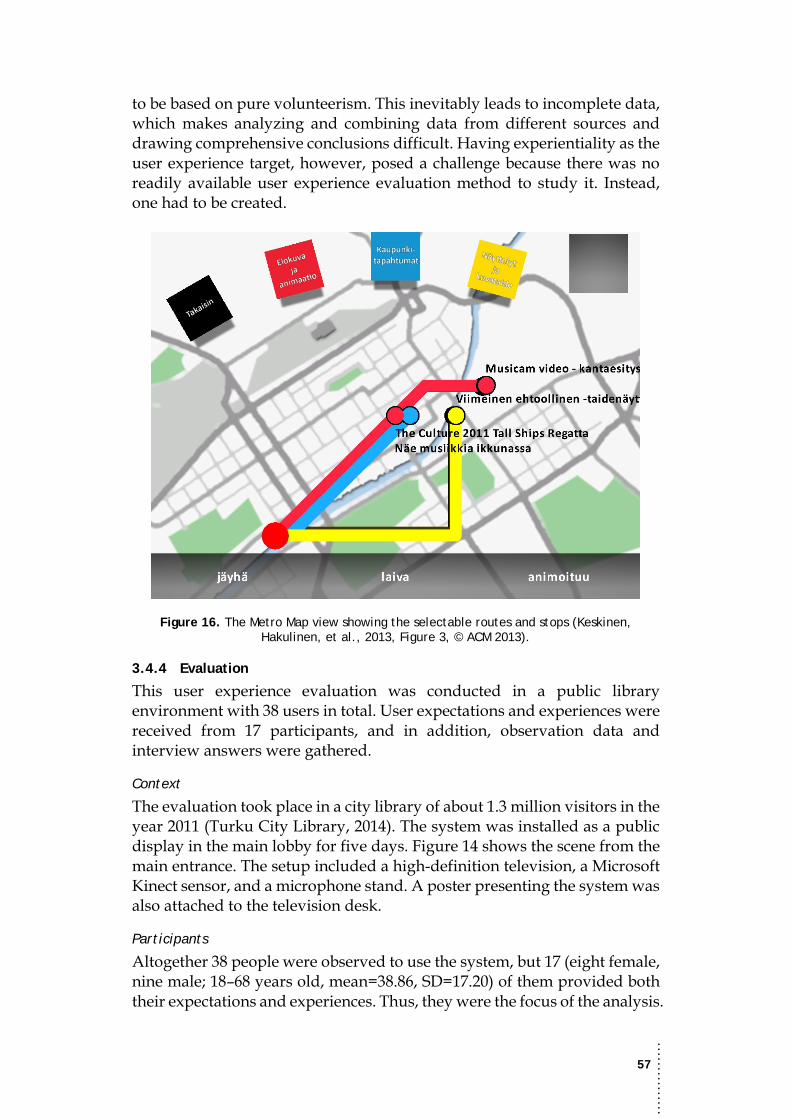
……
……
…
57
to be based on pure volunteerism. This inevitably leads to incomplete data, which makes analyzing and combining data from different sources and drawing comprehensive conclusions difficult. Having experientiality as the user experience target, however, posed a challenge because there was no readily available user experience evaluation method to study it. Instead, one had to be created.
Figure 16. The Metro Map view showing the selectable routes and stops (Keskinen, Hakulinen, et al., 2013, Figure 3, © ACM 2013).
3.4.4 Evaluation
This user experience evaluation was conducted in a public library environment with 38 users in total. User expectations and experiences were received from 17 participants, and in addition, observation data and interview answers were gathered.
Context
The evaluation took place in a city library of about 1.3 million visitors in the year 2011 (Turku City Library, 2014). The system was installed as a public display in the main lobby for five days. Figure 14 shows the scene from the main entrance. The setup included a high-definition television, a Microsoft Kinect sensor, and a microphone stand. A poster presenting the system was also attached to the television desk.
Participants
Altogether 38 people were observed to use the system, but 17 (eight female, nine male; 18–68 years old, mean=38.86, SD=17.20) of them provided both their expectations and experiences. Thus, they were the focus of the analysis.
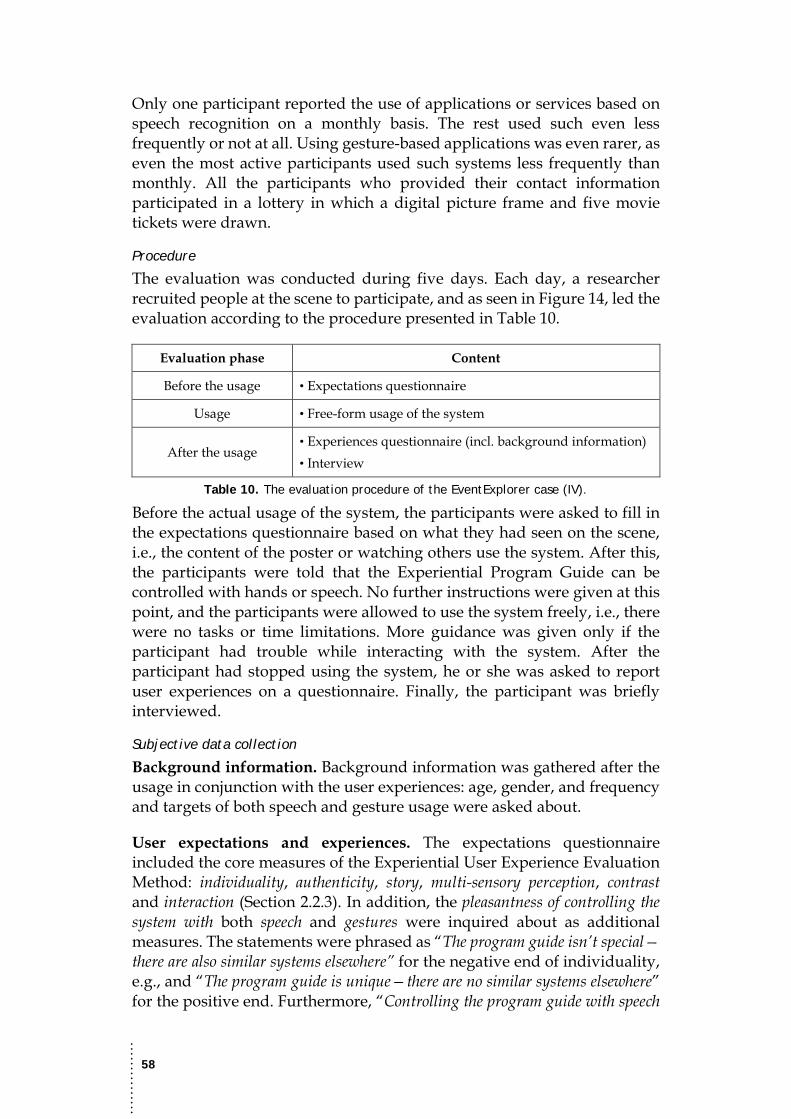
……
……
…
58
Only one participant reported the use of applications or services based on speech recognition on a monthly basis. The rest used such even less frequently or not at all. Using gesture-based applications was even rarer, as even the most active participants used such systems less frequently than monthly. All the participants who provided their contact information participated in a lottery in which a digital picture frame and five movie tickets were drawn.
Procedure
The evaluation was conducted during five days. Each day, a researcher recruited people at the scene to participate, and as seen in Figure 14, led the evaluation according to the procedure presented in Table 10.
Evaluation phase Content
Before the usage • Expectations questionnaire
Usage • Free-form usage of the system
After the usage • Experiences questionnaire (incl. background information) • Interview
Table 10. The evaluation procedure of the EventExplorer case (IV).
Before the actual usage of the system, the participants were asked to fill in the expectations questionnaire based on what they had seen on the scene, i.e., the content of the poster or watching others use the system. After this, the participants were told that the Experiential Program Guide can be controlled with hands or speech. No further instructions were given at this point, and the participants were allowed to use the system freely, i.e., there were no tasks or time limitations. More guidance was given only if the participant had trouble while interacting with the system. After the participant had stopped using the system, he or she was asked to report user experiences on a questionnaire. Finally, the participant was briefly interviewed.
Subjective data collection
Background information. Background information was gathered after the usage in conjunction with the user experiences: age, gender, and frequency and targets of both speech and gesture usage were asked about.
User expectations and experiences. The expectations questionnaire included the core measures of the Experiential User Experience Evaluation Method: individuality, authenticity, story, multi-sensory perception, contrast and interaction (Section 2.2.3). In addition, the pleasantness of controlling the system with both speech and gestures were inquired about as additional measures. The statements were phrased as “The program guide isn’t special—there are also similar systems elsewhere” for the negative end of individuality, e.g., and “The program guide is unique—there are no similar systems elsewhere” for the positive end. Furthermore, “Controlling the program guide with speech
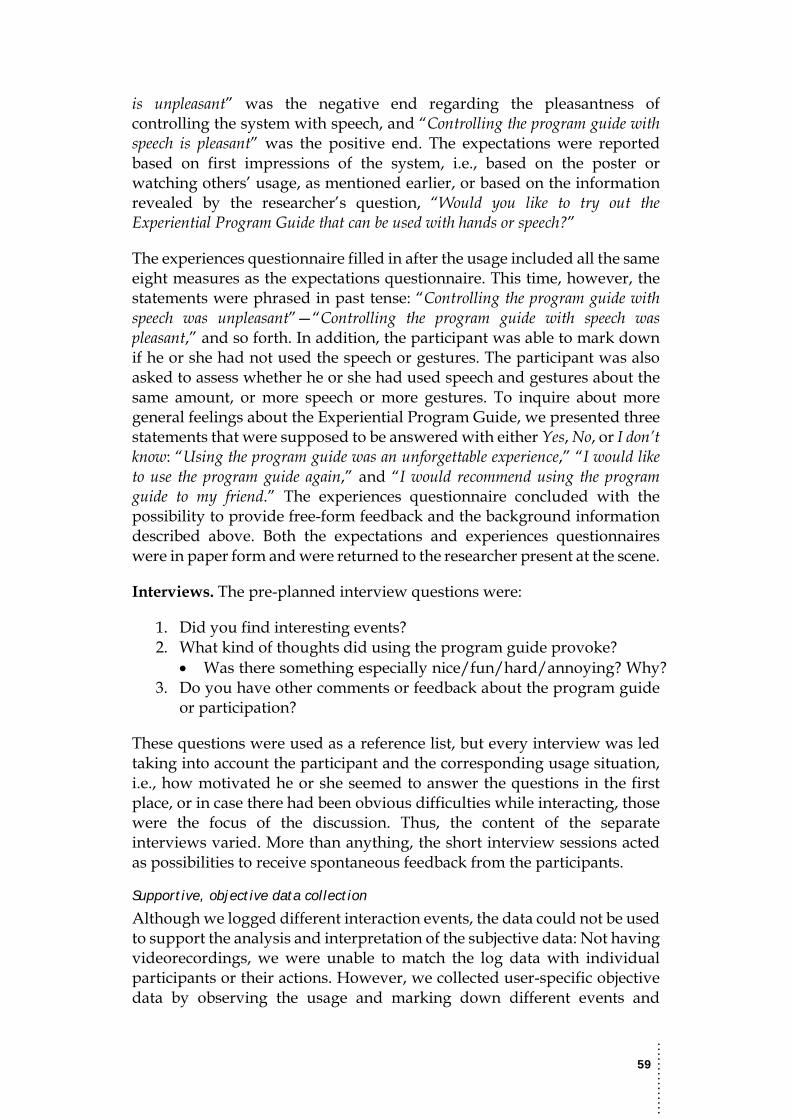
……
……
…
59
is unpleasant” was the negative end regarding the pleasantness of controlling the system with speech, and “Controlling the program guide with speech is pleasant” was the positive end. The expectations were reported based on first impressions of the system, i.e., based on the poster or watching others’ usage, as mentioned earlier, or based on the information revealed by the researcher’s question, “Would you like to try out the Experiential Program Guide that can be used with hands or speech?”
The experiences questionnaire filled in after the usage included all the same eight measures as the expectations questionnaire. This time, however, the statements were phrased in past tense: “Controlling the program guide with speech was unpleasant”—“Controlling the program guide with speech was pleasant,” and so forth. In addition, the participant was able to mark down if he or she had not used the speech or gestures. The participant was also asked to assess whether he or she had used speech and gestures about the same amount, or more speech or more gestures. To inquire about more general feelings about the Experiential Program Guide, we presented three statements that were supposed to be answered with either Yes, No, or I don’t know: “Using the program guide was an unforgettable experience,” “I would like to use the program guide again,” and “I would recommend using the program guide to my friend.” The experiences questionnaire concluded with the possibility to provide free-form feedback and the background information described above. Both the expectations and experiences questionnaires were in paper form and were returned to the researcher present at the scene.
Interviews. The pre-planned interview questions were:
1. Did you find interesting events? 2. What kind of thoughts did using the program guide provoke?
• Was there something especially nice/fun/hard/annoying? Why? 3. Do you have other comments or feedback about the program guide
or participation?
These questions were used as a reference list, but every interview was led taking into account the participant and the corresponding usage situation, i.e., how motivated he or she seemed to answer the questions in the first place, or in case there had been obvious difficulties while interacting, those were the focus of the discussion. Thus, the content of the separate interviews varied. More than anything, the short interview sessions acted as possibilities to receive spontaneous feedback from the participants.
Supportive, objective data collection
Although we logged different interaction events, the data could not be used to support the analysis and interpretation of the subjective data: Not having videorecordings, we were unable to match the log data with individual participants or their actions. However, we collected user-specific objective data by observing the usage and marking down different events and

……
……
…
60
characteristics of the interaction according to a predefined observation form. This included the following information:
• Duration of the usage • Gender of the participant • Age group (<12 / 13–20 / 20–35 / 35–50 / 50–65 / 65+ years) • Spontaneous comments from the participant in the usage situation • What did the participant seem like while using the program guide?
(relaxed, interested / surprised / posing to others / self-conscious / confused, uncertain / something else, what?)
• What kinds of vibes did the participant seem to have, based on his or her comments and actions? (positive / happy /inquisitive / impressed / bored, disappointed / negative / something else, what?)
• Which modalities did the participant utilize? (mainly gestures / mainly speech / both equally)
• Which hand did the participant use for pointing? (left / right / both hands)
• How fast did the participant internalize the function logic of the interface?
o Word Cloud, gestures (immediately / <30 / <60 / >60 seconds / did not understand at all)
o Word Cloud, speech ( –||– ) o Metro Map ( –||– )
• How did the participant proceed (logically) in the application? (used the Word Cloud and stopped / used the Metro Map, selected at least one route / returned to the Word Cloud and again to the Metro Map / even more rounds)
The observation data rely on researcher interpretation. In addition, the evaluation situations and the durations of the usage periods varied a lot, which leads to the observation data not covering everything. For these reasons, the observation findings can be used only to support the findings of the collected subjective data, for instance, rather than as the basis for conclusions.
3.4.5 Outcome and Conclusions
My main responsibility in this evaluation case was to design the collecting of subjective data. This was done by gathering user expectations and experiences according to the created Experiential User Experience Evaluation Method (see Section 2.2.3 for details). The statement-based results can be seen in Figure 17.
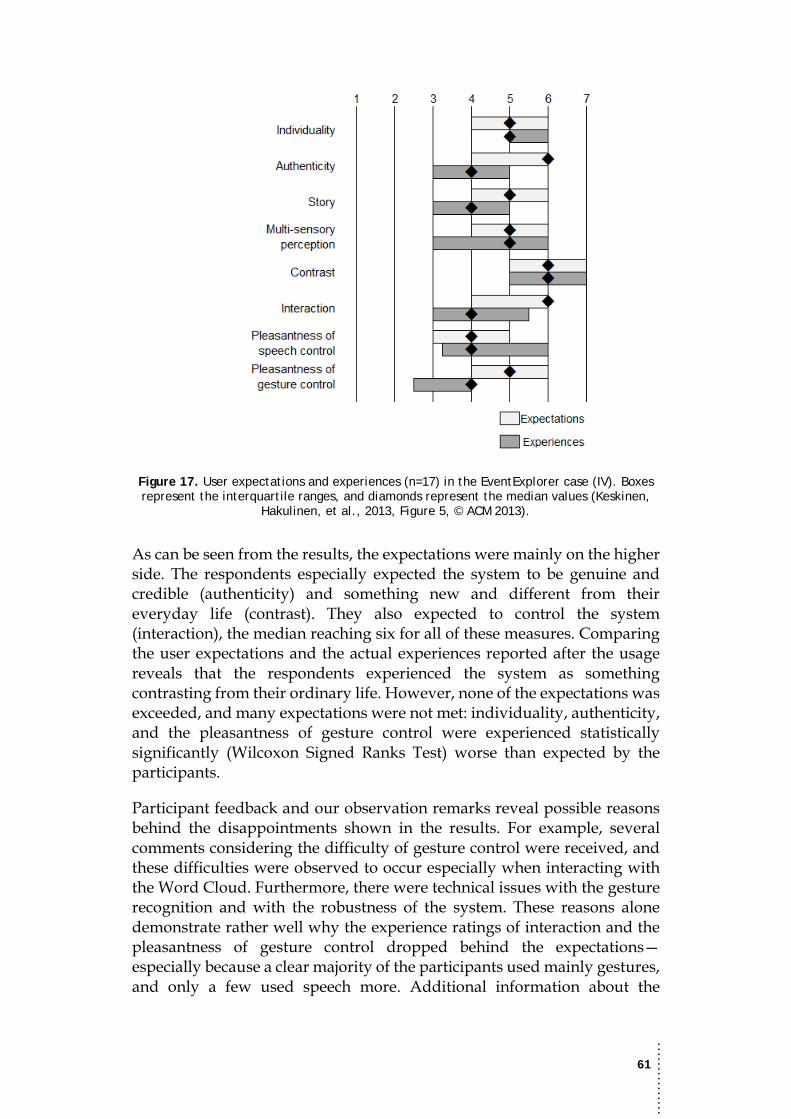
……
……
…
61
Figure 17. User expectations and experiences (n=17) in the EventExplorer case (IV). Boxes represent the interquartile ranges, and diamonds represent the median values (Keskinen,
Hakulinen, et al., 2013, Figure 5, © ACM 2013).
As can be seen from the results, the expectations were mainly on the higher side. The respondents especially expected the system to be genuine and credible (authenticity) and something new and different from their everyday life (contrast). They also expected to control the system (interaction), the median reaching six for all of these measures. Comparing the user expectations and the actual experiences reported after the usage reveals that the respondents experienced the system as something contrasting from their ordinary life. However, none of the expectations was exceeded, and many expectations were not met: individuality, authenticity, and the pleasantness of gesture control were experienced statistically significantly (Wilcoxon Signed Ranks Test) worse than expected by the participants.
Participant feedback and our observation remarks reveal possible reasons behind the disappointments shown in the results. For example, several comments considering the difficulty of gesture control were received, and these difficulties were observed to occur especially when interacting with the Word Cloud. Furthermore, there were technical issues with the gesture recognition and with the robustness of the system. These reasons alone demonstrate rather well why the experience ratings of interaction and the pleasantness of gesture control dropped behind the expectations—especially because a clear majority of the participants used mainly gestures, and only a few used speech more. Additional information about the
……
……
…
62
observation findings is presented by Hakulinen, Heimonen, Turunen, Keskinen, & Miettinen (2013). Moreover, the usefulness of the system in its current content was questioned. The words linked to the events had no real rational connection to the actual events. This may have been experienced as a lack of authenticity and story. The system tried to be something extraordinary and did not use traditional keywords, but at the same time, perhaps failed at being extraordinary enough to raise the participants to an imaginary level at which they would not have assessed it with traditional usefulness-related criteria.
The measurement of the experientiality was one of the main challenges in this user experience evaluation case. Based on the data gathered during the evaluation, the created method seems quite promising in measuring experientiality. Selecting the Experience Pyramid (Tarssanen & Kylänen, 2006) as the basis seems to have been a good choice. The statements constructed based on the six elements of experience appear to be descriptive and clear enough. Several statistically significant correlations were found both within the user expectations and within the user experiences considering the core measures. This suggests that there may be a common factor, experientiality level, that the items together measure. It needs to be emphasized that these estimates are just first impressions, and the method and the measures will need extensive investigations to be systematically validated. Otherwise, the combination of data collection methods provided useful information, and the data received from different sources, although sometimes incomplete in coverage, supported one another rather well in this case. Still, the objective log data could have been a fruitful addition to the material in case it could have been reliably linked to the actions of individual participants. Without videorecordings, this was not possible, however.
Another major challenge in this evaluation case was having a public environment as the evaluation context. Some issues already presented in the literature (e.g., Brignull & Rogers, 2003; Hazlewood, Stolterman, & Connelly, 2011) were realized in practice relatively soon. Attracting people to participate was especially one of the issues, and it was pretty obvious that only a few got involved with the system spontaneously. Instead, to make the evaluation worthwhile and to gather data in the first place, it was necessary to ask people to try out the system—especially, when the scene was empty, i.e., no one was using the system. Other people using the system seemed to attract other users, but there are no systematically gathered recordings about this. Some of the observed challenges are discussed also by Keskinen, Heimonen, Turunen, Hakulinen, and Miettinen (2012).
Resource-wise, it would not have been reasonable to have more than one researcher at the scene: The evaluation was conducted in another city about two hours’ away from us. However, evaluation-wise, only one researcher
……
……
…
63
at a time at the scene does not seem to have been adequate in retrospect. When a potential participant entered the scene, the researcher was occupied with that participant throughout the evaluation procedure. This means that other potential participants observing the situation could not be properly addressed and engaged. Communicating with others would have been impolite to the original participant and could have jeopardized receiving user experiences and other feedback from him or her. Thus, the researcher alone could have a maximum of one user at a time performing the actual evaluation, i.e., welcoming the participant, administrating the collection of user expectations and experiences, the actual usage of the system, and finally, interviewing and discussing with the participant. This made it hard to run a great amount of full evaluation cycles during a “shift.” Moreover, as other people seemed to pay more attention to the system exactly when there was someone interacting with it, it would have been extremely important to have another researcher to captivate the potential participants. Nevertheless, available resources cause limitations for evaluations and force optimization beforehand.
Unfortunately, the timing of the evaluation was not optimal. Firstly, the event content covered the cultural events of the city during one calendar year. Because the evaluation was conducted in October and the year was almost over, the offering of events was already narrow. Therefore, spring and summer would have been a more suitable time for the evaluation, as there would have been more cultural events and, due to summer holidays, perhaps more potential participants. Secondly and more importantly, the daily timing of the evaluation ranged between 10 a.m. and 4 p.m. At these hours, the library visitors seemed to be mostly either schoolchildren or pensioners. The most realistic and beneficial test users for the system would have been working-aged people, who were obviously working at those hours. If some individuals from this user group did visit the library, they may have been on their lunch break, meaning they did not have time to attend. These timing issues were caused by resource limitations. The system was not ready for evaluation during the summer, and the special cultural year of the city was ending. Thus, the evaluation could not be conducted before or after. However, the daily timing of the evaluation could, and should, have been addressed better.
Because the participants were not recruited beforehand and the physical context was a public and open environment, the actions of the participants before entering the evaluation situation could not be controlled and are unknown. Thus, we are unable to say on what the participants based their expectations, i.e., whether they were based on observing other people use the system (successfully or unsuccessfully), conceptions formed from the poster, purely based on their prior experiences or conceptions about technology, or a combination of these. This would have been an important

……
……
…
64
detail to inquire about, because there may be differences in expectations depending on what they are grounded on.
A person who has played a lot of gesture-based games, e.g., probably has a strong personal view on what is meant by gesture control in the first place. Thus, he or she may have totally different expectations towards gesture control compared to a person without actual prior experience with gesture usage who just observed someone else trying to control the system with gestures but having major difficulties. In fact, the data revealed a positive correlation between the expected pleasantness of gesture control and the frequency of gesture usage (Spearman’s rho, r=-0.56, p=0.05; lower numbers indicate more frequent use). For the expectations of speech control pleasantness, similar kinds of correlation with the frequency of usage were not found. Instead, we found that older people expected the speech control to be more pleasant than younger ones (Spearman’s rho, r=0.52, p=0.05), which seems to lack a rational explanation. Because both gestures and speech usage were rare among the participants in general, strong conclusions cannot be made, and the actual reasons or bases behind the expectations considering the pleasantness of these modalities remain unknown.
Hereby, it would be beneficial to know more about the bases of the expectation ratings, but everything cannot be included in questionnaires or asked of participants. Instead, designing the content of gathered data is a constant balancing of the necessary and most important information, and not overloading the participants. Not knowing the bases of the expectations is an issue concerning particularly evaluations in public environments, because the people at the scene cannot be controlled in any way. Although evaluating in a real context in the field, the environment is usually still somewhat closed, and the researchers are in control of the information that is provided to the participants before they give their expectation ratings. Obviously, the prior experiences of the participants cannot be controlled, but we can control that the same information is given to every participant. This applies to, e.g., the MediaCenter (I) and DrillSimulator (II) cases already introduced, but considering the EventExplorer case (IV), we were naturally unable to control whether a potential participant would observe someone else using the system for 10 minutes before his own turn. After this, it would not make much difference whether the researcher tries to keep any hints about the system to a minimum before the participant has provided his or her expectations: the participant probably would have formed an opinion about the system based on his or her observation, which might differ from his or her prior experiences.
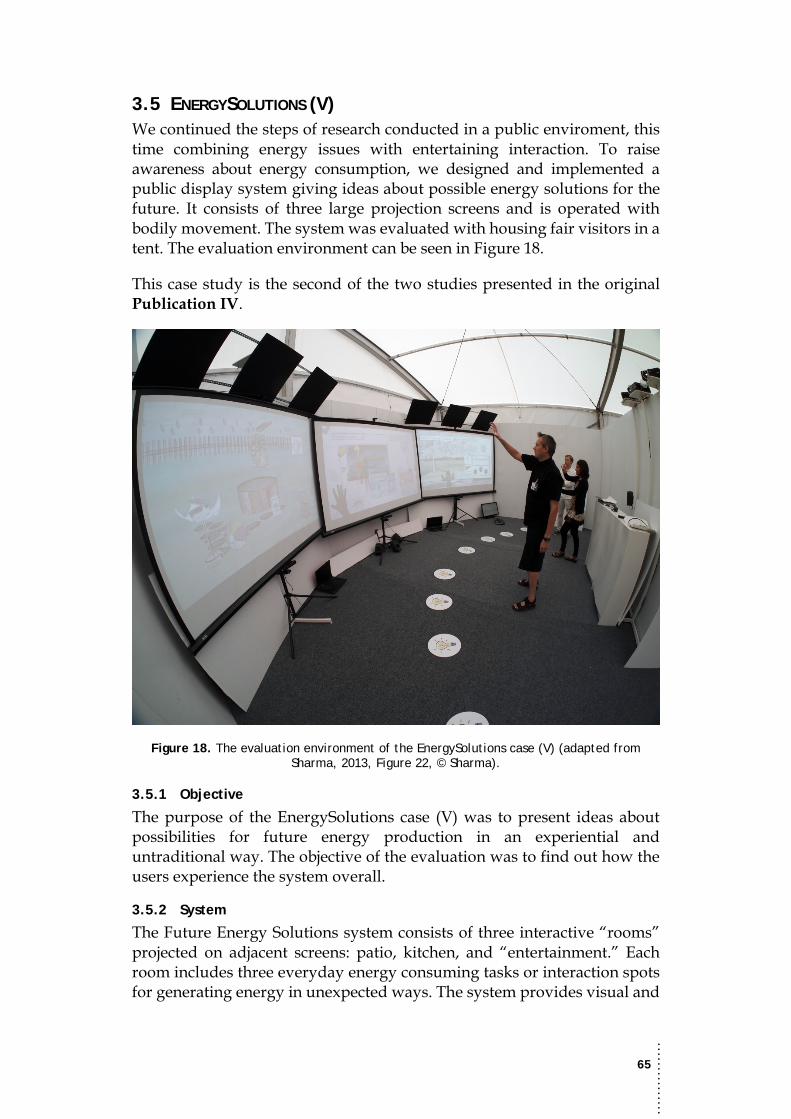
……
……
…
65
3.5 ENERGYSOLUTIONS (V) We continued the steps of research conducted in a public enviroment, this time combining energy issues with entertaining interaction. To raise awareness about energy consumption, we designed and implemented a public display system giving ideas about possible energy solutions for the future. It consists of three large projection screens and is operated with bodily movement. The system was evaluated with housing fair visitors in a tent. The evaluation environment can be seen in Figure 18.
This case study is the second of the two studies presented in the original Publication IV.
Figure 18. The evaluation environment of the EnergySolutions case (V) (adapted from Sharma, 2013, Figure 22, © Sharma).
3.5.1 Objective
The purpose of the EnergySolutions case (V) was to present ideas about possibilities for future energy production in an experiential and untraditional way. The objective of the evaluation was to find out how the users experience the system overall.
3.5.2 System
The Future Energy Solutions system consists of three interactive “rooms” projected on adjacent screens: patio, kitchen, and “entertainment.” Each room includes three everyday energy consuming tasks or interaction spots for generating energy in unexpected ways. The system provides visual and
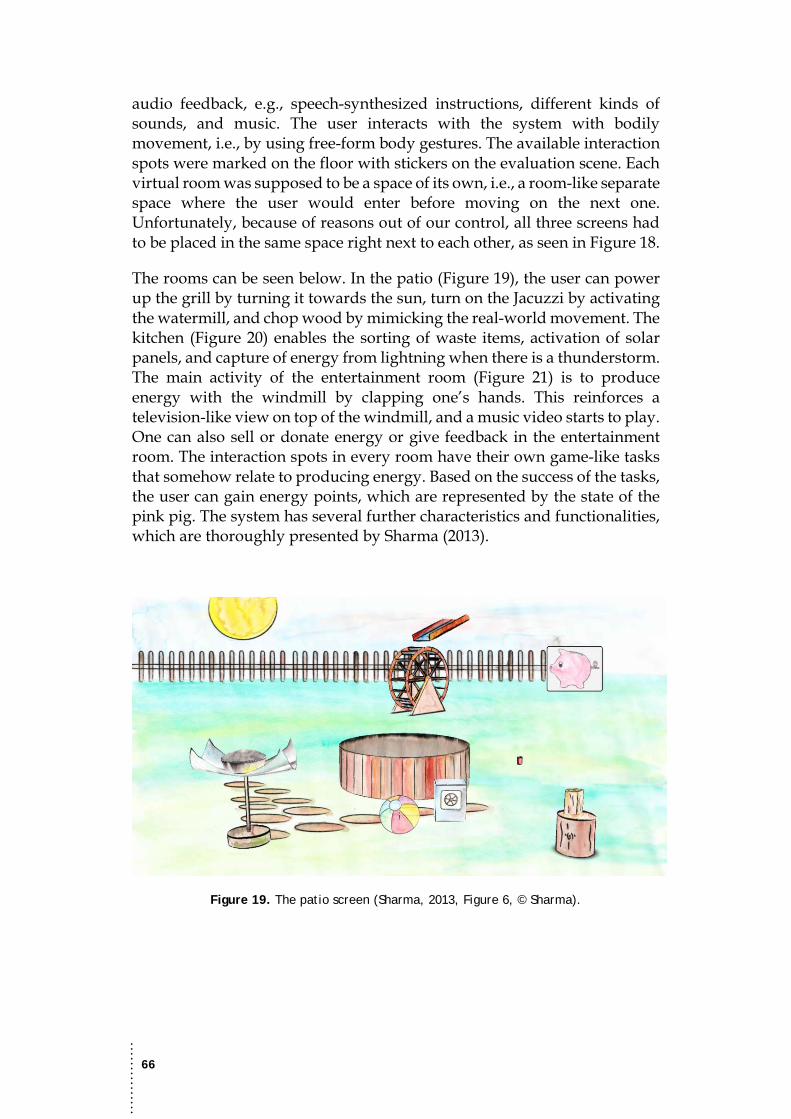
……
……
…
66
audio feedback, e.g., speech-synthesized instructions, different kinds of sounds, and music. The user interacts with the system with bodily movement, i.e., by using free-form body gestures. The available interaction spots were marked on the floor with stickers on the evaluation scene. Each virtual room was supposed to be a space of its own, i.e., a room-like separate space where the user would enter before moving on the next one. Unfortunately, because of reasons out of our control, all three screens had to be placed in the same space right next to each other, as seen in Figure 18.
The rooms can be seen below. In the patio (Figure 19), the user can power up the grill by turning it towards the sun, turn on the Jacuzzi by activating the watermill, and chop wood by mimicking the real-world movement. The kitchen (Figure 20) enables the sorting of waste items, activation of solar panels, and capture of energy from lightning when there is a thunderstorm. The main activity of the entertainment room (Figure 21) is to produce energy with the windmill by clapping one’s hands. This reinforces a television-like view on top of the windmill, and a music video starts to play. One can also sell or donate energy or give feedback in the entertainment room. The interaction spots in every room have their own game-like tasks that somehow relate to producing energy. Based on the success of the tasks, the user can gain energy points, which are represented by the state of the pink pig. The system has several further characteristics and functionalities, which are thoroughly presented by Sharma (2013).
Figure 19. The patio screen (Sharma, 2013, Figure 6, © Sharma).
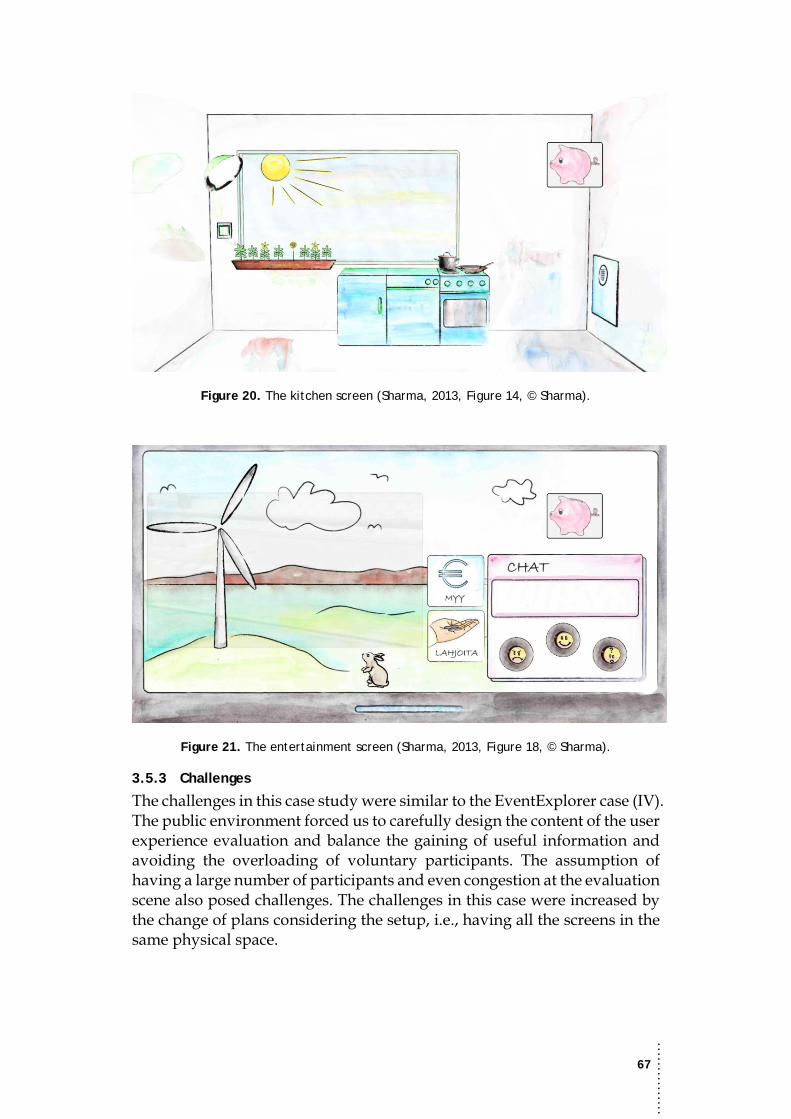
……
……
…
67
Figure 20. The kitchen screen (Sharma, 2013, Figure 14, © Sharma).
Figure 21. The entertainment screen (Sharma, 2013, Figure 18, © Sharma).
3.5.3 Challenges
The challenges in this case study were similar to the EventExplorer case (IV). The public environment forced us to carefully design the content of the user experience evaluation and balance the gaining of useful information and avoiding the overloading of voluntary participants. The assumption of having a large number of participants and even congestion at the evaluation scene also posed challenges. The challenges in this case were increased by the change of plans considering the setup, i.e., having all the screens in the same physical space.

……
……
…
68
3.5.4 Evaluation
This user experience evaluation was conducted in a housing fair, with 193 participants providing their experiences with a questionnaire including user experience statements.
Context
The evaluation took place at a nation-wide housing fair of about 146,000 visitors (Housing Fair Finland Co-op, 2012). The system was available for usage for one month, i.e., the whole duration of the fair, and installed in a large tent where several companies and organizations introduced their housing-related products and services. Although clearly a public environment, the location of the system was a little secluded: First, one had to enter the tent and then the room-like space where the actual installation was. The setup included three adjacent projection screens, each 2.5 meters wide, Microsoft Kinect sensors, and several directional speakers.
Participants
We received user experiences from 193 participants (90 female, 101 male, 2 unknown; 4–74 years old, mean=35.39, SD=14.61). The total number of users is estimated to be many times greater, but here, the focus is kept on users who filled in the experiences questionnaire and are thus considered participants. Using gesture-based applications was rather rare among the participants: A clear majority, 66 percent, of the respondents (n=187) used such applications less frequently than monthly or not at all, while daily or weekly usage covered only about 16 percent of the respondents. The participants did not get any compensation for their participation.
Procedure
The evaluation was conducted during one month. The procedure of the evaluation considering an individual participant is presented in Table 11.
Evaluation phase Content
Usage • Free-form usage of the system
After the usage • Experiences questionnaire (incl. background information) • Interview questions
Table 11. The evaluation procedure of the EnergySolutions case (V).
For the period of one month, the system was available for usage about eight hours daily. One researcher was present all the time, but instead of taking an active role in recruiting, he or she was more of a support person who helped and demonstrated the system when necessary. An optimal evaluation session per participant went so the participant used the system freely and independently, after which he or she filled in the experiences questionnaire and the researcher asked a couple of interview questions verbally. It should be noted that there were a total of seven researchers who stayed at the scene and the role of the researcher is assumed to have varied.
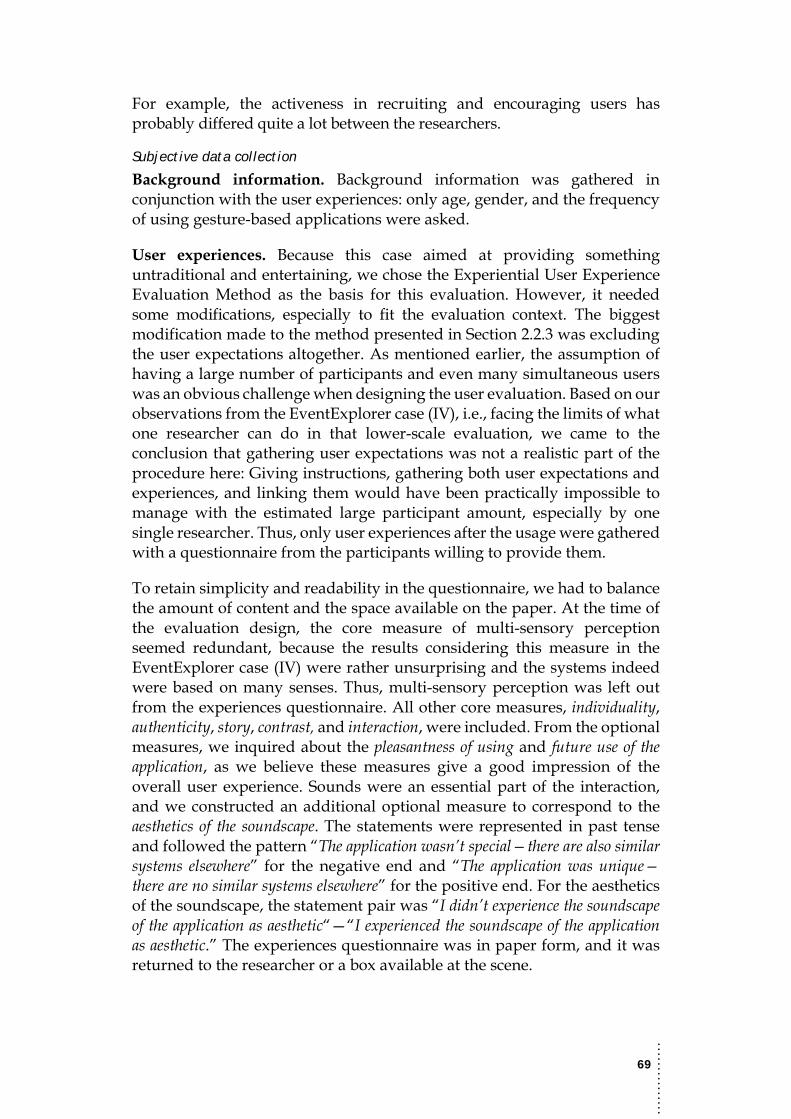
……
……
…
69
For example, the activeness in recruiting and encouraging users has probably differed quite a lot between the researchers.
Subjective data collection
Background information. Background information was gathered in conjunction with the user experiences: only age, gender, and the frequency of using gesture-based applications were asked.
User experiences. Because this case aimed at providing something untraditional and entertaining, we chose the Experiential User Experience Evaluation Method as the basis for this evaluation. However, it needed some modifications, especially to fit the evaluation context. The biggest modification made to the method presented in Section 2.2.3 was excluding the user expectations altogether. As mentioned earlier, the assumption of having a large number of participants and even many simultaneous users was an obvious challenge when designing the user evaluation. Based on our observations from the EventExplorer case (IV), i.e., facing the limits of what one researcher can do in that lower-scale evaluation, we came to the conclusion that gathering user expectations was not a realistic part of the procedure here: Giving instructions, gathering both user expectations and experiences, and linking them would have been practically impossible to manage with the estimated large participant amount, especially by one single researcher. Thus, only user experiences after the usage were gathered with a questionnaire from the participants willing to provide them.
To retain simplicity and readability in the questionnaire, we had to balance the amount of content and the space available on the paper. At the time of the evaluation design, the core measure of multi-sensory perception seemed redundant, because the results considering this measure in the EventExplorer case (IV) were rather unsurprising and the systems indeed were based on many senses. Thus, multi-sensory perception was left out from the experiences questionnaire. All other core measures, individuality, authenticity, story, contrast, and interaction, were included. From the optional measures, we inquired about the pleasantness of using and future use of the application, as we believe these measures give a good impression of the overall user experience. Sounds were an essential part of the interaction, and we constructed an additional optional measure to correspond to the aesthetics of the soundscape. The statements were represented in past tense and followed the pattern “The application wasn’t special—there are also similar systems elsewhere” for the negative end and “The application was unique— there are no similar systems elsewhere” for the positive end. For the aesthetics of the soundscape, the statement pair was “I didn’t experience the soundscape of the application as aesthetic“—“I experienced the soundscape of the application as aesthetic.” The experiences questionnaire was in paper form, and it was returned to the researcher or a box available at the scene.
……
……
…
70
Interviews. The researchers were advised to interview users when possible. The preplanned interview questions were:
1. What kind of thoughts did using the application provoke? • Was there something especially nice/fun/hard/annoying? Why?
2. What room (patio, kitchen, entertainment) did to you like the most? Why?
3. What do you think was the purpose of the application? 4. Do you have other comments or feedback about the application or
participation?
These questions were used as a reference list. The form also included date, time, gender, and age group, which the researcher could mark down based on his or her estimate of the user.
Supportive, objective data collection
Like the EventExplorer case (IV), we logged the interaction events, but without videorecordings, we were unable to link the event log data with individual participants and real-world events. Thus, the log data could not be used to support the subjective data. Furthermore, some researchers made their own notes and observations on the evaluation scene, but these were not systematically controlled or recorded and, thus, do not provide an applicable source of data for the user experience analysis.
3.5.5 Outcome and Conclusions
My main responsibility in this evaluation case was to design the collection of subjective data. This was done by gathering user experiences with a questionnaire adopted from the Experiential User Experience Evaluation Method. The statement-based user experience results can be seen in Figure 22.
As can be seen from the results, the median user experiences are astonishingly in line with each other. As the data received from this evaluation heavily rely on the statement-based user experiences, understanding the reasons behind the experiences and their uniformity is extremely challenging. The one-sided data were probably a consequence of many reasons. Most importantly, although the researchers at the scene were advised to interview participants whenever possible, only 16 interview-like situations were reported. The comments received in these situations ranged from one end to another, and more importantly, the feedback was not linked with the questionnaires. Thus, these data did not provide additional information in interpreting the user experiences. Some researchers took random notes about users’ spontaneous comments, but these were not systematically gathered or linked with the questionnaires either. All in all, the statement-based user experience results are on the positive side. Without additional supportive data, though, gaining insights into the user experiences is not feasible.

……
……
…
71
Figure 22. User experiences (n=193) in the EnergySolutions case (V). Boxes represent the interquartile ranges, and diamonds represent the median values (Adapted from Keskinen,
Hakulinen, et al., 2013, Figure 7, © ACM 2013).
The biggest challenge in this evaluation case was the combination of a public environment and the assumed large number of participants. Based on our experiences from the EventExplorer case (IV), we made some modifications to the evaluation procedure. First, the collection of user expectations was excluded from this evaluation. This was done because of the expected large numbers of participants and especially simultaneous users. The decision was based on the limitations of what one researcher can do, which were seen already in the lower-scale evaluation case EventExplorer (IV). Again, resource-wise, having more than one researcher constantly at the scene was not a realistic option: The evaluation was conducted during the summer holiday period, and the scene was open to the public daily.
Another reason for excluding the collection of user expectations was the physical evaluation’s environment: It was a room-like space that the potential users had to enter, and a researcher watching for “victims” near the entrance may have driven away people who, in fact, would have been interested in the system. At the time of designing the evaluation for EnergySolutions case (V), our decision seemed well justified—especially after the changes in the physical environment of the evaluation. Having three separate room-like spaces, as planned in the beginning, may have enabled collecting the user expectations better, as the users would have gone through a controlled sequence of rooms. However, even this would not have eliminated the limitations of one researcher’s resources or the issue of scaring people away, but it would have made the evaluation situation better structured and decreased the amount of simultaneous users in a specific space.
……
……
…
72
Judging afterwards, excluding the collection of user expectations is one downside of this evaluation. Although we are unable to say whether the participants in the EventExplorer case (IV) were more committed exactly because of the collection of their expectations, it seems collecting them did not do any harm. Instead, we were able to compare the pre-usage expectations or views with the actual experiences after the usage, and thus, better understand the experiences as well as positive and negative aspects of the system itself. It should be noted, however, that gathering user expectations systematically from all participants and linking them with the experiences in this kind of a large-scale evaluation would be extremely challenging, if not impossible, especially with only one researcher.
Although a part of the Experiential User Experience Evaluation Method (Section 2.2.3), the measure of multi-sensory perception was not included in the questionnaire of this evaluation. Luckily, this did not ruin the evaluation. In the EventExplorer case (IV), the measure did not seem to provide interesting information, and like the EventExplorer, the system under evaluation in this case was based on many senses. In addition, we had to optimize the usage of the space in the physical questionnaire form. Based on these arguments, the measure of multi-sensory perception was excluded when designing the questionnaire. Although justified at that time, in retrospect, this was a lapse: The fact that using or experiencing a system is truly based on many senses does not in any way mean, or at least prove, that the users experience the interaction that way. Hence, the decision conflicts with the idea of user experience evaluation, as I see it, the core being the subjective opinion of the user on an issue that might seem obvious objectively.
All in all, this large-scale evaluation case provided us hands-on experience with conducting user studies in a public environment. Obviously, different kinds of additional data would have been needed to understand the users’ experiences and the reasons for their views. Considering the limitations in the resources, evaluation environment, and other characteristics of the evaluation, one realistic option for gathering more data would have been to include at least some open-ended questions in the questionnaire. This way, the statement-based user experiences and the possible explanations behind the experiences would have been automatically linked. Moreover, systematically reported observation data may have provided useful information when interpreting the statement-based results. In this case, however, it would have been a necessity to link the questionnaire and observation data, which would have been challenging given the circumstances. Furthermore, interviewing more users would have been possible. Those data could have been linked with the questionnaire data quite effortlessly, because the interviewer could have received the questionnaire directly from the user at the end of the interview situation. This case demonstrates a good example of a common situation where an

……
……
…
73
optimal evaluation in its whole cannot be conducted by one researcher alone. Conversely, it also highlights the importance of communicating and agreeing on the details within the evaluation team to receive valuable data.
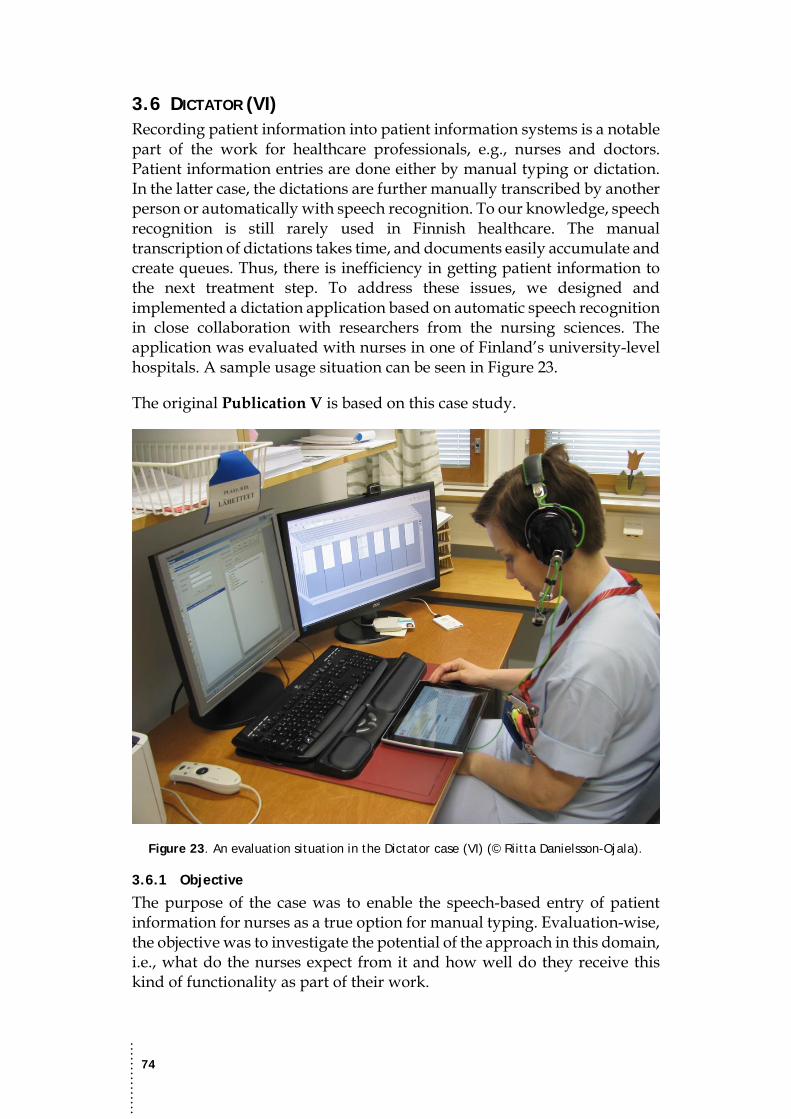
……
……
…
74
3.6 DICTATOR (VI) Recording patient information into patient information systems is a notable part of the work for healthcare professionals, e.g., nurses and doctors. Patient information entries are done either by manual typing or dictation. In the latter case, the dictations are further manually transcribed by another person or automatically with speech recognition. To our knowledge, speech recognition is still rarely used in Finnish healthcare. The manual transcription of dictations takes time, and documents easily accumulate and create queues. Thus, there is inefficiency in getting patient information to the next treatment step. To address these issues, we designed and implemented a dictation application based on automatic speech recognition in close collaboration with researchers from the nursing sciences. The application was evaluated with nurses in one of Finland’s university-level hospitals. A sample usage situation can be seen in Figure 23.
The original Publication V is based on this case study.
Figure 23. An evaluation situation in the Dictator case (VI) (© Riitta Danielsson-Ojala).
3.6.1 Objective
The purpose of the case was to enable the speech-based entry of patient information for nurses as a true option for manual typing. Evaluation-wise, the objective was to investigate the potential of the approach in this domain, i.e., what do the nurses expect from it and how well do they receive this kind of functionality as part of their work.

……
……
…
75
3.6.2 System
The system under evaluation in this case consisted of a tablet end-user client, a server, a Lingsoft 4 speech recognition engine with medical language model, and an M-Files 5 document management system. The most important part visible to the participants was the end-user client, referred to as “the dictation application” here. Its graphical user interface can be seen in Figure 24. The application has functionality for recording, browsing, listening, and editing audios, as well as browsing and editing recognized texts.
Figure 24. The graphical user interface of the dictation application (Keskinen, Melto, et al., 2013, Figure 1).
Users have their own personal user accounts, and the documents are further organized under patients and days. While recording a dictation, the energy level of the audio signal is visualized. A scrolling timeline with bar visualization is also shown. These bars can be later used to navigate in the audio. After the recording is finished, it is sent to the server and then to the speech recognition engine. When the recognition is ready, the user receives a transcript for the dictation. In case there are multiple possible recognitions for a word, that word is highlighted with red, and the options can be accessed by tapping the word and the desired option from the list that appears. All other words can be edited by tapping the word and then typing the desired word. Because of strict policies and restrictions, as well as an enormous workload, our application was not integrated with the official patient information system. Therefore, the final dictation transcriptions were copied from the document management system into the official
4 http://www.lingsoft.fi/?lang=en 5 http://www.m-files.com/en
……
……
…
76
patient information system using a PC. A more detailed description of the technical solutions can be found in the original publication (Keskinen, Melto, et al., 2013).
The medical language model available for the evaluation was based on doctors’ dictations. We noticed that it was not able to recognize the language and terminology used by the wound care nurses at a sufficient level. The word error rate in our recognition tests before the evaluation was over 20 percent at its best, and the participants would have been required to make too many corrections to the recognized text, in our opinion. Thus, we decided to use the Wizard of Oz approach, where a researcher fixes the most obvious recognition errors in the text before it is made available to the end user, i.e., the actual participant in the case of an evaluation. For the wizard, we have another version of the application, which enables her or him to see the recognized text counterparts for participants’ dictations, edit them, and send them back to the server while making them available to the participants as well.
3.6.3 Challenges
The challenges in this case arose from the context in many aspects. First, evaluations in a work environment demand respect to the fact that the participants are actually working while attending the study. This means that what they are asked or asked to do should be somewhat more beneficial compared to the evaluation of entertaining applications, which are mainly evaluated during people’s leisure time. Second, the healthcare domain is a specified field that requires special knowledge and includes many policies and restrictions related to privacy issues, for instance. Although these are not related to user experience per se, practical limitations are an essential part of any evaluation despite the research topic.
3.6.4 Evaluation
This user experience evaluation was conducted in a hospital environment with two female nurse participants, who made altogether 97 dictations. User expectations before the usage period and user experiences after the usage were gathered from them with electronic forms.
Context
This case concerned the healthcare domain and work environment, as the application is meant for professionals working in the field. The physical environment of the evaluation was a university-level hospital's outpatient wound clinic, more specifically a reception room where the patients visit and patient information system entries occur. For the evaluation, the participants were given a tablet computer and a headset including a microphone. The computer already available in the room was also used when copying the final dictation transcriptions to the official patient information system.

……
……
…
77
Although the tablet dictation application itself allows mobile usage, due to the participants’ mainly static work environment, mobile usage was not evaluated here. Furthermore, as the tested integrated microphones in tablets did not produce a sufficient audio quality level, we were forced to use a headset, which would have complicated mobile usage as well.
Participants
We had two female nurse participants aged 30 (P1) and 36 (P2) years. Participant 1 had eight years of work experience in nursing, three years of which at the wound clinic, where she worked one day every second week at the time of the evaluation. Before the evaluation, she wrote all the nursing entries, which she reported to take about 80 to 100 minutes in a work shift. Participant 2, however, had 13 years of work experience in nursing, eight years at the wound clinic, where she now worked two days a week. She usually dictated the nursing entries, which took her about 60 minutes every work shift.
Both participants reported four different systems into which they dictate or write entries. The entries include field-specific information about the wound properties, treatment products and methods, treatment plans, consultations, and so forth. Both participants reported to make notes for the dictations or text entries. Neither one of the participants had used speech recognition before the evaluation, and only participant 1 had tried a tablet computer a few times beforehand. Before the usage, both participants thought speech recognition could be useful in their work, and they also said that they could dictate during the care situation while treating a patient.
Procedure
The evaluation took three months in total. During this time, participant 1 made 30 dictations, and participant 2 made 67 dictations. The difference in the number of dictations is explained by the participants’ differing work shift amounts at the wound clinic. The procedure of the overall evaluation is presented in Table 12, followed by a description of one dictation cycle.
Due to research permission policies, all communication with the participants was done by the nursing science researchers. Thus, the interview and the introduction of the application before the evaluation were done by them. In addition, if there were any problems in using the application, the participants contacted the nursing science researchers.
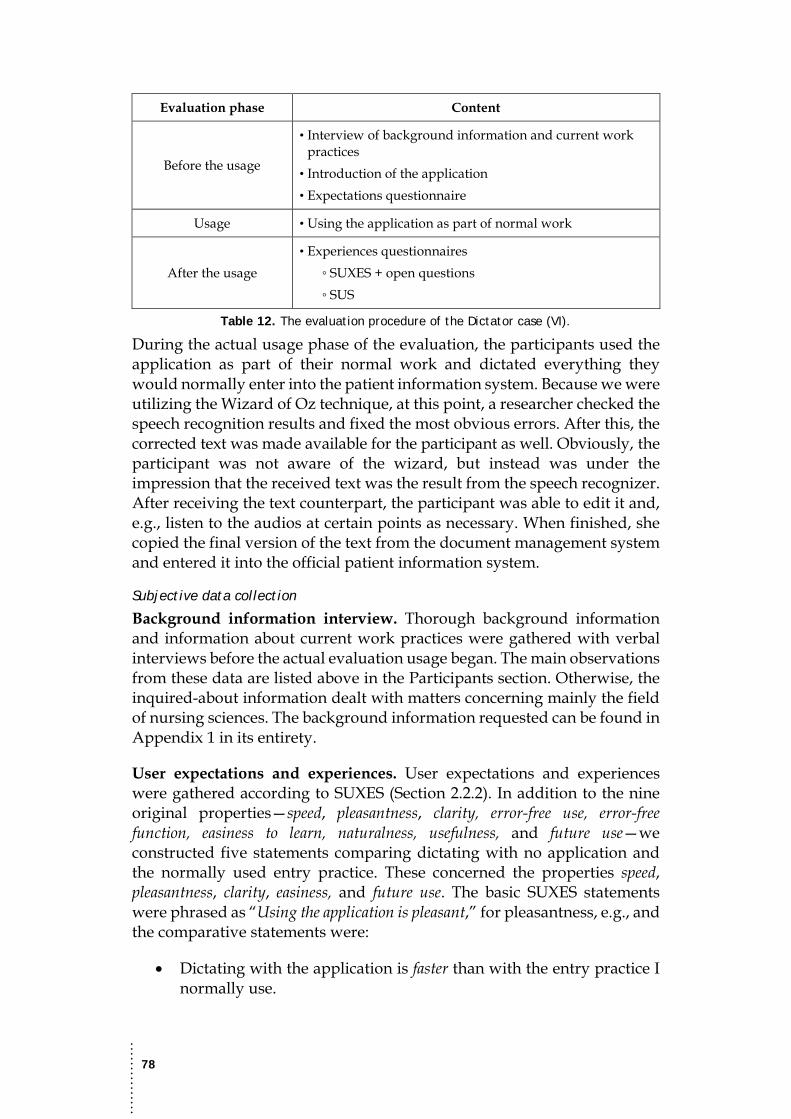
……
……
…
78
Evaluation phase Content
Before the usage
• Interview of background information and current work practices
• Introduction of the application • Expectations questionnaire
Usage • Using the application as part of normal work
After the usage • Experiences questionnaires
◦ SUXES + open questions ◦ SUS
Table 12. The evaluation procedure of the Dictator case (VI).
During the actual usage phase of the evaluation, the participants used the application as part of their normal work and dictated everything they would normally enter into the patient information system. Because we were utilizing the Wizard of Oz technique, at this point, a researcher checked the speech recognition results and fixed the most obvious errors. After this, the corrected text was made available for the participant as well. Obviously, the participant was not aware of the wizard, but instead was under the impression that the received text was the result from the speech recognizer. After receiving the text counterpart, the participant was able to edit it and, e.g., listen to the audios at certain points as necessary. When finished, she copied the final version of the text from the document management system and entered it into the official patient information system.
Subjective data collection
Background information interview. Thorough background information and information about current work practices were gathered with verbal interviews before the actual evaluation usage began. The main observations from these data are listed above in the Participants section. Otherwise, the inquired-about information dealt with matters concerning mainly the field of nursing sciences. The background information requested can be found in Appendix 1 in its entirety.
User expectations and experiences. User expectations and experiences were gathered according to SUXES (Section 2.2.2). In addition to the nine original properties—speed, pleasantness, clarity, error-free use, error-free function, easiness to learn, naturalness, usefulness, and future use—we constructed five statements comparing dictating with no application and the normally used entry practice. These concerned the properties speed, pleasantness, clarity, easiness, and future use. The basic SUXES statements were phrased as “Using the application is pleasant,” for pleasantness, e.g., and the comparative statements were:
• Dictating with the application is faster than with the entry practice I normally use.
……
……
…
79
• Dictating with the application is more pleasant than the entry practice I normally use.
• Dictating with the application is clearer than the entry practice I normally use.
• Dictating with the application is easier than the entry practice I normally use.
• I would rather make the entries with the dictation application in the future than with the entry practice I used before.
Obeying the principles of SUXES, the expectations were reported by giving two values, an acceptable and desired level, and the experiences by giving one value, a perceived level. In addition, the values were given on a seven-step scale ranging from low to high.
To gather more general feedback and development ideas on the application, the experiences questionnaire included the following questions:
• Did using the headset distract you from dictation? (No / Yes / I don’t know)
• If it did distract, how? • Could you use the headset daily, if it was the prerequisite for using
the dictation application? (No / Yes / I don’t know) • How did introducing speech recognition and the dictation application
change your work practices? • What speech commands are missing from the dictation application,
in your opinion? • What buttons are missing from the dictation application, in your opinion? • How could the speech recognition or the dictation application be
developed? • Would you like to comment about anything else?
In addition to the SUXES-based expectations and experiences and the open-ended questions above, the nursing science researchers collected subjective usability-related experiences with the System Usability Scale (SUS) (Brooke, 1996), adapting a Finnish translation presented by Vanhala (2005, p. 26). All of the questionnaires were in electronic form, and the participants filled them in using a PC’s web browser.
Supportive, objective data collection
To find possible user patterns and to monitor the system’s functions, system and user events were logged throughout the evaluation. However, due to the low number of dictations per participant combined with the varying “dictation cases,” analyzing these data was not considered relevant for this dissertation.
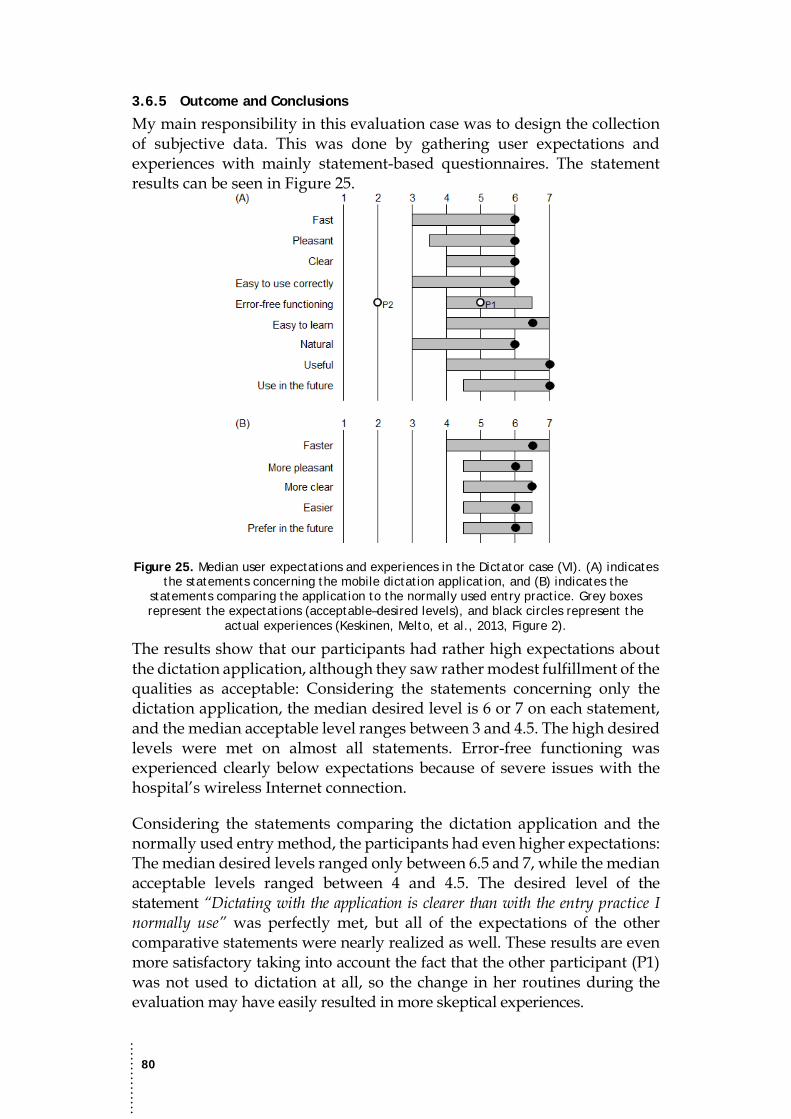
……
……
…
80
3.6.5 Outcome and Conclusions
My main responsibility in this evaluation case was to design the collection of subjective data. This was done by gathering user expectations and experiences with mainly statement-based questionnaires. The statement results can be seen in Figure 25.
Figure 25. Median user expectations and experiences in the Dictator case (VI). (A) indicates the statements concerning the mobile dictation application, and (B) indicates the
statements comparing the application to the normally used entry practice. Grey boxes represent the expectations (acceptable–desired levels), and black circles represent the
actual experiences (Keskinen, Melto, et al., 2013, Figure 2).
The results show that our participants had rather high expectations about the dictation application, although they saw rather modest fulfillment of the qualities as acceptable: Considering the statements concerning only the dictation application, the median desired level is 6 or 7 on each statement, and the median acceptable level ranges between 3 and 4.5. The high desired levels were met on almost all statements. Error-free functioning was experienced clearly below expectations because of severe issues with the hospital’s wireless Internet connection.
Considering the statements comparing the dictation application and the normally used entry method, the participants had even higher expectations: The median desired levels ranged only between 6.5 and 7, while the median acceptable levels ranged between 4 and 4.5. The desired level of the statement “Dictating with the application is clearer than with the entry practice I normally use” was perfectly met, but all of the expectations of the other comparative statements were nearly realized as well. These results are even more satisfactory taking into account the fact that the other participant (P1) was not used to dictation at all, so the change in her routines during the evaluation may have easily resulted in more skeptical experiences.
……
……
…
81
The positive attitude towards the application seen in the statement-based results is further strengthened by the responses to the open questions: The participants were now able to check the text much faster, while normally, it could take about a week before a dictation was available in writing. The participants were not even bothered by the headset. In fact, they would have been ready to use it daily, if necessary. The participants could not come up with missing speech commands or buttons, and the only development area they mentioned was better recognition for compound words. The importance of a working Internet connection was mentioned by the other participant, but based on the statement-based results, even the connection problems did not ruin the satisfaction with the application.
As fully automatic speech recognition could not be used in this case, the evaluation was conducted utilizing the Wizard of Oz technique. Although the user experiences are not based on truly existing automatic speech recognition, the results indicate users’ reactions and opinions on an application having a sufficient speech recognition rate, i.e., a rate that would be acceptable in a work environment. Thus, the user experience results demonstrate the potential of speech-based patient information entry as a true option for manual typing.
Beforehand, the challenges in this case arose from the context, i.e., the work environment and healthcare domain. Because the nurses handled real patient information, all communication with them had to be executed by our project partners, i.e., the nursing science researchers who had permission to access the data. Without the nursing science researchers being responsible for the practical execution of the evaluation, it may have been extremely challenging, if not impossible, to receive approval for the research from the hospital district. Disregarding these limitations and other practical issues, such as technical problems, the evaluation was rather straightforward from the user experience point of view.
The questionnaires had to be designed carefully: The content had to be unambiguous and the items “worthwhile” to avoid wasting the nurses’ time. These are properties of a good questionnaire in every evaluation, naturally, but in this case especially, as we did not have a representative from the field of human-technology interaction present. To investigate the true potential of adopting this kind of application as part of the nurses’ work, statements comparing the application and the current patient information entry practice were created and inquired about in addition to the more familiar SUXES-like statements. The results were mainly extremely positive, and the participants were enthusiastic about the evaluated entry practice. As a possible downside, though, we did not receive any suggestions for improvements aside from the better recognition of compound words, which is a matter that more concerns the language model.
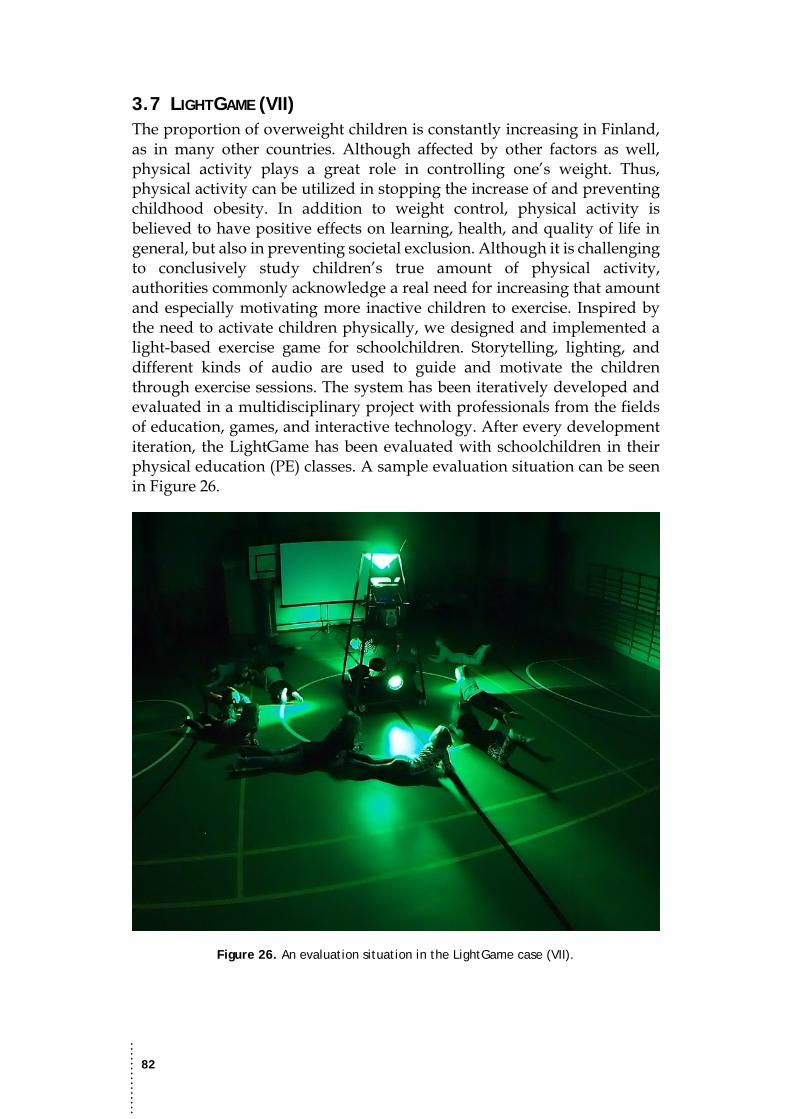
……
……
…
82
3.7 LIGHTGAME (VII) The proportion of overweight children is constantly increasing in Finland, as in many other countries. Although affected by other factors as well, physical activity plays a great role in controlling one’s weight. Thus, physical activity can be utilized in stopping the increase of and preventing childhood obesity. In addition to weight control, physical activity is believed to have positive effects on learning, health, and quality of life in general, but also in preventing societal exclusion. Although it is challenging to conclusively study children’s true amount of physical activity, authorities commonly acknowledge a real need for increasing that amount and especially motivating more inactive children to exercise. Inspired by the need to activate children physically, we designed and implemented a light-based exercise game for schoolchildren. Storytelling, lighting, and different kinds of audio are used to guide and motivate the children through exercise sessions. The system has been iteratively developed and evaluated in a multidisciplinary project with professionals from the fields of education, games, and interactive technology. After every development iteration, the LightGame has been evaluated with schoolchildren in their physical education (PE) classes. A sample evaluation situation can be seen in Figure 26.
Figure 26. An evaluation situation in the LightGame case (VII).
……
……
…
83
This case study contributed to two of the publications included in this dissertation: The original Publication VI resulted from Evaluation I (Section 3.7.4 Evaluation I). Considering this publication, I was involved in the evaluation of the extended version of the system, not with the initial version or its evaluation, nor the co-creation workshops. Thus, the focus here is on the extended version, i.e., the complete version, and its two evaluations, Evaluation I and Evaluation II (Section 3.7.5 Evaluation II), which resulted in the original Publication VII.6
3.7.1 Objective
The goal of the LightGame case (VII) was to create novel, yet affordable content for PE classes. We wanted to motivate schoolchildren to exercise and create a feeling of community, i.e., including everyone without discrimination or a competitive atmosphere. Evaluation-wise, the objective was to study how the children perceive both the concept and the technology. We wanted to inquire about exercise-related, game-related, and interaction-related aspects from the children. As the teachers know their classes and the educational objectives well, we also wanted to receive feedback from the teachers. It was possible to systematically gather teachers’ experiences only in the last evaluation (Section 3.7.5 Evaluation II). This was extremely important, because teachers were another user group, having operated the system themselves. In the last evaluation, we also used objective meters to measure the amount of physical exercise to compare it with the subjective interpretations and experiences.
3.7.2 System
The complete version of the LightGame is designed to fill a 60-minute PE class, and it consists of four main stages: awakening, empowerment, calling, and battle. The story concentrates on a battle between the good “Light” character and the bad “Shadow” character. First, a narrator introduces the game, after which the Light character guides the players through the stages, each containing four exercise tasks. The awakening part includes slow stretching and warm-up exercises. The empowerment part is more active and physical. The calling part is even faster, containing a lot of movement around the space in its four activities. Finally, the battle is the most physical part, consisting of tasks with fast varying movements. After the battle, the narrator returns and guides the players through a relaxation phase with three slow, relaxing activities, such as lying still and concentrating on one’s breathing. The music style and tempo in each part is designed to match the activity level aimed for that part. Based on the feedback received from the evaluation of the initial version, interactivity was added to the complete version. This is done by rating the children’s performance after each activity on a binary scale by the person controlling the game with a wireless controller or a mouse. The rating— an acceptable or great performance—is 6AudioSlides presentation available at http://audioslides.elsevier.com/getvideo.aspx?doi=10.1016/j.entcom.2014.08.009
……
……
…
84
shared instantly with speech output, and after each exercise set, a summation grade of one, two, or three stars is displayed with a projector and projection screen or shown on a laptop screen. The optional projector was sometimes also used to display signature images of the Light and the Shadow characters or images of animals present in the story.
Physically, the setup consists of a laptop PC, a pair of active speakers, a moving head lighting fixture, optionally fixed lights, a projector and a projection screen, and either a PlayStation Move controller® or a regular mouse for input. This economical setup can be assembled for a couple thousand euros (at the time of printing).
3.7.3 Challenges
There were several characteristics that made this user experience evaluation case study challenging. First, having schoolchildren as the main user group posed issues, such as how much and what can be asked from the children while still gaining useful information. In addition, how should the questions or statements be phrased so the children will understand them but they do not become too simple as regards the evaluation? Another issue that needed consideration was having yet another user group involved, the teachers. We were interested in teachers’ educational, usefulness, motivational, and practical points of view, but how would they perceive the overall picture, interpret children’s reactions, and report them based on our inquiries? Second, the school context raised challenges considering the timing and extent of the questionnaires: what to include in the questionnaires and when to fill them in without cutting down the time for actual physical activity but still gathering important information. Moreover, there were some very practical issues considering the physical environments, such as physical space limitations and how to make the space dark enough for the lights to be effective.
3.7.4 Evaluation I
This user experience evaluation was conducted in a school environment with altogether 110 schoolchildren. User experiences were gathered mainly with statement-based questionnaires.
Context
The case concerned a school environment, and the physical environment of the evaluation sessions was a school’s small gym. The equipment described in Section 3.7.2 was set up, and the windows were covered to make the space dark enough. At least the participating group of schoolchildren, the group’s teacher, and one or more researchers were present at the evaluation sessions. Questionnaires were filled in at the scene or afterwards in a classroom.
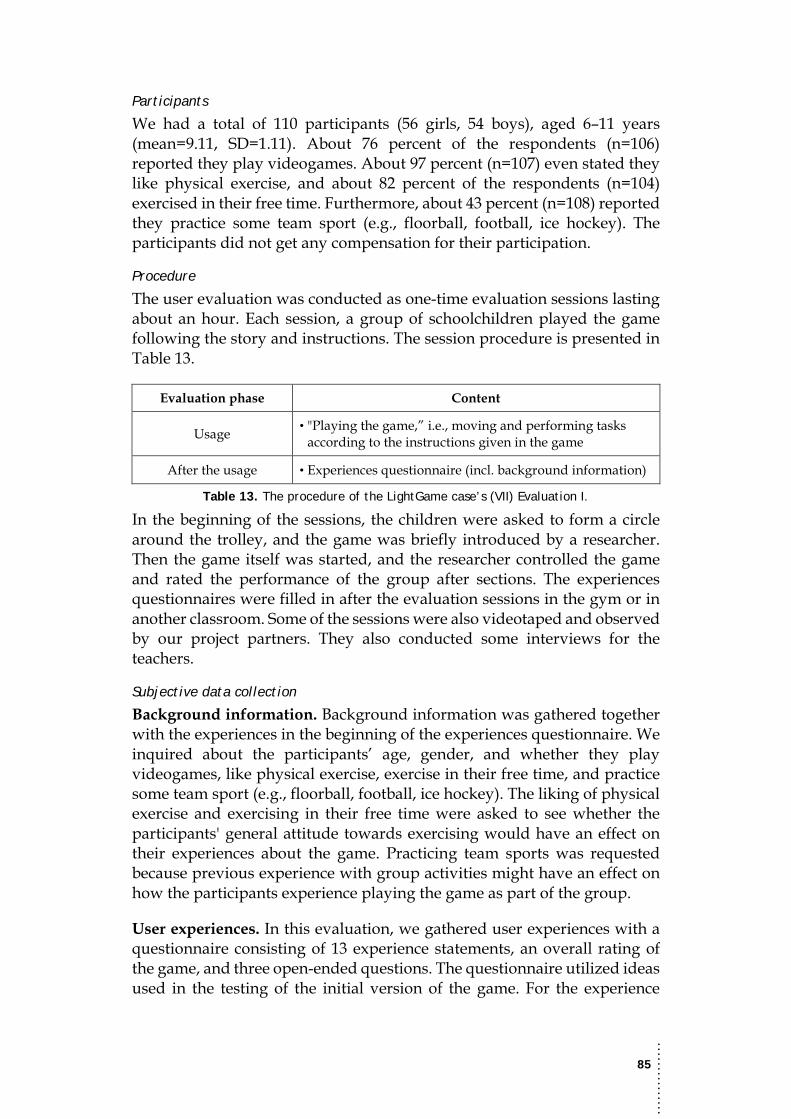
……
……
…
85
Participants
We had a total of 110 participants (56 girls, 54 boys), aged 6–11 years (mean=9.11, SD=1.11). About 76 percent of the respondents (n=106) reported they play videogames. About 97 percent (n=107) even stated they like physical exercise, and about 82 percent of the respondents (n=104) exercised in their free time. Furthermore, about 43 percent (n=108) reported they practice some team sport (e.g., floorball, football, ice hockey). The participants did not get any compensation for their participation.
Procedure
The user evaluation was conducted as one-time evaluation sessions lasting about an hour. Each session, a group of schoolchildren played the game following the story and instructions. The session procedure is presented in Table 13.
Evaluation phase Content
Usage • "Playing the game,” i.e., moving and performing tasks according to the instructions given in the game
After the usage • Experiences questionnaire (incl. background information)
Table 13. The procedure of the LightGame case’s (VII) Evaluation I.
In the beginning of the sessions, the children were asked to form a circle around the trolley, and the game was briefly introduced by a researcher. Then the game itself was started, and the researcher controlled the game and rated the performance of the group after sections. The experiences questionnaires were filled in after the evaluation sessions in the gym or in another classroom. Some of the sessions were also videotaped and observed by our project partners. They also conducted some interviews for the teachers.
Subjective data collection
Background information. Background information was gathered together with the experiences in the beginning of the experiences questionnaire. We inquired about the participants’ age, gender, and whether they play videogames, like physical exercise, exercise in their free time, and practice some team sport (e.g., floorball, football, ice hockey). The liking of physical exercise and exercising in their free time were asked to see whether the participants' general attitude towards exercising would have an effect on their experiences about the game. Practicing team sports was requested because previous experience with group activities might have an effect on how the participants experience playing the game as part of the group.
User experiences. In this evaluation, we gathered user experiences with a questionnaire consisting of 13 experience statements, an overall rating of the game, and three open-ended questions. The questionnaire utilized ideas used in the testing of the initial version of the game. For the experience
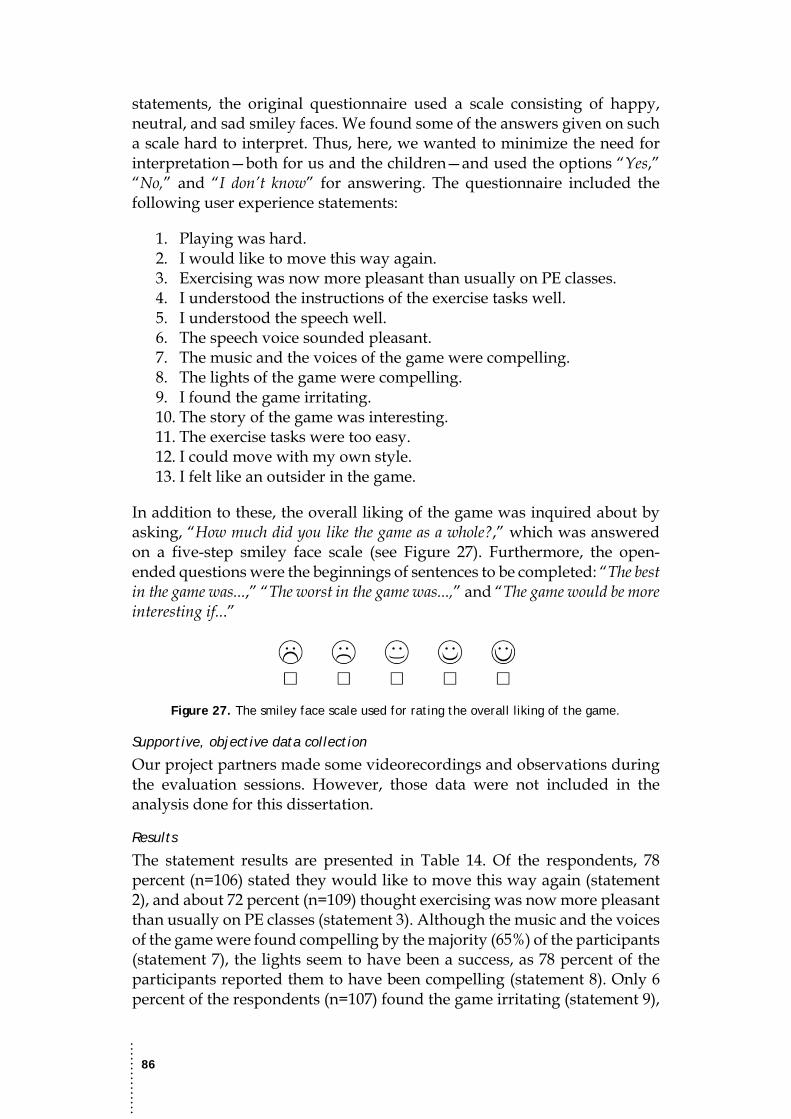
……
……
…
86
statements, the original questionnaire used a scale consisting of happy, neutral, and sad smiley faces. We found some of the answers given on such a scale hard to interpret. Thus, here, we wanted to minimize the need for interpretation—both for us and the children—and used the options “Yes,” “No,” and “I don’t know” for answering. The questionnaire included the following user experience statements:
1. Playing was hard. 2. I would like to move this way again. 3. Exercising was now more pleasant than usually on PE classes. 4. I understood the instructions of the exercise tasks well. 5. I understood the speech well. 6. The speech voice sounded pleasant. 7. The music and the voices of the game were compelling. 8. The lights of the game were compelling. 9. I found the game irritating. 10. The story of the game was interesting. 11. The exercise tasks were too easy. 12. I could move with my own style. 13. I felt like an outsider in the game.
In addition to these, the overall liking of the game was inquired about by asking, “How much did you like the game as a whole?,” which was answered on a five-step smiley face scale (see Figure 27). Furthermore, the open-ended questions were the beginnings of sentences to be completed: “The best in the game was...,” “The worst in the game was...,” and “The game would be more interesting if...”
Figure 27. The smiley face scale used for rating the overall liking of the game.
Supportive, objective data collection
Our project partners made some videorecordings and observations during the evaluation sessions. However, those data were not included in the analysis done for this dissertation.
Results
The statement results are presented in Table 14. Of the respondents, 78 percent (n=106) stated they would like to move this way again (statement 2), and about 72 percent (n=109) thought exercising was now more pleasant than usually on PE classes (statement 3). Although the music and the voices of the game were found compelling by the majority (65%) of the participants (statement 7), the lights seem to have been a success, as 78 percent of the participants reported them to have been compelling (statement 8). Only 6 percent of the respondents (n=107) found the game irritating (statement 9),
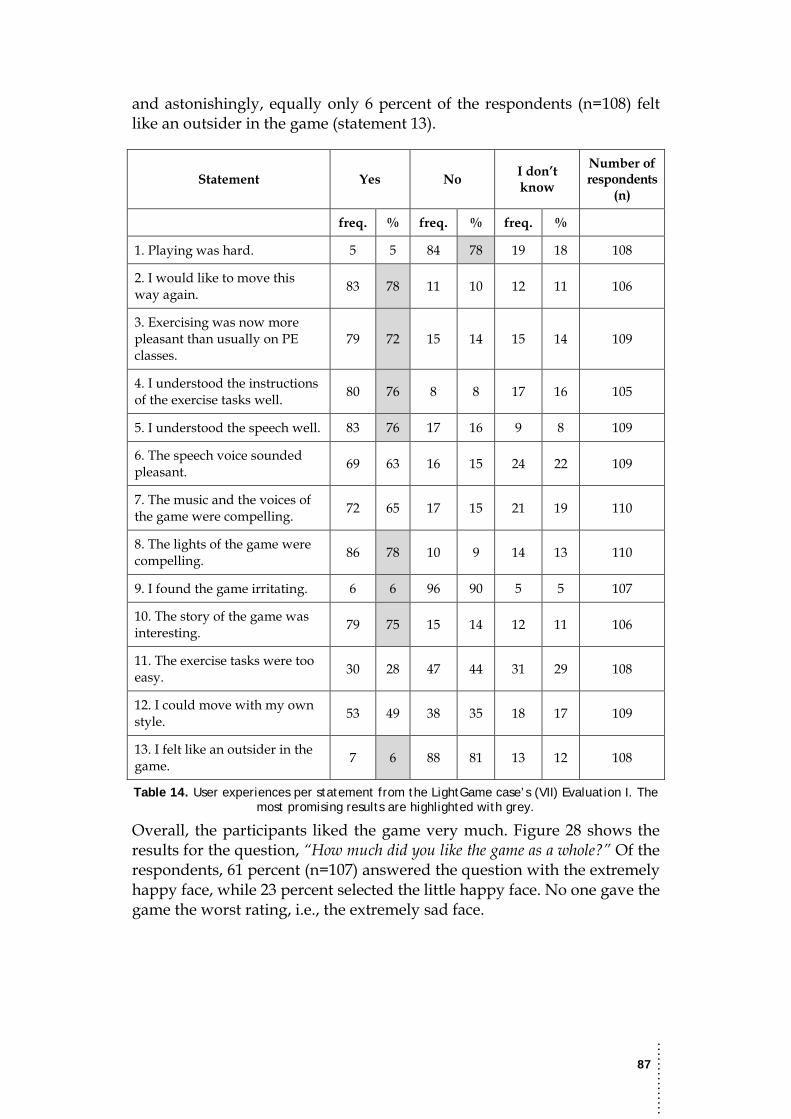
……
……
…
87
and astonishingly, equally only 6 percent of the respondents (n=108) felt like an outsider in the game (statement 13).
Statement Yes No I don’t know
Number of respondents
(n)
freq. % freq. % freq. %
1. Playing was hard. 5 5 84 78 19 18 108
2. I would like to move this way again. 83 78 11 10 12 11 106
3. Exercising was now more pleasant than usually on PE classes.
79 72 15 14 15 14 109
4. I understood the instructions of the exercise tasks well. 80 76 8 8 17 16 105
5. I understood the speech well. 83 76 17 16 9 8 109
6. The speech voice sounded pleasant. 69 63 16 15 24 22 109
7. The music and the voices of the game were compelling. 72 65 17 15 21 19 110
8. The lights of the game were compelling. 86 78 10 9 14 13 110
9. I found the game irritating. 6 6 96 90 5 5 107
10. The story of the game was interesting. 79 75 15 14 12 11 106
11. The exercise tasks were too easy. 30 28 47 44 31 29 108
12. I could move with my own style. 53 49 38 35 18 17 109
13. I felt like an outsider in the game. 7 6 88 81 13 12 108
Table 14. User experiences per statement from the LightGame case’s (VII) Evaluation I. The most promising results are highlighted with grey.
Overall, the participants liked the game very much. Figure 28 shows the results for the question, “How much did you like the game as a whole?” Of the respondents, 61 percent (n=107) answered the question with the extremely happy face, while 23 percent selected the little happy face. No one gave the game the worst rating, i.e., the extremely sad face.
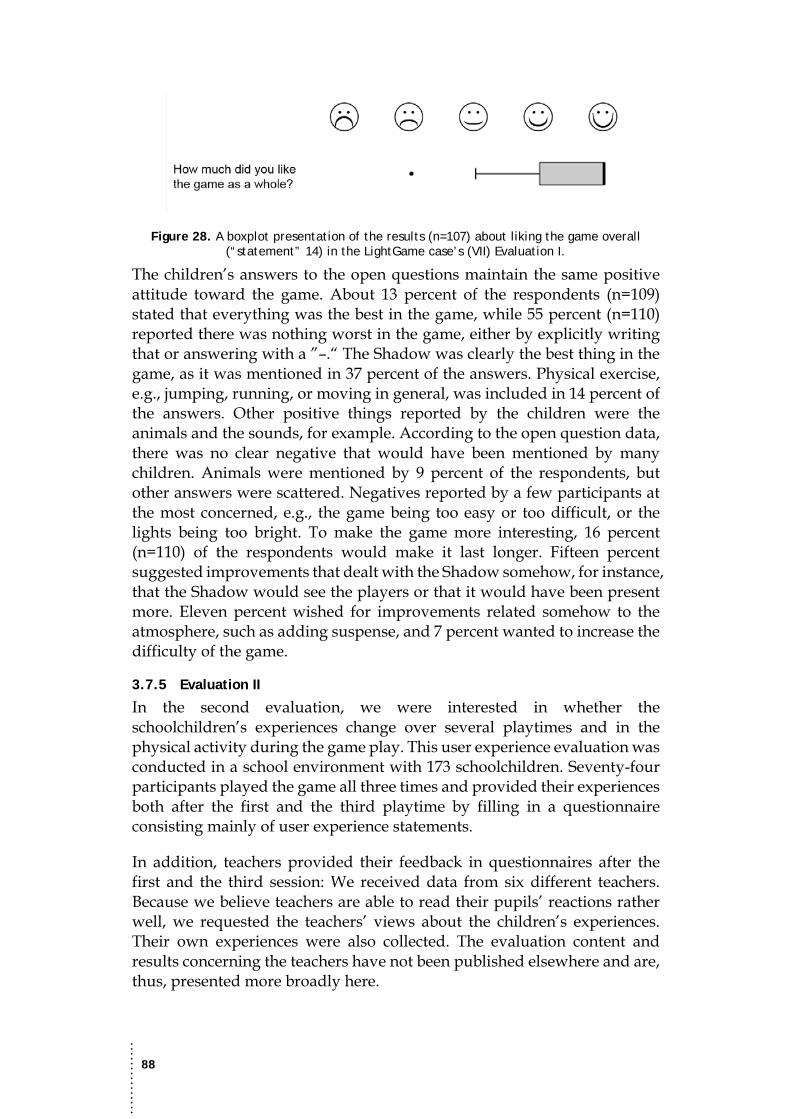
……
……
…
88
Figure 28. A boxplot presentation of the results (n=107) about liking the game overall (“statement” 14) in the LightGame case’s (VII) Evaluation I.
The children’s answers to the open questions maintain the same positive attitude toward the game. About 13 percent of the respondents (n=109) stated that everything was the best in the game, while 55 percent (n=110) reported there was nothing worst in the game, either by explicitly writing that or answering with a ”–.“ The Shadow was clearly the best thing in the game, as it was mentioned in 37 percent of the answers. Physical exercise, e.g., jumping, running, or moving in general, was included in 14 percent of the answers. Other positive things reported by the children were the animals and the sounds, for example. According to the open question data, there was no clear negative that would have been mentioned by many children. Animals were mentioned by 9 percent of the respondents, but other answers were scattered. Negatives reported by a few participants at the most concerned, e.g., the game being too easy or too difficult, or the lights being too bright. To make the game more interesting, 16 percent (n=110) of the respondents would make it last longer. Fifteen percent suggested improvements that dealt with the Shadow somehow, for instance, that the Shadow would see the players or that it would have been present more. Eleven percent wished for improvements related somehow to the atmosphere, such as adding suspense, and 7 percent wanted to increase the difficulty of the game.
3.7.5 Evaluation II
In the second evaluation, we were interested in whether the schoolchildren’s experiences change over several playtimes and in the physical activity during the game play. This user experience evaluation was conducted in a school environment with 173 schoolchildren. Seventy-four participants played the game all three times and provided their experiences both after the first and the third playtime by filling in a questionnaire consisting mainly of user experience statements.
In addition, teachers provided their feedback in questionnaires after the first and the third session: We received data from six different teachers. Because we believe teachers are able to read their pupils’ reactions rather well, we requested the teachers’ views about the children’s experiences. Their own experiences were also collected. The evaluation content and results concerning the teachers have not been published elsewhere and are, thus, presented more broadly here.
……
……
…
89
Context
Like Evaluation I, this evaluation case concerned a school environment, and the physical environment of the evaluation sessions was a school’s gym. The equipment described in Section 3.7.2 was set up, and the windows were covered to make the space dark enough. In addition to the equipment described earlier, FitBit ® Flex™ wireless activity and sleep wristbands7 were fastened to the participants’ wrists for gathering objective activity data. At least the participating group of schoolchildren, the group’s teacher, and one or more researchers were present in the evaluation sessions. Questionnaires were filled in at the scene or afterwards in a classroom.
Participants
We had a total of 173 participants (83 girls, 65 boys, 25 unreported), aged 8–11 years (mean=9.5, SD=1.0). About 94 percent of the respondents (n=145) were right-handed, and about 72 percent reported they play videogames. Eighty-seven percent (n=146) exercised in their free time, and the liking of physical exercise was rated with a median 5 out of 5 (n=148). The most frequently mentioned physical hobbies were football, some type of dance, floorball, and either running or walking. Again, the participants did not get any compensation for their participation.
Procedure
This evaluation included three separate sessions per group. The sessions lasted about an hour and took place for three sequential weeks. The procedures of the evaluation and sessions are presented in Table 15.
The actual playing of the game followed the same pattern for each of the three sessions: First, the children gathered around the trolley in a circle and exercised according to the instructions. The game was controlled and the performance was rated by the group's teacher in each session.
User experiences were gathered both from the schoolchildren themselves and the teachers after the first and third session with paper questionnaires. Objective movement data were gathered with the wristbands during the sessions, meaning the wristbands were handed out and properly fastened to the children's wrists at the beginning of each session.
7 www.fitbit.com/uk/flex
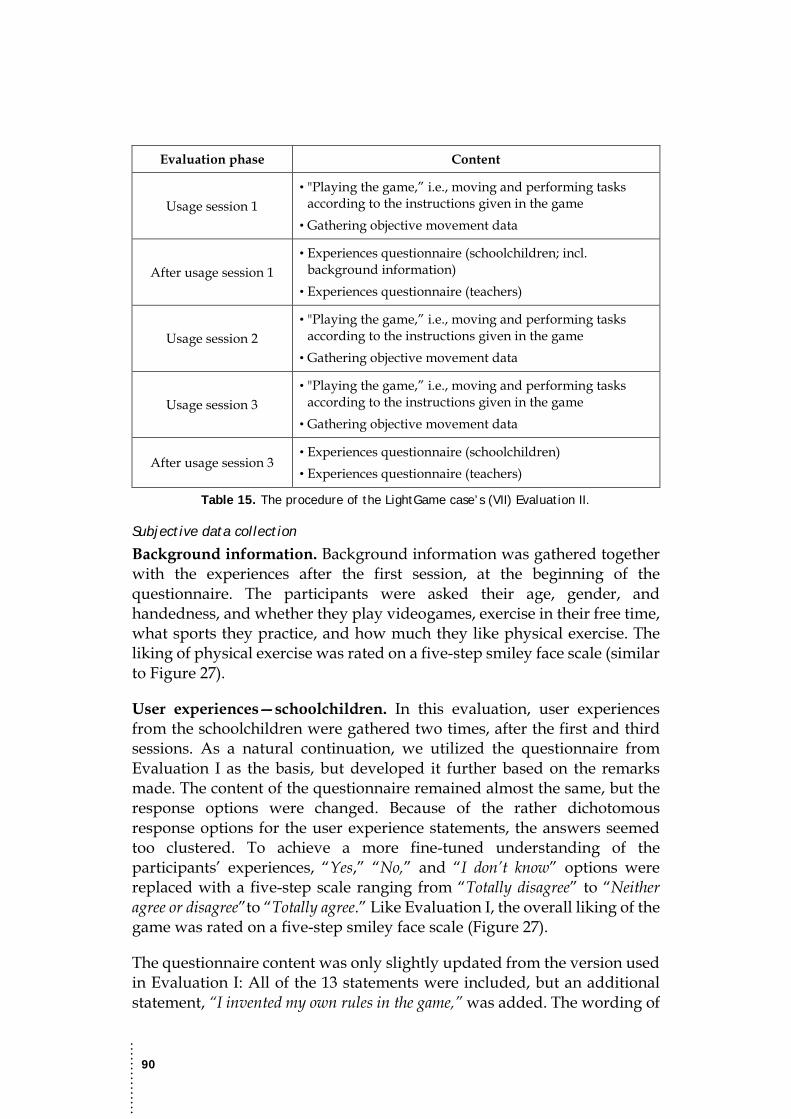
……
……
…
90
Evaluation phase Content
Usage session 1 • "Playing the game,” i.e., moving and performing tasks
according to the instructions given in the game • Gathering objective movement data
After usage session 1 • Experiences questionnaire (schoolchildren; incl.
background information) • Experiences questionnaire (teachers)
Usage session 2 • "Playing the game,” i.e., moving and performing tasks
according to the instructions given in the game • Gathering objective movement data
Usage session 3 • "Playing the game,” i.e., moving and performing tasks
according to the instructions given in the game • Gathering objective movement data
After usage session 3 • Experiences questionnaire (schoolchildren) • Experiences questionnaire (teachers)
Table 15. The procedure of the LightGame case’s (VII) Evaluation II.
Subjective data collection
Background information. Background information was gathered together with the experiences after the first session, at the beginning of the questionnaire. The participants were asked their age, gender, and handedness, and whether they play videogames, exercise in their free time, what sports they practice, and how much they like physical exercise. The liking of physical exercise was rated on a five-step smiley face scale (similar to Figure 27).
User experiences—schoolchildren. In this evaluation, user experiences from the schoolchildren were gathered two times, after the first and third sessions. As a natural continuation, we utilized the questionnaire from Evaluation I as the basis, but developed it further based on the remarks made. The content of the questionnaire remained almost the same, but the response options were changed. Because of the rather dichotomous response options for the user experience statements, the answers seemed too clustered. To achieve a more fine-tuned understanding of the participants’ experiences, “Yes,” “No,” and “I don’t know” options were replaced with a five-step scale ranging from “Totally disagree” to “Neither agree or disagree”to “Totally agree.” Like Evaluation I, the overall liking of the game was rated on a five-step smiley face scale (Figure 27).
The questionnaire content was only slightly updated from the version used in Evaluation I: All of the 13 statements were included, but an additional statement, “I invented my own rules in the game,” was added. The wording of

……
……
…
91
one statement was modified, i.e., “the music and the voices” were now referred to as “the other sounds” to distinguish between the speech voice in the game and all other sounds.
To compare the user experiences received after the first and third sessions, we used equivalent items both times. However, only the statements that seemed most relevant were included in the questionnaire filled in after the third session. This reduction was done because our study had already required reasonable effort from the children at this point. The statements included in the questionnaires of Evaluation II are listed below, and the statements asked about both times are highlighted in bold.
1. Playing was hard. 2. I would like to move this way again. 3. Exercising was now more pleasant than usually on PE classes. 4. I understood the instructions of the exercise tasks well. 5. I understood the speech well. 6. The speech voice sounded pleasant. 7. The other sounds of the game were compelling. 8. The lights of the game were compelling. 9. I invented my own rules in the game. 10. I found the game irritating. 11. The story of the game was interesting. 12. The exercise tasks were too easy. 13. I could move with my own style. 14. I felt like an outsider in the game.
Like Evaluation I, the overall liking of the game was requested, and the children gave their answer on a smiley face scale (see Figure 27) after both the first and third session. The best and the worst of the game were also requested in both questionnaires. However, in the questionnaire filled in after the first session, the children were also asked what would make the game more interesting and what kind of tasks they would want to be included.
User experiences—teachers. Like the children, the teachers were also asked to fill in two questionnaires, one after the first session and the other after the third session. Both of the teachers’ questionnaires included two sections: a part inquiring about the teacher’s interpretations of the children’s experiences and a part asking about the teacher’s own experiences.
We believe teachers usually know their pupils quite well and are able to interpret their experiences. Thus, we wanted to use a technique similar to that in the SymbolChat case (III), where the assistants assessed the system from the intellectually disabled users’ point of view. Both after the first and third session, the teachers were asked to rate and answer exactly the same items and questions as the schoolchildren. Only the phrasing of the
……
……
…
92
statements was modified to correspond to the fact that it was now another person assessing the statements from the perspectiveof others: The statement “I understood the speech well,” for instance, was now phrased as “They understood the speech well.” Consequently, the section concerning the children’s experiences included 14 user experience statements, the overall liking rating, and four open-ended questions in the first questionnaire, and six user experience statements, the overall liking rating, and two open-ended questions in the second questionnaire filled in after the third session. Both times, the teachers were instructed not to ask the children’s opinions or check their answers, but to make their assessments based on the observations made during the game.
The sections concerning teachers’ own experiences and opinions included six user experience statements. To compare the baseline experiences rated after the first session with the overall experiences reported after the third session, we used the same statements both times. Like the children’s statements, the statements concerning teachers’ experiences were rated on a five-step scale ranging between “Totally disagree”—“Neither agree or disagree”—“Totally agree.” The statements were:
1. Controlling the game was easy. 2. I believe I can manage controlling the game independently in the
future. 3. I would like to have a permanent possibility for using the game on
PE classes. 4. I believe the game motivates pupils to exercise more than normally
on PE classes. 5. The game would be suitable for PE classes as it is. 6. The pupils got an appropriate amount of physical exercise in the
game.
In addition to the user experience statements, the teachers were able to comment on their statement answers or anything else. The questionnaires also included two open-ended questions: How would you improve the game considering the pupils and How would you improve the system considering the teacher (i.e., the controller)?
Supportive, objective data collection
To gather objective evidence on children’s physical activity and to find possible connections between the actual activity and subjective ratings, we utilized activity wristbands. The children wore the wristbands during all three sessions. The average step count per participant was 794 on the first week, 884 on the second week, and 945 on the third week. The changes in the average step count indicate an increasing trend in the activity level. Thus, investigating the possibilities and reliability of this kind of a measurement technique is an intriguing topic for future research.
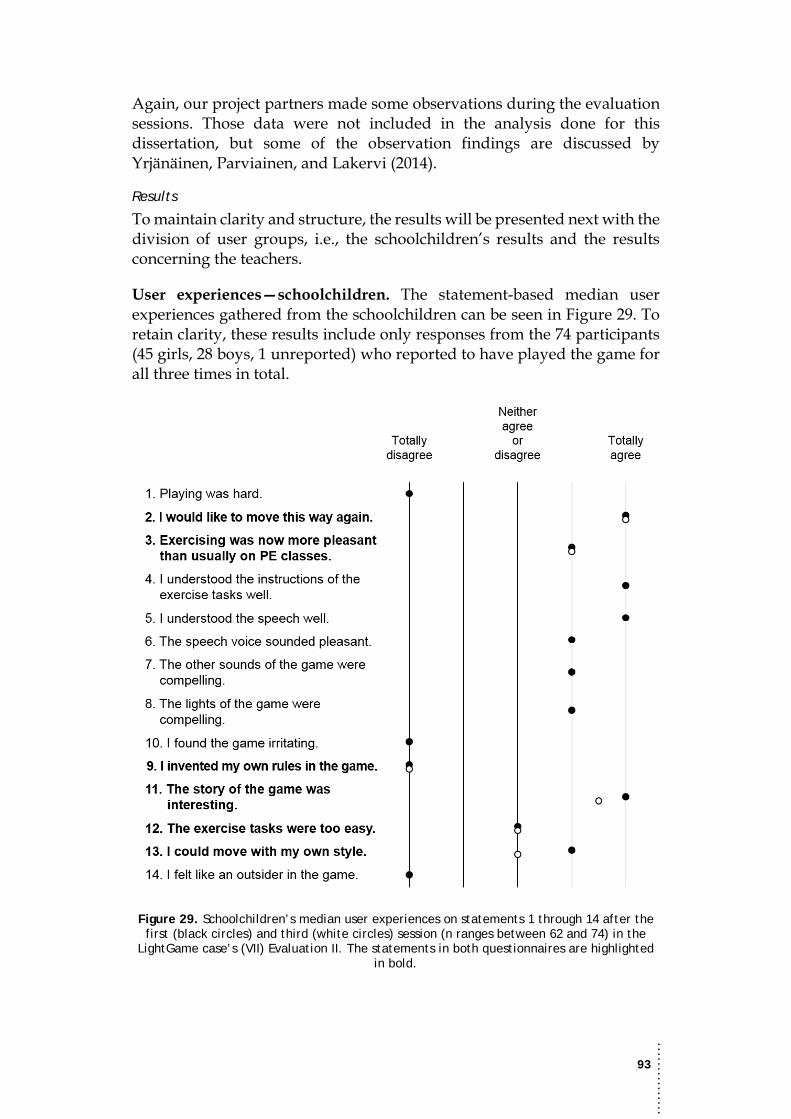
……
……
…
93
Again, our project partners made some observations during the evaluation sessions. Those data were not included in the analysis done for this dissertation, but some of the observation findings are discussed by Yrjänäinen, Parviainen, and Lakervi (2014).
Results
To maintain clarity and structure, the results will be presented next with the division of user groups, i.e., the schoolchildren’s results and the results concerning the teachers.
User experiences—schoolchildren. The statement-based median user experiences gathered from the schoolchildren can be seen in Figure 29. To retain clarity, these results include only responses from the 74 participants (45 girls, 28 boys, 1 unreported) who reported to have played the game for all three times in total.
Figure 29. Schoolchildren’s median user experiences on statements 1 through 14 after the first (black circles) and third (white circles) session (n ranges between 62 and 74) in the
LightGame case’s (VII) Evaluation II. The statements in both questionnaires are highlighted in bold.
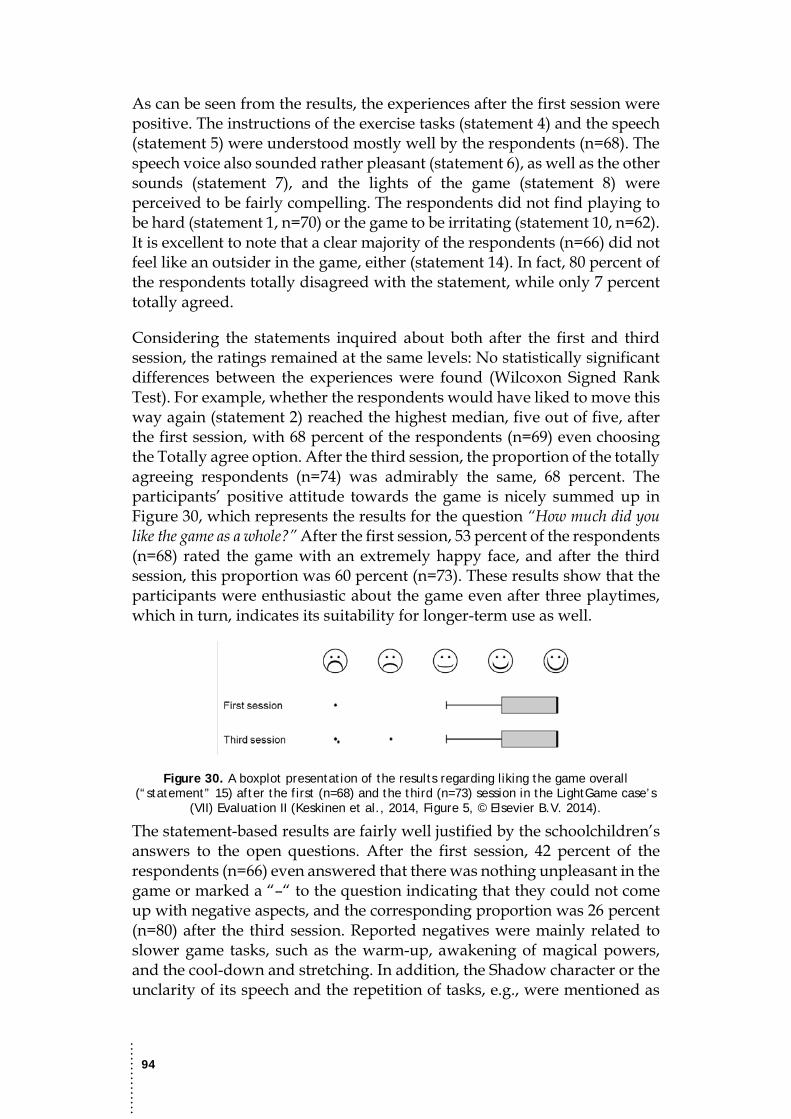
……
……
…
94
As can be seen from the results, the experiences after the first session were positive. The instructions of the exercise tasks (statement 4) and the speech (statement 5) were understood mostly well by the respondents (n=68). The speech voice also sounded rather pleasant (statement 6), as well as the other sounds (statement 7), and the lights of the game (statement 8) were perceived to be fairly compelling. The respondents did not find playing to be hard (statement 1, n=70) or the game to be irritating (statement 10, n=62). It is excellent to note that a clear majority of the respondents (n=66) did not feel like an outsider in the game, either (statement 14). In fact, 80 percent of the respondents totally disagreed with the statement, while only 7 percent totally agreed.
Considering the statements inquired about both after the first and third session, the ratings remained at the same levels: No statistically significant differences between the experiences were found (Wilcoxon Signed Rank Test). For example, whether the respondents would have liked to move this way again (statement 2) reached the highest median, five out of five, after the first session, with 68 percent of the respondents (n=69) even choosing the Totally agree option. After the third session, the proportion of the totally agreeing respondents (n=74) was admirably the same, 68 percent. The participants’ positive attitude towards the game is nicely summed up in Figure 30, which represents the results for the question “How much did you like the game as a whole?” After the first session, 53 percent of the respondents (n=68) rated the game with an extremely happy face, and after the third session, this proportion was 60 percent (n=73). These results show that the participants were enthusiastic about the game even after three playtimes, which in turn, indicates its suitability for longer-term use as well.
Figure 30. A boxplot presentation of the results regarding liking the game overall (“statement” 15) after the first (n=68) and the third (n=73) session in the LightGame case’s
(VII) Evaluation II (Keskinen et al., 2014, Figure 5, © Elsevier B.V. 2014).
The statement-based results are fairly well justified by the schoolchildren’s answers to the open questions. After the first session, 42 percent of the respondents (n=66) even answered that there was nothing unpleasant in the game or marked a “–“ to the question indicating that they could not come up with negative aspects, and the corresponding proportion was 26 percent (n=80) after the third session. Reported negatives were mainly related to slower game tasks, such as the warm-up, awakening of magical powers, and the cool-down and stretching. In addition, the Shadow character or the unclarity of its speech and the repetition of tasks, e.g., were mentioned as
……
……
…
95
negative aspects. The children’s eagerness for physical activity is clearly visible in the answers, as jumping or running, e.g., were mentioned as the best thing in the game by a half of the respondents (48%, n=79) after the first session and by a third (31%, n=72) after the third session. The physical activities were linked with game elements: For example, the children usually praised jumping over the water, rather than mentioning only jumping. The Shadow character was often mentioned in some role among the best things of the game. Ideas for improvement gathered after the first session dealt mainly with additional action, speed, and exercise. Some even suggested that the game could last longer and be more challenging; 27 percent of the respondents (n=71) would not have changed anything or could not think of anything to change.
User experiences—teachers. We received completed questionnaires from six different teachers. These data concerned eight first-time sessions and five third-time sessions, although there were altogether 12 sessions during the first week and nine sessions during the third playweek. Some classes were divided into two groups, i.e. sessions, and some pupils seem to have been participating in different groups from week to week. Furthermore, some teachers have filled in only one questionnaire covering two sessions, for example. Thus, matching all teachers’ questionnaire answers with individual participants per play session, e.g., was practically impossible. The results presented here are based on data from four teachers who filled in the questionnaire both after the first and third session. When comparing the teachers’ responses and the schoolchildren’s own experiences, only participants are included that reported to have participated in each of the three play sessions. The number of such participants corresponding to individual teachers’ responses ranges between 10 and 15, and the total number of these participants is 51.
As described, the teachers’ questionnaires included a part considering the children’s experiences as interpreted by the teachers and a part concerning the teacher’s own experiences. Figure 31 shows the teachers’ median responses to the user experience statements that the teachers were asked to answer from the schoolchildren’s point of view based on their observations after the first and third session. These statements were asked from the participants themselves as well.
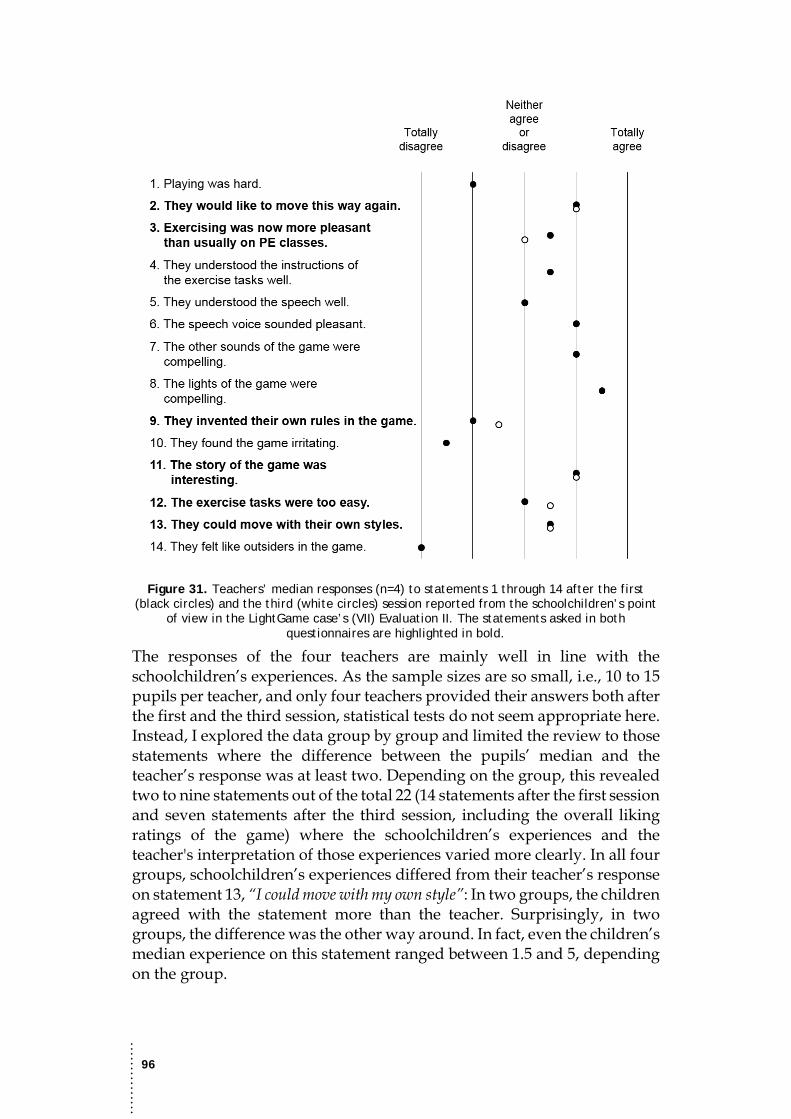
……
……
…
96
Figure 31. Teachers’ median responses (n=4) to statements 1 through 14 after the first (black circles) and the third (white circles) session reported from the schoolchildren’s point
of view in the LightGame case’s (VII) Evaluation II. The statements asked in both questionnaires are highlighted in bold.
The responses of the four teachers are mainly well in line with the schoolchildren’s experiences. As the sample sizes are so small, i.e., 10 to 15 pupils per teacher, and only four teachers provided their answers both after the first and the third session, statistical tests do not seem appropriate here. Instead, I explored the data group by group and limited the review to those statements where the difference between the pupils’ median and the teacher’s response was at least two. Depending on the group, this revealed two to nine statements out of the total 22 (14 statements after the first session and seven statements after the third session, including the overall liking ratings of the game) where the schoolchildren’s experiences and the teacher's interpretation of those experiences varied more clearly. In all four groups, schoolchildren’s experiences differed from their teacher’s response on statement 13, “I could move with my own style”: In two groups, the children agreed with the statement more than the teacher. Surprisingly, in two groups, the difference was the other way around. In fact, even the children’s median experience on this statement ranged between 1.5 and 5, depending on the group.

……
……
…
97
Furthermore, in three groups, the schoolchildren themselves agreed more that the exercising was now more pleasant than usual PE classes (statement 3) after the third session compared to their teachers’ responses. In two groups, there was a clear difference between the children’s and the teachers’ views about the understandability of the instructions and the speech (statements 4 and 5): The teachers felt that the children did not understand the instructions or the speech that well. Issues with the clarity and volume of some voices were mentioned in the open questions as well.
Conversely, there were many statements where the teachers’ answers were very well in line with the schoolchildren’s views. There were five to nine statements (out of the total 22) per group where the teacher’s response was exactly the same as the children’s median experience. The teachers were amazingly able to interpret their pupils’ willingness to move this way again and their overall liking of the game, both after the first and third session. Apart from one teacher’s response regarding the willingness to move this way again (statement 2) after the third session, all responses differed by a maximum of one from the corresponding pupils’ median experience. The teachers’ responses, as well as the children’s median experiences, on liking the game overall ranged between four and five both after the first and third session. Considering all the statements, the responses of neither the teachers nor the corresponding schoolchildren changed between the first and third sessions (Wilcoxon Signed Rank Test).
Regarding the open questions, the teachers’ interpretations matched the children’s answers quite well. They recognized that the children liked jumping over or dodging the light, e.g., but they also mentioned the dim gym as a positive thing—something that the children themselves did not mention, indicating the children concentrated on the game itself when evaluating the best aspects. The main negatives mentioned by the teachers were slow proceeding or repetition at times and the unclarity of the instructions or the speech.
The statement-based results considering the other part of the questionnaires, i.e., the four teachers’ own experiences, can be seen in Figure 32. The teachers felt that controlling the game was easy (statement 1), and they would be able to control it independently in the future (statement 2). However, some of them wished for a more convenient input method, such as a remote control. Although one of the teachers was more positive, the teachers in general were skeptical about whether the game would be suitable for PE classes as is (statement 5) and whether the pupils got an appropriate amount of physical exercise in the game (statement 6). This attitude is well explained by the teachers’ comments: There should be more physical exercise, and the speech voice should be clearer. The teachers also wished that a whole class could attend at the same time, and they had some practical concerns regarding the storage of the trolley, for instance. These
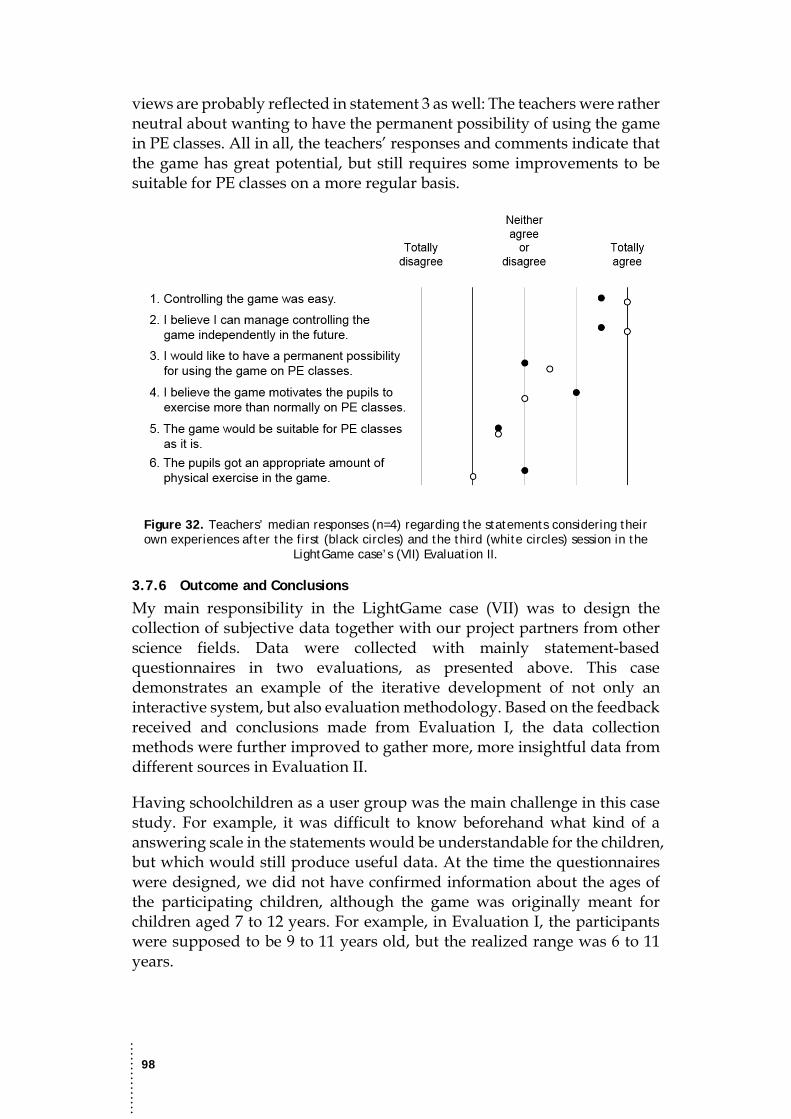
……
……
…
98
views are probably reflected in statement 3 as well: The teachers were rather neutral about wanting to have the permanent possibility of using the game in PE classes. All in all, the teachers’ responses and comments indicate that the game has great potential, but still requires some improvements to be suitable for PE classes on a more regular basis.
Figure 32. Teachers’ median responses (n=4) regarding the statements considering their own experiences after the first (black circles) and the third (white circles) session in the
LightGame case’s (VII) Evaluation II.
3.7.6 Outcome and Conclusions
My main responsibility in the LightGame case (VII) was to design the collection of subjective data together with our project partners from other science fields. Data were collected with mainly statement-based questionnaires in two evaluations, as presented above. This case demonstrates an example of the iterative development of not only an interactive system, but also evaluation methodology. Based on the feedback received and conclusions made from Evaluation I, the data collection methods were further improved to gather more, more insightful data from different sources in Evaluation II.
Having schoolchildren as a user group was the main challenge in this case study. For example, it was difficult to know beforehand what kind of a answering scale in the statements would be understandable for the children, but which would still produce useful data. At the time the questionnaires were designed, we did not have confirmed information about the ages of the participating children, although the game was originally meant for children aged 7 to 12 years. For example, in Evaluation I, the participants were supposed to be 9 to 11 years old, but the realized range was 6 to 11 years.

……
……
…
99
Continuing the methods used in the SymbolChat case (III), I would have liked to use the smiley face scale as the answering scale for the statements. However, we came to the conclusion that formatting some of the statements so they could be answered with the smiley face scale was practically impossible. How would one rate the statement “Playing was hard,” e.g., on the smiley face scale? If the answer was the extremely happy face, what would it mean? Would the respondent totally agree with the statement, or would it actually indicate that playing was not hard at all, but instead very easy and fun? If interpreting the answers would have been this difficult, it seems quite inevitable that the children would have had trouble in answering the statements as well. Thus, instead of using the five-step smiley face scale, the options “Yes,” “No,” and “I don’t know” were used in Evaluation I. These were presumably very comprehensible for the children, but the results were rather clustered.
To force the children to judge their experiences more specifically, or actually to provide them the possibility to do so, in Evaluation II, we expanded the answering options to a five-step Likert-like scale ranging from “Totally disagree” to “Totally agree.” Through this change, it was possible to see how strongly the children disagree or agree with specific statements. With the earlier extremes of yes and no, it was impossible to know how strongly the answer describes the respondent’s actual feeling. There was a risk that the wider rating scale would be too difficult for the children to comprehend, though. Based on the results and the received feedback, however, there are no signs of the scale used in Evaluation II to have been too hard. For example, there were only random missing answers within the participants who had filled in the questionnaires in the first place. Nevertheless, a proper analysis of the scale and children’s answering behavior would require psychological or similar expertise.
Through the statements and questions we asked the schoolchildren, we found out that the game was a success, but it could be further developed by adding more physical activity and suspense. However, because of the differences in the participants’ ages and individual abilities, more precise investigation regarding the optimal amount of exercise, as well as the content and the extent of the story, would be required. Objective sensor-based measuring could be utilized in this, but it would require more extensive tracking of the individuals, i.e., an individual’s normal physical activity level—the baseline—should be measured first, and then compared with the activity levels while playing the LightGame.
Although the data gathered from teachers in Evaluation II were not as extensive as hoped, the answers given by four teachers after the first and third session indicate that the teachers are quite well aware of their pupils’ experiences. The teachers’ feedback indicates that the game has potential, but should be further developed from a physical exercise point of view at
……
……
…
100
least, which probably goes hand-in-hand with pedagogical aims. The majority of the children obviously appreciated the physical side of the game, and some wished for even more physical exercise. Based on the gathered data in the two evaluations, it is possible to conclude that the motivational objective of the game was achieved. However, the game seems to need some improvements to be suitable for a school context as permanent content for PE classes. This final development round requires involving teachers heavily in the ideation, as they have both the practical understanding and experience about teaching physical exercise to schoolchildren and the knowledge about educational objectives. Having the game played in PE classes on a regular basis would necessitate a simple tool for the teachers for modifying and even creating stories and game elements so the content could be enriched and alternated, but also to allow the teachers to create tasks that support the educational objectives.
From a practical point of view, the evaluations conducted in the LightGame case (VII) required quite a few resources. Moving the hardware, setting it up, and controlling and observing the sessions demanded both time and personnel. However, considering only the tasks related to user experience evaluation per se, the case was laborious. Designing, creating, printing, and organizing the paper questionnaires; entering the questionnaire data into electronic form; and analyzing it took a lot of time considering there were almost 300 pupils alone participating in the evaluations. Weighing the used resources and the outcome, this case study was not evaluation-wise very cost-effective. For example, the children’s eagerness to play the game was identifiable even at early stages, and this did not change dramatically. Evaluation II was important in the sense of seeing that the experiences actually did not change over the three sessions. Fewer groups may have been enough to show this. Nevertheless, judging from other aspects, such as involving children and motivating them to exercise in general, the LightGame case (VII) was a positive project.
……
……
…
101
4 The Process of User Experience Evaluation
Based on the eight evaluation cases presented above, I introduce a process model for evaluating the user experience of interactive systems in practice. The model comprises all phases related to evaluation, i.e., the necessary actions before and after conducting the evaluation itself as well. It is important to describe the steps before the actual evaluation, especially because designing the evaluation properly is crucial for the study to succeed: Practically all relevant decisions are made before the evaluation situation itself.
Through my practical experience with designing user evaluations, analyzing the results, and drawing conclusions in several case studies, it has become apparent that there cannot be a single fixed user experience evaluation method that would be suitable as such for any evaluation within the field of human-technology interaction. Thus, I refrained from even trying to provide such a detailed, fit-for-all evaluation method. Instead, I propose a process model for evaluating the user experience of interactive systems. A simple summarizing illustration of the model can be seen in Figure 33.
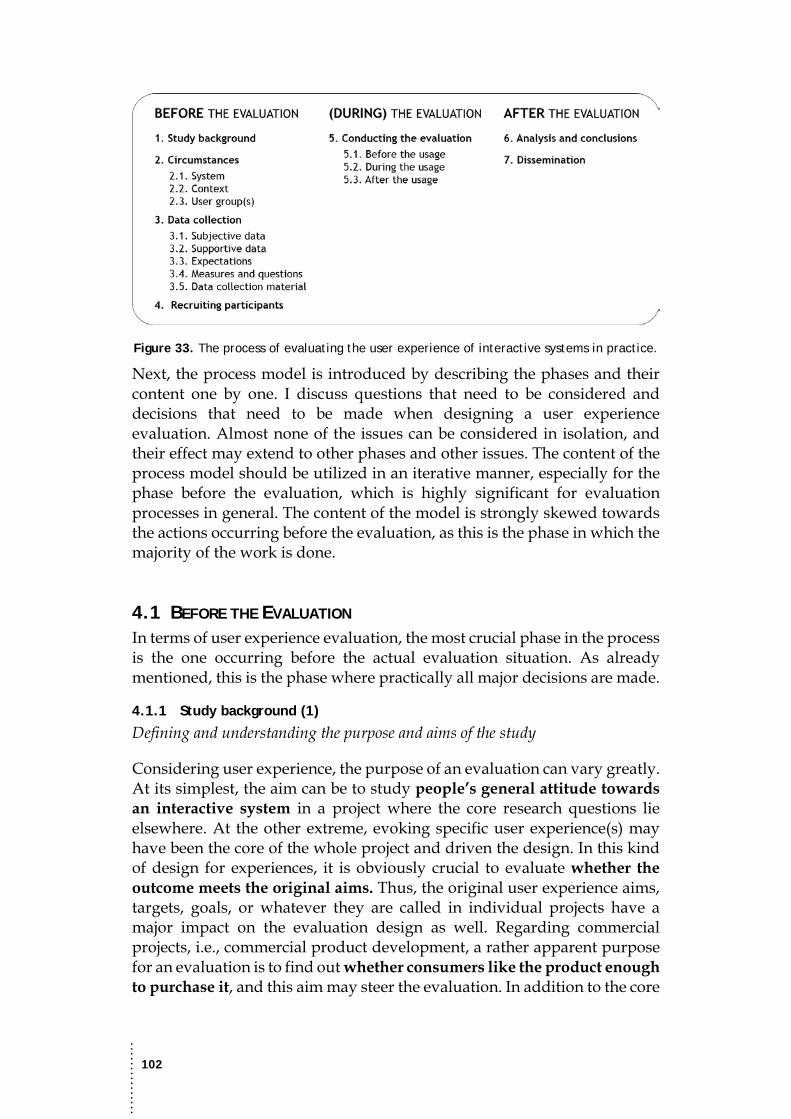
……
……
…
102
Figure 33. The process of evaluating the user experience of interactive systems in practice.
Next, the process model is introduced by describing the phases and their content one by one. I discuss questions that need to be considered and decisions that need to be made when designing a user experience evaluation. Almost none of the issues can be considered in isolation, and their effect may extend to other phases and other issues. The content of the process model should be utilized in an iterative manner, especially for the phase before the evaluation, which is highly significant for evaluation processes in general. The content of the model is strongly skewed towards the actions occurring before the evaluation, as this is the phase in which the majority of the work is done.
4.1 BEFORE THE EVALUATION In terms of user experience evaluation, the most crucial phase in the process is the one occurring before the actual evaluation situation. As already mentioned, this is the phase where practically all major decisions are made.
4.1.1 Study background (1)
Defining and understanding the purpose and aims of the study
Considering user experience, the purpose of an evaluation can vary greatly. At its simplest, the aim can be to study people’s general attitude towards an interactive system in a project where the core research questions lie elsewhere. At the other extreme, evoking specific user experience(s) may have been the core of the whole project and driven the design. In this kind of design for experiences, it is obviously crucial to evaluate whether the outcome meets the original aims. Thus, the original user experience aims, targets, goals, or whatever they are called in individual projects have a major impact on the evaluation design as well. Regarding commercial projects, i.e., commercial product development, a rather apparent purpose for an evaluation is to find out whether consumers like the product enough to purchase it, and this aim may steer the evaluation. In addition to the core

……
……
…
103
aims of an evaluation, the situation may be made more complex by brand-related aims, for instance.
The case studies presented in this dissertation have not aimed at evoking certain user experience(s), i.e., the design processes have not been design for experiences per se. Nor have there been explicit user experience targets discussed that would have systematically controlled the design or implementation decisions. However, each case has had more general-level objectives that have influenced the design, but more importantly the evaluations in respect to my research. The clearest example of how general-level project objectives affect the user experience evaluation is demonstrated by the EventExplorer case study (IV): We wanted to provide something experiential to the users, and this experientiality objective ultimately led to the creation of a whole new user experience evaluation method. Moreover, in the LightGame case (VII), the more general-level objective of motivating schoolchildren to exercise through untraditional content in physical exercise classes affected the evaluation design: For example, their willingness to move this way again, the pleasantness of exercising compared to usual PE classes, and the compellingness of different elements in the game were inquired about, and these all concern motivation somehow.
Nowadays, many projects within the field of human-technology interaction are multidisciplinary, and partners from outside academia are also involved. Different stakeholders have their own backgrounds, expertise, and agendas for studies. It is crucial to ensure that the people involved are on the same page. The aims and the approaches used to achieve them in different fields must be openly discussed. For a researcher, certain things are self-evident, but for other people—and even for researchers from different fields—they may not. Obviously, this applies the other way around: Practitioners have vital knowledge that people from academia lack. Thus, when working with other stakeholders, one needs to communicate even the smallest matters with each other to ensure mutual understanding. Furthermore, if the people responsible for designing the user experience evaluation are new to some key aspects of the forthcoming study, they need to familiarize themselves with these characteristics. By these kinds of aspects, I refer to a domain or user group, for instance. The Dictator case (VI) demonstrates an evaluation within the healthcare domain, and it was important to gain an overview about the nurses’ work routines and their working environment to design the user evaluation properly. However, in the SymbolChat case (III), it was crucial to understand the varying limitations and abilities within the user group of intellectually disabled people. The work started with surveying possible symbol sets that could be used in the system and ended with designing the subjective data collection so at least some data could be gathered from the users themselves, i.e., by utilizing the smiley face cards and very simple questions. Usually, some of
……
……
…
104
the project partners are professionals from the field, and a general understanding of the activity’s environment can be achieved through discussions with them. However, again, it should be noted that self-evident things are easily not communicated, although they would be new and relevant information to people from other fields. This issue needs extra attention to achieve a proper level of common understanding within the project group.
4.1.2 Circumstances (2)
Acknowledging the possibilities, challenges, and limitations in the evaluation
Comprehending the characteristics affecting the evaluation is a necessity to design evaluations properly for individual cases. Next, I introduce the issues that need attention in the evaluation circumstances by focusing on system, context, and user group(s).
System (2.1)
The system under evaluation obviously has a major impact on evaluation design. The fundamental purpose of the system itself makes other aspects of user experience irrelevant and others highly relevant. For example, if the purpose of the system is to make the users have fun and purely entertain people, gathering effectiveness-related perceptions from the users is not a top priority. Conversely, the amusement level of a purely work-related system is hardly something that needs to be inquired about from the users. Although work-related systems have to be pleasant enough to use and should be investigated, it is unlikely that they evoke real joy or a “wow” from users.
In addition to the purpose of the system under evaluation, its key point(s) affect the evaluation design, i.e., how does the system differ from other systems meant for the same purpose. For example, if there are similar kinds of systems already available, but the system under evaluation provides new techniques for interaction, they should be acknowledged in the subjective data collection. To give some examples, in the MediaCenter case (I), our system enabled more efficient browsing of the electronic program guide for visually impaired users through text-to-speech. In the EventExplorer case (IV), our system was controlled by speech and gesture input—a combination not seen normally on public display applications. Finally, in the Dictator case (VI), our system enabled the nurses to enter patient information into the patient information system by speech without the need for extensive typing. These kinds of special and novel characteristics have to be addressed in the subjective data collection to see whether they are successful and whether the intended speciality of the system has been achieved. The same goes for the system’s main functionalities: If there are some unique or especially important functionalities, user experiences about them should be investigated.

……
……
…
105
Context (2.2)
Without going any further into defining context, I loosely refer to the evaluation situation and environment with that term. Context can have physical, social, and cultural aspects, e.g. (Dey, 2001), as well as domain-related differences. The physical evaluation environment is probably the most obvious matter when talking about context, and it also has a quite strong effect on the evaluation design. All of the case studies presented in this dissertation have dealt with physical evaluation environments outside of laboratories. By evaluating outside of laboratories, it is possible to avoid the artificiality inevitably present in laboratory evaluations and get closer to real-world events—although an evaluation situation can hardly ever truly correspond to spontaneous real-world happenings. The downside of being outside of laboratories is, however, the fact that there are many things in the evaluation situation and environment that cannot be controlled. This is especially the case for evaluations conducted in public environments.
Furthermore, subjective data collection cannot take too much time or effort to complete in evaluations where the participants are not recruited beforehand, such as in evaluations conducted in public environments. These kinds of evaluations rely on purely voluntary, spontaneous, and even sudden participation. Recruitment beforehand, however, usually tries to attract possible participants over a longer period of time, and I assume that the participation decision made after consideration may result in deeper commitment to the evaluation compared to spontaneous and sudden participation. Opportunistic recruitment at the evaluation scene and the objective to maximize the amount of collected data require that potential participants and respondents are not scared away, and it is important to have as complete data as possible from whoever participates. Hence, questionnaires have to be limited in content to keep them appealing.
In addition, public environments, such as the evaluation locations in the EventExplorer (IV) and EnergySolutions (V) cases, bring up the social aspects of context. The EventExplorer case’s (IV) evaluation was conducted in a library’s main lobby with other people passing by, and the EnergySolutions case’s evaluation at a housing fair also was in the middle of other people almost constantly around. In these kinds of environments, people may be more hesitant to even participate or be hesitant to really throw themselves into the usage for fear of embarrassing themselves in public.
Context effects have to be considered not only when designing an evaluation, but also when interpreting the results: One cannot conclude that people liked the gesture control over speech input in the EventExplorer case (IV). Although gesture control was preferred based on the usage amounts, the reported user experiences on the pleasantness of each input technique were similar. It is necessary to conclude that in this context

……
……
…
106
participants used the gesture control more, but the experiences may have favored speech input even if the context would have been a private room, e.g., and the participants would have used the speech input more. However, as it was implemented, the system in the EventExplorer case (IV) could not have been controlled with speech exclusively. Another extreme of the social aspects of context might be privacy: When conducting evaluations in private contexts like people’s homes as in the MediaCenter case (I) and the SymbolChat case (III) with some participants, one has to pay special attention to respecting their privacy. This may not affect the user experience data collection content, but it is a practical issue that may have influence on the amount and time spent on the scene, for instance. In this kind of potentially intrusive evaluation, it is important not to bother the participants with irrelevant tasks, questions, and so forth, which applies also to work-related evaluations.
Context can be seen as a domain-related matter as well. By this, I mean industry, e.g., which can be further divided into different fields, such as the healthcare domain or the drilling industry. Although a common concern for both of these may be efficiency in general, these domains have differing relevant aspects that need to be taken into account: Speeding up the overall process of getting critical patient information to the next treatment step in healthcare, e.g., and improving the tangibility of drilling a blast hole for drill masters in the drilling industry. Some evaluation contexts can have principle-level restrictions by norms or laws. The school environment, as in the LightGame case (VII), and healthcare domain, as in the Dictator case (VI), are examples of these kinds of contexts. In both of them, e.g., it is highly important to protect the privacy of individuals.
User group(s) (2.3)
When designing a user experience evaluation, one needs to pay attention to possible restrictions and special characteristics within the user group. There are several properties within users that may affect what can be asked from them, how those things can be asked, and even, what actions can be demanded from the users. A rather obvious example of these kinds of properties is age. When having children as participants, such as in the LightGame case (VII), the questions or the answering scales cannot be too complicated, or when talking about very young children, the data collection cannot necessitate the ability to read or write, i.e., abilities that the children have not acquired yet. These restrictions have a concrete effect on the evaluation design and especially subjective data collection. On the other extreme, when people get older, their operational abilities weaken: Senses, such as vision and hearing, and motor coordination deteriorate. Furthermore, stereotypically, older people’s technical abilities can be assumed to be lower—although this is constantly changing as technically oriented generations become older. Decreased abilities affect the system

……
……
…
107
design, in particular, but they have to be taken into account while designing the questionnaires or evaluation tasks, for instance.
Another situation where the evaluation design requires extra concern is when disabled people are the user group. Disabilities clearly have a major impact on the system design and the purpose of the system to start with, but the effect on the user experience evaluation design and execution can be considerable as well. In the MediaCenter case (I), e.g., all of the participants had some level of visual impairment, and thus, the subjective data collection had to be in a form suitable for screen-reader usage. In the SymbolChat case (III), however, the participants (except for one individual) had an intellectual disability besides other possible disabilities. This meant that we had to provide data collection material in a form that did not require reading or writing skills, and furthermore, was comprehensible enough for the participants. We asked the questions verbally, and the participants answered by selecting a smiley face card from a set of physical cards operating as the answering scale. Due to the limitations within the user group’s abilities, we were not able to gather that much data from the participants themselves. Thus, we broadened the understanding about the feasibility of our system by asking the personal assistants for feedback from the participants’ viewpoint.
Furthermore, participants’ expertise about the subject under evaluation has to be considered when designing not only the evaluation as a whole but also the content of the requested user expectation or experience items. For example, if the participants are university students and the system under evaluation deals with haptic feedback in drill rigs, such as in the DrillSimulator case (II), there is no point in asking about the detailed functionalities of a drill rig. On a more general level, the assumed level of technical knowledge among the participants has to be kept in mind when designing the subjective data collection content. It is obviously a totally different scenario if the participant set is known beforehand, as in the DrillSimulator case (II), compared to a situation where the participants enroll for the evaluation spontaneously, such as in the EventExplorer (IV) and EnergySolutions (V) cases. Thus, the way that the participants are recruited also makes a difference. The background of the participants is not known in all evaluation cases, but also the number of users participating may be hard to assume. If we would know for sure that we will have 50 persons participating in our study in a public environment evaluation, we would be able to design a wider data collection content and still receive almost complete data from 20 persons, for instance.
It is not unusual that a system and an evaluation have more than one user group. In the SymbolChat case (III), the personal assistants of the actual participants were another user group, as they also used the application themselves: The assistants familiarized themselves with, and at least tried,

……
……
…
108
the SymbolChat in the beginning of the evaluation, but some of them performed the physical usage of the application throughout the evaluation. The SymbolChat case’s (III) evaluation demanded quite a few resources as it was, and thus, the personal assistants’ subjective experiences were not explicitly investigated. However, they all used the application, and it would have been possible and surely useful to collect user experience data from their perspective as well. The LightGame case’s (VII) Evaluation II was different: Because the teachers were even more clearly another user group, their subjective opinions were gathered. In case there is more than one identifiable user group for a system, they all should be taken into account in all stages of the system development, i.e., in the evaluation as well. For example, in the LightGame case (VII), it is obviously crucial that the teacher is also happy with the system, as she or he would be the one to control the whole system in real-life usage.
4.1.3 Data collection (3)
Designing the data collection and producing the material for it
Data collection is the fundamental purpose of all user evaluations. Next, I discuss the importance as well as the advantages and disadvantages of different types of data and the content of data to be collected.
Subjective data (3.1)
Because user experiences are subjective, the core of data collection in evaluations has to be based on self-reporting by filling in questionnaires or answering interview questions, essentially, when talking about pre-defined systematic subjective data collection. Regarding user experience evaluation, it is worthwhile to gather at least some quantitative data, i.e., subjective ratings reported on a specific scale. This was done in all of the evaluation cases presented in this dissertation. For example, in the MediaCenter case (I), both user expectations and experiences were gathered considering 36 statements (p. 32), while in the DrillSimulator case (II), subjective expectations and experiences were inquired about with four statements about the haptic feedback (p. 39). Depending on the statements or questions used, these kinds of data allow a rather quick general view of the participants’ opinions through simple statistics, such as the median. The power of quantitative data is in the possibility to easily summarize and compare results.
However, quantitative user experience data, i.e., statement-based data, lack an important aspect of user experiences. The data cannot reveal the reasons behind the experiences. This means that quantitative data can tell exactly how pleasant a mobile phone is to use, e.g., without revealing anything about the reasons behind the pleasantness level. This information is crucial especially when there is something wrong: The developers have to know whether the problem is with the physical shape of the device, e.g., or the responsiveness of the touch screen to improve the product.
……
……
…
109
At least some qualitative data should be gathered, then. Interviewing users may provide a rich data set, but conducting thorough interviews with all participants is rarely possible due to limited personnel and time resources. To gather at least some qualitative data from all participants, it is reasonable to include open questions in the questionnaire. In case the extensive collection of qualitative data is not possible, simple questions like “What was the best in the system?,” and on the contrary, “What was the worst in the system?,” can reveal explicit reasons for exceptionally good or bad user experiences. For example, in the LightGame case’s (VII) Evaluation II, interviewing all the schoolchildren would not have been possible. However, just a few open questions in the questionnaires revealed what kind of game elements many of the children liked or wished for: Physical activities, such as jumping or running, were reported as the best aspect in the game by more than a half after the first session and by a third after the third session (p. 95). This information could not have been concluded from the statement-based data.
In field studies, the subjective data collection part of the evaluation is often also limited by practical time constraints. Participants can be engaged with the evaluation situation only for a certain period of time, and using the system under evaluation is the top priority. This limitation had to be taken into account especially in the evaluations conducted in public environments, i.e., the EventExplorer (IV) and the EnergySolutions (V) cases, but also in the LightGame case’s (VII) evaluations to avoid cutting down the actual time for exercise. Subjective data collection cannot take too much time, and thus, the time spent for questionnaire-filling or interviews has to be limited. In this respect, quantitative data are convenient, as choosing values on a certain scale for certain statements is much faster than writing verbal answers to open questions, for instance. Like collecting qualitative data, the analysis of this kind of data is laborious. Analyzing answers to open questions or interview data, e.g., requires interpretation, categorization, and the reduction of data to represent the results and draw conclusions.
In addition to subjective experience data, at least some background information about the participants should be collected. Because these data are reported by the participants themselves, they can be seen as a type of subjective data, although they are more of an objective nature many times. Aspects like age and gender are fact-based matters, but then again, estimates about prior gesture-control usage, e.g., are subjective in the end. The background information can be collected in conjunction with the experiences after the usage, during the recruitment process, or in the beginning of the evaluation situation. However, to minimize the effect on the actual experiences evoked by the system usage and not to make the participants unnecessarily aware of their prior experiences about specific technology, e.g., gathering the background information at the end of the evaluation situation may be the most reasonable option. This approach was
……
……
…
110
used, e.g., in the EventExplorer (IV) and the EnergySolutions (V) cases, i.e., the background information was collected at the end of the experiences questionnaire.
As background information is not the focus of user experience evaluation, the items gathered must to be limited. However, basic information about the participants should be asked to see whether possible differences in participant properties affect the experiences (or expectations). These differences may also help in understanding reasons behind certain trends in the experiences. At least age, gender, and previous experience or skill level on similar kinds of systems or interaction techniques are advisable to be asked from participants.
Supportive data (3.2)
In addition to subjective data, supportive data may enable a better understanding of the user experiences and the reasons behind them, but more importantly, provide a fact-based description of what actually happened within the usage or how the user seemed to react. By supportive data, I mainly refer to log and observation data. System and interaction event logging obviously stays objective, and thus, provides truly “fact-based” data. However, based on my experience, another but not at all purely alternative option is observation data, which are collected with pre-defined, detailed observation forms to minimize subjective interpretation possibilities by the researcher conducting the observation. This approach was found very useful in the EventExplorer case (IV), for instance. Observation data can be collected as the evaluation situation occurs or afterwards through videorecordings, for instance. “Supportive data” here mean any data that support the interpretation of the subjective data provided by the users themselves. This can vary between pure observation data as collected by the researchers in the EventExplorer case (IV), e.g., or the “proxy” ratings provided by the assistants in the SymbolChat case (III). However, the ratings reported by the assistants can be seen as a type of subjective data as well, because they used the system themselves at least a little.
Expectations (3.3)
Besides the data gathered during and after the usage situation itself, and as described in Section 2.2.1, also gathering user expectations prior to the usage of the system under evaluation may enable a more in-depth understanding of the user experiences. “User expectations” here mean the conceptions and very first impressions that are evoked as a consequence of seeing the system, a short introduction, or even just a verbal description of the system, for instance. These expectations, however, are inevitably based on prior attitudes and opinions that the user has before the evaluation situation itself about similar kinds of systems, interaction techniques, and so forth. By collecting user expectations, it is possible to compare the

……
……
…
111
experiences after the usage towards the user’s thoughts before the usage, which in turn promotes interpreting and understanding the user experiences evoked by the system itself. User expectations were gathered in five evaluation cases presented in this dissertation. The MediaCenter (I), the EventExplorer (IV), and the Dictator (VI) cases demonstrate the systematic collection and utilization of user expectations best.
To enable this kind of comparison, the statements and questions have to be similar in both data collection phases, i.e., the user experiences have to be collected considering at least the same items as expectations, and vice versa. Consequently, when collecting user expectations and comparing them to user experiences, quantitative measures are highly recommended because of interpretational punctuality. In practice, it is almost impossible to phrase open questions that would invariably receive comparable answers. For example, if expectations and experiences about the system in the EventExplorer case (IV) would have been gathered with the open question “What is the coolest aspect of the system?,” the answers from a participant may have been: “The system helps me to decide which cultural event to attend next weekend” as the expectations and “I just said go back, and the system understood me, amazing,” as the experiences. These answers would not be comparable, and thus, using qualitative data about user expectations and experiences is not recommended for comparison purposes—unless very carefully thought through.
Measures and questions (3.4)
The purpose of the evaluation, project, or system and its characteristics ultimately define what exactly is asked from the users considering their expectations and experiences. However, it is reasonable to inquire about some general type of user experience data in all evaluation cases and to specialize the collected data to correspond to the specific evaluation case by having some tailored items. More general user experience properties may include, for example, pleasantness, amusement, and usefulness of using the system, as well as the willingness to use the system again. These types of properties already reveal something about the users’ attitudes: Is the system overall a total disaster, something that has potential, or something excellent? Already, here, one must keep in mind the purpose of the system. Usefulness, e.g., is not a very good indicator of overall user experience for an entertainment-oriented system, such as a videogame could be seen, e.g., but may be a strong indicator of potential user acceptance for work-oriented systems, such as the systems in the Dictator (VI) and the DrillSimulator (II) cases. Pleasantness and willingness to use in the future, however, can be seen as rather universal indicators of user experience. Despite the use context or the purpose of a system, the system can certainly not be considered a success if the users report it to be unpleasant to use or state that they would not like to use it again.
……
……
…
112
The overall user experience information can be further deepened by items focusing on the system’s modalities or other properties or on the aims of the system. In case of a public display application, for example, a modality-focused statement could be “Using speech input was embarrassing.” Conversely, it is often impossible to include extremely detailed statements like “Highlighting a sentence with yellow in Word is easy” into data collection. This is due to practical limitations, such as time and users’ motivation to fill in forms. To receive as complete data as possible from as many users as possible, not everything can be asked. However, one should bear in mind that matters that may seem obvious objectively may be experienced differently by the users. One should ask, not assume. This lesson was learned concretely when pondering the EventExplorer (IV) and EnergySolutions (V) cases and their results: The measure of multi-sensory perception, i.e., “Using/experiencing the application is based on different senses” was left out from the latter (p. 69). Thus, we are unaware whether the users experienced the interaction to concern many “senses” as it was supposed to. In case the system is designed to have such key properties, it is advisable to inquire about the user experiences of these properties to see whether the aim has been achieved.
Essentially, in practical user experience evaluation cases, it is adequate to acquire user experience data that reveals the current state of the system and its key properties, and more importantly, the development needs considering the aims of the system, project, or so forth. What kind of statements and questions reveal this information is ultimately dependent on the evaluation case, and it is impossible to provide a universal, fixed set of data collection items.
Data collection materials (3.5)
Designing a user experience evaluation involves several very practical issues that need to be resolved. For example, one needs to decide whether the subjective data collection, excluding interview data, is done with paper or electronic questionnaires. Electronic questionnaires are much easier because they do not require manual labor between the data collection and the analysis. This is an important point especially with large numbers of participants. However, using electronic questionnaires is not always possible. Using them requires equipment, e.g., a computer or a tablet PC. Furthermore, in some cases, such as the LightGame case (VII), using electronic questionnaires would not be a reasonable approach: There were about 15 children filling in the questionnaires simultaneously straight after the actual usage of the system, i.e., playing the game, and it would have been an inevitable hassle to distribute the needed devices to all of them, guide them in the usage as necessary, and collect the devices. In addition to the actual data collection moment, issues would have arisen from the number of devices needed simultaneously and setting them up for instant form-filling by the pupils. The LightGame case (VII) is one example, when
……
……
…
113
it was easier just to distribute questionnaire papers and to collect or even receive them—regardless of the amount of work needed to type the data into an electronic form for analysis.
Another extremely practical issue with designing subjective data collection is the questionnaire design—despite the electronic or paper form of the questionnaire. How to design a questionnaire that is clear regarding its properties (e.g., language and visual layout) would be a topic of its own and is out of the scope of this thesis. However, this is an important issue that needs attention. Especially when using paper questionnaires, or a hand-held device with smaller displays for that matter, the available space is limited. The layout should be designed so the questionnaire elements are clearly positioned without congestion, the font-size is big enough, and so forth.
In addition, surprising factors may affect the questionnaire design, and in fact, the data to be collected itself: The content may need to fit into a single paper sheet, e.g., which in turn may reduce the number of user experience statements and open questions that can be inquired about in the first place so the layout is still reasonable. Particularly in the EnergySolutions case (V), the questionnaire’s content had to be optimized: The physical evaluation scene was rather constricted, and we expected a large number of participants. For these reasons, the questionnaire had to be appealing and fast to fill in. This was also one of the reasons for not including open questions. More generally, reasons for restricting the content amount in questionnaires may be, e.g., that the same number of people probably will not be willing to provide their feedback if the questionnaire seems too long or the physical evaluation environment does not provide a good setting for exhaustive form-filling, i.e., the participants have to fill in the questionnaire on a hand-held clipboard without the possibility of sitting down, e.g., in a public environment.
4.1.4 Recruiting participants (4)
Participant recruitment is an extremely important but challenging step of an evaluation process. This applies to situations where the participants are recruited well before the actual evaluation as well as to situations where the participants are not recruited beforehand per se, but opportunistically at the evaluation scene. There are three main challenges in participant recruitment. First, the very narrow target user group inevitably poses challenges for recruitment. Finding a suitable recruitment channel, reaching the target user group representatives, and finally, getting them to participate may be almost impossible. This challenge existed in the MediaCenter (I), the DrillSimulator (II), the SymbolChat (III), and the Dictator (VI) cases, although we had project partners from within the target field.
……
……
…
114
A very narrow target user group resulted in a low number of participants in general in the cases, and not all of the participants were representatives of the exact target user groups: In the SymbolChat case (III), despite our objectives and tight contacts with the professionals of the field, our participants were not symbol users. Furthermore, some of them had so severe disabilities that they clearly were not potential users for our system in that sense. Although the potential of the SymbolChat application could be identified with the current participants, we may have been able to find out more about its abilities as a true enabler of communication had the participants been symbol users. In the DrillSimulator case (II), the background of the participants varied between product development and training simulator personnel, and drill masters. However, only the drill masters were optimal participants because they have hands-on experience with operating real drill rigs. These examples demonstrate the importance of having actual representatives of the target user group as participants to investigate the true applicability of a system for its fundamental purpose.
Second: Similar to or overlapping with the narrow target user group, the very specific purpose of a system may complicate recruitment. It is rather obvious that if a system is meant for a certain medical operation, e.g., the evaluation requires expert users to truly find the potential of the system. Third, evaluations that rely on spontaneous participation and have no actual recruitment beforehand are a mystery in terms of getting participants. Such evaluations conducted in public environments, e.g., may have to be started without any certainty regarding how many persons will participate.
In general, finding the best recruitment channel is often an issue. In academic user evaluations, e.g., university students are often recruited as participants. This is not a problem in case the system under evaluation is meant for the general public and its purpose or the targeted use context is not very specific. However, at least in the evaluation cases presented in this dissertation, university students’ feedback would not have been sufficient enough, apart from the EventExplorer (IV) and the EnergySolutions (V) cases, perhaps. Furthermore, the systems in those cases were meant for public environments, and thus, prior recruitment would have made the evaluation artificial. Preliminary feedback received from students may have helped to improve the systems before the actual evaluations.

……
……
…
115
4.2 (DURING) THE EVALUATION The description of this phase assumes that the participant(s) has been recruited beforehand through email lists, project partners, or other recruitment channels, or just recently at the evaluation scene. The steps presented in the following are closely similar to the procedure of the Experiential User Experience Evaluation Method described already in Section 2.2.3 (and in Publication IV). Here, however, the discussion extends to evaluations conducted in environments and situations differing from public locations as well.
4.2.1 Conducting the evaluation (5)
The actual evaluation situation contains three steps: the time before the usage of the system, the actual usage, and the time after the usage. By “evaluation situation,” I refer to the overall period that the participant is present at the scene. Next, I will describe the actions and considerations for each step.
Before the usage (5.1)
Depending on the information given during the recruitment, the system often has to be introduced to the participant before the actual usage, at least at some level. The extent of the introduction can differ a lot between evaluation cases. The “introduction” can be, e.g., a picture, a video, or a verbal description of the system—all with varying levels of detail. In fact, if the recruitment already has included some information about the system, no special introduction may be needed in the beginning of the actual evaluation situation. The intuitiveness of a target system is an interesting aspect, and thus, it may be worthwhile to provide only the necessary information for the participants before the actual usage. This means that if the system includes functionalities, interaction techniques, or so forth, which are not visible but are still vital for the system usage, those should be somehow communicated to the participants. Despite the extent or the manner of the introduction, all participants should be provided with the same information. One should strive not to affect the participants’ attitudes or at least have the effect as similar as possible between participants. Hence, in case of verbal introduction, it is best to write down the speech and follow the same text with each participant.
In case expectations are collected from the participants, they should be gathered as early as possible. Pragmatically, this may mean that the expectations are gathered already before the actual introduction to the system is done. For example, participants may be shown a picture about the system and told that the system can be controlled with speech input. Subsequently, they would be asked to fill in the expectations questionnaire. After receiving the expectations questionnaire, the researcher would introduce the system more properly and explain the possible speech commands to the participant, for instance. Depending on the evaluation

……
……
…
116
case and even within an evaluation case, the expectations that the participants report may be based on different things. In the EventExplorer case (IV), the participants’ expectations were based on the poster at the scene, on watching others interact with the system, or on a combination of these. In evaluation cases or situations where it is not self-evident what information about the system the participant may have perceived before reporting the expectations, and more importantly, where this cannot be controlled, it may be reasonable to ask what they ground their expectations on. However, this may be difficult to ask simply and particularly difficult to answer.
In the beginning of an evaluation, it is also polite to briefly describe the procedure of the evaluation to the participant. However, like the introduction to the system, the evaluation procedure might be kept hidden, apart from necessary information. For example, in the EventExplorer case (IV), the information provided to the participants before the usage was kept to the minimum: They were told that, with the system, they could browse cultural events using speech and hand gestures. Necessary information would be the tasks that the participant is asked to perform if there are such, obviously, but they can be communicated task by task as well as the evaluation proceeds. It can be briefly explained what is going to happen, but it is not reasonable to go into details. For instance, it can be mentioned that, after the usage, there will be some questionnaires to be filled in without specifying that user experiences will be gathered with the same statements as expectations were possibly already collected with.
During the usage (5.2)
When the participant actually starts to use the system, he or she will be advised as designed. If there are certain tasks that need to be performed or certain limitations, those are communicated to the participant. Instructing the participant at this point may be anything, like Use as you wish, as long as you wish, and very restricted tasks. For example, in the MediaCenter (I) and the SymbolChat (III) cases, the main possibilities of the systems were communicated, but the participants could use the systems as they wished. In the DrillSimulator case (II), the participants were rather strictly advised to perform tasks, and in both the LightGame case’s (VII) evaluations, the system gave instructions to the participants throughout the usage sessions. In the Dictator case (VI), however, the nurses were instructed to dictate everything with the application that they would normally enter just into the patient information system.
Depending on the purpose of the evaluation, the given answers to possible questions by the participant may also vary a lot: Sometimes, the aim is to see whether participants are able to use the system individually, and thus, questions will not be answered during the usage. Another reason for not answering questions after a certain point in the evaluation procedure is that
……
……
…
117
this approach helps in keeping all given information as similar as possible among the participants. Hereby, what the actions are during the actual usage is highly dependent on the evaluation case.
An important part of the actual usage step is to gather supportive, objective data. In practice, this usually means at least log data about system events, participant input, and so forth. Objective data can be also video or audio recordings, which tell what occurred in the evaluation situation and can be analyzed afterwards. Supportive data can be collected also by observation. However, data gathered through observation cannot be seen as perfectly objective: It is inevitably an interpretation of some level about real-world happenings. The inherently personal variation between different observers explains the subjectivity of the matter. As was done in the EventExplorer case (IV), the objectivity of observational data can be enhanced by having pre-defined forms that the observer fills in as the interaction occurs. This kind of an observation form helps the observer to focus on the most meaningful things that have been agreed with the research team beforehand and acts as a memory list. Designing a proper observation form is a challenge itself, though, as it should be detailed enough so important aspects about the interaction are not missed, but also compact enough in extent so the observer has the possibility to fill it in as completely as possible during the usage. It should be once again stressed that observation data alone cannot be the basis for user experience evaluation, as it contains only interpretations about user reactions and does not reveal the truth of how the participant felt.
After the usage (5.3)
The actions after the actual usage are obviously the core of the evaluation situation considering user experience evaluation. Without diminishing the importance of collecting expectations or observing the usage, the actual user experience data are gathered after the usage. In practice, this is done by questionnaires or interviews, or optimally, as a combination of the two. The actions after the usage are rather straightforward, as they are planned well before, and they should be planned thoroughly.
If not done before, and as recommended above, participants’ background information should be gathered after the usage. These data can be gathered as the last items of the experiences questionnaire, for instance. As practical actions related to evaluation execution, at this point, one has to ensure that all gathered data are taken into possession. Questionnaires possibly left in a return box, e.g., have to be physically collected, and the supportive, objective data logged into a computer system or recorded with a videocamera must be obtained and secured.

……
……
…
118
4.3 AFTER THE EVALUATION What happens after the evaluation is highly dependent on the purpose of the evaluation and the evaluation design. Thus, this part of the evaluation process is discussed on a very general level.
4.3.1 Analysis and conclusions (6)
Analyzing the data and interpreting the results If not already collected in electronic form, the subjective data, i.e., user expectations and experiences, as well as background information, need to be transcribed into electronic form to enable the usage of computer-based analysis tools. This may seem a minor matter, but this manual labor task should be taken into account in the evaluation design. In fact, a rather significant amount of unnecessary work may be prevented with proper design, i.e., collecting all possible data straight into electronic form. However, as demonstrated earlier considering the LightGame case (VII) (p. 112), e.g., this is not always reasonable or even possible, and a lot of manual entering of the data may be required.
Choosing the statistical analysis tools, especially the statistical analyses, would be a topic of its own and is out of the scope of this dissertation. Such decisions are limited and directed by several things: the type of data, assuming whether the data are normally distributed, sample size, and so forth. In practice, the statistical expertise of the analyzer or the project team affects the used methods as well, although such restrictions should be solved somehow. The majority of the data analyzed in the research done for this dissertation has been of ordinal scale without the assumption of normal distribution. By this, I refer to subjective user expectations and experiences data, which has been collected mainly with disagree–agree like scales with a varying number of steps. Furthermore, the sample size, i.e., the number of participants has been small apart from a few exceptions. Thus, the suitable approaches for analysis have been quite limited. Because of ordinal data, the median has been used as the mean number throughout the case studies. Mainly because of such small sample sizes, the results from the case studies presented here are of a descriptive nature. They consist of numerical expectation and experience values combined with other data, i.e., answers to open or interview questions, observation data, and background information, when possible. The analysis has comprised calculating the medians of the subjective numerical data and then reflecting the results with other sources of data.
Depending on the nature of the evaluation and the collected data, statistical analyses may not be necessary or even possible. However, if applicable, such tests can be used to strengthen the results and interpretations. Conversely, they may reveal details that are not obvious through observing the median values, for instance. In case both expectations and experiences have been gathered and the sample size is reasonable, possible differences
……
……
…
119
between the two valuations can be examined with, e.g., the Wilcoxon Signed Ranks Test. It is a nonparametric test suitable for repeated measurements of ordinal data without the possibility of assuming normal distribution. User expectations and experiences were compared with the test in the EventExplorer case (IV), and this analysis revealed a trend not perceivable in the medians only: Both the expectations and the experiences reached a median of 5, but comparing the answers with the test revealed that some experiences were, in fact, statistically worse than the expectations (p. 61). Furthermore, the Wilcoxon Signed Rank Test was suitable for analyzing the majority of the LightGame case’s (VII) Evaluation II subjective data as well: User experiences from the schoolchildren and the teachers were gathered two times, after the first and the third usage session. Regarding those individuals who had provided their answers both times, the experiences within the user groups were compared with the test. However, no statistically significant differences were found in the experiences of either user group.
To utilize the collected background information, one can check whether there are correlations between participants’ reported properties and their expectations or experiences, such as was done, e.g., in the EventExplorer case (IV) (p. 64) and in the LightGame case’s (VII) Evaluation II (Publication VII, p. 482–483). Possible correlations may help to understand certain trends in the answers. However, despite found correlations would be significant, they can be used as the basis for reflective interpretation and discussion only. Without other proof, correlations cannot be used to draw strong conclusions. They are never the basis for claiming that a property causes a specific experience, for instance.
Subjective, non-numerical data, i.e., answers to open or interview questions, or recorded participant comments, can be used to understand, explain, and interpret numerical experience data at their simplest. For example, when the participants of the LightGame case’s (VII) Evaluation II were asked what was the worst in the game, 42 percent answered that nothing was unpleasant after the first session, and similarly, 26 percent after the third session (p. 94). These great proportions alone make it rather unsurprising that the overall liking of the game reached a median 5 out of 5 after both sessions.
If qualitative data allow, they can be further categorized, and the categories can then be reflected with the numerical data, or at least with the results received from the numerical data. These kinds of qualitative data can include very relevant aspects about the participants’ experiences: Even one comment may quickly reveal reasons for certain experiences and obvious development needs. Supportive, objective data, i.e., observation or log data, or video and audio recordings, can be utilized in a similar manner, but those data may even allow the identification of usage patterns and different types of users, which can then be reflected with subjective data.
……
……
…
120
Depending on the purpose of the evaluation, the depth of the analysis and interpretation of the results can differ substantially between cases. The methods and significance of analyzing data and interpreting results can totally differ, e.g., whether the purpose is to conduct a large-scale evaluation for an interactive system as part of methodology development, to validate a user experience questionnaire, and to publish the results in an academic journal, or to rapidly run a first-phase user experience evaluation for a mobile phone prototype and to share the results in an internal company meeting. However, this step should provide answers to the following questions, at least: What are the results? What do the results mean? What should be done based on the results?
4.3.2 Dissemination (7)
Reporting the results The last but certainly not least step of an evaluation process is reporting the results. Especially in academia, publications are the end products of the research, and thus, a crucial part of science. However, no matter in what form or to what extent they are presented, the outcome of an evaluation also needs to be disseminated in industry, for instance, to make decisions on possible next steps.
The LightGame case (VII) demonstrates a good example of an iterative process, where the system and evaluation approaches have been developed based on the observations and results received from many evaluations. First, a 10-minute version was designed and implemented (Publication VI, p. 313, Section 5.1) to test the concept in general. The initial version was evaluated with over 60 participants, and their experiences were investigated with statements answered on a scale of happy–neutral–sad smiley faces (Publication VI, p. 314, Section 6.1). Based on the feedback, an extended version for 60-minute physical exercise classes was created (the LightGame case (VII), p. 82–). This complete version was first evaluated with 110 participants, and their experiences were gathered with improved statements, which this time had the answering options “Yes,” “No,” and “I don’t know” (the LightGame case’s (VII) Evaluation I, p. 86). Finally, the content and the story of the game were expanded to investigate its suitability for longer-term usage (the LightGame case’s (VII) Evaluation II, p. 88–). The evaluation had altogether 173 participants who played the game three times. In this most recent evaluation, user experiences from both the schoolchildren and the teachers, who controlled the game and were thus another user group, were checked two times: after the first session and the third session. Based on the challenges detected in the previous questionnaire, the user experience statements’ answering scale was modified to a five-step, disagree-agree like scale.
The purpose of the evaluation has a great impact on how the results should be reported. For example, in the different phases of the LightGame case
……
……
…
121
(VII), the findings were first communicated internally and informally within the project team to move to the next phase and only later prepared for academic dissemination, which resulted in several publications. Thus, the target audience and the message that wants to be communicated for it are extremely important.
To sum up, when reporting the results of a user experience evaluation, one should try to answer the following questions—despite the dissemination forum: What was done in the evaluation? What are the results? What do the results mean? What will be done next, or at least what should be done, based on the results?
4.4 SUMMARY To sum up, the proposed process model for evaluating the user experience of interactive systems comprises three main phases: before the evaluation, during the evaluation, and after the evaluation. The phase before the actual evaluation is vital, considering the whole process. There are four main steps that need to be carefully considered and performed to design the evaluation itself properly. These steps and their key action points are as follows:
• Study background: defining and understanding the purpose and aims of the study. Familiarize yourself with the purpose, aims, and the environment of the project and the evaluation. Utilize the professionalism and knowledge available within the project partners. Make sure the whole project group has a common understanding about the study: Demand everyone communicate even small matters that might seem self-evident, and share your own knowledge as well.
• Circumstances: acknowledging the possibilities, challenges, and limitations in the evaluation. Regarding the system under evaluation, consider its fundamental purpose, its unique or especially important functionalities, novel characteristics, such as new interaction techniques, and in general, how it differs from other systems meant for the same purpose. Consider the aspects existing within or raised by the evaluation context: The physical evaluation’s environment, the social aspects of the context, domain-related matters, and principle-level restrictions by norms or laws affect not only the evaluation design but also the interpretation of the results. Remember to take into account users’ characteristics, such as age, expertise regarding the subject under evaluation, technical knowledge, and possible disabilities or other special characteristics. Furthermore, keep in mind that a system and an evaluation may have more than one user group, and design the evaluation accordingly.
……
……
…
122
• Data collection: designing the data collection and producing the material for it. Concentrate on having at least a questionnaire with a set of quantitative user experience items and at least a few open questions to gain some understanding about possible reasons for the experiences. If possible, broaden the data collection to include user expectations to find out participants’ attitudes before the usage and to compare these with the actual experiences. Remember that, to enable the comparison, the asked-about items have to be similar both before and after the usage. To further deepen the results and their interpretation, interviews, observation, and log data, e.g., can be used. In any case, it is advisable to include basic background information, such as age, gender, and previous experience with similar interaction techniques or systems. The actual content of the data collection is case specific, but do include general user experience items, such as pleasantness and willingness for future use, and items corresponding to the special characteristics of the case, such as statements or questions about the system’s interaction techniques. In questionnaire design, pay attention to clarity as well as to the characteristics of the user group(s) and context.
• Recruiting participants. In case participants are recruited beforehand, the recruitment should be started early enough. One’s own recruitment channels may not be sufficient if the target user group or the purpose of the system, e.g., is very specific. Therefore, also utilize stakeholders’ contacts, or contact companies or associations to find suitable recruitment channels. Aim for getting optimal participants who truly represent the target user group. In case there is no beforehand recruitment but the evaluation process relies on spontaneous participation on the evaluation scene, e.g., plan ways to attract participants if necessary.
When all evaluation material is produced, possible participants recruited, the system ready for evaluation, the evaluation scene prepared, and the personnel involved instructed, it is time for conducting the evaluation. The evaluation situation itself can be divided into three stages, and they are as follows:
• Before the usage. The system under evaluation is introduced to the participant in a pre-defined manner and at a pre-defined level of detail. Remember to keep the information provided as objective as possible and similar among participants. As a general rule, it may be best to provide only the necessary information so the participants are able to use the system. In case gathering user expectations is part of the evaluation design, it is advisable to collect them as early as possible to prevent affecting participants’ attitudes with the system introduction, for instance. Before the usage, the necessary information about the evaluation procedure or content may be
……
……
…
123
communicated to the participant. Try to avoid giving out information that may affect participants’ expectations and experiences.
• During the usage. Instruct the participant about what he or she needs to do, be it using the system freely or performing pre-defined tasks. Plan beforehand how to react to participants or answer possible questions: Sometimes, additional information is not given after a certain point in the evaluation to examine the intuitiveness of a system, and also to keep the provided information similar among participants. Perhaps the most important actions during the usage are related to gathering supportive and objective data: Collect log data, video or audio recordings, or observational data during the usage as designed.
• After the usage. Gather the user experience data with questionnaires, interviews, or a combination of these. Remember that this is the most crucial moment and action considering user experience evaluation. If not done before, basic background information is gathered at this point.
When all evaluation sessions are finished and data collected, it is time to investigate the outcome. The steps after the evaluation are as follows:
• Analysis and conclusions: analyzing the data and interpreting the results. If not already in electronic form, prepare the data for analysis, and transcribe it into electronic form. Analyze the data with suitable methods considering the type and scale of data, sample size, possible normal distribution, and so forth. At least calculate medians from the numerical data, and reflect those with the qualitative data, i.e., answers to open and interview questions. Furthermore, reflect the results from the subjective data with the objective data, such as observation or log data. Conclude what the results together mean or indicate.
• Dissemination: reporting the results. Report the results clearly in a manner appropriate for the purpose of the evaluation, and especially the target forum and audience. This reporting should explain what the results mean in practice and what should be done next, if anything.
The process model presented here inevitably extends beyond user experience per se, but the practical issues, such as participant recruitment or available resources, have to be considered and resolved to run a successful evaluation—be the core aim studying user experience or its specific aspects, interaction patterns, or technical functionality, for instance. User evaluations are complex wholes where many things are tightly interlinked, and these need to be taken into account to design and conduct proper user experience evaluations with valuable results.

……
……
…
124
It should be highlighted that the process model and the examples are based on the eight user experience evaluation cases presented in this dissertation. Thus, the model may not be exhaustive considering all kinds of evaluations. For example, the evaluations have mainly considered short-term user experiences evoked from rather short usage periods of the systems. Exceptions to this are demonstrated by the Dictator case (VI), where the evaluation lasted three months, and the LightGame case’s (VII) Evaluation II, which lasted three weeks, including three usage sessions by the participants. The proposed model is suitable for these evaluations, but in case monitoring longer-term user experience with variations would be the focus of an evaluation, the process model might need to be modified accordingly. Furthermore, given that the research has been conducted in an academic environment, the discussion here inevitably concentrates on issues that might be irrelevant for industry, but might lack issues that would be relevant for user evaluations outside of academia.

……
……
…
125
5 Conclusions
The research done for this dissertation focused on the issue of how to evaluate user experience in practice. The research questions were:
• How to evaluate the user experience of interactive systems in challenging circumstances, i.e., context or user groups?
• How to apply known methods to create an appropriate evaluation approach for a specific user experience evaluation case?
These wide and general-level questions are answered through numerous details and summaries in this dissertation. As the main contribution, and as a broad, yet comprehensive answer to the first research question, I have proposed a process model for evaluating the user experience of interactive systems. The model is based on the findings of eight user evaluations conducted with real users outside of laboratories and the expertise gained through the research. The case studies have comprised seven interactive systems and a range of contexts and user groups, as well as new interaction techniques still not consistently used, and especially studied, in the field of human-technology interaction. Because of the varying circumstances, mainly case-by-case-designed user experience evaluation approaches have been required. To gain an appropriate evaluation approach for each evaluation case, it has been necessary to apply already existing methods and to bring in newly created elements and approaches. The thorough descriptions of the used evaluation approaches in the case studies answer the second research question.
After describing the starting point for my research in Chapter 1, I introduced the basics of user experience and its evaluation in Chapter 2. There, I also defined “user experience” as I see it and presented two evaluation methods used, and partly created, within the work done for this
……
……
…
126
dissertation. In Chapter 3, the seven user experience case studies were carefully reported. In two of the studies, the MediaCenter (I) and the SymbolChat (III) cases, the main challenges arose from the user group, the first involving users with visual impairments, and the latter, having users with intellectual disabilities as the target user group. Two of the studies were related to the context of work environment, although from very different fields: The DrillSimulator case (II) concerned the drilling industry, while the Dictator case (VI) studied utilizing speech recognition in the healthcare domain. In the EventExplorer (IV) and the EnergySolutions (V) cases, the evaluations were conducted in public environments, and extra challenges were posed from assessing experientiality, i.e., something beyond the English term “experience.” The LightGame case (VII) and its two evaluations induced challenges from both the context of the school environment and the user group of schoolchildren. Furthermore, the SymbolChat (III) and the LightGame (VII) cases demonstrated situations in which the system under evaluation may have, in fact, more than one user group. Based on the case studies and the practical work experience, in Chapter 4, I finally proposed the process model for evaluating the user experience of interactive systems.
To conclude, the main contributions of my work are:
• The process model for evaluating the user experience of interactive systems. The model is based on eight practical user experience evaluations with differing circumstances and their outcomes. The model provides guidelines and practical considerations concerning the whole evaluation life cycle. It can be used to guide practical user experience evaluations.
• User experience evaluation method development. The Experiential User Experience Evaluation Method (Section 2.2.3) was developed to assess the experiential user experience of interactive display systems in public environments. It is based on knowledge and approaches from two separate fields: the SUXES method (Turunen, Hakulinen, Melto, et al., 2009) from the field of human-technology interaction and the Experience Pyramid model (Tarssanen & Kylänen, 2006), a theoretical framework meant for designing, analyzing, and developing tourism products, in particular. The created evaluation method was used in two case studies.
• Applying user experience evaluation methods in varying evaluation cases. The SUXES method (Section 2.2.2) was strongly utilized in six case studies, and at least some elements of it were employed in an additional two studies. Applying the method varied from using only some of the SUXES statements in the questionnaires, or pursuing the idea of gathering both user expectations and experiences, to following the method as a whole, i.e., gathering user expectations
……
……
…
127
and experiences at least on the set of the nine SUXES statements regarding even individual interaction techniques.
• Taking the context, the user group(s), and other evaluation circumstances into consideration. Overall, the case studies presented have differed substantially due to context or user group, as well as interaction techniques. I have demonstrated a variety of practical user experience evaluation cases and ways to take the circumstances into account in the evaluation design. The evaluation contexts have varied from people’s homes to public and work environments, while the user groups have ranged from people with disabilities, schoolchildren, to professionals in certain fields.
• Transparent reporting of user experience evaluations. I have reported eight user experience evaluations of seven interactive systems in detail, including all the information requested from the participants. Transparent sharing of the evaluation designs and results allows other researchers and practitioners to utilize the information in their own work, and thus, advances the development of practical user experience research.
The contribution of this dissertation is of high practical significance. The dissertation will especially benefit beginning user experience practitioners and young researchers by providing real-world examples of evaluation cases and a step-by-step process model for user experience evaluation that can be utilized as a guideline for practical work. The scientific significance of this work cannot be neglected, either. Strict methodological issues, such as a strong theoretical basis, validated methods, or statistically significant results—something studied by Wechsung (2014), for instance—are out of the scope of this dissertation. However, this work contributes to the research gap of how to evaluate user experience in practice. The practical evaluation work is still a crucial part of the academic research. This dissertation challenges academic researchers to share their evaluation designs, data collection methods, and results transparently with the human-technology interaction community.
Evaluation methods could be more systematically developed, and ultimately also validated, if knowledge and practical considerations would be distributed more openly. For example, a research group focusing on interactive displays operated with hand gestures runs a user evaluation with only 10 participants because of their limited resources. They gather user experiences with a self-constructed questionnaire consisting of 15 statements and a couple of open-ended questions. They report the collected data, their findings, and practical considerations on what went well and what seemed to be the pitfalls—also considering the subjective data collection. Then, another research group focusing on the same matter, but having largely better resources, finds the first article. They notice that the first group has actually used some interesting statements and approaches
……
……
…
128
that they themselves had not thought of. They decide to combine their previously used approaches and questionnaire with the ones presented in the article. Then they run a large-scale user evaluation with 100 participants and analyze the results. The results reveal clear clusters in the answers of different statements. Finally, they report the evaluation procedure, data collection, and their findings in detail. A third research group finds this article, decides to operationalize the clusters into statements, and compares the results gained with the whole set of statements against the set of cluster-statements. They report their research transparently to the community, and again, someone utilizes the knowledge in their own work, and so on. Ultimately, the original, self-constructed approach has gone through an enormous number of developmental iterations and starts to produce consistent and truly beneficial results. Having gone through critical comparative studies, it has become a method commonly acknowledged and approved within the scientific community.
It is rather hypocritical to demand using validated user experience evaluation methods in the still constantly expanding world of interactive systems. One cannot use such methods if they do not exist. Because of varying systems and evaluation circumstances, and the lack of readily suitable and applicable evaluation methods, researchers may have no other option than to create evaluation approaches of their own. Forcing existing methods to certain evaluation circumstances just because they are validated, and thus, treated as acceptable, may be fatal and lead to the absence of any truly useful results. Väänänen-Vainio-Mattila, Olsson, and Häkkilä (2015) conducted a literature review on empirical user experience studies related to ubiquitous computing systems. They found out that the methods and approaches used in studies are rather lightweight and, in fact, do not enable deep understanding of the experiences, which would be important to develop the systems further. It would be crucial to share knowledge achieved through different evaluations. Then, information and methods from separate, but similar kinds of, evaluations could be combined and the methods developed and eventually also validated. The shortage of empirical user experience research is raised (e.g., Hassenzahl & Tractinsky, 2006; Vermeeren et al., 2010; Bargas-Avila & Hornbæk, 2011). However, I believe that empirical user experience research does occur, but is just not reported as openly as it should be—perhaps due to the unwritten requirement of utilizing validated evaluation methods.
The presented case studies and approaches serve as a starting point for evaluations in similar circumstances, but they need further investigation and improvements. In my future work, I will hopefully be able to systematically develop further the evaluation approaches presented here. An ideal outcome would be to have fixed, validated user experience evaluation methods for interactive systems with varying purposes, use contexts, and target user groups. The methods should, however, allow

……
……
…
129
customization, such as including or excluding certain statements or elements based on the circumstances existing in the evaluation case. Modifying the methods should be thoroughly studied and clearly instructed in the end. Developing such methods would require years of work from several persons and is out of the scope of what one person can do alone. A feasible way to accomplish these kinds of evaluation methods would be to study the individual elements step-by-step in separate studies with plenty of participants and then to combine the results into a flexible, yet exhaustive, set of methods for different evaluation circumstances.
Furthermore, as all of the evaluation cases presented in this dissertation have also dealt with novel interaction techniques, I would be interested in investigating and developing interaction-technique-related user experience evaluation approaches. However, this more detailed focus of research seems to remain a secondary aim for me at the moment compared to the wider, more societal issues of the environment and the user group as evaluation circumstances and how they affect not only the evaluation design, but also the user experiences per se. In conclusion, my aim for future work is to contribute to the investigation and development of practical user experience evaluation research that takes into account the three main factors of user experience—the system, the context, and the user.

……
……
…
130

……
……
…
131
6 References
Alben, L. (1996). Quality of experience: defining the criteria for effective interaction design. Interactions, 3(3), 11–15. doi:10.1145/235008.235010
All about UX—definitions (2014). All about UX: User experience definitions: http://www.allaboutux.org/ux-definitions. Referenced August 26th 2014.
All about UX—methods (2014). All about UX: All UX evaluation methods: http://www.allaboutux.org/all-methods. Referenced August 26th 2014.
AttrakDiff (2014). AttrakDiff website: http://attrakdiff.de/. Referenced September 8th 2014.
Bargas-Avila, J. A., & Hornbæk, K. (2011). Old wine in new bottles or novel challenges: a critical analysis of empirical studies of user experience. In Proceedings of the SIGCHI Conference on Human Factors in Computing Systems (CHI '11), 2689–2698. New York, NY, USA: ACM. doi:10.1145/1978942.1979336
Battarbee, K., & Koskinen, I. (2005). Co-experience: user experience as interaction. CoDesign: International Journal of CoCreation in Design and the Arts, 1(1), 5–18. doi:10.1080/15710880412331289917
Brignull, H., & Rogers, Y. (2003). Enticing people to interact with large public displays in public spaces. In M. Rauterberg, M. Menozzi, & J. Wesson (Eds.), Human-Computer Interaction— INTERACT ‘03, 17–24. Amsterdam, The Netherlands: IOS Press.
Brooke, J. (1996). SUS—A quick and dirty usability scale. In P. W. Jordan, B. Thomas, B. A. Weerdmeester, & A. L. McClelland (Eds.), Usability Evaluation in Industry. London, United Kingdom: Taylor and Francis.

……
……
…
132
Desmet, P. M. A., Overbeeke, C. J., & Tax, S. J. E. T. (2001). Designing products with added emotional value:; development and application of an approach for research through design. The Design Journal, 4(1), 32–47. Bloomsbury Journals (formerly Berg Journals). doi:10.2752/146069201789378496
Dey, A. K. (2001). Understanding and using context. Personal and Ubiquitous Computing, 5(1), 4–7. doi:10.1007/s007790170019
FFVI (2012). The Finnish Register of Visual Impairment, Annual Statistics 2012. Retrieved January 30th 2014, from http://www.nkl.fi/ index.php?__file_display_id=7893.
Forlizzi, J., & Battarbee, K. (2004). Understanding experience in interactive systems. In Proceedings of the 5th conference on Designing interactive systems: processes, practices, methods, and techniques (DIS '04), 261–268. New York, NY, USA: ACM. doi:10.1145/1013115.1013152
Gürkök, H. (2012). Mind the sheep! User experience evaluation & brain-computer interface games. Ph.D. thesis. University of Twente. doi:10.3990/1.9789036533959
Gürkök, H., Hakvoort, G., & Poel, M. (2011). Evaluating user experience with respect to user expectations in brain-computer interface games. In Proceedings of the 5th International Brain-Computer Interface Conference (BCI 2011), 348-351.
Gürkök, H., Hakvoort, G., Poel, M., & Nijholt, A. (2011). User expectations and experiences in a speech and thought controlled computer game. T. Romão, N. Correia, M. Inami, H. Kato, R. Prada, T. Terada, E. Dias, & T., Chambel (Eds.), Proceedings of the 8th International Conference on Advances in Computer Entertainment Technology (ACE '11), Article 53, 6 pages. New York, NY, USA: ACM. doi:10.1145/2071423.2071490
Hakulinen, J., Heimonen, T., Turunen, M., Keskinen, T., & Miettinen, T. (2013). Gesture and speech-based public display for cultural event exploration. In Proceedings of the combined meeting of the 10th International Gesture Workshop (GW) and the 3rd Gesture and Speech in Interaction (GESPIN) conference. Available at http://tiger.uvt.nl/pdf/papers/hakulinen.pdf.
Hassenzahl, M. (2008). User experience (UX): towards an experiential perspective on product quality. In Proceedings of the 20th International Conference of the Association Francophone d'Interaction Homme-Machine, 11–15. New York, NY, USA: ACM. doi:10.1145/1512714.1512717
……
……
…
133
Hassenzahl, M., Burmester, M., & Koller, F. (2003). Attrakdiff: ein fragebogen zur messung wahrgenommener hedonischer und pragmatischer qualität. In G. Szwillus, & J. Ziegler (Eds.), Mensch & Computer 2003: Interaktion in Bewegung, Berichte des German Chapter of the ACM, 57, 187–196. Stuttgart, Germany: Vieweg+Teubner Verlag. doi:10.1007/978-3-322-80058-9_19
Hassenzahl, M., & Tractinsky, N. (2006). User experience—a research agenda. Behaviour & Information Technology, 25(2), 91–97. doi:10.1080/01449290500330331
Hazlewood, W. R., Stolterman, E., & Connelly, K. (2011). Issues in evaluating ambient displays in the wild: two case studies. In Proceedings of the SIGCHI Conference on Human Factors in Computing Systems (CHI '11), 877–886. New York, NY, USA: ACM. doi:10.1145/1978942.1979071
Heimonen, T., Turunen, M., Kangas, S., Pallos, T., Pekkala, P., Saarinen, S., Tiitinen, K., Keskinen, T., Luhtala, M., Koskinen, O., Okkonen, J., & Raisamo, R. (2013). Seek'N'Share: a platform for location-based collaborative mobile learning. In Proceedings of the 12th International Conference on Mobile and Ubiquitous Multimedia (MUM '13), Article 38, 4 pages. New York, NY, USA: ACM. doi:10.1145/2541831.2541872
Housing Fair Finland Co-op (2012). Housing Fair Finland Co-op: http://www.asuntomessut.fi/tampere-2012/asuntomessut-tampereen-vuoreksessa-kerasi-145-581-kavijaa. Referenced February 21st 2014.
ISO, International organization for Standardization (1998). ISO 9241-11:1998: Ergonomic requirements for office work with visual display terminals (VDTs)— Part 11: Guidance on usability.
ISO, International organization for Standardization (2010). ISO 9241-210:2010: Ergonomics of human-system interaction— Part 210: Human-centred design for interactive systems.
Jetter, H.-C., & Gerken, J. (2006). A simplified model of user experience for practical application. In Proceedings of the 2nd COST294-MAUSE International Open Workshop "User eXperience - Towards a unified view" (held in conjunction with the 4th Nordic Conference on Human-Computer Interaction (NordiCHI 2006)).
Jokinen, K., & Hurtig, T. (2006). User expectations and real experience on a multimodal interactive system. In Proceedings of the 9th International Conference on Spoken Language Processing (Interspeech 2006 — ICSLP), 1049–1052. Retrieved July 31st 2014, from ISCA Archive: http://www.isca-speech.org/archive/interspeech_2006.

……
……
…
134
Jordan, B., & Henderson, A. (1995). Interaction analysis: foundations and practice. The Journal of the Learning Sciences 4(1), 39–103. doi:10.1207/s15327809jls0401_2
Kahneman, D., Krueger, A. B., Schkade, D. A., Schwarz, N., & Stone, A. A. (2004). A survey method for characterizing daily life experience: the day reconstruction method. Science, 306(5702), 1776–1780. doi:10.1126/science.1103572
Kallioniemi, P., Hakulinen, J., Keskinen, T., Turunen, M., Heimonen, T., Pihkala-Posti, L., Uusi-Mäkelä, M., Hietala, P., Okkonen, J., & Raisamo, R. (2013). Evaluating landmark attraction model in collaborative wayfinding in virtual learning environments. In Proceedings of the 12th International Conference on Mobile and Ubiquitous Multimedia (MUM '13), Article 33, 10 pages. New York, NY, USA: ACM. doi:10.1145/2541831.2541849
Karapanos, E., Martens, J.-B., & Hassenzahl, M. (2012). Reconstructing experiences with iScale. International Journal of Human-Computer Studies 70(11), 849–865. doi:10.1016/j.ijhcs.2012.06.004
Keskinen, T., Hakulinen, J., Heimonen, T., Turunen, M., Sharma, S., Miettinen, T., & Luhtala, M. (2013). Evaluating the experiential user experience of public display applications in the wild. In Proceedings of the 12th International Conference on Mobile and Ubiquitous Multimedia (MUM ‘13), Article 7, 10 pages. New York, NY, USA: ACM. doi:10.1145/2541831.2541840
Keskinen, T., Hakulinen, J., Turunen, M., Heimonen, T., Sand, A., Paavilainen, J., Parviainen, J., Yrjänäinen, S., Mäyrä, F., Okkonen, J., & Raisamo, R. (2014). Schoolchildren’s user experiences on a physical exercise game utilizing audio and lighting. Entertainment Computing, 5(4), 475–484. doi: 10.1016/j.entcom.2014.08.009
Keskinen, T., Heimonen, T., Turunen, M., Hakulinen, J., & Miettinen, T. (2012). Evaluating the user experience of multimodal public displays. In S. Schaffer, J. Seebode, M. Elepfandt, R. Schleicher, T. Keskinen, T. Heimonen, & M. Turunen (Eds.), Proceedings of the "Assessing Multimodal Interaction" workshop (held in conjunction with the 7th Nordic Conference on Human-Computer Interaction (NordiCHI 2012)), 19–22.
Keskinen, T., Heimonen, T., Turunen, M., Rajaniemi, J.-P., & Kauppinen, S. (2012). SymbolChat: a flexible picture-based communication platform for users with intellectual disabilities. Interacting with Computers, 24(5), 374–386. doi:10.1016/j.intcom.2012.06.003

……
……
…
135
Keskinen, T., Melto, A., Hakulinen, J. Turunen, M., Saarinen, S., Pallos, T., Danielsson-Ojala, R., & Salanterä, S. (2013). Mobile dictation with automatic speech recognition for healthcare purposes. In Proceedings of the 8th MobileHCI Workshop on Speech in Mobile and Pervasive Environments (SiMPE 2013), Article 6. Available at http://tinyurl.com/Simpe13.
Keskinen, T., Turunen, M., Raisamo, R., Evreinov, G., & Haverinen, E. (2012). Utilizing haptic feedback in drill rigs. In P. Isokoski, & J. Springare (Eds.), Haptics: Perception, Devices, Mobility, and Communication: 8th International Conference EuroHaptics (EuroHaptics 2012), LNCS 7283, Part II, 73–78. Berlin Heidelberg, Germany: Springer. doi:10.1007/978-3-642-31404-9_13
Kujala, S., Roto, V., Väänänen-Vainio-Mattila, K., Karapanos, E., & Sinnelä, A. (2011). UX Curve: a method for evaluating long-term user experience. Interacting with Computers, 23(5), 473–483. doi:10.1016/j.intcom.2011.06.005
Kuutti, K. (2010). Where are the Ionians of user experience research? In Proceedings of the 6th Nordic Conference on Human-Computer Interaction: Extending Boundaries (NordiCHI '10), 715–718. New York, NY, USA: ACM. doi:10.1145/1868914.1869012
Laugwitz, B., Held, T., & Schrepp, M. (2008). Construction and evaluation of a user experience questionnaire. In A. Holzinger (Ed.), HCI and Usability for Education and Work: 4th Symposium of the Workgroup Human-Computer Interaction and Usability Engineering of the Austrian Computer Society (USAB 2008), LNCS 5298, 63–76. Berlin Heidelberg, Germany: Springer. doi: 10.1007/978-3-540-89350-9_6
Law, E. L.-C., Roto, V., Hassenzahl, M., Vermeeren, A. P. O. S., & Kort, J. (2009). Understanding, scoping and defining user experience: a survey approach. In Proceedings of the 27th International Conference on Human Factors in Computing Systems (CHI '09), 719–728. New York, NY, USA: ACM. doi:10.1145/1518701.1518813
Law, E. L.-C., Roto, V., Vermeeren, A. P. O. S., Kort, J., & Hassenzahl, M. (2008). Towards a shared definition of user experience. In CHI '08 Extended Abstracts on Human Factors in Computing Systems (CHI EA '08), 2395–2398. New York, NY, USA: ACM. doi:10.1145/1358628.1358693
Mahlke, S. (2008). User Experience of Interaction with Technical Systems. Ph.D. thesis. Technische Universität Berlin. http://nbn-resolving.de/urn/resolver.pl?urn:nbn:de:kobv:83-opus-17831
……
……
…
136
Obrist, M., Law, E. L.-C., Väänänen-Vainio-Mattila, K., Roto, V., Vermeeren, A., & Kuutti, K. (2011). UX research: what theoretical roots do we build on -- if any? In CHI '11 Extended Abstracts on Human Factors in Computing Systems (CHI EA '11), 165–168. New York, NY, USA: ACM. doi:10.1145/1979742.1979526
Obrist, M., Roto, V., & Väänänen-Vainio-Mattila, K. (2009). User experience evaluation—do you know which method to use? In CHI '09 Extended Abstracts on Human Factors in Computing Systems (CHI EA '09), 2763–2766. New York, NY, USA: ACM. doi:10.1145/1520340.1520401
Olsson, T. (2012). User Expectations and Experiences of Mobile Augmented Reality Services. Doctoral dissertation. Publication 1085, Tampere University of Technology. http://urn.fi/URN:ISBN:978-952-15-2953-5
Olsson, T. (2014). Layers of user expectations of future technologies: an early framework. In CHI ’14 Extended Abstracts on Human Factors in Computing Systems (CHI EA '14), 1957–1962. New York, NY, USA: ACM. doi:10.1145/2559206.2581225
Raita, E,, & Oulasvirta, A. (2011). Too good to be bad: favorable product expectations boost subjective usability ratings. Interacting with Computers, 23(4), 363–371. doi:10.1016/j.intcom.2011.04.002
Read, J. C., MacFarlane, S. J., & Casey, C. (2002). Endurability, engagement and expectations: measuring children’s fun. In Proceedings of Interaction Design and Children, 189–198. Eindhoven, the Netherlands: Shaker Publishing.
Riihiaho, S. (2009). User testing when test tasks are not appropriate. In L. Norros, H. Koskinen, L. Salo, & P. Savioja (Eds.), European Conference on Cognitive Ergonomics: Designing beyond the Product— Understanding Activity and User Experience in Ubiquitous Environments (ECCE ‘09), Article 21, 9 pages. VTT Technical Research Centre of Finland.
Roto, V. (2006). Web Browsing On Mobile Phones—Characteristics Of User Experience. Ph.D. thesis. TKK Dissertations 49, Helsinki University of Technology. http://lib.tkk.fi/Diss/2006/isbn9512284707/isbn9512284707.pdf
Roto, V., Law, E. L.-C., Vermeeren, A., & Hoonhout, J. (Eds.). (2011). User Experience White Paper—Bringing clarity to the concept of user experience. Retrieved August 26th 2014, from http://www.allaboutux.org/files/UX-WhitePaper.pdf.

……
……
…
137
Roto, V., Obrist, M., & Väänänen-Vainio-Mattila, K. (2009). User experience evaluation methods in academic and industrial contexts. Proceedings of UXEM ‘09 workshop. Retrieved September 9th 2014, from http://www.cs.tut.fi/~kaisavvm/UXEM09-Interact_ObristRotoVVM.pdf.
Shackel, B. (1991). Usability—context, framework, design and evaluation. In B. Shackel, & S. Richardson (Eds.), Human Factors for Informatics Usability, 21–37. New York, NY, USA: Cambridge University Press.
Sharma, S. (2013). Designing for In the Wild Gesture-based Interaction: Lessons Learnt from Vuores. M.Sc. thesis. University of Tampere. http://urn.fi/URN:NBN:fi:uta-201310301546
Tähti, M., Väinämö, S., Vanninen, V., & Isomursu, M. (2004). Catching emotions elicited by mobile services. In Proceedings of the 2nd Australian Conference on Human-Computer Interaction (HCI) (OzCHI 2004), 1–11. Retrieved September 22nd 2014, from http://www.ozchi.org/proceedings/2004/pdfs/ozchi2004-117.pdf.
Tarssanen, S., & Kylänen, M. (2006). Theoretical Model for Producing Experiences—A Touristic Perspective. In M. Kylänen (Ed.). Articles on Experiences 2, 134–154. Lapland Centre of Expertise for the Experience Industry. On April 13th 2015 available at http://www.houseoflapland.fi/wp-content/uploads/2014/06/Articles-on-Experiences-2.pdf.
Turku City Library (2014). Library visits 2011. Retrieved February 17th 2014, from http://www.turku.fi/public/download.aspx?ID=157308&GUID={127B16AF-799C-448C-8947-9676346FF144}.
Turunen, M., Hakulinen, J., Hella J., Rajaniemi, J.-P., Melto, A., Mäkinen, E., Rantala, J., Heimonen, T., Laivo, T., Soronen, H., Hansen, M., Valkama, P., Miettinen, T., & Raisamo, R. (2009). Multimodal media center interface based on speech, gestures and haptic feedback. In T. Gross, J. Gulliksen, P. Kotzé, L. Oestreicher, P. Palanque, R. Oliveira Prates, & M. Winckler (Eds.), Human-Computer Interaction—INTERACT 2009: 12th IFIP TC 13 International Conference, LNCS 5727, Part II, 54-57. Berlin Heidelberg, Germany: Springer. doi:10.1007/978-3-642-03658-3_9
Turunen, M., Hakulinen J., Melto A., Heimonen T., Laivo T., & Hella J. (2009). SUXES—user experience evaluation method for spoken and multimodal interaction. In Proceedings of the 10th Annual Conference of the International Speech Communication Association (Interspeech 2009), 2567–2570. Available at ISCA Archive: http://www.isca-speech.org/archive/archive_papers/interspeech_2009/papers/i09_2567.pdf.
……
……
…
138
Turunen, M., Hakulinen, J., Melto, A., Hella J., Laivo, T., Rajaniemi, J.-P., Mäkinen, E., Soronen, H., Hansen, M., Pakarinen, S., Heimonen, T., Rantala, J., Valkama, P., Miettinen, T., & Raisamo, R. (2010). Accessible Speech-based and Multimodal Media Center Interface for Users with Physical Disabilities. In A. Esposito, N. Campbell, C. Vogel, A. Hussain, & A. Nijholt (Eds.), Development of Multimodal Interfaces: Active Listening and Synchrony, LNCS 5967, 66–79. Berlin Heidelberg, Germany: Springer. doi:10.1007/978-3-642-12397-9_5
Turunen, M., Kuoppala, H., Kangas, S., Hella, J., Miettinen, T., Heimonen, T., Keskinen, T., Hakulinen, J., & Raisamo, R. (2013). Mobile interaction with elevators—improving people flow in complex buildings. In A. Lugmayr, H. Franssila, J. Paavilainen, & H. Kärkkäinen (Eds.), Proceedings of International Conference on Making Sense of Converging Media (AcademicMindTrek '13), 43–50. New York, NY, USA: ACM. doi:10.1145/2523429.2523469
Turunen, M., Melto, A., Hella, J., Heimonen, T., Hakulinen, J., Mäkinen, E., Laivo, T., & Soronen, H. (2009). User expectations and user experience with different modalities in a mobile phone controlled home entertainment system. In Proceedings of the 11th International Conference on Human-Computer Interaction with Mobile Devices and Services (MobileHCI '09), 1–4. New York, NY, USA: ACM. doi:10.1145/1613858.1613898
UEQ (2014). UEQ-online website: http://www.ueq-online.org/. Referenced September 9th 2014.
Väänänen-Vainio-Mattila, K., Olsson, T., & Häkkilä, J. (2015). Towards deeper understanding of user experience with ubiquitous computing systems: systematic literature review and design framework. In J. Abascal, S. Barbosa, M. Fetter, T. Gross, P. Palanque, & M. Winckler (Eds.), Human-Computer Interaction— INTERACT 2015: 15th IFIP TC 13 International Conference, LNCS 9298, Part III, 384–401. Springer International Publishing. doi:10.1007/978-3-319-22698-9_26
Väänänen-Vainio-Mattila, K., Roto, V., & Hassenzahl, M. (2008a). Now let’s do it in practice: user experience evaluation methods in product development. In CHI '08 Extended Abstracts on Human Factors in Computing Systems (CHI EA '08). 3961–3964. New York, NY, USA: ACM. doi:10.1145/1358628.1358967
Väänänen-Vainio-Mattila, K., Roto, V., & Hassenzahl, M. (2008b). Towards practical user experience evaluation methods. In Proceedings of the 5th COST294-MAUSE Open Workshop on Meaningful Measures: Valid Useful User Experience Measurement (VUUM 2008).

……
……
…
139
Vajk, T., Coulton, P., Bamford, W., & Edwards, R. (2008). Using a mobile phone as a “Wii-like” controller for playing games on a large public display. International Journal of Computer Games Technology, 2008, Article ID 539078, 6 pages. doi:10.1155/2008/539078
Vanhala, T. (2005). Kyseelylomakkeet käytettävyystutkimuksessa. In S. Ovaska, A. Aula, & P. Majaranta (Eds.), Käytettävyystutkimuksen menetelmät, 17–36. Report B-2005-1, Department of Computer Sciences, University of Tampere. http://urn.fi/URN:ISBN:978-951-44-9724-7
Vermeeren, A. P. O. S., Law, E. L.-C., Roto, V., Obrist, M., Hoonhout, J., & Väänänen-Vainio-Mattila, K. (2010). User experience evaluation methods: current state and development needs. In Proceedings of the 6th Nordic Conference on Human-Computer Interaction: Extending Boundaries (NordiCHI '10), 521–530. New York, NY, USA: ACM. doi:10.1145/1868914.1868973
Wechsung, I. (2014). An Evaluation Framework for Multimodal Interaction: Determining Quality Aspects and Modality Choice. Ph.D. thesis. In S. Möller, A. Küpper, & A. Raake (Eds.), T-Labs Series in Telecommunication Services. Springer International Publishing. doi:10.1007/978-3-319-03810-0
Wright, P., Wallace, J., & McCarthy, J. (2008). Aesthetics and experience-centered design. Transactions on Computer-Human Interaction, 15(4), Article 18, 21 pages. doi:10.1145/1460355.1460360
Yogasara, T., Popovic, V., Kraal, B. J., & Camorro-Koc, M. (2011). General characteristics of anticipated user experience (AUX) with interactive products. In N. Roozenburg, L.-L. Chen, & P. J. Stappers (Eds.), Proceedings of the 4th World Conference on Design Research: Diversity and Unity (IASDR ‘11), 1–11.
Yrjänäinen, S., Parviainen, J., & Lakervi, H. (2014). Opettaja ja älykäs valo- ja ääniteknologia liikuntatunnilla: Liikuntapedagogisia näkökulmia Valopeliin. In Krokfors, L., Kangas, M., & Kopisto, K. (Eds.), Oppiminen pelissä: Pelit, pelillisyys ja leikillisyys opetuksessa, 168–190. Tampere, Finland: Vastapaino.
Zeithaml, V. A., Parasuraman, A., & Berry, L. L. (1990). Delivering Quality Service; Balancing Customer Perceptions and Expectations. New York, NY, USA: The Free Press.

……
……
…
140
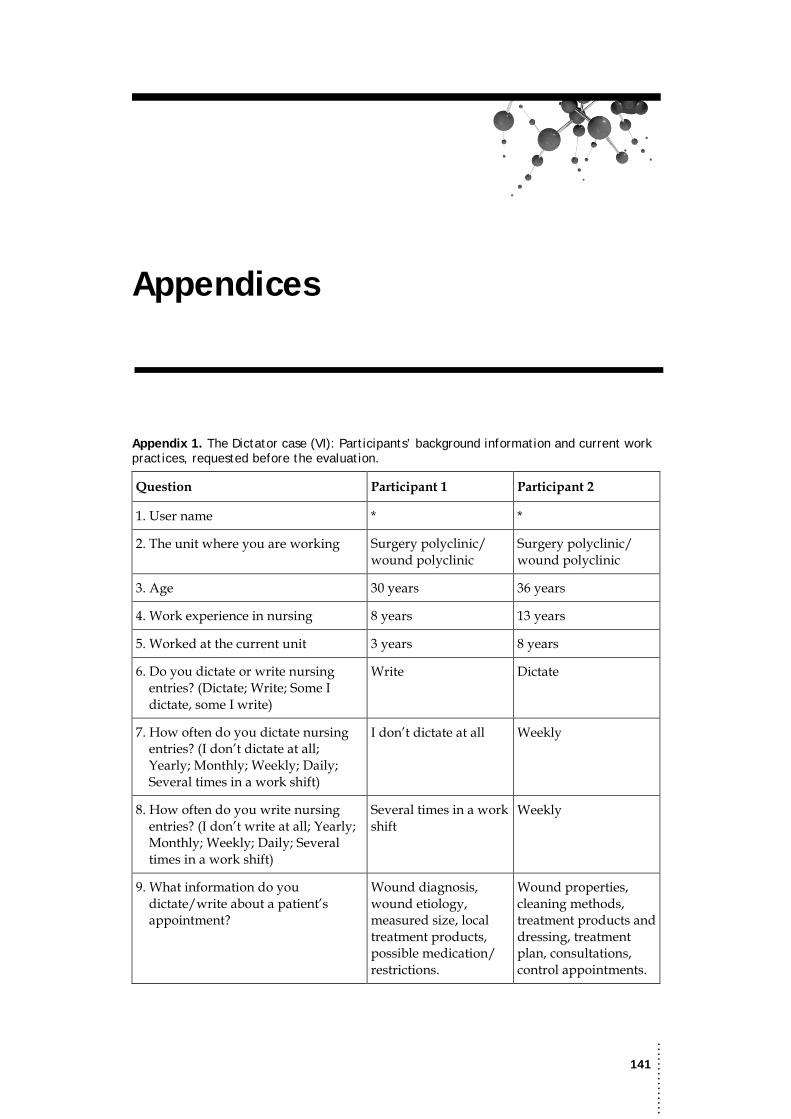
……
……
…
141
Appendices
Appendix 1. The Dictator case (VI): Participants’ background information and current work practices, requested before the evaluation.
Question Participant 1 Participant 2
1. User name * *
2. The unit where you are working Surgery polyclinic/ wound polyclinic
Surgery polyclinic/ wound polyclinic
3. Age 30 years 36 years
4. Work experience in nursing 8 years 13 years
5. Worked at the current unit 3 years 8 years
6. Do you dictate or write nursing entries? (Dictate; Write; Some I dictate, some I write)
Write Dictate
7. How often do you dictate nursing entries? (I don’t dictate at all; Yearly; Monthly; Weekly; Daily; Several times in a work shift)
I don’t dictate at all Weekly
8. How often do you write nursing entries? (I don’t write at all; Yearly; Monthly; Weekly; Daily; Several times in a work shift)
Several times in a work shift
Weekly
9. What information do you dictate/write about a patient’s appointment?
Wound diagnosis, wound etiology, measured size, local treatment products, possible medication/ restrictions.
Wound properties, cleaning methods, treatment products and dressing, treatment plan, consultations, control appointments.
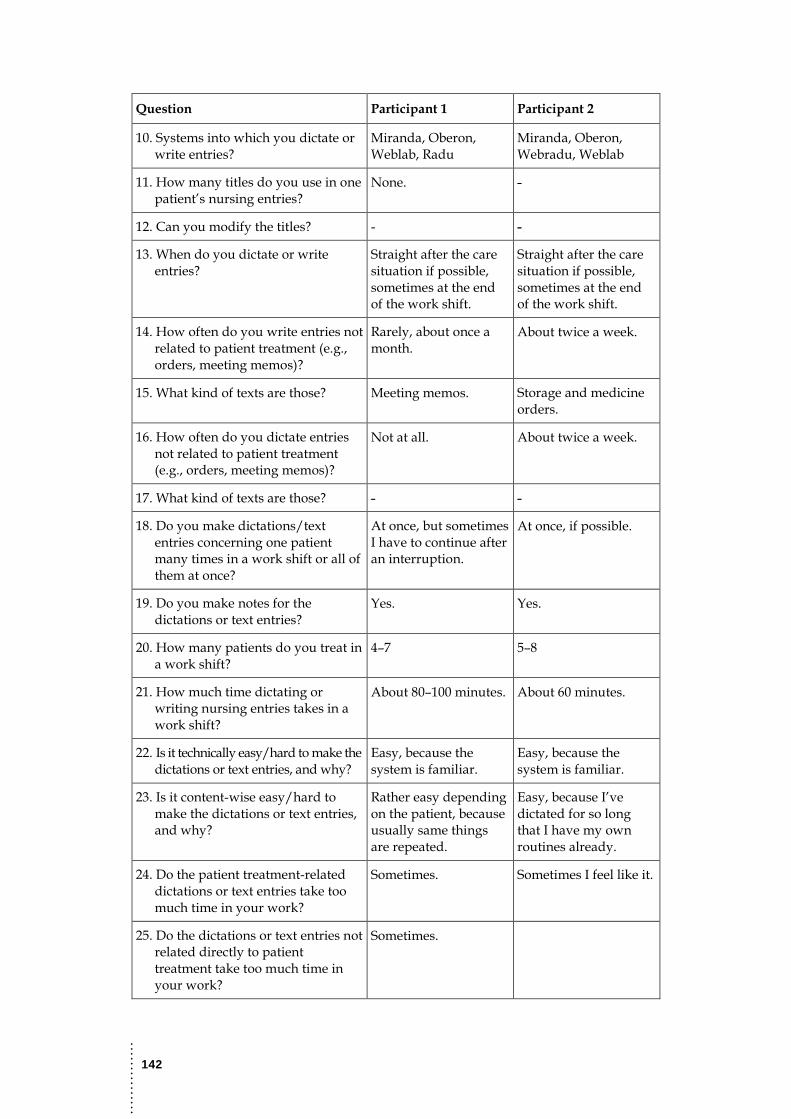
……
……
…
142
Question Participant 1 Participant 2
10. Systems into which you dictate or write entries?
Miranda, Oberon, Weblab, Radu
Miranda, Oberon, Webradu, Weblab
11. How many titles do you use in one patient’s nursing entries?
None. -
12. Can you modify the titles? - -
13. When do you dictate or write entries?
Straight after the care situation if possible, sometimes at the end of the work shift.
Straight after the care situation if possible, sometimes at the end of the work shift.
14. How often do you write entries not related to patient treatment (e.g., orders, meeting memos)?
Rarely, about once a month.
About twice a week.
15. What kind of texts are those? Meeting memos. Storage and medicine orders.
16. How often do you dictate entries not related to patient treatment (e.g., orders, meeting memos)?
Not at all. About twice a week.
17. What kind of texts are those? - -
18. Do you make dictations/text entries concerning one patient many times in a work shift or all of them at once?
At once, but sometimes I have to continue after an interruption.
At once, if possible.
19. Do you make notes for the dictations or text entries?
Yes. Yes.
20. How many patients do you treat in a work shift?
4–7 5–8
21. How much time dictating or writing nursing entries takes in a work shift?
About 80–100 minutes. About 60 minutes.
22. Is it technically easy/hard to make the dictations or text entries, and why?
Easy, because the system is familiar.
Easy, because the system is familiar.
23. Is it content-wise easy/hard to make the dictations or text entries, and why?
Rather easy depending on the patient, because usually same things are repeated.
Easy, because I’ve dictated for so long that I have my own routines already.
24. Do the patient treatment-related dictations or text entries take too much time in your work?
Sometimes. Sometimes I feel like it.
25. Do the dictations or text entries not related directly to patient treatment take too much time in your work?
Sometimes.

……
……
…
143
Question Participant 1 Participant 2
26. In what kind of situations do you listen/read dictations/text entries made by others?
Always before the patient contact if possible. This is how I get to know the patient.
I read the previous text always before taking the patient to the appointment room.
27. How often do you read earlier text entries?
Several times in a work shift.
Several times in a work shift.
28. How often do you listen to earlier dictations?
Weekly. Weekly.
29. How do you search for earlier dictations/text entries regarding a patient?
Based on the specific area and sometimes on the date.
Based on the date and specific area.
30. What information do you search for from earlier dictations/text entries?
Wound situation, wound care (local treatment, products), wound size, possible antibiotics.
The whole text concerning previous appointment, wound size and location, current treatment, planned follow-up treatment, risk information, primary diseases, medication, done examinations, treating party in outpatient care, etc.
31. Do you find the dictations/text entries you are looking for easily?
Yes. Yes.
32. How much experience do you have with a tablet computer? (No experience at all; I have seen one; I’ve tried one a few times at most; I have used several times; I have used a lot)
I’ve tried one a few times, at most.
I have seen one.
33. How much experience do you have with speech recognition? (No experience at all; I have heard/read about it; I’ve used it a few times at most; I have used it several times; I have used it a lot)
I have heard/read about it.
No experience at all.
34. How often do you use speech recognition (e.g., in a device or service)? (Not at all; Yearly; Monthly; Weekly; Daily)
Not at all. Not at all.
35. In what kind of situations would speech recognition be useful in your work?
In making the nursing entries.
It would make it faster and easier to dictate and see the text.
36. Could you dictate during the care situation while treating the patient?
Yes. Yes.

……
……
…
144

Paper I
Turunen, M., Soronen, H., Pakarinen, S., Hella, J., Laivo, T., Hakulinen, J., Melto, A., Rajaniemi, J.-P., Mäkinen, E., Heimonen, T., Rantala, J., Valkama, P., Miettinen, T., & Raisamo, R. (2010). Accessible multimodal media center application forblind and partially sighted people. Computers in Entertainment,8(3), Article 16, 30 pages. New York, NY, USA: ACM.doi:10.1145/1902593.1902595
© ACM, 2010. Reprinted with permission.
145

146
Accessible Multimodal Media CenterApplication for Blind and PartiallySighted People
MARKKU TURUNENUniversity of TampereandHANNU SORONEN and SANTTU PAKARINENTampere University of TechnologyandJUHO HELLA, TUULI LAIVO, JAAKKO HAKULINEN,ALEKSI MELTO, JUHA-PEKKA RAJANIEMI, ERNO MAKINEN,TOMI HEIMONEN, JUSSI RANTALA, PELLERVO VALKAMA,TONI MIETTINEN, and ROOPE RAISAMOUniversity of Tampere
We present a multimodal media center interface designed for blind and partially sighted people.It features a zooming focus-plus-context graphical user interface coupled with speech output andhaptic feedback. A multimodal combination of gestures, key input, and speech input is utilized tointeract with the interface. The interface has been developed and evaluated in close cooperationwith representatives from the target user groups. We discuss the results from longitudinal evalu-ations that took place in participants’ homes, and compare the results to other pilot and laboratorystudies carried out previously with physically disabled and nondisabled users.
Categories and Subject Descriptors: H.5.2 [Information Interfaces and Presentation]: UserInterfaces—Input devices and strategies; Interaction styles; Haptic I/O; Voice I/O
General Terms: Human Factors, Design
This work was supported by the Finnish Funding Agency for Technology and Innovation (TEKES)under the Ubicom program in the “Ambient Intelligence Based on Sound, Speech and MultisensorInteraction” project (TAPLA, grant 40223/07).Authors’ addresses: For authors at University of Tampere: University of Tampere, Kanslerin-rinne 1, FI-33014 Tampere; email address: {[email protected]}; for authors at TampereUniversity of Technology: Tampere University of Technology, Korkeakoulunkatu 10, FI-33720Tampere; email address: {[email protected]}.Permission to make digital or hard copies part or all of this work for personal or classroom useis granted without fee provided that copies are not made or distributed for profit or commercialadvantage and that copies show this notice on the first page or initial screen of a display along withthe full citation. Copyrights for components of this work owned by others than ACM must be hon-ored. Abstracting with credit is permitted. To copy otherwise, to republish, to post on servers, toredistribute to lists, or to use any component of this work in other works requires prior specific per-mission and/or a fee. Permissions may be requested from the Publications Dept., ACM, Inc., 2 PennPlaza, Suite 701, New York, NY 10121-0701 USA, fax +1 (212) 869-0481, or [email protected]© 2010 ACM 1544-3574/2010/12-ART16 $10.00 DOI: 10.1145/1902593.1902595.
http://doi.acm.org/10.1145/1902593.1902595.
ACM Computers in Entertainment, Vol. 8, No. 3, Article 16, Pub. date: December 2010.
147

16: 2 · M. Turunen et al.
Additional Key Words and Phrases: Gestures, haptic feedback, speech recognition, speechsynthesis, digital television, media center, accessibility
ACM Reference Format:Turunen, M., Soronen, H., Pakarinen, S., Hella, J., Laivo, T., Hakulinen, J., Melto, A., Rajaniemi,J.-P., Makinen, E., Heimonen, T., Rantala, J., Valkama, P., Miettinen, T., and Raisamo, R. 2010.Accessible multimodal media center application for blind and partially sighted people. ACMComput. Entertain. 8, 3, Article 16, (December 2010), 30 pages.DOI = 10.1145/1902593.1902595. http://doi.acm.org/10.1145/1902593.1902595.
1. INTRODUCTION
People need to access different kinds of digital content in their everyday livesat an increasing pace. In home environments, the consumption of media con-tent, such as television broadcasts, photographs, music, and videos is an essen-tial part of everyday life. Digital television in particular has a central role inentertainment and media access, with networked television sets enabling theuse of online content in addition to broadcast programming. Typically, televi-sions are operated with a complex remote controller, which makes interactionat times slow, complicated, or even inaccessible for some people, such as thosewith visual impairments. Furthermore, interaction with EPG relies heavily onvisual feedback and affordances, creating huge usability challenges for manyusers. Still, television is considered as important media among visually im-paired users. For example, in the UK, 90% of blind and partially sighted peoplewatch television every two days, even though 60% of them cannot use such acrucial feature as on-screen menu navigation [Petre and Chandler 2009]. Inthe UK alone, this concerns millions of people. The introduction of new fea-tures to televisions, such as electronic program guides and interactive contenthas further exacerbated these issues, as interaction methods have not changed,and there are no accessibility features.
The early research on accessible interfaces for visually impaired usersfocused on making graphical direct interfaces more accessible. More recentresearch focuses on multimodal interfaces that are equally as accessiblefor different user groups. In general, there are high hopes for multimodalinteraction as a facilitator for television accessibility, especially the use ofspeech synthesis, as evidenced by user feedback and industry activity inthe area [Knill 2010]. Novel multimodal solutions may also provide totallyrevolutionary changes in the lives of people with disabilities by makingpreviously inaccessible content and services not only accessible but even veryuseful and enjoyable. Our research is motivated by the fact that in Finlandvisually impaired people have been eagerly waiting the kind of multimodalmedia center solutions we are presenting here.
In this article we describe our solution, the Multimodal Media Center ap-plication that addresses the challenges of efficient and accessible multimodalinteraction in home entertainment. The application has been designed tooffer a variety of different modalities to make the overall user interface bothefficient and accessible for different user groups. For blind users, speechACM Computers in Entertainment, Vol. 8, No. 3, Article 16, Pub. date: December 2010.
148
Media Center Application for Blind and Partially Sighted People · 16: 3
output and haptic feedback provide full access to the information, while azooming graphical user interface (GUI) is accessible for many users withlow vision. Speech input combined with gestures and keypad use makes theinterface more efficient and accessible when compared to conventional remotecontrollers for all people, and especially visually impaired users who cannotuse the visual references often needed in direct manipulation interfaces. Ourearlier work has demonstrated how the interface and its different modalitieswere accepted both by nondisabled and physically disabled users (see, e.g.[Turunen et al. 2010, 2009a, b]. In all of these cases, the same baselinesystem [Turunen et al. 2009d] and evaluation paradigm [Turunen et al. 2009c]have been used. In this article, we focus on visually impaired users and theevaluations carried out with the media center application in their homes.
The rest of the article is organized as follows: we first discuss related workand background, in particular the use of the different modalities in relation tovisually impaired people as the user group. Next, we present the MultimodalMedia Center application and its user interface. We report results from sev-eral user evaluations carried out with the system: first we summarize the keyresults from earlier studies to establish a baseline and then describe in moredetail a study with visually impaired users. We conclude with discussion aboutthe implications of our results for the design of multimodal interfaces for mediaconsumption, and outline avenues for future research in the area.
2. BACKGROUND
Our work is related to a number of systems proposed for improving the useof television and their program guides by utilizing multimodal input and out-put methods. Typically, the dominating control model, the remote controller, isreplaced or accompanied by another control method, such as spoken or tangi-ble interaction. For example, conversational dialogue systems for interactingwith EPG content had already been developed in the 1990s [Cavazza et al.1999]. Typically, the user interacts with a virtual agent using spoken naturallanguage. In a recent example by Goto et al. [2003], the user interacts withan embodied physical television agent using voice interaction based on naturaldialogue, with the agent responding using synthesized voice feedback. The re-sults from their small-scale user study suggest that users found interactingwith the television using voice easy. Additionally, a Wizard-of-Oz study preced-ing the development of their voice interface indicates that in the context of EPGcontrol, people voluntarily restrict their speech in such a way that it mainlydeals with information specific to EPG content, such as program names.
Multimodal approaches for voice-based interaction with EPG include a novelTV program guide proposed by Ibrahim and Johansson [2003].Their approachcombines speech interaction and direct manipulation with remote controlleruse. Their results indicate that users prefer the multimodal approach to purespoken input or pure direct manipulation, as different modalities are bettersuited for different operations, and thus support each other. For special usergroups, they provide alternative methods to interact with the system, whichcan make otherwise cumbersome or inaccessible system not only usable, but
ACM Computers in Entertainment, Vol. 8, No. 3, Article 16, Pub. date: December 2010.
149

16: 4 · M. Turunen et al.
also enjoyable and fun. Balchandran et al. [2008] demonstrated a similar sys-tem, based on multimodal interaction using the remote controller and speechrecognition. It provides both a novice mode with prompts to progressively guidethe spoken dialogue, and an expert mode that allows the user to make morecomplex commands to search and filter the EPG information.
The ZEPI EPG prototype developed by [Tinker et al. 2003] utilizes gesturesand voice recognition combined with a zoomable display, thus resembling ourapproach as presented here. In the ZEPI system, the usage scenario is based ona personable, recommender-like approach built around context-sensitive spo-ken dialogue. The authors state that the spoken interface be context-sensitive,while gestures can be performed with any device capable of emulating mousemovements. The visual structure of the ZEPI interface is designed aroundmultilayered panels, with each containing a subset of the content with varyingtypes of information.
The existing systems described have not been developed with visually im-paired users in mind, and many of them rely on techniques which might behard to use for visually impaired people. Although they all contain speechinterface, which supports accessibility when properly designed, this does notguarantee accessibility. Similarly, multimodality – or multiple modalities –in general does not guarantee more usable or accessible interaction [Oviatt1999]. Although the needs of visually impaired users are addressed in specificprograms [Knill 2010] and there exists research and guidelines on designingaccessible audible [DTG Usability Text To Speech Subgroup 2009] and visual[Rice and Fels 2004] television interfaces, we still lack accessible multimodalinterfaces for digital television which take into account the needs of differentuser groups. Next, we discuss how modalities like speech input and output, ges-tures, and haptic feedback, and their multimodal use can be utilized to makean accessible media center interface.
2.1 Speech Input and Output
Speech has traditionally been applied to support people with visual impair-ments. There are many kinds of visual impairments from complete blindnessto partial sight, and thus the visually impaired have separate needs. For blindusers, audio is the most relevant output channel with tactile feedback forminga promising supporting modality. Television and radio broadcasts are impor-tant for this group, and digital television provides some new possibilities, suchas subtitles being read out loud using speech synthesis. For these users, it isimportant to format the speech output to allow fast browsing through largeamounts of information to gather an overview, for example of the TV and radioprograms to be broadcast during the evening. As the audio of the TV and radioprograms is the content the users are interested in, mixing the user interfacespeech with the broadcast content must be designed carefully. Some programsin digital television broadcasts in Finland also provide a subtitle-based speechsynthesis for people with visual impairments. Because of this, simply using asynthesized voice does not clearly differentiate user interface speech from thebroadcast content.ACM Computers in Entertainment, Vol. 8, No. 3, Article 16, Pub. date: December 2010.
150

Media Center Application for Blind and Partially Sighted People · 16: 5
It is obvious how users with visual impairments benefit from speech output,but speech input can bring many advantages as well. Most importantly, aspeech input interface allows people to interact without the need of seeing allthe visual references – or affordances – that are usually required in interactionwith direct manipulation interfaces. For example, remote controllers, in par-ticular so-called universal remote controllers, often require the user to see thevisual display to successfully operate the controller, thus forcing blind users tomemorize a large number of remote controller layouts in its different operatingmodes. In addition, auditory or haptic feedback is usually totally omittedin favor of visual output. While the proper use of speech output and hapticfeedback can aid in the use of remote controllers, an optimal solution would beto use a true spoken-language interface instead of trying to make the existinggraphical direct manipulation interface accessible for people with visualimpairments.
Building a speech-recognition interface for home entertainment applicationsis a challenging task. Wittenburg et al. [2006] studied unrestricted speech in-put for television content search. They found retrieval performance to be criti-cal to user experience, indicating that unrestricted speech input is viable onlywhen high recognition rates can be achieved. Error correction can solve onlysome of the problems [Berglund and Qvarfordt 2003], so errors should be mini-mized in the first place, especially for those users who cannot use visual displayto correct them. As accuracy in speech recognition depends greatly on the sizeof the language model used for recognition, the optimal selection of grammarsize is vital. Use of domain-specific grammars and vocabularies can be a rea-sonable choice in order to maximize recognition rates and avoid negative userexperiences. Previous research has proposed that even conversational dialogueapplications are realizable with moderate vocabularies (500 to 1000 words) inthis domain [Cavazza et al. 1999], mainly because users have been shown torestrict their speech in this context voluntarily [Goto et al. 2003]. With re-stricted speech, however, the amount of out-of-vocabulary sentences may be-come a problem if users do not receive enough guidance on how to speak. Badlydesigned grammars may also force users to use unnatural language and makespeech recognition tedious to use. If a good balance is found so that thesechallenges are met, speech can provide a powerful input channel: commands,which would require tedious navigation with current interfaces, can be givenwith a single utterance (as “shortcuts”). The optimal solution can vary greatlybetween user groups. Limited grammars, which require learning, may be per-fectly acceptable for those users who find current solutions tedious to use. It isalso possible to adjust the grammars per user to find the optimal solution forthat individual.
2.2 Gestures and Haptic Feedback
Gestures can bring similar benefits as speech input for visually impaired users.In particular, gestures can decrease the need for using keypad buttons, andmake it is possible to control the system without seeing the interface, eithervirtual (e.g., television and mobile phone GUI) or physical (remote controller or
ACM Computers in Entertainment, Vol. 8, No. 3, Article 16, Pub. date: December 2010.
151

16: 6 · M. Turunen et al.
mobile phone buttons and their labels). Gesture-based interaction, in general,can be very useful for all users in a media center interface for controlling basicplayback. For example, Chen et al. [2010] developed a vision-based interfacefor television control that allows the user to carry out operations such as chan-nel selection and volume adjustment without using any additional devices.With gestures, there is no need to see labels on the remote controller buttonsor display, thus making (sensor-based) gestures usable in low light conditions(e.g., when watching movies). Furthermore, gestures complement speechinput and output and haptic feedback well, to provide a rich multimodal userinterface, and thus increase the overall user experience. This has also beennoted by the entertainment industry, as both Sony [2010] and Microsoft [2010]are releasing gesture-based control technology for their gaming consoles,which are also increasingly used to enjoy media content in homes.
Ferscha et al. [2007] investigated how gestures could be used to expressthe most frequently used remote controller commands. They highlight the im-portance of simplicity, affordance, and focused functionality in gesture design.This suggests that when adding gesture interaction to a multimodal home en-tertainment system, we should be cautious not to overload the gesture channelwith too many commands. Care should also be taken if one wants to map re-mote controller commands to gestures so that they become intuitive to createeffective mappings.
Haptic feedback is another promising user interface modality for visuallyimpaired users [Patomaki et al. 2004] and in general for multimodal interfacescontrolled with mobile devices. For blind users, haptic feedback can facilitatethe use of other modalities (e.g., by communicating when the system is receiv-ing a command or processes speech recognition results). For users with low vi-sion, haptic feedback may also augment visual feedback [Saarinen et al. 2006].For nondisabled users, haptic feedback can provide silent feedback without dis-turbing the users, who might be watching movies or listening to music.
3. ACCESSIBLE MULTIMODAL MEDIA CENTER
As a part of the Finnish research project TAPLA (Ambient Intelligence basedon Sound, Speech and Multisensor Interaction), we have built a MultimodalMedia Center application (MMC) to study the use of novel interface modalitiesin home environments. Based on a single baseline system [Turunen et al.2009d] we have created different configurations to experiment with alternativemodalities, such as speech, gestures, haptic [Turunen et al. 2009b]. andphysical touching [Turunen et al. 2009a]. Furthermore, there are optimizedconfigurations for different user groups and even individual users, includingphysically disabled users and visually impaired users, as introduced here.Next, we briefly describe the baseline system, while Section 4 presents themultimodal interface developed in co-operation with visually impaired users.
The MMC application offers the functionality to watch and record televisionbroadcasts, listen to music, and view photographs. Currently, we have focusedon television broadcast functionality. The application provides full control overdigital television content, including a novel Electronic Program Guide.ACM Computers in Entertainment, Vol. 8, No. 3, Article 16, Pub. date: December 2010.
152
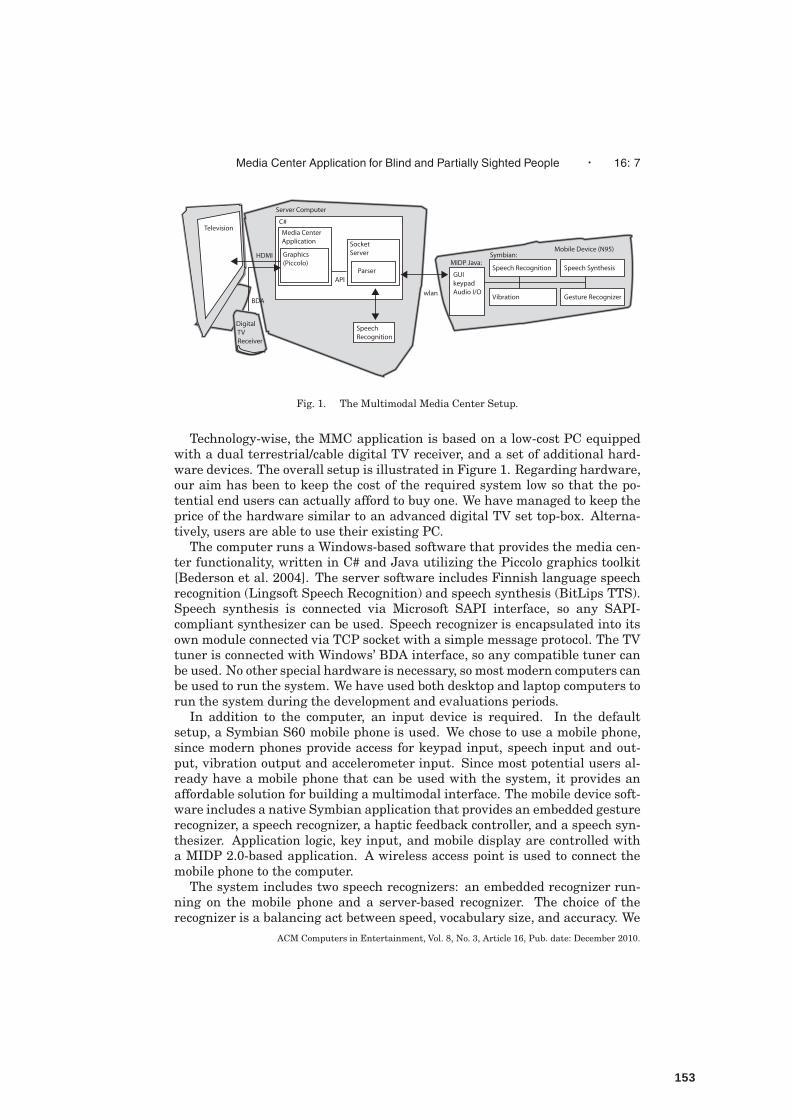
Media Center Application for Blind and Partially Sighted People · 16: 7
Fig. 1. The Multimodal Media Center Setup.
Technology-wise, the MMC application is based on a low-cost PC equippedwith a dual terrestrial/cable digital TV receiver, and a set of additional hard-ware devices. The overall setup is illustrated in Figure 1. Regarding hardware,our aim has been to keep the cost of the required system low so that the po-tential end users can actually afford to buy one. We have managed to keep theprice of the hardware similar to an advanced digital TV set top-box. Alterna-tively, users are able to use their existing PC.
The computer runs a Windows-based software that provides the media cen-ter functionality, written in C# and Java utilizing the Piccolo graphics toolkit[Bederson et al. 2004]. The server software includes Finnish language speechrecognition (Lingsoft Speech Recognition) and speech synthesis (BitLips TTS).Speech synthesis is connected via Microsoft SAPI interface, so any SAPI-compliant synthesizer can be used. Speech recognizer is encapsulated into itsown module connected via TCP socket with a simple message protocol. The TVtuner is connected with Windows’ BDA interface, so any compatible tuner canbe used. No other special hardware is necessary, so most modern computers canbe used to run the system. We have used both desktop and laptop computers torun the system during the development and evaluations periods.
In addition to the computer, an input device is required. In the defaultsetup, a Symbian S60 mobile phone is used. We chose to use a mobile phone,since modern phones provide access for keypad input, speech input and out-put, vibration output and accelerometer input. Since most potential users al-ready have a mobile phone that can be used with the system, it provides anaffordable solution for building a multimodal interface. The mobile device soft-ware includes a native Symbian application that provides an embedded gesturerecognizer, a speech recognizer, a haptic feedback controller, and a speech syn-thesizer. Application logic, key input, and mobile display are controlled witha MIDP 2.0-based application. A wireless access point is used to connect themobile phone to the computer.
The system includes two speech recognizers: an embedded recognizer run-ning on the mobile phone and a server-based recognizer. The choice of therecognizer is a balancing act between speed, vocabulary size, and accuracy. We
ACM Computers in Entertainment, Vol. 8, No. 3, Article 16, Pub. date: December 2010.
153

16: 8 · M. Turunen et al.
used the server-based recognizer for all user evaluations, since the full vocab-ulary is not accurate enough with the current embedded recognizers, and theembedded recognizers are significantly slower than server-based recognizers,even with small vocabularies. In the future, however, both limitations will beremoved, so we expect more use for the embedded recognizer.
A regular television is used as the display. Overall, the equipment usedis common and found in many homes today, even more so in the very nearfuture. For people with low vision, a modern high- definition display is used tomake the fully zoomable graphical interface as readable as possible by the useof several visualization techniques combined with speech output and hapticfeedback. For blind users, it would be possible to use the system in a trulymobile setup by streaming all audio content (both television broadcast and userinterface content) to the mobile phone.
Next, we present a multimodal interface developed for the MMC application.Here, we will focus on those techniques most suitable for visually impairedusers. Some topics are omitted here, and further information can be foundfrom our other publications (e.g., concerning solutions for physically disabledusers [Turunen et al. 2010] and interaction with physical pointing [Turunenet al. 2009a].
4. MULTIMODAL USER INTERFACE FOR VISUALLY IMPAIRED USERS
The overall MMC interface uses several visualizations and interaction tech-niques to support visually impaired users: a fully zoomable focus-plus-contextGUI tightly coupled with speech output, speech input combined with gesturesand mobile phone keypad, and haptic and auditory feedback.
The interface has evolved over several iterations. The evaluations describedin this article are based on two main iterations. The first version was imple-mented in the start of the project before user evaluations. Different evaluationsboth in public pilots and laboratory settings were done with the first version,which resulted in some major redesigns, in particular with gestures and hapticfeedback. The result was the second version, which was used in the evalua-tions with visually impaired users. The second version is highly configurable;this feature was utilized heavily to optimize the interface for visually impairedusers. Next, we describe the interface by looking at each of the modalities.Where there are significant differences between the two iterations, the dif-ferences are described. Unless otherwise noted, the screenshots refer to thesecond version of the system.
4.1 Focus and Context GUI
The main user interface of the MMC consists of several screens for differentmedia applications (e.g., viewing photographs and music playback). Here, wefocus on the Electronic Program Guide (EPG) interface (Figure 2). It consistsof a grid, where columns represent television channels, while rows representtime slots. Cells are individual television programs.
The user interface implements several focus-plus-context techniques, takinginspiration from such techniques as fisheye menus [Bederson 2000] and theACM Computers in Entertainment, Vol. 8, No. 3, Article 16, Pub. date: December 2010.
154
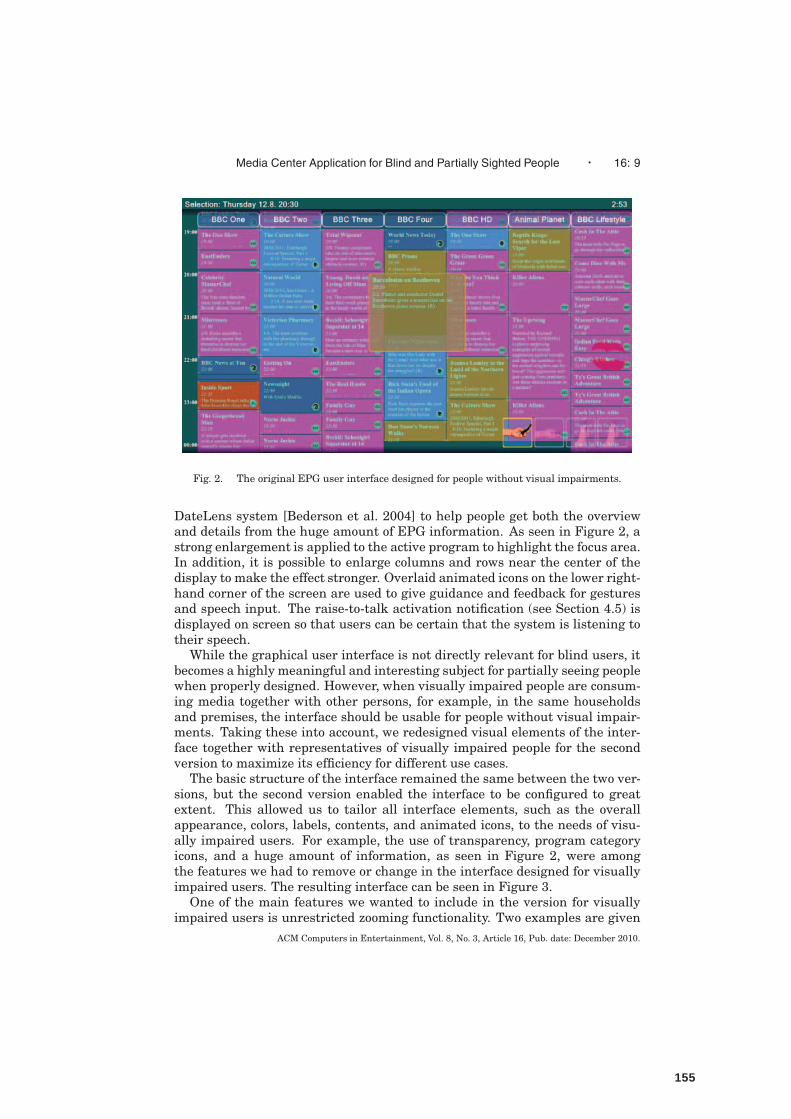
Media Center Application for Blind and Partially Sighted People · 16: 9
Fig. 2. The original EPG user interface designed for people without visual impairments.
DateLens system [Bederson et al. 2004] to help people get both the overviewand details from the huge amount of EPG information. As seen in Figure 2, astrong enlargement is applied to the active program to highlight the focus area.In addition, it is possible to enlarge columns and rows near the center of thedisplay to make the effect stronger. Overlaid animated icons on the lower right-hand corner of the screen are used to give guidance and feedback for gesturesand speech input. The raise-to-talk activation notification (see Section 4.5) isdisplayed on screen so that users can be certain that the system is listening totheir speech.
While the graphical user interface is not directly relevant for blind users, itbecomes a highly meaningful and interesting subject for partially seeing peoplewhen properly designed. However, when visually impaired people are consum-ing media together with other persons, for example, in the same householdsand premises, the interface should be usable for people without visual impair-ments. Taking these into account, we redesigned visual elements of the inter-face together with representatives of visually impaired people for the secondversion to maximize its efficiency for different use cases.
The basic structure of the interface remained the same between the two ver-sions, but the second version enabled the interface to be configured to greatextent. This allowed us to tailor all interface elements, such as the overallappearance, colors, labels, contents, and animated icons, to the needs of visu-ally impaired users. For example, the use of transparency, program categoryicons, and a huge amount of information, as seen in Figure 2, were amongthe features we had to remove or change in the interface designed for visuallyimpaired users. The resulting interface can be seen in Figure 3.
One of the main features we wanted to include in the version for visuallyimpaired users is unrestricted zooming functionality. Two examples are given
ACM Computers in Entertainment, Vol. 8, No. 3, Article 16, Pub. date: December 2010.
155
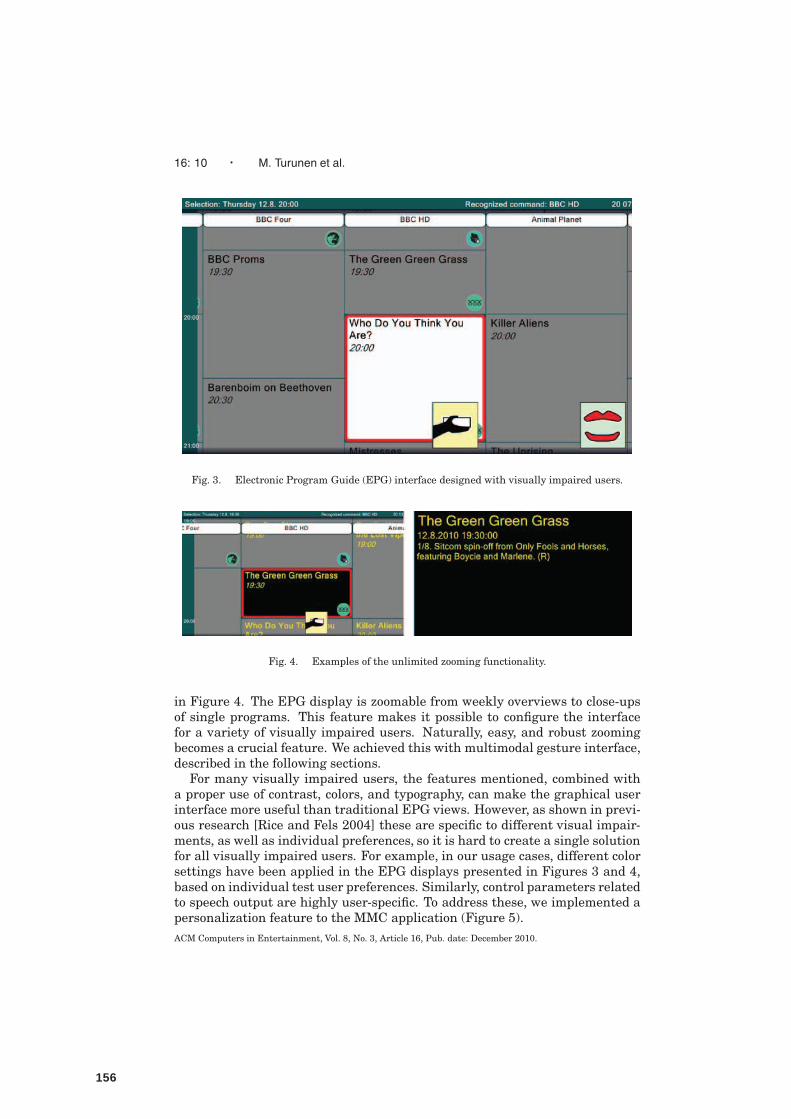
16: 10 · M. Turunen et al.
Fig. 3. Electronic Program Guide (EPG) interface designed with visually impaired users.
Fig. 4. Examples of the unlimited zooming functionality.
in Figure 4. The EPG display is zoomable from weekly overviews to close-upsof single programs. This feature makes it possible to configure the interfacefor a variety of visually impaired users. Naturally, easy, and robust zoomingbecomes a crucial feature. We achieved this with multimodal gesture interface,described in the following sections.
For many visually impaired users, the features mentioned, combined witha proper use of contrast, colors, and typography, can make the graphical userinterface more useful than traditional EPG views. However, as shown in previ-ous research [Rice and Fels 2004] these are specific to different visual impair-ments, as well as individual preferences, so it is hard to create a single solutionfor all visually impaired users. For example, in our usage cases, different colorsettings have been applied in the EPG displays presented in Figures 3 and 4,based on individual test user preferences. Similarly, control parameters relatedto speech output are highly user-specific. To address these, we implemented apersonalization feature to the MMC application (Figure 5).ACM Computers in Entertainment, Vol. 8, No. 3, Article 16, Pub. date: December 2010.
156

Media Center Application for Blind and Partially Sighted People · 16: 11
Fig. 5. User interface personalization screen.
In addition to the main display (on the TV screen), the mobile phone displayshows the latest user input, that is, it provides feedback on speech and gesturerecognition results, and displays contextual help and detailed information forthe currently active view. However, since most mobile phones provide rathersmall displays, we chose to focus on the main display in the second version ofthe system.
4.2 Speech Output
In order to support all visually impaired people, including blind users, thesystem includes a tight integration between the graphical interface and syn-thesized speech output – all of the important information is read aloud withspeech synthesis. For example, the content of an item is spoken out loud assoon as the item is selected. However, the spoken content is not the sameas the content presented on the display, since speech and text have differentstrengths and weaknesses. For example, speech outputs should use full sen-tences to keep the message easily comprehensible, and they should have themost important information at the beginning of the message to allow efficientbrowsing. In EGP navigation, we first presented the name of the channel (onlywhen the active selection moves to a new channel), followed by time, title ofthe program, and, after a short pause, the description of the program. As themost important information is spoken first, users can navigate around quicklyto form an overview. The basic structure of speech output remained the samein both versions of the system.
Since the system incorporates speech synthesis both into the mobile deviceand in the EPG application, we can choose the output channel between thesetwo. Mobile text-to-speech synthesis can provide spatial and voice quality
ACM Computers in Entertainment, Vol. 8, No. 3, Article 16, Pub. date: December 2010.
157

16: 12 · M. Turunen et al.
separation between audio from the television and speech by the system.However, this may cause too large a disparity, especially if audio volumefrom the television is high. The optimal solution depends greatly on the usecontext and the specific user group. We used synthesis on the computer in bothversions of the MMC system, but the feedback from user studies supports thepotential usefulness of spatial separation provided by synthesis on the mobilephone (see Section 5.3.5).
4.3 Haptic and Auditory Feedback
Haptic feedback can be used to enrich the user interface and provide a support-ing channel for visually impaired users, especially when combined with spokenand auditory output. In our case, haptic feedback is given using the vibrationcomponent of the mobile phone in the form of haptic icons. The icons are a se-ries of pulses generated by the vibration engines of modern mobile phones. Weidentified a set of ten control parameters to specify the icons. The parametersare (1) delay before the first pulse; (2) delay before the last pulse; (3) lengthof the first pulse; (4) length of the last pulse; (5) intensity of the first pulse;(6) intensity of the last pulse; (7) direction of the motor (forward or backward);(8) number of single pulse; (9) number of pulse series; and (10) delay betweenpulse series.
Based on the parameters mentioned, we defined a markup language tospecify haptic icons inside applications. Since haptic feedback has many sim-ilarities with music, we used similar approaches as with computer-generated(synthesized) music representations. The resulting markup makes it possibleto create rather sophisticated rhythmic patterns, as presented in the followingexample:
<haptic_patternname = "Speech input ends"begin_delay = "300"end_delay = "1"begin_length = "100"end_length = "1"begin_intensity = "1"end_intensity = "100"direction = "forward"pulses = "5"series = "1"pulse_delay = "0"
/>
For every haptic pattern, we created a corresponding auditory feedback, whichwas played out simultaneously. An example of such a pattern-feedback pair isvisualized in Figure 6.
In our previous studies, we found that even very simple haptic feedback canbe very useful in multimodal user interfaces [Turunen et al. 2008]. On theother hand, previous research has shown that learning more complex hapticACM Computers in Entertainment, Vol. 8, No. 3, Article 16, Pub. date: December 2010.
158
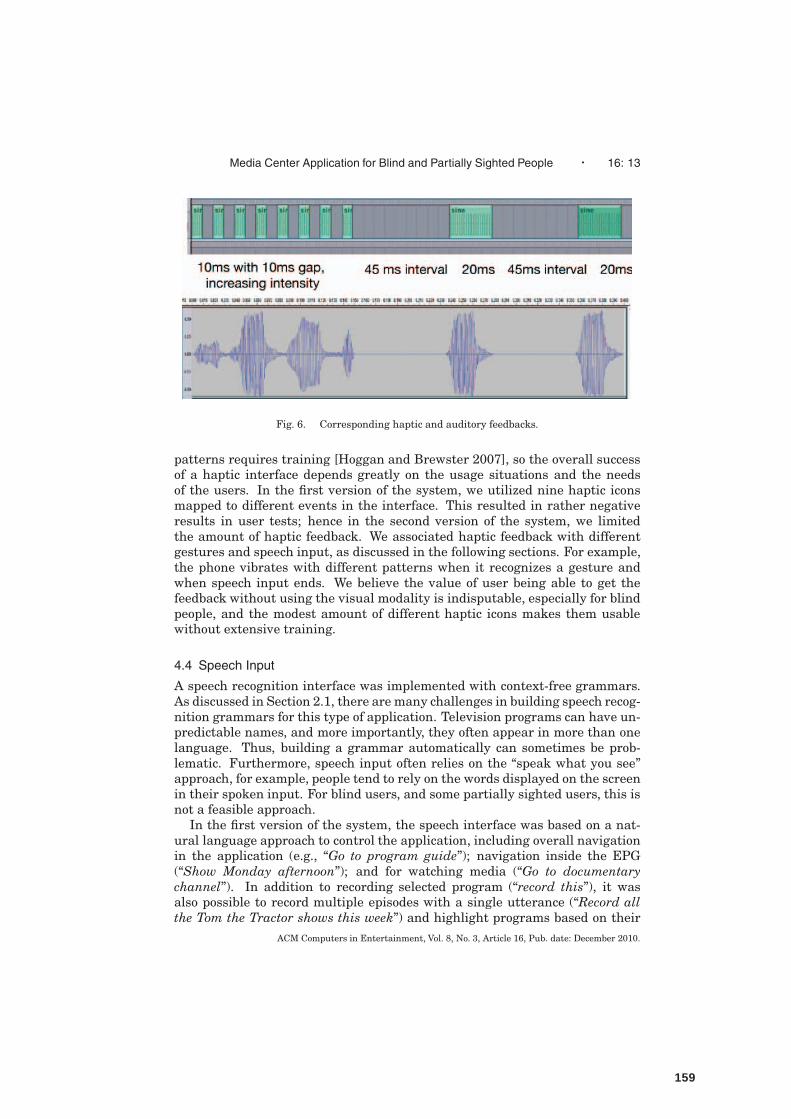
Media Center Application for Blind and Partially Sighted People · 16: 13
Fig. 6. Corresponding haptic and auditory feedbacks.
patterns requires training [Hoggan and Brewster 2007], so the overall successof a haptic interface depends greatly on the usage situations and the needsof the users. In the first version of the system, we utilized nine haptic iconsmapped to different events in the interface. This resulted in rather negativeresults in user tests; hence in the second version of the system, we limitedthe amount of haptic feedback. We associated haptic feedback with differentgestures and speech input, as discussed in the following sections. For example,the phone vibrates with different patterns when it recognizes a gesture andwhen speech input ends. We believe the value of user being able to get thefeedback without using the visual modality is indisputable, especially for blindpeople, and the modest amount of different haptic icons makes them usablewithout extensive training.
4.4 Speech Input
A speech recognition interface was implemented with context-free grammars.As discussed in Section 2.1, there are many challenges in building speech recog-nition grammars for this type of application. Television programs can have un-predictable names, and more importantly, they often appear in more than onelanguage. Thus, building a grammar automatically can sometimes be prob-lematic. Furthermore, speech input often relies on the “speak what you see”approach, for example, people tend to rely on the words displayed on the screenin their spoken input. For blind users, and some partially sighted users, this isnot a feasible approach.
In the first version of the system, the speech interface was based on a nat-ural language approach to control the application, including overall navigationin the application (e.g., “Go to program guide”); navigation inside the EPG(“Show Monday afternoon”); and for watching media (“Go to documentarychannel”). In addition to recording selected program (“record this”), it wasalso possible to record multiple episodes with a single utterance (“Record allthe Tom the Tractor shows this week”) and highlight programs based on their
ACM Computers in Entertainment, Vol. 8, No. 3, Article 16, Pub. date: December 2010.
159
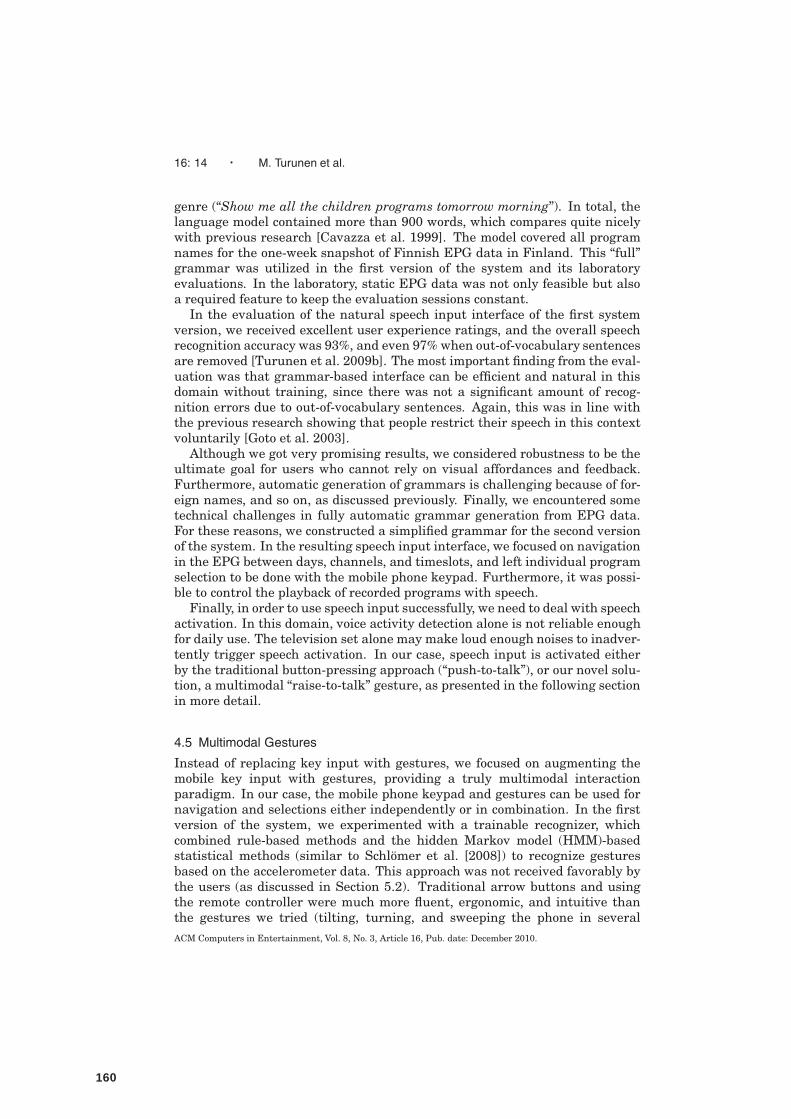
16: 14 · M. Turunen et al.
genre (“Show me all the children programs tomorrow morning”). In total, thelanguage model contained more than 900 words, which compares quite nicelywith previous research [Cavazza et al. 1999]. The model covered all programnames for the one-week snapshot of Finnish EPG data in Finland. This “full”grammar was utilized in the first version of the system and its laboratoryevaluations. In the laboratory, static EPG data was not only feasible but alsoa required feature to keep the evaluation sessions constant.
In the evaluation of the natural speech input interface of the first systemversion, we received excellent user experience ratings, and the overall speechrecognition accuracy was 93%, and even 97% when out-of-vocabulary sentencesare removed [Turunen et al. 2009b]. The most important finding from the eval-uation was that grammar-based interface can be efficient and natural in thisdomain without training, since there was not a significant amount of recog-nition errors due to out-of-vocabulary sentences. Again, this was in line withthe previous research showing that people restrict their speech in this contextvoluntarily [Goto et al. 2003].
Although we got very promising results, we considered robustness to be theultimate goal for users who cannot rely on visual affordances and feedback.Furthermore, automatic generation of grammars is challenging because of for-eign names, and so on, as discussed previously. Finally, we encountered sometechnical challenges in fully automatic grammar generation from EPG data.For these reasons, we constructed a simplified grammar for the second versionof the system. In the resulting speech input interface, we focused on navigationin the EPG between days, channels, and timeslots, and left individual programselection to be done with the mobile phone keypad. Furthermore, it was possi-ble to control the playback of recorded programs with speech.
Finally, in order to use speech input successfully, we need to deal with speechactivation. In this domain, voice activity detection alone is not reliable enoughfor daily use. The television set alone may make loud enough noises to inadver-tently trigger speech activation. In our case, speech input is activated eitherby the traditional button-pressing approach (“push-to-talk”), or our novel solu-tion, a multimodal “raise-to-talk” gesture, as presented in the following sectionin more detail.
4.5 Multimodal Gestures
Instead of replacing key input with gestures, we focused on augmenting themobile key input with gestures, providing a truly multimodal interactionparadigm. In our case, the mobile phone keypad and gestures can be used fornavigation and selections either independently or in combination. In the firstversion of the system, we experimented with a trainable recognizer, whichcombined rule-based methods and the hidden Markov model (HMM)-basedstatistical methods (similar to Schlomer et al. [2008]) to recognize gesturesbased on the accelerometer data. This approach was not received favorably bythe users (as discussed in Section 5.2). Traditional arrow buttons and usingthe remote controller were much more fluent, ergonomic, and intuitive thanthe gestures we tried (tilting, turning, and sweeping the phone in severalACM Computers in Entertainment, Vol. 8, No. 3, Article 16, Pub. date: December 2010.
160
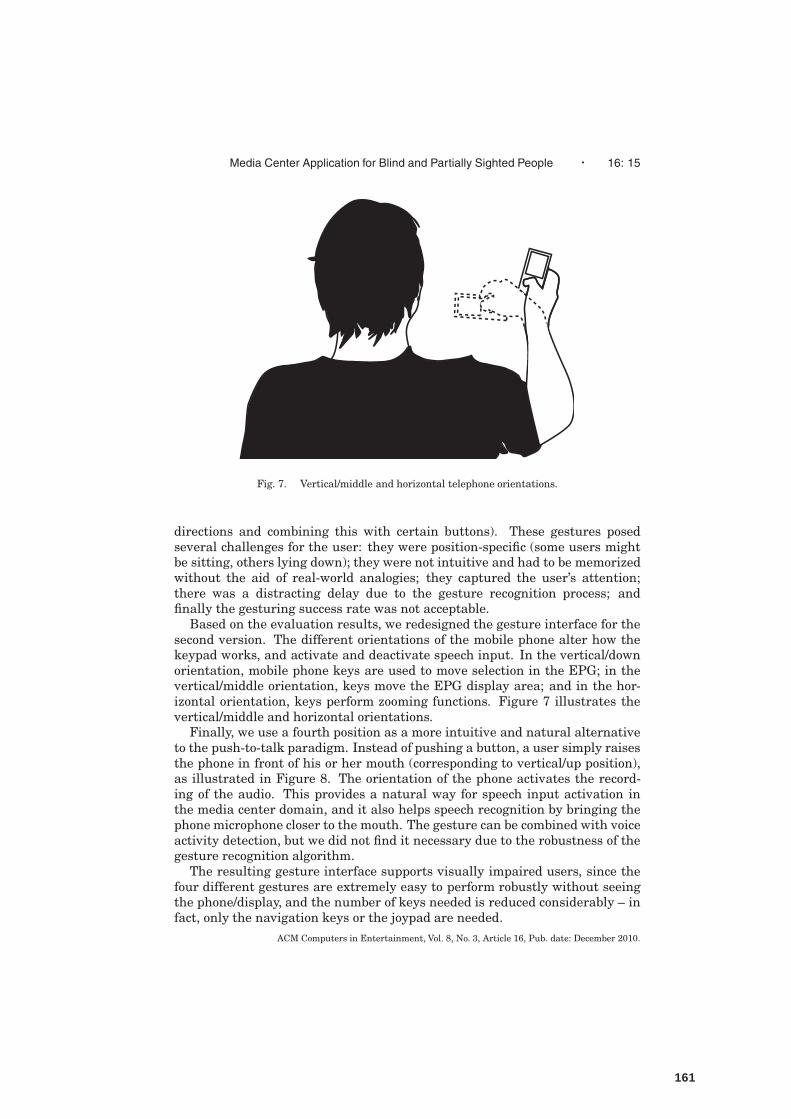
Media Center Application for Blind and Partially Sighted People · 16: 15
Fig. 7. Vertical/middle and horizontal telephone orientations.
directions and combining this with certain buttons). These gestures posedseveral challenges for the user: they were position-specific (some users mightbe sitting, others lying down); they were not intuitive and had to be memorizedwithout the aid of real-world analogies; they captured the user’s attention;there was a distracting delay due to the gesture recognition process; andfinally the gesturing success rate was not acceptable.
Based on the evaluation results, we redesigned the gesture interface for thesecond version. The different orientations of the mobile phone alter how thekeypad works, and activate and deactivate speech input. In the vertical/downorientation, mobile phone keys are used to move selection in the EPG; in thevertical/middle orientation, keys move the EPG display area; and in the hor-izontal orientation, keys perform zooming functions. Figure 7 illustrates thevertical/middle and horizontal orientations.
Finally, we use a fourth position as a more intuitive and natural alternativeto the push-to-talk paradigm. Instead of pushing a button, a user simply raisesthe phone in front of his or her mouth (corresponding to vertical/up position),as illustrated in Figure 8. The orientation of the phone activates the record-ing of the audio. This provides a natural way for speech input activation inthe media center domain, and it also helps speech recognition by bringing thephone microphone closer to the mouth. The gesture can be combined with voiceactivity detection, but we did not find it necessary due to the robustness of thegesture recognition algorithm.
The resulting gesture interface supports visually impaired users, since thefour different gestures are extremely easy to perform robustly without seeingthe phone/display, and the number of keys needed is reduced considerably – infact, only the navigation keys or the joypad are needed.
ACM Computers in Entertainment, Vol. 8, No. 3, Article 16, Pub. date: December 2010.
161
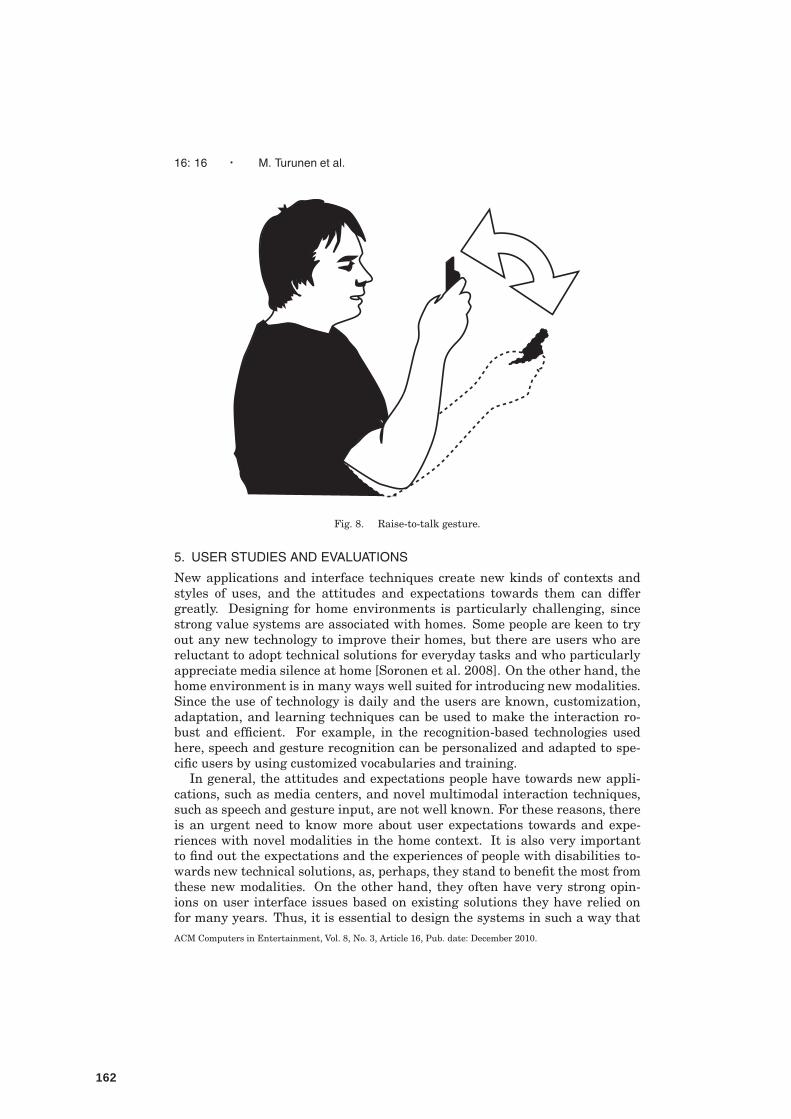
16: 16 · M. Turunen et al.
Fig. 8. Raise-to-talk gesture.
5. USER STUDIES AND EVALUATIONS
New applications and interface techniques create new kinds of contexts andstyles of uses, and the attitudes and expectations towards them can differgreatly. Designing for home environments is particularly challenging, sincestrong value systems are associated with homes. Some people are keen to tryout any new technology to improve their homes, but there are users who arereluctant to adopt technical solutions for everyday tasks and who particularlyappreciate media silence at home [Soronen et al. 2008]. On the other hand, thehome environment is in many ways well suited for introducing new modalities.Since the use of technology is daily and the users are known, customization,adaptation, and learning techniques can be used to make the interaction ro-bust and efficient. For example, in the recognition-based technologies usedhere, speech and gesture recognition can be personalized and adapted to spe-cific users by using customized vocabularies and training.
In general, the attitudes and expectations people have towards new appli-cations, such as media centers, and novel multimodal interaction techniques,such as speech and gesture input, are not well known. For these reasons, thereis an urgent need to know more about user expectations towards and expe-riences with novel modalities in the home context. It is also very importantto find out the expectations and the experiences of people with disabilities to-wards new technical solutions, as, perhaps, they stand to benefit the most fromthese new modalities. On the other hand, they often have very strong opin-ions on user interface issues based on existing solutions they have relied onfor many years. Thus, it is essential to design the systems in such a way thatACM Computers in Entertainment, Vol. 8, No. 3, Article 16, Pub. date: December 2010.
162
Media Center Application for Blind and Partially Sighted People · 16: 17
their needs are respected, taking into account their preferences and habits. Inour case, this means, for example, that a blind user needs to be provided withproper audio and/or tactile feedback.
In order to design a proper interface for different user groups, we conducteda set of user studies and in-situ evaluations. At the beginning of the project, weconducted a large consumer survey with more than one thousand respondents,which showed that people approached speech input with caution [Soronen et al.2008]. However, our experience shows that the actual experiences with a work-ing speech-based system can dramatically shift these attitudes towards thepositive [Turunen et al. 2008]. Thus, introducing novel interaction methods inreal environments is a key issue in making them widely accessible and knownto users. We have run a set of different evaluations to find out what solutionswork with different types of users. Next, we introduce the evaluations we havecarried out with the media center application. First, we summarize the firstexperiences from a ten-month Living Laboratory experiment carried out in alocal media museum. Then, we present the key results from a formal userstudy carried out in our laboratory. Finally, we present in detail the in-situevaluations completed with visually impaired users and discuss the findings inrelation to the previous evaluations.
5.1 Living Laboratory Evaluation
A living lab testing environment was built in the Rupriikki Media Museum inTampere. The first version of MMC application was available for use to all theguests of the museum from May 2008 to May 2009. In the summer of 2008, auser test with 21 participants was organized in the Living Lab environment,where the main objectives were to elicit the expectations of participants to-wards a smart home environment and its input methods. The test consisted ofthree steps; first, expectations were gathered via interviews to assess thoughtsand opinions of using speech and gestures; then, the participants familiarizedthemselves with the media center and the speech and gesture functionality. Af-ter approximately ten minutes of use, the participants were interviewed againto establish how their opinions had changed. The relation between expecta-tions (before use) and experiences (after use) was evaluated. The following sixquestions were asked on a scale from 1 to 5, both before and after use:
—How pleasant is it to control the television with speech / with gestures? (1 =unpleasant, 5 = pleasant).
—How easy is it is to control the television with speech / with gestures? (1 =difficult, 5 = easy)
—How useful is it to control the television with speech / with gestures? (1 =annoying, 5 = useful)
As Figure 9 shows, the distinction was positive with speech, whereas it wasnegative with gestures. The overall satisfaction with the speech interface waspositive compared to expectations. On the other hand, operating the systemvia gestures was more disappointing to the users. However, a single expla-nation for the negative experiences with gestures cannot be identified. There
ACM Computers in Entertainment, Vol. 8, No. 3, Article 16, Pub. date: December 2010.
163
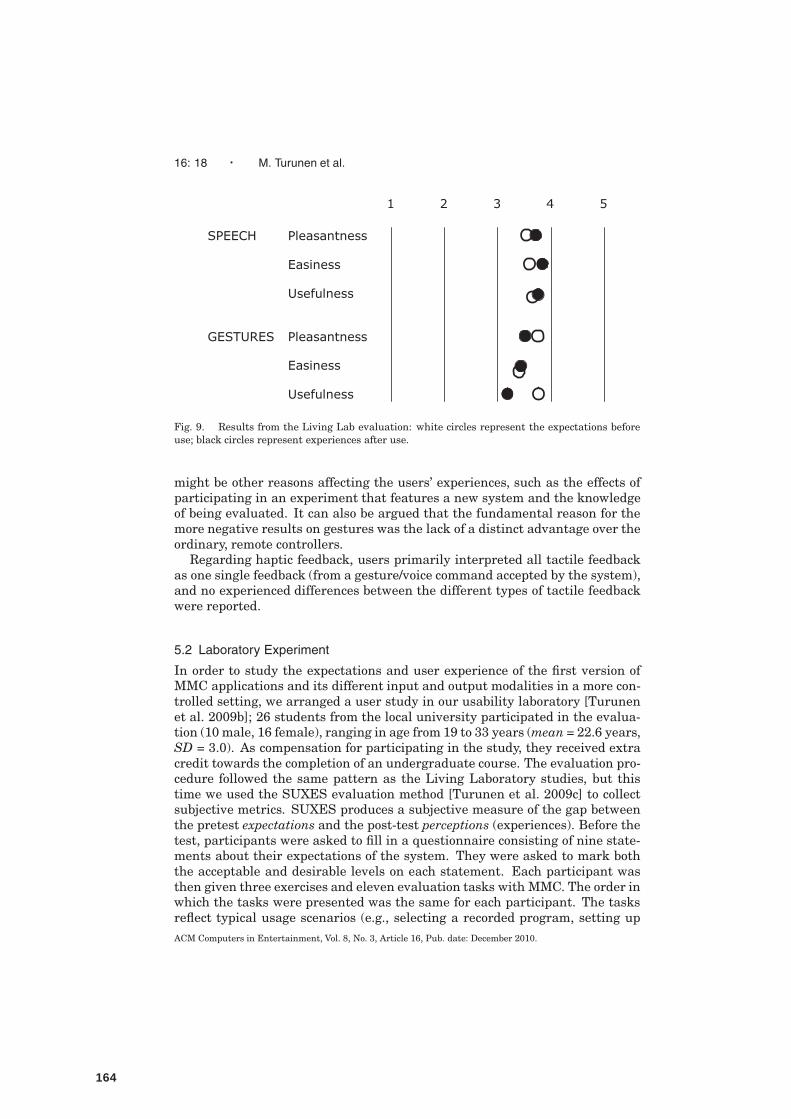
16: 18 · M. Turunen et al.
Fig. 9. Results from the Living Lab evaluation: white circles represent the expectations beforeuse; black circles represent experiences after use.
might be other reasons affecting the users’ experiences, such as the effects ofparticipating in an experiment that features a new system and the knowledgeof being evaluated. It can also be argued that the fundamental reason for themore negative results on gestures was the lack of a distinct advantage over theordinary, remote controllers.
Regarding haptic feedback, users primarily interpreted all tactile feedbackas one single feedback (from a gesture/voice command accepted by the system),and no experienced differences between the different types of tactile feedbackwere reported.
5.2 Laboratory Experiment
In order to study the expectations and user experience of the first version ofMMC applications and its different input and output modalities in a more con-trolled setting, we arranged a user study in our usability laboratory [Turunenet al. 2009b]; 26 students from the local university participated in the evalua-tion (10 male, 16 female), ranging in age from 19 to 33 years (mean = 22.6 years,SD = 3.0). As compensation for participating in the study, they received extracredit towards the completion of an undergraduate course. The evaluation pro-cedure followed the same pattern as the Living Laboratory studies, but thistime we used the SUXES evaluation method [Turunen et al. 2009c] to collectsubjective metrics. SUXES produces a subjective measure of the gap betweenthe pretest expectations and the post-test perceptions (experiences). Before thetest, participants were asked to fill in a questionnaire consisting of nine state-ments about their expectations of the system. They were asked to mark boththe acceptable and desirable levels on each statement. Each participant wasthen given three exercises and eleven evaluation tasks with MMC. The order inwhich the tasks were presented was the same for each participant. The tasksreflect typical usage scenarios (e.g., selecting a recorded program, setting upACM Computers in Entertainment, Vol. 8, No. 3, Article 16, Pub. date: December 2010.
164
Media Center Application for Blind and Partially Sighted People · 16: 19
recordings, and changing channels in the electronic program guide). Partici-pants were free to use any of the input modalities to complete the task. Aftercompletion, they filled in a questionnaire consisting of the same statements asin the pretest questionnaire. This time the participants gave only one value toindicate their perceived experiences.
The SUXES method makes it possible to estimate the current state of theapplication on the basis of expectations and experiences. In this study, wefocused on the following user experience dimensions: speed, pleasure, clarity,error-free use, error-free function, learning curve, naturalness, usefulness, andfuture use for each multimodal input/output method (speech input, gesture,and haptic feedback). The statements and medians of the responses are shownin Figure 10.
Figure 11 summarizes the main results of the experiment. As the resultsshow, speech interface design was received very positively overall. The partic-ipants’ expectations were somewhat reserved, which matched the findings ofour initial user survey [Soronen et al. 2008] and the Living Laboratory studiesin the local media museum. However, speech input clearly surpassed expecta-tions when people found it useful.
As seen in Figure 11, haptic feedback and gestures were received with morecaution, similarly to the Living Laboratory experiences. The conclusion wecan draw is that our nondisabled participants did not consider gestures andhaptic feedback all that useful in this context. Based on the results, we wereable to adapt the graphical and speech interfaces quite directly for the needsof visually impaired people, but we needed to design the gesture and hapticinterfaces from scratch to support this user group. Even the first evaluationswere quite negative concerning gestures and haptic feedback; we wanted totry different designs, since these modalities have a huge potential for visuallyimpaired users.
5.3 Pilot Studies with Visually Impaired People
In order to test how visually impaired people received our user interface, wearranged three pilot studies in the homes of blind and partially sighted users.We present the study and its results in detail:
5.3.1 Methodology. Several methods to collect the data were used: semi-structured face-to-face interviews containing 15 to 20 themes were performedin rea-use contexts both before and after the evaluation period; SUXES ques-tions were used to measure the expectations and actual experience in similarfashion to the laboratory study described previously. In addition, the systemstored all the application data for further use and analysis. Overall, the datacollected included information on interactions and use of modalities. However,no audio (or video) recordings were included for privacy reasons.
5.3.2 Pilot Users. Three participants were recruited in collaborationwith the Finnish Federation of the Visually Impaired.1 The participants
1http://www.nkl.fi
ACM Computers in Entertainment, Vol. 8, No. 3, Article 16, Pub. date: December 2010.
165
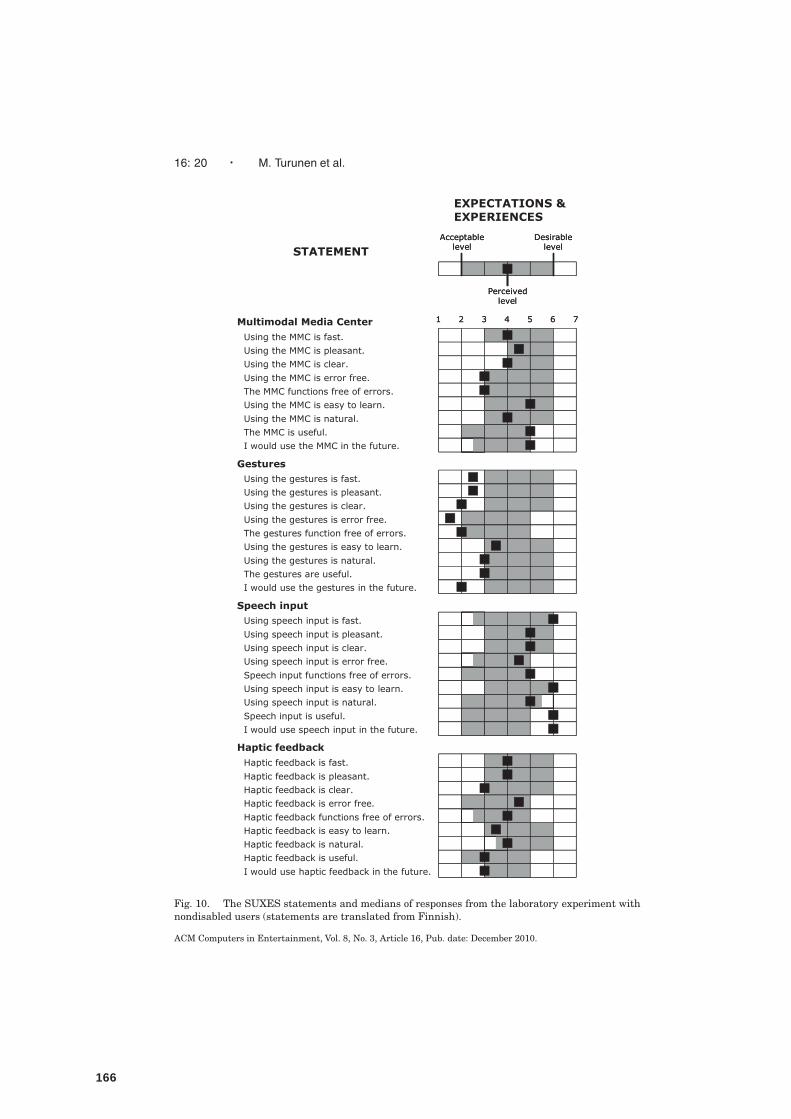
16: 20 · M. Turunen et al.
Fig. 10. The SUXES statements and medians of responses from the laboratory experiment withnondisabled users (statements are translated from Finnish).
ACM Computers in Entertainment, Vol. 8, No. 3, Article 16, Pub. date: December 2010.
166

Media Center Application for Blind and Partially Sighted People · 16: 21
Fig. 11. Summary of user expectations and user experiences of different modalities and the MMCapplication in the laboratory study with nondisabled users.
were middle-aged males with moderate to severe (complete blindness) visualimpairment. They were comfortable with using technology and could easilyverbalize their observations and experiences. Using television was part ofeveryday living for all of them. The evaluation period lasted ten, seven, andfour days, depending on the users’ time schedules. This was considered longenough an exposure to provide reliable, usage-based feedback in the finalinterview, especially in light of our earlier long-term studies where the userslearned to use the system fluently within one week [Turunen et al. 2010].
The interview and SUXES inventory were conducted during the first visitto the participant’s home, then the system was introduced and practised onfor an hour. More guidance was offered via email when needed; otherwise theparticipants used the system themselves.
5.3.3 Results. The overall results are extremely encouraging: all partic-ipants would recommend the system to their friends, under the assumptionthat the stability problems, typical for such a research prototype, were fixed.
ACM Computers in Entertainment, Vol. 8, No. 3, Article 16, Pub. date: December 2010.
167
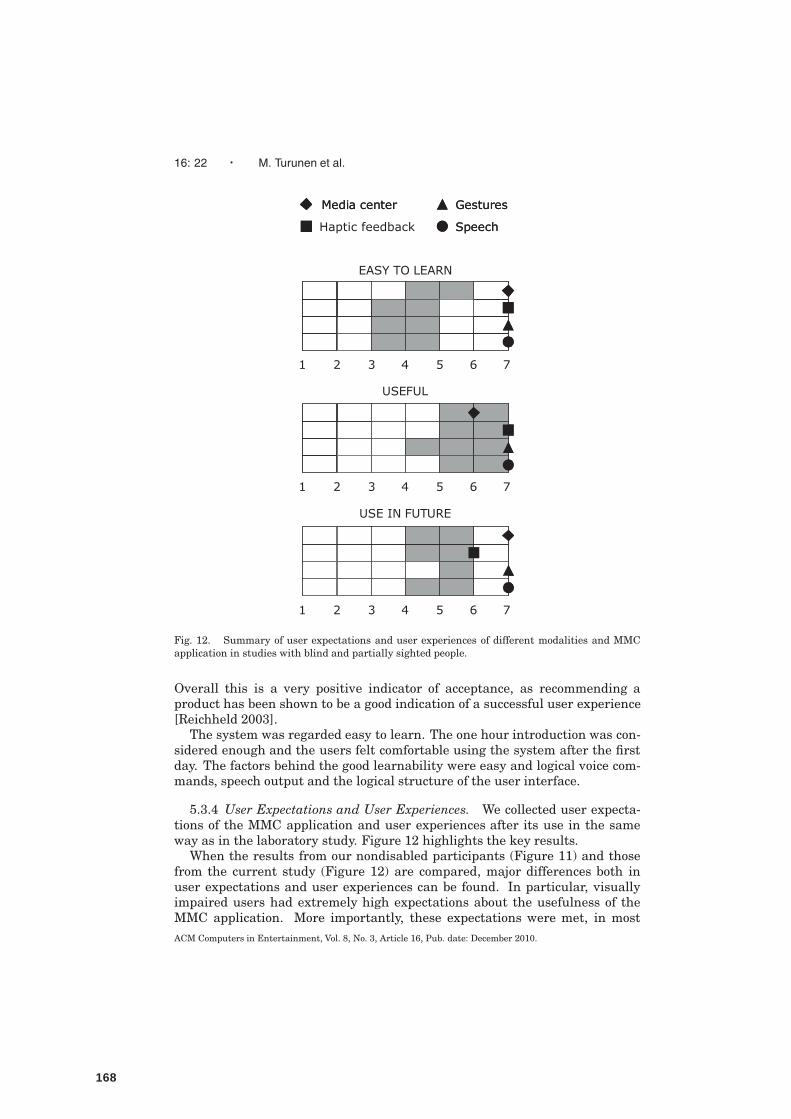
16: 22 · M. Turunen et al.
Fig. 12. Summary of user expectations and user experiences of different modalities and MMCapplication in studies with blind and partially sighted people.
Overall this is a very positive indicator of acceptance, as recommending aproduct has been shown to be a good indication of a successful user experience[Reichheld 2003].
The system was regarded easy to learn. The one hour introduction was con-sidered enough and the users felt comfortable using the system after the firstday. The factors behind the good learnability were easy and logical voice com-mands, speech output and the logical structure of the user interface.
5.3.4 User Expectations and User Experiences. We collected user expecta-tions of the MMC application and user experiences after its use in the sameway as in the laboratory study. Figure 12 highlights the key results.
When the results from our nondisabled participants (Figure 11) and thosefrom the current study (Figure 12) are compared, major differences both inuser expectations and user experiences can be found. In particular, visuallyimpaired users had extremely high expectations about the usefulness of theMMC application. More importantly, these expectations were met, in mostACM Computers in Entertainment, Vol. 8, No. 3, Article 16, Pub. date: December 2010.
168
Media Center Application for Blind and Partially Sighted People · 16: 23
cases, with the highest possible ratings afforded by the response scale. Finally,the results show how willing visually impaired users are to use the system infuture. It is also interesting to note how easy it was for the users to learn thesystem. Next, we present the detailed findings from the study organized byinput/output modality.
5.3.5 Speech Output. Speech output was regarded as the single most im-portant feature of the system by all participants. It minimizes the need forvisual interaction with the system and allows blind users to control the sys-tem. Speech output makes it possible to use the television completely indepen-dently. Our participants could cope with error states and interaction problems,since they got immediate speech output from the system. Using the EPG withspeech output became so natural that the users gave up using their old methods(web-based services and newspapers). Making recordings had long been impos-sible for our blind participant, but now he could easily accomplish it. For themoderately visually impaired participants, the use of the EPG became muchfaster and more pleasant: with speech output the EPG could be browsed froma distance or from another room, instead of sitting very close to the screen andreading the text with a magnifier.
The amount of information that the EPG offered (see Figures 3 and 4) wasconsidered adequate: the name of the channel (provided only when the activecell moves to a new channel), time, title, and description of the program. Ourparticipants appreciated the feature whereby they could skip any speech out-put by pressing a dedicated button or by moving the active cell/cursor.
The speech synthesizer in this evaluation was familiar to the participants,since it is the same as the one used by television voice-subtitling services bythe Finnish Broadcasting Company. Our participants reported that using thesame speech output voice for two separate functions (subtitling and systemoutput) was confusing. They wished to be able to adjust not just speed andvolume but also gender, intonation, and “personality” of the voice. It was alsonoted that in certain contexts it would be beneficial to extract the voice outputfrom television completely and direct it through a separate device such as amobile phone with headphones (as discussed in Section 4.2). This way a visu-ally impaired person could utilize the speech output without disturbing otherpeople in the same room. In one interview, the participant’s spouse expressedmild annoyance towards the synthesizer sound: it was considered just toler-able, but still annoying. In everyday use this could become a problem in thelong run.
5.3.6 Speech Input. Using speech input was embraced enthusiastically.The first impression from participants was typically: “Wow, this is amazing!”Voice commands, instead of using mobile phone keys, were much faster, andpleasant to use for the visually impaired participants. For one participant es-pecially, whose speech recognition rate was very close to perfect, controlling theTV with speech became so attractive that he reported having difficulties withletting go of the new system at the conclusion of the evaluation and returningto the old system.
ACM Computers in Entertainment, Vol. 8, No. 3, Article 16, Pub. date: December 2010.
169
16: 24 · M. Turunen et al.
As discussed in Section 4.4, the first version of the system contained a ratherlarge vocabulary (for grammar-based speech recognition), including completenatural language sentences and full program names, for example. In thesecond version the vocabulary was reduced considerably, interaction consistingof commands, each command consisting typically of only one or two words.This was primarily motivated by the need to ensure high recognition rates ofthe speech interface, even without visual affordances and feedback. It can alsobe argued that since the analogies they were using are the buttons on a remotecontroller, it is natural that pressing or clicking is replaced with a simplephrase, rather than speaking out loud something that is seen on the screen,as is often the case in multimodal speech interfaces. Using one- or two-wordcommands is also faster, since longer commands create larger sound files whichtake longer to analyze, and thus the delay between the command and systemfeedback may grow to be too long. One participant reported experiencingslightly too long delays, which was the only negative aspect of the system hecould think of. According to the log files, speech input delays (response times)were less than one second in general. However, there were technical problems,which caused 2 to 3 second delays in some cases, which may explain thesecomments.
There were some individual differences in the success rate of the voice com-mands. It is impossible to identify misinterpretations from log data alone, andsince we did not have complete audio or video recordings (due to privacy rea-sons) of the usage sessions, we could not measure the actual recognition rates inthe same ways as in the laboratory experiment. One participant reported (ashis subjective measure) numerous misinterpretations and unrecognized com-mands, which we could also observe during the introduction and the final inter-view. Individual differences in speech generation (e.g., pronunciation, volume,tone, gender, and age) are clearly responsible for this, as we had already foundout in the earlier phases of the project. This finding is common when it comesto the use of speech. The participants felt that the commands are intuitive, sothe learnability of the speech input is also very high.
5.3.7 Haptic Feedback and Gestures. For the second iteration of the MCC,we had to rethink and redesign the haptic feedback almost from scratch, asdiscussed in Section 4.3. In the first version, with its set of nine different hap-tic icons, the acceptance of haptic feedback had been quite poor, as discussedin Section 5.1. It was evident, however, that haptic feedback would offer sig-nificant added value for visually impaired users, so a new set of gestures andhaptic feedback was designed expressly for this purpose.
The multimodal gesture designed to activate speech input, as presented inSection 4.5 and illustrated in Figure 8, worked incredibly well: our participantsadopted the gesture immediately, and the gesture recognition rate was excel-lent (based on subjective evaluation, since in the absence of video recordings wecould not get objective measures). In the first version, we used a button-basedpush-to-talk activation, which caused much confusion, and perhaps more im-portantly, always seemed to break the flow of watching TV by drawing attentionto the mobile phone instead of the TV screen. In the present evaluation, theACM Computers in Entertainment, Vol. 8, No. 3, Article 16, Pub. date: December 2010.
170
Media Center Application for Blind and Partially Sighted People · 16: 25
participants’ attention was clearly on the TV or the function that they wereconcentrating on, and the mobile phone was treated merely as a microphone.The flow was never interrupted by the speech activation gesture. This simplefinding may be one of the most important results of this evaluation: the raise-to-talk gesture is really intuitive, accurate, and does not distract the user.
The haptic feedback was generally appreciated, but the users’ opinionsseemed to vary. Our blind participant was hoping for a larger variety of feed-back patterns. However, a moderately visually impaired participants did notdifferentiate between the patterns we offered – they all seemed the same tohim. As presented in Section 5.1, this was also reported by most people inthe Living Laboratory experiment. Haptic feedback was helpful in situationswhere the system is ready to accept new commands or where it recognized acommand. In addition, one participant preferred the haptic feedback to an au-dible sound effect, especially in a social context.
5.3.8 Electronic Program Guide. All of our participants were pleased withthe EPG, although this was mostly due to the speech output alone. The visualoutput (font size, contrast) of the EPG could be adjusted individually. The EPGdisplay could be zoomed in to help reading from a distance. In addition, theinformation panel that contains more information of the selected program couldbe enlarged to cover the whole screen. Two participants had to be quite near thescreen, despite the zooming functions, and in these cases the zooming seemed todisturb the reading because the letters were too large and hence required headmovement to bring all of the text into focus. So it is quite understandable thatthe participants greatly preferred the speech output. One user with moderatevisual impairment suggested a feature that would allow him to fix his sight ona certain position on the screen and the text would then scroll through thatposition. This would be a familiar analogy to some users who are familiar withusing optical aids such as magnifiers.
6. CONCLUSIONS, DISCUSSION, AND FUTURE WORK
We have presented a multimodal media center interface designed for peoplewith different levels of visual impairment. In particular, we have presentedseveral solutions for accessible multimodal navigation in the Electronic Pro-gram Guide (EPG), which is the key component in digital television. Further-more, the solutions presented allow accessible control over all functionality ofdigital television, including recording and watching broadcast content. Theresults can be applied to similar domains, including other media applications(photographs, videos, music).
Our solution uses speech input and output, gestures, haptic feedback, and azoomable graphical interface to make the system accessible. Speech output andhaptic feedback provide full access to information for blind users. The zoomablefocus-plus-context graphical interface, combined with speech output, makes thesystem accessible for people with low vision. Speech input combined with mul-timodal gestures provides a more efficient and accessible input method thantraditional methods, such as remote controllers, for all visually impaired users.Naturally, these solutions are available for other users as well, and designed
ACM Computers in Entertainment, Vol. 8, No. 3, Article 16, Pub. date: December 2010.
171
16: 26 · M. Turunen et al.
to provide rich user experiences for them. Currently, the application has beenpiloted and evaluated with nondisabled [Turunen et al. 2009b] and physicallydisabled [Turunen et al. 2010] users, in addition to the work done with visuallyimpaired users, as presented in this article.
From a technical viewpoint, our system is quite similar to the ZEPI EPG pro-totype developed by Tinker et al. [2003]. Both utilize a zoomable display com-bined with gesture and voice recognition. The visual structure of the ZEPIinterface is designed around multilayered panels with each containing a sub-set of the content with varying types of information; whereas in our system thedesign is built around a zooming grid that progressively discloses informationbased on the zoom level. We believe that our approach may well be more fa-miliar to users, since the visual analogy to the familiar grid-based layout is notbroken even when zooming in and out of the content. In addition, the usage sce-narios for the designs are somewhat different. In the Multimodal Media Centerthe focus is strictly on facilitating the viewing and management of televisioncontent, whereas the ZEPI system provides a more personable, recommender-like approach built around context-sensitive spoken dialogue. Both approachesare highly relevant for further work in the area.
In order to demonstrate the usefulness of the developed solutions, we havepresented results from real use of the system taking place in homes of visuallyimpaired users. To summarize the results: visually impaired users ranked theinterface extremely high, and were willing to take it into everyday use. Evento the extent that some of them were not willing to give the system back to uswhen the pilot period ended. In comparison to previous studies with nondis-abled users, utilizing an earlier version of the system [Turunen et al. 2009b],our evaluation results are really encouraging, although some elements of theinterface, speech input in particular, were already well received with the firstversion of the system. To summarize, together these evaluations show thatboth the natural language speech interface of the first version and the morecommand-oriented interface of the second version provide high user experi-ences. It is also noteworthy that the resulting speech recognition interface forvisually impaired users is quite different when compared to the version tar-geted for physically disabled users [Turunen et al. 2010], although they arebased on the same baseline interface. This emphasizes the need to design forand work closely with the special user groups, and adapt the interface to theirspecific needs. Furthermore, since it is not possible to define common solutionssuitable for even a single user group such as visually impaired people [Rice andFels 2004], the interface must be highly customable.
In comparison to conversational dialogue approaches presented in previousresearch (as discussed in Section 2), our speech interface is quite different. Al-though conversational applications can be very appealing for some users andusage situations, especially when combined with the recommendation features,here we wanted to focus on the efficient basic use of digital television. Typically,conversational systems produce quite lengthy dialogues, as demonstrated inthe examples given in Cavazza et al. [1999] and Goto et al. [2003]. An interest-ing area for future work would be to combine the benefits of these approachesin an adaptive way. In particular, it would be interesting to have an adaptive
ACM Computers in Entertainment, Vol. 8, No. 3, Article 16, Pub. date: December 2010.
172
Media Center Application for Blind and Partially Sighted People · 16: 27
mixed-initiative interface, since this is usually the preferred speech interfacestyle, and there is evidence that it would be preferred in this domain as well[Ibrahim and Johansson 2003]. Similarly, it would be interesting to combineour gesture interface with other novel interaction styles designed for this do-main, such as tangible interfaces for controlling videos [Ferretti et al. 2008].This would nicely complement our current work, in which we have expandedthe MMC application with a RFID-based physical touch interface [Turunenet al. 2009a].
Concerning speech output, our experiences with MMC shows that mix-ing auditory channels, including broadcast audio content, synthesized userinterface content, and synthesized subtitles, can be done in multiple ways,which all have their benefits and drawbacks. In our current implementation,all of these use the same auditory channel, that is, television speakers, andboth synthesizers utilize the same voice. With mobile devices it is possible toprovide spatial and voice quality separation between audio from television andspeech by the system. This could help in the separation of auditory channels,and other people would not be disturbed as easily. However, this may causedisparity and another kind of disturbance. Similarly, while different userinterface voices could help visually impaired people to separate the audiosources, this could lead to a really annoying user interface for other people inthe same room. In the future, we will experiment with alternative options byallowing people to customize these audio sources, and see how they are usedin the long run in real usage situations.
Our results concerning haptic feedback are somewhat mixed. Although theywere very well received in the second version of the system, there is still roomfor improvement. Based on the results, it seems that a large variety of hapticfeedback could be useful for blind people, but for partially sighted users andpeople with normal sight, different haptic icons are not easily recognizable, andmay cause confusion. Again, a configurable haptic interface is needed, and onlyfurther experiments will show what kind of benefits we can get from differenthaptic patterns for users with severe visual impairment. Furthermore, sinceour haptic patterns included parallel auditory feedback, further studies areneeded to find the right combination of haptic and auditory feedback channelsin this context.
The different evaluations of the MMC application were carried out using theSUXES method [Turunen et al. 2009c], which was designed for iterative usercentered development, as demonstrated by MMC. Since SUXES indicates whatthe strong features of the application are, and where further developmentefforts are needed, we were able to focus our efforts on the right areas. In ourfuture work, it will be interesting to see how well we can capture further userexperiences in the home domain. Here, we are essentially dealing with stricttask-based interfaces that are used for entertainment, whereby overall userexperience has multiple dimensions. The question is how we can understandthe effects of the different dimensions. We believe that some answers canbe gained by broadening our viewpoint. Hassenzahl [2004] identifies twoindependent dimensions of product quality: pragmatic quality and hedonicquality. Jetter and Gerken [2006] have further developed Hassenzahl’s model
ACM Computers in Entertainment, Vol. 8, No. 3, Article 16, Pub. date: December 2010.
173
16: 28 · M. Turunen et al.
and introduced the user-product-relationship, which includes traditionalusability, functionality, hedonic quality, and underlying user values. In ourstudy, it is obvious that for the most part the user benefit from the system isfunctional: they can control television more fluently and quickly; functionalityand “cognitive” usability still override hedonic factors. Yet, we noticed thatonce the system becomes stable enough for basic use and more functions areintroduced, use becomes hedonically motivated also: the speech interfaceallows persons to live more independently, improves their abilities and feelingsof equality, and creates pleasure through success. Our current efforts to furtheraddress other dimensions of evaluation are given in Turunen et al. [2009a].
Another interesting area for future evaluation concerns multiple users andthe resulting social context. In this domain, users are quite often with otherpeople. We simply cannot assume that people consume media alone, and whenaccessibility features are introduced, they need to fit in the overall social con-text. A representative example can be seen in one of our evaluations, whereone participant’s spouse expressed annoyance with the sound of the speechsynthesizer. Although there are technical solutions available for such cases, asdiscussed previously, they could change the overall social context quite dramat-ically. In our future work, the social dimensions of the user experience will beamong the key factors.
In our future plans for the MMC system, we have two main strategies. First,we are planning to release the baseline system to the general public to collectfeedback and usage statistics from a large number of actual home users. Whencombined with online evaluation tools, such as those in development for usewith the SUXES-method [Turunen et al. 2009c], enables us to construct trueLiving Laboratory environments. Second, we are studying how the MMC proto-type developed for visually impaired people could be turned into a real productfor visually impaired users. Negotiations to provide such a product based onthe current MMC for the visually impaired users in Finland are in progress.
ACKNOWLEDGMENT
Thanks to Eve Hoggan for designing the haptic patterns and the correspondingauditory feedback.
REFERENCES
BALCHANDRAN, R., EPSTEIN, M. E., POTAMIANOS, G., AND SEREDI, L. 2008. A multi-modalspoken dialog system for interactive TV. In Proceedings of the 10th International Conference onMultimodal Interfaces (ICMI’08). ACM, New York, 191–192.
BEDERSON, B. B. 2000. Fisheye menus. In Proceedings of the 13th Annual ACM Symposium onUser Interface Software and Technology (UIST’00). ACM, New York, 217–225.
BEDERSON, B. B., CLAMAGE, A., CZERWINSKI, M. P., AND ROBERTSON, G. G. 2004. DateLens:A fisheye calendar interface for PDAs. ACM Trans. Comput.-Human Interaction. 11, 1, 90–119.
BEDERSON, B. B., GROSJEAN, J., AND MEYER, J. 2004. Toolkit design for interactive structuredgraphics. IEEE Trans. Softw. Eng. 30, 8, 535–546.
BERGLUND, A. AND QVARFORDT, P. 2003. Error resolution strategies for interactive televisionspeech interfaces. In Proceedings of the International Conference on Human-Computer Interac-tion (INTERACT’03). IFIP, Amsterdam, 2003, 105–112.
ACM Computers in Entertainment, Vol. 8, No. 3, Article 16, Pub. date: December 2010.
174

Media Center Application for Blind and Partially Sighted People · 16: 29
CAVAZZA, M., PEROTTO, W., AND CASHMAN, N. 1999. The “virtual interactive presenter”: A con-versational interface for interactive television. IDMS, 235–243.
CHEN, M., MUMMERT, L., PILLAI, P., HAUPTMANN, A., AND SUKTHANKAR, R. 2010. Controllingyour TV with gestures. In Proceedings of the International Conference on Multimedia InformationRetrieval (MIR’10). ACM, New York, 405–408.
DTG USABILITY TEXT TO SPEECH SUBGROUP. 2009. White paper: Implementation guidelinesand recommendations for text-to-speech v.1.4. (Dec.), DTG.
FERRETTI, S., ROCCETTI, M., AND STROZZI, F. 2008. On developing tangible interfaces for videostreaming control: A real case study. In Proceedings of the 18th International Workshop on Net-work and Operating Systems Support for Digital Audio and Video. table of contents.
FERSCHA, A., VOGL, S., EMSENHUBER, B., AND WALLY, B. 2007. Physical shortcuts for mediaremote controls. In Proceedings of the 2nd International Conference on Intelligent Technologiesfor Interactive Entertainment (ICST). 1–8.
GOTO, J., KOMINE, K., KIM, Y.-B., AND URATANI, N. 2003. A television control system based onspoken natural language dialogue. In Proceedings of INTERACT 2003. IOS Press, 765–768.
HASSENZAHL, M. 2004. The thing and I: Understanding the relationship between user and prod-uct. In Funology: From Usability To Enjoyment. M. A. Blythe Ed. Kluwer, Norwell, MA, 31–42.
HOGGAN, E. AND BREWSTER, S. 2007. Designing audio and tactile crossmodal icons for mobiledevices. In Proceedings of the 9th International Conference on Multimodal Interfaces (ICMI’07).ACM, New York, 162–169.
IBRAHIM, A. AND JOHANSSON, P. 2003. Multimodal dialogue systems: A case study for interactiveTV. In 7th ERCIM International Workshop on User Interfaces for All. LNCS 2615, Springer,Berlin, 209–218.
JETTER, H.-C. AND GERKEN, J. 2006. A simplified model of user experience for practical appli-cation. The 2nd COST294-MAUSE International Open Workshop “User eXperience – Towards aUnified View” (NordiCHI’06).
KNILL, K. 2010. Text-to-speech synthesis to improve TV accessibility. IEEE Signal Process. Soc.Newsl., (July).
MICROSOFT CORP. 2010. Kinect overview. http://www.xbox.com/kinect/.OVIATT, S. 1999. Ten myths of multimodal interaction. Commun. ACM 42, 11, 74–81.PATOMAKI, S., RAISAMO, R., SALO, J., PASTO, V., AND HIPPULA, A. 2004. Experiences on haptic
interfaces for visually impaired young children. In Proceedings of ICMI 2004, The Sixth Interna-tional Conference on Multimodal Interfaces. ACM, New York, 281–288.
PETRE, L. AND CHANDLER, E. 2009. Research into digital television: Analysis of 2007 survey onthe user habits and preferences from blind and partially sighted people. RNIB Rep. (July).
REICHHELD, F. F. 2003. The one number you need to grow. Harvard Bus. Rev. 81, 47–54.RICE, M. AND FELS, D. 2004. Low vision and the visual interface for interactive television. In
Proceedings of the 2nd European Conference on Interactive Television. 80–89.SAARINEN, R., JARVI, J., RAISAMO, R., TUOMINEN, E., KANGASSALO, M., PELTOLA, K., AND
SALO, J. 2006. Supporting visually impaired children with software agents in a multimodallearning environment. Virtual Reality 9, 2-3, 108–117.
SCHLOMER, T., POPPINGA, B., HENZE, N., AND BOLL, S. 2008. Gesture recognition with a Wiicontroller. In Proceedings of the 2nd International Conference on Tangible and Embedded Inter-action (TEI’08). ACM, New York, 11–14.
SONY COMPUTER ENTERTAINMENT AMERICA LLC. 2010. PlayStation R©Move – PS3TM Move,PlayStation R© 3 Motion Controller. http://us.playstation.com/ps3/playstation-move/.
SORONEN, H., TURUNEN, M., AND HAKULINEN, J. 2008. Voice commands in home environment– A consumer survey. In Proceedings of Interspeech 2008. 2078–2081.
TINKER, P., FOX, J., AND DAILY, M. 2003. A zooming, electronic programming interface. In Pro-ceedings of the 3rd Workshop on Personalization in Future TV (TV’03), 7–11.
TURUNEN, M., MELTO, A., HAKULINEN, J., KAINULAINEN, A., AND HEIMONEN, T. 2008. Userexpectations, user experiences and objective metrics in a multimodal mobile application. In Pro-ceedings of the 3rd Workshop on Speech in Mobile and Pervasive Environments.
ACM Computers in Entertainment, Vol. 8, No. 3, Article 16, Pub. date: December 2010.
175

16: 30 · M. Turunen et al.
TURUNEN, M., KALLINEN, A., SANCHEZ, I., RIEKKI, J., HELLA, J., OLSSON, T., MELTO, A.,RAJANIEMI, J.-P., HAKULINEN, J., MAKINEN, E., VALKAMA, P., MIETTINEN, T., PYYKKONEN,M., SALORANTA, T., GILMAN, E., AND RAISAMO, R. 2009a. Multimodal interaction with speechand physical touch interface in a media center application. In Proceedings of the ACE 2009.
TURUNEN, M., MELTO, A., HELLA, J., HEIMONEN, T., HAKULINEN, J., MAKINEN, E., LAIVO, T.,AND SORONEN, H. 2009b. User expectations and user experience with different modalities in amobile phone controlled home entertainment system. In Proceedings of the MobileHCI 2009.
TURUNEN, M., HAKULINEN, J., MELTO, A., HEIMONEN, T., LAIVO, T., AND HELLA, J. 2009c.SUXES – User experience evaluation method for spoken and multimodal interaction. In Pro-ceedings of Interspeech.
TURUNEN, M., HAKULINEN, J., MELTO, A., HELLA, J., RAJANIEMI, J.-P., MAKINEN, E.,RANTALA, J., HEIMONEN, T., LAIVO, T., SORONEN, H., HANSEN, M., VALKAMA, P.,MIETTINEN, T., AND RAISAMO, R. 2009d. Speech-based and Multimodal Media Center for dif-ferent user groups. In Proceedings of Interspeech.
TURUNEN, M., HAKULINEN, J., MELTO, A., HELLA, J., LAIVO, T., RAJANIEMI, J.-P., MAKINEN,E., SORONEN, H., HANSEN, M., PAKARINEN, S., HEIMONEN, T., RANTALA, J., VALKAMA, P.,MIETTINEN, T., AND RAISAMO, R. 2010. Accessible speech-based and multimodal media centerinterface for users with physical disabilities. In Development of Multimodal Interfaces: ActiveListening and Synchrony. Springer, Berlin, 66–79.
WITTENBURG, K., LANNING, T., SCHWENKE, D., SHUBIN, H., AND VETRO, A. 2006. Theprospects for unrestricted speech input for TV content search. In Proceedings of the WorkingConference on Advanced Visual Interfaces (AVI’06). ACM, New York, 352–359.
ACM Computers in Entertainment, Vol. 8, No. 3, Article 16, Pub. date: December 2010.
176
Paper II
Keskinen, T., Turunen, M., Raisamo, R., Evreinov, G., & Haverinen, E. (2012). Utilizing Haptic Feedback in Drill Rigs. In P. Isokoski, & J. Springare (Eds.), Haptics: Perception, Devices,Mobility, and Communication: 8th International ConferenceEuroHaptics (EuroHaptics 2012), LNCS 7283, Part II, 73–78. BerlinHeidelberg, Germany: Springer. doi:10.1007/978-3-642-31404-9_13
© Springer-Verlag Berlin Heidelberg, 2012. Reprinted with permission.
177

178
P. Isokoski and J. Springare (Eds.): EuroHaptics 2012, Part II, LNCS 7283, pp. 73–78, 2012. © Springer-Verlag Berlin Heidelberg 2012
Utilizing Haptic Feedback in Drill Rigs
Tuuli Keskinen1, Markku Turunen1, Roope Raisamo1, Grigori Evreinov1, and Eemeli Haverinen2
1 TAUCHI, University of Tampere Kanslerinrinne 1, FI-33014 University of Tampere, Finland
{firstname.surname}@sis.uta.fi 2 Sandvik Mining and Construction Oy
Pihtisulunkatu 9, FI-33310 Tampere, Finland [email protected]
Abstract. We introduce a haptic user interface to aid driving and rod position-ing in surface drill rigs, and report results from a laboratory evaluation carried out for the implemented prototype. Based on the results, we suggest how haptic interface should be implemented for such situations.
Keywords: haptic feedback, work machines, UX.
1 Introduction
When using working machines, the user’s visual attention is commonly focused on the working activity and the object that is being worked on. It is both cognitively demand-ing and distracting to constantly shift the gaze between the main activity and different displays or meters. Haptic interaction offers many advantages in environments where the sight is already committed to the main working task. It is natural for a human to simultaneously receive both visual and haptic information, and they are processed in the human nervous system in parallel [1]. This gives an excellent starting point for investigating the potential use of haptic feedback while controlling working machines.
Here, we introduce a haptic user interface to aid driving and rod positioning in sur-face drill rigs. We present results from a laboratory evaluation carried out for the im-plemented prototype. The rest of the article is structured as follows. First, we describe the evaluated prototype shortly. Then, we explain the evaluation in detail. Finally, we present the results and suggest how haptics can be used in these settings.
2 Tactile Support for a Surface Drill Rig
A surface drill rig is used for blast hole drilling in quarrying, civil engineering and mining. In our target rig, the user is controlling the driving and the drill rod position-ing with four joysticks, two for both hands. For studying the use of haptics in this equipment, we supplied two joysticks for right hand with vibrating motors to produce tactile feedback for the user. See Fig. 1 for an example drill rig simulator, which was used in the development and evaluation.
179

74 T. Keskinen et al.
Fig. 1. Drill rig simulator with a picture of the user’s view attached to the top left
Based on careful studies of the target environment, two separate functions were chosen for tactile feedback: driving the rig and positioning the drill rod to correct position and angle. While driving, if the inclination of the rig becomes too steep, there is a danger of the rig falling over, and warning feedback is given to the driving joystick (Fig. 2). Amplitude and frequency of the feedback increases when the inclination angle is approaching fall over limit. Also if the crawler oscillation lock was left on during driving by mistake, warning feedback is given to driving joystick.
Fig. 2. Haptic feedback for carrier tilt and roll warning. (Blue bars represent active feedback, and horizontal axis represents time in seconds.)
For aiding positioning the drill rod, tactile feedback is used in the rod moving joystick. Short pulses are given when the rod is in the proximity of the drilling hole point and intensity, both with amplitude and frequency, is increased when rod is approaching the exact position (positioning feedback A, see Fig. 3). In correct position feedback is ceased to inform about successful positioning and not to disturb the drilling. We also implemented the opposite feedback sequence for the rod positioning – feedback intensity started stronger and decreased while approaching the correct point to extinguish completely in the correct position (positioning feedback B).
For practical reasons, the implementation was done on a rig simulator. The simula-tor software was instrumented to send events for feedback in predefined situations through network connection. Every event has a parameter, like a distance or an angle, for altering feedback based on the parameter. Separate tactile feedback software was developed to listen for these events and activate the needed vibrating motors based on the events. The tactile feedback software is run on the simulator computer.
180

Utilizing Haptic Feedback in Drill Rigs 75
Fig. 3. Feedback for rod positioning (approaching correct position, positioning feedback A). (Blue bars represent active feedback, and horizontal axis represents time in seconds.)
3 Evaluation
In order to evaluate the haptic interface we conducted a laboratory experiment focus-ing on user subjective metrics. Next we describe the evaluation in detail.
3.1 Participants
After an extensive search of representative test users we were able to get five partici-pants. All participants were male and aged from 29 to 50 years, median being 43 years. Two of the participants were drill masters, two of them worked in product de-velopment and one was in charge of the training simulator. Years elapsed since the first use of a real drill rig ranged from 2 to 30, median value being 15 years. None of the participants estimated they used a real drill rig as often as daily or weekly. The use of a drill rig simulator was estimated to be more frequent compared to the real drill rig: one participant uses a drill rig simulator daily, one weekly, one monthly and two yearly. Using vibration or other haptic feedback in applications, e.g. force feedback in game console controllers, was rare among the participants: only one participant esti-mated he uses haptic feedback in applications daily, one yearly and even three partic-ipants said they do not use haptic feedback in applications at all.
3.2 Procedure
The procedure of the test consisted of web-based questionnaires, the actual experi-ment and interviews. Before the test, participants were asked to fill in a background information form to find out their experience on a real drill rig, a drill rig simulator and haptic feedback in general. Then the participants were asked to fill in an expecta-tion questionnaire concerning their expectations on speed, pleasantness, usefulness and future use of haptic feedback in a drill rig. Asking the expectations is described in Section 3.3 in more detail. Before starting the actual experiment the participants were asked whether they have expectations or anything to comment before continuing.
The actual experiment consisted of four different tasks. First, there was a driving task where the participant had to drive the rig to a route that was visible from the pre-defined starting point. During this task three events produced feedback: oscillation locked while tramming and both carrier roll and tilt angle. In order to trigger the os-cillation locked event the oscillation was manually locked by test administrators be-fore the task and the participant had to unlock it to stop the feedback. Carrier roll and tilt angle events were triggered automatically during the task because an uneven enough terrain was selected for the task.
181
76 T. Keskinen et al.
After the driving task, a pre-defined drilling scenario was loaded and the partici-pant was asked to drill the five holes that were indicated by red spots on the terrain. This time no haptic feedback was given to the participant from positioning the drill rod. Next, the scenario was reloaded and the participant was again asked to drill the five holes. During this task positioning feedback A was given as a result of triggering the positioning events.
After the task with positioning feedback A, the participant was asked about his ex-periences on speed, pleasantness, usefulness and future use of haptic feedback in a drill rig. As asking expectations, gathering experiences is also explained in Section 3.3 more specifically. After the experience questionnaire, the participant was inter-viewed verbally with a few questions related to the haptic feedback so far in the test. The complete questions can be found in Section 3.3.
The drilling scenario was still once reloaded and the participant was asked to drill the same row of five holes. During this third drilling task positioning feedback B was given to the participant. Finally, the participant was interviewed with a few summa-rizing questions (see Section 3.3).
3.3 Subjective Evaluation Method
Expectations and Experiences. Our main focus was on subjective evaluation of the haptic interface. We used a subjective evaluation metric called SUXES [2] to gather subjective data on both user expectations and experiences. In practice, we asked the users’ pre-test expectations and post-test experiences of haptic feedback in a drill rig when considering speed, pleasantness, usefulness and future use.
Before the usage of the application participants give their expected values on a set of statements. The statements concern different qualities or properties of the modality, application or interaction. A statement can be for example "using the application is easy to learn" or like in this study “haptic feedback is pleasant”. Each statement is given two values: an acceptable level and a desired level. The acceptable level means the lowest acceptable quality level, while the desired level is the uppermost level, i.e., the user considers there is no point to go beyond it. After the test, participants give their perceived value on each statement, which are exactly the same as before the test. This time the participants mark only one value, their experienced level of the quality. Finally, the two expectation values, acceptable and desired level, form a gap, where the experienced value, perceived level, is expected to be usually. The answers are normally given on a seven step scale, as was the case in this study as well.
Here, we used four SUXES statements concerning haptic feedback in a drill rig: (1) Haptic feedback is fast, (2) Haptic feedback is pleasant, (3) Haptic feedback is useful, and (4) I would use haptic feedback in the future.
Interviews. There were two interviews: a short interview after the main part of the test and a summarizing interview or discussion at the end of the test. After the main part of the test including driving task, drilling task without positioning feedback and drilling task with positioning feedback A, the participant was asked: (1) From which functions or events haptic feedback was given? (2) How useful do you feel haptic
182
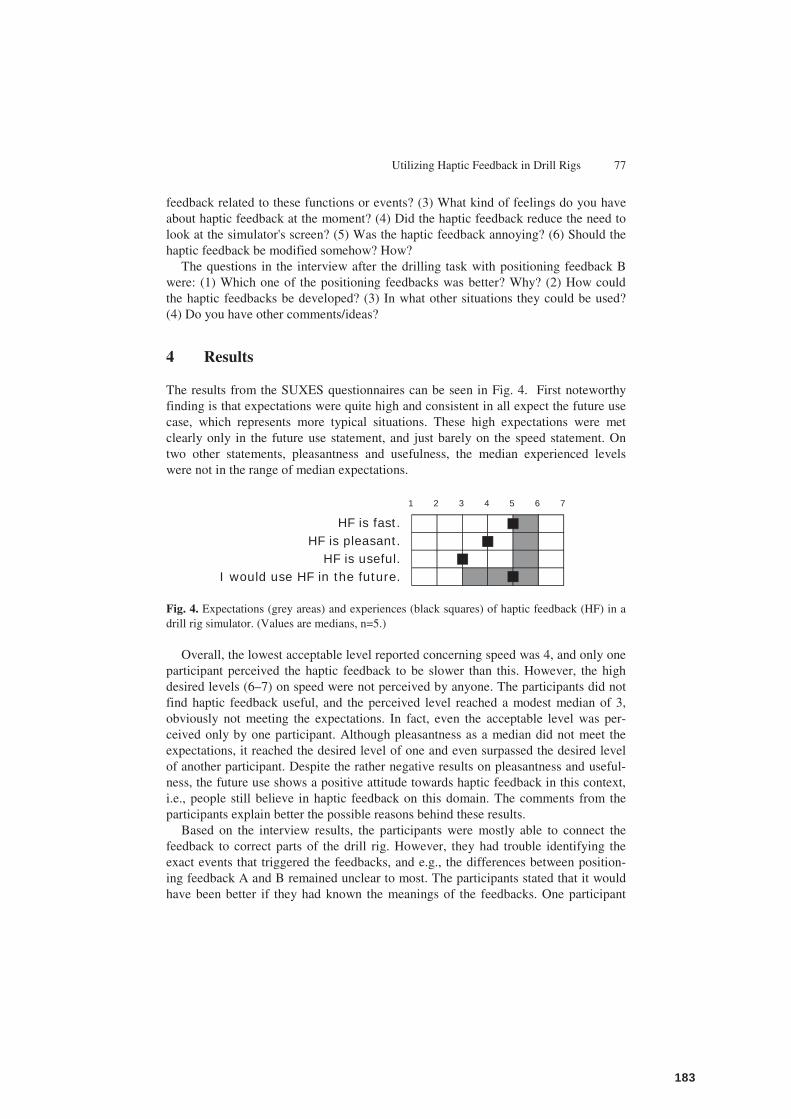
Utilizing Haptic Feedback in Drill Rigs 77
feedback related to these functions or events? (3) What kind of feelings do you have about haptic feedback at the moment? (4) Did the haptic feedback reduce the need to look at the simulator's screen? (5) Was the haptic feedback annoying? (6) Should the haptic feedback be modified somehow? How?
The questions in the interview after the drilling task with positioning feedback B were: (1) Which one of the positioning feedbacks was better? Why? (2) How could the haptic feedbacks be developed? (3) In what other situations they could be used? (4) Do you have other comments/ideas?
4 Results
The results from the SUXES questionnaires can be seen in Fig. 4. First noteworthy finding is that expectations were quite high and consistent in all expect the future use case, which represents more typical situations. These high expectations were met clearly only in the future use statement, and just barely on the speed statement. On two other statements, pleasantness and usefulness, the median experienced levels were not in the range of median expectations.
1 2 3 4 5 6 7
HF is fast.HF is pleasant.
HF is useful.I would use HF in the future.
Fig. 4. Expectations (grey areas) and experiences (black squares) of haptic feedback (HF) in a drill rig simulator. (Values are medians, n=5.)
Overall, the lowest acceptable level reported concerning speed was 4, and only one participant perceived the haptic feedback to be slower than this. However, the high desired levels (6–7) on speed were not perceived by anyone. The participants did not find haptic feedback useful, and the perceived level reached a modest median of 3, obviously not meeting the expectations. In fact, even the acceptable level was per-ceived only by one participant. Although pleasantness as a median did not meet the expectations, it reached the desired level of one and even surpassed the desired level of another participant. Despite the rather negative results on pleasantness and useful-ness, the future use shows a positive attitude towards haptic feedback in this context, i.e., people still believe in haptic feedback on this domain. The comments from the participants explain better the possible reasons behind these results.
Based on the interview results, the participants were mostly able to connect the feedback to correct parts of the drill rig. However, they had trouble identifying the exact events that triggered the feedbacks, and e.g., the differences between position-ing feedback A and B remained unclear to most. The participants stated that it would have been better if they had known the meanings of the feedbacks. One participant
183

78 T. Keskinen et al.
thought the carrier roll and tilt angle feedbacks were related to bumping into some-thing. The usefulness of these feedbacks was also questioned in the light of operating a real drill rig: one would notice if such a heavy machine would incline dangerously. On the other hand, it was stated that the warning feedback may give a feeling of touch while operating on a simulator, especially considering inexperienced users, who are still in the training phase and therefore may not be as aware of the real-life situations. Some participants also told that there is nothing wrong with warning of dangerous situations as long as the feedbacks are clear enough, and there are not feedbacks trig-gered constantly.
The participants clearly stated that the haptic feedbacks used in this study did not reduce the need to look at the control screen. However, a few of them acknowledged that over time this would be possible, and especially if the events would be chosen better. Overall the participants had a relatively positive attitude towards haptic feed-back, but it was stressed throughout the discussions, that the correct and most benefi-cial events should be found in order to gain true usefulness.
5 Discussion and Conclusions
We have presented a carefully designed and evaluated haptic interface for drill rigs. Despite our precise development efforts, the results show that it is extremely chal-lenging to create well received haptic feedback in a context where there may be sev-eral simultaneous events and functions that the user has to pay attention to. The main reason for the results is that haptic feedback could not provide significant additional value for experienced users familiar with the graphical components of the rig. There-fore, adding a haptic interface for such an environment is not enough to meet their high hopes. Instead, the whole interface should be designed to support additional modalities, such as haptics. Here, proactive behavior (predicting forthcoming situa-tions) is more important than reactive behavior (occurred or sure situations).
Acknowledgements. This work was supported by Tekes – the Finnish Funding Agency for Technology and Innovation in the "Grammar of Earcons 3" project (“GEAR3”). We thank Harri Rantala for developing and implementing the prototype and being in charge of the technical issues during the evaluation.
References
1. Goldstein, E.B.: Sensation & Perception, 7th edn. Wadsworth, Belmont (2007) 2. Turunen, M., Hakulinen, J., Melto, A., Heimonen, T., Laivo, T., Hella, J.: SUXES – User
Experience Evaluation Method for Spoken and Multimodal Interaction. In: Proceedings of Interspeech 2009, pp. 2567–2570 (2009)
184

Paper III
Keskinen, T., Heimonen, T., Turunen, M., Rajaniemi, J.-P., & Kauppinen, S. (2012). SymbolChat: a flexible picture-based communication platform for users with intellectual disabilities. Interacting with Computers, 24(5), 374–386. Elsevier B.V. doi:10.1016/j.intcom.2012.06.003
© British Informatics Society Limited, 2012. Reprinted with permission.
185

186
SymbolChat: A flexible picture-based communication platform for userswith intellectual disabilities
Tuuli Keskinen a,⇑,1, Tomi Heimonen a,1, Markku Turunen a,1, Juha-Pekka Rajaniemi a,1, Sami Kauppinen b
aUniversity of Tampere, Kanslerinrinne 1, 33014 Tampere, Finlandb Laurea University of Applied Sciences, Vanha maantie 9, 02650 Espoo, Finland
a r t i c l e i n f o
Article history:Received 30 April 2011Received in revised form 20 June 2012Accepted 22 June 2012Available online 5 July 2012
Keywords:Picture-based communicationInstant messagingAugmentative and alternativecommunicationUser-centered design
a b s t r a c t
Persons with intellectual disabilities benefit from participating in the modern information society, espe-cially the World Wide Web, social media and Internet-mediated communication services. Although sev-eral computer-based prototypes and commercial systems have been introduced for accessible in-personcommunication, currently few applications and services exist to support synchronous remote communi-cation for this user group. We introduce SymbolChat, a software platform that supports the creation ofmultimodal communication applications utilizing picture-based instant messaging. End users and theirsupport personnel can customize the input and output features of the application based on their individ-ual needs and abilities. The interaction is based on touchscreen input and speech output using speechsynthesis technology. The SymbolChat platform was developed together with the prospective end usersand practitioners in the field of special needs care.We evaluated the prototype application in a field study with nine users with varying degrees of intel-
lectual and other disabilities. The results clearly indicate that the participants were able to express them-selves in spontaneous communication using a large-scale picture-based vocabulary (around 2000symbols) even without prior training in the use of symbols. This finding was supported in the construc-tive feedback gathered from professionals working in the area. We also successfully applied methodologyfrom other settings, such as child-computer interaction to evaluate interaction in this challenging con-text.Overall, the results show that social inclusion for people with intellectual disabilities can be improved
with customizable communication tools. The implemented communication platform forms a solid basisfor further improvements and new communication services. In addition, we found that users with motorimpairments would greatly benefit from alternative input and output methods for symbol browsing andselection.
� 2012 British Informatics Society Limited. All rights reserved.
1. Introduction
Advances in assistive and personal technologies can increasethe level of independence and social connectedness for personswith cognitive disabilities (Dawe, 2006), and people around per-sons with cognitive disabilities usually like to maximize the inclu-sion for these individuals (Davies et al., 2001). Further, enablingcommunication may have a huge positive effect on the quality oflife of the people with cognitive disabilities. According to Newellet al. (2002), communication and information technology systemshave great potential to enhance the quality of life for people with
cognitive disabilities by helping to keep them intellectually andphysically active, and by providing methods of communicationthat reduce social isolation. The ability to independently use theInternet could also help expand participation in recreational socialactivities, which are currently hindered by issues ranging fromtransportation problems to limited social skills (Davies et al.,2001).
People with cognitive disabilities are a large and diverse usergroup. It is estimated that there are more than 20 million peoplein America with cognitive disabilities, with more than four millionclassified as having intellectual or developmental disabilities(Braddock et al., 2004). Cognitive disability affects one’s capacityto think, from conceptualizing to remembering and understandingwritten text. Cognitive disabilities include intellectual disabilities,as well as impairments caused by brain injury, degenerativediseases and persistent mental illness. This poses challenges andlimitations for interpersonal communication that does not rely
0953-5438/$ - see front matter � 2012 British Informatics Society Limited. All rights reserved.http://dx.doi.org/10.1016/j.intcom.2012.06.003
⇑ Corresponding author. Tel.: +358 50 318 5850; fax: +358 3 219 1001.E-mail addresses: [email protected] (T. Keskinen), tomi.heimonen@sis.
uta.fi (T. Heimonen), [email protected] (M. Turunen), [email protected] (J.-P. Rajaniemi), [email protected] (S. Kauppinen).
1 Tel.: +358 50 318 5850; fax: +358 3 219 1001.
Interacting with Computers 24 (2012) 374–386
Contents lists available at SciVerse ScienceDirect
Interacting with Computers
journal homepage: www.elsevier .com/ locate/ intcom
187
on speech or other expressive methods such sign language, as ac-cess to textual information is difficult (Lewis, 2005), and oftenthe use of symbols (i.e. graphic representations of objects, actionsand concepts) is the only possible means of written communica-tion (Poulson and Nicolle, 2004). This picture-based communica-tion can take many forms, from selecting pictures usingpersonalized picture folders to using specialized communicationdevices or computer software. Although the severity of cognitiveand learning disability varies by person, there are estimates thatapproximately half the population with speech and language orcognitive disorders make use or could benefit from symbols orsymbol-related text, which in the European Union entails between2 and 5 million people. People with communication impairmentsalso have in many cases limitations with mobility and sensorycapability, such as hearing and vision, and therefore need adapta-tions to access communication aids and computer-based commu-nication tools (Poulson and Nicolle, 2004).
While commercial applications and devices exist for picture-based communication, their adoption is not unproblematic. Onespecific problem is fragmentation caused by multiple specific toolsintended for different purposes. Hayes et al. (2010) report a needfor flexible, customizable visual communication tools that couldbe used for a variety of activities. Ideally, such a tool could be usedto learn the basics of picture-based communication with the assis-tance of a language therapist, to communicate during classroomactivity, and for remote communication outside of the classroom.Another practical consideration is the cost and expertise require-ments of the commercial communications devices, which putsthem outside the reach of many potential users. Additionally, indiscussions with caregivers, we learnt that people with cognitivedisabilities also face challenges in the use of commodity communi-cation software, such as current instant messaging clients, mainlydue to their complexity.
It should be noted that completely independent interactionmight not be suitable for all users and applications, as technologycannot completely replace human caregivers (Fischer and Sullivan,2002). Tradeoffs between independent use and caregiver-led assis-tance and tailoring of the applications for each user’s needs havebeen design goals for other pictogram-based communication sys-tems (Hayes et al., 2010; Keating, 2006). Learning to use such sys-tems is a gradual process that involves repeated practice toovercome the impairments in memory and retention. The role ofcaregivers is essential in fostering the learning process, and thesystem should be adaptable enough so that it can grow with theusers as their skills evolve. Adaptability also provides benefits be-yond immediate usability, such as long-term financial, social andeducation benefits, because the person with cognitive disabilitiescan focus on the primary activities instead of expending time inlearning new interfaces (Patel et al., 2004).
In summary, there is an acute need for picture-based commu-nication interfaces that enable social contact for people with cog-nitive disabilities, and these interfaces should provide ease of use,configuration, and flexibility in different situations for users withdiffering abilities. This article presents our work with a multi-modal picture-based communication platform called SymbolChat,which successfully addresses many of these issues. We report re-sults from the user-centered participatory design process and dis-cuss the findings from a field evaluation of the interface carriedout with prospective end-users. The result of our work is a novel,highly configurable platform for realizing further communicationapplications for people with intellectual disabilities. Furthermore,we present new evaluation methodology for this challengingdomain.
The rest of the article is organized as follows. We begin with areview of existing work and outline design and evaluation consid-erations. Next, we introduce the SymbolChat application. We then
report the results from our field study, and conclude by discussingthe implications of our findings, and provide suggestions for futurework.
2. Related work
In the following we review previous research on enabling com-munication for people with cognitive disabilities through augmen-tative and alternative communication (AAC) tools that enable face-to-face communication with the aid of a computer, and Internet-based computer-mediated communication systems (December,1996) that provide AAC-like features, such as picture-based com-munication. In general terms, assistive technology is a term that de-scribes devices and applications that are intended to assist peoplewith various disabilities, from physical device such as wheelchairsto special computer software such as screen readers (Dawe, 2006).More specifically, augmentative and alternative communication re-fers to forms of communication other than regular spoken commu-nication between humans. These include unaided systems, such asfacial body language, gestures and sign language, and aided com-munication systems that include both non-electronic communica-tion such as communication books, and electronic communicationaids that allow the user to select symbols, letters and words to cre-ate messages (American Speech-Language-Hearing Association,2011). Picture-based communication systems are a form of AACtechnology that is based on the use of graphics, such as drawings,pictograms and symbols. The degree towhich the system resemblesa written language varies, from symbol collections such as PictureCommunication Symbols (2012) or Widgit Symbols (2012) to sym-bol languages with their own grammar such as Blissymbol (2012).In the context of computer-mediated communication, AAC toolsenable communication over computer networks, such as the Inter-net or local area network.
Several systems, both research prototypes and commercialproducts, have been developed for facilitating picture-based com-munication both in the context of face-to-face AAC and for net-worked communication. It should be noted that in the followingthis distinction is made based on the intended purpose of the com-munication tools. As such, adding networked communication facil-ities to picture-based tools intended for local communicationwould enable also remote communication, however undoubtedlyalso the interaction paradigms would require re-design (e.g., estab-lishing a feedback channel from other conversation partners).
2.1. Picture-based communication in AAC tools
Image-Oriented Communication Aid (Patel et al., 2004) is a com-munication interface intended for preliterate users with speech andmotor impairments, whose cognitive and linguistic abilities showpromise for future expressive communication ability but are cur-rently in need of image-based communication support. The inter-face uses the Widgit symbol set (Widgit Symbols, 2012) and isutilized on a touchscreen tablet computer, although also other in-put methods such as mouse can be used and the system adaptedfor alternative input methods for users with motor control disabil-ities. The premise behind the two-dimensional, spatially organizedmessage construction is the difficulties AAC users have with theprevailing linear style of concatenating syntactic units. The authors’argument is that a spatially organized image has the ability to ex-press semantic relationships between words and concepts thatcan be lost in linear organization of text. An important highlightis the need for tradeoffs between the size of the vocabulary and cog-nitive demands placed on the user due to search, navigation andattentive load. The authors also discuss the need for scalability with
T. Keskinen et al. / Interacting with Computers 24 (2012) 374–386 375
188
changing needs and developing abilities, for example in terms ofsymbol complexity, vocabulary size and communicative functions.
Motocos are augmentative communication devices for visualcommunication (Hayes et al., 2010). Designed for children withautism spectrum disorders (ASDs), its use is based on a communi-cation strategy of image exchange, whereby children initiate thecommunication by choosing images or respond to images sent byothers. Their prototype was implemented on a mobile device witha touchscreen, with an associated computer application for manag-ing the image library on the device. The device contained a libraryof preinstalled cards and the caregivers were able to add customcards. The cards could be associated with an audio cue, either re-corded with a microphone or read out loud with the onboardspeech synthesizer. The systemwas designed for flexibility of com-munication, either in structured communication settings duringlearning activities or for use in spontaneous communication. Keyfindings in their study were the importance of customizabilityfor the abilities and skill level of the individual child, ease of find-ing the appropriate image to express the desired concept and theneed for support for end-user creation, sharing and organizationof the materials by the caregivers.
PhotoTalk (Allen et al., 2008) is a mobile application for peoplewith aphasia that enables capturing and managing digital photo-graphs in support of face-to-face communication. It supports com-munication by allowing users to capture and share personallymeaningful photographs with their communication partners,which allows for types of communication that would otherwisebe difficult or impossible due to aphasia. Their findings also high-light the need for customizability in this context, such as the abilityto change the size of user interface elements and screen sensitivity,and manage the display settings of photo captions. They concludethat many of the attributes of PhotoTalk encourage adoption,including its relative simplicity and the provision of increasedindependence and social interaction.
Picture Planner™ (Keating, 2006) is an icon-driven activity-scheduling tool for people with cognitive disabilities and theirassistants. Although not primarily a communication tool, it con-tains many communicative features such as the option to usepersonal images as prompts. It aims to enable independent useby individuals with limited reading ability while also enablingassistance from caregivers. This is facilitated by tri-modal iconsthat consist of an image, label and text-to-speech (TTS) function-ality, uncluttered screen design, an interaction model that avoidsdouble-clicking and a dedicated button for repeating the lastspoken text string. The findings from a user study suggest thatusers with significant cognitive disabilities can potentially bene-fit from such applications with minimal instructions, providedthat they are designed with cognitive impairments in mind. In-creased independent use may also be possible over time.
In addition to research prototypes, several AAC software anddevices exist that allow the user to communicate either by typingor through image-based message construction. A representativeexample is the DynaVox family of devices (DynaVox, 2012) byMayer-Johnson that incorporate the InterAACt language frame-work, which is a customizable suite of communication tools forusers with various ability levels from emergent communicatorsto people with strong literacy skills. While the basic devices are in-tended to enable face-to-face communication through symbolselection and text-to-speech output, the more advanced devicesalso allow for the use of Web, email and text messaging for Inter-net-based information access and communication. Although suchtools are highly customizable and applicable to the needs of thetarget audience, their cost can be prohibitive to adoption. Accord-ing to practitioner feedback, a real need exists for low-cost solu-tions that could be used on existing infrastructure such aslaptops or tablet devices with touchscreens.
2.2. Picture-based computer-mediated communication
In addition to systems enabling face-to-face communication inco-located settings, applications exist for symbol-based remotecommunication. The Messenger Visual (Tuset et al., 2011) instantmessaging service is a very similar system to the SymbolChatframework presented in this article. It allows people to exchangepictogram-based messages in real time across the Internet. Theuser interface is modeled as a simplified instant messaging discus-sion window that also provides access to pictogram categories andthe most frequent pictograms appearing in the discussions. Thefindings from their user study with people with cognitive disabili-ties show that the participants are able to communicate with theservice and find it both interesting and entertaining. Developmentissues affecting future adoption were also uncovered, such as sta-tus notifications from the communication partner, and supportfor more varied input and output methods such as pictogram-to-speech. The main differences to our approach are the lack of alter-native input and output methods (e.g., text-to-speech andtouchscreen).
Communicator (Takasaki and Mori, 2007) is pictogram-basedcommunication software designed and developed for interculturalcollaboration between children in the Internet through email. Thesoftware contains 450 pictograms, designed by community volun-teers. An interesting feature in the software is its translation func-tion that displays the messages using both the recipient andsender’s pictograms. Although valuable in communication be-tween users of different spoken languages, this kind of translationis something that should be considered also between differing pic-togram sets within the same language. The Communicator mes-sage construction panel differs from many other AAC tools inthat it allows for free placement of the pictograms on a canvas likemessage pane. Such a free-form composition style could be usefulalso as an expressive method in the context of pre-literate userswith cognitive disabilities.
The Pictograph Chat Communicator III (Munemori et al., 2010)is another pictogram-based communication tool for cross-culturalcommunication between people who do not share the same spo-ken language. It contains approximately 500 symbols organizedinto eight tabs according to function, such as subjects and questionwords, verbs, adjectives, nouns, alphabets and time. The user inter-face is organized similarly to ours with messages being constructedby selecting them from a grid of available symbols in an instantmessaging like interface. Although the recognition rates for sym-bols were high (over 90%), the subjective feedback suggests someareas for improvement also relevant for users with cognitive dis-abilities such as improving the ease of constructing sentencesusing the symbols, finding appropriate symbols to use and person-alizing the symbol collection.
Zlango (2012) is a commercial Web and mobile service for icon-based messaging that allows users to generate icon based mes-sages that can be shared on the Web, email and on social mediasites such as blogs. It utilizes its own logographic writing systemconsisting of several hundred icons. Although the main targetgroup of the service is not people with cognitive disabilities, it isto our knowledge one of few purely image-based commercialWeb-based communication services. An interface developed ex-pressly accounting for the needs of people with cognitive disabili-ties could allow for equal participation between users with varyingabilities in such a context.
2.3. Implications for the SymbolChat platform
A review of existing systems and research prototypes estab-lished several design criteria that our computer-mediated commu-nication platform should address, including flexibility, possibility
376 T. Keskinen et al. / Interacting with Computers 24 (2012) 374–386
189

to use multiple input and output modalities and inclusion of mul-timodal presentation methods. Flexibility in this context has twokey properties: flexibility through personalization of the applica-tion interface, and adaptability of the communicative content.Overall, flexibility and customizability for different users and usagesituations appears to be a key concern in addressing different com-munication needs and abilities. The system should provide a highdegree of choice in modifying both the interface (e.g. size of text,images, input/output methods) and the symbols that are used forcommunication. For this, their caregivers should have easy-to-use tools that allow them to personalize the content based on indi-vidual needs. In terms of non-standard inputs, touchscreen inputwas commonly used in these existing systems to facilitate interac-tion for users with motor control impairments. Audio, as recordedcues or text-to-speech synthesis, is used or suggested as a support-ing modality for text and symbols. Finally, perhaps the mostimportant design goals are simplicity and clarity of both the inter-face and interaction design, so that the users with cognitivedisability are able to construct, understand and respond to com-municative messages as easily as possible.
3. Designing for cognitive disability
3.1. Design guidelines
Designing interfaces to account for cognitive disability is a mul-tifaceted process. General guidelines developed in different appli-cation domains can be adopted to provide a general level ofcognitive accessibility in the application (Jiwnani, 2012; Robertsonand Hix, 2002; Sutcliffe et al., 2003). Robertson and Hix (2002) sug-gest general user interaction design guidelines for computer appli-cations, which include guidelines based on physical, mental andpsychosocial considerations. While underlining the need for sim-plicity, clarity and use of familiar, real life metaphors, they alsohighlight the need for the computer use to be a shared activityfor the target population, rather than a stand-alone, computer-as-sisted instructional tool. Sutcliffe et al. (2003) note that problemswith working memory can impair the understanding of screeninformation and recall of the current task context. This should beaccounted for in design, for example by using simplified screen lay-outs and system initiatives to remind of and help recapture thetask context and provide visible systems status information. Jiw-nani (2012) proposes a set of guidelines for designing inputs andoutputs for cognitively accessible website that are generic enoughto be also applicable in the context of communication applications.For input, the sequences of actions should be simplified and avail-able choices limited when practical, and direct selection tech-niques favored to support simple, time-independent actions. Theinput features should remain consistent throughout the applica-tion, and pictographic symbols should be used to help the usercommunicate, ask questions and answer them. For output, unclut-tered screens with adjustable display image size should be offered,with appropriate labeling for icons, with combined use of picturesand audio prompts for navigation, and in general multisensory pre-sentation of feedback information. The potential of speech has alsobeen noted in other studies (Braddock et al., 2004; Feng et al.,2010). Feng et al. (2010) found that speech recognition may allevi-ate frustrations with keyboard usage and speech output may helpaddress cognitive limitations, although its effectiveness may belimited by other disabilities.
3.2. Involving users with cognitive disabilities in the design process
One of the tenets of user-centered design is the inclusion of po-tential end-users in the development process. Development in real
usage situations with real users is essential when designing for per-sonswith disabilities (Fischer and Sullivan, 2002). There are specificchallenges in including people with disabilities in the design pro-cess, including difficulties in obtaining informed consent, inabilityto communicate their thoughts, and very specialized or unknownrequirements between individuals and user groups (Newell andGregor, 2000). However, the variety and severity of each individ-ual’s disabilities affect how the application is used, and which inputand outputmethods aremost appropriate. Due to this individuality,one major challenge in designing for users with cognitive disabilityis the generalizability of the results beyond the specific users in-volved in the research. Moffatt et al. (2006) note that there existsa tension between satisfying the immediate needs of the usersand identifying results that could be generalized towards longer-term research goals. They suggest a ‘‘designing in the small, testingin the large’’ approach. Researchers work with a small number ofusers initially in order to design a system that is targeted to theirneeds. Subsequently they evaluate the systemwith a broader groupof users to identify the features of the system that can be general-ized and those that need to be customized for each individual. Weadopted this approach in our work and based the design on feed-back from a relative small group of representatives from the com-munity before evaluating with a diverse set of end-users.
Another challenge that is unique to this domain is the role of thecaregivers who often are used as representatives to gather userneeds and expectations due to problems with gaining feedback di-rectly from the target population (Allen et al., 2008). The inclusionof these domain experts presents its own requirements to the de-sign process in terms of the role they play – be it the role of a re-searcher, a community liaison or representative of the target users.In this work domain experts were involved in all three roles, some-times with one expert playing multiple roles. One member of thecore research team is an assistive care professional and undertookactivities in all three roles, while other domain experts were in-volved in various stages of the project, especially during evalua-tion. This increased the workload of the domain expert in theresearch team, as she was responsible for coordinating the collab-orative effort between local representatives and the research team.
3.3. Evaluation challenges
Evaluating interactive systems with representatives from theend user is especially critical when it comes to people with cogni-tive disabilities. These users are more likely to encounter real bar-riers to their use from design issues that incur increased mentalprocessing, which might merely be annoyances or non-issues tousers without disabilities. However, evaluating the usability andaccessibility of technology and interfaces intended for people withcognitive disabilities is challenging due to many factors and otherstudies highlight the lack of evaluation research with users chal-lenged by cognitive impairments (Lewis, 2005; Sutcliffe et al.,2003). The use of expert evaluations and analytical methods suchas cognitive walkthrough is complicated by insufficient under-standing of cognitive processing by people with intellectual dis-abilities (Lewis, 2005). On the other hand, limitations withparticipants’ self-expression and literacy skills make it hard to em-ploy traditional usability evaluation methods that include e.g. atask-based protocol and a think-aloud (Lepistö and Ovaska,2004). Interviewing participants with cognitive disabilities also re-quires special consideration (Lepistö and Ovaska, 2004), from usingclear, simple language to understanding the participant’s personalcharacteristics in order to interpret the responses.
Given the challenges with traditional usability testing, combi-nations of other observation-based methods have been suggested.Lepistö and Ovaska (2004) utilized informal walkthrough(Riihiaho, 2009) in their evaluation of an Internet-based learning
T. Keskinen et al. / Interacting with Computers 24 (2012) 374–386 377
190
environment. Informal walkthrough combines features fromusability testing, observation and interviews. The key differenceto traditional usability testing is the replacement of pre-definedtest tasks with a session where the participant uses the systemfreely. The developers of the method suggest (Riihiaho, 2009) thatin some contexts the setting will be more natural if a pair or groupof users explores the system at the same time. When evaluatingwith users with moderate to severe cognitive disabilities, the pres-ence of the participant’s caregiver or teacher is required. The re-searcher uses a checklist of features the participants should coverand can use it to e.g. prompt the participant about features thatwere not used or the participant had problems accessing. The ex-pected results describe realistically how easy it is to learn to usethe system, which features are easy to find, used first and desired.The findings from using informal walkthrough with participantswith cognitive disabilities echo the above, suggesting that themethod is effective in showing which parts of the application inter-est the participants most.
4. The SymbolChat application
In the following we describe the SymbolChat application,including its design process, user interface, interaction models,the utilized symbol set and implementation.
4.1. Design process
The SymbolChat application is the result of a collaborative effortbetween practitioners in the field of special needs care and researchpartners from academia. From early on it was clear that best resultswould be achieved by engaging in participatory designwhereby theprospective end users’ needs, context of use and activities form thebasis for the design. The development process started at the end of2009 with a user needs survey and a design workshop where thedifferent stakeholders were able to communicate their expecta-tions and needs for the project. As a result, a set of personas and sce-narios were constructed for use in the wider project context and anumber of tangible project ideas were identified.
Using the constructed personas and scenarios as a startingpoint, we began the design work on the symbol-based remotecommunication concept, with the first half of 2010 spent ondesigning and implementing the SymbolChat prototype in collabo-ration with representatives from the AAC community. During thespring and summer of 2010 the initial versions of the prototypewere evaluated in small-scale studies with users with cognitivedisabilities and their caregivers (Fig. 1). The findings from thesestudies were used to modify both the SymbolChat interface andthe symbol set in preparation of the field trial, which was carriedout in the fall of 2010.
The responsibilities within the project team were dividedaccording to the expertise of the participating units. University ofTampere was responsible for the implementation of the communi-cation prototype and assisting on the technical aspects of the eval-uation. Rinnekoti Foundation provided the expertise on specialneeds of people with cognitive disabilities and alternative and aug-mentative communication, as well as facilities and personnel sup-port to carry out the evaluations. Laurea University of AppliedSciences focused on the field study and evaluation efforts.
4.2. Client user interface
The SymbolChat user interface (see Fig. 2 for an English trans-lated version) is organized into three main sections: (1) the mes-sage history view, (2) the symbol input view and (3) the symbolcategory view. The message history view (area 1) shows the mes-
sages sent by the user and messages received from other users,according to the output method selected by the user (symbols ortext). A list of discussion participants and their pictures is shownto the extreme left of the view. Each message is read out loud usingText-To-Speech (if enabled), and the user is able to replay the mes-sage using a dedicated button prefixing each message. The symbolinput view (area 2) provides functionality for composing, preview-ing and sending of messages. As the user selects symbols, they areadded into the message preview, which can be played back usingtext-to-speech (TTS). Symbols from received messages can beadded into the current message by selecting them in the messagehistory view. This feature was added as a result of the user study,as a means to more easily refer to concepts in the ongoing discus-sion. The symbols are distributed on several ‘pages’ if the categorycontains more symbols that can be fit on the available space, rep-resented by the folder icons on top of the symbol grid.
The symbol category view (area 3) shows a list of available sym-bol categories. Selecting a category item shows a list of subcatego-ries, or in case of a subcategory, updates the symbol input viewaccordingly. The topmost category selection is always availableand acts as a link to a customized set of symbols (Quick Menu).Navigation to previous levels in the category hierarchy is possibleusing the Back button. The symbols and categories are better de-scribed in 4.4 Symbols.
The user interface scales automatically to different screen reso-lutions, however the layout is optimized for a high definition dis-plays of 1920 � 1080 resolution, commonly found in touchscreen enabled all-in-one computers currently on the market.
4.3. Interaction modalities
The SymbolChat client application supports multiple input andoutput interaction methods. The current reference implementa-tion, as presented in Fig. 2, is designed for graphical symbols,speech output and touchscreen input on large displays. In addition,text output, mouse interaction, and keyboard input, depending onuser’s preferences and abilities, can be used. Touch input was se-lected as the main input method since it provides a simple interac-tion paradigm accessible to users with limited computer skills(Holzinger, 2003). Another reason is the variance in motor skillsamong the target users. Users who are not able to accurately con-trol a mouse pointer are potentially better able to activate the userinterface controls using touch. Touch-based interaction was takeninto account in the user interface design by enlarging the buttonsand other interactive controls. The main output modalities aresymbols and synthesized speech, but text output is also supported.The symbols also contain descriptive labels, primarily to facilitatethe finding of symbols during assisted use.
Users are able to personalize their interaction style with theapplication. The input/output modality can be changed on the flyin the application settings. Additional settings are provided forcontrolling the text to speech functionality (e.g. speech synthesisrate) and size of both input and output symbols. This is particularlyuseful for users with motor skill deficiencies and for coping withvarying display resolutions. The TTS functionality was judged dur-ing the design phase to be of critical importance to our cognitivelyimpaired participants, in supporting their short-term memory andmessage recall. It also helps a person in learning (new) symbols,which is extremely important in social media settings, where peo-ple use different symbols, but also useful when people with differ-ent sets of symbols discuss.
4.4. Symbols
The SymbolChat application currently uses a set of Picture Com-munication Symbols (PCSs) by DynaVox Mayer-Johnson LLC. The
378 T. Keskinen et al. / Interacting with Computers 24 (2012) 374–386
191
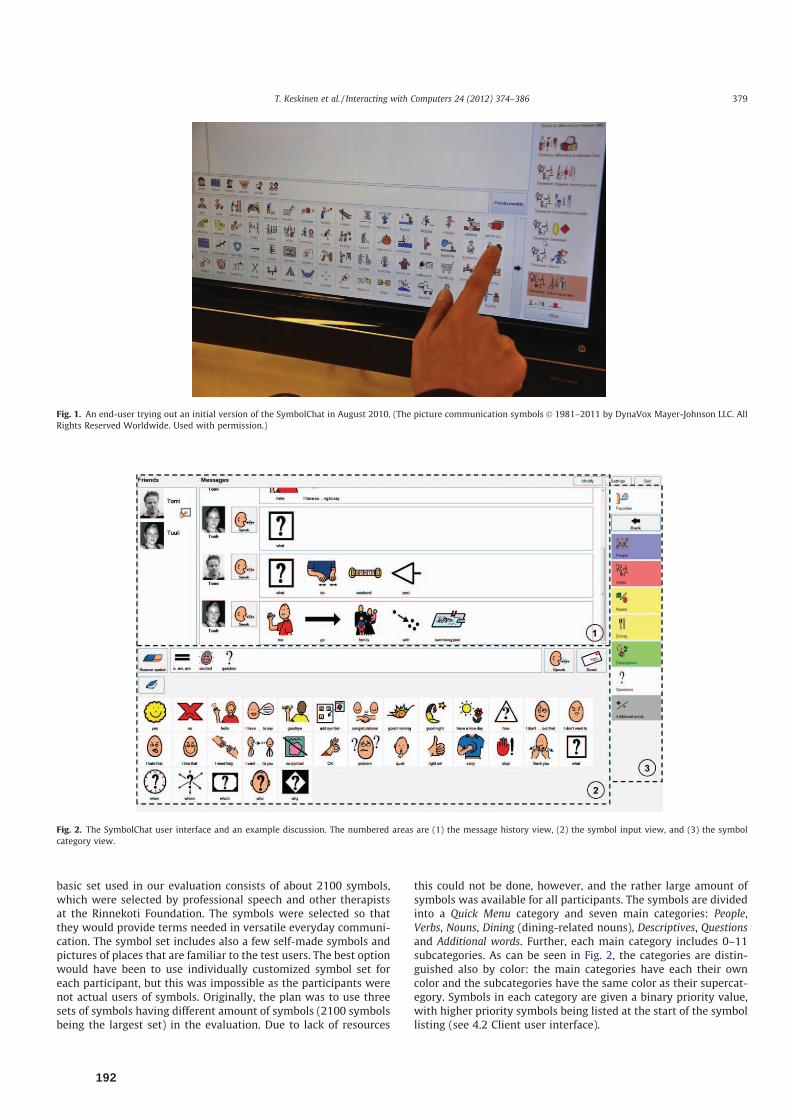
basic set used in our evaluation consists of about 2100 symbols,which were selected by professional speech and other therapistsat the Rinnekoti Foundation. The symbols were selected so thatthey would provide terms needed in versatile everyday communi-cation. The symbol set includes also a few self-made symbols andpictures of places that are familiar to the test users. The best optionwould have been to use individually customized symbol set foreach participant, but this was impossible as the participants werenot actual users of symbols. Originally, the plan was to use threesets of symbols having different amount of symbols (2100 symbolsbeing the largest set) in the evaluation. Due to lack of resources
this could not be done, however, and the rather large amount ofsymbols was available for all participants. The symbols are dividedinto a Quick Menu category and seven main categories: People,Verbs, Nouns, Dining (dining-related nouns), Descriptives, Questionsand Additional words. Further, each main category includes 0–11subcategories. As can be seen in Fig. 2, the categories are distin-guished also by color: the main categories have each their owncolor and the subcategories have the same color as their supercat-egory. Symbols in each category are given a binary priority value,with higher priority symbols being listed at the start of the symbollisting (see 4.2 Client user interface).
Fig. 1. An end-user trying out an initial version of the SymbolChat in August 2010. (The picture communication symbols � 1981–2011 by DynaVox Mayer-Johnson LLC. AllRights Reserved Worldwide. Used with permission.)
Fig. 2. The SymbolChat user interface and an example discussion. The numbered areas are (1) the message history view, (2) the symbol input view, and (3) the symbolcategory view.
T. Keskinen et al. / Interacting with Computers 24 (2012) 374–386 379
192
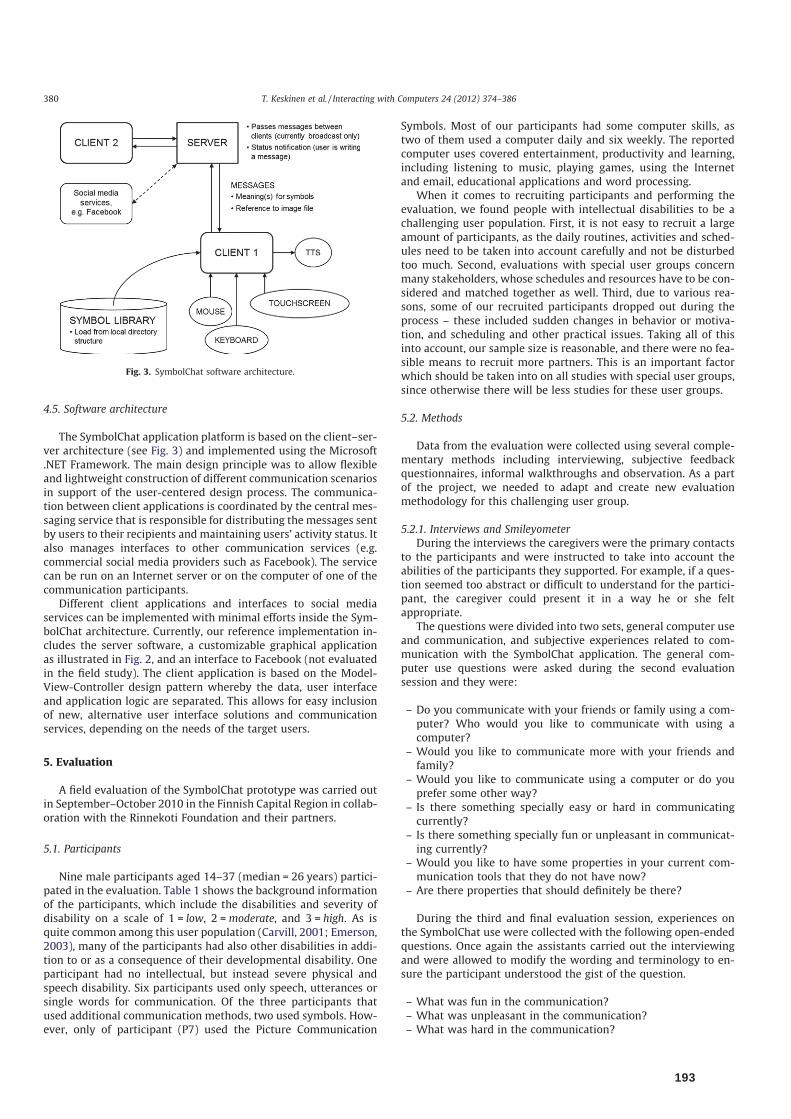
4.5. Software architecture
The SymbolChat application platform is based on the client–ser-ver architecture (see Fig. 3) and implemented using the Microsoft.NET Framework. The main design principle was to allow flexibleand lightweight construction of different communication scenariosin support of the user-centered design process. The communica-tion between client applications is coordinated by the central mes-saging service that is responsible for distributing the messages sentby users to their recipients and maintaining users’ activity status. Italso manages interfaces to other communication services (e.g.commercial social media providers such as Facebook). The servicecan be run on an Internet server or on the computer of one of thecommunication participants.
Different client applications and interfaces to social mediaservices can be implemented with minimal efforts inside the Sym-bolChat architecture. Currently, our reference implementation in-cludes the server software, a customizable graphical applicationas illustrated in Fig. 2, and an interface to Facebook (not evaluatedin the field study). The client application is based on the Model-View-Controller design pattern whereby the data, user interfaceand application logic are separated. This allows for easy inclusionof new, alternative user interface solutions and communicationservices, depending on the needs of the target users.
5. Evaluation
A field evaluation of the SymbolChat prototype was carried outin September–October 2010 in the Finnish Capital Region in collab-oration with the Rinnekoti Foundation and their partners.
5.1. Participants
Nine male participants aged 14–37 (median = 26 years) partici-pated in the evaluation. Table 1 shows the background informationof the participants, which include the disabilities and severity ofdisability on a scale of 1 = low, 2 =moderate, and 3 = high. As isquite common among this user population (Carvill, 2001; Emerson,2003), many of the participants had also other disabilities in addi-tion to or as a consequence of their developmental disability. Oneparticipant had no intellectual, but instead severe physical andspeech disability. Six participants used only speech, utterances orsingle words for communication. Of the three participants thatused additional communication methods, two used symbols. How-ever, only of participant (P7) used the Picture Communication
Symbols. Most of our participants had some computer skills, astwo of them used a computer daily and six weekly. The reportedcomputer uses covered entertainment, productivity and learning,including listening to music, playing games, using the Internetand email, educational applications and word processing.
When it comes to recruiting participants and performing theevaluation, we found people with intellectual disabilities to be achallenging user population. First, it is not easy to recruit a largeamount of participants, as the daily routines, activities and sched-ules need to be taken into account carefully and not be disturbedtoo much. Second, evaluations with special user groups concernmany stakeholders, whose schedules and resources have to be con-sidered and matched together as well. Third, due to various rea-sons, some of our recruited participants dropped out during theprocess – these included sudden changes in behavior or motiva-tion, and scheduling and other practical issues. Taking all of thisinto account, our sample size is reasonable, and there were no fea-sible means to recruit more partners. This is an important factorwhich should be taken into on all studies with special user groups,since otherwise there will be less studies for these user groups.
5.2. Methods
Data from the evaluation were collected using several comple-mentary methods including interviewing, subjective feedbackquestionnaires, informal walkthroughs and observation. As a partof the project, we needed to adapt and create new evaluationmethodology for this challenging user group.
5.2.1. Interviews and SmileyometerDuring the interviews the caregivers were the primary contacts
to the participants and were instructed to take into account theabilities of the participants they supported. For example, if a ques-tion seemed too abstract or difficult to understand for the partici-pant, the caregiver could present it in a way he or she feltappropriate.
The questions were divided into two sets, general computer useand communication, and subjective experiences related to com-munication with the SymbolChat application. The general com-puter use questions were asked during the second evaluationsession and they were:
– Do you communicate with your friends or family using a com-puter? Who would you like to communicate with using acomputer?
– Would you like to communicate more with your friends andfamily?
– Would you like to communicate using a computer or do youprefer some other way?
– Is there something specially easy or hard in communicatingcurrently?
– Is there something specially fun or unpleasant in communicat-ing currently?
– Would you like to have some properties in your current com-munication tools that they do not have now?
– Are there properties that should definitely be there?
During the third and final evaluation session, experiences onthe SymbolChat use were collected with the following open-endedquestions. Once again the assistants carried out the interviewingand were allowed to modify the wording and terminology to en-sure the participant understood the gist of the question.
– What was fun in the communication?– What was unpleasant in the communication?– What was hard in the communication?
Fig. 3. SymbolChat software architecture.
380 T. Keskinen et al. / Interacting with Computers 24 (2012) 374–386
193

– What was easy in the communication?– What properties the application should have had?– What did you think about the pictures (symbols)?
In addition to the open questions, four disagree–agree-likequestions were asked using Smileyometer (Read et al., 2002),which is an emotional Likert scale consisting of a number of smileyfaces. It was originally developed for measuring children’s opinionson interfaces. As normal numerical Likert scales may be difficult tounderstand for people with intellectual disabilities (Huenerfauthet al., 2009), Smileyometer seemed like a useful alternative. Unlikein the original version, we did not use text labels below the smileyfaces, because the participants cannot read. When asking the dis-agree–agree-like questions, the smiley face cards were put on thetable in front of the participant following the order shown in Fig. 4.
After being presented the question verbally, the participantswere asked to pick the card that best expressed their feelings.The questions answered in this way were:
– Was the communication fast?– Was the communication fun?– Was the communication hard?– Would you like to communicate this way again?
We constructed the smiley face cards from black cardboard,sized 10 � 10 cm, to which hand drawn smiley faces were attached(Fig. 4). The scale represented by the cards ranged from ‘‘extremelysad’’ to ‘‘extremely happy’’.
5.2.2. User expectations and experiencesOne of the key aspects in the area of novel interactive systems is
to study what people expect from the interaction and how theseexpectations are met when using the system. We adopted theSUXES (Turunen et al., 2009) method, which is designed to mea-sure the subjective user experience of multimodal interaction.With SUXES, users are asked to report their pre-test expectationsprior to using the system and post-test perceptions based on actual
usage. Before using the application, users state their expectationson a set of statements. After using the application, users providetheir experienced value for each statement. The statements con-cern different qualities or properties of the input/output modali-ties, application or interaction styles. A statement could be: ‘‘Itwill be easy to learn to use the application’’. For expectations, eachstatement is answered by providing two values: an acceptable leveland a desired level. The acceptable level corresponds to the lowestlevel the user would be satisfied with, while the desired level is theuppermost level, i.e., the user considers there is no point to go be-yond it. When reporting experiences, users mark only one value,the experienced level. The two expectation values form a gap,where the experienced level is expected to lie in most cases.
As the participants in our study had cognitive disabilities thatlimit their ability to evaluate the statements, we modified theSUXES methodology to account for this. Instead of directly engag-ing the participants, we asked their therapists and support personsto fill in questionnaires, while keeping in mind the abilities, per-sonality and needs of the particular participant. The primary rea-son was that deciding on expectations could in some cases bevery abstract and therefore too challenging for people with intel-lectual disabilities. We also simplified the collection of expecta-tions to only include one value, which in this case corresponds tothe desired level. We felt this would be an acceptable compromisebetween fidelity and reliability of the gathered data, given theinherent difficulty of reporting expectations on behalf of anotherperson. In this case the distinction between acceptable and desiredlevels, while useful, would not have been reliable enough the datawas collected through a proxy.
The following SUXES statements targeted both the expectationsand experiences, and they were answered using a seven-step scaleranging from low (1) to high (7) level:
– Using the SC is fast.– Using the SC is pleasant.– Using the SC is clear.– Using the SC is error-free.
Table 1Participants’ background information. The numbers related to disabilities represent the severity: 1 = low, 2 = moderate, 3 = high.
P1 P2 P3 P4 P5 P6 P7 P8 P9
Age 26 33 22 37 37 15 14 29 20Intellectual disability 2 1 2 2 2 1 3 2Physical disability 1 3Visual impairment 1Hearing disability 1Speech disability 1 2 2Behavior disorder 1 1Autistic spectrum disorder 3
Communication with other peopleSpeech, utterances or single words � � � � � � � � �
Signing �
Gestures or facial expressions � �
Symbol language � �
Physical communication �
Communication binder �
Fig. 4. Smiley face cards based on the Smileyometer.
T. Keskinen et al. / Interacting with Computers 24 (2012) 374–386 381
194

– The SC functions in an error-free manner.– It is easy to learn to use the SC.– Using the SC is natural.– The SC is useful.– I would like to use the SC in the future.
5.2.3. Informal walkthroughIn the second and third evaluation day informal walkthrough
(Riihiaho, 2009) was used to observe and record the use of theapplication. We chose it as the principal observation method dueto the positive experiences gained when applying it in a similarcontext (Lepistö and Ovaska, 2004). We emphasized the observa-tion of discoverability of various features such as symbol catego-ries and message previews and whether the features were usedwithout assistance, with the possibility to ask clarifying questionswhen needed. As Lepistö and Ovaska (2004) suggest, studying firsttime use would be challenging with this user group due to prob-lems with learning and attentiveness. As such, we decided to startusing the informal walkthrough on the second day, after the partic-ipants had acquired some experience with the system, and alsowith the knowledge that they would need a lot of help duringthe study in order to use the various functions in the application.Thus, the primary focus was on the learning process of the corefunctionality. Before the evaluation we listed all the functions fromthe SymbolChat application to build the observation checklist.Researchers used the checklist to document all the features thatwere used, whether the feature was used correctly and whetherthe participants needed any help in using the features.
5.3. Evaluation procedure
The evaluation consisted of four three-session evaluationweeks.Each week a group of two to three participants used the Symbol-Chat to communicate with each other. Every session lasted fromone to one and a half hours, and they were held on separate days,to avoid fatiguing the participants and disrupting their daily sched-ules. The evaluation sessions were held in classrooms (groups 1 and3) and in participants’ homes or assisted living facilities (groups 2and 4). In addition to the participants and researchers, caregiverswere present to assist the participants in communicating with theresearchers and supporting the use of the prototype.
In the first session of the week, the caregivers introduced theSymbolChat application and its functionality to the participant,with the researchers providing clarifications if necessary. After this,the participants used the application themselves and communi-cated with each other. If needed, the communication wasprompted using a list of discussion topics related activities, dailytasks, hobbies and interests.
In the beginning of the second session, the caregivers acted asrepresentatives to the participants and filled in the SUXES expecta-tions questionnaire. After filling in the questionnaire, the caregiversinterviewed the participants about their current communicationsituation: their typical discussion partners, methods of communi-cation, current challenges and future wishes. For the rest of the sec-ond session, the participants communicated with each other usingthe prototype. The caregivers used the list of discussion topics toprompt interaction if it seemed to stall. The caregiver-led approachwas chosen to ensure that the situation was as familiar as possiblefor the participants and also so that we could accurately record theparticipants’ views: many of our participants had communicativeproblems that the caregivers were familiar with and were thus ableto both present the questions and interpret the answers accurately.
The third session continued with the same kind of semi-struc-tured discussion as the other sessions. The session concluded witha caregiver-led interview about the participants’ experiencesregarding the testing and the SymbolChat prototype. The interview
included open questions and disagree–agree-like questions, whichwere answered using the Smileyometer cards. The caregivers filledin the SUXES experience questionnaire based on their interpreta-tion of the participants’ actions.
6. Results and discussion
In the following, we describe the findings from the interviews,questionnaires, and observations made during the communicationsessions and discuss their significance.
6.1. Interviews
Interviews on participants’ current communication styles wereconducted during the first and second evaluation weeks due prac-tical reasons with different stakeholders. The first interview wasconducted with five participants. Only two of these participantstold they communicate with their friends and family using a com-puter. Three participants told they would like to communicatemore with their friends and family, one said the current amountwas fine and one participant did not know if he wanted more com-munication or not. When asking whether they would like to com-municate using a computer or some other way, one participantstated he prefers calling because phone is easy and more fun touse than the computer. The other four cautiously speculated thatcomputer might be the best tool for communicating.
The interview on experiences about the SymbolChat was suc-cessfully carried out with six participants. Data are missing fromparticipants 2, 7 and 8 to whom the interview could not be admin-istered either because the participant was not present in the lastevaluation session or it was not practical during the evaluation ses-sion. The answers given with the cards can be seen in Table 2.
Although the symbols were unfamiliar to the participants, theyrated the speed of the communication as fairly high (median = 4.5).The perception of speed needs to be taken in the context withwhich the participants currently communicate, e.g. by using sign-ing or communication binders. Compared to these methods, it ispossible that the novelty and interactivity of the SymbolChat inter-face fostered a sense of rapidity even if the actual construction ofmessages was relatively slow, with a single, short message oftentaking several minutes to complete.
According to the participants the communication was also fun(median = 4.5), which is extremely important considering the fu-ture of the application: without any associated fun factor it is un-likely that users would have motivation to use it. When asked whatwas fun in the communication, three participants stated it was theability to discuss with someone. Although the participants thoughtthe communication was fast and fun, they also thought it was fairlyhard (median = 2). While one participant mentioned that nothingwas hard, the difficulties some participants reported were relatedto symbol use: they did not know them or where to find them,or there were too many of them. However, one participant de-scribed how he first could not find what he was looking for becausethere were so many symbols, but that he gradually began toremember locations of specific symbols. Further, when asked opin-ions about the symbols in general, the participants stated thatalthough the symbols were not familiar they were good and clear,and some mentioned they were also easy to learn. Additionally,two of the participants stated that selecting the symbols withtouch was easy. Despite the downsides, the participants clearly re-ported they would like to communicate this way again in the fu-ture (median = 4). Participants 1 and 4 had the most negativeexperiences: according to the feedback from the caregivers, partic-ipant 4 lacked motivation, and not knowing the symbols was men-tioned as a difficulty by both of these participants.
382 T. Keskinen et al. / Interacting with Computers 24 (2012) 374–386
195
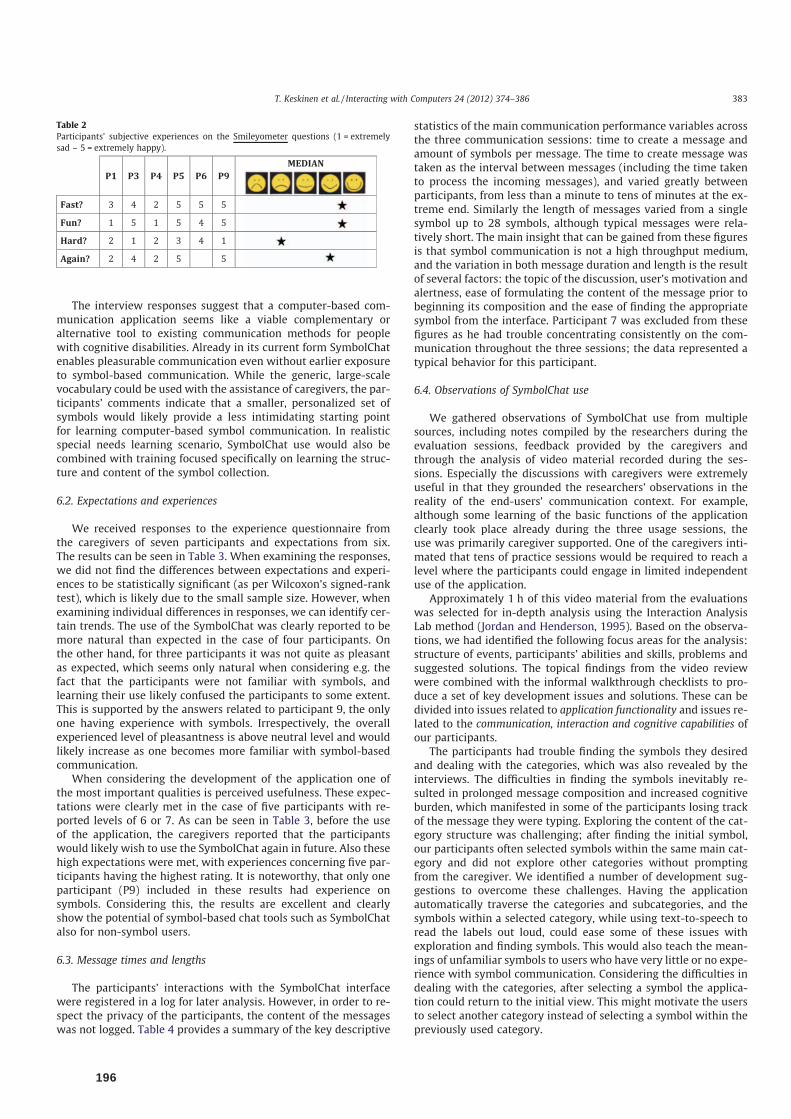
The interview responses suggest that a computer-based com-munication application seems like a viable complementary oralternative tool to existing communication methods for peoplewith cognitive disabilities. Already in its current form SymbolChatenables pleasurable communication even without earlier exposureto symbol-based communication. While the generic, large-scalevocabulary could be used with the assistance of caregivers, the par-ticipants’ comments indicate that a smaller, personalized set ofsymbols would likely provide a less intimidating starting pointfor learning computer-based symbol communication. In realisticspecial needs learning scenario, SymbolChat use would also becombined with training focused specifically on learning the struc-ture and content of the symbol collection.
6.2. Expectations and experiences
We received responses to the experience questionnaire fromthe caregivers of seven participants and expectations from six.The results can be seen in Table 3. When examining the responses,we did not find the differences between expectations and experi-ences to be statistically significant (as per Wilcoxon’s signed-ranktest), which is likely due to the small sample size. However, whenexamining individual differences in responses, we can identify cer-tain trends. The use of the SymbolChat was clearly reported to bemore natural than expected in the case of four participants. Onthe other hand, for three participants it was not quite as pleasantas expected, which seems only natural when considering e.g. thefact that the participants were not familiar with symbols, andlearning their use likely confused the participants to some extent.This is supported by the answers related to participant 9, the onlyone having experience with symbols. Irrespectively, the overallexperienced level of pleasantness is above neutral level and wouldlikely increase as one becomes more familiar with symbol-basedcommunication.
When considering the development of the application one ofthe most important qualities is perceived usefulness. These expec-tations were clearly met in the case of five participants with re-ported levels of 6 or 7. As can be seen in Table 3, before the useof the application, the caregivers reported that the participantswould likely wish to use the SymbolChat again in future. Also thesehigh expectations were met, with experiences concerning five par-ticipants having the highest rating. It is noteworthy, that only oneparticipant (P9) included in these results had experience onsymbols. Considering this, the results are excellent and clearlyshow the potential of symbol-based chat tools such as SymbolChatalso for non-symbol users.
6.3. Message times and lengths
The participants’ interactions with the SymbolChat interfacewere registered in a log for later analysis. However, in order to re-spect the privacy of the participants, the content of the messageswas not logged. Table 4 provides a summary of the key descriptive
statistics of the main communication performance variables acrossthe three communication sessions: time to create a message andamount of symbols per message. The time to create message wastaken as the interval between messages (including the time takento process the incoming messages), and varied greatly betweenparticipants, from less than a minute to tens of minutes at the ex-treme end. Similarly the length of messages varied from a singlesymbol up to 28 symbols, although typical messages were rela-tively short. The main insight that can be gained from these figuresis that symbol communication is not a high throughput medium,and the variation in both message duration and length is the resultof several factors: the topic of the discussion, user’s motivation andalertness, ease of formulating the content of the message prior tobeginning its composition and the ease of finding the appropriatesymbol from the interface. Participant 7 was excluded from thesefigures as he had trouble concentrating consistently on the com-munication throughout the three sessions; the data represented atypical behavior for this participant.
6.4. Observations of SymbolChat use
We gathered observations of SymbolChat use from multiplesources, including notes compiled by the researchers during theevaluation sessions, feedback provided by the caregivers andthrough the analysis of video material recorded during the ses-sions. Especially the discussions with caregivers were extremelyuseful in that they grounded the researchers’ observations in thereality of the end-users’ communication context. For example,although some learning of the basic functions of the applicationclearly took place already during the three usage sessions, theuse was primarily caregiver supported. One of the caregivers inti-mated that tens of practice sessions would be required to reach alevel where the participants could engage in limited independentuse of the application.
Approximately 1 h of this video material from the evaluationswas selected for in-depth analysis using the Interaction AnalysisLab method (Jordan and Henderson, 1995). Based on the observa-tions, we had identified the following focus areas for the analysis:structure of events, participants’ abilities and skills, problems andsuggested solutions. The topical findings from the video reviewwere combined with the informal walkthrough checklists to pro-duce a set of key development issues and solutions. These can bedivided into issues related to application functionality and issues re-lated to the communication, interaction and cognitive capabilities ofour participants.
The participants had trouble finding the symbols they desiredand dealing with the categories, which was also revealed by theinterviews. The difficulties in finding the symbols inevitably re-sulted in prolonged message composition and increased cognitiveburden, which manifested in some of the participants losing trackof the message they were typing. Exploring the content of the cat-egory structure was challenging; after finding the initial symbol,our participants often selected symbols within the same main cat-egory and did not explore other categories without promptingfrom the caregiver. We identified a number of development sug-gestions to overcome these challenges. Having the applicationautomatically traverse the categories and subcategories, and thesymbols within a selected category, while using text-to-speech toread the labels out loud, could ease some of these issues withexploration and finding symbols. This would also teach the mean-ings of unfamiliar symbols to users who have very little or no expe-rience with symbol communication. Considering the difficulties indealing with the categories, after selecting a symbol the applica-tion could return to the initial view. This might motivate the usersto select another category instead of selecting a symbol within thepreviously used category.
Table 2Participants’ subjective experiences on the Smileyometer questions (1 = extremelysad – 5 = extremely happy).
T. Keskinen et al. / Interacting with Computers 24 (2012) 374–386 383
196
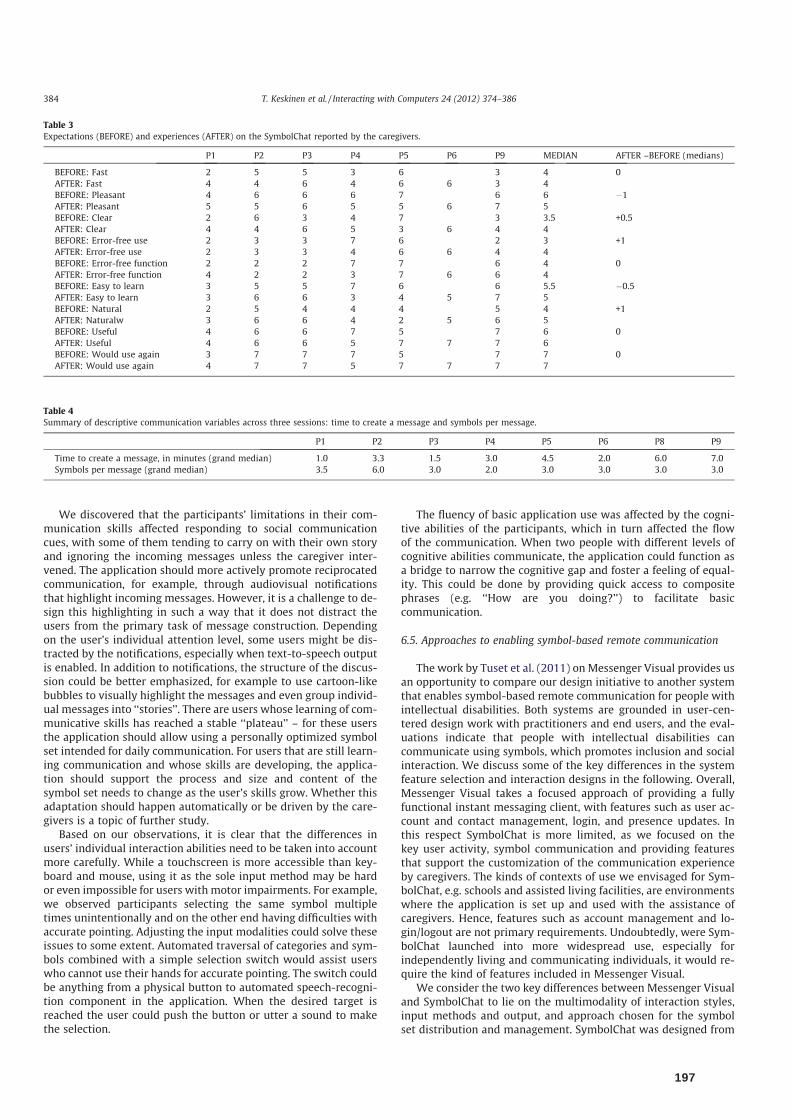
We discovered that the participants’ limitations in their com-munication skills affected responding to social communicationcues, with some of them tending to carry on with their own storyand ignoring the incoming messages unless the caregiver inter-vened. The application should more actively promote reciprocatedcommunication, for example, through audiovisual notificationsthat highlight incoming messages. However, it is a challenge to de-sign this highlighting in such a way that it does not distract theusers from the primary task of message construction. Dependingon the user’s individual attention level, some users might be dis-tracted by the notifications, especially when text-to-speech outputis enabled. In addition to notifications, the structure of the discus-sion could be better emphasized, for example to use cartoon-likebubbles to visually highlight the messages and even group individ-ual messages into ‘‘stories’’. There are users whose learning of com-municative skills has reached a stable ‘‘plateau’’ – for these usersthe application should allow using a personally optimized symbolset intended for daily communication. For users that are still learn-ing communication and whose skills are developing, the applica-tion should support the process and size and content of thesymbol set needs to change as the user’s skills grow. Whether thisadaptation should happen automatically or be driven by the care-givers is a topic of further study.
Based on our observations, it is clear that the differences inusers’ individual interaction abilities need to be taken into accountmore carefully. While a touchscreen is more accessible than key-board and mouse, using it as the sole input method may be hardor even impossible for users with motor impairments. For example,we observed participants selecting the same symbol multipletimes unintentionally and on the other end having difficulties withaccurate pointing. Adjusting the input modalities could solve theseissues to some extent. Automated traversal of categories and sym-bols combined with a simple selection switch would assist userswho cannot use their hands for accurate pointing. The switch couldbe anything from a physical button to automated speech-recogni-tion component in the application. When the desired target isreached the user could push the button or utter a sound to makethe selection.
The fluency of basic application use was affected by the cogni-tive abilities of the participants, which in turn affected the flowof the communication. When two people with different levels ofcognitive abilities communicate, the application could function asa bridge to narrow the cognitive gap and foster a feeling of equal-ity. This could be done by providing quick access to compositephrases (e.g. ‘‘How are you doing?’’) to facilitate basiccommunication.
6.5. Approaches to enabling symbol-based remote communication
The work by Tuset et al. (2011) on Messenger Visual provides usan opportunity to compare our design initiative to another systemthat enables symbol-based remote communication for people withintellectual disabilities. Both systems are grounded in user-cen-tered design work with practitioners and end users, and the eval-uations indicate that people with intellectual disabilities cancommunicate using symbols, which promotes inclusion and socialinteraction. We discuss some of the key differences in the systemfeature selection and interaction designs in the following. Overall,Messenger Visual takes a focused approach of providing a fullyfunctional instant messaging client, with features such as user ac-count and contact management, login, and presence updates. Inthis respect SymbolChat is more limited, as we focused on thekey user activity, symbol communication and providing featuresthat support the customization of the communication experienceby caregivers. The kinds of contexts of use we envisaged for Sym-bolChat, e.g. schools and assisted living facilities, are environmentswhere the application is set up and used with the assistance ofcaregivers. Hence, features such as account management and lo-gin/logout are not primary requirements. Undoubtedly, were Sym-bolChat launched into more widespread use, especially forindependently living and communicating individuals, it would re-quire the kind of features included in Messenger Visual.
We consider the two key differences between Messenger Visualand SymbolChat to lie on the multimodality of interaction styles,input methods and output, and approach chosen for the symbolset distribution and management. SymbolChat was designed from
Table 3Expectations (BEFORE) and experiences (AFTER) on the SymbolChat reported by the caregivers.
P1 P2 P3 P4 P5 P6 P9 MEDIAN AFTER –BEFORE (medians)
BEFORE: Fast 2 5 5 3 6 3 4 0AFTER: Fast 4 4 6 4 6 6 3 4BEFORE: Pleasant 4 6 6 6 7 6 6 �1AFTER: Pleasant 5 5 6 5 5 6 7 5BEFORE: Clear 2 6 3 4 7 3 3.5 +0.5AFTER: Clear 4 4 6 5 3 6 4 4BEFORE: Error-free use 2 3 3 7 6 2 3 +1AFTER: Error-free use 2 3 3 4 6 6 4 4BEFORE: Error-free function 2 2 2 7 7 6 4 0AFTER: Error-free function 4 2 2 3 7 6 6 4BEFORE: Easy to learn 3 5 5 7 6 6 5.5 �0.5AFTER: Easy to learn 3 6 6 3 4 5 7 5BEFORE: Natural 2 5 4 4 4 5 4 +1AFTER: Naturalw 3 6 6 4 2 5 6 5BEFORE: Useful 4 6 6 7 5 7 6 0AFTER: Useful 4 6 6 5 7 7 7 6BEFORE: Would use again 3 7 7 7 5 7 7 0AFTER: Would use again 4 7 7 5 7 7 7 7
Table 4Summary of descriptive communication variables across three sessions: time to create a message and symbols per message.
P1 P2 P3 P4 P5 P6 P8 P9
Time to create a message, in minutes (grand median) 1.0 3.3 1.5 3.0 4.5 2.0 6.0 7.0Symbols per message (grand median) 3.5 6.0 3.0 2.0 3.0 3.0 3.0 3.0
384 T. Keskinen et al. / Interacting with Computers 24 (2012) 374–386
197
the start to enable communication both with text and symbols,accommodate a wide variety of users from pre-literate symbolusers to those able to communicate with written text. With inputmethods, we accounted for the diversity in motor abilities by en-abling input with mouse, keyboard and touch and have identifiedthe need for further accessible input methods. We also foundtext-to-speech output to be an integral feature of the interface,as means to keep track and repeat the message during compositionand facilitate learning of new symbols. In contrast, perhaps be-cause it may be intended for a differently targeted user population,Messenger Visual provides an almost completely unimodal visualinterface. Furthermore, in the Messenger Visual architecture, theshared pictogram set is stored and configured on the server andsynchronized to clients. In our approach the symbol set is storedon each user’s computer, where it can be locally configured to suitthe needs of that particular user. In Messenger Visual, the designchoice to use the full set of pictograms is based on the rationalethat it promotes the independence and learning processes of theusers. Our results show that using a large symbol set makes theinteraction needlessly difficult and is not necessarily needed tofoster learning. The discussions we had with special needsprofessionals suggest that a more reasonable solution is to use apersonalized, stable set for accomplished communicators and agradually expanding set for users in the process of learning symbolcommunication.
Tuset-Peiró (2011) further discusses on the need to adapt andpersonalize Messenger Visual interface to better suit the individualaccessibility requirements of users. They suggest the use of genericuser profiles and automatic adaptation of the client interface basedon these predefined profiles. Our design process findings and con-sultation with AAC professionals has led to a different directionwith personalization. While it may be possible to create such userinterface profiles to cover different user profiles, they may be toocoarse to account for the idiosyncratic requirements and disabili-ties of users. We suggest that onus should be on providing easyto use tools for the caregivers and end users to customize the rel-evant system functionality themselves. However, we share theirsentiment that better guidelines are needed to make Internet ser-vices accessible for individuals with intellectual disabilities.
7. Conclusions and future work
In this paper we presented the SymbolChat application, anapplication that helps people with intellectual disabilities commu-nicate with one another over the Internet. SymbolChat is morethan an application built for a specific purpose: it is a completesoftware platform for creating different kinds of multimodal com-munication services. Our goal is that eventually the end users, peo-ple with intellectual disabilities and their caregivers, will be able toconstruct highly personalized communication applications for dif-ferent usage situations based on individual needs. This includescustomizing the vocabulary of the communication, symbols, andthe input and output modalities.
We also reported the collaborative design and developmentprocess of SymbolChat. The design was carried out together withthe prospective end users and practitioners. We evaluated the pro-totype application in a field study with nine users with varying de-grees of intellectual, motor and other disabilities. Despite thearisen areas that would need further improvement, the resultsdemonstrate the feasibility of our approach, as our participantswere able to communicate and express themselves with a large-scale vocabulary with minimal training. Furthermore, we receivedencouraging feedback from the participants and professional sup-port personnel. Our evaluation demonstrated that with careful de-sign and proper adaptation, analysis methods primarily used with
other user groups can be successfully applied in this context. Forexample, we used the Smileyometer to elicit responses from ourparticipants, the SUXES user experience questionnaire to gatherexpectations and experiences from the caregivers, and informalwalkthrough and interaction analysis lab to collect structuredobservations from usage situations.
In our current and future work, we are investigating the use ofautomated speech recognition for selection of symbols and catego-ries, navigation in the user interface and activation of commands.We are considering the use of different physical control devices,sensor technologies, andmachine vision as additional input modal-ities. With these technologies, we can provide an accessible inter-face also for those users who cannot use touch and speechinterfaces. We are also looking to improve the symbol-based com-munication approach itself to support multiple concurrent lan-guages and text-to-symbols translation. This would enable userswith different language backgrounds to communicate with one an-other using their own preferred language and communicationmethod. In addition, we recently developed a mobile version ofthe platform to enable use on tablet computers and mobile phones.
The results of our study clearly demonstrate that the communi-cation experiences of people with intellectual disabilities can beimproved with proper tools that are designed with simplicity andcustomizability in mind. In comparison to existing tools for pic-ture-based communication, our approach is novel in that it com-bines end user-customization, multimodal inputs and outputsinto a simple yet flexible, fun and easy to use Internet-based mes-saging solution that can be operated on commodity devices.
Acknowledgements
This work was part of Eureka/ITEA2 Programme, and it was sup-ported by the European Commission and Tekes – the Finnish Fund-ing Agency for Technology and Innovation in the ‘‘Do it YourselfSmart Experiences’’ Project (‘‘DiYSE’’). We would like to thank Tuu-la Kotimäki, Maija Rimpiläinen and the Rinnekoti Foundation fortheir assistance with the design and evaluation efforts.
References
Allen, M., McGrenere, J., Purves, B., 2008. The field evaluation of a mobile digitalimage communication application designed for people with Aphasia. ACMTransactions on Accessible Computing 1 (1), 26. Article 5.
Allen, M., Leung, R., McGrenere, J., Purves, B., 2008. Involving domain experts inassistive technology research. Universal Access in Information Society 7 (3),145–154.
American Speech-Language-Hearing Association, 2011. Augmentative andAlternative Communication. <http://www.asha.org/public/speech/disorders/AAC.htm> (checked 19.06.12).
Blissymbolics Communication International, 2012. <http://www.blissymbolics.org/pfw/> (checked 19.06.12).
Braddock, D., Rizzolo, M.C., Thompson, M., Bell, R., 2004. Emerging technologies andcognitive disability. Journal of Special Education Technology 19 (4), 45.Arlington, VA.
Carvill, S., 2001. Sensory impairments, intellectual disability and psychiatry. Journalof Intellectual Disability Research 45 (6), 467–483.
Davies, D.K., Stock, S.E., Wehmeyer, M.L., 2001. Enhancing independent internetaccess for individuals with mental retardation through use of a specialized webbrowser: a pilot study. Education and Training in Mental Retardation andDevelopmental Disabilities 36 (1), 107–113.
Dawe, M., 2006. Desperately seeking simplicity: how young adults with cognitivedisabilities and their families adopt assistive technologies. In: Grinter, Rebecca,Rodden, Thomas, Aoki, Paul, Cutrell, Ed, Jeffries, Robin, Olson, Gary (Eds.),Proceedings of the SIGCHI conference on Human Factors in computing systems(CHI ‘06). ACM, New York, NY, USA, pp. 1143–1152.
December, J., 1996. Units of analysis for internet communication. Journal ofCommunication 46 (1), 14–38.
DynaVox, 2012. <http://www.dynavoxtech.com/> (checked 19.06.12).Emerson, E., 2003. Prevalence of psychiatric disorders in children and adolescents
with and without intellectual disability. Journal of Intellectual DisabilityResearch 47 (1), 51–58.
Feng, J., Lazar, J., Kumin, L., Ozok, A., 2010. Computer usage by children with downsyndrome: challenges and future research. ACM Transactions on AccessibleComputing 2 (3), 44. Article 13.
T. Keskinen et al. / Interacting with Computers 24 (2012) 374–386 385
198

Fischer, G., Sullivan J.F., 2002. Human-centered public transportation systems forpersons with cognitive disabilities – challenges and insights for participatorydesign. In: Proc. 7th Participatory Design Conference, pp. 194–198.
Hayes, G.R., Hirano, S., Marcu, G., Monibi, M., Nguyen, D.H., Yeganyan, M., 2010.Interactive visual supports for children with autism. Personal UbiquitousComputing 14 (7), 663–680.
Holzinger, A., 2003. finger instead of mouse: touch screens as a means of enhancinguniversal access. Universal Access Theoretical Perspectives, Practice, andExperience, Lecture Notes in Computer Science 2615, 387–397.
Huenerfauth, M., Feng, L., Elhadad, N., 2009. Comparing evaluation techniques fortext readability software for adults with intellectual disabilities. In: Proceedingsof the 11th International ACM SIGACCESS Conference on Computers andAccessibility (Assets ‘09). ACM, New York, NY, USA, pp. 3–10.
Jiwnani, K., 2012. Designing for Users with Cognitive Disabilities. UniversalUsability. In Practice. University of Maryland Report. <http://otal.umd.edu/uupractice/cognition/> (checked 19.06.12).
Jordan, B., Henderson, A., 1995. Interaction analysis: foundations and practice. TheJournal of the Learning Sciences 4 (1), 39–103.
Keating, T., 2006. Picture planner: a cognitively accessible personal activityscheduling application. In: Proceedings of the 8th International ACMSIGACCESS Conference on Computers and Accessibility (Assets ‘06). ACM,New York, NY, USA, pp. 239–240.
Lepistö, A., Ovaska, S., 2004. Usability evaluation involving participants withcognitive disabilities. In: Proceedings of the third Nordic Conference on Human-Computer Interaction (NordiCHI ‘04). ACM, New York, NY, USA, pp. 305–308.
Lewis, C., 2005. HCI for people with cognitive disabilities. SIGACCESS Accessibilityand Computing 83, 12–17.
Moffatt, K., Findlater, L., Allen, M., 2006. Generalizability in Research withCognitively Impaired Individuals. CHI 2006 Workshop on Designing forPeople with Cognitive Impairments, April 22–23, Montreal, Quebec.
Munemori, J., Fukuda, T., Yatid, M.B.M., Nishide, T., Itou, J., 2010. Pictograph chatcommunicator III: a chat system that embodies cross-cultural communication.In: Setchi, Rossitza, Jordanov, Ivan, Howlett, Robert J., Jain, Lakhmi C. (Eds.),Proceedings of the 14th International Conference on Knowledge-Based andIntelligent Information and Engineering Systems: Part III (KES’10). Springer-Verlag, Berlin, Heidelberg, pp. 473–482.
Newell, A.F, Gregor, P., 2000. User sensitive inclusive design – in search of a newparadigm. In: Proceedings on the 2000 Conference on Universal Usability (CUU‘00). ACM, New York, NY, USA, pp. 39–44.
Newell, A.F., Carmichael, A., Gregor, P., Alm, N., 2002. Information technology forcognitive support. In: Jacko, Julie A., Sears, Andrew (Eds.), The Human-
Computer Interaction Handbook. L. Erlbaum Associates Inc., Hillsdale, NJ, USA,pp. 464–481.
Patel, R., Pilato, S., Roy, D., 2004. Beyond linear syntax: an image-orientedcommunication aid. Journal of Assistive Technology Outcomes and Benefits 1(1), 57–66.
Picture Communication Symbols, 2012. <http://www.mayer-johnson.com/category/symbols-and-photos/> (checked 19.06.12).
Poulson, D., Nicolle, C., 2004. Making the Internet accessible for people withcognitive and communication Impairments. Universal Access in the InformationSociety 3 (1), 48–56.
Read, J.C, MacFarlane, S.J, Casey, C., 2002. Endurability, engagement andexpectations: measuring children’s fun. In: Proceedings of Interaction Designand Children. Shaker Publishing, Eindhoven, pp. 189–198.
Riihiaho, S. 2009. User testing when test tasks are not appropriate. In: Leena Norros,Hanna Koskinen, Leena Salo, Paula Savioja (Eds.), European Conference onCognitive Ergonomics: Designing beyond the Product – Understanding Activityand User Experience in Ubiquitous Environments (ECCE ‘09). VTT TechnicalResearch Centre of Finland, Finland. Article 21, p. 9.
Robertson, G.L., Hix, D., 2002. Making the computer accessible to mentally retardedadults. Communications of the ACM 45 (4), 171–183.
Sutcliffe, A., Fickas, S., Sohlberg, M.M., Ehlhardt, L.E., 2003. Investigating theusability of assistive user interfaces. Interacting with Computers 15 (4), 577–602 (01.08.03).
Takasaki, T., Mori, Y., 2007. Design and development of a pictogram communicationsystem for children around the world. In: Ishida, T., Fussell, S.R., Vossen, P.T.J.M.(Eds.), Proceedings of the 1st International Conference on InterculturalCollaboration (IWIC’07). Springer-Verlag, Berlin, Heidelberg, pp. 193–206.
M. Turunen, J. Hakulinen, A. Melto, T. Heimonen, T. Laivo, J. Hella, SUXES – UserExperience Evaluation Method for Spoken and Multimodal Interaction. In:Proceedings of Interspeech, 2009, pp. 2567–2570.
Tuset, P., López, J.M., Barberán, P., Cervelló-Pastor, C., Janer, L., 2011. Designingmessenger visual, an instant messaging service for individuals with cognitivedisability. In: Bravo, J., Hervás, R., Villareal, V. (Eds.), Proceedings of 3rdInternational Workshop on Ambient Assisted Living (IWAAL ‘11). Springer, pp.57–64.
Tuset-Peiró, P., 2011. Modeling individuals with learning disabilities to personalizea pictogram-based instant messaging service. In: Konstan, Joseph A., Conejo,Ricardo, Marzo, José L., Oliver, Nuria (Eds.), Proceedings of the 19thInternational Conference on User Modeling, adaption, and Personalization(UMAP’11). Springer-Verlag, Berlin, Heidelberg, pp. 454–457.
Widgit Symbols, 2012. <http://www.widgit.com/symbols/> (checked 19.06.12).Zlango, 2012. <http://www.zlango.com> (checked 19.06.12).
386 T. Keskinen et al. / Interacting with Computers 24 (2012) 374–386
199

200

Paper IV
Keskinen, T., Hakulinen, J., Heimonen, T., Turunen, M., Sharma, S., Miettinen, T., & Luhtala, M. (2013). Evaluating the experiential user experience of public display applications in the wild. In Proceedings of the 12th International Conference on Mobile and Ubiquitous Multimedia (MUM ‘13), Article 7, 10 pages. New York, NY, USA: ACM. doi:10.1145/2541831.2541840
© ACM, 2013. Reprinted with permission.
201

202
Evaluating the Experiential User Experience of Public Display Applications in the Wild
Tuuli Keskinen, Jaakko Hakulinen, Tomi Heimonen, Markku Turunen, Sumita Sharma, Toni Miettinen, and Matti Luhtala
School of Information Sciences, University of Tampere Kanslerinrinne 1, FI-33014 University of Tampere, FINLAND
{firstname.lastname} @sis.uta.fi
203
204

205

Before
Usage
During
After
206
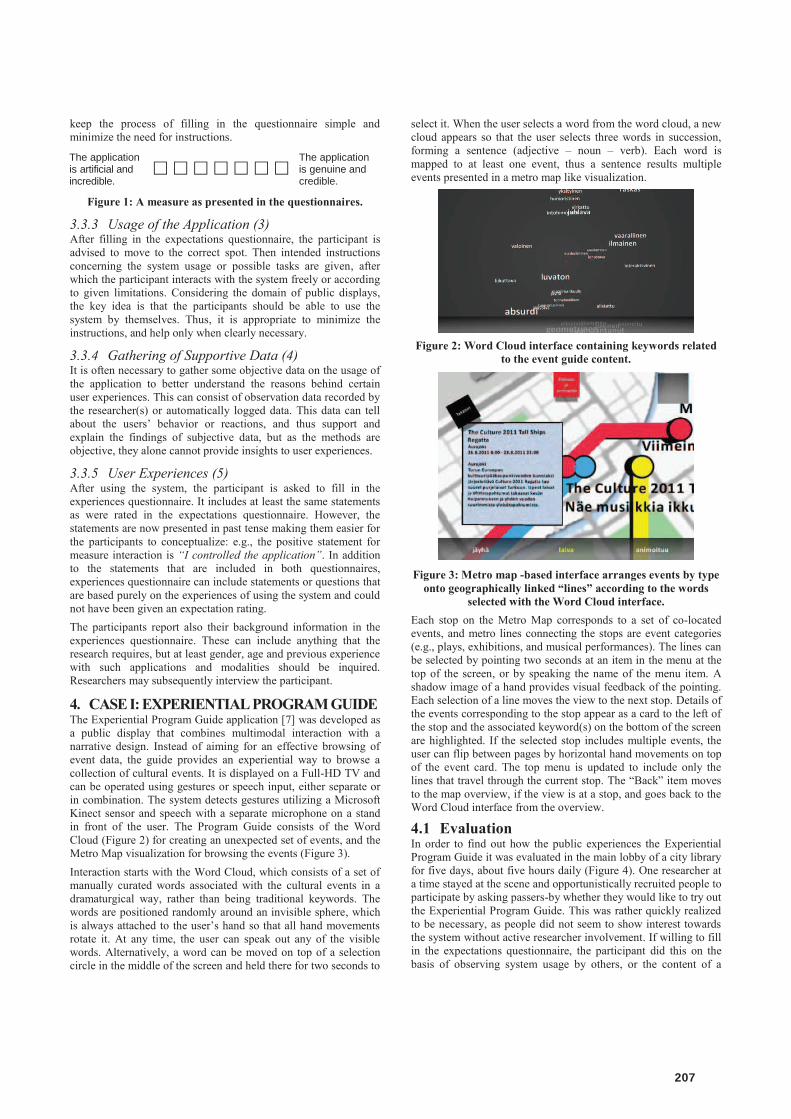
The applicationis artificial and incredible.
The applicationis genuine and credible.
207
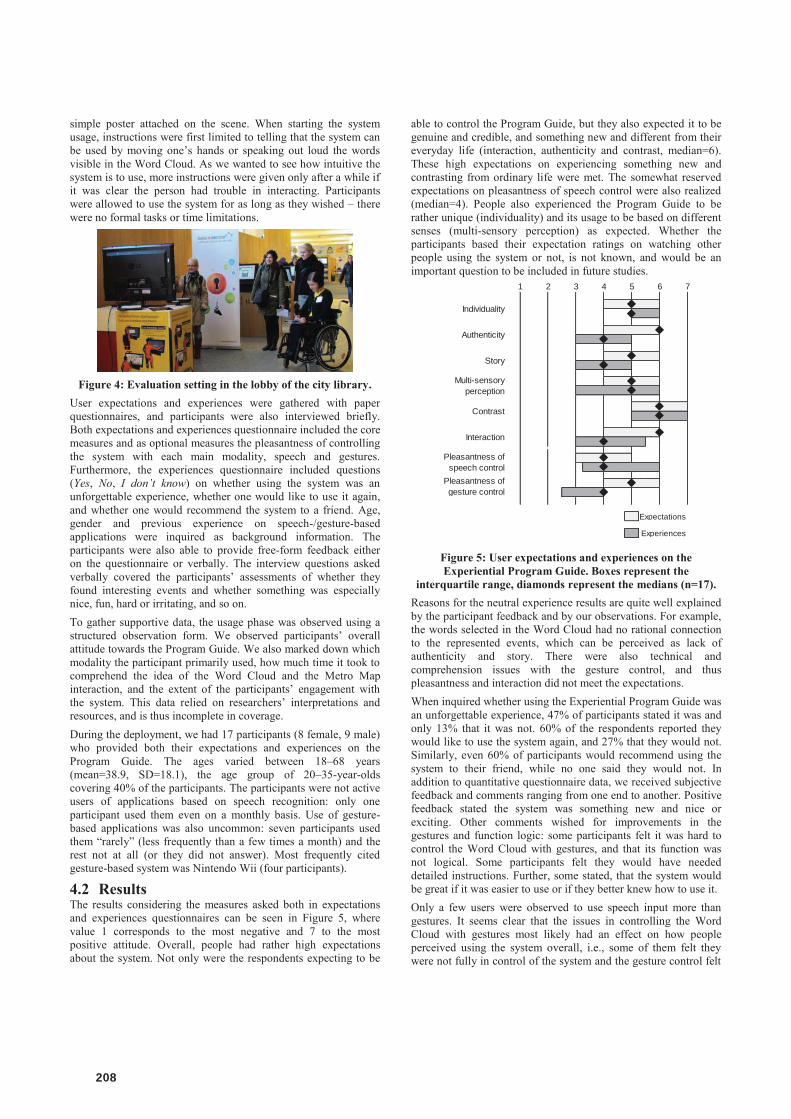
Expectations
Experiences
Pleasantness of speech control
Multi-sensory perception
Pleasantness of gesture control
Contrast
Interaction
Story
7
Individuality
Authenticity
1 2 3 4 5 6
208

209
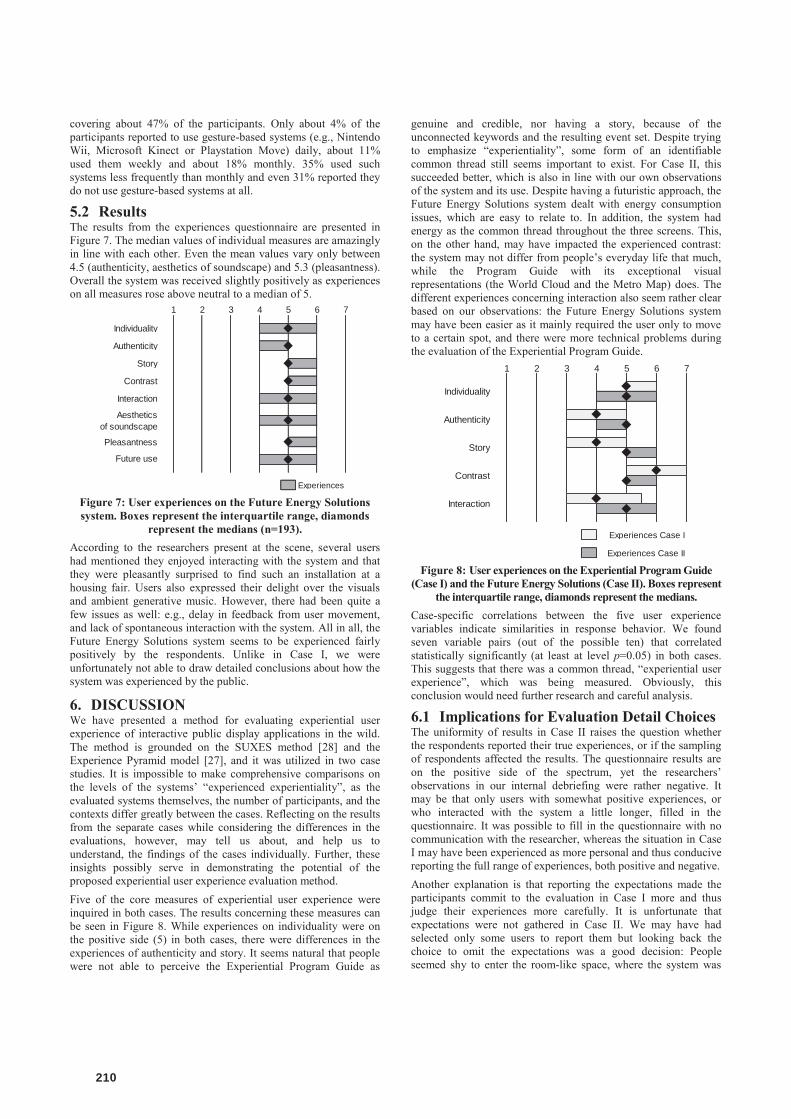
Individuality
Authenticity
Story
Contrast
Interaction
Pleasantness
Future use
Experiences
Aesthetics of soundscape
5 6 71 2 3 4
Experiences Case I
Experiences Case II
Contrast
Interaction
7
Individuality
Authenticity
Story
1 2 3 4 5 6
210
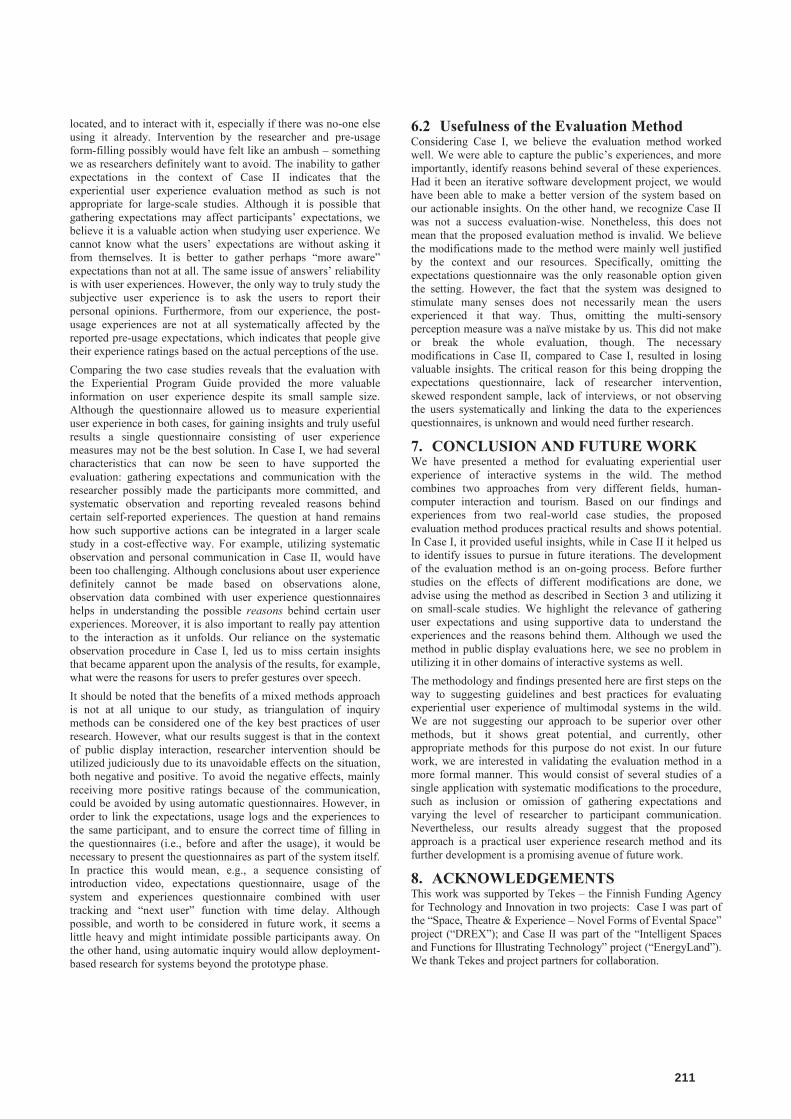
211

212

Paper V
Keskinen, T., Melto, A., Hakulinen, J. Turunen, M., Saarinen, S., Pallos, T., Danielsson-Ojala, R., & Salanterä, S. (2013). Mobile dictation with automatic speech recognition for healthcare purposes. In Proceedings of the 8th MobileHCI Workshop on Speech in Mobile and Pervasive Environments (SiMPE 2013), Article 6. Available at http://tinyurl.com/Simpe13.
Copyright is held by the authors, 2013.
213

214

Mobile Dictation With Automatic Speech Recognition for Healthcare Purposes
Tuuli Keskinen1, Aleksi Melto1, Jaakko Hakulinen1, Markku Turunen1, Santeri Saarinen1, Tamás Pallos1, Riitta Danielsson-Ojala2, and Sanna Salanterä2
1 School of Information Sciences, University of Tampere Kanslerinrinne 1
FI-33014 University of Tampere, Finland {firstname.lastname}@sis.uta.fi
2 Department of Nursing Science, University of Turku Lemminkäisenkatu 1
FI-20014 University of Turku. Finland {firstname.lastname}@utu.fi
ABSTRACTThis paper introduces a mobile dictation application with automatic speech recognition for healthcare purposes, and its evaluation in a real hospital environment. Our work was motivated by the need for improvements in getting dictated patient information to the next treatment step and the complexity of patient information systems. We designed, implemented and evaluated the application as a close collaboration between human-computer interaction and nursing science researchers. The application was evaluated as a Wizard-of-Oz scenario where two nurses used the application as part of their work routines and a researcher acted as the wizard, i.e., checked the recognition results before sending them back to the nurse. The nurse was then still able to edit the text and then copy it to the patient information system. Our main focus was to gather subjective feedback, and we gathered both user expectations and experiences from the participants. The results show true potential for our mobile dictation application.
Categories and Subject DescriptorsH.5.2 [Information Interfaces And Presentation]: User Interfaces – Input devices and strategies, Interaction styles, Haptic I/O, Voice I/O.
General TermsMeasurement, Performance, Design, Experimentation, Human Factors, Languages.
KeywordsSpeech recognition, healthcare dictation, evaluation, user expectations, user experience.
1. INTRODUCTIONSpoken language has traditionally been heavily used in healthcare field, where doctors commonly dictate information on patients. Manual typing of these dictations is still common but utilizing speech recognition is increasing. Through our discussions with
professionals working in the healthcare area, we see problems in getting patient information effectively to the next treatment step: e.g., in the ward we piloted in, the dictated statements may take up to several days before they are available in writing. These are usually statements that are not so urgent, but there are queues and unnecessary delays also with critical dictations and their transcription.
According to Parente et al. [1] first speech recognition systems for healthcare reporting were developed almost twenty years ago, but still they are not widely used, especially within a language like Finnish, which is spoken only by 5.5 million people. One reason behind this is the fact that data for building speech recognition is not as readily available. This is particularly so for healthcare field, where language is very specific for each subfield and separate language models are often necessary, e.g., for doctors working in different fields. For Finnish language, the language modeling is challenging since it is a morphologically rich language. Thus, the recognition method cannot be based on fixed vocabularies because they would grow too big and be practically impossible to create. One example of utilizing speech recognition in Finnish healthcare is presented by Koivikko et al. [2], who followed radiologists changing from conventional cassette-based reporting to speech recognition based dictating.
Motivated by the paucity of using dictation applications with speech recognition in Finnish healthcare, we have developed a mobile dictation application for healthcare purposes to be used by doctors, nurses and other professionals in the field. While many studies on speech recognition in the area of healthcare have been presented, e.g., [1], [3], [4] and [5], these studies focus more or less on objective qualities, e.g., dictation durations and speech recognition error rates. Our main goal was to study the subjective user expectations and experiences of the mobile dictation application and automatic speech recognition from HCI perspective. In addition, the application features a mobile device in the form of a tablet computer, which is designed to support dictation during the regular work and enables not only dictation but also review and editing of both the recording and recognition result on the go. Our primary target user group for the application has been nurses. Most dictation applications in healthcare area are aimed for doctors, whose needs and types of dictations differ from those of nurses. The language nurses dictate is often closer to regular spoken language but still contains a lot of special vocabulary. Nurses also have more often a need for the mobile style of dictation, since they usually work and interact with numerous patients, often in short durations at the time. The work is done as a multidisciplinary collaboration between researchers
215
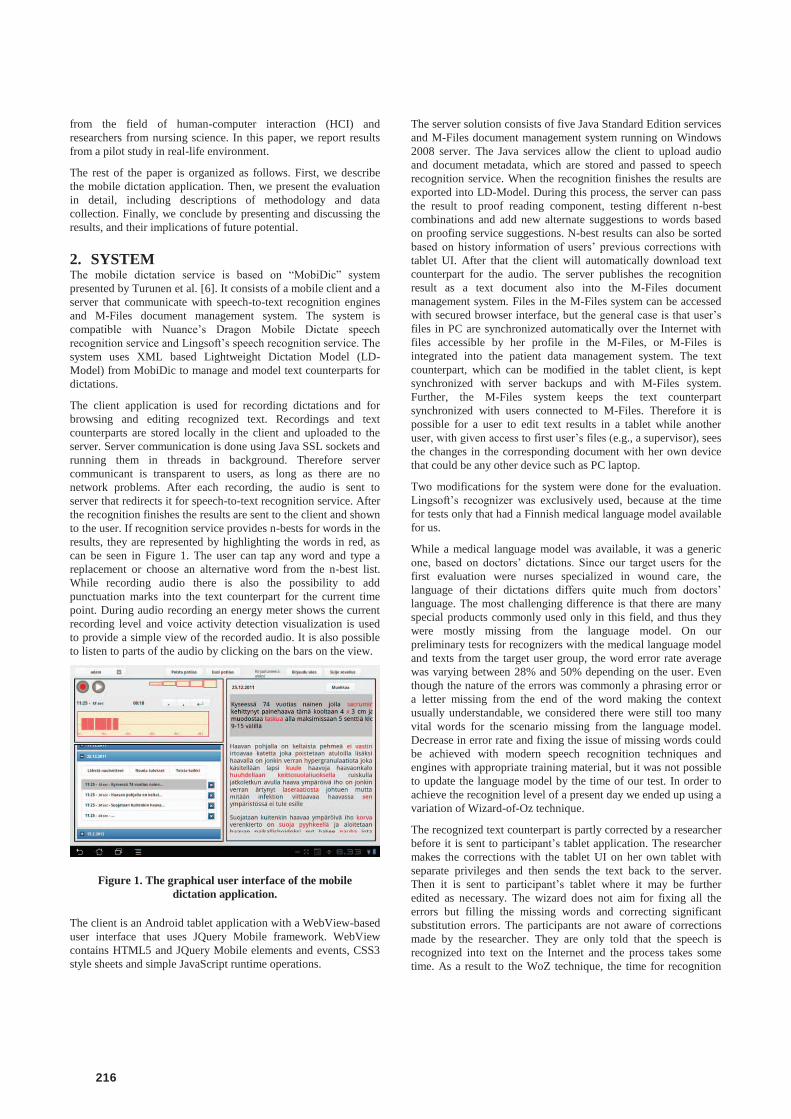
from the field of human-computer interaction (HCI) and researchers from nursing science. In this paper, we report results from a pilot study in real-life environment.
The rest of the paper is organized as follows. First, we describe the mobile dictation application. Then, we present the evaluation in detail, including descriptions of methodology and data collection. Finally, we conclude by presenting and discussing the results, and their implications of future potential.
2. SYSTEM The mobile dictation service is based on “MobiDic” system presented by Turunen et al. [6]. It consists of a mobile client and a server that communicate with speech-to-text recognition engines and M-Files document management system. The system is compatible with Nuance’s Dragon Mobile Dictate speech recognition service and Lingsoft’s speech recognition service. The system uses XML based Lightweight Dictation Model (LD-Model) from MobiDic to manage and model text counterparts for dictations.
The client application is used for recording dictations and for browsing and editing recognized text. Recordings and text counterparts are stored locally in the client and uploaded to the server. Server communication is done using Java SSL sockets and running them in threads in background. Therefore server communicant is transparent to users, as long as there are no network problems. After each recording, the audio is sent to server that redirects it for speech-to-text recognition service. After the recognition finishes the results are sent to the client and shown to the user. If recognition service provides n-bests for words in the results, they are represented by highlighting the words in red, as can be seen in Figure 1. The user can tap any word and type a replacement or choose an alternative word from the n-best list. While recording audio there is also the possibility to add punctuation marks into the text counterpart for the current time point. During audio recording an energy meter shows the current recording level and voice activity detection visualization is used to provide a simple view of the recorded audio. It is also possible to listen to parts of the audio by clicking on the bars on the view.
Figure 1. The graphical user interface of the mobile dictation application.
The client is an Android tablet application with a WebView-based user interface that uses JQuery Mobile framework. WebView contains HTML5 and JQuery Mobile elements and events, CSS3 style sheets and simple JavaScript runtime operations.
The server solution consists of five Java Standard Edition services and M-Files document management system running on Windows 2008 server. The Java services allow the client to upload audio and document metadata, which are stored and passed to speech recognition service. When the recognition finishes the results are exported into LD-Model. During this process, the server can pass the result to proof reading component, testing different n-best combinations and add new alternate suggestions to words based on proofing service suggestions. N-best results can also be sorted based on history information of users’ previous corrections with tablet UI. After that the client will automatically download text counterpart for the audio. The server publishes the recognition result as a text document also into the M-Files document management system. Files in the M-Files system can be accessed with secured browser interface, but the general case is that user’s files in PC are synchronized automatically over the Internet with files accessible by her profile in the M-Files, or M-Files is integrated into the patient data management system. The text counterpart, which can be modified in the tablet client, is kept synchronized with server backups and with M-Files system. Further, the M-Files system keeps the text counterpart synchronized with users connected to M-Files. Therefore it is possible for a user to edit text results in a tablet while another user, with given access to first user’s files (e.g., a supervisor), sees the changes in the corresponding document with her own device that could be any other device such as PC laptop.
Two modifications for the system were done for the evaluation. Lingsoft’s recognizer was exclusively used, because at the time for tests only that had a Finnish medical language model available for us.
While a medical language model was available, it was a generic one, based on doctors’ dictations. Since our target users for the first evaluation were nurses specialized in wound care, the language of their dictations differs quite much from doctors’ language. The most challenging difference is that there are many special products commonly used only in this field, and thus they were mostly missing from the language model. On our preliminary tests for recognizers with the medical language model and texts from the target user group, the word error rate average was varying between 28% and 50% depending on the user. Even though the nature of the errors was commonly a phrasing error or a letter missing from the end of the word making the context usually understandable, we considered there were still too many vital words for the scenario missing from the language model. Decrease in error rate and fixing the issue of missing words could be achieved with modern speech recognition techniques and engines with appropriate training material, but it was not possible to update the language model by the time of our test. In order to achieve the recognition level of a present day we ended up using a variation of Wizard-of-Oz technique.
The recognized text counterpart is partly corrected by a researcher before it is sent to participant’s tablet application. The researcher makes the corrections with the tablet UI on her own tablet with separate privileges and then sends the text back to the server. Then it is sent to participant’s tablet where it may be further edited as necessary. The wizard does not aim for fixing all the errors but filling the missing words and correcting significant substitution errors. The participants are not aware of corrections made by the researcher. They are only told that the speech is recognized into text on the Internet and the process takes some time. As a result to the WoZ technique, the time for recognition
216

progress will increase but the word error rate apparent to user will drop to acceptable level, thus allowing us to focus on the user experience aspects, while the language model is being improved.
The equipment for the evaluation was an Android tablet computer and a headset enabling recording. The integrated microphones in the tablets we tested did not achieve an acceptable level of audio quality for the recognition. We also implemented logging for the system in order to gather objective data and find possible user patterns and support the findings of subjective data. The logging is accurate enough to re-construct the whole use.
3. USER EVALUATION We conducted a user evaluation in real context with real users in one of the university hospitals in Finland. Here, we present the user evaluation in detail.
3.1 MethodologyThe methodology was selected and modified taking into account the three main factors of user experience: system, context and user [7]. The data collection was planned so that it would benefit both research fields, i.e., HCI and nursing science. The core of gathering user expectation and experience data is based on SUXES methodology [8], but experiences after the use were collected also with the System Usability Scale (SUS) [9]. In addition to the more subjective data, we gathered background information and log data to support the analysis and findings.
3.1.1 Background interview Before the actual test phase, the participants were verbally interviewed with a structure consisting of almost 40 questions. They were asked basic questions, such as age and working experience, but the main focus was on their practices on dictating or making entries into the patient information system. They were asked how frequently they do either of these, what information about the patient they record, and what systems they use. The participants were also interviewed about their habits considering making the dictations or writing the entries, e.g., when do they make them (during the treatment situation or at the end of their work shift) and do they make notes for the entries. We were also interested of frequencies, needed time, and the easy and the hard things in making the entries or dictations. As background information, the participants’ previous experience with tablet PCs and speech recognition was inquired as well. Further, they were asked about the potential of utilizing speech recognition in their work.
3.1.2 User Expectations and Experiences We gathered subjective data from the participants utilizing SUXES [8] which is a method for gathering pre-usage expectations and post-usage experiences from users of an interactive system. In SUXES subjective opinions from the users are asked with a set of statements on properties or qualities of the system or, e.g., individual modality, and a seven-step scale ranging from low to high. Expectations before the usage are reported by giving two values for each statement: an acceptable level, i.e., the lowest acceptable level required for even using the system, and a desired level, meaning the highest level that can even be expected of the system or property. After the usage the users report their experiences giving only one value, perceived level, on exactly the same statements. The two expectation values, acceptable and desired levels, form a gap, where the experience
value, perceived level, is expected to rank. The nine statements in the original form of the SUXES relate to speed, pleasantness, clarity, error-free use, error-free function, easiness to learn to use, naturalness, usefulness and future use. A statement can be structured, e.g., “Using the application is fast” and the users report their expectations/experiences by marking the levels the higher the faster they expect/experienced the application to be.
In order to suit the data collection for this case, we made some modifications to the original SUXES. For example, considering the great amount of time it takes to make the patient information system entries, in this context we wanted to gather user expectations and experiences not only on the dictation application, but also to compare the dictation application to the usually used entry practice of the participants. Thus, we asked the users’ opinions on the following comparative statements in addition to the “original” SUXES statements: “Dictating with the application is 1) faster, 2) more pleasant, 3) more clear, 4) easier than with the entry practice I normally use”; and “5) I would rather make the entries with the dictation application than with the entry practice I used before.” These statements were naturally included both in the expectation and experience questionnaires. The questionnaires were in electronic form and could be filled in using a typical web browser on a PC. The experience questionnaire included open questions in addition to the statements: the participants were asked how the dictation application changed their working practices, how speech recognition or the application could be developed, and they were provided with a chance to give free-form feedback.
Due to the multidisciplinary nature of the project, we gathered subjective experiences from the participants also with the System Usability Scale, SUS [9]. The SUS is originally designed to measure usability, but it has a strong subjective approach as the users themselves report the answers. Thus, the results gained by SUS can be considered as subjective user experiences of usability-related properties. In this article we will focus on the SUXES results, though.
3.2 Participants In the first phase evaluation of the mobile dictation application we had two female nurses as participants. Both of them worked in a outpatient wound clinic: one (P2) of them worked there two days a week, and the other (P1) one day every two weeks. Participants’ background information, work practices and earlier experience on tablet PCs and speech recognition can be seen in Table 1. This data was collected before the start of the pilot.
Table 1. Participants’ background information and usual work practices.
P1 P2
Age 30 years 36 years
Work experience in nursing/current unit 8/3 years 13/8 years
Do you dictate or write nursing entries? Write. Dictate.
How often do you dictate nursing entries? Not at all. Weekly.
How often do you write Several times in Weekly.
217
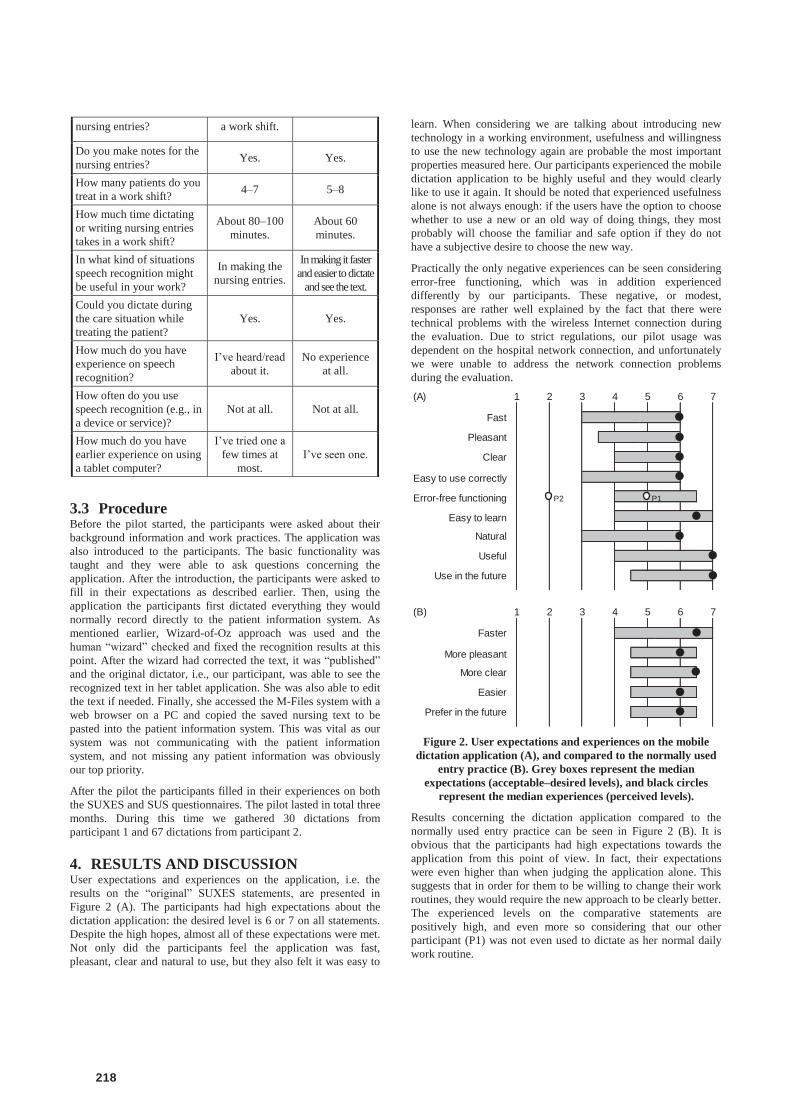
nursing entries? a work shift.
Do you make notes for the nursing entries? Yes. Yes.
How many patients do you treat in a work shift? 4–7 5–8
How much time dictating or writing nursing entries takes in a work shift?
About 80–100minutes.
About 60 minutes.
In what kind of situations speech recognition might be useful in your work?
In making the nursing entries.
In making it faster and easier to dictate
and see the text. Could you dictate during the care situation while treating the patient?
Yes. Yes.
How much do you have experience on speech recognition?
I’ve heard/read about it.
No experience at all.
How often do you use speech recognition (e.g., in a device or service)?
Not at all. Not at all.
How much do you have earlier experience on using a tablet computer?
I’ve tried one a few times at
most. I’ve seen one.
3.3 Procedure Before the pilot started, the participants were asked about their background information and work practices. The application was also introduced to the participants. The basic functionality was taught and they were able to ask questions concerning the application. After the introduction, the participants were asked to fill in their expectations as described earlier. Then, using the application the participants first dictated everything they would normally record directly to the patient information system. As mentioned earlier, Wizard-of-Oz approach was used and the human “wizard” checked and fixed the recognition results at this point. After the wizard had corrected the text, it was “published” and the original dictator, i.e., our participant, was able to see the recognized text in her tablet application. She was also able to edit the text if needed. Finally, she accessed the M-Files system with a web browser on a PC and copied the saved nursing text to be pasted into the patient information system. This was vital as our system was not communicating with the patient information system, and not missing any patient information was obviously our top priority.
After the pilot the participants filled in their experiences on both the SUXES and SUS questionnaires. The pilot lasted in total three months. During this time we gathered 30 dictations from participant 1 and 67 dictations from participant 2.
4. RESULTS AND DISCUSSION User expectations and experiences on the application, i.e. the results on the “original” SUXES statements, are presented in Figure 2 (A). The participants had high expectations about the dictation application: the desired level is 6 or 7 on all statements. Despite the high hopes, almost all of these expectations were met. Not only did the participants feel the application was fast, pleasant, clear and natural to use, but they also felt it was easy to
learn. When considering we are talking about introducing new technology in a working environment, usefulness and willingness to use the new technology again are probable the most important properties measured here. Our participants experienced the mobile dictation application to be highly useful and they would clearly like to use it again. It should be noted that experienced usefulness alone is not always enough: if the users have the option to choose whether to use a new or an old way of doing things, they most probably will choose the familiar and safe option if they do not have a subjective desire to choose the new way.
Practically the only negative experiences can be seen considering error-free functioning, which was in addition experienced differently by our participants. These negative, or modest, responses are rather well explained by the fact that there were technical problems with the wireless Internet connection during the evaluation. Due to strict regulations, our pilot usage was dependent on the hospital network connection, and unfortunately we were unable to address the network connection problems during the evaluation. (A)
Fast
Pleasant
Clear
Natural
Useful
Use in the future
(B)
Faster
More clear
Easier
Prefer in the future
Easy to use correctly
Error-free functioning
Easy to learn
More pleasant
7
7
1 2 3 4 5 6
1 2 3 4 5 6
P2 P1
Figure 2. User expectations and experiences on the mobile dictation application (A), and compared to the normally used
entry practice (B). Grey boxes represent the median expectations (acceptable–desired levels), and black circles
represent the median experiences (perceived levels).
Results concerning the dictation application compared to the normally used entry practice can be seen in Figure 2 (B). It is obvious that the participants had high expectations towards the application from this point of view. In fact, their expectations were even higher than when judging the application alone. This suggests that in order for them to be willing to change their work routines, they would require the new approach to be clearly better. The experienced levels on the comparative statements are positively high, and even more so considering that our other participant (P1) was not even used to dictate as her normal daily work routine.
218

Further, open questions revealed that the participants did not find the headset interfering with the dictating. In fact, they were ready to use it daily if it was a prerequisite for using the application. By introducing speech recognition and dictation application they could now check the text at that moment, while before it took about a week before the text was available for the participant who normally dictated her nursing entries. Neither of the participants reported missing speech commands or buttons. When asking for development areas, the participants wished for a better recognition for compound words. The other participant (P2) also mentioned that the unreliability of the Internet connection took some unnecessary extra time when sending the files.
Obvious willingness to use our application in the future combined with other positive responses, shows a great potential for introducing such a system for Finnish healthcare – not only for dictation purposes, but also as a true option for writing the nursing entries. Be it these are experiences of only two users, they were professionals working in the field, and thus, the application shows a good starting point for further development.
5. CONCLUSIONSWe have presented a mobile dictation application with automatic speech recognition for healthcare. While a more accurate language model for nurses’ purposes is being developed, we evaluated the application using a Wizard-of-Oz scenario: medical language model based on doctors’ dictations was used for the speech recognition, the results were then finished by a researcher, and finally, sent to the participant’s tablet application. The user experiences received from the nurse participants indicate that introducing such an application for Finnish healthcare is warmly welcome: the nurses get a transcript of their dictations almost immediately as opposed to at worst a week, they now have to wait for the text counterpart. Our results show true potential for the approach, thus making our further development and evaluation plans towards a pleasant, useful, and fully automated dictation-to-text process very relevant for Finnish healthcare.
6. ACKNOWLEDGEMENTS This work was supported by the Finnish Funding Agency for Technology and Innovation (TEKES) in the project “Mobile and Ubiquitous Dictation and Communication Application for Medical Purposes” (grant 40056/11). We thank Lingsoft and M-Files, and other project partners, for collaboration.
7. REFERENCES [1] Parente, R., Kock, N., and Sonsini, J., “An analysis of the
implementation and impact of speech-recognition technology in the healthcare sector”. Perspectives in Health InformationManagement, 1(5), 2004.
[2] Koivikko, M., Kauppinen, T., and Ahovuo, J., ”Improvement of report workflow and prodictivity using speech recognition – a follow-up study”. Journal of Digital Imaging, 21(4), 378–382, 2008.
[3] Devine, E., Gaehde, S., and Curtis, A., “Comparative evaluation of three continuous speech recognition software packages in the generation of medical reports”. Journal of the American Medical Informatics Association, 7(5), 462–468,2000.
[4] Borowitz, S., “Computer-based speech recognition as an alternative to medical transcription”. Journal of the American Medical Informatics Association, 8(1), 101–102, 2001.
[5] Mohr, D., Turner, D., Pond, G., Kamath, J., De Vos, C., and Carpenter, P., “Speech recognition as a transcription aid: a randomized comparison with standard transcription”. Journal of the American Medical Informatics Association, 10(1), 85–93, 2003.
[6] Turunen M., Melto A., Kainulainen A., and Hakulinen J., ”Mobidic – A Mobile dictation and notetaking application”. In Proceedings of the 9th Annual Conference of the International Speech Communication Association (Interspeech), 500–503, 2008.
[7] Hassenzahl, M., and Tractinsky, N., “User experience – a research agenda”. Behaviour & Information Technology, 25(2), 91–97, 2006.
[8] Turunen M., Hakulinen J., Melto A., Heimonen T., Laivo T., and Hella J., “SUXES – User Experience Evaluation Method for Spoken and Multimodal Interaction”. In Proceedings of the 10th Annual Conference of the International Speech Communication Association (Interspeech), 2567–2570,2009.
[9] Brooke, J., “SUS – A quick and dirty usability scale”. In P. W. Jordan, B. Thomas, B. A. Weerdmeester, and A. L. McClelland (Eds.), Usability Evaluation in Industry. London: Taylor and Francis, 1996.
219

220

Paper VI
Hakulinen, J., Turunen, M., Heimonen, T., Keskinen, T., Sand, A., Paavilainen, J., Parviainen, J., Yrjänäinen, S., Mäyrä, F., Okkonen, J., & Raisamo, R. (2013). Creating immersive audio and lighting based physical exercise games for schoolchildren. In D. Reidsma, N. Katayose, & A. Nijholt (Eds.), Advances in Computer Entertainment: 10th International Conference (ACE 2013), LNCS 8253, 308-319. Springer International Publishing. doi:10.1007/978-3-319-03161-3_22
© Springer International Publishing Switzerland, 2013. Reprinted with permission.
221

222
D. Reidsma, H. Katayose, and A. Nijholt (Eds.): ACE 2013, LNCS 8253, pp. 308–319, 2013. © Springer International Publishing Switzerland 2013
Creating Immersive Audio and Lighting Based Physical Exercise Games for Schoolchildren
Jaakko Hakulinen1, Markku Turunen1, Tomi Heimonen1, Tuuli Keskinen1, Antti Sand1, Janne Paavilainen1, Jaana Parviainen2, Sari Yrjänäinen3, Frans Mäyrä1,
Jussi Okkonen1, and Roope Raisamo1
1 School of Information Sciences 2 School of Social Sciences and Humanities
3 School of Education FI-33014 University of Tampere, Finland [email protected]
Abstract. We have created story-based exercise games utilizing light and sound to encourage children to participate in physical exercise in schools. Our reason-ably priced technological setup provides practical and expressive means for creating immersive and rich experiences to support physical exercise education in schools. Studies conducted in schools showed that the story and drama ele-ments draw children into the world of the exercise game. Moreover, children who do not like traditional games and exercises engaged in these activities. Our experiences also suggest that children’s imagination plays a great role in the de-sign and engagement into exercise games, which makes co-creation with child-ren a viable and exciting approach to creating new games.
Keywords: Exergaming, interactive lighting, storytelling.
1 Introduction
There is great need to encourage children and adolescents to engage in physical ac-tivity. Childhood obesity is a serious and increasing challenge to public health [1] and regular physical activity in childhood and adolescence is shown to improve health and quality of life [2]. Physical Education (PE) classes in schools play an important role in guiding children to lead a life with healthy amount of exercise, but the actual time available for physical activity can be low [3]. Furthermore, there are children who find physical exercise and sports unpleasant or uninteresting. Supporting the im-provement of physical abilities through games could potentially increase the chances of engaging in and benefitting from the positive outcomes of physical activities [4]. One way to foster health-related behavioral change is to use video games designed for this purpose [5]. Especially exertion-based games have been shown to stimulate phys-ical activity in inactive children [3], and to increase energy expenditure over sedenta-ry activities [6].
We have devised a game-based approach to physical exercises, where storytelling and dramatic elements, such as interactive lighting, guide and motivate children. The
223
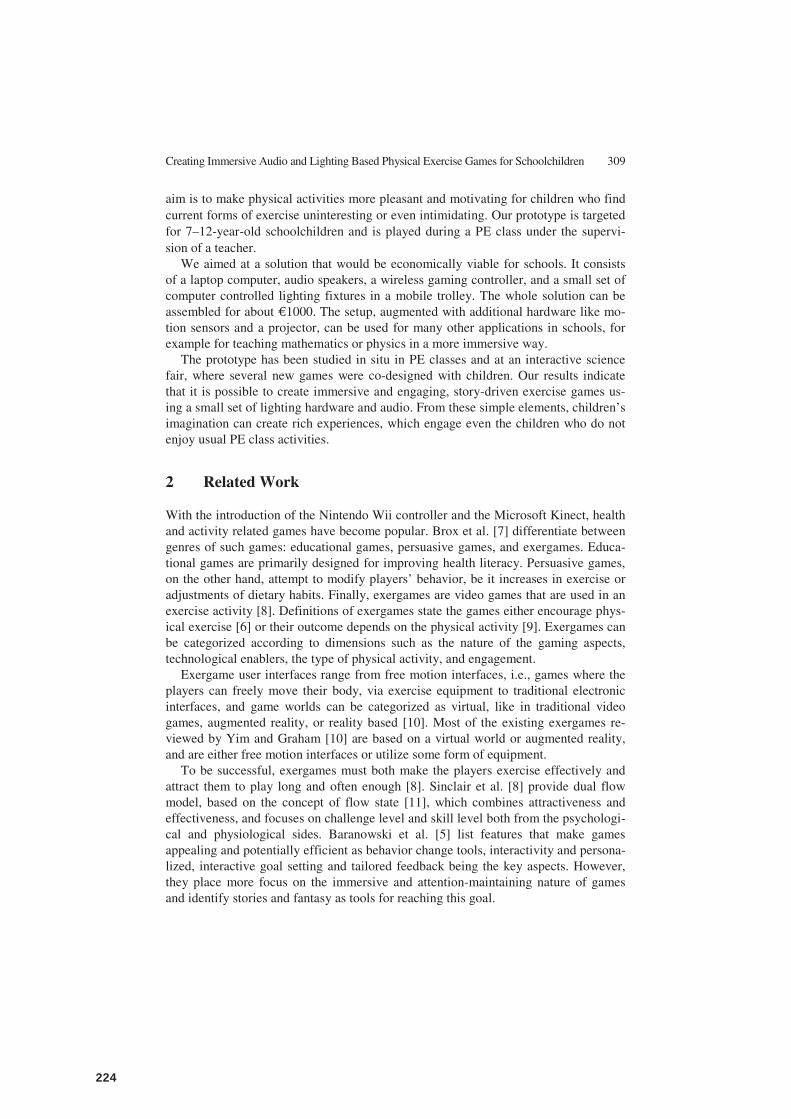
Creating Immersive Audio and Lighting Based Physical Exercise Games for Schoolchildren 309
aim is to make physical activities more pleasant and motivating for children who find current forms of exercise uninteresting or even intimidating. Our prototype is targeted for 7–12-year-old schoolchildren and is played during a PE class under the supervi-sion of a teacher.
We aimed at a solution that would be economically viable for schools. It consists of a laptop computer, audio speakers, a wireless gaming controller, and a small set of computer controlled lighting fixtures in a mobile trolley. The whole solution can be assembled for about 1000. The setup, augmented with additional hardware like mo-tion sensors and a projector, can be used for many other applications in schools, for example for teaching mathematics or physics in a more immersive way.
The prototype has been studied in situ in PE classes and at an interactive science fair, where several new games were co-designed with children. Our results indicate that it is possible to create immersive and engaging, story-driven exercise games us-ing a small set of lighting hardware and audio. From these simple elements, children’s imagination can create rich experiences, which engage even the children who do not enjoy usual PE class activities.
2 Related Work
With the introduction of the Nintendo Wii controller and the Microsoft Kinect, health and activity related games have become popular. Brox et al. [7] differentiate between genres of such games: educational games, persuasive games, and exergames. Educa-tional games are primarily designed for improving health literacy. Persuasive games, on the other hand, attempt to modify players’ behavior, be it increases in exercise or adjustments of dietary habits. Finally, exergames are video games that are used in an exercise activity [8]. Definitions of exergames state the games either encourage phys-ical exercise [6] or their outcome depends on the physical activity [9]. Exergames can be categorized according to dimensions such as the nature of the gaming aspects, technological enablers, the type of physical activity, and engagement.
Exergame user interfaces range from free motion interfaces, i.e., games where the players can freely move their body, via exercise equipment to traditional electronic interfaces, and game worlds can be categorized as virtual, like in traditional video games, augmented reality, or reality based [10]. Most of the existing exergames re-viewed by Yim and Graham [10] are based on a virtual world or augmented reality, and are either free motion interfaces or utilize some form of equipment.
To be successful, exergames must both make the players exercise effectively and attract them to play long and often enough [8]. Sinclair et al. [8] provide dual flow model, based on the concept of flow state [11], which combines attractiveness and effectiveness, and focuses on challenge level and skill level both from the psychologi-cal and physiological sides. Baranowski et al. [5] list features that make games appealing and potentially efficient as behavior change tools, interactivity and persona-lized, interactive goal setting and tailored feedback being the key aspects. However, they place more focus on the immersive and attention-maintaining nature of games and identify stories and fantasy as tools for reaching this goal.
224
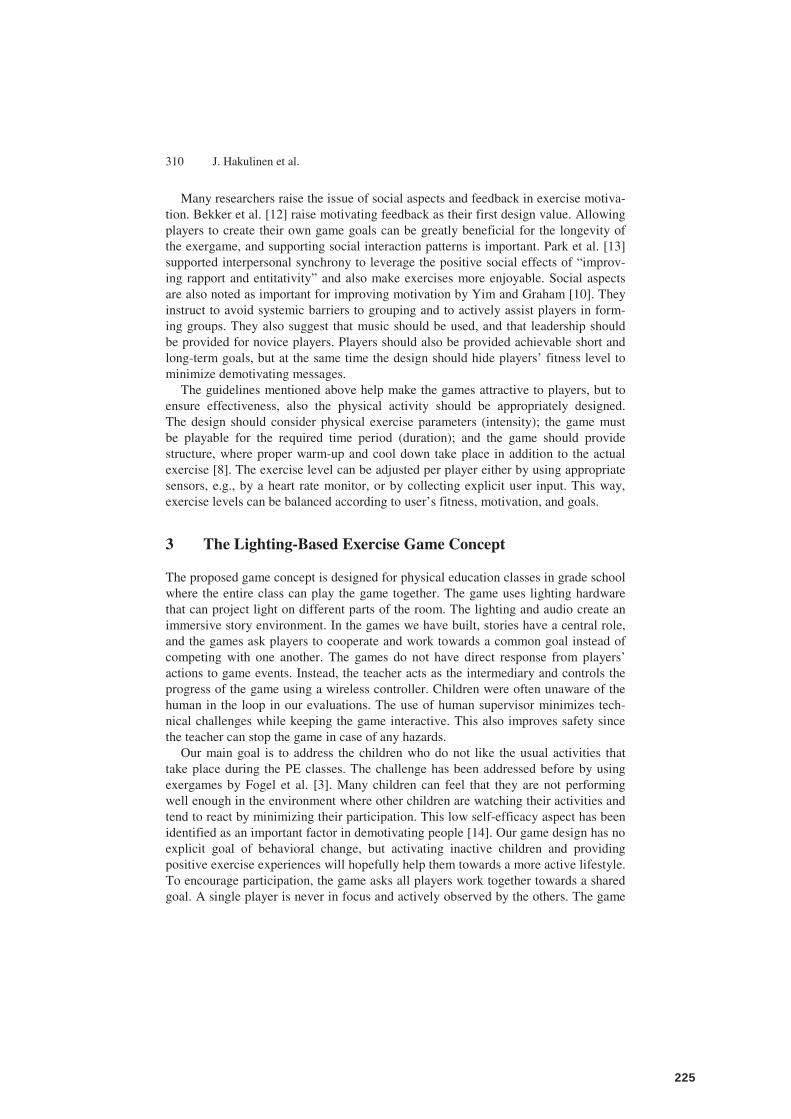
310 J. Hakulinen et al.
Many researchers raise the issue of social aspects and feedback in exercise motiva-tion. Bekker et al. [12] raise motivating feedback as their first design value. Allowing players to create their own game goals can be greatly beneficial for the longevity of the exergame, and supporting social interaction patterns is important. Park et al. [13] supported interpersonal synchrony to leverage the positive social effects of “improv-ing rapport and entitativity” and also make exercises more enjoyable. Social aspects are also noted as important for improving motivation by Yim and Graham [10]. They instruct to avoid systemic barriers to grouping and to actively assist players in form-ing groups. They also suggest that music should be used, and that leadership should be provided for novice players. Players should also be provided achievable short and long-term goals, but at the same time the design should hide players’ fitness level to minimize demotivating messages.
The guidelines mentioned above help make the games attractive to players, but to ensure effectiveness, also the physical activity should be appropriately designed. The design should consider physical exercise parameters (intensity); the game must be playable for the required time period (duration); and the game should provide structure, where proper warm-up and cool down take place in addition to the actual exercise [8]. The exercise level can be adjusted per player either by using appropriate sensors, e.g., by a heart rate monitor, or by collecting explicit user input. This way, exercise levels can be balanced according to user’s fitness, motivation, and goals.
3 The Lighting-Based Exercise Game Concept
The proposed game concept is designed for physical education classes in grade school where the entire class can play the game together. The game uses lighting hardware that can project light on different parts of the room. The lighting and audio create an immersive story environment. In the games we have built, stories have a central role, and the games ask players to cooperate and work towards a common goal instead of competing with one another. The games do not have direct response from players’ actions to game events. Instead, the teacher acts as the intermediary and controls the progress of the game using a wireless controller. Children were often unaware of the human in the loop in our evaluations. The use of human supervisor minimizes tech-nical challenges while keeping the game interactive. This also improves safety since the teacher can stop the game in case of any hazards.
Our main goal is to address the children who do not like the usual activities that take place during the PE classes. The challenge has been addressed before by using exergames by Fogel et al. [3]. Many children can feel that they are not performing well enough in the environment where other children are watching their activities and tend to react by minimizing their participation. This low self-efficacy aspect has been identified as an important factor in demotivating people [14]. Our game design has no explicit goal of behavioral change, but activating inactive children and providing positive exercise experiences will hopefully help them towards a more active lifestyle. To encourage participation, the game asks all players work together towards a shared goal. A single player is never in focus and actively observed by the others. The game
225

Creating Immersive Audio and Lighting Based Physical Exercise Games for Schoolchildren 311
is designed to capture the focus and most of the time the players follow the moving lights. The room is dark during the game, except for the lit areas, and the darkness provides some comfort to those shying from attention. Finally, the immersive story draws the players in so that they want to participate.
4 Technical Setup
The system consists of a laptop PC, audio speakers, a Playstation Move® wireless gaming controller, a moving head light fixture, and optionally fixed lights and a projector. The hardware is mounted on a 1 by 1 by 1.8 meters (w, d, h) sized trolley (Fig. 1). The trolley enables easy transportation of the hardware and acts as a physical extension of the virtual characters in the story.
Fig. 1. The trolley with full system setup during a game
The moving head light (Stairville RoboHead X-3 LED) on top of the trolley has three independent 540-degree joints, and can rotate 360 degrees in about 2 seconds. It creates a sharp, round spot with a diameter of 40 centimeters when pointing down on the floor next to the trolley. Light output is about 15,000 lux at one meter. Color fil-ters alter the spot color while brightness can be adjusted gradually. Optional fixed lights include four RGB LED Par lights on the lowest level of the trolley that illumi-nate the floor on each side, and an RGB LED flood light on the second highest shelf that points upwards to an inverted pyramid shaped reflector.
4.1 Software Architecture
The software consists of an interface component for communicating with the wireless controller, a lighting controller using DMX512 protocol to control the light fixtures [15], a component (AVplayer) that can display graphics, play audio files and control speech synthesizers via Windows SAPI interface, and a central logic component
226
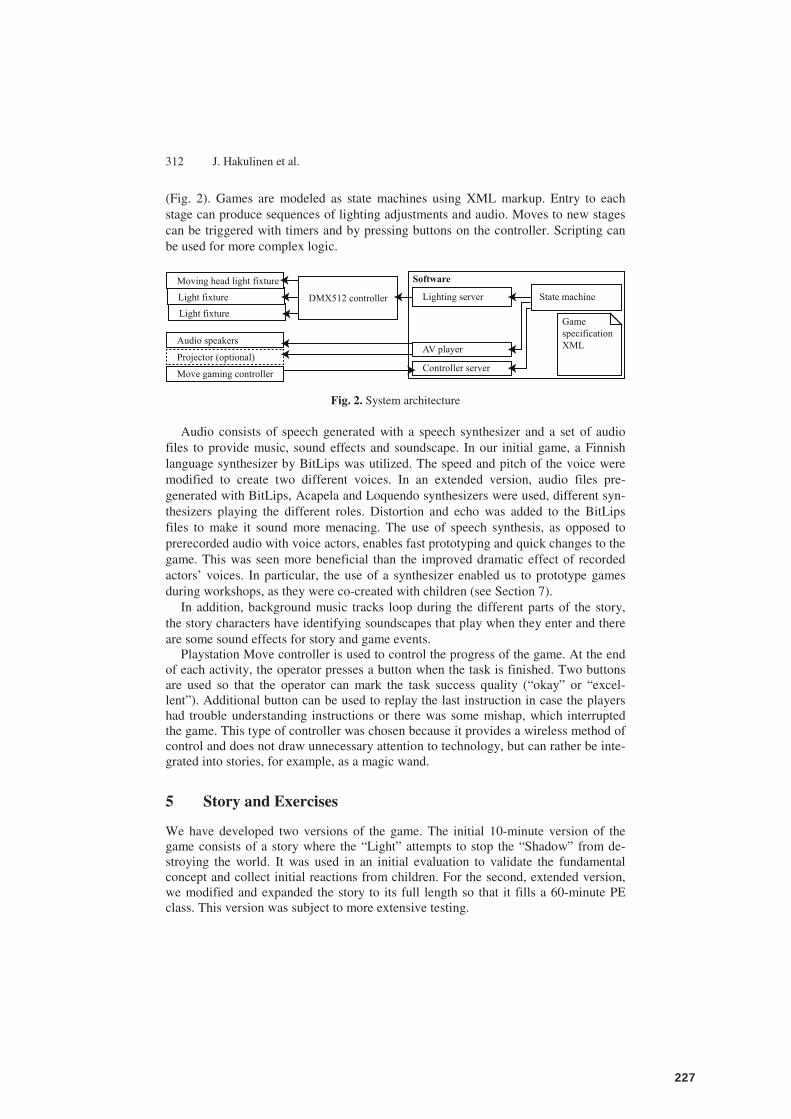
312 J. Hakulinen et al.
(Fig. 2). Games are modeled as state machines using XML markup. Entry to each stage can produce sequences of lighting adjustments and audio. Moves to new stages can be triggered with timers and by pressing buttons on the controller. Scripting can be used for more complex logic.
Light fixture
Audio speakers
Projector (optional)
Move gaming controller
DMX512 controller Lighting server
AV player
Controller server
State machine
Game specificationXML
Light fixtureMoving head light fixture Software
Fig. 2. System architecture
Audio consists of speech generated with a speech synthesizer and a set of audio files to provide music, sound effects and soundscape. In our initial game, a Finnish language synthesizer by BitLips was utilized. The speed and pitch of the voice were modified to create two different voices. In an extended version, audio files pre-generated with BitLips, Acapela and Loquendo synthesizers were used, different syn-thesizers playing the different roles. Distortion and echo was added to the BitLips files to make it sound more menacing. The use of speech synthesis, as opposed to prerecorded audio with voice actors, enables fast prototyping and quick changes to the game. This was seen more beneficial than the improved dramatic effect of recorded actors’ voices. In particular, the use of a synthesizer enabled us to prototype games during workshops, as they were co-created with children (see Section 7).
In addition, background music tracks loop during the different parts of the story, the story characters have identifying soundscapes that play when they enter and there are some sound effects for story and game events.
Playstation Move controller is used to control the progress of the game. At the end of each activity, the operator presses a button when the task is finished. Two buttons are used so that the operator can mark the task success quality (“okay” or “excel-lent”). Additional button can be used to replay the last instruction in case the players had trouble understanding instructions or there was some mishap, which interrupted the game. This type of controller was chosen because it provides a wireless method of control and does not draw unnecessary attention to technology, but can rather be inte-grated into stories, for example, as a magic wand.
5 Story and Exercises
We have developed two versions of the game. The initial 10-minute version of the game consists of a story where the “Light” attempts to stop the “Shadow” from de-stroying the world. It was used in an initial evaluation to validate the fundamental concept and collect initial reactions from children. For the second, extended version, we modified and expanded the story to its full length so that it fills a 60-minute PE class. This version was subject to more extensive testing.
227
Creating Immersive Audio and Lighting Based Physical Exercise Games for Schoolchildren 313
5.1 Initial Version
The first version of the game uses only the moving head light and speakers. The game is played in four groups formed before the game starts. The game starts with an intro-duction, where the story and characters are presented. Some physical activity is also encouraged at this point. The second part is warming up where participants are in-structed (by the Light character) to do some stretching, squatting, etc. Some of the exercises are done simultaneously by all players while others are done group by group so that the light points at the group who is taking turn. Next, four small exercises, each including moving from one place to another (by jumping, one-leg jump, crawl-ing, climbing) are done one group at a time. Motivation for these exercises is given in the story, e.g., crawling is necessary so that the Shadow would not notice the players. Next exercises are done simultaneously by all players participating, e.g., they jump up and down all at the same time to cause an earthquake which would collapse the throne of the Shadow. In the end, the story is wrapped up.
During the game, the two characters are signified by their voice, the soundscape, sound effects, and lighting. Presence of the Light character is signified with white light while the Shadow is represented by a red spotlight. Some exercise sequences also feature colors specific to a group of players. Both the Light and the Shadow ad-dress the players directly in their speech, although only the Light tells the players what to do.
5.2 Extended Version
In this version the game starts with an introduction by a narrator. When the actual game starts, the Light character guides the players and the story goes through four stages: awakening, empowerment, calling, and battle. The awakening part consists of four slow stretching and warm-up exercises. Empowerment contains four more active and physical exercises. Calling part is even faster, containing lot of movement around the space in its four activities. Finally, the battle is the most physical part, consisting of four tasks with fast movements in various ways. Once the story part finishes in the end of the battle, the narrator returns and takes the players through a cool-down phase consisting of three slow, relaxing activities. Each part has its own music, and music style and tempo match the level of activity aimed for the part.
The second version incorporates the five fixed RGB lights, four to illuminate areas on the floor and one to provide overall illumination to the room. Use of a reflector pyramid also created a strong visual point in the tower. We also added a projector and projection screen to display a signature image for both the Shadow and the Light cha-racters, stars to signify players’ success, and images of animals and elements that are awakened and called to help the players during the story.
In this version, the teacher rates activities on binary scale, each activity rated to be either acceptable or great performance. The feedback is given immediately by speech output and after each exercise set, one, two or three stars are displayed with the pro-jector based on the performance.
228
314 J. Hakulinen et al.
6 Evaluations
6.1 Initial Version
The system was evaluated with five groups of 5th and 6th graders (11–13 years old) during two days. The group sizes ranged from 8 to 20 children, some groups consisted of only boys or girls while others had both. In total there were over 60 participants. The system was set up in a small gym in the school. Each group’s own teacher was present and the system was operated either by the teacher or a researcher. Two to three additional researchers were also present and the sessions were videotaped. After the initial introduction, which included positioning the participants in groups around the trolley, participants followed the system’s instructions. Teacher or researcher instructed the children if they had problems following instructions.
The system was updated after the first day based on our observations. There seemed to be too much waiting without any physical activity during the introduction and some children jumped when the spotlight passed their feet. Therefore an explicit instruction to jump was added.
Method. Subjective questionnaire and interview data was gathered. Almost all partic-ipants, 61 in total, filled in a questionnaire and most also participated in interviews, which were conducted in small groups (about 5 persons). The questionnaire included 21 statements which were answered on a scale consisting of three smiley faces, i.e., happy, neutral and sad face. These statements concerned the overall thoughts of the system (e.g., would they like to play again, was it boring), the fluency of the game (e.g., did they understand the instructions, was it too slow), the physical strain of the game (e.g., did they get winded, were the tasks too easy), and the atmosphere of the game (e.g., was the atmosphere good, did they feel outsiders during the game). In addition to the statements, an overall grade between 1 and 10 for the game was in-quired, and open-ended questions were asked: the participants were able to tell what was best and worst in the game, and how could it be made more interesting.
Results. Our findings indicated that the basic concept works well: the system received a favorable average overall grade of 6.84 (SD=2.199), and although some of the children testing the system were a bit older than our target age of 10 years, they were still observed to get into the game and enthusiastically participate in the exercises. Both interviews and observation showed that the current design had too much waiting and too little exercise. Addition of feedback on performance was the most common request in the interview feedback: the static structure of the game provided no feed-back on players’ activities; they could not fail or affect the outcome in any way.
Other opportunities for improvement were also identified. Use of speech synthe-sizer made the speech somewhat hard to understand, the two characters sounded too similar which reduced the emotional effect of the story. This was found both from player feedback and observations. Also, the group size of twenty was too big for the combination of the activities and the very small gym where the tests took place. Con-gestion resulted when groups were supposed to move into the same area and especial-ly when all players chased the light spot as one group.
229
Creating Immersive Audio and Lighting Based Physical Exercise Games for Schoolchildren 315
Overall, while many ways to improve the experience were found, our observation of the tests showed that the fundamental concepts, i.e., the use of audio and lighting created a very powerful effect, immersing the players the very moment the game started. Based on the results, we continued the development.
6.2 Extended Version
The second version was evaluated in a different school with 110 participants (56 girls, 54 boys) over the course of a week. The ages ranged from 1st graders all the way to 6th graders, i.e., the participants were 6–11 years old with a mean age of 9.1 years (SD=1.1). The participant groups were classes either as one or two groups. Almost all participants (97%) liked physical exercise and 77% reported to exercise in their free time, while 42% practiced some team sport. These background variables were not affected by gender. However, boys were more active players of videogames than girls out of the participants who reported playing videogames (74% of respondents).
The teacher was present in most cases but the game was introduced and controlled by a researcher. Additional researchers were present and sessions were videotaped. After the introduction, the researcher remained silent, unless there were significant troubles, which occurred only in a few cases. The fact that the researcher was rating the performances was not told to the children. The game was again updated slightly after the first day, shortening or splitting some of the longest instructions. Some were so long, that the players could not remember all the relevant information and got bored. We split such instructions into two parts and included first part of the activity in between, where possible. Method. We collected subjective experiences with a questionnaire, which was filled in afterwards in class by all the children who played the game. We modified the ques-tionnaire to address some modality-specific statements and shorten it overall. The open-ended questions remained the same but the amount of the experience statements was narrowed down to 13, and they were answered with “Yes”, “No” and “I don’t know” options. The final statements were (translated from Finnish):
1. Playing was hard. 2. I would like to move this way again. 3. Exercising was now more pleasant than usually on PE classes. 4. I understood the instructions of the exercise tasks well. 5. I understood the speech well. 6. The speech voice sounded pleasant. 7. The music and the voices of the game were compelling. 8. The lights of the game were compelling. 9. I found the game irritating.
10. The story of the game was interesting. 11. The exercise tasks were too easy. 12. I could move with my own style. 13. I felt like an outsider in the game.
230

316 J. Hakulinen et al.
The overall grade for the game was reported with a five-step smiley face scale rang-ing from extremely sad to extremely happy as an answer to the question “How much did you like of the game as a whole?” Background questions included age and gender, do they play videogames, do they like physical exercise, do they do exercise in their free-time and do they practice some team sport (e.g., football, ice hockey). Results. The median overall grade for the game was 5 out of 5, and almost 60% of the participants gave the system the extremely happy face. Neutral or a little sad face was selected only by 16% and none of the participants selected the extremely sad face. The participants would like to move this way again (76%) and they felt that exercis-ing was now more pleasant than usually on gym classes (72%). The majority (66%) experienced the music and the voices to be compelling, and even more (78%) saw the lights of the game to be compelling. Only 6% of the participants reported they felt like an outsider in the game and only 5% stated playing the game was hard.
There were several statistically significant (p < 0.05) interactions between the ex-perience variables (according to Pearson Chi-Square test, “I don’t know” responses set as missing values). For example, whether the participants would like to move this way again had an effect on almost all the other responses as well: only difficulty of playing (statement 1), understanding the speech (5) and feeling an outsider (13) did not interact with willingness to move this way again. Similarly, the overall rating affected almost all other experiences while only difficulty of the game (1), ability to move with own style (12) and feeling an outsider (13) had no interaction with the overall rating of the system.
Remarkably, all 17 participants who did not exercise in their free-time felt that ex-ercising now was more pleasant than usually on gym classes (3). We also observed gender related differences in experiences. Girls felt more often (in fact, all girls) that exercising was now more pleasant than usually on gym classes (X2=17.848, df=1, p=0.000) and they also liked the game as a whole clearly more than the boys. Boys, on the other hand, experienced the speech sound less frequently pleasant (X2=4.262, df=1, p=0.039) and the music and voices less compelling than the girls (X2=5.643, df=1, p=0.018).
Age seems to have had slight effect on almost all of the statements: older partici-pants received the system a bit more negatively. The differences in other statements are not that surprising as the story approach of the game may feel a little childish for the oldest children. The only statements that were not significantly affected by age were difficulty of playing the game (statement 1), easiness of the exercise tasks (11), ability to move with own style (12), and feeling an outsider (13).
7 Co-creation of Games with Children
A set of five workshops was held in a science-themed event to further develop the game concept with children. The event took place in a large, dimly lit indoor arena, which was split into about 80 booths. The workshops took place in a 5 by 8 meter booth, enclosed by 2.5 meter high white walls on three sides. The light setup consisted of one moving head
231
Creating Immersive Audio and Lighting Based Physical Exercise Games for Schoolchildren 317
fixture (Martic Mac 300) and four fixed lights RGBW LED fixtures. A pair of active speakers was used for audio and the games were controlled by a researcher operating the laptop where the games were created and run.
In each workshop, a group of 10 to 15 schoolchildren participated and a new game was created. Each workshop lasted 70 to 85 minutes. Participants were free to leave at any time, and in some cases about a third of the participants left after half an hour. Each workshop started with an introduction where the functionality of the lighting hardware was demonstrated. Next, an example game (a 10-minute shortened version of our extended game) was played and after this the actual game design started. The game was designed and implemented during the workshop so that different parts of the game were tested during the development and the full game was played at least once in the end. The created games were finalized after the workshop by adding miss-ing parts like instructions, which were unnecessary for the participants themselves, and fixing other remaining issues. The resulting games were then tested on the last day of the event when interested event visitors were allowed to play the games.
Landry et al. [16] note that it is a challenge to make children aware of the physical and virtual potential of interactive technology. Like them, we made children try out the system to foster understanding of the system, and in addition added an introduc-tion of the technology. However, we went mostly story first and this seemed natural to children. Our process was different from that of Landry et al. in that we worked all the time as one group. This was problematic in larger groups since not everybody could provide their input, and splitting into smaller groups could have worked better. In the end, the exercise and gameplay ideas were less imaginative and followed more on what was in the example game, which suggest the children were biased by their initial exposure to the game environment. However, when testing the games on the last day of the event with interested children, we found that the created games worked well. In particular, the very simple description of the game world (e.g., “You are in the jungle, you are small monkeys.”), together with lights, was enough to create im-mersive environments as children’s imagination did the rest. The players also did the necessary interpretations to figure out ambiguous instructions.
8 Discussion and Conclusions
We built light and sound based exercise games for children. Our evaluations showed that it is possible to create strong, immersive experiences with this technology, capa-ble of pulling children into the world of a story. The use of simple graphics did not seem to significantly improve the effect, at times the opposite. Speech was found to be a powerful way to tell a story while sound effects are very important in building the atmosphere. The story does not need to be told in detail; very simple descriptions of stereotypic scenarios are enough as players’ imagination takes care of the rest. This means that creating new games does not require particular skills in storytelling. The most important part in writing games is to keep the length of the instructions short and keep players active. The story should incorporate activity and the instructions on what to do should be given at the time the players are supposed to do something.
232
318 J. Hakulinen et al.
The basic concepts seemed to work exactly as envisioned, with children participat-ing in the physical activities even if they did not usually like sports and such children reported liking the game more than the usual PE class activities. The facts that the games did not contain strong competitive elements and that the focus is on lighting and the story seemed to help achieve this goal.
The age range of children to which the same game seemed to appeal to was a posi-tive surprise. The original target group was children around 10 years of age. However, even 6-year-olds could easily follow most of the instructions and were very interested in the story. Among children approaching the age of 12, the number of persons consi-dering the game too childish did increase, but many of those who “misbehaved” still did so within the fiction of the game. Only a couple of the most mature children did their best to remain uninterested in the world of the story.
Following the suggestions by Yim and Graham [10] was helpful to the overall suc-cess: the application of music clearly made the experience more engaging and guided players toward the tempo we aimed for in the different exercises. The game also gave direct instructions to players, thus providing leadership. Early on, the users did not yet follow the instructions from the system without hesitation. This changed when they noticed that the game progressed when they did what was asked.
The current version of the game has the temporal extent of one exercise session, i.e., less than an hour. This means the goals we provide to users are only short and medium term goals. We plan to introduce long-term goals, for example by creating alternative endings to the game depending on players’ performance. This could also provide implicit exercise goals, while still hiding players’ fitness levels, which is relevant in helping children with low self-efficacy. In our current solution, we sup-ported players’ self-efficacy during group activity by keeping the story at the center of attention and not putting any individuals in focus during the game. Together, the above aspects created an atmosphere where everybody could enjoy the game without worrying about their performance. The overall design focused on the entire group working together to accomplish a common goal. In this sense the game facilitated grouping and group support. In the second version, there were no elements separating the players. This can also be considered a limitation, since the players could not get the kind of support they could get by forming smaller groups.
Above all, exercise games must also be fun in order to be efficient [8, 10]. We feel the game reached this goal. The lighting and audio provide an immersive and novel experience and the spatial nature of the moving spot light naturally encourages physi-cal activity. We also feel that the game matched reasonably well the players’ abilities.
Acknowledgements. This work is part of the “Active Learning Spaces” project, funded by the Finnish Funding Agency for Technology and Innovation.
References
1. World Health Organization. Global Strategy on Diet, Physical Activity and Health, http://www.who.int/dietphysicalactivity/childhood/en/
2. U.S. Department of Health and Human Services. Physical Activity Guidelines Advisory Committee report. Washington, DC: U.S. Department of Health and Human Services (2008)
233

Creating Immersive Audio and Lighting Based Physical Exercise Games for Schoolchildren 319
3. Fogel, V.A., Miltenberger, R.G., Graves, R., Koehler, S.: The Effects of Exergaming On Physical Activity Among Inactive Children In A Physical Education Classroom. Appl. Behav. Anal. 43(4), 591–600 (2010)
4. Peer, F., Friedlander, A., Mazalek, A., Mueller, F.: Evaluating technology that makes physical games for children more engaging. In: 10th International Conference on Interac-tion Design and Children (IDC 2011), pp. 193–196. ACM, New York (2011)
5. Baranowski, T., Buday, R., Thompson, D.I., Baranowski, J.: Playing for real: Video games and stories for health-related behavior change. Am. J. Prev. Med. 34(1), 74–82 (2008)
6. Whitehead, A., Johnston, H., Nixon, N., Welch, J.: Exergame effectiveness: What the numbers can tell us. In: Spencer, S.N. (ed.) 5th ACM SIGGRAPH Symposium on Video Games (Sandbox 2010), pp. 55–62. ACM, New York (2010)
7. Brox, E., Fernandez-Luque, L., Tøllefsen, T.: Healthy Gaming – Video Game Design to Promote Health. Appl. Clin. Inform. 2(2), 128–142 (2011)
8. Sinclair, J., Hingston, P., Masek, M.: Considerations for the design of exergames. In: 5th International Conference on Computer Graphics and Interactive Techniques in Australia and Southeast Asia (GRAPHITE 2007), pp. 289–295. ACM, New York (2007)
9. Mueller, F., Edge, D., Vetere, F., Gibbs, M.R., Agamanolis, S., Bongers, B., Sheridan, J.G.: Designing sports: A framework for exertion games. In: SIGCHI Conference on Hu-man Factors in Computing Systems (CHI 2011), pp. 2651–2660. ACM, New York (2011)
10. Yim, J., Graham, T.C.N.: Using games to increase exercise motivation. In: 2007 Confe-rence on Future Play (Future Play 2007), pp. 166–173. ACM, New York (2007)
11. Csikszentmihalyi, M., Csikszentmihalyi, I.S. (eds.): Optimal experience: Psychological studies of flow in consciousness. Cambridge University Press (1992)
12. Bekker, T., Sturm, J., Eggen, B.: Designing playful interactions for social interaction and physical play. Personal Ubiquitous Comput. 14(5), 385–396 (2010)
13. Park, T., Lee, U., Lee, B., Lee, H., Son, S., Song, S., Song, J.: ExerSync: Facilitating inter-personal synchrony in social exergames. In: 16th ACM Conference on Computer Sup-ported Cooperative Work and Social Computing (CSCW 2013), pp. 409–422. ACM, New York (2013)
14. Hagger, M.S., Chatzisarantis, N.L., Biddle, S.J.: A meta-analytic review of the theories of reasoned action and planned behavior in physical activity: Predictive validity and the con-tribution of additional variables. J. Sport and Exercise Psychol. 24(1), 3–32 (2002)
15. Hakulinen, J., Turunen, M., Heimonen, T.: Light Control Architecture for Multimodal In-teraction in Physical and Augmented Environments. In: DIS 2012 Workshop on Designing Interactive Lighting (2012)
16. Landry, P., Parés, N., Minsky, J., Parés, R.: Participatory design for exertion interfaces for children. In: 11th International Conference on Interaction Design and Children (IDC 2012), pp. 256–259. ACM, New York (2012)
234
Paper VII
Keskinen, T., Hakulinen, J., Turunen, M., Heimonen, T., Sand, A., Paavilainen, J., Parviainen, J., Yrjänäinen, S., Mäyrä, F., Okkonen, J., & Raisamo, R. (2014). Schoolchildren’s user experiences on a physical exercise game utilizing audio and lighting. Entertainment Computing, 5(4), 475–484. doi: 10.1016/j.entcom.2014.08.009
© Elsevier B.V., 2014. Reprinted with permission.
235

236
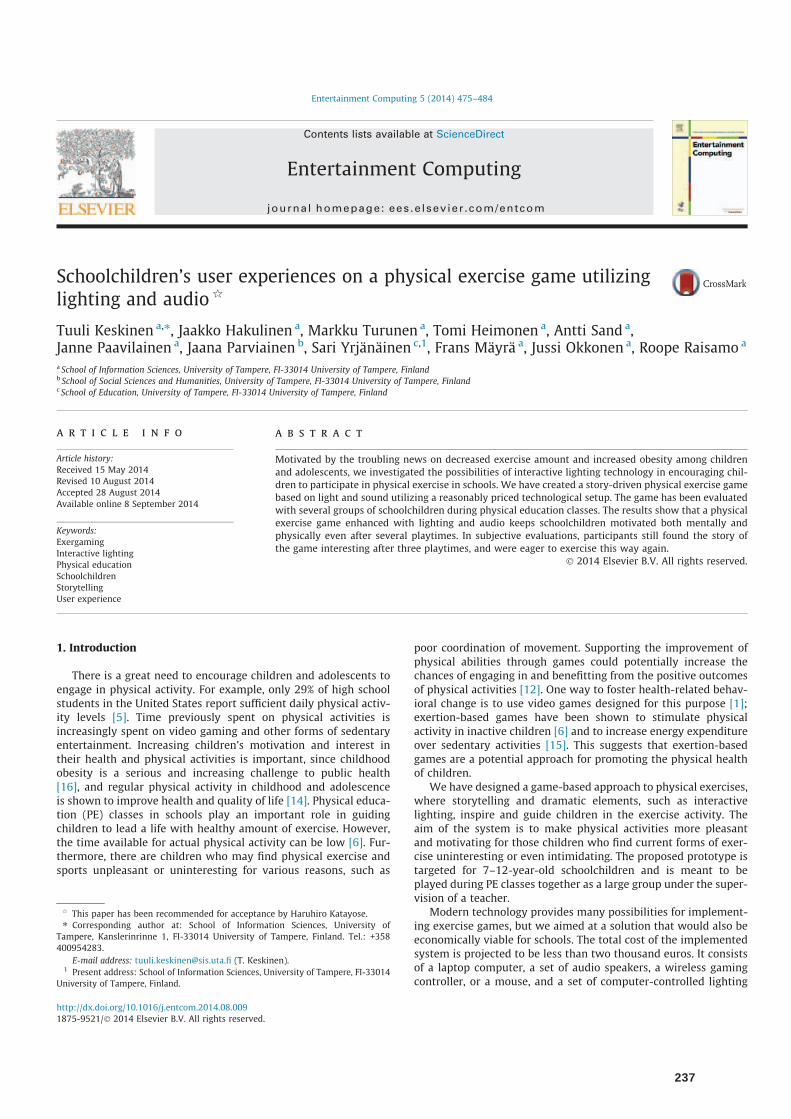
Schoolchildren’s user experiences on a physical exercise game utilizinglighting and audioq
Tuuli Keskinen a,⇑, Jaakko Hakulinen a, Markku Turunen a, Tomi Heimonen a, Antti Sand a,Janne Paavilainen a, Jaana Parviainen b, Sari Yrjänäinen c,1, Frans Mäyrä a, Jussi Okkonen a, Roope Raisamo a
a School of Information Sciences, University of Tampere, FI-33014 University of Tampere, Finlandb School of Social Sciences and Humanities, University of Tampere, FI-33014 University of Tampere, Finlandc School of Education, University of Tampere, FI-33014 University of Tampere, Finland
a r t i c l e i n f o
Article history:Received 15 May 2014Revised 10 August 2014Accepted 28 August 2014Available online 8 September 2014
Keywords:ExergamingInteractive lightingPhysical educationSchoolchildrenStorytellingUser experience
a b s t r a c t
Motivated by the troubling news on decreased exercise amount and increased obesity among childrenand adolescents, we investigated the possibilities of interactive lighting technology in encouraging chil-dren to participate in physical exercise in schools. We have created a story-driven physical exercise gamebased on light and sound utilizing a reasonably priced technological setup. The game has been evaluatedwith several groups of schoolchildren during physical education classes. The results show that a physicalexercise game enhanced with lighting and audio keeps schoolchildren motivated both mentally andphysically even after several playtimes. In subjective evaluations, participants still found the story ofthe game interesting after three playtimes, and were eager to exercise this way again.
� 2014 Elsevier B.V. All rights reserved.
1. Introduction
There is a great need to encourage children and adolescents toengage in physical activity. For example, only 29% of high schoolstudents in the United States report sufficient daily physical activ-ity levels [5]. Time previously spent on physical activities isincreasingly spent on video gaming and other forms of sedentaryentertainment. Increasing children’s motivation and interest intheir health and physical activities is important, since childhoodobesity is a serious and increasing challenge to public health[16], and regular physical activity in childhood and adolescenceis shown to improve health and quality of life [14]. Physical educa-tion (PE) classes in schools play an important role in guidingchildren to lead a life with healthy amount of exercise. However,the time available for actual physical activity can be low [6]. Fur-thermore, there are children who may find physical exercise andsports unpleasant or uninteresting for various reasons, such as
poor coordination of movement. Supporting the improvement ofphysical abilities through games could potentially increase thechances of engaging in and benefitting from the positive outcomesof physical activities [12]. One way to foster health-related behav-ioral change is to use video games designed for this purpose [1];exertion-based games have been shown to stimulate physicalactivity in inactive children [6] and to increase energy expenditureover sedentary activities [15]. This suggests that exertion-basedgames are a potential approach for promoting the physical healthof children.
We have designed a game-based approach to physical exercises,where storytelling and dramatic elements, such as interactivelighting, inspire and guide children in the exercise activity. Theaim of the system is to make physical activities more pleasantand motivating for those children who find current forms of exer-cise uninteresting or even intimidating. The proposed prototype istargeted for 7–12-year-old schoolchildren and is meant to beplayed during PE classes together as a large group under the super-vision of a teacher.
Modern technology provides many possibilities for implement-ing exercise games, but we aimed at a solution that would also beeconomically viable for schools. The total cost of the implementedsystem is projected to be less than two thousand euros. It consistsof a laptop computer, a set of audio speakers, a wireless gamingcontroller, or a mouse, and a set of computer-controlled lighting
http://dx.doi.org/10.1016/j.entcom.2014.08.0091875-9521/� 2014 Elsevier B.V. All rights reserved.
q This paper has been recommended for acceptance by Haruhiro Katayose.⇑ Corresponding author at: School of Information Sciences, University of
Tampere, Kanslerinrinne 1, FI-33014 University of Tampere, Finland. Tel.: +358400954283.
E-mail address: [email protected] (T. Keskinen).1 Present address: School of Information Sciences, University of Tampere, FI-33014
University of Tampere, Finland.
Entertainment Computing 5 (2014) 475–484
Contents lists available at ScienceDirect
Entertainment Computing
journal homepage: ees .e lsevier .com/entcom
237

fixtures mounted into a mobile trolley. The physical setup, aug-mented with additional hardware like motion sensors and a pro-jector as necessary, can be utilized for many other uses inschools as well, for example in teaching mathematics or physicsin a more immersive way. Although obviously very relevant forschool context, pedagogical aspects are not in the core of this arti-cle. Instead, we focus on the entertainment aspects of the game.Thus, subjective experiences gathered from the children them-selves form the central message and contribution of this articlealongside with the introduction of a novel system for inspiringphysical education classes.
The proposed prototype has been iteratively developed andstudied in PE classes with several groups of schoolchildren [9].First, a short version of the game was evaluated in order to validatethe viability of the concept in general, and after extensive develop-ment work, a complete version has been studied with close to 300schoolchildren in total. Here, we focus on the complete version andits evaluations. The results indicate that it is possible to createimmersive and engaging, story-driven exercise games using asmall set of lighting hardware and audio. Children’s imaginationcan create rich experiences from rather simple elements, and theresulting experience helps minimize feelings of exclusion. Ourlong-term evaluation results also show that it is possible to main-tain children’s interest towards the game with rather simple sto-ries and game elements.
In this article, we first cover related work on exercise games andtheir design challenges. Then, we introduce the context of ourresearch, and the audio and lighting based exercise game we devel-oped. Finally, we present our in situ evaluations and the resultsfocusing on user experiences, and conclude by discussing theimplications of our findings.
2. Related work
2.1. Exercise games
With the advances in consumer electronics, such as the intro-duction of the Nintendo Wii controller and the Microsoft Kinect,health and activity related games have become popular. Broxet al. [3] categorize such games into three genres: educationalgames, persuasive games, and exergames. Educational games are pri-marily designed for improving health literacy of both children andadult population. Persuasive games, on the other hand, attempt topersuade people to modify their behavior, be it increases in exer-cise or adjustments of dietary habits. Finally, exergames are videogames that are used in an exercise activity [13]. Different defini-tions exist for exercise-based games. Whitehead et al. [15] forexample, give a general definition for exergames as ‘‘video gamesthat provide encouragement to exercise, particularly for an audiencethat may be reluctant to engage in the more traditional forms of exer-cise’’. Mueller et al. [10], on the other hand, stress the role of phys-ical activity within the game, and define exertion games as ‘‘digitalgames where the outcome of the game is predominately determined byphysical effort’’. Exergames can therefore be categorized accordingto their attributes along various dimensions, such as the natureof the gaming aspects, technological enablers, the type of physicalactivity, and engagement.
Especially in commercial exergames the game-related aspectscreate the biggest draw to the game, as one is rewarded for suc-cessful physical activity in the context of game-play session. Onthe other hand, there are also games that aim to change players’behavior in the long term. These games are most commonly mobileand provide incentives for physical activity during the day.
According to Yim and Graham [17], exergame user interfacesrange from free-motion interfaces, i.e., games where the players
can freely move their body, to traditional electronic interfaces. Inbetween are systems utilizing exercise equipment like exercisebikes. They categorize game worlds as either virtual, like in tradi-tional video games utilizing a TV screen, augmented reality, i.e.,the view of real world overlaid with virtual elements, or reality.Most of the existing exergames reviewed by Yim and Graham arebased on a virtual world or augmented reality and are eitherfree-motion interfaces or utilize some form of equipment. Yimand Graham found no examples of exergames featuring aug-mented reality and utilizing either equipment or traditional elec-tronic interfaces, but find both areas promising research avenues.Our game environment fits this gap, being a blend of augmentedreality and reality approaches, as it combines physical activity inthe real world with virtual elements by augmenting the roomusing interactive lighting. Although the players’ activity takes placewithout equipment per se, the facilitator, i.e., the teacher in school-context, is equipped with a controller in order to direct the flow ofthe game.
In terms of the various attributes of physical activity, Muelleret al. [10] provide an exertion framework with four ‘‘lenses’’: theresponding body, themoving body, the sensing body and the relatingbody. These lenses can be used to view the exercise activity fromdifferent perspectives. Another axis comes from the gaming sidein the form of rules, play and context. Here, rules relate to the uncer-tainty and players’ awareness of the exertion, play relates to howand in which rhythm the exertion is expressed, and context tothe risks related to the physical exertion (e.g., injury) and howthe system supports the development of understanding aboutone’s body.
A critical aspect of game success deals with the fun and enter-tainment players derive from the game. Sinclair et al. [13] examinethese issues in the context of the game’s attractiveness, which ulti-mately controls whether players are compelled to exercise longand hard enough to derive health benefits (effectiveness). Theirdual flow model, which combines attractiveness and effectiveness,is based on the concept of flow state by Csikszentmihalyi [4] – aconcept that has been applied also to video games and is applicablein the context of sports and other similar physical activities as well.Sinclair et al. build their framework by considering the optimalarea in the two-dimensional range of the game’s challenge leveland skill level both from psychological and physiological sides.
2.2. Design of exercise games
To be successful exergames must both attract players, so thatthey are played enough to provide gains, and make the playersactually exercise effectively during the game play [13]. Manyauthors have provided requirements and guidelines on how toreach these goals. Baranowski et al. [1] list features, which makegames appealing and potentially efficient as behavior change tools.While their discussion considers video games in general for health-related targets, these features apply well to exergames. Interactiv-ity and personalized, interactive goal setting and tailored feedbackform the key aspects. However, they put more focus on the immer-sive and attention maintaining nature of games and identify storiesand fantasy as tools for reaching this goal. They also raise the pointthat immersion should be believable in order to be a component ofintrinsic motivation.
While many exergames are aimed for solo play or a very smallnumber of players, many researchers raise the issue of socialaspects in exercise motivation. Technology can support sharedexercise experiences over distance and one of the most interestingimplementation comes from Park et al. [11], who have explicitlyconsidered the concept of interpersonal synchrony to leveragethe positive social effects of ‘‘improving rapport and entitativity’’and also make exercises more enjoyable. They provide technical
476 T. Keskinen et al. / Entertainment Computing 5 (2014) 475–484
238
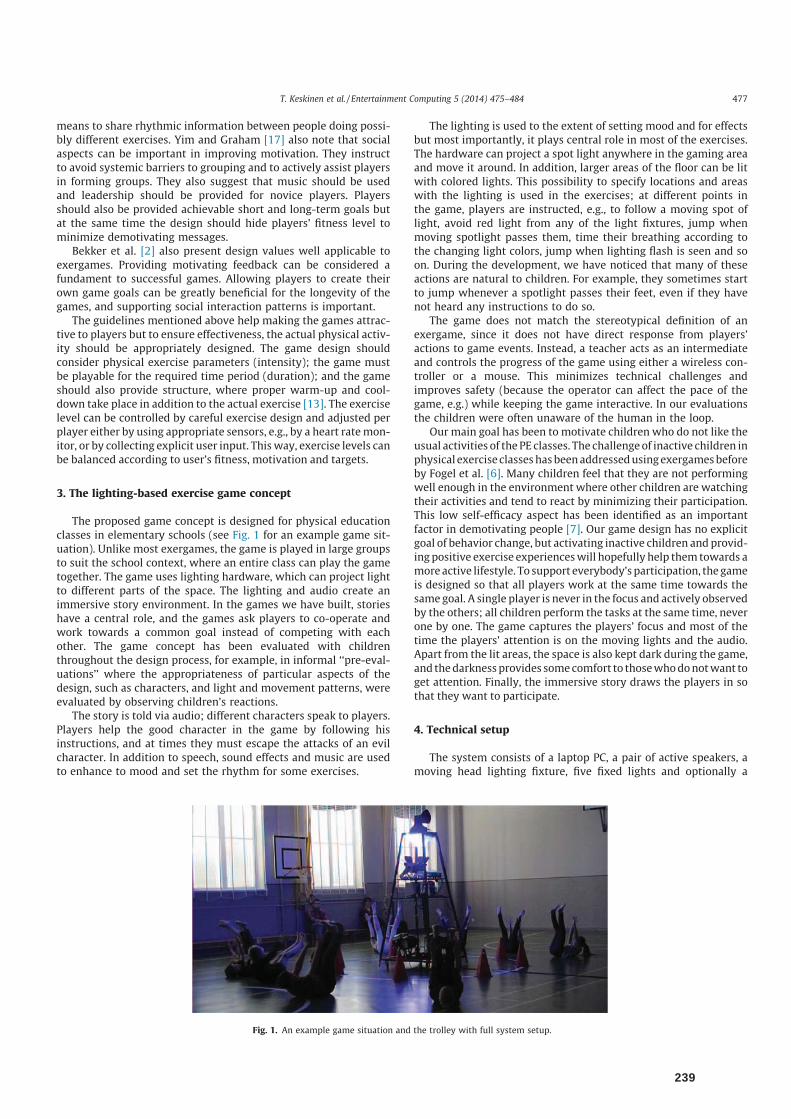
means to share rhythmic information between people doing possi-bly different exercises. Yim and Graham [17] also note that socialaspects can be important in improving motivation. They instructto avoid systemic barriers to grouping and to actively assist playersin forming groups. They also suggest that music should be usedand leadership should be provided for novice players. Playersshould also be provided achievable short and long-term goals butat the same time the design should hide players’ fitness level tominimize demotivating messages.
Bekker et al. [2] also present design values well applicable toexergames. Providing motivating feedback can be considered afundament to successful games. Allowing players to create theirown game goals can be greatly beneficial for the longevity of thegames, and supporting social interaction patterns is important.
The guidelines mentioned above help making the games attrac-tive to players but to ensure effectiveness, the actual physical activ-ity should be appropriately designed. The game design shouldconsider physical exercise parameters (intensity); the game mustbe playable for the required time period (duration); and the gameshould also provide structure, where proper warm-up and cool-down take place in addition to the actual exercise [13]. The exerciselevel can be controlled by careful exercise design and adjusted perplayer either by using appropriate sensors, e.g., by a heart ratemon-itor, or by collecting explicit user input. Thisway, exercise levels canbe balanced according to user’s fitness, motivation and targets.
3. The lighting-based exercise game concept
The proposed game concept is designed for physical educationclasses in elementary schools (see Fig. 1 for an example game sit-uation). Unlike most exergames, the game is played in large groupsto suit the school context, where an entire class can play the gametogether. The game uses lighting hardware, which can project lightto different parts of the space. The lighting and audio create animmersive story environment. In the games we have built, storieshave a central role, and the games ask players to co-operate andwork towards a common goal instead of competing with eachother. The game concept has been evaluated with childrenthroughout the design process, for example, in informal ‘‘pre-eval-uations’’ where the appropriateness of particular aspects of thedesign, such as characters, and light and movement patterns, wereevaluated by observing children’s reactions.
The story is told via audio; different characters speak to players.Players help the good character in the game by following hisinstructions, and at times they must escape the attacks of an evilcharacter. In addition to speech, sound effects and music are usedto enhance to mood and set the rhythm for some exercises.
The lighting is used to the extent of setting mood and for effectsbut most importantly, it plays central role in most of the exercises.The hardware can project a spot light anywhere in the gaming areaand move it around. In addition, larger areas of the floor can be litwith colored lights. This possibility to specify locations and areaswith the lighting is used in the exercises; at different points inthe game, players are instructed, e.g., to follow a moving spot oflight, avoid red light from any of the light fixtures, jump whenmoving spotlight passes them, time their breathing according tothe changing light colors, jump when lighting flash is seen and soon. During the development, we have noticed that many of theseactions are natural to children. For example, they sometimes startto jump whenever a spotlight passes their feet, even if they havenot heard any instructions to do so.
The game does not match the stereotypical definition of anexergame, since it does not have direct response from players’actions to game events. Instead, a teacher acts as an intermediateand controls the progress of the game using either a wireless con-troller or a mouse. This minimizes technical challenges andimproves safety (because the operator can affect the pace of thegame, e.g.) while keeping the game interactive. In our evaluationsthe children were often unaware of the human in the loop.
Our main goal has been to motivate children who do not like theusual activities of the PE classes. The challengeof inactive children inphysical exerciseclasseshasbeenaddressedusingexergamesbeforeby Fogel et al. [6]. Many children feel that they are not performingwell enough in the environment where other children are watchingtheir activities and tend to react by minimizing their participation.This low self-efficacy aspect has been identified as an importantfactor in demotivating people [7]. Our game design has no explicitgoal of behavior change, but activating inactive children and provid-ing positive exercise experienceswill hopefully help themtowards amoreactive lifestyle. To support everybody’s participation, thegameis designed so that all players work at the same time towards thesame goal. A single player is never in the focus and actively observedby the others; all children perform the tasks at the same time, neverone by one. The game captures the players’ focus and most of thetime the players’ attention is on the moving lights and the audio.Apart from the lit areas, the space is also kept dark during the game,and thedarknessprovides somecomfort to thosewhodonotwant toget attention. Finally, the immersive story draws the players in sothat they want to participate.
4. Technical setup
The system consists of a laptop PC, a pair of active speakers, amoving head lighting fixture, five fixed lights and optionally a
Fig. 1. An example game situation and the trolley with full system setup.
T. Keskinen et al. / Entertainment Computing 5 (2014) 475–484 477
239
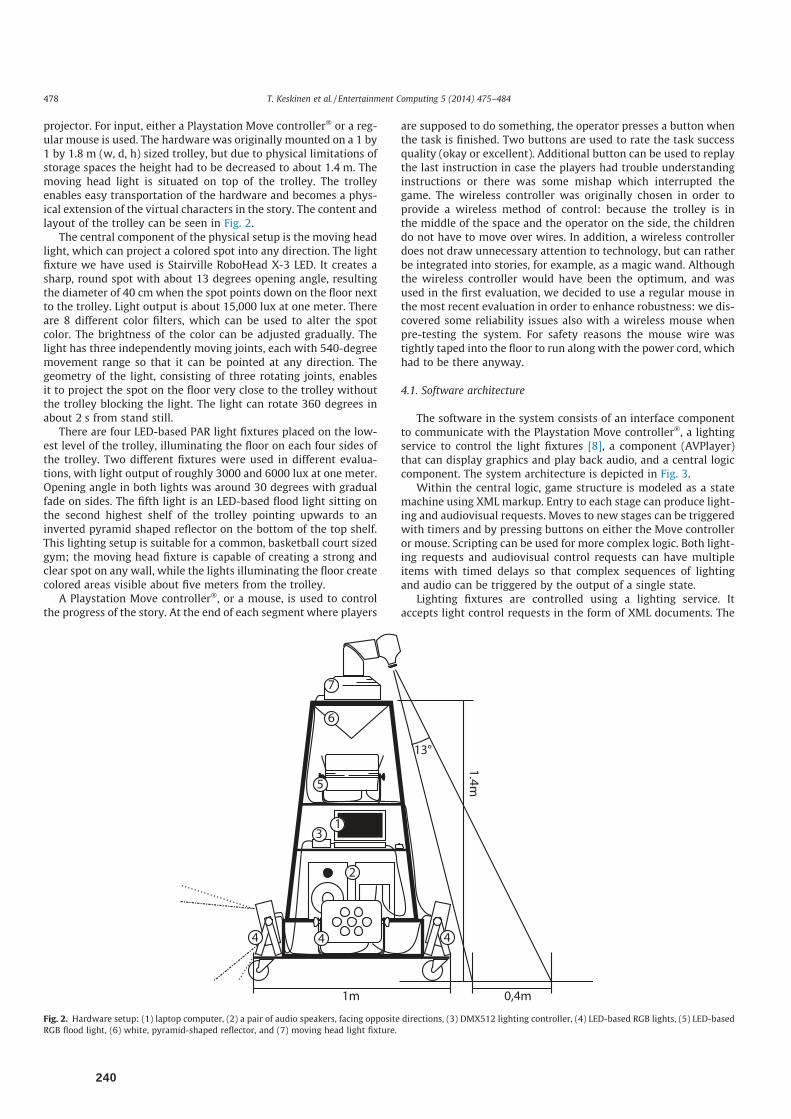
projector. For input, either a Playstation Move controller� or a reg-ular mouse is used. The hardware was originally mounted on a 1 by1 by 1.8 m (w, d, h) sized trolley, but due to physical limitations ofstorage spaces the height had to be decreased to about 1.4 m. Themoving head light is situated on top of the trolley. The trolleyenables easy transportation of the hardware and becomes a phys-ical extension of the virtual characters in the story. The content andlayout of the trolley can be seen in Fig. 2.
The central component of the physical setup is the moving headlight, which can project a colored spot into any direction. The lightfixture we have used is Stairville RoboHead X-3 LED. It creates asharp, round spot with about 13 degrees opening angle, resultingthe diameter of 40 cm when the spot points down on the floor nextto the trolley. Light output is about 15,000 lux at one meter. Thereare 8 different color filters, which can be used to alter the spotcolor. The brightness of the color can be adjusted gradually. Thelight has three independently moving joints, each with 540-degreemovement range so that it can be pointed at any direction. Thegeometry of the light, consisting of three rotating joints, enablesit to project the spot on the floor very close to the trolley withoutthe trolley blocking the light. The light can rotate 360 degrees inabout 2 s from stand still.
There are four LED-based PAR light fixtures placed on the low-est level of the trolley, illuminating the floor on each four sides ofthe trolley. Two different fixtures were used in different evalua-tions, with light output of roughly 3000 and 6000 lux at one meter.Opening angle in both lights was around 30 degrees with gradualfade on sides. The fifth light is an LED-based flood light sitting onthe second highest shelf of the trolley pointing upwards to aninverted pyramid shaped reflector on the bottom of the top shelf.This lighting setup is suitable for a common, basketball court sizedgym; the moving head fixture is capable of creating a strong andclear spot on any wall, while the lights illuminating the floor createcolored areas visible about five meters from the trolley.
A Playstation Move controller�, or a mouse, is used to controlthe progress of the story. At the end of each segment where players
are supposed to do something, the operator presses a button whenthe task is finished. Two buttons are used to rate the task successquality (okay or excellent). Additional button can be used to replaythe last instruction in case the players had trouble understandinginstructions or there was some mishap which interrupted thegame. The wireless controller was originally chosen in order toprovide a wireless method of control: because the trolley is inthe middle of the space and the operator on the side, the childrendo not have to move over wires. In addition, a wireless controllerdoes not draw unnecessary attention to technology, but can ratherbe integrated into stories, for example, as a magic wand. Althoughthe wireless controller would have been the optimum, and wasused in the first evaluation, we decided to use a regular mouse inthe most recent evaluation in order to enhance robustness: we dis-covered some reliability issues also with a wireless mouse whenpre-testing the system. For safety reasons the mouse wire wastightly taped into the floor to run along with the power cord, whichhad to be there anyway.
4.1. Software architecture
The software in the system consists of an interface componentto communicate with the Playstation Move controller�, a lightingservice to control the light fixtures [8], a component (AVPlayer)that can display graphics and play back audio, and a central logiccomponent. The system architecture is depicted in Fig. 3.
Within the central logic, game structure is modeled as a statemachine using XML markup. Entry to each stage can produce light-ing and audiovisual requests. Moves to new stages can be triggeredwith timers and by pressing buttons on either the Move controlleror mouse. Scripting can be used for more complex logic. Both light-ing requests and audiovisual control requests can have multipleitems with timed delays so that complex sequences of lightingand audio can be triggered by the output of a single state.
Lighting fixtures are controlled using a lighting service. Itaccepts light control requests in the form of XML documents. The
Fig. 2. Hardware setup: (1) laptop computer, (2) a pair of audio speakers, facing opposite directions, (3) DMX512 lighting controller, (4) LED-based RGB lights, (5) LED-basedRGB flood light, (6) white, pyramid-shaped reflector, and (7) moving head light fixture.
478 T. Keskinen et al. / Entertainment Computing 5 (2014) 475–484
240
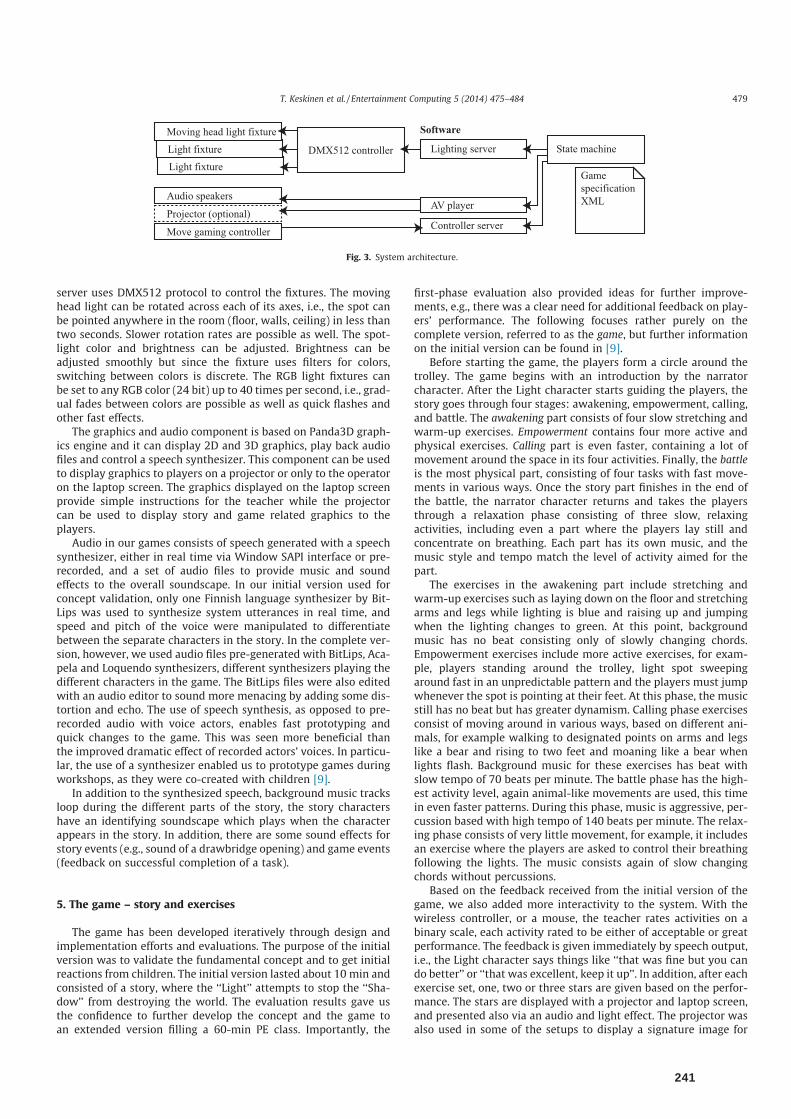
server uses DMX512 protocol to control the fixtures. The movinghead light can be rotated across each of its axes, i.e., the spot canbe pointed anywhere in the room (floor, walls, ceiling) in less thantwo seconds. Slower rotation rates are possible as well. The spot-light color and brightness can be adjusted. Brightness can beadjusted smoothly but since the fixture uses filters for colors,switching between colors is discrete. The RGB light fixtures canbe set to any RGB color (24 bit) up to 40 times per second, i.e., grad-ual fades between colors are possible as well as quick flashes andother fast effects.
The graphics and audio component is based on Panda3D graph-ics engine and it can display 2D and 3D graphics, play back audiofiles and control a speech synthesizer. This component can be usedto display graphics to players on a projector or only to the operatoron the laptop screen. The graphics displayed on the laptop screenprovide simple instructions for the teacher while the projectorcan be used to display story and game related graphics to theplayers.
Audio in our games consists of speech generated with a speechsynthesizer, either in real time via Window SAPI interface or pre-recorded, and a set of audio files to provide music and soundeffects to the overall soundscape. In our initial version used forconcept validation, only one Finnish language synthesizer by Bit-Lips was used to synthesize system utterances in real time, andspeed and pitch of the voice were manipulated to differentiatebetween the separate characters in the story. In the complete ver-sion, however, we used audio files pre-generated with BitLips, Aca-pela and Loquendo synthesizers, different synthesizers playing thedifferent characters in the game. The BitLips files were also editedwith an audio editor to sound more menacing by adding some dis-tortion and echo. The use of speech synthesis, as opposed to pre-recorded audio with voice actors, enables fast prototyping andquick changes to the game. This was seen more beneficial thanthe improved dramatic effect of recorded actors’ voices. In particu-lar, the use of a synthesizer enabled us to prototype games duringworkshops, as they were co-created with children [9].
In addition to the synthesized speech, background music tracksloop during the different parts of the story, the story charactershave an identifying soundscape which plays when the characterappears in the story. In addition, there are some sound effects forstory events (e.g., sound of a drawbridge opening) and game events(feedback on successful completion of a task).
5. The game – story and exercises
The game has been developed iteratively through design andimplementation efforts and evaluations. The purpose of the initialversion was to validate the fundamental concept and to get initialreactions from children. The initial version lasted about 10 min andconsisted of a story, where the ‘‘Light’’ attempts to stop the ‘‘Sha-dow’’ from destroying the world. The evaluation results gave usthe confidence to further develop the concept and the game toan extended version filling a 60-min PE class. Importantly, the
first-phase evaluation also provided ideas for further improve-ments, e.g., there was a clear need for additional feedback on play-ers’ performance. The following focuses rather purely on thecomplete version, referred to as the game, but further informationon the initial version can be found in [9].
Before starting the game, the players form a circle around thetrolley. The game begins with an introduction by the narratorcharacter. After the Light character starts guiding the players, thestory goes through four stages: awakening, empowerment, calling,and battle. The awakening part consists of four slow stretching andwarm-up exercises. Empowerment contains four more active andphysical exercises. Calling part is even faster, containing a lot ofmovement around the space in its four activities. Finally, the battleis the most physical part, consisting of four tasks with fast move-ments in various ways. Once the story part finishes in the end ofthe battle, the narrator character returns and takes the playersthrough a relaxation phase consisting of three slow, relaxingactivities, including even a part where the players lay still andconcentrate on breathing. Each part has its own music, and themusic style and tempo match the level of activity aimed for thepart.
The exercises in the awakening part include stretching andwarm-up exercises such as laying down on the floor and stretchingarms and legs while lighting is blue and raising up and jumpingwhen the lighting changes to green. At this point, backgroundmusic has no beat consisting only of slowly changing chords.Empowerment exercises include more active exercises, for exam-ple, players standing around the trolley, light spot sweepingaround fast in an unpredictable pattern and the players must jumpwhenever the spot is pointing at their feet. At this phase, the musicstill has no beat but has greater dynamism. Calling phase exercisesconsist of moving around in various ways, based on different ani-mals, for example walking to designated points on arms and legslike a bear and rising to two feet and moaning like a bear whenlights flash. Background music for these exercises has beat withslow tempo of 70 beats per minute. The battle phase has the high-est activity level, again animal-like movements are used, this timein even faster patterns. During this phase, music is aggressive, per-cussion based with high tempo of 140 beats per minute. The relax-ing phase consists of very little movement, for example, it includesan exercise where the players are asked to control their breathingfollowing the lights. The music consists again of slow changingchords without percussions.
Based on the feedback received from the initial version of thegame, we also added more interactivity to the system. With thewireless controller, or a mouse, the teacher rates activities on abinary scale, each activity rated to be either of acceptable or greatperformance. The feedback is given immediately by speech output,i.e., the Light character says things like ‘‘that was fine but you cando better’’ or ‘‘that was excellent, keep it up’’. In addition, after eachexercise set, one, two or three stars are given based on the perfor-mance. The stars are displayed with a projector and laptop screen,and presented also via an audio and light effect. The projector wasalso used in some of the setups to display a signature image for
Light fixture
Audio speakers
Projector (optional)
Move gaming controller
DMX512 controller Lighting server
AV player
Controller server
State machine
Game specificationXML
Light fixtureMoving head light fixture Software
Fig. 3. System architecture.
T. Keskinen et al. / Entertainment Computing 5 (2014) 475–484 479
241
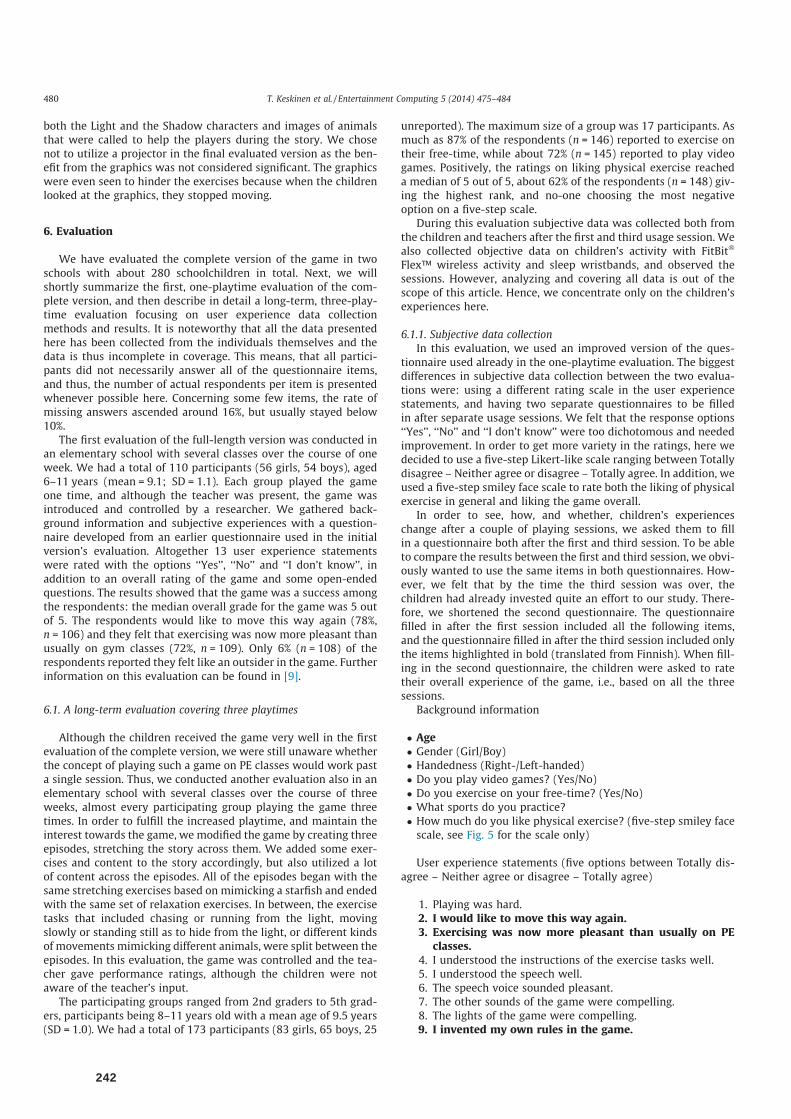
both the Light and the Shadow characters and images of animalsthat were called to help the players during the story. We chosenot to utilize a projector in the final evaluated version as the ben-efit from the graphics was not considered significant. The graphicswere even seen to hinder the exercises because when the childrenlooked at the graphics, they stopped moving.
6. Evaluation
We have evaluated the complete version of the game in twoschools with about 280 schoolchildren in total. Next, we willshortly summarize the first, one-playtime evaluation of the com-plete version, and then describe in detail a long-term, three-play-time evaluation focusing on user experience data collectionmethods and results. It is noteworthy that all the data presentedhere has been collected from the individuals themselves and thedata is thus incomplete in coverage. This means, that all partici-pants did not necessarily answer all of the questionnaire items,and thus, the number of actual respondents per item is presentedwhenever possible here. Concerning some few items, the rate ofmissing answers ascended around 16%, but usually stayed below10%.
The first evaluation of the full-length version was conducted inan elementary school with several classes over the course of oneweek. We had a total of 110 participants (56 girls, 54 boys), aged6–11 years (mean = 9.1; SD = 1.1). Each group played the gameone time, and although the teacher was present, the game wasintroduced and controlled by a researcher. We gathered back-ground information and subjective experiences with a question-naire developed from an earlier questionnaire used in the initialversion’s evaluation. Altogether 13 user experience statementswere rated with the options ‘‘Yes’’, ‘‘No’’ and ‘‘I don’t know’’, inaddition to an overall rating of the game and some open-endedquestions. The results showed that the game was a success amongthe respondents: the median overall grade for the game was 5 outof 5. The respondents would like to move this way again (78%,n = 106) and they felt that exercising was now more pleasant thanusually on gym classes (72%, n = 109). Only 6% (n = 108) of therespondents reported they felt like an outsider in the game. Furtherinformation on this evaluation can be found in [9].
6.1. A long-term evaluation covering three playtimes
Although the children received the game very well in the firstevaluation of the complete version, we were still unaware whetherthe concept of playing such a game on PE classes would work pasta single session. Thus, we conducted another evaluation also in anelementary school with several classes over the course of threeweeks, almost every participating group playing the game threetimes. In order to fulfill the increased playtime, and maintain theinterest towards the game, we modified the game by creating threeepisodes, stretching the story across them. We added some exer-cises and content to the story accordingly, but also utilized a lotof content across the episodes. All of the episodes began with thesame stretching exercises based on mimicking a starfish and endedwith the same set of relaxation exercises. In between, the exercisetasks that included chasing or running from the light, movingslowly or standing still as to hide from the light, or different kindsof movements mimicking different animals, were split between theepisodes. In this evaluation, the game was controlled and the tea-cher gave performance ratings, although the children were notaware of the teacher’s input.
The participating groups ranged from 2nd graders to 5th grad-ers, participants being 8–11 years old with a mean age of 9.5 years(SD = 1.0). We had a total of 173 participants (83 girls, 65 boys, 25
unreported). The maximum size of a group was 17 participants. Asmuch as 87% of the respondents (n = 146) reported to exercise ontheir free-time, while about 72% (n = 145) reported to play videogames. Positively, the ratings on liking physical exercise reacheda median of 5 out of 5, about 62% of the respondents (n = 148) giv-ing the highest rank, and no-one choosing the most negativeoption on a five-step scale.
During this evaluation subjective data was collected both fromthe children and teachers after the first and third usage session. Wealso collected objective data on children’s activity with FitBit�
Flex™ wireless activity and sleep wristbands, and observed thesessions. However, analyzing and covering all data is out of thescope of this article. Hence, we concentrate only on the children’sexperiences here.
6.1.1. Subjective data collectionIn this evaluation, we used an improved version of the ques-
tionnaire used already in the one-playtime evaluation. The biggestdifferences in subjective data collection between the two evalua-tions were: using a different rating scale in the user experiencestatements, and having two separate questionnaires to be filledin after separate usage sessions. We felt that the response options‘‘Yes’’, ‘‘No’’ and ‘‘I don’t know’’ were too dichotomous and neededimprovement. In order to get more variety in the ratings, here wedecided to use a five-step Likert-like scale ranging between Totallydisagree – Neither agree or disagree – Totally agree. In addition, weused a five-step smiley face scale to rate both the liking of physicalexercise in general and liking the game overall.
In order to see, how, and whether, children’s experienceschange after a couple of playing sessions, we asked them to fillin a questionnaire both after the first and third session. To be ableto compare the results between the first and third session, we obvi-ously wanted to use the same items in both questionnaires. How-ever, we felt that by the time the third session was over, thechildren had already invested quite an effort to our study. There-fore, we shortened the second questionnaire. The questionnairefilled in after the first session included all the following items,and the questionnaire filled in after the third session included onlythe items highlighted in bold (translated from Finnish). When fill-ing in the second questionnaire, the children were asked to ratetheir overall experience of the game, i.e., based on all the threesessions.
Background information
� Age� Gender (Girl/Boy)� Handedness (Right-/Left-handed)� Do you play video games? (Yes/No)� Do you exercise on your free-time? (Yes/No)� What sports do you practice?� How much do you like physical exercise? (five-step smiley facescale, see Fig. 5 for the scale only)
User experience statements (five options between Totally dis-agree – Neither agree or disagree – Totally agree)
1. Playing was hard.2. I would like to move this way again.3. Exercising was now more pleasant than usually on PE
classes.4. I understood the instructions of the exercise tasks well.5. I understood the speech well.6. The speech voice sounded pleasant.7. The other sounds of the game were compelling.8. The lights of the game were compelling.9. I invented my own rules in the game.
480 T. Keskinen et al. / Entertainment Computing 5 (2014) 475–484
242

10. I found the game irritating.11. The story of the game was interesting.12. The exercise tasks were too easy.13. I could move with my own style.14. I felt like an outsider in the game.15. How much did you like the game overall? (five-step smi-
ley face scale, see Fig. 5)
Sentences to be completed.
16. The best thing in the game was. . .17. The worst thing in the game was. . .18. The game would be more interesting if. . .19. What kind of an exercise would you like to be included in
the game? (You can mention more than one.)
6.1.2. ResultsDue to inconsistency in data coverage, and in order to maintain
clarity, the results presented here include only the data from theparticipants who reported to have played the game three timesin total (this was asked in the second questionnaire in order toknow the amount of playtimes per participant, and to gather datafrom participants not present in the first and/or second session aswell). Thus, the results cover roughly six groups and 74 partici-pants (45 girls, 28 boys). Further, as all data is based on subjectivereporting it is incomplete in coverage: in our practical experience,complete data coverage is nearly impossible to be achieved outsideof laboratory environment. This is especially the case with childrenbeing the target user, and respondent group. The median resultsconsidering the user experience statements reported after the firstand third session can be seen in Fig. 4.
Fig. 4. Participants’ median responses on the user experience statements 1–14 after the first (black circles) and third (white circles) session (n ranges between 62 and 74). Thedivision between positive and negative statements was done based on the goals of individual statements, i.e., the responses to positive statements are the better, the higher,and correspondingly the better, the lower to negative statements. The statements asked in both questionnaires are highlighted in bold.
Fig. 5. The five-step smiley face scale and the boxplot presentations of the results on the overall liking of the game (statement 15) after the first and third session.
T. Keskinen et al. / Entertainment Computing 5 (2014) 475–484 481
243
As can be seen from the results, the first-impression experi-ences reported after the first session are very positive. First of all,the modality-specific properties were mainly received well. Thespeech (statement 5) and instructions (statement 4) were under-standable. However, these properties correlated with each other(Spearman’s rho: r = 0.556, p = 0.000), and it is not entirely clearwhether the participants truly made a distinction between these.The same issue applies with the pleasantness of the speech voice(statement 6) and the compellingness of the other sounds (state-ment 7): the results considering these properties also correlatedsomewhat (Spearman’s rho: r = 0.417, p = 0.001), and it may bethat the participants rated them overlappingly. The lights, on theother hand, were probably perceived as a separate element, andthe majority received them as compelling (statement 8). The con-tent of the story was also successfully created, as the majority ofthe participants thought it was interesting (statement 11). Overall,the game was welcomed enthusiastically: a clear majority wouldlike to move this way again (statement 2) and many thought exer-cising was now more pleasant than usually on PE classes (state-ment 3), although this statement distributed opinions a bit more.
Considering the division between positive and negative state-ments (seen in Fig. 4, and done mainly to clarify the representa-tion), the goals of individual statements were well achieved. Inthe negative statements, only statement 12 was not a total successas the median response both after the first and third session wasneutral, i.e., the option Neither agree or disagree. Regarding theindividual differences between the participants, the result is onlyunderstandable: some children have better physical skills thanthe others, and vice versa. On the other hand, judging afterwardsthe phrasing of the statement, ‘‘The exercise tasks were too easy’’,was not the optimum, as the answers do not reveal whether theexercise tasks were in fact too easy, too difficult, or suitable bytheir difficultness level. In the positive statements, the statements9 and 13 were not realized as envisioned, depending on the view-point, though. Considering statement 9, ‘‘I invented my own rules inthe game’’, from entertainment point-of-view we wanted the gameto arouse the children’s imagination and them to invent their ownrules, even. Taking into account that the evaluation took place inschool context, it is only reasonable that the children did notinvent their own rules: had the game been played somewhere elseduring the children’s free-time, for example, the responses mayhave been totally different. With the statement 13, ‘‘I could movewith my own style’’, we wanted to find out whether the children felttheir movement style was too restricted by the given instructions.Based on the slightly positive and neutral medians, it seems thechildren felt at least somewhat restricted by the instructions. Theanswers on this statement are probably affected by the school con-text as well.
Open-ended responses from the first questionnaire provideadditional insights into the children’s experiences and preferences.We identified recurrent themes in the response data related toexercising and physical activities, game content and mechanics,social and technical issues, and other miscellaneous concerns.Due to the open-ended nature of the questions, a single responsecould contribute to multiple themes. Physical activities (e.g., jump-ing and running) were mentioned as the best thing in the game inover half of the responses (54%). Positive story and game elements,such as the water spell (20% of responses) and the Shadow (23%)were also prominent. The physical activity aspects were closelyassociated with the story elements, such as jumping over the mov-ing light spots projected on the floor during the water spell. A siz-able number of children explicitly stated having found nothingunpleasant in the game (26%) or answered with a ‘‘�’’ (15%) indi-cating they could not think of negative aspects either. The leastfavorite aspects were primarily related to various issues with thegame content and gameplay, such as the warm-up sequence and
awakening of magical powers (15%), the cool down and stretchingsequence at the end (10%), and the Shadow (6%). The dislike for thefirst two elements was likely influenced by the amount of repeti-tion during the exercise segments (specifically mentioned in 9%of responses). In addition, technical and social issues werereported, including being bothered by glare from the lights (7%),difficulties with understanding the voice of the Shadow character(4%), and other players disturbing the play session (4%). The gamewould have been made more interesting with the addition of morecontent, such as story-related exercises and more action (21%) andlonger play session duration (10%). The responses also suggest thatmaking the game more challenging (7%) and the story elementsmore suspenseful or scary (7%) could improve the game for somechildren. Other suggestions included faster moving lights (7%)and other adjustments to the physical and technical setup of thegame (7%), such as a smaller or darker play area. In the rest ofthe responses, the children either would not have changed any-thing in the game (12%), responded only ‘‘�’’ (16%) or could notthink of anything in particular to change (3%). The new exercisesideated by the children were chiefly aimed at increasing theamount (e.g., more running and jumping) and types of physicalactivity (31%), introducing new or tweaked game mechanics(26%), and new story elements (24%), especially combatting theShadow.
The results of the data gathered after the third session showoutstanding potential for the concept and the game to be usedon PE classes on a regular basis. Although the story and exercisetasks changed from session to session, there was a risk that thechildren would have got too used to, or even bored with, the game.However, their enthusiasm and interest towards the gameremained on a high level. According to Wilcoxon Signed Rank Test,there were no statistically significant differences in the user expe-riences between the first and second questionnaire, i.e., in theexperiences gathered after the first and third session. The ratingsof the overall liking of the game (statement 15) reflect and sumupwell the children’s eagerness towards the game as also observedduring the sessions: the subjective results can be seen in Fig. 5.While no statistical significance, there seemed to be a slight trendtowards more positive answers concerning some statements. Forexample, after the third session as much as 60% (n = 73) of therespondents rated the liking of the game overall with the extre-mely happy face and only 1% selected an option on the negativeside, while the corresponding proportions were 53% (n = 68) and4% after the first session.
The open-ended feedback after the third session was influencedby the experiences from the two additional play sessions. Althoughgame elements with physical activity were still commonlyregarded as the best element of the game (31% of responses), themost prominent positive element was the Shadow (mentioned in47% of responses), both as a story element and in relation to thegameplay activities associated with avoiding and finally defeatingthe Shadow. Other significant positive themes are related to otherspecific story elements, such as the physically activating waterspell (19%) and animal sequences (10%). The primary negativefeedback issues were concerned with the warm-up sequence andawakening of magical powers (35% of responses) and the Shadowcharacter (6%). Technical and environment issues were also pres-ent, such as difficulties with understanding the speech of the Sha-dow (7%), glare from the lights (6%), and soreness of the back fromhaving to lie down on the floor (7%). The proportion of respondentswho explicitly stated they found nothing unpleasant about thegame was nearly as high as after the first session (21%), while 8%indicated the same by responding ‘‘-‘‘and 4% were uncertain (i.e.,‘‘I don’t know’’).
Our analysis revealed, that whether the participants exercisedon their free-time or not, or how much they liked physical exercise
482 T. Keskinen et al. / Entertainment Computing 5 (2014) 475–484
244

in general, had no statistically significant effect on the user experi-ences. However, whether the participants reported to play videogames had a slight effect on whether they found the exercise tasksto be too easy (X2 = 9.874, df = 4, p = 0.043): for example, a biggerproportion of those who played video games (n = 48) totally agreedwith the statement after the first session, but this effect did notexist in the experiences after the third session. Video game playersfound the story of the game to be more interesting (X2 = 11.282,df = 4, p = 0.024) after the third session than those who did not playvideo games.
Although nothing dramatic, some experiences correlated withage statistically significantly (r < ± 0.36, p 6 0.05). After the firstplaytime, surprisingly older participants thought playing washarder and they also understood the instructions of the exercisetasks worse, and after the third session, the older participants ratedthe overall liking of the game higher. A common trend for both rat-ing times was that older participants would like to move this wayagain even more than the younger ones. Gender also had an effecton some of the statements. After the first session, girls thought thatplaying was hard (X2 = 10.289, df = 4, p = 0.0363) and the exercisetasks were not seen as too easy (X2 = 19.506, df = 4, p = 0.001),but also that exercising was now more pleasant than usually onPE classes (X2 = 13.366, df = 4, p = 0.010) more often than the boys.After the third session, however, the only gender-related differencein the experiences was found considering the ability to move withone’s own style: the boys felt more often that they could movewith their own style (X2 = 16.301, df = 4, p = 0.003).
Although not covered here, the children’s extremely positiveattitude towards the game seen in the user experience results iswell in line with our observations, the feedback received fromthe teachers and also with activity levels measured. For example,the average number of steps per participant measured with the Fit-Bit� Flex™ wristbands showed an upward trend during the threeweeks: first week 794, second week 884 and third week 945 stepsper participant on average. This data obviously needs further, thor-ough analysis, but these numbers support the findings of the sub-jective data: the children did not get bored during the three weeks,but instead remained thrilled and kept on moving. Although thesubjective experiences seem overwhelming, based on the datafrom different sources we believe the results are genuine and thechildren were in fact having fun, and not trying to please anyonewith their answers.
7. Discussion
Light and sound do create a very strong effect, pulling childreninto the world of the story immediately. Speech is a powerful wayto tell a story but sound effects are very important in building theatmosphere. The story does not need to be told in any detail, verycompact descriptions of stereotypic scenarios are enough and play-ers’ imagination takes care of the rest. This means that creatingnew games does not require particular skills in storytelling; evenrather straightforward stories told via this kind of light and soundbased interaction seem to be compelling enough to motivate chil-dren to move. Still, the story and the world children’s imaginationcreates based on it seem to be a significant factor in the experience.In our long-term evaluation, as presented in this article, a profes-sional game designer created the story. However, as presented inour previous work [9], games created by children themselves canbe effective as well.
The basic concept works exactly as envisioned, with childrenparticipating in the physical activities even if they do not usuallylike sports. The facts that the game did not contain strong compet-itive elements, the protective element of the story, the darkness,and focus being on the story seemed to help achieve this goal
based on our observations. Although we had received very positivefeedback before from the one-playtime evaluations, we weregladly surprised how interested the children remained even afterthree play sessions. Somewhat contradicting to our previousresults, this time it seemed that older participants liked the gameeven better than the younger. Whether this change was causedby the multiple playtimes, a more interesting story, or somethingelse, is one of our future work items.
Looking at the results in the light of the requirements given byYim and Graham [17], we can see that they explain many parts ofthe success of our game: we applied music, and clearly this madethe experience more engaging and guided players towards thetempowe looked for in the different exercises. The game gave directinstructions to players, thus facilitating leadership. Early on in thegame, it could be noticed that the participants did not yet followthe instructions from the system without hesitation. This changedvery quickly once the game started progressingwhen they followedthe instructions. Before, when the game had the temporal extent ofone exercise session, i.e., less than an hour, the goals we provided toparticipantswere only short andmedium termgoals. The individualexercises could be considered short-term goals, while the entirestory of the game was the medium term goal. To make the gameinteresting in consecutive sessions, we had to introduce also longterm goals. The performance ratings that were given after theexercise tasks may have promoted such a long-term goal idea inthe minds of the participants motivating to succeed even betterthe next time. It should be noted that goals in our case are notdirectly related to exercise goals, which is what Yim and Grahamprimarily refer to. However, the story-based goals do address, atleast to extent the purpose of helping with self-efficacy issues,which they also discuss. Hiding players’ fitness levels is also rele-vant to help childrenwith low self-efficacy. In our solution, we sup-ported this by not putting any individual in focus during the game.The dark space, where light draws players’ attention, the perfor-mance of individual players does not get much focus from thegroup. Furthermore, the game does not really provide opportunitiesfor players to evaluate each other. In our co-creation workshops weobserved children themselves creating games including competi-tive elements [9]. Even these elements may not be preferred bythose with lower self-efficacy if applied for individuals, they mightwork well in group settings, as observed in our workshops.
Together, the above aspects created an atmosphere whereeverybody could enjoy the game without worrying about their per-formance. The game is played as a group and this group is givenbeforehand, and it is usually a class. In this sense the game doesnot really address the issue of grouping. The overall design focusedon the entire group working together to accomplish a commongoal. In this sense the game supported grouping and group sup-port. There were no elements, which separated the players. Thiscan also be considered a limitation, since the players could notget particular support they could get by forming smaller groups.Also, some results that may at first seem to be positive mightbecome challenges in the long run entertainment-wise. For exam-ple, the facts that the majority of the participants did not find play-ing to be hard or that they did not invent their own rules, may beissues that might need further consideration if the purpose of thesystem was purely to act as entertainment. On the other hand, tak-ing into account the varying levels of imagination and physicalabilities of individuals, this kind of a game designed for multiplesimultaneous players could not necessitate these properties tothe other extremes.
Above all, exercise games must be fun to work [13,17]. This goalthe game obviously reached. According to our observations andinterviews of schoolchildren and their teachers, the game matchedwell the players’ abilities and was safe to play, although includingquite hectic movement at times.
T. Keskinen et al. / Entertainment Computing 5 (2014) 475–484 483
245
8. Conclusion
The purpose of our work has been to create fun games for phys-ical education classes in order to motivate schoolchildren to exer-cise. Here, we have introduced our solution which is a systemutilizing speech-synthesized storytelling, audio effects, music andinteractive lighting. Based on our several evaluations in schools,schoolchildren receive the concept enthusiastically. The light andsound based game we have created does seem to encourage chil-dren to participate in physical exercise. The evaluations haveshowed that the story and drama elements can draw children intothe world of the exercise game and make them exercise withouteven realizing. Children’s imagination can play a great role in this.Our reasonably priced technological setup provides practical andexpressive means for creating immersive and rich experiences tosupport physical exercise education in schools.
Acknowledgments
This work was supported by the Finnish Funding Agency forTechnology and Innovation as a part of the ‘‘Active LearningSpaces’’ project, and the European Institute of Innovation &Technology (EIT ICT Labs). We thank the participating schoolsand project partners for collaboration.
References
[1] T. Baranowski, R. Buday, D.I. Thompson, J. Baranowski, Playing for real: videogames and stories for health-related behavior change, Am. J. Prev. Med. 34 (1)(2008) 74–82.
[2] T. Bekker, J. Sturm, B. Eggen, Designing playful interactions for socialinteraction and physical play, Pers. Ubiquitous Comput. 14 (2010) 385–396(5 July 2010).
[3] E. Brox, L. Fernandez-Luque, T. Tøllefsen, Healthy gaming - video game designto promote health, Appl. Clin. Inform. 2 (2) (2011) 128–142.
[4] M. Csikszentmihalyi, I.S. Csikszentmihalyi (Eds.), Optimal Experience:Psychological Studies of Flow in Consciousness, Cambridge University Press,1992.
[5] D.K. Eaton et al., Youth risk behavior surveillance – United States, 2011,Morbidity Mortality Weekly Rep. 61 (SS04) (2011) 1–162.
[6] V.A. Fogel, R.G. Miltenberger, R. Graves, S. Koehler, The effects of exergamingon physical activity among inactive children in a physical education classroom,Appl. Behav. Anal. 43 (4) (2010) 591–600.
[7] M.S. Hagger, N.L. Chatzisarantis, S.J. Biddle, A meta-analytic review of thetheories of reasoned action and planned behavior in physical activity:predictive validity and the contribution of additional variables, J. SportExercise Psychol. (2002).
[8] J. Hakulinen, M. Turunen, T. Heimonen, Spatial control framework forinteractive lighting, in: Proceedings of International Conference on MakingSense of Converging Media (AcademicMindTrek ’13), ACM, New York, NY, USA,2013, pp. 59–66.
[9] J. Hakulinen, M. Turunen, T. Heimonen, T. Keskinen, A. Sand, J. Paavilainen, J.Parviainen, S. Yrjänäinen, F. Mäyrä, J. Okkonen, R. Raisamo, Creating immersiveaudio and lighting based physical exercise games for schoolchildren, in:Dennis Reidsma et al. (Eds.), Proceedings of the 10th International Conferenceon Advances in Computer Entertainment (ACE ’13), Springer InternationalPublishing, 2013, pp. 308–319. LNCS 8253.
[10] F. Mueller, D. Edge, F. Vetere, M.R. Gibbs, S. Agamanolis, B. Bongers, J.G.Sheridan, Designing sports: a framework for exertion games, in: Proceedings ofthe SIGCHI Conference on Human Factors in Computing Systems (CHI ’11),ACM, New York, NY, USA, 2011, pp. 2651–2660.
[11] T. Park, U. Lee, B. Lee, H. Lee, S. Son, S. Song, J. Song, ExerSync: facilitatinginterpersonal synchrony in social exergames, in: Proceedings of the 2013Conference on Computer Supported Cooperative Work (CSCW ’13), ACM, NewYork, NY, USA, 2013, pp. 409–422.
[12] F. Peer, A. Friedlander, A. Mazalek, F. Mueller, Evaluating technology thatmakes physical games for children more engaging, in: Proceedings of the 10thInternational Conference on Interaction Design and Children (IDC ’11), ACM,New York, NY, USA, 2011, pp. 193–196.
[13] J. Sinclair, P. Hingston, M. Masek, Considerations for the design of exergames,in: Proceedings of the 5th International Conference on Computer Graphics andInteractive Techniques in Australia and Southeast Asia (GRAPHITE ’07), ACM,New York, NY, USA, 2007, pp. 289–295.
[14] U.S. Department of Health and Human Services. Physical Activity GuidelinesAdvisory Committee report. U.S. Department of Health and Human Services,Washington, DC, 2008.
[15] A. Whitehead, H. Johnston, N. Nixon, J. Welch, Exergame effectiveness: whatthe numbers can tell us, in: Stephen N. Spencer (Ed.), Proceedings of the 5thACM SIGGRAPH Symposium on Video Games (Sandbox ’10), ACM, New York,NY, USA, 2010, pp. 55–62.
[16] World Health Organization. Global Strategy on Diet, Physical Activity andHealth. Accessible online at: <http://www.who.int/dietphysicalactivity/childhood/en/>.
[17] J. Yim, T.C.N. Graham, Using games to increase exercise motivation, in:Proceedings of the 2007 Conference on Future Play (Future Play ’07), ACM,New York, NY, USA, 2007, pp. 166–173.
484 T. Keskinen et al. / Entertainment Computing 5 (2014) 475–484
246

Publications in the Dissertations in Interactive Technology series
Details of the dissertations are available athttp://www.uta.fi/sis/tauchi/dissertations.html.
1. Timo Partala: Affective Information in Human-Computer Interaction
2. Mika Käki: Enhancing Web Search Result Access with Automatic Categorization
3. Anne Aula: Studying User Strategies and Characteristics for Developing Web Search Interfaces
4. Aulikki Hyrskykari: Eyes in Attentive Interfaces: Experiences from Creating iDict, a Gaze-Aware Reading Aid
5. Johanna Höysniemi: Design and Evaluation of Physically Interactive Games
6. Jaakko Hakulinen: Software Tutoring in Speech User Interfaces
7. Harri Siirtola: Interactive Visualization of Multidimensional Data
8. Erno Mäkinen: Face Analysis Techniques for Human-Computer Interaction
9. Oleg Špakov: iComponent Device-Independent Platform for Analyzing Eye Movement Data and Developing Eye-Based Applications
10. Yulia Gizatdinova: Automatic Detection of Face and Facial Features from Images of Neutral and Expressive Faces
11. Päivi Majaranta: Text Entry by Eye Gaze
12. Ying Liu: Chinese Text Entry with Mobile Phones
13. Toni Vanhala: Towards Computer-Assisted Regulation of Emotions
14. Tomi Heimonen: Design and Evaluation of User Interfaces for Mobile Web Search
15. Mirja Ilves: Human Responses to Machine-Generated Speech with Emotional Content
16. Outi Tuisku: Face Interface
17. Juha Leino: User Factors in Recommender Systems: Case Studies in e-Commerce, News Recommending, and e-Learning
18. Joel S. Mtebe: Acceptance and Use of eLearning Solutions in Higher Education in East Africa
19. Jussi Rantala: Spatial Touch in Presenting Information with Mobile Devices
20. Katri Salminen: Emotional Responses to Friction-based, Vibrotactile, and Thermal Stimuli
21. Selina Sharmin: Eye Movements in Reading of Dynamic On-screen Text in Various Presentation Formats and Contexts
22. Tuuli Keskinen: Evaluating the User Experience of Interactive Systems in Challenging Circumstances
247