
Annual Report 2019-20 Wipro Limited - AnnualReports.com
345
Resilience Annual Report 2019-20 Wipro Limited Empowering
-
Upload
khangminh22 -
Category
Documents
-
view
1 -
download
0
Transcript of Annual Report 2019-20 Wipro Limited - AnnualReports.com

ResilienceAnnual Report 2019-20Wipro Limited
Empowering
Index
Corporate OverviewOverview of the Report 01
About Wipro 02
Empowering Resilience 04
Resilience meets crisis 06
Financial Highlights 08
Key Performance Metrics 10
Sustainability Highlights 12
Chairman’s Letter 16
Board of Directors 20
Leadership Speak 22
Management & Board ReportsManagement Discussion and Analysis
Industry Overview 26
Business Overview 26
Our Business Strategy 28
Operating Segment Overview 31
Good Governance and Management Practices 36
Capitals and Value Creation 39
Financial Capital 43
Human Capital 53
Intellectual Capital 56
Social & Relationship Capital 58
Natural Capital 63
Board’s Report 69
Corporate Governance Report 115
Financial Statements Standalone Financial Statements under Ind AS 137
Consolidated Financial Statements under Ind AS 207
Consolidated Financial Statements under IFRS 279
Business Responsibility Report 336
Glossary 343
Cautionary Statement Regarding Forward-Looking StatementCertain statements in this annual report concerning our future growth prospects are forward-looking statements, which involve a number of risks, and uncertainties that could cause actual results to differ materially from those in such forward-looking statements. The risks and uncertainties relating to these statements include, but are not limited to, risks and uncertainties regarding fluctuations in our earnings, revenue and profits, our ability to generate and manage growth, intense competition in IT Services, our ability to maintain our cost advantage, wage increases in India, our ability to attract and retain highly skilled professionals, time and cost overruns on fixed-price, fixed-time frame contracts, client concentration, restrictions on immigration, our ability to manage our international operations, reduced demand for technology in our key focus areas, disruptions in telecommunication networks, our ability to successfully complete and integrate potential acquisitions, liability for damages on our service contracts, the success of the companies in which we make strategic investments, withdrawal of fiscal governmental incentives, political instability, war, legal restrictions on raising capital or acquiring companies outside India, unauthorized use of our intellectual property, and general economic conditions affecting our business and industry. Additional risks that could affect our future operating results are more fully described in our filings with the United States Securities and Exchange Commission. These filings are available at www.sec.gov. We may, from time to time, make additional written and oral forward-looking statements, including statements contained in the company’s filings with the Securities and Exchange Commission and our reports to shareholders. We do not undertake to update any forward-looking statement that may be made from time to time by us or on our behalf.

Wipro Limited1
Corporate Overview | Management & Board Reports | Financial Statements
Overview of the Report
Welcome to our 5th Integrated Report!
This is our fifth Annual Report which includes financial and non-financial performance of IT business is and aligned to principles of International Integrated Reporting Framework (referred to as <IR> framework) developed by the International Integrated Reporting Council (IIRC).
In addition, the 2019-20 annual report is aligned to GRI Standards* required by Sustainability Reporting Guidelines of Global Reporting Initiative (GRI), Sustainability Accounting Standard Board (SASB), United Nation Global Compact (UNGC) and Business Responsibility Report (BRR) requirements of Securities and Exchange Board of India (SEBI). The Natural Capital section of this report includes the recommendations set out by the Task Force on Climate-related Financial Disclosures (TCFD) and CDSB (Climate Disclosures Standards Board) framework.
The report complies with financial and statutory data requirements of the Companies Act, 2013 (including the Rules made thereunder), Accounting Standards, the Securities and Exchange Board of India (Listing Obligations and Disclosure Requirements) Regulations, 2015 and the Secretarial Standards.
The topics covered in the report were identified through materiality determination exercise and stakeholder engagement process. The report incorporates financial and non- financial information – governance, environmental and social – in a manner that can help stakeholders understand how a company creates and sustains value over the long term.
**Additional supporting metrics are available at https://www.wipro.com/investors/annual-reports/
ResilienceAnnual Report 2019-20Wipro Limited
Empowering

Wipro LimitedAnnual Report 2019-20 2 3
Corporate Overview | Management & Board Reports | Financial Statements
Be passionate about clients’
success
Treat each person with
respect
Be global and responsible
Unyielding integrity in everything
we do
Be passionate about clients’ success. We succeed when we make our clients successful. We collaborate to sharpen our insights and amplify this success. We execute with excellence. Always.
We treat every human being with respect. We nurture an open environment where people are encouraged to learn, share and grow. We embrace diversity of thought, of cultures, and of people.
We will be global in our thinking and our actions. We are responsible citizens of the world. We are energized by the deep connectedness between people, ideas, communities and the environment.
Integrity is our core and is the basis of everything. It is about following the law, but it’s more. It is about delivering on our commitments. It is about honesty and fairness in action. It is about being ethical beyond any doubt, in the toughest of circumstances.
Wipro Limited (NYSE: WIT, BSE: 507685, NSE: WIPRO) is a leading global information technology, consulting and business process services company. We harness the power of cognitive computing, hyper-automation, robotics, cloud, analytics and emerging technologies to help our clients adapt to the digital world and make them successful. A company recognized globally for its comprehensive portfolio of services, strong commitment to sustainability and good corporate citizenship, we have over 180,000 dedicated employees serving clients across six continents. Together, we discover ideas and connect the dots to build a better and a bold new future.
We began our business as a vegetable oil manufacturer in 1945 at Amalner, a small town in Western India and thereafter, forayed into soaps and other consumer care products. During the early 1980s, we entered the Indian IT industry by manufacturing and selling mini computers. In the 1990s, we leveraged our hardware R&D design and software development expertise and began offering software services to global clients. In 2013, we demerged the non-IT Diversified Businesses. With a track record of over 25 years in IT Services, we are, today, focused entirely on the global Information Technology business. Wipro is listed on National Stock Exchange and Bombay Stock Exchange in India and New York Stock Exchange in the US.
For more information, please visit www. wipro.com
ValuesThe Spirit of Wipro is the core of Wipro. These are our Values. It is about who we are. It is our character. It is reflected consistently in all our behavior. The Spirit is deeply rooted in the unchanging essence of Wipro. It also embraces what we must aspire to be. It is the indivisible synthesis of the four values. The Spirit is a beacon. It is what gives us direction and a clear sense of purpose. It energizes us and is the touchstone for all that we do.
75 Years of transformation powered by Values, People, Purpose and Innovation
About Wipro

Annual Report 2019-20 4
Empowering Resilience
decisions have enabled us to meet the needs of changing markets, and will position us to emerge from the current climate stronger.
We have partnered with enterprises around the world to help them chart their paths forward. The adoption of digital business models will accelerate at an unprecedented pace. Technology will enable companies to maintain business continuity and build a foundation for sustainable growth. And ultimately, it will help our clients, our communities and our company be more resilient.
The world changed in a fortnight. As COVID-19 spread across communities, homes and affected businesses, citizens and enterprises alike were forced to rethink how they engage with one another. The global response has paved the way to an altered future, one in which business priorities & conversations have pivoted – maybe for forever. Enterprises are now worried less about disruptive technology, and more about how they can leverage technology to navigate disruption.
Over the years, Wipro has built deep expertise across industry domains, technologies & delivery models to enable growth and innovation for our clients. These strategic
Annual Report 2019-20 4

Wipro Limited5
Corporate Overview | Management & Board Reports | Financial Statements
Our Clients
With traditional businesses interrupted, many clients have expanded into new market segments and built new business models with Wipro by their side. We helped a leading group-purchasing organization develop and launch a new brand and online marketplace to meet the needs of non-acute healthcare facilities. As COVID-19 caused a spike in demand for certain items, the marketplace granted healthcare providers access to essential products they might not otherwise be able to procure. While filling this short-term and urgent need, the new marketplace will also enable the client to serve an untapped market for years to come.
Meanwhile, two of the world’s largest technology companies collaborated with Wipro to reimagine their supply-chain engagements. For one, we developed a new tool so the client could deliver streamlined and personalized communications across their global supplier network. For another, we migrated the functionality of four monolith applications to 39 microservices, reducing the client’s supply-chain maintenance costs and improving its time to market by 100%. With global supply chains reeling, these technologies will ensure our clients can maintain their high quality and respond with greater agility to future market changes.
Working with Wipro, enterprises have realized that the cloud is far more than a tool to improve efficiency and reduce costs. Cloud services play a crucial role across functions and are a foundation from which to accelerate business transformation. We helped a multinational food- and drink-processing company consolidate and migrate its technology landscape from three regions onto a single hybrid-cloud platform. Without disrupting its business, the client reduced its IT spends by 25% while improving its time to market, positioning it to respond with greater agility to future market changes.
Cybersecurity has long been core in our increasingly digitized world. As remote work and distributed talent become the norm, security will be a foundational piece for all sectors and value chains. A leading UK insurance provider worked with Wipro on a long-term roadmap to transform its enterprise security architecture to meet these future demands. By integrating contextual threat intelligence, behavior-based attacker detection and security automation, the client improved its overall security and met regulatory requirements while reducing its vulnerability to cyberattacks, which the World Economic Forum has labeled one of the top-four global threats.
Our Communities
The Spirit of Wipro underscores our unwavering commitment to client success. We also fully embrace our responsibility to be good global citizens. Technology can be a powerful tool for business, and it can deliver incredible results when leveraged for the common good.
When the COVID-19 lockdown began, more than 100 million migrant workers in India who wanted to return home often struggled for food, shelter and transport. We engaged with a group of non-governmental organization to rapidly develop and deploy a platform that connected people in need with assistance agencies across the country. As of May end, the platform had enabled support for more than 50,000 requests for help.
Our Company
Evolution is a Wipro hallmark. We will continue to embrace change to ensure our leadership position in a future that’s still being defined. Many of our investments will prove critical as our clients, community and world begin to normalize.
While enterprises and Chief Marketing Officer (CMOs) reimagine the online and offline customer experience, Wipro’s acquisition of Rational Interaction thrusts us squarely into the Customer Experience (CX) conversation. While Artificial Intelligence (AI) becomes a critical component in forecasting revenue and discovering cures for disease, our Wipro HOLMESTM cognitive platform positions us to contribute. And while social distancing forces a remote-work approach, “Talent as a Service” through Topcoder and our Agile Anywhere engineering framework make Wipro an invaluable resource for businesses worldwide.
As society, business and technology changes, some aspects will remain constant. With the cloud now a staple of modern commerce and operations, our full-stack offerings and Cloud Studios position us to continue delivering meaningful solutions and positive outcomes. With billions of IoT devices now deployed worldwide, our broad Engineering Services can help clients capitalize on those connections and their related data. With the definition of security now expanded beyond physical barriers, our portfolio of Cyber Defense platforms can help protect enterprises across all industries, devices, and geographies. And with companies now seeking powerful yet practical technologies to accelerate their transformation, Wipro Ventures will continue to bring cutting-edge solutions directly to our – and our clients’ – doorstep.
Enterprises have responded to the pandemic by taking a broader view of technology. As we emerge from the current climate, business leaders – much like governments and private citizens – will shift from reactive to proactive thinking. No longer will the focus be on responding to crisis, but on instilling ways of working and embracing solutions that empower a resilient future. Wipro is prepared to help forge that future, one in which everyone thrives: our clients, our communities and our company.
Wipro LimitedAnnual Report 2019-20 6 7
Corporate Overview | Management & Board Reports | Financial StatementsCorporate Overview | Management & Board Reports | Financial Statements
Tales of PERSEVERAnCE
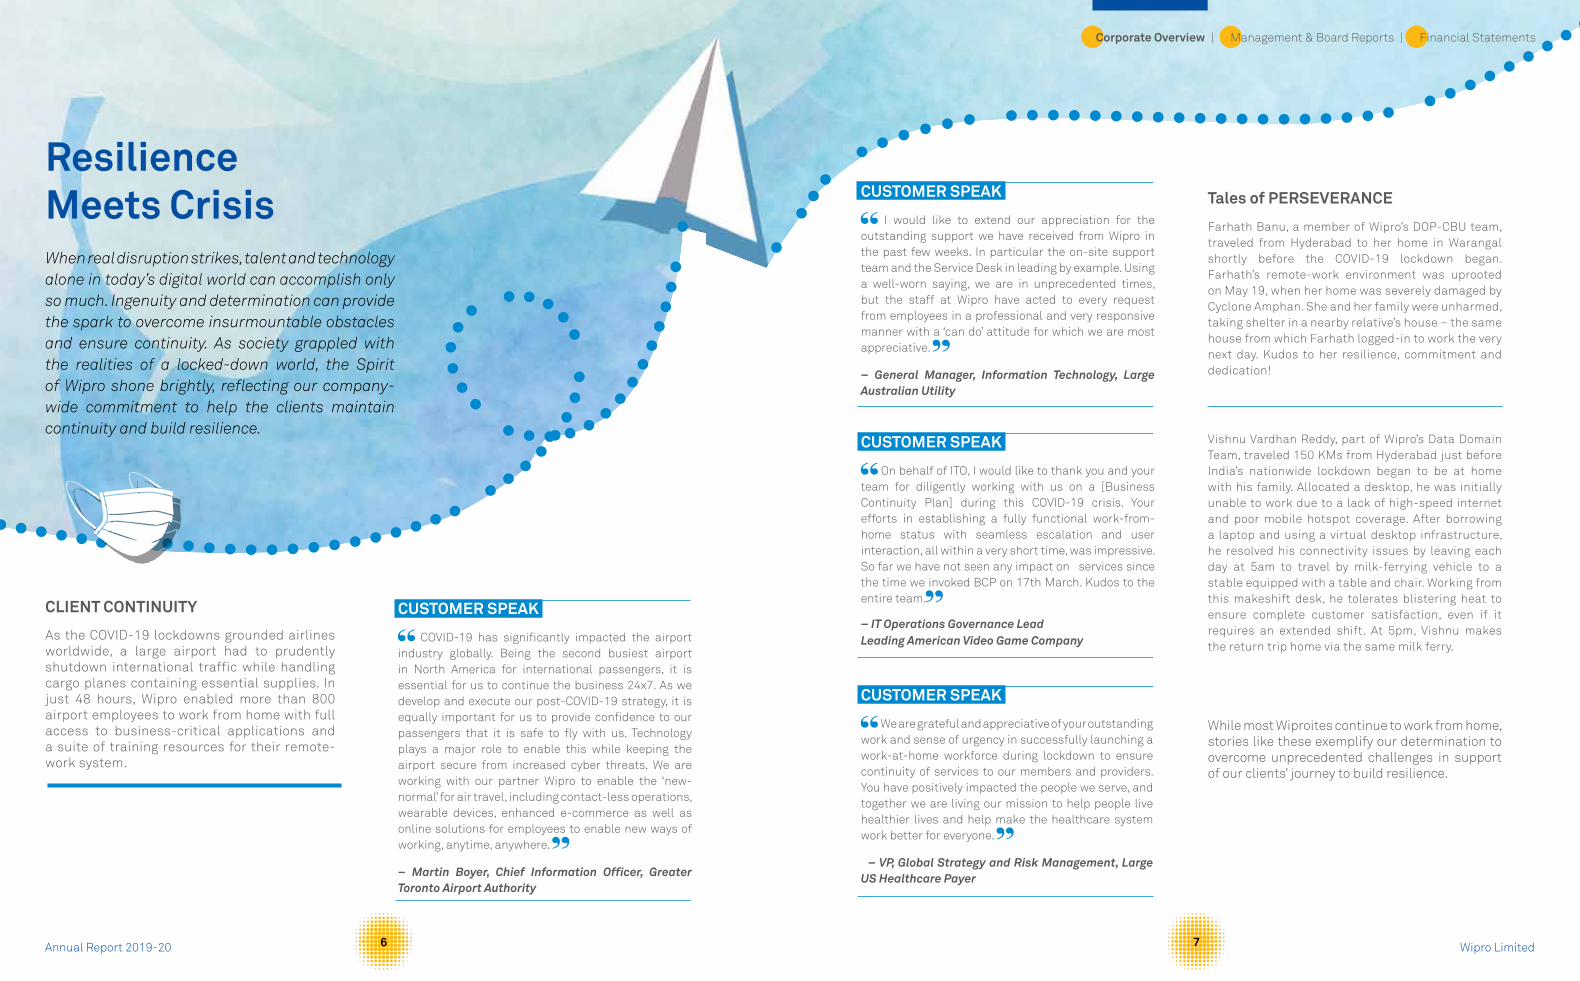
Farhath Banu, a member of Wipro’s DOP-CBU team, traveled from Hyderabad to her home in Warangal shortly before the COVID-19 lockdown began. Farhath’s remote-work environment was uprooted on May 19, when her home was severely damaged by Cyclone Amphan. She and her family were unharmed, taking shelter in a nearby relative’s house – the same house from which Farhath logged-in to work the very next day. Kudos to her resilience, commitment and dedication!
While most Wiproites continue to work from home, stories like these exemplify our determination to overcome unprecedented challenges in support of our clients’ journey to build resilience.
Resilience Meets CrisisWhen real disruption strikes, talent and technology alone in today’s digital world can accomplish only so much. Ingenuity and determination can provide the spark to overcome insurmountable obstacles and ensure continuity. As society grappled with the realities of a locked-down world, the Spirit of Wipro shone brightly, reflecting our company-wide commitment to help the clients maintain continuity and build resilience.
CUSTOMER SPEAk
COVID-19 has significantly impacted the airport industry globally. Being the second busiest airport in North America for international passengers, it is essential for us to continue the business 24x7. As we develop and execute our post-COVID-19 strategy, it is equally important for us to provide confidence to our passengers that it is safe to fly with us. Technology plays a major role to enable this while keeping the airport secure from increased cyber threats. We are working with our partner Wipro to enable the ‘new-normal’ for air travel, including contact-less operations, wearable devices, enhanced e-commerce as well as online solutions for employees to enable new ways of working, anytime, anywhere.
– Martin Boyer, Chief Information Officer, Greater Toronto Airport Authority
CUSTOMER SPEAk
I would like to extend our appreciation for the outstanding support we have received from Wipro in the past few weeks. In particular the on-site support team and the Service Desk in leading by example. Using a well-worn saying, we are in unprecedented times, but the staff at Wipro have acted to every request from employees in a professional and very responsive manner with a ‘can do’ attitude for which we are most appreciative.
– General Manager, Information Technology, Large Australian Utility
CUSTOMER SPEAk
On behalf of ITO, I would like to thank you and your team for diligently working with us on a [Business Continuity Plan] during this COVID-19 crisis. Your efforts in establishing a fully functional work-from-home status with seamless escalation and user interaction, all within a very short time, was impressive. So far we have not seen any impact on services since the time we invoked BCP on 17th March. Kudos to the entire team.
– IT Operations Governance LeadLeading American Video Game Company
CUSTOMER SPEAk
We are grateful and appreciative of your outstanding work and sense of urgency in successfully launching a work-at-home workforce during lockdown to ensure continuity of services to our members and providers. You have positively impacted the people we serve, and together we are living our mission to help people live healthier lives and help make the healthcare system work better for everyone.
– VP, Global Strategy and Risk Management, Large US Healthcare Payer
Vishnu Vardhan Reddy, part of Wipro’s Data Domain Team, traveled 150 KMs from Hyderabad just before India’s nationwide lockdown began to be at home with his family. Allocated a desktop, he was initially unable to work due to a lack of high-speed internet and poor mobile hotspot coverage. After borrowing a laptop and using a virtual desktop infrastructure, he resolved his connectivity issues by leaving each day at 5am to travel by milk-ferrying vehicle to a stable equipped with a table and chair. Working from this makeshift desk, he tolerates blistering heat to ensure complete customer satisfaction, even if it requires an extended shift. At 5pm, Vishnu makes the return trip home via the same milk ferry.
ClIEnT COnTInUITy
As the COVID-19 lockdowns grounded airlines worldwide, a large airport had to prudently shutdown international traffic while handling cargo planes containing essential supplies. In just 48 hours, Wipro enabled more than 800 airport employees to work from home with full access to business-critical applications and a suite of training resources for their remote-work system.

Annual Report 2019-20 8
Financial Highlights
(Figures in ` million except otherwise stated)
Financial performance 2015-16 2016-17 2017-18 2018-19 2019-20
Revenue1 516,307 554,179 546,359 589,060 613,401
Profit before Depreciation, Amortisation, Interest and Tax 111,825 116,986 105,418 119,384 126,592
Depreciation and Amortisation 14,965 23,107 21,124 19,474 20,862
Profit before Interest and Tax 96,860 93,879 84,294 99,910 105,730
Profit before Tax 114,933 110,356 102,474 115,415 122,512
Tax 25,366 25,213 22,390 25,242 24,799
Profit after Tax - attributable to equity holders 89,075 84,895 80,081 90,031 97,218
per share data
Earnings Per Share- Basic(`)2 13.60 13.11 12.64 14.99 16.67
Earnings Per Share- Diluted(`)2 13.57 13.07 12.62 14.95 16.62
Financial position
Share Capital 4,941 4,861 9,048 12,068 11,427
Net Worth 467,384 522,695 485,346 570,753 559,333
Gross cash (A) 303,293 344,740 294,019 379,245 334,134
Total Debt (B) 125,221 142,412 138,259 99,467 78,042
Net Cash (A-B) 178,072 202,328 155,760 279,778 256,092
Property, Plant and Equipment (C) 64,952 69,794 64,443 70,601 81,120
Intangible Assets (D) 15,841 15,922 18,113 13,762 16,362
Property, Plant and Equipment and Intangible Assets (C+D) 80,793 85,716 82,556 84,363 97,482
Goodwill 101,991 125,796 117,584 116,980 131,012
Net Current Assets 284,264 309,355 292,649 357,556 303,458
Capital Employed 592,605 665,107 623,605 670,220 637,375
Shareholding related
Number of Shareholders3 227,369 241,154 269,694 330,075 511,881
Market Price Per Share (`)4 211.6 193.4 210.9 254.8 196.7
1 Revenue is aggregate revenue for the purpose of segment reporting including the impact of exchange rate fluctuations2 EPS adjusted for the years prior to the bonus issue. Bonus issue in the proportion of 1:3 was approved by shareholders in February 20193 Number of shareholders (as at March 31st of respective years) represents holders of equity shares and does not include holders of ADRs4 Market price of shares is based on closing price in NSE as on March 31 of respective years and has been adjusted for bonus issue in 20195 In FY 2019-20, EPS growth is higher than Net profit growth largely due to reduction in number of equity shares due to completion of buyback
Wipro Limited9
Corporate Overview | Management & Board Reports | Financial Statements
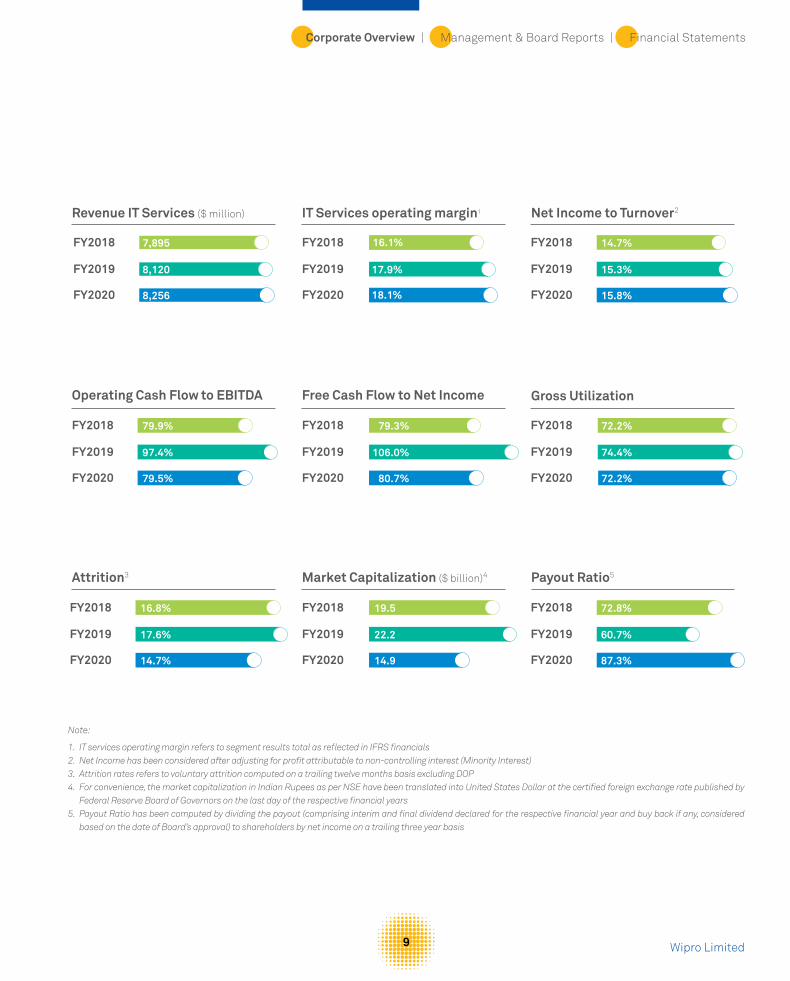
Note:
1. IT services operating margin refers to segment results total as reflected in IFRS financials2. Net Income has been considered after adjusting for profit attributable to non-controlling interest (Minority Interest)3. Attrition rates refers to voluntary attrition computed on a trailing twelve months basis excluding DOP4. For convenience, the market capitalization in Indian Rupees as per NSE have been translated into United States Dollar at the certified foreign exchange rate published by
Federal Reserve Board of Governors on the last day of the respective financial years5. Payout Ratio has been computed by dividing the payout (comprising interim and final dividend declared for the respective financial year and buy back if any, considered
based on the date of Board’s approval) to shareholders by net income on a trailing three year basis
Fy2020
Fy2019
Fy2018
IT Services operating margin1
16.1%
17.9%
18.1%
Fy2020
Fy2019
Fy2018
Free Cash Flow to net Income
79.3%
106.0%
80.7%
Fy2020
Fy2019
Fy2018
net Income to Turnover2
14.7%
15.3%
15.8%
Fy2020
Fy2019
Fy2018
payout Ratio5
72.8%
60.7%
87.3%
Fy2020
Fy2019
Fy2018
Operating Cash Flow to EBITDA
79.9%
97.4%
79.5%
Fy2020
Fy2019
Fy2018
Revenue IT Services ($ million)
7,895
8,120
8,256
Fy2020
Fy2019
Fy2018
Attrition3
16.8%
17.6%
14.7%
Fy2020
Fy2019
Fy2018
Gross Utilization
72.2%
74.4%
72.2%
Fy2020
Fy2019
Fy2018
Market Capitalization ($ billion)4
19.5
22.2
14.9

Wipro LimitedAnnual Report 2019-20 10 11
Corporate Overview | Management & Board Reports | Financial Statements
Annual Report 2019-20 10
natural Capital
612,115498,236
41.0%42.0%
41.0%
3.3%3.0%3.0%
17.21
6.54*
19.47
559,510
Total GHG Emission (tons of CO2 eq.)
Savings due to environmental initiatives (in Mn USD)
Water Recycled(as % of total water consumption)
Waste sent to landfill**
* FY19 valuation is based on new methodology that is detailed under Natural Capital Section. FY17 and FY18 valuation is not adjusted. Valuation for 2020 will be completed by July 2020.
** Excluding construction and demolition debris
Wipro Limited11
Corporate Overview | Management & Board Reports | Financial Statements
key Performance Metrics Fy 2018 Fy 2019 Fy 2020Human Capital
69.5% 33.0% 40.0% 67.6%
localization in On-shore Workforce
442 11035.0%163,827
545 12535.2%175,690
578 13235.0%188,270
Total Employees
Women Employees (%)
Persons with Disabilities
nationalities in Workforce
Intellectual Capital
Patents Filled Cumulatively till date
Patents Granted till Date
R&D Expenses (` million)
3,041
3,942
4,619
2,000+
2,200+
2,300+
380
558
741
Wipro LimitedAnnual Report 2019-20
Social & Relationship Capital
Revenue from Existing Customers
98.6%98.4%
98.1%
CSR Spend(` million)
1,8661,853
1,818
Community Partners
150+175+165+
Active customers
1,2481,1791,140
Total Employees Engagedwith Wipro Cares
25,000+30,000+32,000+
(volunteering or monetary contribution or both)
Increase in Customer net Promoter Score (basis points)
486 bps511 bps99 bps
1110
USA Uk AustraliaContinental Europe

Wipro LimitedAnnual Report 2019-20 12 13
Corporate Overview | Management & Board Reports | Financial Statements
155,000+employees trained in digital skills as of FY20
61,000+employees are members of TopGear - the social learning and crowdsourcing platform.
729,000+
hits on Wipro OnAir Podcasts, 130,000+ employees on the enterprise social platform Yammer and 64,000+ monthly active users on collaborative platforms like MS Teams
Employee Rotation Policy, Promotion Policy, Break-from-work Policy, Sabbatical Policy, Adoption Assistance Program, Company Car Policy and India Paternity Leave Policy enhanced based on employee feedback
100,000+employees covered in 20 locations in India and 8 locations outside India under ISO 14001 and OHSAS certifications
Sustainability Highlights
Empowering Workplace
Annual Report 2019-20
Ecological Sustainability
Wipro Limited
Corporate Overview | Management & Board Reports | Financial Statements
Biodiversity, Waste and Water
• 2.2% reduction in water consumption intensity to 930 liters per employee
• 18.5% YoY reduction in total waste disposed to 5,057 tons
• 3 biodiversity projects completed till date- Butterfly park, Wetland zone and thematic garden in Bengaluru and Pune
• Community Water Programs: Participative urban waterprograms in Bengaluru and Pune. Hosted a two-day program in Hyderabad on Urban Water
• Bengaluru Sustainability Forum: Supported 8 grantproposal on urban water, waste and biodiversity in FY20. Till date we have supported 19 such projects
Energy Emissions
• 35% (84 million units) of our total India Energy Consumption comes from Renewable Energy (RE)
• 53% increase YoY in energy saving due to server virtualization
• 9.8% reduction in business travel footprint in last three years
• 20.9% reduction in employee commute footprint in last three years
• 9.8% increase in global people based emissions intensity to 0.93 tons per person per annum
Wipro LimitedAnnual Report 2019-20 12 13

School Education
• Supported132organizationsworking towards systemic reforms in school education through 198 educational projects and initiatives across 29 states
• Supported16neworganizations in FY20. Cumulatively, 88 organizations supported towards our goal of 100 organizations by FY20; 60 under Seeding program and 28 under the Grants program
• 4RegionalPartners’Meetsorganized with participation from 150 participants
• Nearly42,000childrenfromunderprivileged communities benefited from our 22 education projects in 8 states through our community program
• Supportedtheeducationaland the educational and rehabilitative needs of over 7,200 underprivileged children with disabilities, through 16 projects in 6 states
Sustainability Education
• Recordedhighestparticipation in flagship Wipro Earthian program from 1,498 schools and colleges across 79 districts in 29 states and 3 UT’s in FY20
• LaunchedWiproSustainabilityEducator Program, to support grassroots environment educators across India. 11 educators selected from 10 NGO’s
• FacultyDevelopmentProgram on sustainability, MOOC’s launched at IIMB for 39 faculty across India focusing on simulating exercises on climate change and energy for participants
• 6sustainabilityquizzesconducted with 1,354 participants from 677 teams
• 22collegesustainabilityinternships facilitated at 6 partner organizations
Science Education Fellowship Program
• Wipro Science Education Fellowship Program running in partnership with 7 universities is working with 500 teachers across 35 school districts in 7 states across the USA
• DevelopedUK’sfirstMaster’sprogram in STEM education in partnership with King’s College, London. The first batch which includes 15 in-service teachers on Wipro Fellowship, as well as 2 international students are progressing as per plan
• ‘WiproTeacherFellowship’and ‘Wipro Teacher Mentor’
Engineering Education
• Supported33,000studentsto pursue higher education in engineering through WASE,
Annual Report 2019-20
• Over122,000peoplefromdisadvantaged communities have access to primary healthcare through 9 healthcare projects across 5 states
• Restoredlivelihoodsofmorethan 8,000 people affected by natural disasters (cyclones & floods) through 6 rehabilitation programs across Kerala, Odisha, Uttarakhand and Tamil Nadu
• Urbansolidwastemanagement project in Bengaluru and Mysuru provides social, nutritional and health security to more than 12,000 workers in the informal sector
• Agro-forestryprojectinrural Tamil Nadu helped 100 farmers in integrated farming by planting 40,000 trees and benefited 400 farmers through seed distribution and training programs
Community Care
Wipro Limited
Corporate Overview | Management & Board Reports | Financial Statements
Education
WiSTA and WIMS programs cumulatively. In FY20, the total number of new entrants into the work integrated learning program was 2,697 while the aggregate strength across 4 years was about 9,000
• Trained25,000studentsand 49 faculty in digital technologies through our program TalentNext till date. 10% of students have joined our organization. In FY20, 453 students joined while 757 were selected for FY21
programs in partnership with Sheffield Hallam University (SHU UK) to provide rigorous continuous professional development to STEM teachers. SHU had recruited 35 new STEM teachers and teacher mentors in Q2
• MemberofDowJonesSustainabilityIndex(DJSI),World for the 10th time in a row
• Namedas2020World’sMost Ethical Company for the 9th successive year by the Ethisphere Institute
• Ecovadis-CSRratingofGold
• MemberofVigeoEirisEmerging Market Sustainability Index (comprises of the 70 most advanced companies in the Emerging Market Region)
• MemberofFTSE4GoodIndex Series and also a global sector leader
• ReceivedA-inCarbonDisclosure Project
• Participatedinsustainability assessment anchored by 100+ customers
• AdoptedEPEATprogram in 2016 for IT hardware procurement for laptops, desktops, printers, mobiles and servers. In CY 2019, purchased 108,000+ Gold, Silver and Bronze category products
• Topcoderisourcrowdsourcing platform for enterprise with 1.6 million members from 255 countries- close to 26K challenges and tasks were completed for Wipro customers in FY20
Customer &Suppliers
Rewards & Recognition
(CDP) - Climate Change Assessment
• ReceivedBestofBestAwardfor FY19 from ‘Association for Talent Development’ (ATD)
• CertifiedTopEmployerinAustralia 2020
• CertifiedGreatPlacetoWork, India
• WinnerattheNASSCOMDiversity and Inclusion awards (2019) for the ‘Gender Inclusion’ category
• FeaturedintheBloombergGender Equality Index 2020
• Receivedascoreof90out of 100 on the 2020 Corporate Equality Index
• AnnualHRDistinction
Awards 2019, UK: Winner in the category “Distinction in Inclusion and Diversity”
• 2019WorkingMother& Avtar Most Inclusive Companies Index (MICI): Declared as a “Champion of Inclusion”
• 2019WorkingMother&Avtar Best Companies for Women in India (BCWI) list: declared as one of the “100 Best Companies for Women in India
• “StarPerformeroftheyear” in Everest Group PEAK Matrix™ Service Provider of the Year awards for 2020
14 15

Annual Report 2019-20 16
Dear Stakeholders,
As I write this, we are in the middle of the biggest crisis we have seen in our lifetimes, the COVID-19 pandemic. So far, it has created unprecedented socioeconomic disruption, fear and the tragic loss of human life. The collapse in economic activity this time is likely at a level unseen in previous recessions. The exit path remains a vaccine and till then it is likely to be a bumpy ride with a continuous stop-start rhythm and strict health protocols.
Having said that, most of us have lived through economic crises before. Each time the agony has been different but each time we have adapted and bounced back. I am hopeful that like all previous crises, the COVID-19 calamity will also pass and in time, a fresh wave of business energy will be unleashed. The next few months will be critical for organizations as they build their resilience in order to persist, resurrect their businesses and master the new business environment.
Chairman’s letter
“I am confident that we will emerge from this crisis, a stronger Wipro and a more valuable partner to our clients than ever before.”

Wipro Limited17
Corporate Overview | Management & Board Reports | Financial Statements
Empowering Resilience for a brighter future
As companies focus on resilience to survive and thrive, one trend that I see accelerating is the rapid adoption of technology. Businesses across the world were undertaking large changes, even before the outbreak, but this crisis now provides an opportunity to hasten the transformation which will be imperative to the existence of many. Uneasy consumers will precipitate this shift to digital across industries and markets. We expect a profound impact on the established ways of operations. The work needs to be done ‘anywhere by anyone’. Virtual, remote, community-based and distributed work models will become mainstream, empowered by collaborative technologies. Enterprises will also need to evaluate their technology stack so that it enables them to operate with flexibility and agility, and work with partners who can respond and adjust quickly to changing circumstances.
Our strategy of driving a “Digital first” approach through four foundational pillars of Business Transformation, Modernization, Connected Intelligence and Trust become particularly relevant in this context. We have made differentiated investments to strengthen our offerings in digital, cloud, engineering and cybersecurity. Digital has now become the only way forward. We have made massive strides in accelerating our clients cloud journey through our differentiated cloud studios. We are continuing to enhance go-to-market partnerships with hyper-scalers and focused on creating innovative solutions. We have been endorsed as leaders by key analyst firms which reinforces our position as a trusted partner who drives value across three key pillars – Business acceleration, Customer experience and Connected Insights. We continue to make disproportionate investments in cybersecurity in areas like Security Strategy, Compliance Advisory, Cloud Security and OT & IoT Security to address the dynamic threat landscape. We now have 15 cyber defense centers across the world to locally manage security operations. We have partnered strategically and actively with the start-up ecosystem. Wipro Ventures, our corporate venture fund, has invested in cybersecurity start-ups like IntSights, Vectra.AI, CyCognito and CloudKnox.io. Our delivery model that enables a virtual, adaptive, and intelligent enterprise is based on the principles of distributed, no-shore, agile workforces and a cloud-first approach. We are able to provide virtual and community work models leveraging our solutions, such as Talent as a Service (“TaaS”) through Topcoder. This platform provides continuous connectivity with seamless end-point security, access from anywhere and real-time collaboration.
The other objective that will remain of paramount importance is of employee safety and well-being. In March, at the early onset of COVID-19, we successfully triggered our business continuity plans and enabled work from home for more than 90% for our global employees. What has been heartening is that a change of this scale was executed very smoothly. In these past few months, we have settled well into this new way of working and our focus remains to provide impeccable service to our customers. We actively leverage collaborative technologies to remain connected and engaged, ensuring employee welfare and seamless customer service delivery. We believe strongly that the model of work has changed forever, and we will never go back fully to the old ways of working. We will increasingly leverage more technology to onboard, induct, train and engage with our employees, and our workforce will never come back to a 100% work from office mode.
As the world’s best scientific minds scramble to find a vaccine or a cure for the virus, as businesses we have a deep responsibility to the communities within which we operate. Our response is an integrated set of carefully targeted actions that we are implementing in close collaboration with the Azim Premji Foundation and Wipro Enterprises Pvt Ltd, where we have jointly committed `1,125 crores (~$150M). Our commitment rests on two crucial pillars, the first is to balance short-term relief with medium-term requirements over the next 12-18 months and the second is to prioritize our effort to the most vulnerable sections of society who have been most adversely affected. A crisis like this requires us to think differently and to respond in an innovative, dynamic manner. A good example of this is how we repurposed the kitchen infrastructure in our facilities in Bangalore, Pune and Kolkata to provide cooked meals twice daily for more than 45 days running to thousands of vulnerable families in India. We have been able to provide around 3 million meals during this period serving more than 250,000 people. The other example is re-purposing one of our unused campuses in Pune into a 450 bed COVID-19 isolation hospital. Wipro Limited has specifically committed ̀ 100 crores towards these efforts and contributed `25 crores of this to the Prime Minister’s relief funds.
Our performance & Return to Shareholders
For the year ending 31st March 2020, our IT Services Revenues at $8.26 billion grew by 3.9% YoY (in constant currency and after adjusting for the divestments) and our Net Income at `97.2 billion grew by 8.0% YoY aided by improved operating

Annual Report 2019-20 18
margins, higher other income and lower taxes. For the full year the EPS was at `16.67 per share up 11.2% YoY and the Operating Cash Flows at `100.6 billion was at 103.5% of our Net Income. Our Gross Cash is at $4.4 billion and Net Cash is at $3.4 billion. Our pay-out for FY20 is at `112.2 billion through buyback and dividends (including dividend distribution tax) to our shareholders, which is 115.4% of our Net Income. The cash on our balance sheet provides us with the ability to pursue strategic organic investments as well as mergers & acquisitions.
Our Values & Growth mindset
This year is also a special year in our history as we turn 75. While our company has transformed many times over the years, the one fundamental constant which has always been at our core is our values that we call the ‘Spirit of Wipro’. With every passing year, our commitment to the success of our clients and our resolve of unyielding integrity has only strengthened. The other intangible factor that drives enduring success in business is the culture of the organization which is experienced through five key habits. These habits are our values in action and represent how you experience us every
day. These five habits are Being Respectful, Being Responsive, Always Communicating, Demonstrating Stewardship and Building Trust. I believe in their power together to deliver a great impact. One of the things that I have spent a significant amount of time over the last few months is on this cultural transformation. I am humbled and energized in seeing our values and culture at every level in the organization, not just in matters of business, but also in our strong sense of purpose to our communities and the worlds at large. I am confident that we will emerge from this crisis, a stronger Wipro and a more valuable partner to our clients than ever before.
Earlier this year inJanuary, ourCEO,AbidaliNeemuchwaladecided to step down from his role due to personal commitments, I want to thank Abid for all that he has done for Wipro and for the commitment and passion he has brought to the job every day over in these last five years. The Board and I are pleased to announce the appointment of Thierry Delaporte as our new CEO & Managing Director, effectiveJuly6,2020.Thierrybringswithhimanexceptionalleadership track record, strong international exposure, deep strategic expertise, a unique ability to forge long-standing client relationships, and proven experience of driving transformation and managing technological disruption. I believe that Thierry is the right leader for Wipro to drive us forward in our next phase of growth.
Lastly, I am truly humbled at being appointed Chairman of Wipro Limited. I have begun this journey with a deep sense of gratitude - it is both an honor and a privilege to lead our company. I am thankful to our clients, partners, and other stakeholders who have reposed their trust and confidence in me and team Wipro. We are committed to work through the current environment and our future feels bright and exciting. Together, we shall overcome and triumph!
Very Sincerely,
Rishad A premjiChairman
Together,
we shall
overcome and
triumph!

Wipro Limited19
Corporate Overview | Management & Board Reports | Financial Statements
I am deeply honored to be invited to lead Wipro, an extraordinary company and an exemplary corporate citizen with a deep technology heritage built on a strong foundation of values. I look forward to working closely with Rishad, the Board, senior leadership and the hugely talented employees of Wipro to turn a new chapter of growth and build a better tomorrow for all our stakeholders.
*Chief Executive Officer and Managing Director of the Company with effect from July 6, 2020
Thierry Delaporte*

Wipro LimitedAnnual Report 2019-20 20 21
Corporate Overview | Management & Board Reports | Financial Statements
Board of Directors
Azim H PremjiFounder Chairman
Rishad A PremjiChairman
Ireena VittalIndependent Director
William Arthur OwensIndependent Director
Thierry Delaporte 1Chief Executive Officer & Managing Director (Designate)
Deepak M. Satwalekar 2Independent Director Arundhati Bhattacharya 3
Independent Director
M K SharmaIndependent Director
Patrick DupuisIndependent Director
Dr.PatrickJEnnisIndependent Director
1 Appointed as Chief Executive Officer and Managing Director of the Company with effect from July 6, 20202 Appointed as Independent director with effect from July 1, 20203 Steps down as an Independent director with effect from close of business hours on June 30, 20204
Resigned as the Chief Executive Officer and Managing Director with effect from the end of the day on June 1, 2020
Abidali Z Neemuchwala 4
Chief Executive Officer &
Managing Director

Annual Report 2019-20 22
Given these times, what are the key attributes/factors that distinguish resilient enterprises from others who have struggled to cope with the crisis?
Bhanu: A resilient enterprise distinguishes itself in its preparedness & response during times of crisis. When a crisis hits, we believe that all enterprises are tested in their ability to respond, react and thrive. To respond with urgency, they need to have a strong BCP framework that can be put into action in no time. For instance, we established three task forces to formulate our immediate response to secure and stabilize our workforce, move operations to Work From Home (‘WFH’) model and manage client priorities. From a short-to-medium term, enterprises need to initiate changes to sustain and redefine business operations, such as enabling clients and themselves to “work from anywhere” with digital enablement. Finally, to thrive in the long-term, organizations need to build strategies to come out stronger. Resilient enterprises possess three fundamental attributes that separate them from the rest:
1. Strong leadership, culture and processes to sense and respond with agility, along with a ‘growth mind-set’ to accelerate the pace of change and adaptability
2. A ‘Digital First’ approach that minimizes business disruption and helps to accelerate growth and profitability in the long term
3. Ability to leverage their ecosystem of alliances, partners, start-ups and academia for a collaborative and innovative approach to build enterprise solutions for newer and more complex business problems.
Do you think that the disruption caused by the pandemic will change the pace of ‘Innovation’ if ‘resilience’ becomes priority?
Bhanu: Disruption and uncertainty caused by a pandemic can lead to a knee-jerk reaction & sometimes drive a short term orientation to innovation, while resilience becomes an immediate priority. However, in leading organizations, resilience and innovation go hand in hand. This may require re-purposing businesses to serve new and unforeseen types of demand, new clients and markets. Through our own experiences, we’ve seen how this crisis has challenged enterprises to take bold steps to do the things that were earlier thought to be outside the realm of possibility, such as moving 90-95% of the workforce to a WFH model, managing transitions and cut-overs remotely, or even moving
leadership Speak
Bhanumurthy B.M.Chief Operating Officer
JatinDalalChief Financial Officer
Saurabh GovilChief Human Resources Officer

Wipro Limited23
Corporate Overview | Management & Board Reports | Financial Statements
How will engaging with talent change in this new paradigm of working- in terms of onboarding, reskilling & sustaining positivity of the teams?
Saurabh: We have made significant investments in technology including an upgrade of our hiring and learning management systems to enable a smooth and powerful experience for employees. We have onboarded 5,000 plus employees virtually in a seamless manner in the past few months. Re-skilling has clearly shifted to the hands of the employee with Wipro providing the enabling infrastructure. Learning relevant technologies anywhere / anytime is the way to go. Through Topgear, our internal talent transformation platform, we have been able to make the experience flawless and engaging. At 90%+ employees on a WFH model, the organization has undergone a 10x change compared to normal in a very short span. It is heartening to note that employees have adapted to the new ways of working very well. We have kept our employee at the center during this pandemic, focusing on their safety, wellness and above all, as much as possible, protecting their jobs. Over the next 18 months, I believe that the workplace situations will continue to emerge and organization will have to remain nimble-footed and responsive. We have a well-crafted strategy around it.
significant chunks of workloads to the cloud from a complete on premise model. We also see how the crisis has become a driving force for clients to leverage open innovation networks, partner ecosystems, IP based solutions, and crowdsourcing to innovate and bring changes in ways of working. For example, our clients are embracing open innovation to access niche talent and technology solutions from our start-up ecosystem at Wipro Ventures. Similarly Topcoder’s “Talent as a Service” (TaaS) offering is helping clients access talent from the gig economy to deliver on their most pressing ideas and for faster go-to-market. Clients are also pivoting to re-invent their business and operating models by leveraging our capabilities in design, consulting and digital, a trend we only see accelerating into the future.
Based on the conversations we are having with the customers, where do we see prioritization of investment dollars vs optimization or decreases in spend?
Jatin: Like Bhanu mentioned, most of our customers will continue to invest in technology to thrive in the new environment. Newer business models, need for optimizing resource utilization and staying competitive - all key priorities for a modern day’s enterprise, require IT investments. The top three areas where customers will prioritize their spend are Cloud, Collaboration and Cybersecurity.
We will see cloud-based technologies being adopted at an increased velocity to unlock the next wave of cost savings, to drive greater resiliency and to improve customer experience. Whether it is an AI-supported, digitally optimized contact center with cloud-based communication or cloudifying/SaaSifying supply chains, adopting cloud will be the mainstay for CXOs. With workforces going remote, two things will take center stage, one improving employee experience through use of various collaboration technologies and two managing the cyber threats that have escalated significantly. While Saurabh will talk about how Wipro has managed employee experience for a large WFH environment, I can see why organizations will invest in virtual workplaces. We have observed a surge in productivity and an enhanced engagement among all key stakeholders of the enterprise. The increase in threat surface area also means that CISOs will need boost the security infrastructure. A recent report found that 70% of CIOs will be making additional financial investments in cybersecurity. After all, the cost of a breach is much higher than investing in the first place.
Overall, we believe that the secular trend around IT investments will remain on an upward curve. We anticipate that in order to conserve cash, businesses will look for ways to reduce capex on IT and shift spends to a variable model. We are actively working with our customers on some of these commercial constructs.
Adaptable,
Agile, Safe
and Resilient
Enterprise

Annual Report 2019-20 24
a model that blends the best of work-from-office, remote-working and crowdsourcing making it boundary less while being resilient and secure.
2. Method of ‘The Wipro Way of Working’: A method that involves bringing together years of experience in delivering excellence coupled with innovative methods that deconstructs work and how it is executed in an agile-anywhere, community based and remote manner for a location agnostic (no-shore) world.
3. Machinery as in “Engineering that powers the Wipro Way”: The machinery integrates the technology assets to deliver value at the intersection of partner tools, Wipro and client assets. It comprises of holistic engineering solutions that democratize our engineering assets and capabilities to empower our teams to create value for clients irrespective of where they are.
4. Mind-set of “New age talent focused on problem discovery and solving through continuous learning”: A mind-set that shifts the paradigm from solution execution to problem discovery and problem solving through learning that is on-the-go, fit for purpose and full spectrum resulting in π/X shaped talent.
Simply put, the ‘Proteus Stack’ is Wipro’s answer to transforming the traditional delivery model.
What are the employee safety measures that Wipro will adopt as an organization when they get back to offices?
Saurabh: We continue to have ~90% of our employees in a WFH mode. In parallel, we have put in place a comprehensive plan for those who have to come to our offices including – social distancing, thermal checks before they enter the facility, presence of medical staff in our premises, sanitization of common areas as well as desktops/workstations We are also engaged in campaigns on comprehensive hygiene practices for our employees. Finally, there is continuous dialogue with our employees, assuring them and their families that our offices are safe for work. Over the period of next few months, we will have a phased approach of getting more people to work in our campuses.
Wipro has a robust balance sheet with a gross cash of $4.4 billion and in the past we have made several bold bets in terms of both organic and inorganic investments. What is our strategy going forward?
Jatin: We have a very clearly articulated strategy around which all our organic and inorganic bets are made. Through our ‘big bets’ program we have made differentiated organic investments in four areas of Digital, Cloud, Engineering
We have been investing in a “Digital First” approach now for the last three years, how can these strengths be leveraged by our customers as they get back to business?
Bhanu: As I mentioned earlier, a “Digital First” approach is one of the key attributes that distinguishes resilient enterprises from others. Enterprises where digital has been a core and strategic priority have weathered the crisis bravely. Whether it is the ability to operate in a virtual model, buy/consume services on demand, leverage talent on demand, or drive contactless ways of working, digital enablement has been the critical element in sustaining and accelerating business growth and profitability.
The solutions and frameworks developed as a part of our Digital First approach is already helping customers to be responsive and resilient as they get back to business. For instance, our IP based offerings such as LiVE Workspace™ Connect for efficient remote working, the cloud enabled VirtuaDesk™ VDI solution, Wipro’s SmartTwin and Cognitive SupplyChain solutions to rethink supply chain resilience, Digital Assurance as a Service to enable remote testing and our Wipro HOLMES™ based customer engagement solutions are seeing an increased pace of adoption. Our Digital First approach recently helped some large clients such as those in the financial sector to quickly process loan disbursals, develop online solutions to help their customers avail stimulus packages, and also manage supply chain planning to effectively deliver essential goods to those in need.
As we look into the future, will we need to transform the traditional IT Services delivery model and how ready is Wipro to adapt?
Bhanu: The pandemic has massively accelerated the adoption of the ‘no-shore’ model and tilted most business operations towards remote delivery models. At Wipro we have been at the forefront of pioneering the ‘no-shore concept’ and ‘crowdsourced and community’ model of delivery. Now, as our clients’ ecosystem resets itself and works towards being future ready, we have launched an adaptive and boundary less operating model called the ‘Proteus Stack’ (named after the Greek sea god) to demonstrate our flexibility, versatility and adaptability towards the changing situation.
The ‘Proteus Stack’ is built on our existing ‘4M framework’ that comprises of:
1. Model as in ‘How teams are organized’: As digital transformation accelerates over the next few years, more and more organizations will choose to move to teams/structures that are designed to anticipate customer needs and align to business first principle. We have established

Wipro Limited25
Corporate Overview | Management & Board Reports | Financial Statements
Services and Cyber Security. Most of these investments have been made with a view to building consultative selling, enhancing technical depth and developing a vibrant partner ecosystem. Our ‘Innovation ecosystem’ helps us tap leading-edge and disruptive technologies to bring the best solutions to our clients through our three-pronged initiatives: Wipro Ventures, Horizon Program, and selective M&A.
In FY20 we acquired Rational and ITI technologies. Rational strengthens our customer experience portfolio and ITI enhances our capabilities in Product Lifecycle Management (PLM). We continue to actively look at opportunities that provide us with newer technological capabilities or provide access to a newer market or customer.
Wipro Ventures which was launched as a $100 million Fund in early 2015. We have launched Fund-2 with an allocation of $150 million earlier this year. Wipro Ventures invests in early- to mid-stage enterprise software startups. As of March 31, 2020, Wipro Ventures has active investments in and partnered with 14 startups in the areas of AI, Business Commerce, Cybersecurity, Data Management, Industrial IoT, Automation and Cloud Infrastructure. So far, our experience has been quite encouraging.
The goal of the Horizon Program is to drive organic incubation in emerging areas covering products, platforms, solutions and capabilities. During the year ended March 31, 2020, we funded 12 projects as part of this program in areas such as robotics, software-defined everything, autonomous vehicle, connected cars, digital twins, industry solutions such as cargo management etc.
Wipro’s margins have been resilient over last two years. Given that the demand side pressures that will impact our growth rates in Fy21, what are the levers on the cost side that provide a strategic flexibility?
Jatin: Our ability to defend our margins in the last two years was a result of the actions we took on improving the quality of our revenues, enhancing automation/AI in our delivery and optimizing the costs in our operating subsidiaries. We expect that the demand will remain an evolving topic in FY20-21. In response to this uncertainty, we have developed a comprehensive cost management program. We will have to make some tough choices in short term, but these will be
equitable and in resonance with the scale of challenge I am confident we will come out stronger and fitter from this phase. From a medium-term perspective, automation and offshoring will be the two key levers that will transform our cost structure. Finally, our cost management program is focused on right areas and we will not compromise on investments. In fact, crises like this provide an excellent ‘reset opportunity’ and we remain committed to spends in areas that will shape our future.
Will some of the actions that are necessary to defend margins have any impact on our ability to attract and retain the top talent?
Saurabh: Our cost management program will reflect some tough choices. However, they are equitable and in line with the external environment. Also, these are not taken in isolation but through a continuous dialogue and communication with our employees. Our employees understand the purpose of these actions and that these are short term in nature. The crisis we are in, is unprecedented and our response is a collective and resolute. Such times build our resilience as an organization and an employer. Many of our employees who have worked with us for decades, know and understand that Wipro remains the best employer for long-term career growth. We are confident that will continue to hire and retain top industry talent.
Wipro’s Free cash flows as a % of net Income in the last few years have been amongst the best in the industry. Also, the corporate actions that Wipro has undertaken have ensured a healthy EpS growth of 11.2% yoy. In the post COVID era, do we see a change to our capital allocation philosophy?
Jatin: We have a robust business model. While there is a lot of uncertainty on the horizon, we have been through such adverse cycles before. We are quite confident about continuing to generate healthy free cash flows. Our capital allocation policy is to return 45% to 50% of the Net income to our shareholders over a block of years through a combination of dividends and buy-back. In the last three years our payout ratio has been even higher at 87.3%. Presently we do not foresee any changes to our articulated policy and remain committed to generating consistent returns for our shareholders.

Annual Report 2019-20 26
InDUSTRy OVERVIEWGlobal IT service providers offer a range of end–to-end software development, digital services, IT business solutions, research and development services, technology infrastructure services, business process services, consulting and related support functions. According to the Strategic Review 2020 published by NASSCOM (the “nASSCOM Report”), IT export revenues from India grew by 8.1% to an estimated $147 billion in the fiscal year 2020. India’s global IT industry grew by 7.7% to reach $191 billion during the year ended March 31, 2020. According to the NASSCOM Report, “Digital” continues to drive growth (more than 50% of growth in fiscal year 2020) and now contributes $51 billion to the overall IT industry in India. Technologies such as industrial automation, robotics, cloud, Internet of Things (“IoT”), augmented reality (“AR”)/virtual reality (“VR”) and blockchain continues to fuel growth.
Growth in core traditional services revenues are expected to be moderate, whereas digital technology is continuing to gain prominence due to increased technology adoption by governments and businesses upgrading platforms, products
and solutions to enhance the consumer experience. Big data and analytics, cloud computing, cybersecurity and advanced technologies such as artificial intelligence (“AI”), machine learning (“Ml”), IoT, robotics, and 3D printing are profoundly impacting enterprise, government and end consumer segments by enabling new business opportunities across sectors.
The markets your Company serves are undergoing a massive disruption due to the outbreak of COVID-19. The situation caused by the COVID-19 pandemic continues to evolve and the effects on such markets remain uncertain. The outlook going forward will depend, in addition to other factors, on how COVID-19 continues to affect the global economy.
BUSInESS OVERVIEWWe are a global technology services firm, with employees across over 55 countries and serving enterprise clients across various industries. We provide our clients with competitive advantages by applying various emerging technologies and ensuring cyber resilience and cyber assurance. We work with
Management Discussion and Analysis

Wipro Limited
Corporate Overview | Management & Board Reports | Financial Statements
27
our clients not only to enable their digital future, but also to drive hyper efficiencies across their technology infrastructure, applications and core operations, enabling them to achieve cost leadership in their businesses.
We are recognized by our clients for our ability to bring in “an integrated perspective”, or our ability to bring together broad and deep technology and domain expertise, our ability to draw learnings and apply insights from one company or sector to another and our ability to provide end-to-end services. Our clients value our consistent excellence in execution and our ability to proactively incorporate relevant innovation.
Our IT Services segment provides a range of IT and IT-enabled services which include digital strategy advisory, customer-centric design, technology consulting, IT consulting, custom application design, development, re-engineering and maintenance, systems integration, package implementation, global infrastructure services, analytics services, business process services, research and development and hardware and software design to leading enterprises worldwide.
Our IT products segment provides a range of third-party IT products, which allows us to offer comprehensive IT system integration services. These products include computing, platforms and storage, networking solutions, enterprise information security and software products, including databases and operating systems. We provide IT products as a complement to our IT services offerings rather than sell standalone IT products.
Our ISRE segment consists of IT Services offerings to organizations owned or controlled by the GoI and/or any Indian State Governments. Our ISRE strategy focuses on consulting and digital engagements, and we are selective in bidding for SI projects with long working capital cycles
COVID-19 Impact on Business OutlookOn March 11, 2020, as COVID-19 spread rapidly, both in terms of number of cases and the affected countries, the World Health Organization (“WHO”) characterized COVID-19 as a pandemic.
As a response to COVID-19, we activated our COVID-19 Global Crisis Management task force in early March 2020. The task force was chaired by our Chief Operating Officer and consisted of several cross-functional teams, including business continuity, IT and cybersecurity services. Most of our employees were quickly asked to work from home. In order to better support employees working from home, we enhanced our cybersecurity measures by installing secure agents in our systems. In parallel, we reached out
to our customers, briefed them of the measures we were adopting and sought their approval. Through these efforts, we have been able to continue to support the majority of our customers. Our teams have settled into the new ways of working and our managers are tracking employee welfare, productivity and customer service delivery progress through the use of various tools. We are collaborating with our customers on delivering on our commitments.
However, the markets we serve continue to undergo massive disruptions due to the COVID-19 pandemic. The World Bank predicts that the global Gross Domestic Product (“GDp”) will decline by 5.2% in the year 2020. The economic fallout of and the subsequent recovery from COVID-19 will depend on multiple factors, such as recovery driven by containment efforts, supply chain disruptions, impact of lockdowns etc. The continued spread of COVID-19 could adversely affect workforces, customers, economies and financial markets globally, potentially leading to further economic downturn.
This could decrease our customer’s spend on technology, adversely affect demand for prospective projects / ramp-ups, cause cancellations or ramp-downs of existing projects, increased requests for furloughs, increase pricing pressure, higher travel restrictions, impose supply-side constraints, and adversely impact cash conversion cycles. Macroeconomic conditions caused by COVID-19 could also result in financial difficulties for our clients, including limited access to the credit markets, insolvency or bankruptcy. Further while various cybersecurity control mechanisms are deployed and periodically reinforced, security control mechanisms may not always be successful, considering the complexity of the environments, inter-dependencies, sophisticated attack methodologies, highly dynamic heterogeneous systems, global digital presence hosted both in cloud and on premises with work from home arrangements.
The potential impact to our results going forward will depend to a large extent on future developments regarding COVID-19 that cannot be accurately predicted at this time, including the duration and severity of the pandemic, the extent and effectiveness of containment actions and the impact of these and other factors on our employees, customers, partners and vendors.
In summary, we have a strong Business Continuity Plan framework that enabled us to respond to the COVID-19 crisis with agility. ~90% of our workforce are enabled to work from home and we continue to service our customers, delivering on several time critical milestones and processes. Our ‘Digital- first’ strategy and our investments in Digital, Cloud, Engineering and Cybersecurity have become particularly
Annual Report 2019-20 28
relevant in the post COVID-19 business environment. We will remain resolute in our goals of employee safety, business continuity and of being a trusted partner to our customers.
OUR BUSInESS STRATEGyOur strategy is about driving a “Digital first” approach through four foundational pillars: Business Transformation, Modernization, Connected Intelligence and Trust. As part of this approach, we are prioritizing and investing significantly to drive growth in key strategic fields such as digital, cloud, cybersecurity and industrial and engineering services through our “Big Bet” program. For example, our “Big Bet” in each of digital and cloud is at the heart of our Business Transformation and Modernization pillars, while our “Big Bet” in industrial and engineering services is central to our Connected Intelligence pillar and our “Big Bet” in cybersecurity is central to our Trust pillar. Talent and Delivery Models, IPs and Platforms, and Open Innovation are the underlying strategies that support the four pillars.
Our vision is to earn our clients’ trust and maximize value of their businesses by helping them in their journey to ‘re-invent’ their business and operating models with our “Digital first” approach and best in class execution.
Recent DevelopmentsWe anticipate that our “Digital first” strategy will be particularly relevant as we believe the following consumer and industry trends, driven by the response to the COVID-19 pandemic, will reshape the way businesses and organizations operate. They are:
Accelerate to Digital – The COVID-19 pandemic has precipitated the shift to online/Digital business models globally, across industries and markets, such as Digital only banks and platform-based business models across industries including banking and asset management. Ecosystem collaboration will become a key element of business strategy, and will be driven by the need to optimize for time, cost and de-risking imperatives.
Ways of Working – We anticipate a long-term impact on established ways of operations, including a redefinition of the core compared to non-core workforce and use of community/gig models, in the following ways:
a. Work done ‘anywhere by anyone’. Virtual, remote, community-based and distributed work models such as work from home/remote working will become mainstream, enabled by remote working and collaborative technologies.
b. We believe that in response to the COVID-19 pandemic, mainstream adoption of the community work force and crowdsourced and community models (private, public and hybrid) will accelerate.
Adaptable, Agile and Resilient Enterprise – Enterprises will need to evaluate their technology stack to allow them to operate with flexibility and agility, and work with partners who can respond and adjust quickly to changing circumstances.
Automation and Autonomous – Social distancing will become a key design principle element from an operating model standpoint across businesses and will be a key factor that will accelerate the adoption of automation, autonomous and low or no human touch or contactless ways of working.
Safe Enterprise – Focusing on employee health and safety, enterprise health and risk management. Given large scale disruptions in supply chains globally, we anticipate that organizations will invest in decentralizing and nearshoring supply chains in the future and reduce dependency on a few countries.
Enterprises will increasingly require partners, such as Wipro, who bring capabilities that span across consultancy, design, engineering, systems integration and operations to enable them to achieve the accelerated digital transformation. The transformation can only be effective if delivered in the context of the relevant industry or domain, hence it is critical to us that we provide strong domain expertise along with “Digital.”
Business TransformationBusiness Transformation is the first of our four pillars. It is about redefining customer experiences and changing business and operating models through a Design and Consulting-led approach. We deliver value to our customers under this pillar through our capabilities in Consulting, Industry Domain and Strategic Design, scaled through acquisitions of companies such as Designit and Cooper. Examples include:
• Accelerationofe-commerce,implementingoperatingmodelsto re-imagine supply chains to be resilient and low contact, automated front offices, automated manufacturing back office (supply chain solutions, HOLMESTM) and agile planning, among other things.
• Virtual and community work models leveraging oursolutions, such as Talent as a Service (“TaaS”) through Topcoder; agile, hybrid cloud-based, modular scale-out VDI solutions; software-defined networking in a wide area network (“SD-WAn”).
Our acquisition of Rational Interaction, Inc., a full-service digital CX company, will help us scale our offerings for Chief Marketing Officers, by connecting Rational Interaction, Inc.’s ability to map and orchestrate the customer journey with our ability to design and build experiences at a global scale.

Wipro Limited
Corporate Overview | Management & Board Reports | Financial Statements
29
ModernizationModernization, the second of our four pillars, is about taking an integrated cloud-first and automation-first approach across applications, infrastructure and data to modernize the IT landscape, and leverages our cloud studios, Wipro HOLMESTM, new ways of working, Application Programming Interface (“ApI”) and microservices.
We work with clients to help them drive resilience and adaptability through modernization and automation. Our strategy is to leverage our assets, like cloud studios across various geographies, which provide services such as cloud assessment, cloud migration (Lift and Shift), cloud native and DevOps, among others.
Wipro HOLMESTM helps enterprises hyper-automate processes and offload specific cognitive tasks to the AI platform to gain cost efficiencies, agility and enhanced user experience. Wipro HOLMESTM helps businesses adopt a hybrid mode of operation (i.e., pairing automation and human effort), which is achieved through a combination of virtual agents, predictive systems, cognitive process automation, visual computing applications, knowledge virtualization and AI reasoning.
We also offer automation advisory services to help clients in their journey of AI/automation through designing automation roadmaps and setting up Digital Centers of Excellence for automation initiatives. In addition to the Wipro HOLMESTM platform, we are building a collaboration ecosystem for automation, working with partners such as Robotics Process Automation providers (e.g., Automation Anywhere, Inc.), start-ups (e.g., Avaamo, Inc. and Arago, GmbH) and established partners (e.g., IBM, Amazon.com, Inc., Google LLC, Microsoft Corporation, SAP SE, Oracle Corporation and ServiceNow, Inc.).
For our API and microservices, we have significantly scaled our consulting talent pool and solutions, which includes our Digital Modernization platform.
Connected IntelligenceConnected Intelligence, the third of our four pillars, focuses on driving outcomes through our market leading platforms such as Wipro HOLMES™, Data Discovery Platform, and use-case based AI solutions. Our “connected” capabilities and solutions leverage technologies such as 5G and IoT and are deployed across industries to deliver innovations in areas such as autonomous systems and Industry 4.0.
We continue to invest in scaling end-to-end capabilities across sensors, gateways, connectivity, platforms, analytics, machine learning (“Ml”) and artificial intelligence to drive transformation in a hyper-connected world. We are scaling assets and capabilities in emerging areas such as IoT, 5G, and autonomous systems.
TrustTrust, the fourth pillar, addresses the changing security, privacy, ways of working (virtual, remote and distributed) and regulatory landscape, driven by ubiquitous technology. We use a consulting-led approach in areas such as cyber security, enterprise risk management, data privacy and control assurance. We have leveraged cognitive automation, e.g., automated incident detection and response, to drive security and are building assets such as our cyber defense assurance platform (“CDAp”) and working with security ecosystem partners and governing bodies, such as Cloud Security Alliance and Wipro Ventures Portfolio.
key enablers underlying our strategyOur delivery model that enables a virtual, agile, distributed, intelligent and automated enterprise-based on the fundamental principles of distributed, no-shore, agile workforces and a cloud-first approach. Our delivery model enables flexibility anywhere by anyone and will leverage the community model through Topcoder. The model is predicated on seamless connectivity with seamless end-point security, access from anywhere and real-time collaboration in every workflow.
Focus on Talent : Our Talent strategy is predicated on scaling global, diverse, local and distributed talent, including scaling π/X-shaped talent, product managers, scrum masters and full stack engineers with a product-centric mindset with creative talent to deliver innovation with impact.
products, platforms and Solutions: Underlying our strategy is our focused execution approach and investment rigor. We have a robust product and platform portfolio of cross-industry and industry-specific platforms and products. For example, we have solutions and platforms which have increased relevance during the COVID-19 pandemic, such as VirtuadeskTM (virtual desktop), cloud studios that enable secure and effective cloud migration, our Topcoder platform enabling TaaS, Wipro HOLMESTM solutions for remote working and drug discovery, as well as our CADP. We are also scaling and building industry platforms and solutions that are delivered in an as-a-service construct. Examples of our domain and industry intellectual property (“Ip”) are Netoxygen in our

Annual Report 2019-20 30
Banking, Financial Services and Insurance business unit and Medicare Advantage in our Health Business Unit.
Open Innovation: Open Innovation is about engaging with the “external innovation” ecosystem to tap leading-edge innovation and disruptive technologies to bring the best solutions to our clients. It is about tapping the global innovation network through vehicles such as Wipro Ventures, Research Partnerships and Horizon Program, crowdsourcing models, such as Topcoder and M&A.
Wipro Ventures: The strategic investment arm of Wipro, Wipro Ventures invests in early- to mid-stage enterprise software startups. Wipro Ventures was launched as a $100 million Fund in early 2015. In February 2020, Wipro Ventures received an additional allocation of $150 million for Wipro Ventures Fund II. As of March 31, 2020, Wipro Ventures has active investments in and partnered with 14 startups in the following areas – AI (Avaamo, Inc., Vicarious FPC, Inc.), Business Commerce (Tradeshift, Inc.), Cybersecurity (IntSights Cyber Intelligence Ltd., Vectra Networks, Inc. CyCognito, CloudKnox), Data Management (Incorta), Industrial IoT (Altizon Systems Private Ltd.), Fraud and Risk Mitigation, Testing Automation (Headspin, Inc., Tricentis GmbH, Sealights) and Cloud Infrastructure (CloudGenix, Moogsoft). In addition to direct investments in emerging startups, Wipro Ventures has invested in five enterprise-focused venture funds: B Capital, TLV Partners, Work-Bench Ventures, Glilot Capital Partners and Boldstart Ventures.
Research partnerships: Collaboration with academic institutions and associations in the United States, Europe, Israel and India in the fields of computer and electrical engineering to promote innovative technology research and capability.
Horizon program: The goal of the Horizon Program is to drive organic incubation in emerging areas covering products, platforms, solutions and capabilities. In order to achieve this objective, we are investing in key areas such as AI, robotics, software-defined everything, autonomous vehicle, connected cars, digital twins, cybersecurity, Industry 4.0 and industry solutions such as cargo management. During the year ended March 31, 2020, we funded 12 projects as part of this program.
Crowdsourcing (Topcoder): A community and crowdsourcing platform with over one million developers, designers, data scientists and testers. Topcoder provides focused enterprise offerings around AI/ML and analytics, digital experience (“DX”), Quality as a Service (“QaaS”), workforce transformation, TaaS and hybrid (certified) communities. We are also using the Topcoder Hybrid Crowd Platform to scale and engage in-house
talent pools in emerging technologies such as Full Stack, DevOps, AI/ML, Cloud, Analytics and other Digital skills with our internal TopGear hybrid community. It also acts as a structured learning path for accounts providing hands-on experience across more than 200 skills. We are creating a pool of Challenge Architects, Topcoder Co-pilots and Reviewers to expand the percentage of work delivered through crowdsourcing.
partner Ecosystem: We have a dedicated unit to drive and deepen our partner ecosystem and to drive creation of new markets and solutions, expand in key verticals and geographies, drive innovation in our offerings and drive go-to-market outcomes. We have subdivided the partner ecosystem into the following categories:
a. Strategic Partners: Multiple product lines with significant business volume and potential.
b. Growth Partners: Single practice alliances.
c. Niche Partners: Niche products with differentiated solutions.
M&A: Acquisitions are key enablers for us and drive our capability to build industry domain, focus on key strategic areas, strengthen our presence in emerging technology areas, including Digital, and increase market footprint in newer markets. We focus on opportunities where we can further develop our domain expertise, specific skill sets and our global delivery model to maximize service and product enhancements and create higher margins. We also evaluate business units to determine if divestitures would maximize our focus on key priorities.
We have invested in acquiring new technology and skills. In the last three fiscal years, we have completed several mergers and acquisitions, including the acquisitions of:
i. International TechneGroup Incorporated, a global digital engineering and manufacturing solutions company and a world leader in CAD and PLM interoperability software services;
ii. Rational Interaction, a full-service digital CX solutions firm that brings the strategic capabilities of a consultancy together with the creative and digital prowess of an agency;
iii. Cooper Software Inc., an award-winning design and business strategy consultancy, which expands our digital reach in North America and adding capabilities in professional design education; and
iv. InfoSERVER S.A., an IT services provider providing custom application development and software deployment services in the Brazilian market.

Wipro Limited
Corporate Overview | Management & Board Reports | Financial Statements
31
OpERATInG SEGMEnT OVERVIEWOur business comprises of the IT Services, IT Products and ISRE segments. The ISRE segment consists of IT services offerings to ISRE Customers. Additionally, we provide our IT Services segment revenue and results by industry verticals. Our industry verticals are subject to change and may vary depending on industry trends.
IT Services OfferingsWe are a leading provider of IT services to enterprises across the globe. We provide a range of services, which include digital strategy advisory, customer-centric design, technology consulting, IT consulting, custom application design, development, re-engineering and maintenance, systems integration, package implementation, global infrastructure services, business process services, cloud, mobility and analytics services, research and development and hardware and software design. We offer these services globally leveraging our products, platforms and solutions through a team of over 180,000 employees using our global delivery model. Our key service offerings are outlined below:
Application Services
Digital: Wipro Digital helps global enterprises transform their business, IT and customer experience by leveraging design and technology. As companies define a new normal, CIOs, CMOs and other key stakeholders partner with us to create healthy, resilient and agile businesses.
Our end-to-end offerings encompass Product Strategy and Design, IT Operating Model Transformation, Digital CMO, Intelligent Processes, and High-Performance Software Engineering. These areas form the backbone of our clients’ transformations and are central to helping them build resilience throughout their organization.
Technology increasingly helps enterprises maintain business continuity and chart a path forward. While CMOs conceive new customer engagements, our acquisition of Rational Interaction in February 2020 gives us a stronger voice in the discussion. Simultaneously, while CIOs redefine their IT Operating Model, our “Agile Anywhere” engineering framework offers a powerful resource.
From CX strategy to AI, and from engineering to cloud services, Wipro Digital has the depth and breadth that global enterprises need as they forge their future and navigate a path to a new normal.
Cloud Enterprise platforms (“CEp”): Enterprise applications provide a strong IT backbone to organizations, many of which are grappling with technical debt from legacy systems, unable to support the agility needed by modern businesses.
At CEP we drive the “digital flip” of these applications and enable the digital transformation of businesses, helping them reimagine the businesses and their models by fundamentally changing how value is generated by the enterprise, and how value is delivered to consumer.
CEP is comprised of five units:
• SAP and Oracle units each offer end-to-end servicesfor SAP and Oracle stack both on-premise and on cloud platforms, towards application modernization and digital transformation.
• Process Transformation which provides advisory servicesto transform clients’ business processes such as Record-to-Report, Order-to-Cash, Procure-to-Pay, Hire-to-Retire. The Growth Practices helps customers adopt SaaS based solutions across growing cloud platforms
• Appirio Cloud Services, which focusses on integratingtraditional SaaS technology providers such as Salesforce, Google and related providers such as FinancialForce and MuleSoft combining our capabilities in customer experience.
• Microsoft Dynamics practice which powers the Microsoftbased ERP and CRM applications.
CEP focuses on driving application transformation with contextual solutions for our customers from front office to back office by combining consulting, design and development, continuous testing and integration, automation and operational excellence across industries.
Cloud and Infrastructure Services (“CIS”)
CIS is an end-to-end cloud and IT infrastructure services provider that helps global clients accelerate their digital journey. Our offerings include public and hybrid cloud/modern datacenter solutions, software-defined, DevOps and micro-services, Digital workplace services, ‘connected intelligence’ services including Digital intent-aware network, IoT and 5G across advisory and consulting, transformation and system integration, business continuity services, testing and managed services. Through industry recognized IPs, assets and accelerators such as BoundaryLess Enterprise (BLE), Wipro Virtuadesk™ (VDI), CloudStudio, Wipro Smart

Annual Report 2019-20 32
i-Connect™ (IoT), WANFreedom (SD-WAN), Wipro HOLMES™ (intelligent automation), AppAnywhere and FluidIT, a comprehensive partner ecosystem and our skills in emerging technologies like software-defined everything, opensource, DevOps and IoT ensure that we are a one-stop shop for all cloud and IT infrastructure needs.
Industrial and Engineering Services (“IES”)
IES is the driver of our engineering services portfolio and facilitates more than 375 clients across multiple industries and/or verticals by providing a platform to innovate and engineer the products, platforms and technologies at scale. This platform of services offerings, called “EngineeringNXT”, combines the maturity of engineering processes, the passion for the latest technology and access to a diverse ecosystem to deliver value to customers at various stages of the product or platform life cycle.
Over the years, IES has created value with our engineering services offerings for numerous multinational corporations by engineering innovative customer experiences, personalizing products and technologies for new markets, integrating next-generation technologies, facilitating faster time to market and ensuring global product compliance. Today, with more than 400 patents, IES continues to deliver these services by leveraging its innovative solutions, engineering processes and delivery excellence across the spectrum, covering connectivity (wireless technologies), Cloud and Data Platforms, Systems Design, very-large-scale integration (“VlSI”), next generation software development and testing, electronic data system (“EDS”), PLM, IoT and Industry 4.0.
Data, Analytics and AI (“DAAI”)
As a preferred partner for our customers’ data and insights transformations, we help them in their journey to transform into intelligent enterprises by automating decision making, powered by insights and driven by rich datasets. Wipro leverages AI, ML, advanced analytics, big data and information management capabilities to deliver measurable business outcomes across customers’ journey from data to decisions, focusing on:
• Insights transformation – Transforming legacy decision-making processes into modern, elastic and AI and ML driven, insights-centric capabilities that enable smarter processes. This ensures that our clients get pertinent insights in real-time to the right decision-makers to fuel innovation, productivity and investment, as their organizations become intelligent enterprises.
• Data transformation – Helping clients adopt modern data platforms, processes and methods in on-premises, cloud and hybrid ecosystems to support analytics, AI and ML workloads through a set of themes that brings transformative change to the data landscape.
Cybersecurity and Risk Services (“CRS”)
CRS enables next generation global enterprises to enhance their business resilience through an intelligent and integrated risk approach that has modernizing security at its core. CRS enables the customers to define their cyber strategy and the cybersecurity needs, envisaging best practices across people, process and technology. Leveraging a large pool of experienced security professionals and a global delivery model that leverages our Cyber Defense Centers, we execute projects and deliver managed and hosted services backed by our Cyber Defense Platform. Our unique top-down risk-based approach delivers innovative security platforms for better scalability, improved cost efficiency and greater agility.
Digital Operations and platforms (“DOp”)
Wipro DOP is a leader in providing next generation technology-led business process services to global enterprises. Our mission is to drive superior customer experience and maximize returns by bringing down operating costs and improving efficiency, quality and productivity. Our process excellence and domain expertise helps us reimagine, redesign, standardize and transform business processes and enterprise operations transformation helps clients leverage and deliver benefits from RPA, AI, analytics and other emerging technologies. Some of our leading offerings:
• Digital Customer Experience: Our analytics powered customer service platform resolves various complex interactions via AI chatbots. We also leverage AR and VR in customer care.
• Supply Chain Management: RPA and AI automate our end-to-end order management platform for more than 15 mn+ annual transactions.
• Finance and Accounting: We manage end-to-end services for 134+ global clients delivering benefits through smart operations.
• Marketing-as-a-Service: We manage marketing operations to cover above the line and below the line across design, content management, social media marketing, etc.
• Trust and Safety: We help companies having online presences to monitor, police and prevent fraudulent behavior.

Wipro Limited
Corporate Overview | Management & Board Reports | Financial Statements
33
IT Services Industry VerticalsOur IT Services business is organized into seven industry verticals:
Banking, Financial Services and Insurance (“BFSI”): The BFSI business unit serves over 100 clients globally across Retail Banking, Investment Banking, Capital Markets, Wealth Management and Insurance. We have been instrumental in delivering success to our clients by aligning with their business priorities; we have done this by leveraging state-of-the-art technology and process transformation solutions, digital capabilities, service design innovation, domain expertise, IP and integrated offerings, end-to-end consulting services, insights capabilities, adoption of “new ways of working”, and an ongoing focus on delivery excellence. We also harness the power of cognitive computing, hyper-automation, robotics, cloud, analytics, emerging technologies to help our clients adapt to the digital world.
Health Business Unit (“Health BU”): Health BU is focused on creating superior experiences, efficiency and outcomes across the healthcare continuum. Wipro’s innovation ecosystem integrates the best in technology, strategy, and design and is the perfect partner to enterprises working to deliver better patient outcomes. Shifting the focus from process-first to people-first, we are working to reshape healthcare and life sciences around human-shaped experiences.
Consumer Business Unit (“CBU”) : CBU offers a full array of innovative solutions and services to cater to the entire value chain where the consumer is at the core, through a blend of
domain knowledge, technology expertise and delivery excellence. We offer an integrated environment that allows organizations to model, optimize, forecast, budget, execute, manage and measure product, and customer performance across the globe. Our domain specialists work with customers to provide strong consumer-centric insights and project execution skills that maximize value for our customers’ technology investments across retail and distribution, consumer packaged goods, transportation, travel and hospitality, media and education, the new age segment and the public sector.
Energy, natural Resources and Utilities (“EnU”) : Our in-depth understanding of the energy sector has equipped us to help oil and gas, utilities and mining customers to transform their assets, consumers, workforce and businesses by adopting digital technologies. We actively partner with customers to help them navigate the transition to digital. Building on this experience and capability, we have expanded our customer base to smart infrastructure industries, such as airports, engineering, facilities, real estate management and construction. Analysts have recognized the ENU business unit as an industry leader and major player for delivering great customer and digital experiences in critical industry domain areas.
Manufacturing (“MFG”): Wipro’s MFG business unit caters to manufacturing companies across the industry segments of aerospace and defense, automotive, industrial and process manufacturing. By coupling our digital and extensive domain expertise, we help our customers transform their business processes across product design, supply chain, and aftermarket services to achieve their digital transformation objectives. We have leveraged our network of partners and academia, to develop IP, platforms and industry-focused solutions. Our after-market solutions and services are helping manufacturing customers capture additional market share by adopting new business models. Our ongoing investments in emerging technologies like autonomous systems and robotics, Industry 4.0, aftermarket, industrial IoT, augmented reality and virtual reality are helping customers create new business solutions and create new revenue models.
Technology (“TECH”): Companies across the high-tech value chain; from the silicon providers to software companies, are serviced by Wipro’s TECH business unit. Our extensive customer portfolio includes marquee companies in semiconductors, compute and storage, networking and edge, peripherals, consumer electronics, software products and gaming. We help our customers transition to new business models by helping them build digital products and solutions, digitize their operations, enable their digital marketing and servitization strategies, and transform their business model to an “As a Service” model. With extensive focus on 5G, IoT, Analytics, AI,

Annual Report 2019-20 34
3. Wipro Digital’s integrated propositions in customer mapping and interaction, seamless integration and data science and insight differentiate its approach with customer journey engineering.
4. Our organizational culture of innovation and our early start in deploying cutting edge platforms and technologies that drive hyper-automation and achieve industrialization of service delivery, such as Wipro HOLMESTM.
5. Our investments in developing IP across products, platforms, frameworks, solutions, components, accelerators, tools and apps that enable us to provide standardized solutions to our customers and obtain enormous time-to-market advantage.
6. Our decades of experience in serving in the IT business, proven track record of delivery excellence and satisfied customers who recommend our services to other corporations.
7. Our ability to provide an entire range of research and development services from concept to product realization.
8. Our global delivery model, that leverages our global, regional and local near-shore development centers and collaborative technologies to help us better serve our clients in this modern technology era.
9. Our ability to access, attract and retain highly skilled personnel across key markets.
10. Our emphasis on engaging the culture of our new age acquisitions and integrating these technologies with our executional experience and service offerings to maximize synergies for our clients.
11. Our ability to offer opportunities to work with cutting edge technologies and focus on training is a critical differentiator to the quality of our manpower.
12. The Wipro brand that is recognized globally for its comprehensive portfolio of services, a practitioner’s approach to delivering innovation and an organization-wide commitment to sustainability.
13. Our commitment to the highest levels of corporate governance.
IT productsWe provide IT products as a complement to our IT services offerings rather than sell standalone IT products.
IT products CustomersWe provide our offerings to enterprises in all major industries, primarily in the India market, including government, defense, IT and IT-enabled services, telecommunications,
Edge and cloud native based solutions we bring together an ecosystem of expertise to build IP, platforms and domain/industry-focused solutions that help our customers reach their business goals. Our deep domain knowledge, wide range of service offerings, investments and capabilities in cybersecurity, cloud, open source and next-generation engineering services and solutions has positioned us as a top integrated hardware and software research and engineering service provider.
Communications (“COMM”): Wipro has been enabling the digital transformation journey of Communications Service Providers (“CSps”) across the globe as they transform to become Digital Service Providers. Our digital business solutions are tailored for CSPs customer context, with capabilities in technologies such as 5G, cloud, software-defined networking and network functions virtualization, AI, IoT, blockchain, cybersecurity and a digital workplace in order to focus on new ways of working. We enable the convergence of network, IT and business processes across the entire customer lifecycle. Our investments in new-age start-ups through Wipro Ventures, along with a comprehensive partner ecosystem are enabling CSPs globally to create services that enable new revenue opportunities, build business agility and reduce their time to market in Business-to-Consumer and Business-to-Business environments. Our focus on continuous improvement, alignment to industry standards, investments in the technology solutions of tomorrow, especially as we gear up for the 5G revolution, deliver proven business value to global CSP customers.
IT Services CompetitionThe market for IT services is competitive and rapidly changing. Our competitors in this market include global consulting firms and IT services companies as well as local and niche services providers.
The following factors differentiate us from our competition:
1. The comprehensive and integrated suite of IT solutions, including digital strategy advisory, customer-centric design, technology consulting, IT consulting, custom application design, development, re-engineering and maintenance, systems integration, package implementation, global infrastructure services, cloud, mobility and analytics services, business process services, research and development and hardware and software design.
2. Crowdsourcing (Topcoder): A community and crowdsourcing platform with over one million developers, designers, data scientists and testers. Topcoder provides focused enterprise offerings around AI/ML and analytics, DX, QaaS, workforce transformation, TaaS and hybrid (certified) communities.

Wipro Limited
Corporate Overview | Management & Board Reports | Financial Statements
35
manufacturing, utilities, education and financial services sectors. We have a diverse range of customers. For the year ended March 31, 2020, we had one customer that accounted for 21.9% of our overall IT Products segment revenue.
IT products Sales and MarketingWe are value-added resellers of third-party enterprise products through our direct sales force. Our sales teams are organized by industry vertical. Our global client partners receive support from our corporate marketing team to assist in brand building and other corporate level marketing efforts for various market segments.
IT products CompetitionOur competitors in the IT Products market include global system integrators as well as local and niche services providers operating in specific geographies like India. One of the major challenges we encounter is margin pressure due to competitive pricing. Achieving mindshare and market share in a crowded market place requires differentiated strategies on pricing, branding, delivery and products design. In the system integration market, we believe we are favorably positioned based on our brand, quality leadership, expertise in target markets and our ability to create customer loyalty by delivering value to our customers. The following factors differentiate us from our competition:
1. Our decades of experience in serving in the IT business, a proven track record of delivery excellence and satisfied customers who recommend our services to other corporations.
2. Our deep understanding of the market especially in the India
3. Our trusted ability to provide impartial advice on selection of products.
4. The Wipro brand is recognized for serving the Indian market for over seventy years.
5. Our commitment to environmental sustainability as well as deep engagement with communities.
ISREThe ISRE segment consists of IT Services offerings to departments or ministries of the GoI and/or the Indian State Governments, as well as to corporate entities where more than 51% of the paid-up capital is held by the GoI or any Indian State Government, either individually or jointly (i.e., a “Public Sector Undertaking”). In certain cases, corporate entities which are held by the Central / State Government
(more than 51%), in turn hold more than 51% stake of paid-up capital in other entities (i.e., a controlling stake), such other entities are also classified as an ISRE.
We have pivoted our ISRE strategy to focus more on consulting and digital engagements and to be selective in bidding for SI projects with long working capital cycles.
We will be leveraging our strong practices in areas such as taxation and e-governance, oil and gas and utilities, along with our strong partner system, to work with Indian government entities, Public Sector Undertakings and other large companies classified as ISREs. For BFSI projects in our ISRE segment, we aim to replicate our successes in areas such as core banking transformation, and consulting.
ISRE Customers
We have customers across the GoI, Indian State Governments and in industry segments such as BFSI and ENU in the form of corporate entities where more than 51% of the paid-up capital is held by the Central and/or State governments of India. We work with multiple ISRE customers and our top two ISRE customers contributed approximately 27% of our ISRE revenues for the year ended March 31, 2020. Our largest ISRE customer and second largest ISRE customer accounted for 15.9% and 11.1%, respectively, of our overall ISRE segment revenue for the year ended March 31, 2020.
ISRE Sales and Marketing
Our ISRE business unit will focus on the unique customer requirements and will create a “Go To Market” (“GTM”) approach that will address the needs of the present as well as future.
ISRE Competition
In the ISRE sector, our competition comes from both local and global IT services companies, including large global consulting firms. For the GoI segment, several small companies have entered the market as disruptors, with most of these small companies focused on penetration strategy.
The following factors differentiate us from our competition:
1. Our deep technology knowledge and domain expertise specifically in BFSI and ENU.
2. Our strong partnership with key alliance partners including hardware and software partners.
3. Significant experience in successfully delivering key marquee programs and strong reference ability across the ISRE sector.

Annual Report 2019-20 36
Corporate governanceAt Wipro, Corporate Governance is more than just adherence to the statutory and regulatory requirements. It is equally about focusing on voluntary practices that underlie the highest levels of transparency and propriety. Our Corporate Governance philosophy is put into practice at Wipro through the following four functional layers, namely,
Governance by Shareholders
Governance by Board of Directors
Governance by Sub-Committees of Board of Directors
Audit, Risk and Compliance Committee, which also acts as Risk Management Committee
Board Governance, Nomination and Compensation Committee, which also acts as CSR Committee
Strategy Committee
Administrative, Shareholders and Investors Grievance Committee (Stakeholders Relationship Committee)
Governance by Management process
Risk Management
Code of Business Conduct
Compliance Framework
The Ombuds process
GOOD GOVERnAnCE AnD MAnAGEMEnT pRACTICES
The risk landscape in the current business environment is changing dynamically with the dimensions of Cyber security, Information Security and Business Continuity, Data Privacy and Large Deal Execution figuring prominently in the risk charts of most organizations. To effectively mitigate these risks, we have employed a risk management framework, which helps proactively identify, prioritize and mitigate risks. The framework is based on principles laid out in the four globally recognized standards as below.
Governance by Management process
Ensuring regulatory compliance and adherence to standards is of utmost importance to Wipro. Wipro has a compliance framework and the objective of this framework is to deploy appropriate practices and processes to ensure compliance with all applicable laws and regulations, globally and to ensure compliance risks are identified, and adequately mitigated. The Compliance framework includes the Global Statutory Compliance Policy and Certification Process as approved by the Audit Committee and Board of Wipro Limited. Electronic dashboards, self-declaration checklists on statutory obligations and audits are some of the mechanisms to monitor and manage compliance in Wipro.
The Risk Steering Council and Risk and Governance committee, meet on monthly & quarterly basis respectively, to review key risk themes and provide direction and oversight, to the risk management process.
Governance by Code of Business Conduct
Wipro has an organization wide Code of Business Conduct which reflects general principles to guide employees in making ethical decisions. The Code outlines fundamental ethical considerations as well as specific considerations that need to be maintained for professional conduct. More details are provided in the Corporate Governance report.
RISk MAnAGEMEnT FRAMEWORk
Governance
FrameworkManagement
Risk Ownership
Business Units & Functions
Risk Management Team
Audit Committee of the Board
Oversight Tone @ The
Top
Standard ERM Framework people,
process, Technology
Risk Management| Identification | Analysis | Evaluate |
| Treatment | Monitoring |
Risk Category| Goverance | Strategic | Operational |
| Compliance | Reporting |
Devel
op &
Dep
loy
Polic
y/Fr
amew
ork
Continuous Improvem
ent
• OrangeBookbyUKGovernment Treasury
• COSO;EnterpriseRiskManagement- Integrating with Strategy and Performance (2017) by Tread way Commission
• AS/NZSISO31000:2009RiskManagement – Principles and Guidelines by AUS/NZ Standards Board
• ISO–ISO31000:2018,Riskmanagement – Guidelines

Wipro Limited
Corporate Overview | Management & Board Reports | Financial Statements
37
Major risks Mitigation planDecisions made by local governments or public health bodies owing to the COVID-19 pandemic, posing restrictions on physical movement of employees thereby impacting business continuity
We have a Business Continuity team in place which is cross functional including delivery, legal, office administration, procurement, IT enablement & IT security teams. They are reviewing the situation closely and providing adequate information on the appropriate measures to be taken to remain compliant.
Risk of an COVID-19 outbreak within the company’s premises impacting employee Safety & well-being
Constant communication on building employee awareness, limited working from campus, proper sanitization, availability of medical staff within the premises, appropriate social distancing are already in place. We have a well-crafted BCP plan in place if the outbreak affects one campus.
Escalation of Information Security & Cyber Security risk on account of increase in surface area of devices
Based on the perceived risks, effective security controls implemented to detect, prevent and remediate threats. Program to continuously monitor the effectiveness of the controls are implemented to effectively sustain the security controls. Based on the changing threat landscape, focus is on continuous improvement of the efficacy of the security controls with the adoption of new processes and latest technology solutions.
Change in internal controls over financial reporting In response to the COVID-19 pandemic, we initiated our business continuity program in March 2020 and facilitated our employees to work remotely/work from home. Our business continuity program and the design of our processes allow for remote execution with accessibility to secure data. There were no changes to our internal control over financial reporting that have materially affected or are reasonably likely to materially affect our internal control over financial reporting during the period covered in this Annual Report.
Intellectual property violating or misusing our clients’ intellectual property rights or for breaches of third-party intellectual property rights or confidential information in connection with services to our clients.
Elaborate program exists and is enhanced on an ongoing basis, to assess and mitigate the risks on account of intellectual property, both Customer and Wipro owned. The program is crucial and assists in identifying, monitoring, governing and creating awareness across the organization.
Data privacy regulations (such as General Data Protection Regulation in Europe) relating to personal information dealt with both by and on behalf of Wipro increases the risk of non-compliance.
The Data Privacy program has been augmented keeping into consideration privacy regulatory requirements, with specific emphasis to revalidate all existing frameworks, policies and processes that can be leveraged by respective support function and delivery teams, covering all applicable geographies and areas of operations. Wipro has implemented the Data process/ Data transfer agreements with customers as well as vendors for flow down DTA/DPA to ensure GDPR governance of personal data. We have also strengthened Wipro systems to strengthen personal data governance from controller perspective. Also setup a process to handle subject access requests related to personal data. Implemented Personal incident management process to ensure speedy governance on personal data related incidents; if any.

Annual Report 2019-20 38
Major risks Mitigation planRegulatory Compliances covering various federal, state, local and foreign laws relating to various aspects of the business operations are complex and non- compliances can result in substantial fines, sanctions etc.
A program on statutory compliance is in place with the objective to track all applicable regulations, the obligation arising out of the same and corresponding action items that requires to be adhered to ensure compliance along with necessary workflows enabled. The program is monitored and regularly reviewed to ensure compliance.
Functional and Operational risks arising out of various operational processes.
Appropriate risk and control matrices have been designed for all critical business processes and both design and effectiveness is tested under the SOX & Internal Financial Control Programs and theme based assessments.
Service Delivery risks relating to complex programs providing end-to-end business solutions for our clients.
Risk Management framework has been deployed for large value deals to assess solution fitness, credit risks, financial risks, technology risks among other risk factors. Additionally contract compliance programs are in place with regular reviews, early warning systems as well as customer satisfaction surveys to assess the effectiveness of the service delivery and early detection of any risks arising from the service delivery.
Work place environment, Safety and Security Strong Control measures have been put in place to ensure employee health and safety. Awareness is created about various issues and are communicated on regular basis to employees. Wipro maintains Zero Tolerance for violators of code of business conduct. Also employees are provided with an online web portal to log in concerns relating to various subjects including environment and safety in the work place.
Business Continuity risks arising out of climate change related and other disruptions like natural disasters, IT outages, Cyber, pandemic, terror and unrest, power, water and other resource disruptions etc. which may challenge or impact our customers business and availability of People and process, Technology and Infrastructure.
Effective implementation of Business Continuity Management System (BCMS) and framework aligned to ISO 22301 across global locations, accounts and service functions. The framework will ensure a robust BCM planning to manage any crisis which could disrupt People and process, Technology and Facility level disruption effectively and efficiently.
Geo political risk arising out of entering into contracts in a new country.
An assessment of doing business in a new country is done in order to analyze the feasibility of doing business based on the country’s economic stability, corruption index, investment opportunities, ease of doing business and physical safety.
Risk of protectionism policies impacting the business Appropriate measures are being taken to provide uninterrupted high quality services to the clients at all geographies. Additionally, localization efforts are being prioritized. More than 69% of the USA workforce is local. In Latin America almost all our employees are local.

Wipro Limited
Corporate Overview | Management & Board Reports | Financial Statements
39
Capitals & Value Creation
MATERIAlITy DETERMInATIOn & STAkEHOlDER EnGAGEMEnT At Wipro, stakeholder engagement1 is an ongoing process. Stakeholders identification is based on attributes such as Impact, Influence, Interest, Legitimacy, Urgency and Diverse Perspective. These attributes help identify stakeholders across value chain that are important to business and necessitates meaningful engagement. Based on these attributes, we identified eight stakeholder groups -
Employees, Customer, Investors, Suppliers, Education System, Communities & civil societies, Government and Policy Networks and The Young Citizen and Future
Generation. We believe stakeholder inclusiveness is central to the materiality determination process and it
is important to consider reasonable expectations and interests of stakeholders so as to provide a balanced view of the issues that emerge.
Materiality determination2 for the organization is based on a comprehensive process that include
an internal materiality determination and external benchmarking with peers and sustainability standards.
A significant part of materiality determination stems from the organization’s overall mission, values,
commitments and competitive strategy as well as the impact of or on its economic performance. An internal perspective on risks as identified through organizational processes like risk assessment studies and audits or self-assessments using disclosure frameworks like financial/sustainability reports, DJSI, CDP, etc. is considered. Forexternal benchmarking, we conduct an extensive review of literature to identify issues considered as material and identified as risks by our business peers and also to understand expectations expressed in international standards and agreements like Sustainability Accounting Standard Board (SASB). The issues are then prioritized based on multiple dimensions of risk, returns and relevance.
1 Refer to Summary of Stakeholder Engagement2 Materiality Determination Exercise at https://www.wipro.com/content/dam/nexus/en/sustainability/sustainability_reports/sustainability-report-fy-2018-19.pdf

Wipro LimitedAnnual Report 2019-20
Corporate Overview | Management & Board Reports | Financial Statements
40 41
Our Value Creation Framework
Strategy
VISIOn | MISSIOn | VAlUES | CORPORATE GOVERnAnCE
Human CapitalWorkforce competencies & Skills
Intellectual CapitalR&D Investment
Social & Relationship CapitalCustomers, communities, Investors, Suppliers
natural Capital Natural resources like water, fuel, air, land biodiversity
InPUTS
Financial CapitalFunds available through its business operations, financing and investing activities
Annual Report 2019-20
Business TransformationModernizationConnected IntelligenceTrust
PIllARS
Intellectual Capital
No. of patents filled and granted, No. of people
trained in new skills
Financial CapitalGross Profit, Operating Income,
Finance and Other Income, Income Tax Paid
OUTPUTS
aCtIVItIeSProviding Consulting and IT services in 7 verticals/domains across 6 continents
Social & Relationship CapitalCustomer Satisfaction Scores
Profit attributable to equity holders, Beneficiaries from community
projects, Environment footprint reduction in Supply Chain
natural Capital Emission, Water & Energy
savings, Biodiversity projects in Campus, Advocacy on
Ecological issues
Human CapitalProductivity &
Retention
Wipro Limited
Materiality
Stakeholder Engagement
Risks & Opportunities
InFluenCerSExternal Environment
EnABlERSTalent IP & Platform Open Innovation

Annual Report 2019-20 42
InTER-RElATIOnSHIpS AMOnG CApITAlSWe have used capital framework namely Financial, Human, Intellectual, Social & Relationship and Natural capitals to report on value created by the organization across its value chain. We have classified key material issues under these five capitals and report on our approach, policies, process and initiatives implemented under each capital sections. The table below depicts the interconnectedness of capitals through the lens of material issues for the organisation.
Input Capital Relationship with other capitalsname of Capital Engagement on Material
Issues
Human Capital
Hiring & Onboarding – Improved business performance
Performance & Talent Management
Learning & Development
– Creation of IP, technology expertise
–Customer Engagement and improvement in CSAT/NPS scores
– Improved business performanceEmployee Well-being – Improved business performanceEmployee Engagement & Communication –Customer Engagement and improvement in CSAT/NPS scores
Social & Relationship Capital
Data Security & IT Privacy – Better CSAT/NPS Score
– Revenue, Profitability Customer Engagement – Customer retention and new customer acquisition Supplier Envt/Social Assessment – Reduce impact on environment
Community & Education – Better Employee Satisfaction Survey (ESS)
– Increase in brand and reputation
Intellectual CapitalInnovation – Increase in customer retention and new customer acquisition.
Financial Capital Financial Performance
– Patents, IP, Platforms
– Employee Benefits
– Creating value for Customers Suppliers, Community, Investors
Natural Capital
Emissions & Energy, Waste, Water, Biodiversity
– Operational cost reduction
– Creating value for Customers Suppliers, Community, Investors
Aspect Aspect BoundaryEnergy India (offices and DC’s) –98% coverage – Actuals
Overseas offices – 100% coverage - EstimatedWater& Waste
India - 98% coverage - Actuals Overseas - Not reported
SCOpE & BOUnDARynatural Capital
India: 44 locations (includes 3 data centers) representing 77% of our workforce. 31 of these locations are owned (includes 3 data centers) and the balance are leased. Overseas: 189 office locations. Most locations are leased and used as marketing/liaison offices.Other capitals
Financial, Human, Intellectual, Social & Relationship Capital Entire organization i.e. Wipro Limited.
Manufactured Capital is broadly seen as human-created production-oriented equipment and tools. For the IT services business, these are the fixed assets like buildings, IT hardware and telecommunication equipment. The deployment of the capital is adequately represented in financial capital and through impacts to natural capital. Hence this report does not cover manufactured capital separately.

Wipro Limited
Corporate Overview | Management & Board Reports | Financial Statements
43
WIpRO lIMITED AnD SUBSIDIARIESOur revenues and profits for the years ended March 31, 2019 and 2020 are provided below:
(` in millions except earnings per share data)
Consolidated results Fy 2019 Fy 2020 yoy ChangeRevenues1 589,060 613,401 4.1%Cost of revenues (413,033) (436,085) 5.6%
Gross profit 176,027 177,316 0.7%Selling and marketing expenses (44,510) (42,907) (3.6)%General and administrative expenses (35,951) (29,823) (17.0)%Other Operating Income2 4,344 1,144 (73.7)%Operating Income 99,910 105,730 5.8%Finance Expenses (7,375) (7,328) (0.6)%Finance and Other Income 22,923 24,081 5.1%Income Taxes 25,242 24,799 (1.8)%Profit attributable to equity holders 90,031 97,218 8.0%As a percentage of RevenueGross Margin3 29.7% 28.9% (0.8)%Selling and marketing expenses 7.6% 7.0% (0.6)%General and administrative expenses 6.1% 4.9% (1.2)%Operating Margin3 16.8% 17.2% 0.4%Earnings per share-Basic (`)4 14.99 16.67 11.2%Earnings per share-Diluted (`)4 14.95 16.62 11.2%
1 For segment reporting, we have included the impact of exchange rate fluctuations in revenue. Excluding the impact of exchange rate fluctuations, revenue, as reported in our statements of income, is ` 585,845 million and ` 610,232 million for the years ended March 31, 2019 and 2020 respectively. Further, finance income on deferred consideration earned under multi-year payment terms in certain total outsourcing contracts is included in the revenue of the respective segment and is eliminated under reconciling items.
2 Other operating income represents:(i) For the year ended March 31, 2019, net gain on sale of (a) hosted data center services business, and (b) the Workday business and Cornerstone OnDemand business.(ii) For the year ended March 31, 2020, (a) change in fair value of the callable units upon partial achievement of business targets pertaining to sale of data center
business, and (b) gain on sale of assets pertaining to Workday business and Cornerstone OnDemand business in Portugal, France and Sweden.3 Gross margin and operating margin as a percentage of revenue for year ended March 31, 2020 have been calculated by including Other Operating Income with Revenue.4 In FY 2019-20, EPS growth is higher than Net profit growth largely due to reduction in number of equity shares due to completion of buyback
Financial Capital

Annual Report 2019-20 44
General and Administrative expenses: Our general and administrative expenses as a percentage of revenue decreased from 6.1% for the year ended March 31, 2019 to 4.9% for the year ended March 31, 2020. In absolute terms, general and administrative expenses decreased by 17.0%, primarily due to charges paid against a one-time settlement of a legal claim against the company included in the year ended March 31, 2019. These decreases have been partially offset by the increase in legal and professional fees and travel in the year ended March 31, 2020 as compared to the year ended March 31, 2019.
Other Operating income: During the year ended March 31, 2020, we recorded (a) `992 million toward change in fair value of the callable units upon partial achievement of first and second year’s business targets pertaining to sale of data center business, and (b) `152 million toward gain on sale of assets pertaining to the Workday and Cornerstone OnDemand business in Portugal, France and Sweden, as “Other operating income.”
As a result of the foregoing factors, our operating income increased by 5.8%, from `99,910 million for the year ended March 31, 2019 to `105,730 million for the year ended March 31, 2020. As a result of the above, our results from operating activities as a percentage of revenue (operating margin) increased by 0.4% from 16.8% to 17.2%.
Finance expenses: Our finance expenses decreased from `7,375 million for the year ended March 31, 2019 to `7,328 million for the year ended March 31, 2020. This decrease is primarily due to a decrease in interest expenses on repayment of loan during the year ended March 31, 2020, which was partially offset by an increase in interest expense on adoption of IFRS 16. Refer to Notes 3(viii) and New Accounting Standards adopted by the Company in the Notes to the Consolidated Financial Statements for further information on the adoption of IFRS 16.
Finance and other income: Our finance and other income increased from `22,923 million for the year ended March 31, 2019 to `24,081 million for the year ended March 31, 2020. The increase is primarily due to an increase in interest income by `1,503 million during the year ended March 31, 2020 as compared to the year ended March 31, 2019.
Income taxes: Our income taxes decreased by `443 million from `25,242 million for the year ended March 31, 2019 to `24,799 million for the year ended March 31, 2020. Our effective tax rate has decreased from 21.9% for the year ended March 31, 2019 to 20.2% for the year ended March 31,
Results of operations for the years ended March 31, 2020Revenue: Our revenue increased by 4.1%.
The IT Services segment revenue increased by 4.5%. The revenue of all our industry verticals, except for TECH, grew during the year. The growth was led by three of our industry verticals, BFSI, CBU and ENU. The growth in these industry verticals was a result of increase in our differentiated offerings across our geographic and digital capabilities, as well as the depreciation of the Indian Rupee against foreign currencies, including the U.S. Dollar, Euro, United Kingdom Pound Sterling and Canadian Dollar. Growth was partially offset by a decline in revenues due to the sale of our hosted data center business, divestment of Workday and Cornerstone OnDemand business to Alight Solutions LLC, and the negative impact of COVID-19 on our revenues by an estimated `1,055 million to `1,206 million ($14 million to $16 million).
Revenue of the IT Products segment declined by 10.6%, which was primarily due to our focus on providing IT products as a complement to our IT services offerings rather than selling standalone IT products and our change in strategy to focus on consulting and digital engagements with ISRE clients rather than SI engagements.
Revenue of the ISRE segment declined by 1.7%, which was primarily due to scaling down of large engagements as we are pivoting our ISRE strategy to focus on consulting and digital engagements and to be selective in bidding for SI projects.
profitability: In absolute terms, cost of revenues increased by 5.6% primarily because of increase in employee compensation due to the impact of salary increases, increase in headcount during the year and depreciation of the Indian Rupee against foreign currencies, including the U.S. Dollar, Euro, United Kingdom Pound Sterling and Canadian Dollar. This was partially offset by a reduction in sub-contracting/technical fees and a reduction in the cost of hardware and software. As a result of the foregoing factors, our gross profit as a percentage of our total revenue decreased by 0.8%.
Selling and Marketing expenses : Our selling and marketing expenses as a percentage of total revenue decreased from 7.6% for the year ended March 31, 2019 to 7.0% for the year ended March 31, 2020. In absolute terms, selling and marketing expenses decreased by 3.6% primarily because in the year ended March 31, 2019, there was an impairment charge on certain intangibles assets recognized on acquisitions. This decrease has been partially offset by the increase in travel expenses in the year ended March 31, 2020 as compared to the year ended March 31, 2019

Wipro Limited
Corporate Overview | Management & Board Reports | Financial Statements
45
Revenue: The IT Services segment revenue increased by 4.5%. Revenue for all our industry verticals, except for TECH, grew during the year ended March 31, 2020. The growth was led by three of our industry verticals, BFSI, CBU and ENU. The growth in these industry verticals was a result of increasing our differentiated offerings across our geographic and digital capabilities, as well as depreciation of the Indian Rupee against foreign currencies, including the U.S. Dollar, Euro, United Kingdom Pound Sterling and Canadian Dollar. Growth was partially offset by a decline in revenues due to the sale of our hosted data center business, divestment of Workday and Cornerstone On Demand business to Alight Solutions LLC and the negative impact of COVID-19 on our revenues by an estimated `1,055 million to `1,206 million ($14 million to- $16 million).
profitability: Our gross profit as a percentage of our revenue from our IT Services segment decreased by 1.1%, primarily because of increases in employee compensation due to
IT Services financialsperformance Highlights- IT Services (Figures in ` million except otherwise stated)
IT Services Fy 2019 Fy 2020 yoy Change
Revenues1 568,253 594,041 4.5%
Gross Profit 178,056 178,788 0.4%
Selling and Marketing expenses (44,207) (42,412) (4.1)%
General and administrative expenses (35,690) (29,835) (16.4)%
Other Operating Income 4,344 1,144 (73.7)%
Operating Income2 102,503 107,685 5.1%
As a percentage of Revenue
Gross Margin3 31.1% 30.0% (1.1)%
Selling and marketing expenses 7.8% 7.1% (0.7)%
General and administrative expenses 6.3% 5.0% (1.3)%
Operating Margin3 17.9% 18.1% 0.2%1 For the purpose of segment reporting, we have included the impact of exchange rate fluctuations amounting to `3,208 million and `3,232 million for the years
ended March 31, 2019 and 2020, respectively, in revenue. Further, finance income on deferred consideration earned under multi-year payment terms in certain total outsourcing contracts is included in the revenue of the respective segment and is eliminated under reconciling items.
2 Includes Other Operating Income, which is being included to present the effect from the sale of hosted data center business and Workday and Cornerstone OnDemand business, in the year ended March 31, 2019 and, in the year ended March 31, 2020.
3 Gross margin and segment results as a percentage of revenue have been calculated by including Other Operating Income with Segment Revenue.
salary increases, increase in headcount during the year and depreciation of the Indian Rupee against foreign currencies, including the U.S. Dollar, Euro, United Kingdom Pound Sterling and Canadian Dollar. This was partially offset by a reduction in sub-contracting/technical fees.
Selling and marketing expenses: Selling and marketing expenses as a percentage of revenue from our IT Services segment decreased from 7.8% for the year ended March 31, 2019 to 7.1% for the year ended March 31, 2020. In absolute terms, selling and marketing expenses decreased by `1,795 million primarily because of an impairment charge on certain intangibles assets recognized on acquisitions in the year ended March 31, 2019. This decrease has been offset by the increase in travel expense in the year ended March 31, 2020 as compared to the year ended March 31, 2019.
General and administrative expenses: General and administrative expenses as a percentage of revenue from our
2020. This decrease is primarily due to changes in Indian tax laws during the year ended March 31, 2020.
profit attributable to non-controlling interest: It has increased from `142 million for the year ended March 31, 2019 to `495 million for the year ended March 31, 2020.
As a result of the foregoing factors, our profit attributable to equity holders increased by `7,187 million or 8.0%, from `90,031 million for the year ended March 31, 2019 to `97,218 million for the year ended March 31, 2020.

Annual Report 2019-20 46
• Defermentof annual increases in salaryandprogressioncycles; and
• Optimization of our variable workforce (i.e., sub-contractors), including replacing them with our existing internal pool of talent.
Customer Size Distribution for IT Services
number of clients in year ended March 31,
2019 2020
> $1M 571 574
> $3M 339 341
> $5M 262 260
> $10M 172 166
> $20M 96 96
> $50M 41 40
> $75M 22 22
> $100M 10 15
performance against guidance: Historically, we have followed a practice of providing constant currency revenue guidance for our largest business segment, namely, IT Services in dollar terms. The guidance is provided at the release of every quarterly earnings when revenue outlook for the succeeding quarter is shared. The following table presents the performance of IT Services Revenue against outlook previously communicated for the eight quarters of FY 2020 and FY 2019. Our revenue performance in all the quarters of FY 2019 and FY 2020 has been within the guidance range.
IT Services segment decreased from 6.3% for the year ended March 31, 2019 to 5.0% for the year ended March 31, 2020. In absolute terms, general and administrative expenses decreased by `5,855 million, primarily due to charges paid against a one-time settlement of a legal claim against the company in the year ended March 31, 2019. This was offset by an increase in legal and professional fees.
Other Operating Income: During the year ended March 31, 2020, we recorded (a) `992 million toward change in fair value of the callable units upon partial achievement of first and second year’s business targets pertaining to sale of data center business, and (b) `152 million toward gain on sale of assets pertaining to the Workday and Cornerstone OnDemand business in Portugal, France and Sweden, as “Other operating income”.
As a result of the above, segment results as a percentage of our revenue from our IT Services segment increased by 0.2% , from 17.9% to 18.1%. In absolute terms, the segment results of our IT Services segment increased by 5.1%.
In response to COVID-19, we are focusing on various cost optimization initiatives, including:• Re-skilling and re-deployment of ourworkforce from our
existing pool of talent, and new hiring will be done only for business-critical reasons;
• Optimizationofcostsrelatingtotravel,facilitiesandotherdiscretionary spends like marketing events;
Guided Outlook versus Actuals Amounts in $ millionQuarter ending Guidance Achievement in guided currency Reported currency revenue
31st Mar 2020 2,095-2,137 2,104.1 2,073.7
31st Dec 2019 2,065-2,106 2,085.7 2,094.8
31st Sept 2019 2,039-2,080 2,061.0 2,048.9
31stJun2019 2,046-2,087 2,061.0 2,038.8
31st Mar 2019 2,047-2,088 2,067.9 2,075.5
31st Dec 2018 2,028-2,068 2,056.8 2,046.5
31st Sept 2018 2,009-2,049 2,059.9 2,041.2
31stJun2018 2,015-2,065 2,064.2 2,026.5

Wipro Limited
Corporate Overview | Management & Board Reports | Financial Statements
47
Business Unit Wise performance (Figures in $ millions except otherwise stated)
Business unit Revenue Fy 2019
Revenue Fy 2020
Growth yoy% in reported currency
Growth yoy% in constant currency
Margins Fy 2019
Margins Fy 2020
BFSI 2,503 2,564 2.6% 4.0% 19.3% 18.5%
CBU 1,276 1,346 6.8% 8.1% 18.8% 17.2%
COMM 466 470 0.9% 3.5% 13.5% 15.8%
ENU 1,040 1,062 2.4% 5.4% 9.7% 15.9%
Health BU 1,075 1,090 2.3% 2.8% 11.5% 15.4%
MFG 666 669 1.1% 2.5% 17.9% 19.2%
TECH 1,094 1,054 (1.3)% -0.6% 20.8% 18.9%
Total 8,120 8,256 2.5% 3.9% 17.9% 18.1%
Geography Wise performance (Figures in $ millions except otherwise stated)
Geo Revenue Fy 2019
Revenue Fy 2020
Growth yoy% in reported currency
Growth yoy% in constant currency
Americas 4,615 4,882 7.3% 7.6%Europe 2,069 1,981 (4.3)% (1.3)%Rest of the World 1,436 1,393 (3.0)% (0.4)%Total 8,120 8,256 2.5% 3.9%
IT productsOur IT Products segment accounted for 2.1% and 1.8% of our revenue for the years ended March 31, 2019 and 2020, respectively, and (1.0)% and (0.3)% of our operating income for each of the years ended March 31, 2019 and 2020, respectively.
Operating results of the IT Products segment are as follows:
(Figures in ` million except otherwise stated)Fy 2019 Fy 2020
Revenue1 12,312 11,010
Gross Profit (255) 120
Selling and Marketing expenses (168) (274)
General and administrative expenses (623) (128)
Operating Income (1,047) (282)
As a percentage of Revenue:Gross Margin (2.1)% 1.1%
Selling and Marketing expenses 1.4% 2.5%
General and administrative expenses 5.1% 1.2%
Operating Margin (8.5)% (2.6)%
Revenue: Our revenue from the IT Products segment decreased by 10.6%. The decline was primarily due to our focus on providing IT products as a complement to our IT services offerings rather than sell standalone IT products, and our adoption of a more selective approach in bidding for SI engagements.
profitability: Our gross profit as a percentage of our IT Products segment revenue increased by 3.2%, primarily because of optimization in cost of delivery in certain customer contracts and reduction in sub-contracting/technical fees.
Selling and marketing expenses: Selling and marketing expenses as a percentage of revenue from our IT Products segment increased from 1.4% for the year ended March 31, 2019 to 2.5% for the year ended March 31, 2020. In absolute terms, selling and marketing expenses increased by `106 million.
General and administrative expenses: General and administrative expenses as a percentage of revenue from our IT Products segment decreased from 5.1% for the year ended March 31, 2019 to 1.2% for the year ended March 31, 2020. In

Annual Report 2019-20 48
absolute terms, general and administrative expenses decreased by `496 million primarily on account of decreases in lifetime expected credit loss.
As a result of the above, in absolute terms, segment results of our IT Products segment recorded a loss of `282 million for the year ended March 31, 2020 as compared to segment loss of `1047 million for the year ended March 31, 2019.
ISREOur ISRE segment accounted for 1.5% and 1.4% of our revenue for the years ended March 31, 2019 and 2020, respectively, and (1.8)% and (1.7)% of our operating income for each of the years ended March 31, 2019 and 2020, respectively.
Operating results of the ISRE segment are as follows:
(Figures in ` million except otherwise stated)
Fy 2019 Fy 2020
Revenue1 8,544 8,400 Gross Profit (1382) (1060)Selling and Marketing expenses (294) (368)General and administrative expenses (153) (394)Operating Income (1,829) (1,822)As a percentage of Revenue:Gross Margin (16.2)% (12.6)%Selling and Marketing expenses 3.4% 4.4%General and administrative expenses 1.8% 4.7%Operating Margin (21.4)% (21.7)%1 Finance income on deferred consideration earned under multi-year payment terms in certain total outsourcing contracts is included in the revenue of the
respective segment and is eliminated under reconciling items.
Revenue: Our revenue from the ISRE segment decreased by 1.7%. This was primarily due to scaling down of large engagements and pivoting our ISRE strategy to focus on consulting and digital engagements and to be selective in bidding for SI projects.
profitability: Our gross profit as a percentage of our ISRE segment revenue increased by 3.6%, primarily on account of closure of loss-making engagements.
Selling and marketing expenses: Selling and marketing expenses as a percentage of revenue from our ISRE segment increased from 3.4% for the year ended March 31, 2019 to 4.4% for the year ended March 31, 2020. In absolute terms, selling and marketing
expenses increased by `74 million, primarily due to increase in employee compensation.
General and administrative expenses: General and administrative expenses as a percentage of revenue from our ISRE segment increased from 1.8% for the year ended March 31, 2019 to 4.7% for the year ended March 31, 2020. In absolute terms, general and administrative expenses increased by `241 million. This was primarily on account of increase in lifetime expected credit loss.
As a result of the above, in absolute terms, segment results of our ISRE segment recorded a loss of `1,822 million for the year ended March 31, 2020 as compared to a loss of `1,829 million for the year ended March 31, 2019.
Resource Allocation Strategy(` in millions)
Fy 2019 Fy 2020 yoy change
net cash provided by/ (used in) :Operating activities 116,316 100,643 (15,673)Investing activities 50,126 34,012 (16,114)Financing activities (49,369) (150,998) (101,629)Net change in cash and cash equivalents 117,073 (16,343) (133,416)Effect of exchange rate changes on cash and cash equivalent 526 1,922 1,396 Cash and cash equivalent at the end of the period 158,525 144,104 (14,421)

Wipro Limited
Corporate Overview | Management & Board Reports | Financial Statements
49
As of March 31, 2020, we had cash and cash equivalent and short-term investments of `334,134 million. Cash and cash equivalent and short-term investments, net of total debt, was `256,092 million.
In addition, we have unutilized credit lines of `45,404 million. To utilize these lines of credit, we require the consent of the lender and compliance with certain financial covenants. We have historically financed our working capital and capital expenditures through our operating cash flows and through bank debt, as required.
Cash generated by operating activities for the year ended March 31, 2020 decreased by `15,673 million while profit for the year increased by `7,540 million during the same period. The decrease in cash generated by operating activities is primarily due to increased working capital requirements. This was partially offset by income tax refunds for the previous year received during the year ended March 31, 2020.
Cash generated from investing activities for the year ended March 31, 2020 was `34,012 million. The cash generated from sale of investments (net of purchases) amounted to `34,579 million. Cash utilized for the payment for business acquisitions amounted to `10,003 million. We purchased property, plant and equipment amounting to `23,497 million which was primarily driven by the growth strategy of the Company
Cash used in financing activities for the year ended March 31, 2020 was `150,998 million as against `49,369 million for the year ended March 31, 2019. This is primarily on account of outflow for an equity share buyback amounting to `105,311 million and increased outflow on account of partial repayment of loans taken for acquisitions. Payment toward the dividend including dividend distribution tax for the year ended March 31, 2020 amounted to ̀ 6,863 million. Dividends paid in the year ended March 31, 2020 represents interim (and final) dividend declared for the year ended March 31, 2020 amounting to `1 per share.
We maintain a debt/borrowing level that we have established through consideration of a number of factors including cash flow expectations, cash required for operations and investment plans. We continually monitor our funding requirements, and strategies are executed to maintain sufficient flexibility to access global funding sources, as needed. Please refer to Note 14 of our Notes to the Consolidated Financial Statements for additional details on our borrowings.
As discussed above, cash generated from operations is our primary source of liquidity. We believe that our cash and cash equivalents along with cash generated from operations will be sufficient to meet our working capital requirements as well as repayment obligations with respect to debt and borrowings. Our choices of sources of funding will be driven with the objective of maintaining an optimal capital structure. COVID-19 may have an impact on our cash conversion cycle due to delays in customer payments and may result in increased working capital requirements. However, we believe that we have sufficient cash balances to overcome the incremental increase in working capital requirements.
As of March 31, 2020, we had contractual commitments of `14,011 million ($185.8 million) related to capital expenditures on construction or expansion of software development facilities and `17,024 million ($225.8 million) related to other purchase obligations. Plans to construct or expand our software development facilities are determined by our business requirements.
We will rely on funds generated from operations and external debt to fund potential acquisitions and shareholder returns. We expect that our cash and cash equivalents, investments in liquid and short-term mutual funds and the cash flows expected to be generated from our operations in the future will generally be sufficient to fund the growth aspirations, as applicable.
In the normal course of business, we transfer certain accounts receivables and net investment in finance lease (financial assets) to banks on a non-recourse basis. The incremental impact of such transactions on our cash flow and liquidity for the years ended March 31, 2019 and 2020 is not material. Please refer to Note 19 of our Notes to Consolidated Financial Statements.
As of March 31, 2019 and 2020, our cash and cash equivalents were primarily held in Indian Rupees, U.S. Dollars, United Kingdom Pound Sterling, Euros, and Australian Dollars.
Shareholder ReturnsWe have always strived to enhance shareholder value for our investors. The Company’s policy has been to provide regular, stable and consistent distribution of return. There is no change in our philosophy on shareholder return.
Cash Dividends: During the year ended March 31, 2019 we declared a dividend of `1 per equity share. The cash dividend paid per equity share during the year ended March 31, 2020

Annual Report 2019-20 50
was interim dividend of `1. The Board recommended the adoption of the interim dividend of `1 per equity share as the final dividend for the year ended March 31, 2020.
Buyback of equity shares: During the year ended March 31, 2020, we concluded the buyback of 323,076,923 equity shares at a price of ̀ 325 ($4.31) per equity share, as approved by the Board of Directors on April 16, 2019 and by shareholders resolution dated June1,2019passedthroughpostalballotandelectronicvoting.This has resulted in a total cash outflow of `105,000 million ($1,393 million). As a result of the buyback, our share capital has been reduced by `646 million ($8.57 million).
Assessment of key RisksGlobal Economic and Geo political Risks: We derive approximately 57% of our IT Services revenue from the Americas (including the United States) and 24% of our IT Services revenue from Europe. If the economy in the Americas or Europe continues to be volatile or conditions in the global financial market deteriorate, pricing for our services may become less attractive and our clients located in these geographies may reduce or postpone their technology spending significantly. Reduction in spending on IT services may lower the demand for our services and negatively affect our revenues and profitability. Our clients are concentrated in certain key industries. Any significant decrease in the growth of any one of these industries, or widespread changes in any such industry, may reduce or alter the demand for our services and adversely affect our revenue and profitability.
Uncertainty relating to the global health pandemic on COVID-19: In assessing the recoverability of receivables including unbilled receivables, contract assets and contract costs, goodwill, intangible assets, and certain investments, the Company has considered internal and external information up to the date of approval of these financial statements including credit reports and economic forecasts. The Company has performed sensitivity analysis on the assumptions used herein. Based on the current indicators of future economic conditions, the Company expects to recover the carrying amount of these assets.
The Company basis its assessment believes that the probability of the occurrence of forecasted transactions is not impacted by COVID-19. The Company has also considered the effect of changes, if any, in both counterparty credit risk and own credit risk while assessing hedge effectiveness and measuring hedge ineffectiveness and continues to believe that there is no impact on the effectiveness of its hedges.
The impact of COVID-19 remains uncertain and may be different from what we have estimated as of the date of approval of these consolidated financial statements and the Company will continue to closely monitor any material changes to future economic conditions.
Taxation Risks: Our profits for the period earned from providing services at client premises outside India are subject to tax in the country where we perform the work. Most of our taxes paid in countries other than India can be applied as a credit against our Indian tax liability to the extent that the same income is subject to taxation in India. Currently, we benefit from certain tax incentives under Indian tax laws. These tax incentives include a tax holiday from payment of Indian corporate income taxes for our businesses operating from specially designated Special Economic Zones (“SEZs”). Changes to these incentives and other exemptions we receive due to government policies can impact our financial performance.
Wage pressure: Our wage costs in emerging markets have historically been significantly lower than wage costs in the developed markets for comparably skilled professionals, and this has been one of our competitive advantages. However, wage increases in emerging markets may prevent us from sustaining this competitive advantage and may negatively affect our profit margins. We may need to increase the levels of our employee compensation more rapidly than in the past to retain talent. Unless we are able to continue to increase the efficiency and productivity of our employees over the long term, wage increases may reduce our profit margins. The inability to provide adequate wage increases may result in attrition and impact competitiveness.
Components of Market Risks
Foreign currency risk : We operate internationally and a major portion of our business is transacted in several currencies. Consequently, the Company is exposed to foreign exchange risk through receiving payment for sales and services in the United States and elsewhere, and making purchases from overseas suppliers in various foreign currencies. The exchange rate risk primarily arises from foreign exchange revenue, receivables, cash balances, forecasted cash flows, payables and foreign currency loans and borrowings. A significant portion of our revenue is in U.S. Dollars, United Kingdom Pound Sterling, Euros, Australian Dollars and Canadian Dollars while a large portion of our costs are in Indian Rupees. The exchange rates between the rupee and these currencies have fluctuated significantly in recent years and may continue to fluctuate in the future. Appreciation of

Wipro Limited
Corporate Overview | Management & Board Reports | Financial Statements
51
the Indian Rupee against these currencies can adversely affect our results of operations.
We evaluate our exchange rate exposure arising from these transactions and enter into foreign currency derivative instruments to mitigate such exposure. We follow established risk management policies, including the use of derivatives like foreign exchange forward/option contracts to hedge forecasted cash flows denominated in foreign currency.
We have designated certain derivative instruments as cash flow hedges to mitigate the foreign exchange exposure of forecasted highly probable cash flows. We have also designated foreign currency borrowings as hedges against respective net investments in foreign operations.
As of March 31, 2020, a `1 increase in the spot exchange rate of the Indian rupee with the U.S. dollar would result in approximately `1,972 million (Consolidated Statement of Income `658 million and other comprehensive income `1,314 million) decrease in the fair value, and a `1 decrease would result in approximately `1,912 million (consolidated statement of income `658 million and other comprehensive income `1,254 million) increase in the fair value of foreign currency dollar denominated derivative instruments.
Interest rate risk: Interest rate risk primarily arises from floating rate borrowing, including various revolving and other lines of credit. Our investments are primarily in short-term investments, which do not expose us to significant interest rate risk. From time to time, to manage our net exposure to interest rate risk relating to borrowings, we may enter into interest rate swap agreements, which allows us to exchange periodic payments based on a notional amount and agreed upon fixed and floating interest rates. Certain borrowings are also transacted at fixed interest rates. If interest rates were to increase by 1% from March 31, 2020, additional net annual interest expense on our floating rate borrowing would amount to approximately `773 million.
Credit risk : Credit risk arises from the possibility that customers may not be able to settle their obligations as agreed. To manage this, we periodically assess the financial reliability of customers, considering the financial condition, current economic trends, forward-looking macroeconomic information, analysis of historical bad debts and ageing of accounts receivable. Individual risk limits are set accordingly. No single customer accounted for more than 10% of the accounts receivable as of March 31, 2020 or for revenues for the year ended March 31, 2020. There is no significant concentration of credit risk.
Counterparty risk: Counterparty risk encompasses issuer risk on marketable securities, settlement risk on derivative and money market contracts and credit risk on cash and time deposits. Issuer risk is minimized by only buying securities in India which are at least AAA rated by Indian rating agencies. Settlement and credit risk is reduced by the policy of entering into transactions with counterparties that are usually banks or financial institutions with acceptable credit ratings. Exposure to these risks are closely monitored and maintained within predetermined parameters. There are limits on credit exposure to any financial institution. The limits are regularly assessed and determined based upon credit analysis including financial statements and capital adequacy ratio reviews.
liquidity risk: Liquidity risk is defined as the risk that we will not be able to settle or meet our obligations on time or at a reasonable price. Our corporate treasury department is responsible for liquidity and funding as well as settlement management. In addition, processes and policies related to such risks are overseen by senior management. Management monitors the Company’s net liquidity position through rolling forecasts on the basis of expected cash flows. As of March 31, 2020, our cash and cash equivalents are held with major banks and financial institutions.
Risk management procedures
We manage market risk through a corporate treasury department, which evaluates and exercises independent control over the entire process of market risk management. Our corporate treasury department recommends risk management objectives and policies, which are approved by senior management and Audit Committee. The activities of this department include management of cash resources, implementing hedging strategies for foreign currency exposures, borrowing strategies, and ensuring compliance with market risk limits and policies.
Foreign exchange risk management policy and results
We evaluate our foreign exchange rate exposure arising from operations and enter into foreign currency derivative instruments to mitigate such exposure. We have a consistent hedging policy, designed to minimize the impact of volatility in foreign exchange fluctuations on the earnings and assets & liabilities.
We evaluate exchange rate exposure arising from transactions and positions and enter into foreign currency derivative instruments to mitigate such exposure. We follow established

Annual Report 2019-20 52
risk management policies, including the use of derivatives like foreign exchange forward / option / future contracts to hedge forecasted cash flows denominated in foreign currency. As per the policy, the total hedges shall be 45% to 100% of the next four quarters of inflows in addition to select long term contracts which are beyond one year in tenor.
We have designated certain derivative instruments as cash flow hedges to mitigate the impact of foreign exchange exposure on Profit and Loss account and forecasted highly probable cash flows. We have also designated foreign currency borrowings as hedges against respective net investments in foreign operations.
Our Hedge Book as on March 31, 2020 stood at $ 2.7 billion dollars.
key Ratiosparticulars Fy 2019 Fy 2020 yoy Change
Revenue in ` million (% terms) 589,060 613,401 4.1% FIT Services Operating Margin (% terms) 17.9% 18.1% 0.2% FNet Income Margin (% terms) 15.3% 15.8% 0.5% FEarnings per share in ` (% terms) 14.99 16.67 11.2% FPrice Earning Ratio (times) 17.0 11.8 (0.3) AReturn on Networth (% terms) 17.0% 17.2% 0.2% FCurrent Ratio (times) 2.7 2.4 (0.3) ADebtors Turnover (times) 5.8 5.8 0.01 FFree Cash Flow as % of Net Income (% terms) 106.0% 80.7% (25.3)% ADebt-equity (times) 0.2 0.1 (0.03) FInterest Coverage Ratio (times) 17.8 20.6 2.8 FF - FavourableA - Adverse
Reasons for significant changes:• Our Free Cash flow is computed as operating cash flow less
net capital expenditure. Our operating cash flow was lower due to increased working capital requirements during the year ended March 31, 2020.
• Return on Networth is computed as Net Profit by average Networth. The increase in the Net income from `90,031 million in FY 2019 to ̀ 97,218 million in FY 2020 has resulted in improvement of Return on Networth.
Internal control systems and their adequacy
We have presence across multiple countries, and a large number of employees, suppliers and other partners collaborate to provide solutions to our customer needs. Robust internal controls and scalable processes are imperative to manage the global scale of operations.
The Management has laid down internal financial controls to be followed by the Company. We have adopted policies and procedures for ensuring the orderly and efficient conduct of the business, including adherence to the Company’s policies, the safeguarding of its assets, the prevention and detection of frauds and errors, the accuracy and completeness of the accounting records, and the timely preparation of reliable financial disclosures.
• Price earnings ratio is computed as Market share price by Earnings per share. The decrease in PE ratio was due to impact of COVID-19 crisis on our share price.
Wipro Limited
Corporate Overview | Management & Board Reports | Financial Statements
53
VAlUE CHAInOur human capital approach integrates people strategies which are based on the current and future business requirements. Our policies, processes and systems flow from these strategies which encompass our employee lifecycle. We also make sure these policies, processes and systems comply with the laws of the land and international standards wherever applicable. The outcomes of these people interventions are evident in our people result indicators, which directly or indirectly contribute to the intellectual, social, natural and financial capital of Wipro. As part of our governance process, the strategies, processes, and results are reviewed periodically by the leadership and course corrections are made when and where necessary. Throughout this value chain, our strategies, processes and policies reflect an unflinching commitment to the Spirit of Wipro values, as well as globally recognized principles of business responsibility, human rights and corporate governance.
CUlTURE / VAlUES While our company has transformed many times over the years, the Spirit of Wipro – our core values – has been the only constant. It is our true north that connects us with the past and guides us into the future. As we embark on a journey of culture transformation, these values are put into action through the Five Habits, which are essential to drive
a growth mindset. The Five Habits are Being Respectful, Being Responsive, Always Communicating, Demonstrating Stewardship and Building Trust. We believe in their combined power to build our culture for tomorrow. Five Habits is a movement at Wipro, championed by the Chairman and driven by our leaders for all employees to embrace. The Five Habits will be introduced in phases over 6 - 9 months. As part of phase 1, we have completed immersive sessions with the top 1000 leaders of our organization as we believe they can spearhead and influence the change.
pEOplE STRATEGyOur people strategies are geared towards creating an employee experience through diverse learning opportunities, great careers, a strong employer brand and an empowering and inclusive culture. Our employees find meaning in what they do while they create value for Wipro.
pEOplE pROCESSES: kEy HIGHlIGHTS Fy2020•Hiring and Onboarding: Localization continues to be a
strategic focus for our talent agenda, and we have made considerable progress in our key markets in Europe and APAC in FY20. Our comprehensive onboarding program aided by best-in-class systems help assimilate new talent seamlessly within Wipro. Our recruitment process has become more inclusive with diversity-focused sourcing. As an equal opportunity employer, we do not discriminate on the basis of race, colour, religion, sex, national origin, gender identity, gender expression, sexual orientation, disability status.
•PerformanceandTalentManagement: Our development-focused performance management system is based on the principles of meritocracy, fairness and transparency. Our quarterly review process continues to be a strong platform to encourage candid, constructive and meaningful feedforward discussions between employees and managers. Along with the annual succession planning, there is an annual 360-degree feedback survey where employees in middle and senior level roles receive feedback on 8 qualities from their teams, peers, internal customers, managers, and external customers.
•EmployeeWellbeing
· physical Wellbeing: We are always actively coming up with interventions to enhance the physical wellbeing of our employees, some of the interventions in this regard
Human Capital

Annual Report 2019-20 54
have been around Health and Safety Risk Assessment, all round safety and security measures including training and sensitization to meet the standard competence required by law in performing ones duties. All campuses maintain a conducive work environment in line with Indian/International standards. A Food Safety Standards Authority of India (FSSAI) license is mandatory for vendors operating within Wipro owned locations in India. All our facilities have safety committees, which meet quarterly and participate in risk assessments, safety inspections, incident investigations and hygiene audits. More than 4000 permanent and contract employees participated in committees on safety, food, transport, etc. across India, to represent the interests of the workforce.
· Emotional Wellbeing: With our hectic lifestyles, employees sometimes need additional help and guidance for their emotional wellbeing. Mitr is our employee counseling and support forum in India. In geographies outside India, we have employee counseling services provided as a part of Employee Assistance Programs.
· Financial Wellbeing: We continually strive to provide our full-time and part-time employees with compensation packages commensurate with their skills and experience and in accordance with laws of the land. Our benefits program follow an integrated approach and provide a range of options for better financial and social security, including efficient tax-management options, life and accident insurance, medical packages and assistance in managing financial issues. We started providing long-term incentives by granting restricted stock units (RSUs) in 2004 towards long-term retention of key talent. We continue to drive a high-performance culture through our variable pay programs. Our management compensation is now more closely aligned with organizational objectives and commitments, and significantly rewards higher peformance.
•EmployeeExperiences,EngagementandCommunication:We have instituted several global initiatives and communication channels to enable employee participation, engagement and feedback. These include All Hands Meets, Yammer blogs and employee connects with senior leadership, podcasts, collaborative platforms like MS Teams, WebEx and more. Employee Experience Survey is the formal mechanism to capture employee feedback, annually. We could not have the 2019-20 survey cycle because of the COVID-19 lockdown.
· Digitization and Talent Analytics: We continue to embrace the digital trend, transform our internal systems and find ways to use digitization and talent analytics to drive business outcomes and employee experience.
· Inclusion and Diversity (I&D) – Our I&D charter focuses on gender, persons with disabilities, the LGBTQ+ community, nationalities, underprivileged communities and suppliers. Our definition goes beyond diversity of identities towards inclusion for all- embracing diversity of personalities, age, education, parenthood, religion, function, skill etc. Across the spectrum, we remain focused on building a plurality of ideas and on elimination of unconscious bias. We firmly believe in making Inclusion a “way of life” for each individual in the organization. Our values are the cornerstone of our I&D practices. Further, I&D is a key agenda item in our Board reviews. Wipro’s key diversity initiatives include a focus on returning mothers, support for parents, sensitisation and conversations, inclusion of Persons with Disabilities and LGBTQ employees. In our continuous endeavour to build an inclusive workplace, we inaugurated Mitti Caffe which is run by, Persons with Disabilities, at one of our campuses in Bengaluru.
•Freedom of Association – We respect the right of employees to free association without fear of reprisal, discrimination, intimidation or harassment. Our employees are represented by formal employee representative groups in certain geographies including Continental Europe and Latin America which constitute about 2.7% of our workforce with a further 2.0% under collective bargaining agreements.
•HumanRights&Values atWiproHumanRights relatedpolices and Commitment
· Commitment to Human Rights: Wipro is committed to protecting and respecting Human Rights and remedying rights violations when identified. Providing equal employment opportunity, ensuring distributive, procedural and interactional fairness, creating a harassment-free, safe environment and respecting fundamental rights are some of the ways in which we ensure the same. Our Code of Business Conduct (COBC), Supplier Code of Conduct and Human Rights Policy are aligned to globally accepted standards and frameworks like the U.N. Global Compact, U.N. Universal Declaration of Human Rights and International Labour Organization’s Declaration on Fundamental Principles and Rights at Work (ILO Declaration). They cover all employees, suppliers, clients, communities and countries across geographies where we do business. Wipro is also one of the founding members of CII’s Business for Human Rights Initiative.
· Risk Identification process: We have established committees/processes to review progress and formulate strategies to address issues pertaining to compliance, safety and a harassment-free workplace.

Wipro Limited
Corporate Overview | Management & Board Reports | Financial Statements
55
These processes are periodically reviewed by the top management. We keep our employees informed about these processes regularly through trainings, mailers and internal social media platforms.
· Identified Risks: Through various audits and feedback we have identified the following as potential risks to Human Rights:
- Benefits and engagement of extended/contract workforce
- Unconscious bias at the workplace.
· Mitigation policies/processes: We have created specific interventions to tackle these issues:
- Contract Employee Engagement: We engage contract employees for end user support and infrastructure support for our customers across India. The duration of engagement varies depending upon the project and role. We have structured induction and eLearning modules on Code of Business Conduct, Prevention of Sexual Harassment (POSH) and Data privacy available to partner employees. In addition, a Chatbot is provided to them to address any queries or doubts on policies and guidelines. As part of our Partner Engagement Program, we conduct periodic partner employee connects at account and region level across India where we address their concerns and queries, take feedback and provide career guidance.
- Sensitization on Unconscious Bias: At present, over 1,28,000 employees have undertaken the Unconscious Bias E-module. Additionally, 140000+ employees have been certified through the mandatory Online Assessment module of Prevention of Sexual Harassment.
people ResultsWe have a culture of transparent and voluntary reporting which include the Business Responsibility Report, the Sustainability Report, the Dow Jones Sustainability Index,Ethisphere Institute etc. This has strengthened our employer brand and our internal business processes helping to create differentiated people outcomes. Leaders who significantly influence human capital strategies of the organization are measured on the performance of key indicators in this area. The indicators provide insights into the effectiveness of human capital strategies and are reviewed regularly both at organizational and individual business unit levels. The key targets are:
•Attrition– low to mid double digits with focus on retaining top talent
• Employee Experience Survey (EES) Score – We usually conduct our annual EES survey in March. We could not conduct the EES this year because of the COVID-19 crisis and the challenges associated with it during this timeframe.
SDG AlIGnMEnT Sustainable Development Goals (SDG) are the 17 global goals for 2030 adopted by UN member states in 2015. The goals provide a blueprint for peace and prosperity for people and the planet. At Wipro, some of the key SDGs that our programs map to are given below:

Annual Report 2019-20 56
Intellectual Capital is core to Wipro’s Strategy. It creates value for the customers and drives sustained growth, differentiation, non-linearity and profitability for Wipro. Wipro’s Intellectual Capital comprises scalable domain and technology IPs that are built for high opportunity areas leveraging partners, academia and start-up ecosystem.
Wipro has a versatile portfolio of cutting-edge products and platforms, which are designed to transform business operations, increase the speed of change, and reduce the cost of change across industry domains. They are aligned to Wipro’s ‘Digital First’ strategy, focused on the outcomes of Transformation, Modernization, Connected Intelligence, and Trust. They are easily and quickly deployable and offered in flexible and simplified outcome-based and as-a-service commercial constructs.
Wipro has launched an idea-hunting program called “The Great Blue Heron” (The bird – Great Blue Heron is a great fisher and fishing is used as a metaphor for idea hunting) for capturing high-potential opportunities across
customers, domains and technologies. Great Blue Heron’s HaBBIT Framework is then leveraged to add the solution to the portfolio. Through HaBBIT, the solutions can be commercialized using any of the five ways – Harvest & co-Innovate (Eg. CROAMIS, Pipe Sleuth), Build IP (Eg. VirtuaDeskTM), Buy IP (Eg. Topcoder, Promax), Invest through Wipro Ventures and Technology Themes & Big Bets.
Once the solution and development approach is finalized, it can then be funded through the Horizon Program which is designed to identify & incubate disruptive ideas and drive significant growth & differentiation for Wipro from a 2-3 year horizon standpoint. Through this program, Wipro funds development of products, platforms, solutions and competencies. During FY20, we incubated themes like Intelligent Network Automation, Robotics, and Virtual Automation Engineer (a quality assurance and testing product). The Horizon Program also continued investing in software for Autonomous Vehicle operations, AutoInsights, CROAMIS, SmartTwin (Digital Twin), Open Banking API Platform, TopCoder and SDX 2.0 (Software Defined Everything). Wipro has also funded building new and differentiated skills on Servicenow and Anaplan through this program.
Ip ASSETSWipro has a rich portfolio of 60+ enterprise-grade products, platforms and frameworks and has been actively investing in strengthening, enhancing and refreshing the portfolio. Here are some examples:
Wipro has invested in enhancing VirtuaDesk™ considering steep increase in demand for remote work place solutions. We have added several key features this year such as hybrid-cloud & multi-cloud capabilities, application performance assurance and application life-cycle management in virtual desktop environment.
Wipro HOLMES™ enhanced its end-to-end problem solving capabilities delivering persona-based solutions, targeted at specific stakeholders of enterprises.
In line with the changing priorities of our clients, Wipro’s Open Banking platform has been enhanced over the past year with several new product capabilities and toolsets. The platform is strengthened by reimagining the 360-degree relationship with Banks, FinTechs, 3rd parties, Regulators and the overall Open Banking ecosystem emerging across different geographies.
Intellectual Capital

Wipro Limited
Corporate Overview | Management & Board Reports | Financial Statements
57
Wipro has continued its investments in strengthening assets like NetOxygen, Medicare Advantage, Health Plan Services, Promax and Topcoder.
Co-Innovation and Open Innovation: Our Open Innovation programs extend our innovation capabilities by coopting an extended innovation ecosystem of startup partners, academia and expert networks. During the year ended March 31, 2020, we expanded our academia research footprint by entering into new research collaboration agreements with multiple universities across the world. Today our research teams work with the University of Texas at Austin, Tel Aviv University, Israel, Swinburne University, Melbourne, IIT Kharagpur, IIT Madras, IISc Bangalore, University of Agricultural Sciences, Bangalore, among others where we cover AI, NLP, encryption, 5G, Blockchain, autonomous vehicles, CV and other critical new technologies. We were successful in incubating new innovative startup partners and in scaling many existing relationships through joint engagements. We also did interesting work with select major consortiums and standards organizations that extend our views and influence in the innovations being developed through their work.
Our Robotics practice is developing smart factory solutions using robots, cobots, drones and other technologies that will optimize production lines significantly.. We are digitizing & orchestrating the process for few smart product lines projects, using AI and generating rich analytics that should help reimagine production for the post-COVID normal. We believe that these initiatives will enable the factory of the future.
We have also worked on building capability in application of 5G technologies. We are engaging with IIT Kharagpur and University of Oulu on RF, New waveform and precision localization tech. research for 5G and beyond.
AutoInsights, a connected vehicle and mobility platform, is a strategic investment from Wipro. Today this platform is used across the globe by various Automotive OEM’s and its ecosystem players helping them maximizing a vehicle’s lifetime value. Recently we have also signed a co-innovation agreement with a motorcycle OEM to customize AutoInsights patented solution to build a very unique and industry-first dealership digitalization experience using connected bike data and voice-enabled smart helmet.
Wipro Autonomous Systems team in collaboration with the Indian Institute of Science, focus on research in data
annotation, simulation and the navigation algorithms, social driving behavior, explainable AI, and other areas relevant for autonomous vehicle operations. Wipro is also working together with the National Institute of Design, on design aspects of these vehicles.
Research Areas and Solutions in Advanced Technology Areas: Topcoder, a Wipro Company, is the world’s largest technology network and on-demand digital talent platform with more than 1.5 million developers, designers, data scientists, and testers around the globe. Topcoder empowers organizations to leverage the flexibility of its key enterprise offerings around Enterprise Crowdsourcing (Design, QA, Dev, Data Science), Talent as a Service (TaaS), and Workforce Transformation (Strategic Consulting).
Innovation Centres: Our innovation incubation centers, the Technovation Center at Bengaluru and the Silicon Valley Innovation Center in Mountain View, California, build technology-led innovation to visualize the “art of the possible” in emerging business environments for our customers globally. These Centers bring together an innovation ecosystem, a set of best practices, IP and research and development resources to help our clients develop successful initiatives and hosted around 300+ customers and other visitors over the last year and showcased our best technologies and solutions.
patent Filings: Our R&D work has contributed to some significant patent applications during the FY in key technology domains. As has been reported earlier we have been investing in building a focused patent portfolio that protects critical Wipro IP. As of FY20, we have a total of 2301 patentsfiledinvariousPatentJurisdictionsacrosstheworld,of which 741 have been granted. Recognition of our work in IP creation has come in the form of the prestigious Enterprise Trophy presented to us by the World Intellectual Property Organization, as well as the National IP Award from the Govt. of India.
Highlights for the year
• IntheyearendedMarch31,2020,Wiprofiled255patentsand currently has approximately 741 registered patents and 1560 patent applications pending registrations in various jurisdictions across the world.
• Wiprowonthe“Asia IPElite”awardfromthe IntellectualAsset Management publication for the sixth consecutive year for best IP Practices

Annual Report 2019-20 58
CUSTOMERSFast-evolving technology and societal landscapes, macro economic environments and the emergence of newer business models have created a need for enterprises to look for strategic partners to advise, design and execute their technology transformation and support programs. Large multinational enterprises are engaging global IT Services
companies like ourselves to deliver high quality service on a global scale and at competitive costs. Our comprehensive range of offerings integrate digital solutions through innovative service delivery models and deep industry insights, leveraging our intellectual capital.
COVID-19 pandemic accelerated disruption in the global economy, healthcare, higher education, services, small businesses, and the enterprise. At Wipro, our mission is to help customers manage disruption and accelerate their transformation through service offerings such as Topcoder and Wipro’s LiVE Workspace™ Connect. Topcoder is Wipro’s crowdsourcing platform, helping customers in providing resilient, agile, flexible and on-demand workforce. Wipro’s LiVE Workspace™ Connect is a digital workplace offerings, helping customers to take their work force online efficiently and securely.
We believe in creating value for the customer over and above the contractual obligations. This is based on relationships built in the spirt of trust and collaboration. Active engagement at multiple levels is critical to meet and understand the expectations of our customers. Our processes like Program CSAT, Quarterly Pulse Surveys and the Annual CSAT conducted through third party surveys capture The Voice of the Customer at various levels i.e., at project level, program level, account level and through direct feedback, informal meetings, governance meetings and senior management interaction with the client.
We are collaborating with our customers on delivering on our commitments. Nearly 90% of the employees are working from home and continue to serve clients without interruption. We provided laptops with enhanced cybersecurity to employees to work remotely and deployed various virtual communication tools for managers to track employee welfare, productivity and customer delivery service progress.
The key material issues for our customers continue to be Data privacy, IT Security and our approach on sustainability.
IT Security: Wipro’s IT infrastructure is certified under the ISO 27001 standard which provides assurance in the areas of information security, physical security and business continuity. We benchmark our processes to meet the EU’s General Data Protection Regulation (GDPR) and SOX IT compliance requirements.
An organizations societal license to operate is influenced by its perspective and approach towards being a responsible citizen. For this it has to adopt an engagement that encompasses its key stakeholders - customers, business partners, vendors, employees, investors, communities and civil society. To this we also add another key stakeholder– future generations, which helps bring in a long term perspective of the unrepresented future generations. We talk about each of these stakeholders in brief below.
Social & Relationship Capital

Wipro Limited
Corporate Overview | Management & Board Reports | Financial Statements
59
Data privacy: Being a B2B business, Wipro does not collect, store or monetize information pertaining to our customer’s attributes or actions, including but not limited to, records of communications, content of communications, demographic data, behavioral data, location data, or any other personally identifiable information. Therefore, our company does not receive requests for customer information from government or law enforcement agencies.
In April 2019, we became aware that our system was subject to a cyber-attack by a coordinated and advanced phishing campaign, which was reportedly directed against several major companies, including Wipro. Upon learning of this incident, we collaborated with forensic firms to investigate and have worked closely with our anti-virus provider and our information security team to counter the threat found in our system and implemented a series of additional precautionary and containment measures across our systems. As per the investigations, there is no evidence of data breach or data loss reported. In addition, we had commissioned an independent assessment by a third party. The assessment has been completed and the independent third party has confirmed that they found no evidence of any risk and also that the remediation controls implemented by Wipro are effective.
Sustainability Related Aspects: We have 100+ of our customers who are part of independent raters like CDP, Ecovadis, and industry led consortiums (JAC, Quest) thatassess company’s performance on sustainability related aspects like human rights, environment, supply chain, labor practices, etc.
SUpplIERSThe supplier ecosystem of Wipro can be broadly categorized into two heads – the ‘primary supply chain’ by which we mean extended workforce involved in core delivery of IT Services and Solutions (refer the Human Capital section); and product or services suppliers or ‘secondary supply chain’ who provide materials, equipment and end-products, business support services and facility management services for our operations.
Our Code of Business Conduct (COBC) and the Spirit of Wipro values provide the ethical guidelines and expectations for conducting business and for directing Wipro’s relationship with its suppliers. In addition to the COBC, the Supplier Code of Conduct (SCOC) of Wipro further strengthens and augments the COBC with respect to environmental and social aspects. It is compulsory for all our vendors to submit a signed copy of Wipro COBC/Supplier Code of Conduct (SCOC).
Wipro is an Equal Opportunity employer and strongly advocates the same through its supply chain by encouraging supplier diversity. Our engagement with suppliers focus on improving the capabilities of suppliers in managing their sustainability performance. We have identified manpower service providers in civil, operations and support services as being significant in terms of social impacts. Similarly, providers of electricity, water, waste management and IT Software and hardware and civil have large environmental footprints and are therefore material to our strategy to reduce our environmental impact.
Summary of supplier sustainability engagementSocio-economic Impacts: It is compulsory for all our vendors to acknowledge and accept the Wipro Supplier Code of Conduct (SCOC). High Risk Vendors (HRV) identified based on geography, nature of service and engagements where they interact with government on behalf of Wipro go through additional checks and balances during processing for key words like government payments, miscellaneous expenses, commission, facilitation fee, gift, reward, out of pocket expense, etc. All HRV vendors are required to submit an anti-bribery anti- corruption questionnaire. We also have requirements of stricter negotiating threshold, clear break up of costs and multiple quote regardless of the value.
Environmental Impacts: Based on natural capital valuation, in purchased goods and service category, we identified most of the impacts are concentrated down the value chain of Wipro’s direct suppliers. Of the total impact across tiers, tier 1 constitute 23%, tier 2 – 45% and rest is from tier 3 suppliers. We engage with tier 1 suppliers in improving their sustainability performance so that they are able to cascade these practices down their supply chain.
Summary of initiatives in IT products and servicesIn 2019, we purchased more than 108,400+ EPEAT Gold and over 590 EPEAT Silver and Bronze category products across desktops, laptops, displays, imaging equipment and mobiles. In tangible terms, our procurement of EPEAT certified hardware translates into a saving of 25.9 million kWh of energy over the lifetime of products.
Till date we have migrated 6300 users from traditional physical desktop to Virtual Desktop Infrastructure (VDI). This has led to reduction in energy consumption, easier operations and cost saving.

Annual Report 2019-20 60
Through proactive maintenance and upgrades, we have been able to reutilize 27% of the assets – desktops and laptops post their scheduled end of life.
During the reporting year, we saved 3 million papers in printing and `2.3 million in cost due to duplex savings through Managed Print Services Model - outcome-based model where Wipro’s printing services are managed through an independent third party.
InVESTORSWipro’s endeavor is to not merely report true and fair financial results in a timely manner but also communicate the business outlook, risks and opportunities transparently to the investor community. Increasingly, discerning investors are interested in the longer-term strategy of the organization and issues which are material to the industry. We deploy multiple channels of communications to keep investors informed about various development and events. In FY20 we conducted 5 road shows and held 252 investors meetings & calls; 11 conferences and 4 earning conference calls.
In addition, we participate in leading investor led disclosures likeDowJonesSustainabilityIndex,Vigeo,FTSERussellESG,MSCI ESG, Sustainalytics and Carbon Disclosure Project. WiprowasselectedasamemberoftheglobalDJSI2019forthetenthyearinsuccessionandincludedinboththeDJSIWorldand Emerging Markets Indices. The Euronext Vigeo Emerging Market Sustainability Index also includes Wipro among the 70 most advanced companies in the Emerging Market Region. We are part of FTSE4Good and are a Global Sector leader.
COMMUnITIES AnD CIVIl SOCIETIES At Wipro, we think it is critical for business to engage with the social and ecological challenges that face humanity in a deep and meaningful manner with long-term commitment; for that is the only way by which real change can happen on the ground. We engage with communities on issues that matter to them most. Wipro’s social initiatives center on the three dimensions: Education, Community Care and Ecology. Our programs on Ecology are covered in Natural Capital Section
Key highlights of the program till date and for the year is in Sustainability Highlights section of this report on Page 14
Our key programs in Education: Our work in education covers a range of initiatives in school and higher education in India and overseas. The common vision that ties this together is our belief that good education is a primary enabler of change towards a better society.
Systemic reforms in School Education: Since 2001 we have been working on issues of systemic reform in school education in India on two fronts (a) to support the development and strengthening of good organizations working in this space and (b) to support organizations working in other developmental areas like livelihoods or healthcare and encourage them to expand their work to school education.
Education for underprivileged children The program address a gamut of critical issues faced by disadvantaged communities when it comes to school education – starting from enrolment in schools to nutrition for children, counseling services for parents, remedial education, just to name a few. These children are from some of the most vulnerable groups in our society – urban slums, HIV-affected families, migrant labor families, street children.
Education for Children with Disability: The program supports the educational and rehabilitative needs of children with disabilities from underprivileged backgrounds. Going beyond

Wipro Limited
Corporate Overview | Management & Board Reports | Financial Statements
61
just schooling, our approach tries to integrate enabling factors like availability of nutrition, community support, specially trained teachers, assistive technology, access to healthcare etc. Our work in this space covers multiple categories of disabilities and focuses on early intervention and inclusive education.
Wipro Science Education Fellowship program in USA: Started in 2012, the Wipro Science Education Fellowship (SEF) is a two-year program designed to improve individual teacher practice, foster teacher leadership opportunities and create a district corps of teacher leaders supporting sustainable positive changes in science education.
Wipro Science Education Fellowship program in Uk: Started in 2019, we work with Kings College London to offer UK’s first Master’s program in STEM education. We work with Sheffield Hallam University to provide rigorous continuous professional development to STEM teachers through Wipro Teacher Fellowship and Wipro Teacher Mentor programs.
Sustainability Education: Wipro Earthian, started in 2011, is our flagship program that brings together two of our key concerns, Education and Sustainability, into a nation-wide initiative for schools and colleges. Wipro earthian runs in two phases – the Wipro earthian “a” nation wide outreach program and the Continuous Engagement Program (CEP).
Technology Education: Wipro Academy of Software Excellence (WASE) program run in partnership with the Birla Institute of Technology & Science (BITS), Pilani, India, helps Science graduates to study for a Master’s degree in Software Engineering. Wipro Infrastructure Management School (WIMS) is another program with BITS Pilani, to develop and nurture an exclusive talent in IT infrastructure business, keeping the Cloud Computing as the technology theme. Wipro Software Technology Academy (WiSTA) is run in collaboration with Vellore Institute of Technology (VIT) for data science graduates to offer some specific courses like Data Science, VLSI and Embedded and Information Technology programs.
Talentnext: The program offers Digital Technology courses to faculty members of Engineering Colleges for 2 weeks on Industry relevant skills and certify them. They in turn leverage our course contents, platform, assignments, case studies and assessments to train their 6th semester students as part of the curriculum. The students trained by these faculty have to go through a 250-hour self-directed learning and must qualify coding challenge to participate in Wipro’s campus selection process.
COMMUnITy CAREA core principle of our CSR strategy is that we must engage meaningfully with disadvantaged communities who are proximate to our facilities. Our work is channelled through Wipro Cares, a unique platform that is based on the operating model of employee contributions which are matched 1:1 by Wipro Limited (for COVID-19 contributions the matching is 2:1). Our work spans across following domains:
primary Health Care: We works with partners who provide quality primary health care services to extremely disadvantaged communities in Nagaland, West Bengal, Karnataka, Delhi and Maharashtra. Through our projects we address the issues related to maternal and child health, adolescent health, nutrition, community hygiene and sanitation, preventive and curative care, health education & counseling.
Disaster Rehabilitation: Starting with the Gujarat earthquake in 2001, we have responded to several natural calamities wherein Wipro’s employees have also risen to the occasion and played a sterling role. In past two years, we initiated disaster rehabilitation programs for Kerala floods in 2018 and Cyclonic Strom Fani in 2019.
Community Ecology: Our project in agro-forestry in rural Tamil Nadu help farmers in effectively implementing integrated farming practices. Our projects in urban solid waste management at Bengaluru and Mysore provide comprehensive

Annual Report 2019-20 62
skills upgradation and social, nutritional and health security to workers in the informal sector of waste.
The power of engaged employeesEmployees are integral to many of our social programs in many ways. Providing them a platform to engage develops a sense of citizenship and larger responsibility towards society. Wipro employees are currently engaged with Wipro Cares either through volunteering or by way of monetary contributions or both. In FY 2020, 23000 Wipro employees contributed monetarily and +14,000 employees from nearly 40 chapters in India collectively spent around 44,000 hours in voluntary engagement on a wide range of community and environmental initiatives.
International ChaptersOur employees across the world are keen and enthusiastic participants in local community initiatives. In 2019, through Sprit of Wipro (SoW) Run, more than 13,000 Wipro employees from across the globe contributed for their local charities. In North America, through First Book program +150 Wipro employees volunteered hundreds of hours and distributed more than 13,000 books impacting more than 1,000 at- risk and rural students. Other initiatives are disaster rehabilitation in Australia, biodiversity conservation in Spain, health care in Europe & US, food drives in Brazil & US and education for disadvantaged children, particularly children with disabilities in Philippines.
Our response to COVID-19 pandemicWipro Enterprises Pvt Ltd has committed ` 100 crore towards tackling the unprecedented health and humanitarian crisis arising from the COVID-19 pandemic outbreak. Actions are being taken for a comprehensive on-the-ground response in specific geographies, focused on immediate humanitarian aid, and, augmentation of healthcare capacity, including containing and treating those affected by the COVID-19 outbreak.
Humanitarian Support: Our focus is on the immediate provision of food, dry rations, water, basic medicines and safety kits, etc. for the marginalized communities that are currently bearing the brunt of loss of livelihoods and jobs.
Healthcare Support: Our focus is on augmenting the capacity of our healthcare system to respond effectively at scale, with the urgency the situation demands. We are working with a network of partner organizations on a whole range of interventions starting from the first line of defence like the supply of sanitizers, masks and other essentials, to supporting the build-up of capacity in our health systems - such as Personal Protection Equipment (PPEs), Testing Kits, Ventilators, Isolation Units etc. In parallel, we are also trying to ensure that primary healthcare services continue to be available for the disadvantaged communities in the locations we operate in.
These responses are being carefully coordinated with relevant government institutions and will be executed in an integrated manner by Wipro, Wipro Enterprises Pvt Ltd. and the Azim Premji Foundation.

Wipro Limited
Corporate Overview | Management & Board Reports | Financial Statements
63
GoveRnanceSustainability governance is informed by our strategic choice to work across both dimensions – business operations and with the larger community. The former is about ensuring that the ecological footprint of its operations is minimized and the organization fulfils its essential regulatory duties, and runs its business with integrity. The latter dimension goes beyond the boundaries of the organization and contributes towards development of the larger community.
All key organizational stakeholders, right from the board, executive leadership and different functions have defined
responsibilities related to planning, execution, review, evangelization and advocacy of the sustainability charter. Strategic oversight of sustainability programs rest at the corporate level with our Chairman, Board of Directors and Group Executive Council. The goals and objectives are jointly set with inputs from across functions. The quarterly reviews are attended by the Chairman, Chief Strategy Officer, Chief Financial Officer and Chief HR Officer apart from the Chief Sustainability Officer and Head of Operations. We benchmark our performance with our global peers through extensive disclosures as well as a system of rigorous internal and external audits.
ManaGeMent appRoachAt Wipro, we have identified Energy efficiency and Green House Gases (GHG) mitigation, Water efficiency and Responsible Water management, Pollution and Waste management, and Campus Biodiversity as our most material issues and have developed programs around them
Our Ecological Sustainability Policy, available at https://www.wipro.com/content/dam/nexus/en/sustainability/pdf/ecological-sustainability-policy.pdf forms the structural framework for our environmental programs and management systems. We have been following the guidelines of the ISO 14001 framework for nearly two decades now as one of the cornerstones of our Environmental Management System (EMS). 20 of our campus sites in India and 8 in Australia are certified to ISO 14001 and OHSAS 18001 standard. Other campuses are benchmarked against the same standard as a part of our internal review/audit process. We were one of the early adopters of Green Building Design. We strive to maintain the same standards in the maintenance of our facilities. Our newer campus facilities are IGBC LEED certified. We also monitor Indoor air quality as per international standards of ISHRAE. We have been responding to Carbon Disclosure Project (CDP) Climate Change Investor and Supply Chain for the last 10 years. In addition we have applied the Natural Capital Protocol guidelines to publish our annual Environmental Profit and Loss account. We are also members of LfN (Leaders for Nature) consortium anchored by IUCN in India and CII’s India Business and Biodiversity Initiative (IBBI).
Strategic Partnerships are key to achieving our goals across the value chain. We work with Renewable energy suppliers, energy efficient hardware manufacturers and service providers and other partners who help to reduce our overall
Natural capital refers to the notion that nature provides immense value that is critical to human existence and therefore, any action that depletes natural capital is self-defeating for our society. Wipro’s approach to Natural Capital embraces the continuum of
• Initiatives‘withintheorganization’thatfocus on reducing the energy, water, waste and biodiversity footprint of our business operations; and
• Engagingthroughpartnersonkeyexternalprograms in community ecology.
natural capital

Annual Report 2019-20 64
GHG footprint including employee commute and business travel footprint.
EnVIROnMEnTAl RISkSThe Enterprise Risk Management and Sustainability functions at Wipro jointly oversee environmental and climate change related risk identification and mitigation. Impacts of extreme weather events, urban water stress, air pollution, waste management and their impacts on employee health and wellbeing are the most material issues we engaged with.
Over the past year, we have undertaken a comprehensive Climate change Risk Assessment program, encompassing both physical and transitional risks, for our major operational locations across the globe, covering India (12 cities), China, Philippines, Germany, Romania, the UK and the US. This has been carried out for two scenarios (based on the IPCC defined RCP 4.5 and RCP 8.5) covering medium to long term (2030-2050) time frames.
In both scenarios, we see an increased probability of higher incidence of water stress, hot days and heat waves across cities. For the coastal cities of Mumbai, Chennai, Kolkata and Vizag we see a high probability of increased rainfall events leading to urban flooding while there is the increased likelihood of adverse health impacts due to Air Pollution in the NCR region. The study has also been used to estimate the extent to which we could witness reduction in employee productivity and increase in absenteeism due to these physical risks. Other operational impacts include those on account of changing regulations in the areas of renewable energy, carbon taxes, green buildings, water management and a shift away from fossil fuel based transport.
Outside India, we see increased physical climate risks for our operations in Philippines, China, Romania and the U.S due to floods and cyclones and while Germany and U.K are primarily exposed to transitional risks due to policy and regulatory changes.
Based on a health survey carried out as part of the study with employees, we see emerging linkages to heat- induced health issues as well as seasonal vector borne diseases. These adverse heat impacts are likely to increase in the future, particularly in cities of Delhi, Noida, Mumbai and Vishakhapatnam which are likely to see an increase in extreme heat conditions. Furthermore, the impacts of vector-borne diseases could become more severe in the cities of Chennai, Mumbai, and Kolkata, where we are likely to see increase in rainfall and urban flooding. These impacts may again contribute to a decrease in the productivity of our employees.
Finally, the study also illustrates how climate change induced financial impacts to our global customers across sectors could likely lead to contraction in their spends on IT services. For instance, business loss due to climate change induced financial impacts to energy and utilities sector customers. Going forward we plan to incorporate the findings of the study into our BCP framework.
In the assessment of risks, climate change attribution is still an evolving science. We recognize this fact when evaluating climate risks to our business and the linked fact that such risk assessment will be based on a number of best-fit assumptions. The precautionary principle though requires that we recognize these risk-outcomes formally and as rigorously as possible. Our endeavor going forward therefore will be to continually refine and improve the methodology and approaches used in climate risk assessment.
Climate change related impactOur risk assessment exercise is undertaken at both the company level and at the asset level. A well-defined Business Continuity Policy prescribes principles to plan for climatic disruptions which could disrupt business objectives. The Corporate Business Continuity Team (CBCMT) governs and guides the standard risk assessment methodology at every location to identify risks which could potentially impact continuity of business, financial parameters like revenue & profitability as well as reputational and legal parameters. This group collaborates with various support groups in the organization to assess risks for human resources, facilities & IT infrastructure with identified impacts, probability/likelihood & controls in place. A severity matrix of Low, Medium & High impacts is defined and a defined crisis management group is vested with the responsibility to respond, recover, resume, return & restore from these situations. The detailed climate modeling and impact assessment exercise will help in further calibrating our risk management program.
EnERGy EFFICIEnCy & GHG MITIGATIOn Targets: We have set Science Based Targets for Scope 1, Scope 2 and Scope 3 till 2030 that are based on the well below 2 degree temperature goal. Further, work on aligning our targets with 1.5 degree temperature goals is in progress.
Considering 2017 as the base year, we have set medium-term targets till 2022 and 2030 and longer-term targets till 2040 and 2050. The following goals have been set for the period FY 2017 to FY 2022:

Wipro Limited
Corporate Overview | Management & Board Reports | Financial Statements
65
For India operations, about 84.5 million units constituted renewable energy procured through PPAs (Power Purchase agreements) with private producers. Of this 73.6 million units is with green attributes (zero emissions). Another 10.8 million units is from renewable resources for our downstream leased space.
Energy Intensity: EPI for owned office spaces, measured in terms of energy per unit area has been nearly flat at 144 KwH units per sq. meter per annum. The absolute energy has marginally increased by 0.63% for the reporting year.
Scope 3 Emissions: Our total scope 3 emissions for FY2020 is 421,526 tons of CO2 eq, which accounts for 75% of our total footprint. Out of the 15 categories of scope 3 reporting as per the new GHG corporate value chain standard, we are currently report on all of the 8 categories applicable to us. The table below shows comparison for Business Travel, Employee Commute and Upstream fuel and energy emission category for last three years – these contribute to 50% of our overall emissions
Fy2020
Fy2019
Fy2018 315,254
273,638
281,213
Total Emissions: The overall emissions across all scopes is 559,456 tonnes. Within this, the main contributors to our GHG emissions are: Electricity – Purchased and Generated (23.6%), upstream fuel and energy emissions (13%), Business Travel (22.1%) and Employee Commute (15.1%). Leased office spaces contribute to 7.1% of emissions.
GHG MITIGATIOn MEASURESOur five year GHG mitigation plan consists of three key elements – Energy Efficiency (Reduce), Renewable Energy (RE) Purchase (Replace) and Travel Substitution (Reduce and Replace); of this, RE procurement will contribute the maximum, 80% share to GHG emission mitigation strategy for Scope 1 and 2.
Energy Efficiency: These measures include new retrofit technologies to improve Chiller and Air Handling Units (AHUs), integrated design and monitoring platforms. The Global Energy command centre aggregates Building Management System inputs on a common platform to optimize operational control and improve energy efficiency.
Since 2007, we have been working on a server rationalization and virtualization program, through which we have decommissioned old physical servers and replaced the processing capacity with virtualization technology on fewer numbers of servers. As of March 2020, we have 10155 virtual
a. Emissions reduction of 14% in absolute Scope 1 and 2 GHG emissions
b. Energy Intensity in terms of EPI (Energy Performance Index) - Cumulative reduction of 7.8% in EPI over 5 years
c. GHG Emission Intensity (Scope 1 and Scope 2) on Floor Area (FAR) basis - Cumulative reduction of 16 % in GHG intensity from 117 Kg CO2 eq./ Sq. Mt. (kgpsm) to 98 kgpsm of CO2 –eq
d. Renewable Energy (RE)- Increase renewable energy procurement by 55% to 120 million units
e. Absolute reduction of 10% in Scope 3 emissions for Business Travel, Employee commute and Upstream fuel and energy related emissions.
pERFORMAnCE AGAInST GOAlSAbsolute Emissions: The absolute Scope 1 and 2 emissions (India) for FY 2020 has increased by 17.6% from 117,290 to 137,930 tonnes. This is primarily for few reasons –reduction in RE share by 22% for reasons mentioned later in this section, with concomitant increase in grid electricity as well as increase in share of diesel generated electricity by 9.5%. The dashboard below provides a summary of our Global and India GHG emissions, including data centres. The figures are net emissions for all years, after considering zero emissions
for renewable energy procured.
GHG Scope 1 and 2 (Tons of CO2 Equiv.)
Fy2020
Fy2019
Fy201853,470
4,208
152,361
113,082
135,472
Data Centers Office
2,458
Emissions Intensity: Our India office space emissions intensity (Scope 1 and Scope 2) is at 87.20 Kg CO2 eq. per Sq. Mt. per annum, up by 22% from FY 2019. Concomitantly the global people based emissions intensity has also increased by more than 9.8% to 0.932 tons per person per annum.
Energy Consumption: The overall energy consumption from Scope 1 and 2 boundaries (operational and financial control) is 915.3 million Mjoules, compared to 900.8 million Mjoules in the previous year, a marginal increase of 1.5%. The total energy consumption, electricity and back-up diesel generated, for office spaces in India is 223.7 million units (including leased spaces globally this is 297 million units). Data centers in India contribute to another 5.7 million units.
Annual Report 2019-20 66
servers (6750 in March 2019) running on 409 physical servers which contributes to an energy savings of approximately 45.6 million units in the reporting year. The savings showed an increase of 53% over the previous year. Our current Virtual Desktop Infrastructure (VDI) capacity is 8,000. VDI’s provide high capacity scalable infrastructure with On Demand provisioning, High Availability and High Performance Computing environment. Out of this, we have enabled 6,300 VDI’s across two of our campuses. Thin clients consumes less energy (80% less) compared to Desktop, resulting in savings of 0.75 million units. Over a 5 year period, energy efficiency initiatives have resulted in savings of 120 million units (based on per capita consumption).
RE procurement: For the reporting period of FY 2020, RE purchase contributed to approximately 84.5 million units or 35% of our total India energy consumption, out of which 11 million units is for downstream leased spaces. Our RE consumption this year has reduced due to external reasons like load shedding and grid failure leading to less evacuation in few states.
Rooftop Solar and Captive RE: The rooftop Solar PV installations at 6 of our campuses followed by extensive use of solar water heaters in our guest blocks and cafeterias have resulted in equivalent savings of 1.57 million units of grid electricity in the reporting year
Business Travel: The IT services outsourcing model requires frequent travel across the delivery life cycle to customer locations, mainly overseas, and contributes to around 22% of our overall emissions footprint. This includes travel by air, bus, train, local conveyance and hotel stays. We have seen an increase in emissions by 5.1% as compared to FY2019 – though over the three year period between FY2017 and FY2020 we have reduced emissions by 9.8%.
Employee Commute: Employees have various choices for intra-city commuting. In addition to company arranged transport (33%), employees owned cars & two wheelers contribute to 16% and public transport account for the balance 51%. Over a three year period (FY2017-FY20) our employee commute emissions reduced by 20.9%.
Over the past few years, we have taken steps to facilitate a shift towards improved access to public transport for employees (buses, commuter trains) and carpooling. Our carpooling initiative now has over 1 Lakh registered users across locations. Around 22.7 Million kms of rides were shared in the reporting year saving 4900 tons of CO2 equivalent emissions, more than double from the previous reporting period.
We became the first major Indian business to join EV100, a global initiative by The Climate Group , in our commitment to
transition our global fleet to electric vehicles (EVs) by 2030. In the current year ,we launched the program in 4 more cities and clocked 3.4 Million Kms across 63,000 trips saving around 850 tons of CO2 eq.
WATER EFFICIEnCy AnD RESpOnSIBlE USEAt Wipro, we view water from the inter-related lens of efficiency and conservation coupled with our role as a responsible citizen in engaging with urban water issues outside our own boundaries. Our articulated goals are therefore derived from these dimensions.
Water Efficiency:
a. To improve water efficiency (fresh water use per employee) by 5% year on year
b. To reduce absolute water consumption in existing campuses by 20% between FY 2016 and FY 2021 Water Responsibility
Water Responsibility: To ensure responsible water management in proximate communities, especially in locations that are prone to water scarcity. We are also collaborating on building capacity and advocacy platforms at the city level for integrated urban water management.
Freshwater recycling and efficiency: The per employee water consumption for the reporting year is 930 litres per month as compared to 951 litres in FY 2018, an improvement of 2.2%. Freshwater consumption has seen an increase of 6.75% from last year to 1621 million litres essentially due to leakages from aging underground pipeline network at two locations. Real-time monitoring pilots are being implemented in two of our campuses. Water free systems (where applicable), smart metering, optimizing heating and cooling and recycling of blow down are other initiatives being explored. We have achieved 12.5% reduction in absolute fresh water consumption from FY 2016 .
We recycle 1,118 million litres of water in 27 of our major locations (vs 1,090 million litres in FY 2019) using Sewage Treatment Plants (STPs) and ultra-filtration units. Recycled water represents 41% of our total water consumption. The amount of recycled water as a percentage of freshwater extracted is around 70%. We have completed ultra-filtration and RO projects for STP treated water at three our large locations. Of the total treated water (1090 million liters), 62% is used for flushing and 6% is used in cooling tower. The balance 32% is used mostly in our landscapes and for general cleaning – the quality is equivalent to freshwater (Less than TDS of 1000). Our water recycling initiatives have cumulatively saved 5190 million liters of water over a 5 year period.

Wipro Limited
Corporate Overview | Management & Board Reports | Financial Statements
67
Freshwater use-India Offices:
Fy2020
Fy2019
Fy2018 1,514,703
1,518,934
1,621,501
Fresh water (KL) Area intensity (KL per sq mt) People intensity (KL pp per month)
1.005
0.957
1.044
0.991
0.951
0.930
Sourcing of Water: Our water is from four sources – private water (mainly ground water sourced from tanker water suppliers), municipal and industrial bodies supplied water, in-situ ground water and harvested rain water – with the first two sources accounting for nearly 92% of the sourced water. Water purchased from private sources is primarily extracted from ground water. Not surprisingly, ground water contributes to nearly 60% of our total freshwater consumption across cities in India. Our urban/ peri-urban facilities located in three states – Karnataka, Tamil Nadu and Telengana, are located in water stressed basins. The water supplied by the municipal bodies is sourced primarily from river or lake systems. The table below provides parentage of water sourced from different freshwater sources during the reporting year.
Private Water - 52%
Municipal Water - 40 %
Ground Water - 7 %
Rain Water Harvested - 1 %
pOllUTIOn AnD WASTE MAnAGEMEnTPollution of air and water poses one of the most serious threats to community health and welfare. Managing these ‘commons’ in an urban context again requires business organizations to look beyond its own boundaries and to adopt an integrated approach.
Our waste management strategy includes
a. Regular monitoring of air, water and noise pollution to operate well within regulatory norms.
b. Reducing materials impact through recycling and reuse
c. Arranging for safe disposal of waste that goes outside our organizational boundaries. To operationalize our strategy, we segregate and monitor waste processing across 13 broad categories and nearly 40 sub categories.
Total waste disposed during FY 2020 was 5,057 tons – a reduction of 18.5% compared to the previous year. This is primarily due to reduction of construction and demolition (C&D) debris, mixed metals and scrap and wood/lumber by around 870 tons due to completion of renovation work and initiatives to reduce packaging waste.
Our current recycling rate is 81% (excluding construction and demolition debris). 84% of organic waste is recycled in house and the balance sent as animal feed outside the campus. Close to 100% of the inorganic waste is recycled through approved partners. 70% of the total mixed solid waste and scrap is currently recycled and the rest sent to landfills. Our target is to improve this to 80% by 2021. Biomedical and hazardous waste is incinerated as per approved methods. All our E-waste is currently recycled by approved vendors. Our effective safe disposal , excluding landfill, is hence 97%.
Waste Management Summary (Excluding C&D)
Recycle - 81%
Landfill - 3 %
Other Methods - 10 %
Incineration - 6 %
Others: We monitor diesel generator stack emissions (NOX, SOX and SPM), indoor air quality (CO, CO2, VOC’s, RSPM), treated water quality and ambient noise levels across 25 key locations every month. These meet the specified regulatory norms.
URBAn BIODIVERSITyThe twin primary aims of our campus urban biodiversity program have been to build on them as platforms for wider education and advocacy. One of our goals has been to convert five of our existing campuses to biodiversity zones
Our first flagship project in biodiversity was the unique Butterfly Park and wetland biodiversity zone that uses recycled water and excess flood water at the Electronic City campus in

Annual Report 2019-20 68
Bengaluru. The wetland area now has 106 species of plants across nine thematic areas– integrated across a walking trail with engaging signages. Similarly the Pune project also has more than 300+ native species across five thematic gardens – Aesthetic and palm garden, Spring garden, Ficus garden, Spice and Fruit garden.. In all these programs we work closely with expert partners in biodiversity, conservation, ecological design and communications. A work environment which integrates biodiverse and natural design principles has multiple intangible benefits for employees and visitors – it builds a larger sense of connectedness and a perspective of our place in the world around. We also have drafted a set of biodiversity management guidelines for adoption across our campuses.
URBAn RESIlIEnCE Collaborative advocacy on water: Our long term projects on Urban Water in cities are providing key policy insights and levers for citizen engagement and advocacy on ground water management and its relationships to surface water flows and water bodies like lakes/tanks and wetlands. We bring together hydrogeologists, academia, government, citizen groups for a nuanced understanding of issues catalysing citizen action on the ground. In Bengaluru over the last four years, we have extensively worked in two peri-urban geographies with different land use and demographic profiles. We have now initiated a similar long term program in Pune – which includes citizen led mapping of ground water data and creating institutional capacity with government and other players for revival and rejuvenation work. In the year we also hosted a two day program in Hyderabad on urban water – a workshop followed by an open fair for citizens on water management.
Collaborative advocacy on Biodiversity: Our participation in advocacy on biodiversity issues is through CII’s IBBI (India Business and Biodiversity Initiative) and the Leaders for Nature program from the India chapter of International Union of Conservation Networks (IUCN). We have been supporting the “World Sparrow Day” and the “Wipro-Nature Forever Society Sparrow Awards” for the past six years. We also chair the Bengaluru chapter of CII’s Greenco program.
Collaborative advocacy on Waste: We supported a study to understand the contribution of informal economy to waste and material recycling in India and their perspectives . A book publication , based on the study, has been released. We also supported the art work for a solid waste knowledge center ‘Swacha Kalika Kendra’ in Bangalore.
BEnGAlURU SUSTAInABIlITy FORUM (BSF) This forum was set up in early 2018 and convened by Wipro along with the National Center for Biological Sciences. In the reporting year, the forum continued to participate in dialogues, facilitate conversations around a sustainable future and partner with other institutions. In the year, we partnered with Science Gallery, Bengaluru on their first interactive exhibition “Submerge” at Bangalore International Center and hosted 9 events in the city. We also partnered with Indo-Germany Energy Forum (IGEF) and the German Consulate General on ‘Energy Transition’ traveling exhibition. We extended our support to 8 new small grant proposals in the areas of urban water, waste and biodiversity - with this we have supported 19 such projects till date.
WIpRO’S nATURAl CApITAl VAlUATIOn pROGRAMTotal environmental cost relating to Wipro’s operations and supply chain (tier 1) was equal to 110 million USD in FY 2019 (168 million across all tiers USD in FY18). This accounts for 8.5% of our profit and nearly 1.3% of revenues for the FY19.The difference in valuation between two years is due to change in methodology for calculating impact.
In FY 19 valuation, the methodology uses social cost of carbon based on higher discount rate for developing countries and low discount rate for developed countries – overall a 3% discount rate was used. For calculating the impact due to air pollution only human health Impacts were considered as they contribute to 95% of total impact from air pollution. Land use valuation was based on net change in economic value due to loss of ecosystem service and was calculated only for the electricity procured from the grid mix, since for the direct operations land use change is not considered to be a material impact. For calculating impact due to water consumption the following factors were taken into consideration – impact on human health, incidence infectious disease and impact of energy consumption.
In FY 19, Air Pollution (38%), GHG emission (26%) and land use change (25%) contributed the most. The operational footprint (including business travel and employee commute) accounted for 36.2 million USD of Wipro’s total environmental cost in FY 2019. In supply chain, fuel and energy related activities accounted for 32 million USD and purchased goods and services accounted for 37 million USD during the same period.
The above figures are net of our positive valuation, attributable to our environmental initiatives. The biggest driver of overall environmental cost reduction by 6.54 million USD –were energy efficiency related activities, renewable energy procurement and water recycling. Valuation for FY 2020 is unlikely to vary significantlydifferentandwillbecompletedinJuly2020.

Corporate Overview | Management & Board Reports | Financial Statements
Wipro Limited69
Board’s ReportOn a consolidated basis, our sales increased to ` 610,232 million for the current year as against ` 585,845 million in the previous year, recording an increase of 4.16%. Our net profits increased to ` 97,718 million for the current year as against ` 90,179 million in the previous year, recording an increase of 8.36%.
On a standalone basis, our sales increased to ` 503,877 million for the current year as against ̀ 480,298 million in the previous year, recording an increase of 4.91%. Our net profits increased to ` 86,807 million in the current year as against ` 76,140 million in the previous year, recording an increase of 14.01%.
On behalf of the Board of Directors (the “Board”) of the Company, it gives me immense pleasure to present the 74th Board’s Report, along with the Balance Sheet, Profit and Loss account and Cash Flow statements, for the financial year ended March 31, 2020.
I. Financial PerformanceThe standalone and consolidated financial statements for the financial year ended March 31, 2020, forming part of this Annual Report, have been prepared in accordance with the Indian Accounting Standards (Ind AS) as notified by the Ministry of Corporate Affairs.
Key highlights of financial performance of your Company for the financial year 2019-20 are provided below:
(` in millions)
Standalone Consolidated
2019-20 2018-19 2019-20 2018-19
Sales 503,877 480,298 610,232 585,845
Other Operating Income 193 940 1,144 4,344
Other Income 24,766 25,686 27,250 26,138
Profit before Tax 110,077 98,705 122,519 115,422
Provision for Tax 23,270 22,565 24,801 25,243
Net profit for the year 86,807 76,140 97,718 90,179
Other comprehensive (loss)/income for the year (4,284) 1,246 4,257 800
Total comprehensive income for the year 82,523 77,386 101,975 90,979
Total comprehensive income for the period attributable to:
Minority Interest - - 653 251
Equity holders 82,523 77,386 101,322 90,728
Appropriations
Dividend 5,713 4,524 5,689 4,504
Corporate tax on dividend distribution 1,174 930 1,174 930
EPS *
- Basic 14.88 12.67 16.67 14.99
- Diluted 14.84 12.64 16.63 14.95
* In FY 2019-20, EPS growth is higher than Net profit growth largely on account of reduction in number of equity shares due to buyback.

Annual Report 2019-20 70
DividendPursuant to Regulation 43A of the Securities and Exchange Board of India (Listing Obligations and Disclosure Requirements) Regulations, 2015, as amended (“Listing Regulations”), the Board has approved and adopted a Dividend Distribution Policy. The policy details various considerations based on which the Board may recommend or declare Dividend, your Company’s dividend track record, usage of retained earnings for corporate actions, etc. The policy is available on the Company’s website at https://www.wipro.com/investors/corporate-governance.
Pursuant to the approval of the Board on January 14, 2020, your Company paid an interim dividend of ` 1/- per equity share of face value of ` 2/- each, to shareholders who were on the register of members as on January 27, 2020, being the record date fixed for this purpose. The Board did not recommend a final dividend and the interim dividend of ` 1/- per equity share declared by the Board in January 2020 was considered as the final dividend for the financial year 2019-20. Thus, the total dividend for the financial year 2019-20 remains ` 1/- per equity share.
Your Company is in compliance with its Dividend Distribution policy as approved by the Board.
Buyback of Equity Shares Pursuant to the approval of the Board on April 16, 2019 and approval of shareholders through special resolution dated June 1, 2019 passed through postal ballot/e-voting, your Company concluded the buyback of 323,076,923 equity shares of face value of ` 2/- each at a price of ` 325/- per equity share, for an aggregate amount of ` 105,000 million, in September 2019. The buyback was made from all existing shareholders of the Company as on June 21, 2019, being the record date for the purpose, on a proportionate basis under the tender offer route in accordance with the provisions of the Securities and Exchange Board of India (Buy-Back of Securities) Regulations, 2018 and the Companies Act, 2013 and rules made thereunder.
Transfer to ReservesAppropriations to general reserve for the financial year ended March 31, 2020 as per standalone and consolidated financial statements are as follows:
(` in millions)
Standalone ConsolidatedNet profit for the year 86,807 97,223*Balance of Reserve at the beginning of the year
481,852 552,158
Adjustment on adoption of Ind AS 116
(414) (872)
Transfer to General Reserve - -Balance of Reserve at the end of the year
453,110 541,790
* excluding non-controlling interest
For complete details on movement in Reserves and Surplus during the financial year ended March 31, 2020, please refer to the Statement of Changes in Equity included in the Standalone and Consolidated financial statements on page nos. 150 to 151 and 216 to 217 of this Annual Report respectively.
Share CapitalDuring the financial year 2019-20, the Company allotted 2,498,925 equity shares consequent to exercise of employee stock options. Your Company also extinguished 323,076,923 equity shares consequent to buyback in September 2019 and reduced the paid-up equity share capital by ` 646 million. Consequently, the paid-up equity share capital of the Company as at March 31, 2020 stood at ` 11,426,714,780/- consisting of 5,713,357,390 equity shares of ` 2/- each.
Subsidiary CompaniesIn accordance with Section 129(3) of the Companies Act, 2013, a statement containing salient features of the financial statements of the subsidiary companies in Form AOC-1 is provided at page nos. 275 to 278 of this Annual Report. The statement also provides details of performance and financial position of each of the subsidiaries.
Audited financial statements together with related information and other reports of each of the subsidiary companies have also been placed on the website of the Company at https://www.wipro.com/investors/annual-reports/.
Your Company funds its subsidiaries, from time to time, in the ordinary course of business and as per the fund requirements, through equity, loans, guarantees and other means to meet working capital requirements.

Corporate Overview | Management & Board Reports | Financial Statements
Wipro Limited71
During the financial year 2019-20, your Company has carried out restructuring of its following subsidiaries:
a) Dissolution of Wipro Retail UK Limited and Liquidation of Appirio GmbH
b) Merger of Frontworx Informationstechnologie GmbH with and into Cellent GmbH
c) Merger of Digital Aps with and into Designit A/s
Particulars of Loans, Advances, Guarantees and InvestmentsPursuant to Section 186 of the Companies Act, 2013 and Schedule V of the Listing Regulations, disclosure on particulars relating to Loans, Advances, Guarantees and Investments are provided as part of the financial statements.
II. Business and OperationsYour Company is a global information technology services firm, with employees across 55 countries and serving enterprise clients across various industries. Your Company provides its clients with competitive advantages by applying various emerging technologies and ensuring cyber resilience and cyber assurance. Your Company works with its clients not only to enable their digital future, but also to drive hyper efficiencies across their technology infrastructure, applications and core operations, enabling them to achieve cost leadership in their businesses.
Your Company’s IT Services business provides a range of IT and IT-enabled services which include digital strategy advisory, customer-centric design, technology consulting, IT consulting, custom application design, development, re-engineering and maintenance, systems integration, package implementation, global infrastructure services, analytics services, business process services, research and development and hardware and software design to leading enterprises worldwide.
Your Company’s IT Products segment provides a range of third-party IT products, which allows us to offer comprehensive IT system integration services. These products include computing, platforms and storage, networking solutions, enterprise information security and software products, including databases and operating systems. Your Company continues to focus on being a system integrator of choice where it provides IT products as a complement to its IT services offerings rather than sell standalone IT products.
Your Company’s ISRE segment consists of IT Services offerings to organizations owned or controlled by the Government of India and/or any Indian State Governments. Your Company’s ISRE strategy focuses on consulting and digital engagements, and it is selective in bidding for SI projects with long gestational periods.
The COVID-19 pandemic has savaged human lives and livelihood, presenting a magnitude of crisis that the modern global society has not confronted. This will have a lasting impact on the business environment which will cause acceleration in adoption of technology, disruption in global supply chains and several other changes to the global order. Your Company’s customers will evaluate whether their technology stack & business processes provide them the necessary agility, adaptability and resilience. Need for social distancing and strenuous health protocols will be central to any operating model and will be a key factor that will expedite the adoption of automation, autonomous and low or no human touch or contactless ways of working. Your Company sees a surge in demand in the near term for enterprise efficiency offerings such as cloud, virtual workplace, robotic process automation and cyber security services.
Further information on your Company’s IT services and products offerings, business strategy, operating segments overview and business model are presented as part of the Management Discussion and Analysis report (“MD&A Report”) from page no. 26 onwards.
Outlook Global IT service providers offer a range of end–to-end software development, digital services, IT business solutions, research and development services, technology infrastructure services, business process services, consulting and related support functions. According to the Strategic Review Report 2020 published by NASSCOM, IT export revenues from India grew by 8.1% to an estimated $147 billion in fiscal year 2020.
The markets your Company serves are undergoing a massive disruption due to the outbreak of COVID-19. The situation caused by the COVID-19 pandemic continues to evolve and the effects on such markets remain uncertain. The outlook going forward will depend, in addition to other factors, on how COVID-19 continues to affect the global economy.
Further information regarding the potential impact of COVID-19 and various steps taken by your Company are provided as part of the MD&A Report from page no. 26 onwards.

Annual Report 2019-20 72
Acquisitions, Divestments and Investments Acquisitions are a key enabler for driving capability to build industry domain, focus on key strategic areas, strengthening presence in emerging technology areas including Digital, and increase market footprint in newer markets. Your Company focuses on opportunities where it can further develop its domain expertise, specific skill sets and its global delivery model to maximize service and product enhancements and higher margins.
In October 2019, your Company acquired US based International TechneGroup Incorporated (“ITI”) and its subsidiaries. ITI is a global digital engineering and manufacturing solutions company and a world leader in Computer Aided Design (CAD) and Product Lifecycle Management (PLM) interoperability software services.
In February 2020, your Company acquired Rational Interaction, Inc., and its subsidiaries, a full-service, technology enabled, strategic and creative digital customer experience (CX) company that executes multi-channel digital experiences for customer-centric brands.
In June 2019, your Company sold its remaining 11% equity holding in WAISL Limited (“WAISL”), which was a joint venture between Wipro Limited and Delhi International Airport Limited, to Antariksh Softtech Private Limited and has consequently exited the joint venture. Further, your Company also completed the divestment of Wipro’s Workday & Cornerstone OnDemand Business in Portugal, France and Sweden to Alight Solutions LLC and its group companies.
Wipro Ventures, the strategic investment arm of Wipro, announced a $150 mn Fund II in January 2020, making it a $250 million fund that invests in early to mid-stage enterprise software startups. As of March 31, 2020, Wipro Ventures has active investments in and partnered with 14 startups in the following areas – Artificial Intelligence, Business Commerce, Cybersecurity, Data Management, Industrial IoT, Fraud & Risk Mitigation, Cloud Infrastructure and Testing Automation. In addition to direct investments in emerging startups, Wipro Ventures has invested in five enterprise-focused venture funds: B Capital, TLV Partners, Work-Bench Ventures, Glilot Capital Partners and Boldstart Ventures. In April 2020, Wipro Ventures has divested its stake in Emailage Corporation and CloudGenix.
Management Discussion and Analysis ReportIn terms of Regulation 34 of the Listing Regulations and SEBI circular SEBI/HO/CFD/CMD/CIR/P/2017/10 dated
February 6, 2017, your Company has adopted salient features of Integrated Reporting prescribed by the International Integrated Reporting Council (‘IIRC’) as part of its MD&A Report. The MD&A report, capturing your Company’s performance, industry trends and other material changes with respect to your Company’s and its subsidiaries, wherever applicable, are presented from page no. 26 onwards of this Annual Report.
The MD&A Report provides a consolidated perspective of economic, social and environmental aspects material to its strategy and its ability to create and sustain value to its key stakeholders and includes aspects of reporting as required by Regulation 34 of the Listing Regulations on Business Responsibility Report. Statutory section of Business Responsibility Report is provided from page nos. 336 to 342 of this Annual Report.
III. Governance and Ethics
Corporate GovernanceYour Company believes in adopting best practices of corporate governance. Corporate governance principles are enshrined in the Spirit of Wipro, which form the core values of Wipro. These guiding principles are also articulated through the Company’s code of business conduct, Corporate Governance Guidelines, charter of various sub-committees and disclosure policy.
As per Regulation 34 of the Listing Regulations, a separate section on corporate governance practices followed by your Company, together with a certificate from V. Sreedharan & Associates, Company Secretaries, on compliance with corporate governance norms under the Listing Regulations, is provided at page no. 115 onwards.
Board of DirectorsBoard’s Composition and IndependenceYour Company’s Board consists of global leaders and visionaries who provide strategic direction and guidance to the organization. As on March 31, 2020, the Board comprised two Executive Directors, six non-executive Independent Directors and one non-executive non independent Director.
Definition of ‘Independence’ of Directors is derived from Regulation 16 of the Listing Regulations, NYSE Listed Company Manual and Section 149(6) of the Companies Act, 2013. The Company has received necessary declarations

Corporate Overview | Management & Board Reports | Financial Statements
Wipro Limited73
under Section 149(7) of the Companies Act, 2013 and Regulation 25(8) of the Listing Regulations, from the Independent Directors stating that they meet the prescribed criteria for independence. The Board, after undertaking assessment and on evaluation of the relationships disclosed, considered the following Non-Executive Directors as Independent Directors:
a) Mr. M. K. Sharma
b) Mrs. Ireena Vittal
c) Mr. William Arthur Owens
d) Dr. Patrick J. Ennis
e) Mr. Patrick A. Dupuis
f) Mrs. Arundhati Bhattacharya
All Independent Directors have affirmed compliance to the code of conduct for independent directors as prescribed in Schedule IV to the Companies Act, 2013.
For the purpose of Rule 8(5)(iiia) of the Companies (Accounts) Rules, 2014, there were no independent directors appointed during the year ended March 31, 2020. List of key skills, expertise and core competencies of the Board is provided at page no. 117 of this Annual Report.
Meetings of the BoardThe Board meetings are normally held on a quarterly basis and scheduled over two days. The Board met five times during the financial year 2019-20 on April 15-16, 2019, June 6, 2019, July 16-17, 2019, October 14-15, 2019 and January 13-14, 2020. The necessary quorum was present for all the meetings. The maximum interval between any two meetings did not exceed 120 days.
Directors and Key Managerial PersonnelThe shareholders of the Company approved the appointment of Mrs. Arundhati Bhattacharya as an Independent Director of the Company for a term of 5 years from January 1, 2019 to December 31, 2023 vide resolution dated June 1, 2019 passed by way of postal ballot/e-voting.
At the 73rd Annual General Meeting (AGM) held on July 16, 2019, the shareholders of the Company approved the following:
1. Appointment of Mr. Azim H. Premji as a Non-Executive, Non-lndependent Director of the Company, for a period of five years with effect from July 31, 2019 to July 30, 2024, whose office shall be liable to retire by rotation.
2. Re-appointment of Mr. Rishad A. Premji as a Whole Time Director, designated as Chairman by the Board, for a period of five years with effect from July 31, 2019 to July 30, 2024, whose office shall not be liable to retire by rotation.
3. Designating and appointing Mr. Abidali Z. Neemuchwala as the Managing Director of the Company with effect from July 31, 2019 till the end of current tenure of his appointment i.e. January 31, 2021, in addition to his existing position as Chief Executive Officer of the Company, and whose office shall be liable to retire by rotation.
Dr. Ashok S. Ganguly and Mr. N. Vaghul, retired as Independent Directors from the Board of the Company with effect from July 31, 2019. Further, Mrs. Arundhati Bhattacharya will step down as an Independent Director from the Board of the Company with effect from close of business hours on June 30, 2020. The Board places on record the immense contributions made by Dr. Ashok S. Ganguly, Mr. N. Vaghul and Mrs. Arundhati Bhattacharya to the growth of your Company over the years.
On January 31, 2020, the Company announced that Mr. Abidali Z. Neemuchwala, Chief Executive Officer and Managing Director, has decided to step down due to family commitments. The Board has, at its meeting held on May 29, 2020, noted the resignation of Mr. Abidali Z. Neemuchwala as the Chief Executive Officer and Managing Director with effect from the end of the day on June 1, 2020. The Board places on record the immense contributions made by Mr. Abidali Z. Neemuchwala to the growth of your Company.
The Board has, at its meeting held on May 29, 2020, approved the appointment of:
1. Mr. Thierry Delaporte as the Chief Executive Officer and Managing Director of the Company with effect from July 6, 2020 for a period of five years, subject to the approval of the shareholders and the Central Government, as may be applicable.
2. Mr. Deepak M. Satwalekar as an Additional Director in the capacity of lndependent Director for a term of 5 years with effect from July 1, 2020, subject to approval of the shareholders of the Company.
Pursuant to the provisions of Section 152 of the Companies Act, 2013 and the Articles of Association of the Company, Mr. Azim H. Premji will retire by rotation at the 74th AGM and being eligible, has offered himself for re-appointment.

Annual Report 2019-20 74
Committees of the BoardYour Company’s Board has the following committees:
1. Audit, Risk and Compliance Committee, which also acts as Risk Management Committee.
2. Board Governance, Nomination and Compensation Committee, which also acts as Corporate Social Responsibility Committee
3. Administrative and Shareholders/Investors Grievance Committee (Stakeholders Relationship Committee)
4. Strategy Committee
Details of terms of reference of the Committees, Committee membership changes, and attendance of Directors at meetings of the Committees are provided in the Corporate Governance report from page nos. 122 to 125 of this Annual Report.
Board EvaluationIn line with the Corporate Governance Guidelines of the Company, Annual Performance Evaluation was conducted for all Board Members as well as the working of the Board and its Committees. This evaluation was led by the Chairman of the Board Governance, Nomination and Compensation Committee with specific focus on performance and effective functioning of the Board. The Board evaluation framework has been designed in compliance with the requirements under the Companies Act, 2013 and the Listing Regulations, and in accordance with the Guidance Note on Board Evaluation issued by SEBI in January 2017. The Board evaluation was conducted through questionnaire designed with qualitative parameters and feedback based on ratings.
Evaluation of the Board was based on criteria such as composition and role of the Board, Board communication and relationships, functioning of Board Committees, review of performance of Executive Directors, succession planning, strategic planning, etc.
Evaluation of Committees was based on criteria such as adequate independence of each Committee, frequency of meetings and time allocated for discussions at meetings, functioning of Board Committees and effectiveness of its advice/recommendation to the Board, etc.
Evaluation of Directors was based on criteria such as participation and contribution in Board and Committee meetings, representation of shareholder interest and enhancing shareholder value, experience and expertise to provide feedback and guidance to top management on
business strategy, governance, risk and understanding of the organization’s strategy, etc.
The outcome of the Board Evaluation for the financial year 2019-20 was discussed by the Board Governance, Nomination and Compensation Committee and the Board at their respective meetings held in April 2020. The Board has received highest ratings on Board communication and relationships, functioning of Board Committees and legal and financial duties. The Board noted the actions taken in improving Board effectiveness based on feedback given in the previous year. Further, the Board also noted areas requiring more focus in the future, which include discussion on succession planning and updates to be provided on the recent trends on corporate governance scenario at a global level.
Policy on Director’s Appointment and RemunerationThe Board Governance, Nomination and Compensation Committee has framed a policy for selection and appointment of Directors including determining qualifications and independence of a Director, Key Managerial Personnel (KMP), Senior Management Personnel and their remuneration as part of its charter and other matters provided under Section 178(3) of the Companies Act, 2013.
Pursuant to Section 134(3) of the Companies Act, 2013, the nomination and remuneration policy of the Company which lays down the criteria for determining qualifications, competencies, positive attributes and independence for appointment of Directors and policies of the Company relating to remuneration of Directors, KMP and other employees is available on the Company’s website at h t t p s : // w w w.w i p r o . c o m /c o n t e n t /d a m / n e x u s /e n /investor/corporate-governance/policies-and-guidelines/ ethical-guidelines/wipro-limited-remuneration-policy.pdf. We affirm that the remuneration paid to Directors, senior management and other employees is in accordance with the remuneration policy of the Company.
Risk ManagementYour Company has put in place an Enterprise Risk Management (ERM) framework and adopted an enterprise risk management policy based on globally recognized standards. The ERM framework is administered by the Audit, Risk and Compliance Committee. The objective of the ERM framework is to enable and support achievement of business objectives through risk-intelligent assessment apart from placing
Corporate Overview | Management & Board Reports | Financial Statements
Wipro Limited75
significant focus on constantly identifying and mitigating risks within the business. The ERM Framework covers various categories of risks including, inter alia, information security and cyber security risks, effectiveness of the controls that have been implemented to prevent such risks and continuous improvement of the systems and processes to mitigate such risks. For more details on the Company’s risk management framework, please refer to page nos. 36 to 38 of this Annual Report.
Compliance Management Framework
The Board has approved a Global Statutory Compliance Policy providing guidance on broad categories of applicable laws and process for monitoring compliance. In furtherance to this, your Company has instituted an online compliance management system within the organization to monitor compliances and provide update to the senior management and Board on a periodic basis. The Audit, Risk and Compliance Committee and the Board periodically monitor status of compliances with applicable laws.
Code for Prevention of Insider Trading
Your Company has adopted a Code of Conduct to regulate, monitor and report trading by designated persons and their immediate relatives as per the requirements under the Securities and Exchange Board of India (Prohibition of Insider Trading) Regulations, 2015. This Code of Conduct also includes code for practices and procedures for fair disclosure of unpublished price sensitive information which has been made available on the Company’s website at https://www.wipro.com/investors/corporate-governance/.
Vigil Mechanism
Your Company has adopted an Ombuds process as a channel for receiving and redressing complaints from employees and directors, as per the provisions of Section 177(9) and (10) of the Companies Act, 2013, Regulation 22 of the Listing Regulations and Regulation 9A of Securities and Exchange Board of India (Prohibition of Insider Trading) Regulations, 2015.
Under this policy, your Company encourages its employees to report any incidence of fraudulent financial or other information to the stakeholders, reporting of instance(s) of leak or suspected leak of unpublished price sensitive information, and any conduct that results in violation of the
Company’s code of business conduct, to the management (on an anonymous basis, if employees so desire). Further, your Company has prohibited discrimination, retaliation or harassment of any kind against any employee who reports under the Vigil Mechanism or participates in the investigation.
Awareness of policies is created by, inter alia, sending group mailers highlighting actions taken by the Company against the errant employees. Mechanism followed under the Ombuds process has been displayed on the Company’s intranet and website at https://www.wipro.com/investors/corporate-governance/#WiprosOmbudsProcess.
All complaints received through Ombuds process and investigative findings are reviewed and approved by the Chief Ombudsperson. Dedicated email address ([email protected]) has been created to facilitate receipt of complaints and for ease of reporting. All employees and stakeholders can also register their concerns through web-based portal at https://www.wipro.com/investors/corporate-governance/#WiprosOmbudsProcess. Following an investigation, a decision is made by the appropriate authority on the action to be taken basis the findings of the investigation. In case the complainant is non-responsive for more than 15 days, the concern may be closed without further action.
During the financial year 2019-20, 1,347 complaints were received via the Ombuds process and 1,409 complaints were closed in FY 2020. All cases were investigated and actions taken as deemed appropriate. Based on self-disclosure data, 19% of these were reported anonymously. The top categories of complaints were people processes at 32% and workplace concerns and harassment at 34%. The majority of cases (82%) were resolved through engagement of human resources or mediation, or closed since they were unsubstantiated.
The Audit, Risk and Compliance Committee periodically reviews the functioning of this mechanism. No personnel of the Company were denied access to the Audit, Risk & Compliance Committee.
Information Required under Sexual Harassment of Women at Workplace (Prevention, Prohibition & Redressal) Act, 2013Your Company has constituted Internal Complaints Committee under the Sexual Harassment of Women at Workplace (Prevention, Prohibition and Redressal) Act, 2013

Annual Report 2019-20 76
and also has a policy and framework for employees to report sexual harassment cases at workplace. The Company’s process ensures complete anonymity and confidentiality of information. Adequate workshops and awareness programmes against sexual harassment are conducted across the organization. The below table provides details of complaints received/disposed during the financial year 2019-20:
No. of complaints filed 125 No. of complaints disposed* 98No. of complaints pending 27
* In addition, 21 cases reported in 2018-19 were disposed during
the financial year 2019-20.
Related Party Transactions
Your Company has historically adopted the practice of undertaking related party transactions only in the ordinary and normal course of business and at arm’s length as part of its philosophy of adhering to highest ethical standards, transparency and accountability. In line with the provisions of the Companies Act, 2013 and the Listing Regulations, the Board has approved a policy on related party transactions. An abridged policy on related party transactions has been placed on the Company’s website at https://www.wipro.com/investors/corporate-governance/.
All related party transactions are placed on a quarterly basis before the Audit, Risk and Compliance Committee and before the Board for approval. Prior omnibus approval of the Audit, Risk and Compliance Committee and the Board is obtained for the transactions which are foreseeable and of a repetitive nature.
The particulars of contracts or arrangements with related parties referred to in Section 188(1) and applicable rules of the Companies Act, 2013 in Form AOC-2 is provided as Annexure I to this Annual Report.
Details of transaction(s) of your Company with entity(ies) belonging to the promoter/promoter group which hold(s) more than 10% shareholding in the Company as required under para A of Schedule V of the Listing Regulations are provided as part of the financial statements.
Pursuant to Regulation 23(9) of the Listing Regulations, your Company has filed the reports on related party transactions with the Stock Exchanges.
Directors’ Responsibility StatementYour Directors hereby confirm that:
(a) in the preparation of the annual accounts, the applicable accounting standards have been followed along with proper explanation relating to material departures;
(b) the Directors have selected such accounting policies and applied them consistently and made judgments and estimates that are reasonable and prudent so as to give a true and fair view of the state of affairs of the Company at the end of the financial year and of the profit and loss of the Company for that period;
(c) the Directors have taken proper and sufficient care for the maintenance of adequate accounting records in accordance with the provisions of the Companies Act, 2013 for safeguarding the assets of the Company and for preventing and detecting fraud and other irregularities;
(d) the Directors have prepared the annual accounts on a going concern basis;
(e) the Directors have laid down internal financial controls to be followed by the Company and that such internal financial controls are adequate and operating effectively;
(f) as required under Section 134(5)(f) of the Companies Act, 2013, and according to the information and explanations presented to us, based on the review done by the Audit, Risk and Compliance Committee and as recommended by it, we, the Board, hereby, state that adequate systems and processes, commensurate with the size of the Company and the nature of its business, have been put in place by the Company, to ensure compliance with the provisions of all applicable laws as per the Company’s Global Statutory Compliance Policy and that such systems and processes are operating effectively.
Wipro Employee Stock Option Plans/Restricted Stock Unit PlansYour Company has instituted various employee stock options plans/restricted stock unit plans from time to time to motivate, incentivize and reward employees. The Board Governance, Nomination and Compensation Committee administers these plans. The stock option plans are in compliance with the Securities and Exchange Board of India (Share Based Employee Benefits) Regulations, 2014 as amended (“Employee Benefits Regulations”) and there have been no material changes to these plans during the

Corporate Overview | Management & Board Reports | Financial Statements
Wipro Limited77
financial year. Disclosures on various plans, details of options granted, shares allotted upon exercise, etc. as required under the Employee Benefits Regulations read with the Securities and Exchange Board of India circular no. CIR/CFD/POLICY CELL/2/2015 dated June 16, 2015 are available on the Company’s website at https://www.wipro.com/investors/annual-reports/. No employee was issued stock options during the year equal to or exceeding 1% of the issued capital of the Company at the time of grant.
Particulars of EmployeesInformation required pursuant to Section 197(12) of the Companies Act, 2013 read with Rule 5(1) of the Companies (Appointment and Remuneration of Managerial Personnel) Rules, 2014 is provided as Annexure II to this report.
A statement containing, inter alia, the names of top ten employees in terms of remuneration drawn and every employee employed throughout the financial year and in receipt of remuneration of ` 102 lakhs or more and, employees employed for part of the year and in receipt of remuneration of ` 8.50 lakhs or more per month, pursuant to Rule 5(2) the Companies (Appointment and Remuneration of Managerial Personnel) Rules, 2014 is provided as Annexure III to this report.
IV. Internal Financial Controls and Audit
Internal Financial Controls and their AdequacyThe Board of your Company has laid down internal financial controls to be followed by the Company and that such internal financial controls are adequate and operating effectively. Your Company has adopted policies and procedures for ensuring the orderly and efficient conduct of its business, including adherence to the Company’s policies, the safeguarding of its assets, the prevention and detection of frauds and errors, the accuracy and completeness of the accounting records, and the timely preparation of reliable financial disclosures.
Statutory AuditAt the 71st AGM held on July 19, 2017, Deloitte Haskins & Sells LLP, Chartered Accountants (Registration No. 117366W/W-100018) was appointed as statutory auditors of the Company for a term of 5 years from the financial year 2017-18 onwards. Accordingly, Deloitte Haskins & Sells LLP will continue as statutory auditors of the Company till the financial year 2021- 22.
There are no qualifications, reservations or adverse remarks made by Deloitte Haskins & Sells LLP, Statutory Auditors, in their report for the financial year ended March 31, 2020.
Pursuant to provisions of the Section 143(12) of the Companies Act, 2013, neither the Statutory Auditors nor the Secretarial Auditor has reported any incident of fraud to the Audit, Risk and Compliance Committee during the year under review.
Secretarial AuditPursuant to the provisions of Section 204 of the Companies Act, 2013 and the Companies (Appointment and Remuneration of Managerial Personnel) Rules, 2014, the Company has appointed Mr. V Sreedharan, Partner, V Sreedharan & Associates, a firm of Company Secretaries in Practice, to conduct Secretarial Audit of the Company. The Report of the Secretarial Audit in Form MR-3 for the financial year ended March 31, 2020 is enclosed as Annexure IV to this Report. There are no qualifications, reservations or adverse remarks made by the Secretarial Auditor in his report.
V. Key Awards and RecognitionsYour Company is one of the most admired and recognized companies in the IT industry. Your Company has won several awards and accolades, out of which key recognitions are given below:
1. Wipro was included in the Dow Jones Sustainability Index (DJSI) – World and Emerging Markets for the 10th time in succession.
2. Wipro has been named as 2020 World’s Most Ethical Company for the 9th successive year by the Ethisphere Institute.
3. Wipro has received the award for “Leadership” category in corporate governance practices for 2nd consecutive year under corporate governance scorecard developed by BSE, International Finance Corporation (IFC) and IiAS.
4. Wipro was recognised as leader in Everest Group PEAK MatrixTM in 2019 and 2020 Healthcare payer digital services.
5. Wipro has won the ‘2019 SUSE Global System Integrator Partner of the Year’ award in two categories- Most Innovative Solution and Most Technical Certifications.
6. Wipro has been recognised by the Top Employers Institute as a Top Employer in Australia, for 2020.

Annual Report 2019-20 78
7. Wipro has been positioned as a Leader in ISG Provider Lens™: Network-Software Defined Solutions and Services Global 2019 quadrant report.
8. Wipro has been cited as a Leader and star performer in Everest Group’s application and Digital Services in Capital Market- Services PEAK MatrixTM Assessment 2020.
9. Wipro has been recognized as the ‘Best Global Systems Integrator’ by leading data platform company, Looker.
10. Wipro has been positioned as a ‘Leading Player’ for the 10th consecutive year in the ‘Zinnov Zones for Engineering R&D Services - 2019’ study.
Further details of awards and accolades won by your Company are provided at page no. 15 of this Annual Report.
VI. Social Responsibility and Sustainability
Corporate Social ResponsibilityYour Company is at the forefront of Corporate Social Responsibility (CSR) and sustainability initiatives and practices. Your Company believes in making lasting impact towards creating a just, equitable, humane and sustainable society. Your Company has been involved with social initiatives for more than a decade and half and engages in various activities in the field of education, healthcare and communities, ecology and environment, etc.
As per the provisions of the Companies Act, 2013, a company meeting the specified criteria shall spend at least 2% of its average net profits for three immediately preceding financial years towards CSR activities. Accordingly, your Company spent ` 1,818 million towards CSR activities during the financial year 2019-20. The contents of the CSR policy and CSR Report for the year 2019-20 is attached as Annexure V to this report. Contents of the CSR policy are also available on the Company’s website at https://www.wipro.com/investors/corporate-governance/.
The terms of reference of CSR committee, framed in accordance with Section 135 of the Companies Act, 2013, forms part of Board Governance, Nomination and Compensation Committee. At its meeting held on July 16, 2019, the Board approved changes to the composition of Board Governance, Nomination and Compensation Committee with effect from August 1, 2019.
The Committee consists of three Independent Directors, Mr. William Arthur Owens, Mr. M. K. Sharma and
Mrs. lreena Vittal, as its members. Mr. William Arthur Owens is the Chairman of the Committee.
In addition to annual CSR spends, your Company has committed ` 100 crores towards tackling the unprecedented health and humanitarian crisis arising from the COVID-19 pandemic outbreak. This is intended to help in enabling the dedicated medical and service fraternity in the frontline of the battle against the pandemic and in mitigating its wide-ranging human impact, particularly on the most disadvantaged of our society.
Particulars Regarding Conservation of Energy and Research and Development and Technology Absorption
Details of steps taken by your Company to conserve energy through its “Sustainability” initiatives, Research and Development and Technology Absorption have been disclosed as part of the MD&A Report.
VII. Disclosures
Foreign Exchange Earnings and Outgoings
During the financial year 2019-20, your Company’s foreign exchange earnings were ` 460,794 million and foreign exchange outgoings were ` 229,491 million as against ` 444,584 million of foreign exchange earnings and ̀ 230,362 million of foreign exchange outgoings for the financial year 2018-19.
Extract of Annual Return
Pursuant to Section 92(3) and Section 134(3)(a) of the Companies Act, 2013, extract of the Annual Return as on March 31, 2020 in form MGT-9 is enclosed as Annexure VI to this report. Additionally, the Company has also placed a copy of annual return of the financial year 2018-19 on its website at https://www.wipro.com/investors/annual-reports/.
Material Changes and Commitments Affecting the Financial Position of the Company
Information regarding potential impact of COVID-19 pandemic on your Company’s business operations and financial position are provided as part of the MD&A Report from page no. 26 onwards.

Corporate Overview | Management & Board Reports | Financial Statements
Wipro Limited79
Other Disclosures
a) Your Company has not accepted any deposits from the public and as such, no amount on account of principal or interest on public deposits was outstanding as on the date of the balance sheet.
b) Your Company has not issued shares with differential voting rights and sweat equity shares during the year under review.
c) Your Company has complied with the applicable Secretarial Standards relating to ‘Meetings of the Board of Directors’ and ‘General Meetings’ during the year.
d) Maintenance of cost records and requirement of cost Audit as prescribed under the provisions of Section 148(1) of the Companies Act, 2013 are not applicable to the business activities carried out by the Company.
e) There are no significant material orders passed by the Regulators/Courts which would impact the going concern status of the Company and its future operations.
f) Details of unclaimed dividends and equity shares transferred to the Investor Education and Protection Fund authority have been provided as part of the Corporate Governance report.
Acknowledgements and Appreciation
Your Directors take this opportunity to thank the customers, shareholders, suppliers, bankers, business partners/associates, financial institutions and Central and State Governments for their consistent support and encouragement to the Company. I am sure you will join our Directors in conveying our sincere appreciation to all employees of the Company and its subsidiaries and associates for their hard work and commitment. Their dedication and competence have ensured that the Company continues to be a significant and leading player in the IT Services industry.
For and on behalf of the Board of Directors,
Bengaluru Rishad A. PremjiMay 29, 2020 Chairman

Annual Report 2019-20 80
Ann
exur
e I
Par
ticu
lars
of c
ontr
acts
/arr
ange
men
ts m
ade
wit
h re
late
d pa
rtie
s
Form
No.
AO
C-2
[Pur
suan
t to
clau
se (h
) of s
ub-s
ecti
on (3
) of S
ecti
on 1
34 o
f the
Com
pani
es A
ct, 2
013
and
Rul
e 8(
2) o
f the
Com
pani
es (A
ccou
nts)
Rul
es, 2
014]
This
For
m p
erta
ins
to t
he d
iscl
osur
e of
par
ticu
lars
of
cont
ract
s/ar
rang
emen
ts e
nter
ed i
nto
by t
he C
ompa
ny w
ith
rela
ted
part
ies
refe
rred
to
in
sub-
sect
ion
(1) o
f Sec
tion
188
of t
he C
ompa
nies
Act
, 201
3 in
clud
ing
cert
ain
arm
’s le
ngth
tran
sact
ions
und
er th
ird
prov
iso
ther
eto.
Det
ails
of c
ontr
acts
or a
rran
gem
ents
or t
rans
acti
ons
not
at a
rm’s
leng
th b
asis
Ther
e w
ere
no c
ontr
acts
or
arra
ngem
ents
or
tran
sact
ions
ent
ered
int
o du
ring
the
yea
r en
ded
Mar
ch 3
1, 2
020,
whi
ch w
ere
not
at a
rm’s
len
gth
basi
s.
De t
ails
of m
ater
ial c
ontr
acts
or a
rran
gem
ents
or t
rans
acti
ons
at a
rm’s
leng
th b
asis
Ther
e w
ere
no m
ater
ial c
ontr
acts
or a
rran
gem
ents
or t
rans
acti
ons
ente
red
into
dur
ing
the
year
end
ed M
arch
31,
202
0 cr
ossi
ng th
e m
ater
ialit
y th
resh
old
of 1
0% o
f the
ann
ual c
onso
lidat
ed tu
rnov
er o
f the
Com
pany
. The
det
ails
of c
ontr
acts
or a
rran
gem
ents
or t
rans
acti
ons
at a
rm’s
leng
th b
asis
for t
he y
ear
ende
d M
arch
31,
202
0 ar
e as
follo
ws:
Nam
e of
Rel
ated
Par
tyN
atur
e of
Rel
atio
nshi
pD
urat
ion
of C
ontr
act
Salie
nt te
rms
* A
mou
nt (`
Mn)
Sa
les
of G
oods
and
Ser
vice
sW
ipro
, LLC
Subs
idia
ry01
-04-
05 -
Ongo
ing
As p
er Tr
ansf
er P
ricin
g gu
idel
ines
47,
765
Wip
ro G
alla
gher
Sol
utio
ns, L
LCSu
bsid
iary
01-0
4-16
- Ong
oing
As p
er Tr
ansf
er P
ricin
g gu
idel
ines
1,6
12
Opus
Cap
ital M
arke
ts C
onsu
ltant
s, L
LCSu
bsid
iary
01-0
4-16
- On
goin
gAs
per
Tran
sfer
Pric
ing
guid
elin
es 8
5 W
ipro
Tech
nolo
gies
SA
DE
CVSu
bsid
iary
01-0
1-12
- On
goin
gAs
per
Tran
sfer
Pric
ing
guid
elin
es 6
54
Wip
ro Te
chno
logi
es S
ASu
bsid
iary
01-0
4-09
- On
goin
gAs
per
Tran
sfer
Pric
ing
guid
elin
es 2
6 W
ipro
Info
rmat
ion
Tech
nolo
gy N
ethe
rland
s BV
Subs
idia
ry01
-06-
08- O
ngoi
ngAs
per
Tran
sfer
Pric
ing
guid
elin
es 1
,256
W
ipro
Por
tuga
l S.A
.Su
bsid
iary
01-0
4-07
- On
goin
gAs
per
Tran
sfer
Pric
ing
guid
elin
es 4
3 W
ipro
do
Bras
il Te
chno
logi
a Lt
daSu
bsid
iary
01-0
4-05
- On
goin
gAs
per
Tran
sfer
Pric
ing
guid
elin
es 4
4 W
ipro
Tech
nolo
gies
Gm
bHSu
bsid
iary
01-0
3-11
- Ong
oing
As p
er Tr
ansf
er P
ricin
g gu
idel
ines
1,6
93
Wip
ro Te
chno
logi
es L
imite
dSu
bsid
iary
01-0
5-08
- On
goin
gAs
per
Tran
sfer
Pric
ing
guid
elin
es 4
4 W
ipro
Tech
nolo
gy C
hile
SPA
Subs
idia
ry01
-01-
16 -
Ongo
ing
As p
er Tr
ansf
er P
ricin
g gu
idel
ines
28
Wip
ro O
utso
urci
ng S
ervi
ces
(Irel
and)
Lim
ited
Subs
idia
ry12
-11-
12 -
Ongo
ing
As p
er Tr
ansf
er P
ricin
g gu
idel
ines
21
Wip
ro In
form
atio
n Te
chno
logy
Kaz
akhs
tan
LLP
Subs
idia
ry15
-05-
14 -
Ongo
ing
As p
er Tr
ansf
er P
ricin
g gu
idel
ines
53
Wip
ro (T
haila
nd) C
o. L
imite
dSu
bsid
iary
01-1
1-10
- Ong
oing
As p
er Tr
ansf
er P
ricin
g gu
idel
ines
43
PT W
T In
done
sia
Subs
idia
ry01
-11-
12 -
Ongo
ing
As p
er Tr
ansf
er P
ricin
g gu
idel
ines
244
W
ipro
IT S
ervi
ces
Pola
nd S
P Z.
O.O
Subs
idia
ry01
-04-
14 -
Ongo
ing
As p
er Tr
ansf
er P
ricin
g gu
idel
ines
313
W
ipro
Tech
nolo
gies
Sou
th A
fric
a (P
ropr
ieta
ry) L
imite
dSu
bsid
iary
01-0
4-12
- On
goin
gAs
per
Tran
sfer
Pric
ing
guid
elin
es 7
03
Wip
ro Te
chno
logi
es N
iger
ia L
imite
dSu
bsid
iary
01-0
4-14
- On
goin
gAs
per
Tran
sfer
Pric
ing
guid
elin
es 1
03
Wip
ro S
hang
hai L
imite
dSu
bsid
iary
27-0
4-04
- On
goin
gAs
per
Tran
sfer
Pric
ing
guid
elin
es 0
.09
Wip
ro Te
chno
logi
es A
ustr
alia
Pty
Ltd
Subs
idia
ry01
-08-
12 -
Ongo
ing
As p
er Tr
ansf
er P
ricin
g gu
idel
ines
791
W
ipro
Pro
max
Ana
lytic
s So
lutio
ns A
mer
icas
LLC
Subs
idia
ry01
-04-
16 -
Ongo
ing
As p
er Tr
ansf
er P
ricin
g gu
idel
ines
2
Wip
ro C
heng
du L
imite
dSu
bsid
iary
01-0
4-09
- On
goin
gAs
per
Tran
sfer
Pric
ing
guid
elin
es 9
0 W
ipro
Net
wor
ks P
te L
imite
dSu
bsid
iary
01-0
4-16
- On
goin
gAs
per
Tran
sfer
Pric
ing
guid
elin
es 1
,435
W
ipro
Tech
nolo
gies
SD
N B
HD
Subs
idia
ry01
-04-
13- O
ngoi
ngAs
per
Tran
sfer
Pric
ing
guid
elin
es 7
W
ipro
Sol
utio
ns C
anad
a Li
mite
dSu
bsid
iary
16-0
8-14
- On
goin
gAs
per
Tran
sfer
Pric
ing
guid
elin
es 1
,999
D
esig
nit C
olom
bia
S A
SSu
bsid
iary
01-0
4-18
- On
goin
gAs
per
Tran
sfer
Pric
ing
guid
elin
es 4
4 H
ealth
Plan
Ser
vice
s, In
c.Su
bsid
iary
01-0
6-16
- On
goin
gAs
per
Tran
sfer
Pric
ing
guid
elin
es 8
10
Celle
nt G
mbH
Subs
idia
ry01
-04-
16 -
Ongo
ing
As p
er Tr
ansf
er P
ricin
g gu
idel
ines
23
Appi
rio, I
nc.
Subs
idia
ry01
-01-
17- O
ngoi
ngAs
per
Tran
sfer
Pric
ing
guid
elin
es 1
,118
W
ipro
Hol
ding
s (U
K) L
imite
dSu
bsid
iary
01-0
4-10
- On
goin
gAs
per
Tran
sfer
Pric
ing
guid
elin
es 1
,336

Corporate Overview | Management & Board Reports | Financial Statements
Wipro Limited81
Nam
e of
Rel
ated
Par
tyN
atur
e of
Rel
atio
nshi
pD
urat
ion
of C
ontr
act
Salie
nt te
rms
* A
mou
nt (`
Mn)
W
ipro
Ara
bia
Co. L
imite
dSu
bsid
iary
23-1
2-06
- On
goin
gAs
per
Tran
sfer
Pric
ing
guid
elin
es 7
48
Wip
ro D
oha
LLC
Subs
idia
ry01
-04-
14 -
Ongo
ing
As p
er Tr
ansf
er P
ricin
g gu
idel
ines
555
W
ipro
Gul
f LLC
Subs
idia
ry01
-04-
17 -
Ongo
ing
As p
er Tr
ansf
er P
ricin
g gu
idel
ines
329
W
ipro
Bah
rain
Lim
ited
Co. S
.P.C
Subs
idia
ry01
-01-
15 -
Ongo
ing
As p
er Tr
ansf
er P
ricin
g gu
idel
ines
156
W
ipro
IT S
ervi
ces
Bang
lade
sh L
imite
dSu
bsid
iary
31-0
3-18
- Ong
oing
As p
er Tr
ansf
er P
ricin
g gu
idel
ines
413
W
ipro
Tech
nolo
gies
SRL
Subs
idia
ry01
-04-
14 -
Ongo
ing
As p
er Tr
ansf
er P
ricin
g gu
idel
ines
204
W
ipro
Jap
an K
KSu
bsid
iary
01-0
4-19
- Ong
oing
As p
er Tr
ansf
er P
ricin
g gu
idel
ines
620
D
esig
nit S
pain
Dig
ital,
S.L
Subs
idia
ry01
-10-
19- O
ngoi
ngAs
per
Tran
sfer
Pric
ing
guid
elin
es 7
Ap
pirio
Ltd
(Ire
land
)Su
bsid
iary
01-0
1-18
- Ong
oing
As p
er Tr
ansf
er P
ricin
g gu
idel
ines
63
Appr
io L
td (U
K)Su
bsid
iary
01-0
1-17
- Ong
oing
As p
er Tr
ansf
er P
ricin
g gu
idel
ines
126
In
tern
atio
nal T
echn
egro
up In
cSu
bsid
iary
01-1
0-19
- Ong
oing
As p
er Tr
ansf
er P
ricin
g gu
idel
ines
68
Wip
ro E
nter
pris
es P
rivat
e Li
mite
dEn
tity
cont
rolle
d by
Pro
mot
ers
01-0
4-14
- On
goin
gAs
per
RPT
Pol
icy
guid
elin
es 3
As
ian
Pain
ts L
imite
dCo
mm
on D
irect
ors
Ongo
ing
As p
er R
PT P
olic
y gu
idel
ines
3
Pira
mal
Ent
erpr
ises
Lim
ited
Com
mon
Dire
ctor
sOn
goin
gAs
per
RPT
Pol
icy
guid
elin
es 1
Th
e In
dian
Hot
els
Com
pany
Lim
ited
Com
mon
Dire
ctor
sOn
goin
gAs
per
RPT
Pol
icy
guid
elin
es 0
.001
Ti
tan
Com
pany
Lim
ited
Com
mon
Dire
ctor
sOn
goin
gAs
per
RPT
Pol
icy
guid
elin
es 3
Ve
dant
a Li
mite
dCo
mm
on D
irect
ors
Ongo
ing
As p
er R
PT P
olic
y gu
idel
ines
2
Purc
hase
of S
ervi
ces
Wip
ro, L
LCSu
bsid
iary
01-0
4-05
- On
goin
gAs
per
Tran
sfer
Pric
ing
guid
elin
es 2
,315
In
focr
ossi
ng, L
LCSu
bsid
iary
01-0
4-08
- On
goin
gAs
per
Tran
sfer
Pric
ing
guid
elin
es 1
1 Op
us C
apita
l Mar
kets
Con
sulta
nts,
LLC
Subs
idia
ry01
-04-
16 -
Ongo
ing
As p
er Tr
ansf
er P
ricin
g gu
idel
ines
41
Wip
ro Te
chno
logi
es S
A D
E CV
Subs
idia
ry01
-01-
12 -
Ongo
ing
As p
er Tr
ansf
er P
ricin
g gu
idel
ines
2,1
32
Wip
ro P
hilip
pine
s, In
c.
Subs
idia
ry31
-03-
11 -
Ongo
ing
As p
er Tr
ansf
er P
ricin
g gu
idel
ines
2,4
02
Wip
ro Te
chno
logi
es S
ASu
bsid
iary
01-0
4-09
- On
goin
gAs
per
Tran
sfer
Pric
ing
guid
elin
es 1
0 W
ipro
Pol
and
SP Z
.O.O
Subs
idia
ry01
-04-
10 -
Ongo
ing
As p
er Tr
ansf
er P
ricin
g gu
idel
ines
119
W
ipro
Por
tuga
l S.A
.Su
bsid
iary
01-0
4-07
- On
goin
gAs
per
Tran
sfer
Pric
ing
guid
elin
es 4
62
Wip
ro d
o Br
asil
Tech
nolo
gia
Ltda
Subs
idia
ry01
-04-
05 -
Ongo
ing
As p
er Tr
ansf
er P
ricin
g gu
idel
ines
1,0
84
Wip
ro Te
chno
logi
es G
mbH
Subs
idia
ry01
-03-
11 -
Ongo
ing
As p
er Tr
ansf
er P
ricin
g gu
idel
ines
2,4
39
Wip
ro Te
chno
logi
es L
imite
dSu
bsid
iary
01-0
5-08
- On
goin
gAs
per
Tran
sfer
Pric
ing
guid
elin
es 0
.23
Wip
ro Te
chno
logy
Chi
le S
PASu
bsid
iary
01-0
1-16
- On
goin
gAs
per
Tran
sfer
Pric
ing
guid
elin
es 6
1 W
ipro
Out
sour
cing
Ser
vice
s (Ir
elan
d) L
imite
dSu
bsid
iary
12-1
1-12
- On
goin
gAs
per
Tran
sfer
Pric
ing
guid
elin
es 2
10
Wip
ro Te
chno
logi
es S
RLSu
bsid
iary
01-0
1-10
- On
goin
gAs
per
Tran
sfer
Pric
ing
guid
elin
es 1
,801
W
ipro
(Tha
iland
) Co.
Lim
ited
Subs
idia
ry01
-11-
10- O
ngoi
ngAs
per
Tran
sfer
Pric
ing
guid
elin
es 4
8 PT
WT
Indo
nesi
aSu
bsid
iary
01-1
1-12
- On
goin
gAs
per
Tran
sfer
Pric
ing
guid
elin
es 2
8 W
ipro
IT S
ervi
ces
Pola
nd S
P Z.
O.O
Subs
idia
ry01
-04-
14 -
Ongo
ing
As p
er Tr
ansf
er P
ricin
g gu
idel
ines
1,5
52
Wip
ro Te
chno
logi
es N
iger
ia L
imite
dSu
bsid
iary
01-0
4-14
- On
goin
gAs
per
Tran
sfer
Pric
ing
guid
elin
es 1
W
ipro
Sha
ngha
i Lim
ited
Subs
idia
ry27
-04-
04 -
Ongo
ing
As p
er Tr
ansf
er P
ricin
g gu
idel
ines
68
Wip
ro Te
chno
logi
es A
ustr
alia
Pty
Ltd
Subs
idia
ry01
-08-
12 -
Ongo
ing
As p
er Tr
ansf
er P
ricin
g gu
idel
ines
120
W
ipro
Pro
max
Ana
lytic
s So
lutio
ns A
mer
icas
, LLC
Subs
idia
ry01
-04-
16 -
Ongo
ing
As p
er Tr
ansf
er P
ricin
g gu
idel
ines
8
Wip
ro C
heng
du L
imite
dSu
bsid
iary
01-0
4-09
- On
goin
gAs
per
Tran
sfer
Pric
ing
guid
elin
es 4
79
Wip
ro N
etw
orks
Pte
Lim
ited
Subs
idia
ry01
-04-
16 -
Ongo
ing
As p
er Tr
ansf
er P
ricin
g gu
idel
ines
362
W
ipro
Tech
nolo
gies
Per
u SA
CSu
bsid
iary
01-0
1-16
- On
goin
gAs
per
Tran
sfer
Pric
ing
guid
elin
es 5
W
ipro
Sol
utio
ns C
anad
a Li
mite
dSu
bsid
iary
16-0
8-14
- On
goin
gAs
per
Tran
sfer
Pric
ing
guid
elin
es 5
5 W
ipro
Tech
nolo
gies
Aus
tral
ia P
ty L
tdSu
bsid
iary
01-0
8-12
- On
goin
gAs
per
Tran
sfer
Pric
ing
guid
elin
es 1
8 D
esig
nit A
/SSu
bsid
iary
01-0
4-16
- On
goin
gAs
per
Tran
sfer
Pric
ing
guid
elin
es 1
25
Des
igni
t Den
mar
k A/
SSu
bsid
iary
01-0
3-16
- On
goin
gAs
per
Tran
sfer
Pric
ing
guid
elin
es 3
82
Des
igni
t Ger
man
y G
mbH
Subs
idia
ry31
-03-
16 -O
ngoi
ngAs
per
Tran
sfer
Pric
ing
guid
elin
es 2
8 D
esig
nit T
okyo
Ltd
.Su
bsid
iary
01-0
4-16
- On
goin
gAs
per
Tran
sfer
Pric
ing
guid
elin
es 1
2 D
esig
nit O
slo
A/S
Subs
idia
ry01
-04-
16 -
Ongo
ing
As p
er Tr
ansf
er P
ricin
g gu
idel
ines
3
Des
igni
t Spa
in D
igita
l, S.
LSu
bsid
iary
01-0
4-16
- On
goin
gAs
per
Tran
sfer
Pric
ing
guid
elin
es 1
0 D
esig
nit S
wed
en A
BSu
bsid
iary
01-0
4-16
- On
goin
gAs
per
Tran
sfer
Pric
ing
guid
elin
es 2
83

Annual Report 2019-20 82
Nam
e of
Rel
ated
Par
tyN
atur
e of
Rel
atio
nshi
pD
urat
ion
of C
ontr
act
Salie
nt te
rms
* A
mou
nt (`
Mn)
D
esig
nit T
.L.V
Ltd
.Su
bsid
iary
01-0
4-16
- On
goin
gAs
per
Tran
sfer
Pric
ing
guid
elin
es 3
W
ipro
(Dal
ian)
Lim
ited
Subs
idia
ry30
-12-
15 -
Ongo
ing
As p
er Tr
ansf
er P
ricin
g gu
idel
ines
480
H
ealth
Plan
Ser
vice
s, In
c.Su
bsid
iary
01-0
6-16
- On
goin
gAs
per
Tran
sfer
Pric
ing
guid
elin
es 3
12
Celle
nt G
mbH
Subs
idia
ry01
-04-
16 -
Ongo
ing
As p
er Tr
ansf
er P
ricin
g gu
idel
ines
320
Ce
llent
Gm
bHSu
bsid
iary
01-0
4-16
- On
goin
gAs
per
Tran
sfer
Pric
ing
guid
elin
es 8
Ap
pirio
, Inc
.Su
bsid
iary
01-0
1-17
- Ong
oing
As p
er Tr
ansf
er P
ricin
g gu
idel
ines
3,5
03
Appi
rio L
td (I
rela
nd)
Subs
idia
ry01
-01-
18- O
ngoi
ngAs
per
Tran
sfer
Pric
ing
guid
elin
es 4
4 Ap
prio
Ltd
(UK)
Su
bsid
iary
01-0
1-17
- Ong
oing
As p
er Tr
ansf
er P
ricin
g gu
idel
ines
718
Co
oper
Sof
twar
e, L
LC.
Subs
idia
ry23
-10-
17- O
ngoi
ngAs
per
Tran
sfer
Pric
ing
guid
elin
es 2
45
Wip
ro H
R Se
rvic
es In
dia
Priv
ate
Lim
ited
Subs
idia
ry19
-02-
19- O
ngoi
ngAs
per
Tran
sfer
Pric
ing
guid
elin
es 1
25
FRON
TWOR
X In
form
atio
nste
chno
logi
e G
mbH
^Su
bsid
iary
01-0
4-18
- On
goin
gAs
per
Tran
sfer
Pric
ing
guid
elin
es 1
3 W
ipro
Gal
lagh
er S
olut
ions
, LLC
.Su
bsid
iary
01-0
1-19
- On
goin
gAs
per
Tran
sfer
Pric
ing
guid
elin
es 0
.04
Des
igni
t Per
u, S
.A.C
Subs
idia
ry24
-09-
18 -
Ongo
ing
As p
er Tr
ansf
er P
ricin
g gu
idel
ines
6
Den
im G
roup
Lim
ited
Asso
ciat
e01
-03-
18 -
Ongo
ing
As p
er R
PT P
olic
y gu
idel
ines
60
Driv
estr
eam
, Inc
Asso
ciat
e12
-06-
17 -
Ongo
ing
As p
er R
PT P
olic
y gu
idel
ines
135
W
ipro
Ent
erpr
ises
Priv
ate
Lim
ited
Entit
y co
ntro
lled
by P
rom
oter
s01
-04-
14 -
Ongo
ing
As p
er R
PT P
olic
y gu
idel
ines
741
M
ahin
dra
Wor
ld C
ity D
evel
oper
s Li
mite
dCo
mm
on D
irect
ors
Ongo
ing
As p
er R
PT P
olic
y gu
idel
ines
7
Veda
nta
Lim
ited
Com
mon
Dire
ctor
sOn
goin
gAs
per
RPT
Pol
icy
guid
elin
es 1
2 Ve
dant
a Li
mite
dCo
mm
on D
irect
ors
Ongo
ing
As p
er R
PT P
olic
y gu
idel
ines
12Co
mm
issi
on P
aid
Wip
ro Te
chno
logi
es G
mbH
Subs
idia
ry01
-03-
11 -
Ongo
ing
As p
er Tr
ansf
er P
ricin
g gu
idel
ines
719
W
ipro
Trav
el S
ervi
ces
Lim
ited
Subs
idia
ry01
-02-
03 -
Ongo
ing
As p
er Tr
ansf
er P
ricin
g gu
idel
ines
84
Wip
ro J
apan
KK
Subs
idia
ry26
-03-
01-O
ngoi
ngAs
per
Tran
sfer
Pric
ing
guid
elin
es 2
20
Rent
Pai
dAz
im H
. Pre
mji
KMP
Ongo
ing
As p
er A
gree
men
t 7
Ya
smee
n H
Pre
mji
Rela
tive
of D
irect
orOn
goin
gAs
per
Agr
eem
ent
2
Wip
ro H
oldi
ngs
(UK)
Lim
ited
Subs
idia
ryOn
goin
gAs
per
Agr
eem
ent
51
Wip
ro, L
LCSu
bsid
iary
Ongo
ing
As p
er A
gree
men
t 6
1 D
esig
nit S
pain
Dig
ital,
S.L
Subs
idia
ryOn
goin
gAs
per
Agr
eem
ent
2
Wip
ro J
apan
KK
Subs
idia
ryOn
goin
gAs
per
Agr
eem
ent
16
Wip
ro E
nter
pris
es P
rivat
e Li
mite
dEn
tity
cont
rolle
d by
Pro
mot
ers
Ongo
ing
As p
er A
gree
men
t 2
Co
rpor
ate
Gua
rant
ee C
omm
issi
onW
ipro
, LLC
Subs
idia
ry01
-04-
14- O
ngoi
ngAs
per
Tran
sfer
Pric
ing
guid
elin
es 9
3 W
ipro
Tech
nolo
gies
Gm
bHSu
bsid
iary
16-0
6-17
- Ong
oing
As p
er Tr
ansf
er P
ricin
g gu
idel
ines
8
Wip
ro IT
Ser
vice
s Po
land
sp
z.o.
o.Su
bsid
iary
01-1
2-15
- Ong
oing
As p
er Tr
ansf
er P
ricin
g gu
idel
ines
0.45
Wip
ro S
olut
ions
Can
ada
Ltd
Subs
idia
ry01
-09-
15- O
ngoi
ngAs
per
Tran
sfer
Pric
ing
guid
elin
es 4
5 W
ipro
Tech
nolo
gies
Aus
tral
ia P
ty L
tdSu
bsid
iary
01-0
8-12
- On
goin
gAs
per
Tran
sfer
Pric
ing
guid
elin
es 6
W
ipro
Hol
ding
s (U
K) L
tdSu
bsid
iary
20-0
6-17
- On
goin
gAs
per
Tran
sfer
Pric
ing
guid
elin
es 1
W
ipro
Ara
bia
Co. L
imite
dSu
bsid
iary
01-0
4-14
- Ong
oing
As p
er Tr
ansf
er P
ricin
g gu
idel
ines
15
Wip
ro G
ulf L
LCSu
bsid
iary
01-0
4-14
- Ong
oing
As p
er Tr
ansf
er P
ricin
g gu
idel
ines
37
Rent
al In
com
eW
ipro
Gal
lagh
er S
olut
ions
, LLC
.Su
bsid
iary
01-0
1-16
- On
goin
gAs
per
Agr
eem
ent
2
Wip
ro Tr
avel
Ser
vice
s Li
mite
dSu
bsid
iary
21-1
2-15
- On
goin
gAs
per
Agr
eem
ent
3
Des
igni
t Den
mar
k A/
SSu
bsid
iary
01-0
3-16
- On
goin
gAs
per
Agr
eem
ent
35
Wip
ro, L
LCSu
bsid
iary
Ongo
ing
As p
er A
gree
men
t 1
74
Des
igni
t Dub
aiSu
bsid
iary
15-1
0-19
- On
goin
gAs
per
Agr
eem
ent
2
Wip
ro E
nter
pris
es P
rivat
e Li
mite
dEn
tity
cont
rolle
d by
Pro
mot
ers
01-0
4-14
- On
goin
gAs
per
Agr
eem
ent
44
Azim
Pre
mji
Foun
datio
nEn
tity
cont
rolle
d by
Pro
mot
ers
Ongo
ing
As p
er A
gree
men
t 0
.37
Man
agem
ent S
ervi
ce F
ees
Azim
Pre
mji
Foun
datio
nEn
tity
cont
rolle
d by
Pro
mot
ers
Ongo
ing
Man
agem
ent S
ervi
ce fe
es 3
W
ipro
Ent
erpr
ises
Priv
ate
Lim
ited
Entit
y co
ntro
lled
by P
rom
oter
s01
-04-
14 -
Ongo
ing
Man
agem
ent S
ervi
ce fe
es 4
0

Corporate Overview | Management & Board Reports | Financial Statements
Wipro Limited83
Nam
e of
Rel
ated
Par
tyN
atur
e of
Rel
atio
nshi
pD
urat
ion
of C
ontr
act
Salie
nt te
rms
* A
mou
nt (`
Mn)
Re
stri
cted
Sto
ck U
nit (
RSU
) Com
pens
atio
n Co
st A
lloca
tion
Wip
ro A
rabi
a Co
. Lim
ited
Subs
idia
ryOn
goin
gAs
per
Allo
catio
n 2
W
ipro
do
Bras
il Se
rvic
os d
e Te
cnol
ogia
S.A
.Su
bsid
iary
Ongo
ing
As p
er A
lloca
tion
1
Wip
ro, L
LCSu
bsid
iary
Ongo
ing
As p
er A
lloca
tion
13
Wip
ro d
o Br
asil
Tech
nolo
gia
Ltda
Subs
idia
ryOn
goin
gAs
per
Allo
catio
n 1
W
ipro
Tech
nolo
gies
Gm
bHSu
bsid
iary
Ongo
ing
As p
er A
lloca
tion
14
Wip
ro Te
chno
logi
es S
A D
E CV
Subs
idia
ryOn
goin
gAs
per
Allo
catio
n 5
In
focr
ossi
ng, L
LCSu
bsid
iary
Ongo
ing
As p
er A
lloca
tion
0.1
9 D
esig
nit O
slo
A/S
Subs
idia
ryOn
goin
gAs
per
Allo
catio
n 1
D
esig
nit S
pain
Dig
ital,
S.L
Subs
idia
ryOn
goin
gAs
per
Allo
catio
n 0
.23
Coop
er S
oftw
are,
LLC
Subs
idia
ryOn
goin
gAs
per
Allo
catio
n 1
To
pcod
er, L
LCSu
bsid
iary
Ongo
ing
As p
er A
lloca
tion
8
Wip
ro H
R Se
rvic
es In
dia
Priv
ate
Lim
ited
Subs
idia
ryOn
goin
gAs
per
Allo
catio
n 2
Ap
pirio
, Inc
.Su
bsid
iary
Ongo
ing
As p
er A
lloca
tion
0.2
7 D
esig
nit T
.L.V
Ltd
.Su
bsid
iary
Ongo
ing
As p
er A
lloca
tion
0.3
9 W
ipro
Bah
rain
Lim
ited
Co. S
.P.C
Subs
idia
ryOn
goin
gAs
per
Allo
catio
n 0
.29
Celle
nt G
mbH
Subs
idia
ryOn
goin
gAs
per
Allo
catio
n 0
.45
Wip
ro J
apan
KK
Subs
idia
ryOn
goin
gAs
per
Allo
catio
n 0
.84
Hea
lthPl
an S
ervi
ces,
Inc.
Subs
idia
ryOn
goin
gAs
per
Allo
catio
n 2
Ot
her C
osts
Wip
ro E
nter
pris
es P
rivat
e Li
mite
dEn
tity
cont
rolle
d by
Pro
mot
ers
01-0
4-14
- On
goin
gOn
Act
ual C
ost B
asis
107
Az
im P
rem
ji Fo
unda
tion
Entit
y co
ntro
lled
by P
rom
oter
sOn
goin
gOn
Act
ual C
ost B
asis
8
Asia
n Pa
ints
Lim
ited
Com
mon
Dire
ctor
sOn
goin
gOn
Act
ual C
ost B
asis
0.0
1 At
ria C
onve
rgen
ce Te
chno
logi
es L
imite
dCo
mm
on D
irect
ors
Ongo
ing
On A
ctua
l Cos
t Bas
is 0
.10
Bain
and
Com
pany
Com
mon
Dire
ctor
sOn
goin
gOn
Act
ual C
ost B
asis
129
In
dian
Sch
ool o
f Bus
ines
sCo
mm
on D
irect
ors
Ongo
ing
On A
ctua
l Cos
t Bas
is 3
M
ahin
dra
Wor
ld C
ity D
evel
oper
s Li
mite
dCo
mm
on D
irect
ors
Ongo
ing
On A
ctua
l Cos
t Bas
is 4
Pi
ram
al E
nter
pris
es L
imite
dCo
mm
on D
irect
ors
Ongo
ing
On A
ctua
l Cos
t Bas
is 0
.13
Pl In
tern
atio
nal H
oldi
ngs
LLC
Com
mon
Dire
ctor
sOn
goin
gOn
Act
ual C
ost B
asis
0.0
3 Th
e In
dian
Hot
els
Com
pany
Lim
ited
Com
mon
Dire
ctor
sOn
goin
gOn
Act
ual C
ost B
asis
0.0
5 Ti
tan
Com
pany
Lim
ited
Com
mon
Dire
ctor
sOn
goin
gOn
Act
ual C
ost B
asis
0.1
7 Ve
dant
a Li
mite
dCo
mm
on D
irect
ors
Ongo
ing
On A
ctua
l Cos
t Bas
is 0
.47
Wip
ro G
E H
ealth
care
Priv
ate
Lim
ited
Join
t ven
ture
with
Wip
ro
Ente
rpris
es P
rivat
e Li
mite
d an
d G
ener
al E
lect
ricOn
goin
gOn
Act
ual C
ost B
asis
0.0
3
Inte
rest
Inco
me
Wip
ro IT
Ser
vice
s SE
Subs
idia
ryOn
goin
gAs
per
Agr
eem
ent
0.0
2 W
ipro
, LLC
Subs
idia
ryOn
goin
gAs
per
Agr
eem
ent
23
* Ap
prop
riate
app
rova
ls h
ave
been
take
n fr
om th
e Au
dit C
omm
ittee
and
Boa
rd o
f Dire
ctor
s of
the
Com
pany
from
tim
e to
tim
e fo
r the
rela
ted
part
y tr
ansa
ctio
ns.
Ris
had
A. P
rem
ji M
. K. S
harm
a M
. San
aulla
Kha
n C
hair
man
D
irec
tor
Com
pany
Sec
reta
ry A
bida
li Z
. Nee
muc
hwal
a Ja
tin
Pra
vinc
hand
ra D
alal
Chi
ef E
xecu
tive
Offi
cer
& M
anag
ing
Dir
ecto
r C
hief
Fin
anci
al O
ffice
r B
enga
luru
M
ay 2
9, 2
020

Annual Report 2019-20 84
Annexure IIStatement of Disclosure of Remuneration under Section 197 of Companies Act, 2013 and Rule 5(1) of Companies
(Appointment and Remuneration of Managerial Personnel) Rules, 2014
Remuneration paid to Whole Time Directors
Name of Directors Designation % Increase/Decrease of remuneration in 2020 as
compared to 2019*
Ratio of remuneration to
MRE*
Ratio of remuneration to MRE and WTD*
Rishad A. Premji (1) Chairman -24.56 79.03 79.03Abidali Z. Neemuchwala (2) Chief Executive Officer and
Managing Director18.15 495.10 495.10
Azim H. Premji (3) Founder Chairman NA 15.70 15.70
Remuneration paid to Other Directors
Name of Directors Designation % Increase/Decrease of remuneration in 2020 as
compared to 2019*
Ratio of remuneration to
MRE*
Ratio of remuneration to MRE and WTD *
Azim H. Premji (3) Founder Chairman NA 7.80 7.80Ireena Vittal Independent Director 37.93 15.51 15.51M. K. Sharma Independent Director 47.10 16.53 16.53Dr. Patrick J. Ennis Independent Director 7.84 30.53 30.53Patrick A. Dupuis Independent Director -18.46 23.00 23.00William A. Owens Independent Director 15.46 41.42 41.42Arundhati Bhattacharya (4) Independent Director NA 13.67 13.67Dr. Ashok S. Ganguly (4) Independent Director NA 4.63 4.63N. Vaghul (4) Independent Director NA 5.79 5.79
MRE – Median Remuneration of employees, WTD – Whole Time Director
* Rounded-off to two decimals
(1) Mr. Rishad A. Premji was appointed as Executive Chairman with effect from July 31, 2019.(2) Mr. Abidali Z. Neemuchwala was appointed as Managing Director of the Company with effect from July 31, 2019, in addition to his existing
position as Chief Executive Officer.(3) Mr. Azim H. Premji retired from the position of Executive Chairman and Managing Director with effect from July 30, 2019 and was appointed
as Non-Executive, Non-Independent Director of the Company effective July 31, 2019. Considering the aforesaid, comparable figures have not been provided in the above table.
(4) Comparable figures not provided as Dr. Ashok S. Ganguly and Mr. N. Vaghul retired as directors w.e.f. July 31, 2019 and Mrs. Arundhati Bhattacharya was appointed effective January 1, 2019.
Remuneration paid to other Key Managerial Personnel (KMP)
Name of KMPs Designation % Increase/Decrease of remuneration in 2020 as
compared to 2019*
Ratio of remuneration to
MRE *
Ratio of remuneration to MRE and WTD *
Jatin Pravinchandra Dalal Chief Financial Officer -27.01 68.22 68.22M Sanaulla Khan** Company Secretary -10.40 22.66 22.66
MRE- Median Remuneration of Employees, WTD- Whole Time Director
* Rounded-off to two decimals** Remuneration includes perquisites value of Restricted Stock Units exercised during the respective years.

Corporate Overview | Management & Board Reports | Financial Statements
Wipro Limited85
Notes:
1. The median remuneration of employees (MRE) excluding Whole Time Directors was ̀ 6,52,000 and ̀ 6,00,000 in fiscal 2020 and fiscal 2019 respectively. The increase in MRE excluding the Whole Time Directors in fiscal 2020 as compared to fiscal 2019 is 8.67%.
2. The median remuneration of employees (MRE) including Whole Time Directors was ` 6,52,000 and ` 6,00,000 in fiscal 2020 and fiscal 2019 respectively. The increase in MRE including the Whole Time Directors in fiscal 2020 as compared to fiscal 2019 is 8.67%.
3. The number of permanent employees on the rolls of the Company as of March 31, 2020 and March 31, 2019 was 182,886 and 171,425 respectively.
4. The aggregate remuneration of employees excluding WTD grew by 9.07% over the previous fiscal, attributed to the increase in headcount. The aggregate increase in salary for WTDs and other KMPs was 1.54% in fiscal 2020 over fiscal 2019.
5. In view of the current situation caused by COVID-19, uncertainty in business is likely to last for the next few months. To show solidarity with the team in facing the challenge:
• Mr. Azim H. Premji, Founder Chairman, has foregone the profit linked commission payable to him for the relevant period for financial year 2019-20.
• Mr. Rishad A. Premji, Chairman, has foregone the variable pay and profit linked commission payable to him for the relevant period for financial year 2019-20.
Accordingly, the Board did not determine profit linked commission due to Mr. Azim H. Premji for FY 2019-20, variable pay and profit linked commission due to Mr. Rishad A. Premji for financial year 2019-20 and the remuneration considered for the table above does not include the same.
6. In support of Wipro’s humanitarian efforts to combat COVID-19, Mr. Patrick Dupuis, Independent Director, has foregone the commission payable to him for quarter ended March 31, 2020 and Wipro will contribute Mr. Dupuis’ commission to Wipro Cares for its various COVID-19
related activities as part of its Corporate Social Responsibility program.
7. Mr. Rishad A. Premji’s compensation also included cash bonus (part of his allowances) on an accrual basis, which is payable over a period of time.
8. Computation of remuneration to Mr. Jatin Pravinchandra Dalal is on an accrual basis and it includes the amortization of Restricted Stock Units (RSUs), granted to him, which will vest over a period of time. This also includes RSUs that will vest based on performance parameters of the Company.
9. The Company announced on January 31, 2020 that Mr. Abidali Z. Neemuchwala has resigned from the position of Chief Executive Officer and Managing Director due to family commitments and will, however, continue to hold the office of Chief Executive Officer and Managing Director until a successor is appointed. The Board of Directors has, at its meeting held on May 29, 2020, noted the resignation of Mr. Abidali Z. Neemuchwala as the Chief Executive Officer and Managing Director with effect from the end of the day on June 1, 2020. Compensation for Mr. Abidali Z. Neemuchwala for the year ended March 31, 2020 includes cost of accelerated vesting of unvested options and variable pay.
10. The Company affirms that the remuneration is paid as per the remuneration policy of the Company.
Variable Pay Compensation
The variable pay of top executives including the Chief Executive Officer and Managing Director is based on clearly laid out criteria and measures, which are linked to the desired performance and business objectives of the organization. The criteria for variable pay, which is paid out annually, includes both financial and non-financial parameters like revenue, profit achievement, customer satisfaction and other strategic goals as decided by the Board from time to time.
Apart from the variable pay component, long term (typically greater than one year) incentives granted to top executives including the Chief Executive Officer and Managing Director includes both time-based and performance-based stock units (PSUs).
The vesting of PSUs is based on performance parameters of the Company over a defined performance period and is linked to pre-defined financial goals. Time-based stock units typically vest over a defined period. The vesting pattern and schedule for both these types of stock units are as determined by the Board Governance, Nomination and Compensation Committee.

Annual Report 2019-20 86
Ann
exur
e III
Info
rmat
ion
as p
er R
ule
5(2)
of t
he C
ompa
nies
(App
oint
men
t and
Rem
uner
atio
n of
Man
ager
ial P
erso
nnel
) Rul
es, 2
014
A)
Top
10 e
mpl
oyee
s in
term
s of
sal
ary
draw
n du
ring
the
yea
r 201
9-20
Sl
No.
Nam
e of
the
Empl
oyee
Dat
e of
join
ing
(dd-
mm
-yyy
y)
Gro
ss
Rem
uner
atio
n (`
)Ed
ucat
iona
l Qua
lifica
tion
Age
Expe
rien
ce
(yrs
)La
st E
mpl
oym
ent
Des
igna
tion
1Ab
idal
i Z N
eem
uchw
ala
*#01
-Apr
-15
322,
807,
092
BE, E
lect
roni
cs a
nd
Com
mun
icat
ion,
Mas
ters
in
Indu
stria
l Man
agem
ent
5228
Tata
Con
sulta
ncy
Serv
ices
Chie
f Exe
cutiv
e Of
ficer
and
Man
agin
g D
irect
or
2An
and
Padm
anab
han
02-M
ay-9
461
,329
,152
BE54
30Al
moa
yed
Dat
a G
roup
Pres
iden
t-St
rate
gic
Sale
s an
d G
eogr
aphi
es
3Bh
anum
urth
y B
M03
-Sep
-92
52,0
77,3
15B
Tech
, PG
DM
5633
CMC
Lim
ited
Pres
iden
t and
Chi
ef O
pera
ting
Offic
er
4D
eepa
k Ac
hary
a01
-Feb
-18
29,2
24,6
34BS
c, L
LB, F
CS52
24Pr
octe
r & G
ambl
e Si
ngap
ore
Seni
or V
ice
Pres
iden
t & G
ener
al C
ouns
el
5Ja
tin P
ravi
ncha
ndra
D
alal
***
01-J
ul-0
244
,481
,333
BE, C
A, P
GD
BA, C
FA (U
SA),
CGM
A (U
K), C
MA
4521
GE
Indi
aPr
esid
ent a
nd C
hief
Fin
anci
al O
ffice
r
6Ki
ran
K D
esai
21-S
ep-9
838
,996
,816
BE, P
G D
iplo
ma
5433
Uni
corp
Indu
strie
sSe
nior
Vic
e Pr
esid
ent -
CIS
7Ra
mes
h N
agar
ajan
25-J
an-9
127
,875
,387
ME
5431
Firs
t Em
ploy
men
tSr
. Vic
e Pr
esid
ent -
Clo
ud S
ervi
ces
8Ri
shad
A. P
rem
ji**
20-J
ul-0
751
,528
,776
B.A,
MBA
4321
Bain
& C
ompa
nyEx
ecut
ive
Chai
rman
- W
ipro
Lim
ited
9Ro
hit A
dlak
ha30
-May
-95
28,1
62,4
12BE
4624
Firs
t Em
ploy
men
tSe
nior
Vic
e Pr
esid
ent a
nd G
loba
l Hea
d -
Wip
ro H
OLM
ES
10Sa
urab
h G
ovil
11-M
ay-0
944
,359
,096
B.Sc
., PG
DM
-PM
& IR
5231
GE
Indi
aPr
esid
ent a
nd C
hief
Hum
an R
esou
rces
Offic
er
Not
es:
1.
Rem
uner
atio
n co
mpr
ises
sal
ary,
allo
wan
ces,
com
mis
sion
, per
form
ance
bas
ed p
aym
ents
, per
quis
ite
and
Com
pany
’s c
ontr
ibut
ion
to P
rovi
dent
Fun
d an
d su
per-
annu
atio
n as
per
defi
niti
on
cont
aine
d in
Sec
tion
2(7
8) o
f the
Com
pani
es A
ct, 2
013
paid
dur
ing
the
year
. It
als
o in
clud
es p
erqu
isit
es v
alue
of R
estr
icte
d S
tock
Uni
ts (R
SU
s) e
xerc
ised
, if a
ny, b
y em
ploy
ees.
2.
The
natu
re o
f em
ploy
men
t is
cont
ract
ual i
n al
l the
abo
ve c
ases
.
3.
Non
e of
the
em
ploy
ees
empl
oyed
thr
ough
out
the
fina
ncia
l yea
r or
par
t th
ereo
f, w
ere
in r
ecei
pt o
f rem
uner
atio
n in
tha
t ye
ar, w
hich
in t
he a
ggre
gate
, or
as t
he c
ase
may
be
at a
rat
e w
hich
, in
the
aggr
egat
e, is
in e
xces
s of
that
dra
wn
by th
e M
anag
ing
Dir
ecto
r or W
hole
Tim
e D
irec
tor o
r Man
ager
and
hol
ds b
y hi
mse
lf o
r alo
ng w
ith
his
spou
se a
nd d
epen
dent
chi
ldre
n, n
ot le
ss th
an tw
o pe
rcen
t of t
he e
quit
y sh
ares
of t
he C
ompa
ny.
4.
In te
rms
of p
rovi
so to
Rul
e 5
of th
e C
ompa
nies
(App
oint
men
t and
Rem
uner
atio
n of
Man
ager
ial P
erso
nnel
) Rul
es, 2
014,
par
ticu
lars
of e
mpl
oyee
s po
sted
and
wor
king
in a
cou
ntry
out
side
Indi
a,
not b
eing
Dir
ecto
rs o
r th
eir
rela
tive
s, h
ave
not b
een
incl
uded
in th
e ab
ove
stat
emen
t.
5.
Mr.
Ris
had
A. P
rem
ji, w
ho is
in t
he e
mpl
oym
ent
of t
he C
ompa
ny, i
s th
e so
n of
Mr.
Azi
m H
. Pre
mji,
Fou
nder
Cha
irm
an o
f th
e C
ompa
ny. C
ompu
tati
on o
f re
mun
erat
ion
of M
r. R
isha
d A
. Pre
mji,
C
hair
man
, inc
lude
s ca
sh b
onus
(par
t of h
is a
llow
ance
s) o
n an
acc
rual
bas
is, w
hich
is p
ayab
le o
ver
a pe
riod
of t
ime.
*
The
Com
pany
ann
ounc
ed o
n Ja
nuar
y 31
, 202
0 th
at M
r. A
bida
li Z
. Nee
muc
hwal
a ha
s re
sign
ed fr
om t
he p
osit
ion
of C
hief
Exe
cuti
ve O
ffice
r an
d M
anag
ing
Dir
ecto
r du
e to
fam
ily c
omm
itm
ents
an
d w
ill, h
owev
er, c
onti
nue
to h
old
the
offi
ce o
f Chi
ef E
xecu
tive
Offi
cer a
nd M
anag
ing
Dir
ecto
r unt
il a
succ
esso
r is
appo
inte
d. T
he B
oard
of D
irec
tors
has
, at i
ts m
eeti
ng h
eld
on M
ay 2
9, 2
020,
no
ted
the
resi
gnat
ion
of M
r. A
bida
li Z
. Nee
muc
hwal
a as
the
Chi
ef E
xecu
tive
Offi
cer
and
Man
agin
g D
irec
tor
wit
h ef
fect
fro
m t
he e
nd o
f th
e da
y on
Jun
e 1,
202
0. C
ompe
nsat
ion
for
the
year
en
ded
Mar
ch 3
1, 2
020
incl
udes
cos
t of a
ccel
erat
ed v
esti
ng o
f une
sted
opt
ions
and
var
iabl
e pa
y.
#
Figu
res
men
tion
ed in
` a
re e
quiv
alen
t of a
mou
nts
paid
in U
S$.
**
Mr.
Ris
had
A. P
rem
ji w
as a
ppoi
nted
as
Exe
cuti
ve C
hair
man
of t
he B
oard
wit
h ef
fect
from
Jul
y 31
, 201
9.
***
Com
puta
tion
of r
emun
erat
ion
to th
e C
hief
Fin
anci
al O
ffice
r is
on a
n ac
crua
l bas
is a
nd in
clud
es th
e am
orti
zati
on o
f Res
tric
ted
Sto
ck U
nits
(RS
Us)
, gra
nted
to h
im, w
hich
will
ves
t ove
r a p
erio
d of
tim
e. T
his
also
incl
udes
RS
Us
that
will
ves
t bas
ed o
n pe
rfor
man
ce p
aram
eter
s of
the
Com
pany
.

Corporate Overview | Management & Board Reports | Financial Statements
Wipro Limited87
B) E
mpl
oyee
s dr
awin
g sa
lary
of `
102
lakh
s or
abo
ve p
er a
nnum
and
pos
ted
in In
dia
Nam
e of
the
empl
oyee
Dat
e of
join
ing
(dd-
mm
-yyy
y)G
ross
Re
mun
erat
ion
(in `
)
Educ
atio
nal
Qual
ifica
tion
Age
Expe
rien
ce
(yrs
)La
st E
mpl
oym
ent
Des
igna
tion
Aath
ir Ah
ad20
-Jan
-03
11,3
62,6
29BE
47
24Ba
ngal
ore
Labs
Gen
eral
Man
ager
Ajay
Bha
skar
08-J
ul-0
212
,242
,608
BE, M
BA47
25H
indu
stan
Lev
er L
td.
Vice
Pre
side
nt- H
ead
of C
orpo
rate
Str
ateg
y &
IP
Amit
Bajo
ria30
-Oct
-00
15,7
27,1
25C
A42
19Fi
rst E
mpl
oym
ent
Seni
or V
ice
Pres
iden
t
Amit
S R
23-O
ct-1
510
,851
,304
LLB,
MBA
4320
HCL
Am
eric
a, I
ncG
ener
al M
anag
er a
nd A
ssoc
iate
Gen
eral
Co
unse
l
Anee
sh G
arg
02-F
eb-1
715
,339
,941
Busi
ness
Mgm
t Sc
ienc
e
47
23So
uthe
rland
Glo
bal S
ervi
ces
Seni
or V
ice
Pres
iden
t
Anil
Raib
agi M
adha
v16
-Oct
-02
20,3
66,4
14B.
Com
, MBA
4928
IBM
Seni
or V
ice
Pres
iden
t and
Hea
d - M
& A
Anim
esh
Seng
upta
12-S
ep-0
611
,071
,145
B.Co
m
5029
GE
Mon
ey
Gen
eral
Man
ager
Anja
n M
ukhe
rjee
16-D
ec-1
310
,152
,988
PG D
iplo
ma
4624
Adity
a Bi
rla M
inac
sG
loba
l Hea
d
Anuj
Bha
lla15
-May
-96
25,6
33,3
97BE
, MBA
4924
Firs
t Em
ploy
men
tSe
nior
Vic
e Pr
esid
ent &
Glo
bal D
eliv
ery
Hea
d
Anur
ag S
eth
03-M
ay-9
014
,884
,585
BE, P
GD
BM
- Inf
orm
atio
n M
anag
emen
t
5330
Firs
t Em
ploy
men
tVi
ce P
resi
dent
& H
ead-
Tale
nt Tr
ansf
orm
atio
n,
TopG
ear &
Bus
ines
s Co
ntin
uity
Apar
na Iy
er21
-Apr
-03
11,6
07,8
72C
A
3917
Firs
t Em
ploy
men
tVi
ce P
resi
dent
Arav
ind
V S
22-A
pr-0
218
,208
,870
PGD
BM40
18Fi
rst E
mpl
oym
ent
Seni
or V
ice
Pres
iden
t
Arju
n Ra
mar
aju
08-N
ov-9
423
,900
,064
BE47
25Fi
rst E
mpl
oym
ent
Seni
or V
ice
Pres
iden
t
Arun
kum
ar M
03-F
eb-9
715
,439
,079
BE
4644
IISc
Vice
Pre
side
nt
Asho
k N
agar
11-A
pr-0
514
,117
,639
PGD
CA49
25Te
chno
va In
dia
Pvt.
Ltd.
Gen
eral
Man
ager
Asho
k Ph
ilipo
se16
-Apr
-96
13,9
33,9
57BE
50
25Pe
ntaf
our S
oftw
are
Vice
Pre
side
nt
Ayas
kant
Sar
angi
03-D
ec-1
221
,958
,866
PGD
BM45
22G
E In
dia
Seni
or V
ice
Pres
iden
t - H
uman
Res
ourc
es
Bala
subr
aman
ian
K17
-Apr
-02
15,0
55,7
54B.
Com
,C A
4018
Firs
t Em
ploy
men
tVi
ce P
resi
dent
Bhar
at S
hett
y26
-Feb
-01
10,1
25,3
69BE
44
22M
aste
k Lt
d.
Prac
tice
Hea
d
Chan
dra
Shek
ar S
N06
-Nov
-95
11,2
06,9
73BE
47
24In
dian
Indu
stria
l Mac
hine
sVi
ce P
resi
dent
Dav
id D
lima
23-A
pr-1
512
,075
,824
B. Te
ch, M
S in
Com
pute
r En
gine
erin
g
5531
IBM
glo
bal s
ervi
ces
Vice
Pre
side
nt &
CIS
Con
sulti
ng H
ead
Den
ny J
ohn
12-A
ug-9
612
,008
,435
BE
4829
Mod
i Oliv
etti
Ltd
Vi
ce P
resi
dent
Dev
ende
r Mal
hotr
a23
-Aug
-02
17,2
87,0
50BE
, PG
D48
25Sa
tyam
GE
Soft
war
eVi
ce P
resi
dent
& G
loba
l Del
iver
y H
ead,
CIS
Dip
ak K
umar
Boh
ra14
-Jun
-02
24,4
05,4
02B
Com
, CA,
ICW
AI47
23Ad
itya
Birla
Gro
upSe
nior
Vic
e Pr
esid
ent,
Fina
nce
Gau
tam
Sar
kar
22-A
pr-0
313
,625
,192
PGD
BM
51
27U
sha
Com
mun
icat
ions
Vi
ce P
resi
dent
& B
usin
ess
Hea
d,
Com
mun
icat
ions
Gop
ikris
hnan
Gou
ri Ra
mac
hand
ran
27-A
ug-1
215
,117
,870
PGD
BM
48
24In
fosy
s Li
mite
d
Man
agin
g Pa
rtne
r
Gur
mee
t Sin
gh S
ran
16-J
ul-0
915
,771
,778
M S
c50
25G
enpa
ctSe
nior
Pra
ctic
e D
irect
or
Har
sh B
hatia
07-N
ov-0
220
,059
,450
B.SC
.
5432
Dak
SH
Vi
ce P
resi
dent
- Op
erat
ions
Jay
Prak
ash
Saha
l02
-Nov
-04
10,8
10,3
98C
A
4319
Tata
Ste
el
Vice
Pre
side
nt
Jaya
nt P
rabh
u K
05-A
ug-9
612
,939
,881
BE
44
23Fi
rst E
mpl
oym
ent
Vice
Pre
side
nt
Jaya
nta
Dey
13-O
ct-8
817
,155
,965
BE, M
BA54
32Fi
rst E
mpl
oym
ent
Vice
Pre
side
nt
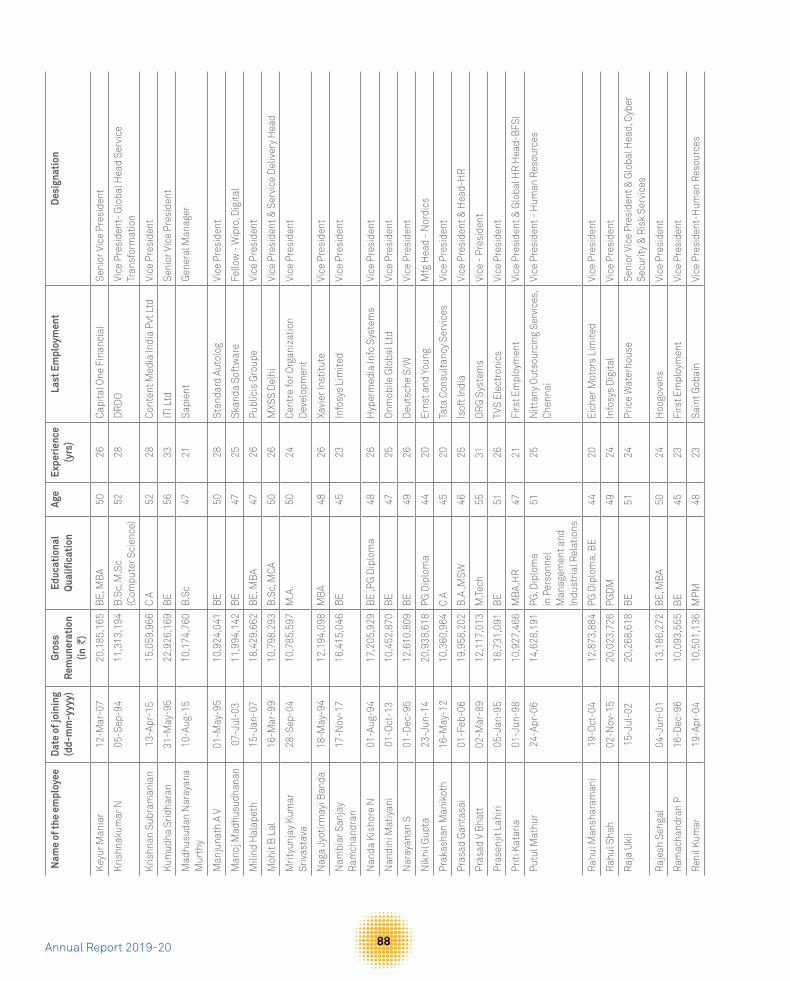
Annual Report 2019-20 88
Nam
e of
the
empl
oyee
Dat
e of
join
ing
(dd-
mm
-yyy
y)G
ross
Re
mun
erat
ion
(in `
)
Educ
atio
nal
Qual
ifica
tion
Age
Expe
rien
ce
(yrs
)La
st E
mpl
oym
ent
Des
igna
tion
Keyu
r Man
iar
12-M
ar-0
720
,185
,165
BE, M
BA50
26Ca
pita
l One
Fin
anci
alSe
nior
Vic
e Pr
esid
ent
Kris
hnak
umar
N05
-Sep
-94
11,3
13,1
94B.
Sc, M
.Sc
(Com
pute
r Sci
ence
)52
28D
RDO
Vice
Pre
side
nt- G
loba
l Hea
d Se
rvic
e Tr
ansf
orm
atio
n
Kris
hnan
Sub
ram
ania
n13
-Apr
-15
15,0
59,9
66C
A
5228
Cont
ent M
edia
Indi
a Pv
t Ltd
Vice
Pre
side
nt
Kum
udha
Srid
hara
n31
-May
-95
22,9
26,1
69BE
5633
ITI L
tdSe
nior
Vic
e Pr
esid
ent
Mad
husu
dan
Nar
ayan
a M
urth
y10
-Aug
-15
10,1
74,7
60B.
Sc
47
21Sa
pien
t
Gen
eral
Man
ager
Man
juna
th A
V01
-May
-95
10,9
24,0
41BE
50
28St
anda
rd A
utol
ogVi
ce P
resi
dent
Man
oj M
adhu
sudh
anan
07-J
ul-0
311
,994
,142
BE
4725
Skan
da S
oftw
are
Fello
w -
Wip
ro, D
igita
l
Mili
nd H
alap
eth
15-J
an-0
718
,429
,662
BE, M
BA47
26Pu
blic
is G
roup
eVi
ce P
resi
dent
Moh
it B
Lal
16-M
ar-9
910
,798
,293
B.Sc
, MCA
5026
MXS
S D
elhi
Vice
Pre
side
nt &
Ser
vice
Del
iver
y H
ead
Mrit
yunj
ay K
umar
Sr
ivas
tava
28-S
ep-0
410
,785
,597
M.A
.
50
24Ce
ntre
for O
rgan
izat
ion
Dev
elop
men
tVi
ce P
resi
dent
Nag
a Jy
otirm
ayi B
anda
18-M
ay-9
412
,194
,098
MBA
4826
Xavi
er In
stitu
te
Vice
Pre
side
nt
Nam
biar
San
jay
Ram
chan
dran
17-N
ov-1
716
,415
,046
BE
4523
Info
sys
Lim
ited
Vi
ce P
resi
dent
Nan
da K
isho
re N
01-A
ug-9
417
,205
,929
BE ,P
G D
iplo
ma
4826
Hyp
erm
edia
Info
Sys
tem
sVi
ce P
resi
dent
Nan
dini
Mat
iyan
i01
-Oct
-13
10,4
52,8
70BE
4725
Onm
obile
Glo
bal L
tdVi
ce P
resi
dent
Nar
ayan
an S
01-D
ec-9
512
,610
,809
BE
4926
Deu
tsch
e S/
W
Vice
Pre
side
nt
Nik
hil G
upta
23-J
un-1
420
,938
,618
PG D
iplo
ma
4420
Erns
t and
You
ngM
fg H
ead
- Nor
dics
Prak
asha
n M
anik
oth
16-M
ay-1
210
,360
,964
C A
45
20Ta
ta C
onsu
ltanc
y Se
rvic
es
Vice
Pre
side
nt
Pras
ad G
anta
sai
01-F
eb-0
619
,958
,202
B.A
,MSW
4625
Isof
t Ind
iaVi
ce P
resi
dent
& H
ead-
HR
Pras
ad V
Bha
tt02
-Mar
-89
12,1
17,0
13M
.Tech
55
31OR
G S
yste
ms
Vice
- Pr
esid
ent
Pras
enjit
Lah
iri05
-Jan
-95
18,7
31,0
91BE
51
26TV
S El
ectr
onic
s
Vi
ce P
resi
dent
Priti
Kat
aria
01-J
un-9
810
,927
,466
MBA
,HR
4721
Firs
t Em
ploy
men
tVi
ce P
resi
dent
& G
loba
l HR
Hea
d-B
FSI
Putu
l Mat
hur
24-A
pr-0
614
,628
,191
PG, D
iplo
ma
in P
erso
nnel
M
anag
emen
t and
In
dust
rial R
elat
ions
5125
Nitt
any
Outs
ourc
ing
Serv
ices
, Ch
enna
i
Vi
ce P
resi
dent
- H
uman
Res
ourc
es
Rahu
l Man
shar
aman
i19
-Oct
-04
12,8
73,8
84PG
Dip
lom
a, B
E
4420
Eich
er M
otor
s Li
mite
dVi
ce P
resi
dent
Rahu
l Sha
h02
-Nov
-15
20,0
23,7
26PG
DM
4924
Info
sys
Dig
ital
Vice
Pre
side
nt
Raja
Uki
l15
-Jul
-02
20,2
68,6
18BE
5124
Pric
e W
ater
hous
eSe
nior
Vic
e Pr
esid
ent &
Glo
bal H
ead,
Cyb
er
Secu
rity
& R
isk
Serv
ices
Raje
sh S
ehga
l04
-Jun
-01
13,1
86,2
72BE
, MBA
5024
Hoo
gove
ns
Vi
ce P
resi
dent
Ram
acha
ndra
n P
16-D
ec-9
610
,093
,555
BE
4523
Firs
t Em
ploy
men
tVi
ce P
resi
dent
Reni
l Kum
ar19
-Apr
-04
10,5
01,1
36M
PM
48
23Sa
int G
obai
n
Vi
ce P
resi
dent
-Hum
an R
esou
rces

Corporate Overview | Management & Board Reports | Financial Statements
Wipro Limited89
Nam
e of
the
empl
oyee
Dat
e of
join
ing
(dd-
mm
-yyy
y)G
ross
Re
mun
erat
ion
(in `
)
Educ
atio
nal
Qual
ifica
tion
Age
Expe
rien
ce
(yrs
)La
st E
mpl
oym
ent
Des
igna
tion
Saib
al B
asu
15-J
ul-0
211
,264
,216
B.Sc
5430
Trig
ent S
oftw
are
Vice
Pre
side
nt
Sam
ir G
adgi
l09
-Oct
-04
21,2
43,4
24M
PM, B
E44
21Ce
dar C
onsu
lting
Vice
Pre
side
nt-H
uman
Res
ourc
es
Sana
ulla
Kha
n M
oham
med
12-M
ay-1
514
,776
,835
M.C
om, F
CS49
26IC
ICI P
rude
ntia
l Life
In
sura
nce
Co. L
td.
Vice
Pre
side
nt &
Com
pany
Sec
reta
ry
Sanj
ay S
anka
r Bas
u06
-May
-19
11,2
49,6
96BE
, PG
DM
5326
SAP
Labs
Indi
a Pv
t. Lt
d.
Vice
Pre
side
nt
Sanj
eev
R07
-Sep
-98
14,7
13,3
22BE
, PG
DAC
4724
CMC
Lim
ited
Vi
ce P
resi
dent
- Eng
inee
ring
& P
resa
les-
H
OLM
ES
Sanj
eev
Sing
h02
-Nov
-18
24,0
24,1
85B.
Tech
, PG
DM
5419
Aegi
s Li
mite
dSe
nior
Vic
e Pr
esid
ent
Sanj
iv K
R16
-Nov
-88
27,7
84,1
60M
MS
5632
DCM
Dat
a Pr
oduc
tsCh
ief T
echn
olog
y Of
ficer
Satis
h Y
19-A
pr-0
012
,823
,961
BE
4724
Jind
al V
ijaya
naga
r Ste
el lt
dVi
ce P
resi
dent
Shan
tanu
Roh
atgi
15-M
ay-8
914
,345
,841
BE, M
BA
52
31Fi
rst E
mpl
oym
ent
Vice
Pre
side
nt-P
RE E
nter
pris
e
Shee
tal S
hara
d M
ehta
16-S
ep-9
419
,547
,195
BE47
26Fi
rst E
mpl
oym
ent
Seni
or V
ice
Pres
iden
t
Som
it Ka
poor
25-F
eb-0
213
,901
,693
BE
4318
New
Hol
land
Vice
Pre
side
nt
Srin
ivas
an G
14-A
pr-9
913
,153
,376
BE50
29In
dche
m E
lect
roni
csVi
ce P
resi
dent
Sriv
atsa
n Ve
nkat
aram
ani
12-J
an-1
210
,770
,706
ACA,
PG
DM
5125
Orac
le fi
nanc
ial s
ervi
ces
ltdG
ener
al M
anag
er
Sudh
ir Ke
sava
n09
-Jan
-17
11,2
20,1
28B.
Tech
46
23Va
lue
Labs
Vice
Pre
side
nt
Suni
ta C
heria
n04
-Nov
-96
22,4
46,8
82B.
Tech
, PG
DBA
4623
Firs
t Em
ploy
men
tSe
nior
Vic
e Pr
esid
ent -
Hum
an R
esou
rces
Supr
iya
Das
01-J
ul-8
712
,273
,448
BE
5532
Firs
t Em
ploy
men
tVi
ce P
resi
dent
Sure
ndra
nath
Gar
imel
la10
-Jul
-06
16,5
86,3
54B.
Sc.,M
CA52
30M
SG S
yste
ms
Vice
Pre
side
nt
Swat
i Obe
roi
06-N
ov-1
712
,026
,000
Mas
ters
in
Busi
ness
Ad
min
istr
atio
n
5229
Tata
Con
sulta
ncy
Serv
ices
G
ener
al M
anag
er
Tham
izha
nam
bi M
m18
-Oct
-13
11,6
86,6
30M
.Sc.
(M
athe
mat
ics)
an
d PG
Dip
lom
a in
M
anag
emen
t
5531
Ram
co S
yste
ms
Vert
ical
Del
iver
y H
ead-
Gov
t
Venk
atar
aman
M
ahad
evan
10-A
ug-0
418
,132
,140
B.Sc
., Ad
vanc
e D
iplo
ma
in S
MGT
4915
NIIT
Lim
ited
Vice
Pre
side
nt
Vija
yasi
mha
Alil
ugha
tta
28-F
eb-1
423
,739
,989
BE46
24In
fosy
s Li
mite
dSe
nior
Vic
e Pr
esid
ent
Vipi
n Ch
andr
an N
air
12-M
ar-1
210
,307
,613
M.A
. in
Econ
omic
s49
26Ti
cker
Plan
t Ltd
G
ener
al M
anag
er &
Hea
d-Co
mm
unic
atio
ns
Vish
al K
umar
Sha
h01
-Oct
-10
10,8
97,9
14Fe
llow
Pro
gram
me
in M
anag
emen
t (P
hD),
PGD
M
4820
Righ
t Man
agem
ent
Vice
Pre
side
nt
Vish
was
Dee
p01
-Mar
-92
11,9
50,3
56BE
, M.Te
ch
51
28Fi
rst E
mpl
oym
ent
Vice
Pre
side
nt a
nd G
loba
l Hea
d- Ta
lent
Ac
quis
ition
Visw
anat
han
Ram
asw
amy
06-F
eb-1
420
,668
,443
M.Te
ch53
33Vo
dafo
ne In
dia
Ltd
Vice
Pre
side
nt

Annual Report 2019-20 90
Nam
e of
the
Em
ploy
eeD
ate
of jo
inin
g (d
d-m
m-y
yyy)
Gro
ss
Rem
uner
atio
n (i
n `
)
Edu
cati
onal
Qua
lifica
tion
Age
Exp
erie
nce
(yrs
)La
st E
mpl
oym
ent
Des
igna
tion
Azim
H. P
rem
ji*17
-Aug
-66
10,2
35,8
47G
radu
ate
Deg
ree
in E
lect
rical
En
gine
erin
g74
53Fi
rst E
mpl
oym
ent
Exec
utiv
e Ch
airm
an a
nd
Man
agin
g D
irect
or
Har
ipra
sad
Heg
de22
-Apr
-02
40,5
83,3
67B.
Tech
, B.S
c, P
G D
iplo
ma
5836
Saty
am C
ompu
ter
Serv
ices
Lim
ited
Vice
Pre
side
nt
Mur
alid
hara
n S
23-A
pr-1
515
,338
,052
B.Sc
. (En
gine
erin
g) M
echa
nica
l60
33Sc
hnei
der E
lect
ric IT
B
usin
ess
Indi
a Pv
t. Lt
d.Se
nior
Vic
e Pr
esid
ent &
Indi
a B
U H
ead
Nee
raj S
ahde
v24
-Mar
-97
16,9
08,7
26B.
Tech
49
25M
ico
Inds
Sof
twar
eVi
ce -
Pres
iden
t
Sanj
esh
K G
upta
04-D
ec-8
419
,400
,796
Dip
lom
a, A
MIE
(E
lec.
& C
omm
unic
atio
n)56
35Te
levi
sta
Elec
tron
ics
– Co
mpu
ter D
ivis
ion
Vice
Pre
side
nt &
Hea
d -
Gov
t. &
Def
ence
, Ind
ia
Sant
hosh
G N
air
30-A
pr-9
013
,613
,082
B.Te
ch, P
GD
M53
30Fi
rst E
mpl
oym
ent
Vice
Pre
side
nt
Shar
ada
Nan
daku
mar
08-N
ov-1
015
,294
,645
B.Sc
.54
32Am
docs
Vice
Pre
side
nt
Sree
nath
A V
enka
ppia
h29
-Nov
-02
19,8
55,9
86BE
5532
Kshe
ma
Tech
nolo
gies
Vice
Pre
side
nt
Sure
sh K
olat
i15
-Jun
-16
14,3
26,9
05BE
5023
Acce
ntur
eVi
ce P
resi
dent
& G
loba
l Hea
d -
BFS
I Dom
ain
& C
onsu
lting
Vasu
deva
n A
31-M
ar-8
621
,135
,214
B.E.
, M.Te
ch58
34Fi
rst E
mlo
ymen
tVi
ce P
resi
dent
C) E
mpl
oyed
for P
art
of t
he Y
ear w
ith
an a
vera
ge s
alar
y of
` 8
.5 la
khs
or a
bove
per
mon
th a
nd p
oste
d in
Indi
a
Not
es
1.
The
abov
e ta
ble
cont
ains
det
ails
of e
mpl
oyee
s in
alp
habe
tica
l ord
er a
nd d
oes
not
incl
ude
the
deta
ils o
f rem
uner
atio
n dr
awn
by t
he to
p 10
em
ploy
ees
as t
heir
det
ails
ar
e pr
ovid
ed in
item
(A) o
f Ann
exur
e III
to th
is B
oard
’s R
epor
t.
2.
Rem
uner
atio
n co
mpr
ises
sal
ary,
allo
wan
ces,
com
mis
sion
, pe
rfor
man
ce b
ased
pay
men
ts,
perq
uisi
te a
nd C
ompa
ny’s
con
trib
utio
n to
pro
vide
nt f
und
and
supe
r-an
nuat
ion
as p
er th
e de
fini
tion
con
tain
ed in
Sec
tion
2(7
8) o
f the
Com
pani
es A
ct, 2
013
paid
dur
ing
the
year
. It a
lso
incl
udes
per
quis
ites
val
ue o
f Res
tric
ted
Sto
ck U
nits
(R
SU
s) e
xerc
ised
, if a
ny, b
y em
ploy
ees.
3.
Th
e na
ture
of e
mpl
oym
ent i
s co
ntra
ctua
l in
all t
he a
bove
cas
es4.
N
one
of t
he e
mpl
oyee
s ex
cept
Mr.
Azi
m H
. Pre
mji,
Fou
nder
Cha
irm
an, h
olds
2%
or
mor
e of
the
pai
d-up
equ
ity
shar
e ca
pita
l of t
he C
ompa
ny a
s pe
r cl
ause
(iii)
of s
ub-
rule
(2) o
f Rul
e 5
of C
ompa
nies
(App
oint
men
t and
Rem
uner
atio
n of
Man
ager
ial P
erso
nnel
) Rul
es, 2
014.
5.
In t
erm
s of
the
pro
viso
to
Rul
e 5
of t
he C
ompa
nies
(A
ppoi
ntm
ent
and
Rem
uner
atio
n of
Man
ager
ial
Per
sonn
el)
Rul
es, 2
014,
par
ticu
lars
of
empl
oyee
s po
sted
and
w
orki
ng in
a c
ount
ry o
utsi
de In
dia,
not
bei
ng D
irec
tors
or
thei
r re
lati
ves,
hav
e no
t bee
n in
clud
ed in
the
abov
e st
atem
ent.
*
Mr.
Azi
m H
. Pre
mji
reti
red
from
the
posi
tion
of E
xecu
tive
Cha
irm
an a
nd M
anag
ing
Dir
ecto
r wit
h ef
fect
from
Jul
y 30
, 201
9. T
he re
mun
erat
ion
disc
lose
d ab
ove
is fo
r the
pe
riod
from
Apr
il 1,
201
9 to
Jul
y 30
, 201
9. M
r. A
zim
H. P
rem
ji is
the
fath
er o
f Mr.
Ris
had
A. P
rem
ji, C
hair
man
.

Corporate Overview | Management & Board Reports | Financial Statements
Wipro Limited91
Annexure IV
Form No. MR-3
SECRETARIAL AUDIT REPORT[Pursuant to sub-section (1) of Section 204 of the Companies Act, 2013 and Rule 9 of the Companies
(Appointment and Remuneration of Managerial Personnel) Rules, 2014]
FOR THE FINANCIAL YEAR ENDED MARCH 31, 2020
To,The Members,Wipro Limited, Doddakannelli,Sarjapur Road,Bengaluru - 560035
We have conducted the secretarial audit of the compliance of applicable statutory provisions and the adherence to good corporate practices by Wipro Limited (the Company). Secretarial Audit was conducted in a manner that provided us a reasonable basis for evaluating the corporate conducts/statutory compliances and expressing our opinion thereon.
Based on our verification of the Company’s books, papers, minute books, forms and returns filed and other records maintained by the Company and also the information provided by the Company, its officers, agents and authorized representatives during the conduct of secretarial audit, we hereby report that in our opinion, the Company has, during the audit period covering the financial year ended on March 31, 2020 (the audit period) complied with the statutory provisions listed hereunder and also that the Company has proper Board-processes and compliance-mechanism in place to the extent, in the manner and subject to the reporting made hereinafter:
We have examined the books, papers, minute books, forms and returns filed and other records maintained by the Company for the financial year ended on March 31, 2020 according to the provisions of:
i. The Companies Act, 2013 (the Act) and the rules made thereunder;
ii. The Securities Contracts (Regulation) Act, 1956 (‘SCRA’) and the rules made thereunder;
iii. The Depositories Act, 1996 and the Regulations and Bye-laws framed thereunder;
iv. Foreign Exchange Management Act, 1999 and the rules and regulations made thereunder to the extent of Foreign
Direct Investment and Overseas Direct Investment. There was no External Commercial Borrowing by the Company during the period under review;
v. The following Regulations and Guidelines prescribed under the Securities and Exchange Board of India Act, 1992 (‘SEBI Act’): -
a. The Securities and Exchange Board of India (Substantial Acquisition of Shares and Takeovers) Regulations, 2011;
b. The Securities and Exchange Board of India (Prohibition of Insider Trading) Regulations, 2015;
c. The Securities and Exchange Board of India (Issue of Capital and Disclosure Requirements) Regulations, 2018;
d. The Securities and Exchange Board of India (Share Based Employee Benefits) Regulations, 2014;
e. The Securities and Exchange Board of India (Issue and Listing of Debt Securities) Regulations, 2008 (Not Applicable to the Company during the Audit Period);
f. The Securities and Exchange Board of India (Registrars to an Issue and Share Transfer Agents) Regulations, 1993 regarding the Companies Act and dealing with client;
g. The Securities and Exchange Board of India (Delisting of Equity Shares) Regulations, 2009 (Not Applicable to the Company during the Audit Period);
h. The Securities and Exchange Board of India (Buyback of Securities) Regulations, 2018; and
i. Securities and Exchange Board of India (Listing Obligations and Disclosure Requirements) Regulations, 2015.
vi. Other laws applicable specifically to the Company namely:
a. Information Technology Act, 2000 and the rules made thereunder

Annual Report 2019-20 92
b. Special Economic Zones Act, 2005 and the rules made thereunder
c. Software Technology Parks of India rules and regulations
We have also examined compliance with the applicable clauses of the following:
i. Secretarial Standards issued by The Institute of Company Secretaries of India on Meetings of the Board of Directors and General Meetings.
ii. Listing Agreements entered into by the Company with BSE Limited and National Stock Exchange of India Limited.
We have not examined compliance by the Company with applicable financial laws, like direct and indirect tax laws, since the same have been subject to review by statutory financial audit and other designated professionals.
During the period under review, the Company has complied with the provisions of the Act, Rules, Regulations, Guidelines, etc. mentioned above.
We further report that:
The Board of Directors of the Company is duly constituted with proper balance of Executive Directors, Non-Executive Directors and Independent Directors. The changes in the composition of the Board of Directors that took place during the period under review were carried out in compliance with the provisions of the Act.
Adequate notice is given to all directors to schedule the Board Meetings, agenda and detailed notes on agenda were sent at least seven days in advance and a system exists for seeking and obtaining further information and clarifications on the agenda items before the meeting and for meaningful participation at the meeting.
As per the minutes of the meetings duly recorded and signed by the Chairman, the decisions of the Board were unanimous and no dissenting views have been recorded.
We further report that based on the review of the compliance reports/certificates of the Company Secretary which were taken on record by the Board of Directors, there are adequate systems and processes in the Company commensurate
with the size and operations of the Company to monitor and ensure compliance with applicable laws, rules, regulations and guidelines.
We further report that during the audit period, except for the following events, there was no event/action having a major bearing on the Company’s affairs in pursuance of the above referred laws, rules, regulations, guidelines etc.,
a. The Company had bought back 32,30,76,923 (Thirty Two Crores Thirty Lakhs Seventy Six Thousand Nine Hundred and Twenty Three) fully paid up Equity Shares of the Company of Face Value of ` 2/- (Rupees Two Only) each at a price of ` 325/- (Rupees Three Hundred and Twenty-Five Only) per Equity Share on a proportionate basis through the tender offer process.
b. Mr. Azim H. Premji (DIN: 00234280) Chairman and Managing Director of the Company, whose period of office was liable to expire on July 30, 2019 was re-appointed and designated as Non-Executive, Non-Independent Director of the Company for a period of five years with effect from July 31, 2019.
c. Mr. Rishad A. Premji (DIN: 02983899) Whole Time Director (designated as Executive Director and Chief Strategy Officer) of the Company whose period of office was liable to expire on April 30, 2020 was re-appointed as Whole Time Director (designated as “Executive Chairman”) of the Company for a period of five years with effect from July 31, 2019.
d. Mr. Abidali Z. Neemuchwala (DIN: 02478060) Whole Time Director who was earlier designated as Chief Executive Officer and Executive Director was designated as Chief Executive Officer and Managing Director of the Company with effect from July 31, 2019.
For V. SREEDHARAN & ASSOCIATESCompany Secretaries
(V. Sreedharan)Partner
FCS: 2347; CP No. 833UDIN No. : F002347B000296168
BengaluruMay 29, 2020
This report is to be read with our letter of even date which is annexed as ‘Annexure-1’ and forms an integral part of this report.

Corporate Overview | Management & Board Reports | Financial Statements
Wipro Limited93
To,The MembersWipro Limited, Doddakannelli,Sarjapur Road,Bengaluru - 560035
Our report of even date is to be read along with this letter:
1. Maintenance of secretarial record is the responsibility of the management of the company. Our responsibility is to express an opinion on these secretarial records based on our audit.
2. We have followed the audit practices and processes as were appropriate to obtain reasonable assurance about the correctness of the contents of the Secretarial records. The verification was done on test basis to ensure that correct facts are reflected in secretarial records. We believe that the processes and practices, we followed provide a reasonable basis for our opinion.
3. We have not verified the correctness and appropriateness of financial records and Books of Accounts of the company.
4. Wherever required, we have obtained the Management representation about the compliance of laws, rules and regulations and happening of events etc.
5. The compliance of the provisions of Corporate and other applicable laws, rules, regulations, standards is the responsibility of management. Our examination was limited to the verification of procedures on test basis.
6. The Secretarial Audit report is neither an assurance as to the future viability of the company nor of the efficacy or effectiveness with which the management has conducted the affairs of the company.
For V. SREEDHARAN & ASSOCIATESCompany Secretaries
(V. Sreedharan)Partner
FCS: 2347; CP No. 833
BengaluruMay 29, 2020
Annexure -1

Annual Report 2019-20 94
Corporate Social Responsibility Report for the financial year 2019-20
We present our report on Wipro’s Corporate Social Responsibility (CSR) for the financial year 2019-20. The values of ‘Spirit of Wipro’ guide all our actions. Our values ‘Being passionate about clients’ success’, ‘Being global and responsible’, ‘Treating each person with respect’, and ‘Unyielding integrity in everything we do’ are the primary drivers of the letter and spirit of being a responsible business.
Our goals are centered around (i) making Wipro more sustainable as defined by the triple bottom-line framework and (ii) contributing to a more just, inclusive and sustainable society through our work in Education, Ecology, Primary Health Care and Disaster Response.
Our areas of work span a wide range- Energy and Climate Change, Water, Solid Waste, Biodiversity, Urban Ecology and Public Spaces, issues of Quality, Access and Inclusion in Education, Sustainability in Education and Access to Primary Health Care for the disadvantaged sections. Our approach emphasizes depth and a systemic, long term view that informs the way we choose our areas of work, the partners we collaborate with and the bedrock of ethics and good governance that underlies all our programs. Collectively, these initiatives help in enhancing social and natural capital while our workplace culture of diversity, inclusion and employee empowerment strengthen human capital. Value is created when all these capitals reinforce each other.
During the reporting year, we made significant progress on our goals through our extensive network of nearly 200 civil
society and academic partner organizations across India and the overseas geographies where we have presence- US, UK, Europe, LATAM and APAC. A detailed articulation of our programs is available in the MD&A Report forming part of this Annual Report. The articulation is aligned with the integrated multiple capitals approach and covers salient facts, metrics and narratives on our goals, programs, outcomes and governance.
Towards the end of the financial year, the whole world came face to face with the COVID-19 crisis, an unprecedented challenge for humanity. The multi-dimensional nature of the crisis- healthcare, humanitarian, economic and social- poses a particularly daunting challenge. At Wipro, we have made a commitment of ` 100 crores for FY21 towards our COVID-19 response. In combination with the commitments of Azim Premji Foundation (` 1,000 Cr) and Wipro Enterprises Private Limited (` 25 Cr), we are weaving together an integrated response that addresses the different facets of the problem in a holistic manner. We recognize that the COVID-19 crisis is going to be with us for some time and therefore, our commitment is not just for immediate short-term relief but designed for impact over the medium and long term as well. Lastly, we would like to highlight that our COVID-19 financial commitment is in addition to our regular CSR work that we will continue to strengthen and focus on in the coming year.
Summary of CSR spend for financial year 2019-20 is provided in the following pages.
Annexure V

Corporate Overview | Management & Board Reports | Financial Statements
Wipro Limited95
Summary of Corporate Social Responsibility (CSR) spend for the financial year 2019-20
1. A brief outline of the Company’s CSR policy, including overview of the projects or programs proposed to be undertaken is available at www.wipro.com.
2. The Composition of the CSR Committee: The terms of reference of CSR broadly comprises and forms part of Board Governance, Nomination and Compensation Committee and these terms of reference are in accordance with Section 135 of the Companies Act, 2013. The Committee comprises of Mr. William Arthur Owens, Mrs. Ireena Vittal and Mr. M. K. Sharma, Independent Directors.
3. Average Net Profit of the Company for the last three financial years: ` 83,442 million
4. Prescribed CSR Expenditure (two percent of the amount as in the point 3 above): 2% of the average PBT for the last three preceding financial years amounts to `1,669 million. Against this, our CSR spending for 2019-20 was ` 1,818 million.
5. Details of the CSR Spent during the financial year:
a) Total amount to be spent for the financial year: ` 1,669 million
b) Amount unspent: Not Applicable
c) Manner in which the amount is spent during the financial year is detailed below.
6. The following table provides a summary of the domain wise expenditure on CSR for the financial year 2019-20 along with the geographies. The list of partners with whom we collaborate is available after the table.
7. In the column ‘Cumulative expenditure till reporting period’, we have chosen to take 2014-15 as the base year. It is however not to be interpreted that this is the first year of our CSR programs. Many of our programs go back more than 10 years and some more than 15 years. Given the practical challenges in reporting the cumulative expenditure from inception, we have chosen to start with 2014-15 as the base year.
8. All our programs are executed and implemented through our partners. The figures under the last column therefore are entirely through our partners.
(` in Million)
Sl. No. CSR project or activity identifiedSector in which
the project is covered
Projects or Programs 1) Local area or other 2) specify the state and district where the project or
programs are undertaken
Amount Outlay
(Budget) Project or Program
Wise
Amount spent on the
Projects or Programs
Cumulative expenditure
up to Previous reporting
period
Cumulative expenditure
up to reporting
period
Amount spent: direct or through
implementing agency
1 Providing preventive and curative health services with specific focus on malnutrition and infant mortality rate
Community Healthcare
Tuensang (Nagaland), Mumbai, Pune (Maharashtra), Mysore (Karnataka), Gurugram, Delhi (NCR), Kolkata (West Bengal)
15 12 35 47 12
2 Education for Underprivileged in proximate communities
Education for Underprivileged
Mumbai, Pune (Maharashtra), Bangalore (Karnataka), Hyderabad (Telangana), Kolkata (West Bengal), New Delhi, Dimapur (Nagaland), Tawang (Arunachal Pradesh), Chennai, Coimbatore (Tamil Nadu)
70 15 116 130 15
Systemic reform initiatives in school education in India, in the areas of ecology, social science, languages and affective education, material development, public advocacy, assessment reform, teacher capacity building, strengthening the school system through community and systemic engagement
Education: Systemic Reforms
Ahmedabad (Gujarat), Akola (Maharashtra), Aligarh (UP), Alipurduar (West Bengal), Ambala (Haryana), Andaman and Nicobar Islands, Ayodhya (UP), Baghpat (UP), Banda (UP), Bangalore (Karnataka), Bantahazam (Jharkhand), Bhopal (Madhya Pradesh), Bhubaneshwar (Odisha), Champawat (Uttarakhand), Chennai (Tamil Nadu), Chhindwara (Madhya Pradesh), Dantewada (Chattisgarh), Delhi), Dewas (Madhya Pradesh), Goa), Gopalganj (Bihar), Guwahati (Assam), Harda (Madhya Pradesh), Haveri (Karnataka), Hyderabad (Telangana), Indore (Madhya Pradesh), Jaipur (Rajasthan), Jalgaon (Maharashtra), Jalpaiguri (West Bengal), Jamui and Munger( Bihar), Karnal (Haryana), Kerala), Khandwa (Madhya Pradesh), Kiphire (Nagaland), Kolhapur (Maharashtra), Kolkata (West Bengal), Koppal (Karnataka), Lucknow (UP), Majuli (Assam), Mewat (Haryana), Mumbai (Maharashtra), NCR), Palampur (Himachal Pradesh), Rayagada (Odisha), Rudraprayag (Uttarakhand), Saharsa (Bihar), Samalkha (Haryana), Sambalpur (Odisha), Seoni (Madhya Pradesh), Sirohi (Rajasthan), Sonbhadra (UP), Sonepur (Odisha), South 24 Parganas (West Bengal), Spiti (Himachal Pradesh), Sukma (Chattisgarh), Sundergarh (Odisha), Ukhrul (Manipur)
90 85 382 467 85

Annual Report 2019-20 96
Sl. No. CSR project or activity identifiedSector in which
the project is covered
Projects or Programs 1) Local area or other 2) specify the state and district where the project or
programs are undertaken
Amount Outlay
(Budget) Project or Program
Wise
Amount spent on the
Projects or Programs
Cumulative expenditure
up to Previous reporting
period
Cumulative expenditure
up to reporting
period
Amount spent: direct or through
implementing agency
Initiatives in Education of children with Disability
Education for Children with
Disability
Delhi (Delhi), Hyderabad (Telangana), Jaipur (Rajasthan), Mumbai, Pune (Maharashtra), Bangalore, Hubli-Dharwad and Koppal (Karnataka)
17 17 110 127 17
Initiatives in sustainability education in schools and colleges across India
Sustainability Education
79 districts in 29 states and 3 Union Territories of India
35 32 138 170 32
Program of higher education in engineering and technology linked to skills development for the IT industry
Higher Education for skills building Bangalore (Karnataka)
1,000 1,167 5,136 6,303 1,167
Initiatives in improving education in engineering colleges in India
Engineering Education
All parts of India 10 5 18 23 5
3 Ensuring environmental sustainability, ecological balance
Water Bangalore (Karnataka), Pune (Maharashtra) 7 5 25 30 5
Biodiversity Bangalore (Karnataka), Pune (Maharashtra) 2 1 30 32 1
Energy Bangalore (Karnataka), Pune (Maharashtra), Hyderabad (Telangana), Chennai (Tamil Nadu)
500 444 2,342 2,786 444
Waste Management
Bangalore, Mysore (Karnataka) 2 2 9 12 2
Sustainability Advocacy and
Research
Bangalore (Karnataka), Balashore (Odisha),Bhubaneshwar (Odisha), Chennai (Tamil Nadu), New Delhi(NCR), Hyderabad(Telangana), Pune(Maharashtra), Chikmagalur (Karnataka), Guwahati (Assam), Kurnool (Kerala), Koraput (Odisha).
20 17 89 105 17
4 Rural Development projects Rural livelihood programs
Cuddalore, Coimbatore (Tamil Nadu), Ernakulam, Alappuzha (Kerala), Puri (Odisha)
8 7 21 28 7
5 Providing humanitarian aid and preventive health care and sanitation
Disaster relief Delhi (NCR), Bangalore (Karnataka) 14 9 - 9 9
Total 1,790 1,818 8,451 10,269 1,818
Note: List of implementing partners is provided below.
9. A responsibility statement of the CSR Committee that the implementation and monitoring of CSR Policy is in compliance with CSR objectives and policy of the Company: Yes, it is in compliance with CSR Policy and Objectives of the Company.
Sd/- Sd/- Rishad A. Premji William Arthur Owens (Chairman) (Chairman of Board Governance, Nomination and Compensation Committee)

Corporate Overview | Management & Board Reports | Financial Statements
Wipro Limited97
Sl. No.
Name of the Organization Location
1 ASHA Community Health and Development Society Delhi
2 Foundation for Mother and Child Health (FMCH) Mumbai 3 Kottapuram Integrated Development Society (KIDS) Ernakulam, Kerala4 Late Vaibhav Phalanikar Memorial Foundation (LVMF) Pune, Maharashtra5 Legal Aid to Women (LAW) Trust Cuddalore, Tamil Nadu6 Niramaya Health Foundation Mumbai, Maharashtra7 Rehoboth Sustainable Development Foundation Coimbatore, Tamil Nadu8 Rural Literacy and Health Programme (RLHP) Mysore, Karnataka9 Sabuj Sangha Kolkatta, West Bengal
10 SNEH Foundation Pune, Maharashtra11 Sukarya Gurugram, Haryana12 The Eleutheros Christian Society (ECS) Tuensang, Nagaland13 The Evangelical Fellowship of India (EFICOR) Alappuzha, Puri, Kerala, Odisha
14 Hasiru Dala Bengaluru Urban, Mysuru, Karnataka
15 C P Ramaswamy Environmental Education Centre (CPREEC)
Chennai, Tamil Nadu
16 Central Himalayan Institute for Nature and Applied Research (CHINAR)
Dehradun, Uttarakhand
17 Centre for Environment Education (CEE) Ahmedabad, Gujarat18 CEPT Research and Development Foundation (CRDF) Ahmedabad, Gujarat19 Green Future Foundation Delhi20 Himalayan Yeti Foundation Leh, Ladakh21 IIM Ahmedabad Ahmedabad, Gujarat22 IIM Bangalore Bangalore Urban, Karnataka23 Institute of Chemical Technology Mumbai, Maharashtra24 North East Network Guwahati, Assam25 Samavesh Society For Development and Governance Bhopal, Madhya Pradesh26 Vayam Jawhar, Maharashtra27 Wild Ecologues Gurugram, Haryana28 Xavier University Bhubaneshwar (XUB) Bhubaneshwar, Orissa29 ACWADAM Pune, Maharashtra30 Art of Waste Management Kadur, Chikkamagaluru,
Karnataka31 Bhujal Abhiyan Trust Pune, Maharashtra32 Biome Environmental Trust Bengaluru Urban, Karnataka33 Cotton University Guwahati, Assam34 Hyderabad Urban Lab Foundation Hyderabad, Telangana35 India Foundation for Humanistic Development Bengaluru Urban, Karnataka36 National Center for Biological Sciences Bengaluru Urban, Karnataka37 Nature Forever Society Nashik, Maharashtra38 Puttenahalli Neighbourhood Lake Improvement Trust Bengaluru Urban, Karnataka39 Svapnya Foundation Bengaluru Urban, Karnataka40 Ujwal Trust Bengaluru Urban, Karnataka41 Yelahanka Puttenahalli Lake and Bird conservation
TrustBengaluru Urban, Karnataka
42 Yuva Vikas Foundation Balasore, Odisha43 Aawaj Jan Kalyan Samiti Aishbaug, Bhopal, Madhya
Pradesh44 Agragamee Kashipur, Rayagada, Odisha45 Alternative Strategies for the Handicapped (ASTHA) Delhi, New Delhi46 Army Navy Airforce Wives Activity Trust (ANAWA) Gautam Buddh Nagar, Noida,
Uttar Pradesh47 Art Sparks Foundation Bangalore, Karnataka48 Aseema Charitable Trust Mumbai, Maharashtra49 ASHA Foundation Bangalore, Karnataka50 Ashray Akruti Hyderabad, Telangana51 Association for the Welfare of Persons with a Mental
Handicap in Maharashtra (AWMH)Mumbai, Maharashtra
52 Bookworm Trust & Library Panaji, Goa53 CARMDAKSH (Centre for Action Research &
Management in Developing Attitudes, Knowledge, Skills in Human Resources)
Korba, Chhattisgarh
Sl. No.
Name of the Organization Location
54 Chale Chalo Sundergarh, Odisha55 Cohesion Foundation Trust Kutch, Gujarat56 Community Educational Centre Society (CECS) Dimapur, Nagaland57 Digantar Shiksha Evam Khelkhud Samiti Jaipur, Rajasthan58 Dnyangangotri Pratishthan Pune, Maharashtra59 Dooars Jagron Banarhat, Jalpaiguri, West
Bengal60 Fourth Wave Foundation (FWF) Dharwad, Koppal, Karnataka61 Gubbachi Learning Community Bangalore, Karnataka62 Innovation and Science Promotion Foundation (ISPF) Bangalore, Karnataka63 Jan Sahas Social Development Society Dewas, Ujjain, Madhya
Pradesh64 Jhamtse Gatsal Children’s Community Lumla Tawang, Arunachal
Pradesh65 Jodo Gyan Educational Services New Delhi66 Joy of Learning Foundation (JLF) Delhi-NCR67 Kalvi Thunai Coimbatore, Tamil Nadu68 Karmakshetra Educational Foundation (Darpana) Ahmedabad, Gujarat69 Maarga Bangalore, Karnataka70 Makkala Jagriti Bangalore, Karnataka71 Muskaan Bhopal, Madhya Pradesh72 Nagaland Centre for Human Development &
Information Technology (NCHD-IT)Kiphire, Nagaland
73 National Association for the Blind (NAB) Delhi-NCR74 National Centre for Promotion of Employment for
Disabled People (NCPEDP)New Delhi
75 NFBM Jagriti School for Blind Girls Pune, Maharashtra76 Olcott Education Society Chennai, Tamil Nadu77 Pararth Samiti Tamia, Chhindwara, Madhya
Pradesh78 Patang Sambalpur, Bargarh, Odisha79 Prayas Society Jaipur, Rajasthan80 Roshni Social Action Centre Hangal, Karnataka81 Rural Aid Kalchini82 Sahasra Deepika International for Education (SDIE) Bangalore, Karnataka83 Samerth Charitable Trust Juhapura, vejalpur,
Ahmedabad, Gujarat84 Samridhdhi Trust Bangalore, Karnataka85 School Education trust for the Disadvantaged (SETD) Aligarh, Uttar Pradesh86 Shaheed Virender Smarak Samiti (SVSS) Samalkha, Haryana87 Shri Sadguru Saibaba Seva Trust Pune, Maharashtra88 Society of Parents of Children with Autistic Disorders
(SOPAN)Mumbai, Maharashtra
89 Society of the Daughters of St.Camillus (Swanthana) Bangalore, Karnataka90 Space for Nurturing Creativity (SNC) Kedarnath valley, Rudraprayag,
Uttarakhand91 Sugra Humayun Mirza Wakf Hyderabad, Telangana92 Swadhar IDWC Pune, Maharashtra93 Synergy Sansthan Harda, Madhya Pradesh94 The Ferdinand Centre for Education (TFC) New Delhi95 The Institution of Social Studies Trust (ISST) New Delhi96 The Society for Door Step School (DSS) Pune, Maharashtra97 Towards Future Kolkata, West Bengal98 Unnati Institute for Social and Educational Change Akola, Maharashtra99 Urmi Foundation Mumbai, Maharashtra
100 Vanangana Banda , Uttar Pradesh101 Vidya Mytri Trust Koppal, Karnataka102 Vikramshila Education Resource Society Kolkata, West Bengal103 Aavishkaar Yaatraa Palampur, Kangra, Himachal
Pradesh104 Antral Ranchi, Jharkhand105 Ayang Trust Majuli, Assam106 Dakshin Foundation Andamans, Andaman&Nicobar
Islands107 Nature Conservation Foundation (NCF) Bangalore Urban, Karnataka108 Teach for Green New Delhi
A. Organizations funded through direct grants

Annual Report 2019-20 98
B. Organizations funded through seeding fellowshipsSl
No.Name of the Organization Location
1 Humane Koraput, Odisha
2 In Season Fish Chennai, Tamil Nadu
3 VIVASWA Kurnool, Andhra Pradesh
4 Adhvan Mumbai, Maharashtra
5 Agrini Samaj Kalyan Samiti Seoni, Madhya Pradesh
6 Amma Social Welfare Association (ASWA) Shadnagar, Telangana
7 Antraal Theatre New Delhi
8 Art of Play Foundation North Delhi, East Delhi, South Delhi (New Delhi), Faridabad (Haryana), Jhunjhunu (Rajasthan), Solan (Himachal Pradesh)
9 Awadh Peoples Forum Faizabad, New Delhi, Uttar Pradesh
10 Barefoot Edu Foundation Mumbai, Maharashtra
11 Better Education Lifestyle and Environment Foundation (BELIEF)
Pune, Maharashtra
12 Gramothhan Sonepur, Odisha
13 Had Anhad Indore, Madhya Pradesh
14 Happy Horizons Trust Saharsa, Bihar
15 Inquilab Inventions Foundation Hyderabad, Telangana
16 I-Saksham Jamui, Bihar
17 Kanavu Cuddalore, Tamil Nadu
18 Key Education Foundation Bangalore, Karnataka
19 Khel Khel Mein Foundation Delhi-NCR
20 Kshamtalaya East Delhi (New Delhi), Udaipur (Rajasthan)
21 Let’s Educate Children in Need (LECIN) South Delhi, Delhi
22 Lets Open a Book Spiti valley, Lahaul and Spiti, Himachal Pradesh
23 Library for All Ukhrul, Imphal, Manipur
24 Loop Education Foundation Hyderabad, Telangana
25 Manzil Mystics South Delhi, New Delhi
26 Mil Ke Chalo Association Amalner, Maharashtra
27 Mobile Pathshala in Sunderbans Kumirmari 24, South Paraganas,
28 Musht Khandwa, Madhya Pradesh
29 North East Education Trust Guwahati, Assam
30 Pi Jam Foundation Pune, Maharashtra
31 Pratyaya EduResearch Lab Pandhurna, Chhindwara, Madhya Pradesh
32 Professionals Alliance for Youths Growth (PRAYOG) Gopalganj, Bihar
33 Recognize, Rise and Empower Association (RREA) Kamjong, Manipur
34 Sahodaya Trust Kohabari, Gaya, Bihar
35 Sajag Mumbai, Maharashtra
36 Samait Shala Ahmedabad, Gujarat
37 Sanjhi Sikhiya Fatehgarh Sahib, Punjab
38 School Social Science Initiative Bhubaneswar, Odisha
39 Self Reliant India (SRI) Rewari, Haryana
40 Shiksharth Trust Sukma, Chhattisgarh
41 Simple Education Foundation South Delhi (Delhi), Tehri Garhwal (Uttarakhand)
42 Sinchan Chakai, Jamui, Bihar
Sl No.
Name of the Organization Location
43 SwaTaleem Foundation Mewat, Haryana
44 Swatantra Talim Lucknow, Sitapur, Uttar Pradesh
45 Tarkeybein Baghpat, Uttar Pradesh
46 Thrive Foundation Chennai, Tamil Nadu
47 Umoya Sports New Delhi, Gurgaon, Haryana
48 Universe Simplified Foundation Mumbai, Maharashtra
49 Upkram Sonbhadra, Uttar Pradesh
50 Vardishnu Amalner, Maharashtra
51 Varitra Foundation Karnal, Haryana
52 Vidhya Vidhai Foundation Chennai, Tamil Nadu
53 Vidyodaya Kolhapur, Maharashtra
54 Virasat-E-Hind Bhubaneswar, Odisha
55 Vision Empower Bangalore , Ramngagara, Mysuru, Davangare, Shivamogga, Kalaburagi, Chikmaglur, Karnataka
56 We, The People Abhiyan New Delhi, Gurgaon (Haryana)
C. Program support partners (not funded through grants)
Sl No.
Name of the Organization Location
1 Arunachal State Council for Science & Technology Itanagar, Arunachal Pradesh
2 Assam State Council for Science & Technology Guwahati, Assam
3 Delhi State Environment Education Department Delhi
4 Himachal State Council for Science & Technology Simla, Himachal Pradesh
5Madhya Pradesh Environmental Planning and Coordination Organization
Bhopal, Madhya Pradesh
6 Meghalaya State Council for Science & Technology Shillong, Meghalaya
7 Mizoram State Council for Science & Technology Aizawl, Mizoram
8 Nagaland State Council for Science & Technology Kohima, Nagaland
9 Sikkim ENVIS and Forest Department Gangtok, Sikkim
10 Tripura State Council for Science & Technology Agartala, Tripura
11 Carbon Disclosure Project India (CDP) Delhi
12Center for Study of Science, Technology and Policy (CSTEP)
Bangalore Urban, Karnataka
13Small-Scale Sustainable Infrastructure Development Fund (S3IDF)
Bangalore Urban, Karnataka
14 World Resources Institute (WRI) Mumbai, Maharashtra
15 Goa Institute of ManagementSanquelim, North Goa district, Goa
16 IIM Kozhikode Kozhikode, Kerala
17 NIT Trichy Trichy, Tamil Nadu
18 TERI School of Advanced Studies Delhi
19 Confederation of Indian Industry (CII) Delhi
20 Government of Karnataka Bengaluru Urban, Karnataka
21 Eklavya Foundation Bhopal, Madhya Pradesh
22 Takshila Educational Society Bhopal, Madhya Pradesh
23 Teacher Plus Hyderabad, Telangana

Corporate Overview | Management & Board Reports | Financial Statements
Wipro Limited99
Annexure VIForm No. MGT-9
EXTRACT OF ANNUAL RETURN as on the financial year ended March 31, 2020
[Pursuant to Section 92(3) of the Companies Act, 2013 and Rule12(1) of the Companies (Management and Administration) Rules, 2014]
I. REGISTRATION AND OTHER DETAILS:
i CIN L32102KA1945PLC020800ii Registration Date December 29, 1945iii Name of the Company Wipro Limitediv Category/Sub-Category of the Company Public Limited Company - Limited by Shares, Indian Non-Government Companyv Address of the Registered office and
contact detailsWipro Limited, Doddakannelli, Sarjapur Road, Bengaluru – 560 035 Ph: 080-28440011, Fax: 080-28440054 Website: www.wipro.com Email: [email protected]
vi Whether listed company Yesvii Name, Address and Contact details of
Registrar and Transfer Agent, if anyKFin Technologies Private Limited, Selenium Tower B, Plot 31-32, Gachibowli, Financial District, Nanakramguda, Hyderabad – 500 032 Contact Person: Mr. B Srinivas, Manager Tel: 040-67162222 Fax: 040-2300 1153 Email: [email protected]
II. PRINCIPAL BUSINESS ACTIVITIES OF THE COMPANY
All the business activities contributing 10% or more of the total turnover of the company shall be stated:-
Sl.No Name and Description of main Products/Services NIC Code of the Product/Service
% to total turnover of the
company
1 IT Software, Services and related activities 62013 62020 100%
III. PARTICULARS OF HOLDING, SUBSIDIARY AND ASSOCIATE COMPANIES
Sl. No.
Name of the Company
Address of the Company
CIN/GLN Holding/ Subsidiary/ Associate
% of shares
held
Applicable Section
1 Wipro, LLC 2 Tower Center Blvd, Suite 2200, East Brunswick, NJ 08816, USA
N/A Subsidiary 100 2(87)
2 Wipro Gallagher Solutions, LLC 18001, Old Cutler Road, Suite 651, Palmetto Bay, Florida 33157, USA
N/A Subsidiary 100 2(87)
3 Opus Capital Market Consultants, LLC
100 Tri State International, Ste, 300A Lincolnshire, IL 60069, USA
N/A Subsidiary 100 2(87)
4 Wipro Promax Analytics Solutions, LLC
2 Tower Center Blvd, Suite 2200, East Brunswick, NJ 08816, USA
N/A Subsidiary 100 2(87)
5 Wipro Insurance Solutions, LLC 1209, Orange St, Wilmington, New Castle Country-19801, USA
N/A Subsidiary 100 2(87)
6 Wipro IT Services, LLC 251, Little Falls Drive, Wilmington 19808 N/A Subsidiary 100 2(87)
7 Wipro Solutions Canada Limited
1 First Canadian Place, 100 King Street West, Suite 6000, Toronto Ontario M5X 1E2
N/A Subsidiary 100 2(87)

Annual Report 2019-20 100
Sl. No.
Name of the Company
Address of the Company
CIN/GLN Holding/ Subsidiary/ Associate
% of shares
held
Applicable Section
8 Wipro Japan KK 2-2-1, Minato-Mirai, Nishi-ku, Yokohama N/A Subsidiary 100 2(87)
9 Wipro Shanghai Limited Room 156, 1st Floor, Changxing Building, NO.888 Bibo Road, Pudong District, Shanghai
N/A Subsidiary 100 2(87)
10 Wipro Information Technology Netherlands BV
Hoogoorddreef 15, 1101BA Amsterdam, The Netherlands
N/A Subsidiary 100 2(87)
11 Wipro Chengdu Limited Room 205#-209#, 304#-308, Floor2-3 of northern part of Building D2, Tianfu Software Park, No. 599, South Shi Ji Cheng Road, Chengdu High-tech District, Sichuan
N/A Subsidiary 100 2(87)
12 Wipro (Thailand) Co. Limited 152, Chartered Square Building, Unit 17-02B, North Sathorn Road, Kwaeng Silom, Khet Bangrak, Bangkok, Thailand
N/A Subsidiary 100 2(87)
13 Wipro Technologies Limited 127473, Moscow city, Krasnoproletarskaya street, dom 16, building 1, pom I et 4 ko 3 (part), Russia
N/A Subsidiary 100 2(87)
14 Wipro Technologies Australia Pty Ltd.
1198 Toorak Road, Camberwell VIC 3124, Australia N/A Subsidiary 100 2(87)
15 PT WT Indonesia Menara BCA 50th Floor, Jl. M.H Thamrin No. 1, Jakarta Pusat, Indonesia
N/A Subsidiary 100 2(87)
16 Wipro Travel Services Limited Sarjapur Road, Doddakannelli, Bengaluru - 560035, India
U91200KA1996PLC020622 Subsidiary 100 2(87)
17 Wipro Trademarks Holding Limited
Sarjapur Road, Doddakannelli, Bengaluru - 560035, India
U93090KA1982PLC021795 Subsidiary 100 2(87)
18 Wipro Networks Pte Limited 31 Cantonment Road, Singapore 089747 N/A Subsidiary 100 2(87)
19 Wipro Technologies SDN BHD Suite 702, 7th Floor, Wisma Hangsam, Jalan Hang Lekir, 50000 Kuala Lumpur, Malaysia
N/A Subsidiary 100 2(87)
20 Wipro Philippines, Inc. Cebu IT Tower 1, Lot 7 corner Archbishop Reyes and Mindanao St. Cebu Business Park, Cebu City, Phillippines
N/A Subsidiary 100 2(87)
21 Wipro Information Technology Kazakhstan LLP
7, Azattyk Ave., Atyrau city, Kazakhstan N/A Subsidiary 100 2(87)
22 Wipro IT Services Ukraine, LLC Shovkovychna street, 42-44, office 317, Kyiv, Ukraine, 01601
N/A Subsidiary 100 2(87)
23 Wipro Arabia Co. Limited P.O. Box 31349, Jarir Complex, Al Khobar 31952, Kingdom of Saudi Arabia
N/A Subsidiary 100 2(87)
24 Women’s Business Park Technologies Limited
PO Box 47033, Riyadh 11552, Kingdom of Saudi Arabia
N/A Subsidiary 100 2(87)
25 Wipro Information Technology Egypt SAE(a)
B-124, Smart Village, Cairo-Alex Desert Road, Giza, Egypt
N/A Subsidiary 100 2(87)
26 Wipro Bahrain Limited Co. S.P.C Seef Business Centre Building, #2795 5th Floor, # 510 Road 2835 , Kingdom of Bahrain
N/A Subsidiary 100 2(87)
27 Wipro Gulf LLC P.O.Box 137, Postal Code 112,Sultanate of Oman N/A Subsidiary 100 2(87)
28 Wipro Doha LLC Servcorp, Level 22, Tomado Tower, West Bay, Doha N/A Subsidiary 100 2(87)
29 Rainbow Software LLC D603, St.14, Building 43, Al Mansour, Baghdad, Iraq N/A Subsidiary 100 2(87)
30 Wipro Technologies SA DE CV Avenida Insurgentes Sur 1271, piso 11, Col. Extremadura Insurgentes, Alc. Benito Juárez, Ciudad de México, Mexico C.P. 03740
N/A Subsidiary 100 2(87)
31 Wipro Do BrasilTechnologia LTDA
João Marchesini street, No. 139 - 5th and 6th floor Post Code: 80215-432 Curitiba/Parana – Brazil
N/A Subsidiary 100 2(87)

Corporate Overview | Management & Board Reports | Financial Statements
Wipro Limited101
Sl. No.
Name of the Company
Address of the Company
CIN/GLN Holding/ Subsidiary/ Associate
% of shares
held
Applicable Section
32 Wipro Do BrasilSistemetas De Informatica Ltd
Av.Maria Coelho Aguiar,215 – Bloco B– 6º. Andar – Jd. São LuisSão Paulo – SP zip code: 05804-900, Brazil
N/A Subsidiary 100 2(87)
33 Wipro Technologies SA Carlos Pellegrini 581/589, 7th Floor, C1009ABK Buenos Aires, Argentina
N/A Subsidiary 100 2(87)
34 Wipro Technologies Peru SAC Av. La Floresta 497, fifth floor, district of San Borja, province and department of Lima.
N/A Subsidiary 100 2(87)
35 Wipro do BrasilServicos de Tecnologia S.A
Dr .Yajiro Takaoka 4.348, 8th floor, Room 809, Alphaville, CEP 06541-038, City of Santana do Parniba, Sao Paulo, Brazil
N/A Subsidiary 100 2(87)
36 Wipro Technologies Vz, C.A Av. Blandin, Edif Corp Banca, Piso 1, Urb. La Castellana, Municipio Chacao, Estado Miranda, Caracas, Venezuela, zona postal 1060
N/A Subsidiary 100 2(87)
37 Wipro Technologies W.T Sociedad Anonima
Los Yoses, Avenida 10, calle 37 bis, Central Law Building, San José, Costa Rica
N/A Subsidiary 100 2(87)
38 Wipro Technologies Chile SPA IsidoraGoyenechea 3000 of 1701, Las Condes Santiago, Chile.
N/A Subsidiary 100 2(87)
39 Wipro Poland SP Z.O.O Al.Jerozolimskie 123a, 02-017 Warszawa, Poland N/A Subsidiary 100 2(87)
40 Wipro IT Services Poland SP Z.O.O
Al.Jerozolimskie 123a, 02-017 Warszawa, Poland N/A Subsidiary 100 2(87)
41 Wipro Portugal SA Rua Eng. Frederico Ulrich, 2650, 4470-605 Moreira, parish of Moreira, municipality of Maia, Portugal
N/A Subsidiary 100 2(87)
42 Wipro Technologies SRL 169A, Floreasca Business Park,Calea Floreasca, Sector 1, 014459, Bucharest
N/A Subsidiary 100 2(87)
43 Wipro Technologies GmbH Hamburger Allee 2-4 (West Gate), 60486 Frankfurt am Main, Germany
N/A Subsidiary 100 2(87)
44 Cellent GmbH Ringtrabe, 70, 70736 Fellbach, Germany N/A Subsidiary 100 2(87)
45 Cellent GmbH Lassallestraße 7b,1020 Vienna, Austria N/A Subsidiary 100 2(87)
46 Designit A/S Bygmestervej 61, 2400 Copenhagen NV, Denmark N/A Subsidiary 100 2(87)
47 Designit Denmark A/S Bygmestervej 61, 2400 Copenhagen NV, Denmark N/A Subsidiary 100 2(87)
48 Designit Germany GmbH Gabrielenstrasse 9, 80636 Munich N/A Subsidiary 100 2(87)
49 Designit Spain Digital S.L Calle Joaquin Maria Lopez, Num. 8 Bis, Planta Bj, 28015 Madrid
N/A Subsidiary 100 2(87)
50 Designit Colombia S A S Carrera 48 20 114 Centro Empresarial Ciudad del Rio, Torre 2, Oficina 0921, Medellín, Colombia
N/A Subsidiary 100 2(87)
51 Designit Peru SAC Av. Alberto del Campo 409, Oficina 503 Distrito Magdalena del Mar, Lima, Peru
N/A Subsidiary 100 2(87)
52 Designit Oslo A/S Akkersbakken 12, 0172 Oslo, Norway N/A Subsidiary 100 2(87)
53 Designit Sweden AB Gustavslundsvägen 143, 167 51, Bromma, Sweden N/A Subsidiary 100 2(87)
54 Designit T.L.V Limited 18 Raoul Wallenberg Street, Tel Aviv, Israel N/A Subsidiary 100 2(87)
55 Designit Tokyo Co., Limited The Park Rex KoamichoBldg 8F, 11-8 KoamichoNihombashi Chuo-ku Tokyo 103-0016
N/A Subsidiary 100 2(87)
56 Wipro IT Services SE (Formerly known as Wipro Cyprus SE)
Kings Court, 185 Kings Road, Reading, Berkshire, RG1 4EX, United Kingdom
N/A Subsidiary 100 2(87)

Annual Report 2019-20 102
Sl. No.
Name of the Company
Address of the Company
CIN/GLN Holding/ Subsidiary/ Associate
% of shares
held
Applicable Section
57 Wipro Holdings Hungary KorlátoltFelelősségűTársaság
1143 Budapest, Stefániaút 101-103, Hungary N/A Subsidiary 100 2(87)
58 Wipro Holdings Investment KorlátoltFelelősségűTársaság
1143 Budapest, Stefániaút 101-103, Hungary N/A Subsidiary 100 2(87)
59 Wipro Outsourcing Services (Ireland) Limited
Dromore House, # 3rd Floor, Eastpark Business Centre, Shannon , Co. Clare, Ireland
N/A Subsidiary 100 2(87)
60 Wipro Holdings (UK) Limited Devonshire House, 60 Goswell Road, London,EC1M 7AD, United Kingdom
N/A Subsidiary 100 2(87)
61 Wipro Europe Limited Devonshire House, 60 Goswell Road, London,EC1M 7AD, United Kingdom
N/A Subsidiary 100 2(87)
62 Wipro UK Limited Devonshire House, 60 Goswell Road, London,EC1M 7AD, United Kingdom
N/A Subsidiary 100 2(87)
63 Wipro Financial Services UK Limited
Devonshire House, 60 Goswell Road, London, United Kingdom, EC1M 7AD
N/A Subsidiary 100 2(87)
64 Wipro IT Services S.R.L Bucharest, 4th District, 133 CaleaSerbanVoda, Central Business Park, Building A, groundfloor, Section A.P.32, Romania
N/A Subsidiary 100 2(87)
65 Wipro Technologies South Africa (Proprietary) Limited
The Forum, 10th Floor Office 162 Maude Street, Sandton, 2198 Johannesburg, South Africa
N/A Subsidiary 100 2(87)
66 Wipro Technologies Nigeria Limited
7th Floor, Mulliner Towers, 39 Alfred Rewane Road, (Kingsway Road), Ikoyi Lagos, Nigeria
N/A Subsidiary 100 2(87)
67 Wipro Corporate Technologies Ghana Ltd
No. 9 Carrot Avenue, East Legon – Accra, Ghana
N/A Subsidiary 100 2(87)
68 Wipro (Dalian) Limited D7, Spring-Field Park, Ganjingzi District, Dalian, China
N/A Subsidiary 100 2(87)
69 Wipro Overseas IT Services Private Limited
Sarjapur Road, Doddakannelli, Bengaluru - 560035,India
U72200KA2015PTC080266 Subsidiary 100 2(87)
70 Healthplan Services Insurance Agency, LLC
3501 E Frontage Rd, Tampa, FL 33607, USA N/A Subsidiary 100 2(87)
71 Healthplan Services, Inc. 3501 E Frontage Rd, Tampa, FL 33607, USA N/A Subsidiary 100 2(87)72 Appirio, Inc. 201 S. Capitol Ave., #1100 Indianapolis,
IN 46225, USAN/A Subsidiary 100 2(87)
73 Cooper Software,LLC 85 2nd Street, 8th Floor San Francisco,CA 94105, USA
N/A Subsidiary 100 2(87)
74 Infocrossing, LLC 425 National Ave STE 200, Mountain View, CA 94043, USA
N/A Subsidiary 100 2(87)
75 Wipro US Foundation 251, Little Falls Drive, Wilmington, country of New Castle, Delware19908
N/A Subsidiary 100 2(87)
76 Appirio, K.K METLIFE Aoyama Building 8F, 2-11-16, Minami Aoyama, Minato-ku, Tokyo, Japan
N/A Subsidiary 100 2(87)
77 Topcoder, LLC 251 Little Falls Drive, Wilmington - 19808-1674 N/A Subsidiary 100 2(87)78 Appirio Limited First Floor Block D, Iveagh Court, Harcourt Road,
Dublin 2, IrelandN/A Subsidiary 100 2(87)
79 Appirio Limited Longcraft House, 2-8 Victoria Avenue, London, EC2M4NS, UK
N/A Subsidiary 100 2(87)
80 Wipro IT Services Bangladesh Limited
Grand Delvista, Level 04, Plot 1A, Gulshan Avenue, Gulshan, Dhaka-1212, Bangladesh
N/A Subsidiary 100 2(87)
81 Wipro HR Services India Private Limited
SJP-1, D Block, A Wing, Second Floor, Doddakannelli, Sarjapur Road, Bengaluru-560035
U74999KA2016PTC129059 Subsidiary 100 2(87)

Corporate Overview | Management & Board Reports | Financial Statements
Wipro Limited103
Sl. No.
Name of the Company
Address of the Company
CIN/GLN Holding/ Subsidiary/ Associate
% of shares
held
Applicable Section
82 Wipro SA Broad Based Ownership Scheme SPV (RF) (PTY) LTD
2 Maude Street, the Forum, 10th Floor Sandton, 2196 , Johannesburg, South Africa
N/A Subsidiary 100 2(87)
83 Rational Interaction, Inc.(b) 1201 3rd Ave, Ste 900, Seattle WA, 98101, United States
N/A Subsidiary 100 2(87)
84 Rational Consulting Australia Pty Limited(b)
C/- A&A Tax Legal Consulting, Level 4 , 34 Queen Street , Melbourne Vic 3000
N/A Subsidiary 100 2(87)
85 Rational Interaction Limited(b) 6th Floor, SouthBankHouse, BarrowStreet, Dublin- 4
N/A Subsidiary 100 2(87)
86 International TechneGroup Incorporated(c)
GH&R Business Services, Inc., 312 Walnut St., Suite 1800, Cincinnati, OH 45202
N/A Subsidiary 100 2(87)
87 International TechneGroup Ltd.(c)
4 Carisbrooke Court Anderson, Road Buckingway Business Park, Swavesey Cambridge, Cambridgeshire, CB24 4UQ
N/A Subsidiary 100 2(87)
88 ITI Proficiency Ltd.(c) 13 Hasadna St., Ra’anana Israel, 4365007 N/A Subsidiary 100 2(87)
89 International Technegroup S.R.L(c)
Torino (TO) Piazza, Solferino 20 CAP 10121 N/A Subsidiary 100 2(87)
90 MechWorks S.R.L(c) Mechworkss.r.l. Uninominale - Via Vallescura 8/2 40136 Bologna
N/A Subsidiary 100 2(87)
91 Drivestream, Inc. 45610 Woodland Road, Suite 150 Sterling, VA 20166, USA
N/A Associate 47.3 2(6)
92 Denim Group Limited 1354 North Loop 1604 E, Suite 110, San Antonio, Texas 78232
N/A Associate 33 2(6)
93 Denim Group Management, LLC
1354 North Loop 1604 E, Suite 110, San Antonio, Texas 78232
N/A Associate 33.33 2(6)
(a) Wipro Information Technology Egypt SAE has been put into liquidation with effect from September 30, 2016.(b) Rational Interaction, Inc., Rational Consulting Australia Pty Ltd. and Rational Interaction Limited were acquired on February 21, 2020. (c) International TechneGroup Incorporated, International TechneGroup Ltd., ITI Proficiency Ltd., International Technegroup S.R.L. and
MechWorks S.R.L. were acquired on October 3, 2019.
Frontworx Informationstechnologie GmbH was merged with and into Cellent GmbH, Austria with effect from August 22, 2019. Therefore, particulars of the entity are not included in the above list.
Appirio GmbH was liquidated with effect from January 22, 2020. Therefore, particulars of the entity are not included in the above list.
Digital Aps was merged with and into Designit A/s with effect from March 16, 2020. Therefore, particulars of Digital Aps are not included in the above list.
Wipro Retail UK Limited was dissolved with effect from July 23, 2019. Therefore, particulars of the entity are not included in the above list.

Annual Report 2019-20 104
IV. SHARE HOLDING PATTERN (Equity Share Capital Breakup as percentage of Total Equity)
i. Category-wise Share Holding
Category Code
Category of Shareholder
No. of shares held at the beginning of the year (April 01, 2019)
No. of shares held at the end of the year (March 31, 2020)
% Change during
the yearDemat Physical Total % of Total
sharesDemat Physical Total % of Total
shares
(A) PROMOTER AND PROMOTER GROUP
1 INDIAN(a) Individual /HUF 254,451,816 - 254,451,816 4.22 241,913,816 - 241,913,816 4.23 0.01
(b) Central Government/State Government(s) - - - - - - - - -
(c) Bodies Corporate (Promoter in his capacity as Director of Private Limited/Section 25 Companies)
22,309,537 - 22,309,537 0.37 21,175,812 - 21,175,812 0.37 0.00
(d) Financial Institutions / Banks - - - - - - - - -
(e) Any Other -Partnership firms (Promoter in his capacity as partner of Partnership firms)
3,381,286,878 - 3,381,286,878 56.04 3,209,456,718 - 3,209,456,718 56.17 0.13
(f) Others - Trust 797,948,834 - 797,948,834 13.22 757,398,687 - 757,398,687 13.26 0.04 Sub-Total A(1) 4,455,997,065 - 4,455,997,065 73.85 4,229,945,033 - 4,229,945,033 74.04 0.192 FOREIGN (a) Individuals (NRIs/Foreign
Individuals) - - - - - - - - -
(b) Bodies Corporate - - - - - - - - -(c) Institutions - - - - - - - - -(d) Qualified Foreign Investor - - - - - - - - -(e) Others - - - - - - - - - Sub-Total A(2) : - - - - - - - - - Total A=A(1)+A(2) : 4,455,997,065 - 4,455,997,065 73.85 4,229,945,033 - 4,229,945,033 74.04 0.19(B) PUBLIC SHAREHOLDING
1 INSTITUTIONS(a) Mutual Funds/UTI 94,005,955 - 94,005,955 1.56 80,903,316 - 80,903,316 1.42 (0.14)(b) Financial Institutions /Banks 29,674,597 - 29,674,597 0.49 40,300,081 - 40,300,081 0.71 0.22
(c) Central Government / State Government(s) - - - - - - - - -
(d) Venture Capital Funds - - - - - - - - -(e) Insurance Companies 267,932,933 - 267,932,933 4.44 278,750,138 - 278,750,138 4.88 0.44
(f) Foreign Institutional Investors 538,940,494 - 538,940,494 8.94 482,637,533 - 482,637,533 8.45 (0.49)
(g) Foreign Venture Capital Investors - - - - - - - - -
(h) Qualified Foreign Investor - - - - - - - - -(i) Others -Alternate
Investment Fund & Qualified Institutional Buyer
528,918 - 528,918 0.01 22,358,046 - 22,358,046 0.39 0.38
Sub-Total B(1) 931,082,897 - 931,082,897 15.44 904,949,114 - 904,949,114 15.84 0.402 NON-INSTITUTIONS (a) Bodies Corporate 126,246,943 110,455 126,357,398 2.09 48,739,941 85,513 48,825,454 0.85 (1.24)(b) NBFCs Registered with RBI 661,552 - 661,552 0.01 54,233 - 54,233 0.00 (0.01)
Overseas Corporate Bodies - - - - - - - - -Individuals (i) Individuals holding nominal share capital upto ` 1 lakh
99,179,142 1,127,021 100,306,163 1.66 121,926,209 853,654 122,779,863 2.15 0.49
(ii) Individuals holding nominal share capital in excess of ` 1 lakh
195,849,721 11,021,921 206,871,642 3.43 189,302,519 7,824,590 197,127,109 3.45 0.02
(c) Qualified Foreign Investor - - - - - - - - -

Corporate Overview | Management & Board Reports | Financial Statements
Wipro Limited105
Category Code
Category of Shareholder
No. of shares held at the beginning of the year (April 01, 2019)
No. of shares held at the end of the year (March 31, 2020)
% Change during
the yearDemat Physical Total % of Total
sharesDemat Physical Total % of Total
shares(d)
Others NON-RESIDENT INDIANS 32,136,878 272 32,137,150 0.54 31,236,530 272 31,236,802 0.55 0.01IEPF 1,706,952 - 1,706,952 0.03 1,742,712 - 1,742,712 0.03 0.00Foreign Bodies - DR 88,748 - 88,748 0.00 84,239 - 84,239 0.00 0.00TRUSTS (a) Wipro Equity Reward Trust * 27,353,853 - 27,353,853 0.45 22,746,081 - 22,746,081 0.40 (0.05)
(b) Other Trusts 9,771,422 - 9,771,422 0.16 12,108,585 - 12,108,585 0.21 0.05Non-Executive Directors and Executive Directors & Relatives
4,978 - 4,978 0.00 - - - - -
CLEARING MEMBERS 4,303,891 - 4,303,891 0.07 1,970,363 - 1,970,363 0.03 (0.04)FOREIGN NATIONAL 56,924 - 56,924 0.00 56,924 - 56,924 0.00 0.00Sub-Total B(2) : 497,361,004 12,259,669 509,620,673 8.44 429,968,336 8,764,029 438,732,365 7.68 (0.76)Total B=B(1)+B(2) : 1,428,443,901 12,259,669 1,440,703,570 23.88 1,334,917,450 8,764,029 1,343,681,479 23.52 (0.36)Total (A+B) : 5,884,440,966 12,259,669 5,896,700,635 97.73 5,564,862,483 8,764,029 5,573,626,512 97.55 (0.18)
(C) Shares held by custodians, against which Depository Receipts have been issued
(1) Promoter and Promoter Group - - - - - - - - -
(2) Public 137,234,753 - 137,234,753 2.27 139,730,878 - 139,730,878 2.45 0.18 GRAND TOTAL (A+B+C): 6,021,675,719 12,259,669 6,033,935,388 100.00 5,704,593,361 8,764,029 5,713,357,390 100.00
* Shares held by Wipro Equity Reward Trust are classified as non-promoter non-public shareholding as per the provisions of SEBI (Share Based Employee Benefits) Regulations, 2014.
Percentage of shareholding in the above table have been subject to rounding-off adjustments.
ii. Shareholding of Promoter and Promoter GroupSr.No.
Shareholder’s Name Shareholding at the beginning of the year (April 1, 2019)
Shareholding at the end of the year(March 31, 2020)
% change in shareholding
during the year (3)
No. of Shares % of total Shares of the Company
% of Shares Pledged/
encumbered to total shares
No. of Shares % of total Shares of the
Company
% of Shares Pledged/
encumbered to total shares
1 Azim H. Premji 249,080,265 4.13 - 236,815,234 4.14 - 0.012 Yasmeen A Premji 2,833,776 0.05 - 2,689,770 0.05 - 0.003 Rishad A. Premji 1,831,109 0.03 - 1,738,057 0.03 - 0.004 Tariq A Premji 706,666 0.01 - 670,755 0.01 - 0.005 Mr. Azim H. Premji Partner representing
Prazim Traders1,187,751,441 19.68 - 1,127,392,315 19.73 - 0.05
6 Mr. Azim H. Premji Partner representing Zash Traders
1,204,319,438 19.96 - 1,143,118,360 20.01 - 0.05
7 Mr. Azim H. Premji Partner representing Hasham Traders
989,215,999 16.39 - 938,946,043 16.43 - 0.04
8 Azim Premji Philanthropic Initiatives Private Limited (1)
20,808,209 0.34 - 19,750,778 0.35 - 0.01
9 Hasham Investment and Trading Co Private Limited
1,501,328 0.02 - 1,425,034 0.02 - 0.00
10 Azim Premji Trust (2) 797,948,834 13.22 - 757,398,687 13.26 - 0.04TOTAL 4,455,997,065 73.85 - 4,229,945,033 74.04 - 0.19
Note: (1) Mr. Azim H. Premji disclaims the beneficial ownership of shares held by Azim Premji Philanthropic Initiatives Private Limited. (2) Mr. Azim H. Premji disclaims the beneficial ownership of shares held by Azim Premji Trust.(3) Percentage change in shareholding of promoters and promoter group at the end of the year is as a result of respective participation in
the buyback, overall reduction of paid-up share capital consequent to buyback and dilution on account of allotment of equity shares to employees pursuant to exercise of stock options.
Percentage of shareholding in the above table have been subject to rounding-off adjustments.

Annual Report 2019-20 106
iii. Change in Promoters’ Shareholding (please specify, if there is no change)
Sl.No.
Shareholder’s Name Shareholding at the beginning of the year (April 1, 2019)
Date Reason
Increase/Decrease in Shareholding
Cumulative Shareholding during the year
No. of shares % of total shares of the
company
No. of Shares % total shares of the
Company
No. of Shares % total shares of the
Company(3)
At the beginning of the year (April 1, 2019)
4,455,997,065 73.85
Date wise Increase / Decrease in Promoters Shareholding during the year specifying the reasons for increase/ decrease (e.g. allotment / transfer / bonus/ sweat equity etc):
1 Azim H. Premji 249,080,265 4.13 09-09-19 Buyback (12,265,031 ) (0.21) 236,815,234 4.14
2 Yasmeen A Premji 2,833,776 0.05 09-09-19 Buyback (144,006) (0.00) 2,689,770 0.05
3 Rishad A. Premji 18,31,109 0.03 09-09-19 Buyback (93,052 ) (0.00) 1,738,057 0.03
4 Tariq A Premji 7,06,666 0.01 09-09-19 Buyback (35,911) (0.00) 670,755 0.01
5 Mr. Azim H. Premji Partner representing Hasham Traders
989,215,999 16.39 09-09-19 Buyback (50,269,956) (0.88) 938,946,043 16.43
6 Mr Azim Hasham Premji Partner Representing Prazim Traders
1,187,751,441 19.68 09-09-19 Buyback (60,359,126) (1.06) 1,127,392,315 19.73
7 Mr Azim Hasham Premji Partner Representing Zash Traders
1,204,319,438 19.96 09-09-19 Buyback (61,201,078 ) (1.07) 1,143,118,360 20.01
8 Hasham Investment and Trading Co Private Limited
1,501,328 0.02 09-09-19 Buyback (76,294) (0.00) 1,425,034 0.02
9 Azim Premji Trust (1) 797,948,834 13.32 09-09-19 Buyback (40,550,147) (0.71) 757,398,687 13.26
10 Azim Premji Philanthropic Initiatives Private Limited(2)
20,808,209 0.34 09-09-19 Buyback (1,057,431) (0.02) 19,750,778 0.35
At the End of the year (March 31, 2020)
4,229,945,033 74.04
(1) Mr. Azim H. Premji disclaims the beneficial ownership of shares held by Azim Premji Trust.(2) Mr. Azim H. Premji disclaims the beneficial ownership of shares held by Azim Premji Philanthropic Initiatives Private Limited.(3) Percentage change in shareholding of promoters and promoter group at the end of the year is as a result of respective participation in
the buyback, overall reduction of paid-up share capital consequent to buyback and dilution on account of allotment of equity shares to employees pursuant to exercise of stock options.
iv. Shareholding Pattern of top ten Shareholders (other than Directors, Promoters and Holders of ADRs):Sl. No.
For Each of the Top 10 Shareholders Shareholding at the beginning of the year Cumulative Shareholding during the year (2019-20)
No. of shares % of total shares of the Company
No. of shares
% of total shares of the Company
1 At the beginning of the year
Refer Annexure A2
Date wise Increase/Decrease in Shareholding during the year specifying the reasons for increase/decrease (e.g. allotment/transfer/bonus/sweat equity etc):
3At the End of the year ( or on the date of separation, if separated during the year)

Corporate Overview | Management & Board Reports | Financial Statements
Wipro Limited107
v. Shareholding of Directors and Key Managerial Personnel:
Sl. No For Each of the Directors and KMP
Shareholding at the beginning of the year April 1, 2019)
Cumulative Shareholding during the year (2019-20)
No. of shares % of total shares of the Company
No. of shares
% of total shares of the
Company1 At the beginning of the year
Refer Annexure B
2 Date wise Increase/Decrease in Shareholding during the year specifying the reasons for increase/ decrease (e.g. allotment/transfer/ bonus/sweat equity etc):
3 At the end of the year (March 31, 2020)
V. INDEBTEDNESS
Indebtedness of the Company including interest outstanding/accrued but not due for payment. (` in Million)
Secured Loans excluding deposits Unsecured Loans Deposits Total
Indebtedness
Indebtedness at the beginning of the financial year
i) Principal Amount 596 50,683 - 51,279
ii) Interest due but not paid - - - -
iii) Interest accrued but not due - 35 - 35
Total (i+ii+iii) 596 50,718 - 51,314
Change in Indebtedness during the financial year
l Addition - 102,509 - 102,509
l Reduction - 106,836 - 106,836
Reclassification to Lease Liabilities on adoption of Ind AS 116 (596) - - (596)
ERF (Gain)/Loss for foreign currency loans - 4,103 - 4,103
Net Change (596) (224) - (820)
Indebtedness at the end of the financial year
i) Principal Amount - 50,459 - 50,459
ii) Interest due but not paid - - - -
iii) Interest accrued but not due - 23 - 23
Total (i+ii+iii) - 50,482 - 50,482
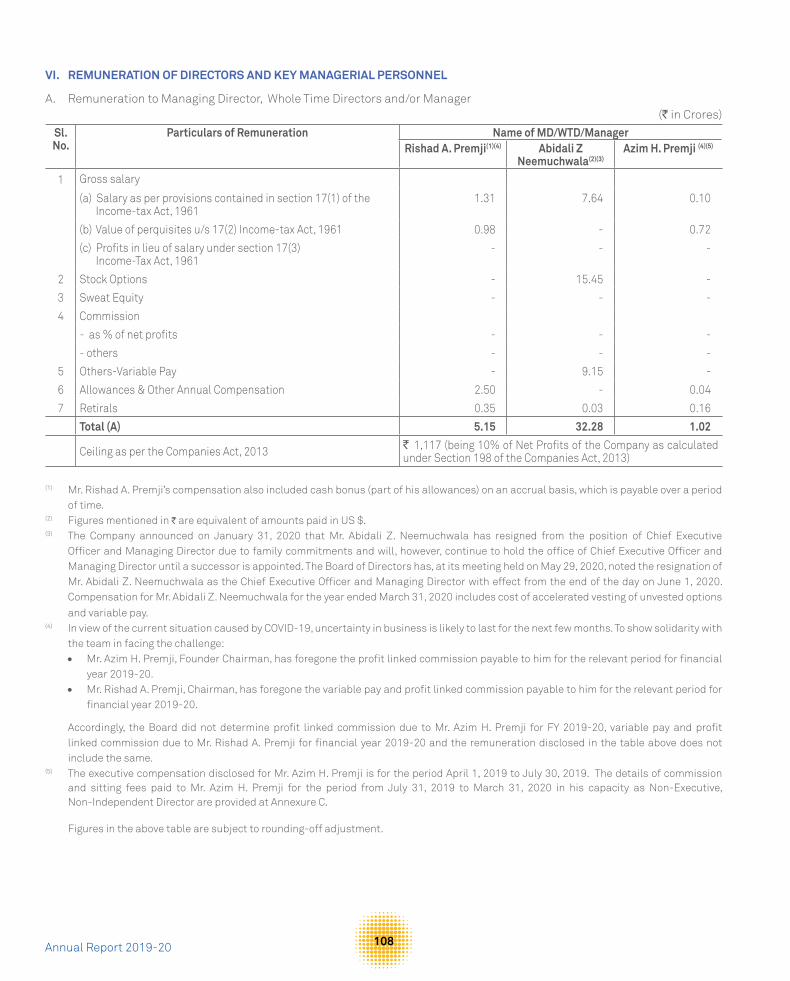
Annual Report 2019-20 108
VI. REMUNERATION OF DIRECTORS AND KEY MANAGERIAL PERSONNEL
A. Remuneration to Managing Director, Whole Time Directors and/or Manager (` in Crores)
Sl. No.
Particulars of Remuneration Name of MD/WTD/ManagerRishad A. Premji(1)(4) Abidali Z
Neemuchwala(2)(3)Azim H. Premji (4)(5)
1 Gross salary
(a) Salary as per provisions contained in section 17(1) of the Income-tax Act, 1961
1.31 7.64 0.10
(b) Value of perquisites u/s 17(2) Income-tax Act, 1961 0.98 - 0.72
(c) Profits in lieu of salary under section 17(3) Income-Tax Act, 1961
- - -
2 Stock Options - 15.45 -
3 Sweat Equity - - -
4 Commission
- as % of net profits - - -
- others - - -
5 Others-Variable Pay - 9.15 -
6 Allowances & Other Annual Compensation 2.50 - 0.04
7 Retirals 0.35 0.03 0.16
Total (A) 5.15 32.28 1.02
Ceiling as per the Companies Act, 2013 ` 1,117 (being 10% of Net Profits of the Company as calculated under Section 198 of the Companies Act, 2013)
(1) Mr. Rishad A. Premji’s compensation also included cash bonus (part of his allowances) on an accrual basis, which is payable over a period of time.
(2) Figures mentioned in ` are equivalent of amounts paid in US $.(3) The Company announced on January 31, 2020 that Mr. Abidali Z. Neemuchwala has resigned from the position of Chief Executive
Officer and Managing Director due to family commitments and will, however, continue to hold the office of Chief Executive Officer and Managing Director until a successor is appointed. The Board of Directors has, at its meeting held on May 29, 2020, noted the resignation of Mr. Abidali Z. Neemuchwala as the Chief Executive Officer and Managing Director with effect from the end of the day on June 1, 2020. Compensation for Mr. Abidali Z. Neemuchwala for the year ended March 31, 2020 includes cost of accelerated vesting of unvested options
and variable pay.(4) In view of the current situation caused by COVID-19, uncertainty in business is likely to last for the next few months. To show solidarity with
the team in facing the challenge:• Mr. Azim H. Premji, Founder Chairman, has foregone the profit linked commission payable to him for the relevant period for financial
year 2019-20. • Mr. Rishad A. Premji, Chairman, has foregone the variable pay and profit linked commission payable to him for the relevant period for
financial year 2019-20.
Accordingly, the Board did not determine profit linked commission due to Mr. Azim H. Premji for FY 2019-20, variable pay and profit linked commission due to Mr. Rishad A. Premji for financial year 2019-20 and the remuneration disclosed in the table above does not include the same.
(5) The executive compensation disclosed for Mr. Azim H. Premji is for the period April 1, 2019 to July 30, 2019. The details of commission and sitting fees paid to Mr. Azim H. Premji for the period from July 31, 2019 to March 31, 2020 in his capacity as Non-Executive, Non-Independent Director are provided at Annexure C.
Figures in the above table are subject to rounding-off adjustment.

Corporate Overview | Management & Board Reports | Financial Statements
Wipro Limited109
B. Remuneration to Other Directors 2019-20: (` in Crores)Sl.no. Particulars of Remuneration Name of Directors
1 Independent Directors • Fee for attending board committee meetings • Commission • Others, please specify
Refer Annexure C
Total (1)
2 Other Non-Executive Directors • Fee for attending board committee meetings • Commission • Others, please specify
Total (2)
Total (B)=(1+2)
Total Managerial Remuneration
Overall Ceiling as per the Companies Act, 2013 ` 111 (being 1% of Net Profits of the Company as calculated as under Section 198 of the Companies Act,2013).
C. Remuneration to Key Managerial Personnel Other Than MD/Manager/WTD (` in Crores)Sl. No
Particulars of Remuneration Key Managerial PersonnelChief Financial Officer* Company Secretary**
1 Gross salary (a) Salary as per provisions contained in section 17(1) of the Income-tax Act, 1961 2.45 1.21 (b) Value of perquisites u/s 17(2) Income-tax Act, 1961 0.21 0.01 (c) Profits in lieu of salary under section 17(3) Income-tax Act, 1961 - -2 Stock Option 1.53 0.19 3 Sweat Equity - -4 Commission - as % of profit - - - others - -5 Retirals 0.25 0.07 Total 4.45 1.48
* Computation of remuneration to the Chief Financial Officer is on an accrual basis and includes the amortization of Restricted Stock Units (RSUs), granted to him, which will vest over a period of time. This also includes RSUs that will vest based on performance parameters of the Company.
** Computation of remuneration of Company Secretary includes perquisites value of RSUs exercised during the financial year and does not include grant of such options.
Figures in the above table have been rounded-off to two decimals.
VII. PENALTIES/PUNISHMENT/COMPOUNDING OF OFFENCES: There were no penalties, punishment or compounding of offences during the year ended March 31, 2020.
Type Section of the companies Act Brief description
Details of Penalty/ Punishment/
Compounding fees imposed
Authority [RD/ NCLT/Court]
Appeal made. If any (give details)
A. CompanyPenalty
NILPunishmentCompounding
B. DirectorsPenalty
NILPunishmentCompounding
C. Other Officers in DefaultPenalty
NILPunishmentCompounding

Annual Report 2019-20 110
Annexure ASHAREHOLDING PATTERN OF TOP 10 SHAREHOLDERS BETWEEN APRIL 01, 2019 AND MARCH 31, 2020 (OTHER THAN DIRECTORS, PROMOTERS AND HOLDERS OF GDR AND ADRS)
Sl.No.
Date of Transaction
Nature of Transaction
Name of the Share Holder Shareholding at the beginning of the Year
Cumulative Shareholding during the Year
No of Shares % of total shares of the
company
No of Shares % of total shares of the Company
1 01/04/2019 Opening Balance LIFE INSURANCECORPORATION OF INDIA
265,166,536 4.39 265,166,536 4.3912/04/2019 Purchase 38,610,038 0.64 303,776,574 5.0326/04/2019 Purchase 13,511,002 0.22 290,265,572 4.8126/04/2019 Sale 13,464,744 0.22 276,800,828 4.5902/08/2019 Purchase 309,605 0.01 276,491,223 4.5802/08/2019 Sale 5,880,679 0.10 270,610,544 4.4813/09/2019 Sale 551,560 0.01 270,058,984 4.7331/03/2020 Closing Balance 270,058,984 4.73
2 01/04/2019 Opening Balance CUSTODIAN OF ENEMY PROPERTY FOR INDIA
45,924,848 0.76 45,924,848 0.7605/04/2019 Sale 45,924,848 0.76 - -31/03/2020 Closing Balance - -
3 01/04/2019 Opening Balance ALCO COMPANY PRIVATE LIMITED 41,866,666 0.69 41,866,666 0.6913/09/2019 Sale 1,943,760 0.03 39,922,906 0.7013/03/2020 Purchase 13,333 0.00 39,936,239 0.70
20/03/2020 Purchase 261 0.00 39,936,500 0.70
31/03/2020 Closing Balance 39,936,500 0.70
4 01/04/2019 Opening Balance GOVERNMENT PENSION FUNDGLOBAL
28,604,032 0.47 28,604,032 0.4705/04/2019 Purchase 1,094,889 0.02 29,698,921 0.4912/04/2019 Purchase 584,789 0.01 30,283,710 0.5019/04/2019 Purchase 130,820 0.00 30,414,530 0.5026/04/2019 Sale 292,626 0.00 30,121,904 0.5003/05/2019 Sale 549,467 0.01 29,572,437 0.4910/05/2019 Sale 1,218,932 0.02 28,353,505 0.4717/05/2019 Purchase 1,181,385 0.02 29,534,890 0.4907/06/2019 Purchase 24,333 0.00 29,559,223 0.4914/06/2019 Purchase 117,537 0.00 29,676,760 0.4921/06/2019 Purchase 101,465 0.00 29,778,225 0.4913/09/2019 Sale 1,442,300 0.03 28,335,925 0.5018/10/2019 Purchase 835,000 0.01 29,170,925 0.5125/10/2019 Purchase 836,553 0.01 30,007,478 0.5306/12/2019 Purchase 1,099,237 0.02 31,106,715 0.5410/01/2020 Purchase 242,504 0.00 31,349,219 0.5517/01/2020 Purchase 328,088 0.01 31,677,307 0.5507/02/2020 Purchase 1,030,073 0.02 32,707,380 0.5728/02/2020 Purchase 314,363 0.01 33,021,743 0.5806/03/2020 Purchase 677,283 0.01 33,699,026 0.5927/03/2020 Purchase 1,215,881 0.02 34,914,907 0.6131/03/2020 Closing Balance - 34,914,907 0.61
5 01/04/2019 Opening Balance WIPRO EQUITY REWARD TRUST 27,353,853 0.45 27,353,853 0.4501/04/2019 to 31/03/2020
Transfer of shares pur-suant to exercise of vested stock options
4,607,772 0.05 22,746,081 0.40
31/03/2020 Closing Balance 22,746,081 0.406 01/04/2019 Opening Balance ICICI PRUDENTIAL VALUE
DISCOVERY FUND 22,849,304 0.38 22,849,304 0.38
13/09/2019 Sale 1,161,155 0.00 21,688,149 0.3831/03/2020 Closing Balance 21,688,149 0.38
7 01/04/2019 Opening Balance LIFE INSURANCE CORPORATION OF INDIA P & GS FUND
20,814,988 0.34 20,814,988 0.3426/04/2019 Purchase 13,501,002 0.22 34,315,990 0.5713/09/2019 Sale 1,591,838 0.00 32,724,152 0.5731/03/2020 Closing Balance 32,724,152 0.57
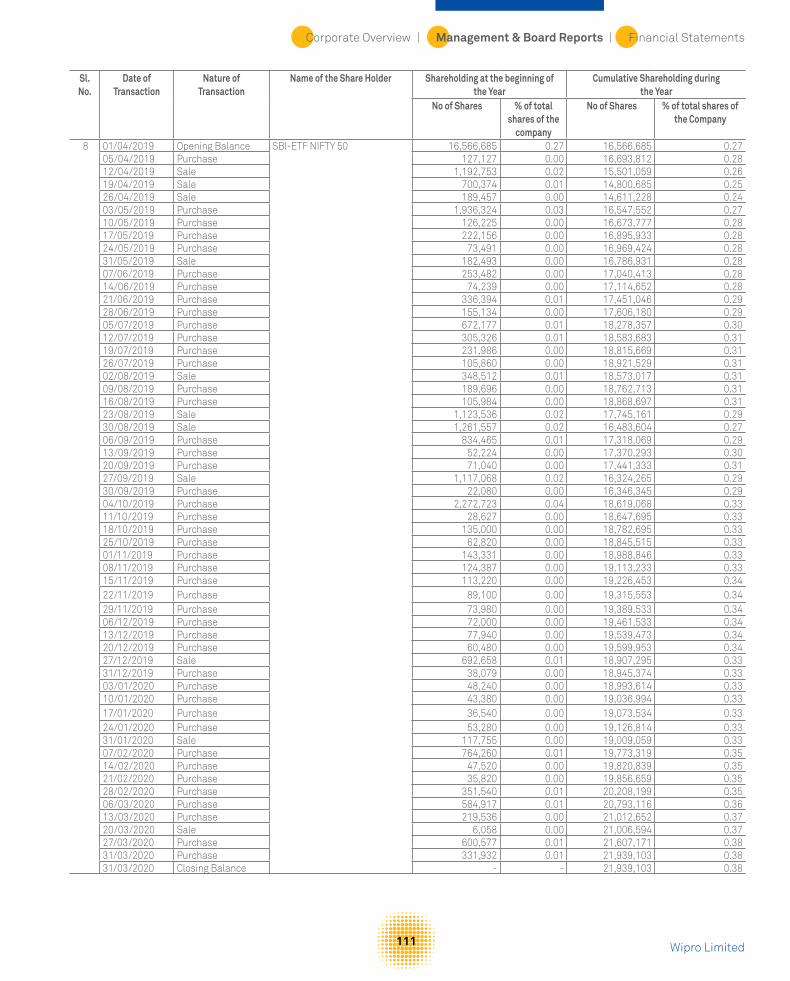
Corporate Overview | Management & Board Reports | Financial Statements
Wipro Limited111
Sl.No.
Date of Transaction
Nature of Transaction
Name of the Share Holder Shareholding at the beginning of the Year
Cumulative Shareholding during the Year
No of Shares % of total shares of the
company
No of Shares % of total shares of the Company
8 01/04/2019 Opening Balance SBI-ETF NIFTY 50 16,566,685 0.27 16,566,685 0.2705/04/2019 Purchase 127,127 0.00 16,693,812 0.2812/04/2019 Sale 1,192,753 0.02 15,501,059 0.2619/04/2019 Sale 700,374 0.01 14,800,685 0.2526/04/2019 Sale 189,457 0.00 14,611,228 0.2403/05/2019 Purchase 1,936,324 0.03 16,547,552 0.2710/05/2019 Purchase 126,225 0.00 16,673,777 0.2817/05/2019 Purchase 222,156 0.00 16,895,933 0.2824/05/2019 Purchase 73,491 0.00 16,969,424 0.2831/05/2019 Sale 182,493 0.00 16,786,931 0.2807/06/2019 Purchase 253,482 0.00 17,040,413 0.2814/06/2019 Purchase 74,239 0.00 17,114,652 0.2821/06/2019 Purchase 336,394 0.01 17,451,046 0.2928/06/2019 Purchase 155,134 0.00 17,606,180 0.2905/07/2019 Purchase 672,177 0.01 18,278,357 0.3012/07/2019 Purchase 305,326 0.01 18,583,683 0.3119/07/2019 Purchase 231,986 0.00 18,815,669 0.3126/07/2019 Purchase 105,860 0.00 18,921,529 0.3102/08/2019 Sale 348,512 0.01 18,573,017 0.3109/08/2019 Purchase 189,696 0.00 18,762,713 0.3116/08/2019 Purchase 105,984 0.00 18,868,697 0.3123/08/2019 Sale 1,123,536 0.02 17,745,161 0.2930/08/2019 Sale 1,261,557 0.02 16,483,604 0.2706/09/2019 Purchase 834,465 0.01 17,318,069 0.2913/09/2019 Purchase 52,224 0.00 17,370,293 0.3020/09/2019 Purchase 71,040 0.00 17,441,333 0.3127/09/2019 Sale 1,117,068 0.02 16,324,265 0.2930/09/2019 Purchase 22,080 0.00 16,346,345 0.2904/10/2019 Purchase 2,272,723 0.04 18,619,068 0.3311/10/2019 Purchase 28,627 0.00 18,647,695 0.3318/10/2019 Purchase 135,000 0.00 18,782,695 0.3325/10/2019 Purchase 62,820 0.00 18,845,515 0.3301/11/2019 Purchase 143,331 0.00 18,988,846 0.3308/11/2019 Purchase 124,387 0.00 19,113,233 0.3315/11/2019 Purchase 113,220 0.00 19,226,453 0.3422/11/2019 Purchase 89,100 0.00 19,315,553 0.3429/11/2019 Purchase 73,980 0.00 19,389,533 0.3406/12/2019 Purchase 72,000 0.00 19,461,533 0.3413/12/2019 Purchase 77,940 0.00 19,539,473 0.3420/12/2019 Purchase 60,480 0.00 19,599,953 0.3427/12/2019 Sale 692,658 0.01 18,907,295 0.3331/12/2019 Purchase 38,079 0.00 18,945,374 0.3303/01/2020 Purchase 48,240 0.00 18,993,614 0.3310/01/2020 Purchase 43,380 0.00 19,036,994 0.3317/01/2020 Purchase 36,540 0.00 19,073,534 0.3324/01/2020 Purchase 53,280 0.00 19,126,814 0.3331/01/2020 Sale 117,755 0.00 19,009,059 0.3307/02/2020 Purchase 764,260 0.01 19,773,319 0.3514/02/2020 Purchase 47,520 0.00 19,820,839 0.3521/02/2020 Purchase 35,820 0.00 19,856,659 0.3528/02/2020 Purchase 351,540 0.01 20,208,199 0.3506/03/2020 Purchase 584,917 0.01 20,793,116 0.3613/03/2020 Purchase 219,536 0.00 21,012,652 0.3720/03/2020 Sale 6,058 0.00 21,006,594 0.3727/03/2020 Purchase 600,577 0.01 21,607,171 0.3831/03/2020 Purchase 331,932 0.01 21,939,103 0.3831/03/2020 Closing Balance - - 21,939,103 0.38

Annual Report 2019-20 112
Sl.No.
Date of Transaction
Nature of Transaction
Name of the Share Holder Shareholding at the beginning of the Year
Cumulative Shareholding during the Year
No of Shares % of total shares of the
company
No of Shares % of total shares of the Company
9 01/04/2019 Opening Balance GOVERNMENT OF SINGAPORE 16,081,827 0.27 16,081,827 0.2705/04/2019 Purchase 264,755 0.00 16,346,582 0.2712/04/2019 Sale 3,615 0.00 16,342,967 0.2703/05/2019 Sale 329,963 0.01 16,013,004 0.2710/05/2019 Sale 651,362 0.01 15,361,642 0.2517/05/2019 Sale 21,043 0.00 15,340,599 0.2524/05/2019 Purchase 62,670 0.00 15,403,269 0.2631/05/2019 Sale 2,712,027 0.04 12,691,242 0.2107/06/2019 Purchase 1,664,166 0.03 14,355,408 0.2414/06/2019 Purchase 32,129 0.00 14,387,537 0.2421/06/2019 Purchase 393,961 0.01 14,781,498 0.2405/07/2019 Purchase 62,498 0.00 14,843,996 0.2512/07/2019 Sale 263,138 0.00 14,580,858 0.2419/07/2019 Sale 236,417 0.00 14,344,441 0.2426/07/2019 Sale 61,592 0.00 14,282,849 0.2402/08/2019 Sale 77,863 0.00 14,204,986 0.2409/08/2019 Sale 154,901 0.00 14,050,085 0.2316/08/2019 Sale 53,915 0.00 13,996,170 0.2323/08/2019 Sale 95,436 0.00 13,900,734 0.2306/09/2019 Purchase 241,849 0.00 14,142,583 0.2313/09/2019 Sale 884,408 0.02 13,258,175 0.2320/09/2019 Sale 70,540 0.00 13,187,635 0.2330/09/2019 Sale 10,543 0.00 13,177,092 0.2304/10/2019 Purchase 151,556 0.00 13,328,648 0.2311/10/2019 Purchase 35,672 0.00 13,364,320 0.2318/10/2019 Purchase 35,381 0.00 13,399,701 0.2325/10/2019 Sale 126,742 0.00 13,272,959 0.2301/11/2019 Sale 33,436 0.00 13,239,523 0.2308/11/2019 Purchase 29,250 0.00 13,268,773 0.2315/11/2019 Purchase 39,545 0.00 13,308,318 0.2322/11/2019 Sale 4,470 0.00 13,303,848 0.2329/11/2019 Sale 833,908 0.01 12,469,940 0.2206/12/2019 Sale 703,818 0.01 11,766,122 0.2113/12/2019 Sale 5,211 0.00 11,760,911 0.2120/12/2019 Purchase 112,382 0.00 11,873,293 0.2131/12/2019 Sale 214,311 0.00 11,658,982 0.2010/01/2020 Purchase 40,024 0.00 11,699,006 0.2017/01/2020 Sale 109,122 0.00 11,589,884 0.2024/01/2020 Sale 85,954 0.00 11,503,930 0.2031/01/2020 Sale 20,809 0.00 11,483,121 0.2007/02/2020 Sale 530,272 0.01 10,952,849 0.1914/02/2020 Purchase 37,473 0.00 10,990,322 0.1921/02/2020 Sale 9,553 0.00 10,980,769 0.1928/02/2020 Sale 11,682 0.00 10,969,087 0.1906/03/2020 Purchase 560,096 0.01 11,529,183 0.2013/03/2020 Sale 24,125 0.00 11,505,058 0.2020/03/2020 Sale 58,856 0.00 11,446,202 0.2027/03/2020 Purchase 33,147 0.00 11,479,349 0.2031/03/2020 Sale 97,414 0.00 11,381,935 0.2031/03/2020 Closing Balance 0.00 11,381,935 0.20
10 01/04/2019 Opening Balance ISHARES EMERGING MARKETS MINIMUM VOLATILITYMAURITIUS
16,030,680 0.27 16,030,680 0.2712/04/2019 Purchase 180690 0.00 16,211,370 0.27 10/05/2019 Sale 148584 0.00 16,062,786 0.27 17/05/2019 Sale 83835 0.00 15,978,951 0.26 24/05/2019 Sale 1496491 0.02 14,482,460 0.24 31/05/2019 Sale 5451573 0.09 9,030,887 0.15 07/06/2019 Sale 472805 0.01 8,558,082 0.14 21/06/2019 Sale 22776 0.00 8,535,306 0.14 29/06/2019 Sale 8535306 0.14 - - 31/03/2020 Closing Balance - -
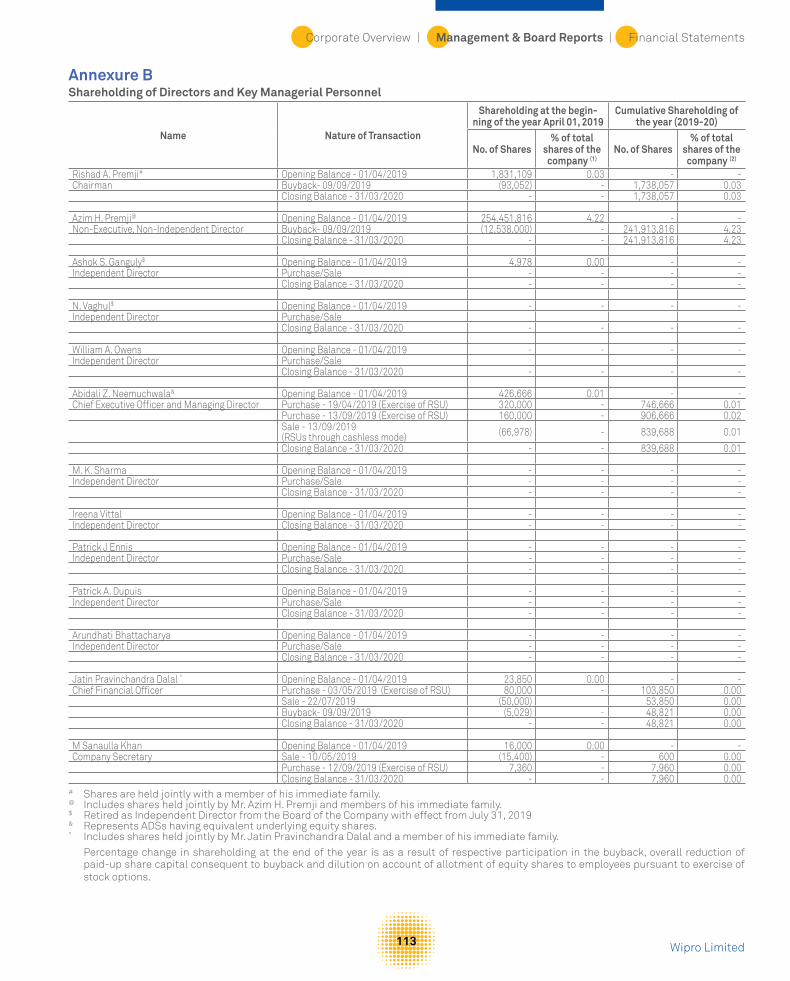
Corporate Overview | Management & Board Reports | Financial Statements
Wipro Limited113
Annexure BShareholding of Directors and Key Managerial Personnel
Name Nature of Transaction
Shareholding at the begin-ning of the year April 01, 2019
Cumulative Shareholding of the year (2019-20)
No. of Shares% of total
shares of the company (1)
No. of Shares% of total
shares of the company (2)
Rishad A. Premji# Opening Balance - 01/04/2019 1,831,109 0.03 - -Chairman Buyback- 09/09/2019 (93,052) - 1,738,057 0.03 Closing Balance - 31/03/2020 - - 1,738,057 0.03
Azim H. Premji@ Opening Balance - 01/04/2019 254,451,816 4.22 - -Non-Executive, Non-Independent Director Buyback- 09/09/2019 (12,538,000) - 241,913,816 4.23 Closing Balance - 31/03/2020 - - 241,913,816 4.23
Ashok S. Ganguly$ Opening Balance - 01/04/2019 4,978 0.00 - -Independent Director Purchase/Sale - - - - Closing Balance - 31/03/2020 - - - -
N. Vaghul$ Opening Balance - 01/04/2019 - - - -Independent Director Purchase/Sale Closing Balance - 31/03/2020 - - - -
William A. Owens Opening Balance - 01/04/2019 - - - -Independent Director Purchase/Sale Closing Balance - 31/03/2020 - - - -
Abidali Z. Neemuchwala& Opening Balance - 01/04/2019 426,666 0.01 - -Chief Executive Officer and Managing Director Purchase - 19/04/2019 (Exercise of RSU) 320,000 - 746,666 0.01 Purchase - 13/09/2019 (Exercise of RSU) 160,000 - 906,666 0.02
Sale - 13/09/2019 (RSUs through cashless mode) (66,978) - 839,688 0.01
Closing Balance - 31/03/2020 - - 839,688 0.01
M. K. Sharma Opening Balance - 01/04/2019 - - - -Independent Director Purchase/Sale - - - - Closing Balance - 31/03/2020 - - - -
Ireena Vittal Opening Balance - 01/04/2019 - - - -Independent Director Closing Balance - 31/03/2020 - - - -
Patrick J Ennis Opening Balance - 01/04/2019 - - - -Independent Director Purchase/Sale - - - - Closing Balance - 31/03/2020 - - - -
Patrick A. Dupuis Opening Balance - 01/04/2019 - - - -Independent Director Purchase/Sale - - - - Closing Balance - 31/03/2020 - - - -
Arundhati Bhattacharya Opening Balance - 01/04/2019 - - - -Independent Director Purchase/Sale - - - - Closing Balance - 31/03/2020 - - - -
Jatin Pravinchandra Dalal ^ Opening Balance - 01/04/2019 23,850 0.00 - -Chief Financial Officer Purchase - 03/05/2019 (Exercise of RSU) 80,000 - 103,850 0.00 Sale - 22/07/2019 (50,000) 53,850 0.00 Buyback- 09/09/2019 (5,029) - 48,821 0.00 Closing Balance - 31/03/2020 - - 48,821 0.00
M Sanaulla Khan Opening Balance - 01/04/2019 16,000 0.00 - -Company Secretary Sale - 10/05/2019 (15,400) - 600 0.00 Purchase - 12/09/2019 (Exercise of RSU) 7,360 - 7,960 0.00 Closing Balance - 31/03/2020 - - 7,960 0.00
# Shares are held jointly with a member of his immediate family.@ Includes shares held jointly by Mr. Azim H. Premji and members of his immediate family. $ Retired as Independent Director from the Board of the Company with effect from July 31, 2019& Represents ADSs having equivalent underlying equity shares.^ Includes shares held jointly by Mr. Jatin Pravinchandra Dalal and a member of his immediate family. Percentage change in shareholding at the end of the year is as a result of respective participation in the buyback, overall reduction of
paid-up share capital consequent to buyback and dilution on account of allotment of equity shares to employees pursuant to exercise of stock options.

Annual Report 2019-20 114
Annexure CRemuneration to other Directors 2019-20: (` in Crores)
Particulars of Remuneration
Independent Directors
Non-Executive
Non- Independent
DirectorMr. William A. Owens*
Mr. M. K. Sharma
Mrs. Ireena Vittal
Dr. Patrick J. Ennis*
Mr. Patrick A. Dupuis* @
Mrs. Arundhati Bhattacharya
Mr. N. Vaghul#
Dr. Ashok Ganguly#
Mr. Azim H. Premji
Fee for attending board and committee meetings
0.04 0.05 0.05 0.04 0.04 0.05 0.02 0.02 0.03
Commission 2.66 1.03 0.96 1.95 1.46 0.84 0.36 0.28 0.48
Others, please specify - - - - - - - - -
TOTAL 2.70 1.08 1.01 1.99 1.50 0.89 0.38 0.30 0.51
* Figures mentioned are ` equivalent of amount paid in US$.@ In support of Wipro’s humanitarian efforts to combat COVID-19, Mr. Patrick Dupuis, Independent Director, has foregone the commission
payable to him for quarter ended March 31, 2020 and Wipro will contribute Mr. Dupuis’ commission to Wipro Cares for its various COVID-19 related activities as part of its Corporate Social Responsibility program.
# Retired as Independent Director from the Board of the Company with effect from July 31, 2019.
Figures in the above table have been rounded-off to two decimals.

Corporate Overview | Management & Board Reports | Financial Statements
Wipro Limited115
I. Wipro’s Philosophy on Corporate Governance
Wipro’s governance framework is driven by the objective of enhancing long term stakeholder value without compromising on ethical standards and corporate social responsibilities. Efficient corporate governance requires a clear understanding of the respective roles of the Board of Directors (“Board”) and of senior management and their relationships with others in the corporate
Corporate Governance Reportstructure. Sincerity, fairness, good citizenship and commitment to compliance are key characteristics that drive relationships of the Board and senior management with other stakeholders.
Corporate governance philosophy of Wipro flows from the “Spirit of Wipro” which represents core values by which policies and practices of the organization are guided. The values encapsulated in the “Spirit of Wipro” are:
Corporate governance at Wipro is implemented through robust board governance processes, internal control systems and processes, and strong audit mechanisms. These are articulated through the Company’s Code of Business Conduct, Corporate Governance Guidelines and charters of various sub-committees of the Board and the Company’s Disclosure Policy. Wipro’s corporate governance practices can be described through the following four layers:
a) Governance by Shareholders
b) Governance by Board of Directors
c) Governance by Sub-committees of Board, and
d) Governance through management process
In this report, we have provided details on how the corporate governance principles are put in to practice within Wipro.
II. Shareholders
The Companies Act, 2013, Securities and Exchange Board of India (Listing Obligations and Disclosure Requirements) Regulations, 2015 (“Listing Regulations”) and New York Stock Exchange (NYSE) Listed Company Manual prescribe the governance mechanism by shareholders in terms of passing of ordinary and special resolutions, voting rights, participation in the corporate actions such as bonus, buyback of shares, declaration of dividend, etc. Your Company follows a robust process
Unyielding integrity in everything we do
Be passionate about clients’ success
Treat each person with respect
Be global and responsible
to ensure that the shareholders of the Company are well informed of Board decisions both on financial and non-financial matters and adequate notice with a detailed explanation is sent to the shareholders well in advance to obtain necessary approvals.
III. Board of Directors
1. Composition of Board
As at March 31, 2020, our Board had two Executive Directors, six non-executive Independent Directors and one non-executive non-independent Director. The Executive Chairman and Whole time Director, and the non-executive non-independent Director are Promoter Directors. The Chief Executive Officer (CEO) and Managing Director is a professional CEO who is responsible for the day to day operations of the Company. Of the seven Non-Executive Directors, six are Independent Directors, free from any business or other relationship that could materially influence their judgment. In the opinion of the Board, all the Independent Directors are independent of the management and satisfy the criteria of independence as defined under the Companies Act, 2013, the Listing Regulations and the NYSE Listed Company manual.
The Board is well diversified and consists of two women Independent Directors and three Directors who are foreign nationals. The profiles of our Directors are available on our website at https://www.wipro.com/leadership.

Annual Report 2019-20 116
2. Board Meetings
We decide about the Board meeting dates in consultation with the Board Governance, Nomination and Compensation Committee and all our Directors. Once approved by the Board Governance, Nomination and Compensation Committee, the schedule of the Board meetings and Board Committee meetings is communicated in advance to the Directors to enable them to attend the meetings.
Our Board meetings are normally scheduled over two days. In addition, every quarter, Independent Directors meet amongst themselves exclusively. In line with Para 4 of Schedule B of Securities and Exchange Board of India (Prohibition of Insider Trading) Regulations, 2015, it is the endeavor of the Company that the gap between the clearance of accounts by audit committee and board meeting is as narrow as possible, and Wipro is committed to adhere to this requirement.
3. Information Flow to the Board Members
Information is provided to the Board Members on a continuous basis for their review, inputs and approval from time to time. More specifically, we present our annual strategic plan and operating plans of our business to the Board for their review, inputs and approval. Likewise, our quarterly financial statements and annual financial statements are first presented to the Audit Committee and subsequently to the Board for their approval. In addition, various matters such as appointment of Directors and Key Managerial Personnel, corporate actions, review of internal and statutory audits, details of investor grievances, acquisitions, important managerial decisions, material positive/negative developments and statutory matters are presented to the respective Committees of the Board and later with the recommendation of Committees to the Board of Directors for their approval.
As a system, in most cases, information to Directors is submitted along with the agenda papers well in advance of the Board meeting. Inputs and feedback of Board Members are taken and considered while preparation of agenda and documents for the Board meeting.
Documents containing Unpublished Price Sensitive Information are submitted to the Board and Committee Members, at a shorter notice, as per the general consent taken from the Board, from time to time.
Post-Meeting Follow-up System
After the Board meeting, we have formal system of follow-up, review and reporting on actions taken by the management on the decisions of the Board and sub-committees of the Board.
4. Appointment of Directors
The Board has adopted the provisions with respect to appointment and tenure of Independent Directors consistent with the Companies Act, 2013 and the Listing Regulations.
As per the provisions of the Companies Act, 2013, the Independent Directors shall be appointed for not more than two terms of maximum of five years each and shall not be liable to retire by rotation.
At the time of appointment of an Independent Director, the Company issues a formal letter of appointment outlining his/her role, function, duties and responsibilities as a Director. The template of the letter of appointment is available on our website at https://www.wipro.com/investors/corporate-governance/.
Details of Directors proposed for appointment/ re-appointment at the 74th Annual General Meeting (AGM) is provided at page no. 73 as part of the Board’s Report and in the notice convening the 74th AGM.
Lead Independent Director
The Board has designated Mr. M. K. Sharma as the Lead Independent Director. The role of the Lead Independent Director is described in the Corporate Governance guidelines of your Company and is available on the Company’s website at https://www.wipro.com/investors/corporate-governance/.
5. Policy for Selection and Appointment of Directors and their Remuneration
The Board Governance, Nomination and Compensation Committee has adopted a policy which, inter alia, deals with the manner of selection of Directors and payment of their remuneration as described herein below.
Criteria of Selection of Independent Directors and Key Skills, Expertise, and Core Competencies of the Board
The Board of the Company comprises of eminent personalities and leaders in their respective fields. These Directors are nominated based on well-defined selection criteria. The Board Governance, Nomination and Compensation Committee considers, inter alia, key qualifications, skills, expertise and competencies, whilst recommending to the Board the candidature for appointment as Independent Director.
In case of appointment of Independent Directors, the Board Governance, Nomination and Compensation Committee satisfies itself about the independence of the Directors vis-à-vis the Company to enable the Board to discharge its functions and duties effectively.
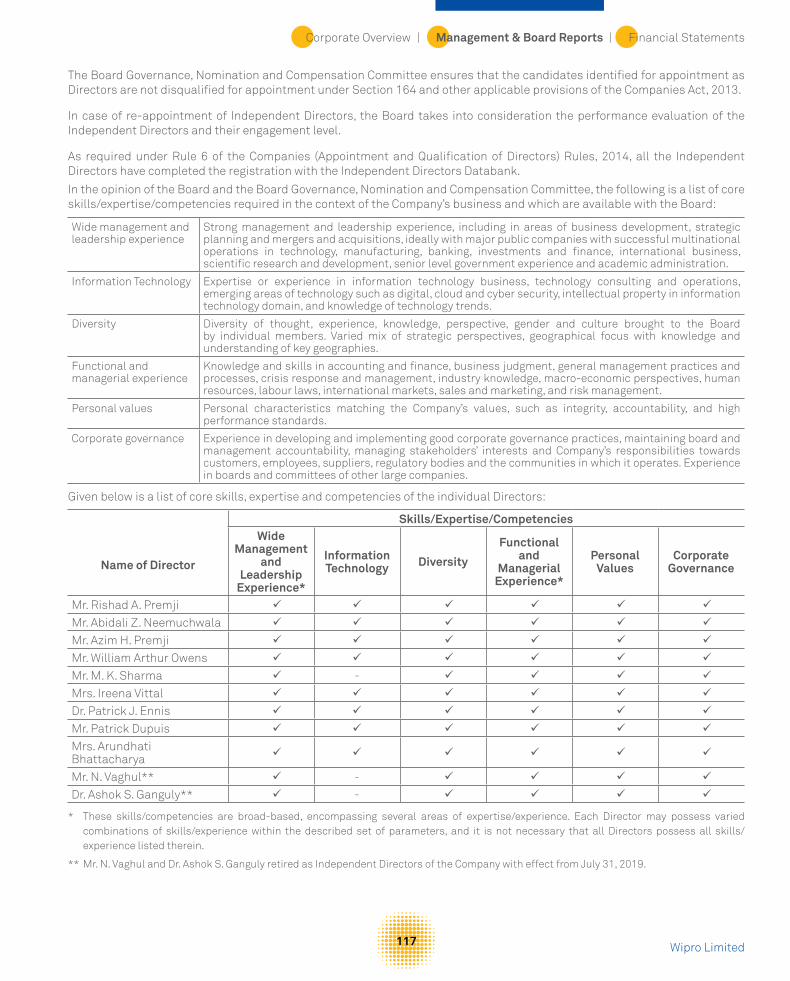
Corporate Overview | Management & Board Reports | Financial Statements
Wipro Limited117
The Board Governance, Nomination and Compensation Committee ensures that the candidates identified for appointment as Directors are not disqualified for appointment under Section 164 and other applicable provisions of the Companies Act, 2013.
In case of re-appointment of Independent Directors, the Board takes into consideration the performance evaluation of the Independent Directors and their engagement level.
As required under Rule 6 of the Companies (Appointment and Qualification of Directors) Rules, 2014, all the Independent Directors have completed the registration with the Independent Directors Databank.
In the opinion of the Board and the Board Governance, Nomination and Compensation Committee, the following is a list of core skills/expertise/competencies required in the context of the Company’s business and which are available with the Board:
Wide management and leadership experience
Strong management and leadership experience, including in areas of business development, strategic planning and mergers and acquisitions, ideally with major public companies with successful multinational operations in technology, manufacturing, banking, investments and finance, international business, scientific research and development, senior level government experience and academic administration.
Information Technology Expertise or experience in information technology business, technology consulting and operations, emerging areas of technology such as digital, cloud and cyber security, intellectual property in information technology domain, and knowledge of technology trends.
Diversity Diversity of thought, experience, knowledge, perspective, gender and culture brought to the Board by individual members. Varied mix of strategic perspectives, geographical focus with knowledge and understanding of key geographies.
Functional and managerial experience
Knowledge and skills in accounting and finance, business judgment, general management practices and processes, crisis response and management, industry knowledge, macro-economic perspectives, human resources, labour laws, international markets, sales and marketing, and risk management.
Personal values Personal characteristics matching the Company’s values, such as integrity, accountability, and high performance standards.
Corporate governance Experience in developing and implementing good corporate governance practices, maintaining board and management accountability, managing stakeholders’ interests and Company’s responsibilities towards customers, employees, suppliers, regulatory bodies and the communities in which it operates. Experience in boards and committees of other large companies.
Given below is a list of core skills, expertise and competencies of the individual Directors:
Name of Director
Skills/Expertise/CompetenciesWide
Management and
Leadership Experience*
Information Technology Diversity
Functional and
Managerial Experience*
Personal Values
Corporate Governance
Mr. Rishad A. Premji
Mr. Abidali Z. Neemuchwala
Mr. Azim H. Premji
Mr. William Arthur Owens
Mr. M. K. Sharma -
Mrs. Ireena Vittal
Dr. Patrick J. Ennis
Mr. Patrick Dupuis
Mrs. Arundhati Bhattacharya
Mr. N. Vaghul** -
Dr. Ashok S. Ganguly** -
* These skills/competencies are broad-based, encompassing several areas of expertise/experience. Each Director may possess varied combinations of skills/experience within the described set of parameters, and it is not necessary that all Directors possess all skills/experience listed therein.
** Mr. N. Vaghul and Dr. Ashok S. Ganguly retired as Independent Directors of the Company with effect from July 31, 2019.

Annual Report 2019-20 118
6. Familiarization Programme and Training for Independent Directors
The Company has an orientation process/familiarization programme for its Independent Directors that includes:
a) Briefing on their role, responsibilities, duties, and obligations as a member of the Board.
b) Nature of business and business model of the Company, Company’s strategic and operating plans.
c) Matters relating to Corporate Governance, Code of Business Conduct, Risk Management, Compliance Programs, Internal Audit, etc.
As a process when a new independent director is appointed, a familiarization programme as described above is conducted by the senior management team and whenever a new member is appointed to a Board Committee, information relevant to the functioning of the Committee and the role and responsibility of Committee members is informed. Each of our Independent Directors have attended such orientation process/familiarization programme when they were inducted into the Board and these programs are generally spread over two days.
As part of ongoing training, the Company schedules quarterly meetings of business heads and functional heads with the Independent Directors. During these meetings, comprehensive presentations are made on the various aspects such as business models, new business strategies and initiatives by business leaders, risk minimization procedures, recent trends in technology, changes in domestic/overseas industry scenario, digital transformation, state of global IT Services industry, and regulatory regime affecting the Company globally. These meetings also facilitate Independent Directors to provide their inputs and suggestions on various strategic and operational matters directly to the business and functional heads. The details of the familiarization programme are also available on the website of the Company at https://www.wipro.com/investors/corporate-governance/.
7. Succession Planning
We have an effective mechanism for succession planning which focuses on orderly succession of Directors, including Executive Directors and other senior management team and other executive officers. The Board Governance, Nomination and Compensation Committee implements this mechanism in concurrence with the Board.
The Board Governance, Nomination and Compensation Committee presents to the Board on a periodic basis,
succession plans for appointments to the Board based on various factors such as current tenure of Directors, outcome of performance evaluation, Board diversity and business requirements. In addition, the Company conducts an annual Talent Review Process for senior management and other executive officers which provides a leadership-level talent inventory and capability map that reflects the extent to which critical talent needs are fulfilled vis-a-vis business drivers.
The Board Governance, Nomination and Compensation Committee reviews the outcome of this process and presents the succession plan for senior management and other executive officers to the Board.
8. Board Evaluation
Details of methodology adopted for Board evaluation have been provided at page no. 74 as part of the Board’s Report.
9. Remuneration Policy and Criteria of Making Payments to Directors, Senior Management and Key Managerial Personnel
The Independent Directors are entitled to receive remuneration by way of sitting fees, reimbursement of expenses for participation in the Board/Committee meetings and commission as detailed hereunder:
a) Sitting fees for each meeting of the Board or Committee of the Board attended by him or her, of such sum as may be approved by the Board within the overall limits prescribed under the Companies Act, 2013.
b) Commission on a quarterly basis, of such sum as may be approved by the Board and Members on the recommendation of the Board Governance, Nomination and Compensation Committee. The aggregate commission payable to the Independent Directors shall not exceed 1% of the net profit of the Company during any financial year. The commission is payable on pro-rata basis to those Directors who occupy office for part of the year.
c) Reimbursement of travel, stay and other expenses for participation in Board/Committee meetings.
d) Independent Directors are not entitled to participate in the stock option schemes of the Company.
Following are the terms of conditions for determining the remuneration of Mr. Azim H. Premji, who is a Non-Executive, Non-independent Director:
a) Remuneration as applicable to other Non-Executive Directors of the Company, in addition to the sitting fees for attending the meetings of the Board thereof,

Corporate Overview | Management & Board Reports | Financial Statements
Wipro Limited119
as may be determined by the Board, provided however that the aggregate remuneration, including commission, paid to the Directors other than the Managing Director and Whole Time Directors in a financial year shall not exceed 1% of the net profits of the Company, in terms of Section 197 of the Companies Act, 2013 and computed in the manner referred to in Section 198 of the Companies Act, 2013.
b) Maintenance of Founder Chairman’s office including executive assistant at Company’s expense.
c) Reimbursement of travel, stay and entertainment expenses actually and properly incurred in the course of business as per the Company’s policy.
In determining the remuneration of Chairman, CEO and Managing Director, and Senior Management Employees and Key Managerial Personnel, the Board Governance, Nomination and Compensation Committee and the Board shall ensure/consider the following:
a) The balance between fixed and variable pay reflecting short-term and long-term performance objectives,
appropriate to the working of the Company and its goals.
b) Alignment of remuneration of Key Managerial Personnel and Directors with long-term interests of the Company.
c) Directors forming part of the Promoter and Promoter Group shall not be entitled to receive stock options.
d) Company’s performance vis-à-vis the annual achievement, individuals’ performance vis-à-vis KRAs/KPIs, industry benchmark and current compensation trends in the market.
The Board Governance, Nomination and Compensation Committee recommends the remuneration for the Chairman, CEO and Managing Director, Senior Management and Key Managerial Personnel. The payment of remuneration to the Executive Directors and Non-Executive Directors is approved by the Board and Members. Prior approval of Members is also obtained in case of remuneration payable to Non-Executive Directors. There was no change to the remuneration policy during the financial year.
Details of Remuneration to Directors
Details of remuneration paid to the Directors for the services rendered and stock options during the financial year 2019-20 are given below. No stock options were granted to any of the Independent Directors and Promoter Directors during the year 2019-20.
(Amt. in `)Rishad A. Premji(c)(e)
Abidali Z. Neemuchwala(a)(f)
Azim H. Premji(c)(g)
William Arthur Owens(a)
M. K. Sharma
Ireena Vittal
Patrick J. Ennis(a)
Patrick Dupuis(a)(d)
Arundhati Bhattacharya(h)
N. Vaghul(b) Ashok S. Ganguly (b)
Relationship with directors
Son of Azim H. Premji
None Father of Rishad A.
Premji
None None None None None None None None
Salary 13,143,006 76,417,305 1,000,000 NA NA NA NA NA NA NA NAAllowances 24,993,243 NA 436,728 NA NA NA NA NA NA NA NACommission/ Incentives/ Variable Pay
NA 91,513,209 4,786,156 26,602,705 10,275,416 9,614,583 19,507,051 14,593,777 8,412,084 3,575,000 2,816,667
Other annual compensation
9,843,915 154,536,941 7,167,731 NA NA NA NA NA NA NA NA
Retirals 3,548,612 339,637 1,631,388 NA NA NA NA NA NA NA NASitting fees NA NA 300,000 400,000 500,000 500,000 400,000 400,000 500,000 200,000 200,000TOTAL 51,528,776 322,807,092 15,322,003 27,002,705 10,775,416 10,114,583 19,907,051 14,993,777 8,912,084 3,775,000 3,016,667Notice period Up to 180
daysUp to 180 days NA NA NA NA NA NA NA NA NA
Notes:a) Figures mentioned in ` are equivalent to amounts paid in US$b) Mr. N. Vaghul and Dr. Ashok S. Ganguly each retired as Independent Directors of the Company with effect from July 31, 2019.c) In view of the current situation caused by COVID-19, uncertainty in business is likely to last for the next few months. To show solidarity with
the team in facing the challenge: i) Mr. Azim H. Premji, Founder Chairman, has foregone the profit linked commission payable to him for the relevant period for FY 2019-20. ii) Mr. Rishad A. Premji, Chairman, has foregone the variable pay and profit linked commission payable to him for the relevant period for
FY 2019-20.
Accordingly, the Board did not determine profit linked commission due to Mr. Azim H. Premji for FY 2019-20, variable pay and profit linked commission due to Mr. Rishad A. Premji for FY 2019-20 and the remuneration disclosed in the table above does not include the same.

Annual Report 2019-20 120
d) In support of Wipro’s humanitarian efforts to combat COVID-19, Mr. Patrick Dupuis, Independent Director, has foregone the commission payable to him for quarter ended March 31, 2020 and Wipro will contribute Mr. Dupuis’ commission to Wipro Cares for its various COVID-19 related activities as part of its Corporate Social Responsibility program.
e) Mr. Rishad A. Premji’s compensation also included cash bonus (part of his allowances) on an accrual basis, which is payable over a period of time.
f) The Company announced on January 31, 2020 that Mr. Abidali Z. Neemuchwala has resigned from the position of Chief Executive Officer and Managing Director due to family commitments and will, however, continue to hold the office of Chief Executive Officer and Managing Director until a successor is appointed. The Board of Directors has, at its meeting held on May 29, 2020, noted the resignation of Mr. Abidali Z. Neemuchwala as the Chief Executive Officer and Managing Director with effect from the end of the day on June 1, 2020. Compensation for the year ended March 31, 2020 includes cost of accelerated vesting of unvested options and variable pay. For further details, refer the “Terms of Employment Arrangements” below.
g) The executive compensation disclosed for Mr. Azim H. Premji is for the period April 1, 2019 to July 30, 2019. The commission and sitting fees disclosed for Mr. Azim H. Premji is for the period from July 31, 2019 to March 31, 2020 in his capacity as Non-Executive, Non-Independent Director.
h) The Board of Directors has, at its meeting held on May 29, 2020, noted the resignation of Ms. Arundhati Bhattacharya as an Independent Director with effect from close of business hours on June 30, 2020.
None of the Non-Executive Directors received remuneration exceeding 50% of the total annual remuneration paid to all Non-Executive Directors for the year ended March 31, 2020.
Terms of Employment Arrangements
Under the Companies Act, 2013, our shareholders must approve the salary, bonus and benefits of all executive directors at a General Meeting of the shareholders. Each of our Executive Directors has signed an agreement containing the terms and conditions of employment, including a monthly salary, performance bonus and benefits including vacation, medical reimbursement and pension fund contributions.
The terms of our employment arrangements with Mr. Rishad A. Premji and Mr. Abidali Z. Neemuchwala
provide for up to a 180-day notice period, up to 21 days of leave per year in addition to statutory holidays, and an annual compensation review. Additionally, they may be required to relocate as we may determine, and to comply with confidentiality provisions. Service contracts with our Executive Directors provide for our standard retirement benefits that consist of pension, provident fund and gratuity which are offered to all of our employees, but no other payout upon termination of employment except as mentioned below.
Pursuant to the terms of the employment arrangement with Mr. Abidali Z. Neemuchwala, if his employment is terminated by the Company, the Company is required to pay Mr. Neemuchwala severance pay equivalent to 12 months’ base pay.
We also indemnify our directors and officers for claims brought under any rule of law to the fullest extent permitted by applicable law.
Among other things, we agree to indemnify our directors and officers for certain expenses, judgments, fines and settlement amounts incurred by any such person in any action or proceeding, including any action by or in the right of the Company, arising out of such person’s services as our director or officer, including claims which are covered by the director’s and officer’s liability insurance policy taken by the Company.
On January 31, 2020, the Company announced that Mr. Neemuchwala has decided to step down due to his family commitments. Mr. Neemuchwala will continue to hold the office of Chief Executive Officer and Managing Director until a successor is appointed for a smooth transition. In appreciation of his services, and to facilitate a smooth transition and to ensure business continuity as usual, the Company has agreed that Mr. Neemuchwala would receive acceleration with respect to an aggregate of 960,000 unvested ADSs granted to Mr. Neemuchwala. In addition, he will be paid variable pay for the year ended March 31, 2020 within the range of remuneration approved by the shareholders, as may be determined by the Board of Directors. Pursuant to the resignation of Mr. Neemuchwala, the Company and Mr. Neemuchwala have agreed to terminate his employment arrangement with effect from the end of the day on June 1, 2020.

Corporate Overview | Management & Board Reports | Financial Statements
Wipro Limited121
Key Information pertaining to Directors as on March 31, 2020 is given below:
Sl. No.
Name of the Director and Director
Identification Number
(DIN)
DesignationDate of initialappointment
Date of appointment
as Independent Director under
Companies Act, 2013 and SEBI Listing
Regulations, (first term)1 of Board
Directorship in other
Companies2
Chairmanship in Committees
of Board of other
Companies3
Membership in
Committees of the Board
of other Companies
Attendance at the last AGM held on July 16,
2019
No. of shares held as on
March 31, 2020
Other Listed Companies where the Director is appointed
as Independent Director
1 Rishad A. Premji (02983899)
Executive Director and Chairman
01-May-2015 - 4 - - Yes 1,738,057@ -
2 Abidali Z. Neemuchwala (02478060)
Chief Executive Officer and Managing Director
01-Feb-2016 - - - - Yes 839,688* -
3 Azim H. Premji (00234280)
Non-Executive, Non- Independent Director
01-Sep-1968 - 12 - - Yes 241,913,816@ -
4 William Arthur Owens(00422976)
Independent Director
01-Jul-2006 23-Jul-2014 - - - Yes - -
5 M. K. Sharma(00327684)
Independent Director
01-Jul-2011 23-Jul-2014 10 1 3 Yes - 1. United Spirits Limited
2. Asian Paints Limited
3. Ambuja Cements Limited
4. Vedanata Limited 6 Ireena Vittal
(05195656) Independent Director
01-Oct-2013 23-Jul-2014 6 - 3 Yes - 1. Godrej Consumer Products Limited
2. Titan Company Limited
3. Housing Development Finance Corporation Limited
7 Patrick J. Ennis (07463299)
Independent Director
01-Apr-2016 01-Apr-2016 - - - Yes - -
8 Patrick Dupuis(07480046)
Independent Director
01-Apr-2016 01-Apr-2016 - - - Yes - -
9 Arundhati Bhattacharya (02011213)
Independent Director
01-Jan- 2019 01-Jan- 2019 6 - 2 Yes - 1. Reliance Industries Limited
2. CRISIL Limited3. Piramal Enterprises
Limited1 At the 70th Annual General Meeting, Mr. M. K. Sharma was re-appointed as Independent Director for a second term from July 1, 2016 to
June 30, 2021.
At the 71st Annual General Meeting, Mr. William Arthur Owens was re-appointed as Independent Director for a second term from August 1, 2017 to July 31, 2022.
At the 72nd Annual General Meeting, Mrs. Ireena Vittal was re-appointed as Independent Director for a second term from October 1, 2018 to September 30, 2023.
2 This does not include position in foreign companies and position as an advisory board member but includes position in private companies and companies under Section 8 of the Companies Act, 2013. None of our Directors hold directorship in more than seven listed companies.
3 In accordance with Regulation 26 of the Listing Regulations, Membership/Chairmanship of only Audit Committees and Stakeholders’ Relationship Committees in all public limited companies have been considered.
* Holds 839,688 ADS having equivalent underlying equity shares.@ includes shares held jointly with immediate family members.

Annual Report 2019-20 122
IV. Committees of Board
Our Board has constituted sub-committees to focus on specific areas and make informed decisions within the authority delegated to each of the Committees. Each Committee of the Board is guided by its Charter, which defines the scope, powers and composition of the Committee. All decisions and recommendations of the Committees are placed before the Board for information or approval.
During the financial year, the Board has accepted the recommendations of Committees on matters where such a recommendation is mandatorily required. There have been no instances where such recommendations have not been considered.
We have four sub-committees of the Board as at March 31, 2020:
a) Audit, Risk and Compliance Committee, which also acts as Risk Management Committee
b) Board Governance, Nomination and Compensation Committee, which also oversees the CSR initiatives of the Company and acts as the CSR Committee
c) Administrative and Shareholders/Investors Grievance Committee (Stakeholders Relationship Committee)
d) Strategy Committee
1. Audit, Risk and Compliance Committee
The Audit, Risk and Compliance Committee of our Board reviews, acts on and reports to our Board with respect to various auditing and accounting matters. The primary responsibilities include overseeing:
a) Auditing and accounting matters, including recommending the appointment of our independent auditors to the shareholders;
b) Compliance with legal and statutory requirements;
c) Integrity of the Company’s financial statements, discussions with the independent auditors regarding the scope of the annual audits, and fees to be paid to the independent auditors;
d) Performance of the Company’s internal audit function, independent auditors and accounting practices;
e) Review of related party transactions and functioning of whistle blower mechanism;
f) Implementation of the applicable provisions of the Sarbanes Oxley Act of 2002 (the “Sarbanes Oxley Act”), including review of the progress of internal control mechanisms to prepare for certification under Section 404 of the Sarbanes Oxley Act;
g) Evaluation of internal financial controls, risk management systems and policies including review of cyber-security; and
h) Review of utilization of loans and advances from, and investment by, the Company in its subsidiaries exceeding Rs.100 crore or 10% of the asset size of the subsidiary, whichever is lower, including existing loans, advances and investments.
The detailed charter of the Committee is posted on our website and available at https://www.wipro.com/investors/corporate-governance. All members of our Audit, Risk and Compliance Committee are Independent Directors and financially literate. The Chairman of our Audit, Risk and Compliance Committee has the accounting and financial management related expertise.
Statutory Auditors as well as Internal Auditors have independent meetings with the Audit, Risk and Compliance Committee and also participate in the Audit, Risk and Compliance Committee meetings. Our Chief Financial Officer, General Counsel, Internal Auditor, Finance Controller and other Corporate Officers make periodic presentations to the Audit, Risk and Compliance Committee on various issues.
Mr. M. K. Sharma, Independent Director, is the Chairman of the Audit, Risk and Compliance Committee. The other members of the Committee as at March 31, 2020 were Mrs. Ireena Vittal and Mrs. Arundhati Bhattacharya. The Chairman of the Committee was present at the Annual General Meeting held on July 16, 2019.
2. Board Governance, Nomination and Compensation Committee
The Board Governance, Nomination and Compensation Committee reviews, acts on and reports to our Board with respect to various governance, nomination and compensation matters. The primary responsibilities include:
a) Developing and recommending to the Board corporate governance guidelines applicable to the Company;
b) Evaluating the Board on a continuing basis, including an assessment of the effectiveness of the full Board, operations of the Board Committees and contributions of individual directors;
c) Establishing policies and procedures to assess the requirements for induction of new members to the Board;
d) Implementing policies and processes relating to corporate governance principles;

Corporate Overview | Management & Board Reports | Financial Statements
Wipro Limited123
e) Ensuring that appropriate procedures are in place to assess Board membership needs and Board effectiveness;
f) Reviewing the Company’s policies that relate to matters of corporate social responsibility (CSR), including public issues of significance to the Company and its shareholders;
g) Formulating the Disclosure Policy, its review and approval of disclosures;
h) Approving and evaluating the compensation plans, policies and programs for full-time directors and senior management;
i) Acting as Administrator of the Company’s Employee Stock Option Plans and Employee Stock Purchase Plans drawn up from time to time; and
j) Reviewing and recommending all remuneration, in whatever form, payable to senior management.
The detailed charter of Board Governance, Nomination and Compensation Committee is posted on our website and is available at https://www.wipro.com/investors/corporate-governance.
Our Chief Human Resources Officer makes periodic presentations to the Board Governance, Nomination and Compensation Committee on compensation reviews and performance linked compensation recommendations. All members of the Board Governance, Nomination and Compensation Committee are non-executive independent directors. The Board Governance, Nomination and Compensation Committee is the apex body that oversees our Corporate Social Responsibility policy and programs.
Mr. William Arthur Owens, Independent Director, is the Chairman of the Board Governance, Nomination and Compensation Committee. The other members of the Committee as at March 31, 2020 were Mrs. Ireena Vittal and Mr. M. K. Sharma. The Chairman of the Committee was present at the Annual General Meeting held on July 16, 2019.
3. Administrative and Shareholders/Investors Grievance Committee (Stakeholders Relationship Committee)
The Administrative and Shareholders/Investors Grievance Committee carries out the role of Stakeholders Relationship Committee in compliance with Section 178 of the Companies Act, 2013 and the Listing Regulations.
The Administrative and Shareholders/Investors Grievance Committee reviews, acts on and reports to
our Board with respect to various matters relating to stakeholders. The primary responsibilities include:
a) Redressal of grievances of the shareholders of the Company pertaining to transfer or transmission of shares, non-receipt of annual report and declared dividends, issue of new or duplicate share certificates, and grievances pertaining to corporate actions;
b) Approving consolidation, split or sub-division of share certificates, transmission of shares, issue of duplicate share certificates, re-materialization of shares;
c) Reviewing the grievance redressal mechanism implemented by the Company in coordination with Company’s Registrar and Transfer Agent (“RTA”) from time to time;
d) Reviewing the measures taken by the Company for effective exercise of voting rights by shareholders;
e) Implementing and overseeing the procedures and processes in handling and maintenance of records, transfer of securities and payment of dividend by the Company, RTA and dividend processing bank;
f) Reviewing the various measures and initiatives taken by the Company for reducing the quantum of unclaimed dividends and ensuring timely receipt of dividend warrants, annual reports and statutory notices by the shareholders of the Company.
g) Overseeing administrative matters like opening and closure of Company’s bank accounts, grant and revocation of general, specific and banking powers of attorney; and
h) Considering and approving allotment of equity shares pursuant to exercise of stock options, setting up branch offices and other administrative matters as delegated by the Board from time to time.
The detailed charter of the Committee is available on our website at https://www.wipro.com/investors/corporate-governance/.
Mr. M. K. Sharma, Independent Director, is the Chairman of the Administrative and Shareholders/Investors Grievance Committee. The other members of the Committee as at March 31, 2020 were Mrs. Arundhati Bhattacharya and Mr. Rishad A. Premji. The Chairman of the Committee was present at the Annual General Meeting held on July 16, 2019.
Mr. M Sanaulla Khan, Company Secretary, is our Compliance Officer under the Listing Regulations.

Annual Report 2019-20 124
Status Report of investor queries and complaints for the period from April 1, 2019 to March 31, 2020 is given below:
Sl.No.
ParticularsNo. of
Complaints1. Investor complaints pending at the
beginning of the yearNIL
2. Investor complaints received during the year
3,442*
3. Investor complaints disposed of during the year
3,442*
4. Investor complaints remaining unresolved at the end of the year
NIL
* of the 3,442 complaints received, 3,080 were clarifications regarding buyback of equity shares.
Apart from these queries/complaints, there are certain pending cases relating to dispute over title to shares, in which in certain cases the Company has been made a party. However, these cases are not material in nature.
4. Strategy Committee
The Strategy Committee reviews, acts and reports to our Board with respect to the mission, vision and strategic direction of the Company. Primary responsibilities of this Committee, inter alia, are:
a) Making recommendations to the Board relating to the Company’s mission, vision, strategic initiatives, major programs and services;
b) Ensuring management has established an effective strategic planning process, including development of a three to five year strategic plan with measurable goals and time targets;
c) Annually reviewing the strategic plan for the Company and for each division and entity as well and recommending updates to the Board;
d) Establishing criteria for management to evaluate potential strategic investments, reviewing proposals for acquisition or divestment opportunities for the Company and making appropriate recommendations to the Board, and reviewing post-transaction integration matters; and
e) Monitoring the Company performance against measurable targets (e.g. market share, increase in revenue, or operating margin) or progress points (such as emerging technologies).
Mr. William Arthur Owens, Independent Director, is the Chairman of the Strategy Committee. The other members of the Committee as at March 31, 2020 were Mr. Azim H. Premji, Mrs. Ireena Vittal, Dr. Patrick J. Ennis, Mr. Patrick Dupuis, Mr. Abidali Z. Neemuchwala and Mr. Rishad A. Premji.
Attendance of Directors at Board and Committee meetings
Details of attendance of Directors at the Board meetings and Committee meetings for the year ended March 31, 2020 were as under:
Board Meeting (1)
Audit, Risk and Compliance
Committee (2)
Board Governance, Nomination and Compensation
Committee (also acts as CSR
Committee) (3)
Strategy Committee
Administrative and Shareholders/
Investors Grievance
Committee (4)
No. of meetings held during FY 2019-20
5 5 5 3 4
Date of meetings
April 15-16, 2019, June 6, 2019,
July 16-17, 2019, October 14-15,
2019, and January 13-14, 2020
April 16, 2019, June 6, 2019, July 17, 2019, October
15, 2019 and January 14, 2020
April 15, 2019, June 6, 2019, July 16,
2019, October 14, 2019 and January
13, 2020
April 15, 2019, October 14, 2019 and January 13,
2020
April 15, 2019, July 16, 2019, October
14, 2019 and January 13, 2020
Attendance of Directors
Rishad A. Premji* 5 NA NA 3 4
Abidali Z. Neemuchwala @ 4 NA NA 3 NA
Azim H. Premji # 5 NA NA 3 NA

Corporate Overview | Management & Board Reports | Financial Statements
Wipro Limited125
Board Meeting (1)
Audit, Risk and Compliance
Committee (2)
Board Governance, Nomination and Compensation
Committee (also acts as CSR
Committee) (3)
Strategy Committee
Administrative and Shareholders/
Investors Grievance
Committee (4)
William Arthur Owens 4 NA 4 3 NA
M. K. Sharma 5 5 2 NA 4
Ireena Vittal 5 5 2 3 2
Dr. Patrick J. Ennis 4 NA NA 3 NA
Patrick Dupuis 4 NA NA 3 NA
Arundhati Bhattacharya^ 5 5 NA NA 2
Dr. Ashok S. Ganguly $ 3 NA 3 NA NA
N. Vaghul $ 3 3 3 NA NA
* Mr. Rishad A. Premji was appointed as Executive Chairman of the Board with effect from July 31, 2019.
@ The Board of Directors has, at its meeting held on May 29, 2020, noted the resignation of Mr. Abidali Z. Neemuchwala as the Chief Executive Officer and Managing Director with effect from the end of the day on June 1, 2020.
# Mr. Azim H. Premji retired from the position of Executive Chairman and Managing Director with effect from July 30, 2019 and was appointed as a Non-Executive, Non-Independent Director of the Company effective July 31, 2019.
^ The Board of Directors has, at its meeting held on May 29, 2020, noted the resignation of Mrs. Arundhati Bhattacharya as an Independent Director with effect from close of business hours on June 30, 2020. In her resignation letter, Mrs. Arundhati Bhattacharya has indicated that the reason for her resignation is her decision to accept a full time role as Chairperson and CEO in another company. She has also confirmed that there is no other material reason, other than the reason stated in her resignation letter.
$ Mr. N. Vaghul and Dr. Ashok S. Ganguly retired as Independent Directors of the Company with effect from July 31, 2019.
1. Board Meeting: Mr. Abidali Z. Neemuchwala, Mr. William Arthur Owens, Dr. Patrick J. Ennis and Mr. Patrick Dupuis did not attend the Board Meeting held on June 6, 2019.
2. Audit, Risk and Compliance Committee: The Committee was re-constituted during the year and Mr. M. K. Sharma was appointed as Chairman of the Committee with effect from August 1, 2019.
3. Board Governance, Nomination and Compensation Committee:
a) The Committee was re-constituted during the year and Mr. William Arthur Owens was appointed as Chairman of the Committee and Mr. M. K. Sharma and Mrs. Ireena Vittal as members of the Committee with effect from August 1, 2019.
b) Since the appointment of Mr. M. K. Sharma and Mrs. Ireena Vittal as members of the Committee, there were two Committee meetings held on October 14, 2019 and January 13, 2020.
c) Mr. William Arthur Owens was not present at the Committee Meeting held on June 6, 2019.
4. Administrative and Shareholders/Investors Grievance Committee:
a) Mrs. Arundhati Bhattacharya was appointed as member of the Committee with effect from August 1, 2019. Consequently, the composition of the Committee is as follows: Mr. M. K. Sharma (Chairman), Mrs. Arundhati Bhattacharya and Mr. Rishad A. Premji (Members).
b) Since the appointment of Mrs. Arundhati Bhattacharya as member of the Committee, there were two Committee meetings held on October 14, 2019 and January 13, 2020.
V. Governance through Management process
1. Code of Business Conduct
In the year 1983, we articulated ‘Wipro Beliefs’ consisting of six statements. At the core of beliefs was integrity, articulated as “individual and company relationship should be governed by the highest standard of conduct and integrity”.
Over years, this articulation has evolved in form but remained constant in substance. Today we articulate it as Code of Business Conduct.
In our Company, the Board and all employees have a responsibility to understand and follow the Code of Business Conduct. All employees are expected to perform their work with honesty and integrity. Wipro’s Code of Business Conduct reflects general principles to guide employees in making ethical decisions. This

Annual Report 2019-20 126
Code is also applicable to our representatives. This Code outlines fundamental ethical considerations as well as specific considerations that need to be maintained for professional conduct. This Code has been displayed on the Company’s website at https://www.wipro.com/investors/corporate-governance.
2. Internal Audit
The Company has a robust Internal Audit function with the stated vision of “To be the best in class Internal Audit function globally”. In pursuit of this vision, the function provides an independent, objective assurance services to value-add and improve operations of business units and processes by:
a) Financial, Business Process and Compliance Auditb) Cyber Defense and Technology Auditc) Operation Reviewsd) Best Practices and Benchmarkinge) Leadership Development
The Head of Internal Audit reports to the Chairman of the Audit, Risk and Compliance Committee and administratively to the Chief Financial Officer. Head of Internal Audit has regular and exclusive meetings with the Audit, Risk and Compliance Committee.
The Internal Audit function is guided by its charter, as approved by the Audit, Risk and Compliance Committee. The Internal Audit function formulates an annual risk based audit plan based on consultations and inputs from the Board and business leaders and presents it to the Audit, Risk and Compliance Committee for approval. Findings of various audits carried out during the financial year are also periodically presented to the Audit, Risk and Compliance Committee. The Internal Audit function adopts a risk based audit approach and covers core areas such as compliance audits, financial audits, technology audits, third party risk audits, M&A audits, etc.
The function, which was the first Indian Internal Audit unit to get ISO certified in 1998 and win International award from Institute of Internal Auditors (IIA) won in 2002, was also an early adopter of the new ISO 9001:2015 Version. During the year, Internal Audit function is assessed to have “Met International Standards” prescribed by the Professional Practice of Internal Auditing issued by “International Institute of Internal Auditors (IIA)” by external firm (KPMG). Testimony to the functions’ innovation and excellence are the IIA awards won in these categories continuously over the last few years.
3. Disclosure Policy
In line with requirements under Regulation 30 of the Listing Regulations, the Company has framed a policy on disclosure of material events and information as per the Listing
Regulations, which is available on our website at https://www.wipro.com/investors/corporate-governance. The objective of this policy is to have uniform disclosure practices and ensure timely, adequate and accurate disclosure of information on an ongoing basis. The Company has constituted a Disclosure Committee consisting of senior officials, which approves all disclosures required to be made by the Company. Parity in disclosures are maintained through simultaneous disclosure on National Stock Exchange of India Limited, the BSE Limited and the New York Stock Exchange.
4. Policy for Preservation of Documents
Pursuant to the requirements under Regulation 9 of the Listing Regulations, the Board has formulated and approved a Document Retention Policy prescribing the manner of retaining the Company’s documents and the time period up to certain documents are to be retained. The policy percolates to all levels of the organization who handle the prescribed categories of documents.
5. Other Policies
The Company has adopted an Ombuds policy (vigil mechanism), a policy for prevention, prohibition & redressal of sexual harassment of women at workplace, as well as a code of conduct to regulate, monitor and report insider trading. Details of these are provided as part of the Board’s report.
VI. Disclosures
1. Disclosure of Materially Significant Related Party Transactions
All related party transactions that were entered during the financial year were at an arm’s length basis and were in the ordinary course of business. There are no materially significant related party transactions made by the Company with Promoters, Directors, Key Managerial Personnel or other designated persons which may have a potential conflict with the interest of the Company at large.
As required under Regulation 23 of the Listing Regulations, the Company has adopted a policy on Related Party Transactions. The abridged policy on Related Party Transactions is available on the Company’s website at https://www.wipro.com/investors/corporate-governance.
Apart from receiving director remuneration, none of the Directors have any pecuniary relationships or transactions vis-à-vis the Company. During the year 2019-20, no transactions of material nature were

Corporate Overview | Management & Board Reports | Financial Statements
Wipro Limited127
entered by the Company with the management or their relatives that may have a potential conflict of interest with the Company and the concerned officials have given undertakings to that effect as per the provisions of the Listing Regulations.
The Register under Section 189 of the Companies Act, 2013 is maintained and particulars of the transactions have been entered in the Register, as applicable.
2. Subsidiary Monitoring Framework
All the subsidiary companies of the Company are managed by their Boards having the rights and obligations to manage these companies in the best interest of respective stakeholders. The Company nominates its representatives on the Board of subsidiary companies and monitors performance of such companies, inter alia, by reviewing:
a) Financial statements, the investment made by the unlisted subsidiary companies, statement containing all significant transactions and arrangements entered by the unlisted subsidiary companies forming part of the financials being reviewed by the Audit, Risk and Compliance Committee of the Company on a quarterly basis.
b) Minutes of the meetings of the unlisted subsidiary companies, if any, are placed before the Company’s Board regularly.
c) Providing necessary guarantees, letter of comfort and other support for their day-to-day operations from time-to-time.
The Company does not have any subsidiary whose income or net worth exceeds 10% of the consolidated income or net worth of the Company in the immediately preceding financial year.
3. Details of non-compliance by the Company, penalties, and strictures imposed on the Company by Stock Exchanges or SEBI or any statutory authority, on any matter related to capital markets, during the last three years.
The Company has complied with the requirements of the Stock Exchanges or SEBI on matters related to Capital Markets, as applicable, during the last three years. No penalties or strictures have been imposed on the Company.
4. Whistle Blower Policy and affirmation that no personnel have been denied access to the Audit, Risk and Compliance Committee
As detailed in the Board’s Report, the Company has adopted an Ombuds process which is a channel for receiving and redressing employees’ complaints. No personnel in the Company has been denied access
to the Audit, Risk and Compliance Committee or its Chairman.
5. Transfer to Investor Education and Protection Fund Authority
a) Pursuant to the Provisions of Section 124(6) of the Companies Act, 2013 and Investor Education and Protection Fund (IEPF) rules, during the year 2019-20, unclaimed dividend for financial years 2011-12 and 2012-13 of ` 7,911,052/- and ` 4,094,448/- respectively, were transferred to the IEPF.
b) Pursuant to the provisions of Section 124(6) of the Companies Act, 2013 and IEPF rules, during the year 2019-20, 35,997 equity shares in respect of which dividend has not been claimed for the final dividend declared in financial year 2011-12 and interim dividend declared in financial year 2012-13 were transferred to the IEPF.
6. Disclosures with respect to demat suspense account/ unclaimed suspense account (Unclaimed Shares)
Pursuant to Regulation 39 of the Listing Regulations, reminder letters have been sent to shareholders whose shares remain unclaimed from the Company. Based on their response, such shares have been transferred to “unclaimed suspense account” as per the provisions of Schedule VI of the Listing Regulations. The disclosure as required under Schedule V of the Listing Regulations is given below:
Sl. No. Particulars No. of
ShareholdersNo. of
Shares1. Aggregate number of
shareholders and the outstanding shares in the suspense account lying at the beginning of the year
303 302,659
2. Number of shareholders who approached the Company for transfer of shares from suspense account during the year
7 30,743
3. Number of shareholders to whom shares were transferred from suspense account during the year
7 30,743
4. Aggregate number of shareholders and the outstanding shares in the suspense account lying at the end of the year
296 271,916
5. Voting rights on these shares shall remain frozen till the rightful owner of such shares claim the same
Yes

Annual Report 2019-20 128
7. Shareholder Information
Various shareholder information required to be disclosed pursuant to Schedule V of the Listing Regulations are provided in Annexure I to this Report.
8. Compliance with Mandatory Requirements
Your Company has complied with all the mandatory corporate governance requirements under the Listing Regulations. Specifically, your Company confirms compliance with corporate governance requirements specified in Regulation 17 to 27 and clauses (b) to (i) of Sub-Regulation (2) of Regulation 46 of the Listing Regulations.
9. Certificates from Practising Company Secretary
The certificate dated May 29, 2020, issued by Mr. V. Sreedharan, Partner, V Sreedharan & Associates, Company Secretaries, is given at page no. 135 of this Annual Report in compliance with corporate governance norms prescribed under the Listing Regulations.
The Company has received certificate dated May 29, 2020, from Mr. V. Sreedharan, Partner, V Sreedharan & Associates, Company Secretaries, confirming that none of the Directors of the Company have been debarred or disqualified from being appointed or continuing as director of companies by the SEBI/Ministry of Corporate of Affairs or any such authority. The certificate is given at page no. 136 of this Annual Report.
VII. Compliance Report on Discretionary requirements under Regulation 27(1) of the Listing Regulations
1. The Board
As per para A of Part E of Schedule II of the Listing Regulations, a non-executive Chairman of the Board may be entitled to maintain a Chairman’s Office at the company’s expense and also allowed reimbursement of expenses incurred in performance of his duties. The Chairman of the Company is an Executive Director and hence this provision is not applicable to us.
2. Shareholders rights
Considering the dynamic shareholder demography due to trading on the stock exchanges, as a prudent measure,
we display our quarterly and half yearly results on our website www.wipro.com and also publish our results in widely circulated newspapers. We have communicated the payment of dividend by e-mail to shareholders in addition to dispatch of letters to all shareholders. We publish the voting results of shareholder meetings and make it available on our website www.wipro.com, and report the same to Stock Exchanges in terms of Regulation 44 of the Listing Regulations.
3. Modified opinion(s) in audit report
The Auditors have issued an un-modified opinion on the financial statements of the Company.
4. Reporting of Internal Auditor
Reporting of Head of Internal Audit is to the Chairman of the Audit, Risk and Compliance Committee and administratively to the Chief Financial Officer. Head of Internal Audit has regular and exclusive meetings with the Audit Committee.
5. NYSE Corporate Governance Listing Standards
The Company has made necessary disclosures in compliance with the New York Stock Exchange Listing Standards and NYSE Listed Company Manual on its website https://www.wipro.com/investors/ corporate-governance and has filed the same with the New York Stock Exchange (NYSE).
Place: Bengaluru Rishad A. PremjiDate: May 29, 2020 Chairman
Declaration as required under Regulation 34(3) and Schedule V of the Listing Regulations
All Directors and senior management personnel of the Company have affirmed compliance with Wipro’s Code of Business Conduct for the financial year ended March 31, 2020.
Rishad A. Premji Abidali Z. NeemuchwalaChairman Chief Executive Officer and
Managing Director
Place: BengaluruDate: May 29, 2020

Corporate Overview | Management & Board Reports | Financial Statements
Wipro Limited129
ANNEXURE I
Shareholder Information
Annual General Meeting
Pursuant to the General Circular No. 14/2020 dated April 8, 2020, General Circular No. 17/2020 dated April 13, 2020 and General Circular No. 20/2020 dated May 5, 2020, issued by the Ministry of Corporate Affairs, the 74th Annual General Meeting (AGM) for the year ended March 31, 2020 is scheduled to be held on Monday, July 13, 2020 at 9.00 AM IST through Video Conferencing.
The Members may attend the 74th AGM scheduled to be held on July 13, 2020, 9:00 AM IST onwards, through VC or watch the live web-cast at https://emeetings.kfintech.com. Detailed instructions for participation are provided in the notice of the 74th AGM. The proceedings of the 74th AGM will be available through VC and live web-cast to the shareholders as on the cut-off date i.e. July 6, 2020.
Annual General Meetings of the Last Three Years and Special Resolutions, if any.
Financial Year
Date and Time
Venue Special resolutions passed
2016-17 July 19, 2017 at 4:00 PM
Wipro Campus, Cafeteria Hall EC-3, Ground Floor, Opp. Tower 8, No. 72, Keonics, Electronic City, Hosur Road, Bengaluru – 561229
i. Re-appointment of Mr. Azim H. Premji (DIN: 00234280) as Executive Chairman and Managing Director of the Company.
ii. Re-appointment of Mr. William Arthur Owens (DIN: 00422976) as Independent Director of the Company
2017-18 July 19, 2018 at 4:00 PM
i. Re-appointment of Mrs. Ireena Vittal (DIN: 05195656) as Independent Director of the Company.
2018-19 July 16, 2019 at 4:00 PM
i. Amendments to the Articles of Association of the Company
ii. Appointment of Mr. Azim H. Premji (DIN: 00234280) as Non-Executive, Non-Independent Director of the Company
Details of resolutions passed through postal ballot during Financial Year 2019-20 and details of the voting pattern:
The Company sought the approval of shareholders through notice of postal ballot dated April 16, 2019 for approval for Buyback of Equity Shares by way of special resolution and for appointment of Mrs. Arundhati Bhattacharya (DIN: 02011213) as an Independent Director of the Company, by way of ordinary resolution. The aforesaid resolutions were duly passed and the results of postal ballot/e-voting were announced on June 3, 2019. Mr. V. Sreedharan, Partner of V Sreedharan & Associates, Practicing Company Secretaries, was appointed as the Scrutinizer to scrutinize the postal ballot and remote e-voting process in a fair and transparent manner.
ResolutionNo. of Votes
PolledNo. of Votes
Cast in FavourNo. of Votes Cast Against
% of Votes Cast in Favour
on Votes Polled
% of Votes Cast Against
on Votes Polled
a) Approval for Buyback of Equity Shares 5,416,305,336 5,406,747,266 9,558,070 99.82 0.18b) Appointment of Mrs. Arundhati
Bhattacharya (DIN: 02011213) as an Independent Director of the Company
5,414,103,223 5,405,400,463 8,702,760 99.84 0.16
Procedure for Postal Ballot
The postal ballot is conducted in accordance with the provisions contained in Section 110 and other applicable provisions, if any, of the Companies Act, 2013, read with Rule 22 of the Companies (Management and Administration) Rules, 2014. The shareholders are provided the facility to vote either by physical ballot or through e-voting. The postal ballot notice is sent to shareholders in electronic form to the email addresses, where available, or in physical form through permitted mode where email addresses are not available. The Company also publishes a notice in the newspapers in accordance with the requirements under the Companies Act, 2013.

Annual Report 2019-20 130
shareholders holding equity shares as on the cut-off date may cast their votes through e-voting or through postal ballot during the voting period fixed for this purpose. After completion of scrutiny of votes, the scrutinizer submits his report to the Chairman and the results of voting by postal ballot are announced within 48 hours of conclusion of the voting period. The results are displayed on the website of the Company (www.wipro.com), and communicated to the Stock Exchanges, Depositories, and Registrar and Share Transfer Agents. The resolutions, if passed by the requisite majority, are deemed to have been passed on the last date specified for receipt of duly completed postal ballot forms or e-voting.
Means of Communication with Shareholders/Analysts:
We have established procedures to disseminate, in a planned manner, relevant information to our shareholders, analysts, employees and the society at large. Our Audit, Risk and Compliance Committee reviews the earnings press releases, Form 20-F filed with the Securities Exchange Commission (SEC) and annual and quarterly reports of the Company, before they are presented to the Board for their approval for release. The details of the means of communication with shareholders/analysts are given below:
News Releases and Presentations
All our news releases and presentations made at investor conferences and to analysts are posted on the Company’s website at https://www.wipro.com/investors.
Quarterly results Our quarterly results are published in widely circulated national newspapers such as Financial Express and the local daily Kannada Prabha.
Website The Company’s website contains a dedicated section for Investors (https://www.wipro.com/investors), where annual reports, earnings press releases, stock exchange filings, quarterly reports, and corporate governance policies are available, apart from the details about the Company, Board of Directors and Management.
Annual Report Annual Report containing audited standalone and consolidated financial statements together with Board’s Report, Corporate Governance Report, Management Discussion and Analysis Report, Auditors Report and other important information are circulated to the Members entitled thereto through permitted mode(s).
Other Disclosures/Filings Our Form 20-F filed with SEC containing detailed disclosures, along with other disclosures including Press Releases etc., are available at https://www.wipro.com/investors.
Communication of Results:
Means of Communications Number of times during 2019-20
Earnings Calls 4
Publication of results 4
Analysts/Investors Meetings Details are provided in the MD&A Report forming part of this Annual Report
Financial Calendar
The financial year of the Company starts from the 1st day of April and ends on 31st day of March of next year. Our tentative calendar for declaration of results for the financial year 2020-21 are as given below. In addition, the Board may meet on other dates as and when required.
Quarter Ending Release of Results
For the Quarter ending June 30, 2020 Third week of July, 2020
For the Quarter and half year ending September 30, 2020 Second week of October, 2020
For the Quarter and nine months ending December 31, 2020 Second week of January, 2021
For the year ending March 31, 2021 Second week of April, 2021
The Register of Members and Share Transfer books will remain closed from Friday, July 10, 2020 to Monday, July 13, 2020 (both days inclusive).

Corporate Overview | Management & Board Reports | Financial Statements
Wipro Limited131
Fees Paid to Statutory Auditors
The details of total fees for all services paid by the Company and its subsidiaries, on a consolidated basis, to the statutory auditor and all the entities in the network firm/network entity of which the statutory auditor is a part, are as follows:
(` Mn)
Type of Service FY 2019-20 FY 2018-19Audit Fees 81 73Tax Fees 51 40Others 17 12Total 149 125
Corporate Information
a) Corporate Identity Number (CIN): L32102KA1945PLC020800b) Company Registration Number: 20800c) International Securities Identification Number (ISIN): INE075A01022d) CUSIP Number for Wipro American Depository Shares: 97651M109e) Details of exchanges where Company’s shares are listed as at March 31, 2020:
Equity shares Stock Codes Address
BSE Limited (BSE) 507685 BSE Limited, Phiroze Jeejeebhoy Towers Dalal Street, Mumbai - 400001
National Stock Exchange of India Limited (NSE)
WIPRO Exchange Plaza, C-1, Block G, Bandra Kurla Complex, Bandra (E), Mumbai – 400051
American Depository Receipts
New York Stock Exchange (NYSE) WIT 11 Wall St, New York, NY 10005, United States of America
Notes:
1. Listing fees for the year 2020-21 have been paid to the Indian Stock Exchanges as on date of this report.
2. Listing fees to NYSE for the calendar year 2020 has been paid as on date of this report.
3. The stock code on Reuters is WIPR.NS and on Bloomberg is WPRO:IN
Distribution of Shareholding as on March 31, 2020
Category (No. of Shares)
31-Mar-20 31-Mar-19
No. of Shareholders
% of Shareholders
No. of Shares% of Total
EquityNo. of
Shareholders% of
ShareholdersNo. of Shares
% of Total Equity
1-5000 507,272 99.10 82,232,977 1.44 329,830 97.55 49,167,404 0.82
5001- 10000 1,697 0.33 12,032,833 0.21 1,793 0.53 12,691,399 0.21
10001- 20000 1,049 0.20 14,869,292 0.26 758 0.22 9,416,449 0.16
20001- 30000 400 0.08 9,808,813 0.17 373 0.11 6,554,524 0.11
30001- 40000 240 0.05 8,376,285 0.15 258 0.08 5,781,677 0.10
40001- 50000 162 0.03 7,250,873 0.13 642 0.19 22,529,224 0.37
50001- 100000 358 0.07 25,599,263 0.45 3,180 0.94 10,973,418 0.18
100001& Above 703 0.14 5,553,187,054 97.20 1,266 0.37 5,916,821,293 98.06
Total 511,881 100.00 5,713,357,390 100.00 338,100 100.00 6,033,935,388 100.00
Percentages in the above table are rounded-off to two deceimals.

Annual Report 2019-20 132
Market Share Price Data
The performance of our stock in the financial year 2019-20 is tabulated below:
April May June July August September October November December January February March
Volume traded NSE 178,492,453 153,419,897 125,300,252 98,971,963 92,371,363 91,876,505 84,915,080 47,239,668 55,643,470 83,627,949 58,548,600 121,332,817
Price in NSE during the month (in ` per share)
High 299.45 298.85 301.6 285.6 276.15 258.9 260.9 261 254.7 258.35 248.55 233.9
Date 30-Apr-19 02-May-19 14-Jun-19 03-Jul-19 01-Aug-19 05-Sep-19 30-Oct-19 01-Nov-19 23-Dec-19 14-Jan-20 20-Feb-20 05-Mar-20
Volume traded NSE 7,339,917 4,539,125 7,965,803 1,258,276 17,651,207 4,405,617 4,059,545 2,530,921 1,850,652 7,296,777 2,120,807 2,970,778
Low 254.95 279.65 280 255.9 245.05 235.75 232.2 236.5 235.4 235 219.7 159.4
Date 04-Apr-19 28-May-19 28-Jun-19 15-Jul-19 16-Aug-19 30-Sep-19 01-Oct-19 26-Nov-19 03-Dec-19 31-Jan-20 28-Feb-20 19-Mar-20
Volume traded NSE 6,419,198 44,137,428 3,149,389 4,747,449 4,972,435 3,298,953 4,377,330 7,690,402 2,865,185 5,553,638 5,637,309 5,990,642
S&P CNX Nifty Index during each month
High 11,856.15 12,041.15 12,103.0 11,981.75 11,181.45 11,694.85 11,945 12,158.8 12,293.9 12,430.5 12,246.7 11,433
Low 11,549.1 11,108.3 11,625.1 10,999.4 10,637.15 10,670.25 11,090.15 11,802.65 11,832.3 11,929.6 11,175.05 7,511.1
Wipro Price Movement vis-a-vis Previous Month High/Low (%)
High % 4.74% -0.20% 0.92% -5.31% -3.31% -6.25% 0.77% 0.04% -2.41% 1.43% -3.79% -5.89%
Low % 0.61% 9.69% 0.13% -8.61% -4.24% -3.80% -1.51% 1.85% -0.47% -0.17% -6.51% -27.45%
S&P CNX Nifty Index Movement vis-à-vis
High % 1.94% 1.56% 0.51% -1.00% -6.68% 4.59% 2.14% 1.79% 1.11% 1.11% -1.48% -6.64%
Low % 6.77% -3.82% 4.65% -5.38% -3.29% 0.31% 3.94% 6.42% 0.25% 0.82% -6.33% -32.79%
ADS Share Price during the Financial Year 2019-20
April May June July August September October November December January February March
Wipro ADS price in NYSE during each month closing ($)
4.6 4.47 4.35 4.19 3.82 3.66 3.99 3.64 3.75 3.63 3.47 3.14
NYSE TMT index during each month closing
9,155 8,762 9,196 9,277 9,027 9,121 9,213 9,470 9,560 9,549 8,910 7,717
Wipro ADS Price Movement (%) Vis a vis Previous month Closing
15.29% -2.83% -2.68% -3.68% -8.83% -4.19% 9.02% -8.77% 3.02% -3.20% -4.41% -9.51%
NYSE TMT Index movement (%) vis a vis Previous month closing
3.80% -4.30% 4.96% 0.88% -2.70% 1.04% 1.01% 2.78% 0.96% -0.12% -6.69% -11.39%

Corporate Overview | Management & Board Reports | Financial Statements
Wipro Limited133
Performance of Wipro equity shares relative to the SENSEX and NYSE Composite index during the period April 1, 2019 to March 31, 2020 is given in the following chart:
Other Disclosures
Description of Voting Rights All our equity shares carry voting rights on a pari-passu basis
Dematerialisation of Shares and Liquidity
99.85% of outstanding equity shares have been dematerialized as at March 31, 2020.
Outstanding ADR/GDR/Warrants or any other Convertible instruments, Conversion Date and Likely Impact on Equity
The Company has 2.45% of outstanding ADRs as on March 31, 2020.
Commodity Price Risk or Foreign Exchange Risk and Hedging Activities
The Company had no exposure to commodity and commodity risks for the financial year 2019-20. For Foreign exchange risk and hedging activities, please refer the MD&A Report for details.
Credit Ratings Wipro is rated A- by Standard & Poor (outlook stable), AAA by ICRA (reaffirmed in May 2020) and 5A1 by Dun & Bradstreet (condition strong) as at March 31, 2020. There has been no change in ratings during the year.
Plant Locations The Company has various offices in India and abroad. Details of these locations as on March 31, 2020 are available on our website www.wipro.com.
Registrar and Transfer Agents
Company’s share transfer and related activities are operated through its Registrar and Share Transfer Agents KFin Technologies Private Limited, Hyderabad.
Share Transfer System
In accordance with the proviso to Regulation 40(1) of the Listing Regulations, effective from April 1, 2019, transfers of shares of the Company shall not be processed unless the shares are held in the dematerialized form with a depository. Accordingly, shareholders holding equity shares in physical form are urged to have their shares dematerialized so as to be able to freely transfer them and participate in various corporate actions.

Annual Report 2019-20 134
Investor Queries and Grievances Redressal
Shareholders may write either to the Company or the Registrar and Share Transfer Agents for redressal of queries and grievances. The address and contact details of the concerned officials are given below.
Registrar and Share Transfer Agent:
KFin Technologies Private Limited, Unit: Wipro LimitedSelenium, Tower B, Plot 31-32, Gachibowli, Financial District, Nanakramguda, Hyderabad – 500 032. Toll Free No.: 1800 3454 001, Phone: (040) 6716 2222
Contact Persons:
Mr. B. Srinivas - E-mail id: [email protected]. Rajitha Cholleti - E-mail id: [email protected] Grievance can also be sent through email to the following designated E-mail id: [email protected].
Overseas Depository for ADSs - J.P. Morgan Chase Bank N.A. 383 Madison Avenue, Floor 11 New York, NY10179General: +1 800 990 1135From outside the U.S.: +1 651 453 2128Tel: +1 212 552 8926 New YorkEmail: [email protected]
Indian Custodian for ADSsIndia Sub CustodyOffice Address: J.P. Morgan Chase Bank, N.A. Mumbai Branch,Paradigm B-Wing, 6th Floor, Mindspace, Malad (W),Mumbai - 400 064Phone: +91 022 6649 2515 | F: +91 022 6649 2509
The e-mail address and contact details for all service related queries is:
Email id: [email protected]
Contact Persons:
Rohit Keer - E mail id: [email protected],Nekzad Behramkamdin - E mail id: [email protected] Vyas - Email id: [email protected]
Web-Based Query Redressal System
Members may utilize this facility extended by the Registrar and Share Transfer Agents for redressal of their queries.
Please visit https://karisma.kfintech.com/ and click on “investors” option for query registration through free identity registration to log on. Investor can submit the query in the “QUERIES” option provided on the website, which will generate the grievance registration number. For accessing the status/response to your query, please use the same number at the option “VIEW REPLY” after 24 hours. The investors can continue to put additional queries relating to the case till they are satisfied.
Shareholders can also send their correspondence to the Company with respect to their shares, dividend, request for annual reports and shareholder grievances. The contact details are provided below:
Mr. M Sanaulla Khan Vice President and Company Secretary Wipro Limited Doddakannelli, Sarjapur Road, Bengaluru - 560 035
Ph: +91 80 28440011 (Extn: 226185)Fax: +91 80 28440054Email: [email protected]
Mr. G Kothandaraman General Manager- FinanceWipro Limited Doddakannelli, Sarjapur Road, Bengaluru - 560 035
Ph: +91 80 28440011 (Extn: 226183)Fax: +91 80 28440054Email:[email protected]
Analysts can reach our Investor Relations Team for any queries and clarification on Financial/Investor Relations related matters:
Ms. Aparna C Iyer Vice President, FinanceCorporate Treasurer and Investor RelationsWipro Limited Doddkannelli, Sarjapur Road, Bengaluru - 560 035
Ph: +91 80 28440011 (Extn: 226186)Fax: +91 80 28440054Email: [email protected]
Mr. Abhishek Kumar Jain General Manager,Investor RelationsWipro Limited Doddkannelli, Sarjapur Road, Bengaluru - 560 035
Ph: +91 80 28440011 (Extn: 226143)Ph: +91-98457 91363Fax: +91 80 28440054Email: [email protected]
Corporate Overview | Management & Board Reports | Financial Statements
Wipro Limited135
Corporate Governance Compliance CertificateCorporate Identity Number: L32102KA1945PLC020800 Nominal Capital: ` 2527.40 crores To the Members of Wipro LimitedDoddakannelli, Sarjapur Road, Bengaluru – 560035
We have examined all the relevant records of Wipro Limited for the purpose of certifying compliance of the conditions of the Corporate Governance under the SEBI (Listing Obligations and Disclosure Requirements) Regulations, 2015 for the financial year ended March 31, 2020. We have obtained all the information and explanations which to the best of our knowledge and belief were necessary for the purposes of certification.
The compliance of conditions of corporate governance is the responsibility of the Management. Our examination was limited to the procedure and implementation process adopted by the Company for ensuring the compliance of the conditions of the corporate governance.
This certificate is neither an assurance as to the future viability of the Company nor of the efficacy or effectiveness with which the management has conducted the affairs of the Company.
In our opinion and to the best of our information and according to the explanations and information furnished to us, we certify that the Company has complied with all the mandatory requirements of Corporate Governance as stipulated in Schedule II of the said Regulations. As regards Discretionary Requirements specified in Part E of Schedule II of the SEBI (Listing Obligations and Disclosure Requirements) Regulations, 2015, the Company has complied with items C, D and E.
For V. SREEDHARAN & ASSOCIATESCompany Secretaries
(V. Sreedharan)Partner
FCS: 2347; CP No. 833UDIN No. : F002347B000296289
BengaluruMay 29, 2020

Annual Report 2019-20 136
Certificate of Non-Disqualification of Directors[Pursuant to Regulation 34(3) and Schedule V Para C clause (10)(i) of the SEBI
(Listing Obligations and Disclosure Requirements) Regulations, 2015] To, The Members of WIPRO LIMITEDDoddakannelli, Sarjapur Road, Bengaluru-560035 We have examined the relevant registers, records, forms, returns and disclosures received from the Directors of WIPRO LIMITED, having CIN L32102KA1945PLC020800 and having registered office at Doddakannelli, Sarjapur Road, Bengaluru-560035 (hereinafter referred to as ‘the Company’), produced before us by the Company for the purpose of issuing this Certificate, in accordance with Regulation 34(3) read with Schedule V Para-C Sub clause 10(i) of the Securities and Exchange Board of India (Listing Obligations and Disclosure Requirements) Regulations, 2015. In our opinion and to the best of our information and according to the verifications (including Directors Identification Number (DIN) status at the portal www.mca.gov.in) as considered necessary and explanations furnished to us by the Company & its officers, we hereby certify that none of the Directors on the Board of the Company as stated below for the Financial Year ending on March 31, 2020 have been debarred or disqualified from being appointed or continuing as Directors of companies by the Securities and Exchange Board of India (SEBI) and Ministry of Corporate Affairs (MCA) or any such other Statutory Authority. Details of Directors:
Sl. No. Name of Director DIN Date of appointment in Company
1. Mr. Azim Premji Hasham 00234280 01/09/1968
2. Mr. Mahendra Kumar Sharma 00327684 01/07/2011
3. Mr. William Arthur Owens 00422976 01/07/2006
4. Mrs. Arundhati Bhattacharya 02011213 01/01/2019
5. Mr. Abidali Z. Neemuchwala 02478060 01/02/2016
6. Mr. Rishad Premji Azim 02983899 01/05/2015
7. Mrs. Ireena Vittal 05195656 01/10/2013
8. Mr. Patrick John Ennis 07463299 01/04/2016
9. Mr. Patrick Lucien Andre Dupuis 07480046 01/04/2016 Ensuring the eligibility for the appointment/continuity of every Director on the Board is the responsibility of the management of the Company. Our responsibility is to express an opinion based on our verification. This certificate is neither an assurance as to the future viability of the Company nor of the efficiency or effectiveness with which the management has conducted the affairs of the Company.
For V. SREEDHARAN & ASSOCIATESCompany Secretaries
(V. Sreedharan)Partner
FCS: 2347; CP No. 833UDIN No. : F002347B000296245
BengaluruMay 29, 2020

Corporate Overview | Management & Board Reports | Financial Statements
Wipro Limited137
To The Members of Wipro Limited
Report on the Audit of the Standalone Financial Statements
Opinion
We have audited the accompanying standalone financial statements of Wipro Limited (“the Company”), which comprise the Balance Sheet as at March 31, 2020, the Statement of Profit and Loss (including Other Comprehensive Income), the Statement of Changes in Equity and the Statement of Cash Flows for the year then ended, and a summary of significant accounting policies and other explanatory information (herein after referred to as “the Standalone Financial Statements”).
In our opinion and to the best of our information and according to the explanations given to us, the aforesaid Standalone Financial Statements give the information required by the Companies Act, 2013 (“the Act”) in the manner so required and give a true and fair view in conformity with the Indian Accounting Standards prescribed under section 133 of the Act read with the Companies (Indian Accounting Standards) Rules, 2015, as amended, (“Ind AS”) and other accounting principles generally accepted in India, of the state of affairs of the Company as at March 31, 2020, its profit, total comprehensive income, changes in equity and its cash flows for the year ended on that date.
Basis for Opinion
We conducted our audit of the Standalone Financial Statements in accordance with the Standards on Auditing specified under section 143(10) of the Act (SAs). Our responsibilities under those Standards are further described in the Auditor’s Responsibility for the Audit of the Standalone Financial Statements section of our report. We are independent of the Company in accordance with the Code of Ethics issued by the Institute of Chartered Accountants of India (ICAI) together with the ethical requirements that are relevant to our audit of the Standalone Financial Statements under the provisions of the Act and the Rules made thereunder, and we have fulfilled our other ethical responsibilities in accordance with these requirements and the ICAI’s Code of Ethics. We believe that the audit evidence obtained by us is sufficient and appropriate to provide a basis for our audit opinion on the Standalone Financial Statements.
Key Audit Matters
Key audit matters are those matters that, in our professional judgment, were of most significance in our audit of the
Independent Auditor’s ReportStandalone Financial Statements of the current period. These matters were addressed in the context of our audit of the Standalone Financial Statements as a whole, and in forming our opinion thereon, and we do not provide a separate opinion on these matters. We have determined the matters described below to be the key audit matters to be communicated in our report.
Fixed price contracts using the percentage of completion method - Refer Notes 2 (iii)(a), 3(xiii)B and 22 to the financial statements.
Key Audit Matter Description
Revenue from fixed-price contracts, including software development, and integration contracts, where the performance obligations are satisfied over time, is recognized using the percentage-of-completion method.
Use of the percentage-of-completion method requires the Company to determine the project costs incurred to date as a percentage of total estimated project costs required to complete the project. The estimation of total project costs involves significant judgement and is assessed throughout the period of the contract to reflect any changes based on the latest available information. In addition, provisions for estimated losses, if any, on uncompleted contracts are recorded in the period in which such losses become probable based on the estimated project costs.
We identified the revenue recognition for fixed price contracts where the percentage-of-completion method is used as a key audit matter because of the significant judgment involved in estimating the efforts to complete such contracts.
This estimate has a high inherent uncertainty and requires consideration of progress of the contract, efforts incurred to-date and estimates of efforts required to complete the remaining contract performance obligations over the lives of the contracts.
This required a high degree of auditor judgment in evaluating the audit evidence supporting the application of the input method used to recognize revenue and a higher extent of audit effort to evaluate the reasonableness of the total estimated amount of revenue recognized on fixed-price contracts.
How the Key Audit Matter Was Addressed in the Audit
Our audit procedures related to estimates of efforts to complete for fixed-price contracts accounted using the

Annual Report 2019-20 138
percentage-of-completion method included the following, among others:
• We tested the effectiveness of controls relating to (1) recording of efforts incurred and estimation of efforts required to complete the remaining contract performance obligations, and (2) access and application controls pertaining to time recording and allocation systems, which prevents unauthorised changes to recording of efforts incurred.
• We evaluated management’s ability to reasonably estimate the progress towards satisfying the performance obligation by comparing actual information to estimates for performance obligations that have been fulfilled.
• We selected a sample of fixed price contracts with customers accounted using percentage-of-completion method and performed the following:
• Read the contract and based on the terms and conditions evaluated whether recognizing revenue over time was appropriate, and the contract was included in management’s calculation of revenue over time.
• Evaluated other information that supported the estimates of the progress towards satisfying the performance obligation.
• Evaluated the appropriateness of and consistency in the application of management’s policies and methodologies to estimate progress towards satisfying the performance obligation.
• Compared efforts incurred with Company’s estimate of efforts incurred to date to identify significant variations and evaluate whether those variations have been considered appropriately in estimating the remaining efforts to complete the contract.
• Tested the estimate for consistency with the status of delivery of milestones and customer acceptances and sign off from customers to identify possible delays in achieving milestones, which require changes in estimated efforts to complete the remaining performance obligations.
Allowance for credit losses Refer Notes 2(iii)(g), 3(ix)(A), and 9 to the financial statements
Key Audit Matter Description
The Company determines the allowance for credit losses based on historical loss experience adjusted to reflect current and estimated future economic conditions. The Company considered current and anticipated future
economic conditions relating to industries the Company deals with and the countries where it operates. In calculating expected credit losses, the Company also considered credit reports and other related credit information for its customers to estimate the probability of default in future and has taken into account estimates of possible effect from the pandemic relating to COVID-19.
We identified allowance for credit losses as a key audit matter because of the significant judgement involved in calculating the expected credit losses. This required a high degree of auditor judgment and an increased extent of effort when performing audit procedures to evaluate the reasonableness of management’s estimate of the expected credit losses.
How the Key Audit Matter Was Addressed in the Audit
Our audit procedures related to the allowance for credit losses for trade receivables, unbilled receivables and contract assets included the following, among others:
• We tested the effectiveness of controls over the (1) development of the methodology for the allowance for credit losses, including consideration of the current and estimated future economic conditions, (2) completeness and accuracy of information used in the estimation of probability of default, and (3) computation of the allowance for credit losses.
• For a sample of customers we tested the input data such as credit reports and other credit related information used in estimating the probability of default by comparing them to external and internal sources of information.
• We evaluated the incorporation of the applicable assumptions into the estimate of expected credit losses and tested the mathematical accuracy and computation of the allowances by using the same input data used by the Company.
• We evaluated the qualitative adjustment to the historical loss rates, including assessing the basis for the adjustments and the reasonableness of the significant assumptions.
Information Other than the Financial Statements and Auditor’s Report Thereon
• The Company’s Board of Directors is responsible for the other information. The other information comprises the information included in the Board’s Report and Corporate Governance Report, but does not include the Consolidated Financial Statements, Standalone Financial Statements and our auditor’s report thereon.
Corporate Overview | Management & Board Reports | Financial Statements
Wipro Limited139
• Our opinion on the Standalone Financial Statements does not cover the other information and we do not express any form of assurance conclusion thereon.
• In connection with our audit of the Standalone Financial Statements, our responsibility is to read the other information and, in doing so, consider whether the other information is materially inconsistent with the Standalone Financial Statements or our knowledge obtained during the course of our audit or otherwise appears to be materially misstated.
• If, based on the work we have performed, we conclude that there is a material misstatement of this other information, we are required to report that fact. We have nothing to report in this regard.
Management’s Responsibility for the Standalone Financial Statements
The Company’s Board of Directors is responsible for the matters stated in section 134(5) of the Act with respect to the preparation of these Standalone Financial Statements that give a true and fair view of the financial position, financial performance including other comprehensive income, changes in equity and cash flows of the Company in accordance with the Ind AS and other accounting principles generally accepted in India. This responsibility also includes maintenance of adequate accounting records in accordance with the provisions of the Act for safeguarding the assets of the Company and for preventing and detecting frauds and other irregularities; selection and application of appropriate accounting policies; making judgments and estimates that are reasonable and prudent; and design, implementation and maintenance of adequate internal financial controls, that were operating effectively for ensuring the accuracy and completeness of the accounting records, relevant to the preparation and presentation of the Standalone Financial Statements that give a true and fair view and are free from material misstatement, whether due to fraud or error.
In preparing the Standalone Financial Statements, management is responsible for assessing the Company’s ability to continue as a going concern, disclosing, as applicable, matters related to going concern and using the going concern basis of accounting unless management either intends to liquidate the Company or to cease operations, or has no realistic alternative but to do so.
Those Board of Directors are also responsible for overseeing the Company’s financial reporting process.
Auditor’s Responsibility for the Audit of the Standalone Financial Statements
Our objectives are to obtain reasonable assurance about whether the Standalone Financial Statements as a whole are free from material misstatement, whether due to fraud or error, and to issue an auditor’s report that includes our opinion. Reasonable assurance is a high level of assurance, but is not a guarantee that an audit conducted in accordance with SAs will always detect a material misstatement when it exists. Misstatements can arise from fraud or error and are considered material if, individually or in the aggregate, they could reasonably be expected to influence the economic decisions of users taken on the basis of these Standalone Financial Statements.
As part of an audit in accordance with SAs, we exercise professional judgment and maintain professional skepticism throughout the audit. We also:
• Identify and assess the risks of material misstatement of the Standalone Financial Statements, whether due to fraud or error, design and perform audit procedures responsive to those risks, and obtain audit evidence that is sufficient and appropriate to provide a basis for our opinion. The risk of not detecting a material misstatement resulting from fraud is higher than for one resulting from error, as fraud may involve collusion, forgery, intentional omissions, misrepresentations, or the override of internal control.
• Obtain an understanding of internal financial control relevant to the audit in order to design audit procedures that are appropriate in the circumstances. Under section 143(3)(i) of the Act, we are also responsible for expressing our opinion on whether the Company has adequate internal financial controls system in place and the operating effectiveness of such controls.
• Evaluate the appropriateness of accounting policies used and the reasonableness of accounting estimates and related disclosures made by the management.
• Conclude on the appropriateness of management’s use of the going concern basis of accounting and, based on the audit evidence obtained, whether a material uncertainty exists related to events or conditions that may cast significant doubt on the Company’s ability to continue as a going concern. If we conclude that a material uncertainty exists, we are required to draw attention in our auditor’s report to the related disclosures in the Standalone Financial Statements or, if such disclosures

Annual Report 2019-20 140
are inadequate, to modify our opinion. Our conclusions are based on the audit evidence obtained up to the date of our auditor’s report. However, future events or conditions may cause the Company to cease to continue as a going concern.
• Evaluate the overall presentation, structure and content of the Standalone Financial Statements, including the disclosures, and whether the Standalone Financial Statements represent the underlying transactions and events in a manner that achieves fair presentation.
Materiality is the magnitude of misstatements in the Standalone Financial Statements that, individually or in aggregate, makes it probable that the economic decisions of a reasonably knowledgeable user of the Standalone Financial Statements may be influenced. We consider quantitative materiality and qualitative factors in (i) planning the scope of our audit work and in evaluating the results of our work; and (ii) to evaluate the effect of any identified misstatements in the Standalone Financial Statements.
We communicate with those charged with governance regarding, among other matters, the planned scope and timing of the audit and significant audit findings, including any significant deficiencies in internal control that we identify during our audit.
We also provide those charged with governance with a statement that we have complied with relevant ethical requirements regarding independence, and to communicate with them all relationships and other matters that may reasonably be thought to bear on our independence, and where applicable, related safeguards.
From the matters communicated with those charged with governance, we determine those matters that were of most significance in the audit of the Standalone Financial Statements of the current period and are therefore the key audit matters. We describe these matters in our auditor’s report unless law or regulation precludes public disclosure about the matter or when, in extremely rare circumstances, we determine that a matter should not be communicated in our report because the adverse consequences of doing so would reasonably be expected to outweigh the public interest benefits of such communication.
Report on Other Legal and Regulatory Requirements
1. As required by Section 143(3) of the Act, based on our audit we report, that:
a) We have sought and obtained all the information and
explanations which to the best of our knowledge and belief were necessary for the purposes of our audit.
b) In our opinion, proper books of account as required by law have been kept by the Company so far as it appears from our examination of those books.
c) The Balance Sheet, the Statement of Profit and Loss (including Other Comprehensive Income), the Statement of Changes in Equity and the Statement of Cash Flows dealt with by this Report are in agreement with the relevant books of account.
d) In our opinion, the aforesaid Standalone Financial Statements comply with the Ind AS specified under Section 133 of the Act.
e) On the basis of the written representations received from the directors as on March 31, 2020 taken on record by the Board of Directors, none of the directors is disqualified as on March 31, 2020 from being appointed as a director in terms of Section 164(2) of the Act.
f) With respect to the adequacy of the internal financial controls over financial reporting of the Company and the operating effectiveness of such controls, refer to our separate Report in “Annexure A”. Our report expresses an unmodified opinion on the adequacy and operating effectiveness of the Company’s internal financial controls over financial reporting.
g) With respect to the other matters to be included in the Auditor’s Report in accordance with the requirements of section 197(16) of the Act, as amended, in our opinion and to the best of our information and according to the explanations given to us, the remuneration paid by the Company to its directors during the year is in accordance with the provisions of section 197 of the Act.
h) With respect to the other matters to be included in the Auditor’s Report in accordance with Rule 11 of the Companies (Audit and Auditors) Rules, 2014, as amended, in our opinion and to the best of our information and according to the explanations given to us:
i. The Company has disclosed the impact of pending litigations on its financial position in its Standalone Financial Statements;
ii. The Company has made provision, as required under the applicable law or accounting

Corporate Overview | Management & Board Reports | Financial Statements
Wipro Limited141
standards, for material foreseeable losses, if any, on long-term contracts including derivative contracts;
iii. There has been no delay in transferring amounts, required to be transferred, to the Investor Education and Protection Fund by the Company.
2. As required by the Companies (Auditor’s Report) Order, 2016 (“the Order”) issued by the Central Government in terms of Section 143(11) of the Act, we give in “Annexure
B” a statement on the matters specified in paragraphs 3 and 4 of the Order.
For DELOITTE HASKINS & SELLS LLPChartered AccountantsFirm Registration Number: 117366W/W-100018
Vikas BagariaPartnerMembership number: 60408
BengaluruMay 29, 2020
Annexure “A” to the Independent Auditor’s Report (Referred to in paragraph (f) under ‘Report on Other Legal and Regulatory Requirements’ section of our report of even date)
Report on the Internal Financial Controls Over Financial Reporting under Clause (i) of Sub-section 3 of Section 143 of the Companies Act, 2013 (“the Act”)
We have audited the internal financial controls over financial reporting of Wipro Limited (“the Company”) as of March 31, 2020 in conjunction with our audit of the Standalone Financial Statements of the Company for the year ended on that date.
Management’s Responsibility for Internal Financial Controls
The Board of Directors of the Company are responsible for establishing and maintaining internal financial controls based on the internal control over financial reporting criteria established by the Company considering the essential components of internal control stated in the Guidance Note on Audit of Internal Financial Controls Over Financial Reporting issued by the Institute of Chartered Accountants of India. These responsibilities include the design, implementation and maintenance of adequate internal financial controls that were operating effectively for ensuring the orderly and efficient conduct of its business, including adherence to company’s policies, the safeguarding of its assets, the prevention and detection of frauds and errors, the accuracy and completeness of the accounting records, and the timely preparation of reliable financial information, as required under the Act.
Auditor’s Responsibility
Our responsibility is to express an opinion on the Company’s internal financial controls over financial reporting of the Company based on our audit. We conducted our audit in accordance with the Guidance Note on Audit of Internal Financial Controls Over Financial Reporting (the “Guidance Note”) issued by the Institute of Chartered Accountants of India and the Standards on Auditing prescribed under Section 143(10) of the Companies Act, 2013, to the extent applicable to an audit of internal financial controls. Those Standards and the Guidance Note require that we comply with ethical requirements and plan and perform the audit to obtain reasonable assurance about whether adequate internal financial controls over financial reporting was established and maintained and if such controls operated effectively in all material respects.
Our audit involves performing procedures to obtain audit evidence about the adequacy of the internal financial controls system over financial reporting and their operating effectiveness. Our audit of internal financial controls over financial reporting included obtaining an understanding of internal financial controls over financial reporting, assessing the risk that a material weakness exists, and testing and evaluating the design and operating effectiveness of internal control based on the assessed risk. The procedures selected depend on the auditor’s judgement, including the assessment of the risks of material misstatement of the financial statements, whether due to fraud or error.
We believe that the audit evidence we have obtained, is sufficient and appropriate to provide a basis for our audit opinion on the Company’s internal financial controls system over financial reporting.

Annual Report 2019-20 142
Meaning of Internal Financial Controls over Financial Reporting
A company’s internal financial control over financial reporting is a process designed to provide reasonable assurance regarding the reliability of financial reporting and the preparation of financial statements for external purposes in accordance with generally accepted accounting principles. A company’s internal financial control over financial reporting includes those policies and procedures that (1) pertain to the maintenance of records that, in reasonable detail, accurately and fairly reflect the transactions and dispositions of the assets of the company; (2) provide reasonable assurance that transactions are recorded as necessary to permit preparation of financial statements in accordance with generally accepted accounting principles, and that receipts and expenditures of the company are being made only in accordance with authorisations of management and directors of the company; and (3) provide reasonable assurance regarding prevention or timely detection of unauthorised acquisition, use, or disposition of the company’s assets that could have a material effect on the financial statements.
Inherent Limitations of Internal Financial Controls over Financial Reporting
Because of the inherent limitations of internal financial controls over financial reporting, including the possibility of collusion or improper management override of controls, material misstatements due to error or fraud may occur and
not be detected. Also, projections of any evaluation of the internal financial controls over financial reporting to future periods are subject to the risk that the internal financial control over financial reporting may become inadequate because of changes in conditions, or that the degree of compliance with the policies or procedures may deteriorate.
Opinion
In our opinion, to the best of our information and according to the explanations given to us, the Company has, in all material respects, an adequate internal financial controls system over financial reporting and such internal financial controls over financial reporting were operating effectively as at March 31, 2020, based on, the internal control over financial reporting criteria established by the Company considering the essential components of internal control stated in the Guidance Note on Audit of Internal Financial Controls Over Financial Reporting issued by the Institute of Chartered Accountants of India.
For DELOITTE HASKINS & SELLS LLPChartered AccountantsFirm Registration Number: 117366W/W-100018
Vikas BagariaPartnerMembership number: 60408
BengaluruMay 29, 2020

Corporate Overview | Management & Board Reports | Financial Statements
Wipro Limited143
Annexure B to the Independent Auditors’ Report
payment of interest has been stipulated and repayments or receipts of principal amounts and interest have been regular as per stipulations.
(c) There is no overdue amount remaining outstanding as at the year-end.
(iv) In our opinion and according to the information and explanations given to us, the Company has complied with the provisions of Sections 185 and 186 of the Act in respect of grant of loans, making investments and providing guarantees and securities, as applicable.
(v) According to the information and explanations given to us the Company has not accepted any deposit during the year and does not have any unclaimed deposits as at March 31, 2020 and therefore, the provisions of the clause 3 (v) of the Order are not applicable to the Company.
(vi) Maintenance of cost records has not been specified by the Central Government under Section 148(1) of the Act, for the business activities carried out by the Company. Thus reporting under Clause 3(vi) of the order is not applicable to the Company.
(vii) According to the information and explanations given to us, in respect of statutory dues:
(a) The Company has generally been regular in depositing undisputed statutory dues, including Provident Fund, Employees’ State Insurance, Income Tax, Sales Tax, Service Tax, Goods and Services Tax, Value Added Tax, Customs Duty, Excise Duty, Cess and other material statutory dues applicable to it with the appropriate authorities.
(b) There were no undisputed amounts payable in respect of Provident Fund, Employees’ State Insurance, Income Tax, Sales Tax, Service Tax, Value Added Tax, Goods and Services Tax, Customs Duty, Excise Duty, Cess and other material statutory dues in arrears as at March 31, 2020 for a period of more than six months from the date they became payable.
(c) Details of dues of Income Tax, Sales Tax, Service Tax, Customs Duty, Excise Duty and Value Added Tax which have not been deposited as at March 31, 2020 on account of dispute are given below:
(Referred to in paragraph 2 under ‘Report on Other Legal and Regulatory Requirements’ section of our report of even date)
(i) In respect of the Company’s fixed assets:
(a) The Company has maintained proper records showing full particulars, including quantitative details and situation of fixed assets.
(b) The Company has a program of verification to cover all the items of fixed assets in a phased manner over a period of 3 years which, in our opinion, is reasonable having regard to the size of the Company and the nature of its assets. Pursuant to the program, certain fixed assets were physically verified by the management during the year. According to the information and explanations given to us, no material discrepancies were noticed on such verification.
(c) According to the information and explanations given to us, the records examined by us and based on the examination of the conveyance deeds/registered sale deeds provided to us, we report that, the title deeds, comprising the immovable properties of land and buildings which are freehold, are held in the name of the Company as at the balance sheet date. Title deed of a land with a carrying amount of Rs. 404 million, pursuant to an agreement for sale, is pending to be registered in the name of the Company.
(ii) As explained to us, the inventories were physically verified during the year by the management at reasonable intervals. There were no material discrepancies noticed on physical verification during the year.
(iii) According to the information and explanations given to us, the Company has granted unsecured loans to one body corporate, covered in the register maintained under section 189 of the Companies Act, 2013, in respect of which:
(a) The terms and conditions of the grant of such loans are, in our opinion, prima facie, not prejudicial to the Company’s interest.
(b) The schedule of repayment of principal and
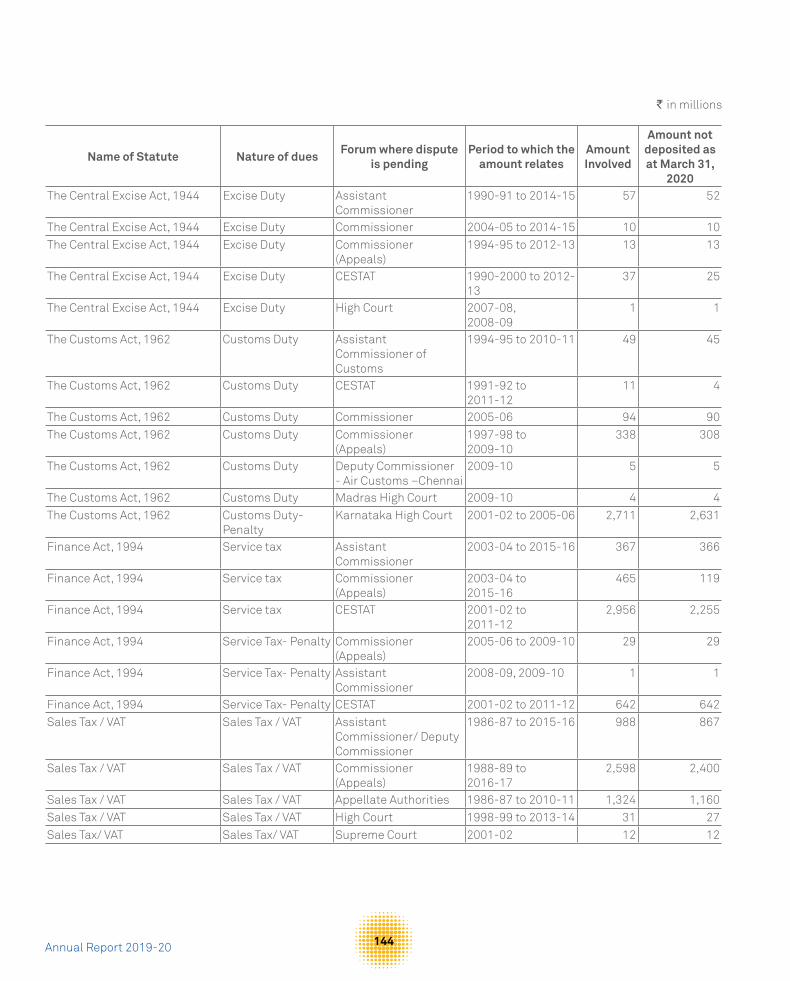
Annual Report 2019-20 144
` in millions
Name of Statute Nature of duesForum where dispute
is pendingPeriod to which the
amount relatesAmount Involved
Amount not deposited as at March 31,
2020The Central Excise Act, 1944 Excise Duty Assistant
Commissioner1990-91 to 2014-15 57 52
The Central Excise Act, 1944 Excise Duty Commissioner 2004-05 to 2014-15 10 10The Central Excise Act, 1944 Excise Duty Commissioner
(Appeals)1994-95 to 2012-13 13 13
The Central Excise Act, 1944 Excise Duty CESTAT 1990-2000 to 2012-13
37 25
The Central Excise Act, 1944 Excise Duty High Court 2007-08,2008-09
1 1
The Customs Act, 1962 Customs Duty Assistant Commissioner of Customs
1994-95 to 2010-11 49 45
The Customs Act, 1962 Customs Duty CESTAT 1991-92 to2011-12
11 4
The Customs Act, 1962 Customs Duty Commissioner 2005-06 94 90The Customs Act, 1962 Customs Duty Commissioner
(Appeals)1997-98 to2009-10
338 308
The Customs Act, 1962 Customs Duty Deputy Commissioner - Air Customs –Chennai
2009-10 5 5
The Customs Act, 1962 Customs Duty Madras High Court 2009-10 4 4The Customs Act, 1962 Customs Duty-
PenaltyKarnataka High Court 2001-02 to 2005-06 2,711 2,631
Finance Act, 1994 Service tax Assistant Commissioner
2003-04 to 2015-16 367 366
Finance Act, 1994 Service tax Commissioner (Appeals)
2003-04 to2015-16
465 119
Finance Act, 1994 Service tax CESTAT 2001-02 to2011-12
2,956 2,255
Finance Act, 1994 Service Tax- Penalty Commissioner (Appeals)
2005-06 to 2009-10 29 29
Finance Act, 1994 Service Tax- Penalty Assistant Commissioner
2008-09, 2009-10 1 1
Finance Act, 1994 Service Tax- Penalty CESTAT 2001-02 to 2011-12 642 642Sales Tax / VAT Sales Tax / VAT Assistant
Commissioner/ Deputy Commissioner
1986-87 to 2015-16 988 867
Sales Tax / VAT Sales Tax / VAT Commissioner (Appeals)
1988-89 to2016-17
2,598 2,400
Sales Tax / VAT Sales Tax / VAT Appellate Authorities 1986-87 to 2010-11 1,324 1,160Sales Tax / VAT Sales Tax / VAT High Court 1998-99 to 2013-14 31 27Sales Tax/ VAT Sales Tax/ VAT Supreme Court 2001-02 12 12

Corporate Overview | Management & Board Reports | Financial Statements
Wipro Limited145
Name of Statute Nature of duesForum where dispute
is pendingPeriod to which the
amount relatesAmount Involved
Amount not deposited as at March 31,
2020Goods and Services Tax Goods and Services
TaxCommissioner (Appeals)
2017-18 58 58
The Income Tax Act, 1961 Income Tax - TDS CIT(A) - TDS 2003-04, 2011-12 35 35
The Income Tax Act, 1961 Income Tax – TDS Income Tax Appellate Tribunal
2009-10 13 3
The Income Tax Act, 1961 Income Tax - TDS High Court 2010-11 61 61The Income Tax Act, 1961 Income Tax Assessing Officer 2007-08 97 42
The Income Tax Act, 1961 Income Tax Commissioner of Income tax (Appeals)
2012-13 16 16
The Income Tax Act, 1961 Income Tax Income Tax Appellate Tribunal
2006-07, 2007-08 2009-10, 2010-11, 2012-13 to 2014-15
6,407 1,529
(viii) In our opinion and according to the information and explanations given to us, the Company has not defaulted in the repayment of loans or borrowings to financial institutions, and banks. The Company has not availed any loans or borrowings from Government. The Company has not issued any debentures.
(ix) The Company has not raised moneys by way of initial public offer or further public offer (including debt instruments) or term loans during the year, hence reporting under clause 3(ix) of the Order is not applicable to the company.
(x) To the best of our knowledge and according to the information and explanations given to us, no fraud by the Company or no material fraud on the Company by its officers or employees has been noticed or reported during the year.
(xi) In our opinion and according to the information and explanations given to us, the Company has paid/provided managerial remuneration in accordance with the requisite approvals mandated by the provisions of section 197 read with Schedule V to the Act.
(xii) The Company is not a Nidhi Company and hence reporting under clause 3 (xii) of the Order is not applicable to the Company.
(xiii) In our opinion and according to the information and explanations given to us, the Company is in compliance with Section 177 and 188 of the Act, where applicable,
for all transactions with the related parties and the details of related party transactions have been disclosed in the Standalone Financial Statements as required by the applicable accounting standards.
(xiv) During the year, the Company has not made any preferential allotment or private placement of shares or fully or partly paid convertible debentures and hence, reporting under clause 3 (xiv) of the Order is not applicable to the Company.
(xv) In our opinion and according to the information and explanations given to us, during the year the Company has not entered into any non-cash transactions with its Directors or persons connected to its directors and hence provisions of section 192 of the Act, are not applicable to the Company.
(xvi) The Company is not required to be registered under section 45-IA of the Reserve Bank of India Act, 1934.
For DELOITTE HASKINS & SELLS LLPChartered AccountantsFirm Registration Number: 117366W/W-100018
Vikas BagariaPartnerMembership number: 60408
BengaluruMay 29, 2020

Annual Report 2019-20 146
Balance Sheet(` in millions, except share and per share data, unless otherwise stated)
NotesAs at
March 31, 2020As at
March 31, 2019
ASSETS
Non-current assets
Property, plant and equipment 4 50,473 38,742
Right-of-Use Assets 5 8,160 -
Capital work-in-progress 18,735 21,127
Goodwill 6 4,571 3,882
Other intangible assets 6 3,190 1,386
Financial assets
Investments 8 77,350 82,503
Derivative assets 20 - 173
Trade receivables 9 4,462 4,373
Other financial assets 11 4,416 3,843
Deferred tax assets (net) 21 4,333 3,910
Non-current tax assets (net) 11,103 20,549
Other non-current assets 13 9,138 12,189
Total non-current assets 195,931 192,677
Current assets
Inventories 12 1,741 3,403
Financial assets
Investments 8 189,635 219,988
Trade receivables 9 92,570 90,463
Cash and cash equivalents 10 104,440 103,902
Derivative assets 20 2,964 4,920
Unbilled receivables 17,964 16,023
Loans to subsidiaries 9,472 -
Other financial assets 11 6,807 5,813
Current tax assets (net) 839 3,307
Contract assets 12,432 10,845
Other current assets 13 18,269 18,640
Total current assets 457,133 477,304
TOTAL ASSETS 653,064 669,981
EQUITY
Equity Share capital 14 11,427 12,068
Other equity 453,110 481,852
TOTAL EQUITY 464,537 493,920
LIABILITIES
Non-current liabilities
Financial liabilities
Borrowings 15 251 220
Derivative liabilities 20 138 -
Other financial liabilities 17 146 -
Lease Liabilities 15 5,997 -

Wipro Limited147
Corporate Overview | Management & Board Reports | Financial Statements
Balance Sheet(` in millions, except share and per share data, unless otherwise stated)
NotesAs at
March 31, 2020As at
March 31, 2019
Provisions 18 2,133 1,196
Deferred tax liabilities (net) 21 - 104
Non-current tax liabilities (net) 11,654 9,978
Other non-current liabilities 19 3,770 3,117
Total non-current liabilities 24,089 14,615
Current liabilities
Financial liabilities
Borrowings 15 50,019 50,522
Trade payables
(a) Total outstanding dues of Micro, small and medium enterprises 16 131 37
(b) Total outstanding dues of creditors other than micro, small and medium enterprises. 45,295 47,618
Derivative liabilities 20 7,231 1,270
Lease Liabilities 15 3,124 -
Other financial liabilities 17 18,657 24,990
Contract liabilities 14,272 14,862
Provisions 18 11,302 9,290
Current tax liabilities (net) 9,758 7,185
Other current liabilities 19 4,649 5,672
Total current liabilities 164,438 161,446
TOTAL LIABILITIES 188,527 176,061
TOTAL EQUITY AND LIABILITIES 653,064 669,981
The accompanying notes form an integral part of these standalone financial statements
As per our report of even date attached For and on behalf of the Board of Directors
for Deloitte Haskins & Sells LLP Rishad A Premji M K Sharma Abidali Z NeemuchwalaChartered Accountants Chairman Director Chief Executive Officer &
Firm's Registration No.: 117366W/W - 100018 Managing Director
Vikas Bagaria Jatin Pravinchandra Dalal M. Sanaulla Khan Partner Chief Financial Officer Company Secretary
Membership No.: 60408
Bengaluru Bengaluru
May 29, 2020 May 29, 2020
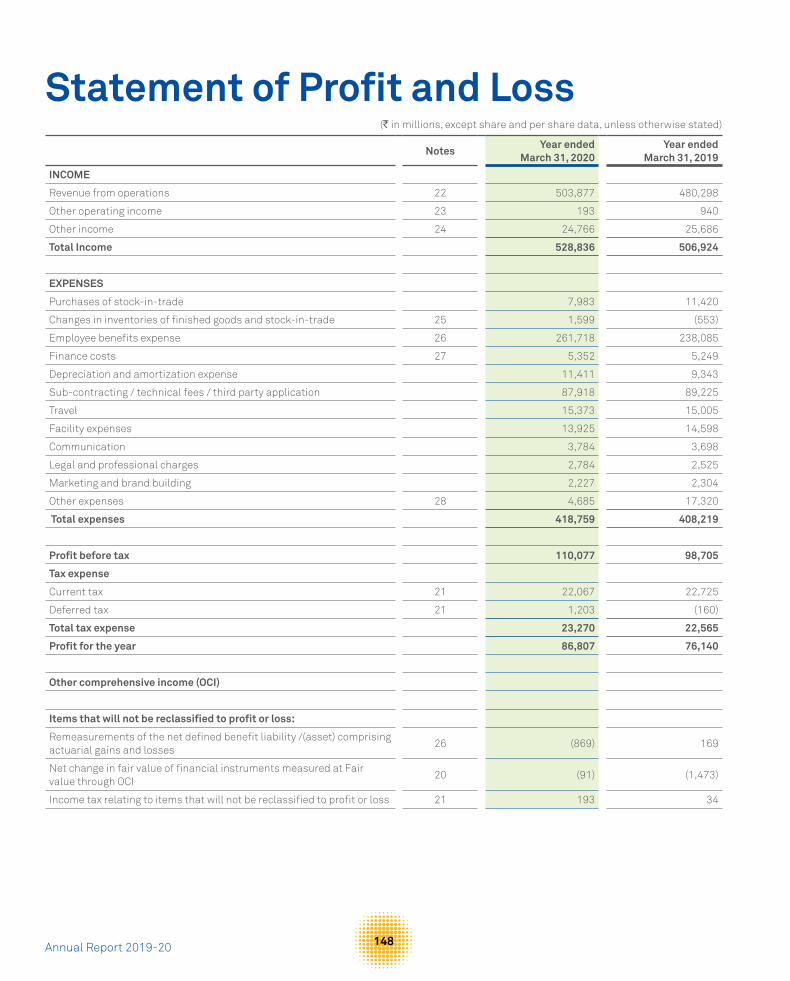
Annual Report 2019-20 148
Statement of Profit and Loss(` in millions, except share and per share data, unless otherwise stated)
NotesYear ended
March 31, 2020Year ended
March 31, 2019
INCOME
Revenue from operations 22 503,877 480,298
Other operating income 23 193 940
Other income 24 24,766 25,686
Total Income 528,836 506,924
EXPENSES
Purchases of stock-in-trade 7,983 11,420
Changes in inventories of finished goods and stock-in-trade 25 1,599 (553)
Employee benefits expense 26 261,718 238,085
Finance costs 27 5,352 5,249
Depreciation and amortization expense 11,411 9,343
Sub-contracting / technical fees / third party application 87,918 89,225
Travel 15,373 15,005
Facility expenses 13,925 14,598
Communication 3,784 3,698
Legal and professional charges 2,784 2,525
Marketing and brand building 2,227 2,304
Other expenses 28 4,685 17,320
Total expenses 418,759 408,219
Profit before tax 110,077 98,705
Tax expense
Current tax 21 22,067 22,725
Deferred tax 21 1,203 (160)
Total tax expense 23,270 22,565
Profit for the year 86,807 76,140
Other comprehensive income (OCI)
Items that will not be reclassified to profit or loss:
Remeasurements of the net defined benefit liability /(asset) comprising actuarial gains and losses
26 (869) 169
Net change in fair value of financial instruments measured at Fair value through OCI
20 (91) (1,473)
Income tax relating to items that will not be reclassified to profit or loss 21 193 34

Wipro Limited149
Corporate Overview | Management & Board Reports | Financial Statements
Statement of Profit and Loss(` in millions, except share and per share data, unless otherwise stated)
NotesYear ended
March 31, 2020Year ended
March 31, 2019
Items that will be reclassified to profit or loss:
Net change in time value of option contracts designated as cash flow hedges
20 (649) 579
Net change in intrinsic value of option contracts designated as cash flow hedges
20 (1,941) 1,014
Net change in fair value of forward contracts designated as cash flow hedges
20 (3,309) 1,567
Net change in fair value of financial instruments measured at Fair value through OCI
1,015 (8)
Income tax relating to items that will be reclassified to profit or loss 21 1,367 (636)
Total other comprehensive (loss)/ income for the year, net of taxes (4,284) 1,246
Total comprehensive income for the year 82,523 77,386
Earnings per equity share: (Equity shares of par value ` 2 each) 29
Basic 14.88 12.67
Diluted 14.84 12.64
Number of shares
Basic 5,833,384,018 6,007,376,837
Diluted 5,847,823,239 6,022,304,367
The accompanying notes form an integral part of these standalone financial statements
As per our report of even date attached For and on behalf of the Board of Directors
for Deloitte Haskins & Sells LLP Rishad A Premji M K Sharma Abidali Z NeemuchwalaChartered Accountants Chairman Director Chief Executive Officer &
Firm's Registration No.: 117366W/W - 100018 Managing Director
Vikas Bagaria Jatin Pravinchandra Dalal M. Sanaulla Khan Partner Chief Financial Officer Company Secretary
Membership No.: 60408
Bengaluru Bengaluru
May 29, 2020 May 29, 2020

Annual Report 2019-20 150
Sta
tem
ent
of C
hang
es in
Equ
ity
(` in
mill
ions
, exc
ept
shar
e an
d pe
r sha
re d
ata,
unl
ess
othe
rwis
e st
ated
)
Equ
ity
shar
e ca
pita
l
Bal
ance
as
at A
pril
1, 2
019
Cha
nge
in e
quit
y sh
are
capi
tal
Bal
ance
as
at M
arch
31,
202
0
12,0
68(6
41)
11,4
27
Bal
ance
as
at A
pril
1, 2
018
Cha
nge
in e
quit
y sh
are
capi
tal
Bal
ance
as
at M
arch
31,
201
9
9,04
83,
020
12,0
68
Oth
er e
quit
y
Part
icul
ars
Shar
e ap
plic
atio
n m
oney
pe
ndin
g al
lotm
ent
Rese
rves
and
Sur
plus
Fore
ign
curr
ency
tr
ansl
atio
n re
serv
e
Cash
flo
w
hedg
ing
rese
rve
Othe
r re
serv
esTo
tal o
ther
eq
uity
Secu
riti
es
Prem
ium
Re
serv
e
Capi
tal
rese
rve
Capi
tal
rede
mpt
ion
rese
rve
Reta
ined
ea
rnin
gs
Com
mon
Co
ntro
l Tr
ansa
ctio
ns
Capi
tal
Rese
rve
Shar
e op
tion
s ou
tsta
ndin
g ac
coun
t
Spec
ial
econ
omic
Zo
ne re
-in
vest
men
t re
serv
e
Bala
nce
as a
t Apr
il 1,
201
9 ^
14
51,
139
1444
3,79
12,
473
2,61
728
,565
1,88
22,
424
(1,1
98)
481,
852
Adju
stm
ent o
n ad
optio
n of
Ind
AS 1
16#
#-
--
-(4
14)
--
--
--
(414
)
Adju
sted
bal
ance
as
at A
pril
1, 2
019
^
145
1,13
914
443,
377
2,47
32,
617
28,5
651,
882
2,42
4(1
,198
)48
1,43
8
Profi
t for
the
year
--
--
86,8
07-
--
--
-86
,807
Othe
r com
preh
ensi
ve in
com
e / (
loss
)-
--
--
--
--
(4,7
39)
455
(4,2
84)
Tota
l com
preh
ensi
ve in
com
e fo
r the
yea
r-
--
-86
,807
--
--
(4,7
39)
455
82,5
23
Issu
e of
equ
ity s
hare
s on
exe
rcis
e of
opt
ions
-74
2-
--
-(7
42)
--
--
-
Issu
e of
sha
res
by c
ontr
olle
d tr
ust o
n ex
erci
se o
f op
tions
*-
--
-1,
026
-(1
,026
)-
--
--
Cash
div
iden
d pa
id (i
nclu
ding
div
iden
d ta
x th
ereo
n) #
--
--
(6,8
87)
--
--
--
(6,8
87)
Buyb
ack
of e
quity
sha
res
#-
--
646
(105
,000
)-
--
--
-(1
04,3
54)
Tran
sact
ion
cost
rela
ted
to b
uyba
ck-
--
-(3
11)
--
--
--
(311
)
Com
pens
atio
n co
st re
late
d to
em
ploy
ee s
hare
bas
ed
paym
ent t
rans
actio
ns-
--
--
-1,
262
--
--
1,26
2
Tran
sfer
red
to s
peci
al e
cono
mic
zon
e re
-inv
estm
ent
rese
rve
--
--
(15,
239)
--
15,2
39-
--
-
Effe
ct o
f mod
ifica
tion
of A
DS
/ RSU
from
equ
ity s
ettle
d to
cas
h se
ttle
d #
##
--
--
--
(561
)-
--
-(5
61)
-74
2-
646
(39,
604)
-(1
,067
)15
,239
-(4
,739
)45
5(2
8,32
8)
Bala
nce
as a
t Mar
ch 3
1, 2
020
^
887
1,13
966
040
3,77
32,
473
1,55
043
,804
1,88
2(2
,315
)(7
43)
453,
110
# R
efer
to N
ote
30
##
Ref
er to
Not
e 3
##
# R
efer
to N
ote
32
*4,6
07,7
72 s
hare
s ha
ve b
een
issu
ed b
y th
e co
ntro
lled
trus
t to
elig
ible
em
ploy
ees
on e
xerc
ise
of o
ptio
ns d
urin
g th
e ye
ar e
nded
Mar
ch 3
1, 2
020.
^ Va
lue
is le
ss th
an `
1

Wipro Limited151
Corporate Overview | Management & Board Reports | Financial Statements
Sta
tem
ent
of C
hang
es in
Equ
ity
(` in
mill
ions
, exc
ept
shar
e an
d pe
r sha
re d
ata,
unl
ess
othe
rwis
e st
ated
)
Part
icul
ars
Shar
e ap
plic
atio
n m
oney
pe
ndin
g al
lotm
ent
Rese
rves
and
Sur
plus
Fore
ign
curr
ency
tr
ansl
atio
n re
serv
e
Cash
flow
he
dgin
g re
serv
e
Othe
r re
serv
esTo
tal o
ther
eq
uity
Secu
riti
es
Prem
ium
Re
serv
e
Capi
tal
rese
rve
Capi
tal
rede
mpt
ion
rese
rve
Reta
ined
ea
rnin
gs
Com
mon
Co
ntro
l Tr
ansa
ctio
ns
Capi
tal
Rese
rve
Shar
e op
tion
s ou
tsta
ndin
g ac
coun
t
Spec
ial
econ
omic
Zo
ne re
-in
vest
men
t re
serv
e
Bala
nce
as a
t Apr
il 1,
201
8 ^
41
21,
139
781
407,
612
-1,
772
-1,
882
(107
)87
413,
578
Adju
stm
ent o
n ad
optio
n of
Ind
AS 1
15-
--
-(1
,605
)-
--
--
-(1
,605
)
Adju
stm
ent o
n ac
coun
t of m
erge
r**
--
--
(3,4
48)
2,47
3-
--
--
(975
)
Adju
sted
bal
ance
as
at A
pril
1, 2
018
^
412
1,13
978
140
2,55
92,
473
1,77
2-
1,88
2(1
07)
8741
0,99
8
Profi
t for
the
year
--
--
76,1
40-
--
--
-76
,140
Othe
r com
preh
ensi
ve in
com
e / (
loss
)-
--
--
--
--
2,53
1(1
,285
)1,
246
Tota
l com
preh
ensi
ve in
com
e fo
r the
yea
r-
--
-76
,140
--
--
2,53
1(1
,285
)77
,386
Issu
e of
equ
ity s
hare
s on
exe
rcis
e of
opt
ions
-52
8-
--
-(5
28)
--
--
-
Issu
e of
sha
res
by c
ontr
olle
d tr
ust o
n ex
erci
se o
f op
tions
*-
--
-56
5-
(565
)-
--
--
Cash
div
iden
d pa
id (i
nclu
ding
div
iden
d ta
x th
ereo
n)-
--
-(5
,454
)-
--
--
-(5
,454
)
Bonu
s is
sue
of e
quity
sha
res
#-
(795
)-
(767
)(1
,454
)-
--
--
-(3
,016
)
Com
pens
atio
n co
st re
late
d to
em
ploy
ee s
hare
ba
sed
paym
ent t
rans
actio
ns-
--
--
-1,
938
--
--
1,93
8
Tran
sfer
red
to s
peci
al e
cono
mic
zon
e re
-in
vest
men
t res
erve
--
--
(28,
565)
--
28,5
65-
--
-
-(2
67)
-(7
67)
41,2
32-
845
28,5
65-
2,53
1(1
,285
)70
,854
Bala
nce
as a
t Mar
ch 3
1, 2
019
^
145
1,13
914
443,
791
2,47
32,
617
28,5
651,
882
2,42
4(1
,198
)48
1,85
2
^ Va
lue
is le
ss th
an `
1
# R
efer
to N
ote
30
*2,5
99,1
83 s
hare
s ha
ve b
een
issu
ed b
y th
e co
ntro
lled
trus
t to
elig
ible
em
ploy
ees
on e
xerc
ise
of o
ptio
ns d
urin
g th
e ye
ar e
nded
Mar
ch 3
1, 2
019.
** P
rofit
on
tran
sfer
of b
usin
ess
betw
een
entit
ies
unde
r com
mon
con
trol
take
n to
rese
rve.
As
per
our
repo
rt o
f eve
n da
te a
ttac
hed
For
and
on b
ehal
f of t
he B
oard
of D
irec
tors
fo
r Del
oitt
e H
aski
ns &
Sel
ls L
LP
Ris
had
A P
rem
ji M
K S
harm
a A
bida
li Z
Nee
muc
hwal
aC
hart
ered
Acc
ount
ants
C
hair
man
D
irec
tor
Chi
ef E
xecu
tive
Offi
cer
&Fi
rm's
Reg
istr
atio
n N
o.: 1
1736
6W
/W -
100
018
Man
agin
g D
irec
tor
Vik
as B
agar
ia
Jati
n P
ravi
ncha
ndra
Dal
al
M
. San
aulla
Kha
n P
artn
er
Chi
ef F
inan
cial
Offi
cer
C
ompa
ny S
ecre
tary
M
embe
rshi
p N
o.: 6
0408
B
enga
luru
B
enga
luru
May
29,
202
0 M
ay 2
9, 2
020
The
acco
mpa
nyin
g no
tes
form
an
inte
gral
par
t of t
hese
sta
ndal
one
finan
cial
sta
tem
ents

Annual Report 2019-20 152
(` in millions, except share and per share data, unless otherwise stated)
For the year ended March 31, 2020
For the year ended March 31, 2019
Cash flows from operating activities:
Profit for the year 86,807 76,140
Adjustments to reconcile profit for the year to net cash generated from operating activities:
(Gain)/ Loss on sale of property, plant and equipment, net 10 (182)
Depreciation and amortization expense 11,411 9,343
Unrealized exchange (gain)/loss, net and exchange loss on borrowings 6,602 (278)
Share-based compensation expense 1,262 1,846
Income tax expense 23,270 22,565
Dividend and interest (income)/expenses, net (20,460) (17,059)
Gain from sale of business and loss of control in subsidiary, net (193) (940)
Provision for diminution in the value of non-current investments - 7,356
Changes in operating assets and liabilities:
Trade receivables (2,058) 4,769
Unbilled receivables and contract assets (3,295) 3,773
Inventories 1,663 (459)
Other assets (503) 130
Trade payables, other liabilities and provisions (7,341) 16,877
Contract liabilities (590) 2,009
Cash generated from operating activities before taxes 96,585 125,890
Income taxes paid, net (5,904) (23,789)
Net cash generated from operating activities 90,681 102,101
Cash flows from investing activities:
Purchase of property, plant and equipment (18,326) (18,688)
Proceeds from sale of property, plant and equipment 490 1,023
Purchase of investments (1,176,999) (924,397)
Investment in subsidiaries - (36,226)
Proceeds from sale of investments 1,209,778 953,979
Proceeds from Redemption of Preference Shares in Subsidiaries 5,055 -
Loans to subsidiaries (9,472) -
Proceeds from sale of hosted data centre business and loss of control in subsidiary, net of related expenses and cash 923 646
Payment for business acquisition, including deposits and escrow, net of cash acquired (3,230) -
Statement of Cash Flows

Wipro Limited153
Corporate Overview | Management & Board Reports | Financial Statements
Statement of Cash Flows(` in millions, except share and per share data, unless otherwise stated)
For the year ended March 31, 2020
For the year ended March 31, 2019
Interest received 22,707 19,604
Dividend received 1,101 353
Net cash generated from/(used in) investing activities 32,027 (3,706)
Cash flows from financing activities:
Proceeds from issuance of equity shares and shares pending allotment 5 4
Repayment of borrowings (106,833) (60,681)
Proceeds from borrowings 102,509 56,537
Payment for buyback of shares, including transaction cost (105,311) -
Repayment of lease liabilities (3,255) -
Interest paid (2,558) (4,357)
Payment of cash dividend (including dividend tax thereon) (6,887) (5,454)
Net cash used in financing activities (122,330) (13,951)
Net increase in cash and cash equivalents during the year 378 84,444
Adjustment on account of merger - 203
Effect of exchange rate changes on cash and cash equivalents 163 30
Cash and cash equivalents at the beginning of the year 103,899 19,222
Cash and cash equivalents at the end of the year (Note 10) 104,440 103,899
Refer to note 15 for supplementary information on statement of cash flows
The accompanying notes form an integral part of these standalone financial statements
As per our report of even date attached For and on behalf of the Board of Directors
for Deloitte Haskins & Sells LLP Rishad A Premji M K Sharma Abidali Z NeemuchwalaChartered Accountants Chairman Director Chief Executive Officer &
Firm's Registration No.: 117366W/W - 100018 Managing Director
Vikas Bagaria Jatin Pravinchandra Dalal M. Sanaulla Khan Partner Chief Financial Officer Company Secretary
Membership No.. 60408
Bengaluru Bengaluru
May 29, 2020 May 29, 2020

Annual Report 2019-20 154
(` in millions, except share and per share data, unless otherwise stated)
Notes to the Standalone Financial Statements
1. The Company overview Wipro Limited (“Wipro” or the “Company” or “we” or “our” or
“us”), is a global information technology (“IT”), consulting and business process services (“BPS”) company.
Wipro is a public limited company incorporated and domiciled in India. The address of its registered office is Wipro Limited, Doddakannelli, Sarjapur Road, Bengaluru – 560 035, Karnataka, India. Wipro has its primary listing with BSE Ltd. (Bombay Stock Exchange) and National Stock Exchange of India Ltd. The Company’s American Depository Shares representing equity shares are also listed on the New York Stock Exchange.
These financial statements were authorized for issue by the Company’s Board of Directors on May 29, 2020.
2. Basis of preparation of financial statements
(i) Statement of compliance and basis of preparation
The standalone financial statements have been prepared in accordance with Indian Accounting Standards (“Ind AS”), the provisions of the Companies Act, 2013 (“the Companies Act”), as applicable and guidelines issued by the Securities and Exchange Board of India (“SEBI”). The Ind AS are prescribed under Section 133 of the Companies Act, 2013 read with Rule 3 of the Companies (Indian Accounting Standards) Rules, 2015 and Companies (Indian Accounting Standards) Amendment Rules, 2016.
Accounting policies have been applied consistently to all periods presented in these financial statements, except for new accounting standards adopted by the Company.
The financial statements correspond to the classification provisions contained in Ind AS 1, “Presentation of Financial Statements”. For clarity, various items are aggregated in the statement of profit and loss and balance sheet. These items are disaggregated separately in the notes to the financial statements, where applicable.
All amounts included in the financial statements are reported in millions of Indian rupees (` in millions) except share and per share data, unless otherwise stated. Due to rounding off, the numbers presented throughout the document may not add up precisely to the totals and percentages may not precisely reflect the absolute figures. Previous year figures have been regrouped/re-arranged, wherever necessary.
(ii) Basis of measurement
These financial statements have been prepared on a historical cost convention and on an accrual basis, except for the following
material items, which have been measured at fair value as required by relevant Ind AS:
a) Derivative financial instruments,
b) Financial instruments classified as fair value through other comprehensive income or fair value through profit or loss, and
c) The defined benefit asset/(liability) is recognized as the present value of defined benefit obligation less fair value of plan assets.
d) Contingent consideration
(iii) Use of estimates and judgment
The preparation of the financial statements in conformity with Ind AS requires management to make judgments, estimates and assumptions that affect the application of accounting policies and the reported amounts of assets, liabilities, income and expenses. Actual results may differ from those estimates.
Estimates and underlying assumptions are reviewed on an ongoing basis. Revisions to accounting estimates are recognized in the period in which the estimates are revised and in any future periods affected. In particular, information about significant areas of estimation, uncertainty and critical judgments in applying accounting policies that have the most significant effect on the amounts recognized in the financial statements are included in the following notes:
a) Revenue recognition: The Company applies judgement to determine whether each product or service promised to a customer is capable of being distinct, and is distinct in the context of the contract, if not, the promised products or services are combined and accounted as a single performance obligation. The Company allocates the arrangement consideration to separately identifiable performance obligation deliverables based on their relative stand-alone selling price. In cases where the Company is unable to determine the stand-alone selling price the Company uses expected cost plus margin approach in estimating the stand-alone selling price. The Company uses the percentage of completion method using the input (cost expended) method to measure progress towards completion in respect of fixed price contracts. Percentage of completion method accounting relies on estimates of total expected contract revenue and costs. This method is followed when reasonably dependable estimates of the revenues and costs applicable to various elements of the contract can be made. Key factors that are reviewed in estimating the future costs to complete include estimates of future labor costs and productivity efficiencies. Because

Wipro Limited155
Corporate Overview | Management & Board Reports | Financial Statements
the financial reporting of these contracts depends on estimates that are assessed continually during the term of these contracts, revenue recognized, profit and timing of revenue for remaining performance obligations are subject to revisions as the contract progresses to completion. When estimates indicate that a loss will be incurred, the loss is provided for in the period in which the loss becomes probable. Volume discounts are recorded as a reduction of revenue. When the amount of discount varies with the levels of revenue, volume discount is recorded based on estimate of future revenue from the customer.
b) Impairment testing: Investments in subsidiaries, goodwill and intangible assets with infinite useful life recognized on business combination are tested for impairment at least annually and when events occur or changes in circumstances indicate that the recoverable amount of the asset or the cash generating unit to which these pertain is less than the carrying value. The Company assesses acquired intangible assets with finite useful life for impairment whenever events or changes in circumstances indicate that the carrying amount may not be recoverable.The recoverable amount of the asset or the cash generating units is higher of value in use and fair value less cost of disposal. The calculation of value in use of an asset or a cash generating unit involves use of significant estimates and assumptions which include turnover, growth rates and net margins used to calculate projected future cash flows, risk-adjusted discount rate, future economic and market conditions.
c) Income taxes: The major tax jurisdictions for the Company are India and the United States of America. Significant judgments are involved in determining the provision for income taxes including judgment on whether tax positions are probable of being sustained in tax assessments. A tax assessment can involve complex issues, which can only be resolved over extended time periods.
d) Deferred taxes: Deferred tax is recorded on temporary differences between the tax bases of assets and liabilities and their carrying amounts, at the rates that have been enacted or substantively enacted at the reporting date. The ultimate realization of deferred tax assets is dependent upon the generation of future taxable profits during the periods in which those temporary differences and tax loss carry-forwards become deductible. The Company considers expected reversal of deferred tax liabilities and projected future taxable income in making this assessment. The amount of deferred tax assets considered realisable, however, could reduce in the near term if estimates of future taxable income during the carry-forward period are reduced.
e) Business combination: In accounting for business combinations, judgment is required in identifying whether an identifiable intangible asset is to be recorded separately from goodwill. Additionally, estimating the acquisition
date fair value of the identifiable assets (including useful life estimates) and liabilities acquired, and contingent consideration assumed involves management judgment. These measurements are based on information available at the acquisition date and are based on expectations and assumptions that have been deemed reasonable by management. Changes in these judgments, estimates, and assumptions can materially affect the results of operations.
f) Defined benefit plans and compensated absences: The cost of the defined benefit plans, compensated absences and the present value of the defined benefit obligations are based on actuarial valuation using the projected unit credit method. An actuarial valuation involves making various assumptions that may differ from actual developments in the future. These include the determination of the discount rate, future salary increases and mortality rates. Due to the complexities involved in the valuation and its long-term nature, a defined benefit obligation is highly sensitive to changes in these assumptions. All assumptions are reviewed at each reporting date.
g) Expected credit losses on financial assets: The impairment provisions of financial assets are based on assumptions about risk of default and expected timing of collection. The Company uses judgment in making these assumptions and selecting the inputs to the expected credit loss calculation based on the Company’s history of collections, customer’s creditworthiness, existing market conditions as well as forward looking estimates at the end of each reporting period.
h) Measurement of fair value of non-marketable equity investments: These instruments are initially recorded at cost and subsequently measured at fair value. Fair value of investments is determined using the market and income approaches. The market approach includes the use of financial metrics and ratios of comparable companies, such as revenue, earnings, comparable performance multiples, recent financial rounds and the level of marketability of the investments. The selection of comparable companies requires management judgment and is based on a number of factors, including comparable company sizes, growth rates and development stages. The income approach includes the use of discounted cash flow model, which requires significant estimates regarding the investees’ revenue, costs, and discount rates based on the risk profile of comparable companies. Estimates of revenue and costs are developed using available historical and forecast data.
i) Useful lives of property, plant and equipment: The Company depreciates property, plant and equipment on a straight-line basis over estimated useful lives of the assets. The charge in respect of periodic depreciation is derived based on an estimate of an asset’s expected useful life and the expected residual value at the end of its life. The lives are based on historical experience with similar assets as well as anticipation of future events, which may impact
Annual Report 2019-20 156
their lives, such as changes in technology. The estimated useful life is reviewed at least annually.
j) Useful lives of intangible assets: The Company amortizes intangible assets on a straight-line basis over estimated useful lives of the assets. The useful life is estimated based on a number of factors including the effects of obsolescence, demand, competition and other economic factors such as the stability of the industry and known technological advances and the level of maintenance expenditures required to obtain the expected future cash flows from the assets. The estimated useful life is reviewed at least annually.
k) Leases: Ind AS 116 defines a lease term as the non-cancellable period for which the lessee has the right to use an underlying asset including optional periods, when an entity is reasonably certain to exercise an option to extend (or not to terminate) a lease. The Company considers all relevant facts and circumstances that create an economic incentive for the lessee to exercise the option when determining the lease term. The option to extend the lease term is included in the lease term, if it is reasonably certain that the lessee would exercise the option. The Company reassesses the option when significant events or changes in circumstances occur that are within the control of the lessee.
l) Other estimates: The share based compensation expense is determined based on the Company’s estimate of equity instruments that will eventually vest. Fair valuation of derivative hedging instruments designated as cash flow hedges involves significant estimates relating to the occurrence of forecasted transaction.
m) Uncertainty relating to the global health pandemic on COVID-19
In assessing the recoverability of receivables including unbilled receivables, contract assets and contract costs, goodwill, intangible assets, and certain investments, the Company has considered internal and external information up to the date of approval of these standalone financial statements including credit reports and economic forecasts. The Company has performed sensitivity analysis on the assumptions used herein. Based on the current indicators of future economic conditions, the Company expects to recover the carrying amount of these assets.
The Company basis its assessment believes that the probability of the occurrence of forecasted transactions is not impacted by COVID-19. The Company has also considered the effect of changes, if any, in both counterparty credit risk and own credit risk while assessing hedge effectiveness and measuring hedge ineffectiveness and continues to believe that there is no impact on effectiveness of its hedges.
The impact of COVID-19 remains uncertain and may be different from what we have estimated as of the date of approval of these standalone financial statements and the Company will continue to closely monitor any material changes to future economic conditions.
3. Significant accounting policies
(i) Functional and presentation currency
These financial statements are presented in Indian rupees, which is the functional currency of the Company.
(ii) Foreign currency transactions and translation
Transactions in foreign currency are translated into the functional currency using the exchange rates prevailing at the date of the transaction. Foreign exchange gains and losses resulting from the settlement of such transactions and from translation at the exchange rates prevailing at the reporting date of monetary assets and liabilities denominated in foreign currencies are recognized in the statement of profit and loss and reported within foreign exchange gains/(losses), net, within results of operating activities except when deferred in other comprehensive income as qualifying cash flow hedges and qualifying net investment hedges. Gains/(losses), net, relating to translation or settlement of borrowings denominated in foreign currency are reported within finance costs. Non-monetary assets and liabilities denominated in foreign currency and measured at historical cost are translated at the exchange rate prevalent at the date of transaction. Translation differences on non-monetary financial assets measured at fair value at the reporting date, such as equities classified as financial instruments measured at fair value through other comprehensive income are included in other comprehensive income, net of taxes.
(iii) Financial instruments
a) Non-derivative financial instruments:
Non derivative financial instruments consist of:
• financial assets, which include cash and cash equivalents, trade receivables, unbilled receivables, finance lease receivables, employee and other advances, investments in equity and debt securities and eligible current and non-current assets; Financial assets are derecognized when substantial risks and rewards of ownership of the financial asset have been transferred. In cases where substantial risks and rewards of ownership of the financial assets are neither transferred nor retained, financial assets are derecognized only when the Company has not retained control over the financial asset.
• financial liabilities, which include long and short-term loans and borrowings, bank overdrafts, trade payables, lease liabilities, and eligible current and non-current liabilities.
Wipro Limited157
Corporate Overview | Management & Board Reports | Financial Statements
Non- derivative financial instruments are recognized initially at fair value. Subsequent to initial recognition, non-derivative financial instruments are measured as described below:
A. Cash and cash equivalents
The Company’s cash and cash equivalents consist of cash on hand and in banks and demand deposits with banks, which can be withdrawn at any time, without prior notice or penalty on the principal.
For the purposes of the cash flow statement, cash and cash equivalents include cash on hand, in banks and demand deposits with banks, net of outstanding bank overdrafts that are repayable on demand and are considered part of the Company’s cash management system. In the balance sheet, bank overdrafts are presented under borrowings within current liabilities.
B. Investments
Financial instruments measured at amortized cost:
Debt instruments that meet the following criteria are measured at amortized cost (except for debt instruments that are designated at fair value through Profit or Loss (FVTPL) on initial recognition):
• the asset is held within a business model whose objective is to hold assets in order to collect contractual cash flows; and
• the contractual terms of the instrument give rise on specified dates to cash flows that are solely payment of principal and interest on the principal amount outstanding.
Financial instruments measured at fair value through other comprehensive income (FVTOCI):
Debt instruments that meet the following criteria are measured at fair value through other comprehensive income (FVTOCI) (except for debt instruments that are designated at fair value through Profit or Loss (FVTPL) on initial recognition)
• the asset is held within a business model whose objective is achieved both by collecting contractual cash flows and selling the financial asset; and
• the contractual terms of the instrument give rise on specified dates to cash flows that are solely payment of principal and interest on the principal amount outstanding.
Interest income is recognized in statement of profit and loss for FVTOCI debt instruments. Other changes in fair value of FVTOCI financial assets are recognized in other comprehensive income. When the investment is disposed of, the cumulative gain or loss previously
accumulated in reserves is transferred to statement of profit and loss.
Financial instruments measured at fair value through profit or loss (FVTPL):
Instruments that do not meet the amortized cost or FVTOCI criteria are measured at FVTPL. Financial assets at FVTPL are measured at fair value at the end of each reporting period, with any gains or losses arising on re-measurement recognized in statement of profit and loss. The gain or loss on disposal is recognized in statement of profit and loss.
Interest income is recognized in statement of profit and loss for FVTPL debt instruments. Dividend on financial assets at FVTPL is recognized when the Company’s right to receive dividend is established.
Investments in equity instruments designated to be classified as FVTOCI:
The Company carries certain equity instruments which are not held for trading. The Company has elected the FVTOCI irrevocable option for these instruments. Movements in fair value of these investments are recognized in other comprehensive income and the gain or loss is not reclassified to statement of profit and loss on disposal of these investments. Dividends from these investments are recognized in statement of profit and loss when the Company’s right to receive dividends is established.
Investments in subsidiaries:
Investment in subsidiaries are measured at cost less impairment.
C. Other financial assets:
Other financial assets are non-derivative financial assets with fixed or determinable payments that are not quoted in an active market. They are presented as current assets, except for those maturing later than 12 months after the reporting date which are presented as non-current assets. These are initially recognized at fair value and subsequently measured at amortized cost using the effective interest method, less any impairment losses. These comprise trade receivables, unbilled receivables, finance lease receivables, employee and other advances and other eligible current and non-current assets.
D. Trade payables and other liabilities
Trade payables and other liabilities are initially recognized at fair value, and subsequently carried at amortized cost using the effective interest method. For these financial instruments, the carrying amounts approximate fair value due to the short-term maturity of these instruments. Contingent consideration recognized in the business combination

Annual Report 2019-20 158
is subsequently measured at fair value through profit or loss.
b) Derivative financial instruments
The Company is exposed to foreign currency fluctuations on foreign currency assets, liabilities, net investment in foreign operations and forecasted cash flows denominated in foreign currency.
The Company limits the effect of foreign exchange rate fluctuations by following established risk management policies including the use of derivatives. The Company enters into derivative financial instruments where the counterparty is primarily a bank.
Derivatives are recognized and measured at fair value. Attributable transaction costs are recognized in statement of profit and loss as cost.
Subsequent to initial recognition, derivative financial instruments are accounted as described below:
A. Cash flow hedges
Changes in the fair value of the derivative hedging instrument designated as a cash flow hedge are recognized in other comprehensive income and held in cash flow hedging reserve, net of taxes, a component of equity, to the extent that the hedge is effective. To the extent that the hedge is ineffective, changes in fair value are recognized in the statement of profit and loss and reported within foreign exchange gains/(losses), net, within results from operating activities. If the hedging instrument no longer meets the criteria for hedge accounting, then hedge accounting is discontinued prospectively. If the hedging instrument expires or is sold, terminated or exercised, the cumulative gain or loss on the hedging instrument recognized in cash flow hedging reserve till the period the hedge was effective remains in cash flow hedging reserve until the forecasted transaction occurs. The cumulative gain or loss previously recognized in the cash flow hedging reserve is transferred to the statement of profit and loss upon the occurrence of the related forecasted transaction. If the forecasted transaction is no longer expected to occur, such cumulative balance is immediately recognized in the statement of profit and loss.
B. Others
Changes in fair value of foreign currency derivative instruments not designated as cash flow hedges are recognized in the statement of profit and loss and reported within foreign exchange gains/(losses), net, within results from operating activities.
Changes in fair value and gains/(losses), net, on settlement of foreign currency derivative instruments relating to borrowings, which have not been designated as hedges are recorded in finance costs.
c) Derecognition of financial instruments
The Company derecognizes a financial asset when the contractual rights to the cash flows from the financial asset expire or it transfers the financial asset and the transfer qualifies for derecognition under Ind AS 109. If the Company retains substantially all the risks and rewards of a transferred financial asset, the Company continues to recognize the financial asset and recognizes a borrowing for the proceeds received. A financial liability (or a part of a financial liability) is derecognized from the Company’s balance sheet when the obligation specified in the contract is discharged or cancelled or expires.
(iv) Equity
a) Share capital and securities premium
The authorized share capital of the Company as at March 31, 2020 is ` 25,274 divided into 12,504,500,000 equity shares of ` 2 each, 25,000,000 preference shares of ` 10 each and 150,000, 10% optionally convertible cumulative preference shares of ` 100 each. Par value of the equity shares is recorded as share capital and the amount received in excess of par value is classified as securities premium.
Every holder of the equity shares, as reflected in the records of the Company as of the date of the shareholder meeting shall have one vote in respect of each share held for all matters submitted to vote in the shareholder meeting.
b) Capital Reserve
Capital reserve amounting to ` 1,139 (March 31, 2019: ` 1,139) is not freely available for distribution.
c) Capital Redemption Reserve
Capital redemption reserve amounting to ` 660 (March 31, 2019: ` 14) is not freely available for distribution.
d) Retained earnings
Retained earnings comprises of the Company’s undistributed earnings after taxes.
e) Common Control Transactions Capital Reserve
The Common Control Transactions Capital Reserve is on account of merger as explained in footnotes to Note 34. This reserve amounting to ` 2,473 (March 31, 2019: ` 2,473) is not freely available for distribution.
f) Share options outstanding account
The share options outstanding account is used to record the value of equity-settled share based payment transactions with employees. The amounts recorded in share options outstanding account are transferred to securities premium reserve upon exercise of stock options and restricted stock unit options by employees.
g) Special Economic Zone Re-Investment reserve
The Special Economic Zone Re-Investment Reserve has

Wipro Limited159
Corporate Overview | Management & Board Reports | Financial Statements
been created out of profit of eligible SEZ units as per provisions of section 10AA (1)(ii) of the Income–tax Act, 1961 for acquiring new plant and machinery. The reserve should be utilized by the Company for acquiring plant and machinery as per terms of section 10AA(2) of the Income-tax Act, 1961. This reserve is not freely available for distribution.
h) Other reserves
Changes in the fair value of financial instruments measured at fair value through other comprehensive income and actuarial gains and losses on defined benefit plans are recognized in other comprehensive income, net of taxes, and presented within equity as other reserves.
i) Cash flow hedging reserve
Changes in fair value of derivative hedging instruments designated and effective as a cash flow hedge are recognized in other comprehensive income, net of taxes, and presented within equity as cash flow hedging reserve.
j) Foreign currency translation reserve (FCTR)
The exchange differences arising from the translation of financial statements of foreign operations with functional currency other than Indian rupees is recognized in other comprehensive income, net of taxes and is presented within equity in the FCTR.
k) Dividend
A final dividend, including tax thereon, on equity shares is recorded as a liability on the date of approval by the shareholders. An interim dividend, including tax thereon, is recorded as a liability on the date of declaration by the Board of directors.
l) Buyback of equity shares
The buyback of equity shares and related transaction costs are recorded as a reduction of free reserves. Further, capital redemption reserve is created as an apportionment from retained earnings.
m) Bonus Issue
For the purpose of bonus issue, the amount is transferred from capital redemption reserves, securities premium and retained earnings to the share capital.
(v) Property, plant and equipment
a) Recognition and measurement
Property, plant and equipment are measured at cost less accumulated depreciation and impairment losses, if any. Cost includes expenditures directly attributable to the acquisition of the asset. General and specific borrowing costs directly attributable to the construction of a qualifying asset are capitalized as part of the cost.
Capital work-in-progress are measured at cost less accumulated impairment losses, if any.
b) Depreciation
The Company depreciates property, plant and equipment over the estimated useful life on a straight-line basis from the date the assets are available for use. Leasehold improvements are amortized over the shorter of estimated useful life of the asset or the related lease term. Term licenses are amortized over their respective contract term. Freehold land is not depreciated. The estimated useful life of assets is reviewed and where appropriate are adjusted, annually. The estimated useful lives of assets are as follows:
Category Useful life
Buildings 28 to 40 years
Plant and machinery 5 to 21 years
Computer equipment and software 2 to 7 years
Furniture, fixtures and equipment 3 to 10 years
Vehicles 4 to 5 years
When parts of an item of property, plant and equipment have different useful lives, they are accounted for as separate items (major components) of property, plant and equipment. Subsequent expenditure relating to property, plant and equipment is capitalized only when it is probable that future economic benefits associated with these will flow to the Company and the cost of the item can be measured reliably.
Deposits and advances paid towards the acquisition of property, plant and equipment outstanding as at each reporting date and the cost of property, plant and equipment not available for use before such date are disclosed under capital work- in-progress.
(vi) Business combination, Goodwill and Intangible assets
a) Business combination
Business combinations are accounted for using the purchase (acquisition) method. The cost of an acquisition is measured as the fair value of the assets transferred, liabilities incurred or assumed and equity instruments issued at the date of exchange by the Company. Identifiable assets acquired and liabilities and contingent liabilities assumed in a business combination are measured initially at fair value at the date of acquisition. Transaction costs incurred in connection with a business acquisition are expensed as incurred.
The cost of an acquisition also includes the fair value of any contingent consideration measured as at the date of acquisition. Any subsequent changes to the fair value of contingent consideration classified as liabilities, other than measurement period adjustments, are recognized in the statement of profit and loss.

Annual Report 2019-20 160
Common Control business combinations
The Company accounts for business combinations involving entities or businesses under common control using the pooling of interests method. The assets and liabilities of the combining entities are reflected at their carrying amounts. The identity of the reserves shall be preserved and shall appear in the financial statements of the transferee in the same form in which they appeared in the financial statements of the transferor. The difference, if any, between the amount recorded as share capital issued plus any additional consideration in the form of cash or other assets and the amount of share capital of the transferor shall be transferred to capital reserve and should be presented separately as Common Control Transactions Capital reserve.
b) Goodwill
The excess of the cost of an acquisition over the Company’s share in the fair value of the acquiree’s identifiable assets and liabilities is recognized as goodwill. If the excess is negative, a bargain purchase gain is recognized in equity as capital reserve. Goodwill is measured at cost less accumulated impairment (if any).
Goodwill associated with the disposal of an operation that is part of cash-generating unit is measured on the basis of the relative values of the operation disposed of and the portion of the cash-generating unit retained, unless the entity can demonstrate that some other method better reflects the goodwill associated with the operation disposed of.
c) Intangible assets
Intangible assets acquired separately are measured at cost of acquisition. Intangible assets acquired in a business combination are measured at fair value as at the date of acquisition. Following initial recognition, intangible assets are carried at cost less accumulated amortization and impairment losses, if any.
The amortization of an intangible asset with a finite useful life reflects the manner in which the economic benefit is expected to be generated.
The estimated useful life of amortisable intangibles are reviewed and where appropriate are adjusted, annually. The estimated useful lives of the amortisable intangible assets for the current and comparative periods are as follows:
Category Useful life
Customer related intangibles 5 to 10 years
Marketing related intangibles 3 to 7 years
(vii) Leases
The Company evaluates each contract or arrangement, whether it qualifies as lease as defined under Ind AS 116.
The Company as a lessee
The Company enters into an arrangement for lease of land, buildings, plant and machinery including computer equipment and vehicles. Such arrangements are generally for a fixed period but may have extension or termination options. The Company assesses, whether the contract is, or contains, a lease, at its inception. A contract is, or contains, a lease if the contract conveys the right to –
a) control the use of an identified asset,
b) obtain substantially all the economic benefits from use of the identified asset, and
c) direct the use of the identified asset
The Company determines the lease term as the non-cancellable period of a lease, together with periods covered by an option to extend the lease, where the Company is reasonably certain to exercise that option.
The Company at the commencement of the lease contract recognizes a Right-of-Use (RoU) asset at cost and corresponding lease liability, except for leases with term of less than twelve months (short term leases) and low-value assets. For these short term and low value leases, the Company recognizes the lease payments as an operating expense on a straight-line basis over the lease term.
The cost of the right-of-use asset comprises the amount of the initial measurement of the lease liability, any lease payments made at or before the inception date of the lease, plus any initial direct costs, less any lease incentives received. Subsequently, the right-of-use assets are measured at cost less any accumulated depreciation and accumulated impairment losses, if any. The right-of-use assets are depreciated using the straight-line method from the commencement date over the shorter of lease term or useful life of right-of-use asset. The estimated useful life of right-of-use assets are determined on the same basis as those of property, plant and equipment.
The Company applies Ind AS 36 to determine whether an RoU asset is impaired and accounts for any identified impairment loss as described in the impairment of non-financial assets below.
For lease liabilities at the commencement of the lease, the Company measures the lease liability at the present value of the lease payments that are not paid at that date. The lease payments are discounted using the interest rate implicit in the lease, if that rate can be readily determined, if that rate is not readily determined, the lease payments are discounted using the incremental borrowing rate that the Company would have to pay to borrow funds, including the consideration of factors such

Wipro Limited161
Corporate Overview | Management & Board Reports | Financial Statements
as the nature of the asset and location, collateral, market terms and conditions, as applicable in a similar economic environment.
After the commencement date, the amount of lease liabilities is increased to reflect the accretion of interest and reduced for the lease payments made.
The Company recognizes the amount of the re-measurement of lease liability as an adjustment to the right-of-use assets. Where the carrying amount of the right-of-use asset is reduced to zero and there is a further reduction in the measurement of the lease liability, the Company recognizes any remaining amount of the re-measurement in statement of profit and loss.
Lease liability payments are classified as cash used in financing activities in the statement of cash flows.
The Company as a lessor
Leases under which the Company is a lessor are classified as finance or operating leases. Lease contracts where all the risks and rewards are substantially transferred to the lessee, the lease contracts are classified as finance leases. All other leases are classified as operating leases.
For leases under which the Company is an intermediate lessor, the Company accounts for the head-lease and the sub-lease as two separate contracts. The sub-lease is further classified either as a finance lease or an operating lease by reference to the RoU asset arising from the head-lease.
(viii) Inventories
Inventories are valued at lower of cost and net realisable value, including necessary provision for obsolescence. Cost is determined using the weighted average method.
(ix) Impairment
A) Financial assets
The Company applies the expected credit loss model for recognizing impairment loss on financial assets measured at amortized cost, debt instruments classified as FVTOCI, trade receivables, unbilled receivables, contract assets, finance lease receivables and other financial assets. Expected credit loss is the difference between the contractual cash flows and the cash flows that the entity expects to receive discounted using effective interest rate.
Loss allowances for trade receivables, unbilled receivables, contract assets and finance lease receivables are measured at an amount equal to lifetime expected credit losses. Lifetime expected credit losses are the expected credit losses that result from all possible default events over the expected life of a financial instrument. Lifetime expected credit loss is computed based on a provision matrix which takes in to the account risk profiling of customers and historical credit loss experience adjusted for forward looking information. For other financial assets, expected credit loss is measured at the amount equal to
twelve months expected credit loss unless there has been a significant increase in credit risk from initial recognition, in which case those are measured at lifetime expected credit loss.
B) Impairment of Investment in subsidiaries
The Company assesses investments in subsidiaries for impairment whenever events or changes in circumstances indicate that the carrying amount of the investment may not be recoverable. If any such indication exists, the Company estimates the recoverable amount of the investment in subsidiary. The recoverable amount of such investment is the higher of its fair value less cost of disposal (FVLCD) and its value-in-use (VIU). The VIU of the investment is calculated using projected future cash flows. If the recoverable amount of the investment is less than its carrying amount, the carrying amount is reduced to its recoverable amount. The reduction is treated as an impairment loss and is recognized in the statement of profit and loss.
C) Non - financial assets
The Company assesses long-lived assets such as property, plant and equipment, right-of-use assets and acquired intangible assets for impairment whenever events or changes in circumstances indicate that the carrying amount of an asset or group of assets may not be recoverable. If any such indication exists, the Company estimates the recoverable amount of the asset or group of assets.
Goodwill is tested for impairment at least annually at the same time and when events occur or changes in circumstances indicate that the recoverable amount of the cash generating unit is less than its carrying value. The goodwill impairment test is performed at the level of cash-generating unit or groups of cash-generating units which represent the lowest level at which goodwill is monitored for internal management purposes.
The recoverable amount of an asset or cash generating unit is the higher of its fair value less cost of disposal (FVLCD) and its value-in-use (VIU). The VIU of long-lived assets is calculated using projected future cash flows. FVLCD of a cash generating unit is computed using turnover and earnings multiples. If the recoverable amount of the asset or the recoverable amount of the cash generating unit to which the asset belongs is less than its carrying amount, the carrying amount is reduced to its recoverable amount. The reduction is treated as an impairment loss and is recognized in the statement of profit and loss. If at the reporting date, there is an indication that a previously assessed impairment loss no longer exists, the recoverable amount is reassessed and the impairment losses previously recognized are reversed such that the asset is recognized at its recoverable amount but not exceeding written down value which would have been reported if the impairment losses had not been recognized initially. An impairment in respect of goodwill is not reversed.
Annual Report 2019-20 162
(x) Employee benefits
a) Post-employment and pension plans
The Company participates in various employee benefit plans. Pensions and other post-employment benefits are classified as either defined contribution plans or defined benefit plans. Under a defined contribution plan, the Company’s only obligation is to pay a fixed amount with no obligation to pay further contributions if the fund does not hold sufficient assets to pay all employee benefits. The related actuarial and investment risks are borne by the employee. The expenditure for defined contribution plans is recognized as an expense during the period when the employee provides service. Under a defined benefit plan, it is the Company’s obligation to provide agreed benefits to the employees. The related actuarial and investment risks are borne by the Company. The present value of the defined benefit obligations is calculated by an independent actuary using the projected unit credit method.
Re-measurement comprising actuarial gains or losses and the return on plan assets (excluding interest) are immediately recognized in other comprehensive income, net of taxes and permanently excluded from profit or loss. Instead net interest recognized in profit or loss is calculated by applying the discount rate used to measure the defined benefit obligation to the net defined benefit liability or asset. The actual return on the plan assets above or below the discount rate is recognized as part of re-measurement of net defined liability or asset through other comprehensive income, net of taxes.
The Company has the following employee benefit plans:
A. Provident fund
Employees receive benefits from a provident fund, which is a defined benefit plan. The employer and employees each make periodic contributions to the plan. A portion of the contribution is made to the approved provident fund trust managed by the Company while the remainder of the contribution is made to the government administered pension fund. The contributions to the trust managed by the Company is accounted for as a defined benefit plan as the Company is liable for any shortfall in the fund assets based on the government specified minimum rates of return.
B. Superannuation
Superannuation plan, a defined contribution scheme is administered by third party fund managers. The Company makes annual contributions based on a specified percentage of each eligible employee’s salary.
C. Gratuity and Pension
In accordance with the Payment of Gratuity Act,
1972, applicable for Indian companies, the Company provides for a lump sum payment to eligible employees, at retirement or termination of employment based on the last drawn salary and years of employment with the Company. The gratuity fund is managed by the third-party fund managers.
The Company also maintains pension and similar plans for employees outside India, based on the country specific regulations. These plans are partially funded, and the funds are managed by third party fund managers. The plans provide for monthly payout after retirement as per salary drawn and service period or for a lumpsum payment as set out in rules of each fund.
The Company’s obligation in respect of above plans, which are defined benefit plans, are provided for based on actuarial valuation using the projected unit credit method. The Company recognizes actuarial gains and losses in other comprehensive income, net of taxes.
b) Termination benefits
Termination benefits are expensed when the Company can no longer withdraw the offer of those benefits.
c) Short-term benefits
Short-term employee benefit obligations are measured on an undiscounted basis and are recorded as expense as the related service is provided. A liability is recognized for the amount expected to be paid under short-term cash bonus or profit-sharing plans, if the Company has a present legal or constructive obligation to pay this amount as a result of past service provided by the employee and the obligation can be estimated reliably.
d) Compensated absences
The employees of the Company are entitled to compensated absences. The employees can carry forward a portion of the unutilized accumulating compensated absences and utilize it in future periods or receive cash at retirement or termination of employment. The Company records an obligation for compensated absences in the period in which the employee renders the services that increases this entitlement. The Company measures the expected cost of compensated absences as the additional amount that the Company expects to pay as a result of the unused entitlement that has accumulated at the end of the reporting period. The Company recognizes accumulated compensated absences based on actuarial valuation using the projected unit credit method. Non-accumulating compensated absences are recognized in the period in which the absences occur.
(xi) Share based payment transactions
Selected employees of the Company receive remuneration in the

Wipro Limited163
Corporate Overview | Management & Board Reports | Financial Statements
form of equity settled instruments or cash settled instruments, for rendering services over a defined vesting period and for Company’s performance-based stock options over the defined period. Equity instruments granted are measured by reference to the fair value of the instrument at the date of grant. In cases, where equity instruments are granted at a nominal exercise price, the intrinsic value on the date of grant approximates the fair value. The expense is recognized in the statement of profit and loss with a corresponding increase to the share options outstanding account, a component of equity.
The equity instruments or cash settled instruments generally vest in a graded manner over the vesting period. The fair value determined at the grant date is expensed over the vesting period of the respective tranches of such grants (accelerated amortization). The stock compensation expense is determined based on the Company’s estimate of equity instruments or cash settled instruments that will eventually vest.
Cash Settled instruments granted are re-measured by reference to the fair value at the end of each reporting period and at the time of vesting. The expense is recognized in the statement of profit and loss with a corresponding increase to the financial liability.
(xii) Provisions
Provisions are recognized when the Company has a present obligation (legal or constructive) as a result of a past event, it is probable that an outflow of economic benefits will be required to settle the obligation and a reliable estimate can be made of the amount of the obligation.
The amount recognized as a provision is the best estimate of the consideration required to settle the present obligation at the end of the reporting period, taking into account the risks and uncertainties surrounding the obligation.
When some or all of the economic benefits required to settle a provision are expected to be recovered from a third party, the receivable is recognized as an asset, if it is virtually certain that reimbursement will be received and the amount of the receivable can be measured reliably.
Provisions for onerous contracts are recognized when the expected benefits to be derived by the Company from a contract are lower than the unavoidable costs of meeting the future obligations under the contract. Provisions for onerous contracts are measured at the present value of lower of the expected net cost of fulfilling the contract and the expected cost of terminating the contract.
(xiii) Revenue
The Company derives revenue primarily from software development, maintenance of software/hardware and related services, business process services, sale of IT and other products.
Effective April 1, 2018, the Company adopted Ind AS 115
“Revenue from Contracts with Customers” using the cumulative catch-up transition method, applied to contracts that were not completed as of April 1, 2018. The adoption of the new standard has resulted in a reduction of ` 1,605 in opening retained earnings, primarily relating to certain contract costs because these do not meet the criteria for recognition as costs to fulfil a contract.
Revenues from customer contracts are considered for recognition and measurement when the contract has been approved by the parties to the contract, the parties to contract are committed to perform their respective obligations under the contract, and the contract is legally enforceable. Revenue is recognized upon transfer of control of promised products or services to customers in an amount that reflects the consideration the Company expects to receive in exchange for those products or services. To recognize revenues, the Company applies the following five step approach: (1) identify the contract with a customer, (2) identify the performance obligations in the contract, (3) determine the transaction price, (4) allocate the transaction price to the performance obligations in the contract, and (5) recognize revenues when a performance obligation is satisfied. When there is uncertainty as to collectability, revenue recognition is postponed until such uncertainty is resolved.
At contract inception, the Company assesses its promise to transfer products or services to a customer to identify separate performance obligations. The Company applies judgement to determine whether each product or service promised to a customer is capable of being distinct, and are distinct in the context of the contract, if not, the promised products or services are combined and accounted as a single performance obligation. The Company allocates the arrangement consideration to separately identifiable performance obligations based on their relative stand-alone selling price or residual method. Stand-alone selling prices are determined based on sale prices for the components when it is regularly sold separately, in cases where the Company is unable to determine the stand-alone selling price the Company uses third-party prices for similar deliverables or the Company uses expected cost-plus margin approach in estimating the stand-alone selling price.
For performance obligations where control is transferred over time, revenues are recognized by measuring progress towards completion of the performance obligation. The selection of the method to measure progress towards completion requires judgment and is based on the nature of the promised products or services to be provided.
The method for recognizing revenues and costs depends on the nature of the services rendered:
A. Time and materials contracts
Revenues and costs relating to time and materials contracts are recognized as the related services are rendered.

Annual Report 2019-20 164
B. Fixed-price contracts
i) Fixed-price development contracts
Revenues from fixed-price contracts, including software development, and integration contracts, where the performance obligations are satisfied over time, are recognized using the “percentage-of-completion” method. The performance obligations are satisfied as and when the services are rendered since the customer generally obtains control of the work as it progresses. Percentage of completion is determined based on project costs incurred to date as a percentage of total estimated project costs required to complete the project. The cost expended (or input) method has been used to measure progress towards completion as there is a direct relationship between input and productivity. If the Company is not able to reasonably measure the progress of completion, revenue is recognized only to the extent of costs incurred for which recoverability is probable. When total cost estimates exceed revenues in an arrangement, the estimated losses are recognized in the statement of profit and loss in the period in which such losses become probable based on the current contract estimates as an onerous contract provision.
A contract asset is a right to consideration that is conditional upon factors other than the passage of time. Contract assets primarily relate to unbilled amounts on fixed-price development contracts and are classified as non-financial asset as the contractual right to consideration is dependent on completion of contractual milestones.
A contract liability is an entity’s obligation to transfer goods or services to a customer for which the entity has received consideration (or the amount is due) from the customer.
Unbilled receivables on other than fixed price development contracts are classified as a financial asset where the right to consideration is unconditional upon passage of time.
ii) Maintenance contracts
Revenues related to fixed-price maintenance contracts are recognized on a straight-line basis when services are performed through an indefinite number of repetitive acts over a specified period or ratably using percentage of completion method when the pattern of benefits from the services rendered to the customers and the cost to fulfil the contract is not even through the period of contract because the services are generally discrete in nature and not repetitive.
Revenue for contracts in which the invoicing is representative of the value being delivered, is recognized based on our right to invoice. If our invoicing
is not consistent with value delivered, revenues are recognized as the service is performed using the percentage of completion method.
In certain projects, a fixed quantum of service or output units is agreed at a fixed price for a fixed term. In such contracts, revenue is recognized with respect to the actual output achieved till date as a percentage of total contractual output. Any residual service unutilized by the customer is recognized as revenue on completion of the term.
iii) Element or Volume based contracts
Revenues and costs are recognized as the related services are rendered.
C. Products
Revenue on product sales are recognized when the customer obtains control of the specified product.
D. Others
− Any change in scope or price is considered as a contract modification. The Company accounts for modifications to existing contracts by assessing whether the services added are distinct and whether the pricing is at the stand-alone selling price. Services added that are not distinct are accounted for on a cumulative catch up basis, while those that are distinct are accounted for prospectively, either as a separate contract if the additional services are priced at the stand-alone selling price, or as a termination of the existing contract and creation of a new contract if not priced at the stand-alone selling price.
− The Company accounts for variable considerations like, volume discounts, rebates, pricing incentives to customers and penalties as reduction of revenue on a systematic and rational basis over the period of the contract. The Company estimates an amount of such variable consideration using expected value method or the single most likely amount in a range of possible consideration depending on which method better predicts the amount of consideration to which the Company may be entitled and when it is probable that a significant reversal of cumulative revenue recognized will not occur when the uncertainty associated with the variable consideration is resolved.
− Revenues are shown net of allowances/ returns, sales tax, value added tax, goods and services tax and applicable discounts and allowances.
− The Company accrues the estimated cost of warranties at the time when the revenue is recognized. The accruals are based on the Company’s historical experience of material usage and service delivery costs.

Wipro Limited165
Corporate Overview | Management & Board Reports | Financial Statements
− Incremental costs that relate directly to a contract and incurred in securing a contract with a customer are recognized as an asset when the Company expects to recover these costs and amortized over the contract term.
− The Company recognizes contract fulfilment cost as an asset if those costs specifically relate to a contract or to an anticipated contract, the costs generate or enhance resources that will be used in satisfying performance obligations in future; and the costs are expected to be recovered. The asset so recognized is amortized on a systematic basis consistent with the transfer of goods or services to customer to which the asset relates.
− The Company assesses the timing of the transfer of goods or services to the customer as compared to the timing of payments to determine whether a significant financing component exists. As a practical expedient, the Company does not assess the existence of a significant financing component when the difference between payment and transfer of deliverables is a year or less. If the difference in timing arises for reasons other than the provision of finance to either the customer or us, no financing component is deemed to exist.
− The Company may enter into arrangements with third party suppliers to resell products or services. In such cases, the Company evaluates whether the Company is the principal (i.e. report revenues on a gross basis) or agent (i.e. report revenues on a net basis). In doing so, the Company first evaluates whether the Company controls the good or service before it is transferred to the customer. If Company controls the good or service before it is transferred to the customer, Company is the principal; if not, the Company is the agent.
− Estimates of transaction price and total costs or efforts are continuously monitored over the term of the contract and are recognized in net profit in the period when these estimates change or when the estimates are revised. Revenues and the estimated total costs or efforts are subject to revision as the contract progresses.
(xiv) Finance costs
Finance costs comprise interest cost on borrowings and lease liabilities, gain or losses arising on re-measurement of financial assets at FVTPL, gains/ (losses) on translation or settlement of foreign currency borrowings and changes in fair value and gains/ (losses) on settlement of related derivative instruments. Borrowing costs that are not directly attributable to a qualifying asset are recognized in the statement of profit and loss using the effective interest method.
(xv) Other income
Other income comprises interest income on deposits, dividend income and gains / (losses) on disposal of investments. Interest income is recognized using the effective interest method. Dividend income is recognized when the right to receive payment is established.
(xvi) Income tax
Income tax comprises current and deferred tax. Income tax expense is recognized in the statement of profit and loss except to the extent it relates to a business combination, or items directly recognized in equity or in other comprehensive income.
a) Current income tax
Current income tax for the current and prior periods are measured at the amount expected to be recovered from or paid to the taxation authorities based on the taxable income for the period. The tax rates and tax laws used to compute the current tax amounts are those that are enacted or substantively enacted as at the reporting date and applicable for the period. While determining the tax provisions, the Company assesses whether each uncertain tax position is to be considered separately or together with one or more uncertain tax positions depending the nature and circumstances of each uncertain tax position. The Company offsets current tax assets and current tax liabilities, where it has a legally enforceable right to set off the recognized amounts and where it intends either to settle on a net basis, or to realize the asset and liability simultaneously.
b) Deferred income tax
Deferred income tax is recognized using the balance sheet approach. Deferred income tax assets and liabilities are recognized for deductible and taxable temporary differences arising between the tax base of assets and liabilities and their carrying amount in financial statements, except when the deferred income tax arises from the initial recognition of goodwill or an asset or liability in a transaction that is not a business combination and affects neither accounting nor taxable profits or loss at the time of the transaction.
Deferred income tax assets are recognized to the extent it is probable that taxable profit will be available against which the deductible temporary differences and the carry forward of unused tax credits and unused tax losses can be utilized.
Deferred income tax liabilities are recognized for all taxable temporary differences except in respect of taxable temporary differences that is expected to reverse within the tax holiday period, taxable temporary differences associated with investments in subsidiaries, associates and foreign branches where the timing of the reversal of the temporary difference can be controlled and it is probable that the temporary difference will not reverse in the foreseeable future.
Annual Report 2019-20 166
The carrying amount of deferred income tax assets is reviewed at each reporting date and reduced to the extent that it is no longer probable that sufficient taxable profit will be available to allow all or part of the deferred income tax asset to be utilized.
Deferred income tax assets and liabilities are measured at the tax rates that are expected to apply in the period when the asset is realized or the liability is settled, based on tax rates (and tax laws) that have been enacted or substantively enacted at the reporting date.
The Company offsets deferred income tax assets and liabilities, where it has a legally enforceable right to offset current tax assets against current tax liabilities, and they relate to taxes levied by the same taxation authority on either the same taxable entity, or on different taxable entities where there is an intention to settle the current tax liabilities and assets on a net basis or their tax assets and liabilities will be realized simultaneously.
(xvii) Earnings per share
Basic earnings per share is computed using the weighted average number of equity shares outstanding during the period adjusted for treasury shares held. Diluted earnings per share is computed using the weighted-average number of equity and dilutive equivalent shares outstanding during the period, using the treasury stock method for options, except where the results would be anti-dilutive.
The number of equity shares and potentially dilutive equity shares are adjusted retrospectively for all periods presented for any splits and bonus shares issues including for change effected prior to the approval of the financial statements by the Board of Directors.
(xviii) Cash flow statement
Cash flows are reported using the indirect method, whereby profit for the period is adjusted for the effects of transactions of a non-cash nature, any deferrals or accruals of past or future operating cash receipts or payments and item of income or expenses associated with investing or financing cash flows. The cash from operating, investing and financing activities of the Company are segregated.
(xix) Assets held for sale
Sale of business is classified as held for sale, if their carrying amount is intended to be recovered principally through sale rather than through continuing use. The condition for classification as held for sale is met when disposal business is available for immediate sale and the same is highly probable of being completed within one year from the date of classification as held for sale.
(xx) Discontinued operations
A discontinued operation is a component of the Company’s business that represents a separate line of business that has been disposed of or is held for sale, or is a subsidiary
acquired exclusively with a view to resale. Classification as a discontinued operation occurs upon the earlier of disposal or when the operation meets the criteria to be classified as held for sale.
(xxi) Non-current assets and disposal groups held for sale
Assets and liabilities of disposal groups that are available for immediate sale and where the sale is highly probable of being completed within one year from the date of classification are considered and classified as assets held for sale and liabilities associated with assets held for sale. Noncurrent assets and disposal groups held for sale are measured at the lower of carrying amount and fair value less costs to sell.
(xxii) Disposal of assets
The gain or loss arising on disposal or retirement of assets is recognized in the statement of profit and loss.
New Accounting standards adopted by the Company:
(xxiii) Ind AS 116 – Leases
On April 1, 2019, the Company has adopted Ind AS 116, Leases, which, applied to all lease contracts outstanding as at April 1, 2019, using modified retrospective method by recording the cumulative effect of initial application as an adjustment to opening retained earnings. The Company has made use of the following practical expedients available in its transition to Ind AS 116 -
(a) The Company will not reassess whether a contract is or contains a lease. Accordingly, the definition of lease in accordance with Ind AS 17 will continue to be applied to lease contracts entered by the Company or modified by the Company before April 1, 2019.
(b) The Company has applied a single discount rate to a portfolio of leases of similar assets in similar economic environment. Consequently, the Company has recorded its lease liability using the present value of remaining lease payments, discounted using the incremental borrowing rate at the date of initial application and the right-of- use asset at its carrying amount as if the standard had been applied since the commencement date of the lease but discounted using the incremental borrowing rate at the date of initial application.
(c) The Company excluded the initial direct costs from measurement of the RoU asset;
(d) The Company does not recognize RoU assets and lease liabilities for leases with less than twelve months of lease term and low-value assets on the date of initial application.
The weighted average rate of discount applied to lease liabilities as at April 1, 2019 is 5.6%.
On adoption of Ind AS 116,
a) the Company had recognized right-of-use assets ` 6,835 and corresponding lease liabilities ` 7,618.

Wipro Limited167
Corporate Overview | Management & Board Reports | Financial Statements
b) the net carrying value of assets procured under the finance lease ` 143 (gross carrying and accumulated depreciation value of ̀ 263 and ̀ 120, respectively) have been reclassified from property, plant and equipment to right- of-use assets.
c) the obligations under finance leases of ` 596 (non-current and current obligation under finance leases ̀ 152 and ̀ 444 respectively) have been reclassified to lease liabilities.
d) prepaid rent on leasehold land and other assets, which were earlier classified under “Other Assets” have been reclassified to right-of-use assets by ` 2,202.
The adoption of the new standard has resulted in a reduction of ` 414 in retained earnings, net of deferred tax asset of ` 115.
During the year ended March 31, 2020, the Company recognized in the statement of profit and loss-
a) Depreciation expense from right-of-use assets of ` 2,800 (Refer to Note 5)
b) Interest expenses on lease liabilities of ` 426
c) Rent expense amounting to ` 17 pertaining to leases of low-value assets and ` 1,812 pertaining to leases with less than twelve months of lease term has been included under facility expenses
d) Income from subleasing right-of-use assets to subsidiaries of ` 209.
Refer to Note 5 for additions to right-of-use assets during the year ended March 31, 2020 and carrying amount of right-of-use assets as at March 31, 2020 by class of underlying asset.
As of March 31, 2020, the Company is committed to certain leases amounting to ` 1,399, which have not yet commenced. The term of such leases ranges from 2 to 8 years.
Lease payments during the year are disclosed under financing activities in the statement of cash flows.
The comparatives as at and for the year ended March 31, 2019 have not been retrospectively adjusted.
The adoption of Ind AS 116 did not have any material impact on the Company’s statement of profit and loss and earnings per share.
The difference between the lease obligation disclosed as of March 31, 2019 under Ind AS 17 and the value of the lease liabilities as of April 1, 2019 is primarily on account of practical expedients exercised for low value assets and short term leases, as at adoption of the standard, in measuring lease liability and discounting the lease liabilities to the present value in accordance with Ind AS 116.
Particulars Total
Operating lease commitments disclosed as at March 31, 2019
` 9,711
(Less): Impact of discounting on opening lease liability
(522)
(Less): Short-term leases not recognized as a liability
(1,429)
(Less): Low-value leases not recognized as a liability
-
(Less): Leases commencing after 1st April, but entered into on or before 31st March
(142)
Lease liability recognized as at April 1, 2019 ` 7,618
Appendix C to Ind AS 12 - Uncertainty over income tax treatments
Appendix C to Ind AS 12 clarifies the accounting for uncertainties in income taxes. The interpretation is to be applied to the determination of taxable profit (tax loss), tax bases, unused tax losses, unused tax credits and tax rates, when there is uncertainty over income tax treatments under Ind AS 12. The adoption of Appendix C to Ind AS 12 did not have any material impact on the standalone financial statements of the Company.
Amendment to Ind AS 12 – Income Taxes
The Ministry of Corporate Affairs issued amendments to Ind AS 12 – Income Taxes. The amendments clarify that an entity shall recognize the income tax consequences of dividends on financial instruments classified as equity according to where the entity originally recognized those past transactions or events that generated distributable profits were recognized. The adoption of amendment to Ind AS 12 did not have any material impact on the standalone financial statements of the Company.
Amendment to Ind AS 19 - Plan Amendment, Curtailment or Settlement
The Ministry of Corporate Affairs issued amendments to Ind AS 19, ‘Employee Benefits’, in connection with accounting for plan amendments, curtailments and settlements requiring an entity to determine the current service costs and the net interest for the period after the remeasurement using the assumptions used for the remeasurement; and determine the net interest for the remaining period based on the remeasured net defined benefit liability or asset. The adoption of amendment to Ind AS 19 did not have any material impact on the standalone financial statements of the Company.
New Accounting Standards not yet adopted by the Company
Ministry of Corporate Affairs (“MCA”) notifies new standard or amendments to the existing standards. There is no such notification which would have been applicable from April 1, 2020.

Annual Report 2019-20 168
4. Property, plant and equipment
Land BuildingsPlant and
machinery *
Furniture and
fixtures
Office equipment
Vehicles Total
Gross carrying value:
As at April 1, 2019 ` 3,555 ` 25,237 ` 68,156 ` 9,539 ` 4,583 ` 874 ` 111,944
Reclassified on adoption of Ind AS 116 - - (263) - - - (263)
Adjusted balance as at April 1, 2019 ` 3,555 ` 25,237 ` 67,893 ` 9,539 ` 4,583 ` 874 ` 111,681
Additions 55 8,418 9,265 1,729 994 - 20,461
Additions through business combination - - 18 1 1 - 20
Disposals - (35) (2,628) (94) (101) (116) (2,974)
As at March 31, 2020 ` 3,610 ` 33,620 ` 74,548 ` 11,175 ` 5,477 ` 758 ` 129,188
Accumulated depreciation/ impairment:
As at April 1, 2019 - ` 5,982 ` 55,673 ` 7,354 ` 3,561 ` 632 ` 73,202
Reclassified on adoption of Ind AS 116 - - (120) - - - (120)
Adjusted balance as at April 1, 2019 - ` 5,982 ` 55,553 ` 7,354 ` 3,561 ` 632 ` 73,082
Depreciation - 904 5,788 786 449 162 8,089
Disposals - (14) (2,286) (43) (11) (102) (2,456)
As at March 31, 2020 - ` 6,872 ` 59,055 ` 8,097 ` 3,999 ` 692 ` 78,715
Net book value as at March 31, 2020 ` 3,610 ` 26,748 ` 15,493 ` 3,078 ` 1,478 ` 66 ` 50,473
Gross carrying value:
As at April 1, 2018 ` 3,490 ` 23,139 ` 65,605 ` 9,149 ` 4,344 ` 1,007 ` 106,734
Additions 65 2,193 6,875 863 332 2 10,330
Additions due to merger - 66 114 38 10 - 228
Disposals - (161) (4,438) (511) (103) (135) (5,348)
As at March 31, 2019 ` 3,555 ` 25,237 ` 68,156 ` 9,539 ` 4,583 ` 874 ` 111,944
Accumulated depreciation/ impairment:
As at April 1, 2018 - ` 5,249 ` 52,602 ` 7,173 ` 3,239 ` 445 ` 68,708
Additions due to merger - 6 43 - 14 - 63
Depreciation - 807 6,849 612 387 282 8,937
Disposals - (80) (3,821) (431) (79) (95) (4,506)
As at March 31, 2019 - ` 5,982 ` 55,673 ` 7,354 ` 3,561 ` 632 ` 73,202
Net book value as at March 31, 2019 ` 3,555 ` 19,255 ` 12,483 ` 2,185 ` 1,022 ` 242 ` 38,742
* Including net carrying value of computer equipment and software amounting to ` 9,959 and ` 8,893 as at March 31, 2020 and 2019, respectively.

Wipro Limited169
Corporate Overview | Management & Board Reports | Financial Statements
5. Right-of-Use Assets
Gross carrying value:
Category of RoU asset
TotalLand Buildings
Plant and machinery*
Vehicles
As at April 1, 2019 ` 2,003 ` 5,564 ` 1,235 ` 378 ` 9,180
Additions - 1,022 543 138 1,703
Additions through business combination - 126 - - 126
Disposals - (27) - (44) (71)
As at March 31, 2020 ` 2,003 ` 6,685 ` 1,778 ` 472 ` 0,938
Accumulated depreciation
Depreciation ` 27 ` 1,850 ` 790 ` 133 ` 2,800
Disposals - (18) - (4) (22)
As at March 31, 2020 ` 27 ` 1,832 ` 790 ` 129 ` 2,778
Net book value as at March 31, 2020 ` 1,976 ` 4,853 ` 988 ` 343 ` 8,160
*Includes computer equipment
6. Goodwill and other intangible assets
The movement in goodwill balance is given below:
Year ended March 31, 2020 March 31, 2019
Balance at the beginning of the year ` 3,882 ` 3,882
Acquisition through business combination (Refer to Note 7) 689 -
Balance at the end of the year ` 4,571 ` 3,882
The Company is organized by three operating segments: IT Services, IT Products and India State Run Enterprises services. Goodwill as at March 31, 2020 and 2019 has been allocated to the IT Services operating segment.
Below is the allocation of the goodwill to the CGUs:
As at March 31, 2020 March 31, 2019
Energy, Natural Resources and Utilities (ENU) ` 3,782 ` 3,782
Banking Financial Services and Insurance (BFSI) 789 100
Total ` 4,571 ` 3,882
For impairment testing, goodwill is allocated to a CGU representing the lowest level within the Company at which goodwill is monitored for internal management purposes, and which is not higher than the Company’s operating segment. Goodwill is tested for impairment at least annually in accordance with the Company’s procedure for determining the recoverable value of each CGU.
The recoverable amount of the CGU is determined on the basis of Fair Value Less Cost of Disposal (FVLCD). The FVLCD of the CGU is determined based on the market capitalization approach, using the turnover and earnings multiples derived from observable market data. The fair value measurement is categorised as a level 2 fair value based on the inputs in the valuation techniques used.
Based on the above testing, no impairment was identified as at March 31, 2020 and 2019 as the recoverable value of the CGUs exceeded the carrying value. Further, none of the CGU’s tested for impairment as at March 31, 2020 and 2019 were at risk of impairment. An analysis of the calculation’s sensitivity to a change in the key parameters (turnover and earnings multiples), did not identify any probable scenarios where the CGU’s recoverable amount would fall below its carrying amount.

Annual Report 2019-20 170
Movement in intangible assets is given below:
Intangible assetsCustomer related Marketing related * Total
Gross carrying value:As at April 1, 2019 ` 2,913 ` 485 ` 3,398Additions through business combination 2,294 32 2,326Disposals - - -As at March 31, 2020 ` 5,207 ` 517 ` 5,724Accumulated amortization/ impairment:As at April 1, 2019 ` 1,527 ` 485 ` 2,012Amortization 520 2 522Disposals - - -As at March 31, 2020 ` 2,047 ` 487 ` 2,534Net carrying value as at March 31, 2020 ` 3,160 ` 30 ` 3,190Gross carrying value:As at April 1, 2018 ` 2,913 ` 78 ` 2,991Additions - - -Additions due to merger - 407 407Disposals - - -As at March 31, 2019 ` 2,913 ` 485 ` 3,398Accumulated amortization/ impairment:As at April 1, 2018 ` 1,151 ` 78 ` 1,229Amortization 376 - 376Additions due to merger - 407 407Disposals - - -As at March 31, 2019 ` 1,527 ` 485 ` 2,012Net carrying value as at March 31, 2019 ` 1,386 ` - ` 1,386
* Marketing related intangible assets include Technical Know-how, patents and trademarks.
Additions due to merger during the year ended March 31, 2019 represents value of intangibles taken over as a part of the merger explained in footnotes to Note 34.
As at March 31, 2020, the estimated remaining amortization period for intangible assets acquired on acquisition are as follows:
Acquisition Estimated remaining amortization period
Vara Infotech Private Limited 6.50 - 9.50 years
Other entities 1.25 – 3 years
7. Business Combination
Summary of material acquisitions during the year ended March 31, 2020 is given below:
On September 30, 2019, the Company has acquired the customer contracts, leased facilities, assets and employees of Vara Infotech Private Limited, through a Business Transfer Agreement for a cash consideration of ` 3,230. This transaction pertains to our service offerings in BFSI industry vertical.
The following table presents the provisional purchase price allocation:
Description Purchase price allocated Net assets ` 215
Customer related intangibles 2,294
Marketing related intangibles 32
Total ` 2,541Goodwill 689
Total purchase price ` 3,230

Wipro Limited171
Corporate Overview | Management & Board Reports | Financial Statements
The goodwill of ` 689 comprises value of acquired workforce and expected synergies arising from the business combination. The goodwill was allocated to IT Services segment and is deductible for income tax purposes in India.
The pro-forma effects of this business combination on the Company’s results were not material.
8. Investments Non-current Investments
As at
March 31, 2020 March 31, 2019
Financial instruments measured at FVTOCI
Equity instruments -unquoted (Refer to note 8.1) ` 152 ` 249
Investment in Subsidiaries- unquoted (Refer to Note 8.4) 77,198 82,254
` 77,350 ` 82,503
Aggregate amount of unquoted investments 77,350 82,503
Aggregate amount of impairment in value of investments in subsidiaries (7,356) (7,356)
Current Investments
As at
March 31, 2020 March 31, 2019
Financial instruments measured at FVTPL
Investments in liquid and short-term mutual funds -unquoted (Refer to Note 8.5) ` 14,795 ` 13,960
Financial instruments measured at FVTOCI
Commercial paper, Certificate of deposits and bonds -unquoted (Refer to note 8.2) 20,126 43,030
Non-convertible debentures, government securities and commercial papers - quoted (Refer to note 8.3) 135,461 142,018
Financial instruments at amortized cost
Inter corporate and term deposits -unquoted * 19,253 20,980
` 189,635 ` 219,988
Aggregate amount of quoted investments and aggregate market value thereof 135,461 142,018
Aggregate amount of unquoted investments 54,174 77,970
* These deposits earn a fixed rate of interest.
* Term deposits include deposits in lien with banks primarily on account of term deposits held as margin money deposits against guarantees amounting to ` 796 (March 31, 2019: ` 463).
Details of investments:
8.1 Details of investments in equity instruments-other than subsidiaries (fully paid-up) – classified as FVTOCI
ParticularsNumber of Shares Carrying value
As at As atMarch 31, 2020 March 31, 2019 March 31, 2020 March 31, 2019
Non-CurrentMycity Technology Limited 44,935 44,935 ` - ` -
Wep Peripherals Limited 306,000 306,000 68 40
Wep Solutions Limited 1,836,000 1,836,000 27 40
Drivestream India Private Limited 267,600 267,600 19 19
Altizon Systems Private Limited 23,758 23,758 38 144
WAISL Limited (formerly Wipro Airport IT Services Limited) (Refer to Note 23) - 550,000 - 6
Total ` 152 ` 249

Annual Report 2019-20 172
8.2 Investment in certificate of deposits/ commercial papers and bonds (unquoted) – classified as FVTOCI
Particulars of issuerAs at
March 31, 2020 March 31, 2019
Current
Axis Bank ` 9,139 ` 4,309
National Bank for Agriculture and Rural Development 8,833 1,000
Small Industries Development Bank of India 1,197 4,302
ICICI Bank 957 11,311
Kotak Mahindra Investments Limited - 2,864
Kotak Mahindra Prime Limited - 2,585
Aditya Birla Finance Limited - 1,988
Tata Capital Housing Finance Limited - 1,881
Tata Capital Financial Services Limited - 1,499
Kotak Mahindra Bank - 9,362
HDFC Bank Limited - 992
HDB Financial Services Limited - 937
Total ` 20,126 ` 43,030
8.3 Investment in non-convertible debentures, government securities and commercial papers (quoted) – classified as FVTOCI
Particulars of issuerAs at
March 31, 2020 March 31, 2019
Current
National Highways Authority of India ` 18,802 ` 18,055
Rural Electrification Corporation Limited 14,114 4,929
HDB Financial Services Limited 13,633 13,038
Government Securities 12,978 6,862
Power Finance Corporation Limited 12,248 13,169
Kotak Mahindra Prime Limited 12,090 10,855
Tata Capital Financial Services Limited 12,000 13,708
Small Industries Development Bank of India 8,914 4,912
Kotak Mahindra Investments Limited 8,283 5,238
Housing Development Finance Corporation Limited 5,692 7,151
Indian Railway Finance Corporation Limited 4,857 4,473
National Bank for Agriculture and Rural Development 4,574 13,460
Aditya Birla Finance Limited 1,882 11,596
Axis Bank 1,823 517
NTPC Limited 1,679 417
Tata Capital Housing Finance Limited 1,273 5,765
HDFC Bank Limited 614 462
ANZ Bank 5 3
LIC Housing Finance Limited - 7,408
Total ` 135,461 ` 142,018

Wipro Limited173
Corporate Overview | Management & Board Reports | Financial Statements
8.4 Details of investment in unquoted equity and preference instruments of subsidiaries (fully paid up)
Name of the subsidiary Currency Face ValueNumber of Units as at Balances as at
March 31, 2020 March 31, 2019 March 31, 2020 March 31, 2019
Non-Current
Equity Instrument
Wipro Trademarks Holding Limited ` 10 93,250 93,250 ` 22 ` 22
Wipro Travel Services Limited ` 10 66,171 66,171 1 1
Wipro, LLC USD - - - 50,496 50,496
Wipro Japan KK JPYNote 1
650 650 6 6
Wipro Japan KK USD 16 16 640 641
Wipro Shanghai Limited Note 2 - - 9 9
Wipro IT Services SE (formerly known as Wipro Cyprus SE) EUR 1 163,617 163,617 18,903 18,903
Wipro Networks Pte Limited SGD 1 28,126,108 28,126,108 1,339 1,339
Wipro Chengdu Limited Note 2 - - 24 24
Wipro Overseas IT Services Pvt. Ltd. ` 10 50,000 50,000 ^ ^
Wipro Holdings (UK) Limited USD 1 130,151,974 130,151,974 4,480 4,480
Wipro IT Services Bangladesh Limited BDT 10 42,499,990 42,499,990 359 359
Wipro HR Services India Private Limited (formerly known as Alight HR Services India Private Limited)
INR 10 70,10,000 70,10,000 8,275 8,275
Sub-total ` 84,554 ` 84,555
Preference Shares
Wipro IT Services SE (formerly known as Wipro Cyprus SE) (Redeemable) EUR 1 - 45,000 ` - ` 5,055
Sub-total ` - ` 5,055
Total Non-Current ` 84,554 ` 89,610
Current
Wipro Airport IT Services Limited (Refer to note 23) ` 10 - 5,50,000 - ^
Total Current ` - ` -
Total investment in unquoted equity and preference instruments of subsidiaries ` 84,554 ` 89,610
Less: Impairment in value of investments in subsidiaries (Note 3 below) (7,356) (7,356)
Net investment in unquoted equity and preference instruments of subsidiaries ` 77,198 ` 82,254
Note 1 - As per the local laws of Japan, the Shares do not have face value.Note 2 - As per the local laws of People’s Republic of China, there is no requirement of number of shares and face value thereof. Hence
the investment by the Company is considered as equity contribution.Note 3 - The impairment is on account of diminution in the value of a step subsidiary of Wipro LLC due to the uncertainties around the
Affordable Care Act.
8.5 Details of Investments in liquid and short-term mutual funds -unquoted – classified as FVTPL
Particulars
Number of Shares Carrying Value
As at As at
March 31, 2020 March 31, 2019 March 31, 2020 March 31, 2019
HDFC Arbitrage Fund - Wholesale Plan - Growth 141,089,753 - ` 2,100 ` -
Kotak Equity Arbitrage Fund - Direct Plan - Growth 67,906,978 - 1,974 -
SBI Overnight Fund Direct Plan Growth 496,725 388,332 1,616 1,201
IDFC Arbitrage Fund - Growth - Direct Plan 48,133,290 - 1,241 -
ICICI Prudential Equity Arbitrage Fund - Direct Plan - Growth 45,551,909 - 1,229 -
UTI Overnight Fund Direct Plan Growth 407,120 462,995 1,113 1,203
UTI Arbitrage Fund-Growth Plan 36,445,590 - 996 -
L&T Cash Fund Direct Plan Growth 460,742 168,996 718 250

Annual Report 2019-20 174
Particulars
Number of Shares Carrying Value
As at As at
March 31, 2020 March 31, 2019 March 31, 2020 March 31, 2019
Axis Overnight Fund 590,406 389,144 623 390
DSP Overnight Fund Direct Plan Growth 488,697 345,742 522 351
HSBC Overnight Fund 479,479 - 500 -
Invesco India Overnight Fund 495,317 - 500 -
ICICI Prudential Overnight Fund Direct Growth 4,526,064 5,864,741 488 600
HDFC Overnight Fund Direct Plan Growth 145,665 70,899 432 200
ABSL Overnight Fund Direct Plan Growth 231,342 1,771,126 250 1,818
Sundaram Overnight Fund 228,041 - 242 -
Tata Overnight Fund 107,199 250,125 113 250
IDFC Overnight Fund 67,569 594,622 72 602
Kotak Overnight Fund 62,144 691,520 66 700
HDFC Arbitrage Fund - Wholesale Plan - Monthly Dividend- Direct Plan - 200,321,433 - 2,097
IDFC Arbitrage Fund – Monthly Dividend- Direct Plan - 88,833,898 - 1,168
ICICI Prudential Equity Arbitrage Fund - Direct Plan - Dividend - 79,919,884 - 1,158
Kotak Equity Arbitrage - Direct - Fortnight Dividend - 83,782,796 - 1,972
Religare Ultra Short Term Fund - Institutional Growth - 15 - ^
Reliance Interval Fund - Monthly Series I - IP - Dividend - 15 - ^
Total Investments in liquid and short-term mutual funds -unquoted ` 14,795 ` 13,960
^ Value of investment is less than `1.
9. Trade receivablesAs at
March 31, 2020 March 31, 2019
Unsecured
Considered good ` 97,032 ` 94,836
Considered doubtful 10,581 11,631
` 107,613 ` 106,467
Less: Allowance for lifetime expected credit loss (10,581) (11,631)
` 97,032 ` 94,836
Included in the balance sheet as follows:
Non-current 4,462 4,373
Current 92,570 90,463
The activity in the allowance for lifetime expected credit loss is given below:
As at
March 31, 2020 March 31, 2019
Balance at the beginning of the year ` 11,631 ` 11,514
Additions during the year, net 857 729
Uncollectable receivables charged against allowance (1,989) (575)
Translation adjustment 82 (37)
Balance at the end of the year ` 10,581 ` 11,631

Wipro Limited175
Corporate Overview | Management & Board Reports | Financial Statements
10. Cash and cash equivalents
Cash and cash equivalents as at March 31, 2020 and 2019 consist of the following:
As at
March 31, 2020 March 31, 2019
Balances with banks
Current accounts ` 13,233 ` 18,838
Unclaimed dividend 85 93
Demand deposits * 90,970 84,818
Cheques, drafts on hand 152 153
` 104,440 ` 103,902
* These deposits can be withdrawn by the Company at any time without prior notice and without any penalty on the principal.
Cash and cash equivalents consists of the following for the purpose of the statement of cash flows:
As atMarch 31, 2020 March 31, 2019
Cash and cash equivalents ` 104,440 ` 103,902
Bank overdrafts - (3)
` 104,440 ` 103,899
11. Other Financial Assets
As at
March 31, 2020 March 31, 2019
Non-current
Security deposits ` 1,266 ` 1,043
Other deposits 253 337
Interest receivable 1,139 1,139
Finance lease receivables 1,758 1,324
` 4,416 ` 3,843
Current
Dues from officers and employees ` 792 ` 591
Finance lease receivables 2,030 908
Interest receivable 2,444 1,714
Security Deposits 886 949
Others 655 1,651
Considered doubtful 887 810
` 7,694 ` 6,623
Less : Provision for doubtful advances (887) (810)
` 6,807 ` 5,813
Total ` 11,223 ` 9,656
The activities in the provision for doubtful advances is given below:
As at
March 31, 2020 March 31, 2019
Balance at the beginning of the year ` 810 ` 790
Addition during the year, net 176 218
Uncollectable advances charged against allowance (99) (198)
Balance at the end of the year ` 887 ` 810

Annual Report 2019-20 176
Finance lease receivables
Leasing arrangements
Finance lease receivables consist of assets that are leased to customers for contract terms ranging from 1 to 7 years, with lease payments due in monthly or quarterly installments. Details of finance lease receivables is given below:
Minimum lease payments
Present value of minimum lease payments
As at March 31,
2020 2019 2020 2019
Not later than one year ` 2,169 ` 999 ` 2,030 ` 908
Later than one year but not later than five years 1,846 1330 1,758 1,283
Later than five years - 44 - 41
Unguaranteed residual values - - - -
Gross investment in lease 4,015 2,373 3,788 2,232
Less: Unearned finance income (227) (141) - -
Present value of minimum lease payment receivables ` 3,788 ` 2,232 ` 3,788 ` 2,232
Included in the balance sheet as follows:
- Non-current finance lease receivables 1,758 1,324
- Current finance lease receivables 2,030 908
12. InventoriesAs at
March 31, 2020 March 31, 2019
Finished goods [including goods in transit - `2] (`1 for March 31, 2019) ` 3 ` 3
Stock-in-trade 1,125 2,724
Stores and spares 613 676
` 1,741 ` 3,403
13. Other assetsAs at
March 31, 2020 March 31, 2019
Non-current
Capital advances ` 1,537 ` 1,354
Prepaid expenses 3,976 4,970
Costs to obtain contract* 579 528
Others 3,046 5,337
` 9,138 ` 12,189
Current
Prepaid expenses ` 7,754 ` 10,120
Dues from officers and employees 428 882
Advances to suppliers 2,534 2,000
Costs to obtain contract* 684 731
Balance with GST and other authorities 6,869 4,907
` 18,269 ` 18,640
Total ` 27,407 ` 30,829
* Amortization during the year ended March 31, 2020 and 2019 amounts to ` 713 and ` 689, respectively.

Wipro Limited177
Corporate Overview | Management & Board Reports | Financial Statements
14. Share Capital
As atMarch 31, 2020 March 31, 2019
Authorized capital
12,504,500,000 (March 31, 2019: 12,504,500,000) equity shares [Par value of ` 2 per share] ` 25,009 ` 25,009
25,000,000 (March 31, 2019: 25,000,000) preference shares [Par value of ` 10 per share] 250 250
150,000 (March 31, 2019:1,50,000) 10% Optionally convertible cumulative preference shares [Par value of ` 100 per share] 15 15
` 25,274 ` 25,274
Issued, subscribed and fully paid-up capital
5,713,357,390 (March 31, 2019: 6,033,935,388) equity shares of ` 2 each 11,427 12,068
` 11,427 ` 12,068
Terms / Rights attached to equity shares
The Company has only one class of equity shares having a par value of ` 2 per share. Each shareholder of equity shares is entitled to one vote per share. The Company declares and pays dividend in Indian Rupees. The final dividend proposed by the Board of Directors is subject to shareholders approval in the ensuing Annual General Meeting.
Following is the summary of per share dividends recognized as distributions to equity shareholders:
For the year endedMarch 31, 2020 March 31, 2019
Interim dividend (Board recommended the adoption of the interim dividend as the final dividend) ` 1 per share ` 1 per share
In the event of liquidation of the Company, the equity shareholders will be entitled to receive the remaining assets of the Company, after distribution of all preferential amounts, if any, in proportion to the number of equity shares held by the shareholders.
i. Reconciliation of number of shares
As at March 31, 2020 As at March 31, 2019No. of Shares ` Million No. of Shares ` Million
Opening number of equity shares / American Depository Receipts (ADRs) outstanding
6,033,935,388 12,068 4,523,784,491 9,048
Equity shares issued pursuant to Employee Stock Option Plan *
2,498,925 5 1,681,717 4
Issue of bonus shares (Refer to note 30) - - 1,508,469,180 3,016
Buyback of equity shares (Refer to note 30) (323,076,923) (646) - -
Closing number of equity shares / ADRs outstanding 5,713,357,390 11,427 6,033,935,388 12,068
*4,607,772 and 2,599,183 shares have been issued by the controlled trust to eligible employees on exercise of options during the year ended March 31, 2020 and 2019 respectively.
ii. Details of shareholders holding more than 5% of the total equity shares of the Company
Name of the ShareholderAs at March 31, 2020 As at March 31, 2019
No. of Shares % held No. of Shares % heldMr. Azim Hasham Premji Partner representing Hasham Traders 938,946,043 16.43 989,215,999 16.39
Mr. Azim Hasham Premji Partner representing Prazim Traders 1,127,392,315 19.73 1,187,751,441 19.68
Mr. Azim Hasham Premji Partner representing Zash Traders 1,143,118,360 20.01 1,204,319,438 19.96
Azim Premji Trust 757,398,687 13.26 797,948,834 13.22

Annual Report 2019-20 178
iii. Other details of equity shares for a period of five years immediately preceding March 31, 2020
(a) 323,076,923 equity shares were bought back by the Company during the year ended March 31, 2020. Refer to Note 30
(b) 1,508,469,180 bonus shares were issued during the year ended March 31, 2019. Refer to note 30.
(c) 2,433,074,327 bonus shares were issued during the year ended March 31, 2018.
(d) 343,750,000 equity shares and 40,000,000 equity shares were bought back by the company during the year ended March 31, 2018 and 2017, respectively.
iv. Shares reserved for issue under option
For details of shares reserved for issue under the employee stock option plan of the Company, Refer to note 32.
15. Borrowings
As atMarch 31, 2020 March 31, 2019
Non-current
SecuredLong term maturities of obligations under finance leases * ` - ` 152
UnsecuredLoans from institutions other than banks ** ` 251 ` 68
Total Non-current ` 251 ` 220
Current
UnsecuredBank overdrafts ` - ` 3
Loans from institutions other than banks ** - 19
Borrowings from banks 50,019 50,500
Total current borrowings ` 50,019 ` 50,522Total borrowings ` 50,270 ` 50,742
* Current obligations under financial leases amounting to ` Nil (March 31, 2019: ` 444) is classified under “Other current financial liabilities”. Refer to note 33.
** Current obligations under Loans from institutions other than banks amounting to ̀ 189 (March 31, 2019: ̀ 93) is classified under “Other current financial liabilities”.
Short-term borrowings
As at March 31, 2020 As at March 31, 2019 Indian Rupee Interest rate Interest rate Indian Rupee
Unsecured bank overdrafts ` - N.A N.A ` 3
Unsecured loans from institutions other than banks - N.A N.A 19
Unsecured borrowings from banks 50,019 LIBOR / T-Bill + Spread 1.39% - 5.30% 50,500
` 50,019 ` 50,522
The principal source of Short-term borrowings from banks as at March 31, 2020 primarily consists of lines of credit of approximately ` 17,960 (2019: ` 7,979) and U.S. Dollar (U.S. $) 909 Million (2019: U.S. $ 1,165 Million) from bankers for working capital requirements and other short-term needs. As at March 31, 2020, the Company has unutilized lines of credit aggregating ` 4,260 (2019: ` 7,957) and U.S.$ 429 Million (2019: U.S. $ 435 Million). To utilize these unused lines of credit, the Company requires consent of the lender and compliance with certain financial covenants. Significant portion of these lines of credit are revolving credit facilities and floating rate foreign currency loans, renewable on a periodic basis.
The Company has non-fund based revolving credit facilities in INR amounting to ` 30,726 and ` 33,791 as at March 31, 2020 and 2019, respectively, towards operational requirements that can be used for the issuance of letters of credit and bank guarantees. As at March 31, 2020 and 2019, an amount of ` 17,215 and ` 20,174, respectively, was unutilized out of these non-fund based facilities.

Wipro Limited179
Corporate Overview | Management & Board Reports | Financial Statements
Long-term borrowings
A summary of long- term borrowings is as follows:
Currency
As at March 31, 2020 As at March 31, 2019 Foreign
currency in millions
Indian Rupee Interest rate Final
maturity
Foreign currency in
millions
Indian Rupee
Unsecured Loans from institutions other than banks
Indian Rupee NA ` 440 8.29% - 9.35% March 2024 NA ` 161
` 440 ` 161
Secured obligations under finance leases - 596
` 440 ` 757
The terms of the other secured and unsecured loans and borrowings also contain certain restrictive covenants primarily requiring the Company to maintain certain financial ratios. As at March 31, 2020 and 2019, the Company has met all the covenants under these arrangements.
Cash and non-cash changes in liabilities arising from financing activities:
April 1, 2019 Cash flow
Non-Cash Changes
March 31, 2020Ind AS 116
Adoption
Additions to lease
liabilities
Foreign exchange
movements
Borrowings from banks ` 50,500 ` (4,584) ` - ` - ` 4,103 ` 50,019
Bank overdrafts 3 (3) - - - -
Obligations under finance leases* 596 - (596) - - -
Loans from institutions other than banks*
180 260 - - - 440
Lease Liabilities - (3,255) 8,214 3,772 390 9,121
Total ` 51,279 ` (7,582) ` 7,618 ` 3,772 ` 4,493 ` 59,580
April 1, 2018 Cash flow
Non-Cash Changes
March 31, 2019
Assets taken on finance
lease
Foreign exchange
movements
Borrowings from banks ` 42,479 ` 6,911 ` - ` 1,110 ` 50,500
Bank overdrafts 3,998 (3,995) - - 3
External commercial borrowings * 9,777 (10,064) - 287 -
Obligations under finance leases * 1,407 (805) 2 (8) 596
Loans from institutions other than banks* 367 (186) - (1) 180
Total ` 58,028 ` (8,139) ` 2 ` 1,388 ` 51,279
* Includes current obligations under borrowings classified under “Other current financial liabilities”
Significant portion of loans, borrowings and bank overdrafts bear floating rates of interest, referenced to LIBOR or other similar country specific official benchmark interest rates and a spread, determined based on market conditions.
The terms of the other secured and unsecured loans and borrowings also contain certain restrictive covenants primarily requiring the Company to maintain certain financial ratios. As at March 31, 2020 and 2019, the Company has met all the covenants under these arrangements.
Obligations under finance leases amounting to ` 596 as at March 31, 2019 were secured by underlying property, plant and equipment.
Interest expense on borrowings was ` 1,721 and ` 1,762 for the year ended March 31, 2020 and 2019, respectively.

Annual Report 2019-20 180
16. Micro, small and medium enterprises
The disclosure pursuant to the Micro, Small and Medium Enterprises Development Act, 2006, [MSMED Act] as at March 31, 2020 and March 31, 2019 is as under:
ParticularsAs at
March 31, 2020 March 31, 2019(a) Principal amount remaining unpaid ` 131 ` 37
(b) Interest due thereon remaining unpaid - 1
(c) Interest paid by the Company in terms of Section 16 of the MSMED Act, along with the amount of the payment made to the supplier beyond the appointed day
294 437
(d) Interest due and payable for the period of delay in making payment (which have been paid but beyond the appointed day during the period) but without adding interest specified under the MSMED Act
- -
(e) Interest accrued and remaining unpaid 3 4
(f) Further interest remaining due and payable even in the succeeding years, until such date when the interest dues as above are actually paid to the small enterprises or the purpose of disallowance as a deductible expenditure under section 23.
- 1
This information has been determined to the extent such parties have been identified on the basis of information available with the Company.
17. Other financial liabilities
As at
March 31, 2020 March 31, 2019
Non-currentCash Settled ADS RSUs (Refer to note 32) ` 146 ` -
` 146 ` -
CurrentSalary Payable ` 15,772 ` 21,873
Current maturities of long-term borrowings (Refer to note 15) 189 93
Current maturities of obligation under finance lease (Refer to note 15) - 444
Interest accrued but not due on borrowing 23 35
Unclaimed dividends 85 93
Cash Settled ADS RSUs (Refer to note 32) 350 -
Others 2,238 2,452
` 18,657 ` 24,990Total ` 18,803 ` 24,990
18. Provisions
As at
March 31, 2020 March 31, 2019
Non-current:
Provision for employee benefits ` 2,131 ` 1,194
Provision for warranty 2 2
` 2,133 ` 1,196
Current:
Provision for employee benefits ` 10,296 ` 8,300
Provision for warranty 317 274
Others 689 716
` 11,302 ` 9,290Total ` 13,435 ` 10,486

Wipro Limited181
Corporate Overview | Management & Board Reports | Financial Statements
Provision for warranty represents cost associated with providing sales support services which are accrued at the time of recognition of revenues and are expected to be utilized over a period of 1 to 2 years. Other provisions primarily include provisions for indirect tax related contingencies and litigations. The timing of cash outflows in respect of such provision cannot be reasonably determined.
A summary of activity in provision for warranty and other provisions is as follows:
Particulars As at March 31, 2020 As at March 31, 2019
Provision for warranty Others Total Provision for
warranty Others Total
Provision at the beginning of the year ` 276 ` 716 ` 992 ` 272 ` 878 ` 1,150
Additions during the year, net 359 139 498 291 13 304
Utilized/ reversed during the year (316) (166) (482) (287) (175) (462)
Provision at the end of the year ` 319 ` 689 ` 1,008 ` 276 ` 716 ` 992
Included in the balance sheet as follows:
Non-current portion ` 2 ` - ` 2 ` 2 ` - ` 2
Current portion ` 317 ` 689 ` 1,006 ` 274 ` 716 ` 990
19. Other liabilities
As at
March 31, 2020 March 31, 2019
Non-current
Others ` 3,770 ` 3,117
` 3,770 ` 3,117
Current
Statutory and other liabilities ` 3,207 ` 3,780
Advance from customers 1,316 1,077
Others 126 815
` 4,649 ` 5,672
Total ` 8,419 ` 8,789
20. Financial instruments
Financial assets and liabilities (carrying value / fair value)
As at
March 31, 2020 March 31, 2019
Assets
Cash and cash equivalents ` 104,440 ` 103,902
Investments
Financial instruments at FVTPL 14,795 13,960
Financial instruments at FVTOCI 155,739 185,297
Financial instruments at amortized cost 19,253 20,980
Investment in Subsidiaries 77,198 82,254
Loans to Subsidiaries 9,472 -
Other financial assets
Trade receivables 97,032 94,836
Unbilled receivables 17,964 16,023
Other assets 11,223 9,656
Derivative assets 2,964 5,093
` 510,080 ` 532,001

Annual Report 2019-20 182
As at
March 31, 2020 March 31, 2019
Liabilities
Trade payables and other payables
Trade payables ` 45,426 ` 47,655
Other financial liabilities 18,614 24,453
Borrowings** 50,459 51,279
Derivative liabilities 7,369 1,270
` 121,868 ` 124,657
** Includes current obligation under borrowings classified under 'other current financial liabilities'.
Offsetting financial assets and liabilities
The following table contains information on other financial assets and trade payables and other payables subject to offsetting:
As at
March 31, 2020 March 31, 2019
Financial Assets:
Gross amounts of recognized other financial assets ` 132,343 ` 126,612
Gross amounts of recognized financial liabilities set off in the balance sheet (6,124) (6,097)
Net amounts of recognized other financial assets presented in the balance sheet ` 126,219 ` 120,515
Financial liabilities
Gross amounts of recognized trade payables and other payables ` 70,164 ` 78,205
Gross amounts of recognized financial liabilities set off in the balance sheet (6,124) (6,097)
Net amounts of recognized trade payables and other payables presented in the balance sheet
` 64,040 ` 72,108
For the financial assets and liabilities subject to offsetting or similar arrangements, each agreement between the Company and the counterparty allows for net settlement of the relevant financial assets and liabilities when both elect to settle on a net basis. In the absence of such an election, financial assets and liabilities will be settled on a gross basis and hence are not offset.
Fair value
Financial assets and liabilities include cash and cash equivalents, trade receivables, unbilled receivables, finance lease receivables, employee and other advances, eligible current and non-current assets, borrowings, trade payables, and eligible current liabilities and non-current liabilities.
The fair value of cash and cash equivalents, trade receivables, unbilled receivables, borrowings, trade payables, other current financial assets and liabilities approximate their carrying amount largely due to the short-term nature of these instruments. The Company’s long-term debt has been contracted at market rates of interest. Accordingly, the carrying value of such long-term debt approximates fair value. Further, finance lease receivables are periodically evaluated based on individual credit worthiness of customers. Based on this evaluation, the Company records allowance for estimated losses on these receivables. As at March 31, 2020, and 2019 the carrying value of such receivables, net of allowances approximates the fair value.
Investments in liquid and short-term mutual funds, which are classified as FVTPL are measured using net asset values at the reporting date multiplied by the quantity held. Fair value of investments in certificate of deposits, commercial papers and bonds classified as FVTOCI is determined based on the indicative quotes of price and yields prevailing in the market at the reporting date. Fair value of investments in equity instruments classified as FVTOCI is determined using market and income approaches.
The fair value of derivative financial instruments is determined based on observable market inputs including currency spot and forward rates, yield curves, currency volatility etc.

Wipro Limited183
Corporate Overview | Management & Board Reports | Financial Statements
Fair value hierarchy
The table below analyses financial instruments carried at fair value, by valuation method. The different levels have been defined as follows:
Level 1 – Quoted prices (unadjusted) in active markets for identical assets or liabilities.
Level 2 – Inputs other than quoted prices included within Level 1 that are observable for the asset or liability, either directly (i.e. as prices) or indirectly (i.e. derived from prices).
Level 3 – Inputs for the assets or liabilities that are not based on observable market data (unobservable inputs). The following table presents fair value of hierarchy of assets and liabilities measured at fair value on a recurring basis:
Particular
As at March 31, 2020 As at March 31, 2019
Total Fair value measurements at
reporting date Total Fair value measurements at
reporting date Level 1 Level 2 Level 3 Level 1 Level 2 Level 3
Assets
Derivative instruments:
Cash flow hedges ` 1,382 - ` 1,382 - ` 3,149 - ` 3,149 -
Others 1,582 - 1,582 - 1,944 - 1,944 -
Investments:
Investment in liquid and short-term mutual funds 14,795 14,795 - - 13,960 13,960 - -
Investment in equity instruments-other than subsidiaries 152 - - 152 249 - - 249
Commercial paper, Certificate of deposits and bonds 155,587 12,983 142,604 - 185,048 6,865 178,183 -
Liabilities
Derivative instruments:
Cash flow hedges (4,057) - (4,057) - (130) - (130) -
Others (3,312) - (3,312) - (1,140) - (1,140) -
The following methods and assumptions were used to estimate the fair value of the level 2 financial instruments included in the above table.
Derivative instruments (assets and liabilities): The Company enters derivative financial instruments with various counterparties, primarily banks with investment grade credit ratings. Derivatives valued using valuation techniques with market observable inputs are mainly interest rate swaps, foreign exchange forward contracts and foreign exchange option contracts. The most frequently applied valuation techniques include forward pricing, swap models and Black Scholes models (for option valuation), using present value calculations. The models incorporate various inputs including the credit quality of counterparties, foreign exchange spot and forward rates, interest rate curves and forward rate curves of the underlying. As at March 31, 2020, the changes in counterparty credit risk had no material effect on the hedge effectiveness assessment for derivatives designated in hedge relationships and other financial instruments recognized at fair value.
Investment in commercial papers, certificate of deposits and bonds: Fair value of these instruments is derived based on the indicative quotes of price and yields prevailing in the market as at reporting date.
The following methods and assumptions were used to estimate the fair value of the level 3 financial instruments included in the above table.
Investment in equity instruments: Fair value of these instruments is determined using market and income approaches.
Details of assets and liabilities considered under Level 3 classificationParticulars Investment in equity instruments Balance as at April 1, 2018 ` 1,773Additions 51
Additions on account of merger 352
Disposals (454)
Loss recognized in other comprehensive income (1,473)
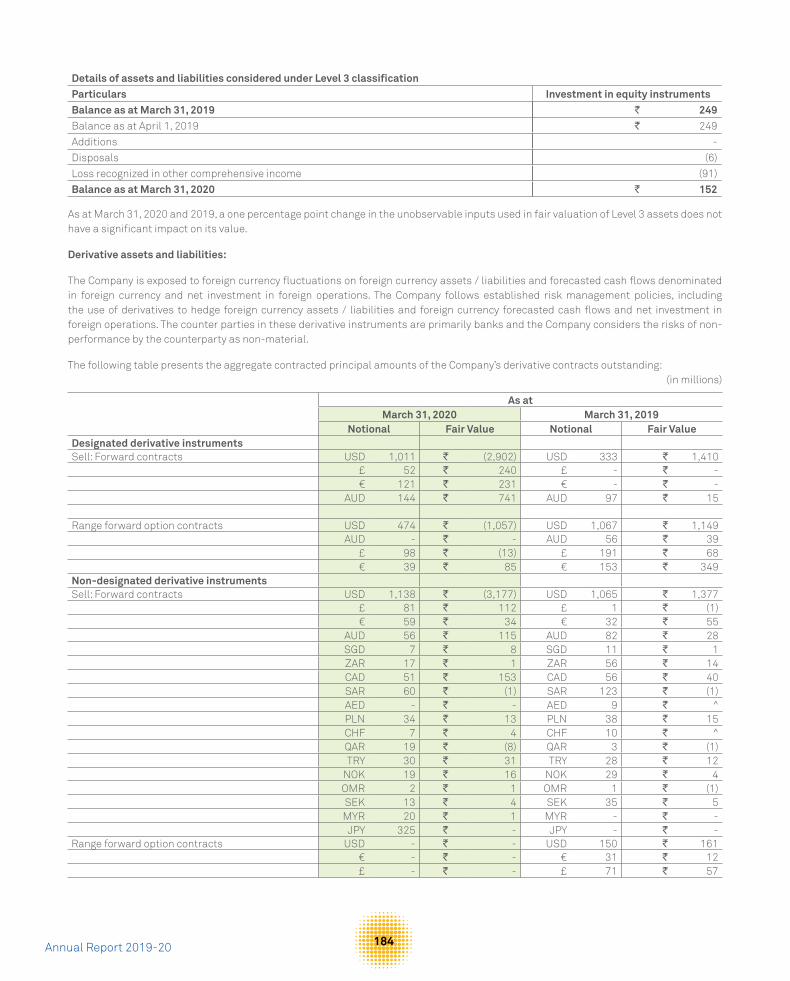
Annual Report 2019-20 184
Details of assets and liabilities considered under Level 3 classificationParticulars Investment in equity instruments Balance as at March 31, 2019 ` 249Balance as at April 1, 2019 ` 249
Additions -
Disposals (6)
Loss recognized in other comprehensive income (91)
Balance as at March 31, 2020 ` 152
As at March 31, 2020 and 2019, a one percentage point change in the unobservable inputs used in fair valuation of Level 3 assets does not have a significant impact on its value.
Derivative assets and liabilities:
The Company is exposed to foreign currency fluctuations on foreign currency assets / liabilities and forecasted cash flows denominated in foreign currency and net investment in foreign operations. The Company follows established risk management policies, including the use of derivatives to hedge foreign currency assets / liabilities and foreign currency forecasted cash flows and net investment in foreign operations. The counter parties in these derivative instruments are primarily banks and the Company considers the risks of non-performance by the counterparty as non-material.
The following table presents the aggregate contracted principal amounts of the Company’s derivative contracts outstanding:(in millions)
As atMarch 31, 2020 March 31, 2019
Notional Fair Value Notional Fair ValueDesignated derivative instrumentsSell: Forward contracts USD 1,011 ` (2,902) USD 333 ` 1,410
£ 52 ` 240 £ - ` - € 121 ` 231 € - ` -
AUD 144 ` 741 AUD 97 ` 15
Range forward option contracts USD 474 ` (1,057) USD 1,067 ` 1,149 AUD - ` - AUD 56 ` 39
£ 98 ` (13) £ 191 ` 68 € 39 ` 85 € 153 ` 349
Non-designated derivative instrumentsSell: Forward contracts USD 1,138 ` (3,177) USD 1,065 ` 1,377
£ 81 ` 112 £ 1 ` (1) € 59 ` 34 € 32 ` 55
AUD 56 ` 115 AUD 82 ` 28 SGD 7 ` 8 SGD 11 ` 1 ZAR 17 ` 1 ZAR 56 ` 14 CAD 51 ` 153 CAD 56 ` 40 SAR 60 ` (1) SAR 123 ` (1) AED - ` - AED 9 ` ^ PLN 34 ` 13 PLN 38 ` 15 CHF 7 ` 4 CHF 10 ` ^ QAR 19 ` (8) QAR 3 ` (1) TRY 30 ` 31 TRY 28 ` 12
NOK 19 ` 16 NOK 29 ` 4 OMR 2 ` 1 OMR 1 ` (1) SEK 13 ` 4 SEK 35 ` 5 MYR 20 ` 1 MYR - ` -
JPY 325 ` - JPY - ` -Range forward option contracts USD - ` - USD 150 ` 161
€ - ` - € 31 ` 12 £ - ` - £ 71 ` 57

Wipro Limited185
Corporate Overview | Management & Board Reports | Financial Statements
As atMarch 31, 2020 March 31, 2019
Notional Fair Value Notional Fair ValueBuy: Forward contracts USD 480 ` 972 USD 730 ` (971)
MXN 11 ` (9) MXN 9 ` ^ JPY - ` - JPY 154 ` ^
DKK 9 ` - DKK 75 ` (13)` (4,405) ` 3,824
^ Value is less than ` 1.
The following table summarizes activity in the cash flow hedging reserve within equity related to all derivative instruments classified as cash flow hedges:
As atMarch 31, 2020 March 31, 2019
Balance as at the beginning of the year ` 3,024 ` (136)
Deferred cancellation gain/ (loss), net (201) 6
Changes in fair value of effective portion of derivatives (2,322) 1,072
Net gain/(loss) reclassified to statement of profit and loss on occurrence of hedged transactions* (3,377) 2,082
Gain/(loss) on cash flow hedging derivatives, net ` (5,900) ` 3,160
Balance as at the end of the year ` (2,876) ` 3,024Deferred tax thereon 561 (600)
Balance as at the end of the year, net of deferred tax ` (2,315) ` 2,424
*Includes net gain/(loss) reclassified to revenue (March 31, 2020: ` (4,761), March 31, 2019: ` 2,585) and cost of revenues (March 31, 2020: ` 1,384, March 31, 2019: ` (503)).
The related hedge transactions for balance in cash flow hedging reserves as at March 31, 2020 are expected to occur and be reclassified to the statement of profit and loss over a period of three years.
As at March 31, 2020 and 2019, there were no significant gains or losses on derivative transactions or portions thereof that have become ineffective as hedges or associated with an underlying exposure that did not occur.
Sale of financial assets
From time to time, in the normal course of business, the Company transfers accounts receivables, unbilled receivables, net investment in finance lease receivables (financials assets) to banks. Under the terms of the arrangements, the Company surrenders control over the financial assets and transfer is without recourse. Accordingly, such transfers are recorded as sale of financial assets. Gains and losses on sale of financial assets without recourse are recorded at the time of sale based on the carrying value of the financial assets and fair value of servicing liability. The incremental impact of such transactions on our cash flow and liquidity for the year ended March 31, 2020 and March 31, 2019 is not material.
In certain cases, transfer of financial assets may be with recourse. Under arrangements with recourse, the Company is obligated to repurchase the uncollected financial assets, subject to limits specified in the agreement with the banks. These are reflected as part of borrowings in the balance sheet.
Financial risk management
Market Risk
Market risk is the risk of loss of future earnings, to fair values or to future cash flows that may result from a change in the price of a financial instrument. The value of a financial instrument may change as a result of changes in the interest rates, foreign currency exchange rates and other market changes that affect market risk sensitive instruments. Market risk is attributable to all market risk sensitive financial instruments including investments, foreign currency receivables, payables and loans and borrowings.
The Company’s exposure to market risk is a function of investment and borrowing activities and revenue generating activities in foreign currency. The objective of market risk management is to avoid excessive exposure of the Company’s earnings and equity to losses.
Risk Management Procedures
The Company manages market risk through a corporate treasury department, which evaluates and exercises independent control over the entire process of market risk management. The corporate treasury department recommends risk management objectives and policies,

Annual Report 2019-20 186
which are approved by senior management and Audit Committee. The activities of this department include management of cash resources, implementing hedging strategies for foreign currency exposures, borrowing strategies, and ensuring compliance with market risk limits and policies.
Foreign currency risk
The Company operates internationally, and a major portion of its business is transacted in several currencies. Consequently, the Company is exposed to foreign exchange risk through receiving payment for sales and services in the United States and elsewhere and making purchases from overseas suppliers in various foreign currencies. The exchange rate risk primarily arises from foreign exchange revenue, receivables, cash balances, forecasted cash flows, payables and foreign currency loans and borrowings. A significant portion of the Company’s revenue is in the U.S. Dollar, the United Kingdom Pound Sterling, the Euro, the Canadian Dollar and the Australian Dollar, while a large portion of costs are in Indian rupees. The exchange rate between the rupee and these currencies has fluctuated significantly in recent years and may continue to fluctuate in the future. Appreciation of the rupee against these currencies can adversely affect the Company’s results of operations.
The Company evaluates exchange rate exposure arising from these transactions and enters foreign currency derivative instruments to mitigate such exposure. The Company follows established risk management policies, including the use of derivatives like foreign exchange forward/option contracts to hedge forecasted cash flows denominated in foreign currency.
The Company has designated certain derivative instruments as cash flow hedges to mitigate the foreign exchange exposure of forecasted highly probable cash flows.
As at March 31, 2020, a ` 1 increase in the spot exchange rate of the Indian rupee with the U.S. dollar would result in approximately ` 1,972 (statement of profit and loss ` 658 and other comprehensive income ` 1,314) decrease in the fair value, and a ` 1 decrease would result in approximately ` 1,912 (statement of profit and loss ` 658 and other comprehensive income ` 1,254) increase in the fair value of foreign currency dollar denominated derivative instruments (forward and option contracts).
The below table presents foreign currency risk from non-derivative financial instruments as of March 31, 2020 and 2019:
Particulars
As at March 31, 2020
US $ Euro Pound
Sterling Australian
Dollar Canadian
Dollar
Other currencies
# Total
Trade receivables ` 47,821 ` 9,839 ` 7,825 ` 3,183 ` 2,339 ` 7,082 ` 78,089Unbilled receivables 9,955 933 2,165 782 292 994 15,121Contract Asset 5,504 1,491 2,845 654 146 654 11,294Cash and cash equivalents 6,878 1,475 1,361 586 1,292 1,531 13,123Other assets 1,713 1,413 168 361 65 896 4,616Loans to subsidiaries 9,472 - - - - - 9,472Lease Liabilities (2,532) (1,712) (373) (214) (16) (1,328) (6,175)Loans, borrowings and bank overdrafts
(36,319) - - - - - (36,319)
Trade payables and other financial liabilities*
(28,542) (3,433) (3,730) (1,420) (604) (2,701) (40,430)
Net assets/ (liabilities) ` 13,950 ` 10,006 ` 10,261 ` 3,932 ` 3,514 ` 7,128 ` 48,791
Particulars
As at March 31, 2019
US $ Euro Pound
Sterling Australian
Dollar Canadian
Dollar
Other currencies
# Total
Trade receivables ` 44,265 ` 8,677 ` 5,779 ` 3,730 ` 2,208 ` 9,023 ` 73,682Unbilled receivables 7,209 1,564 3,145 1,225 199 660 14,002Contract Asset 4,495 1,390 2,270 836 150 476 9,617Cash and cash equivalents 9,295 1,771 1,574 975 1,929 1,989 17,533Other assets 1,483 958 124 764 17 259 3,605Borrowings * (50,516) (20) (21) (33) - (21) (50,611)Trade payables and other financial liabilities*
(27,899) (3,836) (4,365) (1,520) (801) (2,768) (41,189)
Net assets/ (liabilities) ` (11,668) ` 10,504 ` 8,506 ` 5,977 ` 3,702 ` 9,618 ` 26,639
# Other currencies reflect currencies such as Japanese Yen, Swedish Krone, Saudi Riyal, UAE Dirham, Swiss Franc, Singapore Dollar etc.* Includes current obligation under borrowings classified under “Other current financial liabilities”

Wipro Limited187
Corporate Overview | Management & Board Reports | Financial Statements
As at March 31, 2020 and 2019, respectively, every 1% increase/decrease in the respective foreign currencies compared to functional currency of the Company would impact results by approximately ` 488 and ` 266, respectively.
Interest rate risk
Interest rate risk primarily arises from floating rate borrowing, including various revolving and other lines of credit. The Company’s investments are primarily in short-term investments, which do not expose it to significant interest rate risk. The Company manages its net exposure to interest rate risk relating to borrowings by entering into interest rate swap agreements, which allows it to exchange periodic payments based on a notional amount and agreed upon fixed and floating interest rates. Certain borrowings are also transacted at fixed interest rates. If interest rates were to increase by 100 bps as on March 31, 2020, additional net annual interest expense on floating rate borrowing would amount to approximately ` 500.
Credit risk
Credit risk arises from the possibility that customers may not be able to settle their obligations as agreed. To manage this, the Company periodically assesses the financial reliability of customers, taking into account the financial condition, current economic trends, forward looking macroeconomic information, analysis of historical bad debts and ageing of accounts receivable. Individual risk limits are set accordingly. No single customer accounted for more than 10% of the accounts receivable as at March 31, 2020 and 2019, and revenues for the year ended March 31, 2020 and 2019. There is no significant concentration of credit risk.
Counterparty risk
Counterparty risk encompasses issuer risk on marketable securities, settlement risk on derivative and money market contracts and credit risk on cash and time deposits. Issuer risk is minimized by only buying securities which are at least AA rated in India based on Indian rating agencies. Settlement and credit risk is reduced by the policy of entering transactions with counterparties that are usually banks or financial institutions with acceptable credit ratings. Exposure to these risks are closely monitored and maintained within predetermined parameters. There are limits on credit exposure to any financial institution. The limits are regularly assessed and determined based upon credit analysis including financial statements and capital adequacy ratio reviews.
Liquidity risk
Liquidity risk is defined as the risk that the Company will not be able to settle or meet its obligations on time or at a reasonable price. The Company’s corporate treasury department is responsible for liquidity and funding as well as settlement management. In addition, processes and policies related to such risks are overseen by senior management. Management monitors the Company’s net liquidity position through rolling forecasts on the basis of expected cash flows. As at March 31, 2020, cash and cash equivalents are held with major banks and financial institutions.
The table below provides details regarding the remaining contractual maturities of significant financial liabilities at the reporting date. The amounts include estimated interest payments and exclude the impact of netting agreements, if any.
As at March 31, 2020
Contractual cash flows Carrying value
Less than 1 year 1-2 years 2-4years Beyond 4
years Total
Borrowings(1)(3) ` 50,459 ` 51,156 ` 136 ` 115 ` - ` 51,407
Lease Liabilities(3) 9,121 3,490 2,959 2,652 842 9,943
Trade payables and other financial liabilities 64,040 63,894 83 63 - 64,040
Derivative liabilities 7,369 7,231 90 48 - 7,369
As at March 31, 2019
Contractual cash flows Carrying value
Less than 1 year 1-2 years 2-4years Beyond 4
years Total
Borrowings(2)(3) ` 51,279 ` 51,872 ` 207 ` 21 ` - ` 52,100
Trade payables and other financial liabilities(2) 72,108 72,108 - - - 72,108
Derivative liabilities 1,270 1,270 - - - 1,270
(1) Includes current obligation under borrowings classified under “Other current financial liabilities”(2) Includes current obligation under borrowings and financial leases classified under “Other current financial liabilities”(3) Includes future cash outflow toward estimated interest on borrowings and lease liabilities.

Annual Report 2019-20 188
The balanced view of liquidity and financial indebtedness is stated in the table below. This calculation of the net cash position is used by the management for external communication with investors, analysts and rating agencies:
As atMarch 31, 2020 March 31, 2019
Cash and cash equivalents ` 104,440 ` 103,902
Investments 189,635 219,988
Borrowings* (50,459) (51,279)
Loans to subsidiaries 9,472 -
` 253,088 ` 272,611
* Includes current obligation under borrowings classified under “Other current financial liabilities” as at March 31, 2020.
* Includes current obligation under borrowings and financial leases classified under “Other current financial liabilities” as at March 31, 2019
21. Income tax Income tax expense has been allocated as follows:
Year endedMarch 31, 2020 March 31, 2019
Income tax expense
Current taxes ` 22,067 ` 22,725
Deferred taxes 1,203 (160)
Income tax included in other comprehensive income on:
Unrealized gains on investment securities (230) 69
Gains/(losses) on cash flow hedging derivatives (1,161) (629)
Defined benefit plan actuarial gains / (losses) (169) (42)
Total income taxes ` 21,710 ` 21,963
Income tax expense consists of the following:
Year endedMarch 31, 2020 March 31, 2019
Current taxes
Domestic ` 18,038 ` 17,766
Foreign 4,029 4,959
` 22,067 ` 22,725
Deferred taxes
Domestic ` 1,705 ` (196)
Foreign (502) 36
` 1,203 ` (160)
Total income tax expense ` 23,270 ` 22,565
The reconciliation between the provision of income tax and amounts computed by applying the Indian statutory income tax rate to profit before taxes is as follows:
Year endedMarch 31, 2020 March 31, 2019
Profit before tax ` 110,077 ` 98,705
Enacted income tax rate in India 34.94% 34.94%
Computed expected tax expense ` 38,461 ` 34,488
Effect of:
Income exempt from tax ` (12,630) ` (16,057)
Basis differences that will reverse during a tax holiday period 721 (796)

Wipro Limited189
Corporate Overview | Management & Board Reports | Financial Statements
Year endedMarch 31, 2020 March 31, 2019
Income taxed at higher/ (lower) rates (318) 212
Taxes related to prior years 196 (1,092)
Changes in unrecognized deferred tax assets (4,633) 4,399
Expenses disallowed for tax purpose 1,476 1,415
Others, net (3) (4)
Total income taxes expenses ` 23,270 ` 22,565
Effective income tax rate 21.14% 22.86%
The components of deferred tax assets and liabilities are as follows:
As atMarch 31, 2020 March 31, 2019
Carry-forward losses ` 201 ` 100
Other liabilities 3,667 2,743
Allowances for lifetime expected credit losses 3,647 4,366
MAT Credit 3,425 -
Property, plant and equipment 155 -
Cash flow hedges 561 -
Others 33 202
` 11,689 ` 7,411
Property, plant and equipment ` - ` (333)
Amortisable goodwill (99) (77)
Interest income and fair value movement of investments (643) (1,463)
Cash flow hedges - (600)
SEZ Re-investment Reserve (6,614) (1,132)
` (7,356) ` (3,605)
Net deferred tax assets ` 4,333 ` 3,806
Amounts presented in the balance sheet
Deferred tax assets ` 4,333 ` 3,910
Deferred tax liabilities ` - ` 104
Movement in deferred tax assets and liabilities
Movement during the year ended March 31, 2020
ParticularsAs at
April 1, 2019
Credit/ (charge) in the statement of
profit and loss
Credit/ (charge) in other
comprehensive income
As at March 31, 2020
Carry-forward losses ` 100 ` 101 ` - ` 201Other liabilities 2,743 783 141 3,667Allowances for lifetime expected credit losses 4,366 (719) - 3,647Cash flow hedges (600) (4) 1,165 561Property, plant and equipment (333) 364 124 155Amortisable goodwill (77) (22) - (99)Interest income and fair value movement of investments (1,463) 590 230 (643)MAT Credit - 3,425 - 3,425SEZ Re-investment Reserve (1,132) (5,482) - (6,614)Others 202 (239) 70 33Total ` 3,806 ` (1,203) ` 1,730 ` 4,333

Annual Report 2019-20 190
Movement during the year ended March 31, 2019
ParticularsAs at April 1,
2018
Credit/ (charge) in the statement of
profit and loss
Credit/ (charge) in other com-prehensive
income
Others (Note 34)*
As at March 31, 2019
Carry-forward losses ` 407 ` (307) ` - ` - ` 100
Other liabilities 2,761 12 (42) 12 2,743
Allowances for lifetime expected credit losses 4,405 (39) - - 4,366
Cash flow hedges 28 - (628) - (600)
Property, plant and equipment (1,319) 983 - 3 (333)
Amortisable goodwill (90) 13 - - (77)
Interest income and fair value movement of investments (1,739) 207 69 - (1,463)
SEZ Re-investment Reserve - (1,132) - - (1,132)
Others (396) 424 - 174 202
Total ` 4,057 ` 161 ` (601) ` 189 ` 3,806
* Includes additions on account of merger as explained in footnotes to Note 34.
Deferred taxes on unrealized foreign exchange gain / loss relating to cash flow hedges, fair value movements in investments and actuarial gains/losses on defined benefit plans are recognized in other comprehensive income and presented within equity. Other than these, the change in deferred tax assets and liabilities is primarily recorded in the statement of profit and loss.
In assessing the realisability of deferred tax assets, the Company considers the extent to which it is probable that the deferred tax asset will be realized. The ultimate realization of deferred tax assets is dependent upon the generation of future taxable profits during the periods in which those temporary differences and tax loss carry-forwards become deductible. The Company considers the expected reversal of deferred tax liabilities, projected future taxable income and tax planning strategies in making this assessment. Based on this, the Company believes that it is probable that the Company will realize the benefits of these deductible differences. The amount of deferred tax asset considered realisable, however, could be reduced in the near term if the estimates of future taxable income during the carry-forward period are reduced.
The Company has recognized deferred tax assets of ` 201 and ` 100 as at March 31, 2020 and 2019 in respect of capital loss incurred on account of liquidation of a subsidiary. Management’s projections of future taxable capital gain support the assumption that it is probable that sufficient taxable income will be available to utilize this deferred tax asset.
The Company has calculated its tax liability for current domestic taxes after considering MAT. The excess tax paid under MAT provisions over and above normal tax liability can be carried forward and set-off against future tax liabilities computed under normal tax provisions. The Company is carrying deferred tax assets of `3,425 as at March 31, 2020 relating to MAT.
A substantial portion of the profits of the Company’s India operations are exempt from Indian income taxes being profits attributable to export operations and profits from units established under Special Economic Zone, 2005 scheme. Units in designated special economic zones providing service on or after April 1, 2005 will be eligible for a deduction of 100 percent of profits or gains derived from the export of services for the first five years from commencement of provision of services and 50 percent of such profits and gains for a further five years. Certain tax benefits are also available for a further five years subject to the unit meeting defined conditions. Profits from certain other undertakings are also eligible for preferential tax treatment. The tax holiday period being currently available to the Company expires in various years through fiscal 2033-34. The expiration period of tax holiday for each unit within a SEZ is determined based on the number of years that have lapsed following year of commencement of production by that unit. The impact of tax holidays has resulted in a decrease of current tax expense of ` 11,963 and ` 15,390 for the year ended March 31, 2020 and 2019, respectively, compared to the effective tax amounts that we estimate we would have been required to pay if these incentives had not been available. The effect of these tax incentives on earnings per share for the year ended March 31, 2020 and 2019 was ` 2.05 and ` 2.56, respectively.
Deferred income tax liabilities are recognized for all taxable temporary differences except in respect of taxable temporary differences associated with US branch profit tax where the timing of the reversal of the temporary difference can be controlled and it is probable that the temporary difference will not reverse in the foreseeable future. Accordingly, deferred income tax liabilities on branch profit tax @ 15% of the US branch profits have not been recognized as the Company intends to reinvest the earnings in the branch operations. Further, it is not practicable to estimate the amount of the unrecognized deferred tax liabilities for these undistributed earnings.

Wipro Limited191
Corporate Overview | Management & Board Reports | Financial Statements
22. Revenue from operations
Year ended
March 31, 2020 March 31, 2019 Sale of Services ` 494,471 ` 468,529
Sales of Products 9,406 11,769
` 503,877 ` 480,298
A. Contract Assets and Liabilities
The Company classifies its right to consideration in exchange for deliverables as either a receivable or a contract asset.
A receivable is a right to consideration that is unconditional. A right to consideration is unconditional if only the passage of time is required before payment of that consideration is due. For example, the Company recognizes a receivable for revenues related to time and materials contracts or volume-based contracts. The Company presents such receivables as part of unbilled receivables at their net estimated realizable value.
Contract liabilities: During the year ended March 31, 2020 the Company recognized revenue of ` 12,964 arising from contract liabilities as at March 31, 2019. During the year ended March 31, 2019, the Company recognized revenue of ` 10,671 arising from opening unearned revenue as at April 1, 2018.
Contract assets: During the year ended March 31, 2020, ` 9,654 of contract assets pertaining to fixed-price development contracts has been reclassified to receivables on completion of milestones. During the year ended March 31, 2019, ` 9,369, of unbilled revenue pertaining to fixed-price development contracts (balance as at April 1, 2018 of ` 12,417), has been reclassified to receivables on completion of milestones.
Contract assets and liabilities are reported in a net position on a contract by contract basis at the end of each reporting period.
B. Remaining Performance Obligations
Revenue allocated to remaining performance obligations represents contracted revenue that has not yet been recognized, which includes contract liabilities and amounts that will be invoiced and recognized as revenue in future periods. Applying the practical expedient, the Company has not disclosed its right to consideration from customers in an amount that corresponds directly with the value to the customer of the Company’s performance completed to date, which are contracts invoiced on time and material basis and volume based.
As at March 31, 2020, the aggregate amount of transaction price allocated to remaining performance obligations, other than those meeting the exclusion criteria above, was ` 221,618 of which approximately 74% is expected to be recognized as revenues within two years, and the remainder thereafter. This includes contracts, with a substantive enforceable termination penalty if the contract is terminated without cause by the customer, based on an overall assessment of the contract carried out at the time of inception. Historically, customers have not terminated contracts without cause.
As at March 31, 2019, the aggregate amount of transaction price allocated to remaining performance obligations, other than those meeting the exclusion criteria above, was ` 224,184 of which approximately 72% is expected to be recognized as revenues within two years, and the remainder thereafter. This includes contracts, with a substantive enforceable termination penalty if the contract is terminated without cause by the customer, based on an overall assessment of the contract carried out at the time of inception. Historically, customers have not terminated contracts without cause.
C. Disaggregation of Revenues
The tables below present disaggregated revenues from contracts with customers by business segment and contract-type. The Company believes that the below disaggregation best depicts the nature, amount, timing and uncertainty of revenue and cash flows from economic factors
Revenue from operationsYear ended
March 31, 2020 March 31, 2019 Sale of Services ` 494,471 ` 468,529
Sales of Products 9,406 11,769
` 503,877 ` 480,298

Annual Report 2019-20 192
Revenue by nature of contractYear ended
March 31, 2020 March 31, 2019 Fixed price and volume based ` 301,352 ` 270,640
Time and Materials 193,119 197,889
Products 9,406 11,769
` 503,877 ` 480,298
23. Other operating incomeThe Company concluded the sale of Workday business and Cornerstone OnDemand business on May 31, 2019.
Sale of hosted data center service business: During the year ended March 31, 2019, the Company has concluded the divestment of its hosted data center business in Singapore and United Kingdom.
Loss of control in subsidiary: During the year ended March 31, 2019, the Company has reduced its equity holding from 74% to 11% in Wipro Airport IT Services Limited.
The loss/ gain for the year ended March 31, 2019 on these transactions is insignificant.
24. Other income
Year endedMarch 31, 2020 March 31, 2019
Interest income ` 20,599 ` 19,729Dividend income 1,101 353Net Gain on sale of investments classified as FVTPL 1,277 2,014Net Gain on sale of investments classified as FVTOCI 675 311Finance and other income ` 23,652 ` 22,407Foreign exchange gain/(loss), net, on financial instruments measured at FVTPL ` (2,767) ` 1,263
Other foreign exchange differences, net 3,881 2,016Foreign exchange gain/(loss), net ` 1,114 ` 3,279
` 24,766 ` 25,686
25. Changes in inventories of finished goods and stock-in-tradeYear ended
March 31, 2020 March 31, 2019
Opening stockFinished products ` 3 ` 3
Traded goods 2,724 2,171
` 2,727 ` 2,174
Less: Closing StockFinished products ` 3 ` 3
Traded goods 1,125 2,724
` 1,128 ` 2,727
Decrease/ (Increase) ` 1,599 ` (553)
26. Employee benefits a) Employee costs include
Year endedMarch 31, 2020 March 31, 2019
Salaries and bonus ` 253,014 ` 229,693
Employee benefits plans
Gratuity and other defined benefit plans 1,433 1,193
Defined contribution plans 6,047 5,353
Share based compensation 1,224 1,846
` 261,718 ` 238,085

Wipro Limited193
Corporate Overview | Management & Board Reports | Financial Statements
Remeasurements of the net defined benefit liability /(asset) recognized in other comprehensive income include:
Year endedMarch 31, 2020 March 31, 2019
Re-measurement of net defined benefit liability/(asset)
Return on plan assets excluding interest income - (gain)/loss ` 20 ` (35)
Actuarial loss arising from financial assumptions 435 106
Actuarial (gains)/loss arising from demographic assumptions 202 (17)
Actuarial (gains)/loss arising from experience adjustments 212 (223)
` 869 ` (169)
b) Defined benefit plans- Gratuity:
In accordance with the Payment of Gratuity Act, 1972, applicable for Indian companies, the Company provides for a lump sum payment to eligible employees, at retirement or termination of employment based on the last drawn salary and years of employment with the Company. The gratuity fund is managed by certain third-party fund managers. The Company’s obligation in respect of the gratuity plan, which is a defined benefit plan, is provided for based on actuarial valuation using the projected unit credit method. The Company recognizes actuarial gains and losses immediately in other comprehensive income, net of taxes. Amount recognized in the statement of profit and loss in respect of gratuity cost (defined benefit plan) is as follows:
Year endedMarch 31, 2020 March 31, 2019
Current service cost ` 1,437 ` 1,205
Net interest on net defined benefit liability/(asset) (4) (12)
Net gratuity cost/(benefit) 1,433 1,193
Actual return on plan assets ` 539 ` 573Gratuity is applicable only to employees drawing a salary in Indian rupees and there are no other foreign defined benefit gratuity plans.
Change in present value of defined benefit obligation is summarised below:
As atMarch 31, 2020 March 31, 2019
Defined benefit obligation at the beginning of the year ` 8,249 ` 7,539
Transfer in 78 25
Current service cost 1,437 1,205
Interest on obligation 555 526
Benefits paid (915) (912)
Remeasurement (gains)/loss
Actuarial (gains)/loss arising from financial assumptions 435 106
Actuarial (gains)/loss arising from demographic assumptions 202 (17)
Actuarial (gains)/loss arising from experience adjustments 212 (223)
Translation adjustment 88 -Defined benefit obligation at the end of the year ` 10,341 ` 8,249
Change in plan assets is summarised below:
As atMarch 31, 2020 March 31, 2019
Fair value of plan assets at the beginning of the year ` 8,274 ` 7,673
Transfer in 33 -
Expected return on plan assets 559 538
Employer contributions 171 34
Benefits paid - (6)
Remeasurement gains/(loss)
Return on plan assets excluding interest income - gain/(loss) (20) 35
Translation adjustment 75 -Fair value of plan assets at the end of the year ` 9,092 ` 8,274Present value of unfunded obligation (1,249) 25
Recognized asset/(liability) ` (1,249) ` 25

Annual Report 2019-20 194
As at March 31, 2020 and 2019, plan assets were primarily invested in insurer managed funds
The Company has established an income tax approved irrevocable trust fund to which it regularly contributes to finance the liabilities of the gratuity plan. The fund’s investments are managed by certain insurance companies as per the mandate provided to them by the trustees and the asset allocation is within the permissible limits prescribed in the insurance regulations.
The principal assumptions used for the purpose of actuarial valuation of these defined benefit plans are as follows:
As atMarch 31, 2020 March 31, 2019
Discount rate 5.69% 6.63%
Expected return on plan assets 5.69% 6.63%
Expected rate of salary increase 7.40% 7.52%
Duration of defined benefit obligations 7 years 6 years
The expected return on plan assets is based on expectation of the average long-term rate of return expected on investments of the fund during the estimated term of the obligations.
The discount rate is primarily based on the prevailing market yields of Indian government securities for the estimated term of the obligations. The estimates of future salary increases considered takes into account the inflation, seniority, promotion and other relevant factors. Attrition rate considered is the management’s estimate, based on previous years’ employee turnover of the Company.
The expected future contribution and estimated future benefit payments from the fund are as follows:
Expected contribution to the fund during the year ending March 31, 2021 ` 2,956
Estimated benefit payments from the fund for the year ending March 31:
2021 ` 1,372
2022 1,171
2023 1,144
2024 1,125
2025 1,104
Thereafter 9,449
Total ` 15,365
The expected benefits are based on the same assumptions used to measure the Company’s benefit obligations as at March 31, 2020.
Sensitivity for significant actuarial assumptions is computed to show the movement in defined benefit obligation by 0.5 percentage.
As at March 31, 2020, every 0.5 percentage point increase/ (decrease) in discount rate will result in (decrease)/increase of gratuity benefit obligation by approximately ` (384) and `332, respectively.
As at March 31, 2020 every 0.5 percentage point increase/ (decrease) in expected rate of salary will result in increase/ (decrease) of gratuity benefit obligation by approximately ` 312 and ` (291), respectively.
c) Provident fund:
The details of fund and plan assets are given below:
As atMarch 31, 2020 March 31, 2019
Fair value of plan assets ` 61,397 ` 53,015
Present value of defined benefit obligation 61,397 53,015
Net (shortfall)/ excess ` - ` -
The plan assets have been primarily invested in government securities and corporate bonds.
The principal assumptions used in determining the present value obligation of interest guarantee under the deterministic approach are as follows:
As atMarch 31, 2020 March 31, 2019
Discount rate for the term of the obligation 6.05% 7.00%
Average remaining tenure of investment portfolio 7 years 8 years
Guaranteed rate of return 8.50% 8.65%
Also Refer to note 32 for details of employee stock options.

Wipro Limited195
Corporate Overview | Management & Board Reports | Financial Statements
27. Finance costs
Year endedMarch 31, 2020 March 31, 2019
Interest expense ` 3,192 ` 3,320
Exchange fluctuation on foreign currency borrowings, net (to the extent regarded as borrowing cost)
2,160 1,929
` 5,352 ` 5,249
28. Other Expenses
Year endedMarch 31, 2020 March 31, 2019
Rates, taxes and insurance ` 1,943 ` 712
Allowance for lifetime expected credit loss 857 729
Provision for diminution in value of investments in subsidiaries - 7,356
Auditors' remuneration
Audit fees 67 60
For taxation matters 6 4
Other Services 16 8
Out of pocket expenses 6 4
Miscellaneous expenses * 1,790 8,447
` 4,685 ` 17,320
* Miscellaneous expenses for the year ended March 31, 2019 include an amount of ` 5,141 paid to National Grid on settlement of a legal claim against the Company
29. Earnings per equity share
A reconciliation of profit for the year and equity shares used in the computation of basic and diluted earnings per equity share is set out below:
Basic: Basic earnings per share is calculated by dividing the profit attributable to equity shareholders of the Company by the weighted average number of equity shares outstanding during the year, excluding equity shares purchased by the Company and held as treasury shares.
Year endedMarch 31, 2020 March 31, 2019
Profit attributable to equity holders of the Company ` 86,807 ` 76,140
Weighted average number of equity shares outstanding 5,833,384,018 6,007,376,837
Basic earnings per share ` 14.88 ` 12.67
Diluted: Diluted earnings per share is calculated by adjusting the weighted average number of equity shares outstanding during the year for assumed conversion of all dilutive potential equity shares. Employee share options are dilutive potential equity shares for the Company.
The calculation is performed in respect of share options to determine the number of shares that could have been acquired at fair value (determined as the average market price of the Company’s shares during the year). The number of shares calculated as above is compared with the number of shares that would have been issued assuming the exercise of the share options.
Year endedMarch 31, 2020 March 31, 2019
Profit attributable to equity holders of the Company ` 86,807 ` 76,140
Weighted average number of equity shares outstanding 5,833,384,018 6,007,376,837
Effect of dilutive equivalent share options 14,439,221 14,927,530
Weighted average number of equity shares for diluted earnings per share 5,847,823,239 6,022,304,367
Diluted earnings per share ` 14.84 ` 12.64

Annual Report 2019-20 196
30. Dividends, Bonus and Buyback of equity shares
The Company declares and pays dividends in Indian rupees. According to the Companies Act, 2013 any dividend should be declared out of accumulated distributable profits. A Company may, before the declaration of any dividend, transfer a percentage of its profits for that financial year as it may consider appropriate to the reserves.
The cash dividends paid per equity share were ` 1 and ` 1, during the year ended March 31, 2020 and 2019, respectively, including an interim dividend of ` 1 and ` 1 for the year ended March 31, 2020 and 2019.
During the year ended March 31, 2020, the Company has concluded the buyback of 323,076,923 equity shares as approved by the Board of Directors on April 16, 2019. This has resulted in a total cash outflow of ` 105,000. In line with the requirement of the Companies Act, 2013, an amount of ` 105,000 has been utilized from the retained earnings. Further, capital redemption reserve of ` 646 (representing the nominal value of the shares bought back) has been created as an apportionment from retained earnings. Consequent to such buyback, share capital has reduced by ` 646.
During the year ended March 31, 2019, the bonus issue in the proportion of 1:3 i.e.1 (One) bonus equity share of ` 2 each for every 3 (three) fully paid-up equity shares held (including ADS holders) was approved by the shareholders of the Company on February 22, 2019, through Postal Ballot /e-voting. Subsequently, on March 8, 2019, the Company allotted 1,508,469,180 equity shares to shareholders who held equity shares as on the record date of March 7, 2019 and ` 3,016 (representing par value of ` 2 per share) was transferred from capital redemption reserve, securities premium and retained earnings to the share capital.
31. Additional capital disclosures
The key objective of the Company’s capital management is to ensure that it maintains a stable capital structure with the focus on total equity to uphold investor, creditor, and customer confidence and to ensure future development of its business. The Company’s focus is to keep strong total equity base to ensure independence, security, as well as a high financial flexibility for potential future borrowings, if required without impacting the risk profile of the Company.
The Company’s goal is to continue to be able to return excess liquidity to shareholders by continuing to distribute annual dividends in future periods.
The amount of future dividends/ buyback of equity shares will be balanced with efforts to continue to maintain an adequate liquidity status.
The capital structure as of March 31, 2020 and 2019 was as follows:
As at March 31, 2020 March 31, 2019 % Change
Total equity (A) ` 464,537 ` 493,920 (5.95%)
As percentage of total capital 88.63% 90.59%
Current borrowings * ` 50,208 ` 51,059
Non-current borrowings 251 220
Lease Liabilities 9,121 -
Total borrowings and lease liabilities (B) ` 59,580 ` 51,279 16.19%
As percentage of total capital 11.37% 9.41%
Total capital (A) + (B) ` 524,117 ` 545,199 (3.87%)
* Includes current obligation under borrowings classified under “Other current financial liabilities” (Refer to note 15)
32. Employee stock option
The stock compensation expense recognized for employee services received during the year ended March 31, 2020 and March 31, 2019 were ` 1,224 and ` 1,846, respectively.
Wipro Equity Reward Trust (“WERT”)
In 1984, the Company established a controlled trust called the Wipro Equity Reward Trust (“WERT”). In the earlier years, WERT purchased shares of the Company out of funds borrowed from the Company. The Company’s Board Governance, Nomination and Compensation Committee recommends to WERT certain officers and key employees, to whom WERT issues shares from its holdings at nominal price. Such shares are then held by the employees subject to vesting conditions.

Wipro Limited197
Corporate Overview | Management & Board Reports | Financial Statements
Wipro Employee Stock Option Plans and Restricted Stock Unit Option Plans
A summary of the general terms of grants under stock option plans and restricted stock unit option plans are as follows:
Name of Plan No. of options reserved under
the Plan Range of Exercise Prices
Wipro Employee Stock Option Plan 2000 (2000 Plan) *** 747,474,747 ` 171 - 490
Wipro ADS Restricted Stock Unit Plan (WARSUP 2004 plan) * 59,797,979 US $ 0.03
Wipro employee Restricted Stock Unit Plan 2005 (WSRUP 2005 plan) * 59,797,979 ` 2
Wipro employee Restricted Stock Unit Plan 2007 (WSRUP 2007 plan) * 49,831,651 ` 2
Wipro Equity Reward Trust Employee Stock Purchase Plan, 2013 ** 39,546,197 ` 2
Employees covered under Stock Option Plans and Restricted Stock Unit ("RSU") Option Plans (collectively “Stock Option Plans”) are grant-ed an option to purchase shares of the Company at the respective exercise prices, subject to requirements of vesting conditions. These options generally vest in tranches over a period of two to four years from the date of grant. Upon vesting, the employees can acquire one equity share for every option.
* The maximum contractual term for these Stock Option Plans and RSU Option Plans is perpetual until the options are available for grant under the plan.
** The maximum contractual term for these Stock Option Plans is up to May 29, 2023 until the options are available for grant under the plan.
*** The maximum contractual term for these Stock Option Plans is up to July 26, 2020 until the options are available for grant under the plan.
The activity in these stock option plans is summarized below:
ParticularsRange of
exercise prices
Year ended
March 31, 2020 March 31, 2019
Number Weighted
Average Exercise Price
Number Weighted
Average Exercise Price
Outstanding at the beginning of the year ` 2 17,607,463 ` 2 13,543,997 ` 2
US $ 0.03 14,446,790 US $ 0.03 10,199,054 US $ 0.03
Bonus on outstanding ` 2 - ` 2 4,773,755 ` 2
(Refer to note 30) US $ 0.03 - US $ 0.03 3,957,434 US $ 0.03
Granted * ` 2 5,662,500 ` 2 4,607,000 ` 2
US $ 0.03 5,341,000 US $ 0.03 4,849,000 US $ 0.03
Exercised ` 2 (4,610,572) ` 2 (2,739,097) ` 2
US $ 0.03 (2,496,125) US $ 0.03 (1,541,803) US $ 0.03
Modification to Cash Settled RSU's ** ` 2 - ` 2 - -
US $ 0.03 (5,681,966) US $ 0.03 - -
Forfeited and expired ` 2 (3,065,201) ` 2 (2,578,192) ` 2
US $ 0.03 (3,755,159) US $ 0.03 (3,016,895) US $ 0.03
Outstanding at the end of the year ` 2 15,594,190 ` 2 17,607,463 ` 2
US $ 0.03 7,854,540 US $ 0.03 14,446,790 US $ 0.03
Exercisable at the end of the year ` 2 1,502,957 ` 2 1,300,781 ` 2
US $ 0.03 1,212,560 US $ 0.03 948,877 US $ 0.03

Annual Report 2019-20 198
The following table summarizes information about outstanding stock options:
Range of exercise price
2020 2019
Number
Weighted Average
Remaining life (months)
Weighted Average
Exercise Price Number
Weighted Average
Remaining life (months)
Weighted Average
Exercise Price
` 2 15,594,190 23 ` 2 17,607,463 24 ` 2
US $ 0.03 7,854,540 23 US $ 0.03 14,446,790 26 US $ 0.03
The weighted-average grant-date fair value of options granted during the year ended March 31, 2020, and 2019 was ` 260.65 and ` 349.81 for each option, respectively. The weighted average share price of options exercised during the year ended March 31, 2020 and 2019 was ` 267.04 and ` 325.85 for each option, respectively.
As at March 31, 2020, 4,721,388 units (net of units that were exercised or lapsed and forfeited) of Cash Settled RSU were outstanding which include 63,999 exercisable units. The carrying value of liability towards Cash Settled RSU’s outstanding was ` 496 which includes ` 15 towards exercisable units as at March 31, 2020.
* Includes 2,461,500 and 1,567,000 Performance based stock options (RSU) granted during the year ended March 31, 2020 and 2019, respectively. 2,524,600 and 1,673,000 Performance based stock options (ADS) granted during the year ended March 31, 2020 and 2019, respectively. Performance based stock options (RSU) were issued under Wipro Employee Restricted Stock Unit plan 2007 (WSRUP 2007 plan) and Performance based stock options (ADS) were issued under Wipro ADS Restricted Stock Unit Plan (WARSUP 2004 plan).
** Restricted Stock Units arrangement that were modified during the year ended March 31, 2020
Pursuant to the Securities Exchange Board of India (“SEBI”) circular dated October 10, 2019 prohibiting issuance of depository receipts by listed companies to Non-Resident Indians (“NRI”), the Board Governance, Nomination and Compensation Committee in November, 2019 approved cash pay out to its NRI employees in lieu of shares and upon exercise of vested ADS RSU under the Company’s WARSUP 2004 Plan, based on prevailing market price of ADS on the date of exercise. This change was accounted for as a modification and the fair value on the date of modification of ` 561 has been recognized as financial liability with a corresponding adjustment to equity.
33. Finance Lease Payable On April 1, 2019, the Company has adopted Ind AS 116, Leases, applied to all lease contracts outstanding as at March 31, 2019, using
modified retrospective method. Please Refer to Note 3 for additional details
Details of finance lease payable as at March 31, 2019 is as follows:
Minimum lease payments
Present value of minimum lease payments
2019 2019
Not later than one year ` 471 ` 444
Later than one year but not later than five years 158 152
Total minimum lease payments 629 596
Less: Amount representing interest (33) -
Present value of minimum lease payment payables ` 596 ` 596
Included in the balance sheet as follows:
- Long term maturities of finance lease obligations 152
- Current maturities of obligation under finance lease 444
Operating leases: Until March 31, 2019, prior to adoption of Ind AS 116, the Company had taken office, vehicles and IT equipment under cancellable and non-cancellable operating lease agreements that were renewable on a periodic basis at the option of both the lessor and the lessee. The operating lease agreements extended up to a maximum of fifteen years from their respective dates of inception and some of these lease agreements had price escalation clause. Rental payments under operating leases were ̀ 3,494 during the year ended March 31, 2019.

Wipro Limited199
Corporate Overview | Management & Board Reports | Financial Statements
Details of contractual payments under non-cancellable leases as at March 31, 2019 are given below:
As atMarch 31, 2019
Not later than one year ` 4,018
Later than one year and not later than five years 4,991
Later than five years 702
Total ` 9,711
34. Related party relationship and transactions
List of subsidiaries as at March 31, 2020:
Subsidiaries Subsidiaries SubsidiariesCountry of
IncorporationWipro, LLC USA
Wipro Gallagher Solutions, LLC USA
Opus Capital Markets Consultants, LLC USA
Wipro Promax Analytics Solutions Americas, LLC USA
Wipro Insurance Solutions, LLC USA
Wipro IT Services, LLC USA
HealthPlan Services, Inc. ** USA
Appirio, Inc. ** USA
Cooper Software, Inc. USA
Infocrossing, LLC USA
Wipro US Foundation USA
International TechneGroup Incorporated ** USA
Rational Interaction, Inc. ** USA
Wipro Overseas IT Services Pvt. Ltd
India
Wipro Japan KK Japan
Wipro Shanghai Limited China
Wipro Trademarks Holding Limited
India
Wipro Travel Services Limited India
Wipro Holdings (UK) Limited U.K.
Designit A/S Denmark
Designit Denmark A/S Denmark
Designit Germany GmbH Germany
Designit Oslo A/S Norway
Designit Sweden AB Sweden
Designit T.L.V Ltd. Israel
Designit Tokyo Ltd. Japan
Designit Spain Digital, S.L. ** Spain
Wipro Europe Limited U.K.
Wipro UK Limited U.K.
Wipro Financial Services UK Limited
U.K.
Wipro IT Services S.R.L. Romania
Wipro IT Services SE (formerly Wipro Cyprus SE)
U.K.
Wipro Doha LLC # Qatar
Wipro Technologies SA DE CV Mexico
Wipro Philippines, Inc. Philippines

Annual Report 2019-20 200
Subsidiaries Subsidiaries SubsidiariesCountry of
IncorporationWipro Holdings Hungary Korlátolt Felelosségu Társaság
Hungary
Wipro Holdings Investment Korlátolt Felelosségu Társaság
Hungary
Wipro Information Technology Egypt SAE
Egypt
Wipro Arabia Co. Limited * Saudi Arabia
Women's Business Park Technologies Limited * Saudi Arabia
Wipro Poland SP Z.O.O Poland
Wipro IT Services Poland SP Z.O.O Poland
Wipro Technologies Australia Pty Ltd
Australia
Wipro Corporate Technologies Ghana Limited
Ghana
Wipro Technologies South Africa (Proprietary) Limited
South Africa
Wipro Technologies Nigeria Limited Nigeria
Wipro IT Service Ukraine, LLC Ukraine
Wipro Information Technology Netherlands BV.
Netherlands
Wipro Portugal S.A. ** Portugal
Wipro Technologies Limited Russia
Wipro Technology Chile SPA Chile
Wipro Solutions Canada Limited Canada
Wipro Information Technology Kazakhstan LLP Kazakhstan
Wipro Technologies W.T. Sociedad Anonima Costa Rica
Wipro Outsourcing Services (Ireland) Limited Ireland
Wipro Technologies VZ, C.A. Venezuela
Wipro Technologies Peru S.A.C. Peru
Wipro do Brasil Servicos de Tecnologia S.A. Brazil
Wipro do Brasil Technologia Ltda ** Brazil
Wipro Technologies SA Argentina
Wipro Technologies S.R.L. Romania
PT. WT Indonesia Indonesia
Wipro (Thailand) Co. Limited Thailand
Wipro Bahrain Limited Co. S.P.C. Bahrain
Wipro Gulf LLC Sultanate of Oman
Rainbow Software LLC Iraq
Wipro Networks Pte Limited Singapore
Wipro (Dalian) Limited China
Wipro Technologies SDN BHD Malaysia
Wipro Chengdu Limited China
Wipro IT Services Bangladesh Limited
Bangladesh
Wipro HR Services India Private Limited
India
* All the above direct subsidiaries are 100% held by the Company except that the Company holds 66.67% of the equity securities of Wipro Arabia Co. Limited and 55% of the equity securities of Women’s Business Park Technologies Limited are held by Wipro Arabia Co. Limited.
# 51% of equity securities of Wipro Doha LLC are held by a local shareholder. However, the beneficial interest in these holdings is with the Company.

Wipro Limited201
Corporate Overview | Management & Board Reports | Financial Statements
The Company controls ‘The Wipro SA Broad Based Ownership Scheme Trust’, ‘Wipro SA Broad Based Ownership Scheme SPV (RF) (PTY) LTD incorporated in South Africa and Wipro Foundation in India
Vide its order dated March 29, 2019, the Hon’ble National Company Law Tribunal, Bengaluru bench, approved the scheme of amalgamation for the merger of wholly owned subsidiaries Wipro Information Technology Austria GmbH, Wipro Technologies Austria GmbH, NewLogic Technologies SARL and Appirio India Cloud Solutions Private Limited with Wipro Limited. As per the said scheme, the appointed date is April 1, 2018.
** Step Subsidiary details of Wipro Portugal S.A, Wipro do Brasil Technologia Ltda, Designit Spain Digital, S.L, HealthPlan Services, Inc, Appirio, Inc, International TechneGroup Incorporated and Rational Interaction, Inc. are as follows:
Subsidiaries Subsidiaries SubsidiariesCountry of
IncorporationWipro Portugal S.A. Portugal
Wipro Technologies GmbH Germany
Cellent GmbH Germany
Cellent GmbH Austria
Wipro do Brasil Technologia Ltda
Brazil
Wipro Do Brasil Sistemetas De Informatica Ltd
Brazil
Designit Spain Digital, S.L.
Spain
Designit Colombia S A S Colombia
Designit Peru SAC Peru
HealthPlan Services, Inc. USA
HealthPlan Services Insurance Agency, LLC
USA
International TechneGroup Incorporated
USA
International TechneGroup Ltd. U.K.
ITI Proficiency Ltd Israel
International TechneGroup S.R.L. Italy
Mech Works S.R.L. Italy
Appirio, Inc. USA
Appirio, K.K Japan
Topcoder, LLC. USA
Appirio Ltd Ireland
Appirio Ltd (UK) U.K.
Rational Interaction, Inc. USA
Rational Consulting Australia Pty Ltd
Australia
Rational Interaction Limited Ireland
As at March 31, 2020 the Company held 43.7% interest in Drivestream Inc, 33% interest in Denim Group Limited and 33.3% in Denim Group Management, LLC, accounted for using the equity method.
The list of controlled trusts are:
Name of the entity Country of incorporationWipro Equity Reward Trust India
Wipro Foundation India

Annual Report 2019-20 202
The other related parties are:
Name of the related parties: Nature
Azim Premji Foundation Entity controlled by Director
Azim Premji Foundation for Development Entity controlled by Director
Hasham Traders Entity controlled by Director
Prazim Traders Entity controlled by Director
Zash Traders Entity controlled by Director
Hasham Investment and Trading Co. Pvt. Ltd Entity controlled by Director
Azim Premji Philanthropic Initiatives Pvt. Ltd Entity controlled by Director
Azim Premji Trust Entity controlled by Director
Wipro Enterprises (P) Limited Entity controlled by Director
Wipro GE Healthcare Private Limited Entity controlled by Director
Key management personnel
Rishad A Premji Chairman (i)
Abidali Z. Neemuchwala Chief Executive Officer and Managing Director (ii)
Azim H Premji Non-Executive Non-Independent Director (iii)
N Vaghul Non-Executive Director (iv)
Dr. Ashok S. Ganguly Non-Executive Director (iv)
William Arthur Owens Non-Executive Director
M.K. Sharma Non-Executive Director
Ireena Vittal Non-Executive Director
Dr. Patrick J. Ennis Non-Executive Director
Patrick Dupuis Non-Executive Director
Arundhati Bhattacharya Additional Director (v)
Jatin Pravinchandra Dalal Chief Financial Officer
M. Sanaulla Khan Company Secretary
(i) Effective July 31, 2019, Mr. Rishad A Premji was appointed as Whole-time director (designated as Chairiman by the Board of Directors of the Company).
(ii) Effective July 31, 2019, Mr. Abidali Z Neemuchwala was designated and appointed as Managing Director in addition to his existing position as Chief Executive Officer. On January 31, 2020, the Company announced that Mr. Abidali Z Neemuchwala has decided to step down from the position of Chief Executive Officer and Managing Director due to family commitments and he will continue to hold the office of Chief Executive Officer and Managing Director, until a successor is appointed, for a smooth transition and to ensure that business continues as usual. The Board of Directors has, at its meeting held on May 29, 2020, noted the resignation of Mr. Abidali Z. Neemuchwala as the Chief Executive Officer and Managing Director with effect from the end of day on June 1, 2020.
(iii) On July 30, 2019, Mr. Azim H Premji retired as Executive Chairman and Managing Director and was appointed as Non-Executive Non-Independent Director with effect from July 31, 2019.
(iv) Mr. N Vaghul and Dr. Ashok S. Ganguly retired as Non- Executive Director with effect from July 31, 2019.
(v) Ms. Arundhati Bhattacharya was appointed as Non-Executive Director with effect from January 1, 2019. The Board of Directors has, at its meeting held on May 29, 2020, noted the resignation of Ms. Arundhati Bhattacharya as an Independent Director with effect from close of business hours on June 30, 2020.
Relatives of key management personnel:- Yasmeen H. Premji- Tariq Azim Premji

Wipro Limited203
Corporate Overview | Management & Board Reports | Financial Statements
The Company has the following related party transactions for the year ended March 31, 2020 and 2019:
Subsidiaries/ TrustsEntities controlled by
DirectorsKey Management
Personnel #Transaction / balances 2020 2019 2020 2019 2020 2019Sales of services ` 65,671 ` 54,498 ` 43 ` 102 ` - ` -
Purchase of services 22,449 21,084 ^ ^ - -
Assets purchased/ capitalized - - 741 240 - -
Dividend paid 24 21 3,987 3,171 243 191
Dividend received 734 - - - - -
Commission paid 1,023 1,133 - - - -
Rent Paid 130 109 2 8 9 5
Rent Income 216 182 45 43 - -
Redemption of preference shares 5,055 - - - - -
Loans given to subsidiaries 8,934 - - - - -
Other cost recoveries 2,853 3,455 119 63 - -
Buyback of shares - - 69,392 - 4,076 -
Interest Income 23 ^ - - - -
Interest Expense - 6 - - - -
Corporate guarantee commission 206 203 - - - -
Key management personnel *Remuneration and short-term benefits ` 369 ` 356
Other benefits 178 174
Balance as at the year endReceivables ** ` 16,358 ` 18,263 ^ ` 80 ` - ` -
Payables 3,422 3,301 56 8 166 156
* Post-employment benefits comprising compensated absences are not disclosed as these are determined for the Company as a whole. Benefits includes the prorated value of RSU granted to the personnel, which vest over a period of time.
Other benefits include share based compensation ` 170 and ` 166 for the year ended March 31, 2020 and 2019, respectively.
# Including relative of key management personnel.** Includes the following balances being in the nature of loans given to subsidiaries of the Company including interest accrued, where applicable and inter-corporate deposits with subsidiary.
^ Value is less than ` 1.
Loan outstanding from subsidiaries:
Name of the entityBalance
As at March 31,Maximum amount due
during the year2020 2019 2020 2019
Wipro, LLC ` 9,472 ` - ` 9,472 ` -
The following are the significant related party transactions during the year ended March 31, 2020 and 2019:
Year ended March 31, 2020 March 31, 2019
Sale of servicesWipro, LLC ` 47,765 ` 35,074
Wipro Solutions Canada Limited 1,999 2,297
Wipro Technologies Gmbh 1,693 1,673
Wipro Gallagher Solutions, LLC 1,612 1,459
Wipro Networks Pte Limited 1,435 1,839
Wipro Holdings (UK) Limited 1,336 1,511

Annual Report 2019-20 204
Year ended March 31, 2020 March 31, 2019
Wipro Information Technology Netherlands BV. 1,256 1,458
Appirio, Inc. 1,118 1,469
HealthPlan Services, Inc. 810 724
Wipro Arabia Co. Limited 748 548
Wipro Technologies South Africa (Proprietary) Limited 703 1,089
Purchase of servicesAppirio, Inc. ` 3,503 ` 2,390
Wipro Technologies Gmbh 2,439 1,275
Wipro Philippines, Inc. 2,402 2,338
Wipro, LLC 2,315 1,832
Wipro Technologies SA DE CV 2,132 1,680
Wipro Technologies S.R.L. 1,801 2,314
Wipro IT Services Poland SP Z.O.O 1,468 901
Wipro do Brasil Technologia Ltda 1,084 2,374
Appirio Ltd (UK) 718 302
Wipro (Dalian) Limited 480 543
Wipro Chengdu Limited 479 394
Wipro Portugal S.A. 462 934
Designit Denmark A/S 382 315
Wipro Networks Pte Limited 329 335
Cellent GmbH 320 359
Asset purchased/ capitalizedWipro Enterprises (P) Limited ` 741 ` 240
Dividend paidZash Traders ` 1,143 ` 903
Prazim Traders 1,127 891
Hasham Traders 939 742
Azim Premji Trust 757 618
Commission paidWipro Technologies Gmbh ` 719 ` 876
Wipro Japan KK 220 203
Rent paidWipro, LLC ` 61 ` 59
Wipro Holdings (UK) Limited 51 34
Buyback of sharesHasham Traders ` 16,338 ` -
Prazim Traders 19,617 -
Zash Traders 19,890 -
Azim Premji Trust 13,179 -
Azim H Premji 3,986 -
Rental incomeWipro Enterprises (P) Limited ` 44 ` 42
Designit Denmark A/S 35 33
Wipro, LLC 174 139
Remuneration paid to key management personnelAzim H Premji* ` 15 ` 18
Abidali Z Neemuchwala 323 273
Rishad A Premji 52 68
Jatin Pravinchandra Dalal 44 61
M. Sanaulla Khan 15 16
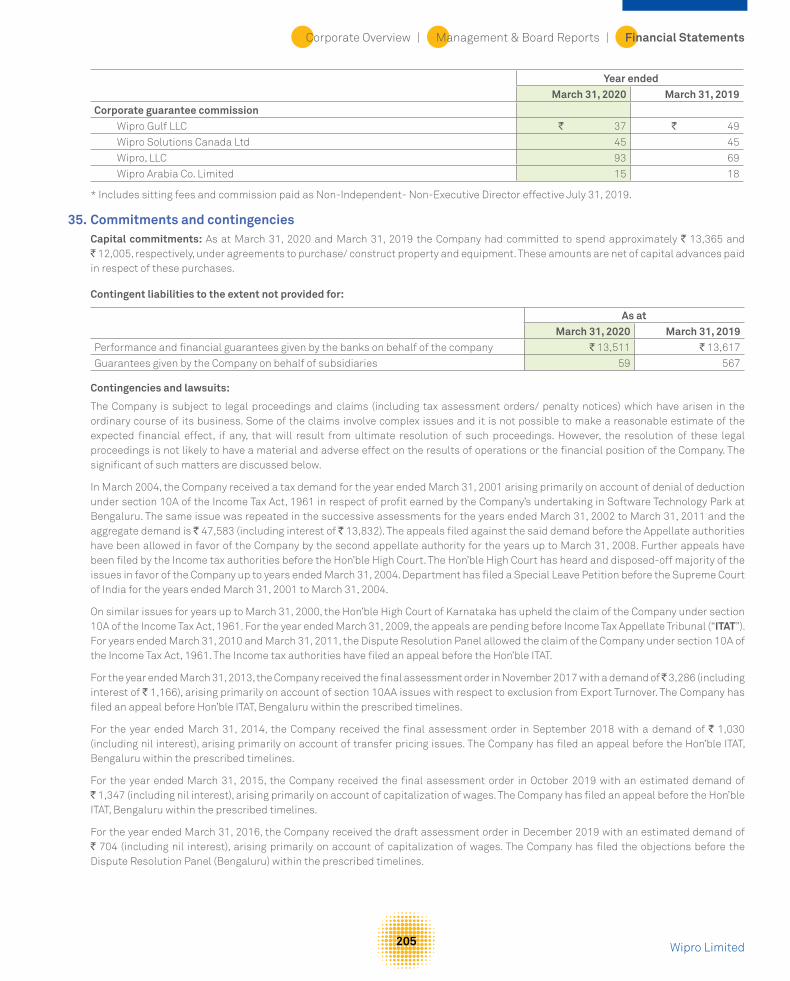
Wipro Limited205
Corporate Overview | Management & Board Reports | Financial Statements
Year ended March 31, 2020 March 31, 2019
Corporate guarantee commissionWipro Gulf LLC ` 37 ` 49
Wipro Solutions Canada Ltd 45 45
Wipro, LLC 93 69
Wipro Arabia Co. Limited 15 18
* Includes sitting fees and commission paid as Non-Independent- Non-Executive Director effective July 31, 2019.
35. Commitments and contingencies Capital commitments: As at March 31, 2020 and March 31, 2019 the Company had committed to spend approximately ` 13,365 and
` 12,005, respectively, under agreements to purchase/ construct property and equipment. These amounts are net of capital advances paid in respect of these purchases.
Contingent liabilities to the extent not provided for:
As atMarch 31, 2020 March 31, 2019
Performance and financial guarantees given by the banks on behalf of the company ` 13,511 ` 13,617
Guarantees given by the Company on behalf of subsidiaries 59 567
Contingencies and lawsuits:
The Company is subject to legal proceedings and claims (including tax assessment orders/ penalty notices) which have arisen in the ordinary course of its business. Some of the claims involve complex issues and it is not possible to make a reasonable estimate of the expected financial effect, if any, that will result from ultimate resolution of such proceedings. However, the resolution of these legal proceedings is not likely to have a material and adverse effect on the results of operations or the financial position of the Company. The significant of such matters are discussed below.
In March 2004, the Company received a tax demand for the year ended March 31, 2001 arising primarily on account of denial of deduction under section 10A of the Income Tax Act, 1961 in respect of profit earned by the Company’s undertaking in Software Technology Park at Bengaluru. The same issue was repeated in the successive assessments for the years ended March 31, 2002 to March 31, 2011 and the aggregate demand is ` 47,583 (including interest of ` 13,832). The appeals filed against the said demand before the Appellate authorities have been allowed in favor of the Company by the second appellate authority for the years up to March 31, 2008. Further appeals have been filed by the Income tax authorities before the Hon’ble High Court. The Hon’ble High Court has heard and disposed-off majority of the issues in favor of the Company up to years ended March 31, 2004. Department has filed a Special Leave Petition before the Supreme Court of India for the years ended March 31, 2001 to March 31, 2004.
On similar issues for years up to March 31, 2000, the Hon’ble High Court of Karnataka has upheld the claim of the Company under section 10A of the Income Tax Act, 1961. For the year ended March 31, 2009, the appeals are pending before Income Tax Appellate Tribunal (“ITAT”). For years ended March 31, 2010 and March 31, 2011, the Dispute Resolution Panel allowed the claim of the Company under section 10A of the Income Tax Act, 1961. The Income tax authorities have filed an appeal before the Hon’ble ITAT.
For the year ended March 31, 2013, the Company received the final assessment order in November 2017 with a demand of ̀ 3,286 (including interest of ` 1,166), arising primarily on account of section 10AA issues with respect to exclusion from Export Turnover. The Company has filed an appeal before Hon’ble ITAT, Bengaluru within the prescribed timelines.
For the year ended March 31, 2014, the Company received the final assessment order in September 2018 with a demand of ` 1,030 (including nil interest), arising primarily on account of transfer pricing issues. The Company has filed an appeal before the Hon’ble ITAT, Bengaluru within the prescribed timelines.
For the year ended March 31, 2015, the Company received the final assessment order in October 2019 with an estimated demand of ` 1,347 (including nil interest), arising primarily on account of capitalization of wages. The Company has filed an appeal before the Hon’ble ITAT, Bengaluru within the prescribed timelines.
For the year ended March 31, 2016, the Company received the draft assessment order in December 2019 with an estimated demand of ` 704 (including nil interest), arising primarily on account of capitalization of wages. The Company has filed the objections before the Dispute Resolution Panel (Bengaluru) within the prescribed timelines.

Annual Report 2019-20 206
For the year ended March 31, 2007 to year ending March 31, 2012, the Company has received a tax demand of ` 227 (including ` 102 interest) for non-deduction of tax at source on some payments. Company has already deposited the demand under protest. The Company received order issued by ITAT, Bengaluru rejecting the Company’s appeal. The Company has filed an appeal against the order with the Hon’ble High Court of Karnataka within the prescribed timelines. The Company has received a favorable order on this issue from the Hon’ble High Court of Karnataka for the earlier years.
Income tax demands against the Company amounting to ` 77,873 and ` 66,441 are not acknowledged as debt as at March 31, 2020 and March 31, 2019, respectively. These matters are pending before various Appellate Authorities and the management expects its position will likely be upheld on ultimate resolution and will not have a material adverse effect on the Company’s financial position and results of operations.
The contingent liability in respect of disputed demands for excise duty, custom duty, sales tax and other matters amounts to ` 8,033 and ` 8,477 as of March 31, 2020 and March 31, 2019. However, the resolution of these disputed demands is not likely to have a material and adverse effect on the results of operations or the financial position of the Company.
The Hon’ble Supreme Court of India, through a ruling in February 2019, provided interpretation on the components of Salary on which the Company and its employees are to contribute towards Provident Fund under the Employee’s Provident Fund Act. Based on the current evaluation, the Company believes it is not probable that certain components of Salary paid by the Company will be subject to contribution towards Provident Fund due to the Supreme Court order. The Company will continue to monitor and evaluate its position based on future events and developments.
36. Corporate Social Responsibilitya. Gross amount required to be spent by the Company during the year ` 1,669 (March 31, 2019: ` 1,761).
b. Amount spent during the year on:
For the year ended March 31, 2020
In Cash Yet to be paid in Cash Total
(i) Construction/ acquisition of any asset ` - ` - ` -
(ii) On purpose other than above (i) above 1,778 40 1,818
Total amount spent during the year ` 1,778 ` 40 ` 1,818
For the year ended March 31, 2019
In Cash Yet to be paid in Cash Total
(i) Construction/ acquisition of any asset ` - ` - ` -
(ii) On purpose other than above (i) above 1,476 377 1,853
Total amount spent during the year ` 1,476 ` 377 ` 1,853
37. Segment information
The Company publishes this financial statement along with the consolidated financial statements. In accordance with Ind AS 108, Operating Segments, the Company has disclosed the segment information in the consolidated financial statements.
As per our report of even date attached For and on behalf of the Board of Directors
for Deloitte Haskins & Sells LLP Rishad A Premji M K Sharma Abidali Z NeemuchwalaChartered Accountants Chairman Director Chief Executive Officer &
Firm's Registration No.: 117366W/W - 100018 Managing Director
Vikas Bagaria Jatin Pravinchandra Dalal M. Sanaulla Khan Partner Chief Financial Officer Company Secretary
Membership No.: 60408
Bengaluru Bengaluru
May 29, 2020 May 29, 2020

Corporate Overview | Management & Board Reports | Financial Statements
Wipro Limited207
To The Members of Wipro Limited
Report on the Audit of the Consolidated Financial Statements
Opinion
We have audited the accompanying consolidated financial statements of Wipro Limited (“the Company”) and its subsidiaries, (the Company and its subsidiaries together referred to as “the Group”), which comprise the Consolidated Balance Sheet as at March 31, 2020, and the Consolidated Statement of Profit and Loss (including Other Comprehensive Income), the Consolidated Statement of Changes in Equity and the Consolidated Statement of Cash Flows for the year then ended, and a summary of significant accounting policies and other explanatory information (herein after referred to as “the Consolidated Financial Statements”).
In our opinion and to the best of our information and according to the explanations given to us, the aforesaid Consolidated Financial Statements give the information required by the Companies Act, 2013 (“the Act”) in the manner so required and give a true and fair view in conformity with the Indian Accounting Standards prescribed under section 133 of the Act read with the Companies (Indian Accounting Standards) Rules, 2015, as amended (‘Ind AS’), and other accounting principles generally accepted in India, of the consolidated state of affairs of the Group as at March 31, 2020, consolidated profit, consolidated total comprehensive income, consolidated changes in equity and consolidated cash flows for the year ended on that date.
Basis for Opinion
We conducted our audit of the Consolidated Financial Statements in accordance with the Standards on Auditing specified under section 143 (10) of the Act (SAs). Our responsibilities under those Standards are further described in the Auditor’s Responsibility for the Audit of the Consolidated Financial Statements section of our report. We are independent of the Group in accordance with the Code of Ethics issued by the Institute of Chartered Accountants of India (ICAI) together with the ethical requirements that are relevant to our audit of the Consolidated Financial Statements under the provisions of the Act and the Rules made thereunder, and we have fulfilled our other ethical responsibilities in accordance with these requirements and the ICAI’s Code of Ethics. We believe that the audit evidence obtained by us is sufficient and appropriate to provide a basis for our audit opinion on the Consolidated Financial Statements.
Key Audit Matters
Key audit matters are those matters that, in our professional judgment, were of most significance in our audit of the Consolidated Financial Statements of the current period. These matters were addressed in the context of our audit of the Consolidated Financial Statements as a whole, and in forming our opinion thereon, and we do not provide a separate opinion on these matters. We have
Independent Auditor’s Reportdetermined the matters described below to be the key audit matters to be communicated in our report.
Fixed price contracts using the percentage of completion method - Refer Notes 2 (iii)(a), 3(xiv)B and 21 to the financial statements.
Key Audit Matter Description
Revenue from fixed-price contracts, including software development, and integration contracts, where the performance obligations are satisfied over time, is recognized using the percentage-of-completion method.
Use of the percentage-of-completion method requires the Company to determine the project costs incurred to date as a percentage of total estimated project costs required to complete the project. The estimation of total project costs involves significant judgement and is assessed throughout the period of the contract to reflect any changes based on the latest available information. In addition, provisions for estimated losses, if any, on uncompleted contracts are recorded in the period in which such losses become probable based on the estimated project costs.
We identified the revenue recognition for fixed price contracts where the percentage-of-completion method is used as a key audit matter because of the significant judgement involved in estimating the efforts to complete such contracts.
This estimate has a high inherent uncertainty and requires consideration of progress of the contract, efforts incurred to-date and estimates of efforts required to complete the remaining contract performance obligations over the lives of the contracts.
This required a high degree of auditor judgment in evaluating the audit evidence supporting the application of the input method used to recognize revenue and a higher extent of audit effort to evaluate the reasonableness of the total estimated amount of revenue recognized on fixed-price contracts.
How the Key Audit Matter Was Addressed in the Audit
Our audit procedures related to estimates of efforts to complete for fixed-price contracts accounted using the percentage-of-completion method included the following, among others:
• We tested the effectiveness of controls relating to (1) recording of efforts incurred and estimation of efforts required to complete the remaining contract performance obligations, and (2) access and application controls pertaining to time recording and allocation systems, which prevents unauthorised changes to recording of efforts incurred.
• We evaluated management’s ability to reasonably estimate the progress towards satisfying the performance obligation by comparing actual information to estimates for performance obligations that have been fulfilled.
Annual Report 2019-20 208
• We selected a sample of fixed price contracts with customers accounted using percentage-of-completion method and performed the following:
• Read the contract and based on the terms and conditions evaluated whether recognizing revenue over time was appropriate, and the contract was included in management’s calculation of revenue over time.
• Evaluated other information that supported the estimates of the progress towards satisfying the performance obligation.
• Evaluated the appropriateness of and consistency in the application of management’s policies and methodologies to estimate progress towards satisfying the performance obligation.
• Compared efforts incurred with Company’s estimate of efforts incurred to date to identify significant variations and evaluate whether those variations have been considered appropriately in estimating the remaining efforts to complete the contract.
• Tested the estimate for consistency with the status of delivery of milestones and customer acceptances to identify possible delays in achieving milestones, which require changes in estimated efforts to complete the remaining performance obligations.
Allowance for credit losses Refer Notes 2(iii)(g), 3(x)(A), and 10 to the financial statements
Key Audit Matter Description
The Company determines the allowance for credit losses based on historical loss experience adjusted to reflect current and estimated future economic conditions. The Company considered current and anticipated future economic conditions relating to industries the Company deals with and the countries where it operates. In calculating expected credit losses, the Company also considered credit reports and other related credit information for its customers to estimate the probability of default in future and has taken into account estimates of possible effect from the pandemic relating to COVID-19.
We identified allowance for credit losses as a key audit matter because of the significant judgement involved in calculating the expected credit losses. This required a high degree of auditor judgment and an increased extent of effort when performing audit procedures to evaluate the reasonableness of management’s estimate of the expected credit losses.
How the Key Audit Matter Was Addressed in the Audit
Our audit procedures related to the allowance for credit losses for trade receivables, unbilled receivables and contract assets included the following, among others:
• We tested the effectiveness of controls over the (1) development of the methodology for the allowance for credit losses, including consideration of the current and estimated future economic conditions, (2) completeness and accuracy of information used in the estimation of probability of default, and (3) computation of the allowance for credit losses.
• For a sample of customers we tested the input data such as credit reports and other credit related information used in estimating the probability of default by comparing them to external and internal sources of information.
• We evaluated the incorporation of the applicable assumptions into the estimate of expected credit losses and tested the mathematical accuracy and computation of the allowances by using the same input data used by the Company.
• We evaluated the qualitative adjustment to the historical loss rates, including assessing the basis for the adjustments and the reasonableness of the significant assumptions.
Information Other than the Financial Statements and Auditor’s Report Thereon
• The Company’s Board of Directors is responsible for the other information. The other information comprises the information included in the Management Discussion and Analysis, Board’s report and Corporate Governance Report, but does not include the Conso lidated Financial Statements, Standalone Financial Statements and our auditor’s report thereon.
• Our opinion on the Consolidated Financial Statements does not cover the other information and we do not express any form of assurance conclusion thereon.
• In connection with our audit of the Consolidated Financial Statements, our responsibility is to read the other information and, in doing so, consider whether the other information is materially inconsistent with the Consolidated Financial Statements or our knowledge obtained during the course of our audit or otherwise appears to be materially misstated.
• If, based on the work we have performed, we conclude that there is a material misstatement of this other information, we are required to report that fact. We have nothing to report in this regard.
Management’s Responsibility for the Consolidated Financial Statements
The Company’s Board of Directors is responsible for the matters stated in section 134(5) of the Act with respect to the preparation and presentation of these Consolidated Financial Statements that give a true and fair view of the consolidated financial position, consolidated financial performance including other comprehensive income, consolidated changes in equity and consolidated cash flows of the Group in accordance with the Ind AS and other accounting principles generally accepted in India. The respective Board of Directors of the companies included in the Group are responsible for maintenance of adequate accounting records in accordance with the provisions of the Act for safeguarding the assets of the Group and for preventing and detecting frauds and other irregularities; selection and application of appropriate accounting policies; making judgments and estimates that are reasonable and prudent; and design, implementation and maintenance of adequate internal financial controls, that were operating effectively for ensuring the accuracy and completeness of the accounting records, relevant to the preparation and presentation of the Consolidated Financial Statements that give a true and fair view and are free from material misstatement, whether due to fraud or error, which have been used for the purpose of preparation of the Consolidated Financial Statements by the Directors of the Company, as aforesaid.

Corporate Overview | Management & Board Reports | Financial Statements
Wipro Limited209
In preparing the Consolidated Financial Statements, the respective Board of Directors of the companies included in the Group are responsible for assessing the ability of the respective entities to continue as a going concern, disclosing, as applicable, matters related to going concern and using the going concern basis of accounting unless the respective Board of Directors either intends to liquidate or cease operations, or has no realistic alternative but to do so.
The respective Board of Directors of the companies included in the Group are also responsible for overseeing the financial reporting process of the Group.
Auditor’s Responsibility for the Audit of the Consolidated Financial Statements
Our objectives are to obtain reasonable assurance about whether the Consolidated Financial Statements as a whole are free from material misstatement, whether due to fraud or error, and to issue an auditor’s report that includes our opinion. Reasonable assurance is a high level of assurance, but is not a guarantee that an audit conducted in accordance with SAs will always detect a material misstatement when it exists. Misstatements can arise from fraud or error and are considered material if, individually or in the aggregate, they could reasonably be expected to influence the economic decisions of users taken on the basis of these Consolidated Financial Statements.
As part of an audit in accordance with SAs, we exercise professional judgment and maintain professional skepticism throughout the audit. We also:
• Identify and assess the risks of material misstatement of the Consolidated Financial Statements, whether due to fraud or error, design and perform audit procedures responsive to those risks, and obtain audit evidence that is sufficient and appropriate to provide a basis for our opinion. The risk of not detecting a material misstatement resulting from fraud is higher than for one resulting from error, as fraud may involve collusion, forgery, intentional omissions, misrepresentations, or the override of internal control.
• Obtain an understanding of internal financial control relevant to the audit in order to design audit procedures that are appropriate in the circumstances. Under section 143(3)(i) of the Act, we are also responsible for expressing our opinion on whether the Company and its subsidiary companies which are companies incorporated in India, has adequate internal financial controls system in place and the operating effectiveness of such controls.
• Evaluate the appropriateness of accounting policies used and the reasonableness of accounting estimates and related disclosures made by the management.
• Conclude on the appropriateness of management’s use of the going concern basis of accounting and, based on the audit evidence obtained, whether a material uncertainty exists related to events or conditions that may cast significant doubt on the ability of the Group to continue as a going concern. If we conclude that a material uncertainty exists, we are required to draw attention in our auditor’s report to the related disclosures in
the Consolidated Financial Statements or, if such disclosures are inadequate, to modify our opinion. Our conclusions are based on the audit evidence obtained up to the date of our auditor’s report. However, future events or conditions may cause the Group to cease to continue as a going concern.
• Evaluate the overall presentation, structure and content of the Consolidated Financial Statements, including the disclosures, and whether the Consolidated Financial Statements represent the underlying transactions and events in a manner that achieves fair presentation.
• Obtain sufficient appropriate audit evidence regarding the financial information of the entities and business activities within the Group to express an opinion on the Consolidated Financial Statements.
Materiality is the magnitude of misstatements in the Consolidated Financial Statements that, individually or in aggregate, makes it probable that the economic decisions of a reasonably knowledgeable user of the Consolidated Financial Statements may be influenced. We consider quantitative materiality and qualitative factors in (i) planning the scope of our audit work and in evaluating the results of our work; and (ii) to evaluate the effect of any identified misstatements in the Consolidated Financial Statements.
We communicate with those charged with governance of the Company regarding, among other matters, the planned scope and timing of the audit and significant audit findings, including any significant deficiencies in internal control that we identify during our audit.
We also provide those charged with governance with a statement that we have complied with relevant ethical requirements regarding independence, and to communicate with them all relationships and other matters that may reasonably be thought to bear on our independence, and where applicable, related safeguards.
From the matters communicated with those charged with governance, we determine those matters that were of most significance in the audit of the Consolidated Financial Statements of the current period and are therefore the key audit matters. We describe these matters in our auditor’s report unless law or regulation precludes public disclosure about the matter or when, in extremely rare circumstances, we determine that a matter should not be communicated in our report because the adverse consequences of doing so would reasonably be expected to outweigh the public interest benefits of such communication.
Report on Other Legal and Regulatory Requirements
1. As required by Section 143(3) of the Act, based on our audit we report that:
a) We have sought and obtained all the information and explanations which to the best of our knowledge and belief were necessary for the purposes of our audit of the aforesaid Consolidated Financial Statements.
b) In our opinion, proper books of account as required by law relating to preparation of the aforesaid Consolidated

Annual Report 2019-20 210
Financial Statements have been kept so far as it appears from our examination of those books.
c) The Consolidated Balance Sheet, the Consolidated Statement of Profit and Loss (including Other Comprehensive Income), the Consolidated Statement of Changes in Equity and the Consolidated Statement of Cash Flows dealt with by this Report are in agreement with the relevant books of account maintained for the purpose of preparation of the Consolidated Financial Statements.
d) In our opinion, the aforesaid Consolidated Financial Statements comply with the Ind AS specified under Section 133 of the Act.
e) On the basis of the written representations received from the directors of the Company as on March 31, 2020 taken on record by the Board of Directors of the Company and its subsidiaries incorporated in India, and the reports of the statutory auditors of its subsidiary companies incorporated in India, none of the directors of the Group companies, incorporated in India is disqualified as on March 31, 2020 from being appointed as a director in terms of Section 164(2) of the Act.
f) With respect to the adequacy of the internal financial controls over financial reporting and the operating effectiveness of such controls, refer to our separate Report in “Annexure A” which is based on the auditors’ reports of the company and its subsidiary companies incorporated in India. Our report expresses an unmodified opinion on the adequacy and operating effectiveness of internal financial controls over financial reporting of those companies.
g) With respect to the other matters to be included in the Auditor’s Report in accordance with the requirements of section 197(16) of the Act, as amended, in our opinion and to
the best of our information and according to the explanations given to us, the remuneration paid by the Company to its directors during the year is in accordance with the provisions of section 197 of the Act.
h) With respect to the other matters to be included in the Auditor’s Report in accordance with Rule 11 of the Companies (Audit and Auditors) Rules, 2014, as amended in our opinion and to the best of our information and according to the explanations given to us:
i) The Consolidated Financial Statements disclose the impact of pending litigations on the consolidated financial position of the Group,
ii) Provision has been made in the Consolidated Financial Statements, as required under the applicable law or accounting standards, for material foreseeable losses, if any, on long-term contracts including derivative contracts;
iii) There has been no delay in transferring amounts, required to be transferred, to the Investor Education and Protection Fund by the Company and its subsidiary companies incorporated in India.
For DELOITTE HASKINS & SELLS LLPChartered AccountantsFirm Registration Number: 117366W/W-100018
Vikas BagariaPartnerMembership number: 60408BengaluruMay 29, 2020
Annexure “A” To The Independent Auditor’s Report (Referred to in paragraph 1(f) under ‘Report on Other Legal and Regulatory Requirements’ section of our report of even date)
Report on the Internal Financial Controls Over Financial Reporting under Clause (i) of Sub-section 3 of Section 143 of the Companies Act, 2013 (“the Act”)
In conjunction with our audit of the Consolidated Financial Statements of the Company as of and for the year ended March 31, 2020, we have audited the internal financial controls over financial reporting of Wipro Limited (hereinafter referred to as “the Company”) and its subsidiary companies, which are companies incorporated in India, as of that date.
Management’s Responsibility for Internal Financial Controls
The respective Board of Directors of the company, and its subsidiary companies, which are companies incorporated in India, are responsible for establishing and maintaining internal financial controls based on the internal control over financial reporting criteria established by the respective Companies considering the
essential components of internal control stated in the Guidance Note on Audit of Internal Financial Controls Over Financial Reporting issued by the Institute of Chartered Accountants of India (“the ICAI”). These responsibilities include the design, implementation and maintenance of adequate internal financial controls that were operating effectively for ensuring the orderly and efficient conduct of its business, including adherence to the respective company’s policies, the safeguarding of its assets, the prevention and detection of frauds and errors, the accuracy and completeness of the accounting records, and the timely preparation of reliable financial information, as required under the Act.
Auditor’s Responsibility
Our responsibility is to express an opinion on the internal financial controls over financial reporting of the Company, and its subsidiary companies, which are companies incorporated in India, based on our audit. We conducted our audit in accordance with the Guidance Note

Corporate Overview | Management & Board Reports | Financial Statements
Wipro Limited211
on Audit of Internal Financial Controls Over Financial Reporting (the “Guidance Note”) issued by the ICAI and the Standards on Auditing, prescribed under Section 143(10) of the Act, to the extent applicable to an audit of internal financial controls. Those Standards and the Guidance Note require that we comply with ethical requirements and plan and perform the audit to obtain reasonable assurance about whether adequate internal financial controls over financial reporting was established and maintained and if such controls operated effectively in all material respects.
Our audit involves performing procedures to obtain audit evidence about the adequacy of the internal financial controls system over financial reporting and their operating effectiveness. Our audit of internal financial controls over financial reporting included obtaining an understanding of internal financial controls over financial reporting, assessing the risk that a material weakness exists, and testing and evaluating the design and operating effectiveness of internal control based on the assessed risk. The procedures selected depend on the auditor’s judgement, including the assessment of the risks of material misstatement of the financial statements, whether due to fraud or error.
We believe that the audit evidence we have obtained, is sufficient and appropriate to provide a basis for our audit opinion on the internal financial controls system over financial reporting of the Company, and its subsidiary companies which are companies incorporated in India.
Meaning of Internal Financial Controls over Financial Reporting
A company’s internal financial control over financial reporting is a process designed to provide reasonable assurance regarding the reliability of financial reporting and the preparation of financial statements for external purposes in accordance with generally accepted accounting principles. A company’s internal financial control over financial reporting includes those policies and procedures that (1) pertain to the maintenance of records that, in reasonable detail, accurately and fairly reflect the transactions and dispositions of the assets of the company; (2) provide reasonable assurance that transactions are recorded as necessary to permit preparation of financial statements in accordance with generally accepted accounting principles, and that receipts and expenditures of the company are being made only in accordance with authorisations
of management and directors of the company; and (3) provide reasonable assurance regarding prevention or timely detection of unauthorised acquisition, use, or disposition of the company’s assets that could have a material effect on the financial statements.
Inherent Limitations of Internal Financial Controls over Financial Reporting
Because of the inherent limitations of internal financial controls over financial reporting, including the possibility of collusion or improper management override of controls, material misstatements due to error or fraud may occur and not be detected. Also, projections of any evaluation of the internal financial controls over financial reporting to future periods are subject to the risk that the internal financial control over financial reporting may become inadequate because of changes in conditions, or that the degree of compliance with the policies or procedures may deteriorate.
Opinion
In our opinion to the best of our information and according to the explanations given to us, the Company, and its subsidiary companies, which are companies incorporated in India, have, in all material respects, an adequate internal financial controls system over financial reporting and such internal financial controls over financial reporting were operating effectively as at March 31, 2020, based on, the internal control over financial reporting criteria established by the respective companies considering the essential components of internal control stated in the Guidance Note on Audit of Internal Financial Controls Over Financial Reporting issued by the ICAI.
For DELOITTE HASKINS & SELLS LLPChartered AccountantsFirm Registration Number: 117366W/W-100018
Vikas BagariaPartnerMembership number: 60408 BengaluruMay 29, 2020

Annual Report 2019-20 212
Consolidated Balance Sheet(` in millions, except share and per share data, unless otherwise stated)
Notes As at March 31, 2020
As at March 31, 2019
ASSETSProperty, plant and equipment 4 60,617 47,665
Right-of-Use Assets 5 16,748 -
Capital work-in-progress 18,811 21,418
Goodwill 6 126,894 113,220
Other intangible assets 6 16,362 13,762
Investments accounted for using the equity method 8 1,383 1,235
Financial assets
Investments 8 9,302 6,916
Derivative assets 9 - 173
Trade receivables 10 6,049 4,373
Other financial assets 11 5,881 5,146
Deferred tax assets (net) 28 6,005 5,604
Non-current tax assets (net) 11,414 20,603
Other non-current assets 12 13,472 17,227
Total non-current assets 292,938 257,342Current assets
Inventories 13 1,865 3,951
Financial assets
Investments 8 189,635 220,716
Trade receivables 10 104,474 100,489
Cash and cash equivalents 14 144,499 158,529
Derivative assets 9 3,025 4,931
Unbilled receivables 25,209 22,880
Other financial assets 11 8,614 14,611
Current tax assets (net) 2,882 7,435
Contract assets 17,143 15,038
Other current assets 12 22,505 23,086
519,851 571,666Assets held for sale 22 - 240
Total current assets 519,851 571,906TOTAL ASSETS 812,789 829,248EQUITY AND LIABILITIESEQUITYEquity share capital 15 11,427 12,068
Other equity 541,790 552,158
Equity attributable to the equity holders of the Company 553,217 564,226Non-controlling interest 1,875 2,637
TOTAL EQUITY 555,092 566,863

Corporate Overview | Management & Board Reports | Financial Statements
Wipro Limited213
Consolidated Balance Sheet(` in millions, except share and per share data, unless otherwise stated)
As per our report of even date attached For and on behalf of the Board of Directors
for Deloitte Haskins & Sells LLP Rishad A. Premji M. K. Sharma Abidali Z. Neemuchwala
Chartered Accountants Chairman Director Chief Executive Officer
& Managing DirectorFirm’s Registration No: 117366W/W- 100018
Vikas Bagaria Jatin Pravinchandra Dalal M. Sanaulla KhanPartner Chief Financial Officer Company SecretaryMembership No. 60408
Bengaluru BengaluruMay 29, 2020 May 29, 2020
Notes As at March 31, 2020
As at March 31, 2019
LIABILITIESNon-current liabilitiesFinancial liabilities
Borrowings 16 4,840 28,368
Derivative liabilities 9 138 -
Lease liabilities 16 12,638 -
Other financial liabilities 17 151 -
Deferred tax liabilities (net) 28 2,793 3,384
Non-current tax liabilities (net) 13,205 11,023
Other non-current liabilities 19 3,771 3,176
Provisions 18 3,768 2,084
Total non-current liabilities 41,304 48,035Current liabilitiesFinancial liabilities
Borrowings 16 54,020 68,085
Trade payables 20 58,400 62,660
Derivative liabilities 9 7,231 1,310
Lease liabilities 16 6,560 -
Other financial liabilities 17 39,810 29,302
Contract liabilities 18,775 24,768
Current tax liabilities (net) 11,731 9,541
Other current liabilities 19 6,503 7,627
Provisions 18 13,363 11,057
Total current liabilities 216,393 214,350TOTAL LIABILITIES 257,697 262,385TOTAL EQUITY AND LIABILITIES 812,789 829,248
The accompanying notes form an integral part of these consolidated financial statements

Annual Report 2019-20 214
NotesYear ended
March 31, 2020 March 31, 2019
INCOMERevenue from operations 21 610,232 585,845Other operating income 22 1,144 4,344Other income 23 27,250 26,138
Total Income 638,626 616,327EXPENSESPurchases of stock-in-trade 9,360 14,073Changes in inventories of finished goods and stock-in-trade 24 2,022 (673)Employee benefits expense 25 326,571 299,774Finance costs 26 7,328 7,375Depreciation, amortization and impairment expense 20,855 19,467Sub-contracting / technical fees / third party application 90,521 94,725Facility expenses 19,733 22,213Travel 18,169 17,768Communication 4,812 4,561Marketing and brand building 2,532 2,714Legal and Professional charges 4,733 4,361 Allowance for lifetime expected credit losses 1,043 980 Other expenses 27 8,457 13,524Total expenses 516,136 500,862Share of net profit /(loss) of associates accounted for using the equity method 29 (43)Profit before tax 122,519 115,422Tax expense
Current tax 28 24,324 23,649Deferred tax 28 477 1,594
Total tax expense 24,801 25,243Profit for the year 97,718 90,179Other Comprehensive Income (OCI)Items that will not be reclassified subsequently to profit or loss:
Remeasurements of the net defined benefit liability /(asset) comprising actuarial gains and losses 25 (1,246) 282
Net change in fair value of financial instruments measured at FVTOCI 700 (539)Income tax relating to items that will not be reclassified to profit or loss 28 220 28
Items that will be reclassified to profit or loss:Foreign currency translation differences 29
Translation difference relating to foreign operations 8,091 3,015Net change in fair value of hedges of net investment in foreign operations - (287)Reclassification of foreign currency translation differences to profit and loss on sale of hosted data center services, Workday business and Cornerstone OnDemand business
- (4,210)
Net change in time value of option contracts designated as cash flow hedges 9 (648) 579Net change in intrinsic value of option contracts designated as cash flow hedges 9 (1,941) 1,014Net change in fair value of forward contracts designated as cash flow hedges 9 (3,305) 1,569Net change in fair value of financial instruments measured at FVTOCI 1,015 (8)Income tax relating to items that will be reclassified to profit or loss 28 1,371 (643)
Total other comprehensive (loss)/income for the year, net of taxes 4,257 800Total comprehensive income for the year 101,975 90,979
Consolidated Statement of Profit & Loss(` in millions, except share and per share data, unless otherwise stated)

Corporate Overview | Management & Board Reports | Financial Statements
Wipro Limited215
Consolidated Statement of Profit & Loss(` in millions, except share and per share data, unless otherwise stated)
NotesYear ended
March 31, 2020 March 31, 2019
Profit for the year attributable to: Equity holders of the Company 97,223 90,037
Non-controlling interest 495 142
97,718 90,179Total comprehensive income for the year attributable to:
Equity holders of the Company 101,322 90,728
Non-controlling interest 653 251
101,975 90,979Earnings per equity share: (Equity shares of par value ` 2 each) 30
Basic 16.67 14.99
Diluted 16.63 14.95
Number of sharesBasic 5,833,384,018 6,007,376,837
Diluted 5,847,823,239 6,022,304,367
The accompanying notes form an integral part of these consolidated financial statements
As per our report of even date attached For and on behalf of the Board of Directors
for Deloitte Haskins & Sells LLP Rishad A. Premji M. K. Sharma Abidali Z. Neemuchwala
Chartered Accountants Chairman Director Chief Executive Officer
& Managing DirectorFirm’s Registration No: 117366W/W- 100018
Vikas Bagaria Jatin Pravinchandra Dalal M. Sanaulla KhanPartner Chief Financial Officer Company SecretaryMembership No. 60408
Bengaluru BengaluruMay 29, 2020 May 29, 2020

Annual Report 2019-20 216
(` in
mill
ions
, exc
ept
shar
e an
d pe
r sh
are
data
, unl
ess
othe
rwis
e st
ated
)Eq
uity
shar
e ca
pita
l
Bala
nce
as a
t Apr
il 1,
201
9Ch
ange
in e
quity
shar
e ca
pita
lBa
lanc
e as
at M
arch
31,
202
0
12,0
68(6
41)
11,4
27
Bala
nce
as a
t Apr
il 1,
201
8Ch
ange
in e
quity
shar
e ca
pita
lBa
lanc
e as
at M
arch
31,
201
9
9,04
83,
020
12,0
68
Othe
r equ
ity
Parti
cula
rs
Rese
rves
and
Surp
lus
Fore
ign
curre
ncy
trans
latio
n re
serv
e
Cash
flow
he
dgin
g re
serv
e
Othe
r co
mpr
ehen
sive
inco
me
Tota
l at
tribu
tabl
e to
equi
ty
hold
ers
of th
e Co
mpa
ny
Non-
cont
rolli
ng
inte
rest
Tota
l
Shar
e ap
plic
atio
n m
oney
pe
ndin
g al
lotm
ent
Secu
ritie
s pr
emiu
m
rese
rve
Capi
tal
rese
rve
Capi
tal
rede
mpt
ion
rese
rve
Reta
ine.
---d
earn
ings
Shar
e Opt
ions
Ou
tsta
ndin
g Ac
coun
t
Spec
ial
econ
omic
Zo
ne re
-in
vest
men
t re
serv
eBa
lanc
e as a
t Apr
il 1, 2
019
^ 60
41,
139
1450
2,22
32,
617
28,5
6514
,048
2,41
553
355
2,15
82,
637
554,
795
Adju
stm
ent o
n ad
optio
n of
Ind
AS 11
6(1)
--
--
(872
)-
--
--
(872
)-
(872
)Ad
just
ed b
alan
ces a
s at A
pril 1
, 201
9 ^
604
1,13
914
501,
351
2,61
728
,565
14,0
482,
415
533
551,
286
2,63
755
3,92
3Pr
ofit f
or th
e yea
r-
--
-97
,223
--
--
-97
,223
495
97,7
18Ot
her c
ompr
ehen
sive i
ncom
e-
--
--
--
7,93
3(4
,730
)89
64,
099
158
4,25
7To
tal c
ompr
ehen
sive i
ncom
e for
the y
ear
--
--
97,2
23-
-7,
933
(4,7
30)
896
101,
322
653
101,
975
Issue
of eq
uity
shar
es on
exer
cise o
f opt
ions
-74
2-
--
(742
)-
--
--
--
Buyb
ack o
f equ
ity sh
ares
(2)
--
-64
6(1
05,0
00)
--
--
(104
,354
)-
(104
,354
)
Tran
sact
ion
cost
rela
ted
to b
uyba
ck-
--
-(3
11)
--
--
-(3
11)
-(3
11)
Issue
of sh
ares
by co
ntro
lled
trust
on ex
ercis
e of
optio
ns*
--
--
1,02
6(1
,026
)-
--
--
--
Com
pens
atio
n co
st re
late
d to
empl
oyee
shar
e ba
sed
paym
ent
--
--
91,
262
--
--
1,27
1-
1,27
1
Effe
ct of
mod
ifica
tion
of A
DS R
SUs f
rom
equi
ty
settl
ed to
cash
settl
ed(3
)-
--
--
(561
)-
--
-(5
61)
-(5
61)
Tran
sfer
red
to S
pecia
l eco
nom
ic zo
ne re
-in
vest
men
t res
erve
--
--
(15,
239)
-15
,239
--
--
--
Cash
divi
dend
pai
d (in
cludi
ng d
ivide
nd ta
x
ther
eon)
(2)
--
--
(6,8
63)
--
--
-(6
,863
)-
(6,8
63)
Cash
divi
dend
pai
d to
Non
-con
trolli
ng in
tere
st-
--
--
--
--
--
(1,4
15)
(1,4
15)
Bala
nce a
s at M
arch
31, 2
020
^ 1,
346
1,13
966
047
2,19
61,
550
43,8
0421
,981
(2,3
15)
1,42
954
1,79
01,
875
543,
665
* I
nclu
des
22,7
46,0
81 a
nd 2
7,35
3,85
3 tre
asur
y sha
res
held
as
at M
arch
31,
202
0 an
d 20
19, r
espe
ctive
ly b
y a c
ontro
lled
trust
. 4,6
07,7
72 a
nd 2
,599
,183
sha
res
have
bee
n tra
nsfe
rred
by t
he c
ontro
lled
trust
to e
ligib
le
empl
oyee
s on
exer
cise
of o
ptio
ns d
urin
g th
e ye
ar e
nded
Mar
ch 3
1, 2
020
and
2019
resp
ectiv
ely.
^ V
alue
less
than
` 1
(1) Re
fer n
ote
3(2
) Refe
r not
e 34
(3) Re
fer n
ote
31
Con
solid
ated
Sta
tem
ent o
f Cha
nges
in E
quit
y
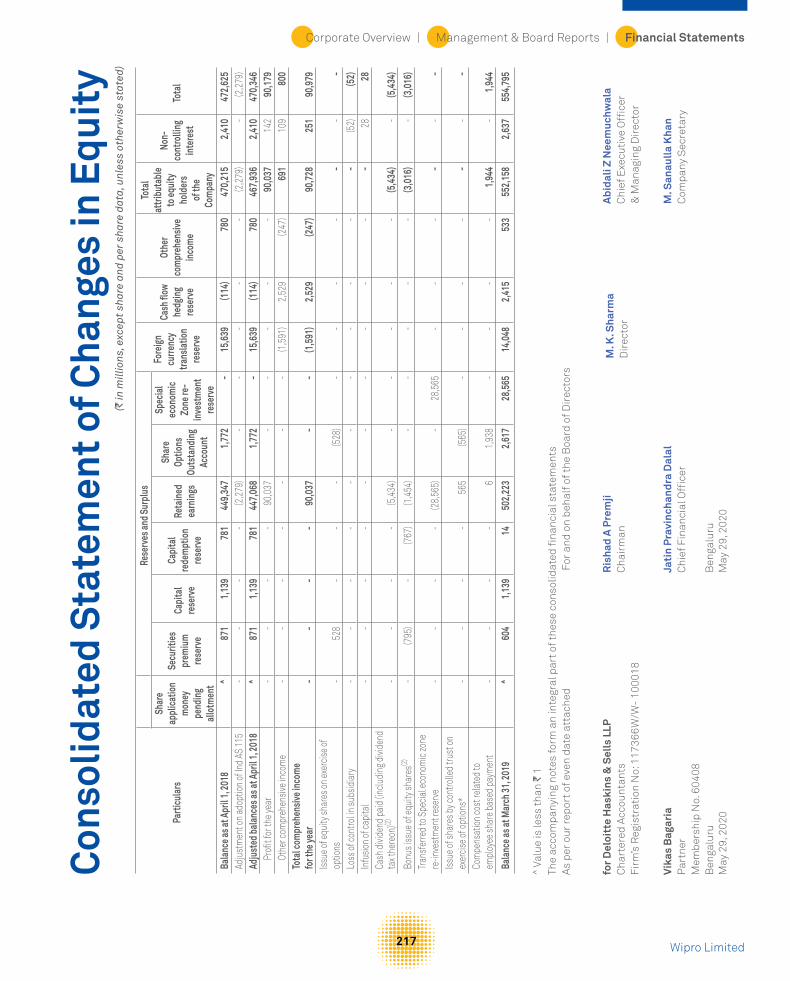
Corporate Overview | Management & Board Reports | Financial Statements
Wipro Limited217
Cons
olid
ated
Sta
tem
ent o
f Cha
nges
in E
quit
y
Parti
cula
rs
Rese
rves
and
Surp
lus
Fore
ign
curre
ncy
trans
latio
n re
serv
e
Cash
flow
he
dgin
g re
serv
e
Othe
r co
mpr
ehen
sive
inco
me
Tota
l at
tribu
tabl
e to
equi
ty
hold
ers
of th
e Co
mpa
ny
Non-
cont
rolli
ng
inte
rest
Tota
l
Shar
e ap
plic
atio
n m
oney
pe
ndin
g al
lotm
ent
Secu
ritie
s pr
emiu
m
rese
rve
Capi
tal
rese
rve
Capi
tal
rede
mpt
ion
rese
rve
Reta
ined
ea
rnin
gs
Shar
e Op
tions
Ou
tsta
ndin
g Ac
coun
t
Spec
ial
econ
omic
Zo
ne re
-in
vest
men
t re
serv
eBa
lanc
e as a
t Apr
il 1, 2
018
^ 87
11,
139
781
449,
347
1,77
2-
15,6
39(1
14)
780
470,
215
2,41
047
2,62
5Ad
just
men
t on
adop
tion
of In
d AS
115
--
--
(2,2
79)
--
--
-(2
,279
)-
(2,2
79)
Adju
sted
bal
ance
s as a
t Apr
il 1, 2
018
^ 87
11,
139
781
447,
068
1,77
2-
15,6
39(1
14)
780
467,
936
2,41
047
0,34
6Pr
ofit f
or th
e yea
r-
--
-90
,037
--
--
-90
,037
142
90,1
79Ot
her c
ompr
ehen
sive i
ncom
e-
--
--
--
(1,5
91)
2,52
9(2
47)
691
109
800
Tota
l com
preh
ensiv
e inc
ome
for t
he ye
ar-
--
-90
,037
--
(1,5
91)
2,52
9(2
47)
90,7
2825
190
,979
Issue
of eq
uity
shar
es on
exer
cise o
f op
tions
-52
8-
--
(528
)-
--
--
--
Loss
of co
ntro
l in su
bsid
iary
--
--
--
--
--
-(5
2)(5
2)In
fusio
n of
capi
tal
--
--
--
--
--
-28
28Ca
sh d
ivide
nd p
aid
(inclu
ding
divi
dend
ta
x the
reon
)(2)
--
--
(5,4
34)
--
--
-(5
,434
)-
(5,4
34)
Bonu
s iss
ue of
equi
ty sh
ares
(2)
-(7
95)
-(7
67)
(1,4
54)
--
--
-(3
,016
)-
(3,0
16)
Tran
sfer
red
to S
pecia
l eco
nom
ic zo
ne
re-in
vest
men
t res
erve
--
--
(28,
565)
-28
,565
--
--
--
Issue
of sh
ares
by co
ntro
lled
trust
on
exer
cise o
f opt
ions
*-
--
-56
5(5
65)
--
--
--
-Co
mpe
nsat
ion
cost
rela
ted
to
empl
oyee
shar
e bas
ed p
aym
ent
--
--
61,
938
--
--
1,94
4-
1,94
4
Bala
nce a
s at M
arch
31, 2
019
^ 60
41,
139
1450
2,22
32,
617
28,5
6514
,048
2,41
553
355
2,15
82,
637
554,
795
(` in
mill
ions
, exc
ept
shar
e an
d pe
r sh
are
data
, unl
ess
othe
rwis
e st
ated
)
^ Va
lue
is le
ss th
an `
1Th
e ac
com
pany
ing
note
s fo
rm a
n in
tegr
al p
art o
f the
se c
onso
lidat
ed fi
nanc
ial s
tate
men
tsA
s pe
r ou
r re
port
of e
ven
date
att
ache
d F
or a
nd o
n be
half
of t
he B
oard
of D
irec
tors
for D
eloi
tte
Has
kins
& S
ells
LLP
Ris
had
A P
rem
jiM
. K. S
harm
aA
bida
li Z
Nee
muc
hwal
aC
hart
ered
Acc
ount
ants
Cha
irm
anD
irec
tor
Chi
ef E
xecu
tive
Offi
cer
Firm
’s R
egis
trat
ion
No:
117
366
W/W
- 10
0018
& M
anag
ing
Dir
ecto
r
Vik
as B
agar
iaJa
tin
Pra
vinc
hand
ra D
alal
M. S
anau
lla K
han
Par
tner
Chi
ef F
inan
cial
Offi
cer
Com
pany
Sec
reta
ryM
embe
rshi
p N
o. 6
0408
Ben
galu
ruB
enga
luru
May
29,
202
0M
ay 2
9, 2
020
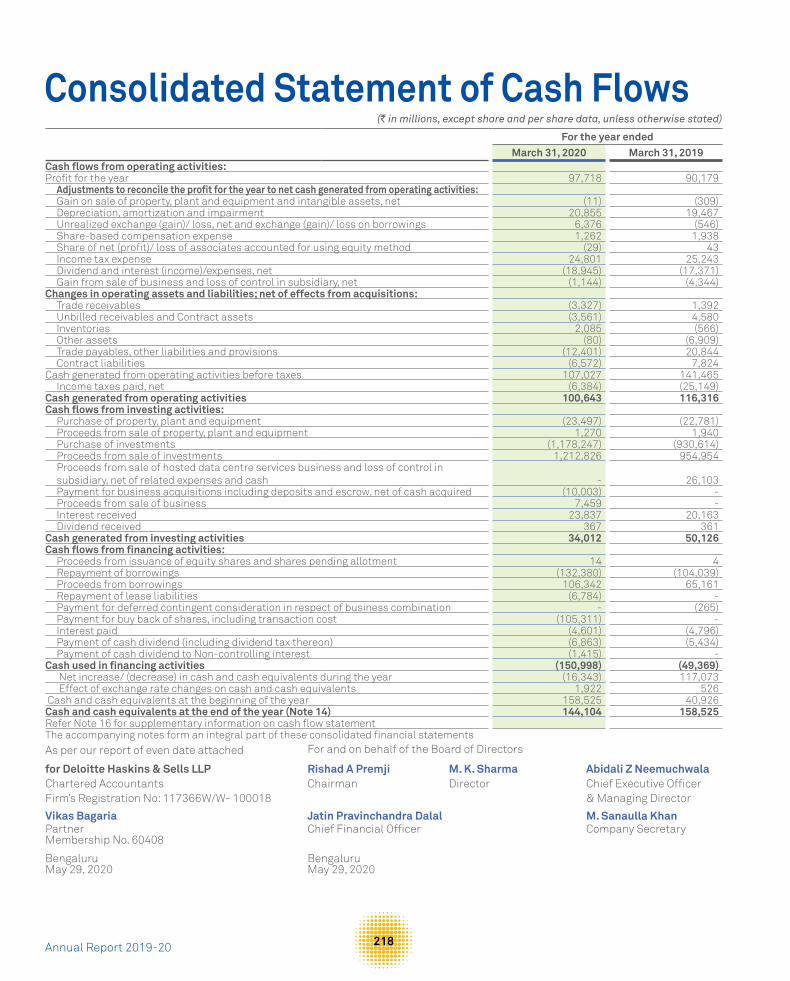
Annual Report 2019-20 218
For the year endedMarch 31, 2020 March 31, 2019
Cash flows from operating activities:Profit for the year 97,718 90,179
Adjustments to reconcile the profit for the year to net cash generated from operating activities:Gain on sale of property, plant and equipment and intangible assets, net (11) (309)Depreciation, amortization and impairment 20,855 19,467Unrealized exchange (gain)/ loss, net and exchange (gain)/ loss on borrowings 6,376 (546)Share-based compensation expense 1,262 1,938Share of net (profit)/ loss of associates accounted for using equity method (29) 43Income tax expense 24,801 25,243Dividend and interest (income)/expenses, net (18,945) (17,371)Gain from sale of business and loss of control in subsidiary, net (1,144) (4,344)
Changes in operating assets and liabilities; net of effects from acquisitions:Trade receivables (3,327) 1,392Unbilled receivables and Contract assets (3,561) 4,580Inventories 2,085 (566)Other assets (80) (6,909)Trade payables, other liabilities and provisions (12,401) 20,844Contract liabilities (6,572) 7,824
Cash generated from operating activities before taxes 107,027 141,465Income taxes paid, net (6,384) (25,149)
Cash generated from operating activities 100,643 116,316Cash flows from investing activities:
Purchase of property, plant and equipment (23,497) (22,781)Proceeds from sale of property, plant and equipment 1,270 1,940Purchase of investments (1,178,247) (930,614)Proceeds from sale of investments 1,212,826 954,954Proceeds from sale of hosted data centre services business and loss of control in subsidiary, net of related expenses and cash - 26,103Payment for business acquisitions including deposits and escrow, net of cash acquired (10,003) -Proceeds from sale of business 7,459 -Interest received 23,837 20,163Dividend received 367 361
Cash generated from investing activities 34,012 50,126Cash flows from financing activities:
Proceeds from issuance of equity shares and shares pending allotment 14 4Repayment of borrowings (132,380) (104,039)Proceeds from borrowings 106,342 65,161Repayment of lease liabilities (6,784) -Payment for deferred contingent consideration in respect of business combination - (265)Payment for buy back of shares, including transaction cost (105,311) -Interest paid (4,601) (4,796)Payment of cash dividend (including dividend tax thereon) (6,863) (5,434)Payment of cash dividend to Non-controlling interest (1,415) -
Cash used in financing activities (150,998) (49,369) Net increase/ (decrease) in cash and cash equivalents during the year (16,343) 117,073 Effect of exchange rate changes on cash and cash equivalents 1,922 526
Cash and cash equivalents at the beginning of the year 158,525 40,926Cash and cash equivalents at the end of the year (Note 14) 144,104 158,525Refer Note 16 for supplementary information on cash flow statementThe accompanying notes form an integral part of these consolidated financial statements
Consolidated Statement of Cash Flows(` in millions, except share and per share data, unless otherwise stated)
As per our report of even date attached For and on behalf of the Board of Directors
for Deloitte Haskins & Sells LLPChartered AccountantsFirm’s Registration No: 117366W/W- 100018
Rishad A PremjiChairman
M. K. SharmaDirector
Abidali Z NeemuchwalaChief Executive Officer& Managing Director
Vikas Bagaria Jatin Pravinchandra Dalal M. Sanaulla KhanPartner Chief Financial Officer Company SecretaryMembership No. 60408
Bengaluru BengaluruMay 29, 2020 May 29, 2020

Corporate Overview | Management & Board Reports | Financial Statements
Wipro Limited219
Notes to the Consolidated Financial Statements(` in millions, except share and per share data, unless otherwise stated)
1. The Company overview Wipro Limited (“Wipro” or the “Parent Company”), together with its subsidiaries and controlled trusts (collectively, “we”, “us”, “our”, “the Company” or the “Group”) is a global information technology “IT”, consulting and business process services “BPS” company.
Wipro is a public limited company incorporated and domiciled in India. The address of its registered office is Wipro Limited, Doddakannelli, Sarjapur Road, Bengaluru – 560 035, Karnataka, India. Wipro has its primary listing with BSE Ltd. (Bombay Stock Exchange) and National Stock Exchange of India Ltd. The Company’s American Depository Shares represendting equity shares are also listed on the New York Stock Exchange.
These consolidated financial statements were authorized for issue by the Company’s Board of Directors on May 29, 2020.
2. Basis of preparation of consolidated financial statements
(i) Statement of compliance and basis of preparation
The consolidated financial statements are prepared in accordance with Indian Accounting Standards (“Ind AS”), the provisions of the Companies Act, 2013 (“the Companies Act”), as applicable and guidelines issued by the Securities and Exchange Board of India (“SEBI”). The Ind AS are prescribed under Section 133 of the Companies Act read with Rule 3 of the Companies (Indian Accounting Standards) Rules, 2015 and Companies (Indian Accounting Standards) Amendment Rules, 2016.
Accounting policies have been applied consistently to all periods presented in these consolidated financial statements except for new accounting standards adopted by the Company.
The consolidated financial statements correspond to the classification provisions contained in Ind AS 1, “Presentation of Financial Statements”. For clarity, various items are aggregated in the consolidated statement of profit and loss and consolidated balance sheet. These items are disaggregated separately in the notes to the consolidated financial statements, where applicable. All amounts included in the consolidated financial statements are reported in Indian rupees (` in millions) except share and per share data, unless otherwise stated. Due to rounding off, the numbers presented throughout the document may not add up precisely to the totals and percentages may not precisely reflect the absolute figures. Previous year figures have been regrouped/re-arranged, wherever necessary.
(ii) Basis of measurement
The consolidated financial statements have been prepared on a historical cost convention and on an accrual basis, except for the
following material items which have been measured at fair value as required by relevant Ind AS:
a. Derivative financial instruments;
b. Financial instruments classified as fair value through other comprehensive income or fair value through profit or loss;
c. The defined benefit asset/ (liability) is recognized as the present value of defined benefit obligation less fair value of plan assets; and
d. Contingent consideration.
(iii) Use of estimates and judgment
The preparation of the consolidated financial statements in conformity with Ind AS requires management to make judgments, estimates and assumptions that affect the application of accounting policies and the reported amounts of assets, liabilities, income and expenses. Actual results may differ from those estimates. Estimates and underlying assumptions are reviewed on an ongoing basis. Revisions to accounting estimates are recognized in the period in which the estimates are revised and in any future periods affected. In particular, information about significant areas of estimation, uncertainty and critical judgments in applying accounting policies that have the most significant effect on the amounts recognized in the consolidated financial statements are included in the following notes: a) Revenue recognition: The Company applies judgement to
determine whether each product or services promised to a customer is capable of being distinct, and are distinct in the context of the contract, if not, the promised product or services are combined and accounted as a single performance obligation. The Company allocates the arrangement consideration to separately identifiable performance obligation deliverables based on their relative stand-alone selling price. In cases where the Company is unable to determine the stand-alone selling price the Company uses expected cost plus margin approach in estimating the stand-alone selling price. The Company uses the percentage of completion method using the input (cost expended) method to measure progress towards completion in respect of fixed price contracts. Percentage of completion method accounting relies on estimates of total expected contract revenue and costs. This method is followed when reasonably dependable estimates of the revenues and costs applicable to various elements of the contract can be made. Key factors that are reviewed in estimating the future costs to complete include estimates of future labor costs and productivity efficiencies. Because the financial reporting of these contracts depends on estimates that are assessed continually during the term of these contracts, revenue recognized, profit and timing of revenue for

Annual Report 2019-20 220
remaining performance obligations are subject to revisions as the contract progresses to completion. When estimates indicate that a loss will be incurred, the loss is provided for in the period in which the loss becomes probable. Volume discounts are recorded as a reduction of revenue. When the amount of discount varies with the levels of revenue, volume discount is recorded based on estimate of future revenue from the customer.
b) Impairment testing: Goodwill and intangible assets with infinite useful life recognized on business combination are tested for impairment at least annually and when events occur or changes in circumstances indicate that the recoverable amount of the asset or the cash generating unit to which these pertain is less than the carrying value. The Company assesses acquired intangible assets with finite useful life for impairment whenever events or changes in circumstances indicate that the carrying amount may not be recoverable. The recoverable amount of the asset or the cash generating units is higher of value-in-use and fair value less cost of disposal. The calculation of value in use of an asset or a cash generating unit involves use of significant estimates and assumptions which include turnover, growth rates and net margins used to calculate projected future cash flows, risk-adjusted discount rate, future economic and market conditions.
b) Income taxes: The major tax jurisdictions for the Company are India and the United States of America. Significant judgments are involved in determining the provision for income taxes including judgment on whether tax positions are probable of being sustained in tax assessments. A tax assessment can involve complex issues, which can only be resolved over extended time periods.
c) Deferred taxes: Deferred tax is recorded on temporary differences between the tax bases of assets and liabilities and their carrying amounts, at the rates that have been enacted or substantively enacted at the reporting date. The ultimate realization of deferred tax assets is dependent upon the generation of future taxable profits during the periods in which those temporary differences and tax loss carry-forwards become deductible. The Company considers expected reversal of deferred tax liabilities and projected future taxable income in making this assessment. The amount of deferred tax assets considered realizable, however, could reduce in the near term if estimates of future taxable income during the carry-forward period are reduced.
d) Business combination: In accounting for business combinations, judgment is required in identifying whether an identifiable intangible asset is to be recorded separately from goodwill. Additionally, estimating the acquisition date fair value of the identifiable assets (including useful life estimates), and liabilities and contingent consideration assumed involves management judgment. These measurements are based on information available at the acquisition date and are based on expectations and assumptions that have been deemed reasonable by management. Changes in these judgments, estimates, and assumptions can materially affect the results of operations.
e) Defined benefit plans and compensated absences: The cost of the defined benefit plans, compensated absences and the
present value of the defined benefit obligations are based on actuarial valuation using the projected unit credit method. An actuarial valuation involves making various assumptions that may differ from actual developments in the future. These include the determination of the discount rate, future salary increases and mortality rates. Due to the complexities involved in the valuation and its long-term nature, a defined benefit obligation is highly sensitive to changes in these assumptions. All assumptions are reviewed at each reporting date.
f) Expected credit losses on financial assets: The impairment provisions of financial assets and contract assets are based on assumptions about risk of default and expected timing of collection. The Company uses judgment in making these assumptions and selecting the inputs to the expected credit loss calculation based on the Company’s history of collections, customer’s creditworthiness, existing market conditions as well as forward looking estimates at the end of each reporting period.
g) Measurement of fair value of non-marketable equity investments: These instruments are initially recorded at cost and subsequently measured at fair value. Fair value of investments is determined using the market and income approaches. The market approach includes the use of financial metrics and ratios of comparable companies, such as revenue, earnings, comparable performance multiples, recent financial rounds and the level of marketability of the investments. The selection of comparable companies requires management judgment and is based on a number of factors, including comparable company sizes, growth rates, and development stages. The income approach includes the use of discounted cash flow model, which requires significant estimates regarding the investees’ revenue, costs, and discount rates based on the risk profile of comparable companies. Estimates of revenue and costs are developed using available historical and forecast data.
h) Useful lives of property, plant and equipment: The Company depreciates property, plant and equipment on a straight-line basis over estimated useful lives of the assets. The charge in respect of periodic depreciation is derived based on an estimate of an asset’s expected useful life and the expected residual value at the end of its life. The lives are based on historical experience with similar assets as well as anticipation of future events, which may impact their life, such as changes in technology. The estimated useful life is reviewed at least annually.
i) Useful lives of intangible assets: The Company amortizes intangible assets on a straight-line basis over estimated useful lives of the assets. The useful life is estimated based on a number of factors including the effects of obsolescence, demand, competition and other economic factors such as the stability of the industry and known technological advances and the level of maintenance expenditures required to obtain the expected future cash flows from the assets. The estimated useful life is reviewed at least annually.
j) Leases: Ind AS 116 defines a lease term as the non-cancellable period for which the lessee has the right to use an underlying asset including optional periods, when an entity is reasonably certain

Corporate Overview | Management & Board Reports | Financial Statements
Wipro Limited221
to exercise an option to extend (or not to terminate) a lease. The Company considers all relevant facts and circumstances that create an economic incentive for the lessee to exercise the option when determining the lease term. The option to extend the lease term is included in the lease term, if it is reasonably certain that the lessee would exercise the option. The Company reassesses the option when significant events or changes in circumstances occur that are within the control of the lessee.
k) Other estimates: The share based compensation expense is determined based on the Company’s estimate of equity instruments that will eventually vest. Fair valuation of derivative hedging instruments designated as cash flow hedges involves significant estimates relating to the occurrence of forecasted transaction.
l) Uncertainty relating to the global health pandemic on COVID-19: In assessing the recoverability of receivables including unbilled receivables, contract assets and contract costs, goodwill, intangible assets, and certain investments, the Company has considered internal and external information up to the date of approval of these consolidated financial statements including credit reports and economic forecasts. The Company has performed sensitivity analysis on the assumptions used herein. Based on the current indicators of future economic conditions, the Company expects to recover the carrying amount of these assets.
The Company basis its assessment believes that the probability of the occurrence of forecasted transactions is not impacted by COVID-19. The Company has also considered the effect of changes, if any, in both counterparty credit risk and own credit risk while assessing hedge effectiveness and measuring hedge ineffectiveness and continues to believe that there is no impact on effectiveness of its hedges.
The impact of COVID-19 remains uncertain and may be different from what we have estimated as of the date of approval of these consolidated financial statements and the Company will continue to closely monitor any material changes to future economic conditions.
3. Significant accounting policies (i) Basis of consolidation
Subsidiaries and controlled trusts
The Company determines the basis of control in line with the requirements of Ind AS 110, Consolidated Financial Statements. Subsidiaries and controlled trusts are entities controlled by the Group. The Group controls an entity when the parent has power over the entity, it is exposed to, or has rights to, variable returns from its involvement with the entity and has the ability to affect those returns through its power over the entity. The financial statements of subsidiaries and controlled trusts are included in the consolidated financial statements from the date on which control commences until the date on which control ceases.
All intra-Group balances, transactions, income and expenses are eliminated in full on consolidation.
Non-controlling interest
Non-controlling interests in the net assets (excluding goodwill) of consolidated subsidiaries are identified separately from the Company’s equity. The interest of non-controlling shareholders may be initially measured either at fair value or at the non-controlling interest’s proportionate share of the fair value of the acquiree’s identifiable net assets. The choice of measurement basis is made on an acquisition to acquisition basis. Subsequent to acquisition, the carrying amount of non-controlling interest is the amount of those interests at initial recognition plus the non-controlling interest’s share of subsequent changes in equity. Total comprehensive income is attributed to non-controlling interests even if it results in the non-controlling interest having a deficit balance.
Investments accounted for using the equity method
Investments accounted for using the equity method are entities in respect of which, the Company has significant influence, but not control, over the financial and operating policies. Generally, a Company has a significant influence if it holds between 20 and 50 percent of the voting power of another entity. Investments in such entities are accounted for using the equity method and are initially recognized at cost. The carrying amount of investment is increased/ decreased to recognized investors share of profit or loss of the investee after the acquisition date.
Non-current assets and disposal groups held for sale
Assets and liabilities of disposal groups that are available for immediate sale and where the sale is highly probable of being completed within one year from the date of classification are considered and classified as assets held for sale and liabilities associated with assets held for sale. Non-current assets and disposal groups held for sale are measured at the lower of carrying amount and fair value less costs to sell.
(ii) Functional and presentation currency
Items included in the financial statements of each of the Company’s entities are measured using the currency of the primary economic environment in which these entities operate (i.e. the “functional currency”). These consolidated financial statements are presented in Indian rupees, which is the functional currency of the Company.
(iii) Foreign currency transactions and translation
a) Transactions and balances
Transactions in foreign currency are translated into the respective functional currencies using the exchange rates prevailing at the date of the transaction. Foreign exchange gains and losses resulting from the settlement of such transactions and from translation at the exchange rates prevailing at the reporting date of monetary assets and liabilities denominated in foreign currencies are recognized in the consolidated statement of profit

Annual Report 2019-20 222
and loss and reported within foreign exchange gains/(losses), net, within results of operating activities except when deferred in other comprehensive income as qualifying cash flow hedges and qualifying net investment hedges. Gains/(losses), net, relating to translation or settlement of borrowings denominated in foreign currency are reported within finance costs. Non-monetary assets and liabilities denominated in foreign currency and measured at historical cost are translated at the exchange rate prevalent at the date of transaction. Translation differences on non-monetary financial assets measured at fair value at the reporting date, such as equities classified as financial instruments measured at fair value through other comprehensive income are included in other comprehensive income, net of taxes.
b) Foreign operations
For the purpose of presenting consolidated financial statements, the assets and liabilities of the Company’s foreign operations that have a functional currency other than Indian rupees are translated into Indian rupees using exchange rates prevailing at the reporting date. Income and expense items are translated at the average exchange rates for the period. Exchange differences arising, if any, are recognized in other comprehensive income and held in foreign currency translation reserve (FCTR), a component of equity, except to the extent that the translation difference is allocated to non-controlling interest. When a foreign operation is disposed of, the relevant amount recognized in FCTR is transferred to the consolidated statement of profit and loss as part of the profit or loss on disposal. Goodwill and fair value adjustments arising on the acquisition of a foreign operation are treated as assets and liabilities of the foreign operation and translated at the exchange rate prevailing at the reporting date.
c) Others
Foreign currency differences arising on the translation or settlement of a financial liability designated as a hedge of a net investment in a foreign operation are recognized in other comprehensive income and presented within equity in the FCTR to the extent the hedge is effective. To the extent the hedge is ineffective, such differences are recognized in the consolidated statement of profit and loss.
When the hedged part of a net investment is disposed of, the relevant amount recognized in FCTR is transferred to the consolidated statement of profit and loss as part of the profit or loss on disposal. Foreign currency differences arising from translation of intercompany receivables or payables relating to foreign operations, the settlement of which is neither planned nor likely in the foreseeable future, are considered to form part of net investment in foreign operation and are recognized in FCTR.
(iv) Financial instruments
A) Non-derivative financial instruments:
Non-derivative financial instruments consist of:
• financial assets, which include cash and cash equivalents, trade receivables, unbilled receivables, finance lease receivables,
employee and other advances, investments in equity and debt securities and eligible current and non-current assets; Financial assets are derecognized when substantial risks and rewards of ownership of the financial asset have been transferred. In cases where substantial risks and rewards of ownership of the financial assets are neither transferred nor retained, financial assets are derecognized only when the Company has not retained control over the financial asset.
• financial liabilities, which include long and short-term loans and borrowings, bank overdrafts, trade payables, lease liabilities and eligible current and non-current liabilities.
Non-derivative financial instruments are recognized initially at fair value. Subsequent to initial recognition, non-derivative financial instruments are measured as described below:
a. Cash and cash equivalents
The Company’s cash and cash equivalents consist of cash on hand and in banks and demand deposits with banks, which can be withdrawn at any time, without prior notice or penalty on the principal.
For the purposes of the cash flow statement, cash and cash equivalents include cash on hand, in banks and demand deposits with banks, net of outstanding bank overdrafts that are repayable on demand and are considered part of the Company’s cash management system. In the consolidated balance sheet, bank overdrafts are presented under borrowings within current liabilities.
b. Investments
Financial instruments measured at amortized cost:
Debt instruments that meet the following criteria are measured at amortized cost (except for debt instruments that are designated at fair value through Profit or Loss (FVTPL) on initial recognition):
• the asset is held within a business model whose objective is to hold assets in order to collect contractual cash flows; and
• the contractual terms of the instrument give rise on specified dates to cash flows that are solely payment of principal and interest on the principal amount outstanding.
Financial instruments measured at fair value through other comprehensive income (FVTOCI):
Debt instruments that meet the following criteria are measured at fair value through other comprehensive income (FVTOCI) (except for debt instruments that are designated at fair value through Profit or Loss (FVTPL) on initial recognition):
• the asset is held within a business model whose objective is achieved both by collecting contractual cash flows and selling the financial asset; and
• the contractual terms of the instrument give rise on specified dates to cash flows that are solely payment of principal and interest on the principal amount outstanding.

Corporate Overview | Management & Board Reports | Financial Statements
Wipro Limited223
Interest income is recognized in the consolidated statement of profit and loss for FVTOCI debt instruments. Other changes in fair value of FVTOCI financial assets are recognized in other comprehensive income. When the investment is disposed of, the cumulative gain or loss previously accumulated in reserves is transferred to the consolidated statement of profit and loss.
Financial instruments measured at fair value through profit or loss (FVTPL):
Instruments that do not meet the amortized cost or FVTOCI criteria are measured at FVTPL. Financial assets at FVTPL are measured at fair value at the end of each reporting period, with any gains or losses arising on re-measurement recognized in consolidated statement of profit and loss. The gain or loss on disposal is recognized in the consolidated statement of profit and loss.
Interest income is recognized in the consolidated statement of profit and loss for FVTPL debt instruments. Dividend on financial assets at FVTPL is recognized when the Group’s right to receive dividend is established.
Investments in equity instruments designated to be classified as FVTOCI:
The Company carries certain equity instruments which are not held for trading. The Company has elected the FVTOCI irrevocable option for these instruments. Movements in fair value of these investments are recognized in other comprehensive income and the gain or loss is not transferred to consolidated statement of profit and loss on disposal of these investments. Dividends from these investments are recognized in the consolidated statement of profit and loss when the Company’s right to receive dividends is established.
c. Other financial assets:
Other financial assets are non-derivative financial assets with fixed or determinable payments that are not quoted in an active market. They are presented as current assets, except for those maturing later than 12 months after the reporting date which are presented as non-current assets. These are initially recognized at fair value and subsequently measured at amortized cost using the effective interest method, less any impairment losses. These comprise trade receivables, unbilled receivables, finance lease receivables, employee and other advances and eligible current and non-current assets.
d. Trade payables and other payables:
Trade payables and other payables are initially recognized at fair value, and subsequently carried at amortized cost using the effective interest method. For these financial instruments, the carrying amounts approximate fair value due to the short-term maturity of these instruments. Contingent consideration recognized in the business combination is subsequently measured at fair value through profit or loss.
B) Derivative financial instruments
The Company is exposed to foreign currency fluctuations on foreign currency assets, liabilities, net investment in foreign operations and forecasted cash flows denominated in foreign currency.
The Company limits the effect of foreign exchange rate fluctuations by following established risk management policies including the use of derivatives. The Company enters into derivative financial instruments where the counterparty is primarily a bank.
Derivatives are recognized and measured at fair value. Attributable transaction costs are recognized in consolidated statement of profit and loss as cost. Subsequent to initial recognition, derivative financial instruments are measured as described below:
a. Cash flow hedges
Changes in the fair value of the derivative hedging instruments designated as a cash flow hedge are recognized in other comprehensive income and held in cash flow hedging reserve, net of taxes, a component of equity, to the extent that the hedge is effective. To the extent that the hedge is ineffective, changes in fair value are recognized in the consolidated statement of profit and loss and reported within foreign exchange gains/(losses), net within results from operating activities. If the hedging instrument no longer meets the criteria for hedge accounting, then hedge accounting is discontinued prospectively. If the hedging instrument expires or is sold, terminated or exercised, the cumulative gain or loss on the hedging instrument recognized in cash flow hedging reserve till the period the hedge was effective remains in cash flow hedging reserve until the forecasted transaction occurs. The cumulative gain or loss previously recognized in the cash flow hedging reserve is transferred to the consolidated statement of profit and loss upon the occurrence of the related forecasted transaction. If the forecasted transaction is no longer expected to occur, such cumulative balance is immediately recognized in the consolidated statement of profit and loss.
b. Hedges of net investment in foreign operations
The Company designates derivative financial instruments as hedges of net investments in foreign operations. The Company designates foreign currency denominated borrowing as a hedge of net investment in foreign operations. Changes in the fair value of the derivative hedging instruments and gains/losses on translation or settlement of foreign currency denominated borrowings designated as a hedge of net investment in foreign operations are recognized in other comprehensive income and presented within equity in the FCTR to the extent that the hedge is effective. To the extent that the hedge is ineffective, changes in fair value are recognized in the consolidated statement of profit and loss and reported within foreign exchange gains/(losses), net within results from operating activities.

Annual Report 2019-20 224
c. Others
Changes in fair value of foreign currency derivative instruments neither designated as cash flow hedges nor hedges of net investment in foreign operations are recognized in the consolidated statement of profit and loss and reported within foreign exchange gains/(losses), net within results from operating activities. Changes in fair value and gains/(losses), net, on settlement of foreign currency derivative instruments relating to borrowings, which have not been designated as hedges are recorded in finance costs.
C) Derecognition of financial instruments
The Company derecognizes a financial asset when the contractual rights to the cash flows from the financial asset expire or it transfers the financial asset and the transfer qualifies for derecognition under Ind AS 109. If the Company retains substantially all the risks and rewards of a transferred financial asset, the Company continues to recognize the financial asset and recognizes a borrowing for the proceeds received. A financial liability (or a part of a financial liability) is derecognized from the group’s balance sheet when the obligation specified in the contract is discharged or cancelled or expires.
(v) Equity and share capital
a) Share capital and Securities premium reserve
The authorized share capital of the Company as at March 31, 2020 is ` 25,274 divided into 12,504,500,000 equity shares of ` 2 each, 25,000,000 preference shares of ` 10 each and 150,000 10% optionally convertible cumulative preference shares of ` 100 each. Par value of the equity shares is recorded as share capital and the amount received in excess of par value is classified as Securities premium reserve.
Every holder of the equity shares, as reflected in the records of the Company as of the date of the shareholder meeting shall have one vote in respect of each share held for all matters submitted to vote in the shareholder meeting.
b) Shares held by controlled trust (Treasury shares)
The Company’s equity shares held by the controlled trust, which is consolidated as a part of the Group are classified as Treasury shares. The Company has 22,746,081 and 27,353,853 treasury shares as at March 31, 2020 and 2019, respectively. Treasury shares are recorded at acquisition cost.
c) Retained earnings
Retained earnings comprises of the Company’s undistributed earnings after taxes.
d) Capital Reserve
Capital Reserve amounting to ` 1,139 (March 31, 2019: ` 1,139) is not freely available for distribution.
e) Capital Redemption Reserve
Capital Redemption Reserve amounting to ̀ 660 (March 31, 2018: ` 14) is not freely available for distribution.
f) Share options outstanding account
The Share options outstanding account is used to record the value of equity-settled share based payment transactions with employees. The amounts recorded in share options outstanding account are transferred to securities premium reserve upon exercise of stock options and restricted stock unit options by employees.
g) Foreign currency translation reserve (FCTR)
The exchange differences arising from the translation of financial statements of foreign subsidiaries, differences arising from translation of long-term inter-company receivables or payables relating to foreign operations settlement of which is neither planned nor likely in the foreseeable future, changes in fair value of the derivative hedging instruments and gains/losses on translation or settlement of foreign currency denominated borrowings designated as hedge of net investment in foreign operations are recognized in other comprehensive income, net of taxes and presented within equity in the FCTR.
h) Cash flow hedging reserve
Changes in fair value of derivative hedging instruments designated and effective as a cash flow hedge are recognized in other comprehensive income, net of taxes, and presented within equity as cash flow hedging reserve.
i) Special Economic Zone re-investment reserve
The SEZ Re-Investment Reserve has been created out of profit of eligible SEZ units as per provisions of section 10AA(1)(ii) of the Income–tax Act, 1961 for acquiring new plant and machinery. The said reserve should be utilized by the Company for acquiring plant and machinery as per terms of Section 10AA(2) of the Income-tax Act, 1961. This reserve is not freely available for distribution.
j) Other reserves
Changes in the fair value of financial instruments measured at fair value through other comprehensive income and actuarial gains and losses on defined benefit plans are recognized in other comprehensive income, net of taxes, and presented within equity in other reserves.
k) Dividend
A final dividend, including tax thereon, on common stock is recorded as a liability on the date of approval by the shareholders. An interim dividend, including tax thereon, is recorded as a liability on the date of declaration by the board of directors.
l) Buyback of equity shares
The buyback of equity shares and related transaction costs are recorded as a reduction of free reserves. Further, capital redemption reserve is created as an apportionment from retained earnings.

Corporate Overview | Management & Board Reports | Financial Statements
Wipro Limited225
(vi) Property, plant and equipment
a) Recognition and measurement
Property, plant and equipment are measured at cost less accumulated depreciation and impairment losses, if any. Cost includes expenditures directly attributable to the acquisition of the asset. General and specific borrowing costs directly attributable to the construction of a qualifying asset are capitalized as part of the cost.
Capital work-in-progress are measured at cost less accumulated impairment losses, if any.
b) Depreciation
The Company depreciates property, plant and equipment over the estimated useful life on a straight-line basis from the date the assets are available for use. Leasehold improvements are amortized over the shorter of estimated useful life of the asset or the related lease term. Term licenses are amortized over their respective contract term. Freehold land is not depreciated. The estimated useful life of assets are reviewed and where appropriate are adjusted, annually. The estimated useful lives of assets are as follows:
Category Useful lifeBuildings 28 to 40 years
Plant and machinery 5 to 21 years
Computer equipment and software 2 to 7 years
Furniture, fixtures and equipment 3 to 10 years
Vehicles 4 to 5 years
When parts of an item of property, plant and equipment have different useful lives, they are accounted for as separate items (major components) of property, plant and equipment. Subsequent expenditure relating to property, plant and equipment is capitalized only when it is probable that future economic benefits associated with these will flow to the Company and the cost of the item can be measured reliably.
The cost of property, plant and equipment not available for use before such date are disclosed under capital work-in-progress.
(vii) Business combination, Goodwill and Intangible assets
a) Business combination
Business combinations are accounted for using the purchase (acquisition) method. The cost of an acquisition is measured as the fair value of the assets transferred, liabilities incurred and equity instruments issued at the date of exchange by the Company. Identifiable assets acquired and liabilities and contingent liabilities assumed in a business combination are measured initially at fair value at the date of acquisition. Transaction costs incurred in connection with a business acquisition are expensed as incurred.
The cost of an acquisition also includes the fair value of any
contingent consideration measured as at the date of acquisition. Any subsequent changes to the fair value of contingent
consideration classified as liabilities, other than measurement period adjustments, are recognized in the consolidated statement of profit and loss.
b) Goodwill
The excess of the cost of an acquisition over the Company’s share in the fair value of the acquiree’s identifiable assets and liabilities is recognized as goodwill. If the excess is negative, a bargain purchase gain is recognized in equity as capital reserve. Goodwill is measured at cost less accumulated impairment (if any).
Goodwill associated with disposal of an operation that is part of cash-generating unit is measured on the basis of the relative values of the operation disposed of and the portion of the cash-generating unit retained, unless some other method better reflects the goodwill associated with the operation disposed of.
c) Intangible assets
Intangible assets acquired separately are measured at cost of acquisition. Intangible assets acquired in a business combination are measured at fair value as at the date of acquisition. Following initial recognition, intangible assets are carried at cost less accumulated amortization and impairment losses, if any.
The amortization of an intangible asset with a finite useful life reflects the manner in which the economic benefit is expected to be generated and is included in selling and marketing expenses in the consolidated statement of profit and loss.
The estimated useful life of amortizable intangibles are reviewed and where appropriate are adjusted, annually. The estimated useful lives of the amortizable intangible assets for the current and comparative periods are as follows:
Category Useful lifeCustomer-related intangibles 5 to 15 years
Marketing related intangibles 3 to 7 years
(viii) Leases
The Company evaluates each contract or arrangement, whether it qualifies as lease as defined under Ind AS 116.
The Company as a lessee
The Company enters into an arrangement for lease of land, buildings, plant and machinery including computer equipment and vehicles. Such arrangements are generally for a fixed period but may have extension or termination options. The Company assesses, whether the contract is, or contains, a lease, at its inception. A contract is, or contains, a lease if the contract conveys the right to –
(a) control use of an identified asset.
(b) obtain substantially all the economic benefits from use of the identified asset, and
(c) direct the use of the identified asset.

Annual Report 2019-20 226
The Company determines the lease term as the non-cancellable period of a lease, together with periods covered by an option to extend the lease, where the Company is reasonably certain to exercise that option.
The Company at the commencement of the lease contract recognizes a Right-of-Use (RoU) asset at cost and corresponding lease liability, except for leases with term of less than twelve months (short term leases) and low-value assets. For these short term and low value leases, the company recognizes the lease payments as an operating expense on a straight-line basis over the lease term.
The cost of the right-of-use assets comprises the amount of the initial measurement of the lease liability, any lease payments made at or before the inception date of the lease plus any initial direct costs, less any lease incentives received. Subsequently, the right-of-use assets is measured at cost less any accumulated depreciation and accumulated impairment losses, if any. The right-of-use assets are depreciated using the straight-line method from the commencement date over the shorter of lease term or useful life of right-of-use assets. The estimated useful lives of right-of-use assets are determined on the same basis as those of property, plant and equipment.
The Company applies Ind AS 36 to determine whether a RoU asset is impaired and accounts for any identified impairment loss as described in the impairment of non-financial assets below.
For lease liabilities at the commencement of the lease, the Company measures the lease liability at the present value of the lease payments that are not paid at that date. The lease payments are discounted using the interest rate implicit in the lease, if that rate is readily determined, if that rate is not readily determined, the lease payments are discounted using the incremental borrowing rate that the Company would have to pay to borrow funds, including the consideration of factors such as the nature of the asset and location, collateral, market terms and conditions, as applicable in a similar economic environment.
After the commencement date, the amount of lease liabilities is increased to reflect the accretion of interest and reduced for the lease payments made.
The Company recognizes the amount of the re-measurement of lease liability as an adjustment to the right-of-use assets. Where the carrying amount of the right-of-use asset is reduced to zero and there is a further reduction in the measurement of the lease liability, the Company recognizes any remaining amount of the re-measurement in consolidated statement of profit and loss.
Lease liability payments are classified as cash used in financing activities in the consolidated statement of cash flows.
The Company as a lessor
Leases under which the Company is a lessor are classified as a finance or operating lease. Lease contracts where all the risks and rewards are substantially transferred to the lessee, are classified as a finance lease. All other leases are classified as operating lease.
For leases under which the Company is an intermediate lessor, the Company accounts for the head-lease and the sub-lease as two separate contracts. The sub-lease is further classified either as a finance lease or an operating lease by reference to the RoU asset arising from the head-lease.
(ix) Inventories
Inventories are valued at lower of cost and net realizable value, including necessary provision for obsolescence. Cost is determined using the weighted average method.
(x) Impairment
A) Financial assets
The Company applies the expected credit loss model for recognizing impairment loss on financial assets measured at amortized cost, debt instruments classified as FVTOCI, trade receivables, unbilled receivables, contract assets, finance lease receivables, and other financial assets. Expected credit loss is the difference between the contractual cash flows and the cash flows that the entity expects to receive, discounted using the effective interest rate.
Loss allowances for trade receivables, unbilled receivables, contract assets and finance lease receivables are measured at an amount equal to lifetime expected credit loss. Lifetime expected credit losses are the expected credit losses that result from all possible default events over the expected life of a financial instrument. Lifetime expected credit loss is computed based on a provision matrix which takes in to account risk profiling of customers and historical credit loss experience adjusted for forward looking information. For other financial assets, expected credit loss is measured at the amount equal to twelve months expected credit loss unless there has been a significant increase in credit risk from initial recognition, in which case those are measured at lifetime expected credit loss.
B) Non-financial assets
The Company assesses long-lived assets such as property, plant and equipment, right-of-use assets and acquired intangible assets for impairment whenever events or changes in circumstances indicate that the carrying amount of an asset or group of assets may not be recoverable. If any such indication exists, the Company estimates the recoverable amount of the asset or group of assets.
Goodwill is tested for impairment at least annually at the same time and when events occur or changes in circumstances indicate that the recoverable amount of the cash generating unit is less than its carrying value. The goodwill impairment test is performed at the level of cash-generating unit or groups of cash -generating units which represents the lowest level at which goodwill is monitored for internal management purposes.
The recoverable amount of an asset or cash generating unit is the higher of its fair value less cost of disposal (FVLCD) and its value-in-use (VIU). The VIU of long-lived assets is calculated

Corporate Overview | Management & Board Reports | Financial Statements
Wipro Limited227
using projected future cash flows. FVLCD of a cash generating unit is computed using turnover and earnings multiples. If the recoverable amount of the asset or the recoverable amount of the cash generating unit to which the asset belongs is less than its carrying amount, the carrying amount is reduced to its recoverable amount. The reduction is treated as an impairment loss and is recognized in the consolidated statement of profit and loss. If at the reporting date, there is an indication that a previously assessed impairment loss no longer exists, the recoverable amount is reassessed and the impairment losses previously recognized are reversed such that the asset is recognized at its recoverable amount but not exceeding written down value which would have been reported if the impairment losses had not been recognized initially. An impairment in respect of goodwill is not reversed.
(xi) Employee benefits
Post-employment and pension plans
The Group participates in various employee benefit plans. Pensions and other post-employment benefits are classified as either defined contribution plans or defined benefit plans. Under a defined contribution plan, the Company’s only obligation is to pay a fixed amount with no obligation to pay further contributions if the fund does not hold sufficient assets to pay all employee benefits. The related actuarial and investment risks are borne by the employee. The expenditure for defined contribution plans is recognized as an expense during the period when the employee provides service. Under a defined benefit plan, it is the Company’s obligation to provide agreed benefits to the employees. The related actuarial and investment risks are borne by the Company. The present value of the defined benefit obligations is calculated by an independent actuary using the projected unit credit method.
Remeasurement comprising actuarial gains or losses and the return on plan assets (excluding interest) are immediately recognized in other comprehensive income, net of taxes and permanently excluded from profit or loss. Instead net interest recognized in profit or loss is calculated by applying the discount rate used to measure the defined benefit obligation to the net defined benefit liability or asset. The actual return on the plan assets above or below the discount rate is recognized as part of re-measurement of net defined liability or asset through other comprehensive income, net of taxes.
The Company has the following employee benefit plans: a. Provident fund
Employees receive benefits from a provident fund, which is a defined benefit plan. The employer and employees each make periodic contributions to the plan. A portion of the contribution is made to the approved provident fund trust managed by the Company while the remainder of the contribution is made to the government administered pension fund. The contributions to the trust managed by the Company is accounted for as a defined benefit plan as the Company is liable for any shortfall in the fund assets based on the government specified minimum rates of return.
b. Superannuation
Superannuation plan, a defined contribution scheme is administered by third party fund managers. The Company makes annual contributions based on a specified percentage of each eligible employee’s salary.
c. Gratuity and Pension
In accordance with the Payment of Gratuity Act, 1972, applicable for Indian companies, the Company provides for a lump sum payment to eligible employees, at retirement or termination of employment based on the last drawn salary and years of employment with the Company. The gratuity fund is managed by third party fund managers.
The Company also maintains pension and similar plans for employees outside India, based on the country specific regulations. These plans are partially funded, and the funds are managed by third party fund managers. The plans provide for monthly payout after retirement as per salary drawn and service period or for a lumpsum payment as set out in rules of each fund.
The Company’s obligation in respect of the above plans, which are defined benefit plans, is provided for based on actuarial valuation using the projected unit credit method. The Company recognizes remeasurement gains and losses of the net defined benefit liability /(asset) in other comprehensive income.
d. Termination benefits
Termination benefits are expensed when the Company can no longer withdraw the offer of those benefits.
e. Short-term benefits
Short-term employee benefit obligations are measured on an undiscounted basis and are recorded as expense as the related service is provided. A liability is recognized for the amount expected to be paid under short-term cash bonus or profit-sharing plans, if the Company has a present legal or constructive obligation to pay this amount as a result of past service provided by the employee and the obligation can be estimated reliably.
f. Compensated absences
The employees of the Company are entitled to compensated absences. The employees can carry forward a portion of the unutilized accumulating compensated absences and utilize it in future periods or receive cash at retirement or termination of employment. The Company records an obligation for compensated absences in the period in which the employee renders the services that increases this entitlement. The Company measures the expected cost of compensated absences as the additional amount that the Company expects to pay as a result of the unused entitlement that has accumulated at the end of the reporting period. The Company recognizes accumulated compensated absences based on actuarial valuation using the projected unit credit method. Non-accumulating compensated

Annual Report 2019-20 228
absences are recognized in the period in which the absences occur.
(xii) Share based payment transactions
Selected employees of the Company receive remuneration in the form of equity settled instruments or cash settled instruments, for rendering services over a defined vesting period and for Company’s performance-based stock options over the defined period. Equity instruments granted are measured by reference to the fair value of the instrument at the date of grant. In cases, where equity instruments are granted at a nominal exercise price, the intrinsic value on the date of grant approximates the fair value. The expense is recognized in the consolidated statement of profit and loss with a corresponding increase to the share options outstanding account, a component of equity.
The equity instruments or cash settled instruments generally vest in a graded manner over the vesting period. The fair value determined at the grant date is expensed over the vesting period of the respective tranches of such grants (accelerated amortization). The stock compensation expense is determined based on the Company’s estimate of equity instruments or cash settled instruments that will eventually vest.
Cash Settled instruments granted are re-measured by reference to the fair value at the end of each reporting period and at the time of vesting. The expense is recognized in the consolidated statement of profit and loss with a corresponding increase to financial liability.
(xiii) Provisions
Provisions are recognized when the Company has a present obligation (legal or constructive) as a result of a past event, it is probable that an outflow of economic benefits will be required to settle the obligation and a reliable estimate can be made of the amount of the obligation.
The amount recognized as a provision is the best estimate of the consideration required to settle the present obligation at the end of the reporting period, taking into account the risks and uncertainties surrounding the obligation.
When some or all of the economic benefits required to settle a provision are expected to be recovered from a third party, the receivable is recognized as an asset, if it is virtually certain that reimbursement will be received and the amount of the receivable can be measured reliably.
Provisions for onerous contracts are recognized when the expected benefits to be derived by the Company from a contract are lower than the unavoidable costs of meeting the future obligations under the contract. Provisions for onerous contracts are measured at the present value of lower of the expected net cost of fulfilling the contract and the expected cost of terminating the contract.
(xiv) Revenue
The Company derives revenue primarily from software development, maintenance of software/hardware and related services, business process services, sale of IT and other products.
Effective April 1, 2018, the Company adopted Ind AS 115 “Revenue from Contracts with Customers” using the cumulative catch-up transition method, applied to contracts that were not completed as of April 1, 2018. The adoption of the new standard has resulted in a reduction of ` 2,279 in opening retained earnings, primarily relating to certain contract costs because these do not meet the criteria for recognition as costs to fulfil a contract.
Revenues from customer contracts are considered for recognition and measurement when the contract has been approved by the parties to the contract, the parties to contract are committed to perform their respective obligations under the contract, and the contract is legally enforceable. Revenue is recognized upon transfer of control of promised products or services to customers in an amount that reflects the consideration the Company expects to receive in exchange for those products or services. To recognize revenues, the Company apply the following five step approach: (1) identify the contract with a customer, (2) identify the performance obligations in the contract, (3) determine the transaction price, (4) allocate the transaction price to the performance obligations in the contract, and (5) recognize revenues when a performance obligation is satisfied. When there is uncertainty as to collectability, revenue recognition is postponed until such uncertainty is resolved.
At contract inception, the Company assesses its promise to transfer products or services to a customer to identify separate performance obligations. The Company applies judgement to determine whether each product or services promised to a customer are capable of being distinct, and are distinct in the context of the contract, if not, the promised product or services are combined and accounted as a single performance obligation. The Company allocates the arrangement consideration to separately identifiable performance obligation based on their relative stand-alone selling price or residual method. Stand-alone selling prices are determined based on sale prices for the components when it is regularly sold separately, in cases where the Company is unable to determine the stand-alone selling price the Company uses third-party prices for similar deliverables or the Company uses expected cost-plus margin approach in estimating the stand-alone selling price.
For performance obligations where control is transferred over time, revenues are recognized by measuring progress towards completion of the performance obligation. The selection of the method to measure progress towards completion requires judgment and is based on the nature of the promised products or services to be provided.The method for recognizing revenues and costs depends on the nature of the services rendered:
A. Time and materials contracts
Revenues and costs relating to time and materials are recognized as the related services are rendered.

Corporate Overview | Management & Board Reports | Financial Statements
Wipro Limited229
B. Fixed-price contracts
i. Fixed-price development contracts
Revenues from fixed-price contracts, including software development, and integration contracts, where the performance obligations are satisfied over time, are recognized using the “percentage-of-completion” method. The performance obligations are satisfied as and when the services are rendered since the customer generally obtains control of the work as it progresses. Percentage of completion is determined based on project costs incurred to date as a percentage of total estimated project costs required to complete the project. The cost expended (or input) method has been used to measure progress towards completion as there is a direct relationship between input and productivity. If the Company is not able to reasonably measure the progress of completion, revenue is recognized only to the extent of costs incurred for which recoverability is probable. When total cost estimates exceed revenues in an arrangement, the estimated losses are recognized in the consolidated statement of profit and loss in the period in which such losses become probable based on the current contract estimates as an onerous contract provision.
A contract asset is a right to consideration that is conditional upon factors other than the passage of time. Contract assets primarily relate to unbilled amounts on fixed-price development contracts and are classified as non-financial asset as the contractual right to consideration is dependent on completion of contractual milestones.
A contract liability is an entity’s obligation to transfer goods or services to a customer for which the entity has received consideration (or the amount is due) from the customer.
Unbilled receivables on other than fixed price development contracts are classified as a financial asset where the right to consideration is unconditional upon passage of time.
ii. Maintenance contracts
Revenues related to fixed-price maintenance contracts are recognized on a straight-line basis when services are recognized based on our right to invoice for services performed through an indefinite number of repetitive acts over a specified period or ratably using percentage of completion method when the pattern of benefits from the services rendered to the customers and the cost to fulfil the contract is not even through the period of contract because the services are generally discrete in nature and not repetitive.
Revenue for contracts in which the invoicing is representative of the value being delivered. If our invoicing is not consistent with value delivered, revenues are recognized as the service is performed using the percentage of completion method.
In certain projects, a fixed quantum of service or output units is agreed at a fixed price for a fixed term. In such contracts, revenue is recognized with respect to the actual output achieved till
date as a percentage of total contractual output. Any residual service unutilized by the customer is recognized as revenue on completion of the term.
iii. Element or Volume based contracts
Revenues and costs are recognized as the related services are rendered.
C. Products
Revenue on product sales are recognized when the customer obtains control of the specified product.
D. Others
• Any change in scope or price is considered as a contract modification. The Company accounts for modifications to existing contracts by assessing whether the services added are distinct and whether the pricing is at the stand-alone selling price. Services added that are not distinct are accounted for on a cumulative catch up basis, while those that are distinct are accounted for prospectively, either as a separate contract if the additional services are priced at the stand-alone selling price, or as a termination of the existing contract and creation of a new contract if not priced at the stand-alone selling price.
• The Company accounts for variable considerations like, volume discounts, rebates, pricing incentives to customers and penalties as reduction of revenue on a systematic and rational basis over the period of the contract. The Company estimates an amount of such variable consideration using expected value method or the single most likely amount in a range of possible consideration depending on which method better predicts the amount of consideration to which the Company may be entitled and when it is probable that a significant reversal of cumulative revenue recognized will not occur when the uncertainty associated with the variable consideration is resolved.
• Revenues are shown net of allowances/ returns, sales tax, value added tax, goods and services tax and applicable discounts and allowances.
• The Company accrues the estimated cost of warranties at the time when the revenue is recognized. The accruals are based on the Company’s historical experience of material usage and service delivery costs.
• Incremental costs that relate directly to a contract and incurred in securing a contract with a customer are recognized as an asset when the Company expects to recover these costs and amortized over the contract term.
• The Company recognizes contract fulfilment cost as an asset if those costs specifically relate to a contract or to an anticipated contract, the costs generate or enhance resources that will be used in satisfying performance obligations in future; and the costs are expected to be recovered. The asset so recognized is amortized on a systematic basis consistent with the transfer of goods or services to customer to which the asset relates.
• The Company assesses the timing of the transfer of goods or services to the customer as compared to the timing of payments
Annual Report 2019-20 230
to determine whether a significant financing component exists. As a practical expedient, the Company does not assess the existence of a significant financing component when the difference between payment and transfer of deliverables is a year or less. If the difference in timing arises for reasons other than the provision of finance to either the customer or us, no financing component is deemed to exist.
• The Company may enter into arrangements with third party suppliers to resell products or services. In such cases, the Company evaluates whether the Company is the principal (i.e. report revenues on a gross basis) or agent (i.e. report revenues on a net basis). In doing so, the Company first evaluates whether the Company controls the good or service before it is transferred to the customer. If Company controls the good or service before it is transferred to the customer, Company is the principal; if not, the Company is the agent.
• Estimates of transaction price and total costs or efforts are continuously monitored over the term of the contract and are recognized in net profit in the period when these estimates change or when the estimates are revised. Revenues and the estimated total costs or efforts are subject to revision as the contract progresses.
(xv) Finance costs
Finance costs comprises interest cost on borrowings and lease liabilities, gains or losses arising on re-measurement of financial assets measured at FVTPL, gains/ (losses), net, on translation or settlement of foreign currency borrowings and changes in fair value and gains/ (losses) on settlement of related derivative instruments. Borrowing costs that are not directly attributable to a qualifying asset are recognized in the consolidated statement of profit and loss using the effective interest method.
(xvi) Other income
Finance and other income comprises interest income on deposits, dividend income and gains / (losses) on disposal of investments. Interest income is recognized using the effective interest method. Dividend income is recognized when the right to receive payment is established. (xvii) Income tax
Income tax comprises current and deferred tax. Income tax expense is recognized in the consolidated statement of profit and loss except to the extent it relates to a business combination, or items directly recognized in equity or in other comprehensive income.
a) Current income tax
Current income tax for the current and prior periods are measured at the amount expected to be recovered from or paid to the taxation authorities based on the taxable income for the period. The tax rates and tax laws used to compute the current tax amounts are those that are enacted or substantively enacted as at the reporting date and applicable for the period. While determining the tax provisions, the Company assesses whether each uncertain tax position is to be considered separately or together with one or more uncertain tax positions depending the
nature and circumstances of each uncertain tax position. The Company offsets current tax assets and current tax liabilities, where it has a legally enforceable right to set off the recognized amounts and where it intends either to settle on a net basis, or to realize the asset and liability simultaneously.
b) Deferred income tax
Deferred income tax is recognized using the balance sheet approach. Deferred income tax assets and liabilities are recognized for deductible and taxable temporary differences arising between the tax base of assets and liabilities and their carrying amount in these consolidated financial statements, except when the deferred income tax arises from the initial recognition of goodwill or an asset or liability in a transaction that is not a business combination and affects neither accounting nor taxable profits or loss at the time of the transaction.
Deferred income tax assets are recognized to the extent it is probable that taxable profit will be available against which the deductible temporary differences and the carry forward of unused tax credits and unused tax losses can be utilized.
Deferred income tax liabilities are recognized for all taxable temporary differences except in respect of taxable temporary differences that is expected to reverse within the tax holiday period, taxable temporary differences associated with investments in subsidiaries, associates and foreign branches where the timing of the reversal of the temporary difference can be controlled and it is probable that the temporary difference will not reverse in the foreseeable future.
The carrying amount of deferred income tax assets is reviewed at each reporting date and reduced to the extent that it is no longer probable that sufficient taxable profit will be available to allow all or part of the deferred income tax asset to be utilized.
Deferred income tax assets and liabilities are measured at the tax rates that are expected to apply in the period when the asset is realized or the liability is settled, based on tax rates (and tax laws) that have been enacted or substantively enacted at the reporting date.
The Company offsets deferred income tax assets and liabilities, where it has a legally enforceable right to offset current tax assets against current tax liabilities, and they relate to taxes levied by the same taxation authority on either the same taxable entity, or on different taxable entities where there is an intention to settle the current tax liabilities and assets on a net basis or their tax assets and liabilities will be realized simultaneously.
(xviii) Earnings per share
Basic earnings per share is computed using the weighted average number of equity shares outstanding during the period adjusted for treasury shares held. Diluted earnings per share is computed using the weighted-average number of equity and dilutive equivalent shares outstanding during the period, using the treasury stock method for options, except where the results would be anti-dilutive.

Corporate Overview | Management & Board Reports | Financial Statements
Wipro Limited231
The number of equity shares and potentially dilutive equity shares are adjusted retrospectively for all periods presented for any splits and bonus shares issues including for change effected prior to the approval of the consolidated financial statements by the Board of Directors.
(xix) Cash flow statement
Cash flows are reported using the indirect method, whereby profit for the period is adjusted for the effects of transactions of a non-cash nature, any deferrals or accruals of past operating cash receipts or payments and item of income or expenses associated with investing or financing cash flows. The cash from operating, investing and financing activities of the Company are segregated.
(xx) Assets held for sale
Sale of business is classified as held for sale, if their carrying amount is intended to be recovered principally through sale rather than through continuing use. The condition for classification as held for sale is met when disposal business is available for immediate sale and the same is highly probable of being completed within one year from the date of classification as held for sale.
(xxi) Discontinued operations
A discontinued operation is a component of the Company’s business that represents a separate line of business that has been disposed of or is held for sale, or is a subsidiary acquired exclusively with a view to resale. Classification as a discontinued operation occurs upon the earlier of disposal or when the operation meets the criteria to be classified as held for sale.
(xxii) Disposal of assets
The gain or loss arising on disposal or retirement of assets are recognized in the consolidated statement of profit and loss.
New Accounting standards adopted by the Company:
Ind AS 116 - Leases
On April 1, 2019, the Company adopted Ind AS 116, Leases, which applied to all lease contracts outstanding as at April 1, 2019, using modified retrospective method by recording the cumulative effect of initial application as an adjustment to opening retained earnings. The Company has made use of the following practical expedients available in its transition to Ind AS 116: -
a) The Company will not reassess whether a contract is or contains a lease. Accordingly, the definition of lease in accordance with Ind AS 17 will continue to be applied to lease contracts entered by the Company or modified by the Company before April 1, 2019,
b) The Company has applied a single discount rate to a portfolio of leases of similar assets in similar economic environment. Consequently, the Company has recorded its lease liability using the present value of remaining lease payments, discounted using the incremental borrowing rate at the date of initial application and the right-of-use asset at its carrying amount as if the standard had been applied since the commencement date of the
lease, but discounted using the incremental borrowing rate at the date of initial application,
c) The Company excluded the initial direct costs from measurement of the RoU asset,
d) The Company does not recognize RoU assets and lease liabilities for leases with less than twelve months of lease term and low-value assets on the date of initial application.
The weighted average of discount rate applied to lease liabilities as at April 1, 2019 is 5.7%.
On adoption of Ind AS 116,
a) the Company has recognized right-of-use assets of ` 13,630 and corresponding lease liability ` 15,379.
b) the net carrying value of assets procured under the finance lease of ` 1,243 (gross carrying and accumulated depreciation value of ` 3,420 and ` 2,177 respectively) have been reclassified from property, plant and equipment to right-of-use assets,
c) obligations under finance leases ` 2,002 (non-current and current obligation under finance leases ` 496 and ` 1,506 respectively) have been reclassified to lease liabilities.
d) prepaid rent on leasehold land and other assets, which were earlier classified under Other assets have been reclassified to right-of-use assets by ` 2,222
The adoption of the new standard has resulted in a reduction of ` 872 in opening retained earnings, net of deferred tax asset of ` 138.
During the year ended March 31, 2020, the Company recognized in the consolidated statement of profit and loss –
a) Depreciation expense from right-of-use assets of ` 5,911 (Refer Note 5)
b) Interest expenses on lease liabilities of ` 914
c) Rent expense amounting to ` 44 pertaining to leases of low-value assets and ` 2,085 pertaining to leases with less than twelve months of lease term has been included under Facility expenses
d) Income from subleasing right-of-use assets is not material
Refer Note 5 for additions to right-of-use assets during the year ended March 31, 2020 and carrying amount of right-of-use assets as at March 31, 2020 by class of underlying asset.
As at March 31, 2020, the Company is committed to certain leases amounting to ` 1,399 which have not yet commenced. The term of such lease’s ranges from 2 to 8 years.
Lease payments during the year are disclosed under financing activities in the consolidated statement of cash flows.
The comparatives as at and for the year ended March 31, 2019 have not been retrospectively restated.
The adoption of Ind AS 116 did not have any material impact on consolidated statement of profit and loss and earnings per share.

Annual Report 2019-20 232
The difference between the lease obligation disclosed as of March 31, 2019 under Ind AS 17 and the value of the lease liabilities as of April 1, 2019 is primarily on account of practical expedients exercised for low value assets and short term leases as at adoption of the standard, in measuring the lease liability and discounting the lease liabilities to the present value in accordance with Ind AS 116.
Particulars TotalOperating lease commitments disclosed as at March 31, 2019 ` 19,741
(Less): Impact of discounting on opening lease liability (1,954)(Less): Short-term leases not recognized as a liability (1,675)(Less): Low-value leases not recognized as a liability (64)(Less): Leases commencing after 1st April, but entered into on or before 31st March (669)
Lease liability recognized as at April 1, 2019 ` 15,379
Appendix C to Ind AS 12 - Uncertainty over income tax treatMments
The Ministry of Corporate Affairs issued Appendix C to Ind AS 12 which clarifies the accounting for uncertainties in income taxes. The interpretation is to be applied to the determination of taxable profit (tax loss), tax bases, unused tax losses, unused tax credits and tax rates, when there is uncertainty over income tax treatments under Ind AS 12. The adoption of Appendix C to Ind AS 12 did not have any material impact on the consolidated financial statements of the Company.
Amendment to Ind AS 12 – Income Taxes
The Ministry of Corporate Affairs issued amendments to Ind AS 12 – Income Taxes. The amendments clarify that an entity shall recognize the income tax consequences of dividends on financial instruments classified as equity according to where the entity originally recognized those past transactions or events that generated distributable profits were recognized. The adoption of amendment to Ind AS 12 did not have any material impact on consolidated financial statements of the Company.
Amendment to Ind AS 19 - Plan Amendment, Curtailment or Settlement
The Ministry of Corporate Affairs issued amendments to Ind AS 19, ‘Employee Benefits’, in connection with accounting for plan amendments, curtailments and settlements requiring an entity to determine the current service costs and the net interest for the period after the remeasurement using the assumptions used for the remeasurement; and determine the net interest for the remaining period based on the remeasured net defined benefit liability or asset. The adoption of amendment to Ind AS 19 did not have any material impact on consolidated financial statements of the Company.
New Accounting standards not yet adopted by the Company:
Ministry of Corporate Affairs (“MCA”) notifies new standard or amendments to the existing standards. There is no such notification which would have been applicable from April 1, 2020.
4. Property, plant and equipment
Land Buildings Plant and machinery *
Furniture and fixtures
Office equipment Vehicles Total
Gross carrying value:As at April 1, 2019 ` 3,697 ` 27,294 ` 92,286 ` 10,500 ` 5,908 ` 948 ` 140,633Reclassified on adoption of Ind AS 116 - - (3,420) - - - (3,420)Adjusted balance as at April 1, 2019 ` 3,697 ` 27,294 ` 88,866 ` 10,500 ` 5,908 ` 948 ` 137,213Translation adjustment 9 84 1,437 64 65 (5) 1,654Additions 55 9,130 13,571 2,435 1,052 11 26,254Additions through business combinations - 5 417 6 1 - 429Disposals - (199) (3,676) (104) (154) (146) (4,279)As at March 31, 2020 ` 3,761 ` 36,314 ` 100,615 ` 12,901 ` 6,872 ` 808 ` 161,271Accumulated depreciation/ impairment:As at April 1, 2019 ` - ` 6,659 ` 73,129 ` 8,163 ` 4,335 ` 682 ` 92,968Reclassified on adoption of Ind AS 116 - - (2,177) - - - (2,177)Adjusted balance as at April 1, 2019 ` - ` 6,659 ` 70,952 ` 8,163 ` 4,335 ` 682 ` 90,791Translation adjustment - 32 1,066 46 45 (2) 1,187Depreciation and impairment ** - 1,315 8,624 992 564 175 11,670Disposals - (118) (2,649) (84) (15) (128) (2,994)As at March 31, 2020 ` - ` 7,888 ` 77,993 ` 9,117 ` 4,929 ` 727 ` 100,654Net book value as at March 31, 2020 ` 3,761 ` 28,426 ` 22,622 ` 3,784 ` 1,943 ` 81 ` 60,617

Corporate Overview | Management & Board Reports | Financial Statements
Wipro Limited233
Land Buildings Plant and
machinery *Furniture and
fixturesOffice
equipment Vehicles Total
Gross carrying value:As at April 1, 2018 ` 3,637 ` 24,949 ` 87,142 ` 9,858 ` 5,817 ` 1,139 ` 132,542Translation adjustment (5) (8) 613 2 (2) (6) 594Additions 65 2,684 10,402 1,477 474 4 15,106Disposals - (331) (5,871) (837) (381) (189) (7,609)As at March 31, 2019 ` 3,697 ` 27,294 ` 92,286 ` 10,500 ` 5,908 ` 948 ` 140,633Accumulated depreciation/ impairment:As at April 1, 2018 ` - ` 5,771 ` 65,269 ` 7,795 ` 4,093 ` 506 ` 83,434Translation adjustment - 8 332 (4) (2) (3) 331Depreciation and impairment ** - 1,031 12,295 788 575 304 14,993Disposals - (151) (4,767) (416) (331) (125) (5,790)As at March 31, 2019 ` - ` 6,659 ` 73,129 ` 8,163 ` 4,335 ` 682 ` 92,968Net book value as at March 31, 2019 ` 3,697 ` 20,635 ` 19,157 ` 2,337 ` 1,573 ` 266 ` 47,665
* Including net carrying value of computer equipment and software amounting to ` 16,844 and ` 16,375 as at March 31, 2020 and 2019, respectively.
** Includes impairment charge on software platform recognized on acquisitions, amounting to Nil and ` 1,480 for the year ended March 31, 2020 and 2019, respectively.
5. Right-of-use assets
Category of RoU Asset Total
Land Buildings Plant and machinery * Vehicles
Gross carrying value:As at April 1, 2019 ` 2,003 ` 11,502 ` 2,941 ` 649 ` 17,095Additions - 3,520 1,210 219 4,949Additions through Business combinations - 364 - - 364Disposals - (41) (47) (59) (147)Translation adjustment - 279 132 17 428As at March 31, 2020 ` 2,003 ` 15,624 ` 4,236 ` 826 ` 22,689Accumulated depreciation:Depreciation ` 27 ` 3,884 ` 1,731 ` 269 ` 5,911Disposals - (18) (47) (10) (75)Translation adjustment - 62 37 6 105As at March 31, 2020 ` 27 ` 3,928 ` 1,721 ` 265 ` 5,941Net carrying value as at March 31, 2020 ` 16,748
* includes computer equipment
6. Goodwill and Other intangible assets
The movement in goodwill balance is given below:
As at
March 31, 2020 March 31, 2019 Balance at the beginning of the year ` 113,220 ` 114,046Translation adjustment 8,841 4,307Disposal (Refer Note 22) - (4,893)Acquisition through business combination (Refer Note 7) 4,833 -Assets reclassified as held for sale (Refer Note 22) - (240)Balance at the end of the year ` 126,894 ` 113,220
The Company is organized by three operating segments: IT Services and IT Products and India State Run Enterprise. Goodwill as at March 31, 2020 and 2019 has been allocated to the IT Services operating segment.
Goodwill recognized on business combinations is allocated to Cash Generating Units (CGUs), within the IT Services operating segment, which are expected to benefit from the synergies of the acquisitions.

Annual Report 2019-20 234
Goodwill has been allocated to the CGUs as at March 31, 2020 as follows:
CGUs March 31, 2020 Banking Financial Services and Insurance (BFSI) ` 19,225Healthcare and Life Sciences (Health BU) 55,642Consumer (CBU) 14,501Energy, Natural Resources and Utilities (ENU) 15,782Manufacturing (MFG) 8,040Technology (TECH) 12,661Communication (COMM) 1,043
` 126,894
Following table presents the allocation of goodwill to the CGUs for the year ended March 31, 2019:
CGUs As at
March 31, 2019Banking Financial Services and Insurance (BFSI) ` 17,713Healthcare and Life Sciences (Health BU) 50,670Consumer (CBU) 13,587Energy, Natural Resources and Utilities (ENU) 15,203Manufacturing (MFG) 5,370Technology (TECH) 9,707Communication (COMM) 970
` 113,220
For impairment testing, goodwill is allocated to a CGU representing the lowest level within the Group at which goodwill is monitored for internal management purposes, and which is not higher than the Company’s operating segment. Goodwill is tested for impairment at least annually in accordance with the Company’s procedure for determining the recoverable value of each CGU.
The recoverable amount of the CGU is determined on the basis of Fair Value Less Cost of Disposal (FVLCD). The FVLCD of the CGU is determined based on the market capitalization approach, using the turnover and earnings multiples derived from observable market data. The fair value measurement is categorized as a level 2 fair value based on the inputs in the valuation techniques used.
Based on the above testing, no impairment was identified as at March 31, 2020 and 2019 as the recoverable value of the CGUs exceeded the carrying value. Further, none of the CGU’s tested for impairment as at March 31, 2020 and 2019 were at risk of impairment. An analysis of the calculation’s sensitivity to a change in the key parameters (turnover and earnings multiples), did not identify any probable scenarios where the CGU’s recoverable amount would fall below its carrying amount.
The movement in intangible assets is given below:
Intangible assets
Customer related Marketing related Total
Gross carrying value:
As at April 1, 2019 ` 26,924 ` 5,945 ` 32,869
Translation adjustment 1,031 382 1,413
Acquisition through business combinations (Refer Note 7) 4,535 371 4,906
As at March 31, 2020 ` 32,490 ` 6,698 ` 39,188
Accumulated depreciation/ impairment:
As at April 1, 2019 ` 15,345 ` 3,762 ` 19,107
Translation adjustment 220 226 446
Amortization and impairment* 2,333 940 3,273
As at March 31, 2020 ` 17,898 ` 4,928 ` 22,826
Net carrying value as at March 31, 2020 ` 14,592 ` 1,770 ` 16,362
Gross carrying value:
As at April 1, 2018 ` 26,586 ` 6,551 ` 33,137
Translation adjustment 555 217 772
Disposal (Refer Note 22) (217) (823) (1,040)
As at March 31, 2019 ` 26,924 ` 5,945 ` 32,869

Corporate Overview | Management & Board Reports | Financial Statements
Wipro Limited235
Intangible assetsCustomer related Marketing related Total
Accumulated depreciation/ impairment:As at April 1, 2018 ` 12,263 ` 2,761 ` 15,024Translation adjustment 35 64 99Amortization and impairment* 3,148 1,136 4,284Disposal (Refer Note 22) (101) (199) (300)As at March 31, 2019 ` 15,345 ` 3,762 ` 19,107Net carrying value as at March 31, 2019 ` 11,579 ` 2,183 ` 13,762
* includes impairment charge on certain intangible assets recognized on acquisitions, amounting to Nil and ̀ 838 for the year ended March 31, 2020 and 2019, respectively.
As at March 31, 2020, the estimated remaining amortization period for intangible assets acquired on acquisition are as follows:
Acquisition Estimated remaining amortization period
ATCO I-Tek 4.50 years
Cellent AG 0.75 – 2.75 years
Appirio Inc. 1.75 years
Vara Infotech Private Limited 6.50 - 9.50 years
International TechneGroup Incorporated 4.50 years
Rational Interaction, Inc. 2.75 - 6.75 years
Other entities 0.25 – 12.25 years
7. Business combination
Summary of material acquisitions during the year ended March 31, 2020 is given below:
During the year ended March 31, 2020, the Company has completed three business combinations (which both individually and in aggregate are not material) for a total consideration of ` 10,433. These include (a) taking over customer contracts, leased facilities, assets and employees of Vara Infotech Private Limited, (b) the acquisition of International TechneGroup Incorporated, a global digital engineering and manufacturing solutions company and (c) the acquisition of Rational Interaction, Inc, a digital customer experience management company.
The following table presents the provisional purchase price allocation:
Description Purchase price allocated
Net assets ` 907Customer related intangibles 4,535Marketing related intangibles 371Deferred tax liabilities on intangible assets (213)Total ` 5,600Goodwill 4,833Total purchase price 10,433
Net assets acquired include ` 317 of cash and cash equivalents and trade receivable valued at ` 831.
The goodwill of ` 4,833 comprises value of acquired workforce and expected synergies arising from the business combinations. The goodwill was allocated to IT Services segment and is partially deductible for income tax purpose in India and United States.
The pro-forma effects of these business combinations on the Company’s results were not material.
Summary of material acquisitions during the year ended March 31, 2018 is given below:
During the year ended March 31, 2018, the Company has completed four business combinations (which both individually and in aggregate are not material) for a total consideration of ̀ 6,924. These transactions include (a) the acquisition of IT service provider which is focused on Brazilian markets, (b) the acquisition of a design and business strategy consultancy firm based in the United States, and (c) the acquisition of intangible assets, assembled workforce and a multi-year service agreement which qualify as business combination.
The following table presents the provisional allocation of purchase price:

Annual Report 2019-20 236
Description Purchase price allocated
Net assets ` 5Customer related intangibles 5,565Other intangible assets 169Total ` 5,739Goodwill 1,185Total purchase price ` 6,924
The goodwill of ` 1,185 comprises value of acquired workforce and expected synergies arising from the acquisition. The goodwill was allocated to IT Services segment and is partially deductible for United States federal income tax purpose.
Net assets acquired include ` 58 of cash and cash equivalents and trade receivables valued at ` 215.
8. Investments
As atMarch 31, 2020 March 31, 2019
Non-currentFinancial instruments measured at FVTOCI
Equity instruments - unquoted (Refer Note 8.1) ` 9,297 ` 6,916Financial instruments at amortized cost
Inter corporate and term deposits - unquoted * 5 -` 9,302 ` 6,916
Aggregate amount of unquoted investments ` 9,302 ` 6,916
CurrentAs at
March 31, 2020 March 31, 2019Financial instruments measured at FVTOCI
Commercial papers, Certificate of deposits and bonds - unquoted (Refer Note 8.3) ` 20,126 ` 43,030Non-convertible debentures, government securities and commercial papers - quoted (Refer Note 8.4)
135,461 142,018
Financial instruments at amortized costInter corporate and term deposits -unquoted * 19,253 21,708
Financial instruments measured at FVTPLInvestments in liquid and short-term mutual funds - unquoted (Refer Note 8.2) 14,795 13,960
` 189,635 ` 220,716Aggregate amount of quoted investments and aggregate market value thereof ` 135,461 ` 142,018Aggregate amount of unquoted investments ` 54,174 ` 78,698
* These deposits earn a fixed rate of interest. Term deposits include non-current and current deposits in lien with banks primarily on account of term deposits held as margin money deposits against guarantees amounting to ` 5 and ` 796, respectively (March 31, 2019: Term Deposits current of ` 463).
Investments accounted for using the equity method
The Company has no material associates as at March 31, 2020. The aggregate summarized financial information in respect of the Company’s immaterial associates that are accounted for using the equity method is set forth below:
As atMarch 31, 2020 March 31, 2019
Carrying amount of the Company’s interest in associates accounted for using the equity method ` 1,383 ` 1,235
For the year ended March 31, 2020 2019
Company’s share of net profit/(loss) of associates accounted for using the equity method in consolidated statement of profit and loss
` 29 ` (43)

Corporate Overview | Management & Board Reports | Financial Statements
Wipro Limited237
Details of investments:
8.1 Details of investments in equity instruments- classified as FVTOCI
ParticularsNumber of Shares Carrying value
As at As atMarch 31, 2020 March 31, 2019 March 31, 2020 March 31, 2019
Non-currentEnsono Holdings, LLC 13,024,920 13,024,920 ` 2,733 ` 1,752Headspin Inc 230,733 230,733 849 401IntSights Cyber Intelligence Limited 2,191,903 1,981,365 641 517Tricentis 4,933,051 4,933,051 588 570Vectra Networks, Inc 1,811,807 1,811,807 582 532TLV Partners - - 567 320Incorta Inc, Ltd. 1,458,272 - 529 -Tradeshift Inc. 384,615 384,615 510 466CloudGenix 1,946,131 1,946,131 378 347Avaamo Inc. 1,887,193 1,887,193 260 238Vicarious FPC, Inc. 42,392 42,392 244 223Moogsoft (Herd) Inc. 1,230,182 1,230,182 227 139TLV Partners II, L.P. - - 190 70Sealights Technologies Ltd 1,343,635 - 151 -CloudKnox Security Inc. 2,389,486 - 151 -Harte Hanks Inc. 9,926 9,926 119 248B Capital Fund II, L.P. - - 118 -Work-Bench Ventures II - A, LP - - 118 44CyCognito 122,075 122,075 99 91Wep Peripherals Ltd. 306,000 306,000 68 40Boldstart Ventures IV, L.P. - - 49 28Altizon Systems Private Limited 23,758 23,758 38 144Glilot Capital Partners III L.P. - - 28 1Wep Solutions Limited 1,836,000 1,836,000 27 40Drivestream India Private Limited 267,600 267,600 19 19TLV Partners III, L,P. - - 14 -Emailage Corp. - 373,800 - 455Imanis Inc (formerly known as Talena Inc.) 10,103,248 - 121eSilicon - 1,485,149 - 104WAISL Limited (formerly Wipro Airport IT Services Limited)
- 550,000 - 6
Mycity Technology Limited 44,935 44,935 - -Opera Solutions LLC 2,390,433 2,390,433 - -
Total ` 9,297 ` 6,916
8.2 Investments in liquid and short-term mutual funds - unquoted – classified as FVTPL
ParticularsNumber of Units Carrying value
As at As atMarch 31, 2020 March 31, 2019 March 31, 2020 March 31, 2019
CurrentHDFC Arbitrage Fund - Wholesale Plan - Monthly Dividend- Direct Plan - 200,321,433 ` - ` 2,097
HDFC Arbitrage Fund - Wholesale Plan - Growth 141,089,753 - 2,100 -
Kotak Equity Arbitrage Fund - Direct Plan - Growth 67,906,978 - 1,974 -
SBI Overnight Fund Direct Plan Growth 496,725 388,332 1,616 1,201IDFC Arbitrage Fund - Growth - Direct Plan 48,133,290 - 1,241 -ICICI Prudential Equity Arbitrage Fund - Direct Plan - Growth 45,551,909 - 1,229 -
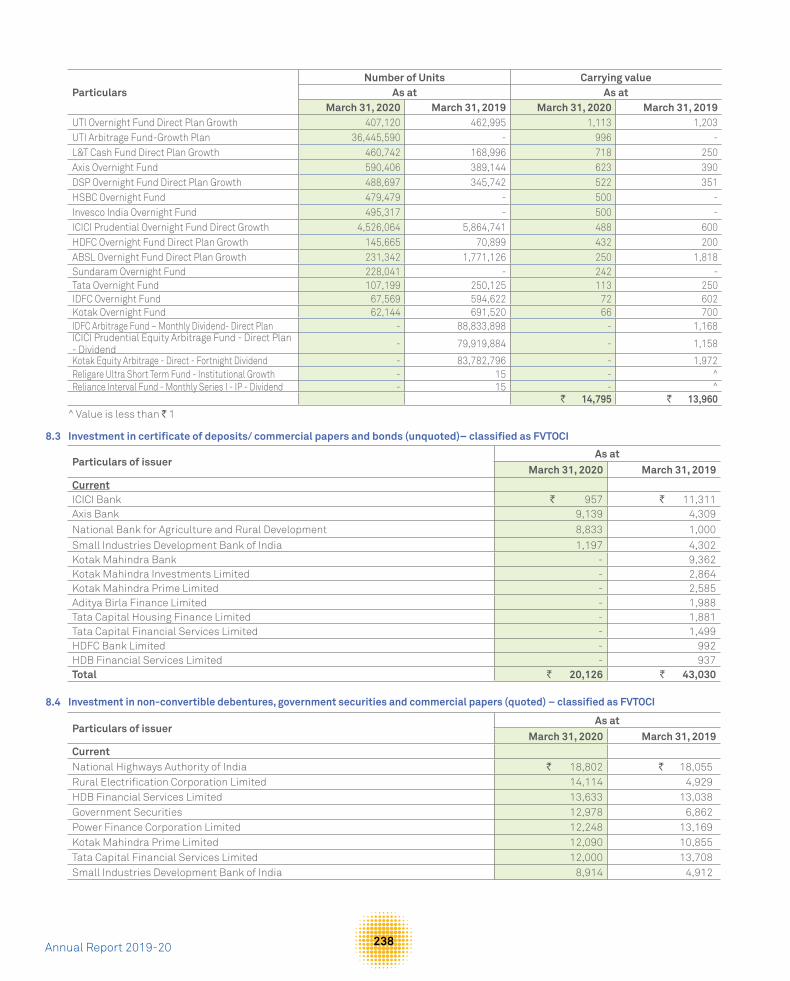
Annual Report 2019-20 238
ParticularsNumber of Units Carrying value
As at As atMarch 31, 2020 March 31, 2019 March 31, 2020 March 31, 2019
UTI Overnight Fund Direct Plan Growth 407,120 462,995 1,113 1,203UTI Arbitrage Fund-Growth Plan 36,445,590 - 996 -L&T Cash Fund Direct Plan Growth 460,742 168,996 718 250Axis Overnight Fund 590,406 389,144 623 390DSP Overnight Fund Direct Plan Growth 488,697 345,742 522 351HSBC Overnight Fund 479,479 - 500 -Invesco India Overnight Fund 495,317 - 500 -ICICI Prudential Overnight Fund Direct Growth 4,526,064 5,864,741 488 600HDFC Overnight Fund Direct Plan Growth 145,665 70,899 432 200ABSL Overnight Fund Direct Plan Growth 231,342 1,771,126 250 1,818Sundaram Overnight Fund 228,041 - 242 -Tata Overnight Fund 107,199 250,125 113 250IDFC Overnight Fund 67,569 594,622 72 602Kotak Overnight Fund 62,144 691,520 66 700IDFC Arbitrage Fund – Monthly Dividend- Direct Plan - 88,833,898 - 1,168ICICI Prudential Equity Arbitrage Fund - Direct Plan - Dividend - 79,919,884 - 1,158
Kotak Equity Arbitrage - Direct - Fortnight Dividend - 83,782,796 - 1,972Religare Ultra Short Term Fund - Institutional Growth - 15 - ^ Reliance Interval Fund - Monthly Series I - IP - Dividend - 15 - ^
` 14,795 ` 13,960
8.3
^ Value is less than ` 1
Investment in certificate of deposits/ commercial papers and bonds (unquoted)– classified as FVTOCI
Particulars of issuerAs at
March 31, 2020 March 31, 2019CurrentICICI Bank ` 957 ` 11,311Axis Bank 9,139 4,309National Bank for Agriculture and Rural Development 8,833 1,000Small Industries Development Bank of India 1,197 4,302Kotak Mahindra Bank - 9,362Kotak Mahindra Investments Limited - 2,864Kotak Mahindra Prime Limited - 2,585Aditya Birla Finance Limited - 1,988Tata Capital Housing Finance Limited - 1,881Tata Capital Financial Services Limited - 1,499HDFC Bank Limited - 992HDB Financial Services Limited - 937Total ` 20,126 ` 43,030
8.4 Investment in non-convertible debentures, government securities and commercial papers (quoted) – classified as FVTOCI
Particulars of issuerAs at
March 31, 2020 March 31, 2019CurrentNational Highways Authority of India ` 18,802 ` 18,055Rural Electrification Corporation Limited 14,114 4,929HDB Financial Services Limited 13,633 13,038Government Securities 12,978 6,862Power Finance Corporation Limited 12,248 13,169Kotak Mahindra Prime Limited 12,090 10,855Tata Capital Financial Services Limited 12,000 13,708Small Industries Development Bank of India 8,914 4,912

Corporate Overview | Management & Board Reports | Financial Statements
Wipro Limited239
As atMarch 31, 2020 March 31, 2019
Kotak Mahindra Investments Limited 8,283 5,238Housing Development Finance Corporation Limited 5,692 7,151Indian Railway Finance Corporation Limited 4,857 4,473National Bank for Agriculture and Rural Development 4,574 13,460Aditya Birla Finance Limited 1,882 11,596Axis Bank 1,823 517NTPC Limited 1,679 417Tata Capital Housing Finance Limited 1,273 5,765HDFC Bank Limited 614 462ANZ Bank 5 3LIC Housing Finance Limited - 7,408Total ` 135,461 ` 142,018
9. Financial instruments
Financial assets and liabilities (carrying value / fair value)As at
March 31, 2020 March 31, 2019Assets:Cash and cash equivalents ` 144,499 ` 158,529Investments
Financial instruments at FVTPL 14,795 13,960Financial instruments at FVTOCI 164,884 191,964Financial instruments at Amortized cost 19,258 21,708
Other financial assetsTrade receivables 110,523 104,862Unbilled receivables 25,209 22,880Other assets 14,495 19,757
Derivative assets 3,025 5,104` 496,688 ` 538,764
Liabilities:Trade payables and other payables
Trade payables ` 58,400 ` 62,660Lease liabilities 19,198 -Other financial liabilities 20,779 26,288
Borrowings * 78,042 99,467Derivative liabilities 7,369 1,310
` 183,788 ` 189,725
* Includes current obligation under borrowings classified under “Other current financial liabilities”
Offsetting financial assets and liabilities
The following table contains information on other financial assets and trade payables and other payables, subject to offsetting:
As atMarch 31, 2020 March 31, 2019
Financial Assets:Gross amount of recognized other financial assets ` 157,304 ` 154,129
Gross amount of recognized financial liabilities set off in the consolidated balance sheet (7,077) (6,630)
Net amount of other financial assets presented in the consolidated balance sheet ` 150,227 ` 147,499Financial liabilitiesTrade payables Gross amount recognized as Trade payables and other payables ` 86,256 ` 95,578Gross amount of recognized financial liabilities set off in the consolidated balance sheet (7,077) (6,630)Net amounts of Trade payables and other payables presented in the consolidated balance sheet ` 79,179 ` 88,948

Annual Report 2019-20 240
For the financial assets and liabilities subject to offsetting or similar arrangements, each agreement between the Company and the counterparty allows for net settlement of the relevant financial assets and liabilities when both elect to settle on a net basis. In the absence of such an election, financial assets and liabilities will be settled on a gross basis and hence are not offset.
Fair value
Financial assets and liabilities include cash and cash equivalents, trade receivables, unbilled receivables, finance lease receivables, employee and other advances, eligible current and non-current assets, borrowings, trade payables, eligible current liabilities and non-current liabilities.
The fair value of cash and cash equivalents, trade receivables, unbilled receivables, borrowings, trade payables, other current financial assets and liabilities approximate their carrying amount largely due to the short-term nature of these instruments. The Company’s long-term debt has been contracted at market rates of interest. Accordingly, the carrying value of such long-term debt approximates fair value.Further, finance lease receivables are periodically evaluated based on individual credit worthiness of customers. Based on this evaluation, the Company records allowance for estimated losses on these receivables. As at March 31, 2020 and 2019, the carrying value of such receivables, net of allowances approximates the fair value.
Investments in liquid and short-term mutual funds, which are classified as FVTPL are measured using net asset values at the reporting date multiplied by the quantity held. Fair value of investments in commercial papers, certificate of deposits and bonds classified as FVTOCI is determined based on the indicative quotes of price and yields prevailing in the market at the reporting date. Fair value of investments in equity instruments classified as FVTOCI is determined using market and income approaches.
The fair value of derivative financial instruments is determined based on observable market inputs including currency spot and forward rates, yield curves, currency volatility etc.
Fair value hierarchy
The table below analyses financial instruments carried at fair value, by valuation method. The different levels have been defined as follows:
Level 1 – Quoted prices (unadjusted) in active markets for identical assets or liabilities.
Level 2 – Inputs other than quoted prices included within Level 1 that are observable for the asset or liability, either directly (i.e. as prices) or indirectly (i.e. derived from prices).
Level 3 – Inputs for the assets or liabilities that are not based on observable market data (unobservable inputs).
The following table presents fair value of hierarchy of assets and liabilities measured at fair value on a recurring basis:
Particulars As at March 31, 2020 As at March 31, 2019
Fair value measurements at reporting date Fair value measurements at reporting date Total Level 1 Level 2 Level 3 Total Level 1 Level 2 Level 3
AssetsDerivative instruments:
Cash flow hedges ` 1,382 ` - ` 1,382 ` - ` 3,149 ` - ` 3,149 ` -
Others 1,643 - 1,643 - 1,955 - 1,955 -Investments:
Investment in liquid and short-term mutual funds
14,795 14,795 - - 13,960 13,960 - -
Investment in equity instruments
9,297 - 119 9,178 6,916 - 248 6,668
Commercial paper, Certificate of deposits and bonds
155,587 12,983 142,604 - 185,048 6,865 178,183 -
LiabilitiesDerivative instruments:
Cash flow hedges ` (4,057) ` - ` (4,057) ` - ` (130) ` - ` (130) ` -Others (3,312) - (3,312) - (1,180) - (1,180) -

Corporate Overview | Management & Board Reports | Financial Statements
Wipro Limited241
The following methods and assumptions were used to estimate the fair value of the level 2 financial instruments included in the above table.
Derivative instruments (assets and liabilities): The Company enters into derivative financial instruments with various counterparties, primarily banks with investment grade credit ratings. Derivatives valued using valuation techniques with market observable inputs are mainly interest rate swaps, foreign exchange forward contracts and foreign exchange option contracts. The most frequently applied valuation techniques include forward pricing, swap models and Black Scholes models (for option valuation), using present value calculations. The models incorporate various inputs including the credit quality of counterparties, foreign exchange spot and forward rates, interest rate curves and forward rate curves of the underlying. As at March 31, 2020, the changes in counterparty credit risk had no material effect on the hedge effectiveness assessment for derivatives designated in hedge relationships and other financial instruments recognized at fair value.
Investment in commercial papers, certificate of deposits and bonds: Fair value of these instruments is derived based on the indicative quotes of price and yields prevailing in the market as at reporting date.
The following methods and assumptions were used to estimate the fair value of the level 3 financial instruments included in the above table.
Investment in equity instruments: Fair value of these instruments is determined using market and income approaches.
Details of assets and liabilities considered under Level 3 classification
Particulars Investment in equity instruments
Balance as at April 1, 2019 ` 6,668Additions 2,124Transfers out of level 3 -Disposal (1,327)Gain recognized in foreign currency translation reserve 855Gain recognized in other comprehensive income 858Balance as at March 31, 2020 ` 9,178Balance as at April 1, 2018 ` 5,685Additions 2,869Transfers out of level 3 (647)Disposal (1,341)Gain recognized in foreign currency translation reserve 203Loss recognized in other comprehensive income (101)Balance as at March 31, 2019 ` 6,668
Description of significant unobservable inputs to valuation:
As at March 31, 2020
Items Valuation technique Significant unobservable Movement Increase Decrease
input by (`) (`)
Unquoted equity investments
Discounted Long term growth rate 0.5% 298 (273) cash flow model Discount rate 0.5% (388) 404
As at March 31, 2019
Items Valuation technique Significant unobservable Movement Increase Decrease
input by (`) (`)Unquoted equity investments
Discounted Long term growth rate 0.5% 201 (187) cash flow model Discount rate 0.5% (243) 256
As at March 31, 2020 and 2019, 0.5 percentage point increase/(decrease) in the unobservable inputs used in fair valuation of other Level 3 assets doesnot have a significant impact in its value.
Derivative assets and liabilities:The Company is exposed to foreign currency fluctuations on foreign currency assets / liabilities, forecasted cash flows denominated in foreign currency and net investment in foreign operations. The Company follows established risk management policies, including the use of derivatives to hedge foreign currency assets / liabilities, foreign currency forecasted cash flows and net investment in foreign operations. The counter parties in these derivative instruments are primarily banks and the Company considers the risks of non-performance by the counterparty as non-material.

Annual Report 2019-20 242
The following table presents the aggregate contracted principal amounts of the Company’s derivative contracts outstanding:
(in million)As at
March 31, 2020 March 31, 2019Notional Fair value Notional Fair value
Designated derivative instrumentsSell: Forward contracts USD 1,011 ` (2,902) USD ` 1,410
€ 121 ` 231 € - -
£ 52 ` 240 £ - -
AUD 144 ` 741 AUD 97 ` 15
Range forward option contracts USD 474 ` (1,057) USD 1,067 ` 1,149
£ 98 ` (13) £ 191 ` 68
€ 39 ` 85 € 153 ` 349
AUD - ` - AUD 56 ` 39
Interest rate swaps USD - ` - USD 75 ` (11)
Non-designated derivative instrumentsSell: Forward contracts* USD 1,314 ` (3,116) USD 1,182 ` 1,359
€ 59 ` 34 € 32 ` 55
£ 81 ` 112 £ 1 ` (1)
AUD 56 ` 115 AUD 82 ` 28
SGD 7 ` 8 SGD 11 ` 1
ZAR 17 ` 1 ZAR 56 ` 14
CAD 51 ` 153 CAD 56 ` 40
SAR 60 ` (1) SAR 123 ` (1)
AED - AED 9 ^
PLN 34 ` 13 PLN 38 ` 15
CHF 7 ` 4 CHF 10 ^
QAR 19 ` (8) QAR 3 ` (1)
TRY 30 ` 31 TRY 28 ` 12
NOK 19 ` 16 NOK 29 ` 4
OMR 2 ` 1 OMR 1 ` (1)
SEK 13 ` 4 SEK 35 ` 5
MYR 20 ` 1 MYR - -
JPY 325 ^ JPY - -
Range forward option contracts USD - - USD 150 ` 161
€ - - € 31 ` 12
£ - - £ 71 ` 57
Buy: Forward contracts USD 480 ` 972 USD 730 ` (971)
JPY - - JPY 154 ^
MXN 11 ` (9) MXN 9 ^
DKK 9 ^ DKK 75 ` (13)
` (4,344) ` 3,794
* USD 1,314 and USD 1,182 includes USD/PHP sell forward of 176 and 117 as at March 31, 2020 and 2019, respectively.^ Value is less than ` 1
1

Corporate Overview | Management & Board Reports | Financial Statements
Wipro Limited243
The following table summarizes activity in the cash flow hedging reserve within equity related to all derivative instruments classified as cash flow hedges:
As atMarch 31, 2020 March 31, 2019
Balance as at the beginning of the year ` 3,019 ` (143)
Deferred cancellation gain/ (loss), net (201) 6Changes in fair value of effective portion of derivatives (2,312) 1,069Net gain/ (loss) reclassified to consolidated statement of profit and loss on occurrence of hedged transactions*
(3,382) 2,087
Gain/(loss) on cash flow hedging derivatives, net ` (5,895) ` 3,162Balance as at the end of the year ` (2,876) ` 3,019Deferred tax thereon 561 (604)Balance as at the end of the year, net of deferred tax ` (2,315) ` 2,415
*Includes net gain/(loss) reclassified to revenue (March 31, 2020: ` (4,761), March 31, 2019: ` 2,585) and cost of revenues (March 31, 2020: ` 1,379, March 31, 2019: ` (498)).
The related hedge transactions for balance in cash flow hedging reserves as at March 31, 2020 are expected to occur and be reclassified to the consolidated statement of profit and loss over a period of three years.
As at March 31, 2020 and 2019, there were no significant gains or losses on derivative transactions or portions thereof that have become ineffective as hedges or associated with an underlying exposure that did not occur.
Sale of financial assets
From time to time, in the normal course of business, the Company transfers accounts receivables, unbilled receivables, net investment in finance lease receivables (financials assets) to banks. Under the terms of the arrangements, the Company surrenders control over the financial assets and transfer is without recourse. Accordingly, such transfers are recorded as sale of financial assets. Gains and losses on sale of financial assets without recourse are recorded at the time of sale based on the carrying value of the financial assets and fair value of servicing liability. The incremental impact of such transactions on our cash flow and liquidity for the year ended March 31, 2020 and 2019 is not material.
In certain cases, transfer of financial assets may be with recourse. Under arrangements with recourse, the Company is obligated to repurchase the uncollected financial assets, subject to limits specified in the agreement with the banks. These are reflected as part of loans and borrowings in the consolidated balance sheet.
Financial risk management
Market Risk
Market risk is the risk of loss of future earnings, to fair values or to future cash flows that may result from a change in the price
of a financial instrument. The value of a financial instrument may change as a result of changes in the interest rates, foreign currency exchange rates and other market changes that affect market risk sensitive instruments. Market risk is attributable to all market risk sensitive financial instruments including investments, foreign currency receivables, payables and borrowings.
The Company’s exposure to market risk is a function of investment and borrowing activities and revenue generating activities in foreign currency. The objective of market risk management is to avoid excessive exposure of the Company’s earnings and equity to losses.
Risk Management Procedures
The Company manages market risk through a corporate treasury department, which evaluates and exercises independent control over the entire process of market risk management. The corporate treasury department recommends risk management objectives and policies, which are approved by senior management and Audit Committee. The activities of this department include management of cash resources, implementing hedging strategies for foreign currency exposures, borrowing strategies, and ensuring compliance with market risk limits and policies.
Foreign currency risk
The Company operates internationally, and a major portion of its business is transacted in several currencies. Consequently, the Company is exposed to foreign exchange risk through receiving payment for sales and services in the United States and elsewhere and making purchases from overseas suppliers in various foreign currencies. The exchange rate risk primarily arises from foreign exchange revenue, receivables, cash balances, forecasted cash flows, payables and foreign currency loans and borrowings. A significant portion of the Company’s

Annual Report 2019-20 244
revenue is in the U.S. Dollar, the United Kingdom Pound Sterling, the Euro, the Canadian Dollar and the Australian Dollar, while a large portion of costs are in Indian rupees. The exchange rate between the rupee and these currencies has fluctuated significantly in recent years and may continue to fluctuate in the future. Appreciation of the rupee against these currencies can adversely affect the Company’s results of operations.
The Company evaluates exchange rate exposure arising from these transactions and enters into foreign currency derivative instruments to mitigate such exposure. The Company follows established risk management policies, including the use of derivatives like foreign exchange forward/option contracts to hedge forecasted cash flows denominated in foreign
currency. The Company has designated certain derivative instruments as cash flow hedges to mitigate the foreign exchange exposure of forecasted highly probable cash flows. The Company also designates foreign currency borrowings as hedge against respective net investments in foreign operations.
As at March 31, 2020, a ` 1 increase in the spot exchange rate of the Indian rupee with the U.S. dollar would result in approximately ` 1,972 (consolidated statement of profit and loss ` 658 and other comprehensive income ` 1,314) decrease in the fair value, and a ` 1 decrease would result in approximately ` 1,912 (consolidated statement of profit and loss ` 658 and other comprehensive income ` 1,254) increase in the fair value of foreign currency dollar denominated derivative instruments
(forward and option contracts).
The below table presents foreign currency risk from non-derivative financial instruments as at March 31, 2020 and 2019:
Particulars As at March 31, 2020
US $ Euro Pound Sterling
Australian Dollar
Canadian Dollar
Other currencies# Total
Trade receivables ` 42,329 ` 8,860 ` 7,735 ` 3,044 ` 1,388 ` 4,522 ` 67,878
Unbilled receivables 11,127 1,030 2,221 784 291 1,126 16,579
Contract assets 5,517 1,559 2,850 654 146 790 11,516
Cash and cash equivalents
13,481 3,978 1,697 586 1,292 1,733 22,767
Other assets 49,835 4,314 3,283 413 1,447 1,805 61,097
Borrowings* (36,578) - - - - - (36,578)
Lease Liabilities (3,393) (2,606) (373) (214) (16) (1,412) (8,014)
Trade payables and other financial liabilities
(27,457) (3,419) (3,718) (1,228) (605) (3,087) (39,514)
Net assets/ (liabilities) ` 54,861 ` 13,716 ` 13,695 ` 4,039 ` 3,943 ` 5,477 ` 95,731
Particulars As at March 31, 2019
US $ Euro Pound Sterling
Australian Dollar
Canadian Dollar
Other currencies# Total
Trade receivables ` 39,896 ` 8,030 ` 5,212 ` 3,542 ` 1,528 ` 3,880 ` 62,088
Unbilled receivables 8,038 1,609 3,146 1,225 204 743 14,965
Contract assets 4,706 1,445 2,270 836 150 598 10,005
Cash and cash equivalents
21,997 2,884 1,573 1,003 1,928 2,204 31,589
Other assets 8,553 1,173 4,056 1,038 1,033 4,544 20,397
Borrowings* (50,516) (20) (21) (33) - (21) (50,611)
Trade payables and other financial liabilities
(27,202) (5,779) (4,646) (1,526) (806) (2,787) (42,746)
Net assets/ (liabilities) ` 5,472 ` 9,342 ` 11,590 ` 6,085 ` 4,037 ` 9,161 ` 45,687
# Other currencies reflect currencies such as Swiss Franc, UAE Dirham, Saudi Riyal, Singapore Dollar etc.* Includes current obligation under borrowings classified under “Other current financial liabilities”

Corporate Overview | Management & Board Reports | Financial Statements
Wipro Limited245
As at March 31, 2020 and 2019, respectively, every 1% increase/decrease in the respective foreign currencies compared to functional currency of the Company would impact results by approximately ` 957 and ` 457, respectively.
Interest rate risk
Interest rate risk primarily arises from floating rate borrowing, including various revolving and other lines of credit. The Company’s investments are primarily in short-term investments, which do not expose it to significant interest rate risk. The Company manages its net exposure to interest rate risk relating to borrowings by entering into interest rate swap agreements, which allows it to exchange periodic payments based on a notional amount and agreed upon fixed and floating interest rates. Certain borrowings are also transacted at fixed interest rates. If interest rates were to increase by 100 bps as on March 31, 2020, additional net annual interest expense on floating rate borrowing would amount to approximately ` 773.
Credit risk
Credit risk arises from the possibility that customers may not be able to settle their obligations as agreed. To manage this, the Company periodically assesses the financial reliability of customers, taking into account the financial condition, current economic trends, forward looking macroeconomic information, analysis of historical bad debts and ageing of accounts receivable. Individual risk limits are set accordingly. No single customer accounted for more than 10% of the accounts receivable as of March 31, 2020 and 2019, and revenues for the
year ended March 31, 2020 and 2019. There is no significant concentration of credit risk.
Counterparty risk
Counterparty risk encompasses issuer risk on marketable securities, settlement risk on derivative and money market contracts and credit risk on cash and time deposits. Issuer risk is minimized by only buying securities which are at least AA rated in India based on Indian rating agencies. Settlement and credit risk is reduced by the policy of entering into transactions with counterparties that are usually banks or financial institutions with acceptable credit ratings. Exposure to these risks are closely monitored and maintained within predetermined parameters. There are limits on credit exposure to any financial institution. The limits are regularly assessed and determined based upon credit analysis including financial statements and capital adequacy ratio reviews.
Liquidity risk
Liquidity risk is defined as the risk that the Company will not be able to settle or meet its obligations on time or at a reasonable price. The Company’s corporate treasury department is responsible for liquidity and funding as well as settlement management. In addition, processes and policies related to such risks are overseen by senior management. Management monitors the Company’s net liquidity position through rolling forecasts on the basis of expected cash flows. As of March 31, 2020, cash and cash equivalents are held with major banks and financial institutions.
The table below provides details regarding the remaining contractual maturities of significant financial liabilities at the reporting date. The amounts include estimated interest payments and exclude the impact of netting agreements, if any.
Contractual cash flows
As at March 31, 2020 Carrying
value Less than
1 year 1-2 years 2-4 years Beyond
4 years Total
Borrowings (1) (3) ` 78,042 ` 74,663 ` 4,761 ` 119 ` - ` 79,543
Lease Liabilities (3) 19,198 7,322 6,128 5,425 2,192 21,067
Trade payables and other financial liabilities
79,179 79,028 88 63 - 79,179
Derivative liabilities 7,369 7,231 90 48 - 7,369
Contractual cash flows
As at March 31, 2019 Carrying
value Less than
1 year 1-2 years 2-4 years Beyond
4 years Total
Borrowings (2) ` 99,467 ` 73,559 ` 24,887 ` 4,309 ` - ` 102,755
Trade payables and other financial liabilities (2)
88,948 88,948 - - - 88,948
Derivative liabilities 1,310 1,310 - - - 1,310

Annual Report 2019-20 246
The balanced view of liquidity and financial indebtedness is stated in the table below. This calculation of the net cash position is used by the management for external communication with investors, analysts and rating agencies:
As atMarch 31, 2020 March 31, 2019
Cash and cash equivalents ` 144,499 ` 158,529
Investments 189,635 220,716
Borrowings (1) (78,042) (99,467)` 256,092 ` 279,778
(1) Includes current obligation under borrowings classified under “Other current financial liabilities”(2)Includes current obligation under borrowings and financial leases classified under “Other current financial liabilities”(3) Includes future cash outflow toward estimated interest on borrowings and lease liabilities.
10. Trade receivables
As atMarch 31, 2020 March 31, 2019
UnsecuredConsidered good ` 110,523 ` 104,862Considered doubtful 13,937 14,824
` 124,460 ` 119,686Less: Provision for doubtful receivables (13,937) (14,824)
` 110,523 ` 104,862Included in the consolidated balance sheet as follows:
Non-current ` 6,049 ` 4,373Current ` 104,474 ` 100,489
The activity in the allowance for doubtful receivables is given below:
As atMarch 31, 2020 March 31, 2019
Balance at the beginning of the year ` 14,824 ` 14,570Additions during the year, net uncollectable receivables 1,043 980Uncollectable receivables charged against allowance (2,139) (772)Translation adjustments 209 46Balance at the end of the year ` 13,937 ` 14,824
11. Other Financial Assets
As atMarch 31, 2020 March 31, 2019
Non-currentSecurity deposits ` 1,581 ` 1,436Other deposits 802 777Interest receivables 1,139 1,139Finance lease receivables 2,359 1,794
` 5,881 ` 5,146CurrentSecurity Deposits ` 1,127 ` 1,050Other deposits 5 33Dues from officers and employees 1,040 738Finance lease receivables 2,811 1,618Interest receivables 2,581 1,789Others 1,050 9,383Considered doubtful 976 854
` 9,590 ` 15,465Less: Provision for doubtful advances (976) (854)
` 8,614 ` 14,611Total ` 14,495 ` 19,757

Corporate Overview | Management & Board Reports | Financial Statements
Wipro Limited247
The activities in the provision for doubtful advances is given below:
As at
March 31, 2020 March 31, 2019
Balance at the beginning of the year ` 854 ` 815
Addition during the year, net 284 243
Reversals/Uncollectable advances charged against allowance (168) (204)
Translation Adjustment 6 ^
Balance at the end of the year ` 976 ` 854
^ Value is less than ` 1
12. Other assets
As atMarch 31, 2020 March 31, 2019
Non-currentPrepaid expenses ` 4,535 ` 6,323Costs to obtain contract* 4,030 ` 4,212Costs to fulfil contract 305 - Capital advances 1,537 1,355Others 3,065 5,337
` 13,472 ` 17,227CurrentPrepaid expenses ` 9,876 ` 12,148Dues from officers and employees 310 871Advances to suppliers 3,121 3,247Balance with GST and other authorities 7,805 5,543Cost to obtain contract* 1,258 1,170Others 135 107
` 22,505 ` 23,086Total ` 35,977 ` 40,313
* Amortization during the year ended March 31, 2020 and 2019 amounting to ` 1,237 and ` 934, respectively.
13. Inventories
As atMarch 31, 2020 March 31, 2019
Finished goods [including goods-in-transit - ` 2 (` 1 for March 31, 2019)] ` 3 ` 3Traded goods 1,251 3,273Stores and spares 611 675
` 1,865 ` 3,951
14. Cash and cash equivalents
Cash and cash equivalents as of March 31, 2020 and 2019 consist of the following:
As atMarch 31, 2020 March 31, 2019
Balances with banksCurrent accounts ` 33,840 ` 41,715Demand deposits * 110,412 116,563
Unclaimed dividends 85 93Cheques, drafts on hand 162 158
` 144,499 ` 158,529
* These deposits can be withdrawn by the Company at any time without prior notice and without any penalty on the principal.

Annual Report 2019-20 248
Cash and cash equivalents consist of the following for the purpose of the statement of cash flows:
As atMarch 31, 2020 March 31, 2019
Cash and cash equivalents (as above) ` 144,499 ` 158,529Bank overdrafts (395) (4)
` 144,104 ` 158,525
15. Share Capital
As atMarch 31, 2020 March 31, 2019
Authorized capital
12,504,500,000 (March 31, 2019: 12,504,500,000) equity shares [Par value of ` 2 per share]
` 25,009 ` 25,009
25,000,000 (March 31, 2019: 25,000,000) preference shares [Par value of ` 10 per share] 250 250
150,000 (March 31, 2019: 150,000) 10% Optionally convertible cumulative preference shares [Par value of ` 100 per share]
15 15
` 25,274 ` 25,274Issued, subscribed and fully paid-up capital5,713,357,390 (March 31, 2019: 6,033,935,388) equity shares of ` 2 each ` 11,427 ` 12,068
` 11,427 ` 12,068
Terms / Rights attached to equity shares
The Company has only one class of equity shares having a par value of ` 2 per share. Each shareholder of equity shares is entitled to one vote per share. The Company declares and pays dividend in Indian Rupees. The final dividend proposed by the Board of Directors is subject to shareholders approval in the ensuing Annual General Meeting.
Following is the summary of per share dividends recognized as distributions to equity shareholders:
For the year endedMarch 31, 2020 March 31, 2019
Interim dividend (Board recommended the adoption of the interim dividend as the final dividend)
` 1 per share ` 1 per share
In the event of liquidation of the Company, the equity shareholders will be entitled to receive the remaining assets of the Company, after distribution of all preferential amounts, if any, in proportion to the number of equity shares held by the shareholders.
i. Reconciliation of number of shares
As at March 31, 2020 As at March 31, 2019
No. of Shares ` Million No. of Shares ` Million
Opening number of equity shares / American Depository Receipts (ADRs) outstanding
6,033,935,388 12,068 4,523,784,491 9,048
Equity shares issued pursuant to Employee Stock Option Plan *
2,498,925 5 1,681,717 4
Issue of bonus shares (Refer Note 34) - - 1,508,469,180 3,016
Buyback of equity shares (Refer Note 34) (323,076,923) (646) - -
Closing number of equity shares / ADRs outstanding
5,713,357,390 11,427 6,033,935,388 12,068
*4,607,772 and 2,599,183 shares have been transferred by the controlled trust to eligible employees on exercise of options during the year ended March 31, 2020 and 2019, respectively.

Corporate Overview | Management & Board Reports | Financial Statements
Wipro Limited249
ii. Details of shareholders holding more than 5% of the total equity shares of the Company
Name of the ShareholderAs at March 31, 2020 As at March 31, 2019
No. of Shares % held No. of Shares % heldMr. Azim Hasham Premji Partner representing Hasham Traders
938,946,043 16.43 989,215,999 16.39
Mr. Azim Hasham Premji Partner representing Prazim Traders
1,127,392,315 19.73 1,187,751,441 19.68
Mr. Azim Hasham Premji Partner representing Zash Traders 1,143,118,360 20.01 1,204,319,438 19.96
Azim Premji Trust 757,398,687 13.26 797,948,834 13.22
iii. Other details of equity shares for a period of five years immediately preceding March 31, 2020
(a) 323,076,923, 343,750,000 and 40,000,000 equity shares were bought back by the Company during the year ended March 31, 2020, 2018 and 2017, respectively. Refer note 34.
(b) 1,508,469,180 and 2,433,074,327bonus shares were issued during the year ended March 31, 2019 and 2018. Refer note 34.
iv. Shares reserved for issue under option
For details of shares reserved for issue under the employee stock option plan of the Company, Refer Note 31.
16. BorrowingsAs at
March 31, 2020 March 31, 2019Non-currentSecured
Obligations under finance leases * ` - ` 496` - ` 496
UnsecuredTerm loans:
Borrowings from banks ` 4,535 ` 27,666Loans from institutions other than banks 305 206
` 4,840 ` 27,872Total Non-current ` 4,840 ` 28,368CurrentUnsecured
Bank overdrafts ` 395 ` 4Borrowings from Banks ** 53,624 68,041Loans from institutions other than banks *** 1 40
Total Current ` 54,020 ` 68,085Total Borrowings ` 58,860 ` 96,453
* Current obligations under financial leases amounting to Nil (March 31, 2019: ` 1,506) is classified under “Other current financial liabilities”
** Current obligations under borrowings from banks amounting to ` 18,898 (March 31, 2019: ` 1,272) is classified under “Other current financial liabilities’”
*** Current maturities of loans from institutions other than bank amounting to ` 284 (March 31, 2019: ` 236) is classified under “Other current financial liabilities”
Short-term borrowings
The Company had loans, borrowings and bank overdrafts amounting to ` 54,020 and ` 68,085, as at March 31, 2020 and 2019, respectively. The principal source of borrowings from banks as at March 31, 2020 primarily consists of lines of credit of approximately ` 17,960, U.S. Dollar (U.S.$) 955 million, Canadian Dollar (CAD) 71 million, Saudi Riyal (SAR) 128 million, Euro (EUR) 19 million, Great British Pound (GBP) 7 million, Chinese Yuan (CNY) 20 million, Qatari Riyal (QAR) 10 million, Brazilian Real (BRL) 10 million, Mexican Peso (MXN) 33 million, and Indonesian Rupiah (IDR) 13,000 million from bankers for working capital requirements and other short-term needs. As at March 31, 2020, the Company has unutilized lines of credit aggregating ` 4,260, U.S. Dollar (U.S.$) 471 million, Canadian Dollar (CAD) 3 million, Saudi Riyal (SAR) 128 million, Euro (EUR) 19 million, Great British Pound (GBP) 7 million, Chinese Yuan (CNY) 20 million, Qatari Riyal (QAR) 10 million, Brazilian Real (BRL) 1 million, Mexican Peso (MXN) 33 million, and Indonesian Rupiah (IDR) 13,000 million. To utilize these unused lines of credit, the Company requires consent of the lender and compliance with certain financial covenants. Significant portion of these lines of credit are revolving credit facilities and floating rate foreign currency loans, renewable on a periodic basis.

Annual Report 2019-20 250
The Company has non-fund based revolving credit facilities in various currencies equivalent to ` 41,597 and ` 40,470 as of March 31, 2020 and 2019, respectively, towards operational requirements that can be used for the issuance of letters of credit and bank guarantees. As of March 31, 2020, and 2019, an amount of ` 22,790 and ` 22,014,respectively, was unutilized out of these non-fund based facilities.
Long-term loans and borrowings
A summary of long- term loans and borrowings is as follows:
Currency
As at March 31, 2020 As at March 31, 2019 Foreign
currency in millions
Indian Rupee Interest rate Final maturity Foreign
currency in millions
Indian Rupee
Unsecured term loansU.S. Dollar (U.S.$) 311 23,478 2.20% - 3.81% July-21 382 26,395Canadian Dollar (CAD) ^ 25 1.48% - 3.26% July-21 52 2,701Indian Rupee (INR) - 440 8.29% - 9.35% March-24 - 162Australian Dollar (AUD) 1 44 4.65% January-22 1 70Great British Pound (GBP) ^ 22 2.93% February-22 ^ 31Euro (EUR) ^ 13 2.87% March-23 ^ 19Brazilian Real (BRL) - - ^ 2
` 24,022 ` 29,380Obligations under finance leases 2,002
` 31,382Non-current portion of long-term loans and borrowings 4,840 28,368
Current portion of long-term loans and borrowings 19,182 3,014
^ Value is less than 1
Cash and non-cash changes in liabilities arising from financing activities:
April 1, 2019 Cash flow
Non-cash changes
March 31, 2020 Ind AS 116 adoption
Additions to lease liabilities
Foreign exchange
movements Borrowings from banks ` 96,979 ` (26,138) ` - ` - ` 6,217 ` 77,058Bank overdrafts 4 391 - - - 395Obligations under finance leases 2,002 - (2,002) - - -Loans from other than banks 482 100 - - 7 589Lease liabilities - (6,784) 17,381 7,942 659 19,198
` 99,467 ` (32,431) ` 15,379 ` 7,942 ` 6,883 ` 97,240
April 1, 2018 Cash flow
Non-cash changes
March 31, 2019 Assets taken on finance
lease
Foreign exchange
movements Borrowings from banks ` 119,689 ` (26,228) ` - ` 3,518 ` 96,979Bank overdrafts 3,999 (3,995) - - 4External commercial borrowings 9,777 (10,064) - 287 -Obligations under finance leases (Refer Note 33) 3,973 (2,234) 14 249 2,002Loans from other than banks 821 (352) - 13 482
` 138,259 ` (42,873) ` 14 ` 4,067 ` 99,467
Significant portion of these facilities bear floating rates of interest, referenced to LIBOR or other similar country specific official benchmark interest rates and a spread, determined based on market conditions.
The terms of the other secured and unsecured loans and borrowings also contain certain restrictive covenants primarily requiring the Company to maintain certain financial ratios. As at March 31, 2020 and 2019, the Company has met all the covenants under these arrangements.
Obligations under finance leases amounting to ` 2,002 as at March 31, 2019 were secured by underlying property, plant and equipment.
Interest expense on borrowings was ` 3,166 and ` 4,058 for the Year ended March 31, 2020 and 2019, respectively.

Corporate Overview | Management & Board Reports | Financial Statements
Wipro Limited251
17. Other financial liabilitiesAs at
March 31, 2020 March 31, 2019Non-current
Cash Settled ADS RSUs (Refer Note 31) ` 146 ` -
Deposits and others 5 -
` 151 ` -
Current
Salary payable ` 19,729 ` 25,644
Current maturities of long-term borrowings * 19,182 1,508
Current maturities of obligation under finance lease * - 1,506
Interest accrued but not due on borrowing 55 166
Unclaimed dividends 85 93
Cash Settled ADS RSUs (Refer Note 31) 350 -
Deposits and others 409 385
` 39,810 ` 29,302
Total ` 39,961 ` 29,302
* For rate of interest and other term and conditions, refer to Note 16.
18. ProvisionsAs at
March 31, 2020 March 31, 2019
Non-current:
Employee benefits obligations ` 3,766 ` 2,082
Provision for warranty 2 2
` 3,768 ` 2,084
Current:
Employee benefits obligations ` 12,358 ` 10,065
Provision for warranty 316 275
Others 689 717
` 13,363 ` 11,057
Total ` 17,131 ` 13,141
Provision for warranty represents cost associated with providing sales support services which are accrued at the time of recognition of revenues and are expected to be utilized over a period of 1 to 2 years. Other provisions primarily include provisions for indirect tax related contingencies and litigations. The timing of cash outflows in respect of such provision cannot be reasonably determined.
Particulars As at March 31, 2020 As at March 31, 2019
Provision for warranty Others Total Provision for
warranty Others Total
Provision at the beginning of the year ` 277 ` 717 ` 994 ` 293 ` 878 ` 1,171
Additions during the year, net 359 138 497 295 620 915
utilized/ reversed during the year (318) (166) (484) (311) (781) (1,092)
Provision at the end of the year ` 318 ` 689 ` 1,007 ` 277 ` 717 ` 994
Included in the consolidated balance sheet as follows:
Non-current portion ` 2 ` - ` 2 ` 2 ` - ` 2
Current portion ` 316 ` 689 ` 1,005 ` 275 ` 717 ` 992
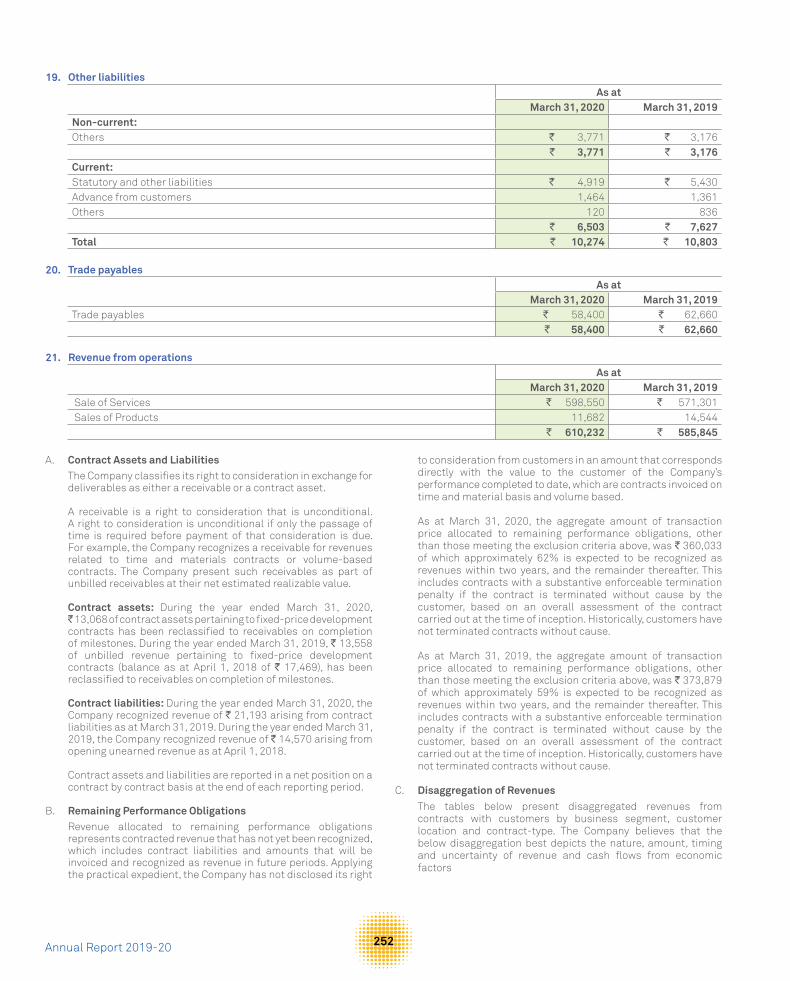
Annual Report 2019-20 252
19. Other liabilitiesAs at
March 31, 2020 March 31, 2019Non-current:Others ` 3,771 ` 3,176
` 3,771 ` 3,176Current:Statutory and other liabilities ` 4,919 ` 5,430Advance from customers 1,464 1,361Others 120 836
` 6,503 ` 7,627Total ` 10,274 ` 10,803
20. Trade payablesAs at
March 31, 2020 March 31, 2019Trade payables ` 58,400 ` 62,660
` 58,400 ` 62,660
21. Revenue from operationsAs at
March 31, 2020 March 31, 2019 Sale of Services ` 598,550 ` 571,301 Sales of Products 11,682 14,544
` 610,232 ` 585,845
A. Contract Assets and Liabilities The Company classifies its right to consideration in exchange for
deliverables as either a receivable or a contract asset.
A receivable is a right to consideration that is unconditional. A right to consideration is unconditional if only the passage of time is required before payment of that consideration is due. For example, the Company recognizes a receivable for revenues related to time and materials contracts or volume-based contracts. The Company present such receivables as part of unbilled receivables at their net estimated realizable value.
Contract assets: During the year ended March 31, 2020, ` 13,068 of contract assets pertaining to fixed-price development contracts has been reclassified to receivables on completion of milestones. During the year ended March 31, 2019, ` 13,558 of unbilled revenue pertaining to fixed-price development contracts (balance as at April 1, 2018 of ` 17,469), has been reclassified to receivables on completion of milestones.
Contract liabilities: During the year ended March 31, 2020, the Company recognized revenue of ` 21,193 arising from contract liabilities as at March 31, 2019. During the year ended March 31, 2019, the Company recognized revenue of ` 14,570 arising from opening unearned revenue as at April 1, 2018.
Contract assets and liabilities are reported in a net position on a contract by contract basis at the end of each reporting period.
B. Remaining Performance Obligations Revenue allocated to remaining performance obligations
represents contracted revenue that has not yet been recognized, which includes contract liabilities and amounts that will be invoiced and recognized as revenue in future periods. Applying the practical expedient, the Company has not disclosed its right
to consideration from customers in an amount that corresponds directly with the value to the customer of the Company’s performance completed to date, which are contracts invoiced on time and material basis and volume based.
As at March 31, 2020, the aggregate amount of transaction price allocated to remaining performance obligations, other than those meeting the exclusion criteria above, was ` 360,033 of which approximately 62% is expected to be recognized as revenues within two years, and the remainder thereafter. This includes contracts with a substantive enforceable termination penalty if the contract is terminated without cause by the customer, based on an overall assessment of the contract carried out at the time of inception. Historically, customers have not terminated contracts without cause.
As at March 31, 2019, the aggregate amount of transaction price allocated to remaining performance obligations, other than those meeting the exclusion criteria above, was ` 373,879 of which approximately 59% is expected to be recognized as revenues within two years, and the remainder thereafter. This includes contracts with a substantive enforceable termination penalty if the contract is terminated without cause by the customer, based on an overall assessment of the contract carried out at the time of inception. Historically, customers have not terminated contracts without cause.
C. Disaggregation of Revenues The tables below present disaggregated revenues from
contracts with customers by business segment, customer location and contract-type. The Company believes that the below disaggregation best depicts the nature, amount, timing and uncertainty of revenue and cash flows from economic factors

Corporate Overview | Management & Board Reports | Financial Statements
Wipro Limited253
Info
rmat
ion
on d
isag
greg
atio
n of
reve
nues
for t
he y
ear e
nded
Mar
ch 3
1, 2
020
is a
s fo
llow
s:
IT S
ervi
ces
IT P
rodu
cts
ISRE
T
otal
BF
SIH
ealt
h BU
CBU
ENU
TECH
MFG
COM
M T
otal
A. R
even
ue
Rend
erin
g of
ser
vice
s`1
83,3
68`7
7,79
4`9
6,50
9`
75,9
58`
75,4
46`
47,8
59`
33,6
55`
590,
589
` -
` 7,
961
` 59
8,55
0Sa
les
of p
rodu
cts
--
--
--
--
11,6
82-
11,6
82
` 18
3,36
8`
77,7
94`
96,5
09`
75,9
58`
75,4
46`
47,8
59`
33,6
55`
590,
589
` 11
,682
` 7,
961
` 61
0,23
2
B. R
even
ue b
y ge
ogra
phy
Indi
a`
5,24
1`
2,52
2`
1,02
5`
1,83
2`
942
` 1,
908
` 2,
109
` 15
,579
` 6,
675
` 7,
961
` 30
,215
Amer
icas
107,
467
60,2
4567
,988
24,3
1557
,092
23,3
279,
075
349,
509
918
-35
0,42
7Eu
rope
45,0
677,
540
17,2
7531
,090
14,1
0718
,547
8,05
614
1,68
22,
390
-14
4,07
2Re
st o
f the
Wor
ld25
,593
7,48
710
,221
18,7
213,
305
4,07
714
,415
83,8
191,
699
-85
,518
` 18
3,36
8`
77,7
94`
96,5
09`
75,9
58`
75,4
46`
47,8
59`
33,6
55`
590,
589
` 11
,682
` 7,
961
` 61
0,23
2
C. R
even
ue b
y na
ture
of c
ontr
act
Fixe
d pr
ice
and
volu
me
base
d`
101,
875
` 49
,951
` 53
,575
` 52
,084
` 49
,733
` 33
,793
` 21
,908
` 36
2,91
9`
-`
6,41
5`
369,
334
Tim
e an
d m
ater
ials
81,4
9327
,843
42,9
3423
,874
25,7
1314
,066
11,7
4722
7,67
0-
1,54
622
9,21
6Pr
oduc
ts-
--
--
--
-11
,682
-11
,682
` 18
3,36
8`
77,7
94`
96,5
09`
75,9
58`
75,4
46`
47,8
59`
33,6
55`
590,
589
` 11
,682
` 7,
961
` 61
0,23
2
Info
rmat
ion
on d
isag
greg
atio
n of
reve
nues
for t
he y
ear e
nded
Mar
ch 3
1, 2
019
is a
s fo
llow
s:
IT S
ervi
ces
IT P
rodu
cts
ISRE
T
otal
BF
SIH
ealt
h BU
CBU
ENU
TECH
MFG
COM
M T
otal
A. R
even
ue
Rend
erin
g of
ser
vice
s`
173,
516
` 73
,942
` 88
,797
` 72
,329
` 76
,108
` 46
,155
` 32
,489
` 56
3,33
6`
-`
7,96
5`
571,
301
Sale
s of
pro
duct
s-
--
--
--
-14
,544
-14
,544
` 17
3,51
6`
73,9
42`
88,7
97`
72,3
29`
76,1
08`
46,1
55`
32,4
89`
563,
336
` 14
,544
` 7,
965
` 58
5,84
5
B. R
even
ue b
y ge
ogra
phy
Indi
a`
3,86
8`
2,29
5`
1,00
6`
1,69
0`
1,39
2`
1,53
4`
3,09
5`
14,8
80`
8,15
4`
7,96
5`
30,9
99Am
eric
as98
,428
57,2
0459
,262
22,7
3954
,679
21,5
417,
694
321,
547
2,11
2-
323,
659
Euro
pe46
,856
7,59
117
,636
29,7
9516
,441
18,2
117,
420
143,
950
2,24
0-
146,
190
Rest
of t
he W
orld
24,3
646,
852
10,8
9318
,105
3,59
64,
869
14,2
8082
,959
2,03
8-
84,9
97
` 17
3,51
6`
73,9
42`
88,7
97`
72,3
29`
76,1
08`
46,1
55`
32,4
89`
563,
336
` 14
,544
` 7,
965
` 58
5,84
5
C. R
even
ue b
y na
ture
of c
ontr
act
Fixe
d pr
ice
and
volu
me
base
d`
89,3
78`
53,4
62`
50,4
25`
51,7
99`
47,0
55`
31,8
43`
19,8
47`
343,
809
` -
` 6,
176
` 34
9,98
5
Tim
e an
d m
ater
ials
84,1
3820
,480
38,3
7220
,530
29,0
5314
,312
12,6
4221
9,52
7-
1,78
922
1,31
6Pr
oduc
ts-
--
--
--
-14
,544
-14
,544
` 17
3,51
6`
73,9
42`
88,7
97`
72,3
29`
76,1
08`
46,1
55`
32,4
89`
563,
336
` 14
,544
` 7,
965
` 58
5,84
5

Annual Report 2019-20 254
22. Other operating income
Year ended March 31, 2020
During the year ended March 31, 2020, the Company concluded the sale of assets pertaining to Workday business and Cornerstone On Demand business in Portugal, France and Sweden. A gain of ` 152 arising from such transaction has been recognized under other operating income.
During the year ended March 31, 2020, the Company has partially met the first year and second year business targets pertaining to sale of data center business concluded during the year ended March 31, 2019. Change in fair value of the callable units pertaining to achievement of the business targets amounting to ` 992 for the year ended March 31, 2020 respectively, has been recognized under other operating income.
Year ended March 31, 2019
Sale of hosted data center services business: During the year ended March 31, 2019, the Company has concluded the divestment of its hosted data center services business.
The calculation of the gain on sale is shown below:
Particulars TotalCash consideration (net of disposal costs ` 660) ` 25,432
Less: Carrying amount of net assets disposed (including goodwill of ` 13,009) (26,455)
Add: Reclassification of exchange difference on foreign currency translation 4,131
Gain on sale ` 3,108
In accordance with the sale agreement, total cash consideration is ` 28,124 and the Company paid ` 3,766 to subscribe for units issued by the buyer. Units amounting to ` 2,032 are callable by the buyer if certain business targets committed by the Company are not met over a period of three years. The fair value of these callable units is estimated to be insignificant as at reporting date. Consequently, the sale consideration comprises cash consideration of ` 24,358 and units issued by the buyer amounting to ` 1,734.
Loss of control in subsidiary: During the year ended March 31, 2019, the Company has reduced its equity holding from 74% to 11% in Wipro Airport IT Services Limited. The loss/ gain on this transaction is insignificant.
The assets and liabilities associated with these transactions were classified as assets held for sale and liabilities directly associated with assets held for sale amounting to ` 27,201 and ` 6,212 respectively as at March 31, 2018.
Sale of Workday business and Cornerstone On Demand business: During the year ended March 31, 2019, the Company has concluded the Sale of Workday business and Cornerstone On Demand business except in Portugal, France and Sweden.
The calculation of the gain is as shown below:
Particulars TotalCash consideration ` 6,645
Less: Carrying amount of net assets disposed (includes goodwill of ` 4,893 and intangible assets of ` 740) (5,475)
Add: Reclassification of exchange difference on foreign currency translation 79
Gain on sale ` 1,249
Assets pertaining to Portugal, France, and Sweden are expected to conclude in the quarter ending June 30, 2019, subject to obtaining regulatory approvals are classified as assets held for sale amounting to ` 240 as at March 31, 2019.
These disposal groups do not constitute a major component of the Company and hence were not classified as discontinued operations.

Corporate Overview | Management & Board Reports | Financial Statements
Wipro Limited255
23. Other income
Year ended
March 31, 2020 March 31, 2019
Interest income ` 21,764 ` 20,261
Dividend income 367 361
Net gain from investments classified as FVTPL 1,275 1,990
Net gain from investments classified as FVTOCI 675 311
Finance and other income ` 24,081 ` 22,923Foreign exchange gains, net, on financial instruments measured at FVTPL ` 2,144 ` 1,251
Other exchange differences, net 1,025 1,964
Foreign exchange gains, net ` 3,169 ` 3,215
` 27,250 ` 26,138
24. Changes in inventories of finished goods and stock-in-tradeYear ended
March 31, 2020 March 31, 2019Opening stock
Traded goods ` 3,273 ` 2,600
Finished products 3 3
` 3,276 ` 2,603
Less: Closing stock
Traded goods ` 1,251 ` 3,273
Finished products 3 3
` 1,254 ` 3,276
` 2,022 ` (673)
25. Employee benefits
a) Employee costs includes
Year ended
March 31, 2020 March 31, 2019
Salaries and bonus ` 315,036 ` 289,005
Employee benefits plans
Gratuity and other defined benefit plans 1,845 1,459
Defined contribution plans 8,428 7,372
Share-based compensation 1,262 1,938
` 326,571 ` 299,774
Remeasurements of the net defined benefit liability /(asset) recognized in other comprehensive income include:Year ended
March 31, 2020 March 31, 2019Remeasurement of net defined benefit liability/(asset)
Return on plan assets excluding interest income - (gain)/loss ` 76 ` (49)
Actuarial (gain)/loss arising from financial assumptions 749 73
Actuarial (gain)/loss arising from demographic assumptions 227 (40)
Actuarial (gain)/loss arising from experience adjustments 194 (266)
` 1,246 ` (282)

Annual Report 2019-20 256
b) Defined benefit plans
Defined benefit plans include gratuity for employees drawing salary in Indian rupees and certain benefits plans in foreign jurisdictions.
Amount recognized in the consolidated statement of profit and loss in respect of defined benefit plans is as follows:
Year endedMarch 31, 2020 March 31, 2019
Current service cost ` 1,782 ` 1,434Net interest on net defined benefit liability/(asset) 63 25Net gratuity cost ` 1,845 ` 1,459Actual return on plan assets ` 513 ` 607
Change in present value of defined benefit obligation is summarized below:
As atMarch 31, 2020 March 31, 2019
Defined benefit obligation at the beginning of the year ` 10,485 ` 8,654Acquisitions 229 1,094Current service cost 1,782 1,434Interest on obligation 652 583Benefits paid (1,123) (1,047)Remeasurement (gains)/losses -
Actuarial (gain)/loss arising from financial assumptions 749 73Actuarial (gain)/loss arising from demographic assumptions 227 (40)Actuarial (gain)/loss arising from experience adjustments 194 (266)
Translation adjustment 270 -Defined benefit obligation at the end of the year ` 13,465 ` 10,485
Change in plan assets is summarized below:As at
March 31, 2020 March 31, 2019Fair value of plan assets at the beginning of the year ` 9,443 ` 8,507Acquisitions 58 109Expected return on plan assets 589 558Employer contributions 383 254Benefits paid (95) (34)Remeasurement (loss)/gain
Return on plan assets excluding interest income - (loss)/gain (76) 49Translation adjustment 233 -Fair value of plan assets at the end of the year ` 10,535 ` 9,443Present value of unfunded obligation ` (2,930) ` (1,042)Recognized liability ` (2,930) ` (1,042)
As at March 31, 2020 and 2019, plan assets were primarily invested in insurer managed funds.
The Company has established an income tax approved irrevocable trust fund to which it regularly contributes to finance the liabilities of the gratuity plan. The fund’s investments are managed by certain insurance companies as per the mandate provided to them by the trustees and the asset allocation is within the permissible limits prescribed in the insurance regulations.
The principal assumptions used for the purpose of actuarial valuation of these defined benefit plans are as follows:
As atMarch 31, 2020 March 31, 2019
Discount rate 5.05% 6.05%Expected return on plan assets 5.05% 6.05%Expected rate of salary increase 6.60% 6.80%Duration of defined benefit obligations 9 years 8 years
The expected return on plan assets is based on expectation of the average long-term rate of return expected on investments of the fund during the estimated term of the obligations.
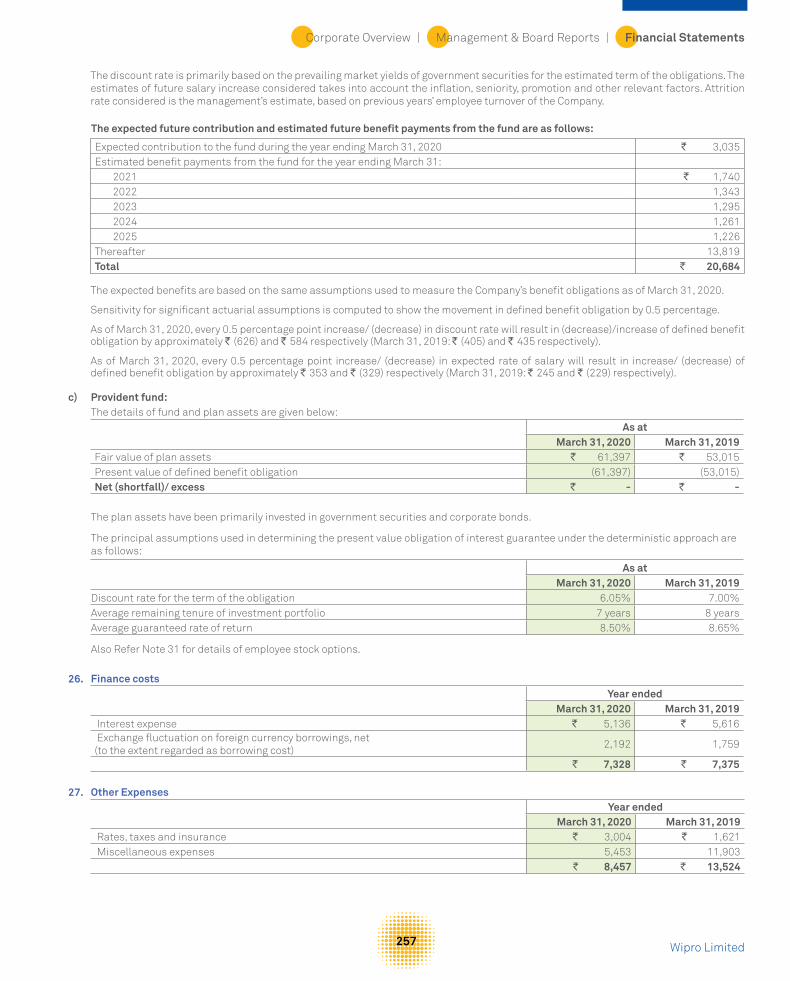
Corporate Overview | Management & Board Reports | Financial Statements
Wipro Limited257
The discount rate is primarily based on the prevailing market yields of government securities for the estimated term of the obligations. The estimates of future salary increase considered takes into account the inflation, seniority, promotion and other relevant factors. Attrition rate considered is the management’s estimate, based on previous years’ employee turnover of the Company.
The expected future contribution and estimated future benefit payments from the fund are as follows:
Expected contribution to the fund during the year ending March 31, 2020 ` 3,035Estimated benefit payments from the fund for the year ending March 31:
2021 ` 1,7402022 1,3432023 1,2952024 1,2612025 1,226
Thereafter 13,819Total ` 20,684
The expected benefits are based on the same assumptions used to measure the Company’s benefit obligations as of March 31, 2020.
Sensitivity for significant actuarial assumptions is computed to show the movement in defined benefit obligation by 0.5 percentage.
As of March 31, 2020, every 0.5 percentage point increase/ (decrease) in discount rate will result in (decrease)/increase of defined benefit obligation by approximately ` (626) and ` 584 respectively (March 31, 2019: ` (405) and ` 435 respectively).
As of March 31, 2020, every 0.5 percentage point increase/ (decrease) in expected rate of salary will result in increase/ (decrease) of defined benefit obligation by approximately ` 353 and ` (329) respectively (March 31, 2019: ` 245 and ` (229) respectively).
c) Provident fund:The details of fund and plan assets are given below:
As atMarch 31, 2020 March 31, 2019
Fair value of plan assets ` 61,397 ` 53,015Present value of defined benefit obligation (61,397) (53,015)Net (shortfall)/ excess ` - ` -
The plan assets have been primarily invested in government securities and corporate bonds.
The principal assumptions used in determining the present value obligation of interest guarantee under the deterministic approach are as follows:
As atMarch 31, 2020 March 31, 2019
Discount rate for the term of the obligation 6.05% 7.00%Average remaining tenure of investment portfolio 7 years 8 yearsAverage guaranteed rate of return 8.50% 8.65%
Also Refer Note 31 for details of employee stock options.
26. Finance costsYear ended
March 31, 2020 March 31, 2019 Interest expense ` 5,136 ` 5,616 Exchange fluctuation on foreign currency borrowings, net (to the extent regarded as borrowing cost)
2,192 1,759
` 7,328 ` 7,375
27. Other ExpensesYear ended
March 31, 2020 March 31, 2019 Rates, taxes and insurance ` 3,004 ` 1,621 Miscellaneous expenses 5,453 11,903
` 8,457 ` 13,524
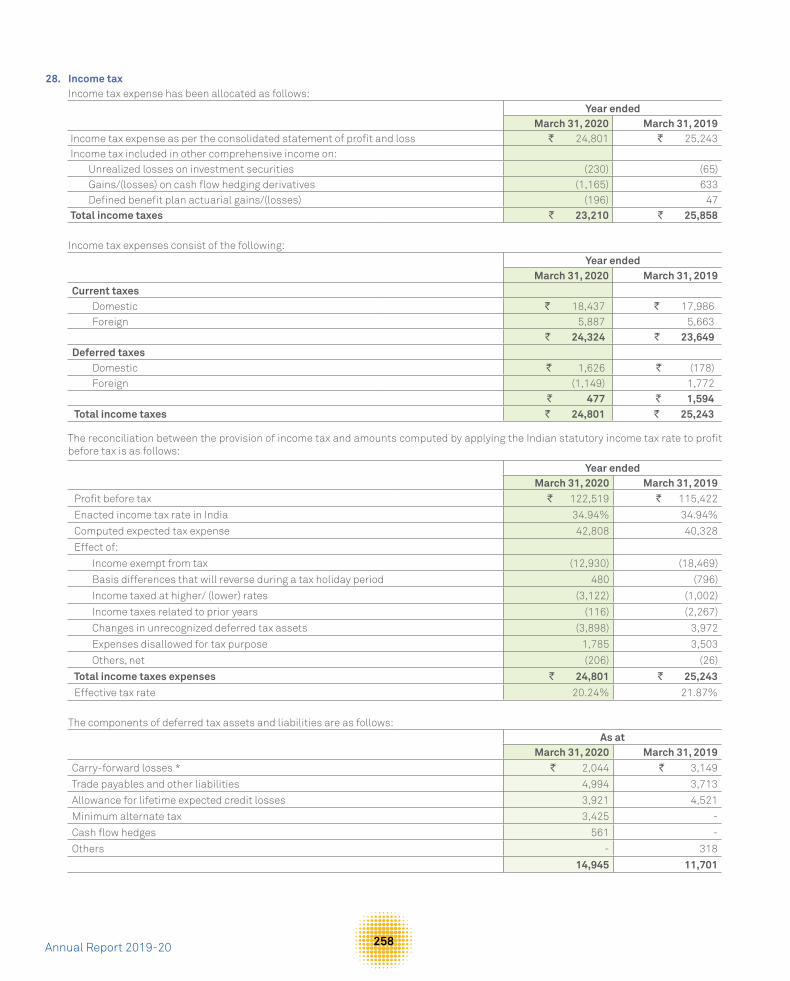
Annual Report 2019-20 258
28. Income taxIncome tax expense has been allocated as follows:
Year endedMarch 31, 2020 March 31, 2019
Income tax expense as per the consolidated statement of profit and loss ` 24,801 ` 25,243 Income tax included in other comprehensive income on:
Unrealized losses on investment securities (230) (65) Gains/(losses) on cash flow hedging derivatives (1,165) 633 Defined benefit plan actuarial gains/(losses) (196) 47
Total income taxes ` 23,210 ` 25,858
Income tax expenses consist of the following:Year ended
March 31, 2020 March 31, 2019Current taxes
Domestic ` 18,437 ` 17,986 Foreign 5,887 5,663
` 24,324 ` 23,649Deferred taxes
Domestic ` 1,626 ` (178) Foreign (1,149) 1,772
` 477 ` 1,594 Total income taxes ` 24,801 ` 25,243
The reconciliation between the provision of income tax and amounts computed by applying the Indian statutory income tax rate to profit before tax is as follows:
Year endedMarch 31, 2020 March 31, 2019
Profit before tax ` 122,519 ` 115,422
Enacted income tax rate in India 34.94% 34.94%
Computed expected tax expense 42,808 40,328
Effect of:
Income exempt from tax (12,930) (18,469)
Basis differences that will reverse during a tax holiday period 480 (796)
Income taxed at higher/ (lower) rates (3,122) (1,002)
Income taxes related to prior years (116) (2,267)
Changes in unrecognized deferred tax assets (3,898) 3,972
Expenses disallowed for tax purpose 1,785 3,503
Others, net (206) (26)
Total income taxes expenses ` 24,801 ` 25,243
Effective tax rate 20.24% 21.87%
The components of deferred tax assets and liabilities are as follows:As at
March 31, 2020 March 31, 2019Carry-forward losses * ` 2,044 ` 3,149
Trade payables and other liabilities 4,994 3,713
Allowance for lifetime expected credit losses 3,921 4,521
Minimum alternate tax 3,425 -
Cash flow hedges 561 -
Others - 318
14,945 11,701

Corporate Overview | Management & Board Reports | Financial Statements
Wipro Limited259
As at
March 31, 2020 March 31, 2019 Property, plant and equipment (654) (1,807) Amortizable goodwill (2,166) (1,899) Intangible assets (1,541) (2,295) Interest Income and fair value movement of investment (626) (1,455) Cash flow hedges - (604) Contract liabilities (11) (289) SEZ re-investment reserve (6,614) (1,132) Others (121) -
` (11,733) ` (9,481)Net deferred tax assets ` 3,212 ` 2,220
Amounts presented in the consolidated balance sheetDeferred tax assets ` 6,005 ` 5,604Deferred tax liabilities ` (2,793) ` (3,384)
* Includes deferred tax asset recognized on carry-forward losses pertaining to business combinations.
Movement in deferred tax assets and liabilities
Movement during the year ended March 31, 2020 As at April 1, 2019
Credit/ (charge) in the consolidated
statement of profit and loss
Credit/ (charge) in other
comprehensive income*
On account of business
combination
As at March 31, 2020
Carry-forward losses ` 3,149 ` (1,287) ` 182 ` - ` 2,044Trade payables and other liabilities 3,713 1,033 248 - 4,994Allowance for lifetime expected credit losses 4,521 (591) (9) - 3,921Minimum alternate tax - 3,425 - - 3,425Property, plant and equipment (1,807) 1,148 5 - (654)Amortizable goodwill (1,899) (92) (175) - (2,166)Intangible assets (2,295) 1,021 (90) (177) (1,541)Interest Income and fair value movement of investment (1,455) 599 230 - (626)Cash flow hedges (604) - 1,165 - 561Contract liabilities (289) 285 (7) - (11)SEZ re-investment reserve (1,132) (5,482) - - (6,614)Others 318 (536) 97 - (121)Total ` 2,220 ` (477) ` 1,646 ` (177) ` 3,212
Movement during the year ended March 31, 2019 As at April 1, 2018
Credit/ (charge) in the consolidated
statement of profit and loss
Credit/ (charge) in other
comprehensive income*
Others (Refer Note 41)
As at March 31, 2019
Carry-forward losses ` 5,694 ` (2,879) ` 334 ` - ` 3,149Trade payables and other liabilities 3,107 295 (22) 333 3,713Allowance for lifetime expected credit losses 4,499 9 2 11 4,521Minimum alternate tax 74 (74) - - -Property, plant and equipment (2,132) 217 (93) 201 (1,807)Amortizable goodwill (1,810) 16 (105) - (1,899)Intangible assets (3,190) 1,076 (181) - (2,295)Interest Income and fair value movement of investment (1,712) 186 71 - (1,455)Cash flow hedges 29 - (633) - (604)Contract liabilities (273) (1) (15) - (289)SEZ re-investment reserve - (1,132) - - (1,132)Others (403) 693 27 1 318Total ` 3,883 ` (1,594) ` (615) ` 546 ` 2,220
*Includes impact of foreign currency translation.

Annual Report 2019-20 260
Deferred taxes on unrealized foreign exchange gain / loss relating to cash flow hedges, fair value movements in investments and actuarial gains/losses on defined benefit plans are recognized in other comprehensive income. Deferred tax liability on the intangible assets identified and carry forward losses on acquisitions is recorded by an adjustment to goodwill. Other than these, the change in deferred tax assets and liabilities is primarily recorded in the consolidated statement of profit and loss.
In assessing the realizability of deferred tax assets, the Company considers the extent to which it is probable that the deferred tax asset will be realized. The ultimate realization of deferred tax assets is dependent upon the generation of future taxable profits during the periods in which those temporary differences and tax loss carry-forwards become deductible. The Company considers the expected reversal of deferred tax liabilities, projected future taxable income and tax planning strategies in making this assessment. Based on this, the Company believes that it is probable that the Company will realize the benefits of these deductible differences. The amount of deferred tax asset considered realizable, however, could be reduced in the near term if the estimates of future taxable income during the carry-forward period are reduced.
Deferred tax asset amounting to ̀ 8,124 and ̀ 6,769 as at March 31, 2020 and 2019, respectively in respect of unused tax losses have not been recognized by the Company. The tax loss carry-forwards of ̀ 29,736 and ̀ 24,355 as at March 31, 2020 and 2019, respectively, relates to certain subsidiaries on which deferred tax asset has not been recognized by the Company, because there is a lack of reasonable certainty that these subsidiaries may generate future taxable profits. Approximately, ̀ 14,429 and ` 8,191 as at March 31, 2020 and 2019, respectively, of these tax loss carry-forwards is not currently subject to expiration dates. The remaining tax loss carry-forwards of approximately ̀ 15,307 and ` 16,164 as at March 31, 2020 and 2019, respectively, expires in various years through fiscal 2038.
The Company has recognized deferred tax assets of ` 2,044 and ` 3,149 primarily in respect of carry forward losses of its various subsidiaries as at March 31, 2020 and 2019, respectively. Management’s projections of future taxable income and tax planning strategies support the assumption that it is probable that sufficient taxable income will be available to utilize these deferred tax assets.
29. Foreign currency translation reserveThe movement in foreign currency translation reserve attributable to equity holders of the Company is summarized below:
As at
March 31, 2020 March 31, 2019Balance at the beginning of the year ` 14,048 ` 15,639
Translation difference related to foreign operations, net ` 7,933 ` 2,906Reclassification of foreign currency translation differences to profit and loss on sale of hosted data center services business - (4,131)
Reclassification of foreign currency translation differences to profit and loss on sale of Workday business and Cornerstone OnDemand business - (79)
Change in effective portion of hedges of net investment in foreign operations - (287)Total change during the year ` 7,933 ` (1,591)Balance at the end of the year ` 21,981 ` 14,048
The Company has calculated its tax liability for current domestic taxes after considering MAT. The excess tax paid under MAT provisions over and above normal tax liability can be carried forward and set-off against future tax liabilities computed under normal tax provisions. The Company was required to pay MAT and accordingly, a deferred tax asset of ` 3,425 and Nil has been recognized in the consolidated balance sheet as at March 31, 2020 and 2019, respectively.
A substantial portion of the profits of the Company’s India operations are exempt from Indian income taxes being profits attributable to export operations and profits from units established under the Special Economic Zone Act, 2005 scheme. Units designated in special economic zones providing service on or after April 1, 2005 will be eligible for a deduction of 100 percent of profits or gains derived from the export of services for the first five years from commencement of provision of services and 50 percent of such profits and gains for a further five years. Certain tax benefits are also available for a further five years subject to the unit meeting defined conditions. Profits from certain other undertakings are also eligible for preferential tax treatment. The tax holiday period being currently available to the Company expires in various years through fiscal 2033-34. The expiration period of tax holiday for each unit within a SEZ is determined based on the number of years that have lapsed following year of commencement of production by that unit. The impact of tax holidays has resulted in a decrease of current tax expense of ` 11,963 and ` 15,390 for the years ended March 31, 2020 and 2019, respectively, compared to the effective tax amounts that we estimate the Company would have been required to pay if these incentives had not been available. The per share effect of these tax incentives for the years ended March 31, 2020 and 2019 was ` 2.05 and ` 2.56, respectively.
Deferred income tax liabilities are recognized for all taxable temporary differences except in respect of taxable temporary differences associated with investments in subsidiaries where the timing of the reversal of the temporary difference can be controlled and it is probable that the temporary difference will not reverse in the foreseeable future. Accordingly, deferred income tax liabilities on cumulative earnings of subsidiaries amounting to ` 56,391 and ` 52,488 as at March 31, 2020 and 2019, respectively and branch profit tax @ 15% of the US branch profit have not been recognized. Further, it is not practicable to estimate the amount of the unrecognized deferred tax liabilities for these undistributed earnings.

Corporate Overview | Management & Board Reports | Financial Statements
Wipro Limited261
30. Earnings per equity share
A reconciliation of profit for the year and equity shares used in the computation of basic and diluted earnings per equity share is set out below:
Basic: Basic earnings per share is calculated by dividing the profit attributable to equity shareholders of the Company by the weighted average number of equity shares outstanding during the year, excluding equity shares purchased by the Company and held as treasury shares.
Year endedMarch 31, 2020 March 31, 2019
Profit attributable to equity holders of the Company ` 97,223 ` 90,037 Weighted average number of equity shares outstanding 5,833,384,018 6,007,376,837 Basic earnings per share ` 16.67 ` 14.99
Diluted: Diluted earnings per share is calculated by adjusting the weighted average number of equity shares outstanding during the year for assumed conversion of all dilutive potential equity shares. Employee share options are dilutive potential equity shares for the Company.
The calculation is performed in respect of share options to determine the number of shares that could have been acquired at fair value (determined as the average market price of the Company’s shares during the year). The number of shares calculated as above is compared with the number of shares that would have been issued assuming the exercise of the share options.
Year endedMarch 31, 2020 March 31, 2019
Profit attributable to equity holders of the Company ` 97,223 ` 90,037 Weighted average number of equity shares outstanding 5,833,384,018 6,007,376,837 Effect of dilutive equivalent share options 14,439,221 14,927,530 Weighted average number of equity shares for diluted earnings per share 5,847,823,239 6,022,304,367 Diluted earnings per share ` 16.63 ` 14.95
31. Employee stock option
The stock compensation expense recognized for employee services received during the Year ended March 31, 2020 and 2019 were ` 1,262 and ` 1,938, respectively.
Wipro Equity Reward Trust (“WERT”)
In 1984, the Company established a controlled trust called the Wipro Equity Reward Trust (“WERT”). In the earlier years, WERT purchased shares of the Company out of funds borrowed from the Company. The Company’s Board Governance, Nomination and Compensation Committee recommends to WERT certain officers and key employees, to whom WERT issues shares from its holdings at nominal price subject to vesting conditions. WERT held22,746,081and 27,353,853treasury shares as atMarch 31, 2020 and 2019, respectively.
Wipro Employee Stock Option Plans and Restricted Stock Unit Option Plans
A summary of the general terms of grants under stock option plans and restricted stock unit option plans are as follows:
Name of Plan Number of Options reserved under the plan
Range of Exercise Price
Wipro ADS Restricted Stock Unit Plan (WARSUP 2004 plan) * 59,797,979 US $ 0.03Wipro Employee Restricted Stock Unit Plan 2005 (WSRUP 2005 plan) * 59,797,979 ` 2Wipro Employee Restricted Stock Unit Plan 2007 (WSRUP 2007 plan) * 49,831,651 ` 2Wipro Equity Reward Trust Employee Stock Purchase Plan, 2013 ** 39,546,197 ` 2Wipro Employee Stock Option plan 2000 (2000 plan) *** 747,474,747 ` 171 - 490
Employees covered under Stock Option Plans and Restricted Stock Unit (RSU) Option Plans (collectively “Stock Option Plans”) are granted an option to purchase shares of the Company at the respective exercise prices, subject to requirements of vesting conditions. These options generally vest in tranches over a period of two to four years from the date of grant. Upon vesting, the employees can acquire one equity share for every option. * The maximum contractual term for these Stock Option Plans and RSU Option Plans isperpetual until the options are available for grant under
the plan.** The maximum contractual term for these Stock Option Plans isup to May 29, 2023, until the options are available for grant under the plan.*** The maximum contractual term for these Stock Option Plans isup to July 26, 2020, until the options are available for grant under the plan.

Annual Report 2019-20 262
The activity in these stock option plans is summarized below:
Particulars Range of exercise price
Year ended March 31, 2020 March 31, 2019
Number Weighted Average Exercise Price Number Weighted Average
Exercise Price
Outstanding at the beginning of the year` 2 17,607,463 ` 2 13,543,997 ` 2
US $ 0.03 14,446,790 US $ 0.03 10,199,054 US $ 0.03
Bonus on outstanding(Refer Note 34)
` 2 - ` 2 4,773,755 ` 2US $ 0.03 - US $ 0.03 3,957,434 US $ 0.03
Granted*` 2 5,662,500 ` 2 4,607,000 ` 2
US $ 0.03 5,341,000 US $ 0.03 4,849,000 US $ 0.03
Exercised` 2 (4,610,572) ` 2 (2,739,097) ` 2
US $ 0.03 (2,496,125) US $ 0.03 (1,541,803) US $ 0.03
Modification to Cash Settled RSU’s **` 2 - ` 2 - -
US $ 0.03 (5,681,966) US $ 0.03 - -
Forfeited and expired` 2 (3,065,201) ` 2 (2,578,192) ` 2
US $ 0.03 (3,755,159) US $ 0.03 (3,016,895) US $ 0.03
Outstanding at the end of the year` 2 15,594,190 ` 2 17,607,463 ` 2
US $ 0.03 7,854,540 US $ 0.03 14,446,790 US $ 0.03
Exercisable at the end of the year` 2 1,502,957 ` 2 1,300,781 ` 2
US $ 0.03 1,212,560 US $ 0.03 948,877 US $ 0.03
As at March 31, 2020, 4,721,388 units (net of units that were exercised or Lapsed and Forfeited) of Cash Settled RSUs were outstanding which include 63,999 exercisable units. The carrying value of liability towards Cash Settled RSU’s outstanding was ` 496 which includes ` 15 towards exercisable units as at March 31, 2020.
* Includes 2,461,500 and 1,567,000 Performance based stock options (RSU) during the year ended March 31, 2020 and 2019,respectively. 2,524,600 and 1,673,000 Performance based stock options (ADS) during the year ended March 31, 2020 and 2019,respectively. Performance based stock options (RSU) were issued under Wipro Employee Restricted Stock Unit plan 2007 (WSRUP 2007 plan) and Performance based stock options (ADS) were issued under Wipro ADS Restricted Stock Unit Plan (WARSUP 2004 plan).
** Restricted Stock Units arrangement that were modified during the year ended March 31, 2020
Pursuant to the Securities Exchange Board of India (SEBI) circular dated October 10, 2019 prohibiting issuance of depository receipts by listed companies to Non-Resident Indians (NRIs), the Board Governance, Nomination and Compensation Committee in November, 2019 approved cash pay out to its NRI employees in lieu of shares and upon exercise of vested ADS RSU under the Company’s WARSUP 2004 Plan, based on prevailing market price of ADS on the date of exercise. This change was accounted for as a modification and the fair value on the date of modification of ` 561 has been recognized as financial liability with a corresponding adjustment to equity.
The following table summarizes information about outstanding stock options and restricted stock unit option plan:
Range of exercise price
Year ended March 31, 2020 2019
Numbers Weighted Average
Remaining life (months)
Weighted Average Exercise Price Numbers
Weighted Average Remaining life
(months)
Weighted Average Exercise Price
` 2 15,594,190 23 ` 2 17,607,463 24 ` 2US $ 0.03 7,854,540 23 US $ 0.03 14,446,790 26 US $ 0.03
The weighted-average grant-date fair value of options granted during the year ended March 31, 2020 and 2019 was ` 260.65 and ` 349.81 for each option, respectively. The weighted average share price of options exercised during the year ended March 31, 2020 and 2019 was ` 267.04 and ` 325.85 for each option, respectively.
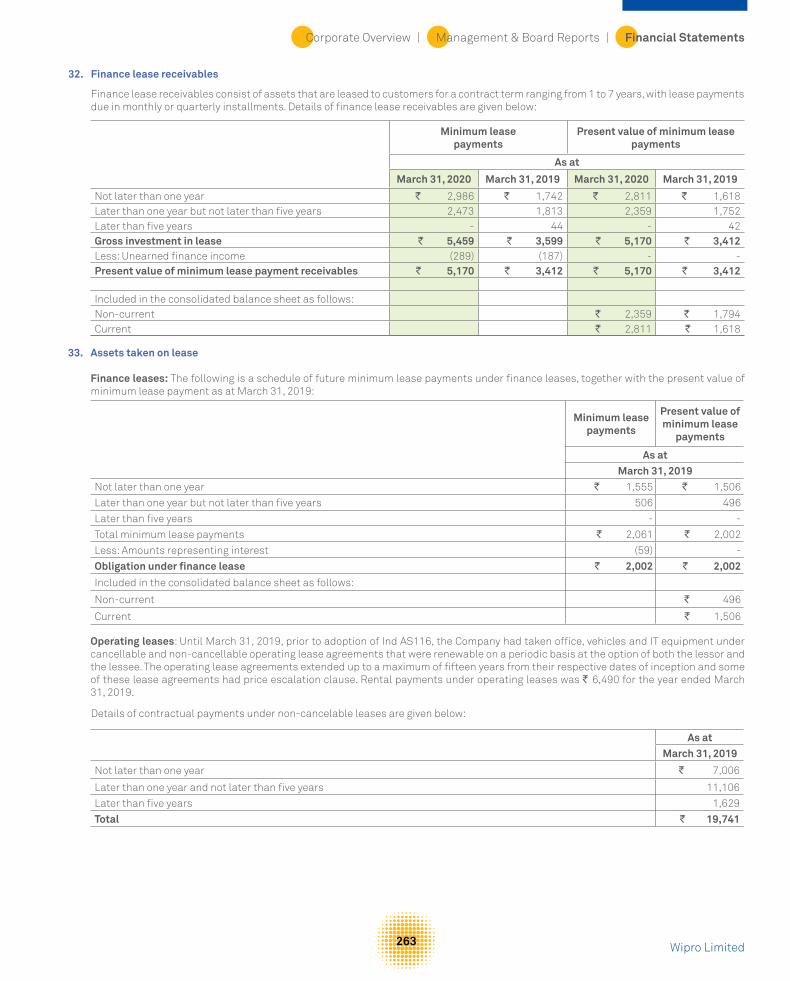
Corporate Overview | Management & Board Reports | Financial Statements
Wipro Limited263
32. Finance lease receivables
Finance lease receivables consist of assets that are leased to customers for a contract term ranging from 1 to 7 years, with lease payments due in monthly or quarterly installments. Details of finance lease receivables are given below:
Minimum lease payments
Present value of minimum lease payments
As at
March 31, 2020 March 31, 2019 March 31, 2020 March 31, 2019
Not later than one year ` 2,986 ` 1,742 ` 2,811 ` 1,618Later than one year but not later than five years 2,473 1,813 2,359 1,752Later than five years - 44 - 42Gross investment in lease ` 5,459 ` 3,599 ` 5,170 ` 3,412Less: Unearned finance income (289) (187) - -Present value of minimum lease payment receivables ` 5,170 ` 3,412 ` 5,170 ` 3,412
Included in the consolidated balance sheet as follows: Non-current ` 2,359 ` 1,794Current ` 2,811 ` 1,618
33. Assets taken on lease
Finance leases: The following is a schedule of future minimum lease payments under finance leases, together with the present value of minimum lease payment as at March 31, 2019:
Minimum lease payments
Present value of minimum lease
payments
As atMarch 31, 2019
Not later than one year ` 1,555 ` 1,506
Later than one year but not later than five years 506 496
Later than five years - -
Total minimum lease payments ` 2,061 ` 2,002
Less: Amounts representing interest (59) -
Obligation under finance lease ` 2,002 ` 2,002
Included in the consolidated balance sheet as follows:
Non-current ` 496
Current ` 1,506
Operating leases: Until March 31, 2019, prior to adoption of Ind AS116, the Company had taken office, vehicles and IT equipment under cancellable and non-cancellable operating lease agreements that were renewable on a periodic basis at the option of both the lessor and the lessee. The operating lease agreements extended up to a maximum of fifteen years from their respective dates of inception and some of these lease agreements had price escalation clause. Rental payments under operating leases was ` 6,490 for the year ended March 31, 2019.
Details of contractual payments under non-cancelable leases are given below:
As atMarch 31, 2019
Not later than one year ` 7,006
Later than one year and not later than five years 11,106
Later than five years 1,629
Total ` 19,741

Annual Report 2019-20 264
34. Dividends, Bonus and Buyback of equity shares
The Company declares and pays dividends in Indian rupees. According to the Companies Act, 2013 any dividend should be declared out of accumulated distributable profits. A Company may, before the declaration of any dividend, transfer a percentage of its profits for that financial year as it may consider appropriate to the reserves.
The cash dividends paid per equity share were ` 1 and ` 1, during the years ended March 31, 2020 and 2019, respectively, including an interim dividend of ` 1 and ` 1 for the year ended March 31, 2020 and 2019, respectively.
During the year ended March 31, 2020, the Company has concluded the buyback of 323,076,923 equity shares as approved by the Board of Directors on April 16, 2019. This has resulted in a total cash outflow of ` 105,000. In line with the requirement of the Companies Act 2013, an amount of ̀ 105,000 has been utilized from retained earnings respectively. Further, capital redemption reserve (included in other reserves) of ` 646 (representing the nominal value of the shares bought back) has been created as an apportionment from retained earnings. Consequent to such buyback, share capital has reduced by ` 646.
During the year ended March 31, 2019,the bonus issue in the proportion of 1:3 i.e.1 (One) bonus equity share of ` 2 each for
The capital structure as of March 31, 2020 and 2019 was as follows: As at
March 31, 2020 March 31, 2019 % Change Equity attributable to the equity shareholders of the Company (A) ` 553,217 ` 564,226 (1.95)% As percentage of total capital 85% 85% Current borrowings* 73,202 71,099 Non-current borrowings 4,840 28,368 Lease liabilities 19,198 - Total borrowings and lease liabilities (B) ` 97,240 ` 99,467 (2.24)% As percentage of total capital 15% 15% Total capital (A) + (B) ` 650,457 ` 663,693 (1.99)%
* Includes current obligations under borrowings classified under “Other current financial liabilities”
Borrowings represents 15 % and 15% of total capital as of March 31, 2020 and 2019, respectively. The Company is not subjected to any externally imposed capital requirements.
36. Commitments and contingencies
Capital commitments: As at March 31, 2020 and 2019 the Company had committed to spend approximately ` 14,011 and ` 12,443 respectively, under agreements to purchase/ construct property and equipment. These amounts are net of capital advances paid in respect of these purchases.
Guarantees: As at March 31, 2020 and 2019, performance and financial guarantees provided by banks on behalf of the Company to the Indian Government, customers and certain other agencies amount to approximately ` 18,655 and ` 18,456 respectively, as part of the bank line of credit.
every 3 (three) fully paid-up equity shares held (including ADS holders) was approved by the shareholders of the Company on February 22, 2019, through Postal Ballot /e-voting. Subsequently, on March 8, 2019, the Company allotted 1,508,469,180 equity shares to shareholders who held equity shares as on the record date of March 7, 2019 and ` 3,016 (representing par value of ` 2 per share) was transferred from capital redemption reserve, securities premium reserve and retained earnings to the share capital.
35. Additional capital disclosures
The key objective of the Company’s capital management is to ensure that it maintains a stable capital structure with the focus on total equity to uphold investor, creditor, and customer confidence and to ensure future development of its business. The Company’s focus is on keeping a strong total equity base to ensure independence, security, as well as a high financial flexibility for potential future borrowings, if required without impacting the risk profile of the Company.
The Company’s goal is to continue to be able to return excess liquidity to shareholders by continuing to distribute annual dividends in future periods.
The amount of future dividends/ buyback of equity shares will be balanced with efforts to continue to maintain an adequate liquidity status.
Contingencies and lawsuits: The Company is subject to legal proceedings and claims (including tax assessment orders/ penalty notices) which have arisen in the ordinary course of its business. Some of the claims involve complex issues and it is not possible to make a reasonable estimate of the expected financial effect, if any, that will result from ultimate resolution of such proceedings. However, the resolution of these legal proceedings is not likely to have a material and adverse effect on the results of operations or the financial position of the Company. The significant of such matters are discussed below.
In March 2004, the Company received a tax demand for the year ended March 31, 2001 arising primarily on account of denial of deduction under section 10A of the Income Tax Act, 1961 in respect of profit earned by the Company’s undertaking in Software Technology Park at Bengaluru. The same issue was repeated in the successive assessments for the years ended

Corporate Overview | Management & Board Reports | Financial Statements
Wipro Limited265
on the Company’s financial position and results of operations.
The contingent liability in respect of disputed demands for excise duty, custom duty, sales tax and other matters amounts to ` 8,033 and ` 8,477 as of March 31, 2020 and March 31, 2019, respectively. However, the resolution of these disputed demands is not likely to have a material and adverse effect on the results of operations or the financial position of the Company.
The Hon’ble Supreme Court of India, through a ruling in February 2019, provided interpretation on the components of Salary on which the Company and its employees are to contribute towards Provident Fund under the Employee’s Provident Fund Act. Based on the current evaluation, the Company believes it is not probable that certain components of Salary paid by the Company will be subject to contribution towards Provident Fund due to the Supreme Court order. The Company will continue to monitor and evaluate its position based on future events and developments.
37. Segment information
The Company is organized into the following operating segments: IT Services, IT Products and India State Run Enterprise services segment (“ISRE”).
IT Services: The IT Services segment primarily consists of IT Service offerings to customers organized by industry verticals.
The industry verticals are as follows: Banking, Financial Services and Insurance (“BFSI”), Health Business unit (“Health BU”), Consumer Business unit (“CBU”), Energy, Natural Resources & Utilities (“ENU”), Manufacturing (“MFG”), Technology (“TECH”) and Communications (“COMM”). Key service offerings to customers include software application development and maintenance, research and development services for hardware and software design, business application services, analytics, consulting, infrastructure outsourcing services and business process services.
IT Products: The Company is a value-added reseller of desktops, servers, notebooks, storage products, networking solutions and packaged software for leading international brands. In certain total outsourcing contracts of the IT Services segment, the Company delivers hardware, software products and other related deliverables. Revenue relating to the above items is reported as revenue from the sale of IT Products.
ISRE:During the year ended March 31, 2019, the Company has organized ISRE as a separate segment, which was part of IT Services segment. This segment consists of IT Services offerings to entities or departments owned or controlled by Government of India and/ or any State Governments.
The Chairman of the Company has been identified as the Chief Operating Decision Maker (“CODM”) as defined by Ind AS 108, “Operating Segments.” The Chairman of the Company evaluates the segments based on their revenue growth and operating income.
Assets and liabilities used in the Company’s business are not identified to any of the operating segments, as these are used interchangeably between segments. Management believes that it is currently not practicable to provide segment disclosures relating to total assets and liabilities since a meaningful segregation of the available data is onerous.
March 31, 2002 to March 31, 2011 and the aggregate demand is ` 47,583 (including interest of ` 13,832). The appeals filed against the said demand before the Appellate authorities have been allowed in favor of the Company by the second appellate authority for the years up to March 31, 2008. Further appeals have been filed by the Income tax authorities before the Hon’ble High Court. The Hon’ble High Court has heard and disposed-off majority of the issues in favor of the Company up to years ended March 31, 2004. Department has filed a Special Leave Petition before the Supreme Court of India for the years ended March 31, 2001 to March 31, 2004.
On similar issues for years up to March 31, 2000, the Hon’ble High Court of Karnataka has upheld the claim of the Company under section 10A of the Income Tax Act, 1961. For the year ended March 31, 2009, the appeals are pending before Income Tax Appellate Tribunal (“ITAT”). For years ended March 31, 2010 and March 31, 2011, the Dispute Resolution Panel allowed the claim of the Company under section 10A of the Income Tax Act, 1961. The Income tax authorities have filed an appeal before the Hon’ble ITAT.
For the year ended March 31, 2013, the Company received the final assessment order in November 2017 with a demand of ` 3,286 (including interest of ` 1,166), arising primarily on account of section 10AA issues with respect to exclusion from Export Turnover. The Company has filed an appeal before Hon’ble ITAT, Bengaluru within the prescribed timelines.
For the year ended March 31, 2014, the Company received the final assessment order in September 2018 with a demand of ` 1,030 (including nil interest), arising primarily on account of transfer pricing issues. The Company has filed an appeal before the Hon’ble ITAT, Bengaluru within the prescribed timelines.
For the year ended March 31, 2015, the Company received the final assessment order in October 2019 with an estimated demand of ` 1,347 (including nil interest), arising primarily on account of capitalization of wages. The Company has filed an appeal before the Hon’ble ITAT, Bengaluru within the prescribed timelines.
For the year ended March 31, 2016, the Company received the draft assessment order in December 2019 with an estimated demand of ` 704 (including nil interest), arising primarily on account of capitalization of wages. The Company has filed the objections before the Dispute Resolution Panel (Bengaluru) within the prescribed timelines.
For the year ended March 31, 2007 to year ended March 31, 2012, the Company has received a tax demand of ̀ 227 (including ̀ 102 interest) for non-deduction of tax at source on some payments. The Company has already deposited the demand under protest. The Company received order issued by ITAT, Bengaluru rejecting the Company’s appeal. The Company has filed an appeal against the order with the Hon’ble High Court of Karnataka within the prescribed timelines. The Company has received a favorable order on this issue from the Hon’ble High Court of Karnataka for the earlier years.
Income tax demands against the Company amounting to ` 77,873 and ` 66,441 are not acknowledged as debt as at March 31, 2020 and March 31, 2019, respectively. These matters are pending before various Appellate Authorities and the management expects its position will likely be upheld on ultimate resolution and will not have a material adverse effect

Annual Report 2019-20 266
Info
rmat
ion
on re
port
able
seg
men
t for
the
year
end
ed M
arch
31,
202
0 is
as
follo
ws:
IT S
ervi
ces
IT
Prod
ucts
ISRE
Reco
ncili
ng
Item
sTo
tal
BFSI
Hea
lth
BUCB
UEN
UTE
CHM
FGCO
MM
Tota
lRe
venu
e`
18
4,45
7`
7
8,24
0`
9
7,00
8`
7
6,44
3`
7
5,89
5`
4
8,15
8`
3
3,84
0`
5
94,0
41`
11,
010
`
8,40
0`
(5
0)`
613,
401
Othe
r ope
ratin
g in
com
e-
--
--
--
1,14
4-
-1,
144
Segm
ent R
esul
t34
,132
12,0
2716
,729
12,1
7614
,312
9,25
25,
336
103,
964
(282
)(1
,822
)15
610
2,01
6
Una
lloca
ted
2,57
7-
-2,
577
Segm
ent R
esul
t Tot
al`
1
07,6
85`
(
282)
` (
1,82
2)`
15
6`
105
,737
Fina
nce
cost
s(7
,328
)
Fina
nce
and
othe
r inc
ome
24,0
81
Shar
e of
net
pro
fit /(
loss
) of
asso
ciat
es a
ccou
nted
for
usin
g th
e eq
uity
met
hod
29
Profi
t bef
ore
tax
` 12
2,51
9
Inco
me
tax
expe
nse
(24,
801)
Profi
t for
the
year
` 9
7,71
8
Dep
reci
atio
n, a
mor
tizat
ion
and
impa
irmen
t exp
ense
` 2
0,85
5
Info
rmat
ion
on re
port
able
seg
men
t for
the
year
end
ed M
arch
31,
201
9 is
as
follo
ws:
IT S
ervi
ces
IT P
rodu
cts
ISRE
Reco
ncili
ng
Item
sTo
tal
BFSI
Hea
lth
BUCB
UEN
UTE
CHM
FGCO
MM
Tota
l
Reve
nue
`
175
,262
`
75
,081
`
89,
313
`
72,
830
`
76,
591
`
46,
496
`
32,
680
`
568
,253
` 1
2,31
2`
8,5
44`
(4
9)`
589
,060
Othe
r ope
ratin
g in
com
e-
--
--
--
4,34
4-
--
4,34
4
Segm
ent R
esul
t33
,831
8,63
816
,828
7,08
115
,916
8,32
74,
396
95,0
17(1
,047
)(1
,829
)29
092
,431
Una
lloca
ted
3,14
2-
--
3,14
2
Segm
ent R
esul
t Tot
al`
1
02,5
03`
(1,
047)
` (
1,82
9)`
290
`
99,9
17
Fina
nce
cost
s(7
,375
)
Fina
nce
and
othe
r inc
ome
22,9
23
Shar
e of
net
pro
fit /(
loss
) of
asso
ciat
es a
ccou
nted
for
usin
g th
e eq
uity
met
hod
(43)
Profi
t bef
ore
tax
` 1
15,4
22
Inco
me
tax
expe
nse
(25,
243)
Profi
t for
the
year
`
90,1
79
Dep
reci
atio
n, a
mor
tizat
ion
and
impa
irmen
t exp
ense
`
19,4
67

Corporate Overview | Management & Board Reports | Financial Statements
Wipro Limited267
The Company has four geographic segments: India, Americas, Europe and Rest of the world. Revenues from the geographic segments based on domicile of the customer are as follows:
Year ended March 31, 2020 March 31, 2019
India ` 30,158 ` 30,999Americas* 352,319 325,432Europe 144,876 147,074Rest of the world 86,048 85,555Total ` 613,401 ` 589,060* Substantially related to Operations in the United States of America
No customer individually accounted for more than 10% of the revenues during the year ended March 31, 2020 and 2019.
Management believes that it is currently not practicable to provide disclosure of geographical location wise assets, since the meaningful segregation of the available information is onerous.
Notes:
a) “Reconciling items” includes elimination of inter-segment transactions and other corporate activities.
b) Revenue from sale of traded cloud-based licenses is reported as part of IT Services revenues
c) Revenue from sale of Company owned Intellectual Properties is reported as a part of IT Services revenues.
d) For the purpose of segment reporting, the Company has included the impact of foreign exchange gains of ` 3,169 and ` 3,215 for the year ended March 31, 2020 and 2019, respectively, net, in revenues (which is reported as a part of ‘Other income’ in the consolidated statement of profit and loss).
e) For evaluating performance of the individual operating segments, stock compensation expense is allocated on the basis of straight-line amortization. The differential impact of accelerated amortization of stock compensation expense over stock compensation expense allocated to the individual operating segments is reported in reconciling items.
f) The Company generally offers multi-year payment terms in certain total outsourcing contracts. These payment terms primarily relate to IT hardware, software and certain transformation services in outsourcing contracts. The finance income on deferred consideration earned under these contracts is included in the revenue of the respective segment and is eliminated under reconciling items.
g) Other Operating income of ` 1,144 and ` 4,344 for the year ended March 31, 2020 and 2019, respectively, is included as a part of IT Services segment results. Refer Note 22.
h) Segment results for ENU industry vertical for the year ended March 31, 2019, is after considering the impact of ` 5,141 paid to National Grid on settlement of a legal claim against the Company.
i) Segment results for Health BU industry vertical for the year ended March 31, 2019, is after considering the impact of impairment charges on certain software platform and intangible assets recognized on acquisitions amounting to ` 2,318.
j) Segment results of IT Services segment are after recognition of share-based compensation expense ` 1,229 and ` 1,841 for the year ended March 31, 2020 and 2019, respectively. The share-based compensation expense pertaining to other segments is not material.

Annual Report 2019-20 268
38. Related party relationship and transactions
List of subsidiaries and associates as of March 31, 2020 are provided in the table below:
Subsidiaries Subsidiaries Subsidiaries Country of Incorporation
Wipro, LLC USAWipro Gallagher Solutions, LLC USA
Opus Capital Markets Consultants, LLC USAWipro Promax Analytics Solutions Americas, LLC
USA
Wipro Insurance Solutions, LLC USAWipro IT Services, LLC USA
HealthPlan Services, Inc. ** USAAppirio, Inc. ** USACooper Software, Inc. USAInfocrossing, LLC USAWipro US Foundation USAInternational TechneGroup Incorporated ** USARational Interaction, Inc. ** USA
Wipro Overseas IT Services Pvt. Ltd IndiaWipro Japan KK JapanWipro Shanghai Limited ChinaWipro Trademarks Holding Limited IndiaWipro Travel Services Limited IndiaWipro Holdings (UK) Limited U.K.
Designit A/S DenmarkDesignit Denmark A/S DenmarkDesignit Germany GmbH GermanyDesignit Oslo A/S NorwayDesignit Sweden AB SwedenDesignit T.L.V Ltd. IsraelDesignit Tokyo Ltd. JapanDesignit Spain Digital, S.L. ** Spain
Wipro Europe Limited U.K.Wipro UK Limited U.K.
Wipro Financial Services UK Limited U.K.Wipro IT Services S.R.L. Romania
Wipro IT Services SE (formerly Wipro Cyprus SE)
U.K.Wipro Doha LLC # QatarWipro Technologies SA DE CV MexicoWipro Philippines, Inc. PhilippinesWipro Holdings Hungary Korlátolt Felelosségu Társaság
Hungary
Wipro Holdings Investment Korlátolt Felelosségu Társaság
Hungary
Wipro Information Technology Egypt SAE EgyptWipro Arabia Co. Limited * Saudi Arabia
Women’s Business Park Technologies Limited *
Saudi Arabia
Wipro Poland SP Z.O.O PolandWipro IT Services Poland SP Z.O.O PolandWipro Technologies Australia Pty Ltd AustraliaWipro Corporate Technologies Ghana Limited GhanaWipro Technologies South Africa (Proprietary) Limited
South Africa
Wipro Technologies Nigeria Limited NigeriaWipro IT Service Ukraine, LLC UkraineWipro Information Technology Netherlands BV. Netherlands
Wipro Portugal S.A. ** PortugalWipro Technologies Limited RussiaWipro Technology Chile SPA ChileWipro Solutions Canada Limited Canada

Corporate Overview | Management & Board Reports | Financial Statements
Wipro Limited269
Subsidiaries Subsidiaries Subsidiaries Country of Incorporation
Wipro Information Technology Kazakhstan LLP
Kazakhstan
Wipro Technologies W.T. Sociedad Anonima Costa RicaWipro Outsourcing Services (Ireland) Limited
Ireland
Wipro Technologies VZ, C.A. VenezuelaWipro Technologies Peru S.A.C. PeruWipro do Brasil Servicos de Tecnologia S.A. BrazilWipro do Brasil Technologia Ltda ** Brazil
Wipro Technologies SA ArgentinaWipro Technologies S.R.L. RomaniaPT. WT Indonesia IndonesiaWipro (Thailand) Co. Limited ThailandWipro Bahrain Limited Co. S.P.C. Bahrain
Wipro Gulf LLCSultanate of
OmanRainbow Software LLC Iraq
Wipro Networks Pte Limited SingaporeWipro (Dalian) Limited ChinaWipro Technologies SDN BHD Malaysia
Wipro Chengdu Limited ChinaWipro IT Services Bangladesh Limited BangladeshWipro HR Services India Private Limited India
* All the above direct subsidiaries are 100% held by the Company except that the Company holds 66.67% of the equity securities of Wipro Arabia Co. Limited and 55% of the equity securities of Women’s Business Park Technologies Limited are held by Wipro Arabia Co. Limited.
# 51% of equity securities of Wipro Doha LLC are held by a local shareholder. However, the beneficial interest in these holdings is with the Company. The Company controls ‘The Wipro SA Broad Based Ownership Scheme Trust’, ‘Wipro SA Broad Based Ownership Scheme SPV (RF) (PTY) LTD incorporated in South Africa and Wipro Foundation in India
** Step Subsidiary details of Wipro Portugal S.A, Wipro do Brasil Technologia Ltda, Designit Spain Digital, S.L, HealthPlan Services, Inc, Appirio, Inc, International TechneGroup Incorporated and Rational Interaction, Inc. are as follows:
Subsidiaries Subsidiaries Subsidiaries Country of Incorporation
Wipro Portugal S.A. PortugalWipro Technologies GmbH Germany
Cellent GmbH GermanyCellent GmbH Austria
Wipro do Brasil Technologia Ltda BrazilWipro Do Brasil Sistemetas De Informatica Ltd Brazil
Designit Spain Digital, S.L. SpainDesignit Colombia S A S ColombiaDesignit Peru SAC Peru
HealthPlan Services, Inc. USAHealthPlan Services Insurance Agency, LLC USA
International TechneGroup Incorporated USAInternational TechneGroup Ltd. U.K.ITI Proficiency Ltd IsraelInternational TechneGroup S.R.L. Italy
Mech Works S.R.L. ItalyAppirio, Inc. USA
Appirio, K.K JapanTopcoder, LLC. USAAppirio Ltd Ireland
Appirio Ltd (UK) U.K.Rational Interaction, Inc. USA
Rational Consulting Australia Pty Ltd AustraliaRational Interaction Limited Ireland

Annual Report 2019-20 270
As at March 31, 2020 the Company held 43.7% interest in Drivestream Inc, 33% interest in Denim Group Limited and 33.3% in Denim Group Management, LLC, accounted for using the equity method.
The list of controlled trusts are:Name of the entity Country of incorporationWipro Equity Reward Trust IndiaWipro Foundation India
The other related parties are:Name of the related parties: NatureAzim Premji Foundation Entity controlled by DirectorAzim Premji Foundation for Development Entity controlled by DirectorHasham Traders Entity controlled by DirectorPrazim Traders Entity controlled by DirectorZash Traders Entity controlled by DirectorHasham Investment and Trading Co. Pvt. Ltd Entity controlled by DirectorAzim Premji Philanthropic Initiatives Pvt. Ltd Entity controlled by DirectorAzim Premji Trust Entity controlled by DirectorWipro Enterprises (P) Limited Entity controlled by DirectorWipro GE Healthcare Private Limited Entity controlled by Director
Key management personnelRishad A Premji Chairman (i)Abidali Z Neemuchwala Chief Executive Officer and Managing Director (ii)Azim H. Premji Non-Executive Non-Independent Director (iii)N Vaghul Non-Executive Director (iv)Dr. Ashok S. Ganguly Non-Executive Director (iv)William Arthur Owens Non-Executive DirectorM.K. Sharma Non-Executive DirectorIreena Vittal Non-Executive DirectorDr. Patrick J. Ennis Non-Executive DirectorPatrick Dupuis Non-Executive DirectorArundhati Bhattacharya Non-Executive Director (v)Jatin Pravinchandra Dalal Chief Financial OfficerM. Sanaulla Khan Company Secretary
(i) Effective July 31, 2019, Mr. Rishad A. Premji was appointed as Whole-Time Director (designated as Chairman by the Board of Directors of the Company).
(ii) Effective July 31, 2019, Mr. Abidali Z Neemuchwala was designated and appointed as Managing Director in addition to his existing position as Chief Executive Officer. On January 31, 2020, the Company announced that Mr. Abidali Z Neemuchwala has decided to step down from the position of Chief Executive Officer and Managing Director due to family commitments and he will continue to hold the office of Chief Executive Officer and Managing Director, until a successor is appointed, for a smooth transition and to ensure that business continues as usual. The Board of Directors has, at its meeting held on May 29, 2020, noted the resignation of Mr. Abidali Z. Neemuchwala as the Chief Executive Officer and Managing Director with effect from the end of day on June 1, 2020.
(iii) On July 30, 2019, Mr. Azim H. Premji retired as Executive Chairman and Managing Director and was appointed as Non-Executive Non-Independent Director with effect from July 31, 2019.
(iv) Mr. N. Vaghul and Dr. Ashok S. Ganguly retired as Non- Executive Director with effect from July 31, 2019.
(v) Ms. Arundhati Bhattacharya was appointed as Non-Executive Director with effect from January 1, 2019. The Board of Directors has, at its meeting held on May 29, 2020, noted the resignation of Ms. Arundhati Bhattacharya as an Independent Director with effect from close of business hours on June 30, 2020.
Relatives of key management personnel:- Yasmeen A Premji- Tariq A Premji

Corporate Overview | Management & Board Reports | Financial Statements
Wipro Limited271
The Company has the following related party transactions:
Transaction / balancesEntities controlled by Directors Key Management Personnel
March 31, 2020 March 31, 2019 March 31, 2020 March 31, 2019Sales of goods and services ` 43 ` 102 ` - ` -Assets purchased 741 240 - -Dividend 3,987 3,171 243 191Buyback of shares 69,392 - 4,076 -Rental Income 45 43 - -Rent Paid 2 8 9 5Others 119 63 - -
Key management personnel *Remuneration and short-term benefits ` - ` - ` 369 ` 356Other benefits - - 178 174
Balance as at the year endReceivables ` 94 ` 132 ` - ` -Payables ` 23 ` 8 ` 167 ` 156
* Post employment benefit comprising compensated absences is not disclosed as this are determined for the Company as a whole. Benefits includes the prorated value of RSU granted to the personnel, which vest over a period of time. Other benefits include share-based compensation ` 170 and ` 166 for the year ended March 31, 2020 and 2019, respectively.
The following are the significant related party transactions during the year ended March 31, 2020 and 2019:
Year ended March 31, 2020 March 31, 2019
Asset purchased/ capitalizedWipro Enterprises (P) Limited ` 741 ` 240
Sales of goods and servicesWipro Enterprises (P) Limited ` 43 ` 102
Dividend paidHasham Traders ` 939 ` 742Prazim Traders 1,127 891Zash Traders 1,143 903Azim Premji Trust 757 618Azim H. Premji 237 187
Buyback of sharesHasham Traders ` 16,338 ` -Prazim Traders 19,617 -Zash Traders 19,890 -Azim Premji Trust 13,179 -Azim H. Premji 3,986 -
Rental incomeWipro Enterprises (P) Limited ` 45 ` 42
Remuneration paid to key management personnelAzim H. Premji* ` 15 ` 18Abidali Z Neemuchwala 323 273Rishad A Premji 52 68Jatin Pravinchandra Dalal 44 61M. Sanaulla Khan 15 16
* This includes sitting fees and commission paid as non-independent and non-executive director effective July 31, 2019.

Annual Report 2019-20 272
39. Corporate Social Responsibility
a. Gross amount required to be spent by the Company during the year ` 1,690 (March 31, 2019: ` 1,783).
b. Amount spent during the year on: For the year ended March 31, 2020
In Cash Yet to be paid in Cash Total (i) Construction/ acquisition of any asset ` - ` - ` -(ii) On purpose other than above (i) above 1,777 82 1,859Total amount spent during the year ` 1,777 ` 82 ` 1,859
For the year ended March 31, 2019 In Cash Yet to be paid in Cash Total
(i) Construction/ acquisition of any asset ` - ` - ` -(ii) On purpose other than above (i) above 1,482 380 1,862
Total amount spent during the year ` 1,482 ` 380 ` 1,862
40. Additional information pursuant to para 2 of general instructions for the preparation of consolidated financial statements
Name of the SubsidiaryNet Asset Share in Profit or Loss Share in Other
comprehensive incomeShare in total
comprehensive income
As % of total Amount in ` As % of total Amount in ` As % of total Amount in ` As % of total Amount in `
ParentWipro Limited 74.4% ` 465,540 98.8% ` 86,799 110.6% ` (4,312) 98.4% ` 82,487Indian SubsidiariesWipro Overseas IT Services Pvt. Ltd - ` - - ` - - ` - - ` -Wipro Trademarks Holding Limited 0.0% 46 0.0% 3 - - 0.0% 3Wipro Travel Services Limited 0.0% 145 0.0% 19 - - 0.0% 19Wipro HR Services India Private Limited 0.8% 5,304 1.1% 970 0.9% (35) 1.1% 935Foreign SubsidiariesAppirio Ltd 0.0% ` 45 0.0% `20 (0.1)% ` 3 0.0% `23Appirio Ltd (UK) (0.1)% (543) (0.1)% (85) 0.4% (17) (0.1)% (102)Appirio, Inc. 0.8% 4,937 0.0% 4 (9.1)% 354 0.4% 358Appirio, K.K (0.0)% (224) 0.0% 4 0.6% (23) (0.0)% (19)Cellent GmbH 0.2% 1,388 (0.1)% (45) (3.3)% 128 0.1% 83Cellent GmbH 0.1% 579 0.2% 140 (0.9)% 36 0.2% 176Cooper Software, Inc. (0.1)% (323) (0.3)% (275) 0.5% (21) (0.4)% (296)Designit A/S 0.1% 769 (0.2)% (202) (12.4)% 483 0.3% 281Designit Colombia S A S (0.0)% (28) (0.0)% (24) (0.1)% 4 (0.0)% (20)Designit Denmark A/S 0.1% 489 (0.2)% (210) (1.0)% 38 (0.2)% (172)Designit Germany GmbH (0.1)% (379) (0.2)% (175) 0.5% (21) (0.2)% (196)Designit Oslo A/S 0.0% 59 0.0% 14 0.2% (6) 0.0% 8Designit Peru SAC (0.0)% (45) (0.0)% (16) 0.1% (2) (0.0)% (18)Designit Spain Digital, S.L 0.0% 12 (0.0)% (25) (0.0)% 1 (0.0)% (24)Designit Sweden AB (0.0)% (205) (0.2)% (194) 0.1% (2) (0.2)% (196)Designit T.L.V Ltd. 0.0% 161 0.0% 5 (0.4)% 16 0.0% 21Designit Tokyo Ltd. (0.0)% (61) 0.0% 4 0.2% (6) (0.0)% (2)HealthPlan Services Insurance Agency, LLC 0.0% 183 0.1% 129 (0.3)% 13 0.2% 142HealthPlan Services, Inc. 0.1% 560 0.6% 536 (1.8)% 72 0.7% 608Infocrossing, LLC (0.7)% (4,564) 1.6% 1,373 (4.5)% 174 1.8% 1,547International TechneGroup Incorporated 0.1% 666 (0.1)% (103) (0.6)% 25 (0.1)% (78)International TechneGroup Ltd. 0.0% 99 (0.0)% (6) (0.2)% 7 0.0% 1International TechneGroup S.R.L. 0.0% 210 - - 0.2% (7) (0.0)% (7)ITI Proficiency Ltd (0.0)% (283) (0.0)% (17) 0.3% (12) (0.0)% (29)Mech Works S.R.L. 0.0% 103 0.0% 42 (0.2)% 6 0.1% 48

Corporate Overview | Management & Board Reports | Financial Statements
Wipro Limited273
Name of the SubsidiaryNet Asset Share in Profit or Loss Share in Other
comprehensive incomeShare in total
comprehensive incomeAs % of total Amount in ` As % of total Amount in ` As % of total Amount in ` As % of total Amount in `
Opus Capital Markets Consultants, LLC 0.0% 212 (0.2)% (189) (0.6)% 22 (0.2)% (167)PT. WT Indonesia 0.2% 1,060 0.3% 265 1.5% (59) 0.2% 206Rainbow Software LLC (0.0)% (6) (0.0)% (1) 0.0% (1) (0.0)% (2)Rational Consulting Australia Pty Ltd (0.0)% (15) (0.0)% (2) (0.0)% 1 (0.0)% (1)Rational Interaction Limited 0.0% 22 0.0% 1 (0.0)% 1 0.0% 2Rational Interaction, Inc. 0.0% 61 0.0% 15 (0.1)% 3 0.0% 18Topcoder, LLC. (0.1)% (437) (0.4)% (371) 0.7% (29) (0.5)% (400)Wipro (Dalian) Limited 0.1% 808 0.2% 208 (0.7)% 29 0.3% 237Wipro (Thailand) Co. Limited 0.1% 503 0.1% 61 (0.6)% 24 0.1% 85Wipro Arabia Co. Limited 1.0% 6,306 2.2% 1,909 (13.1)% 511 2.9% 2,420Wipro Bahrain Limited Co. S.P.C 0.1% 565 0.0% 25 (1.1)% 43 0.1% 68Wipro Chengdu Limited 0.2% 1,500 0.5% 414 (1.4)% 54 0.6% 468Wipro Corporate Technologies Ghana Limited 0.0% 33 0.0% 1 (0.0)% 1 0.0% 2Wipro do Brasil Servicos de Tecnologia S.A. 0.1% 351 0.2% 196 1.8% (72) 0.1% 124Wipro Do Brasil Sistemetas De Informatica Ltd 0.0% 2 0.0% 37 - - 0.0% 37Wipro do Brasil Technologia Ltda 0.3% 1,749 0.1% 59 9.7% (379) (0.4)% (320)Wipro Doha LLC 0.0% 266 (0.2)% (148) (1.6)% 62 (0.1)% (86)Wipro Europe Limited 0.0% 58 0.0% 2 - - 0.0% 2Wipro Financial Services UK Limited (0.0)% (47) (0.0)% (5) 0.0% (1) (0.0)% (6)Wipro Gallagher Solutions, LLC 0.7% 4,128 0.4% 336 (2.8)% 110 0.5% 446Wipro Gulf LLC 0.2% 1,396 0.4% 391 (1.8)% 71 0.5% 462Wipro Holdings (UK) Limited 0.3% 1,698 (0.9)% (801) (1.5)% 58 (0.9)% (743)Wipro Holdings Hungary Korlátolt Felelosségu Társaság 6.0% 37,530 1.3% 1,153 - - 1.4% 1,153
Wipro Holdings Investment Korlátolt Felelosségu Társaság 4.3% 26,673 3.0% 2,617 - - 3.1% 2,617
Wipro Information Technology Egypt SAE (0.0)% (136) 0.0% 10 0.6% (24) (0.0)% (14)
Wipro Information Technology Kazakhstan LLP (0.0)% (13) 0.0% 5 (0.0)% 1 0.0% 6
Wipro Information Technology Netherlands BV. 0.6% 3,629 0.1% 50 0.4% (15) 0.0% 35
Wipro Insurance Solutions, LLC 0.0% 176 0.0% 25 (0.4)% 14 0.0% 39Wipro IT Service Ukraine, LLC 0.0% 1 (0.0)% (1) - - (0.0)% (1)Wipro IT Services Bangladesh Limited 0.1% 609 0.1% 88 (1.2)% 46 0.2% 134Wipro IT Services Poland SP Z.O.O 0.1% 901 0.4% 373 (0.0)% 1 0.4% 374Wipro IT Services S.R.L. 0.0% 21 0.1% 47 - - 0.1% 47Wipro IT Services SE 3.7% 23,496 1.2% 1,026 - - 1.2% 1,026Wipro IT Services, LLC 1.5% 9,099 (7.4)% (6,501) 37.7% (1,473) (9.5)% (7,974)Wipro Japan KK 0.1% 700 0.0% 29 (1.8)% 70 0.1% 99Wipro Networks Pte Limited 0.3% 1,752 (0.0)% (6) (1.9)% 75 0.1% 69Wipro Outsourcing Services (Ireland) Limited 0.0% 250 0.0% 29 (0.4)% 15 0.1% 44Wipro Philippines, Inc. 2.3% 14,436 4.8% 4,185 (38.7)% 1,509 6.8% 5,694Wipro Poland SP Z.O.O 0.1% 414 0.0% 19 (0.1)% 3 0.0% 22Wipro Portugal S.A. 0.6% 3,847 0.0% 26 (4.5)% 177 0.2% 203Wipro Promax Analytics Solutions Americas, LLC
(0.1)% (428) 0.0% 23 0.9% (37) (0.0)% (14)
Wipro SA Broad based Ownership Scheme SPV(RF)(Pty) Ltd.
0.1% 775 - - - - - -
Wipro SA Broad based Ownership Scheme Trust
0.0% 206 - - (1.8)% 72 0.1% 72
Wipro Shanghai Limited 0.1% 429 0.0% 27 (0.4)% 14 0.0% 41Wipro Solutions Canada Limited (0.6)% (3,668) 1.4% 1,190 3.6% (140) 1.2% 1,050

Annual Report 2019-20 274
Name of the SubsidiaryNet Asset Share in Profit or Loss Share in Other
comprehensive incomeShare in total
comprehensive incomeAs % of total Amount in ` As % of total Amount in ` As % of total Amount in ` As % of total Amount in `
Wipro Technologies Australia Pty Ltd (0.0)% (240) 0.2% 208 (0.5)% 19 0.3% 227Wipro Technologies GmbH (0.1)% (916) 0.6% 541 35.7% (1,393) (1.0)% (852)Wipro Technologies Limited 0.0% 210 0.0% 31 0.6% (23) 0.0% 8Wipro Technologies Nigeria Limited 0.0% 122 0.1% 118 (0.1)% 2 0.1% 120
Wipro Technologies Peru S.A.C. 0.0% 160 0.1% 57 (0.2)% 7 0.1% 64
Wipro Technologies S.R.L. 0.1% 598 (0.3)% (273) (0.8)% 32 (0.3)% (241)
Wipro Technologies SA 0.0% 212 0.1% 73 1.6% (62) 0.0% 11
Wipro Technologies SA DE CV 0.0% 2 0.3% 290 0.2% (6) 0.3% 284
Wipro Technologies SDN BHD 0.0% 5 (0.0)% (1) - - (0.0)% (1)
Wipro Technologies South Africa (Proprietary) Limited
0.1% 538 0.1% 117 1.7% (68) 0.1% 49
Wipro Technologies VZ, C.A. (0.0)% (2) (0.0)% (13) (0.3)% 11 (0.0)% (2)
Wipro Technologies W.T. Sociedad Anonima (0.1)% (684) (0.2)% (195) 1.7% (68) (0.3)% (263)
Wipro Technology Chile SPA 0.0% 10 (0.1)% (79) 0.1% (3) (0.1)% (82)
Wipro UK Limited 0.0% 159 0.0% 31 0.4% (17) 0.0% 14
Wipro, LLC 1.7% 10,355 (9.6)% (8,413) (0.2)% 7 (10.0)% (8,406)
Women’s Business Park Technologies Limited (0.0)% (32) (0.1)% (97) - - (0.1)% (97)
Trusts
Wipro Equity Reward Trust 0.2% ` 1,293 0.1% ` 72 - ` - 0.1% ` 72
Wipro Foundation (0.0)% (5) (0.0)% (21) - - (0.0)% (21)
Total 100% ` 627,337 100% ` 87,948 100% ` (3,909) 100% ` 84,039
Non-controlling interest ` (1,875) ` (495) ` (158) ` (653)
Adjustment arising out of consolidation (72,245) 9,770 8,166 17,936
Grand Total ` 553,217 ` 97,223 ` 4,099 ` 101,322
41. During the year ended March 31, 2019, as part of a customer contract with Alight LLC, Wipro has acquired Alight HR Services India Private Limited (currently known as Wipro HR Services India Private Limited) for a consideration of ` 8,275. Considering the terms and conditions of the agreement, the Company has concluded that this transaction does not meet the definition of Business under Ind AS103 – Business Combinations. The transaction was consummated on September 1, 2018. Net assets taken over was ` 4,128. The excess of consideration paid, and net assets taken over is accounted as ‘costs to obtain contract’, which will be amortized over the tenure of the contract as reduction in revenues.
As per our report of even date attached For and on behalf of the Board of Directors
for Deloitte Haskins & Sells LLP Rishad A. Premji M. K. Sharma Abidali Z. Neemuchwala
Chartered Accountants Chairman Director Chief Executive Officer
& Managing DirectorFirm’s Registration No: 117366W/W- 100018
Vikas Bagaria Jatin Pravinchandra Dalal M. Sanaulla KhanPartner Chief Financial Officer Company SecretaryMembership No. 60408
Bengaluru BengaluruMay 29, 2020 May 29, 2020

Corporate Overview | Management & Board Reports | Financial Statements
Wipro Limited275
Purs
uant
to fi
rst p
rovi
so to
sub
-sec
tion
(3) o
f sec
tion
129
of C
ompa
nies
Act
, 201
3, re
ad w
ith
rule
5 o
f Com
pani
es (A
ccou
nts)
Rul
es,2
014
- AOC
-1, t
he
Com
pany
is p
rese
ntin
g su
mm
aris
ed fi
nanc
ial i
nfor
mat
ion
abou
t ind
ivid
ual s
ubsi
diar
ies
as a
t Mar
ch 3
1, 2
020
/ Dec
embe
r 31,
201
9 In
form
atio
n re
lati
ng to
Sub
sidi
arie
s as
at M
arch
31,
202
0/D
ecem
ber 3
1, 2
019
Par
t -A-
Sub
sidi
arie
s
Sr.
No.
Nam
e of t
he S
ubsid
iary
Date
of
beco
min
g the
su
bsid
iary
/ac
quisi
tion
Repo
rting
pe
riod
Repo
rting
Cu
rrenc
yEx
chan
ge
rate
as on
M
arch
31
, 202
0/
Dece
mbe
r 31
, 201
9
Shar
e ca
pita
l
(j)
Rese
rves
&
Surp
lus
(j)
Tota
l As
sets
(j)
Tota
l Li
abili
ties
excl
udin
g (6
) & (7
)
(j)
Inve
stm
ents
(i) &
(j)
% of
Ho
ldin
g Tu
rnov
er
(k)
Profi
t be
fore
ta
xatio
n (k)
Prov
ision
fo
r ta
xatio
n (k)
Profi
t af
ter
taxa
tion
(k)
Prop
osed
Di
viden
d (in
cl.
divid
end
tax)
(k
)
(1)
(2)
(3)
(4)
(5)
(6)
(7)
(8)
(9)
(10)
(11)
(12)
(13)
(14)
(15)
(16)
1 W
ipro
, LLC
07-J
ul-9
831
-Mar
-20
USD
76
68,2
54
(54,
844)
68,6
38
55,2
29
8,54
4 10
0% 75
,623
(8
,067
) 34
1 (8
,408
) -
2 W
ipro
Ara
bia C
o. Li
mite
d19
-Jun
-07
31-D
ec-1
9SA
R19
57
1 4,
866
10,6
84
5,24
8 -
67
% 11
,105
1,
487
256
1,23
1 -
3 W
ipro
HR
Serv
ices I
ndia
Priv
ate
Lim
ited
31-A
ug-1
831
-Mar
-20
INR
1 70
5,
119
8,29
9 3,
110
-
100%
10,3
59
1,24
2 42
2 82
0 -
4 He
alth
plan
Ser
vices
, Inc
29-F
eb-1
631
-Dec
-19
USD
71
5,42
5 (4
,200
) 5,
356
4,13
1 -
10
0% 10
,102
(3
,335
) -
(3
,335
) -
5 W
ipro
Phi
lippi
nes,
Inc.
16-O
ct-0
731
-Mar
-20
PHP
1 28
2 14
,154
16
,221
1,
785
302
100%
10,0
02
4,31
0 11
3 4,
197
-
6 Ap
pirio
Inc.
23-N
ov-1
631
-Mar
-20
USD
76
* 2,
999
5,71
1 2,
712
-
100%
9,37
1 41
4 23
2 18
2 -
7 W
ipro
Sol
utio
ns C
anad
a Lim
ited
16-A
ug-1
431
-Mar
-20
CAD
53
1,69
7 (5
,365
) 5,
432
9,10
0 -
10
0% 8,
055
1,30
7 11
8 1,
190
-
8 W
ipro
Tech
nolo
gies
Gm
bH30
-Jun
-06
31-M
ar-2
0EU
R83
62
2 (3
92)
12,7
49
12,5
19
-
100%
7,85
6 12
8 (2
64)
393
-
9 In
focr
ossin
g, LL
C20
-Sep
-07
31-M
ar-2
0US
D76
*
1,65
5 4,
686
3,03
1 -
10
0% 7,
307
1,95
1 57
7 1,
373
-
10
Wip
ro IT
Ser
vices
, LLC
06-A
pr-1
531
-Mar
-20
USD
76
68,9
99
(49,
773)
46,2
89
27,0
63
-
100%
7,26
8 (5
,880
) 62
0 (6
,501
) -
11
Wip
ro Te
chno
logi
es S
A DE
C V
13-J
un-0
731
-Mar
-20
MXN
3 63
5 (6
33)
2,66
9 2,
667
-
100%
5,78
8 36
4 74
29
0 -
12
Wip
ro d
o Bra
sil Te
chno
logi
a Ltd
a29
-May
-01
31-D
ec-1
9BR
L18
45
5 1,
495
3,15
3 1,
202
-
100%
4,38
5 19
5 10
6 89
-
13
Celle
nt G
mbH
15-J
an-1
631
-Mar
-20
EUR
83
446
928
2,08
3 70
9 -
10
0% 3,
895
(38)
4 (4
1) -
14
Opus
Cap
ital M
arke
ts C
onsu
ltant
s LL
C14
-Jan
-14
31-M
ar-2
0US
D76
76
13
8 1,
710
1,49
6 -
10
0% 3,
783
(452
) (2
63)
(189
) -
15
Wip
ro G
alla
gher
Sol
utio
ns, L
LC01
-Jul
-08
31-M
ar-2
0US
D76
3,
731
1,09
4 5,
366
541
-
100%
3,43
3 47
0 13
5 33
6 -
16
Wip
ro Te
chno
logi
es S
.R.L
17-A
ug-0
631
-Mar
-20
RON
17
185
412
2,51
0 1,
913
-
100%
3,37
3 (2
87)
(15)
(273
) -
17
Wip
ro G
ulf L
LC01
-Jun
-11
31-M
ar-2
0OM
R19
6 29
1,
361
2,43
1 1,
041
-
100%
2,98
7 47
5 75
40
0 -
18
Wip
ro IT
Ser
vices
Pol
and
SP Z
.O.O
06-A
pr-1
231
-Mar
-20
PLN
18
* 89
7 1,
749
852
-
100%
2,88
9 46
8 98
37
1 -
19
Wip
r o N
etwo
rks P
te Li
mite
d15
-Dec
-99
31-M
ar-2
0US
D76
1,
691
(350
) 3,
003
1,66
2 -
10
0% 2,
809
(31)
9 (4
0) -
20
Wip
ro d
o Bra
sil S
ervic
os d
e Te
cnol
ogia
S.A
10-A
pr-1
731
-Dec
-19
BRL
18
262
130
1,05
5 66
4 -
10
0% 2,
066
239
68
171
-
21
Wip
ro H
oldi
ngs (
UK) L
imite
d09
-Dec
-02
31-M
ar-2
0GB
P93
7,
416
(5,2
13)
11,5
19
9,31
7 4,
487
100%
1,79
3 (7
81)
20
(801
) -
22
Wip
ro Te
chno
logi
es S
outh
Afri
ca
(Pro
prie
tary
) Lim
ited
02-N
ov-1
031
-Mar
-20
ZAR
4 22
51
4 93
8 40
2 -
10
0% 1,
746
170
52
117
-
23
PT W
T Ind
ones
ia24
-Jul
-09
31-M
ar-2
0ID
R0.
005
62
1,02
9 1,
435
343
-
100%
1,53
5 31
8 87
23
1 -
24
Wip
ro C
heng
du Li
mite
d13
-Oct
-08
31-D
ec-1
9CN
Y10
39
1 92
4 2,
184
870
-
100%
1,48
4 43
4 66
36
8 -
25
Appi
rio Lt
d. (U
K)23
-Nov
-16
31-M
ar-2
0GB
P93
*
(543
) 47
1 1,
014
-
100%
1,44
3 (1
47)
(63)
(85)
-
26
Wip
ro In
form
atio
n Tec
hnol
ogy
Neth
erla
nds B
V30
-Jun
-06
31-M
ar-2
0EU
R83
1,
823
2,39
8 6,
807
2,58
6 -
10
0% 1,
392
75
25
50
-
27
Wip
ro (D
alia
n) Li
mite
d25
-Dec
-15
31-D
ec-1
9CN
Y10
54
1 21
1 1,
141
389
-
100%
1,26
9 24
1 39
20
2 -
28
Wip
ro Te
chno
logi
es A
ustra
lia P
ty Lt
d30
-Apr
-12
31-M
ar-2
0AU
D46
*
(186
) 1,
097
1,28
4 -
10
0% 1,
247
136
(80)
216
-

Annual Report 2019-20 276
Sr.
No.
Nam
e of t
he S
ubsid
iary
Date
of
beco
min
g the
su
bsid
iary
/ac
quisi
tion
Repo
rting
pe
riod
Repo
rting
Cu
rrenc
yEx
chan
ge
rate
as on
M
arch
31
, 202
0/
Dece
mbe
r 31
, 201
9
Shar
e ca
pita
l
(j)
Rese
rves
&
Surp
lus
(j)
Tota
l As
sets
(j)
Tota
l Li
abili
ties
excl
udin
g (6
) & (7
)
(j)
Inve
stm
ents
(i) &
(j)
% of
Ho
ldin
g Tu
rnov
er
(k)
Profi
t be
fore
ta
xatio
n (k)
Prov
ision
fo
r ta
xatio
n (k)
Profi
t af
ter
taxa
tion
(k)
Prop
osed
Di
viden
d (in
cl.
divid
end
tax)
(k
)
29
Wip
ro IT
Ser
vices
SE
(For
mer
ly kn
own
as W
ipro
Cyp
rus S
E)27
-Apr
-06
31-M
ar-2
0IN
R1
10
23,4
86
37,3
59
13,8
62
-
100%
1,21
9 1,
164
138
1,02
6 -
30
Celle
nt G
mbH
15-J
an-1
631
-Mar
-20
EUR
83
6 57
2 78
3 20
5 -
10
0% 1,
075
159
35
124
-
31
Wip
ro P
ortu
gal S
A30
-Jun
-06
31-M
ar-2
0EU
R83
4
3,01
6 3,
253
233
-
100%
930
78
32
46
-
32
Wip
ro Ja
pan
KK01
-May
-98
31-M
ar-2
0JP
Y1
300
400
1,27
3 57
2 -
10
0% 89
2 17
(5
) 23
-
33
Wip
ro D
oha L
LC26
-Feb
-14
31-M
ar-2
0QA
R21
4
276
677
397
-
49%
867
(147
) *
(147
) -
34
Coop
er S
oftw
are,
LLC
23-O
ct-1
731
-Mar
-20
USD
76
16
(978
) 41
2 1,
374
-
100%
837
(143
) 13
2 (2
75)
-
35
TopC
oder
, LLC
. 23
-Nov
-16
31-M
ar-2
0US
D76
1,
323
(1,7
61)
53
491
-
100%
812
(371
) -
(3
71)
-
36
Inte
rnat
iona
l Tec
hneG
roup
In
corp
orat
ed (a
)03
-Oct
-19
31-M
ar-2
0US
D76
20
66
4 1,
292
609
-
100%
688
(103
) -
(1
03)
-
37
Wip
ro IT
Ser
vices
Ban
glad
esh
Lim
ited
09-J
an-1
831
-Mar
-20
BDT
1 37
8 23
3 1,
280
668
-
100%
665
57
-
57
-
38
Appi
rio, K
.K.
23-N
ov-1
631
-Mar
-20
JPY
1 6
(219
) 44
2 65
5 -
10
0% 60
8 18
3
15
-
39
Desig
nit O
slo A
/S01
-Dec
-06
31-M
ar-2
0NO
K7
* 58
19
8 14
0 -
10
0% 53
2 9
2 7
-
40
Wip
ro O
utso
urcin
g Ser
vices
(Irel
and)
Li
mite
d14
-May
-12
31-M
ar-2
0EU
R83
*
253
430
177
-
100%
500
33
2 31
-
41
Desig
nit A
/S31
-May
-13
31-M
ar-2
0DK
K11
11
1 1,
866
3,63
4 1,
657
-
100%
494
(1,2
89)
(10)
(1,2
79)
-
42
Appi
rio Lt
d.23
-Nov
-16
31-M
ar-2
0EU
R83
23
3 (1
83)
1,86
9 1,
819
-
100%
457
31
7 24
-
43
Desig
nit S
wede
n AB
11-J
un-0
731
-Mar
-20
SEK
7 *
33
112
78
-
100%
411
(194
) -
(1
94)
-
44
Wip
ro B
ahra
in Li
mite
d Co
. S.P.
C28
-Oct
-09
31-M
ar-2
0BH
D19
9 10
55
5 65
3 88
-
10
0% 37
0 25
-
25
-
45
Ratio
nal In
tera
ctio
n, In
c. (b
)21
-Feb
-20
31-M
ar-2
0US
D76
*
61
773
712
-
100%
370
22
7 15
-
46
Wip
ro Te
chno
logy
Chi
le S
PA19
-Dec
-11
31-M
ar-2
0CL
P0.
09
251
(240
) 31
4 30
3 -
10
0% 36
4 (7
9) *
(79)
-
47
Desig
nit S
pain
Dig
ital S
L04
-Nov
-10
31-M
ar-2
0EU
R83
*
13
307
294
-
100%
360
(41)
(8)
(33)
-
48
Wip
ro Te
chno
logi
es N
igeria
Lim
ited
15-A
ug-1
231
-Mar
-20
NGN
0.20
3
119
714
591
-
100%
359
128
9 11
8 -
49
Heal
thpl
an S
ervic
es In
sura
nce
Agen
cy, L
LC29
-Feb
-16
31-D
ec-1
9US
D71
*
159
159
* -
10
0% 33
1 11
2 -
11
2 -
50
Desig
nit T
.L.V
Ltd.
01-M
ar-0
531
-Mar
-20
ILS21
*
157
213
56
-
100%
312
7 2
4 -
51
Wip
ro Te
chno
logi
es S
A22
-Apr
-08
31-M
ar-2
0AR
S1
149
58
319
112
-
100%
304
48
20
27
-
52
Wip
ro Te
chno
logi
es P
eru
SAC
15-A
ug-1
231
-Mar
-20
PEN
22
41
119
240
80
-
100%
233
60
3 57
-
53
Wip
ro (T
haila
nd) C
o, Li
mite
d30
-Jul
-07
31-M
ar-2
0TH
B2
237
266
551
48
-
100%
215
42
7 35
-
54
Wip
ro Te
chno
logi
es W
T Soc
ieda
d An
onim
a15
-Oct
-10
31-M
ar-2
0CR
C0.
13
* (6
84)
283
967
-
100%
213
(195
) *
(195
) -
55
Desig
nit G
erm
any G
mbH
07-N
ov-0
731
-Mar
-20
EUR
83
2 (4
03)
111
511
-
100%
197
(179
) -
(1
79)
-
56
Wip
ro IT
Ser
vices
S.R
.L01
-Nov
-18
31-M
ar-2
0RO
N17
*
20
93
72
-
100%
183
57
9 47
-
57
Wip
ro D
o Bra
sil S
istem
etas
De
Info
rmat
ica Lt
d.22
-Aug
-14
31-D
ec-1
9BR
L18
25
(4
1) 29
9 31
5 -
10
0% 15
8 *
4 (3
) -
58
Desig
nit T
okyo
Ltd.
06-M
ay-1
331
-Mar
-20
JPY
1 11
(6
5) 72
12
5 -
10
0% 15
2 4
(6)
10
-
59
Desig
nit C
olom
bia S
A S
21-D
ec-1
531
-Dec
-19
COP
0.02
57
(5
3) 94
90
-
10
0% 14
8 (2
8) *
(28)
-
60
Wip
ro In
sura
nce S
olut
ions
, LLC
30-N
ov-1
231
-Mar
-20
USD
76
30
146
208
32
-
100%
132
19
(6)
25
-
61
Inte
rnat
iona
l Tec
hneG
roup
Ltd. (a
)03
-Oct
-19
31-M
ar-2
0GB
P93
28
7 (1
87)
315
216
-
100%
127
(8)
(1)
(6)
-
62
Wip
ro P
olan
d Sp
Z.o.
o.01
-Jul
-08
31-M
ar-2
0PL
N18
*
402
425
22
-
100%
119
20
7 13
-

Corporate Overview | Management & Board Reports | Financial Statements
Wipro Limited277
Sr.
No.
Nam
e of t
he S
ubsid
iary
Date
of
beco
min
g the
su
bsid
iary
/ac
quisi
tion
Repo
rting
pe
riod
Repo
rting
Cu
rrenc
yEx
chan
ge
rate
as on
M
ar 31
, 20
20/ D
ec
31, 2
019
Shar
e ca
pita
l
(j)
Rese
rves
&
Surp
lus
(j)
Tota
l As
sets
(j)
Tota
l Li
abili
ties
excl
udin
g (6
) & (7
)
(j)
Inve
stm
ents
(i) &
(j)
% of
Ho
ldin
g ur
nove
r (k
)
Profi
t be
fore
ta
xatio
n (k)
Prov
ision
fo
r ta
xatio
n (k)
Profi
t af
ter
taxa
tion
(k)
Prop
osed
Di
viden
d (in
cl.
divid
end
tax)
(k
)
63
Wip
ro In
form
atio
n Tec
hnol
ogy
Kaza
khst
an LL
P27
-Sep
-06
31-M
ar-2
0KZ
T0.
17
5 (1
8) 23
0 24
3 -
10
0% 11
0 *
(5)
5 -
64
Mec
hWor
ks S
.R.L
. (a)
03-O
ct-1
931
-Mar
-20
EUR
83
337
(234
) 17
6 73
-
10
0% 99
56
13
42
-
65
Wip
ro S
hang
hai L
imite
d27
-Apr
-04
31-D
ec-1
9CN
Y10
11
0 29
5 67
4 26
8 -
10
0% 91
23
*
23
-
66
Wip
ro Tr
avel
Ser
vices
Lim
ited
10-J
un-9
631
-Mar
-20
INR
1 *
142
506
364
-
100%
86
26
7 19
-
67
Wip
ro Te
chno
logi
es Li
mite
d08
-Feb
-08
31-D
ec-1
9RU
B1
11
237
301
52
-
100%
68
5 1
4 -
68
Desig
nit P
eru
S. A
. C01
-Sep
-16
31-D
ec-1
9PE
N21
54
(4
8) 34
29
-
10
0% 59
(1
6) (2
) (1
3) -
69
Wip
ro P
rom
ax A
nalyt
ics S
olut
ions
Am
erica
s, LL
C30
-Apr
-12
31-M
ar-2
0US
D76
2
(430
)19
862
6 -
10
0% 41
(5
8) (8
1) 23
-
70
ITI P
rofic
ienc
y Ltd
(a)
03-O
ct-1
931
-Mar
-20
ILS21
*
(284
) 36
32
0 -
10
0% 22
(1
8) -
(1
8) -
71
Ratio
nal In
tera
ctio
n Li
mite
d (b
)21
-Feb
-20
31-M
ar-2
0EU
R83
*
22
23
* -
10
0% 10
*
* *
-
72
Wip
ro Te
chno
logi
es S
DN B
HD16
-Nov
-06
31-M
ar-2
0M
YR17
*
6 14
8
-
100%
8 *
* *
-
73
Wip
ro H
oldi
ngs I
nves
tmen
t Kor
láto
lt Fe
lelő
sség
ű Tár
sasá
g23
-Mar
-17
31-D
ec-1
9US
D71
1
25,8
54
25,8
67
12
-
100%
-
738
66
672
-
74
Wip
ro H
oldi
ngs H
unga
ry K
orlá
tolt
Fele
lőss
égű T
ársa
ság
17-S
ep-0
731
-Dec
-19
USD
71
1,96
3 37
,639
39
,604
2
-
100%
-
559
62
497
-
75
Wip
ro In
form
atio
n Tec
hnol
ogy E
gypt
SA
E (c
)
22-M
ay-0
831
-Mar
-20
EGP
5 4
(140
) 28
16
4 -
10
0% -
10
-
10
-
76
Wip
ro Tr
adem
arks
Hol
ding
Lim
ited
30-O
ct-8
231
-Mar
-20
INR
1 *
45
47
* -
10
0% -
3
* 2
-
77
Wip
ro Te
chno
logi
es VZ
, C.A
.13
-Jun
-13
31-D
ec-1
9VE
F0.
002
* *
-
* -
10
0% -
(2
) -
(2
) -
78
Ratio
nal C
onsu
lting
Aus
tralia
Pty
Lt
d. (b
)
21-F
eb-2
031
-Mar
-20
AUD
46
* (1
5) *
16
-
100%
-
(2)
-
(2)
-
79
Wip
ro F
inan
cials
serv
ices U
K Lt
d.
30-A
pr-1
231
-Mar
-20
GBP
93
* (4
7) 5
52
-
100%
-
(6)
(1)
(5)
-
80
Wip
ro U
K Li
mite
d01
-Jun
-11
31-M
ar-2
0GB
P93
66
77
1,
414
1,27
1 -
10
0% -
(2
5) (3
) (2
2) -
81
Wom
en's
Busin
ess P
ark
Tech
nolo
gies
Ltd.
26
-Oct
-17
31-M
ar-2
0SA
R20
75
(1
07)
676
707
-
55%
-
(114
) (1
8) (9
7) -
82
Desig
nit D
enm
ark A
/S
13-S
ep-9
031
-Mar
-20
DKK
11
13
772
2,14
5 1,
360
-
100%
-
(227
) (1
3) (2
15)
-
83
Wip
ro S
A Br
oad
Base
d Ow
ners
hip
Sche
me S
PV (R
f) (P
ty) L
td.
17-J
an-1
431
-Mar
-20
ZAR
4 58
2 *
583
* -
10
0% -
*
-
* -
84
Inte
rnat
iona
l Tec
hneg
roup
S.R
.L (a
)03
-Oct
-19
31-M
ar-2
0EU
R83
*
231
339
108
-
100%
-
* -
*
-
85
Wip
ro E
urop
e Lim
ited
01-J
un-1
131
-Mar
-20
GBP
93
9 10
3 11
2 -
-
10
0% -
-
-
-
-
86
Wip
ro C
orpo
rate
Tech
nolo
gies
Gh
ana L
imite
d09
-Jul
-14
31-M
ar-2
0GH
S13
30
2
34
1 -
10
0% -
*
-
* -
87
Wip
ro IT
Ser
vices
Ukr
aine
, LLC
06-O
ct-1
431
-Mar
-20
UAH
3 5
(4)
5 4
-
100%
-
* -
*
-
88
Rain
bow
Softw
are L
LC10
-Jan
-16
31-D
ec-1
9IQ
D0.
06
* (5
) *
5 -
10
0% -
*
-
* -
89
Wip
ro O
vers
eas I
T Ser
vices
Pvt
Ltd.
12-M
ay-1
531
-Mar
-20
INR
1 *
* *
* -
10
0% -
*
-
* -
90
Wip
ro U
S Fo
unda
tion (d
)25
-Jan
-19
31-M
ar-2
0US
D76
-
-
-
-
-
10
0% -
-
-
-
-

Annual Report 2019-20 278
Ris
had
A. P
rem
ji M
. K. S
harm
aA
bida
li Z
. Nee
muc
hwal
a C
hair
man
D
irec
tor
Chi
ef E
xecu
tive
Offi
cer
& M
anag
ing
Dir
ecto
r
Jati
n P.
Dal
alM
. San
aulla
Kha
nC
hief
Fin
anci
al O
ffice
rC
ompa
ny S
ecre
tary
Ben
galu
ruM
ay 2
9, 2
020
Part
B -A
ssoc
iate
s an
d Jo
int V
entu
res
Nam
e of
the
asso
ciat
es/
Join
t Ve
ntur
es
Late
st
audi
ted
Bala
nce
Sh
eet d
ate
Dat
e on
w
hich
the
Asso
ciat
e or
Joi
nt
Vent
ure
was
as
soci
ated
or
acq
uire
d
No.
of s
hare
s he
ld b
y th
e Co
mpa
ny in
As
soci
ate
on th
e ye
aren
d
Amon
t of
inve
stm
ent i
n As
soci
ates
Exte
nt o
f H
oldi
ng (i
n pe
rcen
tage
)
Des
crip
tion
of
how
ther
e is
sig
nific
ant
influ
ence
Reas
on w
hy
the
asso
ciat
e/jo
int v
entu
re
is n
ot
cons
olid
ated
Net
wor
th
attr
ibut
able
to
shar
ehol
ding
as
per
late
st
audi
ted
Bala
nce
Shee
t
Profi
t or L
oss
for t
he y
ear
Cons
ider
ed in
Co
nsol
idat
ion
Not
Con
side
red
in C
onso
lidat
ion
Driv
estr
eam
31-D
ec-1
812
-Jun
-17
94,5
27 S
eris
A
Pref
erre
d St
ock
27,8
65 c
omm
on
s toc
k 19
0,52
5 Se
ries
B Pr
efer
red
stoc
k
USD
9,4
80,0
3243
.75%
Exte
nt o
feq
uity
hol
ding
in
the
asso
ciat
e co
mpa
ny
exce
eds
20%
Not
Ap
plic
able
USD
(2,4
26,2
80)
USD
(269
,869
)U
SD (3
47,0
13)
Den
im G
roup
Lt
d.31
-Dec
-18
1-M
ar-1
851
0 Se
ries
A Pr
efer
red
Uni
ts U
SD 8
,833
,333
33
.33%
Exte
nt o
f equ
ity
hold
ing
in
the
asso
ciat
e co
mpa
ny
exce
eds
20%
Not
Ap
plic
able
USD
3,2
49,7
54
USD
685
,325
U
SD 1
,152
,671
Den
im G
roup
M
anag
emen
t, LL
C
-1-
Mar
-18
500
Mem
bers
hip
Uni
tsU
SD 2
00,0
00
33%
Exte
nt o
f equ
ity
hold
ing
in
the
asso
ciat
e co
mpa
ny
exce
eds
20%
Not
Ap
plic
able
- -
-
Not
e:
(a
) In
t ern
atio
nal T
echn
eGro
up In
corp
orat
ed, I
nter
natio
nal T
echn
eGro
up L
td.,
Mec
hWor
ks S
.R.L
., IT
I Pro
ficie
ncy
Ltd.
and
Inte
rnat
iona
l Tec
hneg
roup
S.R
.L. ,
wer
e ac
quire
d on
Oct
ober
3, 2
019.
(b)
Ratio
nal I
nter
actio
n, In
c., R
atio
nal I
nter
actio
n Li
mite
d an
d R
atio
nal C
onsu
lting
Aus
tral
ia P
ty L
td. w
ere
acqu
ired
on F
ebru
ary
21, 2
020.
(c
) W
ipro
Info
rmat
ion
Tech
nolo
gy E
gypt
SAE
has
bee
n pu
t int
o liq
uida
tion
with
eff
ect f
rom
Sep
tem
ber 3
0, 2
016.
(d
) W
ipr o
US
Foun
datio
n is
yet
to s
tart
ope
ratio
ns.
(e)
Fron
twor
x In
form
atio
nste
chno
logi
e G
mbH
was
mer
ged
with
and
into
Cel
lent
Gm
bH, A
ustr
ia w
ith e
ffec
t fro
m A
ugus
t 22,
201
9. T
here
fore
, par
ticul
ars
of th
e en
tity
are
not i
nclu
ded
in th
e ab
ove
list.
(f)
Appi
rio G
mbH
is li
quid
ated
with
eff
ect f
rom
Jan
uary
22,
202
0. T
here
fore
, par
ticul
ars
of th
e en
tity
are
not i
nclu
ded
in th
e ab
ove
list.
(g)
Dig
ital A
ps w
as m
erge
d w
ith a
nd in
to D
esig
nit A
/s w
ith e
ffec
t fro
m M
arch
16,
202
0. T
here
fore
, par
ticul
ars
of th
e en
tity
are
not i
nclu
ded
in th
e ab
ove
list
(h)
Wip
ro R
etai
l UK
is d
isso
lved
with
eff
ect f
rom
Jul
y 23
, 201
9. T
here
fore
, par
ticul
ars
of th
e en
tity
are
not i
nclu
ded
in th
e ab
ove
list.
(i)
Inve
stm
ents
exc
lude
s in
vest
men
ts in
sub
sidi
arie
s an
d as
soci
ates
.(j)
In
dian
r upe
e eq
uiva
lent
s of
the
figur
es in
fore
ign
curr
enci
es o
f acc
ount
s of
the
subs
idia
ry c
ompa
nies
are
bas
ed o
n th
e ex
chan
ge ra
tes
as o
f the
resp
ectiv
e re
port
ing
perio
d en
d da
tes.
(k)
Indi
an ru
pee
equi
vale
nts
of th
e fig
ures
in fo
reig
n cu
rren
cies
of a
ccou
nts
of th
e su
bsid
iary
com
pani
es a
re c
onve
rted
on
the
year
ly a
vera
ge e
xcha
nge
rate
s.(*
) Va
lue
is le
ss th
an O
ne M
illio
n Ru
pees

Corporate Overview | Management & Board Reports | Financial Statements
Wipro Limited279
Indepependent Auditor’s ReportReport of Independent Registered Public Accounting Firm
To the shareholders and the Board of Directors of Wipro Limited
Opinion on the Financial Statements
We have audited the accompanying consolidated statements of financial position of Wipro Limited and subsidiaries (the “Company”) as of March 31, 2020 and 2019, the related consolidated statements of income, comprehensive income, shareholders’ equity, and cash flows, for each of the three years in the period ended March 31, 2020, and the related notes (collectively referred to as the “financial statements”). In our opinion, the financial statements present fairly, in all material respects, the financial position of the Company as of March 31, 2020 and 2019, and the results of its operations and its cash flows for each of the three years in the period ended March 31, 2020, in conformity with the International Financial Reporting Standards as issued by the International Accounting Standards Board.
We have also audited, in accordance with the standards of the Public Company Accounting Oversight Board (United States) (PCAOB), the Company’s internal control over financial reporting as of March 31, 2020, based on criteria established in Internal Control — Integrated Framework (2013) issued by the Committee of Sponsoring Organizations of the Treadway Commission and our report dated May 29, 2020, expressed an unqualified opinion on the Company’s internal control over financial reporting.
Change in Accounting Principle
As discussed in Note 3 and 3(xiv) to the financial statements, the Company has changed its method of accounting for leases in fiscal year 2020 and revenue from contracts with customers in fiscal year 2019 due to adoption of International Financial Reporting Standard 16, Leases and International Financial Reporting Standard 15, Revenue from Contracts with Customers respectively.
Basis for Opinion
These financial statements are the responsibility of the Company’s management. Our responsibility is to express an opinion on the Company’s financial statements based on our audits. We are a public accounting firm registered with the PCAOB and are required to be independent with respect to the Company in accordance with the U.S. federal securities laws and the applicable rules and regulations of the Securities and Exchange Commission and the PCAOB.
We conducted our audits in accordance with the standards of the PCAOB. Those standards require that we plan and perform the audit to obtain reasonable assurance about
whether the financial statements are free of material misstatement, whether due to error or fraud. Our audits included performing procedures to assess the risks of material misstatement of the financial statements, whether due to error or fraud, and performing procedures that respond to those risks. Such procedures included examining, on a test basis, evidence regarding the amounts and disclosures in the financial statements. Our audits also included evaluating the accounting principles used and significant estimates made by management, as well as evaluating the overall presentation of the financial statements. We believe that our audits provide a reasonable basis for our opinion.
Critical Audit Matters
The critical audit matters communicated below are matters arising from the current-period audit of the financial statements that were communicated or required to be communicated to the audit committee and that (1) relate to accounts or disclosures that are material to the financial statements and (2) involved our especially challenging, subjective, or complex judgments. The communication of critical audit matters does not alter in any way our opinion on the financial statements, taken as a whole, and we are not, by communicating the critical audit matters below, providing separate opinions on the critical audit matters or on the accounts or disclosures to which they relate.
Fixed price contracts using the percentage of completion method - Refer Notes 2 (iv)(a), 3(xiv)B and 24 to the financial statements.
Critical Audit Matter Description
Revenue from fixed-price contracts, including software development, and integration contracts, where the performance obligations are satisfied over time, is recognized using the percentage-of-completion method.
Use of the percentage-of-completion method requires the Company to determine the project costs incurred to date as a percentage of total estimated project costs required to complete the project. The estimation of total project costs involves significant judgement and is assessed throughout the period of the contract to reflect any changes based on the latest available information. In addition, provisions for estimated losses, if any, on uncompleted contracts are recorded in the period in which such losses become probable based on the estimated project costs.
We identified the revenue recognition for fixed price contracts where the percentage-of-completion method is used as a critical audit matter because of the significant judgement involved in estimating the efforts to complete such contracts.

Annual Report 2019-20 280
This estimate has a high inherent uncertainty and requires consideration of progress of the contract, efforts incurred to-date and estimates of efforts required to complete the remaining contract performance obligations over the lives of the contracts.
This required a high degree of auditor judgment in evaluating the audit evidence supporting the application of the input method used to recognize revenue and a higher extent of audit effort to evaluate the reasonableness of the total estimated amount of revenue recognized on fixed-price contracts.
How the Critical Audit Matter Was Addressed in the Audit
Our audit procedures related to estimates of efforts to complete for fixed-price contracts accounted using the percentage-of-completion method included the following, among others:
• We tested the effectiveness of controls relating to (1) recording of efforts incurred and estimation of efforts required to complete the remaining contract performance obligations, and (2) access and application controls pertaining to time recording and allocation systems, which prevents unauthorised changes to recording of efforts incurred.
• We evaluated management’s ability to reasonably estimate the progress towards satisfying the performance obligation by comparing actual information to estimates for performance obligations that have been fulfilled.
• We selected a sample of fixed price contracts with customers accounted using percentage-of-completion method and performed the following:
o Read the contract and based on the terms and conditions evaluated whether recognizing revenue over time was appropriate, and the contract was included in management’s calculation of revenue over time.
o Evaluated other information that supported the estimates of the progress towards satisfying the performance obligation.
o Evaluated the appropriateness of and consistency in the application of management’s policies and methodologies to estimate progress towards satisfying the performance obligation.
o Compared efforts incurred with Company’s estimate of efforts incurred to date to identify significant variations and evaluate whether those variations have been considered appropriately in estimating the remaining efforts to complete the contract.
o Tested the estimate for consistency with the status of delivery of milestones and customer acceptances to identify possible delays in achieving milestones, which require changes in estimated efforts to complete the remaining performance obligations.
Allowance for credit losses Refer Notes 2(iv)(g), 3(x)(A), 9 and 25 to the financial statements
Critical Audit Matter Description
The Company determines the allowance for credit losses based on historical loss experience adjusted to reflect current and estimated future economic conditions. The Company considered current and anticipated future economic conditions relating to industries the Company deals with and the countries where it operates. In calculating expected credit losses, the Company also considered credit reports and other related credit information for its customers to estimate the probability of default in future and has taken into account estimates of possible effect from the pandemic relating to COVID-19.
We identified allowance for credit losses as a critical audit matter because of the significant judgement involved in calculating the expected credit losses. This required a high degree of auditor judgment and an increased extent of effort when performing audit procedures to evaluate the reasonableness of management’s estimate of the expected credit losses.
How the Critical Audit Matter Was Addressed in the Audit
Our audit procedures related to the allowance for credit losses for trade receivables, unbilled receivables and contract assets included the following, among others:
• We tested the effectiveness of controls over the (1) development of the methodology for the allowance for credit losses, including consideration of the current and estimated future economic conditions, (2) completeness and accuracy of information used in the estimation of probability of default, and (3) computation of the allowance for credit losses.
• For a sample of customers we tested the input data such as credit reports and other credit related information used in estimating the probability of default by comparing them to external and internal sources of information.
• We evaluated the incorporation of the applicable assumptions into the estimate of expected credit losses and tested the mathematical accuracy and computation of the allowances by using the same input data used by the Company.
• We evaluated the qualitative adjustment to the historical loss rates, including assessing the basis for the adjustments and the reasonableness of the significant assumptions.
/S/Deloitte Haskins & Sells LLP
Bengaluru, IndiaMay 29, 2020
We have served as the Company’s auditor since fiscal 2018.

Corporate Overview | Management & Board Reports | Financial Statements
Wipro Limited281
NotesAs at
March 31, 2019As at
March 31, 2020As at
March 31, 2020 Convenience
translation into US dollar in millions
(unaudited) Refer to Note 2(iii)
ASSETSGoodwill 6 116,980 131,012 1,738
Intangible assets 6 13,762 16,362 217
Property, plant and equipment 4 70,601 81,120 1,076
Right-of-use assets 5 - 16,748 222
Financial assets
Derivative assets 19 173 - -
Investments 8 6,916 9,302 123
Trade receivables 9 4,373 6,049 80
Other financial assets 12 5,146 5,881 78
Investments accounted for using the equity method 8 1,235 1,383 18
Deferred tax assets 21 5,604 6,005 80
Non-current tax assets 20,603 11,414 151
Other non-current assets 13 15,872 11,935 158
Total non-current assets 261,265 297,211 3,941Inventories 10 3,951 1,865 25
Financial assets
Derivative assets 19 4,931 3,025 40
Investments 8 220,716 189,635 2,515
Cash and cash equivalents 11 158,529 144,499 1,917
Trade receivables 9 100,489 104,474 1,386
Unbilled receivables 22,880 25,209 335
Other financial assets 12 14,611 8,614 114
Contract assets 15,038 17,143 228
Current tax assets 7,435 2,882 38
Other current assets 13 23,086 22,505 299
571,666 519,851 6,897
Assets held for sale 240 - -
Total current assets 571,906 519,851 6,897TOTAL ASSETS 833,171 817,062 10,838EQUITY
Share capital 12,068 11,427 152
Securities premium reserve 533 1,275 17
Retained earnings 534,700 519,907 6,896
Share-based payment reserve 2,617 1,550 21
Other components of equity 18,198 23,299 309
Equity attributable to the equity holders of the Company 568,116 557,458 7,395Non-controlling interest 2,637 1,875 25
TOTAL EQUITY 570,753 559,333 7,420
Consolidated Statement of Financial Position(` in millions, except share and per share data, unless otherwise stated)

Annual Report 2019-20 282
NotesAs at
March 31, 2019As at
March 31, 2020As at
March 31, 2020 Convenience
translation into US dollar in millions
(unaudited) Refer to Note 2(iii)
LIABILITIESFinancial liabilities
Long - term loans and borrowings 14 28,368 4,840 64
Derivative liabilities 19 - 138 2
Lease liabilities 14 - 12,638 168
Other financial liabilities 16 - 151 2
Deferred tax liabilities 21 3,417 2,825 37
Non-current tax liabilities 11,023 13,205 175
Other non-current liabilities 17 5,258 7,537 100
Provisions 18 2 2 ^
Total non-current liabilities 48,068 41,336 548Financial liabilities
Loans, borrowings and bank overdrafts 14 71,099 73,202 971
Derivative liabilities 19 1,310 7,231 96
Trade payables and accrued expenses 15 88,304 78,129 1,036
Lease liabilities 14 - 6,560 87
Other financial liabilities 16 644 899 12
Contract liabilities 24,768 18,775 249
Current tax liabilities 9,541 11,731 156
Other current liabilities 17 18,046 19,254 255
Provisions 18 638 612 8
Total current liabilities 214,350 216,393 2,870TOTAL LIABILITIES 262,418 257,729 3,418TOTAL EQUITY AND LIABILITIES 833,171 817,062 10,838^ Value is less than 1
The accompanying notes form an integral part of these consolidated financial statements.
Consolidated Statement of Financial Position(` in millions, except share and per share data, unless otherwise stated)

Corporate Overview | Management & Board Reports | Financial Statements
Wipro Limited283
NotesYear ended
March 31, 2018Year ended
March 31, 2019Year ended
March 31, 2020Year ended
March 31, 2020 Convenience
translation into US dollar
in millions (unaudited) Refer
to Note 2(iii) Revenues 24 544,871 585,845 610,232 8,094
Cost of revenues 25 (385,575) (413,033) (436,085) (5,784)
Gross profit 159,296 172,812 174,147 2,310Selling and marketing expenses 25 (42,349) (44,510) (42,907) (569)
General and administrative expenses 25 (34,141) (35,951) (29,823) (396)
Foreign exchange gains/(losses), net 28 1,488 3,215 3,169 42
Other operating income 26 - 4,344 1,144 15
Results from operating activities 84,294 99,910 105,730 1,402Finance expenses 27 (5,830) (7,375) (7,328) (97)
Finance and other income 28 23,999 22,923 24,081 319
Share of net profit /(loss) of associates accounted for using the equity method
8 11 (43) 29 ^
Profit before tax 102,474 115,415 122,512 1,624Income tax expense 21 (22,390) (25,242) (24,799) (329)
Profit for the year 80,084 90,173 97,713 1,295Profit attributable to:Equity holders of the Company 80,081 90,031 97,218 1,288
Non-controlling interest 3 142 495 7
Profit for the year 80,084 90,173 97,713 1,295Earnings per equity share: 29
Attributable to equity shareholders of the CompanyBasic 12.64 14.99 16.67 0.22
Diluted 12.62 14.95 16.62 0.22
Weighted average number of equity sharesused in computing earnings per equity shareBasic 6,333,391,200 6,007,376,837 5,833,384,018 5,833,384,018
Diluted 6,344,482,633 6,022,304,367 5,847,823,239 5,847,823,239
^ Value is less than 1
The accompanying notes form an integral part of these consolidated financial statements.
Consolidated Statement of Income(` in millions, except share and per share data, unless otherwise stated)

Annual Report 2019-20 284
NotesYear ended
March 31, 2018Year ended
March 31, 2019Year ended
March 31, 2020Year ended
March 31, 2020 Convenience
translation into US dollar
in millions (unaudited)
Refer to Note 2(iii)
Profit for the year 80,084 90,173 97,713 1,295
Other comprehensive income (OCI)Items that will not be reclassified to profit and loss in sub-sequent periodsDefined benefit plan actuarial gains/(losses) 567 235 (1,050) (14)
Net change in fair value of financial instruments through OCI (750) (464) 724 10
(183) (229) (326) (4)Items that may be reclassified to profit and loss in subse-quent periodsForeign currency translation differences 20
Translation difference relating to foreign operations 3,576 3,238 8,447 112
Net change in fair value of hedges of net investment in foreign operations (49) (287) - -
Reclassification of foreign currency translation differ-ences to profit and loss on sale of hosted data center services, Workday business and Cornerstone OnDemand business - (4,210) - -
Net change in time value of option contracts designated as cash flow hedges 1 463 (520) (7)
Net change in intrinsic value of option contracts designated as cash flow hedges (76) 811 (1,558) (21)
Net change in fair value of forward contracts designated as cash flow hedges (5,945) 1,255 (2,652) (35)
Net change in fair value of financial instruments through OCI (433) (18) 1,222 16
(2,926) 1,252 4,939 65
Total other comprehensive income, net of taxes (3,109) 1,023 4,613 61
Total comprehensive income for the year 76,975 91,196 102,326 1,356
Total comprehensive income attributable to:Equity holders of the Company 76,956 90,945 101,673 1,347
Non-controlling interest 19 251 653 9
76,975 91,196 102,326 1,356
The accompanying notes form an integral part of these consolidated financial statements.
Consolidated Statement of Comprehensive Income(` in millions, except share and per share data, unless otherwise stated)

Corporate Overview | Management & Board Reports | Financial Statements
Wipro Limited285
Con
solid
ated
Sta
tem
ent
Of C
hang
es In
Equ
ity
(` in
mill
ions
, exc
ept
shar
e an
d pe
r sha
re d
ata,
unl
ess
othe
rwis
e st
ated
)
Par
ticu
lars
Num
ber o
f S
hare
s*
Sha
re
capi
tal,
fully
pai
d-up
Sec
urit
ies
prem
ium
re
serv
e
Ret
aine
d ea
rnin
gs
Sha
re-
base
d pa
ymen
t re
serv
e
Oth
er c
ompo
nent
s of
equ
ity
Equ
ity
attr
ibut
able
to
the
equ
ity
hold
ers
of t
he
Com
pany
Non
-co
ntro
lling
in
tere
st
Tota
l eq
uity
Fore
ign
curr
ency
tr
ansl
atio
n re
serv
e
Cas
h fl
ow
hedg
ing
rese
rve
Oth
er
rese
rves
As
at A
pril
1, 2
017
2,43
0,90
0,56
54,
861
469
490,
930
3,55
513
,107
5,90
61,
476
520,
304
2,39
152
2,69
5To
tal c
ompr
ehen
sive
inco
me
for t
he
year
Pro
fit f
or th
e ye
ar-
--
80,0
81-
--
-80
,081
380
,084
Oth
er c
ompr
ehen
sive
inco
me
--
--
3,51
1(6
,020
)(6
16)
(3,1
25)
16(3
,109
)To
tal c
ompr
ehen
sive
inco
me
for t
he
year
--
-80
,081
-3,
511
(6,0
20)
(616
)76
,956
1976
,975
Tran
sact
ion
wit
h ow
ners
of t
he
Com
pany
, rec
ogni
zed
dire
ctly
in
equi
tyC
ontr
ibut
ions
by
and
dist
ribu
tion
s to
ow
ners
of t
he C
ompa
nyC
ash
divi
dend
pai
d (in
clud
ing
divi
dend
tax
ther
eon)
--
-(5
,420
)-
--
-(5
,420
)-
(5,4
20)
Issu
e of
equ
ity
shar
es o
n ex
erci
se o
f op
tion
s3,
559,
599
81,
987
-(1
,971
)-
--
24-
24
Issu
e of
sha
res
by c
ontr
olle
d tr
ust o
n ex
erci
se o
f opt
ions
--
-1,
182
(1,1
82)
--
--
--
Buy
back
of e
quit
y sh
ares
#(3
43,7
50,0
00)
(687
)(1
,656
)(1
08,3
44)
--
-68
7(1
10,0
00)
-(1
10,0
00)
Tran
sact
ion
cost
rela
ted
to b
uyba
ck-
--
(312
)-
--
-(3
12)
(312
)B
onus
issu
e of
equ
ity
shar
es2,
433,
074,
327
4,86
6-
(4,8
66)
--
--
--
Com
pens
atio
n co
st re
late
d to
em
ploy
ee s
hare
-bas
ed p
aym
ent
--
-14
1,37
0-
--
1,38
4-
1,38
4
Tota
l tra
nsac
tion
s w
ith
owne
rs o
f th
e C
ompa
ny2,
092,
883,
926
4,18
733
1(1
17,7
46)
(1,7
83)
--
687
(114
,324
)-
(114
,324
)
As
at M
arch
31,
201
84,
523,
784,
491
9,04
880
045
3,26
51,
772
16,6
18(1
14)
1,54
748
2,93
62,
410
485,
346
The
acco
mpa
nyin
g no
tes
form
an
inte
gral
par
t of t
hese
con
solid
ated
fina
ncia
l sta
tem
ents
.

Annual Report 2019-20 286
Con
solid
ated
Sta
tem
ent
of C
hang
es In
Equ
ity
(` in
mill
ions
, exc
ept
shar
e an
d pe
r sha
re d
ata,
unl
ess
othe
rwis
e st
ated
)
Par
ticu
lars
Num
ber o
f S
hare
s*
Sha
re
capi
tal,
fully
pa
id-
up
Sec
urit
ies
prem
ium
re
serv
e
Ret
aine
d ea
rnin
gs
Sha
re-
base
d pa
ymen
t re
serv
e
Oth
er c
ompo
nent
s of
equ
ity
Equ
ity
attr
ibut
able
to
the
equ
ity
hold
ers
of
the
Com
pany
Non
-co
ntro
lling
in
tere
st
Tota
l eq
uity
Fore
ign
curr
ency
tr
ansl
atio
n re
serv
e
Cas
h fl
ow
hedg
ing
rese
rve
Oth
er
rese
rves
As
at A
pril
1, 2
018
4,52
3,78
4,49
19,
048
800
453,
265
1,77
216
,618
(114
)1,
547
482,
936
2,41
048
5,34
6A
djus
tmen
t on
adop
tion
of I
FRS
15
--
-(2
,279
)-
--
-(2
,279
)-
(2,2
79)
Adj
uste
d ba
lanc
e as
at A
pril
1,
2018
4,52
3,78
4,49
19,
048
800
450,
986
1,77
216
,618
(114
)1,
547
480,
657
2,41
048
3,06
7
Tota
l com
preh
ensi
ve in
com
e fo
r th
e ye
arP
rofi
t for
the
year
--
-90
,031
--
--
90,0
3114
290
,173
Oth
er c
ompr
ehen
sive
inco
me
--
--
-(1
,368
)2,
529
(247
)91
410
91,
023
Tota
l com
preh
ensi
ve in
com
e fo
r th
e ye
ar-
--
90,0
31-
(1,3
68)
2,52
9(2
47)
90,9
4525
191
,196
Tran
sact
ion
wit
h ow
ners
of t
he
Com
pany
, rec
ogni
zed
dire
ctly
in
equi
tyC
ontr
ibut
ions
by
and
dist
ribu
tion
s to
ow
ners
of t
he
Com
pany
Issu
e of
equ
ity
shar
es o
n ex
erci
se
of o
ptio
ns1,
681,
717
452
8-
(528
)-
--
4-
4
Issu
e of
sha
res
by c
ontr
olle
d tr
ust o
n ex
erci
se o
f opt
ions
--
-56
5(5
65)
--
--
--
Cas
h di
vide
nd p
aid
(incl
udin
g di
vide
nd ta
x th
ereo
n) #
--
-(5
,434
)-
--
-(5
,434
)-
(5,4
34)
Bon
us is
sue
of e
quit
y sh
ares
#1,
508,
469,
180
3,01
6(7
95)
(1,4
54)
--
-(7
67)
--
-Lo
ss o
f con
trol
in s
ubsi
diar
y-
--
--
--
--
(52)
(52)
Infu
sion
of c
apit
al-
--
--
--
--
2828
Com
pens
atio
n co
st re
late
d to
em
ploy
ee s
hare
-bas
ed p
aym
ent
--
-6
1,93
8-
--
1,94
4-
1,94
4
Tota
l tra
nsac
tion
s w
ith
owne
rs
of t
he C
ompa
ny1,
510,
150,
897
3,02
0(2
67)
(6,3
17)
845
--
(767
)(3
,486
)(2
4)(3
,510
)
As
at M
arch
31,
201
96,
033,
935,
388
12,0
6853
353
4,70
02,
617
15,2
502,
415
533
568,
116
2,63
757
0,75
3
The
acco
mpa
nyin
g no
tes
form
an
inte
gral
par
t of t
hese
con
solid
ated
fina
ncia
l sta
tem
ents
.

Corporate Overview | Management & Board Reports | Financial Statements
Wipro Limited287
Con
solid
ated
Sta
tem
ent
of C
hang
es in
Equ
ity
(` in
mill
ions
, exc
ept
shar
e an
d pe
r sha
re d
ata,
unl
ess
othe
rwis
e st
ated
)
Par
ticu
lars
Num
ber o
f S
hare
s*
Sha
re
capi
tal,
fully
pa
id-u
p
Sec
urit
ies
prem
ium
re
serv
e
Ret
aine
d ea
rnin
gs
Sha
re-
base
d pa
ymen
t re
serv
e
Oth
er c
ompo
nent
s of
equ
ity
Equ
ity
attr
ibut
able
to
the
eq
uity
ho
lder
s of
the
C
ompa
ny
Non
-co
ntro
lling
in
tere
st
Tota
l eq
uity
Fore
ign
curr
ency
tr
ansl
atio
n re
serv
e
Cas
h fl
ow
hedg
ing
rese
rve
Oth
er
rese
rves
As
at A
pril
1, 2
019
6,03
3,93
5,38
812
,068
533
534,
700
2,61
715
,250
2,41
553
356
8,11
62,
637
570,
753
Adj
ustm
ent o
n ad
opti
on o
f IFR
S 1
6 #
#-
--
(872
)-
--
-(8
72)
-(8
72)
Adj
uste
d ba
lanc
e as
at A
pril
1, 2
019
6,03
3,93
5,38
812
,068
533
533,
828
2,61
715
,250
2,41
553
356
7,24
42,
637
569,
881
Tota
l com
preh
ensi
ve in
com
e fo
r the
yea
rP
rofi
t for
the
year
--
-97
,218
--
--
97,2
1849
597
,713
Oth
er c
ompr
ehen
sive
inco
me
--
--
-8,
289
(4,7
30)
896
4,45
515
84,
613
Tota
l com
preh
ensi
ve in
com
e fo
r the
yea
r-
--
97,2
18-
8,28
9(4
,730
)89
610
1,67
365
310
2,32
6Tr
ansa
ctio
n w
ith
owne
rs o
f the
Com
pany
, re
cogn
ized
dir
ectl
y in
equ
ity
Con
trib
utio
ns b
y an
d di
stri
buti
ons
to o
wne
rs
of t
he C
ompa
nyIs
sue
of e
quit
y sh
ares
on
exer
cise
of o
ptio
ns2,
498,
925
574
2-
(742
)-
--
5-
5B
uyba
ck o
f equ
ity
shar
es #
(323
,076
,923
)(6
46)
-(1
05,0
00)
--
-64
6(1
05,0
00)
-(1
05,0
00)
Tran
sact
ion
cost
rela
ted
to b
uyba
ck-
--
(311
)-
--
-(3
11)
-(3
11)
Issu
e of
sha
res
by c
ontr
olle
d tr
ust o
n ex
erci
se
of o
ptio
ns-
--
1,02
6(1
,026
)-
--
--
-C
ompe
nsat
ion
cost
rela
ted
to e
mpl
oyee
sh
are-
base
d pa
ymen
t-
--
91,
262
--
-1,
271
-1,
271
Eff
ect o
f mod
ifica
tion
of A
DS
RS
Us
from
eq
uity
set
tled
to c
ash
sett
led
##
#-
--
-(5
61)
--
-(5
61)
-(5
61)
Cas
h di
vide
nd p
aid
(incl
udin
g di
vide
nd ta
x th
ereo
n) #
--
-(6
,863
)-
--
(6,8
63)
-(6
,863
)C
ash
divi
dend
pai
d to
Non
-con
trol
ling
inte
rest
--
--
--
--
(1,4
15)
(1,4
15)
Tota
l tra
nsac
tion
s w
ith
owne
rs o
f the
C
ompa
ny(3
20,5
77,9
98)
(641
)74
2(1
11,1
39)
(1,0
67)
--
646
(111
,459
)(1
,415
)(1
12,8
74)
As
at M
arch
31,
202
05,
713,
357,
390
11,4
271,
275
519,
907
1,55
023
,539
(2,3
15)
2,07
555
7,45
81,
875
559,
333
Con
veni
ence
tra
nsla
tion
into
US
dol
lar i
n m
illio
ns
(una
udit
ed) R
efer
to N
ote
2(iii
)15
217
6,89
621
312
(31)
287,
395
257,
420
* In
clud
es 2
3,09
7,21
6, 2
7,35
3,85
3 an
d 22
,746
,081
trea
sury
sha
res
held
as
at M
arch
31,
201
8, 2
019
and
2020
, res
pect
ivel
y by
a c
ontr
olle
d tr
ust.
4,35
1,77
5, 2
,599
,183
and
4,6
07,7
72 s
hare
s ha
ve b
een
tran
sfer
red
by th
e co
ntro
lled
trus
t to
elig
ible
em
ploy
ees
on e
xerc
ise
of o
ptio
ns d
urin
g th
e ye
ar e
nded
Mar
ch 3
1, 2
018,
201
9 an
d 20
20, r
espe
ctiv
ely.
# R
efer
to N
ote
22#
# R
efer
to N
ote
3
##
# R
efer
to N
ote
30
The
acc
ompa
nyin
g no
tes
form
an
inte
gral
par
t of t
hese
con
solid
ated
fina
ncia
l sta
tem
ents
.

Annual Report 2019-20 288
Year ended March 31,
2018
Year ended March 31,
2019Year ended
March 31, 2020Year ended March
31, 2020Convenience
translation into US dollar in mil-
lions (unaudited) Refer to Note
2(iii)Cash flows from operating activities:Profit for the year 80,084 90,173 97,713 1,295
Adjustments to reconcile profit for the year to net cash generated from operating activities:
Gain on sale of property, plant and equipment and intangible as-sets, net (334) (309) (11) ^
Depreciation, amortization and impairment 21,124 19,474 20,862 277
Unrealized exchange (gain)/ loss, net and exchange (gain)/ loss on borrowings 4,794 (546) 6,376 85
Share based compensation expense 1,347 1,938 1,262 17
Share of net (profit) /loss of associates accounted for using the equity method 11 43 (29) ^
Income tax expense 22,390 25,242 24,799 329
Dividend and interest (income)/expenses, net (20,547) (17,371) (18,945) (251)
Gain from sale of business and loss of control in subsidiary, net - (4,344) (1,144) (15)
Other non-cash items 4,405 - - -
Changes in operating assets and liabilities; net of effects from acquisitions:
Trade receivables (9,735) 1,392 (3,327) (44)
Unbilled receivables and Contract assets 2,192 4,580 (3,561) (47)
Inventories 545 (566) 2,085 28
Other assets (170) (6,909) (80) (1)
Trade payables, accrued expenses, other liabilities and provisions 4,499 20,844 (12,401) (164)
Contract liabilities 1,733 7,824 (6,572) (87)
Cash generated from operating activities before taxes 112,338 141,465 107,027 1,422
Income taxes paid, net (28,105) (25,149) (6,384) (85)
Net cash generated from operating activities 84,233 116,316 100,643 1,337Cash flows from investing activities:
Purchase of property, plant and equipment (21,870) (22,781) (23,497) (312)
Proceeds from sale of property, plant and equipment 1,171 1,940 1,270 17
Purchase of investments (782,475) (930,614) (1,178,247) (15,629)
Proceeds from sale of investments 830,448 954,954 1,212,826 16,087
Proceeds from sale of hosted data center services business and loss of control in subsidiary, net of related expenses and cash - 26,103 - -
Payment for business acquisitions including deposits and escrow, net of cash acquired (6,652) - (10,003) (133)
Proceeds from sale of business - - 7,459 99
Interest received 14,347 20,163 23,837 316
Dividend received 609 361 367 5
Consolidated Statement of Cash Flows(` in millions, except share and per share data, unless otherwise stated)

Corporate Overview | Management & Board Reports | Financial Statements
Wipro Limited289
Year ended March 31,
2018
Year ended March 31,
2019Year ended
March 31, 2020Year ended March
31, 2020Convenience
translation into US dollar in mil-
lions (unaudited) Refer to Note
2(iii)Net cash generated in investing activities 35,578 50,126 34,012 450Cash flows from financing activities:
Proceeds from issuance of equity shares/shares pending allotment 24 4 14 ^
Repayment of loans and borrowings (155,254) (104,039) (132,380) (1,756)
Proceeds from loans and borrowings 144,271 65,161 106,342 1,411
Repayment of lease liabilities - - (6,784) (90)
Payment for deferred contingent consideration in respect of busi-ness combination (164) (265) - -
Payment for buy back of shares, including transaction cost (110,312) - (105,311) (1,397)
Interest paid (3,123) (4,796) (4,601) (61)
Payment of cash dividend (including dividend tax thereon) (5,420) (5,434) (6,863) (91)
Payment of cash dividend to Non-controlling interest - - (1,415) (19)
Net cash used in financing activities (129,978) (49,369) (150,998) (2,003)Net increase/ (decrease) in cash and cash equivalents during the year (10,167) 117,073 (16,343) (216)
Effect of exchange rate changes on cash and cash equivalents 375 526 1,922 25
Cash and cash equivalents at the beginning of the year 50,718 40,926 158,525 2,103
Cash and cash equivalents at the end of the year (Note 11) 40,926 158,525 144,104 1,912Refer to Note 14 for supplementary information on the consolidated statement of cash flows.^ Value is less than 1
The accompanying notes form an integral part of these consolidated financial statements.
Consolidated Statement of Cash Flows(` in millions, except share and per share data, unless otherwise stated)

Annual Report 2019-20 290
(` in millions, except share and per share data, unless otherwise stated)
Notes to the Consolidated Financial Statements
1. The Company overview Wipro Limited (“Wipro” or the “Parent Company”), together with its subsidiaries and controlled trusts (collectively, “we”, “us”, “our”, “the Company” or the “Group”) is a global information technology (“IT”), consulting and business process services (“BPS”) company.
Wipro is a public limited company incorporated and domiciled in India. The address of its registered office is Wipro Limited, Doddakannelli, Sarjapur Road, Bengaluru – 560 035, Karnataka, India. Wipro has its primary listing with BSE Ltd. and National Stock Exchange of India Ltd. The Company’s American Depository Shares representing equity shares are also listed on the New York Stock Exchange.
These consolidated financial statements were authorized for issue by the Company’s Board of Directors on May 29, 2020.
2. Basis of preparation of consolidated financial statements
(i) Statement of compliance and basis of preparation
The consolidated financial statements have been prepared in accordance with International Financial Reporting Standards and its interpretations (“IFRS”), as issued by the International Accounting Standards Board (“IASB”). All accounting policies have been applied consistently to all periods presented in these consolidated financial statements, except for new accounting standards adopted by the Company.
The consolidated financial statements correspond to the classification provisions contained in IAS 1(revised), “Presentation of Financial Statements”. For clarity, various items are aggregated in the consolidated statement of income, consolidated statement of comprehensive income and consolidated statement of financial position. These items are disaggregated separately in the notes to the consolidated financial statements, where applicable.
All amounts included in the consolidated financial statements are reported in millions of Indian rupees (` in millions) except share and per share data, unless otherwise stated. Due to rounding off, the numbers presented throughout the document may not add up precisely to the totals and percentages may not precisely reflect the absolute figures.
(ii) Basis of measurement
The consolidated financial statements have been prepared on a historical cost convention and on an accrual basis, except for the following material items which have been measured at fair value as required by relevant IFRS:
a. Derivative financial instruments,
b. Financial instruments classified as fair value through other comprehensive income or fair value through profit or loss,
c. The defined benefit asset/ (liability) is recognized as the present value of defined benefit obligation less fair value of plan assets; and
d. Contingent consideration.
(iii) Convenience translation (unaudited)
The accompanying consolidated financial statements have been prepared and reported in Indian rupees, the functional currency of the Parent Company. Solely for the convenience of the readers, the consolidated financial statements as at and for the year ended March 31, 2020, have been translated into United States dollars at the certified foreign exchange rate of $1 = ̀ 75.39 as published by Federal Reserve Board of Governors on March 31, 2020. No representation is made that the Indian rupee amounts have been, could have been or could be converted into United States dollars at such a rate or any other rate. Due to rounding off, the translated numbers presented throughout the document may not add up precisely to the totals.
(iv) Use of estimates and judgment
The preparation of the consolidated financial statements in conformity with IFRS requires management to make judgments, estimates and assumptions that affect the application of accounting policies and the reported amounts of assets, liabilities, income, and expenses. Actual results may differ from those estimates.
Estimates and underlying assumptions are reviewed on an ongoing basis. Revisions to accounting estimates are recognized in the period in which the estimates are revised and in any future periods affected. In particular, information about significant areas of estimation, uncertainty and critical judgments in applying accounting policies that have the most significant effect on the amounts recognized in the consolidated financial statements are included in the following notes:
a) Revenue recognition: The Company applies judgement to determine whether each product or service promised to a customer is capable of being distinct, and is distinct in the context of the contract, if not, the promised products or services are combined and accounted as a single performance obligation. The Company allocates the arrangement consideration to separately identifiable performance obligation deliverables based on their relative stand-alone selling price. In cases where the Company is unable to determine the stand-alone selling price the company uses expected cost plus margin approach in estimating the stand-alone selling price. The Company uses the percentage of completion method using the input (cost expended) method to measure progress towards completion in respect of fixed price contracts. Percentage of completion method accounting relies on estimates of total expected contract revenue and costs. This method is followed when reasonably

Corporate Overview | Management & Board Reports | Financial Statements
Wipro Limited291
dependable estimates of the revenues and costs applicable to various elements of the contract can be made. Key factors that are reviewed in estimating the future costs to complete include estimates of future labor costs and productivity efficiencies. Because the financial reporting of these contracts depends on estimates that are assessed continually during the term of these contracts, revenue recognized, profit and timing of revenue for remaining performance obligations are subject to revisions as the contract progresses to completion. When estimates indicate that a loss will be incurred, the loss is provided for in the period in which the loss becomes probable. Volume discounts are recorded as a reduction of revenue. When the amount of discount varies with the levels of revenue, volume discount is recorded based on estimate of future revenue from the customer.
b) Impairment testing: Goodwill and intangible assets with infinite useful life recognized on business combination are tested for impairment at least annually and when events occur or changes in circumstances indicate that the recoverable amount of the asset or the cash generating unit to which these pertain is less than the carrying value. The Company assesses acquired intangible assets with finite useful life for impairment whenever events or changes in circumstances indicate that the carrying amount may not be recoverable. The recoverable amount of the asset or the cash generating units is higher of value-in-use and fair value less cost of disposal. The calculation of value in use of an asset or a cash generating unit involves use of significant estimates and assumptions which include turnover, growth rates and net margins used to calculate projected future cash flows, risk-adjusted discount rate, future economic and market conditions.
c) Income taxes: The major tax jurisdictions for the Company are India and the United States of America. Significant judgments are involved in determining the provision for income taxes including judgment on whether tax positions are probable of being sustained in tax assessments. A tax assessment can involve complex issues, which can only be resolved over extended time periods.
d) Deferred taxes: Deferred tax is recorded on temporary differences between the tax bases of assets and liabilities and their carrying amounts, at the rates that have been enacted or substantively enacted at the reporting date. The ultimate realization of deferred tax assets is dependent upon the generation of future taxable profits during the periods in which those temporary differences and tax loss carry-forwards become deductible. The Company considers expected reversal of deferred tax liabilities and projected future taxable income in making this assessment. The amount of deferred tax assets considered realizable, however, could reduce in the near term if estimates of future taxable income during the carry-forward period are reduced.
e) Business combination: In accounting for business combinations, judgment is required in identifying whether an identifiable intangible asset is to be recorded separately from goodwill. Additionally, estimating the acquisition date fair value
of the identifiable assets (including useful life estimates) and liabilities acquired, and contingent consideration assumed involves management judgment. These measurements are based on information available at the acquisition date and are based on expectations and assumptions that have been deemed reasonable by management. Changes in these judgments, estimates, and assumptions can materially affect the results of operations.
f) Defined benefit plans and compensated absences: The cost of the defined benefit plans, compensated absences and the present value of the defined benefit obligations are based on actuarial valuation using the projected unit credit method. An actuarial valuation involves making various assumptions that may differ from actual developments in the future. These include the determination of the discount rate, future salary increases and mortality rates. Due to the complexities involved in the valuation and its long-term nature, a defined benefit obligation is highly sensitive to changes in these assumptions. All assumptions are reviewed at each reporting date.
g) Expected credit losses on financial assets: The impairment provisions of financial assets are based on assumptions about risk of default and expected timing of collection. The Company uses judgment in making these assumptions and selecting the inputs to expected credit loss calculation based on the Company’s past history of collections, customer’s creditworthiness, existing market conditions as well as forward looking estimates at the end of each reporting period.
h) Measurement of fair value of non-marketable equity investments: These instruments are initially recorded at cost and subsequently measured at fair value. Fair value of investments is determined using the market and income approaches. The market approach includes the use of financial metrics and ratios of comparable companies, such as revenue, earnings, comparable performance multiples, recent financial rounds and the level of marketability of the investments. The selection of comparable companies requires management judgment and is based on number of factors, including comparable company sizes, growth rates, and development stages. The income approach includes the use of discounted cash flow model, which requires significant estimates regarding the investees’ revenue, costs, and discount rates based on the risk profile of comparable companies. Estimates of revenue and costs are developed using available historical and forecast data.
i) Useful lives of property, plant and equipment: The Company depreciates property, plant and equipment on a straight-line basis over estimated useful lives of the assets. The charge in respect of periodic depreciation is derived based on an estimate of an asset’s expected useful life and the expected residual value at the end of its life. The life is based on historical experience with similar assets as well as anticipation of future events, which may impact their life, such as changes in technology. The estimated useful life is reviewed at least annually.
j) Useful lives of intangible assets: The Company amortizes

Annual Report 2019-20 292
intangible assets on a straight-line basis over estimated useful lives of the assets. The useful life is estimated based on a number of factors including the effects of obsolescence, demand, competition and other economic factors such as the stability of the industry and known technological advances and the level of maintenance expenditures required to obtain the expected future cash flows from the assets. The estimated useful life is reviewed at least annually.
k) Leases: IFRS 16 defines a lease term as the non-cancellable period for which the lessee has the right to use an underlying asset including optional periods, when an entity is reasonably certain to exercise an option to extend (or not to terminate) a lease. The Company considers all relevant facts and circumstances that create an economic incentive for the lessee to exercise the option when determining the lease term. The option to extend the lease term is included in the lease term, if it is reasonably certain that the lessee would exercise the option. The Company reassesses the option when significant events or changes in circumstances occur that are within the control of the lessee.
l) Other estimates: The share-based compensation expense is determined based on the Company’s estimate of equity instruments that will eventually vest. Fair valuation of derivative hedging instruments designated as cash flow hedges involves significant estimates relating to the occurrence of forecasted transaction.
m) Uncertainty relating to the global health pandemic on COVID-19: In assessing the recoverability of receivables including unbilled receivables, contract assets and contract costs, goodwill, intangible assets, and certain investments, the Company has considered internal and external information up to the date of approval of these financial statements including credit reports and economic forecasts. The Company has performed sensitivity analysis on the assumptions used herein. Based on the current indicators of future economic conditions, the Company expects to recover the carrying amount of these assets.
The Company basis its assessment believes that the probability of the occurrence of forecasted transactions is not impacted by COVID-19. The Company has also considered the effect of changes, if any, in both counterparty credit risk and own credit risk while assessing hedge effectiveness and measuring hedge ineffectiveness and continues to believe that there is no impact on effectiveness of its hedges.
The impact of COVID-19 remains uncertain and may be different from what we have estimated as of the date of approval of these consolidated financial statements and the Company will continue to closely monitor any material changes to future economic conditions.
3. Significant accounting policies
(i) Basis of consolidation
Subsidiaries and controlled trusts
The Company determines the basis of control in line with the requirements of IFRS 10, Consolidated Financial Statements. Subsidiaries and controlled trusts are entities controlled by the Group. The Group controls an entity when the parent has power over the entity, it is exposed to, or has rights to, variable returns from its involvement with the entity and has the ability to affect those returns through its power over the entity. The financial statements of subsidiaries and controlled trusts are included in the consolidated financial statements from the date on which control commences until the date on which control ceases.
All intra-Group balances, transactions, income and expenses are eliminated in full on consolidation.
Non-controlling interest
Non-controlling interests in the net assets (excluding goodwill) of consolidated subsidiaries are identified separately from the Company’s equity. The interest of non-controlling shareholders may be initially measured either at fair value or at the non-controlling interest’s proportionate share of the fair value of the acquiree’s identifiable net assets. The choice of measurement basis is made on an acquisition to acquisition basis. Subsequent to acquisition, the carrying amount of non-controlling interest is the amount of those interests at initial recognition plus the non-controlling interest’s share of subsequent changes in equity. Total comprehensive income is attributed to non-controlling interests even if it results in the non-controlling interest having a deficit balance.
Investments accounted for using the equity method
Investments accounted for using the equity method are entities in respect of which, the Company has significant influence, but not control, over the financial and operating policies. Generally, a Company has a significant influence if it holds between 20 and 50 percent of the voting power of another entity. Investments in such entities are accounted for using the equity method and are initially recognized at cost. The carrying amount of investment is increased/ decreased to recognize investors share of profit or loss of the investee after the acquisition date.
Non-current assets and disposal groups held for sale
Assets and liabilities of disposal groups that are available for immediate sale and where the sale is highly probable of being completed within one year from the date of classification are considered and classified as assets held for sale and liabilities associated with assets held for sale. Non-current assets and disposal groups held for sale are measured at the lower of carrying amount and fair value less costs to sell.

Corporate Overview | Management & Board Reports | Financial Statements
Wipro Limited293
(ii) Functional and presentation currency
Items included in the financial statements of each of the Company’s entities are measured using the currency of the primary economic environment in which these entities operate (i.e. the “functional currency”). These consolidated financial statements are presented in Indian rupees, which is the functional currency of the Parent Company.
(iii) Foreign currency transactions and translation
a) Transactions and balances
Transactions in foreign currency are translated into the respective functional currencies using the exchange rates prevailing at the date of the transaction. Foreign exchange gains and losses resulting from the settlement of such transactions and from translation at the exchange rates prevailing at the reporting date of monetary assets and liabilities denominated in foreign currencies are recognized in the consolidated statement of income and reported within foreign exchange gains/(losses), net, within results of operating activities except when deferred in other comprehensive income as qualifying cash flow hedges and qualifying net investment hedges. Gains/(losses), net, relating to translation or settlement of borrowings denominated in foreign currency are reported within finance expense. Non-monetary assets and liabilities denominated in foreign currency and measured at historical cost are translated at the exchange rate prevalent at the date of transaction. Translation differences on non-monetary financial assets measured at fair value at the reporting date, such as equities classified as financial instruments measured at fair value through other comprehensive income are included in other comprehensive income, net of taxes.
b) Foreign operations
For the purpose of presenting consolidated financial statements, the assets and liabilities of the Company’s foreign operations that have a functional currency other than Indian rupees are translated into Indian rupees using exchange rates prevailing at the reporting date. Income and expense items are translated at the average exchange rates for the period. Exchange differences arising, if any, are recognized in other comprehensive income and held in foreign currency translation reserve (FCTR), a component of equity, except to the extent that the translation difference is allocated to non-controlling interest. When a foreign operation is disposed of, the relevant amount recognized in FCTR is transferred to the consolidated statement of income as part of the profit or loss on disposal. Goodwill and fair value adjustments arising on the acquisition of a foreign operation are treated as assets and liabilities of the foreign operation and translated at the exchange rate prevailing at the reporting date.
c) Others
Foreign currency differences arising on the translation or settlement of a financial liability designated as a hedge of a net investment in a foreign operation are recognized in other comprehensive income and presented within equity in the FCTR
to the extent the hedge is effective. To the extent the hedge is ineffective, such differences are recognized in the consolidated statement of income.
When the hedged part of a net investment is disposed of, the relevant amount recognized in FCTR is transferred to the consolidated statement of income as part of the profit or loss on disposal. Foreign currency differences arising from translation of intercompany receivables or payables relating to foreign operations, the settlement of which is neither planned nor likely in the foreseeable future, are considered to form part of net investment in foreign operation and are recognized in FCTR.
(iv) Financial instruments
A) Non-derivative financial instruments:
Non-derivative financial instruments consist of:
• financial assets which include cash and cash equivalents, trade receivables, unbilled receivables, finance lease receivables, employee and other advances, investments in equity and debt securities and eligible current and non-current assets; Financial assets are derecognized when substantial risks and rewards of ownership of the financial asset have been transferred. In cases where substantial risks and rewards of ownership of the financial assets are neither transferred nor retained, financial assets are derecognized only when the Company has not retained control over the financial asset.
• financial liabilities which include long and short-term loans and borrowings, bank overdrafts, trade payables and accrued expenses, lease liabilities and eligible current and non-current liabilities.
Non-derivative financial instruments are recognized initially at fair value. Subsequent to initial recognition, non-derivative financial instruments are measured as described below:
a. Cash and cash equivalents
The Company’s cash and cash equivalents consist of cash on hand and in banks and demand deposits with banks, which can be withdrawn at any time, without prior notice or penalty on the principal.
For the purposes of the cash flow statement, cash and cash equivalents include cash on hand, in banks and demand deposits with banks, net of outstanding bank overdrafts that are repayable on demand and are considered part of the Company’s cash management system. In the consolidated statement of financial position, bank overdrafts are presented under borrowings within current liabilities.
b. Investments
Financial instruments measured at amortized cost:
Debt instruments that meet the following criteria are measured at amortized cost (except for debt instruments that are designated at fair value through Profit or Loss (FVTPL) on initial recognition):

Annual Report 2019-20 294
• the asset is held within a business model whose objective is to hold assets in order to collect contractual cash flows; and
• the contractual terms of the instrument give rise on specified dates to cash flows that are solely payment of principal and interest on the principal amount outstanding.
Financial instruments measured at fair value through other comprehensive income (FVTOCI):
Debt instruments that meet the following criteria are measured at fair value through other comprehensive income (FVTOCI) (except for debt instruments that are designated at fair value through Profit or Loss (FVTPL) on initial recognition):
• the asset is held within a business model whose objective is achieved both by collecting contractual cash flows and selling the financial asset; and
• the contractual terms of the instrument give rise on specified dates to cash flows that are solely payment of principal and interest on the principal amount outstanding.
Interest income is recognized in the consolidated statement of income for FVTOCI debt instruments. Other changes in fair value of FVTOCI financial assets are recognized in other comprehensive income. When the investment is disposed of, the cumulative gain or loss previously accumulated in reserves is transferred to the consolidated statement of income.
Financial instruments measured at fair value through profit or loss (FVTPL):
Instruments that do not meet the amortized cost or FVTOCI criteria are measured at FVTPL. Financial assets at FVTPL are measured at fair value at the end of each reporting period, with any gains or losses arising on re-measurement recognized in consolidated statement of income. The gain or loss on disposal is recognized in the consolidated statement of income.
Interest income is recognized in the consolidated statement of income for FVTPL debt instruments. Dividend on financial assets at FVTPL is recognized when the Group’s right to receive dividend is established.
Investments in equity instruments designated to be classified as FVTOCI:
The Company carries certain equity instruments which are not held for trading. The Company has elected the FVTOCI irrevocable option for these instruments. Movements in fair value of these investments are recognized in other comprehensive income and the gain or loss is not transferred to consolidated statement of income on disposal of these investments. Dividends from these investments are recognized in the consolidated statement of income when the Company’s right to receive dividends is established.
c. Other financial assets:
Other financial assets are non-derivative financial assets with fixed or determinable payments that are not quoted in an active market. They are presented as current assets, except for those maturing later than 12 months after the reporting date which are presented as non-current assets. These are initially recognized at fair value and subsequently measured at amortized cost using the effective interest method, less any impairment losses. These comprise trade receivables, unbilled receivables, finance lease receivables, employee and other advances and eligible current and non-current assets.
d. Trade payables, accrued expenses, and other liabilities
Trade payables, accrued expenses, and other liabilities are initially recognized at fair value, and subsequently carried at amortized cost using the effective interest method. For these financial instruments, the carrying amounts approximate fair value due to the short-term maturity of these instruments. Contingent consideration recognized in the business combination is subsequently measured at fair value through profit or loss.
B) Derivative financial instruments
The Company is exposed to foreign currency fluctuations on foreign currency assets, liabilities, net investment in foreign operations and forecasted cash flows denominated in foreign currency.
The Company limits the effect of foreign exchange rate fluctuations by following established risk management policies including the use of derivatives. The Company enters into derivative financial instruments where the counterparty is primarily a bank.
Derivatives are recognized and measured at fair value. Attributable transaction costs are recognized in consolidated statement of income as cost.
Subsequent to initial recognition, derivative financial instruments are accounted as described below:
a. Cash flow hedges
Changes in the fair value of the derivative hedging instruments designated as a cash flow hedge are recognized in other comprehensive income and held in cash flow hedging reserve, net of taxes, a component of equity, to the extent that the hedge is effective. To the extent that the hedge is ineffective, changes in fair value are recognized in the consolidated statement of income and reported within foreign exchange gains/(losses), net, within results from operating activities. If the hedging instrument no longer meets the criteria for hedge accounting, then hedge accounting is discontinued prospectively. If the hedging instrument expires or is sold, terminated or exercised, the cumulative gain or loss on the hedging instrument recognized in cash flow hedging reserve till the period the hedge was effective remains in cash flow hedging reserve until the forecasted

Corporate Overview | Management & Board Reports | Financial Statements
Wipro Limited295
transaction occurs. The cumulative gain or loss previously recognized in the cash flow hedging reserve is transferred to the consolidated statement of income upon the occurrence of the related forecasted transaction. If the forecasted transaction is no longer expected to occur, such cumulative balance is immediately recognized in the consolidated statement of income.
b. Hedges of net investment in foreign operations
The Company designates derivative financial instruments as hedges of net investments in foreign operations. The Company also designates foreign currency denominated borrowing as a hedge of net investment in foreign operations. Changes in the fair value of the derivative hedging instruments and gains/(losses) on translation or settlement of foreign currency denominated borrowings designated as a hedge of net investment in foreign operations are recognized in other comprehensive income and presented within equity in the FCTR to the extent that the hedge is effective. To the extent that the hedge is ineffective, changes in fair value are recognized in the consolidated statement of income and reported within foreign exchange gains/(losses), net within results from operating activities.
c. Others
Changes in fair value of foreign currency derivative instruments neither designated as cash flow hedges nor hedges of net investment in foreign operations are recognized in the consolidated statement of income and reported within foreign exchange gains/(losses), net within results from operating activities. Changes in fair value and gains/(losses), net, on settlement of foreign currency derivative instruments relating to borrowings, which have not been designated as hedges are recorded in finance expenses.
C) Derecognition of financial instruments
The Company derecognizes a financial asset when the contractual rights to the cash flows from the financial asset expire or it transfers the financial asset and the transfer qualifies for derecognition under IFRS 9. If the Company retains substantially all the risks and rewards of a transferred financial asset, the Company continues to recognize the financial asset and recognizes a borrowing for the proceeds received. A financial liability (or a part of a financial liability) is derecognized from the Company’s statement of financial position when the obligation specified in the contract is discharged or cancelled or expires.
(v) Equity and share capital
a) Share capital and Securities premium reserve
The authorized share capital of the Company as at March 31, 2020 is ` 25,274 divided into 12,504,500,000 equity shares of ` 2 each, 25,000,000 preference shares of ` 10 each and 150,000 10% optionally convertible cumulative preference shares of ` 100 each. Par value of the equity shares is recorded as share capital and the amount received in excess of par value is classified as securities premium reserve.
Every holder of the equity shares, as reflected in the records of the Company, as at the date of the shareholder meeting shall have one vote in respect of each share held for all matters submitted to vote in the shareholder meeting.
b) Shares held by controlled trust (Treasury shares)
The Company’s equity shares held by the controlled trust, which is consolidated as a part of the Group are classified as Treasury shares. The Company has 23,097,216, 27,353,853 and 22,746,081 treasury shares as at March 31, 2018, 2019 and 2020, respectively. Treasury shares are recorded at acquisition cost.
c) Retained earnings
Retained earnings comprises of the Company’s undistributed earnings after taxes. This includes Capital reserve as at March 31, 2018, 2019 and 2020 amounting to ` 1,139, ` 1,139, and ` 1,139 respectively, which is not freely available for distribution.
It also includes Nil, ` 28,565 and ` 43,804 as at March 31, 2018, 2019 and 2020, respectively representing the Special Economic Zone (“SEZ”) Re-Investment Reserve. The SEZ Re-Investment Reserve has been created out of profit of eligible SEZ units as per provisions of section 10AA(1)(ii) of the Income–tax Act, 1961 for acquiring new plant and machinery. The said reserve should be utilized by the Company for acquiring plant and machinery as per terms of Section 10AA(2) of the Income-tax Act, 1961. This reserve is not freely available for distribution.
d) Share-based payment reserve
The share-based payment reserve is used to record the value of equity-settled share-based payment transactions with employees. The amounts recorded in share-based payment reserve are transferred to securities premium reserve upon exercise of stock options and restricted stock unit options by employees.
e) Foreign currency translation reserve (FCTR)
The exchange differences arising from the translation of financial statements of foreign subsidiaries, differences arising from translation of long-term inter-company receivables or payables relating to foreign operations settlement of which is neither planned nor likely in the foreseeable future, changes in fair value of the derivative hedging instruments and gains/losses on translation or settlement of foreign currency denominated borrowings designated as hedge of net investment in foreign operations are recognized in other comprehensive income, net of taxes and presented within equity in the FCTR.
f) Cash flow hedging reserve
Changes in fair value of derivative hedging instruments designated and effective as a cash flow hedge are recognized in other comprehensive income, net of taxes and presented within equity as cash flow hedging reserve.

Annual Report 2019-20 296
g) Other reserves
Changes in the fair value of financial instruments measured at fair value through other comprehensive income and actuarial gains and losses on defined benefit plans are recognized in other comprehensive income, net of taxes and presented within equity in other reserves.
Other reserves also include Capital redemption reserve as at March 31, 2018, 2019 and 2020 amounting to ` 767, ` Nil and ` 646, respectively, which is not freely available for distribution.
h) Dividend
A final dividend, including tax thereon, on common stock is recorded as a liability on the date of approval by the shareholders. An interim dividend, including tax thereon, is recorded as a liability on the date of declaration by the board of directors.
i) Buyback of equity shares
The buyback of equity shares and related transaction costs are recorded as a reduction of free reserves. Further, capital redemption reserve is created as an apportionment from retained earnings.
(vi) Property, plant and equipment
a) Recognition and measurement
Property, plant and equipment are measured at cost less accumulated depreciation and impairment losses, if any. Cost includes expenditures directly attributable to the acquisition of the asset. General and specific borrowing costs directly attributable to the construction of a qualifying asset are capitalized as part of the cost.
Capital work- in-progress are measured at cost less accumulated impairment losses, if any.
b) Depreciation
The Company depreciates property, plant and equipment over the estimated useful life on a straight-line basis from the date the assets are available for use. Leasehold improvements are amortized over the shorter of estimated useful life of the asset or the related lease term. Term licenses are amortized over their respective contract term. Freehold land is not depreciated. The estimated useful life of assets is reviewed and where appropriate are adjusted, annually. The estimated useful lives of assets are as follows:
Category Useful life
Buildings 28 to 40 years
Plant and machinery 5 to 21 years
Computer equipment and software 2 to 7 years
Furniture, fixtures and equipment 3 to 10 years
Vehicles 4 to 5 years
When parts of an item of property, plant and equipment have different useful lives, they are accounted for as separate items (major components) of property, plant and equipment.
Subsequent expenditure relating to property, plant and equipment is capitalized only when it is probable that future economic benefits associated with these will flow to the Company and the cost of the item can be measured reliably.
Deposits and advances paid towards the acquisition of property, plant and equipment outstanding as at each reporting date and the cost of property, plant and equipment not available for use before such date are disclosed under capital work- in-progress.
(vii) Business combination, Goodwill, and Intangible assets
a) Business combination
Business combinations are accounted for using the purchase (acquisition) method. The cost of an acquisition is measured as the fair value of the assets transferred, liabilities incurred or assumed, and equity instruments issued at the date of exchange by the Company. Identifiable assets acquired, and liabilities and contingent liabilities assumed in a business combination are measured initially at fair value at the date of acquisition. Transaction costs incurred in connection with a business acquisition are expensed as incurred.
The cost of an acquisition also includes the fair value of any contingent consideration measured as at the date of acquisition. Any subsequent changes to the fair value of contingent consideration classified as liabilities, other than measurement period adjustments, are recognized in the consolidated statement of income.
b) Goodwill
The excess of the cost of an acquisition over the Company’s share in the fair value of the acquiree’s identifiable assets and liabilities is recognized as goodwill. If the excess is negative, a bargain purchase gain is recognized immediately in the consolidated statement of income. Goodwill is measured at cost less accumulated impairment (if any).
Goodwill associated with disposal of an operation that is part of cash-generating unit is measured on the basis of the relative values of the operation disposed of and the portion of the cash-generating unit retained, unless the entity can demonstrate that some other method better reflects the goodwill associated with the operation disposed of.
c) Intangible assets
Intangible assets acquired separately are measured at cost of acquisition. Intangible assets acquired in a business combination are measured at fair value as at the date of acquisition. Following initial recognition, intangible assets are carried at cost less accumulated amortization and impairment losses, if any.
The amortization of an intangible asset with a finite useful life reflects the manner in which the economic benefit is expected to be generated and is included in selling and marketing expenses in the consolidated statement of income.

Corporate Overview | Management & Board Reports | Financial Statements
Wipro Limited297
The estimated useful life of amortizable intangibles are reviewed and where appropriate are adjusted, annually. The estimated useful lives of the amortizable intangible assets for the current and comparative periods are as follows:
Category Useful life
Customer-related intangibles 5 to 15 years
Marketing related intangibles 3 to 7 years
(viii) Leases
The Company evaluates each contract or arrangement, whether it qualifies as lease as defined under IFRS 16.
The Company as a lessee
The Company enters into an arrangement for lease of land, buildings, plant and machinery including computer equipment and vehicles. Such arrangements are generally for a fixed period but may have extension or termination options. The Company assesses, whether the contract is, or contains, a lease, at its inception. A contract is, or contains, a lease if the contract conveys the right to –
(a) control the use of an identified asset,
(b) obtain substantially all the economic benefits from use of the identified asset, and
(c) direct the use of the identified asset.
The Company determines the lease term as the non-cancellable period of a lease, together with periods covered by an option to extend the lease, where the Company is reasonably certain to exercise that option.
The Company at the commencement of the lease contract recognizes a Right-of-Use (RoU) asset at cost and corresponding lease liability, except for leases with term of less than twelve months (short term leases) and low-value assets. For these short term and low value leases, the company recognizes the lease payments as an operating expense on a straight-line basis over the lease term.
The cost of the right-of-use assets comprises the amount of the initial measurement of the lease liability, any lease payments made at or before the inception date of the lease plus any initial direct costs, less any lease incentives received. Subsequently, the right-of-use assets are measured at cost less any accumulated depreciation and accumulated impairment losses, if any. The right-of-use assets are depreciated using the straight-line method from the commencement date over the shorter of lease term or useful life of right-of-use assets. The estimated useful lives of right-of-use assets are determined on the same basis as those of property, plant and equipment.
The Company applies IAS 36 to determine whether a RoU asset is impaired and accounts for any identified impairment loss as described in the impairment of non-financial assets below.
For lease liabilities at the commencement of the lease, the Company measures the lease liability at the present value of the lease payments that are not paid at that date. The lease payments are
discounted using the interest rate implicit in the lease, if that rate is readily determined, if that rate is not readily determined, the lease payments are discounted using the incremental borrowing rate that the Company would have to pay to borrow funds, including the consideration of factors such as the nature of the asset and location, collateral, market terms and conditions, as applicable in a similar economic environment.
After the commencement date, the amount of lease liabilities is increased to reflect the accretion of interest and reduced for the lease payments made.
The Company recognizes the amount of the re-measurement of lease liability as an adjustment to the right-of-use assets. Where the carrying amount of the right-of-use assets is reduced to zero and there is a further reduction in the measurement of the lease liability, the Company recognizes any remaining amount of the re-measurement in consolidated statement of income.
Lease liability payments are classified as cash used in financing activities in the consolidated statement of cash flows.
The Company as a lessor
Leases under which the Company is a lessor are classified as a finance or operating lease. Lease contracts where all the risks and rewards are substantially transferred to the lessee are classified as a finance lease. All other leases are classified as operating lease.
For leases under which the Company is an intermediate lessor, the Company accounts for the head-lease and the sub-lease as two separate contracts. The sub-lease is further classified either as a finance lease or an operating lease by reference to the RoU asset arising from the head-lease.
(ix) Inventories
Inventories are valued at lower of cost and net realizable value, including necessary provision for obsolescence. Cost is determined using the weighted average method.
(x) Impairment
A) Financial assets
The Company applies the expected credit loss model for recognizing impairment loss on financial assets measured at amortized cost, debt instruments classified as FVTOCI, trade receivables, unbilled receivables, contract assets, finance lease receivables, and other financial assets. Expected credit loss is the difference between the contractual cash flows and the cash flows that the entity expects to receive, discounted using the effective interest rate.
Loss allowances for trade receivables, unbilled receivables, contract assets and finance lease receivables are measured at an amount equal to lifetime expected credit loss. Lifetime expected credit losses are the expected credit losses that result from all possible default events over the expected life of a financial instrument. Lifetime expected credit loss is computed based on a provision matrix which takes in to account risk profiling of customers and historical credit loss experience adjusted for forward looking information. For other

Annual Report 2019-20 298
financial assets, expected credit loss is measured at the amount equal to twelve months expected credit loss unless there has been a significant increase in credit risk from initial recognition, in which case those are measured at lifetime expected credit loss.
B) Non-financial assets
The Company assesses long-lived assets such as property, plant and equipment, right-of-use assets and acquired intangible assets for impairment whenever events or changes in circumstances indicate that the carrying amount of an asset or group of assets may not be recoverable. If any such indication exists, the Company estimates the recoverable amount of the asset or group of assets.
Goodwill is tested for impairment at least annually at the same time and when events occur or changes in circumstances indicate that the recoverable amount of the cash generating unit is less than its carrying value. The goodwill impairment test is performed at the level of cash-generating unit or groups of cash -generating units which represents the lowest level at which goodwill is monitored for internal management purposes.
The recoverable amount of an asset or cash generating unit is the higher of its fair value less cost of disposal (FVLCD) and its value-in-use (VIU). The VIU of long-lived assets is calculated using projected future cash flows. FVLCD of a cash generating unit is computed using turnover and earnings multiples. If the recoverable amount of the asset or the recoverable amount of the cash generating unit to which the asset belongs is less than its carrying amount, the carrying amount is reduced to its recoverable amount. The reduction is treated as an impairment loss and is recognized in the consolidated statement of income. If at the reporting date, there is an indication that a previously assessed impairment loss no longer exists, the recoverable amount is reassessed and the impairment losses previously recognized are reversed such that the asset is recognized at its recoverable amount but not exceeding written down value which would have been reported if the impairment losses had not been recognized initially. An impairment in respect of goodwill is not reversed.
(xi) Employee benefits
Post-employment and pension plans
The Group participates in various employee benefit plans. Pensions and other post-employment benefits are classified as either defined contribution plans or defined benefit plans. Under a defined contribution plan, the Company’s only obligation is to pay a fixed amount with no obligation to pay further contributions if the fund does not hold sufficient assets to pay all employee benefits. The related actuarial and investment risks are borne by the employee. The expenditure for defined contribution plans is recognized as an expense during the period when the employee provides service. Under a defined benefit plan, it is the Company’s obligation to provide agreed benefits to the employees. The related actuarial and investment risks are borne by the Company. The present value of the defined benefit obligations is calculated by an independent actuary using the projected unit credit method.
Remeasurement comprising actuarial gains or losses and the return
on plan assets (excluding interest) are immediately recognized in other comprehensive income, net of taxes and permanently excluded from profit or loss. Instead net interest recognized in profit or loss is calculated by applying the discount rate used to measure the defined benefit obligation to the net defined benefit liability or asset. The actual return on the plan assets above or below the discount rate is recognized as part of remeasurement of net defined liability or asset through other comprehensive income, net of taxes.
The Company has the following employee benefit plans:
a. Provident fund
Employees receive benefits from a provident fund, which is a defined benefit plan. The employer and employees each make periodic contributions to the plan. A portion of the contribution is made to the approved provident fund trust managed by the Company while the remainder of the contribution is made to the government administered pension fund. The contributions to the trust managed by the Company is accounted for as a defined benefit plan as the Company is liable for any shortfall in the fund assets based on the government specified minimum rates of return.
b. Superannuation
Superannuation plan, a defined contribution scheme is administered by third party fund managers. The Company makes annual contributions based on a specified percentage of each eligible employee’s salary.
c. Gratuity and Pension
In accordance with the Payment of Gratuity Act, 1972, applicable for Indian companies, the Company provides for a lump sum payment to eligible employees, at retirement or termination of employment based on the last drawn salary and years of employment with the Company. The gratuity fund is managed by third party fund managers.
The Company also maintains pension and similar plans for employees outside India, based on the country specific regulations. These plans are partially funded, and the funds are managed by third party fund managers. The plans provide for monthly payout after retirement as per salary drawn and service period or for a lumpsum payment as set out in rules of each fund.
The Company’s obligation in respect of above plans, which are defined benefit plans, are provided for based on actuarial valuation using the projected unit credit method. The Company recognizes actuarial gains and losses in other comprehensive income, net of taxes.
d. Termination benefits
Termination benefits are expensed when the Company can no longer withdraw the offer of those benefits.
e. Short-term benefits
Short-term employee benefit obligations are measured on an undiscounted basis and are recorded as expense as the related service is provided. A liability is recognized for the amount expected to be paid under short-term cash bonus or profit-sharing plans, if the Company has a present legal or constructive obligation to pay this

Corporate Overview | Management & Board Reports | Financial Statements
Wipro Limited299
amount as a result of past service provided by the employee and the obligation can be estimated reliably.
f. Compensated absences
The employees of the Company are entitled to compensated absences. The employees can carry forward a portion of the unutilized accumulating compensated absences and utilize it in future periods or receive cash at retirement or termination of employment. The Company records an obligation for compensated absences in the period in which the employee renders the services that increases this entitlement. The Company measures the expected cost of compensated absences as the additional amount that the Company expects to pay as a result of the unused entitlement that has accumulated at the end of the reporting period. The Company recognizes accumulated compensated absences based on actuarial valuation using the projected unit credit method. Non-accumulating compensated absences are recognized in the period in which the absences occur.
(xii) Share-based payment transactions
Selected employees of the Company receive remuneration in the form of equity settled instruments or cash settled instruments, for rendering services over a defined vesting period and for Company’s performance-based stock options over the defined period. Equity instruments granted are measured by reference to the fair value of the instrument at the date of grant. In cases, where equity instruments are granted at a nominal exercise price, the intrinsic value on the date of grant approximates the fair value. The expense is recognized in the consolidated statement of income with a corresponding increase to the share-based payment reserve, a component of equity.
The equity instruments or cash settled instruments generally vest in a graded manner over the vesting period. The fair value determined at the grant date is expensed over the vesting period of the respective tranches of such grants (accelerated amortization). The stock compensation expense is determined based on the Company’s estimate of equity instruments or cash settled instruments that will eventually vest.
Cash Settled instruments granted are re-measured by reference to the fair value at the end of each reporting period and at the time of vesting. The expense is recognized in the consolidated statement of income with a corresponding increase to financial liability.
(xiii) Provisions
Provisions are recognized when the Company has a present obligation (legal or constructive), as a result of a past event, it is probable that an outflow of economic benefits will be required to settle the obligation and a reliable estimate can be made of the amount of the obligation.
The amount recognized as a provision is the best estimate of the consideration required to settle the present obligation at the end of the reporting period, taking into account the risks and uncertainties surrounding the obligation.
When some or all of the economic benefits required to settle a provision are expected to be recovered from a third party, the receivable is recognized as an asset, if it is virtually certain that
reimbursement will be received, and the amount of the receivable can be measured reliably.
Provisions for onerous contracts are recognized when the expected benefits to be derived by the Company from a contract are lower than the unavoidable costs of meeting the future obligations under the contract. Provisions for onerous contracts are measured at the present value of lower of the expected net cost of fulfilling the contract and the expected cost of terminating the contract.
(xiv) Revenue
The Company derives revenue primarily from software development, maintenance of software/hardware and related services, business process services, sale of IT and other products.
Effective April 1, 2018, the Company adopted IFRS 15 “Revenue from Contracts with Customers” using the cumulative catch-up transition method, applied to contracts that were not completed as of April 1, 2018. The adoption of the new standard has resulted in a reduction of ` 2,279 in opening retained earnings, primarily relating to certain contract costs because these do not meet the criteria for recognition as costs to fulfil a contract.
Revenues from customer contracts are considered for recognition and measurement when the contract has been approved by the parties to the contract, the parties to contract are committed to perform their respective obligations under the contract, and the contract is legally enforceable.
Revenue is recognized upon transfer of control of promised products or services to customers in an amount that reflects the consideration the Company expects to receive in exchange for those products or services. To recognize revenues, the Company applies the following five step approach: (1) identify the contract with a customer, (2) identify the performance obligations in the contract, (3) determine the transaction price, (4) allocate the transaction price to the performance obligations in the contract, and (5) recognize revenues when a performance obligation is satisfied. When there is uncertainty as to collectability, revenue recognition is postponed until such uncertainty is resolved.
At contract inception, the Company assesses its promise to transfer products or services to a customer to identify separate performance obligations. The Company applies judgement to determine whether each product or service promised to a customer is capable of being distinct, and are distinct in the context of the contract, if not, the promised products or services are combined and accounted as a single performance obligation. The Company allocates the arrangement consideration to separately identifiable performance obligation based on their relative stand-alone selling price or residual method. Stand-alone selling prices are determined based on sale prices for the components when it is regularly sold separately, in cases where the Company is unable to determine the stand-alone selling price the Company uses third-party prices for similar deliverables or the Company uses expected cost-plus margin approach in estimating the stand-alone selling price.
For performance obligations where control is transferred over time,

Annual Report 2019-20 300
revenues are recognized by measuring progress towards completion of the performance obligation. The selection of the method to measure progress towards completion requires judgment and is based on the nature of the promised products or services to be provided.
The method for recognizing revenues and costs depends on the nature of the services rendered:
A. Time and materials contracts
Revenues and costs relating to time and materials contracts are recognized as the related services are rendered.
B. Fixed-price contracts
i. Fixed-price development contracts
Revenues from fixed-price contracts, including software development, and integration contracts, where the performance obligations are satisfied over time, are recognized using the “percentage-of-completion” method. The performance obligations are satisfied as and when the services are rendered since the customer generally obtains control of the work as it progresses. Percentage of completion is determined based on project costs incurred to date as a percentage of total estimated project costs required to complete the project. The cost expended (or input) method has been used to measure progress towards completion as there is a direct relationship between input and productivity. If the Company is not able to reasonably measure the progress of completion, revenue is recognized only to the extent of costs incurred, for which recoverability is probable. When total cost estimates exceed revenues in an arrangement, the estimated losses are recognized in the consolidated statement of income in the period in which such losses become probable based on the current contract estimates as an onerous contract provision.
A contract asset is a right to consideration that is conditional upon factors other than the passage of time. Contract assets primarily relate to unbilled amounts on fixed-price development contracts and are classified as non-financial asset as the contractual right to consideration is dependent on completion of contractual milestones.
A contract liability is an entity’s obligation to transfer goods or services to a customer for which the entity has received consideration (or the amount is due) from the customer.
Unbilled receivables on other than fixed price development contracts are classified as a financial asset where the right to consideration is unconditional upon passage of time.
ii. Maintenance contracts
Revenues related to fixed-price maintenance contracts are recognized on a straight-line basis when services are performed through an indefinite number of repetitive acts over a specified period or ratably using percentage of completion method when the pattern of benefits from the services rendered to the customers and the cost to fulfil the contract is not even through the period of contract because the services are generally discrete in nature and not repetitive. Revenue for contracts in which the invoicing is representative of the value being delivered, is recognized based
on our right to invoice. If our invoicing is not consistent with value delivered, revenues are recognized as the service is performed using the percentage of completion method.
In certain projects, a fixed quantum of service or output units is agreed at a fixed price for a fixed term. In such contracts, revenue is recognized with respect to the actual output achieved till date as a percentage of total contractual output. Any residual service unutilized by the customer is recognized as revenue on completion of the term.
iii. Element or Volume based contracts
Revenues and costs are recognized as the related services are rendered.
C. Products
Revenue on product sales are recognized when the customer obtains control of the specified product.
D. Others
• Any change in scope or price is considered as a contract modification. The Company accounts for modifications to existing contracts by assessing whether the services added are distinct and whether the pricing is at the stand-alone selling price. Services added that are not distinct are accounted for on a cumulative catch up basis, while those that are distinct are accounted for prospectively, either as a separate contract if the additional services are priced at the stand-alone selling price, or as a termination of the existing contract and creation of a new contract if not priced at the stand-alone selling price.
• The Company accounts for variable considerations like, volume discounts, rebates, pricing incentives to customers and penalties as reduction of revenue on a systematic and rational basis over the period of the contract. The Company estimates an amount of such variable consideration using expected value method or the single most likely amount in a range of possible consideration depending on which method better predicts the amount of consideration to which the Company may be entitled and when it is probable that a significant reversal of cumulative revenue recognized will not occur when the uncertainty associated with the variable consideration is resolved.
• Revenues are shown net of allowances/ returns, sales tax, value added tax, goods and services tax and applicable discounts and allowances.
• The Company accrues the estimated cost of warranties at the time when the revenue is recognized. The accruals are based on the Company’s historical experience of material usage and service delivery costs.
• Incremental costs that relate directly to a contract and incurred in securing a contract with a customer are recognized as an asset when the Company expects to recover these costs and amortized over the contract term.
• The Company recognizes contract fulfilment cost as an asset if those costs specifically relate to a contract or to an anticipated

Corporate Overview | Management & Board Reports | Financial Statements
Wipro Limited301
contract, the costs generate or enhance resources that will be used in satisfying performance obligations in future; and the costs are expected to be recovered. The asset so recognized is amortized on a systematic basis consistent with the transfer of goods or services to customer to which the asset relates.
• The Company assesses the timing of the transfer of goods or services to the customer as compared to the timing of payments to determine whether a significant financing component exists. As a practical expedient, the Company does not assess the existence of a significant financing component when the difference between payment and transfer of deliverables is a year or less. If the difference in timing arises for reasons other than the provision of finance to either the customer or us, no financing component is deemed to exist.
• The Company may enter into arrangements with third party suppliers to resell products or services. In such cases, the Company evaluates whether the Company is the principal (i.e. report revenues on a gross basis) or agent (i.e. report revenues on a net basis). In doing so, the Company first evaluates whether the Company controls the good or service before it is transferred to the customer. If Company controls the good or service before it is transferred to the customer, Company is the principal; if not, the Company is the agent.
• Estimates of transaction price and total costs or efforts are continuously monitored over the term of the contract and are recognized in net profit in the period when these estimates change or when the estimates are revised. Revenues and the estimated total costs or efforts are subject to revision as the contract progresses.
(xv) Finance expenses
Finance expenses comprises interest cost on borrowings and lease liabilities, gains or losses arising on re-measurement of financial assets measured at FVTPL, gains/ (losses) on translation or settlement of foreign currency borrowings and changes in fair value and gains/ (losses) on settlement of related derivative instruments. Borrowing costs that are not directly attributable to a qualifying asset are recognized in the consolidated statement of income using the effective interest method.
(xvi) Finance and other income
Finance and other income comprise interest income on deposits, dividend income and gains / (losses) on disposal of investments. Interest income is recognized using the effective interest method. Dividend income is recognized when the right to receive payment is established.
(xvii) Income tax
Income tax comprises current and deferred tax. Income tax expense is recognized in the consolidated statement of income except to the extent it relates to a business combination, or items directly recognized in equity or in other comprehensive income.
a) Current income tax
Current income tax for the current and prior periods are measured at the amount expected to be recovered from or paid to the taxation
authorities based on the taxable income for the period. The tax rates and tax laws used to compute the current tax amounts are those that are enacted or substantively enacted as at the reporting date and applicable for the period. While determining the tax provisions, the Company assesses whether each uncertain tax position is to be considered separately or together with one or more uncertain tax positions depending upon the nature and circumstances of each uncertain tax position. The Company offsets current tax assets and current tax liabilities, where it has a legally enforceable right to set off the recognized amounts and where it intends either to settle on a net basis, or to realize the asset and liability simultaneously.
b) Deferred income tax
Deferred income tax is recognized using the balance sheet approach. Deferred income tax assets and liabilities are recognized for deductible and taxable temporary differences arising between the tax base of assets and liabilities and their carrying amount in financial statements, except when the deferred income tax arises from the initial recognition of goodwill or an asset or liability in a transaction that is not a business combination and affects neither accounting nor taxable profits or loss at the time of the transaction. Deferred income tax assets are recognized to the extent it is probable that taxable profit will be available against which the deductible temporary differences and the carry forward of unused tax credits and unused tax losses can be utilized.
Deferred income tax liabilities are recognized for all taxable temporary differences except in respect of taxable temporary differences that is expected to reverse within the tax holiday period, taxable temporary differences associated with investments in subsidiaries, associates and foreign branches where the timing of the reversal of the temporary difference can be controlled and it is probable that the temporary difference will not reverse in the foreseeable future.
The carrying amount of deferred income tax assets is reviewed at each reporting date and reduced to the extent that it is no longer probable that sufficient taxable profit will be available to allow all or part of the deferred income tax asset to be utilized.
Deferred income tax assets and liabilities are measured at the tax rates that are expected to apply in the period when the asset is realized, or the liability is settled, based on tax rates (and tax laws) that have been enacted or substantively enacted at the reporting date.
The Company offsets deferred income tax assets and liabilities, where it has a legally enforceable right to offset current tax assets against current tax liabilities, and they relate to taxes levied by the same taxation authority on either the same taxable entity, or on different taxable entities where there is an intention to settle the current tax liabilities and assets on a net basis or their tax assets and liabilities will be realized simultaneously.
(xviii) Earnings per share
Basic earnings per share is computed using the weighted average number of equity shares outstanding during the period adjusted for treasury shares held. Diluted earnings per share is computed using the weighted-average number of equity and dilutive equivalent

Annual Report 2019-20 302
shares outstanding during the period, using the treasury stock method for options, except where the results would be anti-dilutive.
The number of equity shares and potentially dilutive equity shares are adjusted retrospectively for all periods presented for any splits and bonus shares issues including for change effected prior to the approval of the consolidated financial statements by the Board of Directors.
(xix) Cash flow statement
Cash flows are reported using the indirect method, whereby profit for the period is adjusted for the effects of transactions of a non-cash nature, any deferrals or accruals of past or future operating cash receipts or payments and item of income or expenses associated with investing or financing cash flows. The cash from operating, investing and financing activities of the Company are segregated.
(xx) Assets held for sale
Sale of business is classified as held for sale, if their carrying amount is intended to be recovered principally through sale rather than through continuing use. The condition for classification as held for sale is met when disposal business is available for immediate sale and the same is highly probable of being completed within one year from the date of classification as held for sale.
(xxi) Discontinued operations
A discontinued operation is a component of the Company’s business that represents a separate line of business that has been disposed of or is held for sale, or is a subsidiary acquired exclusively with a view to resale. Classification as a discontinued operation occurs upon the earlier of disposal or when the operation meets the criteria to be classified as held for sale.
(xxii) Disposal of assets
The gain or loss arising on disposal or retirement of assets is recognized in the consolidated statement of income.
New Accounting standards adopted by the Company:
IFRS 16 - Leases
On April 1, 2019, the Company adopted IFRS 16, Leases, which applied to all lease contracts outstanding as at April 1, 2019, using modified retrospective method by recording the cumulative effect of initial application as an adjustment to opening retained earnings. The Company has made use of the following practical expedients available in its transition to IFRS 16: -
a) The Company will not reassess whether a contract is or contains a lease. Accordingly, the definition of lease in accordance with IAS 17 and IFRIC-4 will continue to be applied to lease contracts entered by the Company or modified by the Company before April 1, 2019,
b) The Company has applied a single discount rate to a portfolio of leases of similar assets in similar economic environment. Consequently, the Company has recorded its lease liability using the present value of remaining lease payments, discounted using the incremental borrowing rate at the date of initial application
and the right-of-use asset at its carrying amount as if the standard had been applied since the commencement date of the lease, but discounted using the incremental borrowing rate at the date of initial application,
c) The Company excluded the initial direct costs from measurement of the RoU asset,
d) The Company does not recognize RoU assets and lease liabilities for leases with less than twelve months of lease term and low-value assets on the date of initial application.
The weighted average of discount rate applied to lease liabilities as at April 1, 2019 is 5.7%.
On adoption of IFRS 16,
a) the Company has recognized right-of-use assets of ` 13,630 and corresponding lease liability of `15,379,
b) the net carrying value of assets procured under the finance lease of ` 1,243 (gross carrying and accumulated depreciation value of ` 3,420 and ` 2,177, respectively) have been reclassified from property, plant and equipment to right- of-use assets,
c) the obligations under finance leases of ` 2,002 (non-current and current obligation under finance leases ` 496 and ` 1,506, respectively) have been reclassified to lease liabilities,
d) prepaid rent on leasehold land and other assets, which were earlier classified under “Other Assets” have been reclassified to right-of-use assets by ` 2,222.
The adoption of the new standard has resulted in a reduction of ` 872 in retained earnings, net of deferred tax asset of ` 138.
During the year ended March 31, 2020, the Company recognized in the consolidated statement of income –
a) Depreciation expense from right-of-use assets of ` 5,911 (Refer to Note 5)
b) Interest expenses on lease liabilities of ` 914
c) Rent expense amounting to ` 44 pertaining to leases of low-value assets and ` 2,085 pertaining to leases with less than twelve months of lease term has been included under Facility expenses
d) Income from subleasing right-of-use assets is not material.
Refer to Note 5 for additions to right-of-use assets during the year ended March 31, 2020 and carrying amount of right-of-use assets as at March 31, 2020 by class of underlying asset.
As of March 31, 2020, the Company is committed to certain leases amounting to ` 1,399 which have not yet commenced. The term of such lease’s ranges from 2 to 8 years.
Lease payments during the period are disclosed under financing activities in the consolidated statement of cash flows.
The comparatives as at and for the year ended March 31, 2019 and March 31, 2018 have not been retrospectively restated.
The adoption of IFRS 16 did not have any material impact on the

Corporate Overview | Management & Board Reports | Financial Statements
Wipro Limited303
Company’s consolidated statement of income and earnings per share.
The difference between the lease obligation disclosed as of March 31, 2019 under IAS 17 and the value of the lease liabilities as of April 1, 2019 is primarily on account of practical expedients exercised for low value assets and short term leases as at adoption of the standard, measuring lease liability and discounting the lease liabilities to the present value in accordance with IFRS 16.
Particulars Total
Operating lease commitments disclosed as at March 31, 2019
` 19,741
(Less): Impact of discounting on opening lease liability (1,954)
(Less): Short-term leases not recognized as a liability (1,675)
(Less): Low-value leases not recognized as a liability (64)
(Less): Leases commencing after 1st April, but entered into on or before 31st March
(669)
Lease liability recognized as at April 1, 2019 ` 15,379
IFRIC 23 – Uncertainty over Income Tax treatments
The IASB has clarified the accounting for uncertainties in income taxes. The interpretation is to be applied to the determination of taxable profit (tax loss), tax bases, unused tax losses, unused tax credits and tax rates, when there is uncertainty over income tax treatments under IAS 12. The adoption of IFRIC 23 did not have any material impact on the consolidated financial statements of the Company.
Amendment to IAS 19 - Plan Amendment, Curtailment or Settlement
The IASB has issued amendments to IAS 19, ‘Employee Benefits’, in connection with accounting for plan amendments, curtailments and settlements requiring an entity to determine the current service costs and the net interest for the period after the remeasurement using the assumptions used for the remeasurement; and determine the net interest for the remaining period based on the remeasured net defined benefit liability or asset. The adoption of amendment to IAS 19 did not have any material impact on consolidated financial statements of the Company.
Amendment to IAS 12 – Income Taxes
The IASB had issued amendments to IAS 12 – Income Taxes. The amendments clarify that an entity shall recognize the income tax consequences of dividends on financial instruments classified as equity according to where the entity originally recognized those past transactions or events that generated distributable profits were recognized. The adoption of amendment to IAS 12 did not have any impact on consolidated financial statements of the Company.
New accounting standards not yet adopted by the Company:
Certain new standards, amendments to standards and interpretations are not yet effective for annual periods beginning after April 1 2019 and have not been applied in preparing these consolidated financial statements. New standards, amendments to
standards and interpretations that could have potential impact on the consolidated financial statements of the Company are:
Amendment to IFRS 3 - Business combination
On October 22, 2018, the IASB issued amendments to IFRS 3, ‘Business Combinations’, in connection with clarification of business definition, which help in determining whether an acquisition made is of a business or a group of assets. The amendment added a test that makes it easier to conclude that a company has acquired a group of assets, rather than a business, if the value of the assets acquired is substantially all concentrated in a single asset or a group of similar assets. These amendments are effective for annual reporting periods beginning on or after January 1, 2020, with earlier application permitted. The adoption of amendment to IFRS 3 is not expected to have any impact on the consolidated financial statements of the Company.
Amendment to IFRS 9, IAS 39 and IFRS 7 – Interest Rate Benchmark Reform
On September 26, 2019, the IASB amended some of its requirements for hedge accounting. The amendments provide relief from potential effects of the uncertainty caused by the IBOR reform. In addition, the amendments require companies to provide additional information to investors about their hedging relationships that are directly affected by these uncertainties. These amendments are effective for annual reporting periods beginning on or after January 1, 2020, with earlier application permitted. The Company does not expect the amendment to have any significant impact on its consolidated financial statements.
Amendment to IAS 1 and IAS 8 – Definition of Material
On October 30, 2018, the IASB issued Amendment to IAS 1 Presentation of Financial Statements and IAS 8 Accounting Policies, Changes in Accounting Estimates and Errors to update a new definition of material in IAS 1. The amendments clarify the definition of “material” and how it should be applied by including in the definition guidance that until now has featured elsewhere in IFRS Standards. The new definition clarifies that, information is considered material if omitting, misstating, or obscuring such information, could reasonably be expected to influence the decisions that the primary users of general-purpose financial statements make on the basis of those financial statements. The definition of material in IAS 8 has been replaced by a reference to the definition of material in IAS 1. In addition, the IASB amended other Standards and the Conceptual Framework that contain a definition of material or refer to the term ‘material’ to ensure consistency. These amendments are effective prospectively for annual reporting periods beginning on or after January 1, 2020, with earlier application permitted. The Company does not expect the amendment to have any material impact on its evaluation of materiality in relation to its consolidated financial statements.
Amendment to IAS 1 – Presentation of Financial Statements
On January 23, 2020, the IASB has issued “Classification of liabilities as Current or Non-Current (Amendments to IAS 1)” providing a more general approach to the classification of liabilities under IAS 1 based on the contractual arrangement in place at the reporting

Annual Report 2019-20 304
date. The amendments aim to promote consistency in applying the requirements by helping companies to determine whether, in the statement of financial position, debt and other liabilities with an uncertain settlement date should be classified as current (due or potentially due to be settled within one year) or non-current. The amendments also clarified the classification requirements for debt a company might settle by converting it into equity. These amendments are effective for annual reporting periods beginning on or after January 1, 2022 and are to be applied retrospectively, with earlier application permitted. The Company is currently evaluating the impact of amendment to IAS 1 on its consolidated financial statements.
Amendment to IAS 37 – Onerous Contracts – Cost of Fulfilling a Contract
On May 14, 2020, the IASB issued “Onerous Contracts — Cost of Fulfilling a Contract (Amendments to IAS 37)”, amending the standard regarding costs a company should include as the cost of fulfilling a contract when assessing whether a contract is onerous. The amendment specifies that the “cost of fulfilling” a contract comprises the “costs that relate directly to the contract”. Costs that relate directly to a contract can either be incremental costs of fulfilling that contract or an allocation of other costs that relate
directly to fulfilling contracts. These amendments are effective for annual reporting periods beginning on or after January 1, 2022, with earlier application is permitted. The Company is currently evaluating the impact of amendment to IAS 37 on its consolidated financial statements.
Amendment to IFRS 16 – Leases
On May 15, 2020, the IASB issued amendments to IFRS 16, “Leases”, provide lessees with an exemption from assessing whether a COVID-19-related rent concession is a lease modification. The amendments allowed the expedient to be applied to COVID-19-related rent concessions to payments originally due on or before 30 June 2021 and also require disclosure of the amount recognized in profit or loss to reflect changes in lease payments that arise from COVID-19-related rent concessions. The reporting period in which a lessee first applies the amendment, it is not required to disclose certain quantitative information required under IAS 8. These amendments are effective for periods beginning on or after June 1, 2020, with earlier application is permitted. The Company is currently evaluating the impact of amendment to IFRS 16 on its consolidated financial statements.
4. Property, plant and equipment
Land BuildingsPlant and
machinery *
Furniture fixtures and equipment
Vehicles Total
Gross carrying value:
As at April 1, 2018 ` 3,637 ` 25,145 ` 87,222 ` 15,772 ` 1,139 ` 132,915
Translation adjustment (5) (8) 613 - (6) 594
Additions 65 2,684 10,402 1,951 4 15,106
Disposals - (331) (5,871) (1,218) (189) (7,609)
As at March 31, 2019 3,697 27,490 92,366 16,505 948 141,006
Accumulated depreciation/ impairment:
As at April 1, 2018 - ` 5,824 ` 65,325 ` 11,983 ` 506 ` 83,638
Translation adjustment - 8 332 (6) (3) 331
Depreciation and impairment ** - 1,034 12,298 1,363 304 14,999
Disposals - (151) (4,767) (747) (125) (5,790)
As at March 31, 2019 ` - ` 6,715 ` 73,188 ` 12,593 ` 682 ` 93,178
Capital work-in-progress ` 22,773
Net carrying value including Capital work-in-progress as at March 31, 2019 ` 70,601
Gross carrying value:
As at April 1, 2019 ` 3,697 ` 27,490 ` 92,366 ` 16,505 ` 948 ` 141,006
Reclassified on adoption of IFRS 16 - - (3,420) - - (3,420)
Adjusted balance as at April 1, 2019 ` 3,697 ` 27,490 ` 88,946 ` 16,505 ` 948 ` 137,586Translation adjustment 9 84 1,437 129 (5) 1,654
Additions 55 9,130 13,571 3,487 11 26,254
Additions through Business combinations - 5 417 7 - 429
Disposals - (199) (3,676) (258) (146) (4,279)
As at March 31, 2020 ` 3,761 ` 36,510 ` 100,695 ` 19,870 ` 808 ` 161,644
Accumulated depreciation/ impairment:
As at April 1, 2019 - 6,715 73,188 12,593 682 ` 93,178
Reclassified on adoption of IFRS 16 - - (2,177) - - (2,177)

Corporate Overview | Management & Board Reports | Financial Statements
Wipro Limited305
Land BuildingsPlant and
machinery *
Furniture fixtures and equipment
Vehicles Total
Adjusted balance as at April 1, 2019 ` - ` 6,715 ` 71,011 ` 12,593 ` 682 ` 91,001Translation adjustment - 32 1,066 91 (2) 1,187
Depreciation and impairment ** - 1,319 8,628 1,556 175 11,678
Disposals - (118) (2,649) (99) (128) (2,994)
As at March 31, 2020 ` - ` 7,948 ` 78,056 ` 14,141 ` 727 ` 100,872
Capital work-in-progress ` 20,348
Net carrying value including Capital work-in-progress as at March 31, 2020 ` 81,120
* Including net carrying value of computer equipment and software amounting to ` 16,375 and ` 16,844, as at March 31, 2019 and 2020, respectively.
** Includes impairment charge on software platform recognized on acquisitions, amounting to Nil, ̀ 1,480 and Nil, for the year ended March 31, 2018, 2019 and 2020, respectively, is included in cost of revenues in the consolidated statement of income.
5. Right-of-use assets
Category of RoU asset
Land BuildingsPlant and ma-
chinery *Vehicles Total
Gross carrying value:
As at April 1, 2019 ` 2,003 ` 11,502 ` 2,941 ` 649 ` 17,095
Additions - 3,520 1,210 219 4,949
Additions through Business combinations - 364 - - 364
Disposals - (41) (47) (59) (147)
Translation adjustment - 279 132 17 428
As at March 31, 2020 ` 2,003 ` 15,624 ` 4,236 ` 826 ` 22,689
Accumulated depreciation:
Depreciation 27 3,884 1,731 269 5,911
Disposals - (18) (47) (10) (75)
Translation adjustment - 62 37 6 105
As at March 31, 2020 ` 27 ` 3,928 ` 1,721 ` 265 ` 5,941
Net carrying value as at March 31, 2020 ` 16,748
* Includes computer equipment.
6. Goodwill and intangible assets
The movement in goodwill balance is given below:
Year ended March 31, 2019 2020
Balance at the beginning of the year ` 117,584 ` 116,980
Translation adjustment 4,529 9,199
Acquisition through business combination (Refer to Note 7) - 4,833
Disposal (Refer to Note 26) (4,893) -
Assets reclassified as held for sale (Refer to Note 26) (240) -
Balance at the end of the year ` 116,980 ` 131,012
The Company is organized by three operating segments: IT Services, IT Products and India State Run Enterprise Services. Goodwill as at March 31, 2019 and 2020 has been allocated to the IT Services operating segment.
Goodwill recognized on business combinations is allocated to Cash Generating Units (CGUs), within the IT Services operating segment, which are expected to benefit from the synergies of the acquisitions.

Annual Report 2019-20 306
Goodwill has been allocated to the CGUs as at March 31, 2020 as follows:
CGUs As at
March 31, 2020 Banking Financial Services and Insurance (BFSI) ` 19,225Healthcare and Life Sciences (Health BU) 55,642Consumer (CBU) 14,501Energy, Natural Resources and Utilities (ENU) 15,782Manufacturing (MFG) 11,998Technology (TECH) 12,821Communication (COMM) 1,043
` 131,012
Following table presents the allocation of goodwill to the CGUs for the year ended March 31, 2019:
CGUs As at
March 31, 2019 Banking Financial Services and Insurance (BFSI) ` 17,713
Healthcare and Life Sciences (Health BU) 50,670Consumer (CBU) 13,587Energy, Natural Resources and Utilities (ENU) 15,203Manufacturing (MFG) 8,991Technology (TECH) 9,846Communication (COMM) 970
` 116,980
For impairment testing, goodwill is allocated to a CGU representing
the lowest level within the Group at which goodwill is monitored for
internal management purposes, and which is not higher than the
Company’s operating segment. Goodwill is tested for impairment
at least annually in accordance with the Company’s procedure for
determining the recoverable value of each CGU.
The recoverable amount of the CGU is determined on the basis of
Fair Value Less Cost of Disposal (FVLCD). The FVLCD of the CGU is
determined based on the market capitalization approach, using the
turnover and earnings multiples derived from observable market
data. The fair value measurement is categorized as a level 2 fair value
based on the inputs in the valuation techniques used.
Based on the above testing, no impairment was identified as at March
31, 2019 and 2020, as the recoverable value of the CGUs exceeded the
carrying value. Further, none of the CGU’s tested for impairment as
at March 31, 2019 and 2020 were at risk of impairment. An analysis
of the calculation’s sensitivity to a change in the key parameters
(turnover and earnings multiples), did not identify any probable
scenarios where the CGU’s recoverable amount would fall below its
carrying amount.
The movement in intangible assets is given below:
Intangible assets
Customer related Marketing related Total
Gross carrying value:
As at April 1, 2018 ` 26,586 ` 6,551 ` 33,137
Translation adjustment 555 217 772
Disposal (Refer to Note 26) (217) (823) (1,040)
As at March 31, 2019 ` 26,924 ` 5,945 ` 32,869
Accumulated amortization/ impairment:
As at April 1, 2018 ` 12,263 ` 2,761 ` 15,024
Translation adjustment 35 64 99
Amortization and impairment * 3,148 1,136 4,284
Disposal (Refer to Note 26) (101) (199) (300)
As at March 31, 2019 ` 15,345 ` 3,762 ` 19,107Net carrying value as at March 31, 2019 ` 11,579 ` 2,183 ` 13,762
Gross carrying value:
As at April 1, 2019 ` 26,924 ` 5,945 ` 32,869
Translation adjustment 1,031 382 1,413
Acquisition through business combinations (Refer to Note 7) 4,535 371 4,906
As at March 31, 2020 ` 32,490 ` 6,698 ` 39,188
Accumulated amortization/ impairment:
As at April 1, 2019 ` 15,345 ` 3,762 ` 19,107
Translation adjustment 220 226 446
Amortization and impairment * 2,333 940 3,273
As at March 31, 2020 ` 17,898 ` 4,928 ` 22,826Net carrying value as at March 31, 2020 ` 14,592 ` 1,770 ` 16,362
* includes impairment charge on certain intangible assets recognized on acquisitions, amounting to ` 643, ` 838 and ` Nil for the year ended March 31, 2018, 2019 and 2020, respectively.

Corporate Overview | Management & Board Reports | Financial Statements
Wipro Limited307
Amortization and impairment expense on intangible assets are included in selling and marketing expenses in the consolidated statement of income.
As at March 31, 2020, the estimated remaining amortization period for intangible assets acquired on acquisition are as follows:
Acquisition Estimated remaining
amortization period ATCO I-Tek 4.50 years
Cellent AG 0.75 – 2.75 years
Appirio Inc. 1.75 years
Vara Infotech Private Limited 6.50 - 9.50 years
International TechneGroup Incorporated 4.50 years
Rational Interaction, Inc. 2.75 - 6.75 years
Other entities 0.25 – 12.25 years
7. Business combinationSummary of material acquisitions during the year ended March 31, 2018 is given below:
During the year ended March 31, 2018, the Company has completed four business combinations (which individually and in aggregate are not material) for a total consideration of ` 6,924. These transactions include (a) the acquisition of IT service provider which is focused on Brazilian markets, (b) the acquisition of a design and business strategy consultancy firm based in United States, and (c) the acquisition of intangible assets, assembled workforce and a multi-year service agreement which qualify as business combination.
The following table presents the allocation of purchase price:
Description Purchase price allocated
Net assets ` 5
Customer related intangibles 5,565
Other intangible assets 169
Total ` 5,739Goodwill 1,185
Total purchase price ` 6,924
The goodwill of ` 1,185 comprises value of acquired workforce and expected synergies arising from the acquisition. The goodwill was allocated to IT Services segment and is partially deductible for United States federal income tax purpose.
Net assets acquired include ` 58 of cash and cash equivalents and trade receivables valued at ` 215.
Summary of material acquisitions during the year ended March 31, 2020 is given below:
During the year ended March 31, 2020, the Company has completed three business combinations (which both individually and in aggregate are not material) for a total consideration of ̀ 10,433. These include (a) taking over customer contracts, leased facilities, assets and employees of Vara Infotech Private Limited, (b) the acquisition of
International TechneGroup Incorporated, a global digital engineering and manufacturing solutions company, and (c) the acquisition of Rational Interaction, Inc, a digital customer experience management company. The following table presents the provisional purchase price allocation:
Description Purchase price allocated
Net assets ` 907
Customer related intangibles 4,535
Marketing related intangibles 371
Deferred tax liabilities on intangible assets (213)
Total ` 5,600Goodwill 4,833
Total purchase price ` 10,433
Net assets acquired include ` 317 of cash and cash equivalents and trade receivables valued at ` 831.
The goodwill of ` 4,833 comprises value of acquired workforce and expected synergies arising from the business combinations. The goodwill was allocated to IT Services segment and is partially deductible for income tax purposes in India and United States.
The pro-forma effects of these business combinations on the Company’s results were not material.
8. Investments
Investments consist of the following:
As at March 31,2019 2020
Non-current
Financial instruments at FVTOCI
Equity instruments ` 6,916 ` 9,297
Financial instruments at amortized cost
Inter corporate and term deposits * - 5
` 6,916 ` 9,302
Current
Financial instruments at FVTPL
Investments in liquid and short-term mutual funds
` 13,960 ` 14,795
Financial instruments at FVTOCI
Commercial paper, Certificate of deposits and bonds
185,048 155,587
Financial instruments at amortized cost
Inter corporate and term deposits * 21,708 19,253
` 220,716 ` 189,635
Total ` 227,632 ` 198,937
* These deposits earn a fixed rate of interest. Term deposits include non- current and current deposits in lien with banks primarily on account of term deposits held as margin money deposits against guarantees amounting to ` 5, and ` 796, respectively (March 31, 2019: Term deposits current of ` 463).

Annual Report 2019-20 308
Investments accounted for using the equity method
The Company has no material associates as at March 31, 2019 and 2020. The aggregate summarized financial information in respect of the Company’s immaterial associates that are accounted for using the equity method is set forth below:
As at March 31, 2019 2020
Carrying amount of the Company’s interest in associates accounted for using the equity method
` 1,235 ` 1,383
For the year ended March 31,
2018 2019 2020
Company’s share of net profit /(loss) of associates accounted for using the equity method in consolidated statement of income
` 11 ` (43) ` 29
9. Trade receivables
As at March 31,2019 2020
Trade receivables ` 119,686 ` 124,460
Allowance for lifetime expected credit loss
(14,824) (13,937)
` 104,862 ` 110,523
Non-current 4,373 6,049
Current 100,489 104,474
The activity in the allowance for lifetime expected credit loss is given below:
As at March 31,2019 2020
Balance at the beginning of the year ` 14,570 ` 14,824
Additions during the year, net (Refer to Note 25)
980 1,043
Charged against allowance (772) (2,139)
Translation adjustment 46 209
Balance at the end of the year ` 14,824 ` 13,937
10. Inventories
Inventories consist of the following:
As at March 31,2019 2020
Stores and spare parts ` 677 ` 613
Finished and traded goods 3,274 1,252
` 3,951 ` 1,865
11. Cash and cash equivalentsCash and cash equivalents as at March 31, 2018, 2019 and 2020, consist of cash and balance in deposits with banks. Cash and cash equivalents consist of the following:
As at March 31,2018 2019 2020
Cash and bank balances ` 23,300 ` 41,966 ` 34,087
Demand deposits with banks * 21,625 116,563 110,412
` 44,925 ` 158,529 ` 144,499
* These deposits can be withdrawn by the Company at any time without prior notice and without any penalty on the principal.
Cash and cash equivalents consist of the following for the purpose of the cash flow statement:
As at March 31,2018 2019 2020
Cash and cash equivalents (as above)
` 44,925 ` 158,529 ` 144,499
Bank overdrafts (3,999) (4) (395)` 40,926 ` 158,525 ` 144,104
12. Other financial assets
As at March 31,2019 2020
Non-currentSecurity deposits ` 1,436 ` 1,581Interest receivables 1,139 1,139Finance lease receivables 1,794 2,359Other deposits 777 802
` 5,146 ` 5,881CurrentSecurity deposits ` 1,050 ` 1,127Dues from officers and employees 738 1,040Finance lease receivables 1,618 2,811Interest receivables 1,789 2,581Other deposits 33 5Others 9,383 1,050
` 14,611 ` 8,614` 19,757 ` 14,495
Finance lease receivables
Finance lease receivables consist of assets that are leased to customers for a contract term normally ranging 1 to 7 years, with lease payments due in monthly or quarterly installments. Details of finance lease receivables are given below:
Minimum lease payments
Present value of minimum lease
paymentsAs at March 31,
2019 2020 2019 2020Not later than one year ` 1,742 ` 2,986 ` 1,618 ` 2,811
Later than one year but not later than five years 1,813 2,473 1,752 2,359
Later than five years 44 - 42 -
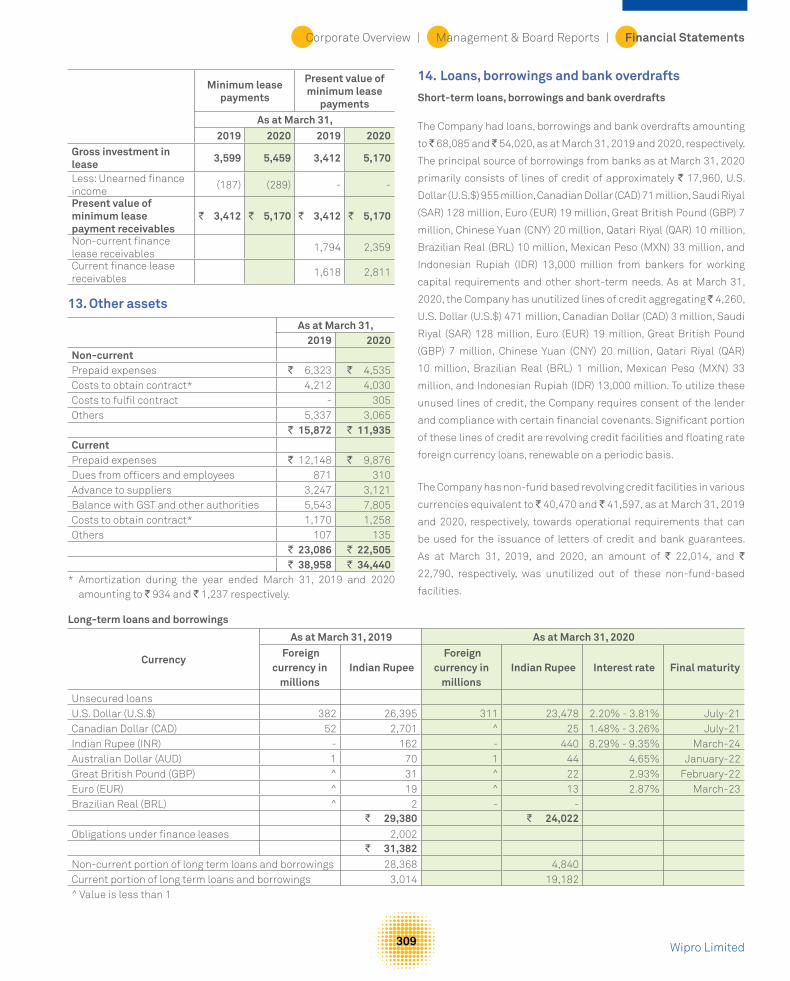
Corporate Overview | Management & Board Reports | Financial Statements
Wipro Limited309
Minimum lease payments
Present value of minimum lease
paymentsAs at March 31,
2019 2020 2019 2020Gross investment in lease 3,599 5,459 3,412 5,170
Less: Unearned finance income
(187) (289) - -
Present value of minimum lease payment receivables
` 3,412 ` 5,170 ` 3,412 ` 5,170
Non-current finance lease receivables
1,794 2,359
Current finance lease receivables
1,618 2,811
13. Other assets
As at March 31,2019 2020
Non-currentPrepaid expenses ` 6,323 ` 4,535Costs to obtain contract* 4,212 4,030Costs to fulfil contract - 305Others 5,337 3,065
` 15,872 ` 11,935CurrentPrepaid expenses ` 12,148 ` 9,876Dues from officers and employees 871 310Advance to suppliers 3,247 3,121Balance with GST and other authorities 5,543 7,805Costs to obtain contract* 1,170 1,258Others 107 135
` 23,086 ` 22,505` 38,958 ` 34,440
* Amortization during the year ended March 31, 2019 and 2020 amounting to ` 934 and ` 1,237 respectively.
14. Loans, borrowings and bank overdrafts
Short-term loans, borrowings and bank overdrafts
The Company had loans, borrowings and bank overdrafts amounting
to ̀ 68,085 and ̀ 54,020, as at March 31, 2019 and 2020, respectively.
The principal source of borrowings from banks as at March 31, 2020
primarily consists of lines of credit of approximately ` 17,960, U.S.
Dollar (U.S.$) 955 million, Canadian Dollar (CAD) 71 million, Saudi Riyal
(SAR) 128 million, Euro (EUR) 19 million, Great British Pound (GBP) 7
million, Chinese Yuan (CNY) 20 million, Qatari Riyal (QAR) 10 million,
Brazilian Real (BRL) 10 million, Mexican Peso (MXN) 33 million, and
Indonesian Rupiah (IDR) 13,000 million from bankers for working
capital requirements and other short-term needs. As at March 31,
2020, the Company has unutilized lines of credit aggregating ` 4,260,
U.S. Dollar (U.S.$) 471 million, Canadian Dollar (CAD) 3 million, Saudi
Riyal (SAR) 128 million, Euro (EUR) 19 million, Great British Pound
(GBP) 7 million, Chinese Yuan (CNY) 20 million, Qatari Riyal (QAR)
10 million, Brazilian Real (BRL) 1 million, Mexican Peso (MXN) 33
million, and Indonesian Rupiah (IDR) 13,000 million. To utilize these
unused lines of credit, the Company requires consent of the lender
and compliance with certain financial covenants. Significant portion
of these lines of credit are revolving credit facilities and floating rate
foreign currency loans, renewable on a periodic basis.
The Company has non-fund based revolving credit facilities in various
currencies equivalent to ` 40,470 and ` 41,597, as at March 31, 2019
and 2020, respectively, towards operational requirements that can
be used for the issuance of letters of credit and bank guarantees.
As at March 31, 2019, and 2020, an amount of ` 22,014, and `
22,790, respectively, was unutilized out of these non-fund-based
facilities.
Long-term loans and borrowings
Currency
As at March 31, 2019 As at March 31, 2020 Foreign
currency in millions
Indian Rupee Foreign
currency in millions
Indian Rupee Interest rate Final maturity
Unsecured loansU.S. Dollar (U.S.$) 382 26,395 311 23,478 2.20% - 3.81% July-21Canadian Dollar (CAD) 52 2,701 ^ 25 1.48% - 3.26% July-21Indian Rupee (INR) - 162 - 440 8.29% - 9.35% March-24Australian Dollar (AUD) 1 70 1 44 4.65% January-22Great British Pound (GBP) ^ 31 ^ 22 2.93% February-22Euro (EUR) ^ 19 ^ 13 2.87% March-23Brazilian Real (BRL) ^ 2 - -
` 29,380 ` 24,022Obligations under finance leases 2,002
` 31,382Non-current portion of long term loans and borrowings 28,368 4,840Current portion of long term loans and borrowings 3,014 19,182^ Value is less than 1

Annual Report 2019-20 310
Cash and non-cash changes in liabilities arising from financing activities
April 1, 2018 Cash flow
Non-cash changes March 31,
2019 Assets taken
on finance lease
Foreign exchange
movements Borrowings from banks ` 119,689 ` (26,228) ` - ` 3,518 ` 96,979
Bank overdrafts 3,999 (3,995) - - 4
External commercial borrowings 9,777 (10,064) - 287 -
Obligations under finance leases 3,973 (2,234) 14 249 2,002
Loans from other than banks 821 (352) - 13 482
` 138,259 ` (42,873) ` 14 ` 4,067 ` 99,467
April 1, 2019 Cash flow
Non-cash changes March 31,
2020 IFRS 16
adoption
Additions to lease
liabilities
Foreign exchange
movements Borrowings from banks ` 96,979 ` (26,138) ` - ` - ` 6,217 ` 77,058
Bank overdrafts 4 391 - - - 395
Obligations under finance leases 2,002 - (2,002) - - -
Loans from other than banks 482 100 - - 7 589
Lease Liabilities - (6,784) 17,381 7,942 659 19,198
` 99,467 ` (32,431) ` 15,379 ` 7,942 ` 6,883 ` 97,240
Significant portion of loans, borrowings and bank overdrafts bear floating rates of interest, referenced to LIBOR or other similar country specific official benchmark interest rates and a spread, determined based on market conditions.
The terms of the other secured and unsecured loans and borrowings also contain certain restrictive covenants primarily requiring the Company to maintain certain financial ratios. As at March 31, 2019 and 2020, the Company has met all the covenants under these arrangements.
Obligations under finance leases amounting to ` 2,002 as at March 31, 2019 were secured by underlying property, plant and equipment.
Interest expense on loans, borrowings and bank overdrafts was ` 3,045, ` 4,058, and ` 3,166 for the year ended March 31, 2018, 2019 and 2020, respectively.
Details of finance lease payables are given below:
As at March 31, 2019
Minimum lease
payments
Present value of minimum
lease payment
Not later than one year ` 1,555 ` 1,506
Later than one year but not later than five years 506 496
Total minimum lease payments 2,061 2,002
Less: Amounts representing interest (59) -
Obligation under finance lease ` 2,002 ` 2,002Non-current finance lease payables 496
Current finance lease payables 1,506
15. Trade payables and accrued expensesTrade payables and accrued expenses consist of the followings:
As at March 31,2019 2020
Trade payables ` 28,527 ` 27,053
Accrued expenses 59,777 51,076
` 88,304 ` 78,129
16. Other financial liabilitiesAs at March 31,
2019 2020
Non-current
Cash Settled ADS RSUs (Refer to Note 30)
` - ` 146
Deposits and others - 5
` - ` 151
Current
Cash Settled ADS RSUs (Refer to Note 30)
` - ` 350
Deposits and others 644 549
` 644 ` 899
` 644 ` 1,050
17. Other liabilitiesAs at March 31,
2019 2020
Non-current
Employee benefits obligations ` 2,083 ` 3,767
Others 3,175 3,770
` 5,258 ` 7,537

Corporate Overview | Management & Board Reports | Financial Statements
Wipro Limited311
As at March 31,2019 2020
Current
Statutory and other liabilities ` 5,430 ` 4,919
Employee benefits obligations 10,065 12,356
Advance from customers 1,361 1,464
Others 1,190 515
` 18,046 ` 19,254
` 23,304 ` 26,791
18. ProvisionsAs at March 31,
2019 2020Non-currentProvision for warranty ` 2 ` 2
` 2 ` 2CurrentProvision for warranty ` 275 ` 317Others 363 295
` 638 ` 612` 640 ` 614
A summary of activity in provision for warranty and other provisions is as follows:
Year ended March 31, 2019 Year ended March 31, 2020 Provision for
warranty Others Total
Provision for warranty
Others Total
Balance at the beginning of the year ` 293 ` 506 ` 799 ` 277 ` 363 ` 640
Additional provision during the year 295 13 308 360 98 458
Provision used during the year (311) (156) (467) (318) (166) (484)
Balance at the end of the year ` 277 ` 363 ` 640 ` 319 ` 295 ` 614
Provision for warranty represents cost associated with providing sales support services which are accrued at the time of recognition of revenues and are expected to be utilized over a period of 1 to 2 years. Other provisions primarily include provisions for indirect tax related contingencies and litigations. The timing of cash outflows in respect of such provision cannot be reasonably determined.
19. Financial instrumentsFinancial assets and liabilities (carrying value / fair value)
As at March 31,2019 2020
Assets:
Cash and cash equivalents ` 158,529 ` 144,499
Investments
Financial instruments at FVTPL 13,960 14,795
Financial instruments at FVTOCI 191,964 164,884
Financial instruments at Amortized cost
21,708 19,258
Other financial assets
Trade receivables 104,862 110,523
Unbilled receivables 22,880 25,209
Other assets 19,757 14,495
Derivative assets 5,104 3,025
` 538,764 ` 496,688
Liabilities:
Trade payables and other payables
Trade payables and accrued expenses ` 88,304 ` 78,129
Lease liabilities - 19,198
Other liabilities 644 1,050
Loans, borrowings and bank over-drafts
99,467 78,042
Derivative liabilities 1,310 7,369
` 189,725 ` 183,788
Offsetting financial assets and liabilities
The following table contains information on other financial assets and trade payable and other liabilities subject to offsetting:
Financial assets Gross amounts
of recognized other financial
assets
Gross amounts of recognized
financial liabilities set off
in the balance sheet
Net amounts of recognized other financial assets presented in the
balance sheet
As at March 31, 2019 ` 154,129 ` (6,630) ` 147,499
As at March 31, 2020 ` 157,304 ` (7,077) ` 150,227
Financial liabilities Gross amounts
of recognized trade payables
and other payables
Gross amounts of recognized
financial liabilities set off
in the balance sheet
Net amounts of recognized trade
payables and other payables
presented in the balance sheet
As at March 31, 2019 ` 95,578 ` (6,630) ` 88,948
As at March 31, 2020 ` 86,256 ` (7,077) ` 79,179
For the financial assets and liabilities subject to offsetting or similar arrangements, each agreement between the Company and the counterparty allows for net settlement of the relevant financial assets and liabilities when both elect to settle on a net basis. In the absence of such an election, financial assets and liabilities will be settled on a gross basis and hence are not offset.
Fair value
Financial assets and liabilities include cash and cash equivalents, trade receivables, unbilled receivables, finance lease receivables, employee and other advances, eligible current and non-current assets, loans, borrowings and bank overdrafts, trade payable and

Annual Report 2019-20 312
accrued expenses, and eligible current liabilities and non-current liabilities.
The fair value of cash and cash equivalents, trade receivables, unbilled receivables, loans, borrowings and bank overdrafts, trade payables and accrued expenses, other current financial assets and liabilities approximate their carrying amount largely due to the short-term nature of these instruments. The Company’s long-term debt has been contracted at market rates of interest. Accordingly, the carrying value of such long-term debt approximates fair value. Further, finance lease receivables are periodically evaluated based on individual credit worthiness of customers. Based on this evaluation, the Company records allowance for estimated losses on these receivables. As at March 31, 2020 and 2019, the carrying value of such receivables, net of allowances approximates the fair value.
Investments in liquid and short-term mutual funds, which are classified as FVTPL are measured using net asset values at the reporting date multiplied by the quantity held. Fair value of investments in commercial papers, certificate of deposits and bonds classified as FVTOCI is determined based on the indicative quotes of
price and yields prevailing in the market at the reporting date. Fair value of investments in equity instruments classified as FVTOCI is determined using market and income approaches.
The fair value of derivative financial instruments is determined based on observable market inputs including currency spot and forward rates, yield curves, currency volatility etc.
Fair value hierarchy
The table below analyses financial instruments carried at fair value, by valuation method. The different levels have been defined as follows:
Level 1 – Quoted prices (unadjusted) in active markets for identical assets or liabilities.
Level 2 – Inputs other than quoted prices included within Level 1 that are observable for the asset or liability, either directly (i.e. as prices) or indirectly (i.e. derived from prices).
Level 3 – Inputs for the assets or liabilities that are not based on observable market data (unobservable inputs).
The following table presents fair value of hierarchy of assets and liabilities measured at fair value on a recurring basis:
Particular As at March 31, 2019 As at March 31, 2020
Fair value measurements at reporting date Fair value measurements at reporting date Total Level 1 Level 2 Level 3 Total Level 1 Level 2 Level 3
Assets
Derivative instruments:
Cash flow hedges ` 3,149 ` - ` 3,149 ` - ` 1,382 ` - ` 1,382 ` -
Others 1,955 - 1,955 - 1,643 - 1,643 -
Investments:
Investment in liquid and short-term mutual funds 13,960 13,960 - - 14,795 14,795 - -
Investment in equity instruments 6,916 - 248 6,668 9,297 - 119 9,178
Commercial paper, Certificate of deposits and bonds 185,048 6,865 178,183 - 155,587 12,983 142,604 -
Liabilities
Derivative instruments:
Cash flow hedges ` (130) ` - ` (130) ` - ` (4,057) ` - ` (4,057) ` -
Others (1,180) - (1,180) - (3,312) - (3,312) -
The following methods and assumptions were used to estimate the fair value of the level 2 financial instruments included in the above table.
Derivative instruments (assets and liabilities): The Company enters derivative financial instruments with various counterparties, primarily banks with investment grade credit ratings. Derivatives valued using valuation techniques with market observable inputs are mainly interest rate swaps, foreign exchange forward contracts and foreign exchange option contracts. The most frequently applied valuation techniques include forward pricing, swap models and Black Scholes models (for option valuation), using present value calculations. The models incorporate various inputs including the credit quality of counterparties, foreign exchange spot and forward
rates, interest rate curves and forward rate curves of the underlying. As at March 31, 2020, the changes in counterparty credit risk had no material effect on the hedge effectiveness assessment for derivatives designated in hedge relationships and other financial instruments recognized at fair value.
Investment in commercial papers, certificate of deposits and bonds: Fair value of these instruments is derived based on the indicative quotes of price and yields prevailing in the market as at reporting date.
The following methods and assumptions were used to estimate the fair value of the level 3 financial instruments included in the above table.

Corporate Overview | Management & Board Reports | Financial Statements
Wipro Limited313
Investment in equity instruments: Fair value of these instruments is determined using market and income approaches.
Details of assets and liabilities considered under Level 3 classification
Investment in equity instruments
Balance as at April 1, 2018 ` 5,685
Additions 2,869
Transfers out of level 3 (647)
Disposal (1,341)
Gain recognized in foreign currency translation reserve 203
Loss recognized in other comprehensive income (101)
Balance as at March 31, 2019 ` 6,668 Balance as at April 1, 2019 ` 6,668
Additions 2,124
Transfers out of level 3 -
Disposal (1,327)
Gain recognized in foreign currency translation reserve 855
Gain recognized in other comprehensive income 858
Balance as at March 31, 2020 ` 9,178
Description of significant unobservable inputs to valuation:
As at March 31, 2019
Items Valuation technique Significant unobservable Movement Increase Decrease
input by (`) (`)
Unquoted equity investments
Discounted cash flow model
Long term growth rate 0.5% 201 (187)
Discount rate 0.5% (243) 256
As at March 31, 2020
Items Valuation technique Significant unobservable Movement Increase Decrease
input by (`) (`)Unquoted equity Discounted Long term growth rate 0.5% 298 (273)
investments cash flow model Discount rate 0.5% (388) 404
As at March 31, 2019 and 2020, 0.5 percentage point increase/(decrease) in the unobservable inputs used in fair valuation of other Level 3 assets does not have a significant impact in its value.
Derivative assets and liabilities:
The Company is exposed to foreign currency fluctuations on foreign currency assets / liabilities, forecasted cash flows denominated in foreign currency and net investment in foreign operations. The Company follows established risk management policies, including the use of derivatives to hedge foreign currency assets / liabilities, foreign currency forecasted cash flows and net investment in foreign operations. The counter parties in these derivative instruments are primarily banks and the Company considers the risks of non-performance by the counterparty as non-material.
The following table presents the aggregate contracted principal amounts of the Company’s derivative contracts outstanding:(in million)
As at March 31,2019 2020
Notional Fair value Notional Fair valueDesignated derivative instrumentsSell : Forward contracts
USD 333 ` 1,410USD
1,011` (2,902)
€ - - € 121 ` 231£ - - £ 52 ` 240
AUD 97 ` 15 AUD 144 ` 741

Annual Report 2019-20 314
As at March 31,2019 2020
Notional Fair value Notional Fair value Range forward option contracts USD 1,067 ` 1,149 USD 474 ` (1,057)
£ 191 ` 68 £ 98 ` (13)€ 153 ` 349 € 39 ` 85 AUD 56 ` 39 AUD - -
Interest rate swaps USD 75 ` (11) USD - -Non-designated derivative instrumentsSell : Forward contracts * USD 1,182 ` 1,359 USD 1,314 ` (3,116)
€ 32 ` 55 € 59 ` 34£ 1 ` (1) £ 81 ` 112AUD 82 ` 28 AUD 56 ` 115SGD 11 ` 1 SGD 7 ` 8ZAR 56 ` 14 ZAR 17 ` 1CAD 56 ` 40 CAD 51 ` 153SAR 123 ` (1) SAR 60 ` (1)AED 9 ^ AED - -PLN 38 ` 15 PLN 34 ` 13CHF 10 ^ CHF 7 ` 4QAR 3 ` (1) QAR 19 ` (8)TRY 28 ` 12 TRY 30 ` 31NOK 29 ` 4 NOK 19 ` 16OMR 1 ` (1) OMR 2 ` 1SEK 35 ` 5 SEK 13 ` 4MYR - - MYR 20 ` 1JPY - - JPY 325 ^
Range forward option contracts USD 150 ` 161 USD - -€ 31 ` 12 € - -£ 71 ` 57 £ - -
Buy : Forward contracts USD 730 ` (971) USD 480 ` 972JPY 154 ^ JPY - -MXN 9 ^ MXN 11 ` (9)DKK 75 ` (13) DKK 9 ^
` 3,794 ` (4,344)
* USD 1,182 and USD 1,314 includes USD/PHP sell forward of USD 117 and USD 176 as at March 31, 2019 and 2020, respectively.^ Value is less than ` 1
The following table summarizes activity in the cash flow hedging reserve within equity related to all derivative instruments classified as cash flow hedges:
As at March 31,2019 2020
Balance as at the beginning of the year ` (143) ` 3,019
Deferred cancellation gain/ (loss), net 6 (201)
Changes in fair value of effective portion of derivatives 1,069 (2,312)
Net gain/(loss) reclassified to consolidated statement of income on occurrence of hedged transactions *
2,087 (3,382)
Gain/(loss) on cash flow hedging derivatives, net ` 3,162 ` (5,895)
Balance as at the end of the year 3,019 (2,876)Deferred tax thereon (604) 561
Balance as at the end of the year, net of deferred tax ` 2,415 ` (2,315)
*Includes net gain/(loss) reclassified to revenue (March 31, 2019: ` 2,585, March 31, 2020: ` (4,761)) and cost of revenues (March 31, 2019: ` (498), March 31, 2020: ` 1,379).

Corporate Overview | Management & Board Reports | Financial Statements
Wipro Limited315
The related hedge transactions for balance in cash flow hedging reserves as at March 31, 2020 are expected to occur and be reclassified to the consolidated statement of income over a period of three years.
As at March 31, 2019 and 2020 there were no significant gains or losses on derivative transactions or portions thereof that have become ineffective as hedges or associated with an underlying exposure that did not occur.
Sale of financial assets
From time to time, in the normal course of business, the Company transfers accounts receivables, unbilled receivables, net investment in finance lease receivables (financials assets) to banks. Under the terms of the arrangements, the Company surrenders control over the financial assets and transfer is without recourse. Accordingly, such transfers are recorded as sale of financial assets. Gains and losses on sale of financial assets without recourse are recorded at the time of sale based on the carrying value of the financial assets and fair value of servicing liability. The incremental impact of such transactions on our cash flow and liquidity for the year ended March 31, 2018, 2019 and 2020 is not material.
In certain cases, transfer of financial assets may be with recourse. Under arrangements with recourse, the Company is obligated to repurchase the uncollected financial assets, subject to limits specified in the agreement with the banks. These are reflected as part of loans and borrowings in the consolidated statement of financial position.
Financial risk management
Market Risk
Market risk is the risk of loss of future earnings, to fair values or to future cash flows that may result from a change in the price of a financial instrument. The value of a financial instrument may change as a result of changes in the interest rates, foreign currency exchange rates and other market changes that affect market risk sensitive instruments. Market risk is attributable to all market risk sensitive financial instruments including investments, foreign currency receivables, payables and loans and borrowings.
The Company’s exposure to market risk is a function of investment and borrowing activities and revenue generating activities in foreign currency. The objective of market risk management is to avoid excessive exposure of the Company’s earnings and equity to losses.
Risk Management Procedures
The Company manages market risk through a corporate treasury
department, which evaluates and exercises independent control over the entire process of market risk management. The corporate treasury department recommends risk management objectives and policies, which are approved by senior management and Audit Committee. The activities of this department include management of cash resources, implementing hedging strategies for foreign currency exposures, borrowing strategies, and ensuring compliance with market risk limits and policies.
Foreign currency risk
The Company operates internationally, and a major portion of its business is transacted in several currencies. Consequently, the Company is exposed to foreign exchange risk through receiving payment for sales and services in the United States and elsewhere and making purchases from overseas suppliers in various foreign currencies. The exchange rate risk primarily arises from foreign exchange revenue, receivables, cash balances, forecasted cash flows, payables and foreign currency loans and borrowings. A significant portion of the Company’s revenue is in the U.S. Dollar, the United Kingdom Pound Sterling, the Euro, the Canadian Dollar and the Australian Dollar, while a large portion of costs are in Indian rupees. The exchange rate between the rupee and these currencies has fluctuated significantly in recent years and may continue to fluctuate in the future. Appreciation of the rupee against these currencies can adversely affect the Company’s results of operations.
The Company evaluates exchange rate exposure arising from these transactions and enters foreign currency derivative instruments to mitigate such exposure. The Company follows established risk management policies, including the use of derivatives like foreign exchange forward/option contracts to hedge forecasted cash flows denominated in foreign currency.
The Company has designated certain derivative instruments as cash flow hedges to mitigate the foreign exchange exposure of forecasted highly probable cash flows. The Company also designates foreign currency borrowings as hedge against respective net investments in foreign operations.
As at March 31, 2020, a ` 1 increase in the spot exchange rate of the Indian rupee with the U.S. dollar would result in approximately ̀ 1,972 (consolidated statement of income ` 658 and other comprehensive income ` 1,314) decrease in the fair value, and a ` 1 decrease would result in approximately ` 1,912 (consolidated statement of income ` 658 and other comprehensive income ` 1,254) increase in the fair value of foreign currency dollar denominated derivative instruments (forward and option contracts).
The below table presents foreign currency risk from non-derivative financial instruments as at March 31, 2019 and 2020:
As at March 31, 2019
US $ Euro Pound
Sterling Australian
Dollar Canadian
Dollar Other
currencies # Total
Trade receivables ` 39,896 ` 8,030 ` 5,212 ` 3,542 ` 1,528 ` 3,880 ` 62,088
Unbilled receivables 8,038 1,609 3,146 1,225 204 743 14,965
Contract assets 4,706 1,445 2,270 836 150 598 10,005

Annual Report 2019-20 316
As at March 31, 2019
US $ Euro Pound
Sterling Australian
Dollar Canadian
Dollar Other
currencies # Total
Cash and cash equivalents 21,997 2,884 1,573 1,003 1,928 2,204 31,589
Other assets 8,553 1,173 4,056 1,038 1,033 4,544 20,397
Loans, borrowings and bank overdrafts
(50,516) (20) (21) (33) - (21) (50,611)
Trade payables, accrued expenses and other liabilities
(27,202) (5,779) (4,646) (1,526) (806) (2,787) (42,746)
Net assets/ (liabilities) ` 5,472 ` 9,342 ` 11,590 ` 6,085 ` 4,037 ` 9,161 ` 45,687 As at March 31, 2020
US $ Euro Pound
Sterling Australian
Dollar Canadian
Dollar Other
currencies # Total
Trade receivables ` 42,329 ` 8,860 ` 7,735 ` 3,044 ` 1,388 ` 4,522 ` 67,878
Unbilled receivables 11,127 1,030 2,221 784 291 1,126 16,579
Contract assets 5,517 1,559 2,850 654 146 790 11,516
Cash and cash equivalents 13,481 3,978 1,697 586 1,292 1,733 22,767
Other assets 49,835 4,314 3,283 413 1,447 1,805 61,097
Loans, borrowings and bank overdrafts (36,578) - - - - - (36,578)
Lease Liabilities (3,393) (2,606) (373) (214) (16) (1,412) (8,014)
Trade payables, accrued expenses and other liabilities (27,457) (3,419) (3,718) (1,228) (605) (3,087) (39,514)
Net assets/ (liabilities) ` 54,861 ` 13,716 ` 13,695 ` 4,039 ` 3,943 ` 5,477 ` 95,731
# Other currencies reflect currencies such as Swiss Franc, UAE Dirham, Saudi Riyal, Singapore Dollar, etc.
As at March 31, 2019 and 2020, respectively, every 1% increase/decrease in the respective foreign currencies compared to functional currency of the Company would impact results by approximately ` 457 and ` 957, respectively.
Interest rate risk
Interest rate risk primarily arises from floating rate borrowing, including various revolving and other lines of credit. The Company’s investments are primarily in short-term investments, which do not expose it to significant interest rate risk. From time to time, the Company manages its net exposure to interest rate risk relating to borrowings by entering into interest rate swap agreements, which allows it to exchange periodic payments based on a notional amount and agreed upon fixed and floating interest rates. Certain borrowings are also transacted at fixed interest rates. If interest rates were to increase by 100 bps as on March 31, 2020, additional net annual interest expense on floating rate borrowing would amount to approximately ` 773.
Credit risk
Credit risk arises from the possibility that customers may not be able to settle their obligations as agreed. To manage this, the Company periodically assesses the financial reliability of customers, taking into account the financial condition, current economic trends, forward looking macroeconomic information, analysis of historical bad debts and ageing of accounts receivable. Individual risk limits are set accordingly. No single customer accounted for more than 10% of the accounts receivable as at March 31, 2019 and 2020, or revenues for the year ended March 31, 2018, 2019 and 2020. There is no significant concentration of credit risk.
Counterparty risk
Counterparty risk encompasses issuer risk on marketable securities, settlement risk on derivative and money market contracts and credit risk on cash and time deposits. Issuer risk is minimized by only buying securities which are at least AA rated in India based on Indian rating agencies. Settlement and credit risk is reduced by the policy of entering transactions with counterparties that are usually banks or financial institutions with acceptable credit ratings. Exposure to these risks are closely monitored and maintained within predetermined parameters. There are limits on credit exposure to any financial institution. The limits are regularly assessed and determined based upon credit analysis including financial statements and capital adequacy ratio reviews.
Liquidity risk
Liquidity risk is defined as the risk that the Company will not be able to settle or meet its obligations on time or at a reasonable price. The Company’s corporate treasury department is responsible for liquidity and funding as well as settlement management. In addition, processes and policies related to such risks are overseen by senior management. Management monitors the Company’s net liquidity position through rolling forecasts on the basis of expected cash flows. As at March 31, 2020, cash and cash equivalents are held with major banks and financial institutions.
The table below provides details regarding the remaining contractual maturities of significant financial liabilities at the reporting date. The amounts include estimated interest payments and exclude the impact of netting agreements, if any.

Corporate Overview | Management & Board Reports | Financial Statements
Wipro Limited317
As at March 31, 2019 Carrying
value Less than 1
year 1-2 years 2-4 years Beyond 4 years Total
Loans, borrowings and bank overdrafts * ` 99,467 ` 73,559 ` 24,887 ` 4,309 ` - ` 102,755
Trade payables and accrued expenses 88,304 88,304 - - - 88,304
Derivative liabilities 1,310 1,310 - - - 1,310
Other liabilities 644 644 - - - 644
As at March 31, 2020 Carrying
value Less than 1
year 1-2 years 2-4 years Beyond 4years Total
Loans, borrowings and bank overdrafts * ` 78,042 ` 74,663 ` 4,761 ` 119 ` - ` 79,543
Lease Liabilities * 19,198 7,322 6,128 5,425 2,192 21,067
Trade payables and accrued expenses 78,129 78,129 - - - 78,129
Derivative liabilities 7,369 7,231 90 48 - 7,369
Other liabilities 1,050 899 88 63 - 1,050
* Includes future cash outflow towards estimated interest on borrowings and lease liabilities
The balanced view of liquidity and financial indebtedness is stated in the table below. This calculation of the net cash position is used by the management for external communication with investors, analysts and rating agencies:
As at March 31,2019 2020
Cash and cash equivalents ` 158,529 ` 144,499
Investments 220,716 189,635
Loans, borrowings and bank overdrafts (99,467) (78,042)
` 279,778 ` 256,092
20. Foreign currency translation reserveThe movement in foreign currency translation reserve attributable to equity holders of the Company is summarized below:
As at March 31,2019 2020
Balance at the beginning of the year ` 16,618 ` 15,250
Translation difference related to foreign operations, net
3,129 8,289
Reclassification of foreign currency translation differences to profit and loss on sale of hosted Data center services business
(4,131) -
Reclassification of foreign currency translation differences to profit and loss on sale of Workday business and Cornerstone OnDemand business
(79) -
Change in effective portion of hedges of net investment in foreign operations
(287) -
Total change during the year (1,368) 8,289
Balance at the end of the year ` 15,250 ` 23,539
21. Income taxesIncome tax expense has been allocated as follows:
Year ended March 31, 2018 2019 2020
Income tax expense as per the consolidated statement of income
` 22,390 ` 25,242 ` 24,799
Income tax included in other comprehensive income on:
Unrealized losses on investment securities
(644) (65) (230)
Gains/(losses) on cash flow hedging derivatives
(1,448) 633 (1,165)
Defined benefit plan actuarial gains/(losses)
255 47 (196)
` 20,553 ` 25,857 ` 23,208
Income tax expense consists of the following:
Year ended March 31,
2018 2019 2020
Current taxes
Domestic ` 18,500 ` 17,987 ` 18,437
Foreign 7,834 5,663 5,887
26,334 23,650 24,324
Deferred taxes
Domestic 3 (180) 1,624
Foreign (3,947) 1,772 (1,149)
(3,944) 1,592 475
` 22,390 ` 25,242 ` 24,799

Annual Report 2019-20 318
The reconciliation between the provision of income tax and amounts computed by applying the Indian statutory income tax rate to profit before taxes is as follows:
Year ended March 31,
2018 2019 2020
Profit before taxes ` 102,474 ` 115,415 ` 122,512Enacted income tax rate in India
34.61% 34.94% 34.94%
Computed expected tax expense
35,466 40,326 42,806
Effect of: Income exempt from tax (12,878) (18,469) (12,930)Basis differences that will reverse during a tax holiday period
167 (796) 480
Income taxed at higher/ (lower) rates
(111) (1,002) (3,122)
Reversal of deferred tax for past years due to rate reduction *
(1,563) - -
Taxes related to prior years (380) (2,267) (116)Changes in unrecognized deferred tax assets
239 3,972 (3,898)
Expenses disallowed for tax purpose
1,431 3,503 1,785
Others, net 19 (25) (206)Income tax expense ` 22,390 ` 25,242 ` 24,799Effective income tax rate 21.85% 21.87% 20.24%
* The “Tax Cuts and Jobs Act,” was signed into law on December 22, 2017 (‘US tax reforms’) which among other things, makes significant changes to the rules applicable to the taxation of corporations, such as changing the corporate tax rate from 35% to 21% rate effective January 1, 2018. For the year ended March 2018, the Company took a positive impact of ` 1,563 on account of re-statement of deferred tax items pursuant to US tax reforms.
The components of deferred tax assets and liabilities are as follows:
As at March 31,
2019 2020
Carry forward losses * ` 3,149 ` 2,044
Trade payables, accrued expenses and other liabilities
3,713 4,994
Allowances for lifetime expected credit loss
4,521 3,921
Minimum alternate tax - 3,425
Cash flow hedges - 561
Others 318 -
11,701 14,945
Property, plant and equipment (1,840) (686)
Amortizable goodwill (1,899) (2,166)
Intangible assets (2,295) (1,541)
Interest income and fair value movement of investments
(1,455) (626)
Cash flow hedges (604) -
Contract liabilities (289) (11)
SEZ Re-investment Reserve (1,132) (6,614)
Others - (121)
(9,514) (11,765)
Net deferred tax assets ` 2,187 ` 3,180
Amounts presented in consolidated statement of financial position:
Deferred tax assets ` 5,604 ` 6,005
Deferred tax liabilities ` (3,417) ` (2,825)
* Includes deferred tax asset recognized on carry forward losses pertaining to business combinations.
Movement in deferred tax assets and liabilities
Movement during the year ended March 31, 2018
As at April 1, 2017
Credit/ (charge) in the consolidated statement of
income
Credit/ (charge) in other
comprehensive income *
On account of business
combination
Assets held for sale
As at March 31, 2018
Carry forward losses ` 5,513 ` 133 ` 48 ` - ` - ` 5,694Trade payables, accrued expenses and other liabilities 3,151 243 (246) - (41) 3,107Allowances for lifetime expected credit loss 2,955 1,564 2 - (22) 4,499Minimum alternate tax 1,520 (1,446) - - - 74Property, plant and equipment (4,153) 912 (75) - 1,150 (2,166)Amortizable goodwill (4,057) 1,522 (53) - 778 (1,810)Intangible assets (4,511) 1,546 (112) (113) - (3,190)Interest income and fair value movement of investments (2,245) (112) 645 - - (1,712)Cash flow hedges (1,419) - 1,448 - - 29Contract liabilities (183) (35) (9) - (46) (273)Others (87) (383) (75) - 142 (403)Total ` (3,516) ` 3,944 ` 1,573 ` (113) ` 1,961 ` 3,849

Corporate Overview | Management & Board Reports | Financial Statements
Wipro Limited319
Movement during the year ended March 31, 2019
As at April 1, 2018
Credit/ (charge) in the consolidated statement of
income
Credit/ (charge) in other
comprehensive income *
Others (Note 36)
As at March 31, 2019
Carry forward losses ` 5,694 ` (2,879) ` 334 ` - ` 3,149
Trade payables, accrued expenses and other liabilities 3,107 295 (22) 333 3,713
Allowances for lifetime expected credit loss 4,499 9 2 11 4,521
Minimum alternate tax 74 (74) - - -
Property, plant and equipment (2,166) 219 (94) 201 (1,840)
Amortizable goodwill (1,810) 16 (105) - (1,899)
Intangible assets (3,190) 1,076 (181) - (2,295)
Interest income and fair value movement of investments (1,712) 186 71 - (1,455)
Cash flow hedges 29 - (633) - (604)
Contract liabilities (273) (1) (15) - (289)
SEZ Re-investment Reserve - (1,132) - - (1,132)
Others (403) 693 27 1 318
Total ` 3,849 ` (1,592) ` (616) ` 546 ` 2,187
Movement during the year ended March 31, 2020
As at April 1, 2019
Credit/ (charge) in the consolidated statement of
income
Credit/ (charge) in other
comprehensive income *
On account of business
combination
As at March 31, 2020
Carry forward losses ` 3,149 ` (1,287) ` 182 ` - ` 2,044
Trade payables, accrued expenses and other liabilities 3,713 1,033 248 - 4,994
Allowances for lifetime expected credit loss 4,521 (591) (9) - 3,921
Minimum alternate tax - 3,425 - - 3,425
Property, plant and equipment (1,840) 1,150 4 - (686)
Amortizable goodwill (1,899) (92) (175) - (2,166)
Intangible assets (2,295) 1,021 (90) (177) (1,541)
Interest income and fair value movement of investments (1,455) 599 230 - (626)
Cash flow hedges (604) - 1,165 - 561
Contract liabilities (289) 285 (7) - (11)
SEZ Re-investment Reserve (1,132) (5,482) - - (6,614)
Others 318 (536) 97 - (121)
Total ` 2,187 ` (475) ` 1,645 ` (177) ` 3,180
*Includes impact of foreign currency translation.
Deferred taxes on unrealized foreign exchange gain / loss relating to cash flow hedges, fair value movements in investments and actuarial gains/losses on defined benefit plans are recognized in other comprehensive income. Deferred tax liability on the intangible assets identified and carry forward losses on acquisitions is recorded by an adjustment to goodwill. Other than these, the change in deferred tax assets and liabilities is primarily recorded in the consolidated statement of income.
In assessing the realizability of deferred tax assets, the Company considers the extent to which it is probable that the deferred tax
asset will be realized. The ultimate realization of deferred tax assets is dependent upon the generation of future taxable profits during the periods in which those temporary differences and tax loss carry-forwards become deductible. The Company considers the expected reversal of deferred tax liabilities, projected future taxable income and tax planning strategies in making this assessment. Based on this, the Company believes that it is probable that the Company will realize the benefits of these deductible differences. The amount of deferred tax asset considered realizable, however, could be reduced in the near term if the estimates of future taxable income during the carry-forward period are reduced.

Annual Report 2019-20 320
Deferred tax asset amounting to ` 6,769 and ` 8,124 as at March 31, 2019 and 2020, respectively in respect of unused tax losses have not been recognized by the Company. The tax loss carry-forwards of ` 24,355 and ` 29,736 as at March 31, 2019 and 2020, respectively, relates to certain subsidiaries on which deferred tax asset has not been recognized by the Company, because there is a lack of reasonable certainty that these subsidiaries may generate future taxable profits. Approximately, ` 8,191, and ` 14,429 as at March 31, 2019 and 2020, respectively, of these tax loss carry-forwards is not currently subject to expiration dates. The remaining tax loss carry-forwards of approximately ` 16,164 and ` 15,307 as at March 31, 2019 and 2020, respectively, expires in various years through fiscal 2038.
The Company has recognized deferred tax assets of ` 3,149 and ` 2,044 primarily in respect of carry forward losses of its various subsidiaries as at March 31, 2019 and 2020, respectively. Management’s projections of future taxable income and tax planning strategies support the assumption that it is probable that sufficient taxable income will be available to utilize these deferred tax assets.
The Company has calculated its tax liability for current domestic taxes after considering MAT. The excess tax paid under MAT provisions over and above normal tax liability can be carried forward and set-off against future tax liabilities computed under normal tax provisions. The Company was required to pay MAT and accordingly, a deferred tax asset of Nil and ` 3,425 has been recognized in the statement of consolidated financial position as at March 31, 2019 and 2020, respectively.
A substantial portion of the profits of the Company’s India operations are exempt from Indian income taxes being profits attributable to export operations and profits from units established under the Special Economic Zone Act, 2005 scheme. Units designated in special economic zones providing service on or after April 1, 2005 will be eligible for a deduction of 100 percent of profits or gains derived from the export of services for the first five years from commencement of provision of services and 50 percent of such profits and gains for a further five years. Certain tax benefits are also available for a further five years subject to the unit meeting defined conditions. Profits from certain other undertakings are also eligible for preferential tax treatment. The tax holiday period being currently available to the Company expires in various years through fiscal 2033-34. The expiration period of tax holiday for each unit within a SEZ is determined based on the number of years that have lapsed following year of commencement of production by that unit. The impact of tax holidays has resulted in a decrease of current tax expense of ̀ 11,635, ̀ 15,390 and ̀ 11,963 for the years ended March 31, 2018, 2019 and 2020, respectively, compared to the effective tax amounts that we estimate the Company would have been required to pay if these incentives had not been available. The per share effect of these tax incentives for the years ended March 31, 2018, 2019 and 2020 was ` 1.84, ` 2.56, and ` 2.05, respectively.
Deferred income tax liabilities are recognized for all taxable temporary differences except in respect of taxable temporary differences associated with investments in subsidiaries where the timing of the reversal of the temporary difference can be controlled
and it is probable that the temporary difference will not reverse in the foreseeable future. Accordingly, deferred income tax liabilities on cumulative earnings of subsidiaries amounting to ` 52,488 and ` 56,391 as at March 31, 2019 and 2020, respectively and branch profit tax @ 15% of the US branch profit have not been recognized. Further, it is not practicable to estimate the amount of the unrecognized deferred tax liabilities for these undistributed earnings.
22. Dividends, Bonus and Buyback of equity sharesThe Company declares and pays dividends in Indian rupees. According to the Companies Act, 2013 any dividend should be declared out of accumulated distributable profits. A Company may, before the declaration of any dividend, transfer a percentage of its profits for that financial year as it may consider appropriate to the reserves.
The cash dividends paid per equity share were ` 1, ` 1 and ` 1, during the years ended March 31, 2018, 2019 and 2020, respectively, including an interim dividend of ` 1, ` 1 and ` 1 for the year ended March 31, 2018, 2019 and 2020, respectively.
During the year ended March 31, 2018, the bonus issue in the proportion of 1:1 i.e.1 (One) bonus equity share of ` 2 each for every 1 (one) fully paid-up equity share held (including ADS holders) had been approved by the shareholders of the Company on June 03, 2017 through Postal Ballot /e-voting. For this purpose, June 14, 2017, was fixed as the record date. Consequently, on June 15, 2017, the Company allotted 2,433,074,327 shares and ` 4,866 (representing par value of ` 2 per share) has been transferred from retained earnings to share capital.
During the year ended March 31, 2019, the bonus issue in the proportion of 1:3 i.e.1 (One) bonus equity share of ` 2 each for every 3 (three) fully paid-up equity shares held (including ADS holders) was approved by the shareholders of the Company on February 22, 2019, through Postal Ballot /e-voting. Subsequently, on March 8, 2019, the Company allotted 1,508,469,180 equity shares to shareholders who held equity shares as on the record date of March 7, 2019 and ` 3,016 (representing par value of ` 2 per share) was transferred from capital redemption reserve, securities premium reserve and retained earnings to the share capital.
During the year ended March 31, 2018, the Company has concluded the buyback of 343,750,000 equity shares as approved by the Board of Directors on July 20, 2017. This has resulted in a total cash outflow of ` 110,000. In line with the requirement of the Companies Act, 2013, an amount of ` 1,656 and ` 108,344 has been utilized from the securities premium reserve and retained earnings, respectively. Further, capital redemption reserve (included in other reserves) of ` 687 (representing the nominal value of the shares bought back) has been created as an apportionment from retained earnings. Consequent to such buyback, share capital has reduced by ` 687.
During the year ended March 31, 2020, the Company has concluded the buyback of 323,076,923 equity shares as approved by the Board of Directors on April 16, 2019. This has resulted in a total cash outflow of ̀ 105,000. In line with the requirement of the Companies Act, 2013, an amount of ` 105,000 has been utilized from retained earnings.

Corporate Overview | Management & Board Reports | Financial Statements
Wipro Limited321
Further, capital redemption reserve (included in other reserves) of ` 646 (representing the nominal value of the shares bought back) has been created as an apportionment from retained earnings. Consequent to such buyback, share capital has reduced by ` 646.
23. Additional capital disclosuresThe key objective of the Company’s capital management is to ensure that it maintains a stable capital structure with the focus on total equity to uphold investor, creditor, and customer confidence and to ensure future development of its business. The Company’s focus is to keep strong total equity base to ensure independence, security, as well as a high financial flexibility for potential future borrowings, if required without impacting the risk profile of the Company.
The Company’s goal is to continue to be able to return excess liquidity to shareholders by continuing to distribute annual dividends in future periods. The amount of future dividends/ buyback of equity shares will be balanced with efforts to continue to maintain an adequate liquidity status.
The capital structure as at March 31, 2019 and 2020 was as follows:
As at March 31,
2019 2020 %
Change Equity attributable to the equity shareholders of the Company
` 568,116 ` 557,458 -1.88%
As percentage of total capital 85% 85%
Current loans, borrowings and bank overdrafts
71,099 73,202
Long-term loans and borrowings
28,368 4,840
Lease liabilities - 19,198
Total loans, borrowings and bank overdrafts and lease liabilities
` 99,467 ` 97,240 -2.24%
As percentage of total capital 15% 15%
Total capital ` 667,583 ` 654,698 -1.93%
Loans and borrowings represent 15 % and 15% of total capital as at March 31, 2019 and 2020, respectively. The Company is not subjected to any externally imposed capital requirements.
24. Revenue
Year ended March 31,
2018 2019 2020
Rendering of services ` 524,543 ` 571,301 ` 598,550
Sales of products 20,328 14,544 11,682
` 544,871 ` 585,845 ` 610,232
A. Contract Assets and Liabilities
The Company classifies its right to consideration in exchange for deliverables as either a receivable or a contract asset.
A receivable is a right to consideration that is unconditional. A right to consideration is unconditional if only the passage of time is required before payment of that consideration is due. For example, the Company recognizes a receivable for revenues related to time and materials contracts or volume-based contracts. The Company presents such receivables as part of unbilled receivables at their net estimated realizable value. The same is tested for impairment as per the guidance in IFRS 9 using expected credit loss method.
Contract liabilities: During the year ended March 31, 2019, the Company recognized revenue of ` 14,570 arising from opening unearned revenue as at April 1, 2018. During the year ended March 31, 2020, the Company recognized revenue of ` 21,193 arising from contract liabilities as at March 31, 2019.
Contract assets: During the year ended March 31, 2019, ` 13,558 of unbilled revenue pertaining to fixed-price development contracts (balance as at April 1, 2018: ` 17,469), has been reclassified to receivables on completion of milestones. During the year ended March 31, 2020, ` 13,068 of contract assets pertaining to fixed-price development contracts has been reclassified to receivables on completion of milestones.
Contract assets and liabilities are reported in a net position on a contract by contract basis at the end of each reporting period.
B. Remaining Performance Obligations
Revenue allocated to remaining performance obligations represents contracted revenue that has not yet been recognized, which includes contract liabilities and amounts that will be invoiced and recognized as revenue in future periods. Applying the practical expedient, the Company has not disclosed its right to consideration from customers in an amount that corresponds directly with the value to the customer of the Company’s performance completed to date, which are contracts invoiced on time and material basis and volume based.
As at March 31, 2019, the aggregate amount of transaction price allocated to remaining performance obligations, other than those meeting the exclusion criteria above, was ` 373,879 of which approximately 59% is expected to be recognized as revenues within two years, and the remainder thereafter. This includes contracts with a substantive enforceable termination penalty if the contract is terminated without cause by the customer, based on an overall assessment of the contract carried out at the time of inception. Historically, customers have not terminated contracts without cause.
As at March 31, 2020, the aggregate amount of transaction price allocated to remaining performance obligations, other than those meeting the exclusion criteria above, was ` 360,033 of which approximately 62% is expected to be recognized as revenues within two years, and the remainder thereafter. This includes contracts with a substantive enforceable termination penalty if the contract is terminated without cause by the customer, based on an overall assessment of the contract carried out at the time of inception. Historically, customers have not terminated contracts without cause.

Annual Report 2019-20 322
C. Disaggregation of Revenues
The tables below present disaggregated revenues from contracts with customers by business segment, customer location and contract-type. The Company believes that the below disaggregation best depicts the nature, amount, timing and uncertainty of revenue and cash flows from economic factors.
Information on disaggregation of revenues for the year ended March 31, 2019 is as follows:
IT Services IT Prod-ucts
ISRE Total BFSI Health BU CBU ENU TECH MFG COMM Total
A. Revenue
Rendering of services ` 173,516 ` 73,942 ` 88,797 ` 72,329 ` 76,108 ` 46,155 ` 32,489 ` 563,336 ` - ` 7,965 ` 571,301
Sales of products - - - - - - - - 14,544 - 14,544
` 173,516 ` 73,942 ` 88,797 ` 72,329 ` 76,108 ` 46,155 ` 32,489 ` 563,336 ` 14,544 ` 7,965 ` 585,845
B. Revenue by geography
India ` 3,868 ` 2,295 ` 1,006 ` 1,690 ` 1,392 ` 1,534 ` 3,095 ` 14,880 ` 8,154 ` 7,965 ` 30,999
Americas 98,428 57,204 59,262 22,739 54,679 21,541 7,694 321,547 2,112 - 323,659
Europe 46,856 7,591 17,636 29,795 16,441 18,211 7,420 143,950 2,240 - 146,190
Rest of the World 24,364 6,852 10,893 18,105 3,596 4,869 14,280 82,959 2,038 - 84,997
` 173,516 ` 73,942 ` 88,797 ` 72,329 ` 76,108 ` 46,155 ` 32,489 ` 563,336 ` 14,544 ` 7,965 ` 585,845
C. Revenue by nature of contract
Fixed price and volume based ` 89,378 ` 53,462 ` 50,425 ` 51,799 ` 47,055 ` 31,843 ` 19,847 ` 343,809 ` - ` 6,176 ` 349,985
Time and materials 84,138 20,480 38,372 20,530 29,053 14,312 12,642 219,527 - 1,789 221,316
Products - - - - - - - - 14,544 - 14,544
` 173,516 ` 73,942 ` 88,797 ` 72,329 ` 76,108 ` 46,155 ` 32,489 ` 563,336 ` 14,544 ` 7,965 ` 585,845
Information on disaggregation of revenues for the year ended March 31, 2020 is as follows:
IT Services IT Products
ISRE Total BFSI Health BU CBU ENU TECH MFG COMM Total
A. Revenue
Rendering of services ` 183,368 ` 77,794 ` 96,509 ` 75,958 ` 75,446 ` 47,859 ` 33,655 ` 590,589 ` - ` 7,961 ` 598,550
Sales of products - - - - - - - - 11,682 - 11,682
` 183,368 ` 77,794 ` 96,509 ` 75,958 ` 75,446 ` 47,859 ` 33,655 ` 590,589 ` 11,682 ` 7,961 ` 610,232
B. Revenue by geography
India ` 5,241 ` 2,522 ` 1,025 ` 1,832 ` 942 ` 1,908 ` 2,109 ` 15,579 ` 6,675 ` 7,961 ` 30,215
Americas 107,467 60,245 67,988 24,315 57,092 23,327 9,075 349,509 918 - 350,427
Europe 45,067 7,540 17,275 31,090 14,107 18,547 8,056 141,682 2,390 - 144,072
Rest of the World 25,593 7,487 10,221 18,721 3,305 4,077 14,415 83,819 1,699 - 85,518
` 183,368 ` 77,794 ` 96,509 ` 75,958 ` 75,446 ` 47,859 ` 33,655 ` 590,589 ` 11,682 ` 7,961 ` 610,232
C. Revenue by nature of contract
Fixed price and volume based ` 101,875 ` 49,951 ` 53,575 ` 52,084 ` 49,733 ` 33,793 ` 21,908 ` 362,919 ` - ` 6,415 ` 369,334
Time and materials 81,493 27,843 42,934 23,874 25,713 14,066 11,747 227,670 - 1,546 229,216
Products - - - - - - - - 11,682 - 11,682
` 183,368 ` 77,794 ` 96,509 ` 75,958 ` 75,446 ` 47,859 ` 33,655 ` 590,589 ` 11,682 ` 7,961 ` 610,232

Corporate Overview | Management & Board Reports | Financial Statements
Wipro Limited323
25. Expenses by nature
Year ended March 31,
2018 2019 2020
Employee compensation ` 272,223 ` 299,774 ` 326,571
Sub-contracting/ technical fees 84,437 94,725 90,521
Cost of hardware and software 18,985 13,567 11,491
Travel 17,399 17,768 18,169
Facility expenses 21,044 22,213 19,733
Depreciation, amortization and impairment*
21,124 19,474 20,862
Communication 5,353 4,561 4,812
Legal and professional fees 4,690 4,361 4,733
Rates, taxes and insurance 2,400 1,621 3,004
Marketing and brand building 3,140 2,714 2,532
Lifetime expected credit loss and pro-vision for deferred contract cost**
6,565 980 1,043
Miscellaneous expenses*** 4,705 11,736 5,344
Total cost of revenues, selling and marketing expenses and general and administrative expenses
` 462,065 ` 493,494 ` 508,815
* Depreciation, amortization, and impairment includes impairment on certain software platform and intangible assets recognized on acquisitions, amounting to ` 643, ` 2,318 and Nil, for the year ended March 31, 2018, 2019 and 2020, respectively.
** Consequent to insolvency of two of our customers, the Company has recognized provision of ̀ 4,612 for impairment of receivables and deferred contract cost for the year ended March 31, 2018. ` 416 and ` 4,196 of these provisions have been included in cost of revenue and general and administrative expenses, respectively.
*** Miscellaneous expenses for the year ended March 31, 2019, includes an amount of ` 5,141 ($ 75 million) paid to National Grid on settlement of a legal claim against the Company.
26. Other operating incomeYear ended March 31, 2019
Sale of hosted data center services business: During the year ended March 31, 2019, the Company has concluded the divestment of its hosted data center services business.
The calculation of the gain on sale is shown below:
Particulars TotalCash consideration (net of disposal costs of ` 660) ` 25,432
Less: Carrying amount of net assets disposed (including goodwill of ` 13,009)
(26,455)
Add: Reclassification of exchange difference on foreign currency translation
4,131
Gain on sale ` 3,108
In accordance with the sale agreement, total cash consideration is ` 28,124 and the Company paid ` 3,766 to subscribe for units issued
by the buyer. Units amounting to ` 2,032 are callable by the buyer if certain business targets committed by the Company are not met over a period of three years. The fair value of these callable units is estimated to be insignificant as at reporting date. Consequently, the sale consideration comprises cash consideration of ` 24,358 and units issued by the buyer amounting to ` 1,734.
Loss of control in subsidiary: During the year ended March 31, 2019, the Company has reduced its equity holding from 74% to 11% in Wipro Airport IT Services Limited. The loss/ gain on this transaction is insignificant.
The assets and liabilities associated with these transactions were classified as assets held for sale and liabilities directly associated with assets held for sale amounting to ` 27,201 and ` 6,212 respectively as at March 31, 2018.
Sale of Workday business and Cornerstone OnDemand business: During the year ended March 31, 2019, the Company has concluded the Sale of Workday business and Cornerstone OnDemand business except in Portugal, France and Sweden.
The calculation of the gain is as shown below:
Particulars Total
Cash consideration ` 6,645
Less: Carrying amount of net assets disposed (includes goodwill of ` 4,893 and intangible assets of ` 740)
(5,475)
Add: Reclassification of exchange difference on foreign currency translation
79
Gain on sale ` 1,249
Assets pertaining to Portugal, France, and Sweden expected to conclude in the quarter ending June 30, 2019, subject to obtaining regulatory approvals are classified as assets held for sale amounting to ` 240 as at March 31, 2019.
These disposal groups do not constitute a major component of the Company and hence were not classified as discontinued operations.
Year ended March 31, 2020
During the year ended March 31, 2020, the Company concluded the sale of assets pertaining to Workday business and Cornerstone OnDemand business in Portugal, France, and Sweden. A gain of ` 152 arising from such transaction has been recognized under other operating income.
During the year ended March 31, 2020, the Company has partially met the first year and second year business targets pertaining to sale of data center business concluded during the year ended March 31, 2019. Change in fair value of the callable units pertaining to achievement of the business targets amounting to ` 992 for the year ended March 31, 2020, has been recognized under other operating income.

Annual Report 2019-20 324
27. Finance expenses
Year ended March 31,
2018 2019 2020
Interest expense ` 3,451 ` 5,616 ` 5,136
Exchange fluctuation on foreign currency borrowings, net
2,379 1,759 2,192
` 5,830 ` 7,375 ` 7,328
28. Finance and other income and Foreign exchange gains/(losses), net
Year ended March 31,
2018 2019 2020
Interest income ` 17,806 ` 20,261 ` 21,764
Dividend income 609 361 367
Net gain from investments classified as FVTPL 5,410 1,990 1,275
Net gain from investments classified as FVTOCI 174 311 675
Finance and other income ` 23,999 ` 22,923 ` 24,081Foreign exchange gains/(losses), net, on financial instruments measured at FVTPL (107) 1,251 2,144
Other Foreign exchange gains/(losses), net 1,595 1,964 1,025
Foreign exchange gains/(losses), net ` 1,488 ` 3,215 ` 3,169
` 25,487 ` 26,138 ` 27,250
29. Earnings per equity shareA reconciliation of profit for the year and equity shares used in the computation of basic and diluted earnings per equity share is set out below:
Basic: Basic earnings per share is calculated by dividing the profit attributable to equity shareholders of the Company by the weighted average number of equity shares outstanding during the period, excluding equity shares purchased by the Company and held as treasury shares.
Year ended March 31,
2018 2019 2020
Profit attributable to equity holders of the Company
` 80,081 ` 90,031 ` 97,218
Weighted average number of equity shares outstanding
6,333,391,200 6,007,376,837 5,833,384,018
Basic earnings per share ` 12.64 ` 14.99 ` 16.67
Diluted: Diluted earnings per share is calculated by adjusting the weighted average number of equity shares outstanding during the year for assumed conversion of all dilutive potential equity shares. Employee share options are dilutive potential equity shares for the Company.
The calculation is performed in respect of share options to determine the number of shares that could have been acquired at fair value (determined as the average market price of the Company’s shares during the year). The number of shares calculated as above is compared with the number of shares that would have been issued assuming the exercise of the share options.
Year ended March 31, 2018 2019 2020
Profit attributable to equity holders of the Company
` 80,081 ` 90,031 ` 97,218
Weight average number of equity shares outstanding
6,333,391,200 6,007,376,837 5,833,384,018
Effect of dilutive equivalent share options
11,091,433 14,927,530 14,439,221
Weight average number of equity shares for diluted earnings per share
6,344,482,633 6,022,304,367 5,847,823,239
Diluted earnings per share
` 12.62 ` 14.95 ` 16.62
Earnings per share and number of share outstanding for the year ended March 31, 2018, have been proportionately adjusted for the bonus issue in the ratio of 1:3 i.e.1 (One) bonus equity share of ` 2 each for every 3 (three) fully paid-up equity shares held (including ADS holders). Refer to Note 22.
30. Employee stock incentive plansThe stock compensation expense recognized for employee services received during the year ended March 31, 2018, 2019 and 2020, were ` 1,347, ` 1,938, and ` 1,262, respectively.
Wipro Equity Reward Trust (“WERT”)
In 1984, the Company established a controlled trust called the Wipro Equity Reward Trust (“WERT”). In the earlier years, WERT purchased shares of the Company out of funds borrowed from the Company. The Company’s Board Governance, Nomination and Compensation Committee recommends to WERT certain officers and key employees, to whom WERT issues shares from its holdings at nominal price subject to vesting conditions. WERT held 23,097,216, 27,353,853 and 22,746,081 treasury shares as at March 31, 2018, 2019 and 2020, respectively.

Corporate Overview | Management & Board Reports | Financial Statements
Wipro Limited325
Wipro Employee Stock Option Plans and Restricted Stock Unit Option Plans
A summary of the general terms of grants under stock option plans and restricted stock unit option plans are as follows:
Name of Plan Number of Options reserved under the plan Range of Exercise Price
Wipro ADS Restricted Stock Unit Plan (WARSUP 2004 plan) * 59,797,979 US $ 0.03Wipro Employee Restricted Stock Unit Plan 2005 (WSRUP 2005 plan) * 59,797,979 ` 2Wipro Employee Restricted Stock Unit Plan 2007 (WSRUP 2007 plan) * 49,831,651 ` 2Wipro Equity Reward Trust Employee Stock Purchase Plan, 2013 ** 39,546,197 ` 2Wipro Employee Stock Option plan 2000 (2000 plan) *** 747,474,747 ` 171 - 490
Employees covered under Stock Option Plans and Restricted Stock Unit (“RSU”) Option Plans (collectively “Stock Option Plans”) are granted an option to purchase shares of the Company at the respective exercise prices, subject to requirements of vesting conditions. These options generally vest in tranches over a period of two to four years from the date of grant. Upon vesting, the employees can acquire one equity share for every option.
* The maximum contractual term for these Stock Option Plans and RSU Option Plans is perpetual until the options are available for grant under the plan.
** The maximum contractual term for these Stock Option Plans is up to May 29, 2023 until the options are available for grant under the plan.*** The maximum contractual term for these Stock Option Plans is up to July 26, 2020 until the options are available for grant under the plan.
The activity in these stock option plans and restricted stock unit option plan is summarized below:
Particulars Range of exercise price
Year ended March 31, 2018 2019 2020
Numbers Weighted
Average Exercise Price
Numbers Weighted
Average Exercise Price
Numbers Weighted
Average Exercise Price
Outstanding at the beginning of the year
` 480.20 20,181 ` 480.20 - ` 480.20 - ` 480.20` 2 7,952,083 ` 2 13,543,997 ` 2 17,607,463 ` 2
US $ 0.03 5,288,783 US $ 0.03 10,199,054 US $ 0.03 14,446,790 US $ 0.03
Bonus on outstanding (Refer to Note 22)
` 480.20 - ` 480.20 - ` 480.20 - ` 480.20` 2 6,968,406 ` 2 4,773,755 ` 2 - ` 2
US $ 0.03 4,077,070 US $ 0.03 3,957,434 US $ 0.03 - US $ 0.03
Granted *` 480.20 - ` 480.20 - ` 480.20 - ` 480.20` 2 4,612,400 ` 2 4,607,000 ` 2 5,662,500 ` 2
US $ 0.03 3,897,000 US $ 0.03 4,849,000 US $ 0.03 5,341,000 US $ 0.03
Exercised` 480.20 (20,181) ` 480.20 - ` 480.20 - ` 480.20` 2 (5,325,217) ` 2 (2,739,097) ` 2 (4,610,572) ` 2
US $ 0.03 (2,565,976) US $ 0.03 (1,541,803) US $ 0.03 (2,496,125) US $ 0.03
Modification to Cash Settled RSU’s **` 480.20 - - - - - 480.20` 2 - - - - - 2.00
US $ 0.03 - - - - (5,681,966) US $ 0.03
Forfeited and Expired
` 480.20 - ` 480.20 - ` 480.20 - ` 480.20` 2 (663,675) ` 2 (2,578,192) ` 2 (3,065,201) ` 2
US $ 0.03 (497,823) US $ 0.03 (3,016,895) US $ 0.03 (3,755,159) US $ 0.03
Outstanding at the end of the year
` 480.20 - ` 480.20 - ` 480.20 - ` 480.20` 2 13,543,997 ` 2 17,607,463 ` 2 15,594,190 ` 2
US $ 0.03 10,199,054 US $ 0.03 14,446,790 US $ 0.03 7,854,540 US $ 0.03
Exercisable at the end of the year
` 480.20 - ` 480.20 - ` 480.20 - ` 480.20` 2 1,875,994 ` 2 1,300,781 ` 2 1,502,957 ` 2
US $ 0.03 789,962 US $ 0.03 948,877 US $ 0.03 1,212,560 US $ 0.03
As at March 31, 2020, 4,721,388 units (net of units that were exercised or lapsed and forfeited) of Cash Settled RSU were outstanding which include 63,999 exercisable units. The carrying value of liability towards Cash Settled RSU’s outstanding was ` 496 which includes ` 15 towards exercisable units as at March 31, 2020.
* Includes 1,097,600, 1,567,000 and 2,461,500 Performance based stock options (RSU) during the year ended March 31, 2018, 2019 and 2020, respectively. 1,113,600, 1,673,000 and 2,524,600 Performance based stock options (ADS) during the year ended March 31, 2018, 2019 and 2020, respectively. Performance based stock options (RSU) were issued under Wipro Employee Restricted Stock Unit plan 2007 (WSRUP 2007 plan) and Performance based stock options (ADS) were issued under Wipro ADS Restricted Stock Unit Plan (WARSUP 2004 plan).

Annual Report 2019-20 326
** Restricted Stock Units arrangement that were modified during the year ended March 31, 2020
Pursuant to the Securities Exchange Board of India (“SEBI”) circular dated October 10, 2019 prohibiting issuance of depository receipts by listed companies to Non-Resident Indians (“NRIs”), the Board Governance, Nomination and Compensation Committee in November,
2019 approved cash pay out to its NRI employees in lieu of shares and upon exercise of vested ADS RSU under the Company’s WARSUP 2004 Plan, based on prevailing market price of ADS on the date of exercise. This change was accounted for as a modification and the fair value on the date of modification of ` 561 has been recognized as financial liability with a corresponding adjustment to equity.
The following table summarizes information about outstanding stock options and restricted stock unit option plan :
Range of exercise
price
Year ended March 31, 2018 2019 2020
Numbers
Weighted Average
Remaining life
(months)
Weighted Average Exercise
Price
Numbers
Weighted Average
Remaining life
(months)
Weighted Average Exercise
Price
Numbers
Weighted Average
Remaining life
(months)
Weighted Average Exercise
Price
` 2 13,543,997 27 ` 2 17,607,463 24 ` 2 15,594,190 23 ` 2
US $ 0.03 10,199,054 28 US $ 0.03 14,446,790 26 US $ 0.03 7,854,540 23 US $ 0.03
The weighted-average grant-date fair value of options granted during the year ended March 31, 2018, 2019 and 2020 was ` 337.74, ` 349.81, and ` 260.65 for each option, respectively. The weighted average share price of options exercised during the year ended March 31, 2018, 2019 and 2020 was ` 303.44, ` 325.85, and ` 267.04 for each option, respectively.
31. Employee benefits
a) Employee costs includes
Year ended March 31, 2018 2019 2020
Salaries and bonus ` 261,981 ` 289,005 ` 315,036
Employee benefits plans
Gratuity and other defined benefit plans
1,532 1,459 1,845
Defined contribution plans
7,363 7,372 8,428
Share based compensation
1,347 1,938 1,262
` 272,223 ` 299,774 ` 326,571
The employee benefit cost is recognized in the following line items in the consolidated statement of income:
Year ended March 31, 2018 2019 2020
Cost of revenues ` 228,937 ` 251,818 ` 279,356
Selling and marketing expenses
28,070 30,972 30,763
General and administrative expenses
15,216 16,984 16,452
` 272,223 ` 299,774 ` 326,571
Defined benefit plan actuarial (gains)/ losses recognized in other comprehensive income include:
Year ended March 31, 2018 2019 2020
Re-measurement of net defined benefit liability/(asset)
Return on plan assets excluding interest income - Loss/(Gain)
` (18) ` (49) ` 76
Actuarial loss/ (gain) arising from financial assumptions
(296) 73 749
Actuarial loss/ (gain) arising from demographic assumptions
(54) (40) 227
Actuarial loss/ (gain) arising from experience adjustments
(454) (266) 194
` (822) ` (282) ` 1,246
b) Defined benefit plans
Defined benefit plans include gratuity for employees drawing salary in Indian rupees and certain benefits plans in foreign jurisdictions. Amount recognized in the consolidated statement of income in respect of defined benefit plans is as follows:
Year ended March 31, 2018 2019 2020
Current service cost ` 1,525 ` 1,434 ` 1,782
Net interest on net defined benefit liability/(asset)
7 25 63
Net gratuity cost/(benefit) ` 1,532 ` 1,459 ` 1,845
Actual return on plan assets ` 501 ` 607 ` 513
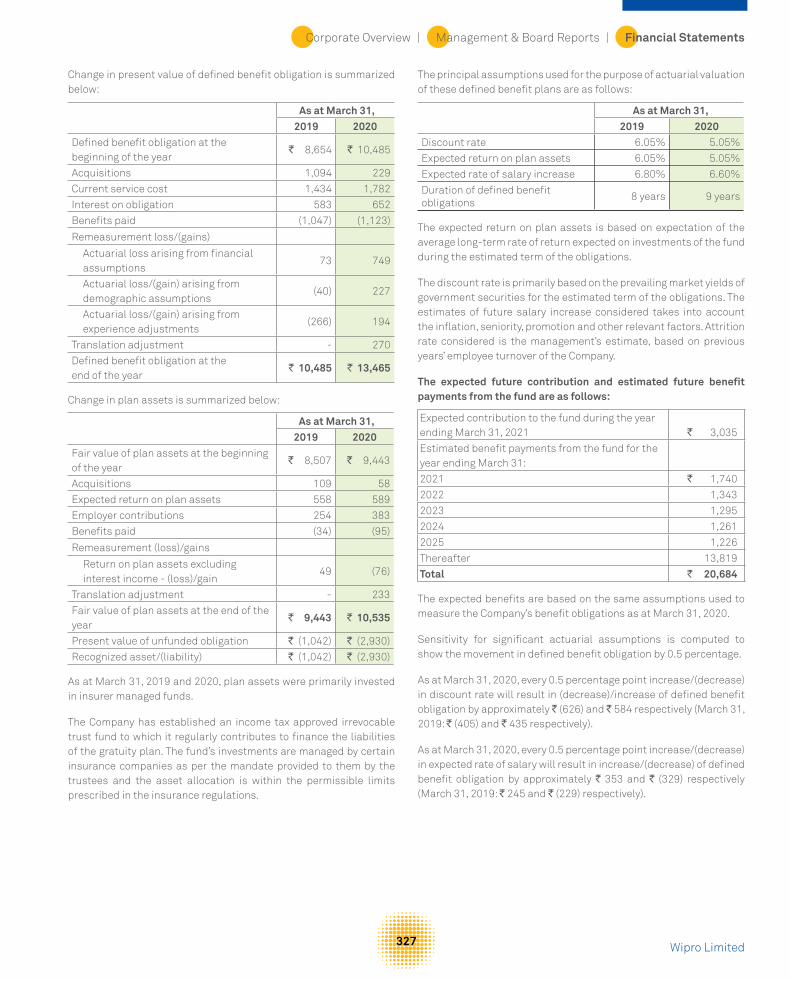
Corporate Overview | Management & Board Reports | Financial Statements
Wipro Limited327
Change in present value of defined benefit obligation is summarized below:
As at March 31, 2019 2020
Defined benefit obligation at the beginning of the year
` 8,654 ` 10,485
Acquisitions 1,094 229
Current service cost 1,434 1,782
Interest on obligation 583 652
Benefits paid (1,047) (1,123)
Remeasurement loss/(gains)
Actuarial loss arising from financial assumptions
73 749
Actuarial loss/(gain) arising from demographic assumptions
(40) 227
Actuarial loss/(gain) arising from experience adjustments
(266) 194
Translation adjustment - 270
Defined benefit obligation at the end of the year
` 10,485 ` 13,465
Change in plan assets is summarized below:
As at March 31, 2019 2020
Fair value of plan assets at the beginning of the year
` 8,507 ` 9,443
Acquisitions 109 58
Expected return on plan assets 558 589
Employer contributions 254 383
Benefits paid (34) (95)
Remeasurement (loss)/gains
Return on plan assets excluding interest income - (loss)/gain
49 (76)
Translation adjustment - 233
Fair value of plan assets at the end of the year
` 9,443 ` 10,535
Present value of unfunded obligation ` (1,042) ` (2,930)
Recognized asset/(liability) ` (1,042) ` (2,930)
As at March 31, 2019 and 2020, plan assets were primarily invested in insurer managed funds.
The Company has established an income tax approved irrevocable trust fund to which it regularly contributes to finance the liabilities of the gratuity plan. The fund’s investments are managed by certain insurance companies as per the mandate provided to them by the trustees and the asset allocation is within the permissible limits prescribed in the insurance regulations.
The principal assumptions used for the purpose of actuarial valuation of these defined benefit plans are as follows:
As at March 31, 2019 2020
Discount rate 6.05% 5.05%
Expected return on plan assets 6.05% 5.05%
Expected rate of salary increase 6.80% 6.60%
Duration of defined benefit obligations
8 years 9 years
The expected return on plan assets is based on expectation of the average long-term rate of return expected on investments of the fund during the estimated term of the obligations.
The discount rate is primarily based on the prevailing market yields of government securities for the estimated term of the obligations. The estimates of future salary increase considered takes into account the inflation, seniority, promotion and other relevant factors. Attrition rate considered is the management’s estimate, based on previous years’ employee turnover of the Company.
The expected future contribution and estimated future benefit payments from the fund are as follows:
Expected contribution to the fund during the year ending March 31, 2021 ` 3,035
Estimated benefit payments from the fund for the year ending March 31:
2021 ` 1,740
2022 1,343
2023 1,295
2024 1,261
2025 1,226
Thereafter 13,819
Total ` 20,684
The expected benefits are based on the same assumptions used to measure the Company’s benefit obligations as at March 31, 2020.
Sensitivity for significant actuarial assumptions is computed to show the movement in defined benefit obligation by 0.5 percentage.
As at March 31, 2020, every 0.5 percentage point increase/(decrease) in discount rate will result in (decrease)/increase of defined benefit obligation by approximately ` (626) and ` 584 respectively (March 31, 2019: ` (405) and ` 435 respectively).
As at March 31, 2020, every 0.5 percentage point increase/(decrease) in expected rate of salary will result in increase/(decrease) of defined benefit obligation by approximately ` 353 and ` (329) respectively (March 31, 2019: ` 245 and ` (229) respectively).

Annual Report 2019-20 328
c) Provident fund:
The details of fund and plan assets are given below:
As at March 31,
2019 2020
Fair value of plan assets ` 53,015 ` 61,397
Present value of defined benefit obligation
(53,015) (61,397)
Net (shortfall)/ excess ` - ` -
The plan assets have been primarily invested in government securities and corporate bonds.
The principal assumptions used in determining the present value obligation of interest guarantee under the deterministic approach are as follows:
As at March 31, 2019 2020
Discount rate for the term of the obligation
7.00% 6.05%
Average remaining tenure of investment portfolio
8 years 7 years
Guaranteed rate of return 8.65% 8.50%
32. Related party relationship and transactionsList of subsidiaries and associates as at March 31, 2020, are provided in the table below:
Subsidiaries Subsidiaries Subsidiaries Country of Incorporation
Wipro, LLC USA
Wipro Gallagher Solutions, LLC USA
Opus Capital Markets Consultants, LLC
USA
Wipro Promax Analytics Solutions Americas, LLC USA
Wipro Insurance Solutions, LLC USA
Wipro IT Services, LLC USA
HealthPlan Services, Inc. ** USA
Appirio, Inc. ** USA
Cooper Software, Inc. USA
Infocrossing, LLC USA
Wipro US Foundation USA
International TechneGroup Incorporated ** USA
Rational Interaction, Inc. ** USA
Wipro Overseas IT Services Pvt. Ltd
India
Wipro Japan KK Japan
Wipro Shanghai Limited China
Wipro Trademarks Holding Limited
India
Wipro Travel Services Limited India
Wipro Holdings (UK) Limited U.K.
Designit A/S Denmark
Designit Denmark A/S Denmark
Designit Germany GmbH Germany
Designit Oslo A/S Norway
Designit Sweden AB Sweden
Designit T.L.V Ltd. Israel
Designit Tokyo Ltd. Japan
Designit Spain Digital, S.L. ** Spain
Wipro Europe Limited U.K.
Wipro UK Limited U.K.
Wipro Financial Services UK Limited U.K.
Wipro IT Services S.R.L. Romania

Corporate Overview | Management & Board Reports | Financial Statements
Wipro Limited329
Subsidiaries Subsidiaries Subsidiaries Country of Incorporation
Wipro IT Services SE (formerly Wipro Cyprus SE)
U.K.
Wipro Doha LLC # Qatar
Wipro Technologies SA DE CV Mexico
Wipro Philippines, Inc. Philippines
Wipro Holdings Hungary Korlátolt Felelosségu Társaság
Hungary
Wipro Holdings Investment Korlátolt Felelosségu Társaság
Hungary
Wipro Information Technology Egypt SAE
Egypt
Wipro Arabia Co. Limited * Saudi Arabia
Women’s Business Park Technologies Limited * Saudi Arabia
Wipro Poland SP Z.O.O Poland
Wipro IT Services Poland SP Z.O.O Poland
Wipro Technologies Australia Pty Ltd Australia
Wipro Corporate Technologies Ghana Limited
Ghana
Wipro Technologies South Africa (Proprietary) Limited
South Africa
Wipro Technologies Nigeria Limited Nigeria
Wipro IT Service Ukraine, LLC Ukraine
Wipro Information Technology Netherlands BV.
Netherlands
Wipro Portugal S.A. ** Portugal
Wipro Technologies Limited Russia
Wipro Technology Chile SPA Chile
Wipro Solutions Canada Limited Canada
Wipro Information Technology Kazakhstan LLP Kazakhstan
Wipro Technologies W.T. Sociedad Anonima Costa Rica
Wipro Outsourcing Services (Ireland) Limited Ireland
Wipro Technologies VZ, C.A. Venezuela
Wipro Technologies Peru S.A.C. Peru
Wipro do Brasil Servicos de Tecnologia S.A. Brazil
Wipro do Brasil Technologia Ltda ** Brazil
Wipro Technologies SA Argentina
Wipro Technologies S.R.L. Romania
PT. WT Indonesia Indonesia
Wipro (Thailand) Co. Limited Thailand
Wipro Bahrain Limited Co. S.P.C. Bahrain
Wipro Gulf LLC Sultanate of Oman
Rainbow Software LLC Iraq
Wipro Networks Pte Limited Singapore
Wipro (Dalian) Limited China
Wipro Technologies SDN BHD Malaysia
Wipro Chengdu Limited China
Wipro IT Services Bangladesh Limited
Bangladesh
Wipro HR Services India Private Limited
India

Annual Report 2019-20 330
* All the above direct subsidiaries are 100% held by the Company except that the Company holds 66.67% of the equity securities of Wipro Arabia Co. Limited and 55% of the equity securities of Women’s Business Park Technologies Limited are held by Wipro Arabia Co. Limited.# 51% of equity securities of Wipro Doha LLC are held by a local shareholder. However, the beneficial interest in these holdings is with the Company. The Company controls ‘The Wipro SA Broad Based Ownership Scheme Trust’, ‘Wipro SA Broad Based Ownership Scheme SPV (RF) (PTY) LTD incorporated in South Africa and Wipro Foundation in India** Step Subsidiary details of Wipro Portugal S.A, Wipro do Brasil Technologia Ltda, Designit Spain Digital, S.L, HealthPlan Services, Inc, Appirio, Inc, International TechneGroup Incorporated and Rational Interaction, Inc. are as follows:
Subsidiaries Subsidiaries Subsidiaries Country of Incorporation
Wipro Portugal S.A. Portugal
Wipro Technologies GmbH Germany
Cellent GmbH Germany
Cellent GmbH Austria
Wipro do Brasil Technologia Ltda Brazil
Wipro Do Brasil Sistemetas De Informatica Ltd
Brazil
Designit Spain Digital, S.L. Spain
Designit Colombia S A S Colombia
Designit Peru SAC Peru
HealthPlan Services, Inc. USA
HealthPlan Services Insurance Agency, LLC
USA
International TechneGroup Incorporated
USA
International TechneGroup Ltd. U.K.
ITI Proficiency Ltd Israel
International TechneGroup S.R.L. Italy
Mech Works S.R.L. Italy
Appirio, Inc. USA
Appirio, K.K Japan
Topcoder, LLC. USA
Appirio Ltd Ireland
Appirio Ltd (UK) U.K.
Rational Interaction, Inc. USA
Rational Consulting Australia Pty Ltd Australia
Rational Interaction Limited Ireland
As at March 31, 2020 the Company held 43.7% interest in Drivestream Inc, 33% interest in Denim Group Limited and 33.3% in Denim Group Management, LLC, accounted for using the equity method.
The list of controlled trusts are:
Name of the entity Country of incorporationWipro Equity Reward Trust India
Wipro Foundation India
The other related parties are:
Name of the related parties: Nature
Azim Premji Foundation Entity controlled by Director
Azim Premji Foundation for Development Entity controlled by Director
Hasham Traders Entity controlled by Director
Prazim Traders Entity controlled by Director
Zash Traders Entity controlled by Director
Hasham Investment and Trading Co. Pvt. Ltd Entity controlled by Director
Azim Premji Philanthropic Initiatives Pvt. Ltd Entity controlled by Director

Corporate Overview | Management & Board Reports | Financial Statements
Wipro Limited331
Name of the related parties: Nature
Azim Premji Trust Entity controlled by Director
Wipro Enterprises (P) Limited Entity controlled by Director
Wipro GE Healthcare Private Limited Entity controlled by Director
Key management personnel
Rishad A Premji Chairman (i)
Abidali Z Neemuchwala Chief Executive Officer and Managing Director (ii)
Azim H Premji Non-Executive Non-Independent Director (iii)
N Vaghul Non-Executive Director (iv)
Dr. Ashok S. Ganguly Non-Executive Director (iv)
William Arthur Owens Non-Executive Director
M.K. Sharma Non-Executive Director
Ireena Vittal Non-Executive Director
Dr. Patrick J. Ennis Non-Executive Director
Patrick Dupuis Non-Executive Director
Arundhati Bhattacharya Non-Executive Director (v)
Jatin Pravinchandra Dalal Chief Financial Officer
(i) Effective July 31, 2019, Mr. Rishad A Premji was appointed as Whole-time director (designated as Chairman by the Board of Directors of the Company)
(ii) Effective July 31, 2019, Mr. Abidali Z Neemuchwala was designated and appointed as Managing Director in addition to his existing position as Chief Executive Officer. On January 31, 2020, the Company announced that Mr. Abidali Z Neemuchwala has decided to step down from the position of Chief Executive Officer and Managing Director due to family commitments and he will continue to hold the office of Chief Executive Officer and Managing Director, until a successor is appointed, for a smooth transition and to ensure that business continues as usual. The Board of Directors has, at its meeting held on May 29, 2020, noted the resignation of Mr. Abidali Z. Neemuchwala as the Chief Executive Officer and Managing Director with effect from the end of day on June 1, 2020.
(iii) On July 30, 2019, Mr. Azim H Premji retired as Executive Chairman and Managing Director and was appointed as Non-Executive Non- Independent Director with effect from July 31, 2019.
(iv) Mr. N Vaghul and Dr. Ashok S. Ganguly retired as Non- Executive Director with effect from July 31, 2019.
(v) Ms. Arundhati Bhattacharya was appointed as Non-Executive Director with effect from January 1, 2019. The Board of Directors has, at its meeting held on May 29, 2020, noted the resignation of Ms. Arundhati Bhattacharya as an Independent Director with effect from close of business hours on June 30, 2020.
Relatives of key management personnel:
- Yasmeen A Premji
- Tariq A Premji
The Company has the following related party transactions:
Transaction / balancesEntities controlled by Directors Key Management Personnel
2018 2019 2020 2018 2019 2020
Sales of goods and services ` 136 ` 102 ` 43 ` - ` - ` -
Assets purchased 290 240 741 - - -
Dividend 3,171 3,171 3,987 191 191 243
Buyback of shares 63,745 - 69,392 ^ - 4,076
Rental income 42 43 45 - - -
Rent Paid 7 8 2 6 5 9
Others 31 63 119 - - -

Annual Report 2019-20 332
Transaction / balancesEntities controlled by Directors Key Management Personnel
2018 2019 2020 2018 2019 2020
Key management personnel *
Remuneration and short-term benefits ` - ` - ` - ` 248 ` 341 ` 354
Other benefits - - - 130 173 178
Balance as at the year end
Receivables ` 39 ` 132 ` 94 ` - ` - ` -
Payables 57 8 23 55 155 166
^ Value is less than ` 1
* Post-employment benefits comprising compensated absences is not disclosed as these are determined for the Company as a whole. Benefits includes the prorated value of RSU granted to the personnel, which vest over a period of time. Other benefits include share-based compensation ` 124, ` 166, and ` 170, as at March 31, 2018, 2019 and 2020, respectively.
33. Commitments and contingenciesUntil March 31, 2019, prior to adoption of IFRS 16, the Company had taken office, vehicles and IT equipment under cancellable and non-cancellable operating lease agreements that were renewable on a periodic basis at the option of both the lessor and the lessee. The operating lease agreements extended up to a maximum of fifteen years from their respective dates of inception and some of these lease agreements had price escalation clause. Rental payments under operating leases were ` 6,236 and ` 6,490 for the year ended March 31, 2018, and March 31, 2019, respectively.
As at March 31, 2019
Not later than one year ` 7,006
Later than one year but not later five years 11,106
Later than five years 1,629
` 19,741
Capital commitments: As at March 31, 2019 and 2020, the Company had committed to spend approximately ` 12,443 and ` 14,011 respectively, under agreements to purchase/ construct property and equipment. These amounts are net of capital advances paid in respect of these purchases.
Guarantees: As at March 31, 2019 and 2020, performance and financial guarantees provided by banks on behalf of the Company to the Indian Government, customers and certain other agencies amount to approximately ` 18,456 and ` 18,655 respectively, as part of the bank line of credit.
Contingencies and lawsuits: The Company is subject to legal proceedings and claims (including tax assessment orders/ penalty notices) which have arisen in the ordinary course of its business. Some of the claims involve complex issues and it is not possible to make a reasonable estimate of the expected financial effect, if any, that will result from ultimate resolution of such proceedings. However, the resolution of these legal proceedings is not likely to have a material and adverse effect on the results of operations or the financial position of the Company. The significant of such matters are discussed below.
In March 2004, the Company received a tax demand for the year ended March 31, 2001 arising primarily on account of denial of
deduction under section 10A of the Income Tax Act, 1961 in respect of profit earned by the Company’s undertaking in Software Technology Park at Bengaluru. The same issue was repeated in the successive assessments for the years ended March 31, 2002 to March 31, 2011 and the aggregate demand is ̀ 47,583 (including interest of ̀ 13,832). The appeals filed against the said demand before the Appellate authorities have been allowed in favor of the Company by the second appellate authority for the years up to March 31, 2008. Further appeals have been filed by the Income tax authorities before the Hon’ble High Court. The Hon’ble High Court has heard and disposed-off majority of the issues in favor of the Company up to years ended March 31, 2004. Department has filed a Special Leave Petition before the Supreme Court of India for the years ended March 31, 2001 to March 31, 2004.
On similar issues for years up to March 31, 2000, the Hon’ble High Court of Karnataka has upheld the claim of the Company under section 10A of the Income Tax Act, 1961. For the year ended March 31, 2009, the appeals are pending before Income Tax Appellate Tribunal (“ITAT”). For years ended March 31, 2010 and March 31, 2011, the Dispute Resolution Panel allowed the claim of the Company under section 10A of the Income Tax Act, 1961. The Income tax authorities have filed an appeal before the Hon’ble ITAT.
For the year ended March 31, 2013, the Company received the final assessment order in November 2017 with a demand of ` 3,286 (including interest of ` 1,166), arising primarily on account of section 10AA issues with respect to exclusion from Export Turnover. The Company has filed an appeal before Hon’ble ITAT, Bengaluru within the prescribed timelines.
For the year ended March 31, 2014, the Company received the final assessment order in September 2018 with a demand of ` 1,030 (including nil interest), arising primarily on account of transfer pricing issues. The Company has filed an appeal before the Hon’ble ITAT, Bengaluru within the prescribed timelines.
For the year ended March 31, 2015, the Company received the final assessment order in October 2019 with an estimated demand of ` 1,347 (including nil interest), arising primarily on account of capitalization of wages. The Company has filed an appeal before the Hon’ble ITAT, Bengaluru within the prescribed timelines.
For the year ended March 31, 2016, the Company received the draft

Corporate Overview | Management & Board Reports | Financial Statements
Wipro Limited333
assessment order in December 2019 with an estimated demand of ` 704 (including nil interest), arising primarily on account of capitalization of wages. The Company has filed the objections before the Dispute Resolution Panel (Bengaluru) within the prescribed timelines.
For the year ended March 31, 2007 to year ended March 31, 2012, the Company has received a tax demand of ` 227 (including ` 102 interest) for non-deduction of tax at source on some payments. The Company has already deposited the demand under protest. The Company received order issued by ITAT, Bengaluru rejecting the Company’s appeal. The Company has filed an appeal against the order with the Hon’ble High Court of Karnataka within the prescribed timelines. The Company has received a favorable order on this issue from the Hon’ble High Court of Karnataka for the earlier years.
Income tax demands against the Company amounting to ` 66,441 and ` 77,873 are not acknowledged as debt as at March 31, 2019 and March 31, 2020, respectively. These matters are pending before various Appellate Authorities and the management expects its position will likely be upheld on ultimate resolution and will not have a material adverse effect on the Company’s financial position and results of operations.
The contingent liability in respect of disputed demands for excise duty, custom duty, sales tax and other matters amounts to ` 8,477 and ` 8,033 as of March 31, 2019 and March 31, 2020, respectively. However, the resolution of these disputed demands is not likely to have a material and adverse effect on the results of operations or the financial position of the Company.
The Hon’ble Supreme Court of India, through a ruling in February 2019, provided interpretation on the components of Salary on which the Company and its employees are to contribute towards Provident Fund under the Employee’s Provident Fund Act. Based on the current evaluation, the Company believes it is not probable that certain components of Salary paid by the Company will be subject to contribution towards Provident Fund due to the Supreme Court order. The Company will continue to monitor and evaluate its position based on future events and developments.
34. Segment informationThe Company is organized by the following operating segments: IT Services, IT Products, and India State Run Enterprise services segment (“ISRE”).
IT Services: The IT Services segment primarily consists of IT Service
offerings to customers organized by industry verticals. Effective April 1, 2018, consequent to change in organization structure, the Company reorganized its industry verticals. The Manufacturing (“MFG”) and Technology (“TECH”) business units are split from the former Manufacturing & Technology (“MNT”) business unit.
The revised industry verticals are as follows: Banking, Financial Services and Insurance (“BFSI”), Health Business unit (“Health BU”) previously known as Health Care and Life Sciences Business unit (“HLS”), Consumer Business unit (“CBU”), Energy, Natural Resources & Utilities (“ENU”), MFG, TECH and Communications (“COMM”). Key service offerings to customers include software application development and maintenance, research and development services for hardware and software design, business application services, analytics, consulting, infrastructure outsourcing services and business process services.
Comparative information has been restated to give effect to the above changes.
IT Products: The Company is a value-added reseller of desktops, servers, notebooks, storage products, networking solutions and packaged software for leading international brands. In certain total outsourcing contracts of the IT Services segment, the Company delivers hardware, software products and other related deliverables. Revenue relating to the above items is reported as revenue from the sale of IT Products.
ISRE: During the year ended March 31, 2019, the Company has organized ISRE as a separate segment, which was part of IT Services segment. This segment consists of IT Services offerings to entities or departments owned or controlled by Government of India and/ or any State Governments.
Comparative information has been restated to give effect to this change.
The Chairman of the Company has been identified as the Chief Operating Decision Maker (“CODM”) as defined by IFRS 8, “Operating Segments.” The Chairman of the Company evaluates the segments based on their revenue growth and operating income.
Assets and liabilities used in the Company’s business are not identified to any of the operating segments, as these are used interchangeably between segments. Management believes that it is currently not practicable to provide segment disclosures relating to total assets and liabilities since a meaningful segregation of the available data is onerous.
Information on reportable segment for the year ended March 31, 2018 is as follows:
IT Services IT Prod-ucts ISRE Reconcil-
ing Items TotalBFSI Health BU CBU ENU TECH MFG COMM Total
Revenue ` 144,139 ` 74,136 ` 77,914 ` 67,841 ` 73,947 ` 46,081 ` 33,658 ` 517,716 ` 17,998 ` 10,694 ` (49) ` 546,359
Segment Result 24,549 9,624 12,619 8,097 14,680 7,007 3,236 79,812 362 454 319 80,947
Unallocated 3,347 - - 3,347
Segment Result Total ` 83,159 ` 362 ` 454 ` 319 ` 84,294Finance expense (5,830)
Finance and other income 23,999

Annual Report 2019-20 334
IT Services IT Prod-ucts ISRE Reconcil-
ing Items TotalBFSI Health BU CBU ENU TECH MFG COMM Total
Share of profit/ (loss) of associates accounted for using the equity method 11
Profit before tax ` 102,474Income tax expense (22,390)
Profit for the year ` 80,084Depreciation, amortization and impairment ` 21,124
Information on reportable segment for the year ended March 31, 2019 is as follows:
IT Services IT Products ISRE Reconcil-
ing Items TotalBFSI Health BU CBU ENU TECH MFG COMM Total
Revenue ` 175,262 ` 75,081 ` 89,313 ` 72,830 ` 76,591 ` 46,496 ` 32,680 ` 568,253 ` 12,312 ` 8,544 ` (49) ` 589,060Other operating income - - - - - - - 4,344 - - - 4,344Segment Result 33,831 8,638 16,828 7,081 15,916 8,327 4,396 95,017 (1,047) (1,829) 283 92,424Unallocated 3,142 - - 3,142Segment Result Total ` 102,503 ` (1,047) ` (1,829) ` 283 ` 99,910Finance expense (7,375)Finance and other income 22,923Share of profit/ (loss) of associates accounted for using the equity method (43)Profit before tax ` 115,415Income tax expense (25,242)Profit for the year ` 90,173Depreciation, amortization and impairment ` 19,474
Information on reportable segment for the year ended March 31, 2020 is as follows:
IT Services IT Products ISRE Reconcil-
ing Items TotalBFSI Health BU CBU ENU TECH MFG COMM TotalRevenue ` 184,457 ` 78,240 ` 97,008 ` 76,443 ` 75,895 ` 48,158 ` 33,840 ` 594,041 ` 11,010 ` 8,400 ` (50) ` 613,401Other operating income - - - - - - - 1,144 - - - 1,144Segment Result 34,132 12,027 16,729 12,176 14,312 9,252 5,336 103,964 (282) (1,822) 149 102,009Unallocated 2,577 - - - 2,577Segment Result Total ` 107,685 ` (282) ` (1,822) ` 149 ` 105,730Finance expense (7,328)Finance and other income 24,081Share of profit/ (loss) of associates accounted for using the equity method 29Profit before tax ` 122,512Income tax expense (24,799)Profit for the year ` 97,713Depreciation, amortization and impairment ` 20,862
The Company has four geographic segments: India, Americas, Europe, and Rest of the world. Revenues from the geographic segments based on domicile of the customer are as follows:
Year ended March 31, 2018 2019 2020
India ` 43,099 ` 30,999 ` 30,158
Americas * 283,515 325,432 352,319
Europe 138,597 147,074 144,876
Rest of the world 81,148 85,555 86,048
` 546,359 ` 589,060 ` 613,401
* Substantially related to operations in the United States of America.

Corporate Overview | Management & Board Reports | Financial Statements
Wipro Limited335
No customer individually accounted for more than 10% of the revenues during the year ended March 31, 2018, 2019 and 2020.
Management believes that it is currently not practicable to provide disclosure of geographical location wise assets, since the meaningful segregation of the available information is onerous.
Notes:
a) “Reconciling items” includes elimination of inter-segment transactions and other corporate activities.
b) Revenue from sale of traded cloud-based licenses is reported as part of IT Services revenues.
c) Revenue from sale of company owned intellectual properties is reported as part of IT Services revenues
d) For the purpose of segment reporting, the Company has included the impact of “foreign exchange gains / (losses), net” in revenues (which is reported as a part of operating profit in the consolidated statement of income).
e) For evaluating performance of the individual operating segments, stock compensation expense is allocated on the basis of straight-line amortization. The differential impact of accelerated amortization of stock compensation expense over stock compensation expense allocated to the individual operating segments is reported in reconciling items.
f) The Company generally offers multi-year payment terms in certain total outsourcing contracts. These payment
terms primarily relate to IT hardware, software and certain transformation services in outsourcing contracts. The finance income on deferred consideration earned under these contracts is included in the revenue of the respective segment and is eliminated under reconciling items.
g) Segment results for ENU and COMM industry vertical for the year ended March 31, 2018, are after considering the impact of provision by ` 3,175 and ` 1,437, respectively, for impairment of receivables and deferred contract cost. Refer to Note 25.
h) Other operating income of ` Nil, ` 4,344 and ` 1,144 is included as part of IT Services segment result for the year ended March 31, 2018, 2019 and 2020, respectively. Refer to Note 26.
i) Segment results for ENU industry vertical for the year ended March 31, 2019, are after considering the impact of ` 5,141 ($ 75 million) paid to National Grid on settlement of a legal claim against the Company. Refer to Note 25
j) Segment results for Health BU industry vertical for the year ended March 31, 2018 and 2019, are after considering the impact of impairment charges on certain software platform and intangible assets recognized on acquisitions. Refer to Note 25.
k) Segment results of IT Services segment are after recognition of share-based compensation expense ` 1,402, ` 1,841, and ` 1,229 for the year ended March 31, 2018, 2019 and 2020, respectively. The share-based compensation expense pertaining to other segments is not material.
35. Bank balanceDetails of balance with banks as at March 31, 2020 are as follows:
In Current Account
In Deposit Account Total
HDFC Bank ` 599 ` 35,670 ` 36,269ICICI Bank - 34,883 34,883Citi Bank 18,902 7,247 26,149Axis Bank 1 22,988 22,989HSBC 6,729 4,672 11,401Saudi British Bank 955 3,311 4,266Wells Fargo Bank 2,627 - 2,627Kotak Mahindra Bank 2 1,200 1,202BNP Paribas 1,034 - 1,034ANZ Bank 426 302 728Deutsche Bank 496 - 496Standard Chartered Bank 341 - 341UniCredit Bank Austria 334 - 334United Amara Bank 259 - 259JP Morgan Chase 107 139 246MUFG Bank 132 - 132Rabo Bank 129 - 129Silicon Valley Bank 109 - 109Intesa San Paolo 108 - 108Others 797 - 797Total ` 34,087 ` 110,412 ` 144,499
36. During the year ended March 31, 2019, as part of a customer contract with Alight LLC, Wipro has acquired Alight HR Services India Private Limited (currently known as Wipro HR Services India Private Limited) for a consideration of ` 8,275 ($ 117 million). Considering the terms and conditions of the agreement, the Company has concluded that this transaction does not meet the definition of Business under IFRS 3. The transaction was consummated on September 1, 2018. Net assets taken over was ` 4,128. The excess of consideration paid, and net assets taken over is accounted as ‘costs to obtain contract’, which will be amortized over the tenure of the contract as reduction in revenues.
The accompanying notes form an integral part of these consolidated financial statements

Annual Report 2019-20 336
Business Responsibility Report (BRR)Ministry of Corporate Affairs (MCA) revised National Voluntary Guidelines (NVG) 2011 on Social, Environmental and Economic Responsibilities of Business and aligned it with the national and international developments in sustainability space. This resulted in formulation of National Guidelines on Responsible Business Conduct (NGRBC) in 2019.
At Wipro, the NVG’s Principles and Core elements are deeply integrated into practices and processes. During the reporting year, we assessed our position with the new NGRBC guidelines, a brief of which is given below:
• As early adopters of GRI (Global Reporting Initiative) and IR (Integrated Reporting), our policies and processes cover most elements of the NGRBC – which include identification and engagement with key stakeholders, materiality determination and adopting a comprehensive approach that makes responsible business conduct an integral part of our strategy.
• Our policies like the Ecological Sustainability Policy, Health and Safety Policy, Human Right Policy, Code of Business Conduct, Supplier Code of Conduct, Data Privacy and CSR policy are implemented by specific operational guidelines and procedures under a cross functional charter which includes the Risk function, Legal and Compliance, Human Resources, Information Security, Operations, Procurement and Ombuds among others. The tenets of Protect-Respect-Remedy are also integrated in implementation. We ensure appropriate due diligence of these programs through process and performance audits - both internal and external - through frameworks like ISOO14001, OHSAS and GRI among others.
• The details of governance by sub-committees of the board are provided as part of our Corporate Governance Report from page no. 122 of this Annual Report.
• Communications – transparent disclosure is made through various public forums like CDP, Annual reporting through benchmarking frameworks like DJSI, FTSE, MSCI, Vigeo among other. In addition, leadership actively evangelizes these values-based approaches through regular forums.
• We have robust internal processes to track performance of different elements in NGRBC at multiple levels of detail and coverage – many of which are covered in our public disclosures. We are currently assessing preparedness to
report on all indicators – essential and leadership – for FY21. This BRR is based on NVG of 2011.
Section A: General Information about the Company
1. Corporate Identity Number (CIN) of the Company L32102KA1945PLC020800.
2. Name of the Company Wipro Limited
3. Registered address Doddakannelli, Sarjapur Road, Bengaluru-560035,
Karnataka, India
4. Website https://www.wipro.com
5. E-mail id [email protected]
6. Financial Year reported April 1, 2019 to March 31, 2020 (FY 2019-20)
7. Sector(s) that the Company is engaged in (industrial activity code-wise)
IT Software, Services and related activities. NIC Code-62013, 62020.
8. List three key products/services that the Company manufactures/provides (as in balance sheet)
Please refer page nos. 31 to 35 of this Annual Report
9. Total number of locations where business activity is undertaken by the Company
i. Number of international locations (Provide details of major 5)
189 office locations
Please refer complete list of locations available on the Company’s website at https://www.wipro.com.
ii. Number of national locations
44 locations (including 3 data centers)
Please refer complete list of locations available on the Company’s website at https://www.wipro.com.

Corporate Overview | Management & Board Reports | Financial Statements
Wipro Limited337
10. Markets served by the Company – Local/State/ National/International/
Please refer to “Geography Wise Performance” on page no. 47 of this Annual Report.
Section B: Financial Details of the Company
1. Paid up Capital
As at March 31, 2020, the paid up equity share capital of the Company stood at ` 11,426,714,780/- consisting of 5,713,357,390 equity shares of ` 2 each.
2. Total Turnover
For the financial year 2019-20, the total turnover of the Company on a consolidated basis was ` 610,232 million.
3. Total profit after taxes
For the financial year 2019-20, the net profit of the Company on a consolidated basis was ` 97,718 million.
4. Total spending on Corporate Social Responsibility (CSR) as percentage of profit after tax
Please refer to the Corporate Social Responsibility Report for the year from page nos. 94 to 98 of this Annual Report.
5. List of activities in which expenditure in 4 above has been incurred:-
Please refer to the Corporate Social Responsibility Report for the year from page nos. 94 to 98 of this Annual Report.
Section C: Other Details
1. Does the Company have any Subsidiary Company/ Companies?
The Company has 90 subsidiaries as on March 31, 2020. Please refer the complete list from page nos. 99 to 103 of this Annual Report.
2. Do the Subsidiary Company/Companies participate in the BR Initiatives of the parent company? If yes, then indicate the number of such subsidiary company(s).
As the BR Initiatives of the Company are run at global level, all subsidiaries participate in the BR Initiatives.
3. Do any other entity/entities (e. g. suppliers, distributors etc.) that the Company does business with, participate in the BR initiatives of the Company? If yes, then indicate the percentage of such entity/entities? [Less than 30%, 30-60%, More than 60%]
Yes, less than 30%.
Section D: BR Information
1. Details of Director responsible for BR
a) Details of the Director responsible for implementation of the BR policy/policies
The “Board Governance, Nomination and Compensation Committee” is responsible for the implementation of the CSR policy. Please refer page nos. 122 to 123 of this Annual Report.
b) Details of the BR head
DIN (if applicable) Not applicableName Anurag BeharDesignation Chief Sustainability OfficerTelephone No. 080 28440011Email id [email protected]
2. Principle-wise (as per NVGs) BR Policy/policies (Reply in Y/N)
a) Do you have a policy /policies for:
• Principle 1: Yes. Wipro has a policy on Ethics, Transparency and Accountability. Our Code of Business Conduct (COBC) is applicable to our customers, suppliers, partners, competitors, employees and other stakeholders, which is available at https://www.wipro.com/content/dam/nexus/en/investor/corporate-governance/policies-and-guidelines/ethical-guidelines/ code-of-business-conduct-and-ethics.pdf.
• Principle 2: Yes. Our Policy on Ecological Sustainability is available at https://www.wipro.com/content/dam/nexus/en/sustainability/pdf/ecological-sustainability-policy.pdf.
• Principle 3: Yes. Wipro’s COBC and policy on Health and Safety is available at https://www.wipro.com/content/dam/nexus/en/sustainability/pdf/ health-and-safety-policy.pdf.
• Principle 4: Yes. Policy on Corporate Social Responsibility is available at https://www.wipro.com/content/dam/nexus/en/investor/ corporate-governance/policies-and-guidelines/ethical-guidelines/12773-policy-on-corporate-social-responsibility.pdf.
• Principle 5: Yes. Wipro’s COBC addresses principles of Human Rights as per the principles of the UN Global Compact and is available at

Annual Report 2019-20 338
https://www.wipro.com/content/dam/nexus/en/sustainability/pdf/Human-Rights-Policy.pdf.
• Principle 6: Yes. Our Policy on Ecological Sustainability.
• Principle 7: There is no distinct policy on public advocacy. However, refer to human capital (page nos. 53 to 55), natural capital (page nos. 63 to 68) and social & relationship capital (page nos. 58 to 62) for our engagements through various organizations on material issues.
• Principle 8: Wipro does not have a separate policy. However, these aspects are covered in the COBC, the Ecological Sustainability Commitment and policy on Corporate Social Responsibility.
• Principle 9: Yes. Wipro’s COBC covers this.
b) Has the policy being formulated in consultation with the relevant stakeholders?
Yes, for all principles.
c) Does the policy conform to any national/ international standards? If yes, specify? (50 words)
• Principle 1: Yes. Wipro’s COBC subscribes to the Foreign Corrupt Practices Act of USA. Our financial reporting, internal controls and procedures and disclosures are in compliance with Generally Accepted Accounting Principles (GAAP) and International Financial Reporting Standards (IFRS).
• Principle 2: Yes. Wipro has been following the ISO 14001 Standard and Guidelines for our Environmental Management System. For designing our Green Buildings, we have adhered to the international Leadership in Energy and Environmental Design (LEED) standard.
• Principle 3: Yes. We are certified against OHSAS 18001 Standard across our key locations.
• Principle 4: Yes. We carry out assurance against Global Reporting Initiative (GRI), IIRC and TCFD recommendations which have a key stakeholder engagement requirement.
• Principle 5: The Human Right policy is guided by UN Global Compact, UNDHR and the ILO Declaration. Wipro also supports the UN guiding principles on Business and Human Rights.
• Principle 6: Yes. Our Environmental Management System is based on the ISO 14001 Standard and the Green Buildings complies with the international LEED standard.
• Principle 7: Not Applicable
• Principle 8: Yes. We subscribe to the UN Global Compact principles. We also disclose details of our programs and key outcomes as part of UNGC Communication on Progress.
• Principle 9: Yes. We subscribe to the UN Global Compact principles with respect to this principle.
d) Is the policy being approved by the Board? If yes, has it been signed by MD/owner/CEO/ appropriate Board Director?
• Principle 1: Yes. The COBC is approved by our Board of Directors and endorsed by our Chairman.
• Principle 2: Yes. The Policy on Ecological Sustainability is approved by the Board of Directors and has been signed by the Chief Executive Officer and Managing Director.
• Principle 3: Yes. The COBC is approved by the Board of Directors. Wipro Global Statement on Health and Safety has been signed by the President & Chief Human Resources Officer.
• Principle 4: Yes. The COBC is approved by our Board of Directors and endorsed by our Chairman. The Policy on Corporate Social Responsibility is approved by the Board of Directors.
• Principle 5: Yes. The COBC is approved by our Board of Directors and endorsed by our Chairman. The Human rights policy is endorsed by the board.
• Principle 6: Yes. The COBC is approved by our Board of Directors and endorsed by our Chairman. The Policy on Ecological Sustainability has been signed by the Chief Executive Officer and Managing Director.
• Principle 7: Not Applicable.
• Principle 8: Yes. The Policy on Corporate Social Responsibility (CSR) is approved by the Board of Directors. The COBC is approved by our Board of Directors and endorsed by our Chairman. The Policy on Ecological Sustainability is approved by the Board and has been signed by the Chief Executive Officer and Managing Director.

Corporate Overview | Management & Board Reports | Financial Statements
Wipro Limited339
• Principle 9: Yes. The COBC is approved by our Board of Directors and endorsed by our Chairman. The Policy on Ecological Sustainability is approved by the Board of Directors and has been signed by the Chief Executive Officer and Executive Director.
e) Does the Company have a specified committee of the Board/Director/Official to oversee the implementation of the policy?
The “Board Governance, Nomination and Compensation Committee” oversees the implementation of policies and initiatives related to CSR. The CSR policy is available at https://www.wipro.com/content/dam/nexus/en/investor/ corporate-governance/policies-and-guidelines/ethical-guidelines/12773-policy-on-corporate-social-responsibility.pdf.
f) Indicate the link for the policy to be viewed online.
COBC-
https://www.wipro.com/content/dam/nexus/en/investor/corporate-governance/policies-and-guidelines/ethical-guidelines/code-of-business-conduct-and-ethics.pdf.
Policy on Health and Safety-
https://www.wipro.com/content /dam/nexus/ en/sustainability/pdf/health-and-safety-policy.pdf.
Policy on Ecological Sustainability-
https://www.wipro.com/content/dam/nexus/en/sustainability/pdf/ecological-sustainability-policy.pdf.
Policy on Corporate Social Responsibility-
https://www.wipro.com/content/dam/nexus/en/investor/corporate-governance/policies-and-guidelines/ethical-guidelines/12773-policy-on-corporate-social-responsibility.pdf.
Policy on Human Rights-
https://www.wipro.com/content/dam/nexus/en/sustainability/pdf/Human-Rights-Policy.pdf.
GRI Report FY 2018-19
https://www.wipro.com/content /dam/nexus/ e n / s u s t a i n a b i l i t y / s u s t a i n a b i l i t y _ r e p o r t s /sustainability-report-fy-2018-19.pdf.
g) Has the policy been formally communicated to all relevant internal and external stakeholders?
Yes, the policies have been formally communicated to internal and external stakeholders. They are available online for all stakeholders to refer to in the links mentioned earlier.
h) Does the Company have in-house structure to implement the policy/policies?
Yes, for all principles, although Wipro does not have a policy on public policy and advocacy. The sustainability organization and government relations group oversees the public policy initiatives.
i) Does the Company have a grievance redressal mechanism related to the policy/policies to address stakeholders’ grievances related to the policy/policies?
Yes, for all principles.
Dedicated email address ([email protected]) has been created to facilitate receipt of complaints and for ease of reporting. All employees and stakeholders can also register their concerns through web-based portal at https://www.wipro.com/investors/corporate-governance/#Wipros OmbudsProcess.
Analyst and Investors provide regular feedback through media, interviews and ratings. Employees have multiple channels for grievance redressal.
Suppliers can provide feedback either through the ombuds process, helpline, helpdesk or forums like the annual supplier meet.
Customers have multiple channels for raising grievances– account managers, client engagement managers, the customer advocacy group and through independently administered satisfaction surveys. There are ongoing, project based and annual feedbacks from our Customers.
j) Has the Company carried out independent audit/evaluation of the working of this policy by an internal or external agency
We have a program which covers verification against frameworks like ISO14001, OHSAS, ISO27001 and corporate reporting frameworks like GRI, IIRC, TCFD throughout the year.

Annual Report 2019-20 340
Internal Audit Function: The internal audit function carries out an audit of processes and practices across functions of the organization using the COBC as the guideline.
3. Governance related to BR
Indicate the frequency with which the Board of Directors, Committee of the Board or CEO assess the BR performance of the Company. Within 3 months, 3-6 months, Annually, More than 1 year.
Quarterly.
Does the Company publish a BR or a Sustainability Report? What is the hyperlink for viewing this report? How frequently it is published?
Wipro’s Annual Report includes an articulation of the 9 NVG principles. We also publish an annual Sustainability Report which is available at https://www.wipro.com/sustainability/.
Section E: Principle-wise performance
Principle 1
1.1 Does the policy relating to ethics, bribery and corruption cover only the Company? COBC extends to the Group/Joint Ventures/ Suppliers/Contractors/NGOs/Others?
Yes, COBC extends to all.
1.2 How many stakeholder complaints have been received in the past financial year and what percentage was satisfactorily resolved by the management? If so, provide the details thereof, in about 50 words or so.
Please refer page no. 75 of this Annual Report.
Principle 2
2.1 List up to 3 of your products or services whose design has incorporated social or environmental concerns, risks and/or opportunities.
Our work in the space of IT services and consulting includes cloud based services, managed services, internet of things, infrastructure services and digital offerings, all of which fundamentally are premised on improving resource efficiency and reducing environmental footprint. We work in the domains of health care and life sciences, government services, banking, transportation, energy and natural resources, helping enhance provisioning of services across all sections of the society.
2.2 For each such product, provide the following details in respect of resource use (energy, water, raw material etc.) per unit of product (optional): Reduction during sourcing/production/distribution achieved since the
previous year throughout the value chain, Reduction during usage by consumers (energy, water) that has been achieved since the previous year?
1) Wipro offers a range of IT services and solutions like cloud based services, managed services, internet of things, digital offerings which significantly help improve process efficiency and business outcomes for our customers. All these solutions directly or indirectly also improve the environmental impacts for our customers. However due to the nature of our services, it is difficult to quantify.
2) The natural capital valuation study (refer page no. 68) and the green initiatives in ICT hardware procurement cover initiatives across the value chain.
2.3 Does the Company have procedures in place for sustainable sourcing (including transportation)? If yes, what percentage of your inputs was sourced sustainably? Also, provide the details thereof, in about 50 words or so.
Green Procurement program for ICT Hardware and Electronic End of Life as part of which we sourced more than 108,400 Electronic Product Environmental Assessment Tool (EPEAT) registered electronic products in calendar year 2019.
Please refer page nos. 59 to 60 of this Annual Report.
2.4 Has the Company taken any steps to procure goods and services from local & small producers, including communities surrounding their place of work? If yes, what steps have been taken to improve their capacity and capability of local and small vendors?
Local Procurement: Wipro encourages sourcing from the local economy. Local sourcing reduces costs, provides local employment benefits and reduced environmental footprint in sourcing.
Please refer page nos. 59 to 60 of this Annual Report.
2.5 Does the Company have a mechanism to recycle products and waste? If yes what is the percentage of recycling of products and waste (separately as <5%, 5-10%, >10%). Also, provide the details thereof, in about 50 words or so.
Please refer page nos. 66 to 67 of this Annual Report.
Principle 3
3.1 Please indicate the total number of employees.
Please refer page no. 10 of this Annual Report.

Corporate Overview | Management & Board Reports | Financial Statements
Wipro Limited341
3.2 Please indicate the total number of employees hired on temporary/contractual/casual basis.
Please refer page no. 10 of this Annual Report.
3.3 Please indicate the number of permanent women employees.
Please refer page no. 10 of this Annual Report.
3.4 Please indicate the number of permanent employees with disabilities
Please refer page no. 10 of this Annual Report.
3.5 Do you have an employee association that is recognized by management?
Please refer page no. 54 of this Annual Report.
3.6 What percentage of your permanent employees are members of this recognized employee association?
Please refer to page no. 54 of this Annual report.
3.7 Please indicate the number of complaints relating to child labor, forced labor, involuntary labor, sexual harassment, in the last financial year, and those that are pending, as on the end of the financial year.
Please refer page no. 76 of this Annual Report.
3.8 What percentage of your under mentioned employees were given safety & skill up-gradation training in the last year?
1. Permanent Employees
2. Permanent Women Employees
3. Casual/Temporary/Contract employees
4. Employees with disability
Safety training is provided to 100% of the employees.
For information on skill up-gradation training, please refer page nos. 54 to 55 of this Annual Report.
Principle 4
4.1 Has the Company mapped its internal and external stakeholders?
Yes.
4.2 Out of the above, has the Company identified the disadvantaged, vulnerable & marginalized stakeholders?
Please refer page nos. 60 to 62 of this report.
4.3 Are there any special initiatives undertaken by the Company to engage with the disadvantaged, vulnerable and marginalized stakeholders? If so, provide the details thereof, in about 50 words or so.
Please refer page nos. 60 to 62 of this Annual Report.
Principle 5
5.1 Does the policy of the Company on human rights cover only the Company or extend to the Group/Joint Ventures/Suppliers/Contractors/ NGOs/Others?
Human Rights policy extends to the Group/Joint Ventures/Suppliers/Contractors/NGOs/others.
5.2 How many stakeholder complaints have been received in the past financial year, and what percentage was satisfactorily resolved by the management?
Please refer page no. 75 of this Annual Report.
Principle 6
6.1 Does the policy related to Principle 6 cover only the Company or extends to the Group/Joint Ventures/Suppliers/Contractors/NGOs/others.
Yes, it extends to all.
6.2 Does the Company have strategies/initiatives to address global environmental issues such as climate change, global warming, etc.? Yes/No. If yes, please give hyperlink for the webpage, etc.
Yes. Please refer to page nos. 64 to 68 of this report. https://www.wipro.com/investors/annual-reports/
6.3 Does the Company identify and assess potential environmental risks?
Yes.
6.4 Does the Company have any project related to Clean Development Mechanism? If so, provide the details thereof, in about 50 words or so. Also, if yes, whether any environmental compliance report has been filed?
No.
6.5 Has the Company undertaken any other initiatives on–clean technology, energy efficiency, renewable energy, etc.? Yes/No. If yes, please give hyperlink for the web page, etc.
Yes. Please refer page nos. 64 to 68 of this report. https://www.wipro.com/investors/annual-reports/
6.6 Are the emissions/waste generated by the Company within the permissible limits given by CPCB/SPCB for the financial year being reported?
Yes.

Annual Report 2019-20 342
6.7 Number of show cause/legal notices received from CPCB/SPCB which are pending (i.e., not resolved to satisfaction) as on end of Financial Year.
None.
Principle 7
7.1 Is your Company a member of any trade and chamber or association? If yes, name only those major ones that your business deals with.
We are members of industry and business forums in countries where we have significant operations. Business Round Table, U.S. Chamber of Commerce (USCC) and Global Business Alliance (GBA) are the top three by financial contribution. The total contribution made to BRT, USCC, GBA is $287,500 during FY19-20.
7.2 Have you advocated/lobbied through the above associations for the advancement or improvement of public good? Yes/No. If yes, specify the broad areas (Governance and Administration, Economic Reforms, Inclusive Development Policies, Energy Security, Water, Food Security, Sustainable Business Principles, Others).
Yes. Through Industry forums and networks in India, we work on a range of issues related to sustainability and community aspects- including energy, water, green buildings, bio-diversity, waste management among others. We also support flexibility in movement of labor.
Principle 8
8.1 Does the Company have specified programs/ initiatives/projects in pursuit of the policy related to Principle 8? If yes, provide the details thereof.
Yes. Please refer page nos. 61 to 62 of this Annual Report.
8.2 Are the programs/projects undertaken through an in-house team/own foundation/external NGO/government structures/any other organization?
Wipro partners with non governmental organizations working on the areas of our focus.
8.3 Have you done any impact assessment of your initiative?
We do extensive due diligence of our partners and monitor and evaluate progress/outcomes during the
course of the program, and on a quarterly basis with the Chairman. Due to the nature of a large part of our work (systemic reform in education, for example), we have not conducted a formal impact assessment of our initiatives.
8.4 What is your Company’s direct contribution to community development projects- Amount in INR and the details of the projects undertaken.
Please refer page nos. 10 to 11 and 61 to 62 of this Annual Report.
8.5 Have you taken steps to ensure that this community development initiative is successfully adopted by the community? Please explain in 50 words or so.
The nature of the programs supported by Wipro ensures successful adoption by communities. Also, Wipro works with organizations which has a good connect and presence in the local communities.
For more details, please refer page nos. 61 to 62 of this Annual Report.
Principle 9
9.1 What percentage of customer complaints/ consumer cases are pending as on the end of financial year?
We do not have any complaint relating to violation of this principle. However, we would have routine customer related commercial litigations/disputes.
9.2 Does the Company display product information on the product label, over and above what is mandated as per local laws? Yes/No/N.A./remarks (additional information).
Not Applicable.
9.3 Is there any case filed by any stakeholder against the Company regarding unfair trade practices, irresponsible advertising and/or anti-competitive behavior during the last five years and pending as on end of financial year? If so, provide the details thereof, in about 50 words or so.
Not Applicable.
9.4 Did your Company carry out any consumer survey/consumer satisfaction trends?
Please refer page nos. 11 and 58 to 59 of this Annual Report.

Wipro Limited343 Wipro Limited343
GlossarySl. No
Abbreviation Expansion
1 AAS As A Service
2 ADR American Depository Receipt
3 ADS American Depository Share
4 AGM Annual General Meeting
5 AI Artificial Intelligence
6 AI/ML Artificial Intelligence/Machine Learning
7 APAC Asia Pacific
8 API Application Programming Interface
9 AR Augmented Reality
10 ATD Association for Talent Development
11 B2B Business to Business
12 BCMS Business Continuity Management System
13 BCP Business Continuity Plan
14 BCWI Best Companies for Women in India
15 BFSI Banking, Financial Services & Insurance
16 BI Business Intelligence
17 BITS Birla Institute of Technology & Science
18 BPS Business process services
19 BSE BSE Limited
20 BU Business Unit
21 C&D Construction and demolition
22 CAD Computer Aided Design
23 CAGR Compounded Annual Growth Rate
24 CBCMT Corporate Business Continuity Team
25 CBU Consumer Business Unit
26 CDAP Cyber Defense Assurance platform
27 CDP Carbon disclosure Project
28 CDSB Climate disclosures Standards Board
29 CEO Chief Executive Officer
30 CEP Continuous Engagement Program
31 CFO Chief Financial Officer
32 CGU Cash Generated Units
33 CII Confederation of Indian Industry
34 CIN Corporate Identification Number
35 CIS Cloud and Infrastructure Services
36 CMO Chief Marketing Officer
37 COBC Code of Business Conduct
Sl. No
Abbreviation Expansion
38 COMM Communications
39 COSO Company of Sponsoring Trade way Organisation
40 CRM Customer Relationship Management
41 CROAMIS Cargo Reservations, Operations, Accounting and Management Information System
42 CRS Cybersecurity and Risk Services
43 CSAT Customer Satisfaction
44 CSPs Communication Service Providers
45 CSR Corporate Social Responsibility
46 CTO Chief Technology Officer
47 CUSIP Committee on Uniform Securities Identification Procedures
48 CX Customer Experience
49 CXO Chief Executive’s Office
50 D&I Diversity & Inclusion
51 DAAI Data Analytics and Artificial Intelligence
52 DDT Dividend distribution tax
53 DIN Director Identification Number
54 DJSI Dow Jones Sustainability Index
55 DOP Digital Operations and Platforms
56 DPA Data process agreements
57 DSO Day Sales Outstanding
58 DTA Data Transfer agreements
59 DX Digital Experience
60 EBITDA Earnings before Interest, Tax, Depreciations and Amortization
61 EDS Electronic Data Systems
62 EMS Environmental Management System
63 ENU Energy, Natural Resources and Utilities
64 EPEAT Electronic Product Environmental Assessment Tool
65 EPI Energy Performance Index
66 EPS Earnings Per Share
67 ERM Enterprise Risk Management
68 ESG Environmental, Social and Governance
Corporate Overview | Management & Board Reports | Financial Statements

Annual Report 2019-20 344
Sl. No
Abbreviation Expansion
69 ESOP Employee Stock Option
70 ESS Employee Satisfaction Survey
71 FCTR Foreign Currency Translation Reserve
72 FSSAI Food Safety Standards Authority of India
73 FTSE Russell ESG
Financial Times Stock Exchange Russell Environmnetal Social and Governance
74 GAAP Generally Accepted Accounting Principles
75 GDP Gross Domestic Product
76 GDPR General Data Protection Regulation
77 GDS Global Depository Share
78 GHG Green House Gases
79 GIS Global Infrastructure Services
80 GRI Global Reporting Initiative
81 HLS Healthcare and Life Sciences
82 HPS Health Plan Services
83 HRV High Risk Vendors
84 HUF Hindu Undivided Family
85 I&D Inclusion and Diversity
86 IAAS Infrastructure as a Service
87 IAS International Accounting Standard
88 IASB International Accounting Standards Board
89 IBBI Biodiversity Initiative
90 ICT Information and communications technology
91 IEPF Investor Education and Protection Fund
92 IES Industrial and Engineering Services
93 IFRIC IFRS Interpretations Committee
94 IFRS International Financial Reporting Standards
95 IGEF Indo-Germany Energy Forum
96 IIRC International Integrated Reporting Council
97 IISc Indian Institute of Science
98 IIT Indian Institute of Technology
99 ILO International Labour Organization
100 Ind AS Indian Accounting Standards
101 IoT Internet of Things
102 IP Intellectual Property
Sl. No
Abbreviation Expansion
103 ISG Information Services Group
104 ISHRAE The Indian Society of Heating, Refrigerating and Air Conditioning Engineers
105 ISIN International Securities Identification Number
106 ISO International Standards Organisation
107 ISRE India State Run Enterprises
108 IT Information Technology
109 ITI International TechneGroup Incorporated
110 ITO IT Operations
111 IUCN International Union of Conservation Networks
112 JAC Joint Audit Consortium
113 KMP Key Managerial Personnel
114 KPI Key Performance Indicator
115 KRA Key Result Area
116 LAN Local Area Network
117 LATAM Latin America
118 LED Light Emitting Diode
119 LEED Leadership in Energy and Environmental Designs
120 LIBOR London Inter Bank Offered Rate
121 M&A Mergers and Acquisitions
122 MAS Modern application Services
123 MAT Minimum Alternate Tax
124 MCA Ministry of Corporate Affairs
125 MD Managing Director
126 MD&A Management Discussion and Analysis
127 MFG Manufacturing and Technology
128 MICI Most Inclusive Companies Index
129 ML Machine Learning
130 MOU Memorandum of Understanding
131 MPS Managed Print Services
132 MRE Median Remuneration of employees
133 MSCI ESG Morgan Stanley Capital International Environmental Social and Governance
134 NASSCOM National Association of Software and Services Companies
135 NLP Natural Language Processing
136 NPS Net Promoter Score
137 NSE National Stock Exchange of India Limited

Wipro Limited345 Wipro Limited345
Sl. No
Abbreviation Expansion
138 NVGs National Voluntary Guidelines
139 NYSE New York Stock Exchange
140 OEM Original Equipment Manufacturer
141 OHSAS Occupational Health and Safety Assessment Series
142 OT Operational Technology
143 PLM Product Lifecycle Management
144 PPA Power Purchase agreements
145 PPE Personal Protection Equipment
146 PSH/POSH Prevention of Sexual Harrassment
147 PSUs Performance-based stock units
148 QaaS Quality as a Service
149 R&D Research and Development
150 REC Renewable Energy Certificate
151 RPA Robotic process automation
152 RPT Related Party Transactions
153 RSPM Respirable Suspended Particulate Matter
154 RSU Restricted Stock Unit
155 RTA Registrar and Transfer Agent
156 SaaS Software as a Service
157 SASB Sustainibilty Accounting Standard Board
158 SCOC Supplier Code of Conduct
159 SD Skills Development
160 SDG Sustainable Development Goals
161 SD-WAN Software-defined networking in a Wide Area Network
162 SDx Software Defined Everything
163 SEBI Securities and Exchange Board of India
164 SEC Securities and Exchange Commission, USA
Sl. No
Abbreviation Expansion
165 SEF Science Education Fellowship
166 SEZ Special Economic Zones
167 SI System Integrator
168 SoW Spirit of Wipro
169 SOX Sarbanes’ Oxley
170 STP Sewage Treatment Plants
171 SWM Solid Waste Management
172 T&D Transmission and Distribution
173 T&M Time and Material
174 TaaS Talent as a Service
175 TCFD Task Force on Climate related Financial disclosures
176 TECH Technology
177 UN GCNI United Nations Global Compact Network India
178 USSEF United States Science Education Fellowship
179 VDI Virtual Desktop Infrastructure
180 VIU Value-in-Use
181 VLSI Very-large-scale integration
182 VoC Voice of Customer
183 VR Virtual Reality
184 WASE Wipro Academy of Software Excellence
185 WERT Wipro Equity Reward Trust
186 WFH Work from Home
187 WIMS Wipro Infrastructure Management School
188 Wipro SEF Wipro Science Education Fellowship
189 WiSTA Wipro Software Technology Academy
190 WRI World Resource Institute
191 WTD Whole Time Director
Corporate Overview | Management & Board Reports | Financial Statements

Annual Report 2019-20 346
NOTES

Wipro Limited347
NOTES

Annual Report 2019-20 348
NOTES

Board of DirectorsRishad A Premji – Chairman
Azim H Premji – Founder Chairman
Thierry Delaporte (w.e.f. July 6, 2020)
Ireena Vittal
William Arthur Owens
M K Sharma
Dr.PatrickJEnnis
Patrick Dupuis
Deepak M. Satwalekar (w.e.f. July 1, 2020)
Arundhati Bhattacharya (till June 30, 2020)
Chief Financial OfficerJatinPravinchandraDalal
Statutory AuditorsDeloitte Haskins & Sells LLP
Auditors- IFRSDeloitte Haskins & Sells LLP
Company SecretaryM Sanaulla Khan
Depository for AmericanDepository SharesJ.P.MorganChaseBankN.A.
Registrar and Share TransferAgentsKFin Technologies Private Limited
Registered & Corporate OfficeWipro LimitedDoddakannelli, Sarjapur RoadBengaluru – 560 035, IndiaPh: +91 (80) 28440011Fax: +91 (80) 28440054Website: wipro.com
Corporate Information

Wipro limited
Doddakannelli, Sarjapur Road, Bengaluru - 560035, India
CIN: L32102KA1945PLC020800 | Email: [email protected]
wipro.com