
L&T Annual Report 2019-20 - AnnualReports.com
612
for TECHNOLOGY SUSTAINABLE GROWTH
-
Upload
khangminh22 -
Category
Documents
-
view
0 -
download
0
Transcript of L&T Annual Report 2019-20 - AnnualReports.com

forTECHNOLOGYSUSTAINABLE
GROWTH

AWARDS & RECOGNITION
Every year, L&T and its people receive a number of national and international awards that acknowledge its varied accomplishments. Presented by the media, industry associations, independent bodies and academia, they honour the Company’s contribution in various spheres of business, technology, financial performance, growth and environmental protection.
For details of recent awards, please visit www.Larsentoubro.com

1
Dear ShareholdersA.M. NAik
Group Chairman i am addressing you at a time when
the nation is grappling with a global
pandemic, while simultaneously
gearing itself for a phased reopening
of the economy, and preparing
for life beyond Covid-19. Further,
simmering tensions along our
northern border have precipitated
an anti-China sentiment within the
country. The world too is witnessing
a growing groundswell of opinion
against China, and seeking viable
alternative sources of supply. i believe
this is the opportune moment for
the Government of india and indian
industry to act in unison to minimise
our external dependencies and
enhance self-reliance.
our hon’ble prime minister’s call
for ‘aaatma nirbhar Bharat’ has
resonated across the country. To
ensure that the pm’s thrust on
self-dependence achieves the desired
outcomes swiftly, it is essential
for the Government to introduce
much-needed reforms in several
areas including Land acquisition,
Competency & Skill Building. in
tandem, the administration would
do well to streamline processes
and accelerate the pace of decision
making.
We are confident that if these
measures are adopted and if
the nation remains united, our
determination and resolve will enable
us to overcome the challenges ahead.
Your company, as always, stands by
the country and its leadership in this
hour of need.
right from the onset of the
pandemic, L&T adopted stringent
safety measures to ensure the safety
and wellbeing of its people and
stakeholders. as a good corporate
CHAiRMAN’S STaTEmEnT annuaL rEporT 2019-20
This is the opportune moment for the Government of India and Indian industry to act in unison towards minimising our external dependencies, enhancing self-reliance and making ‘aatma nirbhar Bharat’ a reality.

2
citizen with a social conscience, we responded to the
humanitarian crisis caused by the virus with monetary and
material assistance. L&T, at the group level, contributed
R 150 crore for the pm CarES fund in FY 2019-20, and
further donated medical equipment including personnel
protective Equipment worth R 40 crore to states across the
country.
amid widespread concerns about the plight of daily wage
earners, we took it upon ourselves to ensure that the
1,60,000 contract workmen at our project sites received
good care. We continued to pay them their wages, provide
food, shelter and medical assistance while maintaining
prescribed Covid 19 preventive & containment protocols.
This has involved an outlay of approximately R 500 crore per
month.
as india’s leading technology, engineering and construction
company, we are also extending expert assistance for the
cause. our construction business has converted hospitals to
CoViD care centres at six locations around the country. our
array of smart solutions helps civic administrators in different
cities to monitor crowds and alert the authorities. Your
company’s public spirited initiatives have been appreciated
by various state governments.
Economic Scenario
The year witnessed faltering economic growth and under-
utilization of capacity due to a combination of contributory
factors. private sector investments, already under stress,
were further affected by fiscal slippages at the Centre and
States and tight liquidity conditions. Consumption spends,
which hitherto had been a robust driver of economic
growth, lost momentum in FY 2019-20. Expectedly, both
export earnings and tax collections were weak. in its bid
to revive the economy, the Government initiated several
monetary and fiscal measures. amongst them were a
reduction in corporate tax rates, re-capitalisation of banks
and consolidation within the banking sector, initiatives to
improve credit availability, faster resolution of stressed assets
and the announcement of packages for sectors like real
estate and exports.
These steps did lead to some encouraging results. The
onset of the pandemic however, negated these gains,
dragging real GDp growth down to 4.2% for FY 2019-20
as a whole. The lockdown imposed towards the end of
FY 2019-20, has dealt a severe blow to both demand and
supply. in response, the Government has initiated a wide
range of stimulus measures. Booster doses of fiscal and
monetary resources aimed at improving liquidity have been
announced, providing relief to stressed sections of society
and revitalizing economic activity. While these measures are
stemming the slide, it is likely that economic growth will still
take a few more quarters to revive fully.
on the global front, the world is bracing itself for growing
insularity and economic uncertainty. We see a marked
slowdown in manufacturing and trade, and heightened
geo-political tensions. The domino effect of the uS-China
trade dispute is being felt in different geographies as more
countries begin to view international relations through
a bipolar lens. increasingly, countries are adopting a
protectionist stance in an attempt to safeguard their own
economies. meanwhile, oil prices remained soft due to
shifting demand-supply positions and rapidly changing
geopolitical alignments. This has led to fiscal imbalances in
oil producing countries.
it is this volatile situation which the onslaught of the
pandemic has roiled further. Lockdowns in country after
country have stalled the world’s growth engine casting a
long shadow of economic uncertainty for some time to
come. a few countries are now on the road to recovery
and have sought to re-boot growth by injecting stimulus
measures through a combination of monetary and fiscal
resources. These accommodative fiscal and monetary
policies are likely to continue through 2020.
National infrastructure Pipeline (NiP)
The Government has formulated a national infrastructure
project pipeline of R 111 lac crore over a 6-year period.
although inadequate given the scale of india’s infrastructure
CHAiRMAN’S STaTEmEnT annuaL rEporT 2019-20

3
special ‘Shramik’ trains and buses arranged by the Central
Government in coordination with State Governments have
been imprinted on our minds through mainstream and
social media. While L&T on its part has taken measures to
provide relief to workmen at our project sites, we have not
been immune to the impact of labour disruption. From a
sub-contracted labour force of around 2,25,000 working at
project sites prior to the Covid-19 outbreak, the workforce
came down to 1,60,000 at the beginning of the lockdown
and dropped further as project sites were progressively
reopened. normalcy is being gradually restored and is
expected to stabilise to near regular levels in the second
quarter of FY 2020-21
Group performance overview
in a year overshadowed by uncertainty, your Company
turned in a creditable performance and registered growth
in key performance parameters. order inflows which enable
the core EpC business to flourish and grow, expanded by
9% over the previous year. revenues which demonstrate
the ability of the Company to execute and deliver on
customer commitments grew by 8%. Shareholder value
was delivered through healthy profit after Tax which stood
at R 9,549 crores representing a growth of 7% over the
previous year. The total order Book of R 303,857 crores as
on 31st march, 2020 grew by 4% over the previous year-end
and provides multi-year revenue visibility to the Company.
revenue growth in the core business was provided by
infrastructure, hydrocarbon, heavy Engineering and Defence
Engineering Segments. Businesses in the iT and Technology
Services Segment, which could transition, with relative ease,
to a ‘work from home’ environment grew significantly,
aided by inclusion of revenues from an acquisition made
in FY 2019-20. The Financial Services business also
registered modest growth, even while grappling with
constraints of tight liquidity, stoppage of disbursements in
end-march, 2020 and the dominant risk-averse sentiment of
the lending community.
it gives me great pleasure to inform you that the Board
of Directors has recommended a Dividend of R 18.00 per
deficit, this is a step forward. This project pipeline consists
of around 6,500 projects to be collectively funded by
Central Government and State Governments to the extent
of 79%. The remaining 21% is envisaged to come from
the private sector. a reading of the nip indicates that the
next few years are likely to see increased public spends
in areas of water, metro rail networks, roads, renewable
energy, power transmission and distribution as well as urban
infrastructure. projected investments by the private sector,
however, appear a bit optimistic, despite corporate tax cuts.
Since infrastructure investments serve the twin benefits of
improving productivity and generating employment, we
believe that the underlying macro drivers for investments
in india remain intact and that the Company is poised to
capitalise on these opportunities in the future.
Performance 2019-20
For most of the year, L&T exhibited growth and strength
on all key performance parameters – even in the face
of a stressed economic environment. Your Company’s
strategically diversified business portfolio, geographical
dispersion, robust Balance Sheet, strong order Book position
and execution strengths have stood L&T in good stead.
Covid-19 impact: The period leading up to the lockdown
and the subsequent stoppage of all economic activity from
25th march, 2020 has adversely affected your Company’s
operations in late FY 2019-20 as well as the better part of
Q1 FY 2020-21. The lockdown was progressively lifted from
14th april, 2020, with the initial resumption of operations
being conducted under restrictions imposed by local
authorities. Currently most of these project sites are active,
and execution of jobs is progressing with a reasonable level
of labour workforce.
Sub-contracted labour force
The sections of society hardest hit by the prolonged
lockdown are daily wage earners and contract labour.
images of migrant workers returning to their homes, some
on foot, some by hitch-hiking and a large number through

4
share including interim dividend of R 10.00 paid before
31st march, 2020.
international business
The Company has, over the years, expanded its international
footprint through a geographical diversification and de-
risking strategy. While the middle East region has obviously
remained an area of focus, the Company has turned its
attention to north and East africa. We have also looked at
Bhutan, Sri Lanka, Bangladesh and other South East asian
countries to steadily augment our international business. as
things stand, the middle East region constitutes 57% of the
international order Book of R 75,038 crores.
Talent management and succession planning
people continue to be the fulcrum of your Company’s
operations and focused attention is given to retention and
professional development of talent at all levels. L&T has a
well-structured 7-step leadership development program
designed to develop leadership at multiple levels spanning
junior through middle to top management. Several
initiatives including monetary and non-monetary rewards are
in place to incentivise performance and provide our people
the impetus to surpass themselves. The top management
devotes considerable attention to ensuring that employees
are given opportunities for professional development and
are able to grow along with the businesses they work for.
Business Developments
During the year, your Company acquired a majority
stake in mindtree Ltd., an iT-enabled services company.
This acquisition has helped the services segment of the
L&T Group to expand and contribute to higher revenues
and profits. Going forward, we are confident that the
contribution of the services businesses will exceed 40 per
cent of Group turnover. The process of integrating the staff
of mindtree and aligning common interests was completed
through the active engagement of top management. This is
now paying off through improved performance and growth.
L&T has been steadfastly following its 5-year Strategic plan
under the overarching theme of improving the Consolidated
return on Equity (roE). The impact of the pandemic and
additional provisions in Financial Services business has,
however, depressed the roE for FY 2019-20. We are also
incubating new age businesses which are expected to
provide growth in the coming years.
Sustainable development
Your Company takes a 360-degree view of sustainable
development that encompasses the social, economic,
governance and financial aspects of an organisation. We
have been disclosing our sustainability performance through
our annual Sustainability / integrated reports which are
being published for the last 12 years. The reports, which
serve as ESG progress score cards, also adhere to the
Global reporting initiative (Gri) Standards and Sustainable
Development Goals (SDGs), and are independently verified
by a third-party assurance agency.
our approach covers a wide spectrum – ranging from
progressive reduction of carbon emission intensity at
our campuses and project sites, water conservation at
the locations we operate in and the phased induction of
alternative and recycled substitutes in our operations. The
health, safety and well-being of your Company’s staff and
all those who work at our factories and project sites are
accorded the highest priority.
Wherever we are and whatever we do, we make sure that
the communities around us see a tangible and durable
benefit from our presence. They see it in the shape of better
access to potable water, an improved level of sanitation,
and facilities for health, education and skill building. We
believe each of these steps contribute to building a happier
community which in turn will lead to a more harmonious
society.
Outlook
The Covid-19 pandemic and its fallout makes it difficult to
forecast the future with any degree of certainty. While we
CHAiRMAN’S STaTEmEnT annuaL rEporT 2019-20

5
are hopeful that the 2nd half of FY 2020-21 will herald
better economic and business activity in terms of tendering,
good liquidity and revival of labour and supply chains, it
would be premature to predict the Company’s business
outcomes for FY 2020-21. The company is putting in
enormous efforts to mitigate the impact of the pandemic,
and register enhanced performance in FY 2021-22.
at this point in time, we see prospects in the areas of
Government buildings, data centres, healthcare infra,
airports, metro railways, water projects including waste-
water treatment and irrigation, hydel projects, expressways
as well as onshore and offshore hydrocarbon projects. We
are uncertain, however, of the timelines when these projects
will take off.
We are all passing through a crisis of unprecedented
magnitude, and i would like to thank Team L&T as well
as our customers, vendors and other stakeholders for the
confidence and trust they have reposed in us. i also thank
my fellow Board members for their invaluable support in
guiding the Company and enabling another year of growth.
Thank You
a.m. naik

6
CONTENTS annuaL rEporT 2019-20
CONTENTS
Company information 7
organisation Structure 8-9
Leadership Team 10
Executive Committee 11
L&T nationwide network & Global presence 12-13
Corporate Social responsibility 14-20
annual Business responsibility report (aBrr) 2019-20 22-43
Standalone Financials - 10 Year highlights 44
Consolidated Financials - 10 Year highlights 45
Graphs 46-47
aGm notice 48-69
Board report 70-181
management Discussion & analysis 182-335
auditors’ report on Standalone Financial Statements 337-349
Balance Sheet 350-351
Statement of profit and Loss 352-353
Statement of Changes in Equity 354-355
Cash Flow Statement 356-357
notes Forming part of the Financial Statements 358-458
auditors’ report on Consolidated Financial Statements 459-469
Consolidated Balance Sheet 470-471
Consolidated Statement of profit and Loss 472-473
Consolidated Statement of Changes in Equity 474-475
Consolidated Cash Flow Statement 476-477
notes Forming part of the Consolidated Financial Statements 478-593
information regarding Subsidiary Companies 594-606
Shareholder’s Satisfaction Survey Form – 2019-20 607-608

7
MR. A. M. NAIK Group Chairman
MR. S. N. SUBRAHMANYANChief Executive officer and managing Director
MR. R. SHANKAR RAMANWhole-time Director & Chief Financial officer
MR. SHAILENDRA NARAIN ROYWhole-time Director & Sr. Executive Vice president (power)
MR. D. K. SENWhole-time Director & Sr. Executive Vice president (infrastructure)
MR. M. V. SATISHWhole-time Director & Sr. Executive Vice president (Buildings, minerals and metals)
MR. JAYANT DAMODAR PATILWhole-Time Director & Sr. Executive Vice president(Defence & Smart Technologies) MR. M. M. CHITALEindependent Director
MR. SUBODH BHARGAVAindependent Director
MR. M. DAMODARANindependent Director
MR. VIKRAM SINGH MEHTAindependent Director
MR. ADIL SIRAJ ZAINULBHAIindependent Director
MRS. SUNITA SHARMAnominee of Life insurance Corporation of india
MR. SUBRAMANIAN SARMAnon-Executive Director
MRS. NAINA LAL KIDWAIindependent Director
MR. SANJEEV AGAindependent Director
MR. NARAYANAN KUMARindependent Director
MR. HEMANT BHARGAVAnominee of Life insurance Corporation of india
Company Secretarymr. Sivaram nair a
Registered OfficeL&T house, Ballard Estate, mumbai - 400 001
Auditorsm/s.Deloitte haskins & Sells LLp
Registrar & Share Transfer AgentsKFin Technologies private Limited
75th annual General meeting through Video Conferencing or other audio Visual means on Thursday, 13th august 2020 at 3.30 p.m. iST
COMPANY INFORMATION
BoarD oF DirECTorS
COMPANY inFormaTion annuaL rEporT 2019-20
(as on 5th June 2020)

88
ORGANISATION STRUCTURE ANNUAL REPORT 2019-20

99

10
LEADERSHiP TEam annuaL rEporT 2019-20
A. M. NaikGroup Chairman
S. N. SubrahmanyanCEO & Managing Director
R. Shankar Raman Whole-time Director &Chief Financial Officer
D. k. Sen Whole-time Director &
Sr. Executive Vice President(Infrastructure)
Subramanian SarmaNon-Executive Director, L&TCEO & Managing Director
(L&T Hydrocarbon Engineering)
M. V. Satish Whole-time Director &
Sr. Executive Vice President(Buildings, Minerals & Metals)
S. N. Roy Whole-time Director &
Sr. Executive Vice President(Power & Corporate Affairs)
J. D. Patil Whole-time Director &
Sr. Executive Vice President(Defence & Smart Technologies)
LEADERSHIPTEam

11
ExEcutivECommittee (eCom)
S. N. Subrahmanyan CEO & Managing Director
R. Shankar Raman Whole-time Director & Chief Financial Officer
D. K. Sen Whole-time Director &
Sr. Executive Vice President(Infrastructure)
Hasit Joshipura Sr. Vice President & HeadElectrical & Automation
T Madhava Das Sr. Vice President & Head
Power Transmission & Distribution
Yogi Sriram S. Rajavel Y. S. Trivedi
S. V. Desai Sr. Vice President & HeadHeavy Civil Infrastructure
Shrikant joshi CEO & Managing Director
L&T Realty Limited
Subramanian Sarma Non-Executive Director, L&TCEO & Managing Director
(L&T Hydrocarbon Engineering)
M. V. Satish Whole-time Director &
Sr. Executive Vice President(Buildings, Minerals & Metals)
S. N. Roy Whole-time Director &
Sr. Executive Vice President(Power & Corporate Affairs)
J. D. Patil Whole-time Director &
Sr. Executive Vice President(Defence & Smart Technologies)

12
This
pict
oria
l rep
rese
ntat
ion
does
not
pur
port
to b
e th
e po
litica
l map
of I
ndia
.
NATiONWiDE nETWorK & GLoBaL prESEnCE annuaL rEporT 2019-20
NATIONWIDEnETWorK
Registered Office
Campus+
Power Plant
Shipyards
Offices
Knowledge City
Leadership Development Academy
Corporate Technology and Engineering Academy
Construction Skills Training Institutes*
+ ‘Campus’ denotes facilities for design and manufacture* Part of L&T’s Corporate Social Initiatives
ChandigarhRajpura
New Delhi
Faridabad
JaipurLucknow
Ahmedabad
Jamnagar
Bhopal
Varanasi
Guwahati
Vadodara Pithampur JamshedpurSerampore
Kolkata
HaziraNagpur Raipur
RourkelaCuttack
Ahmednagar
TalegaonPune
MumbaiMadh
PanvelLonavala
Hyderabad
Bengaluru
Mysuru
Coimbatore
Kochi
PulicatKattupalli
ChennaiKancheepuram
Puducherry
Vijayawada
Durgapur
Udaipur
Bhubaneswar
Visakhapatnam
Ranchi

13
Not
e: M
ap is
bro
adly
repr
esen
tativ
e of
L&T
’s pr
esen
ce in
mar
kets
wor
ldw
ide.
For d
etai
ls of
est
ablis
hmen
ts w
ithin
Indi
a, p
leas
e re
fer t
o ‘N
atio
nwid
e N
etw
ork’
.
GLOBALprESEnCE
Offi
ces
Engi
neer
ing
& Co
nstru
ctio
n Pr
ojec
tsPr
oduc
t & E
quip
men
t Sup
ply
Man
ufac
turin
g / F
abric
atio
n Fa
ciliti
esAg
ents

14
CORPORATE SOCIAL RESPONSIBILITY ANNUAL REPORT 2019-20
WATER & SANiTATiONThrough its integrated Community Development programme (iCDp), which L&T started in 2014-15, water for drinking, sanitation and agriculture has been made available to 5 formerly water-stressed locations in rajasthan, maharashtra and Tamil nadu covering 25875 households across 11596 hectares.
infrastructure The affected communities were involved in the implementation of the solutions to their problems. Their contributions, such as labour, were used to construct water-harvesting structures. now, water for household use is available for 2-3 extra months in a year for 95% of the households as compared to 54% families in 2014. The ground water level has increased in project locations by 2 metres on an average. resilience against fluctuating rainfall
CORPORATE SOCIAL RESPONSIBILITY
cycles has been built. The project has been extended to another 4 water-stressed locations covering 50,965 households since 2018.
Depth of water from ground surface (mtrs)120
100
80
60
40
20
0pathardi Chettipalayam pappampatti Kumbhalgarh Bhim
6.5
4.5
366
262
305
204
8
6
30
28
Baseline achievement
Building india’s Social infrastructureL&T’s deep concern for the underprivileged stems from a philosophy of inclusive, sustainable growth and development. Long before CSr was mandated by the Companies act 2013, L&T was providing health and educational services to the underprivileged around its facilities. Today, L&T’s CSr programmes are well-entrenched, focusing on areas that align with the global and national matrices of development: water & sanitation, health, education and skill-building
Anicut in Rajasthan - to help ease water stress in the area.

15
increase in arable land (ha)10000
1000
100
10
1Chettipalayam pappampatti Kumbhalgarh Bhim
Baseline achievement
140 282
1474428248
450
1769502
Fallow land brought under cultivation (ha)
Treated fallow land remaining fallow land
Treated fallow land remaining fallow land
Treated fallow land remaining fallow land
pathardi
pappampatti
Bhim
Chettipalayam
Kumbhalgarh
100% 68%
32%
75%
25%
72%
28%
0%
100%
0%
Percentage of households with access to Water
2014-15
54%
2019-20
95%
Percentage of households with Toilets
2014-15
34%
2019-20
91%
Sanitation drives
The Government’s Swachha Bharat programme provided an impetus to L&T’s existing rural sanitation drive. L&T constructed over 1000 well-designed toilet-cum-bathrooms using local skills and material. Community-based monitoring committees ensured that these villages became free of open-defecation. Today, 91% households have toilets in the iCDp area, compared to 34% in 2014-15.
WASH initiative
as many schools in the project area lacked proper sanitation facilities, L&T provided adequate Water, Sanitation and hygiene (WaSh) infrastructure for over 3000 children and trained them in using toilets and keeping their schools clean and hygienic.
Capacity Building
The communities concerned were trained to facilitate optimum, equitable and efficient water use and implement other agricultural methods and technology to increase their yield.

16
CORPORATE SOCIAL RESPONSIBILITY ANNUAL REPORT 2019-20
Farm field training trained the farmers in • Horticulture
• Zero-budgetnaturalfarming
• Bestpracticesongrains,pulse,vegetablenurseryandfruit orchards.
• Sustainableagriculturalpractices
indigenous knowledge on managing livestock was revived, and youth and women trained in ethno-veterinary care. Women’s groups were given training in the retention of the nutritional value of food and in kitchen gardening.
Workshops are held on participatory hydrological monitoring for ground water resource estimation and water budgeting for ensuring optimum, equitable and most efficient use of water
Sustainability
Community groups were set up to maintain and regulate the use of the structures and resources created through the project and democratically manage the community fund. Capacity building of these groups is undertaken regularly.
a sustainability index indicating the maturity and readiness of the local committees to sustain project efforts was computed.
Today, all the project areas have access to drinking water and sanitation, as well as water to cultivate fodder for livestock and extra crops.
Case study:
Barren land blossoms
60-year-old mithu Singh, a farmer, lives with his family in Kookra in Bhim rajasthan, in a house overlooking the 2.5 to 3 bighas of land he owns and cultivates fruit on. it was barren, until an anicut was built next to it, recharging the well on his field. Lush green vegetation has sprung up, despite the poor rainfall this year.
over the last three years, mithu’s yield has risen from 20 kg to 100 kg, due to the watershed management, seeds and training provided by L&T.
EDUCATiONThe backbone of social development is education. it has been accorded priority as part of L&T’s efforts towards inclusive development. L&T enhances the quality of education in resource-stressed slums, rural and tribal schools, by strengthening the concrete infrastructure as well as improving the quality of education in many ways.
Technology-related interventions: L&T has provided computer laboratories and digital classrooms to several rural schools.
Awareness programmes in schools help children to understand the importance of water & sanitation Farm field training sessions improve crop quality

17
STEM Project: most future jobs will involve digital technology comprising skills in Science, Technology, Engineering and mathematics (STEm), which intimidate students from resource-poor schools. Therefore, this year, L&T introduced the STEm ‘Engineering Futures’ project in 103 upper primary Government schools. Teachers in these schools were trained in collaborative and interactive teaching methods to replace rote learning with experiential learning. Students were encouraged to participate in science exhibitions and competitions. parents were encouraged to persuade their daughters to participate in order to bridge the gender gap in STEm-related careers.
The STEM programme impacted 103 schools, 465 teachers and 23000 students this year.
infrastructure: L&T constructed and repaired classrooms, toilet blocks and water stations for basic hygiene facilities, kitchens and sports grounds. L&T has developed school infrastructure that is child-friendly, learning-based and fun-based.
Educational supplies: Supplies are provided to schools in remote rural and tribal villages.
Balwadis: L&T improves the quality of balwadis and anganwadis in urban slums and rural areas.
After-school community study centres: These centres offer supplementary education to underprivileged children, monitoring learning levels.
Capacity Building: Teacher training programmes are held in Government schools.
Overall development: underprivileged children benefit from life skills, extra-curricular activities, educational and recreational outings, health camps and health education sessions.
Creating a home learning environment: School committees and parents are encouraged to dialogue and assume responsibility to maintain the infrastructure and create a learning environment at home.
Case study: ‘Engineering Futures’ opens up a whole new world
Gulrez is in Std.7 in one of the 25 schools undertaking L&T’s Engineering Futures project.
Born with dwarfism, 11-year-old Gulrez does not let his physical limitations hamper his enthusiasm.
Computers enhance learning in resource poor schools. Digital classrooms make learning interactive.

18
CORPORATE SOCIAL RESPONSIBILITY ANNUAL REPORT 2019-20
he believes the project brought about positive changes in his academic and social life, boosting his self-confidence and popularity.
Gulrez revealed, “my dream is to be an Engineer one day. using models to learn improves my critical thinking, and i believe this approach will help me achieve my dream.’’
HEALTHTo make health care accessible and affordable to the underprivileged, L&T undertakes several initiatives.
Health Centres: L&T’s 12 multi-speciality health Centres are professionally staffed and equipped to provide outpatient and tertiary health services. Focus is laid on preventing infant, child and maternal mortality.
Psychological health: psychiatric opDs and counselling clinics provide services for mental health and stress-related issues.
infrastructure: L&T provides medical equipment and construction/refurbishment services to health centres and hospitals run by the Government or charitable trusts.
Health Camps: mobile vans take L&T’s health services to the underprivileged. Specialised health camps cover eye care, dental, paediatric and gynaecological care. Camps on reproductive health are conducted for disadvantaged children and adolescents.
HiV/AiDS programmes: L&T has a comprehensive programme for hiV/aiDS management and state-of-the-art diagnostic and counselling facilities. it provides the Government’s free anti-retroviral Therapy (arT) at its arT health centre in mumbai in association with the national aiDS Control organisation (naCo). This Centre is an example of successful public-private collaboration.
Tuberculosis (TB) services: L&T takes preventive and curative steps towards the control and management of TB.
Dialysis Centres: L&T runs artificial kidney dialysis centres for the underprivileged at highly subsidised rates at its health Centres at mumbai, Thane, Vadodara, Surat and Chennai.
Cancer camps: Camps on preventive education and early diagnosis are held – especially for women, with a focus on breast and cervical cancers. mammography and pap smear services are also provided.
Case study: Koldongri TB Clinic at Mumbai
L&T runs an exclusive TB clinic in Koldongri in partnership with the municipal Corporation of Greater mumbai (mCGm). This partnership started in 1981. in 2005, L&T set up a modern integrated centre for TB and arT.
While the mCGm provided the land and the building space, L&T ensures that the services of specialist physicians
L&T TB Clinic at Koldongri, Andheri, MumbaiCancer awareness and detection camps are held in and around L&T’s construction sites in Mumbai, Aurangabad and Tamil Nadu.

19
and counselors are available. L&T ensures the high quality of diagnostics and treatment. procedures are nationally standardised. Trained community health workers make follow-up home visits to ensure treatment completion. Families and communities are educated in preventing TB and supporting patients.
in FY 19-20, the clinic registered 1449 patients. 408 patients sought consultation for TB. 263 were put on DoTS treatment and counselled. For those provided CaT i, ii and iV treatments, a cure rate of 85-90% was achieved. 550 cases of multi Drug resistant Tuberculosis registered and started treatment.
SkiLL DEVELOPMENTa key strategy to realize the potential of india’s demographic advantage is skill development. L&T helps to create the human resources to improve india’s competitiveness and growth – especially in construction skills – by training underprivileged youth.
L&T’s Construction Skills Training institutes (CSTis) provide free standardized industrial training to prepare the large unorganised workforce to meet the demand for skilled workers in india and abroad. The skills imparted include bar-bending, formwork, electrical work, tiling, masonry, welding, carpentry and solar electrical work.
Smart City Skill Development Centre at Hyderabad Trainees at Smart City Skill Development Centre
With an emphasis on technology and innovation, new courses have been introduced at the Smart City Skill Development Center, hyderabad.
integral elements of all the skill-training deliverables are digital training, digital study material, micro-learning modules on mobile apps, augmented reality / Virtual reality Training, safety, quality standards and soft skills training. periodic online assessments are undertaken.
The hands-on training and the L&T certificate prepare the trainees to earn and support their families. many have found jobs abroad. L&T thus helps to bridge the schism between the skill demands of industry and the aspirations of the youth.
L&T has 9 CSTis in 8 states – Tamil nadu, maharashtra, uttar pradesh, Telangana, orissa, Karnataka, Gujarat and West Bengal.
This year, 10033 youth completed various courses at these CSTis of which 7109 (71%) were employed.
Case Study: Skilling for success
Despite a monthly salary of only R 6000, uttam mahato’s farm labourer father managed to give him an iTi education. however, uttam was unable to find a job. informed by a friend about L&T’s CSTis, he registered for a 3-month formwork course, which also instilled in him a sense

20
CORPORATE SOCIAL RESPONSIBILITY ANNUAL REPORT 2019-20
of excellence, motivating him to develop the values and attitudes to meet his challenges with maturity and confidence. uttam secured ‘a’ grade and now works as a technician, earning a monthly salary about R 13,500.
“L&T’s skill training changed my life”, he emphasises.
Other initiatives
L&T imparts education and vocational training to underprivileged youth and women to enable them live with self-reliance, dignity and respect.
Case study: Empowerment of Tribal Girls
in partnership with a hospital in Gujarat, L&T organized a nursing aide course for tribal girls of Dangs and Surat District.
a year later, their transformation is visible. Gone are the shy faces, timid voices, low self-esteem and fear of the future. They have emerged as a powerhouses, with confidence, ambition, communication abilities, and technological know-how. The course has equipped them with the subject knowledge as well as the ethics, values and sensitivity to carve out successful careers and sustain the futures.
Employee Volunteering
L&T’s employee volunteers, or L&T-eers, play a crucial role in fostering the Company’s CSr tradition. agents of change, they facilitate development activities. L&T-eering initiatives
range from augmenting the running of urban community learning centres, to aiding the visually challenged, conducting awareness on social issues, among others.
This year 7122 employees volunteered 51,422 hours for various social initiatives.
Over 1.38 million beneficiaries (including L&T Public Charitable Trust)
Water & Sanitation 1,31,988 Beneficiaries
Education 3,63,377 Beneficiaries
Health 7,95,736 Beneficiaries
Skill Development 84,240 Beneficiaries
Hands-on training fosters job-readiness.L&T’s employee volunteers - L&Teers - conduct an HIV-awareness camp for construction workers.


22
ANNUAL BUSiNESS RESPONSiBiLiTY REPORT 2019-20
L&T is committed to fulfilling its economic, environmental and social responsibilities while conducting its business. The Company is conscious of its impact on the society within which it operates, and has systems to either eliminate or control any adverse impacts of its operations. The Company works towards resource conservation, improving social relations within the communities where it operates and works towards generating value for all stakeholders. L&T’ s Sustainability roadmap 2021 aligned with its Business plan, LaKShYa 2021, has produced encouraging results, including outcomes obtained through various digitalization initiatives.The Business responsibility report (Brr) is prepared in accordance with the national Voluntary Guidelines
on Social, Environmental and Economic responsibilities of the Business (nVG – SEE) released by the ministry of Corporate affairs, Government of india. The Brr complies with the regulations 34 (2) (f) of the Securities Exchange Board of india (SEBi) (Listing obligation and Disclosure requirements) regulations 2015. Last year, L&T published its 2nd integrated report (<ir>) 2018-19, in line with the international integrated reporting Council (iirC) reporting framework. The externally assured <ir> was also in accordance with the Global reporting initiative (Gri) Standards ‘Comprehensive’ option. From FY2018, the <ir> has replaced the sustainability reports of the organization. The integrated report and previous sustainability reports can be accessed at www.Lntsustainability.com
SECTiON A: GENERAL iNFORMATiON ABOUT THE COMPANY
1. Corporate identity number (Cin) of the Company: L99999MH1946PLC0047682. name of the Company: Larsen & Toubro Limited3. registered address: L&T House, Ballard Estate, Mumbai, 400 001, india4. Website: www.Larsentoubro.com 5. E-mail id: [email protected] 6. Financial Year reported: 1st April 2019 - 31st March 20207. Sector(s) that the Company is engaged in (industrial activity code-wise):
Group Class Sub Class Description
271 2710 manufacture of electric motors, generators, transformers and electricity distribution and control apparatus
282 2824 28246 manufacture of parts and accessories for machinery / equipment used by construction and mining industries.
301 3011 30111 Building of commercial vessels, passenger vessels, ferry boats, cargo ships, tankers, tugs, hovercraft (except recreation type hovercraft), etc.
30112 Building of warships and scientific investigation ships, etc.
30114 Construction of floating or submersible drilling platforms.
410 4100 41001 Construction of buildings carried out on own-account basis or on a fee or contract basis.
421 4210 42101 Construction and maintenance of motorways, streets, roads, other vehicular and pedestrian ways, highways, bridges, tunnels and subways.
42102 Construction and maintenance of railways and rail-bridges.
422 4220 42201 Construction and maintenance of power plants
42202 Construction / erection and maintenance of power, telecommunication and transmission lines.
42901 Construction and maintenance of industrial facilities such as refineries, chemical plants, etc.

23
Group Class Sub Class Description
465 4659 46594 Wholesale of construction and civil engineering machinery and equipment.
681 6810 68100 real estate activities with own or leased property.
711 7110 71100 architectural and engineering activities and related technical consultancy.
8. List three key products/services that the Company manufactures/provides (as in balance sheet)
1. Construction and project related activity
2. Manufacturing and trading activity
3. Engineering services
9. Total number of locations where business activity is undertaken by the Company
i. Number of international Locations : 31 (excluding listed subsidiaries and limited life project sites)
- the listed iT and Technology Services subsidiaries operate from another additional 81 international locations
ii. Number of National Locations : 51
(The above locations exclude limited life project sites)
10. markets served by the Company – Local/State/national/international/: all
SECTiON B: FiNANCiAL DETAiLS OF THE COMPANY
1. paid up Capital (inr) : R 280.78 crore
2. Total Turnover (inr) : R 82,383.65 crore [revenue from operations]
3. Total profit after taxes (inr) : R 6,679.21 crore
4. Total Spending on Corporate Social responsibility (CSr) as percentage of profit after tax (%): 2.18%
as per Section 135 of the Companies act, 2013, the CSr spend is 2.01% of the average net profits of the previous three financial years.
5. List of activities in which expenditure in 4 above has been incurred: our focus areas in Corporate Social responsibility are as follows:
i. health
ii. Education
iii. Water & Sanitation
iv. Skill Building
SECTiON C: OTHER DETAiLS
1. Does the Company have any Subsidiary Company/ Companies?
Yes
2. Do the Subsidiary Company/Companies participate in the BR initiatives of the parent company? if yes, then indicate the number of such subsidiary company(s):
Yes. The Business responsibility (Br) initiatives of the Company are extended to the Subsidiary/associate Companies and they are also encouraged to participate in Business responsibility initiatives of the parent organization. in addition, companies like L&T Finance holdings, L&T infotech, L&T Technology Services (Listed entities) will have their separate Business responsibility report (Brr) as a part of the annual report. L&T hydrocarbon Engineering and other subsidiary companies participate in our Business responsibility initiatives.

24
3. Do any other entity/entities (e.g. suppliers, distributors etc.) that the Company does business with; participate in the BR initiatives of the Company? if yes, then indicate the percentage of such entity/entities? [Less than 30%, 30-60%, More than 60%]:
Yes. The suppliers are critical to the organization’s operation and supply chain sustainability issues can impact its operations. The Company promotes Br initiatives in its value chain. at present, less than 30% of its suppliers/distributors participate in Br initiatives.
SECTiON D: BR iNFORMATiON
1. Details of Director/Directors responsible for BR
a) Details of the Director/Directors responsible for implementation of the Br policy/policies
•DINNumber:NA
•Name:Dr. Hasit Joshipura
•Designation:Senior Vice President & Head – Electrical & Automation
b) Details of the Br head
S. No Particulars Details
1. Din number (if applicable) Not Applicable
2. name Mr. Anup Sahay
3. Designation Head – Corporate Strategy & Special initiatives
4. Telephone number +91-22-61238666
5. Email iD [email protected]
2. Principle-wise (as per NVGs) BR Policy/policies (Reply in Y/N)
name of principles:
p1 – Businesses should conduct and govern themselves with Ethics, Transparency and accountability
p2 – Businesses should provide goods and services that are safe and contribute to sustainability throughout their life cycle
p3 – Businesses should promote the well-being of all employees
p4 – Businesses should respect the interests of, and be responsive towards all stakeholders, especially those who are disadvantaged, vulnerable and marginalized
p5 – Businesses should respect and promote human rights
p6 – Businesses should respect, protect, and make efforts to restore the environment
p7 – Businesses, when engaged in influencing public and regulatory policy, should do so in a responsible manner
p8 – Businesses should support inclusive growth and equitable development
p9 – Businesses should engage with and provide value to their customers and consumers in a responsible manner
S. No Questions P1 P2 P3 P4 P5 P6 P7 P8 P9
1. Do you have a policy / policies for the following principles?
Y Y Y Y Y Y Y Y Y
2. has the policy been formulated in consultation with the relevant stakeholders?
Y Y Y Y Y Y Y Y Y
3. Does the policy conform to any national /international standards? if yes, specify? (50 words)
Yes. The policies are aligned with the principles of NVG guidelines and conform to international standards of iSO 9001, iSO 14001, OHSAS 18001 and iLO principles.
25
S. No Questions P1 P2 P3 P4 P5 P6 P7 P8 P9
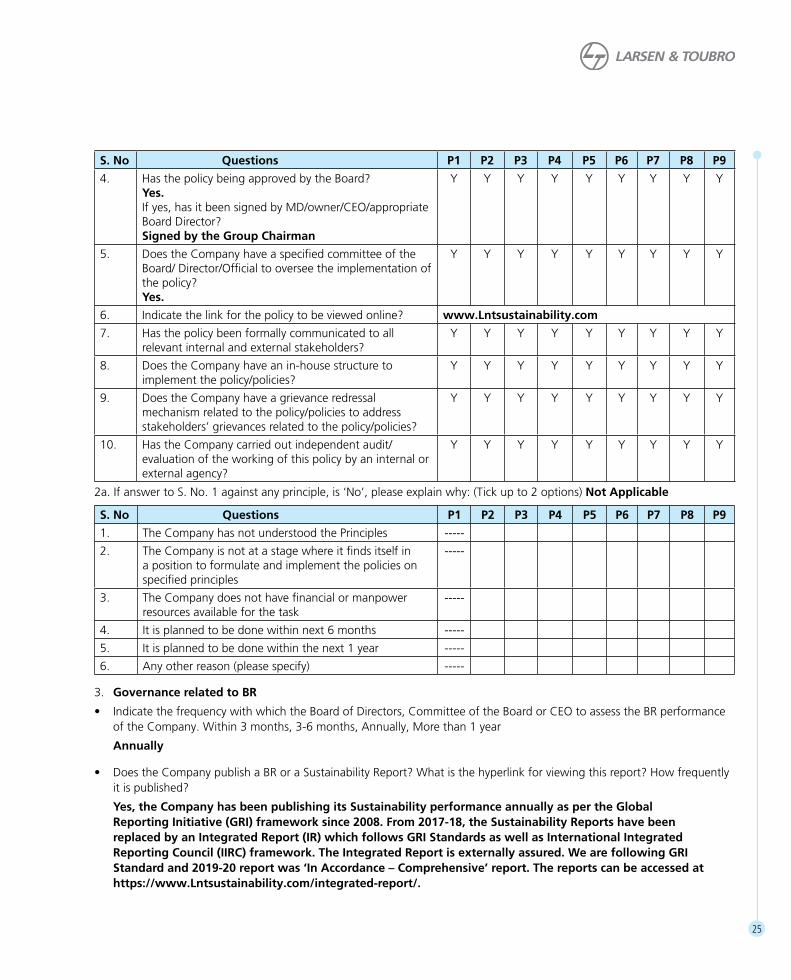
4. has the policy being approved by the Board? Yes. if yes, has it been signed by mD/owner/CEo/appropriate Board Director? Signed by the Group Chairman
Y Y Y Y Y Y Y Y Y
5. Does the Company have a specified committee of the Board/ Director/official to oversee the implementation of the policy?Yes.
Y Y Y Y Y Y Y Y Y
6. indicate the link for the policy to be viewed online? www.Lntsustainability.com
7. has the policy been formally communicated to all relevant internal and external stakeholders?
Y Y Y Y Y Y Y Y Y
8. Does the Company have an in-house structure to implement the policy/policies?
Y Y Y Y Y Y Y Y Y
9. Does the Company have a grievance redressal mechanism related to the policy/policies to address stakeholders’ grievances related to the policy/policies?
Y Y Y Y Y Y Y Y Y
10. has the Company carried out independent audit/evaluation of the working of this policy by an internal or external agency?
Y Y Y Y Y Y Y Y Y
2a. if answer to S. no. 1 against any principle, is ‘no’, please explain why: (Tick up to 2 options) Not Applicable
S. No Questions P1 P2 P3 P4 P5 P6 P7 P8 P9
1. The Company has not understood the principles -----
2. The Company is not at a stage where it finds itself in a position to formulate and implement the policies on specified principles
-----
3. The Company does not have financial or manpower resources available for the task
-----
4. it is planned to be done within next 6 months -----
5. it is planned to be done within the next 1 year -----
6. any other reason (please specify) -----
3. Governance related to BR
• IndicatethefrequencywithwhichtheBoardofDirectors,CommitteeoftheBoardorCEOtoassesstheBRperformanceof the Company. Within 3 months, 3-6 months, annually, more than 1 year
Annually
• DoestheCompanypublishaBRoraSustainabilityReport?Whatisthehyperlinkforviewingthisreport?Howfrequentlyit is published?
Yes, the Company has been publishing its Sustainability performance annually as per the Global Reporting initiative (GRi) framework since 2008. From 2017-18, the Sustainability Reports have been replaced by an integrated Report (iR) which follows GRi Standards as well as international integrated Reporting Council (iiRC) framework. The integrated Report is externally assured. We are following GRi Standard and 2019-20 report was ‘in Accordance – Comprehensive’ report. The reports can be accessed at https://www.Lntsustainability.com/integrated-report/.

26
SECTiON E:
Principle 1: Businesses should conduct and govern themselves with Ethics, Transparency and Accountability
at Larsen & Toubro, Corporate Governance is fundamental to the business and core to its existence. The philosophy is based on the transparent governance and disclosure practices, respect for human rights, individual dignity and adherence to norms of moral and professional conduct. L&T is a professionally managed indian multi-national and committed to total customer satisfaction and enhanced value creation. The vision of the Company is inclusive with a culture of caring and trust supplemented with corporate policies. These are also applicable to all its subsidiary and associate companies.
The Company has laid down its Code of Conduct (CoC), which is applicable to Board members, senior management and employees. The objective is to remain committed and vigilant towards ethical conduct of business processes and instil a sense ownership of the Company. all designated employees including Board members need to adhere to and provide an annual declaration of their compliance with the CoC.
a separate detailed CoC is in force for all other employees covering supervisory, executive and management staff. apart from a preamble explaining principles of honesty, ethics and integrity, the Code covers all aspects of functioning including anti-trust behaviour, information security, insider trading rules, professional engagements, use of Company assets and brand logo, intellectual property, respect for human rights, overarching corporate hr philosophy including equal opportunity employment, prohibited items, social media code of conduct, use of information technology assets, anti-bribery policies and other aspects of individual governance codes. The Code incorporates reporting structures and a graded escalation matrix to be followed in case any breaches are noticed or pointed out, including reference to the Whistle Blower investigation Committee in appropriate cases. The Code is also applicable to unlisted subsidiaries.
The CoC is available at https://investors.Larsentoubro.com/CodeofConduct.aspx. periodic training is conducted for relevant stakeholders to make them aware of the CoC and amendments thereof. all new employees undergo training on the CoC in induction / orientation programmes. The training module on the CoC is also hosted on the Company’s intranet-based ‘any Time Learning’ (aTL) portal. newly inducted Graduate Engineering Trainees (GETs) and post Graduate Engineering Trainees (pGETs) also learn about the CoC in their ‘praYaG’ and ‘SWaGaT’ (special orientation) training modules.
Whistle Blower Policy
The policy was formulated in 2004 and has been reviewed and updated periodically. The policy aims to offer an impartial vigilance mechanism in place for directors, senior management and employees to report their concerns about potential, suspected and actual frauds, unethical behaviour, and violations of the CoC. The Whistle Blower policy is an effective method available to employees to report – without fear – any wrong practices, unethical behaviour or non-compliance which may have a detrimental effect on the organization, including financial damage and impact on brand image.
During 2019-20, a total of 55 complaints were received through the whistle-blower mechanism, all of which were scrutinized and addressed in accordance with the Company’s protocol. 54 complaints were resolved and one complaint is in the process of being resolved. The Whistle Blower investigation committee and management maintain the anonymity of the whistle-blower at all times. The stakeholder complaints are included in the Director’s report section of the annual report.
The Whistle-blower policy has also been extended to suppliers and contractors, which enables them to report their concerns about unethical behaviour, misconduct, violation of legal and other requirements, improper practices, actual or suspected fraud by Company officials - without the fear of unfair treatment or punishment (including loss of business).
The senior management and the audit Committee of the Board are apprised of the internal processes on a periodical basis, which covers internal controls, statutory compliance and assurance.
27
including one Green Factory and a certified Green Campus (viz., the Leadership Development academy at Lonavala). our 24 campuses have adopted the zero-wastewater discharge approach and continue to ensure water positive status. Energy efficiency programmes and climate change mitigation measures are extensively implemented across L&T, contributing to greener campuses and project sites. renewable energy is harnessed at campuses and project sites as well.
our green product and services portfolio consists of metro rail projects, efficient power transmission and distribution systems, small hydro-electric power stations, solar pV-based power plants, green buildings, energy efficient equipment (power management systems, aC drives, smart metering), water treatment & distribution infrastructure, supercritical and ultra-supercritical thermal power plants and equipment, emission control equipment and coal gasifiers. our green portfolio is focused on minimizing environmental impact, e.g. reduced water consumption, carbon emissions, material consumption and reduced waste generation. These help our clients to move onto the low-carbon economy path.
The Company extensively participates in the ‘make in india’ programme and promotes local sourcing of products and services. The transportation of material at the project sites is optimized based on the project execution stage. many of our infrastructure projects are at remote locations, and therefore goods and services are procured from local producers and surrounding areas as far as possible. L&T has adopted the 3r (reduce, recycle & recover) principle for material conservation. material recycling and the use of alternative materials (in place of natural materials) are extensively practiced by our infrastructure business. The Sustainability roadmap 2021 targets increasing recycling / use of recycled material by 5%.
Fly ash is used as a substitute to cement in construction, crushed sand is used in place of natural sand, and blast furnace slag is used. These are some of the conservation methods practiced at project sites. however, since most of our products are ‘engineered to order’ and based on customer-specific requirements, the potential for use of recycled material for products is limited.
The Company has established a separate Code of Conduct for suppliers and vendors which covers various aspects such as compliance with environmental regulations, health and safety, labour practices, human rights aspects, minimum wages rule, freedom of association and collective bargaining, prohibition on child labour, forced and compulsory labour, ethical behaviour, reducing the negative impact on society due to their operations, transparency in business processes and environment conservation.
Every new supplier needs to sign this CoC when he/she wants to do business with the Company. So far, more than 43,000 suppliers have signed this CoC. Training workshops, including capability-building programmes are periodically conducted for vendors and sub-contractors, and cover topics such as Environment, health & Safety (EhS), human rights, business process improvements and sustainability. The Company ensures compliance by its vendors and suppliers to the CoC through periodic quality appraisals, EhS audits and assessments.
Principle 2: Businesses should provide goods and services that are safe and contribute to sustainability throughout their life cycle
L&T ensures that environment, health, and safety aspects are taken into consideration at the design stage itself while manufacturing products or providing services to customers. it is our endeavour to provide safe and sustainable goods and services to our clients. our business portfolio consists of infrastructure, energy (oil & gas/power), defence, heavy engineering, electrical & automation products, hydrocarbon projects, iT, Technology Services and Financial Services. Sustainability aspects, including lower emissions and resource conservation, are integrated into our engineering and design. The Company also provides training to customers and customers’ personnel in the safe use and handling of products.
L&T offers conservation-based products and projects, such as green buildings, wastewater treatment, recycling plants and solar pV-based power plants. These help our clients contain pollution and conserve resources. at our own campuses, we have 17 certified green buildings

28
nation Global Compact) principles which include human rights clauses. These clauses are part of our contracts with suppliers, partners and nGos, and are extended across our supply chain.
The Company recognizes the employees’ right to form unions and associations affiliated with trade unions at its manufacturing campuses. 5.67% of permanent employees are covered under the unionized employee category. L&T has provided direct employment to 83 persons With Disabilities (pWDs) and the supply chain has employed 43 persons With Disabilities. in 2019-20, the Company did not receive any complaint in respect of child labour, forced / involuntary labour or about sexual harassment at the workplace.
Total workforce
L&T employees refer “Standalone financials – 10-year highlights” section of annual report
number of permanent women employees
2,756
number of contract workmen
246,502
Training and skill-building are the pillars which support L&T’s skill development agenda. regular training and exposure to the challenges of the future are vital parts of
Principle 3: Business should promote the well-being of employees
The Company’s growth depends upon the growth of the employees within the organization. The commitment, enthusiasm and dedication of employees has helped L&T become a large organisation of repute within india and in other geographies where we operate. The Company nurtures and motivates its talent pool through its leadership programmes and other forms of monetary and non-monetary incentives. The Company recognises that employees spend a better part of their working lives at their workplace. The organisation hence provides workplace infrastructure that is conducive to the well being of staff - this includes good iT infrastructure, ergonomic seating, recreation areas, high standards of hygiene and other services such as basic medical care facilities. The policies of the Corporate human resources Department forms a strong framework for workforce management. Fostering a culture of caring and trust is embedded in various corporate policies like the Environment, health & Safety (EhS) policy, Whistle-Blower policy, protection of Women’s rights at Workplace policy and the CoC.
L&T does not discriminate against employees based on caste, religion, region, gender or physical disability, and the merit of candidates is always accorded top priority for selection and promotion. L&T adheres to the unGC (united
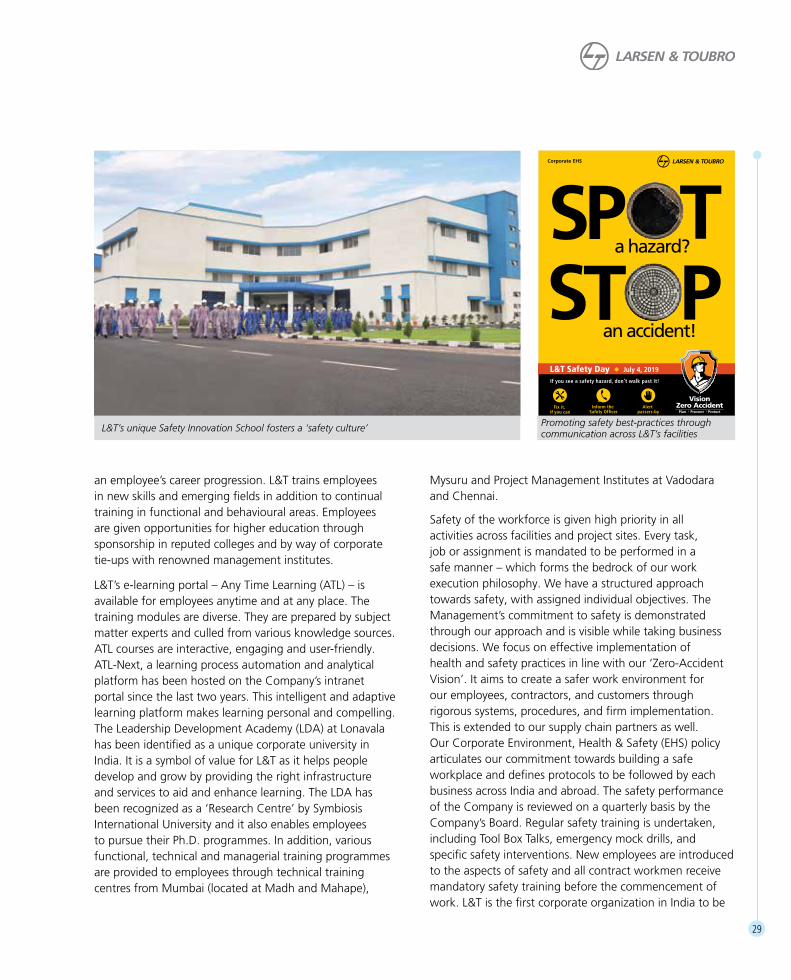
L&T’s 24-acre Leadership Development Academy at Lonavala, near Mumbai
L&T’s Switchgear Training Centres promote good electrical practices
29
an employee’s career progression. L&T trains employees in new skills and emerging fields in addition to continual training in functional and behavioural areas. Employees are given opportunities for higher education through sponsorship in reputed colleges and by way of corporate tie-ups with renowned management institutes.
L&T’s e-learning portal – any Time Learning (aTL) – is available for employees anytime and at any place. The training modules are diverse. They are prepared by subject matter experts and culled from various knowledge sources. aTL courses are interactive, engaging and user-friendly. aTL-next, a learning process automation and analytical platform has been hosted on the Company’s intranet portal since the last two years. This intelligent and adaptive learning platform makes learning personal and compelling. The Leadership Development academy (LDa) at Lonavala has been identified as a unique corporate university in india. it is a symbol of value for L&T as it helps people develop and grow by providing the right infrastructure and services to aid and enhance learning. The LDa has been recognized as a ‘research Centre’ by Symbiosis international university and it also enables employees to pursue their ph.D. programmes. in addition, various functional, technical and managerial training programmes are provided to employees through technical training centres from mumbai (located at madh and mahape),
mysuru and project management institutes at Vadodara and Chennai.
Safety of the workforce is given high priority in all activities across facilities and project sites. Every task, job or assignment is mandated to be performed in a safe manner – which forms the bedrock of our work execution philosophy. We have a structured approach towards safety, with assigned individual objectives. The management’s commitment to safety is demonstrated through our approach and is visible while taking business decisions. We focus on effective implementation of healthandsafetypracticesinlinewithour‘Zero-AccidentVision’. it aims to create a safer work environment for our employees, contractors, and customers through rigorous systems, procedures, and firm implementation. This is extended to our supply chain partners as well. our Corporate Environment, health & Safety (EhS) policy articulates our commitment towards building a safe workplace and defines protocols to be followed by each business across india and abroad. The safety performance of the Company is reviewed on a quarterly basis by the Company’s Board. regular safety training is undertaken, including Tool Box Talks, emergency mock drills, and specific safety interventions. new employees are introduced to the aspects of safety and all contract workmen receive mandatory safety training before the commencement of work. L&T is the first corporate organization in india to be
SS
PPT
Ta hazard?
an accident!
Inform the Safety Officer
If you see a safety hazard, don’t walk past it!
Fix it, if you can
Alert passers-by
L&T Safety Day July 4, 2019
L&T’s unique Safety Innovation School fosters a ‘safety culture’ Promoting safety best-practices through communication across L&T’s facilities

30
accredited as ‘Course provider’ by national Examination Board in occupational Safety & health (nEBoSh), uK, for delivering the course on international General Certificate by the institution of occupational Safety & health (ioSh), uK.
more than 5.1 million man-hours of safety training were provided in FY 2019-20 to our workforce. our wellness programme ‘Working on Wellness’ is a unique initiative undertaken by Corporate health and Welfare Department, which conducts counselling, awareness sessions, health programmes, diagnostics camps and health workshop activities aimed at enhancing employees’ wellness and well-being at office. These health interventions are grouped into six critical areas like cancer, diabetes, cardiac disease, obesity, ergonomic issues, and stress.
Principle 4: Business should respect the interests of and be responsive towards all stakeholders, especially those who are disadvantaged, vulnerable and marginalized
our responsibility to stakeholders is reflected in the way we conduct our business. The contribution of shareholders and investors to the growth of the Company is deeply valued, and we strive to ensure that we deliver value to all stakeholders.
L&T maps both internal and external stakeholders along with vulnerable, marginalized and disadvantaged stakeholders. This large and mixed community has varied and extended expectations, and L&T strives to match or exceed expectations from all stakeholders. active engagement with a large and varied ecosystem of stakeholders (shareholders, employees, customers, bankers, vendors, government, communities, society at large et al) is done through a multiple touch points.
L&T is a pioneer in providing a counselling helpline for its employees and their families in india, in collaboration with Tata institute of Social Science (TiSS).
our Corporate Social responsibility (CSr) department runs specific programmes focused on providing livelihood opportunities to vulnerable and marginalized stakeholders, both near and away from our campuses and project sites to ensure that the benefits reach the maximum number of beneficiaries.
one of our flagship CSr programmes is the integrated Community Development (iCD) programme, which focuses on improving the quality of life of communities living in the ‘water-stressed’ regions of india. The iCD programme works towards providing access to clean drinking water, sanitation facilities and water for agriculture in these
L&T’s education initiatives in resource-stressed schools make learning more enriching
L&T’s many agricultural initiatives help farmers and their crops thrive

31
For internal stakeholdersEmployees Employee satisfaction surveys
Employee engagement surveys for improvement in employees’ engagement processCirculars, messages from Corporate and Line managementCorporate Social initiativesWelfare initiatives for employees and their families online news bulletins to convey topical developmentsa large bouquet of print and on-line in-house magazines (some location-specific, some business-specific), a CSr programme newsletter L&T helpdesk, toll-free number
Principle 5: Business should respect and promote Human Rights
L&T is an indian multi-national Company (mnC) with a presence in 47 countries and is exposed to human rights issues. L&T publishes an annual Communication on progress (Cop) as part of its compliance to un Global Compact (unGC) and is a member of Global Compact network india (GCni). The policies and practices related to human rights are extended to subsidiary and associate
regions. it is followed by CSr interventions in health, education and skill-building.
We use the following communication channels to engage with various stakeholders:
External StakeholdersStakeholders Engagement modesShareholders and investors
press releases, info desk - an online service, dedicated email id for investor Grievances, Quarterly results, annual reports, Sustainability / integrated reports, aGm (Shareholders interaction), Quarterly investor presentations, investors meets and shareholder visit to works, corporate website.
Suppliers / Contractors
regular supplier, dealer and stockist meets
media press releases, Quarterly results, annual reports, Sustainability / integrated reports, aGm (Shareholders interaction), access to information & responses to queries
Community periodic feedback mechanism Customers regular business interactions, Client
satisfaction surveysGovernment press releases, Quarterly results, annual
reports, Sustainability / integrated reports, Stock Exchange filings, issue specific meetings
th17 September 2012 Chairman & Managing DirectorA M NAIK
We are committed to enhancing the
holistic health and wellness of Team L&T.
•
•
•
Promotion & propagation of Preventive
Health Care
Enhancement of Employees Health Index
Fostering of addiction-free workplaces at
all our campuses
Consistent practice of these precepts will
benefit employees, their family members
as well as the community at large.
We will actively work towards:
Supplier Meets help stakeholders understand new concepts and products better
L&T’s policies ensure the holistic well-being of its employees and the community at large

32
companies as well. L&T’s human resource policy covers human rights aspects and iLo conventions. prohibition of child labour, the prohibition of forced and compulsory labour, non-discrimination, freedom of collective bargaining, etc. are covered in our Code of Conduct for employees and human resource policy.
L&T believes that every employee should have the opportunity to work in an environment free from any conduct which can be considered as Sexual harassment. The Company is committed to treating every employee with dignity and respect and hence has laid out a policy based on the laws and regulations in india. The policy is applicable to all L&T establishments located in india.
This policy encompasses the following objectives:
• TodefineSexualHarassment
• TolaydowntheguidelinesforreportingactsofSexualharassment at the workplace, and
• Toprovidetheprocedurefortheresolutionandredressalof complaints of Sexual harassment.
To ensure implementation and compliance with the provisions of the Sexual harassment of Women at the Workplace (prevention, prohibition & redressal) act & rules 2013 and ensure coverage across all locations in india, two apex Committees have been constituted whose jurisdictions are separate based on coverage of business verticals and geographies.
a detailed procedure for making a complaint and initiating an enquiry to the redressal process and finally the process of preparation of a report within a stipulated timeline is laid out in the policy document. The policy also covers Disciplinary action for Sexual harassment.
The policy is a part of the Company’s Code of Conduct. Training programmes for the members and awareness sessions for its employees are organised throughout the year. There programmes are created on a digital platform as well. During 2019-20, a total of 104 workshops were conducted across the Company on awareness of Sexual harassment at the Workplace.
Principle 6: Business should respect, protect and make efforts to restore the environment
Environment protection and the conservation of natural resources are part of L&T’s business philosophy. our Corporate Environment, health & Safety (EhS) policy lays emphasis on incorporating environmental consideration into all business processes. as a part of our Sustainability programme, we set quantifiable targets with a timeline and action plan to achieve sustainability goals. our Sustainability roadmap 2021 is aligned with our business plan, LaKShYa 2021, which incorporates measurable targets and key initiatives. The Sustainability roadmap
L&T regularly organises tree-plantation drives at its premises, project sites and allotted public areas
L&T’s green portfolio includes green buildings and several eco-friendly products, systems and solutions

33
our climate-change interventions programme focuses on climate change mitigation and abatement. We focus on controlling / reducing the energy consumption intensity (GJ/billion turnover), implementing energy conservation projects and increasing the use of renewable energy in our operations. We also maintained Carbon neutrality in two of our campuses, i.e. powai (mumbai) and Chennai in 2019-20 as well. We have aligned our practices with the Government of india’s national action plan on Climate Change (napCC) and its eight missions, and continue to report progress on this front in our Sustainability / integrated reports. increased energy efficiency, developing low emission technologies, building sustainable infrastructure, increasing the green cover, and dissemination of sustainability knowledge are some of the measures adopted by the organization. We also invest in lower emission and clean energy programmes, thus promoting sustainable growth.
our green product and services portfolio helps our clients to reduce their carbon footprint. We comply with applicable environmental regulatory requirements from the State pollution Control Board (SpCB) and Central pollution Control Board (CpCB). Compliance with these pollution control norms is also covered by the statutory compliance certificates submitted by Business heads on a quarterly basis. Sustainability assurance by an independent
is extended to Subsidiary & associate Companies and they are encouraged to set similar targets and roadmaps. Environmental risks and opportunities from operations are periodically identified and addressed at the business level.
a separate Code of Conduct has been extended to vendors and service providers which covers the need for compliance with environmental regulations, health and safety, labour practices, human rights aspects, minimum wages, freedom of association, collective bargaining, prohibition of child labour, forced and compulsory labour, ethical behaviour, transparency in business processes and environment conservation. all new vendors / service providers need to sign this combined CoC as part of the initial empanelment process. So far more than 43,000 vendors have signed the Code.
We continue to conduct water assessment surveys at our campuses. all 24 campuses maintained their ‘Water positive’ status in 2019-20. Water conservation and rainwater harvesting are practiced within our premises; additionally, our community interventions consist of rainwater harvesting, check dam construction, creation of farm ponds, soil moisture conservation programmes, etc. The outcomes have been encouraging so far. all our 24 campuses have been maintaining zero-wastewater-discharge status since 2014.
Elevated Storage Reservoirs at Pune, Maharashtra

34
assurance agency on an annual basis covers compliance with environmental regulations, including submission of compliance reports to regulatory agencies. During 2019-20, there were no pending or unresolved show cause / legal notices from CpCB / SpCB. renewable energy at manufacturing campuses is utilized, wherever feasible. Currently, eight campuses are sourcing renewable energy (wind and solar) from external sources, and all 24 campuses are generating renewable energy onsite.
Fully-grown trees are natural carbon sinks, and biodiversity plays an important role in the sustenance of human lives on this planet. L&T undertakes tree plantation both within and outside its premises (as part of our CSr programme) and we engage with agencies / nGos to conduct plantation at public places, national parks and on Government land. During the year 2019-20 more than 14 lakh trees were planted by our people in project locations across india. We continue to nurture self-sustaining mini forests at four locations in india through the miyawaki technique and green areas like public gardens are developed and maintained.
Principle 7: Responsible Public Advocacy
We engage with multiple business and trade organizations and professional bodies. our senior executives participate
through active dialogue with the Government, be it on new policy consultations or presenting views of different stakeholders. They provide their expertise and business acumen during public policy consultations and present views of industry at large.
industrial forums and institutes where L&T actively participates include:
• AssociationofBusinessCommunicatorsofIndia
• AssociatedChambersofCommerceandIndustryofIndia(aSSoCham)
• BombayChamberofCommerce&Industry(BCCI)
• BureauofIndianStandards
• ConstructionIndustryDevelopmentCouncil(CIDC)
• ConfederationofIndianIndustry-CentreofExcellencefor Sustainable Development (Cii-CESD)
• CII-GreenBusinessCentre(GBC)
• FederationofIndianChambersofCommerceandindustry (FiCCi)
• IndianElectricalandElectronicsManufacturers’association (iEEma)
• IndianInstituteofChemicalEngineers(IIChE)
• NationalSafetyCouncil
• NationalFireProtectionInstitution
L&T’s water conservation efforts have turned all 24 of its campuses water-positive
L&T’s Integrated Report 2018-19 won a silver at Asia Sustainability Reporting Awards

35
The Company interacts regularly with the Confederation of indian industry – Centre of Excellence for Sustainable Development (Cii - CESD) on Sustainability and integrated reporting <ir> policies, regulations, and L&T is a member of <ir> lab india. The Federation of indian Chambers of Commerce and industry (FiCCi) engages with L&T for CSr and india Sanitation Coalition. L&T regularly interacts with the indian institute of Corporate affairs (iiCa) on CSr- related aspects as well. L&T is also an active member of committees such as Environment & recycling Council by Cii – Green Business Centre (GBC), Cii EhS Council (Western region), Corporate Social responsibility (CSr), etc.
Principle 8: Support inclusive growth
The Company spent R 145.29 Crore in 2019-20 towards CSr activities as per the Companies act 2013 and additionally contributed R 150 crores at the group level towards the pm Cares Fund in 2019-20.
The following corporate policies of L&T put emphasis on inclusive growth, by empowering communities and accelerating sustainable development.
• CorporateSocialResponsibilityPolicy
• CorporateHumanResourcePolicies
• CorporateEnvironment,Health&Safety(EHS)Policy
• SustainabilityPolicy
nation-building and community development are integral to L&T ‘s Strategic vision. The company’s CSr programmes are based on the theme ‘Building india’s Social infrastructure’. The objective is to contribute positively to society, improve the quality of life of those who are at the bottom of the pyramid, provide sustainable solutions and make a meaningful impact on people’s lives.
The CSr interventions of the Company are based on the CSr policy and in line with the Companies act 2013 and CSr rules 2014. The CSr Committee of the Board oversees the implementation of CSr programmes at the corporate level. They are ably supported by Sustainability and CSr coordinators from all businesses.
We strive to provide access to essential services in health and education for the underprivileged and provide for equality of opportunity by empowering people through capability-building and skill development. We believe that with access to these opportunities, communities will be able to strike a balance between globalization and self-sufficiency, aiding economic development for all.
L&T impacts communities across india through initiatives in the areas of education, health, water & sanitation and skill-building. From empowering students in rural areas through digital literacy to building toilet blocks in schools. From
An L&T employee volunteer teaches children to make the most out of waste - conservation and creativity!
L&T’s employee volunteers help make resource-stressed schools more inviting

36
ensuring water reaches far-flung fields to creating access to sanitation facilities. From capability building among local communities to creating a talent bank of employable young men and women. Each initiative is instrumental in bridging the gap between the underprivileged and the resources available.
Below are the highlights of L&T’s CSr interventions focused across four key thrust areas (including areas attended to by L&T public Charitable Trust and administered by L&T’s CSr Department).
Water & Sanitation:
• ImplementationofIntegratedCommunityDevelopment(iCD) programme aimed at making water for drinking, sanitation and agriculture, available to communities staying in water-stressed regions of maharashtra, Tamil nadu and rajasthan.
• Creatingawarenessandaccesstosanitationthroughthebuilding of toilets and bathrooms with the objective of making communities open-defecation-free
• Implementingsoilandmoistureconservationprogrammes, building water-harvesting structures, check dams and field bunds, and implementing other sustainable agricultural techniques
• Strengtheningbasicinfrastructureandservicesinruralindia and creating livelihood options, once water-sufficiency is achieved
• Capability-buildingofthepeople’sinstitutionslikeVillageDevelopment Committees, Farmers’ Groups and Self-help Groups to ensure participation in decision- making and ownership
• Sustainedcommunityactionfortheoperationandmaintenance of assets created and further development of the potential of the natural resources in the watershed area
• TreeplantationinandaroundL&ToperationsandatICDlocations. more than 14 lakh trees were planted this year and many green areas like public gardens developed and maintained
• Numberofbeneficiaries:1,31,988
Education
• Enhancingpre-primaryandprimaryeducationtoensureenrolment and prevent dropouts
• Infrastructuredevelopmentinschoolsforcreatingaconducive learning environment
• STEMEducationProgrammeforencouragingscientificrigour among students and introducing new age skills to
L&T has built over 200 check-dams in rural water-stressed areas
School kits are distributed by L&T to children in tribal and rural schools

37
prepare students for contemporary careers focussed on technology and innovation
• ‘ScienceonWheels’–aninitiativethattakessciencetothe doorsteps of rural children sparking scientific temper in young minds,
• Introductionofinnovativeteachingandlearningtechniques to teach English and Science.
• E-learningthroughdigitizationofcontent,smartclassrooms and computer labs
• Providinginnovativeteachingaidsandcapacity-buildingprogrammes for teachers in techno-pedagogy
• Urbanandruralcommunitylearningcentrestoprovide after-school academic support to children from disadvantaged communities and help them to cope up with their curriculum and prevent them from dropping out
• L&T’semployeevolunteeringprogramme(L&T-eering)to augment the running of urban community learning centres. The programs encompass a multitude of activities and assistance such as aiding the visually challenged (in recording audio books, helping them with the studies and functioning as scribes in various exams), designing low cost teaching aids to explain concepts in
science and math, organising various education sessions (such as programs on safety, caring for the environment, celebrating days of national importance with them, organising extra-curricular programs and events for development of various art forms) in schools that do not have sufficient resources, mentoring children from low-income communities to develop various aspects of their personality and mentoring young adults for confidence building and making them job ready.
• Conductingworkshopsonlifeskillsandawarenessonsocial issues
• Conductingsummercamps,sportsactivitiesandconducting extracurricular activities for overall development and to help children expand their horizons
• Numberofbeneficiaries:3,63,377
Health
• Providinghealthandwelfarefacilitiesfortheunderprivileged across L&T’s locations in india
• Conductingmalnutritionandanaemiamitigationcamps
• Conductingeyecheck-ups,blooddonationcampsandhealth awareness programmes
• Providinghealthservicesinremotelocationsthroughmobile health vans
L&T’s mobile medical vans take medical care to urban slums as well as rural and tribal areas
A respiratory check-up at the TB clinic run by L&T in partnership with the Municipal Corporation of Greater Mumbai at Koldongri

38
• Dedicatedhealthcentresat10locationsacrossIndiaprovide Family Welfare services, maternal and child health care and reproductive health, specialty and super-specialty consultations, low-risk day care surgeries (capacity of 8 beds), services in diagnostic and clinical camps, immunization and health education
• Servicesforpsychologicalhealth,childguidanceclinic,physiotherapy and occupational therapy
• Outreachtreatmentservicesthroughsatelliteclinics
• TBClinicservicestotreatMultiDrugResistantTuberculosis and counselling the patients and their families
• TreatingandsupportingHIV/AIDSpatientsthroughanti-retroviral Therapy (arT) centre at mumbai
• Artificialkidneydialysiscentres
• Numberofbeneficiaries:7,95,736
Skill Development
• Providingfreetraininginvariousconstructionskillslikebar bending, formwork carpentry, masonry, scaffolding, welding, electric wiring etc., through Construction Skills Training institutes (CSTis) to rural and urban youth to enhance their employability
• Introducinginnovativeandtechnology-basedskill-training in Solar pV Technician skills, oFC & CCTV installation and maintenance
• DigitalisingCSTIswithe-learningmodules
• TrainingCSTItraineesinsafetyandsoftskills
• Vocationaltrainingprogrammesforwomen:Tailoring,beautician, home nursing and food processing courses
• Impartingskillsanddevelopmentofself-helpgroupsatiCD locations
• Collaborationwithstate-runtechnicalinstitutes(ITIs)
• Numberofbeneficiaries:84,240
Principle 9: Engage with and provide value to customers
The range of projects, products and services offered by L&T has a far reaching impact on customers and considerable attention is consequently devoted to the design, development and execution of these offerings.
inputs on changing customer preferences and market trends culled from interactive customer engagement and study of markets are incorporated into products and services through training, r&D, design, testing,
Scaffolding and formwork training at L&T’s Construction Skills Training Institute (CSTI)
Training with bar-tying machine at one of L&T’s CSTIs

39
manufacturing and best-in-class construction methodologies. The business has also leveraged new age technology for productivity improvements that benefit both Company and customer. These include artificial intelligence, machine Learning, use of Geospatial technologies (Lidar, radar, Sonar, Thermal, optical), Virtual reality (including extensive usage in worker safety applications and training), augmented reality, analytics tools, Bots, Laser, radiography, extensive use of ioT platforms and adoption of different components of the industry 4.0 value chain. health and safety aspects are also carefully incorporated into product lifecycles.
products carry requisite labelling, and maintenance manuals include related specifications and codes that render transparency and provide maintenance utility to customers. products undergo testing in conformity with national and international Standards such as indian Standards, international organization of Standardization (iSo), rohS (for relevant products) and international Electro Technical Commission. Training of customer personnel on product characteristics, usage and maintenance forms an integral part of services offered by the Company. in case of electrical products, the Company has well equipped training centres in 6 different locations (pune, Lucknow, Conoor, Vadodar, Delhi and Kolkata) where specialised training on usage and maintenance of electrical products is imparted to customers as well as people involved in the electrical supply chain ecosystem.
L&T’s green product and services portfolio helps its clients to reduce their energy, water and material footprint and helps them to follow a low carbon economy path. The
Company regularly engages with customers through customer meets, customer satisfaction surveys and market-based research, including training and capability building programmes for customers. Senior management actively reviews customer feedback and suggests corrective and/or preventive action as required.
a survey of 66 customers conducted by an external agency in 2019-20 (most customers having been associated with L&T for more than 5 years) reaffirms the high levels of our customer engagement.
Excellent Good Satisfactory not satisfied
0%11%
42%
47%
Level of satisfaction with L&T’s response to address customer queries and grievances
Excellent Good Satisfactory not satisfied
0%8%
24%
68%
Customers’ experience with L&T personnel interaction

40
ANNEXURE: MAPPiNG TO THE SEBi FRAMEWORk
Question Reference Description
Section Page Number
Section A: General information about the Company
1. Corporate identity number (Cin) of the Company
2. name of the Company
3. registered address
ar 22
22
22
4. Website ar 22
5. Email id ar 22
6. Financial Year reported ar 22
7. Sector(s) that the Company is engaged in (industrial activitycode-wise)
ar 22 and 23
8. List three key products/services that the Company manufactures/provides (as in balance sheet)
ar 23
9. Total number of locations where business activity is undertaken by the Company
ar 23
i. number of international Locations (provide details of major 5) ar 23
ii. number of national Locations ar 23
10. markets served by the Company – Local/State/national/international ar 23
Section B: Financial Details of the Company
1. paid up Capital (inr) ar 23
2. Total Turnover (inr) 23
3. Total profit after taxes (inr) ar 23
4. Total spending on Corporate Social responsibility (CSr) as percentage of profit after tax (%)
ar 23
5. List of activities in which expenditure in 4 above has been incurred: ar 23
Section C: Other Details
1. Does the Company have any Subsidiary Company/ Companies? ar 23
2. Do the Subsidiary Company/Companies participate in the Br initiatives of the parent company? if yes, then indicate the number of such subsidiary company(s)
ar 23
3. Do any other entity/entities (e.g. suppliers, distributors etc.) that the Company does business with, participate in the Br initiatives of the Company? if yes, then indicate the percentage of such entity/entities? [Less than 30%, 30-60%, more than 60%]
ar 24
Section D: BR information
1. Details of Director/Directors responsible for Bra) Details of the Director/Director the Br policy/policies •DINNumber•Name•Designationb) Details of the Br head •DINNumber(ifapplicable)•Name•Designation •Telephonenumber•e-mailID
ar 24
principle-wise (as per nVGs) Br policy / policies ar 24-25

41
Question Reference Description
Section Page Number
3. Governance related to Br indicate the frequency with which theBoard of Directors, Committee of the Board or CEo to assess the Brperformance of the Company. Within 3 months, 3-6 months, annually,more than 1 year.
ar 25
Does the Company publish a Br or a Sustainability report? What is the hyperlink for viewing this report? how frequently it is published?
ar 25
Section E: Principle-wise Performance
Principle 1: Ethics, Transparency and Accountability
Does the policy relating to ethics, bribery and corruption cover only thecompany?Does it extend to the Group/Joint Ventures/ Suppliers/Contractors/nGos/others?
ar 26-27
how many stakeholder complaints have been received in the pastfinancial year and what percentage was satisfactorily resolved by themanagement?
The details related to stakeholder complaints are included in the Director’s report Section of this annual report.
26-27, 105
Principle 2: Sustainable Products and Services
List up to 3 of your products or services whose design has incorporatedsocial or environmental concerns, risks and/or opportunities.
ar 27
For each such product, provide the following details in respect ofresource use (energy, water, raw material, etc.) per unit of product(optional):
ar 27
Does the company have procedures in place for sustainable sourcing(including transportation)?
ar 27
has the company taken any steps to procure goods and servicesfrom local & small producers, including communities surrounding theirplace of work?
ar 27
if yes, what steps have been taken to improve their capacity andcapability of local and small vendors?
ar 27
Does the company have a mechanism to recycle products and waste?if yes what is the percentage of recycling of products and waste(separately as <5%, 5-10%, >10%). also, provide details thereof, inabout 50 words or so.
The Company is a leading EpC solution provider for Solar photo Voltaic (pV) based power plants helping customers save on the energy bills and contribute to reduction of GhG emissions from consumption of indirect energy.

42
Question Reference Description
Section Page Number
Principle 3: Employee Well Being
Total number of employees.Total number of employees hired on temporary/contractual casual basis.number of permanent women employees.number of permanent employees with disabilitiesDo you have an employee association that is recognized bymanagement?What percentage of your permanent employees and members of thisrecognized employee association?
ar 28-30
please indicate the number of complaints relating to child labour,forced labour, involuntary labour, sexual harassment in the last financialyear and pending, as on the end of the finacial year.
ar 28-30
What percentage of your under-mentioned employees were givensafety and skill upgradation training in the last year?
ar 28-30
Principle 4: Valuing Marginalized Stakeholders
has the company mapped its internal and external stakeholders? ar 30-31
out of the above, has the company identified the disadvantaged,vulnerable & marginalized stakeholders? are there any special initiativestaken by the company to engage with the disadvantaged, vulnerableand marginalized stakeholders.
ar 30-31
Principle 5: Human Rights
Does the policy of the company on human rights cover only thecompany or extend to the Group/Joint Ventures/SuppliersContractors/nGos/others?
ar 31-32
how many stakeholder complaints have been received in the pastfinancial year and what percent was satisfactorily resolved by themanagement?
ar 31-32
Principle 6: Environment
Does the policy relate to principle 6 cover only the company or extendsto the Group/Joint Ventures/Suppliers/Contractors nGos/others?
ar 32-34
Does the company have strategies/ initiatives to address globalenvironmental issues such as climate change, global warming, etc?
ar 32-34
Does the company identify and assess potential environmental risks? ar 32-34
Does the company have any project related to Clean Developmentmechanism?
ar 32-34
has the company undertaken any other initiatives on – cleantechnology, energy efficiency, renewable energy, etc.? Y/n.
ar 32-34
are the Emissions/Waste generated by the company within thepermissible limits given by CpCB/SpCB for the financial year beingreported?
ar 32-34
number of show cause/ legal notices received from CpCB/SpCB whichare pending (i.e. not resolved to satisfaction) as on end of Financial Year.
ar 32-34
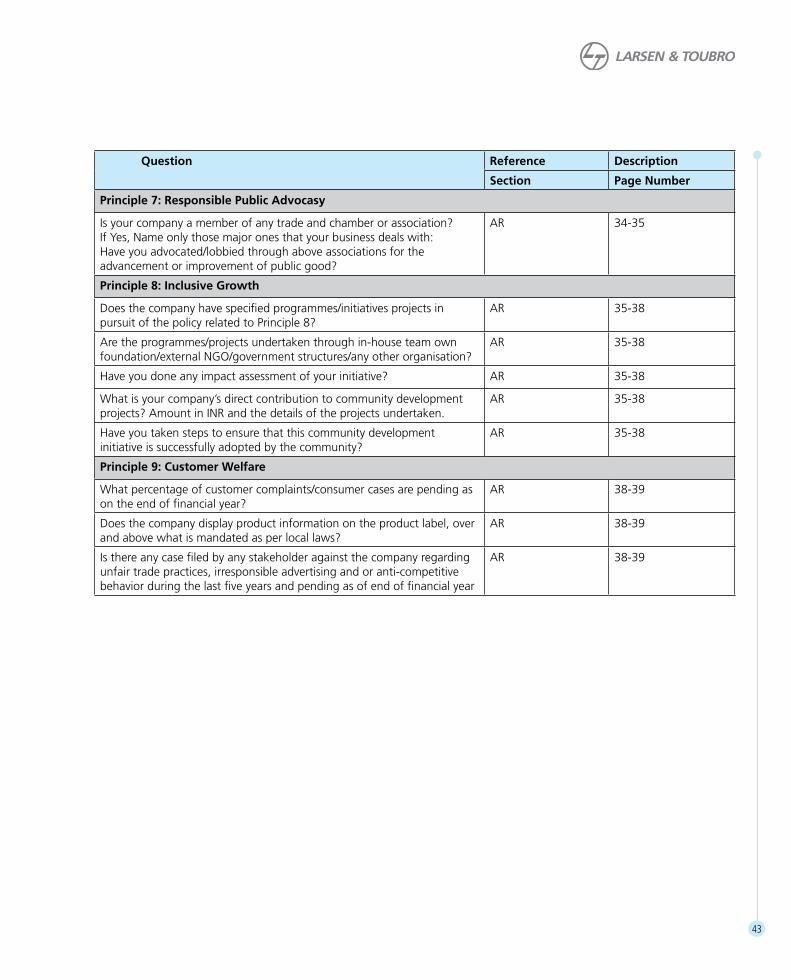
43
Question Reference Description
Section Page Number
Principle 7: Responsible Public Advocasy
is your company a member of any trade and chamber or association? if Yes, name only those major ones that your business deals with:have you advocated/lobbied through above associations for theadvancement or improvement of public good?
ar 34-35
Principle 8: inclusive Growth
Does the company have specified programmes/initiatives projects inpursuit of the policy related to principle 8?
ar 35-38
are the programmes/projects undertaken through in-house team ownfoundation/external nGo/government structures/any other organisation?
ar 35-38
have you done any impact assessment of your initiative? ar 35-38
What is your company’s direct contribution to community developmentprojects? amount in inr and the details of the projects undertaken.
ar 35-38
have you taken steps to ensure that this community developmentinitiative is successfully adopted by the community?
ar 35-38
Principle 9: Customer Welfare
What percentage of customer complaints/consumer cases are pending ason the end of financial year?
ar 38-39
Does the company display product information on the product label, overand above what is mandated as per local laws?
ar 38-39
is there any case filed by any stakeholder against the company regardingunfair trade practices, irresponsible advertising and or anti-competitivebehavior during the last five years and pending as of end of financial year
ar 38-39

10 YEAR HIGHLIGHTS ANNUAL REPORT 2019-20
44
STANDALONE FINANCIALS-10 YEAR HIGHLIGHTS
v crore
Ind AS [11] IGAAP [11]
Description 2019-20 2018-19 2017-18 2016-17 2015-16 2014-15 2013-14 2012-13 2011-12 2010-11 [10] [8]
Statement of Profit and Loss
Gross revenue from operations [1] 82384 82287 74612 66301 63813 57558 57164 52196 53738 44296
PBDIT[1][2] 6838 7653 7701 6481 5829 6488 6667 5473 6283 5640
Profit after tax (excluding extraordinary & exceptional items) 6069 6009 4861 4560 4454 4699 4905 4169 4413 3676
Profit after tax (including extraordinary & exceptional items) 6679 7491 5387 5454 5000 5056 5493 4384 4457 3958
Balance Sheet
Net worth 52175 50048 49174 46013 42135 37085 33662 29291 25223 21846
Loan funds 25785 11990 10561 10558 13924 12936 11459 8478 9896 7161
Capital employed 77960 62038 59735 56571 56059 50021 45121 37769 35119 29007
Ratios and statistics
PBDIT as % of net revenue from operations [1][3] 8.30 9.30 10.34 9.86 9.23 11.38 11.78 10.60 11.82 12.84
PAT as % of net revenue from operations [1][4] 7.31 8.44 7.23 8.30 7.91 8.87 9.71 8.50 8.38 9.01
RONW % [5] 13.07 15.74 11.32 12.37 12.39 14.30 17.46 16.06 18.95 19.73
Gross Debt: Equity ratio 0.49:1 0.24:1 0.21:1 0.23:1 0.33:1 0.35:1 0.34:1 0.29:1 0.39:1 0.33:1
Basic earnings per equity share (R) [6] 47.59 53.43 38.46 39.00 35.81 36.31 39.57 35.55 32.41 29.04
Book value per equity share (R) [7] 371.65 356.79 350.90 328.79 301.57 265.85 241.97 211.39 182.90 159.31
Dividend per equity share (R) [7][9] 18.00 18.00 16.00 14.00 12.17 10.83 9.50 8.22 7.33 6.44
No. of equity shareholders 12,51,569 10,21,275 8,99,902 9,23,628 10,28,541 8,53,824 832,831 854,151 926,719 8,53,485
No. of employees 45,467 45,205 42,924 41,466 43,354 44,081 54,579 50,592 48,754 45,117
[1] From Continuing Operations in 2019-20 and 2018-19.[2] Profit before depreciation, interest and tax (PBDIT) is excluding extraordinary & exceptional items wherever applicable and other income.[3] PBDIT as % of net revenue from operations =[(PBDIT)/(gross revenue from operations less excise duty up to June 30, 2017)].[4] Profit After Tax (PAT) as % of net revenue from operations =[(PAT including extraordinary & exceptional items)/(gross revenue from opertions less
excise duty up to June 30, 2017)].[5] RONW [(PAT including extraordinary & exceptional items)/(average net worth excluding revaluation reserve)].[6] Basic earnings per equity share has been calculated including extraordinary & exceptional items and adjusted for all the years for issue of bonus
shares.[7] After considering adjustments for issue of bonus shares during the respective years.[8] Figures for the year 2010-11 to 2011-12 include Hydrocarbon business which has been transferred w.e.f April 1, 2013 to a wholly owned subsidiary.[9] Dividend for the year 2019-20 includes interim dividend of R 10.00 per share and final dividend of R 8.00 per share.[10] Figures for 2019-20 and 2018-19 include the impact of the merger of L&T Shipbuilding Limited with the Company.[11] Figures from 2015-16 to 2019-20 are as per Ind AS and for earlier periods as per IGAAP and hence not directly comparable.

45
CONSOLIDATED FINANCIALS-10 YEAR HIGHLIGHTSv crore
Ind AS IGAAP
Description 2019-20 2018-19 2017-18 2016-17 2015-16 2014-15 2013-14 2012-13 2011-12 2010-11
Statement of Profit and Loss
Gross revenue from operations [1] 145452 135220 119862 110011 101975 92762 85889 75195 64960 52470
PBDIT[1] [2] 16329 15330 13641 11130 10463 11258 10730 9929 8884 7677
Profit attributable to Group shareholders (excluding extraordinary & exceptional items) 9549 8713 7151 5920 4154 4470 4547 4911 4649 4238
Profit attributable to Group shareholders (including extraordinary & exceptional items) 9549 8905 7370 6041 4233 4765 4902 5206 4694 4456
Balance Sheet
Net worth 66723 62375 54904 50217 44180 40909 37712 33860 29387 25051
Non-controlling interest 9521 6826 5201 3564 2893 4999 3179 2653 1753 1026
Loan funds 141007 125555 107524 93954 88135 90571 80330 62672 47150 32798
Capital employed 217251 194756 167629 147735 135208 136479 121221 99185 78290 58875
Ratios and statistics
PBDIT as % of net revenue from operations [1] [3] 11.23 11.34 11.40 10.18 10.35 12.24 12.60 13.33 13.81 14.75
PAT as % of net revenue from operations [1] [4] 6.12 6.16 6.16 5.53 4.19 5.18 5.76 6.99 7.30 8.56
RONW % [5] 14.80 15.35 14.12 12.80 9.91 12.13 13.71 16.47 17.26 19.38
Gross debt: Equity ratio 1.85:1 1.81:1 1.79:1 1.75:1 1.87:1 2.21:1 2.13:1 1.85:1 1.61:1 1.31:1
Basic earnings per equity share (R) [6] 68.04 63.51 52.62 43.20 30.32 34.22 35.31 37.69 34.14 32.69
Book value per equity share (R) [7] 475.27 444.67 391.78 358.83 316.20 293.29 271.10 244.40 213.09 182.65
Dividend per equity share (R) [7] [8] 18.00 18.00 16.00 14.00 12.17 10.83 9.50 8.22 7.33 6.44
Figures for 2015-16 to 2019-20 are as per Ind AS and for earlier periods as per IGAAP and hence not directly comparable.[1] From Continuing Operations in 2019-20 and 2018-19[2] Profit before depreciation, interest and tax [PBDIT] is excluding extraordinary & exceptional items wherever applicable and other income.[3] PBDIT as % of net revenue from operations =[PBDIT/(gross revenue from operations less excise duty upto June 30, 2017)].[4] Profit after tax (PAT) as % of net revenue from operations = [PAT including extraordinary & exceptional items/gross revenue from operations less excise
duty upto June 30, 2017].[5] RONW = [(PAT including extraordinary & exceptional items)/(average net worth excluding revaluation reserve)].[6] Basic earnings per equity share has been calculated including extraordinary & exceptional items and adjusted for all the years for issue of bonus shares.[7] After considering adjustment for issue of bonus shares during respective years.[8] Dividend for the year 2019-20 includes interim dividend of R 10.00 per share and final dividend of R 8.00 per share.

GRAPHS ANNUAL REPORT 2019-20
46
L&T CONSOLIDATED - ORDER INFLOW*
210000 –
190000 –
170000 –
150000 –
130000 –
110000 –
90000 –
70000 –
50000 –
30000 –
v cr
ore
Domestic International
14727416%
9%
113046 125701126262
186356
34228
45116
170817
60094
– – – –
2017-18 2018-19 2019-20
L&T CONSOLIDATED - GROSS REVENUE FROM OPERATIONS*
170000 –
150000 –
130000 –
110000 –
90000 –
70000 –
50000 –
30000 –
v cr
ore
Domestic International
114653
18%
8%
7641091643 96985
145452
38243
43577
135220
48467
– – – –
2017-18 2018-19 2019-20
L&T CONSOLIDATED - ORDER BOOK*
229110
61670
199365
60714
228819
360000 –
310000 –
260000 –
210000 –
160000 –
110000 –
60000 –
v cr
ore
Domestic International
26007912%
4% 303857290780
75038
– – – –
As at 31-3-2018 As at 31-3-2019 As at 31-3-2020
L&T CONSOLIDATED - SEGMENT-WISE ORDER INFLOW 2019-20
Infrastructure
Power
Heavy Engineering
Defence Engineering
Hydrocarbon
IT & Technology Services
Financial Services
Developmental Projects
Others
v crore
102678 55%
22135 12%
13822 8%
2361 1%
2233 1%
20964 11%
5265 3%4850
3%
12048 6%
L&T CONSOLIDATED - SEGMENT-WISE EXTERNAL REVENUE 2019-20
Infrastructure
Power
Heavy Engineering
Defence Engineering
Hydrocarbon
IT & Technology Services
Financial Services
Developmental Projects
Others
v crore
73037 50%
17420 12%
22135 15%
13822 10%
2853 2%
3970 3%
5070 3%4850
3%
2294 2%
L&T CONSOLIDATED - SEGMENT-WISE ORDER BOOK 2019-20
Infrastructure
Power
Heavy Engineering
Defence Engineering
Hydrocarbon
Others
v crore
224467 74%
15849 5%
44130 15%
6074 2%
4121 1%
9216 3%

47
L&T CONSOLIDATED - PBDIT AS % OF NET REVENUE FROM OPERATIONS*
– – – –
17000 –
15000 –
13000 –
11000 –
9000 –
7000 –
5000 –
– 14.0
– 13.5
– 13.0
– 12.5
– 12.0
– 11.5
– 11.0
– 10.5
– 10.0
– 9.5
– 9.0
v cr
ore
Perc
enta
ge
2017-18 2018-19 2019-20
PBDIT PBDIT as % of net revenue from operations
12826
15330
16329
11.2 11.3 11.2
L&T CONSOLIDATED - PAT AND RONW %
– – – –
10000 –
9000 –
8000 –
7000 –
6000 –
5000 –
4000 –
– 24.0
– 22.0
– 20.0
– 18.0
– 16.0
– 14.0
– 12.0
– 10.0
v cr
ore
Perc
enta
ge
2017-18 2018-19 2019-20
PAT RONW
7370
8905
9549
14.115.3 14.8
L&T CONSOLIDATED - SEGMENT-WISE EBIT
2018-19 2019-20
– – – – – – – – – –
Infra
struc
ture
Powe
r
Heav
y Eng
ineer
ing
Defe
nce
Engin
eerin
g
Hydr
ocar
bon
IT &
Tech
nolog
y Se
rvice
s
Finan
cial S
ervic
es
Deve
lopm
enta
l Pr
ojects
Othe
rs
6000 –
5000 –
4000 –
3000 –
2000 –
1000 –
0 –
v cr
ore
5389
487
130 47
2
1178
3084
3053
314 77
6
5207
566
236 57
6
1746
3693
2679
387
969
Total Segment wise EBIT 2018-19 : R 14883 crore and 2019-20 : R 16059 crore
L&T CONSOLIDATED - SEGMENT-WISE NET ASSETS
31.03.2019 31.03.2020
– – – – – – – – – –
Infra
struc
ture
Powe
r
Heav
y Eng
ineer
ing
Defe
nce
Engin
eerin
g
Hydr
ocar
bon
IT &
Tech
nolog
y Se
rvice
s
Finan
cial S
ervic
es
Deve
lopm
enta
l Pr
ojects
Othe
rs
30000 –
25000 –
20000 –
15000 –
10000 –
5000 –
0 –
v cr
ore
2394
0
1192 25
03 2862
2128
7071
1186
9
2163
1
5884
2827
9
1745 29
06 3014
2880
1963
8
1346
1
2439
8
7135
Segment wise Net Assets as at 31.03.2019 R 79080 crore and as at 31.03.2020 R 103456 crore
L&T CONSOLIDATED - EPS
80.00 –
70.00 –
60.00 –
50.00 –
40.00 –
30.00 –
20.00 –
10.00 –
0.00 –
in v
52.62
63.5168.04
– – – –
Earning per share
2017-18 2018-19 2019-20
L&T STANDALONE - EPS# & DPS
80.00 –
70.00 –
60.00 –
50.00 –
40.00 –
30.00 –
20.00 –
10.00 –
0.00 –
in v
35.21
53.43
47.59
1618 18
– – – –
Earning per share Dividend per share
2017-18 2018-19 2019-20
*For comparability purposes, numbers for 2017-18 exclude Electrical & Automation (E&A) business # For comparability purposes, EPS of 2017-18 includes operations of the Shipbuilding subsidiary which has been subsequently merged with L&T standalone entity

48
NOTICE ANNUAL REPORT 2019-20
Notice
NOTICE IS HEREBY GIVEN THAT the Seventy Fifth Annual General Meeting of LARSEN & TOUBRO LIMITED will be held through VIDEO CONFERENCING OR OTHER AUDIO VISUAL MEANS on Thursday, August 13, 2020 at 3.30 P.M. IST to transact the following business :-
1) To consider and adopt the audited financial statements of the Company for the year ended March 31, 2020 and the Reports of the Board of Directors and Auditors thereon and the audited consolidated financial statements of the Company and the report of the auditors thereon for the year ended March 31, 2020;
2) To declare final dividend on equity shares;
3) To appoint a Director in place of Mr. Subramanian Sarma (DIN: 00554221), who retires by rotation and is eligible for re-appointment;
4) To appoint a Director in place of Mrs. Sunita Sharma (DIN: 02949529), who retires by rotation and is eligible for re-appointment;
5) To appoint a Director in place of Mr. A.M Naik (DIN: 00001514), who retires by rotation and is eligible for re-appointment;
6) To consider and, if thought fit, to pass, as a SPECIAL RESOLUTION the following:
“RESOLVED THAT approval of the Company be and is hereby accorded for the re-appointment and continuation of Mr. A.M Naik (DIN: 00001514) as a Non-Executive Director of the Company who has attained the age of seventy-five years.”
7) To consider and, if thought fit, to pass as an ORDINARY RESOLUTION the following:
“RESOLVED THAT Mr. Sudhindra Vasantrao Desai (DIN: 07648203) who was appointed as an Additional Director and holds office upto the date of this Annual General Meeting of the Company, and
is eligible for appointment and in respect of whom the Company has received a Notice in writing from a member under the provisions of Section 160 of the Companies Act, 2013 proposing his candidature for the office of Director, be and is hereby appointed as a Director.”
8) To consider and, if thought fit, to pass as an ORDINARY RESOLUTION the following:
“RESOLVED THAT Mr. T. Madhava Das (DIN: 08586766) who was appointed as an Additional Director and holds office upto the date of this Annual General Meeting of the Company, and is eligible for appointment and in respect of whom the Company has received a Notice in writing from a member under the provisions of Section 160 of the Companies Act, 2013 proposing his candidature for the office of Director, be and is hereby appointed as a Director.”
9) To consider and, if thought fit, to pass, as an ORDINARY RESOLUTION the following:
“RESOLVED THAT pursuant to Sections 196,197,203 and other applicable provisions, if any, of the Companies Act, 2013 read with Schedule V of the said Act and the rules made thereunder, approval be and is hereby granted to the re-appointment of Mr. D.K Sen (DIN: 03554707) as the Whole-time Director of the Company with effect from October 1, 2020 upto and including April 7, 2023.
RESOLVED FURTHER THAT Mr. D.K Sen in his capacity as Whole-time Director, be paid remuneration as may be fixed by the Board, from time to time, as prescribed under the Companies Act, 2013 and within the limits approved by the members as per the details given in the explanatory statement.”
LARSEN & TOUBRO LIMITEDRegd. Office : L&T House, Ballard Estate, Mumbai 400 001.
CIN : L99999MH1946PLC004768 Email: [email protected] • Website: www.larsentoubro.com
Tel No.: 022-67525656 • Fax No.: 022-67525893

49
10) To consider and, if thought fit, to pass, as an ORDINARY RESOLUTION the following:
“RESOLVED THAT pursuant to Sections 196,197,203 and other applicable provisions, if any, of the Companies Act, 2013 read with Schedule V of the said Act and the rules made thereunder and subject to such approvals as may be required, approval be and is hereby granted to the appointment of Mr. Subramanian Sarma (DIN: 00554221) as the Whole-time Director of the Company with effect from August 19, 2020 upto and including August 18, 2025.
RESOLVED FURTHER THAT Mr. Subramanian Sarma in his capacity as Whole-time Director, be paid remuneration as may be fixed by the Board, from time to time, as prescribed under the Companies Act, 2013 and within the limits approved by the members as per the details given in the explanatory statement.”
11) To consider and, if thought fit, to pass as an ORDINARY RESOLUTION the following:
“RESOLVED THAT pursuant to Sections 196,197,203 and other applicable provisions, if any, of the Companies Act, 2013 read with Schedule V of the said Act and the rules made thereunder, approval be and is hereby granted to the appointment of Mr. Sudhindra Vasantrao Desai (DIN: 07648203) as the Whole-time Director of the Company with effect from July 11, 2020 upto and including July 10, 2025.
RESOLVED FURTHER THAT Mr. Sudhindra Vasantrao Desai in his capacity as Whole-time Director, be paid remuneration as may be fixed by the Board, from time to time, as prescribed under the Companies Act, 2013 and within the limits approved by the members as per the details given in the explanatory statement.”
12) To consider and, if thought fit, to pass as an ORDINARY RESOLUTION the following:
“RESOLVED THAT pursuant to Sections 196,197,203 and other applicable provisions, if any, of the Companies Act, 2013 read with Schedule V of the said Act and the rules made thereunder, approval be and is hereby granted to the appointment of Mr. T. Madhava Das (DIN: 08586766) as the Whole-time
Director of the Company with effect from July 11, 2020 upto and including July 10, 2025.
RESOLVED FURTHER THAT Mr. T.Madhava Das in his capacity as Whole-time Director, be paid remuneration as may be fixed by the Board, from time to time, as prescribed under the Companies Act, 2013 and within the limits approved by the members as per the details given in the explanatory statement.”
13) To consider and, if thought fit, to pass as a SPECIAL RESOLUTION the following:
“RESOLVED THAT in supersession of the resolution no. 14 passed by the Members at the 74th Annual General Meeting of the Company held on August 1, 2019 in this regard and in accordance with the provisions of Sections 41, 42, 62 and other applicable provisions, if any of the Companies Act, 2013 (including any statutory modifications or re-enactments thereof for the time being in force) as amended from time to time, Foreign Exchange Management Act, 1999, Securities and Exchange Board of India (Issue of Capital and Disclosure Requirements) Regulations, 2018 (‘SEBI Regulations’), Securities and Exchange Board of India (Listing Obligations and Disclosure Requirements) Regulations, 2015, enabling provisions in the Memorandum and Articles of Association of the Company as also provisions of any other applicable laws, rules and regulations (including any amendments thereto or re-enactments thereof for the time being in force) and subject to such approvals, consents, permissions and sanctions of the Securities and Exchange Board of India (SEBI), Government of India (GOI), Reserve Bank of India (RBI) and all other appropriate and/or concerned authorities, or bodies and subject to such conditions and modifications, as may be prescribed by any of them in granting such approvals, consents, permissions and sanctions which may be agreed to by the Board of Directors of the Company (‘Board’) (which term shall be deemed to include any Committee which the Board may have constituted or hereafter constitute for the time being exercising the powers conferred on the Board by this resolution), the Board be and is hereby authorized to offer , issue and allot in one or more tranches, to Investors whether Indian or Foreign, including

50
NOTICE ANNUAL REPORT 2019-20
Foreign Institutions, Foreign Institutional Investors, Foreign Portfolio Investors, Foreign Venture Capital Fund Investors, Venture Capital Funds, Non-resident Indians, Corporate Bodies, Mutual Funds, Banks, Insurance Companies, Pension Funds, Individuals or otherwise, whether shareholders of the Company or not, through an issue of convertible bonds and/or equity shares through depository receipts, including by way of Qualified Institutions Placement (‘QIP’), to Qualified Institutional Buyers (‘QIB’) in terms of Chapter VI of the SEBI Regulations, through one or more placements of Equity Shares (hereinafter collectively referred to as “Securities”), whether by way of private placement or otherwise as the Board may determine, where necessary in consultation with the Lead Managers, Underwriters, Merchant Bankers, Guarantors, Financial and/or Legal Advisors, Rating Agencies/ Advisors, Depositories, Custodians, Principal Paying/Transfer/Conversion agents, Listing agents, Registrars, Trustees, Auditors, Stabilizing agents and all other Agencies/Advisors so that the total amount raised through issue of the Securities shall not exceed INR 4500 Crore (Rupees Four Thousand Five Hundred Crore) or US $600 Mn (US Dollars Six Hundred Million), if the value is higher.
RESOLVED FURTHER THAT for the purpose of giving effect to the above, the Board be and is hereby also authorised to determine the form, terms and timing of the issue(s), including the class of investors to whom the Securities are to be allotted, number of Securities to be allotted in each tranche, issue price, face value, premium amount in issue/ conversion/ exercise/ redemption, rate of interest, redemption period, listings on one or more stock exchanges in India or abroad as the Board may in its absolute discretion deems fit and to make and accept any modifications in the proposals as may be required by the authorities involved in such issue(s) in India and/or abroad, to do all acts, deeds, matters and things and to settle any questions or difficulties that may arise in regard to the issue(s).
RESOLVED FURTHER THAT in case of QIP issue it shall be completed within 12 months from the date of passing of this resolution.
RESOLVED FURTHER THAT in case of QIP issue the relevant date for determination of the floor price of the Equity Shares to be issued shall be -
i) in case of allotment of equity shares, the date of meeting in which the Board decides to open the proposed issue
ii) in case of allotment of eligible convertible securities, either the date of the meeting in which the Board decides to open the issue of such convertible securities or the date on which the holders of such convertible securities become entitled to apply for the equity shares, as may be determined by the Board.
RESOLVED FURTHER THAT the Equity Shares so issued shall rank pari passu with the existing Equity Shares of the Company in all respects.
RESOLVED FURTHER THAT the Equity Shares to be offered and allotted shall be in dematerialized form.
RESOLVED FURTHER THAT for the purpose of giving effect to any offer, issue or allotment of Securities, the Board, be and is hereby authorised on behalf of the Company to do all such acts, deeds, matters and things as it may, in absolute discretion, deem necessary or desirable for such purpose, including without limitation, the determination of the terms thereof, for entering into arrangements for managing, underwriting, marketing, listing and trading, to issue placement documents and to sign all deeds, documents and writings and to pay any fees, commissions, remuneration, expenses relating thereto and with power on behalf of the Company to settle all questions, difficulties or doubts that may arise in regard to such offer(s) or issue(s) or allotment(s) as it may, in its absolute discretion, deems fit.
RESOLVED FURTHER THAT the Board be and is hereby authorised to appoint Lead Manager(s) in offerings of Securities and to remunerate them by way of commission, brokerage, fees or the like and also to enter into and execute all such arrangements, agreements, memoranda, documents, etc. with Lead Manager(s) and to seek listing of such securities.
RESOLVED FURTHER THAT the Company do apply for listing of the new Equity Shares as may be issued with the BSE Limited and National Stock Exchange of India Limited or any other Stock Exchange(s).
RESOLVED FURTHER THAT the Company do apply to the National Securities Depository Limited and/

51
or Central Depository Services (India) Limited for admission of the Securities.
RESOLVED FURTHER THAT the Board be and is hereby authorised to create necessary charge on such of the assets and properties (whether present or future) of the Company in respect of Securities and to approve, accept, finalize and execute facilities, sanctions, undertakings, agreements, promissory notes, credit limits and any of the documents and papers in connection with the issue of Securities.
RESOLVED FURTHER THAT the Board be and is hereby authorised to delegate all or any of the powers in such manner as they may deem fit.”
14) To re-appoint Statutory Auditors and fix their remuneration and for that purpose to pass, as an ORDINARY RESOLUTION the following:
“RESOLVED THAT pursuant to Section 139 of the Companies Act, 2013 read with the Companies (Audit and Auditors) Rules, 2014 and other applicable provisions, if any, M/s. Deloitte Haskins & Sells LLP, Chartered Accountants, ICAI Registration no. 117366W-W100018 be and are hereby re-appointed as the Statutory Auditors of the Company, for the second and final term of 5 years, to hold office from conclusion of 75th Annual General Meeting till conclusion of 80th Annual General Meeting.
RESOLVED FURTHER THAT the Board of Directors, or Audit Committee thereof, be and is hereby authorized to decide and finalise the terms and conditions of appointment, including the remuneration of the Statutory Auditors.”
15) To consider and ratify the remuneration payable to Cost Auditors and for that purpose to pass, as an ORDINARY RESOLUTION the following:
“RESOLVED THAT pursuant to Section 148 and other applicable provisions, if any, of the Companies Act, 2013 and the Companies (Audit and Auditors) Rules, 2014, the Company hereby ratifies the remuneration of R 13 lakhs plus applicable taxes and out of pocket expenses at actuals for travelling and boarding/lodging for the financial year ending March 31, 2021 to M/s R. Nanabhoy & Co. Cost Accountants (Regn. No. 00010), who are appointed as Cost Auditors to conduct the audit of cost records
maintained by the Company for the Financial Year 2020-21.”
By Order of the Board of Directors
For LARSEN & TOUBRO LIMITED,
SIVARAM NAIR A COMPANY SECRETARY
M.NO – F3939
Mumbai, July 11, 2020
Notes:
[a] In view of the COVID-19 pandemic and the need for ensuring social distancing, the Government of India, Ministry of Corporate Affairs (“MCA”) allowed conducting Annual General Meeting through video conferencing (VC) or other audio-visual means (OAVM) without the physical presence of Members at a common venue. Accordingly, MCA issued Circular No. 14/2020 dated April 08, 2020, Circular No.17/2020 dated April 13, 2020 and Circular No. 20/2020 dated May 05, 2020 (“MCA Circulars”), prescribing the procedures and manner of conducting the Annual General Meeting through VC/OAVM. Securities and Exchange Board of India (“SEBI”) also vide its Circular dated May 12, 2020 (“SEBI Circular”), permitted holding of Annual General Meetings through VC/OAVM. In compliance with the applicable provisions of the Companies Act, 2013, MCA Circulars and applicable provisions of the SEBI Circular, the 75th Annual General Meeting (AGM) of the Members will be held through VC/ OAVM. Hence, Members can attend and participate in the AGM through VC/OAVM only. The venue of the Meeting shall be deemed to be the registered office of the Company.
[b] Since this General Meeting is held through VC/OAVM the physical attendance of members is dispensed with and no proxies would be accepted by the Company pursuant to the relevant MCA Circulars.
[c] No attendance slip/route map has been sent along with this Notice of the Meeting as the meeting is held through Audio Visual means
[d] Members who are shareholders as on Thursday, August 6, 2020 can join the AGM 30 minutes before the commencement of the AGM i.e at 3.00 P.M and till the time of the conclusion of the Meeting by following the procedure mentioned in this Notice.

52
NOTICE ANNUAL REPORT 2019-20
[e] The attendance through VC/OAVM is restricted and hence members will be allowed on first come first serve basis. However, attendance of Members holding more than 2% of the shares of the Company, Institutional Investors as on Thursday, August 6, 2020 and Directors and Key Managerial Personnel, the Chairpersons of the Audit Committee, Nomination and Remuneration Committee, the Stakeholders Relationship Committee and Auditors will not be restricted on first come first serve basis.
[f] Members attending the Meeting through VC/OAVM will be counted for the purposes of reckoning of Quorum under Section 103 of the Companies Act, 2013.
[g] In line with the MCA Circulars and the SEBI Circular, the Notice calling the AGM has been uploaded on the website of the Company at www.larsentoubro.com. The Notice can also be accessed from the websites of the Stock Exchanges i.e. BSE Limited and National Stock Exchange of India Limited at www.bseindia.com and www.nseindia.com respectively and is also available on the website of KFintech at https://evoting.karvy.com/
[h] The information required to be provided under the SEBI (Listing Obligations and Disclosure Requirement Regulations), 2015 and the Secretarial Standards on General Meetings, regarding the Directors who are proposed to be appointed/re-appointed and the relative Explanatory Statement pursuant to Section 102 of the Companies Act, 2013, in respect of the business under items 6 to 15 set out above are annexed hereto.
[i] The Register of Members and Transfer Books of the Company will be closed from Friday, August 7, 2020 to Thursday, August 13, 2020 (both days inclusive).
[j] Members holding shares in physical form are requested to furnish bank details, email address, change of address etc. to KFin Technologies Private Limited (“KFintech”), Karvy Selenium, Tower B, Plot 31-32, Gachibowli, Financial District, Nanakramguda, Hyderabad 500 032, who are the Company’s Registrar and Share Transfer Agents so as to reach them latest by Thursday, August 6, 2020, in order to take note of the same. In respect of members holding shares in electronic mode, the details as would be
furnished by the Depositories as at the close of the aforesaid date will be considered by the Company. Hence, members holding shares in demat mode should update their records at the earliest.
[k] Considering the difficulties caused due to the Covid-19 pandemic, MCA and SEBI have dispensed with the requirement of printing and sending physical copies of the Annual Report and the Notice of this Meeting and the Annual Reports have been sent via email to all those members who have registered their email ids with the Company or the Registrar and Transfer Agent or the Depositories or the Depository Participants as on Friday, July 10, 2020.
Those Members who have not yet registered their email address are requested to get their email addresses registered by following the procedure given below:
1. Those Members who have registered/not registered their mail address and mobile nos. including address and bank details may please contact and validate/update their details with the Depository Participant in case of shares held in electronic form and with Registrar and Transfer Agents KFin Technologies Private Ltd in case the shares are held in physical form.
2. Members may also visit the website of the Company www.larsentoubro.com or the website of KFintech at https://evoting.karvy.com/ for downloading the Annual Report and Notice of the AGM.
3. Alternatively, Members may send an e-mail request to the email id [email protected] along with scanned copy of the signed request letter providing the email address, mobile number, self-attested PAN copy and Client Master copy in case of electronic folio and copy of share certificate in case of physical folio.
[l] Members who have already registered their email addresses are requested to get their email addresses validated with their Depository Participants / the Company’s Registrar and Share Transfer Agent, KFin Technologies Private Limited to enable servicing of notices / documents / Annual Reports electronically to their email address.

53
[m] In terms of the MCA Circulars and in the view of the Board of Directors, all matters included in this Notice are unavoidable and hence are proposed for seeking approval at this AGM. All documents referred to in the accompanying Notice and the Explanatory Statement have been uploaded on the website of the Company at www.larsentoubro.com. All shareholders will be able inspect all documents referred to in the Notice electronically without any fee from the date of circulation of this Notice up to the date of AGM. Members seeking to inspect such documents can send an email to [email protected].
The Register of Directors and Key Managerial Personnel and their shareholding maintained under Section 170 of the Companies Act, 2013, the Register of Contracts or Arrangements in which the directors are interested, maintained under Section 189 of the Act, and the relevant documents referred to in the Notice will be available electronically for inspection by the members during the AGM.
Pursuant to Section 124 of the Companies Act, 2013 the unpaid dividends that are due for transfer to the Investor Education and Protection Fund are as follows:
Dividend No.
Date of Declaration
For the year ended
Due for Transfer on
84 22.08.2013 31.03.2013 27.09.2020
85 22.08.2014 31.03.2014 27.09.2021
86 09.09.2015 31.03.2015 15.10.2022
87 26.08.2016 31.03.2016 02.10.2023
88 22.08.2017 31.03.2017 27.09.2024
89 23.08.2018 31.03.2018 28.09.2025
90 01.08.2019 31.03.2019 06.09.2026
91 18.03.2020 31.03.2020 24.04.2027
Members who have not encashed their dividend warrants pertaining to the aforesaid years may approach the Company/its Registrar, for obtaining payments thereof atleast 20 days before they are due for transfer to the said fund.
Final Dividend if approved by the Members at this Meeting will be directly credited to the bank accounts
of the shareholders as on the Book Closure Date i.e Thursday, August 6, 2020 for shares held in demat form and Thursday, August 13, 2020 for shares held in physical form, as per the details available with the Company within the prescribed timelines. In case of shareholders who have not registered their bank details with the Company, dividend warrants/demand drafts will be sent to them in due course of time and upon normalization of postal services.
[n] Investor Grievance Redressal:
The Company has designated an exclusive e-mail id viz. [email protected] to enable Investors to register their complaints, if any.
[o] Adhering to the various requirements set out in the Investor Education and Protection Fund Authority (Accounting, Audit, Transfer and Refund) Rules, 2016, as amended, the Company has during the financial year 2019-20 transferred to the IEPF Authority all shares in respect of which dividend has remained unpaid or unclaimed for seven consecutive years or more as on the due date of transfer i.e November 30, 2019. Details of shares transferred to IEPF Authority are available on the website of the Company and the same can be accessed through the link: http://investors.larsentoubro.com/resources.aspx. The said details have also been uploaded on the website of the IEPF Authority and the same can be accessed through the link: www.iepf.gov.in.
[p] SEBI has decided that securities of listed companies can be transferred only in dematerialized form with effect from April 1, 2019. In view of the above and to avail various benefits of dematerialisation, members are advised to dematerialize shares held by them in physical form.
[q] Pursuant to Finance Act 2020, dividend income will be taxable in the hands of shareholders w.e.f. April 1, 2020 and the Company is required to deduct tax at source from dividend paid to shareholders at the prescribed rates. For the prescribed rates for various categories, the shareholders are requested to refer to the Finance Act, 2020 and amendments thereof. The shareholders are requested to update their PAN with the Company/KFintech (in case of shares held in physical mode) and with the Depositories/ Depository Participants (in case of shares held in demat mode).

54
NOTICE ANNUAL REPORT 2019-20
For Resident Shareholders, who have provided PAN, taxes shall be deducted at source under Section 194 of the Income Tax Act, 1961 at 7.5% on the amount of dividend. If no PAN is provided, then the tax shall be deducted at source at 20% as per Section 206AA of the Act. No tax shall be deducted on the dividend payable to a resident individual if the total dividend to be received by the resident shareholders during Financial Year 2020-21 does not exceed R 5,000. In cases where the shareholder provides Form 15G / Form 15H and provided that all the required eligibility conditions are met, no tax will be deducted at source.
Apart from above cases following categories of shareholders are exempt from tax deduction at source:
(a) Life Insurance Corporation of India [clause (a) to 2nd proviso to section 194]
(b) General Insurance Corporation of India/ The New India Assurance Company Ltd / United India Insurance Company Ltd / The Oriental Insurance Company Limited / National Insurance Company Ltd [clause (b) to 2nd proviso to section 194]
(c) any other insurer in respect of any shares owned by it or in which it has full beneficial interest [clause (c) to 2nd proviso to section 194]
The following payees are also not subject to TDS in view of the provisions of sections 196, 197A of the Act and CBDT notification:
(a) Government [section 196(i)]
(b) Reserve Bank of India [section 196(ii)]
(c) a corporation established by or under a Central Act which is, under any law for the time being in force, exempt from income-tax on its income [section 196(iii)]
(d) Mutual Fund [section 196(iv)]
(e) any person for, or on behalf of, the New Pension System Trust referred to in section 10(44) [subsection 1E to section 197A]
(f) Category I or a Category II Alternative Investment Fund (registered with SEBI as per section 115UB) as per Notification 51/2015 since
their income, other than profits and gains of business and profession.
For Foreign Portfolio Investor (FPI) category Shareholders, taxes shall be deducted at source under Section 196D of the Income Tax Act, 1961 at 20% (plus applicable surcharge and cess) on the amount of dividend payable.
For other Non-resident Shareholders, taxes are required to be deducted in accordance with the provisions of Section 195 of the Income tax Act, 1961, at the rates in force. As per the relevant provisions of the Income tax Act, 1961, the tax shall be deducted at the rate of 20% (plus applicable surcharge and cess) on the amount of dividend payable to them. However, as per Section 90(2) of the Income tax Act, 1961, the non-resident shareholder has the option to be governed by the provisions of the Double Tax Avoidance Agreement (DTAA) between India and the country of tax residence of the shareholder, if they are more beneficial to them. To avail benefit of rate of deduction of tax at source under DTAA, such non-resident shareholders will have to provide the following:
1. Self-attested copy of the PAN allotted by the Indian Income Tax authorities;
2. Tax residency certificate from the jurisdictional tax authorities confirming residential status [for the dividend declared in FY 2020-21] – TRC
3. Declaration by the non- resident in prescribed form 10F
4. Self-declaration by the non-resident shareholder as to:
• Eligibility to claim tax treaty benefits based on the tax residential status of the shareholder, including having regard to the Principal Purpose Test (if any), introduced in the applicable tax treaty with India;
• No Permanent Establishment / fixed base in India in accordance with the applicable tax treaty;

55
• Shareholder being the beneficial owner of the dividend income to be received on the equity shares.
In order to enable us to determine the appropriate tax rate at which tax has to be deducted at source under the respective provisions of the Income-tax Act, 1961, we request you to upload the abovementioned details and documents in the format provided by us and as applicable to you on the link https://ris.KFintech.com/form15/ by 05.00 p.m. IST on Thursday, August 6, 2020.
Please note that the Company is not obligated to apply the beneficial DTAA rates at the time of tax deduction/withholding on dividend amounts. Application of beneficial DTAA Rate shall depend upon the completeness and satisfactory review by the Company, of the documents submitted by Non- Resident shareholder.
[r] Instruction for attending the meeting through VC:
Convenience of different persons positioned in different time zones has been kept in mind before scheduling the time for this Meeting.
The Company has appointed M/s KFin Technologies Private Limited (“KFintech”), to provide Video Conferencing facility for the AGM and the attendant enablers for conducting of the e-AGM. Member will be provided with a facility to attend the e-AGM through video conferencing platform provided by KFintech. Members may access the same at https://emeetings.KFintech.com by clicking “AGM video conference”
Members are requested to follow the procedure given below:
i. Launch internet browser (chrome/firefox/safari) by typing the URL: https://emeetings.KFintech.com
ii. Enter the login credentials (i.e., User ID and password for e-voting).
iii. After logging in, click on “Video Conference” option
iv. Then click on camera icon appearing against AGM event of Larsen & Toubro Limited, to attend the Meeting.
Please note that the members who do not have the User ID and Password for e-Voting or have forgotten their User ID and Password may retrieve the same by following the remote e-Voting instructions mentioned in the notice.
Members can participate in AGM through smart phone/laptop. However, for better experience and smooth participation it is advisable to join the Meeting using Google Chrome, through Laptops connected through broadband.
Further Members will be required to use Internet with a good speed to avoid any disturbance during the meeting.
Please note that Participants connecting from Mobile Devices or Tablets or through Laptop via Mobile Hotspot may experience Audio/Video loss due to fluctuation in their respective network. It is therefore recommended to use Stable Wi-Fi or LAN Connection to mitigate any kind of aforesaid glitches.
Members seeking any information with regard to the accounts or any matter to be placed at the AGM, are requested to write to the Company on or before Thursday, August 6, 2020 through email on [email protected]. The same will be replied by the Company suitably. Please note that, members’ queries/ questions will be responded to only, if the shareholder continues to hold the shares as on the cut-off date i.e Thursday, August 6, 2020.
Members intending to ask questions at the AGM, may login at https://emeetings.KFintech.com and click on “Speaker Registration” by mentioning the demat account number/folio number, city, email id, mobile number and submit. A reference number shall be displayed on the screen which may be preserved for recalling during the Q&A session in the e-AGM meeting.
The “Speaker Registration” window shall be activated on Saturday, August 8, 2020 at 9.00 A.M and shall be closed on Monday, August 10, 2020 at 09.00 A.M. The Company reserves the right to restrict the number of questions and number of

56
NOTICE ANNUAL REPORT 2019-20
speakers, depending upon availability of time as appropriate for smooth conduct of the AGM.
Members who are not able to join this Meeting over video conferencing will be able to view the live webcast of proceedings of AGM by logging on the e-voting website of KFintech at https://emeetings.KFintech.com/ using their remote e-voting credentials.
Members who need assistance before or during the AGM, can contact KFintech on [email protected] or call on toll free numbers 1800-425-8998 / 1800-345-4001 . Kindly quote your name, DP ID-Client ID / Folio no. and E-voting Event Number in all your communications.
[s] E-voting
The businesses as set out in the Notice may be transacted through electronic voting system and the Company will provide a facility for voting by electronic means. In compliance with the provisions of Section 108 of the Act, read with Rule 20 of the Companies (Management and Administration) Rules, 2014, Standard 2 of the Secretarial Standards on General Meetings and Reg. 44 of the SEBI (Listing Obligations and Disclosure Requirement) Regulations, 2015, the Company is pleased to offer the facility of voting through electronic means. The said facility of casting the votes by the members using electronic means (remote e-voting) will be provided by KFintech.
A person whose name is recorded in the register of members or in the register of beneficial owners maintained by the depositories as on the cut-off date of Thursday, August 6, 2020 shall be entitled to avail the facility of remote e-voting or e-voting on the day of the Meeting. Persons who are not members as on the cut-off date should treat this notice for information purposes only.
The Notice will be displayed on the website of the Company www.larsentoubro.com and on the website of KFintech.
The members who have cast their vote through remote e-voting prior to the AGM may also attend the AGM through video-conferencing but shall not be entitled to cast their vote again.
The remote e-voting period commences on Monday, August 10, 2020 at 9.00 A.M and ends on Wednesday, August 12, 2020 at 05.00 P.M During this period, members of the Company holding shares either in physical or dematerialised form, as on the cut-off date of Thursday, August 6, 2020 may cast their vote by remote e-voting. The remote e-voting module shall be disabled by KFintech for voting thereafter.
Instructions for e-voting during the AGM:
The e-Voting window shall be activated upon instructions of the Chairman during the AGM proceedings. Members shall vote as per the credentials displayed in the e-voting window.
Members would need to click on the “Instapoll” icon and follow the instructions to vote on the resolutions.
Only those shareholders, who are present in the AGM and have not casted their vote on the Resolutions through remote e-Voting and are otherwise not barred from doing so, shall be eligible to vote through e-Voting system available during the e-AGM.
The Members, whose names appear in the Register of Members / list of Beneficial Owners as on Thursday, August 6, 2020, i.e. the commencement of the book closure date are entitled to vote on the Resolutions set forth in this Notice. Eligible members who have acquired shares after the despatch of the Annual Report and holding shares as on the cut-off date i.e Thursday, August 6, 2020 may approach the Company for issuance of the User ID and Password for exercising their right to vote by electronic means.
Members who are already registered with KFintech for remote e-voting can use their existing user ID and password for casting their vote. In case they don’t remember their password, they can reset their password by using “Forgot User Details/Password” option available on https://evoting.karvy.com
The Company has appointed Mr. S. N. Ananthasubramanian, Practicing Company Secretary, (Membership No. 4206, COP No. 1774) or failing him Mrs. Aparna Gadgil, Practicing Company Secretary, (Membership No. 14713, COP No. 8430), to act as the Scrutinizer for conducting the voting and remote e-voting process in a fair and transparent manner.

57
Members are requested to follow the instructions below to cast their votes through e-voting:
A. In case a Member receives an e-mail from KFintech (for Members whose e-mail addresses are registered with the Company/ Depository Participants) the following needs to be done:
(i) Launch internet browser by typing the URL: https://evoting.karvy.com.
(ii) Enter the login credentials (i.e. User ID and Password which are mentioned in the email). Your Folio No./ DP ID-Client ID will be your User ID. However, if you are already registered with KFintech for e-voting, you can use your existing User ID and password for casting your vote.
(iii) After entering these details appropriately, Click on “LOGIN”.
(iv) You will now reach password change Menu wherein you are required to mandatorily change your password. The new password shall comprise of minimum 8 characters with at least one upper case (A-Z), one lower case (a-z), one numeric value (0-9) and a special character (@,#,$, etc.). The system will prompt you to change your password and update your contact details like mobile number, email ID, etc. on first login. You may also enter a secret question and answer of your choice to retrieve your password in case you forget it. It is strongly recommended that you do not share your password with any other person and that you take utmost care to keep your password confidential.
(v) You need to login again with the new credentials.
(vi) On successful login, the system will prompt you to select the “EVENT” i.e., Larsen & Toubro Limited.
(vii) On the voting page, enter the number of shares (which represents the number of votes) as on the Cut Off date under “FOR/AGAINST” or alternatively, you may partially enter any number in “FOR” and partially in “AGAINST” but the total number in
“FOR/AGAINST” taken together should not exceed your total shareholding as on the cut-off date. You may also choose the option ABSTAIN. If the Member does not indicate either “FOR” or “AGAINST” it will be treated as “ABSTAIN” and the shares held will not be counted under either head.
(viii) Members holding multiple folios/demat accounts shall choose the voting process separately for each folios/demat accounts.
(ix) You may then cast your vote by selecting an appropriate option and click on “Submit”.
(x) A confirmation box will be displayed. Click “OK” to confirm else “CANCEL” to modify. Once you confirm, you will not be allowed to modify your vote. During the voting period, Members can login any number of times till they have voted on the resolution(s).
(xi) Institutional shareholders (i.e. other than individuals, HUF, NRI, etc.) are required to send scanned copy (PDF/JPG format) of the relevant Board Resolution/ Authority letter etc., together with attested specimen signature of the duly authorized signatory(ies) who are authorized to vote, to the Scrutinizer through e-mail to [email protected], with a copy marked to [email protected].
(xii) In case of any queries, please visit Help and Frequently Asked Questions (FAQs) section available at evoting website https://evoting.karvy.com.
Based on the report received from the Scrutinizer, the Company will submit within 48 hours of the conclusion of the Meeting to the stock exchanges details of the voting results as required under Reg. 44(3) of the SEBI (Listing Obligations and Disclosure Requirements) Regulations, 2015.
A Member can opt for only one mode of voting i.e. either through remote e-voting or at the Meeting. If a Member has cast his vote by remote e-voting then he will not be eligible to vote at the Meeting.
The details of the person who may be contacted for any grievances connected with the facility for

58
NOTICE ANNUAL REPORT 2019-20
e-voting on the day of the AGM shall be the same as mentioned in the instructions for remote-evoting.
The Scrutinizer will submit his report to the Chairman after completion of the scrutiny. The result of the voting on the Resolutions at the Meeting shall be announced by the Chairman or any other person authorized by him immediately after the results are declared.
Facility to cast vote through e-voting will be made available on the Video Conferencing screen and will be activated once the same is announced by the Chairman during the Meeting.
The results declared alongwith the Scrutinizer’s report, will be posted on the website of the Company www.larsentoubro.com and on the website of e-voting at https://evoting.karvy.com and will be displayed on the Notice Board of the Company at its Registered Office as well as Corporate Office immediately after the declaration of the result by the Chairman or any person authorised by him in writing and will be communicated to the Stock Exchanges.
EXPLANATORY STATEMENT
As required by Section 102 of the Companies Act, 2013, the following Explanatory Statement sets out material facts relating to the business under items 6 to 15 of the accompanying Notice dated July 11, 2020.
Item No. 6:
Mr. A.M Naik has been associated with Larsen & Toubro Limited for over five decades. During his tenure as Executive Chairman he played a key role in the Company’s rise to its pre-eminent position, and its presence overseas, boosting employee morale and focusing on delivering superior value to stakeholders. After his superannuation as Executive Chairman, Mr. Naik has been guiding the Executive Management ensuing smooth transition as Non-Executive Chairman since October 1, 2017.
Mr. A.M Naik, currently aged 78 years, was appointed as a Non-Executive Chairman of the Company with effect from October 1, 2017, after his superannuation as Executive Chairman of the Company. The shareholders in their meeting held on August 26, 2018 had approved appointment and continuation of Mr. Naik as Non-Executive Chairman in accordance applicable regulations.
The Board of Directors at its meeting held on June 5, 2020 re-appointed Mr. A.M Naik as Non-Executive
Chairman of the Company for a further period of 3 years with effect from October 1, 2020 and upto September 30, 2023.
Mr. A.M. Naik is strongly identified with the growth of the Company and its contribution to strategic sectors of Defence, Nuclear Power, Space Research and Infrastructure. Mr. Naik has been awarded four doctorates and numerous awards from institutions and industry. He has also served as the Chairman of IIM, Ahmedabad.
Mr. Naik in the capacity of Non-Executive Chairman, in addition to sitting fees, will be entitled to remuneration/ benefits as per the following terms and conditions:
1. Commission: Fixed amount of upto R 5 crore p.a. within the overall limits approved by the shareholders of the Company for payment of remuneration to NED’s.
2. Car & Driver, telephone & communication facilities and club membership.
3. Maintain an office with staff at the Company’s expense.
4. Reimbursement of medical expenses in accordance with the policy of the Company.
5. Perquisite value of Company accommodation.
Regulation 17(1A) of the SEBI(Listing Obligations and Disclosure Requirements) Regulations, 2015, effective April 1, 2019, requires companies to obtain approval of shareholders by passing a special resolution for appointment or continuation of any Non-Executive Director who has attained the age of seventy-five years.
Mr. Naik is liable to retire by rotation in this AGM and hence is proposed to be re-appointed. Accordingly, approval of the shareholders of the Company is sought for continuation of Mr. Naik as Non-Executive Chairman by passing Special Resolution.
Disclosure, as required under Secretarial Standard 2 on General Meetings, is provided as an Annexure to the Notice.
The Board recommends approval of re-appointment of Mr. Naik as Non-Executive Chairman of the Company, liable to retire by rotation and continuation beyond 75 years of age.
Except Mr. Naik being the appointee, none of the Directors or the Key Managerial Personnel of the
59
Company and their relatives are concerned or interested in the resolution set out at Item No. 6.
Item No. 7 and 11
On the recommendation of the Nomination & Remuneration Committee, the Board of Directors appointed Mr. Sudhindra Vasantrao Desai (DIN: 07648203) as an Additional Director with effect from July 11, 2020. In terms of Section 161(1) of the Companies Act, 2013, Mr. Desai holds office as additional director upto the date of this Annual General Meeting. The Company has received a notice in writing from a member under Section 160 of the Companies Act, 2013, proposing his candidature for the office of Director of the Company.
On the recommendation of the Nomination & Remuneration Committee, the Board of Directors appointed Mr. Sudhindra Vasantrao Desai (DIN: 07648203) as a Whole-time Director of the Company with effect from July 11, 2020 upto and including July 10, 2025, subject to the approval of the members in the Annual General Meeting.
Mr. S.V. Desai, a second rank holder in Civil Engineering from Gulbarga University, Karnataka in 1984 and a Post-Graduate [M Tech] from IIT Madras in 1986, started his career with National Buildings Construction Corporation Limited [NBCC] as Management trainee.
He was involved in Light Combat Aircraft [LCA], HAL and then four years at Male’ Rep. of Maldives for an Hospital project, funded by Govt. of India on deputation to MEA. Then he was selected and rostered in Common Wealth Secretariat, London (UK) and UN Centre for Human Settlements (HABITAT), Nairobi, Kenya.
Mr. Desai began his career in L&T in 1997 as a Construction Manager. During initial period of his career, he developed expertise in Tendering & Contracts management and then became the Head of Tender & Contracts of B&F-IC for domestic and international projects. He made remarkable contribution, as Head of Procurement & Contracts, in our prestigious Delhi International Airport Project, handling various national & international stakeholders.
Subsequently in 2012, from B&F-IC, he was moved to Heavy Civil Infrastructure IC and was responsible for Metros & Defence businesses, and then took over as the Head of Heavy Civil Infrastructure IC in October 2015.
In HCI, he has been handling many JVs, international partners, Corporates, Government Departments and a wide variety of jobs in the field of Elevated and Underground Metros, Bridges, Tunnel, Hydro, Nuclear, Ports & Harbours and Defence infrastructure.
Mr. Desai is known for his expertise in the areas of Bid-estimation, negotiation and finalization of Mega Projects. In Heavy Civil, he was instrumental in bagging landmark infrastructure projects like Riyadh Metro, Qatar Metro, mega Defence infrastructure project. He has been inducted as a member of the Executive Committee of L&T in 2020.
In his new role, over and above his current responsibilities of Heavy Civil Infra IC, he will oversee the functioning of Transportation Infra IC.
Part III, of Schedule V of the Companies Act, 2013 and Secretarial Standard – 2 on General Meetings provides that the appointment and remuneration of Managing Directors and Whole-time Directors in accordance with Part I and Part II of the Schedule V shall be subject to approval by resolution of the shareholders in a General Meeting.
At the Annual General Meeting of the Company held on August 26, 2016 the shareholders had fixed the maximum limits within which the Board was delegated authority to decide the remuneration of the Whole-time Directors of the Company. Pursuant to this, the Board has fixed the remuneration payable to Mr. Sudhindra Vasantrao Desai during his tenure as Whole-time Director.
The Company will enter into an Agreement with Mr. Sudhindra Vasantrao appointing him as a Whole-time Director for the period from July 11, 2020 to July 10, 2025. During the period of this agreement and so long as the Whole-time Director performs his services as per the terms and conditions provided by this agreement, he shall be entitled to the following:
Salary : R 8,75,000/- (Rupees Eight Lac Seventy Five Thousand Only) per month in the scale of R 650000-R 75000-R 1025000-R 100000-R 1525000 with the annual increment due on April 1 every year.
Commission : The commission will be paid as per the parameters fixed by the Nomination and Remuneration Committee and the Board of Directors within the overall limits approved by the shareholders of the Company.

60
NOTICE ANNUAL REPORT 2019-20
Perquisites : 12 lakh per annum excluding free furnished accommodation or House Rent Allowance in lieu thereof.
The above perquisites will exclude value of Stock Option benefits, if any, computed as per Income Tax Act/Rules, tax on which will be borne by the Company.
Others : Company’s contribution to retirement funds, official use of car / driver and communication facilities for Company’s business, as per rules of the Company.
Disclosures as required under Secretarial Standard 2 on General Meetings are provided as an Annexure to this Notice.
The draft agreement to be entered into by the Company with Mr. Sudhindra Vasantrao Desai, in respect of his appointment as Whole-time Director, contains the terms and conditions of his appointment including remuneration.
The draft Agreement to be entered into with Mr. Sudhindra Vasantrao Desai will be open for inspection in the manner specified in the Notice up to the date of the Annual General Meeting.
The Board recommends approval of the appointment and remuneration of Mr. Sudhindra Vasantrao Desai, as Whole-time Director of the Company.
Except Mr. Desai, being the appointee, none of the Directors and Key Managerial Personnel of the Company and their relatives are concerned or interested, in the resolutions set out at Item No. 7 and 11
Item No. 8 and 12
On the recommendation of the Nomination & Remuneration Committee, the Board of Directors appointed Mr. T. Madhava Das (DIN: 08586766) as an Additional Director with effect from July 11, 2020. In terms of Section 161(1) of the Companies Act, 2013, Mr. T. Madhava Das holds office as additional director upto the date of this Annual General Meeting. The Company has received a notice in writing from a member under Section 160 of the Companies Act, 2013, proposing his candidature for the office of Director of the Company.
On the recommendation of the Nomination & Remuneration Committee, the Board of Directors appointed Mr. T. Madhava Das (DIN: 08586766) as a Whole-time Director of the Company with effect from July 11, 2020 upto and including July 10, 2025, subject
to the approval of the members in the Annual General Meeting.
Mr. T. Madhava Das a graduate in Electrical Engineering from Regional Engineering College (now NIT), Calicut, joined L&T in 1985 as a GET. He has also completed his Post Graduation from Xavier Institute of Management, Bhubaneswar.
During his career, he held various key positions in Electrical business of ECC such as Regional Projects Manager (Hyderabad Region), Sector Projects Manager (UAE) and Chief - Business Initiatives & Contracts (Transmission Lines).
He was instrumental in expanding tower manufacturing capacity by setting up a new plant in Pithampur and in modernizing other manufacturing units. Subsequently, he headed Tranmission Line Business in domestic and later moved to GCC as Head of International Cluster-I.
Mr. Madhava Das was elevated to the position of Head - PT&D IC in 2014. Under his leadership, the domestic Transmission Line EPC, Tower Manufacturing, Tower Testing Services and the PT&D business in UAE, Saudi Arabia, Oman and Kuwait has grown significantly, besides moving to new geographies in ASEAN and Africa.
He has also successfully incubated Solar Business and has steered it to grow to the current level, besides adding microgrid and energy storage capabilities, making it one of the largest Solar EPCs in the country.
He has been inducted as a member of the Executive Committee of L&T in 2017. He is currently the Co-Chairman of Confederation of Indian Industry (CII)’s Transmission Line Committee.
In his new role, over and above his current responsibilities of the Power Transmission & Distribution IC, he will oversee the functioning of Water & Effluent Treatment (WET) IC.
Part III, of Schedule V of the Companies Act, 2013 and Secretarial Standard – 2 on General Meetings provides that the appointment and remuneration of Managing Directors and Whole-time Directors in accordance with Part I and Part II of the Schedule V shall be subject to approval by resolution of the shareholders in a General Meeting.
At the Annual General Meeting of the Company held on August 26, 2016 the shareholders had fixed the

61
maximum limits within which the Board was delegated authority to decide the remuneration of the Whole-time Directors of the Company. Pursuant to this, the Board has fixed the remuneration payable to Mr. T. Madhava Das during his tenure as Whole-time Director.
The Company will enter into an Agreement with Mr. T. Madhava Das appointing him as a Whole-time Director for the period from July 11, 2020 to July 10, 2025. During the period of this agreement and so long as the Whole-time Director performs his services as per the terms and conditions provided by this agreement, he shall be entitled to the following:
Salary : R 8,75,000/- (Rupees Eight Lac Seventy Five Thousand Only) per month in the scale of R 650000-R 75000-R 1025000-R 100000-R 1525000 with the annual increment due on April 1 every year.
Commission : The commission will be paid as per the parameters fixed by the Nomination and Remuneration Committee and the Board of Directors within the overall limits approved by the shareholders of the Company.
Perquisites : 12 lakh per annum excluding free furnished accommodation or House Rent Allowance in lieu thereof.
The above perquisites will exclude value of Stock Option benefits, if any, computed as per Income Tax Act/Rules, tax on which will be borne by the Company.
Others : Company’s contribution to retirement funds, official use of car / driver and communication facilities for Company’s business, as per rules of the Company.
Disclosures as required under Secretarial Standard 2 on General Meetings are provided as an Annexure to this Notice.
The draft agreement to be entered into by the Company with Mr. T. Madhava Das, in respect of his appointment as Whole-time Director, contains the terms and conditions of his appointment including remuneration.
The draft Agreement to be entered into with Mr. T. Madhava Das will be open for inspection in the manner specified in the Notice up to the date of the Annual General Meeting.
The Board recommends approval of the appointment and remuneration of Mr. T. Madhava Das, as Whole-time Director of the Company.
Except Mr. T. Madhava Das, being the appointee, none of the Directors and Key Managerial Personnel of the Company and their relatives are concerned or interested, in the resolutions set out at Item No. 8 and 12.
Item No. 9:
Mr. D.K Sen (DIN: 03554707) was appointed as the Whole-time Director of the Company for a term of five years from October 1, 2015 upto and including September 30, 2020.
The Board of Directors, on the recommendation of the Nomination & Remuneration Committee, approved the re-appointment of Mr. D.K Sen (DIN: 03554707) as a Whole-time Director of the Company with effect from October 1, 2020 upto and including April 7, 2023, subject to the approval of the members in the Annual General Meeting.
Mr. Dip Kishore Sen is the Whole Time Director and Senior Executive Vice President (Development Projects), Larsen & Toubro Ltd. A Civil Engineering graduate from IIT Kharagpur and a Post Graduate in Business Management from XLRI, Jamshedpur, prior to joining Larsen & Toubro, Mr. Sen worked for 12 years for reputed companies like M/s. Tata Steel, Jamshedpur, M/s. Development Consultants, Kolkata and was involved in a turnkey EPC Transmission line project in Malaysia.
Mr. Sen started his tenure at L&T in 1989 as Sr. Manager (Civil & Structural Design) in EDRC Kolkata and has subsequently headed various portfolios like Head (Civil & Structural Design) EDRC Kolkata, Project Manager - Safal F&V Market Project, Bangalore, SPM (B&F) Kolkata Region, Regional Manager – Mumbai, Project Director Mumbai International Airport & Head - Transportation Infrastructure. His uniqueness is in his versatility of having worked across domains like Design & Engineering, Business Development, Tendering and hardcore construction.
Driven by a passion to succeed and possessing the requisite talent, Mr. Sen steadily rose up the ranks and during this period he led several marquee projects that underscored L&T’s standing as ‘a builder of nations’. The most notable amongst which was the highly complex, mega project of the Mumbai International Airport. As Project Director from 2007 to 2011, he oversaw the most critical phase of project and was chiefly instrumental in paving the way to delivering a world-class airport in time, for which the organization takes great pride.

62
NOTICE ANNUAL REPORT 2019-20
Mr. Sen took over as Senior Vice President and Head -Transportation Infrastructure in 2011 to spearhead the organization’s efforts in the realms of roads, highways, elevated corridors and railways. Under his leadership, the business completed several high value projects in both India and the Gulf.
Under his leadership, several major breakthroughs were achieved in the Railways sector and he has successfully steered the business to bag the prestigious projects like Metro Express Project in Mauritius & Dhaka Metro Project in Bangladesh.
He has played a very prominent role in establishing L&T in the GCC Countries by securing several landmark projects, notable among which are the Maffraq - Ghweifat Road Project, the Abu Dhabi International Airport etc. Under his leadership L&T bagged their first Railways job in the Kingdom of Saudi Arabia, some urban infra development projects in Qatar, Oman & UAE.
Part III, of Schedule V of the Companies Act, 2013 and the Secretarial Standard – 2 on General Meetings provides that the appointment and remuneration of Managing Directors and Whole-time Directors, in accordance with Part I and Part II of the Schedule V, shall be subject to approval by resolution of the shareholders in a General Meeting.
At the Annual General Meeting of the Company held on August 26, 2016 the shareholders had fixed the maximum limits within which the Board was delegated authority to decide the remuneration of the Whole-time Directors of the Company. Pursuant to this, the Board has fixed the remuneration payable to Mr. D.K Sen during his tenure as Whole-time Director.
The Company would enter into an Agreement with Mr. D.K Sen re-appointing him as a Whole-time Director for the period from October 1, 2020 to April 7, 2023. During the period of this agreement and so long as the Whole-time Director performs his services as per the terms and conditions provided by this agreement, he shall be entitled to the following:
Salary : 12,25,000 (Rupees Twelve Lac Twenty Five Thousand only) per month in the scale of 6,50,000 - 75,000 – 10,25,000 – 1,00,000 - 15,25,000 with the annual increment due on April 1 every year.
Commission : The commission will be paid as per the parameters fixed by the Nomination and Remuneration
Committee and the Board of Directors within the overall limits approved by the shareholders of the Company.
Perquisites : 12 lakh per annum excluding free furnished accommodation or House Rent Allowance in lieu thereof.
The above perquisites will exclude value of Stock Option benefits, if any, computed as per Income Tax Act/Rules, tax on which will be borne by the Company.
Others : Company’s contribution to retirement funds, official use of car / driver and communication facilities for Company’s business, as per rules of the Company.
Disclosures as required under Secretarial Standard 2 on General Meetings are provided as an Annexure to this Notice.
The draft agreement to be entered into by the Company with Mr. D.K Sen, in respect of his re-appointment as Whole-time Director, would contain the terms and conditions of his re-appointment including remuneration.
The draft Agreement to be entered into with Mr. D.K Sen will be open for inspection in the manner specified in the Notice up to the date of the Annual General Meeting.
The Board recommends approval of the re-appointment and remuneration of Mr. D.K Sen, as Whole-time Director of the Company.
Except Mr. Sen, being the appointee, none of the Directors and Key Managerial Personnel of the Company and their relatives are concerned or interested, in the resolution set out at Item No. 9.
Item No. 10
On the recommendation of the Nomination & Remuneration Committee, the Board of Directors appointed Mr. Subramanian Sarma (DIN: 00554221) as a Whole-time Director of the Company with effect from August 19, 2020 upto and including August 18, 2025, subject to the approval of the members in the Annual General Meeting.
Mr.Sarma is the Chief Executive Officer (CEO) and Managing Director (MD) of L&T Hydrocarbon Engineering Ltd, a wholly-owned subsidiary of Larsen & Toubro Ltd. In this role, he leads the worldwide Hydrocarbon projects portfolio of L&T.
A graduate in Chemical Engineering, Mr. Sarma completed his Master’s from IIT Mumbai. A seasoned

63
professional, he has over 37 years of experience, with the last 28 being in the Middle East.
During his career span, Mr. Sarma has handled the complete Oil & Gas value chain including Executive Management, Business Development, Project Management and Process Engineering.
Mr. Sarma is the recipient of the CHEMTECH CEW, Business Leader of the year 2017 for Engineering Services.
Immediately prior to joining L&T, Mr. Sarma served as Managing Director of Petrofac - Onshore Engineering & Construction, with complete responsibility for all of the Company’s onshore projects worldwide.
He was appointed as a Non-Executive Director of the Company and the Chief Executive Officer and Managing Director of L&T Hydrocarbon Engineering Limited with effect from August 19, 2015.
In his new role, over and above his current responsibilities as CEO and Managing Director of L&T Hydrocarbon Engineering Limited, Mr. Sarma will assume charge of Power IC.
Part III, of Schedule V of the Companies Act, 2013 and Secretarial Standard – 2 on General Meetings provides that the appointment and remuneration of Managing Directors and Whole-time Directors, in accordance with Part I and Part II of the Schedule V, shall be subject to approval by resolution of the shareholders in a General Meeting.
At the Annual General Meeting of the Company held on August 26, 2016 the shareholders had fixed the maximum limits within which the Board was delegated authority to decide the remuneration of the Whole-time Directors of the Company. Pursuant to this, the Board has fixed the remuneration payable to Mr. Subramanian Sarma during his tenure as Whole-time Director.
Mr. Subramanian Sarma has not been a resident in India for a continuous period of 12 months immediately preceding his date of appointment, the Company will seek approval of the Central Government as required under Schedule V and other applicable provisions of the Companies Act, 2013 and the ruled made thereunder.
The Company will enter into an Agreement with Mr. Subramanian Sarma appointing him as a Whole-time Director for the period from August 19, 2020 to August 18, 2025. During the period of this agreement and so
long as the Whole-time Director performs his services as per the terms and conditions provided by this agreement, he shall be entitled to the following:
Salary : R 14,25,000 (Rupees Fourteen Lakh Twenty Five Thousand Only) per month in the scale of R 10,25,000 - R 1,00,000 – R 19,25,000 with the annual increment due on April 1 every year.
Commission : The commission will be paid as per the parameters fixed by the Nomination and Remuneration Committee and the Board of Directors within the overall limits approved by the shareholders of the Company.
Perquisites : 12 lakh per annum excluding free furnished accommodation or House Rent Allowance in lieu thereof.
The above perquisites will exclude value of Stock Option benefits, if any, computed as per Income Tax Act/Rules, tax on which will be borne by the Company.
Others : Company’s contribution to retirement funds, official use of car / driver and communication facilities for Company’s business, as per rules of the Company.
Disclosures as required under Secretarial Standard 2 on General Meetings are provided as an Annexure to this Notice.
The draft agreement to be entered into by the Company with Mr. Subramanian Sarma, in respect of his appointment as Whole-time Director, contains the terms and conditions of his appointment including remuneration.
The draft Agreement to be entered into with Mr. Subramanian Sarma will be open for inspection in the manner specified in the Notice up to the date of the Annual General Meeting.
The Board recommends approval of the appointment and remuneration of Mr. Subramanian Sarma, as Whole-time Director of the Company.
Except Mr. Sarma, being the appointee, none of the Directors and Key Managerial Personnel of the Company and their relatives are concerned or interested, in the resolution set out at Item No. 10.
Item No. 13
The Company requires adequate capital to meet the needs of growing business. While it is expected that the internal generation of funds would partially finance the need for capital, debt raising would be another source of

64
NOTICE ANNUAL REPORT 2019-20
funds and hence it is thought prudent for the Company to have enabling approvals to raise a part of the funding requirements for the said purposes as well as for such other corporate purposes as may be permitted under applicable laws through the issue of appropriate securities as defined in the resolution, in Indian or international markets.
The fund raising may be through a mix of equity/ equity-linked instruments, as may be appropriate. Members’ approval is sought for the issue of equity shares, securities linked to or convertible into Equity Shares or depository receipts of the Company. SEBI (Listing Obligations and Disclosure Requirements) Regulations, 2015 also provide that the Company shall, in the first instance, offer all Securities for subscription pro-rata to the Shareholders unless the Shareholders in a general meeting decide otherwise. Members’ approval is sought for issuing any such instrument as the Company may deem appropriate to parties other than the existing shareholders. Whilst no specific instrument has been identified at this stage, in the event the Company issues any equity linked instrument, the issue will be structured in a manner such that the additional share capital that may be issued would not be more than 5% of the paid-up capital of the Company (as at the date when the Board recommended passing of the Special Resolution). The equity shares, if any, allotted on issue, conversion of Securities shall rank in all respects pari passu with the existing Equity Shares of the Company.
The Company may also opt for issue of securities through Qualified Institutions Placement (QIP). A QIP of the shares of the Company would be less time consuming and more economical than other modes of raising capital.
Accordingly, the Company may issue securities by way of a QIP in terms of Chapter VI of the Securities and Exchange Board of India (Issue of Capital and Disclosure Requirements) Regulations, 2018 (‘SEBI Regulations’). These securities will be allotted only to Qualified Institutional Buyers (QIBs) as per the SEBI Regulations and there will be no issue to retail individual investors and existing retail shareholders. The resolution proposed is an enabling resolution and the exact price, proportion and timing of the issue of the securities will be decided by the Board based on an analysis of the specific requirements after necessary consultations. Therefore, the proposal seeks to confer upon the Board the absolute discretion to determine the terms of issue in consultation with the Lead Managers to the Issue.
As per Chapter VI of the SEBI Regulations, an issue of securities on QIP basis shall be made at a price not less than the average of the weekly high and low of the closing prices of the related shares quoted on the stock exchange during the two weeks preceding the “relevant date.” The Board may, at its absolute discretion, issue equity shares at a discount of not more than five percent or such other discount as may be permitted under applicable regulations to the ‘floor price’ as determined in terms of the SEBI Regulations, subject to Section 53 of the Companies Act, 2013.
As the pricing of the offer cannot be decided except at a later stage, it is not possible to state the price of shares to be issued.
However, the same would be in accordance with the provisions of the SEBI Regulations, the Companies Act, 2013, or any other guidelines / regulations / consents as may be applicable or required.
In case of issue of convertible bonds and/or equity shares through depository receipts the price will be determined on the basis of the then current market price and other relevant guidelines.
The “relevant date” for the above purpose, shall be -
i) in case of allotment of equity shares, the date of meeting in which the Board decides to open the proposed issue
ii) in case of allotment of eligible convertible securities, either the date of the meeting in which the Board decides to open the issue of such convertible securities or the date on which the holders of such convertible securities become entitled to apply for the equity shares, as may be determined by the Board.
The Stock Exchange for the same purpose is BSE Limited / National Stock Exchange of India Limited.
The Shareholders through a resolution passed at their meeting held on August 1, 2019, had approved issue of Securities for an aggregate sum up to US$ 600 Million (or its rupee equivalent) or INR 4500 Crore, if higher. The Company has not raised any funds under the said approval. However, Shareholders’ resolution for QIP issuance is valid for a period of 12 months from the date of passing of the resolution. Accordingly, the Shareholders’ approval is sought for renewal of the approval.

65
The Directors recommend this Resolution for approval of the Shareholders.
None of the Directors and Key Managerial Personnel of the Company and their relatives are concerned or interested, in the resolution set out at Item No. 13.
Item No. 14:In accordance with the provisions of Section 139 of the Companies Act, 2013 read with the Companies (“Audit and Auditors Rules, 2014), M/s. Deloitte Haskins & Sells LLP (“DHS”), were appointed as the Statutory Auditors of the Company, at the Annual General Meeting held on September 9, 2015, to hold office for a period of 5 years from the conclusion of the 70th AGM till the conclusion of the 75th AGM.
DHS would be completing their first term of five years at this AGM. The Board of Directors (“Board”) of the Company on the recommendation of the Audit Committee (“Committee”) recommended the re-appointment of DHS for a second and final term of five years to hold office from the conclusion of the 75th AGM till the conclusion of the 80th AGM in accordance with the provisions of Section 139 of the Companies Act, 2013 and the Companies (Audit and Auditors) Rules, 2014.
Credentials of DHS:
Deloitte Haskins & Sells LLP, registered since 1983, is one of the member firms of Deloitte Touche Tohmatsu Limited, a UK private company limited by guarantee (“DTTL”). Each DTTL member firm provides services in particular geographic areas and is subject to the laws and professional regulations of the particular country or countries in which it operates.
Deloitte Haskins & Sells LLP tied up with CC Chokshi & Co in 1983 which was one of the largest Indian Independent audit and accounting firms. After that, it got merged with Fraser & Ross, PC Hansotia & Co and later with SB Billimoria (SBB) in 1999. In 2004, AF Ferguson & Co (one of India’s oldest audit firm) merged into existing DHS firms.
Deloitte is now a global network with circa 286,000 people with revenues over $43 billion. Deloitte India has more than 10,000 professionals operating out of 13 cities – Ahmedabad, Bengaluru, Vadodara, Chennai, Coimbatore, Goa, Gurgaon, Hyderabad, Jamshedpur, Kochi, Kolkata, Mumbai and Pune providing professional services in the areas of Audit, Risk Advisory, Tax, Consulting, and Financial Advisory services to public
and private clients spanning multiple industries. It draws its strength from its people, which include 2,500+ professionals in Audit, 2,350 + in Tax, 1,900+ in Consulting, and 1000+ in Financial Advisory.
Rationale for re-appointment:
The Board and the Audit Committee considered various parameters while approving the re-appointment of DHS as Statutory Auditors of the Company including but not limited to their capability to serve a diverse and complex business landscape as that of the Company, existing experience in the Company’s business verticals and segments, market standing of the firm, clientele, technical knowledge and found DHS suited to continue to handle the scale, diversity and complexity associated with the audit of the financial statements of the Company.
Terms and Conditions of re-appointment:
Term of Re-Appointment –
5 years from the conclusion of the 75th AGM till the conclusion of the 80th AGM
Remuneration –
Fixed Remuneration for Statutory Audit of R 205 lakh for FY 2020-21 plus applicable taxes, travelling and other out of pocket expenses incurred by them in connection with the statutory audit. The proposed fees is based on the scope of work, knowledge, industry experience, expertise, time and efforts required to be put by DHS for FY 2020-21. The proposed fees are also in line with the industry benchmarks. The fees for services in the nature of limited review, statutory certifications and other professional work will be in addition to the audit fee as above and will be decided by the Management in consultation with the Auditors and will be subject to approval by the Board of Directors and/or the Audit Committee.
Further, the remuneration for the remaining tenure of DHS as Statutory Auditors for the FY 2021-22 to FY 2024-25 will be decided by the Management in consultation with the Auditors and will be subject to the approval by the Board of Directors and/or the Audit Committee
DHS has given their consent to act as Statutory Auditors of the Company and have confirmed that the said re-appointment if made will be in accordance with the conditions prescribed under Section 139 and 141 of the Companies Act, 2013.

66
NOTICE ANNUAL REPORT 2019-20
Accordingly, consent of the members is sought for the aforesaid purpose.
The Directors recommend this resolution for approval of the shareholders.
None of the Directors and Key Managerial Personnel of the Company and their relatives are concerned or interested in the resolution set out at Item No. 14.
Item No. 15:
In accordance with the provisions of Section 148 of the Companies Act, 2013 (“the Act”) and the Companies (Audit and Auditors) Rules, 2014 (“the Rules”) the Company is required to appoint a cost auditor to audit the cost records of the Company, for products and services, specified under Rules issued in pursuance to the above section. On the recommendation of the Audit Committee, the Board of Directors had approved the appointment of M/s. R. Nanabhoy & Co, Cost Accountants (Regn. No. 00010), as the Cost Auditors of the Company to conduct audit of cost records maintained by the Company for the Financial Year 2020-21, at a remuneration of R 13 lakhs plus applicable taxes and out of pocket expenses at actuals for travelling and boarding/lodging.
M/s. R. Nanabhoy & Co., Cost Accountants, have furnished certificates regarding their eligibility for appointment as Cost Auditors of the Company. In accordance with the provisions of Section 148 of the Act read with the Rules, the remuneration payable to the cost auditor has to be ratified by the shareholders of the Company.
Accordingly, consent of the members is sought for the aforesaid purpose.
The Directors recommend this resolution for approval of the shareholders.
None of the Directors and Key Managerial Personnel of the Company and their relatives are concerned or interested, in the resolution set out at Item No. 15.
By Order of the Board of Directors
For LARSEN & TOUBRO LIMITED,
SIVARAM NAIR A COMPANY SECRETARY
M.No – F3939
Mumbai, July 11, 2020

67
(ANNEXURE TO NOTICE DATED JULY 11, 2020)DETAILS OF DIRECTORS SEEKING APPOINTMENT/RE-APPOINTMENT AT THE FORTHCOMING
ANNUAL GENERAL MEETING[Pursuant to Regulation 36(3) of the SEBI(Listing Obligations and Disclosure Requirements) Regulations, 2015
and Secretarial Standard 2 on General Meetings]
Name of the Director
Mr. Subramanian Sarma Ms. Sunita Sharma Mr. A.M Naik Mr. D.K Sen
Date of Birth February 4, 1958 March 9, 1959 June 9, 1942 March 19, 1956Date of Appointment on the Board
August 19, 2015 April 1, 2015 November 23, 1989 October 1, 2015
Qualifications Masters’ Degree in Chemical Engineering from IIT Bombay
Masters Degree in Science
B.E (Mech.) B.Tech (Hons.) in Civil Engineering from IIT, Kharagpur. 1977 and
MBA (PGDBM) from XLRI, Jamshedpur. 1986
Expertise Expertise in managing large business portfolios in energy sector.
Vast Experience in Insurance and Housing Finance
Diverse and vast experience in General Management, Technology, Engineering & Construction
Vast experience in Design and Engineering, Business Development, Tendering and construction
Directorships held in other public companies including private companies which are subsidiaries of public companies (excluding foreign companies)
L&T Hydrocarbon Engineering Limited
L&T Power Limited
National Stock Exchange of India Limited
1. Larsen & Toubro Infotech Limited
2. L&T Technology Services Limited
3. L&T Construction Equipment Limited
4. L&T Welfare Company Limited5. L&T Employees Welfare
Foundation Private Limited 6. Mindtree Limited7. National Skill Development
Council
1. L&T Infrastructure Engineering Limited
2. L&T Aviation Services Private Limited
3. L&T Power Development Limited
4. Nabha Power Limited5. Raykal Aluminum Company
Private Limited6. Larsen & Toubro Qatar LLC7. Larsen & Toubro Oman LLC8. Construction Skill
Development Council of India
Memberships/Chairmanships of committees across all companies
MemberRisk Management CommitteeLarsen & Toubro Limited
ChairpersonStakeholders Relationship CommitteeLarsen & Toubro Limited
MemberNomination & Remuneration CommitteeLarsen & Toubro Limited
Larsen & Toubro Infotech Limited
L&T Technology Services Limited
MemberCorporate Social Responsibility CommitteeLarsen & Toubro Limited
Number of Meetings attended during the year
5 of 5 5 of 5 4 of 5 5 of 5
Shareholding of Non-Executive Directors
NA 100 624958 NA
Relationships between directors inter-se
Nil Nil Nil Nil

68
NOTICE ANNUAL REPORT 2019-20
Name of the Director Mr. Sudhindra Vasantrao Desai Mr. T. Madhava dasDate of Birth July 5, 1960 January 25, 1963Date of Appointment on the Board
July 11, 2020 July 11, 2020
Qualifications Masters in Civil Engineering from IIT B.E from NIT Calicut, Post Graduate in Management from Xavier Institute, Bhubaneshwar
Expertise Vast Experience in Heavy Civil and Infrastructure Space Expertise in managing large business portfolios in power transmission and distribution segment
Directorships held in other public companies including private companies which are subsidiaries of public companies (excluding foreign companies)
L&T Arunachal Hydropower Limited
L&T Himachal Hydropower Limited
L&T Uttaranchal Hydropower Limited
L&T Infrastructure Engineering Limited
International Seaports Dredging Private Limited
Indian Electricals and Electronics Manufacturers Association
Memberships/Chairmanships of committees across all companies
Member
Corporate Social Responsibility Committee
L&T Uttaranchal Hydropower Limited
NA
Number of Meetings attended during the year
NA NA
Shareholding of Non-Executive Directors
NA NA
Relationships between directors inter-se
Nil Nil

69
INFORMATION AT A GLANCE:
Sr. no Particulars Details
1 Day, Date and Time of AGM Thursday, August 13, 2020, 3.30 P.M
2 Mode Video Conference (VC) and Other Audio Visual Means (OAVM)
3 Participation through VC/OAVM Members can login from 03.00 P.M (IST) on the date of the AGM at https://emeetings.kfintech.com
4 Helpline Number for VC/OAVM participation
1800-425-8998/1800-345-4001
5 Submission of Questions/Queries before AGM
Members seeking any information with regard to the accounts or any matter to be placed at the AGM, are requested to write to the Company on or before Thursday, August 6, 2020 through email on [email protected]. The same will be replied by the Company suitably. Please note that, members queries/ questions will be responded to only, if the shareholder continues to hold the shares as on the cut-off date i.e Thursday, August 6, 2020.
6 Speaker Registration before AGM Visit https://emeetings.kfintech.com and click on “Speaker Registration” during the period from Saturday, August 8, 2020 (9.00 A.M IST) to Monday August 10, 2020 (09.00 A.M IST)
7 Recorded Transcript Will be made available post AGM at www.larsentoubro.com
8 Dividend for FY 2020 recommended by the Board
R 8 per equity share of the face value of R 2 each
9 Dividend Book Closure Dates Friday, August 7, 2020 to Thursday, August 13, 2020 (both days inclusive)
10 Dividend Payment Date 17th August, 2020
11 Cut-off date for e-voting Thursday, August 6, 2020
12 Remote e-voting start time and date Monday, August 10, 2020, 09.00 A.M
13 Remote e-voting end time and date Wednesday, August 12, 2020, 05.00 P.M
14 Remote e-voting website of Kfintech https://evoting.karvy.com
15 Name, address and contact details of e-voting service provider and registrar and transfer agent
KFin Technologies Private Limited (“Kfintech”), Karvy Selenium, Tower B, Plot 31-32, Gachibowli, Financial District, Nanakramguda, Hyderabad 500 032 Tel No: 1800-425-8998/1800-345-4001 Email: [email protected]
16 Email Registration and Contact Updation Process
Demat Shareholders: Contact respective Depository Participant
Physical Shareholders:KFintech Website: https://ris.KFintech.com/email_registration/

70
Board RepoRt ANNUAL RepoRt 2019-20
Board reportDear Members,
the Directors have pleasure in presenting their 75th Annual Report and Audited Financial Statements for the year ended 31st March 2020.
FINaNCIaL rESULTS:
particulars 2019-20v crore
2018-19v crore
profit Before Depreciation, exceptional items & tax 7379.43 8576.66
Less: Depreciation, amortization, impairment and obsolescence 1020.51 999.55
profit before exceptional items and tax 6358.92 7577.11
Add: exceptional Items 626.99 1642.35profit before tax 6985.91 9219.46Less: provision for tax 961.15 2271.13profit for the year from
continuing operations 6024.76 6948.33profit before tax from
discontinued operations 865.38 812.40Less: tax expense of discontinued
operations 210.93 269.34Net profit after tax from
discontinued operations 654.45 543.06Net profit after tax from
continuing operations and discontinued operations 6679.21 7491.39
Add: Balance brought forward from the previous year 15046.99 14250.01
Less: Business combination impact – 3291.90
Less: Ind AS 115 transition adjustment – 704.04
Less: Ind AS 116 transition adjustment 3.97 –
Less: Dividend paid for the previous year (Including dividend distribution tax) 2754.94 2596.78
Less: Interim dividend paid during the year 1403.89 –
Less: Loss on remeasurement of the net defined benefits plans / equity instruments through other Comprehensive Income 512.96 20.37
Balance available for disposal (which the Directors appropriate as follows) 17050.44 15128.31
Less: Debenture Redemption Reserve 93.27 81.32
Balance to be carried forward 16957.17 15046.99
STaTE oF CoMPaNY aFFaIrS:
the total income for the financial year under review was R 85,192 crore as against R 84,999 crore for the previous financial year, registering an increase of 0.23%. the profit before tax from continuing operations including exceptional items was R 6,986 crore for the financial year under review as against R 9,219 crore for the previous financial year, registering a decrease of 24%. the profit after tax from continuing operations including exceptional items was R 6,025 crore for the financial year under review as against R 6,948 crore for the previous financial year, registering a decrease of 13%.
aMoUNT To BE CarrIEd To rESErVE:
the Company has not transferred any amount to the reserves during the current financial year.
dIVIdENd:
During the Financial Year ended March 31, 2020, the Company paid an interim dividend of R 10/- (500%) per equity share amounting to R 1,403.89 crore
the Directors recommend payment of dividend of R 8/- (400%) per equity share of R 2/- each on the share capital amounting to R 1,123.11 crore for FY 2020.
the total dividend for FY 2020, including the final dividend, if approved by shareholders, would amount to R 18/- (900%) per equity share.
the Dividend payment is based upon the parameters mentioned in the Dividend Distribution policy approved by the Board of Directors of the Company which is in line with regulation 43A of the SeBI (Listing obligations & Disclosure Requirements) Regulations, 2015 (‘SeBI LoDR Regulations’). the policy is provided as Annexure ‘G’ forming a part of this Board Report and also uploaded on the Company’s website at http://investors.larsentoubro.com/Listing-Compliance.aspx.
CaPITaL & FINaNCE:
During the year under review, the Company allotted 7,83,249 equity shares of R 2/- each upon exercise of stock options by the eligible employees under the employee Stock option Schemes.
on exercise of the conversion option of US$200 million 0.675% convertible bonds due in 2019, the Company has allotted 3,79,388 equity shares of R 2/- each against conversion of 7,970 FCCBs of the face value of US$ 1000 each. Remaining 1,92,030 Bonds of the face value of US$1000 each were redeemed/repaid.

71
the Company repaid long-term borrowings of USD 492.03 million (approx. R 3,500 crore) during the year under review on scheduled due dates. on the other hand, the Company raised USD 425 million of foreign currency borrowings for meeting business requirements and certain capital expenditure.
the Company has issued and allotted on private placement basis, Unsecured, Rated, Listed, Redeemable Non-convertible Debentures (NCDs) aggregating to R 5900 crore during the financial year 2019-20. the funds raised through issuance of NCDs had been utilised for capital expenditures, long-term working capital, business expenses, treasury investments and bonafide purposes in the normal course of business. these NCDs are listed on the Wholesale Debt Market Segment of National Stock exchange of India Limited and BSe Limited.
Listing of CPs
the Company has issued Commercial papers amounting to R 4,845 Crore during the FY 2019-20.
pursuant to the SeBI Circular dated october 2019, the Company has listed the Commercial papers on BSe Limited.
the Company has not defaulted on any of its dues to the financial lenders.
the Company’s borrowings are rated by CRISIL and ICRA. the details of the same are given on page 115 in Annexure ‘B’ - Report on Corporate Governance forming part of this Board Report and is also available on the website of the Company.
dIVESTMENT oF ELECTrICaL & aUToMaTIoN BUSINESS:
As disclosed in our previous Report, the Company had on 1st May 2018 signed, subject to regulatory approvals, definitive agreements with Schneider electric, a global player in energy management and automation for strategic divestment of its electrical and Automation (e&A) business for an all-cash consideration of R 14,000 crore. As reported last time, Schneider electric had received approval from Competition Commission of India for the proposed combination, vide letter dated 18th April 2019. the process of divestment was progressing well. However, due to the Covid-19 pandemic and subsequent lock-down, the process has been delayed and the Company expects the transaction to close after normalcy is restored.
CaPITaL EXPENdITUrE:
As at 31st March 2020, the gross property, plant and equipment, investment property and other intangible assets including leased assets, stood at R 13,559.73 crore and the net property, plant and equipment, investment property and other intangible assets, including leased assets, at R 8,637.58 crore. Capital expenditure during the year amounted to R 1,370.51 crore.
dEPoSITS:
the Company has not accepted deposits from the public falling within the ambit of Section 73 of the Companies Act, 2013. the Company does not have any unclaimed deposits as of date. All unclaimed deposits have been transferred to Investor education & protection Fund.
pursuant to the Ministry of Corporate Affairs (MCA) notification amending the Companies (Acceptance of Deposits) Rules, 2014, the Company has filed with the Registrar of Companies (RoC) the requisite returns for outstanding receipt of money/loan by the Company, which is not considered as deposits.
dEPoSITorY SYSTEM:
As the members are aware, the Company’s shares are compulsorily tradable in electronic form. As on 31st March 2020, 98.68% of the Company’s total paid up capital representing 1,38,52,96,740 shares are in dematerialized form.
SeBI LoDR Regulations mandate that the transfer, except transmission and transposition, of securities are to be carried out in dematerialized form only with effect from 1st April 2019. In view of the numerous advantages offered by the Depository system as well as to avoid frauds, members holding shares in physical mode are advised to avail of the facility of dematerialization from either of the depositories. Accordingly, any investor desirous of transferring shares (which are held in physical form) can transfer only after their shares are dematerialized.
Further in adherence to SeBI’s circular to enhance the due-diligence for dematerialization of the physical shares, the Company has provided the static database of the shareholders holding shares in physical form to the depositories to augment the integrity of its existing systems and enable the depositories to validate any dematerialization request.

72
Board RepoRt ANNUAL RepoRt 2019-20
TraNSFEr To INVESTor EdUCaTIoN aNd ProTECTIoN FUNd:
the Company has been regularly sending communications to members whose dividends are unclaimed, requesting them to provide/update bank details with RtA/Company, so that dividends paid by the Company are credited to the investor’s account on time. efforts are also made by the Company in co-ordination with the Registrar to locate the shareholders who have not claimed their dues.
Despite these efforts, an amount of R 5,27,14,490 which was due & payable and remained unclaimed and unpaid for a period of seven years, was transferred to Investor education & protection Fund (IepF) as provided in section 125 of the Companies Act, 2013 and the rules made thereunder. Cumulatively, the amount transferred to the said fund was R 29,61,28,286 as on 31st March 2020.
In accordance with the provisions of the Section 124(6) of the Companies Act, 2013 and Rule 6(3)(a) of the Investor education and protection Fund Authority (Accounting, Audit, transfer and Refund) Rules, 2016 (‘IepF Rules’), the Company has transferred 2,47,300 equity shares of R 2 each (0.02% of total number of shares) held by 2,709 shareholders (0.24% of total shareholders) to IepF. the said shares correspond to the dividend which had remained unclaimed for a period of seven consecutive years from the financial year 2011-12. Subsequent to the transfer, the concerned shareholders can claim the said shares along with the dividend(s) by making an application to IepF Authority in accordance with the procedure available on www.iepf.gov.in and on submission of such documents as prescribed under the IepF Rules.
the Company sends specific advance communication to the concerned shareholders at their address registered with the Company and also publishes notice in newspapers providing the details of the shares due for transfer so as to enable them to take appropriate action. All corporate benefits accruing on such shares viz. bonus shares, etc. including dividend except right shares shall be credited to IepF.
SUBSIdIarY / aSSoCIaTE / JoINT VENTUrE CoMPaNIES:
During the year under review, the Company subscribed to / acquired equity / preference shares in various subsidiary / associate / joint venture companies. the details of
investments / divestments in subsidiary companies during the year are as under:
a) Shares acquired during the year:
Name of the Company Type of Shares
No. of shares
L&t Shipbuilding Limited (Note 1)
equity 1,33,20,000
Mindtree Limited (Note 2) equity 10,05,27,734L&t Construction Machinery Limited (Note 3)
equity 19,91,32,091
L&t Construction equipment Limited (Note 3)
equity 4,71,600
L&t Construction equipment Limited (Note 3)
preference 64,83,00,000
Note:
1. the Company had acquired the entire stake held by tamil Nadu Industrial Development Corporation (tIDCo) in L&t Shipbuilding Limited thereby making it a wholly owned subsidiary of the Company. Subsequently, pursuant to the National Company Law tribunal (Mumbai & Chennai bench) approval for the Scheme of Amalgamation, L&t Shipbuilding Limited has merged with the Company (appointed date 1st April 2019 and effective date 18th May 2020).
2. the Company acquired 3,27,60,229 equity shares of Mindtree Limited, pursuant to the Share purchase Agreement. Further, 164,42,134 equity shares of Mindtree Limited have been acquired in the open market and 5,13,25,371 equity shares have been acquired through open offer.
3. pursuant to the approval of the Composite Scheme of Amalgamation & Arrangement between L&t Realty Limited (LtR), L&t Construction equipment Limited (LtCeL) and L&t Construction Machinery Limited (LtCML) by National Company Law tribunal, Mumbai bench (appointed date 1st April 2018 and effective date 17th May 2020), LtR has been amalgamated into LtCeL and the manufacturing business of LtCeL has been demerged into LtCML. As consideration towards this amalgamation and demerger, the Company has been allotted 19,91,32,091 equity shares of R 10 each by L&t Construction Machinery Limited and 4,71,600 equity shares of R 10 each and 64,83,00,000 12% non-convertible preference shares of R 10 each by L&t Construction equipment Limited.

73
B) Equity shares sold / transferred / reduced during the year:
Name of the Company Number of shares
L&t technology Services Limited (Note 1) 40,63,632L&t Kobelco Machinery private Limited (LtKM) (Note 2)
2,55,00,000
pursuant to the amendment agreement entered by the Company with Canadian pension plan Investment Board (CCpIB), L&t Infrastructure Development projects Limited, (L&t IDpL), a wholly owned subsidiary of the Company, has allotted 30,84,62,468 equity shares to CCpIB India private Holdings Inc. Accordingly, the Company presently holds 51% in L&t IDpL.
Note:
1. the Company had sold shares of L&t technology Services Limited in the open market and through offer for Sale towards achieving the minimum public shareholding norm. pursuant to this sale, the present public shareholding in L&t technology Services Limited is more than 25% and is in compliance of SeBI requirements.
2. Sale of 51% stake of L&t in LtKM to the JV partner is in line with L&t’s strategy to move away from the non-core businesses.
C) Companies Struck off:
L&t Cassadian Limited has applied to the Ministry of Corporate Affairs for strike off under the provisions of Companies Act, 2013 and is awaiting approval for the same.
d) Performance and Financial Position of subsidiary / associate and joint venture companies:
A statement containing the salient features of the financial statement of subsidiary / associate / joint venture companies and their contribution to the overall performance of the Company is provided on pages 594 to 607 of this Annual Report.
the Company has formulated a policy on identification of material subsidiaries in line with Regulation 16(c) of the SeBI LoDR Regulations and the same is placed on the website at http://investors.larsentoubro.com/Listing-Compliance.aspx. the Company does not have any material subsidiaries.
ParTICULarS oF LoaNS GIVEN, INVESTMENTS MadE, GUaraNTEES GIVEN or SECUrITY ProVIdEd BY THE CoMPaNY:
the Company has disclosed the full particulars of the loans given, investments made or guarantees given or security provided as required under section 186 of the Companies Act, 2013, Regulation 34(3) and Schedule V of the SeBI LoDR Regulations in Note 58 forming part of the financial statement.
ParTICULarS oF CoNTraCTS or arraNGEMENTS WITH rELaTEd ParTIES:
the Audit Committee and the Board of Directors have approved the Related party transactions policy, signifying the individual threshold limits for each transaction and the same has been uploaded on the Company’s website http://investors.larsentoubro.com/Listing-Compliance.aspx.
the Company has a process in place to periodically review and monitor Related party transactions.
All the related party transactions were in the ordinary course of business and at arm’s length. the Audit Committee has approved the related party transactions for the FY 2019-20 and estimated related party transactions for FY 2020-21.
there were no materially significant related party transactions that may have conflict with the interest of the Company.
MaTErIaL CHaNGES aNd CoMMITMENTS aFFECTING THE FINaNCIaL PoSITIoN oF THE CoMPaNY, BETWEEN THE ENd oF THE FINaNCIaL YEar aNd THE daTE oF THE rEPorT:
the Company had filed a petition for merger of L&t Shipbuilding Limited with the Company. the amalgamation was approved by National Company Law tribunals at Mumbai & Chennai. L&t Shipbuilding Limited has thus merged with the Company (appointed date 1st April 2019 and effective date 18th May 2020).
there are no other material changes and commitments affecting the financial position of the Company between the end of the financial year and the date of this report.
CoMPaNY rESPoNSE To CoVId-19
During March 2020, the CoVID pandemic increased rapidly forcing Governments of most countries to enforce a lockdown of all activities. Heeding to the

74
Board RepoRt ANNUAL RepoRt 2019-20
various guidelines issued in India by the Central and State Governments and abroad by various agencies on the Covid-19 pandemic, all establishments, offices & factories of the Company had shut down operations from March 25, 2020. Your Company immediately took several measures to ensure health and safety of its workers and other employees and thereafter, steps were taken to ensure business continuity of essential services including Security and It lights-on operations. Special permissions were also taken for ensuring that very critical operations such as defence business, dewatering in Metro projects, etc. continued with all the precautionary measures.
A Decision Response team was formed which consisted of members from the executive Committee to assess the situation and take appropriate decisions. Smaller teams/task forces were set up at each location / site / factory / manufacturing units etc to regularly monitor the situation.
Your Company employs more than 250,000 contract labourers around various sites in India and abroad. Your Company set up labour camps at their sites to house these labourers including migrant labourers. During the lockdown period, your Company ensured food, shelter and medical facilities in these labour camps and timely remittance of wages to workmen and payments to subcontractors, directly to their bank accounts.
Your Company along with its subsidiary companies and employees who donated two days salary, contributed R 150 Crore to the pM-CAReS Fund, responding to the call given by Hon’ble prime Minister of India. Additionally, your Directors, executive Committee members, with equivalent contribution from the Company, contributed R 5.58 crore to the pM CAReS fund. Your Company also provided a wide range of material assistance viz., donated medical equipment to various hospitals and other institutions, distributed grocery kits and cooked food to doctors, sanitation workers, stranded families and migrant workers. Your Company has also extended its technological expertise to partner with civic authorities and the police to set up monitoring systems and manage Command & Control Centers. Such centers are in operation in over 20 cities including Mumbai, pune, Nagpur, prayagraj, Ahmedabad, Visakhapatnam and Hyderabad. As of date, your Company has re-purposed sections of hospitals in Delhi, Dwarka, Bettiah, puducherry, Kolkata and Gorakhpur to meet the needs of CoVID patients.
For the quarter ended 31 March 2020, the impact due to CoVID 19 on your Company’s revenues and net profits was approximately R 1800 crore and R 400 crore respectively. this was due to stoppage of work in almost all the sites for the last part of March 2020 as well as the disruption to the last mile work, like physical inspection, customer clearance etc., that could not be completed due to lockdown restrictions.
Your Company resumed partial service of operations from April 14, 2020, after implementation of standard protocols in line with the guidelines prescribed. As on the date of this report, your Company has resumed work in all offices/manufacturing units, barring some establishments in Maharashtra where the employees continue to Work from Home. 90% of the domestic project sites of the Company are working with restricted labour capacity. the Company is remobilizing the workmen as a significant percentage of the migrant workmen have gone back to their villages.
All international sites have also resumed work after some interruptions. employees are working in a staggered manner with mandatory rotation on a periodic basis and in adherence to all the safety protocols.
In fact, all the plants and office establishments that have started functioning have implemented safety and hygiene protocols like wearing of face masks, social distancing norms, workplace sanitation and employee awareness programmes. the protocols are regularly reviewed and updated based on revisions in guidelines received from authorities concerned from time to time.
With the graded opening of sites and factories, the Company is making every effort possible to make up for the lost time, due to the pandemic, during the year. the impact of the lockdown disruption is being assessed from time to time. A lot depends on the success of the various pandemic containment efforts being undertaken by the State and Central Government and Health authorities.
CoNSErVaTIoN oF ENErGY, TECHNoLoGY aBSorPTIoN, ForEIGN EXCHaNGE EarNINGS aNd oUTGo:
Information as required to be given under Section 134(3)(m) read with Rule 8(3) of the Companies (Accounts) Rules, 2014 is provided in Annexure ‘A’ forming part of this Board Report.

75
rISK MaNaGEMENT:
the Risk Management Committee was reconstituted during the year and comprises of Mr. Adil Zainulbhai, Mr. Sanjeev Aga and Mr. Subramanian Sarma, Directors of the Company. Mr. Adil Zainulbhai is the Chairman of the Committee.
the Company has formulated a risk management policy and has in place a mechanism to inform the Board Members about risk assessment. the risk assessment includes review of strategic risks of the group at the domestic and international level, including Sectoral developments, risk related to market, financial, geographical, political and reputational issues, environment, Social and Governance (eSG) risks, cyber security and risk minimization initiatives. the Committee periodically reviews the risk to ensure that executive management controls risk by means of a properly designed framework.
A detailed note on risk management is given under financial review section of the Management Discussion and Analysis on pages 331 to 334 of this Annual Report.
CorPoraTE SoCIaL rESPoNSIBILITY:
the Corporate Social Responsibility Committee comprises of Mr. M. M. Chitale, Mr. R. Shankar Raman and Mr. D. K. Sen as the Members. Mr. Chitale is the Chairman of the Committee.
the CSR policy framework is available on its website http://investors.larsentoubro.com/Listing-Compliance.aspx.
A brief note regarding the Company’s initiatives with respect to CSR is given in Annexure ‘B’ - Report on Corporate Governance forming part of this Board Report. please refer to pages 105 to 107 of this Annual Report.
the disclosures required to be given under Section 135 of the Companies Act, 2013 read with Rule 8(1) of the Companies (Corporate Social Responsibility policy) Rules, 2014 are given in Annexure ‘C’ forming part of this Board Report.
dETaILS oF dIrECTorS aNd KEY MaNaGErIaL PErSoNNEL aPPoINTEd/ rESIGNEd:
Mr. Akhilesh Gupta ceased to be an Independent Director of the Company w.e.f. 8th September 2019 on account of completion of his term as Independent Director.
Mr. Arvind Gupta, Nominee Director representing equity interest of the Administrator of the Specified Undertaking of the Unit trust of India (SUUtI) on the Board of the Company, has demitted the office as a Nominee Director of the Company with effect from 26th March 2020 on account of withdrawal of his nomination by SUUtI, pursuant to divestment of their stake held in the Company.
Mr. thomas Mathew t. ceased to be an Independent Director of the Company w.e.f. 2nd April 2020 on account of completion of his term as Independent Director.
Mr. Ajay Shankar ceased to be an Independent Director of the Company w.e.f. 29th May 2020 on account of completion of his term as Independent Director.
Mr. N. Hariharan, executive Vice-president & Company Secretary superannuated from the services of the Company with effect from 1st January, 2020.
the Board places on record its appreciation towards valuable contribution made by them during their tenure as Directors and Key Managerial personnel of the Company.
pursuant to the recommendation of the Nomination and Remuneration Committee, the Board at its Meeting held on 23rd october 2019, approved the appointment of Mr. Sivaram Nair A as the Company Secretary and Compliance officer with effect from 2nd January 2020.
the Board has re-appointed Mr. D. K. Sen as a Whole-time Director of the Company from 1st october 2020 to 7th April 2023, subject to the approval of the shareholders.
the Board has re-appointed Mr. A M Naik as Non-executive Chairman of the Company for a period of 3 years from 1st october 2020, subject to the approval of the shareholders.
Mr. Subramanian Sarma, Ms. Sunita Sharma and Mr. A M Naik, retire by rotation at the ensuing AGM and being eligible, offer themselves for re-appointment.
the notice convening the AGM includes the proposal for re-appointment of Directors.
the terms and conditions of appointment of the Independent Directors are in compliance with the provisions of the Companies Act, 2013 and are placed on

76
Board RepoRt ANNUAL RepoRt 2019-20
the website of the Company http://investors.larsentoubro.com/Listing-Compliance.aspx.
the Company has also disclosed on its website http://investors.larsentoubro.com/Listing-Compliance.aspx details of the familiarization programs to educate the Directors regarding their roles, rights and responsibilities in the Company and the nature of the industry in which the Company operates, the business model of the Company, etc.
NUMBEr oF MEETINGS oF THE Board oF dIrECTorS:
this information is given in Annexure ‘B’ - Report on Corporate Governance forming part of this Report. Members are requested to refer to pages 92 and 93 of this Annual Report.
aUdIT CoMMITTEE:
the Company has in place an Audit Committee in terms of the requirements of the Companies Act, 2013 read with the rules made thereunder and Regulation 18 of the SeBI LoDR Regulations. the details relating to the same are given in Annexure ‘B’ - Report on Corporate Governance forming part of this Board Report. Members are requested to refer to pages 98 to 100 of this Annual Report.
CoMPaNY PoLICY oN dIrECTorS’ aPPoINTMENT aNd rEMUNEraTIoN:
the Company has in place a Nomination and Remuneration Committee in accordance with the requirements of the Companies Act, 2013 read with the rules made thereunder and Regulation 19 of the SeBI LoDR Regulations. the details relating to the same are given in Annexure ‘B’ - Report on Corporate Governance forming part of this Board Report. Members are requested to refer to pages 100 to 104 of this Annual Report.
the Committee has formulated a policy on Directors’ appointment and remuneration including recommendation of remuneration of the key managerial personnel and senior management personnel, composition and the criteria for determining qualifications, positive attributes and independence of a Director. the Nomination and Remuneration policy is provided as Annexure ‘H’ forming part of this Board Report and is also disclosed on the Company’s website at http://investors.larsentoubro.com/Listing-Compliance.aspx.
the Committee has also formulated a separate policy on Board Diversity.
dECLaraTIoN oF INdEPENdENCE:
the Company has received Declarations of Independence as stipulated under Section 149(7) of the Companies Act, 2013 from Independent Directors confirming that he/she is not disqualified from appointing/continuing as Independent Director as laid down in section 149(6) of the Companies Act, 2013 and Regulation 16(1)(b) of SeBI LoDR Regulations. the same are also displayed on the website of the Company http://investors.larsentoubro.com/Listing-Compliance.aspx. the Independent Directors have complied with the Code for Independent Directors prescribed in Schedule IV to the Companies Act, 2013.
the Independent Directors of the Company have registered / in the process of registering themselves with the data bank maintained by Indian Institute of Corporate Affairs (IICA). In terms of Section 150 of the Act read with Rule 6(4) of the Companies (Appointment & Qualification of Directors) Rules, 2014, the Independent Directors are required to undertake online proficiency self-assessment test conducted by the IICA within a period of one (1) year from the date of inclusion of their names in the data bank. the said online proficiency self-assessment test will be undertaken by the Independent Directors of the Company, as applicable, within the prescribed timelines.
EXTraCT oF aNNUaL rETUrN:
As per the provisions of Section 92(3) of the Companies Act, 2013, an extract of the Annual Return in Form MGt-9 is attached as Annexure ‘F’ to this Report.
dIrECTorS’ rESPoNSIBILITY STaTEMENT:
the Board of Directors of the Company confirms:
a) In the preparation of Annual Accounts, the applicable accounting standards have been followed along with proper explanation relating to material departures;
b) the Directors have selected such accounting policies and applied them consistently and made judgements and estimates that are reasonable and prudent so as to give a true and fair view of the state of affairs of the Company at the end of the financial year and of the profit of the Company for that period;
c) the Directors have taken proper and sufficient care for the maintenance of adequate accounting records in accordance with the provisions of the Companies

77
Act, 2013 for safeguarding the assets of the Company and for preventing and detecting fraud and other irregularities;
d) the Directors have prepared the Annual Accounts on a going concern basis;
e) the Directors have laid down an adequate system of internal financial control to be followed by the Company and such internal financial controls are adequate and operating efficiently;
f) the Directors have devised proper systems to ensure compliance with the provisions of all applicable laws and that such systems were adequate and were operating effectively.
adEQUaCY oF INTErNaL FINaNCIaL CoNTroL:
the Company has designed and implemented a process driven framework for Internal Financial Controls (“IFC”) within the meaning of the explanation to Section 134(5)(e) of the Companies Act, 2013. For the year ended 31st March 2020, the Board is of the opinion that the Company has sound IFC commensurate with the nature and size of its business operations and operating effectively and no material weakness exists. the Company has a process in place to continuously monitor the same and identify gaps, if any, and implement new and/or improved controls wherever the effect of such gaps would have a material effect on the Company’s operations.
PErForMaNCE EVaLUaTIoN oF THE Board, ITS CoMMITTEES, dIrECTorS aNd CHaIrMaN:
the Nomination & Remuneration Committee and the Board have laid down the manner in which formal annual evaluation of the performance of the Board, committees, individual directors and the Chairman has to be made. All Directors responded through a structured questionnaire giving feedback about the performance of the Board, its Committees, Individual directors and the Chairman.
For the year under review, the questionnaire was modified suitably to include qualitative criteria, based on the comments and suggestions received from Independent Directors. As in the previous years, an external consultant was engaged to receive the responses of the Directors and consolidate/ analyze the responses. the same external consultant’s It platform was used from initiation till conclusion of the entire board evaluation process. this ensured that the process was transparent and
independent of involvement of the Management or the Company. this has enabled unbiased feedback.
the Board performance evaluation inputs, including areas of improvement, for the Directors, Board processes and related issues for enhanced Board effectiveness were discussed in the meeting of the Independent Directors held on 18th May, 2020 and in the subsequent meeting of Nomination and Remuneration Committee and the Board.
Most of the suggestions from the Board evaluation exercise of FY 2019-20 have been suitably implemented such as considering qualitative criteria for performance evaluation exercise.
dISCLoSUrE oF rEMUNEraTIoN:
the details of remuneration as required to be disclosed under the Companies Act, 2013 and the rules made thereunder, are given in Annexure ‘D’ forming part of this Board report.
the information in respect of employees of the Company required pursuant to Rule 5(2) and 5(3) of the Companies (Appointment and Remuneration of Managerial personnel) Rules, 2014, as amended from time to time, is provided in Annexure ‘I’ forming part of this report. In terms of Section 136(1) of the Act and the rules made thereunder, the Report and Accounts are being sent to the shareholders excluding the aforesaid Annexure. Any Shareholder interested in obtaining a copy of the same may write to the Company Secretary at the Registered office of the Company. None of the employees listed in the said Annexure is related to any Director of the Company.
CoMPLIaNCE WITH SECrETarIaL STaNdardS oN Board aNd GENEraL MEETINGS:
the Company has complied with Secretarial Standards issued by the Institute of Company Secretaries of India on Board Meetings and General Meetings.
ProTECTIoN oF WoMEN aT WorKPLaCE:
the Company has formulated a policy on ‘protection of Women’s Rights at Workplace’ as per the provisions of the Sexual Harassment of Women at Workplace (prevention, prohibition & Redressal) Act, 2013. the policy has been widely disseminated. the Company has constituted Internal Complaints Committees as per the above Act.
No complaint was received in the Company during the F.Y. 2019-20.

78
Board RepoRt ANNUAL RepoRt 2019-20
In addition to the continuous online awareness programs, more than 100 awareness workshops and training programs were conducted during the year across the Company to sensitize employees to uphold the dignity of their colleagues at workplace specially with respect to prevention of sexual harassment.
oTHEr dISCLoSUrES:
zz eSop Disclosures: there has been no material change in the employee Stock option Schemes (eSop schemes) during the current financial year. the eSop Schemes are in compliance with Securities and exchange Board of India (Share Based employee Benefit) Regulations, 2014 (“SBeB Regulations”).
the disclosures relating to eSops required to be made under the provisions of the Companies Act, 2013 and the rules made thereunder and the SBeB Regulations is provided on the website of the Company http://investors.larsentoubro.com/Listing-Compliance.aspx.
the certificate obtained from the Statutory Auditors, confirming compliance with the Companies Act, 2013 and the SBeB Regulations is also provided in Annexure ‘B’ forming part of this Report.
zz Corporate Governance: pursuant to Regulation 34 of the SeBI LoDR Regulations, a Report on Corporate Governance and a certificate obtained from the Statutory Auditors confirming compliance, are provided in Annexure ‘B’ forming part of this Report.
zz Integrated Reporting: pursuant to SeBI Circular on Integrated Reporting, the Company is complying with the applicable requirements of the Integrated Reporting Framework. the Sustainability Report has been replaced by an Integrated Report which tracks the sustainability performance of the organization and its interconnectedness with the financial performance, showcasing how the Company is adding value to its stakeholders.
the Integrated Report encompasses areas such as Corporate Governance, the IR & Sustainability Structure, Sustainability Roadmap 2021, Risks & opportunities, enhancement of Financial Capital, Manufactured Capital, Intellectual Capital, Human Capital, Natural Capital and Social & Relationship Capital and alignment to sustainable development goals. It also covers strategy, business model and resource allocation.
the integrated Report for the year 2018-19 is available on the Company’s website http://www.larsentoubro.com/corporate/sustainability/integrated-report/ and the report for the year 2019-20 shall be published shortly.
zz Statutory Compliance: the Company complies with all applicable laws and regulations, pays applicable taxes on time, takes care of all its stakeholders, ensures statutory CSR spend and initiates sustainable activities.
zz MSMe: the Ministry of Micro, Small and Medium enterprises vide their Notification dated 2nd November 2018 has instructed all the Companies registered under the Companies Act, 2013, with a turnover of more than Rupees Five Hundred crore to get themselves onboarded on the trade Receivables Discounting system platform (tReDS), set up by the Reserve Bank of India. In compliance with this requirement, the Company has registered itself on tReDS through the service providers Receivables exchange of India Limited (RXIL).
the Company complies with the requirement of submitting a half yearly return to the Ministry of Corporate Affairs within the prescribed timelines.
zz IBC: there is no Corporate Insolvency Resolution process initiated under the Insolvency and Bankruptcy Code, 2016 (IBC).
VIGIL MECHaNISM:
As per the provisions of Section 177(9) of the Companies Act, 2013 (‘Act’), the Company is required to establish an effective Vigil Mechanism for directors and employees to report genuine concerns.
the Company has a Whistle-blower policy in place since 2004 to encourage and facilitate employees to report concerns about unethical behaviour, actual/ suspected frauds and violation of Company’s Code of Conduct or ethics policy. the policy has been suitably modified to meet the requirements of Vigil Mechanism under the Companies Act, 2013. the policy provides for adequate safeguards against victimisation of persons who avail the same and provides for direct access to the Chairperson of the Audit Committee. the policy also establishes adequate mechanism to enable employees report instances of leak of unpublished price sensitive information. the Audit Committee of the Company oversees the implementation of the Whistle-Blower policy.

79
the Company has disclosed information about the establishment of the Whistle Blower policy on its website http://investors.larsentoubro.com/corporategovernance.aspx. During the year, no person has been declined access to the Audit Committee, wherever desired.
Also see page 108 forming part of Annexure ‘B’ of this Board Report.
BUSINESS rESPoNSIBILITY rEPorTING:
As per Regulation 34 of the SeBI LoDR Regulations, a separate section on Business Responsibility Reporting forms a part of this Annual Report (refer pages 22 to 43).
dETaILS oF SIGNIFICaNT aNd MaTErIaL ordErS PaSSEd BY THE rEGULaTorS or CoUrTS or TrIBUNaLS:
During the year under review, there were no material and significant orders passed by the regulators or courts or tribunals impacting the going concern status and the Company’s operations in future.
CoNSoLIdaTEd FINaNCIaL STaTEMENTS:
Your Directors have pleasure in attaching the Consolidated Financial Statements pursuant to Section 129(3) of the Companies Act, 2013 and Regulation 34 of the SeBI LoDR Regulations and prepared in accordance with the Indian Accounting Standards (Ind AS) notified under the Companies (Indian Accounting Standards) Rules, 2015 and amendments thereof issued by the Ministry of Corporate Affairs in exercise of the powers conferred by section 133 of the Companies Act, 2013.
aUdIT rEPorT:
the Auditors’ report to the shareholders does not contain any qualification, observation or adverse comment.
SECrETarIaL aUdIT rEPorT:
the Secretarial Audit Report issued by M/s. S. N. Ananthasubramanian & Co., Company Secretaries is attached as Annexure ‘e’ forming part of this Board Report.
aUdITorS:
In view of the mandatory rotation of auditors’ requirement and in accordance with the provisions of Companies Act, 2013, M/s. Deloitte Haskins & Sells LLp were appointed as Statutory Auditors for a period of 5 continuous years from the conclusion of 70th Annual
General Meeting till the conclusion of 75th Annual General Meeting of the Company.
Accordingly, in terms of Section 139 of the Companies Act, 2013 read with the Companies (Audit and Auditors) Rules, 2014, the present Statutory Auditors of the Company, M/s Deloitte Haskins & Sells LLp would hold office until the conclusion of the ensuing Annual General Meeting. they have expressed their willingness to be reappointed for a further term.
the Board of Directors of the Company, after considering the recommendation of the Audit Committee, recommends the re-appointment of M/s Deloitte Haskins & Sells LLp for the 2nd and final term of five consecutive years from the conclusion of this ensuing 75th Annual General Meeting till the conclusion of 80th Annual General Meeting of the Company.
M/s Deloitte Haskins & Sells LLp has submitted their confirmation to the effect that they continue to satisfy the criteria provided in Section 141 of the Companies Act, 2013 and that their appointment is within the limits prescribed under Section 141(3)(g) of the Act.
the Auditors have confirmed that they have subjected themselves to the peer review process of Institute of Chartered Accountants of India (ICAI) and hold valid certificate issued by the peer Review Board of the ICAI.
the Auditors have also furnished a declaration confirming their independence as well as their arm’s length relationship with the Company as well as declaring that they have not taken up any prohibited non-audit assignments for the Company.
the Audit Committee reviews the independence and objectivity of the Auditors and the effectiveness of the Audit process.
the Auditors attend the Annual General Meeting of the Company.
the Notice convening the AGM includes a resolution for their re-appointment. the terms and conditions of their appointment including remuneration are specified in the explanatory statement which is a part of the notice convening the AGM.
Also see pages 108 and 109 forming part of Annexure ‘B’ of this Board Report.

80
Board RepoRt ANNUAL RepoRt 2019-20
rEPorTING oF FraUd:
the Auditors of the Company have not reported any instances of fraud committed against the Company by its officers or employees as specified under Section 143(12) of the Companies Act, 2013.
CoST aUdITorS:
pursuant to the provisions of Section 148 of the Companies Act, 2013 and as per the Companies (Cost Records and Audit) Rules, 2014 and amendments thereof, the Board, on the recommendation of the Audit Committee, at its meeting held on 5th June 2020, has approved the appointment of M/s R. Nanabhoy & Co., Cost Accountants as the Cost Auditors for the Company for the financial year ending 31st March 2021 at a remuneration of R 13 lakhs.
A proposal for ratification of remuneration of the Cost Auditor for the financial year 2020-21 is placed before the shareholders.
the Report of the Cost Auditors for the financial year ended 31st March 2020 is under finalization and shall be filed with the Ministry of Corporate Affairs within the prescribed period.
the provisions of Section 148(1) of the Companies Act, 2013 are applicable to the Company and accordingly the Company has maintained cost accounts and records in respect of the applicable products for the year ended 31st March 2020.
aCKNoWLEdGEMENT
Your Directors take this opportunity to thank the customers, supply chain partners, employees, Financial Institutions, Banks, Central and State Government authorities, Regulatory authorities, Stock exchanges and all the various stakeholders for their continued co-operation and support to the Company. Your Directors also wish to record their appreciation for the continued co-operation and support received from the Joint Venture partners / Associates.
For and on behalf of the Board
a. M. Naik Group Chairman (DIN: 00001514)
Date : 5th June 2020 place : Mumbai

81
annexure ‘a’ to the Board report
Information as required to be given under Section 134(3)(m) read with Rule 8(3) of the Companies (Accounts) Rules, 2014.
[a] CoNSErVaTIoN oF ENErGY:
(i) Steps taken or impact on conservation of energy:
zz Implementation of LeD lights in He-Hazira campus and other project sites and Solar pipes in SG fabrication area.
zz Installation of an off Grid Mini-Solar power plant for meeting the energy requirement of site & workmen habitats at Ranchi Smart City project.
zz Installed Local pre/ post Weld Heat treatment (pWHt) using pID technology which ensures uniform heating and reduction in energy wastage.
zz Implemented the use of Metal Halide (400 Watt) eot Crane under bay lights with LeD Lights.
zz Installed energy efficient burners for Furnaces and pre heating.
zz Usage of electro Slag Strip Cladding (eSSC) Iot station and usage of Submerged Arc Welding (SAW) Iot station which reduces welding process time per shell.
zz Installation of Ie-2 Class energy Motors (315 kW, 37 kW, 11 kW) for Flushing facility.
zz Retrofitting of VtL machine with 828 D energy efficient system and retrofitting of edge Bevelling machine with energy efficient drive mechanism.
zz Usage of pWHt & pBHt combined cycle in Furnace for HMeL bends and double layer loading in Furnace to reduce the number of cycle.
zz Replacing existing aged in efficient pumps (Water, Sewage & HVAC ) with energy efficient.
zz Development of energy efficient screw chiller with BMS system for 120t AC plant.
zz Implemented enpI monitoring of etS precision tool manufacturing energy consumption
and enpI reduction of CG moulding energy consumption.
zz Implemented Smart CoMM energy Management system at ASW & Digital Dashboard.
zz Replacement of conventional light fittings with Solar lighting system in SSII, open yard-5 and Grit blasting & painting areas at production/Utility areas at eWL Kancheepuram factory and Kansbahal works.
zz Replacement of conventional MH Lamps and fluorescent tube lights by LeD lamps in working areas at office and projects as well as for street lights.
zz Installation of energy efficient water coolers and submersible pumps
zz Replacing existing aged inefficient Split AC units with energy efficient units
zz Utilization of Chiller for HVAC System – Campus FMD initiated and control the chiller running hour for HVAC need during holidays and extended working hours.
zz Initiative has been taken for replacement of Air-Cooled Chiller with Water Cooled Chiller.
zz Commissioned Air Compressor with Variable Speed Drive which reduced the air pressure from 5.5 to 6.5 bar to 5.2 bar constant pressure.
zz Utilization of Solar Lights for lighting around compound walls.
zz Development of panasonic make MIG Welding Machines.
zz Development of ApFC relay automation for maintaining power factor and without Joint single point electrode - 8mm small electrode.
zz Implementation of timer in Vertical Brazing machine for CM90516 production and eliminating Corona process from pad printing.
zz Installation of Ducting in tool programming Cell Department.
zz Replacement of 90t Centralized Chiller type Air Conditioning with VRF type Air Conditioning.

82
aNNEXUrE to tHe BoARD RepoRt ANNUAL RepoRt 2019-20
zz Replacement of Solar inverter with solar generation.
zz Replacement of one chiller coil for improvement in efficiency of the chiller.
zz Successfully completed Bureau Veritas Surveillance audit of ISo50001 energy Management System of all 3 ASW eSp MFG. campus.
zz Reducing carbon footprint by replacing a portion of cement with GGBS in the mix design at Varsha Inner Harbour, Kochi Dry Dock, Bangalore Metro Rail Limited, MtHL and MCRp.
zz effective usage of Flyash in the mix design thus reducing the cement content at Ahmedabad Metro Rail project and Kudankulam HtS project has reduced the carbon footprint of the structure.
zz Installation of small Lt power at temporary locations like bridge and structures where the work duration is shorter.
zz A dedicated energy monitoring cell is set up at HQ to explore technological upgrades and for better monitoring and control.
zz Installation of seven asphalt mix plants in RReC are technology ready for recycled asphalt production (RAp).
zz the transmission tower manufacturing facilities re-use galvanizing plant rinse water for pickling acid preparation.
zz Zinc Recovery machines have been installed to recover zinc from zinc ash generated during galvanizing process.
zz online monitoring of Gas, electricity and Water consumption is practised.
zz By installing gantry cranes, usage of hydra has been reduced thereby saving requirement of High Speed Diesel.
zz Increased use of digital collaboration tools such as Microsoft teams and Virtual Inspections have led to reduced travel thereby leading to less carbon footprint.
zz Adoption of digital tools such as Integrated Vehicle Management System have led to fuel savings.
(ii) Steps taken by the Company for utilizing alternate sources of energy:
zz Shift towards usage of windmill power in the place of State electricity Board at Kanchipuram factory
zz Dedicated motor for oil cooling to reduce energy consumption
zz Development of Ie3 Class Motor for otR presses
zz Use of therminol Fluid in place of Steam heating for 55” tube presses
zz Implemented 120w led luminaries instead of 250w HpMH lamp in Shop floor and energy saved 3500 KWH / Annum.
zz Implemented VFD drive in Line 1 De dusting and energy saved 66000KWH/Annum.
zz Rainwater harvesting implemented and the water used for Fire hydrant sump. energy saved 8900KWH /Annum 1400KL water saved in Sump.
zz time based oN /oFF compressor controller implemented and energy saved 9000KWH /Annum.
zz Installing Solar panels on Rooftop.
zz Solar panels installed at project sites.
zz Alternate usage of M-sand instead of Natural Sand at all project sites has produced a considerable impact in conserving the natural resource.
zz Implementation of usage of alternative solution of curing compound for all the vertical structures in the projects.
zz Usage of the power source from the electricity grid in the metro projects for tunnel Boring machine operations.
zz Usage of pNG at DIAL project to power the Hot Mix plant.

83
(iii) Capital investment on energy conservation equipments:
zz Use of High-tension breakers maintenance (effective monitoring of power consumption)
zz transformer oil servicing towards effective functioning & reduce heat losses.
zz Installation of Auto Cut off sensors at Vizag.
zz Using the methodology of parallel work, both the tanks were made ready for Hpt at the same time. this methodology helped in re-usage of 50 tons of fresh water which would have been drained out otherwise.
the measures taken have resulted in savings in cost of production, power consumption and processing time at all locations.
[B] TECHNoLoGY aBSorPTIoN:
(i) Efforts made towards technology absorption:
zz Development of capabilities in High-end Finite element Analysis including automation of Finite element Model generation.
zz Development of capability for multi-physics simulation in areas such as Fluid Structure Interaction.
zz Advanced manufacturing simulation technology for 3D analysis of multi-layer weld overlay distortion prediction.
zz Design development for Multi-tubular Reactor Systems and methodology for piping flexibility analysis of complex Refinery systems.
zz Development of Chemical process technology in the area of residue up-gradation (petroleum Refining) and Coal/petcoke Gasification.
zz Developed a 3D Concrete printing which has the potential to radically redefine the way concrete buildings are constructed.
zz Developed Internal painting Robot for construction application and also at Ap Housing projects.
zz Developed Acid concentration meter with auto pump operation in Derusting tank to reduce the acid consumption and spent acid generation.
zz Implemented Acid level indicator with visual display in paintshop communication room to monitor the HCL acid stock.
zz Implemented Advanced scada monitoring and data lodging system in paint shop Dryer for effective monitoring of paint shop.
zz Implemented Demand controller in eB panel to maintain the allotted demand for power consumption monitoring & control.
zz Implemented VFD Drive with multi speed running of Blower in Line 1 De dusting and energy conservation is achieved.
zz Implemented semi-automated Stp plant with online monitoring (parameters like pH, Dissolved oxygen, Running hours, Flow rate) with SMS.
zz Implemented the online monitoring system for compressor Air consumption & energy consumption.
zz Development of tandem Wagon traverser with rack & pinion pusher drive, 10000 tpH C-Frame stacker reclaimer and plant dedusting system including development of manual damper for process plant.
zz Development of pCR Column type Hydraulic tire Curing press, Column type V orientation Hydraulic tire Curing press, 1100 t Bladder Curing press – BAto, otR / Ultra otR Gt Lube spraying machine.
zz Implementation of cured tyre handling Automation system, load control for 84” cracker Mill through Digital load cell arrangement, otR presses for tulip Mold and otR – Radial II Stage tire building
zz Innovated new MCCBs, new variants of ACBs, Contactors, Isolators and panel solutions for new emerging market segments like Solar & Railways, new state of art motor protection relays, controllers for power Quality solution, Intelligent products for Agriculture segments etc
zz Implemented additional pendent type Remote for Robomaster Fixed bender manual operation to increase the Human safety.
zz In Manual Cutting Machine implemented scale with stand for measuring purpose to increase the productivity.

84
aNNEXUrE to tHe BoARD RepoRt ANNUAL RepoRt 2019-20
zz Implemented the colour tag FG Material to easily identify and reduce the Loading time and reduce the Customer complaint.
zz Implemented Colour tag Quarter wise for Raw Material to Follow FIFo.
zz Implemented Integrated Life Support System – for tejas Aircraft (oxygen Generation System)
zz Developed Chemical Warfare Agent Detection System
zz Developed ICRS- Intelligent Collaborative Robotic System, Robot Sentry, mini UGV & Ballbot, MARF & Control software and Integration of complete collaborative system.
zz Developed Wireless Smart Handheld Device, secure communication (Voice and Data) between users and Modular system with clear separation between App, Security and Network.
zz Developed power Amplifier Module, product development, product improvement, cost reduction, manufacturing of the power Amplifier Module and developed in house test jigs for testing.
zz Development of Autonomous Underwater Vehicle “Amogh” for oceanographic Surveys in collaboration with foreign partner.
zz Development of Mine plough for t72 tanks in collaboration with foreign partner.
zz Development of Indigenous Fire Control Radar in collaboration with foreign technology partner.
zz Indigenization of subsystems for K9 Vajra Artillery Gun.
zz Manufacturing of test panels for sonar domes using Resin Film Infusion technology by partnering with DRDo.
zz Development of Acoustic payloads for Autonomous Underwater Vehicles in partnership with DRDo.
zz Developed three types of efficient hull forms with low resistance suitable for various warships/patrol vessels in collaboration with IIt Kharagpur.
zz Development of design of Avionics LRUs with Standby engine Instrument and Standby Instrumentation System for Helicopter platforms.
zz Deployment Communication Lte based 4G Network in a Box (NIB)-chassis including electronics using in-house Base station.
zz Development of a separate internal Rapid Deployment Communication System including electronics and chassis for customer demos and trials and includes qualification testing.
zz Development of Lt Vega (Unmanned Surface Vessel) and Wireless Client Device.
zz Development of Ammunition Handling tube in composite material for K9 Vajra Artillery Gun.
zz Designed and manufactured track mounted mobile roll crusher (for Coal application).
zz Developed skid mounted crushing plant with impactor to meet specific customer application.
zz Development of higher capacity surface miner KSM404 and operational in coal application.
zz Developed Bulk Reception unit for feeding coal after receiving from dumper.
zz Developed tertiary reversible impact crusher (RI6363t) which is presently under manufacturing.
zz experimental investigation on usage of shredded waste plastics in construction of bituminous layers in flexible pavements.
zz Development of high early strength concrete without affecting target strength using special sleeper grade cement.
zz Investigation on seismic performance of various precast connections of buildings with shear walls.
zz Fire resistance tests on load bearing RC wall panels for various fire rating in association with CBRI, Roorkee.
zz Developed sizing optimization Software (iBoSS- intelligent Buildings optimum Structural Sizing) for mid and high-rise buildings using genetic algorithms.
zz proof of concept studies were undertaken with IItM Chennai to explore the feasibility of 3D printing technology.

85
zz Development of new indigenous precast connections for RC walls.
zz Feasibility study on the use of high-performance concrete base (M100 grade) suitable for wind turbine generators construction, in place of steel.
zz Development of pervious concrete for parking bays and pavements
zz Laboratory Studies on the effect of coarse aggregate grading of fresh & hardened concrete properties.
zz Laboratory study on the determination of volume of coarse aggregate content in the hardened concrete by titration method.
zz Use of precast geo-polymer concrete for non-structural components like manhole covers.
zz Indigenous development and import substitute of co-efficient of thermal expansion test equipment for the study of a material’s expansion or contraction with temperature.
zz Development of in-house Dynamic Cone penetration and Light cone penetration apparatus for quick estimation of in-situ soil strength characteristics.
zz Development of pods using light weight concrete.
zz Developed Slab transport wagon in steel plant, roll/coil/slab transfer car for hot strip mill project, Wing tripper and wagon loader in for stockpile generation / wagon loading, C-frame stacker reclaimer with 58 m lg boom in port.
zz Developed machine performance and health monitoring system through Iot and implemented for Stacker reclaimer machine, indurating machine for pellet plant, pelletizing disc with modified drive arrangement.
zz Developed Spillage protection arrangement in track Hopper & mechanism for auto opening during plough feeder operation, drag type plough feeder technology and composite weigh hopper gate for Blast furnace.
zz Developed roller compact concrete conveying system developed inhouse to convey RCC from batching plant to feed to punatsangchhu hydel project construction, complete inhouse design of
downhill conveyors and complete inhouse design of pipe conveyors 5.5km and even more.
zz Absorbed the technology of pipe Bursting which is a trenchless method of pipe installation that allows for minimal disruption to existing infrastructure in Udaipur Integrated Infrastructure project.
zz Development of an in-house L&t SBBR technology which is a method for biological treatment of domestic waste-water.
zz Developed SafeArmZ & VieweHS applications which are structured platforms designed with an intention to enhance eHS compliance at project sites and institutionalize incident reporting.
zz Replaced the ordinary submersible pump in Stp plant with new cutter pump
zz Development of SFF energy Meter, Meter with 2G & 4G Communication modules and Smart prepaid Meter with 4G & NBIot Communication modules
zz Developed one of the largest Smart Meter project based on LpR technology in the country.
zz Introduced Feeder pillars, CSS (Compact Sub Station) & Front RMU with FRtU for Utilities segment
zz Introduced Sub-Main Distribution Board (SMDB) and GIS for wind segment to cater for the infrastructure sector like Metros, Airports, Smart cities, high-end residential complexes for international markets.
zz Introduced a pre-Fabricated electrical Substation building, known as “e-House”, customized to house all electrical equipment as per project requirements
zz Developed domestic LV Switchboards with “Closed Door operation” feature which were offered to key customers in refinery and power plant segments
zz Indigenously developed and released industrial platform i-Visionmax®; and deployed at various industry verticals.
zz Developed a centralized o&M Incident Management which is a Web and Mobile App based GIS application that helps in keeping track

86
aNNEXUrE to tHe BoARD RepoRt ANNUAL RepoRt 2019-20
of project incidents, resolving the tickets and maintaining the required SLA.
zz SWIFt (Supply and Work Integrated Finishing on time)
zz Developed in-house by SWC Digital team, a proactive project Monitoring tool (Start to Finish) from managing approvals digitally (Smart Signoff), to monitoring completion of packages/file in a project, Identifying items that are in critical status, draw Responsibility & Accountability for the project stake holders and to generate timely alerts by way of SMS / emails.
zz Developed Smart Meter-project Management which collects data on the field, store data in cloud, present real-time dashboards to all stakeholders facilitating multiple touch points access across mobile and desktop.
zz the RC wall thickness of 100mm was successfully implemented at AptIDCo project after the successful fire rating investigation at CBRI Roorkee.
zz optimized precast connection systems are implemented based on the outcome of the test results.
zz iBoSS software has been successfully tested on many real time projects.
zz Introduction of curing admixtures in pQC mix to improve the concrete permeability, which in-turn improves the quality and long-term performance of concrete.
zz Introduction of gauge conversion for side rollers used in compactors and graders.
(ii) Benefits derived like product improvement, cost reduction, product development or import substitution:
zz Integrated Life Support System acts like a technology enabler to develop variants for other platforms like Helicopter, Dornier Do 228 and to Develop products for High Altitude survival kits.
zz Developed first-of-its-kind crowd management system that proactively interprets crowd dynamics and provides timely alerts.
zz Developed real time notifications of crowd density at different locations which provided efficient means.
zz Innovated deep Learning based Alert Generation for identifying crowd gatherings.
zz Implemented Crowd Management Analytics of Line Count (counting number of people crossing the line in either direction to determine entry and exit) at the prominent entry exit routes.
zz Monitoring the real-time crowd density to notify law enforcement officials when the pilgrims in a square metre area exceeds above 3.6 threshold.
zz Developed & deployed a Deep learning based Social Distance monitoring solution to aid law enforcement agencies to pin down areas.
zz Deployed Computer Vision enabled pothole detection algorithm to notify city authorities on areas with high intensity of potholes.
zz Deployed Machine learning based vehicle movement restriction solution beyond 3 Kms. through automated correlation on license plate recognition data.
zz pilot deployment of state-of-the art patrol Management solution for efficient and effective patrolling operations for a large state police force.
zz Usage of Chemical Warfare Agent Detection System addresses Indian & international market needs and also enables to develop variants like Integrated Nuclear Sensor and Integrated Network Chemical Agent Detector System for different platforms.
zz Usage of ICRS has resulted in enabling the Company to gain good expertise in Robotics field and develop their own Robots not only for Military applications but also for industrial applications in smartcity as well.
zz Development of Amogh acts as import substitution for applications of oceanographic surveys up to depth of 1000 m
zz Development of efficient hull forms has enabled the Company to select lower capacity propulsion systems, which is a major cost element in the ships.
zz Avionics has the potential for Business in the Helicopter programs, can also be targeted for

87
other platforms (Fixed Wing Aircrafts), civil and military configurations
zz RDCS enables the Company to address tCS, MCCS, MINt and other upcoming projects and will also be useful for Civilian applications including Disaster relief & public safety operations
zz Integration of new communication technologies such as 4G, NBIot and LoRa in the Smart Meters.
zz MV portfolio was enhanced by improved range of Gas Insulated Switchgear (GIS) for Wind energy applications and Metro projects
zz Adoption of face-recognition based attendance system for workmen at Buxar project site helps achieving contact-less, faster attendance and also provides video footage
zz Development of virtual guard (Video analytics) for weighbridge unmanned surveillance to provide better control over weighbridge process.
zz Adoption of RpA bot for automating some repetitive processes e.g. generating comparison sheets for rate contract items, saving time of buyers.
zz Implemented Iot for tracking critical p&Ms such as concreting machinery, welding machines, vehicles. this has helped improve asset utilization.
zz Usage of smart glass for remote project review and remote inspection at vendor’s saves travel time and cost.
zz Implemented in-house scripted and video shoot 360o Virtual reality-based films in 5 languages for unsafe scenarios for workmen. these immersive videos implemented at all project sites help workmen understand unsafe scenarios and its consequences.
zz L&t has adopted its own private cloud infrastructure services for some of its critical systems and business continuity.
zz Increased self-reliance and savings in Foreign exchange in process plant, refinery and power plant equipment sector
zz Reduction in production cycle time, cost and rework due to implementation of advanced manufacturing
zz Continuous improvement in on-site fabrication capability and on-going improvement in existing product & technology
zz Received grants from e&A business 81 patents and 09 trademarks.
zz the use of lightweight structural concrete utilizing by products of flyash leads to improved fire and thermal resistance, improved productivity with environment friendly.
zz Reduction in the optimum binder content of the mix and improved the strength of the mix by considerably.
zz Superpave mix design was found to reduce the optimum binder content of Dense Bituminous Macadam (DBM) and Bituminous Concrete (BC) mixes by 0.5%.
zz precast connection seismic performance study helps to optimize the connection cost with improved safety.
zz Reduced thickness of RC walls for the desired fire rating has saved huge quantity of concrete with increased carpet area for mass housing projects.
zz the cycle time required for making each precast structural element is significantly brought down by using the high early-age strength concrete mix
zz pervious concrete is an economical alternative to paver concrete blocks and sustainable product
zz Developed a new resurfacing technology for bridge decks with light weight concrete, geotextiles and asphalt concrete
zz Implemented optimized pavement overlay solution by LtCRtC and optimization of conventional concrete mixes for foundation structures for various ptD project sites
zz the Casting Gantry is a new generation portable mould system for casting precast, post-tensioned I-Beams, designed for the Second Ishwar

88
aNNEXUrE to tHe BoARD RepoRt ANNUAL RepoRt 2019-20
Gupta Setu project, for West Bengal Highway Development Corporation Ltd.
zz epoxy Coated pile Rebar Cage Machine Dia 1.2 m to 2.2 m is an in-house innovation done for Mechanization of the pile rebar cage fabrication process.
zz economical and cost-effective piles in solar projects which saves time.
(iii) Information regarding technology imported during the last 3 years:
S. No.
Technology Imported
Year of Import
Status of absorption & reasons for non-absorption, if any
a) UV disinfection system
2017 Implementation of UltraViolet (UV) disinfection system for secondary treated wastewater. this is preferred over the conventional chlorination system which has harmful side effects due to the presence of carcinogens in residual chlorine.
b) MBR (Membrane Bioreactor) technology
2017 Implementing MBR technology for 11 MLD Stp and 13 MLD Cetp for BIDKIN Infrastructural Development project. Major advantage of MBR technology includes the production of high quality effluent suited to be discharged to the surface water or to be utilized for urban irrigation. Further, it also offers small footprint, easy retrofit and upgrade of old wastewater treatment plants.
c) Vortex Grit Removal in Sewage treatment plant
2017 Fully absorbed this technology and are implementing the same with other projects like 318 MLD WWtp at Coronation pillar, DJB – Cluster Stps.
S. No.
Technology Imported
Year of Import
Status of absorption & reasons for non-absorption, if any
d) Unistage tire Building machine passenger- 12-17 and electrical platen Heating System
2017 Indigenized Rubber processing Machines by designing, developing specifications and adapting to International customers’ needs.
e) 3D Virtual Reality Model in Ctp-14
2017 enhancing the demonstration capabilities for the civil components viz., track, embankment, bridges, drain, retaining wall, etc.
f) Magnetic Field Analysis for Underground 220kV power cables inside power Duct
2018 electromagnetic Field for Underground Cables inside power Duct with different level depths for Amaravati projects has been done and analyzed which henceforth concluded with a satisfactory result, Field Strength being under the acceptable electromagnetic pollution limit set to protect health of the public.
g) Verse equipment 2019 Non-destructive measurement of stress-free temperature of track.
h) electrical Storage System
2019 the electrical Storage System (eSS) are capable of storing energy and powering trains during failure of traction Supply.
eSS system are also capable of voltage stabilization-smoothening the voltage fluctuation caused by normal traction operations.

89
S. No.
Technology Imported
Year of Import
Status of absorption & reasons for non-absorption, if any
optimization of both inverter capacity as well as battery capacity has been achieved for eSS system, which is leading to economies in project execution.
i) DC traction System Design
2019 optimization of ratings of rectifiers and transformers using the overload capacity has also been developed, which is leading to economy in project execution.
(iv) Expenditure incurred on research & development:
v crore
2019-20Capital 41.01Recurring (includes customer funded of R 0.08 crore)
198.82
Total 239.83total R&D expenditure as a percentage of total turnover
0.28%
[C] ForEIGN EXCHaNGE EarNINGS aNd oUTGo:v crore
2019-20Foreign exchange earned 10,133.03Foreign exchange saved / deemed exports 54.96Total 10,187.99Foreign exchange used 24,947.51
90
aNNEXUrE to tHe BoARD RepoRt ANNUAL RepoRt 2019-20
annexure ‘B’ to the Board report
a. CorPoraTE GoVErNaNCE Corporate Governance is a set of principles, processes and systems which govern a company. the elements of
Corporate Governance are independence, transparency, accountability, responsibility, compliance, ethics, values and trust. Corporate Governance enables an organization to perform efficiently and ethically generate long term wealth and create value for all its stakeholders.
the Company believes that sound Corporate Governance is critical for enhancing and retaining investor trust and your Company always seeks to ensure that its performance goals are met accordingly. the Company has established systems and procedures to ensure that its Board of Directors is well informed and well equipped to fulfill its overall responsibilities and to provide management with the strategic direction needed to create long term shareholders value. the Company has adopted many ethical and transparent governance practices even before they were mandated by law. the Company has always worked towards building trust with shareholders, employees, customers, suppliers and other stakeholders based on the principles of good corporate governance.
B. CoMPaNY’S CorPoraTE GoVErNaNCE PHILoSoPHY
the Company’s essential character revolves around values based on transparency, integrity, professionalism and accountability. At the highest level, the Company continuously endeavors to improve upon these aspects on an ongoing basis and adopts innovative approaches for leveraging resources, converting opportunities into achievements through proper empowerment and motivation, fostering a healthy growth and development of human resources to take the Company forward.
C. THE GoVErNaNCE STrUCTUrE
the Company has four tiers of Corporate Governance structure, viz.:
(i) Strategic Supervision – by the Board of Directors comprising the executive, Non-executive Directors and Independent Directors.
(ii) Executive Management – by the executive Committee (eCom) comprising of the Chief executive officer and Managing Director, 5 executive Directors, 1 Non-executive Director and a few senior leaders.
(iii) Strategy & operational Management – by the Independent Company Boards of each Independent Company (IC) (not legal entities) comprising of representatives from the Company Board, Senior executives from the IC and independent members.
(iv) operational Management – by the Business Unit (BU) Heads.
the four-tier governance structure, besides ensuring greater management accountability and credibility, facilitates increased autonomy to the businesses, performance discipline and development of business leaders, leading to increased public confidence.
d. roLES oF VarIoUS CoNSTITUENTS oF CorPoraTE GoVErNaNCE IN THE CoMPaNY
a. Board of directors (the Board):
the Directors of the Company are in a fiduciary position, empowered to oversee the management functions with a view to ensuring its effectiveness and enhancement of shareholder value. the Board also provides strategic direction, reviews and approves management’s business objectives and plans.
b. The Group Chairman (GC):
the GC is the Chairman of the Board. His primary role is to provide leadership to the Board and guidance and mentorship to the Ceo & MD and executive Directors for realizing the approved strategic plan and business objectives. He presides over the Board and the Shareholders’ meetings.

91
c. Executive Committee (ECom):
the eCom provides a companywide operations review and plays a key role in strengthening linkages between the ICs and the Company’s Board, as well as in rapidly realizing inter-IC synergies. In addition, the eCom deliberates upon strategic issues that cut across ICs and Corporate. the agenda includes:
zz Review of major order prospects (Standalone/ Group) / “Integrated offerings”
zz Review of consolidated financials including working capital, cash flow, capital structure, etc.
zz Review of Monthly / Quarterly / Yearly financial performance
zz Review of Revenue, Capital & Manpower Budget and performance there against
zz Review and discuss strategic issues which impact the entire organization, viz.,
i. International business expansion
ii. IC synergies
iii. HR Update/ talent Management / Service contract extensions for senior management personnel
iv. Digitalization & Analytics initiatives
zz Approval of common policies
zz Sharing of best practices, etc.
zz Strategic plans and business portfolio reviews
d. The Chief Executive officer and Managing director (CEo & Md):
the Ceo & MD is fully accountable to the Board for the Company’s business development, operational excellence, business results, leadership development and other related responsibilities.
e. Executive directors (Ed) / Senior Management Personnel:
the executive Directors, as members of the Board, along with the Senior Management personnel in the executive Committee, contribute to the strategic management of the Company’s businesses within Board approved direction and framework. they assume overall responsibility for strategic management of business and corporate functions including its governance processes and top management effectiveness.
f. Non-Executive directors (NEd) / Independent directors:
the Non-executive Directors / Independent directors play a critical role in enhancing balance to the Board processes with their independent judgment on issues of strategy, performance, resources, standards of conduct, safety, etc., besides providing the Board with valuable inputs.
g. Independent Company Board (IC Board):
As a part of Lakshya 2016, the Company decided to have Hybrid Holdco Structure. Accordingly, 10 Independent Companies (ICs) were created. During the process of evolving Lakshya 2021, the structure was reviewed and it was decided to continue with the IC structure with modified mandate. Needless to mention that the IC structure has enabled the Company to empower people and achieve substantial growth in their businesses. Looking to the long-term objective of the company, a detailed exercise on perspective planning and Strategic planning have been undertaken. It is expected to be completed during the current financial year.
E. Board oF dIrECTorS
a. Composition of the Board:
the Company’s policy is to have an appropriate mix of executive, Non-executive & Independent Directors. As on 31st March 2020, the Board comprised of the Group Chairman, the Chief executive officer & Managing

92
aNNEXUrE to tHe BoARD RepoRt ANNUAL RepoRt 2019-20
Director, 5 executive Directors, 3 Non-executive Directors (2 representing financial institutions) and 10 Independent Directors, including one Independent Woman Director. the composition of the Board, as on 31st March 2020, is in conformity with the provisions of the Companies Act, 2013 and Regulation 17 of the SeBI (Listing obligations & Disclosure Requirements) Regulations, 2015 (‘SeBI LoDR Regulations’).
b. Meetings of the Board:
the Meetings of the Board are generally held at the Registered office of the Company at L&t House, Ballard estate, Mumbai 400 001 and whenever necessary, in locations, where the Company operates. the Meetings of the Board have been held at regular intervals with a time gap of not more than 120 days between two consecutive Meetings. During the year under review, 5 meetings were held on 10th May 2019, 23rd July 2019, 30th September 2019, 23rd october 2019 and 22nd January 2020.
the Independent Directors met on 18th May 2020 to discuss, interalia, the performance evaluation of the Board, Committees, Chairman and the individual Directors.
the Company Secretary prepares the agenda and the explanatory notes, in consultation with the Group Chairman / Chief executive officer & Managing Director and circulates the same in advance to the Directors. every Director is free to suggest inclusion of items on the agenda. the Board meets at least once every quarter, inter alia, to review the quarterly results. the Company also provides Video Conference facility, if required, for participation of the Directors at the Board/Committee Meetings. Additional Meetings are held, whenever necessary. presentations are made on business operations to the Board by Independent Companies / Business Units. Senior management personnel are invited to provide additional inputs for the items being discussed by the Board of Directors as and when necessary. the respective Chairman of the Board Committees apprise the Board Members of the important issues and discussions in the Committee Meetings. Minutes of Committee meetings are also circulated to the Board.
the Minutes of the proceedings of the Meetings of the Board of Directors are noted and the draft minutes are circulated amongst the Members of the Board for their perusal. Comments, if any, received from the Directors are also incorporated in the Minutes, in consultation with the Chairman. the minutes are approved and entered in the minutes book within 30 days of the Board meeting. thereafter, the minutes are signed and dated by the Chairman of the Board at the next meeting.
the following is the composition of the Board of Directors as on 31st March 2020. the Directors strive to attend all the Board / Committee meetings. their attendance at the Meetings during the year and at the last Annual General Meeting is as under:
Name of director Category Meetings held during the year
No. of Board Meetings attended
attendance at last aGM
Mr. A. M. Naik GC 5 4 YeSMr. S. N. Subrahmanyan Ceo & MD 5 5 YeSMr. R. Shankar Raman eD 5 5 YeSMr. Shailendra Roy eD 5 5 YeSMr. D. K. Sen eD 5 5 YeSMr. M. V. Satish eD 5 5 YeSMr. J. D. patil eD 5 5 YeSMr. M. M. Chitale ID 5 5 YeSMr. Subodh Bhargava ID 5 5 YeSMr. M. Damodaran ID 5 3 YeSMr. Vikram Singh Mehta ID 5 5 YeSMr. Adil Zainulbhai ID 5 5 No

93
Name of director Category Meetings held during the year
No. of Board Meetings attended
attendance at last aGM
Mr. Akhilesh Gupta & ID 2 2 YeSMrs. Sunita Sharma (Note 1) NeD 5 5 YeSMr. thomas Mathew t.$ ID 5 5 YeSMr. Ajay Shankar # ID 5 5 YeSMr. Subramanian Sarma NeD 5 5 YeSMs. Naina Lal Kidwai ID 5 5 YeSMr. Sanjeev Aga ID 5 5 YeSMr. Narayanan Kumar ID 5 4 YeSMr. Arvind Gupta (Note 2) @ NeD 5 5 YeSMr. Hemant Bhargava (Note 1) NeD 5 2 NoMeetings held during the year are expressed as number of meetings eligible to attendNote: 1. Representing equity interest of LIC 2. Representing equity interest of SUUtI& - ceased to be a Director w.e.f 8th September, 2019$ - ceased to be a Director w.e.f. 2nd April 2020@ - resigned as a Director w.e.f 26th March 2020 pursuant to withdrawal of nomination by SUUtI# ceased to be a Director w.e.f. 29th May 2020GC – Group Chairman Ceo & MD – Chief executive officer & Managing DirectoreD – executive Director NeD – Non-executive DirectorID – Independent Director
1. None of the above Directors are related inter-se.
2. None of the Directors hold the office of director in more than the permissible number of companies under the Companies Act, 2013 or Regulation 17A of the SeBI LoDR Regulations.
As on 31st March 2020, the number of other Directorships & Memberships / Chairmanships of Committees of the Board of Directors along with the names of the listed entities (whose equities securities are listed) wherein the Director holds directorships are as follows:
Name of director No. of other company
directorships
No. of Committee
Membership
No. of Committee
Chairmanship
Names of other Listed entities where he holds directorship
Category of directorship
Mr. A. M. Naik 5 0 0 Larsen & toubro Infotech Limited
Non-executive Chairman
L&t technology Services Limited
Non-executive Chairman
Mindtree Limited Non-executive Chairman
Mr. S. N. Subrahmanyan
5 1 0 Larsen & toubro Infotech Limited
Non- executive Vice- Chairman
L&t technology Services Limited
Non- executive Vice- Chairman
Mindtree Limited Non- executive Vice-Chairman
Mr. R. Shankar Raman
9 6 0 Larsen & toubro Infotech Limited
Non-executive Director

94
aNNEXUrE to tHe BoARD RepoRt ANNUAL RepoRt 2019-20
Name of director No. of other company
directorships
No. of Committee
Membership
No. of Committee
Chairmanship
Names of other Listed entities where he holds directorship
Category of directorship
L&t Finance Holdings Limited
Non-executive Director
Mindtree Limited Non- executive Director
Mr. Shailendra Roy 7 1 0 NilMr. D. K. Sen 2 0 0 NilMr. M. V. Satish 1 0 0 NilMr. J. D. patil 3 0 0 Mindtree Limited Non- executive
DirectorMr. M. M. Chitale 6 4 3 essel propack Limited Independent Director
Atul Limited Independent DirectorLarsen & toubro Infotech Limited
Independent Director
Bhageria Industries Limited
Independent Director
Mr. Subodh Bhargava
1 1 0 Batliboi Limited Independent Director
Mr. M. Damodaran 8 4 4 Crisil Limited Independent DirectorHero Motocorp Limited Independent Directortech Mahindra Limited Independent DirectorBiocon Limited Independent DirectorInterglobe Aviation Limited
Chairman- Independent Director
Mr. Vikram Singh Mehta
6 3 1 Colgate-palmolive (India) Limited
Independent Director
Ht Media Limited Independent DirectorApollo tyres Limited Independent DirectorMahindra & Mahindra Limited
Independent Director
Jubiliant Foodworks Limited
Independent Director
Mr. Adil Zainulbhai 7 4 5 Reliance Industries Limited
Independent Director
Network18 Media & Investment Limited
Chairman- Independent Director
Cipla Limited Independent DirectortV18 Broadcast Limited Chairman -
Independent DirectorMrs. Sunita Sharma
1 0 1 Nil
Mr. thomas Mathew t.*
5 3 2 L&t Finance Holdings Limited
Independent Director
ptC India Financial Services Ltd
Independent Director

95
Name of director No. of other company
directorships
No. of Committee
Membership
No. of Committee
Chairmanship
Names of other Listed entities where he holds directorship
Category of directorship
Mr. Ajay Shankar # 1 2 0 NilMr. Subramanian Sarma
1 0 0 Nil
Ms. Naina Lal Kidwai
4 3 2 Cipla Limited Independent Director
Max Financial Services Limited
Independent Director
Mr. Sanjeev Aga 4 3 2 Larsen & toubro Infotech Limited
Independent Director
UFo Moviez India Limited
Chairman and Independent Director
pidilite Industries Limited Independent DirectorMahindra Holidays & Resorts India Limited
Independent Director
Mr. Narayanan Kumar
7 2 4 L&t technology Services Limited
Independent Director
Mphasis Limited Independent Directortake Solutions Limited Chairman -
Independent Directorentertainment Network (India) Limited
Independent Director
Bharti Infratel Limited Independent DirectorMr. Hemant Bhargava
3 1 0 the tata power Company Limited
Nominee Director
Voltas Limited Non-executive DirectorItC Limited Non- executive
Director
Notes: * - ceased to be a Director w.e.f. 2nd April 2020
# ceased to be a Director w.e.f. 29th May 2020
zz other Company Directorships includes directorships in all public limited companies whose equity shares are listed. However, it excludes private limited companies, foreign companies and Section 8 companies.
zz the details of Committee Chairmanships / Memberships are disclosed as per Regulation 26 of the SeBI LoDR Regulations.
c. Information to the Board:
the Board of Directors has complete access to the information within the Company, which inter alia includes -
zz Annual revenue budgets and capital expenditure plans
zz Quarterly results and results of operations of ICs and business segments
zz Financing plans of the Company
zz Minutes of meeting of Board of Directors, Audit Committee, Nomination & Remuneration Committee, Stakeholders Relationship Committee and Corporate Social Responsibility Committee

96
aNNEXUrE to tHe BoARD RepoRt ANNUAL RepoRt 2019-20
zz Details of any joint venture, acquisitions of companies or collaboration agreement or sale of investments, subsidiaries, assets Quarterly report on fatal or serious accidents or dangerous occurrences, any material effluent or pollution problems, etc.
zz Any materially relevant default, if any, in financial obligations to and by the Company or substantial non-payment for goods sold or services rendered, if any
zz Any issue, which involves possible public or product liability claims of substantial nature, including any Judgment or order, if any, which may have strictures on the conduct of the Company
zz Developments in respect of human resources/industrial relations
zz Compliance or Non-compliance of any regulatory, statutory nature or listing requirements and investor service such as non-payment of dividend, delay in share transfer, etc., if any
zz Quarterly details of foreign exchange exposures and the steps taken by management to limit the risks of adverse exchange rate movement, if material.
d. Post-meeting internal communication system:
the important decisions taken at the Board / Committee meetings are communicated to the concerned departments / ICs promptly. An Action taken Report is regularly presented to the Board.
e. Board Skill Matrix:
the matrix setting out the skills / expertise/competence of the Board of Directors is given below:
Sr. No
Experience / Expertise / attribute
Comments
1 Leadership Ability to envision the future and prescribe a strategic goal for the Company, help the Company to identify possible road maps, inspire and motivate the strategy, approach, processes and other such key deliverables and mentor the leadership team to channelize its energy/efforts in appropriate direction. Be a thought leader for the Company and be a role model in good governance and ethical conduct of business, while encouraging the organization to maximize shareholder value. Should have had hands on experience of leading an entity at the highest level of management practices.
2 Industry knowledge and experience
Should possess domain knowledge in businesses in which the Company participates viz. Infrastructure, power, Heavy engineering, Defence, Hydrocarbon, Financial Services, Information technology and technology Services. Must have the ability to leverage the developments in the areas of engineering and technology and other areas as appropriate for betterment of Company’s business.
3 experience and exposure in policy shaping and industry advocacy
Should possess ability to develop professional relationship with the policy makers and Regulators for contributing to the shaping of Government policies in the areas of Company’s businesses.
4 Governance including legal compliance
Commitment, belief and experience in setting corporate governance practices to support the Company’s robust legal compliance systems and governance policies/practices.

97
Sr. No
Experience / Expertise / attribute
Comments
5 expertise/experience in Finance & Accounts / Audit / Risk Management areas
Ability to understand financial policies, accounting statements and disclosure practices and contribute to the financial/risk management policies/ practices of the Company across its business lines and geography of operations.
6 Global experience / International exposure
Ability to have access and understand business models of global corporations, relate to the developments with respect to leading global corporations and assist the Company to adapt to the local environment, understand the geo political dynamics and its relations to the Company’s strategies and business prospects and have a network of contacts in global corporations and industry worldwide.
the above list of core skills/expertise/competencies identified by the Board of Directors as required in the context of its business(es) and sector(s) for it to function effectively, are available with the Board.
the mapping of the Skill Matrix for the FY 2019-20 for all the Directors is as follows:
Sr. No
Name of the director 1 2 3 4 5 6
1 Mr. A.M Naik √ √ √ √ √ √
2 Mr. S.N Subrahmanyan √ √ √ √ √ √
3 Mr. R. Shankar Raman √ √ √ √ √ X
4 Mr. Shailendra Roy √ √ √ √ X X
5 Mr. D.K Sen √ √ X √ X √
6 Mr. M.V Satish √ √ X √ X √
7 Mr. J.D patil √ √ √ √ X X
8 Mr. M.M Chitale √ X √ √ √ X
9 Mr. Subodh Bhargava √ X √ √ X √
10 Mr. M. Damodaran √ X √ √ √ X
11 Mr. Vikram Singh Mehta √ √ √ X X √
12 Mr. Adil Zainulbhai √ X √ √ X √
13 Ms. Sunita Sharma √ X √ √ √ X
14 Mr. thomas Mathew t * √ X √ √ √ X
15 Mr. Ajay Shankar # √ √ √ X X √
16 Mr. Subramanian Sarma √ √ √ X X √
17 Ms. Naina Lal Kidwai √ X √ √ √ X
18 Mr. Sanjeev Aga √ X √ √ √ X
19 Mr. Narayanan Kumar √ √ √ X √ X
20 Mr. Hemant Bhargava √ X √ √ √ X
Notes: * - ceased to be a Director w.e.f. 2nd April 2020
# - ceased to be a Director w.e.f. 29th May 2020
Absence of any skill does not necessarily mean that the Director does not possess the skill.

98
aNNEXUrE to tHe BoARD RepoRt ANNUAL RepoRt 2019-20
F. Board CoMMITTEES
the Board currently has 5 Committees: 1) Audit Committee, 2) Nomination and Remuneration Committee, 3) Stakeholders’ Relationship Committee, 4) Corporate Social Responsibility Committee and 5) Risk Management Committee. the terms of reference of the Board Committees are in compliance with the provisions of the Companies Act, 2013, SeBI LoDR Regulations and are also reviewed by the Board from time to time. the Board is responsible for constituting, assigning and co-opting the members of the Committees. the meetings of each Board Committee are convened by the Company Secretary in consultation with the respective Committee Chairperson. the role and composition of these Committees, including the number of meetings held during the financial year and the related attendance are provided below.
1) audit Committee
the Company constituted the Audit Committee in 1986, well before it was made mandatory by law.
i) Terms of reference:
the role of the Audit Committee includes the following:
zz oversight of the Company’s financial reporting process and the disclosure of its financial information to ensure that the financial statement is correct, sufficient and credible.
zz Recommending to the Board, the appointment, re-appointment, terms of appointment and, if required, the replacement or removal of the statutory auditor and the fixation of audit fees.
zz Approval of payment to statutory auditors for any other services rendered by the statutory auditors.
zz Discussion with statutory auditors before the audit commences about the nature and scope of audit as well as post-audit discussion to ascertain any area of concern.
zz Reviewing, with the management, the annual financial statements and the audit report before submission to the
board for approval, with particular reference to:
1. Matters required to be included in the Director’s Responsibility Statement to be included in the Board’s report in terms of sub-section (5) of Section 134 of the Companies Act, 2013
2. Changes, if any, in accounting policies and practices and reasons for the same
3. Major accounting entries involving estimates based on the exercise of judgment by management
4. Significant adjustments made in the financial statements arising out of audit findings
5. Compliance with listing and other legal requirements relating to financial statements
6. Disclosure of any related party transactions
7. Qualifications in the draft audit report.
zz Reviewing, with the management, the quarterly financial statements before submission to the board for approval.
zz Reviewing, with the management, the statement of uses / application of funds raised through an issue (public issue, rights issue, preferential issue, etc.), the statement of funds utilized for purposes other than those stated in the offer document/prospectus/notice and the report submitted by the monitoring agency monitoring the utilisation of proceeds of public or rights issue, and making appropriate recommendations to the Board to take up steps in this matter, if any.
zz Reviewing, with the management, performance of statutory and internal auditors, and adequacy of the internal control systems.

99
zz Reviewing the adequacy of internal audit function, if any, including the structure of the internal audit department, staffing and seniority of the official heading the department, reporting structure, coverage and frequency of internal audit.
zz Discussion with internal auditors about any significant findings and follow up there on.
zz Reviewing the findings of any internal investigations by the internal auditors into matters where there is suspected fraud or irregularity or a failure of internal control systems of a material nature and reporting the matter to the board.
zz to look into the reasons for substantial defaults in the payment to the depositors, debenture holders, shareholders (in case of non-payment of declared dividends) and creditors.
zz to review the functioning of the Whistle Blower mechanism.
zz Approval of appointment of CFo (i.e., the whole-time Finance Director or any other person heading the finance function or discharging that function) after assessing the qualifications, experience & background, etc. of the candidate.
zz Carrying out any other function as is mentioned in the terms of reference of the Audit Committee.
zz the recommendation for appointment, remuneration and terms of appointment of cost auditors of the Company.
zz Review and monitor the auditor’s independence and performance, and effectiveness of audit process.
zz Review the management discussion and analysis of financial condition and results of operations.
zz Approval or any subsequent modification of transactions of the Company with related parties.
zz Reviewing the utilization of loans and/ or advances from/investment in the subsidiary companies exceeding rupees 100 crore or 10% of the asset size of the subsidiary, whichever is lower including existing loans / advances / investments.
zz Valuation of undertakings or assets of the company, wherever it is necessary.
zz evaluation of internal financial controls and risk management systems.
zz Monitoring the end use of funds raised through public offers and related matters.
Minutes of the Audit Committee Meetings are circulated to the Board of Directors and discussed, when necessary.
ii) Composition:
As on 31st March 2020, the Audit Committee comprised of four Independent Directors.
iii) Meetings:
During the year ended 31st March 2020, 8 meetings of the Audit Committee were held on18th April 2019, 9th May 2019, 22nd July 2019, 21st August 2019, 22nd october 2019, 27th November, 2019, 21st January 2020 and 28th February 2020.
the members of the Audit Committee also meet without the presence of management.
the attendance of Members at the Meetings was as follows:
Name Status No. of meetings
held during
the year
No. of Meetings Attended
Mr. M. M. Chitale Chairman 8 8
Mr. M. Damodaran Member 8 5
Mr. Sanjeev Aga Member 8 7
Mr. Narayanan Kumar Member 8 8
Meetings held during the year are expressed as number of meetings eligible to attend.

100
aNNEXUrE to tHe BoARD RepoRt ANNUAL RepoRt 2019-20
All the members of the Audit Committee are financially literate and have accounting or related financial management expertise.
the Chief executive officer & Managing Director, Whole-time Director & Chief Financial officer and Head - Corporate Audit Services are permanent invitees to the Meetings of the Audit Committee. the Company Secretary is the Secretary to the Committee.
iv) Internal audit:
the Company has an internal corporate audit team consisting of Chartered Accountants / Cost Accountants and engineers. over a period , the Corporate Audit department has acquired in-depth knowledge about the Company, its businesses, its systems & procedures, which knowledge is now institutionalized. the Company’s Internal Audit function is ISo 9001:2015 certified. the Head of Corporate Audit Services is responsible to the Audit Committee. the staff of Corporate Audit department is rotated periodically to have a holistic view of the entire operations and share the findings and good practices.
the Corporate Audit Services team carries out theme-based audits (revenue recognition, It controls, etc.), joint audits with other Corporate departments for specific functions, identifies risk-based focus areas in project audits, benchmarks the audit processes with large companies, encourages its team members to obtain globally renowned CISA, CIA and CFe Certification, etc. the audit plan is finalized based on the value of the contract in case of construction projects and the geographical spread of the Company. It is ensured that, on an average, all operations get covered in a span of two years. the Corporate Audit Services team has its offices at Mumbai and Chennai and all overseas audits are shared between these two zones.
From time to time, the Company’s systems of internal controls covering financial, operational, compliance, It applications, etc. are reviewed by external experts.
presentations are made to the Audit Committee, on the findings of such reviews.
the Corporate Audit Services team of the Company also covers the internal audit of all ICs and Subsidiary Companies. An in-depth audit is conducted by the team. the major deviations are highlighted and discussed with the concerned IC and / or subsidiary company Boards and the report highlighting the variations and the suggested corrective actions are also placed before the Audit Committee of the Company. Some subsidiaries have engaged external firms for conducting internal audit.
2) Nomination & remuneration Committee (NrC)
the Nomination & Remuneration Committee was constituted in 1999 even before it was mandated by law.
i) Terms of reference:
zz Identify persons who are qualified to become directors and who may be appointed in senior management in accordance with the criteria laid down by the Committee;
zz Recommend to the Board appointment and removal of such persons;
zz Formulate criteria for determining qualifications, positive attributes and independence of a director;
zz Devise a policy on Board diversity;
zz Formulation of criteria for evaluation of directors, Board and the Board Committees;
zz Carry out evaluation of the Board and directors;
zz Recommend to the Board a policy, relating to remuneration for the Directors and Key Managerial personnel (KMp);
zz Administration of employee Stock option Scheme (eSoS);
zz Recommend to the Board, all remuneration, in whatever form, payable to senior management.

101
ii) Composition:
As at 31st March 2020, the Committee comprised of 3 Independent Directors and the Group Chairman.
iii) Meetings:
During the year ended 31st March 2020, 4 meetings of the Nomination & Remuneration Committee were held on 10th May 2019, 23rd July 2019, 23rd october 2019 and 22nd January 2020.
the attendance of Members at the Meetings was as follows:
Name Status No. of meetings
held during
the year
No. of Meetings Attended
Mr. Subodh Bhargava Chairman 4 4
Mr. A. M. Naik Member 4 4
Mr. Adil Zainulbhai Member 4 4
Mr. Thomas Mathew T. *
Member 4 4
Meetings held during the year are expressed as number of meetings eligible to attend.
* ceased to be a member w.e.f. 2nd April 2020
iv) Board Membership Criteria:
While screening, selecting and recommending to the Board new members, the Committee ensures that the Board is objective, there is absence of conflict of interest, ensures availability of diverse perspectives, business experience, legal, financial & other expertise, integrity, leadership and managerial qualities, practical wisdom, ability to read & understand financial statements, commitment to ethical standards and values of the Company and there are healthy debates & sound decisions.
While evaluating the suitability of a Director for re-appointment, besides the above criteria, the NRC considers Board evaluation
results, attendance & participation in and contribution to the activities of the Board by the Director.
the Independent Directors comply with the definition of Independent Directors as given under Section 149(6) of the Companies Act, 2013 and all the applicable provisions of the SeBI LoDR Regulations. While appointing / re-appointing any Independent Directors / Non-executive Directors on the Board, the NRC considers the criteria as laid down in the Companies Act, 2013 and the SeBI LoDR Regulations.
All the Independent Directors give a certificate confirming that they meet the “independence criteria” as mentioned in Section 149(6) of the Companies Act, 2013 and SeBI LoDR Regulations.
the Board has taken on record the declaration and confirmation submitted by the Independent Directors and after assessing the veracity of the same, the Board is of the opinion that the Independent Directors fulfill the conditions specified in the SeBI LoDR Regulations and are independent of the management.
these certificates have been placed on the website of the Company http://investors.larsentoubro.com/corporategovernance.aspx.
v) remuneration Policy:
the remuneration of the Board members is based on the Company’s size & global presence, its economic & financial position, industrial trends, compensation paid by the peer companies, etc. Compensation reflects each Board member’s responsibility and performance. the level of compensation to executive Directors is designed to be competitive in the market for highly qualified executives.
the Company pays remuneration to executive Directors by way of salary, perquisites & retirement benefits (fixed components) & commission (variable component), based on recommendation of the NRC, approval of the Board and the shareholders. the commission payable is

102
aNNEXUrE to tHe BoARD RepoRt ANNUAL RepoRt 2019-20
based on the overall performance of the Company, performance of the business / function as well as qualitative factors. the commission is calculated with reference to net profits of the Company in the financial year subject to overall ceilings stipulated under Section 197 of the Companies Act, 2013.
the Independent Directors / Non-executive Directors are paid remuneration by way of commission & sitting fees. the Company paid sitting fees of R 1,00,000/- per meeting of the Board and R 50,000/- for Audit Committee, Nomination and Remuneration Committee and Risk Management Committee meetings and R 35,000/- for Stakeholders Relationship Committee and Corporate Social Responsibility Committee meetings during the year to the Independent Directors / Non-executive Directors. the commission is paid subject to a limit not exceeding 1% p.a. of the profits of the Company as approved by shareholders (computed in accordance with section 197 of the Companies Act, 2013).
the Group Chairman provides leadership to Board and guidance and mentorship to the leadership team for implementing the strategy plan and business objectives. the commission to the Independent Directors / Non-executive Directors is distributed broadly on the basis of their attendance, contribution at the Board, the Committee meetings, Chairmanship of Committees and participation in IC meetings.
In the case of nominees of Financial Institutions, the commission is paid to the Financial Institutions.
As required by the provisions of Regulation 46 of the SeBI LoDR Regulations, the criteria for payment to Independent Directors / Non-executive Directors is made available on the investor page of our corporate website http://investors.larsentoubro.com/Listing-Compliance.aspx.
Performance Evaluation Criteria for Independent directors:
the performance evaluation questionnaire covers qualitative/ subjective criteria’s with
respect to the structure, culture, Board processes and selection, effectiveness of the Board and Committees, strategic decision making, functioning of the Board and Committees, Committee composition, information availability, remuneration framework, familiarization program, succession planning, adequate participation, assessment of their independence, etc. It also contains specific criteria for evaluating the Chairman and individual Directors. An external consultant was engaged to receive the responses of the Directors and consolidate/analyze the responses.
the Chairman of the Company discusses the performance evaluation results with the Chairman of the NRC and interacts with all the Non-executive Directors & Independent Directors on a one-to-one basis. the NRC Chairman also interacts with the executive Directors.
Members are also requested to refer to page 77 of the Board Report.
vi) Training & Succession Planning:
the Company has institutionalized Leadership Development through a Seven Step leadership pipeline for development of a robust stage-wise leadership by a structured process of talent management. the thrust is on facilitating the transformation of managers into leaders, leaders into ‘corporate entrepreneurs (intrapreneurs)’ and to create a large pool of leaders who can envision, inspire, and successfully deploy global growth strategies thus creating a result-oriented culture of multiplying value.
each step of this Leadership pipeline development process has been meticulously customized to equip managers at various levels, with the required knowledge, skill & mind-set to transition seamlessly to the next level of leadership and global entrepreneurship. In this effort, the Company has partnered with globally renowned senior faculty and premier institutes like Harvard Business School, INSeAD, IIM Ahmedabad, and Stephen

103
M. Ross School of Business- University of Michigan. the programs are designed to provide inputs on vital areas of strategic importance such as innovation-based strategies, integrated business models to take on global multinationals, cross-cultural challenges, organic and inorganic growth etc., and thus mark an important milestone in the journey towards leadership development in the global context.
to facilitate enhanced global acumen & international exposure, which are critical competencies for establishing a global footprint, the Company continues to nominate select senior leaders for Advanced Management programs offered by globally renowned business schools like INSeAD, Wharton, Harvard, IMD, London Business School, oxford and the likes. As a part of Leadership development at the top echelons of the organization, a structured & systematic approach to mentoring has been initiated to leverage on the leadership experiences & networks of senior leaders and to enable them to leave a legacy of success mantras.
In order to continuously monitor the progress of high potentials (HIGH potS) who go through the Seven Step Leadership Development process and to ensure that they are given challenging roles and responsibilities, a top talent Management System is also put in place which is essential to ensure progress of a strong leadership pipeline.
to ensure that the Company has sufficient pool of probable employees who can be nominated for Leadership pipeline, efforts are taken at the grass root level. there exist several structured core developmental programs, conducted by reputed institutions like IIM-Bangalore, IIM-Calcutta, XLRI, Symbiosis and NMIMS for deserving employees to develop superior management skills and capabilities. A host of strategic and behavioral programs are conducted to address specific training and developmental needs of employees. A comprehensive e-learning portal AtL (Any time Learning) is available with multiple on-line programs and
courses for employees to enable learning ‘at any time, at any place’ at locations remote or otherwise. the portal provides access to on-line data bases, references, management videos, e-books and journals.
the NRC reviews on a periodic basis the succession planning process being followed by the Company especially at the level of the Board and senior management.
vii) details of remuneration paid / payable to directors for the year ended 31st March 2020:
(a) Executive directors:
the details of remuneration paid / payable to the executive Directors for FY 2019-20 is as follows:
v croreNames Salary Perquisites Perquisites
related to ESOP*
Retirement Benefits
Commission Total
Mr. S. N. Subrahmanyan
2.592 0.272 12.175 3.132 9.008 27.179
Mr. R. Shankar Raman
1.830 0.180 3.229 2.083 5.885 13.207
Mr. Shailendra N. Roy
1.710 0.180 - 1.373 3.374 6.637
Mr. D. K. Sen 1.350 0.180 - 0.912 2.027 4.469Mr. M. V. Satish 1.350 0.225 - 1.181 3.023 5.779Mr. J. D. Patil 1.140 0.180 - 1.043 2.723 5.086
*Represents perquisite value related to ESOPs exercised during the year in respect of stock options granted over the past several years by Larsen & Toubro Infotech Limited and L&T Technology Services Limited.
zz Notice period for termination of appointment of Chief executive officer & Managing Director and other Whole-time Directors is six months on either side.
zz No severance pay is payable on termination of appointment.
zz Details of options granted under employee Stock option Schemes are provided on the website of the Company www.larsentoubro.com.
zz Apart from eSops of the Company, Mr. S. N. Subrahmanyam has also been vested 40,000 stock options in Larsen & toubro Infotech Limited and L&t technology Services Limited each and he has

104
aNNEXUrE to tHe BoARD RepoRt ANNUAL RepoRt 2019-20
exercised the same. Similarly, Mr. R. Shankar Raman has been vested 20,000 stock options in Larsen & toubro Infotech Limited and he has exercised the same. the perquisite amount on exercise of these options is considered as a part of the remuneration/ of these Directors.
zz Considering the impact of Covid-19 on the business, the executive Directors have taken a voluntary reduction of 50% on the entitled commission.
(b) Non-Executive directors:
the details of remuneration paid / payable to the Non-executive Directors for the year 2019-20 is as follows:
v croreNames Sitting
Fees for Board
Meeting
Sitting Fees for
Committee Meeting
Commission Others^ Total
Mr. A. M. Naik 0.040 0.020 3.100 3.022 6.182
Mr. M. M. Chitale 0.050 0.047 0.392 – 0.489
Mr. Subodh Bhargava 0.050 0.020 0.433 – 0.503
Mr. M. Damodaran 0.030 0.025 0.180 – 0.235
Mr. Vikram Singh Mehta
0.050 0.004 0.240 – 0.294
Mr. Adil Zainulbhai 0.050 0.020 0.315 – 0.385
Mr. Akhilesh Gupta * 0.020 – 0.058 – 0.078
Mrs. Sunita Sharma 0.050 0.014 0.191 # – 0.255
Mr. Thomas Mathew T. &
0.050 0.020 0.274 – 0.344
Mr. Ajay Shankar $ 0.050 0.014 0.273 – 0.337
Mr. Subramanian Sarma
– – – – –
Ms. Naina Lal Kidwai 0.050 – 0.145 – 0.195
Mr. Sanjeev Aga 0.050 0.035 0.237 – 0.322
Mr. Narayanan Kumar 0.040 0.040 0.198 – 0.278
Mr. Arvind Gupta @ 0.050 – 0.145 # – 0.195
Mr. Hemant Bhargava 0.020 – 0.023 # – 0.043
Notes: ^ Others include pension of R 3 crore and perquisite value of medical R 0.022 crore
* ceased to be a Director w.e.f. 8th September 2019 @ resigned as a Director w.e.f. 26th March 2020 pursuant to
withdrawal of nomination by SUUTI & ceased to be a Director w.e.f. 2nd April 2020 $ ceased to be a Director w.e.f. 29th May 2020 # Payable to respective Institutions they represent.
Details of shares and convertible instruments held by the Non-executive Directors as on 31st March 2020 are as follows:
Names No. of Shares held
Mr. A. M. Naik 4,24,958
Mr. M. M. Chitale 2,443
Mr. Subodh Bhargava 1,125
Mr. M. Damodaran 225
Mr. Vikram Singh Mehta 1,327
Mr. Adil Zainulbhai 150
Mr. Sanjeev Aga 4,500
Mr. Thomas Mathew T. 150
Mr. Subramanian Sarma 94,650
Mr. Narayanan Kumar 1,500
Mrs. Sunita Sharma * 100
Mr. Ajay Shankar 150
Ms. Naina Lal Kidwai 150
Mr. Hemant Bhargava * 100
Mr. Hemant Bhargava 90
* held jointly with the Institution they represent.
3) Stakeholders’ relationship Committee:
i) Terms of reference:
the terms of reference of the Stakeholders’ Relationship Committee are as follows:
zz Resolving the grievances of the security holders of the company including complaints related to transfer/transmission of shares, non-receipt of annual report, non-receipt of declared dividends, issue of new/duplicate certificates, general meetings etc.
zz Review of measures taken for effective exercise of voting rights by shareholders.
zz Review of adherence to the service standards adopted by the Company in respect of various services being rendered by the Registrar & Share transfer Agent.
zz Review of the various measures and initiatives taken by the Company for

105
reducing the quantum of unclaimed dividends and ensuring timely receipt of dividend warrants/annual reports/statutory notices by the shareholders of the company.
ii) Composition:
As on 31st March 2020 the Stakeholders’ Relationship Committee comprised of 1 Non-executive Director, 1 Independent Director and 1 executive Director.
iii) Meetings:
During the year ended 31st March 2020, 4 meetings of the Stakeholders’ Relationship Committee were held on 10th May 2019, 28th June 2019, 23rd october 2019 and 22nd January 2020.
the attendance of Members at the Meetings was as follows-
Name Status No. of meetings
held during
the year
No. of Meetings Attended
Mrs. Sunita Sharma Chairperson 4 4
Mr. Ajay Shankar $ Member 4 4
Mr. Shailendra Roy Member 4 4
Meetings held during the year are expressed as number of meetings eligible to attend.
$ - ceased as a Member w.e.f. 29th May 2020
Mr. N. Hariharan, Company Secretary was the Compliance officer till 1st January 2020. Mr. Sivaram Nair A, Company Secretary is the Compliance officer with effect from 2nd January 2020.
iv) Number of requests / Complaints:
During the year, the Company has resolved investor grievances expeditiously except for the cases constrained by disputes or legal impediments.
During the year, the Company / its Registrar’s received the following complaints from SeBI / Stock exchanges and queries
from shareholders, which were resolved within the time frames laid down by SeBI.
Particulars Opening Balance
Received Resolved Pending*
Complaints:
SEBI / Stock Exchange
16 97 112 1
Shareholder Queries:
Dividend Related
500 12006 12495 11
Transmission / Transfer
164 2325 2489 0
Demat / Remat 132 1914 2042 4
* Investor complaints / queries shown outstanding as on 31st March 2020 have been subsequently resolved to the complete satisfaction of the investors. The Company repeatedly sends reminders to shareholders regarding unclaimed shares and dividends. This results in an increase in the number of queries received.
the Board has delegated the powers to approve transfer of shares to a Share transfer Committee of executives comprising of four Senior executives. this Committee held 14 meetings during the year and approved the transfer of shares lodged with the Company. pursuant to SeBI press releases dated 3rd December 2018 and 27th March, 2019, except in case of transmission or transposition of securities, requests for effecting transfer of securities subsequent to 1st April 2019, have not been processed by the Company unless the securities were held in the dematerialized form with a depository.
4) Corporate Social responsibility Committee:
i) Terms of reference:
the terms of reference of the CSR Committee are as follows:
(a) formulate and recommend to the Board, a Corporate Social Responsibility policy which shall indicate the activities to be undertaken by the Company;
(b) recommend the amount of expenditure to be incurred on the activities referred to in clause (a); and

106
aNNEXUrE to tHe BoARD RepoRt ANNUAL RepoRt 2019-20
(c) monitor the Corporate Social Responsibility policy of the Company from time to time.
ii) Composition:
As on 31st March 2020, the CSR Committee comprised of 1 Independent Director and 2 executive Directors.
iii) Meetings:
During the year ended 31st March 2020, 3 meetings of the CSR Committee were held on 9th August 2019, 11th December 2019 and 11th March 2020.
the attendance of Members at the Meetings was as follows-
Name Status No. of meetings
held during
the year
No. of Meetings Attended
Mr. Vikram Singh Mehta #
Chairman 1 1
Mr. M. M. Chitale * Chairman 2 2
Mr. R. Shankar Raman Member 3 2
Mr. D. K. Sen Member 3 2
Meetings held during the year are expressed as number of meetings eligible to attend.
# ceased to be a member w.e.f. 11th December 2019
* appointed as Chairman w.e.f. 11th December 2019
iv) CSr activities & Impact assessment:
the Company, through its CSR Committee, is committed to improve the social infrastructure of the country. the Company is leveraging its countrywide presence to reduce disparities through interventions in Water and sanitation, Healthcare, education and Skill building. Close interactions with the local community members have enabled the Company to identify and address their most pressing needs and the social interventions for community development have been specifically aligned.
Under flagship program of “Integrated Community Development” (ICD), the Company has launched programs towards holistic development in the following areas based on need assessment:
zz Water & Sanitation: For the availability of safe drinking water and proper sanitation facilities
zz education: to improve access to education (increased enrollment in pre-school, children attending neighborhood schools) and improving quality of learning (better school infrastructure, better teaching-learning process)
zz Health: Improvement in access to quality health care (expanding infrastructure of health centres, increased number of people availing quality health care)
zz Skill development: enhancing employability of youth (enhancing training capacity, improved infrastructure of skill development centres).
102 Village Development Committees (VDCs) and Farmers Groups have been formed across locations, with participation from women. A quarterly review of the ICD projects is done with the village panchayats and local authorities.
Access to cleaner water, hygienic surroundings, better health, education and new skills, has altered the lives of around 0.77 million individuals through our CSR programs in 2019-20.
All CSR projects have defined goals and milestones which are tracked as per the periodicity defined for the project. the progress is compared with the baseline data that is gathered before the commencement of the project. this is carried out through an onsite evaluation as well as the reports generated from the project. the indirect impacts that accrue are also factored and

107
documented in the monthly reporting process. these are subsequently vetted /measured during the external Social Audit or Impact Assessment. the social audit report is discussed during the Committee meetings.
the detailed disclosures of CSR spending during the year has been given in Annexure ‘C’ forming part of this Board Report. please refer to pages 126 to 131 of this Annual Report.
5) risk Management Committee:
the Company has re-constituted the Risk Management Committee on 22nd January 2020 and renamed it as ‘Board Risk Management Committee (BRMC)’. the erstwhile Apex Risk Management Committee continues to exist and reviews the operational risks including client quality, manpower availability, logistics and other aspects which impact the Company and the Group.
i) Terms of reference:
the terms of reference of the Board Risk Management Committee are as follows:
zz Review of the existing Risk Management policy, framework and processes, Risk Management Structure and Risk Mitigation Systems. Broadly, the key risks will cover strategic risks of the group at the domestic and international level, including Sectoral developments, risk related to market, financial, geographical, political and reputational issues, environment, Social and Governance (eSG) risks, etc.
zz evaluate risks related to cyber security.
ii) Composition:
As on 31st March 2020, the Board Risk Management Committee comprised of 2 Independent Directors and 1 Non-executive Director.
iii) Meetings:
During the year ended 31st March 2020, 6 meetings of the Apex Risk Management Committee were held on 16th May 2019 (two meetings), 27th May 2019, 25th July 2019 and 25th october 2019 (two meetings).
the attendance of Members at the Meetings was as follows-
Name Status No. of meetings
held during the
year
No. of Meetings Attended
Mr. S. N. Subrahmanyan Chairman 6 6Mr. R. Shankar Raman Member 6 5Mr. Subramanian Sarma Member 6 4
Meetings held during the year are expressed as number of meetings eligible to attend.
Note : The Board Risk Management Committee comprising of Mr. Adil Zainulbhai, Sanjeev Aga and Mr. Subramanian Sarma as Members was constituted on January 22, 2020. Mr. Adil Zainulbhai is the Chairman of the Committee. No meetings were held in FY 2020.
G. oTHEr INForMaTIoN a) directors’ Familiarization Program: All our directors are aware and are also
updated as and when required, of their role, responsibilities & liabilities.
the Company holds Board meetings at its registered office and wherever necessary, in locations, where it operates. Site / factory visits are organized at various locations for the Directors.
the internal newsletters of the Company, the press releases, etc. are circulated to all the Directors so that they are updated about the operations of the Company.
presentations are made regularly to the Board / NRC / Audit Committee (AC) (minutes of AC, NRC, SRC and CSR Committee are circulated to the Board). presentations, inter alia, cover business strategies, management structure, HR policy, management development and succession planning, quarterly and annual results, budgets, treasury policy, review of Internal Audit, risk management framework, operations of subsidiaries and associates, etc. the Directors get an opportunity to interact with senior managers during the course of these presentations.
Independent Directors have the freedom to interact with the Company’s management. Interactions happen during Board / Committee meetings, when senior company personnel are asked to make presentations about performance of their Independent Company (IC) / Business Unit, to the Board.

108
aNNEXUrE to tHe BoARD RepoRt ANNUAL RepoRt 2019-20
Some of the Independent Directors are members of the IC Board. they share the learnings from these meetings with the remaining Non-executive Directors / Independent Directors formally and informally. Such interactions also happen when these Directors meet senior management in IC meetings and informal gatherings.
As part of the appointment letter issued to Independent Directors, the Company has stated that it will facilitate attending seminars/programs/conferences designed to train directors to enhance their role as an Independent Director.
this information is also available on the website of the Company http://investors.larsentoubro.com/Listing-Compliance.aspx.
b) risk Management Framework:
please refer to page 75 of the Board Report.
c) Vigil Mechanism / Whistle Blower Policy:
the Company has a Whistle Blower policy in place since April 2004. the said policy was modified in line with the requirements of the Vigil Mechanism under the Companies Act, 2013. the Company has a Whistle Blower Investigation Committee (WBIC) to manage complaints from “Identified” Whistle Blowers. In addition, WBIC considers “Anonymous” complaints which in their judgement are serious in nature and require investigation. the WBIC has five members viz. Chief Financial officer, Company Secretary, Head-Corporate HR, Chief Internal Auditor and a senior executive. the WBIC is responsible for end to end management of the investigations from receipt of complaints to bringing them to a logical conclusion, keeping in mind the interest of the Company.
employees are encouraged to report any acts of unacceptable behaviour inconsistent with the Company’s Code of Conduct having an adverse effect on the Company’s financials / image and instances of sharing of unpublished price sensitive information. An employee can report any such conduct in oral or written form. Whistle-blowers are assured by the management of full protection from any kind of harassment, retaliation, victimization or unfair treatment.
Complaints under the Whistle Blower policy are received by the Corporate Audit Services of the Company. the Chief Internal Auditor reviews the same and convenes a meeting of the WBIC for discussions. the WBIC, after screening the complaint, decides on the further course of action which will include requesting the complainant to provide further details, internal investigation by the Internal Audit department, investigation by external agencies, wherever necessary, opportunity to the defendant to present his / her case, etc. Based on the findings of the investigation, the WBIC decides the action to be taken and recommends the same to the executive Committee for implementation.
the WBIC meets formally and reviews the complaints and their progress. In addition, discussions also take place over video-conferencing, telephone and emails amongst the WBIC members.
the Audit Committee is periodically briefed about the various cases received, the status of the investigation, findings and action taken, if any.
During the year, the Company has investigated the complaints received under the Whistle Blower policy and suitable action has been taken against employees, wherever necessary.
Also refer to pages 78 and 79 of the Board Report.
d) Statutory auditors:
In the case of appointment of new auditors, a Committee, comprising of the Chairman of the Audit Committee, the CFo and the Company Secretary, evaluates various audit firms based on approved criteria as given herein below. the Audit firms are required to make a presentation to this Committee. the Committee considers factors such as compliance with the legal provisions, number / nature / size and variation in client base, skill sets available in the firm both at partner level and staff level, international experience, systems and processes followed by the firm, training and development by the firm to its partners and staff, etc. during the process of evaluation. Based on merit and the factors mentioned above, the Committee finalizes the firm to be appointed and recommends the same

109
to the Audit Committee. The Audit Committee reviews the same before recommending to the Board and shareholders for approval.
The above process was followed by the Company while re-appointing M/s Deloitte Haskins & Sells LLP (‘DHS’) as the Auditors of the Company for second and final term of five years in 2020.
Deloitte Haskins & Sells LLP, registered since 1983, is one of the member firms of Deloitte Touche Tohmatsu Limited, a UK private company limited by guarantee (“DTTL”). Each DTTL member firm provides services in particular geographic areas and is subject to the laws and professional regulations of the particular country or countries in which it operates.
Deloitte Haskins & Sells LLP tied up with CC Chokshi & Co in 1983 which was one of the largest Indian Independent audit and accounting firms. After that, it merged with Fraser & Ross, PC Hansotia & Co and later with SB Billimoria (SBB) in 1999. In 2004, AF Ferguson & Co (one of India’s oldest audit firm) merged into existing DHS firms.
Deloitte is now a global network with circa 286,000 people with revenues over $43 billion. Deloitte India has more than 10,000 professionals operating out of 13 cities – Ahmedabad, Bangalore, Vadodara, Chennai, Coimbatore, Goa, Gurgaon, Hyderabad, Jamshedpur, Kochi, Kolkata, Mumbai and Pune providing professional services in the areas of Audit, Risk Advisory, Tax, Consulting, and Financial Advisory services to public and private clients spanning multiple industries. It draws its strength from its people, which include 2,500+ professionals in Audit, 2,350 + in Tax, 1,900+ in Consulting, and 1000+ in Financial Advisory.
For the financial year 2019-20, the total fees paid by the Company and its subsidiaries, on a consolidated basis, to Deloitte Haskins & Sells LLP, Statutory Auditor and all entities in the network firm/network entity of which the statutory auditors are a part thereof for all the services provided by them is R 12.91 crore.
Also refer to page 79 of the Board Report.
e) Code of Conduct:
The Company has laid down a Code of Conduct for all Board members and senior management personnel. The Code of Conduct is available on the website of the Company www.larsentourbo.com. The declaration of the Chief Executive Officer & Managing Director is given below:
To the Shareholders of Larsen & Toubro Limited
Sub: Compliance with Code of Conduct
I hereby declare that all the Board Members and Senior Management Personnel have affirmed compliance with the Code of Conduct as adopted by the Board of Directors and Senior Management Personnel.
S. N. Subrahmanyan Chief Executive Officer & Managing Director
Date: 5th June, 2020 Place: Mumbai
f) General Body Meetings:
The last three Annual General Meetings of the Company were held as under:
Financial Year
Date Venue Time
2018-2019 1st August, 2019
Birla Matushri Sabhagar
3.00 p.m.
2017-2018 23rd August 2018
Birla Matushri Sabhagar
3.00 p.m.
2016-2017 22nd August 2017
St. Andrews Auditorium
3.00 p.m.
The following Special Resolutions were passed by the members during the past 3 Annual General Meetings:
Annual General Meeting held on 1st August 2019:
zz To re-appoint Mr. M. M. Chitale as an Independent Director of the Company for a five year term upto March 31, 2024.
zz To re-appoint Mr. M. Damodaran as an Independent Director of the Company for a five year term upto March 31, 2024.
zz To re-appoint Mr. Vikram Singh Mehta as an Independent Director of the Company for a five year term upto March 31, 2024.

110
aNNEXUrE to tHe BoARD RepoRt ANNUAL RepoRt 2019-20
zz to re-appoint Mr. Adil Zainulbhai as an Independent Director of the Company for a five year term upto May 28, 2024.
zz to amend the object clause of the Memorandum of Association of the Company
zz to approve raising of capital through QIp’s by issue of shares / convertible debentures / securities upto an amount of USD 600 million or R 4,000 crore.
Annual General Meeting held on 23rd August 2018:
zz to appoint Mr. A.M. Naik as a Non- executive Director of the Company with effect from 1st october 2017 who has attained the age of 75 years.
zz to approve the payment of remuneration to Mr. A.M. Naik, being in excess of fifty percent of the total annual remuneration payable to all the Non-executive Directors.
zz to approve raising of finances through issue of debentures upto R 6000 crore.
Annual General Meeting held on 22nd August 2017:
zz to re-appoint Mr. Subodh Bhargava as an Independent Director of the Company for a five year term upto 29th March 2022.
zz to approve raising of capital through QIp’s by issue of shares / convertible debentures / securities upto an amount of USD 600 million or R 4,000 crore.
zz to approve raising of finances through issue of debentures upto R 6000 crore.
Note : the resolution relating to raising of finances have been taken at each of the above AGMs since the validity of the resolution is one year.
g) resolution(s) passed through Postal Ballot:
No postal ballot was conducted during the financial year 2019-20. there is no immediate proposal for passing any resolution through postal ballot.
h) disclosures:
1. During the year, there were no transactions of material nature with the Directors or the Management or relatives or the subsidiaries that had potential conflict with the interests of the Company.
2. Details of all related party transactions form a part of the accounts as required under IND AS 24 and the same are given in Note 47 forming part of the financial statements.
3. the Company has followed all relevant Accounting Standards notified by the Companies (Indian Accounting Standards) Rules, 2015 while preparing the Financial Statements.
4. the Company makes presentations to Institutional Investors & equity Analysts on the Company’s performance on a quarterly basis. the same are provided to the Stock exchanges and also available on our website http://investors.larsentoubro.com/Announcements.aspx.
5. there were no instances of non-compliance, penalties, strictures imposed on the Company by the Stock exchanges on any matter related to the capital markets, during the last three years.
6. the policies for determining material subsidiaries and related party transactions are available on our website http://investors.larsentoubro.com/Listing-Compliance.aspx.
7. Details of risk management including foreign exchange risk, commodity price risk and hedging activities form a part of the Management Discussion & Analysis. please refer to pages 331 to 334 of this Annual Report.
8. As required under the provisions of SeBI LoDR Regulations, a certificate confirming that none of the Directors on the Board have been debarred or disqualified by the Board/Ministry of Corporate Affairs or any such statutory authority obtained from M/s S. N. Ananthasubramanian & Co., Company Secretaries is a part of the Corporate Governance report.

111
9. Details in relation to the Sexual Harassment of Women at Workplace (prevention, prohibition and Redressal) Act, 2013 form a part of the Board Report. please refer to pages 77 and 78 of this Annual Report.
i) Means of communication:
Financial Results and other Communications
Quarterly & Annual Results are published in prominent daily newspapers viz. the Financial express, the Hindu Business Line & Loksatta. the results are also posted on the Company’s website: www.larsentoubro.com. Advertisements relating to IepF, e-Voting, AGM related compliances, etc. are published in the Financial express & Loksatta.
News Releases official news releases are sent to stock exchanges as well as displayed on the Company’s website: www.larsentoubro.com.
Website the Company’s corporate website www.larsentoubro.com provides comprehensive information about its portfolio of businesses. Section on “Investors” serves to inform and service the Shareholders allowing them to access information at their convenience. the quarterly shareholding pattern of the Company is available on the website of the Company as well as the stock exchanges. the entire Annual Report and Accounts of the Company and subsidiaries are available in downloadable formats. the entire Annual Report and Accounts of the Company would also be made available on the websites of the Stock exchanges.
Filing with Stock exchanges
Information to Stock exchanges is now being also filed online on NeApS for NSe, BSe online for BSe and RNS for London Stock exchange.
Annual Report and Annual General Meeting
Annual Report is circulated to all the members and all others like auditors, equity analysts, etc. In order to enable a larger participation of shareholders for the Annual General Meeting, the Company has provided Webcast facility of its last three Annual General Meeting in co-ordination with NSDL/Kfintech. this year, due to CoVID pandemic, the Company will be conducting the Annual General Meeting through Audio Visual Means, as permitted by Ministry of Corporate Affairs and SeBI. the Annual Report is sent to all members who have registered their email ids with the Company. the Company suitably responds to the queries, if any, raised by the shareholders.
SeBI Complaints Redress System (SCoReS):
Investor complaints are processed at SeBI in a centralized web-based complaints redress system. the salient features of this system are centralised database of all complaints, online upload of Action taken Reports (AtRs) by concerned companies and online viewing by investors of actions taken on the complaints and their current status.
Management Discussion & Analysis
this forms a part of the Annual Report which is mailed to the shareholders of the Company.
presentations made to Institutional Investors and Analysts
the schedule of analyst / institutional investor meets and presentations made to them on a quarterly basis are informed to the Stock exchanges and also displayed on the website.
H. UNCLaIMEd SHarES
the Company does not have any unclaimed shares lying with it from any public issue. However certain shares resulting out of the bonus shares issued by

112
aNNEXUrE to tHe BoARD RepoRt ANNUAL RepoRt 2019-20
the Company are unclaimed by the shareholders. As required under Regulation 39(4) of the SeBI LoDR Regulations, the Company has already sent reminders in the past to the shareholders to claim these shares. these share certificates are regularly released on requests received from the eligible shareholders after due verification.
In accordance with the provisions of the Section 124(6) and Rule 6(3)(a) of the Investor education and protection Fund Authority (Accounting, Audit, transfer and Refund) Rules, 2016 (‘IepF Rules’), the Company has transferred equity shares on which dividend has remained unclaimed for a period of seven consecutive years from the financial year 2011-12. the details are given in the Board Report. please refer to page 72 of this Annual Report.
All corporate benefits on such shares viz. bonus shares, etc. shall be transferred in accordance with the provisions of IepF Rules read with Section 124(6) of the Companies Act, 2013. the eligible shareholders are requested to note the same and make an application to IepF Authority in accordance with the procedure available on www.iepf.gov.in and submit such documents as prescribed under the IepF Rules to claim these shares. Mr. Sivaram Nair A., has been appointed as the Nodal officer of the Company.
I. GENEraL SHarEHoLdErS’ INForMaTIoN
a) annual General Meeting:
the Annual General Meeting of the Company has been convened on thursday, 13th August 2020 through Video Conferencing (“VC”) / other Audio Visual Means (“oAVM”) pursuant to the MCA Circular dated May 5, 2020 at 3.30 p.m.
b) Financial calendar:
1. Annual Results of 2019-20
5th June 2020
2. E-Mailing of Annual Reports
fourth week of July 2020
3. First Quarter Results During the fourth week of July 2020 *
4. Annual General Meeting Thursday, 13th August 2020
5. Payment of Dividend 17th August 2020
6. Second Quarter results During third week of October 2020 *
7. Third Quarter results During third week of January 2021 *
* Tentative
c) Book Closure: the dates of Book Closure are from 7th day
of August 2020 to 13th day of August 2020 (both days inclusive) to determine the members entitled to the dividend for financial year 2019-2020.
d) Listing of equity shares / shares underlying Gdrs on Stock Exchanges:
the shares of the Company are listed on BSe Limited (BSe) and the National Stock exchange of India Limited (NSe).
GDRs are listed on Luxembourg Stock exchange and admitted for trading on London Stock exchange.
e) Listing Fees to Stock Exchanges: the Company has paid the Listing Fees for the
year 2020-21 to BSe in May 2020. the Fees to Luxembourg Stock exchange has been paid in March, 2020. the Company is in the process of payment of Listing fees to NSe. Fees to London Stock exchange will be paid on receipt of the bill.
f) Custodial Fees to depositories: the Company has made payment of custodial
fees for the year 2020-21 to National Securities Depository Limited (NSDL). the fees to Central Depository Services (India) Limited (CDSL) shall be paid on the receipt of their invoice.
g) Stock Code / Symbol: the Company’s equity shares / GDRs are listed on
the following Stock exchanges and admitted for trading in London Stock exchange:BSE Limited (BSE) : Scrip Code - 500510National Stock Exchange of India Limited (NSE)
: Scrip Code - LT
ISIN : INE018A01030Reuters RIC : LART.BOLuxembourg Exchange Stock Code : 005428157London Exchange Stock Code : LTOD

113
the Company’s shares constitute a part of BSe 30 Index of the BSe Limited as well as NIFtY Index of the National Stock exchange of India Limited.
h) Stock market data for the year 2019-20:
Month L&T BSE Price (v) BSE SENSEX
2019High Low Month
CloseHigh Low Month
Close
April 1427.00 1337.30 1347.75 39487.45 39083.16 39031.55
May 1606.70 1284.90 1557.95 40124.96 39500.56 39714.20
June 1584.70 1495.00 1553.05 40312.07 40031.05 39394.64
July 1591.60 1361.20 1387.15 40032.41 39858.33 37481.12
August 1399.00 1274.10 1328.10 37807.55 37449.69 37332.79
September 1554.05 1289.10 1476.60 39441.12 38913.06 38667.33
October 1495.95 1382.00 1473.40 40392.22 40054.89 40129.05
November 1481.00 1315.05 1330.60 41163.79 40996.08 40793.81
December 1342.40 1255.60 1298.95 41809.96 41636.11 41253.74
2020
January 1376.35 1283.60 1369.10 42273.87 41850.29 40723.49
February 1383.85 1162.35 1183.00 41709.30 41338.31 38297.29
March 1211.50 661.05 806.85 39083.17 38386.68 29468.49
20001900180017001600150014001300120011001000900800700600
45000
42500
40000
37500
35000
32500
30000
27500
25000
BSE
SEN
SEX
L&T-
BSE
(V)
Apr19
May19
Jun19
Jul19
Aug19
Sep19
Daily Closing Price
Stock Performance
Oct19
Nov19
Dec19
Jan20
Feb20
Mar20
L&T BSE (v) BSE SENSEX
Month L&T NSE Price (v) NIFTY
2019High Low Month
CloseHigh Low Month
CloseApril 1426.95 1336.60 1348.55 11856.15 11549.10 11748.15May 1607.00 1285.30 1557.55 12041.15 11108.30 11922.80June 1585.00 1495.25 1553.20 12103.05 11625.10 11788.85July 1591.65 1360.50 1387.30 11981.75 10999.40 11118.00August 1399.40 1274.00 1328.25 11181.45 10637.15 11023.25September 1551.00 1289.10 1474.25 11694.85 10670.25 11474.45
Month L&T NSE Price (v) NIFTY
2019High Low Month
CloseHigh Low Month
CloseOctober 1496.45 1381.05 1473.05 11945.00 11090.15 11877.45November 1481.05 1314.15 1330.55 12158.80 11802.65 12056.05December 1342.90 1255.00 1298.20 12293.90 11832.30 12168.452020 January 1377.00 1283.35 1369.30 12430.50 11929.60 11962.10February 1383.70 1162.00 1187.55 12246.70 11175.05 11201.75March 1212.35 661.00 808.50 11433.00 7511.10 8281.10
13000
12400
11800
11200
10600
10000
9400
8800
8200
7600
7000
NSE
NIF
TY
L&T-
NSE
(V)
Apr19
May19
Jun19
Jul19
Aug19
Sep19
Daily Closing Price
Stock Performance
Oct19
Nov19
Dec19
Jan20
Feb20
Mar20
L&T NSE (v) NSE NIFTY20001900180017001600150014001300120011001000900800700600
i) registrar and Share Transfer agents (rTa):
KFin technologies private Limited. (previously known as Karvy Fintech pvt. Ltd) Unit: Larsen & toubro Limited Karvy Selenium tower B, plot number 31 & 32 Financial District Gachibowli, Nanakramguda, Hyderabad, telangana - 500 032.
j) Share Transfer System:
pursuant to SeBI press releases dated 3rd December 2018 and 27th March, 2019, except in case of transmission or transposition of securities, requests for effecting transfer of securities subsequent to 1st April 2019, shall not be processed by the Company unless the securities are held in the dematerialized form with a depository. the share related information is available online.
physical shares received for dematerialization are processed and completed within a period of 21 days from the date of receipt.
As required under Regulation 40 of the SeBI LoDR Regulations, a certificate on half yearly basis confirming due compliance of
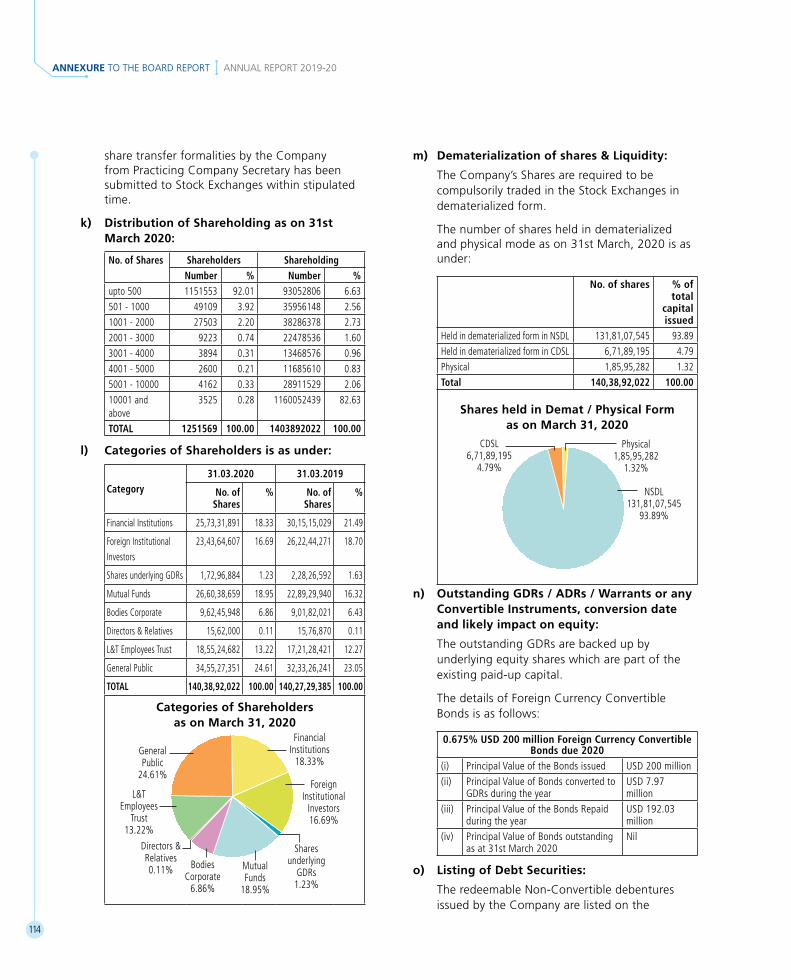
114
aNNEXUrE to tHe BoARD RepoRt ANNUAL RepoRt 2019-20
share transfer formalities by the Company from practicing Company Secretary has been submitted to Stock exchanges within stipulated time.
k) distribution of Shareholding as on 31st March 2020:
No. of Shares Shareholders ShareholdingNumber % Number %
upto 500 1151553 92.01 93052806 6.63501 - 1000 49109 3.92 35956148 2.561001 - 2000 27503 2.20 38286378 2.732001 - 3000 9223 0.74 22478536 1.603001 - 4000 3894 0.31 13468576 0.964001 - 5000 2600 0.21 11685610 0.835001 - 10000 4162 0.33 28911529 2.0610001 and above
3525 0.28 1160052439 82.63
TOTAL 1251569 100.00 1403892022 100.00
l) Categories of Shareholders is as under:
Category31.03.2020 31.03.2019
No. of Shares
% No. of Shares
%
Financial Institutions 25,73,31,891 18.33 30,15,15,029 21.49
Foreign Institutional Investors
23,43,64,607 16.69 26,22,44,271 18.70
Shares underlying GDRs 1,72,96,884 1.23 2,28,26,592 1.63
Mutual Funds 26,60,38,659 18.95 22,89,29,940 16.32
Bodies Corporate 9,62,45,948 6.86 9,01,82,021 6.43
Directors & Relatives 15,62,000 0.11 15,76,870 0.11
L&T Employees Trust 18,55,24,682 13.22 17,21,28,421 12.27
General Public 34,55,27,351 24.61 32,33,26,241 23.05
TOTAL 140,38,92,022 100.00 140,27,29,385 100.00
Categories of Shareholders as on March 31, 2020
Financial Institutions
18.33%
Foreign Institutional
Investors 16.69%
Shares underlying
GDRs 1.23%
Mutual Funds
18.95%
Bodies Corporate
6.86%
Directors & Relatives 0.11%
L&T Employees
Trust 13.22%
General Public
24.61%
m) dematerialization of shares & Liquidity:
the Company’s Shares are required to be compulsorily traded in the Stock exchanges in dematerialized form.
the number of shares held in dematerialized and physical mode as on 31st March, 2020 is as under:
No. of shares % of total
capital issued
Held in dematerialized form in NSDL 131,81,07,545 93.89Held in dematerialized form in CDSL 6,71,89,195 4.79Physical 1,85,95,282 1.32Total 140,38,92,022 100.00
Shares held in demat / Physical Form as on March 31, 2020
NSDL 131,81,07,545
93.89%
Physical 1,85,95,282
1.32%
CDSL 6,71,89,195
4.79%
n) outstanding Gdrs / adrs / Warrants or any Convertible Instruments, conversion date and likely impact on equity:
the outstanding GDRs are backed up by underlying equity shares which are part of the existing paid-up capital.
the details of Foreign Currency Convertible Bonds is as follows:
0.675% USD 200 million Foreign Currency Convertible Bonds due 2020
(i) Principal Value of the Bonds issued USD 200 million(ii) Principal Value of Bonds converted to
GDRs during the yearUSD 7.97 million
(iii) Principal Value of the Bonds Repaid during the year
USD 192.03 million
(iv) Principal Value of Bonds outstanding as at 31st March 2020
Nil
o) Listing of debt Securities:
the redeemable Non-Convertible debentures issued by the Company are listed on the

115
Wholesale Debt Market (WDM) of National Stock exchange of India Limited and / or BSe Limited.
p) Listing of Commercial Paper:
the Commercial papers issued by the Company are listed on BSe Limited.
q) debenture Trustees (for privately placed debentures):
IDBI trusteeship Services Limited Ground Floor, Asian Building 17, R. Kamani Marg Ballard estate Mumbai – 400 001
r) Credit rating:
the Company has obtained rating from CRISIL Limited and ICRA Limited during the financial year 2019-20. there has been no revision in credit ratings during the financial year 2019-20.
Rating Agency
Type of Instrument
Rating
CRISIL Limited
Non-Convertible Debentures
‘CRISIL AAA/Stable’
Inflation-linked Capital- Indexed Non-Convertible Debentures
‘CRISIL AAA/Stable’
Commercial Paper ‘CRISIL A1+’
ICRA Limited
Non-Convertible Debentures Programme
‘[ICRA] AAA (stable)’
Commercial Paper ‘[ICRA] A1+’
s) Plant Locations:
the L&t Group’s facilities for design, engineering, manufacture, modular fabrication and production are based at multiple locations within India including Ahmednagar, Bengaluru, Chennai, Coimbatore, Faridabad, Hazira (Surat), Kattupalli (near Chennai), Kanchipuram, Mumbai, Navi Mumbai, Mysuru, pithampur, puducherry, Rajpura, Kansbahal (Rourkela), talegaon, Vadodara and Visakhapatnam. L&t’s international manufacturing footprint covers the Gulf (oman, Saudi Arabia, UAe, Kuwait), South east Asia (Malaysia and Indonesia) and the U.K. the L&t Group also has an extensive network
of offices in India and around the globe. See pages 12 and 13 of this Annual Report.
t) address for correspondence:
Larsen & toubro Limited, L&t House, Ballard estate, Mumbai 400 001. tel. No. (022) 6752 5656, Fax No. (022) 6752 5893
Shareholder correspondence may be directed to the Company’s Registrar and Share transfer Agent, whose address is given below:
1. KFin technologies private Limited Unit: Larsen & toubro Limited Karvy Selenium tower B, plot 31 & 32, Gachibowli, Financial District, Nanakramguda, Hyderabad, telengana - 500 032 tel : (040) 6716 2222 toll free number: 1-800-3454-001 Fax: (040) 2342 0814 email: [email protected] Website: www.kfintech.com
2. KFin technologies private Limited Unit: Larsen & toubro Limited 24-B, Raja Bahadur Mansion, Ground Floor, Ambalal Doshi Marg, Behind BSe Limited, Fort, Mumbai – 400 023. tel : (022) 6623 5454/ 5412/ 5427
u) Investor Grievances:
the Company has designated an exclusive e-mail id viz. [email protected] to enable investors to register their complaints, if any.
v) Securities dealing Code:
pursuant to the SeBI (prohibition of Insider trading) Regulations, 2015 (‘SeBI pIt Regulations’), the Company had suitably modified its Securities Dealing Code (‘Code’) for prevention of insider trading with effect from May 15, 2015. the objective of the Code is to prevent purchase and / or sale of shares of the Company by an Insider based on unpublished price sensitive information. Under this Code, Designated persons (Directors, Advisors, officers and other concerned employees / persons) are prevented from dealing in the Company’s shares

116
aNNEXUrE to tHe BoARD RepoRt ANNUAL RepoRt 2019-20
during the closure of trading Window. to deal in securities beyond specified limit, permission of Compliance officer is also required. Directors and designated employees who buy and sell shares of the Company are prohibited from executing contra-trades during the next six months following the prior transactions. the Company has a policy for acting against employees who violate the SeBI pIt Regulations / Code. pursuant to the enactment of the SeBI (prohibition of Insider trading) (Amendment) Regulations, 2018, the Company has suitably modified the provisions of the Code which are effective from 1st April 2019.
Mr. N. Hariharan, Company Secretary was the Compliance officer till 1st January 2020. Mr. Sivaram Nair A, Company Secretary has been designated as the Compliance officer from 2nd January 2020.
the Company has appointed Mr. Arnob Mondal, Vice president (Corporate Accounts & Investor Relations), as Chief Investor Relations officer. the Company also formulated Code of practices and procedures for Fair Disclosure of Unpublished price Sensitive Information which is available on Company’s Website http://investors.larsentoubro.com/Listing-Compliance.aspx.
w) Stakeholder Engagement:
the Company recognizes that its stakeholders form a vast and heterogeneous community. our customers, shareholders, employees, suppliers, community, etc. have been guideposts of our decision-making process. the Company engages with its identified stakeholders on an ongoing basis through business level engagements and structured stakeholder engagement programs. the Company maintains its focus on delivering value to all its stakeholders, especially the disadvantaged communities.
the Company has a dedicated Corporate Brand Management & Communications department which facilitates an on-going dialogue between the Company and its stakeholders. the communication channels include:
zz For external stakeholders - Stakeholder engagement sessions, client satisfaction surveys, shareholder satisfaction assessment,
dealer and stockists meet, analyst / investors meet, periodic feedback mechanism, general meeting for shareholders, factory visits for shareholders, online service and dedicated e-mail service for grievances, corporate website and access to business media to respond to queries, etc.
zz For internal stakeholders – employee satisfaction surveys, employee engagement surveys for improvement in employee engagement processes, circulars and messages from management, corporate social initiatives, welfare initiatives for employees and their families, online news bulletins for conveying topical developments, large bouquet of print and online in-house magazines, helpdesk facility, etc.
each of the businesses have their internal mechanisms to address the grievances of its stakeholders. In addition, at the corporate level, there are committees which can be approached if the stakeholders are not satisfied with the functioning of such internal mechanisms. As part of the vigil mechanism, the Whistle Blower policy provides access for various stakeholders to the Chairperson of the Audit Committee. the Whistle Blower policy for Vendors & Channel partners is displayed on the website of the Company http://investors.larsentoubro.com/CorporateGovernance.aspx.
x) awareness Sessions / Workshops on Governance practices:
employees across the Company as well as the group are being sensitized about the various policies and governance practices of the Company. the Company has designed in-house training workshops on Corporate Governance with the help of an external faculty covering basics of Corporate Governance as well as internal policies and compliances under Code of Conduct, Whistle Blower policy, Sexual Harassment of Women at Workplace (prevention, prohibition & Redressal) Act, 2013, SeBI pIt Regulations, etc.
the Company has created a batch of trainers across businesses who in turn conduct training

117
/ awareness sessions within their business regularly during the year.
y) ISo 9001:2015 Certification:
the Company’s Secretarial Department which provides secretarial services and investor services for the Company and its Subsidiaries and Associate Companies is ISo 9001:2015 certified.
z) Secretarial audit as per SEBI requirements:
As stipulated by SeBI, a Qualified practicing Company Secretary carries out Reconciliation of Share Capital Audit to reconcile the total admitted capital with National Securities Depository Limited (NSDL) and Central Depository Services (India) Limited (CDSL) and the total issued and listed capital. this audit is carried out every quarter and the report thereon is submitted to the Stock exchanges. the Audit confirms that the total Listed and paid-up capital is in agreement with the aggregate of the total number of shares in dematerialized form and in physical form.
the secretarial department of the Company at Mumbai is manned by competent and experienced professionals. the Company has a system to review and audit its secretarial and other statutory compliances by competent professionals, who are employees of the Company. Appropriate actions are taken to continuously improve the quality of compliance.
the Company also has adequate software and systems to monitor compliance.
aa) Secretarial audit as per Companies act, 2013:
pursuant to the provisions of Section 204(1) of the Companies Act, 2013, M/s. S. N. Ananthasubramanian & Co., Company Secretaries, conducts the secretarial audit of the compliance of applicable statutory provisions and the adherence of good corporate practices by the Company.
pursuant to the SeBI circular no. CIR/CFD/CMD1/27/2019 dated 8th February 2019, the Company has obtained an annual secretarial compliance report from M/s. S. N. Ananthasubramanian & Co., Company
Secretaries and shall submit the same to the Stock exchanges within the prescribed timelines.
bb) Statutory Compliance System:
the Company complies with applicable laws, rules and regulations impacting Company’s business. these comprise of Central Acts / Rules and those of state governments where the Company generally carries on business. the applicable laws are reviewed by the Corporate Legal and Legal departments of each Independent Company (IC) as well as an external consultant on a periodic basis and updated whenever required.
each IC / Business head certifies compliance of all applicable laws by the IC on a quarterly basis. Based on these confirmations, the Company Secretary gives a compliance certificate to the Board of Directors.
the Company has a process of verifying the compliances through a random review of the process / system / documentation of the location of the IC / Corporate function / Group Company. the review is placed before the Board of the respective IC / group company. existing internal controls are also reviewed. the audit process includes planning the audit, discussion with auditee before audit commencement to explain the scope and purpose of the audit, verifying the compliances based on the supporting documentation, post audit meeting for explaining the observations, etc.
cc) Group Governance Policy:
Vide its circular dated 10th May 2018, SeBI has introduced the concept of Group Governance Unit. the circular expects listed companies to monitor their governance through a Governance Committee and establishment of a strong and effective group governance policy.
“Corporate Governance” in the Company and its subsidiaries broadly includes strategic supervision by the Board and its Committees, compliance of Code of Conduct, Statutory Compliance including compliance of Companies Act / applicable SeBI Regulations, avoiding conflict of interest, Risk Management, Internal Controls and Audit.

118
aNNEXUrE to tHe BoARD RepoRt ANNUAL RepoRt 2019-20
the Company has four listed entities within the group. each of these entities have their own Board and Board Committees in compliance with the Companies Act 2013 & SeBI LoDR Regulations. the oversight of their subsidiaries (137 subsidiaries) is as per Companies Act 2013 & SeBI LoDR Regulations. the Board Report and its annexures of these listed companies contains various disclosures dealing with subsidiary companies.
Most of these listed entities has one executive Director and one Independent Director of the Company on its Board. Any financial assistance to the above companies or purchase/sale by the Company of their shares, is dealt with by the Company’s Board.
these listed entities publish their independent Auditors’ certificate on Corporate Governance, secretarial audit report of practising Company Secretary and Ceo/CFo’s certificate for internal controls for financial reporting.
Responsibility of the Company’s corporate team in the areas of statutory compliance (including corporate laws), Risk Management, Internal Controls and Internal Audit, covers all unlisted subsidiaries. the four listed entities have their own teams to carry out these functions.
the Company has a multi –tier governance system, where major business divisions operate as Independent Companies (ICs). these ICs are not legal entities, however, have their own Ceo’s, Functional Heads and Independent Boards, including external independent members from the respective business sectors, executive Directors of the Company and Senior executives from the IC’s. All IC’s have independent directors of the Company as their Board Members.
the ICs have separate internal teams to oversee their legal and compliance functions. All Subsidiary Companies associated with the respective ICs are reviewed by their respective IC Boards.
the subsidiary companies also function independently and have separate Boards which consists of representatives of the Company who are senior executives of the Company, representatives of Joint Venture partners, representative of the Company’s Board as well
as Independent Directors as required by law. As per law, these companies, wherever required, also have Audit Committee, Nomination & Remuneration Committee and CSR Committee.
Major subsidiary companies have some executive Directors and Independent Directors of the Company on their Board. the Key Managerial personnel of subsidiary companies like Chief executives, Chief Financial officers and Company Secretaries are mostly employees of the Company or are nominated by the Company as per the terms of the Joint Venture Agreement. the subsidiary companies’ performance is also reviewed by the Company’s Board periodically (included in quarterly results presented to the Company’s L&t Board). F&A heads of some of the subsidiary companies are functionally reporting to senior executives in the Company.
thus, the overall functioning of these Subsidiary companies is monitored by the Group directly or through their respective IC’s.
A voluntary Secretarial Audit is conducted for all subsidiary companies, including foreign companies and companies which are not covered under the purview of Companies Act, 2013. thus, there is a complete audit of the compliance of applicable statutory provisions and adherence to good corporate practices.
the Company’s Code of Conduct (Code) is required to be adhered by all unlisted group companies covering employees, directors, suppliers, contractors, etc. In addition to this, the subsidiaries set up their own vigil mechanism, if they meet the thresholds given in the Companies Act. the Audit Committee/Board of these companies monitor this mechanism. the Vigil Mechanism Framework to report breach of code is a structured process, which encourages and facilitates all covered, to report without fear, wrongdoings or any unethical or improper practice which may adversely impact the image, credibility and/or the financials of the company, through an appropriate forum.
the Secretarial Department of the Company has qualified Company Secretaries (CS) with vast experience in the field of compliance and law. It consists of fulltime professionals dedicated to performing corporate secretarial and subsidiary governance duties. Qualified CS in secretarial

119
department monitor the compliance related to subsidiaries under Companies Act / Rules. the Company’s Secretarial Department develops a broad Governance policy for the Company and its group of subsidiaries.
the Company’s Secretarial Department is involved in all major corporate actions of subsidiaries like Ipo’s, raising of capital,
restructuring, major financial assistance to subsidiaries etc.
Appropriate disclosures related to subsidiaries are made in financial statements / directors’ report of the Company as well as its subsidiaries as per Companies Act 2013 / applicable SeBI Regulations and applicable Accounting Standards. All companies are subject to Statutory Audit and applicable Secretarial Audit.

120
aNNEXUrE to tHe BoARD RepoRt ANNUAL RepoRt 2019-20
Independent auditor’s Certificate on Corporate GovernanceTo THE MEMBErS oF LarSEN & ToUBro LIMITEd
INdEPENdENT aUdITor’S CErTIFICaTE oN CorPoraTE GoVErNaNCE
1. this certificate is issued in accordance with the terms of our engagement letter dated September 26, 2019.
2. We, Deloitte Haskins & Sells LLp, Chartered Accountants, the Statutory Auditors of Larsen & toubro Limited (the “Company”), have examined the compliance of conditions of Corporate Governance by the Company, for the year ended on March 31, 2020, as stipulated in regulations 17 to 27 and clauses (b) to (i) of regulation 46(2) and para C and D of Schedule V of the SeBI (Listing obligations and Disclosure Requirements) Regulations, 2015, as amended from time to time (the “Listing Regulations”).
MaNaGEMENTS’ rESPoNSIBILITY
3. the compliance of conditions of Corporate Governance is the responsibility of the Management. this responsibility includes the design, implementation and maintenance of internal control and procedures to ensure the compliance with the conditions of the Corporate Governance stipulated in Listing Regulations.
aUdITor’S rESPoNSIBILITY
4. our responsibility is limited to examining the procedures and implementation thereof, adopted by the Company for ensuring compliance with the conditions of the Corporate Governance. It is neither an audit nor an expression of opinion on the financial statements of the Company.
5. We have examined the books of account and other relevant records and documents maintained by the Company for the purposes of providing reasonable assurance on the compliance with Corporate Governance requirements by the Company.
6. We have carried out an examination of the relevant records of the Company in accordance with the Guidance Note on Certification of Corporate Governance issued by the Institute of the Chartered Accountants of India (the ”ICAI”), the Standards on Auditing specified under Section 143(10) of the Companies Act 2013, in so far as applicable for the purpose of this certificate and as per the Guidance Note on Reports or Certificates for Special purposes issued by the ICAI which requires that we comply with the ethical requirements of the Code of ethics issued by the ICAI.
7. We have complied with the relevant applicable requirements of the Standard on Quality Control (SQC) 1, Quality Control for Firms that perform Audits and Reviews of Historical Financial Information, and other Assurance and Related Services engagements.
oPINIoN
8. Based on our examination of the relevant records and according to the information and explanations provided to us and the representations provided by the Management, we certify that the Company has complied with the conditions of Corporate Governance as stipulated in regulations 17 to 27 and clauses (b) to (i) of regulation 46(2) and para C and D of Schedule V of the Listing Regulations during the year ended March 31, 2020.
9. We state that such compliance is neither an assurance as to the future viability of the Company nor the efficiency or effectiveness with which the Management has conducted the affairs of the Company.
For dELoITTE HaSKINS & SELLS LLP Chartered Accountants
(Firm’s Registration No. 117366W/ W-100018)
Sanjiv V. Pilgaonkar partner
(Membership No. 039826) UDIN: 20039826AAAADG5355
Mumbai, June 05, 2020

121
Independent auditor’s Certificate in respect of the implementation of Employee Stock option Schemes of the Company To THE MEMBErS oF LarSEN & ToUBro LIMITEd
INdEPENdENT aUdITor’S CErTIFICaTE IN rESPECT oF THE IMPLEMENTaTIoN oF EMPLoYEE SToCK oPTIoN SCHEMES oF THE CoMPaNY.
1. this certificate is issued in accordance with the terms of our engagement letter dated September 26, 2019.
2. We, Deloitte Haskins & Sells LLp, Chartered Accountants (Firm Registration Number 117366W/W-100018), the Statutory Auditors of Larsen & toubro Limited (“L&t”/ “Company”), pursuant to the requirement of clause 13 of Securities and exchange Board of India (Share Based employee Benefits) Regulations, 2014, as amended by Circular No. SeBI/LADNRo/GN/2015-16/021 dated September 18, 2015 and vide Notification no.SeBI/LAD/NGo/GN/2016-17/037 dated March 6, 2017 (the “Regulations”) are required to certify for the year ended March 31, 2020, that the employee Stock option Schemes, L&t Limited eSop Scheme -2003 and L&t Limited eSop Scheme -2006 (the “Schemes”) have been implemented in accordance with the Regulations and in accordance with the special resolutions passed in the general meeting held on August 26, 1999 and August 25, 2006 (the “Resolutions”).
MaNaGEMENT’S rESPoNSIBILITY
3. Implementation of the Schemes in accordance with the provisions of the Regulations and Resolutions and compilation of the relevant information for financial reporting is the responsibility of the Management of the Company. this includes the design, implementation and maintenance of internal control necessary to ensure accurate compilation of information necessary of the purpose and maintenance of all accounting and other relevant supporting records and documents and applying an appropriate basis of preparation of the relevant information for financial reporting; and making estimates that are reasonable in the circumstances.
aUdITor’S rESPoNSIBILITY
4. It is our responsibility to certify whether the Company has complied with the applicable provisions of the Regulations and Resolutions during the year ended March 31, 2020, in implementing the Schemes on the basis of information compiled or collated by Management and the accounting and other relevant supporting records and documents provided to us for our examination.
5. We conducted our examination and obtained the explanations in accordance with the Guidance Note on Reports or Certificates for Special purposes issued by the Institute of Chartered Accountants of India (“ICAI”) and the Standards on Auditing specified under Section 143(10) of the Companies Act, 2013 which include the concepts of test checks and materiality. this Guidance Note requires that we comply with the ethical requirements of the Code of ethics issued by the ICAI.
6. We have complied with the relevant applicable requirements of the Standard on Quality Control (SQC) 1, Quality Control for Firms that perform Audits and Review Historical Financial Information, and other Assurance and Related Services engagements.

122
aNNEXUrE to tHe BoARD RepoRt ANNUAL RepoRt 2019-20
CrITErIa aNd SCoPE
7. the criteria against which the information is evaluated are the following:
a) the Schemes;
b) the Regulations;
c) the Resolutions; and
d) Written representation provided by the Management.
oPINIoN
8. Based on our examination of the accounting and other relevant supporting records and documents maintained by the Company as aforesaid, and according to the information and explanations give to us, in our opinion, the Company has complied with the applicable provisions of the Regulations and Resolutions in implementing the Schemes during the year ended March 31, 2020.
rESTrICTIoN oN USE
9. this certificate is addressed to and provided to the Members of the Company solely for the purpose of compliance with Clause 13 of the Regulations. this certificate should not be circulated, copied, used/referred to for any other purpose, without our prior written consent. Accordingly, we do not accept or assume any liability or any duty of care of for any other purpose or to any other party to whom it is shown or into whose hands it may come without our prior consent in writing.
For dELoITTE HaSKINS & SELLS LLP Chartered Accountants
(Firm’s Registration No. 117366W/W-100018)
Sanjiv V. Pilgaonkar partner
(Membership No. 039826) UDIN: 20039826AAAADH7874
Mumbai, June 5, 2020

123
CErTIFICaTE oF NoN-dISQUaLIFICaTIoN oF dIrECTorS
[pursuant to Regulation 34(3) and Schedule V para C Clause (10) (i) of Securities and exchange Board of India (Listing obligations and Disclosure Requirements) Regulations, 2015]
to, The Members of Larsen & Toubro Limited L & t House, Ballard estate, Mumbai 400001.
We have examined the following documents:
i) Declaration of non-disqualification as required under Section 164 of Companies Act, 2013 (‘the Act’);
ii) Disclosure of concern or interests as required under Section 184 of the Act; (hereinafter referred to as ‘relevant documents’)
as submitted by the Directors of Larsen & Toubro Limited (‘the Company’) bearing CIN: L99999MH1946PLC004768 and having its registered office at L & t House, Ballard estate, Mumbai 400001, to the Board of Directors of the Company (‘the Board’) for the Financial Year 2019-20 and Financial Year 2020-21 and relevant registers, records, forms and returns maintained by the Company and as made available to us for the purpose of issuing this Certificate in accordance with Regulation 34(3) read with Schedule V para C Clause 10(i) of SeBI (LoDR) Regulations, 2015. We have considered non-disqualification to include non-debarment by Regulatory/ Statutory Authorities.
It is the responsibility of Directors to submit relevant documents with complete and accurate information in accordance with the provisions of the Act.
ensuring the eligibility for the appointment / continuity of every Director on the Board is the responsibility of the management of the Company. our responsibility is to express an opinion based on our verification.
Based on our examination as aforesaid and such other verifications carried out by us as deemed necessary and adequate (including Directors Identification Number (DIN) status at the portal www.mca.gov.in), in our opinion and to the best of our information and knowledge and according to the explanations provided by the Company, its officers and authorized representatives, we hereby certify that during the Financial Year ended 31st March 2020, none of the Directors on the Board of the Company, as listed hereunder have been debarred or disqualified from being appointed or continuing as Directors of Companies by Securities and exchange Board of India/ Ministry of Corporate Affairs or any such statutory authority.
Sr. No.
Name of director director Identification Number (dIN)
date of appointment
date of Cessation
01 Mr. Anilkumar Manibhai Naik 00001514 23-11-1989 –
02 Mr. Mukund Manohar Chitale 00101004 06-07-2004 –
03 Mr. Subodh Kumar Bhargava 00035672 03-07-2007 –
04 Mr. Sekharipuram Narayanan Subrahmanyan 02255382 01-07-2011 –
05 Mr. Ramamurthi Shankar Raman 00019798 01-10-2011 –
06 Mr. Shailendra Narain Roy 02144836 09-03-2012 –
07 Mr. Meleveetil Damodaran 02106990 22-10-2012 –
08 Mr. Vikram Singh Mehta 00041197 22-10-2012 –

124
aNNEXUrE to tHe BoARD RepoRt ANNUAL RepoRt 2019-20
Sr. No.
Name of director director Identification Number (dIN)
date of appointment
date of Cessation
09 Mr. Adil Siraj Zainulbhai 06646490 30-05-2014 –
10 Mr. Akhilesh Krishna Gupta 00359325 09-09-2014 08/09/2019
11 Mrs. Sunita Sharma 02949529 01-04-2015 –
12 Mr. thomas Mathew t. 00130282 03-04-2015 02/04/2020
13 Mr. Ajay Shankar 01800443 30-05-2015 –
14 Mr. Subramanian Sarma 00554221 19-08-2015 –
15 Mr. Dip Kishore Sen 03554707 01-10-2015 –
16 Mr. M. V. Satish 06393156 29-01-2016 –
17 Mrs. Naina Lal Kidwai 00017806 01-03-2016 –
18 Mr. Sanjeev Aga 00022065 25-05-2016 –
19 Mr. N. Kumar 00007848 27-05-2016 –
20 Mr. Jayant Damodar patil 01252184 01-07-2017 –
21 Mr. Arvind Gupta 00090360 01-07-2017 26/03/2020
22 Mr. Hemant Bhargava 01922717 28-05-2018 –
this Certificate is neither an assurance as to the future viability of the Company nor of the efficiency or effectiveness with which the management has conducted the affairs of the Company.
this Certificate has been issued at the request of the Company to make disclosure in its Corporate Governance Report for the Financial Year ended 31st March, 2020.
For S. N. aNaNTHaSUBraMaNIaN & Co. Company Secretaries
ICSI Unique Code p1991MH040400 peer Review Cert. No. 606/2019
S. N. ananthasubramanian partner
FCS : 4206 Cop No. : 1774
ICSI UDIN : F004206B000257591
thane, 19 May, 2020

125
To the Board of directors of Larsen & Toubro Limited
Dear Sirs,
Sub: CEo / CFo Certificate
[Issued in accordance with provisions of regulation 17(8) of SEBI (Listing obligations and disclosure requirements), regulations, 2015]
We have reviewed the consolidated financial statements, read with the consolidated cash flow statement of Larsen & toubro Limited for the year ended March 31, 2020 and that to the best of our knowledge and belief, we state that;
(a) (i) these statements do not contain any materially untrue statement or omit any material fact or contain statements that may be misleading;
(ii) these statements present a true and fair view of the Company’s affairs and are in compliance with current accounting standards, applicable laws and regulations.
(b) there are, to the best of our knowledge and belief, no transactions entered into by the Company during the period which are fraudulent, illegal or in violation of the Company’s code of conduct.
(c) We accept responsibility for establishing and maintaining internal controls for financial reporting. We have evaluated the effectiveness of internal control systems of the Company pertaining to financial reporting and have disclosed to the Auditors and the Audit Committee, deficiencies, if any, in the design or operation of such internal controls of which we are aware and steps taken or proposed to be taken for rectifying these deficiencies.
(d) We have indicated to the Auditors and the Audit Committee:
(i) that there were no significant changes in internal controls over financial reporting during the year; and
(ii) that there were no significant changes in accounting policies made during the year except the change in accounting policy on leases pursuant to Ind AS 116; and
(iii) that there were no instances of significant fraud of which we have become aware.
Yours sincerely,
r. Shankar raman Whole-time Director & Chief
Financial officer DIN: 00019798
S. N. Subrahmanyan Chief executive officer &
Managing Director DIN: 02255382
Date: June 5, 2020

126
aNNEXUrE to tHe BoARD RepoRt ANNUAL RepoRt 2019-20
CSr aCTIVITIES For 2019-20
1. a brief outline of the Company’s CSr policy, including overview of projects or programs proposed to be undertaken and a reference to the web-link to the CSr policy and projects or programs.
the CSR projects of the Company are focused on communities that are disadvantaged, vulnerable and marginalized. the Company strives to contribute positively to improve their standard of living; through our interventions in water & sanitation, heath, education and skill development.
the Company’s CSR policy framework details the mechanisms for undertaking various programmes in accordance with Section 135 of the Companies Act, 2013 (the Act) for the benefit of the community.
the Company will primarily focus on ‘Building India’s Social Infrastructure’ as part of its CSR programme which will include, amongst others, the following areas, viz.
zz Water & Sanitation – includes but not limited to watershed development -access to water, promoting rain water harvesting, soil and moisture conservation, enhancing ground water levels by facilitating setting up of community based institutions such as village development committees , Self-help groups, farmer groups and community management of water resources for improving conditions related to sanitation, health, education and livelihoods of communities through an integrated approach .
zz education - includes but not limited to education infrastructure support to educational Institutions, educational programs & nurturing talent at various levels. promoting learning enhancement amongst children, both in schools and in communities through interventions in pre-school education, innovative teaching methodology and training teachers in formal schools, providing
interesting “teaching learning material”, with special focus on Science, technology engineering and Maths (SteM) subjects.
this is achieved through support to Balwadi’s and Anganwadis strengthening the in school interventions, providing after school study classes in the community and creating platforms to spark the curiosity of children through science fairs, visits and competitions.
zz Health - includes but not limited to community health centres, mobile medical vans, dialysis centres, general and specialized health camps and outreach programs, support to HIV / AIDS, tuberculosis control programs.
zz Skill Development - includes but not limited to vocational training such as skill building, computer training, women empowerment, support to ItI’s, support to specially abled (infrastructure support & vocational training), Construction Skills training Centres and providing employability skills to women and youth.
Governance, technology and Innovation would be the Key enabling factors across all these verticals.
the detailed CSR policy Framework is given in the Governance section on the website of the Company. please see the link http://investors.larsentoubro.com/Listing-Compliance.aspx.
2. Composition of the CSr Committee.
the CSR Committee of the Board comprises of
1. Mr. M. M. Chitale Chairman
2. Mr. R. Shankar Raman Member
3. Mr D. K. Sen Member
Mr. Sivaram Nair A acts as the Secretary of the Committee.
annexure ‘C’ to the Board report

127
3. average net profit of the Company for the last three financial years.
the average net profit of the Company for the last three financial years is R 7,239.43 Cr.
4. Prescribed CSr expenditure (two percent of the amount as in item 3 above).
the Company is required to spend an amount of R 144.79 Cr. as CSR expenditure during the financial year 2019-20.
5. details of CSr spent during the financial year:
a. total amount to be spent for the financial year
the Company was required to spend R 144.79 Cr during the financial year 2019-20. As against this mandate, the Company spent R 145.29 Cr towards various activities for the benefit of the community. this exceeds the required spend by R 0.50 Cr. the CSR spend for FY 2019-20 is 2.01% of net profit.
b. Amount unspent, if any
Nil
c. Manner in which the amount was spent in the financial year is detailed below:
As per table enclosed
6. reasons for not spending the amount during the financial year.
NA
7. CSr Committee responsibility Statement:
the CSR Committee hereby affirms that:
zz the Company has duly formulated a CSR policy Framework which includes formulation of a CSR theme, CSR budget and roles and responsibilities of the Committee as well as the various internal committees formed for implementation of the CSR policy;
zz the Company has constituted a mechanism to monitor and report on the progress of the CSR programs;
zz the activities undertaken by the Company as well as the implementation and monitoring mechanisms are in compliance with its CSR objectives and CSR policy.
S. N. Subrahmanyan M. M. Chitale
Chief executive officer & Managing Director
DIN: 02255382
Chairman – CSR Committee
DIN: 00101004

128
aNNEXUrE to tHe BoARD RepoRt ANNUAL RepoRt 2019-20
S. No. CSR Project or activity identified Sector in which the project is covered
Projects or Programes 1. Local Area or other 2. Specify the state and district where projects or program was undertaken
Amount outlay
(budget) project or programe
wise (R In Lakh)
Direct expenditure on projects
or programs (R In Lakh)
Overhead (R In
Lakh)
Cumulative expenditure upto to the
reporting period
(R In Lakh)
Amount spent: direct or through implementing agency
1 School support programme-Enhancing the quality of education and learning levels in government schools/ schools running for children from underprivileged backgrounds (teachers training, play way methods, support for English and Mathematics, capacity building, promoting extra curricular activities)
Education Chandigarh, Gujarat (Vadodara, Ahmedabad, Hazira, Ranoli), Jharkhand (Jamshedpur), Karnataka (Mysuru, Bengaluru), Maharashtra (Mumbai, Ahmednagar, Nagpur), New Delhi, Odisha (Rayagada, Kansbahal, Bhubaneswar), Tamil Nadu (Chennai, Coimbatore), West Bengal (Kolkata)
924.248 869.468 41.474 910.942 Implementing agency
2 Community based programmes- Study Centres/ balwadis/anganwadis run for developing pre school foundation, promoting healthy and hygienic environment for education, developing the learning levels of children at par with their mainstream grades and providing nutritional supplements
Education Karnataka (Bengaluru, Mysuru), Maharashtra (Mumbai, Navi Mumbai, Pune), New Delhi, Odisha (Rayagada), Tamil Nadu (Chennai)
268.969 255.800 12.202 268.002 Implementing agency
3 Providing infrastructure support for education (drinking water and sanitation facilities, renovation of classrooms, water proofing of school buildings, providing furniture and light fittings, donation of computers, up gradation of libraries, playground development, distribution of solar lamps)
Education Andhra Pradesh(Vizag, Mangalagiri, Vijayawada, Nellore, Anantapur), Bihar (Buxar, Bettiah, Patna, Bihar Sharif, Madhubani, Supaul), Gujarat (Vadodara, Hazira, Ranoli, Ahmedabad, Dhandhusar, Mahesana), Haryana (Faridabad, Mewat, Bhiwani), Jharkhand (Ranchi, Hazaribagh), Karnataka (Mysuru, Bengaluru, Bellary, Bagalkot, Koppala, Haveri), Kerala (Thiruvananthapuram), Madhya Pradesh (Bhopal, Indore, Khandwa, Alirajpur, Seoni, Tikamgarh, Rajgarh, Satna, Chhatarpur, Dewas, Sehore), Maharashtra (Aurangabad, Ahmednagar, Dolvi, Nagpur, Latur, Pue, Tanda, Talegaon ), Meghalaya (Shilong), Odisha (Rayagada, Daripali, Cuttack, Brhampura, Nuapada, Jashipur, Mayurbanj, Kalahandi, Kendrapada, Ganjam), Puducherry, Punjab (Moga, Mohali), Rajasthan (Jaipur, Jhunjhunu, Ganganagar, Nagaur, Taranagar, Dungarpur, Pali, Alwar, Karauli, Kushalgarh, Udaipur),Sikkim (Penlong), Tamil Nadu (Kancheepuram, Coimbatore, Chennai, Kottaram), Telangana (Hyderabad, Warangal), Uttar Pradesh (Tanda, Varanasi, Gorakhpur, Bulandshahr), Uttarakhand (Singoli), West Bengal (Kolkata, North 24 Parganas, Minakhan, Indpur, Taltangara, Bankura),
1,853.622 1,703.935 81.278 1,785.212 Direct

129
S. No. CSR Project or activity identified Sector in which the project is covered
Projects or Programes 1. Local Area or other 2. Specify the state and district where projects or program was undertaken
Amount outlay
(budget) project or programe
wise (R In Lakh)
Direct expenditure on projects
or programs (R In Lakh)
Overhead (R In
Lakh)
Cumulative expenditure upto to the
reporting period
(R In Lakh)
Amount spent: direct or through implementing agency
4 Providing infrastructure support for education (drinking water and sanitation facilities, renovation of classrooms, water proofing of school buildings, providing furniture and light fittings, donation of computers, up gradation of libraries, playground development, distribution of solar lamps)
Education Gujarat (Chonda), West Bengal (Kolkata), Telangana (Hyderabad)
236.964 226.070 10.784 236.854 Implementing agency
5 Providing educational aids to children- books, stationary, sports equipment, uniforms, school bags, shoes, woolen clothes, raincoats etc.
Education Andhra Pradesh (Vizag), Assam (Guwahati), Bihar (Madhepura, Patna), Chandigarh, Gujarat (Vadodara, Ahmedabad, Hazira, Ranoli), Haryana (Faridabad), Karnataka (Bengaluru), Kerala (Kochi), Maharashtra (Mahape, Nagpur), New Delhi, Odisha (Rayagada), Puducherry, Rajasthan (Jaipur), Tamil Nadu (Coimbatore)
264.628 236.521 11.282 247.803 Direct
6 Awareness programmes (health and hygiene, road safety, career guidance, personality development)
Education Gujarat (Hazira, Ranoli) 14.751 14.068 0.671 14.739 Direct
7 Science Technology Enginering & Maths
Education Gujarat (Vadodara, Hazira), Haryana (Faridabad), Maharashtra (Mumbai), Puducherry, Rajasthan (Jaipur), Tamil Nadu (Chennai, Vayalur)
421.991 402.907 19.219 422.126 Implementing agency
8 Community Health Centres (running multi-specialty center offering diagnostic services including family planning, gynecological, pediatric, immunization, chest & TB, ophthalmic consultation, dialysis services, HIV/AIDS awareness, detection, treatment, counseling services at free / nominal cost to the community)
Health Maharashtra (Mumbai, Thane, Ahmednagar)
648.754 545.711 26.030 571.741 Direct
9 Health Camps (general, eye, dental, vaccinations) and health awareness
Health Andhra Pradesh (Vizag), Gujarat (Hazira, Ranoli), Haryana (Faridabad), Odisha (Rayagada), Telangana (Ranga Reddy)
75.070 70.109 3.344 73.453 Direct
10 Health Camps (general, eye, dental, vaccinations) and health awareness
Health Andhra Pradesh (Vizag), Bihar(Bettiah), Chandigarh, Chhattisgarh (Raipur), Gujarat (Ranoli, Hazira), Kerala (Kunnur), Maharashtra (Mumbai, Nagpur), Odisha (Bhubaneswar, Berhampur, Keonjhar, Cuttack, Kendrapada, Boudh, Naupada), Rajasthan (Jaipur, Jodhpur), Tamil Nadu (Chennai), West Bengal (Kolkata)
172.819 160.019 7.633 167.652 Implementing agency

130
aNNEXUrE to tHe BoARD RepoRt ANNUAL RepoRt 2019-20
S. No. CSR Project or activity identified Sector in which the project is covered
Projects or Programes 1. Local Area or other 2. Specify the state and district where projects or program was undertaken
Amount outlay
(budget) project or programe
wise (R In Lakh)
Direct expenditure on projects
or programs (R In Lakh)
Overhead (R In
Lakh)
Cumulative expenditure upto to the
reporting period
(R In Lakh)
Amount spent: direct or through implementing agency
11 Blood donation camps Health Andhra Pradesh (Vizag), Chhattisgarh (Raipur), Gujarat (Vadodara), Karnataka (Bengaluru), Kerela (Kochi), Madhya Pradesh (Bhopal), Maharashtra (Pune), New Delhi, Odisha (Bhuwaneshwar), Rajasthan (Jaipur), Tamil Nadu (Chennai, Coimbatore), Telangana (Hyderabad), Uttar Pradesh (Lucknow), West Bangal (Kolkata)
11.176 10.028 0.478 10.506 Implementing agency
12 "Infrastructure support to medical centres "
Health Maharashtra (Nagpur), Gujarat (Hazira), Tamil Nadu (Chennai)
117.159 83.906 4.002 87.908 Direct
13 "Infrastructure support to medical centres "
Health Tamil Nadu (Kancheepuram, Vellore) 1,101.500 1,052.757 50.217 1,102.973 Implementing agency
14 Construction Skill Training Institute - CSTI
Skill Building Gujarat (Ahmedabad), Karnataka (Bengaluru), Maharashtra (Panvel), Odisha (Cuttack), Tamil Nadu (Kancheepuram), Telangana (Hyderabad, Jadcherla), Uttar Pradesh (Pilkhuwa), West Bengal (Kolkata)
4,288.654 4,050.656 193.216 4,243.872 Direct
15 Vocational and Computer training for youth
Skill Building New Delhi, Telangana (Hyderabad), Gujarat (Hazira), Uttar Pradesh (Lucknow)
71.798 68.008 3.244 71.252 Direct
16 Vocational Training Skill Building Andhra Pradesh (Vizag), Madhya Pradesh (Bhopal, Malwa), Tamil Nadu (Kancheepuram, Pulicat), West Bengal (Kolkata), Gujarat (Vadodara, Hazira), Uttar Pradesh (Lucknow)
217.849 201.017 9.589 210.606 Direct
17 Vocational Training Skill Building Maharashtra (Ahmednagar, Pune) 75.265 71.948 3.432 75.380 Implementing agency
18 Women empowerment through vocational training
Skill Building Odisha (Rayagada), Gujarat (Vadodara, Ahmedabad), Chandigarh, Madhya Pradesh (Bhopal), Rajasthan (Jaipur), West Bangal (kolkata)
95.441 82.929 3.956 86.885 Direct
19 Skill building for differently abled (Neev)
Skill Building Andhra Pradesh (Vizag), Kerala (Kochi, Keezhmadu), Maharashtra (Pune, Nagpur, Jalgaon), Rajasthan (Jaipur), Telangana (Hyderabad), Tamil Nadu (Chennai), West Bengal (Kolkata)
112.034 101.142 4.824 105.967 Implementing agency
20 Basic infrastructure support in the community (Water, Health, Sanitation, Solar lights, roads etc.)
Community Development
Andhra Pradesh (Vizag), Gujarat (Hazira, Tapi), Karnataka (Bengaluru), Madhya Pradesh (Indore), Maharashtra (Ahmednagar, Aurangabad, Bhiwandi, Pune, Mumbai), Pondicherry, Tamil Nadu (Chennai, Kancheepuram), Telangana (Medigadda, Hyderabad), West Bengal (Kolkata)
470.008 418.125 19.945 438.070 Direct

131
S. No. CSR Project or activity identified Sector in which the project is covered
Projects or Programes 1. Local Area or other 2. Specify the state and district where projects or program was undertaken
Amount outlay
(budget) project or programe
wise (R In Lakh)
Direct expenditure on projects
or programs (R In Lakh)
Overhead (R In
Lakh)
Cumulative expenditure upto to the
reporting period
(R In Lakh)
Amount spent: direct or through implementing agency
21 Integrated Community Development Programme
Water & Sanitation, Health, Education, Skill Building
Maharashtra (Pathardi, Devgaon, Nagzari), Rajasthan (Bhim, Kumbhalgarh, Sewantri), Tamil Nadu (Chetipalayam, Gudyatham, Pappampatti)
3,033.972 2,754.373 132.051 2,886.424 Implementing agency
22 Development of gardens and maintenance of public spaces
Environment Gujarat (Vadodara), Maharashtra (Mumbai, Nasik, Mahape, Ahmednagar, Talegaon), New Delhi
164.477 153.552 7.324 160.876 Direct
23 Tree plantation and environment protection
Environment Andhra Pradesh (Vizag), Gujarat (Hazira), Karnataka (Ballari, Bengaluru), Madhya Pradesh (Bhopal, Indore), Odisha (Rayagada, Jharsuguda, Mayurbhanj), Rajasthan (Jaipur), Tamil Nadu (Chennai), Uttar Pradesh (Ghaziabad)
123.978 117.336 5.597 122.933 Direct
24 Awareness programmes - environment, energy conservation,road safety
Environment Gujarat (Hazira) 95.519 91.309 4.355 95.665 Implementing agency
25 Employee Volunteering Employee volunteers
Andhra Pradesh (Vizag), Gujarat (Hazira, Ranoli, Vadodara), Jharkhand (Jamshedpur), Karnataka (Mysuru), Maharashtra (Mumbai), New Delhi, Tamil Nadu (Chennai, Coimbatore)
150.214 125.366 5.980 131.346 Direct
Total 15,010.858 13,867.061 662.126 14,529.188

132
aNNEXUrE to tHe BoARD RepoRt ANNUAL RepoRt 2019-20
annexure ‘d’ to the Board report
a. ratio of the remuneration of each director to the median remuneration of the employees of the Company for the financial year 2019-20, the percentage increase in remuneration of each director & Company Secretary during the financial year 2019-20 and comparison of the remuneration of each of the Key Managerial Personnel against the performance of the company:
v crore
Name of the director/KMP
2019-20
designation Total remuneration
ratio of remuneration of director to the
median remuneration $
Percentage increase in
remuneration
A. M. Naik Group Chairman 6.182 72.07 -24.19%
S. N. Subrahmanyan Chief executive officer & Managing Director
27.179 316.85 -43.91%
R. Shankar Raman Whole-time Director & Chief Financial officer
13.207 153.97 -47.33%
Shailendra Roy Whole-time Director & Senior executive Vice president (power)
6.636 77.37 -53.01%
D. K. Sen Whole-time Director & Senior executive Vice president (Infrastructure)
4.468 52.09 -36.15%
M. V. Satish Whole-time Director & Senior executive Vice president (Buildings, Minerals & Metals)
5.778 67.37 -38.41%
J. D. patil Whole-time Director & Senior executive Vice president (Defence & Smart technologies)
5.086 59.29 -38.91%
M. M. Chitale Independent Director 0.489 5.70 -3.46%
Subodh Bhargava Independent Director 0.503 5.86 -22.91%
M. Damodaran Independent Director 0.235 2.74 -51.93%
Vikram Singh Mehta Independent Director 0.294 3.43 -33.63%
Adil Zainulbhai Independent Director 0.385 4.49 -19.03%
Akhilesh Gupta @ Independent Director 0.078 0.40 *
Sunita Sharma^ Nominee of Life Insurance Corporation of India
0.255 2.97 675.08%
thomas Mathew t. Independent Director 0.344 4.01 -19.96%
Ajay Shankar Independent Director 0.337 3.93 -11.66%
Subramanian Sarma Non- executive Director – – –

133
v crore
Name of the director/KMP
2019-20
designation Total remuneration
ratio of remuneration of director to the
median remuneration $
Percentage increase in
remuneration
Naina Lal Kidwai Independent Director 0.195 2.27 -25.43%
Sanjeev Aga Independent Director 0.322 3.75 -14.18%
Narayanan Kumar Independent Director 0.278 3.24 -29.89%
Mr. Arvind Gupta ^ # Nominee of SUUtI 0.195 2.25 *
Mr. Hemant Bhargava ^ Nominee of Life Insurance Corporation of India
0.043 0.50 17.49%
N. Hariharan ! Company Secretary 1.998 17.61 *
Sivaram Nair A. % Company Secretary 0.433 1.24 *
$ Ratio of remuneration of director to the median remuneration is calculated on pro-rata basis for those directors who served for only part of the financial year 2019-20.
^ part of the remuneration has been paid to the financial institution he/she represents
@ Ceased to be a Director w.e.f. 8th September 2019
* Details not given as the Director / KMp was there for part of the year
# Ceased to be a Director w.e.f. 26th March 2020
! Ceased to be Company Secretary w.e.f. 1st January 2020
% Appointed as Company Secretary w.e.f. 2nd January 2020
B. Percentage increase in the median remuneration of all employees in the financial year 2019-20:
the median remuneration of employees of the Company during the financial year was R 8.57 lakh. In the financial year, there was an increase of 5.70% in the median remuneration of employees.
C. Number of permanent employees on the rolls of Company as on 31st March 2020:
there were 45,268 permanent employees on the rolls of Company as on 31st March 2020.
d. average percentile increase already made in the salaries of the employees other than the managerial personnel in the last financial year and its comparison with the percentile increase in the managerial remuneration and justification thereof and point out if there are any exceptional circumstances for increase in managerial remuneration
Average percentage increase made in the salaries of employees other than the managerial personnel for the year 2019-20 was 4.70% whereas there is decline in the managerial remuneration by 42.21%. Reduction in Managerial remuneration is mainly due to cost reduction measures voluntarily adopted by executive Directors in the current pandemic scenario and reduced perquisite value.
E. affirmation that the remuneration is as per the remuneration policy of the company:
It is hereby affirmed that the remuneration paid is as per the Remuneration policy for Directors, Key Managerial personnel and other employees.

134
aNNEXUrE to tHe BoARD RepoRt ANNUAL RepoRt 2019-20
to, the Members, Larsen & toubro Limited CIN: L99999MH1946pLC004768 L&t House, Ballard estate, Mumbai – 400 001.
We have conducted the Secretarial Audit of the compliance of applicable statutory provisions and the adherence to good corporate practices by Larsen & Toubro Limited (hereinafter called ‘the Company’). Secretarial Audit was conducted in a manner that provided us a reasonable basis for evaluating the corporate conducts/ statutory compliances and expressing our opinion thereon.
Based on our verification of the Company’s books, papers, minute books, forms and returns filed and other records maintained by the Company and also the information provided by the Company, its officers, agents and authorized representatives during the conduct of secretarial audit, we hereby report that in our opinion, the Company has, during the audit period covering the financial year ended on 31st March 2020, complied with the statutory provisions listed hereunder and also that the Company has proper Board-processes and compliance-mechanism in place to the extent, in the manner and subject to the reporting made hereinafter:
We have examined the books, papers, minute books, forms and returns filed and other records maintained by the Company for the financial year ended on 31st March, 2020 according to the provisions of:
i. the Companies Act, 2013 (the Act) and the rules made thereunder;
ii. the Securities Contracts (Regulation) Act, 1956 (‘SCRA’) and the rules made thereunder;
iii. the Depositories Act, 1996 and the Regulations and Bye-laws framed thereunder;
iv. Foreign exchange Management Act, 1999 and the rules and regulations made thereunder to the extent of Foreign Direct Investment, overseas Direct Investment and external Commercial Borrowings;
v. the following Regulations and Guidelines prescribed under the Securities and exchange Board of India Act, 1992 (‘SeBI Act’):
a. the Securities and exchange Board of India (Substantial Acquisition of Shares and takeovers) Regulations, 2011;
b. the Securities and exchange Board of India (prohibition of Insider trading) Regulations, 2015;
c. Securities and exchange Board of India (Issue of Capital and Disclosure Requirements) Regulations, 2018 - Not applicable as there was no reportable event during the financial year under review;
d. the Securities and exchange Board of India (Share Based employee Benefits) Regulations, 2014;
e. the Securities and exchange Board of India (Issue and Listing of Debt Securities) Regulations, 2008;
f. the Securities and exchange Board of India (Registrars to an Issue and Share transfer Agents) Regulations, 1993 regarding the Companies Act and dealing with client - Not applicable as the Company is not registered as registrar to Issue and Share Transfer agent during the financial year under review;
g. the Securities and exchange Board of India (Delisting of equity Shares) Regulations, 2009 - Not applicable as the Company has not delisted/ proposed to delist its equity shares from any Stock Exchange during the financial year under review;
h. the Securities and exchange Board of India (Buyback of Securities) Regulations, 2018 - Not applicable as there was no reportable event during the financial year under review;
i. the Securities and exchange Board of India (Listing obligations and Disclosure Requirements), Regulations, 2015;
annexure ‘E’ to the Board report
Form No. Mr-3
SECrETarIaL aUdIT rEPorT For THE FINaNCIaL YEar ENdEd 31st MarCH, 2020
[pursuant to section 204(1) of the Companies Act, 2013 and Rule 9 of the Companies (Appointment and Remuneration of Managerial personnel) Rules, 2014]

135
vi. the Company has informed that there are no laws which are specifically applicable to the Company.
We have also examined compliance with the applicable provisions of the following:
(i) Secretarial Standards with regard to Meetings of Board of Directors (SS-1) and General Meetings (SS-2) issued by the Institute of Company Secretaries of India;
(ii) Listing Agreements entered into by the Company with National Stock exchange of India Limited and BSe Limited.
During the period under review the Company has complied with the provisions of the Act, Rules, Regulations, Guidelines, Standards, etc.
We further report that:-
zz the Board of Directors of the Company is duly constituted with proper balance of executive Directors, Non-executive Directors including Independent Directors and Women Directors. the changes in the composition of the Board of Directors which took place during the period under review were carried out in compliance with the provisions of the Act;
zz Adequate notice is given to all Directors of the schedule of the Board and Committee Meetings and Agenda & detailed notes on agenda were sent at least seven days in advance except for the meetings where consent of the Directors was obtained for receiving notice and agenda and notes to agenda less than seven days before the meeting;
zz there exists a system for seeking and obtaining further information and clarifications on the agenda items before the meeting for meaningful participation at the meeting;
zz All decisions of Board and Committee meetings were carried unanimously.
We further report that based on review of compliance mechanism established by the Company and on the basis of the Compliance Certificate(s) issued by the Company Secretary and taken on record by the Board of Directors at their meeting(s), we are of the opinion that there are adequate systems and processes in place in the Company which is commensurate with the size and operations of the Company to monitor and ensure compliance with applicable laws, rules, regulations and guidelines.
We further report that during the audit period the following events have occurred which had a major bearing on the Company’s affairs in pursuance of the above referred laws, rules, regulations, guidelines, standards etc:
the Company has
zz completed acquisition and control of Mindtree Limited (“Mindtree”), a listed Company by acquiring 61.08% of its paid-up share capital;
zz issued 59,000 Non- Convertible Debentures of R 10 Lac each aggregating to R 5900 Crore (Rupees Five thousand Nine Hundred Crore only)
zz the members at the Annual General Meeting held on 1st August 2019, passed Special Resolutions :
zz to amend the object Clause of the Memorandum of Association of the Company to specifically authorise manufacture and supply of defence equipment as required by the authorities.
zz to authorise the Board of Directors to raise funds through issuance of securities in one or more tranches upto amount not exceeding R 4000 Crore (Rupees Four thousand Crore only) or US $600 Mn (US Dollars Six Hundred Million), whichever is higher.
zz obtained sanction from National Company Law tribunal (NCLt) to the Scheme of Arrangement for merger of L& t Shipbuilding Limited, a Wholly owned Subsidiary with the Company and filed the necessary forms with Ministry of Company Affairs on 18th May 2020 to give effect to the Scheme.
this Report is to be read with our letter of even date which is annexed as Annexure A and forms an integral part of this report.
For S. N. aNaNTHaSUBraMaNIaN & Co. Company Secretaries ICSI Unique Code: p1991MH040400
S. N. ananthasubramanian partner FCS: 4206 | Cop No.: 1774 ICSI UDIN: F004206B000257569 peer Review Cert. No.: 606/2019
Date : May 19, 2020 place : thane

136
aNNEXUrE to tHe BoARD RepoRt ANNUAL RepoRt 2019-20
annexure-‘a’
to, the Members, Larsen & toubro Limited CIN L99999MH1946pLC004768 L& t House, Ballard estate, Mumbai – 400 001.
our Secretarial Audit Report for the Financial Year ended 31st March, 2020, of even date is to be read along with this letter.
Management’s responsibility
1. It is the responsibility of the management of the Company to maintain secretarial records, devise proper systems to ensure compliance with the provisions of all applicable laws and regulations and to ensure that the systems are adequate and operate effectively.
auditor’s responsibility
2. our responsibility is to express an opinion on these secretarial records, standards and procedures followed by the Company with respect to secretarial compliances.
3. We believe that audit evidence and information obtained from the Company’s management is adequate and appropriate for us to provide a basis for our opinion.
4. Wherever required, we have obtained the management’s representation about the compliance of laws, rules and regulations and happening of events etc.
disclaimer
5. the Secretarial Audit Report is neither an assurance as to the future viability of the Company nor of the efficacy or effectiveness with which the management has conducted the affairs of the Company.
6. We have not verified the correctness and appropriateness of financial records and books of accounts of the Company
For S. N. aNaNTHaSUBraMaNIaN & Co. Company Secretaries ICSI Unique Code: p1991MH040400
S. N. ananthasubramanian partner FCS: 4206 | Cop No.: 1774 ICSI UDIN: F004206B000257569 peer Review Cert. No.: 606/2019
Date : May 19, 2020 place : thane

137
annexure ‘F’ to the Board report
ForM No. MGT-9EXTraCT oF aNNUaL rETUrN as on the financial year ended on March 31, 2020
[pursuant to section 92(3) of the Companies Act, 2013 and rule 12(1) of the Companies (Management and Administration) Rules, 2014]
I. rEGISTraTIoN aNd oTHEr dETaILS:
i) CIN L99999MH1946pLC004768
ii) Registration Date February 7, 1946
iii) Name of the Company LARSeN & toUBRo LIMIteD
iv) Category pUBLIC LIMIteD CoMpANY
v) Sub-Category of the Company CoMpANY HAVING SHARe CApItAL
vi) Address of the Registered office and contact details
L&t HoUSe, N. M. MARG, BALLARD eStAte, MUMBAI - 400 001 teL : 022-67525656 FAX: 022-67525893
vii) Whether listed company LISteD
viii) Name, Address and Contact details of Registrar andtransfer Agent, if any
KFin technologies private Limited Unit: Larsen & toubro Limited Karvy Selenium tower B, plot 31 & 32, Gachibowli, Financial District, Nanakramguda, Hyderabad, telengana - 500 032 tel : (040) 6716 2222 toll free number: 1-800-3454-001 Fax: (040) 2342 0814
II. PrINCIPaL BUSINESS aCTIVITIES oF THE CoMPaNY
All the business activities contributing 10 % or more of the total turnover of the company shall be stated:-
Sl. No.
Name and description of main products/ services
NIC Code of the Product/service
% to total turnover of the company #
1 Construction of Buildings 410 15.53%2 Construction of Roads and Railways 421 29.37%3 Construction of Utility projects 422 39.46%
# on the basis of gross turnover
III. ParTICULarS oF HoLdING, SUBSIdIarY aNd aSSoCIaTE CoMPaNIES –
Sl. No Name of the Company
Address of the Company CIN/GLN Holding/Subsidiary/Associate
% of Shares held
Applicable Section
1 AHMEDABAD-MALIYA TOLLWAY LIMITED
MOUNT POONAMALLE ROAD, POST BOX NO. 979, MANAPAKKAM, CHENNAI - 600089
U45203TN2008PLC069211 SUBSIDIARY 51.00 Section 2(87)(ii)
2 BHILAI POWER SUPPLY COMPANY LIMITED
9TH FLOOR, AMBADEEP BUILDING, 14, KASTURBA GANDHI MARG, CONNAUGHT PLACE, NEW DELHI-110001
U74899DL1995PLC070704 SUBSIDIARY 99.90 Section 2(87)(ii)

138
aNNEXUrE to tHe BoARD RepoRt ANNUAL RepoRt 2019-20
Sl. No Name of the Company
Address of the Company CIN/GLN Holding/Subsidiary/Associate
% of Shares held
Applicable Section
3 CHENNAI VISION DEVELOPERS PRIVATE LIMITED
MOUNT POONAMALLE ROAD, POST BOX NO 979, MANAPAKKAM, CHENNAI - 600089
U70101TN2008PTC068877 SUBSIDIARY 100.00 Section 2(87)(ii)
4 ESENCIA TECHNOLOGIES INC
2350 MISSION COLLEGE BLVD SUITE 490, SANTA CLARA, CA 95054, USA
0479598-9 SUBSIDIARY 74.62 Section 2(87)(ii)
5 ESENCIA TECHNOLOGIES INDIA PRIVATE LIMITED
3RD FLOOR, 26TH, 5TH BLOCK, 5TH CROSS, KORAMANAGALA, BANGALORE 560095
U74140KA2011PTC061480 SUBSIDIARY 74.62 Section 2(87)(ii)
6 GRAPHENE SEMICONDUCTORS SERVICES PRIVATE LIMITED
#1154, 10TH B CROSS , YELAHANKA NEW TOWN , BANGALORE, KARNATAKA -560064
U74900KA2013PTC068574 SUBSIDIARY 74.62 Section 2(87)(ii)
7 GRAPHENE SOLUTIONS PTE LTD
30 CECIL STREET, #19-08, PRUDENTIAL TOWER, SINGAPORE
201524512K SUBSIDIARY 74.62 Section 2(87)(ii)
8 GRAPHENE SOLUTIONS SDN.BHD
C-2-20, SME1, SME TECHNOPRENEUR CENTRE, 2270, JALAN USAHAWAN 2, CYBER 6 , 63000 CYBERJAYA, SELANGOR, MALAYSIA
1231163-D SUBSIDIARY 74.62 Section 2(87)(ii)
9 GRAPHENE SOLUTIONS TAIWAN LTD.
6F, NO. 378, CHANGCHUN ROAD, ZHONGSHAN DISTRICT, TAIPEI CITY 104, TAIWAN (R.O.C)
50787314 SUBSIDIARY 74.62 Section 2(87)(ii)
10 HENIKWON CORPORATION SDN.BHD
2A-03-2, LORONG BATU NILAM 4A, BANDAR BUKIT TINGGI, 41200, KLANG, SELANGOR, MALAYSIA
161535-W SUBSIDIARY 100.00 Section 2(87)(ii)
11 HI-TECH ROCK PRODUCTS & AGGREGATE LIMITED
MOUNT POONAMALLE ROAD, POST BOX NO. 979, MANAPAKKAM, CHENNAI - 600089
U14290TN2008PLC065900 SUBSIDIARY 100.00 Section 2(87)(ii)
12 KANA CONTROLS GENERAL TRADING & CONTRACTING COMPANY WLL
OFFICE NO. 14, 5TH FLOOR, AL-FARWANIYA, BLOCK NO. 44, BLDG. NO. 6, GHASHAM FAHED AL-BASMAN, KUWAIT
10292 SUBSIDIARY 49.00 Section 2(87)(i)
13 KESUN IRON AND STEEL COMPANY PRIVATE LIMITED
L&T ENERGY CENTRE, NEAR CHHANI JAKAT NAKA, VADODARA, GUJARAT-390002
U27100GJ2009PTC055901 SUBSIDIARY 95.00 Section 2(87)(ii)
14 KUDGI TRANSMISSION LIMITED
MOUNT POONAMALLE ROAD, POST BOX NO. 979, MANAPAKKAM, CHENNAI - 600089
U40106TN2012GOI111122 SUBSIDIARY 51.00 Section 2(87)(ii)
15 L&T - GULF PRIVATE LIMITED
L&T HOUSE, BALLARD ESTATE, N M MARG, MUMBAI, MAHARASHTRA - 400001
U74140MH2008PTC177765 SUBSIDIARY 100.00 Section 2(87)(ii)
16 L&T ARUNACHAL HYDROPOWER LIMITED
L&T HOUSE, BALLARD ESTATE, N M MARG, MUMBAI, MAHARASHTRA - 400001
U40300MH2010PLC204778 SUBSIDIARY 100.00 Section 2(87)(ii)
17 L&T AVIATION SERVICES PRIVATE LIMITED
L&T HOUSE, BALLARD ESTATE, N M MARG, MUMBAI, MAHARASHTRA - 400001
U62100MH2009PTC196917 SUBSIDIARY 100.00 Section 2(87)(ii)
18 L&T CAPITAL COMPANY LIMITED
L&T HOUSE, BALLARD ESTATE, N M MARG, MUMBAI, MAHARASHTRA - 400001
U67190MH2000PLC125653 SUBSIDIARY 100.00 Section 2(87)(ii)
19 L&T CAPITAL MARKETS LIMITED
BRINDAVAN, PLOT NO. 177, C.S.T. ROAD, KALINA,SANTACRUZ (EAST),MUMBAI - 400 098, MAHARASHTRA, INDIA.
U67190MH2013PLC240261 SUBSIDIARY 63.72 Section 2(87)(ii)

139
Sl. No Name of the Company
Address of the Company CIN/GLN Holding/Subsidiary/Associate
% of Shares held
Applicable Section
20 L&T CAPITAL MARKETS(MIDDLE EAST) LIMITED
501,502, LEVEL 5, LIBERTY HOUSE, DUBAI INTERNATIONAL FINANCIAL CENTRE, DUBAI - 506895 UAE
2908 SUBSIDIARY 63.72 Section 2(87)(ii)
21 L&T CASSIDIAN LIMITED*
L&T HOUSE, BALLARD ESTATE, N M MARG, MUMBAI, MAHARASHTRA - 400001
U29253MH2011PLC216258 SUBSIDIARY 100.00 Section 2(87)(ii)
22 L&T CHENNAI TADA TOLLWAY LIMITED
MOUNT POONAMALLE ROAD, POST BOX NO. 979, MANAPAKKAM, CHENNAI - 600089
U45309TN2008PLC066938 SUBSIDIARY 51.00 Section 2(87)(ii)
23 L&T CONSTRUCTION EQUIPMENT LIMITED
L&T HOUSE, BALLARD ESTATE, N M MARG, MUMBAI, MAHARASHTRA - 400001
U29119MH1997PLC109700 SUBSIDIARY 100.00 Section 2(87)(ii)
24 L&T CONSTRUCTION MACHINERY LIMITED
L&T HOUSE, BALLARD ESTATE, N M MARG, MUMBAI, MAHARASHTRA - 400001
U29248MH2018PLC318481 SUBSIDIARY 100.00 Section 2(87)(ii)
25 L&T DECCAN TOLLWAYS LIMITED
MOUNT POONAMALLE ROAD, POST BOX NO. 979, MANAPAKKAM, CHENNAI - 600089
U45203TN2011PLC083661 SUBSIDIARY 52.89 Section 2(87)(ii)
26 L&T ELECTRICAL & AUTOMATION FZE
WAREHOUSE NO. FZS2ABO5 262158, JEBEL ALI FREE ZONE, DUBAI, UNITED ARAB EMIRATES
107673 SUBSIDIARY 100.00 Section 2(87)(ii)
27 L&T ELECTRICAL AND AUTOMATION SAUDI ARABIA COMPANY LIMITED LLC
MH-4, PLOT NO. 17+19, IIND INDUSTRIAL CITY, DAMMAM, P.O. BOX 77186, AL KHOBAR 31952, KINGDOM OF SAUDI ARABIA
2050051589 SUBSIDIARY 100.00 Section 2(87)(ii)
28 L&T ELECTRICALS AND AUTOMATION LIMITED
L&T HOUSE, BALLARD ESTATE, N M MARG, MUMBAI, MAHARASHTRA - 400001
U31501MH2007PLC176667 SUBSIDIARY 100.00 Section 2(87)(ii)
29 L&T FINANCE HOLDINGS LIMITED
BRINDAVAN, PLOT NO. 177, C.S.T. ROAD, KALINA,SANTACRUZ (EAST),MUMBAI - 400 098, MAHARASHTRA, INDIA.
L67120MH2008PLC181833 SUBSIDIARY 63.72 Section 2(87)(ii)
30 L&T FINANCE LIMITED TECHNOPOLICE, 7TH FLOOR, A WING, PLOT NO. 4, BLOCK-BP, SECTOR- V, SALT LAKE, KOLKATA -700091
U65910WB1993FLC060810 SUBSIDIARY 63.72 Section 2(87)(ii)
31 L&T FINANCIAL CONSULTANTS LIMITED
BRINDAVAN, PLOT NO. 177, C.S.T. ROAD, KALINA,SANTACRUZ (EAST),MUMBAI - 400 098, MAHARASHTRA, INDIA.
U65100MH2011PLC299024 SUBSIDIARY 63.72 Section 2(87)(ii)
32 L&T GLOBAL HOLDINGS LIMITED
UNIT 7, LEVEL 3, GATE PRECINCT, BUILDING 2, DUBAI INTERNATIONAL FINANCIAL CENTRE, P.O BOX 63671, DUBAI, UAE
CL2106 SUBSIDIARY 100.00 Section 2(87)(ii)
33 L&T HALOL-SHAMLAJI TOLLWAY LIMITED
MOUNT POONAMALLE ROAD, POST BOX NO. 979, MANAPAKKAM, CHENNAI - 600089
U45203TN2008PLC069210 SUBSIDIARY 24.98 Section 2(87)(ii)
34 L&T HIMACHAL HYDROPOWER LIMITED
RAMA COTTAGE, KANLOG, SHIMLA-171001
U40102HP2010PLC031697 SUBSIDIARY 100.00 Section 2(87)(ii)
35 L&T HOUSING FINANCE LIMITED
BRINDAVAN, PLOT NO. 177, C.S.T. ROAD, KALINA,SANTACRUZ (EAST),MUMBAI - 400 098, MAHARASHTRA, INDIA.
U45200MH1994PLC259630 SUBSIDIARY 63.72 Section 2(87)(ii)

140
aNNEXUrE to tHe BoARD RepoRt ANNUAL RepoRt 2019-20
Sl. No Name of the Company
Address of the Company CIN/GLN Holding/Subsidiary/Associate
% of Shares held
Applicable Section
36 L&T HOWDEN PRIVATE LIMITED
L&T HOUSE, BALLARD ESTATE, N M MARG, MUMBAI, MAHARASHTRA - 400001
U31401MH2010PTC204403 SUBSIDIARY 50.10 Section 2(87)(ii)
37 L&T HYDROCARBON CASPIAN LLC
AGHA NEMATULLA STREET 224, NARIMANOV DISTRICT BAKU CITY, ALGERIA
1503665631 SUBSIDIARY 50.00 Section 2(87)(i)
38 L&T HYDROCARBON ENGINEERING LIMITED
L&T HOUSE, BALLARD ESTATE, N M MARG, MUMBAI, MAHARASHTRA - 400001
U11200MH2009PLC191426 SUBSIDIARY 100.00 Section 2(87)(ii)
39 L&T HYDROCARBON INTERNATIONAL FZE
WAREHOUSE NO. LV 38-B, HAMRIYAH FREE ZONE, SHARJAH, U.A.E
17744 SUBSIDIARY 100.00 Section 2(87)(ii)
40 L&T INFORMATION TECHNOLOGY SERVICES (SHANGHAI) CO., LTD.
ROOM 1317, NO. 35, DINGBIAN ROAD / LANE, JIADING DISTRICT, SHANGHAI
310000400714060 (JIADING) SUBSIDIARY 74.53 Section 2(87)(ii)
41 L&T INFORMATION TECHNOLOGY SPAIN SOCIEDAD LIMITADA
PASEO DE LA CASTELLANA 81 STREET, FLOOR 11, 28046, MADRID, SPAIN
B87472072 SUBSIDIARY 74.53 Section 2(87)(ii)
42 L&T INFOTECH FINANCIAL SERVICES TECHNOLOGIES INC
2810, MATHESON BLVD EAST SUITE 500, MISSISSAUGA, ONL4W 4X7 CANADA
770556-5 SUBSIDIARY 74.53 Section 2(87)(ii)
43 L&T INFOTECH S. DE. RL.C.V
BOSQUE DE CIRUELOS 180, SUITE PP 101, COL.BOSQUES DE LAS LOMAS, 11700 MEXICO CITY, MEXICO
N-2017020633 SUBSIDIARY 74.53 Section 2(87)(ii)
44 L&T INFRA CONTRACTORS PRIVATE COMPANY LIMITED
L&T HOUSE, BALLARD ESTATE, N M MARG, MUMBAI 400001
U45400MH2017PTC292586 SUBSIDIARY 100.00 Section 2(87)(ii)
45 L&T INFRA DEBT FUND LIMITED
PLOT NO. 177, CTS 6970, 6971,VIDYANAGARI MARG, C.S.T. ROAD, KALINA,SANTACRUZ (EAST), MUMBAI - 400098
L67100MH2013PLC241104 SUBSIDIARY 63.72 Section 2(87)(ii)
46 L&T INFRA INVESTMENT PARTNERS ADVISORY PRIVATE LIMITED
PLOT NO. 177, CTS 6970, 6971,VIDYANAGARI MARG, C.S.T. ROAD, KALINA,SANTACRUZ (EAST), MUMBAI - 400098
U67190MH2011PTC218046 SUBSIDIARY 63.72 Section 2(87)(ii)
47 L&T INFRA INVESTMENT PARTNERS TRUSTEE PRIVATE LIMITED
PLOT NO. 177, VIDYANAGARI MARG, C.S.T. ROAD, KALINA,SANTACRUZ (EAST), MUMBAI - 400098
U65900MH2011PTC220896 SUBSIDIARY 63.72 Section 2(87)(ii)
48 L&T INFRASTRUCTURE DEVELOPMENT PROJECTS LIMITED
MOUNT POONAMALLE ROAD, POST BOX NO. 979, MANAPAKKAM, CHENNAI - 600089
U65993TN2001PLC046691 SUBSIDIARY 51.00 Section 2(87)(ii)
49 L&T INFRASTRUCTURE ENGINEERING LIMITED
MOUNT POONAMALLE ROAD, POST BOX NO. 979, MANAPAKKAM, CHENNAI - 600089
U74140TN1998PLC039864 SUBSIDIARY 100.00 Section 2(87)(ii)
50 L&T INFRASTRUCTURE FINANCE COMPANY LIMITED
BRINDAVAN, PLOT NO. 177, C.S.T. ROAD, KALINA,SANTACRUZ (EAST),MUMBAI - 400 098, MAHARASHTRA, INDIA.
U67190TN2006PLC059527 SUBSIDIARY 63.72 Section 2(87)(ii)
51 L&T INTERSTATE ROAD CORRIDOR LIMITED
MOUNT POONAMALLE ROAD, POST BOX NO. 979, MANAPAKKAM, CHENNAI - 600089
U45203TN2006PLC058735 SUBSIDIARY 51.00 Section 2(87)(ii)

141
Sl. No Name of the Company
Address of the Company CIN/GLN Holding/Subsidiary/Associate
% of Shares held
Applicable Section
52 L&T INVESTMENT MANAGEMENT LIMITED
BRINDAVAN, PLOT NO. 177, C.S.T. ROAD, KALINA,SANTACRUZ (EAST),MUMBAI - 400 098, MAHARASHTRA, INDIA.
U65991MH1996PLC229572 SUBSIDIARY 63.72 Section 2(87)(ii)
53 L&T MBDA MISSILE SYSTEMS LIMITED
L&T HOUSE, BALLARD ESTATE, N M MARG, MUMBAI, MAHARASHTRA - 400001
U29308MH2017PLC293402 SUBSIDIARY 51.00 Section 2(87)(i)
54 L&T METRO RAIL (HYDERABAD) LIMITED
HYDERABAD METRO RAIL ADMINISTRATIVE BUILDING, UPPAL MAIN ROAD, NAGOLE, HYDERABAD, TELANGANA 500039.
U45300TG2010PLC070121 SUBSIDIARY 100.00 Section 2(87)(ii)
55 L&T MODULAR FABRICATION YARD LLC
PO BOX 236, P.C 322, FALAZ AL QABAIL, SOHAR, SULTANATE OF OMAN
1001910 SUBSIDIARY 70.00 Section 2(87)(ii)
56 L&T MUTUAL FUND TRUSTEE LIMITED
L&T HOUSE BALLARD ESTATE, P.O. BOX 278, MUMBAI 400001
U65993MH1996PLC211198 SUBSIDIARY 63.72 Section 2(87)(ii)
57 L&T OVERSEAS PROJECTS NIGERIA LIMITED
252E, MURI OKUNOLA STREET, VICTORIA ISLAND, LAGOS, NIGERIA
601723 SUBSIDIARY 100.00 Section 2(87)(ii)
58 L&T POWER DEVELOPMENT LIMITED
L&T HOUSE, BALLARD ESTATE, N M MARG, MUMBAI, MAHARASHTRA - 400001
U40101MH2007PLC174071 SUBSIDIARY 100.00 Section 2(87)(ii)
59 L&T POWER LIMITED L&T HOUSE, BALLARD ESTATE, N M MARG, MUMBAI, MAHARASHTRA - 400001
U40100MH2006PLC160413 SUBSIDIARY 99.99 Section 2(87)(ii)
60 L&T RAJKOT-VADINAR TOLLWAY LIMITED
MOUNT POONAMALLE ROAD, POST BOX NO. 979, MANAPAKKAM, CHENNAI - 600089
U45203TN2008PLC069184 SUBSIDIARY 51.00 Section 2(87)(ii)
61 L&T SAMAKHIALI GANDHIDHAM TOLLWAY LIMITED
MOUNT POONAMALLE ROAD, POST BOX NO. 979, MANAPAKKAM, CHENNAI - 600089
U45203TN2010PLC074501 SUBSIDIARY 51.01 Section 2(87)(ii)
62 L&T SAMBALPUR - ROURKELA TOLLWAY LIMITED
MOUNT POONAMALLE ROAD, POST BOX NO. 979, MANAPAKKAM, CHENNAI - 600089
U45206TN2013PLC093395 SUBSIDIARY 51.00 Section 2(87)(ii)
63 L&T SAPURA OFFSHORE PRIVATE LIMITED
MOUNT POONAMALLE ROAD, POST BOX NO. 979, MANAPAKKAM, CHENNAI - 600089
U11200TN2010PTC077214 SUBSIDIARY 60.00 Section 2(87)(ii)
64 L&T SAPURA SHIPPING PRIVATE LIMITED
MOUNT POONAMALLE ROAD, POST BOX NO 979, MANAPAKKAM, CHENNAI - 600089
U61100TN2010PTC077217 SUBSIDIARY 60.00 Section 2(87)(ii)
65 L&T SEAWOODS LIMITED
L&T HOUSE, BALLARD ESTATE, N M MARG, MUMBAI, MAHARASHTRA - 400001
U45203MH2008PLC180029 SUBSIDIARY 100.00 Section 2(87)(ii)
66 L&T SPECIAL STEELS AND HEAVY FORGINGS PRIVATE LIMITED
L&T HOUSE, BALLARD ESTATE, N M MARG, MUMBAI, MAHARASHTRA - 400001
U27109MH2009PTC193699 SUBSIDIARY 74.00 Section 2(87)(ii)
67 L&T Technology Services (Canada) Limited
200 BURRARD STREET, VANCOUVER BC, CANADA V6C 3L6
5020583 SUBSIDIARY 74.62 Section 2(87)(ii)
68 L&T Technology Services (Shanghai) Co. Ltd
UNIT 3031, ROOM 302, BUILDING 1, SHENGIX RD, 399, SHANGHAI PILOT FREE TRADE ZONE, CHINA
91310115MA1K4DK527 SUBSIDIARY 74.62 Section 2(87)(ii)

142
aNNEXUrE to tHe BoARD RepoRt ANNUAL RepoRt 2019-20
Sl. No Name of the Company
Address of the Company CIN/GLN Holding/Subsidiary/Associate
% of Shares held
Applicable Section
69 L&T TECHNOLOGY SERVICES LIMITED
L&T HOUSE, BALLARD ESTATE, N M MARG, MUMBAI, MAHARASHTRA - 400001
L72900MH2012PLC232169 SUBSIDIARY 74.62 Section 2(87)(ii)
70 L&T TECHNOLOGY SERVICES LLC
200, WEST ADAMS STREET, CHICAGO, ILLINOIS-60606
0479598-9 SUBSIDIARY 74.62 Section 2(87)(ii)
71 L&T THALES TECHNOLOGY SERVICES PRIVATE LIMITED
RR V TOWER, 6TH FLOOR, 33A, DEVELOPED PLOTS, SIDCO INDUSTRIAL ESTATE, GUINDY, CHENNAI-600032
U72200TN2006PTC059421 SUBSIDIARY 55.22 Section 2(87)(ii)
72 L&T TRANSPORTATION INFRASTRUCTURE LIMITED
MOUNT POONAMALLE ROAD, POST BOX NO 979, MANAPAKKAM, CHENNAI - 600089
U45203TN1997PLC039102 SUBSIDIARY 63.86 Section 2(87)(ii)
73 L&T UTTARANCHAL HYDROPOWER LIMITED
VILLAGE BEDUBAGAR P.O AUGUSTMUNI RUDRAPRAYAG RUDRA PRAYAG UR 246421
U31401UR2006PLC032329 SUBSIDIARY 100.00 Section 2(87)(ii)
74 L&T VALVES LIMITED L&T HOUSE, BALLARD ESTATE, N M MARG, MUMBAI, MAHARASHTRA - 400001
U74999MH1961PLC012188 SUBSIDIARY 100.00 Section 2(87)(ii)
75 L&T VISION VENTURES LIMITED
MOUNT POONAMALLE ROAD, POST BOX NO 979, MANAPAKKAM, CHENNAI - 600089
U74210TN2006PLC061845 SUBSIDIARY 68.00 Section 2(87)(ii)
76 L&T-MHPS BOILERS PRIVATE LIMITED
L&T HOUSE, BALLARD ESTATE, N M MARG, MUMBAI, MAHARASHTRA - 400001
U29119MH2006PTC165102 SUBSIDIARY 51.00 Section 2(87)(ii)
77 L&T-MHPS TURBINE GENERATORS PRIVATE LIMITED
L&T HOUSE, BALLARD ESTATE, N M MARG, MUMBAI, MAHARASHTRA - 400001
U31101MH2006PTC166541 SUBSIDIARY 51.00 Section 2(87)(ii)
78 L&T-SARGENT & LUNDY LIMITED
L&T HOUSE, BALLARD ESTATE, N M MARG, MUMBAI, MAHARASHTRA - 400001
U74210MH1995PLC088099 SUBSIDIARY 50.0001 Section 2(87)(ii)
79 LARSEN & TOUBRO (EAST ASIA) SDN. BHD
SUITE 702, 7TH FLOOR, WISMA HANGSAM, JALAN HANG LEKIR, 50000 KUALA LUMPUR, MALAYSIA
390357-T SUBSIDIARY 30.00 Section 2(87)(i)
80 L&T HYDROCARBON SAUDI COMPANY LLC (formerly known as LARSEN & TOUBRO ATCO SAUDIA LLC)
AL-TURKI BUILDING, KING KHALED STREET, P.O. BOX 91, DAMMAM
2050055625 SUBSIDIARY 100.00 Section 2(87)(ii)
81 LARSEN & TOUBRO ELECTROMECH LLC
P.O. BOX 1999, RUWI, POSTAL CODE 112, MUSCAT
1/04445/1 SUBSIDIARY 70.00 Section 2(87)(ii)
82 LARSEN & TOUBRO HEAVY ENGINEERING LLC
P.O. BOX 281, POSTAL CODE 325, W LIWA, SULTANATE OF OMAN
1042928 SUBSIDIARY 70.00 Section 2(87)(ii)
83 LARSEN & TOUBRO HYDROCARBON INTERNATIONAL LIMITED LLC @@
P.O. BOX 6391, AL KHOBAR 34423, KINGDOM OF SAUDI ARABIA
2051053464 SUBSIDIARY 100.00 Section 2(87)(ii)
84 LARSEN & TOUBRO INFOTECH CANADA LIMITED
2810, MATHESON BLVD EAST SUITE 500, MISSISSAUGA, ONL4W 4X7 CANADA
1415026 SUBSIDIARY 74.53 Section 2(87)(ii)
85 LARSEN & TOUBRO INFOTECH GMBH
MARCEL-BREUER-STR. 15, 80807 MUNICH, GERMANY
HRB15958 SUBSIDIARY 74.53 Section 2(87)(ii)
86 LARSEN & TOUBRO INFOTECH LIMITED
L&T HOUSE, BALLARD ESTATE, N M MARG, MUMBAI, MAHARASHTRA - 400001
L72900MH1996PLC104693 SUBSIDIARY 74.53 Section 2(87)(ii)
87 LARSEN & TOUBRO INFOTECH LLC
1220, N. MARKET ST., SUITE 806, WILMINGTON, DE 19801, USA
270596763 SUBSIDIARY 74.53 Section 2(87)(ii)

143
Sl. No Name of the Company
Address of the Company CIN/GLN Holding/Subsidiary/Associate
% of Shares held
Applicable Section
88 LARSEN & TOUBRO INFOTECH NORGE AS
MARTIN LINGES VEI 25, 1364 FORNEBU, 0219 BAERUM, NORWAY
921 974 248 SUBSIDIARY 74.53 Section 2(87)(ii)
89 LARSEN & TOUBRO INTERNATIONAL FZE
OFFICE LOB 16 G 08, POST BOX 41558, HAMRIYAH FREE ZONE, SHARJAH, UNITED ARAB EMIRATES
0067 SUBSIDIARY 100.00 Section 2(87)(ii)
90 LARSEN & TOUBRO KUWAIT CONSTRUCTION GENERAL CONTRACTING COMPANY, WITH LIMITED LIABILITY
PLOT NO. 3, BUILDING NO.1, SHARQ, KUWAIT
117668 SUBSIDIARY 49.00 Section 2(87)(i)
91 LARSEN & TOUBRO LLC
113, BARKSDALE PROFESSIONAL CENTRE, NEWARK CITY, COUNTRY OF NEW CASTLE, G56 ZIP CODE-19711, U.S.A
6 DEL.C 18-101 SUBSIDIARY 98.79 Section 2(87)(ii)
92 LARSEN & TOUBRO OMAN LLC
P.O. BOX 1127, RUWI, POSTAL CODE 112, SULTANATE OF OMAN
1/40304/4 SUBSIDIARY 65.00 Section 2(87)(ii)
93 LARSEN & TOUBRO QATAR LLC
P.O. BOX 24399, SH. THAMOUR BLDG., MEZZANINE FLOOR, AL-HANDASA AREA, NEAR JAIDAH FLYOVER, B RING ROAD, DOHA, QATAR
27454 SUBSIDIARY 49.00 Section 2(87)(i)
94 LARSEN & TOUBRO SAUDI ARABIA LLC
P.O. BOX NO.20, RIYADH 11351, KINGDOM OF SAUDI ARABIA 11351
1010154437 SUBSIDIARY 100.00 Section 2(87)(ii)
95 LARSEN & TOUBRO TANDD SA (PTY) LIMITED
2ND FLOOR, 4 PENCARROW CRESCENT, LA LUCIA RIDGE OFFICE ESTATE, SOUTH AFRICA 4019
2010/018159/07 SUBSIDIARY 72.50 Section 2(87)(ii)
96 LARSEN AND TOUBRO INFOTECH SOUTH AFRICA (PTY) LIMITED
6TH FLOOR, 119 HERTZOG BOULEVARD, FORESHORE, CAPETOWN, SOUTH AFRICA 8001
2011/007226/07 SUBSIDIARY 55.83 Section 2(87)(ii)
97 LARSEN TOUBRO ARABIA LLC
ALMADA TOWER, PRINCE TURKI STREET, AL KHOBAR, SAUDI ARABIA
2051049523 SUBSIDIARY 75.00 Section 2(87)(ii)
98 LTH MILCOM PRIVATE LIMITED
L & T HOUSE, BALLARD ESTATE, MUMBAI 400001
U74999MH2015PTC267502 SUBSIDIARY 56.67 Section 2(87)(ii)
99 LTIDPL INDVIT SERVICES LIMITED
5TH FLOOR, SKCL - TECH SQUARE, LAZER ST, SOUTH PHASE, SIDCO INDUSTRIAL ESTATE, GUINDY, CHENNAI CHENNAI TN 600032
U45203TN1999PLC042518 SUBSIDIARY 51.00 Section 2(87)(ii)
100 LTR SSM PRIVATE LIMITED
L&T HOUSE, BALLARD ESTATE, N M MARG, MUMBAI, MAHARASHTRA - 400001
U70109MH2018PTC314632 SUBSIDIARY 99.00 Section 2(87)(ii)
101 LYMBYC SOLUTIONS INC
1452, HUGHES ROAD, SUITE #200, GRAPEVINE, TEXAS - 76051, USA
0801748966 SUBSIDIARY 74.53 Section 2(87)(ii)
102 LYMBYC SOLUTIONS PRIVATE LIMITED
PLOT NO. 3726, DOOR NO. 41, ‘MA FOI HOUSE’, 6TH AVENUE, Q- BLOCK, ANNA NAGAR, CHENNAI TAMIL NADU 600040 IN
U74900TN2012PTC087141 SUBSIDIARY 74.53 Section 2(87)(ii)
103 MUDIT CEMENT PRIVATE LIMITED
5TH FLOOR, DCM BUILDING, 16, BARAKHAMBA ROAD, CONNAUGHT PLACE, NEW DELHI - 110001
U26942DL1990PTC041941 SUBSIDIARY 63.72 Section 2(87)(ii)
104 NABHA POWER LIMITED
PO BOX NO-28, NEAR VILLAGE NALASH, RAJPURA, PATIALA, PUNJAB-140401
U40102PB2007PLC031039 SUBSIDIARY 100.00 Section 2(87)(ii)

144
aNNEXUrE to tHe BoARD RepoRt ANNUAL RepoRt 2019-20
Sl. No Name of the Company
Address of the Company CIN/GLN Holding/Subsidiary/Associate
% of Shares held
Applicable Section
105 NEILSEN+PARTNER UNTERNEHMENSBERATER GMBH
GROSSER BURSTAH 45, 20457 HAMBURG, GERMANY
HRB 60455 SUBSIDIARY 74.53 Section 2(87)(ii)
106 NIELSEN&PARTNER CO., LTD.
12A FLOOR, UNIT B1 AND B2, SIAM PIWAT TOWER, 989 RAMA 1 ROAD, PATHUMWAN, BANGKOK, THAILAND
0105561057293 SUBSIDIARY 74.53 Section 2(87)(ii)
107 NIELSEN&PARTNER PTY LTD
ADDISONS, LEVEL 12 , 60 CARRINGTON STREET, SYDNEY, NSW 2000, AUSTRALIA
ACN 624 699 627 SUBSIDIARY 74.53 Section 2(87)(ii)
108 NIELSEN+ PARTNER S.A.
5, RUE DES PRIMEURS, L-2361, STRASSEN LUXEMBOURG
R.C.S Luxembourg B213716 SUBSIDIARY 74.53 Section 2(87)(ii)
109 NIELSEN+PARTNER PTE LTD.
11 COLLYER QUAY #09-09 THE ARCADE, SINGAPORE 049317
RCB Reg. No. 201306219M SUBSIDIARY 74.53 Section 2(87)(ii)
110 NIELSEN+PARTNER UNTERNEHMENSBERATER AG
STAMPFENBACHSTRASSE 52, CH-8006 ZüRICH, SWITZERLAND
UID: CHE-113.683.377 SUBSIDIARY 74.53 Section 2(87)(ii)
111 PANIPAT ELEVATED CORRIDOR LIMITED
MOUNT POONAMALLE ROAD, POST BOX NO 979, MANAPAKKAM, CHENNAI - 600089
U45203TN2005PLC056999 SUBSIDIARY 51.00 Section 2(87)(ii)
112 PNG TOLLWAY LIMITED
MOUNT POONAMALLE ROAD, POST BOX NO.979, MANAPAKKAM, CHENNAI - 600089
U45203TN2009PLC070741 SUBSIDIARY 37.74 Section 2(87)(ii)
113 POWERUPCLOUD TECHNOLOGIES PRIVATE LIMITED
16, RAJIV NAGAR, 3RD STREET, SAMUNDIPURAM, TIRUPUR TN 641603
U72200TZ2015PTC021473 SUBSIDIARY 74.53 Section 2(87)(ii)
114 PT TAMCO INDONESIA JALAN RAYA PASAR SERANG, NO. 15, KANDANG RODA, CIKARANG BEKASI 17330, INDONESIA
C2-18.177.HT.01.01.HT 94 SUBSIDIARY 100.00 Section 2(87)(ii)
115 PT. LARSEN & TOUBRO HYDROCARBON ENGINEERING INDONESIA
THE CITY TOWER, 12TH FLOOR, UNIT 1-N, J1.MH., THAMRIN NO.81, CENTRAL JAKARTA, INDONESIA 10310
AHU-0110258.AH.01.09 SUBSIDIARY 95.00 Section 2(87)(ii)
116 RAYKAL ALUMINIUM COMPANY PRIVATE LIMITED
ANNAPURNA COMPLEX, 559, LEWIS ROAD, BHUBANESWAR, KHORDHA-751014
U13203OR1999PTC005673 SUBSIDIARY 75.50 Section 2(87)(ii)
117 RULETRONICS LIMITED 43 FARNSWORTH COURT, WEST PARKSIDE, LONDON SE10 0QG
7946822 SUBSIDIARY 74.53 Section 2(87)(ii)
118 RULETRONICS SYSTEMS INC
271 US HIGHWAY 46, STE C104, FAIRFIELD, NJ 07004, USA
0450075646 SUBSIDIARY 74.53 Section 2(87)(ii)
119 RULETRONICS SYSTEMS PRIVATE LIMITED
24A-1611/2,46965,DWARAKA, APARTMENTS 401, ALLASANI, PEDDANNA STREET, ELURU, ANDHRA PRADESH
U72200AP2014PTC094911 SUBSIDIARY 74.53 Section 2(87)(ii)
120 SAHIBGANJ GANGES BRIDGE-COMPANY PRIVATE LIMITED *
L&T HOUSE BALLARD ESTATE MUMBAI 400001
U45309MH2016PTC283661 SUBSIDIARY 100.00 Section 2(87)(ii)
121 SEASTAR LABS PRIVATE LIMITED
501, SARKAR-1, OPP. GANDHIGRAM RAILWAY STATION, ASHRAM ROAD AHMEDABAD -380009
U72900GJ2015PTC083374 SUBSIDIARY 74.62 Section 2(87)(ii)
122 SERVOWATCH SYSTEMS LIMITED
THE WOODROPE BUILDING, WOODROLFE ROAD, TOLLESBURY, MALDONESSEX CM9 8SE, UNITED KINGDOM
2159287 SUBSIDIARY 100.00 Section 2(87)(ii)
123 SYNCORDIS LIMITED 8 RUE PAUL BELMONDO 75012 PARIS, FRANCE
10045506 SUBSIDIARY 74.53 Section 2(87)(ii)

145
Sl. No Name of the Company
Address of the Company CIN/GLN Holding/Subsidiary/Associate
% of Shares held
Applicable Section
124 SYNCORDIS PSF S.A. (formerly known as SYNCORDIS SUPPORT SERVICES S.A.)
105, ROUTE D’ARLON, L-8009, STRASSEN, LUXEMBOURG
B217963 SUBSIDIARY 74.53 Section 2(87)(ii)
125 SYNCORDIS S.A. LUXEMBOURG
105 ROUTE D’ARLON, L-8009 STRASSEN RCS LUXEMBOURG B NUM’ERO 105331
B105331 SUBSIDIARY 74.53 Section 2(87)(ii)
126 SYNCORDIS SARL 8, RUE, PAUL BELMONDO, PARIS, FRANCE - 75012
514135862 SUBSIDIARY 74.53 Section 2(87)(ii)
127 SYNCORDIS SOFTWARE SERVICES INDIA PRIVATE LIMITED
BLOCK 4, 10TH FLOOR “A-WING”, DLF IT PARK (SEZ CAMPUS),1/124 SHIVAJI GARDENS, MANAPAKKAM, CHENNAI – 600 089
U72900TN2015FTC101675 SUBSIDIARY 74.53 Section 2(87)(ii)
128 TAMCO ELECTRICAL INDUSTRIES AUSTRALIA PTY LTD
31, KITCHEN ROAD, DANDENONG, VICTORIA 3175, AUSTRALIA
ACN006140512 SUBSIDIARY 100.00 Section 2(87)(ii)
129 TAMCO SWITCHGEAR (MALAYSIA) SDN BHD
UNIT C508, BLOCK C, KELANA SQUARE, JALAN SS7/26, KELANA JAYA 47301, PETALING JAYA SELANGOR DAR UL EHSAN, MALAYSIA
775268-H SUBSIDIARY 100.00 Section 2(87)(ii)
130 THALEST LIMITED ENDEAVOUR HOUSE, BENTALLS INDUSTRIAL ESTATE, HOLLOWAY ROAD, MALDON, ESSEX, C9 4ER, UNITED KINGDOM
01201246 SUBSIDIARY 100.00 Section 2(87)(ii)
131 VADODARA BHARUCH TOLLWAYS LIMITED
MOUNT POONAMALLE ROAD, POST BOX NO 979, MANAPAKKAM, CHENNAI - 600089
U45203TN2005PLC058417 SUBSIDIARY 51.00 Section 2(87)(ii)
132 MINDTREE LIMITED GLOBAL VILLAGE, RVCE POST, MYSORE ROAD, BENGALURU - 560059
L72200KA1999PLC025564 SUBSIDIARY 61.08 Section 2(87)(ii)
133 MINDTREE SOFTWARE (SHANGHAI) CO. LIMITED
ROOM 2986, 29F, NO. 501, MIDDLE YIN CHENG ROAD, PUDONG DISTRICT, SHANGHAI, CHINA.
913101150609180327 SUBSIDIARY 61.08 Section 2(87)(ii)
134 BLUEFIN SOLUTIONS SDN. BHD
1 SENTRAL , LEVEL 16 JALAN, STESEN SENTRAL, KL SENTRAL, 50470, KUALA LUMPUR, MALAYSIA
829837 U SUBSIDIARY 61.08 Section 2(87)(ii)
135 BLUEFIN SOLUTIONS PTE LIMITED #
6, SHENTON WAY, #33-00 OUE DOWNTOWN 2, SINGAPORE
201220020M SUBSIDIARY 61.08 Section 2(87)(ii)
136 BLUEFIN SOLUTIONS INC. #
200 S WACKER DRIVE FLOOR 31, CHICAGO, IL 60606, USA.
4480544 SUBSIDIARY 61.08 Section 2(87)(ii)
1 GRAMEEN CAPITAL INDIA LIMITED
402, 36 TURNER ROAD,BANDRA WEST, MUMBAI - 400050
U65923MH2007PTC168721 ASSOCIATE 16.57 Section 2(6)
2 GUJARAT LEATHER INDUSTRIES LIMITED @@
NO 3001, GIDC INDUSTRIAL ESTATE, ANKLESHWAR, GUJARAT
U18104GJ1978SGC003134 ASSOCIATE 50.00 Section 2(6)
3 INDIRAN ENGINEERING PROJECTS AND SYSTEMS KISH (LLC)
POST BOX 1267, NEHA APARTMENT, BAZAAR-E-DANOOS, KISH ISLAND, IRAN
3744 ASSOCIATE 50.00 Section 2(6)
4 INTERNATIONAL SEAPORTS (HALDIA) PRIVATE LIMITED
FLAT NO. 27, 5TH FLOOR, KOHINOOR BUILDING, 105, PARK STREET, KOLKATA 700016
U45205WB1999PTC090733 ASSOCIATE 21.74 Section 2(6)
5 L& T-CHIYODA LIMITED
L&T HOUSE, BALLARD ESTATE, N M MARG, MUMBAI, MAHARASHTRA - 400001
U28920MH1994PLC083035 ASSOCIATE 50.00 Section 2(6)

146
aNNEXUrE to tHe BoARD RepoRt ANNUAL RepoRt 2019-20
Sl. No Name of the Company
Address of the Company CIN/GLN Holding/Subsidiary/Associate
% of Shares held
Applicable Section
6 L&T CAMP FACILITIES LLC
P. O. BOX 44357, DUBAI, UNITED ARAB EMIRATES
600640 ASSOCIATE 49.00 Section 2(6)
7 LARSEN & TOUBRO QATAR & HBK CONTRACTING LLC
P. O. BOX 1362, DOHA, QATAR 28634 ASSOCIATE 50.00 Section 2(6)
8 MAGTORQ PRIVATE LIMITED
NO. 58-C, SIPCOT INDUSTRIAL COMPLEX, HOSUR, TAMIL NADU 635126
U02520TZ1989PTC002458 ASSOCIATE 42.85 Section 2(6)
9 MAGTORQ ENGINEERING SOLUTIONS PRIVATE LIMITED
NO. 58-C, SIPCOT INDUSTRIAL COMPLEX, HOSUR, TAMIL NADU 635126
U02520TZ1989PTC002458 ASSOCIATE 39.28 Section 2(6)
* Under process of Strike off @@ the Company is under Liquidation # liquidated during the year.
IV. SHarE HoLdING PaTTErN:
i) Category-wise Share Holding
Category of Shareholders No. of Shares held at the beginning of the year No. of Shares held at the end of the year % Change during the
yearDemat Physical Total % of Total
SharesDemat Physical Total % of Total
Shares
A. Promoters
(1) Indian
a) Individual/HUF 0 0 0 0.00 0 0 0 0.00 0.00
b) Central Govt 0 0 0 0.00 0 0 0 0.00 0.00
c) State Govt (s) 0 0 0 0.00 0 0 0 0.00 0.00
d) Bodies Corp. 0 0 0 0.00 0 0 0 0.00 0.00
e) Banks / FI 0 0 0 0.00 0 0 0 0.00 0.00
f) Any Other…. 0 0 0 0.00 0 0 0 0.00 0.00
Sub-total (A) (1):- 0 0 0 0.00 0 0 0 0.00 0.00
(2) Foreign
a) NRIs -Individuals 0 0 0 0.00 0 0 0 0.00 0.00
b) Other –Individuals 0 0 0 0.00 0 0 0 0.00 0.00
c) Bodies Corp. 0 0 0 0.00 0 0 0 0.00 0.00
d) Banks / FI 0 0 0 0.00 0 0 0 0.00 0.00
e) Any Other…. 0 0 0 0.00 0 0 0 0.00 0.00
Sub-total (A) (2):- 0 0 0 0.00 0 0 0 0.00 0.00
Total shareholding of Promoter (A) =(A)(1)+(A)(2)
0 0 0 0.00 0 0 0 0.00 0.00
B Public Shareholding
(1) Institutions
a) MutualFunds 228,916,062 13,878 228,929,940 16.32 266,024,781 13,878 266,038,659 18.95 2.63
b) Banks / FI 7,652,527 45,887 7,698,414 0.55 1,309,016 45,787 1,354,803 0.10 -0.45
c) Central Govt 3,590,744 0 3,590,744 0.26 5,292,298 0 5,292,298 0.38 0.12
d) State Govt(s) 0 0 0 0.00 0 0 0 0.00 0.00
e) Venture Capital Funds 0 0 0 0.00 0 0 0 0.00 0.00
f) Insurance Companies 294,374,166 675 294,374,841 20.99 257,329,522 675 257,330,197 18.33 -2.66
i) FIIs 848,582 52,558 901,140 0.06 648,377 51,002 699,379 0.05 -0.01
j) Foreign Venture Capital Funds
0 0 0 0.00 0 0 0 0.00 0.00
Sub-total (B)(1):- 535,382,081 112,998 535,495,079 38.18 530,603,994 111,342 530,715,336 37.80 -0.37

147
Category of Shareholders No. of Shares held at the beginning of the year No. of Shares held at the end of the year % Change during the
yearDemat Physical Total % of Total
SharesDemat Physical Total % of Total
Shares
(2) Non-Institutions
a) Bodies Corp.
i) Indian 73,662,439 406,668 74,069,107 5.28 100,461,693 361,203 100,822,896 7.18 1.90
ii) Overseas 39,713 3,260 42,973 0.00 48,005 3,260 51,265 0.00 0.00
b) Individuals
i) Individual shareholders holding nominal share capital upto R 2 lakh
249,613,337 20,377,228 269,990,565 19.25 261,628,429 17,656,402 279,284,831 19.89 0.65
ii) Individual shareholders holding nominal share capital in excess of R 2 lakh
31,436,696 5 31,436,701 2.24 13,671,581 5 13,671,586 0.97 -1.27
c) Others (specify)
i) Directors & Relatives 1,576,520 350 1,576,870 0.11 1,562,000 0 1,562,000 0.11 0.00
ii) Foreign Nationals 547,173 21,705 568,878 0.04 547,173 21,705 568,878 0.04 0.00
iii) Foreign Portfolio Investors
261,343,131 0 261,343,131 18.63 233,665,228 0 233,665,228 16.64 -1.99
iv) Non-Residents 12,841,446 477,413 13,318,859 0.95 14,341,881 436,865 14,778,746 1.05 0.10
v) Employee Trust 172,128,421 0 172,128,421 12.27 185,524,682 0 185,524,682 13.22 0.94
vi) Qualified Foreign Investor
0 0 0 0.00 0 0 0 0.00 0.00
vii) IEPF 1,292,037 0 1,292,037 0.09 1,530,131 0 1,530,131 0.11 0.02
viii) Alternate Investment Funds
1,115,268 0 1,115,268 0.08 2,060,287 0 2,060,287 0.15 0.07
ix) Trust 17,520,404 4,500 17,524,904 1.25 22,354,772 4,500 22,359,272 1.59 0.34
Sub-total (B)(2):- 823,116,585 21,291,129 844,407,714 60.20 837,395,862 18,483,940 855,879,802 60.96 0.77
Total Public Shareholding (B)=(B)(1)+ (B)(2)
1,358,498,666 21,404,127 1,379,902,793 98.37 1,367,999,856 18,595,282 1,386,595,138 98.77 0.40
C. Shares held byCustodian for GDRs & ADRs
22,826,592 0 22,826,592 1.63 17,296,884 0 17,296,884 1.23 -0.40
Grand Total (A+B+C) 1,381,325,258 21,404,127 1,402,729,385 100.00 1,385,296,740 18,595,282 1,403,892,022 100.00 0.00
(ii) Shareholding of Promoters
Sl Shareholders Name Shareholding at the beginning of the year Shareholding at the end of the year % change in share holding
during the year
No. of Shares % of total Shares of
the Company
%of Shares Pledged/
encumbered to total shares
No. of Shares % of total Shares of
the Company
%of Shares Pledged/
encumbered to total shares
1 NIL NIL
Total NIL NIL

148
Annexure to the Board report aNNUaL report 2019-20
(iii) Change in Promoters’ Shareholding (please specify, if there is no change)
Sl. No.
Shareholding at the beginning of the year
Cumulative Shareholding during the year
No. of shares % of total shares of the Company
No. of shares % of total shares of the Company
1 At the beginning of the year
NIL NIL
2 Date wise Increase / Decrease in Promoters Share holding during the year specifying the reasons for increase /decrease (e.g. allotment / transfer / bonus / sweat equity etc):
3 At the End of the year NIL NIL
(iv) Shareholding Pattern of top ten Shareholders (other than Directors, Promoters and Holders of GDrs and ADrs):
Cumulative Shareholding during the Year
Sl. No.
Name of the Share Holder Date Increase/Decrease in share holding
Reason No. of Shares
% of total shares of the
Company1 LIFE INSURANCE CORPORATION
OF INDIAShareholding at the
beginning of the Year246676682 17.59
Date wise Increase / Decrease in Shareholding during the year specifying the reasons for increase and decrease (e.g. allotment/transfer/bonus/sweat etc.)
05/04/2019 -2835629 Transfer 243841053 17.3812/04/2019 -2587133 Transfer 241253920 17.2019/04/2019 -2583225 Transfer 238670695 17.0126/04/2019 -3570177 Transfer 235100518 16.7603/05/2019 -1456282 Transfer 233644236 16.6610/05/2019 2450 Transfer 233646686 16.6610/05/2019 -480983 Transfer 233165703 16.6217/05/2019 2000 Transfer 233167703 16.6217/05/2019 -2000 Transfer 233165703 16.6224/05/2019 -550516 Transfer 232615187 16.5831/05/2019 -1978618 Transfer 230636569 16.4407/06/2019 -1497501 Transfer 229139068 16.3314/06/2019 -2171316 Transfer 226967752 16.1821/06/2019 -1703892 Transfer 225263860 16.0528/06/2019 5320 Transfer 225269180 16.0628/06/2019 -1840767 Transfer 223428413 15.9205/07/2019 31280 Transfer 223459693 15.9305/07/2019 -2135980 Transfer 221323713 15.7712/07/2019 200400 Transfer 221524113 15.7912/07/2019 -1250131 Transfer 220273982 15.7019/07/2019 265715 Transfer 220539697 15.7219/07/2019 -2932877 Transfer 217606820 15.51

149
Cumulative Shareholding during the Year
Sl. No.
Name of the Share Holder Date Increase/Decrease in share holding
Reason No. of Shares
% of total shares of the
Company
Date wise Increase / Decrease in Shareholding during the year specifying the reasons for increase and decrease (e.g. allotment/transfer/bonus/sweat etc.)
26/07/2019 422000 Transfer 218028820 15.5426/07/2019 -634166 Transfer 217394654 15.4902/08/2019 1850 Transfer 217396504 15.4902/08/2019 -1850 Transfer 217394654 15.4909/08/2019 22830 Transfer 217417484 15.4909/08/2019 -842667 Transfer 216574817 15.4316/08/2019 -1297822 Transfer 215276995 15.3423/08/2019 111925 Transfer 215388920 15.3523/08/2019 -2432900 Transfer 212956020 15.1830/08/2019 500 Transfer 212956520 15.1830/08/2019 -1908933 Transfer 211047587 15.0406/09/2019 1400 Transfer 211048987 15.0406/09/2019 -1099280 Transfer 209949707 14.9613/09/2019 2000 Transfer 209951707 14.9613/09/2019 -498942 Transfer 209452765 14.9320/09/2019 42050 Transfer 209494815 14.9320/09/2019 -872536 Transfer 208622279 14.8727/09/2019 -749400 Transfer 207872879 14.8104/10/2019 -33604 Transfer 207839275 14.8111/10/2019 -583276 Transfer 207255999 14.7718/10/2019 -1323061 Transfer 205932938 14.6825/10/2019 14965 Transfer 205947903 14.6825/10/2019 -706004 Transfer 205241899 14.6301/11/2019 -1242502 Transfer 203999397 14.5308/11/2019 560000 Transfer 204559397 14.5708/11/2019 -1144595 Transfer 203414802 14.4915/11/2019 -1119539 Transfer 202295263 14.4122/11/2019 -1950488 Transfer 200344775 14.2729/11/2019 610 Transfer 200345385 14.2729/11/2019 -610 Transfer 200344775 14.2727/12/2019 -299864 Transfer 200044911 14.2507/02/2020 654700 Transfer 200699611 14.3014/02/2020 469118 Transfer 201168729 14.3321/02/2020 399150 Transfer 201567879 14.3621/02/2020 -150 Transfer 201567729 14.3628/02/2020 1263852 Transfer 202831581 14.4506/03/2020 2600275 Transfer 205431856 14.6313/03/2020 1856570 Transfer 207288426 14.77

150
Annexure to the Board report aNNUaL report 2019-20
Cumulative Shareholding during the Year
Sl. No.
Name of the Share Holder Date Increase/Decrease in share holding
Reason No. of Shares
% of total shares of the
Company
Date wise Increase / Decrease in Shareholding during the year specifying the reasons for increase and decrease (e.g. allotment/transfer/bonus/sweat etc.)
13/03/2020 -2150 Transfer 207286276 14.7720/03/2020 1614818 Transfer 208901094 14.8820/03/2020 -15500 Transfer 208885594 14.8827/03/2020 298262 Transfer 209183856 14.90
At the end of the year 209183856 14.902
L&T EMPLOYEES TRUSTShareholding at the
beginning of the Year172128421 12.27
Date wise Increase / Decrease in Shareholding during the year specifying the reasons for increase and decrease (e.g. allotment/transfer/bonus/sweat etc.)
27/03/2020 4396261 176524682 12.5731/03/2020 9000000 185524682 13.22
At the end of the year 185524682 13.22
3 HDFC TRUSTEE CO LTD A/C HDFC EQUITY FUND
Shareholding at the beginning of the Year
55081556 3.93
Date wise Increase / Decrease in Shareholding during the year specifying the reasons for increase and decrease (e.g. allotment/transfer/bonus/sweat etc.)
05/04/2019 8541 Transfer 55090097 3.9305/04/2019 -11550 Transfer 55078547 3.9312/04/2019 102606 Transfer 55181153 3.9312/04/2019 -4872 Transfer 55176281 3.9319/04/2019 -3289 Transfer 55172992 3.9326/04/2019 26710 Transfer 55199702 3.9426/04/2019 -3968 Transfer 55195734 3.9303/05/2019 2439 Transfer 55198173 3.9403/05/2019 -1280 Transfer 55196893 3.9310/05/2019 5959 Transfer 55202852 3.9417/05/2019 26020 Transfer 55228872 3.9424/05/2019 28487 Transfer 55257359 3.9424/05/2019 -8881 Transfer 55248478 3.9431/05/2019 22036 Transfer 55270514 3.9431/05/2019 -50000 Transfer 55220514 3.9407/06/2019 2065 Transfer 55222579 3.9407/06/2019 -700000 Transfer 54522579 3.8914/06/2019 272403 Transfer 54794982 3.9121/06/2019 46008 Transfer 54840990 3.9121/06/2019 -875 Transfer 54840115 3.9128/06/2019 6792 Transfer 54846907 3.9128/06/2019 -5049 Transfer 54841858 3.9105/07/2019 206268 Transfer 55048126 3.9212/07/2019 5567 Transfer 55053693 3.9219/07/2019 496521 Transfer 55550214 3.96

151
Cumulative Shareholding during the Year
Sl. No.
Name of the Share Holder Date Increase/Decrease in share holding
Reason No. of Shares
% of total shares of the
Company
Date wise Increase / Decrease in Shareholding during the year specifying the reasons for increase and decrease (e.g. allotment/transfer/bonus/sweat etc.)
26/07/2019 6866 Transfer 55557080 3.9602/08/2019 109299 Transfer 55666379 3.9709/08/2019 13426 Transfer 55679805 3.9716/08/2019 5234 Transfer 55685039 3.9723/08/2019 1373337 Transfer 57058376 4.0730/08/2019 446674 Transfer 57505050 4.1006/09/2019 642840 Transfer 58147890 4.1406/09/2019 -92 Transfer 58147798 4.1413/09/2019 166526 Transfer 58314324 4.1620/09/2019 400233 Transfer 58714557 4.1827/09/2019 424240 Transfer 59138797 4.2127/09/2019 -1020 Transfer 59137777 4.2130/09/2019 1222 Transfer 59138999 4.2104/10/2019 1817 Transfer 59140816 4.2104/10/2019 -126 Transfer 59140690 4.2111/10/2019 408236 Transfer 59548926 4.2411/10/2019 -11859 Transfer 59537067 4.2418/10/2019 503339 Transfer 60040406 4.2825/10/2019 207476 Transfer 60247882 4.2925/10/2019 -50000 Transfer 60197882 4.2901/11/2019 22631 Transfer 60220513 4.2908/11/2019 3079 Transfer 60223592 4.2915/11/2019 504 Transfer 60224096 4.2915/11/2019 -14882 Transfer 60209214 4.2922/11/2019 30798 Transfer 60240012 4.2929/11/2019 94552 Transfer 60334564 4.3006/12/2019 67873 Transfer 60402437 4.3006/12/2019 -2971 Transfer 60399466 4.3013/12/2019 54483 Transfer 60453949 4.3120/12/2019 1483309 Transfer 61937258 4.4120/12/2019 -1666 Transfer 61935592 4.4127/12/2019 1023283 Transfer 62958875 4.4927/12/2019 -2506 Transfer 62956369 4.4931/12/2019 24430 Transfer 62980799 4.4903/01/2020 501949 Transfer 63482748 4.5210/01/2020 368017 Transfer 63850765 4.5517/01/2020 4698 Transfer 63855463 4.5524/01/2020 66583 Transfer 63922046 4.55

152
Annexure to the Board report aNNUaL report 2019-20
Cumulative Shareholding during the Year
Sl. No.
Name of the Share Holder Date Increase/Decrease in share holding
Reason No. of Shares
% of total shares of the
Company
Date wise Increase / Decrease in Shareholding during the year specifying the reasons for increase and decrease (e.g. allotment/transfer/bonus/sweat etc.)
31/01/2020 1567 Transfer 63923613 4.5531/01/2020 -289 Transfer 63923324 4.5507/02/2020 22649 Transfer 63945973 4.5614/02/2020 24576 Transfer 63970549 4.5614/02/2020 -377 Transfer 63970172 4.5621/02/2020 106113 Transfer 64076285 4.5621/02/2020 -50000 Transfer 64026285 4.5628/02/2020 170175 Transfer 64196460 4.5728/02/2020 -25000 Transfer 64171460 4.5706/03/2020 22279 Transfer 64193739 4.5713/03/2020 38116 Transfer 64231855 4.5813/03/2020 -7875 Transfer 64223980 4.5820/03/2020 423907 Transfer 64647887 4.6120/03/2020 -73500 Transfer 64574387 4.6027/03/2020 865885 Transfer 65440272 4.6627/03/2020 -137625 Transfer 65302647 4.6531/03/2020 240872 Transfer 65543519 4.6731/03/2020 -6000 Transfer 65537519 4.67
At the end of the year 65537519 4.674 ICICI PRUDENTIAL CAPITAL
PROTECTION ORIENTED FUNDShareholding at the
beginning of the Year32321704 2.30
Date wise Increase / Decrease in Shareholding during the year specifying the reasons for increase and decrease (e.g. allotment/transfer/bonus/sweat etc.)
05/04/2019 34903 Transfer 32356607 2.3105/04/2019 -324010 Transfer 32032597 2.2812/04/2019 391319 Transfer 32423916 2.3112/04/2019 -459530 Transfer 31964386 2.2819/04/2019 985 Transfer 31965371 2.2819/04/2019 -24520 Transfer 31940851 2.2826/04/2019 60313 Transfer 32001164 2.2826/04/2019 -195418 Transfer 31805746 2.2703/05/2019 2341 Transfer 31808087 2.2703/05/2019 -26119 Transfer 31781968 2.2710/05/2019 463006 Transfer 32244974 2.3010/05/2019 -16210 Transfer 32228764 2.3017/05/2019 569599 Transfer 32798363 2.3417/05/2019 -109323 Transfer 32689040 2.3324/05/2019 83719 Transfer 32772759 2.3424/05/2019 -99347 Transfer 32673412 2.3331/05/2019 112664 Transfer 32786076 2.34

153
Cumulative Shareholding during the Year
Sl. No.
Name of the Share Holder Date Increase/Decrease in share holding
Reason No. of Shares
% of total shares of the
Company
Date wise Increase / Decrease in Shareholding during the year specifying the reasons for increase and decrease (e.g. allotment/transfer/bonus/sweat etc.)
31/05/2019 -556463 Transfer 32229613 2.3007/06/2019 48675 Transfer 32278288 2.3007/06/2019 -102204 Transfer 32176084 2.2914/06/2019 54621 Transfer 32230705 2.3014/06/2019 -23840 Transfer 32206865 2.3021/06/2019 2971 Transfer 32209836 2.3021/06/2019 -946541 Transfer 31263295 2.2328/06/2019 1159 Transfer 31264454 2.2328/06/2019 -747077 Transfer 30517377 2.1805/07/2019 4866 Transfer 30522243 2.1805/07/2019 -102815 Transfer 30419428 2.1712/07/2019 2185 Transfer 30421613 2.1712/07/2019 -157653 Transfer 30263960 2.1619/07/2019 307626 Transfer 30571586 2.1819/07/2019 -30750 Transfer 30540836 2.1826/07/2019 42675 Transfer 30583511 2.1826/07/2019 -318247 Transfer 30265264 2.1602/08/2019 8862 Transfer 30274126 2.1602/08/2019 -11546 Transfer 30262580 2.1609/08/2019 31082 Transfer 30293662 2.1616/08/2019 49736 Transfer 30343398 2.1616/08/2019 -636 Transfer 30342762 2.1623/08/2019 124246 Transfer 30467008 2.1723/08/2019 -243944 Transfer 30223064 2.1530/08/2019 44902 Transfer 30267966 2.1630/08/2019 -617512 Transfer 29650454 2.1106/09/2019 226352 Transfer 29876806 2.1306/09/2019 -306338 Transfer 29570468 2.1113/09/2019 247922 Transfer 29818390 2.1213/09/2019 -1008998 Transfer 28809392 2.0520/09/2019 74832 Transfer 28884224 2.0620/09/2019 -2946 Transfer 28881278 2.0627/09/2019 55667 Transfer 28936945 2.0627/09/2019 -748097 Transfer 28188848 2.0130/09/2019 14599 Transfer 28203447 2.0130/09/2019 -137556 Transfer 28065891 2.0004/10/2019 366728 Transfer 28432619 2.0304/10/2019 -1284495 Transfer 27148124 1.93

154
Annexure to the Board report aNNUaL report 2019-20
Cumulative Shareholding during the Year
Sl. No.
Name of the Share Holder Date Increase/Decrease in share holding
Reason No. of Shares
% of total shares of the
Company
Date wise Increase / Decrease in Shareholding during the year specifying the reasons for increase and decrease (e.g. allotment/transfer/bonus/sweat etc.)
11/10/2019 6750546 Transfer 33898670 2.4211/10/2019 -52037 Transfer 33846633 2.4118/10/2019 4021 Transfer 33850654 2.4118/10/2019 -1463445 Transfer 32387209 2.3125/10/2019 10126 Transfer 32397335 2.3125/10/2019 -1230093 Transfer 31167242 2.2201/11/2019 17779 Transfer 31185021 2.2201/11/2019 -680765 Transfer 30504256 2.1708/11/2019 20918 Transfer 30525174 2.1708/11/2019 -337836 Transfer 30187338 2.1515/11/2019 349 Transfer 30187687 2.1515/11/2019 -429228 Transfer 29758459 2.1222/11/2019 7088 Transfer 29765547 2.1222/11/2019 -424080 Transfer 29341467 2.0929/11/2019 891591 Transfer 30233058 2.1529/11/2019 -813667 Transfer 29419391 2.1006/12/2019 1063464 Transfer 30482855 2.1706/12/2019 -2074 Transfer 30480781 2.1713/12/2019 1852496 Transfer 32333277 2.3013/12/2019 -136524 Transfer 32196753 2.2920/12/2019 3887 Transfer 32200640 2.2920/12/2019 -98378 Transfer 32102262 2.2927/12/2019 109959 Transfer 32212221 2.3027/12/2019 -1482100 Transfer 30730121 2.1931/12/2019 1525 Transfer 30731646 2.1931/12/2019 -1683 Transfer 30729963 2.1903/01/2020 5676 Transfer 30735639 2.1903/01/2020 -3075 Transfer 30732564 2.1910/01/2020 104351 Transfer 30836915 2.2010/01/2020 -16069 Transfer 30820846 2.2017/01/2020 127798 Transfer 30948644 2.2017/01/2020 -7395 Transfer 30941249 2.2024/01/2020 14096 Transfer 30955345 2.2124/01/2020 -1831382 Transfer 29123963 2.0731/01/2020 212977 Transfer 29336940 2.0931/01/2020 -919116 Transfer 28417824 2.0207/02/2020 1015541 Transfer 29433365 2.1007/02/2020 -816621 Transfer 28616744 2.04

155
Cumulative Shareholding during the Year
Sl. No.
Name of the Share Holder Date Increase/Decrease in share holding
Reason No. of Shares
% of total shares of the
Company
Date wise Increase / Decrease in Shareholding during the year specifying the reasons for increase and decrease (e.g. allotment/transfer/bonus/sweat etc.)
14/02/2020 72165 Transfer 28688909 2.0414/02/2020 -1854 Transfer 28687055 2.0421/02/2020 2003 Transfer 28689058 2.0421/02/2020 -195708 Transfer 28493350 2.0328/02/2020 2065812 Transfer 30559162 2.1828/02/2020 -100000 Transfer 30459162 2.1706/03/2020 992330 Transfer 31451492 2.2406/03/2020 -302142 Transfer 31149350 2.2213/03/2020 432195 Transfer 31581545 2.2513/03/2020 -951339 Transfer 30630206 2.1820/03/2020 209949 Transfer 30840155 2.2020/03/2020 -143703 Transfer 30696452 2.1927/03/2020 491180 Transfer 31187632 2.2227/03/2020 -1654761 Transfer 29532871 2.1031/03/2020 170955 Transfer 29703826 2.1231/03/2020 -298281 Transfer 29405545 2.09
At the end of the year 29405545 2.095 SBI - ETF SENSEX Shareholding at the
beginning of the Year32277232 2.30
Date wise Increase / Decrease in Shareholding during the year specifying the reasons for increase and decrease (e.g. allotment/transfer/bonus/sweat etc.)
05/04/2019 326133 Transfer 32603365 2.3212/04/2019 1768 Transfer 32605133 2.3212/04/2019 -2907 Transfer 32602226 2.3219/04/2019 43335 Transfer 32645561 2.3319/04/2019 -13789 Transfer 32631772 2.3326/04/2019 95830 Transfer 32727602 2.3326/04/2019 -2 Transfer 32727600 2.3303/05/2019 153541 Transfer 32881141 2.3410/05/2019 135814 Transfer 33016955 2.3517/05/2019 249185 Transfer 33266140 2.3717/05/2019 -50000 Transfer 33216140 2.3724/05/2019 612005 Transfer 33828145 2.4124/05/2019 -2532 Transfer 33825613 2.4131/05/2019 266874 Transfer 34092487 2.4331/05/2019 -34400 Transfer 34058087 2.4307/06/2019 459686 Transfer 34517773 2.4607/06/2019 -52143 Transfer 34465630 2.4614/06/2019 87393 Transfer 34553023 2.4621/06/2019 98291 Transfer 34651314 2.47

156
Annexure to the Board report aNNUaL report 2019-20
Cumulative Shareholding during the Year
Sl. No.
Name of the Share Holder Date Increase/Decrease in share holding
Reason No. of Shares
% of total shares of the
Company
Date wise Increase / Decrease in Shareholding during the year specifying the reasons for increase and decrease (e.g. allotment/transfer/bonus/sweat etc.)
28/06/2019 43440 Transfer 34694754 2.4728/06/2019 -14224 Transfer 34680530 2.4705/07/2019 540859 Transfer 35221389 2.5105/07/2019 -331 Transfer 35221058 2.5112/07/2019 294203 Transfer 35515261 2.5319/07/2019 264616 Transfer 35779877 2.5526/07/2019 120799 Transfer 35900676 2.5602/08/2019 272751 Transfer 36173427 2.5809/08/2019 216344 Transfer 36389771 2.5909/08/2019 -8299 Transfer 36381472 2.5916/08/2019 115989 Transfer 36497461 2.6023/08/2019 98285 Transfer 36595746 2.6123/08/2019 -27400 Transfer 36568346 2.6130/08/2019 160650 Transfer 36728996 2.6230/08/2019 -18210 Transfer 36710786 2.6206/09/2019 65951 Transfer 36776737 2.6206/09/2019 -5 Transfer 36776732 2.6213/09/2019 72434 Transfer 36849166 2.6313/09/2019 -5504 Transfer 36843662 2.6320/09/2019 74590 Transfer 36918252 2.6320/09/2019 -16 Transfer 36918236 2.6327/09/2019 7 Transfer 36918243 2.6327/09/2019 -71525 Transfer 36846718 2.6330/09/2019 17365 Transfer 36864083 2.6330/09/2019 -7117 Transfer 36856966 2.6304/10/2019 59163 Transfer 36916129 2.6311/10/2019 33346 Transfer 36949475 2.6311/10/2019 -2 Transfer 36949473 2.6318/10/2019 196884 Transfer 37146357 2.6525/10/2019 130110 Transfer 37276467 2.6601/11/2019 429281 Transfer 37705748 2.6901/11/2019 -20000 Transfer 37685748 2.6808/11/2019 361505 Transfer 38047253 2.7108/11/2019 -2 Transfer 38047251 2.7115/11/2019 211095 Transfer 38258346 2.7315/11/2019 -12668 Transfer 38245678 2.7222/11/2019 169706 Transfer 38415384 2.7422/11/2019 -126 Transfer 38415258 2.74

157
Cumulative Shareholding during the Year
Sl. No.
Name of the Share Holder Date Increase/Decrease in share holding
Reason No. of Shares
% of total shares of the
Company
Date wise Increase / Decrease in Shareholding during the year specifying the reasons for increase and decrease (e.g. allotment/transfer/bonus/sweat etc.)
29/11/2019 272995 Transfer 38688253 2.7629/11/2019 -525000 Transfer 38163253 2.7206/12/2019 141996 Transfer 38305249 2.7306/12/2019 -10059 Transfer 38295190 2.7313/12/2019 69320 Transfer 38364510 2.7313/12/2019 -396248 Transfer 37968262 2.7120/12/2019 100757 Transfer 38069019 2.7120/12/2019 -2352 Transfer 38066667 2.7127/12/2019 6050 Transfer 38072717 2.7127/12/2019 -116636 Transfer 37956081 2.7031/12/2019 309727 Transfer 38265808 2.7303/01/2020 71223 Transfer 38337031 2.7310/01/2020 74443 Transfer 38411474 2.7417/01/2020 71054 Transfer 38482528 2.7417/01/2020 -3886 Transfer 38478642 2.7424/01/2020 82355 Transfer 38560997 2.7524/01/2020 -180000 Transfer 38380997 2.7331/01/2020 107583 Transfer 38488580 2.7431/01/2020 -6078 Transfer 38482502 2.7407/02/2020 120077 Transfer 38602579 2.7507/02/2020 -298892 Transfer 38303687 2.7314/02/2020 73961 Transfer 38377648 2.7321/02/2020 50890 Transfer 38428538 2.7421/02/2020 -3538 Transfer 38425000 2.7428/02/2020 479163 Transfer 38904163 2.7706/03/2020 1210937 Transfer 40115100 2.8613/03/2020 341121 Transfer 40456221 2.8813/03/2020 -17500 Transfer 40438721 2.8820/03/2020 11301237 Transfer 51739958 3.6920/03/2020 -6788247 Transfer 44951711 3.2027/03/2020 1601429 Transfer 46553140 3.3231/03/2020 512241 Transfer 47065381 3.35
At the end of the year 47065381 3.35

158
Annexure to the Board report aNNUaL report 2019-20
Cumulative Shareholding during the Year
Sl. No.
Name of the Share Holder Date Increase/Decrease in share holding
Reason No. of Shares
% of total shares of the
Company6 ICICI PRUDENTIAL LIFE
INSURANCE COMPANY LIMITED Shareholding at the
beginning of the Year25077416 1.79
Date wise Increase / Decrease in Shareholding during the year specifying the reasons for increase and decrease (e.g. allotment/transfer/bonus/sweat etc.)
05/04/2019 -86737 Transfer 24990679 1.7812/04/2019 9312 Transfer 24999991 1.7819/04/2019 -50468 Transfer 24949523 1.7826/04/2019 2175397 Transfer 27124920 1.9303/05/2019 319787 Transfer 27444707 1.9610/05/2019 284007 Transfer 27728714 1.9817/05/2019 -6709 Transfer 27722005 1.9824/05/2019 17656 Transfer 27739661 1.9831/05/2019 395398 Transfer 28135059 2.0107/06/2019 247629 Transfer 28382688 2.0207/06/2019 -65000 Transfer 28317688 2.0214/06/2019 3286 Transfer 28320974 2.0221/06/2019 1081 Transfer 28322055 2.0228/06/2019 29794 Transfer 28351849 2.0205/07/2019 446726 Transfer 28798575 2.0512/07/2019 265041 Transfer 29063616 2.0712/07/2019 -4822 Transfer 29058794 2.0719/07/2019 -19854 Transfer 29038940 2.0726/07/2019 253158 Transfer 29292098 2.0902/08/2019 1653 Transfer 29293751 2.0902/08/2019 -65000 Transfer 29228751 2.0809/08/2019 -316660 Transfer 28912091 2.0616/08/2019 -45000 Transfer 28867091 2.0623/08/2019 7824 Transfer 28874915 2.0630/08/2019 81280 Transfer 28956195 2.0630/08/2019 -65000 Transfer 28891195 2.0606/09/2019 -143205 Transfer 28747990 2.0513/09/2019 -32086 Transfer 28715904 2.0520/09/2019 -97093 Transfer 28618811 2.0427/09/2019 -471431 Transfer 28147380 2.0104/10/2019 439430 Transfer 28586810 2.0411/10/2019 253465 Transfer 28840275 2.0618/10/2019 -125684 Transfer 28714591 2.0525/10/2019 -57809 Transfer 28656782 2.0401/11/2019 -64807 Transfer 28591975 2.0408/11/2019 100000 Transfer 28691975 2.04

159
Cumulative Shareholding during the Year
Sl. No.
Name of the Share Holder Date Increase/Decrease in share holding
Reason No. of Shares
% of total shares of the
Company
Date wise Increase / Decrease in Shareholding during the year specifying the reasons for increase and decrease (e.g. allotment/transfer/bonus/sweat etc.)
08/11/2019 -224146 Transfer 28467829 2.0315/11/2019 -48052 Transfer 28419777 2.0222/11/2019 -822 Transfer 28418955 2.0229/11/2019 -58314 Transfer 28360641 2.0206/12/2019 -115027 Transfer 28245614 2.0113/12/2019 -300932 Transfer 27944682 1.9920/12/2019 466362 Transfer 28411044 2.0227/12/2019 -205038 Transfer 28206006 2.0131/12/2019 -40934 Transfer 28165072 2.0103/01/2020 60078 Transfer 28225150 2.0110/01/2020 -139636 Transfer 28085514 2.0017/01/2020 336107 Transfer 28421621 2.0224/01/2020 21516 Transfer 28443137 2.0331/01/2020 565067 Transfer 29008204 2.0707/02/2020 -581332 Transfer 28426872 2.0314/02/2020 -269 Transfer 28426603 2.0321/02/2020 -188746 Transfer 28237857 2.0128/02/2020 -365972 Transfer 27871885 1.9906/03/2020 1696 Transfer 27873581 1.9913/03/2020 -838974 Transfer 27034607 1.9320/03/2020 160775 Transfer 27195382 1.9427/03/2020 -126519 Transfer 27068863 1.9331/03/2020 -140283 Transfer 26928580 1.92
At the end of the year 26928580 1.927 GOVERNMENT OF SINGAPORE - E Shareholding at the
beginning of the Year12426432 0.89
Date wise Increase / Decrease in Shareholding during the year specifying the reasons for increase and decrease (e.g. allotment/transfer/bonus/sweat etc.)
05/04/2019 83363 Transfer 12509795 0.8919/04/2019 7518 Transfer 12517313 0.8903/05/2019 -32645 Transfer 12484668 0.8910/05/2019 -52463 Transfer 12432205 0.8917/05/2019 -6593 Transfer 12425612 0.8924/05/2019 8938 Transfer 12434550 0.8924/05/2019 -47419 Transfer 12387131 0.8831/05/2019 646440 Transfer 13033571 0.9307/06/2019 755068 Transfer 13788639 0.9814/06/2019 42727 Transfer 13831366 0.9921/06/2019 -12453 Transfer 13818913 0.9805/07/2019 24837 Transfer 13843750 0.99

160
Annexure to the Board report aNNUaL report 2019-20
Cumulative Shareholding during the Year
Sl. No.
Name of the Share Holder Date Increase/Decrease in share holding
Reason No. of Shares
% of total shares of the
Company
Date wise Increase / Decrease in Shareholding during the year specifying the reasons for increase and decrease (e.g. allotment/transfer/bonus/sweat etc.)
12/07/2019 -26557 Transfer 13817193 0.9819/07/2019 136266 Transfer 13953459 0.9919/07/2019 -16711 Transfer 13936748 0.9926/07/2019 83849 Transfer 14020597 1.0002/08/2019 167341 Transfer 14187938 1.0109/08/2019 434049 Transfer 14621987 1.0416/08/2019 231943 Transfer 14853930 1.0623/08/2019 230069 Transfer 15083999 1.0730/08/2019 1454571 Transfer 16538570 1.1806/09/2019 430564 Transfer 16969134 1.2113/09/2019 84337 Transfer 17053471 1.2220/09/2019 14085 Transfer 17067556 1.2220/09/2019 -7271 Transfer 17060285 1.2227/09/2019 406826 Transfer 17467111 1.2404/10/2019 74064 Transfer 17541175 1.2511/10/2019 -14849 Transfer 17526326 1.2518/10/2019 19447 Transfer 17545773 1.2525/10/2019 -49966 Transfer 17495807 1.2501/11/2019 -9327 Transfer 17486480 1.2508/11/2019 8222 Transfer 17494702 1.2515/11/2019 228070 Transfer 17722772 1.2622/11/2019 196684 Transfer 17919456 1.2829/11/2019 -495118 Transfer 17424338 1.2406/12/2019 -325435 Transfer 17098903 1.2213/12/2019 23946 Transfer 17122849 1.2213/12/2019 -72958 Transfer 17049891 1.2120/12/2019 68560 Transfer 17118451 1.2231/12/2019 43107 Transfer 17161558 1.2203/01/2020 29454 Transfer 17191012 1.2210/01/2020 285344 Transfer 17476356 1.2510/01/2020 -44094 Transfer 17432262 1.2417/01/2020 -93479 Transfer 17338783 1.2424/01/2020 -9023 Transfer 17329760 1.2331/01/2020 1175362 Transfer 18505122 1.3207/02/2020 1158822 Transfer 19663944 1.4007/02/2020 -34789 Transfer 19629155 1.4014/02/2020 286418 Transfer 19915573 1.4221/02/2020 318876 Transfer 20234449 1.44

161
Cumulative Shareholding during the Year
Sl. No.
Name of the Share Holder Date Increase/Decrease in share holding
Reason No. of Shares
% of total shares of the
Company
Date wise Increase / Decrease in Shareholding during the year specifying the reasons for increase and decrease (e.g. allotment/transfer/bonus/sweat etc.)
28/02/2020 436847 Transfer 20671296 1.4706/03/2020 452149 Transfer 21123445 1.5013/03/2020 1687884 Transfer 22811329 1.6320/03/2020 2184277 Transfer 24995606 1.7820/03/2020 -582975 Transfer 24412631 1.7427/03/2020 362947 Transfer 24775578 1.7631/03/2020 -47248 Transfer 24728330 1.76
At the end of the year 24728330 1.768 GENERAL INSURANCE
CORPORATION OF INDIA Shareholding at the
beginning of the Year24400000 1.74
Date wise Increase / Decrease in Shareholding during the year specifying the reasons for increase and decrease (e.g. allotment/transfer/bonus/sweat etc.)
24/05/2019 -40000 Transfer 24360000 1.7431/05/2019 -60000 Transfer 24300000 1.7307/06/2019 -49000 Transfer 24251000 1.7328/06/2019 -51000 Transfer 24200000 1.7219/07/2019 35000 Transfer 24235000 1.7326/07/2019 65000 Transfer 24300000 1.7309/08/2019 10000 Transfer 24310000 1.7316/08/2019 40000 Transfer 24350000 1.7423/08/2019 50000 Transfer 24400000 1.7413/09/2019 5000 Transfer 24405000 1.7420/09/2019 5000 Transfer 24410000 1.7427/09/2019 20000 Transfer 24430000 1.7408/11/2019 25000 Transfer 24455000 1.7415/11/2019 75000 Transfer 24530000 1.7522/11/2019 40000 Transfer 24570000 1.7529/11/2019 60000 Transfer 24630000 1.7506/12/2019 50000 Transfer 24680000 1.7613/12/2019 250000 Transfer 24930000 1.7817/01/2020 10000 Transfer 24940000 1.7824/01/2020 80000 Transfer 25020000 1.7807/02/2020 65000 Transfer 25085000 1.7914/02/2020 45000 Transfer 25130000 1.7921/02/2020 50000 Transfer 25180000 1.7928/02/2020 40000 Transfer 25220000 1.8013/03/2020 20000 Transfer 25240000 1.8020/03/2020 21500 Transfer 25261500 1.8027/03/2020 1500 Transfer 25263000 1.80
At the end of the year 25263000 1.80

162
Annexure to the Board report aNNUaL report 2019-20
Cumulative Shareholding during the Year
Sl. No.
Name of the Share Holder Date Increase/Decrease in share holding
Reason No. of Shares
% of total shares of the
Company9 RELIANCE CAPITAL TRUSTEE
CO LTDShareholding at the
beginning of the Year19730114 1.41
Date wise Increase / Decrease in Shareholding during the year specifying the reasons for increase and decrease (e.g. allotment/transfer/bonus/sweat etc.)
05/04/2019 1494622 Transfer 21224736 1.5105/04/2019 -35160 Transfer 21189576 1.5112/04/2019 426300 Transfer 21615876 1.5419/04/2019 200219 Transfer 21816095 1.5619/04/2019 -1728 Transfer 21814367 1.5626/04/2019 626444 Transfer 22440811 1.6026/04/2019 -7004 Transfer 22433807 1.6003/05/2019 46 Transfer 22433853 1.6003/05/2019 -5813 Transfer 22428040 1.6010/05/2019 154428 Transfer 22582468 1.6110/05/2019 -374430 Transfer 22208038 1.5817/05/2019 212080 Transfer 22420118 1.6017/05/2019 -254 Transfer 22419864 1.6024/05/2019 137197 Transfer 22557061 1.6124/05/2019 -133915 Transfer 22423146 1.6031/05/2019 40710 Transfer 22463856 1.6031/05/2019 -746250 Transfer 21717606 1.5507/06/2019 10340 Transfer 21727946 1.5507/06/2019 -520435 Transfer 21207511 1.5114/06/2019 504189 Transfer 21711700 1.5514/06/2019 -180000 Transfer 21531700 1.5321/06/2019 28569 Transfer 21560269 1.5421/06/2019 -90140 Transfer 21470129 1.5328/06/2019 5008 Transfer 21475137 1.5328/06/2019 -182035 Transfer 21293102 1.5205/07/2019 167477 Transfer 21460579 1.5305/07/2019 -48161 Transfer 21412418 1.5312/07/2019 1080337 Transfer 22492755 1.6012/07/2019 -573730 Transfer 21919025 1.5619/07/2019 591049 Transfer 22510074 1.6026/07/2019 120065 Transfer 22630139 1.6126/07/2019 -83677 Transfer 22546462 1.6102/08/2019 132233 Transfer 22678695 1.6202/08/2019 -125125 Transfer 22553570 1.6109/08/2019 427103 Transfer 22980673 1.6409/08/2019 -611634 Transfer 22369039 1.59

163
Cumulative Shareholding during the Year
Sl. No.
Name of the Share Holder Date Increase/Decrease in share holding
Reason No. of Shares
% of total shares of the
Company
Date wise Increase / Decrease in Shareholding during the year specifying the reasons for increase and decrease (e.g. allotment/transfer/bonus/sweat etc.)
16/08/2019 186697 Transfer 22555736 1.6123/08/2019 377028 Transfer 22932764 1.6330/08/2019 227363 Transfer 23160127 1.6530/08/2019 -1370 Transfer 23158757 1.6506/09/2019 27750 Transfer 23186507 1.6506/09/2019 -13170 Transfer 23173337 1.6513/09/2019 2577 Transfer 23175914 1.6513/09/2019 -2625 Transfer 23173289 1.6520/09/2019 30983 Transfer 23204272 1.6520/09/2019 -20000 Transfer 23184272 1.6527/09/2019 85166 Transfer 23269438 1.6627/09/2019 -551335 Transfer 22718103 1.6230/09/2019 9495 Transfer 22727598 1.6204/10/2019 831674 Transfer 23559272 1.6804/10/2019 -230179 Transfer 23329093 1.6611/10/2019 -34659 Transfer 23294434 1.6618/10/2019 75920 Transfer 23370354 1.6718/10/2019 -948 Transfer 23369406 1.6725/10/2019 87484 Transfer 23456890 1.6725/10/2019 -305790 Transfer 23151100 1.6501/11/2019 25 Transfer 23151125 1.6501/11/2019 -61189 Transfer 23089936 1.6508/11/2019 352510 Transfer 23442446 1.6708/11/2019 -422087 Transfer 23020359 1.6415/11/2019 240507 Transfer 23260866 1.6615/11/2019 -314148 Transfer 22946718 1.6322/11/2019 42684 Transfer 22989402 1.6422/11/2019 -306878 Transfer 22682524 1.6229/11/2019 206 Transfer 22682730 1.6229/11/2019 -40270 Transfer 22642460 1.6106/12/2019 717462 Transfer 23359922 1.6606/12/2019 -97929 Transfer 23261993 1.6613/12/2019 5706 Transfer 23267699 1.6613/12/2019 -970617 Transfer 22297082 1.5920/12/2019 67550 Transfer 22364632 1.5920/12/2019 -977 Transfer 22363655 1.5927/12/2019 4464 Transfer 22368119 1.5927/12/2019 -71820 Transfer 22296299 1.59

164
Annexure to the Board report aNNUaL report 2019-20
Cumulative Shareholding during the Year
Sl. No.
Name of the Share Holder Date Increase/Decrease in share holding
Reason No. of Shares
% of total shares of the
Company
Date wise Increase / Decrease in Shareholding during the year specifying the reasons for increase and decrease (e.g. allotment/transfer/bonus/sweat etc.)
31/12/2019 43396 Transfer 22339695 1.5931/12/2019 -20170 Transfer 22319525 1.5903/01/2020 616112 Transfer 22935637 1.6303/01/2020 -9063 Transfer 22926574 1.6310/01/2020 338304 Transfer 23264878 1.6610/01/2020 -3000 Transfer 23261878 1.6617/01/2020 3451 Transfer 23265329 1.6617/01/2020 -898 Transfer 23264431 1.6624/01/2020 204370 Transfer 23468801 1.6724/01/2020 -418256 Transfer 23050545 1.6431/01/2020 1994235 Transfer 25044780 1.7831/01/2020 -627 Transfer 25044153 1.7807/02/2020 414340 Transfer 25458493 1.8107/02/2020 -12 Transfer 25458481 1.8114/02/2020 59926 Transfer 25518407 1.8214/02/2020 -1120236 Transfer 24398171 1.7421/02/2020 177948 Transfer 24576119 1.7521/02/2020 -620000 Transfer 23956119 1.7128/02/2020 465934 Transfer 24422053 1.7428/02/2020 -1419275 Transfer 23002778 1.6406/03/2020 218039 Transfer 23220817 1.6506/03/2020 -512589 Transfer 22708228 1.6213/03/2020 78034 Transfer 22786262 1.6213/03/2020 -515617 Transfer 22270645 1.5920/03/2020 672643 Transfer 22943288 1.6320/03/2020 -546725 Transfer 22396563 1.6027/03/2020 971074 Transfer 23367637 1.6627/03/2020 -264102 Transfer 23103535 1.6531/03/2020 26337 Transfer 23129872 1.6531/03/2020 -10875 Transfer 23118997 1.65
At the end of the year 23118997 1.65

165
Cumulative Shareholding during the Year
Sl. No.
Name of the Share Holder Date Increase/Decrease in share holding
Reason No. of Shares
% of total shares of the
Company10 NPS TRUST- A/C KOTAK
PENSION FUND SCHEME E - TIER
Shareholding at the beginning of the Year
15111340 1.08
Date wise Increase / Decrease in Shareholding during the year specifying the reasons for increase and decrease (e.g. allotment/transfer/bonus/sweat etc.)
05/04/2019 47760 Transfer 15159100 1.0812/04/2019 61754 Transfer 15220854 1.0919/04/2019 9901 Transfer 15230755 1.0926/04/2019 9401 Transfer 15240156 1.0903/05/2019 4086 Transfer 15244242 1.0910/05/2019 8080 Transfer 15252322 1.0917/05/2019 239625 Transfer 15491947 1.1024/05/2019 113300 Transfer 15605247 1.1131/05/2019 41600 Transfer 15646847 1.1207/06/2019 66250 Transfer 15713097 1.1214/06/2019 3468 Transfer 15716565 1.1221/06/2019 53100 Transfer 15769665 1.1228/06/2019 25600 Transfer 15795265 1.1305/07/2019 60700 Transfer 15855965 1.1312/07/2019 70863 Transfer 15926828 1.1419/07/2019 170218 Transfer 16097046 1.1526/07/2019 183550 Transfer 16280596 1.1626/07/2019 -27369 Transfer 16253227 1.1602/08/2019 203367 Transfer 16456594 1.1702/08/2019 -11716 Transfer 16444878 1.1709/08/2019 70992 Transfer 16515870 1.1816/08/2019 67404 Transfer 16583274 1.1816/08/2019 -31700 Transfer 16551574 1.1823/08/2019 82493 Transfer 16634067 1.1930/08/2019 111172 Transfer 16745239 1.1930/08/2019 -80 Transfer 16745159 1.1906/09/2019 52846 Transfer 16798005 1.2013/09/2019 79850 Transfer 16877855 1.2020/09/2019 172699 Transfer 17050554 1.2227/09/2019 93570 Transfer 17144124 1.2204/10/2019 9000 Transfer 17153124 1.2211/10/2019 21250 Transfer 17174374 1.2218/10/2019 94400 Transfer 17268774 1.2325/10/2019 9950 Transfer 17278724 1.2301/11/2019 56500 Transfer 17335224 1.24

166
Annexure to the Board report aNNUaL report 2019-20
Cumulative Shareholding during the Year
Sl. No.
Name of the Share Holder Date Increase/Decrease in share holding
Reason No. of Shares
% of total shares of the
Company
Date wise Increase / Decrease in Shareholding during the year specifying the reasons for increase and decrease (e.g. allotment/transfer/bonus/sweat etc.)
08/11/2019 52900 Transfer 17388124 1.2415/11/2019 87850 Transfer 17475974 1.2522/11/2019 82928 Transfer 17558902 1.2529/11/2019 125367 Transfer 17684269 1.2606/12/2019 148159 Transfer 17832428 1.2713/12/2019 104756 Transfer 17937184 1.2820/12/2019 57085 Transfer 17994269 1.2827/12/2019 154600 Transfer 18148869 1.2931/12/2019 87750 Transfer 18236619 1.3003/01/2020 114359 Transfer 18350978 1.3110/01/2020 128524 Transfer 18479502 1.3217/01/2020 21829 Transfer 18501331 1.3224/01/2020 55621 Transfer 18556952 1.3231/01/2020 14516 Transfer 18571468 1.3207/02/2020 43316 Transfer 18614784 1.3314/02/2020 113925 Transfer 18728709 1.3321/02/2020 52230 Transfer 18780939 1.3421/02/2020 -8000 Transfer 18772939 1.3428/02/2020 428090 Transfer 19201029 1.3728/02/2020 -8000 Transfer 19193029 1.3706/03/2020 141533 Transfer 19334562 1.3813/03/2020 146709 Transfer 19481271 1.3920/03/2020 114200 Transfer 19595471 1.4027/03/2020 337515 Transfer 19932986 1.4231/03/2020 8821 Transfer 19941807 1.42
At the end of the year 19941807 1.4211 NOMURA INDIA INVESTMENT
FUND MOTHER FUND Shareholding at the
beginning of the Year13077063 0.93
Date wise Increase / Decrease in Shareholding during the year specifying the reasons for increase and decrease (e.g. allotment/transfer/bonus/sweat etc.)
01/11/2019 -200000 Transfer 12477063 0.9020/12/2019 -962889 Transfer 11514174 0.8927/12/2019 -150000 Transfer 11364174 0.8203/01/2020 -100000 Transfer 11264174 0.8124/01/2020 -250000 Transfer 11014174 0.8014/02/2020 -100000 Transfer 10914174 0.7821/02/2020 -502000 Transfer 10412174 0.7828/02/2020 -400000 Transfer 10012174 0.7420/03/2020 -200000 Transfer 9812174 0.7127/03/2020 -9812174 Transfer 0 0.70
At the end of the year 0 0.00

167
(v) Shareholding of directors and Key Managerial Personnel:
Sl. No.
Shareholding at the beginning of the year
Cumulative Shareholding during the year
Name of Director / KMP No. of shares
% of total Shares of the
Company
No. of shares
% of total Shares of the
Company1 A. M. NAIK At the Beginning of the year 424,958 0.03
Date wise Increase / Decrease in Promoters Share holding during the year specifying the reasons for increase /decrease (e.g. allotment / transfer / bonus/sweat equity etc);
At the end of the year 424,958 0.032 S. N. SUBRAHMANYAN At the beginning of the year 265,584 0.02
Date wise Increase / Decrease in Promoters Share holding during the year specifying the reasons for increase /decrease (e.g. allotment / transfer / bonus/sweat equity etc):
At the End of the year 265,584 0.023 R. SHANKAR RAMAN At the beginning of the year 328,500 0.02
Date wise Increase / Decrease in Promoters Share holding during the year specifying the reasons for increase /decrease (e.g. allotment / transfer / bonus/sweat equity etc):
At the End of the year 328,500 0.024 SHAILENDRA N. ROY At the beginning of the year 90,125 0.01
Date wise Increase / Decrease in Promoters Share holding during the year specifying the reasons for increase /decrease (e.g. allotment / transfer / bonus/sweat equity etc):
23/05/2019 (Sold) -50024/05/2019 (Sold) -1,00027/05/2019 (Sold) -1,500
At the End of the year 87,125 0.015 D. K. SEN At the beginning of the year 46,054 0.00
Date wise Increase / Decrease in Promoters Share holding during the year specifying the reasons for increase /decrease (e.g. allotment / transfer / bonus/sweat equity etc):
At the End of the year 46,054 0.00

168
aNNEXUrE to tHe BoARD RepoRt ANNUAL RepoRt 2019-20
Sl. No.
Shareholding at the beginning of the year
Cumulative Shareholding during the year
Name of Director / KMP No. of shares
% of total Shares of the
Company
No. of shares
% of total Shares of the
Company6 M. V. SATISH At the beginning of the year 64,312 0.00
Date wise Increase / Decrease in Promoters Share holding during the year specifying the reasons for increase /decrease (e.g. allotment / transfer / bonus/sweat equity etc):
14/06/2019 (Sold) -15,000
At the End of the year 49,312 0.007 J. D. PATIL As on the date of
appointment as director 174,100 0.01
Date wise Increase / Decrease in Promoters Share holding during the year specifying the reasons for increase /decrease (e.g. allotment / transfer / bonus/sweat equity etc):
At the End of the year 174,100 0.018 M. M. CHITALE At the beginning of the year 2,443 0.00
Date wise Increase / Decrease in Promoters Share holding during the year specifying the reasons for increase /decrease (e.g. allotment / transfer / bonus/sweat equity etc):
At the End of the year 2,443 0.009 SUBODH BHARGAVA At the beginning of the year 1,125 0.00
Date wise Increase / Decrease in Promoters Share holding during the year specifying the reasons for increase /decrease (e.g. allotment / transfer / bonus/sweat equity etc):
At the End of the year 1,125 0.0010 M. DAMODARAN At the beginning of the year 225 0.00
Date wise Increase / Decrease in Promoters Share holding during the year specifying the reasons for increase /decrease (e.g. allotment / transfer / bonus/sweat equity etc):
At the End of the year 225 0.00

169
Sl. No.
Shareholding at the beginning of the year
Cumulative Shareholding during the year
Name of Director / KMP No. of shares
% of total Shares of the
Company
No. of shares
% of total Shares of the
Company11 VIKRAM SINGH MEHTA At the beginning of the year 1,327 0.00
Date wise Increase / Decrease in Promoters Share holding during the year specifying the reasons for increase /decrease (e.g. allotment / transfer / bonus/sweat equity etc):
At the End of the year 1,327 0.0012 ADIL ZAINULBHAI At the beginning of the year 150 0.00
Date wise Increase / Decrease in Promoters Share holding during the year specifying the reasons for increase /decrease (e.g. allotment / transfer / bonus/sweat equity etc):
-
At the End of the year 150 0.0013 AKHILESH GUPTA At the beginning of the year 7,680 0.00
Date wise Increase / Decrease in Promoters Share holding during the year specifying the reasons for increase /decrease (e.g. allotment / transfer / bonus/sweat equity etc):
08/09/2019 (ceased to be Director)
Ceased as Director
At the End of the year - - 14 NARAYANAN KUMAR At the beginning of the year 1,500 0.00
Date wise Increase / Decrease in Promoters Share holding during the year specifying the reasons for increase /decrease (e.g. allotment / transfer / bonus/sweat equity etc):
At the End of the year 1,500 0.0015 SANJEEV AGA At the beginning of the year 4,500 0.00
Date wise Increase / Decrease in Promoters Share holding during the year specifying the reasons for increase /decrease (e.g. allotment / transfer / bonus/sweat equity etc):
At the End of the year 4,500 0.00

170
aNNEXUrE to tHe BoARD RepoRt ANNUAL RepoRt 2019-20
Sl. No.
Shareholding at the beginning of the year
Cumulative Shareholding during the year
Name of Director / KMP No. of shares
% of total Shares of the
Company
No. of shares
% of total Shares of the
Company16 SUNITA SHARMA jointly
with LIFE INSURANCE CORPORATION OF INDIA
At the beginning of the year 150 0.00
Date wise Increase / Decrease in Promoters Share holding during the year specifying the reasons for increase /decrease (e.g. allotment / transfer / bonus/sweat equity etc):
22.04.2019 (Transfer back to LIC)
-50
At the End of the year 100 0.0017 THOMAS MATHEW T. At the beginning of the year 150 0.00
Date wise Increase / Decrease in Promoters Share holding during the year specifying the reasons for increase /decrease (e.g. allotment / transfer / bonus/sweat equity etc):
At the End of the year 150 0.0018 AJAY SHANKAR At the beginning of the year 150 0.00
Date wise Increase / Decrease in Promoters Share holding during the year specifying the reasons for increase /decrease (e.g. allotment / transfer / bonus/sweat equity etc):
At the End of the year 150 0.0019 SUBRAMANIAN SARMA At the beginning of the year 94,650 0.01
Date wise Increase / Decrease in Promoters Share holding during the year specifying the reasons for increase /decrease (e.g. allotment / transfer / bonus/sweat equity etc):
At the End of the year 94,650 0.0120 NAINA LAL KIDWAI At the beginning of the year 150 0.00
Date wise Increase / Decrease in Promoters Share holding during the year specifying the reasons for increase /decrease (e.g. allotment / transfer / bonus/sweat equity etc):
At the End of the year 150 0.00

171
Sl. No.
Shareholding at the beginning of the year
Cumulative Shareholding during the year
Name of Director / KMP No. of shares
% of total Shares of the
Company
No. of shares
% of total Shares of the
Company21 ARVIND GUPTA jointly
with ADMINISTRATOR OF THE SPECIFIED UNDERTAKING OF THE UNIT TRUST OF INDIA
At the beginning of the year 100 0.00
Date wise Increase / Decrease in Promoters Share holding during the year specifying the reasons for increase /decrease (e.g. allotment / transfer / bonus/sweat equity etc):
26/03/2020 (ceased to be a Director)
Ceased as Director
At the End of the year - 22 HEMANT BHARGAVA
jointly with LIFE INSURANCE CORPORATION OF INDIA
At the beginning of the year
100 0.00
Date wise Increase / Decrease in Promoters Share holding during the year specifying the reasons for increase /decrease (e.g. allotment / transfer / bonus/sweat equity etc):
At the End of the year 100 0.0023 HEMANT BHARGAVA At the beginning of the year 90 0.00
Date wise Increase / Decrease in Promoters Share holding during the year specifying the reasons for increase /decrease (e.g. allotment / transfer / bonus/sweat equity etc):
At the End of the year 90 0.0024 N. HARIHARAN At the beginning of the year 34,710 0.00
Date wise Increase / Decrease in Promoters Share holding during the year specifying the reasons for increase /decrease (e.g. allotment / transfer / bonus/sweat equity etc):
01-Jan-20 (ceased to be Company Secretary)
Ceased to be Company
Secretary
At the End of the year – –

172
aNNEXUrE to tHe BoARD RepoRt ANNUAL RepoRt 2019-20
Sl. No.
Shareholding at the beginning of the year
Cumulative Shareholding during the year
Name of Director / KMP No. of shares
% of total Shares of the
Company
No. of shares
% of total Shares of the
Company24 SIVARAM NAIR A Appointed as Company
Secretary on 02/01/2020 2,750 0.00
Date wise Increase / Decrease in Promoters Share holding during the year specifying the reasons for increase /decrease (e.g. allotment / transfer / bonus/sweat equity etc):
24/03/2020 (Purchase) 500
At the End of the year 3,250 0.00
V. INdEBTEdNESS
Indebtedness of the Company including interest outstanding/accrued but not due for payment as on 31st March 2020
v croreSecured Loans
excluding deposits
Unsecured Loans
deposits Total Indebtedness
Indebtedness at the beginning of the financial year
i) principal Amount * 1750.08 10239.61 – 11989.69
ii) Interest due but not paid – – – –
iii) Interest accrued but not due – – – –
Total (i+ii+iii) 1750.08 10239.61 – 11989.69
Change in Indebtedness during the financial year
Addition ^ 2925.22 60120.67 – 63045.89
Reduction (2508.20) (47032.39) – (49540.59)
exchange Gain / (Loss) 1.76 288.55 – 290.31
Interest accrued but not due – – – –
Net Change 418.78 13376.83 – 13795.61
Indebtedness at the end of the financial year
i) principal Amount * 2168.86 23616.44 – 25785.30
ii) Interest due but not paid – – – –
iii) Interest accrued but not due – – – –
Total (i+ii+iii) 2168.86 23616.44 – 25785.30
* principal amount mentioned includes interest accrued but not due.
^ Addition during the financial year includes interest accrued but not due.

173
VI. rEMUNEraTIoN oF dIrECTorS aNd KEY MaNaGErIaL PErSoNNEL
a. rEMUNEraTIoN To MaNaGING dIrECTor, WHoLE-TIME dIrECTorS aNd / or MaNaGEr:
V croreSl. No.
Particulars of Remuneration Name of MD / WTD / Manager Total AmountS. N.
SUBRAHMANYANR SHANKAR RAMAN SHAILENDRA ROY D. K. SEN M. V. SATISH J. D. PATIL
1 Gross salary(a) Salary as per provisions
contained in section 17(1) of the Income-tax Act, 1961
2.592 1.830 1.710 1.350 1.350 1.140 9.972
(b) Value of perquisites u/s 17(2) Income-tax Act, 1961
12.447 3.409 0.180 0.180 0.225 0.180 16.621
(c) Profits in lieu of salary under section 17(3) Income tax Act, 1961
– – – – – – –
2 Stock Option – – – – – – –3 Sweat Equity – – – – – – –4 Commission
- as % of profit 9.008 5.885 3.374 2.027 3.023 2.723 26.040- others, specify… – – – – – – –
5 Others (Contribution to Provident Fund & Superannuation Fund)
3.132 2.083 1.373 0.912 1.181 1.043 9.724
Total (A) 27.179 13.207 6.637 4.469 5.779 5.086 62.357Ceiling as per the Act 744.79
B. rEMUNEraTIoN To oTHEr dIrECTorS
V croreSl. No.
Particulars of Remuneration
Name of Directors Total AmountA M Naik M M Chitale Subodh
BhargavaM Damodaran Vikram Singh
MehtaAdil
ZainulbhaiAkhilesh
GuptaSunita Sharma Thomas
Mathew TAjay Shankar Subrmanian
SarmaNaina Lal
KidwaiSanjeev Aga Narayanan
KumarArvind Gupta
Hemant Bhargava
1 Independent DirectorsFee for attending board / committee meetings
– 0.097 0.070 0.055 0.054 0.070 0.020 – 0.070 0.064 – 0.050 0.085 0.080 – – 0.715
Commission – 0.392 0.433 0.180 0.240 0.315 0.058 – 0.274 0.273 – 0.145 0.237 0.198 – – 2.745Others, please specify
– – – – – – – – – – – – – – – – –
Total (1) – 0.489 0.503 0.235 0.294 0.385 0.078 – 0.344 0.337 – 0.195 0.322 0.278 – – 3.4602 Other
Non-Executive DirectorsFee for attending board / committee meetings
0.060 – – – – – – 0.064 – – – – – – 0.050 0.020 0.194
Commission 3.100 – – – – – – 0.191* – – – – – – 0.145* 0.023* 3.459Others, please specify - @
3.022 – – – – – – – – – – – – – – – 3.022
Total (2) 6.182 – – – – – – 0.255 – – – – – – 0.195 0.043 6.675Total (B)=(1+2) 6.182 0.489 0.503 0.235 0.294 0.385 0.078 0.255 0.344 0.337 – 0.195 0.322 0.278 0.195 0.043 10.135Total Managerial Remuneration (A) + (B)
72.492
Overall Ceiling as per the Act
819.270
@ Others include pension of R 3 crore and perquisite value of medical R 0.022 crore * Paid to the institutions they represent

174
aNNEXUrE to tHe BoARD RepoRt ANNUAL RepoRt 2019-20
C. rEMUNEraTIoN To KEY MaNaGErIaL PErSoNNEL oTHEr THaN Md / MaNaGEr / WTd
V crore
Sl. No.
Particulars of Remuneration Key Managerial PersonnelCEO Company
Secretary (N. Hariharan) till
01.01.2020
Company Secretary (Sivaram
Nair) from 02.01.2020
CFO Total
1 Gross salary(a) Salary as per provisions contained
in section 17(1) of the Income-tax Act, 1961
Not Applicable
1.868 0.308
Not Applicable
2.176
(b) Value of perquisites u/s 17(2) Income-tax Act, 1961
0.050 0.001 0.051
(c) Profits in lieu of salary under section 17(3) Income tax Act, 1961
– – –
2 Stock Option – 0.088 0.088 3 Sweat Equity – – – 4 Commission
- as % of profit - others, specify…
– – –
5 Others (Contribution to Provident Fund & Superannuation Fund)
0.080 0.036 0.116
Total 1.998 0.433 2.431
VII. PENaLTIES / PUNISHMENT/ CoMPoUNdING oF oFFENCES:
Type Section of the Companies act
Brief description
details of Penalty/
Punishment/Compounding fees imposed
authority [rd/NCLT/CoUrT]
appeal made, if any (give
details)
a. CoMPaNY
penalty
NIL punishment
Compounding
B. dIrECTorS
penalty
NIL punishment
Compounding
C. oTHEr oFFICErS IN dEFaULT
penalty
NIL punishment
Compounding

175
annexure ‘G’ to the Board reportdIVIdENd dISTrIBUTIoN PoLICY INTrodUCTIoN
As per Regulation 43A of the Securities and exchange Board of India (Listing obligations and Disclosure Requirements) Regulations, 2015, prescribed Listed Companies are required to frame a Dividend Distribution policy.
PUrPoSEthe purpose of this policy is to regulate the process of dividend declaration and its pay-out by the Company which would ensure a regular dividend income for the shareholders and long term capital appreciation for all stakeholders of the Company.
aUTHorITYthis policy has been adopted by the Board of Directors of Larsen & toubro Limited (‘the Company’) at its Meeting held on 22nd November, 2016. the policy shall also be displayed in the annual reports and also on the website of the Company.
ForMS oF dIVIdENdSthe Companies Act provides for two forms of Dividend:
• FinalDividend
the final dividend is paid once for the financial year after the annual accounts are prepared. the Board of Directors of the Company has the power to recommend the payment of final dividend to the shareholders for their approval at the general meeting of the Company. the declaration of final dividend shall be included in the ordinary business items that are required to be transacted at the Annual General Meeting.
• InterimDividend
this form of dividend can be declared by the Board of Directors one or more times in a financial year as may be deemed fit by it. the Board of Directors shall have the absolute power to declare interim dividend during the financial year, in line with this policy. the Board should consider declaring an interim dividend after finalization of quarterly/ half yearly financial results. this would be in order to supplement the annual dividend or to reward shareholders in exceptional circumstances.
QUaNTUM oF dIVIdENd aNd dISTrIBUTIoNDividend payout in a particular year shall be determined after considering the operating and financial performance of the Company and the cash requirement for financing the Company’s future growth. In line with the past practice, the payout ratio is expected to grow in accordance with the profitable growth of the Company under normal circumstances.
dECLaraTIoN oF dIVIdENdDividend shall be declared or paid only out of-
1) Current financial year’s profit:
a) after providing for depreciation in accordance with law;
b) after transferring to reserves such amount as may be prescribed or as may be otherwise considered appropriate by the Board at its discretion
2) the profits for any previous financial year(s) after providing for depreciation in accordance with law and remaining undistributed; or
3) out of 1) & 2) both.
the circumstances under which shareholders may not expect dividend/or when the dividend could not be declared by the Company shall include, but are not limited to, the following:
a. Due to operation of any other law in force;
b. Due to losses incurred by the Company and the Board considers it appropriate not to declare dividend for any particular year;
c. Due to any restrictions and covenants contained in any agreement as may be entered with the Lenders and
d. Due to any default on part of the company.
FaCTorS aFFECTING dIVIdENd dECLaraTIoN
the Dividend pay-out decision of any company, depends upon certain external and internal factors-
External Factors:
• Legal/StatutoryProvisionsandRegulatoryconcern:the Board should keep in mind the restrictions imposed by Companies Act, any other applicable laws with regard to declaration and distribution

176
aNNEXUrE to tHe BoARD RepoRt ANNUAL RepoRt 2019-20
of dividend. Further, any restrictions on payment of dividends by virtue of any regulation as may be applicable to the Company may also impact the declaration of dividend.
• StateofEconomy:TheBoardwillendeavortoretainlarger part of profits to build up reserves to absorb future shocks in case of uncertain or recessionary economic conditions and in situation where the policy decisions of the Government have a bearing on or affect the business of the Company.
• NatureofIndustry:Thenatureofindustryinwhicha company is operating, influences the dividend decision. Like the industries with stable demand throughout the year are in a position to have stable earnings and thus declare stable dividends.
• TaxationPolicy:Thetaxpolicyofacountryalsoinfluences the dividend policy of a company. the rate of tax directly influences the amount of profits available to the company for declaring dividends.
• CapitalMarkets:Incaseofunfavorablemarketconditions, Board may resort to a conservative dividend pay-out in order to conserve cash outflows and reduce the cost of raising funds through alternate resources.
Internal Factors:
Apart from the various external factors, the Board shall take into account various internal factors including the financial parameters while declaring dividend, which inter alia will include -
• MagnitudeandStabilityofEarnings:Theextentofstability and magnitude of company’s earnings will directly influence the dividend declaration. thus, the dividend is directly linked with the availability of the earnings (including accumulated earnings) with the company.
• LiquidityPosition:Acompany’sliquiditypositionalsodetermines the level of dividend. If a company does
not have sufficient cash resources to make dividend payment, then it may reduce the amount of dividend pay-out.
• FutureRequirements:Ifacompanyforeseessomeprofitable investment opportunities in near future including but not limited to Brand/ Business Acquisitions, expansion / Modernization of existing businesses, Additional investments in subsidiaries/associates of the Company, Fresh investments into external businesses, then it may decide for lower dividend payout and vice-versa.
• LeverageprofileandliabilitiesoftheCompany.
• AnyotherfactorasdeemedfitbytheBoard.
rETaINEd EarNINGS
the portion of profits not distributed among the shareholders but retained and used in business are termed as retained earnings. It is also referred to as ploughing back of profit. the Company should ensure to strike the right balance between the quantum of dividend paid and amount of profits retained in the business for various purposes. these earnings may be utilized for internal financing of its various projects and for fixed as well as working capital. thus the retained earnings shall be utilized for carrying out the main objectives of the company and maintaining adequate liquidity levels.
ParaMETErS THaT SHaLL BE adoPTEd WITH rEGard To VarIoUS CLaSSES oF SHarE
the Company does not have different classes of shares and follows the ‘one share, one vote’ principle.
rEVIEW & aMENdMENT
the policy shall be reviewed as and when required to ensure that it meets the objectives of the relevant legislation and remains effective. the executive Management Committee has the right to change/amend the policy as may be expedient taking into account the law for the time being in force.

177
annexure ‘H’ to the Board report
NoMINaTIoN aNd rEMUNEraTIoN PoLICY
the Board of Directors of Larsen & toubro Limited (“the Company”) had constituted the “Nomination and Remuneration Committee” which is in compliance with the requirements of the Companies Act, 2013 (“Act”) and SeBI (Listing obligations and Disclosure Requirements) Regulations, 2015 (“LoDR”).
1. oBJECTIVE:
the Nomination and Remuneration Committee and this policy shall be in compliance with Section 178 of the Act read along with the applicable rules thereto and Regulation 19 of LoDR. the Key objectives of the Committee would be:
zz to identify persons who are qualified to become directors and who may be appointed in senior management in accordance with the criteria laid down, recommend to the Board their appointment and removal and shall specify the manner for effective evaluation of performance of Board, its Committees and individual directors to be carried out by the Board or the Nomination & Remuneration Committee or by an Independent external Agency and review its implementation and compliance;
zz to formulate the criteria for determining qualifications, positive attributes and independence of a director and recommend to the Board a policy, relating to the remuneration for the directors, key managerial personnel and other employees;
zz to ensure that level and composition of remuneration is reasonable and sufficient to attract, retain and motivate directors of the quality required to run the company successfully;
zz Relationship of remuneration to performance is clear and meets appropriate performance benchmarks;
zz Remuneration to directors, key managerial personnel and senior management involves a balance between fixed and incentive pay reflecting short and long-term performance objectives appropriate to the working of the company and its goals;
zz Devising a policy on Board diversity;
2. dEFINITIoNS:
2.1. act means the Companies Act, 2013 or Companies Act, 1956 as may be applicable and Rules framed thereunder, as amended from time to time.
2.2. Board means Board of Directors of the Company.
2.3. directors means Directors of the Company.
2.4. Executive directors means the Executive Chairman if any, Chief Executive officer and Managing director, deputy Managing director, if any and Whole-time directors.
2.5. Key Managerial Personnel means
zz Chief executive officer or the Managing Director or the Manager;
zz Whole-time directors;
zz Chief Financial officer;
zz Company Secretary;
zz Senior Management personnel designated as such by the Board; and
zz Such other officer as may be prescribed.
2.6. Senior Management Personnel means all members of management one level below the Executive directors including the Chief Financial officer and Company Secretary. Presently, persons in Sr. Vice President grade and F&a heads of Independent Companies reporting to Whole-time directors will be covered as Senior Management Personnel.
3. roLE oF CoMMITTEE:
3.1. Matters to be dealt with, perused and recommended to the Board by the Nomination and remuneration Committee
the Committee shall:
zz Formulate the criteria for determining qualifications, positive attributes and independence of a director.
zz Identify persons who are qualified to become Director and persons who may be appointed

178
aNNEXUrE to tHe BoARD RepoRt ANNUAL RepoRt 2019-20
in Key Managerial and Senior Management positions in accordance with the criteria laid down in this policy.
zz Recommend to the Board, appointment and removal of Director, KMp and Senior Management personnel.
3.2. Policy for appointment and removal of director, KMP and Senior Management
3.2.1. appointment criteria and qualifications
a) the Committee shall identify and ascertain the integrity, qualification, expertise and experience of the person for appointment as Director and recommend to the Board his/her appointment.
Appointment and Remuneration of KMp or Senior Management personnel is in accordance with the HR policy of the Company. the Company’s policy is committed to acquire, develop and retain a pool of high calibre talent, establish systems and practises for maintaining transparency, fairness and equity and provides for payment of competitive pay packages matching industry standards.
b) A person should possess adequate qualification, expertise and experience for the position he / she is considered for appointment. the Committee has discretion to decide whether qualification, expertise and experience possessed by a person is sufficient / satisfactory for the concerned position.
c) the Company shall not appoint or continue the employment of any person as Director who has attained the retirement age fixed by the Board or as approved by the Shareholders pursuant to the requirement of the Act/LoDR.
3.2.2. Term / Tenure
a) Executive directors:
the Company shall appoint or re-appoint any person as its executive Director for a term not exceeding five years at a time. No re-appointment shall be made earlier than one year before the expiry of term.
b) Independent director:
- An Independent Director shall hold office for a term up to five consecutive years on the
Board of the Company and will be eligible for re-appointment on passing of a special resolution by the Company and disclosure of such appointment in the Board’s report. the rationale for such re-appointment shall also be provided in the Notice to Shareholders proposing such re-appointment.
- No Independent Director shall hold office for more than two consecutive terms, but such Independent Director shall be eligible for appointment after expiry of three years of ceasing to become an Independent Director. provided that an Independent Director shall not, during the said period of three years, be appointed in or be associated with the Company in any other capacity, either directly or indirectly.
- At the time of appointment of Independent Director it should be ensured that number of Boards on which such Independent Director serves is restricted to seven listed companies as an Independent Director and three listed companies as an Independent Director in case such person is serving as a Whole-time Director of a listed company or such other number as may be prescribed under the Act.
c) Maximum Number of directorships:
- A person shall not be appointed as a Director in case he is a Director in more than eight listed companies after April 1, 2019 and seven listed companies after April 1, 2020. For the purpose of this clause listed companies would mean only those companies whose equity shares are listed.
3.2.3. Evaluation
the Committee shall by itself or through the Board or an independent external agency carry out evaluation of performance of the Board/Committee(s), Individual Directors and Chairman at regular interval (yearly) and review implementation and compliance.
the Company may disclose in the Annual Report:
a. observation of the Board evaluation for the year under review
b. previous years observations and actions taken

179
c. proposed actions based on current year’s observations
3.2.4. removal
Due to reasons for any disqualification mentioned in the Act or under any other applicable Act, rules and regulations thereunder, the Committee may recommend, to the Board with reasons recorded in writing, removal of a Director, KMp or Senior Management personnel subject to the provisions and compliance of the said Act, rules and regulations.
3.2.5. retirement
the Director, KMp and Senior Management personnel shall retire as per the applicable provisions of the Act or the prevailing policy of the Company, as applicable. the Board/Committee will have the discretion to retain the Director, KMp, Senior Management personnel in the same position/ remuneration or otherwise even after attaining the retirement age, for the benefit of the Company.
3.3. Policy relating to the remuneration of Executive director, KMP and Senior Management Personnel
3.3.1. General:
a) the remuneration / compensation / commission etc. to the executive Directors will be determined by the Committee and recommended to the Board for approval. the remuneration / compensation / commission etc. shall be subject to the approval of the shareholders of the Company and Central Government, wherever required.
b) the remuneration and commission to be paid to the executive Directors shall be in accordance with the percentage / limits / conditions laid down in the Articles of Association of the Company and as per the provisions of the Act.
c) Increments to the existing remuneration/ compensation structure may be recommended by the Committee to the Board which should be within the limits approved by the Shareholders in the case of executive Directors.
d) Where any insurance is taken by the Company on behalf of its executive Directors, Chief executive officer, Chief Financial officer, the
Company Secretary and any other employees for indemnifying them against any liability, the premium paid on such insurance shall not be treated as part of the remuneration payable to any such personnel. provided that if such person is proved to be guilty, the premium paid on such insurance shall be treated as part of the remuneration.
e) Remuneration of other KMp or Senior Management personnel, in any form, shall be as per the policy of the Company based on the grade structure in the Company.
3.3.2. remuneration to Executive directors/ KMP and Senior Management Personnel:
a) Fixed pay:
the executive Directors/ KMp and Senior Management personnel shall be eligible for a monthly remuneration as may be approved by the Board on the recommendation of the Committee or policy of the Company. In case of remuneration to Directors, the breakup of the pay scale and quantum of perquisites including, employer’s contribution to p.F, pension scheme, medical expenses, club fees etc. shall be decided and approved by the Board/ the person authorized by the Board on the recommendation of the Committee and approved by the shareholders and Central Government, wherever required.
b) Minimum remuneration:
If, in any financial year, the Company has no profits or its profits are inadequate, the Company shall pay remuneration to its executive Directors in accordance with the provisions of Schedule V of the Act and if it is not able to comply with such provisions, with the previous approval of the Central Government.
c) Provisions for excess remuneration:
If any Chairman/Managing Director/Whole-time Directors draws or receives, directly or indirectly by way of remuneration any such sums in excess of the limits prescribed under the Act or without the prior sanction of the Central Government, where required, he / she shall refund such sums to the Company and until such sum is

180
aNNEXUrE to tHe BoARD RepoRt ANNUAL RepoRt 2019-20
refunded, hold it in trust for the Company. the Company shall not waive recovery of such sum refundable to it unless permitted by the Central Government.
d) Stock options in Subsidiary Companies:
executive Directors may be granted stock options in subsidiary companies as per their Schemes and after taking necessary approvals. perquisites may be added to the remuneration of concerned directors and considered in the limits applicable to the Company.
3.3.3. remuneration to Non- Executive / Independent director:
a) remuneration / Commission:
the remuneration / commission shall be fixed as per the limits and conditions mentioned in the Articles of Association of the Company and the Act.
b) Sitting Fees:
the Non- executive / Independent Director may receive remuneration by way of fees for attending meetings of Board or Committee thereof. provided that the amount of such fees shall not exceed R one Lac per meeting of the Board or Committee or such amount as may be prescribed by the Central Government from time to time.
c) Commission:
Commission may be paid within the monetary limit approved by shareholders, subject to the limit not exceeding 1% of the profits of the Company computed as per the applicable provisions of the Act. the Board of Directors will fix the Commission payable to Directors on the basis of number of Board/Committee meetings attended during the year and Chairmanships of Committees.
d) Stock options:
An Independent Director shall not be entitled to any stock option of the Company. Non-executive Directors are eligible for Stock options in accordance with Schemes formulated by the Company. Nominee Directors are not entitled to stock options as per their respective nomination letters received by the Company.
4. MEMBErSHIP
4.1 the Committee shall consist of a minimum 3 non-executive directors, half of them being independent.
4.2 Minimum two (2) members or one-third of the members whichever is greater including atleast one Independent Director shall constitute a quorum for the Committee meeting.
4.3 Membership of the Committee shall be disclosed in the Annual Report.
4.4 term of the Committee shall be continued unless terminated by the Board of Directors.
5. CHaIrPErSoN
5.1 Chairperson of the Committee shall be an Independent Director.
5.2 Chairperson of the Company may be appointed as a member of the Committee but shall not be a Chairman of the Committee.
5.3 In the absence of the Chairperson, the members of the Committee present at the meeting shall choose one amongst them to act as Chairperson.
5.4 Chairman of the Nomination and Remuneration Committee meeting could be present at the Annual General Meeting or may nominate some other member to answer the shareholders’ queries.
6. FrEQUENCY oF MEETINGS
the meeting of the Committee shall be held atleast once in a year and at such regular intervals as may be required.
7. CoMMITTEE MEMBErS’ INTErESTS 7.1 A member of the Committee is not entitled to be
present/participate in discussion when his or her own remuneration is discussed at a meeting or when his or her performance is being evaluated.
7.2 the Committee may invite such executives, as it considers appropriate, to be present at the meetings of the Committee.
8. SECrETarY the Company Secretary of the Company shall act as Secretary of the Committee.
9. VoTING Matters arising for determination at Committee meetings shall be decided by a majority of votes of Members

181
present and voting and any such decision shall for all purposes be deemed a decision of the Committee.
10. NoMINaTIoN dUTIES
the duties of the Committee in relation to nomination matters include:
10.1 ensuring that on appointment to the Board, Non-executive Directors receive a formal letter of appointment in accordance with the Guidelines provided under the Act;
10.2 Determining the appropriate size, diversity and composition of the Board;
10.3 Setting a formal and transparent procedure for selecting new Directors for appointment to the Board;
10.4 Developing a succession plan for the Board and Senior Management and regularly reviewing the plan;
10.5 evaluating the performance of the Board members and Senior Management in the context of the Company’s performance from business and compliance perspective;
10.6 Making recommendations to the Board concerning any matters relating to the continuation in office of any Director at any time including the suspension or termination of service of an executive Director as an employee of the Company subject to the provision of the law and their service contract.
10.7 Delegating any of its powers to one or more of its members or the Secretary of the Committee;
10.8 Recommend any necessary changes to the Board; and
10.9 Considering any other matters, as may be requested by the Board.
11. rEMUNEraTIoN dUTIES
the duties of the Committee in relation to remuneration matters include:
11.1 to consider and determine the Remuneration policy, based on the performance and also bearing in mind that the remuneration is reasonable and sufficient to attract retain and motivate members of the Board and such other factors as the Committee shall deem appropriate and all elements of the remuneration of the members of the Board.
11.2 to ensure the remuneration maintains a balance between fixed and incentive pay reflecting short and long term performance objectives appropriate to the working of the Company.
11.3 to delegate any of its powers to one or more of its members or the Secretary of the Committee.
11.4 to consider any other matters as may be requested by the Board.
11.5 professional indemnity and liability insurance for Directors and senior management.
12. MINUTES oF NoMINaTIoN aNd rEMUNEraTIoN CoMMITTEE MEETING
proceedings of all meetings must be minuted and signed by the Chairman of the Committee at the subsequent meeting. Minutes of the Committee meetings will be tabled at the subsequent Board and Committee meeting.
13. rEVIEW & aMENdMENT:
the policy shall be reviewed as and when required to ensure that it meets the objectives of the relevant legislation and remains effective. the executive Committee has the right to change/amend the policy as may be expedient taking into account the law for the time being in force.

MANAGEMENT DISCUSSION AND ANALYSIS ANNUAL REPORT 2019-20
182
MANAGEMENT DISCUSSION AND ANALYSIS
The Indian economy has been exhibiting lacklustre growth in the face of global volatility amidst weak manufacturing, muted domestic demand and volatility in oil prices.
Real GDP growth has slowed down from 6.1 per cent in fiscal 2018-19 to 4.2 per cent in the backdrop of the slowdown in private consumption, lower tax collections, fund allocation challenges at the State and Central Government levels, and a sharp slowdown in credit growth. To overcome the slowdown, various reforms were announced by the Government in FY 2019-20, viz. reduction in corporate tax rates, a scheme to provide a one-time partial credit guarantee to public sector banks (PSBs) for purchase of pooled assets of financially sound non-banking financial companies (NBFCs), recapitalization of public sector banks, relaxation of external commercial borrowing guidelines for affordable housing, setting up of a Realty Fund for stalled housing projects, merger of 10 public sector banks into four entities and revised Priority Sector Lending (PSL) norms for exports.
Private sector investments continued to be muted in the areas of industrial capex and building infrastructure. Public sector spending, however, remained firm and was robust in the areas of core infrastructure, driven by the Government’s commitment to boost investment across multiple infrastructure sectors. The Government also announced the National Infrastructure Pipeline (NIP) of projects worth R 100+ lakh crore up to FY25, with a focus on energy, roads, railways, urban infrastructure and irrigation projects
to provide a much-needed productivity boost to the Indian economy and fulfil India’s aspiration to become a USD 5 trillion economy by 2025. The NIP, coupled with other ’pro-business’ policy initiatives, is expected to lead to a rebound in domestic demand in the medium and long term.
Global EconomyThe global economy had its share of upheavals in the year 2019-20. Amid prolonged trade disputes and wide-ranging policy uncertainties, growth suffered broad-based deterioration. Global trade has declined and there has been a marked slowing-down in manufacturing activities, even though the service-sector activity has held up to some extent.
The escalation of tension between the US and China is expected to further dampen global growth. The fall in crude oil prices, occasioned by changes in the demand-supply position and geopolitical events across OPEC+ countries, has also had an impact on commodity prices, which have been largely depressed globally. The pandemic has led to a sharp contraction in the demand for oil and commodities, and recovery is likely to happen only after global economies tide over the COvID-19 crisis. Fragilities in the financial sector in a number of economies continue to remain a concern, though this has been partly addressed through increased liquidity, which has been boosted by a series of stimulus measures undertaken by all large economies.

183
COVID-19 OutbreakThe pandemic and the nationwide lockdown that it triggered has dealt both demand and supply shocks to the economy, with wide ramifications on revenue collections and economic growth. It is likely to take quite some time for the consequent stress in the economy to be relieved and for growth to revive.
The crisis has prompted the Government to announce a series of monetary and fiscal relief packages designed to inject liquidity into the system and provide relief to stressed sectors. While these stimulus measures will provide relief to the affected people and some industries, the slowdown in economic activity is expected to significantly lower India’s GDP growth in FY 2020-21.
Global supply chains have also been threatened by the pandemic. Governments around the world have been quick to respond to the crisis by implementing meaningful stimulus measures through a combination of fiscal and monetary easing, increased health spending and direct support to cover losses in incomes and revenues. Sustained efforts from Governments, focused on these measures could soften the economic impact of the Coronavirus.
Against this backdrop, the Company has undertaken a series of measures to mitigate the crisis, which includes securing the safety and livelihood of its staff and sub-contracted labour working at project sites, curtailing and
reducing overheads at all operating levels, enhancing liquidity on its Balance Sheet through increased market borrowings and controlling working capital requirements through a mix of judicious cashflow planning and measured project execution.
Digital @ L&TAt L&T, digital technologies have made a significant impact in data-driven decision making. Plant & Machinery remote monitoring cells are a case in point; powered by Industrial IoT and Artificial intelligence, these cells enable remote monitoring, provide advanced analysis and insights, and facilitate decision making for plant and machinery operations. For instance, in one such remote monitoring cell, a plant & machinery head is analysing equipment productivity vs. internal hiring charges to take decisions on hiring of concrete batching plants. An engineer zooms into the dashboard of a tower crane operating thousands of kilometres away to analyse and understand utilization and lifting patterns. Factory heads are able to centrally monitor and benchmark OEE of manufacturing plants located across the country.
Today, more than 50 digital solutions have been deployed across the organization – spanning bidding, engineering, procurement, construction, manufacturing, supply chain, safety, quality, customer experience and finance. These digital solutions are designed and developed leveraging Artificial Intelligence (Machine learning, Computer

MANAGEMENT DISCUSSION AND ANALYSIS ANNUAL REPORT 2019-20
184
vision, Natural Language Processing, Natural Language Understanding, Conversational AI), Industrial IoT, Cloud computing, virtual reality, Augmented reality, and Geospatial technologies. All these solutions are deployed at scale enabling significant improvement on operational efficiency, accelerating project completion, enhancing workplace safety and improving quality.
Digital for construction & project businessesAsset Insight, L&T’s connected equipment platform, acquires a variety of operational, performance and health data from construction equipment, analyses this data by leveraging advanced analytics, AI and machine learning, and provides necessary insights to project and operations personnel. Today, more than 11,000 equipment across various project sites are connected to the Asset Insight, streaming real-time equipment data. Insights derived from the Asset Insight platform have enabled L&T to increase equipment productivity, enhance capacity utilization, right-size assets, improve fuel efficiency, reduce capital expenditure and much more.
WISA – Worker Induction and Skills Application is an end-to-end digital solution for smooth on-boarding of blue-collar workers into construction sites. This solution spans mobilization, screening of records, KYC, health screening, skill grading, attendance management, performance records and observations, appreciations, violations, and training management. Today more than 300,000 workers are on-boarded in WISA. This solution extensively leverages mobile technologies, statistical analysis, and artificial intelligence to provide insights that have enabled faster mobilization of workers, reduction in on-boarding lead time and better understanding of the demographics and performance of our workforce.
Integrated safety platform provides holistic visibility, analysis and insights to improve workplace safety across all construction sites. More than 10,000 forms are submitted digitally every day giving visibility into prestart checklists, work permits, near misses, incidents, safety observations, inspections, audit findings, safe and unsafe conditions. This data is analysed to arrive at an integrated safety performance score-card. Natural language processing helps in analysing the free text entered in the forms to categorize the safety incidents and provide targeted safety training. Computer vision helps detect safe and unsafe conditions and acts based on the photographs captured during the form submissions and using the CCTv footage. More than 50 virtual Reality (vR) based safety modules have been created, covering different scenarios such as working at height, excavation, tower construction and so on. These vR modules are pre-installed in portable vR
devices and distributed across various construction sites. Safety awareness sessions for workers using these vR modules create a vivid immersive experience about safe work practices.
At the place, by the person, at the time of work: This is the guiding principle of Procube, a progress-monitoring solution. This mobile-enabled solution helps capture project progress information in near-real-time. This data is further analysed using statistical analysis and machine-learning techniques to provide insights to different project management stakeholders with role-based visualization. These insights enable project managers and operations personnel to take informed decisions for removing constraints and adding resources that enable timely completion of projects.
Geospatial solutions use a range of sensors (Lidar, Radar, Sonar, Thermal, Optical) mounted on multiple platforms (Terrestrial, Mobile, Aerial) for capturing geographical information. A variety of analyses – such as temporal analysis, flood flow analysis, cut-fill analysis and quantity estimations – are performed on this data to provide location-based intelligence and insights. This is further integrated with data from other digital solutions to provide map-based integrated dashboards and visualizations to different stakeholders. These solutions enable multi-fold improvements in accuracy and time taken to acquire and analyze geographical information. This results in better design and estimation as well as faster start of procurement and execution.
These digital solutions provide high-velocity data with a significant volume and huge variety. Alchemy, an advanced analytics and artificial intelligence initiative, helps in understanding, analysing and deriving insights from this data. For instance, statistical analysis is used extensively on weighbridge data to detect weighment anomalies and provide real-time alerts. Natural language processing helps in automatically comprehending large complex contract documents and flag risky clauses. Machine learning techniques are used for analysing equipment condition and predicting failure to improve equipment availability. Conversational AI is used to provide seamless interaction between humans and systems through FAQ bots, information bots, transaction bots, and knowledge bots.
Digital for manufacturing businessesEmbracing Industry 4.0: The Internet of Things for manufacturing has been applied to connect machines, cranes, welding machines and other equipment across various manufacturing plants for remote monitoring and maintenance. Installing multiple sensors and intelligent

185
gateways on the machines and equipment enables the business to obtain real-time operational, production and condition-based data without human intervention. Some of these data points are location, movement, arcing time, switch on and switch off time, idling time, work done, number of hours worked, pressure, temperature and welding consumables consumption and many other variables, depending on the type of equipment.
Laser & Radiography: These technologies have helped reduce the job set-up times from days to hours, automate non-destructive quality testing methods and integrate manufacturing processes for real-time information visibility.
Mobile Applications: All digital applications are made mobile first to ensure real-time, anytime and anywhere information visibility across the enterprise.
Smart Glass: These wearables allow our customers to undertake remote inspection of their work-in-process orders in a collaborative manner. This has helped the Company to save the time and energy spent on third party or customer inspections, thereby facilitating faster time-to-market of products and faster delivery of customer orders.
RFID / Near-field communications (NFC) / Beacons: These technologies have been widely used for real-time monitoring of workers entering hazardous areas, monitoring and tracking of materials across the supply chain, monitoring of materials at open-storage locations and tracking of moving assets across project sites.
Virtual Reality and Augmented Reality are used to create captivating experiences such as augmented technical training of products, enabling the sales team to gain a higher order conversion ratio and an immersive 360-degree view of products. This technology has also been applied to increase the work safety at project sites. The application of this technology in scenarios such as working at heights, material handling, working in confined spaces, heavy vehicle management, high temperature welding and working in marine environments has helped create a vivid immersive experience and imprint the rules of safety firmly on the minds of the workers.
Artificial Intelligence is used across the value chain in applications such as cognitive comprehension of bid documents, price prediction, image analytics to automate quality testing, contractual risk analysis and auto-validation of in-bound material quality.
Implementation, Change Management & Benefit RealizationOver the last four years, digital solutions have been rolled out pervasively across the business with speed and scale at every project site and every manufacturing plant.
Employees on the field actively use these digital solutions. This has been made possible by continuous engagement, training, active change management and governance.
L&T is a diversified organization with a variety of businesses. Its Digital Council is a confluence of digital leaders from all L&T businesses under the aegis of the Chief Digital Officer of L&T. The Council provides a platform to discuss ideas, understand challenges, adopt best practices, leverage technologies and solutions implemented across different businesses. It provides the necessary direction, governance and oversight for driving digital initiatives within L&T.
With digital solutions deployed at scale, cyber security assumes paramount importance. All the digital solutions are designed and developed with in-built security principles under the guidance of the Company’s Chief Information Security Officer. All the solutions are subjected to frequent security reviews, testing and monitoring. Regular governance meetings involving the CISO team and the Digital Council enable key digital stakeholders to take stock of the current status, understand the cyber risks, and adopt relevant mitigations and counter-measures towards enhancing cyber security.
SPEED, a structured programme for benefit realization from digital solutions, has been in operation for the past 2 years. This programme has different tracks for driving adoption of digital solutions, programme management and governance, KPIs and benchmarking, and driving actions based on insights derived from digital solutions. The SPEED programme has helped create significant business impact from digital solutions.
OutlookDigital transformation can be broadly categorized into four areas; transforming operations, building connected products and services, transforming customer experience, and creating new business models enabled by digital. So far in L&T, the digital solutions were focussed on transforming operations. The Company is now in the process of developing digital solutions in the areas of connected products and services and customer experience.
Digital solutions have assumed greater importance in the current environment. The progress made in digitalisation will put the group in an advantageous position to leverage technology to devise newer ways of working safely and efficiently under ever-changing circumstances.
Further, with in-house success, the digital solutions are ready to be marketed, creating a new business portfolio for the organisation.

MANAGEMENT DISCUSSION AND ANALYSIS ANNUAL REPORT 2019-20
186
Information TechnologyThe business environment today is rapidly evolving with the emergence of new technologies, and a high-stakes global game of digital disruption is currently under way. It is fuelled by the latest wave of technology: advances in Artificial Intelligence, data analytics, robotics, the Internet of Things, and new software-enabled industrial platforms that incorporate all these technologies and more. Every enterprise leader recognizes that, as a result, the prevailing business models and the way of working in his or her industry could drastically and fundamentally change. Add to this, the interconnections between corporate networks and other networks to conduct business online. The technology innovations being rapidly adopted online have created access across people, information, systems and assets worldwide. We are today, in the true sense of the word, a network-delivered society.
At L&T, we are constantly enabling business with such innovative technologies to enable collaboration between individuals, and between people and machines. This reduces friction and deepens insights to facilitate quick decision making. It is not enough to just bring in technology; its adoption is far more important. A special IT group is formed to handhold the users. Technology always has a flip side – and that is cybersecurity. A special taskforce has been formed under Chief Information Security Officer (CISO) to keep a tab on all such developments, guide the organization and create a cyber-safe environment to conduct business.
The proof of virtual presence through IT was put to test when, due to the sudden disruption caused by COvID-19, the staff had to shift to Work From Home (WFH) mode for the first time. The IT systems built over the period ensured a smooth transition. In addition, the Company’s IT infrastructure was upgraded / modified on a war-footing to enable WFH for almost all the employees and also enable them to connect across locations without worrying about productivity dips. Adequate training was provided to employees to enable them to handle such situations. Additional cybersecurity controls and 24x7 monitoring mechanisms were implemented. This enabled the Company to execute business as usual in unusual times.
Human Resources Manpower - the key resource in business and more so in project and services businesses - is the pillar of business growth. A strong organisation supported by an evolving leadership continues to play a key role in the success of a business. L&T can confidently affirm having a robust leadership pipeline to support current and future business requirements. The Company’s signature leadership
development practices continue to be designed and deployed so that leaders are identified, developed and groomed to take up larger responsibilities, faster. The Development Centres, pivotal to the Company’s core philosophy of grooming internal talent, ensure that the right leadership talent is identified through a rigorous process. To reflect the changing business context and the required leadership capabilities, the Development Centres have been revamped across different levels. Additionally, they have been digitised and training can be imparted virtually. The outcomes of Development Centres are used for talent management, succession planning, training and leadership development.
The Development Centre’s efforts are augmented by the Seven-Step Leadership Programme, developed in-house. The programme provides access to world-class management gurus from the most reputed institutions from across the globe and curates learning experiences which are not only transformational for the participants but result in breakthrough outcomes for the organization. The Action Learning Projects that participants undertake not only help them to assimilate and apply the learnings but also to work on live business improvement projects under the guidance of high-calibre business leaders. The mentoring programme, in which senior executives including the Group Chairman, CEO & MD and other Directors and Business Heads mentor emerging leaders, serves as the ultimate leadership experience that few organizations can provide. These initiatives have ensured a steady talent pool of leaders.
The Company has been developing project management capabilities which are key for the success of its core businesses through its Project Leadership Programme. This will augment the project execution capability building efforts spearheaded by the in-house Institute of Project Management.
L&T’s Leadership Development Academy at Lonavala, its captive Technical Training Institutes along with the Corporate Learning and Development Centre, continue to provide a world-class learning eco-system with high quality and business-relevant capability-building programmes that augment the skills and abilities of the human resources of the Company.
To sustain a culture of safety, which is of paramount importance for the Company, the Corporate Learning & Development team offers specialized programmes to train employees and integrate safety in every aspect of work. To develop internal training capabilities in EHS, the Company has partnered with the National Examination Board in Occupational Safety & Health (NEBOSH) and The Institution

187
of Occupational Safety & Health (IOSH) to become an accredited course provider for its employees.
L&T’s Corporate Technology & Engineering Academy (CTEA), with centres at Madh and Mysuru, plays a critical role in bridging the skill gap of young engineers, making them job-ready and focussing on developing their technical competence by providing hands-on training in contemporary technologies.
L&T has been at the forefront of digital learning. Its state-of-the-art Artificial Intelligence and Machine Learning-driven learning experience platform ATLNext won the prestigious People Matters - Learning & Development Award 2019 in the ‘Best in L&D Technology and Analytics’ category.
The digitalisation of HR processes received further impetus during 2019-20. The digital roadmap put in place an integrated cloud-based platform to anchor all talent processes. This platform harbours a contemporary and transparent interface for the employees and includes HR processes as diverse as employee life cycle operations, performance management, leadership development, efficient query management and robust data for HR Analytics. In addition, digital platforms are being planned for talent acquisition and learning management; these digital platforms will be seamlessly integrated with existing platforms so as to provide a superior employee experience and to be leveraged for organization-level talent interventions, reviews and data-driven decision making.
These investments in digitalisation of HR processes ensured minimal disruption to work during the COvID-19 crisis, ensuring that employees are productive and engaged while working remotely during the lockdown.
L&T continued to be recognised externally for its Human Resources practices. Forbes magazine again named L&T amongst the global best employers. The 2019 Randstad Most Attractive Employer Brand Research ranked L&T #6. Business Standard named L&T ‘The Company of The Year’. Apart from these accolades, L&T received other rankings, such as the Business World ranking of #12 in the Most Respected Companies list, Business Today, People Strong ranking at #13 in the Best Companies to Work for 2020, Universum ranking at #7 as Most Attractive Employers in India amongst engineering students – affirming its stature as a strong employer brand. The signature Technology Leadership Programme for the Defence business received the SHRM HR Excellence Award 2019 – recognition as a best practice in developing leaders for tomorrow.
COVID-19 ResponseThe HR response to COvID-19 was timely, caring and effective, ensuring the safety of over 250000 personnel operating across 200+ sites and offices in India and overseas.
As soon as the first signs of the pandemic emerged, a robust structure and comprehensive process was put in place to collate information and take quick decisions. Under the aegis of the Executive Committee, a Direct Response Team comprising senior executives was set up. This was followed by local leadership teams being set up for the respective businesses, regions, projects, clusters, manufacturing sites and offices. The HR Council, comprising HR Heads of the businesses, swung into action to integrate the efforts at the enterprise and local levels. A system of daily monitoring and reporting of COvID-19 suspected and positive cases was put in place.
Periodic health advisories and SOPs were issued on what steps should be taken towards the safety of employees, contractual personnel and their families, apart from the security of business assets. These ensured timely, clear and consistent communication. Government orders were suitably communicated to ensure strict compliance. In the wake of the lockdown, adequate measures were taken with speed and agility – including setting up a medical helpline, a counselling helpline and the necessary IT infrastructure to facilitate ‘Work From Home’.
Work From Home guidelines were issued, and detailed plans and infrastructure was put in place to ensure that employees not only complied with the Government guidelines to stay safe but also remain engaged and productive while working from home. Additional e-learning and virtual training infrastructure was immediately set up to facilitate capability-building. A host of webinars curated in-house, by academic institutions and training partners were offered to employees on a wide range of themes relevant to business as well as mental well-being. Taskforces were set up to take up projects for process improvements and various other initiatives.
The CEO & MD and the Business Heads have undertaken a massive communication exercise through different media to reach out to all employees and apprise them of the current situation, what actions were to be taken and how the future was likely to unfold. This served as a very effective platform for top-down and bottom-up communication.

MANAGEMENT DISCUSSION AND ANALYSIS INFRASTRUCTURE BUSINESS ANNUAL REPORT 2019-20
188
INFRASTRUCTURE BUSINESS
Sector Performance in FY 2019-2020The Infrastructure sector is a key driver for the Indian economy, and contributes to India’s overall development. The sector, accordingly, receives focused attention and resource allocation from both Central and State Governments.
FY 2019-20 was a challenging year both for the Indian economy, which performed below its true potential, as well as the construction sector, which recorded a six-year low growth of 1.3%.
Cement production saw a marginal decrease of 0.8% in FY 2019-20 as compared to 13.3% increase in FY 2018-19. India’s crude steel production was down by 1.5 percent and finished steel production was flat at 109.2 MT in FY 2019-20 against 110.9 MT in FY 2018-19.
Despite the challenges, the Government’s thrust areas continued to provide a business opportunity basket for the Company, which was in the pole position to capitalize on the business prospects that came to fruition during the year. The continuing weakness in the Realty sector was countered with a Government focused boost to the affordable mass housing and health segments. With the Government’s focus on improving air-connectivity, opportunities in the airport segment continue to arise at periodic intervals.
The construction of highways slowed to 28 km a day during FY 2019-20, from 29.7 km a day achieved in FY 2018-19. The Ministry of Road Transport & Highways is hopeful of increasing it to 32 km a day in FY 2020-21.
Competition in this sector has increased with a higher frequency of smaller-sized bids attracting interest from smaller players. This sector is also beset with challenging payment terms in Government tenders coupled with slow progress in land acquisition.
With a discernable thrust on renewable energy, the award of some contracts in this area has been gaining momentum, which has offset the tapering of prospects on centrally sponsored intensive electrification projects under the ‘Saubhagya’ initiatives. As on March 31, 2020, over 26 million households have been provided with electricity connections under the Scheme.
As the implementation of Mass Rapid Transit System (MRTS) at various metros progressed well, the Government’s focus has turned to Tier II cities, and opportunities are being sighted there.
The Government’s emphasis on augmenting local water resources launched under the Jal Jeevan Mission is also giving rise to good prospects.
Under the National Infrastructure Pipeline (NIP), roads, urban and housing, railways, power (renewable and
Al Wakrah Bypass Road Project, Qatar

189
conventional) and irrigation comprise ~80% of the total plan. This investment and initiative from the Government will create a good opportunity for the infrastructure sector in the coming years.
Public sector spending on the Infrastructure sector, as a whole, continues to witness focused attention through a combination of Central, State Government and PSU capex. The combined Budgetary Capex spends (including PSU Capex) amount to over R 16 lakh crore for FY 2020-21, which translates to over 7% of expected nominal GDP. The COvID-19 crisis is likely to adversely affect revenue collections and GDP growth in FY 2020-21, which in turn could lead to contraction of spends on Infrastructure. The Central and State Governments are attempting to mitigate the impact of lower tax collections through significantly higher market borrowings than originally budgeted for the year FY 2020-21, and the increase could be in the region of R 9 lakh crore. Multi-lateral funding of projects, which has increased in recent years, is providing additional resources for building infrastructure within the country.
On the international front, amid geo-political upheavals, the Middle East countries have been investing in non-oil capex as well, which has offered some business opportunities to the Company, especially in Saudi Arabia and the UAE. Geographical diversification has been yielding
results in the last few years, and the segment saw some big-value successes in countries other than the Middle East region.
The Infrastructure business, which faces normal execution challenges in terms of ‘Right of Way’ and delayed client clearances, encountered some unprecedented issues in FY 2019-20. Change in some State Governments, led to reassessment of awarded contracts, while some environmental-related work stoppages adversely affected work progress in some projects. The impact of these challenges was accentuated with the onset of the pandemic in the last fortnight of the financial year, which slowed down the economy, with the lockdown being implemented by various Governments. The pandemic has affected execution in the last quarter of the year, which otherwise is the busiest quarter for the segment in terms of progress and collections. This has had an impact on both revenues and profits, since the sites had to be shut temporarily.
With the changing environment, the project sites are also required to adapt to a new set of norms for continuation of work, which will hamper progress for some time. The impact of the pandemic is expected to continue into the next financial year, and may taper off as normalcy gradually returns.
Hyderabad International Airport, Telangana

MANAGEMENT DISCUSSION AND ANALYSIS INFRASTRUCTURE BUSINESS ANNUAL REPORT 2019-20
190
BUILDINGS AND FACTORIES
Overview:L&T’s Buildings & Factories (B&F) business is the leader in Engineering, Procurement and Construction (EPC) of airports, hospitals, stadiums, retail spaces, educational institutions, IT parks, office buildings, datacentres, residential buildings, high-rise structures, mass housing complexes, cement plants, industrial warehouses, and other factory structures in India and overseas. The business is well-known for its capabilities in constructing engineering marvels and landmark structures.
The business comprises six business units (BUs) – Airports, Health, Public Spaces, IT & Office Space (ITOS), Residential Buildings and Factories.
Airports: B&F offers design-and-build solutions for passenger terminal buildings and allied service buildings, and cargo terminal buildings, with integrated airport system solutions like baggage-handling systems, passenger-flow monitoring system, passenger boarding bridges, visual docking guidance systems and other facilities.
Health: This business unit handles hospitals, medical and nursing colleges. Healthcare
infrastructure is delivered with end-to-end healthcare facilities, including medical equipment, right from concept to commissioning.
Public Spaces: Design and execution of special structures like tall statues, metro stations, convention centres, secretariat buildings, hotels, malls, integrated development and educational institutions are handled by this business unit.
IT & Office Spaces: This business unit focuses on providing turnkey solutions for IT and office spaces. Leveraging the strong mechanical, electrical and plumbing (MEP) competencies of B&F, it also offers concept-to-commissioning services for building Data Centres.
Residential Buildings: This business unit is a prime EPC solutions provider of elite, affordable and mass housing projects.
Factories: This business unit is a one-stop solution for the EPC requirements of factories like cement plants, automobile plants, glass manufacturing and food processing plants.
In line with L&T’s Perspective Plan 2026, the business is venturing into a new segment – B&F Fast – to explore and create value from advanced construction technologies such as Prefabricated
Motera Cricket Stadium, Gujarat Ford Global Technology & Business Centre

191
Prefinished volumetric Construction, Offsite Manufacturing, Structural Steel Construction and 3D printing.
A state-of-the-art design facility, competency cells, advanced formwork systems, highly mechanized project execution, digitalized project control and a talented pool of employees helps sustain the leadership position of the business, retain key customers and secure major orders. An efficient supply chain and extraordinary project management expertise, acquired over decades, adds to the competitive edge.
Business EnvironmentThe Indian economy started the year FY20 on a high note with higher GDP growth projections of up to 8% year on year. Government of India’s intention to drive more investments into developing infrastructure and thereby improving the growth, was evident in the Union Budget 2020. The tax sops for sovereign wealth funds investing in infrastructure sector, proposal of an Investment Clearance Cell, viability gap funding for projects in healthcare and logistics were some of the initiatives proposed. The allocation of funds towards the National Infrastructure Pipeline, announced earlier by the Finance Minister, has also offered promise to the Infrastructure industry, specifically
the health care segment, in which B&F has a proven expertise of handling design, turnkey execution including the supply and commissioning of medical equipment.
The data localization policy has also paved the way for more Datacenters in India, a segment in which B&F has concept to commissioning capabilities.
The real estate industry was the focal point of the Indian economy in FY 2019-20, but not for the ideal reasons. The Government of India had announced substantial relief packages to support the real estate industry by improving liquidity and enabling developers to come out of stuck realty projects. However, sizeable orders emerged from the affordable and mass housing industry and major developers from elite housing business were making a move to capture the market in this segment.
Assembly elections and the political instability that followed had created problems viz. delayed tender results and lack of clarity in governmental policies and decisions in this fiscal.
Additionally, the spread of the COvID-19 pandemic towards the end of the financial year and the consequential lockdown has posed severe concerns for the economy. Construction activities across the country have been impacted due to the lockdown.
Academic Block for West Bengal Medical College Asian Paints Factory, Mysuru

MANAGEMENT DISCUSSION AND ANALYSIS INFRASTRUCTURE BUSINESS ANNUAL REPORT 2019-20
192
Major Orders secured • CIDCO Housing Project at Navi Mumbai
• One of the largest greenfield airports in India at Navi Mumbai
• Mandarin Oriental Hotel, Muscat in Oman
Key projects completed Key projects commissioned during the year include:
• Government Hospital & Medical College, Madhepura, Bihar
• Ford Global Technology & Business Centre, Chennai
• ITC Royal Bengal, Kolkata
• Police Bhawan – Signature Building, Lucknow
• Prestige Song of the South, Bengaluru
• Asian Paints Factory, visakhapatnam
The business has also achieved important milestones in the execution of major landmark projects, as given below:
• The pitch-laying process was completed at the Al Rayyan - FIFA Stadium, Qatar in under 12 hours
• South Asia’s largest skybridge weighing a massive 2000 MT was erected in 8 hours at ITC Colombo by the in-house team
• The largest cricket stadium in the world at Motera, Gujarat was substantially completed and was the venue for the meeting between the Prime Minister of India and the President of the US
• AIIMS Gorakhpur’s OPD block was completed and handed over
AwardsThe business has received numerous accolades from renowned international and national agencies for its superior standards in EHS and quality.
• Bengaluru International Airport Project bagged three coveted awards from the Confederation of Indian Industries – Southern Region
• Multiple International agencies – such as Project Management Associates (PMA), American Concrete Institute (ACI) and Engineering News Record – have showered praises on the construction of the iconic Statue of Unity project in Gujarat
• The Prestige Lakeside Habitat secured the ACCE(I) Billimoria Award for ‘Excellence in Construction of High-rise Buildings’
• WIPRO Kodathi was conferred the ICI (BC) Birla Super Endowment Award for the Outstanding Concrete Structure of Karnataka 2019 in the Building Category
Godrej The Trees, Mumbai Government Medical College Hospital, Madhepura

193
• Police Bhawan, Lucknow was conferred an award by ICI Ultratech – Lucknow Centre, for the Outstanding Concrete Structure of 2019 in the Institutional Building Category
Significant InitiativesThe business has been the frontrunner in developing digital applications customized to serve its project sites in streamlining various activities and statutory processes. Apart from the consistent success in employing advanced Building Information Modelling (BIM) in construction, the business was able to leverage the latest technologies like Geospatial Information System, Image Recognition, Artificial Intelligence and Robotic Process Automation through various applications developed in-house.
Geospatial technology using LiDAR (Light Detection and Ranging) was utilized to map existing structures and create 3D models. The Workforce Induction and Screening Application (WISA) is extensively used to digitize the workmen induction process and build a database of over 2 lakh workmen including their skill details and images captured using face recognition technology. Robotic Process automation helps in replacing human effort in mundane activities like indent creation and other accounting functions.
The Digital Stores initiative has digitized the processes of indent generation, approval, material issue and indent creation in an ERP system. The data generated through this application has helped in better inventory management.
Using 3D-printing technology, the team successfully printed a 2.8 m-high residential building at Kancheepuram, the first full-scale 3D-printed building in India. The mix design developed by the team enabled the use of crusher sand in 3D printing of concrete for the first time in the world. Further research is in progress.
Environment, Health and SafetyThe business has rolled out its EHS Professional Development Programme (EHSPDP) and comprehensive Risk Management training for front-line engineers to ensure better EHS practices.
In an effort to develop a positive safety culture based on the principles of BBS (Behaviour Based Safety), SIM (Safety Improvements made by Me) has been introduced. To date, more than 4000 interventions (SIM cards) were made at all levels of employees at the project sites.
As a testimony of superior EHS standards, the business was certified for ISO 45001:2018 Occupational Health & Safety on June 13, 2019 by M/s DNvGL.
ICC Towers, Mumbai IKEA Navi Mumbai

MANAGEMENT DISCUSSION AND ANALYSIS INFRASTRUCTURE BUSINESS ANNUAL REPORT 2019-20
194
Significant statistics for the year include:
• 93% of projects achieved Zero Accidents status
• 65 projects achieved more than 3 million safe man-hours
• 20 projects achieved more than 10 million safe man-hours
The business was conferred several prestigious awards during the year, including:
• British Safety Council’s Sword of Honour, for the fourth consecutive year, with ten of its projects securing the award
• The Royal Society for the Prevention of Accidents (UK)’ Gold Awards for Occupational Health & Safety for eleven projects
• 18 National Safety Council awards in various categories
The business has also taken up several initiatives to safeguard employees and workmen within the country and abroad at the onset of the pandemic. The various project sites across India are housing workmen in labour camps equipped with all essential facilities, medical care and competent supervision. COvID-19 Emergency Response Teams (ERT) constituted at the cluster-level pan-India are tasked with reaching out to staff, especially those at project sites, to check on their well-being.
The business has also banned the use of single use plastic in all forms across all offices, sites and establishments.
Human ResourcesWith people as the prime assets, the business ensures that it nurtures talent through new initiatives and value-adding training programmes. The business has introduced a Testing & Commissioning Management Development Programme to develop a specialist group of individuals to deliver Testing & Commissioning of Airports, Data Centres and Smart Buildings. To further develop a specialist group of ‘Finishes professionals’, a customized programme covering Masonry & Plaster, Dry Finishes, Wet Finishes, Interiors and Façades was launched in December 2019.
Risks and ConcernsThe housing and real estate business is increasingly witnessing the political risks of Government decisions being reversed and projects halted due to changes in regime in the States. A robust political risk index is conceived and being developed to effectively identify and mitigate the same at the bidding stage.
In the case of a few projects, specifically Government projects, hand-over of encumbrance-free sites on time, remains a key issue that halts the project’s momentum.
In jobs executed on a design-and-build contract basis, frequent changes in design by the client and
ITC One - Colombo, Sri Lanka ITC Royal Bengal, Kolkata

195
client-appointed consultants are a huge concern. Though in-house Engineering, Design & Research Centre (EDRC) is proactive and is improving continuously by documenting and implementing the learning from previous experiences in new jobs, unexpected changes suggested by clients hinder timely completion of jobs. Such changes are thoroughly documented and communicated to clients by the Contracts Administration team to pursue claims.
The strategy of the business to develop a specialized vertical – B&F Fast – to modularize, standardize and focus on ‘prefab plus assembly’ building solutions for different types of buildings is a step towards mitigating the growing risk of the non-availability of skilled manpower in the industry. The solution will also cater to the increasing need of customers for quicker construction.
Presently, the world economy is facing a downturn triggered by the COvID-19 pandemic, which has spread to almost all the countries across the globe. The Infrastructure industry is among one of the badly affected industries due to the contagion-led lockdown and eventual new norms of working. It has also impacted the supply chain and the availability of the workforce.
The business is working on identifying different scenarios and preparing contingency plans for each scenario. All necessary measures are being taken to ensure the collection of payments due and to have a hard look at fixed costs and optimize overheads during the lockdown period.
Outlook Currently the economy is opening up with restrictions on construction activities completely lifted.
The lockdown has led to a reduction in consumption demand in the country, leaving government spending in social sectors as the key driver of economic growth. The opportunities for the business in the upcoming year will be majorly from Healthcare industry, as increased government spending is expected in this segment. Also, there is a negative sentiment about China and many countries currently are looking to move out of China which was their manufacturing base. This is expected to trigger opportunities for the factories segment in B&F as most companies are likely to set up their manufacturing establishments in India. However, the commercial and residential real estate business in the country will witness a prolonged impact of the pandemic. The investments into the development of Airport construction may slow down and are expected to rebound only during the latter part of FY 21.
The major challenge for the construction industry will be supply chain disruptions including limited availability of labourers as the migrant workers constituted a very large share of the workforce. The business has already initiated the implementation of long-term solutions to face such challenges like reducing the dependency on human resources by leveraging advanced construction technology.
Prestige Song of South, Bengaluru TANCEM Cement Plant, Tamil Nadu

MANAGEMENT DISCUSSION AND ANALYSIS INFRASTRUCTURE BUSINESS ANNUAL REPORT 2019-20
196
Also, the business is considering implementation of techniques like Zero Based Budgeting for cutting down unnecessary expenses and optimizing resource utilization.
On the international front, B&F will employ a cautious approach in the Middle East and also while exploring opportunities to enter new geographies like Bangladesh and Africa.
The business is confident of its ability to tide over the challenges arising from subdued demand and executional challenges through its customer- centric approach, construction expertise and technology leadership in the industry.
TRANSPORTATION INFRASTRUCTURE
Overview:L&T’s Transportation Infrastructure business (TI) is one of the oldest, largest and most reputed EPC contractors in India in the Road, Railway and Airport sectors and has two Strategic Business Groups (SBGs), namely, Roads, Runways & Elevated Corridors (RREC) and Railways Business Group (RBG).
The RREC’s major business unit, the Roads & Runways BU (R&R), provides EPC Design & Build Construction services for all types of roads (asphalt and concrete) including all associated structures, cross drainage, toll booths, wayside amenities, etc., to NHAI, MoRTH, State Governments and certain private clients. In the Airport sector, the R&R BU undertakes EPC construction of complete airside infrastructure, namely, runways, taxiways, aprons, airfield ground lighting, fuel hydrant systems, etc., both greenfield and brownfield. The R&R BU is also a pioneer in providing complete civil infrastructure for greenfield city infrastructure projects, e.g. Smart Cities. The Elevated Corridor Segment (EC) is engaged in EPC construction of all types of urban flyover projects for City Traffic Decongestion, and the Dedicated Freight Corridor Corporation of India (DFCC) - civil works projects in both the Eastern and Western Dedicated Freight Corridors.
The Railways SBG (RBG) consists of the Mainline Business Unit (MLBU) and the Metro Business Unit (MTBU). The MLBU provides EPC construction services for all Mainline Railway Projects, Western & Eastern Dedicated Freight Corridors including Track Laying, Overhead Electrification, Dedicated Railway Linking for Port & Mining facilities, etc.
A section of the 13km Phase 1 of Mauritius Metro

197
The MTBU executes EPC projects for all Signalling & Telecommunication Systems Works, Mass Rapid System Projects for metro projects in India, Riyadh Metro, Dhaka Metro and end-to-end Integrated Transit System complete with Civil and Systems Works (Mauritius Light Rail Transit – LRT).
On the international front, the business recently completed several large and complex road projects in the UAE, Oman and Qatar. The RBG is currently executing major projects in Mauritius and Bangladesh.
The business leverages its vast experience in project management, engineering design and construction management to achieve international standards of safety, quality and operational efficiency. It has engineering design centres in Mumbai, Faridabad and Chennai. In addition, it has a Competency Development Centre at Kancheepuram for the RBG and a Workmen Training Centre at Ahmedabad for the RREC. In FY 2019-20, the transportation infrastructure business has executed approximately 1 million sq. mtr. of airside construction, 1347 lane km of roads, 389 km of track linking and 981 km of Railway Electrification (OHE).
Business Environmenta) Roads, Runways & Elevated CorridorsOver the last 5 years, the budgetary support for road construction has seen a steady increase. However, the award of contracts has shrunk significantly in FY 2019-20 owing to land- acquisition issues. The delay in the financial closure of Hybrid Annuity Model (HAM) projects has impacted the Government’s ambition to infuse private investment into the sector. Any shift towards a higher proportion of EPC projects will impact NHAI’s awarding capability due to higher funding requirement for civil works related to EPC projects. Due to difficult contractual terms, the working capital requirement for road projects is becoming very high. The delays in settling contractual issues like extension of time, arbitration award, etc., are compounding problems. In FY 2019-20, approximately 5,100 km of road were awarded and 9,855 km of road were constructed. Construction of highways at 28 km/day in 2019-20, has been steady from FY 2017-18 onwards, with an increased focus on delivery of projects. The market continues to have many small EPC contractors, consequently intensifying the competition.
In the year 2019-20, a few major airports have been initiated, such as the Delhi International Airport and Navi Mumbai International Airport, providing opportunities for the business.
Area Development Works, Bidkin, Maharashtra Runway for Bengaluru International Airport

MANAGEMENT DISCUSSION AND ANALYSIS INFRASTRUCTURE BUSINESS ANNUAL REPORT 2019-20
198
City Infrastructure Development has seen a lull in orders in FY 2019-20, with no significant awards. The Delhi–Mumbai industrial corridor is at an advanced stage, with multiple projects substantially completed in Dholera and Bidkin industrial township.
The Government announced a National Infrastructure Pipeline with a total outlay of R 100+ lakh crore for FY20-FY25. Out of this, 19% of the capital expenditure is earmarked for Roads, which is expected to give a considerable boost to the sector.
b) Railways:The Indian Railways (IR) has significantly improved its EPC tendering model. The new EPC tender document (Single Stage 2 packet) has been finalized, with industry suggestions suitably incorporated. However, the IR needs successful and faster implementation of EPC tendering. No major project was awarded in FY 2019-20.
High Speed Rail, the tendering for which was expected to gather momentum, has been deferred, with the major bids being extended multiple times. Steady projects in metro rails in various States are expected to help increase business. The Public-Private Partnership (PPP) component has been made mandatory for availing Central assistance for new metro projects.
Major Orders • Navi Mumbai International Airport - design, engineering,
procurement and construction of Passenger Terminal Building, runway, taxiways and aprons, landside roads, utility infrastructure and drainage
• Delhi International Airport Limited – Fuel Hydrant System
• Three Systems packages on EPC basis for the Eastern Dedicated Freight Corridor
• EPC Overhead Electrification job from CORE
• Track works for two packages of Mumbai Metro Line 3
Projects CompletedThe business has completed the following projects:
• Rewa–Katni–Jabalpur–Lakhnadon Road Project – 4 Packages, 288 km, 4-lane, Madhya Pradesh
• Bijapur–Humnabad Road Project, 220 km, 2-lane, Karnataka
• Raipur–Bilaspur Road Project, 42 km, 4-lane, Chhattisgarh
• Hospet–Chitradurga Road Project, 108 km, 4-lane, Karnataka
• North–South Parallel Runway commissioned for Bangalore International Airport, Phases 1 & 2
Rewa-Katni-Jabalpur Road

199
• Kanakura–Madar section (OHE – 294 TKM) and the Alwar–Bandikui section (OHE – 68 TKM)
• Khaliapali–Loisinga (11.15 TKM) track section of the Sambalpur–Tilagarh Doubling Project
• GMRCL – Meg Track Project – Priority Stretch (13 TKM)
• Hyderabad Metro OHE and Track Package (25 TKM)
• Track-linking for the Rewari–Iqbalgarh section of CTP 1&2 (1400 TKM)
• Commercial Trial runs are in progress in the Rewari–Madar section
• Mauritius Light Rail Transit system (Phase I, 25 TKM)
• Roads and Transport Authority (RTA) 1028 (Extension of Tripoli Street)
• RTA 1048 Improvement of Expo 2020 Roads Network contract No R 1048/1 & 5
During the year some other notable achievements were:
• DFCC – (Civil track package) CTP3R project had the highest single-day production of 1.16 L cu.m/Day Earthwork in filling and record of executing 20.30 lakhs cu.m in May 2019
• Mumbai–Nagpur Expressway Project, Mumbai–vadodara Road Project - 80% design completed in 6 months’ time
under the Design Acceleration Initiative of the RREC business
• Aurangabad–Karodi Road project milestone II achieved 6 months ahead of time
Significant InitiativesThe major fixed cost for the RREC business includes hiring charges for asset operation & maintenance, fuel, etc. Special initiatives of P&M as a profit centre with a focus on productivity-driven decision-making have resulted in cost-reduction on all these fronts.
The business continues to leverage the benefits of the extensive use of Linear Project Management tools, such as TILOS, to effectively visualize and plan mega linear projects across domains. Driven by a dedicated ‘Track Planning Cell’, this strategic initiative facilitates centralized planning of not only civil and track projects but also mega OHE (Overhead Electrification) projects.
An Internal Project Management Consultant (IPMC) team was formed to conduct a quality audit of ongoing projects. The team will ensure that construction complies with design specifications, specified materials are used during construction, codal specifications meet with the requirements, as well as review the status of non-conformance reports and aid closure.
RTA 1028 Road Network, Dubai

MANAGEMENT DISCUSSION AND ANALYSIS INFRASTRUCTURE BUSINESS ANNUAL REPORT 2019-20
200
Engineering Project Monitoring & Control Cell was formed under the project controls team and tasked with development of a design and drawing tracker to monitor the delivery with respect to agreed time lines, optimization of quantities with respect to initial design, coordination and monitoring of the actual quantity reported by the design department progressively and development of a model for indices for quantities of projects of a similar nature to support ongoing projects and the tendering department.
The thrust on mechanization in the railway business for faster execution has been a remarkable success, involving simultaneous stringing of Contact and Catenary, which reduces operational costs and execution time. Having been well-established in DFCC, such mechanization is also being used in other EPC projects, such as the Konkan Railway in the Western Ghats – a project requiring OHE installations amidst highly restrictive ‘block sections’ involving significant material handling and extraordinary erection methodologies.
DigitalisationConnected assets and geospatial solutions are two high-impact solutions for the business. Digital data now backs the majority of equipment mobilization and hiring decisions, as well as fuel distribution. On the geospatial front, drone-based photogrammetry or LiDAR-based surveys are conducted wherever possible for every new project.
Work has commenced on an Artificial Intelligence (AI) based Contracts Administration Platform to introduce smarter ways to manage contracts.
Environment, Health and SafetyTransportation Infrastructure projects are typically spread across hundreds of kilometres, with a multitude of discrete safety risks that are both location and task specific. RtR (Reverse the Risk) and PREP are digital applications which have been developed to identify the risk level. Continuous monitoring of the risk level using digital applications and implementation of effective control measures helps mitigate risk.
Well-planned implementation of traffic diversions as per IRC SP55 to prevent work zone incidents is undertaken. To monitor live road activities and prevent traffic accidents, the business has introduced the ‘verify and Ensure Controlling Traffic’ (vECT) initiative.
Across all the projects, digitally enabled training modules – such as virtual reality safety modules and augmented reality EHS Golden Rule modules – have been developed to increase the EHS awareness in the workforce. A ‘Zero Fatal Award’ has been introduced for projects having zero fatality for the entire duration of the project cycle.
A structured Environment Management System (EMS) has been implemented. Every project has a specific
E&AM System Works, Dhaka Metro Bata Nagar Flyover, Kolkata, West Bengal

201
Environment Plan which conforms to ISO 14001 2015, individual contractual needs and the business’ Integrated Management System (IMS) manual. Micro-level preparation takes place at each project to define a set of processes, followed by Impact Aspect Assessment. The defined control measures are implemented during job execution, and that facilitates the reduction of the negative environmental impact and the mitigation of all potential environmental aspects. Detailed Environment Impact Assessments (EIA) are conducted in the pre-execution construction planning stage. various control measures are identified and implemented. Along with dedicated methodology / SOP and engineering control, many new initiatives are taken.
During FY 2019-20, the business won 19 international awards (five Gold Awards, two Silver Awards from the Royal Society for the Prevention of Accidents, a Sword of Honour and a BSC OHS Audit Five Star Rating from the British Safety Council, one distinction, 4 merit and 5 pass certificate from British Safety Council). Other than international, the business has received seven prestigious safety awards by the National Safety Council, a prestigious award by the Institution of Engineers India and two awards by India HSE Summit.
Human ResourcesThe focus of the business has been on developing a culture of recognition, innovation and process improvement. The business conceptualized the DELTA Awards - Digital
Breakthrough, Energy Optimization, Large scale reuse of Scrap/ Waste, Time reduction (Reduction in Cycle Time), Advances (Innovation). To strengthen its safety culture using positive motivation, the LIFE (Loss & Injury Free Environment) Award was conceptualized.
Risks and Concerns Land acquisition is a critical factor. very often, there are delays in handing over encumbrance-free land and Right of Way, impacting progress of work and idling of resources. Commercial terms in the business are getting tougher, resulting in working capital pressures. The sector is also exposed to delays in various approvals, leading to a domino effect. Extreme environmental events (such as unprecedented rainfall), National Green Tribunal bans and construction bans due to pollution pose an adverse risk to the business.
Outlooka) RREC businessOver the next 5 years, the Government has planned to expand the National Highway network by ~60,000 km, with about 20,000 km in major economic corridors, strategic areas and major tourist destinations.
The Department of Civil Aviation envisages 100 new airports will be built in the country over the next 10 to
Ghoshpukur-Salsalabari Road, West Bengal Overhead Electrification for Delhi Metro Phase 3

MANAGEMENT DISCUSSION AND ANALYSIS INFRASTRUCTURE BUSINESS ANNUAL REPORT 2019-20
202
15 years. It is also working on the cargo policy, which will provide a boost to the nation’s logistics capacity. The Government has envisaged an investment of more than R 1.43 lakh crore for airports under the National Infrastructure plan over a period of 5 years. The Government’s focus on developing a strong express highway network, along with changes in contractual terms, is expected.
b) Railway businessThe Indian Railways is planning its highest outlay of R 1.61 lakh crore for FY 2020-21, an increase of over ~3% on last year’s outlay of R 1.58 lakh crore.
The conventional projects of the Indian Railways continue to get a big thrust, backed by strong institutional funding like LIC, IRFC, etc. The Indian Railways is planning to tackle Mainline Capacity constraints through a New Line of ~5,000 km, Capacity Augmentation (Doubling & Tripling) of ~12,000 km and Gauge Conversion of ~2,500 km in the next five years. About 10,000 km of electrification is also expected to be awarded under the banner of ‘Mission Electrification’ over the next four years.
There is a major thrust on electrification of the entire railway network by 2024. New projects including port connectivity dedicated rail links, etc., are planned to be implemented through SPvs owned by State-Centre Jvs.
Tendering for three New Dedicated Freight Corridors is to be initiated in the next 2-3 years.
India is well on its way to creating a world-class MRT system as an integral part of community infrastructure development across all metros and major cities, including Tier 1 and Tier 2 cities in the country. System works in MRTS provide good business opportunities; nevertheless such opportunities are increasingly becoming multiple smaller packages, especially in Tier 2 cities, and hence may not be attractive enough for the business to participate in.
The Indian Railways has floated tenders for a Detailed Project Report (DPR) on each new Dedicated Freight Corridor. The Government has not yet secured funding for these projects. Certain packages are being contemplated on the PPP mode. Packages worth ~ R 68,000 crore are expected to be finalized in the next five years.
On the international front, the focus is on the neighbouring geographies and in geographies where the business already exists. The funding needs to be through secured sources, such as the Indian Government or from any bi-lateral / multilateral agencies like JICA.
c) InternationalSince all the major infra projects related to EXPO 2020 in Dubai and FIFA 2022 in Qatar are already awarded and are
Signaling & Telecommunication for WDFC Trial run at Western Dedicated Freight Corridor

203
at an advanced stage and oil prices have dropped, no more major prospects are visible in the near horizon in the Middle East. Africa posted very few opportunities during 2019-20 and stiff competition persisted from Chinese contractors. The key hubs for investment in 2020 are expected to be Morocco, Egypt, Ghana, Cote D’Ivoire, Namibia, Botswana, Rwanda, Ethiopia and Kenya.
In general, with the disruptions due to the COvID-19 lockdown, funding for new projects is likely to get affected. The lockdown may trigger shortage of raw material and workmen, disruption in the supply chain, a significant increase in costs related to operating at site, coupled with reduced productivity due to controlled working environment, need for hygiene infrastructure and various safety measures requirements. There may be a decline in project awarding by various other authorities owing to rising debts, limited capital and reduced private investment.
HEAVY CIVIL INFRASTRUCTURE
Overview:L&T’ s Heavy Civil Infrastructure business is a market leader in Engineering, Procurement, and Construction (EPC) projects in core civil infrastructure segments that are crucial to the economy, viz. Metros, Nuclear, Special Bridges,
Hydel and Tunnels, Ports and Harbours and Defence.
As an industry leader in augmenting capabilities for urban mass rail transit systems, the business is involved in the construction of metro rail systems in almost all the major Indian cities. It provides extensive end-to-end engineering and construction services for both elevated and underground metro systems. During the year, the construction of the Hyderabad Metro was completed.
In the Nuclear segment, the business provides EPC solutions in civil, mechanical, electrical and instrumentation, including seismic qualification and modular construction technology. Its expertise extends to both pressurized heavy water reactor (PHWR) and light water reactor (LWR) technologies.
The Special Bridges segment has extensive experience in executing a wide range of bridges, such as cable-stayed, precast, pre-stressed concrete, steel and concrete composite construction using ingenious cutting-edge construction techniques, viz. incremental launching, segmental construction, balance cantilever construction and span-by-span construction.
The Hydel and Tunnel segment offers EPC solutions for complete Hydroelectric Power Projects,
Cable Stayed Bridge across Durgam Cheruvu Lake, Telangana

MANAGEMENT DISCUSSION AND ANALYSIS INFRASTRUCTURE BUSINESS ANNUAL REPORT 2019-20
204
large-diameter Transport / Water Tunnels and complex Irrigation projects. The business also provides expertise for road and railway tunnelling projects, which cater to nation-building.
The Ports & Harbours vertical has extensive experience in greenfield ports, shipyard structures and seawater intake systems in all coastal states of India. It provides EPC solutions for breakwaters, berths, jetties and wharfs, dry docks and shore protection structures. It has unique expertise in providing design and construction solutions for state-of-the-art Shiplift structures.
Backed by the expertise and experience gained from managing mega projects, L&T has established a position of pre-eminence in shoring up the country’s defences. L&T offers single-point EPC solutions in the form of infrastructure facilities for defence bases, underground facilities and surveillance.
The business has a strong presence in India, the Middle East, Bhutan, and Bangladesh. The ability to provide ‘tailor-made’ design-&-build and EPC solutions to suit the specific requirements of customers for complex infrastructure projects has made the business a market leader in India. Dedicated design and technical centres, competency cells, specialized training centres, digital project management, and a talented pool of employees
help the business sustain a leading role, attract key clients, penetrate new geographies and secure major orders.
L&T Geostructure is a unique entity which focuses on foundation and ground improvement related projects. It has a strong and professional foundation specialist team with the knowledge of design, equipment and methods to execute and supervise sophisticated foundation works. It has expertise in deep piling and diaphragm walls, multi-cellular intake wells for river-linking, marine terminals with berths and jetties and deep cut-off walls.
Business Environment Infrastructure is a major sector that propels the overall development of the Indian economy. The Government maintains India’s upward growth trajectory and continues to target gradual and sustained growth. Infrastructure was one of the country’s budget priorities this year.
With major metropolitan areas on the metro map, both the Central and the State Governments have now turned their attention towards Tier-II cities such as Kanpur, Agra, Surat, Patna, Meerut, Ahmedabad, Nagpur, etc. due to their increasing population density. The business has been awarded two packages of the 82-km Delhi-Ghaziabad-Meerut Regional Rapid Transit System (RRTS) line in Uttar Pradesh.
Singoli Bhatwari Hydro Power Project, Uttarakhand Multi-modal terminal at Sahibganj, Jharkhand

205
The Ministry of Defence has identified an urgent need to upgrade the country’s defence infrastructure, and major projects are currently in the planning stage.
Bridge construction in India is witnessing significant interest from international funding agencies like JICA, the World Bank, ADB, etc.
India’s ports and trade-related infrastructure accelerate growth in the manufacturing industry and assist the ‘Make in India’ initiative. India has 12 major ports and approximately 200 non-major ports administered by Central and State Governments respectively. With a view to promoting the expansion of port infrastructure and facilitating trade and commerce, the Ministry of Shipping’s proposal to replace the Major Port Trusts Act, 1963 by the Major Port Authorities Bill, 2020, was approved. The Major Port Authorities Bill, 2020 will empower the major ports to perform with greater efficiency on account of full autonomy in decision-making and by modernizing the institutional framework of the major ports. The business has secured the Dabhol Breakwater Project (offshore structures) located at Ratnagiri.
FY 2019-20 saw a steady increase in projects tendered out by the Government in the Hydel, Tunnel and Irrigation segments, as the Government introduced a few structural
policy changes to promote the Hydropower sector based recommendations of the Standing Committee on Energy (2019).
India’s total nuclear power generation capacity is 6,780 MWe, which comprises 2 percent of the country’s overall power generation. The Energy policy of the country calls for 25 percent of electricity to be generated from nuclear power by 2050. The business is expecting the Government to move forward with a proposal for 10 pressurized heavy-water reactor (PHWR) fleet. Major tenders in the Nuclear industry were delayed and were pushed to FY 2020-21 due to lack of clarity about The Civil Liability for Nuclear Damage Act, 2010 amongst civil contractors.
However, the momentum of project awards suffered due to delays in bid evaluations, board approvals, etc., towards the end of the FY, and was further aggravated due to the impact of COvID-19 in March 2020. These delays have affected the much-anticipated order inflow for the business.
Major AchievementsOrders Won• Rishikesh – Karnaprayag Rail Link Project (Package# 2),
Uttarakhand
Kakrapar Atomic Power Plant, Gujarat

MANAGEMENT DISCUSSION AND ANALYSIS INFRASTRUCTURE BUSINESS ANNUAL REPORT 2019-20
206
• Dabhol Breakwater Project (offshore structures) located near Ratnagiri, Maharashtra
• Delhi-Meerut Regional Rapid Transit System (RRTS) – two packages, Delhi and Uttar Pradesh
• Strategic Defence Facility project
Projects Completed• Medigadda Barrage, Kaleshwaram Irrigation Project,
Telangana
• Singoli Bhatwari HEP, Uttarakhand
• Hyderabad Metro Rail Project (HMRP) Raidurgam Stretch, Telangana
• Doha Metro Gold Line, Qatar
• Durgam Cheruvu cable-stayed bridge, Telangana
• Kakrapar Atomic Power Plant (KAPP MPCW), Gujarat
Other Key Achievements• The business won a slew of awards during the financial
year from august bodies, including the Indian Chapter of ACI Excellence in Concrete Construction Awards in the ’Infrastructure’ category for the Kakrapar Atomic Power Project 3 & 4, and the Indian Concrete Institute for
‘Outstanding Concrete Structure of Telangana-2019’ for the Medigadda Barrage Project.
• A 16 m-high wall was cast in a single pour at the Kudankulam Nuclear Power Plant Project, setting a benchmark in the industry.
• The first-of-its-kind superstructure erection was undertaken using heavy cranes across the congested Delhi-Mumbai live railway line in a block period of 4 hours at DFCC 15C project.
• The first span for Mumbai Trans Harbour Link (MTHL Package 1) was erected in January 2020.
Significant InitiativesWith high potential business opportunities anticipated in tunnelling projects, an in-house Tunnelling Excellence Academy (TEA), the first-of-its-kind in India, was built at Kancheepuram, Chennai, India. It has been set up with international expertise to build strong technical capability in the design and execution of complex tunnelling projects conforming to world-class standards, with high quality and safety compliance. The academy has in-house subject-matter experts who are capable of training the staff on various technical aspects to upskill them in alignment with the needs of the business. The objective of this institute is to create a pool of certified tunnelling professionals for the business in order to meet international industry standards in safety, quality and productivity.
Mumbai Coastal Road Package 1

207
DigitalisationDigitalisation has become an integral part of business processes. It has opened up new-age capabilities to measure, analyse and improve business performance. The business digitally monitors all productivity factors – Men, Material and Machinery – in real-time. For effective project delivery, the business is committed to digitalisation and innovation through the use of digital platforms such as vR for workmen training in EHS (Environment Health and Safety), BIM (building information modelling), Drones and 3D laser scanners.
Environment, Health and SafetyCommitted to the mission of ‘Zero Harm’, the business clocked 330 million safe man-hours in the year, and 76 thousand man-hours were invested in EHS awareness and training. Key EHS training initiatives were implemented, including P&M operations, tunnelling, incident investigation, marine construction, scaffolding, sustainable skills, auditing, EHS leadership, behaviour-based safety and certifications in NEBOSH IGC and IOSH Managing safety. The business has successfully fulfilled the corporate EHS strategic plan 2019-20 with key EHS deliverables that have been implemented across all its operations.
Digital applications have been launched to regulate safe working conditions, such as inspections, work permits, P&M inspections before use, and monthly reporting status.
various projects across the business have received safety awards:
1. Six projects received International Safety Awards and one project received a Gold medal (for the 9th consecutive time) from The Royal Society for the Prevention of Accidents (RoSPA) – UK, for the year 2019.
2. International Safety Awards were conferred for various projects from the British Safety Council – UK for the year 2019.
3. various projects received awards and appreciation certificates from the National Safety Council – India (NSCI) under the Construction Award Scheme 2019.
Human ResourcesThe prime focus is on talent development and talent engagement. Policies and programmes for employee growth and development, employee appreciation and employee satisfaction are put in place to pave the way for future leaders. Programmes – such as those conducted at the Trainees Engagement & Development Centre (TEDC), an initiative of HR’s Talent Development cell – focus on the engagement and development potential of the recruits. Other training programmes deliver customized training,
One of the underground tunnels for Mumbai Metro Riyadh Metro Line 3, Kingdom of Saudi Arabia

MANAGEMENT DISCUSSION AND ANALYSIS INFRASTRUCTURE BUSINESS ANNUAL REPORT 2019-20
208
partnering with subject-matter experts to enhance relevant skillsets.
In collaboration with IIM-Trichy and Great Lakes Institute of Management, long-term capability-development programmes have been initiated in order to develop future leaders. Different methodologies, mentoring and coaching forums and L&T-specific case studies have been created to make the Competency Development model more relevant to the business context.
Risks and ConcernsEach construction project is unique and comes with its own set of challenges and opportunities. Major risks for the business are delay in obtaining Right of Way (RoW), work front, third-party liability, epidemic risks, schedules, approvals/clearances, design approvals, and change in design.
We have a strong risk management system and process in place. The risks identified in the pre-bid and post-bid stages are continuously monitored through regular reviews throughout the project cycle for mitigation/resolution.
Outlook A National Infrastructure Pipeline (NIP) has been prepared for capital investment worth R 100+ lakh crore in
infrastructure through FY25, pledging about R 65 lakh crore for ports, urban development, irrigation, railways and roads and power.
Out of the total NIP, R 34 lakh crore (30%) worth of projects are at the conceptualization stage, and R 22 lakh crore (20%) worth of projects are under development. Several big-ticket and first-of-its-kind projects are proposed by the Government – such as High-speed Rail, Dedicated Freight Corridors, Urban Transport / MRTS projects – which are expected to provide an impetus to the business in the coming years. Strategic investments in the North East and the J&K region in Hydel projects are expected to enter the implementation phase in the next 2-3 years.
The Government has also identified an urgent need to upgrade the country’s defence infrastructure. Plans for the upgrade of Naval and Air force bases as well as the creation of underground infrastructure for strategic assets by the Government are in progress.
However, the COvID-19 situation may lead to a shift in priorities and a slowdown in decision-making by customers for the award of projects. Elevated investments in infrastructure will be the key to ensuring that India recovers from the COvID-19 crisis at the earliest. The Government has already identified infrastructure as one of the 5 pillars to make India a self-reliant economy, and various stimulus
The Mumbai Trans Harbour Link

209
packages proposed by the Government to revive the economy will be a big boost for the infrastructure sector.
POWER TRANSMISSION & DISTRIBUTION
Overview:L&T’s Power Transmission and Distribution (PT&D) business vertical is a leading EPC player in the field of power transmission & distribution and solar energy. It offers integrated solutions and end-to-end services – ranging from design, manufacture, supply, installation and commissioning of transmission lines, substations, underground cable networks, distribution networks, power quality improvement projects, infrastructure electrification and fibre optic backbone infrastructure, to solar Pv plants including floating solar, battery energy storage systems and mini / micro grid projects. Besides being a dominant player in the Indian subcontinent, the business enjoys a significant share and a strong reputation in the Middle East, Africa and ASEAN markets.
The business comprises several business segments:
The Substation business unit provides turnkey solutions for Extra High voltage (EHv) air insulated / gas insulated substations, Flexible AC Transmission Systems (FACTS) and substation automation and digital substation solutions for utilities and power plants, EHv cable systems and complete electrical and instrumentation solutions for various infrastructure projects, such as metros and airports.
The Power Distribution business unit provides a range of EPC services related to urban/ rural electrification, including last-mile connectivity, augmenting, reforming and strengthening of high voltage and low voltage distribution networks, distribution automation solutions and power quality improvement works.
The Transmission Line business offers turnkey EPC solutions for overhead lines for power evacuation and transmission, bolstered by its state-of-the-art tower manufacturing units at Puducherry, Pithampur and Kancheepuram, which have supplied over seventeen lakh tonnes of tower components over the years. The Testing and Research station at Kancheepuram is accredited by NABL (National Accreditation Board for Testing and Calibration Laboratories), and is one of the largest in Asia, apart from being amongst the most renowned testing
220 kV Transmission Line, Uttarakhand 5 million households electrified

MANAGEMENT DISCUSSION AND ANALYSIS INFRASTRUCTURE BUSINESS ANNUAL REPORT 2019-20
210
centres in the world. The clientele of this testing facility includes utilities from 30 different countries.
The Optic Fibre Cabling (OFC) segment provides turnkey solutions for deploying a gigabit-scale optical fibre backbone for both government agencies and private telecommunication companies by establishing a state-of-the-art network infrastructure, typically involving a vast geographic spread. The business also provides operation & maintenance support to ensure the health of the Optic Fibre Cable by maintaining Mean Time Between Failure (MTBF) and Mean Time To Repair (MTTR) figures as per the agreed Service Level Agreements (SLAs).
The Renewables business provides single-point EPC turnkey solutions for solar Photo voltaic (Pv) related projects, including energy storage solutions and microgrids. Its experience ranges from flat to highly undulating as well as to landfill topologies, with specialized technologies, including designing and executing contour-following solar Pv power plants. The solar business has in-house capabilities to produce different module-mounting structure types – such as Fixed Tilt, Seasonal Tilt and HSAT – offering the customer a range of solutions. As grid stability and power conditioning requirements gain significance in the wake of large-scale renewable
integration, standalone and Pv integrated storage solutions are being offered, ranging from rooftop systems to floating solar systems.
The International units of the business in the Middle East, Africa and the ASEAN region offer complete solutions in the field of power transmission and distribution up to 500 kv. These include substations, power transmission lines, EHv cabling, distribution networks, solar plants and Electrical, Instrumentation and Controls (EI&C) works for infrastructure projects such as airports, oil & gas industries, etc.
The Middle East business unit that caters to the UAE, Saudi Arabia, Qatar, Oman, Kuwait and Bahrain, has garnered a coveted place in the GCC region. With a presence spanning over 25 years and numerous milestones, it enjoys an enviable track record in the region.
The once-fledgling Africa business unit has established itself as a force to reckon with, in 10 countries across the North, East and South of the continent. With a sizeable market share in the addressable segment, and projects from all the business lines within the PT&D spectrum, the business unit is now poised to make inroads into the western parts of Africa.
250 MWp Solar PV Plant, Madhya Pradesh

211
In the ASEAN region, a proven track record of successful project execution in Malaysia and Thailand has helped the business foray into Myanmar and the Philippines.
Larsen & Toubro Saudi Arabia LLC (LTSA) is a wholly owned subsidiary providing engineering, construction and contracting services in the sphere of Transmission & Distribution in the Kingdom of Saudi Arabia.
Business EnvironmentOn the power distribution front in India, the achievement of electrical connectivity to all villages and the near closure of centrally sponsored schemes such as Saubhagya and R-APDRP redirected the focus to strengthening of urban distribution networks and intensification of electrification in select States. As the State DISCOMS depended mainly on multilateral funding, finalization delays were witnessed. However, the business was able to maintain its market share and garner significant orders from Karnataka, Tamil Nadu and Uttar Pradesh.
In the transmission system space, investments were driven by the packages finalized based on tariff-based competitive bidding and through the State utilities that could secure multilateral funding. With the continuing general lack of investment in the conventional power generation and industry segments, centrally-driven transmission schemes
were not aplenty. States such as West Bengal and Tamil Nadu finalized packages for strengthening their intra-state transmission line networks and associated substations.
The neighbouring countries of Nepal and Bangladesh too offered potential across the T&D spectrum, viz. substations, transmission lines and distribution.
Despite the fact that the solar industry faced a lower capacity addition in FY 2019-20 as compared to the previous year, in the face of political changes in some States and the dependence on China for modules, the solar business portfolio surpassed a cumulative capacity of 2.3 GW. Measures such as the removal of the ceiling on tariff, acceptance of corporate guarantees in lieu of bank guarantees, etc., boosted the confidence of the developers. Central PSU tenders with a domestic content requirement gave a fillip to prospects.
In the Middle East, though the macro-economic scenario was mixed in FY 2019-20, the business garnered a major portion of the opportunities that arose. The continued trend of non-oil based economic diversification has opened up infrastructure project development in these countries.
In Africa, certain countries in need of facilitation in terms of funding and expertise to build transmission lines and substations at EHv levels resorted to the MOU route with reliable partners.
400 kV Grid Station at Misfah, Oman 400/220/66 kV Substation at Wangtoo, Himachal Pradesh
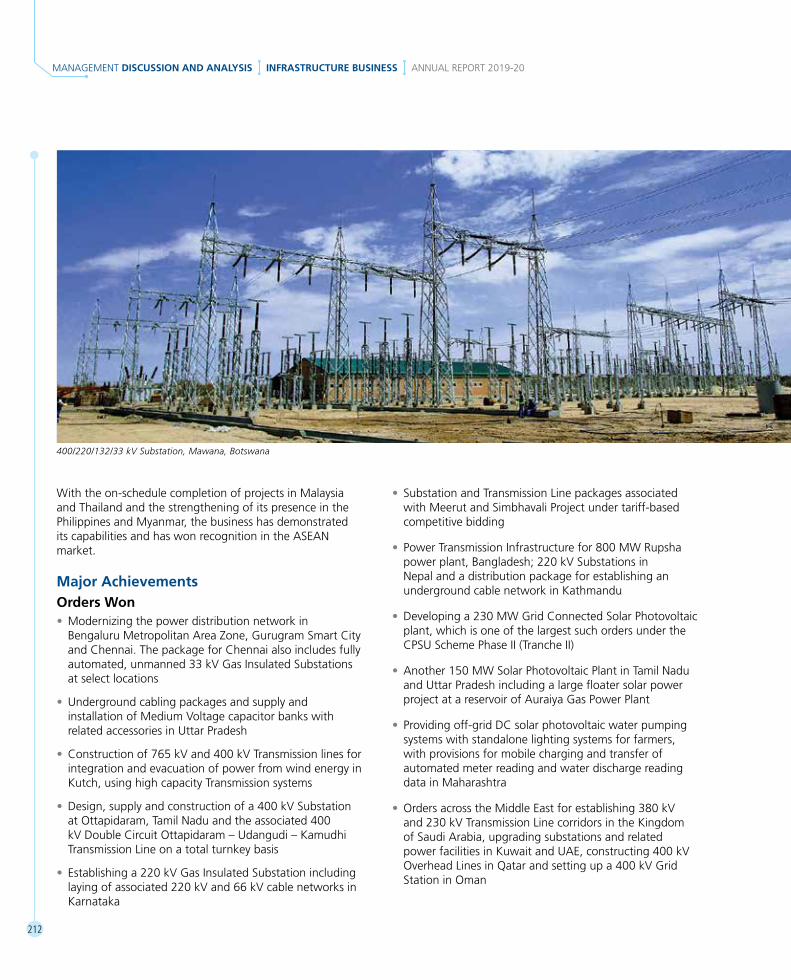
MANAGEMENT DISCUSSION AND ANALYSIS INFRASTRUCTURE BUSINESS ANNUAL REPORT 2019-20
212
With the on-schedule completion of projects in Malaysia and Thailand and the strengthening of its presence in the Philippines and Myanmar, the business has demonstrated its capabilities and has won recognition in the ASEAN market.
Major AchievementsOrders Won • Modernizing the power distribution network in
Bengaluru Metropolitan Area Zone, Gurugram Smart City and Chennai. The package for Chennai also includes fully automated, unmanned 33 kv Gas Insulated Substations at select locations
• Underground cabling packages and supply and installation of Medium voltage capacitor banks with related accessories in Uttar Pradesh
• Construction of 765 kv and 400 kv Transmission lines for integration and evacuation of power from wind energy in Kutch, using high capacity Transmission systems
• Design, supply and construction of a 400 kv Substation at Ottapidaram, Tamil Nadu and the associated 400 kv Double Circuit Ottapidaram – Udangudi – Kamudhi Transmission Line on a total turnkey basis
• Establishing a 220 kv Gas Insulated Substation including laying of associated 220 kv and 66 kv cable networks in Karnataka
• Substation and Transmission Line packages associated with Meerut and Simbhavali Project under tariff-based competitive bidding
• Power Transmission Infrastructure for 800 MW Rupsha power plant, Bangladesh; 220 kv Substations in Nepal and a distribution package for establishing an underground cable network in Kathmandu
• Developing a 230 MW Grid Connected Solar Photovoltaic plant, which is one of the largest such orders under the CPSU Scheme Phase II (Tranche II)
• Another 150 MW Solar Photovoltaic Plant in Tamil Nadu and Uttar Pradesh including a large floater solar power project at a reservoir of Auraiya Gas Power Plant
• Providing off-grid DC solar photovoltaic water pumping systems with standalone lighting systems for farmers, with provisions for mobile charging and transfer of automated meter reading and water discharge reading data in Maharashtra
• Orders across the Middle East for establishing 380 kv and 230 kv Transmission Line corridors in the Kingdom of Saudi Arabia, upgrading substations and related power facilities in Kuwait and UAE, constructing 400 kv Overhead Lines in Qatar and setting up a 400 kv Grid Station in Oman
400/220/132/33 kV Substation, Mawana, Botswana

213
• Engineering, Procurement and Construction of the 400 kv Overhead Transmission Line between the towns of Chimuara and Alto Molocue in Zambezia Province in Mozambique, Africa. In Ethiopia and Uganda, orders have been received for establishing distribution networks involving medium / low voltage distribution lines and last-mile consumer connections
• 500 kv Substation order in the Philippines
Projects completed and commissioned • Three STATCOM projects in Hyderabad, Udumalpet and
Trichy
• Commissioned one of the highest-altitude 400 kv GIS at Wangtoo, Himachal Pradesh, at an altitude of 1727 m above MSL, overcoming cold weather conditions
• More than 1900 CKM-long transmission corridors were completed in 2019-20
• Communication backbone networks involving aerial / underground optic fibre cable links of more than 11000 km have been established
• The first biggest utility-scale solar-cum-MWh-scale energy storage project in India was substantially completed. Also, the first MW scale floating solar project in India (4 MWp) was rendered ready for commissioning
• Across the Middle East, 26 substations were commissioned, including major 400 kv substations in Qatar and Oman. More than 200 km of overhead transmission lines and 325 km of underground cable networks capable of high capacity energy transfer were built
• Building upon the successful commissioning of EHv substation projects in Africa, the business has now completed a 220 kv Transmission Line in Egypt and a 500 kv HvDC Transmission Line in Kenya
• In Malaysia, a 500 kv Transmission Line from Yong to Peng to Segamat has been successfully commissioned on schedule
Awards and RecognitionsThe business won laurels for its technological and execution prowess.
• For its innovativeness amongst the emerging technologies, the Energy Management System for BESS used in hybrid and microgrid systems won several awards, including World Innovation Congress 2020 Awards, ET Now Solar Leadership Award 2020 and the ISGF Innovation Award 2020
• The smart portable mobile solution L&T Mobisol won the World Innovation Congress 2020 and ET Now Solar Leadership Awards 2020
132/33 kV Grid Station at Ghala Heights, Oman

MANAGEMENT DISCUSSION AND ANALYSIS INFRASTRUCTURE BUSINESS ANNUAL REPORT 2019-20
214
• The Bihar rural electrification project was adjudged as the best use of solar for societal benefits, and the Andaman Energy Storage project was hailed as the energy storage project of the year by ET NOW
• The automatic module dry cleaning system won the award for the best smart technology of the year from India Smart Grid Foundation (ISGF)
• The 132 kv Ghala Heights Substation earned L&T Oman the Dossier Award for the Best Contractor for Infrastructure Projects
• The power transmission & distribution projects in KSA and UAE bagged five Middle East Economic Digest (MEED) awards in different categories
• The Union Territory of Puducherry conferred the Swachhata hi Sewa award for a water management related CSR project of the Puducherry factory
Significant InitiativesThe containerized integration facility for battery energy storage systems set up at Kancheepuram was commissioned successfully and started despatch. The ready-for -commissioning cell that was created to quicken the handing-over of completed transmission line stretches has started to have a beneficial impact on customer delight. Improvised modularization initiatives such as kitting
of tower components and remote electrification items continue.
In the vast expanses of Africa, mechanized bush-clearing activities and the adoption of advanced techniques, such as the Aerial LiDAR survey, have led to timely project completion with desired productivity levels. With mechanized trenching and in-house GIS surveys with 360° cameras, increased productivity was witnessed in the domestic optic fibre cabling projects too. The TL9000 certification meant for the supply chain of telecommunications industry has been obtained.
The MoMRA (Ministry of Municipal and Rural Affairs) certification for L&T Saudi Arabia has opened up opportunities with Royal Commission tenders.
DigitalisationTaking a step towards the next level of digitalisation, a specific Opex initiative has been launched to orchestrate the data captured by digital means and to articulate the organizational wisdom in a replicable manner. This initiative is expected to enhance the predictive abilities and make the plans robust, so as to better manage risks and achieve the desired speed and scale. The Industry 4.0 journey has gained momentum in the manufacturing facilities, resulting in a marked improvement in the overall
Floating Solar Project, Tirupati, Andhra Pradesh

215
equipment efficiency (OEE). At the core of such initiatives is the centralized facilitator set-up named PRAPTI – Planning, Reviewing and Assisting Projects to Improve – that equips the site team with the requisite tools and analytics to improve productivity.
Digital initiatives such as 3D/4D BIM, deployment of drones and mobility devices for project progress monitoring, connected plant and machinery, geospatial technology-based surveying, integrated material management, quality / EHS incident reporting, etc., have yielded tangible benefits. Novel solutions have been deployed, and a fibre track application that facilitates patrol management for Operation & Maintenance of cross-country cables laid is just one such example.
Also, to measure the depth profile of trenches in real time accurately, a sophisticated digital method has been used.
Environment, Health and SafetyEHS practices implemented by the business are aligned with a corporate EHS policy that is strictly followed, along with clear policies laid out at the business level. The EHS policy is supported by standard operating procedures (SOPs) at the business-unit level, and the aim of ‘Zero Harm’ is cascaded down to the project level through various digital and technical initiatives.
The start-and-stop OTP (One Time Password) based process with a 3-level approval mechanism for shut-down works is an example of an improvised fail-safe EHS practice meant for the geographically distributed electrification work involving workmen of different skill levels. virtual reality-based training modules, gamified mobile training modules, etc., are utilized to inculcate a safety culture. A nimble communication platform named Prakasha vani was launched for dial-out conferencing with large teams of field staff. WISA (Workmen Induction & Skills Application) Card implementation is used for workmen screening and allocation of tasks according to skill levels and proficiency.
In the Middle East, the Occupational Health and Safety System was migrated from OHSAS 18001:2007 to ISO 45001:2018.
The business bagged 21 British Safety Council (BSC) Awards, 8 awards from NSCI under various categories and 15 RoSPA Awards. Also, ASSE awards and appreciation certificates from several domestic and overseas customers such as PGCIL, Aramco, SEC and OETC have been received.
Human ResourcesThe business has been constantly engaged in developing employees for greater roles and responsibilities, ensuring that there is a talent pipeline of managers prepared to take up challenging roles.
400/132 kV Grid Station at Qabel, Oman 500/220 kV S4 Ras Ghareb Gas Insulated Substation, Egypt

MANAGEMENT DISCUSSION AND ANALYSIS INFRASTRUCTURE BUSINESS ANNUAL REPORT 2019-20
216
A blend of robust processes like the Performance Management System, the Individual Development Plans, Job rotation Plan, cross-learning and cross-training opportunities help to develop young managers. They are assigned new situations and challenges which expand their skill sets and encourage them to think on their feet. Many of the new projects sites in Africa have been staffed by young managers and engineers transferred from India in accordance with the employee development plan.
A wide array of digital platforms has been implemented to connect and engage with employees as well as encourage them to undertake new learning opportunities. A year-long Employee Engagement Calendar has been launched, with specific focus on a range of activities built around the core values of the organisation. The initiatives to recruit and induct young engineers of diverse nationalities continue.
Risks and ConcernsTowards the end of the financial year, the outbreak of the COvID-19 pandemic and the resultant lockdown caused uncertainties in timely delivery of a few supply items planned. Adequate contractual safeguards have been put in place and extensive scenario planning exercises have been carried out.
Recovery is expected to be prolonged and necessitates a multi-pronged approach towards prudent financial
management, workmen management, etc., as it provides an opportunity for new methods of working and revised cost estimates.
The business has implemented a bespoke digital platform for Enterprise Risk Management that supports the pre-bid and execution risk reviews with robust stage gates.
OutlookThe proposed amendment to the Electricity Act envisages stricter enforcement of obligations that are to be fulfilled by State utilities, thereby improving their financial health. It may also open up new models of participation in the distribution sector.
The Union Budget 2020-21 hinted on a centrally sponsored scheme, focussed on smart metering, feeder segregation and AT&C loss reduction. Early formulation and implementation, along with project packaging and models of participation, are crucial.
Though the investment levels delineated in the National Infrastructure Pipeline are not markedly higher than historical trends, the report contains a KPI-based framework with specific targets on AT&C loss reduction, etc., by 2023.
In urban areas and cyclone-prone zones, HT and LT overhead lines are being replaced with underground
500 kV Bang Saphan-2 to Surat Thani Transmission Line

217
cables. New 11 kv feeders are created for load bifurcation. Such projects improve the overall reliability of the power distribution network and, in particular, help in avoiding unscheduled power cuts during rains and gusty winds.
The transmission lines and substations related to the second phase of Green Energy Corridors for evacuation of renewable energy are expected to get finalized. These are under various stages of bidding through the Tariff-based Competitive Bidding mode. In addition, intra-state system strengthening-related opportunities are expected to come up in select States. Also, certain mass transit projects which involve receiving substations and power supply networks are envisaged in key cities.
Grid integration of intermittent renewable energy and the emerging prospects of distributed generation require investments in power quality devices such as STATCOM, thyristor-controlled reactor (TCR) and SvC to ensure voltage stability, reactive power compensation and reduction of harmonics.
System Strengthening and Generation Linked Schemes, especially those funded by Indian Lines of Credit and multilateral aids, offer potential in Bangladesh and Nepal.
Despite the slow pace of solar EPC tenders from private developers being incommensurate with ambitious targets, there are ample opportunities, especially from PSUs.
Preference for Hybrid renewable projects and floating solar projects are also on the rise. There is a perceivable shift towards solar-cum-storage projects. The expanding support to the International Solar Alliance is a positive factor in attracting investments into the renewable energy sector in India.
The Indian market for Optical Fibre Cable has been projected to grow at a CAGR of 17 percent through 2023. Growth in the market is majorly expected to be backed by the rising investments in OFC network infrastructure by the Indian Government to increase internet penetration across the country, in line with the Government’s initiatives such as Smart Cities vision and Digital India. Also, the success of 5G technology will ultimately depend on the strength of Optical Fibre Cable connectivity.
In the Middle East, the business is cautiously optimistic in its outlook as oil prices are hovering in the lower ranges; commodity prices are volatile, and the geopolitical stalemates continue. The investment in infrastructure will depend on the fiscal surplus and financial buffers available with the countries. However, the diversification of the economy to non-oil sectors will continue to provide opportunities in terms of upgradation to higher voltage levels, integration of renewable energy sources to the existing power grid and interconnections of transmission networks.
765 kV Gas Insulated Substation, Varanasi, Uttar Pradesh 132/33 kV Underground Cable at Ghala Heights, Oman

MANAGEMENT DISCUSSION AND ANALYSIS INFRASTRUCTURE BUSINESS ANNUAL REPORT 2019-20
218
The business continues to concentrate on key African economies that have a clear road map to build transmission and distribution networks to meet increasing demand. Ambitious plans – such as the Kenya vision 2030, Growth and Transformation Plan II of Ethiopia and the National Development Plan of Botswana – point to significant opportunities to scale up faster. Grid strengthening, regional interconnection and rural electrification opportunities are being pursued in select countries. Renewable generation is another area that holds potential. Consolidating the breakthroughs achieved in countries forayed into, exploring renewable energy opportunities and the opening-up of select West African countries will hold the key to success in the coming year.
The rising power demand in ASEAN countries continues to pave the way for significant investments in grid interconnections, grid development and strengthening. The entry into the Philippines, Myanmar and Cambodia is expected to provide a fillip in the region. Plans are afoot for an expanded presence in Malaysia and Thailand.
Given the visibility of prospects in traditional strongholds and the thriving expansion in renewables and new geographies, the growth momentum of the PT&D business is intact, backed by a strong order book and ably supported by cost leadership, technology leverage, delivery excellence and employee engagement initiatives.
WATER & EFFLUENT TREATMENT
Overview:The Water & Effluent Treatment business undertakes the construction of water infrastructure for the efficient usage, conservation and treatment of water. The business has proven to be a lead player in the domestic market and has also had successes in international markets. The business comprises the following verticals:
• Water supply & distribution business, which caters to the supply of potable water.
• Wastewater business, which provides infrastructure by building sewer networks and sewage treatment plants to collect and treat municipal wastewater for safe disposal of the treated effluent.
• Large Water business, which irrigates lakhs of hectares of land in order to enhance the livelihood of millions, pumps and lifts water from rivers to delivery chambers and distributes it using automated outlet management systems. The business also constructs combined effluent treatment plants for industries and desalination plants.
12 Million cu.m storage reservoir for Vizag Steel Plant, Andhra Pradesh

219
• Smart Water Infrastructure business, which develops utility infrastructure in the cities as well as the shortlisted brownfield cities under the Smart City Mission.
• The International arm, which focuses on building water infrastructure, viz. sewage treatment plants, water treatment plants and water transmission and distribution projects. The business has a presence in the UAE, Qatar, Oman, Tanzania and Sri Lanka.
Business EnvironmentAiming to provide piped water supply to all households, the Government has announced the Jal Jeevan Mission. The scheme places emphasis on augmenting local water sources and recharging existing sources, and will promote water harvesting and de-salination. The ‘Har Ghar Jal’ scheme to provide a functional tap connection to all households by 2024 is part of the Jal Jeevan Mission.
The business accounts for an average of more than 35% share of the domestic market. Over the years, it has emerged as a strong contender in the water segment, meeting the requirements of the public at large. Each business unit is independent, and faces stiff competition in the market including international competition from Chinese and European players.
FY 2019-20 has been volatile, with the General Elections and the change in Governments of key states. This has resulted in some delays in new prospects fructifying, and the execution of projects being stalled or reviewed by a few states. The COvID-19 pandemic also continues to have a profound impact on the Indian construction industry.
Major AchievementsThe business continued its momentum in securing repeat orders from existing customers as well as attracting new customers. These orders were secured across the various business portfolios.
Major Orders Secured In India • Parwati Mega Lift Irrigation Schemes Phase III & Iv,
Madhya Pradesh
• 100 MLD Sea Water Reverse Osmosis Desalination (SWRO) Plant in Dahej district
• 477 MLD Water Treatment Plant at Chandrawal
• Area Based Development for Rajkot, Gujarat
• Gunjawani Lift Irrigation Scheme
375 MLD Sewage Treatment Plant, Jebel Ali, UAE

MANAGEMENT DISCUSSION AND ANALYSIS INFRASTRUCTURE BUSINESS ANNUAL REPORT 2019-20
220
• Bhubaneshwar Sewerage Scheme
• Rural Water Supply Scheme to Keonjhar District in Odisha
• 30 MLD Combined Effluent Treatment Plant (CETP) at Ahmedabad, Gujarat
• Water Supply Schemes to 4 blocks in Medinipur, West Bengal
• Water Management projects in Hubballi-Dharwad, Belagavi and Kalaburgi districts of Karnataka
International • Al Dhakhliya Water Transmission System, Phase-II project
in the Sultanate of Oman
• Kundasale Haragama Water Supply Project, Sri Lanka
• Supply of Recycled Water along Abu Dhabi Al Ain Road – Package B, UAE
AwardsDuring the year, the business won a slew of prestigious awards:
• 7 awards from Zee Business as part of the National CSR Leadership Congress including ‘Best Water
Company’ and ‘Best Rural Drinking Water Solutions Provider’
• ‘Overall Infrastructure Development’ award from Dun & Bradstreet
• Water Optimization Awards ‘Technology Excellence in Design & Engineering’ and ‘Best Water Management in Ash Handling’ from Mission Energy Foundation
• The prestigious Golden Peacock Award for HR Excellence for 2019
The business is proud of commissioning its largest 375 MLD Sewage Treatment Plant in Jebel Ali, UAE and successfully undertaking its operation and maintenance.
The desalination project bagged by the L&T-Tecton Jv this year uses the Split Partial Method for the Reverse Osmosis (RO) process, the first of its kind to be implemented in India. This is an in-house design innovation and will reap benefits during the progress of the project.
Significant InitiativesThe business keeps continuously honing its operations and process knowhow capabilities by implementing strategic initiatives for the effective working of its project sites.
137 MLD Water Treatment Plant, Nashik, Maharashtra Secondary clarifiers under construction for 318 MLD Waste Water Treatment Plant, Coronation Pillar, New Delhi

221
With significant focus on digitalisation, the business has developed many web and mobile applications such as:
• Project monitoring tool ePragati, from which data is captured for visualization of project progress using 3D GIS platform for pipeline and civil structures
• The customized pipe fabrication (P-Fab) application to track the status of pipes – from manufacturing to installation
• The Material Schedule Tracker (MST) to ensure timely supply of items by effective monitoring and tracking
• The WISA application for elaborate and faster on-boarding, monitoring and screening of the workforce
• Using artificial intelligence in contracts for classifying, extracting and assessing the risk in the tender’s clauses
The continuous emphasis on strengthening the in-house design team has resulted in shortening the design duration by leveraging technological solutions, such as:
• Use of LiDAR surveys to capture accurate, speedy and voluminous data
• Automated design-to-drawing preparation of ESRs using in-house developed tools
• Extensive utilization of BIM for project monitoring and progress review
• Creation of value engineering centres and process improvement techniques to aid in innovation and design optimization
Apart from digitalisation, the business has also developed strong process teams and tie-ups with educational institutions like IIT Madras, Anna University and BITS, Goa for research in the field of wastewater and sludge management.
Environment, Health and SafetyThe business:
• Achieved 112 million safe man-hours and clocked 5.9 lakh man-hours for training the workmen and staff
• Developed training videos for MS pipe manufacturing process (conventional and spiral), pipe-handling methodology, safe erection of transmission towers, micro tunnelling safety and pipe-bursting methodology
• Developed Project Risk Index Map for real-time hazards and risk-monitoring of sites
• Developed a comprehensive Safety Mobile application, viewEHS, capturing safe execution cards (SEC), observation and audit reviews
Pump house for Chhaigaonmakhan Lift Irrigation Scheme, Madhya Pradesh
Lift Canal System for Upper Indravati Irrigation Project, Odisha

MANAGEMENT DISCUSSION AND ANALYSIS INFRASTRUCTURE BUSINESS ANNUAL REPORT 2019-20
222
• Planted more than 14 lakh tree saplings, with 7 lakh+ saplings in a single day on World Environment Day 2019, and donated 4300 units of blood
• Received several awards from RoSPA (Royal Society of Prevention of Accidents), British Safety Council, Confederation of Indian Industry and National Safety Council
Human ResourcesContinuous learning, improvement and excellence are the focus of the business, which has 5700+ staff across India and abroad. various programmes are conducted to appreciate employees, such as RAvE (Recognition Awards for value Engineering Excellence) which aims to recognize individuals and teams in L&T’s Engineering, Design & Research Centre (EDRC) for their outstanding contribution to fulfilling business objectives; and PRAISE, which recognized 124 staff members for the innovations or improvements implemented by them at work.
To engage employees beyond work, various events were organized to commemorate World Water Day, World Environment Day as well as various national and regional festivals. The business also organized sporting events across all projects, which helped employees de-stress and develop a sense of togetherness and camaraderie.
Succession planning is the key to ensuring the seamless continuity of a business. A leadership programme, ASCEND, was initiated to build leadership capabilities in women managers. EMEX (Engineering Management Excellence Programme) was organized to build the project engineering management capabilities of the EDRC’s managers.
Risks and ConcernsOperational risks include delays in land acquisition, ROW/ROU issues and volatile steel prices. With the majority of the business’ clients being state government authorities, there isn’t much risk related to projects getting shelved or concerns pertaining to creditworthiness. However, the year evidenced the cashflow rationalisation in the case of change in state governments.
The assessment of risks associated with the projects is carried out frequently to track and review the project cost, cash flows, margins as well as physical progress, and thus determine the overall health of the portfolio. Also, state-wise exposure is dynamically monitored to track any early signals of cashflow constraints.
The business proactively ensures that it has a healthy mixture of projects funded by various credit-worthy clients and bodies like the Central Government, State Governments, Municipal Corporations, Urban Local Bodies,
Moradabad Sewerage Treatment Plant, Uttar Pradesh Pump house for Nandawadagi Lift Irrigation Scheme, Karnataka

223
Multilateral Funding Agencies, etc. Wherever feasible, the payment terms with supplier and vendor partners are aligned to customer terms to avoid cash gaps.
Foreign currency exposure in the case of international projects, is minimised by ensuring a natural hedge at the bid stage. Further, hedging policies are also in place for exposures, if any.
OutlookThe business is anticipating an increase of multilateral funded projects in the next year from the domestic market. The Jal Jeevan Mission is envisioned to provide piped water supply to every rural household under the ‘Har Ghar Jal Yojana’ scheme by 2024, which will bring greater coherence to policy objectives and the decision-making process.
However, the business foresees challenges in terms of payment slowdown, mobilization of the workforce and loss of the productive months of the year due to the ongoing pandemic.
A revision of the National Water Policy 2012 with key changes in the water governance structure and regulatory framework is anticipated in FY 2020-21, with more emphasis on water management and river interlinking. This is expected to give impetus to the business.
The Union budget proposed an allocation of R 11,500 crore during the year 2020-21 towards the Jal Jeevan Mission. The Jal Shakti Ministry has been formed by merging the Ministry of Drinking Water and Sanitation (MDWS) and the Ministry of Water Resources and Ganga Rejuvenation (MoWR).
SMART WORLD & COMMUNICATION
Overview:L&T’s Smart World & Communication (SWC) vertical was created in 2016 to address the emerging need for a safe, smart and digital India. As a Master Systems Integrator, SWC operates and retains market leadership in the following segments:
• Smart Cities & Smart Infrastructure: Smart Cities, e-gov, Smart Energy, Smart Education, etc.
• Safe Cities: Public Safety, Critical Infra Security, Intelligent Traffic Management, etc.
• Communication & Telecom Infrastructure: Wired & Wireless i.e. IP/MPLS backbones, Dense Wavelength Division Multiplexing, Global System for Mobile Wi-Fi, Satellite, Microwave, Emergency Communications like APCO, Tetra, Early Warning Dissemination, 5G, etc.
Command & Control Centre, Prayagraj

MANAGEMENT DISCUSSION AND ANALYSIS INFRASTRUCTURE BUSINESS ANNUAL REPORT 2019-20
224
The business has gained experience across 26+ cities and 44 agencies in the country. It has built a technology and project management team with over 800 personnel, to cater to the needs of both projects and Operations & Maintenance. The business is currently in the process of rolling out various initiatives to transform itself as a ‘thought partner’ to its clients; a value-adding Master System Integrator (MSI) with futuristic solutions, strategic partnerships, as well as Integration & Analytics and domain-specific centres of excellence.
Business Environment A growing number of cities is adopting elements of smart city infrastructure, such as intelligent traffic management and surveillance systems, smart electric grids and lighting, fibre optic cabling and transport and logistics systems. Out of the 100 Smart Cities planned in the Smart Cities Mission, an integrated command and control centre along with various Smart City solutions is operational in 47 cities, with 17 more cities being in the process of implementation.
To provide 100% population coverage for telecom and high-quality broadband services for the socio-economic empowerment of every citizen and end-to-end online delivery of government services, the Government will continue its investment in the Bharat Net Programme.
During the COvID-19 pandemic lockdown, the authorities leveraged Smart City or Safe City Command and Control Centres set up by the business, with cutting-edge technologies like AI, IoT, etc. The business has rolled out smart technology solutions to combat COvID-19 in 20 major cities across India. These technologies are helping the administration in cities such as Mumbai, Pune, Nagpur, Prayagraj, Raipur, Ahmedabad, visakhapatnam and Hyderabad in fighting the pandemic through Command Centres or City Operations Centres.
Major AchievementsThe business received several major orders, as follows:
a. The business won a large order to establish the first-of-its-kind, state-of-the-art Unified Network Management System to Manage, Support and Operate a countrywide Armed Forces Network under the Network for Spectrum (NFS)
b. Jhansi Smart City involving deployment of an Integrated Command and Control Centre, Intelligent Traffic Management System, City Surveillance, City Wi-Fi, technology-enabled Solid Waste Management, GIS, Citizen Portal and e-Office Applications
Data Center, Hyderabad Tourist Information Kiosk, Jaipur

225
c. SUMITRA Project, which is a pilot project for Surveillance using Multilayer Intelligent Tracking, Response and Analysis system on a turnkey basis
d. Army IP MPLS - an order to create an IP MPLS Network Backbone for the Armed Forces
e. Hyderabad ITMS Expansion an order for expansion of the Intelligent Traffic Management System for Rachakonda and Cyberabad
Other AchievementsThe Early Warning Dissemination System (EWDS) for Odisha was effectively utilized in disaster management by the Government during Cyclone Fani enabling the Government of Odisha to save millions of lives through dissemination of warnings through text messages (26 million messages), Sirens and Radio communication.
The business successfully rolled out 1 million+ Smart Meters, with Meter Data Management System and Head End System hosted on the cloud, in the states of Uttar Pradesh and Haryana as part of the ongoing project to deploy 5 million Smart Meters.
The business commissioned the E-shiksha (Hi-Tech Lab) project for the state of Tamil Nadu, involving the largest roll-out of ICT for more than 6000 schools in Tamil Nadu.
The largest City Surveillance and Intelligent Traffic Management System for Hyderabad was declared Go-Live.
The Early Warning Dissemination System (EWDS) for Andhra Pradesh was successfully commissioned and covers 10 coastal districts.
Raipur Smart City was successfully commissioned and declared Go-Live.
Awards and RecognitionIn the year under review, the business won over 10 prestigious awards, including: -
• ‘Best Smart City Award’ at the Dun & Bradstreet Infra Awards 2019, for Nagpur Smart City
• ‘Best Safe & Secure Initiative’ Award at the 5th BW Digital India Awards, for Prayagraj Smart City
• Unique Artificial Intelligence-based Solutions at the Data Science Excellence Awards, CYPHER, for Prayagraj Smart City
Significant InitiativesThe business has taken the following initiatives in the areas of tendering, technology, supply chain management and operational efficiency improvement:
• In order to solve problems utilising the huge amount of data being collected in 25+ Smart and Safe cities,
City Operation Centre, Nagpur

MANAGEMENT DISCUSSION AND ANALYSIS INFRASTRUCTURE BUSINESS ANNUAL REPORT 2019-20
226
the business has set up an Analytics & Integration CoE using Big Data, IoT and Artificial Intelligence technologies. The business has also undertaken the development of a world-class Integrated platform, which allows the creation of one Operating System to solve business problems as against point solutions. This value-based approach helps in retaining clients. Under this initiative, a pilot use case of in-house AI-based crowd management solutions was successfully deployed in Telangana State to manage ‘Samakka Saralamma Jatara’, Asia’s largest tribal fair
• The business is continuously working with global partners, reputed academic institutions and start-up ecosystems to co-develop customised solutions, blending the partner’s technology and its domain expertise. This approach will position the business as ‘value-adding MSI’ and help transform it into a ‘thought partner’ to clients
• The business launched a multitude of digital solutions to support the business functionalities, viz.
• SWIFT: ‘Supply and Work Integrated Finishing on Time’ to enable procurement
• Centralized O&M: A GIS-based tool to track O&M activities and incident management
• VR Training Module: A virtual reality training module for site staff/workmen
• QMS Tool: QMS Manual and Risk / Opportunity / Objective Tracking
Environment, Health and Safety • The business completed 4.93 million safe manhours
during this financial year
• The business planted 35,974 saplings and donated 403 units of blood
• The business won 4 RoSPA Gold Awards from The Royal Society for the Prevention of Accidents, UK, for Lucknow Metro Rail Project, Raipur Smart City, MEGA Telecommunication Project and Prayagraj Smart City
• The business launched its second digital application, vIEW EHS, this year and received copyrights over the application
• After successful completion of transition audits by DNv-GL, the business has been recommended for ISO 45001:2018 certification
Human ResourcesThe team comprises multi-domain technical talent with specialists in the areas of communication, IoT, server and storage, Cloud in Smart Cities, Safe Cities and
Early Warning Dissemination System, Odisha Smart Pole, Vizag
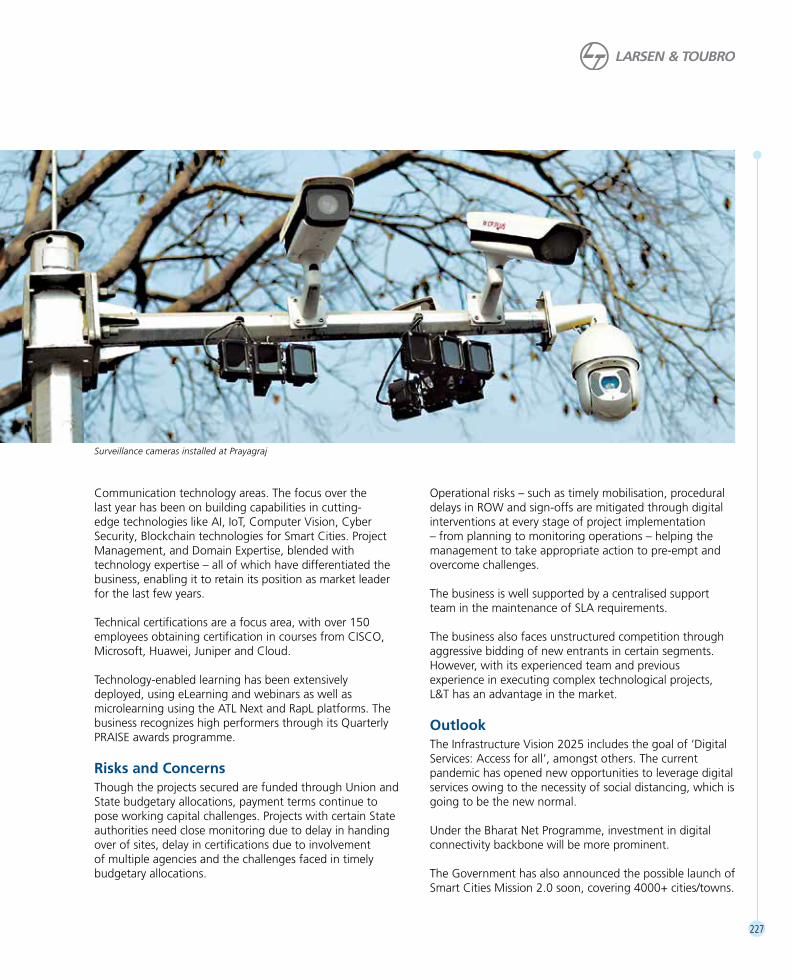
227
Communication technology areas. The focus over the last year has been on building capabilities in cutting-edge technologies like AI, IoT, Computer vision, Cyber Security, Blockchain technologies for Smart Cities. Project Management, and Domain Expertise, blended with technology expertise – all of which have differentiated the business, enabling it to retain its position as market leader for the last few years.
Technical certifications are a focus area, with over 150 employees obtaining certification in courses from CISCO, Microsoft, Huawei, Juniper and Cloud.
Technology-enabled learning has been extensively deployed, using eLearning and webinars as well as microlearning using the ATL Next and RapL platforms. The business recognizes high performers through its Quarterly PRAISE awards programme.
Risks and ConcernsThough the projects secured are funded through Union and State budgetary allocations, payment terms continue to pose working capital challenges. Projects with certain State authorities need close monitoring due to delay in handing over of sites, delay in certifications due to involvement of multiple agencies and the challenges faced in timely budgetary allocations.
Operational risks – such as timely mobilisation, procedural delays in ROW and sign-offs are mitigated through digital interventions at every stage of project implementation – from planning to monitoring operations – helping the management to take appropriate action to pre-empt and overcome challenges.
The business is well supported by a centralised support team in the maintenance of SLA requirements.
The business also faces unstructured competition through aggressive bidding of new entrants in certain segments. However, with its experienced team and previous experience in executing complex technological projects, L&T has an advantage in the market.
OutlookThe Infrastructure vision 2025 includes the goal of ‘Digital Services: Access for all’, amongst others. The current pandemic has opened new opportunities to leverage digital services owing to the necessity of social distancing, which is going to be the new normal.
Under the Bharat Net Programme, investment in digital connectivity backbone will be more prominent.
The Government has also announced the possible launch of Smart Cities Mission 2.0 soon, covering 4000+ cities/towns.
Surveillance cameras installed at Prayagraj

MANAGEMENT DISCUSSION AND ANALYSIS INFRASTRUCTURE BUSINESS ANNUAL REPORT 2019-20
228
Under the Smart Meter National Programme, the Government aims to replace 250 million conventional meters with Smart Meters in the next 5 years. With the Government’s focus on reducing commercial losses and providing a choice of suppliers to consumers through Smart Meters, this programme is likely to be implemented at an accelerated mode with a target of completion of 3 years.
The Ministry of Home Affairs continues its focus on Safe Cities and the modernization of the Police force. It is expected to launch multiple City Surveillance projects and augment the scope of the existing Safe City projects.
With the continued need for perimeter security for all critical installations – including defence establishments, air/army bases, armament factories, nuclear power plants, etc. – investments are expected to flow into projects designed to meet these security needs.
Another focus area in the National Infrastructure Pipeline is the creation of technology-driven learning. This focus on creating ICT infrastructure for primary and secondary schools through ‘Samagra Shiksha Abhiyan’ is expected to create many new opportunities in e-Education.
The Union Budget 2020-21 also announced the National Mission on Quantum Technologies & Applications with an outlay of R 8,000 crore over the next 5 years to focus on a quantum computing domain and its impact on new
frontiers in computing, communications and cyber security, with widespread applications including smart cities.
The business has the unique advantage of in-house domain expertise, enabling it to provide end-to-end offerings to its customers. This enables it to play the role of a Master System Integrator for the Smart Cities of the future.
METALLURGICAL AND MATERIAL HANDLING
Overview:L&T’s Metallurgical and Material Handling (MMH) business offers complete EPC solutions for the metal (ferrous and non-ferrous) sectors across the globe. The business undertakes end-to-end engineering, procurement, manufacture, supply, construction, erection and commissioning, covering the complete spectrum from mineral processing to finished metal products with state of the art Process Plants.
The business also offers comprehensive product solutions such as Mineral Crushing Equipment and Plants, Surface Miners, Premium Sand Plants, Material Handling Equipment (Stackers, Reclaimers, Wagon Tipplers, Ship Unloaders, Multipurpose
Chhabra Coal Handling Plant, Rajasthan

229
Cranes and other Mining Equipment), as well as Steel Plant Machinery catering to core industrial sectors, including Cement, Mining, Power, Construction, Steel, Fertilizers and Chemical Plants. The complete range of product solutions is backed by 5 decades of experience and knowledge, in-house design resources and state-of-the-art manufacturing capabilities. The manufacturing centres of its product lines are in Kansbahal, Odisha and Kancheepuram, Tamil Nadu with facilities for fabrication, machining and assembly of custom-made equipment and critical structures. The business commands a leadership position in the sectors it serves.
Business Environment The metal sector, as a whole and specifically the base metal sector, witnessed a subdued price level globally on account of less-than-anticipated growth in demand.
The demand for Manufactured Sand witnessed a rise with the increasing restrictions / bans on river-sand mining. The replacement of river sand with quality manufactured sand continues to gain momentum, improving prospects for the business.
The successful completion of the steel industry consolidation and allocation of iron ore mines in Q4 FY20
has brought all the majors on par as vertically integrated producers. Despite the liquidity crunch during the consolidation cycle and new expansions not immediately on the anvil, the refurbishment and de-bottlenecking of newly acquired assets to synergise with their existing products will be something very much on the cards.
The business faces reduced competition in EPC contracts and technology-oriented projects due to the scarcity of players matching qualification requirements.
In the wake of the COvID-19 pandemic, the global demand has plummeted and business cycles have been disrupted, resulting in a major production cut by the industry. The industry is expected to take time to attain full capacity again.
Major AchievementsThe continued focus on the Middle East and North Africa (MENA) has yielded good results in FY 2019-20, with the award of major orders from the Ma’aden-Gold Plant Project in Saudi Arabia and the Etihad Rail – Freight-handling package in UAE. Despite the limited opportunities available during the current year in India, the business has managed to stay ahead of its competitors in terms of order booking.
Finishing Mill for Rourkela Steel Plant

MANAGEMENT DISCUSSION AND ANALYSIS INFRASTRUCTURE BUSINESS ANNUAL REPORT 2019-20
230
Marquee projects commissioned / at an advanced stage of completion in the year 2019-20 are:
• Hot Strip Mill at Rourkela Steel Plant
• Basic Oxygen Furnace plant at Bokaro Steel Plant – Commissioned
• Tandem Tippler at JSW Paradip – Commissioned (hydraulically driven largest tippler in India)
• CHP & AHP at Tanda, Khargone
• CHP Lingaraj, Chhabra (Phase 1)
• 10 Large-capacity state-of-the-art sand plants commissioned for various customers
• 3 Newly-developed Track-Mounted Mobile Roll Crushers commissioned for coal-crushing applications
• 5 Surface Miners commissioned in Coal India subsidiaries
• 1100 MT Sky bridge in Colombo, fabricated in a factory at EWL works Kancheepuram.
Significant Initiatives The business has strategic alliances with leading global technologists to offer comprehensive EPC solutions across the various sectors of mineral beneficiation, steel processing units and mega-sized by-product plants. The technical
collaboration with Kemco of Japan was strengthened to enable the addition of many new products for the construction industry.
Digitalisation There is an increased thrust on digitalisation of processes / activities to enhance operational efficiency through faster decision-making with ready availability of data. The large international projects are being executed through Building Information Modelling (BIM) connected philosophy where in-house 3D engineering capability is being extended to 4D for scheduling with Work Breakdown Structure (WBS). Comprehensive solutions for EPC Planning and Monitoring, as well as Communication and Document Management solutions are implemented for projects under execution. Many of the sites have digitalised the workmen induction and tracking processes, while the initiative on connected equipment began giving results in terms of increased utilization.
The business has further strengthened real-time monitoring systems for Stockyard Machines, Sand Plant and Surface Miners through IOT and linked customized dashboards for optimum utility of the system for customers.
Environment, Health and Safety Leadership and management commitment are demonstrated at all locations and levels, by continual
7C Stacker-cum-Reclaimer installed at Khargone

231
improvement in the EHS processes and their implementation. various digital tools, including virtual Reality (vR) based training modules for ‘Safe Rigging Practices’, have been deployed at all project sites. Concerted efforts are made to involve and engage every employee, including workmen, in the safety cultural transformation, with a training coverage of 0.52 million manhours. Similarly, IB4U (Inspection Before Use) has been launched to track the inspection details of various materials and equipment including P&M, tools and tackle, PPE, etc.
All operations have been certified for ISO 45001: Occupational Health & Safety.
various national and international awards and accolades have been received for projects and factories in recognition of EHS excellence from the Ministry of Labour and Employment, RoSPA, ICC and customers.
Human Resources Focussed interventions for employee learning and growth were implemented through various virtual platforms like RAPL and webinars after mapping the needs across various levels and functions. To reinforce the latest developments in technology and automation in processes, the business has developed a pool of internal trainers. They share knowledge and enhance implementation of these initiatives at all locations for the development of our personnel and to improve productivity. To increase employee satisfaction, the business uses open communication channels like Connect HR, Townhalls, 2-way feedback and an internal newsletter - Sampark, while continuing with appreciation schemes, such as Hi5, NMR and PRAISE.
For building future leaders, a focused way of talent building across positions and levels, employees are provided with challenging opportunities across various functions, including job rotation with active handholding and mentoring by senior leaders. Leaders have been identified for senior key positions as part of the succession planning process.
Risks and ConcernsThe impact of the pandemic on the global and national economy and the time the situation takes to return to normalcy will determine the confidence of industry, especially the private sector, towards fresh capital expenditure.
COvID-19 will impact business operations, with restrictions on the mobilization of the workforce to MENA and disruptions in the supply chain, which may have adverse effects on the projects under execution. However, strategies to overcome these difficulties are being put in place to minimize impact, and customers are taken into confidence.
Outlook While sentiments looked positive for FY 2020-21, the COvID-19 pandemic has put the industry across the globe on the back foot. Global investments may be impacted in developing nations.
While the base and light metal prices continued to be subdued, the demand for these metals in the medium-to-long term looks robust enough to meet the growing needs of domestic consumption.
While oil prices are recovering after hitting new lows due to weak demand, impact on earnings of the GCC countries may slow down the capex plans of governments. Even though there is a slump in prices of base metals due to weak demand, GCC nations (e.g. KSA) with their own mines are expected to move ahead with capex plans to compensate for the loss of revenues from the oil sector.
With expected growth pick-up in the coal and cement sectors, core products like Crushing Plants, Surface Miners and Material Handling equipment are expected to grow at a good pace, especially in the second half of FY 2020-21.

MANAGEMENT DISCUSSION AND ANALYSIS POWER BUSINESS ANNUAL REPORT 2019-20
232
POWER BUSINESS
Overview:L&T has established itself as one of the leading EPC players in the Power Plant business in India and is known to deliver complete turnkey business solutions from concept to commissioning for the thermal power industry.
The business has built on its core competencies and capabilities and has emerged as a major player in new technologies such as Flue Gas Desulphurization (FGD) in the thermal power plant industry. It now has a sizeable presence in the FGD business.
The business has developed its own capabilities for executing large and complex power projects, which include in-house engineering, state-of-the-art manufacturing facilities, competent manpower and decades of experience earned in executing large and complex projects within and outside India. The business has a proven track record of delivering complete power plant solutions with scale and sophistication to meet India’s growing energy needs.
L&T’s integrated power equipment manufacturing facility at Hazira, Gujarat, is one of the most advanced in the world. The facility manufactures ultra-supercritical / supercritical boilers, turbines and generators, pulverisers, axial fans and air preheaters, components of FGD and electrostatic precipitators.
The business has project management offices at vadodara and Faridabad.
The business is now gearing up to make its mark to provide EPC solutions for Turbine Island of nuclear power plants and has taken the necessary steps to participate in tenders for upcoming nuclear power projects.
The business has the following Jvs within its fold:
L&T-MHPS Boilers Private Limited, a joint venture with Mitsubishi Hitachi Power Systems Limited (MHPS) Japan, for the engineering, design, manufacture, erection and commissioning of ultra-supercritical / supercritical boilers in India up to a single unit of 1000 MW.
L&T-MHPS Turbine Generators Private Limited, a joint venture with Mitsubishi Hitachi Power Systems Limited (MHPS), Japan and Mitsubishi Electric Corp. (MELCO), for manufacture of Steam Turbine Generator (STG) equipment of capacity ranging from 500 MW to 1,000 MW. It is engaged in engineering, design, manufacture, erection and commissioning of ultra-supercritical / supercritical turbines and generators in India.
L&T Howden Private Limited, a joint venture with Howden Holdings B.v. L&T Howden, is in the business of regenerative air-preheaters and variable
400 MW Combined Cycle Power Plant, Bibiyana-III, Bangladesh

233
pitch axial fans (equipment, after-market spares and services) for power plants.
L&T Sargent & Lundy, a joint venture with Sargent & Lundy LLC, USA, which is engaged in the business of providing design, engineering and project management services for the power sector.
Business EnvironmentIn the wake of the Government’s increasing emphasis on renewable energy, the thermal power sector is growing at a slow pace. However, compared to the previous year, this year witnessed improved ordering in coal-based power projects with the advent of major hydel players like SJvN Limited and THDC India Limited in the coal sector.
L&T’s FGD segment continued its order-winning streak with a total of 13.4 GW out of 65 GW of orders from the Central, State and Private sector companies chasing the deadline of installing FGDs to meet revised emission norms by 2022.
Going forward, the power sector will continue to face challenges like availability of funds, lowering plant load factor, financial stress, load balancing, coal and water availability issues, payment assurances, etc. Further, muted demand from the private sector and excess manufacturing capacity of suppliers continues to put pressure on prices.
Major Achievements Some of the major achievements by the business during the year include:
• Achieved Commercial Operation of India’s First Ultra Supercritical power project for Central Utility in Madhya Pradesh. Also achieved completion of Performance Guarantee Test of 1st unit and completion of Trial Operation of 2nd unit of this project
• Forayed into Turbines for Nuclear sector in collaboration with MHPS, Japan and participated in NPCIL’s ambitious tender for 6x700 MW Turbine Island package for Gorakhpur and Kaiga projects, which are expected to be ordered in financial year 2020-21
• Received Certification for completion of Phased Manufacturing Program (PMP) for Supercritical Steam Generators and Steam Turbine Generators as required under CEA’s regulation for setting-up of Indigenous manufacturing facilities
Significant InitiativesAs a part of continuous improvement in operating efficiency, the workshop at Hazira (near Surat) for manufacturing of ESP Collecting Electrodes was upgraded to undertake manufacturing of casings made of exotic material (nickel-based high alloy) for absorbers required in FGDs.
2x660 MW Khargone Thermal Power Plant, Madhya Pradesh, India

MANAGEMENT DISCUSSION AND ANALYSIS POWER BUSINESS ANNUAL REPORT 2019-20
234
The business has embarked upon several initiatives to reduce cost in areas like procurement, manufacturing, logistics, value engineering, overheads, etc., and has utilized the services of leading consultants/subject matter experts. The business has been able to improve its competitiveness due to these initiatives and intends to continue its cost-saving journey in the coming years. The business also enhanced its focus on initiatives to achieve quality and EHS excellence and expand its global footprint.
DigitalisationThe business is working on various digital technologies at its project sites and offices. Its key initiatives include deployment of the Internet of Things (IoT) in various plants and on machinery at sites to benchmark and improve its machine utilization, health of machines and their duty cycles; use of Artificial Intelligence (AI) & Machine Learning (ML) for video analytics like weighbridge and store surveillance; Robotic Process Automation (RPA) to automate repetitive processes to improve people productivity; virtual Reality (vR) using immersive videos for imparting safety training more effectively and Augmented Reality (AR) for initiatives like smart-glass for remote project monitoring to reduce travel time and cost. Efforts are also being made to leverage the available data to get insights such as price
discovery for SCM and sentiment analysis for HR using various analytics methodologies.
Environment, Health and SafetySafety is one of the core elements of the business. Besides ensuring implementation of robust engineering solutions to enhance safety, various initiatives are being undertaken to sensitize the workforce. The theme-based safety skit is one such innovative platform. Online hazard and near-miss reporting and compliance is an example of embracing digitalisation in safety processes. The business’ commitment towards safety is reaffirmed by various means, including monthly theme-based safety campaigns, audits and inspections.
Risks and ConcernsWith the increased emphasis on renewable energy, the business may face some headwinds on the opportunities available. However, the business anticipates that coal will continue to be a dominant source of power generation in India and that may continue to offer market opportunities. Excess manufacturing capacity, however, will continue to drive the prices downwards and would reflect in the financials of EPC players. The onslaught of the pandemic has set in some uncertainty on project execution timelines, for which the business has initiated the required steps considering force majeure conditions.
2x660 MW Chhabra Thermal Power Plant, Rajasthan, India

235
OutlookThe projection of 292 GW thermal power capacity by FY25 in the National Infrastructure Pipeline (NIP) report published by the Department of Economic Affairs (Ministry of Finance) and retirals of old, inefficient and polluting power plants indicate that thermal power is still going to be the mainstay in the country’s power generation mix. Considering the huge number of old and inefficient power plants which are nearing retirement, the business is confident of growth in capacity addition in the thermal power sector to match projected rise in demand for power. Coal-fired stations will continue to be in demand as it would ensure stable power and provide peaking power requirements and ensure a balanced grid.
It is estimated that the total installed capacity of power plants in which FGDs are to be installed is around 167 GW, involving 440 FGD units. Of this, 65 GW of orders have already been placed, while additional 100 GW of orders are expected to gain momentum in time to come.
The Government has an ambitious plan to increase the nuclear power production to 23 GW by 2031 from the current level of 7GW. The business sees large value opportunities in this segment and has tied up with world-class OEMs.
Gas-based plants are expected to be slowly revived in India. Since the revival of the domestic gas sector is going to take some time, the business continues to focus on markets outside India for gas-based power plants. The target countries are Bangladesh, Sri Lanka, Myanmar and GCC countries. The business has taken steps to strengthen its presence in the Middle East to capitalise on the available opportunities in this sector.
The L&T-MHPS Boiler Jv and L&T-MHPS Turbine Generator Jv are looking forward to leveraging upcoming spares and service opportunities in the domestic market and will continue to explore business opportunities in the international market for export orders.
Supercritical boiler internals being manufactured at Hazira, Gujarat Supercritical turbine being manufactured at Hazira, Gujarat
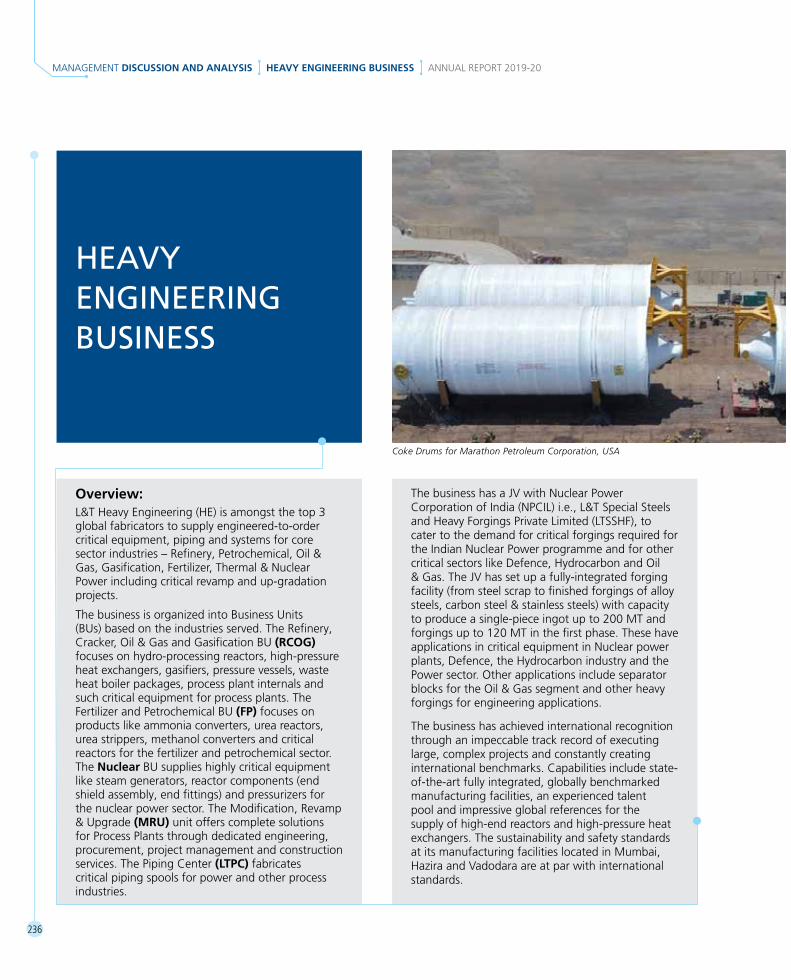
MANAGEMENT DISCUSSION AND ANALYSIS HEAVY ENGINEERING BUSINESS ANNUAL REPORT 2019-20
236
HEAVY ENGINEERING BUSINESS
Overview:L&T Heavy Engineering (HE) is amongst the top 3 global fabricators to supply engineered-to-order critical equipment, piping and systems for core sector industries – Refinery, Petrochemical, Oil & Gas, Gasification, Fertilizer, Thermal & Nuclear Power including critical revamp and up-gradation projects.
The business is organized into Business Units (BUs) based on the industries served. The Refinery, Cracker, Oil & Gas and Gasification BU (RCOG) focuses on hydro-processing reactors, high-pressure heat exchangers, gasifiers, pressure vessels, waste heat boiler packages, process plant internals and such critical equipment for process plants. The Fertilizer and Petrochemical BU (FP) focuses on products like ammonia converters, urea reactors, urea strippers, methanol converters and critical reactors for the fertilizer and petrochemical sector. The Nuclear BU supplies highly critical equipment like steam generators, reactor components (end shield assembly, end fittings) and pressurizers for the nuclear power sector. The Modification, Revamp & Upgrade (MRU) unit offers complete solutions for Process Plants through dedicated engineering, procurement, project management and construction services. The Piping Center (LTPC) fabricates critical piping spools for power and other process industries.
The business has a Jv with Nuclear Power Corporation of India (NPCIL) i.e., L&T Special Steels and Heavy Forgings Private Limited (LTSSHF), to cater to the demand for critical forgings required for the Indian Nuclear Power programme and for other critical sectors like Defence, Hydrocarbon and Oil & Gas. The Jv has set up a fully-integrated forging facility (from steel scrap to finished forgings of alloy steels, carbon steel & stainless steels) with capacity to produce a single-piece ingot up to 200 MT and forgings up to 120 MT in the first phase. These have applications in critical equipment in Nuclear power plants, Defence, the Hydrocarbon industry and the Power sector. Other applications include separator blocks for the Oil & Gas segment and other heavy forgings for engineering applications.
The business has achieved international recognition through an impeccable track record of executing large, complex projects and constantly creating international benchmarks. Capabilities include state-of-the-art fully integrated, globally benchmarked manufacturing facilities, an experienced talent pool and impressive global references for the supply of high-end reactors and high-pressure heat exchangers. The sustainability and safety standards at its manufacturing facilities located in Mumbai, Hazira and vadodara are at par with international standards.
Coke Drums for Marathon Petroleum Corporation, USA

237
Business EnvironmentThe business faced fierce competition from European, Korean and domestic fabricators, while Korean, Chinese and European companies continued to get preference due to ECA (Export Credit Agency) financing requirements. Excess global capacities and limited demand put pressure on pricing and deliveries.
Amidst stiff competition, the business continued to bag significant orders from global and domestic clients for hydrocracker reactors, ethylene oxide reactors, coke drums, HP heat exchanger and heavy columns, mainly for projects in Middle East, South East Asia, North America and Mexico. In the domestic market, the business bagged orders for high pressure & exotic material heat exchangers for HPCL’s RUF Project and an ethylene oxide reactor for IOCL’s Paradip Project.
The domestic Nuclear sector continued to remain sluggish due to delay in fleet procurement orders.
Major AchievementsIn the domestic market, the business has secured the order for the first Coal Gasifier using Air Product Technology solutions for the Talcher Gasification Project. During the year, the country’s heaviest hydrocracker reactor weighing 1858 MT was dispatched to HPCL’s vizag Refinery.
On the international front, the business dispatched 16 critical Chrome-Moly-vanadium reactors for ADNOC-Takreer refinery, Abu Dhabi – all delivered before time. The MRU business vertical executed a benchmark project – revamp of an FCCU reactor for the ORPIC Refinery in Oman.
On the Nuclear front, the base section and upper cylinder of the Cryostat, a key component of the world’s largest fusion reactor, was delivered to ITER at Cadarache, France. Cycle time for NPCIL’s 700 MWe Steam Generator, currently under manufacturing, was reduced from contractual 48 months to a record 30 months, setting an industrial benchmark.
In the Defence sector, LTSSHF has been qualified as the only indigenous producer of large and heavy forgings and thick plates for the prestigious Submarine Programme.
Significant InitiativesL&T Heavy Engineering embarked on a journey to be the best manufacturer of critical fabricated equipment in the world, determined to ‘Transform for Future NOW!’ to improve competitiveness and deal with the challenging market scenario. In 2019-20, the business focused on cultural transformation, specifically streamlining initiatives across the units and aligning with the Mission Statement. The Root Cause Analysis (RCA) system was strengthened to
Cryostat Base Section for ITER, France

MANAGEMENT DISCUSSION AND ANALYSIS HEAVY ENGINEERING BUSINESS ANNUAL REPORT 2019-20
238
expand beyond quality and safety to cover project cost and other overruns.
Environment, Health and SafetyThe business conducted awareness sessions through the celebration of National Safety Day, Road Safety Week and World Environment Day at the workplace as well as in Surat City. During the year, 48 batches of safety training programmes were conducted at the Safety Innovation School, Hazira for neighbouring industries. As a part of the safe workplace initiative, oxygen sensors were installed at confined locations and various initiatives were undertaken for treatment of emissions, effluents, industrial gases/wastes. The business has adopted ISO 45001:2018 standard from the earlier OHSAS 18001. The business won the ‘Platinum category Energy & Environment Global Safety Award 2020’ at the 10th World Petro Coal Congress 2020.
Human ResourcesThe business continued to improve its Performance Management System from SMART (Specific, Measurable, Attainable, Relevant and Time-based) goal-setting to meaningful performance dialogue and subsequent fair performance evaluation. Special programmes were designed with help from internal and external faculty for staff and workmen. These programmes focus on driving the culture of Safety, Quality and Productivity and
emphasize upon Transparency, Trust, Action-orientation and Teamwork.
Employee Engagement was a thrust area for FY20 with the introduction of the ‘Josh Brigade’ – teams of Employee Engagement Champions who drive initiatives at the department level. The Mentorship initiative was extended to promising young managers. Critical role-holders were identified, and succession planning is in progress for a sustainable leadership pipeline.
Risks and ConcernsThe business faces the risk of reduced investments in the refinery sector due to falling crude prices. To mitigate the same, it has expanded its MRU offering, which continues to grow due to focus on upgrades, modernization and revamps of existing plants.
Shrinking markets and increasing competition, on both the International and domestic fronts, continues to be a challenge. To sharpen the competitive advantage of engineering strength, the business has identified the role of CTO (Chief Technology Officer) as being exclusively responsible to build and develop engineering and technological capabilities and knowledge management within the Company.
Capabilities have been developed for niche equipment for specialty chemicals and petrochemicals like Purified
India’s heaviest Hydrocracking Reactor (1858 MT) for HPCL Visakh Refinery

239
Terephthalic Acid (PTA) and Acrylic acid. The business is also expanding into new geographies like North Africa, Egypt, Mexico and MRU offerings for the Middle East and Asia Pacific region. To mitigate the risk of doing business in new geographies, the business avails of export credit insurance to secure credit risk.
The business faces foreign competition in domestic projects. To have a level playing field, it is proactively suggesting policy changes to the ministries through industry associates. Anomalies in implementation of Make-in-India and GST by Public Sector Units (PSUs) procurement are being addressed.
On the supply chain front, competitive sourcing remains a focus area. With increasing price pressure, the business has identified and developed new vendors in China, Eastern Europe and India. The direct impact of COvID-19 on orders under execution is covered under the force majeure clause of the contract on account of expected delay.
OutlookThe global pandemic of COvID-19, combined with global recession and a tough business environment, may lead to reduced demand for heavy engineering equipment in the short term. However, with a global recovery expected towards the end of FY 2020-21, we expect the crude
prices to improve, which may lead to revival of the capital expenditure cycle.
Nuclear customers are increasingly adopting strategies like reverse auction and qualifying new suppliers. This is resulting in a huge supply-demand gap with less demand and excess global capacity, and thus causing increased pressure on price and margin.
For the ongoing domestic bids, we expect slow progress in project finalization on account of the COvID-19 pandemic. In the domestic market, we expect new projects in the sectors of Coal to Chemicals, Petrochemical and the Specialty Chemicals industry, and increased demand for MRU services. Nuclear fleet procurement opportunities (700 MWe PHWR projects) are expected to be tendered in FY 2021.
For the LTSSHF business, the domestic sectors in the fields of nuclear and defence are expected to grow in the coming years. The Government has cleared the proposal of investment in 10 domestic nuclear power plant (700 MWe each) through bulk ordering. This has opened up opportunities for the Jv with the placement of orders for supply of Steam Generator forgings for 6 units, End Shield Plates for 4 units and forgings for Pressurizer and Bleed Cooler for 4 units.
Forging of Nuclear Component at L&T Special Steels and Heavy Forgings

MANAGEMENT DISCUSSION AND ANALYSIS DEFENCE BUSINESS ANNUAL REPORT 2019-20
240
DEFENCE BUSINESS
Overview:L&T has been active in the Defence and strategic sector since the mid-80s, well ahead of the opening up of the sector for private industry participation, by associating with the Defence Research & Development Organisation (DRDO) and Naval indigenisation programmes. Having built a portfolio of technologies, products, systems, platforms and solutions, today L&T Defence provides design-to-delivery solutions across chosen defence segments with a focus on indigenous design, development and production of Naval (Submarines and Warships) and Land Platforms (Armoured Systems, Howitzers), Weapon Systems, Engineering Systems, Missile & Space Launch vehicle subsystems, Sensors, Radar Systems and Avionics. These are complemented by R&D and Design & Engineering Centres for targeted Platforms, Systems & Solutions development.
The operations span across two R&D centres, three Design & Engineering Centres and Production centres at multiple locations spread across India to serve the Defence & Aerospace sectors. These include the following facilities:
• Submarine hull-building facility and an Armoured Systems manufacturing, integration & testing facility at L&T’s Hazira Complex (near Surat)
• Modern shipyard at Kattupalli (near Chennai)
• Aerospace manufacturing shops for rocket motors for India’s Space Launch vehicles at Powai and Coimbatore
• Precision Manufacturing & Systems Complex for Aerospace & Missiles manufacturing at Coimbatore
• Advanced Composites facilities at vadodara and Coimbatore
• Strategic Systems Complex for Weapon & Engineering Systems and Sensors at Talegaon near Pune
• Strategic Electronics Centre at Bengaluru
Besides these dedicated facilities, L&T also operates a facility at visakhapatnam under the Government Owned Contractor Operated (GOCO) model for a Strategic Programme. These Work Centres are complemented by R&D Centres at Powai (Mumbai) and Bengaluru, and Design and Engineering Centres for Warship, Submarine and Weapon & Engineering Equipment at Powai and Chennai.
The Defence Business is structured into two business groups:
1. Defence & Aerospace
2. Defence Shipbuilding
L&T-made K9 Vajra-T at Republic Day Parade in New Delhi

241
1. Defence & Aerospace Over the years, the Defence and Aerospace (D&A)
business has built a bouquet of a wide range of indigenous products, systems, solutions, platforms and technologies through in-house efforts as well as by teaming up with the DRDO, and participation in the Indian Navy’s indigenisation programme for the development of a range of Engineering Systems and Weapon Systems and the realisation of Systems within the country. To date, the D&A strategic business group has indigenously developed more than 250 defence products, and more than 50 of them have been industrialised and delivered in serial production mode. The business model uniquely differentiates with focus on in-house technology and product development, innovation at the core of offerings, mature and equated partnerships with global majors, all of which enable it to maintain market leadership position in an environment where the Government is aggressively pursuing the indigenisation agenda for the long run, and where most indigenous players are dependent on the Transfer of Technology (ToT) model to pursue defence production. The D&A SBG also has a Joint venture (Jv) with MBDA, a global leader in missiles and missile systems. The Jv is well positioned to indigenously offer advanced missile systems to the Indian Armed Forces.
2. Defence Shipbuilding L&T’s Shipbuilding business offers end-to-end
solutions for design, construction and through-life
support of defence ships. L&T operates two defence shipyards – one at Hazira Manufacturing Complex, and another greenfield mega defence shipyard at Kattupalli, near Chennai. Located across a sprawling 900-acre complex, the Kattupalli Shipyard is India’s largest yard. The design and construction of the yard ensures adaptation of global best practices like modular construction, construction under covered shops, use of a shiplift with dry and wet berths, etc., to enable simultaneous construction of different classes of vessels until near-completion on land and then launching them through the shiplift. A large number of Industry 4.0 practices have been instituted, enhancing the efficiency of construction.
A dedicated Warship Design Centre at Chennai is equipped with the latest integrated 3D design, analysis and Product Lifecycle Management tools, and interfaced with project management and ERP systems, in line with global best practices.
The Kattupalli Shipyard has been largely engaged in new build and refits / repairs of defence ships of the Indian Navy and Indian Coast Guard. Since 2010, the Shipbuilding business of L&T has designed, constructed and delivered 57 Defence vessels, which include a Floating Dock (Navy), Interceptor Boats and Offshore Patrol vessels (for the Coast Guard) in record time. The unique capability of the business to achieve on-time or ahead of contractual delivery performance in all the
Offshore Patrol Vessel for Indian Coast Guard L&T has provided systems for most of India’s space missions - including those to themoon and Mars

MANAGEMENT DISCUSSION AND ANALYSIS DEFENCE BUSINESS ANNUAL REPORT 2019-20
242
contracts for Defence vessels is a benchmark in itself in the Indian Shipbuilding Industry. The shipyard has a track record of delivering first-of-class vessels on / ahead of schedule with design and construction maturity and in-built quality.
L&T purchased the 3% stake held by the Tamil Nadu Industrial Development Corporation Ltd (TIDCO) in L&T Shipbuilding Ltd (LTSB) in April 2019, making it a wholly owned subsidiary. In July 2019, the L&T Board approved the Scheme of Amalgamation of LTSB with L&T wef 1st April, 2019 as record date. The NCLT permissions have since been obtained and LTSB has now been merged with parent Larsen & Toubro Limited.
Business EnvironmentThe macro picture has been a mixed bag over the recent years. On the one hand, the Government of India (GoI) is taking substantive steps to promote defence exports, boost the acquisition pipeline by preferential categorization in favour of indigenous procurement of Defence systems and accelerating the process of AoNs and RFPs, while, on the other hand, budget constraints have seen orders slip by. There has been a gradual increase in the Defence Modernisation budget. However, the inclusion of the GST (since July 2017) and Customs Duties (since April 2016) as additional outflows from funds allocated to the Ministry of Defence (MoD) had, in effect, cut the capital allocations to
Defence in real terms. The consequent decrease in funds available for Defence Modernisation is visible from the drop in the volume of orders placed on Indian companies in preference to imports to address urgent gaps in capability. A few steps have been taken during the FY 2019-20 to defray the Customs duties and IGST on the MoD’s imports (Government-to-Government deals) and specific programmes ordered on system integrators (DPSUs), necessitating import inputs not produced in India and, in the process, freeing some capital for indigenous acquisition from within the budget allocation.
As per the Rajya Sabha Q&A data, the MoD has cleared AoNs totalling more than R 409,000 crore worth of programmes for Indian industries to participate in over the last five years.
The intent of the Government to achieve a higher degree of indigenisation and self-reliance is visible in the latest policy measures, such as Strategic Partnerships. The Defence procurement policy and procedures continue to evolve with earnest and positive impetus towards ‘Make in India’ and industry friendliness, as can be seen from the draft DPP-2020. While the GoI has taken steps to ensure ease of doing business, concern regarding a level playing field for the private sector continues in the form of retention of provisions to nominate large Defence programmes to state-owned companies.
Pinaka Multi Barrel Rocket Launcher Indigenous ASW Rocket Launcher

243
Major AchievementsDuring the year, the business has had multiple successes and proud moments, uniquely reaffirming L&T’s positioning as a ‘Nation Builder’. These include:
• L&T has been shortlisted as one of the two final contenders as Strategic Partners for P75 (I) submarine programme, and await issuance of the RFP
• Successfully delivered multiple Weapon Launch Systems (Land & Naval), Engineering Systems and Missile Systems to the Indian Armed forces
• The Work-Centres have set new benchmarks in terms of deliveries (OPvs, K9 vajra-T, PINAKA, Satcom systems to name few), safety and digitalisation
• Delivered 44 K9 vajra-T Self-propelled Howitzers ahead of schedule during the year, having reached a peak of 10 deliveries a month, with the team at ASC Hazira ramping up operations
• The R&D and Design & Engineering teams have developed a range of new technologies, products and solutions with a focus on emerging technologies such as Unmanned Systems, AR/vR, Image Processing and Predictive Maintenance that were on display at Defexpo 2020, emphasizing uniqueness of offerings, innovation and presence across the value chain
• The Kattupalli Shipyard attained the globally unique distinction of complete sea acceptance trials of OPv5 on its maiden sea sortie and cut the build time to below 20 months from the keel-laying
• Delivered 2 Offshore Patrol vessels and 5 Interceptor Boats to the Indian Coast Guard, all ahead of contracted schedule
• L&T Shipbuilding achieved a breakthrough by initiating execution of a large export order for 12 High Speed Guard Boats from South East Asia and achieved a significant milestone in public-private-partnership by securing workshare from a DPSU Yard for construction of three Defence vessels
Significant InitiativesIn addition to the focus on Defence Manufacturing to serve the Indian Armed Forces, Direct Exports of our matured weapon systems offerings, either solo or by partnering with DPSU / OFB for weapons, and entering into PPP relationships for and workshare with DPSUs are being pursued as two additional engines for growth. L&T has been working closely with DPSUs over the years and this relationship is being leveraged to target specific programmes and explore new opportunities in both domestic and international markets.
The teams embarked on consolidation of work centres and merged its Rabale operations into its Strategic Systems
Modular Bridging Systems Floating Dock for Indian Navy

MANAGEMENT DISCUSSION AND ANALYSIS DEFENCE BUSINESS ANNUAL REPORT 2019-20
244
Complex (SSC) Talegaon. R&D has been the backbone of the Defence business since its inception and the business will continue investing in R&D to develop new-age technologies and products such as Unmanned Systems (all four segments), Robotics, Additive Manufacturing and Artificial Intelligence.
The L&T-MBDA Jv achieved an important landmark, with readiness to operationalize the new inert integration facility at Coimbatore.
L&T has been building a strong position in digital design since the mid-90s, and has attained proficiency in elements of Industry 4.0 in its multiple R&D, Design & Engineering Centres and Production work centres that extend to the building of platforms such as warships and submarines. The in-house Warship Design Centre employs highly skilled designers to build platforms in 3D / virtual Domains and extensively use vR/AR tools for walk-through analysis for highly engineered designs which suit the modern production facilities on the shop-floor.
L&T’s lead in submarine construction and outfitting and system integration with indigenously developed home-grown technologies draws from its early initiative in the digital domain nearly two decades ago. L&T has been gradually adopting an Industry 4.0 environment using
model digital data, tracking and scanning tools and data analytics for planning, quality control and sequencing.
The Armoured Systems Complex (factory) built recently at L&T’s Hazira Complex is a modern ‘Industry 4.0-ready’ set-up. It has created a sizeable opportunity for shop-floor engineers and technicians to acquire skill in automation, robotization and multi-disciplinary system integration in order to attain >90% automated welding of armoured vehicle hulls and turrets using a series of robots, as well as to build complex components under the same roof using 3D printing wire-deposition processes for volume deposition.
Environment, Health and SafetyThe safety track record across work centres, customer locations, and Business Partners’ premises has been exemplary. L&T Shipbuilding’s Kattupalli Yard has won the prestigious ‘Sword of Honour’ from the British Safety Council during FY20, making it the first shipyard in India and the fourth globally to achieve such a feat. The business has also implemented digital workmen safety systems such as RFID-based tracking especially in confined spaces, like submarines and warships, as well as tagging of assets for online tracking. The business continues to focus on the triple bottom line and green initiatives. It has achieved significant y-o-y reduction in water and energy consumption, in line with L&T’s sustainability focus.
Chemical Agent Detector Fire Control Radar - designed and developed by L&T

245
Human ResourcesHR initiatives have been aligned to the overall business strategy by focussing on identifying and grooming high-potential talent, critical for having a competitive advantage, through various management and leadership programmes. L&T Defence has implemented a Technology Leadership Programme to maintain a market leadership position and continue to focus on development of niche technologies. Attention to leadership and talent development continues as a business imperative. Further, with renewed emphasis, the business has embarked upon employee engagement initiatives to retain and grow talent and continue to be an employer of choice.
Risks and ConcernsWhile the cyclical nature of the business affects the entire Defence sector, for L&T, which has developed a bouquet of products across the segment through in-house efforts, the risk is primarily that of delays and deferment of orders, given the vagaries of Capital budget allocation. It can be seen from parliamentary standing committee reports that the defence modernisation budget allocation was not sufficient even to cover the committed liabilities over the last two years, leading to acquisition programmes getting deferred, cancelled or even reduced in quantities after issuance of RFPs. The lack of funds for new acquisitions has resulted in very low order placement of about R 77,000 crore on Indian industries over the past three years, with large portions being nominated to DPSUs. The rest of the orders are placed on foreign suppliers to address urgent capability gaps.
OutlookThe impact of social spending as a consequence of the COvID-19 pandemic may further affect the already-inadequate Capex budget available for Armed Forces Modernisation and Indian Space Programmes. Also, the decision-making window in FY 2020-21 is expected to shrink due to the pandemic, leading to the spill-over of a few significant contracts from Defence as well as Space
sectors into the next FY. The current slowdown in the economy of the country is expected to marginally affect the release of funds against the Navy’s Capital budget, while the Revenue budget is likely to be significantly impacted, in turn impacting ship refits in the short term.
In order to offset the risk of order inflow, the business is pursuing a portion of business from major orders with DPSUs and is exploring increased export opportunities in the short term. To compensate for the effect of productivity loss due to the pandemic, various measures have been initiated for cost reduction in project procurement and revenue expenses, accelerated cash conversion cycle, targeted digitalisation, and reduced outsourcing to gainfully use idling manhours.
The outlook for Defence business remains cautious in the short run but positive in medium- long-term, as indigenous production picks up in a big way with the Government making concerted efforts to implement some of its major policy initiatives, such as Strategic Partnership and Indigenously Designed and Manufactured category programmes. By 2027, the Indian Navy intends to operate 175 warships and submarines. Such an aggressive fleet expansion plan, combined with the ‘Make in India’ initiative of the Government, provides wider opportunities to Indian shipyards for construction of warships and submarines for defence forces. Further, L&T’s decades-long partnership with the DRDO in indigenous design and development programmes, including Strategic Programmes, augurs well, with unprecedented opportunities in the pipeline.
In the short run, Shipbuilding sees some significant opportunities, given the number of shipbuilding RFPs issued by the MoD during the last FY. Weapons Systems & Engineering Systems programmes have served to offer a strong foundation to consolidate and build upon. The Indian Space Research Organization (ISRO) has initiated action to involve private sector firms in launch vehicle integration, which is likely to create sizeable opportunities in the aerospace segment in the coming years.

MANAGEMENT DISCUSSION AND ANALYSIS ELECTRICAL & AUTOMATION BUSINESS ANNUAL REPORT 2019-20
246
ELECTRICAL & AUTOMATION BUSINESS
Overview:L&T’s Electrical & Automation (E&A) business, is a leading supplier of electrical equipment in India. It is engaged in manufacturing low and medium voltage electrical switchgear products (both standard & customized) and energy meters, and executes projects in the control & automation space.
In the low voltage (Lv) segment, E&A has two categories of products – standard switchgear products and customised switchboards / electrical panels – and commands the highest market share in India. These products are widely accepted in international markets, particularly in South East Asia, the GCC and select African geographies. E&A’s electrical Agri products have occupied the agricultural market for more than 40 years. Its innovative control-gear products as well as new generation solar energy-supported products give a technological push to the Indian agricultural ecosystem.
L&T’s Lv products are manufactured at three locations in India. Customised Lv switchboards are manufactured at two locations in India and one location each in the Kingdom of Saudi Arabia (KSA) and Indonesia.
The medium voltage (Mv) range of switchgear products is manufactured in India and Malaysia. E&A’s group Company ‘Tamco Switchgear’ enjoys a
market-leading share in Malaysia and has a strong foothold in the MENA region, the SEA region, and select geographies in Europe and Australia.
E&A has the distinction of being the single largest manufacturer of single-phase energy meters with a leading market position in India. The business has significant capacity to manufacture three-phase / tri-vector meters, and is a pioneer in developing new products. It is one of the first to deploy smart prepaid meters in the country on a large scale.
E&A’s System Integration business possesses project management experience of more than 25 years. The business is supported by an in-house manufacturing facility for control panels, combined with its own copyrighted software solution- i-visionmax®. The business provides a one-stop engineered solution coupled with project management skills. The domestic business serves the Indian market and neighbouring countries like Bangladesh, Nepal and Indonesia, while its international arm addresses the GCC market.
Clients of the business span a wide range of sectors including Metro Rail, Airports, Renewable Energy/Solar, Defence, Hospitals, Educational Institutions, Data Centres, Realty, Auto, Food & Beverages, Chemical, Pharma, Textile, Sugar, Automobile and Steel.
City Command & Control Centre, Vadodara Municipal Corporation

247
The business’ Lv standard switchgear and agricultural products are marketed through a network of over 650 stockists. Automation products, such as drives and PLCs, are sold through around 75 Integrated solution providers. In addition, the retail market is serviced through a network of 165 Retail Distributors and around 350 Distribution Select Partners. Customers of E&A include both private and publicly-owned undertakings and select corporates.
E&A is a full-suite business with strong in-house design and development teams. It has five DSIR-approved R&D facilities and two NABL-accredited testing laboratories for testing products across diverse testing parameters. The design and development team collaborates with international laboratories, testing centres and academic institutions. The business is supported by state-of-the-art tooling facilities which produce a range of high precision tools to service the in-house business needs as well as external customers.
To promote good electrical practices in the industry, the business conducts a wide range of training programmes for technicians, customers, engineers, professionals and even students through its Switchgear Training Centres at Pune, Lucknow, Coonoor, Delhi, Kolkata and vadodara.
The business has an international presence through the following entities within the group:
TAMCO Switchgear is an established manufacturer of low and medium voltage switchgear. Together with its direct subsidiary in Indonesia, Tamco’s international market spans MENA regions, select geographies in Europe, ASEAN countries and Australia.
L&T Electrical & Automation FZE (LTEAFZE), located at Jebel Ali Free Zone (Dubai, UAE) provides turnkey engineering, assembly, integration of electrical, instrumentation and telecommunication solutions. It taps into a customer base in the Middle East and Africa. It has a state-of-the-art integration facility in Jebel Ali Free Zone.
L&T Electrical & Automation Saudi Arabia Company Limited, located at Dammam in the Kingdom of Saudi Arabia, offers the Gulf market a spectrum of products and services comprising Air Insulated Switchgear (AIS), Gas Insulated Switchgear (GIS), Ring Main Units, Lv Switchgear, Motor Control Centre (MCC) - Fixed / Drawout, Pre-Fabricated / Packaged Sub-stations. Offerings include variable Frequency Drive panels and automation systems, Security Systems and allied equipment such as Transformers, Busducts, DC/UPS, Power Quality Management Systems, as well as erection, testing, commissioning and retrofitting services and maintenance contracts.
E&A’s range of switchgear

MANAGEMENT DISCUSSION AND ANALYSIS ELECTRICAL & AUTOMATION BUSINESS ANNUAL REPORT 2019-20
248
Henikwon Corporation is a leading Malaysia-based Lv and Mv busduct systems’ manufacturer, with offerings for the building and infra segments.
The UK-based Servowatch Systems Limited, offers technology in the control & automation space for marine applications as well as other emerging segments. Servowatch is recognized as a world-leading system integrator for modern naval platforms, Super Yacht installations and commercial marine operators. The unique software design allows integration of third-party software into a common operator platform environment.
Kana Controls, Kuwait, is a local company that helps L&T penetrate the Kuwait market and enhance its domain expertise in design, engineering, supply and commissioning, as well as render after-sales support of Integrated Automation and Telecommunication Systems based on various global OEM products and technologies.
Business EnvironmentThe various Government reforms initiated – such as focus on improving 41 different areas, primarily the Energy, Infrastructure and Irrigation sectors in India and making India a USD 5.0 trillion economy by 2024-25 – led the business to begin FY 2019-20 with a healthy order backlog.
As the General Elections in India were held at the beginning of the financial year, it was expected that
economic performance would remain benign in view of the model code of conduct and slowing down of the decision-making process by the Government in the first quarter of FY 2019-20. The pro-incumbency mandate received by the Government reassured the sustenance of the ‘reform’ agenda.
NITI Aayog’s focus on the North Eastern region by proposing to set up industrial estates/parks in such areas set up a platform for growth for the standard product’s division of the business during FY 2019-20. The Government’s continued emphasis on improving rural infrastructure translated into opportunities for the business. various announcements made in the Finance Budget by the Government of India paved the way for creating new infrastructure, public transport systems and airports. The support for renewable energy provided significant opportunities for E&A’s standard switchgear products and switchboards divisions which are functional in the Lv and Mv space.
Other notable initiatives like UDAY, Smart Cities, Smart Grid, Pradhan Mantri Krishi Sinchayee Yojana, Pradhan Mantri Kisan Samman Nidhi Yojana and Digital villages continued to remain highlights in FY 2019-20. The Metering division of the business found major opportunities owing to these initiatives and was able to successfully roll out one of the largest Smart Meter projects in India based on the linear polarisation resistance technology. Continued emphasis on smart cities has helped the
Smart Meters

249
Control & Automation division of the business to provide technologically superior solutions to the domestic market.
The business also has a significant presence in Malaysia and South East Asian countries through TAMCO. With the drop in growth rates in Malaysia, business opportunities for TAMCO were scaled down.
Supported by market demand, enhancement in public-private partnership projects and Government reforms, the business performed on expected lines until January 2020 by achieving profitable growth. However the COvID-19 pandemic began to impact business from February 2020 onwards.
Awards • The business’s New Product Development function
bagged the Deming Prize, the highest award in Quality. L&T is the first switchgear manufacturing company outside Japan to receive this prestigious award
• E&A’s Metering & Protection Systems business unit won the coveted IMC Ramkrishna Bajaj National Quality Award (RBNQA) Performance Excellence Trophy 2019
Significant Initiatives• The switchboard business initiated the manufacture of
its ‘Compact Substation’ switchboard at Ahmednagar to enhance manufacturing excellence. A web-based portal
for asset management has been developed to monitor Lv switchgear and other electrical system equipment
• The business received grants for as many as 81 patents, 9 trademarks and 9 design applications in India
Product Launches• New MCCBs, new variants of ACBs, contactors, isolators
and panel solutions for emerging market segments such as Solar and Railways, new state-of-the-art motor protection relays, controllers for Power Quality Solutions, intelligent products for the Agricultural segment, etc. were launched
• The Electrical Systems & Equipment business introduced feeder pillars, compact sub-stations and front RMU with FRTU for the Utilities segment. For the international market, sub-main distribution boards (SMDBs) and GIS for the wind segment were introduced to cater to the Infrastructure sector, including Metros, Airports, Smart Cities and high-end residential complexes. The business also introduced a pre-fabricated electrical substation building, known as ‘E-House’, customized to house all electrical equipment as per project requirements
• The Mv portfolio was enhanced by an improved range of GIS for Wind Energy applications and Metro projects
• ‘SMART’ Ring Main Units were in high demand in Smart Cities. The domestic Lv Switchboards with the
Control panels at MRPL

MANAGEMENT DISCUSSION AND ANALYSIS ELECTRICAL & AUTOMATION BUSINESS ANNUAL REPORT 2019-20
250
closed-door operation feature were offered to key customers in the refinery and power plant segments
• The Metering division worked on the integration of new communication technologies such as 4G, NBIoT and LoRa in the Smart Meter segment
• The business successfully rolled out one of India’s largest Smart Meter projects based on the Linear Polarisation Resistance (LPR) technology
DigitalisationKey digital initiatives which comprised both new as well as scope enhancement in projects under implementation included:
1. Asset Lifecycle Management, using Radio Frequency Identification (RFID)
2. Robotic Process Automation (RPA) & AI
3. Augmented reality (AR)
4. virtual Reality (vR) - virtual factory visit and Safety Training
5. Sales Force Dot Com (SFDC): The business recently implemented SFDC as a single platform for structured planning, database management and analytics to improve decision-making for its Electrical Standard Product (ESP) sales, business development, product management and service functions.
The business also developed a retail management system for the Retail and Agricultural business of its ESP division.
Environment, Health and SafetyEnergy conservation remained a major focus area in FY20 across all manufacturing locations. various initiatives undertaken have saved total energy of 962580 kWh. Notable initiatives include use of LED lights, optimum temperature setting for ACs, installation of solar panels to reduce conventional energy consumption and the use of the energy-saving option on CNC machines.
The Bureau veritas Surveillance audit of the ISO50001 Energy Management. System of the ESP manufacturing campus at Ahmednagar was successfully completed.
There have been no accidents reported at the Mahape, Coimbatore and Mysore facilities in the last 2 years. The business conducted a Human Safety Audit at manufacturing locations through M/s TCE in August 2019. One of the outcomes of this audit was the conducting of Safety Leadership Training of line managers and supervisors who are directly responsible for safety at the workplace. This has resulted in safety awareness among employees, and manufacturing facilities have started reporting ‘near miss’ incidents.
Air Insulated Switchgear

251
Human ResourcesThe business has rolled out several digital initiatives to manage the indirect workforce, leading to enhanced productivity and process efficiency. There has been consistent encouragement to adopt on-line learning through Anytime Learning (ATL) and ATL Next across the organization. various leadership development programmes linked to competency requirements at different career stages help build a robust internal pipeline of leadership to take charge of the current and future requirements of the organization. Despite the overhang of divestment, the business has been able to successfully recruit the right talent to meet its manpower requirements. Focus on employee health and wellness, succession and career planning and need-based developmental opportunities have helped retain top talent.
The HR practices of the business are well-aligned to the business strategy, and the outreach for development encompasses not just employees but also channel partners and customers, through a variety of training interventions.
Risks and ConcernsThe key concern for the business is keeping pace with fast-evolving technologies to stay relevant to the market. For this, investments in Research and Development are essential.
By aligning its business strategy and product portfolio, the business strives to make a winning proposition amidst changing business environments and Government policies.
With the progress in the process of divesting the business to Schneider Electric, an impact was felt due to customers’
apprehensions about continuity of service quality. Also, with the pandemic, market sentiments have been affected overall, and the new norms mandated may impact operations.
OutlookWith the outbreak of the COvID-19 pandemic, economies are expected to contract in the near term, leading to reduced capex by the private sector. The Middle East economies continue to reel under the oil-price meltdown, impacting opportunities in that region. With limited opportunities, the competition is expected to intensify.
However, the Government’s emphasis on ‘vocal for Local’ and the push in the rural economy in view of the large migration of workforce from cities to rural areas may work in favour of the business. With the Government’s focus on the large-scale roll-out of Smart Prepaid Meters in order to improve the fiscal health of the DISCOMs, the Metering division stands to gain majorly due to its in-house design and customization capabilities and its large manufacturing capacity. Better prospects are visible in Malaysia for large Mv orders through TAMCO.
The growing trade-tensions between the US and China and the world’s changing perception towards China may result in the shifting of manufacturing bases for some of industries to India, Indonesia, etc. The business is likely to benefit from this.
The divestment process of the business to Schneider Electric is on course. The approval of the Competition Commission of India, subject to fulfilment of certain conditions, has been received and the business has been classified as a discontinued operation from June 2019.

MANAGEMENT DISCUSSION AND ANALYSIS HYDROCARBON BUSINESS ANNUAL REPORT 2019-20
252
HYDROCARBON BUSINESS
Overview:L&T Hydrocarbon Engineering Limited (LTHE), a wholly-owned subsidiary of L&T, provides integrated ‘design-to-build’ turnkey solutions for the hydrocarbon industry globally. The business executes projects for oil and gas extraction and processing, petroleum refining, chemicals and petrochemicals, fertilizers, cross-country pipelines and terminals. In-house capabilities range from front-end design through detailed engineering, procurement, fabrication, project management, construction and installation up to commissioning services.
LTHE has a fully integrated capability chain, including in-house engineering and R&D centres, world-class modular fabrication facilities, as well as onshore construction and offshore installation capabilities. Major facilities in India include Engineering & Project Management Centres at Mumbai, vadodara, and Chennai, as well as Fabrication Yards at Hazira (near Surat) and Kattupalli (near Chennai). The business has an overseas presence in the Middle East, i.e. in the UAE (Sharjah), Saudi Arabia (Al-Khobar), Kuwait and Oman (Muscat), as well as in Algeria. The business also has a major Modular Fabrication and Heavy Engineering Facility at Sohar in Oman.
LTHE caters to clients across the hydrocarbon value-chain through five key business verticals:
OffshoreLumpsum turnkey EPCIC solutions are offered to the global offshore oil & gas industry encompassing wellhead platforms, process platforms and modules, subsea pipelines, brownfield developments, offshore drilling rigs (upgrade and new-builds), FPSO modules, deep-water subsea manifold & structures, living quarters, transportation & installation services, offshore wind-farm projects and decommissioning projects.
As a full-fledged EPCI player, it also has in-house offshore installation capability comprising a self-propelled heavy-lift-cum-pipe-lay vessel – LTS 3000 – held in a joint venture, and a wholly-owned pipe-lay barge – LTB 300.
OnshoreThe business vertical provides EPCC solutions for a wide range of onshore hydrocarbon projects covering upstream oil & gas processing, refining, petrochemicals, fertilizers (ammonia & urea complexes), cryogenic storage tanks and LNG regasification terminals and cross-country pipelines. The business has a track record of concurrent execution of multiple mega projects successfully, with diverse technology process licensors. The vertical is
Bassein Development 3 Well Platform & Pipeline Project for ONGC

253
complemented by the Design Engineering capabilities of L&T-Chiyoda for onshore engineering and L&T Gulf for pipeline engineering.
Construction ServicesThis business vertical renders turnkey construction services for refineries, petrochemicals, chemical plants, fertilizers, gas-gathering stations, crude oil & gas terminals and underground cavern storage systems for LPG and cross-country oil & gas pipelines.
Its major capabilities include heavy-lift competency, application of advanced welding technologies, high levels of automation, management of manpower and material in large volumes at construction sites and Quality / HSE systems conforming to international practices. The business has also invested in strategic construction equipment, a range of pipeline-spread equipment, automatic welding machines and other plant and machinery for electro-mechanical construction works.
Modular Fabrication ServicesThe vertical specialises in fabrication and supply of modules and static equipment for offshore oil & gas fields, refineries, petrochemical plants and fertilizer complexes. It has world-class modular fabrication facilities strategically located at Hazira (India’s west coast), Kattupalli (India’s east coast) and Sohar (Oman), with a combined annual capacity
in excess of 200,000 MT (depending on the product mix). The business is also equipped to supply foundations and other modules for offshore wind-farm projects and modular e-houses. The all-weather waterfront facilities provide easy access to clients across the globe and have load-out jetties suitable for the dispatch of large and heavy modules via ocean-going vessels and barges.
A new Integrated Manufacturing Facility has been recently opened at Jubail in Saudi Arabia to cater to the local market.
Advanced Value Engineering & Technology Services (AdVENT)AdvENT (the erstwhile ‘Engineering Services’ vertical) offers customer-centric solutions for the Hydrocarbon sector and emerging industries, while addressing the specific needs of the changing energy sector. Leveraging its domain expertise in high-end engineering and the experience gained from the execution of large-scale, technologically complex EPC projects, AdvENT delivers comprehensive solutions encompassing Design & Engineering, Project Management, Strategic Project Delivery, Modularization, Smart Asset Management and Green Energy to global clients.
Business EnvironmentDuring FY 2019-20, two key drivers impacting a structural shift were the increase in oil supply by OPEC and the
The heaviest fully integrated gas platform in Saudi Aramco’s history installed by float-over method at the Hasbah field in Saudi Arabia

MANAGEMENT DISCUSSION AND ANALYSIS HYDROCARBON BUSINESS ANNUAL REPORT 2019-20
254
collapse in oil demand by the shuttering of the global economy due to the coronavirus pandemic. The price of oil fell 30% due to oversupply in the first week in March, even before the impact of COvID-19 was factored in.
The domestic market also witnessed deferment of projects by a few quarters due to overcapacity in the domestic refining sector. The domestic segment also witnessed stiff competition from new entrants.
In the Middle East, the other major focus region for LTHE - the business was impacted by the oil prices coming under pressure due to over-supply and the price war between Saudi Arabia and Russia. Saudi Arabia - where LTHE has a decent market share of the Offshore business, given its position of being the select contractor under the Long Term Agreement (LTA) - saw new contractors being pre-qualified. This impacted LTHE’s share in the contracts being awarded under LTA. Concerted localization efforts in the Kingdom of Saudi Arabia are in progress to position LTHE as a compliant contractor to achieve IKTvA (In-Kingdom Total value Add). In other geographies, such as the UAE and Qatar, the business is addressing the increasing ICv (In-country value) requirements.
With a focus on ‘Execution Par Excellence’, LTHE achieved robust financial performance, as compared to its global peers.
Major AchievementsMajor orders won during the year:
• EPCIC contract for the development of the Heera Panna Block of the Western Offshore basin involving wellhead platforms, subsea rigid pipelines, riser installation and modification work at existing platforms
• EPCIC contract for the development of the Mumbai High South field of the Western Offshore basin involving a Water Injection Platform Bridge connected to the existing WIS platform, Living Quarters, modification and interconnection of all the utilities with the existing platforms
• Marjan Incremental Development Project by Saudi Aramco, a mega project in consortium with EMAS AMC PTE Ltd. (a Subsea 7 Company) involving tie-in platforms, tie platform module, production deck modules, 217 km of subsea pipelines and 145 km of subsea cables
• EPCI contract from Saudi Aramco, involving 28 offshore jackets in Saudi Arabia’s Zuluf, Marjan, Safaniya and Ribyan offshore fields in consortium with EMAS AMC PTE Ltd.
• EPCC contract for setting up a 3.55 MMTPA Residue Upgradation Facility (RUF) for visakh Refinery Modernisation Project (vRMP) at HPCL’s vizag Refinery to convert the heaviest oils into high-quality Euro 6 diesel
Three Gas Production Deck Modules (PDMs) for Saudi Aramco, ready for dispatch from LTHE’s Modular Fabrication Facility at Hazira, India

255
• EPCC contract for setting up a new 9 MMTPA Atmospheric & vacuum Distillation Unit (AvU) and allied facilities for Barauni Refinery Capacity Expansion Project of Indian Oil Corporation
• Process and Piperack Modules (28,000 MT) for a Refinery Project in South East Asia from EPC Contractors Consortium, as a repeat order
• Supply of critical modules for Air Separation Process Modules for a leading International Technology Company for their projects in USA and Algeria, as a repeat order
• Three Instrumentation Houses for an international client for a project in Algeria
Projects Completed• During the year, the Offshore vertical achieved partial
mechanical completion for Hasbah II project of Saudi Aramco and completed ONGC’s Bassein Development 3 Well Platform & Pipeline Project and Neelam Re-development & B173AC Project
• The Onshore vertical achieved mechanical completion of the IndMax FCC Unit for IOCL Bongaigaon and completed the major milestone of Ready for Commissioning – Multiphase Pump for Haliba Field Development project of Al Dhafra Petroleum Operations Company Ltd., UAE.
• The Construction business achieved the Commissioning of Phase-2 of the Coal Bed Methane Development Project at Shahdol in Madhya Pradesh for Reliance Industries, Commissioning of Syngas Phase 2 Project at Kochi for Air Products involving expansion of gas separation facility based on cold-box technology and laying & commissioning of pipeline for Barmer–Pali and Palanpur–Pali projects
Significant InitiativesThe mission of ‘Execution Par Excellence’ is reflected in LTHE’s continued emphasis on sharper bidding to enhance its market share and execute projects within time and cost to protect bid margins. The business continued its journey with its Operational Excellence initiative, which has yielded results by way of enhanced cost-competitiveness in its bids and further improvement in its bottom-line for projects under execution.
The business is resorting to newer manufacturing techniques such as the Assembly Line Concept and Serial Production technique for fabricating multiple jackets concurrently. Additionally, cutting-edge technologies in the pipe-welding process through automation and process upgradation are implemented at its fabrication facilities and construction sites for increased productivity and better quality. Additionally, Construction Competency Centres and Skill Development Centres have been augmented.
Cracker Furnace Package under execution for HMEL, Bathinda, India
INDMAX FCC Unit including LPG Treatment Facility for IOCL, Bongaigaon, India

MANAGEMENT DISCUSSION AND ANALYSIS HYDROCARBON BUSINESS ANNUAL REPORT 2019-20
256
LTHE has proactively embarked on an organisation-wide Digital Transformation Programme for integrating Business Processes, Enterprise Software and robust In-house IT applications to enhance execution efficiency. This will result in shorter project cycles, project progress visualisation through Digital Walls, assured delivery schedules, cost-competitiveness and enhanced risk mitigation; thereby providing business differentiators for delivering projects. Additionally, connected-construction machinery and connected-workmen are being tracked through IoT to improve productivity.
To create a strong foundation for business intelligence, analytics and knowledge management, LTHE has implemented an Enterprise-wide Project Lifecycle Management programme (EPSILON). This provides a collaborative space for all project stakeholders to interact around a 3D-model-based integrated workspace wherein project teams can plan together, conduct what-if analysis, share and view project updates and manage changes.
In order to create new opportunities with a sustained revenue stream, the AdvENT vertical is pursuing several initiatives such as Smart Asset Management, Operation & Maintenance (O&M) services and development of Green Energy projects. The AdvENT business is actively engaged with various R&D Centres and startups to harness emerging technologies and create differentiated solutions for its customers.
Environment, Health and SafetyThe business remains committed to achieving HSE excellence at the workplace and beyond by continuously striving to improve, protect and develop the health, safety, and environmental assets of its employees and stakeholders. LTHE strongly believes that every incident is preventable, and is committed, through its ‘Zero Incident Credo’, to providing a safe and healthy workplace. During the year, the business clocked over 102 million safe man hours at a stretch across a dozen successful projects in both the domestic as well as international markets, including the three modular fabrication yards.
The business drives HSE excellence across the EPC value chain, from engineering to commissioning of projects, applied to all stakeholders by reinforcing a safe working culture through various initiatives. HSE Assurance Audits were initiated and carried out for all the verticals to ensure the effective implementation of the HSE management system across the business. Besides introducing new HSE Training and HSE Design Policies, it redefined a set of ‘Golden Safety Rules’ to strengthen and transform the safety culture.
Considering HSE performance an important factor for business, many new HSE leading and lagging parameters were added in the monthly online reporting system. Further, various HSE Digitalisation Initiatives were undertaken, such as vR (virtual Reality) based HSE Training,
Normal Paraffin & Derivative Complex for Farabi Petrochemical Company, Yanbu, KSA

257
Electronic Permit to Work (e-PTW), Online Incident Reporting & Investigation, Behaviour-based Safety and Digital Health Monitoring.
During the year, the business bagged 22 national and 10 international level awards for best HSE performance. These include:
• The British Safety Council’s International Safety Award for demonstrating a strong commitment to good Health & Safety Management
• Middle East Energy Award 2019 under the category of ‘HSE Innovation of the Year’ for Workmen Safety Observation Programme
• Indian Chamber of Commerce’s National Occupational Safety & Health Award 2019
• Confederation of Indian Industry’s Safety Best Practices Award in recognition of the various HSE initiatives
• The Royal Society for the Prevention of Accident Gold Award for Health & Safety performance during the year 2019
The business also received HSE recognition from several clients, a few of which are listed below:
• Certificate of appreciation for achieving 32 million safe man-hours from Saudi Aramco for HASBAH Offshore Gas Facilities Increment II
• EHSS excellence award for achieving 25 million safe man-hours from Farabi Petrochemical for N-Paraffin and Derivative complex
• Certificate of appreciation for achieving 8 million safe man-hours and for Best HSE performance from IOCL for the Indmax FCC project
• Certificate of appreciation for achieving 5 million safe man-hours from EIL for the HPCL CDU vDU project
As a responsible corporate citizen, LTHE is determined to continue operating in an environmentally sustainable manner by fostering the HSE culture in all its activities.
Human ResourcesThe business focuses on recruiting and retaining a unique and diverse set of talented and passionate individuals.
The organization utilizes various state-of-the-art training infrastructure and resources like the L&T Leadership Development Academy (LDA), the Institute of Project Management (IPM) and technical training centres to develop the employees’ Project Management skills, Functional and Leadership competencies, as well as nurture and groom talent.
In order to inculcate a culture of driving continuous career advancement of internal talent, the business has initiated a ‘DREAM’ Career Planning architecture for sustainable growth of employees, and is strengthening its position in
Coal Bed Methane Project (Phase II) for Reliance Industries at Shahdol, India
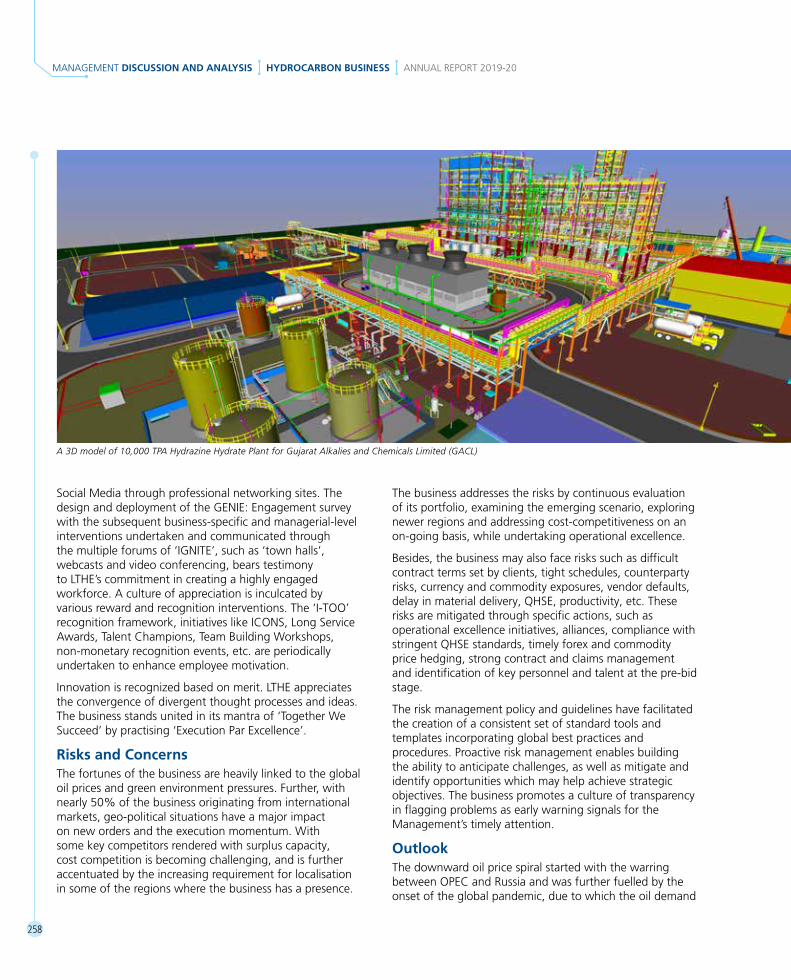
MANAGEMENT DISCUSSION AND ANALYSIS HYDROCARBON BUSINESS ANNUAL REPORT 2019-20
258
Social Media through professional networking sites. The design and deployment of the GENIE: Engagement survey with the subsequent business-specific and managerial-level interventions undertaken and communicated through the multiple forums of ‘IGNITE’, such as ‘town halls’, webcasts and video conferencing, bears testimony to LTHE’s commitment in creating a highly engaged workforce. A culture of appreciation is inculcated by various reward and recognition interventions. The ‘I-TOO’ recognition framework, initiatives like ICONS, Long Service Awards, Talent Champions, Team Building Workshops, non-monetary recognition events, etc. are periodically undertaken to enhance employee motivation.
Innovation is recognized based on merit. LTHE appreciates the convergence of divergent thought processes and ideas. The business stands united in its mantra of ‘Together We Succeed’ by practising ‘Execution Par Excellence’.
Risks and ConcernsThe fortunes of the business are heavily linked to the global oil prices and green environment pressures. Further, with nearly 50% of the business originating from international markets, geo-political situations have a major impact on new orders and the execution momentum. With some key competitors rendered with surplus capacity, cost competition is becoming challenging, and is further accentuated by the increasing requirement for localisation in some of the regions where the business has a presence.
The business addresses the risks by continuous evaluation of its portfolio, examining the emerging scenario, exploring newer regions and addressing cost-competitiveness on an on-going basis, while undertaking operational excellence.
Besides, the business may also face risks such as difficult contract terms set by clients, tight schedules, counterparty risks, currency and commodity exposures, vendor defaults, delay in material delivery, QHSE, productivity, etc. These risks are mitigated through specific actions, such as operational excellence initiatives, alliances, compliance with stringent QHSE standards, timely forex and commodity price hedging, strong contract and claims management and identification of key personnel and talent at the pre-bid stage.
The risk management policy and guidelines have facilitated the creation of a consistent set of standard tools and templates incorporating global best practices and procedures. Proactive risk management enables building the ability to anticipate challenges, as well as mitigate and identify opportunities which may help achieve strategic objectives. The business promotes a culture of transparency in flagging problems as early warning signals for the Management’s timely attention.
OutlookThe downward oil price spiral started with the warring between OPEC and Russia and was further fuelled by the onset of the global pandemic, due to which the oil demand
A 3D model of 10,000 TPA Hydrazine Hydrate Plant for Gujarat Alkalies and Chemicals Limited (GACL)

259
depleted to a record low. To stabilise the plummeting oil prices, OPEC and Russia have reached an agreement to cut oil production. Further, the U.S. also cut its 2020 oil production forecast by more than 1 million barrels a day due to the plummeting demand and collapsing crude prices. Oil prices are expected to predominantly remain under stress during 2020. volatility and uncertainty in oil prices is expected to delay project awards in the hydrocarbon segment. Further, most of the Middle Eastern GCC economies plan to diversify into several other sectors other than hydrocarbon.
With international oil companies evincing interest in the market, investments in West and North Africa may fructify in case crude oil prices show upward movement.
On the domestic front, the Ministry of Petroleum and Natural Gas is working in collaboration with various Central Government Ministries, State Governments, and stakeholders to make efforts to achieve reduction in import dependency for oil in the long run through use of alternative fuels like ethanol and biodiesel through the Ethanol Blending in Petrol (EBP) Programme and Biodiesel blending in diesel. The Government has formulated a
National Biofuel Policy 2018 to boost the availability of biofuels in country. It has launched a Sustainable Alternative Towards Affordable Transportation (SATAT) initiative for producing Bio CNG by setting up 5000 Bio-CNG plants in next five years.
The Union Budget has proposed a capital outlay of R 98,522 crore for oil and gas companies for FY 2020-21, comprising R 52,019 crore for the Exploration and Production segment, R 41,654 crore for the Refining & Market segment R 4,754 crore for the Petrochemical sector. Major domestic pipeline projects which were deferred in FY 2019-20 are expected to pick up during FY 2020-21.
The Company will expand its bid pipeline and explore new clients and new markets in the adjacency of its existing capabilities.
With the onslaught of the pandemic, numerous challenges are also expected in project execution. The aim of the business will be to remain cash-positive and adopt the PIO approach, viz. Protect the business, be Innovative in approach for solving unanticipated problems and look for Opportunities in the marketplace that could give strategic advantages in the medium and long term.
Lowering of new strategic gas export pipeline (Size: 30” / 40” x 146 km) from North Kuwait to Mina Al-Ahmadi for Kuwait Oil Company

MANAGEMENT DISCUSSION AND ANALYSIS IT & TECHNOLOGY SERVICES ANNUAL REPORT 2019-20
260
IT & TECHNOLOGY SERVICES
L&T INFOTECH
Overview:L&T Infotech (LTI) is a global technology consulting and digital solutions company helping more than 420 clients succeed in a converging world. With operations in 32 countries, the business goes that extra mile for its clients and accelerates their digital transformation with its Mosaic platform – enabling their mobile, social, analytics, IoT and cloud journeys. Founded in 1997 as a subsidiary of Larsen & Toubro Limited, its unique heritage gives it an unrivalled real-world expertise to solve the most complex challenges of enterprises across all industries. Each day, the team of more than 30,000 LTItes enables clients to improve the effectiveness of their business and technology operations and deliver value to their customers, employees and shareholders.
The business has a strong presence in each of the following verticals:
• Banking and Financial Services
• Insurance
• Manufacturing
• Energy and Utilities
• Consumer packaged goods (CPG), Retail and Pharma
• Hi-Tech, Media and Entertainment
To further augment its digital capabilities, LTI announced two acquisitions in FY 2019-20. In July 2019, it acquired Lymbyc, a specialist in AI, machine learning and advanced analytics. The Lymbyc acquisition adds to LTI’s Mosaic platform offering. In October 2019, it acquired Powerup, a born-in-cloud company, with cloud consulting capabilities across all three leading cloud platforms – AWS, Microsoft Azure and Google cloud. In addition to cloud-consulting capabilities, Powerup also adds 2 AI products to LTI’s powerful suite of offerings.
Business EnvironmentThe global Information Technology-Business Process Management (IT-BPM) market, excluding hardware and Engineering, Research & Development (ER&D), grew 5.6% over the last year and stood at USD 1.5 trillion in 2019. Indian IT-BPM industry revenues including hardware and ER&D spend stood at USD 191 billion in FY20. The industry added ~USD 14 billion in incremental revenues last year, representing year-on-year growth of ~ 7.7% in USD terms. IT-BPM export revenues for the industry for FY 2019-20 are expected to reach USD 147 billion, a growth of 8.1% over the past year.
LTI’s Delivery Center in Warsaw, Poland

261
The share of digital in industry revenues has jumped from ~20% last year to a range of 26%-28%. Nine digital technology areas will emerge as the fastest-growing and highest-impacting, with the combined potential to deliver one-third of the USD 100 trillion. The nine areas include three foundational technologies – Big Data and Analytics, Cloud Computing, and Cybersecurity – and six advanced technologies – Artificial Intelligence, Internet of Things, 3D Printing, Robotics, Blockchain, and Immersive Media.
The strong digital foundation that Indian technology has built over the last decade underpinned the remarkable agility and resilience in responding to the COvID-19 crisis; ensuring business continuity for all global clients while prioritizing the safety of its professionals.
The vertical specific key trends observed are as follows:
a) Banking and Financial Services: With the Banking industry being a fast adopter of advanced data analytics and AI-based strategies, as customer data segmentation and enhanced decision support become key priorities, this sector saw an increase in spend on digital technologies. COvID-19 has the potential to change the way people bank, forever marking a clear shift towards digital and cloud. It is expected that most routine operations would move to the cloud as cloud-native technologies can enhance customer experience while reducing costs at the same time.
b) Insurance: Cost optimization and legacy systems’ modernization are the key drivers of growth, and many insurers are shifting from the product-centric to a customer-centric business model, so insurance companies are open to form partnerships with ‘InsurTechs’ which will help them cut costs and improve business process efficiencies, as well as provide a better customer experience.
c) Manufacturing: This sector includes Industrial Manufacturing, Automotive & Aerospace. The automotive industry has been facing an unprecedented technology and business model transformation, driven mainly by Connected, Autonomous, Shared and Electric mobility (CASE). These trends will continue to drive the industry evolution going forward. The industrial manufacturing sector is witnessing the importance of the Digital Twin in maintaining operations within the manufacturing ecosystem, and the emerging and expanding role of collaborative robots, remote work and the ‘virtual shift’ in the manufacturing sectors.
d) Energy and Utilities: Cloud migration has helped companies leverage solutions for automated adaptive planning and scheduling of production, logistics and service processes, which in turn will enhance operational efficiency by reducing human interventions.
e) CPG, Retail and Pharma: Competition from Direct-to-consumer companies is changing business
LTI Headquarters, Powai, Mumbai

MANAGEMENT DISCUSSION AND ANALYSIS IT & TECHNOLOGY SERVICES ANNUAL REPORT 2019-20
262
models for CPG players. Companies are investing in customer-centric digital technologies, such as virtual Shelves, Digital Kiosks, Self-Checkout, Digital Reality, etc. As pharma companies generate a huge amount of health data, linking them to new technologies to build digital platforms is the way forward to transform their businesses. Emerging technologies, such as mHealth, Robotic Surgeries and 3D Printing, are paving their way in the Life Sciences industry.
f) Hi-Tech, Media and Entertainment: Direct-to-Consumer is a strong theme emerging from the necessity to understand customer preferences and behaviour. In the Media and Entertainment sector, content creation and prediction, along with personalization, are the keys to providing a seamless user experience. In Hi-Tech, 5G technology is slated to drive the market for the next several years and open opportunities in Over-the-top (OTT) and E-commerce.
FY 2019-20 marks the fourth consecutive year of industry-leading double-digit growth from LTI in constant currency terms.
Major AchievementsIn FY 2019-20, LTI further strengthened its partnership and alliances ecosystem. LTI received the AWS SAP Competency partner certification, positioning it on an exclusive list of AWS global partners. Elevation of LTI to ‘Gold’ partnership
with Pega and ‘Premier’ partnership with MuleSoft reaffirms the resolve of the business to remain relevant to clients.
During the year, LTI’s long-term rating has been upgraded by CRISIL to AAA/Stable from AA+/Positive. The National Stock Exchange of India Ltd. (NSE) has included LTI in its Nifty Next 50 Index.
Large Deal Wins a) A US based insurance company, a new logo has
selected LTI for a multi-year, multi-million-dollar managed services deal for its IT infrastructure and IT security operations
b) A US based utility company, a new logo has selected LTI for multi-year, multi-million-dollar deal to provide Cloud and Infrastructure Managed services
c) Won a multi-year, multi-million-dollar managed services engagement with a European financial institution, a new logo
d) A leading power generation company chose LTI as its partner for a greenfield and organization-wide implementation of SAP S/4 HANA
e) A multi-year, multi-million-dollar deal for transforming the global application operations of a global auto ancillary manufacturer
Mosaic Experience Centre

263
f) An apex government body selected LTI to create a conceptual framework on Data Management, integrating and harmonizing the available data sets in various key sectors through a single-window system for better governance
g) A multi-year, multi-million-dollar deal for complete digital transformation, enhancing productivity and quality of service of a key government ministry by implementing new microservices-based applications and building a data and analytics platform
h) A large energy retail company selected LTI for an end-to-end managed services deal for its IT applications and infrastructure operations
Awards and Recognitiona) LTI ranked as a Leader in AI-based Automation
Capability in Software Testing Services: AI and Digital Next-Gen Testing NelsonHall NEAT report 2019
b) LTI’s Digital Transformative Agribusiness case study recognized in ISG’s Global Digital Excellence: 25 Winning Partnerships Book
c) LTI ranked as HFS Top 10 IoT Service Providers 2019
d) LTI featured as a Major Contender in Everest Group Talent Readiness for Next-generation IT Services PEAK Matrix™ Assessment 2020
e) LTI positioned as a Major Contender and Star Performer in Everest Group Application and Digital Services in Banking – Services PEAK Matrix™ Assessment 2020
f) Won the SAP Pinnacle Award for Industry Innovation Partner of the Year 2020
g) LTI is now a constituent of the FTSE4Good Index Series following the June 2019 index review
h) LTI has been felicitated with the ZEE Business National CSR Leadership Award 2019 for Innovation in CSR practices
Significant InitiativesThe advent of newer and efficient technologies is driving extraordinary changes across different industry verticals all over the world. During these tumultuous shifts, there are early signs of winners who would outgrow their competitors and establish themselves as Breakaway Enterprises. The common thread across these companies is they are fast adopters of technology and are reshaping their organisation at a pace and agility that has not been witnessed in the past.
LTI’s state-of-the-art Delivery Center in Johannesburg, South Africa

MANAGEMENT DISCUSSION AND ANALYSIS IT & TECHNOLOGY SERVICES ANNUAL REPORT 2019-20
264
At LTI, we believe enterprises need to master four essential plays to be a breakaway leader:
• Operate to transform – leveraging automation in everyday operations and solving for the unstated needs
• Data driven Organization – harnessing the power of analytics
• Experience Transformation for their customers and employees
• Digitize the Core by leveraging real-world know-how of the client’s industry domain
LTI’s go-to-market strategy that is believed to help enterprises to be breakaway leaders continues to be the same as last year. It is continuously working towards ‘strengthening to solve’ along these four plays by investing in people and sharpening capabilities. LTI’s programmatic capability building focuses on hiring and re-skilling employees in digital technologies, developing vertical-centric platforms, augmenting key partnerships and acquiring unique capabilities.
xFH – LTI Design for Thriving in the WFH Future For the foreseeable future, WFH is the new global norm. As with any competitive landscape, some organizations will find ways to adapt and thrive under a fully distributed model, while others will, unfortunately, flounder.
That’s what the xFH model is all about: helping organizations make sense of their own WFH model, understand the layers that comprise it, then drive meaningful and impactful interventions at each of those layers – and across all layers – to ensure optimal business outcomes.
At LTI, the WFH is broken down into five layers, each with a specific set of interventions, tools, governance and outcomes – these layers traverse foundational needs to include both team and individual requirements.
LTI has demonstrated agility and nimbleness to adapt to the challenges posed by COvID-19. This, combined with its strategy to help customers become Breakaway Enterprises, is enabling LTI stand out in the marketplace.
Human ResourcesLTI crossed the 30,000-employee mark in FY 2019-20. The LTI culture is one of inclusivity and transparency. A gender-inclusive workforce is a natural result of this outlook, which is deeply woven into its ways of working. As of March 31, 2020, 31% of its workforce comprises women. LTI’s unique recruitment programme ‘Revive with LTI’ provides return-to-work opportunities to experienced women professionals, who are currently on sabbatical, under which they receive on-the-job training, mentorship from senior leaders and the opportunity to work on trending technologies in LTI.
In the area of talent management and digital skilling, the business has launched an AI-based solution that will help
LTI Welcome Center in Powai

265
contextualize and speed up hiring, skilling – specifically focused on digital – and deployment. It provides accurate ways of matching the right talent with the relevant job at speeds that significantly cut down on sourcing and hiring times. Besides providing a business-context based skill map-gap analysis, it also ensures an improved employee as well as candidate experience.
A key goal for the business in FY 2019-20 has been to focus on continuous reduction in attrition. Towards this, LTI launched the ‘iLead’ series to help first-time managers develop their leadership skills and help in talent retention.
To tap the vast talent pool in colleges, LTI flagged off the ‘Brand Icon’ initiative – a strategic programme designed to engage with selected colleges, not just for branding but from a 360-degree-development perspective between academia and corporates. Student development programmes like webinars and workshops were conducted by the LTI industry experts.
The global sales leadership incubation programme – ‘iRise’ – has won recognition at the ‘2019 Stevie Awards for Great Employers’. Currently in its 3rd batch, iRise is a 12-month onboarding programme aimed at building the global sales leaders of tomorrow. In its recent report “Talent Readiness for Next-generation IT Services PEAK Matrix™ Assessment 2020: Closing the Demand-Supply Gap”, the Everest Group has ranked LTI as the leading service provider for talent readiness for next-generation data services skills. This
ranking is on account of LTI’s focused talent development efforts across the entire data value chain of data storage and management, data gathering, and data analytics.
In response to the COvID-19 outbreak, LTI has swiftly enabled the work-from-home option for almost all of its employees, ensuring the safety and well-being of its employees, while maintaining continuity of operations. A global helpline and email address have been set up to answer questions about COvID-19. Regular updates and information to employees through emails, Intranet and other communication channels have been ensured. An internal portal has been set up which acts as a one-stop destination for accurate information and guidelines about COvID-19.
For India-based employees, LTI SafeRadius - a GDPR-compliant return-to-work app-based solution was launched to track and monitor an employee’s health and safety, and for issuing regional alerts from the HR and Admin teams.
Risks and ConcernsClient relationships are at the core of the business. LTI enjoys a history of high client retention and continues to derive a significant proportion of revenue from repeat business built on the successful execution of prior engagements. Also, efforts are on to expand the client base and geographies, as well as increase the value-add of deliverables.
LTI‘s Delivery Center at Pune LTI’s Delivery Center in Bengaluru, India

MANAGEMENT DISCUSSION AND ANALYSIS IT & TECHNOLOGY SERVICES ANNUAL REPORT 2019-20
266
The major risks faced by the business include failure to align the services portfolio with newer and in-demand technologies, leading to lower operating revenue. A technology architecture group has been created to ensure continuous skill alignment with market needs. Evolving geo- political and economic conditions may affect the client’s business and LTI’s delivery, which is mitigated by regular monitoring. Changes in immigration policies of countries where LTI has significant business may affect its ability to position consultants at client locations.
With a majority of the revenue being foreign currency denominated, the business carries translation and transaction foreign exchange risks. However, expenses in respective currencies provide a natural hedge.
Employees are the real assets for the IT industry. In order to compete effectively, the ability of the business to attract and retain qualified employees is critical. Attrition of experienced and talented employees impacts organizational knowledge and relationships. LTI has launched programmes for employee engagement and has a framework in place to reward high-potential employees.
OutlookThe risks emanating from the global pandemic continue to evolve. With sustained investments in capabilities and clients concurring with a xFH approach in response to COvID-19, the business is confident of a robust, resilient and sustainable business model.
MINDTREE
Overview:During the year, subsequent to acquisition of control, Mindtree was consolidated as a subsidiary in the L&T Group, from the second quarter of the financial year.
Mindtree is a global technology consulting and services company, helping Global 2000 corporations marry scale with agility to achieve a competitive advantage. ‘Born digital’ in 1999, more than 340 enterprise clients rely on the entity’s deep domain knowledge to break down silos, make sense of digital complexity and bring new initiatives to market faster. Mindtree enables IT to move at the speed of business, leveraging emerging technologies and the efficiencies of continuous delivery to spur business innovation.
Mindtree offers an extensive range of technology-driven customized solutions. Mindtree’s digital strategy is pivoted on multiple solutions, IPs, and frameworks cutting across several service offerings, covering areas such as real-time recommendations, social media intelligence, workforce productivity, customer analytics, and sales enablement. The entity’s expertise in digital solutions span across
Mindtree West Campus, Bengaluru

267
Adobe, Salesforce, and Sitecore. It services clients in diverse industries such as Retail, CPG and Manufacturing, Travel & Hospitality, Banking, Financial Services & Insurance, High-Technology and Media.
Mindtree is a Digital Next company with the main emphasis on the digital transformation of its clients to make them a better suited for future disruptions. Mindtree has grown as a trusted service provider for its clients and has repeatedly proven its technological expertise and domain capabilities.
Digital Next Intelligent Enterprise for Future Possibilities Mindtree plays the foremost role in its clients’ digital transformation and customer experience development. Mindtree’s clients’ businesses are highly influenced by their customer experience and the ease of use of all provided services. Emerging technologies are defining businesses even more than before. Therefore, companies have to be more aggressive in their uptake of new offerings, before they disrupt their business models.
Mindtree develops innovative solutions and platforms around such unique customer and cross-sector requirements.
AutomationAt Mindtree, automation strategy is platform and technology agonistic. Niche technologies like Machine Learning and RPA are used to automate repeatable and reusable tasks. At present, 764 BOTs are employed along with Mindtree Minds to provide top-notch client deliverables.
Application Managed Services Mindtree has developed unique end-to-end workflow-driven Application Managed Services that take complete lifecycle ownership of client enterprise applications. Through the AMS practice, Mindtree has grown to become a strategic partner for clients’ business growth. The wide range of services provided to clients through this practice includes:
• Transition and planning management – Performing system audit and creating a tailored plan for IT transformation completely aligned to business objectives and relevant KPIs
• DevOps – Automation of all possible IT services and transforming existing business into an agile and lean IT system
• Test Automation capabilities – For complete software test automation of client application with reduced time to production
Immersive Aurora Experience Center

MANAGEMENT DISCUSSION AND ANALYSIS IT & TECHNOLOGY SERVICES ANNUAL REPORT 2019-20
268
• End-to-end Managed Services – Providing omnichannel support and business aligned KPIs
• Application Modernization – To identify and eliminate redundancies in client systems, thereby enhancing customer experience through increased speed of operation, new features and add-ons
Expert Thinking Mindtree helps its clients re-imagine their business, providing unique solutions and digital transformation by leveraging next-generation and emerging technologies, including Blockchain, Machine Learning and Artificial Intelligence, Internet of Things and Cloud. Services ranging from ideation to customized solution building and implementation are carried out across the entire digital value chain.
Alliance and Partnerships• Microsoft: Gold Cloud Partner, through which
access to all Microsoft resources is available, delivering the best possible solutions to its customers
• Salesforce partner ecosystem: A Platinum partner, specialising in Salesforce implementation strategies to drive digital growth through client engagement
• SAP: Mindtree is the world’s only integrated service provider with expertise on the SAP HANA platform
• Amazon Web Services: Advanced Consulting Partner in the Amazon Partner Network (APN) for AWS
• Adobe: Business Partner within the Adobe Solution Partner Programme, which brings together a full suite of customer experience transformation services and Adobe Experience Cloud solutions to accelerate the digital transformation journey
Business Environment The IT BPM sector in India grew at the rate of 6.1% year-on-year. The IT and ITES industry grew from USD 170 billion in FY19 to USD 181 billion in FY20. India’s IT industry contributed around 7.7% of the country’s GDP. India has become the largest digital capabilities hub in the world with about 75% of the global digital talent being present here.
The COvID-19 pandemic has had an unprecedented impact at different levels viz. health and safety risks for Mindtree Minds, impact on clients which may lead to reduction in customer discretionary IT spends, delivery disruptions as well as increase in financial, compliance and operational risks. Mindtree set up a War Room consisting of senior leaders from different functions to co-ordinate response to COvID-19.
Kalinga Campus, Bhubaneswar

269
Significant Initiatives Customer satisfaction is one of the key performance indicators in Mindtree. Customer feedback is regularly gathered through quarterly Project Feedback Survey (PFS) and annual Customer Experience Survey (CES) which helps in monitoring account health and interest.
AwardsThe entity has been recognized on multiple fronts for its capabilities in a wide range of offerings including Digital, Cloud, Automation and other next generation developments. A few highlights include:
• Mindtree has been placed on ‘The Best of The Global Outsourcing 100®’ list by the International Association of Outsourcing Professionals (IAOP)
• Zinnov positions Mindtree in the Leadership Zone in Overall Digital Services and across Six Categories in the Zinnov Zones for Digital Services 2019 Report
• Mindtree named Overall Winner of the 2019 ISG Star of Excellence Awards™ for Core Technology Services
• Mindtree won at the 2019 Paragon Awards™ in the Excellence Category for Outstanding Service Delivery for a Global Airline
• Mindtree recognized as an Innovator in Avasant’s Intelligent Automation Services Radarview™ Report 2019 - 2020
• Received several awards from The ISG Provider Lens™ Report viz. Leader for providing Professional Services for Salesforce Sales and Service Cloud in USA, Leader for Private/Hybrid Cloud – Data Center Services & Solutions, Rising Star in Service Operation and Delivery (US), Global Leader for Next-gen ADM services
• Conferred South Asian Federation of Accountants (SAFA) best-presented accounts award for its strong ethics, excellence in financial reporting and corporate governance
• Best Compliance Framework award by UBS Forums
Environment, Health and Safety The entity is determined to reduce its carbon footprint through initiatives to conserve energy and water. It continuously strives to improve energy efficiency, increase the use of renewable energy, enhance water sustainability and reduce waste to landfills.
The entity has installed a turbo core chiller, resulting in an average annualized reduction of power consumption. Installation of LED fixtures across locations, UPS optimization, AC retrofit activity, shift rationalization through Routematic Application, a common bus system and so on led to reduced carbon emissions. In order to reduce freshwater consumption and to make its Pune facility a zero-discharge facility, its sewage treatment plant was upgraded to a newer technology. At Bengaluru,
Digital Pumpkin, London Digital Pumpkin, Bengaluru

MANAGEMENT DISCUSSION AND ANALYSIS IT & TECHNOLOGY SERVICES ANNUAL REPORT 2019-20
270
various water conservation programmes, such as installation of advanced aerators and reuse of RO reject water, resulted in saving of fresh water.
Gladius IoT, a full-fledged building IoT solution which integrates all aspects of building management systems with the IT systems, is operational at Mindtree Kalinga and Bengaluru West campus. The system monitors energy consumption in the building, across the floors and prevents avoidable energy losses.
The entity is committed to providing a safe and healthy workplace to employees. The aim is to make it a zero-incident campus. Post COvID-19, the entity is closely following WHO guidelines for health and safety. It has set up a 24-hour medical hotline for all employees to report any COvID-19 concerns, including diagnoses. Top priority has been given to safeguarding the health and safety of employees, while also ensuring the continuity of customer deliverables.
Human ResourcesMindtree creates a work environment where Mindtree Minds feel recognized for their efforts and contribution, thus creating an organization nurturing high performance, innovation and execution excellence. Through its focus on diversity and inclusion, women-centric leadership programmes cover more lady minds throughout the
organization. The onboarding programme for new Mindtree Minds and Mindtree Kalinga – The Global Learning Center was designed to create Engineers of Tomorrow. The homegrown, cloud-based learning platform – Yorbit – has over 2400 courses that cover 900+ skills. More than 87,000 courses have been completed on Yorbit in the current FY. The entity also has an Enterprise Leadership Programme for leaders identified from a combination of Talent Review and Leadership nominations to ensure a diverse group across functions (sales, delivery, enabling functions) and geographies. SpotOn – Mindtree’s Rewards and Recognition tool – has been built to strengthen the ways by which Mindtree Minds can recognize each other, and provides People Manager and Peer Awards that focus on instantaneous recognition.
Risks and ConcernsAs a global enterprise, Mindtree is exposed to a range of external as well as internal risks that have a significant impact on its performance. In order to efficiently manage these, a strong risk management architecture has been built. The entity identifies, assesses, manages and reports on the principal risks that could affect its ability to implement strategies and deliver commitments. Its robust enterprise risk management programme propels a culture of informed and responsible risk handling to achieve the desired growth.
Digital Pumpkin, New Jersey

271
The business faces the risk of revenue concentration with top clients. Changes in immigration policies of countries like the US, which is tightening its visa norms, where Mindtree has significant business, may affect its ability to position consultants at client locations. It could face margin pressures due to competitive pricing, tactical movements by competitors to gain market share, or escalating costs. With a majority of the revenue being foreign currency denominated, the business carries translation and transaction foreign exchange risks. A formal Board-approved hedging strategy is reviewed periodically.
Cyber Risk has emerged as a top risk across industries as organizations are moving to newer areas of engagement such as social, mobile computing and cloud computing. The entity has leveraged leading industry standards to develop cyber security frameworks. In the knowledge industry, attracting and retaining people with the right skills is imperative for long-term success. Employee-friendly policies, learning plans and career growth options have ensured that attrition remains at tolerable limits.
Outlook The COvID-19 outbreak has been creating an unprecedented level of uncertainty with major economies virtually coming to a halt. The business is well equipped to handle the global crisis based on the business continuity plan that has been successfully implemented to ensure the health and safety of employees while fully supporting
clients worldwide. Looking ahead in 2020-21, the business anticipates a drop in demand, curtailment of discretionary spends and cost-optimization pressure within clients’ business. At the same time, the business also expects demand from clients for digital and transformational services as they invest into data, cloud-enabled solutions, customer-centric and end user experience businesses.
Focus would be on signing multi-year annuity deals, rationalizing tail-accounts and going deeper into the limited set of strategic clients. The business will continue co-selling with long-standing strategic partners.
The business will continue to drive operational efficiencies for margin-expansion and continue the profitable growth journey.
L&T TECHNOLOGY SERVICES
Overview:L&T Technology Services Limited (LTTS) is a leading global pure-play Engineering Research & Development (ER&D) services company. It offers design and development solutions throughout the product development chain and provides services and solutions in the areas of mechanical and manufacturing engineering, embedded systems, engineering analytics and plant engineering. LTTS’ customer base includes 69 Fortune 500 companies
Network Operations Center, Bengaluru LTTS prototype of the Battery Management System used in Electric Vehicles

MANAGEMENT DISCUSSION AND ANALYSIS IT & TECHNOLOGY SERVICES ANNUAL REPORT 2019-20
272
and 53 of the world’s top ER&D companies across industrial products, transportation, telecom & hi-tech, medical devices and plant engineering. The business also provides digital engineering advisory services to some of the world’s leading enterprises. The key differentiators for LTTS’ business are its customer-centric industry innovations, domain expertise, and multi-vertical presence spanning major industry segments.
Transportation: LTTS offers the complete gamut of engineering services and solutions for its global customers in the transportation industry, including OEMs and Tier 1 suppliers in the Automotive, Trucks & Off-Highway vehicles and Aerospace sectors. In the automotive sector, LTTS helps its customers through best-in-class platforms and solutions in areas such as Advanced Driver Assistance System (ADAS), Autonomous Drive (AD) and Electrical vehicles (Ev). In the Aerospace sector, LTTS’ offerings encompass a wide spectrum, including aero engine, aero structure & systems, avionics, air traffic management and new-age disruptive digital transformation solutions, which cater to all phases of the Aircraft Lifecycle – design, manufacturing, and aftermarket services. LTTS has over a decade of domain expertise in the Trucks and Off-highway segment, and offers services across industries like Construction & Mining, Cranes & Material Handlers, Commercial vehicles, Agricultural & Gardening Equipment, Powersports and Polymer.
Industrial Products: LTTS helps its OEM customers across building automation, home and office products, energy, process control and machinery backed by its deep domain expertise across software, electronics, connectivity, mechanical engineering, industrial networking protocols, User Interface/User Experience (UI/UX), test frameworks and enterprise control solutions.
Telecom & Hi-tech: LTTS’ Telecom and Hi-tech vertical provides engineering services and solutions that cater to five key sectors: Telecom, Consumer Electronics, Semiconductor, ISv, and Media & Entertainment. For the Telecom sector, the services provided include product variant design & development, maintenance, testing, support, optimization, system integration and professional services (pre-deployment, deployment & post-deployment). For the Semiconductors industry, LTTS provides turnkey design services, IC design services, hardware system design, platform software, modem services, verification & validation, multimedia, connectivity, storage, mechanical engineering, and customer engineering support. For the Consumer Electronics segment, it provides services in the areas of product conceptualization, design & development, platform software, testing & certification, manufacturing support, product maintenance, and product launch support. For the Media & Entertainment industry, it provides services in product engineering, product conceptualization,
Headquartered at Knowledge City, Vadodara, L&T Technology Services helps clients gain the competitive edge by building smart products, enabling smartmanufacturing and offering smart services.

273
design & development, testing & certification, manufacturing support, product maintenance, and value engineering. And in ISv, LTTS undertakes application engineering, vLSI, cloud engineering, product uplift, platform development & migration, product support, testing and certification.
Plant Engineering: As an engineering, procurement, and construction management (EPCM) specialist, LTTS supports every phase of a plant’s lifecycle, from concept to commissioning. The business enables its customers to address all their engineering requirements to streamline their processes, resolve downtime issues, and adhere to statutory, human safety, machine safety, regulatory compliance as well as local and global standards. LTTS provides end-to-end solutions in the areas of plant design, process engineering, project management, construction management, MOC (management of change), and handover of operations to its customers in the Chemical, Consumer Packaged Goods (CPG), and Oil & Gas sectors.
Medical Devices: LTTS helps medical device OEMs address various industry challenges, including acceleration of the product development cycle, reduction of time-to-market, value engineering, and product launches in various geographies in compliance with the regional regulatory requirements. It focuses on delivering solutions
in in-vitro diagnostics, patient mobility services, musculoskeletal services, surgical services, cardiovascular, home healthcare and general medical. LTTS also provides pre-compliance testing and validation support, including product/compliance remediation, complaint management, and regulatory documentation support.
Business EnvironmentAccording to NASSCOM, India’s ER&D services sector (comprising embedded systems, ER&D and product engineering services) is the fastest growing sector within the Indian technology space – estimated to grow at 11 percent Y-o-Y to reach USD 32.7 billion in FY20. NASSCOM reports that, over the last 5-6 years, India’s ER&D services sector has been a story of consistent double-digit growth, even as the overall IT industry has grown in single digits.
The global ER&D spend remained strong at USD 1.5 trillion in the calendar year 2019 (growth of 5.3% Y-o-Y), driven by increasingly software-led engineering and digital technologies (like IoT and analytics). Digital Engineering is going to be the focus area for enterprises with growing requirements for a better user experience and personalization, greater adoption of platforms and cloud, and consolidation to build full-stack capabilities.
Zinnov reiterates this fact by observing that the global ER&D spend is resilient and has witnessed growth despite the slowdown and geo-political factors. Zinnov also forecasts that enterprises will continue to invest in Digital
The IoT Innovation Hub in Bengaluru is where IoT solutions come to life - from connected workers to smart fuel dispensers

MANAGEMENT DISCUSSION AND ANALYSIS IT & TECHNOLOGY SERVICES ANNUAL REPORT 2019-20
274
Engineering initiatives to stay relevant. The global spend of Digital Engineering is expected to grow at a CAGR of 19 percent, from USD 403 billion in 2019 to reach USD 1153 billion by 2025.
LTTS’ service portfolios have well-defined offerings in the ER&D sector. Through its services and solutions in the areas of Core Engineering, Digital Engineering and Digital Advisory Practice combined with its Innovation Engine, the entity is well- positioned to provide customers with business value propositions throughout their value chain needs across domains and industries. This is further corroborated through its positioning as an established technology leader by industry experts such as Zinnov, ISG, ARC, IDC, NelsonHall, and Frost & Sullivan.
Major AchievementsLTTS had a healthy inflow of projects across all its verticals. Several multi-million-dollar deals were won across the globe.
Order WinsTransportation• Airbus India selected LTTS to manage their Avionics
Software Development, v&v (validation & verification) and Data Analytics
• A European components supplier for autonomous vehicles has selected LTTS as its engineering partner for
key programmes in Advanced Driving Assistance Systems (ADAS) and Automated Driving (AD) domains
• A leading Swedish Automotive OEM has awarded LTTS a multi-year programme to set up a SCRUM team to develop and manage the software components in Brakes, Steering, Suspension and Climate Control Domains
• A leading auto parts maker has awarded LTTS a multi-year programme for design and development of their Engine Control Unit (ECU) for enhanced fuel efficiency for a new range of powertrains for their vehicles
• A global automotive manufacturer has chosen LTTS for the development of their AUTOSAR platform and integration of 5G telematics modules
• LTTS was selected as strategic partner by a European automotive manufacturer for its electric Powertrain (ePowertrain) practice
Industrial Products• For an industrial automation company, LTTS won an
order to develop IoT firmware for next-generation motor drives and controllers
• LTTS is setting up a development and design centre in India for a European manufacturer to provide engineering projects across Embedded, Mechanical and Connectivity domains
LTTS’ Motor Dyne system conducts troubleshooting of power electronics LTTS’ Hardware & Test Equipment covers sectors like avionics, communication, and security systems
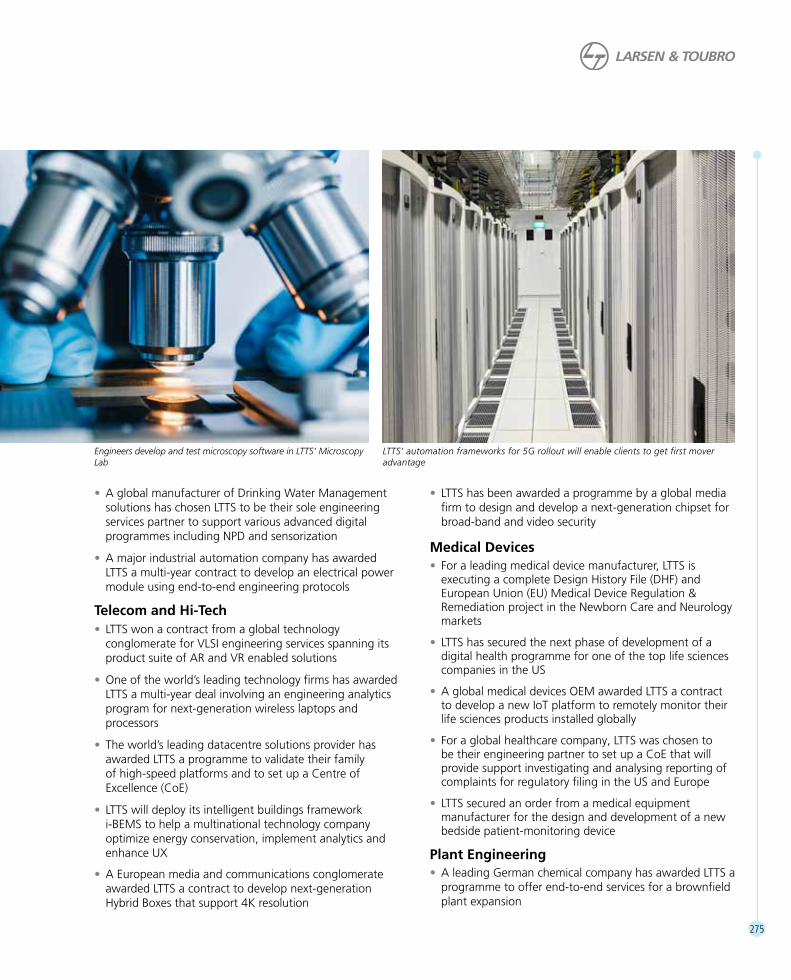
275
• A global manufacturer of Drinking Water Management solutions has chosen LTTS to be their sole engineering services partner to support various advanced digital programmes including NPD and sensorization
• A major industrial automation company has awarded LTTS a multi-year contract to develop an electrical power module using end-to-end engineering protocols
Telecom and Hi-Tech • LTTS won a contract from a global technology
conglomerate for vLSI engineering services spanning its product suite of AR and vR enabled solutions
• One of the world’s leading technology firms has awarded LTTS a multi-year deal involving an engineering analytics program for next-generation wireless laptops and processors
• The world’s leading datacentre solutions provider has awarded LTTS a programme to validate their family of high-speed platforms and to set up a Centre of Excellence (CoE)
• LTTS will deploy its intelligent buildings framework i-BEMS to help a multinational technology company optimize energy conservation, implement analytics and enhance UX
• A European media and communications conglomerate awarded LTTS a contract to develop next-generation Hybrid Boxes that support 4K resolution
• LTTS has been awarded a programme by a global media firm to design and develop a next-generation chipset for broad-band and video security
Medical Devices• For a leading medical device manufacturer, LTTS is
executing a complete Design History File (DHF) and European Union (EU) Medical Device Regulation & Remediation project in the Newborn Care and Neurology markets
• LTTS has secured the next phase of development of a digital health programme for one of the top life sciences companies in the US
• A global medical devices OEM awarded LTTS a contract to develop a new IoT platform to remotely monitor their life sciences products installed globally
• For a global healthcare company, LTTS was chosen to be their engineering partner to set up a CoE that will provide support investigating and analysing reporting of complaints for regulatory filing in the US and Europe
• LTTS secured an order from a medical equipment manufacturer for the design and development of a new bedside patient-monitoring device
Plant Engineering• A leading German chemical company has awarded LTTS a
programme to offer end-to-end services for a brownfield plant expansion
Engineers develop and test microscopy software in LTTS’ Microscopy Lab
LTTS’ automation frameworks for 5G rollout will enable clients to get first mover advantage

MANAGEMENT DISCUSSION AND ANALYSIS IT & TECHNOLOGY SERVICES ANNUAL REPORT 2019-20
276
• LTTS won a large deal to implement over 600 engineering applications for a leading US-based EPC company
• One of the largest beverage companies in the world has selected LTTS for an Engineering, Procurement and Construction Management Programme (EPCM) to replace the age-old wastewater treatment system at one of its key manufacturing plants
• LTTS was awarded a project to set up an Engineering value Centre (EvC) by a multinational brewery company for execution of site-based projects
Customer Recognition• LTTS launched the ‘Smartest Office Campus in the World’
in Israel for a leading technology conglomerate, which runs on its proprietary smart building platform i-BEMS
• Agappe Diagnostics, a diagnostics reagents and equipment manufacturer, launched the first indigenously developed blood cell counter in partnership with LTTS. The blood cell counter provides accurate diagnostics for critical ailments such as dengue fever, rat fever, allergic conditions, leukaemia, typhoid, and anaemia
• LTTS was conferred with the ‘Performance Excellence Award’ by a leading global OEM for exceeding performance standards including quality, cost and service
Awards and Recognition• The Confederation of Indian Industry (CII) conferred
LTTS with the CII Industrial Innovation Award, 2019 and recognized it as one of the most innovative Indian companies in the Services category in the ‘Large Enterprises’ segment
• LTTS was awarded recognition for ‘High Growth in Women Employment’ and ‘Highest Exporter-IT (Mysuru Region)’ by the Software Technology Parks of India (STPI)
• LTTS was rated as an ‘Expansive and Established Leader’ across 10 verticals by Zinnov
• LTTS was recognized as a ‘Leader’ in Product Engineering and Manufacturing Services in the Automotive & Aerospace sectors by ISG
• NelsonHall rated LTTS as an overall leader in Digital Manufacturing Services
• LTTS was rated as ‘Leader’ in Worldwide Business and Industrial IoT Engineering and Managed Services 2020 by IDC
• Everest Group recognized L&T Technology Services as ‘Leader’ in Automotive Engineering Services
Significant InitiativesLTTS believes in incremental efforts to enhance its technology and service footprint across the industry
5G Test Solutions are vital in the deployment and success of evolving 5G networks LTTS’ Transport Instrument Cluster takes signals from various sensors and conveys them to the driver

277
sectors that it caters to globally, and has launched various initiatives that enable it to realize its vision and demonstrate its commitment towards excellence.
• LTTS inaugurated an Aerospace and Defence Engineering Design Centre in Rockford, Illinois, to cater to the new-age digital requirements of the aerospace and defence markets
• LTTS developed the world’s first cost-effective Robotic Endo-training Kit in association with GITA and Department of Science and Technology (DST). This kit is a futuristic surgical training robot that gives a high-definition observation of the patient’s anatomy and the instruments. The research and development for the kit has been a joint effort between India and the Republic of Korea
• LTTS’ new framework unveiled a line-up of Digital Manufacturing Solutions that can unlock value-based digital transformation and help global manufacturers scale-up their digital initiatives
Environment, Health and SafetyLTTS has aligned its sustainability goals with that of its parent, L&T, with the objective of contributing to the creation of a sustainable world by minimizing environmental impact, maximizing social outreach and offering sustainable solutions. As part of this roadmap, LTTS
is constantly undertaking various initiatives in the areas of water and energy conservation as well as efforts to reduce the carbon footprint.
From water-cooled chillers, occupancy sensors, LED lighting, and elevator operation optimization to pressmatic taps, wastewater treatment and usage of technology to reduce travel and logistics, LTTS ensures optimal measures to safeguard the environment. LTTS also follows and implements all the industry standards, protocols, and best practices to ensure the workplace health, safety, and well-being of its workforce of over 16,000+ employees.
Human ResourcesLTTS’ HR policies have strongly focussed on creating a culture of excellence and achievement. Abiding by the People, Process, and Portals parameters, the entity is striving towards making employees at all levels an integral part of the decision-making system. LTTS launched multiple new employee support and welfare initiatives this year.
A few of these are:
Global Engineering Academy (GEA): The GEA provides an invaluable opportunity for LTTS employees to reskill and reboot their domain knowledge. There are 15 technology tracks that employees can select from to advance their digital skillsets and be eligible for new opportunities across technology domains.
LTTS’ Creative Think Studio showcases design aspects of the product to create delightful customer experiences

MANAGEMENT DISCUSSION AND ANALYSIS IT & TECHNOLOGY SERVICES ANNUAL REPORT 2019-20
278
DIGICIANDOS: This programme helps employees gain proficiency in the latest technologies. With over 400 attendees, 3 sessions have successfully trained participants on AI and Mobility. An additional USP, byte-sized learning modules that can be accessed through handheld devices will be launched soon, enabling employees to learn on-the-go.
Risks and ConcernsThe economic slowdown in key geographies or cyclical downturns in key segments could materially affect revenue growth and profitability. The inability to innovate and develop new services and solutions to keep up with customer expectations and evolving technologies could result in lower growth traction. Changing immigration laws and policies can impact the entity’s ability to provide services to customers. Exchange rate fluctuations could materially impact the results of operations.
OutlookAccording to NASSCOM, the Indian ER&D landscape has been growing at a healthy rate of 11 percent y-o-y. As an ER&D leader in the industry, this bodes well for LTTS. The entity’s strategic approach is to assess the changing business needs of customers and build innovation
infrastructure to meet those needs, thereby enabling customers to gain a market share and the technology edge.
Current circumstances have presented a unique opportunity for providing unwavering support to the customers at a difficult time. LTTS has identified areas where it can support customers to see through the current challenges as well as help them come out stronger. It has launched services for the manufacturing industry to address the shift in demand with its Manufacturing Line Expansion/Re-Design/Transfer services, achieve business continuity with its AGILE Sourcing and Supply Chain services and plan healthcare for their machines with the Remote Asset Care services.
Furthermore, based on conversations with the customers and industry experts, to address the RoI disparity in the implementation of the digital initiatives, the business has carved out a Digital Advisory Practice (DAP). The practice goes beyond selling solutions and services and helps companies to architect and execute their digital roadmap with LTTS as a consulting partner.
The industry outlook points to a steady demand for ER&D-led innovation in the form of cutting-edge technology solutions that will help transform customer experiences. LTTS aspires to be the transformation agent that customers can bank upon to realize their vision and aspirations.
At LTTS’ Imaging Lab, engineers develop various Innovative AI-based imaging solutions
The Tear Down Lab is where engineers disassemble products for detailed analysis

279
FINANCIAL SERVICES BUSINESS
Overview:L&T Finance Holdings (LTFH) is the holding company for the financial services businesses of the Larsen & Toubro Group. It is one of India’s most valued and diversified NBFCs, having a strong presence across the Lending & Investment management businesses. LTFH is a financial solutions provider catering to the diverse needs of its customers across various sectors, including:
• Rural Finance, comprising Farm Equipment Finance, Two-Wheeler Finance, Micro Loans and Consumer Loans
• Housing Finance, comprising Home Loans, Loan against Property and Real Estate Finance
• Infrastructure Finance
• Mutual Funds
The Wealth management business is being divested to IIFL wealth, the approval for which was received in April ’20. With the aim of creating a single, unified lending entity with a wider and stronger capital and asset base, the process of amalgamating three lending entities – L&T Finance Ltd., L&T Infrastructure Finance Company Ltd. and L&T Housing Finance Ltd. – has been initiated.
Business EnvironmentThe Indian economy in FY 2019-20 began on a downward trajectory, and continued to slow down further, weighed by structural stresses, such as sluggish private investment, a significant decline in savings rate and the highest unemployment rate ever recorded. A broad-based breakdown in consumption further accentuated the slowdown.
On the sectoral front, a bountiful monsoon supported the growth in agriculture and allied activities. The healthy water reservoirs augured well for rabi crops. Industrial growth, however, slowed down on the back of sluggish manufacturing activity. Growth in the services sector too was moderate due to subdued activity in the trade, hotel, transport and communication sectors.
India’s fiscal deficit stood at 4.6% of GDP in 2019-20 as per the official report of the Department of Expenditure, Government of India. The financial markets remained jittery in FY20 due to the domestic economic slowdown, concerns on fiscal slippage and geo-political tensions. Weaknesses in overall economic activity also put pressure on the business growth of lenders, including NBFCs.
Government revenues have taken a significant hit due to the COvID-19 impact and the lockdown. On the other hand, expenditures have risen due to the various costs
Micro Loans

MANAGEMENT DISCUSSION AND ANALYSIS FINANCIAL SERVICES BUSINESS ANNUAL REPORT 2019-20
280
arising from the many virus containment efforts and the enforcement of the lockdown.
However, AAA rated, large-sized NBFCs were relatively better placed with liquidity, comprising liquid assets, undrawn lines from banks, and, in some cases, funding lines from group companies.
Overall, FY 2019-20 was a very challenging year, with funding markets seeing multiple periods of disruption and risk aversion from Mutual Funds and Banks especially towards NBFCs. However, in these difficult times, LTFH has been able to time the markets and has successfully raised highest annual long-term incremental borrowing (across various instruments) since FY 2016.
The business is comfortably placed with respect to both liquidity and interest rate risks, due to its robust Asset Liability Management (ALM) and strong risk management framework.
The average assets under Management for the Mutual Fund business had marginal Y-o-Y increase in FY20, the key focus areas being:
• Continued focus on retailisation of assets with diversified mix of distributors and customers
• Increase in market share through new customers
• Enhancing market share in high-quality fixed-income assets
Significant Initiatives During FY 2019-20, the business continued to focus on sustainability of performance with steady margins, stable asset quality, focused growth and building a strong liability franchise. The specific focus for the year was on the following areas:
a) Diversification of sources of funds leading to stronger liability franchise
The business has a well-diversified borrowing mix in the form of Bank borrowings (including PSL), NCDs (retail and wholesale), Preference shares and ECBs. It has strengthened its liability profile with higher proportion of long-term borrowings through diversified sources of funding during the year.
b) Business realignment with focus on the ‘Right to Win’
Some of the key business changes undertaken include:
• The business launched a pilot run of consumer loans in Q3 FY2019-20 and has disbursed the product to ~12,000 active customers with an excellent track record of repayment with the aid of data analytic tools
Farm Equipment Finance

281
• In the Infrastructure Finance segment, the business is also evaluating diversification into new sectors including funding to City Gas Distribution (CGD) companies, ports and airports. In line with the strategy of investing in products with a ‘Right to Win’, the Structured Finance Group (SFG) and Debt Capital Markets (DCM) were classified as defocused business during the year and have been run down significantly over the last year (50% YoY reduction)
c) Maintained market share by leveraging on business strengths
LTFH increased its market share in the Farm and Two-wheeler sectors, while maintaining business strengths across the businesses, through investing in footprint expansion, team quality enhancement, technology infrastructure and data analytics framework.
Major AchievementsLTFH, through rigorous execution of digital proposition and domain expertise, has been able to capture a 9.3% market share in the Two-Wheeler Finance segment in FY 2019-20. A new scheme, ‘Sabse Khaas Loan’ was introduced to target the unfinanced sector with no hypothecation and a lower rate of interest as compared with credit cards. LTFH focussed on touch-free collections, which accounted for 32% of the total collection in FY20. LTFH has been
able to maintain its market share of 14% in Farm Loans and strengthen its position as the #2 player in the Farm Equipment Finance industry. The rich customer base in Tractor Financing services, built over the years, is further strengthened by extending the refinancing facility to its prime customers with a good credit and payment history.
LTFH has strengthened its Right to Win in business by moving to a desired OEM and Asset mix and by de-risking over-dependencies. Disbursement from preferred OEMs now contributes 73% of the total disbursements in FY 2019-20.
LTFH disbursed R 9,884 crore of micro loans in FY 2019-20, benefiting over 28 lakh women in rural and semi-urban areas who depend on dairy, grocery shops and similar allied activities for earning their daily livelihood.
LTFH introduced the ‘Mid Term Renewal Product’ (MTRP) scheme which aims to provide pre-approved early repeat loans for existing customers with an excellent repayment history, resulting in repeat business contributing 40% of the total business.
Despite the challenging environment witnessed in the housing market, direct sourcing initiatives have helped scale up home loans from 69% in FY 2018-19 to 72% in FY 2019-20.
Infrastructure Finance

MANAGEMENT DISCUSSION AND ANALYSIS FINANCIAL SERVICES BUSINESS ANNUAL REPORT 2019-20
282
With the strategy to optimise its sectoral mix, the business scouted for disbursement opportunities in newer infra-related sectors and, during the year, has funded 2 projects of City Gas distribution (CGD) which are being executed by the AG&P group.
Asset origination with a clear perspective of ‘Churn’, the business achieved a key milestone of R 25,000 crore of cumulative sell-down since FY’17. Further, while there was a reduction in overall sell-down volumes during the year due to the liquidity challenges being faced by NBFCs and the consolidation of PSU banks, it managed to sell down R 780 crore of Hybrid Annuity Model (HAM) road projects to public sector banks.
FY 2019-20 was a year which also saw more rating downgrades than upgrades. In such a difficult operating environment, LTFH was successful in being assigned a AAA rating by CRISIL for the first time (October 2019). With this, all 4 rating agencies (viz., CRISIL, India Ratings, CARE and ICRA) have reaffirmed / rated LTFH as ‘AAA’ during FY 2019-20.
Environment, Health and SafetyLTFH recognises that the physical risks of climate change are very high, and thereby ensures that its operations and investments have a positive environmental impact in line
with its Sustainability Policy. The policy has environmental objectives including:
• Products and services that contribute to the sustainable development of the Indian economy while ensuring application of environmentally friendly practices
• To reduce the adverse impact of climate change, and promote energy efficiency and environmentally friendly operations
The business is working towards lowering Greenhouse Gas (GHG) emissions through its operations. It believes that its operational efficiency can be enhanced by measuring, managing and mitigating GHG emissions. The business is also in the process of phasing out ozone-depleting substances (ODS) by reducing their usage and has installed inverters in place of DGs to reduce carbon emissions.
Investments in technology are a part of LTFH’s commitment towards sustainability. The digital transformation efforts – e-communications and mobile apps across its business segments – have led to an impressive reduction in paper usage and, in turn, emission reduction. 100% E-waste is re-cycled through registered recyclers in accordance with the E-Waste Management and Handling Rules.
Housing Finance Mutual Funds

283
Human ResourcesThe business believes that its people are its most important asset, and works with a clear plan for capitalizing and building upon their capabilities.
LTFH competes on the strength of its people; employees who are united by the core values of pride, integrity, discipline and ambition, and thrive in the climate of the ‘Right People for the Right Culture’. A culture of entrepreneurship and empowerment has been built, with ‘Results, Not Reasons’ being at its core. Believing that knowledge is the differentiator, the business has modelled itself as a learning organisation by focusing on ‘Stretch, Learn and Grow’.
The business talent strategy, aligned with its goals, is performance oriented. The business believes that building individual capabilities with focus and direction and leveraging them in a structured manner through job rotation builds up organisational capability. It encourages employees who have demonstrated the right capability, the right attitude and the desire to ‘Step Up’. As part of its strategy to groom talent who are future-ready, cross-functional movements are encouraged and they are up-skilled through ‘Education, Exposure and Experience’.
LTFH is an equal-opportunity employer, where meritocracy is the norm, and helps build a forward-looking organisation that can deal with the ever-changing business landscape.
Risks and ConcernsAt this juncture, there are several uncertainties that cloud India’s growth outlook and macroeconomic stability during FY 2020-21. The critical GDP contributors for India, comprising private consumption, investment and external trade, may get significantly impacted on the plausible scenario of a prolonged lockdown to contain the COvID-19 outbreak. The pandemic may have credit risk and liquidity implications for the NBFC sector. Despite steep monetary easing by the RBI, the cost of borrowing for NBFCs has witnessed an increase owing to fiscal slippage expectations and elevated risk premia for NBFCs. Furthermore, asymmetry in loan moratorium relief announced during the lockdown period (concessions from the asset side but not from the liability side) is likely to create liquidity stresses and ALM challenges for NBFCs.
The business of NBFCs is expected to experience a pressure on the NIMs owing to surplus liquidity in the banking system, coupled with a significant drop in new disbursements and fee income. Lower collections due to restrictive measures to counter the COvID-19 outbreak and the adverse impact on the earnings of the borrowers are likely to put additional pressures on asset quality and credit costs, which could be more pronounced in certain relatively more vulnerable segments, such as micro loans, loans against property (LAP), affordable housing and real estate segments.
Real Estate Finance Two-Wheeler Finance

MANAGEMENT DISCUSSION AND ANALYSIS FINANCIAL SERVICES BUSINESS ANNUAL REPORT 2019-20
284
With the onset of the pandemic in March 2020, the RBI has undertaken a series of radical policy measures to infuse liquidity into the banking system via Targeted Long Term Repo Operation (TLTRO), reduction in policy rate, widening the Liquidity Adjustment Facility (LAF) corridor, availability of funding for NBFC/HFC sector (TLTRO 2.0), etc. This has helped restore a degree of normalcy in short-term market rates. However, there has not been much effect on medium-long term rates which, at best, saw a marginal decline.
In April, following the Government’s decision to hike its gross market borrowings for FY21 in the light of the economic package to mitigate the impact of the economic slowdown, there has been a rise in G-Sec yields reflecting market nervousness on account of anticipated higher fiscal deficit. Credit spreads have remained wide on account of heightened risk aversion from market participants, who see repayment stress affecting in particular, the NBFC sector, due to which interest rates for FY 2020-21 are anticipated to be elevated. This is despite the fact that the inflation rate is expected to remain benign due to the demand crunch both in the rural as well as the urban sectors and also due to likely low crude oil prices in the world market.
The business is confident of managing the hazards of adverse business conditions with the help of in-depth business knowledge, strong managerial capabilities, an agile execution engine, deep market penetration, risk mitigation through various market and credit checks, robust early warning systems and the extensive use of analytics.
Outlook The global macroeconomic outlook is overcast with the adverse impact of the COvID-19 pandemic which has caused dislocations in global supply chains, among others. Several multilateral agencies have projected a recession for the global economy in 2020, with the International Monetary Fund (IMF) warning of the worst global recession
in almost a century. Major nations, including India, have responded by expansionary monetary and fiscal policies to ensure liquidity and credit flow to their economies. Nevertheless, the pace of the containment of the pandemic will determine the depth of the recession while the policy responses announced in the meanwhile will support the pace of recovery in 2021.
Rating agencies and economic think-tanks have lowered India’s growth projections for the year FY 2020-21 to a lowly positive growth print on the back of factory shutdowns, supply chain disruptions, travel restrictions, reduced discretionary spending and a recessionary outlook for the global economy. Many believe this decline as a cyclical event and that India’s structural story is intact. However, a prolonged economic slowdown could adversely affect all credit intermediaries and financial markets. The asset quality of banks and NBFCs could further deteriorate amid the broad-based economic slowdown.
The outlook on inflation remains subdued during FY 2020-21 due to adequate buffer stocks in cereals, a good rabi harvest, record decline in global crude prices, low pricing power of firms and expectations of a normal monsoon in FY 2020-21.
LTFH expects that disbursements in retail will start gradually as the economy opens up, and in Infrastructure and Real Estate will be largely limited to tranche disbursements, while fresh disbursements are subject to higher risk controls.
LTFH remains resilient by continuing to focus on the strengths built over the past few years, viz. a strong ALM and enhanced liquidity on the back of well-established liability franchise, a strong balance sheet demonstrated through reduction in GS3 and comfortable capital adequacy.

285
L&T INFRASTRUTURE DEVELOPMENT PROJECTS LIMITED (L&T IDPL)
Overview:L&T Infrastructure Development Projects Limited (L&T IDPL) is a pioneer of the Public-Private Partnership (PPP) model of development in India, which involves the development of infrastructure projects by private-sector players in partnership with the Central and State Governments. Since its inception in 2001, the entity has completed landmark infrastructure projects across key sectors like roads, bridges, transmission lines, ports, airports, water supply, renewable energy and urban infrastructure. It is one of India’s largest road developers, as measured by lane kilometres under concession agreements signed with Union and State Government authorities. Currently, L&T IDPL has 10 operational road assets and the Kudgi Transmission Project in its portfolio. It also manages 5 operational road assets transferred to Indinfravit Trust, an InvIT that the entity sponsored
DEVELOPMENT PROJECTS BUSINESS
The Development Projects business segment comprises:
a) Infrastructure projects executed through its joint venture company, L&T Infrastructure Development Projects Limited and its subsidiaries and associates (the L&T IDPL Group)
b) The Hyderabad Metro Rail project, executed through its subsidiary, L&T Metro Rail Hyderabad Limited
c) Power development projects executed through its subsidiary L&T Power Development Limited and its subsidiaries (the L&T PDL Group)
The operations of the Development Projects business segment primarily involve the development, operation and maintenance of basic infrastructure projects in the Public- Private Partnership (PPP) format, toll collection including annuity-based road projects, power development, power transmission and providing related advisory services.
Vadodara-Bharuch Tollway Limited

MANAGEMENT DISCUSSION AND ANALYSIS DEVELOPMENT PROJECTS BUSINESS ANNUAL REPORT 2019-20
286
and launched in May 2018 as the first privately placed InvIT in India, with 77% holding from an international pension fund and insurance investors.
Two decades of extensive experience of working with governments, multi-lateral agencies, international and domestic financial institutions and corporate entities has helped the business to develop proven competencies in viability Assessment, Financial Closure, Project Management, Operations & Maintenance and Portfolio Management of Infrastructure Assets across various sectors.
The Canada Pension Plan Investment Board (CPPIB) made substantial financial investments in L&T IDPL in two investment tranches, in December 2014 and December 2015 respectively. This is the first direct private investment by the largest Canadian pension fund into an Indian Infrastructure Development company. During the year, on conversion of Compulsorily Convertible Preference Shares, the CPPIB became a 49% equity holder and L&T’s stake in L&T Infrastructure Development Projects Ltd (L&T IDPL) has been diluted to 51%.
Business Environment Transportation sectorConsidering that the private sector has moved away from Build Operate Transfer and the response to Hybrid Annuity Model projects has also been dwindling, NHAI has focussed on the Toll Operate Transfer (TOT) model. During the year, the entity associated itself with the National Infrastructure & Investment Fund (NIIF) and the CPPIB for their consortium bid for TOT Bundle 3.
In order to drive the Digital India vision of Electronic Toll Collection (ETC), the Ministry of Road Transport & Highways (MoRTH), with effect from December 2019, made the Fastag mandatory for all commercial and private vehicles plying on NHAI roads. The entity successfully led the Fastag implementation on some of the busiest stretches in the country. ETC collections, as a proportion of total toll collections, went up from 27% in March 2019 to 72% in March 2020. This has increased user convenience and reduced cash-handling issues.
Transmission LinesDuring the year, the entity resumed bidding activities and participated in five bids under the TBCB (Tariff-Based Competitive Bid) framework.
The Ministry of Power, GoI, Central Electricity Authority (CEA) and Solar Energy Corporation of India have
Interstate Road Corridor Limited

287
collectively decided to construct a Green Energy Corridor across the country to make India grid-ready for upcoming power generation through renewable energy sources. CEA has approved 24 projects worth R 32,000 crore for bidding under TBCB. However, the timelines for bidding are uncertain due to COvID-19.
Major AchievementsMoRTH has instituted the ‘National Highways Excellence Awards’ to recognize the country’s best-performing road assets and toll plazas, both concessionaire-managed and NHAI-managed. For the year 2019-20, Krishnagiri Thoppur Tollways Ltd (KTTL) managed by IDPL won the Silver award, while several others owned/managed by IDPL figured in various categories as Champions. These road assets are highlighted in the annual calendar and dossier of MoRTH, which are widely distributed across the country.
In a road subsidiary for a project terminated in 2015, there was a favourable arbitration award for termination payments. Another road subsidiary received a favourable arbitration award for a construction claim.
The entity actively supported Indian Highways Management Company Limited (IHMCL), the agency responsible to carry out Electronic Tolling, at various policy level discussions, SOPs and operational experiences to enhance the applicability and efficacy of Fastag across the nation. In
the Transmission Service Agreement of the project, the key aspect is its availability. In FY 2019-20, Kudgi Transmission Line (KTL) achieved an availability of 99.99% and thereby earned incentives. The maintenance cost of KTL was also reduced substantially as compared to the previous year.
Significant InitiativesDuring FY 2019-20, remarkable advancements were made towards digitalisation. Ahead of Fastag being called in mandatorily, the business proactively envisaged the strong need to push IT infrastructure to facilitate an enhanced user experience and efficient operations. This resulted in the development of the completely automated and centrally monitored Fastag control system. This system enables the automatic generation of all related transactional reports and expeditious notification of class discrepancy evidence to the acquiring bank, arresting revenue leakages.
The various other Digital Initiatives across the functions include:
• End-to-End Integrated new age SAP S4 Hana replacing existing ERP
During the year, the project for implementing SAP S4 Hana 1909 along with various other bolt-on products/applications, such as SAP Ariba, vendor Portal, Business on Maps, Mobile Application for route operations and O&M teams, etc., were initiated. All these applications,
Kudgi Transmission Limited

MANAGEMENT DISCUSSION AND ANALYSIS DEVELOPMENT PROJECTS BUSINESS ANNUAL REPORT 2019-20
288
once implemented, will be integrated with SAP, and will enhance the speed of reporting and response.
This initiative also includes the implementation of 17+ SAP modules, some of which are first of their kind in India to be implemented in an integrated way. Go-Live is planned by August 2020.
• Human Resources
In the current financial year, the entire spectrum of HR operations has moved to a sophisticated application called EmployWise, which covers the entire employee life cycle from ‘Hire to Retire’. It is on the cloud (SAAS - Software as a service).
• Security-related Implementation
Numerous measures have been taken to tighten security, and various tools and components have been introduced and implemented. Network segregation has been done at all toll plazas as well. People were enabled to work from home in a secure way via secured vPN, end-point security, etc.
• Kudgi Transmission Ltd (KTL) has gone completely digital in its Operations and Maintenance
Environment, Health and Safety The business is committed to providing a safe and healthy workplace for their employees and stakeholders and to
conserving the environment. EHS is one of the essential pillars of a good and robust corporate governance structure.
To facilitate the implementation of the EHS policy, various Standard Operating Procedures (SOPs) have been formulated defining individual responsibilities and procedures relating to Environmental, Health and Safety matters.
A system called Route Operations Management System (ROMS) has been implemented, which enables immediate reporting of any incident to the project head and functional head concerned in the form of a Preliminary Accident Information Report (PAIR) and Final Accident Information Report (FAIR).
Kudgi Transmission Line (KTL) has successfully achieved a full safe year for all its manpower.
With the onset of the COvID-19 pandemic, the entity enhanced its preparedness early on. A range of preventive measures were undertaken in line with the guidelines under Government advisories/regulations. The entity has also been an early mover in rolling-out a detailed Operations SOPs for not only dealing with the contagion but also ensuring business continuity, including establishing a concrete Disaster Recovery Plan.
Sambalpur Rourkela Tollway Limited

289
Human ResourcesThe business has well-laid practices in terms of recruitment of talent and retention. Employees are kept engaged by providing access to learning opportunities, Development Centres, challenging business assignments, and individual need-based specific development interventions. The Development Centre is a systematic and objective method to measure competence to provide insights into the strengths and development areas of individuals.
The business has in place a Rewards & Recognition (R&R) programme to drive performance and boost the morale of the employees spanning across the categories. ‘An engaged workforce will be a very productive workforce’ is the principle based on which the R&R programme has been devised.
With the aim of building future leaders, the business has devised a 9-month long learning programme, called ‘Capability Capitalization’, for a select few potential future leaders. This journey aims to mould an employee into a well-rounded leader. The sessions comprise psychometric tools to enhance self-awareness, awareness of the ecosystem, etc. Tools are administered to further enhance the Emotional Intelligence quotient. Change orientation, mastering the change curve, team behaviour using tools such as Belbin and Business Simulations are also covered.
Getting these potential future leaders to understand the importance of communication for influence, business thinking and developing managerial acumen are integral parts of this learning journey.
Risks and ConcernsTraffic & Tariff are key factors in the Toll business. In the aftermath of COvID-19, the nature of recovery across various sectors, such as automobiles, mining, construction, exports, etc., will play a pivotal role in determining the traffic growth characteristics across the portfolio. Further, in some of the projects, the annual toll tariff revisions are based on the wholesale price index (WPI). Lower WPI coupled with lower traffic could lead to lower toll collections. The impact of the pandemic on toll collections is being addressed by the business by resorting to provisions under the Concession Agreements under force majeure.
The mandatory implementation of Fastag has led to various challenges, such as plaza-level cyber security, data management and timely discrepancy reporting to acquiring banks. However, the entity proactively recognised the associated risks and reinforced the IT infrastructure requirements and SOPs. This resulted in the seamless shift towards Fastag implementation across the SPvs. Currently, the entity hosts a completely digitalised and centrally monitored in-house data management and monitoring
Sambalpur Rourkela Tollway Limited

MANAGEMENT DISCUSSION AND ANALYSIS DEVELOPMENT PROJECTS BUSINESS ANNUAL REPORT 2019-20
290
framework for Fastag transactions, which is thoroughly secured.
Outlook The Government of India intends to provide a strong thrust to the Infrastructure sector via the National Infrastructure Pipeline (NIP). Out of the total project capital expenditure of NIP, 19% ~ R 20 lakh crore would be spent on the Transportation sector.
Prior to COvID-19, toll revenue was expected to increase to the tune of 6%. However, in the near term, the toll revenues are expected to contract as compared to the previous year due to lower traffic growth and lower WPI. COvID-19 has presented an unprecedented challenge, resulting in a nationwide lockdown and hence a sharp decline in traffic across the country. This event has been categorised as a force majeure event under the concession agreement, the cashflow for the year will be stressed, and hence cash conservation will be the key.
The MoRTH has issued a memorandum providing relief to contractors / developers of the road sector under the ‘Atmanirbhar Bharat’ Scheme and directing NHAI to provide force majeure relief to concessionaires impacted by COvID-19. A separate committee is being set up under the chairmanship of Director General (RD) & Special Secretary to suggest further steps in this regard.
The Ministry of Finance (Department of Expenditure), Government of India has also issued a circular to provide extension of concession period between 3 to 6 months. Expeditious approval in the Change of Scope in contracts, extension of Concession Period, and provision of Revenue Shortfall Loans are some of the immediate relief measures mentioned in the memorandum published by MoRTH. In addition, certain SPvs of the entity have availed of the debt repayment moratorium announced by the RBI to take care of immediate cashflow requirements.
The business has initiated necessary action and believes that the impact will be substantially mitigated.
L&T METRO RAIL (HYDERABAD) LIMITED (L&TMRHL)
Overview:L&T Metro Rail (Hyderabad) Limited (L&TMRHL) is a Special Purpose vehicle (SPv) incorporated on 24th August, 2010 to undertake the business to construct, operate and maintain the Metro Rail System including the Transit Oriented Development (TOD), in Hyderabad under the Public Private Partnership model on Design, Build, Finance, Operate and Transfer (DBFOT) basis. L&TMRHL
Hyderabad Metro Rail - Hitec City line

291
entered into a Concession Agreement with the erstwhile Government of Andhra Pradesh on 4th September, 2010.
The Concession Agreement includes construction of 71.16 km of elevated metro rail corridor and rights for real estate development of 18.5 million sq. ft., with strategically located land parcels interspersed in prime city locations adjoining metro stations and metro corridors. The concession period of the project is 35 years, from the appointed date of 5th July, 2012 including the initial construction period of 5 years. This is extendable for a further period of 25 years, subject to fulfilment of certain conditions by the SPv as set out in the Concession Agreement.
As per the Concession Agreement (CA), the scheduled Commercial Operation date (COD) for the project was 5th July, 2017. However, due to delays in providing required RoW and confirming alignment changes by the Government, extension of the COD to 30th June, 2020 was approved. L&TMRHL completed execution of the project well ahead of the extended time granted. L&TMRHL completed commissioning of the entire stretch progressively, with the last stage getting commissioned in February 2020. The entire project is now operational.
During the year, the construction of 1.28 million sq. ft. of Transit Oriented Development (TOD) consisting of 4 malls and an office block has been completed and has commenced commercial operations. Construction work of 0.5 million sq. ft. of office space at Raidurg site is currently under way. The entity is chalking out plans for phased development of the balance TOD.
Business EnvironmentThe Hyderabad Metro Rail is the world’s largest metro project in public-private partnership mode. It brings together ‘best in class’ resources and technology in every aspect of the project – stations, rolling stock, track work, depots, AFC, power supply, traction and SCADA system, signalling and train control systems and telecom systems.
Metros are an environment-friendly, safe and punctual mode of transport. They ease commuting in densely populated cities and towns. Given the population density of Hyderabad, L&TMRHL has been working on various value-added initiatives to minimize the commuters’ pain points, such as last-mile connectivity, digital ticketing, mobile apps, etc., which ensure higher ridership of the metro system. Establishing successful last-mile connectivity is a challenge, and discussions with the Government are in progress to intensify steps to this end.
Hyderabad Metro Rail on the Viaduct

MANAGEMENT DISCUSSION AND ANALYSIS DEVELOPMENT PROJECTS BUSINESS ANNUAL REPORT 2019-20
292
However, with the onset of the COvID-19 pandemic, the environment has been impacted in the short term. The entity is looking at various innovative business models to overcome this challenge.
Significant Initiatives• Robust and affordable last mile connectivity initiatives to
enhance the ridership
• Launched corporate shuttle services from metro stations to corporate offices
• All metro stations have a bike-rental facility
• Exploring non-fare revenue generating options, viz. royalty amount from QR ticketing partners, consultancy services for other metros, cross-selling of products to commuters
• Tied up with ticketing partners like Goibibo, MakeMyTrip, Phonepe, Paytm, etc. and launched Mobile Ticketing (QR Code generation) solution for the convenience of metro commuters
• Provision of skywalks from the Metro stations to the adjoining TOD malls to enhance convenience and business potential
DigitalisationEasing the pressure of reconciling huge, heterogeneous data on fare collection, L&TMRHL has automated Fare
Revenue Reconciliation between Automatic Fare Collection System Reports vs Payment Channel Reports vs Bank Reports. To make the metro travel easy and trouble-free, it is coming up with the EMv-based Open Loop Ticketing (Euro Master visa (EMv) card) solution for metro commuters.
L&TMRHL has started using Business Intelligence IT tools like Alteryx and Tableau for both business and passenger data analysis/interpretation, which will improve Management decisions.
L&TMRHL has put in place a process for automation of refunds to customers by developing an auto verification process of the refund data using software tools. This software tool verifies items of refund reported by the Automatic Fare Collection System (AFC) with the smart card history data base. The tool helps minimising the process time and facilitates timely refunds to customers.
Awards and RecognitionPrestigious awards received by L&TMRHL during FY 2019-20 include:
1. DCD National Awards 2019 – Hybrid IT Project of the Year Award
2. Institute of Economic Studies – Enhancing the Image of Metro Rails in India - Globally
Hyderabad Metro Rail Uppal Depot and Nagole Station

293
3. DCD Global Awards 2019 – Hybrid IT Project of the Year Award
4. CSO 100 Awards 2019 – the Information Security Project has added significant benefit to the organization, its employees, associates and vendors
Environment, Health and SafetyA mass transit system helps move large numbers of commuters away from private vehicles, helping reduce the carbon footprint of the city. It helps reduce the air pollution, since it operates on electricity and hence there is no emission of greenhouse gases. It also helps reduce sound pollution due to the efficiency of the coaches and the advanced engineering that has been used for building the track, viaduct as well as metro coaches. Further, the smart-card option reduces paper consumption.
The Automatic Train Protection (ATP) System implemented continuously monitors safe train operations. Automatic Train Supervision (ATS) pre-empts unscheduled interruptions of train services. Station equipment such as Computer-based Interlocking (CBI), wayside ATP, etc., are vital signalling equipment and ensure safe and uninterrupted train operations. Passenger Emergency Stop Plungers are provided on each platform and in the Station Control Room (SCR) to stop a train immediately in case of an emergency.
Risks and ConcernsWith the Metro fully commissioned, the risks related to construction phase are averted, except for the financial risks of close out of pending claims. While the operational risks now kick in viz. safety of passengers and assets, bus mode of transport being preferred, considering the connectivity and a drop in commuters in the feeder industry, especially IT.
The business has a robust risk mitigation process and several initiatives have been taken to avert / minimise the impact of various risks, including:
• The appointment of Keolis, a reputed O&M operator from France, with experience of providing safety solutions
• Discussions with local bus transport authorities, impressing upon them the need to work complementarily
• Thrust on developing additional revenue sources
However, the COvID-19 pandemic in the end of the financial year is expected to have an impact on the commuters, additional costs and real estate monetisation. The business is working on ways to facilitate contactless travel, increase focus on sanitisation of the metro system, etc.
Sharp bend of the Viaduct

MANAGEMENT DISCUSSION AND ANALYSIS DEVELOPMENT PROJECTS BUSINESS ANNUAL REPORT 2019-20
294
OutlookWith the entity getting into first full year of operation of the metro, things had started looking up, aided by the planned partial monetisation of the real estate. However, the pandemic has brought in the challenges of:
• Commuters preference for avoidance of mass transit
• ITES commuters’ preference to continue to Work from Home
• Drop in advertisement income due to curtailment of expenses by various corporates
• Drop in oil prices, making alternative modes of transport more attractive
• TOD revenues impacted by overall business sluggishness
• Major investments in realty sector may be on hold in the short to medium term
All efforts are being taken to make Hyderabad Metro the safest and cleanest transportation mode keeping in mind the current pandemic situation. This gives L&TMRHL the opportunity to shift the new customer segment to Metro rail from other transportation modes like bus, auto, etc. Also, contactless travel system integrated with other transport modes focus on making travel safe.
Strategy alignment through innovative business models to retain the competitive advantage in TOD and station retail developments is a focus area.
L&T POWER DEVELOPMENT GROUP
Overview:L&T Power Development Limited, a wholly-owned subsidiary of L&T, is engaged in developing, operating and maintaining power generation assets. The portfolio comprises projects in thermal and hydel power generation projects aggregating to 1499 MW. In the hydel sector, L&T Uttaranchal Hydropower Limited is executing a hydel power project of capacity 99 MW in the state of Uttarakhand, which is at an advanced stage of construction and is expected to be commissioned in FY 2020-21. The hydel projects in L&T Himachal Hydropower and L&T Arunachal Hydropower have been shelved. In the thermal sector, Nabha Power Limited owns and operates a 2 X 700 MW supercritical thermal power plant at Rajpura, Punjab.
Rajpura project at the cusp of completion in December 2013

295
Nabha Power Limited (NPL)Business ProfileNPL is operating a 2 X 700 MW supercritical thermal power plant at Rajpura, Punjab. 100% of the power generated from this plant is tied-up to Punjab State Power Corporation Limited (PSPCL) for a period of twenty-five years upto 2039 under a Power Purchase Agreement (PPA). The plant is the first indigenously manufactured supercritical power plant, built using technology sourced from Mitsubishi, Japan.
The plant sources its fuel from South Eastern Coalfields Ltd. (SECL), a subsidiary of Coal India Limited, under a 20-year Fuel Supply Agreement (FSA). NPL has also secured approvals to arrange coal from alternative sources to make up for any shortage in supply of coal under the FSA. The Bhakra-Nangal distributary is the perennial source of water for the plant under an allocation by the State Government. The plant is operated by an in-house team of experienced operations and maintenance professionals.
The power plant has been running successfully for over six years with an availability of over 85 % during FY20. NPL has been the most reliable source of power for the state of Punjab and has supported its requirements with uninterrupted supply during the peak season also.
NPL is the lowest cost thermal power producer within Punjab, with benchmark-setting operational efficiency.
Business EnvironmentIndia’s Installed Capacity rose to 3,70,106 MW in FY 2019-20, a marginal increase of 1.41% over the previous year, of which the Installed Capacity of thermal power plants is 55%. Dependence on the thermal generation is clearly reflective, as it fulfils 71% of the total power requirement in the country.
The Average Power Demand in Punjab was 6486 MW in FY 2019-20 and NPL contributed to 14% of the demand. The Average Power Purchase rate was R 3.60 per KWh in FY20 vs R 3.48 per KWh in FY19.
Third Party Sampling and testing through CIMFR (Central Institute of Mining and Fuel Research) has been operating quite well to mitigate the grade variation issues in linkage coal.
Unit 1 was under a planned shutdown since Feb. 1, 2020 for 77 days for the first major capital overhaul in which 1004 personnel were involved. The task involved rectification and replacement of various equipment under turbine, boiler, electrostatic precipitator.
Rajpura 2x700 MW Supercritical Technology based Thermal Power Plant

MANAGEMENT DISCUSSION AND ANALYSIS DEVELOPMENT PROJECTS BUSINESS ANNUAL REPORT 2019-20
296
During the year, in order to comply with the emission compliance norms the construction work of Flue Gas Desulphurisation has been awarded to L&T Power, who emerged as a successful bidder in the competitive bidding process.
During the COvID-19 lockdown, NPL, being classified as delivering an essential service, maintained business continuity, while ensuring the health and safety of all its employees and contract staff. various steps were undertaken, including social distancing and following best safety practices with robust Standard Operating Procedure (SOP).
Major Achievements• Best Operational Performance: - Annual Plant Load Factor
(PLF): 71%, (All India Thermal Average: 56%)
• Received a Favourable Order from Supreme Court on the washing charges petition and received partial payment from PSPCL
• Partial Favourable Order received from PSERC in imported coal matter, clearing partial dues
• Ensured Fuel Adequacy, as no lapsing despite flooding of mines in Korba Coalfields of South Eastern Coalfields Limited (SECL) and approval for imported coal
• During the year, NPL was awarded the following awards:
• National Energy Leader Award, CII
• Excellent Energy Efficient Unit Award, CII
• Winner - Water Management and Ash Handling, Mission Energy Foundation
• Finalist, Global Platts Energy Excellence Award S&P USA
• Gold Award, Grow Care India CSR Award 2019
• Best Operating Thermal Power Generator, IPPAI Third Consecutive Year
• National Best Employer Brands 2019
Significant Initiatives• Reduction in costs through alternate sourcing, reverse
engineering
• Digital Initiatives
• Implementation of Energy Management System
• Management Dashboard upgradation
Aerial view of cooling towers, Rajpura Thermal Power Plant

297
Environment, Health and Safety NPL is committed to generating reliable and environment-friendly power under safe working conditions. A policy on Quality, Environment, Health and Safety has been put in place. Emphasis is laid on continual improvement of processes and practices to achieve improved environmental, health and safety performance. Training on HSE for employees and stakeholders is undertaken on a regular basis to foster a culture of health and safety.
Human ResourcesNPL has a team of 296 personnel including professionals experienced in the field of operations and maintenance of power plants and other support staff. NPL focusses on leadership development and communication skills. Emphasis is laid on participation in various training and development programmes organized internally and externally.
Risks and ConcernsAs a private developer, NPL faces the following major risks:
• Delay in plant scheduling – increase in yard loss
• Delay in receipt of payment from DISCOM for monthly bills
• Dispute for force majeure with DISCOM
• Coal quality from different mines
• Flue Gas Desulphurisation environmental compliances
The risk management policy of NPL provides for a robust risk management framework which involves risk identification, assessment & evaluation, strategy & mitigation, and monitoring and review mechanisms. NPL has implemented multiple measures in each of the risk areas to ensure a proactive approach and timely mitigation.
OutlookDue to the lockdown to contain spread of COvID-19, power demand by industrial units and farmers in Punjab has dropped substantially since March 2020. PSPCL may prefer to optimize its power purchase costs by purchasing power from the cheaper sources as the power exchange prices have dropped substantially.
NPL is likely to remain the lowest cost thermal power producer amongst the Independent Power Producers (IPPs) in the state with an expected plant load factor of 73% in FY21.
On the fuel side, coal supply continues to be challenging. The GoI and GoP are pushing for reduction in coal imports to reduce the cost of power. Non-approval of imported coal may have adverse implications. Higher usage of RoM coal may lead to higher maintenance and auxiliary consumption and lower boiler efficiency.
NPL is geared to address the challenging times and has been taking proactive steps like deferring capex/modifications/non-routine purchases, negotiating better credit from suppliers of coal, etc.

MANAGEMENT DISCUSSION AND ANALYSIS OTHERS ANNUAL REPORT 2019-20
298
real estate development in Powai, spanning over 90 acres. Phase I has been completed and is now occupied by over 780 residents. Development of further phases of the project is in full swing.
2. Crescent Bay (Mumbai) Situated at the most desirable location – Parel,
with the Arabian Sea as the backdrop – Crescent Bay is a residential complex with the perfect setting for an extraordinary life. Crescent Bay raises urban living to top-notch quality, with a sky deck and associated amenities on level 21. It is currently occupied by 1000+ residents and the last tower is being built.
3. Raintree Boulevard (Bengaluru) Conceptualized on the live-work-play idea,
Raintree Boulevard is a 65-acre mixed-use project located in the premium, high-growth micro-market of Bengaluru. The project offers premium flats with elegant and majestic layouts, along with the leisure of fine-living and best-in-class amenities. The project also includes fully furnished studio units, which were launched in March 2020.
OTHERS
‘Others’ business comprises:
a. Realty Business
b. L&T valves Limited
c. Construction Equipment & others
REALTY BUSINESS
Overview:L&T Realty is positioned amongst the top real estate developers in India, with a total portfolio of over 70 Mn sq. ft. across segments like residential, commercial and retail in key metro cities, viz. Mumbai, Bengaluru and Chennai. L&T Realty is focused on delivering higher value to its customers through efficient designs, cutting-edge technologies and superior project management skills. The business model involves development of large land banks in metro cities, partnership with co-developers and sale/lease of commercial spaces.
Residential Segment1. Emerald Isle (Mumbai) This flagship residential project, the finest gated
community at a premium location, is part of a prime
Rejuve 360 - Mulund, Mumbai
Artist’s Impression

299
4. Seawoods Residences (Navi Mumbai) Part of India’s first Transit-Oriented Development,
Seawoods Residences is part of a large development spread across over 40 acres. The project offers unmatched connectivity and is surrounded by breath-taking views. Launched in June 2019, the project received an excellent response and was sold out within a month.
5. Rejuve 360 (Mumbai) This residential complex is designed around wellness,
and is focused on the rejuvenation of mind, body and soul. Conveniently located in the bustling neighbourhood of Mulund West, Mumbai, it is planned to stand 57 storeys tall. Phase I was launched recently and gained traction quickly.
Commercial Segment1. L&T Business Towers (Mumbai) L&T Business Towers offers commercial office space that
taps into the excesses of nature, gives an uninterrupted view of Powai lake, and has cutting-edge technological features. It is a part of a mixed-use development, designed on the live-work-play concept.
2. Seawoods Grand Central (Navi Mumbai) India’s first Transit-Oriented Development (TOD) is
spread across 40 acres and offers 2.6 Mn sq. ft of Grade A development with a unique combination of commercial and retail business spaces coupled with the captive local train station. It offers spacious, well-planned and completely customizable office spaces.
3. L&T Business Park (Mumbai) Designed to provide superior workspaces, L&T Business
Park is one of the most coveted corporate addresses in Powai, Mumbai. It offers about 1 Mn. sq. ft. of high-quality, Grade A office spaces, which are occupied by marquee MNC clients.
4. Technology Park, Bengaluru Located in the premium and rapidly growing micro
market, the project has the potential for development of commercial office spaces of 3.3 Mn. Sq. ft., which is being taken up in phases. With unmatched connectivity and well-designed spaces, it is set to become the most favoured address for many technology companies.
Business Environment Over the last few years, though reforms and changes like demonetization, RERA, GST, IBC, and the ban on
Seawoods Residences, Navi Mumbai
Artist’s Impression

MANAGEMENT DISCUSSION AND ANALYSIS OTHERS ANNUAL REPORT 2019-20
300
subvention schemes have caused disruption; these measures also have helped the sector by bringing about much-needed transparency, accountability and fiscal discipline. The resultant stress on over-stretched balance sheets has witnessed a higher rate of collaborations. The ensuing consolidation has further strengthened the position of L&T Realty in the market.
In FY 2019-20, the residential segment witnessed an increase of 21% in new launches in key metro cities, with affordable housing contributing significantly to this supply. Residential sales also gained momentum, recording a y-o-y rise of 5%. Nearly 52 Mn. sq. ft. of Grade A office space was completed, of which 46 Mn. sq. ft. was absorbed in the top 7 cities in the year 2019. The office space market grew at a robust 40% y-o-y with net absorption across the top seven cities – creating a new record. This growth in demand was led mainly by the expansion of IT/ITeS (42% of overall leasing) and co-working operators (14% of overall leasing) in cities with robust fundamentals and planned infrastructure improvements. However, retail sector leasing was hit as consumer spending went down, resulting in 35% reduction in retail leasing activity in the top 7 cities.
The maiden Real Estate Investment Trust (REIT), which aimed to attract private investments and relieve the burden on formal banking institutions, was listed in 2019. This has set the stage for other real estate developers to consider
the REIT as a vehicle to raise funds. The Government of India (GoI), on its part, has introduced various fiscal measures and policy reforms like the special window for funding of stalled affordable and middle-income projects, the Insolvency & Bankruptcy Code (Amendment) Bill 2019, digitization of land records and reduction in corporate tax rates. Indian real estate attracted USD 6.2 Bn of private equity investments in the year.
The last quarter of FY 2019-20 threw up a unique challenge in the form of the COvID-19 pandemic, first threatening the health and safety of individuals and then in the form of uncertainties in business continuity. While the situation continues to remain fluid, the long-term impact of this can perhaps only be assessed in the time to come.
Major Achievements • Successful launch of two new premium residential
projects in Mumbai. Project Seawoods Residences was sold out within a month of the launch and project Rejuve 360, Mulund, gained robust traction in the toughest micro market of Mumbai
• Phase I of project Raintree Boulevard was completed on time and hand-over started
• Blackstone Group made investments in Seawoods Grand Central project
Emerald Isle Phase II, Powai, Mumbai
Artist’s Impression

301
Awards and RecognitionL&T Realty has been conferred many national and international awards for the brand as well as individual projects during the year. A few of them are listed below:
• Business Excellence in Real Estate – CNN News 18 Real Estate Award
• Best Corporate Social Responsibility Practices and Institution Building – World HRD Congress
• Most Customer Centric Company & Best Use of voice of Customer – Customer FEST Leadership Award
• Smart Real Estate Project of the Year, Luxury Project of the Year, Best Residential Luxury Project of the Year – ET Now – Real Estate Awards 2020
• Iconic Excellence in Residential Development - 4th Times Realty Icons 2019 Awards
• Commercial Project of the year (L&T Business Towers) - Abu Dhabi Real Estate Leadership Awards
• Received Sword of Honour from British Safety Council,UK
Significant InitiativesDigitalisationL&T Realty is working on multiple digital initiatives covering all aspects of the business. A state-of-the-art smart office complex is being built in Powai aiming at the manifold
improvement of employee safety, health and efficiency. The I-BEMS IOT solution, an employee mobile app and – to improve quality further – a mobile-based inspection app called ‘SQAD’ have been implemented. The BIM solution has been adopted for an advanced design process, and soon 4D BIM initiatives will be started to track progress visually. To provide a better customer experience at each touchpoint, the Salesforce ecosystem for digital marketing, sales and CRM has been implemented, complemented by deploying augmented reality solutions and digital flipbooks.
InnovationBesides excellence in design and development, L&T Realty strives for innovation in every project. Emerald Isle (Phase 2) features the first residential building in Mumbai constructed with pre-finished bathroom PoDs (Prefabricated on Demand), leading to reduction in finishing time and delivery of an enhanced quality product.
Human ResourcesL&T Realty makes every effort to generate a never-ending desire to collaborate, learn and build a talent pool to stay relevant to customers’ needs at all times. The business is focused on creating a young vibrant organization; currently the average age in the organization is 37 years. With emphasis on gender diversity, L&T Realty has one of the highest number of women employees in the Indian real estate sector.
L&T Seawoods Grand Central, Navi Mumbai
Artist’s Impression

MANAGEMENT DISCUSSION AND ANALYSIS OTHERS ANNUAL REPORT 2019-20
302
Focusing on the employees’ physical and mental well-being, a one-of-its-kind programme ‘Couch to 5K / 10K’ was initiated this year, in which employees were professionally trained and motivated towards their own well-being through specially organized city marathons. The business has been providing avenues for capability building and continuous learning and this year clocked 1,920 man-days of dedicated personnel training.
Risks and ConcernsAs the after-effects of COvID-19 evolve, the real estate sector is expected to be considerably impacted. Markets have shown a negative sentiment towards real estate sector. Further, the lockdown and stalling of construction activity will lead to delayed construction schedules, which will be further impacted by the unavailability of labour. On the demand side, the lockdown has affected customer walk-ins; and buying decisions have been deferred due to the uncertainty regarding the return of normalcy. For the next few quarters, office space demand is also expected to remain subdued as the expansion plans and capital expenditures of major corporates has been put on hold.
OutlookBefore COvID-19, the Indian real estate sector was slowly coming out of the difficult phase. The residential segment was in distress and the commercial segment was doing well. Post the advent of the pandemic, the distress spread
across the industry chain. The commercial segment has been largely dependent on US companies for a large part of the annual offtake. As the impact of COvID-19 is maximum in the US, companies may defer their expansion or office consolidation plans. The segment is expected to contract 20 – 30% in the short term before it starts to gain traction again.
Near-term troubles are certain for the sector. However, with Government support, the medium-to-long-term outlook is positive. Other asset classes becoming riskier in the current situation, smart investors, especially HNIs, are expected to take advantage of the investment opportunities. Big real estate funds are facing their own challenges; however, many believe in the long-term story of the country and are expected to continue with their investments to capture attractive valuations.
The softening of interest rates would encourage buyers who are re-looking at investment options, as hard assets will be more lucrative than stock markets. NRIs may want to own a house back in India, considering the uncertain economic environment in their host countries.
Developers will focus on conserving cash and optimizing resources. New launches will be paused for next few quarters and, as a measure to pool in liquidity, the focus would be on selling the inventory in hand. The marketing approach to reach customers is already undergoing a change, with enhanced digital outreach to sell directly.
L&T Tech Park, Hebbal, Bengaluru
Artist’s Impression

303
In the changed business scenario, the industry is looking at a big wave of consolidation. L&T Realty is set to take advantage of the situation and is confident of its growth and expansion, given its strong business framework and the brand connect with its customers.
L&T VALVES LIMITED
Overview:L&T valves (LTvL) is a leading manufacturer of industrial valves with a global manufacturing presence. The business leverages six decades of manufacturing excellence to serve key sectors of the economy – such as oil and gas, defence, nuclear & aerospace, power, petrochemicals, chemicals, water and pharmaceuticals – in India and overseas. L&T valves manufactures a wide range of products, such as Gate, Globe, Check, Ball, Butterfly, Plug and Control valves, as well as automation solutions. The business also runs a global after-market business to support its installed base with service and spares needs.
The business has three state-of-the-art facilities in Tamil Nadu and Gujarat in India, and has established two new facilities in the USA and Saudi Arabia respectively. LTvL’s products enhance safety, reliability and performance in industries across the world.
Business EnvironmentMarket indicators such as prices of crude oil and natural gas, environmental norms for fugitive emissions as well as economic parameters of GDP growth, pace of urbanization and capital investment in projects remain the key drivers of demand for LTvL. The business environment in most of these parameters remained stable through the first three quarters in FY 2019-20. The investment climate across sectors was lukewarm with an increased thrust on cost reduction and faster implementation. LTvL has maintained its portfolio spread in terms of domestic v/s international business. In FY 2019-20, approximately 40% of its order inflows were secured from overseas markets.
With structural challenges ailing the power sector, there were no significant capacity additions in the thermal power space. However, the new fugitive emission norms introduced by the GoI opened up some opportunities in the form of Flue Gas Desulfurization (FGD) projects.
Major AchievementsMajor Orders ReceivedThe business focussed on diligent build-up of its order book during FY 2019-20 with a focus on improvement in margins and on-time delivery performance. Some of the order highlights include:
• Critical valves for naval applications from the MoD
100 inch Triple-offset Butterfly Valve
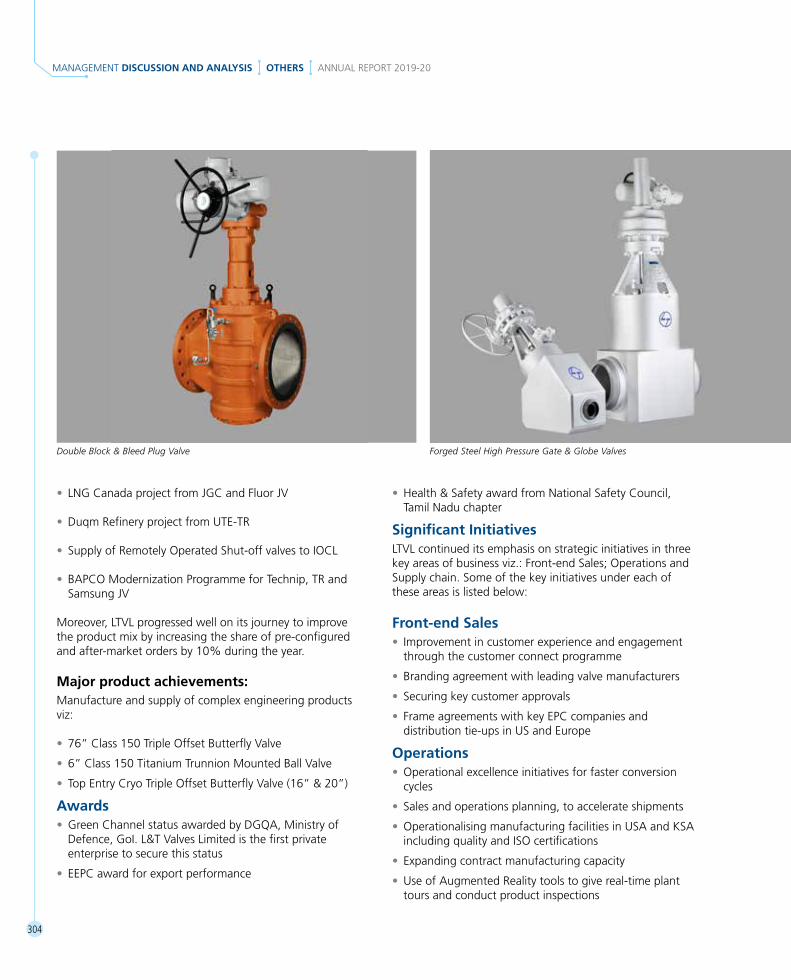
MANAGEMENT DISCUSSION AND ANALYSIS OTHERS ANNUAL REPORT 2019-20
304
• LNG Canada project from JGC and Fluor Jv
• Duqm Refinery project from UTE-TR
• Supply of Remotely Operated Shut-off valves to IOCL
• BAPCO Modernization Programme for Technip, TR and Samsung Jv
Moreover, LTvL progressed well on its journey to improve the product mix by increasing the share of pre-configured and after-market orders by 10% during the year.
Major product achievements:Manufacture and supply of complex engineering products viz:
• 76” Class 150 Triple Offset Butterfly valve
• 6” Class 150 Titanium Trunnion Mounted Ball valve
• Top Entry Cryo Triple Offset Butterfly valve (16” & 20”)
Awards • Green Channel status awarded by DGQA, Ministry of
Defence, GoI. L&T valves Limited is the first private enterprise to secure this status
• EEPC award for export performance
• Health & Safety award from National Safety Council, Tamil Nadu chapter
Significant InitiativesLTvL continued its emphasis on strategic initiatives in three key areas of business viz.: Front-end Sales; Operations and Supply chain. Some of the key initiatives under each of these areas is listed below:
Front-end Sales• Improvement in customer experience and engagement
through the customer connect programme
• Branding agreement with leading valve manufacturers
• Securing key customer approvals
• Frame agreements with key EPC companies and distribution tie-ups in US and Europe
Operations• Operational excellence initiatives for faster conversion
cycles
• Sales and operations planning, to accelerate shipments
• Operationalising manufacturing facilities in USA and KSA including quality and ISO certifications
• Expanding contract manufacturing capacity
• Use of Augmented Reality tools to give real-time plant tours and conduct product inspections
Double Block & Bleed Plug Valve Forged Steel High Pressure Gate & Globe Valves

305
Supply chain• Capacity enhancement for raw material inputs to provide
supply chain sustainability
• Geographical diversification of supply chain with focus on cost and quality
• Consolidation of its input sources in India
Cost reduction• Fixed and variable cost reduction initiatives across the
business spectrum
• Design optimization
• Cost reduction strategies in sourcing and logistics
The business’s focus to pursue opportunities in the global distribution space gained momentum during the year mainly in the Americas and Europe. It also entered into branding agreements with some global majors during the year.
DigitalisationDigitalisation initiatives at LTvL largely were focussed on process automation through ERP and material management during the year. Key initiatives included:
• Bar coding of key input components such as castings and forgings
• Automated full kit availability and management module
• Management of pattern allocation to foundries
• Automated supplier evaluation and allocation
• AR-based real-time plant tour and product inspections
• Fully automated product costing system
Environment, Health and SafetyEnvironment, Health and Safety are at the core of LTvL’s operations and the business remains committed to achieving EHS excellence in its workplaces. various initiatives in the area of health, safety and environment helped the business achieve a ‘zero man-days lost’ record during the year.
• Emissions maintained well below statutory requirement
• Maintaining water consumption at the same level despite increase in production by 40%
• Single use, throw-away plastic items restricted across manufacturing locations
• Daylight harvesting through solar dome installation on building tops
• Tree-plantation drive undertaken at Coimbatore campus
• Reduction in diesel consumption through reduced DG set operation
• Common air-line testing to reduce energy consumption by 1.2L units using vFD compressor
• Increase in usage of LED light panels and LED flood lamps
R&D Facility – Flow Co-efficient Test Jamnagar Plant

MANAGEMENT DISCUSSION AND ANALYSIS OTHERS ANNUAL REPORT 2019-20
306
Human ResourcesThe business has built a committed and experienced team of professionals over the decades. Special emphasis is laid on training and development of the workforce. In addition to competency building programmes, focus is also laid on soft skills and leadership development. various engagement initiatives are undertaken to motivate employees and maintain a harmonious workplace.
During the year, the business launched a focussed initiative, committed to drive change management and talent development under the flagship programme DISHA. At the heart of this programme is the improvement of the effectiveness of LTvL’s workforce in the marketplace. Developmental initiatives, including training, mentoring and coaching programmes, were organized for upskilling high-potential employees. Cross-functional collaboration workshops were identified as another key focus area and a programme series was launched during the year to achieve the team goals.
Risks and ConcernsThe industrial valves market is a highly fragmented space. With an increased focus by customers on faster deliveries and lower costs, the market environment is highly competitive. However, given the geographical spread of the demand base, the business has a high market share gain
potential through its geographical, channel and product expansion strategies.
The post-COvID-19 market scenario remains fraught with uncertainty. Further, the business has major linkage to the fortunes of the oil & gas segment, which is currently facing major turmoil. Some of the major risks identified are weakening demand, supply chain disruption, liquidity crunch, delays in project awards, availability of labour workforce and working capital management.
LTvL has a robust risk management framework in place and has taken several initiatives to mitigate the risks, viz.
• Market share gain strategies through geographical, product and channel expansions
• Building alternative revenue streams through brand labelling
• Consolidating Aftermarket business presence
• Refining its product mix with focus on standard products
• Global manufacturing presence
• Global supply chain
• Enhanced Contract Manufacturing capacity
• Improving cost competitiveness through cost reduction measures
• Operational excellence initiatives to improve delivery performance
Digital Solutions for valves

307
Outlook The business is closely monitoring key demand indicators such as crude oil prices, capacity additions, liquidity, project capex spending and GDP trends in the relevant geographies. It does expect a slowdown in the market in the coming year if the lockdown across the world continues for a longer than expected duration thereby affecting its demand indicators and prospects. The dip in oil prices normally affects the valve industries by one-year time lag. Capital spending is expected to stay tepid for a few quarters in the new financial year. Liquidity may also pose a challenge due to the COvID-19 pandemic for the first two quarters of next year.
The initiatives on geographical expansion of markets and operations, product mix, focus on aftermarket business, brand labelling, etc., provide immense opportunities and will act as mitigation measures. The business is taking adequate steps to maintain liquidity and preserve cash.
Once the situation normalises, the entity is geared to expand its market share gain strategies and to develop an alternative supply chain to enhance its cost and delivery efficiency. With a strong order book, it continues to position itself as a brand that maintains high customer focus and high standards of quality and design. It also expects the COvID-19 pandemic to provide opportunities for its maintenance, repair and operations segment. With the oil prices expected to redeem in Q4 of FY 21, and the fragmented nature of the global valve market together
with the strategies deployed by LTvL, the outlook remains positive.
CONSTRUCTION EQUIPMENT & OTHERS
Overview:The Construction Equipment & Others (CE&O) business manufactures, distributes and provides after-sales support for construction and mining equipment for diverse industries and applications. The business also manufactures and markets Tyre Curing Presses and Tyre Building Machines and provides solutions for the tyre manufacturing industry globally.
The CE&O business consists of two broad business segments, namely, Construction & Mining Machinery (CMM) and Rubber Processing Machinery (RPM). CMM further comprises Construction & Mining Machinery business unit (CMB) and L&T Construction Equipment Limited (LTCEL), a wholly owned subsidiary of L&T. Under a scheme of arrangement the business under LTCEL has been transferred on going concern basis to a new entity L&T Construction Machinery Limited (LTCML) on receipt of approval from NCLT. In April 2019, L&T fully exited its investment in L&T Kobelco Machinery
L&T 9020sx Wheel Loader Komatsu PC210-10M0 Hydraulic Excavator

MANAGEMENT DISCUSSION AND ANALYSIS OTHERS ANNUAL REPORT 2019-20
308
Private Limited (LTKMPL) with Kobe buying the 51% stake held by L&T, while L&T continued to represent LTKMPL for marketing its products.
The CMB division focuses on distribution and after-sales service for hydraulic excavators and dump trucks manufactured by Komatsu India Private Limited (KIPL) and other mining and construction equipment manufactured by Komatsu worldwide. It also handles the distribution and providing of after-sales support for a range of construction equipment including wheel loaders, compactors and hydraulic excavators manufactured by LTCML and Mining Tipper Trucks manufactured by Scania India. CMB’s offerings include products such as surface miners, sand plants, crushing solutions and apron feeders, manufactured by L&T at Kansbahal Works.
LTCML, located in Doddaballapura near Bengaluru, manufactures vibratory compactors, wheel loaders, hydraulic excavators, asphalt paver finishers, pneumatic tyred rollers, skid steer loaders, hydraulic power packs, cylinders, pumps and other components.
LTRPM, located in Kancheepuram near Chennai, manufactures and markets rubber processing machinery, i.e. mechanical and hydraulic tyre curing presses, tyre building machines, conveyor systems and tyre automation systems for the global tyre industry, including India.
The Product Development Centre (PDC), based at Coimbatore, renders engineering and product development support for all the businesses.
Business EnvironmentConstruction & Mining Machinery Business (CMM)The construction and mining sectors are the key demand drivers of the CMM business.
During the year, highway construction activity decreased as compared to the previous year as the overall contract awarding activity fell. Further prolonged slowdown in real estate projects continue to weigh on the business.
The Union budget FY 2020-21 proposes to invest about R 82,000 crore on road construction and R 70,000 crore on Railways. With the above budget proposals, construction activity is expected to pick up pace during the coming year.
In the mining sector, coal production registered a growth of ~3.8% over the previous year. The Indian Government has approved an ordinance that opens up the coal sector by allowing commercial coal mining as well as removing end-use restrictions. The move is likely to increase the coal mining activity in the coming years. Iron ore production too registered a growth of ~6.7% over the previous year.
L&T 990HF Tandem Compactor L&T Surface Miner - KM404

309
The installed capacity in the cement sector has increased from 480 MT to 499 MT in FY 2019-20, with an increase in overall production from 334 MT to 344 MT in FY 2019-20.
The above positives are likely to boost the demand for mining equipment.
However, the NBFC crisis’ continuing to impact liquidity in the economy, coupled with stiff competition from domestic and Chinese mining equipment manufacturers, has impacted growth.
Rubber Processing Machinery Business (RPM)The demand for the machinery manufactured by the LTRPM unit is dependent on tyre demand and is indirectly linked to the automobile industry.
FY 2019-20 was not a good year for automotive market globally. Currently, the automobile industry is at crossroads due to an increased preference for shared mobility. Coupled with a fall in demand is the technology shift towards greener electric cars. The protracted slowdown has taken a toll on the automotive industry, with 2-4% de-growth in automobile sales across the world.
The automobile industry witnessed one of its sharpest declines in domestic sales due to subdued demand and consumer sentiments, besides lower production in view of the transition to BS vI emission norms, affecting wholesale
despatches. Due to the severe challenges, the industry witnessed a decline in production of 14.73% compared to FY 2018-19. Despite the current situation, the Indian automobile sector still has enormous potential and is anticipating demand growth.
The global tyre market reached a volume of 3.2 billion units in 2019-20, growing at a CAGR of around 4% during 2014-2019. However, the sales growth tapered in 2019, with growth seen in select geographies only. In line with automobile sales, the OEM tyre market has come down approximately by 2-4%. The replacement tyre demand continues to be mostly flat and stable due to higher passenger vehicles on road. Along with this, the growing infrastructure activities in both the developed and developing countries, combined with agricultural activities is giving a boost to tyre sales in select segments.
The Indian tyre market has reached a consumption volume of 185 million units in 2019-20. The market is currently being driven by the increasing use of radial tyres, especially for buses and trucks. There has been the constant threat of cheaper imports from China, etc. Tyre industry investments have been slow due to uncertain demand growth. There has been a marked slowdown in industry investment starting almost from Q2’ FY20. Tyre majors across the globe are concentrating on realising the money out of their earlier investments and are choosing to either cancel or defer their orders.
Scania G440 Heavy Tipper Komatsu PC1250 Hydraulic Excavator loading Komatsu HD785 Dump Truck in opencast project

MANAGEMENT DISCUSSION AND ANALYSIS OTHERS ANNUAL REPORT 2019-20
310
Significant InitiativesConstruction & Mining Machinery Business (CMM)CMB introduced a number of business expansion activities during FY 2019-20. It introduced new equipment models of construction and mining equipment such as Komatsu PC 210-10M0 excavator and SCANIA G440 Mining Tipper truck with better machine capabilities and attachments for piling equipment from MOvAX, which helped in partially mitigating the depressed market. With the availability of spares being brought closer to customer sites, the availability guarantee of the machines has been maintained at the present levels of ~90% to achieve customer confidence, thereby increasing sales of spares for the business.
With a continued focus on capturing the hiring segment, CMB promoted lease financing programmes with low investment and low EMI. In order to retain customers and overcome the competition, CMB has been educating customers on evaluating the equipment on the basis of lower life-cycle costs, quick serviceability, etc.
To ensure faster servicing of equipment, CMB increased the dealer workshop network from 3 locations in FY 2017-18 to 9 in FY 2019-20.
Rubber Processing Machinery Business (RPM)LTRPM has successfully launched various new products in the market:
• Floor-mounted passenger car Hydraulic Tyre Curing press in India and Germany
• Compact v-orientation passenger car Hydraulic Curing press
• Zeus single stage two-wheeler Tyre Building Machine (TBM) to Thailand
• OTR Tyre Building Machine successfully commissioned in USA
• Custom-built products like Batch-off Units and Lube-spray machine
LTRPM developed an ‘In-house Panel shop’ to assemble the control panels required in its products. This special focus gives significant cost benefits and an opportunity to supply the panels to other customers as well. The formation of a ‘Technology Centre’ is helping it to adapt advanced technologies for the tyre industry and add futuristic products to its portfolio.
LTRPM also strengthened its portfolio of Tyre Handling Automation Solutions and increased its focus on product
OTR Mechanical Tyre Curing Press PCR Floor Mounted Hydraulic Tyre Curing Press

311
support and services. Apart from these, the unit continues to focus on process initiatives including design process modernisation, long-term vendor contracts, product reliability enhancements, digitalisation, automated submerged arc welding, etc.
It is working on service offerings to the tyre industry like maintenance contracts and value-added programming services. The unit is also working on upgradation kits to help its customers to improve the productivity of existing machines with minimal investment.
LTRPM won the Prestigious Gold plus Award for Business Excellence from CII. It has also won a Gold Award in the Indian Green Manufacturing challenge and in 5S won a Platinum Award and a Sustenance award from ABK- AOTS Dosokai.
DigitalisationDigitalisation in CMB has been one of the focus areas in the past year. During the year, a new initiative, ‘EQUIPCARE’, was implemented to serve the customers’ post-sales service requirements. An App - ‘Customer Connect’ - is being developed to help customers access complete service information pertaining to their machines on their mobile phones. Migration to SAP S4 HANA was completed during the year, helping the users to process data faster.
On the digital front, the LTRPM business has established a system for the Total Productivity Management (TPM) track, monitoring adaptive feed and collision monitoring in the manufacturing process. The unit also has initiated digitalisation of customer connectivity through the proposed E-CRM portal.
Environment, Health and SafetySafety Officers are appointed at all the units and report to management personnel. They are responsible for ensuring that the safety practices are strictly adhered to. Safety audits are conducted regularly to ensure that the safety practices are in place and are being followed.
The manufacturing unit of RPM is certified in OHSAS under Integrated Management Systems. LTCML has been certified for its Integrated Management System (Environmental Management systems as per ISO 14001:2004 and OHSAS 18001:2007 for Occupational Health and Safety Management systems).
Human ResourcesThe business has progressively built a team of committed professionals across its manufacturing plants and corporate offices. Emphasis on training and development of the workforce has been the focus area. Additionally, competency building programmes for leadership
OTR tyre Building Machine

MANAGEMENT DISCUSSION AND ANALYSIS OTHERS ANNUAL REPORT 2019-20
312
development and various engagement initiatives have been undertaken to sustain the employees’ motivation and maintain a harmonious workplace.
The Industrial Relations scenario has remained cordial in the manufacturing units of the business. There were no cases of violations during the year under the whistle-blower policy and the policy on ‘Protection of Women’s Rights at Workplace’.
Risks and Concerns Increased market competition and macro-economic volatility are continuing concerns for the business.
Due to the lockdown because of COvID-19 and its economic impact, it is anticipated that the customers may request for deferment of orders or extension of credit. In the CMB business, immediate availability of contract workmen at the customer sites post lifting of the lockdown will pose a challenge.
OutlookCMB plans to strengthen its position in the premium segment and increase its focus on large contractors, large irrigation projects and coal OB (over burden) removal contractors. With a targeted spend plan of over R 100 lakh crore by the government in the next 5 years in infrastructure, there is a large scope for CMB to achieve higher business volumes.
Government initiatives in infrastructure development in roads, railways, irrigation, ports, urban & rural infra, affordable housing, etc., are expected to drive demand in the cement and metal sectors, which in turn will boost demand for excavators, dump trucks, dozers and other road construction and mining equipment. With ~60% of demand for mining equipment coming from coal PSUs, CMB is planning to target selective tenders along with Komatsu.
The dozer segment is expected to grow by ~18%. Demand for Komatsu excavators is expected to increase by ~10%
for FY 2020-21. The motor graders segment is expected to increase by ~10%. CMB also expects the spares and auxiliaries’ business to grow by ~4%.
In the parts and services segment, CMB plans to introduce newer and more innovative, user-friendly spares. It is also in discussion with the dealers to develop component repair service for construction equipment. However, as an aftermath of COvID-19, major capex or investments are likely to be deferred by the customers, thus impacting the order inflow.
Post COvID-19, people may continue to observe social distancing norms even after the crisis has subsided and that will change the way people commute. Daily commuters may prefer avoiding public transport and shared mobility might take a short-term hit. As a result, the demand for entry-level cars and two-wheelers might increase. But this again depends on economic/ market sentiments and consumer purchasing power. With the shutdown of all non-essential services, the demand for commercial vehicles is expected to further plummet. Tyre demand is likely to remain low and tyre companies may not make any immediate major fresh investments. However, companies which have already committed the money may wish to expedite their activity.
Further to the COvID-19 outbreak, it is anticipated that there will be limitations to global travel, at least in the immediate future. Also, some tyre companies may prefer to source locally. While this augurs well for LTRPM in the domestic market, it may be a disadvantage in European projects with stiff competition from suppliers in Europe.
LTRPM plans to be selective in its order intake by executing orders which require a shorter production time to minimise the inventory holding. It will also focus on spare parts and retrofit kits which will increase productivity to the customer at minimal cost. Further, joint development of machines with the client, along with service opportunities, are being explored.

313
I. L&T CONSOLIDATED
A. PERFORMANCE REVIEWThe Indian economy faced a challenging year in FY 2019-20. Post the general elections, the Indian economy witnessed sluggish investment momentum on the back of weak consumer sentiment, lower tax collections and fiscal slippages. The stress in the financial system due to non-performing loans led to risk aversion and low credit growth. The demand destruction in vital sectors such as real estate, automobiles, etc., led to the slowing economic growth and absence of broad-based private investment in industrial capex and infrastructure development. The onset of the global pandemic at the very end of the financial year led to the lockdown of the country’s social and economic activity, adding further impetus to the economic slowdown.
To counter these challenges, the Government along with the RBI initiated several measures both monetary and fiscal at various times during the year, viz. reduction in corporate tax rates, capital infusion into Public Sector banks, relaxation of External Commercial Borrowing guidelines for affordable housing, Realty Fund for stalled housing projects and periodic lowering of interest rates in line with an overall moderated inflation trajectory. The Government’s firm commitment to substantially boost investment in infrastructure development, rural electrification, airports, railroads, water supply & irrigation, social sector, education and health is expected to provide opportunities to the Company’s various business segments; although in the near term, the Company would be required to deal with the economic fallout of the Covid-19 pandemic. Further, with the Government’s focus on structural reforms and the launch of the National Infrastructure Pipeline (NIP) of R 100+ lakh crore, the Company expects the measures to improve India’s long-term growth potential.
The global economy witnessed significant volatility in 2019-20. The continued slump in manufacturing coupled with challenges relating to growth, inflation and employment, weakened the global GDP. Driven by protectionist policies in developed economies, trade wars intensified in various pockets across the world. The year 2019-20 also witnessed delayed Brexit, an oil price war between Saudi Arabia and Russia, rising geo-political tensions in the Middle East and the onslaught of the global pandemic, leading to major lockdown measures across countries. All these effectively created recessionary conditions in the world economy towards the end of the fiscal year.
Against the backdrop of such an environment, the Group recorded satisfactory growth in order inflows
and revenues during FY 2019-20, though the impact of the pandemic will inevitably be felt in the FY 2020-21. Slowdown of infrastructure projects in multiple states due to change in State Governments, macroeconomic concerns and the systemic liquidity challenges slowed down the growth plans of the Company for FY 2019-20. The diversified portfolio of the Company coupled with the acquisition and the quick integration of Mindtree Limited, has however helped register reasonable growth at the Group level.
Post the acquisition of Mindtree Limited during the year, the entity has been consolidated as a subsidiary from the second quarter of FY 2019-20. The acquisition will help consolidate the Company’s position in the IT-enabled services sector. In compliance with regulatory requirements, the Company further diluted its stake in L&T Technology Services (LTTS) to achieve 25% minimum public shareholding during the year.
Shareholding in L&T Infrastructure Development Projects Ltd (L&T IDPL) was also diluted to 51% on the partner Canadian Pension Plan Investment Board obtaining statutory approvals for conversion of Compulsorily Convertible Preference Shares (CCPS) into a 49% equity stake in L&T IDPL under a negotiated agreement. L&T Shipbuilding Limited which was a 100% subsidiary company has now been merged with L&T standalone entity as an adjusting event after obtaining NCLT approval to the scheme of amalgamation. Also, during the year FY 2019-20 the Company exited its shareholding in L&T Kobelco Machinery Private Limited by selling its stake to its JV partner Kobe Steel Ltd.
The Company is on course to complete divestment of its Electrical & Automation (EA) business to Schneider Electric. The approval of Competition Commission of India subject to fulfilment of certain conditions has been received and the business has been classified as ‘discontinued operation’ from June 2019, pursuant to which the previous year figures have been regrouped wherever necessary. Progress is being made on fulfilling the conditions precedent to the divestment.
L&T Metro Rail (Hyderabad) Limited, a subsidiary company, successfully operationalized and commissioned the last stretch of the metro rail during FY 2019-20, thereby completing the full network of close to 70 km in the city of Hyderabad. Another subsidiary company, viz. Nabha Power Limited, which houses two units of a thermal power plant at Rajpura in Punjab, received a favourable Supreme Court judgement on its income related disputes with Punjab State Power Corporation Ltd. Also, in compliance with environment norms, this subsidiary has placed an order for construction of Flue Gas Desulphurisation system and work on this is in progress.
Financial Review 2019-20

MANAGEMENT DISCUSSION AND ANALYSIS FINANCIAL REVIEW ANNUAL REPORT 2019-20
314
As at March 31, 2020, L&T Group comprises 117 subsidiaries, 6 associates, 25 joint venture companies and 35 joint operations. Most of the group companies are strategic extensions of the project and product businesses of L&T, while the Hydrocarbon business is housed in a separate set of group companies to provide the desired focus and independent functioning. The majority of the subsidiaries support L&T’s core businesses and enable access to new geographies, products and business segments. Certain distinct service businesses such as Information Technology, Technology Services, and Financial Services are housed in separate listed subsidiaries. The development projects business resides in separate subsidiaries and joint venture companies.
The Company continued on its journey of shareholder value creation by focusing on cost efficiencies, leveraging technology for productivity gains, efficient fund management and targeting select international opportunities beyond the Middle East. The Company’s strong Balance Sheet, coupled with sound policies and procedures and committed work force is helping it tide over the current volatile economic environment and will enable business to thrive and grow, once the environment improves.
Order Inflow and Order Book
125701 126262
– – –
R croreOrder Inflow
250000 –
200000 –
150000 –
100000 –
50000 –
0 –2018-19
170817186356
26%32%
74% 68%
Domestic International2019-20
45116 60094
9.1%
R crore
Order Inflow Composition
Total Order Inflow: R 186356 crore during the year 2019-20 [Figures in brackets relate to previous year]
Infrastructure Power Defence Engineering Heavy Engineering Hydrocarbon IT & Technology
Services Financial Services Development projects Others
102678 55%, (56%)
12048 6%, (2%)
2233 1%, (2%)
2361 1%, (2%)
20964 11%, (16%)
22135 12%, (8%)
13822 8%, (8%)
4850 3%, (3%)
52653%, (3%)
L&T Group achieved order inflows of R 186356 crore during the year 2019-20, registering a growth of 9.1% over the previous year, growth largely being driven by international business. The year witnessed some noteworthy order wins in thermal power, affordable mass housing, a substation & transmission line project in Africa, gold beneficiation order in Saudi Arabia, residue upgradation in refinery modernisation and an order for offshore oil facilities in Saudi Arabia. Despite deferral of various prospects, Infrastructure contributed 55% of the total order inflow, while the share of Power increased from 2% in previous year to 6% in the current year on receipt of a large value thermal order and increased ordering by thermal power plants for emission control equipment to meet environmental norms.
229110 228819
– – –
R croreOrder Book
400000 –
320000 –
240000 –
160000 –
80000 –
0 –As at 31-03-2019
290780 303857
21% 25%
79% 75%
Domestic International
As at 31-03-2020
61670 75038
4.5%
R crore
Order Book Composition
Total Order Book: R 303857 crore as at March 31, 2020 [Figures in brackets relate to previous year]
Infrastructure
Power
Defence Engineering
Heavy Engineering
Hydrocarbon
Others
224467 74%, (76%)
15849 5%, (2%)
9216 3%, (4%)
6074 2%, (2%)44130
15%, (14%)
4121 1%, (2%)
The Group crossed the R 3 lakh crore mark as at March 31, 2020 with the Order Book standing at R 303857 crore. Infrastructure segment constitutes the highest proportion of the consolidated Order Book at 74% share, though reduced from 76% as at March 2019, with increase in the share of the Power segment from 2% to 5% on higher order inflows during the year.

315
The Order Book growth at 4.5% was constrained on deletion of some non-moving orders from the portfolio, mainly impacted by review decisions in the post-Covid scenario and change of Government in Andhra Pradesh during the Financial Year. The Order Book comprises of 27% from various State Governments, including local authorities. With major orders received from Public Sector Undertakings during the year FY 2019-20, the composition of the Order Book from that customer segment increased from 35% to 44%.
International Order Book Composition
Total International Order Book: R 75038 crore as at March 31, 2020 [Figures in brackets relate to previous year]
Saudi Qatar UAE Oman Kuwait Bangladesh Africa Far East America Europe ROW
28% (17%)
7% (11%)
7% (8%)
8% (7%)
7% (10%)
5% (7%)
24% (23%)
0% (1%)
2% (1%)
2% (3%)
10% (12%)
FY 2019-20 order inflow growth being driven by international business, the share of the international Order Book grew from 21% to 25%, with Saudi Arabia and Africa contributing the majority of the growth – resulting in their increased share in the overall international Order Book to 28% and 24% respectively.
Consolidated Revenue from Operations
91643 96985
– – –
R crore
Gross Revenue from Operations
200000 –
150000 –
100000 –
50000 –
0 –2018-19
135220145452
32% 33%
68% 67%
Domestic International2019-20
43577 48467
7.6%
L&T Group recorded revenue of R 145452 crore during the year, registering a growth of 7.6%. The growth however, was below expected levels with execution impediments of Covid-19 in the last few weeks of the year, coupled with delayed clearances, right of way constraints and the
review of awarded tenders by some state governments leading to stoppage of work in the Infrastructure segment for a prolonged period of time during the year. With the consolidation of Mindtree Limited acquired in early July 2019, the composition of international revenue at the Group level increased to 33% in year FY 2019-20.
R crore
Segment-wise Gross Revenue*
* includes inter segment revenue R 1590 crore for FY 20 and R 1700 crore for FY 19 [Figures in brackets relate to previous year]
7377750%, (53%)
23182%, (3%)3979
3%, (3%)
32052%, (2%)
1744512%, (11%)
2233515%, (11%)
138229%, (9%)
48503%, (4%)
53094%, (4%)
Infrastructure Power Defence Engineering Heavy Engineering Hydrocarbon IT & Technology
Services
Financial Services
Development projects
Others
Despite the challenges faced in the Infrastructure segment and sharp deceleration of business activity in the last few weeks of the year due to Covid-19, satisfactory growth in the Segment Revenue for the year was achieved with pick up of execution momentum mainly in Hydrocarbon and Heavy Engineering segments. The composition of IT&TS segment in the overall portfolio registered a growth of 400 bps achieved with consolidation of Mindtree on acquisition of control from Q2 FY 2019-20 onwards.
Operating Expenses and PBDIT
Operating Expenses and PBDIT 2019-20
[% to revenue]
[Figures in brackets relate to previous year]
Mfg., Construction & Operating Expenses
Staff Expenses
Sales, Administration & Other Expenses
Operating Profit (PBDIT)66.9%(70.7%)
15.9% (12.9%)
5.9% (5.0%)
11.2% (11.3%)
Manufacturing, Construction and Operating (MCO) expenses for FY 2019-20 at R 97363 crore increased by 1.8% over the previous year. These expenses mainly

MANAGEMENT DISCUSSION AND ANALYSIS FINANCIAL REVIEW ANNUAL REPORT 2019-20
316
Profit Before Interest and Tax
Segment-wise composition of PBIT for FY 2019-20 is represented below:
R croreSegment-wise PBIT Composition
[Figures in brackets relate to previous year]
520732%, (36%)
2361%, (1%)
5764%, (3%)
5664%, (3%)
174611%, (8%)
369323%, (21%)
267917%, (21%)
3872%, (2%)
9696%, (5%)
Infrastructure Power Defence Engineering Heavy Engineering Hydrocarbon IT & Technology
Services
Financial Services
Development projects
Others
Other Income Aided by profit on sale of liquid investments, interest earnings and dividend income from treasury investment, Other income at R 2361 crore, increased by 28.6% over R 1837 crore in the previous year.
Finance costThe interest expenses for the year 2019-20 at R 2797 crore was higher by 55.2% over R 1803 crore for the previous year. The increase was mainly attributable to the higher interest cost in L&T Hyderabad Metro Rail upon commencement of full operations, interest on lease liability on application of Ind AS 116 and higher level of borrowings in the standalone entity to fund the higher level of working capital caused by the tight liquidity conditions. Average borrowing cost for the year FY 2019-20 increased to 8.1% from 7.9% in the previous year.
Exceptional ItemsThere are no exceptional items during the year under review. Previous year exceptional item of R 192 crore (post-tax) represents write back of certain customer dues upon realization based on favourable NCLAT order.
Tax Expense Income Tax charge for FY 2019-20 (excluding tax charge on discontinued operations) decreased to R 3263 crore compared to R 4067 crore in FY 2018-19 on adoption of tax ordinance resulting in lower effective tax rate, partially offset by write-down of opening DTA for the rate differential and write-off of opening MAT credit, due
comprise cost of construction material, raw materials and components, subcontracting expenses and interest costs in Financial Services business. This represent 66.9% of revenue, a decrease by 380 bps, mainly on account of increased share of IT&TS segment as well as cost control initiatives at the Group level.
Staff expenses for the year 2019-20 at R 23114 crore increased by 32.3% over the previous year mainly on consolidation of Mindtree - adjusted for the same, the increase is 10.5% on a like-to-like basis. Adjusted for IT&TS segment (where manpower augmentation for revenue growth has led to an increase in the total headcount), the staff cost as a percentage to revenue increased by 30 bps, representing normal escalation. The Group has sharpened its focus on productivity improvement, digitalization and manpower rationalization.
Sales and administration expenses increased by 27.3% y-o-y to R 8647 crore - when adjusted for Mindtree consolidation, the increase stands at 17.7% on a like-to-like basis. The increase is mainly in Financial Services due to higher credit cost and provisions in conformity with RBI guidelines (issued consequent on moratorium relief given to borrowers in the Covid-19 scenario). Other increases that contributed to the rise include Expected Credit Loss provisions for financial and contract assets, donations to PM Cares fund and provision for write down of Yes Bank AT1 bonds under regulatory mandate.
The Group operating profit at R 16329 crore for the year 2019-20 registered growth of 6.5% y-o-y. The EBITDA margins for the year was lower by 10 basis points at 11.2%. Cost overruns encountered in some projects coupled with slow progress in some jobs mainly in Infrastructure segment impacted the operating margin. The drop was partially offset by a favourable job mix, coupled with execution efficiencies in Defence and Hydrocarbon segments, and the reversal of provision on a favourable arbitration award in the Power business.
Depreciation and Amortization charge
Depreciation and amortization charge for the year 2019-20 increased by 28% to R 2462 crore, compared to R 1923 crore in previous year. The increase was largely due to consolidation of Mindtree, full operationalization of the Hyderabad Metro Rail concession and amortization of Right of Use asset on adoption of the newly introduced Ind AS 116 accounting standard in 2019-20.

317
to its unavailability under the new tax regime. Creation of DTA in 2019-20 for set-off of capital losses has also contributed to the lower tax charge.
Consolidated Profit after Tax and EPS
Consolidated Profit after Tax (PAT) at R 9549 crore for the year 2019-20 rose by 7.2% over the previous year at R 8905 crore.
Consolidated Basic Earnings per Share (EPS) from continuing operations and discontinued operations for the year 2019-20 at R 68.04 registered growth over previous year at R 63.51.
Return on Consolidated Net Worth
The Net Worth, as on March 31, 2020, at R 66723 crore, reflects net increase of R 4348 crore, as compared to the position as on March 31, 2019. Return on Net Worth (RONW) for the year 2019-20 was lower at 14.8%, compared to 15.3% in the previous year. RONW for the current year has been adversely affected by Covid impact and provisions in financial services business.
Liquidity & Gearing
Cash flow from operations (excluding change in loans and advances towards financing activities) decreased to R 6687 crore as compared to R 9100 crore in the previous year due to delay in customer collections, impacted by fund constraints with Government and Public Sector clients. Borrowings increased by R 13874 crore to sustain higher level of operations and increased working capital requirements in a liquidity-constrained environment. During the year, borrowing was supplemented by additional funds generated from divestment of stake in subsidiary companies, profit on sale of investment and treasury income.
Funds were used mainly for purchase of stake in Mindtree Limited. Further, the Group incurred capital expenditure of R 3299 crore (including capex for full operationalisation of Hyderabad Metro Rail concession). Funds were also utilized for payment of final dividend for FY 2018-19 R 2526 crore, towards interim dividend of R 1404 crore for FY 2019-20 and DDT R 621 crore. The cash outflow also included net interest expense of R 2903 crore during the year FY 2019-20.
Consequently, there was a net increase of R 4809 crore in the cash balances as at March 31, 2020 as compared to the beginning of the year.
Consolidated Fund Flow Statement v croreParticulars 2019-20 2018-19Operating activities 6687 9100Borrowings/(Repayment) of Borrowings 13874 4319Treasury and dividend income 952 983Sale/(Purchase) of other investments 3983 (8252)ESOP Proceeds (net) 18 11Sources of Funds 25424 6161Capital expenditure (net) 3299 3499Net investment/(divestment) 9802 255Dividend paid 4551 2647Interest paid 2903 2983Increase/(Decrease) in cash balance 4809 (338)Payment (to)/from minority interest (net) 60 (2885)Utilisation of Funds 25424 6161
The total borrowings as at March 31, 2020 stood at R 141007 crore as compared to R 125555 crore as at March 31, 2019. The major increase is in the standalone entity to support the increasing business volumes, increase in borrowings of Financial Services and higher debt availed to complete operationalization of the Hyderabad Metro Rail concession. The gross debt:equity ratio increased to 1.85:1 as at March 31, 2020 from 1.81:1 as at March 31, 2019. The net debt:equity ratio stood at 1.53:1, as at March 31, 2020 from 1.52:1 as at March 31, 2019.
Details of significant changes in key financial ratios along with explanation:In compliance with the requirement of listing regulations, the key financial ratios of the Group were examined and the ratios with significant changes i.e. change of 25% or more as compared to the immediately previous financial year have been provided hereunder along with the explanation for the changes:Sr. No. Particulars 2018-19 2019-20
(i) Interest Coverage ratio* (Interest cost excludes Financial Services and Finance Lease Activity)
8.93 6.12 -31.5%
(ii) Net Working Capital % of Sales** (Excluding Financial Services & Corporate)
18.1% 23.7% 30.9%
* The significant change in the Interest Coverage Ratio for FY 2019-20 has been due to implementation of Ind AS 116 resulting in accounting for interest on lease liability, as well as full commissioning of L&T Hyderabad Metro Rail leading to cessation of capitalization of interest on borrowing done hitherto.
** The significant changes in Net Working Capital % of sales is due to delay in customer collections, impacted by fund constraints with Government and Public Sector clients as well as support extended to vendors and sub-contractors in a tight liquidity environment.

MANAGEMENT DISCUSSION AND ANALYSIS FINANCIAL REVIEW ANNUAL REPORT 2019-20
318
B. SEGMENT-WISE PERFORMANCE (GROUP)
1. Infrastructure Segment
80897 73169
– – –
R crore
Order Inflow
140000 –
120000 –
100000 –
80000 –
60000 –
40000 –
20000 –
0 –2018-19
95743 102678
16% 29%
84% 71%
Domestic International
2019-20
14846 29509
7.2%
The Infrastructure segment won orders worth R 102678 crore, higher by 7.2% over the previous year, mainly from Public Sector Undertakings. Large value orders were bagged by Building & Factories, Power Transmission & Distribution, Water Effluent Treatment and Metallurgical and Material Handling businesses. Investment by the Maharashtra State Government in the affordable housing segment and by private sector players in the airport and health segments boosted the order inflow momentum of the Buildings & Factories business vertical. Heavy Civil Infrastructure registered growth with receipt of orders in Hydel and Tunnel business, the Power Transmission & Distribution business recorded growth on receipt of key international orders, while the Metallurgical and Material Handling business registered significant growth with the receipt of a large value Gold beneficiation plant order and railway freight facility package in the MENA region.
The order inflow momentum was maintained in the Smart World & Communication business with the receipt of an order for an army network management system from the Indian Army and in the Water Effluent & Treatment business with order wins in the water supply and distribution segment.
De-growth was registered in the Transportation Infrastructure business due to deferral of some large value award decisions.
The share of international order inflow for the Infrastructure segment increased to 29%, from 16% in previous year. The Middle East region contributed 65% of the international order inflow. Lower contribution from South East Asian countries was compensated by a higher proportion of orders from African countries, reflecting the result of past efforts to expand presence in those
countries. International order wins were predominantly in Power Transmission & Distribution and Metallurgical and Material Handling business.
5409555879
– – –
R crore
Gross Revenue from Operations
100000 –
80000 –
60000 –
40000 –
20000 –
0 –2018-19
73204
8.1%
73777
26% 24%
74% 76%
Domestic International OPM %
2019-20
19109 17898
0.8%
8.5%
Infrastructure segment clocked gross revenue of R 73777 crore for the year 2019-20 registering a nominal growth of around 1% over the previous year. Revenue was impacted due to lack of progress in jobs in Andhra Pradesh with the stand taken by new state government to reassess new awards, execution challenges in some projects viz. obtaining approvals, securing Right of Way, rationalisation of fund allocation in certain states, and stay on execution due to litigations concerning environmental clearances. The sharp deceleration in execution in the last few weeks of the year on account of the pandemic and consequent regulatory clampdown on business activities also impacted revenue growth for the year as a whole.
Revenue from international operations constituted 24% of the total revenues of the segment during the year as compared to 26% in the previous year with some large value orders in the opening Order Book nearing completion, especially in Heavy Civil Infrastructure.
Infrastructure Segment earned operating profit of R 5912 crore. There was a decline in margins from 8.5% to 8.1% due to cost and time overruns in certain projects in Transportation Infrastructure and Buildings & Factories business. The decline was also due to the margin impact caused by Covid-19 led slowdown / lockdown in March 2020 and lower margin earned during the year in Heavy Civil Infrastructure business partially offset by realization of claims in Transportation Infrastructure and Water & Effluent Treatment business.
The Funds employed by the segment at R 28279 crore as at March 31, 2020 registered a sharp increase of 18.1%

319
vis-à-vis March 31, 2019, mainly due to stalled projects and fund allocation issues in certain State Government contracts. The funds employed were also impacted by the mandated stoppage of business activity / lockdown in the last 2 weeks of the financial year, a period that is usually characterized by a high level of customer collections.
2. Power Segment
2444
11784
– – –
R croreOrder Inflow
15000 –
12000 –
9000 –
6000 –
3000 –
0 –2018-19
2919
12048
264
16%
2%
84%
98%
Domestic International2019-20
475
>100%
The Power segment order inflow registered a substantial growth by bagging orders worth R 12048 crore as compared to R 2919 crore in the previous year. The segment received a large domestic order for an ultra-supercritical thermal power project, an order for a comprehensive Boiler Island package by L&T–MHPS Boiler JV, consolidated for L&T share, and several Flue Gas Desulphurisation projects following the mandate from Ministry of Environment, Forest and Climate Change to install emission control equipment in a timebound manner.
2599
1932
– – –
R croreGross Revenue from Operations
6000 –
5000 –
4000 –
3000 –
2000 –
1000 –
0 –2018-19
3983 12.0%
231835%
17%65%
83%
Domestic International OPM %2019-20
1384
386
(41.8%)
4.5%
Despite the surge in order inflow, the Power segment’s revenue declined y-o-y by 41.8% to R 2318 crore, since the new orders are yet to pick up execution momentum, as well as tapering of execution in coal-based projects nearing completion. Composition of revenue from international projects decreased to 17% of total revenue for the segment, from 35% in previous year due to
diminishing revenue contribution from a Bangladesh gas-fired power project nearing completion in 2019-20.
Segment operating profit has improved from R 177 crore in previous year to R 275 crore in FY 2019-20, with the margin improving to 12% mainly due to reversal of provision on receipt of favourable arbitration award.
The Funds employed by the segment stood at R 1745 crore as at March 31, 2020 registering a growth of 46.3% over the previous year due to delay in collection of retention amount in jobs nearing completion and higher carrying value of Investment in Joint Ventures under Power Group, consolidated through equity method under Ind AS.
3. Heavy Engineering Segment
1321 1018
– – –
R croreOrder Inflow
6000 –
5000 –
4000 –
3000 –
2000 –
1000 –
0 –2018-19
4049
236167%
57%
33% 43%
Domestic International2019-20
2728
1343
(41.7%)
The Heavy Engineering segment recorded an order inflow of R 2361 crore for the year ending March 31, 2020, lower by 41.7% as compared to the previous year due to deferment of orders, coupled with the loss of international orders on aggressive pricing from global fabricators in a low-demand-cum-surplus-capacity scenario. Share of orders from international business decreased from 67% in the previous year to 57% in FY 2019-20, largely attributable to reduced prospects of Marine Pollution Control equipment.
1330 1777
– – –
R croreGross Revenue from Operations
4000 –3500 –3000 –2500 –2000 –1500 –1000 –
500 –0 –
2018-19
2514
21.5%
3205
47%45%
53%55%
Domestic International OPM %2019-20
1184
1428
27.5%
24.5%

MANAGEMENT DISCUSSION AND ANALYSIS FINANCIAL REVIEW ANNUAL REPORT 2019-20
320
The segment’s gross revenue of R 3205 crore registered a growth of 27.5% compared to the previous year on the back of good progress in executing the Opening Order Book of the refinery, oil and gas equipment business. Revenue from international operations constituted 45% of the total revenue for the segment.
The segment recorded an increase in the operating profit for the year at R 612 crore. The margin, however registered a decline from 24.5% to 21.5% due to prudential provisions made in an international project, partially offset by cost saving initiatives and a favourable claim settlement.
Funds employed by the segment as on March 31, 2020 at R 2906 crore, registered an increase of 16.1% over the previous year on higher working capital due to pending milestone completion in some refinery projects.
4. Defence Engineering Segment
25101773
– – –
R croreOrder Inflow
5000 –
4000 –
3000 –
2000 –
1000 –
0 –2018-19
3016
223317%
21%
83% 79%
Domestic International2019-20
506
460
(25.9%)
The Defence Engineering segment recorded an order inflow of R 2233 crore for the year ending March 31, 2020, lower by 25.9% over the previous year with deferment of orders from the Ministry of Defence. The share of international orders for FY 2019-20 was higher at 21% as compared to the previous year.
35163637
– – –
R crore
Gross Revenue from Operations
6000 –
5000 –
4000 –
3000 –
2000 –
1000 –
0 –2018-19
3849
18.2%
39799% 9%
91% 91%
Domestic International OPM %
2019-20
333 342
3.4%
16.2%
The segment’s gross revenue of R 3979 crore improved by 3.4% compared to the previous year. Growth was mainly contributed by the brisk execution of a tracked artillery gun order and partially offset by decline in the Shipbuilding business. Revenue from international operations was steady at 9% of the total revenue for the segment.
The operating margin improved from 16.2% in the previous year to 18.2% in FY 2019-20 due to cost savings across multiple projects in the Defence & Aerospace business and a favourable claim settlement in Shipbuilding business.
Funds employed by the segment as on March 31, 2020 at R 3014 crore increased by 5.3% y-o-y, due to delay in collections from a fund constrained MoD.
5. Hydrocarbon Segment
15379 13323
– – –
R croreOrder Inflow
40000 –
32000 –
24000 –
16000 –
8000 –
0 –2018-19
27871
2096445%36%
55% 64%
Domestic International2019-20
124927641
(24.8%)
The Hydrocarbon segment achieved order inflows of R 20964 crore, registering a decline of 24.8% due to deferment of orders mainly in the Onshore vertical. The share of international orders decreased to 36% in FY 2019-20 from 45% in the previous year, which included one mega order received in Algeria. The Order Book, at R 44,130 crore, however, still provides multi-year revenue visibility even in the current uncertain environment of low oil prices.
7205 9893
– – –
R croreGross Revenue from Operations
25000 –
20000 –
15000 –
10000 –
5000 –
0 –2018-19
1517617445
53% 43%
47% 57%
Domestic International OPM %2019-20
79717552
15.0%
8.8% 10.9%

321
Segment revenue at R 17445 crore for the year grew by 15% y-o-y, enabled by peaking of execution activities in key projects. The share of International revenue in FY 2019-20 was lower at 43% of the total revenue of the segment as compared to 53% in the previous year, with closing stage progress of some large value international orders in the opening Order Book.
The segment’s operating profit for the year improved to R 1898 crore, with the margin increasing by 210 basis points from 8.8% to 10.9%, reflecting operational / execution efficiencies and claim settlements in a few projects.
Funds employed by the segment as on March 31, 2020 at R 2880 crore increased by 35.3% as compared to March 31, 2019, mainly due to the increase in current outstanding from customers in a tight liquidity environment.
6. IT & Technology Services (IT & TS) Segment
The Company acquired a controlling stake of 60.59% in Mindtree Limited as of 2nd July, 2019. Subsequent to the acquisition of control, the financials have been consolidated from the second quarter of FY 2019-20 and reported under the IT & TS segment. The resultant figures for the current periods are not comparable with the previous periods to that extent. An additional 0.49% stake was acquired in March 2020, taking the total shareholding as on March 31, 2020 to 61.08%.
– – –
R crore
Gross Revenue and OPM%
28000 –
24000 –
20000 –
16000 –
12000 –
8000 –
4000 –
0 –
53.5%
2018-19
14553
22335
23.2%
20.9%
Revenue OPM %
2019-20
The IT & TS segment comprises publicly listed companies L&T Infotech Limited and its group of companies, L&T Technology Services Limited and its group of companies, and Mindtree Limited and its subsidiaries. The segment recorded a gross revenue of R 22335 crore for the year ended March 31, 2020, registering a growth of 53.5% over the previous year, including R 5915 crore on account of the Mindtree acquisition in FY 2019-20. Excluding
Mindtree, the growth would have been 13% on a like-to-like basis. International revenue constitutes a steady 91% of the total revenue of the segment. Like other businesses within the Group, the IT&TS Segment was also initially affected by the transition challenges of work-from-home / lockdown situation that prevailed towards the end of the year. The businesses have, however, quickly ramped up the work-from-home business model on various projects under execution during the lockdown period in line with approvals obtained from customers. The end-customer geographical segments in the US and Europe continue to witness stress due the pandemic that has severely impacted these geographies.
The Segment’s Operating Profit was at R 4635 crore for the year 2019-20 as compared to R 3336 crore in the previous year including a contribution of R 951 crore from Mindtree. The Operating Margin declined by 230 basis points, mainly on account of an increase in manpower cost, coupled with a drop in utilization and donations to the PM Cares fund set up for Covid-19 relief purposes.
The Funds employed by the segment as on March 31, 2020 at R 19638 crore increased by 178% compared to March 31, 2019 mainly due to investment in goodwill and intangible assets of customer contracts on acquisition of Mindtree Limited.
During the year, the Company divested 4.26% stake in L&T Technology Services, towards meeting the regulatory requirement of minimum public shareholding of 25% within three years from listing of its shares. L&T’ s shareholding in LTI and LTTS as on March 31, 2020 is 74.53% and 74.62% respectively.
7. Financial Services (FS) Segment
The Financial Services segment comprises Rural, Infrastructure and Housing Finance and Asset Management. The segment’s revenue grew by 9.4% y-o-y at R 13822 crore for the year FY 2019-20 aided by growth in the loan assets of ‘focused’ business lines.
– – –
R crore
Gross Revenue
20000 –
15000 –
10000 –
5000 –
0 –
9.4%
2018-19
1263813822
2019-20
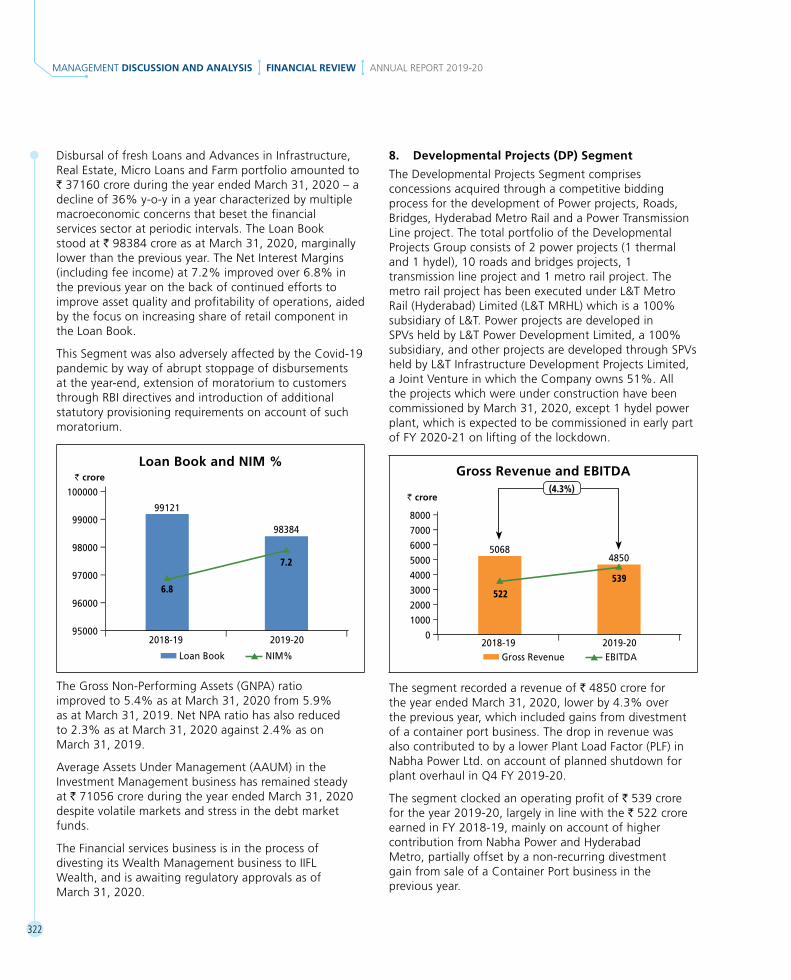
MANAGEMENT DISCUSSION AND ANALYSIS FINANCIAL REVIEW ANNUAL REPORT 2019-20
322
Disbursal of fresh Loans and Advances in Infrastructure, Real Estate, Micro Loans and Farm portfolio amounted to R 37160 crore during the year ended March 31, 2020 – a decline of 36% y-o-y in a year characterized by multiple macroeconomic concerns that beset the financial services sector at periodic intervals. The Loan Book stood at R 98384 crore as at March 31, 2020, marginally lower than the previous year. The Net Interest Margins (including fee income) at 7.2% improved over 6.8% in the previous year on the back of continued efforts to improve asset quality and profitability of operations, aided by the focus on increasing share of retail component in the Loan Book.
This Segment was also adversely affected by the Covid-19 pandemic by way of abrupt stoppage of disbursements at the year-end, extension of moratorium to customers through RBI directives and introduction of additional statutory provisioning requirements on account of such moratorium.
– – –
R crore
Loan Book and NIM %
100000 –
99000 –
98000 –
97000 –
96000 –
95000 –2018-19
99121
98384
6.8
7.2
Loan Book NIM%
2019-20
The Gross Non-Performing Assets (GNPA) ratio improved to 5.4% as at March 31, 2020 from 5.9% as at March 31, 2019. Net NPA ratio has also reduced to 2.3% as at March 31, 2020 against 2.4% as on March 31, 2019.
Average Assets Under Management (AAUM) in the Investment Management business has remained steady at R 71056 crore during the year ended March 31, 2020 despite volatile markets and stress in the debt market funds.
The Financial services business is in the process of divesting its Wealth Management business to IIFL Wealth, and is awaiting regulatory approvals as of March 31, 2020.
8. Developmental Projects (DP) Segment
The Developmental Projects Segment comprises concessions acquired through a competitive bidding process for the development of Power projects, Roads, Bridges, Hyderabad Metro Rail and a Power Transmission Line project. The total portfolio of the Developmental Projects Group consists of 2 power projects (1 thermal and 1 hydel), 10 roads and bridges projects, 1 transmission line project and 1 metro rail project. The metro rail project has been executed under L&T Metro Rail (Hyderabad) Limited (L&T MRHL) which is a 100% subsidiary of L&T. Power projects are developed in SPVs held by L&T Power Development Limited, a 100% subsidiary, and other projects are developed through SPVs held by L&T Infrastructure Development Projects Limited, a Joint Venture in which the Company owns 51%. All the projects which were under construction have been commissioned by March 31, 2020, except 1 hydel power plant, which is expected to be commissioned in early part of FY 2020-21 on lifting of the lockdown.
– – –
R crore
Gross Revenue and EBITDA
8000 –
7000 –
6000 –
5000 –
4000 –
3000 –
2000 –
1000 –
0 –
(4.3%)
2018-19
50684850
522
539
Gross Revenue EBITDA2019-20
The segment recorded a revenue of R 4850 crore for the year ended March 31, 2020, lower by 4.3% over the previous year, which included gains from divestment of a container port business. The drop in revenue was also contributed to by a lower Plant Load Factor (PLF) in Nabha Power Ltd. on account of planned shutdown for plant overhaul in Q4 FY 2019-20.
The segment clocked an operating profit of R 539 crore for the year 2019-20, largely in line with the R 522 crore earned in FY 2018-19, mainly on account of higher contribution from Nabha Power and Hyderabad Metro, partially offset by a non-recurring divestment gain from sale of a Container Port business in the previous year.

323
9. Others Segment
2994 2214
– – –
R croreGross Revenue and OPM%
8000 –
7000 –
6000 –
5000 –
4000 –
3000 –
2000 –
1000 –
0 –2018-19
59355309
Industrial Machinery, Products & Others Realty OPM%
2019-20
2941 3095
(10.5%)
28.6%
20.9%
The Others segment covers Realty, Construction and Mining Machinery, Rubber Processing Machinery and Valves businesses. Revenue for the segment registered a decline of 10.5% from R 5935 crore in 2018-19 to R 5309 crore in 2019-20. The decline was mainly in the Realty business, which in the previous year included a large value sale of commercial property and higher hand over of residential properties. Construction Equipment and other allied businesses have recorded a decline with lower demand for wheel loaders and excavators. The Valves business, registered growth with focus on its distribution business and higher order intake in the previous year. The Operating Margin declined over the previous year, which included a lumpy gain on sale of commercial property in the Realty business.
II. L&T STANDALONE
PERFORMANCE REVIEW
L&T’s standalone financials reflects the performance of Infrastructure segment, Power, Heavy Engineering, Defence Engineering, and Others. The Others segment comprises of a part of Hydrocarbon business, Realty, Construction & Mining Machinery and Rubber Processing Machinery.
L&T Shipbuilding which was earlier a subsidiary has been merged with the Company with effect from April 1, 2019 pursuant to an NCLT Order. Accordingly, the previous year’s financials are restated for comparison purpose.
L&T standalone continues to be the major contributor to revenue and profits of the Group’s performance.
Order Inflow and Order Book
90030 86938
– – –
R crore
Order Inflow
150000 –
125000 –
100000 –
75000 –
50000 –
25000 –
0 –2018-19
107627 114825
16% 24%
84% 76%
Domestic International
2019-20
17597 27887
6.7%
The order inflow during FY 2019-20 grew by 6.7% at R 114825 crore as compared to R 107627 crore in the previous year. The Infrastructure segment contributed 86% of the total order inflow during the year on receipt of orders from the airport sector, affordable housing sector, and a few international orders. The Power business registered growth with the receipt of orders for an ultra-supercritical thermal power project and several Flue Gas Desulphurisation projects.
The international order inflow increased to 24% of the total order inflow for FY 2019-20 as compared to 16% in the previous year.
206463 200276
– – –
R crore
Order Book
320000 –
240000 –
160000 –
80000 –
0 –As at 31-03-2019
245628 250151
16% 20%
84% 80%
Domestic International
As at 31-03-2020
39165 49875
1.8%
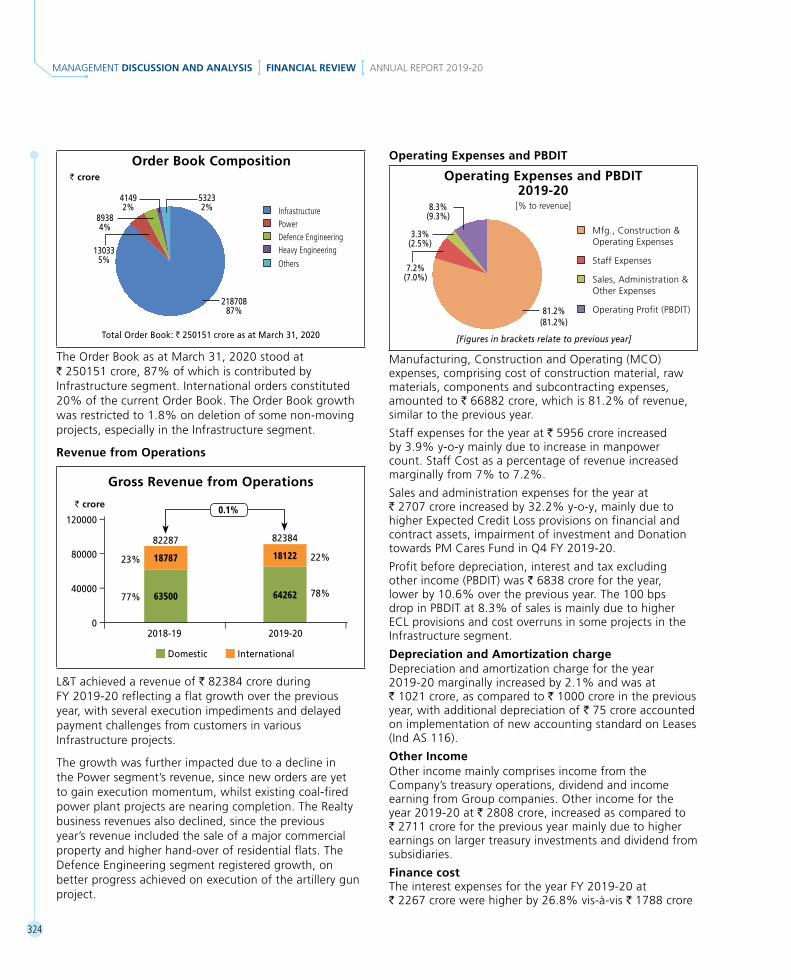
MANAGEMENT DISCUSSION AND ANALYSIS FINANCIAL REVIEW ANNUAL REPORT 2019-20
324
R crore
Order Book Composition
Total Order Book: R 250151 crore as at March 31, 2020
Infrastructure Power Defence Engineering Heavy Engineering
Others
218708 87%
130335%
89384%
41492%
53232%
The Order Book as at March 31, 2020 stood at R 250151 crore, 87% of which is contributed by Infrastructure segment. International orders constituted 20% of the current Order Book. The Order Book growth was restricted to 1.8% on deletion of some non-moving projects, especially in the Infrastructure segment.
Revenue from Operations
63500 64262
– – –
R crore
Gross Revenue from Operations
120000 –
80000 –
40000 –
0 –2018-19
82287 82384
23% 22%
77% 78%
Domestic International
2019-20
18787 18122
0.1%
L&T achieved a revenue of R 82384 crore during FY 2019-20 reflecting a flat growth over the previous year, with several execution impediments and delayed payment challenges from customers in various Infrastructure projects.
The growth was further impacted due to a decline in the Power segment’s revenue, since new orders are yet to gain execution momentum, whilst existing coal-fired power plant projects are nearing completion. The Realty business revenues also declined, since the previous year’s revenue included the sale of a major commercial property and higher hand-over of residential flats. The Defence Engineering segment registered growth, on better progress achieved on execution of the artillery gun project.
Operating Expenses and PBDIT
[Figures in brackets relate to previous year]
Mfg., Construction & Operating Expenses
Staff Expenses
Sales, Administration & Other Expenses
Operating Profit (PBDIT)81.2%(81.2%)
7.2% (7.0%)
3.3% (2.5%)
8.3% (9.3%)
Operating Expenses and PBDIT 2019-20
[% to revenue]
Manufacturing, Construction and Operating (MCO) expenses, comprising cost of construction material, raw materials, components and subcontracting expenses, amounted to R 66882 crore, which is 81.2% of revenue, similar to the previous year.
Staff expenses for the year at R 5956 crore increased by 3.9% y-o-y mainly due to increase in manpower count. Staff Cost as a percentage of revenue increased marginally from 7% to 7.2%.
Sales and administration expenses for the year at R 2707 crore increased by 32.2% y-o-y, mainly due to higher Expected Credit Loss provisions on financial and contract assets, impairment of investment and Donation towards PM Cares Fund in Q4 FY 2019-20.
Profit before depreciation, interest and tax excluding other income (PBDIT) was R 6838 crore for the year, lower by 10.6% over the previous year. The 100 bps drop in PBDIT at 8.3% of sales is mainly due to higher ECL provisions and cost overruns in some projects in the Infrastructure segment.
Depreciation and Amortization chargeDepreciation and amortization charge for the year 2019-20 marginally increased by 2.1% and was at R 1021 crore, as compared to R 1000 crore in the previous year, with additional depreciation of R 75 crore accounted on implementation of new accounting standard on Leases (Ind AS 116).
Other Income Other income mainly comprises income from the Company’s treasury operations, dividend and income earning from Group companies. Other income for the year 2019-20 at R 2808 crore, increased as compared to R 2711 crore for the previous year mainly due to higher earnings on larger treasury investments and dividend from subsidiaries.
Finance costThe interest expenses for the year FY 2019-20 at R 2267 crore were higher by 26.8% vis-à-vis R 1788 crore

325
for the previous year. The increase is mainly attributable to an increase of R 13,795 crore in borrowings as at March 31, 2020 compared to borrowings as at March 31, 2019, as well as a higher quantum of interest-bearing customer advances. The average borrowing cost for the year 2019-20 was at 7.4% p.a., lower from the 7.6% p.a. in the previous year.
Exceptional ItemsExceptional Items of R 610 crore (net of tax) for the year 2019-20 represents gain on dilution of stake in L&T Technology Services, while the previous year included gains on dilution of stake in L&T Infotech and L&T Technology Services, as well as recovery of a receivable amount under Insolvency & Bankruptcy Code, partly offset by impairment of some investments in JVs.
Profit after Tax and EPS
– – –R crore Profit After Tax9000 –
7500 –
6000 –
4500 –
3000 –
1500 –
0 –2018-19
7491
6679
2019-20
Profit after Tax (PAT), including exceptional items, for the year 2019-20 at R 6679 crore, registered a decline of 11% as compared to R 7491 crore in the previous year mainly due to lower operating margin, higher interest expenses and lower exceptional income. The Company has opted for the lower tax rate under the tax ordinance introduced during the year under review. This has resulted in saving in current tax. The said saving is partially offset by write down of opening Deferred Tax Asset for revised rate and surrender of Minimum Alternate Tax credit not being available under the new tax ordinance.The Basic Earnings per Share (EPS) from continuing operations & discontinued operations for the year 2019-20 at R 47.59 has declined compared to R 53.43 in the previous year. Other Comprehensive Income (OCI)Other Comprehensive income during the year reflected a loss of R 519 crore, vis-à-vis loss of R 118 crore in the previous year, mainly due to impact of fair valuation of investments in Mindtree prior to acquiring controlling stake.
Return on Net WorthThe Net Worth of the Company as on March 31, 2020 at R 52175 crore increased by R 2127 crore as compared to March 31, 2019, reflecting mainly profit for the year, reduced by the payment of interim dividend of R 10 per paid up equity share in March ‘20.
Return on Net worth (RONW) including Exceptional Items for the year 2019-20 at 13.1% is lower as compared to 15.7% in the previous year. The decline is largely due to higher exceptional income in 2018-19, which mainly included gains on dilution of stakes in LTI & LTTS.
Liquidity & GearingBorrowings increased during FY 2019-20 by R 13452 crore to sustain a higher level of operations, increase in the working capital and for the acquisition of Mindtree Limited. During the year, additional funds were generated from liquidation of other investments, dividend income R 1384 crore and Treasury income R 518 crore.
Besides the Mindtree acquisition and operations, the funds were deployed for capex of R 1309 crore, payment of dividend R 4159 crore comprising of final dividend of R 2526 crore for FY 2018-19, Dividend Distribution Tax of R 229 crore and interim dividend of R 1404 crore for FY 2019-20 and net interest expense of R 1893 crore during the year. There was a net increase of R 464 crore in the cash balances as at March 31, 2020 as compared to the beginning of the year.
Fund flow statement v croreParticulars 2019-20 2018-19Borrowings (net of repayment) 13452 (493)Sale/(Purchase) of Other investments 3463 (2612)Treasury and dividend income 1902 1937ESOP Proceeds (net of buyback expenses) 18 11Sources of Funds 18835 (1157)Operating activities 121 (2557)Capital expenditure (net) 1309 792Net investment/(divestment) 10889 (3053)Dividend paid 4159 2597Interest paid 1893 1528Increase/(decrease) in cash balance 464 (464)Utilisation of Funds 18835 (1157)
Total borrowings as at March 31, 2020 stood at R 25785 crore as compared to R 11990 crore in the previous year. The loan portfolio of the Company comprises a mix of domestic and suitably hedged foreign currency loans. The gross debt:equity ratio increased to 0.49:1 as at March 31, 2020 from 0.24:1 as at March 31, 2019. The net debt:equity ratio has increased to 0.31:1 as at March 31, 2020 from 0.08:1 as at March 31, 2019 – the increase has primarily been driven by increased working capital requirements and the acquisition of Mindtree Limited.

MANAGEMENT DISCUSSION AND ANALYSIS FINANCIAL REVIEW ANNUAL REPORT 2019-20
326
III. STRATEGY, BUSINESS MODEL AND RESOURCE ALLOCATION
Strategy Formulation
Business strategy formulation seeks to set long-term goals and strategies that help the Company in exploiting its strengths, identifying and realizing new opportunities and building new capabilities. This is enabled through three plans with time horizons ranging from long-term (7-10 years) to medium-term (5 years) to short-term (annual). Each plan dovetails into the next.
Last year, the Company had embarked on the development of a ‘Perspective Plan’, with a long-term view of 7-10 years. The process started with the identification of emerging megatrends and potential disruptions in current businesses. This was followed by a call for ideas for new businesses as well as adjacencies and growth areas, conducted through group-wide exercises, large-scale interactive processes, brainstorming sessions and interactions with experts. Ideas were filtered based on certain criteria. Some ideas went through a stage-gated assessment and a few were selected for pursuing further. The exercise culminated in a future outlook for the Group along with seeding of potential new businesses in Digital Platforms such as the B2B marketplace, skilling platform, etc. The insights garnered from the Perspective Plan exercise, tweaked for the changed circumstances of the pandemic, would be used for creating the next 5-year strategic plan.
The strategic plan, which runs for a period of 5 years, is developed through a collaborative and consultative process across the organization. Formulating the plan involves a lookback analysis of performance against the previous plan, scanning market opportunities, outlook on investment and identification of critical areas to be addressed. The outcomes of the exercise are priorities for growth, key initiatives at business unit and corporate level, talent and leadership pipeline plan, financial resources plan, and broad financial targets for each business. The ensuing year (2020-21) is the terminal year of the current 5-year strategic plan, ‘Lakshya 21’. The Company would be undertaking the development of next 5-year strategic plan ‘Lakshya 26’, which would lay down the strategic guideposts for the Company from FY 22 to FY 26. Changes in various industry segments as well as new areas of business, after considering the impact of the recent Covid-19 pandemic, would get factored into ‘Lakshya 26’. The Strategic Plan usually gets to be reviewed after, say, three years for mid-course correction, if any.
While the 5-year business outlook and broad financial goals are embedded as an overarching strategic plan, the annual operating plan is formulated before the commencement of every financial year. This helps provide flexibility in tailoring annual operating and financial budgets to changing circumstances while keeping the 5-year strategic plan in view.
Strategy Formulation Schematic:
Perspective Plan 5 Year Strategic Plan Annual Plan
Objective
Timelines
Scope
• Long Term Business Vision
• Assessing Global Megatrends
• Assessment Of Emerging Technologies & New Growth Opportunities
• Identifying relevant growth Initiatives
7-10 years
•Business Portfolio•Geographical Business Strategy• Investment In Emerging
Businesses•Organization Structure•Leadership Pipeline•Long Term Capex Outlay
•Mid-Long term Business Outlook•Assessment of Global and
Domestic Macro Environment•5 Year Business Plan•Key Strategic Initiatives
5 year
•Detailed Growth Plan•Assessment of Investment
Environment and Competition•Medium Term Opportunities•Talent Management and
Leadership Development•Strategic Partnerships•Portfolio Assessment
•Annual Business Plan•Financial KPIs: Order Wins,
Revenues, Profits, Working Capital and ROE Targets•Operational KPI: Productivity
Targets
1 year
•Annual Budgets•Order Prospect Pipeline•Bid Management Policies•Key Account Management•Order Book Execution Plan•Capex And Liquidity Plan•Resource Allocation
Strategy Formulation Schematic:
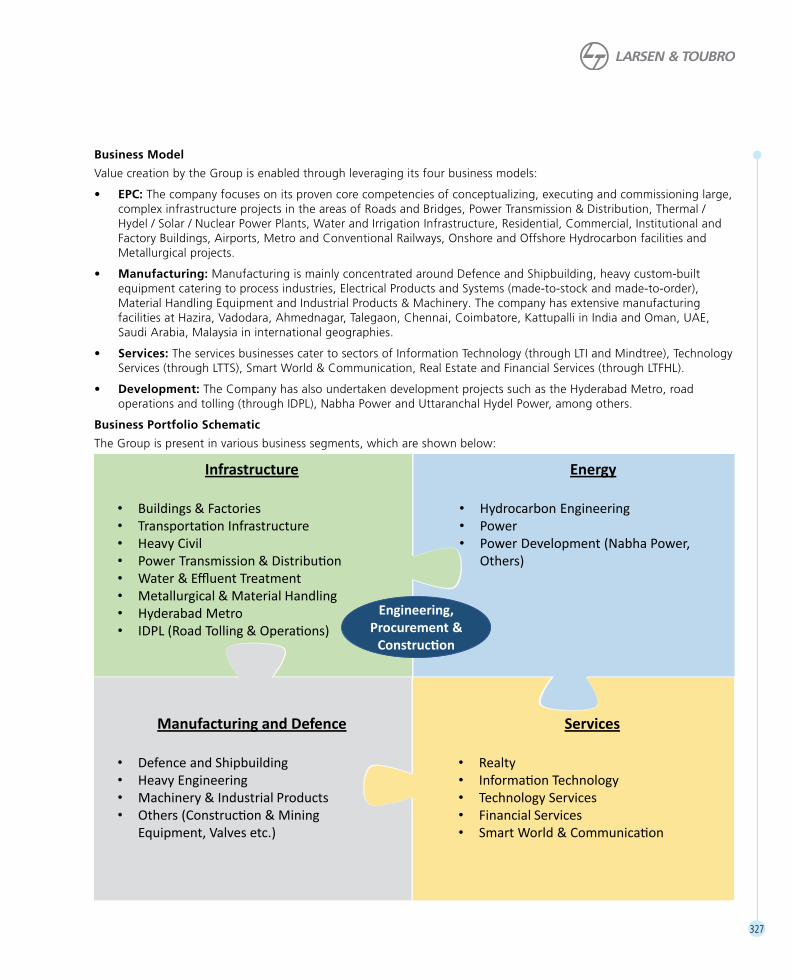
327
Business Model
Value creation by the Group is enabled through leveraging its four business models:
• EPC: The company focuses on its proven core competencies of conceptualizing, executing and commissioning large, complex infrastructure projects in the areas of Roads and Bridges, Power Transmission & Distribution, Thermal / Hydel / Solar / Nuclear Power Plants, Water and Irrigation Infrastructure, Residential, Commercial, Institutional and Factory Buildings, Airports, Metro and Conventional Railways, Onshore and Offshore Hydrocarbon facilities and Metallurgical projects.
• Manufacturing: Manufacturing is mainly concentrated around Defence and Shipbuilding, heavy custom-built equipment catering to process industries, Electrical Products and Systems (made-to-stock and made-to-order), Material Handling Equipment and Industrial Products & Machinery. The company has extensive manufacturing facilities at Hazira, Vadodara, Ahmednagar, Talegaon, Chennai, Coimbatore, Kattupalli in India and Oman, UAE, Saudi Arabia, Malaysia in international geographies.
• Services: The services businesses cater to sectors of Information Technology (through LTI and Mindtree), Technology Services (through LTTS), Smart World & Communication, Real Estate and Financial Services (through LTFHL).
• Development: The Company has also undertaken development projects such as the Hyderabad Metro, road operations and tolling (through IDPL), Nabha Power and Uttaranchal Hydel Power, among others.
Business Portfolio Schematic
The Group is present in various business segments, which are shown below:
Infrastructure
• Buildings & Factories• Transportation Infrastructure• Heavy Civil• Power Transmission & Distribution• Water & Effluent Treatment• Metallurgical & Material Handling• Hyderabad Metro• IDPL (Road Tolling & Operations)
Energy
• Hydrocarbon Engineering• Power• Power Development (Nabha Power,
Others)
Manufacturing and Defence
• Defence and Shipbuilding• Heavy Engineering• Machinery & Industrial Products• Others (Construction & Mining
Equipment, Valves etc.)
Services
• Realty• Information Technology• Technology Services• Financial Services• Smart World & Communication
Engineering,Procurement &
Construction
Business Segment Schematic:

MANAGEMENT DISCUSSION AND ANALYSIS FINANCIAL REVIEW ANNUAL REPORT 2019-20
328
Portfolio Strategy
The portfolio strategy aims to de-risk the revenue while improving profitability in the pursuit of growth. This strategy focuses on:
• Complementingthematurebusinesseswithgrowth-stagebusinesses,withafocusonasset-light,capex-lightandhigh-margin businesses. The Group is also trying to reduce exposure to asset-heavy businesses. Businesses requiring periodic capital infusion such as Financial Services will be reassessed from time to time in the context of emerging strategic significance.
• Well-balancedandgeographicallydiversifiedbusinessesacrossdomesticandinternationalmarkets.Over35%ofthe business comes from international markets (primarily the Americas, Middle East & Africa and Europe). To further de-risk the geographical concentration and pursue new growth opportunities, the focus on few more high-potential countries in Africa and ASEAN region will be enhanced.
• BalancingthecyclicalnatureoftheEPCbusinessthroughaportfolioofmanufacturingandservicesbusinesses.The‘Services’ businesses contribute over 25% of the Group’s revenues. With the aim of better profitability and a stable revenue profile, the Group intends to step up the proportion of services business while factoring the growth in the traditional EPC and manufacturing businesses. The acquisition of Mindtree Limited was a step in this direction.
• Supplementingthestandaloneofferingswithpartnerships:FortheEPCandmanufacturingbusinesses,theCompany has partnered with several large global process and technology licensors, and for the IT and Technology Services businesses, the group has extensive partnerships with established global software product and technology companies. These engagements enable the group to offer a bouquet of value-added services to customers in different businesses.
Businesses and offerings are closely linked to global megatrends and the Company continues to build on these to address future challenges.

329
Our Business Offerings Backed by Megatrends
Urbanization
Sustainability
Mobility
Demographic Challenge
Increasing population density in cities leading to various challenges e.g. congestion, call for better solutions with improved service levels
Climate change and resource scarcity; need for solutions to balance global needs with environment
Safe, fast, cheap and environment friendly solutions for people and goods
Universal coverage for basic amenities, keeping up with growing demands for global population
Technology and services offerings to aid new age businesses across various domains
High rise buildings for better utilization of land space (B&F)
Underground multi-level car parks (Geo)
Safe and Smart cities (SWC)
Redesigned utility networks (PT&D, WET)
Renewables – Solar, Energy Storage (PT&D, HC)
Green buildings (B&F)
Water Recycling and Reuse solutions (WET)
Use of waste materials e.g. Fly Ash, furnace slag, c&d waste in construction
Energy efficient manufacturing units
Water neutral campuses
Expressways & elevated corridors (TI)
Mass Rapid Transit Systems (TI, HC)
EV and Autonomous systems (LTTS)
World class airports (B&F, TI)
Water Treatment and sewage systems (WET)
Affordable & Mass Housing (B&F)
Big Data, AI / ML in BFSI, Retail and Media (LTI, LTTS, MT)
Automation, IoT in Manufacturing, HiTech, Industrial Products, Medical devices (LTTS, L&T-NxT)
Platforms (B2B marketplace, skilling)
Cloud, Cybersecurity (LTI, MT)
Electricity distribution systems and microgrids (PT&D)
Financial services (LTFS)
Digitalization
Mobile, Drones, AR/VR/MR (LTI, LTTS, MT)

MANAGEMENT DISCUSSION AND ANALYSIS FINANCIAL REVIEW ANNUAL REPORT 2019-20
330
Strategic Thrust and Direction
The focus of the Group’s strategy is to create economic value for its shareholders, investors and clients while generating social and environmental value for its employees and other societal stakeholders. This is enabled by:
• EnsuringefficientconversionoftheOrderBookintohealthymarginsthroughexecution,operationalexcellenceanddigitalization initiatives
• DrivinggrowthoftheservicesbusinesseswhichhaveahigherRoEprofile
• Maintaininganoptimummixbetweendomesticandinternationalbusiness
• Managingfinancialresourcesforthegrowthofthebusinessesandstrongfinancialhealthtofacilitateaccesstocapital markets, as and when required
• Incubatingnewbusinessestotapfuturegrowthopportunities
• Engagingwithstart-upstoaccessinnovationstoenhancecapabilitiesanddevelopnewofferings
• Unlockingcapitalfromnon-corebusinessesandassetsearningsub-parreturns
• Leveragingdigitalsolutionsandanalyticsacrossvariouspartsofitsbusinesses,spanningareassuchasremoteassetmanagement, material tracking, employee productivity enhancement, safety and procurement, among others
• Focusonbusinessescontributingtoenvironmentsustainabilitysuchassolar,energystorage,waterreuseandrecycling
• ThrustonopportunitieslinkedtoachievingtheSustainableDevelopmentGoals,likeaccesstocleanwaterforeveryone, reduction in consumption of virgin material in construction, energy efficiency solutions, etc.
The Group retains its thrust on improving ROE.
Resource Allocation:
The Company has a well laid-out plan of resource allocation to meet its strategic goals which includes:
• MaintainingadequateliquidityontheBalanceSheettoexploitgrowthopportunitiesandfundemergingandhighgrowth businesses
• Prudentallocationofresources(CapexandWorkingCapital)tofundgrowthindifferentbusinesses.Financialresources are monitored and directed at a central level with mandates for control at a local level
• Attractingandretainingarobustandthrivingtalentpoolthroughemployeeengagementprogrammes,monetaryand non-monetary incentives, leadership development initiatives, offering professional development opportunities and fostering a conducive organisation climate. The Company has evolved a series of structured HR policies to enable this resource allocation
• Long-termlastingengagementswithlaboursub-contractorstoensureasteadyaugmentationofresourcesatprojectsites
• Long-termengagementwithvendorsofservices,materialsandequipmenttoprovideadequateresourcesforbusiness growth in various business verticals
• MaintainingstrongfinancialhealthtofacilitateraisingofresourcesfromCapitalMarketsasandwhenrequired
• Ensuringjudiciousallocationofmanpowerandmonetaryresourcestocompany-widesustainabilityandgrowthinitiatives such as CSR, Digitalisation and operational excellence programs
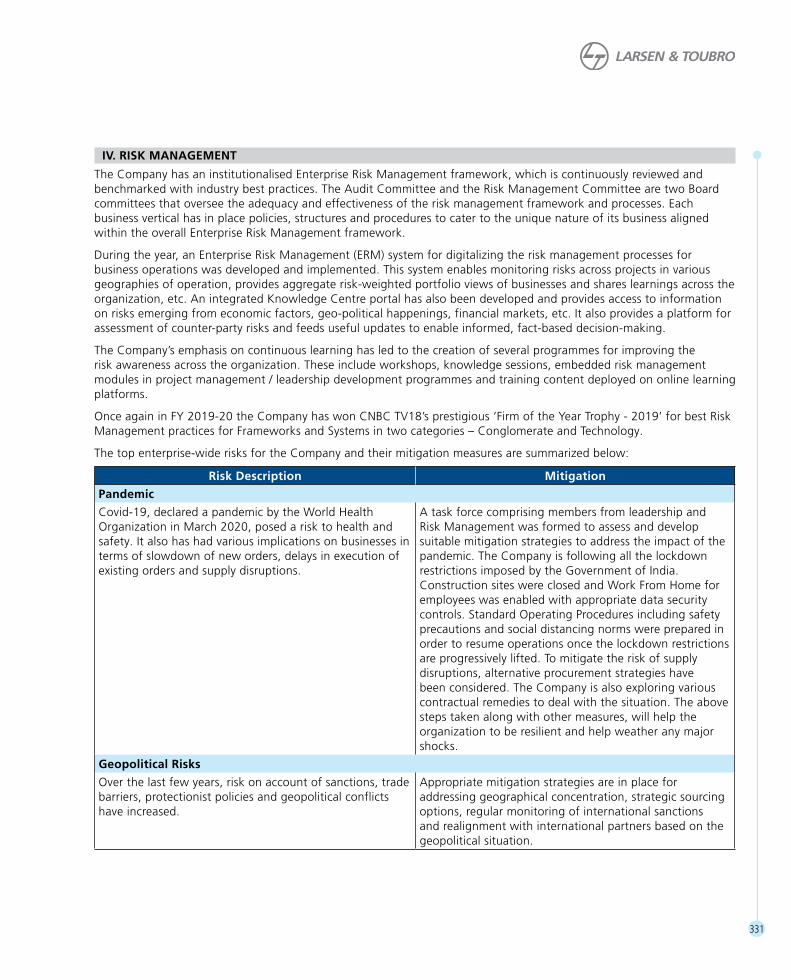
331
IV. RISk MANAGEMENT
The Company has an institutionalised Enterprise Risk Management framework, which is continuously reviewed and benchmarked with industry best practices. The Audit Committee and the Risk Management Committee are two Board committees that oversee the adequacy and effectiveness of the risk management framework and processes. Each business vertical has in place policies, structures and procedures to cater to the unique nature of its business aligned within the overall Enterprise Risk Management framework.
During the year, an Enterprise Risk Management (ERM) system for digitalizing the risk management processes for business operations was developed and implemented. This system enables monitoring risks across projects in various geographies of operation, provides aggregate risk-weighted portfolio views of businesses and shares learnings across the organization, etc. An integrated Knowledge Centre portal has also been developed and provides access to information on risks emerging from economic factors, geo-political happenings, financial markets, etc. It also provides a platform for assessment of counter-party risks and feeds useful updates to enable informed, fact-based decision-making.
The Company’s emphasis on continuous learning has led to the creation of several programmes for improving the risk awareness across the organization. These include workshops, knowledge sessions, embedded risk management modules in project management / leadership development programmes and training content deployed on online learning platforms.
Once again in FY 2019-20 the Company has won CNBC TV18’s prestigious ‘Firm of the Year Trophy - 2019’ for best Risk Management practices for Frameworks and Systems in two categories – Conglomerate and Technology.
The top enterprise-wide risks for the Company and their mitigation measures are summarized below:
Risk Description Mitigation
Pandemic
Covid-19, declared a pandemic by the World Health Organization in March 2020, posed a risk to health and safety. It also has had various implications on businesses in terms of slowdown of new orders, delays in execution of existing orders and supply disruptions.
A task force comprising members from leadership and Risk Management was formed to assess and develop suitable mitigation strategies to address the impact of the pandemic. The Company is following all the lockdown restrictions imposed by the Government of India. Construction sites were closed and Work From Home for employees was enabled with appropriate data security controls. Standard Operating Procedures including safety precautions and social distancing norms were prepared in order to resume operations once the lockdown restrictions are progressively lifted. To mitigate the risk of supply disruptions, alternative procurement strategies have been considered. The Company is also exploring various contractual remedies to deal with the situation. The above steps taken along with other measures, will help the organization to be resilient and help weather any major shocks.
Geopolitical Risks
Over the last few years, risk on account of sanctions, trade barriers, protectionist policies and geopolitical conflicts have increased.
Appropriate mitigation strategies are in place for addressing geographical concentration, strategic sourcing options, regular monitoring of international sanctions and realignment with international partners based on the geopolitical situation.

MANAGEMENT DISCUSSION AND ANALYSIS FINANCIAL REVIEW ANNUAL REPORT 2019-20
332
Risk Description Mitigation
Slowdown in economy
There has been a slowdown in various sectors like infrastructure, hydrocarbon, power, defence, metals & minerals, realty, etc., on account of several factors, such as budgetary allocation, funding issues, decline in oil prices, slow pace of decision-making, lack of investment demand, green initiatives and delays in environmental clearances. Due to Covid-19 there will be further stress on the resources available with central and state governments.
Being a diversified conglomerate has helped mitigate the risk of such a slowdown in some specific sectors, which is compensated by growth in certain other sectors like water, airport construction, renewable energy, metro network, health infrastructure etc. The Company will continue to seek opportunities and take appropriate measures to offset the impact of the slowdown and the pandemic. The Company is also analysing various sectors to identify areas of growth and reallocate resources accordingly.
Terms of Trade
Over the years, terms of trade have become more restrictive and stringent both in terms of aggressive timelines as well as contract clauses such as payment terms, etc.
Various mitigation strategies are undertaken by the Company, such as negotiating with the customer for equitable terms with better value offerings. The Company also enters into back-to-back arrangements with vendors and sub-contractors.
Competition
Due to the overall slowdown and limited opportunities, there has been aggressive bidding from various foreign and domestic players in the past few years.
The Company’s competitive strength is derived from its engineering expertise, excellence in executing projects, particularly the large and complex ones, reputation for quality, usage of technology, project management expertise and strong resource base, including the Balance Sheet strength. The Company has also taken various initiatives, such as digitalisation and cost-optimisation via value engineering, and this has helped to win new orders.
Reputation and Brand
The Company has a presence across sectors in various geographies, and the size and scale of projects being prospected / executed is of increasing magnitude and high visibility, hence maintaining its reputation / brand is paramount.
The Company addresses the potential risk of erosion of reputation and brand value through a strong corporate governance framework and delivering projects on time and in conformity with contracted quality of deliverables. It has a Compliance Policy in place, mandating adherence to a Code of Conduct and Internal Controls, complemented by regular knowledge-sharing of best practices across the organisation and mechanisms to track various social media platforms.
The Company’s Corporate Brand Management & Communications department also protects and bolsters the brand in Indian and international markets through a wide range of online and offline media.
Cyber Security
As IT systems get increasingly interconnected and with implementation of various digitalisation initiatives, cyber security has become a key concern for Governments and businesses.
The Company has taken several steps to mitigate the cyber risks. These include roll-out of an enterprise-wide cyber security framework that provides for technology solutions to enforce detective and preventive controls and employee education to create awareness of cyber risks.

333
Risk Description Mitigation
Execution Challenges
The Company faces execution challenges like unanticipated geological conditions, availability of work front, land acquisition and Right-of-Way (ROW), delay in approvals and clearances from Government agencies, working in difficult/harsh weather conditions, manpower issues, etc.
The Company closely tracks the key risks for each project to ensure timely mitigation with proper escalation and resolution mechanism as required.
Counter Party Risks
The Company partners with different contractors (joint venture / consortium projects) across businesses based on technical requirements / local market conditions. The partner’s performance and financial strength is crucial for project success.
Learnings from past projects are incorporated in the inter-se agreements with the partners and clauses on liability of each partner is carefully drafted after legal due diligence. On a periodic basis the Company carries out a financial assessment of its key counter parties and appropriate measures are adopted based on the outcome of the analysis.
Working capital challenges
Project delays and adverse contractual payment terms lead to increased working capital requirements.
Guidelines have been issued to monitor and manage working capital, both at the project level as well as the business level. The Company also deploys specific cashflow management strategies at both client and vendor level, to mitigate working capital challenges on a case-to-case basis.
Claims Management
The EPC business has an inherent risk of timely and acceptable settlement of claims due to dependency on various stakeholders for approval and clearances.
The Company maintains a strong documentation and follow-up protocol with various stakeholders for any claim management and to ensure timely and equitable settlement of such claims. Documentation in relation to Covid-19 / force majeure is being reviewed on a project-to-project basis and is being suitably taken up with all stakeholders.
FINANCIAL RISkS
Inflation in India remained benign in the first half of FY 2019-20 but picked up sharply in the second half mainly due to the rise in food prices driven by supply concerns. Further economic growth remained a challenge amidst follow-on concerns on domestic credit growth, corporate deleveraging cycle and lack of pick-up in private consumption. The US Dollar remained strong in FY 2019-20, primarily on the back of strong growth divergence between the US and rest of the world including emerging market countries. Slowdown in manufacturing gripped countries from Europe to China and various emerging markets in the first half of the year 19-20. During the second half of the year, risks pertaining to Trade War and Brexit temporarily abated. Liquidity infusion by Central banks and Corporate Tax cuts provided thrust to various asset classes. The Indian
currency depreciated accordingly but less so due to better fundamentals compared to other emerging market economies.
The last quarter of FY 2019-20 witnessed elevated financial market volatility, primarily due to the emergence of the Covid-19 pandemic, thereby halting economic activity across the globe. Lockdown and closure of customer offices, non-completion of certification inspections and the Company’s inability to generate invoicing resulted in significant amount of collections not being realized within the financial year. This has led to a sharp increase in working capital levels in the current year, which, for the last 3 years had been on a targeted improvement path. The Company believes that this is a temporary setback and hopes to pull back working capital levels in the next year or two.

MANAGEMENT DISCUSSION AND ANALYSIS FINANCIAL REVIEW ANNUAL REPORT 2019-20
334
Capital structure, liquidity and interest rate risks
The Company maintains a conservative capital structure. Low gearing levels equip the Company to balance business stresses on one hand and raise growth capital on the other. This policy provided the Company the required flexibility for fundraising at short notice to deal with the sudden worsening of the working capital due to the lockdown and also build up a liquidity buffer as the year FY 2019-20 ended.
The Company has been investing capital into subsidiaries as scheduled and also to optimise overall Group interest costs. The Company also completed the acquisition of shares of Mindtree Limited from a few of the existing shareholders of Mindtree and the Open Offer, which evidenced an overwhelming subscription resulting in acquisition of over 60% stake in Mindtree Limited.
Despite the lower liquidity environment in FY 2019-20 on the back of risk aversion (post defaults by some large AAA-rated entities in the NBFC sector) by both retail and institutional investors, slower consumer demand and the sluggishness around investments in the private sector as well as disruption caused due to the Covid-19 outbreak, the Company managed to meet its fund requirements and also managed to add to the cash and cash equivalents of the Company from R 7588 crore at the end of December 31, 2019 to R 9998 crore at March 31, 2020.
The Company plans to maintain adequate liquidity on the Balance Sheet to deal with the ongoing Covid-19 crisis and downturn in economic conditions. With the implementation of the Large Exposure Framework guidelines of RBI from April 1, 2019, the banking limits sanctioned by domestic banks to any of the Group companies will need to fit within 25% of Tier 1 capital of banks versus 40% of Tier 1 and Tier 2 capital prevalent till now. This is likely to constrain the availability of bank limits (both fund-based and non-fund-based) and also impact the pricing of the same for the Group unless some regulatory relaxation is granted and may have some adverse impact on the growth plans of the Group.
The Company judiciously deploys its surplus funds in short-term investments in line with the Corporate Treasury policy. It constantly monitors the liquidity levels, economic and capital market conditions and maintains access to the lowest cost means of sourcing liquidity through banking lines, trade finance and capital markets. Given the extra liquidity buffer planned to be kept on the balance sheet due to the Covid-19 situation, both the debt and investments on the balance sheet are likely to remain elevated in FY 2020-21. The Company dynamically
manages interest rate risks through a mix of fund-raising products, investment products and derivative products across maturity profiles and currencies within a robust risk management framework.
Foreign Exchange and Commodity Price Risks
The businesses of the Company are exposed to fluctuations in foreign exchange rates and commodity prices. Additionally, it has exposures to foreign currency denominated financial assets and liabilities. The business-related financial risks, especially involving commodity prices, by and large, are managed contractually through price variation clauses, while the foreign exchange risks and residual commodity price risks are managed by treasury products.
The disclosure of commodity exposures as required under clause 9(n) of Part C of Schedule V of the SEBI (Listing Obligations and Disclosure Requirements) Regulations, 2015 in the format specified vide SEBI Circular dated 15th November, 2018 is given separately on page 335 of this Annual Report.
Financial risk management is governed by the Risk Management framework and policy approved by the Audit Committee and authorised by the Board. Financial risks in each business portfolio are measured and managed by Corporate Treasury.
Despite currency weakness and elevated financial market volatility, the Company’s robust financial risk management processes ensured that financial costs remain under control.
V. INTERNAL CONTROLS
The Company maintains a robust framework of internal controls sized appropriately with the nature of business, size of operations, geographical spread and changing risk complexity, which are impacted by varying internal and external factors. This framework forms the building blocks of a strong corporate culture of good governance.
The Company has aligned its internal financial controls with the requirements of Companies Act, 2013 and the globally accepted framework issued by the Committee of Sponsoring Organizations (COSO) of the Treadway Commission that operates at both entity and process levels. The internal controls systems and activities at L&T cover the operational controls in the business processes besides the requirement of Internal Controls over Financial Reporting (ICoFR).
The internal controls are designed to provide reasonable assurance on recording of transactions and providing

335
reliable financial and operational information. The Company has well documented policies, procedures and authorization guidelines commensurate with the level of responsibility, besides standard operating procedures specific to respective businesses. This ensures the propriety of transactions and authorisations at an appropriate level of management.
The Corporate Policy on internal controls sets the tone at the top and serves as the foundation for sound internal controls. The internal control teams at corporate and business levels assist the executive management, who are responsible for establishing, operating and upgrading the internal controls system. The Corporate team reviews and assesses the processes, formulates the policies, guidance notes and advisories. It also shares best practices across the organisation.
The effectiveness of internal controls is tested by Statutory Auditors as well as by the Corporate Audit Services team. The Corporate Audit Services department develops an audit plan for the Company, which covers core business operations, corporate departments as well as support functions. The Audit Committee of the Board reviews the annual internal audit plan. Significant audit observations from the independent internal audits
conducted by Corporate Audit Services are presented quarterly to the Audit Committee along with the status of the management actions and the progress of the implementation of recommended remedial measures.
The Corporate Governance is strengthened by a ‘Code of Conduct’ applicable to the employees and implementation of a separate ‘Code of Conduct’ for Business Partners, which reinforces ethical behaviour by aligning them to the unique corporate culture and values of the Company. The whistle-blower mechanism forms another integral component of the internal control system, which is overseen by the Audit Committee. It is available to both employees and business partners, to enable them to raise genuine concerns about any actual or suspected ethical / legal violations or misconduct or fraud, with adequate safeguards against victimisation, fear of punishment or unfair treatment. The Company also has an institutionalised mechanism of dealing with complaints of sexual harassment through a formal committee constituted in line with the Company’s Policy on ‘Protection of Women’s Rights at Workplace’ under relevant statutory guidelines. This policy has been widely disseminated across the Company and all complaints are addressed in a time bound manner.
Disclosure of commodity exposures as required under clause 9(n) of Part C of Schedule V of the SEBI (Listing Obligations and Disclosure Requirements) Regulations, 2015
Sr No
Commodity Name Exposure in INR towards
the particular commodity
(R crore)
Exposure in Quantity terms
towards the particular
commodity (Tn)
% of such exposure hedged through commodity derivatives
Domestic market International market Total
OTC Exchange OTC Exchange
1 Silver (Buy) 353 60 – – – – –
2 Copper (Buy) 873 18,788 – – 76.90 – 76.90
3 Copper (Sell) (502) (12,221) – – 68.26 – 68.26
4 Steel (Buy) 11735 3,128,865 – – – – –
5 Aluminium (Buy) 546 40,353 – – 86.07 – 86.07
6 Aluminium (Sell) (141) (12,629) – – 34.52 – 34.52
7 Iron Ore (Buy) 44 108,129 – – 42.13 – 42.13
8 Coking Coal (Buy) 55 44,524 – – 42.13 – 42.13
9 Zinc (Buy) 90 5,388 – – 100.00 – 100.00
10 Lead (Buy) 63 4,149 – – 100.00 – 100.00
11 Cement (Buy) 2941 5,911,690 – – – – –
12 Nickel (Buy) 66 660 – – 37.88 – 37.88

At L&T, we are increasingly embracing digital technologies to energize processes and systems, deliver transformational solutions, create a safer environment for our workforce and a better world for the communities we impact.
We turn technology buzzwords into benefits, delivering speed and scale through innovation – propelling the Company, its clients and the country to the next level.
www.Larsentoubro.com
Regd. Office: Larsen & Toubro Limited, L&T House, N. M. Marg, Ballard Estate, Mumbai - 400 001. CIN: L99999MH1946PLC004768
CBM
C/M
D/07
2020
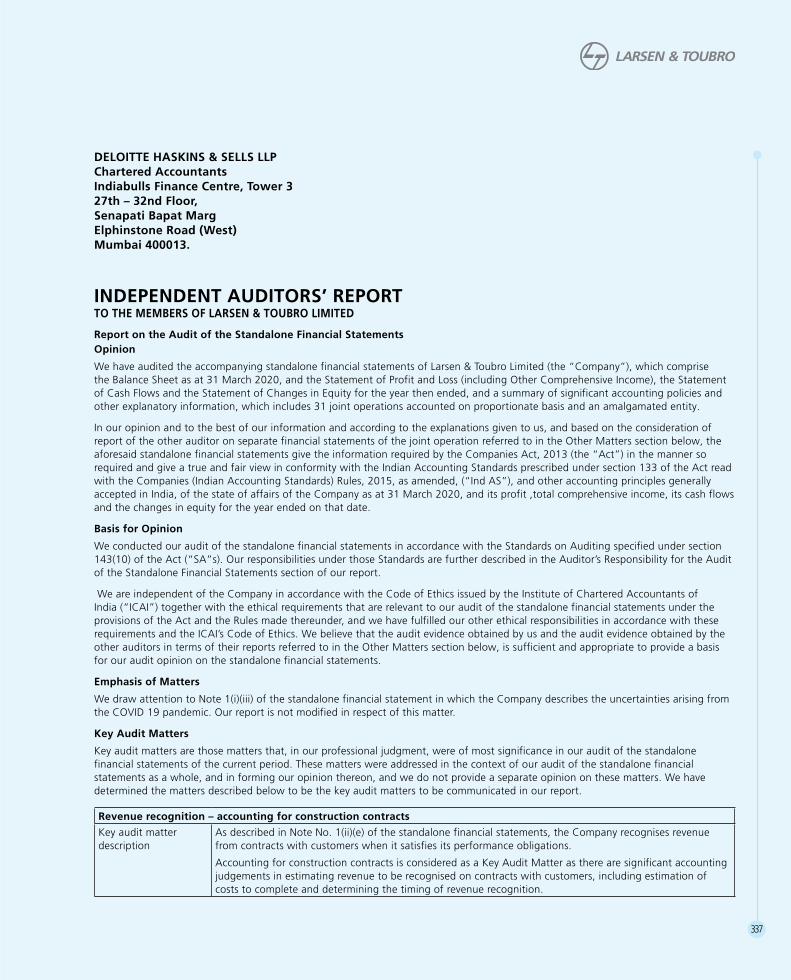
337
INDEPENDENT AUDITORS’ REPORT TO THE MEMBERS OF LARSEN & TOUBRO LIMITED
Report on the Audit of the Standalone Financial StatementsOpinion
We have audited the accompanying standalone financial statements of Larsen & Toubro Limited (the “Company”), which comprise the Balance Sheet as at 31 March 2020, and the Statement of Profit and Loss (including Other Comprehensive Income), the Statement of Cash Flows and the Statement of Changes in Equity for the year then ended, and a summary of significant accounting policies and other explanatory information, which includes 31 joint operations accounted on proportionate basis and an amalgamated entity.
In our opinion and to the best of our information and according to the explanations given to us, and based on the consideration of report of the other auditor on separate financial statements of the joint operation referred to in the Other Matters section below, the aforesaid standalone financial statements give the information required by the Companies Act, 2013 (the “Act”) in the manner so required and give a true and fair view in conformity with the Indian Accounting Standards prescribed under section 133 of the Act read with the Companies (Indian Accounting Standards) Rules, 2015, as amended, (“Ind AS”), and other accounting principles generally accepted in India, of the state of affairs of the Company as at 31 March 2020, and its profit ,total comprehensive income, its cash flows and the changes in equity for the year ended on that date.
Basis for Opinion
We conducted our audit of the standalone financial statements in accordance with the Standards on Auditing specified under section 143(10) of the Act (“SA”s). Our responsibilities under those Standards are further described in the Auditor’s Responsibility for the Audit of the Standalone Financial Statements section of our report.
We are independent of the Company in accordance with the Code of Ethics issued by the Institute of Chartered Accountants of India (“ICAI”) together with the ethical requirements that are relevant to our audit of the standalone financial statements under the provisions of the Act and the Rules made thereunder, and we have fulfilled our other ethical responsibilities in accordance with these requirements and the ICAI’s Code of Ethics. We believe that the audit evidence obtained by us and the audit evidence obtained by the other auditors in terms of their reports referred to in the Other Matters section below, is sufficient and appropriate to provide a basis for our audit opinion on the standalone financial statements.
Emphasis of Matters
We draw attention to Note 1(i)(iii) of the standalone financial statement in which the Company describes the uncertainties arising from the COVID 19 pandemic. Our report is not modified in respect of this matter.
Key Audit Matters
Key audit matters are those matters that, in our professional judgment, were of most significance in our audit of the standalone financial statements of the current period. These matters were addressed in the context of our audit of the standalone financial statements as a whole, and in forming our opinion thereon, and we do not provide a separate opinion on these matters. We have determined the matters described below to be the key audit matters to be communicated in our report.
Revenue recognition – accounting for construction contracts
Key audit matter description
As described in Note No. 1(ii)(e) of the standalone financial statements, the Company recognises revenue from contracts with customers when it satisfies its performance obligations.
Accounting for construction contracts is considered as a Key Audit Matter as there are significant accounting judgements in estimating revenue to be recognised on contracts with customers, including estimation of costs to complete and determining the timing of revenue recognition.
DELOITTE HASKINS & SELLS LLP Chartered Accountants Indiabulls Finance Centre, Tower 3 27th – 32nd Floor, Senapati Bapat Marg Elphinstone Road (West) Mumbai 400013.

338
INDEPENDENT AUDITORS’ REPORT ANNUAL REPORT 2019-20
Revenue recognition – accounting for construction contracts
The Company recognises revenue and profit/loss based on stage of completion based on the proportion of contract costs incurred at balance sheet date, relative to the total estimated costs of the contract at completion. The recognition of revenue is thus dependent on estimates in relation to total estimated costs of each contract.
Cost contingencies are included in these estimates to take in to account specific uncertain risks, or disputed claims against the Company, arising within each contract.
These contingencies are reviewed by the Management on a regular basis throughout the contract life and adjusted where appropriate.
The revenue on contracts may also include variable consideration (variations and claims). Variable consideration is recognised when the probability of reversal of such revenue is low.
Further, Refer to Note No. 41 for the disclosures made in the Standalone Financial Statements as per IND AS 115 ‘Revenue from Contracts with Customers’.
Principal Audit Procedures
The procedures performed included the following:
• obtained an understanding of the process followed by the Company in determination of the estimates and contract revenue;
• performed walkthrough procedures over the process of identification of performance obligation;
• tested the design and implementation of internal control over the quantification of the estimates used as well as the operating effectiveness of such control;
• tested segregation of duties while recording the contracts in the Company’s information system and recognising revenue from such contracts;
• tested the General IT Controls over the relevant information technology systems’ access and change management controls relating to contracts and related information used in recording and disclosing revenue in accordance with Ind AS 115 – Revenue from Contracts with Customers;
• tested sample of contracts for:
- appropriate identification of performance obligations;
- change orders and the impact on the estimated costs to complete;
- evaluation of reasonability of estimates of costs to complete ; and
- tested the appropriateness of the timing of recognizing the revenue from the contracts;
• tested the appropriateness of the variable considerations recognized based on the low probability of reversal of such revenue; and
• tested appropriateness of the disclosures in the financial statements in respect of such construction contracts to ensure compliance with Ind AS 115.
Measurement of contract assets in respect of overdue milestones and receivables in respect of overdue invoices.
Key audit matter description
The Company, in its contract with customers, promises to transfer distinct services to its customers, which may be rendered in the form of engineering, procurement, and construction (EPC) services through design-build contracts, and other forms of construction contracts. The recognition of revenue is based on contractual terms, which could be based on agreed unit price or lump-sum revenue arrangements. At each reporting date, revenue is accrued for costs incurred against work performed that may not have been invoiced.
Identifying whether the Company’s performance has resulted in a service that would be billable and collectable where the works carried out have not been acknowledged by customers as of the reporting date, or in the case of certain defence contracts, where the evidence of work carried out and cost incurred are covered by confidentiality arrangements, involves a significant amount of judgment.
Assessing the recoverability of contract assets related to overdue milestones and amounts overdue against invoices raised which have remained unsettled for a significantly long period after the end of the contractual credit period also involves a significant amount of judgment. Refer to Note No. 1(ii)(e) and 1(ii)(m) of the standalone financial statements.

339
Measurement of contract assets in respect of overdue milestones and receivables in respect of overdue invoices.
Principal Audit Procedures
The procedures performed included the following:
• obtained an understanding of the Company’s processes in collating the evidence supporting execution of work for each disaggregated type of revenue;
• obtained an understanding of the Company’s processes in assessing the recoverability of amounts overdue and process over estimating the expected credit loss allowance;
• tested the design and operating effectiveness of the key controls over the completeness and accuracy of the key inputs and assumptions into the provisioning model;
• evaluated controls over authorisation and calculation of provisioning model;
• for defence contracts which are covered under statutory confidentiality arrangements, for sample of contracts, the auditors have compared the revenue recognised with amounts collected from customers to ensure that the gap between revenue recognised and collections is below the materiality threshold;
• evaluated the delivery and collection history of customers against whose contracts un-invoiced revenue is recognised;
• verified for the sample selected, receipts post balance sheet date upto the approval of the financial statements by the Board of Directors of the Parent Company;
• performed an overall assessment of the expected credit loss provision to determine if they were reasonable considering the Company’s portfolio, risk profile, credit risk management practices and the macroeconomic environment; and
• tested the appropriateness of the disclosures in the financial statements to ensure compliance with Ind AS 115.
Assessment of the carrying value of unquoted equity instrument and debt instrument in loss making joint ventures.
Key audit matter description
As described in Note No. 1(ii)(j) for Impairment of assets in the standalone financial statements, as at the end of each financial year, the Company reviews the carrying amounts of its investments joint venture company to determine whether there is any indication that those assets have suffered an impairment loss.
Further, refer to Note 1(ii)(m)(B) under Financial instruments in the Standalone Financial Statements for the Company’s policy for impairment assessment of Debt Instruments.
The impairment review of unquoted equity instrument and debt with a carrying value of R 1342 crore, is considered to be a risk area due to the size of the balance as well as the judgmental nature of key assumptions, which may be subject to management override.
The carrying value of such unquoted equity instrument and debt is at risk of recoverability. The net worth of the underlying entity has significantly eroded and the orders in hand are below the break-even production levels of these facilities. The estimated recoverable amount is subjective due to the inherent uncertainty involved in forecasting and discounting future cash flows.
How the scope of our audit responded to the key audit matter
Besides obtaining an understanding of Management’s processes and controls with regard to testing of impairment of the unquoted equity and debt instruments in such financially stressed joint venture.
The procedures performed included the following:
• Tested the data used by the Management in their impairment review including the key assumptions and the management controls over completeness and accuracy of the data.
• Engaged internal fair valuation experts to challenge management’s underlying assumptions and appropriateness of the valuation model used.
• Compared the Company’s assumptions with comparable benchmarks in relation to key inputs such as long-term growth rates and discount rates to relevant market information.
• Assessed the appropriateness of the forecast cash flows within the budgeted period based on their understanding of the business, sector experience and impact due to COVID-19, if any.
• Considered historical forecasting accuracy, by comparing previously forecasted cash flows to actual results achieved.
• Performed a sensitivity analysis in relation to key assumptions.
• Obtained specific representations detailing basis in which projections were prepared.
• Tested the appropriateness of the disclosures in the financial statements

340
INDEPENDENT AUDITORS’ REPORT ANNUAL REPORT 2019-20
Physical verification of inventory
Key audit matter description
The Company’s management conducts physical verification of inventories during the year at reasonable intervals, however, on account of the COVID-19 related lockdown restrictions, management was able to perform year end physical verification of inventories, only at certain locations. Management has carried out other procedures to validate the existence of its inventory as at the year-end, such as carrying out consumption analysis, and performing roll-back procedures from the subsequent year end physical verification date to determine the quantities of the inventory at the balance sheet date.
Refer Note No. 1(ii)(n) of the standalone financial statements.
Principal Audit Procedures
The procedures performed included the following:
• Understood the process and tested the management’s internal controls to establish the existence of inventory in relation to the process of periodic physical verification carried out by the management, the scope and coverage of the periodic verification programme, the results of such verification including analysis of discrepancies, if any;
• At selected locations subsequent to year-end, where the management appointed third party independent chartered accountants to perform physical verification, sent instructions to the third party chartered accountants to carry out the physical verification and provided samples to be verified by them. We have received the report of the physical verification carried out by the third party independent chartered accountants. Obtained the roll back procedures performed by the management from the subsequent year-end physical verification date to arrive at the quantities as at the balance sheet date. Traced the samples physically verified by the third party independent chartered accountants roll back workings provided by the management.
• Inspected, for samples selected, supporting documentation relating to purchases and consumption, and such other third party evidences where applicable.
• Tested the analytical reviews performed by the Company such as consumption analysis.
Information Other than the Financial Statements and Auditor’s Report Thereon
The respective Board of Directors of the Company and its Joint Operation Companies are responsible for the preparation of other information. The other information comprise the information included in the Management Discussion and Analysis, Board’s Report including Annexures to Board’s Report, Business Responsibility Report, Corporate Governance and Shareholder’s Information, but does not include the standalone financial statements and our auditor’s report.
Our opinion on the standalone financial statements does not cover the other information and we do not express any form of assurance conclusion thereon
In connection with our audit of the standalone financial statements, our responsibility is to read the other information and, in doing so, consider whether the other information is materially inconsistent with the standalone financial statements or our knowledge obtained during the course of our audit or otherwise appears to be materially misstated.
If, based on the work we have performed, we conclude that there is material misstatement of this other information, we are required to report that fact. We have nothing to report in this regard.
Management’s Responsibility for the Standalone Financial Statements
The Company’s Board of Directors is responsible for the matters stated in section 134(5) of the Companies Act, 2013 (the “Act”) with respect to the preparation of these standalone financial statements that give a true and fair view of the financial position, financial performance including other comprehensive income, cash flows and changes in equity of the Company in accordance with the Ind AS and other accounting principles generally accepted in India.
This responsibility also includes maintenance of adequate accounting records in accordance with the provisions of the Act for safeguarding the assets of the Company and for preventing and detecting frauds and other irregularities; selection and application of appropriate accounting policies; making judgments and estimates that are reasonable and prudent; and design, implementation and maintenance of adequate internal financial controls, that were operating effectively for ensuring the accuracy and completeness of the accounting records, relevant to the preparation and presentation of the standalone financial statement that give a true and fair view and are free from material misstatement, whether due to fraud or error.

341
In preparing the standalone financial statements, management is responsible for assessing the Company’s ability to continue as a going concern, disclosing, as applicable, matters related to going concern and using the going concern basis of accounting unless management either intends to liquidate the Company or to cease operations, or has no realistic alternative but to do so.
Those Board of Directors are also responsible for overseeing the Company’s financial reporting process.
Auditor’s Responsibility for the Audit of the Standalone Financial Statements
Our objectives are to obtain reasonable assurance about whether the standalone financial statements as a whole are free from material misstatement, whether due to fraud or error, and to issue an auditor’s report that includes our opinion. Reasonable assurance is a high level of assurance, but is not a guarantee that an audit conducted in accordance with SAs will always detect a material misstatement when it exists. Misstatements can arise from fraud or error and are considered material if, individually or in the aggregate, they could reasonably be expected to influence the economic decisions of users taken on the basis of these standalone financial statements.
As part of an audit in accordance with SAs, we exercise professional judgment and maintain professional scepticism throughout the audit. We also:
• Identifyandassesstherisksofmaterialmisstatementofthestandalonefinancialstatements,whetherduetofraudorerror,designand perform audit procedures responsive to those risks, and obtain audit evidence that is sufficient and appropriate to provide a basis for our opinion. The risk of not detecting a material misstatement resulting from fraud is higher than for one resulting from error, as fraud may involve collusion, forgery, intentional omissions, misrepresentations, or the override of internal control.
• Obtainanunderstandingofinternalfinancialcontrolrelevanttotheauditinordertodesignauditproceduresthatareappropriatein the circumstances. Under section 143(3)(i) of the Act, we are also responsible for expressing our opinion on whether the Company has adequate internal financial controls system in place and the operating effectiveness of such controls.
• Evaluatetheappropriatenessofaccountingpoliciesusedandthereasonablenessofaccountingestimatesandrelateddisclosuresmade by the management.
• Concludeontheappropriatenessofmanagement’suseofthegoingconcernbasisofaccountingand,basedontheauditevidenceobtained, whether a material uncertainty exists related to events or conditions that may cast significant doubt on the Company’s ability to continue as a going concern. If we conclude that a material uncertainty exists, we are required to draw attention in our auditor’s report to the related disclosures in the standalone financial statements or, if such disclosures are inadequate, to modify our opinion. Our conclusions are based on the audit evidence obtained up to the date of our auditor’s report. However, future events or conditions may cause the Company to cease to continue as a going concern.
• Evaluatetheoverallpresentation,structureandcontentofthestandalonefinancialstatements,includingthedisclosures,andwhether the standalone financial statements represent the underlying transactions and events in a manner that achieves fair presentation.
• ObtainsufficientappropriateauditevidenceregardingthefinancialinformationoftheCompanyanditsjointoperationstoexpressan opinion on the standalone financial statements. We are responsible for the direction, supervision and performance of the audit of the financial statements of such entities included in the standalone financial statements of which we are the independent auditors. For the other entities included in the standalone financial statements, which have been audited by the other auditors, such other auditors remain responsible for the direction, supervision and performance of the audits carried out by them. We remain solely responsible for our audit opinion.
Materiality is the magnitude of misstatements in the standalone financial statements that, individually or in aggregate, makes it probable that the economic decisions of a reasonably knowledgeable user of the standalone financial statements may be influenced. We consider quantitative materiality and qualitative factors in (i) planning the scope of our audit work and in evaluating the results of our work; and (ii) to evaluate the effect of any identified misstatements in the standalone financial statements.
We communicate with those charged with governance regarding, among other matters, the planned scope and timing of the audit and significant audit findings, including any significant deficiencies in internal control that we identify during our audit.
We also provide those charged with governance with a statement that we have complied with relevant ethical requirements regarding independence, and to communicate with them all relationships and other matters that may reasonably be thought to bear on our independence, and where applicable, related safeguards.

342
INDEPENDENT AUDITORS’ REPORT ANNUAL REPORT 2019-20
From the matters communicated with those charged with governance, we determine those matters that were of most significance in the audit of the standalone financial statements of the current period and are therefore the key audit matters. We describe these matters in our auditor’s report unless law or regulation precludes public disclosure about the matter or when, in extremely rare circumstances, we determine that a matter should not be communicated in our report because the adverse consequences of doing so would reasonably be expected to outweigh the public interest benefits of such communication.
Other Matter
• Asdescribedinnote1(i)(ab)ofthestandalonefinancialstatements,thefiguresforthecurrentandpreviousfinancialyearshavebeen recast to include the financial information of the erstwhile L&T Shipbuilding Limited which has been amalgamated with the Company with effect from 1st April, 2019. The financial statement of the erstwhile L&T Shipbuilding Limited was audited by another firm of Chartered Accountants whose reports have been furnished to us, and our opinion in so far as it relates to the amounts and disclosures included in respect of the erstwhile L&T Shipbuilding Limited, is based solely on the reports of such other auditor.
• Wedidnotauditthefinancialinformationof28jointoperationsanderstwhileL&TShipbuildingLimitedincludedinthestandalone financial statements, whose financial information reflect total assets of R 6,161.16 crore as at 31st March, 2020, total revenues of R 4,462.36 crore, total net loss after tax (net) of R 385.33crore,totalcomprehensiveloss(net)ofR 384.02croreandnet cash outflows (net) of R 114.57 crore for the year ended 31st March, 2020, respectively, as considered in the standalone financial statements. The financial information of these joint operations and erstwhile L&T Shipbuilding Limited have been audited, by the other auditors whose reports have been furnished to us, and our opinion in so far as it relates to the amounts and disclosures included in respect of these joint operations and erstwhile L&T Shipbuilding Limited, is based solely on the reports of such other auditors and the procedures performed by us as stated under Auditor’s Responsibilities section above.
Our report on the standalone financial statements is not modified in respect of the above matters with respect to our reliance on the work done and the reports of the other auditors.
• TheStatementalsoincludesthefinancialinformationof2jointoperationswhichhavenotbeenauditedbytheirauditors,whosefinancial information reflect total assets of R 0.03 crore as at 31st March, 2020 and total revenues of R 2.08crore,totalnetlossafter tax of R 0.63 crore, total comprehensive loss of R 0.63 crore and net cash outflows (net) of R 0.20 crore for the year ended 31st March, 2020, respectively, as considered in the Statement. The financial information of these joint operations has been unaudited and has been furnished to us by the Management and our opinion on the Statement, in so far as it relates to the amounts and disclosures included in respect of these joint operations, is based solely on such unaudited financial information which is certified by Management. In our opinion and according to the information and explanation given to us by the Management, the financial information of these joint operations are not material to the Company.
Our report on the Statement is not modified in respect of these matters.
Report on Other Legal and Regulatory Requirements
As required by Section 143(3) of the Act, based on our audit we report that:
a) We have sought and obtained all the information and explanations, which to the best of our knowledge and belief were necessary for the purposes of our audit.
b) In our opinion, proper books of account as required by law have been kept by the Company so far as it appears from our examination of those books and the reports of the other auditors.
c) The Balance Sheet, the Statement of Profit and Loss including Other Comprehensive Income, the Cash Flow Statement and Statement of Changes in Equity dealt with by this Report are in agreement with the relevant books of account.
d) In our opinion, the aforesaid standalone financial statements comply with the IndAS specified under Section 133 of the Act.
e) On the basis of the written representations received from the directors as on 31st March, 2020 taken on record by the Board of Directors, none of the directors are disqualified as on 31st March, 2020 from being appointed as a director in terms of Section 164(2) of the Act.
f) With respect to the adequacy of the internal financial controls over financial reporting of the Company and the operating effectiveness of such controls, refer to our separate Report in “Annexure A”. Our report expresses an unmodified opinion on the adequacy and operating effectiveness of the Company’s internal financial controls over financial reporting.

343
g) With respect to the other matters to be included in the Auditor’s Report in accordance with the requirements of section 197(16) of the Act, as amended,
In our opinion and to the best of our information and according to the explanations given to us, the remuneration paid by the Company to its directors during the year is in accordance with the provisions of section 197 of the Act.
h) With respect to the other matters to be included in the Auditor’s Report in accordance with Rule 11 of the Companies (Audit and Auditors) Rules, 2014, as amended in our opinion and to the best of our information and according to the explanations given to us:
i. The Company has disclosed the impact of pending litigations on its financial position in its standalone financial statements
ii. The Company has made provision, as required under the applicable law or accounting standards, for material foreseeable losses, if any, on long-term contracts including derivative contracts;
iii. There has been no delay in transferring amounts, required to be transferred, to the Investor Education and Protection Fund by the Company.
2. As required by the Companies (Auditor’s Report) Order, 2016 (“the Order”) issued by the Central Government in terms of Section 143(11) of the Act, we give in “Annexure B” a statement on the matters specified in paragraphs 3 and 4 of the Order.
For DELOITTE HASKINS & SELLS LLP Chartered Accountants (Firm’sRegistrationNo.117366W/W-100018)
SANjIv v. PILgAONKAR (Partner) (MembershipNo.39826) (UDIN:20039826AAAADI1893)
Place: Mumbai Date: 5th June, 2020

344
INDEPENDENT AUDITORS’ REPORT ANNUAL REPORT 2019-20
ANNEXURE “A” TO THE INDEPENDENT AUDITOR’S REPORT(Referred to in paragraph 1(f) under “Report on Other Legal and Regulatory Requirements” section of our report of even date)
Report on the Internal Financial Controls Over Financial Reporting under Clause (i) of Sub-section 3 of Section 143 of the Companies Act, 2013 (the “Act”)
We have audited the internal financial controls over financial reporting of Larsen and Toubro Limited (the “Company”) as of March 31, 2020 in conjunction with our audit of the standalone Ind AS financial statements of the Company for the year ended on that date which includes internal financial controls over financial reporting of one of the Company’s 31 joint operations which is a company incorporated in India.
Management’s Responsibility for Internal Financial Controls
The Company’s management is responsible for establishing and maintaining internal financial controls based on the internal control over financial reporting criteria established by the Company considering the essential components of internal control stated in the Guidance Note on Audit of Internal Financial Controls Over Financial Reporting issued by the Institute of Chartered Accountants of India. These responsibilities include the design, implementation and maintenance of adequate internal financial controls that were operating effectively for ensuring the orderly and efficient conduct of its business, including adherence to respective company’s policies, the safeguarding of its assets, the prevention and detection of frauds and errors, the accuracy and completeness of the accounting records, and the timely preparation of reliable financial information, as required under the Companies Act, 2013.
Auditor’s Responsibility
Our responsibility is to express an opinion on the Company’s internal financial controls over financial reporting of the Company and its joint operations company incorporated in India, based on our audit. We conducted our audit in accordance with the Guidance Note on Audit of Internal Financial Controls Over Financial Reporting (the “Guidance Note”) issued by the Institute of Chartered Accountants of India and the Standards on Auditing prescribed under Section 143(10) of the Companies Act, 2013, to the extent applicable to an audit of internal financial controls. Those Standards and the Guidance Note require that we comply with ethical requirements and plan and perform the audit to obtain reasonable assurance about whether adequate internal financial controls over financial reporting was established and maintained and if such controls operated effectively in all material respects.
Our audit involves performing procedures to obtain audit evidence about the adequacy of the internal financial controls system over financial reporting and their operating effectiveness. Our audit of internal financial controls over financial reporting included obtaining an understanding of internal financial controls over financial reporting, assessing the risk that a material weakness exists, and testing and evaluating the design and operating effectiveness of internal control based on the assessed risk. The procedures selected depend on the auditor’s judgement, including the assessment of the risks of material misstatement of the financial statements, whether due to fraud or error.
We believe that the audit evidence we have obtained and the audit evidence obtained by the other auditor of the joint operations which is a company incorporated in India, in terms of their reports referred to in the Other Matters paragraph below, is sufficient and appropriate to provide a basis for our audit opinion on the Company’s internal financial controls system over financial reporting.
Meaning of Internal Financial Controls Over Financial Reporting
A company’s internal financial control over financial reporting is a process designed to provide reasonable assurance regarding the reliability of financial reporting and the preparation of financial statements for external purposes in accordance with generally accepted accounting principles. A company’s internal financial control over financial reporting includes those policies and procedures that (1) pertain to the maintenance of records that, in reasonable detail, accurately and fairly reflect the transactions and dispositions of the assets of the company; (2) provide reasonable assurance that transactions are recorded as necessary to permit preparation of financial statements in accordance with generally accepted accounting principles, and that receipts and expenditures of the company are being made only in accordance with authorisations of management and directors of the company; and (3) provide reasonable assurance regarding prevention or timely detection of unauthorised acquisition, use, or disposition of the company’s assets that could have a material effect on the financial statements.
Inherent Limitations of Internal Financial Controls Over Financial Reporting
Because of the inherent limitations of internal financial controls over financial reporting, including the possibility of collusion or improper management override of controls, material misstatements due to error or fraud may occur and not be detected. Also, projections of any evaluation of the internal financial controls over financial reporting to future periods are subject to the risk that the internal financial control over financial reporting may become inadequate because of changes in conditions, or that the degree of compliance with the policies or procedures may deteriorate.

345
Opinion
In our opinion, to the best of our information and according to the explanations given to us and based on the consideration of the reports of the other auditor on internal financial controls system over financial reporting of the joint operation referred to in the Other Matters paragraph below, the Company has, in all material respects, an adequate internal financial controls system over financial reporting and such internal financial controls over financial reporting were operating effectively as at March 31, 2020, based on the criteria for internal financial control over financial reporting established by the respective Company considering the essential components of internal control stated in the Guidance Note on Audit of Internal Financial Controls Over Financial Reporting issued by the Institute of Chartered Accountants of India.
Other Matters
Our aforesaid report under Section 143(3)(i) of the Act on the adequacy and operating effectiveness of the internal financial controls over financial reporting insofar as it relates to one joint operation which is a company incorporated in India, is based on the corresponding reports of the other auditor of such company incorporated in India.
Our opinion is not modified in respect of this matter.
For DELOITTE HASKINS & SELLS LLP Chartered Accountants (Firm’sRegistrationNo.117366W/W-100018)
SANjIv v. PILgAONKAR (Partner) (MembershipNo.39826) (UDIN:20039826AAAADI1893)
Place: Mumbai Date: 5th June, 2020

346
INDEPENDENT AUDITORS’ REPORT ANNUAL REPORT 2019-20
ANNEXURE “B” TO THE INDEPENDENT AUDITORS’ REPORT(Referred to in paragraph 2 under ‘Report on Other Legal and Regulatory Requirements’ section of our report to the Members of Larsen & Toubro Limited of even date)
(i) In respect of the Company’s property, plant and equipment:
(a) The Company has maintained proper records showing full particulars, including quantitative details and situation of property, plant and equipment.
(b) The Company has a program of physical verification of its property, plant and equipment to cover all the items of property, plant and equipment in a phased manner over a period of 3 years which, in our opinion, is reasonable having regard to the size of the Company and the nature of its property, plant and equipment. Pursuant to the program, certain property, plant and equipment were physically verified by the Management during the year. According to the information and explanations given to us, no material discrepancies were noticed on such verification.
(c) According to the information and explanations given to us , Management has represented that the title deeds, comprising all the immovable properties of land and buildings are held in the name of the Company as at the balance sheet date, except the following:
v crore
Type of asset Total no. of cases
Leasehold/ Freehold
gross block as at March 31, 2020
Net block as at March 31, 2020
Remark
Land 3 Freehold 1.14 1.14 Conveyance deed pending to be executed as the matter is sub judice.
Building 2 Freehold 0.29 0.15
In respect of immovable properties of land and buildings that have been taken on lease and disclosed as property, plant and equipment in the financial statements, the lease agreements are in the name of the Company, where the Company is the lessee in the agreement.
On account of the lockdown imposed post the outbreak of the COVID 19 pandemic, we were not able to physically verify the title deeds.
(ii) As explained to us, the inventories were physically verified during the year by the Management, at reasonable intervals, and no material discrepancies were noticed on physical verification between the physical stock and the books of accounts.
(iii) According to the information and explanations given to us, during the year, the Company has not entered into any contracts or arrangementscoveredundersection189oftheCompaniesAct,2013(the“Act”)andhencereportingunderparagraph3(iii)ofthe Order is not applicable to the Company.
(iv) In our opinion and according to the information and explanations given to us, the Company has complied with the provisions ofSections185and186oftheAct,totheextentapplicable,inrespectofgrantofloans,makinginvestmentsandprovidingguarantees and securities during the year, as applicable.
(v) According to the information and explanations given to us, the Company has not accepted any deposits during the year and does not have any unclaimed deposits as at March 31, 2020 and hence, the provisions of the clause 3 (v) of the Order is not applicable to the Company.
(vi) ThemaintenanceofcostrecordshasbeenspecifiedbytheCentralGovernmentundersection148(1)oftheAct.Wehavebroadlyreviewed the cost records maintained during the year by the Company pursuant to the Companies (Cost Records and Audit) Rules, 2014,asamendedandprescribedbytheCentralGovernmentundersub-section(1)ofSection148oftheAct,andareoftheopinion that, prima facie, the prescribed cost records have been made and maintained by the company. We have, however, not made a detailed examination of the cost records with a view to determine whether they are accurate or complete.
(vii) According to the information and explanations given to us, in respect of statutory dues:
(a) The Company has been generally regular during the year, in depositing undisputed statutory dues, including Provident Fund, Employees’ State Insurance, Income-tax, Goods and Service Tax, Customs Duty, cess and other material statutory dues applicable to it to the appropriate authorities.

347
(b) There were no undisputed amounts payable in respect of Provident Fund, Employees’ State Insurance, Income-tax, Goods and Service Tax, Customs Duty, cess and other material statutory dues in arrears as at March 31, 2020 for a period of more than six months from the date they became payable.
(c) Details of dues of Income-tax, Sales Tax, Service Tax, Customs Duty, Excise Duty, Goods and Service Tax and Value Added Tax which have not been deposited as on March 31, 2020 on account of disputes are given below:-
Name of Statute
Nature of Dues Forum where Dispute is Pending
Period to which Amount Relates
Amount Involved (v crore)
Amount Unpaid
(v crore)
The Central Excise Act,1944, Service Tax under Finance Act, 1994 and Customs Act, 1962
Classification dispute and other matters
Supreme Court
2000-01 to 2006-07 12.12 3.13
Dispute regarding questions of law, classification dispute and other matters
High Court 1987-88,1993to1994,1998to2013
258.12 224.47
Disallowance of CENVAT credit, short payment of service tax, MRP Valuation disputes, dispute regarding classification of services, disallowances of excise duty exemption, Non Maintenance of Separate Books of Accounts, Export rebate disallowance, and other matters.
CESTAT 1989-90,1991-92,1993-94 to 1996-97, 1999-2018
832.98 753.12
Disallowance of CENVAT credit, short payment of service tax , pending forms, service tax rate dispute, valuation dispute and other matters
Commissioner (Appeal)
1996-97, 1999-00 to 2017-18
2,880.01 2,798.53
Differential Custom Duty DGFT 2016-17, 2019-20 1.05 0.79
The Central Sales Tax Act, Entry tax, Local Sales Tax Act, Works Contract Tax Act and Goods & Services Tax Act
Taxability of sub-contractor turnover, rate of tax for declared goods, disallowance of labour turnover and non- submission of forms
Supreme Court
2006-07, 2009-10 to 2012-13
492.64 492.58
Dispute regarding questions of law, classification dispute, local VAT and Works contract disputes.
High Court 1986-87,1993-94,1997-98,1999-00to2000-01, 2003-04 to 2009-10, 2012-13
7.92 6.48
Non submission of Forms, classification disputes, inter-state sale turnover, Rate of tax of declared goods, Labour & service charges disallowed, Disallowance of exemptions claimed for imports & Sales in transit, Sale mismatch & levy of tax on import of goods through Way bill, Road permit issue and other matters
Sales Tax/VAT Tribunal
1994-95to2017-18 56.64 48.03

348
INDEPENDENT AUDITORS’ REPORT ANNUAL REPORT 2019-20
Name of Statute
Nature of Dues Forum where Dispute is Pending
Period to which Amount Relates
Amount Involved (v crore)
Amount Unpaid
(v crore)
The Central Sales Tax Act, Entry tax, Local Sales Tax Act, Works Contract Tax Act and Goods & Services Tax Act
Dispute regarding questions of law, classification dispute, sales in transit, high sea sales, non-submission of C forms & E1 forms, disallowance of ITC, valuation of goods and other matters
Commissioner (Appeal)
1999-00 to 2015-16 70.65 44.66
Additional Commissioner
2007-08 0.06 0.06
Additional Commissioner (Appeal)
2010-11to2017-18 1.82 1.82
Joint Commissioner
2006-07 to 2014-15 134.38 125.65
Joint Commissioner (Appeal)
1996-97, 2000-01 to 2015-16
81.57 78.45
Assistant/ Deputy Commissioner
1996-97to2017-18 409.11 377.21
Deputy Commissioner (Appeals)
2008-09,2009-10 0.07 0.07
Special Objection Hearing Authority
2012-13 to 2015-16 0.56 0.56
State Revenue Board
2011-12 0.01 0.01
Assessing / Commercial Tax Officer
2001-02 to 2016-17 2.62 2.6
Goods and Service Tax Act
Disallowance of credits claimed in Tran-1
Assistant Joint Commissioner
2017-18 16.25 14.86
Income Tax Act, 1961
Demand arising out of Regular Assessment/Reassessment
ITAT 2004-05 & 2009-10 to 2012-13
1,038.46 256.76
Demand arising out of Regular Assessment/Reassessment
CIT(A) 2014-15 to 2016-17 1,246.58 1,233.87
(viii) In our opinion and according to the information and explanations given to us, during the year, the Company has not defaulted in the repayment of loans or borrowings to financial institutions and banks and dues to debenture holders. The Company has not borrowed any funds from the government during the year.
(ix) In our opinion and according to the information and explanations given to us, during the year, the Company has not raised any money by way of initial public offer or further public offer (including debt instruments) and money raised by way of the term loans have been applied by the Company during the year for the purposes for which they were raised.
(x) To the best of our knowledge and according to the information and explanations given to us, no material fraud by the Company and no material fraud on the Company by its officers or employees has been noticed or reported during the year.

349
(xi) In our opinion and according to the information and explanations given to us, during the year, the Company has paid / provided managerial remuneration in accordance with the requisite approvals mandated by the provisions of section 197 read with Schedule V to the Act.
(xii) In our opinion and according to the information and explanations given to us, the Company is not a Nidhi Company and hence reporting under paragraph 3 (xii) of the Order is not applicable to the Company.
(xiii) In our opinion and according to the information and explanations given to us, the Company is in compliance with Section 177 and188oftheAct,whereapplicable,foralltransactionswithrelatedpartiesundertakenduringtheyearandthedetailsofsuchrelated party transactions have been disclosed in the financial statements as required by the applicable accounting standards.
(xiv) According to the information and explanations given to us, during the year, the Company has not made any preferential allotment or private placement of shares or fully or partly convertible debentures and hence reporting under paragraph 3 (xiv) of the Order is not applicable to the Company.
(xv) In our opinion and according to the information and explanations given to us, during the year, the Company has not entered into any non-cash transactions with its directors or persons connected with him and hence provisions of section 192 of the Act is not applicable to the Company.
(xvi) The Company is not required to be registered under section 45-IA of the Reserve Bank of India Act, 1934.
For DELOITTE HASKINS & SELLS LLP Chartered Accountants (Firm’sRegistrationNo.117366W/W-100018)
SANjIv v. PILgAONKAR (Partner) (MembershipNo.39826) (UDIN:20039826AAAADI1893)
Place: Mumbai Date: 5th June, 2020

350
BALANCE SHEET ANNUAL REPORT 2019-20
Balance Sheet as at March 31, 2020As at 31-3-2020 As at 31-3-2019
Note v crore v crore v crore v croreASSETS:Non-current assets Property, plant and equipment 2 6853.43 7982.02 Capital work-in-progress 2 796.55 567.31 Investment property 3 490.40 381.26 Intangible assets 4 83.72 228.72 Intangible assets under development 4 0.66 171.69 Right-of-use assets 54(c) 412.82 – Financial assets Investments 5 27975.28 18197.30 Loans 6 3507.00 1279.76 Other financial assets 7 304.48 577.00
31786.76 20054.06 Deferred tax assets (net) 44(e) 1428.20 841.86 Other non-current assets 8 4068.94 3373.64Current assets Inventories 9 2769.90 3349.24 Financials assets Investments 10 6059.15 4706.85 Trade receivables 11 27912.96 28212.55 Cash and cash equivalents 12 3262.83 2733.45 Other bank balances 13 675.56 4886.52 Loans 14 515.14 1305.94 Other financial assets 15 1997.59 1955.40
40423.23 43800.71 Other current assets 16 49661.61 43867.50 Group(s) of assets classified as held for sale 39 2780.37 41.72
TOTAL ASSETS 141556.59 124659.73

351
As at 31-3-2020 As at 31-3-2019Note v crore v crore v crore v crore
EQUITY AND LIABILITIES:Equity Equity share capital 17 280.78 280.55 Other equity 18 51894.57 49767.87
Total equity 52175.35 50048.42LiabilitiesNon-current liabilities Financial liabilities Borrowings 19 7185.71 3772.07 Lease liability 24.18 – Other financial liabilities 20 179.62 81.69
7389.51 3853.76 Provisions 21 611.23 497.62 Other non-current liabilities 22 0.22 0.58Current liabilities Financial liabilities Borrowings 23 15044.11 4086.16 Current maturities of long term borrowings 24 3555.48 4131.46 Lease liability 132.27 - Trade payables: Due to micro enterprises and small enterprises 379.88 201.96 Due to others 25 36249.51 36023.07 Other financial liabilities 26 1709.09 1931.73
57070.34 46374.38 Other current liabilities 27 20758.05 22080.45 Provisions 28 1555.39 1483.61 Current tax liabilities(net) 628.92 320.91 Liabilities associated with the group(s) of assets classified as held for sale 39 1367.58 –
TOTAL EQUITY AND LIABILITIES 141556.59 124659.73
CONTINgENT LIABILITIES 29COMMITMENTS (capital and others ) 30NOTES FORMINg PART OF THE FINANCIAL STATEMENTS 1 to 63
Balance Sheet as at March 31, 2020 (contd.)
In terms of our report attachedFor DELOITTE HASKINS & SELLS LLPChartered Accountants S.N.SUBRAHMANYAN
Chief Executive Officer & Managing Director (DIN02255382)
Chennai
Firm’sRegistrationNo.117366W/W-100018by the hand of
SANJIV V. PILGAONKAR Partner R.SHANKAR RAMAN M.M.CHITALE
Independent DirectorMembershipNo.39826 Whole-time Director & Chief Financial Officer(DIN00019798) (DIN00101004) Mumbai Mumbai
SIVARAM NAIR ACompany Secretary & Compliance OfficerM. No. FCS3939Mumbai
Mumbai, June 5, 2020

352
STATEMENT OF PROFIT AND LOSS ANNUAL REPORT 2019-20
Statement of Profit and Loss for the year ended March 31, 20202019-20 2018-19
Note v crore v crore v crore v crore
Continuing operationsINCOME:Revenue from operations 31 82383.65 82287.42Other income 32 2807.87 2711.19
Total Income 85191.52 84998.61
EXPENSES:Manufacturing, construction and operating expenses 33 Cost of raw materials components consumed 5486.99 5712.54 Construction materials consumed 28632.03 29482.65 Purchase of stock-in-trade 855.63 906.49 Stores, spares and tools consumed 1520.47 2312.83 Sub-contracting charges 22488.74 21647.74 Changes in inventories of finished goods, stock-in-trade and work-in-progress
(64.01) (1126.17)
Other manufacturing, construction and operating expenses 7962.36 7917.78
66882.21 66853.86Employee benefits expense 34 5955.98 5732.60Sales, administration and other expenses 35 2707.34 2047.87Finance costs 36 2266.56 1787.62Depreciation, amortisation, impairment and obsolescence 1020.51 999.55
Total Expenses 78832.60 77421.50Profit before exceptional items and tax 6358.92 7577.11Exceptional items 59 626.99 1642.35Profit before tax 6985.91 9219.46Tax expenses 44(a) Current tax 1525.60 2409.73 Deferred tax (564.45) (138.60)
961.15 2271.13
Net profit after tax from continuing operations 6024.76 6948.33Discontinued operationsProfit before tax from discontinued operations 39(a)(i) 865.38 812.40Tax expense of discontinued operations 44(a) 210.93 269.34Net profit after tax from discontinued operations 654.45 543.06Net profit after tax from continuing operations & discontinued operations 6679.21 7491.39Other Comprehensive income A Items that will not be reclassified to Profit or Loss: Equity instruments through Other Comprehensive Income (382.17) Gain/(loss) on remeasurement of the defined benefits plan (174.60) (31.31) Income tax (expenses)/income on remeasurments of the defined benefits plan 43.81 10.94
(130.79) (20.37)B Items that will be reclassified to Profit and Loss Debt instruments through Other Comprehensive Income 157.07 (78.85) Income tax (expenses)/income on debt instruments through Other Comprehensive Income (34.28) 16.68
122.79 (62.17)
Carried forward - Other comprehensive Income (390.17) (82.54)

353
2019-20 2018-19
Note v crore v crore v crore v croreBrought forward - Other comprehensive Income (390.17) (82.54) Exchange differences in translating the financial statements of foreign operations
(14.28) 9.31
Income tax (expenses)/income on exchange differences in translating the financial statements of foreign operations 4.45 (3.25)
(9.83) 6.06 Effective portion of gains/(losses) on hedging instruments in a cash flow hedge
(147.87) (88.13)
Income tax (expenses)/income on effective portion of gains/(losses) on hedging instruments in a cash flow hedge 47.60 30.59
(100.27) (57.54) Cost of hedging reserve (25.76) 25.38 Income tax (expenses)/income on cost of hedging reserve 7.11 (8.87)
(18.65) 16.51
Other Comprehensive Income for the year [net of tax] (518.92) (117.51)
Total Comprehensive Income for the year 6160.29 7373.88
Earnings per share (EPS) of R 2 each from continuing operations:Basic earnings per equity share (R) 49 42.93 49.56Diluted earnings per equity share (R) 49 42.87 49.47Earnings per share (EPS) of R 2 each from discontinued operations:Basic earnings per equity share (R) 49 4.66 3.87Diluted earnings per equity share (R) 49 4.66 3.87Earnings per share (EPS) of R 2 each from continuing operations & discontinued operations:Basic earnings per equity share (R) 49 47.59 53.43Diluted earnings per equity share (R) 49 47.53 53.34
Face value per equity share (R) 2.00 2.00
NOTES FORMINg PART OF THE FINANCIAL STATEMENTS 1 to 63
Statement of Profit and Loss for the year ended March 31, 2020 (contd.)
In terms of our report attachedFor DELOITTE HASKINS & SELLS LLPChartered Accountants S.N.SUBRAHMANYAN
Chief Executive Officer & Managing Director (DIN02255382)
Chennai
Firm’sRegistrationNo.117366W/W-100018by the hand of
SANJIV V. PILGAONKAR Partner R.SHANKAR RAMAN M.M.CHITALE
Independent DirectorMembershipNo.39826 Whole-time Director & Chief Financial Officer(DIN00019798) (DIN00101004) Mumbai Mumbai
SIVARAM NAIR ACompany Secretary & Compliance OfficerM. No. FCS3939Mumbai
Mumbai, June 5, 2020

354
STATEMENT OF CHANGES IN EqUITY ANNUAL REPORT 2019-20
Statement of changes in Equity for the year ended March 31, 2020A. Equity share capital
Particulars
2019-20 2018-19
Number of shares
v crore Number of shares
v crore
Issued, subscribed and fully paid up equity share outstanding at the beginning of the year 1,40,27,29,385 280.55 1,40,13,69,456 280.27Add: Shares issued on exercise of employee stock options during the year 7,83,249 0.16 13,59,929 0.28Add: Shares issued on conversion of foreign currency convertible bonds during the year 3,79,388 0.07 – –
Issued, subscribed and fully paid up equity shares outstanding at the end of the year 1,40,38,92,022 280.78 1,40,27,29,385 280.55
B. Other equity(v crore)
Particulars
Share application
money pending
allotment
Equity component
of foreign currency
convertible bonds
Reserves and surplus Items of Other Comprehensive income
Total Other equityCapital
reserve
Capital reserve on
business combination
Securities premium
Employee share
options (net)
Debenture redemption
reserve General reserve
Retained earnings
Foreign currency
translation reserve
Hedging reserve
Debt instruments
through Other
Comprehen-sive Income
Equity instrument
through Other
Comprehen-sive Income
Balance as at 31-3-2018 3.56 153.20 10.52 (6.36) 8363.02 108.59 458.94 25395.78 14250.01 (0.37) 102.16 54.93 48893.98Business combination [Note 38] – – – (19.41) – – – – (3291.90) – (3.34) – – (3314.65)Change in accounting policy [Ind AS 115] – – – – – – – – (704.04) – – – – (704.04)
Restated balance as at 1-4-2018 3.56 153.20 10.52 (25.77) 8363.02 108.59 458.94 25395.78 10254.07 (0.37) 98.82 54.93 – 44875.29
Profit for the period (a) – – – – – – – – 7491.39 – – – – 7491.39Other Comprehensive Income (b) – – – – – – – – (20.37) 6.06 (41.03) (62.17) – (117.51)
Total Comprehensive Income for the year (a+b) – – – – – – – – 7471.02 6.06 (41.03) (62.17) – 7373.88
Issue of equity shares (3.56) – – – 108.97 – – – – – – – – 105.41Transfer to non- financial assets/liability – – – – – – – – – – (0.38) – – (0.38)Transfer from/to general reserve/retained
earnings during the year – – – – (12.13) (18.68) 112.13 (81.32) – – – – –Employee share options (net) – – – – 10.45 – – – – – – – 10.45Dividend paid for previous year – – – – – – – – (2243.18) – – – – (2243.18)Dividend distribution tax paid for previous year – – – – – – – – (353.60) – – – – (353.60)
Balance as at 31-3-2019 – 153.20 10.52 (25.77) 8471.99 106.91 440.26 25507.91 15046.99 5.69 57.41 (7.24) – 49767.87

355
Statement of changes in Equity for the year ended March 31, 2020 (contd.)(v crore)
Particulars
Share application
money pending
allotment
Equity component
of foreign currency
convertible bonds
Reserves and surplus Items of Other Comprehensive income
Total Other equityCapital
reserve
Capital reserve on
business combination
Securities premium
Employee share
options (net)
Debenture redemption
reserve General reserve
Retained earnings
Foreign currency
translation reserve
Hedging reserve
Debt instruments
through Other
Comprehen-sive Income
Equity instrument
through Other
Comprehen-sive Income
Balance as at 31-3-2019 – 153.20 10.52 (25.77) 8471.99 106.91 440.26 25507.91 15046.99 5.69 57.41 (7.24) – 49767.87Change in accounting policy [Ind AS 116]
[Note 54(a)] – – – – – – – – (3.97) – – – – (3.97)
Restated balance as at 1-4-2019 – 153.20 10.52 (25.77) 8471.99 106.91 440.26 25507.91 15043.02 5.69 57.41 (7.24) – 49763.90
Profit for the year (c) – – – – – – – – 6679.21 – – – – 6679.21 Other Comprehensive Income (d) – – – – – – – – (130.79) (9.83) (118.92) 122.79 (382.17) (518.92)
Total Comprehensive Income for the year (c+d) – – – – – – – – 6548.42 (9.83) (118.92) 122.79 (382.17) 6160.29
Issue of equity shares – – – – 127.61 – – – – – – – – 127.61Settlement of foreign currency convertible
bonds – (153.20) – – – – – 153.20 – – – – – –Transfer to non- financial assets/liability – – – – – – – – – – 0.20 – – 0.20Transfer from/to general reserve/retained
earnings during the year – – – – – (8.39) 93.27 8.39 (475.44) – – – 382.17 –Employee share options (net) – – – – – 1.40 – – – – – – – 1.40Dividend paid for previous year – – – – – – – – (2525.72) – – – – (2525.72)Interim equity dividend – – – – – – – – (1403.89) – – – – (1403.89)Dividend distribution tax paid for previous
year – – – – – – – – (229.22) – – – – (229.22)
Balance as at 31-3-2020 – – 10.52 (25.77) 8599.60 99.92 533.53 25669.50 16957.17 (4.14) (61.31) 115.55 – 51894.57
In terms of our report attachedFor DELOITTE HASKINS & SELLS LLPChartered Accountants S.N.SUBRAHMANYAN
Chief Executive Officer & Managing Director (DIN02255382)
Chennai
Firm’sRegistrationNo.117366W/W-100018by the hand of
SANJIV V. PILGAONKAR Partner R.SHANKAR RAMAN M.M.CHITALE
Independent DirectorMembershipNo.39826 Whole-time Director & Chief Financial Officer(DIN00019798) (DIN00101004) Mumbai Mumbai
SIVARAM NAIR ACompany Secretary & Compliance OfficerM. No. FCS3939Mumbai
Mumbai, June 5, 2020

356
STATEMENT OF CASH FLOWS ANNUAL REPORT 2019-20
Statement of Cash Flows for the year ended March 31, 20202019-20 2018-19
v crore v croreA. Cash flow from operating activities:
Profit before tax from (excluding exceptional items) from:Continuing operations 6358.92 7577.11Discontinued operations 865.38 812.40
Profit before tax including discontinued operations (excluding exceptional items) 7224.30 8389.51Adjustments for:Dividend received (1387.29) (1512.12)Depreciation, amortisation, impairment and obsolescence (net) 1020.51 999.55 Exchange difference on items grouped under financing/investing activities (39.14) (78.95)Effect of exchange rate changes on cash and cash equivalents (46.52) 3.64 Expenditure on share buy back – 17.38Expenditure on demerger – 71.49 Interest expense 2266.56 1787.62Interest income (561.48) (474.85)(Profit)/loss on sale of fixed assets (net) 30.92 (594.25)(Profit)/loss on sale of investments (net) (including fair valuation) (503.71) (230.58)Impairment of current investment 100.00 – (Gain)/loss on derivatives at fair value through Profit or Loss – 22.60 Employee stock option-discount forming part of employee benefits expense 47.40 74.70 Non-cash items related to discontinued operations 45.85 145.46
Operating profit before working capital changes 8197.40 8621.20Adjustments for:(Increase)/decrease in trade and other receivables (6572.53) (8979.11)(Increase)/decrease in inventories (183.14) (296.63)Increase/(decrease) in trade payables and customer advances 173.27 5898.28
Cash (used in)/generated from operations 1615.00 5243.74 Direct taxes refund/(paid) [net] (1736.30) (2687.32)
Net cash (used in)/from operating activities (121.30) 2556.42
B. Cash flow from investing activities:Expenditure on acquisition of fixed assets (1370.51) (1576.79)Sale of fixed assets (including advance received) 61.50 785.22Investment in subsidiaries, associates and joint venture companies (10231.82) (469.84)Divestment of stake in subsidiaries, associates and joint venture companies 734.53 3835.36Purchase of non-current investments – (17.49)Sale of non-current investments 24.46 3.82(Purchase)/sale of current investments (net) (788.79) 1146.46 Change in other bank balance and cash not available for immediate use 4226.96 (3722.45)Deposits/Loans (given) - subsidiaries, associates, joint venture companies and third parties (8901.99) (12740.83)Deposits/Loans repaid - subsidiaries, associates, joint venture companies and third parties 7510.01 12427.56 Interest received 516.20 427.47 Dividend received from subsidiaries and joint venture companies 1383.95 1330.60 Dividend received from other investments 1.76 178.70Settlement of derivative contracts related to current investments – (22.60)
Net cash (used in)/from investing activities (6833.74) 1585.19

357
Statement of Cash Flows for the year ended March 31, 2020 (contd.)2019-20 2018-19
v crore v croreC. Cash flow from financing activities:
Proceeds from fresh issue of share capital (including share application money)[net] 17.56 11.31 Proceeds from non-current borrowings [Note 43] 6617.46 789.41Repayment of non-current borrowings [Note 43] (4209.10) (974.33)(Repayments)/Proceeds from other borrowings (net) [Note 43] 10804.33 (616.54)Settlement of derivative contracts related to borrowings 308.29 308.95Interest paid on Lease Liability (12.65) – Principal repayment on Lease Liability [Note 43] (67.95) – Dividends paid (3929.61) (2243.18)Additional tax on dividend (229.22) (353.60)Interest paid (including cash flows from interest rate swaps) (1880.49) (1527.61)
Net cash (used in)/from financing activities 7418.62 (4605.59)
Net (decrease)/increase in cash and cash equivalents (A + B + C) 463.58 (463.98)
Cash and cash equivalents at beginning of the year 2723.77 3187.75Cash and cash equivalents for discontinued operations (asset held for sale) (0.07) –
Cash and cash equivalents at end of the year 3187.28 2723.77
Notes: 1. Statement of cash flows has been prepared under the indirect method as set out in the Ind AS 7 “Statement of Cash Flows” as specified
in the Companies (Indian Accounting Standards) Rules, 2015. 2. Purchase of fixed assets represents additions to property, plant and equipment, investment property and other intangible assets
adjusted for movement of (a) capital work in progress for property, plant and equipment and investment property and (b) intangible assets under development during the year.
3. Cash and cash equivalents included in the Statement of Cash Flows comprise the following:
2019-20 2018-19v crore v crore
(a) Cash and cash equivalents disclosed under current assets [Note 12] 3262.83 2733.45 (b) Other bank balances disclosed under current assets [Note 13] 675.56 4886.52(c) Cash and bank balance disclosed under non-current assets [Note 7] 273.76 289.76Total Cash and cash equivalents as per Balance Sheet 4212.15 7909.73 Add: Unrealised exchange (gain)/loss on cash and cash equivalents (reflected in Statement of
Profit and loss) (38.88) 7.64 Add: Unrealised exchange (gain)/loss on cash and cash equivalents (reflected in Other
Comprehensive Income) (36.67) (17.32)Less: Other bank balances disclosed under current assets [Note 13] 675.56 4886.52Less: Cash and bank balance disclosed under non-current assets [Note 7] 273.76 289.76Total Cash and cash equivalents as per Statement of Cash Flows 3187.28 2723.77
4. Previous year’s figures have been regrouped/reclassified wherever applicable.
In terms of our report attachedFor DELOITTE HASKINS & SELLS LLPChartered Accountants S.N.SUBRAHMANYAN
Chief Executive Officer & Managing Director (DIN02255382)
Chennai
Firm’sRegistrationNo.117366W/W-100018by the hand of
SANJIV V. PILGAONKAR Partner R.SHANKAR RAMAN M.M.CHITALE
Independent DirectorMembershipNo.39826 Whole-time Director & Chief Financial Officer(DIN00019798) (DIN00101004) Mumbai Mumbai
SIVARAM NAIR ACompany Secretary & Compliance OfficerM. No. FCS3939Mumbai
Mumbai, June 5, 2020

358
NOTES FORMING PART OF THE FINANCIAL STATEMENTS ANNUAL REPORT 2019-20
NOTE [1](i)
Company overview
Larsen & Toubro is a major technology, engineering, construction, manufacturing and financial services conglomerate, with global operations. L&T addresses critical needs in key sectors - Hydrocarbon, Infrastructure, Power, Process Industries and Defence - for customers in over 30 countries around the world.
L&T is engaged in core, high impact sectors of the economy and its integrated capabilities span the entire spectrum of ‘design to deliver’.With8decadesofastrong,customerfocusedapproachandacontinuousquestforworld-classquality,L&Thasunmatchedexpertise across Technology, Engineering, Construction, Infrastructure Projects and Manufacturing, and maintain a leadership in all its major lines of business. Every aspect of L&T’s businesses is characterised by professionalism and high standards of corporate governance. Sustainability is embedded into Company’s long-term strategy for growth.
The Company’s manufacturing footprint extends across eight countries in addition to India. L&T has several international offices and a supply chain that extends around the globe.
NOTE [1](ii)
Significant Accounting Policies
(a) Statement of compliance
The Company’s financial statements have been prepared in accordance with the provisions of the Companies Act, 2013 and the Indian Accounting Standards (“Ind AS”) notified under the Companies (Indian Accounting Standards) Rules, 2015 and amendments thereof issued by Ministry of Corporate Affairs in exercise of the powers conferred by section 133 of the Companies Act, 2013. In addition, the guidance notes/announcements issued by the Institute of Chartered Accountants of India (ICAI) are also applied except where compliance with other statutory promulgations require a different treatment. These financial statements have been approved for issue by the Board of Directors at its meeting held on June 5, 2020.
(b) Basis of accounting
The Company maintains its accounts on accrual basis following historical cost convention, except for certain assets and liabilities that are measured at fair value in accordance with Ind AS.
Fair value measurements are categorised as below, based on the degree to which the inputs to the fair value measurements are observable and the significance of the inputs to the fair value measurement in its entirety:
(i) Level 1 inputs are quoted prices (unadjusted) in active markets for identical assets or liabilities that the Company can access at measurement date;
(ii) Level 2 inputs are inputs, other than quoted prices included in level 1, that are observable for the asset or liability, either directly or indirectly; and
(iii) Level 3 inputs are unobservable inputs for the valuation of assets or liabilities.
Above levels of fair value hierarchy are applied consistently and generally, there are no transfers between the levels of the fair value hierarchy unless the circumstances change warranting such transfer.
(c) Presentation of financial statements
The Balance Sheet, Statement of Profit and Loss and Statement of Changes in Equity are prepared and presented in the format prescribed in the Schedule III to the Companies Act, 2013 (“the Act”). The Statement of Cash Flows has been prepared and presented as per the requirements of Ind AS 7 “Statement of Cash Flows”. The disclosure requirements with respect to items in the Balance Sheet and Statement of Profit and Loss, as prescribed in the Schedule III to the Act, are presented by way of notes forming part of the financial statements along with the other notes required to be disclosed under the notified Accounting Standards and the SEBI (Listing Obligations and Disclosure Requirements) Regulations, 2015 as amended.
Amounts in the financial statements are presented in Indian Rupees in crore [1 crore = 10 million] rounded off to two decimal places as permitted by Schedule III to the Companies Act, 2013. Per share data are presented in Indian Rupees to two decimals places.
Notes forming part of the Financial Statements

359
(d) Operating cycle for current and non-current classification
Operating cycle for the business activities of the Company covers the duration of the specific project/contract/product line/service including the defect liability period wherever applicable and extends up to the realisation of receivables (including retention monies) within the agreed credit period normally applicable to the respective lines of business.
(e) Revenue recognition
The Company recognises revenue from contracts with customers when it satisfies a performance obligation by transferring promised good or service to a customer. The revenue is recognised to the extent of transaction price allocated to the performance obligation satisfied. Performance obligation is satisfied over time when the transfer of control of asset (good or service) to a customer is done over time and in other cases, performance obligation is satisfied at a point in time. For performance obligation satisfied over time, the revenue recognition is done by measuring the progress towards complete satisfaction of performance obligation. The progress is measured in terms of a proportion of actual cost incurred to-date, to the total estimated cost attributable to the performance obligation.
Transaction price is the amount of consideration to which the Company expects to be entitled in exchange for transferring good or service to a customer excluding amounts collected on behalf of a third party. Variable consideration is estimated using the expected value method or most likely amount as appropriate in a given circumstance. Payment terms agreed with a customer are as per business practice and there is no financing component involved in the transaction price.
Costs to obtain a contract which are incurred regardless of whether the contract was obtained are charged-off in Statement of Profit and Loss immediately in the period in which such costs are incurred. Incremental costs of obtaining a contract, if any, and costs incurred to fulfil a contract are amortised over the period of execution of the contract in proportion to the progress measured in terms of a proportion of actual cost incurred to-date, to the total estimated cost attributable to the performance obligation.
Significant judgments are used in:
1. Determining the revenue to be recognised in case of performance obligation satisfied over a period of time; revenue recognition is done by measuring the progress towards complete satisfaction of performance obligation. The progress is measured in terms of a proportion of actual cost incurred to-date, to the total estimated cost attributable to the performance obligation.
2. Determining the expected losses, which are recognised in the period in which such losses become probable based on the expected total contract cost as at the reporting date.
(i) Revenue from operations
Revenue includes adjustments made towards liquidated damages and variation wherever applicable. Escalation and other claims, which are not ascertainable/acknowledged by customers are not taken into account.
A . Revenue from sale of goods including contracts for supply/commissioning of complex plant and equipment is recognised as follows:
Revenue from sale of manufactured and traded goods is recognised when the control of the same is transferred to the customer and it is probable that the Company will collect the consideration to which it is entitled for the exchanged goods.
Performance obligations in respect of contracts for sale of manufactured and traded goods is considered as satisfied at a point in time when the control of the same is transferred to the customer and where there is an alternative use of the asset or the Company does not have either explicit or implicit right of payment for performance completed till date.
In case where there is no alternative use of the asset and the Company has either explicit or implicit right of payment considering legal precedents, performance obligation is considered as satisfied over a period of time and revenue is recognised over time.
Notes forming part of the Financial Statements (contd.)NOTE [1](ii)Significant Accounting Policies (contd.)

360
NOTES FORMING PART OF THE FINANCIAL STATEMENTS ANNUAL REPORT 2019-20
B. Revenue from construction/project related activity is recognised as follows:
1. Cost plus contracts: Revenue from cost plus contracts is recognised over time and is determined with reference to the extent performance obligations have been satisfied. The amount of transaction price allocated to the performance obligations satisfied represents the recoverable costs incurred during the period plus the margin as agreed with the customer.
2. Fixed price contracts: Contract revenue is recognised over time to the extent of performance obligation satisfied and control is transferred to the customer. Contract revenue is recognised at allocable transaction price which represents the cost of work performed on the contract plus proportionate margin, using the percentage of completion method. Percentage of completion is the proportion of cost of work performed to-date, to the total estimated contract costs.
Impairment loss (termed as provision for foreseeable losses in the financial statements) is recognised in the Statement of Profit and Loss to the extent the carrying amount of the contract asset exceeds the remaining amount of consideration that the Company expects to receive towards remaining performance obligations (after deducting the costs that relate directly to fulfill such remaining performance obligations). In addition, the Company recognises impairment loss (termed as provision for expected credit loss on contract assets in the financial statements) on account of credit risk in respect of a contract asset using expected credit loss model on similar basis as applicable to trade receivables.
For contracts where the aggregate of contract cost incurred to date plus recognised profits (or minus recognised losses as the case may be) exceeds the progress billing, the surplus is shown as contract asset and termed as “Due from customers”. For contracts where progress billing exceeds the aggregate of contract costs incurred to-date plus recognised profits (or minus recognised losses, as the case may be), the surplus is shown as contract liability and termed as “Due to customers”. Amounts received before the related work is performed are disclosed in the Balance Sheet as contract liability and termed as “Advances from customer”. The amounts billed on customer for work performed and are unconditionally due for payment i.e only passage of time is required before payment falls due, are disclosed in the Balance Sheet as trade receivables. The amount of retention money held by the customers pending completion of performance milestone is disclosed as part of contract asset and is reclassified as trade receivables when it becomes due for payment.
C. Revenue from property development activities is recognised when performance obligation is satisfied, customer obtains control of the property transferred and a reasonable expectation of collection of the sale consideration from the customer exists. The costs incurred on property development activities are carried as “Inventories” till such time the aforesaid conditions are fulfilled.
D. Revenue from rendering of services is recognised over time as and when the customer receives the benefit of the Company’s performance and the Company has an enforceable right to payment for services transferred.
Unbilled revenue represents value of services performed in accordance with the contract terms but not billed.
E. Revenue from contracts for rendering of engineering design services and other services which are directly related to the construction of an asset is recognised on the same basis as stated in (B) supra.
F. Commission income is recognised as and when the terms of the contract are fulfilled.
G. Other operational revenue represents income earned from the activities incidental to the business and is recognised when the performance obligation is satisfied and right to receive the income is established as per the terms of the contract.
(ii) Other income
A. Interest income on investments and loans is accrued on a time basis by reference to the principal outstanding and the effective interest rate including interest on investments classified as fair value through Profit or Loss or fair value through Other Comprehensive Income. Interest receivable on customer dues is recognised as income in the Statement of Profit and Loss on accrual basis provided there is no uncertainty towards its realisation.
B. Dividend income is accounted in the period in which the right to receive the same is established.
Notes forming part of the Financial Statements (contd.)NOTE [1](ii)Significant Accounting Policies (contd.)

361
C . Government grants, which are revenue in nature and are towards compensation for the qualifying costs, incurred by the Company, are recognised as other income in the Statement of Profit and Loss in the period in which such costs are incurred. Government grant receivable in the form of duty credit scrips is recognised as other income in the Statement of Profit and Loss in the period in which the application is made to the government authorities and to the extent there is no uncertainty towards its receipt.
D. Other items of income are accounted as and when the right to receive such income arises and it is probable that the economic benefits will flow to the Company and the amount of income can be measured reliably.
(f) Exceptional items
An item of income or expense which by its size, type or incidence requires disclosure in order to improve an understanding of the performance of the Company is treated as an exceptional item and disclosed as such in the financial statements.
(g) Property, plant and equipment (PPE)
PPE is recognised when it is probable that future economic benefits associated with the item will flow to the Company and the cost of the item can be measured reliably. PPE is stated at original cost net of tax/duty credits availed, if any, less accumulated depreciation and cumulative impairment, if any. All directly attributable costs related to the acquisition of PPE and borrowing costs in case of qualifying assets are capitalised in accordance with the Company’s accounting policy.
Own manufactured PPE is capitalised at cost including an appropriate share of overheads. Administrative and other general overhead expenses that are specifically attributable to construction or acquisition of PPE or bringing the PPE to working condition are allocated and capitalised as a part of the cost of the PPE.
Subsequent costs are included in the asset’s carrying amount or recognised as a separate asset, as appropriate, only when it is probable that future economic benefits associated with the item will flow to the Company and the cost can be measured reliably.
PPE not ready for the intended use on the date of the Balance Sheet are disclosed as “capital work-in-progress”. (Also refer to policy on leases, borrowing costs, impairment of assets and foreign currency transactions infra).
Depreciation is recognised using straight-line method so as to write off the cost of the assets (other than freehold land and properties under construction) less their residual values over their useful lives specified in Schedule II to the Companies Act, 2013, or in the case of assets where the useful life was determined by technical evaluation, over the useful life so determined.
Depreciation method is reviewed at each financial year end to reflect the expected pattern of consumption of the future economic benefits embodied in the asset. The estimated useful life and residual values are also reviewed at each financial year end and the effect of any change in the estimates of useful life/residual value is accounted on prospective basis.
Where cost of a part of the asset (“asset component”) is significant to total cost of the asset and useful life of that part is different from the useful life of the remaining asset, useful life of that significant part is determined separately and such asset component is depreciated over its separate useful life.
Depreciation on additions to/deductions from, owned assets is calculated pro rata to the period of use.
Depreciation charge for impaired assets is adjusted in future periods in such a manner that the revised carrying amount of the asset is allocated over its remaining useful life.
Freehold land is not depreciated.
PPE is derecognised upon disposal or when no future economic benefits are expected from its use or disposal. Any gain or loss arising on derecognition is recognised in the Statement of Profit and Loss in the same period.
(h) Investment property
Properties, including those under construction, held to earn rentals and/or capital appreciation are classified as investment property and are measured and reported at cost, including transaction costs and borrowing cost capitalised for qualifying assets, in accordance with the Company’s accounting policy.
Notes forming part of the Financial Statements (contd.)NOTE [1](ii)Significant Accounting Policies (contd.)

362
NOTES FORMING PART OF THE FINANCIAL STATEMENTS ANNUAL REPORT 2019-20
Depreciation is recognised using straight-line method so as to write off the cost of the investment property less their residual values over their useful lives specified in Schedule II to the Companies Act, 2013 or in the case of assets where the useful life was determined by technical evaluation, over the useful life so determined. Depreciation method is reviewed at each financial year end to reflect the expected pattern of consumption of the future benefits embodied in the investment property. The estimated useful life and residual values are also reviewed at each financial year end and the effect of any change in the estimates of useful life/ residual value is accounted on prospective basis. Freehold land and properties under construction are not depreciated.
An investment property is derecognised upon disposal or when the investment property is permanently withdrawn from use and no future economic benefits are expected from the disposal. Any gain or loss arising on derecognition of property is recognised in the Statement of Profit and Loss in the same period.
(i) Intangible assets
Intangible assets are recognised when it is probable that the future economic benefits that are attributable to the asset will flow to the Company and the cost of the asset can be measured reliably. Intangible assets are stated at original cost net of tax/duty credits availed, if any, less accumulated amortisation and cumulative impairment. Administrative and other general overhead expenses that are specifically attributable to acquisition of intangible assets are allocated and capitalised as a part of the cost of the intangible assets.
Research and development expenditure on new products:
(i) Expenditure on research is expensed under respective heads of account in the period in which it is incurred.
(ii) Development expenditure on new products is capitalised as intangible asset, if all of the following can be demonstrated:
A. the technical feasibility of completing the intangible asset so that it will be available for use or sale;
B. the Company has intention to complete the intangible asset and use or sell it;
C. the Company has ability to use or sell the intangible asset;
D. the manner in which the probable future economic benefits will be generated including the existence of a market for output of the intangible asset or intangible asset itself or if it is to be used internally, the usefulness of intangible assets;
E. the availability of adequate technical, financial and other resources to complete the development and to use or sell the intangible asset; and
F. the Company has ability to reliably measure the expenditure attributable to the intangible asset during its development. Development expenditure that does not meet the above criteria is expensed in the period in which it is incurred.
Intangible assets not ready for the intended use on the date of the Balance Sheet are disclosed as “intangible assets under development”.
Intangible assets are amortised on straight-line basis over the estimated useful life. The method of amortisation and useful life are reviewed at the end of each financial year with the effect of any changes in the estimate being accounted for on a prospective basis.
Amortisation on impaired assets is provided by adjusting the amortisation charge in the remaining periods so as to allocate the asset’s revised carrying amount over its remaining useful life.
(j) Impairment of assets
As at the end of each accounting year, the Company reviews the carrying amounts of its PPE, investment property, intangible assets and investments in subsidiary, associate and joint venture companies to determine whether there is any indication that those assets have suffered an impairment loss. If such indication exists, PPE, investment property, intangible assets and investments are tested for impairment so as to determine the impairment loss, if any. Intangible assets with indefinite life are tested for impairment each year.
Notes forming part of the Financial Statements (contd.)NOTE [1](ii)Significant Accounting Policies (contd.)

363
Impairment loss is recognised when the carrying amount of an asset exceeds its recoverable amount. Recoverable amount is determined:
(i) in the case of an individual asset, at the higher of the net selling price and the value in use; and
(ii) in the case of a cash generating unit (the smallest identifiable group of assets that generates independent cash flows), at the higher of the cash generating unit’s net selling price and the value in use.
The amount of value in use is determined as the present value of estimated future cash flows from the continuing use of an asset, which may vary based on the future performance of the Company and from its disposal at the end of its useful life. For this purpose, the discount rate (pre-tax) is determined based on the weighted average cost of capital of the Company suitably adjusted for risks specified to the estimated cash flows of the asset.
If recoverable amount of an asset (or cash generating unit) is estimated to be less than its carrying amount, such deficit is recognised immediately in the Statement of Profit and Loss as impairment loss and the carrying amount of the asset (or cash generating unit) is reduced to its recoverable amount.
When an impairment loss subsequently reverses, the carrying amount of the asset (or cash generating unit) is increased to the revised estimate of its recoverable amount, such that the increased carrying amount does not exceed the carrying amount that would have been determined had no impairment loss been recognised for the asset (or cash generating unit) in prior years. A reversal of an impairment loss is recognised immediately in the Statement of Profit and Loss.
(k) Employee Benefits
(i) Short-term employee benefits:
Employee benefits such as salaries, wages, short-term compensated absences, cost of bonus, ex-gratia and performance-linked rewards falling due wholly within twelve months of rendering the service are classified as short-term employee benefits and are expensed in the period in which the employee renders the related service.
(ii) Post-employment benefits:
A. Defined contribution plans: The Company’s superannuation scheme, state governed provident fund scheme, employee state insurance scheme and employee pension scheme are defined contribution plans. The contribution paid/payable under the schemes is recognised during the period in which the employee renders the related service.
B. Defined benefit plans: The employees’ gratuity fund schemes and employee provident fund schemes managed by board of trustees established by the Company, the post-retirement medical care plan and the Company pension plan represent defined benefit plans. The present value of the obligation under defined benefit plans is determined based on actuarial valuation using the Projected Unit Credit Method.
The obligation is measured at the present value of the estimated future cash flows using a discount rate based on the market yield on government securities of a maturity period equivalent to the weighted average maturity profile of the defined benefit obligations at the Balance Sheet date.
Re-measurement, comprising actuarial gains and losses, the return on plan assets (excluding amounts included in net interest on the net defined benefit liability or asset) and any change in the effect of asset ceiling (if applicable) is recognised in Other Comprehensive Income and is reflected in Retained earnings and the same is not eligible to be reclassified to Profit or Loss.
Defined benefit costs comprising current service cost, past service cost and gains or losses on settlements are recognised in the Statement of Profit and Loss as employee benefits expense. Interest cost implicit in defined benefit employee cost is recognised in the Statement of Profit and Loss under finance cost. Gains or losses on settlement of any defined benefit plan are recognised when the settlement occurs. Past service cost is recognised as expense at the earlier of the plan amendment or curtailment and when the Company recognises related restructuring costs or termination benefits.
In case of funded plans, the fair value of the plan assets is reduced from the gross obligation under the defined benefit plans to recognise the obligation on a net basis.
Notes forming part of the Financial Statements (contd.)NOTE [1](ii)Significant Accounting Policies (contd.)

364
NOTES FORMING PART OF THE FINANCIAL STATEMENTS ANNUAL REPORT 2019-20
(iii) Long-term employee benefits:
The obligation recognised in respect of long-term benefits such as compensated absences, long service award etc. is measured at present value of estimated future cash flows expected to be made by the Company and is recognised in a similar manner as in the case of defined benefit plans vide (ii)(B) supra.
Long-term employee benefit costs comprising current service cost and gains or losses on curtailments and settlements, re-measurements including actuarial gains and losses are recognised in the Statement of Profit and Loss as employee benefit expenses. Interest cost implicit in long-term employee benefit cost is recognised in the Statement of Profit and Loss under finance cost.
(iv) Termination benefits:
Termination benefits such as compensation under employee separation schemes are recognised as expense when the Company’s offer of the termination benefit is accepted or when the Company recognises the related restructuring costs whichever is earlier.
(l) Leases
Leases are accounted as per Ind AS 116 which has become mandatory from April 1, 2019.
Assets taken on lease are accounted as right-of-use assets and the corresponding lease liability is accounted at the lease commencement date.
Initially the right-of-use asset is measured at cost which comprises the initial amount of the lease liability adjusted for any lease payments made at or before the commencement date, plus any initial direct costs incurred and an estimate of costs to dismantle and remove the underlying asset or to restore the underlying asset or the site on which it is located, less any lease incentives received.
The lease liability is initially measured at the present value of the lease payments, discounted using the Company’s incremental borrowing rate. It is remeasured when there is a change in future lease payments arising from a change in an index or a rate, or a change in the estimate of the guaranteed residual value, or a change in the assessment of purchase, extension or termination option. When the lease liability is remeasured in this way, a corresponding adjustment is made to the carrying amount of the right-of-use asset, or is recorded in the Statement of Profit and Loss if the carrying amount of the right-of-use asset has been reduced to zero.
The right-of-use asset is measured by applying cost model i.e. right-of-use asset at cost less accumulated depreciation and cumulative impairment, if any. The right-of-use asset is depreciated using the straight-line method from the commencement date to the end of the lease term or useful life of the underlying asset whichever is earlier. Carrying amount of lease liability is increased by interest on lease liability and reduced by lease payments made.
Lease payments associated with following leases are recognised as expense on straight-line basis:
(i) Low value leases; and
(ii) Leases which are short-term.
Assets given on lease are classified either as operating lease or as finance lease. A lease is classified as a finance lease if it transfers substantially all the risks and rewards incidental to ownership of an underlying asset. Initially asset held under finance lease is recognised in balance sheet and presented as a receivable at an amount equal to the net investment in the lease. Finance income is recognised over the lease term, based on a pattern reflecting a constant periodic rate of return on Company’s net investment in the lease. A lease which is not classified as a finance lease is an operating lease.
The Company recognises lease payments in case of assets given on operating leases as income on a straight-line basis. The Company presents underlying assets subject to operating lease in its balance sheet under the respective class of asset.
(Also refer to policy on depreciation, supra)
(m) Financial instruments
Financial assets and/or financial liabilities are recognised when the Company becomes party to a contract embodying the related financial instruments. All financial assets, financial liabilities and financial guarantee contracts are initially measured at
Notes forming part of the Financial Statements (contd.)NOTE [1](ii)Significant Accounting Policies (contd.)

365
transaction values and where such values are different from the fair value, at fair value. Transaction costs that are attributable to the acquisition or issue of financial assets and financial liabilities (other than financial assets and financial liabilities at fair value through profit or loss) are added to or deducted from as the case may be, the fair value of such financial assets or liabilities, on initial recognition. Transaction costs directly attributable to the acquisition of financial assets or financial liabilities at fair value through profit or loss are recognised immediately in Profit or Loss.
In case of funding to subsidiary companies in the form of interest free or concession loans and preference shares, the excess of the actual amount of the funding over initially measured fair value is accounted as an equity investment.
A financial asset and a financial liability is offset and presented on net basis in the balance sheet when there is a current legally enforceable right to set-off the recognised amounts and it is intended to either settle on net basis or to realise the asset and settle the liability simultaneously.
(i) Financial assets:
A. All recognised financial assets are subsequently measured in their entirety either at amortised cost or at fair value depending on the classification of the financial assets as follows:
1. Investments in debt instruments that are designated as fair value through profit or loss (FVTPL) - at fair value. Debt instruments at FVTPL is a residual category for debt instruments, if any, and all changes are recognised in Profit or Loss.
2. Investments in debt instruments that meet the following conditions are subsequently measured at amortised cost (unless the same designated as fair value through profit or loss):
• Theassetisheldwithinabusinessmodelwhoseobjectiveistoholdassetsinordertocollectcontractualcashflows; and
• Thecontractualtermsofinstrumentgiveriseonspecifieddatestocashflowsthataresolelypaymentsofprincipal and interest on the principal amount outstanding.
3. Investment in debt instruments that meet the following conditions are subsequently measured at fair value through Other Comprehensive Income [FVTOCI] (unless the same are designated as fair value through profit or loss)
• Theassetisheldwithinabusinessmodelwhoseobjectiveisachievedbothbycollectingcontractualcashflowsand selling financial assets; and
• Thecontractualtermsofinstrumentgiveriseonspecifieddatestocashflowsthataresolelypaymentsofprincipal and interest on the principal amount outstanding.
4. Investment in equity instruments issued by subsidiary, associate and joint venture companies are measured at cost less impairment.
5. Investment in preference shares of the subsidiary companies are treated as equity instruments if the same are convertible into equity shares or are redeemable out of the proceeds of equity instruments issued for the purpose of redemption of such investments. Investment in preference shares not meeting the aforesaid conditions are classified as debt instruments at FVTPL.
6. Investments in equity instruments issued by other than subsidiaries are classified as at FVTPL, unless the related instruments are not held for trading and the Company irrevocably elects on initial recognition to present subsequent changes in fair value in Other Comprehensive Income.
7. Trade receivables, security deposits, cash and cash equivalents, employee and other advances – at amortised cost
B. For financial assets that are measured at FVTOCI, income by way of interest and dividend, provision for impairment and exchange difference, if any, (on debt instrument) are recognised in Profit or Loss and changes in fair value (other than on account of above income or expense) are recognised in Other Comprehensive Income and accumulated in Other equity. On disposal of debt instruments at FVTOCI, the cumulative gain or loss previously accumulated in Other equity is reclassified to Profit or Loss. In case of equity instruments at FVTOCI, such cumulative gain or loss is not reclassified to Profit or Loss on disposal of investments.
Notes forming part of the Financial Statements (contd.)NOTE [1](ii)Significant Accounting Policies (contd.)

366
NOTES FORMING PART OF THE FINANCIAL STATEMENTS ANNUAL REPORT 2019-20
C. A financial asset is primarily derecognised when:
1. the right to receive cash flows from the asset has expired, or
2. the Company has transferred its rights to receive cash flows from the asset or has assumed an obligation to pay the received cash flows in full without material delay to a third party under a pass-through arrangement; and (a) the Company has transferred substantially all the risks and rewards of the asset, or (b) the Company has neither transferred nor retained substantially all the risks and rewards of the asset, but has transferred control of the asset.
On derecognition of a financial asset in its entirety, the difference between the carrying amount measured at the date of derecognition and the consideration received is recognised in Profit or Loss.
D. Impairment of financial assets: The Company recognises impairment loss on trade receivables using expected credit loss model, which involves use of a provision matrix constructed on the basis of historical credit loss experience as permitted under Ind AS 109. Impairment loss on investments is recognised when the carrying amount exceeds its recoverable amount. For all other financial assets, expected credit losses are measured at an amount equal to 12-month expected credit losses or at an amount equal to lifetime expected credit losses if the credit risk on the financial asset has increased significantly since initial recognition.
(ii) Financial liabilities:
A. Financial liabilities, including derivatives and embedded derivatives, which are designated for measurement at FVTPL are subsequently measured at fair value. Financial guarantee contracts are subsequently measured at the amount of impairment loss allowance or the amount recognised at inception net of cumulative amortisation, whichever is higher. All other financial liabilities including loans and borrowings are measured at amortised cost using Effective Interest Rate (EIR) method.
B. A financial liability is derecognised when the related obligation expires or is discharged or cancelled.
(iii) The Company designates certain hedging instruments, such as derivatives, embedded derivatives and in respect of foreign currency risk, certain non-derivatives, as either fair value hedges, cash flow hedges or hedges of net investments in foreign operations. Hedges of foreign exchange risk on firm commitments are accounted as cash flow hedges.
A. Fair value hedges: Changes in fair value of the designated portion of derivatives that qualify as fair value hedges are recognised in Profit or Loss immediately, together with any changes in the fair value of the hedged asset or liability that are attributable to the hedged risk.
Hedge accounting is discontinued when the hedging instrument expires or is sold, terminated, or exercised, or when it no longer qualifies for hedge accounting. The fair value adjustment to the carrying amount of the hedged item arising from the hedged risk is amortised to Profit or Loss from that date.
B. Cash flow hedges: In case of transaction related hedges, the effective portion of changes in the fair value of derivatives that are designated and qualify as cash flow hedges is recognised in Other Comprehensive Income and accumulated in equity as “Hedging reserve”. The gain or loss relating to the ineffective portion is recognised immediately in Profit or Loss. Amounts previously recognised in Other Comprehensive Income and accumulated in equity relating to the effective portion, are reclassified to Profit or Loss in the periods when the hedged item affects Profit or Loss, in the same head as the hedged item. The effective portion of the hedge is determined at the lower of the cumulative gain or loss on the hedging instrument from inception of the hedge and the cumulative change in the fair value of the hedged item from the inception of the hedge and the remaining gain or loss on the hedging instrument is treated as ineffective portion.
In case of time period related hedges, the premium element and the spot element of a forward contract is separated and only the change in the value of the spot element of the forward contract is designated as the hedging instrument. Similarly, wherever applicable, the foreign currency basis spread is separated from the financial instrument and is excluded from the designation of that financial instrument as the hedging instrument in case of time period related hedges. The changes in the fair value of the premium element of the forward contract or the foreign currency basis spread of the financial instrument is accumulated in a separate component of equity as “Cost of hedging reserve”. The changes in the fair value of such premium element or foreign currency basis spread are reclassified to Profit or Loss as a reclassification adjustment on a straight-line basis over the period of the forward contract or the financial instrument.
Notes forming part of the Financial Statements (contd.)NOTE [1](ii)Significant Accounting Policies (contd.)

367
Hedge accounting is discontinued when the hedging instrument expires or is sold, terminated, or exercised, or when it no longer qualifies for hedge accounting. Any gain or loss recognised in Other Comprehensive Income and accumulated in equity at that time remains in equity and is recognised when the forecast transaction is ultimately recognised in Profit or Loss. When a forecast transaction is no longer expected to occur, the gain or loss accumulated in equity is recognised immediately in Profit or Loss.
(iv) Compound financial instruments issued by the Company which can be converted into fixed number of equity shares at the option of the holders irrespective of changes in the fair value of the instrument are accounted by separately recognising the liability and the equity components. The liability component is initially recognised at the fair value of a comparable liability that does not have an equity conversion option. The equity component is initially recognised at the difference between the fair value of the compound financial instrument as a whole and the fair value of the liability component. The directly attributable transaction costs are allocated to the liability and the equity components in proportion to their initial carrying amounts. Subsequent to initial recognition, the liability component of the compound financial instrument is measured at amortised cost using the effective interest method. The equity component of a compound financial instrument is not remeasured subsequently.
(n) Inventories
Inventories are valued after providing for obsolescence, as under:
(i) Raw materials, components, construction materials, stores, spares and loose tools at lower of weighted average cost or net realisable value. However, these items are considered to be realisable at cost if the finished products in which they will be used, are expected to be sold at or above cost.
(ii) Manufacturing work-in-progress at lower of weighted average cost including related overheads or net realisable value. In some cases, manufacturing work-in-progress are valued at lower of specifically identifiable cost or net realisable value. In the case of qualifying assets, cost also includes applicable borrowing costs vide policy relating to borrowing costs.
(iii) Finished goods and stock-in-trade (in respect of goods acquired for trading) at lower of weighted average cost or net realisable value. Cost includes costs of purchases, costs of conversion and other costs incurred in bringing the inventories to their present location. Taxes which are subsequently recoverable from taxation authorities are not included in the cost.
(iv) Completed property/work-in-progress (including land) in respect of property development activity at lower of specifically identifiable cost or net realisable value.
Assessment of net realisable value is made at each reporting period end and when the circumstances that previously caused inventories to be written-down below cost no longer exist or when there is clear evidence of an increase in net realisable value because of changed economic circumstances, the write-down, if any, in the past period is reversed to the extent of the original amount written-down so that the resultant carrying amount is the lower of the cost and the revised net realisable value.
(o) Cash and bank balances
Cash and bank balances also include fixed deposits, margin money deposits, earmarked balances with banks and other bank balances which have restrictions on repatriation. Short-term and liquid investments being subject to more than insignificant risk of change in value, are not included as part of Cash and cash equivalents.
(p) Securities premium
(i) Securities premium includes:
A. The difference between the face value of the equity shares and the consideration received in respect of shares issued.
B. The fair value of the stock options which are treated as expense, if any, in respect of shares allotted pursuant to Stock Options Scheme.
(ii) The issue expenses of securities which qualify as equity instruments are written off against Securities premium.
(q) Borrowing costs
Borrowing costs include finance costs calculated using the effective interest method, finance charges in respect of assets acquired on lease and exchange differences arising on foreign currency borrowings to the extent they are regarded as an adjustment to
Notes forming part of the Financial Statements (contd.)NOTE [1](ii)Significant Accounting Policies (contd.)

368
NOTES FORMING PART OF THE FINANCIAL STATEMENTS ANNUAL REPORT 2019-20
finance costs. In cases where hedging instruments are acquired for protection against exchange rate risk related to borrowings and are accounted as hedging a time-period related hedge item, the borrowing costs also include the amortisation of premium element of the forward contract and foreign currency basis spread as applicable, over the period of the hedging instrument.
Borrowing costs net of any investment income from the temporary investment of related borrowings that are attributable to the acquisition, construction or production of a qualifying asset are capitalised/inventoried as part of cost of such asset till such time the asset is ready for its intended use or sale. A qualifying asset is an asset that necessarily requires a substantial period of time to get ready for its intended use or sale. All other borrowing costs are recognised in the Statement of Profit and Loss in the period in which they are incurred.
(r) Share-based payment arrangements
The stock options granted to employees pursuant to the Company’s Stock Options Schemes, are measured at the fair value of the options at the grant date. The fair value of the options is treated as discount and accounted as employee compensation cost over the vesting period on a straight-line basis. The amount recognised as expense in each year is arrived at based on the number of grants expected to vest. If a grant lapses after the vesting period, the cumulative discount recognised as expense in respect of such grant is transferred to the General reserve within equity.
The fair value of the stock options granted to employees of the Company by the Company’s subsidiaries is accounted as employee compensation cost over the vesting period and where such fair value is not recovered by the subsidiaries, the same is treated as dividend declared by them. The share based payment equivalent to the fair value as on the date of grant of employee stock options granted to key managerial personnel is disclosed as a related party transaction in the year of grant.
(s) Foreign currencies
(i) The functional currency and presentation currency of the Company is Indian Rupee.
(ii) Transactions in currencies other than the Company’s functional currency are recorded on initial recognition using the exchange rate at the transaction date. At each Balance Sheet date, foreign currency monetary items are reported at the closing spot rate. Non-monetary items that are measured in terms of historical cost in foreign currency are not retranslated. Exchange differences that arise on settlement of monetary items or on reporting of monetary items at each Balance Sheet date at the closing spot rate are recognised in the Statement of Profit and Loss in the period in which they arise except for:
A. exchange differences on foreign currency borrowings relating to assets under construction for future productive use, which are included in the cost of those assets when they are regarded as an adjustment to finance costs on those foreign currency borrowings; and
B. exchange differences on transactions entered into in order to hedge certain foreign currency risks.
(iii) Exchange rate as of the date on which the non-monetary asset or non-monetary liability is recognised on payment or receipt of advance consideration is used for initial recognition of related asset, liability, expense or income.
(iv) Financial statements of foreign operations whose functional currency is different than Indian Rupee are translated into Indian Rupee as follows:
A. assets and liabilities for each Balance Sheet presented are translated at the closing rate at the date of that Balance Sheet;
B. income and expenses for each income statement are translated at average exchange rates; and
C. all resulting exchange differences are recognised in Other Comprehensive Income and accumulated in equity as “Foreign currency translation reserve” for subsequent reclassification to Profit or Loss on disposal of such foreign operations.
(t) Accounting and reporting of information for Operating Segments
Operating segments are those components of the business whose operating results are regularly reviewed by the chief operating decision making body in the Company to make decisions for performance assessment and resource allocation.
The reporting of segment information is the same as provided to the management for the purpose of the performance assessment and resource allocation to the segments.
Notes forming part of the Financial Statements (contd.)NOTE [1](ii)Significant Accounting Policies (contd.)

369
Segment accounting policies are in line with the accounting policies of the Company. In addition, the following specific accounting policies have been followed for segment reporting:
i) Segment revenue includes sales and other operational revenue directly identifiable with/allocable to the segment including inter segment revenue.
ii) Expenses that are directly identifiable with/allocable to segments are considered for determining the segment result.
iii) Most of the centrally incurred costs are allocated to segments mainly on the basis of their respective expected segment revenue estimated at the beginning of the reported period.
iv) Income which relates to the Company as a whole and not allocable to segments is included in “unallocable corporate income/ (expenditure)(net)”.
v) Segment result includes margins on inter-segment capital jobs, which are reduced in arriving at the profit before tax of the Company.
vi) Segment result includes the finance costs incurred on interest bearing advances with corresponding credit included in “unallocable corporate income/(expenditure)(net).
vii) Segment results have not been adjusted for the exceptional item attributable to the corresponding segment. The said exceptional item has been included in “unallocable corporate income/(expenditure)(net)”. The corresponding segment assets have been carried under the respective segments without adjusting the exceptional item.
viii) Segment revenue resulting from transactions with other business segments is accounted on the basis of transfer price which are either determined to yield a desired margin or agreed on a negotiated basis.
ix) Segment assets and liabilities include those directly identifiable with the respective segments. Unallocable corporate assets and liabilities represent the assets and liabilities that relate to the Company as a whole.
x) Segment non-cash expenses forming part of segment expenses includes the fair value of the employee stock options which is accounted as employee compensation cost [Note 1(r) supra] and is allocated to the segment.
(u) Taxes on income
Tax on income for the current period is determined on the basis of taxable income and tax credits computed in accordance with the provisions of the Income Tax Act,1961 and based on the expected outcome of assessments/appeals.
Deferred tax is recognised on temporary differences between the carrying amounts of assets and liabilities in the Company’s financial statements and the corresponding tax bases used in computation of taxable profit and quantified using the tax rates as per laws enacted or substantively enacted as at the Balance Sheet date.
Deferred tax liabilities are generally recognised for all taxable temporary differences including the temporary differences associated with investments in subsidiaries and associates, and interests in joint ventures, except where the Company is able to control the reversal of the temporary difference and it is probable that the temporary difference will not reverse in the foreseeable future.
Deferred tax assets are generally recognised for all taxable temporary differences to the extent that is probable that taxable profits will be available against which those deductible temporary differences can be utilised. The carrying amount of deferred tax assets is reviewed at the end of each reporting period and reduced to the extent that it is no longer probable that sufficient taxable profits will be available to allow all or part of the asset to be recovered.
Deferred tax assets relating to unabsorbed depreciation/business losses/losses under the head “capital gains”/other temporary differences are recognised and carried forward to the extent of available taxable temporary differences or where there is convincing other evidence that sufficient future taxable income will be available against which such deferred tax assets can be realised.
The measurement of deferred tax liabilities and assets reflects the tax consequences that would follow from the manner in which the Company expects, at the end of reporting period, to recover or settle the carrying amount of its assets and liabilities.
Transaction or event which is recognised outside Profit or Loss, either in Other Comprehensive Income or in Equity, is recorded along with the tax as applicable.
Notes forming part of the Financial Statements (contd.)NOTE [1](ii)Significant Accounting Policies (contd.)

370
NOTES FORMING PART OF THE FINANCIAL STATEMENTS ANNUAL REPORT 2019-20
The Company uses estimates and judgements based on the relevant rulings in the areas of allowances and disallowances which are exercised while determining the provision for income tax.
(v) Interests in joint operations
The Company as a joint operator recognises in relation to its interest in a joint operation, its share in the assets/liabilities held/ incurred jointly with the other parties of the joint arrangement. Revenue is recognised for its share of revenue from the sale of output by the joint operation. Expenses are recognised for its share of expenses incurred jointly with other parties as part of the joint arrangement.
Interests in joint operations are included in the segments to which they relate.
(w) Provisions, contingent liabilities and contingent assets
Provisions are recognised only when:
(i) the Company has a present obligation (legal or constructive) as a result of a past event;
(ii) it is probable that an outflow of resources embodying economic benefits will be required to settle the obligation; and
(iii) a reliable estimate can be made of the amount of the obligation.
Provision is measured using the cash flows estimated to settle the present obligation and when the effect of time value of money is material, the carrying amount of the provision is the present value of those cash flows. Reimbursement expected in respect of expenditure required to settle a provision is recognised only when it is virtually certain that the reimbursement will be received.
Contingent liability is disclosed in case of:
(i) a present obligation arising from past events, when it is not probable that an outflow of resources will be required to settle the obligation; and
(ii) a present obligation arising from past events, when no reliable estimate is possible. Contingent assets are disclosed where an inflow of economic benefits is probable.
Provisions, contingent liabilities and contingent assets are reviewed at each Balance Sheet date.
Where the unavoidable costs of meeting the obligations under the contract exceed the economic benefits expected to be received under such contract, the present obligation under the contract is recognised and measured as a provision.
(x) Commitments
Commitments are future liabilities for contractual expenditure, classified and disclosed as follows:
(i) estimated amount of contracts remaining to be executed on capital account and not provided for;
(ii) uncalled liability on shares and other investments partly paid;
(iii) funding related commitment to subsidiary, associate and joint venture companies; and
(iv) other non-cancellable commitments, if any, to the extent they are considered material and relevant in the opinion of management.
Other commitments related to sales/procurements made in the normal course of business are not disclosed to avoid excessive details.
(y) Discontinued operations and non-current assets held for sale
Discontinued operation is a component of the Company that has been disposed of or classified as held for sale and represents a major line of business.
Non-current assets and disposal groups are classified as held for sale if their carrying amount is intended to be recovered principally through a sale (rather than through continuing use) when the asset (or disposal group) is available for immediate sale in its present
Notes forming part of the Financial Statements (contd.)NOTE [1](ii)Significant Accounting Policies (contd.)
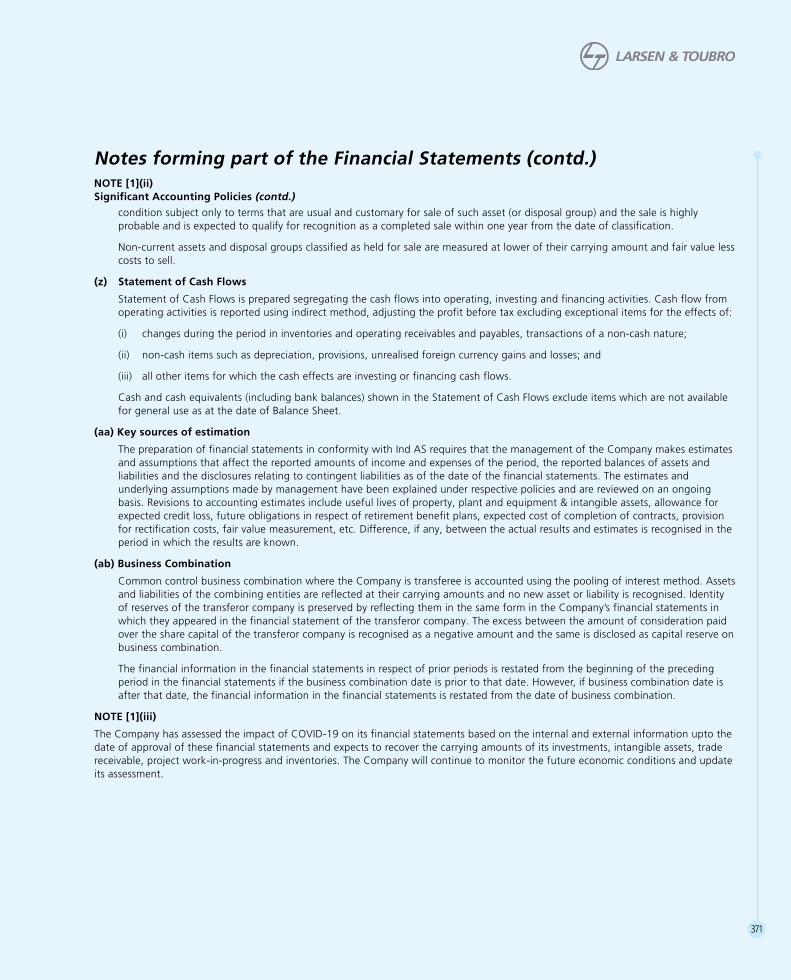
371
Notes forming part of the Financial Statements (contd.)NOTE [1](ii)Significant Accounting Policies (contd.)
condition subject only to terms that are usual and customary for sale of such asset (or disposal group) and the sale is highly probable and is expected to qualify for recognition as a completed sale within one year from the date of classification.
Non-current assets and disposal groups classified as held for sale are measured at lower of their carrying amount and fair value less costs to sell.
(z) Statement of Cash Flows
Statement of Cash Flows is prepared segregating the cash flows into operating, investing and financing activities. Cash flow from operating activities is reported using indirect method, adjusting the profit before tax excluding exceptional items for the effects of:
(i) changes during the period in inventories and operating receivables and payables, transactions of a non-cash nature;
(ii) non-cash items such as depreciation, provisions, unrealised foreign currency gains and losses; and
(iii) all other items for which the cash effects are investing or financing cash flows.
Cash and cash equivalents (including bank balances) shown in the Statement of Cash Flows exclude items which are not available for general use as at the date of Balance Sheet.
(aa) Key sources of estimation
The preparation of financial statements in conformity with Ind AS requires that the management of the Company makes estimates and assumptions that affect the reported amounts of income and expenses of the period, the reported balances of assets and liabilities and the disclosures relating to contingent liabilities as of the date of the financial statements. The estimates and underlying assumptions made by management have been explained under respective policies and are reviewed on an ongoing basis. Revisions to accounting estimates include useful lives of property, plant and equipment & intangible assets, allowance for expected credit loss, future obligations in respect of retirement benefit plans, expected cost of completion of contracts, provision for rectification costs, fair value measurement, etc. Difference, if any, between the actual results and estimates is recognised in the period in which the results are known.
(ab) Business Combination
Common control business combination where the Company is transferee is accounted using the pooling of interest method. Assets and liabilities of the combining entities are reflected at their carrying amounts and no new asset or liability is recognised. Identity of reserves of the transferor company is preserved by reflecting them in the same form in the Company’s financial statements in which they appeared in the financial statement of the transferor company. The excess between the amount of consideration paid over the share capital of the transferor company is recognised as a negative amount and the same is disclosed as capital reserve on business combination.
The financial information in the financial statements in respect of prior periods is restated from the beginning of the preceding period in the financial statements if the business combination date is prior to that date. However, if business combination date is after that date, the financial information in the financial statements is restated from the date of business combination.
NOTE [1](iii)
The Company has assessed the impact of COVID-19 on its financial statements based on the internal and external information upto the date of approval of these financial statements and expects to recover the carrying amounts of its investments, intangible assets, trade receivable, project work-in-progress and inventories. The Company will continue to monitor the future economic conditions and update its assessment.

372
NOTES FORMING PART OF THE FINANCIAL STATEMENTS ANNUAL REPORT 2019-20
NOTE [2]
Property, Plant and Equipment & Capital work-in-progressv crore
Class of assets
Cost/Valuation Depreciation Impairment Book value
As at 1-4-2019 Additions
Assets held for
sale
T/f to ROU asset
Trf to/from Investment
property
Foreign currency
fluctuationDeductions As at
31-03-2020Up to
31-3-2019For the
period[1]Assets held
for saleT/f to ROU
asset
Trf to Investment
property
Foreign currency
fluctuationDeductions Up to
31-03-2020Up to
31-3-2019Up to
31-03-2020 As at
31-03-2020 As at
31-3-2019
Land Freehold 703.70 38.94 (3.64) – 1.18 – – 737.82 – – – – – – – – – – 737.82 703.70 Leasehold 344.82 – (10.81) (282.10) – – – 51.92 15.68 0.71 (0.94) (12.54) – – 0.00 2.92 – – 49.00 329.14 Sub total -Land 1048.53 38.94 (14.45) (282.10) 1.18 – – 789.74 15.68 0.71 (0.94) (12.54) – – 0.00 2.92 – – 786.82 1032.84 Buildings 2719.92 224.44 (279.57) – 152.01 5.78 6.95 2511.60 441.67 86.47 (44.22) – 0.12 5.71 5.12 484.39 87.25 89.30 1937.91 2190.99 Plant & equipment Owned 6161.01 398.71 (620.67) – – 20.14 183.67 5775.52 2809.73 609.90 (323.45) – – 14.35 123.93 2986.60 15.01 15.05 2773.87 3336.28 Leased out 2.11 – – – – – – 2.11 1.44 0.20 – – – – – 1.64 – – 0.47 0.67 Sub total- Plant & equipment
6163.12 398.71 (620.67) – – 20.14 183.67 5777.63 2811.17 610.11 (323.45) – – 14.35 123.93 2988.24 15.01 15.05 2774.34 3336.95
Computers 408.94 78.42 (44.13) – – 0.34 19.34 424.23 259.26 67.95 (22.96) – – 0.27 17.92 286.61 – – 137.63 149.68 Office equipment 193.97 27.22 (12.43) – – 0.73 1.34 208.15 123.91 30.19 (6.53) – – 0.65 1.31 146.90 0.01 0.01 61.24 70.05 Furniture & fixtures 163.17 9.77 (31.32) – – 0.70 2.73 139.59 90.12 16.46 (14.25) – – 0.58 2.50 90.41 0.24 0.24 48.94 72.81 Vehicles 236.93 32.36 (7.17) – – 1.32 15.84 247.60 99.09 32.11 (2.48) – – 1.01 10.78 118.94 – – 128.66 137.84 Other assets Ships 36.73 46.94 – – – – – 83.67 18.93 7.39 – – – – – 26.31 – – 57.36 17.81 Dredged Channel 418.11 – – – – – – 418.11 156.27 (0.71) – – – – – 155.56 – – 262.54 261.84 Breakwater
Structures 585.81 1.11 – – – – – 586.93 53.41 43.85 – – – – – 97.25 – – 489.67 532.41 Aircraft 195.22 – – – – – – 195.22 16.41 10.48 – – – – – 26.89 – – 168.33 178.81 Sub total - Other assets
1235.87 48.05 – – – – – 1283.92 245.01 61.01 – – – – – 306.02 – – 977.90 990.86
Total 12170.45 857.92 (1009.74) (282.10) 153.19 29.00 229.88 11382.47 4085.92 905.02 (414.82) (12.54) 0.12 22.56 161.57 4424.44 102.51 104.60 6853.43 7982.02
Previous year 11031.55 1391.33 – – (6.03) 26.25 284.71 12170.45 3181.98 1052.50 – – (1.19) 15.79 165.55 4085.92 102.51 102.51 Add : Capital work-in-progress 796.55 567.31 [1] R 1.38 crore pertains to Foreign currency fluctuation 7649.98 8549.34
a) Cost of freehold land includes R 1.14 crore (previous year: R 1.27 crore) for which conveyance is yet to be completed.
b) Cost of buildings includes ownership accommodations:
(i) A. in various co-operative societies, shop-owners’ associations and non-trading corporations : R 68.26crore,including2615shares of R 50 each, 75 shares of R 100 each. (previous year: in various co-operative societies, shop-owners’ associations and non-trading corporations : R 65.75 crore, including 2615 shares of R 50each,80sharesofR 100 each).
B. in various apartments : R 9.42 crore. (previous year: R 9.42 crore).
C. in various co-operative societies : R 0.36 crore (previous year: R 0.36 crore) for which share certificates are yet to be issued.
D. in proposed co-operative societies R 30.59 crore. (previous year: R 30.59 crore).
Notes forming part of the Financial Statements (contd.)
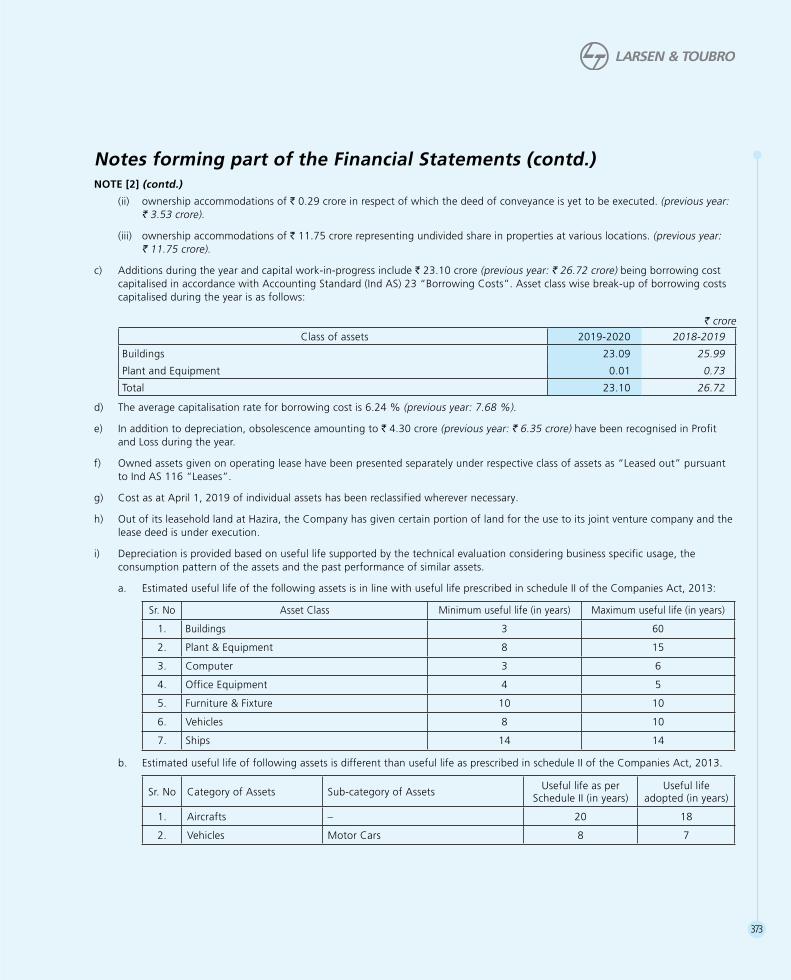
373
(ii) ownership accommodations of R 0.29 crore in respect of which the deed of conveyance is yet to be executed. (previous year: R 3.53 crore).
(iii) ownership accommodations of R 11.75 crore representing undivided share in properties at various locations. (previous year: R 11.75 crore).
c) Additions during the year and capital work-in-progress include R 23.10 crore (previous year: R 26.72 crore) being borrowing cost capitalised in accordance with Accounting Standard (Ind AS) 23 “Borrowing Costs”. Asset class wise break-up of borrowing costs capitalised during the year is as follows:
v croreClass of assets 2019-2020 2018-2019
Buildings 23.09 25.99
Plant and Equipment 0.01 0.73
Total 23.10 26.72
d) The average capitalisation rate for borrowing cost is 6.24 % (previousyear:7.68%).
e) In addition to depreciation, obsolescence amounting to R 4.30 crore (previous year: R 6.35 crore) have been recognised in Profit and Loss during the year.
f) Owned assets given on operating lease have been presented separately under respective class of assets as “Leased out” pursuant to Ind AS 116 “Leases”.
g) Cost as at April 1, 2019 of individual assets has been reclassified wherever necessary.
h) Out of its leasehold land at Hazira, the Company has given certain portion of land for the use to its joint venture company and the lease deed is under execution.
i) Depreciation is provided based on useful life supported by the technical evaluation considering business specific usage, the consumption pattern of the assets and the past performance of similar assets.
a. Estimated useful life of the following assets is in line with useful life prescribed in schedule II of the Companies Act, 2013:
Sr. No Asset Class Minimum useful life (in years) Maximum useful life (in years)
1. Buildings 3 60
2. Plant & Equipment 8 15
3. Computer 3 6
4. Office Equipment 4 5
5. Furniture & Fixture 10 10
6. Vehicles 8 10
7. Ships 14 14
b. Estimated useful life of following assets is different than useful life as prescribed in schedule II of the Companies Act, 2013.
Sr. No Category of Assets Sub-category of Assets Useful life as per Schedule II (in years)
Useful life adopted (in years)
1. Aircrafts – 20 18
2. Vehicles Motor Cars 8 7
Notes forming part of the Financial Statements (contd.)NOTE [2] (contd.)

374
NOTES FORMING PART OF THE FINANCIAL STATEMENTS ANNUAL REPORT 2019-20
A Assets used in Heavy Engineering Business:
Sr. No Category of Assets Sub-category of Assets
Useful life as per Schedule II
(in years)
Useful life adopted (in years)
1. Plant & Equipment General
Boring/Rolling/Drilling/Milling machines
15
10-30
Modular Furnace 5-15
Other Furnaces 5-30
Horizontal Autoclaves 10-30
Load bearing structures 50
Flushing Facility 3
Cranes 10-30
2. Roads Carpeted Roads-other than RCC 5 5-15
B Assets used in Shipbuilding Business:
Sr. No Category of Assets Sub-category of Assets
Useful life as per Schedule II
(in years)
Useful life adopted (in years)
1. Marine structures 30* 50
2. Plant & equipment Ship lift structures, Control system, Chiller units, Condition monitoring system, Ship position system, Ship transfer system, other ship lift related structures
30* 20
Land berth and piled platforms 30* 40
Rail Mounted quay Cranes, Rubber Tyre Gantry Cranes having capacity of 40 Tons or more
15 20
Tower cranes and EOT cranes 15 25
Rails 15 20
Air-Conditioner & refrigeration equipment 15 12
Diesel generator 15 12
3. Buildings Production shops 30 50
Container yards 30 20
Internal roads 5 15
4. Vehicles Motor Cars 8 7
*Represents licence period as per agreement executed with the Tamil Nadu Maritime Board.
Notes forming part of the Financial Statements (contd.)NOTE [2] (contd.)

375
Notes forming part of the Financial Statements (contd.)NOTE [2] (contd.)
C Assets used in Defence Business:
Sr. No Category of Assets Sub-category of Assets Useful life as per
Schedule II (in years)Useful life adopted
(in years)
1. Buildings Factory Buildings 30 2 - 60
2. Buildings Non-Factory Buildings 3 – 60 5 - 50
3. Plant and Equipment General 8–15 1 – 50
4. Plant & Equipment Photographic equipment 15 8
Laboratory Equipment 10 1
Electrical Installation 10 1 – 21
Air conditioning and refrigeration equipment
12 1 – 12
5. Computer 3 – 6 1–8
6. Office Equipment 4 – 5 1 – 15
7. Furniture and Fixture 10 1 – 20
D Assets used in Electrical & Automation business:
Sr. No Category of Assets Sub-category of Assets Useful life as per
Schedule II (in years)Useful life adopted
(in years)
1. Plant & Equipment General Specialised machine tools, dies, jigs, fixtures, gauges for electrical business
15 5
E Assets used in Construction business:
Sr. No Category of Assets Sub-category of Assets Useful life as per
Schedule II (in years)Useful life adopted
(in years)
1. Office Equipment Assets deployed at project site 5 3
2. Air conditioning and refrigeration equipment
Assets deployed at project site15 3
3. Canteen Equipment Assets deployed at project site 15 3
4. Laboratory Equipment Assets deployed at project site 10 3
5. Photographic equipment Assets deployed at project site 15 3
In addition to above, any assets purchased for project site with acquisition value less than R 50,000 for above 5 categories of Asset, full cost is depreciated in the same financial year.
j) Carrying value of Property, plant and equipment pledged as collateral for liabilities and/or commitments as at March 31, 2020 amounts to R 1718.30crore(as at March 31, 2019: R 1973.52 crore)

376
NOTES FORMING PART OF THE FINANCIAL STATEMENTS ANNUAL REPORT 2019-20
NOTE [3]
Investment Propertyv crore
Class of assets
Cost Depreciation Book Value
As at 1-4-2019 Additions
Transferred from PPE/to Inventories
Deductions As at 31-3-2020
As at 31-3-2019 Additions
Transferred from PPE/to Inventories
Deductions Upto 31-3-2020
As at 31-3-2020
As at 31-3-2019
Land 52.77 – 1.18 – 53.95 – – – – – 53.95 52.77
Buildings 357.20 0.33 151.96 7.77 501.72 48.79 16.63 0.08 0.22 65.27 436.45 308.41
Total 409.97 0.33 153.15 7.77 555.68 48.79 16.63 0.08 0.22 65.27 490.40 361.18
Previous year 523.16 7.62 (8.93) 111.88 409.97 48.18 15.49 (1.34) 13.54 48.79
Add : Capital work-in-progress – 20.08
490.40 381.26
(a) Additions during the year and capital work-in-progress include R 0.33 crore (previous year: R 1.38crore) being borrowing cost capitalised in accordance with Accounting Standard (Ind AS) 23 “Borrowing Costs”. Asset class wise break-up of borrowing costs capitalised during the year is as follows:
R crore
Class of assets 2019-2020 2018-2019
Buildings 0.33 1.38
(b) Depreciation is provided based on useful life supported by the technical evaluation considering business specific usage, the consumption pattern of the assets and the past performance of similar assets:
Class of assetsMinimum useful life
(in years)Maximum useful life
(in years)
Buildings 3 60
(c) Disclosure pursuant to Ind AS 40 “Investment Property”
(i) Amount recognised in the Statement of Profit and Loss for Investment property:
v crore
Sr. No.
Particulars2019-20 2018-19
1 Rental income derived from Investment property 137.81 179.92
2 Direct operating expenses arising from Investment property that generated rental income 79.14 66.74
3 Direct operating expenses arising from Investment property that did not generate rental income 0.63 0.67
(ii) Fair value of Investment property : R 2644.31 crore as at March 31, 2020 (R 2932.97 crore as at March 31, 2019)
(iii) The fair values of investment properties have been determined with the help of internal architectural department and independent valuer on a case to case basis. Fair value of properties that are evaluated by independent valuer amounts to R 1802.82crore(R 2932.97 crore as at March 31, 2019). Valuation is based on government rates, market research, market trend and comparable values as considered appropriate.
Notes forming part of the Financial Statements (contd.)

377
NOTE [4]
Intangible assets & Intangible assets under developmentv crore
Class of assets
Cost Amortisation Book value
As at 1-4-2019 Additions Assets held
for sale Deductions As at 31-03-2020
Up to 31-3-2019
For the period
Assets held for sale Deductions Up to
31-3-2020 As at
31-3-2020 As at
31-3-2019
Specialised softwares 226.69 12.02 (31.48) – 207.22 182.07 13.56 (25.18) – 170.45 36.77 44.62
Technical knowhow 106.55 8.34 (14.20) – 100.69 43.02 24.43 (13.72) – 53.74 46.95 63.52
New product design and development 229.38 54.08 (277.20) – 6.26 108.81 7.64 (110.18) – 6.26 0.00 120.58
Total 562.62 74.44 (322.88) – 314.17 333.90 45.63 (149.08) – 230.45 83.72 228.72
Previous year 463.99 98.63 – – 562.62 270.57 63.33 – – 333.90
Add: Intangible assets under development 0.66 171.69
84.38 400.41
(a) Additions during the year
v crore
Class of assetsFY 2019-20 FY 2018-19
Internal development
Acquired - external
Total Internal development
Acquired - external
Total
Specialised softwares – 12.02 12.02 – 23.16 23.16Technical knowhow 8.34 – 8.34 – 7.48 7.48New product design and development 54.08 – 54.08 67.99 – 67.99Total 62.42 12.02 74.44 67.99 30.64 98.63
(b) Note : Depreciation is provided based on useful life supported by the technical evaluation considering business specific usage, the consumption pattern of the assets and the past performance of similar assets:
Sr. No. Class of assetsMinimum useful life
(in years)Maximum useful life
(in years)1. Specialised softwares 1 102. Technical knowhow 1 103. New product design and development 1 6
Notes forming part of the Financial Statements (contd.)

378
NOTES FORMING PART OF THE FINANCIAL STATEMENTS ANNUAL REPORT 2019-20
NOTE [5]
Non-current Assets: Financial Assets - Investments
ParticularsAs at 31-3-2020 As at 31-3-2019
v crore v crore v crore v crore (A) Investment in equity instruments (a) Subsidiary companies 26339.03 16537.52 (b) Associate companies 4.42 4.42 (c) Joint venture companies 1539.91 1539.51 (d) Other companies 73.42 97.35
27956.78 18178.80(B) Other investments in Subsidiary Company 18.50 18.50
27975.28 18197.30
Details of Non-current Assets: Financial Assets - Investments
Number of unitsParticulars Face value
per unit As at
31-3-2020As at
31-3-2020As at
31-3-2019v v crore v crore
(A) Investments in fully paid equity instruments (a) Subsidiary companies: (i) Investments in fully paid equity instruments:
L&T Valves Limited 100 18,00,000 161.23 161.23 Bhilai Power Supply Company Limited 10 49,950 0.05 0.05 Hi-Tech Rock Products & Aggregates Limited 10 50,000 0.05 0.05 Kesun Iron & Steel Company Private Limited 10 9,500 0.01 0.01 L&T Aviation Services Private Limited 10 4,56,00,000 45.60 45.60 L&T Capital Company Limited 10 50,000 0.05 0.05 L&T Cassidian Limited [Net of provision R 0.05 crore (previous year:
R 0.05 crore)]10 50,000 – –
L&T Finance Holdings Limited (quoted) 10 1,27,75,20,203 3468.17 3468.17 L&T Metro Rail (Hyderabad) Limited 10 2,43,89,99,999 2439.00 2427.18 L&T Power Development Limited 10 3,11,27,00,000 3112.70 3112.70 L&T Power Limited 10 51,157 0.05 0.05 L&T Construction Equipment Limited [1] 10 16,71,60,700 107.72 107.72 L&T Seawoods Limited 10 1,65,45,50,000 1654.55 1654.55 Mindtree Limited 10 10,05,27,734 9567.93 – L&T Electricals and Automation Limited 10 74,38,796 40.36 40.36 L&T Hydrocarbon Engineering Limited 10 1,00,00,50,000 1000.05 1000.05 L&T Technology Services Limited (quoted) 2 7,79,86,899 805.25 805.49 Larsen & Toubro Infotech Limited (quoted) 1 12,97,84,034 108.05 108.05 Larsen & Toubro Hydrocarbon International Limited LLC [Net of provision R 0.68
crore (previous year:R 0.68 crore)]SAR 1000 450 – –
Larsen & Toubro LLC USD 1 50,000 0.23 0.23 L&T Construction Machinery Limited [1] 10 19,91,42,091 22.27 22.27 Larsen & Toubro (Saudi Arabia) LLC SAR 1000 625 1.05 1.05 L&T Infrastructure Engineering Limited 10 36,00,000 21.85 21.85 L&T Global Holdings Limited USD 100 80,000 53.16 53.16
22609.38 13029.87
Notes forming part of the Financial Statements (contd.)

379
NOTE [5]
Details of Non-current Assets: Financial Assets - Investments (contd.)
Number of unitsParticulars Face value
per unit As at
31-3-2020As at
31-3-2020As at
31-3-2019v v crore v crore
(ii) Preference share considered equity as per terms: L&T Seawoods Limited -10% Non-cumulative, optionally convertible redeemable
preference shares, March 30, 2022. 2 82,60,00,000 826.00 826.00
L&T Seawoods Limited -10% Non-cumulative, optionally convertible redeemable preference shares, May 12, 2022
2 4,80,00,000 48.00 48.00
L&T Seawoods Limited -10% Non-cumulative, optionally convertible redeemable preference shares, July 14, 2022
2 4,22,50,000 42.25 42.25
L&T Seawoods Limited -10% Non-cumulative, optionally convertible redeemable preference shares, September 3, 2022
2 4,20,00,000 42.00 42.00
L&T Hydrocarbon Engineering Ltd -10% Non-cumulative, optionally convertible redeemable at par preference shares, February 6, 2029
10 50,00,00,000 500.00 500.00
L&T Hydrocarbon Engineering Ltd -12% Non-cumulative, optionally convertible, redeemable at par preference shares, October 19, 2030
10 13,00,00,000 130.00 130.00
L&T Hydrocarbon Engineering Ltd -12% Non-cumulative,optionally convertible, redeemable at par preference shares, March 30, 2031
10 13,00,00,000 130.00 130.00
L&T Uttaranchal Hydropower Limited - 10% Non-cumulative, optionally convertible redeemable preference shares, July 17, 2029.
2 1,36,24,50,000 1362.45 1140.45
L&T Construction Equipment Limited - 12% Non-cumulative and optionally convertible, redeemable at par preference shares, May 26, 2025. [1]
10 64,83,00,000 648.30 648.30
3729.00 3507.00 (iii) Other equity investments: L&T Aviation Services Private Limited 0.65 0.65
0.65 0.65 Total - (a) = (i)+(ii)+(iii) 26339.03 16537.52 (b) Associate companies:
Gujarat Leather Industries Limited [Net of provision R 0.56 crore (previous year: R 0.56 crore)]
10 7,35,000 – –
Magtorq Private Limited 100 9,000 4.42 4.42 4.42 4.42
(c) Joint venture companies: (i) Investments in fully paid equity instruments:
Ahmedabad-Maliya Tollway Limited [R 1000 (previous year: R 1000)] 10 100 – –L&T Chennai-TADA Tollway Limited [R 1000 (previous year: R 1000)] 10 100 – –L&T Halol-Shamlaji Tollway Limited [R 1000 (previous year: R 1000)] 10 100 – –L&T Howden Private Limited 10 1,50,30,000 15.03 15.03 L&T Infrastructure Development Projects Limited [Net of provision R 1723 crore
(previous year: R 950 crore)]10 32,10,59,096 1021.48 973.48
L&T Kobelco Machinery Private Limited 10 – – 25.50 L&T-MHPS Boilers Private Limited 10 11,93,91,000 119.39 119.39 L&T-MHPS Turbine Generators Private Limited 10 36,24,06,000 362.41 362.41 L&T Rajkot-Vadinar Tollway Limited [R 1000 (previous year: R 1000)] 10 100 – –L&T Samakhiali Gandhidham Tollway Limited 10 13,000 0.01 0.01
Carried forward 1518.32 1495.82
Notes forming part of the Financial Statements (contd.)

380
NOTES FORMING PART OF THE FINANCIAL STATEMENTS ANNUAL REPORT 2019-20
Notes forming part of the Financial Statements (contd.)
Number of unitsParticulars Face value
per unit As at
31-3-2020As at
31-3-2020As at
31-3-2019v v crore v crore
(i) Investments in fully paid equity instruments: (contd.) Brought forward 1518.32 1495.82
L&T Special Steels and Heavy Forgings Private Limited [Net of provision R 419.28 crore (previous year: R 419.28 crore)]
10 41,92,84,000 – –
L&T Transportation Infrastructure Limited 10 1,08,64,000 10.86 10.86 L&T-Sargent & Lundy Limited 10 27,82,736 0.82 0.82 PNG Tollway Limited 10 100 – 22.42 Raykal Aluminum Company Private Limited 10 37,750 0.04 0.04 L&T MBDA Missile Systems Limited 10 5,10,000 0.51 0.51
1530.55 1530.47 (ii) Other equity investments:
L&T-MHPS Boilers Private Limited 2.24 2.24 L&T-MHPS Turbine Generators Private Limited 7.13 6.80
9.36 9.04 (iii) Preference shares-(equity portion):
L&T Special Steels & Heavy Forgings Private Limited - 6% Cumulative, non-convertible redeemable at par preference shares, December 8, 2024 [Net of provision R 78.33 crore (previous year: R 78.33)]
10 15,54,00,000 – –
L&T Special Steels & Heavy Forgings Private Limited - 6% Cumulative, non-convertible redeemable at par preference shares, December 8, 2025 [Net of provision R 97.91 crore (previous year: R 97.91)]
10 17,76,00,000 – –
L&T Special Steels & Heavy Forgings Private Limited - 6% Cumulative, non-convertible redeemable at par preference shares, December 8, 2026 [Net of provision R 84.41 crore (previous year: R 84.41)]
10 14,20,80,000 – –
– – Total - (c) = (i)+(ii)+(iii) 1539.91 1539.51 (d) Other companies:
International Seaport Dredging Limited [Net of provision R 15.90 crore (previous year: R 15.90 crore)]
10000 15,899 – –
BBT Elevated Road Private Limited 10 1,00,000 0.10 0.10 Utmal Multi purpose Service Co-operative Society Limited (B Class) (non-trade
investments) [R 30,000 (previous year: R 30,000)]100 300 – –
Tidel Park Limited [note 53(f)] 10 40,00,000 68.30 65.58 VP Global Fibre and Yarns Private Limited [R 22,900 (previous year: R 20,600)] 100 229 – –New Vision Wind Power Private Limited 10 2,700 – –The New India Assurance Company Limited 10 4,45,803 5.01 11.92 ICICI Securities Limited 5 – – 19.73
Total - (d) 73.42 97.35 Total - (A) =(a)+(b)+(c)+(d) 27956.78 18178.80
NOTE [5]
Details of Non-current Assets: Financial Assets - Investments (contd.)

381
Number of unitsParticulars Face value
per unit As at
31-3-2020As at
31-3-2020As at
31-3-2019v v crore v crore
(B) Investment in preference shares of Joint Venture companies: (Fair value debt portion):
L&T Special Steels & Heavy Forgings Private Limited - 6% Cumulative, non-convertible redeemable at par preference shares, December 8, 2024 [Net of provision R 77.77 crore (previous year: R 77.77)]
10 15,54,00,000 – –
L&T Special Steels & Heavy Forgings Private Limited - 6% Cumulative, non-convertible redeemable at par preference shares, December 8, 2025 [Net of provision R 79.12 crore (previous year: R 79.12)]
10 17,76,00,000 – –
L&T Special Steels & Heavy Forgings Private Limited - 6% Cumulative, non-convertible redeemable at par preference shares, December 8, 2026 [Net of provision R 56.28 crore (previous year: R 56.28)]
10 14,20,80,000 – –
Total - (B) – –(C) Other investments: Subsidiary companies: In limited liability partnership: L&T Geo structure LLP 18.50 18.50 Total - (B) 18.50 18.50 Total Non Current Investment =(A)+(B) 27975.28 18197.30
Details of quoted / unquoted investments:
Particulars As at 31-3-2020
As at 31-3-2019
v crore v crore(a) Aggregate amount of quoted investments and market value thereof; Book Value 13954.41 4413.37 Market Value 42534.94 53882.38(b) Aggregate amount of unquoted investments; Book Value 14020.87 13783.93(c) Aggregate amount of Impairment in value of investments 2633.29 2633.29
[1] The composite scheme of amalgamation and arrangement between L&T Realty Limited and L&T Construction Equipment Limited and L&T Construction Machinery Limited has been approved by National Company Law Tribunal on April 23,2020 with appointed date as April1,2018.Pursuanttothescheme:
a. Pursuant to amalgamation of L&T Realty Limited with L&T Constructure Equipment Limited, L&T Construction Equipment Limited issued 4,71,60,700 equity shares of R 10eachand64,83,00,000,12%non-cumulativeredeemablepreferencesharesofR 10 each to Larsen & Toubro Limited as a consideration towards transfer of all assets and liabilities by L&T Realty Limited. The cost of acquisition of shares issued is deemed to be the cost at which Larsen & Toubro Limited acquired shares of L&T Realty Limited. Accordingly, the value of investment in L&T Construction Equipment Limited has been increased by R 47.16 crore towards equity shares and R 648.30croretowardspreferencesharesw.e.f.April1,2018andcorrespondinglyinvestmentinequityandpreferenceshares of L&T Realty Limited stands cancelled.
b. Subject to the approval of the Registrar of Companies, L&T Construction Equipment Limited is proposed to be renamed as L&T Realty Developers Limited and L&T Construction Machinery Limited is proposed to be renamed as L&T Construction Equipment Limited.
c. Pursuant to demerger of Manufacturing business of L&T Construction Equipment Limited, L&T Construction Machinery Limited issued 19,91,32,091 equity shares of R 10 each to Larsen & Toubro Limited as a consideration towards transfer of certain assets and liabilities by L&T Construction Equipment Limited. The cost of acquisition of these shares issued is derived based on book value of assets transferred to the total value of assets of L&T Construction Equipment Limited as at appointed date. Accordingly, the value of investment in L&T Construction Machinery Limited has been increased by R 22.26 crore and reduced in L&T Construction EquipmentLimitedw.e.f.April1,2018.
Notes forming part of the Financial Statements (contd.)NOTE [5]
Details of Non-current Assets: Financial Assets - Investments (contd.)

382
NOTES FORMING PART OF THE FINANCIAL STATEMENTS ANNUAL REPORT 2019-20
NOTE [6]
Non-current Assets: Financial Assets - Loans
Particulars As at 31-3-2020 As at 31-3-2019
v crore v crore v crore v crore
Unsecured security deposits, considered good: 152.45 106.32
Less: Allowance for expected credit loss 36.54 28.30
115.91 78.02
Unsecured loan and advances to related parties:
Subsidiarycompanies,consideredgood[Note57&58(A)] 2074.59 –
Jointventurecompanies,consideredgood[Note57&58(A)] 1578.79 1463.59
Less: Allowance for expected credit loss 263.00 263.00
1315.79 1200.59
Other loans, considered good:
Secured – 0.08
Unsecured 0.71 1.07
0.71 1.15
3507.00 1279.76
NOTE [7]
Non-current Assets: Financial Assets - Others
Particulars As at 31-3-2020 As at 31-3-2019
v crore v crore
Cash and bank balances not available for immediate use [Note 7(a)] 273.76 289.76
Forward contract receivables 19.87 102.43
Premium receivable on financial guarantee contracts 10.53 10.54
Other receivables – 174.27
Fixed deposits with banks (maturity more than 12 months) 0.32 –
304.48 577.00
Notes forming part of the Financial Statements (contd.)

383
7(a) Particulars of cash and bank balances not available for immediate use v crore
Sr. No. Particulars As at
31-3-2020As at
31-3-20191 Amount received (including interest accrued thereon) from customers of property
development business – to be handed over to housing society on its formation. 26.02 25.252 Contingency deposit (including interest accrued thereon) received from customers of
property development business towards their sales tax liability - to be refunded/adjusted depending on the outcome of the legal case. 26.49 25.97
3 Other bank balances (including interest accrued thereon) not available for immediate use being in the nature of security offered for bids submitted, loans availed, acquisition etc. 575.28 4372.34Total 627.79 4423.56Less: Amount reflected under current assets [Note 13] 354.03 4133.80Amount reflected under other financial assets - non-current [Note 7] 273.76 289.76
NOTE [8]Other non-current assets
Particulars As at 31-3-2020 As at 31-3-2019
v crore v croreCapital advances: Secured 0.15 1.84 Unsecured 237.94 19.29Advance recoverable other than in cash 1758.01 1636.04Current tax receivable (net) 2072.84 1716.47
4068.94 3373.64
NOTE [9]Current Assets: Inventories
Particulars As at 31-3-2020 As at 31-3-2019
v crore v croreRaw materials [includes goods-in-transit R 1.12 crore
(previous year: R 14.83crore)] 377.44 332.93
Components [includes goods-in-transit R 10.58crore (previous year: R 19.29 crore)] 82.04 296.27
Construction materials [includes goods-in-transit R 17.11 crore (previous year: R 114.39 crore)] 48.34 144.09
Manufacturing work-in-progress 367.48 489.87
Finished goods 18.12 230.41
Stock-in-trade [includes goods-in-transit R 37.10 crore (previous year: R 38.79crore)] 308.36 386.27
Stores and spares [includes goods-in-transit R 1.14 crore (previous year: R 2.22 crore)] 133.60 130.74
Loose tools 2.96 3.69
Property development related work-in-progress 1431.56 1334.97
2769.90 3349.24
Note: During the year R 73.98crore(previous year: R 1.09 crore) was recognised as expense towards write-down of inventories.
Notes forming part of the Financial Statements (contd.)

384
NOTES FORMING PART OF THE FINANCIAL STATEMENTS ANNUAL REPORT 2019-20
NOTE [10]
Current Assets: Financial Assets - Investments
Particulars As at 31-3-2020 As at 31-3-2019
v crore v crore v crore v crore(A) Government and trust securities 757.82 924.53(B) Debentures and bonds (i) Subsidiary companies 331.40 273.07 (ii) Joint venture companies 836.53 741.94 (iii) Other debentures & bonds 2132.58 1123.75
3300.51 2138.76(C) Mutual funds 2000.82 1643.56
6059.15 4706.85
Details of current investments in Subsidiary companies and joint venture companies
Number of unitsParticulars Face value
per unit As at
31-3-2020As at
31-3-2020As at
31-3-2019v v crore v crore
Debentures and Bonds (quoted): (i) Subsidiary companies:
9.10% L&T Finance Ltd. NCD April 13, 2022 1000 2,00,000 20.83 –7.65% L&T Finance Ltd. NCD November 13, 2020 2500000 80 20.819.50% L&T Metro Rail (Hyderabad) Limited SR-F NCD November 26, 2030 1000000 1,500 172.96 162.61 9.55% L&T Metro Rail (Hyderabad) Limited SR-F NCD September 28, 2030 1000000 1,000 116.81 110.47 Total- (i) 331.40 273.07
(ii) Joint Venture companies: 9.14% Kudgi Transmission Limited SR-K NCD April 25, 2028 1000000 230 27.20 25.84 9.14% Kudgi Transmission Limited SR-L NCD April 25, 2029 1000000 240 28.52 26.96 9.14% Kudgi Transmission Limited SR-M NCD April 25, 2030 1000000 270 32.01 30.19 9.14% Kudgi Transmission Limited SR-N NCD April 25, 2031 1000000 280 33.35 31.00 9.14% Kudgi Transmission Limited SR-O NCD April 25, 2032 1000000 290 34.50 31.94 9.50% Kudgi Transmission Limited SR-P NCD April 25, 2033 1000000 310 37.85 35.03 9.50% Kudgi Transmission Limited SR-Q NCD April 25, 2034 1000000 330 40.37 – 9.50% Kudgi Transmission Limited SR-R NCD April 25, 2035 1000000 360 43.90 40.64 9.50% Kudgi Transmission Limited SR-S NCD April 25, 2036 1000000 390 47.83 44.08 9.50% Kudgi Transmission Limited SR-T NCD April 25, 2037 1000000 410 50.56 46.39 9.50% Kudgi Transmission Limited SR-U NCD April 25, 2038 1000000 350 43.36 39.64 9.50% Kudgi Transmission Limited SR-V NCD April 25, 2039 1000000 960 119.34 108.82 9.50% Kudgi Transmission Limited SR-W NCD April 25, 2040 1000000 250 31.15 28.36 8.60% LTIDPL NCD December 26, 2026 1000000 2,500 266.60 253.06
Total- (ii) 836.53 741.94
Details of quoted / unquoted investments:
Particulars As at 31-3-2020
As at 31-3-2019
v crore v crore(a) Aggregate amount of quoted current investments and market value thereof; Book Value 4058.33 3063.29 Market Value 4058.33 3063.29 (b) Aggregate amount of unquoted current investments; Book Value (Accounted based on NAV) 2000.82 1643.56
Notes forming part of the Financial Statements (contd.)

385
NOTE [11]
Current Assets: Financial Assets - Trade receivables
Particulars As at 31-3-2020 As at 31-3-2019
v crore v crore v crore v crore
Unsecured, considered good 29056.56 29438.93
Less: Allowance for expected credit loss 1313.12 1411.43
27743.44 28027.50
Credit Impaired 1234.68 1044.24
Less: Allowance for expected credit loss 1065.16 859.19
169.52 185.05
27912.96 28212.55
NOTE [12]Current Assets: Financial Assets - Cash and cash equivalents
Particulars As at 31-3-2020 As at 31-3-2019
v crore v crore
Balance with banks 2130.13 1862.20
Cheques and drafts on hand 66.04 174.42
Cash on hand 4.16 2.06
Fixed deposits with banks (maturity less than 3 months) 1062.50 694.77
3262.83 2733.45
NOTE [13]Current Assets: Financial Assets - Other bank balances
Particulars As at 31-3-2020 As at 31-3-2019
v crore v crore
Fixed deposits with banks 185.35 647.64
Earmarked balances with banks-unclaimed dividend 114.27 84.64
Earmarked balances with banks-Section 4(2)(1)(D)RERA[1] 0.15 –
Margin money deposits with banks 21.76 20.44
Cash and bank balances not available for immediate use 354.03 4133.80
675.56 4886.52
[1] Real Estate (Regulation and Development) Act, 2016
Notes forming part of the Financial Statements (contd.)
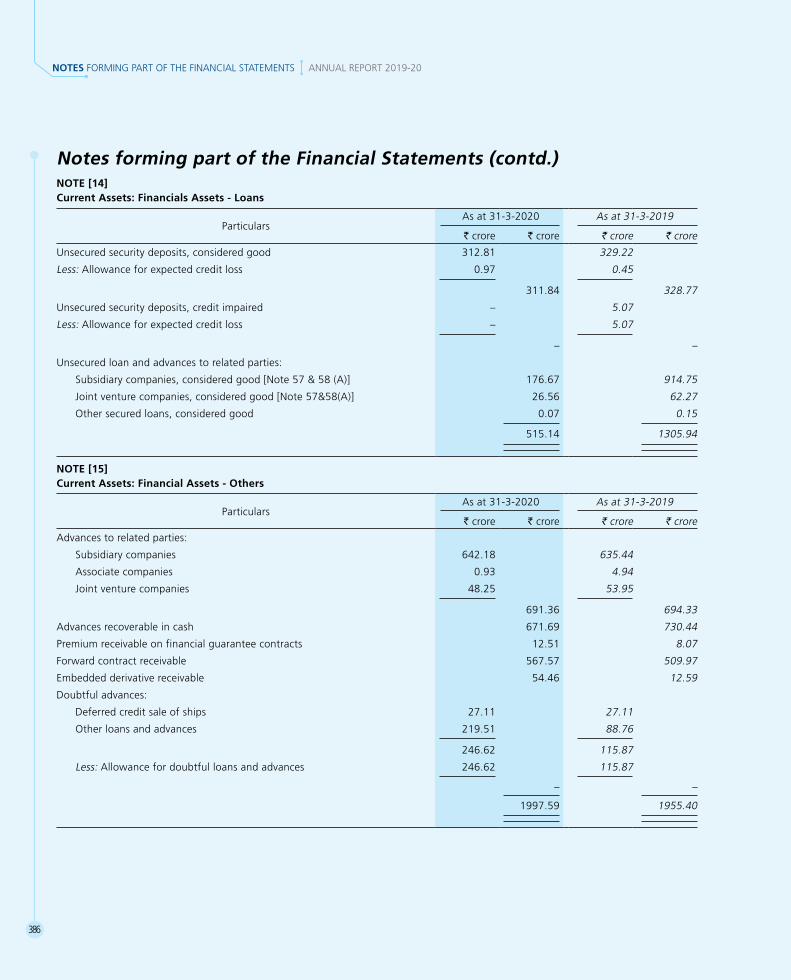
386
NOTES FORMING PART OF THE FINANCIAL STATEMENTS ANNUAL REPORT 2019-20
NOTE [14]Current Assets: Financials Assets - Loans
Particulars As at 31-3-2020 As at 31-3-2019
v crore v crore v crore v crore
Unsecured security deposits, considered good 312.81 329.22
Less: Allowance for expected credit loss 0.97 0.45
311.84 328.77
Unsecured security deposits, credit impaired – 5.07
Less: Allowance for expected credit loss – 5.07
– –
Unsecured loan and advances to related parties:
Subsidiarycompanies,consideredgood[Note57&58(A)] 176.67 914.75
Jointventurecompanies,consideredgood[Note57&58(A)] 26.56 62.27
Other secured loans, considered good 0.07 0.15
515.14 1305.94
NOTE [15]Current Assets: Financial Assets - Others
Particulars As at 31-3-2020 As at 31-3-2019
v crore v crore v crore v crore
Advances to related parties:
Subsidiary companies 642.18 635.44
Associate companies 0.93 4.94
Joint venture companies 48.25 53.95
691.36 694.33
Advances recoverable in cash 671.69 730.44
Premium receivable on financial guarantee contracts 12.51 8.07
Forward contract receivable 567.57 509.97
Embedded derivative receivable 54.46 12.59
Doubtful advances:
Deferred credit sale of ships 27.11 27.11
Other loans and advances 219.51 88.76
246.62 115.87
Less: Allowance for doubtful loans and advances 246.62 115.87
– –
1997.59 1955.40
Notes forming part of the Financial Statements (contd.)

387
Notes forming part of the Financial Statements (contd.)NOTE [16]
Other current assets
Particulars As at 31-3-2020 As at 31-3-2019
v crore v crore v crore v crore
Contract Assets [Refer Note 41(d)]
Due from customers (construction and project related activity) 31750.52 28311.36
Retention money including unbilled revenue 13238.42 11953.54
44988.94 40264.90
Advance recoverable other than in cash 4601.02 3513.52
Government grants receivable 71.65 89.08
Doubtful other loans and advances 7.00 7.00
Less: Provision for doubtful advances 7.00 7.00
– –
49661.61 43867.50
NOTE [17]
Equity share capital(a) Share capital authorised, issued, subscribed and paid up:
Particulars
As at 31-3-2020 As at 31-3-2019
Number of shares
v crore Number of shares
v crore
Authorised:Equity shares of R 2 each 1,62,50,00,000 325.00 1,62,50,00,000 325.00
Issued, subscribed and fully paid up:Equity shares of R 2 each 1,40,38,92,022 280.78 1,40,27,29,385 280.55
(b) Reconciliation of the number of equity shares and share capital:
Particulars
2019-20 2018-19
Number of shares
v crore Number of shares
v crore
Issued, subscribed and fully paid up equity share outstanding at the beginning of the year 1,40,27,29,385 280.55 1,40,13,69,456 280.27
Add: Shares issued on exercise of employee stock options during the year 7,83,249 0.16 13,59,929 0.28Add: Shares issued on conversion of foreign currency convertible bonds during
the year 3,79,388 0.07 – –Issued, subscribed and fully paid up equity shares outstanding at the end of the
year 1,40,38,92,022 280.78 1,40,27,29,385 280.55
(c) Terms/rights attached to equity shares:
The Company has only one class of share capital, i.e., equity shares having face value of R 2 per share. Each holder of equity share is entitled to one vote per share.

388
NOTES FORMING PART OF THE FINANCIAL STATEMENTS ANNUAL REPORT 2019-20
(d) Shareholder holding more than 5% of equity shares:
Name of the shareholders
As at 31-3-2020 As at 31-3-2019
Number of shares
Shareholding %
Number of shares
Shareholding %
Life Insurance Corporation of India 20,91,83,856 14.90 24,66,76,682 17.59
L&T Employees Trust 18,55,24,682 13.22 17,21,28,421 12.27
(e) Shares reserved for issue under options outstanding on un-issued share capital:
Particulars
As at 31-3-2020 As at 31-3-2019
Number of equity shares to be issued as fully paid
R crore (at face value)
Number of equity shares
to be issued as fully paid
R crore (at face value)
Employee stock options granted and outstanding [3] 25,21,389[5] 0.50[1] 28,85,240[5] 0.58[1]
0.675% 5 years & 1 day US$ denominated foreign currency convertible bonds (FCCB) [4] – – 95,20,455[5] 1.90[2]
[1] The equity shares will be issued at a premium of R 63.06 crore (previous year: R 71.99 crore)
[2] The equity shares will be issued at a premium of R Nil (previous year: R 1214.50 crore) on the exercise of options by the bond holders
[3] Note 17(h)(i) for terms of employee stock option schemes
[4] Note 19(b) for terms of foreign currency convertible bonds
[5] The number of options have been adjusted consequent to bonus issue wherever applicable
(f) The aggregate number of equity shares allotted as fully paid up by way of bonus shares in immediately preceding five years ended March 31, 2020 are 46,67,64,755 (previous period of five years ended March 31, 2019: 46,67,64,755 shares).
(g) The aggregate number of equity shares issued pursuant to contract, without payment being received in cash in immediately preceding last five years ended on March 31, 2020 – Nil (previous period of five years ended March 31, 2019: Nil).
(h) Stock option schemes
i. Terms:
A. The grant of options to the employees under the stock option schemes is on the basis of their performance and other eligibility criteria. The options are vested equally over a period of 4 years [5 years in the case of series 2006(A)], subject to the discretion of the management and fulfillment of certain conditions.
B. Options can be exercised anytime within a period of 7 years from the date of grant and would be settled by way of issue of equity shares. Management has discretion to modify the exercise period.
Notes forming part of the Financial Statements (contd.)NOTE [17]
Equity share capital (contd.)

389
ii. The details of the grants under the aforesaid schemes under various series are summarised below:
Sr. No.
Series reference2000 2002(A) 2002(B) 2003(A) 2003(B) 2006(A)
2019-20 2018-19 2019-20 2018-19 2019-20 2018-19 2019-20 2018-19 2019-20 2018-19 2019-20 2018-19
1 Grant price - (R) 2.00 2.00 2.00 2.00 2.00 2.00 7.80 7.80 7.80 7.80 267.10 267.10
2 Grant dates 1-6-2000 19-4-2002 19-4-2002 23-5-2003 onwards 23-5-2003 onwards 1-7-2007 onwards
3 Vesting commences on 1-6-2001 19-4-2003 19-4-2003 23-5-2004 onwards 23-5-2004 onwards 1-7-2008 onwards
4 Options granted and outstanding at the beginning of the year – 19,800 – 48,375 – 89,325 – 70,767 1,73,309 4,87,892 27,11,931 35,49,464
5 Options lapsed – 19,800 – 48,375 – 89,325 – 70,767 13,837 1,05,342 2,64,380 3,51,935
6 Options granted – – – – – – – – 38,700 25,200 6,58,915 6,39,890
7 Options exercised – – – – – – – – 52,237 2,34,441 7,31,012 11,25,488
8 Options granted and outstanding at the end of the year, of which: – – – – – – – – 1,45,935 1,73,309 23,75,454 27,11,931
Options vested – – – – – – – – 49,762 10,750 6,51,653 9,76,795
Options yet to vest – – – – – – – – 96,173 1,62,559 17,23,801 17,35,136
9 Weighted average remaining contractual life of options (in years) Nil Nil Nil Nil Nil Nil Nil Nil 4.63 4.95 4.61 4.15
iii. The number and weighted average exercise price of stock options are as follows:
Particulars
2019-20 2018-19
No. of stock options
Weighted average exercise price (R)
No. of stock options
Weighted average exercise price (R)
(A) Options granted and outstanding at the beginning of the year 28,85,240 251.52 42,65,623 223.35
(B) Options granted 6,97,615 252.72 6,65,090 257.28
(C) Options allotted 7,83,249 249.81 13,59,929 222.40
(D) Options lapsed 2,78,217 254.20 6,85,544 139.58
(E) Options granted and outstanding at the end of the year 25,21,389 252.09 28,85,240 251.52
(F) Options exercisable at the end of the year out of (E) supra 7,01,415 248.70 9,87,545 264.28
iv. Weighted average share price at the date of exercise for stock options exercised during the year is R 1065.30 (previous year: R 1272.80) per share.
v. A. In respect of stock options granted pursuant to the Company’s stock options schemes, the fair value of the options is treated as discount and accounted as employee compensation over the vesting period.
B. Expense on Employee Stock Option Schemes debited to the Statement of Profit and Loss during 2019-20 is R 49.44 crore (previous year: R 72.47 crore) net of recoveries of R 0.46 crore (previous year: R 1.63 crore) from its group companies towards the stock options granted to deputed employees, pursuant to the employee stock option schemes. The entire amount pertains to equity-settled employee share-based payment plans.
Notes forming part of the Financial Statements (contd.)NOTE [17]
Equity share capital (contd.)

390
NOTES FORMING PART OF THE FINANCIAL STATEMENTS ANNUAL REPORT 2019-20
vi. During the year, the Company has recovered R 5.54 crore (previous year: R 17.15 crore) from its subsidiary companies towards the stock options granted to their employees, pursuant to the employee stock option schemes.
vii. Weighted average fair values of options granted during the year is R 804.63(previous year: R 986.95) per option.
viii. The fair value has been calculated using the Black-Scholes Option Pricing Model and the significant assumptions and inputs to estimate the fair value of options granted during the year are as follows:
Sr. No. Particulars 2019-20 2018-19
(A) Weighted average risk-free interest rate 6.23 % 7.44%
(B) Weighted average expected life of options 4.12 years 4.09 years
(C) Weighted average expected volatility 25.40% 25.73%
(D) Weighted average expected dividends over the life of the option R 74.07 per option R 65.41 per option
(E) Weighted average share price R 1056.34 per option R 1225.00 per option
(F) Weighted average exercise price R 252.72 per option R 257.28pershare
(G) Method used to determine expected volatility Expected volatility is based on the historical volatility of the Company’s share price applicable to the total expected life of each option.
ix. The balance in share options (net) account as at March 31, 2020 is R 99.92 crore (previous year: R 106.91 crore), including R 47.54 crore (previous year: R 52.29 crore) for which the options have been vested to employees as at March 31, 2020.
(i) Capital Management:
The Company continues its policy of a conservative capital structure which has ensured that it retains the highest credit rating even amidst an adverse economic environment. Low gearing levels also equip the Company with the ability to navigate business stresses on one hand and raise growth capital on the other. This policy also provides flexibility of fund raising options for future, which is especially important in times of global economic volatility. The gross debt equity ratio is 0.49.1 as at March 31, 2020 (as at March 31, 2019 0.24:1).
During the year ended March 31, 2020, the Company paid the final dividend of R 18perequitysharefortheyearendedMarch31, 2019 amounting to R 2525.72 crore and dividend distribution tax of R 229.22 crore.
During the year ended March 31, 2020, the Company paid the Interim dividend of R 10 per equity share for the year ended March 31, 2020 amounting to R 1403.89crore.
On June 5, 2020, the Board of Directors has recommended the final dividend of R 8perequitysharefortheyearendedMarch31,2020 subject to approval from shareholders. On approval, the total dividend payment based on number of shares outstanding as at March 31, 2020 is expected to be R 1123.11 crore.
Notes forming part of the Financial Statements (contd.)NOTE [17]
Equity share capital (contd.)

391
NOTE [18]
Other equity
Particulars As at 31-3-2020 As at 31-3-2019
v crore v crore v crore v crore Equity component of foreign currency convertible bonds [5] – 153.20Capital reserve[1] 10.52 10.52Capital reserve on business combination[2] (25.77) (25.77)Securities premium 8599.60 8471.99Employee share options (net) Employee share options outstanding 166.80 177.63 Deferred employee compensation expense (66.88) (70.72)
99.92 106.91Debenture redemption reserve[3] 533.53 440.26General reserve[4] 25669.50 25507.91Retained earnings 16957.17 15046.99Foreign currency translation reserve (4.14) 5.69 Hedging reserve Cash flow hedging reserve (46.83) 53.24 Cost of hedging reserve (14.48) 4.17
(61.31) 57.41Debt instruments through Other Comprehensive Income 115.55 (7.24)
51894.57 49767.87
[1] Capital Reserve : It represents the gains of capital nature which mainly include the excess of value of net assets acquired over consideration paid by the Company for business amalgamation transactions in earlier years.
[2] Capital reserve on business combination: It arises on transfer of business between entities under common control. It represents the difference, between the amount recorded as share capital issued plus any additional consideration in the form of cash or other assets and the amount of share capital of the transferor [refer to note 1(ab)].
[3] Debenture redemption reserve (DRR) : The Ministry of Corporate Affairs vide notification dated August 16, 2019, amended the Companies (Share capital and Debenture) Rules, 2014 by which the Company is no longer required to create DRR towards the debentures issued. Earlier to this amendment, the Company was required to maintain a DRR of 25% of the value of debentures issued, either by a public issue or on a private placement basis and the amounts credited to the DRR was not to be utilised by the Company except to redeem debentures. The above amount represents the DRR created out of profits of the Company prior to the said notification.
[4] general Reserve : The Company created a General Reserve in earlier years pursuant to the provisions of the Companies Act,1956 where in certain percentage of profits was required to be transferred to General Reserve before declaring dividends. As per Companies Act 2013, the requirements to transfer profits to General Reserve is not mandatory. General Reserve is a free reserve available to the Company.
[5] Equity component of foreign currency convertible bonds : Pursuant to Ind AS 32, Foreign Currency Convertible Bonds (FCCB) issued by the Company are split into equity and liability component and presented under other equity and financial liabilities respectively.
Notes forming part of the Financial Statements (contd.)

392
NOTES FORMING PART OF THE FINANCIAL STATEMENTS ANNUAL REPORT 2019-20
Notes forming part of the Financial Statements (contd.)NOTE [19]
Non-current liabilities: Financial Liabilities - Borrowings
Particulars
As at 31-3-2020 As at 31-3-2019
Secured Unsecured Total Secured Unsecured Total
v crore v crore v crore v crore v crore v crore
Redeemable non-convertible fixed rate debentures [Note 19(a)(i) & (ii)] 1380.78 5034.13 6414.91 1380.20 2180.66 3560.86
Redeemable non-convertible inflation linked debentures [Note 19(a)(iii)] – 124.11 124.11 – 120.48 120.48
Term loan from banks [Note 19(c)] – 646.69 646.69 – 90.67 90.67Finance lease – – – – 0.06 0.06
1380.78 5804.93 7185.71 1380.20 2391.87 3772.07
19(a) (i) Secured redeemable non-convertible fixed rate debentures (privately placed):
Sr. No.
Face value per debenture (R)
Date of allotment
As at 31-3-2020
R crore
As at 31-3-2019
R crore
Interest for the year 2019-20
Terms of repayment for debentures outstanding as at 31-03-2020
1 10,00,000 October 25, 2012
301.77 301.66 9.10% p.a. payable annually
Redeemable at face value at the end of 15 years from the date of allotment or on exercise of call option.
The Company has call option to redeem debentures at the end of 10th year from the date of allotment.
2 10,00,000 October 25, 2012
269.67 269.56 9.10% p.a. payable annually
Redeemable at face value at the end of 14 years from the date of allotment or on exercise of call option.
The Company has call option to redeem debentures at the end of 10th year from the date of allotment.
3 10,00,000 October 25, 2012
269.72 269.61 9.10% p.a. payable annually
Redeemable at face value at the end of 13 years from the date of allotment or on exercise of call option.
The Company has call option to redeem debentures at the end of 10th year from the date of allotment.
4 10,00,000 October 25, 2012
269.78 269.66 9.10% p.a. payable annually
Redeemable at face value at the end of 12 years from the date of allotment or on exercise of call option.
The Company has call option to redeem debentures at the end of 10th year from the date of allotment.
5 10,00,000 October 25, 2012
269.85 269.71 9.10% p.a. payable annually
Redeemable at face value at the end of 11 years from the date of allotment or on exercise of call option.
The Company has call option to redeem debentures at the end of 10th year from the date of allotment.
Total 1380.78 1380.20

393
Security
13,310 fully paid redeemable non-convertible debentures having face value of R 10,00,000 /- each issued on private placement basis are secured by :
i) First pari-passu charge over the assets of the Company with an asset cover of 1.25 times; and
ii) Charge on the designated account under the Debenture Trust Deed.
19 (a) (ii) Unsecured redeemable non-convertible fixed rate debentures (privately placed):
Sr. No.
Face value per debenture (R)
Date of allotment
As at 31-3-2020
R crore
As at 31-3-2019
R crore
Interest for the year 2019-20
Terms of repayment for debentures outstanding as on 31-3-2020
1 1000000 April 10,2012 273.69 273.56 9.75% p.a. payable annually
Redeemable at face value at the end of 10th year from the date of allotment.
2 1000000 May 26,2011 322.81 322.71 8.95%p.a.payable annually
Redeemable at face value at the end of 10th year from the date of allotment.
3 1000000 May 11,2010 324.35 324.32 9.15% p.a. payable annually
Redeemable at face value at the end of 10th year from the date of allotment.
4 1000000 April 13,2010 216.96 216.95 8.80%p.a.payable annually
Redeemable at face value at the end of 10th year from the date of allotment.
5 1000000 September 24, 2015
1043.66 1043.12 8.40%p.a.payable annually
Redeemable at face value at the end of 5th year from the date of allotment.
6 1000000 April18,2019
1611.87 – 7.87%p.a.payable annually
Redeemable at face value at the end of 3rd year from the date of allotment.
7 1000000 May 22, 2019 2136.82 – 8.02%p.a.payable annually
Redeemable at face value at the end of 3rd year from the date of allotment.
8 1000000 January 24, 2020
1011.36 – 6.72% p.a. payable annually
Redeemable at face value at the end of 3rd year from the date of allotment.
9 1000000 August 19, 2019
1458.36 – 6.77% p.a. payable annually
Redeemable at face value at the end of 1st year from the date of allotment.
Total 8400.28 2180.66
Less: 3366.15 – Current maturity of long-term borrowings [Note 24]
5034.13 2180.66 Borrowings – non-current [Note 19]
Notes forming part of the Financial Statements (contd.)NOTE [19] (contd.)

394
NOTES FORMING PART OF THE FINANCIAL STATEMENTS ANNUAL REPORT 2019-20
Notes forming part of the Financial Statements (contd.)NOTE [19] (contd.)
19 (a) (iii) Unsecured redeemable non-convertible inflation linked debentures:
Face value per debenture (R)
Date of allotment
As at 31-3-2020
R crore
As at 31-3-2019
R crore
Interest for the year 2019-20
Terms of repayment for debentures outstanding as on 31-3-2020
1000000 May 23,2013 124.11 [1] 120.48[1] 1.65% p.a. payable on Inflation Adjusted
Principal as on the date of coupon
payment
Redeemable at the end of 10th year from the date of allotment. Redemption value calculated as [{Average Ref WPI (on Maturity Date) / Average Ref WPI (on Issue Date)} x Face Value] with Floor Rate as 3 % and Cap Rate as 12%. WPI here refers to Wholesale Price Index
[1] The principal amount has been calculated as [{Average Ref WPI as at reporting period/Average Ref WPI (as at 23/5/2013)} x Face Value]
19(b) Foreign Currency Convertible Bonds: 0.675% USD denominated 5 years & 1 day Foreign Currency Convertible Bonds (FCCB) carried at R NIL as at March 31, 2020 (as at
March 2019: R 1363.39 crore, represent 200,000 bonds of USD 1000 each).
19(c) Details of term Loans (Unsecured):
Sr. No.
As at 31-3-2020
R crore
As at 31-3-2019
R crore
Rate of Interest for the year 2019-20
Terms of repayment of term loan outstanding as at 31-3-2020
1 – 1382.59 – –
2 – 691.28 – –
3 – 694.20 – –
4 556.02 – USD LIBOR + Spread RepayableonFebruary28,2025
5 31.79 31.79 8.40%p.a.payablemonthly Repayable on May 7, 2023
6 58.88 58.88 9.00% p.a. payable monthly Repayable on October 19, 2023
7 189.33 – USD LIBOR + Spread Repayable on July 20, 2020
Total 836.02 2858.74
Less: 189.33 2768.07 Current maturity of long-term borrowings [Note 24]
646.69 90.67 Borrowings non–current [Note 19]
Loans guaranteed by directors - R Nil (previous year: R Nil)

395
19(d)AnnualdisclosureasLargeCorporatepursuanttoSEBICirculardatedNovember26,2018. Annexure A
Sr. No. Particulars Details
1 Name of the company Larsen & Toubro Limited
2 CIN L99999MH1946PLC004768
3 Outstanding borrowing of company as on March 31, 2020, as applicable (in R Cr) (Audited) R 25785.30crore
4 Highest Credit Rating During the previous financial year along with name of the Credit Rating Agency CRISIL & ICRA AAA (Stable)
5 Name of Stock Exchange in which the fine shall be paid, in case of shortfall in the required borrowing under the framework National Stock Exchange of India Limited
Annexure B
Sr. No. Particulars Amount R crore
1 Incremental borrowing done in financial year 2019-20 (a) 5,900[1]
2 Mandatory borrowing to be done through issuance of debt securities (b) = (25% of a) 1475
3 Actual borrowings done through debt securities in financial year 2019-20 (c) 5900
4 Shortfall in the mandatory borrowing through debt securities, if any (d) = (b) - (c)
{If the calculated value is zero or negative, the shortfall considered is “Nil”}
NIL
5 Reasons for short fall, if any, in mandatory borrowings through debt securities Not applicable
[1] Incremental borrowing represents actual long-term borrowing raised by the Company during financial year 2019-20
NOTE [20]
Non current liabilities: Other financial liabilities
ParticularsAs at 31-3-2020 As at 31-3-2019
v crore v crore
Forward contract payables 133.44 6.76
Embedded derivative payables – 26.63
Financial guarantee contracts 10.98 11.19
Due to others 35.20 37.11
179.62 81.69
NOTE [21]
Non-current liabilities: Provisions
ParticularsAs at 31-3-2020 As at 31-3-2019
v crore v crore
Employee pension scheme 339.63 308.36
Post-retirement medical benefits plan 271.60 189.26
611.23 497.62
Notes forming part of the Financial Statements (contd.)NOTE [19] (contd.)

396
NOTES FORMING PART OF THE FINANCIAL STATEMENTS ANNUAL REPORT 2019-20
NOTE [22]
Other non-current liabilities
Particulars As at 31-3-2020 As at 31-3-2019
v crore v crore
Other Payables (Deferred income on day fair valuation of financial instrument) 0.22 0.58
NOTE [23]
Current liabilities: Financial Liabilities - Borrowings
Particulars
As at 31-3-2020 As at 31-3-2019
Secured Unsecured Total Secured Unsecured Total
v crore v crore v crore v crore v crore v crore
Loans repayable on demand from banks 746.37 746.37 364.76 – 364.76Short term loan and advances from banks 41.71 7697.54 7739.25 5.12 3683.55 3688.67Commercial Paper – 4702.36 4702.36 – – – Loans from related parties: Subsidiary companies – 1796.45 1796.45 – 32.73 32.73 Joint venture companies – 59.68 59.68 – – –
788.08 14256.03 15044.11 369.88 3716.28 4086.16
23(a) Loans guaranteed by directors R Nil (previous year:R Nil)
23(b) Loans repayable on demand from banks include fund based working capital facilities viz. cash credits and demand loans .
The secured portion of loans repayable on demand from banks, short-term loans and advances from the banks, working capital facilities and other non-fund based facilities viz. bank guarantees and letter of credit, are secured by hypothecation of inventories and trade receivables. Amount of inventories and trade receivables that are pledged as collateral: R 6041.61 crore as at March 31, 2020 (March 31,2019 : R 6188.63crore)
NOTE [24]
Current liabilities: Financial liabilities - Current maturities of long-term borrowings
Particulars As at 31-3-2020 As at 31-3-2019
v crore v croreUnsecured: Redeemable non-convertible fixed rate debentures 3366.15 – Term loans from banks 189.33 2768.07 0.675% Foreign currency convertible bonds – 1363.39
3555.48 4131.46
Notes forming part of the Financial Statements (contd.)

397
NOTE [25]
Current liabilities: Financial liabilities - Other trade Payables
Particulars As at 31-3-2020 As at 31-3-2019
v crore v crore v crore v crore Acceptances 243.50 522.49Due to related parties: Subsidiary companies 1071.65 776.49 Associate companies 13.04 4.04 Joint venture companies 1183.55 1006.51
2268.24 1787.04Due to others 33737.77 33713.54
36249.51 36023.07
NOTE [26]
Current liabilities: Other financial liabilities
Particulars As at 31-3-2020 As at 31-3-2019
v crore v croreUnclaimed dividend 114.27 84.64Forward contract payable 458.23 237.02Embedded derivative payable 95.11 68.17Financial guarantee contracts 12.99 8.57Due to others [1] 1028.49 1533.33
1709.09 1931.73
[1] Due to others include due to directors R 29.13 crore (previous year: R 57.00 crore)
NOTE [27]
Other current liabilities
Particulars As at 31-3-2020 As at 31-3-2019
v crore v crore v crore v crore Contract Liabilities Due to customers (Construction and project related activity) 6277.21 6678.88 Advances from customers 13780.04 14593.57
20057.25 21272.45Other Payables 700.80 808.00
20758.05 22080.45
Notes forming part of the Financial Statements (contd.)

398
NOTES FORMING PART OF THE FINANCIAL STATEMENTS ANNUAL REPORT 2019-20
NOTE [28]Current liabilities - provisions
Particulars As at 31-3-2020 As at 31-3-2019
v crore v crore v crore v crore Provision for employee benefits: Gratuity 87.01 103.26 Compensated absences 621.76 592.75 Employee pension scheme 25.64 24.52 Post-retirement medical benefits plan 13.01 7.84
747.42 728.37 Other Provisions (Ind AS 37 related) 807.97 755.24
1555.39 1483.61
NOTE [29]Contingent liabilities
Particulars As at 31-3-2020 As at 31-3-2019
v crore v crore(a) Claims against the Company not acknowledged as debts 3005.42 2199.74(b) Sales tax liability that may arise in respect of matters in appeal 186.16 157.68(c) Excise duty/service tax/customs duty liability that may arise including those
in respect of matters in appeal/challenged by the Company in Writ 164.44 218.41(d) Income tax liability that may arise in respect of which the Company is in
appeal 922.89 677.83(e) Corporate and bank guarantees for debt given on behalf of subsidiary
companies/ joint venture companies 6130.39 6189.77(f) Corporate and bank guarantees for performance given on behalf of
subsidiary companies/ joint venture companies 27894.61 31292.90(g) Contingent liabilities, incurred in relation to interests in joint operations 7460.44 7586.12(h) Share in contingent liabilities of joint operations for which the Company is
contingently liable 64.05 84.92(i) Contingent liabilities in respect of liabilities of other joint operators of joint
operations 5464.89 7187.07
Notes:
1. The Company does not expect any reimbursements in respect of the above contingent liabilities.
2. It is not practicable to estimate the timing of cash outflows, if any, in respect of matters at (a) to (d) above pending resolution of the arbitration/appellate proceedings. Further, the liability mentioned in (a) to (d) above includes interest except in cases where the Company has determined that the possibility of such levy is remote.
3. In respect of matters at (e), the cash outflows, if any, could generally occur up to eleven years, being the period over which the validity of the guarantees extends except in a few cases where the cash outflows, if any, could occur any time during the subsistence of the borrowing to which the guarantees relate.
4. In respect of matters at (f), the cash outflows, if any, could generally occur up to four years, being the period over which the validity of the guarantees extends.
5. In respect of matters at (g) to (i), the cash outflows, if any, could generally occur up to completion of projects undertaken by the respective joint operations.
Notes forming part of the Financial Statements (contd.)

399
Notes forming part of the Financial Statements (contd.)NOTE [30]
Commitments
ParticularsAs at 31-3-2020 As at 31-3-2019
v crore v crore v crore v crore (a) Estimated amount of contracts remaining to be executed on capital
account (net of advances) (i) Estimated amount of contracts remaining to be executed on
Property,plant & equitpment 758.85 632.24 (ii) Estimated amount of contracts remaining to be executed on
Intangible assets 1.79 3.64
760.64 635.88(b) Funding committed by way of equity/loans to subsidiary companies 93.00 845.00(c) Funding committed by way of equity (including investment through
purchase of investments from other parties) [1] – 10732.85
[1]TheCompanyhadenteredintoadefinitivesharepurchaseagreementtoacquire20.32%stakeinMindtreeLimitedonMarch18,2019 at a price of R 980pershareaggregatingtoconsiderationofR 3269.00 crore. Further, the Company had placed a purchase order with its stock broker for acquiring 15% stake through on-market purchases for an overall consideration amount not exceeding R 2434.00 crore from any recognised stock exchange, but only after receipt of relevant approvals from regulatory authorities. The Company had also made an open offer to acquire 31% stake for a consideration of R 5029.85croreinaccordancewiththerequirements of the SEBI (Substantial Acquisition of Shares and Takeover) Regulations, 2011.
NOTE [31]
Revenue from operations
Particulars2019-20 2018-19
v crore v crore v crore v crore Sales and service: Construction and project related activity 78091.00 77376.85 Manufacturing and trading activity 2065.73 2098.23 Property development activity 174.82 642.08 Engineering and service fees 46.87 10.06 Servicing 1141.31 808.52 Commission 98.25 160.16
81617.98 81095.90Other operational income: Lease rentals 78.70 126.58 Profit/(loss) on sale of investment properties – 565.60 Income from services to Group companies 62.61 91.15 Premium earned (net) on related forward exchange contracts 38.59 26.22 Miscellaneous Income 585.77 381.97
765.67 1191.52
82383.65 82287.42

400
NOTES FORMING PART OF THE FINANCIAL STATEMENTS ANNUAL REPORT 2019-20
NOTE [32]
Other income
Particulars2019-20 2018-19
v crore v crore v crore v crore Interest income: Subsidiaries, associates and joint venture companies 214.63 186.72 Others 405.07 419.61
619.70 606.33Dividend income: Subsidiary companies 1373.00 1313.98 Joint venture Companies 12.53 19.44 Others 1.76 178.70
1387.29 1512.12Net gain/(loss) on sale or fair valuation of investments 503.71 230.58Net gain/(loss) on derivatives at fair value through profit or loss – (22.60)Net gain/(loss) on sale of property, plant and equipment (30.92) 28.10Lease rentals 110.30 81.36Miscellaneous income (net of expenses) 217.79 275.30
2807.87 2711.19
Notes forming part of the Financial Statements (contd.)

401
NOTE [33]
Manufacturing, construction and operating expenses
Particulars2019-20 2018-19
v crore v crore v crore v crore Materials consumed: Raw materials and components 5537.59 5764.78 Less: Scrap sales 50.60 52.24
5486.99 5712.54Construction materials consumed 28632.03 29482.65Purchase of stock-in-trade 855.63 906.49Stores, spares and tools consumed 1520.47 2312.83Sub-contracting charges 22488.74 21647.74Changes in inventories of finished goods,work-in-progress and stock-in-trade and property development : Closing stock: Finished goods 18.12 2.74 Stock-in-trade 308.36 291.28 Work-in-progress 5578.14 5546.59
5904.62 5840.61
Less: Opening stock: Finished goods 2.74 6.69 Stock-in-trade 291.28 224.34 Work-in-progress 5546.59 4483.41
5840.61 4714.44
(64.01) (1126.17)Other manufacturing, construction and operating expenses: Power and fuel 1700.02 1675.98 Royalty and technical know-how fees 119.51 42.86 Packing and forwarding 522.74 435.47 Engineering, technical and consultancy fees 898.98 1205.92 Insurance 244.33 234.49 Rent and hire charges 1948.27 1859.73 Rates and taxes 568.57 527.80 Travelling and conveyance 744.57 715.24 Repairs to plant and equipment 67.48 64.38 Repairs to buildings 20.87 21.98 General repairs and maintenance 560.36 393.61 Bank guarantee charges 223.62 193.17 Provision/(reversal) for foreseeable losses on construction contracts (14.50) 35.37 Other provisions 23.58 175.23 Miscellaneous expenses 333.96 336.55
7962.36 7917.78
66882.21 66853.86
Notes forming part of the Financial Statements (contd.)

402
NOTES FORMING PART OF THE FINANCIAL STATEMENTS ANNUAL REPORT 2019-20
Notes forming part of the Financial Statements (contd.)NOTE [34]Employee benefits expense
Particulars2019-20 2018-19
v crore v crore v crore v crore Salaries, wages and bonus 5294.89 5318.48Contribution to and provision for : Provident funds and pension fund 145.87 120.75 Superannuation/employee pension schemes 10.14 14.11 Gratuity funds 69.42 60.91
225.43 195.77Expenses on employees stock option schemes 47.40 67.73Insurance expenses - medical and others 100.10 86.49Staff welfare expenses 584.16 547.84Recoveries on account of deputation (296.00) (483.71)
5955.98 5732.60
[Employee benefits expense includes remuneration paid to employees engaged in CSR activities R 16.36 crore (previous year: R 17.02 crore). Refer to Note 60 for details of CSR expenses.]
NOTE [35]Sales, administration and other expenses
Particulars2019-20 2018-19
v crore v crore v crore v crore Power and fuel 55.50 59.18Packing and forwarding 44.68 40.59Professional fees 409.40 339.08Audit fees 5.84 5.76Insurance 51.15 45.84Rent & Hire charges 128.59 294.30Rates and taxes 117.64 47.03Travelling and conveyance 225.97 260.18Repairs to buildings 16.68 18.90General repairs and maintenance 274.52 221.63Directors’ fees 1.72 2.60Telephone, postage and telegrams 93.05 99.46Advertising and publicity 54.14 62.29Stationery and printing 35.48 40.80Commission: Distributors and agents 20.67 18.41 Others 0.79 0.40Bank charges 101.51 89.19Miscellaneous expenses[1] 888.37 585.90Bad debts and advances written off (net of written back) (48.58) 233.76Less: Allowance for doubtful debts and advances written back 118.37 189.70
(166.95) 44.06Allowance for doubtful debts and advances (net) 597.58 11.74Exchange (gain)/loss (net) (175.72) (119.38)Other provisions 121.70 58.27Recoveries from subsidiary and associates (194.97) (178.36)
2707.34 2047.87
[1] Miscellaneous expenses include expenditure incurred on CSR activities R 128.93crore(previous year: R 104.66 crore). Refer to Note 60 for details of CSR

403
NOTE [36]
Finance costs
Particulars 2019-20 2018-19
v crore v croreInterest expenses 2225.99 1747.48Other borrowing costs 7.30 3.03Exchange loss (attributable to finance costs) 33.27 37.11
2266.56 1787.62
NOTE [37]
Aggregation of expenses disclosed vide Note 33 - Manufacturing, construction and operating expenses, Note 34 - Employee benefits expense and Note 35 - Sales, administration and other expenses. v crore
Sr. No.
Nature of expenses
2019-20 2018-19Note 33 -
Manufacturing, construction
and operating expenses
Note 34- Employee
benefits expense
Note 35 - Sales, administration
and other expenses
Total Note 33 - Manufacturing,
construction and operating expenses
Note 34- Employee
benefits expense
Note 35 -Sales, administration and
other expenses
Total
1 Power and fuel 1700.02 – 55.50 1755.52 1675.98 – 59.18 1735.162 Packing and forwarding 522.74 – 44.68 567.42 435.47 – 40.59 476.063 Insurance 244.33 100.10 51.15 395.58 234.49 86.49 45.84 366.824 Rent and hire charges 1948.27 – 128.59 2076.86 1859.73 – 294.30 2154.035 Rates and taxes 568.57 – 117.64 686.21 527.80 – 47.03 574.836 Travelling and conveyance 744.57 – 225.97 970.54 715.24 – 260.18 975.427 Repairs to buildings 20.87 – 16.68 37.55 21.98 – 18.90 40.888 General repairs and
maintenance 560.36 – 274.52 834.88 393.61 – 221.63 615.249 Miscellaneous expenses 333.96 – 888.37 1222.33 336.55 – 585.90 922.45
NOTE [38]
Disclosure pursuant to Ind AS 103 “Business Combinations”:
L&T Shipbuilding Limited (LTSB), a wholly owned subsidiary, is merged with the Company under a scheme of amalgamation approved by National Company Law Tribunal, Chennai on March 10, 2020 and National Company Law Tribunal, Mumbai on April 24, 2020. The merger is effective from the appointed date April 01, 2019. LTSB has a registered office in Chennai, India and is engaged in the business of Shipbuilding and Ship related activities.
No fresh shares are issued to effect the merger as LTSB is wholly owned subsidiary of the Company. Further the merger is accounted using pooling of interest method, involving the following:
a. The assets and liabilities of LTSB are reflected at their carrying amounts. No adjustment is made to reflect the fair values, or recognise any new asset or liability.
b. The balance of Retained earnings appearing in the financial statements of LTSB is aggregated with the corresponding balance appearing in the financial statements of the Company.
c. The excess of amount of investment by the Company in LTSB over the share capital of LTSB is treated as Capital reserve in Company’sfinancialstatementsandthesameispresentedseparatelyfromotherCapitalreserves[ReferNote18].
d. RestatingthefinancialsoftheCompanyfromApril01,2018.
Notes forming part of the Financial Statements (contd.)

404
NOTES FORMING PART OF THE FINANCIAL STATEMENTS ANNUAL REPORT 2019-20
Notes forming part of the Financial Statements (contd.)NOTE [39]
Disclosure pursuant to Ind AS 105 “Non-current assets held for sale and discontinued operations”:
R crore
ParticularsAs at
31-03-2020As at
31-03-2019Group(s) of assets classified as held for sale 2780.37 41.72Liabilities associated with the group(s) of assets classified as held for sale 1367.58 –
The Company has following non-current assets/disposal group recognised as held for sale as at March 31, 2020:
(a) OnMay1,2018,theCompanyhadsigned,subjecttoregulatoryapprovals,definitiveagreementswithSchneiderElectricfor strategic divestment of its Electrical and Automation (E&A) business [refer Note 40 for description of E&A business]. The CompetitionCommissionofIndia(CCI)accordedonApril18,2019itsapproval(thedetailedorderwasuploadedonitswebsiteonJune 6, 2019) for acquisition of the Company’s Electrical & Automation (E&A) business by Schneider Electric, subject to fulfilment of certain conditions.
As the sale was likely to be completed within the next one year from then, E&A business has been classified as discontinued operation from q1 2019-20 onwards. The Company remains committed to its divestment plan. Based on the progress of the divestment process and its current status, the Company continues to classify its Electrical & Automation (E&A) business as discontinued operations.
i. Financial performance related to discontinued operations:R crore
Particulars 2019-20 2018-19Revenue 4557.34 4930.56Expense 3691.96 4118.16Profit before tax 865.38 812.40Income tax 210.93 269.34Profit after tax 654.45 543.06
ii. Cash flow disclosure with respect to discontinued operations:R crore
Particulars 2019-20 2018-19Cash flow from operating activities 560.79 562.06Cash flow from investing activities[1] (110.13) (123.13)Cash flow from financing activities – –
Activities related to borrowings and investments of surplus funds have been managed at Corporate and accordingly form part of unallocable corporate assets/liabilities (Refer to Note 40). There are no borrowings or investments specifically allocable to EAIC business.
[1] represents additions & deletions to property, plant and equipment, investment property and intangible assets adjusted for movement of (a) capital work-in-progress for property, plant and equipment and investment property and (b) Intangible assets under development during the year.

405
iii. Major classes of assets and liabilities classified as held for sale:R crore
ParticularsAs at
March 31, 2020Group of assets classified as held for sale: Property, plant and equipment 594.72 Capital work-in-progress 21.79 Intangible assets 173.80 Intangible assets under development 122.25 Loans 1.78 Inventories 763.30 Trade receivables 905.29 Cash and bank balances 0.07 Other assets 196.74Total 2779.74Liabilities related to group of assets classified as held for sale: Trade payables 937.95 Provisions 126.53 Other liabilities 303.10Total 1367.58Amount recognised in OCI (cumulative) related to disposal group assets Hedging Reserve (net of tax) [gain/(loss)] 1.08 Gain/(loss) on remeasurement of the defined benefits plan (net of tax) (6.18)
Above assets and liabilities form part of “Electrical & Automation” segment [refer Note 40].
(b) Assets held for sale also include:
i. Plant & Equipment of R 0.20 crore situated at Hazira, Gujarat. The asset forms part of “Defence Engineering” segment [refer Note 40].
ii. Building of R 0.43 crore situated at Chennai, Tamil Nadu. The asset forms part of Realty business which is reported under “Others” segment [refer Note 40].
The Company has following non-current asset recognised as held for sale as at March 31, 2019:
Equity investment in L&T Technology Services Limited R 41.72crore.Regulation38oftheSEBI(ListingObligationandDisclosureRequirements) Regulation, 2015 requires a listed entity to comply with the minimum public shareholding requirements as specified in rules 19(2) and 19A of the Securities Contracts (Regulation) Rules, 1957 (“SCRR). Rule 19(2)(b) of the SCRR requires the maintenance of a minimum public shareholding of 25% at all times of each class or kind of equity shares or convertible debentures issued by a listed company.
TheCompanywasholding78.88%initslistedsubsidiarycompanyL&TTechnologyServicesLimited.Inordertocomplywiththesaid requirement, the Company planned to divest its investment in the said subsidiary in the open market within twelve months from March 31, 2019.
The above investment forms part of the unallocable corporate assets. [refer Note 40].
Notes forming part of the Financial Statements (contd.)NOTE [39]Disclosure pursuant to Ind AS 105 “Non-current assets held for sale and discontinued operations” (contd.)

406
NOTES FORMING PART OF THE FINANCIAL STATEMENTS ANNUAL REPORT 2019-20
NOTE [40]
DisclosurepursuanttoIndAS108“OperatingSegment”
(a) Information about reportable segment
v crore
ParticularsFor the year ended 31-3-2020 For the year ended 31-3-2019
External Inter-segment Total External Inter-segment TotalRevenueInfrastructure 69947.91 341.47 70289.38 68452.30 456.23 68908.53Power 2300.06 18.40 2318.46 3975.77 7.32 3983.09Heavy Engineering 3197.96 6.95 3204.91 2477.76 35.49 2513.25Defence Engineering 3973.42 5.75 3979.17 3752.32 97.26 3849.58Electrical & Automation [Note 39(a)(i)] 4463.78 93.56 4557.34 4760.96 169.60 4930.56Others 2964.30 27.87 2992.17 3629.27 31.43 3660.70Sub-total 86847.43 494.00 87341.43 87048.38 797.33 87845.71Less: Revenue of discontinued operations 4463.78 93.56 4557.34 4760.96 169.60 4930.56Less: Inter-segment revenue – 400.44 400.44 – 627.73 627.73Total 82383.65 – 82383.65 82287.42 – 82287.42Segment result [Profit /(loss) before interest and tax]Infrastructure 4853.15 5000.11Power 235.68 129.84Heavy Engineering 565.15 486.79 Defence Engineering 576.65 389.03 Electrical & Automation [Note 39(a)(i)] 865.38 812.40Others 367.34 1230.27Total 7463.35 8048.44Result of discontinued operations (865.38) (812.40)Inter-segment margins on capital jobs (44.27) (10.11)Unallocable corporate income net of expenditure 2071.78 2138.80Interest expense (2266.56) (1787.62)Exceptional items 626.99 1642.35Profit before tax 6985.91 9219.46Provision for Current tax (1525.60) (2409.73)Provision for Deferred tax 564.45 138.60Net profit after tax from continuing operations 6024.76 6948.33 Profit before tax from discontinued operations 865.38 812.40Tax expense of discontinued operations (210.93) (269.34)Net profit after tax from discontinued operations 654.45 543.06Net profit after tax from continuing operations & discontinued operations 6679.21 7491.39
v crore
Segment assets Segment liabilitiesParticulars As at As at As at As at
31-3-2020 31-3-2019 31-3-2020 31-3-2019Infrastructure 74562.94 68926.08 48676.59 47253.59 Power 5000.45 5095.07 4381.75 4838.09Heavy Engineering 3255.02 2932.34 1415.24 1528.56Defence Engineering 7270.89 7792.13 4246.42 4944.47 Electrical & Automation (discontinued operations) [Note 39(a)(iii)] 2779.74 2726.08 1367.58 1562.30 Others 4160.76 3399.31 1892.15 1530.76Segment Total 97029.80 90871.01 61979.73 61657.77Unallocable corporate assets/liabilities 45167.17 34452.06 28041.89 13616.88Inter-segment assets/liabilities (640.38) (663.34) (640.38) (663.34)Total assets/liabilities 141556.59 124659.73 89381.24 74611.31
Notes forming part of the Financial Statements (contd.)

407
v crore
Particulars
Depreciation, amortisation &
obsolescence included in segment expense
Other non-cash expenses included in
segment expense
Finance cost included in segment expense
Interest income included in segment
income
Additions to non-current assets
For the year
ended 31-3-2020
For the year
ended 31-3-2019
For the year
ended 31-3-2020
For the year
ended 31-3-2019
For the year
ended 31-3-2020
For the year
ended 31-3-2019
For the year
ended 31-3-2020
For the year
ended 31-3-2019
For the year
ended 31-3-2020
For the year
ended 31-3-2019
Infrastructure 654.68 708.05 40.31 46.40 379.58 297.87 20.08 34.29 1244.77 1137.18 Power 38.07 47.16 0.94 2.99 – – 58.21 – 97.67 62.96 Heavy Engineering 46.29 44.95 1.18 2.12 – – – – 176.76 107.94 Defence Engineering 144.46 132.94 1.40 2.59 – – – – 159.50 219.31Electrical & Automation [Discontinued operations]
43.35 139.16 2.50 6.37 – – – – 201.05 240.35
Others 28.19 37.27 0.66 1.41 – – – – 367.66 369.81 Total 955.04 1109.53 47.00 61.88 379.58 297.87 78.29 34.29 2247.41 2137.55Unallocated corporate 108.82 28.53 2.90 12.82 (379.58) (297.87) (78.29) (34.29) 852.08 227.05Inter-segment (8.64) (82.26)Total 1063.86 1138.06 49.90 74.70 – – – – 3090.85 2282.34
Note : There is no impairment in non-financial assets of the segments. Unallocable corporate expenses include impariment loss of R Nil for the year ended March 31,2020 (previous year: R 1929.10 crore)
(b) Geographical information
v croreRevenue by location of
customers
Particulars For the year ended
For the year ended
31-3-2020 31-3-2019India (i) 68216.73 67779.36Foreign countries: United Arab Emirates 3073.72 5123.08 qatar 3559.21 3913.10 Kuwait 2327.60 800.73 Other countries 9670.17 9432.11Total foreign countries (ii) 18630.70 19269.02Total (i+ii) 86847.43 87048.38Less: Discontinued operations 4463.78 4760.96Total 82383.65 82287.42
v croreNon-current assets by location
of customers
Particulars As at 31-3-2020
As at 31-3-2019
India (i) 12402.07 12340.16Foreign countries (ii) 304.45 364.48Total (i+ii) 12706.52 12704.64
Notes forming part of the Financial Statements (contd.)NOTE [40]DisclosurepursuanttoIndAS108“OperatingSegment”(contd.)

408
NOTES FORMING PART OF THE FINANCIAL STATEMENTS ANNUAL REPORT 2019-20
(c) Revenue contributed by any single customer in any of the operating segments, whether reportable or otherwise, does not exceed ten percent of the Company’s total revenue.
(d) The Company’s reportable segments are organised based on the nature of products and services offered by these segments.
(e) Basis of identifying operating segments, reportable segments, segment profit and definition of each reportable segment:
i) Basis of identifying Operating segments:
Operating segments are identified as those components of the Company (a) that engage in business activities to earn revenues and incur expenses (including transactions with any of the Company’s other components; (b) whose operating results are regularly reviewed by the corporate executive management to make decisions about resource allocation and performance assessment; and (c) for which discrete financial information is available.
The company has five reportable segments as described under “segment composition” below. The nature of products and services offered by these businesses are different and are managed separately given the different sets of technology and competency requirements.
ii) Reportable segments
An operating segment is classified as reportable segment if reported revenue (including inter-segment revenue) or absolute amount of result or assets exceed 10% or more of the combined total of all the operating segments.
iii) Segment profit
Performance of a segment is measured based on segment profit (before interest and tax), as included in the internal management reports that are reviewed by the corporate executive management.
iv) Segment composition
• Infrastructure segment comprises engineering and construction of building and factories, transportation infrastructure, heavy civil infrastructure, power transmission & distribution, water & effluent treatment, smart world & communication projects and metallurgical & material handling systems.
• Power segment comprises turnkey solutions for Coal-based and Gas-based thermal power plants including power generation equipment with associated systems and/or balance-of-plant packages.
• Heavy Engineering segment comprises manufacture and supply of custom designed, engineered critical equipment & systems to core sector industries like Fertiliser, Refinery, Petrochemical, Chemical, Oil & Gas and Thermal & Nuclear Power.
• Defence engineering segment comprises (a) design, development, serial production and through lifesupport of equipment, systems and platforms for Defence and Aerospace sectors and (b) design, construction, and repair/refit of defence vessels.
• Electrical & Automation segment comprises manufacture and sale of low and medium voltage switchgear components, custom built low and medium voltage switchboards, electronic energy meters/protection (relays) systems and control & automation products.
• Others segment includes Realty (reported as a separate segment in the previous year which has been reclassified and reported under “Others” segment as the thresholds for reportability have not been met in the current period), Hydrocarbon, marketing and servicing of construction & mining machinery and parts thereof, manufacture and sale of rubber processing machinery.
Notes forming part of the Financial Statements (contd.)NOTE [40]DisclosurepursuanttoIndAS108“OperatingSegment”(contd.)

409
NOTE [41]
Disclosure pursuant to Ind AS 115 “Revenue from Contracts with Customers”
(a) Disaggregation of revenue into Operating Segments and Geographical areas
i. For the year ended March 31, 2020: v crore
SegmentRevenue as per Ind AS 115 Other
RevenueTotal as per Profit and
Loss/Segment reportingDomestic Foreign Total
Infrastructure 54911.98 14812.74 69724.72 223.19 69947.91
Power 1849.87 385.96 2235.83 64.23 2300.06
Heavy Engineering 1735.83 1428.48 3164.31 33.65 3197.96
Defence Engineering 3627.74 342.49 3970.23 3.19 3973.42
Electrical & Automation (discontinued operations)
3963.15 493.46 4456.61 7.17 4463.78
Others 1791.18 1164.55 2955.73 8.57 2964.30
Total 67879.75 18627.68 86507.43 340.00 86847.43
Less: Electrical & Automation (discontinued operations)
3963.15 493.46 4456.61 7.17 4463.78
Revenue for continuing operations 63916.60 18134.22 82050.82 332.83 82383.65
ii. For the year ended March 31, 2019: v crore
SegmentRevenue as per Ind AS 115 Other
RevenueTotal as per Profit and
Loss/Segment reportingDomestic Foreign Total
Infrastructure 53180.19 15098.78 68278.97 173.33 68452.30
Power 2585.90 1383.77 3969.67 6.10 3975.77
Heavy Engineering 1256.63 1195.04 2451.67 26.09 2477.76
Defence Engineering 3420.80 331.52 3752.32 – 3752.32
Electrical & Automation 4259.81 482.13 4741.94 19.02 4760.96
Others 2231.20 768.89 3000.09 629.18 3629.27
Total 66934.53 19260.13 86194.66 853.72 87048.38
Less: Electrical & Automation (discontinued operations)
4259.81 482.13 4741.94 19.02 4760.96
Revenue for continuing operations 62674.72 18778.00 81452.72 834.70 82287.42
(b) Out of the total revenue recognised under Ind AS 115 during the year, R 78785.01crore(previous year: R 78223.40crore) is recognised over a period of time and R 7722.42 crore (previous year: R 7971.27 crore) is recognised at a point in time.
Notes forming part of the Financial Statements (contd.)

410
NOTES FORMING PART OF THE FINANCIAL STATEMENTS ANNUAL REPORT 2019-20
(c) Movement in Expected Credit Loss during the year:
v crore
Provision on Trade receivables covered under Ind AS 115
Provision on Contract assets
Particulars 2019-20 2018-19 2019-20 2018-19Opening balance as at April 1 2270.62 2240.91 639.20 108.55Impact of Ind AS 115 – – – 693.26Changes in loss allowance for expected credit loss: Provision/(reversal) of allowance for expected credit loss 334.21 68.72 127.12 (162.61) Additional provision (net) towards credit impaired receivables 32.69 188.35 – – Write off as bad debts (157.19) (227.36) – –Less: Balance classified as held for sale 102.05 – 0.93 –Closing balance as at March 31 2378.28 2270.62 765.39 639.20
(d) Contract balances:
i. Movement in contract balances during the year. v crore
Particulars 2019-20 2018-19
Contract assets
Contract liabilities
Net contract balances
Contract assets
Contract liabilities
Net contract balances
Opening balance as at April 01 40264.90 21272.46 18992.44 37257.89 19426.80 17831.09Closing balance as at March 31 44988.94 20057.25 24931.69 40264.90 21272.46 18992.44Net Increase/(Decrease) 4724.04 (1215.21) 5939.25 3007.01 1845.66 1161.35
Balances as at March 31, 2020 does not include balances classified as held for sale.
i. During the current year, increase in net contract balances is primarily due to higher revenue recognition as compared to progress bills raised.
During the previous year, increase in net contract balances is primarily due to higher revenue recognition as compared to progress bills raised and Ind AS 115 transition adjustment.
ii. Revenue recognised from opening balance of contract liabilities amounts to R 4689.36crore(previous year: R 6313.77 crore)
iii. Revenue recognised from the performance obligation satisfied (or partially satisfied) upto previous year (arising out of contract modifications) amounts to R 19.25 crore (previous year: R 29.11 crore)
(e) Cost to obtain the contract:
i. Amortisation in Statement of Profit and Loss: Nil (previous year: Nil)
ii. Recognised as contract assets at March 31, 2020: Nil (previous year: Nil)
Notes forming part of the Financial Statements (contd.)NOTE [41]Disclosure pursuant to Ind AS 115 “Revenue from Contracts with Customers” (contd.)

411
(f) Reconciliation of contracted price with revenue during the year:v crore
Particulars 2019-20 2018-19
Opening contracted price of orders at the start of the year[1] 541935.92 469236.01
Add:
Fresh orders/change orders received (net) 113719.79 109901.49
Increase due to additional consideration recognised as per contractual terms/(decrease) due to scope reduction-net (23309.98) 2015.38
Increase due to exchange rate movements (net) 3712.25 2496.79
Less:
Orders completed during the year 39155.88 41713.95
Closing contracted price of orders on hand at the end of the year[1] 596908.10 541935.92
Total Revenue recognised during the year: 86507.43 86194.66
a. Revenue out of orders completed during the year 8236.06 9139.70
b. Revenue out of orders under execution at the end of the year (I) 78271.37 77054.96
Revenue recognised upto previous year (from orders pending completion at the end of the year) (II) 265885.42 217974.38
Increase/(Decrease) due to exchange rate movements (net) (III) 1260.01 (109.65)
Balance revenue to be recognised in future viz. Order book (IV) 251491.30 247016.23
Closing contracted price of orders on hand at the end of the year[1] (I+II+III+IV) 596908.10 541935.92
Closing contracted price of orders on hand at the end of the year – Continuing operations 594723.33
Closing contracted price of orders on hand at the end of the year – Discontinued operations 2184.77
[1] including full value of partially executed contracts
(g) Remaining performance obligations and its expected conversion into revenue:v crore
Remaining performance obligation
Total Expected conversion in revenue
Upto 1 Year
From 1 to 2 years
From 2 to 3 years
From 3 to 4 years
From 4 to 5 years
Beyond 5 years
As at March 31, 2020
Total 251491.30 89106.26 85065.38 52195.32 17343.83 3951.19 3829.32
Continuing operations 250162.34 87947.19 85018.42 52165.14 17320.66 3933.74 3777.19
Discontinued operations 1328.96 1159.07 46.96 30.18 23.17 17.45 52.13
As at March 31, 2019 247016.23 89614.61 89131.73 41302.97 16670.17 5893.87 4402.88
Notes forming part of the Financial Statements (contd.)NOTE [41]Disclosure pursuant to Ind AS 115 “Revenue from Contracts with Customers” (contd.)

412
NOTES FORMING PART OF THE FINANCIAL STATEMENTS ANNUAL REPORT 2019-20
NOTE [42]
Disclosure pursuant to Ind AS 1 “Presentation of financial statements”:
(a) Current assets expected to be recovered within twelve months and after twelve months from the reporting date:
v crore
Particulars Note
As at 31-3-2020 As at 31-3-2019
Within twelve
months
After twelve
monthsTotal
Within twelve
months
After twelve
monthsTotal
Inventories 9 1521.49 1248.40 2769.90 2283.31 1065.93 3349.24
Trade receivables 11 27352.66 560.30 27912.96 27928.29 284.26 28212.55
Loans 14 515.13 0.01 515.14 1305.94 – 1305.94
Other financial assets 15 1997.58 0.01 1997.59 1955.40 – 1955.40
Other current assets 16 41457.51 8204.10 49661.61 36841.33 7026.17 43867.50
(b) Current liabilities expected to be settled within twelve months and after twelve months from the reporting date:
v crore
Particulars Note
As at 31-3-2020 As at 31-3-2019
Within twelve
months
After twelve
monthsTotal
Within twelve
months
After twelve
monthsTotal
Trade payables:
Due to micro enterprises and small enterprises 323.62 56.26 379.88 193.80 8.16 201.96
Due to others 25 34823.16 1426.35 36249.51 35235.94 787.13 36023.07
Lease Liability 81.69 50.58 132.27 – – –
Other financial liabilities 26 1690.15 18.94 1709.09 1909.06 22.67 1931.73
Other current liabilities 27 16060.48 4697.57 20758.05 17601.62 4478.83 22080.45
Provisions 28 1375.38 180.01 1555.39 1332.10 151.51 1483.61
NOTE [43]
Disclosure pursuant to Ind AS 7 “Statement of Cash Flows” - Changes in liabilities arising from financing activities:
v crore
Sr. No.
Particulars Non-current borrowings
(Note 19)
Current borrowings
(Note 23)
Current maturities
of long term borrowings
(Note 24)
Lease liability Total
1 Balanceasat1-4-2018 6875.00 4569.45 936.27
NA
12380.72
2 Changes from financing cash flows 789.41 (616.54) (974.33) (801.46)
3 The effect of changes in foreign exchange rates – 133.01 226.64 359.65
4 Interest accrued 5.01 0.24 45.53 50.78
5 Other changes (transfer within categories) (3897.35) – 3897.35 –
6 Balance as at 31-3-2019 3772.07 4086.16 4131.46 11989.69
Notes forming part of the Financial Statements (contd.)

413
v crore
Sr. No.
Particulars Non-current borrowings
(Note 19)
Current borrowings
(Note 23)
Current maturities
of long term borrowings
(Note 24)
Lease liability Total
7 Lease liability recognised on Ind AS 116 transition (refer Note 54) (0.07) – – 125.70 125.63
8 Additions to lease liability – – – 98.70 98.70
9 Changes from financing cash flows 6617.46 10804.33 (4209.10) (67.95) 13144.74
10 The effect of changes in foreign exchange rates 22.52 137.79 130.00 – 290.31
11 Interest accrued 146.20 15.83 185.46 – 347.49
12 Other changes (transfer within categories) (3372.47) – 3372.47 – –
13 Conversion into equity – – (54.81) – (54.81)
14 Balance as at 31-3-2020 7185.71 15044.11 3555.48 156.45 25941.75
Amounts reported in statement of cash flows under financing activities:v crore
Particulars 2019-20 2018-19
Proceeds from non-current borrowings 6617.46 789.41
Repayments of non-current borrowings (4209.10) (974.33)
(Repayments)/Proceeds from other borrowings (net) 10804.33 (616.54)
Repayments of lease liability (67.95) –
Total changes from financing cash flows (refer to Sr. No. 9 & 2 supra) 13144.74 (801.46)
Notes forming part of the Financial Statements (contd.)NOTE [43] Disclosure pursuant to Ind AS 7 “Statement of Cash Flows” - Changes in liabilities arising from financing activities: (contd.)

414
NOTES FORMING PART OF THE FINANCIAL STATEMENTS ANNUAL REPORT 2019-20
[NOTE 44]
Disclosure pursuant to Ind AS 12 “Income Taxes”
(a) Major components of tax expense/(income): v crore
Sr. No. Particulars 2019-20 2018-19
1. Profit or Loss section
(i) Current Income tax:
Current income tax expense 1756.13 2460.08
Tax expense in respect of earlier years (60.68) 227.14
(ii) Deferred Tax:
Tax expense on origination and reversal of temporary differences (145.33) 83.75
Minimum alternate tax (MAT) credit 230.23 (230.23)
Effect of previously unrecognised tax losses on which deferred tax benefit is recognised (787.94) (0.27)
Effect on deferred tax balances due to the change in income tax rate 179.67 –
Income tax expense reported in Profit or Loss [(i)+(ii)] 1172.08 2540.47
Income tax expense is attributable to:
Profit from continuing operations 961.15 2271.13
Profit from discontinued operations 210.93 269.34
1,172.08 2,540.47
2. Other Comprehensive Income (OCI) Section:
(i) Items not to be reclassified to Profit or Loss in subsequent periods:
Current tax expense/(income):
On remeasurement of defined benefit plans (43.81) (10.94)
(43.81) (10.94)
(ii) Items to be reclassified to Profit or Loss in subsequent periods:
(A) Current tax expense/(income):
On gain/(loss) on cash flow hedges other than mark to market 36.29 (76.46)
On foreign currency translation of Joint Operations – 0.49
36.29 (75.97)
(B) Deferred Tax:
On mark to market gain/(loss) on cash flow hedges (83.89) 45.87
Net gain/(loss) on cost of hedge reserve (7.11) 8.87
On gain/(loss) fair value of debt securities 34.28 (16.68)
On foreign currency translation of joint operations (4.45) 2.76
(61.17) 40.82
Income tax expense reported in the OCI section [(i)+(ii)] (68.69) (46.09)
3. Retained earnings:
Deferred tax (1.86) (335.11)
Income tax expense/(income) reported in retained earnings (1.86) (335.11)
Notes forming part of the Financial Statements (contd.)

415
(b) Reconciliation of tax expense and the accounting profit multiplied by domestic tax rate applicable in India: v crore
Sr. No. Particulars 2019-20 2018-19
(1) Profit before tax from:
Continuing Operations 6985.91 9219.46
Discontinued Operations 865.38 812.40
7851.29 10031.86
(2) Corporate tax rate as per Income tax Act, 1961 25.17% 34.94%
(3) Tax on accounting profit (3)=(1)*(2) 1976.01 3505.53
(4) (i) Tax on Income exempt from tax :
(A) Dividend income (347.18) (523.73)
(B) Long-term capital gains exempt from tax (121.27) (978.42)
(C) Interest on tax free bonds (1.04) (2.50)
(ii) Tax on expenses not tax deductible:
(A) CSR expenses 36.57 42.52
(B) Expenses in relation to exempt income 36.42 28.35
(C) Tax on employee perquisites borne by the Company 2.08 1.52
(iii) WeighteddeductionsonR&Dexpenditureanddeductionu/s80IA – (147.05)
(iv) Effect of previously unrecognised tax losses used to reduce deferred tax expense (787.94) (0.27)
(v) Tax effect on impairment and fair valuation losses recognised on which deferred tax asset is not recognised – 685.62
(vi) Effect on deferred tax balances due to the change in income tax rate 179.67 –
(vii) Effect of current year net capital/business loss on which no deferred tax asset is recognised – (123.61)
(viii) Effect of current tax related to earlier years (60.68) 227.14
(ix) Effect of previously unrecognised tax losses used to reduce current tax expense – (477.86)
(x) Tax effect of losses in joint operation of current year on which no deferred tax asset is recognised 3.87 37.68
(xi) Tax effect on various other items 25.34 18.33
(xii) Reversal of MAT credit entitlement 230.23 –
Total effect of tax adjustments [(i) to (xii)] (803.93) (965.08)
(5) Tax expense recognised during the year (5)=(3)+(4) 1172.08 2540.47
(6) Effective tax Rate (6)=(5)/(1) 14.93% 25.32%
The Company has opted to pay the tax under section 115BAA of the Income Tax Act,1961. Accordingly;
(I) the provision for current and deferred tax has been determined at the rate of 25.17%,
(II) the deferred tax assets and deferred tax liabilities as at April 1, 2019 have been restated at the rate of 25.17% and
(III) the unutilised credit for minimum alternate tax as at April 1, 2019 has been written-off.
Notes forming part of the Financial Statements (contd.)[NOTE 44]Disclosure pursuant to Ind AS 12 “Income Taxes” (contd.)

416
NOTES FORMING PART OF THE FINANCIAL STATEMENTS ANNUAL REPORT 2019-20
(c) (i) Unused tax losses for which no deferred tax asset (DTA) is recognised in Balance Sheet
Sr. No. Particulars
As at 31-3-2020 As at 31-3-2019
Base Amount (v crore)
Deferred Tax (v crore)
Expiry date Base Amount (v crore)
Deferred Tax (v crore)
Expiry date
Business loss and unabsorbed depreciation
- Amount of losses having expiry 2028.43 510.52 FY 2021-28 2033.64 710.63 FY 2020-28
- Amount of losses having no expiry 981.38 246.99 981.38 342.93
Capital loss – – 3355.81 614.38 FY 2025-27
Total 3009.81 757.51 6370.83 1667.94
(ii) Unrecognised deductible temporary differences for which no deferred tax asset (DTA) is recognised in Balance Sheetv crore
Sr. No. Particulars
As at 31-3-2020 As at 31-3-2019
Base Amount Deferred Tax Base Amount Deferred Tax
1. Deductible temporary differences towards provision for diminution in value of investments on which DTA not created 2966.98 686.82 3017.55 705.59
2. Temporary differences arising out of revaluation of tax base of assets (on account of indexation benefit) 6541.94 1496.80 5813.32 1354.27
3. Other items giving rise to temporary differences 78.08 19.65 78.08 27.29
Total 9587.00 2203.27 8908.95 2087.15
(d) Components of deferred tax (assets) and liabilities recognised in the Balance Sheet and Statement of Profit and loss
v crore
Sr. No.
ParticularsBalance Sheet Statement of Profit or Loss
As at 31-3-2020
As at 31-3-2019
2019-20 2018-19
1. Disputed statutory liability claimed on payment basis u/s 43B of the Income Tax Act, 1961 124.73 155.57 (30.84) 19.10
2. Items disallowed u/s 43B of Income Tax Act, 1961 (243.05) (257.89) 14.84 (49.31)
3. Provision for doubtful debt and advances (877.60) (1048.46) 170.65 58.27
4. Difference in book depreciation and income tax depreciation 406.52 507.75 (101.23) (11.52)
5. Gain/(loss) on derivative transactions (44.97) 46.03 – –
6. Minimum alternate tax credit – (230.23) 230.23 (230.23)
7. Deferred tax on capital losses (787.94) – (787.94) –
8. Other temporary differences (5.89) (14.63) (19.08) 66.94
Deferred tax expense/(income) (523.37) (146.75)
Net deferred tax (assets)/liabilities (1428.20) (841.86)
Notes forming part of the Financial Statements (contd.)[NOTE 44]Disclosure pursuant to Ind AS 12 “Income Taxes” (contd.)

417
(e) Reconciliation of deferred tax (assets)/liabilities
v crore
Sr. No. Particulars 2019-20 2018-19
1. Opening Balance as at April 1 (841.86) (400.62)
2. Tax (income)/expense recognised in opening Retained earnings (1.86) (335.11)
3. Tax (income)/expense during the period recognised in:
(i) Statement of Profit and Loss in Profit or Loss section (523.37) (146.75)
(ii) Statement of Profit and Loss under OCI section (61.17) 40.82
(iii) Hedge reserve (other than through OCI) 0.06 (0.20)
Closing balance as at March 31 (1428.20) (841.86)
NOTE [45]
Disclosure pursuant to Indian Accounting Standard (Ind AS) 19 “Employee Benefits”
i Defined contribution plans: [Note [1](k)(ii)(A)]: Amount of R 81.68crore(previous year: R 89.98crore) is recognised as an expense. Out of which R 6.54 crore (previous year: R 6.31 crore) pertains to discontinued operations.
ii Defined benefit plans:[Note [1](k)(ii)(B)]:
a) The amount recognised in Balance Sheet are as follows:v crore
Particulars
Gratuity plan Post-retirement medical benefit plan
Company pension plan Trust-managed provident fund plan
As at 31-3-2020
As at 31-3-2019
As at 31-3-2020
As at 31-3-2019
As at 31-3-2020
As at 31-3-2019
As at 31-3-2020
As at 31-3-2019
A) Present value of defined benefit obligation
-Wholly funded 618.49 497.14 – – – – 2802.92 2503.86
-Wholly unfunded 87.71 103.26 297.18 197.10 365.27 332.88 – –
706.20 600.40 297.18 197.10 365.27 332.88 2802.92 2503.86
Less: Fair value of plan assets 511.12 433.39 – – – – 2968.51 2516.99
Amount to be recognised as liability/(asset) 195.08 167.02 297.18 197.10 365.27 332.88 (165.59) (13.13)
B) Amounts reflected in the Balance Sheet
Liabilities 194.38 167.02 284.60 197.10 365.27 332.88 25.55 27.10
Assets – – – – – – – –
Net liability/(asset) 194.38 167.02 284.60 197.10 365.27 332.88 25.55 27.10
Net liability/(asset)-current 194.38 167.02 13.01 7.84 25.64 24.52 25.55 [1] 27.10 [1]
Net liability/(asset)-Non current – – 271.60 189.26 339.63 308.36 – –
Net liability/(asset) classified as Held for sale 0.70 – 12.57 – – – – –
[1] Employer’s and employees’ contribution due towards Provident Fund.
Notes forming part of the Financial Statements (contd.)[NOTE 44]Disclosure pursuant to Ind AS 12 “Income Taxes” (contd.)
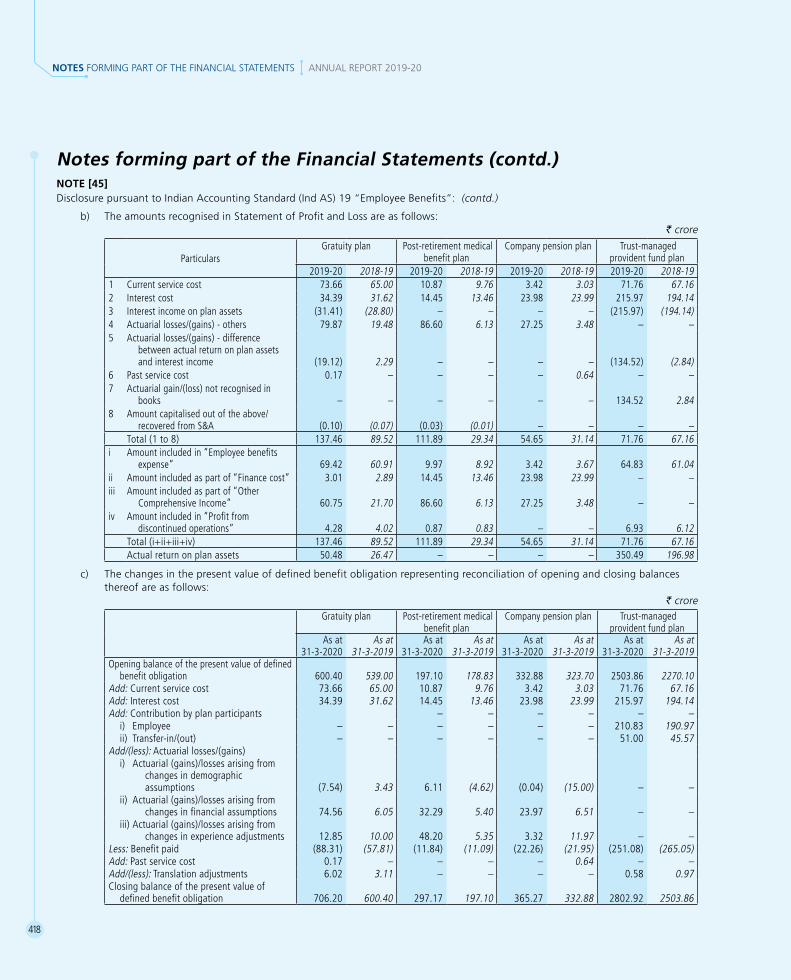
418
NOTES FORMING PART OF THE FINANCIAL STATEMENTS ANNUAL REPORT 2019-20
b) The amounts recognised in Statement of Profit and Loss are as follows:v crore
ParticularsGratuity plan Post-retirement medical
benefit plan Company pension plan Trust-managed
provident fund plan2019-20 2018-19 2019-20 2018-19 2019-20 2018-19 2019-20 2018-19
1 Current service cost 73.66 65.00 10.87 9.76 3.42 3.03 71.76 67.16 2 Interest cost 34.39 31.62 14.45 13.46 23.98 23.99 215.97 194.14 3 Interest income on plan assets (31.41) (28.80) – – – – (215.97) (194.14)4 Actuarial losses/(gains) - others 79.87 19.48 86.60 6.13 27.25 3.48 – – 5 Actuarial losses/(gains) - difference
between actual return on plan assets and interest income (19.12) 2.29 – – – – (134.52) (2.84)
6 Past service cost 0.17 – – – – 0.64 – – 7 Actuarial gain/(loss) not recognised in
books – – – – – – 134.52 2.84 8 Amount capitalised out of the above/
recovered from S&A (0.10) (0.07) (0.03) (0.01) – – – – Total (1 to 8) 137.46 89.52 111.89 29.34 54.65 31.14 71.76 67.16
i Amount included in “Employee benefits expense” 69.42 60.91 9.97 8.92 3.42 3.67 64.83 61.04
ii Amount included as part of “Finance cost” 3.01 2.89 14.45 13.46 23.98 23.99 – – iii Amount included as part of “Other
Comprehensive Income” 60.75 21.70 86.60 6.13 27.25 3.48 – – iv Amount included in “Profit from
discontinued operations” 4.28 4.02 0.87 0.83 – – 6.93 6.12Total (i+ii+iii+iv) 137.46 89.52 111.89 29.34 54.65 31.14 71.76 67.16 Actual return on plan assets 50.48 26.47 – – – – 350.49 196.98
c) The changes in the present value of defined benefit obligation representing reconciliation of opening and closing balances thereof are as follows:
v croreGratuity plan Post-retirement medical
benefit plan Company pension plan Trust-managed
provident fund planAs at
31-3-2020As at
31-3-2019As at
31-3-2020As at
31-3-2019As at
31-3-2020As at
31-3-2019As at
31-3-2020As at
31-3-2019Opening balance of the present value of defined
benefit obligation 600.40 539.00 197.10 178.83 332.88 323.70 2503.86 2270.10Add: Current service cost 73.66 65.00 10.87 9.76 3.42 3.03 71.76 67.16 Add: Interest cost 34.39 31.62 14.45 13.46 23.98 23.99 215.97 194.14 Add: Contribution by plan participants – – – – – – i) Employee – – – – – – 210.83 190.97 ii) Transfer-in/(out) – – – – – – 51.00 45.57 Add/(less): Actuarial losses/(gains) i) Actuarial (gains)/losses arising from
changes in demographic assumptions (7.54) 3.43 6.11 (4.62) (0.04) (15.00) – –
ii) Actuarial (gains)/losses arising from changes in financial assumptions 74.56 6.05 32.29 5.40 23.97 6.51 – –
iii) Actuarial (gains)/losses arising from changes in experience adjustments 12.85 10.00 48.20 5.35 3.32 11.97 – –
Less: Benefit paid (88.31) (57.81) (11.84) (11.09) (22.26) (21.95) (251.08) (265.05)Add: Past service cost 0.17 – – – – 0.64 – – Add/(less): Translation adjustments 6.02 3.11 – – – – 0.58 0.97 Closing balance of the present value of
defined benefit obligation 706.20 600.40 297.17 197.10 365.27 332.88 2802.92 2503.86
Notes forming part of the Financial Statements (contd.)NOTE [45]Disclosure pursuant to Indian Accounting Standard (Ind AS) 19 “Employee Benefits”: (contd.)

419
d) Changes in the fair value of plan assets representing reconciliation of the opening and closing balances thereof are as follows:
v crore
Particulars
Gratuity plan Trust-managed provident fund plan
As at 31-3-2020
As at 31-3-2019
As at 31-3-2020
As at 31-3-2019
Opening balance of the fair value of the plan assets 433.39 400.72 2516.99 2287.82
Add: Interest income on plan assets [1] 31.41 28.80 215.97 194.14
Add/(Less): Actuarial gains/(losses): – – – –
Difference between actual return on plan assets and interest income 19.12 (2.29) 134.52 2.84
Add: Contribution by the employer 62.22 45.05 76.99 64.57
Add/(less): Transfer in/(out) 0.09 – 51.00 45.57
Add: Contribution by plan participants – – 224.11 187.10
Less: Benefits paid (35.11) (38.89) (251.08) (265.05)
Closing balance of the plan assets 511.12 433.39 2968.51 2516.99
[1] Basis used to determine interest income on plan assets:
The Trust formed by the Company manages the investments of provident funds and gratuity fund. Interest income on plan assets is determined by multiplying the fair value of the plan assets by the discount rate determined at the start of the annual reporting period.
The Company expects to fund R 103.05 crore (previous year: R 60.97 crore) towards its gratuity plan and R 79.24 crore (previous year: R 73.88crore) towards its trust-managed provident fund plan during the year 2020-21.
e) The fair values of major categories of plan assets are as follows:
v crore
ParticularsGratuity plan
As at 31-3-2020 As at 31-3-2019Quoted Unquoted Total Quoted Unquoted Total
Cash and cash equivalents – 2.05 2.05 – 0.61 0.61 Equity instruments 10.24 – 10.24 15.81 – 15.81 Debt instruments - Corporate Bonds 229.45 – 229.45 172.10 – 172.10Debt instruments - Central government Bonds 140.89 – 140.89 132.95 – 132.95 Debt instruments - State government Bonds 90.66 – 90.66 77.63 – 77.63 Debt instruments - PSU Bonds 8.74 – 8.74 8.41 – 8.41 Mutual funds - Equity 11.62 9.35 20.97 6.90 9.88 16.78 Mutual funds - Debt – – – – 4.75 4.75 Mutual funds - Others 0.25 2.62 2.87 – – – Insurer managed funds – 0.82 0.82 – 0.85 0.85 Fixed Deposits – 3.00 3.00 – 1.85 1.85 Special Deposit Scheme – 1.49 1.49 – 1.49 1.49 Other (Payables)/Receivables – (0.09) (0.09) – 0.16 0.16 Closing balance of the plan assets 491.85 19.24 511.09 413.80 19.59 433.39
Notes forming part of the Financial Statements (contd.)NOTE [45]Disclosure pursuant to Indian Accounting Standard (Ind AS) 19 “Employee Benefits”: (contd.)

420
NOTES FORMING PART OF THE FINANCIAL STATEMENTS ANNUAL REPORT 2019-20
v crore
ParticularsTrust-managed provident fund plan
As at 31-3-2020 As at 31-3-2019Quoted Unquoted Total Quoted Unquoted Total
Cash and cash equivalents – 17.12 17.12 – 4.78 4.78 Equity instruments 11.84 – 11.84 0.06 – 0.06 Debt instruments - Corporate Bonds 841.07 – 841.07 509.01 – 509.01 Debt instruments - Central government Bonds 646.52 – 646.52 582.09 – 582.09 Debt instruments - State government Bonds 717.25 – 717.25 592.89 – 592.89 Debt instruments - PSU Bonds 454.38 – 454.38 535.32 – 535.32 Mutual funds - Equity 44.77 40.65 85.42 33.03 46.57 79.60 Mutual funds - Debt – – – – 21.47 21.47 Mutual funds - Others 6.48 – 6.48 – 1.12 1.12 Fixed Deposits – – – – – – Special Deposit Scheme – 188.43 188.43 – 190.60 190.60 Other (Payables)/Receivables 0.01 – 0.01 – 0.04 0.04Closing balance of the plan assets 2722.32 246.20 2968.52 2252.40 264.58 2516.98
f) The average duration of the defined benefit plan obligations at the end of the reporting period is as follows:
Plans As at 31-3-2020 As at 31-3-2019
1) Gratuity plan 7.24 6.17
2) Post-retirement medical benefit plan 13.88 13.86
3) Company pension plan 7.78 7.67
g) Principal actuarial assumptions at the Balance Sheet date (expressed as weighted averages):
Particulars As at 31-3-2020 As at 31-3-2019i) Discount rate:
a) Gratuity plan 6.63% 7.48%b) Company pension plan 6.63% 7.48%c) Post-retirement medical benefit plan 6.63% 7.48%
ii) Annual increase in healthcare costs (refer note vii infra) 5.00% 5.00%iii) Salary growth rate:
a) Gratuity plan 6.00% 5.00%b) Company pension plan 8.00% 7.00%
iv) Attrition Rate:
a) For gratuity plan the attrition rate varies from 1% to 11% (previous year: 1% to 12%) for various age groups.
b) For Company pension plan, the attrition rate varies from 0% to 2% (previous year: 0% to 2%) for various age groups.
c) For post-retirement medical benefit plan, the attrition rate varies from 1% to 11% (previous year: 1% to 11%) for various age groups.
v) The estimates of future salary increases, considered in actuarial valuation, take into account inflation, seniority, promotion and other relevant factors, such as supply and demand in the employment market.
Notes forming part of the Financial Statements (contd.)NOTE [45]Disclosure pursuant to Indian Accounting Standard (Ind AS) 19 “Employee Benefits”: (contd.)

421
vi) The interest payment obligation of trust-managed provident fund is assumed to be adequately covered by the interest income on long-term investments of the fund. Any shortfall in the interest income over the interest obligation is recognised immediately in the statement of Profit and Loss.
vii) The obligation of the Company under the post-retirement medical benefit plan is limited to the overall ceiling limits. At present, healthcare cost, as indicated in the principal actuarial assumption given infra, has been assumed to increase at 5.00% p.a.
viii) (A) One percentage point change in actuarial assumptions would have the following effects on the defined benefit obligation of gratuity plan:
v crore
ParticularsEffect of 1% increase Effect of 1% decrease
2019-20 2018-19 2019-20 2018-19
Impact of change in salary growth rate 47.34 32.77 (42.19) (29.71)
Impact of change in discount rate (41.58) (28.82) 47.47 32.27
(B) One percentage point change in actuarial assumptions would have the following effects on the defined benefit obligation of Company pension plan:
v crore
ParticularEffect of 1% increase Effect of 1% decrease
2019-20 2018-19 2019-20 2018-19
Impact of change in discount rate (27.14) (24.05) 31.28 27.66
(C) One percentage point change in actuarial assumptions would have the following effects on the defined benefit obligation of post-retirement medical benefit plan:
v crore
ParticularsEffect of 1% increase Effect of 1% decrease
2019-20 2018-19 2019-20 2018-19
Impact of change in health care cost 20.59 19.99 (16.91) (16.44)
Impact of change in discount rate (37.38) (24.76) 47.25 30.96
h) Characteristics of defined benefit plans and associated risks: 1 Gratuity plan: The Company operates gratuity plan through a trust wherein every employee is entitled to the benefit equivalent to
fifteen days last salary drawn for each completed year of service. The same is payable on termination of service or retirement whichever is earlier. The benefit vests after five years of continuous service. The Company’s scheme is more favorable as compared to the obligation under Payment of Gratuity Act, 1972.
The defined benefit plan for gratuity of the Company is administered by separate gratuity funds that are legally separate from the Company. The trustees nominated by the Company are responsible for the administration of the plan. There are no minimum funding requirements of these plans. The funding of these plans are based on gratuity fund’s actuarial measurement framework set out in the funding policies of the plan. These actuarial measurements are similar compared to the assumptions set out in (g) supra. Employees do not contribute to any of these plans.
Unfunded gratuity represents a small part of gratuity plan which is not material. Further, the unfunded portion included amounts payable in respect of the Company’s foreign operations which result in gratuity payable to employees engaged as per local laws of country of operation.
2 Post-retirement medical care plan: The Post-retirement medical benefit plan provides for reimbursement of health care costs to certain categories of
employees post their retirement. The reimbursement is subject to an overall ceiling sanctioned based on cadre of the employee at the time of retirement. The plan is unfunded. Employees do not contribute to the plan.
Notes forming part of the Financial Statements (contd.)NOTE [45]Disclosure pursuant to Indian Accounting Standard (Ind AS) 19 “Employee Benefits”: (contd.)

422
NOTES FORMING PART OF THE FINANCIAL STATEMENTS ANNUAL REPORT 2019-20
3 Company’s pension plan:
In addition to contribution to state-managed pension plan (EPS scheme), the Company operates a post retirement pension scheme, which is discretionary in nature for certain cadres of employees. The quantum of pension depends on the cadre of the employee at the time of retirement. The plan is unfunded. Employees do not contribute to the plan.
4 Trust managed provident fund plan:
The Company manages provident fund plan through a provident fund trust for its employees which is permitted under The Employees’ Provident Fund and Miscellaneous Provisions Act, 1952. The plan mandates contribution by employer at a fixed percentage of employee’s salary. Employees also contribute to the plan at a fixed percentage of their salary as a minimum contribution and additional sums at their discretion. The plan guarantees interest at the rate notified by Employees’ Provident Fund Organisation. The contribution by employer and employee together with interest are payable at the time of separation from service or retirement whichever is earlier. The benefit under this plan vests immediately on rendering of service.
The interest payment obligation of trust-managed provident fund is assumed to be adequately covered by the interest income on long-term investments of the fund. Any shortfall in the interest income over the interest obligation is recognised immediately in the Statement of Profit and Loss as actuarial loss. Any loss/gain arising out of the investment risk and actuarial risk associated with the plan is also recognised as expense or income in the period in which such loss/gain occurs.
All the above defined benefit plans expose the Company to general actuarial risks such as interest rate risk and market (investment) risk.
NOTE [46]
Disclosure pursuant to Ind AS 20 “Accounting for Government Grants and Disclosure of Government Assistance”
The Company’s exports qualify for various export benefits offered in the form of duty credit scrips under foreign trade policy framed by Department General of Foreign Trade India (DGFT). Income accounted towards such export incentives and duty drawback amounts to R 119.68crore(previous year: R 200.57 crore).
NOTE [47]
Disclosure of related parties/related party transactions pursuant to Ind AS 24 “ Related Party Disclosures”
(a) List of related parties over which control exist and status of transactions entered during the year:
Sr No.
Name of the Subsidiary Company Nature of relationship Transaction entered during the year (Yes/
No)1 L&T Construction Equipment Limited Wholly owned subsidiary [WOS] Yes2 L&T Construction Machinery Limited WOS Yes3 Bhilai Power Supply Company Limited Subsidiary Yes4 L&T Electricals and Automation Limited WOS Yes5 Kesun Iron and Steel Company Private Limited Subsidiary Yes6 L&T Power Limited Subsidiary Yes7 L&T Aviation Services Private Limited WOS Yes8 L&T Capital Company Limited WOS Yes9 L&T Infra Contractors Private Limited WOS of L&T Capital Limited Yes10 Larsen & Toubro International FZE WOS of L&T Global Holdings Limited Yes11 Larsen & Toubro (East Asia) SDN. BHD. Subsidiary Yes12 L&T Global Holdings Limited WOS Yes13 L&T Cassidian Limited [4] WOS No14 Larsen & Toubro Heavy Engineering LLC Subsidiary of Larsen & Toubro International FZE Yes
Notes forming part of the Financial Statements (contd.)NOTE [45]Disclosure pursuant to Indian Accounting Standard (Ind AS) 19 “Employee Benefits”: (contd.)

423
Sr No.
Name of the Subsidiary Company Nature of relationship Transaction entered during the year (Yes/
No)15 L&T Hydrocarbon Engineering Limited WOS Yes16 L&T Modular Fabrication Yard LLC Subsidiary of Larsen & Toubro International FZE Yes17 L&T Overseas Projects Nigeria Limited WOS of Larsen & Toubro International FZE No18 PT Larsen & Toubro Hydrocarbon Engineering Indonesia Subsidiary of Larsen & Toubro International FZE No19 Larsen & Toubro Kuwait Construction General Contracting
Company WLLSubsidiary of Larsen & Toubro International FZE Yes
20 Larsen Toubro Arabia LLC Subsidiary Yes21 L&T Hydrocarbon Saudi Company (formerly known as
Larsen & Toubro ATCO Saudi LLC)Subsidiary of L&T Hydrocarbon Engineering Limited No
22 Larsen & Toubro Electromech LLC Subsidiary No23 L&T Gulf Private Limited [5] WOS of L&T Hydrocarbon Engineering Limited Yes24 Hi-Tech Rock Products and Aggregates Limited WOS Yes25 L&T Geostructure LLP Subsidiary Yes26 L&T Geo – L&T JV for Maharatangarh project WOS of L&T Geostructure LLP No27 L&T Geo – L&T UJV CMRL CS WOS of L&T Geostructure LLP No28 L&T Infrastructure Engineering Limited WOS Yes29 Larsen & Toubro (Oman) LLC Subsidiary of Larsen & Toubro International FZE Yes30 Larsen & Toubro qatar LLC [7] Subsidiary of Larsen & Toubro International FZE No31 Larsen & Toubro (Saudi Arabia) LLC Subsidiary Yes32 Larsen & Toubro T&D SA (Proprietary) Limited Subsidiary of Larsen & Toubro International FZE Yes33 L&T Seawoods Limited WOS Yes34 L&T Asian Realty Project LLP Subsidiary of L&T Realty Limited Yes35 L&T Parel Project LLP Subsidiary of L&T Realty Limited Yes36 Chennai Vision Developers Private Limited WOS of L&T Realty Limited Yes37 L&T Vision Ventures Limited Subsidiary of L&T Realty Limited Yes38 L&T Westend Project LLP Subsidiary of L&T Realty Limited No39 LTR SSM Private Limited [4] Subsidiary Yes40 L&T Valves Limited WOS Yes41 L&T Valves Arabia Manufacturing LLC [15] WOS of L&T Valves Limited No42 L&T Valves USA LLC [10] WOS of L&T Valves Limited No43 L&T Finance Holdings Limited Subsidiary Yes44 L&T Housing Finance Limited WOS of L&T Finance Holdings Limited Yes45 L&T Finance Limited WOS of L&T Finance Holdings Limited Yes46 L&T Capital Markets Limited WOS of L&T Finance Holding Limited Yes47 L&T Investment Management Limited WOS of L&T Finance Holdings Limited Yes48 L&T Mutual Fund Trustee Limited WOS of L&T Finance Holdings Limited Yes49 L&T Infrastructure Finance Company Limited WOS of L&T Finance Holdings Limited Yes50 L&T Infra Debt Fund Limited WOS of L&T Infrastructure Finance Company Limited Yes51 L&T Infra Investment Partners Advisory Private Limited WOS of L&T Infrastructure Finance Company Limited Yes52 L&T Infra Investment Partners Trustee Private Limited WOS of L&T Infrastructure Finance Company Limited Yes53 L&T Financial Consultants Limited WOS of L&T Finance Holdings Limited Yes54 Mudit Cement Private Limited WOS of L&T Financial Consultants Limited Yes
Notes forming part of the Financial Statements (contd.)NOTE [47](a) List of related parties over which control exist and status of transactions entered during the year: (contd.)

424
NOTES FORMING PART OF THE FINANCIAL STATEMENTS ANNUAL REPORT 2019-20
NOTE [47](a) List of related parties over which control exist and status of transactions entered during the year: (contd.)
Sr No.
Name of the Subsidiary Company Nature of relationship Transaction entered during the year (Yes/
No)55 L&T Infra Investment Partners Subsidiary of L&T Infrastructure Finance Company Limited No56 L&T Capital Market (Middle East) Limited WOS of L&T Finance Holdings Limited No57 Larsen & Toubro Infotech Limited Subsidiary Yes58 L&T Technology Services Limited Subsidiary Yes59 L&T Thales Technology Services Private Limited Subsidiary of L&T Technology Services Limited Yes60 Esencia Technologies India Private Limited Subsidiary of Esencia USA Yes61 Syncordis Software Services India Private Limited Subsidiary of L&T Infotech Limited Yes62 Larsen & Toubro Infotech LLC WOS of Larsen & Toubro Infotech Limited No63 Larsen & Toubro Infotech, GmbH WOS of Larsen & Toubro Infotech Limited No64 Larsen & Toubro Infotech Canada Limited WOS of Larsen & Toubro Infotech Limited No65 Larsen & Toubro LLC Subsidiary No66 L&T Infotech Financial Services Technologies Inc. WOS of Larsen & Toubro Infotech Limited No67 Larsen & Toubro Infotech South Africa (PTY) Limited Subsidiary of Larsen & Toubro Infotech Limited No68 L&T Information Technology Services (Shanghai) Co.
LimitedWOS of Larsen & Toubro Infotech Limited No
69 L&T Technology Services LLC WOS of L&T Technology Services Limited Yes70 L&T Information Technology Spain SL WOS of Larsen & Toubro Infotech Limited No71 Esencia Technologies Inc Subsidiary of L&T Technology Services LLC No72 L&T Infotech S. DE R.L. DE C.V. Subsidiary of L&T Infotech Limited No73 Larsen & Toubro Infotech Norge AS WOS of Larsen and Toubro Infotech Limited No74 Syncordis S.A. WOS of Larsen and Toubro Infotech Gmbh No75 Syncordis SARL WOS of Syncordis S.A. No76 Syncordis Limited WOS of Syncordis S.A. No77 Syncordis PSF S.A. (formerly known as Syncordis Support
Services S.A.)WOS of Syncordis S.A. Yes
78 Graphene Semiconductor Services Private Limited WOS of L&T Technology Services Limited No79 Graphene Solutions PTE Ltd. WOS of Graphene Semiconductor Services Private Limited No80 Graphene Solutions SDN. BHD. WOS of Graphene Semiconductor Services Private Limited No81 Graphene Solutions Taiwan Limited WOS of Graphene Semiconductor Services Private Limited No82 Seastar Labs Private Limited WOS of Graphene Semiconductor Services Private Limited Yes83 Nielsen+Partners Germany WOS Larsen & Toubro Infotech GmbH No84 Nielsen+Partners Switzerland WOS of Nielsen + Partners Germany No85 Nielsen+Partners Singapore WOS of Nielsen + Partners Germany No86 Nielsen+Partners Luxembourg WOS of Nielsen + Partners Germany No87 Nielsen+Partners Thailand WOS of Nielsen + Partners Germany No88 Nielsen+Partners Australia WOS of Nielsen + Partners Germany No89 Ruletronics Limited WOS of Larsen and Toubro Infotech Gmbh No90 Ruletronics Systems Inc. WOS of Larsen and Toubro Infotech Gmbh No91 Ruletronics Systems Private Limited [15] WOS of Larsen and Toubro Infotech Limited Yes92 Mindtree Limited [1] Subsidiary Yes93 Mindtree Software (Shanghai) Co. Limited [14] WOS of Mindtree Limited94 Bluefin Solutions SDN. BHD. [14] WOS of Mindtree Limited95 Lymbyc Solutions Inc. [11] WOS of Lymbyc Solutions Private Limited No
Notes forming part of the Financial Statements (contd.)

425
Sr No.
Name of the Subsidiary Company Nature of relationship Transaction entered during the year (Yes/
No)96 Lymbyc Solutions Private Limited [2] WOS of Larsen and Toubro Infotech Limited No97 Powerup Cloud Technologies Private Limited [3] WOS of Larsen and Toubro Infotech Limited No98 L&T Technology Services (Shanghai) Co. Limited [12] WOS of L&T Technology Services Limited No99 L&T Technology Services (Canada) Limited [13] WOS of L&T Technology Services LLC100 L&T Power Development Limited WOS Yes101 L&T Uttaranchal Hydropower Limited WOS of L&T Power Development Limited Yes102 L&T Arunachal Hydropower Limited WOS of L&T Power Development Limited Yes103 L&T Himachal Hydropower Limited WOS of L&T Power Development Limited Yes104 Nabha Power Limited WOS of L&T Power Development Limited Yes105 L&T Metro Rail (Hyderabad) Limited Subsidiary Yes106 Sahibganj Ganges Bridge-Company Private Limited [4] WOS of L&T Capital Limited No107 Thalest Limited WOS of Larsen & Toubro International FZE No108 Servowatch Systems Limited WOS of Thalest Limited Yes109 L&T Electricals & Automation Saudi Arabia Company LLC Subsidiary of Larsen & Toubro International FZE Yes110 Tamco Switchgear (Malaysia) SDN. BHD. WOS of Larsen & Toubro International FZE Yes111 Henikwon Corporation SDN. BHD. WOS of Tamco Switchgear (Malaysia) SDN. BHD No112 Tamco Electrical Industries Australia Pty Limited WOS of Larsen & Toubro International FZE No113 PT Tamco Indonesia Subsidiary of Larsen & Toubro International FZE Yes114 L&T Electrical & Automation FZE WOS of Larsen & Toubro International FZE Yes115 Kana Controls General Trading & Contracting Company
W.L.L.Subsidiary of L&T Electrical & Automation FZE No
116 L&T Hydrocarbon International FZE WOS of L&T Hydrocarbon Engineering Limited No117 L&T Realty Limited [6] WOS Yes118 Larsen & Toubro Infotech Austria GmbH [8] WOS of Larsen & Toubro Infotech Limited No119 L&T Realty FZE [9] WOS of L&T Realty Limited No120 Larsen & Toubro Hydrocarbon International Limited LLC [16] Subsidiary No
121 Bluefin Solutions Inc. USA [17] WOS of Mindtree Limited No
122 Bluefin Solutions Pte Limited [18] WOS of Mindtree Limited No[1] The Company has acquired stake on July 2, 2019[2] The Company through its subsidiary has acquired stake on August 29, 2019[3] The Company through its subsidiary has acquired stake on October 25, 2019[4] The Company is in process of being struck off from the register of companies.[5] The Company is reclassified as subsidiary w.e.f. November 20, 2019[6] MergedwithL&TConstructionEquipmentLimitedw.e.f.April1,2018[7] In process of liquidation[8] Liquidated on August 20, 2019[9] Liquidated on January 27, 2020[10] IncorporatedonMay28,2019[11] The Company through its subsidiary has acquired stake on August 29, 2019[12] Incorporated on August 6, 2019[13] Incorporated on August 20, 2019[14] The Company through its subsidiary has acquired stake on July 2, 2019[15] Incorporated on May 30, 2019[16] Liquidated as on May 16, 2020[17] Liquidated on December 17, 2019. The Company through its subsidiary had acquired stake on July 2, 2019[18] Liquidated on March 20, 2020. The Company through its subsidiary had acquired stake on July 2, 2019
Notes forming part of the Financial Statements (contd.)NOTE [47](a) List of related parties over which control exist and status of transactions entered during the year: (contd.)

426
NOTES FORMING PART OF THE FINANCIAL STATEMENTS ANNUAL REPORT 2019-20
(b) (i) Name of associate companies with whom transactions were carried out during the year:
Sr. No Associate Companies
1 L&T-Chiyoda Limited
2 L&T Camp Facilities LLC
3 Magtorq Private Limited
(ii) Names of joint venture companies with whom transactions were carried out during the year:
Sr. No. Joint Venture Companies Sr. No. Joint Venture Companies1 L&T-MHPS Boilers Private Limited 2 L&T-MHPS Turbine Generators Private Limited3 L&T Howden Private Limited 4 L&T-Sargent & Lundy Limited 5 L&T Special Steels and Heavy Forgings Private
Limited6 L&T MBDA Missile Systems Limited
7 L&T Sapura Offshore Private Limited 8 L&T Sapura Shipping Private Limited9 L&T-Gulf Private Limited [1] 10 L&T Infrastructure Development Projects Limited11 L&T Rajkot-Vadinar Tollway Limited 12 L&T Deccan Tollways Limited13 L&T Samakhiali Gandhidham Tollway Limited 14 Kudgi Transmission Limited15 Krishnagiri Walajahpet Tollway Limited [3] 16 Devihalli Hassan Tollway Limited [3]
17 Krishnagiri Thopur Toll Road Limited [3] 18 Western Andhra Tollways Limited [3]
19 Beawar Pali Pindwara Tollway Limited [3] 20 L&T Sambalpur-Rourkela Tollway limited21 Panipat Elevated Corridor Limited 22 Vadodara Bharuch Tollway Limited23 L&T Transportation Infrastructure Limited 24 L&T Interstate Road Corridor Limited25 Ahmedabad-Maliya Tollway Limited 26 L&T Halol-Shamlaji Tollway Limited27 L&T Kobelco Machinery Private Limited [2] 28 Raykal Aluminium Company Private Limited29 L&T Hydrocarbon Caspian LLC 30 L&T Chennai-Tada Tollway Limited31 PNG Tollway Limited
[1] Re-classified as subsidiary w.e.f. November 20, 2019 due to purchase of additional stake [2] The Company has sold its stake on April 17, 2019
[3]TheCompanyhassolditsstakeonMay4,2018
(iii) Name of post-employment benefit plans with whom transactions were carried out during the year
Sr. No Provident Fund Trust1 Larsen & Toubro Officers & Supervisory Staff Provident Fund2 Larsen & Toubro Limited Provident Fund of 19523 Larsen & Toubro Limited Provident Fund4 L&T Kansbahal Officers & Supervisory Provident Fund5 L&T Kansbahal Staff & Workmen Provident Fund
Sr. No Gratuity Trust1 Larsen & Toubro Officers & Supervisors Gratuity Fund2 Larsen & Toubro Gratuity Fund3 L&T Shipbuilding Limited Employees Group Gratuity Assurance Scheme
Superannuation Trust Larsen & Toubro Limited Senior Officers’ Superannuation Scheme
Notes forming part of the Financial Statements (contd.)NOTE [47] (contd.)

427
NOTE [47] (contd.) (iv) Name of key management personnel and their relatives with whom transactions were carried out during the year:
(i) Executive Director
Sr. No. Sr. No.
1 Mr. S. N. Subrahmanyan (Chief Executive Officer and Managing Director)
2 Mr. R. Shankar Raman (Whole-time Director and Chief Financial Officer)
3 Mr. Shailendra Roy (Whole-time Director) 4 Mr. D. K. Sen (Whole-time Director)
5 Mr. M. V. Satish (Whole-time Director) 6 Mr. J. D. Patil (Whole-time Director)
(ii) Independent/Non-executive Director
Sr. No. Sr. No.
1 Mr. A.M. Naik (Group Chairman) 2 Mr. M. M. Chitale
3 Mr. Subodh Bhargava 4 Mr. M. Damodaran
5 Mr. Vikram Singh Mehta 6 Mr. Adil Zainulbhai
7 Mr. Akhilesh Krishna Gupta [1] 8 Ms. Sunita Sharma
9 Mr. Thomas Mathew T [5] 10 Mr. Ajay Shankar [6]
11 Mr. Subramanian Sarma 12 Ms. Naina Lal Kidwai
13 Mr. Sanjeev Aga 14 Mr. Narayanan Kumar
15 Mr. Arvind Gupta [2] 16 Mr. Hemant Bhargava [3]
17 Mr. Sushobhan Sarker [4]
[1]Ceasedw.e.f.September8,2019 [2] Ceased w.e.f. March 26, 2020
[3]Appointedw.e.f.May28,2018 [4]Ceasedw.e.f.May2,2018
[5] Ceased w.e.f. April 2, 2020 [6] Ceased w.e.f. May 29, 2020
(c) Disclosure of related party transactions:
v crore
Sr. No. Nature of transaction/relationship/major parties
2019-20 2018-19
Amount Amounts for major parties
Amount Amounts for major parties
i. Purchase of goods & services (including commission paid)
Subsidiaries, including: 1210.51 1065.87
L&T Geostructure LLP 364.58 400.56
Hi-Tech Rock Products and Aggregates Limited 410.75 360.04
Tamco Switchgear (Malaysia) SDN. BHD. 121.24
Joint ventures, including: 729.26 1073.38
L&T-MHPS Boilers Private Limited 559.36 773.12
L&T Special Steels and Heavy Forgings Private Limited 75.58
L&T-MHPS Turbine Generators Private Limited 158.57
Associates, including: 10.87 7.44
L&T-Chiyoda Limited 1.07
Magtorq Private Limited 10.47 6.37
Total 1950.64 2146.69
Notes forming part of the Financial Statements (contd.)

428
NOTES FORMING PART OF THE FINANCIAL STATEMENTS ANNUAL REPORT 2019-20
v crore
Sr. No. Nature of transaction/relationship/major parties
2019-20 2018-19
Amount Amounts for major parties
Amount Amounts for major parties
ii.(a) Sale of goods/contract revenue & services
Subsidiaries, including: 1288.28 1291.44
L&T Metro Rail (Hyderabad) Limited 198.32 371.94
L&T Hydrocarbon Engineering Limited 543.87 570.22
Larsen & Toubro (East Asia) SDN. BHD. 136.66 –
Joint ventures, including: 89.53 159.43
L&T MHPS Boilers Private Limited 85.90 147.20
Associate: – 0.13
L&T-Chiyoda Limited – 0.13
Total 1377.81 1451.00
ii(b) Reversal of sale of goods/contract revenue & services
Subsidiary: – 4.16
Nabha Power Limited – 4.16
Joint ventures, including: – 25.99
L&T Deccan Tollways Limited – 23.86
Total – 30.15
iii. Purchase/lease of property, plant and equipment Subsidiaries, including: 14.33 50.25 Larsen & Toubro (Oman) LLC 10.74 9.25 Larsen & Toubro Infotech Limited 2.46 6.16 Larsen & Toubro Heavy Engineering LLC 33.48 Joint ventures, including: 0.05 0.38 L&T-MHPS Boilers Private Limited 0.05 L&T-MHPS Turbine Generators Private Limited 0.13 L&T Special Steels and Heavy Forgings Private Limited 0.13 L&T Kobelco Machinery Private Limited 0.12
Total 14.38 50.63
iv. Sale of property, plant and equipment Subsidiaries, including: 3.96 5.58 L&T Geostructure LLP 3.95 1.95 L&T Hydrocarbon Engineering Limited 3.07 Joint venture: 0.44 0.69 L&T-MHPS Boilers Private Limited 0.44 0.69 Key management personnel: – 6.25 Mr. Shailendra Roy – 6.25
Total 4.40 12.52
Notes forming part of the Financial Statements (contd.)NOTE [47] (contd.)

429
v crore
Sr. No. Nature of transaction/relationship/major parties
2019-20 2018-19
Amount Amounts for major parties
Amount Amounts for major parties
v. Investments including subscription to equity and preference shares (equity portion)
Subsidiaries, including: 233.82 488.11
L&T Metro Rail (Hyderabad) Limited 220.20
L&T Uttaranchal Hydropower Limited 222.00 249.40
Joint ventures: 0.33 1.18
L&T MBDA Missile Systems Limited 0.48
L&T-MHPS Turbine Generators Private Limited 0.33 0.69
Total 234.15 489.29
vi. Subscription debentures/bonds net of redemption:
Subsidiary: – 250.00
L&T Metro Rail (Hyderabad) Limited 250.00
Total – 250.00
vii. Sale/Redemption of investments in Subsidiary: 345.00 L&T Seawoods Limited 345.00 Joint venture: 22.42 L&T Infrastructure Development Projects Limited 22.42
Total 692.04 345.00
viii. Net inter corporate deposits given/(repaid by) Subsidiaries(net), including: 1276.77 228.79 L&T Metro Rail (Hyderabad) Limited 1238.94 106.86 Nabha Power Limited (210.88) L&T Hydrocarbon Engineering Limited 54.03 Hi-Tech Rock Products and Aggregates Limited 299.78 Joint venture: 115.21 84.48 L&T Special Steels and Heavy Forgings Private Limited 115.21 84.48
Total 1391.98 313.27
ix. Net inter corporate borrowing taken from/(repaid to) Subsidiaries, including: 1756.61 (393.80) L&T Seawoods Limited 497.78 (275.34) L&T Hydrocarbon Engineering Limited 1249.50 (129.91) Joint venture: 57.50 – L&T MBDA Missile Systems Limited 57.50
Total 1814.11 (393.80)
Notes forming part of the Financial Statements (contd.)NOTE [47] (contd.)

430
NOTES FORMING PART OF THE FINANCIAL STATEMENTS ANNUAL REPORT 2019-20
NOTE [47] (contd.)
v crore
Sr. No. Nature of transaction/relationship/major parties
2019-20 2018-19
Amount Amounts for major parties
Amount Amounts for major parties
x. Charges paid for miscellaneous services Subsidiaries, including: 185.45 153.83 Larsen & Toubro Infotech Limited 135.26 114.79 L&T Aviation Services Private Limited 19.57 16.58 L&T Technology Services Limited 22.02 Joint ventures, including: 7.55 5.42 L&T-Sargent & Lundy Limited 7.08 4.92
Total 193.00 159.25
xi. Rent paid, including lease rentals under leasing/hire purchase arrangements Subsidiaries, including: 1.30 0.97 L&T Electrical & Automation FZE 0.69 0.26 PT Tamco Indonesia 0.28 0.31 Larsen & Toubro Infotech Limited 0.31 Joint Ventures, including: 3.41 1.24 L&T Special Steels and Heavy Forgings Private Limited 3.20 1.20
Total 4.71 2.21
xii. Rent received, overheads recovered and miscellaneous income Subsidiaries, including: 510.53 510.30 Larsen & Toubro Infotech Limited 84.95 77.24 L&T Technology Services Limited 54.02 55.58 L&T Hydrocarbon Engineering Limited 155.98 132.20 L&T Geostructure LLP 74.24 68.87 L&T Finance Limited 53.55 Joint ventures, including: 72.03 77.84 L&T-MHPS Boilers Private Limited 28.30 35.00 L&T Sargent & Lundy Limited 11.38 11.75 L&T-MHPS Turbine Generators Private Limited 8.31 8.03 L&T Infrastructure Development Projects Limited 7.93 Associate: 12.26 16.87 L&T-Chiyoda Limited 12.26 16.87 Key management personnel: – 0.03 Mr. D.K. Sen – 0.03
Total 594.82 605.04
Notes forming part of the Financial Statements (contd.)

431
v crore
Sr. No. Nature of transaction/relationship/major parties
2019-20 2018-19
Amount Amounts for major parties
Amount Amounts for major parties
xiii.(a) Charges incurred for deputation of employees from related parties
Subsidiaries, including: 12.94 9.75
L&T Electricals & Automation Saudi Arabia Company Limited LLC 1.00
L&T Electrical and Automation FZE 7.83 5.95
PT Tamco Indonesia 1.34 1.45
Kana Controls General Trading and Contracting Company WLL 1.52
Total 12.94 9.75
xiii.(b) Charges recovered for deputation of employees to related parties
Subsidiaries, including: 67.58 87.87
L&T Parel Project LLP 7.14 18.59
L&T Construction Equipment Limited 13.30
L&T Geostructure LLP 12.82 13.97
L&T Seawoods Limited 7.22
Joint ventures, including: 1.42 3.58
L&T-MHPS Boilers Private Limited 0.61
L&T Special Steels and Heavy Forgings Private Limited 0.77 1.35
L&T Infrastructure Development Projects Limited 0.66 1.62
Associate: 6.59 12.88
L&T- Chiyoda Limited 6.59 12.88
Total 75.59 104.33
xiv. Dividend received
Subsidiaries, including: 1373.00 1313.98
Larsen & Toubro Infotech Limited 364.48 353.60
L&T Technology Services Limited 164.27 163.90
L&T Finance Holdings Limited 242.73
L&T Hydrocarbon Engineering Limited 326.21 331.21
Mindtree Limited 269.06 –
L&T Construction Equipment Limited 318.00
Joint Ventures, including: 12.53 19.44
L&T-Sargent & Lundy Limited 7.50
L&T-MHPS Boilers Private Limited 11.94 11.94
Total 1385.53 1333.42
Notes forming part of the Financial Statements (contd.)NOTE [47] (contd.)

432
NOTES FORMING PART OF THE FINANCIAL STATEMENTS ANNUAL REPORT 2019-20
Notes forming part of the Financial Statements (contd.)
v crore
Sr. No. Nature of transaction/relationship/major parties
2019-20 2018-19
Amount Amounts for major parties
Amount Amounts for major parties
xv. Commission received, including those under agency arrangements
Subsidiary: 7.63 10.58
L&T Construction Equipment Limited 7.63 10.58
Joint venture: – 3.75
L&T Kobelco Machinery Private Limited – 3.75
Total 7.63 14.33
xvi. Guarantee charges recovered from
Subsidiaries, including: 62.32 43.11
Nabha Power Limited 9.25 6.62
L&T Hydrocarbon Engineering Limited 32.85 16.37
Larsen Toubro Arabia LLC 9.82 10.36
Joint ventures, including: 0.55 0.52
L&T-MHPS Turbine Generators Private Limited 0.55 0.50
Total 62.87 43.63
xvii. Interest paid to
Subsidiaries, including: 229.69 231.31
L&T Hydrocarbon Engineering Limited 201.68 199.36
L&T Seawoods Limited 23.15
Joint ventures: 4.16 1.81
L&T MBDA Missile Systems Limited 2.42
L&T MHPS Turbine Generators Private Limited 1.74 1.81
Total 233.85 233.12
xviii. Interest received from
Subsidiaries, including: 134.36 89.65
Nabha Power Limited 21.72 31.55
L&T Finance Holdings Limited 17.95
L&T Metro Rail (Hyderabad) Limited 59.16 12.15
Hi-Tech Rock Products and Aggregates Limited 24.80
L&T Infrastructure Finance Company Limited 16.81 –
L&T Finance Limited 16.57 16.57
Joint ventures, including: 128.49 106.83
L&T Special Steels and Heavy Forgings Private Limited 104.14 106.83
L&T Infrastructure Development Projects Limited 21.56
Total 262.85 196.48
NOTE [47] (contd.)

433
v crore
Sr. No. Nature of transaction/relationship/major parties
2019-20 2018-19
Amount Amounts for major parties
Amount Amounts for major parties
xix. Amount written off as bad debts
Subsidiaries, including: 0.08 1.35
Kesun Iron and Steel Company Private Limited 0.08
Bhilai Power Supply Company Limited 1.26
Joint venture: – 25.08
PNG Tollway Limited – 25.08
Total 0.08 26.43
xx. Investments written off
Subsidiaries, including: – 0.02
Seawoods Retail Private Limited – 0.01
Seawoods Realty Private Limited – 0.01
Total – 0.02
xxi. Amount recognised/(reversed) in Profit and Loss as provision towards bad and doubtful debts (including expected credit loss on account of delay) Subsidiaries, including: 13.02 (2.09) L&T Metro Rail (Hyderabad) Limited 8.39 PT Tamco Indonesia 2.28 Nabha Power Limited (1.48) L&T Electricals & Automation Saudi Arabia Company Limited LLC (1.74) L&T Parel Project LLP 0.57 L&T Seawoods Limited 0.65 Larsen & Toubro Heavy Engineering LLC (0.53) L&T Uttaranchal Hydropower Limited 0.31 Joint ventures, including: (0.33) (0.38) L&T Special Steels and Heavy Forgings Private Limited 0.08 (0.09) L&T-MHPS Turbine Generators Private Limited 0.10 L&T Howden Private Limited (0.33) (0.33) L&T Samakhiali Gandhidham Tollway Limited (1.54) L&T-MHPS Boilers Private Limited (0.37) 1.55
Total 12.69 (2.47)
xxii. Amount recognised in Profit and Loss on account of impairment loss on investment and inter-corporate deposit
Joint ventures: – 1666.10
L&T Infrastructure Development Projects Limited 773.00
L&T Special Steels and Heavy Forgings Private Limited 1156.10
Total – 1666.10
Notes forming part of the Financial Statements (contd.)NOTE [47] (contd.)

434
NOTES FORMING PART OF THE FINANCIAL STATEMENTS ANNUAL REPORT 2019-20
v crore
Sr. No. Nature of transaction/relationship/major parties
2019-20 2018-19
Amount Amounts for major parties
Amount Amounts for major parties
xxiii. Rent deposit returned
Key management personnel: – 0.08
Mr. D.K. Sen – 0.08
Total – 0.08
xxiv. Guarantee given on behalf of
Subsidiaries, including: 4739.58 14766.31
L&T Hydrocarbon Engineering Limited 1705.47 9308.23
Larsen & Toubro Arabia LLC 3217.46
Nabha Power Limited 2500.00
Total 4739.58 14766.31
xxv. Contribution to post employment benefit plans
(a) Towards employer’s contribution to provident fund trusts, including: 78.63 69.02
Larsen & Toubro Officers & Supervisory Staff Provident Fund 67.79 59.19
Larsen & Toubro Limited Provident Fund of 1952 8.11 8.22
Total 78.63 69.02
(b) Towards employer’s contribution to gratuity fund trusts, including: 60.95 45.08
Larsen & Toubro Officers & Supervisors Gratuity Fund 55.65 43.35
Larsen & Toubro Gratuity Fund
Total 60.95 45.08
(c) Towards employer’s contribution to superannuation trust: 10.99 9.78
Larsen & Toubro Limited Senior Officers’ Superannuation Scheme 10.99 9.78
Total 10.99 9.78
“Major parties” denote entities accounting for 10% or more of the aggregate for that category of transaction during respective period.
Notes forming part of the Financial Statements (contd.)NOTE [47] (contd.)

435
xxvi. Compensation paid to key management personnel: v crore
Key Management Personnel
2019-20 2018-19Short-term employee
benefits
Post-employment
benefitsTotal
Short-term employee
benefits
Post-employment
benefitsTotal
Executive Directors:(a) Mr. S.N.Subrahmanyan 11.87 3.13 15.00 21.28 5.67 26.95(b) Mr. R. Shankar Raman 7.89 2.08 9.97 14.06 3.75 17.81(c) Mr. Shailendra Roy 5.26 1.37 6.63 9.16 2.33 11.49(d) Mr. D. K. Sen 3.56 0.91 4.47 5.54 1.46 7.00(e) Mr. M. V. Satish 4.60 1.18 5.78 7.43 1.95 9.38(f) Mr. J. D. Patil 4.04 1.04 5.08 6.51 1.71 8.22Non-Executive/Independent Directors:(a) Mr. A.M. Naik 3.18 3.00 [1] 6.18 5.15 3.00 [1] 8.15(b) Other Non-Executive/Independent Directors 3.95 – 3.95 5.03 – 5.03Total 44.35 12.71 57.06 74.16 19.87 94.03
[1] Represents pension(d) Amount due to/from related parties:
v crore
Sr. No. Category of balance/relationship/parties
As at 31-3-2020 As at 31-3-2019
Amount Amounts for major parties
Amount Amounts for major parties
i Accounts receivable
Subsidiaries, including: 1064.16 1213.73
L&T Metro Rail (Hyderabad) Limited 686.36 822.67
L&T Hydrocarbon Engineering Limited 133.70 140.54
Joint ventures, including: 111.32 255.20
L&T-MHPS Boilers Private Limited 92.11 115.36
L&T MBDA Missile Systems Limited 12.00
L&T Infrastructure Development Projects Limited 53.04
L&T Deccan Tollways Limited 75.62
Associate – 0.01
L&T-Chiyoda Limited – 0.01
Total 1175.48 1468.94
Notes forming part of the Financial Statements (contd.)NOTE [47] (contd.)

436
NOTES FORMING PART OF THE FINANCIAL STATEMENTS ANNUAL REPORT 2019-20
v crore
Sr. No. Category of balance/relationship/parties
As at 31-3-2020 As at 31-3-2019
Amount Amounts for major parties
Amount Amounts for major parties
ii. Accounts payables, including other payables
Subsidiaries, including: 1100.12 780.67
Tamco Switchgear (Malaysia) SDN. BHD. 119.21
L&T Geostructure LLP 440.76 296.97
Hi-Tech Rock Products and Aggregates Limited 97.76
Larsen and Toubro (Oman) LLC 110.36
Joint ventures, including: 1184.92 1029.15
L&T-MHPS Boilers Private Limited 717.66 460.21
L&T-MHPS Turbine Generators Private Limited 446.92 503.41
Associates, including 13.04 4.04
Magtorq Private Limited 3.99
L&T Camp Facilities LLC 11.94
Total 2298.08 1813.86
iii. Investment in debt securities [including preference shares (debt portion)]
Subsidiaries, including: 331.40 273.07
L&T Metro Rail (Hyderabad) Limited 289.77 273.07
L&T Finance Limited 41.64
Joint ventures, including: 1049.70 955.11
L&T Special Steels and Heavy Forgings Private Limited 213.17 213.17
Kudgi Transmission Limited 569.93 488.89
L&T Infrastructure Development Private Limited 266.60 253.06
Total 1381.10 1228.18
iv Impairment loss on investment in debt securities
Joint venture: 213.17 213.17
L&T Special Steels and Heavy Forgings Private Limited 213.17 213.17
Total 213.17 213.17
v. Loans & advances recoverable
Subsidiaries, including: 2895.19 1557.58
Hi-Tech Rock Products and Aggregates Limited 342.39 363.37
L&T Metro Rail (Hyderabad) Limited 1394.35
Nabha Power Limited 386.48 386.69
Joint venture: 1892.57 1677.53
L&T Special Steels and Heavy Forgings Private Limited 1635.62 1539.83
Associates, including: 3.26 7.38
L&T- Chiyoda Limited 0.93 4.94
Magtorq Private Limited 2.34 2.44
Total 4791.02 3242.49
Notes forming part of the Financial Statements (contd.)NOTE [47] (contd.)

437
Notes forming part of the Financial Statements (contd.)
v crore
Sr. No. Category of balance/relationship/parties
As at 31-3-2020 As at 31-3-2019
Amount Amounts for major parties
Amount Amounts for major parties
vi. Impairment loss on loans & advances recoverable
Joint venture: 263.00 263.00
L&T Special Steels and Heavy Forgings Private Limited 263.00 263.00
Total 263.00 263.00
vii. Unsecured loans (including lease finance)
Subsidiaries, including: 1796.45 32.73
L&T Hydrocarbon Engineering Limited 1249.50
L&T Seawoods Limited 524.65 19.56
L&T Valves Limited 12.22
Joint venture: 59.68 –
L&T MBDA Missile Systems Limited 59.68
Total 1856.13 32.73
viii. Advances received in the capacity of supplier of goods/services classified as “advances from customers” in the Balance Sheet
Subsidiaries, including: 139.47 40.33
L&T Seawoods Limited 5.48
L&T Hydrocarbon Engineering Limited 77.21 29.61
L&T Metro Rail (Hyderabad) Limited 13.99
L&T Construction Equipment Limited 46.59
Joint venture: 6.97 7.15
L&T-MHPS Boilers Private Limited 6.97 6.97
Total 146.44 47.48
ix. Due to directors : [1]
Key management personnel, including: 29.13 57.00
Mr. S. N. Subrahmanyan 9.01 18.60
Mr. R. Shankar Raman 5.88 12.15
Mr. Shailendra N Roy 3.37 7.05
Mr. D. K. Sen 2.03 4.20
Mr. M. V. Satish 3.02 6.00
Mr. J.D. Patil 2.72 5.30
Total 29.13 57.00
NOTE [47] (contd.)
[1] Includes commission due to Non-Executive directors R 3.10 crore (previous year: R 3.70 crore).

438
NOTES FORMING PART OF THE FINANCIAL STATEMENTS ANNUAL REPORT 2019-20
v crore
Sr. No. Category of balance/relationship/parties
As at 31-3-2020 As at 31-3-2019
Amount Amounts for major parties
Amount Amounts for major parties
x. Post-employment benefit plan
(a) Due to provident fund trusts, including: 29.26 27.73
Larsen & Toubro Officers & Supervisory Staff Provident Fund 24.81 24.77
Total 29.26 27.73
(b) Due to gratuity trusts: 107.04 63.76
Larsen & Toubro Officers & Supervisors Gratuity Fund 94.08 49.70
Larsen & Toubro Gratuity Fund 8.92 11.22
Total 107.04 63.76
(c) Due to superannuation trust: 3.91 7.99
Larsen & Toubro Limited Senior Officers’ Superannuation Scheme 3.91 7.99
Total 3.91 7.99
xi.(a) Capital commitment given
Subsidiaries, including: 1.65 2.15
Larsen & Toubro (Oman) LLC 1.11
L&T Technology Services Limited 0.28 0.85
L&T Construction Machinery Limited 0.31
Larsen & Toubro Infotech Limited 0.96
Joint ventures: – 0.12
L&T Special Steels and Heavy Forgings Private Limited 0.02
L&T-MHPS Turbine Generators Private Limited 0.10
Total 1.65 2.27
xi.(b) Revenue commitment given
Subsidiaries, including: 1084.75 1228.95
L&T Geostructure LLP 685.77 914.90
Joint ventures, including: 2311.24 392.05
L&T-MHPS Boilers Private Limited 1224.91 207.55
L&T-MHPS Turbine Generators Private Limited 668.92 42.63
L&T Howden Private Limited 103.60
Associates, including: 25.49 19.92
Magtorq Private Limited 23.18 19.06
Total 3421.48 1640.92
xii. Commitment to Fund Subsidiaries: 93.00 845.00 L&T Uttaranchal Hydropower Limited 93.00 298.00 L&T Metro Rail (Hyderabad) Limited – 547.00
Total 93.00 845.00
Notes forming part of the Financial Statements (contd.)NOTE [47] (contd.)

439
Notes forming part of the Financial Statements (contd.)
v crore
Sr. No. Category of balance/relationship/parties
As at 31-3-2020 As at 31-3-2019
Amount Amounts for major parties
Amount Amounts for major parties
xiii. Revenue commitment received Subsidiaries, including: 3264.93 2336.85 L&T Metro Rail (Hyderabad) Limited 587.50 651.26 L&T Parel Project LLP 969.27 Nabha Power Limited 571.01 L&T Asian Realty Project LLP 815.00 L&T Construction Equipment Limited 357.55 320.82 L&T Hydrocarbon Engineering Limited 328.59 Joint ventures, including: 65.13 168.49 L&T MBDA Missile Systems Limited 30.00 69.19 L&T-Gulf Private Limited – 18.77 L&T-MHPS Boilers Private Limited 21.28 80.18 L&T-MHPS Turbine Generators Private Limited 6.88
Total 3330.06 2505.34
xiv. Guarantee given on behalf of Subsidiaries, including: 33510.25 36936.01 L&T Hydrocarbon Engineering Limited 19593.31 18476.12 Larsen Toubro Arabia LLC 4285.17 8442.15 Nabha Power Limited 3916.00 4241.00 Joint Ventures, including: 514.74 546.66 L&T-MHPS Turbine Generators Private Limited 394.94 427.31 L&T Special Steels and Heavy Forgings Private Limited 90.42 90.42
Total 34024.99 37482.67
xv. Provision for doubtful debts related to the amount of outstanding balances Subsidiaries, including: 19.73 6.60 Nabha Power Limited 2.04 2.04 L&T Metro Rail (Hyderabad) Limited 8.39 L&T Hydrocarbon Engineering Limited 0.68 PT. Tamco Indonesia 3.09 0.81 L&T Parel Project LLP 0.81 Joint ventures, including: 23.09 23.54 L&T- MHPS Boilers Private Limited 23.00 23.37
Total 42.82 30.14
“Major parties” denote entities account for 10% or more of the aggregate for that category of balance during respective period.
Note : 1. All the related party contracts/arrangements have been entered on arm’s length basis.
2. The amount of outstanding balances as shown above are unsecured and will be settled/recovered in cash.
NOTE [47] (contd.)

440
NOTES FORMING PART OF THE FINANCIAL STATEMENTS ANNUAL REPORT 2019-20
Notes forming part of the Financial Statements (contd.)NOTE [48]
Disclosure pursuant to Ind AS 27 “Separate Financial Statements”
Investment in following subsidiaries, associates and joint ventures is accounted at cost.
Subsidiaries:
As at 31-3-2020 As at 31-3-2019
Sr. No. Name of the subsidiary
Principal place of business
Proportion of direct
ownership (%)
Proportion of effective ownership
Interest (%)
Proportion of effective
voting power held (%)
Proportion of direct
ownership (%)
Proportion of effective ownership
Interest (%)
Proportion of effective
voting power held (%)
Indian subsidiaries
1 Bhilai Power Supply Company Limited India 99.90 99.90 99.90 99.90 99.90 99.90
2 L&T Electricals and Automation Limited India 100.00 100.00 100.00 100.00 100.00 100.00
3 Hi-Tech Rock Products & Aggregates Limited
India 100.00 100.00 100.00 100.00 100.00 100.00
4 L&T Seawoods Limited India 100.00 100.00 100.00 100.00 100.00 100.00
5 Kesun Iron & Steel Company Private Limited India 95.00 95.00 95.00 95.00 95.00 95.00
6 L&T Geostructure LLP India 74.00 100.00 100.00 74.00 100.00 100.00
7 L&T Valves Limited India 100.00 100.00 100.00 100.00 100.00 100.00
8 L&T Power Limited India 99.99 99.99 99.99 99.99 99.99 99.99
9 L&T Cassidian Limited [1] India 100.00 100.00 100.00 100.00 100.00 100.00
10 L&T Aviation Services Private Limited India 100.00 100.00 100.00 100.00 100.00 100.00
11 Larsen & Toubro Infotech Limited India 74.53 74.53 74.53 74.80 74.80 74.80
12 L&T Finance Holdings Limited India 63.72 63.72 63.72 63.91 63.91 63.91
13 L&T Capital Company Limited India 100.00 100.00 100.00 100.00 100.00 100.00
14 L&T Power Development Limited India 100.00 100.00 100.00 100.00 100.00 100.00
15 L&T Metro Rail (Hyderabad) Limited [4] India 100.00 100.00 100.00 100.00 100.00 100.00
16 L&T Technology Services Limited India 74.62 74.62 74.62 78.88 78.88 78.88
17 L&T Construction Equipment Limited [3] India 100.00 100.00 100.00 100.00 100.00 100.00
18 L&T Infrastructure Engineering Limited India 100.00 100.00 100.00 100.00 100.00 100.00
19 L&T Hydrocarbon Engineering Limited India 100.00 100.00 100.00 100.00 100.00 100.00
20 L&T Construction Machinery Limited [3] India 100.00 100.00 100.00 100.00 100.00 100.00
21 Mindtree Limited [2] India 61.08 61.08 61.08 – – –
[1] Applied for strike off[2] The Company has acquired stake on July 2, 2019[3] Refer to Note 5[1]
[4] Proportion of ownership is more than 99.99%

441
Foreign Subsidiaries:
As at 31-3-2020 As at 31-3-2019
Sr. No. Name of subsidiary company
Principal place of business
Proportion of direct
ownership (%)
Proportion of effective ownership
Interest (%)
Proportion of effective
voting power held (%)
Proportion of direct
ownership (%)
Proportion of effective ownership
Interest (%)
Proportion of effective
voting power held (%)
1 Larsen & Toubro LLC USA 95.24 98.79 98.79 95.24 98.80 98.80 2 Larsen & Toubro Hydrocarbon International
Limited LLC [1]
Kindgom of Saudi Arabia 90.00 100.00 100.00 90.00 100.00 100.00
3 Larsen & Toubro (Saudi Arabia) LLC Kindgom of Saudi Arabia 4.35 100.00 100.00 4.35 100.00 100.00
4 L&T Global Holdings Limited UAE 100.00 100.00 100.00 100.00 100.00 100.00 [1] Liquidated on May 16, 2020
Associates:
As at 31-3-2020 As at 31-3-2019
Sr. No. Name of associate
Principal place of business
Proportion of direct
ownership (%)
Proportion of effective ownership
Interest (%)
Proportion of effective
voting power held (%)
Proportion of direct
ownership (%)
Proportion of effective ownership
Interest (%)
Proportion of effective
voting power held (%)
1 Gujarat Leather Industries Limited [1] India 50.00 50.00 50.00 50.00 50.00 50.002 Magtorq Private Limited India 42.85 42.85 42.85 42.85 42.85 42.85
[1] Under liquidation
joint ventures:
As at 31-3-2020 As at 31-3-2019
Sr. No. Name of the joint venture
Principal place of business
Proportion of direct
ownership (%)
Proportion of effective ownership
Interest (%)
Proportion of direct
ownership (%)
Proportion of effective ownership
Interest (%)1 L&T Chennai–Tada Tollway Limited India [1] 51.00 [1] 97.45 2 L&T Rajkot-Vadinar Tollway Limited India [1] 51.00 [1] 97.45 3 L&T Samakhiali Gandhidham Tollway Limited India 0.02 51.01 0.02 97.45 4 L&T Infrastructure Development Projects Limited India 51.00 51.00 97.45 97.45 5 L&T Transportation Infrastructure Limited India 26.24 63.86 26.24 98.12 6 L&T Ahmedabad-Maliya Tollway Limited India [1] 51.00 [1] 97.45 7 L&T Halol-Shamlaji Tollway Limited India [1] 24.98 [1] 47.75 8 L&T Howden Private Limited India 50.10 50.10 50.10 50.10 9 L&T-MHPS Boilers Private Limited India 51.00 51.00 51.00 51.00 10 L&T-MHPS Turbine Generators Private Limited India 51.00 51.00 51.00 51.00 11 Raykal Aluminium Company Private Limited India 75.50 75.50 75.50 75.50 12 L&T Special Steels and Heavy Forgings Private Limited India 74.00 74.00 74.00 74.00 13 PNG Tollway Limited India [1] 37.74 13.26 72.11 14 L&T Kobelco Machinery Private Limited [2] India – – 51.00 51.00 15 L&T MBDA Missile Systems Limited India 51.00 51.00 51.00 51.00 16 L&T-Sargent & Lundy Limited India 50.00 50.00 50.00 50.00
[1] Proportion of direct ownership is less than 0.01%.[2] The Company has sold its stake on April 17, 2019
Notes forming part of the Financial Statements (contd.)NOTE [48] (contd.)

442
NOTES FORMING PART OF THE FINANCIAL STATEMENTS ANNUAL REPORT 2019-20
Notes forming part of the Financial Statements (contd.)NOTE [49]:
Basic and diluted Earnings per share [EPS] computed in accordance with Ind AS 33 “Earnings per Share”:
Particulars 2019-20 2018-19
Basic earnings per share
Profit after tax from continuing operations as per accounts (R crore) A 6024.76 6948.33
Profit after tax from discontinued operations as per accounts (R crore) B 654.45 543.06
Profit after tax from continuing & discontinued operations as per accounts (R crore) C=A+B 6679.21 7491.39
Weighted average number of equity shares outstanding D 1,40,33,69,848 1,40,20,87,033
Basic EPS from continuing operations (R) A/D 42.93 49.56
Basic EPS from discontinued operations (R) B/D 4.66 3.87
Basic EPS from continuing & discontinued operations (R) C/D 47.59 53.43
Diluted earnings per share
Profit after tax from continuing operations as per accounts (R crore) A 6024.76 6948.33
Profit after tax from discontinued operations as per accounts (R crore) B 654.45 543.06
Profit after tax from continuing & discontinued operations as per accounts (R crore) C=A+B 6679.21 7491.39
Weighted average number of equity shares outstanding D 1,40,33,69,848 1,40,20,87,033
Add: Weighted average number of potential equity shares on account of employee stock options E 18,52,930 24,57,688
Weighted average number of equity shares outstanding for diluted EPS F=D+E 1,40,52,22,778 1,40,45,44,721
Diluted EPS from continuing operations (R) A/F 42.87 49.47
Diluted EPS from discontinued operations (R) B/F 4.66 3.87
Diluted EPS from continuing & discontinued operations (R) C/F 47.53 53.34
Face value per share (R) 2 2
The following potential ordinary shares are anti-dilutive and are therefore excluded from the weighted average number of equity shares for the purpose of diluted earnings per share:
Particulars 2019-20 2018-19
Weighted average number of potential equity shares on account of conversion of foreign currency convertible bonds 51,90,133 95,20,455

443
NOTE [50]
Disclosures pursuant to Ind AS 37 “Provisions, Contingent Liabilities and Contingent Assets”
a) Movement in provisions:v crore
Sr. No. Particulars
Class of provisions
Product warranties
Expected tax liability in respect of
indirect taxes
Litigation related
obligations
Contractual rectification
cost - construction
contracts
Total
1 Balance as at 1.4.2019 45.61 204.80 59.10 445.73 755.24
2 Additional provision during the year 16.72 46.25 85.00 397.14 545.11
3 Provision used during the year (13.58) (45.54) (0.84) (9.16) (69.12)
4 Provision reversed during the year (0.01) (8.98) (373.56) (382.55)
5 Additional provision for unwinding of interest and change in discount rate 0.92 – – – 0.92
6 Classified as held for sale (41.63) – – – (41.63)
7 Balance as at 31.3.2020 (6=1+2+3+4+5+6) 8.03 196.53 143.26 460.15 807.97
b) Nature of provisions:
i. Product warranties: The Company gives warranties on certain products and services, undertaking to repair or replace the items that fail to perform satisfactorily during the warranty period. Provision made as at March 31, 2020 represents the amount of the expected cost of meeting such obligations of rectification/replacement. The timing of the outflows is expected to be within a period of 1 to 3 years from the date of Balance Sheet.
ii. Expected tax liability in respect of indirect taxes represents mainly the differential sales tax liability on account of non-collection of declaration forms.
iii. Provision for litigation related obligations represents liabilities that are expected to materialise in respect of matters in appeal.
iv. Contractual rectification cost represents the estimated cost the Company is likely to incur during defect liability period as per the contract obligations in respect of completed construction contracts accounted under Ind AS 115 “ Revenue from Contracts with customers ”.
c) Disclosure in respect of contingent liabilities is given as part of Note 29 to the Balance Sheet.
NOTE [51]
The expenditure on research and development activities recognised as expense in the Statement of Profit and Loss is R 198.74crore(Discontinued operations: R 80.97crore)(previous year: R 168.23crore (Discontinued operations: R 68.82crore)). Further, the Company has incurred capital expenditure on research and development activities as follows:
(a) on tangible assets of R 7.60 crore (Discontinued operations: R 4.19 crore) (previous year: R 5.46 crore (Discontinued operations: R 2.95 crore)) ;
(b) on intangible assets being expenditure on new product development of R 32.27 crore (Discontinued operations: R 30.17 crore) (previous year: R 40.53 crore (Discontinued operations: R 40.07 crore)); and
(c) on other intangible assets of R 1.14 crore (Discontinued operations: Nil) (previous year: R 1.96 crore (Discontinued operations: Nil)).
In addition, the Company has incurred expenditure of R 0.08crore(Discontinuedoperations:Nil)(previous year: R 0.52 crore (Discontinued operations: Nil)) which is customer funded.
Notes forming part of the Financial Statements (contd.)

444
NOTES FORMING PART OF THE FINANCIAL STATEMENTS ANNUAL REPORT 2019-20
Notes forming part of the Financial Statements (contd.)NOTE [52]
Disclosure pursuant to Ind AS 107 “Financial Instruments: Disclosures”: Market risk management
(a) Foreign exchange rate and interest rate risk:
The Company regularly reviews its foreign exchange forward and option positions and interest rate swaps, both on a standalone basis and in conjunction with its underlying foreign currency and interest rate related exposures. The Company follows cash flow hedge accounting for Highly Probable Forecasted Exposures (HPFE) hence the movement in mark to market (MTM) of the hedge contracts undertaken for such exposures is likely to be offset by contra movements in the underlying exposures values. However, till the point of time that the HPFE becomes an on-balance sheet exposure, the changes in MTM of the hedge contracts will impact the Balance Sheet of the Company. Further, given the effective horizons of the Company’s risk management activities which coincide with the durations of the projects under execution and could extend across 3-4 years and given the business uncertainties associated with the timing and estimation of the project exposures, the recognition of the gains and losses related to these instruments may not always coincide with the timing of gains and losses related to the underlying economic exposures and, therefore, may affect the Company’s financial condition and operating results. Hence, the Company monitors the potential risk arising out of the market factors like exchange rates, interest rates, price of traded investment products etc. on a regular basis. For on-balance sheet exposures, the Company monitors the risks on net unhedged exposures.
(i) Foreign exchange rate risk:
In general, the Company is a net receiver of foreign currency. Accordingly, changes in exchange rates, and in particular a strengthening of the Indian Rupee may negatively affect the Company’s net sales and gross margins as expressed in Indian Rupees. There is a risk that the Company will have to adjust local currency product pricing due to competitive pressures when there have been significant volatility in foreign currency exchange rates.
The Company may enter into foreign currency forward and option contracts with financial institutions to protect against foreign exchange risks associated with certain existing assets and liabilities, certain firmly committed transactions, forecasted future cash flows and net investments in foreign subsidiaries. In addition, the Company has entered, and may enter in future, into non-designated foreign currency contracts to partially offset the foreign currency exchange gains and losses on its foreign-denominated debt issuances. The Company’s practice is to hedge a portion of its material foreign exchange exposures with tenors in line with the project/business life cycle. However, the Company may choose not to hedge certain foreign exchange exposures for a variety of reasons.
The net exposure to foreign currency risk (based on notional amount) in respect of recognised financial assets, recognised financial liabilities and derivatives is as follows:
v crore
Particulars
As at 31-3-2020 As at 31-3-2019US Dollars including
pegged currencies
EURO Japanese Yen
US Dollars including
pegged currencies
EURO Japanese Yen
Net exposure to foreign currency risk in respect of recognised financial assets/(recognised financial liabilities) (4303.15) (573.33) (419.49) (3193.61) 136.84 (4.02)Derivatives including embedded derivatives for hedging receivable/(payable) exposure with respect to non-financial assets/(liabilities) 217.94 (28.50) – 552.57 222.95 –Derivatives including embedded derivatives for hedging receivable/(payable) exposure with respect to firm commitments and highly probable transactions 2159.48 (1253.24) 962.38 1368.13 (833.18) 540.83 Receivable/(payable) exposure with respect to forward contracts and embedded derivatives not designated as cash flow hedge (518.73) 25.37 (27.02) (104.88) 122.63 (24.22)
To provide a meaningful assessment of the foreign currency risk associated with the Company’s foreign currency derivative positions against off Balance Sheet exposures and unhedged portion of on-balance sheet financial assets and liabilities, the Company uses a multi-currency correlated value-at-risk (“VAR”) model. The VAR model uses a Monte Carlo simulation to generate thousands of random market price paths for foreign currencies against Indian Rupee taking into account the

445
correlations between them. The VAR is the expected loss in value of the exposures due to overnight movement in spot exchange rates, at 95% confidence interval. The VAR model is not intended to represent actual losses but is used as a risk estimation tool. The model assumes normal market conditions and is a historical best fit model. Because the Company uses foreign currency instruments for hedging purposes, the loss in fair value incurred on those instruments are generally offset by increases in the fair value of the underlying exposures for on-balance sheet exposures. The overnight VAR for the Company at 95% confidence level is R 28.78croreasatMarch31,2020andR 29.88croreasatMarch31,2019.
Actual future gains and losses associated with the Company’s investment portfolio and derivative positions may differ materially from the sensitivity analysis performed as at March 31, 2020 due to the inherent limitations associated with predicting the timing and amount of changes in foreign currency exchange rates and the Company’s actual exposures and position.
(ii) Interest rate risk:
The Company’s exposure to changes in interest rates relates primarily to the Company’s outstanding floating rate debt. While most of the Company’s outstanding debt in local currency is on fixed rate basis and hence not subject to interest rate risk, a major portion of foreign currency debt is linked to international interest rate benchmarks like LIBOR. The Company also hedges a portion of these risks by way of derivative instruments like Interest rate swaps and currency swaps.
The exposure of the Company’s borrowing to interest rate changes at the end of the reporting period is as follows:
v crore
Particulars As at 31-3-2020 As at 31-3-2019
Floating rate borrowings 7671.90 5926.55
A hypothetical 50 basis point shift in respective currency LIBORs and other benchmarks on the unhedged loans would result in a corresponding increase/decrease in interest cost for the Company on a yearly basis as follows:
v crore
Particulars
Impact on Profit and Loss after tax
Impact on Equity
2019-20 2018-19 As at 31-3-2020
As at 31-3-2019
Indian RupeeInterest rates -increase by 0.5% in INR interest rate [1] (1.77) (1.58) (1.77) (1.58)Interest rates -decrease by 0.5% in INR interest rate [1] 1.77 1.58 1.77 1.58US DollarInterest rates -increase by 0.5% in USD interest rate [1] (26.94) (17.70) (26.94) (17.70) Interest rates -decrease by 0.5% in USD interest rate [1] 26.94 17.70 26.94 17.70
[1] Holding all other variables constant
(b) Liquidity Risk Management:
The Company manages liquidity risk by maintaining sufficient cash and marketable securities and by having access to funding through an adequate amount of committed credit lines. Given the need to fund diverse businesses, the Company maintains flexibility in funding by maintaining availability under committed credit lines to meet obligations when due. Management regularly monitors the position of cash and cash equivalents vis-à-vis projections. Assessment of maturity profiles of financial assets and financial liabilities including debt financing plans and maintenance of Balance Sheet liquidity ratios are considered while reviewing the liquidity position.
The Company’s investment policy and strategy are focused on preservation of capital and supporting the Company’s liquidity requirements. The Company uses a combination of internal and external management to execute its investment strategy and achieve its investment objectives. The Company typically invests in money market funds, large debt funds, Government of India securities, equity funds and other highly-rated securities under a limits framework which governs the credit exposure to any one issuer as defined in its investment policy. The policy requires investments generally to be investment grade, with the primary objective of minimising the potential risk of principal loss. To provide a meaningful assessment of the price risk associated with the Company’s investment portfolio, the Company performed a sensitivity analysis to determine the impact of change in prices of the securities on the value of the investment portfolio assuming a 0.5% movement in debt funds and debt securities and a 5% movement in the NAV of the equity funds. Based on the investment position, a hypothetical 0.5% change in the fair market
Notes forming part of the Financial Statements (contd.)NOTE [52] (contd.)

446
NOTES FORMING PART OF THE FINANCIAL STATEMENTS ANNUAL REPORT 2019-20
Notes forming part of the Financial Statements (contd.)
value of debt securities would result in a value change of +/- R 17.80croreasatMarch31,2020and+/- R 11.08croreasatMarch 31, 2019. A 5% change in the equity funds’ NAV would result in a value change of +/- R 3.90 crore as at March 31, 2020 and +/- R 38.91croreasatMarch31,2019 respectively. The investments in money market funds are for the purpose of liquidity management only and hence not subject to any material price risk.
(c) Credit Risk Management: The Company’s customer profile include public sector enterprises, state owned companies and large private corporates.
Accordingly, the Company’s customer credit risk is low. The Company’s average project execution cycle is around 24 to 36 months. General payment terms include mobilisation advance, monthly progress payments with a credit period ranging from 45 to 90 days and certain retention money to be released at the end of the project. In some cases, retentions are substituted with bank/corporate guarantees. The Company has a detailed review mechanism of overdue customer receivables at various levels within the organisation to ensure proper attention and focus for realisation.
(i) The Company is making provisions on trade receivables based on Expected Credit Loss (ECL) model. The reconciliation of ECL is as follows:
v crore
Particulars 2019-20 2018-19Opening balance as at April 1 2270.62 2240.91Changes in allowance for expected credit loss: Provision/(reversal) of allowance for expected credit loss 334.21 68.72 Additional provision (net) towards credit impaired receivables 32.69 188.35 Write off as bad debts (157.19) (227.36)Less: Balance reported under held for sale 102.05 Closing balance as at March 31[refer Note 11] 2378.28 2270.62
(ii) Trade receivable written off during the year but still enforceable for recovery amounts to Nil (previous year: Nil)
NOTE [53]
Other disclosure pursuant to Ind AS 107 “Financial Instruments: Disclosures”:
(a) Category-wise classification for applicable financial assets:
R croreSr. No.
Particulars NoteAs at
31-3-2020As at
31-3-2019I. Measured at fair value through Profit or Loss (FVTPL):
(i) Investment in equity instruments 5 73.42 97.35 (ii) Investment in mutual funds 10 2000.82 1643.56 (iii) Investment in bonds 10 997.65 656.38(iv) Derivative instruments not designated as cash flow hedges 7,15 35.44 9.84(v) Embedded derivatives not designated as cash flow hedges 7,15 53.52 12.40 Sub-total (I) 3160.85 2419.53
II. Measured at amortised cost:(i) Loans 6,14 4022.14 2585.69(ii) Trade receivables 11 27912.96 28212.55(iii) Advances recoverable in cash 15 671.68 730.43 (iv) Cash and cash equivalents and bank balances 7,12,13 4212.47 7909.71 (v) Other receivables 714.41 887.22Sub-total (II) 37533.66 40325.60
III. Measured at fair value through Other Comprehensive Income (FVTOCI):(i) Investment in government securities, bonds and debentures 10 3060.68 2406.91 (ii) Derivative financial instruments designated as cash flow hedges 7,15 552.00 602.56(iii) Embedded Derivatives designated as cash flow hedges 7,15 0.94 0.19Sub-total (III) 3613.62 3009.66Total (I+II+III) 44308.13 45754.79
NOTE [52] (contd.)

447
NOTE [53] (contd.)
(b) Category-wise classification for applicable financial liabilities:
R croreSr. No.
Particulars NoteAs at
31-3-2020As at
31-3-2019I. Measured at fair value through Profit or Loss (FVTPL):
(i) Derivative instruments not designated as cash flow hedges 20,26 23.14 6.86(ii) Embedded derivatives not designated as cash flow hedges 20,26 56.80 3.26 Sub-total (I) 79.94 10.12
II. Measured at amortised cost:(i) Borrowings 19,23,24 25785.29 11989.70(ii) Trade payables Due to micro enterprises and small enterprises 379.88 201.95 Due to others 25 36249.51 36023.08(iii) Others 1334.41 1655.08Sub-total (II) 63749.09 49869.81
III. Derivative instruments (including embedded derivatives) through Other Comprehensive Income:(i) Derivative instruments designated as cash flow hedges 20,26 568.53 236.92 (ii) Embedded derivatives designated as cash flow hedges 20,26 38.31 91.54 Sub-total (III) 606.84 328.46
IV. Financial guarantee contracts 20,26 23.97 19.76 Total (I+II+III+IV) 64459.84 50228.15
(c) Items of income, expense, gains or losses related to financial instruments:
R croreSr. No.
Particulars2019-20 2018-19
I Net gains/(losses) on financial assets, financial liabilities measured at fair value through Profit or Loss and amortised cost:
A (i) Financial assets or financial liabilities mandatorily measured at fair value through Profit or Loss: 1. Gains/(losses) on fair valuation or sale of investments 331.59 293.46 2. Gains/(losses) on fair valuation/settlement of derivative: a. On forward contracts not designated as cash flow hedges (94.69) 42.02 b. On embedded derivatives contracts not designated as cash flow hedges (13.75) (9.51) c. On futures not designated as cash flow hedges – (22.60) 3. Impairment loss on investments – (213.17)Sub-total (A) 223.15 90.20
B Financial assets measured at amortised cost:(i) Exchange gains/(losses) on revaluation or settlement of items denominated in foreign currency
(trade receivables, loans given etc.) 586.25 266.24 (ii) Allowance/(reversal) for expected credit loss during the year in the Statement of Profit or Loss (334.21) (68.72)(iii) Provision for impairment loss (other than expected credit loss) [net] (171.67) (412.47)(iv) Gains/(losses) on derecognition: 1. Bad debts (written off)/written back (net) 166.95 250.69 2. Gains/(losses) on transfer of financial assets (on non-recourse basis) (27.13) (31.68)Sub-total (B) 220.19 4.06
C Financial liabilities measured at amortised cost:(i) Exchange gains/(losses) on revaluation or settlement of items denominated in foreign currency
(trade payables, borrowing availed etc.) (666.44) (410.37)(ii) Unclaimed credit balances written back 162.62 73.16 Sub-total (C) (503.82) (337.21)Total [I] = (A+B+C) (60.48) (242.95)
Notes forming part of the Financial Statements (contd.)

448
NOTES FORMING PART OF THE FINANCIAL STATEMENTS ANNUAL REPORT 2019-20
Notes forming part of the Financial Statements (contd.)
R croreSr. No.
Particulars2019-20 2018-19
II Net gains/(losses) on financial assets and financial liabilities measured at fair value through Other Comprehensive Income:
A Gains/(losses) recognised in Other Comprehensive Income:(i) Financial assets measured at fair value through Other Comprehensive Income: 1. Gains/(losses) on fair valuation or sale of government securities, bonds, debentures etc. 311.54 (141.74)(ii) Derivative measured at fair value through Other Comprehensive Income : 1. Gains/(losses) on fair valuation or settlement of forward contracts designated as cash
flow hedges (111.09) (153.74) 2. Gains/(losses) on fair valuation or settlement of embedded derivative contracts
designated as cash flow hedges 44.56 39.09 Sub-total (A) 245.01 (256.39)Less:
B Gains/(losses) reclassified to Profit or Loss from Other Comprehensive Income:(i) Financial assets measured at fair value through Other Comprehensive Income : 1. On government securities, bonds, debentures etc. upon sale of government securities,
bonds, debentures etc. 154.47 (62.89)(ii) Derivative measured at fair value through Other Comprehensive Income: 1. On forward contracts upon hedged future cash flows affecting the Profit or loss or
related asset or liability 319.29 247.47 2. On embedded derivative contracts upon hedged future cash flows affecting the Profit or
Loss or related asset or liability 9.01 0.64Sub-total (B) 482.77 185.22Net gains/(losses) recognised in Other Comprehensive Income [II]= (A)-(B) (237.76) (441.62)
C Impairment loss on financial assets measured at fair value through Other Comprehensive Income 100.00 – III Other income/(expenses):A Dividend income:
Dividend income from investments measured at FVTPL 1.76 178.70Sub-total (A) 1.76 178.70
B Interest income:(a) Financial assets measured at amortised cost 398.01 259.83(b) Financial assets measured at fair value through Other Comprehensive Income 214.09 180.69(c) Financial assets measured at fair value through Profit or Loss 7.22 32.80Sub-total (B) 619.32 473.32
C Interest expense:(a) Derivative instruments (including embeded derivatives) that are measured at fair value through
Other Comprehensive Income (reclassified to Profit or Loss during the year) (150.06) (259.02)(b) Financial liabilities that are measured at amortised cost (1624.11) (1147.88)(c) Financial liabilities that are measured at fair value through Profit or Loss 5.95 (0.06)Sub-total (C) (1768.22) (1,406.96)Total [III] = (A+B+C) (1147.14) (754.94)
NOTE [53](c) Items of income, expense, gains or losses related to financial instruments: (contd.)

449
Notes forming part of the Financial Statements (contd.)
(d) Fair value of financial assets and financial liabilities measured at amortised cost: (i) Financial assets measured at amortised cost: The carrying amounts of trade receivables, loans, advances and cash and other bank balances are considered to be the same
as their fair values due to their short-term nature. The carrying amounts of long-term loans given with floating rate of interest are considered to be close to the fair value.
(ii) Financial liabilities measured at amortised cost:v crore
ParticularsAs at 31-3-2020 As at 31-3-2019 Fair value
hierarchyCarrying amount
Fair Value Carrying amount
Fair Value
0.675 % Foreign currency convertible bond – – 1363.39 1375.81 L2[1]
Redeemable non-convertible fixed rate debentures 9781.06 9966.73 3560.86 3652.38 L2[1]
Term loan from banks 90.67 95.34 90.67 101.09 L2[1]
Total 9871.73 10062.07 5014.92 5129.28
Note: The carrying amounts of trade and other payables are considered to be the same as their fair values due to their short-term nature. The carrying amounts of borrowings with floating rate of interest are considered to be close to the fair value.
[1] Valuation technique L2: Future cash flows discounted using G-sec/LIBOR rates plus corporate spread.
(e) Fair value hierarchy of financial assets and liabilities measured at fair value: v crore
ParticularsNote As at 31-3-2020 As at 31-3-2019
Level 1 Level 2 Level 3 Total Level 1 Level 2 Level 3 TotalFinancial assets: Investments at FVTPL:(i) Equity shares (other than those held in subsidiary, joint
venture and associate companies)5
5.01 – 68.41 73.42 31.67 – 65.68 97.35 (ii) Mutual fund units 10 2000.82 – – 2000.82 1643.56 – – 1643.56 (iii) Bonds 10 997.65 – – 997.65 656.38 – – 656.38 (iv) Derivative instruments not designated as cash flow
hedges7,15
– 35.44 – 35.44 – 9.84 – 9.84 (v) Embedded derivative Instruments not designated as
cash flow hedges7,15
– 53.52 – 53.52 – 12.40 – 12.40Investments at FVTOCI:(i) Debt instruments viz. government securities, bonds and
debentures10
3060.68 – – 3060.68 2406.91 – – 2406.91 (ii) Derivative financial instruments designated as cash
flow hedges7,15
– 552.00 – 552.00 – 602.56 – 602.56(iii) Embedded derivative financial instruments designated
as cash flow hedges7,15
– 0.94 – 0.94 – 0.19 – 0.19Total 6064.16 641.90 68.41 6774.47 4738.52 624.99 65.68 5429.19Financial Liabilities:(i) At FVTPL - Designated at FVTPL:(a) Derivative instruments not designated as cash flow
hedges20,26
– 23.14 – 23.14 – 6.86 – 6.86 (b) Embedded derivative instruments not designated as
cash flow hedges20,26
– 56.80 – 56.80 – 3.26 – 3.26 (ii) Designated at FVTOCI:(a) Derivative financial instruments designated as cash
flow hedges20,26
– 568.53 – 568.53 – 236.92 – 236.92 (b) Embedded derivative financial instruments designated
as cash flow hedges20,26
– 38.31 – 38.31 – 91.54 – 91.54 Total – 686.78 – 686.78 – 338.58 – 338.58
NOTE [53] (contd.)

450
NOTES FORMING PART OF THE FINANCIAL STATEMENTS ANNUAL REPORT 2019-20
NOTE [53](e) Fair value hierarchy of financial assets and liabilities measured at fair value: (contd.)
Notes forming part of the Financial Statements (contd.)
Valuation technique and key inputs used to determine fair value:
1. Level-1: Mutual fund, bonds, debentures and government securities- quoted price in the active market
2. Level-2: Derivative Instrument – Mark to market on forward covers and embedded derivative instruments is based on forward exchange rates at the end of reporting period and discounted using G-sec rate plus applicable spread.
(f) Movement of items measured using unobservable inputs (Level 3):R crore
Particulars Equity Investment in Tidel Park LimitedBalanceasat01-04-2018 64.27 FairvaluationgainrecognisedinProfitorLossduring2018-19 1.31Balance as at 31-3-2019 65.58Fair valuation gain recognised in Profit or Loss during 2019-20 2.72 Balance as at 31-3-2020 68.30
Significant unobservable inputs used in level 3 fair value measurements and sensitivity of the fair value measurement to changes in unobservable inputs:
v crore
ParticularsFair Value
as at 31-3-2020
Fair Value as at
31-3-2019
Significant unobservable inputs Sensitivity
Equity Investment in “Tidel Park Limited”
68.30 65.58 31-3-2020: 1. Net realization per month R 31.827 per sq/ft. 2. Capitalisation rate 12.25% 31-3-2019: 1. Net realization per month R 30.90 per sq/ft. 2. Capitalisation rate 12.25%
31-3-2020 : 1% change in net realisation would result in +/- R 0.33 crore (post tax- R 0.24 crore) 25 bps change in capitalisation rate would result in +/- R 0.65 crore (post tax- R 0.49 crore) 31-3-2019 : 1% change in net realization would result in +/- R 0.32 crore (post tax- R 0.21 crore) 25 bps change in capitalization rate would result in +/- R 0.63 crore (post tax- R 0.41 crore)
(g) Maturity profile of financial liabilities (undiscounted values):
v crore
Particulars Note
As at 31-3-2020 As at 31-3-2019Within twelve
months
After twelve months
TotalWithin twelve
months
After twelve months
Total
A. Non-derivative liabilities: Borrowings 19, 23, 24 19522.50 8318.68 27841.18 8655.38 4586.26 13241.64 Trade payables: Due to micro enterprises and small enterprises 323.48 56.26 379.74 193.80 8.16 201.96 Due to others 25 34823.28 1426.35 36249.63 35235.91 787.13 36023.04 Other financial liabilities 20, 26 1155.74 46.18 1201.92 1600.37 74.47 1674.84 Lease liabilities 91.21 89.21 180.42 – – – Total 55916.21 9936.68 65852.89 45685.46 5456.02 51141.48B. Derivative liabilities: Forward contracts 20, 26 468.46 144.61 613.07 241.12 8.10 249.22 Embedded derivatives 20, 26 99.90 – 99.90 69.75 28.91 98.66 Total 568.36 144.61 712.97 310.87 37.01 347.88

451
(h) Details of outstanding hedge instruments for which hedge accounting is followed:
(i) Outstanding currency exchange rate hedge instruments:
(A) Forward covers taken to hedge exchange rate risk and accounted as cash flow hedge:
Particulars
As at 31-3-2020 As at 31-3-2019Nominal amount (R crore)
Average rate
(R)
Within twelve
months (R crore)
After twelve
months (R crore)
Nominal amount (R crore)
Average rate
(R)
Within twelve
months (R crore)
After twelve
months (R crore)
(a) Receivable hedges:US Dollars 6543.80 75.80 5211.30 1332.50 5602.72 72.61 4131.54 1471.18Bangladeshi Taka 1859.64 0.90 1,674.92 184.72 – – – –Japanese Yen 1640.41 0.69 1324.82 315.59 1449.58 0.68 1284.36 165.22qatari Riyals 1401.35 20.99 1319.31 82.04 1551.27 19.72 1227.83 323.44Arab Emirates Dirham 1174.53 20.78 830.91 343.62 1228.16 19.34 1228.16 –EURO 925.80 86.60 818.04 107.76 1208.20 85.76 944.89 263.31Kuwaiti Dinars 863.67 239.79 641.12 222.55 695.55 235.50 403.43 292.12Omani Riyal 485.60 193.42 107.43 378.17 230.00 187.51 150.51 79.49Malaysian Ringgit 173.51 17.85 125.19 48.32 113.99 17.54 53.36 60.63Mauritian Rupee 149.67 1.86 111.93 37.74 – – – –Saudi Riyal 52.82 19.97 52.82 – 96.64 21.04 96.64 – Thai Baht 1.56 2.35 1.56 – – – – –British Pound 0.94 94.68 0.94 – 3.15 96.62 3.15 –
Particulars
As at 31-3-2020 As at 31-3-2019Nominal amount (R crore)
Average rate
(R)
Within twelve
months (R crore)
After twelve
months (R crore)
Nominal amount (R crore)
Average rate
(R)
Within twelve
months (R crore)
After twelve
months (R crore)
(b) Payable hedges:US Dollars 10530.38 75.14 10330.69 199.69 10554.47 70.53 9828.41 726.06EURO 2513.05 84.70 2222.79 290.26 3150.91 81.76 3016.81 134.10Bangladeshi Taka 766.73 0.88 766.73 – – – – –Japanese Yen 701.78 0.70 587.70 114.08 1058.26 0.66 874.72 183.54Arab Emirates Dirham 396.31 20.75 396.31 – – – – –Mauritian Rupee 385.17 1.86 385.17 – – – – –Swiss Franc 176.13 76.89 176.13 – 294.76 72.76 294.76 – Kuwaiti Dinars 101.63 239.12 101.63 – 8.69 235.83 8.69 – Chinese Yuan 84.13 10.67 75.36 8.77 – – – –Canadian Dollar 31.46 54.37 31.46 – 40.53 54.04 40.53 –British Pound 10.87 96.00 10.87 – 30.52 95.54 30.52 – Omani Riyal – – – – 28.71 180.36 28.71 –
(B) Forward covers taken to hedge exchange rate risk and accounted as net investment hedge:
Particulars
As at 31-3-2020 As at 31-3-2019Nominal amount (R crore)
Average rate
(R)
Within twelve
months (R crore)
After twelve
months (R crore)
Nominal amount (R crore)
Average rate
(R)
Within twelve
months (R crore)
After twelve
months (R crore)
Receivable:Arab Emirates Dirham 102.55 20.11 102.55 – 81.20 20.46 – 81.20qatari Riyal 45.77 20.70 45.77 – 116.68 20.91 116.68 –US Dollars 29.00 72.51 29.00 – 28.73 71.83 28.73 –Saudi Riyal – – – – 51.07 19.34 51.07 –
Notes forming part of the Financial Statements (contd.)NOTE [53] (contd.)

452
NOTES FORMING PART OF THE FINANCIAL STATEMENTS ANNUAL REPORT 2019-20
NOTE [53] (contd.)
Notes forming part of the Financial Statements (contd.)
(ii) Outstanding interest rate hedge instruments:
Interest rate swaps taken to hedge interest rate risk and accounted as cash flow hedge:
Particulars
As at 31-3-2020 As at 31-3-2019Nominal amount (R crore)
Average rate (%)
Within twelve
months (R crore)
After twelve
months (R crore)
Nominal amount (R crore)
Average rate (%)
Within twelve
months (R crore)
After twelve
months (R crore)
US Dollars – – – – 365.26 7.17 365.26 –
(iii) Outstanding commodity price hedge instruments:
Commodity forward contract:
Particulars
As at 31-3-2020 As at 31-3-2019Nominal amount (R crore)
Average rate
(R)
Within twelve
months (R crore)
After twelve months (R crore)
Nominal amount (R crore)
Average rate
(R)
Within twelve
months (R crore)
After twelve
months (R crore)
Copper(Tn)[1] (39.12) 447208.55 (65.52) 26.40 (305.35) 432547.41 (305.35) – Aluminium(Tn) 179.91 134905.03 179.91 – 199.84 149482.10 199.84 – Iron Ore(Tn) 25.71 5643.17 15.18 10.53 38.32 5469.41 29.47 8.85Coking Coal(Tn) 24.58 13101.74 15.50 9.08 39.27 13631.02 29.26 10.01 Zinc(Tn) – – – – 42.44 189480.24 42.44 – Lead(Tn) 28.98 145469.79 28.98 – 27.21 143913.20 27.21 –
[1] Negative nominal amount represents sell position.
(i) Carrying amounts of hedge instruments for which hedge accounting is followed:
Cash flow hedge:
R crore
Particulars
As at 31-3-2020 As at 31-3-2019Currency exposure
Interest rate exposure
Commodity price
exposure
Currency exposure
Interest rate exposure
Commodity price
exposure(i) Forward contracts Current: Asset-Other financial assets 449.39 – 83.69 382.66 – 56.94 Liability-Other financial liabilities 398.37 – 78.32 248.92 – 46.85 Non-current: Asset-Other financial assets 19.87 – – 99.28 – – Liability-Other financial liabilities 68.63 – 1.71 32.58 – – (ii) Swap contracts Current: Asset-Other financial assets – – – 48.84 0.88 – Non-current: Liability-Other financial liabilities 59.55 – – – – –

453
Notes forming part of the Financial Statements (contd.)
Net investment hedge:R crore
Particulars
As at 31-3-2020 As at 31-3-2019
Currency exposure
Interest rate exposure
Commodity price
exposure
Currency exposure
Interest rate exposure
Commodity price
exposure
(i) Forward contracts
Current:
Asset-Other financial assets – – – 11.48 – –
Liability-Other financial liabilities 0.26 – – 0.11 – –
Non-current:
Asset-Other financial assets – – – 2.68 – –
(j) Breakup of Hedging reserve & Cost of hedging reserve balance:
v crore
Particulars
As at 31-3-2020 As at 31-3-2019
Cash flow hedging reserve
Cost of hedging reserve
Cash flow hedging reserve
Cost of hedging reserve
Balance towards continuing hedges (76.81) (14.48) 89.10 5.05
Balance for which hedge accounting discontinued 29.98 – (35.86) (0.88)
(k) Reclassification of Hedging reserve & Cost of hedging reserve to Profit or Loss:
v crore
Particulars
Hedging reserve/Cost of hedging reserve
2019-20 2018-19
Future cash flows are no longer expected to occur:
Sales, administration and other expenses 32.32 (13.47)
Hedged expected future cash flows affecting Profit or Loss:
Progress billing (75.17) (40.72)
Revenue from operation 25.99 (2.34)
Manufacturing, construction and operating expenses (46.53) 19.75
Finance costs (150.06) (259.02)
Sales, administration and other expenses 313.14 243.08
Discontinued operations 3.38 1.10
NOTE [53](i) Carrying amounts of hedge instruments for which hedge accounting is followed (contd.)
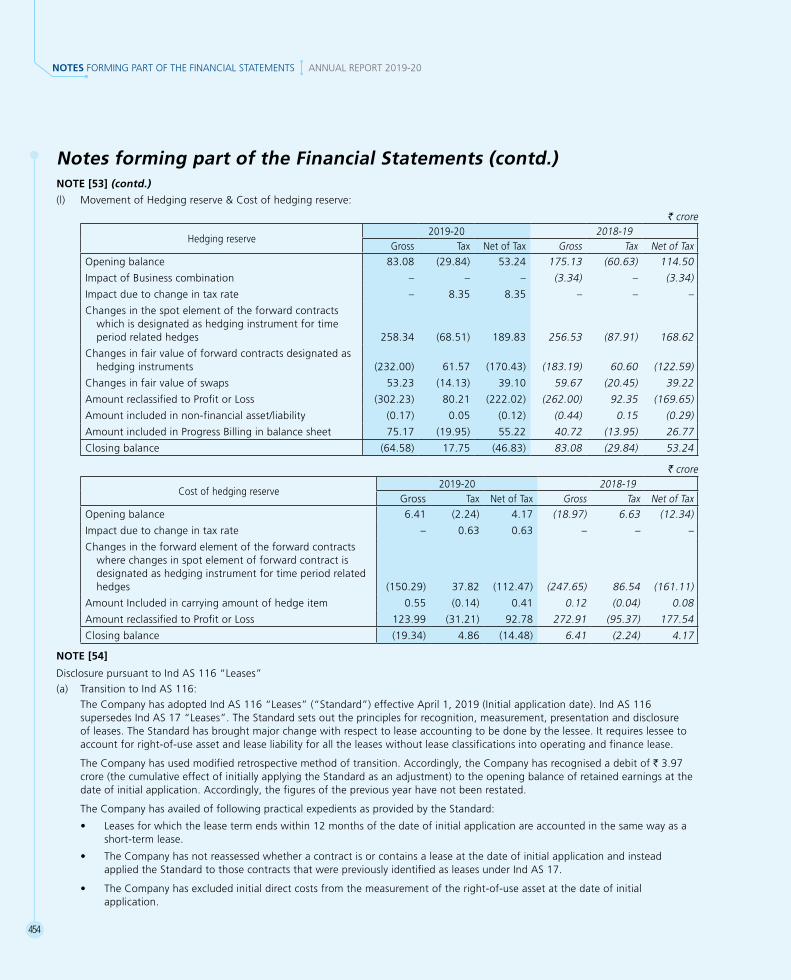
454
NOTES FORMING PART OF THE FINANCIAL STATEMENTS ANNUAL REPORT 2019-20
(l) Movement of Hedging reserve & Cost of hedging reserve:
v crore
Hedging reserve2019-20 2018-19
Gross Tax Net of Tax Gross Tax Net of TaxOpening balance 83.08 (29.84) 53.24 175.13 (60.63) 114.50
Impact of Business combination – – – (3.34) – (3.34)
Impact due to change in tax rate – 8.35 8.35 – – –
Changes in the spot element of the forward contracts which is designated as hedging instrument for time period related hedges 258.34 (68.51) 189.83 256.53 (87.91) 168.62
Changes in fair value of forward contracts designated as hedging instruments (232.00) 61.57 (170.43) (183.19) 60.60 (122.59)
Changes in fair value of swaps 53.23 (14.13) 39.10 59.67 (20.45) 39.22
Amount reclassified to Profit or Loss (302.23) 80.21 (222.02) (262.00) 92.35 (169.65)
Amount included in non-financial asset/liability (0.17) 0.05 (0.12) (0.44) 0.15 (0.29)
Amount included in Progress Billing in balance sheet 75.17 (19.95) 55.22 40.72 (13.95) 26.77
Closing balance (64.58) 17.75 (46.83) 83.08 (29.84) 53.24
v crore
Cost of hedging reserve2019-20 2018-19
Gross Tax Net of Tax Gross Tax Net of TaxOpening balance 6.41 (2.24) 4.17 (18.97) 6.63 (12.34)
Impact due to change in tax rate – 0.63 0.63 – – –
Changes in the forward element of the forward contracts where changes in spot element of forward contract is designated as hedging instrument for time period related hedges (150.29) 37.82 (112.47) (247.65) 86.54 (161.11)
Amount Included in carrying amount of hedge item 0.55 (0.14) 0.41 0.12 (0.04) 0.08
Amount reclassified to Profit or Loss 123.99 (31.21) 92.78 272.91 (95.37) 177.54
Closing balance (19.34) 4.86 (14.48) 6.41 (2.24) 4.17
NOTE [54]
Disclosure pursuant to Ind AS 116 “Leases”(a) Transition to Ind AS 116: The Company has adopted Ind AS 116 “Leases” (“Standard”) effective April 1, 2019 (Initial application date). Ind AS 116
supersedes Ind AS 17 “Leases”. The Standard sets out the principles for recognition, measurement, presentation and disclosure of leases. The Standard has brought major change with respect to lease accounting to be done by the lessee. It requires lessee to account for right-of-use asset and lease liability for all the leases without lease classifications into operating and finance lease.
The Company has used modified retrospective method of transition. Accordingly, the Company has recognised a debit of R 3.97 crore (the cumulative effect of initially applying the Standard as an adjustment) to the opening balance of retained earnings at the date of initial application. Accordingly, the figures of the previous year have not been restated.
The Company has availed of following practical expedients as provided by the Standard:
• Leasesforwhichtheleasetermendswithin12monthsofthedateofinitialapplicationareaccountedinthesamewayasashort-term lease.
• TheCompanyhasnotreassessedwhetheracontractisorcontainsaleaseatthedateofinitialapplicationandinsteadapplied the Standard to those contracts that were previously identified as leases under Ind AS 17.
• TheCompanyhasexcludedinitialdirectcostsfromthemeasurementoftheright-of-useassetatthedateofinitialapplication.
Notes forming part of the Financial Statements (contd.)NOTE [53] (contd.)

455
Notes forming part of the Financial Statements (contd.)
For leases previously classified as operating leases under Ind AS 17 and which are not low value leases or short-term leases, the Company has recognised:
• aleaseliabilityatpresentvalueoftheremainingleasepayments,discountedusingCompany’sincrementalborrowingrateof7.93% at transition date.
• aright-of-useassetatitscarryingamountasiftheStandardhasbeenappliedsincetheleasecommencementdatebutdiscounted using Company’s incremental borrowing rate at the date of initial application.
For leases previously classified as finance leases under Ind AS 17, the carrying amount of lease asset and lease liability as at March 31, 2019 have been considered as right-of-use asset and lease liability respectively as at April 1, 2019 under Ind AS 116.
Reconciliation between operating lease commitments disclosed as per Ind AS 17 as at March 31, 2019 and lease liabilities recognised in the balance sheet at the date of initial application i.e. April 1, 2019 is as follows:
v crore
Operating lease commitments under Ind AS 17 as at April 1, 2019 34.02Less: Commitments pertaining to short-term leases 5.22Less: Commitments pertaining to low value leases 0.68Less: Impact of discounting of lease payments 8.75Add: Extension and termination options reasonably certain to be exercised 106.26Add: Commitments relating to leases previously classified as finance leases 0.07Lease liabilities recognised under Ind AS 116 as at April 1, 2019 125.70
(b) Where the Company is a lessor:
Operating leases: The Company has given buildings and plant & equipment under operating lease. The lease income received during the year is R 189.00crore.Leasesarerenewedonlyonmutualconsentandataprevalentmarketpriceandsub-leaseisgenerally restricted.
Annual undiscounted lease payments receivable is as under:v crore
Particulars Upto 1 year 1 – 2 years 2-3 years 3-4 years 4-5years Beyond 5 years TotalAmount 6.75 0.26 0.09 0.09 0.09 - 7.28
(c) Where the Company is a lessee:
The Company has taken various assets on lease such as, plant & equipment, buildings, office premises, vehicles. Generally, leases are renewed only on mutual consent and at a prevalent market price and sub-lease is restricted.
Details with respect to right-of-use assets:v crore
Class of asset Depreciation for the year Additions to right-of-use asset during the year
Carrying amount of the asset as at March 31, 2020
Land 3.79 – 267.74Buildings 33.74 27.54 57.51Plant & equipment 37.37 78.39 87.33Vehicles 0.11 0.15 0.24Total 74.91 106.08 412.82
i. Interest expense on lease liabilities amounts to R 12.65 crore.
ii. The expense relating to payments not included in the measurement of the lease liability and recognised as expense in the Statement of Profit and Loss during the year are as follows:
• Lowvalueleases-R 2.16 crore.
• Short-termleases-R 1987.91crore.
iii. Total cash outflow for leases amounts to R 1983.09croreduringtheyearincludingcashoutflowofshort-termandlowvalueleases.
NOTE [54] (contd.)

456
NOTES FORMING PART OF THE FINANCIAL STATEMENTS ANNUAL REPORT 2019-20
NOTE [55]
The Company has amounts due to suppliers under The Micro, Small and Medium Enterprises Development Act, 2006, [MSMED Act] as at March 31, 2020. The disclosure pursuant to the said Act is as under:
v crore
Particulars 2019-2020 2018-19Principal amount due to suppliers under MSMED Act, 2006 98.91 133.56Interest accrued, due to suppliers under MSMED Act on the above amount, and unpaid – 0.11Payment made to suppliers (other than interest) beyond the appointed day during the year 77.12 124.38Interest paid to suppliers under MSMED Act (Section 16) 0.43 0.30Interest due and payable towards suppliers under MSMED Act for payments already made 0.49 0.55Interest accrued and remaining unpaid at the end of the year to suppliers under MSMED Act 12.27 10.97Amount of further interest remaining due and payable even in the succeeding years 8.19 8.14
NOTE [56]
There are no amounts due and outstanding to be credited to Investor Education & Protection Fund as at March 31, 2020.
NOTE [57]
Particulars in respect of loans and advances in the nature of loans to related parties as required by the SEBI (Listing Obligations and Disclosure Requirements) Regulations, 2015:
v crore
Sr. No.
Name of the companyBalance as at Maximum outstanding during
As at 31-3-2020
As at 31-3-2019
2019-20 2018-19
Loans and advances in the nature of loans given to subsidiaries:
(i) L&T Seawoods Private Limited – – – 147.29
(ii) L&T Special Steels & Heavy Forgings Private Limited 1605.35[1] 1507.65[1] 1605.35 1507.65
(iii) L&T Hydrocarbon Engineering Limited – 54.06 54.05 56.64
(iv) L&T Construction Equipment Limited 176.67 70.04 176.67 92.08
(v) Nabha Power Limited 377.59 379.80 594.39 1009.87
(vi) L&T Finance Limited – – – 1506.84
(vii) L&T Metro Rail (Hyderabad) Limited 1372.83 109.00 1372.83 109.00
(viii) L&T Finance Holdings Limited – – – 1016.16
(ix) Hi-Tech Rock Products & Aggregates Limited 324.17 301.85 324.17 301.85
(x) L&T Infrastructure Development Projects Limited – 18.20 – 18.20
(xi) L&T Infrastructure Finance Co. Ltd. – – 1013.98 –
Total 3856.61 2440.60
[1] excluding impairment of R 263 crore.
Notes:
• Abovefiguresincludeinterestaccrued.
• Loanstoemployees(includingdirectors)undervariousschemesofthecompany(suchashousingloan,furnitureloan,educationloan, etc.) have been considered to be outside the purview of disclosure requirements.
• SubsidiaryclassificationisinaccordancewiththeCompaniesAct,2013.
Notes forming part of the Financial Statements (contd.)

457
Notes forming part of the Financial Statements (contd.)NOTE [58]
Disclosurepursuanttosection186ofTheCompaniesAct2013:
v croreSr. No.
Nature of the transaction (loans given/investments made/guarantees given/security provided)
Purpose for which the loan/guarantee/security is proposed to be utilised by the recipient
2019-20 2018-19
(A) Loan and Advances Subsidiary Companies: (a) L&T Construction Equipment Limited Project funding 176.67 70.04 (b) L&T Special Steels & Heavy Forgings Private
Limited Working Capital and Project funding 1605.35 [1] 1507.65 [1]
(c) L&T Hydrocarbon Engineering Limited Working capital – 54.06 (d) Nabha Power Limited Part financing of original project cost 377.59 379.80 (e) L&T Metro Rail (Hyderabad) Limited Temporary project funding and Working capital 1372.83 109.00 (f) Hi-Tech Rock Products & Aggregates Limited General corporate purposes & investments 324.17 301.85 (g) L&T Infrastructure Development Projects
Limited General corporate purpose – 18.20Total 3856.61 2440.60
(B) Guarantees Subsidiary Companies: (a) L&T Aviation Services Private Limited
Corporate Guarantee given for subsidiary’s Debt
6.53 11.94 (b) L&T-MHPS Turbine Generators Private
Limited394.94 427.31
(c) Nabha Power Limited 3700.00 4025.00 (d) L&T Global holdings Limited 691.30 735.56 (e) L&T Hydrocarbon Engineering Ltd 809.62 739.96 (f) L&T Metro Rail (Hyderabad) Ltd 250.00 250.00 (g) Larsen & Toubro ATCO Saudia LLC
Corporate Guarantee given for subsidiary’s project performance
2469.61 2260.03 (h) Larsen & Toubro Arabia LLC 4285.17 8442.15 (i) L&T Technology Services Limited 564.31 770.67 (j) L&T Technology Services LLC 151.33 138.31 (k) Larsen & Toubro (Saudi Arabia) LLC 1304.69 1610.23 (l) L&T Hydrocarbon Engineering Limited 18783.70 17736.16 (m) L&T - MHPS Boilers Private Limited 29.38 28.93 (n) Nabha Power Limited 216.00 216.00 (o) L&T Special Steel & Heavy Forgings
Pvt Ltd90.42 90.42
(p) L&T Metro Rail (Hyderabad) Ltd Guarantee issued by bank out of the Company’s sanctioned limits on behalf of LTMRHL towards DSRA (Debt Service Reserve Account) to SBI Cap Trustee
278.00 –
Total 34025.00 37482.67(C) Investments in fully paid equity instruments and
Current Investments[Note 5 and Note 10]
[1] excluding impairment of R 263 crore.

458
NOTES FORMING PART OF THE FINANCIAL STATEMENTS ANNUAL REPORT 2019-20
NOTE [59]
Exceptional item for the year ended March 31, 2020 includes the following:
(i) Gain of R 626.99 crore on sale of the Company’s stake in subsidiary company viz. L&T Technology Services Limited
Exceptional items for the year ended March 31, 2019 include the following:
(i) Gain of R 3276.70 crore on sale of the Company’s stake in subsidiary companies viz. Larsen & Toubro Infotech Limited R 2142.90 crore and L&T Technology Services Limited R 1133.80crore;
(ii) Write back of trade receivable and retention money of certain customer dues now considered recoverable R 294.75 crore
(iii) impairment of investment in group companies viz L&T Infrastructure Development project Limited R 773.00 crore and L&T Special Steels and Heavy Forging Private Limited R 1156.10 crore
NOTE [60]
Amount required to be spent by the Company on Corporate Social Responsibility (CSR) related activities during the year is R 144.80crore (previous year: R 121.47 crore).
The amount recognised as expense in the Statement of Profit and Loss on CSR related activities is R 145.29 crore (previous year: R 121.68crore), which comprises:
v crore
Sr. No. Particulars
Disclosed under
2019-20 2018-19
Paid Provided Total Paid Provided Total
(a) Construction/acquisition of assets shown under sales, administration, and other expenses Note 35 6.69 0.74 7.43 3.80 0.18 3.98
(b) Other revenue expenses:
Shown under miscellaneous expenses in sales, administration, and other expenses Note 35 109.52 11.98 121.50 91.02 9.66 100.68
Shown under employee benefits expense Note 34 16.36 – 16.36 16.99 0.03 17.02
Total 132.57 12.72 145.29 111.81 9.87 121.68
NOTE [61]
Auditors’ remuneration (excluding service tax):
v croreSr. No. Particulars 2019-20 2018-19
a. Paid as Auditor(i) Statutory audit fees 2.05 1.90(ii) Limited review of standalone and consolidated financial statements on a quarterly basis 1.65 1.50
b. For Taxation matters 0.60 0.55c. For Company law matters 0.35 0.30d. For Other services including certification work 1.39 1.62e. For reimbursement of expenses 0.10 0.13
NOTE [62]
The Company purchased Electoral Bonds for R 50 crore and issued the same to political parties as Company’s political contribution. (previous year: R 35 crore).
NOTE [63]
Figures for the previous year have been regrouped/reclassified to conform to the figures of the current year.
Notes forming part of the Financial Statements (contd.)

459
INDEPENDENT AUDITORS’ REPORTTO THE MEMBERS OF LARSEN & TOUBRO LIMITED
Report on the Audit of the Consolidated Financial StatementsOpinion
We have audited the accompanying consolidated financial statements of Larsen & Toubro Limited (the “Parent”) and its subsidiaries, (the Parent and its subsidiaries together referred to as the “Group”) which includes 35 joint operations of the Group accounted on proportionate basis and the Group’s share of profit in its associates and joint ventures, which comprise the Consolidated Balance Sheet as at 31st March 2020, and the Consolidated Statement of Profit and Loss (including Other Comprehensive Income), the Consolidated Statement of Cash Flows and the Consolidated Statement of Changes in Equity for the year then ended, and a summary of significant accounting policies and other explanatory information.
In our opinion and to the best of our information and according to the explanations given to us, and based on the consideration of reports of the other auditors on separate financial information of the joint operations, subsidiaries, associates and joint ventures referred to in the Other Matters section below, the aforesaid consolidated financial statements give the information required by the Companies Act, 2013 (the “Act”) in the manner so required and give a true and fair view in conformity with the Indian Accounting Standards prescribed under section 133 of the Act read with the Companies (Indian Accounting Standards) Rules, 2015, as amended (“Ind AS”), and other accounting principles generally accepted in India, of the consolidated state of affairs of the Group as at 31st March 2020, and their consolidated profit, their consolidated total comprehensive income, their consolidated cash flows and their consolidated changes in equity for the year ended on that date.
Basis for Opinion
We conducted our audit of the consolidated financial statements in accordance with the Standards on Auditing specified under section 143 (10) of the Act (“SA”s). Our responsibilities under those Standards are further described in the Auditor’s Responsibility for the Audit of the Consolidated Financial Statements section of our report. We are independent of the Group, its associates and joint ventures in accordance with the Code of Ethics issued by the Institute of Chartered Accountants of India (“ICAI”) together with the ethical requirements that are relevant to our audit of the consolidated financial statements under the provisions of the Act and the Rules made thereunder, and we have fulfilled our other ethical responsibilities in accordance with these requirements and the ICAI’s Code of Ethics. We believe that the audit evidence obtained by us and the audit evidence obtained by the other auditors in terms of their reports referred to in the Other Matters section below, is sufficient and appropriate to provide a basis for our audit opinion on the consolidated financial statements.
Emphasis of Matter
We draw attention to Note [1](III) to the Consolidated Financial Statements in which the Group describes the uncertainties arising from the COVID-19 pandemic.
Our report is not modified in respect of this matter.
Key Audit Matters
Key audit matters are those matters that, in our professional judgment, were of most significance in our audit of the consolidated financial statements of the current period. These matters were addressed in the context of our audit of the consolidated financial statements as a whole, and in forming our opinion thereon, and we do not provide a separate opinion on these matters. We have determined the matters described below to be the key audit matters to be communicated in our report.
DELOITTE HASKINS & SELLS LLPChartered AccountantsIndiabulls Finance Centre, Tower 327th – 32nd Floor, Senapati Bapat Marg Elphinstone Road (West)Mumbai 400 013.

460
AUDITORS’ REPORT ON CONSOLIDATED FINANCIAL STATEMENTS ANNUAL REPORT 2019-20
Revenue recognition – accounting for construction contracts
Key audit matter description
As described in Note No. [1](II)(i) of the Consolidated Financial Statements, the Group recognises revenue from contracts with customers when it satisfies its performance obligations.
Accounting for construction contracts is considered as a Key Audit Matter as there are significant accounting judgements in estimating revenue to be recognised on contracts with customers, including estimation of costs to complete and determining the timing of revenue recognition.
The Group recognises revenue and profit/loss based on stage of completion based on the proportion of contract costs incurred at balance sheet date, relative to the total estimated costs of the contract at completion. The recognition of revenue is thus dependent on estimates in relation to total estimated costs of each contract.
Cost contingencies are included in these estimates to take in to account specific uncertain risks, or disputed claims against the Group, arising within each contract. These contingencies are reviewed by the Management on a regular basis throughout the contract life and adjusted where appropriate.
The revenue on contracts may also include variable consideration (variations and claims). Variable consideration is recognised when the probability of reversal of such revenue is low.
Further, Refer to Note No. 47 for the disclosures made in the Consolidated Financial Statements as per Ind AS 115 ‘Revenue from Contracts with Customers’.
Principal Audit Procedures
The procedures performed included the following:
• obtained an understanding of the process followed by the Group in determination of the estimates and contract revenue;
• performed walkthrough procedures over the process of identification of performance obligation;
• tested the design and implementation of internal control over the quantification of the estimates used as well as the operating effectiveness of such control;
• tested segregation of duties while recording the contracts in the Group’s information system and recognising revenue from such contracts;
• tested the General IT Controls over the relevant information technology systems’ access and change management controls relating to contracts and related information used in recording and disclosing revenue in accordance with Ind AS 115 – Revenue from Contracts with Customers;
• tested sample of contracts for:
- appropriate identification of performance obligations;
- change orders and the impact on the estimated costs to complete;
- evaluation of reasonability of estimates of costs to complete; and
- tested the appropriateness of the timing of recognizing the revenue from the contracts;
• tested the appropriateness of the variable considerations recognised based on the low probability of reversal of such revenue; and
• tested appropriateness of the disclosures in the financial statements in respect of such construction contracts to ensure compliance with Ind AS 115.
Measurement of contract assets in respect of overdue milestones and receivables in respect of overdue invoices.
Key audit matter description
The Group, in its contract with customers, promises to transfer distinct services to its customers, which may be rendered in the form of engineering, procurement, and construction (EPC) services through design-build contracts, and other forms of construction contracts. The recognition of revenue is based on contractual terms, which could be based on agreed unit price or lump-sum revenue arrangements. At each reporting date, revenue is accrued for costs incurred against work performed that may not have been invoiced.
Identifying whether the Group’s performance has resulted in a service that would be billable and collectable where the works carried out have not been acknowledged by customers as of the reporting date, or in the case of certain defence contracts, where the evidence of work carried out and cost incurred are covered by confidentiality arrangements, involves a significant amount of judgment.
Assessing the recoverability of contract assets related to overdue milestones and amounts overdue against invoices raised which have remained unsettled for a significantly long period after the end of the contractual credit period also involves a significant amount of judgment. Refer to Note No. [1](II)(i) and [1](II)(r) of the Consolidated Financial Statements.

461
Principal Audit Procedures
The procedures performed included the following:
• obtained an understanding of the Group’s processes in collating the evidence supporting execution of work for each disaggregated type of revenue;
• obtained an understanding of the Group’s processes in assessing the recoverability of amounts overdue and process over estimating the expected credit loss allowance;
• tested the design and operating effectiveness of the key controls over the completeness and accuracy of the key inputs and assumptions into the provisioning model;
• evaluated controls over authorisation and calculation of provisioning model;
• for defence contracts which are covered under statutory confidentiality arrangements, for sample of contracts, the auditors have compared the revenue recognised with amounts collected from customers to ensure that the gap between revenue recognised and collections is below the materiality threshold;
• evaluated the delivery and collection history of customers against whose contracts un-invoiced revenue is recognised;
• verified for the sample selected, receipts post balance sheet date upto the approval of the financial statements by the Board of Directors of the Parent Company;
• performed an overall assessment of the expected credit loss provision to determine if they were reasonable considering the Group’s portfolio, risk profile, credit risk management practices and the macroeconomic environment; and
• tested the appropriateness of the disclosures in the financial statements to ensure compliance with Ind AS 115.
Appropriateness of revenues and onerous obligations in respect of fixed price contracts involves critical estimates for services relating to Information Technology & Technology Services Segment
Key audit matter description
Estimated effort is a critical estimate to determine revenues and provision for onerous obligations on fixed price contracts. This estimate has a high inherent uncertainty as it requires consideration of progress of the contract, efforts/cost incurred till date, efforts/cost required to complete the remaining contract performance obligations.
Refer to Note No. [1](II)(i) of the Consolidated Financial Statements.
Principal Audit Procedures
The procedures performed by component auditors (being other firms of chartered accountants) included the following:
• evaluated the design and implementation of internal controls over recording of actual cost/efforts till date and the process of estimation of cost/efforts required to complete the performance obligations;
• tested the operating effectiveness of the said internal controls for a selected sample of contracts.
• selected a sample of new and existing contracts and performed following procedures;
o read, analysed and identified the distinct performance obligations in these contracts.
o compared such performance obligations with those identified and recorded by the Group.
o verified contract terms to determine the transaction price including any variable consideration and verified allocation of the transaction price to each performance obligation after adjusting the estimated variable consideration.
• in respect of a sample of fixed price contracts, progress towards satisfaction of performance obligation used to compute recorded revenue was verified with the efforts/cost recorded and estimated efforts/cost from the corresponding information systems;
• verified sample of contracts with unbilled revenues to identify possible delays in achieving milestones, which require change in estimated efforts to complete the remaining performance obligations.
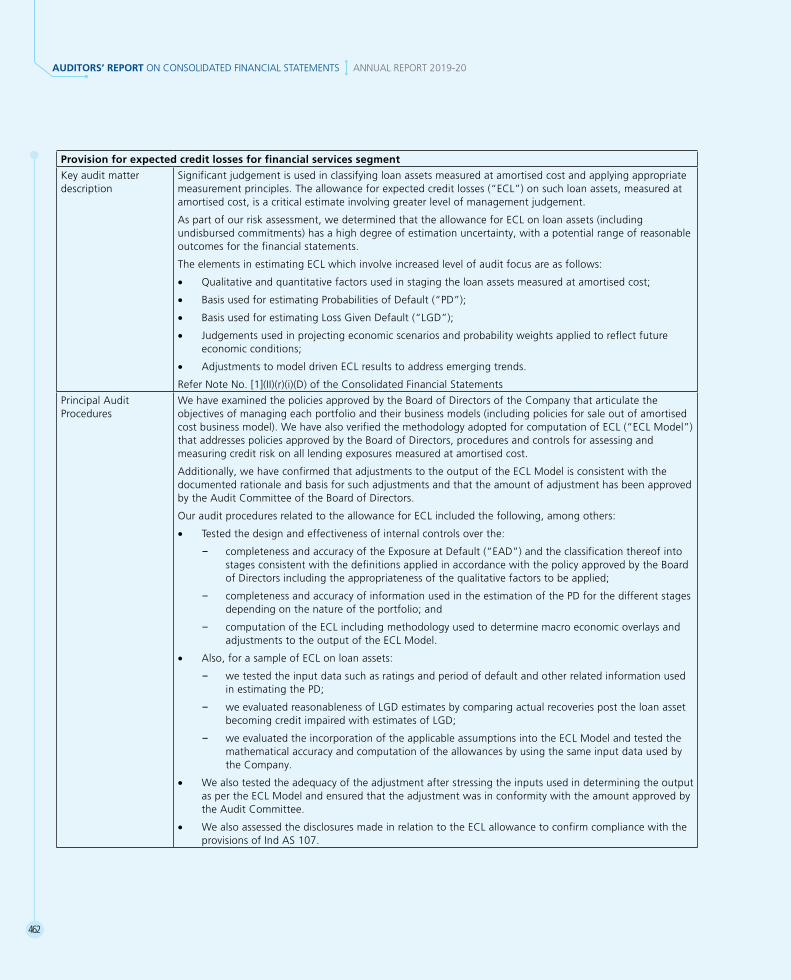
462
AUDITORS’ REPORT ON CONSOLIDATED FINANCIAL STATEMENTS ANNUAL REPORT 2019-20
Provision for expected credit losses for financial services segment
Key audit matter description
Significant judgement is used in classifying loan assets measured at amortised cost and applying appropriate measurement principles. The allowance for expected credit losses (“ECL”) on such loan assets, measured at amortised cost, is a critical estimate involving greater level of management judgement.
As part of our risk assessment, we determined that the allowance for ECL on loan assets (including undisbursed commitments) has a high degree of estimation uncertainty, with a potential range of reasonable outcomes for the financial statements.
The elements in estimating ECL which involve increased level of audit focus are as follows:
• Qualitative and quantitative factors used in staging the loan assets measured at amortised cost;
• Basis used for estimating Probabilities of Default (“PD”);
• Basis used for estimating Loss Given Default (“LGD”);
• Judgements used in projecting economic scenarios and probability weights applied to reflect future economic conditions;
• Adjustments to model driven ECL results to address emerging trends.
Refer Note No. [1](II)(r)(i)(D) of the Consolidated Financial Statements
Principal Audit Procedures
We have examined the policies approved by the Board of Directors of the Company that articulate the objectives of managing each portfolio and their business models (including policies for sale out of amortised cost business model). We have also verified the methodology adopted for computation of ECL (“ECL Model”) that addresses policies approved by the Board of Directors, procedures and controls for assessing and measuring credit risk on all lending exposures measured at amortised cost.
Additionally, we have confirmed that adjustments to the output of the ECL Model is consistent with the documented rationale and basis for such adjustments and that the amount of adjustment has been approved by the Audit Committee of the Board of Directors.
Our audit procedures related to the allowance for ECL included the following, among others:
• Tested the design and effectiveness of internal controls over the:
– completeness and accuracy of the Exposure at Default (“EAD”) and the classification thereof into stages consistent with the definitions applied in accordance with the policy approved by the Board of Directors including the appropriateness of the qualitative factors to be applied;
– completeness and accuracy of information used in the estimation of the PD for the different stages depending on the nature of the portfolio; and
– computation of the ECL including methodology used to determine macro economic overlays and adjustments to the output of the ECL Model.
• Also, for a sample of ECL on loan assets:
– we tested the input data such as ratings and period of default and other related information used in estimating the PD;
– we evaluated reasonableness of LGD estimates by comparing actual recoveries post the loan asset becoming credit impaired with estimates of LGD;
– we evaluated the incorporation of the applicable assumptions into the ECL Model and tested the mathematical accuracy and computation of the allowances by using the same input data used by the Company.
• We also tested the adequacy of the adjustment after stressing the inputs used in determining the output as per the ECL Model and ensured that the adjustment was in conformity with the amount approved by the Audit Committee.
• We also assessed the disclosures made in relation to the ECL allowance to confirm compliance with the provisions of Ind AS 107.

463
Impairment of Toll Collection Rights of certain operating projects who have incurred continuous losses.
Key audit matter description
Toll collection rights obtained in consideration for rendering construction services, represent the right to collect toll revenue during the concession period in respect of Build-Operate-Transfer ("BOT") and Design-Build-Operate-Transfer (“DBOT”) projects. Toll collection rights are capitalised as intangible assets upon completion of the project at the cumulative construction costs plus the present value of obligation towards negative grants and additional concession fee payable to National Highways Authority of India ("NHAI")/State Authorities, if any.
The Group has carried out an evaluation for impairment of such toll collection rights where indicators of impairment were identified. Due to the multitude of factors and assumptions involved in determining the forecasted revenues/cash flows and discount rate in the projection period, significant judgments are required to estimate the recoverable values.
Management has estimated the future cash flows arising from achieving revenues and costs in line with the increase in traffic as well as refinancing/restructuring. As such estimations involve complex and subjective judgements by the Management, there is a risk that there may be an impairment that has not been recorded.
Refer Note No. [1](II)(o) of the Consolidated Financial Statements.
Principal Audit Procedures
The component auditors (being other firms of chartered accountants) have performed the following audit procedures:
• conducted discussions with Company personnel to identify factors, if any, that should be taken into account in the impairment analysis;
• evaluated the design and implementation of the relevant controls and the operating effectiveness of such internal controls in estimating the future projections including assumptions used in determining the value in use;
• compared the actual revenues and cash flows generated by the entities during the year as compared to the projections and estimates considered in the previous year and evaluated the basis of future projections with regard to the revenue and cash flows;
• evaluated the appropriateness of key assumptions in the valuations including discount rate, growth rate, and consulted internal specialists for such evaluation. The challenge was based on the auditors’ assessment of the historical accuracy of the Group’s estimates in the prior periods and an assessment of the consistency of assumptions across all the subsidiaries and comparison of the assumptions with public data wherever available;
• the component auditors have also performed a sensitivity analysis to assess the impact of possible different assumptions related to revenue and cost estimates including:
i. Increase/decrease in revenue growth rate; and
ii. Increase/decrease to cost forecasts.
Physical verification of inventory
Key audit matter description
The Company’s management conducts physical verification of inventories during the year at reasonable intervals, however, on account of the COVID-19 related lockdown restrictions, management was able to perform year end physical verification of inventories, only at certain locations. Management has carried out other procedures to validate the existence of its inventory as at the year end, such as carrying out consumption analysis, and performing roll-back procedures from the subsequent year end physical verification date to determine the quantities of the inventory at the balance sheet date.
Refer Note No. [1](II)(s) of the Consolidated Financial Statements.
The procedures performed included the following:
• Understood the process and tested the Management’s internal controls to establish the existence of inventory in relation to the process of periodic physical verification carried out by the management, the scope and coverage of the periodic verification programme, the results of such verification including analysis of discrepancies, if any;

464
AUDITORS’ REPORT ON CONSOLIDATED FINANCIAL STATEMENTS ANNUAL REPORT 2019-20
• At selected locations subsequent to year-end, where the management appointed third party independent chartered accountants to perform physical verification, sent instructions to the third party chartered accountants to carry out the physical verification and provided samples to be verified by them. We have received the report of the physical verification carried out by the third party independent chartered accountants. Obtained the roll back procedures performed by the management from the subsequent year-end physical verification date to arrive at the quantities as at the balance sheet date. Traced the samples physically verified by the third party independent chartered accountants roll back workings provided by the management.
• Inspected, for samples selected, supporting documentation relating to purchases and consumption, and such other third party evidences where applicable.
• Tested the analytical reviews performed by the Company such as consumption analysis.
Information Other than the Financial Statements and Auditor’s Report Thereon
i. The Parent’s Company’s Board of Directors is responsible for the other information. The other information comprises the information included in the Management Discussion and Analysis, Board’s Report including Annexures to Board’s Report, Business Responsibility Report, Corporate Governance and Shareholder’s Information, but does not include the consolidated financial statements, standalone financial statements and our auditor’s report thereon.
ii. Our opinion on the consolidated financial statements does not cover the other information and we do not express any form of assurance conclusion thereon.
In connection with our audit of the consolidated financial statements, our responsibility is to read the other information, compare with the financial statements of the joint operations, subsidiaries, joint ventures and associates audited by the other auditors, to the extent it relates to these entities and, in doing so, place reliance on the work of the other auditors and consider whether the other information is materially inconsistent with the consolidated financial statements or our knowledge obtained during the course of our audit or otherwise appears to be materially misstated. Other information so far as it relates to the joint operations, subsidiaries, joint ventures and associates, is traced from their financial statements audited by the other auditors.
If based on the work we have performed, we conclude that there is a material misstatement of this other information, we are required to report that fact. We have nothing to report in this regard.
Management’s Responsibility for the Consolidated Financial Statements
The Parent’s Company’s Board of Directors is responsible for the matters stated in section 134(5) of the Act with respect to the preparation of these consolidated financial statements that give a true and fair view of the consolidated financial position, consolidated financial performance including other comprehensive income, consolidated cash flows and consolidated changes in equity of the Group including its associates and joint ventures in accordance with the Ind AS and other accounting principles generally accepted in India.
The respective Board of Directors of the companies included in the Group and of its associates and joint ventures are responsible for maintenance of adequate accounting records in accordance with the provisions of the Act for safeguarding the assets of the Group and its associates and its joint ventures and for preventing and detecting frauds and other irregularities; selection and application of appropriate accounting policies; making judgments and estimates that are reasonable and prudent; and design, implementation and maintenance of adequate internal financial controls, that were operating effectively for ensuring the accuracy and completeness of the accounting records, relevant to the preparation and presentation of the financial statements that give a true and fair view and are free from material misstatement, whether due to fraud or error, which have been used for the purpose of preparation of the consolidated financial statements by the Directors of the Parent Company, as aforesaid.
In preparing the consolidated financial statements, the respective Board of Directors of the companies included in the Group and of its associates and joint ventures are responsible for assessing the ability of the respective entities to continue as a going concern, disclosing, as applicable, matters related to going concern and using the going concern basis of accounting unless the respective Board of Directors either intends to liquidate their respective entities or to cease operations, or has no realistic alternative but to do so.
The respective Board of Directors of the companies included in the Group and of its associates and joint ventures are also responsible for overseeing the financial reporting process of the Group and of its associates and joint ventures.
Auditor’s Responsibility for the Audit of the Consolidated Financial Statements
Our objectives are to obtain reasonable assurance about whether the consolidated financial statements as a whole are free from material misstatement, whether due to fraud or error and to issue an auditor’s report that includes our opinion. Reasonable assurance is a high level of assurance but is not a guarantee that an audit conducted in accordance with SAs will always detect a material

465
misstatement when it exists. Misstatements can arise from fraud or error and are considered material if, individually or in the aggregate, they could reasonably be expected to influence the economic decisions of users taken on the basis of these consolidated financial statements.
As part of an audit in accordance with SAs, we exercise professional judgment and maintain professional skepticism throughout the audit. We also:
• Identifyandassesstherisksofmaterialmisstatementoftheconsolidatedfinancialstatements,whetherduetofraudorerror,design and perform audit procedures responsive to those risks, and obtain audit evidence that is sufficient and appropriate to provide a basis for our opinion. The risk of not detecting a material misstatement resulting from fraud is higher than for one resulting from error, as fraud may involve collusion, forgery, intentional omissions, misrepresentations, or the override of internal control.
• Obtainanunderstandingofinternalfinancialcontrolrelevanttotheauditinordertodesignauditproceduresthatareappropriatein the circumstances. Under section 143(3)(i) of the Act, we are also responsible for expressing our opinion on whether the Parent Company has adequate internal financial controls system in place and the operating effectiveness of such controls.
• Evaluatetheappropriatenessofaccountingpoliciesusedandthereasonablenessofaccountingestimatesandrelateddisclosuresmade by the management.
• Concludeontheappropriatenessofmanagement’suseofthegoingconcernbasisofaccountingand,basedontheauditevidenceobtained, whether a material uncertainty exists related to events or conditions that may cast significant doubt on the ability of the Group and its associates and joint ventures to continue as a going concern. If we conclude that a material uncertainty exists, we are required to draw attention in our auditor’s report to the related disclosures in the consolidated financial statements or, if such disclosures are inadequate, to modify our opinion. Our conclusions are based on the audit evidence obtained up to the date of our auditor’s report. However, future events or conditions may cause the Group and its associates and joint ventures to cease to continue as a going concern.
• Evaluatetheoverallpresentation,structureandcontentoftheconsolidatedfinancialstatements,includingthedisclosures,andwhether the consolidated financial statements represent the underlying transactions and events in a manner that achieves fair presentation.
• ObtainsufficientappropriateauditevidenceregardingthefinancialinformationoftheentitiesorbusinessactivitieswithintheGroup and its associates and joint ventures to express an opinion on the consolidated financial statements. We are responsible for the direction, supervision and performance of the audit of the financial statements of such entities or business activities included in the consolidated financial statements of which we are the independent auditors. For the other entities included in the consolidated financial statements, which have been audited by the other auditors, such other auditors remain responsible for the direction, supervision and performance of the audits carried out by them. We remain solely responsible for our audit opinion.
Materiality is the magnitude of misstatements in the consolidated financial statements that, individually or in aggregate, makes it probable that the economic decisions of a reasonably knowledgeable user of the consolidated financial statements may be influenced. We consider quantitative materiality and qualitative factors in (i) planning the scope of our audit work and in evaluating the results of our work; and (ii) to evaluate the effect of any identified misstatements in the consolidated financial statements.
We communicate with those charged with governance of the Parent Company and such other entities included in the consolidated financial statements of which we are the independent auditors regarding, among other matters, the planned scope and timing of the audit and significant audit findings, including any significant deficiencies in internal control that we identify during our audit.
We also provide those charged with governance with a statement that we have complied with relevant ethical requirements regarding independence, and to communicate with them all relationships and other matters that may reasonably be thought to bear on our independence, and where applicable, related safeguards.
From the matters communicated with those charged with governance, we determine those matters that were of most significance in the audit of the consolidated financial statements of the current period and are therefore the key audit matters. We describe these matters in our auditor’s report unless law or regulation precludes public disclosure about the matter or when, in extremely rare circumstances, we determine that a matter should not be communicated in our report because the adverse consequences of doing so would reasonably be expected to outweigh the public interest benefits of such communication.

466
AUDITORS’ REPORT ON CONSOLIDATED FINANCIAL STATEMENTS ANNUAL REPORT 2019-20
Other Matters
• Wedidnotauditthefinancialinformationof28jointoperationsincludedinthestandalonefinancialstatementsofthecompaniesincluded in the Group whose financial information reflect total assets of R 3,728.86croreasat31stMarch,2020,totalrevenueof R 4,112.64crore,totalnetlossaftertaxofR 119.39 crore, total comprehensive loss of R 119.39 crore and net cash outflows amounting to R 115.90 crore for the year ended 31st March, 2020, as considered in the respective standalone financial statements of the companies included in the Group. The financial information of these joint operations have been audited by the other auditors whose reports have been furnished to us by the Management, and our opinion in so far as it relates to the amounts and disclosures included in respect of these joint operations and our report in terms of subsection (3) of Section 143 of the Act, in so far as it relates to the aforesaid joint operations, is based solely on the report of such other auditors.
• Wedidnotauditthefinancialinformationof68subsidiaries,whosefinancialinformationreflecttotalassetsofR 1,00,047.10 crore as at 31st March, 2020, total revenues of R 36,971.08crore,totalnetprofitaftertaxofR 3,965.32crore,totalcomprehensive income of R 3,236.04croreandnetcashinflowsamountingtoR 2,151.28crorefortheyearended31stMarch,2020, as considered in the consolidated financial statements. The consolidated financial statements also include the Group’s share of loss after tax of R 29.61crorefortheyearended31stMarch,2020andtotalcomprehensivelossofR 2.81crorefortheyearended31stMarch,2020,asconsideredintheconsolidatedfinancialstatements,inrespectof3associatesand8jointventures,whose financial information have not been audited by us. These financial information have been audited by other auditors whose reports have been furnished to us by the Management and our opinion on the consolidated financial statements, in so far as it relates to the amounts and disclosures included in respect of these subsidiaries, joint ventures and associates, and our report in terms of subsection (3) of Section 143 of the Act, in so far as it relates to the aforesaid subsidiaries, joint ventures and associates is based solely on the reports of the other auditors.
• Wedidnotauditthefinancialinformationof6jointoperationsincludedinthestandalonefinancialstatementsofthecompaniesincluded in the Group whose financial information reflect total assets of R 239.74 crore as at 31st March, 2020, total revenue of R 257.69crore,totalnetprofitaftertaxofR 15.40 crore, total comprehensive income of R 15.40 crore and net cash inflows amount to R 32.30 crore for the year ended 31st March, 2020, as considered in the respective standalone financial statements of the companies included in the Group. These financial information are unaudited and have been furnished to us by the Management and our opinion on the consolidated financial statements, in so far as it relates to the amounts and disclosures included in respect of these joint operations, is based solely on such unaudited financial information. In our opinion and according to the information and explanations given to us by the Management, these financial information are not material to the Group.
• Wedidnotauditthefinancialinformationof46subsidiaries,whosefinancialinformationreflecttotalassetsofR 1,019.63croreas at 31st March, 2020, total revenues of R 742.37 crore, total net loss after tax of R 6.01crore,totalcomprehensivelossofR 10.71 crore and net cash inflows amounting to R 36.85crorefortheyear31stMarch,2020,asconsideredintheconsolidatedfinancial statements. The consolidated financial statements also include the Group’s share of after tax of R 10.40 crore and total comprehensive loss of R 10.36crorefortheyearended31stMarch,2020,asconsideredintheconsolidatedfinancialstatements,inrespectof3associatesand6jointventures,financialinformationhavenotbeenauditedbyus.Thesefinancialinformationareunaudited and have been furnished to us by the Management and our opinion on the consolidated financial statements, in so far as it relates to the amounts and disclosures included in respect of these subsidiaries, joint ventures and associates, is based solely on such unaudited financial information. In our opinion and according to the information and explanations given to us by the Management, these financial information are not material to the Group.
Our opinion on the consolidated financial statements above and our report on Other Legal and Regulatory Requirements below, is not modified in respect of the above matters with respect to our reliance on the work done and the reports of the other auditors and the financial information certified by the Management.
Report on Other Legal and Regulatory Requirements
As required by Section 143(3) of the Act, based on our audit and on the consideration of the reports of the other auditors on the separate financial information of the joint operations, subsidiaries, associates and joint ventures referred to in the Other Matters section above we report, to the extent applicable that:
a) We have sought and obtained all the information and explanations which to the best of our knowledge and belief were necessary for the purposes of our audit of the aforesaid consolidated financial statements.
b) In our opinion, proper books of account as required by law relating to preparation of the aforesaid consolidated financial statements have been kept so far as it appears from our examination of those books and the reports of the other auditors.

467
c) The Consolidated Balance Sheet, the Consolidated Statement of Profit and Loss including Other Comprehensive Income, the Consolidated Statement of Cash Flows and the Consolidated Statement of Changes in Equity dealt with by this Report are in agreement with the relevant books of account maintained for the purpose of preparation of the consolidated financial statements.
d) In our opinion, the aforesaid consolidated financial statements comply with the Ind AS specified under Section 133 of the Act.
e) On the basis of the written representations received from the directors of the Parent Company as on 31st March, 2020 taken on record by the Board of Directors of the Company and the reports of the statutory auditors of its joint operation companies, subsidiary companies, associate companies and joint venture companies incorporated in India, none of the directors of the Group companies, its associate companies and joint venture companies incorporated in India is disqualified as on 31st March, 2020 from beingappointedasadirectorintermsofSection164(2)oftheAct.
f) With respect to the adequacy of the internal financial controls over financial reporting and the operating effectiveness of such controls, refer to our separate Report in “Annexure A” which is based on the auditors’ reports of the Parent company, subsidiary companies, associate companies and joint venture companies incorporated in India. Our report expresses an unmodified opinion on the adequacy and operating effectiveness of internal financial controls over financial reporting of those companies.
g) WithrespecttotheothermatterstobeincludedintheAuditor’sReportinaccordancewiththerequirementsofsection197(16)ofthe Act, as amended,
In our opinion and to the best of our information and according to the explanations given to us, the remuneration paid by the Parent Company to its directors during the year is in accordance with the provisions of section 197 of the Act.
h) With respect to the other matters to be included in the Auditor’s Report in accordance with Rule 11 of the Companies (Audit and Auditors) Rules, 2014, as amended in our opinion and to the best of our information and according to the explanations given to us:
i. The consolidated financial statements disclose the impact of pending litigations on the consolidated financial position of the Group, its associates and joint ventures;
ii. Provision has been made in the consolidated financial statements, as required under the applicable law or accounting standards, for material foreseeable losses, if any, on long-term contracts including derivative contracts; and
iii. There has been no delay in transferring amounts, required to be transferred, to the Investor Education and Protection Fund by the Parent Company and its subsidiary companies, associate companies and joint venture companies incorporated in India.
For DELOITTE HASKINS & SELLS LLP Chartered Accountants (Firm’sRegistrationNo.117366W/W-100018)
Sanjiv V. Pilgaonkar (Partner) (MembershipNo.039826) UDIN:20039826AAAADJ8143
Mumbai, June 5, 2020

468
AUDITORS’ REPORT ON CONSOLIDATED FINANCIAL STATEMENTS ANNUAL REPORT 2019-20
ANNEXURE “A” TO THE INDEPENDENT AUDITORS’ REPORT (Referred to in paragraph “(f)” under ‘Report on Other Legal and Regulatory Requirements’ section of our report of even date)
Report on the Internal Financial Controls Over Financial Reporting under Clause (i) of Sub-section 3 of Section 143 of the Companies Act, 2013 (the “Act”)
In conjunction with our audit of the consolidated financial statements of the Company as of and for the year ended March 31, 2020, we have audited the internal financial controls over financial reporting of LARSEN & TOUBRO LIMITED (hereinafter referred to as “Parent”) and its subsidiary companies which includes one of the Group’s 35 joint operations which is a company incorporated in India, its associate companies and joint ventures, which are companies incorporated in India, as of that date.
Management’s Responsibility for Internal Financial Controls
The respective Board of Directors of the Parent, its subsidiary companies, its joint operation, its associate companies and joint ventures, which are companies incorporated in India, are responsible for establishing and maintaining internal financial controls based on the internal control over financial reporting criteria established by the respective Companies considering the essential components of internal control stated in the Guidance Note on Audit of Internal Financial Controls Over Financial Reporting issued by the Institute of Chartered Accountants of India (“ICAI”). These responsibilities include the design, implementation and maintenance of adequate internal financial controls that were operating effectively for ensuring the orderly and efficient conduct of its business, including adherence to the respective company’s policies, the safeguarding of its assets, the prevention and detection of frauds and errors, the accuracy and completeness of the accounting records, and the timely preparation of reliable financial information, as required under the Companies Act, 2013.
Auditor’s Responsibility
Our responsibility is to express an opinion on the internal financial controls over financial reporting of the Parent, its subsidiary companies, its joint operation, its associate companies and its joint ventures, which are companies incorporated in India, based on our audit. We conducted our audit in accordance with the Guidance Note on Audit of Internal Financial Controls Over Financial Reporting (the “Guidance Note”) issued ICAI and the Standards on Auditing (“SA”), prescribed under Section 143(10) of the Companies Act, 2013, to the extent applicable to an audit of internal financial controls. Those Standards and the Guidance Note require that we comply with ethical requirements and plan and perform the audit to obtain reasonable assurance about whether adequate internal financial controls over financial reporting was established and maintained and if such controls operated effectively in all material respects.
Our audit involves performing procedures to obtain audit evidence about the adequacy of the internal financial controls system over financial reporting and their operating effectiveness. Our audit of internal financial controls over financial reporting included obtaining an understanding of internal financial controls over financial reporting, assessing the risk that a material weakness exists, and testing and evaluating the design and operating effectiveness of internal control based on the assessed risk. The procedures selected depend on the auditor’s judgement, including the assessment of the risks of material misstatement of the financial statements, whether due to fraud or error.
We believe that the audit evidence we have obtained and the audit evidence obtained by other auditors of the subsidiary companies, joint operation, associate companies and joint ventures, which are companies incorporated in India, in terms of their reports referred to in the Other Matters paragraph below, is sufficient and appropriate to provide a basis for our audit opinion on the internal financial controls system over financial reporting of the Parent, its subsidiary companies, its joint operation, its associate companies and its joint ventures, which are companies incorporated in India.
Meaning of Internal Financial Controls Over Financial Reporting
A company’s internal financial control over financial reporting is a process designed to provide reasonable assurance regarding the reliability of financial reporting and the preparation of financial statements for external purposes in accordance with generally accepted accounting principles. A Company’s internal financial control over financial reporting includes those policies and procedures that (1) pertain to the maintenance of records that, in reasonable detail, accurately and fairly reflect the transactions and dispositions of the assets of the company; (2) provide reasonable assurance that transactions are recorded as necessary to permit preparation of financial statements in accordance with generally accepted accounting principles, and that receipts and expenditures of the company are being made only in accordance with authorisations of management and directors of the company; and (3) provide reasonable assurance regarding prevention or timely detection of unauthorised acquisition, use, or disposition of the company’s assets that could have a material effect on the financial statements.
Inherent Limitations of Internal Financial Controls Over Financial Reporting
Because of the inherent limitations of internal financial controls over financial reporting, including the possibility of collusion or improper management override of controls, material misstatements due to error or fraud may occur and not be detected. Also, projections of any evaluation of the internal financial controls over financial reporting to future periods are subject to the risk that

469
the internal financial control over financial reporting may become inadequate because of changes in conditions, or that the degree of compliance with the policies or procedures may deteriorate.
Opinion
In our opinion to the best of our information and according to the explanations given to us and based on the consideration of the reports of the other auditors referred to in the Other Matters paragraph below, the Parent, its subsidiary companies, its joint operation, its associate companies and joint ventures, which are companies incorporated in India, have, in all material respects, an adequate internal financial controls system over financial reporting and such internal financial controls over financial reporting were operating effectively as at March 31, 2020, based on the criteria for internal financial controls over financial reporting established by the respective companies considering the essential components of internal control stated in the Guidance Note.
Other Matters
Our aforesaid report under Section 143(3)(i) of the Act on the adequacy and operating effectiveness of the internal financial controls over financial reporting in so far as it relates to 31 subsidiary companies, 1 joint operation company, 3 associate companies and 7 joint ventures, which are companies incorporated in India, is based solely on the corresponding reports of the auditors of such companies incorporated in India.
Our aforesaid report under Section 143(3)(i) of the Act on the adequacy and operating effectiveness of the internal financial controls over financial reporting in so far as it relates to 12 subsidiary companies, 1 associate and 3 joint venture companies, which are companies incorporated in India, whose financial information is unaudited and whose efficacy of internal financial controls over financial reporting is based solely on the Management’s certification provided to us and our opinion on the adequacy and operating effectiveness of the internal financial controls over financial reporting of the Group is not affected as the financial information of such entities is not material to the Group.
Our opinion is not modified in respect of the above matters with respect to our reliance on the work done by and the reports of such other auditors and the financial information certified by the Management.
For DELOITTE HASKINS & SELLS LLP Chartered Accountants (Firm‘sRegistrationNo.117366W/W-100018)
Sanjiv V. Pilgaonkar Partner (MembershipNo.039826) UDIN:20039826AAAADJ8143
Mumbai, June 5, 2020

470
CONSOLIDATED BALANCE SHEET ANNUAL REPORT 2019-20
Consolidated Balance Sheet as at March 31, 2020As at 31-3-2020 As at 31-3-2019
Note v crore v crore v crore v croreASSETS:Non-current assets Property, plant and equipment 2 10103.79 10889.56 Capital work-in-progress 2 3224.91 2483.56 Investment property 3 3714.72 4254.56 Goodwill 4 8011.40 1826.91 Other intangible assets 5 19596.98 4222.91 Intangible assets under development 5 86.18 11435.93 Right-of-use assets 61(c)(iii) 2226.49 – Financial assets Investments in joint ventures and associates 43(e) 2851.01 2642.29 Other investments 6 4496.72 4318.64 Loans towards financing activities 7 58589.36 57788.88 Other loans 8 1522.33 1481.08 Other financial assets 9 638.15 1144.05
68097.57 67374.94 Deferred tax assets (net) 51(d) 3846.58 3418.93 Other non-current assets 10 6541.62 5648.62Current assets Inventories 11 5746.65 6413.93 Financial assets Investments 12 12699.75 13946.17 Trade receivables 13 40731.52 36845.87 Cash and cash equivalents 14 11324.57 6509.49 Other bank balances 15 3793.21 5216.75 Loans towards financing activities 16 41723.42 42530.82 Other loans 17 716.00 626.69 Other financial assets 18 2927.87 2551.25
113916.34 108227.04 Other current assets 19 58659.69 52143.06Group(s) of assets classified as held for sale 45(d) 4367.21 7.41
TOTAL ASSETS 308140.13 278347.36

471
As at 31-3-2020 As at 31-3-2019Note v crore v crore v crore v crore
EQUITY AND LIABILITIES:Equity Equity share capital 20 280.78 280.55 Other equity 21 66442.44 62094.25
Equity attributable to owners of the Company 66723.22 62374.80 Non-controlling interests 9520.83 6826.11LiabilitiesNon-current liabilities Financial liabilities Borrowings 22 82331.33 74120.79 Lease liability 1741.60 – Other financial liabilities 23 901.14 354.83
84974.07 74475.62 Provisions 24 708.67 556.84 Deferred tax liabilities (net) 51(d) 1453.04 311.13 Other non-current liabilities 25 31.09 0.55 Current liabilities Financial liabilities Borrowings 26 35021.02 29223.84 Current maturities of long term borrowings 27 23654.77 22210.54 Lease liability 424.95 – Trade payables: Due to micro enterprises and small enterprises 479.51 261.12 Due to others 28 43164.42 42733.69 Other financial liabilities 29 4923.23 4622.78
107667.90 99051.97 Other current liabilities 30 30816.67 31166.55 Provisions 31 2750.85 2443.43 Current tax liabilities (net) 1509.62 1137.16Liabilities associated with group(s) of assets classified as held for sale 45(d) 1984.17 3.20
TOTAL EQUITY AND LIABILITIES 308140.13 278347.36
CONTINGENT LIABILITIES 32 COMMITMENTS (capital and others) 33NOTES FORMING PART OF THE FINANCIAL STATEMENTS 1 to 64
Consolidated Balance Sheet as at March 31, 2020 (contd.)
In terms of our report attachedFor DELOITTE HASKINS & SELLS LLPChartered Accountants S.N.SUBRAHMANYAN
Chief Executive Officer & Managing Director (DIN02255382)
Chennai
Firm’sRegistrationNo.117366W/W-100018by the hand of
SANJIV V. PILGAONKAR Partner R.SHANKAR RAMAN M.M.CHITALE
Independent DirectorMembershipNo.39826 Whole-time Director & Chief Financial OfficerMumbai (DIN00019798) (DIN00101004)
Mumbai Mumbai
SIVARAM NAIR ACompany Secretary & Compliance OfficerM. No. FCS3939Mumbai
June 5, 2020

472
CONSOLIDATED STATEMENT OF PROFIT AND LOSS ANNUAL REPORT 2019-20
Consolidated Statement of Profit and Loss for the year ended March 31, 20202019-20 2018-19
Note v crore v crore v crore v crore
Continuing operationsINCOME:Revenue from operations 34 145452.36 135220.29 Other income 35 2360.90 1836.53Total income 147813.26 137056.82EXPENSES:Manufacturing, construction and operating expenses: 36 Cost of raw materials, components consumed 15548.66 14771.56 Construction materials consumed 30316.12 31230.44 Purchase of stock-in-trade 841.09 887.87 Stores, spares and tools consumed 2184.46 2812.31 Sub-contracting charges 26454.05 26011.91 Changes in inventories of finished goods, work-in-progress, stock-in-trade and property development 647.70 (731.11) Other manufacturing, construction and operating expenses 13328.71 13264.43 Finance cost of financial services business and finance lease activity 8041.88 7385.63
97362.67 95633.04Employee benefits expense 37 23114.00 17466.40Sales, administration and other expenses 38 8646.71 6791.21Finance costs 39 2796.66 1802.55Depreciation, amortisation, impairment and obsolescence 2462.27 1923.03 Total expenses 134382.31 123616.23Profit before exceptional items and tax 13430.95 13440.59 Exceptional items (net) 48 – 294.75 Profit before tax 13430.95 13735.34 Tax expense: 51(a) Current tax 3564.58 4402.95 Deferred tax (net) (301.38) (335.86)
3263.20 4067.09Net profit after tax from continuing operations 10167.75 9668.25Share in profit/(loss) after tax of joint ventures/associates (net) 43(f) 71.96 (21.00)Profit for the year from continuing operations 10239.71 9647.25Discontinued operationsProfit from discontinued operations 45(e) 883.25 845.57Tax expense of discontinued operations 51(a) 228.68 276.24Net profit after tax from discontinued operations 654.57 569.33Net profit after tax from continuing operations & discontinued operations 10894.28 10216.58Other comprehensive incomeA Items that will not be reclassified to profit or loss: Equity instruments through other comprehensive income (386.05) – Income tax (expenses)/income on equity instruments through other comprehensive income – –
(386.05) – Gain/(loss) on remeasurements of the net defined benefit plans (205.94) (30.47) Income tax (expenses)/income on remeasurements of the net defined benefit plans 50.60 10.98
(155.34) (19.49) Share in other comprehensive income of joint ventures/associates (net) 27.75 24.52 B Items that will be reclassified to profit or loss: Debt instruments through other comprehensive income 115.22 (63.01) Income tax (expenses)/income on debt instruments through other comprehensive income (19.46) 7.61
95.76 (55.40)Carried forward - Other comprehensive income (417.88) (50.37)

473
2019-20 2018-19
Note v crore v crore v crore v croreBrought forward - Other comprehensive income (417.88) (50.37) Foreign currency translation reserve 43.60 (34.83) Income tax (expenses)/income on foreign currency translation reserve 4.45 (3.25)
48.05 (38.08) Effective portion of gains/(losses) on hedging instruments in a cash flow hedge (1281.83) (275.64) Income tax (expenses)/income on effective portion of gains/(losses) on hedging instruments in a cash flow hedge 334.42 106.69
(947.41) (168.95) Cost of hedging reserve (29.18) 26.65 Income tax (expenses)/income on cost of hedging reserve 8.14 (9.31)
(21.04) 17.34 Share in other comprehensive income of joint ventures/associates (net) 23.62 10.18Other comprehensive income for the year [net of tax] (1314.66) (229.88)Total comprehensive income for the year 9579.62 9986.70Profit for the year attributable to:- Owners of the Company 9549.03 8905.13- Non-controlling interests 1345.25 1311.45
10894.28 10216.58Other comprehensive income for the year attributable to:- Owners of the Company (1032.83) (273.99)- Non-controlling interests (281.83) 44.11
(1314.66) (229.88)Total comprehensive income for the year attributable to:- Owners of the Company 8516.20 8631.14- Non-controlling interests 1063.42 1355.56
9579.62 9986.70Earnings per share (EPS) of R 2 each from continuing operations:Basic earnings per equity share (R) 55 63.38 59.45 Diluted earnings per equity share (R) 55 63.29 59.35 Earnings per share (EPS) of R 2 each from discontinued operations:Basic earnings per equity share (R) 55 4.66 4.06Diluted earnings per equity share (R) 55 4.66 4.05 Earnings per share (EPS) of R 2 each from continuing operations & discontinued operations:Basic earnings per equity share (R) 55 68.04 63.51Diluted earnings per equity share (R) 55 67.95 63.40Face value per equity share (R) 2.00 2.00
NOTES FORMING PART OF THE FINANCIAL STATEMENTS 1 to 64
Consolidated Statement of Profit and Loss for the year ended March 31, 2020 (contd.)
In terms of our report attachedFor DELOITTE HASKINS & SELLS LLPChartered Accountants S.N.SUBRAHMANYAN
Chief Executive Officer & Managing Director (DIN02255382)
Chennai
Firm’sRegistrationNo.117366W/W-100018by the hand of
SANJIV V. PILGAONKAR Partner R.SHANKAR RAMAN M.M.CHITALE
Independent DirectorMembershipNo.39826 Whole-time Director & Chief Financial OfficerMumbai (DIN00019798) (DIN00101004)
Mumbai Mumbai
SIVARAM NAIR ACompany Secretary & Compliance OfficerM. No. FCS3939Mumbai
June 5, 2020

474
CONSOLIDATED STATEMENT OF CHANGES IN EQUITY ANNUAL REPORT 2019-20
Consolidated Statement of Changes in Equity for the year ended March 31, 2020A. Equity share capital
Particulars
2019-20 2018-19
Number of shares
v crore Number of shares
v crore
Issued, subscribed and fully paid up equity shares outstanding at the beginning of the year 1,40,27,29,385 280.55 1,40,13,69,456 280.27Add: Shares issued on exercise of employee stock options during the year 7,83,249 0.16 13,59,929 0.28Add: Shares issued on conversion of foreign currency convertible bonds during the year 3,79,388 0.07 – –
Issued, subscribed and fully paid up equity shares outstanding at the end of the year 1,40,38,92,022 280.78 1,40,27,29,385 280.55
B. Other equityv crore
Particulars
Share application
money pending
allotment
Equity component
of foreign currency
convertible bonds
Reserves and surplus Items of other comprehensive income
Total other equity
Non-controlling
interestsTotalCapital
reserveCapital
redemption reserve
Securities premium
Employee share
options (net)
Statutory reserves
Retained earnings
Foreign currency
translation reserve
Hedging reserve
Debt instruments
through other
compre-hensive income
Equity instruments
through other
compre-hensive income
Balance as at 31-3-2018 3.56 153.20 282.44 42.00 8363.02 313.56 3352.91 41077.32 572.67 437.77 24.78 – 54623.23 5201.43 59824.66 Change in accounting policy [Ind AS 115] – – – – – – – (1237.65) – – – – (1237.65) (2.73) (1240.38)Restated balance as at 1-4-2018 3.56 153.20 282.44 42.00 8363.02 313.56 3352.91 39839.67 572.67 437.77 24.78 – 53385.58 5198.70 58584.28 Profit for the year (a) – – – – – – – 8905.13 – – – – 8905.13 1311.45 10216.58 Other comprehensive income (b) – – – – – – – (18.72) (31.94) (192.40) (55.15) 24.22 (273.99) 44.11 (229.88)
Total comprehensive income for the year (a+b) – – – – – – – 8886.41 (31.94) (192.40) (55.15) 24.22 8631.14 1355.56 9986.70
Issue of equity shares (3.56) – – – 108.97 – – – – – – – 105.41 6.50 111.91 Transfer to non- financial assets/liabilities – – – – – – – – – (0.37) – – (0.37) – (0.37)Transfer from/(to) retained earnings during
the year – – – – – (12.19) 498.77 (486.58) – – – – – – – Employee share options (net) – – – – – 35.68 – – – – – – 35.68 117.43 153.11 Dividend paid for previous year – – – – – – – (2243.18) – – – – (2243.18) (199.53) (2442.71)Additional tax on dividend paid for the
previous year – – – – – – – (427.02) – – – – (427.02) (50.01) (477.03)Net gain/loss on transactions with
non-controlling interests – – – – – – – 2634.66 – – – – 2634.66 (2634.66) – Increase in non-controlling interest due to
dilution/divestment/acquisition – – – – – – – (27.65) – – – – (27.65) 3032.12 3004.47
Balance as at 31-3-2019 – 153.20 282.44 42.00 8471.99 337.05 3851.68 48176.31 540.73 245.00 (30.37) 24.22 62094.25 6826.11 68920.36

475
Consolidated Statement of Changes in Equity for the year ended March 31, 2020 (contd.)v crore
Particulars
Share application
money pending
allotment
Equity component
of foreign currency
convertible bonds
Reserves and surplus Items of other comprehensive income
Total other equity
Non-controlling
interestsTotalCapital
reserveCapital
redemption reserve
Securities premium
Employee share
options (net)
Statutory reserves
Retained earnings
Foreign currency
translation reserve
Hedging reserve
Debt instruments
through other
compre-hensive income
Equity instruments
through other
compre-hensive income
Balance as at 31-3-2019 – 153.20 282.44 42.00 8471.99 337.05 3851.68 48176.31 540.73 245.00 (30.37) 24.22 62094.25 6826.11 68920.36 Change in accounting policy [Ind AS 116]
[Note 61] – – – – – – – (79.09) – – – (79.09) (24.24) (103.33)Restated balance as at 1-4-2019 – 153.20 282.44 42.00 8471.99 337.05 3851.68 48097.22 540.73 245.00 (30.37) 24.22 62015.16 6801.87 68817.03 Profit for the year (c) – – – – – – – 9549.03 – – – – 9549.03 1345.25 10894.28 Other comprehensive income (d) – – – – – – – (150.88) 41.83 (682.12) 95.70 (337.36) (1032.83) (281.83) (1314.66)
Total comprehensive income for the year (c+d) – – – – – – – 9398.15 41.83 (682.12) 95.70 (337.36) 8516.20 1063.42 9579.62
Issue of equity shares – – – – 127.61 – – – – – – – 127.61 – 127.61 Transfer to non- financial assets/liabilities – – – – – – – – – 0.20 – – 0.20 – 0.20 Transfer from/(to) retained earnings during
the year – (153.20) – – – (10.68) 305.87 (471.88) – – – 329.89 – – – Employee share options (net) – – – – – 75.12 – – – – – – 75.12 7.32 82.44 Dividend paid (including interim dividend) – – – – – – – (3929.61) – – – – (3929.61) (486.90) (4416.51)Additional tax on dividend paid – – – – – – – (748.05) – – – – (748.05) (96.42) (844.47)Non-controlling interest on acquisition of
a subsidiary – – – – – – – – – – – – – 2023.88 2023.88 Net gain/loss on transactions with
non-controlling interests – – – – – – – 360.90 – – – – 360.90 (360.90) – Increase in non-controlling interest due to
dilution/divestment/acquisition – – – – – – – 24.91 – – – – 24.91 568.56 593.47
Balance as at 31-3-2020 – – 282.44 42.00 8599.60 401.49 4157.55 52731.64 582.56 (436.92) 65.33 16.75 66442.44 9520.83 75963.27
In terms of our report attachedFor DELOITTE HASKINS & SELLS LLPChartered Accountants S.N.SUBRAHMANYAN
Chief Executive Officer & Managing Director (DIN02255382)
Chennai
Firm’sRegistrationNo.117366W/W-100018by the hand of
SANJIV V. PILGAONKAR Partner R.SHANKAR RAMAN M.M.CHITALE
Independent DirectorMembershipNo.39826 Whole-time Director & Chief Financial OfficerMumbai (DIN00019798) (DIN00101004)
Mumbai Mumbai
SIVARAM NAIR ACompany Secretary & Compliance OfficerM. No. FCS3939Mumbai
June 5, 2020

476
CONSOLIDATED STATEMENT OF CASH FLOWS ANNUAL REPORT 2019-20
Consolidated Statement of Cash Flows for the year ended March 31, 20202019-20 2018-19
v crore v croreA. Cash flow from operating activities:
Profit before tax (excluding non-controlling interests and exceptional items) from -- Continuing operations 13430.95 13440.59 - Discontinued operations 883.25 845.57
Profit before tax including discontinued operations (excluding non-controlling interest and exceptional items) 14314.20 14286.16Adjustments for:Dividend received (101.60) (236.91)Depreciation, amortisation, impairment and obsolescence 2462.27 1923.03 Exchange difference on items grouped under financing/investing activities 5.69 (97.48)Effect of exchange rate changes on cash and cash equivalents (88.14) 7.40 Expenditure on share buy back – 17.38Finance costs 2796.66 1802.55Interest income (829.07) (894.99)(Profit)/loss on sale of property, plant and equipment and investment property (net) 33.28 (590.36)(Profit)/loss on sale/fair valuation of investments (net) (733.84) (65.33)(Profit)/loss on sale of stake in a subsidiary of developmental projects segment – (415.61)(Gain)/loss on derivatives at fair value through profit or loss (13.19) 21.81Employee stock option-discount forming part of employee benefits expense 190.84 151.00 Non-cash items related to discontinued operations 49.44 166.92Business combination expenses 84.28 –Impairment of debt instruments 350.59 –Impairment loss recognised on non-current assets held for sale 3.93 –(Gain)/loss on de-recognition of lease liability/right-of-use assets (1.85) –Interest expenses/(income) related to discontinued operations 1.33 (2.10)
Operating profit before working capital changes 18524.82 16073.47Adjustments for:(Increase)/decrease in trade and other receivables (11278.83) (9240.98)(Increase)/decrease in inventories 353.19 330.58Increase/(decrease) in trade payables and customer advances 3134.23 6819.06
Cash generated from operations before financing activities 10733.41 13982.13(Increase)/decrease in loans and advances towards financing activities 6.92 (13855.16)
Cash generated from operations 10740.33 126.97Direct taxes refund/(paid) [net] (4046.45) (4882.80)
Net cash (used in)/from operating activities 6693.88 (4755.83)
B. Cash flow from investing activities:Purchase of fixed assets (3436.82) (4307.38)Sale of fixed assets (including advance received) 137.39 807.97Purchase of non-current investments (1870.64) (1862.44)Sale of non-current investments 2245.29 653.36(Purchase)/sale of current investments (net) 2065.74 (3032.80)Change in other bank balance and cash not available for immediate use 1439.82 (3988.12)Deposits/loans given to associates, joint ventures and third parties (115.21) (88.67)Deposits/loans repaid by associates, joint ventures and third parties 17.69 43.75 Interest received 837.54 726.80Dividend received from joint ventures/associates 12.53 19.44 Dividend received on other investments 101.60 236.91Settlement of derivative contracts related to current investments 13.19 (21.81)Consideration received on disposal of subsidiaries (including advance received) – 67.00Consideration received on disposal of joint venture 43.16 –Consideration paid on acquisition of subsidiaries (9895.93) (309.86)Cash & cash equivalents acquired pursuant to acquisition of subsidiaries 210.72 33.05 Cash & cash equivalents (of subsidiaries) classified as held for sale (other than discontinued operations) (14.34) –Consideration paid on acquisition of additional stake in a joint venture (48.00) –
Net cash (used in)/from investing activities (8256.27) (11022.80)

477
Consolidated Statement of Cash Flows for the year ended March 31, 2020 (contd.)2019-20 2018-19
v crore v croreC. Cash flow from financing activities:
Proceeds from issue of share capital (including share application money) 17.56 11.31 Proceeds from non-current borrowings [Note 50] 42587.43 24181.62Repayment of non-current borrowings [Note 50] (33685.03) (14081.42)Proceeds from other borrowings (net) [Note 50] 4915.20 7765.14Payment (to)/from non-controlling interest (net)- including sale proceeds on divestment of part stake in subsidiary companies (60.05) 2884.85Settlement of derivative contracts related to borrowings 308.29 308.95Dividends paid (3929.61) (2243.18)Additional tax on dividend (621.72) (403.93)Repayment of lease liability [Note 50] (258.03) –Interest paid on lease liability (162.79) –Interest paid (including cash flows on account of interest rate swaps) (2739.70) (2983.17)Net cash (used in)/from financing activities 6371.55 15440.17 Net (decrease)/increase in cash and cash equivalents (A + B + C) 4809.16 (338.46)Cash and cash equivalents at beginning of the year 6460.23 6798.69Cash and cash equivalents for discontinued operations (classified as held for sale) (151.44) –Cash and cash equivalents at end of the year 11117.95 6460.23
Notes:1. Statement of Cash Flows has been prepared under the indirect method as set out in the Indian Accounting Standard (Ind AS) 7
“Statement of Cash Flows” as specified in the Companies (Indian Accounting Standards) Rules, 2015.2. Purchase & Sale of fixed assets represents additions & deletions to property, plant and equipment, investment property and
intangible assets adjusted for movement of (a) capital work-in-progress for property, plant and equipment and investment property and (b) Intangible assets under development during the year.
3. Cash and cash equivalents included in the Statement of Cash Flows comprise the following:
2019-20 2018-19
v crore v crore(a) Cash and cash equivalents disclosed under current assets [Note 14] 11324.57 6509.49(b) Other bank balances disclosed under current assets [Note 15] 3793.21 5216.75(c) Cash and bank balances disclosed under non-current assets [Note 9] 273.82 290.07
Total cash and cash equivalents as per Balance Sheet 15391.60 12016.31
Add: (i) Unrealised exchange (gain)/loss on cash and cash equivalents (reflected in Statement of Profit and loss) (116.39) (28.25)
Add: (ii) Unrealised exchange (gain)/loss on cash and cash equivalents (reflected in Other Comprehensive Income) (90.23) (21.01)
Less: (iii) Other bank balances disclosed under current assets [Note 15] 3793.21 5216.75Less: (iv) Cash and bank balances disclosed under non-current assets [Note 9] 273.82 290.07
Total cash and cash equivalents as per Statement of Cash Flows 11117.95 6460.23
4. Previous year’s figures have been regrouped/reclassified wherever applicable.
In terms of our report attachedFor DELOITTE HASKINS & SELLS LLPChartered Accountants S.N.SUBRAHMANYAN
Chief Executive Officer & Managing Director (DIN02255382)
Chennai
Firm’sRegistrationNo.117366W/W-100018by the hand of
SANJIV V. PILGAONKAR Partner R.SHANKAR RAMAN M.M.CHITALE
Independent DirectorMembershipNo.39826 Whole-time Director & Chief Financial OfficerMumbai (DIN00019798) (DIN00101004)
Mumbai Mumbai
SIVARAM NAIR ACompany Secretary & Compliance OfficerM. No. FCS3939Mumbai
June 5, 2020

478
NOTES FORMING PART OF THE CONSOLIDATED FINANCIAL STATEMENTS ANNUAL REPORT 2019-20
NOTE [1](I)
Corporate Information
The Consolidated Financial Statements comprise financial statements of “Larsen & Toubro Limited” (“L&T”, the “Parent Company”) and its subsidiaries (collectively referred to as “the Group”) for the year ended March 31, 2020.
The principal activities of the Group, its Joint Ventures and associates consist of providing Engineering and Construction solutions in key sectors such as Infrastructure, Hydrocarbon, Power, Process Industries and Defence, Information Technology and Financial Services. FurtherdetailsofthebusinessoperationsoftheGrouparementionedinNote[46]SegmentInformation.
NOTE [1](II)
Significant Accounting Policies
(a) Statement of compliance
The Group’s financial statements have been prepared in accordance with the provisions of the Companies Act, 2013 and the Indian Accounting Standards (Ind AS) notified under the Companies (Indian Accounting Standards) Rules, 2015 and amendments thereof issued by the Ministry of Corporate Affairs in exercise of the powers conferred by section 133 of the Companies Act, 2013. In addition, the guidance notes/announcements issued by the Institute of Chartered Accountants of India (ICAI) are also applied except where compliance with other statutory promulgations require a different treatment. These financials statements have been approved for issue by the Board of Directors at their meeting held on June 5, 2020.
(b) Basis of accounting
The Group maintains its accounts on accrual basis following historical cost convention, except for certain assets and liabilities that are measured at fair value in accordance with Ind AS.
Fair value measurements are categorised as below based on the degree to which the inputs to the fair value measurements are observable and the significance of the inputs to the fair value measurement in its entirety:
(i) Level 1 inputs are quoted prices (unadjusted) in active markets for identical assets or liabilities that the Group can access at measurement date
(ii) Level 2 inputs are inputs, other than quoted prices included in level 1, that are observable for the asset or liability, either directly or indirectly; and
(iii) Level 3 inputs are unobservable inputs for the valuation of assets or liabilities
Above levels of fair value hierarchy are applied consistently and generally, there are no transfers between the levels of the fair value hierarchy unless the circumstances change warranting such transfer.
(c) Presentation of financial statements
The Balance Sheet, Statement of Profit and Loss and Statement of Changes in Equity are prepared and presented in the format prescribed in the Schedule III to the Companies Act, 2013 (“the Act”). The Statement of Cash Flows has been prepared and presented as per the requirements of Ind AS 7 “Statement of Cash Flows”. The disclosure requirements with respect to items in the Balance Sheet and Statement of Profit and Loss, as prescribed in the Schedule III to the Act, are presented by way of notes forming part of the financial statements along with the other notes required to be disclosed under the notified Accounting Standards and the SEBI (Listing Obligations and Disclosure Requirements) Regulations, 2015 as amended.
Amounts in the financial statements are presented in Indian Rupees in crore [1 crore = 10 million] rounded off to two decimal places as permitted by Schedule III to the Companies Act, 2013. Per share data are presented in Indian Rupees to two decimal places.
(d) Basis of consolidation
(i) The consolidated financial statements incorporate the financial statements of the Parent Company and its subsidiaries. For this purpose, an entity which is, directly or indirectly, controlled by the Parent Company is treated as subsidiary. The Parent Company together with its subsidiaries constitute the Group. Control exists when the Parent Company, directly or indirectly, has power over the investee, is exposed to variable returns from its involvement with the investee and has the ability to use its power to affect its investor’s returns.
Notes forming part of the Consolidated Financial Statements
479
(ii) Consolidation of a subsidiary begins when the Parent Company, directly or indirectly, obtains control over the subsidiary and ceases when the Parent Company, directly or indirectly, loses control of the subsidiary. Income and expenses of a subsidiary acquired or disposed of during the year are included in the consolidated Statement of Profit and Loss from the date the Parent Company, directly or indirectly, gains control until the date when the Parent Company, directly or indirectly, ceases to control the subsidiary.
(iii) The consolidated financial statements of the Group combines financial statements of the Parent Company and its subsidiaries line-by-line by adding together the like items of assets, liabilities, income and expenses. All intra-group assets, liabilities, income, expenses and unrealised profits/losses on intra-group transactions are eliminated on consolidation. The accounting policies of subsidiaries have been harmonised to ensure the consistency with the policies adopted by the Parent Company. The consolidated financial statements have been presented to the extent possible, in the same manner as Parent Company’s standalone financial statements.
Profit or loss and other comprehensive income are attributed to the owners of the Parent Company and to the non- controlling interests and have been shown separately in the financial statements.
(iv) Non-controlling interests represent that part of the total comprehensive income and net assets of subsidiaries attributable to interest which is not owned, directly or indirectly, by the Parent Company.
(v) The gains/losses in respect of part divestment/dilution of stake in subsidiary companies not resulting in ceding of control, are recognised directly in other equity attributable to the owners of the Parent Company.
(vi) The gains/losses in respect of divestment of stake resulting in ceding of control in subsidiary companies are recognised in the Statement of Profit and Loss. The investment representing the interest retained in a former subsidiary, if any, is initially recognised at its fair value with the corresponding effect recognised in the Statement of Profit and Loss as on the date the control is ceded. Such retained interest is subsequently accounted as an associate or a joint venture or a financial asset.
(e) Investments in joint ventures and associates
When the Group has with other parties joint control of the arrangement and rights to the net assets of the joint arrangement, it recognises its interest as joint ventures. Joint control exists when the decisions about the relevant activities require unanimous consent of the parties sharing the control. When the Group has significant influence over the other entity, it recognises such interests as associates. Significant influence is the power to participate in the financial and operating policy decisions of the entity but is not control or joint control over the entity.
The results, assets and liabilities of joint ventures and associates are incorporated in the consolidated financial statements using equity method of accounting after making necessary adjustments to achieve uniformity in application of accounting policies, wherever applicable.
An investment in joint venture or associate is initially recognised at cost and adjusted thereafter to recognise the Group’s share of profit or loss and other comprehensive income of the joint venture or associate. Gain or loss in respect of changes in other equity of joint ventures or associates resulting in divestment or dilution of stake in the joint ventures and associates is recognised in the Statement of Profit and Loss. On acquisition of investment in a joint venture or associate, any excess of cost of investment over the fair value of the assets and liabilities of the joint venture and associate, is recognised as goodwill and is included in the carrying value of the investment in the joint venture and associate. The excess of fair value of assets and liabilities over the investment is recognised directly in equity as capital reserve. The unrealised profits/losses on transactions with joint ventures and associates are eliminated by reducing the carrying amount of investment.
The carrying amount of investment in joint ventures and associates is reduced to recognise impairment, if any, when there is evidence of impairment.
When the Group’s share of losses of a joint venture or an associate exceeds the Group’s interest in that joint venture or associate (which includes any long term interests that, in substance, form part of the Group’s net investment in the joint venture or associate), the Group discontinues recognising its share of further losses. Additional losses are recognised only to the extent that the Group has incurred legal or constructive obligations or made payments on behalf of the joint venture or associate.
Notes forming part of the Consolidated Financial Statements (contd.)NOTE [1](II) (contd.)

480
NOTES FORMING PART OF THE CONSOLIDATED FINANCIAL STATEMENTS ANNUAL REPORT 2019-20
(f) Interests in joint operations
When the Group has joint control of the arrangement based on contractually determined right to the assets and obligations for liabilities, it recognises such interests as joint operations. Joint control exists when the decisions about the relevant activities require unanimous consent of the parties sharing the control. In respect of its interests in joint operations, the Group recognises its share in assets, liabilities, income and expenses line-by-line in the standalone financial statements of the entity which is party to such joint arrangement which then becomes part of the consolidated financial statements of the Group when the financial statements of the Parent Company and its subsidiaries are combined for consolidation. Interests in joint operations are included in the segments to which they relate.
(g) Business Combination/Goodwill on consolidation
The Group accounts for its business combinations under acquisition method of accounting. Acquisition related costs are recognised in the Statement of Profit and Loss as incurred. The acquiree’s identifiable assets, liabilities and contingent liabilities that meet the condition for recognition are recognised at their fair values at the acquisition date.
Goodwill on consolidation as on the date of transition i.e. April 1, 2015 represents the excess of cost of acquisition at each point of time of making the investment in the subsidiary over the Group’s share in the net worth of a subsidiary. For this purpose, the Group’s share of net worth is determined on the basis of the latest financial statements, prior to the acquisition, after making necessary adjustments for material events between the date of such financial statements and the date of respective acquisition. Capital reserve on consolidation represents excess of the Group’s share in the net worth of a subsidiary over the cost of acquisition at each point of time of making the investment in the subsidiary.
Goodwill on consolidation arising on acquisitions on or after the date of transition represents the excess of (a) consideration paid for acquiring control and (b) acquisition date fair value of previously held ownership interest, if any, in a subsidiary over the Group’s share in the fair value of the net assets (including identifiable intangibles) of the subsidiary as on the date of acquisition of control.
Goodwill on consolidation is allocated to cash generating units or group of cash generating units that are expected to benefit from the synergies of the acquisition.
Goodwill arising on consolidation is not amortised, however, it is tested for impairment annually. In the event of cessation of operations of a subsidiary, the unimpaired goodwill is written off fully.
Business combinations arising from transfers of interests in entities that are under common control are accounted at historical cost. The difference between any consideration given and the aggregate historical carrying amounts of assets and liabilities of the acquired entity are recorded in shareholders’ equity.
(h) Operating cycle for current and non-current classification
Operating cycle for the business activities of the Group covers the duration of the specific project/contract/product line/service including the defect liability period, wherever applicable and extends up to the realisation of receivables (including retention monies) within the agreed credit period normally applicable to the respective lines of business.
(i) Revenue recognition
The Group recognises revenue from contracts with customers when it satisfies a performance obligation by transferring promised goods or service to a customer. The revenue is recognised to the extent of transaction price allocated to the performance obligation satisfied. Performance obligation is satisfied over time when the transfer of control of good or service to a customer is done over time and in other cases, performance obligation is satisfied at a point in time. For performance obligation satisfied over time, the revenue recognition is done by measuring the progress towards complete satisfaction of performance obligation. The progress is measured in terms of a proportion of actual cost incurred to-date, to the total estimated cost attributable to the performance obligation.
Transaction price is the amount of consideration to which the Group expects it to be entitled in exchange for transferring goods or services to a customer excluding amounts collected on behalf of a third party. Variable consideration is estimated using the expected value method or most likely amount as appropriate in a given circumstance. Payment terms agreed with a customer are as per business practice and the financing component, if significant, is separated from the transaction price and accounted as interest income.
Notes forming part of the Consolidated Financial Statements (contd.)NOTE [1](II) (contd.)

481
Costs to obtain a contract which are incurred regardless of whether the contract was obtained are charged-off in profit & loss immediately in the period in which such costs are incurred. Incremental costs of obtaining a contract, if any, and costs incurred to fulfil a contract are amortised over the period of execution of the contract in proportion to the progress measured in terms of a proportion of actual cost incurred to-date, to the total estimated cost attributable to the performance obligation.
Significant judgments are used in:
a. Determining the revenue to be recognised in case of performance obligation satisfied over a period of time. Revenue recognition is done by measuring the progress towards complete satisfaction of performance obligation. The progress is measured in terms of a proportion of actual cost incurred to-date, to the total estimated cost attributable to the performance obligation.
b. Determining the estimated losses, which are recognised in the period in which such losses become probable based on the expected total contract cost as at the reporting date.
c. Determining the method to be applied to arrive at the variable consideration requiring an adjustment to the transaction price.
Revenue includes adjustments made towards liquidated damages and variation wherever applicable. Escalation and other claims, which are not ascertainable/acknowledged by customers are not taken into account.
A. Revenue from sale of goods including contracts for supply/commissioning of complex plant and equipment is recognised as follows:
Revenue from sale of manufactured and traded goods is recognised when the control of the same is transferred to the customer and it is probable that the Group will collect the consideration to which it is entitled for the exchanged goods. Performance obligations in respect of contracts for sale of manufactured and traded goods is considered as satisfied at a point in time when the control of the same is transferred to the customer and where there is an alternative use of the asset or the company does not have either explicit or implicit right of payment for performance completed till date. In case where there is no alternative use of the asset and the company has either explicit or implicit right of payment considering legal precedents, performance obligation is considered as satisfied over a period of time and revenue is recognised over time.
B. Revenue from construction/project related activity is recognised as follows:
• Costpluscontracts:Revenuefromcostpluscontractsisrecognisedovertimeandisdeterminedwithreferencetotheextent performance obligations have been satisfied. The amount of transaction price allocated to the performance obligations satisfied represents the recoverable costs incurred during the period plus the margin as agreed with the customer.
• Fixedpricecontracts:Contractrevenueisrecognisedovertimetotheextentofperformanceobligationsatisfiedandcontrol is transferred to the customer. Contract revenue is recognised at allocable transaction price which represents the cost of work performed on the contract plus proportionate margin, using the percentage of completion method. Percentage of completion is the proportion of cost of work performed to-date, to the total estimated contract costs.
Impairment loss (termed as provision for foreseeable losses in the financial statements) is recognised in profit or loss to the extent the carrying amount of the contract asset exceeds the remaining amount of consideration that the company expects to receive towards remaining performance obligations (after deducting the costs that relate directly to fulfill such remaining performance obligations). In addition, the Group recognises impairment loss (termed as provision for expected credit loss on contract assets in the financial statements) on account of credit risk in respect of a contract asset using expected credit loss model on similar basis as applicable to trade receivables.
For contracts where the aggregate of contract cost incurred to date plus recognised profits (or minus recognised losses as the case may be) exceeds the progress billing, the surplus is shown as contract asset and termed as “Due from customers”. For contracts where progress billing exceeds the aggregate of contract costs incurred to-date plus recognised profits (or minus recognised losses, as the case may be), the surplus is shown as contract liability and termed as “Due to customers”. Amounts received before the related work is performed are disclosed in the Balance Sheet as contract liability and termed as “Advances from customer”. The amounts billed on customer for work performed and are unconditionally due for payment i.e only passage of time is required before payment falls due, are disclosed in the Balance Sheet as trade receivables. The amount of
Notes forming part of the Consolidated Financial Statements (contd.)NOTE [1](II) (contd.)

482
NOTES FORMING PART OF THE CONSOLIDATED FINANCIAL STATEMENTS ANNUAL REPORT 2019-20
retention money held by the customers pending completion of performance milestone is disclosed as part of contract asset and is reclassified as trade receivables when it becomes due for payment.
C. Revenue from construction/project related activity and contracts executed in joint arrangements under work-sharing arrangement [being joint operations, in terms of Ind AS 111 “Joint Arrangements”], is recognised on the same basis as adopted in respect of contracts independently executed by the Group.
D. Revenue from property development activities is recognised when performance obligation is satisfied, customer obtains control of the property transferred and a reasonable expectation of collection of the sale consideration from the customer exists. The costs incurred on property development activities are carried as “Inventories” till such time the aforesaid conditions are fulfilled.
E. In the case of the developmental project business and the realty business, revenue includes profit on sale of investment properties or sale of stake in the subsidiary and/or joint venture companies as the sale/divestments are inherent in the business model.
F. Rendering of services
Revenue from rendering of services is recognised over time as and when the customer receives the benefit of the company’s performance and the company has an enforceable right to payment for services transferred.
Unbilled revenue represents value of services performed in accordance with the contract terms but not billed.
In respect of information technology (IT) business and technology services business, revenue from contracts awarded on time and material basis is recognised over a period of time when relevant services are rendered and related costs are incurred. Revenue from fixed price contracts is recognised over a period of time using the proportionate completion method.
Revenue from contracts for rendering of engineering design services and other services which are directly related to the construction of an asset is recognised on the same basis as stated in (i) B above.
G. Income from interest-bearing loans is recognised on accrual basis over the life of the loans based on the effective yield. Income from bill discounting, advisory and syndication services and other financing activities is accounted on accrual basis.
H. Revenue on account of construction services rendered in connection with Build-Operate-Transfer (BOT) projects undertaken by the Group is recognised during the period of construction using percentage of completion method. After the completion of construction period, revenue relatable to fare/toll collections of such projects from users of facilities is accounted when the amount is due and recovery is certain. License fees for way-side amenities are accounted on accrual basis.
I. Commission income is recognised as and when the terms of the contract are fulfilled.
J. Income from investment management fees is recognised in accordance with the contractual terms and the SEBI regulations based on average Assets Under Management (AUM) of mutual fund schemes over the period of the agreement in terms of which services are performed. Portfolio management fees are recognised in accordance with the related contracts entered with the clients over the period of the agreement. Trusteeship fees are accounted on accrual basis.
K. Revenue from port operation services (upto the date of sale) is recognised on completion of respective services or as per terms agreed with the port operator, wherever applicable.
L. Revenue from charter hire is recognised based on the terms of the time charter agreement.
M. Revenue from operation and maintenance services of power plant receivable under the Power Purchase Agreement is recognised on accrual basis.
N. Other operational revenue represents income earned from the activities incidental to the business and is recognised when the performance obligation is satisfied and the right to receive the income is established as per the terms of the contract.
(j) Other income
A. Interest income on investments and loans is accrued on a time basis by reference to the principal outstanding and the effective interest rate including interest on investments classified as fair value through profit or loss or fair value through other
Notes forming part of the Consolidated Financial Statements (contd.)NOTE [1](II) (contd.)

483
comprehensive income. Interest receivable on customer dues is recognised as income in the Statement of Profit and Loss on accrual basis provided there is no uncertainty towards its realisation.
B. Dividend income is accounted in the period in which the right to receive the same is established.
C. Government grants, which are revenue in nature and are towards compensation for the qualifying costs, incurred by the Group, are recognised as other income/ reduced from underlying expenses in the Statement of Profit and Loss in the period in which such costs are incurred. Government grant receivable in the form duty credit scrips is recognised as other income in the Statement of Profit and Loss in the period in which the application is made to the government authorities and to the extent there is no uncertainty towards its receipt.
D. Other items of income are accounted as and when the right to receive such income arises and it is probable that the economic benefits will flow to the group and the amount of income can be measured reliably.
(k) Exceptional items
An item of income or expense which by its size, type or incidence requires disclosure in order to improve an understanding of the performance of the Group is treated as an exceptional item and the same is disclosed in the notes to accounts. (read with Note [1](II)(y)(i)(b))
(l) Property, plant and equipment (PPE)
PPE is recognised when it is probable that future economic benefits associated with the item will flow to the Group and the cost of the item can be measured reliably. PPE is stated at original cost net of tax/duty credits availed, if any, less accumulated depreciation and cumulative impairment, if any.
All directly attributable costs related to the acquisition of PPE and borrowing costs in case of qualifying assets are capitalised in accordance with the Group’s accounting policy.
Own manufactured PPE is capitalised at cost including an appropriate share of overheads. Administrative and other general overhead expenses that are specifically attributable to construction or acquisition of PPE or bringing the PPE to working condition are allocated and capitalised as a part of the cost of the PPE.
Subsequent costs are included in the assets’ carrying amount or recognised as a separate asset, as appropriate, only when it is probable that future economic benefits associated with the item will flow to the entity and the cost can be measured reliably.
PPE not ready for the intended use on the date of the Balance Sheet are disclosed as “capital work-in-progress”. (Also refer to policies on leases, borrowing costs, impairment of assets and foreign currency transactions below).
Depreciation is recognised using straight line method so as to write off the cost of the assets (other than freehold land and properties under construction) less their residual values over their useful lives specified in Schedule II to the Companies Act, 2013, or in case of assets where the useful life was determined by technical evaluation, over the useful life so determined. Depreciation method is reviewed at each financial year end to reflect the expected pattern of consumption of the future economic benefits embodied in the asset. The estimated useful life and residual values are also reviewed at each financial year end with the effect of any change in the estimates of useful life/residual value is accounted on prospective basis.
Where cost of a part of the asset (“asset component”) is significant to total cost of the asset and useful life of that part is different from the useful life of the remaining asset, useful life of that significant part is determined separately and such asset component is depreciated over its separate useful life.
Depreciation on additions to/deductions from, owned assets is calculated pro rata from the date it is ready for use.
Depreciation charge for impaired assets is adjusted in future periods in such a manner that the revised carrying amount of the asset is allocated over its remaining useful life.
Freehold land is not depreciated. PPE is derecognised upon disposal or when no future economic benefits are expected from its use or disposal.
Any gain or loss arising on derecognition is recognised in the Statement of Profit and Loss in the same period.
Notes forming part of the Consolidated Financial Statements (contd.)NOTE [1](II) (contd.)

484
NOTES FORMING PART OF THE CONSOLIDATED FINANCIAL STATEMENTS ANNUAL REPORT 2019-20
(m) Investment property
Properties (including those under construction) held to earn rentals and/or capital appreciation are classified as investment property and are measured and reported at cost, including transaction costs and borrowing cost capitalised for qualifying assets, in accordance with the Group’s accounting policy.
Depreciation is recognised using straight line method so as to write off the cost of the investment property less their residual values over their useful lives specified in Schedule II to the Companies Act, 2013, or in the case of assets where the useful life was determined by technical evaluation, over the useful life so determined. Depreciation method is reviewed at each financial year end to reflect the expected pattern of consumption of the future benefits embodied in the investment property. The estimated useful life and residual values are also reviewed at each financial year end and the effect of any change in the estimates of useful life/ residual value is accounted on prospective basis. Freehold land and properties under construction are not depreciated.
An investment property is derecognised upon disposal or when the investment property is permanently withdrawn from use and no future economic benefits are expected from the disposal. Any gain or loss arising on derecognition of property is recognised in the Statement of Profit and Loss in the same period.
(n) Intangible assets
Intangible assets are recognised when it is probable that the future economic benefits that are attributable to the asset will flow to the enterprise and the cost of the asset can be measured reliably. Intangible assets are stated at original cost net of tax/duty credits availed, if any, including borrowing costs capitalised for qualifying assets and reduced by accumulated amortisation and cumulative impairment. Administrative and other general overhead expenses that are specifically attributable to acquisition of intangible assets are allocated and capitalised as a part of the cost of the intangible assets.
Research and development expenditure on new products:
(i) Expenditure on research is expensed under respective heads of account in the period in which it is incurred
(ii) Development expenditure on new products is capitalised as intangible asset, if all of the following can be demonstrated:
A. the technical feasibility of completing the intangible asset so that it will be available for use or sale;
B. the Group has intention to complete the intangible asset and use or sell it;
C. the Group has ability to use or sell the intangible asset;
D. the manner in which the probable future economic benefits will be generated including the existence of a market for output of the intangible asset or intangible asset itself or if it is to be used internally, the usefulness of intangible assets;
E. the availability of adequate technical, financial and other resources to complete the development and to use or sell the intangible asset; and
F. the Group has ability to reliably measure the expenditure attributable to the intangible asset during its development. Development expenditure that does not meet the above criteria is expensed in the period in which it is incurred.
Intangible assets not ready for the intended use on the date of the Balance Sheet are disclosed as “intangible assets under development”.
Intangible assets are amortised on straight line basis over the estimated useful life. The method of amortisation and useful life are reviewed at the end of each accounting year with the effect of any changes in the estimate being accounted for on a prospective basis. The estimated useful life for major categories of the intangible assets are as follows:
(i) Specialised software: over a period of three to ten years;
(ii) Technical know-how: over a period of three to seven years;
(iii) Development costs for new products: over a period of five years;
(iv) Customer contracts and relationships: over a period of the contract which generally is over three to ten years;
(v) Tradename: over a period of 5 years;
(vi) Intangible assets with indefinite useful life that are acquired separately are carried at cost less accumulated impairment losses;
Notes forming part of the Consolidated Financial Statements (contd.)NOTE [1](II) (contd.)

485
(vii) Fare collection rights obtained in consideration for rendering construction services represent the right to collect fare during the concession period in respect of Build-Operate-Transfer (BOT) projects undertaken by the Group. Fare collection rights are capitalised as intangible asset upon completion of the project at the cumulative construction costs including related margins. Till the completion of the project, the same is recognised as intangible assets under development. Fare collection rights are amortised using the straight-line method over the period of concession; and
(viiii) Amortisation on impaired assets is provided by adjusting the amortisation charge in the remaining periods so as to allocate the asset’s revised carrying amount over its remaining useful life.
(o) Impairment of assets
As at the end of each accounting year, the Group reviews the carrying amounts of its PPE, investment property and intangible assets to determine whether there is any indication that those assets have suffered an impairment loss. If such indication exists, the PPE, investment property and intangible assets are tested for impairment so as to determine the impairment loss, if any. Goodwill and the intangible assets with indefinite life are tested for impairment each year.
Impairment loss is recognised when the carrying amount of an asset exceeds its recoverable amount. Recoverable amount is determined:
(i) in the case of an individual asset, at the higher of the net selling price and the value in use; and
(ii) in the case of a cash generating unit (the smallest identifiable group of assets that generates independent cash flows), at the higher of the cash generating unit’s net selling price and the value in use.
(The amount of value in use is determined as the present value of estimated future cash flows from the continuing use of an asset, which may vary based on the future performance of the entity and from its disposal at the end of its useful life. For this purpose, the discount rate (pre-tax) is determined based on the weighted average cost of capital of the company suitably adjusted for risks specified to the estimated cash flows of the asset).
If recoverable amount of an asset (or cash generating unit) is estimated to be less than its carrying amount, such deficit is recognised immediately in the Statement of Profit and Loss as impairment loss and the carrying amount of the asset (or cash generating unit) is reduced to its recoverable amount. For this purpose, the impairment loss recognised in respect of a cash generating unit is allocated first to reduce the carrying amount of any goodwill allocated to such cash generating unit and then to reduce the carrying amount of the other assets of the cash generating unit on a pro-rata basis.
When an impairment loss subsequently reverses, the carrying amount of the asset (or cash generating unit), except for allocated goodwill, is increased to the revised estimate of its recoverable amount, so that the increased carrying amount does not exceed the carrying amount that would have been determined had no impairment loss is recognised for the asset (or cash generating unit) in prior years. A reversal of an impairment loss (other than impairment loss allocated to goodwill) is recognised immediately in the Statement of Profit and Loss.
(p) Employee benefits
(i) Short term employee benefits:
Employee benefits such as salaries, wages, short term compensated absences, expected cost of bonus, ex-gratia, and performance linked rewards falling due wholly within twelve months of rendering the service are classified as short term employee benefits and are expensed in the period in which the employee renders the related service.
(ii) Post-employment benefits:
A. Defined contribution plans: The Group’s superannuation scheme, state governed provident fund scheme, employee state insurance scheme, social security contributions and employee pension scheme are defined contribution plans. The contribution paid/payable under the schemes is recognised during the period in which the employee renders the related service.
B. Defined benefit plans: The employees’ gratuity fund schemes and employee provident fund schemes managed by board of trustees established by the company, the post-retirement medical care plan and the Parent Company pension plan represent defined benefit plans. The present value of the obligation under defined benefit plans is determined based on actuarial valuation using the Projected Unit Credit Method.
Notes forming part of the Consolidated Financial Statements (contd.)NOTE [1](II) (contd.)

486
NOTES FORMING PART OF THE CONSOLIDATED FINANCIAL STATEMENTS ANNUAL REPORT 2019-20
The obligation is measured at the present value of the estimated future cash flows using a discount rate based on the market yield on government securities of a maturity period equivalent to the weighted average maturity profile of the defined benefit obligations at the Balance Sheet date.
Re-measurement, comprising actuarial gains and losses, the return on plan assets (excluding amounts included in net interest on the net defined benefit liability or asset) and any change in the effect of asset ceiling (if applicable) is recognised in other comprehensive income and is reflected in retained earnings and the same is not eligible to be reclassified to profit or loss.
Defined benefit costs comprising current service cost, past service cost and gains or losses on settlements are recognised in the Statement of Profit and Loss as employee benefits expense. Interest cost implicit in defined benefit employee cost is recognised in the Statement of Profit and Loss under finance cost. Gains or losses on settlement of any defined benefit plan are recognised when the settlement occurs. Past service cost is recognised as expense at the earlier of the plan amendment or curtailment and when the Group recognises related restructuring costs or termination benefits.
In case of funded plans, the fair value of the plan assets is reduced from the gross obligation under the defined benefit plans to recognise the obligation on a net basis.
(iii) Long term employee benefits:
The obligation recognised in respect of long term benefits such as compensated absences, long service award etc. is measured at present value of estimated future cash flows expected to be made by the Group and is recognised in a similar manner as in the case of defined benefit plans vide (ii) B above.
Long term employee benefit costs comprising current service cost and gains or losses on curtailments and settlements, re-measurements including actuarial gains and losses are recognised in the Statement of Profit and Loss as employee benefit expenses. Interest cost implicit in long term employee benefit cost is recognised in the Statement of Profit and Loss under finance cost.
(iv) Termination benefits:
Termination benefits such as compensation under employee separation schemes are recognised as expense when the company’s offer of the termination benefit is accepted or when the Group recognises the related restructuring costs whichever is earlier.
(q) Leases
LeasesareaccountedasperIndAS116whichhasbecomemandatoryfromApril1,2019.
Assets taken on lease are accounted as right-of-use assets and the corresponding lease liability is accounted at the lease commencement date.
Initially the right-of-use asset is measured at cost which comprises the initial amount of the lease liability adjusted for any lease payments made at or before the commencement date, plus any initial direct costs incurred and an estimate of costs to dismantle and remove the underlying asset or to restore the underlying asset or the site on which it is located, less any lease incentives received.
The lease liability is initially measured at the present value of the lease payments, discounted using the Group’s incremental borrowing rate. It is remeasured when there is a change in future lease payments arising from a change in an index or a rate, or a change in the estimate of the guaranteed residual value, or a change in the assessment of purchase, extension or termination option. When the lease liability is remeasured in this way, a corresponding adjustment is made to the carrying amount of the right-of-use asset, or is recorded in profit or loss if the carrying amount of the right-of-use asset has been reduced to zero.
The right-of-use asset is measured by applying cost model i.e. right-of-use asset at cost less accumulated depreciation/impairment losses . The right-of-use asset is depreciated using the straight-line method from the commencement date to the end of the lease term or useful life of the underlying asset whichever is lower. Carrying amount of lease liability is increased by interest on lease liability and reduced by lease payments made.
Notes forming part of the Consolidated Financial Statements (contd.)NOTE [1](II) (contd.)

487
Lease payments associated with following leases are recognised as expense on straight-line basis:
(i) Low value leases; and
(ii) Leases which are short-term.
Assets given on lease are classified either as operating lease or as finance lease. A lease is classified as a finance lease if it transfers substantially all the risks and rewards incidental to ownership of an underlying asset. Initially asset held under finance lease is recognised in balance sheet and presented as a receivable at an amount equal to the net investment in the lease. Finance income is recognised over the lease term, based on a pattern reflecting a constant periodic rate of return on Group’s net investment in the lease. A lease which is not classified as a finance lease is an operating lease.
The Group recognises lease payments in case of assets given on operating leases as income on a straight-line basis. The Group presents underlying assets subject to operating lease in its balance sheet under the respective class of asset.
(Also refer to policy on depreciation, supra)
(r) Financial instruments
Financial assets and/or financial liabilities are recognised when the Group becomes party to a contract embodying the related financial instruments. All financial assets, financial liabilities and financial guarantee contracts are initially measured at transaction values and where such values are different from the fair value, at fair value. Transaction costs that are attributable to the acquisition or issue of financial assets and financial liabilities (other than financial assets and financial liabilities at fair value through profit or loss) are added to or deducted from, as the case may be, the fair value of such financial assets or liabilities on initial recognition. Transaction costs directly attributable to the acquisition of financial assets or financial liabilities at fair value through profit or loss are recognised immediately in profit or loss.
A financial asset and a financial liability is offset and presented on net basis in the balance sheet when there is a current legally enforceable right to set-off the recognised amounts and it is intended to either settle on net basis or to realise the asset and settle the liability simultaneously.
(i) Financial assets
A. All recognised financial assets are subsequently measured in their entirety at either amortised cost or fair value, depending on the classification of the financial assets as follows:
1. Investments in debt instruments that are designated as fair value through profit or loss (FVTPL) - at fair value
2. Other investments in debt instruments – at amortised cost, subject to following conditions:
• Theassetisheldwithinabusinessmodelwhoseobjectiveistoholdassetsinordertocollectcontractualcashflows; and
• Thecontractualtermsofinstrumentgiveriseonspecifieddatestocashflowsthataresolelypaymentsofprincipal and interest on the principal amount outstanding.
3. Debt instruments that meet the following conditions are subsequently measured at fair value through other comprehensive income [FVTOCI] (unless the same are designated as fair value through profit or loss)
• Theassetisheldwithinabusinessmodelwhoseobjectiveisachievedbothbycollectingcontractualcashflowsand selling financial assets; and
• Thecontractualtermsofinstrumentgiveriseonspecifieddatestocashflowsthataresolelypaymentsofprincipal and interest on the principal amount outstanding.
4. Debt instruments at FVTPL is a residual category for debt instruments, if any, and all changes are recognised in profit or loss.
Notes forming part of the Consolidated Financial Statements (contd.)NOTE [1](II) (contd.)
488
NOTES FORMING PART OF THE CONSOLIDATED FINANCIAL STATEMENTS ANNUAL REPORT 2019-20
5. Investments in equity instruments are classified as FVTPL, unless the related instruments are not held for trading and the Group irrevocably elects on initial recognition to present subsequent changes in fair value in other comprehensive income.
6. Tradereceivables,securitydeposits,cashandcashequivalents,employeeandotheradvances–atamortisedcost
7. The group has elected to measure the investments in associates and joint ventures held through unit trusts at FVTPL.
B. For financial assets that are measured at FVTOCI, income by way of interest and dividend, provision for impairment and exchange difference, if any, (on debt instrument) are recognised in profit or loss and changes in fair value (other than on account of above income or expense) are recognised in other comprehensive income and accumulated in other equity. On disposal of debt instruments at FVTOCI, the cumulative gain or loss previously accumulated in other equity is reclassified to profit or loss. In case of equity instruments at FVTOCI, such cumulative gain or loss is not reclassified to profit or loss on disposal of investments.
C. A financial asset is primarily derecognised when:
1. the right to receive cash flows from the asset has expired, or
2. the group has transferred its rights to receive cash flows from the asset or has assumed an obligation to pay the received cash flows in full without material delay to a third party under a pass-through arrangement; and a) the group has transferred substantially all the risks and rewards of the asset, or b) the group has neither transferred nor retained substantially all the risks and rewards of the asset, but has transferred control of the asset.
On derecognition of a financial asset in its entirety, the difference between the carrying amount measured at the date of derecognition and the consideration received is recognised in profit or loss.
D. Impairment of financial assets: The Group recognises impairment loss on trade receivables using expected credit loss model which involves use of a provision matrix constructed on the basis of historical credit loss experience as permitted under Ind AS 109.
For all other financial assets, expected credit losses are measured at an amount equal to 12-month expected credit losses or at an amount equal to lifetime expected credit losses if the credit risk on the financial asset has increased significantly since initial recognition.
In respect of financial services business, the Group applies a separate model of the expected credit loss for recognising impairment loss on financial assets measured at amortised cost, debt instruments at FVTOCI, lease receivables, trade receivables and other contractual rights to receive cash or other financial asset and financial guarantees not designated as at FVTPL as follows:
• Expectedcreditlossesaretheweightedaverageofcreditlosseswiththerespectiverisksofdefaultoccurringastheweights. Credit loss is the difference between all contractual cash flows that are due to the Group in accordance with the contract and all the cash flows that the Group expects to receive (i.e. all cash shortfalls), discounted at the original effective interest rate (or credit- adjusted effective interest rate for purchased or originated credit-impaired financial assets). The Group estimates cash flows by considering all contractual terms of the financial instrument (for example, prepayment, extension, call and similar options) through the expected life of that financial instrument.
• TheGroupmeasuresthelossallowanceforafinancialinstrumentatanamountequaltothelifetimeexpectedcreditlosses if the credit risk on that financial instrument has increased significantly since initial recognition. If the credit risk on a financial instrument has not increased significantly since initial recognition, the Group measures the loss allowance for that financial instrument at an amount equal to 12-month expected credit losses. 12-month expected credit losses are portion of the lifetime expected credit losses and represent the lifetime cash shortfalls that will result if default occurs within the 12 months weighted by the probability of default after the reporting date and thus, are not cash shortfalls that are predicted over the next 12 months.
Notes forming part of the Consolidated Financial Statements (contd.)NOTE [1](II) (contd.)

489
• Whenmakingtheassessmentofwhethertherehasbeenasignificantincreaseincreditrisksinceinitialrecognition,the Group uses the change in the risk of a default occurring over the expected life of the financial instrument instead of the change in the amount of expected credit losses. To make that assessment, the Group compares the risk of a default occurring on the financial instrument as at the reporting date with the risk of a default occurring on the financial instrument as at the date of initial recognition and considers reasonable and supportable information, that is available without undue cost or effort, that is indicative of significant increases in credit risk since initial recognition.
(ii) Financial liabilities
A. Financial liabilities, including derivatives and embedded derivatives, which are designated for measurement at FVTPL are subsequently measured at fair value. Financial guarantee contracts are subsequently measured at the amount of impairment loss allowance or the amount recognised at inception net of cumulative amortisation, whichever is higher. All other financial liabilities including loans and borrowings, trade and other payables are initially recognised at fair value and subsequently measured at amortised cost using Effective Interest Rate (EIR) method.
B. A financial liability is derecognised when the related obligation expires or is discharged or cancelled.
(iii) The Group designates certain hedging instruments such as derivatives, embedded derivatives and in respect of foreign currency risk, certain non-derivatives as either fair value hedges, cash flow hedges, or hedges of net investments in foreign operations. Hedges of foreign exchange risk on firm commitments are accounted as cash flow hedges.
A. Fair value hedges: Changes in fair value of the designated portion of derivatives that qualify as fair value hedges are recognised in profit or loss immediately, together with any changes in the fair value of the hedged asset or liability that are attributable to the hedged risk. Hedge accounting is discontinued when the hedging instrument expires or is sold, terminated, or exercised, or when it no longer qualifies for hedge accounting. The fair value adjustment to the carrying amount of the hedged item arising from the hedged risk is amortised to profit or loss from that date.
B. Cash flow hedges: In case of transaction related hedges, the effective portion of changes in the fair value of derivatives that are designated and qualify as cash flow hedges is recognised in other comprehensive income and accumulated in equity as ‘hedging reserve’. The gain or loss relating to the ineffective portion is recognised immediately in profit or loss. Amounts previously recognised in other comprehensive income and accumulated in equity relating to the effective portion are reclassified to profit or loss in the periods when the hedged item affects profit or loss, in the same head as the hedged item. The effective portion of the hedge is determined at the lower of the cumulative gain or loss on the hedging instrument from inception of the hedge and the cumulative change in the fair value of the hedged item from the inception of the hedge and the remaining gain or loss on the hedging instrument is treated as ineffective portion.
In case of time period related hedges, the premium element and the spot element of a forward contract is separated and only the change in the value of the spot element of the forward contract is designated as the hedging instrument. Similarly, wherever applicable, the foreign currency basis spread is separated from the financial instrument and is excluded from the designation of that financial instrument as the hedging instrument in case of time period related hedges. The changes in the fair value of the premium element of the forward contract or the foreign currency basis spread of the financial instrument is accumulated in a separate component of equity as ‘cost of hedging’. The changes in the fair value of such premium element or foreign currency basis spread are reclassified to profit or loss as a reclassification adjustment on a straight-line basis over the period of the forward contract or the financial instrument.
The cash flow hedges are allocated to the forecast transactions on gross exposure basis. Where the hedged forecast transaction results in the recognition of a non-financial asset, such gains / losses are transferred from Hedge Reserve (but not as reclassification adjustment) and included in the initial measurement cost of the non-financial asset.
Hedge accounting is discontinued when the hedging instrument expires or is sold, terminated, or exercised, or when it no longer qualifies for hedge accounting. Any gain or loss recognised in other comprehensive income and accumulated in equity at that time remains in equity and is recognised in profit or loss when the forecast transaction is ultimately recognised in profit or loss. When a forecast transaction is no longer expected to occur, the gain or loss accumulated in equity is recognised immediately in profit or loss.
Notes forming part of the Consolidated Financial Statements (contd.)NOTE [1](II) (contd.)

490
NOTES FORMING PART OF THE CONSOLIDATED FINANCIAL STATEMENTS ANNUAL REPORT 2019-20
(iv) Compound financial instruments issued by the Group which can be converted into fixed number of equity shares at the option of the holders irrespective of changes in the fair value of the instrument are accounted by separately recognising the liability and the equity components. The liability component is initially recognised at the fair value of a comparable liability that does not have an equity conversion option. The equity component is initially recognised at the difference between the fair value of the compound financial instrument as a whole and the fair value of the liability component. The directly attributable transaction costs are allocated to the liability and the equity components in proportion to their initial carrying amounts.
Subsequent to initial recognition, the liability component of the compound financial instrument is measured at amortised cost using the effective interest method. The equity component of a compound financial instrument is not remeasured subsequently.
(s) Inventories
Inventories are valued after providing for obsolescence, as under:
(i) Raw materials, components, construction materials, stores, spares and loose tools at lower of weighted average cost or net realizable value. However, these items are considered to be realisable at cost if the finished products in which they will be used, are expected to be sold at or above cost.
(ii) Manufacturing work-in-progress at lower of weighted average cost including related overheads or net realisable value. In some cases, manufacturing work-in-progress are valued at lower of specifically identifiable cost or net realisable value. In the case of qualifying assets, cost also includes applicable borrowing costs vide policy relating to borrowing costs.
(iii) Finished goods and stock-in-trade (in respect of goods acquired for trading) at lower of weighted average cost or net realisable value. Cost includes costs of purchases, costs of conversion and other costs incurred in bringing the inventories to their present location. Taxes which are subsequently recoverable from taxation authorities are not included in the cost.
(iv) Completed property/work-in-progress (including land) in respect of property development activity at lower of specifically identifiable cost or net realisable value.
Assessment of net realisable value is made at each subsequent period end and when the circumstances that previously caused inventories to be written-down below cost no longer exist or when there is clear evidence of an increase in net realisable value because of changed economic circumstances, the write-down, if any, in the past period is reversed to the extent of the original amount written-down so that the resultant carrying amount is the lower of the cost and the revised net realisable value.
(t) Cash and bank balances
Cash and bank balances also include fixed deposits, margin money deposits, earmarked balances with banks and other bank balances which have restrictions on repatriation. Short term and liquid investments being subject to more than insignificant risk of change in value, are not included as part of cash and bank balances.
(u) Securities premium
(i) Securities premium includes:
A. The difference between the face value of the equity shares and the consideration received in respect of shares issued.
B. The fair value of the stock options which are treated as expense, if any, in respect of shares allotted pursuant to Stock Options Scheme.
(ii) The issue expenses of securities which qualify as equity instruments are written off against securities premium.
(v) Borrowing Costs
Borrowing costs include finance costs calculated using the effective interest method, finance charges in respect of assets acquired on lease and exchange differences arising on foreign currency borrowings, to the extent they are regarded as an adjustment to finance costs. In cases where hedging instruments are acquired for protection against exchange rate risk related to borrowings and are accounted as hedging a time-period related hedge item, the borrowing costs also include the amortization of premium element of the forward contract and foreign currency basis spread as applicable, over the period of the hedging instrument.
Notes forming part of the Consolidated Financial Statements (contd.)NOTE [1](II) (contd.)

491
Borrowing costs net of any investment income from the temporary investment of related borrowings that are attributable to the acquisition, construction or production of a qualifying asset are capitalised/inventoried as part of cost of such asset till such time the asset is ready for its intended use or sale. A qualifying asset is an asset that necessarily requires a substantial period of time to get ready for its intended use or sale. All other borrowing costs are recognised in profit or loss in the period in which they are incurred.
(w) Share-based payment arrangements
The stock options granted to employees pursuant to the Group’s Stock Options Schemes, are measured at the fair value of the options at the grant date. The fair value of the options is treated as discount and accounted as employee compensation cost over the vesting period on a straight line basis. The amount recognised as expense in each year is arrived at based on the number of grants expected to vest. If a grant lapses after the vesting period, the cumulative discount recognised as expense in respect of such grant is transferred to the general reserve within equity. The share based payment equivalent to the fair value as on the date of grant of employee stock options granted to key managerial personnel is disclosed as a related party transaction in the year of grant.
(x) Foreign currencies
(i) The functional currency and presentation currency of the Group is Indian Rupee. Functional currency of the Group and foreign operations has been determined based on the primary economic environment in which the Group and its foreign operations operate considering the currency in which funds are generated, spent and retained.
(ii) Transactions in currencies other than the Group’s functional currency are recorded on initial recognition using the exchange rate at the transaction date. At each Balance Sheet date, foreign currency monetary items are reported at the closing spot rate. Non-monetary items that are measured in terms of historical cost in foreign currency are not retranslated. Exchange differences that arise on settlement of monetary items or on reporting of monetary items at each Balance Sheet date at the closing spot rate are recognised in the Statement of Profit and Loss in the period in which they arise except for:
A. exchange differences on foreign currency borrowings relating to assets under construction for future productive use, which are included in the cost of those assets when they are regarded as an adjustment to finance costs on those foreign currency borrowings;
B. exchange differences on transactions entered into in order to hedge certain foreign currency risks; and
C. exchange differences on monetary items receivable from or payable to a foreign operation for which settlement is neither planned nor likely to occur (therefore forming part of the net investment in foreign operation), which are recognised initially in other comprehensive income and reclassified from equity to profit or loss on repayment of the monetary items.
(iii) Exchange rate as of the date on which the non-monetary asset or non-monetary liability is recognised on payment or receipt of advance consideration is used for initial recognition of related asset, expense or income.
(iv) Financial statements of foreign operations whose functional currency is different than Indian Rupees are translated into Indian Rupees as follows:
A. assets and liabilities for each Balance Sheet presented are translated at the closing rate at the date of that Balance Sheet;
B. income and expenses for each income statement are translated at average exchange rates; and
C. all resulting exchange differences are recognised in other comprehensive income and accumulated in equity as foreign currency translation reserve for subsequent reclassification to profit or loss on disposal of such foreign operations. The portion of foreign currency translation reserve attributed to non-controlling interests is reflected as part of non-controlling interests.
(y) Accounting and reporting of information for Operating Segments
Operating segments are those components of the business whose operating results are regularly reviewed by the chief operating decision making body in the Group to make decisions for performance assessment and resource allocation. The reporting of segment information is the same as provided to the management for the purpose of the performance assessment and resource allocation to the segments.
Notes forming part of the Consolidated Financial Statements (contd.)NOTE [1](II) (contd.)

492
NOTES FORMING PART OF THE CONSOLIDATED FINANCIAL STATEMENTS ANNUAL REPORT 2019-20
Segment accounting policies are in line with the accounting policies of the Group. In addition, the following specific accounting policies have been followed for segment reporting:
(i) Segment revenue includes sales and other operational revenue directly identifiable with/allocable to the segment including (a) inter- segment revenue and (b) profit on sale of stake in the subsidiary and/or joint venture companies under Developmental projects segment and Realty business grouped under “Others” segment
(ii) Expenses that are directly identifiable with/allocable to segments are considered for determining the segment result. In respect of (a) Financial Services segment and (b) Power Generation projects under Developmental Projects segment which are classified as assets given on finance lease, the finance costs on borrowings are accounted as segment expenses.
(iii) Most of the centrally incurred costs are allocated to segments mainly on the basis of their respective expected segment revenue estimated at the beginning of the reported period.
(iv) Income which relates to the Group as a whole and not allocable to segments is included in “unallocable corporate income”.
(v) Segment result includes margins on inter-segment capital jobs, which are reduced in arriving at the profit before tax of the Group.
(vi) Segment result includes the finance costs incurred on interest bearing advances with corresponding credit included in “unallocable corporate income”
(vii) Segment results are not adjusted for the exceptional item attributable to the corresponding segment. The said exceptional item has been included in “unallocable corporate income net of expenditure”. The corresponding segment assets are being carried under the respective segments without adjusting the exceptional item.
(viii) Segment assets and liabilities include those directly identifiable with the respective segments. In respect of (a) Financial Services segment, and (b) Power Generation projects under Developmental Projects segment which are classified as assets given on finance lease, segment liabilities include borrowings as the finance costs on borrowings are accounted as segment expenses in respect of the segment and projects. Investment in joint ventures and associates identified with a particular segment are reported as part of the segment assets of those respective segments.
Unallocable corporate assets and liabilities represent the assets and liabilities that relate to the Group as a whole.
(ix) Segment non-cash expenses forming part of segment expenses includes the fair value of the employee stock options which is accounted as employee compensation cost [see Note 1(w) above] and is allocated to the segment.
(x) Segment revenue resulting from transactions with other business segments is accounted on the basis of transfer price which are either determined to yield a desired margin or agreed on a negotiated basis.
(z) Taxes on income
Tax on income for the current period is determined on the basis of taxable income (or on the basis of book profits wherever minimum alternate tax is applicable) and tax credits computed in accordance with the provisions of the applicable tax laws and based on the expected outcome of assessments/appeals.
Deferred tax is recognised on temporary differences between the carrying amounts of assets and liabilities in the Group’s financial statements and the corresponding tax bases used in computation of taxable profit and quantified using the tax rates and laws enacted or substantively enacted as on the Balance Sheet date.
Deferred tax liabilities are generally recognised for all taxable temporary differences including the temporary differences associated with investments in subsidiaries and associates, and interests in joint ventures, except where the Group is able to control the reversal of the temporary difference and it is probable that the temporary difference will not reverse in the foreseeable future.
Deferred tax assets are generally recognised for all temporary differences to the extent that is probable that taxable profits will be available against which those deductible temporary differences can be utilised. The carrying amount of deferred tax assets is reviewed at the end of each reporting period and reduced to the extent that it is no longer probable that sufficient taxable profits will be available to allow all or part of the asset to be recovered.
Notes forming part of the Consolidated Financial Statements (contd.)NOTE [1](II) (contd.)

493
Deferred tax assets relating to unabsorbed depreciation/business losses/losses under the head “capital gains”/ other temporary differences are recognised and carried forward to the extent of available taxable temporary differences or where there is convincing other evidence that sufficient future taxable income will be available against which such deferred tax assets can be realised. Deferred tax assets in respect of unutilised tax credits which mainly relate to minimum alternate tax and dividend distribution tax paid or payable by the subsidiary companies are recognised, to the extent it is probable that such unutilised tax credits will get realised, in the period in which such determination is made.
The measurement of deferred tax liabilities and assets reflects the tax consequences that would follow from the manner in which the Group expects, at the end of reporting period, to recover or settle the carrying amount of its assets and liabilities.
Transaction or event which is recognised outside profit or loss, either in other comprehensive income or in equity or in case of business combination, is recorded along with the tax as applicable.
The Group uses estimates and judgements based on the relevant rulings in the areas of allowances and disallowances which is exercised while determining the provision for income tax.
(aa) Provisions, contingent liabilities and contingent assets
Provisions are recognised only when:
(i) the Group entity has a present obligation (legal or constructive) as a result of a past event; and
(ii) it is probable that an outflow of resources embodying economic benefits will be required to settle the obligation; and
(iii) a reliable estimate can be made of the amount of the obligation
Provision is measured using the cash flows estimated to settle the present obligation and when the effect of time value of money is material, the carrying amount of the provision is the present value of those cash flows. Reimbursement expected in respect of expenditure required to settle a provision is recognised only when it is virtually certain that the reimbursement will be received.
Contingent liability is disclosed in case of:
(i) a present obligation arising from past events, when it is not probable that an outflow of resources will be required to settle the obligation; and
(ii) a present obligation arising from past events, when no reliable estimate is possible.
Contingent assets are disclosed where an inflow of economic benefits is probable. Provisions, contingent liabilities and contingent assets are reviewed at each Balance Sheet date.
Where the unavoidable costs of meeting the obligations under the contract exceed the economic benefits expected to be received under such contract, the present obligation under the contract is recognised and measured as a provision.
(ab) Commitments
Commitments are future liabilities for contractual expenditure, classified and disclosed as follows:
a) estimated amount of contracts remaining to be executed on capital account and not provided for;
b) uncalled liability on shares and other investments partly paid;
c) funding related commitment to associate and joint venture companies; and
d) other non-cancellable commitments, if any, to the extent they are considered material and relevant in the opinion of management.
Other commitments related to sales/procurements made in the normal course of business are not disclosed to avoid excessive details.
Notes forming part of the Consolidated Financial Statements (contd.)NOTE [1](II) (contd.)

494
NOTES FORMING PART OF THE CONSOLIDATED FINANCIAL STATEMENTS ANNUAL REPORT 2019-20
Notes forming part of the Consolidated Financial Statements (contd.)NOTE [1](II) (contd.)(ac) Discontinued Operations and non-current assets held for sale
Discontinued operation is a component of the Group that has been disposed of or classified as held for sale and represents a major line of business.
Non-current assets and disposal groups are classified as held for sale if their carrying amount is intended to be recovered principally through a sale (rather than through continuing use) when the asset (or disposal group) is available for immediate sale in its present condition subject only to terms that are usual and customary for sale of such asset (or disposal group) and the sale is highly probable and is expected to qualify for recognition as a completed sale within one year from the date of classification.
Non-current assets and disposal groups classified as held for sale are measured at lower of their carrying amount and fair value less costs to sell.
(ad) Statement of Cash Flows
Statement of Cash Flows is prepared segregating the cash flows into operating, investing and financing activities. Cash flow from operating activities is reported using indirect method adjusting the net profit for the effects of:
i. changes during the period in inventories and operating receivables and payables, transactions of a non-cash nature;
ii. non-cash items such as depreciation, provisions, deferred taxes, unrealised foreign currency gains and losses, and undistributed profits of associates and joint ventures; and
iii. all other items for which the cash effects are investing or financing cash flows.
Cash and cash equivalents (including bank balances) shown in the Statement of Cash Flows exclude items which are not available for general use as at the date of Balance Sheet.
(ae) Key sources of estimation
The preparation of financial statements in conformity with Ind AS requires that the management of the Group makes estimates and assumptions that affect the reported amounts of income and expenses of the period, the reported balances of assets and liabilities and the disclosures relating to contingent liabilities as of the date of the financial statements. The estimates and underlying assumptions made by the management have been explained under respective policies and are reviewed on an ongoing basis. Revisions to accounting estimates include useful lives of property, plant and equipment & intangible assets, allowance for doubtful debts/advances, future obligations in respect of retirement benefit plans, expected cost of completion of contracts, provision for rectification costs, fair value measurement etc. Difference, if any, between the actual results and estimates is recognised in the period in which the results are known.
NOTE [1](III)
The Group has assessed the impact of COVID-19 on its financial statements based on the internal and external information upto the date of approval of these financial statements and expects to recover the carrying amounts of its investments, intangible assets, goodwill, trade receivable, project work-in-progress and inventories. The Group will continue to monitor the future economic conditions and update its assessment.

495
NOTE [2]
Property, plant and equipment and Capital work-in-progressv crore
Class of assets
Cost Depreciation Impairment Book value
As at 1-4-2019
Transfer to right-of-
use assets
Business combination Additions
Foreign currency
fluctuation
Classified as held for
saleDeductions As at
31-3-2020Up to
31-3-2019
Transfer to right-of-
use assets
Business combination
For the year
Foreign currency
fluctuation
Classified as held for
saleDeductions Up to
31-3-2020Up to
31-3-2019Up to
31-3-2020 As at
31-3-2020 As at
31-3-2019
Land Freehold 921.18 – 105.60 39.91 (0.09) 19.88 1.80 1044.92 – – – – – – – – – 1044.92 921.18 Land - leasehold 440.81 (297.45) – – 0.97 3.64 – 140.69 23.99 (15.27) – 3.22 0.32 0.94 – 11.32 – – 129.37 416.82 Sub-total 1361.99 (297.45) 105.60 39.91 0.88 23.52 1.80 1185.61 23.99 (15.27) – 3.22 0.32 0.94 – 11.32 – – 1174.29 1338.00Buildings 3840.03 – 449.32 292.40 33.28 452.86 218.90 3943.27 637.27 – 169.05 157.64 13.77 92.20 48.10 837.43 195.54 207.79 2898.05 3007.22Plant & equipment – Owned 7848.42 – 102.88 539.32 71.39 685.15 320.93 7555.93 3559.16 – 92.17 777.63 44.80 348.10 211.00 3914.66 28.95 29.93 3611.34 4260.31 Leased out 184.37 – – 27.04 – – 71.09 140.32 15.00 – – 14.94 – – 7.07 22.87 – – 117.45 169.37Sub-total 8032.79 – 102.88 566.36 71.39 685.15 392.02 7696.25 3574.16 – 92.17 792.57 44.80 348.10 218.07 3937.53 28.95 29.93 3728.79 4429.68Computers Owned 848.53 – 390.21 293.89 3.57 51.65 53.76 1430.79 483.66 – 310.04 223.69 2.20 28.12 51.80 939.67 – – 491.12 364.87 Leased out 0.28 – – – – – – 0.28 0.26 – – – – – – 0.26 – – 0.02 0.02 Sub-total 848.81 – 390.21 293.89 3.57 51.65 53.76 1431.07 483.92 – 310.04 223.69 2.20 28.12 51.80 939.93 – – 491.14 364.89 Office equipment Owned 376.21 – 115.23 77.24 3.62 16.75 12.63 542.92 239.01 – 92.11 67.50 3.12 8.87 12.13 380.74 0.01 0.01 162.17 137.19 Leased out 0.02 – – – – – – 0.02 – – – – – – – – – – 0.02 0.02 Sub-total 376.23 – 115.23 77.24 3.62 16.75 12.63 542.94 239.01 – 92.11 67.50 3.12 8.87 12.13 380.74 0.01 0.01 162.19 137.21 Furniture and fixtures Owned 404.88 – 52.92 59.58 6.68 41.46 21.88 460.72 221.06 – 35.66 49.22 5.91 20.13 18.12 273.60 0.24 0.24 186.88 183.58 Leased out 7.89 – – – – – – 7.89 5.78 – – 0.56 – – – 6.34 – – 1.55 2.11Sub-total 412.77 – 52.92 59.58 6.68 41.46 21.88 468.61 226.84 – 35.66 49.78 5.91 20.13 18.12 279.94 0.24 0.24 188.43 185.69 Vehicles Owned 423.86 – 3.06 52.13 10.03 9.88 47.63 431.57 209.15 – 3.06 52.11 8.02 3.29 34.71 234.34 – – 197.23 214.71 Leased out 13.65 – – – – – 9.32 4.33 6.55 – – 1.34 – – 5.81 2.08 – – 2.25 7.10Sub-total 437.51 – 3.06 52.13 10.03 9.88 56.95 435.90 215.70 – 3.06 53.45 8.02 3.29 40.52 236.42 – – 199.48 221.81 Other assets Aircraft 244.45 – – – – – – 244.45 30.05 – – 13.89 – – – 43.94 – – 200.51 214.40 Ships 129.52 – – 55.60 – – – 185.12 19.96 – – 14.18 – – – 34.14 – – 150.98 109.56 Dredged
channel and Breakwater structures 1013.44 – – 1.11 – – – 1014.55 210.53 – – 53.34 – – – 263.87 – – 750.68 802.91
Leasehold Improvements 140.71 – 166.37 73.75 0.05 1.48 10.81 368.59 62.52 – 127.81 30.54 0.04 1.33 10.24 209.34 – – 159.25 78.19
Sub-total 1528.12 – 166.37 130.46 0.05 1.48 10.81 1812.71 323.06 – 127.81 111.95 0.04 1.33 10.24 551.29 – – 1261.42 1205.06 Total 16838.25 (297.45) 1385.59 1511.97 129.50 1282.75 768.75 17516.36 5723.95 (15.27) 829.90 1459.80 78.18 502.98 398.98 7174.60 224.74 237.97 10103.79 10889.56 Previous year 15250.34 – 3.40 1863.01 86.26 – 364.76 16838.25 4390.38 – 1.76 1523.39 43.10 – 234.68 5723.95 – 224.74 Add: Capital work-in-progress 3224.91 2483.56
13328.70 13373.12
Notes:(a) Carrying value of property, plant and equipment pledged as collateral for liabilities and/or commitments as at March 31, 2020
R 1824.66crore(previous year: R 2073.80crore).(b) Carrying value of property, plant and equipment having restriction on title as at March 31, 2020 R 1808.84crore(previous year:
R 2047.41 crore).(c) Depreciation for the year includes R 5.23 crore (previous year: R 7.92 crore) on account of obsolescence.(d) Increase in impairment as on March 31, 2020 is on account of foreign currency fluctuation R 11.15 crore (previous year: R 6.82
crore). Further impairment on capital work-in-progress during the year is Nil (previous year: R 175.55 crore).
Notes forming part of the Consolidated Financial Statements (contd.)

496
NOTES FORMING PART OF THE CONSOLIDATED FINANCIAL STATEMENTS ANNUAL REPORT 2019-20
(e) Owned assets given on operating lease have been presented separately under respective class of assets as “Leased out” pursuant toIndAS116“Leases”.
(f) Cost as at April 1, 2019 of individual assets has been reclassified, wherever necessary.
(g) Range of useful life of property, plant and equipment is as below:
Sr. no. Class of assets Minimum useful life
(in years)Maximum useful life
(in years)1 Leasehold land 15 992 Owned buildings 3 613 Owned plant and equipment 3 354 Computers 2 75 Office equipment 3 306 Furniture and fixtures 3 127 Owned vehicles 3 158 Aircraft 18 189 Ships 5 1510 Dredged channel and Breakwater structures 41 50
NOTE [3]
Investment propertyv crore
Class of assets
Cost Depreciation Impairment Book value
As at 1-4-2019 Additions
Foreign currency
fluctuation
Classified as held for
sale
Transfer (to)/from
inventories and
owners occupied property
Deductions As at 31-3-2020
Up to 31-3-2019
For the period
Foreign currency
fluctuation
Classified as held for
sale
Transfer (to)/from
inventories and
owners occupied property
Deductions Up to 31-3-2020
Up to 31-3-2019
Up to 31-3-2020
As at 31-3-2020
As at 31-3-2019
Land 553.78 112.17 1.01 2.02 (105.56) 11.74 547.64 12.68 9.48 – – – – 22.16 4.71 – 525.48 536.39 Buildings 1374.62 336.56 – 37.90 (57.78) 8.11 1607.39 38.63 31.37 – 2.79 (0.76) 0.22 66.23 – – 1541.16 1335.99 Total 1928.40 448.73 1.01 39.92 (163.34) 19.85 2155.03 51.31 40.85 – 2.79 (0.76) 0.22 88.39 4.71 – 2066.64 1872.38
Previous year 1978.65 219.79 0.62 – (158.02) 112.64 1928.40 34.95 34.78 – – (5.17) 13.25 51.31 – 4.71 Add: Capital work-in-progress 1648.08 2382.18
3714.72 4254.56
Notes:(a) Carrying value of investment property pledged as collateral for liabilities and/or commitments and having restriction on title as at
March 31, 2020 R 0.16crore(previous year: R 0.16crore).(b) Usefullifeofbuildingincludedininvestmentproperty:20to60years.
(c) Amount recognised in the Statement of Profit and Loss for investment property:v crore
Sr. no. Particulars 2019-20 2018-191 Rental income derived from investment property 129.29 148.712 Direct operating expenses arising from investment property that generated rental income 5.24 7.373 Direct operating expenses arising from investment property that did not generate rental income 0.63 0.67
(d) Fair value of investment property: R 5582.46croreasatMarch31,2020(previous year: R 6456.76crore).
Notes forming part of the Consolidated Financial Statements (contd.)NOTE [2] (contd.)

497
(e) The fair values of investment property have been determined with the help of internal architectural department and independent valuer on a case to case basis. Fair value of property that are evaluated by independent valuer amounted to R 3279.01 crore (previous year: R 2693.38crore). Valuation is based on government rates, market research, marked trend and comparable values as considered appropriate.
(f) Depreciation for the year includes R 15.28croreimpairment,ofwhichR 12.00 crore in respect of investment property classified as held for sale. The investment property having impairment of R 4.71 crore as on 31-3-2019 and R 3.28crorerecognisedduringtheyear has been disposed off during the current year.
NOTE [4]Goodwill
v crore
Class of assetsCost Impairment Book value
As at 1-4-2019
Business combination Additions Foreign currency
fluctuationClassified as held for sale Deductions As at
31-3-2020 As at
31-3-2020 As at
31-3-2020 As at
31-3-2019Goodwill on consolidation 1875.01 6467.91 2.02 48.00 333.44 – 8059.50 48.10 8011.40 1826.91Previous year 1609.88 259.67 – 5.46 – – 1875.01 48.10 1826.91
NOTE [5] Other Intangible assets and Intangible assets under development
v crore
Class of assets
Cost Amortisation Book value
As at 1-4-2019
Business Combination Additions
Foreign currency
fluctuation
Classified as held for
sale Deductions As at
31-3-2020 Up to
31-3-2019Business
Combination For the
year
Foreign currency
fluctuation
Classified as held for
saleDeductions Up to
31-3-2020 As at
31-3-2020 As at
31-3-2019
Specialised software 1204.86 132.38 137.30 12.59 33.07 4.42 1449.64 978.16 114.27 122.43 10.29 26.46 3.95 1194.74 254.90 226.70 Technical knowhow 120.98 – 8.34 – 14.20 – 115.12 57.32 – 24.47 – 13.72 – 68.07 47.05 63.66 Trade names 10.10 297.00 – – – – 307.10 10.10 – 44.55 – – – 54.65 252.45 – New product design
and development 292.54 – 58.11 2.03 342.19 0.16 10.33 143.72 – 9.63 1.13 145.94 0.06 8.48 1.85 148.82 Customer contracts
and relationship 268.69 3015.60 1.21 12.84 – – 3298.34 160.72 – 308.15 7.08 – – 475.95 2822.39 107.97 Fare collection rights 3723.40 – 12659.63 – – – 16383.03 47.64 – 117.05 – – – 164.69 16218.34 3675.76 Total 5620.57 3444.98 12864.59 27.46 389.46 4.58 21563.56 1397.66 114.27 626.28 18.50 186.12 4.01 1966.58 19596.98 4222.91
Previous year 3178.66 57.73 2386.69 12.93 – 15.44 5620.57 1148.15 0.01 257.22 7.31 – 15.03 1397.66 Add: Intangible assets under development 86.18 11435.93
19683.16 15658.84
Addition to other intangible assets include internally developed intangible assets: R 106.43crore(previous year: R 88.02crore)
Notes:(a) Borrowing cost capitalised in accordance with Ind AS 23 “Borrowing Costs” is as follows:
v crore
Class of assets 2019-20 2018-19Investment property 5.73 13.89Capital work-in-progress (Property, plant and equipment) 130.16 134.34Intangible assets under development 726.84 942.07
862.73 1090.30
(b) Theaveragecapitalisationrateforborrowingcostis9.83%(previousyear:9.70%).
Notes forming part of the Consolidated Financial Statements (contd.)NOTE [3] (contd.)

498
NOTES FORMING PART OF THE CONSOLIDATED FINANCIAL STATEMENTS ANNUAL REPORT 2019-20
NOTE [6]
Non-current assets: Financial assets - Other investments
Particulars As at 31-3-2020 As at 31-3-2019
v crore v crore
Equity instruments 579.87 574.21
Preference shares 89.20 99.13
Government and trust securities 0.07 1832.55
Debentures and bonds 1098.28 813.20
Mutual funds 93.21 19.69
Security receipts 2498.65 791.07
Units of fund 106.44 188.79
Other investments 31.00 –
4496.72 4318.64
NOTE [7]
Non-current assets: Financial assets - Loans towards financing activities
Particulars As at 31-3-2020 As at 31-3-2019
v crore v crore v crore v crore
Considered good - secured 39485.69 38843.70
Less: Allowance for expected credit loss 199.75 155.71
39285.94 38687.99
Considered good - unsecured 14466.13 14988.60
Less: Allowance for expected credit loss 129.70 139.05
14336.43 14849.55
Having significant increase in credit risk 3469.63 2029.89
Less: Allowance for expected credit loss 188.53 178.47
3281.10 1851.42
Credit impaired 5470.39 6270.60
Less: Allowance for expected credit loss 3784.50 3870.68
1685.89 2399.92
58589.36 57788.88
Notes forming part of the Consolidated Financial Statements (contd.)

499
NOTE [8]
Non-current assets: Financial assets - Other loans
Particulars As at 31-3-2020 As at 31-3-2019
v crore v crore v crore v crore Security deposits Considered good - unsecured 425.26 244.12 Less: Allowance for expected credit loss 36.54 28.30
388.72 215.82Loans and advances to related parties Considered good - unsecured 1072.90 1264.11
Other loans Considered good - secured – 0.08 Considered good - unsecured 174.51 114.87 Less: Allowance for expected credit loss 113.80 113.80
60.71 1.07
1522.33 1481.08
NOTE [9]
Non-current assets: Financial assets - Others
Particulars As at 31-3-2020 As at 31-3-2019
v crore v crore
Cash and bank balances not available for immediate use 273.82 290.07
Fixed deposits with banks (maturity more than 12 months) 1.04 201.04
Forward contract receivables 257.00 432.32
Embedded derivative receivables 54.20 6.15
Other receivables 52.09 214.47
638.15 1144.05
NOTE [10]
Other non-current assets
Particulars As at 31-3-2020 As at 31-3-2019
v crore v crore v crore v crore Capital advances: Secured 0.78 5.38 Unsecured 271.23 165.72
272.01 171.10 Advance recoverable other than in cash 2125.54 1986.60Current tax receivable (net) 4144.07 3490.92
6541.62 5648.62
Notes forming part of the Consolidated Financial Statements (contd.)

500
NOTES FORMING PART OF THE CONSOLIDATED FINANCIAL STATEMENTS ANNUAL REPORT 2019-20
NOTE [11]Current assets: Inventories
Particulars As at 31-3-2020 As at 31-3-2019
v crore v croreRaw materials [include goods-in-transit R 16.56crore
(previous year: R 53.34 crore)] 860.49 722.75
Components [include goods-in-transit R 15.89crore (previous year: R 31.55 crore)] 403.39 529.55
Construction materials [include goods-in-transit R 17.13 crore (previous year: R 114.55 crore)] 95.86 221.57
Manufacturing work-in-progress 467.87 651.70
Finished goods 98.56 301.74
Stock-in-trade (in respect of goods acquired for trading) [include goods-in-transit R 37.10 crore (previous year: R 38.79crore)] 308.36 386.27
Stores and spares [include goods-in-transit R 1.14 crore (previous year: R 2.25 crore)] 295.98 295.49
Loose tools [include goods-in-transit Nil (previous year: R 0.05 crore)] 13.38 14.66
Property development projects (including land) 3202.76 3290.20
5746.65 6413.93
Note: During the year R 83.39crore(previous year: R 468.74crore) was recognised as expense towards write-down of inventories.
NOTE [12] Current assets: Financial assets - Investments
Particulars As at 31-3-2020 As at 31-3-2019
v crore v croreEquity shares 3.04 8.28Preference shares 0.68 0.68Government and trust securities 758.35 962.66Debentures and bonds 3959.79 4192.93 Mutual funds 7677.60 8781.62Other investments 300.29 –
12699.75 13946.17
NOTE [13] Current assets: Financial assets - Trade receivables
Particulars As at 31-3-2020 As at 31-3-2019
v crore v crore v crore v crore Considered good - secured 160.37 68.99Considered good - unsecured 42365.84 38576.64Less: Allowance for expected credit loss 1963.85 1989.56
40401.99 36587.08Credit impaired 1386.52 1201.07 Less: Allowance for expected credit loss 1217.36 1011.27
169.16 189.80
40731.52 36845.87
Notes forming part of the Consolidated Financial Statements (contd.)

501
NOTE [14]
Current assets: Financial assets - Cash and cash equivalents
Particulars As at 31-3-2020 As at 31-3-2019
v crore v croreBalance with banks 4535.56 4261.34
Cheques and drafts on hand 173.66 624.49
Cash on hand 6.64 37.44
Fixed deposits with banks (maturity less than 3 months) 6608.71 1586.22
11324.57 6509.49
NOTE [15]
Current assets: Financial assets - Other bank balances
Particulars As at 31-3-2020 As at 31-3-2019
v crore v croreFixed deposits with banks 1876.65 845.70
Earmarked balances with banks-unclaimed dividend 120.08 85.34
Earmarked balances with banks-Section 4(2)(l)(D) of RERA* 0.25 0.41
Earmarked balances with banks-others 505.61 1.10
Margin money deposits with banks 930.84 149.08
Cash and bank balances not available for immediate use 359.78 4135.12
3793.21 5216.75
*RealEstate(RegulationandDevelopment)Act,2016
NOTE [16]
Current assets: Financial assets - Loans towards financing activities
Particulars As at 31-3-2020 As at 31-3-2019
v crore v crore v crore v crore Considered good - secured 33534.47 34028.69Less: Allowance for expected credit loss 61.72 52.19 Less: Net fair value changes 220.84 130.77
33251.91 33845.73Considered good - unsecured 7584.55 8108.95Less: Allowance for expected credit loss 169.82 146.77
7414.73 7962.18Having significant increase in credit risk 1147.73 801.03Less: Allowance for expected credit loss 90.95 78.12
1056.78 722.91
41723.42 42530.82
Notes forming part of the Consolidated Financial Statements (contd.)

502
NOTES FORMING PART OF THE CONSOLIDATED FINANCIAL STATEMENTS ANNUAL REPORT 2019-20
NOTE [17]
Current assets: Financial assets - Other loans
Particulars As at 31-3-2020 As at 31-3-2019
v crore v crore v crore v crore Security deposits Considered good - unsecured 502.72 508.60 Less: Allowance for expected credit loss 0.97 0.46
501.75 508.14 Credit impaired – 5.07 Less: Allowance for expected credit loss – 5.07
– – Loans and advances to related parties Considered good - unsecured 194.87 66.46Other loans Considered good - secured 0.07 0.15 Considered good - unsecured 19.31 51.94
716.00 626.69
NOTE [18]
Current assets: Financial assets - Others
Particulars As at 31-3-2020 As at 31-3-2019
v crore v crore v crore v crore
Advances to related parties:
Associate companies 8.73 11.56
Joint venture companies 51.83 61.11
60.56 72.67
Advances recoverable in cash 1748.66 1519.17
Forward contract receivables 886.42 919.66
Embedded derivative receivables 232.23 39.75
Doubtful advances:
Deferred credit sale of ships 27.11 27.11
Other loans and advances 758.73 617.30
785.84 644.41
Less: Allowance for expected credit loss 785.84 644.41
– -
2927.87 2551.25
Notes forming part of the Consolidated Financial Statements (contd.)

503
NOTE [19]
Other current assets
Particulars As at 31-3-2020 As at 31-3-2019
v crore v crore v crore v crore Contract assets [Note 47(d)(i)] Due from customers (construction and project related activity) 36124.80 31847.85 Retention money including unbilled revenue 15724.83 14627.48
51849.63 46475.33Balance with customs, port trust, etc. 5.95 16.88Advance recoverable other than in cash 6420.65 5276.50Government grant receivable 149.91 123.51 Other loans and advances 7.00 7.00 Less: Allowance for expected credit loss 7.00 7.00
– –Others 233.55 250.84
58659.69 52143.06
NOTE [20]
Equity share capital
(a) Share capital authorised, issued, subscribed and paid up:
Particulars
As at 31-3-2020 As at 31-3-2019
Number of shares
v crore Number of shares
v crore
Authorised:Equity shares of R 2 each 1,62,50,00,000 325.00 1,62,50,00,000 325.00
Issued, subscribed and fully paid up:Equity shares of R 2 each 1,40,38,92,022 280.78 1,40,27,29,385 280.55
(b) Reconciliation of the number of equity shares and share capital:
Particulars
2019-20 2018-19
Number of shares
v crore Number of shares
v crore
Issued, subscribed and fully paid up equity shares outstanding at the beginning of the year 1,40,27,29,385 280.55 1,40,13,69,456 280.27
Add: Shares issued on exercise of employee stock options during the year 7,83,249 0.16 13,59,929 0.28
Add: Shares issued on conversion of foreign currency convertible bonds during the year 3,79,388 0.07 – –
Issued, subscribed and fully paid up equity shares outstanding at the end of the year 1,40,38,92,022 280.78 1,40,27,29,385 280.55
(c) Terms/rights attached to equity shares:
The Company has only one class of share capital, i.e., equity shares having face value of R 2 per share. Each holder of equity share is entitled to one vote per share.
Notes forming part of the Consolidated Financial Statements (contd.)

504
NOTES FORMING PART OF THE CONSOLIDATED FINANCIAL STATEMENTS ANNUAL REPORT 2019-20
(d) Shareholder holding more than 5% of equity shares as at the end of the year:
Name of the shareholder
As at 31-3-2020 As at 31-3-2019
Number of shares
Shareholding %
Number of shares
Shareholding %
Life Insurance Corporation of India 20,91,83,856 14.90 24,66,76,682 17.59L&T Employees Trust 18,55,24,682 13.22 17,21,28,421 12.27
(e) Shares reserved for issue under options outstanding as at the end of the year on un-issued share capital:
Particulars
As at 31-3-2020 As at 31-3-2019
Number of equity shares to be issued as fully paid
R crore (at face
value)
Number of equity shares
to be issued as fully paid
R crore (at face
value)
Employee stock options granted and outstanding # 25,21,389@ 0.50* 28,85,240@ 0.58*0.675%5years&1dayUS$denominatedforeigncurrency
convertible bonds (FCCB) – – 95,20,455@ 1.90** * The equity shares will be issued at a premium of R 63.06crore(previous year: R 71.99 crore)
** The equity shares will be issued at a premium of Nil (previous year: R 1214.50 crore) on the exercise of options by the bond holders
# Note 20 (h) for terms of employee stock option schemes
@ Thenumberofoptionshavebeenadjustedconsequenttobonusissuewhereverapplicable
(f) The aggregate number of equity shares allotted as fully paid up by way of bonus shares in immediately preceding five years ended March31,2020are46,67,64,755(previousperiodoffiveyearsendedMarch31,2019:46,67,64,755shares).
(g) The aggregate number of equity shares issued pursuant to contract, without payment being received in cash in immediately preceding last five years ended on March 31, 2020– Nil (previous period of five years ended March 31, 2019: Nil).
(h) Stock option of the parent company:
i. Terms:
A. The grant of options to the employees under the stock option schemes is on the basis of their performance and other eligibilitycriteria.Theoptionsarevestedequallyoveraperiodof4years[5yearsinthecaseofseries2006(A)],subjectto the discretion of the management and fulfillment of certain conditions.
B. Options can be exercised anytime within a period of 7 years from the date of grant and would be settled by way of issue of equity shares. Management has discretion to modify the exercise period.
ii. The details of the grants under the aforesaid schemes under various series are summarised below:
Sr. No.
Series reference 2000 2002(A) 2002(B) 2003(A) 2003(B) 2006(A)
Particulars 2019-20 2018-19 2019-20 2018-19 2019-20 2018-19 2019-20 2018-19 2019-20 2018-19 2019-20 2018-19
i. Grant price - (R) 2.00 2:00 2.00 2.00 2.00 2.00 7.80 7.80 7.80 7.80 267.10 267.10
ii. Grant dates 1-6-2000 19-4-2002 19-4-2002 23-5-2003 onwards 23-5-2003 onwards 1-7-2007 onwards
iii. Vesting commences on 1-6-2001 19-4-2003 19-4-2003 23-5-2004 onwards 23-5-2004 onwards 1-7-2008 onwards
iv. Options granted and outstanding at the beginning of the year – 19,800 – 48,375 – 89,325 – 70,767 1,73,309 4,87,892 27,11,931 35,49,464
v. Options lapsed – 19,800 – 48,375 – 89,325 – 70,767 13,837 1,05,342 2,64,380 3,51,935
vi. Options granted – – – – – – – – 38,700 25,200 6,58,915 6,39,890
vii. Options exercised – – – – – – 52,237 2,34,441 7,31,012 11,25,488
Notes forming part of the Consolidated Financial Statements (contd.)NOTE [20] (contd.)

505
Sr. No.
Series reference 2000 2002(A) 2002(B) 2003(A) 2003(B) 2006(A)
Particulars 2019-20 2018-19 2019-20 2018-19 2019-20 2018-19 2019-20 2018-19 2019-20 2018-19 2019-20 2018-19
viii. Options granted and outstanding at the end of the year, of which – – – – – – – – 1,45,935 1,73,309 23,75,454 27,11,931
Options vested – – – – 49,762 10,750 6,51,653 9,76,795
Options yet to vest – – – – 96,173 1,62,559 17,23,801 17,35,136
ix. Weighted average remaining contractual life of options (in years) Nil Nil Nil Nil Nil Nil Nil Nil 4.63 4.95 4.61 4.15
iii. The number and weighted average exercise price of stock options are as follows:
Particulars
2019-20 2018-19No. of stock
optionsWeighted
average exercise price
(R)
No. of stock options
Weighted average
exercise price (R)
(A) Options granted and outstanding at the beginning of the year 28,85,240 251.52 42,65,623 223.35(B) Options granted 6,97,615 252.72 6,65,090 257.28(C) Options allotted 7,83,249 249.81 13,59,929 222.40(D) Options lapsed 2,78,217 254.20 6,85,544 139.58(E) Options granted and outstanding at the end of the year 25,21,389 252.09 28,85,240 251.52(F) Options exercisable at the end of the year out of (E) supra 7,01,415 248.70 9,87,545 264.28
iv. Weighted average share price at the date of exercise for stock options exercised during the year is R 1065.30(previous year: R 1272.80) per share.
v. In respect of stock options granted pursuant to the Company’s stock options schemes, the fair value of the options is treated as discount and accounted as employee compensation over the vesting period.
vi. Weighted average fair values of options granted during the year is R 804.63(previous year: R 986.95) per option. vii. The fair value has been calculated using the Black-Scholes Option Pricing Model and the significant assumptions and inputs to
estimate the fair value of options granted during the year are as follows:
Sr. No. Particulars 2019-20 2018-19
(A) Weighted average risk-free interest rate 6.23% 7.44%(B) Weighted average expected life of options 4.12 years 4.09 years(C) Weighted average expected volatility 25.40% 25.73%(D) Weighted average expected dividends over the life of the option R 74.07 per option R 65.41peroption(E) Weighted average share price R 1056.34peroption R 1225.00 per option(F) Weighted average exercise price R 252.72 per share R 257.28pershare(G) Method used to determine expected volatility Expected volatility is based on the historical
volatility of the Company’s share price applicable to the total expected life of each option.
viii. The balance in share options (net) account as at March 31, 2020 is R 99.91 crore (previous year: R 106.91crore), including R 47.54 crore (previous year: R 52.29 crore) for which the options have been vested to employees as at March 31, 2020.
(i) During the year ended March 31, 2020, the Company paid the final dividend of R 18perequitysharefortheyearendedMarch 31, 2019.
(j) During the year ended March 31, 2020, the Company paid interim dividend of R 10 per equity share amounting to R 1403.89crore.
(k) On June 5, 2020, the Board of Directors recommended a final dividend of R 8perequitysharefortheyearendedMarch31,2020subject to approval from shareholders. On approval, the total dividend payment based on number of shares outstanding as on March 31, 2020 is expected to be R 1123.11 crore.
Notes forming part of the Consolidated Financial Statements (contd.)NOTE [20] (contd.)

506
NOTES FORMING PART OF THE CONSOLIDATED FINANCIAL STATEMENTS ANNUAL REPORT 2019-20
(l) Capital Management The Group continues its policy of a conservative capital structure which has ensured that it retains the highest credit rating.
Low gearing levels also equip the Group with the ability to navigate business stresses on one hand and raise growth capital on the other. This policy also provides flexibility of fund raising options for future, which is especially important in times of global economicvolatility.Thegrossdebtequityratiois1.85:1(asat31-3-2019:1.81:1).
(m) Stock option scheme of subsidiary companies: (i) Larsen & Toubro Infotech Limited Employee Stock Ownership Scheme (‘ESOS Plan’) (A) The options are vested equally over a period of 5 years subject to the discretion of the management and fulfilment of
certain conditions. The options can be exercised anytime within a period of 7 years from the date of grant and would be settled by way of issue of equity shares. Management has discretion to modify the exercise period.
(B) The details of the grants under the aforesaid schemes under various series are summarised below:
Sr. no.
Particulars
ESOP Scheme 2000 ESOP Scheme 2000 U.S. Stock Option Sub-plan
ESOP Scheme
I,II & III IV - XXI 2006 20152019-20 2018-19 2019-20 2018-19 2019-20 2018-19 2019-20 2018-19
i Grant price R 5 R 5 R 2 R 2 USD 2.4 USD 2.4 R 1 R 1ii Grant dates 1 April 2001
onwards1 October 2001
onwards15 March 2007
onwards10 June 2016
onwardsiii Vesting commences on 1 April 2002
onwards1 October 2002
onwards15 March 2008
onwards10 June 2017
onwardsiv Options granted and outstanding
at the beginning of the year 11,840 21,345 58,190 6,85,302 33,000 39,000 21,16,860 28,50,140v Options reinstated during the year – – – – – – – –vi Options granted during the year – – – – – – 63,660 3,59,400vii Options allotted/exercised during
the year 2,055 9,130 15,065 6,15,091 – 6,000 5,99,565 8,80,600viii Options lapsed/cancelled during
the year 9,785 375 43,125 12,021 33,000 – 55,560 2,12,080ix Options granted and outstanding
at the end of the year – 11,840 – 58,190 – 33,000 15,25,395 21,16,860x Options vested at the end of the
year out of (ix) – 11,840 – 58,190 – 33,000 6,24,400 1,02,360xi Options unvested at the end of the
year out of (ix) – – – – – – 9,00,995 20,14,500xii Weighted average remaining
contractual life of options (in years) – – – – – – 3.8 4.7
(C) The number and weighted average exercise price of stock options are as follows:
Sr. no.
Particulars
2019-20 2018-19No. of stock
optionsWeighted
average exercise price
(R)
No. of stock options
Weighted average
exercise price (R)
i Options granted and outstanding at the beginning of the year 22,19,890 3.50 35,95,787 2.89
ii Options granted during the year 63,660 1.00 3,59,400 1.00iii Options allotted during the year 6,16,685 1.04 15,10,821 2.09iv Options lapsed/cancelled during the year 1,41,470 40.06 2,24,476 1.06v Options granted and outstanding at the end of the year 15,25,395 1.00 22,19,890 3.50vi Options vested at the end of the year out of (v) 6,24,400 1.00 2,05,390 28.02
Notes forming part of the Consolidated Financial Statements (contd.)NOTE [20] (contd.)

507
NOTE [20] (contd.) (D) Weighted average share price at the date of exercise for stock options exercised during the year is R 1581.00pershare
(previous year: R 1617.00pershare).
(E) Weighted average fair value of options granted during the year is R 1540.66pershare(previous year: R 1649.62pershare).
(F) The fair value has been calculated using the Black-Scholes Option Pricing model and significant assumptions and inputs to estimate the fair value options granted during the year are as follows:
Sr. no. Particulars 2019-20 2018-19
i Weighted average risk-free interest rate 6.18% 7.49%
ii Weighted average expected life of options 3 years 3 years
iii Weighted average expected volatility 17.44% 17.72%
iv Weighted average expected dividends over the life of option R 148.29 R 108.91
v Weighted average share price R 1541.55 R 1650.48
vi Weighted average exercise price R 1 R 1
vii Method used to determine expected volatility The expected volatility has been calculated entirely based on historic volatility of the IT Index.
(ii) L&T Technology Services Limited
(A) Employee stock option plan (ESOP)
(i) TheobjectiveoftheESOPScheme,2016istorewardthoseemployeeswhocontributesignificantlytotheCompany’s profitability and shareholder’s value as well as encourage improvement in performance and retention of talent. The options are vested equally over a period of 5 years subject to the discretion of the management and fulfillment of certain conditions.
(ii) TheexerciseperiodfortheoptionsgrantedundertheESOPScheme,2016wouldbesevenyears(84months)fromthedateofgrantofoptionsorsixyears(72months)fromthedateoffirstvestingorthreeyears(36months)fromthe date of retirement/death, whichever is earlier, subject to any change as may be approved by the Board. The exercise price may be decided by the Board, in such manner, during such period, in one or more tranches and on such terms and conditions as it may deem fit, provided that the exercise price per option shall not be less than the par value of the equity share of our Company and shall not be more than the market price as defined in the SEBI (Share Based Employee Benefits) Regulations, 2014 and shall be subject to compliance with accounting policies under the said regulation. The number of shares to be allotted on exercise of options should not exceed the total number of unexercised vested options that may be exercised by the employee. Details of grant under ESOP Scheme, 2016issummarisedbelow:
Sr. no. Particulars
ESOPscheme,2016
2019-20 2018-19
i Grant price R 2 R 2
ii Grant dates 28-07-2016onwards
iii Vesting commences on 28-07-2017onwards
iv Options granted and outstanding at the beginning of the year 17,38,667 32,24,945
v Options lapsed during the year 84,000 1,64,000
vi Options granted during the year 1,66,000 2,35,000
vii Options exercised during the year 4,98,233 15,57,278
viii Options granted and outstanding at the end of the year-(a) 13,22,434 17,38,667
of (a) above - vested outstanding options 1,05,074 82,187
of (a) above - unvested outstanding options 12,17,360 16,56,480
ix Weighted average remaining contractual life of options (in years) 2.99 4.51
Notes forming part of the Consolidated Financial Statements (contd.)

508
NOTES FORMING PART OF THE CONSOLIDATED FINANCIAL STATEMENTS ANNUAL REPORT 2019-20
(B) No options were granted to key managerial personnel during the current year as well as previous year.
(C) The number and weighted average exercise price of stock options are as follows:
Sr. no.
Particulars
2019-20 2018-19
No. of stock options
Weighted average exercise
price (R)
No. of stock options
Weighted average exercise
price (R)i Options granted and outstanding at the
beginning of the year 17,38,667 2.00 32,24,945 2.00ii Options granted during the year 1,66,000 2.00 2,35,000 2.00iii Options exercised during the year 4,98,233 2.00 15,57,278 2.00iv Options lapsed during the year 84,000 2.00 1,64,000 2.00v Options granted and outstanding at the end of
the year 13,22,434 2.00 17,38,667 2.00vi Options exercisable at the end of the year out
of (v) above 1,05,074 2.00 82,187 2.00 (D) Weighted average share price at the date of exercise for stock options exercised during the year is R 1619.53pershare
(previous year: R 1435.59 per share).
(E) In respect of stock options granted pursuant to the Company’s stock options schemes, the fair value of the options is treated as discount and accounted as employee compensation over the vesting period.
(F) The fair value at grant date of options granted during the year ended 31-3-2020 is R 1588.88peroptionandR 1527.59 per option (previous year: R 1231.30 per option). The fair value of grant date is determined using the Black-Scholes Option Pricing Model which takes into account the exercise price, term of option, share price at grant date and expected price volatility of the underlying share, the expected dividend yield and the risk free interest rate for the term of the option. The model inputs for options granted during the year included:
Sr. no. Particulars 2019-20 2018-19i Weighted average exercise price R 2.00 R 2.00 R 2.00ii Grant date 19-Jul-19 18-Oct-19 23-Jul-18iii Expiry date 18-Jul-26 17-Oct-26 22-Jul-25iv Weighted average share price at grant date R 1660.45per
optionR 1593.30 per
optionR 1281.80per
optionv Weighted average expected price volatility of
company’s share 24.01% 23.21% 22.47%vi Weighted average expected dividend yield over life of
option 5.30% 5.08% 5.06%vii Weighted average risk-free interest 6.22% 6.03% 7.67%viii Method used to determine expected volatility The expected price volatility is based on the historic
volatility (based on the remaining life of the options), adjusted for any expected changes to future volatility due to publicly available information.
(iii) L&T Finance Holdings Limited The Company has formulated Employee Stock Option Schemes 2010 (ESOP Scheme 2010) and 2013 (ESOP Scheme 2013).
The grant of options to the employees under the stock option schemes is on the basis of their performance and other eligibilitycriteria.Theoptionsallottedunderthescheme2010arevestedoveraperiodoffouryearsintheratioof15%,20%,30%and35%respectivelyfromtheendof12monthsfromthedateofgrant,subjecttothediscretionofthemanagement and fulfillment of certain conditions. The options granted under the scheme 2013 are vested in a graded manneroveraperiodoffouryearswith0%,33%,33%and34%ofgrantsvestingeachyear,commencingfromtheendof24monthsfromthedateofgrantorw.e.f.July10,2019vestedinagradedmanneroveraperiodoffouryearswith25%,25%,25%and25%ofgrantsvestingeachyear,commencingfromtheendof12monthsfromthedateofgrant.
Notes forming part of the Consolidated Financial Statements (contd.)NOTE [20] (contd.)

509
(A) The details of the grants are summarised below:
Sr. no. Particulars
Scheme 2010 Scheme 20132019-20 2018-19 2019-20 2018-19
i Grant Price R 44.20 R 10.00*/Market Priceii Options granted and outstanding at the beginning of the
year 49,52,000 42,04,925 4,16,34,600 3,00,90,000iii Options granted during the year 2,45,000 15,10,000 1,56,63,240 1,64,90,000iv Options cancelled/lapsed during the year 12,59,250 3,77,125 67,64,000 21,95,800v Options exercised and shares allotted during the year 10,17,250 3,85,800 50,04,000 27,49,600vi Options granted and outstanding at the end of the year 29,20,500 49,52,000 4,51,95,840 4,16,34,600
of which:Options vested 6,19,250 5,04,000 89,77,400 44,32,000Options yet to vest 23,01,250 44,48,000 3,62,18,440 3,72,02,600
vii Weighted average remaining contractual life of options (in years) 4.78 5.63 5.80 5.92
* w.e.f. July 10, 2019
(B) Average fair value of options granted during the year is R 108.82peroption(previous year: R 58.54peroption).
(C) The fair value has been calculated using the Black-Scholes Option Pricing Model and the significant assumptions and inputs to estimate the fair value of options granted during the year are as follows:
Sr. no. Particulars 2019-20 2018-19i Weighted average risk-free interest rate 6.10% 7.42%ii Weighted average expected life of options 2.94 years 3.24 yearsiii Weighted average expected volatility 35.28% 32.78%iv Weighted average expected dividends R 3.25 per option R 3.65peroptionv Weighted average share price R 120.25 per option R 168.93peroptionvi Weighted average exercise price R 10.53 per option R 161.05peroptionv Method used to determine expected volatility Expected volatility is based on the historical volatility
of the Company’s share price applicable to the expected life of each option.
(iv) Mindtree Limited (A) Employee Restricted Stock Purchase Plan 2012 (‘ERSP 2012’) ERSP2012wasinstitutedwitheffectfromJuly16,2012toissueequitysharesofnominalvalueofR 10.00 each.
Shares under this program are granted to employees at an exercise price of not less than R 10.00 per equity share or such higher price as determined by the Nomination and Remuneration Committee. Shares shall vest over such term as determined by the Nomination and Remuneration Committee not exceeding ten years from the date of the grant. All shares will have a minimum lock in period of one year from the date of allotment.
Sr. no. Particulars2019-20
No. of stock optionsWeighted average
exercise price (R)
i Options granted and outstanding at the beginning of the year – –
ii Options granted during the year 3,60,025 10.00
iii Options exercised during the year 3,60,025 10.00
iv Options lapsed/forfeited during the year – –
v Options granted and outstanding at the end of the year – –
vi Options vested at the end of the year out of (v) – –
Notes forming part of the Consolidated Financial Statements (contd.)NOTE [20] (contd.)

510
NOTES FORMING PART OF THE CONSOLIDATED FINANCIAL STATEMENTS ANNUAL REPORT 2019-20
(B) Other Stock based compensation arrangements
The Group has also granted phantom stock options and letter of intent to issue shares under ERSP 2012 plan to certain employees which is subject to certain vesting conditions. Details of the outstanding options/units as at March 31, 2020 are given below:
Sr. no.
Particulars2019-20
Phantom stock options plani Total no. of units/shares 5,00,000ii Vested units/shares 4,25,000iii Lapsed units/shares –iv Forfeited units/shares –v Cancelled units/shares 75,000vi Contractual life 1 yearvii Grant date 1-Apr-2018,24-Jul-2019viii Grant price per share/unit R 772 per share/ R 930 per share
Sr. no.
Particulars2019-20
Employee Restricted Stock Option Plan 2012 **i Outstanding units/shares as at the beginning of the year 3,69,650ii Number of units/shares granted under letter of intent during the
year 3,12,900iii Vested units/shares 3,60,025iv Lapsed units/shares –v Forfeited units/shares –vi Cancelled units/shares 82,075vii Outstanding units/shares as at the end of the year 2,40,450viii Contractual life 1-2 yearsix Grant date* 24-Jul-2019, 2-Aug-2019,
24-Oct-2019,28-Jan-2020x Grant price per share/ unit* R 10 per share
*Based on letter of intent
**Does not include direct allotment of shares
The weighted average fair value of each unit under the above mentioned ERSP 2012 plan, granted during the year ended March 31, 2020 was R 697.78usingtheBlack-Scholesmodelwiththefollowingassumptions:
Sr. no. Particulars 2019-20
i Weighted average grant date share price R 697.78
ii Weighted average exercise price R 10.00
iii Dividendyield% 0.43%
iv Expected life 1-2 years
v Risk-free interest rate 5.96%
vi Volatility 34.72%
Notes forming part of the Consolidated Financial Statements (contd.)NOTE [20] (contd.)

511
NOTE [21]
Other equity
Particulars As at 31-3-2020 As at 31-3-2019
v crore v crore v crore v crore
Equity component of foreign currency convertible bonds – 153.20
Capital reserve [Note 1(II)(g)]
Capital reserve 10.52 10.52
Capital reserve on consolidation 271.92 271.92
282.44 282.44
Capital redemption reserve* 42.00 42.00
Securities premium account [Note 1(II)(u)] 8599.60 8471.99
Employee share options (net) [Note 1(II)(w)]
Employee share options outstanding 580.76 525.76
Deferred employee compensation expense (179.27) (188.71)
401.49 337.05
Statutory reserves
Debenture redemption reserve ^ 1407.28 1423.04
Reserve u/s 45 IC of Reserve Bank of India Act, 1934 1919.93 1694.87
Reserveu/s29CofNationalHousingBankAct,1987 168.81 146.46
Reserveu/s36(1)(viii)ofIncometaxAct,1961 645.71 587.31
Impairment reserve as per Reserve Bank of India # 15.82 –
4157.55 3851.68
Retained earnings 52731.64 48176.31
Foreign currency translation reserve [Note 1(II)(x)(iv)] 582.56 540.73
Hedging reserve [Note 1(II)(r)(iii)(B)]
Cash flow hedging reserve (421.77) 239.11
Cost of hedging reserve (15.15) 5.89
(436.92) 245.00
Debt instruments through other comprehensive income [Note 1(II)(r)(i)(B)] 65.33 (30.37)
Equity instruments through other comprehensive income [Note 1(II)(r)(i)(B)] 16.75 24.22
66442.44 62094.25
* Capital redemption reserve (CRR): CRR has been created on redemption of preference shares (by a subsidiary) out of profits in accordance with Section 55(2)(c) of the Companies Act, 2013.
^ Debenture redemption reserve (DRR): DRR has been created on non-convertible debentures in accordance with the Companies (Share capital and Debenture) Rules, 2014 (as amended).
# Impairment reserve as per Reserve Bank of India: Impairment reserve has been created pursuant to circular issued by the Reserve Bank of India where impairment allowance as per Ind AS 109 is lower than the provisioning required as per extant prudential norms.
Notes forming part of the Consolidated Financial Statements (contd.)

512
NOTES FORMING PART OF THE CONSOLIDATED FINANCIAL STATEMENTS ANNUAL REPORT 2019-20
NOTE [22]
Non-current liabilities: Financial liabilities - Borrowings
Particulars
As at 31-3-2020 As at 31-3-2019
Secured Unsecured Total Secured Unsecured Total
v crore v crore v crore v crore v crore v crore
Redeemable non-convertible fixed rate debentures 29336.17 12055.08 41391.25 28587.12 7865.92 36453.04Redeemable non-convertible inflation indexed debentures – 124.11 124.11 – 120.48 120.48Preference shares – 1404.03 1404.03 – 976.29 976.29Term loans from banks 37184.03 2227.91 39411.94 28711.08 7859.84 36570.92Finance lease obligation – – – – 0.06 0.06
66520.20 15811.13 82331.33 57298.20 16822.59 74120.79
Loans guaranteed by directors Nil (previous year: Nil)
NOTE [23]
Non-current liabilities: Other financial liabilities
Particulars As at 31-3-2020 As at 31-3-2019
v crore v croreForward contract payables 696.66 12.80
Embedded derivative payables 0.21 139.78
Financial guarantee contracts 0.44 0.65
Due to others 203.83 201.60
901.14 354.83
NOTE [24]
Non-current liabilities: Provisions
Particulars As at 31-3-2020 As at 31-3-2019
v crore v croreEmployee pension scheme [Note 52(b)(i)] 339.63 308.36
Post-retirement medical benefits plan [Note 52(b)(i)] 318.66 226.66
Provision for other employee benefits 19.86 14.09
Otherprovisions[Note56(a)] 30.52 7.73
708.67 556.84
Notes forming part of the Consolidated Financial Statements (contd.)
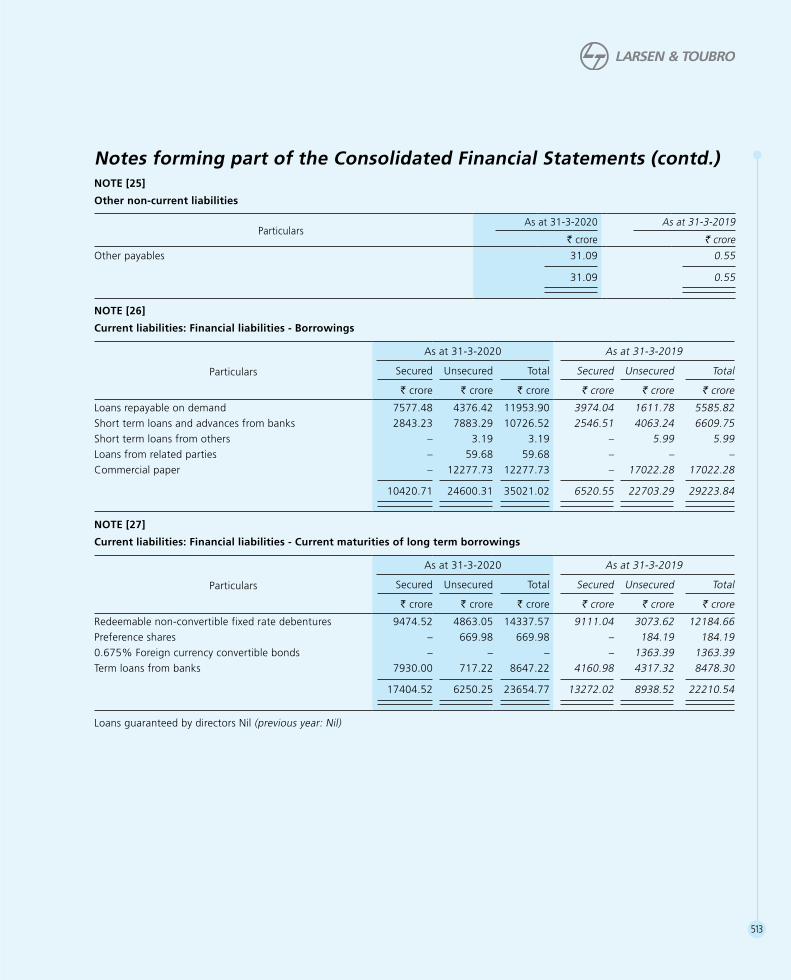
513
NOTE [25]
Other non-current liabilities
Particulars As at 31-3-2020 As at 31-3-2019
v crore v crore
Other payables 31.09 0.55
31.09 0.55
NOTE [26]
Current liabilities: Financial liabilities - Borrowings
Particulars
As at 31-3-2020 As at 31-3-2019
Secured Unsecured Total Secured Unsecured Total
v crore v crore v crore v crore v crore v crore
Loans repayable on demand 7577.48 4376.42 11953.90 3974.04 1611.78 5585.82Short term loans and advances from banks 2843.23 7883.29 10726.52 2546.51 4063.24 6609.75Short term loans from others – 3.19 3.19 – 5.99 5.99 Loans from related parties – 59.68 59.68 – – – Commercial paper – 12277.73 12277.73 – 17022.28 17022.28
10420.71 24600.31 35021.02 6520.55 22703.29 29223.84
NOTE [27]
Current liabilities: Financial liabilities - Current maturities of long term borrowings
Particulars
As at 31-3-2020 As at 31-3-2019
Secured Unsecured Total Secured Unsecured Total
v crore v crore v crore v crore v crore v crore
Redeemable non-convertible fixed rate debentures 9474.52 4863.05 14337.57 9111.04 3073.62 12184.66Preference shares – 669.98 669.98 – 184.19 184.190.675%Foreigncurrencyconvertiblebonds – – – – 1363.39 1363.39Term loans from banks 7930.00 717.22 8647.22 4160.98 4317.32 8478.30
17404.52 6250.25 23654.77 13272.02 8938.52 22210.54
Loans guaranteed by directors Nil (previous year: Nil)
Notes forming part of the Consolidated Financial Statements (contd.)

514
NOTES FORMING PART OF THE CONSOLIDATED FINANCIAL STATEMENTS ANNUAL REPORT 2019-20
NOTE [28]
Current liabilities: Financial liabilities - Other trade payables
Particulars As at 31-3-2020 As at 31-3-2019
v crore v crore v crore v crore Acceptances 237.30 520.99 Due to related parties: Associate companies 109.26 47.68 Joint venture companies 1300.77 1092.73
1410.03 1140.41 Due to others 41517.09 41072.29
43164.42 42733.69
NOTE [29]
Current liabilities: Other financial liabilities
Particulars As at 31-3-2020 As at 31-3-2019
v crore v croreUnclaimed dividend 114.27 84.64
Unclaimed interest on debentures 17.99 15.31
Financial guarantee contracts 0.58 1.13
Forward contract payables 1277.04 380.65
Embedded derivative payables 118.21 145.48
Due to others 3395.14 3995.57
4923.23 4622.78
NOTE [30]
Other current liabilities
Particulars As at 31-3-2020 As at 31-3-2019
v crore v crore v crore v croreContract liabilities [Note 47(d)(i)]
Due to customers (construction and project related activity) 11666.09 11001.87
Advances from customers 16353.36 17270.56
28019.45 28272.43
Other payables 2797.22 2894.12
30816.67 31166.55
Notes forming part of the Consolidated Financial Statements (contd.)

515
NOTE [31]Current liabilities: Provisions
Particulars As at 31-3-2020 As at 31-3-2019
v crore v crore v crore v crore Provision for employee benefits: Gratuity [Note 52(b)(i)] 233.47 254.53 Compensated absences 1337.85 1133.19 Employee pension scheme [Note 52(b)(i)] 29.49 28.92 Post-retirement medical benefits plan [Note 52(b)(i)] 21.61 14.97 Others 0.83 0.84
1623.25 1432.45 Others: Additional tax on dividend – 91.62 Otherprovisions[Note56(a)] 1127.60 919.36
1127.60 1010.982750.85 2443.43
NOTE [32]Contingent Liabilities
Particulars As at 31-3-2020 As at 31-3-2019
v crore v crorea) Claims against the Group not acknowledged as debts 3630.92 3354.54 b) Sales tax liability that may arise in respect of matters in appeal 305.37 257.37 c) Excise duty/Service Tax/Custom duty/Entry Tax/Stamp duty/Municipal cess
liability that may arise, including those in respect of matters in appeal/challenged by the Group in Writ 736.87 387.28
d) Income tax liability (including penalty) that may arise in respect of which the Group is in appeal 1239.61 947.52
e) Guarantees or Letter of credit or letter of comfort given to third parties 2258.84 2566.68f) Corporate guarantees for debt given on behalf of joint ventures 394.94 427.31 g) Bank guarantees given on behalf of joint ventures 29.38 28.93h) Contingent Liabilities incurred in relation to interest in joint operations 7460.44 7586.12i) Share in contingent liabilities of joint operations for which the Group is
contingently liable 64.05 84.92j) Contingent liabilities in respect of liabilities of other joint operators in
respect of joint operations 5464.89 7187.07k) Share of contingent liabilities incurred jointly with other investors of the
associate 0.68 0.68l) Share of joint ventures’ contingent liabilities in respect of a legal claim(s)
lodged against the entity 193.53 240.08Notes:(i) The Group expects reimbursements of R 11.25 crore (previous year: R 9.30 crore) in respect of the above contingent liabilities. (ii) It is not practicable to estimate the timing of cash outflows, if any, in respect of matters at (a) to (d) above pending resolution
of the arbitration/appellate proceedings. Further, the liability mentioned in (a) to (d) above excludes interest and penalty in cases where the Group has determined that the possibility of such levy is remote.
(iii) In respect of matters at (e), the cash outflows, if any, could occur any time during the subsistence of the underlying agreement. (iv) In respect of matters at (f), the cash outflows, if any, could generally occur up to ten years, being the period over which the validity
of the guarantees extends except in a few cases where the cash outflows, if any, could occur any time during the subsistence of the borrowing to which the guarantees relate.
(v) In respect of matters at (g), the cash outflows, if any, could generally occur up to three years, being the period over which the validity of the guarantees extends.
(vi) In respect of matters at (h) to (j), the cash outflows, if any, could generally occur upto completion of projects undertaken by the respective joint operations.
(vii) In respect of matters at (k) and (l), the cash outflows, in any, could generally occur any time up to settlement of claims or during subsistence of the underlying agreements.
Notes forming part of the Consolidated Financial Statements (contd.)

516
NOTES FORMING PART OF THE CONSOLIDATED FINANCIAL STATEMENTS ANNUAL REPORT 2019-20
NOTE [33]Commitments
Particulars As at 31-3-2020 As at 31-3-2019
v crore v crore(a) Estimated amount of contracts remaining to be executed on capital
account (net of advances): (i) Property, plant and equipment 1188.49 795.18 (ii) Intangible assets 187.14 929.85 (iii) Investment property 117.02 183.83(b) Funding committed by way of equity/loans to Joint venture companies/
other companies: (i) Joint venture companies 19.56 42.87 (ii) Other companies (including investment through purchase of
investments from other parties)* – 10732.85
* TheCompanyhadenteredintoadefinitivesharepurchaseagreementtoacquire20.32%stakeinMindtreeLimitedonMarch18,2019atapriceofR 980pershareaggregatingtoconsiderationofR 3269.00crore.Further,thecompanyhadplacedapurchaseorderwithitsstockbrokerforacquiring15%stakethroughon-marketpurchasesforanoverallconsiderationamountnot exceeding R 2434.00 crore from any recognised stock exchange, but only after receipt of relevant approvals from regulatory authorities.TheCompanyhadalsomadeanopenoffertoacquire31%stakeforaconsiderationofR 5029.85croreinaccordancewith the requirements of the SEBI (Substantial Acquisition of Shares and Takeover) Regulations, 2011.
NOTE [34]Revenue from operations
Particulars2019-20 2018-19
v crore v crore v crore v crore Sales & service: Construction and project related activity 97452.17 95787.45 Manufacturing and trading activity 3225.64 3123.29 Engineering service fees 5649.10 5172.01 Software development products and services 16620.95 9330.75 Income from financing activity/annuity based projects 14442.06 13009.42 Property development activity 2065.94 2255.75 Fare collection and related activity 370.14 166.49 Servicing fees 1321.35 857.01 Commission 123.38 198.45 Charter hire income 1.78 1.27 Investment/portfolio management and trusteeship fees 353.25 618.64 Fees for operation and maintenance of power plant 2682.29 2821.67
144308.05 133342.20 Other operational income: Lease rentals 150.91 170.00 Property maintenance recoveries 69.71 48.48 Premium earned (net) on related forward exchange contracts 44.55 32.76 Profit on sale of a subsidiary under developmental projects segment – 415.61 Profit on sale of investment property – 565.60 Technical fees 0.06 1.02 Miscellaneous income 879.08 644.62
1144.31 1878.09
145452.36 135220.29
Notes forming part of the Consolidated Financial Statements (contd.)

517
NOTE [35]Other income
Particulars2019-20 2018-19
v crore v crore v crore v crore Interestincome[Note46(a)]: Loans and advances to joint venture and associate companies 109.34 113.16 Investments 378.65 389.71 Others 341.08 392.12
829.07 894.99Dividend income: Trade investments 1.76 2.09 Current investments 0.60 176.73 Others 99.24 58.09
101.60 236.91Net gain/(loss) on sale or fair valuation of investments 733.84 65.33Net gain/(loss) on derivatives at fair value through profit or loss 13.19 (21.81)Net gain/(loss) on sale of property, plant and equipment (33.28) 24.76Lease rentals 19.94 5.07 Miscellaneous income (net of expenses) 696.54 631.28
2360.90 1836.53
NOTE [36]Manufacturing, construction and operating expenses
Particulars2019-20 2018-19
v crore v crore v crore v crore Cost of raw materials, components consumed: Raw materials and components 15632.01 14887.42 Less: Scrap sales 83.35 115.86
15548.66 14771.56Construction materials consumed 30316.12 31230.44 Purchase of stock-in-trade 841.09 887.87Stores, spares and tools consumed 2184.46 2812.31Sub-contracting charges 26454.05 26011.91Changes in inventories of finished goods, stock-in-trade, work-in-progress and property development: Closing stock: Finished goods 98.56 55.09 Stock-in-trade 308.36 291.28 Work-in-progress 5748.17 5609.37 Cost of built up space and property development land: Work-in-progress 3130.39 3174.88 Completed property 72.37 115.32
9357.85 9245.94
Carried forward 9357.85 75344.38 9245.94 75714.09
Notes forming part of the Consolidated Financial Statements (contd.)

518
NOTES FORMING PART OF THE CONSOLIDATED FINANCIAL STATEMENTS ANNUAL REPORT 2019-20
Particulars2019-20 2018-19
v crore v crore v crore v crore Brought forward 9357.85 75344.38 9245.94 75714.09 Less: Opening stock: Finished goods 55.09 61.84 Stock-in-trade 291.28 224.81 Work-in-progress 5609.37 4345.49 Cost of built up space and property development land: Work-in-progress 3174.88 3744.40 Completed property 115.32 138.29
9245.94 8514.83
(111.91) (731.11) Inventorisation of investment property 759.61 –
647.70 (731.11)Other manufacturing, construction and operating expenses: Power and fuel 1922.13 2085.09 Royalty and technical know-how fees 119.52 42.94 Packing and forwarding 572.93 485.06 Rent and hire charges 2714.02 2930.62 Bank guarantee charges 248.67 208.40 Engineering, professional, technical and consultancy fees 2003.15 2084.53 Insurance 321.32 285.08 Rates and taxes 632.18 622.53 Travelling and conveyance 1113.94 1113.65 Repairs to plant and equipment 90.48 77.64 Repairs to buildings 22.22 23.00 General repairs and maintenance 640.32 473.21 Provision/(reversal) for foreseeable losses on construction contracts (103.28) 183.51 Other provisions 12.84 148.06 Expenses on construction job in realty business 392.48 850.63 Software development expenses 1759.24 933.07 Miscellaneous expenses 866.55 717.41
13328.71 13264.43Finance cost of financial services business and finance lease activity: Interest and other financing charges 8041.88 7385.63
97362.67 95633.04
Notes forming part of the Consolidated Financial Statements (contd.)NOTE [36]Manufacturing, construction and operating expenses (contd.)

519
NOTE [37]Employee benefits expense
Particulars2019-20 2018-19
v crore v crore v crore v crore Salaries, wages and bonus 20821.99 15760.62Contribution to and provision for: Provident fund and pension fund 407.06 289.91 Superannuation/employee pension and social security schemes 199.13 212.55 Gratuity funds [Note 52(b)(ii)] 154.25 144.75
760.44 647.21Expenses on employee stock option scheme 190.84 151.00 Employee medical and other insurance premium expenses 411.48 196.85Staff welfare expenses 1133.82 1052.56Recoveries on account of deputation charges (204.57) (341.84)
23114.00 17466.40
NOTE [38]Sales, administration and other expenses
Particulars2019-20 2018-19
v crore v crore v crore v crore Power and fuel 157.71 120.51 Packing and forwarding 67.30 66.45Insurance 113.37 90.18Rent and hire charges 244.17 526.66Rates and taxes 392.89 209.28Travelling and conveyance 946.82 704.26Repairs to buildings 98.85 38.86General repairs and maintenance 544.72 466.49Professional fees 1176.94 920.36Directors’ fees 11.64 8.95Telephone, postage and telegrams 227.03 202.14 Advertising and publicity 206.94 169.40Stationery and printing 69.61 68.75Commission: Distributors and agents 62.30 378.76 Others 1.61 2.30
63.91 381.06Bank charges 182.24 150.55 Miscellaneous expenses 1230.03 796.70Bad debts and advances written off (net of written back) 1759.76 1830.59Less: Allowances for doubtful debts and advances written back 1885.56 1653.15
(125.80) 177.44 Receivable discounting charges -non recourse 29.38 39.36Impairment of debt instruments 350.59 –Allowances for expected credit loss 2724.43 1789.07Loss on fair valuation of loans towards financing activities (net) 93.31 77.62Recoveries from joint venture and associate companies (40.40) (46.22)Exchange (gain)/loss (net) (438.96) (235.08)Other provisions 319.99 68.42
8646.71 6791.21
Notes forming part of the Consolidated Financial Statements (contd.)

520
NOTES FORMING PART OF THE CONSOLIDATED FINANCIAL STATEMENTS ANNUAL REPORT 2019-20
NOTE [39]
Finance costs
Particulars 2019-20 2018-19
v crore v croreInterest expenses 2723.26 1752.65
Other borrowing costs 12.71 12.79
Exchange (gain)/loss [net] (attributable to finance costs) 60.69 37.11
2796.66 1802.55
39(a)Aggregationofexpensesdisclosedvide[Note36-Manufacturing,constructionandoperatingexpenses],[Note37-Employeebenefitsexpense],[Note38-Sales,administrationandotherexpenses]and[Note39-Financecosts]
R crore
Sr. No.
Nature of expenses
2019-20 2018-19
Note 36: Manufacturing,
construction and operating
expenses
Note 37: Employee
benefits expense
Note 38: Sales,
administration and other expenses
Note 39: Finance costs
Total Note 36: Manufacturing,
construction and operating
expenses
Note 37: Employee
benefits expense
Note 38: Sales,
administration and other expenses
Note 39: Finance costs
Total
1 Power and fuel 1922.13 – 157.71 – 2079.84 2085.09 – 120.51 – 2205.60
2 Packing and forwarding 572.93 – 67.30 – 640.23 485.06 – 66.45 – 551.51
3 Insurance 321.32 411.48 113.37 – 846.17 285.08 196.85 90.18 – 572.11
4 Rent and hire charges 2714.02 – 244.17 – 2958.19 2930.62 – 526.66 – 3457.28
5 Rates and taxes 632.18 – 392.89 – 1025.07 622.53 – 209.28 – 831.81
6 Travelling and conveyance 1113.94 – 946.82 – 2060.76 1113.65 – 704.26 – 1817.91
7 Repairs to plant and equipment 90.48 – – – 90.48 77.64 – – – 77.64
8 Repairs to buildings 22.22 – 98.85 – 121.07 23.00 – 38.86 – 61.86
9 General repairs and maintenance 640.32 – 544.72 – 1185.04 473.21 – 466.49 – 939.70
10 Engineering, professional, technical and consultancy fees 2003.15 – 1176.94 – 3180.09 2084.53 – 920.36 – 3004.89
11 Interest and other financing charges 8041.88 – – 2796.66 10838.54 7385.63 – – 1802.55 9188.18
12 Miscellaneous expenses 866.55 – 1230.03 – 2096.58 717.41 – 796.70 – 1514.11
Notes forming part of the Consolidated Financial Statements (contd.)

521
NOTE [40]
The List of subsidiaries, associates, joint ventures and joint operations included in the Consolidated Financial Statements are as under:
As at 31-3-2020 As at 31-3-2019
Sr. no. Name of subsidiaries
Principal place of business
Proportion of effective ownership
interest (%)
Proportion of voting power
held (%)
Proportion of effective ownership
interest (%)
Proportion of voting power
held (%)
Indian subsidiaries1 Hi-Tech Rock Products and Aggregates Limited India 100.00 100.00 100.00 100.00 2 L&T Geostructure LLP India 100.00 100.00 100.00 100.00 3 L&T Geo – L&T JV for Maharatangarh project India 100.00 100.00 100.00 100.00 4 L&T Geo – L&T UJV CMRL CS India 100.00 100.00 100.00 100.00 5 L&T Infrastructure Engineering Limited India 100.00 100.00 100.00 100.00 6 L&T Cassidian Limited # India 100.00 100.00 100.00 100.00 7 L&T Hydrocarbon Engineering Limited India 100.00 100.00 100.00 100.00 8 L&T Gulf Private Limited ## India 100.00 100.00 – – 9 Larsen & Toubro Infotech Limited India 74.53 74.53 74.80 74.80 10 Syncordis Software Services India Private Limited India 74.53 74.53 74.80 74.80 11 Ruletronics Systems Private Limited India 74.53 74.53 74.80 74.80 12 Lymbyc Solutions Private Limited % India 74.53 74.53 – – 13 Powerup Cloud Technologies Private Limited @ India 74.53 74.53 – – 14 L&T Technology Services Limited India 74.62 74.62 78.88 78.88 15 L&T Thales Technology Services Private Limited India 55.22 55.22 58.37 58.37 16 Graphene Semiconductor Services Private Limited India 74.62 74.62 78.88 78.88 17 Seastar Labs Private Limited India 74.62 74.62 78.88 78.88 18 Esencia Technologies India Private Limited India 74.62 74.62 78.88 78.88 19 Mindtree Limited @@ India 61.08 61.08 – – 20 L&T Capital Markets Limited India 63.72 63.72 63.91 63.91 21 L&T Finance Holdings Limited India 63.72 63.72 63.91 63.91 22 L&T Housing Finance Limited India 63.72 63.72 63.91 63.91 23 L&T Infra Debt Fund Limited India 63.72 63.72 63.91 63.91 24 L&T Infra Investment Partners Advisory Private Limited India 63.72 63.72 63.91 63.91 25 L&T Infra Investment Partners Trustee Private Limited India 63.72 63.72 63.91 63.91 26 L&T Infrastructure Finance Company Limited India 63.72 63.72 63.91 63.91 27 L&T Investment Management Limited India 63.72 63.72 63.91 63.91 28 L&T Mutual Fund Trustee Limited India 63.72 63.72 63.91 63.91 29 L&T Financial Consultants Limited India 63.72 63.72 63.91 63.91 30 Mudit Cement Private Limited India 63.72 63.72 63.91 63.91 31 L&T Finance Limited India 63.72 63.72 63.91 63.91 32 L&T Infra Investment Partners India 34.99 34.99 35.11 35.11 33 L&T Metro Rail (Hyderabad) Limited India 100.00 100.00 100.00 100.00 34 Sahibganj Ganges Bridge-Company Private Limited # India 100.00 100.00 100.00 100.00 35 L&T Arunachal Hydropower Limited India 100.00 100.00 100.00 100.00 36 L&T Himachal Hydropower Limited India 100.00 100.00 100.00 100.00 37 L&T Power Development Limited India 100.00 100.00 100.00 100.00 38 L&T Uttaranchal Hydropower Limited India 100.00 100.00 100.00 100.00 39 Nabha Power Limited India 100.00 100.00 100.00 100.00 40 Chennai Vision Developers Private Limited India 100.00 100.00 100.00 100.00 41 L&T Asian Realty Project LLP India 100.00 100.00 100.00 100.00 42 L&T Parel Project LLP India 100.00 100.00 100.00 100.00 43 L&T Realty Limited * India NA NA NA NA44 L&T Westend Project LLP India 100.00 100.00 100.00 100.00 45 LTR SSM Private Limited # India 99.00 99.00 99.00 99.00 46 L&T Seawoods Limited India 100.00 100.00 100.00 100.00 47 L&T Vision Ventures Limited India 68.00 68.00 68.00 68.00 48 L&T Electricals and Automation Limited India 100.00 100.00 100.00 100.00 49 L&T Construction Equipment Limited India 100.00 100.00 100.00 100.00 50 L&T Construction Machinery Limited India 100.00 100.00 100.00 100.00
Notes forming part of the Consolidated Financial Statements (contd.)

522
NOTES FORMING PART OF THE CONSOLIDATED FINANCIAL STATEMENTS ANNUAL REPORT 2019-20
As at 31-3-2020 As at 31-3-2019
Sr. no. Name of subsidiaries
Principal place of business
Proportion of effective ownership
interest (%)
Proportion of voting power
held (%)
Proportion of effective ownership
interest (%)
Proportion of voting power
held (%)
Indian subsidiaries51 L&T Valves Limited India 100.00 100.00 100.00 100.00 52 L&T Shipbuilding Limited ** India NA NA 97.00 97.00 53 Bhilai Power Supply Company Limited India 99.90 99.90 99.90 99.90 54 L&T Power Limited India 99.99 99.99 99.99 99.99 55 Kesun Iron and Steel Company Private Limited India 95.00 95.00 95.00 95.00 56 L&T Aviation Services Private Limited India 100.00 100.00 100.00 100.00 57 L&T Capital Company Limited India 100.00 100.00 100.00 100.00 58 L&T Infra Contractors Private Limited India 100.00 100.00 100.00 100.00
# The company is in process of being struck off from the register of companies## The company is reclassified as subsidiary w.e.f. November 20, 2019 due to purchase of additional stake% The Group has acquired stake on August 29, 2019@ The Group has acquired stake on October 25, 2019@@ The Group has acquired stake on July 2, 2019* The company is merged with L&T Construction Equipment Limited w.e.f. April 1, 2018** The company is merged with Larsen & Toubro Limited w.e.f. April 1, 2019
As at 31-3-2020 As at 31-3-2019
Sr. no. Name of subsidiaries
Principal place of business
Proportion of effective ownership
interest (%)
Proportion of voting power
held (%)
Proportion of effective ownership
interest (%)
Proportion of voting power
held (%)
Foreign subsidiaries1 Larsen & Toubro (Oman) LLC Sultanate of
Oman 65.00 65.00 65.00 65.00 2 Larsen & Toubro Qatar LLC # Qatar 49.00 100.00 49.00 100.00 3 Larsen & Toubro Saudi Arabia LLC Kingdom of
Saudi Arabia 100.00 100.00 100.00 100.00 4 Larsen & Toubro T&D SA (Proprietary) Limited South Africa 72.50 72.50 72.50 72.50 5 Larsen & Toubro Heavy Engineering LLC Sultanate of
Oman 70.00 100.00 70.00 100.00 6 Larsen & Toubro Hydrocarbon International Limited
LLC ##Kingdom of Saudi Arabia 100.00 100.00 100.00 100.00
7 L&T Modular Fabrication Yard LLC Sultanate of Oman 70.00 100.00 70.00 100.00
8 L&T Overseas Projects Nigeria Limited Nigeria 100.00 100.00 100.00 100.00 9 Larsen Toubro Arabia LLC Kingdom of
Saudi Arabia 75.00 100.00 75.00 100.00 10 L&T Hydrocarbon Saudi Company Kingdom of
Saudi Arabia 100.00 100.00 100.00 100.00 11 Larsen & Toubro Kuwait Construction General
Contracting Company WLL Kuwait 49.00 100.00 49.00 100.00 12 PT Larsen & Toubro Hydrocarbon Engineering
Indonesia Indonesia 95.00 95.00 95.00 95.00 13 Larsen & Toubro Electromech LLC Sultanate of
Oman 70.00 100.00 70.00 100.00 14 L&T Hydrocarbon International FZE UAE 100.00 100.00 100.00 100.00 15 L&T Information Technology Services (Shanghai) Co.,
Ltd. China 74.53 74.53 74.80 74.80 16 L&T Infotech Financial Services Technologies Inc. Canada 74.53 74.53 74.80 74.80 17 Larsen & Toubro Infotech Canada Limited Canada 74.53 74.53 74.80 74.80 18 Larsen & Toubro Infotech LLC USA 74.53 74.53 74.80 74.80 19 Larsen & Toubro Infotech South Africa (Proprietary)
Limited South Africa 55.83 55.83 56.02 56.02
Notes forming part of the Consolidated Financial Statements (contd.)NOTE [40] (contd.)

523
As at 31-3-2020 As at 31-3-2019
Sr. no. Name of subsidiaries
Principal place of business
Proportion of effective ownership
interest (%)
Proportion of voting power
held (%)
Proportion of effective ownership
interest (%)
Proportion of voting power
held (%)
Foreign subsidiaries20 Larsen & Toubro Infotech GmbH Germany 74.53 74.53 74.80 74.80 21 Larsen & Toubro Infotech Austria GmbH % Austria - - 74.80 74.80 22 L&T Information Technology Spain SL Spain 74.53 74.53 74.80 74.80 23 Larsen & Toubro Infotech Norge AS Norway 74.53 74.53 74.80 74.80 24 Larsen & Toubro LLC USA 98.79 98.79 98.80 98.80 25 L&T Infotech S. DE R.L. DE C.V. Mexico 74.53 74.53 74.80 74.80 26 Syncordis S.A. Luxembourg 74.53 74.53 74.80 74.80 27 Syncordis SARL France 74.53 74.53 74.80 74.80 28 Syncordis Limited UK 74.53 74.53 74.80 74.80 29 Syncordis PSF S.A. (formerly known as Syncordis
Support Services S.A.) Luxembourg 74.53 74.53 74.80 74.80 30 Nielsen+Partner Unternehmensberater GmbH Germany 74.53 74.53 74.80 74.80 31 Nielsen+Partner Unternehmensberater AG Switzerland 74.53 74.53 74.80 74.80 32 Nielsen+Partner Pte Ltd Singapore 74.53 74.53 74.80 74.80 33 NIELSEN+PARTNER S.A. Luxembourg 74.53 74.53 74.80 74.80 34 Nielsen&Partner Company Limited Thailand 74.53 74.53 74.80 74.80 35 Nielsen&Partner Pty Ltd Australia 74.53 74.53 74.80 74.80 36 Ruletronics Limited UK 74.53 74.53 74.80 74.80 37 Ruletronics Systems Inc. USA 74.53 74.53 74.80 74.80 38 Lymbyc Solutions Inc. @ USA 74.53 74.53 - - 39 L&T Technology Services LLC USA 74.62 74.62 78.88 78.88 40 Graphene Solutions PTE Ltd. Singapore 74.62 74.62 78.88 78.88 41 Graphene Solutions SDN. BHD. Malaysia 74.62 74.62 78.88 78.88 42 Graphene Solutions Taiwan Limited Taiwan 74.62 74.62 78.88 78.88 43 Esencia Technologies Inc. USA 74.62 74.62 78.88 78.88 44 L&T Technology Services (Shanghai) Co. Ltd @@ China 74.62 74.62 - - 45 L&T Technology Services (Canada) Ltd * Canada 74.62 74.62 - - 46 Mindtree Software (Shanghai) Co. Limited ** China 61.08 61.08 - - 47 Bluefin Solutions Sdn. Bhd. ** Malaysia 61.08 61.08 - - 48 L&T Realty FZE $ UAE - - 100.00 100.00 49 Henikwon Corporation SDN. BHD. Malaysia 100.00 100.00 100.00 100.00 50 Kana Controls General Trading & Contracting Company
W.L.L. Kuwait 49.00 100.00 49.00 100.00 51 L&T Electrical & Automation FZE UAE 100.00 100.00 100.00 100.00 52 L&T Electricals & Automation Saudi Arabia Company
Limited LLCKingdom of Saudi Arabia 100.00 100.00 100.00 100.00
53 PT. Tamco Indonesia Indonesia 100.00 100.00 100.00 100.00 54 Servowatch Systems Limited UK 100.00 100.00 100.00 100.00 55 Tamco Electrical Industries Australia Pty Limited Australia 100.00 100.00 100.00 100.00 56 Tamco Switchgear (Malaysia) SDN BHD Malaysia 100.00 100.00 100.00 100.00 57 Thalest Limited UK 100.00 100.00 100.00 100.00 58 Larsen & Toubro (East Asia) Sdn.Bhd. Malaysia 30.00 100.00 30.00 100.00 59 Larsen & Toubro International FZE UAE 100.00 100.00 100.00 100.00 60 L&T Global Holdings Limited UAE 100.00 100.00 100.00 100.00 61 L&T Capital Markets (Middle East) Ltd UAE 63.72 63.72 63.91 63.91 62 L&T Valves Arabia Manufacturing LLC $$ Kingdom of
Saudi Arabia 100.00 100.00 – –63 L&T Valves USA LLC ^ USA 100.00 100.00 – –# The company is in process of liquidation ## The company is liquidated on May 16, 2020% The company is liquidated on August 20, 2019 @ The Group has acquired stake on August 29, 2019@@ The company has been incorporated on August 6, 2019 * The company has been incorporated on August 20, 2019** The Group has acquired stake on July 2, 2019 $ The company is liquidated on January 27, 2020$$ The company has been incorporated on May 30, 2019 ^ The company has been incorporated on May 28, 2019
Note: The Group has acquired stake in Bluefin Solutions Inc., USA and Bluefin Solutions Pte Ltd, Singapore on July 2, 2019. These companies have been liquidated on December 17, 2019 and March 20, 2020 respectively.
Notes forming part of the Consolidated Financial Statements (contd.)NOTE [40] (contd.)

524
NOTES FORMING PART OF THE CONSOLIDATED FINANCIAL STATEMENTS ANNUAL REPORT 2019-20
As at 31-3-2020 As at 31-3-2019
Sr. no. Name of associates
Principal place of business
Proportion of effective ownership
interest (%)
Proportion of voting power
held (%)
Proportion of effective ownership
interest (%)
Proportion of voting power
held (%)
1 L&T-Chiyoda Limited India 50.00 50.00 50.00 50.00 2 Gujarat Leather Industries Limited # India 50.00 50.00 50.00 50.00 3 Larsen & Toubro Qatar & HBK Contracting Co. WLL Qatar 50.00 50.00 50.00 50.00 4 L&T Camp Facilities LLC UAE 49.00 49.00 49.00 49.00 5 Magtorq Private Limited India 42.85 42.85 42.85 42.85 6 Magtorq Engineering Solutions Private Limited India 39.28 39.28 39.28 39.28
# The company is under liquidation
As at 31-3-2020 As at 31-3-2019
Sr. no. Name of joint ventures Principal place of business
Proportion of effective ownership interest (%)
Proportion of effective ownership interest (%)
Joint ventures1 L&T-MHPS Boilers Private Limited India 51.00 51.00 2 L&T-MHPS Turbine Generators Private Limited India 51.00 51.00 3 L&T Howden Private Limited India 50.10 50.10 4 L&T-Sargent & Lundy Limited India 50.00 50.00 5 L&T Special Steels and Heavy Forgings Private Limited India 74.00 74.00 6 L&T MBDA Missile Systems Limited India 51.00 51.00 7 L&T Sapura Offshore Private Limited India 60.00 60.00 8 L&T Sapura Shipping Private Limited India 60.00 60.00 9 L&T-Gulf Private Limited # India – 50.00 10 L&T Hydrocarbon Caspian LLC Azerbaijan 50.00 50.00 11 L&T Infrastructure Development Projects Limited India 51.00 97.45 12 L&T Chennai–Tada Tollway Limited India 51.00 97.45 13 L&T Rajkot-Vadinar Tollway Limited India 51.00 97.45 14 L&T Deccan Tollways Limited India 52.89 97.45 15 L&T Samakhiali Gandhidham Tollway Limited India 51.01 97.45 16 Kudgi Transmission Limited India 51.00 97.45 17 L&T Sambalpur-Rourkela Tollway limited India 51.00 97.45 18 Panipat Elevated Corridor Limited India 51.00 97.45 19 Vadodara Bharuch Tollway Limited India 51.00 97.45 20 L&T Transportation Infrastructure Limited India 63.86 98.12 21 L&T Interstate Road Corridor Limited India 51.00 97.45 22 Ahmedabad-Maliya Tollway Limited India 51.00 97.45 23 L&T Halol-Shamlaji Tollway Limited India 24.98 47.75 24 PNG Tollway Limited India 37.74 72.11 25 L&T Kobelco Machinery Private Limited ## India – 51.00 26 Raykal Aluminium Company Private Limited India 75.50 75.50 27 Indiran Engineering Projects and Systems Kish PJSC Iran 50.00 50.00
# The company is reclassified as subsidiary w.e.f. November 20, 2019 due to purchase of additional stake
## The Group has sold its stake on April 17, 2019
Notes forming part of the Consolidated Financial Statements (contd.)NOTE [40] (contd.)

525
As at 31-3-2020 As at 31-3-2019
Sr. no.
Name of joint operations (with specific ownership interest in the arrangement)
Principal place of business
Proportion of effective ownership interest (%)
Proportion of effective ownership interest (%)
1 Desbuild L&T Joint Venture India 49.00 49.00 2 Larsen and Toubro Limited-Shapoorji Pallonji & Co. Ltd. Joint
Venture India 50.00 50.00 3 Al Balagh Trading & Contracting Co W.L.L- L&T Joint Venture Qatar 80.00 80.00 4 L&T-AM Tapovan Joint Venture India 65.00 65.00 5 HCC-L&T Purulia Joint Venture India 43.00 43.00 6 International Metro Civil Contractors Joint Venture India 26.00 26.00 7 Metro Tunneling Group India 26.00 26.00 8 L&T-Hochtief Seabird Joint Venture India 90.00 90.00 9 Metro Tunneling Chennai-L&T Shanghai Urban Construction
(Group) Corporation Joint Venture India 75.00 75.00 10 Metro Tunneling Delhi- L&T Shanghai Urban Construction
(Group) Corporation Joint Venture India 60.00 60.00 11 L&T-Shanghai Urban Construction (Group) Corporation Joint
Venture CC27 Delhi India 68.00 68.00 12 Aktor-Larsen & Toubro-Yapi Merkezi-STFA-Al Jaber Engineering
Joint Venture Qatar 22.00 22.00 13 Civil Works Joint Venture Kingdom of Saudi
Arabia 29.00 29.00 14 L&T-Shanghai Urban Construction (Group) Corporation Joint
Venture India 51.00 51.00 15 DAEWOO and L&T Joint Venture India 50.00 50.00 16 L&T-STEC JV MUMBAI India 65.00 65.00 17 L&T-ISDPL (JV) India 100.00 100.00 18 L&T-IHI Consortium India 100.00 100.00 19 L&T-Eastern Joint Venture UAE 65.00 65.00 20 Larsen and Toubro Limited-Scomi Engineering BHD Consortium-
Residual Joint Works Joint Venture India 60.00 60.00 21 Larsen and Toubro Limited-Scomi Engineering BHD Consortium-
O&M Joint Venture India 50.00 50.00 22 L&T- Inabensa Consortium India 100.00 100.00 23 L&T-Delma Mafraq Joint Venture UAE 100.00 100.00 24 L&T-AL-Sraiya LRDP 6 Joint Venture Qatar 75.00 75.00 25 Larsen & Toubro Limited & NCC Limited Joint Venture India 55.00 55.00 26 Besix-Larsen & Toubro Joint Venture UAE 50.00 50.00 27 Larsen & Toubro Ltd - Passavant Energy & Environment JV India 50.00 50.00 28 LNT-Shriram EPC Tanzania UJV Tanzania 90.00 90.00 29 LTH Milcom Private Limited India 56.67 56.67 30 L&T-Tecton JV India 60.00 60.00 31 L&T-Powerchina JV # UAE 55.00 –32 Bauer- L&T Geo Joint Venture India 50.00 50.00 33 EMAS Saudi Arabia Ltd Kingdom of Saudi
Arabia 50.00 50.00 34 L&T Infrastructure Engineering - LEA Associates South Asia JV @ India 61.00 –35 L&T Infra Engineering JV United Consultancy @@ Bhutan 75.81 –
# The joint arrangement was entered into on November 27, 2019@ The joint arrangement was entered into on February 12, 2020@@ The joint arrangement was entered into on December 7, 2019
Notes forming part of the Consolidated Financial Statements (contd.)NOTE [40] (contd.)

526
NOTES FORMING PART OF THE CONSOLIDATED FINANCIAL STATEMENTS ANNUAL REPORT 2019-20
Sr. no. Name of joint operations (with specific proportion of activity carried out through the arrangement) Principal place of business
1 L&T Sojitz Consortium India
2 L&T-KBL (UJV) Hyderabad India
3 L&T-KBL-MAYTAS UJV India
4 Mallanna Sagar Reservoir LnT-Prasad-RK Infra JV India
5 Larsen & Toubro Limited Waterleau Consortium Qatar
6 L&T-BRAPL JV (package II) India
7 L&T-BRAPL JV (package III) India
8 IIS-L&T Consortium India
9 PES Engg P ltd-L&T Consortium India
10 L&T ISDPL - DI (JV) India
11 L&T Galfar Consortium Oman
12 Sojitz Corporation-L&T Consortium India
13 Sojitz Corporation-Gayathri Projects Ltd-L&T Consortium India
14 PESB and Larsen & Toubro Joint Venture Malaysia
15 Scomi Engineering Bhd-L&T Consortium India
16 L&T-PCIPL JV India
17 Consortium of M/s. J. Ray McDermott Sdn. Bhd. and M/s. L&T Hydrocarbon Engineering Limited India
18 Consortium of L&T Hydrocarbon Engineering Limited and EMAS AMC Pte. Ltd. Kingdom of Saudi Arabia
19 Consortium of L&T Hydrocarbon Engineering Limited and Reliance Naval and Engineering Limited India
20 Consortium of L&T Hydrocarbon Engineering Limited, GE Oil & Gas UK Ltd, McDermott International Management S. de RL, Berlian McDermott Sdn Bhd and Vetco Gray Pte Ltd India
21 Consortium of L&T Hydrocarbon Engineering Limited, Technip France and Technic India Limited India
22 L&T Parel Project LLP-Omkar Realtors & Developers Pvt. Ltd. (Crescent bay) India
23 L&T Asian Realty Project LLP-Nirmal Life Style Developers Pvt. Ltd. (Nirmal Lifestyle) India
24 L&T Infrastructure Engineering Limited-Fortress Infrastructure Advisory Services (for 4 projects) India
25 L&T Infrastructure Engineering Limited-Mahindra Consulting Engineers Ltd. India
26 L&T Infrastructure Engineering Limited-Pricewaterhouse Coopers Pvt.Ltd.(for 2 projects) India
27 L&T Infrastructure Engineering Limited-Rajendran Associates (for 2 projects) India
28 L&T Infrastructure Engineering Limited-Transtek Engineers & Services Pvt.Ltd. India
29 L&T Infrastructure Engineering Limited-Vax Consultants Pvt.Ltd.(for 5 projects) India
30 L&T Infrastructure Engineering Limited-Aakar Abhinav Consultants Pvt Ltd India
31 L&T Infrastructure Engineering Limited-Centre for Symbiosis of Technology Environment & Management (STEM) India
32 L&T Infrastructure Engineering Limited-CRISIL Risk & Infrastructure Solutions Ltd India
33 L&T Infrastructure Engineering Limited-Rites Ltd and KPMG India
NOTE [41]
The components of other equity shown in the Consolidated Balance Sheet include the Group’s share in the respective reserves of subsidiaries. Reserve attributable to non-controlling interest is reported separately in the Consolidated Balance Sheet. Retained earnings comprise Group’s share in general reserve and balance of Profit and Loss.
Notes forming part of the Consolidated Financial Statements (contd.)NOTE [40] (contd.)

527
NOTE [42]
Disclosure pursuant to Ind AS 112 “Disclosure of Interest in other entities”: Subsidiaries
(a) Change in the Group’s ownership interest in a subsidiary (without ceding control)
(i) On account of divestment of part stake
Duringtheyear2019-20,theGrouphassold3.89%stakeinL&TTechnologyServicesLimited.TheproceedsondisposalofR 668.95crorewerereceivedincash.AnamountofR 118.37crore(beingtheproportionateshareofthecarryingamountof the net assets of L&T Technology Services Limited) has been transferred to non-controlling interests. The difference of R 550.58crorebetweentheconsiderationreceivedandtheincreaseinthenon-controllinginterestshasbeencreditedtoretained earnings.
Duringtheyear2018-19,theGrouphassold7.44%stakeinLarsen&ToubroInfotechLimitedand8.43%stakeinL&TTechnology Services Limited. The proceeds on disposal of R 3378.02crorewerereceivedincash.AnamountofR 417.19 crore (being the proportionate share of the carrying amount of the net assets of Larsen & Toubro Infotech Limited and L&T Technology Services Limited) has been transferred to non-controlling interests. The difference of R 2960.83crorebetweentheconsideration received and the increase in the non-controlling interests has been credited to retained earnings.
(ii) On account of dilution
During the year 2019-20, the Group’s continuing interest has reduced on account of dilution due to exercise of ESOPs by 0.19%,0.26%,0.38%and0.04%inL&TFinanceHoldingsLimited,inLarsen&ToubroInfotechLimited,inL&TTechnologyServices Limited and Mindtree Limited respectively. The proceeds on dilution of R 39.98crorewerereceivedincash.Anamount of R 89.68crore(beingtheproportionateshareofthecarryingamountofthenetassetsofL&TFinanceHoldingsLimited, Larsen & Toubro Infotech Limited, L&T Technology Services Limited and Mindtree Limited) has been transferred to non-controlling interests. The difference of R 49.70 crore between the increase in the non-controlling interests and the consideration received has been debited to retained earnings.
Duringtheyear2018-19,theGroup’scontinuinginteresthasreducedonaccountofdilutionduetoexerciseofESOPsby0.10%,0.72%and1.33%inL&TFinanceHoldingsLimited,inLarsen&ToubroInfotechLimitedandinL&TTechnologyServices Limited respectively. The proceeds on dilution of R 22.13 crore were received in cash. An amount of R 132.23 crore (being the proportionate share of the carrying amount of the net assets of L&T Finance Holdings Limited, Larsen & Toubro Infotech Limited and L&T Technology Services Limited) has been transferred to non-controlling interests. The difference of R 110.10 crore between the increase in the non-controlling interests and the consideration received has been debited to retained earnings.
(b) The effect of divestment with ceding of control in subsidiary during the period is as under: v crore
Name of subsidiary
Effect on consolidated profit/(loss) after non-controlling
interest Line item in Statement of Profit & Loss in which the gain/(loss) is recognised
2019-20 2018-19Marine Infrastructure Developer Private Limited – 415.61 Other operational incomeTotal – 415.61
Notes forming part of the Consolidated Financial Statements (contd.)

528
NOTES FORMING PART OF THE CONSOLIDATED FINANCIAL STATEMENTS ANNUAL REPORT 2019-20
Notes forming part of the Consolidated Financial Statements (contd.)NOTE [42] (contd.)(c) Disclosure of subsidiaries having material non-controlling interest: (i) Summarised Statement of Profit and Loss
v crore
ParticularsL&T Finance Limited L&T Finance Holdings Limited2019-20 2018-19 2019-20 2018-19
Revenue 8184.78 6890.59 475.28 481.73Profit/(loss) for the year 366.28 845.93 266.81 267.79Other comprehensive income (149.36) (1.38) (0.11) (0.32) Total comprehensive income 216.92 844.55 266.70 267.47Effective%ofnon-controllinginterest 36.28% 36.09% 36.28% 36.09%Profit/(loss) allocated to non-controlling interest (including
consolidation adjustments) 370.93 539.68 (58.38) (28.76)Dividend (including dividend distribution tax) to non-
controlling interest – – 137.30 71.87
v crore
ParticularsLarsen & Toubro Infotech
LimitedL&T Technology Services
Limited2019-20 2018-19 2019-20 2018-19
Revenue 10287.59 9016.17 5225.65 4781.37Profit/(loss) for the year 1552.36 1475.06 790.03 700.10 Other comprehensive income (438.10) 25.87 (260.32) (2.13) Total comprehensive income 1114.26 1500.93 529.71 697.97Effective%ofnon-controllinginterest 25.46% 25.20% 25.38% 21.12%Profit/(loss) allocated to non-controlling interest (including
consolidation adjustments) 367.53 314.13 189.98 118.82Dividend (including dividend distribution tax) to non-
controlling interest 143.38 115.89 66.10 37.66
v crore
ParticularsMindtree Limited (consolidated)#
2019-20Revenue 5917.18Profit/(loss) for the year 538.17Other comprehensive income (438.10)Total comprehensive income 100.07 Effective%ofnon-controllinginterest 38.92%Profit/(loss) allocated to non-controlling interest (including consolidation adjustments) 144.33 Dividend (including dividend distribution tax) to non-controlling interest 211.01
# from the date of acquisition
(ii) Summarised Balance Sheetv crore
ParticularsL&T Finance Limited L&T Finance Holdings Limited
As at 31-3-2020
As at 31-3-2019
As at 31-3-2020
As at 31-3-2019
Current assets (a) 29825.41 32026.49 1153.20 866.85Current liabilities (b) 20300.36 20353.11 2099.72 1370.42 Net current assets (c)=(a) - (b) 9525.05 11673.38 (946.52) (503.57) Non-current assets (d) 23163.98 23810.66 10101.69 9182.03Non-current liabilities (e) 23795.26 26583.43 1393.23 848.11Net non-current assets (f)=(d) - (e) (631.28) (2772.77) 8708.46 8333.92Net assets (g)=(c) + (f) 8893.77 8900.61 7761.94 7830.35Accumulated non-controlling interest 1734.51 1492.01 2765.91 2766.57

529
Notes forming part of the Consolidated Financial Statements (contd.)
v crore
Particulars
Larsen & Toubro Infotech Limited
L&T Technology Services Limited
As at 31-3-2020
As at 31-3-2019
As at 31-3-2020
As at 31-3-2019
Current assets (a) 5985.20 4838.98 2779.82 2271.41 Current liabilities (b) 2084.65 1482.92 980.61 783.45Net current assets (c)=(a) - (b) 3900.55 3356.06 1799.21 1487.96Non-current assets (d) 2331.61 1379.71 1301.88 953.93 Non-current liabilities (e) 1003.32 22.32 481.06 5.97 Net non-current assets (f)=(d) - (e) 1328.29 1357.39 820.82 947.96Net assets (g)=(c) + (f) 5228.84 4713.45 2620.03 2435.92 Accumulated non-controlling interest 1320.47 1177.75 672.69 507.15
v crore
ParticularsMindtree Limited
(consolidated)As at 31-3-2020
Current assets (a) 3208.74Current liabilities (b) 1323.75 Net current assets (c)=(a) - (b) 1884.99Non-current assets (d) 1901.73 Non-current liabilities (e) 676.13Net non-current assets (f)=(d) - (e) 1225.60Net assets (g)=(c) + (f) 3110.59 Accumulated non-controlling interest 1829.41
(iii) Summarised Statement of Cash Flows
v crore
ParticularsL&T Finance Limited L&T Finance Holdings Limited2019-20 2018-19 2019-20 2018-19
Cash flows from operating activities 4266.99 (7560.70) 82.24 774.99 Cash flows from investing activities 676.41 (2145.81) (1006.23) (1306.32)Cash flows from financing activities (3756.15) 10888.36 924.08 520.56Net increase/(decrease) in cash and cash equivalents 1187.25 1181.85 0.09 (10.77)
v crore
ParticularsLarsen & Toubro Infotech
LimitedL&T Technology Services
Limited2019-20 2018-19 2019-20 2018-19
Cash flows from operating activities 1643.93 1247.62 664.41 739.58Cash flows from investing activities (578.11) (682.89) (280.52) (489.03)Cash flows from financing activities (918.39) (595.07) (377.23) (202.13)Net increase/(decrease) in cash and cash equivalents 147.43 (30.34) 6.66 48.42
v crore
ParticularsMindtree Limited (consolidated)#
2019-20Cash flows from operating activities 634.00Cash flows from investing activities 153.40 Cash flows from financing activities (614.70)Net increase/(decrease) in cash and cash equivalents 172.70
# from the date of acquisition
NOTE [42] (contd.)

530
NOTES FORMING PART OF THE CONSOLIDATED FINANCIAL STATEMENTS ANNUAL REPORT 2019-20
Notes forming part of the Consolidated Financial Statements (contd.)NOTE [43]
Disclosures pursuant to Ind AS 112 “Disclosure of interest in other entities”:- Joint Ventures and Associates
(a) Summarised Balance Sheet of material joint ventures:
v crore
Particulars
L&T-MHPS Boilers Private Limited
L&T Special Steels and Heavy Forgings Private
Limited
L&T Infrastructure Development Projects Limited (consolidated)
As at 31-3-2020
As at 31-3-2019
As at 31-3-2020
As at 31-3-2019
As at 31-3-2020
As at 31-3-2019
Current assets:Cash and bank balances 850.71 318.67 0.05 0.15 1220.91 923.34 Other assets 2500.57 3112.87 312.31 278.67 1089.26 2739.12 Total current assets (A) 3351.28 3431.54 312.36 278.82 2310.17 3662.46Total non-current assets (including Goodwill) (B) 514.40 501.86 1198.72 1255.08 11504.11 11799.38Current liabilities:Financial liabilities (excluding trade payables) 469.40 565.09 1710.89 1585.44 1233.69 2184.58Other liabilities (including trade payables) 1663.34 1918.24 146.66 138.37 420.88 297.50 Total current liabilities (C) 2132.74 2483.33 1857.55 1723.81 1654.57 2482.08Non-current liabilities:Financial liabilities (excluding trade payables) – 4.65 672.74 606.25 9341.03 10690.79Other liabilities (including trade payables) – – 15.78 16.32 511.95 434.73 Total non-current liabilities (D) – 4.65 688.52 622.57 9852.98 11125.52 Non-controlling interest (NCI) (E) – – – – 163.78 161.26Net assets (A+B-C-D-E) 1732.94 1445.42 (1034.99) (812.48) 2142.95 1692.98
(b) Reconciliation of carrying amounts of material joint ventures:v crore
Particulars
L&T-MHPS Boilers Private Limited
L&T Special Steels and Heavy Forgings Private
Limited
L&T Infrastructure Development Projects Limited (consolidated)
As at 31-3-2020
As at 31-3-2019
As at 31-3-2020
As at 31-3-2019
As at 31-3-2020
As at 31-3-2019
Opening net assets 1445.42 1185.66 (812.48) (598.57) 1692.98 1349.86Profit/(loss) for the year (net of NCI) 312.20 279.96 (222.12) (213.89) (284.03) 588.70Dividend distributed during the year (including
dividend tax) (28.22) (28.22) – – – – Other comprehensive income (net of NCI) 3.54 8.02 (0.26) (0.02) 56.01 24.71 Infusion during the year (including securities
premium) – – – – 863.00 – Amount adjusted against securities premium – – – – (148.29) (246.59)Equity component of other financial instruments – – – – (70.00) 70.00 Other adjustments – – (0.12) – 33.28 (93.70)Closing net assets 1732.94 1445.42 (1034.98) (812.48) 2142.95 1692.98Group’sshare(%) 51.00% 51.00% 74.00% 74.00% 51.00% 97.45%Group’s share 883.80 737.16 (765.88) (601.24) 1247.68 1657.53Impairment – – – – – (288.44)Parent’s investment in group companies – – – – 10.88 33.30Adjusted against other long term interest – – 731.75 594.41 – – Other adjustments – – 34.13 6.83 36.33 (127.58)Carrying amount 883.80 737.16 – – 1294.89 1274.81

531
(c) Summarised Statement of Profit and Loss of material joint ventures: v crore
Particulars
L&T-MHPS Boilers Private Limited
L&T Special Steels and Heavy Forgings Private
Limited
L&T Infrastructure Development Projects Limited (consolidated)
2019-20 2018-19 2019-20 2018-19 2019-20 2018-19
Revenue 2035.62 2735.70 222.78 211.63 1759.15 1666.57
Interest Income 36.22 20.26 0.20 0.12 137.25 29.71
Depreciation and amortisation (65.00) (62.32) (48.59) (47.65) (487.30) (452.16)
Finance cost (5.19) (17.72) (199.45) (181.59) (1063.40) (1070.17)
Tax expense (117.60) (137.93) – – (118.47) (36.97)
Profit/(loss) from continuing operations (net of NCI) 312.20 279.96 (222.12) (213.89) (284.03) 607.52
Profit from discontinued operations (net of NCI) – – – – – (18.82)
Profit/(loss) for the year (net of NCI) 312.20 279.96 (222.12) (213.89) (284.03) 588.70
Other comprehensive income (net of NCI) 3.54 8.02 (0.26) (0.02) 56.01 24.71
Total comprehensive income (net of NCI) 315.74 287.98 (222.38) (213.91) (228.02) 613.41
(d) Financial Information in respect of individually not material joint ventures/associates
v crore
ParticularsAs at
31-3-2020As at
31-3-2019Aggregate carrying amount of investment in individually not material joint ventures/associates 672.32 630.32Aggregate amounts of the Group’s share of:Profit/(loss) for the year 55.20 66.11Other comprehensive income for the year 24.93 6.02Total comprehensive income for the year 80.13 72.13
(e) Carrying amount of investments in joint ventures/associates
v crore
ParticularsAs at
31-3-2020As at
31-3-2019Non-material associates 115.02 88.52Non-material joint ventures 557.30 541.80Sub-total 672.32 630.32Material joint ventures 2178.69 2011.97 Total 2851.01 2642.29
(f) Share in profit /(loss) of joint ventures/associates (net)
v croreParticulars 2019-20 2018-19
Non-material associates 25.88 17.72 Non-material joint ventures 29.32 48.39Sub-total 55.20 66.11Material joint ventures 16.76 (87.11)Total 71.96 (21.00)
Notes forming part of the Consolidated Financial Statements (contd.)NOTE [43] (contd.)

532
NOTES FORMING PART OF THE CONSOLIDATED FINANCIAL STATEMENTS ANNUAL REPORT 2019-20
Notes forming part of the Consolidated Financial Statements (contd.)NOTE [44]
Disclosure pursuant to Ind AS 103 “Business Combinations”:
(a) Acquisition of Mindtree Limited:
(i) PursuanttocompletionofOpenOfferonJuly2,2019,theCompanyacquired60.06%stakeinMindtreeLimited,whichisamultinational information technology and outsourcing company headquartered in Bengaluru, India and New Jersey, USA. The stake was acquired in stages through direct share purchase, open market purchases and open offer.
The acquisition is in line with the Company’s strategy of expanding its asset light services business portfolio.
(ii) Assets acquired and liabilities recognised on the date of acquisition are as follows:v crore
Mindtree Limited
Assets
Non-current assets
Customer relationships 2826.40
Customer contracts 189.20
Trade names 297.00
Property, plant and equipment 377.70
Fair value of land/building over book value 177.78
Other non-current assets 974.95 4843.03
Current assets
Trade receivables 1315.30
Cash and bank balances 190.00
Other current assets 1314.40 2819.70
Total Assets 7662.73
Liabilities
Non-current liabilities
Deferred tax liabilities 1126.18
Other non-current liabilities 512.30 1638.48
Current Liabilities
Trade payables 235.00
Other current financial liabilities 294.10
Other current liabilities 400.44
Contingent liability taken over [Note(vi)] 26.85 956.39
Total Liabilities 2594.87
Net Assets acquired 5067.86
(iii) Calculation of Goodwill:v crore
Mindtree Limited
Purchaseconsiderationfor31.20%stakepurchasedinopenoffer(A) 5038.57
Fairvaluationofexisting28.86%stake(B) 4333.96
Total consideration (C)=(A+B) 9372.53
Add: Non-controlling interest 2023.88
Less: Fair value of net assets acquired 5067.86
Goodwill 6328.55

533
Notes forming part of the Consolidated Financial Statements (contd.)
(iv) Goodwill is attributable to future growth of business out of synergies from this acquisition and assembled workforce. The goodwill is not deductible for income tax purposes.
(v) The transaction cost of R 96.39crore(including R 12.12 crore in previous year) have been expensed in the Statement of Profit and Loss .
(vi) Contingent liability of R 26.85crorehasbeenrecognisedinrespectofcertainclaims(mainlytaxdisputes)whichhavenotbeen acknowledged as debt.
(vii) Thenon-controllinginterest(39.94%ownershipinMindtreeLimited)recognisedattheacquisitiondatewasmeasuredatproportionate share of Mindtree Limited’s net assets.
(viii) TheCompanyfairvalueditsacquisitiondatestakeof28.86%asonJuly2,2019andconsequently,alossofR 329.89crorewas recognised in other comprehensive income.
(ix) MIndtree Limited has reported revenue of R 5917.18croreandprofitaftertaxofR 538.17crorefromthedateofacquisitiontill March 31, 2020. Had the entity been acquired from April 1, 2019, it would have reported revenue of R 7764.25croreandprofit after tax of R 630.87croreduring2019-20.
(x) Out of the R 1315.30 crore trade receivables acquired, R 1249.54 crore have been collected during the year.
(b) Acquisition of Lymbyc Group:
(i) OnAugust29,2019,theGrouphasacquired100%stakeinLymbycSolutionsPrivateLimited,aBengalurubasedcompany,operating in the IT & Technology Services segment.
Lymbyc is a specialist Al, machine learning and advanced analytics company with their proprietary product ‘Leni’. The platform has a combination of natural language processing, data visualisation and predictive analytics capabilities.
(ii) Assets acquired and liabilities recognised on the date of acquisition are as follows:v crore
Lymbyc Group
Assets
Non-current assets
Intangible assets (including under development) 3.70
Software development asset 13.94
Property, plant and equipment 0.06
Other non-current assets 0.86 18.56
Current assets
Trade receivables 1.84
Cash and bank balances 0.02
Other current assets 0.23 2.09
Total Assets 20.65
Liabilities
Non-current liabilities
Long term borrowings 0.20
Deferred tax laibilty 3.51
Other non-current liabilities 0.60 4.31
Current liabilities
Trade payables 0.56
Other current liabilities 3.54 4.10
Total Liabilities 8.41
Net Assets acquired 12.24
NOTE [44] (contd.)

534
NOTES FORMING PART OF THE CONSOLIDATED FINANCIAL STATEMENTS ANNUAL REPORT 2019-20
Notes forming part of the Consolidated Financial Statements (contd.)
(iii) Calculation of Goodwill:v crore
Lymbyc Group
Purchase consideration:
Cash (A) 12.94
Deferred consideration (B) 5.00
Present value of contingent consideration payable over future years (C) 14.42
Purchase consideration (D=A+B+C) 32.36
Less: Fair value of net assets acquired 12.24
Goodwill 20.12
(iv) Goodwill is attributable to future growth of business out of synergies from this acquisition and assembled workforce. The goodwill is not deductible for income tax purposes.
(v) The Group has recognised contingent consideration in accordance with the terms of the share purchase agreement. The maximum contingent consideration of R 16.00croreispayabletothepromotersofLymbycuponachievementofthespecifiedfinancial targets. The fair value of the contingent consideration is determined by assigning probabilities to achievement of targets.
(vi) These entities have reported revenue of R 6.33croreandprofitaftertaxofR 1.06crorefromthedateofacquisitiontillMarch31, 2020. Had the entities been acquired from April 1, 2019, they would have reported revenue of R 9.54 crore and profit after tax of R 0.71 crore during 2019-20.
(vii) The transaction costs of R 0.40 crore related to the acquisition have been included in the Statement of Profit and Loss for the year ended March 31, 2020.
(viii) Trade receivables acquired have been collected during the year.
(c) Acquisition of Powerup Cloud Technologies Private Limited (“Powerup”)
(i) OnOctober25,2019,theGrouphasacquired100%stakeinPowerupCloudTechnologiesPrivateLimited,aBengalurubasedcompany, operating in the IT & Technology Services segment. Powerup is an AWS premier consulting partner with capabilities in cloud consulting, migration, cloud native application development and managed services and also specialises in Azure and GCP cloud Platforms.
(ii) Assets acquired and liabilities recognised on the date of acquisition are as follows:
v crore
Powerup
Assets
Non-current assets
Property, plant and equipment 0.01
Deferred tax assets 2.09
Other non-current assets 7.69 9.79
Current assets
Trade receivables 6.98
Cash and bank balances 0.95
Other current assets 7.09 15.02
Total Assets 24.81
NOTE [44] (contd.)

535
Notes forming part of the Consolidated Financial Statements (contd.)
v crore
Powerup
Liabilities
Non-current liabilities
Long term borrowings 0.95
Other non-current liabilities 7.92 8.87
Current liabilities
Trade payables 5.90
Other current liabilities 23.25 29.15
Total Liabilities 38.02
Net Assets acquired (13.21)
(iii) Calculation of Goodwill:v crore
Powerup
Purchase consideration:
Cash (A) 28.80
Deferred consideration (B) 5.00
Contingent consideration payable over one year (C) 46.65
Purchase consideration (D=A+B+C) 80.45
Less: Fair value of net assets acquired (13.21)
Goodwill 93.66
(iv) Goodwill is attributable to future growth of business out of synergies from this acquisition and assembled workforce. The goodwill is not deductible for income tax purposes.
(v) The Group has recognised contingent consideration in accordance with terms of share purchase and subscription agreement. The maximum contingent consideration of R 52.13 crore is payable to the promoters and identified employees of Powerup upon achievement of specified financial targets. The fair value of contingent consideration is determined by assigning probabilities to achievement of the targets.
(vi) The entity has reported revenue of R 16.12croreandlossofR 1.55 crore from the date of acquisition till March 31, 2020. Had the entity been acquired from April 1, 2019, it would have reported revenue of R 34.86croreandlossofR 13.85croreduring 2019-20.
(vii) The transaction costs of R 0.47 crore related to the acquisition have been included in the Statement of Profit and Loss for the year ended March 31, 2020.
(viii) Out of R 6.98croreoftradereceivablesacquired,R 6.62crorehavebeencollectedduringtheyear.
NOTE [44] (contd.)

536
NOTES FORMING PART OF THE CONSOLIDATED FINANCIAL STATEMENTS ANNUAL REPORT 2019-20
(d) Acquisition of further stake in L&T Gulf Private Limited
(i) OnNovember20,2019,theGrouphasacquiredfurther50%stakeinL&TGulfPrivateLimited.Theentityhasbecomeawholly owned subsidiary. It operates in the Hydrocarbon segment.
(ii) Assets acquired and liabilities recognised on the date of acquisition are as follows:v crore
L&T Gulf Private LimitedAssets Non-current assets Property, plant and equipment 0.41 Deferred tax assets 0.48 Other non-current assets 0.85 1.74 Current assets Trade receivables 4.66 Cash and bank balances 19.76 Other current assets 3.47 27.89Total Assets 29.63Liabilities Current liabilities Trade payables 3.43 Other current liabilities 1.78 5.21Total Liabilities 5.21Net Assets acquired 24.42
(iii) Calculation of Goodwill:v crore
L&T Gulf Private LimitedPurchaseconsiderationpaidincashfor50%stake(A) 25.00Fairvaluationofexisting50%stake(B) 25.00Total (C=A+B) 50.00Less: Fair value of net assets acquired 24.42Goodwill 25.58
(iv) Goodwill is attributable to future growth of business out of synergies from this acquisition and assembled workforce. The goodwill is not deductible for income tax purposes.
(v) The entity has reported revenue of R 12.13 crore and profit after tax of R 8.65crorefromthedateofacquisitiontillMarch31,2020. Had the entity been acquired from April 1, 2019, it would have reported revenue of R 14.76croreandprofitaftertaxof R 1.63croreduring2019-20.
(vi) Out of R 4.66croreoftradereceivablesacquired,R 3.40 crore have been collected during the year.
(e) The Hon’ble National Company Law Tribunal, Chennai Bench vide order dated March 10, 2020 and the Hon’ble National Company Law Tribunal, Mumbai Bench vide order dated April 24, 2020 have approved the scheme of amalgamation of L&T Shipbuilding Ltd (wholly-owned subsidiary) with the Company (‘the Scheme’), the appointed date being April 1, 2019. Accordingly, the effect of theSchemehasbeengiveninthestandalonefinancialsoftheCompanyfortheyear2019-20and2018-19.
(f) The Hon’ble National Company Law Tribunal, Mumbai Bench vide its order dated April 23, 2020 approved the composite scheme of arrangement between L&T Realty Limited, L&T Construction Equipment Limited and L&T Construction Machinery Limited (all wholly-owned subsidiaries of the Company) and their respective shareholders and creditors (‘the Scheme’), the appointed date beingApril1,2018.Accordingly,theeffectoftheSchemehasbeengiveninthestandalonefinancialsoftherespectivecompaniesfortheyear2019-20and2018-19.
Notes forming part of the Consolidated Financial Statements (contd.)NOTE [44] (contd.)

537
NOTE [45]
Disclosure pursuant to Ind AS 105 “Non-current Assets Held for Sale and Discontinued Operations”:
(a) The Group has following non-current assets/disposal group recognised as held for sale as on March 31, 2020
Assets/disposal group Reportable segment
Electrical & Automation business [Note (i)] Electrical & AutomationWealth management business [L&T Capital Markets Limited & L&T Capital Markets
(Middle East) Limited] [Note (ii)] Financial ServicesNon-current assets (buildings) (L&T Financial Consultants Limited) Financial ServicesCurrent assets (L&T Vision Ventures Limited) OthersNon-current assets (land taken on finance lease and buildings) (Mindtree Limited) IT and Technology Services
Notes:
(i) OnMay1,2018,theGrouphadsigned,subjecttoregulatoryapprovals,definitiveagreementswithSchneiderElectricforstrategicdivestmentofitsElectrical&Automation(E&A)business[Note46-compositionofE&Abusiness].TheCompetitionCommissionofIndia(CCI)accordedonApril18,2019itsapproval(thedetailedorderwasuploadedonitswebsiteonJune6,2019) for acquisition of the Group’s E&A business by Schneider Electric subject to fulfilment of certain conditions.
As the sale was likely to be completed within the next one year from then, E&A business had been classified as discontinued operations from Q1 2019-20 onwards. The Group remains committed to its divestment plan. Based on the progress of the divestment process and its current status, the Group continues to classify its E&A business as discontinued operation.
(ii) Subsequent to the year under review, the Group has divested its entire stake in L&T Capital Markets Limited to IIFL Wealth Finance Limited on April 24, 2020.
(b) The Group has following non-current assets/disposal group recognised as held for sale as on March 31, 2019
Assets/disposal group Reportable segmentNon-current assets (buildings) (L&T Financial Consultants Limited) Financial ServicesCurrent assets (L&T Vision Ventures Limited) Others
(c) The proposed sale is expected to be completed within 1 year from the respective reporting dates.
(d) The details of assets/disposal group classified as held for sale and liabilities associated thereto are as under:
v crore
ParticularsAs at
31-3-2020As at
31-3-2019Group(s) of assets classified as held for sale: Property, plant and equipment 780.95 1.17 Capital work-in-progress 21.79 – Investment property 25.13 – Goodwill 333.44 – Other intangible assets 203.35 – Intangible assets under development 122.25 – Right-of-use assets 32.83 – Other loans 3.52 – Inventories 1009.04 – Trade receivables 1184.41 – Cash and cash equivalents 165.78 – Tax assets 4.74 – Other assets 479.98 6.24 Total 4367.21 7.41
Notes forming part of the Consolidated Financial Statements (contd.)
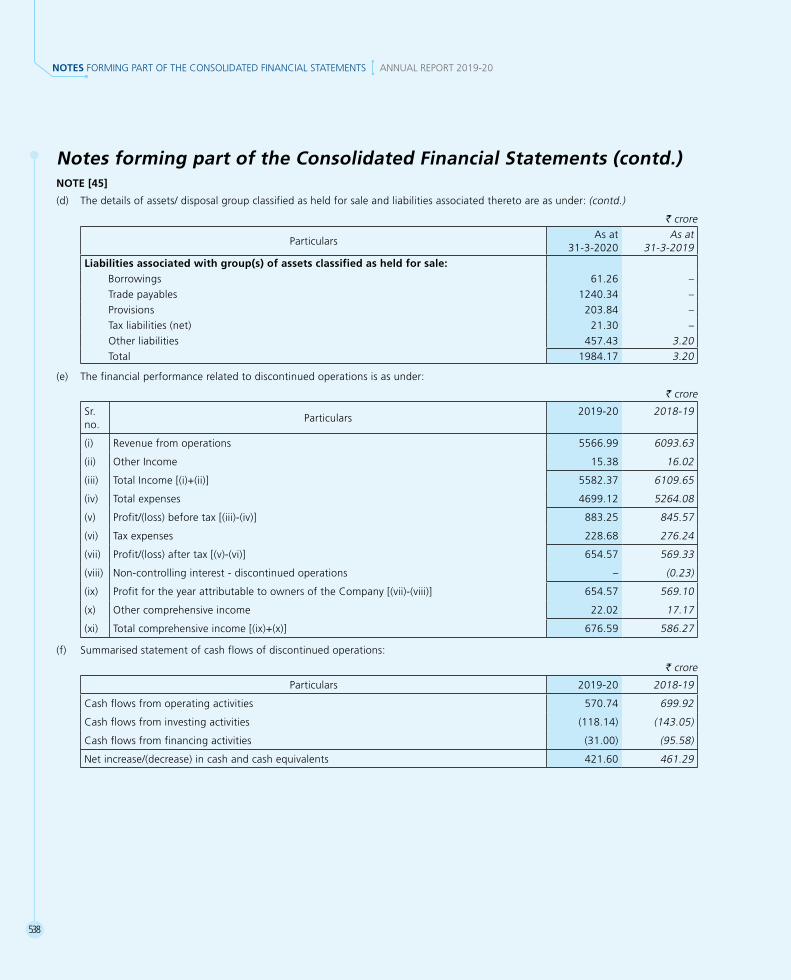
538
NOTES FORMING PART OF THE CONSOLIDATED FINANCIAL STATEMENTS ANNUAL REPORT 2019-20
NOTE [45]
(d) The details of assets/ disposal group classified as held for sale and liabilities associated thereto are as under: (contd.)
v crore
ParticularsAs at
31-3-2020As at
31-3-2019Liabilities associated with group(s) of assets classified as held for sale: Borrowings 61.26 – Trade payables 1240.34 – Provisions 203.84 – Tax liabilities (net) 21.30 – Other liabilities 457.43 3.20 Total 1984.17 3.20
(e) The financial performance related to discontinued operations is as under:
v crore
Sr. no.
Particulars2019-20 2018-19
(i) Revenue from operations 5566.99 6093.63
(ii) Other Income 15.38 16.02
(iii) Total Income [(i)+(ii)] 5582.37 6109.65
(iv) Total expenses 4699.12 5264.08
(v) Profit/(loss) before tax [(iii)-(iv)] 883.25 845.57
(vi) Tax expenses 228.68 276.24
(vii) Profit/(loss) after tax [(v)-(vi)] 654.57 569.33
(viii) Non-controlling interest - discontinued operations – (0.23)
(ix) Profit for the year attributable to owners of the Company [(vii)-(viii)] 654.57 569.10
(x) Other comprehensive income 22.02 17.17
(xi) Total comprehensive income [(ix)+(x)] 676.59 586.27
(f) Summarised statement of cash flows of discontinued operations:
v crore
Particulars 2019-20 2018-19
Cash flows from operating activities 570.74 699.92
Cash flows from investing activities (118.14) (143.05)
Cash flows from financing activities (31.00) (95.58)
Net increase/(decrease) in cash and cash equivalents 421.60 461.29
Notes forming part of the Consolidated Financial Statements (contd.)

539
NOTE [46]DisclosurepursuanttoIndAS108“OperatingSegment”:(a) Information about reportable segments
v crore
ParticularsFor the year ended 31-3-2020 For the year ended 31-3-2019
External Inter-segment Total External Inter-segment TotalRevenueInfrastructure 73036.56 740.75 73777.31 72418.05 785.71 73203.76 Power 2293.62 24.84 2318.46 3971.50 11.59 3983.09 Heavy Engineering 2853.18 351.86 3205.04 2174.22 339.44 2513.66 Defence Engineering 3970.47 8.70 3979.17 3751.97 97.27 3849.24 Electrical & Automation [Note 45] 5232.29 334.70 5566.99 5786.81 306.82 6093.63 Hydrocarbon 17420.45 25.02 17445.47 15131.58 44.65 15176.23 IT & Technology Services 22135.33 199.91 22335.24 14371.36 181.74 14553.10 Financial Services 13822.36 – 13822.36 12637.69 – 12637.69 Developmental Projects 4850.33 – 4850.33 5068.04 – 5068.04 Others 5070.06 238.66 5308.72 5695.88 239.10 5934.99 Total 150684.65 1924.44 152609.09 141007.10 2006.33 143013.43 Less: Revenue from discontinued operations 5232.29 334.70 5566.99 5786.81 306.82 6093.63 Elimination – 1589.74 1589.74 – 1699.51 1699.51Total 145452.36 – 145452.36 135220.29 – 135220.29 Segment result [Profit/(Loss) before interest and tax]Infrastructure 5207.37 5388.77 Power 236.11 129.88 Heavy Engineering 566.01 487.01 Defence Engineering 575.84 472.22 Electrical & Automation [Note 45] 888.06 850.09 Hydrocarbon 1746.18 1178.10 IT & Technology Services 3693.23 3084.20 Financial Services 2678.65 3052.64 Developmental Projects 387.28 314.35 Others 969.43 776.20 Total 16948.16 15733.46 Result of discontinued operations (888.06) (850.09)Inter-segment margins on capital jobs (63.01) (5.50)Finance costs (2796.66) (1802.55)Unallocated corporate income net of expenditure 230.52 365.27 Exceptional items (net) – 294.75 Profit before tax 13430.95 13735.34 Tax expense: Current tax (3564.58) (4402.95) Deferred tax (net) 301.38 335.86 Net profit after tax from continuing operations 10167.75 9668.25 Share in profit/(loss) after tax of joint ventures/associates
(net) 71.96 (21.00)Profit for the year from continuing operations 10239.71 9647.25 Discontinued operationsProfit from discontinued operations 883.25 845.57 Tax expense of discontinued operations (228.68) (276.24)Net profit after tax from discontinued operations 654.57 569.33 Net profit after tax from continuing operations &
discontinued operations 10894.28 10216.58 Non-controlling interest for the year (1345.25) (1311.45)Net profit after tax, non-controlling interests and
share in profit/(loss) of joint ventures/associates 9549.03 8905.13
Notes forming part of the Consolidated Financial Statements (contd.)

540
NOTES FORMING PART OF THE CONSOLIDATED FINANCIAL STATEMENTS ANNUAL REPORT 2019-20
v crore
Segment Assets Segment Liabilities
Particulars As at As at As at As at
31-3-2020 31-3-2019 31-3-2020 31-3-2019
Infrastructure 80369.92 74848.71 52090.81 50908.92
Power 6126.80 6030.51 4381.75 4838.09
Heavy Engineering 4320.26 4020.13 1414.15 1517.38
Defence Engineering 7279.68 7826.76 4265.88 4964.28
Electrical & Automation [Note 45] 4370.28 4183.22 1973.08 2053.88
Hydrocarbon 15355.49 12224.57 12475.30 10096.59
IT & Technology Services 26514.97 9647.21 6876.49 2575.96
Financial Services 108481.90 104842.19 95021.16 92973.64
Developmental Projects 33166.54 30998.97 8768.35 9368.08
Others 10681.05 9819.89 3546.15 3936.13
Segment total 296666.89 264442.16 190813.12 183232.95
Corporate unallocated assets/liabilities 15365.22 16165.54 44974.94 28173.84
Inter-segment assets/liabilities (3891.98) (2260.34) (3891.98) (2260.34)
Consolidated total assets/liabilities 308140.13 278347.36 231896.08 209146.45
v crore
Particulars
Depreciation, amortisation, impairment & obsolescence
included in segment expense
Non-cash expenses other than depreciation included in
segment expense
2019-20 2018-19 2019-20 2018-19
Infrastructure 704.44 764.59 40.31 46.40
Power 38.07 47.16 0.94 2.99
Heavy Engineering 46.29 56.98 1.18 2.19
Defence Engineering 145.26 134.03 1.40 2.59
Electrical & Automation [Note 45] 46.94 161.63 2.50 6.97
Hydrocarbon 151.56 151.83 2.81 7.82
IT & Technology Services 941.28 251.34 52.08 7.25
Financial Services 78.44 49.01 88.64 68.15
Developmental Projects 151.77 207.22 – –
Others 92.48 96.77 0.58 1.46
Segment total 2396.53 1920.56 190.44 145.82
Unallocable 131.89 164.10 2.90 12.15
Less: Relates to discontinued operations 46.94 161.63 2.50 6.97
Inter-segment 19.21 – – –
Consolidated total 2462.27 1923.03 190.84 151.00
Note: Impairment loss included in segment expense: Financial Services segment R 12 crore (previous year: Nil), Developmental Projects segment Nil (previous year: R 127.94 crore), Other segment R 3.28crore(previous year: R 2.08crore) and Corporate Unallocated R 2.09 crore (previous year: R 146.93crore).
Notes forming part of the Consolidated Financial Statements (contd.)NOTE [46]
(a) Information about reportable segments (contd.)

541
v crore
Particulars
Interest income included in segment income
Finance costs included in segment expense
Profit/(loss) of associates and joint ventures accounted
applying equity method not included in segment result
2019-20 2018-19 2019-20 2018-19 2019-20 2018-19
Infrastructure 2.52 6.37 379.58 297.87 0.80 0.96
Power – – – – 204.81 183.60
Heavy Engineering – – – – (162.88) (156.81)
Defence Engineering (0.11) 1.29 – – (1.14) 0.40
Electrical & Automation [Note 45] 3.21 6.61 – – – –
Hydrocarbon 242.95 244.92 – – 9.98 17.70
IT & Technology Services 36.43 5.20 – – – –
Financial Services 232.10 286.25 7519.97 6859.46 – –
Developmental Projects 2.35 1.17 562.24 599.54 (16.88) (90.38)
Others 60.52 66.58 – – (0.03) 6.24
Segment total 579.97 618.39 8461.79 7756.87 34.66 (38.29)
Unallocable 626.12 629.65 (365.83) (297.87) 37.30 17.29
Less: Relates to discontinued operations 3.21 6.61 – – – –
Inter-segment 373.81 346.44 54.08 73.37 – –
Consolidated total 829.07 894.99 8041.88 7385.63 71.96 (21.00)
v crore
Particulars
Additions to non-current assets Investment in associates and joint ventures accounted applying equity method
included in segment assets
2019-20 2018-19 As at 31-3-2020
As at 31-3-2019
Infrastructure 1287.98 1251.62 6.22 4.70
Power 97.67 62.96 1123.84 933.37
Heavy Engineering 176.76 76.76 – –
Defence Engineering 185.09 219.15 5.71 6.36
Electrical & Automation [Note 45] 235.19 258.30 – –
Hydrocarbon 300.18 386.99 419.82 394.60
IT & Technology Services 12711.68 667.31 – –
Financial Services 474.70 860.12 – –
Developmental Projects 2007.26 2938.11 1296.49 1275.49
Others 662.33 629.99 0.20 26.93
Segment total 18138.84 7351.31 2852.28 2641.45
Unallocable 852.08 228.58 (1.27) 0.84
Inter-segment (54.47) (105.29) – –
Consolidated total 18936.45 7474.60 2851.01 2642.29
Notes forming part of the Consolidated Financial Statements (contd.)NOTE [46]
(a) Information about reportable segments (contd.)

542
NOTES FORMING PART OF THE CONSOLIDATED FINANCIAL STATEMENTS ANNUAL REPORT 2019-20
NOTE [46] (contd.)(b) Geographical information
v crore
ParticularsRevenue by location of customers
2019-20 2018-19India (i) 100897.26 95898.05Foreign countries (ii): United States of America 14143.55 8826.86 Kingdom of Saudi Arabia 4938.82 6575.22 Sultanate of Oman 2966.19 3031.69 United Arab Emirates 3851.08 6306.93 Qatar 3692.20 4146.69 Netherland 2677.88 2941.18 Other countries 17517.67 13280.48Total foreign countries (ii) 49787.39 45109.05Total (i+ii) 150684.65 141007.10Less: Discontinued operations 5232.29 5786.81Total 145452.36 135220.29
v crore
ParticularsNon-current assets
As at 31-3-2020
As at 31-3-2019
India 51262.37 38648.66Foreign countries 2243.72 2113.39Total 53506.09 40762.05
(c) Revenue contributed by any single customer in any of the operating segments, whether reportable or otherwise, does not exceed ten percent of the group’s total revenue.
(d) The group’s reportable segments are organised based on the nature of products and services offered by these segments.
(e) Segment reporting: basis of identifying operating segments, reportable segments and definition of each reportable segment:
(i) Basis of identifying operating segments:
Operating segments are identified as those components of the groups (a) that engage in business activities to earn revenues and incur expenses (including transactions with any of the group’s other components); (b) whose operating results are regularly reviewed by the Group’s Corporate Executive Management to make decisions about resource allocation and performance assessment; and (c) for which discrete financial information is available.
The group has nine reportable segments [described under “segment composition”] which are the group’s independent businesses. The nature of products and services offered by these businesses are different and are managed separately given the different sets of technology and competency requirements. In arriving at the reportable segment, the seven operating segments have been aggregated and reported as “infrastructure segment” as these operating segments have similar economic characteristics in terms of long term average gross margins, nature of the products and services, type of customers, methods used to distribute the products and services and the nature of regulatory environment applicable to them.
(ii) Reportable segments
An operating segment is classified as reportable segment if reported revenue (including inter-segment revenue) or absolute amountofresultorassetsexceed10%ormoreofthecombinedtotalofalltheoperatingsegments.
(iii) Performance of a segment is measured based on segment profit (before interest and tax), as included in the internal management reports that are reviewed by the Group’s Corporate Executive Management. The performance of financial services segment and finance lease activities of power development segment are measured based on segment profit (before tax) after deducting the interest expense.
Notes forming part of the Consolidated Financial Statements (contd.)

543
(iv) Segment composition
• Infrastructure segment comprises engineering and construction of building and factories, transportation infrastructure, heavy civil infrastructure, power transmission & distribution, water & effluent treatment, smart world & communication projects and metallurgical & material handling systems.
• Power segment comprises turnkey solutions for Coal-based and Gas-based thermal power plants including power generation equipment with associated systems and/or balance-of-plant packages.
• Heavy Engineering segment comprises manufacture and supply of custom designed, engineered critical equipment & systems to core sector industries like Fertiliser, Refinery, Petrochemical, Chemical, Oil & Gas and Thermal & Nuclear Power.
• Defence Engineering segment comprises (a) design, development, serial production and through life-support of equipment, systems and platforms for Defence and Aerospace sectors and (b) design, construction and repair/refit of defence vessels.
• Electrical & Automation segment comprises manufacture and sale of low and medium voltage switchgear components, custom built low and medium voltage switchboards, electronic energy meters/protection (relays) systems and control & automation products.
• Hydrocarbon segment comprises complete EPC solutions for the global Oil & Gas Industry from front-end design through detailed engineering, modular fabrication, procurement, project management, construction, installation and commissioning.
• IT & Technology Services segment comprises information technology and integrated engineering services.
• Financial Services segment comprises rural finance, housing finance, wholesale finance, mutual fund and wealth management.
• Developmental projects segment comprises development, operation and maintenance of basic infrastructure projects, toll and fare collection, power development, development and operation of port facilities (till the date of sale) and providing related advisory services.
• Others segment includes realty, manufacture and sale of industrial valves, manufacture, marketing and servicing of construction equipment and parts thereof, marketing and servicing of mining machinery and parts thereof, manufacture and sale of rubber processing machinery, mining and aviation. None of the businesses reported as part of others segment meet any of the quantitative thresholds for determining reportable segments for the year ended March 31, 2020.
Notes forming part of the Consolidated Financial Statements (contd.)NOTE [46] (contd.)

544
NOTES FORMING PART OF THE CONSOLIDATED FINANCIAL STATEMENTS ANNUAL REPORT 2019-20
NOTE [47]
Disclosure pursuant to Ind AS 115 “Revenue from Contracts with Customers”:
(a) Disaggregation of revenue into operating segments and geographical areas:v crore
Segment
2019-20Revenue as per Ind AS 115
Other revenue
Total as per Statement of
Profit and Loss/ Segment report
Domestic Foreign Total
Infrastructure 54988.27 17883.72 72871.99 164.57 73036.56Power 1848.75 385.96 2234.71 58.91 2293.62Heavy Engineering 1390.92 1428.61 2819.53 33.65 2853.18Defence Engineering 3624.88 342.40 3967.28 3.19 3970.47Electrical & Automation (discontinued operations) 3904.50 1320.59 5225.09 7.20 5232.29Hydrocarbon 9804.07 7527.39 17331.46 88.99 17420.45IT & Technology Services 1834.31 20301.02 22135.33 – 22135.33Financial Services 669.83 – 669.83 13152.53 13822.36Developmental Projects 3712.05 – 3712.05 1138.28 4850.33Others 4448.14 570.69 5018.83 51.23 5070.06Total 86225.72 49760.38 135986.10 14698.55 150684.65Less: Revenue from discontinued
operations 3904.50 1320.59 5225.09 7.20 5232.29Revenue from continuing operations 82321.22 48439.79 130761.01 14691.35 145452.36
v crore
Segment
2018-19Revenue as per Ind AS 115
Other revenue
Total as per Statement of
Profit and Loss/ Segment report
Domestic Foreign Total
Infrastructure 53212.17 19095.51 72307.68 110.37 72418.05Power 2583.78 1383.77 3967.55 3.95 3971.50Heavy Engineering 964.08 1184.05 2148.13 26.09 2174.22Defence Engineering 3420.43 331.54 3751.97 – 3751.97Electrical & Automation (discontinued operations) 4234.45 1533.30 5767.75 19.06 5786.81Hydrocarbon 7174.51 7945.69 15120.20 11.38 15131.58IT & Technology Services 1217.91 13153.45 14371.36 – 14371.36Financial Services 1135.97 – 1135.97 11501.72 12637.69Developmental Projects 3521.39 – 3521.39 1546.65 5068.04Others 4581.92 443.95 5025.87 670.01 5695.88Total 82046.61 45071.26 127117.87 13889.23 141007.10Less: Revenue from discontinued
operations 4234.45 1533.30 5767.75 19.06 5786.81Revenue from continuing operations 77812.16 43537.96 121350.12 13870.17 135220.29
Notes forming part of the Consolidated Financial Statements (contd.)
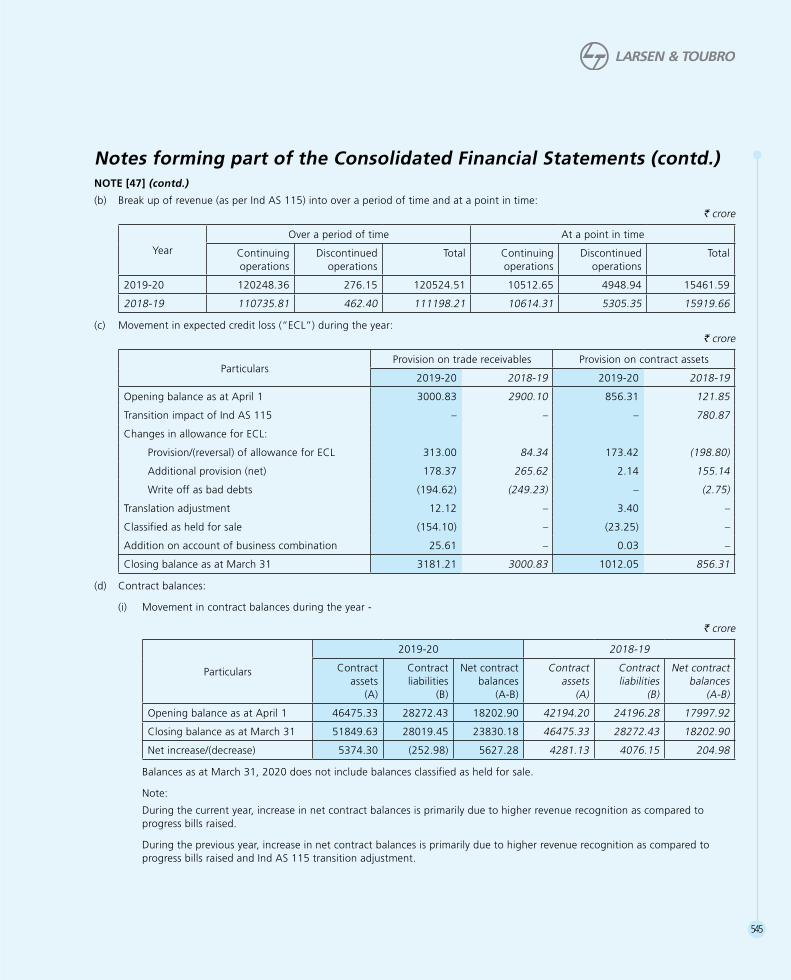
545
(b) Break up of revenue (as per Ind AS 115) into over a period of time and at a point in time:v crore
Year
Over a period of time At a point in time
Continuing operations
Discontinued operations
Total Continuing operations
Discontinued operations
Total
2019-20 120248.36 276.15 120524.51 10512.65 4948.94 15461.59
2018-19 110735.81 462.40 111198.21 10614.31 5305.35 15919.66
(c) Movement in expected credit loss (“ECL”) during the year:v crore
ParticularsProvision on trade receivables Provision on contract assets
2019-20 2018-19 2019-20 2018-19
Opening balance as at April 1 3000.83 2900.10 856.31 121.85
Transition impact of Ind AS 115 – – – 780.87
Changes in allowance for ECL:
Provision/(reversal) of allowance for ECL 313.00 84.34 173.42 (198.80)
Additional provision (net) 178.37 265.62 2.14 155.14
Write off as bad debts (194.62) (249.23) – (2.75)
Translation adjustment 12.12 – 3.40 –
Classified as held for sale (154.10) – (23.25) –
Addition on account of business combination 25.61 – 0.03 –
Closing balance as at March 31 3181.21 3000.83 1012.05 856.31
(d) Contract balances:
(i) Movement in contract balances during the year -
v crore
Particulars
2019-20 2018-19
Contract assets
(A)
Contract liabilities
(B)
Net contract balances
(A-B)
Contract assets
(A)
Contract liabilities
(B)
Net contract balances
(A-B)
Opening balance as at April 1 46475.33 28272.43 18202.90 42194.20 24196.28 17997.92
Closing balance as at March 31 51849.63 28019.45 23830.18 46475.33 28272.43 18202.90
Net increase/(decrease) 5374.30 (252.98) 5627.28 4281.13 4076.15 204.98
Balances as at March 31, 2020 does not include balances classified as held for sale.
Note:
During the current year, increase in net contract balances is primarily due to higher revenue recognition as compared to progress bills raised.
During the previous year, increase in net contract balances is primarily due to higher revenue recognition as compared to progress bills raised and Ind AS 115 transition adjustment.
Notes forming part of the Consolidated Financial Statements (contd.)NOTE [47] (contd.)

546
NOTES FORMING PART OF THE CONSOLIDATED FINANCIAL STATEMENTS ANNUAL REPORT 2019-20
(ii) Revenue recognised from opening balance of contract liabilities amounts to R 7536.12crore(previous year: R 9724.78crore).
(iii) Revenue recognised from the performance obligation satisfied (or partially satisfied) upto previous year (arising out of contract modifications) amounts to R 295.31 crore (previous year: R 221.00 crore).
(e) Cost to obtain/fulfil the contract:
(i) Amortisation in Statement of Profit and Loss: R 18.97crore(previous year: R 5.32 crore).
(ii) Recognised as contract assets as at March 31, 2020 R 118.87crore(as at March 31, 2019 R 30.26crore)
(f) Reconciliation of contracted price with revenue during the year:
v crore
Particulars 2019-20 2018-19
Opening contracted price of orders on hand as at April 1* 640145.61 560785.57
Add:
Fresh orders/change orders received (net) 176430.35 160021.63
Increase due to additional consideration recognised as per contractual terms/(decrease) due to scope reduction (net) (24041.59) 2164.52
Addition on account of business combination 2320.76 –
Increase due to exchange rate movements (net) 6929.54 2798.27
Less:
Orders completed during the year 75306.08 85624.38
Closing contracted price of orders on hand as at March 31* 726478.59 640145.61
Total revenue recognised during the year 135986.10 127117.87
Less: Revenue out of orders completed during the year 34451.56 27545.23
Revenue out of orders under execution at the end of the year (I) 101534.54 99572.64
Revenue recognised upto previous year (from orders pending completion at the end of the year) (II) 304746.53 242938.20
Increase/(decrease) due to exchange rate movements (net) (III) 2422.33 (68.63)
Balance revenue to be recognised in future viz. Order book (IV) 317775.19 297703.40
Closing contracted price of orders on hand as at March 31* (I+II+III+IV) 726478.59 640145.61
Closing contracted price of orders on hand at the end of the year - Continuing operations 722210.41
Closing contracted price of orders on hand at the end of the year - Discontinued operations 4268.18
* including full value of partially executed contracts
(g) Remaining performance obligations and its expected conversion into revenue:v crore
Remaining performance obligation
TotalExpected conversion in revenue
Upto 1 Year
From 1 to 2 years
From 2 to 3 years
From 3 to 4 years
From 4 to 5 years
Beyond 5 years
As at March 31, 2020
Total 317775.19 126750.06 104518.84 58127.31 19742.88 4517.78 4118.32Continuing operations 315199.16 124719.69 104141.46 58051.78 19719.71 4500.33 4066.19Discontinued operations 2576.03 2030.37 377.38 75.53 23.17 17.45 52.13
As at March 31, 2019 297703.40 116804.46 108730.85 44795.85 16996.20 5926.62 4449.42
Notes forming part of the Consolidated Financial Statements (contd.)NOTE [47] (contd.)

547
(h) The Group has undertaken a project for construction, operation and maintenance of the Metro Rail System on Design-Build-Finance-Operate-Transfer (DBFOT) basis as per the concession agreement with the government authorities. The significant terms of the arrangement are as under:
Period of the concession
Initial period of 35 years and extendable by another 25 years at the option of the concessionaire subject to fulfilment of certain conditions under concession agreement.
Remuneration Fare collection rights from the users of the Metro Rail System, license to use land provided by the government for constructing depots and for transit oriented development and earn lease rental income on such development and grant of viability gap fund.
Funding from grantor Viability Gap Funding of R 1458crore.
Infrastructure return at the end of the concession period
Being DBFOT project, the project assets have to be transferred at the end of concession period.
Renewal and termination options
Further extension of 25 years will be granted at the option of the concessionaire upon satisfaction of Key Performance Indicators laid under the concession agreement. This option is to be exercised by the concessionaire during the 33rd year of the initial concession period. Termination of the concession agreement can either be due to (a) Force Majeure (b) Non Political event (c) Indirect political event (d) Political event. On occurrence of any of the above events, the obligations, dispute resolution, termination payments etc are as detailed in the concession agreement.
Rights & Obligations Major obligations of the concessionaire are relating to –
(a) project agreements
(b) change in ownership
(c) issuance of Golden Share to the Government
(d) maintenance of aesthetic quality of the Rail System
(e) operation and maintenance of the rolling stock and equipment necessary and sufficient for handlingUsersequivalentto110%oftheAveragePHPDTetc.
Major obligations of the Government are –
(a) providing required constructible right of way for construction of rail system and land required for construction of depots and transit oriented development
(b) providing reasonable support and assistance in procuring applicable permits required for construction
(c) providing reasonable assistance in obtaining access to all necessary infrastructure facilities and utilities
(d) obligations relating to competing facilities
(e) obligations relating to supply of electricity etc.
Classification of service arrangement
Intangible assets have been recognised towards rights to charge the users of the utility
Construction revenue recognised
R 512.75 crore (previous year: R 387.33crore) [included in Note 47 (a) above]
NOTE [48]
Exceptionalitemfor2018-19representsrecognitionofcertaincustomerdueswhichwerewrittenoffearliersubsequentlyconsideredrecoverable.
Notes forming part of the Consolidated Financial Statements (contd.)NOTE [47] (contd.)

548
NOTES FORMING PART OF THE CONSOLIDATED FINANCIAL STATEMENTS ANNUAL REPORT 2019-20
NOTE [49]
Disclosure pursuant to Ind AS 1 ”Presentation of financial statements“:
(a) Current assets expected to be recovered within twelve months and after twelve months from the reporting date:
v crore
Sr. No.
Particulars
Note As at 31-3-2020 As at 31-3-2019
Within twelve
months
After twelve
monthsTotal
Within twelve
months
After twelve
monthsTotal
1 Inventories 11 3637.58 2109.07 5746.65 5318.60 1095.33 6413.93
2 Trade receivables 13 40284.22 447.30 40731.52 36453.46 392.41 36845.87
3 Other loans 17 716.00 – 716.00 625.59 1.10 626.69
4 Other financial assets 18 2926.52 1.35 2927.87 2551.25 – 2551.25
5 Other current assets 19 49689.89 8969.80 58659.69 44772.56 7370.50 52143.06
(b) Current liabilities expected to be settled within twelve months and after twelve months from the reporting date:
v crore
Sr. No.
Particulars
Note As at 31-3-2020 As at 31-3-2019
Within twelve
months
After twelve
monthsTotal
Within twelve
months
After twelve
monthsTotal
1 Lease liability 374.37 50.58 424.95 – – –
2 Trade payables:
Due to micro enterprises and small enterprises 423.25 56.26 479.51 252.96 8.16 261.12
Due to others 28 41695.77 1468.65 43164.42 41583.63 1150.06 42733.69
3 Other financial liabilities 29 4902.41 20.82 4923.23 4542.62 80.16 4622.78
4 Other current liabilities 30 25575.15 5241.52 30816.67 26333.88 4832.67 31166.55
5 Provisions 31 2536.17 214.68 2750.85 2270.39 173.04 2443.43
Notes forming part of the Consolidated Financial Statements (contd.)

549
NOTE [50]
Disclosure pursuant to Ind AS 7 “Statement of Cash Flows” - Changes in liabilities arising from financing activities:
v crore
Sr. No.
Particulars
Non-current
borrowings (Note 22)
Current borrowings (Note26)
Current maturities
of long term
borrowings (Note 27)
Non-current
lease liability
Current lease
liability
Total
a Balanceasat1-4-2018 72914.76 19331.85 15277.47
NA
107524.08
b Changes from financing cash flows 8493.76 7765.14 1606.44 17865.34
c The effect of changes in foreign exchange rates 46.45 210.74 240.30 497.49
d Interest accrued (net of interest paid) (250.03) 0.11 (81.82) (331.74)
e Other changes (transfer within categories) (7084.15) 1916.00 5168.15 –
f Balance as at 31-3-2019 (f = a to e) 74120.79 29223.84 22210.54 – – 125555.17
g TransitionimpactofIndAS116 (0.06) – – 876.58 298.48 1175.00
h Additions to lease liability – – – 380.66 279.57 660.23
i Changes from financing cash flows 29105.80 4915.20 (20203.40) (58.66) (199.37) 13559.57
j The effect of changes in foreign exchange rates 391.81 246.68 157.81 41.25 4.61 842.16
k Interest accrued (net of interest paid) (142.63) 696.56 399.10 – – 953.03
l Other changes (transfer within categories) (21145.53) – 21145.53 (58.90) 58.90 –
m Conversion to equity – – (54.81) – – (54.81)
n De-recognition of lease liability – – – (15.17) (1.12) (16.29)
o Liabilities classified as held for sale – (61.26) – – (17.57) (78.83)
p Addition on account of business combination 1.15 – – 575.84 1.45 578.44
q Balance as at 31-3-2020 (q = f to p) 82331.33 35021.02 23654.77 1741.60 424.95 143173.67
Amounts reported in Statement of Cash Flows under financing activities -v crore
Sr. No. Particulars 2019-20 2018-19
a Proceeds from non-current borrowings 42587.43 24181.62
b Repayment of non-current borrowings (33685.03) (14081.42)
c Proceeds from other borrowings (net) 4915.20 7765.14
d Repayment of lease liability (258.03) –
e Total changes from financing cash flows (e = a to d) 13559.57 17865.34
Notes forming part of the Consolidated Financial Statements (contd.)

550
NOTES FORMING PART OF THE CONSOLIDATED FINANCIAL STATEMENTS ANNUAL REPORT 2019-20
NOTE [51]
Disclosure pursuant to Ind AS 12 “Income Taxes”:(a) Major components of tax expense/(income):
v croreSr. No.
Particulars2019-20 2018-19
Consolidated Statement of Profit and Loss:(a) Profit and Loss section:
(i) Current income tax: Current income tax expense 3983.86 5001.69 Effect of previously unrecognised tax losses and tax offsets used during the current year (148.77) (567.92) Tax expense in respect of earlier years (80.96) 259.55
3754.13 4693.32(ii) Deferred tax: Tax expense on origination and reversal of temporary differences (251.71) (349.72) Effect of previously unrecognised tax losses and tax offsets on which deferred tax benefit is recognised (752.38) (0.27) Effect on deferred tax balances due to the change in income tax rate 741.84 –
(262.25) (349.99)Income tax expense/(income) reported in the consolidated Statement of Profit and Loss [(i)+(ii)] 3491.88 4343.33Income tax expense attributable to:Profit from continuing operations 3263.20 4067.09Profit from discontinued operations 228.68 276.24
3491.88 4343.33(b) Other comprehensive income section:
(i) Items not to be reclassified to profit or loss in subsequent periods: (A) Current tax expense/(income): On re-measurement of defined benefit plans (49.19) (11.37)
(49.19) (11.37) (B) Deferred tax expense/(income): On re-measurement of defined benefit plans (1.41) 0.39
(1.41) 0.39 (ii) Items to be reclassified to profit or loss in subsequent periods: (A) Current tax expense/(income): On gain/(loss) on cash flow hedges other than mark to market 36.29 (88.36) On foreign currency translation – 0.49
36.29 (87.87) (B) Deferred tax expense/(income): Net gain/(loss) on cost of hedging reserve (8.14) 9.31 On mark to market gain/(loss) on cash flow hedges (370.71) (18.33) On gain/(loss) on fair value of debt securities 19.46 (7.61) On foreign currency translation (4.45) 2.76
(363.84) (13.87)Income tax expense/(income) reported in the other comprehensive income [(i)+(ii)] (378.15) (112.72)
(c) Retained earnings:Deferred tax (31.03) (606.15)Income tax expense/(income) reported in retained earnings (31.03) (606.15)
Notes forming part of the Consolidated Financial Statements (contd.)

551
(b) Reconciliation of income tax expense and accounting profit multiplied by domestic tax rate applicable in India:
v croreSr. No. Particulars 2019-20 2018-19(a) Profit before tax from:
Continuing operations 13430.95 13735.34 Discontinued operations 883.25 845.57
14314.20 14580.91(b) CorporatetaxrateasperIncometaxAct,1961 25.17% 34.94%(c) Tax on accounting profit [(c)=(a)*(b)] 3602.60 5095.16(d) (i) Tax on Income exempt from tax:
Dividend income and interest on tax free bonds (7.08) (69.75)(ii) Tax on expense not tax deductible: (A) Corporate Social Responsibility expenses 69.39 60.10 (B) Expenses in relation to exempt income 80.04 48.58 (C) Tax on employee perquisites borne by the Group 2.08 1.57 (iii) WeighteddeductiononResearch&Developmentexpenditureanddeductionu/s80IA (0.76) (151.25)(iv) Tax effect on impairment and fair valuation losses recognised on which deferred tax
asset is not recognised (6.83) 168.15(v) Effect of previously unrecognised tax losses and unutilised tax credits used to reduce
tax expense (856.79) (773.88)(vi) Tax effect of losses of current year on which no deferred tax benefit is recognised 106.56 580.92(vii) Effect of tax paid on foreign source income which is exempt from tax in India (254.55) (321.18)(viii) Effect on deferred tax due to change in income tax rate 741.84 –(ix) Effect of tax benefit on business combination under common control (164.47) (228.35)(x) Tax effect on various other Items 179.85 (66.74)Total effect of tax adjustments [(i) to (x)] (110.72) (751.83)
(e) Tax expense recognised during the year[(e)=(c)-(d)] 3491.88 4343.33(f) Effective tax rate [(f)=(e)/(a)] 24.39% 29.79%
TheParentCompanyandsomeofthesubsidiarieshaveoptedtopaythetaxundersection115BAAoftheIncomeTaxAct,1961.Accordingly,(a)theprovisionforcurrentanddeferredtaxhasbeendeterminedattherateof25.17%,(b)thedeferredtaxassetsanddeferredtaxliabilitiesasonApril1,2019havebeenrestatedattherateof25.17%and(c)theunutilisedcreditforminimumalternate tax as on April 1, 2019 has been written-off.
(c) (i) Unused tax losses and unused tax credits for which no deferred tax asset is recognised in Balance Sheet:
ParticularsAs at 31-3-2020 As at 31-3-2019v crore Expiry year v crore Expiry year
Tax losses (Business loss and unabsorbed depreciation)- Amount of losses having expiry 3554.29 FY 2021-35 3615.27 FY 2020-34- Amount of losses having no expiry 10425.08 8084.24Tax losses (Capital loss) 614.58 FY2021-28 3901.55 FY 2020-27Unused tax credits [Minimum Alternate Tax (MAT) credit not
recognised] – 199.12 FY 2029-34Total 14593.95 15800.18
Notes forming part of the Consolidated Financial Statements (contd.)NOTE [51] (contd.)

552
NOTES FORMING PART OF THE CONSOLIDATED FINANCIAL STATEMENTS ANNUAL REPORT 2019-20
(ii) Unrecognised deductible temporary differences for which no deferred tax asset is recognised in Balance Sheet: v crore
Sr. No. Particulars As at
31-3-2020As at
31-3-2019(a) Towards provision for diminution in value of investments 628.25 783.94(b) Arising out of upward revaluation of tax base of assets (on account of indexation
benefit) 2718.10 2491.23(c) Other items giving rise to temporary differences 78.08 78.08
Total 3424.43 3353.25
(d) Major components of deferred tax liabilities and deferred tax assets: v crore
Particulars
Deferred tax liabilities/
(assets) as at 31-3-2019
Charge/(credit) to
retained earnings
Charge/(credit) to Statement
of Profit and Loss
Effect due to acquisition/
disposal
Classified as held for
sale
Charge/(credit) to other
comprehensive income
Debit/(credit) to hedge
reserve (other than through
OCI)
Reversal of deferred tax
asset on DDT credit utilised
during the year
Exchange difference
Deferred tax liabilities/
(assets) as at 31-3-2020
Deferred tax liabilities:- Difference between book base and tax
base of property, plant & equipment, investment property and intangible assets 1663.57 – (242.14) – – – – – – 1421.43
- Disputed statutory liabilities paid and claimed as deduction for tax purposes but not debited to Statement of Profit and Loss 157.21 – (23.55) – – – – – – 133.66
- Gain on derivative transactions to be offered for tax purposes in the year of transfer/settlement 70.71 – – – – (68.68) – – – 2.03
- Other items giving rise to temporary differences (401.53) – (217.84) 1170.38 (19.72) – – – (1.87) 529.42
Deferred tax liabilities: 1489.96 – (483.53) 1170.38 (19.72) (68.68) – – (1.87) 2086.54Offsetting of deferred tax liabilities with
deferred tax (assets) (1178.83) (633.50)Net deferred tax liabilities 311.13 1453.04 Deferred tax (assets):- Provision for doubtful debts, loans &
advances and contract assets (2206.94) – 470.09 (5.03) – – – – – (1741.88)- Unpaid statutory liabilities (291.32) – (63.40) – – (1.13) – – – (355.85)- Unabsorbed depreciation (283.03) – 86.50 – – – – – – (196.53)- Carried forward tax losses (119.18) – (737.86) (2.15) – – – – – (859.19)- Unutilised MAT credit (793.84) – 480.86 – 3.98 – – – – (309.00)- Loss on derivative transactions to be
claimed for tax purposes in the year of transfer/settlement 40.08 – 9.13 – – (280.44) 0.07 – – (231.16)
- Difference between book base and tax base of property, plant & equipment, investment property and intangible assets 14.66 – (4.12) (8.59) 0.14 – – – – 2.09
- Other items giving rise to temporary differences (958.19) (31.03) (19.92) (27.55) 16.77 (15.00) – 248.03 (1.67) (788.56)
Deferred tax (assets): (4597.76) (31.03) 221.28 (43.32) 20.89 (296.57) 0.07 248.03 (1.67) (4480.08)Offsetting of deferred tax (assets) with
deferred tax liabilities 1178.83 633.50Net deferred tax (assets) (3418.93) (3846.58)Net deferred tax liability/(assets) (3107.80) (31.03) (262.25) 1127.06 1.17 (365.25) 0.07 248.03 (3.54) (2393.54)
Notes forming part of the Consolidated Financial Statements (contd.)NOTE [51] (contd.)

553
NOTE [52]
Disclosure pursuant to Ind AS 19 “Employee Benefits” [Note 1(II)(p)]:
(a) Defined contribution plans: Amount of R 463.20crore(previous year: R 403.86crore) is recognised as an expense. Out of above, R 443.18crore(previous year: R 386.24crore) is included in “employee benefit expense” [Note 37] and R 19.61crore(previous year: R 16.82crore) pertains to discontinued operations in the Statement of Profit and Loss and R 0.41 crore (previous year: R 0.80crore) has been capitalised.
(b) Defined benefit plans:
(i) The amounts recognised in Balance Sheet are as follows:
v crore
Particulars
Gratuity plan Post-retirement medical benefit plan
Pension plan Trust-managed provident fund plan
As at 31-3-2020
As at 31-3-2019
As at 31-3-2020
As at 31-3-2019
As at 31-3-2020
As at 31-3-2019
As at 31-3-2020
As at 31-3-2019
A) Present value of defined benefit obligation– Wholly funded 1051.92 753.52 – – – – 4671.90 4090.42 – Wholly unfunded 233.47 254.53 340.27 241.63 369.12 337.28 – –
1285.39 1008.05 340.27 241.63 369.12 337.28 4671.90 4090.42 Less: Fair value of plan assets 851.04 649.28 – – – – 4960.42 4128.60 Less: Unrecognised past service costs – – – – – – – – Add: Amount not recognised as an asset
[limit in para 64(b)] 1.40 3.24 – – – – 6.34 3.38 Amount to be recognised as liability or (asset) 435.75 362.01 340.27 241.63 369.12 337.28 (282.18) (34.80)
B) Amounts reflected in the Balance SheetLiabilities 438.09 364.96 340.27 241.63 369.12 337.28 51.82 46.33 Assets (2.34) (2.95) – – – – – (0.10) Net liability/(asset) 435.75 362.01 340.27 241.63 369.12 337.28 51.82 46.23 Net liability/(asset) - Current 435.75 362.01 21.61 14.97 29.49 28.92 51.82 46.23 Net liability/(asset) - Non-current – – 318.66 226.66 339.63 308.36 – –
(ii) The amounts recognised in Statement of Profit and Loss are as follows:
v crore
ParticularsGratuity plan Post-retirement medical
benefit planPension plan Trust-managed
provident fund plan2019-20 2018-19 2019-20 2018-19 2019-20 2018-19 2019-20 2018-19
1 Current service cost 164.01 149.50 22.41 20.01 3.57 3.14 157.67 $ 136.98 $2 Interest cost 62.53 53.22 17.65 16.71 24.31 24.22 357.39 314.71 3 Interest income on plan assets (50.73) (44.24) – – – – (357.39) (314.71)4 Actuarial losses/(gains) - Difference
between actual return on plan assets and interest income (21.53) 5.74 – – – – (253.37) (18.86)
5 Actuarial losses/(gains) - Others 117.60 28.77 83.68 (5.40) 26.24 4.57 – –6 Past service cost 0.17 – – 0.05 – 0.63 – –7 Actuarial gain/(loss) not recognised in
books – – – – – – 253.37 18.86 8 Adjustment for earlier years – 1.29 – – – – – – 9 Effect of the limit in para 64(b) (0.33) (2.76) – – – – – – 10 Translation adjustments (2.14) 1.22 – – – – – – 11 Amount capitalised out of the above (0.34) (1.19) (0.03) (0.01) – – – –
Total (1 to 11) 269.24 191.55 123.71 31.36 54.12 32.56 157.67 136.98
Notes forming part of the Consolidated Financial Statements (contd.)

554
NOTES FORMING PART OF THE CONSOLIDATED FINANCIAL STATEMENTS ANNUAL REPORT 2019-20
v crore
ParticularsGratuity plan Post-retirement medical
benefit planPension plan Trust-managed
provident fund plan2019-20 2018-19 2019-20 2018-19 2019-20 2018-19 2019-20 2018-19
I. Amount included in “Employee benefits expense” 154.25 144.75 21.51 20.93 3.57 3.77 150.74 130.86
II. Amount included as part of “Manufacturing, construction and operating expenses” 0.64 0.31 – – – – – –
III. Amount included as part of “Finance costs” 10.54 7.47 17.65 15.00 24.31 24.22 – –
IV. Amount included as part of “Other comprehensive income” 96.02 31.12 83.68 (5.40) 26.24 4.57 – –
V. Amount included in “Profit from discontinued operations” 7.79 7.90 0.87 0.83 – – 6.93 6.12 Total (I+II+III+IV+V) 269.24 191.55 123.71 31.36 54.12 32.56 157.67 136.98 Actual return on plan assets 72.26 38.50 – – – – 610.76 333.57
(iii) The changes in the present value of defined benefit obligation representing reconciliation of opening and closing balances thereof are as follows:
v crore
Particulars
Gratuity plan Post-retirement medical benefit plan
Pension plan Trust-managed provident fund plan
As at 31-3-2020
As at 31-3-2019
As at 31-3-2020
As at 31-3-2019
As at 31-3-2020
As at 31-3-2019
As at 31-3-2020
As at 31-3-2019
Opening balance of the present value of defined benefit obligation 1008.05 892.09 241.63 222.16 337.28 326.68 4090.42 3633.31 Add: Current service cost 164.01 149.50 22.41 20.01 3.57 3.14 157.67 $ 136.98 $ Add: Interest cost 62.53 53.22 17.65 16.71 24.31 24.22 357.39 314.71 Add: Contribution by plan participants i) Employer – – – – – – – – ii) Employee – – – – – – 414.78 352.78 iii) Transfer-in/(out) – – – – – – – – Add/(less): Actuarial losses/(gains) arising
from changes in - i) Demographic assumptions (1.98) 6.32 6.78 (11.43) (0.04) (15.00) – – ii) Financial assumptions 93.00 11.66 40.13 8.40 24.41 7.60 – – iii) Experience adjustments 26.26 10.79 36.76 (2.37) 1.87 11.96 – – Less: Benefits paid (158.46) (109.45) (12.52) (11.85) (22.28) (21.96) (483.54) (477.56)Less: Unfunded liability classified as held
for sale (23.40) – (12.57) – – – – – Add: Past service cost 0.17 – – – – 0.64 – – Add: Liabilities assumed on transfer of
employees 0.46 (15.31) – – – – 134.63 128.71 Add: Business combination/acquisition 95.16 0.19 – – – – – – Add: Adjustment for earlier years (0.17) 1.48 – – – – (0.07) – Add/(less): Translation adjustments 19.76 7.56 – – – – 0.62 1.49 Closing balance of the present value of defined benefit obligation 1285.39 1008.05 340.27 241.63 369.12 337.28 4671.90 4090.42
Notes forming part of the Consolidated Financial Statements (contd.)NOTE [52] (contd.)

555
(iv) Changes in the fair value of plan assets representing reconciliation of the opening and closing balances thereof are as follows:v crore
Particulars
Gratuity plan Trust-managed provident fund plan
As at 31-3-2020
As at 31-3-2019
As at 31-3-2020
As at 31-3-2019
Opening balance of the fair value of the plan assets 649.28 610.99 4128.60 3676.19
Add: Interest income on plan assets* 50.73 44.24 357.39 314.71
Add/(less): Actuarial gains/(losses) - Difference between actual return on plan assets and interest income 21.53 (5.74) 253.37 18.86
Add: Contribution by the employer 136.91 69.11 160.88 132.76
Add: Contribution by plan participants – – 408.23 334.82
Add: Assets assumed on transfer of employees 0.10 – 135.02 128.98
Add: Business combination/disposal (net) 63.80 – – –
Less: Benefits paid (71.31) (69.16) (483.54) (477.56)
Add: Adjustment for earlier years – – 0.47 0.18
Less: Settlements – (0.16) – (0.34)
Closing balance of the plan assets 851.04 649.28 4960.42 4128.60
Notes: The fair value of the plan assets under the trust managed provident fund plan has been determined at amounts based on their value at the time of redemption, assuming a constant rate of return to maturity.
* Basis used to determine interest income on plan assets:
The Trust formed by the Parent Company and a few subsidiaries manage the investments of provident funds and gratuity fund. Interest income on plan assets is determined by multiplying the fair value of the plan assets by the discount rate stated in (vii) below both determined at the start of the annual reporting period.
The Group expects to fund R 168.82crore(previous year: R 111.90 crore) towards its gratuity plan and R 174.71 crore (previous year: R 143.83crore) towards its trust-managed provident fund plan during the year 2020-21.
$ Employer’scontributiontoprovidentfund.
(v) The fair value of major categories of plan assets are as follows:
v crore
Particulars
Gratuity plan
As at 31-3-2020 As at 31-3-2019
Quoted Unquoted Total Quoted Unquoted Total
Cash and cash equivalents – 3.06 3.06 – 1.78 1.78
Equity instruments 11.62 – 11.62 15.81 – 15.81
Debt instruments - Corporate bonds 244.33 – 244.33 193.00 – 193.00
Debt instruments - Central Government bonds 170.41 – 170.41 162.66 – 162.66
Debt instruments - State Government bonds 92.54 – 92.54 77.63 – 77.63
Debt instruments - Public Sector Unit bonds 14.91 – 14.91 8.41 – 8.41
Mutual funds - Equity 11.62 9.35 20.97 7.20 9.88 17.08
Mutual funds - Debt – – – – 4.75 4.75
Notes forming part of the Consolidated Financial Statements (contd.)NOTE [52] (contd.)

556
NOTES FORMING PART OF THE CONSOLIDATED FINANCIAL STATEMENTS ANNUAL REPORT 2019-20
Notes forming part of the Consolidated Financial Statements (contd.)NOTE [52] (contd.)
v crore
Particulars
Gratuity plan
As at 31-3-2020 As at 31-3-2019
Quoted Unquoted Total Quoted Unquoted Total
Mutual funds - Others 0.25 2.62 2.87 – – –
Special deposit scheme – 2.60 2.60 – 1.49 1.49
Fixed deposits – 3.00 3.00 – 1.85 1.85
Insurer managed fund – 277.54 277.54 – 163.17 163.17
Other (payables)/receivables – 7.19 7.19 – 1.65 1.65
Closing balance of the plan assets 545.68 305.36 851.04 464.71 184.57 649.28
v crore
Particulars
Trust-managed provident fund plan
As at 31-3-2020 As at 31-3-2019
Quoted Unquoted Total Quoted Unquoted Total
Cash and cash equivalents – 24.63 24.63 – 7.28 7.28
Equity instruments 16.09 – 16.09 0.06 – 0.06
Debt instruments - Corporate bonds 1391.85 – 1391.85 831.42 – 831.42
Debt instruments - Central Government bonds 1069.27 – 1069.27 956.71 – 956.71
Debt instruments - State Government bonds 1236.85 – 1236.85 988.14 – 988.14
Debt instruments - Public Sector Unit bonds 774.67 – 774.67 890.85 – 890.85
Mutual funds - Equity 77.90 66.76 144.66 56.48 75.28 131.76
Mutual funds - Debt 0.09 – 0.09 0.34 34.09 34.43
Mutual funds - Others 10.84 0.04 10.88 – 1.98 1.98
Special deposit scheme – 271.69 271.69 – 271.20 271.20
Fixed deposits – 2.13 2.13 – 2.60 2.60
Other (payables)/receivables 13.26 4.35 17.61 7.99 4.18 12.17
Closing balance of the plan assets 4590.82 369.60 4960.42 3731.99 396.61 4128.60
(vi) The average duration of the defined benefit obligation at the end of the reporting period is as follows:
Plans As at 31-3-2020 As at 31-3-2019
1. Gratuity 6.83 6.16
2. Post-retirement medical benefit plan 14.60 14.60
3. Pension plan 7.81 7.70

557
(vii) Principal actuarial assumptions at the Balance Sheet date (expressed as weighted average):
Plans As at 31-3-2020 As at 31-3-2019
(A) Discount rate:
(a) Gratuity plan 6.48% 7.31%
(b) Pension plan 6.48% 7.31%
(c) Post-retirement medical benefit plan 6.48% 7.31%
(B) Annual increase in healthcare costs (see note below) 5.00% 5.00%
(C) Salary growth rate:
(a) Gratuity plan 5.77% 5.12%
(b) Pension plan 7.92% 7.00%
(D) Attrition Rate:
(a) Forgratuityplan,theattritionratevariesfrom1%to25%(previousyear:1%to25%)for various age groups.
(b) Forpensionplan,theattritionratevariesfrom0%to2%(previousyear:0%to2%) for various age groups.
(c) Forpost-retirementmedicalbenefitplan,theattritionratevariesfrom1%to19%(previousyear:1%to11%) for various age groups.
(E) The estimates of future salary increases, considered in actuarial valuation, take into account inflation, seniority, promotion and other relevant factors, such as supply and demand in the employment market.
(F) The interest payment obligation of trust-managed provident fund is assumed to be adequately covered by the interest income on long term investments of the fund. Any shortfall in the interest income over the interest obligation is recognised immediately in the Statement of Profit and Loss as actuarial losses.
(G) The obligation of the Group under the post-retirement medical benefit plan is limited to the overall ceiling limits. At present, healthcare cost, as indicated in the principal actuarial assumption given above, has been assumed to increase at 5%p.a.
(H) One percentage point change in actuarial assumptions would have the following effects on defined benefit obligation:
v crore
ParticularsEffectof1%increase Effectof1%decrease
As at 31-3-2020
As at 31-3-2019
As at 31-3-2020
As at 31-3-2019
Gratuity
Impact of change in salary growth rate 86.20 58.64 (76.84) (53.14)
Impact of change in discount rate (76.50) (51.99) 86.74 58.35
Post-retirement medical benefit plan
Impact of change in health care cost 27.19 26.97 (22.27) (22.03)
Impact of change in discount rate (46.36) (33.66) 59.00 41.66
Company pension plan
Impact of change in discount rate (27.51) (24.45) 31.72 28.13
(viii) Characteristics of defined benefit plans and associated risks:
(A) Gratuity plan:
The Parent Company operates gratuity plan through a trust wherein every employee is entitled to the benefit equivalent to fifteen days salary last drawn for each completed year of service. The same is payable on termination of service or
Notes forming part of the Consolidated Financial Statements (contd.)NOTE [52] (contd.)

558
NOTES FORMING PART OF THE CONSOLIDATED FINANCIAL STATEMENTS ANNUAL REPORT 2019-20
retirement whichever is earlier. The benefit vests after five years of continuous service. The company’s scheme is more favourable as compared to the obligation under The Payment of Gratuity Act, 1972.
The defined benefit plans for gratuity of the Parent Company and material domestic subsidiary companies are administered by separate gratuity funds that are legally separate from the Parent Company and the material domestic subsidiary companies. The trustees nominated by the Group are responsible for the administration of the plans. There are no minimum funding requirements of these plans. The funding of these plans is based on gratuity fund’s actuarial measurement framework set out in the funding policies of the plan. These actuarial measurements are similar compared to the assumptions set out in (vii) supra. An insignificant portion of the gratuity plan of the group attributable to subsidiary companies is administered by the respective subsidiary companies and is funded through insurer managed funds. A part of the gratuity plan is unfunded and managed within the Group. Further, the unfunded portion also includes amounts payable in respect of the Group’s foreign operations which result in gratuity payable to employees engaged as per the local laws of country of operation. Employees do not contribute to any of these plans.
(B) Post-retirement medical care plan:
The post-retirement medical benefit plan provides for reimbursement of health care costs to certain categories of employees post their retirement. The reimbursement is subject to an overall ceiling sanctioned based on cadre of the employee at the time of retirement. The plan is unfunded. Employees do not contribute to the plan.
(C) Pension plan:
In addition to contribution to state-managed pension plan (EPS scheme), the Group operates a post retirement pension scheme, which is discretionary in nature for certain cadres of employees. The quantum of pension depends on the cadre of the employee at the time of retirement. The plan is unfunded. Employees do not contribute to the plan.
(D) Trust-managed provident fund plan:
The Parent Company and a few subsidiaries manage provident fund plan through a provident fund trust for its employees which is permitted under The Employees’ Provident Funds and Miscellaneous Provisions Act, 1952. The plan mandates contribution by employer at a fixed percentage of employee’s salary. Employees also contribute to the plan at a fixed percentage of their salary as a minimum contribution and additional sums at their discretion. The plan guarantees interest at the rate notified by the provident fund authority. The contribution by employer and employee together with interest are payable at the time of separation from service or retirement whichever is earlier. The benefit under this plan vests immediately on rendering of service.
The interest payment obligation of trust-managed provident fund is assumed to be adequately covered by the interest income on long term investments of the fund. Any shortfall in the interest income over the interest obligation is recognised immediately in the Statement of Profit and Loss as actuarial loss. Any loss/gain arising out of the investment risk and actuarial risk associated with the plan is also recognised as expense or income in the period in which such loss/gain occurs.
All the above defined benefit plans expose the Group to general actuarial risks such as interest rate risk and market (investment) risk.
NOTE [53]
Disclosure pursuant to Ind AS 20 “Accounting for Government Grants and Disclosure of Government Assistance”:
The Group’s exports qualify for various export benefits offered in the form of duty credit scrips under foreign trade policy framed by Department General of Foreign Trade India (DGFT). Income/reduction from underlying expenses recognised towards such export incentives and duty drawback amounts to R 253.61crore(previous year: R 252.91crore).
Notes forming part of the Consolidated Financial Statements (contd.)NOTE [52] (contd.)

559
NOTE [54]
Disclosure of related parties/related party transactions pursuant to Ind AS 24 “Related Party Disclosures”
(a) List of related parties: (i) Name of associate companies with whom transactions were carried out during the year:
Associate Companies:1 L&T-Chiyoda Limited 2 Magtorq Private Limited3 L&T Camp Facilities LLC 4 Larsen & Toubro Qatar & HBK Contracting Co. WLL
(ii) Name of joint venture companies with whom transactions were carried out during the year:
Joint Venture Companies:1 L&T Interstate Road Corridor Limited 2 L&T-Sargent & Lundy Limited3 Ahmedabad - Maliya Tollway Limited 4 L&T Halol-Shamlaji Tollway Limited5 L&T Chennai-Tada Tollway Limited 6 Krishnagiri Walajahpet Tollway Limited*7 Beawar Pali Pindwara Tollway Limited* 8 Devihalli Hassan Tollway Limited*9 L&T Rajkot-Vadinar Tollway Limited 10 L&T Howden Private Limited
11 L&T Deccan Tollways Limited 12 L&T Sapura Shipping Private Limited13 L&T Samakhiali Gandhidham Tollway Limited 14 L&T Sapura Offshore Private Limited15 Kudgi Transmission Limited 16 L&T-GulfPrivateLimited@17 L&T Sambalpur- Rourkela Tollway limited 18 L&T-MHPS Boilers Private Limited19 L&T Infrastructure Development Projects Limited 20 L&T-MHPS Turbine Generators Private Limited21 Panipat Elevated Corridor Limited 22 Raykal Aluminium Company Private Limited23 Krishnagiri Thopur Toll Road Limited* 24 L&T Special Steels and Heavy Forgings Private Limited25 Western Andhra Tollways Limited* 26 PNG Tollway Limited27 Vadodara Bharuch Tollway Limited 28 L&T Kobelco Machinery Private Limited **29 L&T Transportation Infrastructure Limited 30 L&T MBDA Missile Systems Limited31 L&T Hydrocarbon Caspian LLC
*TheGrouphassolditsstakeonMay4,2018 ** The Group has sold its stake on April 17, 2019 @Reclassifiedassubsidiaryw.e.f.November20,2019duetopurchaseofadditionalstake.
(iii) Name of post-employment benefit plans with whom transactions were carried out during the year:
Provident Fund Trusts:1 Larsen & Toubro Officers & Supervisory Staff Provident Fund2 Larsen & Toubro Limited Provident Fund of 19523 Larsen & Toubro Limited Provident Fund4 L&T Kansbahal Officers & Supervisory Provident Fund5 L&T Kansbahal Staff & Workmen Provident Fund6 L&T Construction Equipment Provident Fund Trust7 L&T Valves Employees Provident Fund
Gratuity Trusts:1 Larsen & Toubro Officers & Supervisors Gratuity Fund2 Larsen & Toubro Gratuity Fund3 L&T Technology Services Limited Employee Group Gratuity Scheme 4 L&T Shipbuilding Limited Employees Group Assurance Scheme5 Nabha Power Limited Employees’ Group Gratuity Assurance Scheme6 L&T Hydrocarbon Engineering Ltd Group Gratuity Scheme7 Mindtree Limited Employees Gratuity Fund Trust *
* w.e.f. July 2, 2019
Superannuation Trust Larsen & Toubro Limited Senior Officers’ Superannuation Scheme
Notes forming part of the Consolidated Financial Statements (contd.)

560
NOTES FORMING PART OF THE CONSOLIDATED FINANCIAL STATEMENTS ANNUAL REPORT 2019-20
(iv) Name of Key Management Personnel (of the parent company) and their relatives with whom transactions were carried out during the year:
(A) Executive Directors:1 Mr. S. N. Subrahmanyan (Chief Executive Officer and
Managing Director)2 Mr. R. Shankar Raman (Whole-time Director and
Chief Financial Officer)3 Mr. Shailendra Roy (Whole-time Director) 4 Mr. D. K. Sen (Whole-time Director)5 Mr. M. V. Satish (Whole-time Director) 6 Mr. J.D. Patil (Whole-time Director)
(B) Independent/Non-executive Directors:1 Mr. A.M. Naik (Group Chairman) 2 Mr. M. M. Chitale3 Mr. Subodh Bhargava 4 Mr. M. Damodaran5 Mr. Vikram Singh Mehta 6 Mr. Adil Zainulbhai7 Mr. Akhilesh Gupta * 8 Mrs. Sunita Sharma9 Mr.ThomasMathewT$ 10 Mr. Ajay Shankar #
11 Mr. Subramanian Sarma 12 Mrs. Naina Lal Kidwai13 Mr. Sanjeev Aga 14 Mr. N. Kumar15 Mr. Arvind Gupta ** 16 Mr.HemantBhargava@17 Mr. Sushobhan Sarker ##
*Ceasedw.e.f.September8,2019 **Ceasedw.e.f.March26,2020 @Appointedw.e.f.May28,2018 $Ceasedw.e.f.April2,2020 #Ceasedw.e.f.May29,2020 ##Ceasedw.e.f.May2,2018
(v) Entity with common Key Management Personnel
Mindtree Foundation*
*w.e.f. September 17, 2019
(b) Disclosure of related party transactions:
v crore
Sr. No. Nature of transaction/relationship/major parties
2019-20 2018-19
Amount Amounts for major parties
Amount Amounts for major parties
(i) Purchase of goods & services (including commission paid) Joint ventures, including: 853.97 1210.35 L&T-MHPS Boilers Private Limited 587.70 779.49 L&T-MHPS Turbine Generators Private Limited 117.38 187.78 Associates, including: 249.53 162.15 L&T-Chiyoda Limited 234.65 154.52
Total 1103.50 1372.50
(ii) (A) Sale of goods/contract revenue & services Joint ventures, including: 104.31 184.85 L&T-MHPS Boilers Private Limited 96.79 168.41 Associate: – 0.13 L&T-Chiyoda Limited – 0.13
Total 104.31 184.98
(B) Reversal of sale of goods/contract revenue & services Joint ventures: 0.01 25.99 L&T Deccan Tollways Limited – 23.86 L&T Samakhiali Gandhidham Tollway Limited – 2.13 L&T-Sargent & Lundy Limited 0.01 –
Total 0.01 25.99
Notes forming part of the Consolidated Financial Statements (contd.)NOTE [54] (contd.)
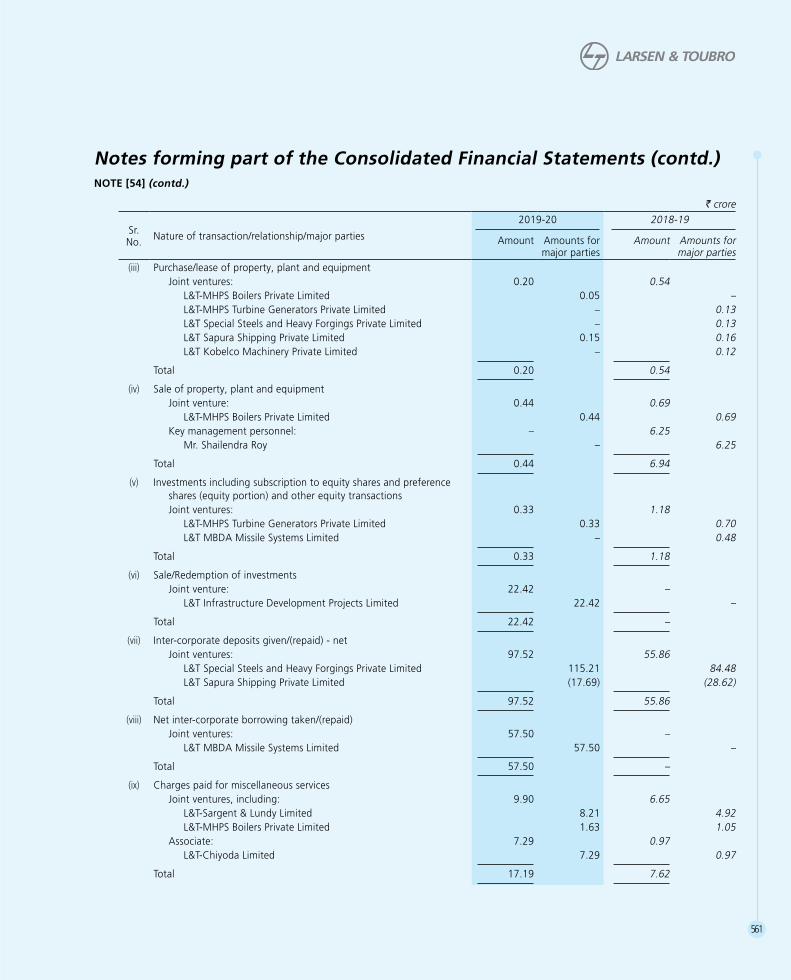
561
v crore
Sr. No. Nature of transaction/relationship/major parties
2019-20 2018-19
Amount Amounts for major parties
Amount Amounts for major parties
(iii) Purchase/lease of property, plant and equipment Joint ventures: 0.20 0.54 L&T-MHPS Boilers Private Limited 0.05 – L&T-MHPS Turbine Generators Private Limited – 0.13 L&T Special Steels and Heavy Forgings Private Limited – 0.13 L&T Sapura Shipping Private Limited 0.15 0.16 L&T Kobelco Machinery Private Limited – 0.12
Total 0.20 0.54
(iv) Sale of property, plant and equipment Joint venture: 0.44 0.69 L&T-MHPS Boilers Private Limited 0.44 0.69 Key management personnel: – 6.25 Mr. Shailendra Roy – 6.25
Total 0.44 6.94
(v) Investments including subscription to equity shares and preference shares (equity portion) and other equity transactions Joint ventures: 0.33 1.18 L&T-MHPS Turbine Generators Private Limited 0.33 0.70 L&T MBDA Missile Systems Limited – 0.48
Total 0.33 1.18
(vi) Sale/Redemption of investments Joint venture: 22.42 – L&T Infrastructure Development Projects Limited 22.42 –
Total 22.42 –
(vii) Inter-corporate deposits given/(repaid) - net Joint ventures: 97.52 55.86 L&T Special Steels and Heavy Forgings Private Limited 115.21 84.48 L&T Sapura Shipping Private Limited (17.69) (28.62)
Total 97.52 55.86
(viii) Net inter-corporate borrowing taken/(repaid) Joint ventures: 57.50 – L&T MBDA Missile Systems Limited 57.50 –
Total 57.50 –
(ix) Charges paid for miscellaneous services Joint ventures, including: 9.90 6.65 L&T-Sargent & Lundy Limited 8.21 4.92 L&T-MHPS Boilers Private Limited 1.63 1.05 Associate: 7.29 0.97 L&T-Chiyoda Limited 7.29 0.97
Total 17.19 7.62
Notes forming part of the Consolidated Financial Statements (contd.)NOTE [54] (contd.)

562
NOTES FORMING PART OF THE CONSOLIDATED FINANCIAL STATEMENTS ANNUAL REPORT 2019-20
v crore
Sr. No. Nature of transaction/relationship/major parties
2019-20 2018-19
Amount Amounts for major parties
Amount Amounts for major parties
(x) Rent paid, including lease rentals under leasing arrangements Joint ventures, including: 3.49 1.24 L&T Special Steels and Heavy Forgings Private Limited 3.20 1.20
Total 3.49 1.24
(xi) Rent received, overheads recovered and miscellaneous income Joint ventures, including: 72.71 79.40 L&T-MHPS Boilers Private Limited 28.40 35.10 L&T-Sargent & Lundy Limited 11.39 11.77 L&T-MHPS Turbine Generators Private Limited 8.32 8.04 L&T Infrastructure Development Projects Limited 7.93 6.06 Associate: 18.44 23.20 L&T-Chiyoda Limited 18.44 23.20 Key management personnel: – 0.03 Mr. D. K. Sen – 0.03
Total 91.15 102.63
(xii) (A) Charges incurred for deputation of employees from related parties Joint venture: – 1.00 L&T Infrastructure Development Projects Limited – 1.00
Total – 1.00
(B) Charges recovered for deputation of employees to related parties Joint ventures, including: 5.50 7.71 L&T Infrastructure Development Projects Limited 0.66 1.62 L&T Special Steels and Heavy Forgings Private Limited 0.77 1.35 L&T Sapura Shipping Private Limited 4.08 4.13 Associate: 6.59 12.88 L&T-Chiyoda Limited 6.59 12.88
Total 12.09 20.59
(xiii) Dividend received Joint ventures: 12.53 19.44 L&T-MHPS Boilers Private Limited 11.94 11.94 L&T Kobelco Machinery Private Limited 0.59 – L&T-Sargent & Lundy Limited – 7.50
Total 12.53 19.44
(xiv) Commission received, including those under agency arrangements Joint ventures: 0.05 3.80 L&T-MHPS Boilers Private Limited 0.05 0.05 L&T Kobelco Machinery Private Limited – 3.75
Total 0.05 3.80
Notes forming part of the Consolidated Financial Statements (contd.)NOTE [54] (contd.)

563
v crore
Sr. No. Nature of transaction/relationship/major parties
2019-20 2018-19
Amount Amounts for major parties
Amount Amounts for major parties
(xv) Guarantee charges recovered from Joint ventures, including: 0.55 0.52 L&T-MHPS Turbine Generators Private Limited 0.55 0.50
Total 0.55 0.52
(xvi) Interest paid to Joint ventures: 4.16 1.81 L&T MBDA Missile Systems Limited 2.42 – L&T-MHPS Turbine Generators Private Limited 1.74 1.81
Total 4.16 1.81
(xvii) Interest received from Joint ventures, including: 133.10 111.86 L&T Special Steels and Heavy Forgings Private Limited 104.14 106.83 L&T Infrastructure Development Projects Limited 21.56 – Associate: – 0.26 L&T Camp Facilities LLC – 0.26
Total 133.10 112.12
(xviii) Amount written off as bad debts Joint venture: – 25.08 PNG Tollway Limited – 25.08
Total – 25.08
(xix) Amount recognised/(reversed) in P&L as provision towards bad and doubtful debts (including expected credit loss on account of delay) Joint ventures: 4.76 (0.38) L&T Special Steels and Heavy Forgings Private Limited 0.08 (0.09) L&T Howden Private Limited (0.13) (0.33) L&T-MHPS Boilers Private Limited (0.37) 1.55 L&T-MHPS Turbine Generators Private Limited 0.10 0.03 L&T Sapura Offshore Private Limited 5.08 – L&T Samakhiali Gandhidham Tollway Limited – (1.54)
Total 4.76 (0.38)
(xx) Donation Given: Entity with common key management personnel: 1.15 – Mindtree Foundation 1.15 –
Total 1.15 –
(xxi) Rent deposit returned: Key management personnel: – 0.08 Mr. D.K. Sen – 0.08
Total – 0.08
Notes forming part of the Consolidated Financial Statements (contd.)NOTE [54] (contd.)
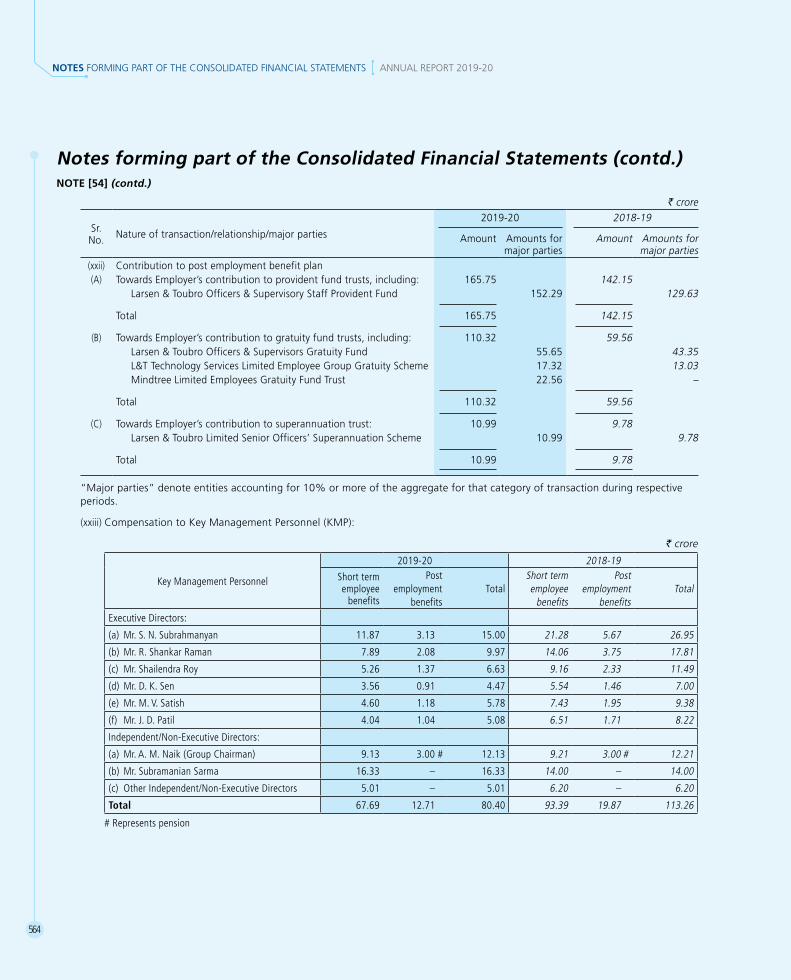
564
NOTES FORMING PART OF THE CONSOLIDATED FINANCIAL STATEMENTS ANNUAL REPORT 2019-20
v crore
Sr. No. Nature of transaction/relationship/major parties
2019-20 2018-19
Amount Amounts for major parties
Amount Amounts for major parties
(xxii) Contribution to post employment benefit plan(A) Towards Employer’s contribution to provident fund trusts, including: 165.75 142.15
Larsen & Toubro Officers & Supervisory Staff Provident Fund 152.29 129.63
Total 165.75 142.15
(B) Towards Employer’s contribution to gratuity fund trusts, including: 110.32 59.56 Larsen & Toubro Officers & Supervisors Gratuity Fund 55.65 43.35 L&T Technology Services Limited Employee Group Gratuity Scheme 17.32 13.03 Mindtree Limited Employees Gratuity Fund Trust 22.56 –
Total 110.32 59.56
(C) Towards Employer’s contribution to superannuation trust: 10.99 9.78 Larsen & Toubro Limited Senior Officers’ Superannuation Scheme 10.99 9.78
Total 10.99 9.78
“Majorparties”denoteentitiesaccountingfor10%ormoreoftheaggregateforthatcategoryoftransactionduringrespectiveperiods.
(xxiii) Compensation to Key Management Personnel (KMP):
v crore
Key Management Personnel
2019-20 2018-19
Short term employee
benefits
Post employment
benefitsTotal
Short term employee
benefits
Post employment
benefitsTotal
Executive Directors:
(a) Mr. S. N. Subrahmanyan 11.87 3.13 15.00 21.28 5.67 26.95
(b) Mr. R. Shankar Raman 7.89 2.08 9.97 14.06 3.75 17.81
(c) Mr. Shailendra Roy 5.26 1.37 6.63 9.16 2.33 11.49
(d) Mr. D. K. Sen 3.56 0.91 4.47 5.54 1.46 7.00
(e) Mr. M. V. Satish 4.60 1.18 5.78 7.43 1.95 9.38
(f) Mr. J. D. Patil 4.04 1.04 5.08 6.51 1.71 8.22
Independent/Non-Executive Directors:
(a) Mr. A. M. Naik (Group Chairman) 9.13 3.00 # 12.13 9.21 3.00 # 12.21
(b) Mr. Subramanian Sarma 16.33 – 16.33 14.00 – 14.00
(c) Other Independent/Non-Executive Directors 5.01 – 5.01 6.20 – 6.20
Total 67.69 12.71 80.40 93.39 19.87 113.26
# Represents pension
Notes forming part of the Consolidated Financial Statements (contd.)NOTE [54] (contd.)
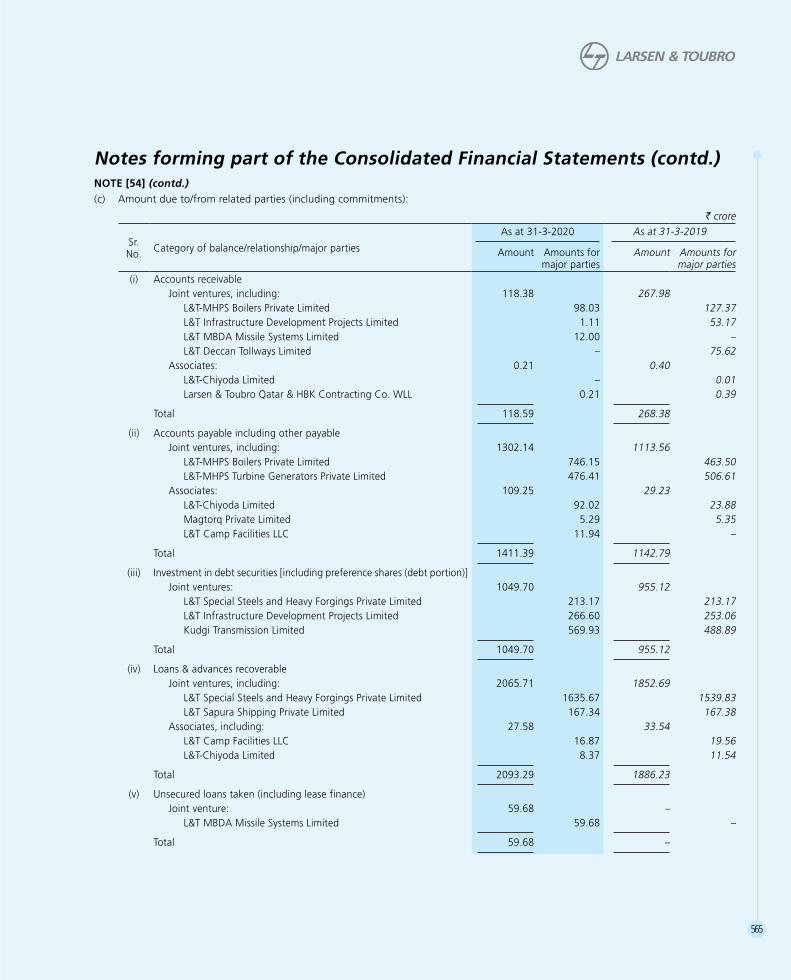
565
(c) Amount due to/from related parties (including commitments):
v crore
Sr. No. Category of balance/relationship/major parties
As at 31-3-2020 As at 31-3-2019
Amount Amounts for major parties
Amount Amounts for major parties
(i) Accounts receivable Joint ventures, including: 118.38 267.98 L&T-MHPS Boilers Private Limited 98.03 127.37 L&T Infrastructure Development Projects Limited 1.11 53.17 L&T MBDA Missile Systems Limited 12.00 – L&T Deccan Tollways Limited – 75.62 Associates: 0.21 0.40 L&T-Chiyoda Limited – 0.01 Larsen & Toubro Qatar & HBK Contracting Co. WLL 0.21 0.39
Total 118.59 268.38
(ii) Accounts payable including other payable Joint ventures, including: 1302.14 1113.56 L&T-MHPS Boilers Private Limited 746.15 463.50 L&T-MHPS Turbine Generators Private Limited 476.41 506.61 Associates: 109.25 29.23 L&T-Chiyoda Limited 92.02 23.88 Magtorq Private Limited 5.29 5.35 L&T Camp Facilities LLC 11.94 –
Total 1411.39 1142.79
(iii) Investment in debt securities [including preference shares (debt portion)] Joint ventures: 1049.70 955.12 L&T Special Steels and Heavy Forgings Private Limited 213.17 213.17 L&T Infrastructure Development Projects Limited 266.60 253.06 Kudgi Transmission Limited 569.93 488.89
Total 1049.70 955.12
(iv) Loans & advances recoverable Joint ventures, including: 2065.71 1852.69 L&T Special Steels and Heavy Forgings Private Limited 1635.67 1539.83 L&T Sapura Shipping Private Limited 167.34 167.38 Associates, including: 27.58 33.54 L&T Camp Facilities LLC 16.87 19.56 L&T-Chiyoda Limited 8.37 11.54
Total 2093.29 1886.23
(v) Unsecured loans taken (including lease finance) Joint venture: 59.68 – L&T MBDA Missile Systems Limited 59.68 –
Total 59.68 –
Notes forming part of the Consolidated Financial Statements (contd.)NOTE [54] (contd.)

566
NOTES FORMING PART OF THE CONSOLIDATED FINANCIAL STATEMENTS ANNUAL REPORT 2019-20
v crore
Sr. No. Category of balance/relationship/major parties
As at 31-3-2020 As at 31-3-2019
Amount Amounts for major parties
Amount Amounts for major parties
(vi) Advances received in the capacity of supplier of goods/ services classified as ”advances from customers” Joint venture: 6.97 7.15 L&T-MHPS Boilers Private Limited 6.97 6.97
Total 6.97 7.15
(vii) Due to Directors#: 40.29 66.27 Key management personnel, including: Mr. A. M. Naik 2.06 1.75 Mr. S. N. Subrahmanyan 9.01 18.60 Mr. R. Shankar Raman 5.88 12.15 Mr. Shailendra Roy 3.37 7.05 Mr. D. K. Sen 2.03 4.20 Mr. M. V. Satish 3.02 6.00 Mr. J.D. Patil 2.72 5.30 Mr. Subramanian Sarma 8.33 6.68
Total 40.29 66.27
(viii) Post employment benefit plans(A) Due to provident fund trusts, including: 53.33 43.05
Larsen & Toubro Officers & Supervisory Staff Provident Fund 48.19 39.55
Total 53.33 43.05
(B) Due to gratuity trusts: 159.35 72.45 Larsen & Toubro Officers & Supervisors Gratuity Fund 94.08 49.70 L&T Technology Services Limited Employee Group Gratuity Scheme 17.00 8.69 Larsen & Toubro Gratuity Fund 8.92 11.22 Mindtree Limited Employees Gratuity Fund Trust 27.24 –
Total 159.35 72.45
(C ) Due to superannuation fund: 3.91 7.99 Larsen & Toubro Limited Senior Officers’ Superannuation Scheme 3.91 7.99
Total 3.91 7.99
(ix) Capital commitment given Joint ventures: – 34.07 L&T Special Steels and Heavy Forgings Private Limited – 0.02 L&T-MHPS Turbine Generators Private Limited – 34.05
Total – 34.07
Notes forming part of the Consolidated Financial Statements (contd.)NOTE [54] (contd.)

567
v crore
Sr. No. Category of balance/relationship/major parties
As at 31-3-2020 As at 31-3-2019
Amount Amounts for major parties
Amount Amounts for major parties
(x) Revenue commitment given Joint ventures, including: 2316.16 401.52 L&T-MHPS Boilers Private Limited 1224.92 207.56 L&T-MHPS Turbine Generators Private Limited 668.92 42.63 L&T Howden Private Limited 160.70 103.60 Associates, including: 245.94 205.99 L&T-Chiyoda Limited 220.96 186.89
Total 2562.10 607.51
(xi) Revenue commitment received Joint ventures, including: 59.70 88.31 L&T-MHPS Boilers Private Limited 15.85 – L&T Special Steels and Heavy Forgings Private Limited 5.90 0.29 L&T-MHPS Turbine Generators Private Limited 6.88 – L&T MBDA Missile Systems Limited 30.00 69.19 L&T-Gulf Private Limited – 18.77
Total 59.70 88.31
(xii) Provision for doubtful debts on outstanding balances in respect of Joint ventures, including: 23.09 23.55 L&T-MHPS Boilers Private Limited 23.00 23.37
Total 23.09 23.55
(xiii) Guarantees given on behalf of Joint ventures: 514.74 546.66 L&T-MHPS Boilers Private Limited 29.38 28.93 L&T-MHPS Turbine Generators Private Limited 394.94 427.31 L&T Special Steels and Heavy Forgings Private Limited 90.42 90.42
Total 514.74 546.66
“Majorparties”denoteentitiesaccountingfor10%ormoreoftheaggregateforthatcategoryofbalanceduringrespectiveperiods.
# includes commission due to other Non-executive directors R 3.87crore(as at 31-3-2019 : R 4.54 crore)
Note: 1. All related party contracts/arrangements have been entered on arm’s length basis.
2. The amount of outstanding balances as shown above are unsecured and will be settled/recovered in cash.
Notes forming part of the Consolidated Financial Statements (contd.)NOTE [54] (contd.)

568
NOTES FORMING PART OF THE CONSOLIDATED FINANCIAL STATEMENTS ANNUAL REPORT 2019-20
NOTE [55]
Basic and Diluted Earnings per share [EPS] computed in accordance with Ind AS 33 ”Earnings per Share”:
Particulars 2019-20 2018-19
Basic EPS
Profit after tax from continuing operations as per accounts (R crore) A 8894.46 8336.03
Profit after tax from discontinued operations as per accounts (R crore) B 654.57 569.10
Profit after tax from continuing operations & discontinued operations as per accounts (R crore) C=A+B 9549.03 8905.13
Weighted average number of equity shares outstanding D 1,40,33,69,848 1,40,20,87,033
Basic EPS from continuing operations (R) A/D 63.38 59.45
Basic EPS from discontinued operations (R) B/D 4.66 4.06
Basic EPS from continuing operations & discontinued operations (R) C/D 68.04 63.51
Diluted EPS
Profit after tax from continuing operations as per accounts (R crore) A 8894.46 8336.03
Profit after tax from discontinued operations as per accounts (R crore) B 654.57 569.10
Profit after tax from continuing operations & discontinued operations as per accounts (R crore) C=A+B 9549.03 8905.13
Weighted average number of equity shares outstanding D 1,40,33,69,848 1,40,20,87,033
Add: Weighted average number of potential equity shares on account of employee stock options E 18,52,930 24,57,688
Weighted average number of equity shares outstanding for diluted EPS F=D+E 1,40,52,22,778 1,40,45,44,721
Diluted EPS from continuing operations (R) A/F 63.29 59.35
Diluted EPS from discontinued operations (R) B/F 4.66 4.05
Diluted EPS from continuing operations & discontinued operations (R) C/F 67.95 63.40
Face value per share (R) 2 2
The following potential equity shares are anti-dilutive and are therefore excluded from the weighted average number of equity shares for the purpose of diluted earnings per share:
Particulars 2019-20 2018-19
Weighted average number of potential equity shares on account of conversion of foreign currency convertible bonds 51,90,133 95,20,455
Notes forming part of the Consolidated Financial Statements (contd.)

569
NOTE [56]
Disclosure pursuant to Ind AS 37 “Provisions, Contingent Liabilities and Contingent Assets”:
(a) Movement in provisions: v crore
Sr. No. Particulars
Class of provisionsProduct
warrantiesExpected tax
liability in respect of
indirect taxes
Litigation related
obligations
Contractual rectification
cost-construction
contracts
Others* Total
1 Balance as at 1-4-2019 63.71 243.55 59.53 532.85 27.45 927.09 2 Additional provision during the year 26.34 125.97 146.34 452.14 66.20 816.99 3 Provision used during the year (16.06) (45.54) (0.84) (9.16) (2.98) (74.58) 4 Unused provision reversed during the period (3.03) (15.95) – (415.64) (2.64) (437.26) 5 Addition on account of business combination 0.92 – 9.12 – 0.53 10.57 6 Classified as held for sale (60.73) – – – (27.94) (88.67) 7 Translation adjustments 0.98 – – 1.16 0.82 2.96 8 Additional provision for unwinding of interest and
change in discount rate 1.02 – – – – 1.02 9 Balance as at 31-3-2020 (1 to 8) 13.15 308.03 214.15 561.35 61.44 1158.12
* includes backwork charges, provision for foreseeable losses and onerous contract.
Breakup of provisions: v crore
Particulars Note 24 Note 31 TotalBalance as at 1-4-2019 7.73 919.36 927.09Balance as at 31-3-2020 30.52 1127.60 1158.12
(b) Nature of provisions: (i) Product warranties: The Group gives warranties on certain products and services, undertaking to repair or replace the items
that fail to perform satisfactorily during the warranty period.
Provision made as at March 31, 2020 represents the amount of the expected cost of meeting such obligations of rectification/replacement. The timing of the outflows is expected to be within a period of five years from the date of Balance Sheet.
(ii) Expected tax liability in respect of indirect taxes represents mainly the differential sales tax liability on account of non-collection of declaration forms for the period prior to five years.
(iii) Provision for litigation related obligations represents liabilities that are expected to materialise in respect of matters in appeal.
(iv) Contractual rectification cost represents the estimated cost the Group is likely to incur during defect liability period as per the contract obligations and in respect of completed construction contracts accounted under Ind AS 115 “Revenue from contracts with customers”.
(c) Disclosure in respect of contingent liabilities is given in Note 32.
NOTE [57]Research & DevelopmentThe expenditure on research and development activities recognised as expense in the Statement of Profit and Loss is R 247.69crore(including R 88.32crorepertainingtodiscontinuedoperations)[previous year: R 232.27 crore (including R 76.30crorepertainingtodiscontinued operations)] Further, the Group has incurred capital expenditure on research and development activities as follows:a) on property, plant & equipment R 7.60crore(includingR 4.19 crore pertaining to discontinued operations) [previous
year: R 5.59 crore (including R 2.95 crore pertaining to discontinued operations)] b) on intangible assets being expenditure on new product development R 34.28crore(includingR 30.17 crore pertaining to
discontinued operations) [previous year: R 52.54 crore (including R 46.61crorepertainingtodiscontinuedoperations)] c) on other intangible assets R 3.07 crore (including R 1.93 crore pertaining to discontinued operations) [previous year: R 1.96crore
(including Nil pertaining to discontinued operations)] In addition,the Group has incurred expenditure of R 0.08crore(includingNilpertainingtodiscontinuedoperations)[previous year: R 0.52 crore (including Nil pertaining to discontinued operations)] which is customer funded.
Notes forming part of the Consolidated Financial Statements (contd.)

570
NOTES FORMING PART OF THE CONSOLIDATED FINANCIAL STATEMENTS ANNUAL REPORT 2019-20
NOTE [58]
Disclosure pursuant to Ind AS 107 “Financial Instruments: Disclosures”: Market risk management
(a) Foreign exchange rate and interest rate risk:
The Group regularly reviews its foreign exchange forward and option positions and interest rate swaps, both on a standalone basis and in conjunction with its underlying foreign currency and interest rate related exposures. The Group primarily follows cash flow hedge accounting for Highly Probable Forecasted Exposures (HPFE) hence the movement in mark to market (MTM) of the hedge contracts undertaken for such exposures is likely to be offset by contra movements in the underlying exposures values. However, till the point of time the HPFE becomes an on-balance sheet exposure, the changes in MTM of the hedge contracts will impact the Balance Sheet of the Group. Further, given the effective horizons of the Group’s risk management activities which coincide with the durations of the projects under execution and could extend across 3-4 years and given the business uncertainties associated with the timing and estimation of the project exposures, the recognition of the gains and losses related to these instruments may not always coincide with the timing of gains and losses related to the underlying economic exposures and, therefore, may affect the Group’s financial condition and operating results. Hence, the Group monitors the potential risk arising out of the market factors like exchange rates, interest rates, price of traded investment products etc. on a regular basis. For on-balance sheet exposures, the Group monitors the risks on net unhedged exposures.
(i) Foreign exchange rate risk:
In general, the Group is a net receiver of foreign currency. Accordingly, changes in exchange rates, and in particular a strengthening of the Indian Rupee, will negatively affect the Group’s net sales and gross margins as expressed in Indian Rupee. There is a risk that the Group may have to adjust local currency product pricing due to competitive pressures when there have been significant volatility in foreign currency exchange rates.
The Group may enter into foreign currency forward and option contracts with financial institutions to protect against foreign exchange risks associated with certain existing assets and liabilities, certain firmly committed transactions, forecasted future cash flows and net investments in foreign subsidiaries. In addition, the Group has entered, and may enter in the future, into non-designated foreign currency contracts to partially offset the foreign currency exchange gains and losses on its foreign denominated debt issuances. The Group’s practice is to hedge a portion of its material net foreign exchange exposures with tenors in line with the project/business life cycle. However, the Group may choose not to hedge certain foreign exchange exposures for a variety of reasons.
The net exposure to foreign currency risk (based on notional amount) in respect of recognised financial assets and recognised financial liabilities and derivatives is as follows:
v crore
Particulars
As at 31-3-2020 As at 31-3-2019US Dollar including
pegged currencies
EURO Malaysian Ringgit
Canadian Dollar
Japanese Yen
Kuwaiti Dinar
US Dollar including
pegged currencies
EURO Malaysian Ringgit
Canadian Dollar
Japanese Yen
Kuwaiti Dinar
Net exposure to foreign currency risk in respect of recognised financial assets/(recognised financial liabilities) (5875.09) 320.56 127.86 129.31 (394.37) 314.93 (5395.96) 286.37 67.37 91.74 (10.43) 162.25
Derivatives including embedded derivatives for hedging receivable/(payable) exposure with respect to non-financial assets/(non-financial liabilities) 494.65 (28.50) – – – – 552.57 222.95 – – – –
Derivatives including embedded derivatives for hedging receivable/(payable) exposures with respect to firm commitments and highly probable forecast transactions 27222.66 (213.93) 163.93 (29.22) 890.32 877.29 16327.53
(813.82) 102.09 (38.66) 538.14 974.77
Receivable/(payable) exposures with respect to forward contracts and embedded derivatives not designated as cash flow hedge (2991.34) 56.90 – – 21.08 – (1237.61) 586.94 – – 31.73 –
Options (written) not designated as cash flow hedge – (776.25) – – – – (527.50)
(533.77) – – – –
Notes forming part of the Consolidated Financial Statements (contd.)

571
To provide a meaningful assessment of the foreign currency risk associated with the Group’s foreign currency derivative positions against off-balance sheet exposures and unhedged portion of on-balance sheet financial assets and liabilities, the Group uses a multi-currency correlated value-at-risk (“VAR”) model. The VAR model uses a Monte Carlo simulation to generate thousands of random market price paths for foreign currencies against Indian Rupee taking into account the correlations between them. The VAR is the expected loss in value of the exposures due to overnight movement in spot exchangerates,at95%confidenceinterval.TheVARmodelisnotintendedtorepresentactuallossesbutisusedasariskestimation tool. The model assumes normal market conditions and is a historical best fit model. Because the Group uses foreign currency instruments for hedging purposes, the loss in fair value incurred on those instruments are generally offset by increase in the fair value of the underlying exposures for on-balance sheet exposures. The overnight VAR for the Group at 95%confidencelevelisR 111.39 crore as at March 31, 2020 and R 106.11croreasatMarch31,2019.
Actual future gains and losses associated with the Group’s investment portfolio and derivative positions may differ materially from the sensitivity analysis performed as at March 31, 2020 due to the inherent limitations associated with predicting the timing and amount of changes in foreign currency exchange rates and the Group’s actual exposures and position.
(ii) Interest rate risk:
The Group’s exposure to changes in interest rates relates primarily to the Group’s outstanding floating rate debt and lending. The Group’s outstanding debt in local currency is a combination of fixed rate and floating rate. For the portion of local currency debt on fixed rate basis, there is no interest rate risk. For the portion of local currency debt on floating rate basis, there is a natural hedge with receivables in respect of financial services business. There is a portion of debt that is linked to international interest rate benchmarks like LIBOR. The Group also hedges a portion of these risks by way of derivative instruments like interest rate swaps and currency swaps.
The exposure of the Group’s borrowing to interest rate changes at the end of the reporting period is as follows:
v crore
ParticularsAs at
31-3-2020As at
31-3-2019
Floating rate borrowings 59703.45 49107.01
A hypothetical 50 basis point shift in respective currency LIBOR and other benchmarks on the unhedged loans would result in a corresponding increase/decrease in interest cost for the Group on a yearly basis as follows:
v crore
ParticularsImpact on profit after tax Impact on equity
2019-20 2018-19 As at 31-3-2020
As at 31-3-2019
Indian RupeeInterestrates-increaseby0.50%inINRinterestrate* (24.65) 1.63 (24.65) 1.63Interestrates-decreaseby0.50%inINRinterestrate* 24.65 (1.63) 24.65 (1.63)US DollarInterestrates-increaseby0.50%inUSDinterestrate* (30.02) (20.44) (30.02) (20.44) Interestrates-decreaseby0.50%inUSDinterestrate* 30.02 20.44 30.02 20.44
* Holding all other variables constant
(b) Liquidity risk management:
The Group manages liquidity risk by maintaining sufficient cash and marketable securities and by having access to funding through an adequate amount of committed credit lines. Given the need to fund diverse businesses, the Group maintains flexibility in funding by maintaining availability under committed credit lines to meet obligations when due. Management regularly monitors the position of cash and cash equivalents vis-à-vis projections. Assessment of maturity profiles of financial assets and financial liabilities including debt financing plans and maintenance of Balance Sheet liquidity ratios are considered while reviewing the liquidity position.
The Group’s investment policy and strategy are focused on preservation of capital and supporting the Group’s liquidity requirements. The Group uses a combination of strategies to achieve its investment objectives. The Group typically invests in money market funds, large debt funds, Government of India securities, equity and equity marketable securities and other highly rated securities under a limits framework which governs the credit exposure to any one issuer as defined in its investment policy.
Notes forming part of the Consolidated Financial Statements (contd.)NOTE [58] (contd.)

572
NOTES FORMING PART OF THE CONSOLIDATED FINANCIAL STATEMENTS ANNUAL REPORT 2019-20
The policy requires investments generally to be investment grade, with the primary objective of minimising the potential risk of principal loss. To provide a meaningful assessment of the price risk associated with the Group’s investment portfolio, the Group performed a sensitivity analysis to determine the impact of change in prices of the securities on the value of the investment portfolioassuminga0.50%movementindebtfundsanddebtsecuritiesanda5%movementintheNAVoftheequityandequitymarketablesecurities.Basedontheinvestmentposition,ahypothetical0.50%changeinthefairmarketvalueofdebtsecuritieswould result in a value change of +/- R 39.42 crore as at March 31, 2020 and +/- R 38.01croreasatMarch31,2019.A5%change in the equity funds’ NAV would result in a value change of +/- R 6.49croreasatMarch31,2020and+/-R 39.16croreas at March 31, 2019 respectively. The investments in money market funds are for the purpose of liquidity management only and hence not subject to any material price risk.
(c) Credit risk management: (i) Financial services business: Financial services business has a risk management framework that monitors and ensures that the business lines operate within
the defined risk appetite and risk tolerance levels as defined by the senior management. Risk management function is closely involved in management and control of credit risk, portfolio monitoring, market risks including liquidity risk and operational risks. The credit risk function independently evaluates proposals based on well-established sector specific internal frameworks, in order to identify, mitigate and allocate risks as well as to enable risk-based pricing of assets. Regulatory and process risks are identified, mitigated and managed by a separate Group. Risk management policies are made under the guidance of Risk Management Committee and are approved by Board of Directors.
(ii) Other than financial services business: The Group’s customer profile include public sector enterprises, state owned companies and large private corporates.
Accordingly,theGroup’scustomercreditriskislow.TheGroup’saverageprojectexecutioncycleisaround24to36months.General payment terms include mobilisation advance, monthly progress payments with a credit period ranging from 45 to 90 days and certain retention money to be released at the end of the project. In some cases retentions are substituted with bank/corporate guarantees. The Group has a detailed review mechanism of overdue customer receivables at various levels within the organisation to ensure proper attention and focus for realisation.
(iii) Reconciliation of loss allowance provision for financial services business - Loans:
v crore
ParticularsLoss allowance
measured at 12-month ECL
Loss allowance measured at life time ECL Financial assets for which
credit risk has increased significantly and credit not
impaired
Financial assets for which credit risk has increased
significantly and credit impaired
Lossallowanceasat1-4-2018 279.81 192.61 4920.40
Provision on new financial assets 313.71 33.49 123.00
Transferred to and from 12-month ECL to life time ECL
28.36 (25.78) (2.58)
Higher/(lower) provision on existing financial assets
(141.88) 27.79 (1127.94)
Loss allowance as at 31-3-2019 480.00 228.11 3912.88
Provision on new financial assets 339.90 34.94 77.01
Transferred to and from 12-month ECL to life time ECL
29.05 (177.03) 147.98
Higher/(lower) provision on existing financial assets
(278.60) 182.61 (355.16)
Loss allowance as at 31-3-2020 570.35 268.63 3782.71
Notes forming part of the Consolidated Financial Statements (contd.)NOTE [58] (contd.)

573
(iv) Reconciliation of allowance for expected credit loss (“ECL”) on trade receivables (other than financial services business):
v croreParticulars 2019-20 2018-19
Opening balance as at April 1 3000.83 2900.10 Changes in allowance for ECL: Provision/(reversal) of allowance for ECL 313.00 84.34 Additional provision (net) 178.37 265.62 Write off as bad debts (194.62) (249.23)Translation adjustment 12.12 –Classified as held for sale (154.10) –Addition on account of business combination 25.61 –Closing balance as at March 31 (Note 13) 3181.21 3000.83
(v) Amounts written off:
v crore
Particulars 2019-20 2018-19
Amount of financial assets written off during the period but still enforceable 900.38 1534.95
NOTE [59]
Other disclosure pursuant to Ind AS 107 “Financial Instruments: Disclosures”:
(a) Category-wise classification for applicable financial assets:v crore
Sr. No.
ParticularsNote As at
31-3-2020As at
31-3-2019I. Measured at fair value through Profit or Loss (FVTPL):
(i) Investment in equity instruments 6,12 582.81 582.49(ii) Investment in preference shares 6,12 89.21 99.81(iii) Investment in mutual funds and units of fund 6,12 7877.25 8990.10(iv) Investment in government securities, debentures and bonds 6,12 1798.48 1523.26(v) Derivative instruments not designated as cash flow hedges 9,18 99.93 139.12 (vi) Embedded derivatives not designated as cash flow hedges 9,18 177.84 28.40(vii) Investment in security receipts 6 2498.65 791.07 (viii) Loans 7,8,16,17 24877.64 24395.92 (ix) Other investments 6,12 0.94 –Sub-total (I) 38002.75 36550.17
II. Measured at amortised cost:(i) Loans 7,8,16,17 77673.47 78031.55(ii) Investment in government securities, debentures and bonds 6,12 59.73 1832.55(iii) Other investments 6,12 330.35 –(iv) Trade receivables 13 40731.52 36845.87(v) Advances recoverable in cash 18 1748.66 1519.17 (vi) Cash and bank balances 9,14,15 15392.64 12217.35 (vii) Other receivables 112.65 287.14Sub-total (II) 136049.02 130733.63
III. Measured at fair value through Other Comprehensive Income (FVTOCI):(i) Investment in government securities, debentures and bonds 6,12 3958.28 4445.53 (ii) Investment in equity instruments 6,12 0.10 –(iii) Investment in preference shares 6,12 0.67 –(iv) Derivative instruments designated as cash flow hedges 9,18 1043.49 1212.86(v) Embedded derivatives designated as cash flow hedges 9,18 108.59 17.50 Sub-total (III) 5111.13 5675.89Total (I+II+III) 179162.90 172959.69
Notes forming part of the Consolidated Financial Statements (contd.)NOTE [58] (contd.)

574
NOTES FORMING PART OF THE CONSOLIDATED FINANCIAL STATEMENTS ANNUAL REPORT 2019-20
(b) Category-wise classification for applicable financial liabilities:
v crore
Sr. No.
ParticularsNote As at
31-3-2020 As at
31-3-2019
I. Measured at fair value through Profit or Loss (FVTPL):
(i) Derivative instruments not designated as cash flow hedges 23,29 158.76 24.93
(ii) Embedded derivatives not designated as cash flow hedges 23,29 57.18 99.41
(iii) Others 218.20 157.00
Sub-total (I) 434.14 281.34
II. Measured at amortised cost:
(i) Borrowings 22,26,27 141007.12 125555.17
(ii) Trade payables
Due to micro enterprises and small enterprises 479.51 261.12
Due to others 28 43164.42 42733.69
(iii) Lease liability 2166.55 –
(iv) Others 3513.03 4140.12
Sub-total (II) 190330.63 172690.10
III. Derivative instruments (including embedded derivatives) through Other Comprehensive Income:
(i) Derivative instruments designated as cash flow hedges 23,29 1814.94 368.52
(ii) Embedded derivatives designated as cash flow hedges 23,29 61.24 185.85
Sub-total (III) 1876.18 554.37
IV. Financial guarantee contracts 23,29 1.02 1.78
Total (I+II+III+IV) 192641.97 173527.59
(c) Items of income, expenses, gains or losses related to financial instruments:
v croreSr. No.
Particulars2019-20 2018-19
I. Net gains/(losses) on financial assets and financial liabilities measured at fair value through Profit or Loss and amortised cost:
A. (i) Financial assets or financial liabilities mandatorily measured at fair value through Profit or Loss:
1. Gains/(losses) on fair valuation or sale of investments 561.72 137.91
2. Gains/(losses) on fair valuation or sale of loans (Financial Services) (93.31) (77.62)
3. Gains/(losses) on fair valuation/settlement of derivative:
(a) Gains/(losses) on fair valuation or settlement of forward contracts not designated as cash flow hedges (300.59) 7.73
(b) Gains/(losses) on fair valuation or settlement of embedded derivative contracts not designated as cash flow hedges 124.73 (1.65)
(c) Gains/(losses) on fair valuation or settlement of futures not designated as cash flow hedges 13.19 (21.81)
Sub-total (A) 305.74 44.56
Notes forming part of the Consolidated Financial Statements (contd.)NOTE [59] (contd.)

575
v croreSr. No.
Particulars2019-20 2018-19
B. Financial assets measured at amortised cost:
(i) Exchange difference gains/(losses) on revaluation or settlement of items denominated in foreign currency (trade receivables, loans given etc.)
1076.54 464.22
(ii) (Allowance)/reversal for expected credit loss during the year (1950.15) (699.45)
(iii) Provision for impairment loss (other than ECL) [net] (311.09) (815.30)
(iv) Gains/(losses) on derecognition:
(a) Bad debts written off (net) 175.60 442.28
(b) Gains/(losses) on transfer of financial assets (non-recourse) (78.35) (363.83)
Sub-total (B) (1087.45) (972.08)
C. Financial liabilities measured at amortised cost:
(i) Exchange difference gains/(losses) on revaluation or settlement of items denominated in foreign currency (trade payables, borrowing availed etc.)
(777.86) (454.18)
(ii) Unclaimed credit balances written back 190.30 79.98
Sub-total (C) (587.56) (374.20)
Total [I] = (A+B+C) (1369.27) (1301.72)
II. Net gains/(losses) on financial assets and financial liabilities measured at fair value through Other Comprehensive Income:
A. Gains recognised in Other Comprehensive Income:
(i) Financial assets measured at fair value through Other Comprehensive Income:
(a) Gains/(losses) on fair valuation or sale of government securities, bonds, debentures etc. 269.68 (125.90)
(ii) Derivative measured at fair value through Other Comprehensive Income:
(a) Gains/(losses) on fair valuation or settlement of forward contracts designated as cash flow hedges
(1039.11) (231.75)
(b) Gains/(losses) on fair valuation or settlement of embedded derivative contracts designated as cash flow hedges
100.98 18.49
Sub-total (A) (668.45) (339.16)
Less:
B. Gains reclassified to Profit or Loss from Other Comprehensive Income:
(i) Financial assets measured at fair value through Other Comprehensive Income:
1. On government securities, bonds, debentures etc. upon sale 154.47 (62.89)
(ii) Derivative measured at fair value through Other Comprehensive Income:
1. On forward contracts upon hedged future cash flows affecting the Profit or Loss or related assets or liabilities
355.35 347.80
2. On embedded derivative contracts upon hedged future cash flows affecting the Profit or Loss or related assets or liabilities
(18.39) 15.42
Sub-total (B) 491.43 300.33
Net gains recognised in Other Comprehensive Income (A-B) (1159.88) (639.49)
C. Impairment loss recognised in Statement of Profit and Loss (350.59) –
Total [II] = (A-B+C) (1510.47) (639.49)
Notes forming part of the Consolidated Financial Statements (contd.)NOTE [59] (contd.)

576
NOTES FORMING PART OF THE CONSOLIDATED FINANCIAL STATEMENTS ANNUAL REPORT 2019-20
v croreSr. No.
Particulars2019-20 2018-19
III. Other income/(expense):
A. Dividend Income:
Dividend income from investments measured at FVTPL 101.62 236.91
Sub-total (A) 101.62 236.91
B. Interest Income:
(i) Financial assets measured at amortised cost 11306.24 10895.57
(ii) Financial assets measured at fair value through Other Comprehensive Income 371.43 356.91
(iii) Financial assets measured at fair value through Profit or Loss 3332.76 2197.22
Sub-total (B) 15010.43 13449.70
C. Interest expense:
(i) Financial liabilities measured at amortised cost (10168.49) (8526.13)
(ii) Derivative instruments (including embedded derivatives) that are measured at fair value through Other Comprehensive Income (reclassified to Profit or Loss during the year)
(150.06) (259.02)
(iii) Financial liabilities measured at fair value through Profit or Loss 5.95 (0.06)
Sub-total (C) (10312.60) (8785.21)
Total [III] =(A+B+C) 4799.45 4901.40
(d) Fair value of financial assets and financial liabilities measured at amortised cost:
v crore
Particulars NoteAs at 31-3-2020 As at 31-3-2019
Carrying amount
Fair value Carrying amount
Fair value
Financial assets:
Loans 7,8,16,17 62953.79 58651.32 62234.11 57890.20
Government securities, debentures and bonds 6,12 59.73 59.73 1832.55 1899.07
Total 63013.52 58711.05 64066.66 59789.27
Financial liabilities:
Borrowings 22,26,27 57893.50 58847.68 51252.31 51656.55
Total 57893.50 58847.68 51252.31 51656.55
Notes:
1. Carrying amount of loans is gross of provision for expected credit losses.
2. The carrying amounts of trade and other receivables, cash and cash equivalents, trade and other payables are considered to be the same as their fair values due to their short term nature. The carrying amounts of loans given and borrowings taken for short term or at floating rate of interest are considered to be close to the fair value. Accordingly these items have not been included in the above table.
Notes forming part of the Consolidated Financial Statements (contd.)NOTE [59] (contd.)

577
(e) Disclosure pursuant to Ind AS 113 “Fair Value Measurement” - Fair value hierarchy of financial assets and financial liabilities measured at amortised cost:
v crore
As at 31-3-2020Level 1 Level 2 Level 3 Total Valuation technique for
level 3 items
Financial assets:
Loans – 8663.10 49988.22 58651.32 Discounted cash flow
Government securities, debentures and bonds 59.66 0.07 - 59.73 Discounted cash flow
Total 59.66 8663.17 49988.22 58711.05
Financial liabilities:
Borrowings 737.02 13948.82 44161.84 58847.68 Discounted cash flow
Total 737.02 13948.82 44161.84 58847.68
v crore
As at 31-3-2019 Level 1 Level 2 Level 3 Total Valuation technique for
level 3 items
Financial assets:
Loans – 8783.50 49106.70 57890.20 Discounted cash flow
Government securities, debentures and bonds – 1899.07 – 1899.07 Discounted cash flow
Total – 10682.57 49106.70 59789.27
Financial liabilities:
Borrowings 737.02 9360.96 41558.57 51656.55 Discounted cash flow
Total 737.02 9360.96 41558.57 51656.55
Valuation technique Level 2: Future cash flows discounted using G-sec/LIBOR rates plus corporate spread.
(f) Fair value hierarchy of financial assets and financial liabilities at fair value:
v crore
ParticularsNote As at 31-3-2020 As at 31-3-2019
Level 1 Level 2 Level 3 Total Level 1 Level 2 Level 3 Total
Financial assets:
Financial assets at FVTPL:
(i) Equity shares 6, 12 39.66 – 543.15 582.81 39.93 – 542.56 582.49
(ii) Preference shares 6, 12 – – 89.21 89.21 – – 99.81 99.81
(iii) Mutual fund 6, 12 7770.81 – – 7770.81 8801.31 – – 8801.31
(iv) Debt instruments viz. government securities, bonds and debentures
6, 12 997.64 – 800.84 1798.48 656.38 0.53 866.35 1523.26
(v) Derivative instruments not designated as cash flow hedges
9,18 – 99.93 – 99.93 – 139.12 – 139.12
(vi) Embedded derivative instruments not designated as cash flow hedges
9,18 – 177.84 – 177.84 – 28.40 – 28.40
(vii) Other investments 6, 12 – 0.94 2605.09 2606.03 – – 979.86 979.86
(viii) Loans (Financial Services) 16 – – 24877.64 24877.64 – – 24395.92 24395.92
Notes forming part of the Consolidated Financial Statements (contd.)NOTE [59] (contd.)

578
NOTES FORMING PART OF THE CONSOLIDATED FINANCIAL STATEMENTS ANNUAL REPORT 2019-20
v crore
ParticularsNote As at 31-3-2020 As at 31-3-2019
Level 1 Level 2 Level 3 Total Level 1 Level 2 Level 3 Total
Financial assets at FVTOCI:
(i) Debt instruments viz. government securities, bonds and debentures
6, 12 2729.27 1162.42 66.58 3958.27 2133.84 2303.29 8.40 4445.53
(ii) Preference shares 6 – – 0.67 0.67 – – – –
(iii) Equity shares 6 – – 0.10 0.10 – – – –
(iv) Derivative financial instruments designated as cash flow hedges
9,18 – 1043.49 – 1043.49 – 1212.86 – 1212.86
(v) Embedded derivative financial instruments designated as cash flow hedges
9,18 – 108.60 – 108.60 – 17.50 – 17.50
Total 11537.38 2593.22 28983.28 43113.88 11631.46 3701.70 26892.90 42226.06
Financial liabilities:
Financial liabilities at FVTPL:
(i) Designated at FVTPL:
(a) Derivative instruments not designated as cash flow hedges
23,29 – 158.76 – 158.76 – 24.93 – 24.93
(b) Embedded derivative instruments not designated as cash flow hedges
23,29 – 57.18 – 57.18 – 99.41 – 99.41
(c) Others 23,29 – – 218.20 218.20 – – 157.00 157.00
(ii) Designated at FVTOCI:
(a) Derivative financial instruments designated as cash flow hedges
23,29 – 1814.94 – 1814.94 – 368.52 – 368.52
(b) Embedded derivative financial instruments designated as cash flow hedges
23,29 – 61.24 – 61.24 – 185.85 – 185.85
Total – 2092.12 218.20 2310.32 – 678.71 157.00 835.71
Valuation technique and key inputs used to determine fair value:
A. Level 1: Mutual funds, bonds, debentures and government securities - quoted price in the active market.
B. Level 2: (a) Derivative Instruments – Present value technique using forward exchange rates at the end of reporting period.
(b) Preference share and government securities, bonds and debentures – Future cash flows are discounted using G-sec rates as at reporting date.
Notes forming part of the Consolidated Financial Statements (contd.)NOTE [59] (contd.)

579
(g) Movement of items measured using unobservable inputs (Level 3):
v crore
ParticularsEquity shares Preference
shares Debt
instruments Loans Other
investments Total
Balanceasat31-3-2018 741.83 69.67 918.35 16836.61 1145.50 19711.96 Addition during the year 565.76 – 11.19 14248.11 192.46 15017.52 Disposal during the year (571.03) – (33.33) (6688.80) (123.44) (7416.60) Gains/(losses) recognised in Profit or Loss (194.00) 30.14 (21.46) – (234.66) (419.98)Balance as at 31-3-2019 542.56 99.81 874.75 24395.92 979.86 26892.90 Addition during the year 0.10 0.67 – 6927.18 2099.75 9027.70 Disposal during the year – (6.17) (6.10) (6415.32) (298.05) (6725.64) Gains/(losses) recognised in Profit or Loss 0.59 (4.43) (1.23) (30.14) (176.47) (211.68)Balance as at 31-3-2020 543.25 89.88 867.42 24877.64 2605.09 28983.28
(h) Sensitivity disclosure for level 3 fair value measurements:
Particulars
Fair value as at
Significant unobservable inputs
SensitivityAs at
31-3-2020As at
31-3-2019
v crore
Equity shares
474.95 476.98 Book value 2020: Increase/(decrease) of 5% in the book value would result in impact on profit or loss by R 19.57 crore 2019: Increase/(decrease) of 5% in the book value would result in impact on profit or loss by R 18.02 crore”
68.30 65.58 31-3-2020: 1. Net realisation per
month R 31.83 per sq/ft. 2. Capitalisation rate
12.25% 31-3-2019: 1. Net realisation per
month R 30.90 per sq/ft. 2. Capitalisation rate
12.25%
2020 : 1% change in net realisation would result in +/- R 0.33 crore (post tax- R 0.24 crore) 25 bps change in capitalisation rate would result in +/- R 0.65 crore (post tax- R 0.49 crore) 2019 : 1% change in net realisation would result in +/- R 0.32 crore (post tax- R 0.21 crore) 25 bps change in capitalisation rate would result in +/- R 0.63 crore (post tax- R 0.41 crore)
Preference shares
89.88 99.81 Expected yield 2020: Increase/(decrease) in the fair value by 5% would result in impact on profit or loss by R 4.44 crore 2019: Increase/(decrease) in the fair value by 5% would result in impact on profit or loss by R 4.74 crore
Debt instruments 867.42 874.75 Expected yield 2020: Increase/(decrease) in fair value by 0.25% would result in impact on profit or loss by R 1.79 crore 2019: Increase/(decrease) in fair a by 0.25% would result in impact on profit or loss by R 1.65 crore
Loans 24877.64 24395.92 Expected yield 2020: Increase/(decrease) in fair value by 0.25% would result in impact on profit or loss by R 46.54 crore 2019: Increase/(decrease) in fair value by 0.25% would result in impact on profit or loss by R 39.68 crore
Other investments
2605.09 979.83 Net Assets Value (NAV) 2020: Increase/(decrease) in the NAV by 5% would result in impact on profit or loss R 97.47 crore 2019: Increase/(decrease) in the NAV by 5% would result in impact on profit or loss R 31.87 crore
Notes forming part of the Consolidated Financial Statements (contd.)NOTE [59] (contd.)

580
NOTES FORMING PART OF THE CONSOLIDATED FINANCIAL STATEMENTS ANNUAL REPORT 2019-20
(i) Movement of financial liabilities measured using unobservable inputs (Level 3):v crore
Particulars Contingent consideration
Balanceasat31-3-2018 121.60
Acquisitions during the year 75.01
Charge recognised in Statement of Profit and Loss (1.60)
Amounts settled during the year (33.13)
Foreign exchange difference (4.88)
Balance as at 31-3-2019 157.00
Acquisitions during the year 60.20
Charge recognised in Statement of Profit and Loss 9.64
Amounts settled during the year (20.67)
Foreign exchange difference 12.03
Balance as at 31-3-2020 218.20
Note: A one percentage point change in the unobservable inputs used in fair valuation of Level 3 liabilities does not have a significant impact on the value.
(j) Maturity profile of financial liabilities based on undiscounted cash flows:
v crore
Particulars
Note As at 31-3-2020 As at 31-3-2019
Within twelve
months
After twelve
monthsTotal
Within twelve
months
After twelve
monthsTotal
A. Non-derivative liabilities:
Borrowings 22,26,27 64508.28 95134.82 159643.10 53909.10 84473.80 138382.90
Trade payables:
Due to micro enterprises and small enterprises 423.25 56.26 479.51 252.96 8.16 261.12
Due to others 28 41695.77 1468.65 43164.42 41583.63 1150.06 42733.69
Other financial liabilities 23,29 3458.62 272.61 3731.23 4069.35 227.76 4297.11
Lease liability 407.46 1783.06 2190.52 – – –
Total 110493.38 98715.40 209208.78 99815.04 85859.78 185674.82
B. Derivative liabilities:
Forward contracts 23,29 1287.28 707.84 1995.12 384.74 14.14 398.88
Embedded derivatives 23,29 121.12 2.09 123.21 147.05 142.08 289.13
Total 1408.40 709.93 2118.33 531.79 156.22 688.01
Notes forming part of the Consolidated Financial Statements (contd.)NOTE [59] (contd.)

581
(k) Details of outstanding hedge instruments for which hedge accounting is followed: (i) Outstanding currency exchange rate hedge instruments: (A) Forward covers taken to hedge exchange rate risk and accounted as cash flow hedge:
Particulars
As at 31-3-2020 As at 31-3-2019
Nominal amount
(v crore)
Average rate (v)
Within twelve
months (v crore)
After twelve
months (v crore)
Nominal amount
(v crore)
Average rate (v)
Within twelve
months (v crore)
After twelve
months (v crore)
(a) Receivable hedges
US Dollar 33569.57 76.26 19267.26 14302.31 24682.61 73.43 15833.62 8848.99
EURO 2277.73 84.47 2068.58 209.15 2373.28 84.81 1643.94 729.34
Malaysian Ringgit 173.51 17.85 125.19 48.32 113.99 17.54 53.37 60.62
Omani Riyal 485.60 193.42 107.43 378.17 230.00 187.51 150.51 79.49
Arab Emirates Dirham 1174.53 20.78 830.91 343.62 1228.16 19.34 1228.16 –
British Pound 55.12 99.23 55.12 – 87.48 96.74 87.48 –
Japanese Yen 1640.41 0.69 1324.82 315.59 1449.58 0.68 1284.36 165.22
Kuwaiti Dinar 1393.32 238.30 1170.76 222.56 1524.52 237.38 1232.40 292.12
Qatari Riyal 1401.35 20.99 1319.32 82.03 1551.27 19.72 1227.83 323.44
Bangladesh Taka 1859.64 0.90 1674.92 184.72 873.53 0.88 854.91 18.62
Saudi Riyal 52.82 19.97 52.82 – 96.64 21.04 96.64 –
South African Rand 2.96 5.00 2.96 – – – – –
Mauritian Rupee 149.67 1.91 111.93 37.74 – – – –
Thai Baht 1.56 2.35 1.56 – – – – –
(b) Payable hedges
US Dollar 16377.55 73.86 12888.45 3489.10 13738.88 70.57 12789.54 949.34
EURO 4376.52 84.32 4086.26 290.26 4472.40 81.43 4338.30 134.10
Arab Emirates Dirham 396.31 20.75 396.31 – – – – –
British Pound 47.35 94.10 47.35 – 71.10 94.52 71.10 –
Japanese Yen 771.37 0.70 657.29 114.08 1060.96 0.66 877.42 183.54
Kuwaiti Dinar 409.62 236.91 409.62 – 531.77 232.14 531.77 –
Omani Riyal – – – – 28.71 180.36 28.71 –
Swiss Franc 176.13 76.89 176.13 – 302.59 72.69 302.59 –
Chinese Yuan 84.13 10.67 75.37 8.76 – – – –
Bangladesh Taka 766.73 0.88 766.73 – – – – –
Norwegian Krone – – – – 5.20 9.16 5.20 –
Mauritian Rupee 385.17 1.86 385.17 – – – – –
Canadian Dollar 31.46 54.37 31.46 – 40.53 54.04 40.53 –
Notes forming part of the Consolidated Financial Statements (contd.)NOTE [59] (contd.)

582
NOTES FORMING PART OF THE CONSOLIDATED FINANCIAL STATEMENTS ANNUAL REPORT 2019-20
(B) Options taken to hedge exchange rate risk and accounted as cash flow hedge:
Particulars
As at 31-3-2020 As at 31-3-2019Nominal amount
(v crore)
Average rate (v)
Within twelve
months (v crore)
After twelve
months (v crore)
Nominal amount
(v crore)
Average rate (v)
Within twelve
months (v crore)
After twelve
months (v crore)
(a) Receivable hedges:US Dollars/Indian Rupees 915.51 R 87.19 – 915.51 1422.50 R 71.13 to
R 74.94 1422.50 –
EURO/US Dollars 970.48 $ 1.16 to $ 1.25
516.55 453.93 632.65 $ 1.17 to $ 1.25
363.68 268.97
(b) Payable hedges:US Dollars/Indian Rupees – – – – 750.00 R 67.69 to
R 75 750.00 –
(C) Forward covers taken to hedge exchange rate risk and accounted as fair value hedge:
Particulars
As at 31-3-2020 As at 31-3-2019Nominal amount
(v crore)
Average rate (v)
Within twelve
months (v crore)
After twelve
months (v crore)
Nominal amount
(v crore)
Average rate (v)
Within twelve
months (v crore)
After twelve
months (v crore)
(a) Receivable hedgesUS Dollar 1694.48 73.82 1694.48 – 1094.17 71.00 1094.17 – Canadian Dollar 14.45 53.00 14.45 – 21.84 52.00 21.84 – British Pound 40.12 89.00 40.12 – 10.54 92.00 10.54 – Australian Dollar 10.60 44.00 10.60 – 9.03 49.00 9.03 – South African Rand 37.99 5.00 37.99 – 10.67 5.00 10.67 – Danish krone 4.41 11.00 4.41 – 2.10 11.00 2.10 – Norwegian Krone 3.70 7.00 3.70 – 3.64 8.00 3.64 – Swedish krona 18.46 8.00 18.46 – 5.46 8.00 5.46 –
(D) Forward covers taken to hedge exchange rate risk and accounted as net investment hedge:
Particulars
As at 31-3-2020 As at 31-3-2019Nominal amount
(v crore)
Average rate (v)
Within twelve
months (v crore)
After twelve
months (v crore)
Nominal amount
(v crore)
Average rate (v)
Within twelve
months (v crore)
After twelve
months (v crore)
(a) Receivable hedges:US Dollar 29.00 72.51 29.00 – 28.73 71.83 28.73 – Arab Emirates Dirham 102.55 20.11 102.55 – 81.20 20.46 – 81.20Qatari Riyal 45.77 20.70 45.77 – 116.68 20.91 116.68 – Saudi Riyal – – – – 51.07 19.34 51.07 –
Notes forming part of the Consolidated Financial Statements (contd.)NOTE [59] (contd.)

583
NOTE [59] (contd.)
(ii) Outstanding interest rate hedge instruments: Interest rate swaps taken to hedge interest rate risk and accounted as cash flow hedge:
Particulars
As at 31-3-2020 As at 31-3-2019Nominal amount
(v crore)
Average rate (%)
Within twelve
months (v crore)
After twelve
months (v crore)
Nominal amount
(v crore)
Average rate (%)
Within twelve
months (v crore)
After twelve
months (v crore)
Floating interest rate borrowings - US Dollar
4.32 7.35 4.32 - 373.90 7.26 369.58 4.32
(iii) Outstanding commodity price hedge instruments: Commodity forward Contract:
Particulars
As at 31-3-2020 As at 31-3-2019Nominal amount
(v crore)
Average rate (v)
Within twelve
months (v crore)
After twelve
months (v crore)
Nominal amount
(v crore)
Average rate (v)
Within twelve
months (v crore)
After twelve
months (v crore)
Copper (Tn)* 53.65 404260.66 27.25 26.40 (271.25) 514615.22 (271.25) – Aluminium (Tn) 355.02 133756.31 355.02 – 202.04 148790.59 202.04 – Iron Ore (Tn) 25.71 5643.17 15.18 10.53 38.32 5469.41 29.47 8.85 Coking Coal (Tn) 24.58 13101.74 15.50 9.08 39.27 13631.02 29.26 10.01 Zinc (Tn) – – – – 42.44 189480.24 42.44 – Lead (Tn) 42.56 146921.65 42.56 – 33.63 142435.43 33.63 – Nickel (Tn) 112.49 992854.36 112.49 – – – – –
*Negative nominal amount represents sell position.
(l) Carrying amounts of hedge instruments for which hedge accounting is followed: (A) Cash flow hedge:
v crore
Particulars
As at 31-3-2020 As at 31-3-2019Currency exposure
Interest rate exposure
Commodity price
exposure
Currency exposure
Interest rate exposure
Commodity price
exposure(i) Forward contracts (a) Current: Asset - Other financial assets 795.47 (0.96) 83.78 714.76 (0.40) 56.94 Liability - Other financial liabilities 1055.95 – 136.18 396.78 – 46.57 (b) Non-current: Asset - Other financial assets 53.00 – – 366.37 (0.40) – Liability - Other financial liabilities 580.21 – 1.71 109.95 – – (ii) Swap contracts (a) Current: Asset - Other financial assets – – – 49.11 0.88 – Liability - Other financial liabilities – – – – – – (b) Non-current: Asset - Other financial assets 155.06 – – – – – Liability - Other financial liabilities 59.55 – – – – – (iii) Option contracts (a) Current: Asset - Other financial assets 26.61 – – 22.43 – – Liability - Other financial liabilities 8.97 – – 0.96 – – (b) Non-current: Asset - Other financial assets 39.13 – – 6.51 – – Liability - Other financial liabilities 33.36 – – – – –
Notes forming part of the Consolidated Financial Statements (contd.)

584
NOTES FORMING PART OF THE CONSOLIDATED FINANCIAL STATEMENTS ANNUAL REPORT 2019-20
(B) Fair value hedge:
v crore
Particulars
As at 31-3-2020 As at 31-3-2019
Currency exposure
Interest rate exposure
Commodity price
exposure
Currency exposure
Interest rate exposure
Commodity price
exposure
(i) Forward contracts
(a) Current:
Asset - Other financial assets – – – – – –
Liability - Other financial liabilities 63.86 – – – – –
(b) Non-current:
Asset - Other financial assets – – – 20.90 – –
Liability - Other financial liabilities – – – – – –
(ii) Option contracts
(a) Current:
Asset - Other financial assets 4.84 – – – – –
Liability - Other financial liabilities – – – – – –
(b) Non-current:
Asset - Other financial assets 4.67 – – 3.08 – –
Liability - Other financial liabilities – – – – – –
(C) Net investment hedge:
v crore
Particulars
As at 31-3-2020 As at 31-3-2019
Currency exposure
Interest rate exposure
Commodity price
exposure
Currency exposure
Interest rate exposure
Commodity price
exposure
(i) Forward contracts
(a) Current:
Asset - Other financial assets – – – 11.48 – –
Liability - Other financial liabilities 0.26 – – 0.11 – –
(b) Non-current:
Asset - Other financial assets – – – 2.68 – –
Liability - Other financial liabilities – – – – – –
(m) Breakup of cash flow hedging reserve and cost of hedging reserve:
v crore
Particulars
As at 31-3-2020 As at 31-3-2019
Cash flow hedging reserve
Cost of hedging reserve
Cash flow hedging reserve
Cost of hedging reserve
Balance towards continuing hedges (412.63) (13.78) 360.54 6.77
Balance for which hedge accounting discontinued (9.14) (1.37) (121.43) (0.88)
Total (421.77) (15.15) 239.11 5.89
Notes forming part of the Consolidated Financial Statements (contd.)NOTE [59] (contd.)

585
(n) Reclassification of hedging reserve and cost of hedging reserve to Profit or Loss:
v crore
Particulars 2019-20 2018-19
(A) Future cash flows are no longer expected to occur:
(i) Revenue from operations – 109.03
(ii) Manufacturing, construction and operating expenses – –
(iii) Sales, administration and other expenses (16.65) (45.53)
(iv) Other income – 0.34
(B) Hedged expected future cash flows affecting Profit or Loss:
(i) Progress billing (100.64) (28.32)
(ii) Revenue from operations 167.20 67.98
(iii) Manufacturing, construction and operating expenses (131.85) (24.26)
(iv) Finance costs (150.26) (259.35)
(v) Sales, administration and other expenses 313.90 262.37
(vi) Discontinued operations 3.38 1.10
(o) Movement of cash flow hedging reserve and cost of hedging reserve:
v crore
Cash flow hedging reserve 2019-20 2018-19
Opening balance 239.11 449.22
Changes in the spot element of the forward contracts which is designated as hedging instruments for time period related hedges 248.63 261.47
Changes in fair value of forward contracts designated as hedging instruments (1001.89) (301.78)
Changes in intrinsic value of option contracts 3.64 –
Changes in fair value of swaps (43.85) 59.82
Amount reclassified to Profit or Loss (307.86) (364.94)
Amount included in non-financial asset/liability 5.39 0.31
Amount included in progress billing in Balance Sheet 100.64 28.32
Taxes related to above 334.42 106.69
Closing balance (421.77) 239.11
v crore
Cost of hedging reserve 2019-20 2018-19
Opening balance 5.89 (11.45)
Changes in the forward element of the forward contracts where changes in spot element of forward contract is designated as hedging instruments for time period related hedges (151.87) (226.43)
Included in carrying amount of hedge item 0.55 0.13
Amount reclassified to Profit or Loss 122.14 252.95
Taxes related to above 8.14 (9.31)
Closing balance (15.15) 5.89
Notes forming part of the Consolidated Financial Statements (contd.)NOTE [59] (contd.)

586
NOTES FORMING PART OF THE CONSOLIDATED FINANCIAL STATEMENTS ANNUAL REPORT 2019-20
Notes forming part of the Consolidated Financial Statements (contd.)NOTE [60]
Value of financial assets and inventories pledged as collateral for liabilities and/or commitments and/or contingent liabilities:
v crore
ParticularsAs at
31-3-2020As at
31-3-2019
Current:
Investments – 22.90
Inventories and trade receivables 16023.44 13604.92
Cash and cash equivalents 199.81 683.26
Loans 29479.39 24703.11
Other assets 965.59 749.80
Total inventories and current financial assets pledged as collateral 46668.23 39763.99
Non-current:
Investments 1447.99 87.48
Loans 58312.78 42797.67
Total non-current financial assets pledged as collateral 59760.77 42885.15
NOTE [61]
DisclosurepursuanttoIndAS116“Leases”:
(a) Transition disclosure:
TheGrouphasadoptedIndAS116“Leases”(“Standard”)effectiveApril1,2019(initialapplicationdate).IndAS116supersedesInd AS 17 “Leases”. The Standard sets out the principles for recognition, measurement, presentation and disclosure of leases. The Standard has brought major changes with respect to lease accounting for the lessee. It requires a lessee to account for right-of-use asset and lease liability for all the leases without classification into operating and finance lease.
The Group has used modified retrospective method of transition. Accordingly, the Group has recognised a debit of R 79.09 crore (the cumulative effect of initially applying the Standard as an adjustment) to the opening balance of retained earnings at the date of initial application. Accordingly, the figures of the previous year have not been restated.
The Group has availed of following practical expedients as at the transition date as provided by the Standard:
• Leasesforwhichtheleasetermendswithin12monthsofthedateofinitialapplicationareaccountedinthesamewayasshort term leases.
• TheGrouphasnotreassessedwhetheracontractisorcontainsaleaseatthedateofinitialapplicationandinsteadappliedthe Standard to those contracts that were previously identified as leases under Ind AS 17.
• TheGrouphasexcludedinitialdirectcostsfromthemeasurementoftheright-of-useassetatthedateofinitialapplication.
For leases previously classified as operating leases under Ind AS 17 and which are neither low value leases nor short term leases, the Group has recognised:
• aleaseliabilityatpresentvalueoftheremainingleasepayments,discountedusingGroup’sincrementalborrowingrateof8.11%atthetransitiondate.
• aright-of-useassetatitscarryingamountasiftheStandardhasbeenappliedsincetheleasecommencementdatebutdiscounted using Group’s incremental borrowing rate at the date of initial application, except in few cases wherein the right-of-use asset is determined as an amount equal to the lease liability as at the transition date.
For leases previously classified as finance leases under Ind AS 17, the carrying amount of lease asset and lease liability as at March31,2019havebeenconsideredasright-of-useassetandleaseliabilityrespectivelyasatApril1,2019underIndAS116.

587
Notes forming part of the Consolidated Financial Statements (contd.)
Reconciliation between operating lease commitments disclosed as per Ind AS 17 as at March 31, 2019 and lease liabilities recognised in the Balance Sheet at the date of initial application i.e. April 1, 2019 is as follows:
Particulars v croreOperating lease commitments under Ind AS 17 as at March 31, 2019 1258.68Less: Commitments pertaining to short term leases 79.69Less: Commitments pertaining to low value leases 11.21Less:ImpactofdiscountingofleasepaymentsunderIndAS116 368.48Add: Extension and termination options reasonably certain to be exercised 375.70 Add: Commitments relating to leases previously classified as finance leases 0.06LeaseliabilityrecognisedunderIndAS116asatApril1,2019 1175.06
(b) Where the Group is a lessor: (i) Finance leases: A. Assets given under leases mainly include power plant where the Group has agreed to manufacture/construct an
asset and convey, in substance, a right to the beneficiary to use the asset over a major part of its economic life, for a pre-determined consideration.
B. Finance lease income recognised in the Statement of Profit and Loss during the year amounts to R 1035.33 crore (R 1003.04 crore is on the net investment in finance lease and R 32.29 crore is income relating to variable lease payments not included in the measurement of the net investment in finance leases). Further, an amount of R 0.25 crore is accounted as sub-lease income classified as finance lease.
C. The gross investment in these leases and the present value of minimum lease payments receivable is as under:v crore
Sr. No.
Particulars
Minimum Lease Payments
Present value of minimum lease
paymentsAs at 31-3-2020 As at 31-3-2020
1 Receivable not later than 1 year 1189.58 214.762 Receivable later than 1 year and not later than 2 years 1137.71 185.553 Receivable later than 2 years and not later than 3 years 1231.54 306.334 Receivable later than 3 years and not later than 4 years 1511.98 637.005 Receivable later than 4 years and not later than 5 years 1289.63 476.966 Receivable later than 5 years 13467.38 6087.227 Unguaranteed residual value 990.36 990.36
Grossinvestmentinleases(1+2+3+4+5+6+7) 20818.18 8898.18Less: Unearned finance income 11920.00Present value of minimum lease payments receivable 8898.18
D. Reconciliation of carrying amount of net investment in finance lease receivables is as under:v crore
Sr. No. Particulars Net investment in finance lease1 Opening balance as at April 1, 2019 9067.702 ImpactofIndAS116-derecognitionofright-of-useassetonsub-lease
treated as finance lease 3.263 Finance income/sub-lease income recognised during the year 1003.294 Addition to finance lease during the year 76.105 Lease rental received during the year (1252.17)
Closing balance as at March 31, 2020 (1+2+3+4+5) 8898.18
NOTE [61] (contd.)

588
NOTES FORMING PART OF THE CONSOLIDATED FINANCIAL STATEMENTS ANNUAL REPORT 2019-20
Notes forming part of the Consolidated Financial Statements (contd.)
(ii) Operating leases: A. The Group has given certain assets under non-cancellable operating lease such as buildings, plant & equipment
and vehicles. Leases are renewed only on mutual consent and at a prevalent market price and sub-lease is generally restricted.
B. Operating lease income recognised in the Statement of Profit and Loss during the year amounts to R 170.85crore.Further, an amount of R 1.28croreisaccountedassub-leaseincomeclassifiedasoperatinglease.
C. Annual undiscounted lease payments receivable is as under:v crore
Sr. No. Particulars As at 31-3-20201 Receivable not later than 1 year 116.972 Receivable later than 1 year and not later than 2 years 81.773 Receivable later than 2 years and not later than 3 years 50.784 Receivable later than 3 years and not later than 4 years 27.285 Receivable later than 4 years and not later than 5 years 7.416 Receivable later than 5 years 0.61
Total(1+2+3+4+5+6) 284.82
(c) Where the Group is a lessee: (i) The Group has taken various assets on lease such as plant & equipment, buildings, office premises, vehicles. Generally, leases
are renewed only on mutual consent and at a prevalent market price and sub-lease is restricted. (ii) The Group during the year has leased out surplus capacity in leased assets and has accounted an income of R 1.53 crore on
such sub-leases. (iii) Details with respect to right-of-use assets:
v crore
Class of asset Depreciation for the year* Addition to right-of-use
asset during the year**Carrying amount of asset
as at 31-3-2020Land 17.81 26.57 385.44Buildings 288.15 1125.51 1716.20Plant & equipment 45.60 114.52 117.77 Furniture & fixtures 1.67 – 6.81Vehicles 0.21 0.15 0.27 Total 353.44 1266.75 2226.49
* Depreciation for the year includes depreciation on land R 0.14 crore and on buildings R 0.04 crore pertaining to discontinued operations.
** Addition to right-of-use asset during the year includes addition on account of business combination R 607.03crore(R 23.89croreinlandandR 583.14croreinbuildings).
(iv) Interest expense on lease liabilities amounts to R 162.79crore(includingR 0.74 crore pertaining to discontinued operations).
(v) The expense relating to payments not included in the measurement of the lease liability and recognised as expense in the Statement of Profit and Loss during the year are as follows:
A. Short term leases - R 2749.00 crore (including R 10.91 crore pertaining to discontinued operations);
B. Low value leases - R 48.45crore(includingNilpertainingtodiscontinuedoperations).
(vi) Total cash outflow for leases amounts to R 3090.44 crore (including R 13.63crorepertainingtodiscontinuedoperations)during the year including cash outflow of short term and low value leases.
(vii) The Group has entered into certain lease agreements, which had not commenced by the year end and as a result, a lease liability and right-of-use asset has not been recognised as at March 31, 2020. The aggregate future cash flows to which the Group is exposed in respect of these contracts are: Fixed payments of R 17.99 crore per year, over the lease term ranging from 1 to 9 years.
NOTE [61] (contd.)
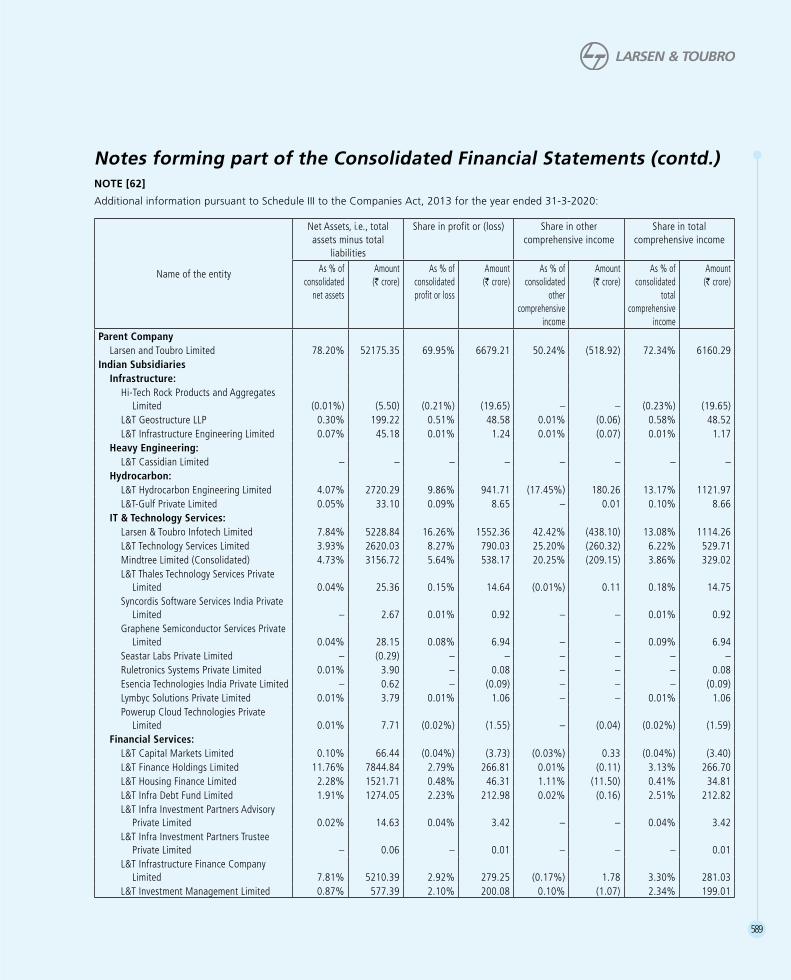
589
Notes forming part of the Consolidated Financial Statements (contd.)NOTE [62]
Additional information pursuant to Schedule III to the Companies Act, 2013 for the year ended 31-3-2020:
Name of the entity
Net Assets, i.e., total assets minus total
liabilities
Share in profit or (loss) Share in other comprehensive income
Share in total comprehensive income
As % of consolidated
net assets
Amount (R crore)
As % of consolidated profit or loss
Amount (R crore)
As % of consolidated
other comprehensive
income
Amount (R crore)
As % of consolidated
total comprehensive
income
Amount (R crore)
Parent Company Larsen and Toubro Limited 78.20% 52175.35 69.95% 6679.21 50.24% (518.92) 72.34% 6160.29 Indian Subsidiaries Infrastructure:
Hi-Tech Rock Products and Aggregates Limited (0.01%) (5.50) (0.21%) (19.65) – – (0.23%) (19.65)
L&T Geostructure LLP 0.30% 199.22 0.51% 48.58 0.01% (0.06) 0.58% 48.52 L&T Infrastructure Engineering Limited 0.07% 45.18 0.01% 1.24 0.01% (0.07) 0.01% 1.17
Heavy Engineering: L&T Cassidian Limited – – – – – – – – Hydrocarbon: L&T Hydrocarbon Engineering Limited 4.07% 2720.29 9.86% 941.71 (17.45%) 180.26 13.17% 1121.97 L&T-Gulf Private Limited 0.05% 33.10 0.09% 8.65 – 0.01 0.10% 8.66 IT & Technology Services:
Larsen & Toubro Infotech Limited 7.84% 5228.84 16.26% 1552.36 42.42% (438.10) 13.08% 1114.26 L&T Technology Services Limited 3.93% 2620.03 8.27% 790.03 25.20% (260.32) 6.22% 529.71 Mindtree Limited (Consolidated) 4.73% 3156.72 5.64% 538.17 20.25% (209.15) 3.86% 329.02 L&T Thales Technology Services Private
Limited 0.04% 25.36 0.15% 14.64 (0.01%) 0.11 0.18% 14.75 Syncordis Software Services India Private
Limited – 2.67 0.01% 0.92 – – 0.01% 0.92 Graphene Semiconductor Services Private
Limited 0.04% 28.15 0.08% 6.94 – – 0.09% 6.94 Seastar Labs Private Limited – (0.29) – – – – – – Ruletronics Systems Private Limited 0.01% 3.90 – 0.08 – – – 0.08 Esencia Technologies India Private Limited – 0.62 – (0.09) – – – (0.09)Lymbyc Solutions Private Limited 0.01% 3.79 0.01% 1.06 – – 0.01% 1.06 Powerup Cloud Technologies Private
Limited 0.01% 7.71 (0.02%) (1.55) – (0.04) (0.02%) (1.59) Financial Services:
L&T Capital Markets Limited 0.10% 66.44 (0.04%) (3.73) (0.03%) 0.33 (0.04%) (3.40)L&T Finance Holdings Limited 11.76% 7844.84 2.79% 266.81 0.01% (0.11) 3.13% 266.70 L&T Housing Finance Limited 2.28% 1521.71 0.48% 46.31 1.11% (11.50) 0.41% 34.81 L&T Infra Debt Fund Limited 1.91% 1274.05 2.23% 212.98 0.02% (0.16) 2.51% 212.82 L&T Infra Investment Partners Advisory
Private Limited 0.02% 14.63 0.04% 3.42 – – 0.04% 3.42 L&T Infra Investment Partners Trustee
Private Limited – 0.06 – 0.01 – – – 0.01 L&T Infrastructure Finance Company
Limited 7.81% 5210.39 2.92% 279.25 (0.17%) 1.78 3.30% 281.03 L&T Investment Management Limited 0.87% 577.39 2.10% 200.08 0.10% (1.07) 2.34% 199.01

590
NOTES FORMING PART OF THE CONSOLIDATED FINANCIAL STATEMENTS ANNUAL REPORT 2019-20
Notes forming part of the Consolidated Financial Statements (contd.)
Name of the entity
Net Assets, i.e., total assets minus total
liabilities
Share in profit or (loss) Share in other comprehensive income
Share in total comprehensive income
As % of consolidated
net assets
Amount (R crore)
As % of consolidated profit or loss
Amount (R crore)
As % of consolidated
other comprehensive
income
Amount (R crore)
As % of consolidated
total comprehensive
income
Amount (R crore)
L&T Mutual Fund Trustee Limited – 1.31 – (0.12) – – – (0.12)L&T Financial Consultants Limited 0.12% 82.16 0.55% 52.75 – (0.03) 0.63% 52.72 Mudit Cement Private Limited (0.06%) (42.16) (0.17%) (15.96) – – (0.19%) (15.96)L&T Finance Limited 13.33% 8893.59 3.84% 366.29 14.46% (149.37) 2.55% 216.92 L&T Infra Investment Partners (The Fund) 0.73% 489.24 – 0.20 – – – 0.20
Developmental Projects:L&T Metro Rail (Hyderabad) Limited 2.76% 1842.71 (4.00%) (382.21) (0.47%) 4.85 (4.43%) (377.36)Sahibganj Ganges Bridge-Company
Private Limited – – – – – – – – Power Development:
L&T Arunachal Hydropower Limited – (0.18) – (0.07) – – – (0.07)L&T Himachal Hydropower Limited – (2.29) (0.01%) (1.29) – – (0.02%) (1.29)L&T Power Development Limited 4.28% 2854.22 (1.19%) (113.73) – – (1.34%) (113.73)L&T Uttaranchal Hydropower Limited 2.28% 1518.79 (0.06%) (5.74) – – (0.07%) (5.74)Nabha Power Limited 5.25% 3503.86 2.55% 243.03 (1.52%) 15.74 3.04% 258.77
Realty:Chennai Vision Developers Private Limited – (0.02) – (0.01) – – – (0.01)L&T Asian Realty Project LLP (0.05%) (30.77) (0.04%) (3.88) – – (0.05%) (3.88)L&T Parel Project LLP 0.34% 227.93 1.80% 171.71 – 0.02 2.03% 171.73 L&T Construction Equipment Limited 0.90% 599.29 2.51% 239.88 – – 2.82% 239.88 LTR SSM Private Limited – 0.05 – (0.05) – – – (0.05)L&T Seawoods Limited 4.11% 2744.20 0.40% 38.66 – (0.01) 0.45% 38.65 L&T Vision Ventures Limited (0.01%) (4.67) – (0.02) – – – (0.02)L&T Electricals and Automation Limited – 0.30 (0.02%) (1.73) – – (0.02%) (1.73)
Valves, Construction Equipment and Others: L&T Construction Machinery Limited 0.30% 199.74 0.02% 1.97 0.21% (2.19) – (0.22) L&T Valves Limited 0.64% 424.28 0.03% 3.34 1.75% (18.10) (0.17%) (14.76) Others:
Bhilai Power Supply Company Limited – 0.05 – – – – – – L&T Power Limited 0.01% 5.54 – 0.28 – – – 0.28 Kesun Iron and Steel Company Private
Limited – – – 0.27 – – – 0.27 L&T Aviation Services Private Limited 0.05% 34.82 0.01% 0.94 – (0.04) 0.01% 0.90 L&T Capital Company Limited 0.01% 5.04 – 0.16 – – – 0.16 L&T Infra Contractors Private Limited – (0.01) – – – – – –
Foreign Subsidiaries Infrastructure:
Larsen & Toubro (Oman) LLC 0.67% 446.44 0.25% 23.58 (3.84%) 39.61 0.75% 63.19 Larsen & Toubro Qatar LLC – 0.20 – (0.32) – 0.02 – (0.30)Larsen & Toubro Saudi Arabia LLC 0.84% 558.07 1.41% 134.95 (1.35%) 13.99 1.76% 148.94 Larsen & Toubro T&D SA (Proprietary)
Limited – 2.81 – 0.20 0.03% (0.36) – (0.16)Larsen & Toubro (East Asia) Sdn. Bhd. – 2.42 0.01% 1.31 (0.01%) 0.07 0.02% 1.38
NOTE [62] (contd.)

591
Notes forming part of the Consolidated Financial Statements (contd.)
Name of the entity
Net Assets, i.e., total assets minus total
liabilities
Share in profit or (loss) Share in other comprehensive income
Share in total comprehensive income
As % of consolidated
net assets
Amount (R crore)
As % of consolidated profit or loss
Amount (R crore)
As % of consolidated
other comprehensive
income
Amount (R crore)
As % of consolidated
total comprehensive
income
Amount (R crore)
Hydrocarbon:Larsen & Toubro Heavy Engineering LLC (0.11%) (74.69) (0.04%) (3.96) – – (0.05%) (3.96)Larsen & Toubro Hydrocarbon
International Limited LLC – – 0.03% 2.79 0.01% (0.07) 0.03% 2.72 L&T Modular Fabrication Yard LLC 0.30% 201.21 1.05% 100.74 – – 1.18% 100.74 L&T Overseas Projects Nigeria Limited – (0.08) – (0.06) – – – (0.06)Larsen Toubro Arabia LLC (0.55%) (369.15) 0.56% 53.39 3.16% (32.68) 0.24% 20.71 L&T Hydrocarbon Saudi Company (0.82%) (547.87) (0.34%) (32.20) – – (0.38%) (32.20)Larsen & Toubro Kuwait Construction
General Contracting company WLL 0.01% 4.91 0.03% 3.08 (0.03%) 0.31 0.04% 3.39 PT Larsen & Toubro Hydrocarbon
Engineering Indonesia – – – – – – – – Larsen & Toubro Electromech LLC 0.11% 76.29 1.55% 147.73 (0.23%) 2.38 1.76% 150.11 L&T Hydrocarbon International FZE – (0.19) – (0.30) – – – (0.30)
IT & Technology Services:L&T Information Technology Services
(Shanghai) Co., Ltd. – (1.39) (0.01%) (0.96) 0.01% (0.06) (0.01%) (1.02)L&T Infotech Financial Services
Technologies Inc. 0.37% 248.76 0.73% 70.00 (0.71%) 7.35 0.91% 77.35 Larsen & Toubro Infotech Canada Limited 0.04% 24.28 0.12% 11.42 (0.05%) 0.50 0.14% 11.92 Larsen & Toubro Infotech LLC 0.01% 3.99 – 0.32 (0.03%) 0.34 0.01% 0.66 Larsen and Toubro Infotech South Africa
(Proprietary) Limited 0.01% 4.10 0.02% 1.46 0.05% (0.49) 0.01% 0.97 Larsen & Toubro Infotech GmbH 0.50% 332.94 (0.05%) (5.02) 0.80% (8.22) (0.16%) (13.24)L&T Information Technology Spain SL – 1.67 (0.01%) (0.93) (0.01%) 0.12 (0.01%) (0.81)Larsen & Toubro Infotech Norge AS – 0.32 – 0.32 – – – 0.32 Larsen & Toubro LLC – 2.88 – 0.04 (0.02%) 0.25 – 0.29 L&T Infotech S. DE R.L. DE C.V. – 0.30 0.01% 0.99 0.01% (0.09) 0.01% 0.90 Syncordis S.A. 0.03% 18.27 (0.04%) (4.01) (0.10%) 1.03 (0.03%) (2.98)Syncordis SARL (0.01%) (4.78) (0.06%) (5.29) – (0.04) (0.06%) (5.33)Syncordis Limited (0.02%) (16.39) (0.12%) (11.28) 0.05% (0.56) (0.14%) (11.84)Syncordis PSF S.A. (formerly known as
Syncordis Support Services S.A.) 0.01% 3.36 (0.01%) (0.89) (0.01%) 0.13 (0.01%) (0.76)Nielsen+Partner Unternehmensberater
GmbH 0.02% 11.68 (0.03%) (2.77) (0.06%) 0.59 (0.03%) (2.18)Nielsen+Partner Unternehmensberater AG – 3.25 0.01% 0.78 (0.04%) 0.41 0.01% 1.19 Nielsen+Partner Pte Ltd 0.03% 22.11 0.13% 12.16 (0.08%) 0.84 0.15% 13.00 Nielsen+Partner S.A 0.02% 12.47 0.07% 7.04 (0.07%) 0.71 0.09% 7.75 Nielsen&Partner Company Limited – (0.24) – (0.10) (0.01%) 0.06 – (0.04)Nielsen&Partner Pty Ltd – 0.04 – (0.47) – 0.01 (0.01%) (0.46)Ruletronics Limited 0.01% 7.26 – 0.34 (0.02%) 0.25 0.01% 0.59 Ruletronics Systems Inc – 1.96 (0.02%) (1.56) (0.02%) 0.23 (0.02%) (1.33)Lymbyc Solutions Inc. – (0.39) – (0.02) – (0.01) – (0.03)L&T Technology Services LLC 0.28% 184.13 0.34% 32.58 (1.45%) 15.01 0.56% 47.59
NOTE [62] (contd.)
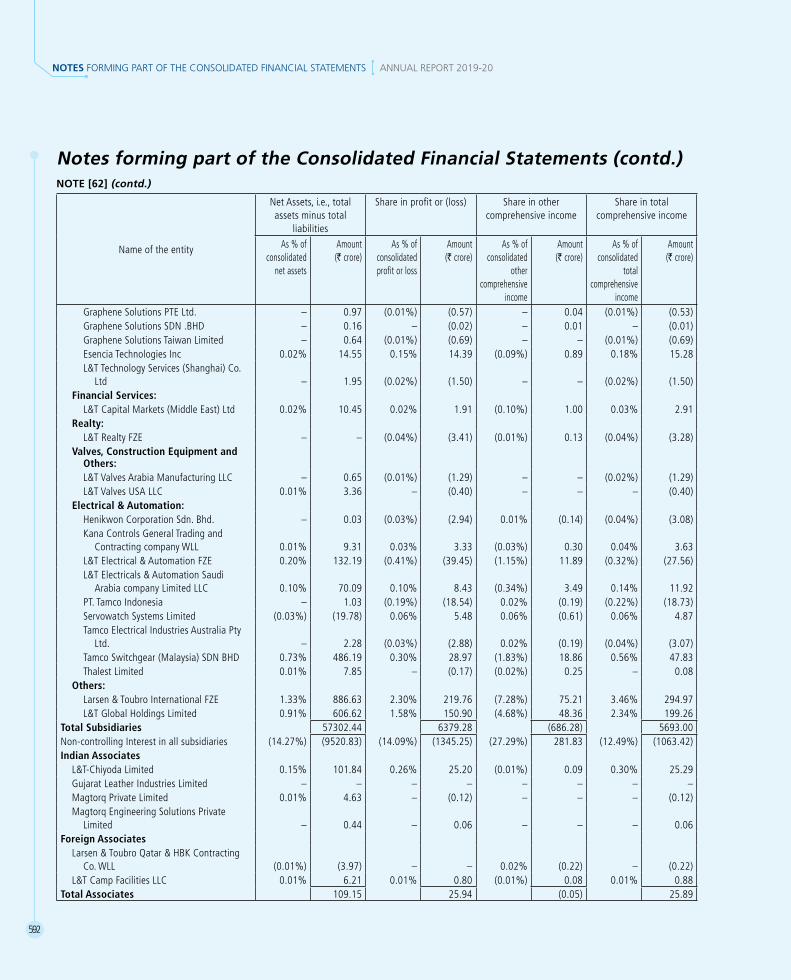
592
NOTES FORMING PART OF THE CONSOLIDATED FINANCIAL STATEMENTS ANNUAL REPORT 2019-20
Notes forming part of the Consolidated Financial Statements (contd.)
Name of the entity
Net Assets, i.e., total assets minus total
liabilities
Share in profit or (loss) Share in other comprehensive income
Share in total comprehensive income
As % of consolidated
net assets
Amount (R crore)
As % of consolidated profit or loss
Amount (R crore)
As % of consolidated
other comprehensive
income
Amount (R crore)
As % of consolidated
total comprehensive
income
Amount (R crore)
Graphene Solutions PTE Ltd. – 0.97 (0.01%) (0.57) – 0.04 (0.01%) (0.53)Graphene Solutions SDN .BHD – 0.16 – (0.02) – 0.01 – (0.01)Graphene Solutions Taiwan Limited – 0.64 (0.01%) (0.69) – – (0.01%) (0.69)Esencia Technologies Inc 0.02% 14.55 0.15% 14.39 (0.09%) 0.89 0.18% 15.28 L&T Technology Services (Shanghai) Co.
Ltd – 1.95 (0.02%) (1.50) – – (0.02%) (1.50) Financial Services: L&T Capital Markets (Middle East) Ltd 0.02% 10.45 0.02% 1.91 (0.10%) 1.00 0.03% 2.91 Realty:
L&T Realty FZE – – (0.04%) (3.41) (0.01%) 0.13 (0.04%) (3.28)Valves, Construction Equipment and
Others:L&T Valves Arabia Manufacturing LLC – 0.65 (0.01%) (1.29) – – (0.02%) (1.29)L&T Valves USA LLC 0.01% 3.36 – (0.40) – – – (0.40)
Electrical & Automation:Henikwon Corporation Sdn. Bhd. – 0.03 (0.03%) (2.94) 0.01% (0.14) (0.04%) (3.08)Kana Controls General Trading and
Contracting company WLL 0.01% 9.31 0.03% 3.33 (0.03%) 0.30 0.04% 3.63 L&T Electrical & Automation FZE 0.20% 132.19 (0.41%) (39.45) (1.15%) 11.89 (0.32%) (27.56)L&T Electricals & Automation Saudi
Arabia company Limited LLC 0.10% 70.09 0.10% 8.43 (0.34%) 3.49 0.14% 11.92 PT. Tamco Indonesia – 1.03 (0.19%) (18.54) 0.02% (0.19) (0.22%) (18.73)Servowatch Systems Limited (0.03%) (19.78) 0.06% 5.48 0.06% (0.61) 0.06% 4.87 Tamco Electrical Industries Australia Pty
Ltd. – 2.28 (0.03%) (2.88) 0.02% (0.19) (0.04%) (3.07)Tamco Switchgear (Malaysia) SDN BHD 0.73% 486.19 0.30% 28.97 (1.83%) 18.86 0.56% 47.83 Thalest Limited 0.01% 7.85 – (0.17) (0.02%) 0.25 – 0.08
Others: Larsen & Toubro International FZE 1.33% 886.63 2.30% 219.76 (7.28%) 75.21 3.46% 294.97 L&T Global Holdings Limited 0.91% 606.62 1.58% 150.90 (4.68%) 48.36 2.34% 199.26 Total Subsidiaries 57302.44 6379.28 (686.28) 5693.00 Non-controlling Interest in all subsidiaries (14.27%) (9520.83) (14.09%) (1345.25) (27.29%) 281.83 (12.49%) (1063.42)Indian Associates
L&T-Chiyoda Limited 0.15% 101.84 0.26% 25.20 (0.01%) 0.09 0.30% 25.29 Gujarat Leather Industries Limited – – – – – – – – Magtorq Private Limited 0.01% 4.63 – (0.12) – – – (0.12)Magtorq Engineering Solutions Private
Limited – 0.44 – 0.06 – – – 0.06 Foreign Associates
Larsen & Toubro Qatar & HBK Contracting Co. WLL (0.01%) (3.97) – – 0.02% (0.22) – (0.22)
L&T Camp Facilities LLC 0.01% 6.21 0.01% 0.80 (0.01%) 0.08 0.01% 0.88 Total Associates 109.15 25.94 (0.05) 25.89
NOTE [62] (contd.)

593
Notes forming part of the Consolidated Financial Statements (contd.)
Name of the entity
Net Assets, i.e., total assets minus total
liabilities
Share in profit or (loss) Share in other comprehensive income
Share in total comprehensive income
As % of consolidated
net assets
Amount (R crore)
As % of consolidated profit or loss
Amount (R crore)
As % of consolidated
other comprehensive
income
Amount (R crore)
As % of consolidated
total comprehensive
income
Amount (R crore)
Indian Joint Ventures Power:
L&T-MHPS Boilers Private Limited 1.32% 883.79 1.67% 159.22 (0.18%) 1.81 1.89% 161.03 L&T-MHPS Turbine Generators Private
Limited 0.25% 169.81 0.26% 25.06 0.19% (1.96) 0.27% 23.10 L&T Howden Private Limited 0.08% 52.86 0.09% 7.48 – (0.01) 0.09% 7.47 L&T-Sargent & Lundy Limited 0.06% 41.08 0.13% 11.29 0.07% (0.69) 0.12% 10.60
Heavy Engineering:L&T Special Steels and Heavy Forgings
Private Limited (1.15%) (765.89) (1.72%) (164.37) 0.02% (0.19) (1.93%) (164.56) Defence Engineering: L&T MBDA Missile Systems Limited – (0.57) (0.01%) (1.02) – – (0.01%) (1.02) Hydrocarbon: L&T Sapura Offshore Private Limited – 0.29 – – – – – – L&T Sapura Shipping Private Limited 0.47% 316.64 (0.12%) (11.63) (2.67%) 27.54 0.19% 15.91 L&T-Gulf Private Limited – – (0.04%) (3.68) – – (0.04%) (3.68) Developmental Projects:
L&T Infrastructure Development Projects Limited (Consolidated) 1.40% 931.81 (1.52%) (144.85) (2.77%) 28.56 (1.37%) (116.29)
Others:Raykal Aluminium Company Private
Limited – 0.20 – (0.03) – – – (0.03)Foreign Joint Ventures Hydrocarbon:
Indiran Engineering Projects & Systems, Kish, (PJSC) – (0.27) – 0.08 – 0.05 – 0.13
L&T Hydrocarbon Caspian LLC – – – – – – – – Total Joint Ventures 1629.75 (122.45) 55.11 (67.34)CFS Adjustment and elimination (52.41%) (34972.64) (21.65%) (2067.70) 15.93% (164.52) (26.21%) (2232.22)Total 66723.22 9549.03 (1032.83) 8516.20
NOTE [63]
There are no amounts due and outstanding to be credited to Investor Education & Protection Fund as at March 31, 2020.
NOTE [64]
Figures for the previous year have been regrouped/re-classified to conform to the figures of the current year.
NOTE [62] (contd.)

salient features of the financial statements of subsidiaries/associate companies/joint ventures annuaL report 2019-20
594
statement containing salient features of the financial statements of subsidiaries/associate companies/joint venturesPart a: “subsidiaries” [as per section 2(87) of the companies act, 2013] v crore
Sr. No. 1 2 3 4 5 6Sr. no.
Particulars Bhilai Power Supply Company
Limited
L&T Electricals and Automation
Limited
Hi-Tech Rock Products and
Aggregates Limited
L&T Seawoods Limited
Kesun Iron and Steel Company Private Limited
L&T Valves Limited
Financial year ending on 31-Mar-20 31-Mar-20 31-Mar-20 31-Mar-20 31-Mar-20 31-Mar-20Currency INR INR INR INR INR INRExchange rate on the last day of financial year – – – – – – Date of Acquisition 11-Jul-95* 12-Dec-07* 01-Jan-08* 13-Mar-08* 16-Jan-09* 23-Nov-61*
1 Share capital (including share application money pending allotment) 0.05 7.44 0.05 1654.55 0.01 18.00
2 Other equity/Reserves and surplus (as applicable) – (7.14) (5.55) 1089.65 (0.01) 406.27
3 Liabilities 1.06 12.88 446.57 290.42 0.00 915.65 4 Total equity and liabilities 1.11 13.18 441.06 3034.62 0.00 1339.93 5 Total assets 1.11 13.18 441.06 3034.62 0.00 1339.93 6 Investments – – 299.78 – – 5.48 7 Turnover – – 412.18 510.20 – 1028.43 8 Profit before taxation – (1.73) (19.65) 43.72 0.27 39.85 9 Provision for taxation – 0.00 – 5.06 – 36.51 10 Profit after taxation – (1.73) (19.65) 38.66 0.27 3.34 11 Interim dividend - equity – – – – – – 12 Interim dividend - preference – – – – – – 13 Proposed dividend - equity – – – – – – 14 Proposed dividend - preference – – – – – – 15 % of share holding 99.90 100.00 100.00 100.00 95.00 100.00
Sr. No. 7 8 9 10 11 12Sr. no.
Particulars Chennai Vision Developers
Private Limited
L&T Vision Ventures Limited
L&T Power Limited
L&T Cassidian Limited
L&T Aviation Services Private
Limited
Larsen & Toubro Infotech Limited
Financial year ending on 31-Mar-20 31-Mar-20 31-Mar-20 31-Mar-20 31-Mar-20 31-Mar-20Currency INR INR INR INR INR INRExchange rate on the last day of financial year – – – – – – Date of Acquisition 14-Aug-08* 22-Dec-06* 09-Mar-06* 15-Apr-11* 06-Nov-09* 23-Dec-96*
1 Share capital (including share application money pending allotment) 0.01 0.05 0.05 0.05 45.60 17.41
2 Other equity/Reserves and surplus (as applicable) (0.03) (4.72) 5.49 (0.05) (10.78) 5211.42
3 Liabilities 0.03 10.91 0.15 – 8.15 3087.87 4 Total equity and liabilities 0.00 6.24 5.69 – 42.97 8316.70 5 Total assets 0.00 6.24 5.69 – 42.97 8316.70 6 Investments 0.00 – 5.67 – – 2873.50 7 Turnover – – – – 19.65 10184.20 8 Profit before taxation (0.01) (0.02) 0.38 – 1.27 2007.00 9 Provision for taxation – – 0.10 – 0.33 454.60 10 Profit after taxation (0.01) (0.02) 0.28 – 0.94 1552.40 11 Interim dividend - equity – – – – – (217.66) 12 Interim dividend - preference – – – – – – 13 Proposed dividend - equity – – – – – (269.90) 14 Proposed dividend - preference – – – – – – 15 % of share holding 100.00 68.00 99.99 100.00 100.00 74.53
Note: * Date of incorporation

595
Sr. No. 13 14 15 16 17 18Sr. no.
Particulars L&T Finance Holdings Limited
L&T Housing Finance Limited
L&T Finance Limited
L&T Capital Markets Limited
L&T Investment Management
Limited
L&T Mutual Fund Trustee Limited
Financial year ending on 31-Mar-20 31-Mar-20 31-Mar-20 31-Mar-20 31-Mar-20 31-Mar-20Currency INR INR INR INR INR INRExchange rate on the last day of financial year – – – – – – Date of Acquisition 01-May-08* 09-Oct-12 31-Dec-12 07-Feb-13* 25-Apr-96* 30-Apr-96*
1 Share capital (including share application money pending allotment) 2004.83 165.37 1599.14 52.31 251.82 0.15
2 Other equity/Reserves and surplus (as applicable) 5840.02 1356.34 7294.45 14.13 325.53 1.16
3 Liabilities 3492.97 13546.10 43683.13 7.02 46.28 0.05 4 Total equity and liabilities 11337.82 15067.80 52576.72 73.46 623.63 1.36 5 Total assets 11337.82 15067.80 52576.72 73.46 623.63 1.36 6 Investments 10069.68 131.04 3077.45 60.82 90.13 0.96 7 Turnover 475.44 1323.10 8184.41 34.27 381.28 0.05 8 Profit before taxation 283.74 71.65 813.96 0.08 200.06 (0.12) 9 Provision for taxation 16.93 25.34 447.67 3.81 – – 10 Profit after taxation 266.81 46.31 366.29 (3.73) 200.06 (0.12) 11 Interim dividend - equity – (37.21) (183.90) – (123.39) – 12 Interim dividend - preference – – – – – – 13 Proposed dividend - equity – – – – – – 14 Proposed dividend - preference – – – – – – 15 % of share holding 63.72 63.72 63.72 63.72 63.72 63.72
Sr. No. 19 20 21 22 23 24Sr. no.
Particulars L&T Infrastructure
Finance Company Limited
L&T Infra Debt Fund Limited
L&T Infra Investment
Partners Advisory Private Limited
L&T Infra Investment
Partners Trustee Private Limited
L&T Financial Consultants
Limited
Mudit Cement Private Limited
Financial year ending on 31-Mar-20 31-Mar-20 31-Mar-20 31-Mar-20 31-Mar-20 31-Mar-20Currency INR INR INR INR INR INRExchange rate on the last day of financial year – – – – – – Date of Acquisition 18-Apr-06* 19-Mar-13* 30-May-11* 12-Aug-11* 16-Jun-11* 27-Dec-13
1 Share capital (including share application money pending allotment) 1505.30 490.18 5.00 0.10 18.75 2.10
2 Other equity/Reserves and surplus (as applicable) 3705.09 783.87 9.63 (0.04) 63.41 (44.26)
3 Liabilities 26446.16 8594.18 0.30 0.01 370.69 67.96 4 Total equity and liabilities 31656.55 9868.23 14.93 0.07 452.85 25.80 5 Total assets 31656.55 9868.23 14.93 0.07 452.85 25.80 6 Investments 2325.96 635.31 12.47 (0.00) 4.26 – 7 Turnover 3056.00 901.82 6.14 0.03 89.31 – 8 Profit before taxation 709.56 212.98 4.78 0.01 74.30 (18.74) 9 Provision for taxation 430.31 – 1.36 0.00 21.55 (2.78) 10 Profit after taxation 279.25 212.98 3.42 0.01 52.75 (15.96) 11 Interim dividend - equity – – – – – – 12 Interim dividend - preference – – – – – – 13 Proposed dividend - equity – – – – – – 14 Proposed dividend - preference – – – – – – 15 % of share holding 63.72 63.72 63.72 63.72 63.72 63.72
statement containing salient features of the financial statements of subsidiaries/associate companies/joint venturesPart a: “subsidiaries” [as per section 2(87) of the companies act, 2013] (contd.) v crore
Note: * Date of incorporation

salient features of the financial statements of subsidiaries/associate companies/joint ventures annuaL report 2019-20
596
Sr. No. 25 26 27 28 29 30Sr. no.
Particulars L&T Capital Company Limited
L&T Power Development
Limited
L&T Uttaranchal Hydropower
Limited
L&T Arunachal Hydropower
Limited
L&T Himachal Hydropower
Limited
Nabha Power Limited
Financial year ending on 31-Mar-20 31-Mar-20 31-Mar-20 31-Mar-20 31-Mar-20 31-Mar-20Currency INR INR INR INR INR INRExchange rate on the last day of financial year – – – – – – Date of Acquisition 06-Apr-00* 12-Sep-07* 13-Nov-06* 24-Jun-10* 22-Jun-10* 09-Apr-07*
1 Share capital (including share application money pending allotment) 0.05 3112.70 161.05 40.39 200.55 2325.00
2 Other equity/Reserves and surplus (as applicable) 4.99 (258.48) 1357.74 (40.57) (202.84) 1178.85
3 Liabilities 0.21 1.37 112.33 0.17 2.37 7733.88 4 Total equity and liabilities 5.25 2855.59 1631.12 0.01 0.08 11237.73 5 Total assets 5.25 2855.59 1631.12 0.01 0.08 11237.73 6 Investments 0.01 2850.32 13.25 – – – 7 Turnover – 5.33 – – – 3766.66 8 Profit before taxation 0.22 (113.70) (5.74) (0.07) (1.29) 249.42 9 Provision for taxation 0.06 0.03 0.00 0.00 0.00 6.38 10 Profit after taxation 0.16 (113.73) (5.74) (0.07) (1.29) 243.04 11 Interim dividend - equity – – – – – – 12 Interim dividend - preference – – – – – – 13 Proposed dividend - equity – – – – – – 14 Proposed dividend - preference – – – – – – 15 % of share holding 100.00 100.00 100.00 100.00 100.00 100.00
Sr. No. 31 32 33 34 35 36Sr. no.
Particulars L&T Metro Rail (Hyderabad)
Limited
L&T Technology Services Limited
L&T Construction Equipment
Limited
L&T Infrastructure
Engineering Limited
L&T Thales Technology
Services Private Limited
Sahibganj Ganges Bridge-
Company Private Limited
Financial year ending on 31-Mar-20 31-Mar-20 31-Mar-20 31-Mar-20 31-Mar-20 31-Mar-20Currency INR INR INR INR INR INRExchange rate on the last day of financial year – – – – – – Date of Acquisition 24-Aug-10* 14-Jun-12* 29-Jul-97* 09-Dec-98* 15-Feb-14 14-Jul-16*
1 Share capital (including share application money pending allotment) 2439.00 20.90 167.16 3.60 2.05 0.01
2 Other equity/Reserves and surplus (as applicable) (596.29) 2599.13 432.13 41.58 23.31 (0.01)
3 Liabilities 16220.29 1461.67 850.87 44.37 74.25 – 4 Total equity and liabilities 18063.00 4081.70 1450.16 89.55 99.61 – 5 Total assets 18063.00 4081.70 1450.16 89.55 99.61 – 6 Investments – 765.19 227.58 – 3.26 – 7 Turnover 1359.65 5181.27 733.98 70.65 142.80 – 8 Profit before taxation (382.21) 1055.02 296.30 1.84 20.77 – 9 Provision for taxation – 264.99 56.42 0.60 6.13 – 10 Profit after taxation (382.21) 790.03 239.88 1.24 14.64 – 11 Interim dividend - equity – (78.20) – – – – 12 Interim dividend - preference – – – – – – 13 Proposed dividend - equity – (141.09) – – – – 14 Proposed dividend - preference – – – – – – 15 % of share holding 100.00 74.62 100.00 100.00 55.22 100.00
statement containing salient features of the financial statements of subsidiaries/associate companies/joint venturesPart a: “subsidiaries” [as per section 2(87) of the companies act, 2013] (contd.) v crore
Note: * Date of incorporation

597
Sr. No. 37 38 39 40 41 42Sr. no.
Particulars L&T Hydrocarbon Engineering
Limited
L&T Infra Contractors
Private Limited
Esencia Technologies India Private
Limited
Syncordis Software
Services India Private Limited
LTR SSM Private Limited
L&T-Sargent & Lundy Limited
Financial year ending on 31-Mar-20 31-Mar-20 31-Mar-20 31-Mar-20 31-Mar-20 31-Mar-20Currency INR INR INR INR INR INRExchange rate on the last day of financial year – – – – – – Date of Acquisition 02-Apr-09* 17-Mar-17* 31-May-17 11-Dec-17 24-Sep-18* 05-May-95*
1 Share capital (including share application money pending allotment) 1000.05 0.01 0.01 0.45 0.10 5.57
2 Other equity/Reserves and surplus (as applicable) 1720.24 (0.02) 0.60 2.22 (0.10) 76.59
3 Liabilities 11824.24 0.01 0.01 5.62 – 39.42 4 Total equity and liabilities 14544.53 0.00 0.62 8.29 – 121.58 5 Total assets 14544.53 0.00 0.62 8.29 – 121.58 6 Investments 1694.43 – – – – 54.57 7 Turnover 14410.56 – – 10.25 – 111.94 8 Profit before taxation 1329.86 (0.00) (0.09) 1.19 (0.05) 26.27 9 Provision for taxation 388.15 – – 0.27 – 3.69 10 Profit after taxation 941.71 (0.00) (0.09) 0.92 (0.05) 22.58 11 Interim dividend - equity (245.02) – – – – – 12 Interim dividend - preference (60.90) – – – – – 13 Proposed dividend - equity (100.01) – – – – – 14 Proposed dividend - preference (20.30) – – – – – 15 % of share holding 100.00 100.00 74.62 74.53 99.00 50.00
Sr. No. 43 44 45 46 47 48Sr. no.
Particulars L&T Gulf Private Limited
L&T-MHPS Boilers Private
Limited
L&T-MHPS Turbine
Generators Private Limited
Raykal Aluminium
Company Private Limited
L&T Special Steels and Heavy Forgings Private
Limited
L&T Howden Private Limited
Financial year ending on 31-Mar-20 31-Mar-20 31-Mar-20 31-Mar-20 31-Mar-20 31-Mar-20Currency INR INR INR INR INR INRExchange rate on the last day of financial year – – – – – – Date of Acquisition 11-Jan-08* 09-Oct-06* 27-Dec-06* 23-Feb-99* 01-Jul-09* 17-Jun-10*
1 Share capital (including share application money pending allotment) 8.00 234.10 710.60 0.05 566.60 30.00
2 Other equity/Reserves and surplus (as applicable) 25.10 1498.84 (377.64) 0.22 (1601.58) 75.50
3 Liabilities 4.33 2132.74 2204.45 0.70 2546.06 121.57 4 Total equity and liabilities 37.43 3865.68 2537.41 0.97 1511.08 227.07 5 Total assets 37.43 3865.68 2537.41 0.97 1511.08 227.07 6 Investments 17.68 312.91 528.93 – – – 7 Turnover 14.76 2035.62 802.02 – 222.78 149.08 8 Profit before taxation 9.04 429.80 49.13 (0.03) (222.12) 20.66 9 Provision for taxation 0.39 117.60 0.00 – – 5.73 10 Profit after taxation 8.65 312.20 49.13 (0.03) (222.12) 14.93 11 Interim dividend - equity – – – – – – 12 Interim dividend - preference – – – – – – 13 Proposed dividend - equity – – – – – – 14 Proposed dividend - preference – – – – – – 15 % of share holding 100.00 51.00 51.00 75.50 74.00 50.10
statement containing salient features of the financial statements of subsidiaries/associate companies/joint venturesPart a: “subsidiaries” [as per section 2(87) of the companies act, 2013] (contd.) v crore
Note: * Date of incorporation

salient features of the financial statements of subsidiaries/associate companies/joint ventures annuaL report 2019-20
598
Sr. No. 49 50 51 52 53 54Sr. no.
Particulars L&T Sapura Offshore Private
Limited
L&T Sapura Shipping Private
Limited
L&T MBDA Missile Systems
Limited
L&T Infrastructure Development
Projects Limited
Panipat Elevated Corridor Limited
Vadodara Bharuch Tollway
Limited
Financial year ending on 31-Mar-20 31-Mar-20 31-Mar-20 31-Mar-20 31-Mar-20 31-Mar-20Currency INR USD INR INR INR INRExchange rate on the last day of financial year – 75.67 – – – – Date of Acquisition 02-Sep-10* 02-Sep-10* 05-Apr-17* 26-Feb-01* 21-Jul-05* 23-Dec-05*
1 Share capital (including share application money pending allotment) 0.01 158.85 1.00 629.52 30.05 43.50
2 Other equity/Reserves and surplus (as applicable) 0.48 368.94 (2.11) 2619.54 (304.53) (94.12)
3 Liabilities 5.98 313.81 117.81 660.99 445.93 728.22 4 Total equity and liabilities 6.47 841.60 116.70 3910.05 171.45 677.60 5 Total assets 6.47 841.60 116.70 3910.05 171.45 677.60 6 Investments – – – 3094.16 0.31 26.69 7 Turnover – 95.57 21.18 152.73 79.20 358.45 8 Profit before taxation 0.00 (19.07) (1.67) 9.23 13.23 119.36 9 Provision for taxation 0.00 0.31 0.33 34.11 – 21.04 10 Profit after taxation 0.00 (19.38) (2.00) (24.88) 13.23 98.32 11 Interim dividend - equity – – – – – – 12 Interim dividend - preference – – – – – – 13 Proposed dividend - equity – – – – – – 14 Proposed dividend - preference – – – – – – 15 % of share holding 60.00 60.00 51.00 51.00 51.00 51.00
Sr. No. 55 56 57 58 59 60Sr. no.
Particulars L&T Interstate Road Corridor
Limited
L&T Transportation Infrastructure
Limited
L&T Halol-Shamlaji Tollway
Limited
Ahmedabad-Maliya Tollway
Limited
L&T Samakhiali Gandhidham
Tollway Limited
L&T Deccan Tollways Limited
Financial year ending on 31-Mar-20 31-Mar-20 31-Mar-20 31-Mar-20 31-Mar-20 31-Mar-20Currency INR INR INR INR INR INRExchange rate on the last day of financial year – – – – – – Date of Acquisition 02-Feb-06* 24-Sep-97* 09-Sep-08* 09-Sep-08* 05-Feb-10* 20-Dec-11*
1 Share capital (including share application money pending allotment) 57.16 41.40 795.35 149.00 80.54 285.34
2 Other equity/Reserves and surplus (as applicable) (12.36) 328.31 (441.30) (65.68) (333.52) (510.46)
3 Liabilities 219.51 39.80 819.64 1228.32 1880.88 2278.09 4 Total equity and liabilities 264.31 409.51 1173.69 1311.64 1627.90 2052.97 5 Total assets 264.31 409.51 1173.69 1311.64 1627.90 2052.97 6 Investments 63.93 91.90 – 34.38 – 14.97 7 Turnover 27.90 142.84 95.02 190.28 165.08 141.91 8 Profit before taxation 2.64 219.04 (30.86) (8.33) (129.37) (241.69) 9 Provision for taxation 1.42 60.64 – – – 0.07 10 Profit after taxation 1.22 158.40 (30.86) (8.33) (129.37) (241.76) 11 Interim dividend - equity – – – – – – 12 Interim dividend - preference – – – – – – 13 Proposed dividend - equity – – – – – – 14 Proposed dividend - preference – – – – – – 15 % of share holding 51.00 63.86 24.98 51.00 51.01 52.89
statement containing salient features of the financial statements of subsidiaries/associate companies/joint venturesPart a: “subsidiaries” [as per section 2(87) of the companies act, 2013] (contd.) v crore
Note: * Date of incorporation

599
Sr. No. 61 62 63 64 65 66Sr. no.
Particulars Kudgi Transmission
Limited
L&T Sambalpur-Rourkela Tollway
Limited
PNG Tollway Limited
L&T Rajkot-Vadinar Tollway
Limited
L&T Chennai - Tada Tollway
Limited
Graphene Semiconductor
Services Private Limited
Financial year ending on 31-Mar-20 31-Mar-20 31-Mar-20 31-Mar-20 31-Mar-20 31-Mar-20Currency INR INR INR INR INR INRExchange rate on the last day of financial year – – – – – – Date of Acquisition 30-Aug-13 18-Oct-13* 16-Feb-09* 08-Sep-08* 24-Mar-08* 15-Oct-18
1 Share capital (including share application money pending allotment) 192.60 290.03 169.10 110.00 42.00 1.43
2 Other equity/Reserves and surplus (as applicable) 219.97 (113.32) (330.39) (265.02) (5.62) 26.72
3 Liabilities 1571.23 1077.28 174.30 983.29 351.13 6.14 4 Total equity and liabilities 1983.80 1253.99 13.01 828.27 387.51 34.29 5 Total assets 1983.80 1253.99 13.01 828.27 387.51 34.29 6 Investments 207.90 25.63 1.12 9.81 – – 7 Turnover 193.52 158.83 – 104.76 – 46.30 8 Profit before taxation 64.03 (47.12) (2.63) (34.54) (0.13) 9.01 9 Provision for taxation 1.11 0.08 0.08 – – 2.07 10 Profit after taxation 62.92 (47.20) (2.71) (34.54) (0.13) 6.94 11 Interim dividend - equity – – – – – – 12 Interim dividend - preference – – – – – – 13 Proposed dividend - equity – – – – – 18.04 14 Proposed dividend - preference – – – – – – 15 % of share holding 51.00 51.00 37.74 51.00 51.00 74.62
Sr. No. 67 68 69 70 71 72Sr. no.
Particulars Seastar Labs Private Limited
L&T Construction Machinery
Limited
Ruletronics Systems Private
Limited
Mindtree Limited Lymbyc Solutions Private Limited
Powerup Cloud Technologies
Private LimitedFinancial year ending on 31-Mar-20 31-Mar-20 31-Mar-20 31-Mar-20 31-Mar-20 31-Mar-20Currency INR INR INR INR INR INRExchange rate on the last day of financial year – – – – – – Date of Acquisition 15-Oct-18 18-Dec-18* 01-Feb-19 02-Jul-19 29-Aug-19 25-Oct-19
1 Share capital (including share application money pending allotment) 0.05 199.14 0.51 164.60 1.15 0.02
2 Other equity/Reserves and surplus (as applicable) (0.34) 0.60 3.39 2992.00 2.65 7.69
3 Liabilities 2.18 159.44 3.83 1999.90 4.78 21.02 4 Total equity and liabilities 1.89 359.18 7.73 5156.50 8.58 28.73 5 Total assets 1.89 359.18 7.73 5156.50 8.58 28.73 6 Investments – – – 774.40 0.56 – 7 Turnover – 350.43 5.03 7764.03 6.33 16.10 8 Profit before taxation (0.00) 1.27 0.17 828.70 1.35 (2.09) 9 Provision for taxation – (0.70) 0.09 197.90 0.29 (0.54) 10 Profit after taxation (0.00) 1.97 0.08 630.80 1.06 (1.55) 11 Interim dividend - equity – – – (49.37) – – 12 Interim dividend - preference – – – – – – 13 Proposed dividend - equity – – – (164.57) – – 14 Proposed dividend - preference – – – – – – 15 % of share holding 74.62 100.00 74.53 61.08 74.53 74.53
statement containing salient features of the financial statements of subsidiaries/associate companies/joint venturesPart a: “subsidiaries” [as per section 2(87) of the companies act, 2013] (contd.) v crore
Note: * Date of incorporation

salient features of the financial statements of subsidiaries/associate companies/joint ventures annuaL report 2019-20
600
Sr. No. 73 74 75 76 77 78 Sr. no.
Particulars Larsen & Toubro LLC
Larsen & Toubro Infotech GmbH
Larsen & Toubro Infotech Canada
Limited
Larsen & Toubro Infotech LLC
L&T Infotech Financial Services
Technologies Inc.
Larsen and Toubro Infotech
South Africa (Proprietary) LTD
Financial year ending on 31-Mar-20 31-Mar-20 31-Mar-20 31-Mar-20 31-Mar-20 31-Mar-20Currency USD EURO CAD USD CAD ZAR Exchange rate on the last day of financial year 75.67 82.77 53.08 75.67 53.08 4.23 Date of Acquisition 02-Jan-01* 14-Jun-99* 25-Apr-00 21-Jul-09* 01-Jan-11 25-Jul-12
1 Share capital (including share application money pending allotment) 0.40 1.03 0.00 – 199.06 0.19
2 Other equity/Reserves and surplus (as applicable) 2.48 365.75 24.54 3.99 52.27 3.94
3 Liabilities 2.06 160.84 17.99 0.59 21.23 10.16 4 Total equity and liabilities 4.94 527.62 42.53 4.58 272.56 14.29 5 Total assets 4.94 527.62 42.53 4.58 272.56 14.29 6 Investments – – – – – – 7 Turnover 3.68 88.15 214.36 6.66 304.75 21.67 8 Profit before taxation 0.06 2.05 15.75 0.32 97.32 1.73 9 Provision for taxation 0.02 0.17 4.21 – 26.61 0.49 10 Profit after taxation 0.04 1.88 11.54 0.32 70.71 1.24 11 Interim dividend - equity – (11.35) – – (73.37) – 12 Interim dividend - preference – – – – – – 13 Proposed dividend - equity – – – – – – 14 Proposed dividend - preference – – – – – – 15 % of share holding 98.79 74.53 74.53 74.53 74.53 55.83
Sr. No. 79 80 81 82 83 84 Sr. no.
Particulars L&T Information Technology
Services (Shanghai) Co.,
Ltd.
Larsen & Toubro International FZE
Larsen & Toubro Hydrocarbon International Limited LLC #
Thalest Limited Servowatch Systems Limited
L&T Modular Fabrication Yard
LLC
Financial year ending on 31-Dec-19 31-Mar-20 31-Dec-19 31-Mar-20 31-Mar-20 31-Dec-19Currency CNY USD SAR GBP GBP OMR Exchange rate on the last day of financial year 10.25 75.67 19.03 93.50 93.50 185.42 Date of Acquisition 28-Jun-13* 25-Sep-01* 17-Jun-13* 04-Apr-12 04-Apr-12 05-Jul-06*
1 Share capital (including share application money pending allotment) 1.10 827.40 0.95 1.25 23.84 53.49
2 Other equity/Reserves and surplus (as applicable) (2.60) 55.53 (3.78) 6.60 (43.62) 174.17
3 Liabilities 3.62 4.66 5.21 – 43.06 200.53 4 Total equity and liabilities 2.12 887.59 2.38 7.85 23.28 428.19 5 Total assets 2.12 887.59 2.38 7.85 23.28 428.19 6 Investments – 53.64 – – – – 7 Turnover 20.63 – – – 50.42 461.22 8 Profit before taxation 0.23 226.55 0.01 (0.17) 5.48 43.76 9 Provision for taxation – 6.79 – – – 6.32 10 Profit after taxation 0.23 219.76 0.01 (0.17) 5.48 37.44 11 Interim dividend - equity – (177.39) – – – – 12 Interim dividend - preference – – – – – – 13 Proposed dividend - equity – – – – – – 14 Proposed dividend - preference – – – – – – 15 % of share holding 74.53 100.00 100.00 100.00 100.00 70.00
statement containing salient features of the financial statements of subsidiaries/associate companies/joint venturesPart a: “subsidiaries” [as per section 2(87) of the companies act, 2013] (contd.) v crore
Note: * Date of incorporation

601
Sr. No. 85 86 87 88 89 90 Sr. no.
Particulars Larsen & Toubro (East
Asia) Sdn. Bhd.
Larsen & Toubro Qatar
LLC
L&T Overseas Projects Nigeria
Limited
L&T Electricals & Automation
Saudi Arabia company
Limited LLC
Larsen & Toubro Kuwait
Construction General
Contracting company WLL
Larsen & Toubro Saudi
Arabia LLC
Financial year ending on 31-Mar-20 31-Dec-19 31-Dec-19 31-Mar-20 31-Dec-19 31-Dec-19Currency MYR QAR NGN SAR KWD SAR Exchange rate on the last day of financial year 17.52 19.60 0.20 20.15 235.44 19.03 Date of Acquisition 13-Jun-96* 31-Mar-04* 15-Jul-04* 22-Aug-06* 29-Nov-06* 22-Jun-99*
1 Share capital (including share application money pending allotment) 1.31 0.39 0.33 114.86 47.09 27.35
2 Other equity/Reserves and surplus (as applicable) 0.99 (1.26) (0.35) (43.77) (42.96) 496.09
3 Liabilities 81.82 1.00 0.10 114.78 40.44 1094.73 4 Total equity and liabilities 84.12 0.13 0.08 185.87 44.57 1618.17 5 Total assets 84.12 0.13 0.08 185.87 44.57 1618.17 6 Investments – – – – – – 7 Turnover 143.24 – – 160.76 80.36 1079.16 8 Profit before taxation 2.64 (0.32) (0.06) 10.77 2.64 131.22 9 Provision for taxation – – – 2.05 – 26.21 10 Profit after taxation 2.64 (0.32) (0.06) 8.72 2.64 105.01 11 Interim dividend - equity – – – – – (175.76) 12 Interim dividend - preference – – – – – – 13 Proposed dividend - equity – – – – – – 14 Proposed dividend - preference – – – – – – 15 % of share holding 30.00 49.00 100.00 100.00 49.00 100.00
Sr. No. 91 92 93 94 95 96 Sr. no.
Particulars Larsen Toubro Arabia LLC
L&T Hydrocarbon
Saudi Company
Tamco Switchgear
(Malaysia) SDN BHD
Henikwon Corporation Sdn.
Bhd.
Tamco Electrical Industries
Australia Pty Ltd.
PT. Tamco Indonesia
Financial year ending on 31-Dec-19 31-Dec-19 31-Mar-20 31-Mar-20 31-Mar-20 31-Dec-19Currency SAR SAR MYR MYR AUD IDR Exchange rate on the last day of financial year 19.03 19.03 17.52 17.52 46.08 0.01 Date of Acquisition 01-Jul-12* 08-Jul-07* 29-May-07 03-Jul-12 23-Apr-08 23-Apr-08
1 Share capital (including share application money pending allotment) 19.03 1.90 175.15 27.06 75.90 57.13
2 Other equity/Reserves and surplus (as applicable) (374.42) (472.14) 310.95 (27.04) (73.62) (68.79)
3 Liabilities 950.89 985.12 304.16 18.25 13.47 85.71 4 Total equity and liabilities 595.50 514.88 790.26 18.27 15.75 74.05 5 Total assets 595.50 514.88 790.26 18.27 15.75 74.05 6 Investments – – – – – – 7 Turnover 478.83 1340.14 549.56 33.92 23.41 39.94 8 Profit before taxation 7.61 19.41 38.17 (2.96) (2.88) (16.01) 9 Provision for taxation 0.68 2.98 9.20 (0.00) – (3.37) 10 Profit after taxation 6.93 16.43 28.97 (2.96) (2.88) (12.64) 11 Interim dividend - equity – – (86.96) – – – 12 Interim dividend - preference – – – – – – 13 Proposed dividend - equity – – – – – – 14 Proposed dividend - preference – – – – – – 15 % of share holding 75.00 100.00 100.00 100.00 100.00 100.00
statement containing salient features of the financial statements of subsidiaries/associate companies/joint venturesPart a: “subsidiaries” [as per section 2(87) of the companies act, 2013] (contd.) v crore
Note: * Date of incorporation

salient features of the financial statements of subsidiaries/associate companies/joint ventures annuaL report 2019-20
602
Sr. No. 97 98 99 100 101 102 Sr. no.
Particulars Larsen & Toubro Heavy
Engineering LLC
L&T Electrical & Automation FZE
Kana Controls General Trading and Contracting
company WLL
Larsen & Toubro T&D SA
(Proprietary) Limited
L&T Technology Services LLC
L&T Global Holdings Limited
Financial year ending on 31-Dec-19 31-Mar-20 31-Mar-20 31-Mar-20 31-Mar-20 31-Mar-20Currency OMR AED KWD ZAR USD USD Exchange rate on the last day of financial year 185.42 20.60 246.75 4.23 75.67 75.67 Date of Acquisition 07-Apr-08* 04-Apr-08* 10-Sep-13 06-Sep-10* 26-Jun-14* 24-Feb-16*
1 Share capital (including share application money pending allotment) 105.04 2.06 2.47 3.17 113.57 60.53
2 Other equity/Reserves and surplus (as applicable) (107.42) 130.13 4.28 (0.37) 70.95 546.09
3 Liabilities 209.94 258.12 23.11 0.23 160.48 692.77 4 Total equity and liabilities 207.56 390.31 29.86 3.03 345.00 1299.39 5 Total assets 207.56 390.31 29.86 3.03 345.00 1299.39 6 Investments – 15.89 – – 137.36 1297.82 7 Turnover 201.89 287.21 26.16 – 316.04 – 8 Profit before taxation (22.46) (33.55) 3.33 0.20 22.45 150.90 9 Provision for taxation (0.65) 5.90 – – (10.10) – 10 Profit after taxation (21.81) (39.45) 3.33 0.20 32.55 150.90 11 Interim dividend - equity – – – – – – 12 Interim dividend - preference – – – – – – 13 Proposed dividend - equity – – – – – – 14 Proposed dividend - preference – – – – – – 15 % of share holding 70.00 100.00 49.00 72.50 74.62 100.00
Sr. No. 103 104 105 106 107 108 Sr. no.
Particulars L&T Information Technology
Spain SL
Larsen & Toubro (Oman) LLC
Esencia Technologies Inc
Syncordis S.A. Syncordis SARL Syncordis Limited
Financial year ending on 31-Mar-20 31-Dec-19 31-Mar-20 31-Dec-19 31-Dec-19 31-Mar-20Currency EURO OMR USD EURO EURO GBP Exchange rate on the last day of financial year 82.77 185.42 75.67 80.10 80.10 93.50 Date of Acquisition 01-Feb-16* 29-Jan-94* 31-May-17 15-Dec-17 15-Dec-17 15-Dec-17
1 Share capital (including share application money pending allotment) 0.41 27.02 0.01 0.28 0.12 0.01
2 Other equity/Reserves and surplus (as applicable) (1.93) 427.20 28.17 19.09 (3.66) (13.50)
3 Liabilities 12.97 2424.38 12.14 56.95 10.67 – 4 Total equity and liabilities 11.45 2878.60 40.32 76.32 7.13 (13.49) 5 Total assets 11.45 2878.60 40.32 76.32 7.13 (13.49) 6 Investments – – – – – – 7 Turnover 27.78 2018.97 88.64 123.02 19.95 9.47 8 Profit before taxation (1.32) 26.33 18.99 (1.02) 5.26 (13.16) 9 Provision for taxation (0.33) (4.24) 5.20 0.01 0.75 (2.46) 10 Profit after taxation (0.99) 30.57 13.79 (1.03) 4.51 (10.70) 11 Interim dividend - equity – – – – – – 12 Interim dividend - preference – – – – – – 13 Proposed dividend - equity – – – – – – 14 Proposed dividend - preference – – – – – – 15 % of share holding 74.53 65.00 74.62 74.53 74.53 74.53
statement containing salient features of the financial statements of subsidiaries/associate companies/joint venturesPart a: “subsidiaries” [as per section 2(87) of the companies act, 2013] (contd.) v crore
Note: * Date of incorporation

603
Sr. No. 109 110 111 112 113 114 Sr. no.
Particulars Syncordis PSF S.A.
L&T Infotech S. DE R.L. DE C.V.
Larsen & Toubro Electromech LLC
L&T Capital Market (Middle
East) Ltd
Larsen & Toubro Infotech Norge
AS
Graphene Solutions PTE
Ltd. Financial year ending on 31-Dec-19 31-Dec-19 31-Dec-19 31-Mar-20 31-Mar-20 31-Mar-20Currency EURO MXN OMR USD NOK SGD Exchange rate on the last day of financial year 80.10 3.77 185.42 75.67 7.22 53.03 Date of Acquisition 15-Dec-17 01-Mar-17* 01-Jan-05 01-Jul-18* 20-Nov-18* 15-Oct-18
1 Share capital (including share application money pending allotment) 3.20 0.00 5.56 12.48 0.02 0.32
2 Other equity/Reserves and surplus (as applicable) (0.20) 0.03 35.13 (2.03) 0.44 0.65
3 Liabilities 5.89 7.58 109.67 10.59 15.81 0.39 4 Total equity and liabilities 8.89 7.61 150.36 21.04 16.27 1.36 5 Total assets 8.89 7.61 150.36 21.04 16.27 1.36 6 Investments – – – – – – 7 Turnover 15.97 19.75 215.23 20.02 13.28 3.89 8 Profit before taxation (1.04) 1.04 114.92 (0.31) 0.61 (0.57) 9 Provision for taxation 0.01 0.52 0.00 – 0.14 – 10 Profit after taxation (1.05) 0.52 114.92 (0.31) 0.47 (0.57) 11 Interim dividend - equity – – – – – – 12 Interim dividend - preference – – – – – – 13 Proposed dividend - equity – – – – – – 14 Proposed dividend - preference – – – – – – 15 % of share holding 74.53 74.53 70.00 63.72 74.53 74.62
Sr. No. 115 116 117 118 119 120 Sr. no.
Particulars Graphene Solutions SDN.BHD.
Graphene Solutions
Taiwan Limited
L&T Hydrocarbon International
FZE
L&T Valves Arabia
Manufacturing LLC
L&T Valves USA LLC
NIELSEN+PARTNER Unternehmensberater
GmbH
Financial year ending on 31-Mar-20 31-Dec-19 31-Mar-20 31-Mar-20 31-Mar-20 31-Jan-20Currency MYR TWD AED SAR USD EUR Exchange rate on the last day of financial year 17.52 2.39 20.60 20.15 75.67 78.79 Date of Acquisition 15-Oct-18 15-Oct-18 09-Sep-18* 30-May-19* 28-May-19* 01-Feb-19
1 Share capital (including share application money pending allotment) 0.18 1.19 0.31 2.02 3.78 1.62
2 Other equity/Reserves and surplus (as applicable) (0.02) (0.02) (0.50) (1.37) (0.42) 10.52
3 Liabilities 0.02 0.45 0.82 11.67 7.03 6.67 4 Total equity and liabilities 0.18 1.62 0.63 12.32 10.39 18.81 5 Total assets 0.18 1.62 0.63 12.32 10.39 18.81 6 Investments – – – – – – 7 Turnover – 1.33 – 5.22 0.90 36.47 8 Profit before taxation (0.02) 0.25 (0.30) (1.61) (0.50) (1.16) 9 Provision for taxation – 0.16 – (0.32) (0.10) (0.18) 10 Profit after taxation (0.02) 0.09 (0.30) (1.29) (0.40) (0.98) 11 Interim dividend - equity – – – – – – 12 Interim dividend - preference – – – – – – 13 Proposed dividend - equity – – – – – – 14 Proposed dividend - preference – – – – – – 15 % of share holding 74.62 74.62 100.00 100.00 100.00 74.53
statement containing salient features of the financial statements of subsidiaries/associate companies/joint venturesPart a: “subsidiaries” [as per section 2(87) of the companies act, 2013] (contd.) v crore
Note: * Date of incorporation

salient features of the financial statements of subsidiaries/associate companies/joint ventures annuaL report 2019-20
604
Sr. No. 121 122 123 124 125 126 Sr. no.
Particulars NIELSEN+PARTNER Unternehmensberater
AG
NIELSEN+PARTNER Pte Ltd
NIELSEN+PARTNER S.A
NIELSEN&PARTNER Company Limited
NIELSEN&PARTNER Pty Ltd
Ruletronics Limited
Financial year ending on 31-Dec-19 31-Dec-19 31-Dec-19 31-Dec-19 31-Dec-19 29-Feb-20Currency CHF SGD EUR THB AUD GBP Exchange rate on the last day of financial year 73.84 53.05 80.10 2.40 50.05 92.97 Date of Acquisition 01-Feb-19 01-Feb-19 01-Feb-19 01-Feb-19 01-Feb-19 01-Feb-19
1 Share capital (including share application money pending allotment) 0.74 0.53 0.40 0.24 0.00 0.00
2 Other equity/Reserves and surplus (as applicable) 1.96 15.98 8.33 (0.43) (1.08) 7.61
3 Liabilities 4.40 10.13 2.64 5.24 7.60 – 4 Total equity and liabilities 7.10 26.64 11.37 5.05 6.52 7.61 5 Total assets 7.10 26.64 11.37 5.05 6.52 7.61 6 Investments – – 0.00 – – – 7 Turnover 20.19 43.52 23.30 5.65 7.25 23.14 8 Profit before taxation 2.64 8.21 6.20 0.01 (1.21) 1.22 9 Provision for taxation 0.55 1.27 1.51 – (0.03) 0.23 10 Profit after taxation 2.09 6.94 4.69 0.01 (1.18) 0.99 11 Interim dividend - equity – – – – – – 12 Interim dividend - preference – – – – – – 13 Proposed dividend - equity – – – – – – 14 Proposed dividend - preference – – – – – – 15 % of share holding 74.53 74.53 74.53 74.53 74.53 74.53
Sr. No. 127 128 129 130 131 132 Sr. no.
Particulars Ruletronics Systems Inc
Lymbyc Solutions Inc.
L&T Technology Services
(Shanghai) Co. Ltd
Mindtree Software
(Shanghai) Co. Ltd
Bluefin Solutions Sdn
Bhd
LT IDPL INDVIT Services Limited
Financial year ending on 31-Dec-19 31-Dec-19 31-Dec-19 31-Mar-20 31-Mar-20 31-Mar-20Currency USD USD CNY CNY MYR INRExchange rate on the last day of financial year 71.39 71.39 10.25 10.63# 17.45# –Date of Acquisition 01-Feb-19 29-Aug-19 06-Aug-19* 02-Jul-19 02-Jul-19 20-May-99*
1 Share capital (including share application money pending allotment) – 0.66 3.37 1.40 0.20 13.95
2 Other equity/Reserves and surplus (as applicable) 2.76 (1.06) – 0.10 – 25.00
3 Liabilities 2.41 0.40 – 0.10 – 79.05 4 Total equity and liabilities 5.17 – 3.37 1.60 0.20 118.00 5 Total assets 5.17 – 3.37 1.60 0.20 118.00 6 Investments – – – – – 12.00 7 Turnover 17.58 – – 0.70 – 9.00 8 Profit before taxation (0.29) (0.04) – 0.10 – 4.00 9 Provision for taxation 0.00 – – – – 2.00 10 Profit after taxation (0.29) (0.04) – 0.10 – 2.00 11 Interim dividend - equity – – – – – – 12 Interim dividend - preference – – – – – – 13 Proposed dividend - equity – – – – – – 14 Proposed dividend - preference – – – – – – 15 % of share holding 74.53 74.53 74.62 61.08 61.08 51.00
statement containing salient features of the financial statements of subsidiaries/associate companies/joint venturesPart a: “subsidiaries” [as per section 2(87) of the companies act, 2013] (contd.) v crore
Note: * Date of incorporation # Exchange rate considered by intimidate parent

605
notes: a) names of subsidiaries which are yet to commence operations: a) pt Larsen & toubro Hydrocarbon engineering indonesia
b) L&t Hydrocarbon caspian LLc
c) L&t infra contractors private Limited
d) Ltr ssm private Limited
e) L&t Hydrocarbon international FZe
f) L&t technology services (canada) Limited
g) raykal aluminium company private Limited
h) Kesun iron and steel company private Limited
B) names of subsidiaries which have been merged/sold/dissolved/struck-off. (1) merged: a) L&t realty Limited (merged with L&t construction equipment Limited)
b) L&t shipbuilding Limited (merged with Larsen & toubro Limited)
(2) sold: a) L&t Kobelco machinery private Limited
(3) liquidated/Dissolved/struck-off: a) Larsen & toubro infotech austria GmbH
b) L&t realty FZe
c) bluefin solutions pte Ltd
d) bluefin solutions inc
statement containing salient features of the financial statements of subsidiaries/associate companies/joint venturesPart a: “subsidiaries” [as per section 2(87) of the companies act, 2013] (contd.)

salient features of the financial statements of subsidiaries/associate companies/joint ventures annuaL report 2019-20
606
statement containing salient features of the financial statements of subsidiaries/associate companies/joint ventures
s.n.subraHmanYanchief executive officer & managing director
(din 02255382) chennai
r.sHanKar ramanWhole-time director & chief Financial officer(din00019798)mumbai
m.m.cHitaLeindependent director(din00101004) mumbai
sivaram nair acompany secretary & compliance officerm. no. Fcs3939mumbai
june 5, 2020
Part B: ”associates/Joint ventures”
Sr. No.
Sr. No. 1 2 3 4 5 6 7 8Name of associates/joint ventures L&T-Chiyoda
LimitedInternational
Seaport (Haldia) Private
Limited*
L&T Camp Facilities LLC
Larsen & Toubro
Qatar & HBK Contracting
Co. WLL
Magtorq Private Limited
Magtorq Engineering
Solutions Private Limited
Indiran Engineering Projects and
Systems Kish PJSC
Gujarat Leather
Industries Limited
1 Latest audited balance sheet date 31-Mar-20 31-Mar-19 31-Dec-19 31-Dec-19 31-Mar-20 31-Mar-20 Refer Note 22 Date on which the associate or joint venture
was associated or acquired 26-Oct-94 11-Feb-05 13-Sep-07 28-Jul-04 2-Aug-10 2-Aug-10 31-Oct-09 27-Jun-913 Shares of associate/joint venture held by the
company at the year end Number 45,00,000 98,30,000 2,450 100 9,000 22,000 875 7,35,000 Amount of investment in associate/joint
venture (R crore) 4.50 9.83 4.76 0.18 4.42 0.22 0.39 – Total share capital (R crore) 9.00 44.06 9.72 0.39 0.21 0.24 0.78 – Reserves closing 194.68 26.04 (0.41) (7.77) 10.60 0.87 (1.33) – Total no. of shares 90,00,000 4,40,58,020 5,000 200 21,003 24,000 1,750 Refer Note 3Extent of holding % (Effective) 50.00% 14.25% 49.00% 50.00% 42.85% 39.28% 50.00% 50.00%
4 Description of how there is significant influence Refer Note 15 Reason why the associate/joint venture is not
consolidated Refer Note 36 Net worth attributable to shareholding as per
latest audited Balance Sheet (R crore) 101.84 9.99 4.56 (3.69) 4.63 0.44 (0.27) – 7 Profit/(Loss) for the year (R crore)
Considered in consolidation 50.41 24.47 2.09 – (0.29) 0.16 0.16 – Not considered in consolidation – – – – – – – –
* The company is associate of a subsidiary company under Companies Act, 2013.
Notes:1. Significant influence is demonstrated by holding 20% or more of the total voting power, or control of or participation in business decisions under an
agreement of the investee.2. The Incorporated joint venture is not required to be audited as per regulatory laws in Iran. Hence the management certified accounts have been considered
for consolidation.3. The associate company is under liquidation process and investment is fully provided in the accounts.

Fold here
Fold
her
eFold here
LARSEN & TOUBRO LIMITEDCIN : L99999MH1946PLC004768
Regd. Office : L&T House, Ballard Estate, Mumbai 400 001. Tel. No.: (022) 6752 5656, Fax No.: (022) 6752 5893
Email: [email protected], Website: www.larsentoubro.com
Dear Shareholder, Date: 5th June 2020
We are privileged to have you as our shareholder. It has been our constant endeavour to improve the services to our Investors and in this pursuit, we are once again sending you this Feedback Form, which is a self addressed prepaid Inland letter. We request you to kindly spare some time and retum the same to us duly completed. We look forward to your feedback/valuable suggestions.
Thanking you,
Yours faithfully,
For Larsen & Toubro LimiTed
sivaram nair a Company Secretary M. No. F3939
sHareHoLder’s FeedbaCK Form
Name and address of the shareholderPhone No: (with STD code)
E-maii ID:
Folio No./DP ID & Client ID
shareholders satisfaction survey Questionnaire(please 3 the appropriate box)
A. Do you perceive the Company as creating shareholder value in the: (i) Short Term Yes No (ii) Long Term or Yes No (iii) Both Yes No
B. Are you satisfied with the growth strategy of the Company?
Yes No Not aware
Excellent Good Poor* Not experienced
C. Please rate the contents and quality of Annual Report
D. Please rate the contents and quality of the website of the Company
E. Arrangements made at the last AGM
F. Quality and accuracy of response to your queries and complaints:
- by Company
- by Registrar
G. Timeliness of response form
- the Company
- the Registrar
H. Please rate the hospitality and efficiency of the persons attending to you when you interact with
- Investors Relation Cell
- Office of Registrars
I. Overall quality of service provided by
- the Company
- the Registrar
* Kindly let us know your experience in space provided overleafJ. Do you have any grievance which has not been redressed Yes No
Signature

First Fold
Second Fold
Fold here
Fold
her
e Fold herebusiness rePLY LeTTer
b. r. PermiT no.: mbi GPo - 0049 mumbai G.P.o.
mumbai - 400 001.
Larsen & Toubro Limited Secretarial Department L&T House, Ballard Estate, Mumbai - 400 001.
Postage will be paid by
addresssee
No Postage stamp
necessary if posted in
India
* In case your response to any question overleaf is “Poor”, kindly share your experience and let us know the reason/instances to enable us to investigate the matter.
In case of any queries, kindly contact our Registrar:
KFin Technologies Private Limited (previously known as Karvy Fintech Pvt. Ltd)
unit: Larsen & Toubro Limited Karvy Selenium Tower B, Plot number 31 & 32, Financial District Gachibowli, Nanakramguda, Hyderabad, Telangana - 500 032
Tel : (040) 6716 2222 • Toll free number: 1-800-3454-001 • Email: [email protected]

AWARDS & RECOGNITION
Every year, L&T and its people receive a number of national and international awards that acknowledge its varied accomplishments. Presented by the media, industry associations, independent bodies and academia, they honour the Company’s contribution in various spheres of business, technology, financial performance, growth and environmental protection.
For details of recent awards, please visit www.Larsentoubro.com


![arXiv:1902.02501v2 [cs.CR] 20 Apr 2019](https://static.fdokumen.com/doc/165x107/6317704f9076d1dcf80bcc36/arxiv190202501v2-cscr-20-apr-2019.jpg)


![mechaNICAL ENGINEERING [CAY 2019-20]](https://static.fdokumen.com/doc/165x107/6315d572c72bc2f2dd04da92/mechanical-engineering-cay-2019-20.jpg)