HCL Technologies Limited - Consolidated Financial Statements
72
Consolidated Financial Statements - IFRS For the year ended 31 March 2022 and 2021 HCL Technologies Limited
-
Upload
khangminh22 -
Category
Documents
-
view
1 -
download
0
Transcript of HCL Technologies Limited - Consolidated Financial Statements

Consolidated Financial Statements - IFRS
For the year ended 31 March 2022 and 2021
HCL Technologies Limited
The Board of Directors HCL Technologies Lim ited :
KPMG Assurance and Consulting Services LLP Building No 10, 8th Floor, Tower-C DLF Cyber City, Phase II Gurugram. 122 002, (India)
Independent Auditors' Report
Terephone: +91 124 307 4000 Fax: +91 124 254 9101 Internet www.kpmg com/in
Report on the Audit of the Consolidated Financial Statements Opinion
We have audited the consolidated financial statements of HCL Technologies Limited and its subsidiaries (the Company), which comprise the consol idated balance sheet as of March 31 , 2022 and 2021 and April 1, 2020, and the rela ted consolidated statements of profit or loss, profit or loss and other comprehensive income, changes in equity, and cash flows for the years ended March 31 , 2022 and 2021 , and the related notes to the consolidated financial statements.
In our opinion , the accompanying consol idated financial statements present fairly, in all material respects, the financial position of the Company as of March 31 , 2022 and 2021 and April 1, 2020, and its financial performance and its cash flows for the years ended March 31 , 2022 and 2021 in accordance with International Financial Reporting Standards as issued by the International Accounting Standards Board. Change in Basis of Accounting
As discussed in Note 1(a) and 4 to the consolidated financial statements, in the year ended March 31, 2022 the Company changed its basis of accounting from Indian Accounting Standards (Ind AS) to International Financial Report ing Standards as issued by the International Accounting Standards Board. Basis for Opinion
We conducted our audits in accordance with auditing standards generally accepted in the United States of America (GAAS) . Our responsibil ities under those standards are further described in the Auditors' Responsibilities for the Audit of the Consolidated Financial Statements section of our report. We are required to be independent of the Company and to meet our other ethical responsibilities, in accordance with the relevant ethica l requirements relat ing to our audits. We believe that the audit evidence we have obtained is sufficient and appropriate to provide a basis for our audit opinion .
Responsibilities of Management for the Consolidated Financial Statements
Management is responsible for the preparation and fair presentation of the consolidated financia l statements in accordance wi th International Financial Reporting Standards as issued by the International Accounting Standards Board , and for the design, implementation, and maintenance of internal control relevant to the preparation and fair presentation of consolidated financial statements that are free from material misstatement, whether due to fraud or error.
In preparing the consol idated financial statements, management is required to evaluate whether there are conditions or events , considered in the aggregate, that ra ise substantial doubt about the Company's ability to continue as a going concern for one year after the date that the consolidated financial statements are available to be issued .
KPMG An ul"IIIUI and Con5Ull,ng Sflrvlce1 U.P. •n lnd,.n llmi1ed bbllity P"MeMi? and a menibtr rwm_ of Iha KPMG networl<. or Independent membef 1irm1 elfllleled wtth KPMG lnlem1Uon1I Coopefalivil n<J>MG lr1l1m1hon1q I s.,;u enbly
KPMG (Regl1terod) (I PIIM0rlhlp hlTTI with Regl1lu1t,011 No. BA.-6244S) coowrtod Into KPMG As 5Uflll"ICfl Ind Consuttlng Se,-,,,ce, LLP(allmltfdllab lbly P1ttrl1r1hlp....-1lh LL PReg1strahouN0 M T-0l67J. wtlh1ff t11:llromJuly23. 2020
Rf1J l1tilf0d Offlc.. Lodhil Ellc.11.J1,hl FloorApoloMJ11 ComPQUrld. N. M Joshi M.ug. Mahalahhml. Mumb.:r.1- 400 01 '
Auditors ' Responsibilities for the Audit of the Consolidated Financial Statements
Our objectives are to obtain reasonable assurance about whether the consolidated financial statements as a whole are free from material misstatement, whelher due to fraud or error, and to issue an auditors' report that includes our opinion. Reasonable assurance is a high level of assurance but is not absolute assurance and therefore is not a guarantee that an audit conducted in accordance with GAAS will always detect a material misstatement when it exists. The risk of not detecting a material misstatement resulting from fraud is higher than for one resulting from error, as fraud may involve collusion, forgery, intentional omissions, misrepresentations, or the override of internal control. Misstatements are considered material if there is a substantial likelihood that, individually or in the aggregate, they would influence the judgment made by a reasonable user based on the consolidated financial statements.
In performing an audit in accordance with GMS, we:
Exercise professional judgment and maintain professional skepticism throughout the audit.
Identify and assess the risks of material misstatement of the consolidated financial statements, whether due to fraud or error, and design and perform audit procedures responsive to those risks. Such procedures include examining, on a test basis, evidence regarding the amounts and disclosures in the consolidated financial statements.
Obtain an understanding of internal control relevant to the audit in order to design audit procedures that are appropriate in the circumstances, but not for the purpose of expressing an opinion on the effectiveness of the Company's internal control. Accordingly, no such opinion is expressed.
Evaluate the appropriateness of accounting policies used and the reasonableness of significant accounting estimates made by management, as well as evaluate the overall presentation of the consolidated financial statements.
Conclude whether, in our judgment, there are conditions or events, considered in the aggregate, that raise substantial doubt about the Company's ability to continue as a going concern for a reasonable period of time.
We are required to communicate with those charged with governance regarding, among other matters, the planned scope and timing of the audit, significant audit findings, and certain internal control related matters that we identified during the audit.
Gurugram, Haryana, India April 21 , 2022
2
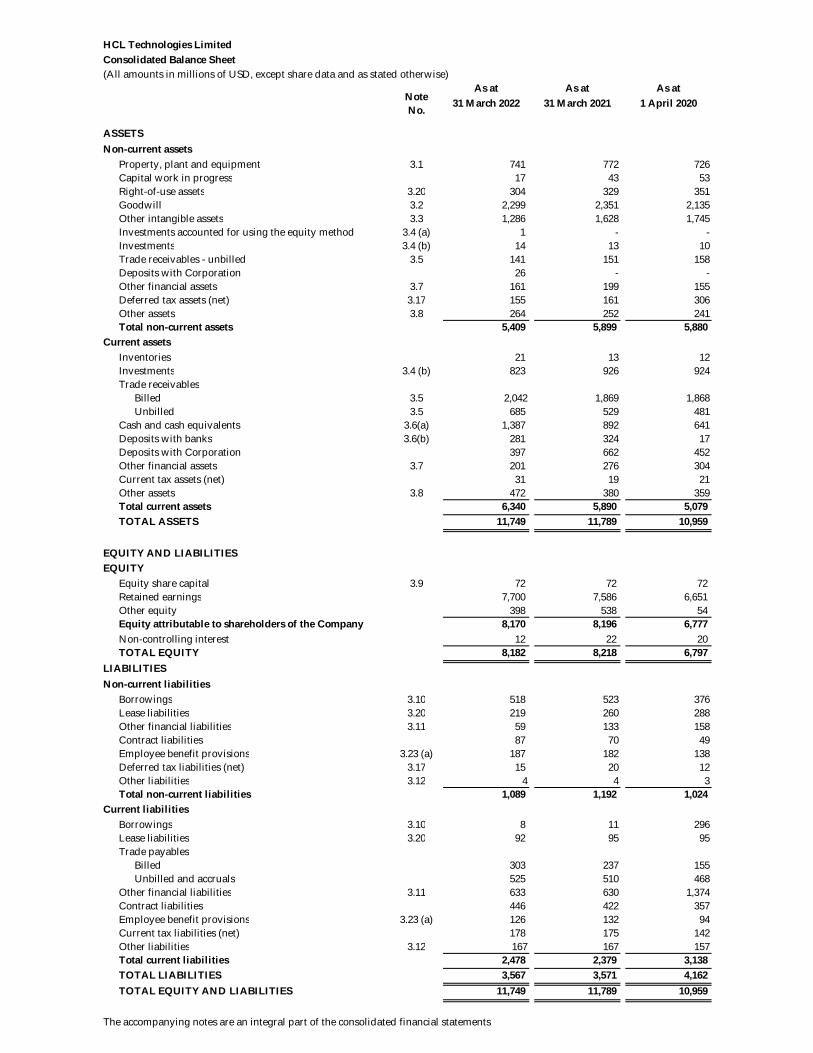
HCL Technologies Limited Consolidated Balance Sheet(All amounts in millions of USD, except share data and as stated otherwise)
As at As at As at31 March 2022 31 March 2021 1 April 2020
ASSETSNon-current assets
Property, plant and equipment 3.1 741 772 726 Capital work in progress 17 43 53 Right-of-use assets 3.20 304 329 351 Goodwill 3.2 2,299 2,351 2,135 Other intangible assets 3.3 1,286 1,628 1,745 Investments accounted for using the equity method 3.4 (a) 1 - - Investments 3.4 (b) 14 13 10 Trade receivables - unbilled 3.5 141 151 158 Deposits with Corporation 26 - - Other financial assets 3.7 161 199 155 Deferred tax assets (net) 3.17 155 161 306 Other assets 3.8 264 252 241 Total non-current assets 5,409 5,899 5,880
Current assetsInventories 21 13 12 Investments 3.4 (b) 823 926 924 Trade receivables
Billed 3.5 2,042 1,869 1,868 Unbilled 3.5 685 529 481
Cash and cash equivalents 3.6(a) 1,387 892 641 Deposits with banks 3.6(b) 281 324 17 Deposits with Corporation 397 662 452 Other financial assets 3.7 201 276 304 Current tax assets (net) 31 19 21 Other assets 3.8 472 380 359 Total current assets 6,340 5,890 5,079 TOTAL ASSETS 11,749 11,789 10,959
EQUITY AND LIABILITIESEQUITY
Equity share capital 3.9 72 72 72 Retained earnings 7,700 7,586 6,651 Other equity 398 538 54 Equity attributable to shareholders of the Company 8,170 8,196 6,777 Non-controlling interest 12 22 20 TOTAL EQUITY 8,182 8,218 6,797
LIABILITIESNon-current liabilities
Borrowings 3.10 518 523 376 Lease liabilities 3.20 219 260 288 Other financial liabilities 3.11 59 133 158 Contract liabilities 87 70 49 Employee benefit provisions 3.23 (a) 187 182 138 Deferred tax liabilities (net) 3.17 15 20 12 Other liabilities 3.12 4 4 3 Total non-current liabilities 1,089 1,192 1,024
Current liabilitiesBorrowings 3.10 8 11 296 Lease liabilities 3.20 92 95 95 Trade payables
Billed 303 237 155 Unbilled and accruals 525 510 468
Other financial liabilities 3.11 633 630 1,374 Contract liabilities 446 422 357 Employee benefit provisions 3.23 (a) 126 132 94 Current tax liabilities (net) 178 175 142 Other liabilities 3.12 167 167 157 Total current liabilities 2,478 2,379 3,138 TOTAL LIABILITIES 3,567 3,571 4,162 TOTAL EQUITY AND LIABILITIES 11,749 11,789 10,959
The accompanying notes are an integral part of the consolidated financial statements
Note No.
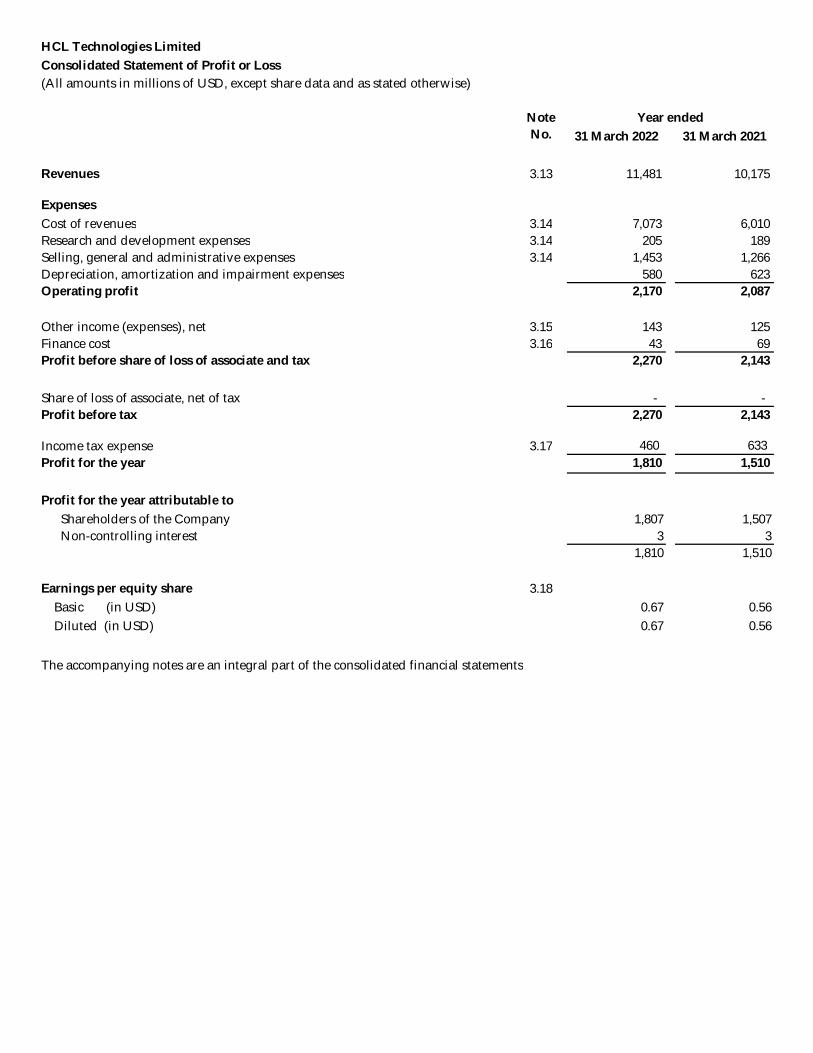
HCL Technologies Limited Consolidated Statement of Profit or Loss
31 March 2022 31 March 2021
Revenues 3.13 11,481 10,175
ExpensesCost of revenues 3.14 7,073 6,010 Research and development expenses 3.14 205 189 Selling, general and administrative expenses 3.14 1,453 1,266 Depreciation, amortization and impairment expenses 580 623 Operating profit 2,170 2,087
Other income (expenses), net 3.15 143 125 Finance cost 3.16 43 69 Profit before share of loss of associate and tax 2,270 2,143
Share of loss of associate, net of tax - - Profit before tax 2,270 2,143
Income tax expense 3.17 460 633Profit for the year 1,810 1,510
Profit for the year attributable toShareholders of the Company 1,807 1,507 Non-controlling interest 3 3
1,810 1,510
Earnings per equity share 3.18 Basic (in USD) 0.67 0.56 Diluted (in USD) 0.67 0.56
The accompanying notes are an integral part of the consolidated financial statements
(All amounts in millions of USD, except share data and as stated otherwise)
Year endedNoteNo.
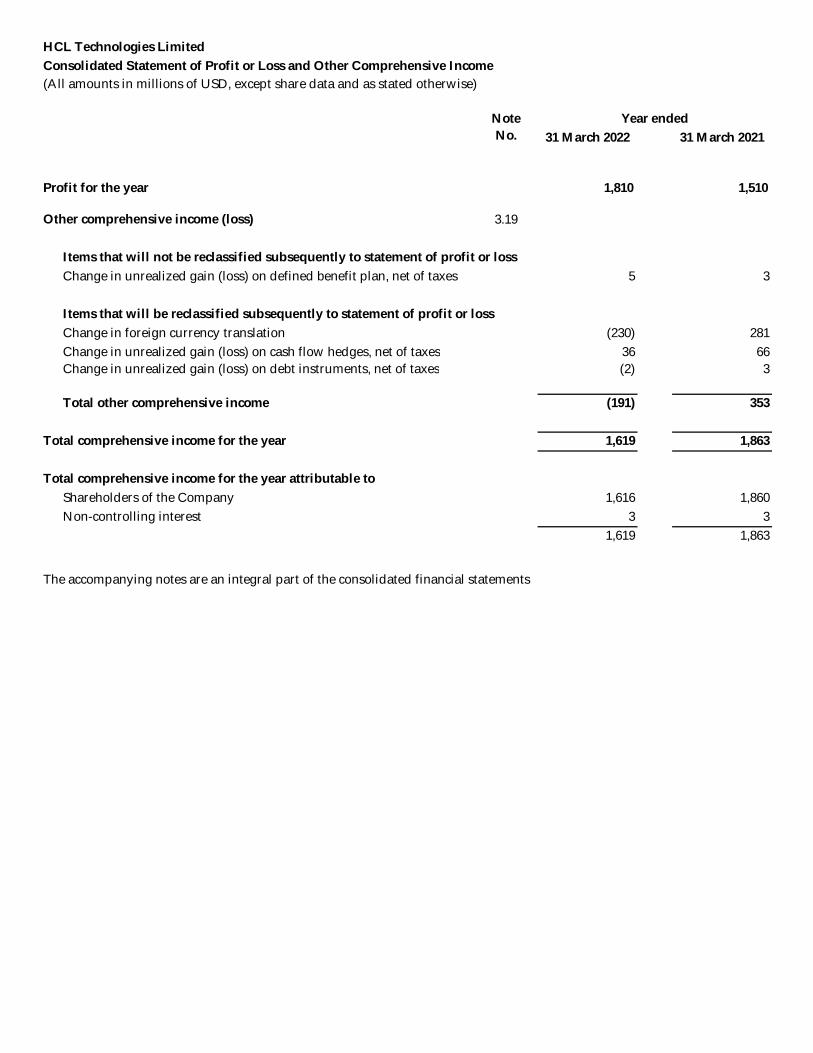
HCL Technologies Limited Consolidated Statement of Profit or Loss and Other Comprehensive Income
31 March 2022 31 March 2021
Profit for the year 1,810 1,510
Other comprehensive income (loss) 3.19
Items that will not be reclassified subsequently to statement of profit or lossChange in unrealized gain (loss) on defined benefit plan, net of taxes 5 3
Items that will be reclassified subsequently to statement of profit or lossChange in foreign currency translation (230) 281 Change in unrealized gain (loss) on cash flow hedges, net of taxes 36 66 Change in unrealized gain (loss) on debt instruments, net of taxes (2) 3
Total other comprehensive income (191) 353
Total comprehensive income for the year 1,619 1,863
Total comprehensive income for the year attributable toShareholders of the Company 1,616 1,860 Non-controlling interest 3 3
1,619 1,863
The accompanying notes are an integral part of the consolidated financial statements
(All amounts in millions of USD, except share data and as stated otherwise)
NoteNo.
Year ended
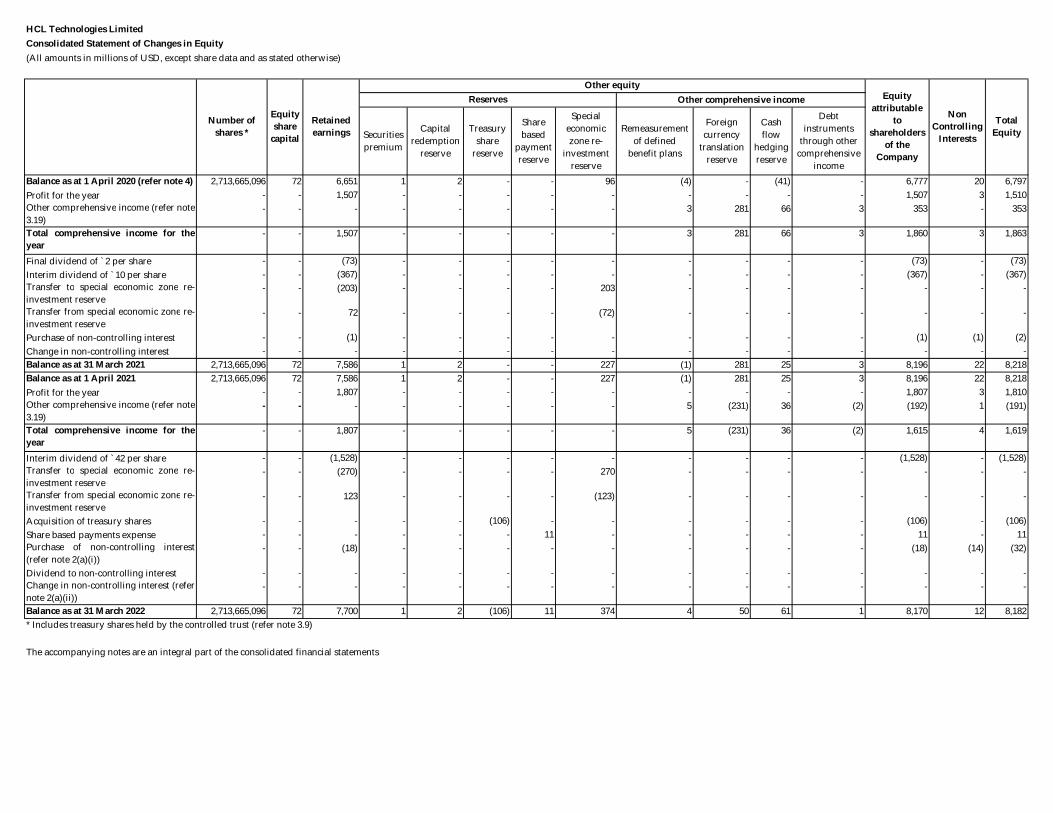
HCL Technologies Limited Consolidated Statement of Changes in Equity(All amounts in millions of USD, except share data and as stated otherwise)
Securitiespremium
Capital redemption
reserve
Treasury share
reserve
Sharebased
paymentreserve
Special economic zone re-
investment reserve
Remeasurementof defined
benefit plans
Foreigncurrency
translationreserve
Cashflow
hedgingreserve
Debtinstruments
through othercomprehensive
incomeBalance as at 1 April 2020 (refer note 4) 2,713,665,096 72 6,651 1 2 - - 96 (4) - (41) - 6,777 20 6,797 Profit for the year - - 1,507 - - - - - - - - - 1,507 3 1,510 Other comprehensive income (refer note3.19)
- - - - - - - - 3 281 66 3 353 - 353
Total comprehensive income for theyear
- - 1,507 - - - - - 3 281 66 3 1,860 3 1,863
Final dividend of `2 per share - - (73) - - - - - - - - - (73) - (73)Interim dividend of `10 per share - - (367) - - - - - - - - - (367) - (367)Transfer to special economic zone re-investment reserve
- - (203) - - - - 203 - - - - - - -
Transfer from special economic zone re-investment reserve
- - 72 - - - - (72) - - - - - - -
Purchase of non-controlling interest - - (1) - - - - - - - - - (1) (1) (2)Change in non-controlling interest - - - - - - - - - - - - - - - Balance as at 31 March 2021 2,713,665,096 72 7,586 1 2 - - 227 (1) 281 25 3 8,196 22 8,218 Balance as at 1 April 2021 2,713,665,096 72 7,586 1 2 - - 227 (1) 281 25 3 8,196 22 8,218 Profit for the year - - 1,807 - - - - - - - - - 1,807 3 1,810 Other comprehensive income (refer note3.19)
- - - - - - - - 5 (231) 36 (2) (192) 1 (191)
Total comprehensive income for theyear
- - 1,807 - - - - - 5 (231) 36 (2) 1,615 4 1,619
Interim dividend of `42 per share - - (1,528) - - - - - - - - - (1,528) - (1,528)Transfer to special economic zone re-investment reserve
- - (270) - - - - 270 - - - - - - -
Transfer from special economic zone re-investment reserve
- - 123 - - - - (123) - - - - - - -
Acquisition of treasury shares - - - - - (106) - - - - - - (106) - (106)Share based payments expense - - - - - - 11 - - - - - 11 - 11 Purchase of non-controlling interest(refer note 2(a)(i))
- - (18) - - - - - - - - - (18) (14) (32)
Dividend to non-controlling interest - - - - - - - - - - - - - - - Change in non-controlling interest (refernote 2(a)(ii))
- - - - - - - - - - - - - - -
Balance as at 31 March 2022 2,713,665,096 72 7,700 1 2 (106) 11 374 4 50 61 1 8,170 12 8,182
The accompanying notes are an integral part of the consolidated financial statements
* Includes treasury shares held by the controlled trust (refer note 3.9)
Number of shares *
TotalEquity
Equityshare
capital
Other comprehensive incomeNon
ControllingInterests
Reserves
Retainedearnings
Other equityEquity
attributable to
shareholders of the
Company
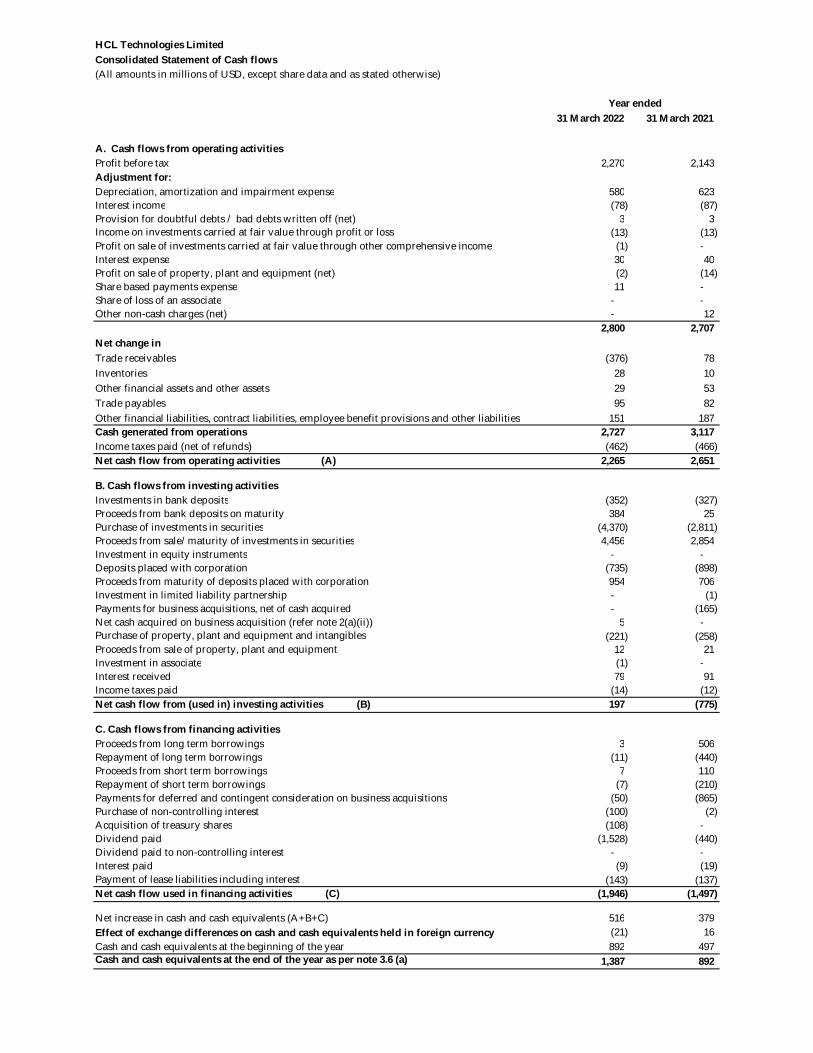
HCL Technologies Limited
(All amounts in millions of USD, except share data and as stated otherwise)
31 March 2022 31 March 2021
A. Cash flows from operating activitiesProfit before tax 2,270 2,143 Adjustment for:Depreciation, amortization and impairment expense 580 623 Interest income (78) (87) Provision for doubtful debts / bad debts written off (net) 3 3 Income on investments carried at fair value through profit or loss (13) (13) Profit on sale of investments carried at fair value through other comprehensive income (1) - Interest expense 30 40 Profit on sale of property, plant and equipment (net) (2) (14) Share based payments expense 11 - Share of loss of an associate - - Other non-cash charges (net) - 12
2,800 2,707 Net change inTrade receivables (376) 78 Inventories 28 10 Other financial assets and other assets 29 53 Trade payables 95 82 Other financial liabilities, contract liabilities, employee benefit provisions and other liabilities 151 187 Cash generated from operations 2,727 3,117 Income taxes paid (net of refunds) (462) (466) Net cash flow from operating activities (A) 2,265 2,651
B. Cash flows from investing activitiesInvestments in bank deposits (352) (327) Proceeds from bank deposits on maturity 384 25 Purchase of investments in securities (4,370) (2,811) Proceeds from sale/maturity of investments in securities 4,456 2,854 Investment in equity instruments - - Deposits placed with corporation (735) (898) Proceeds from maturity of deposits placed with corporation 954 706 Investment in limited liability partnership - (1) Payments for business acquisitions, net of cash acquired - (165) Net cash acquired on business acquisition (refer note 2(a)(ii)) 5 - Purchase of property, plant and equipment and intangibles (221) (258) Proceeds from sale of property, plant and equipment 12 21 Investment in associate (1) - Interest received 79 91 Income taxes paid (14) (12) Net cash flow from (used in) investing activities (B) 197 (775)
C. Cash flows from financing activitiesProceeds from long term borrowings 3 506 Repayment of long term borrowings (11) (440) Proceeds from short term borrowings 7 110 Repayment of short term borrowings (7) (210) Payments for deferred and contingent consideration on business acquisitions (50) (865) Purchase of non-controlling interest (100) (2) Acquisition of treasury shares (108) - Dividend paid (1,528) (440) Dividend paid to non-controlling interest - - Interest paid (9) (19)
(143) (137) Net cash flow used in financing activities (C) (1,946) (1,497)
Net increase in cash and cash equivalents (A+B+C) 516 379 Effect of exchange differences on cash and cash equivalents held in foreign currency (21) 16 Cash and cash equivalents at the beginning of the year 892 497 Cash and cash equivalents at the end of the year as per note 3.6 (a) 1,387 892
Consolidated Statement of Cash flows
Year ended
Payment of lease liabilities including interest
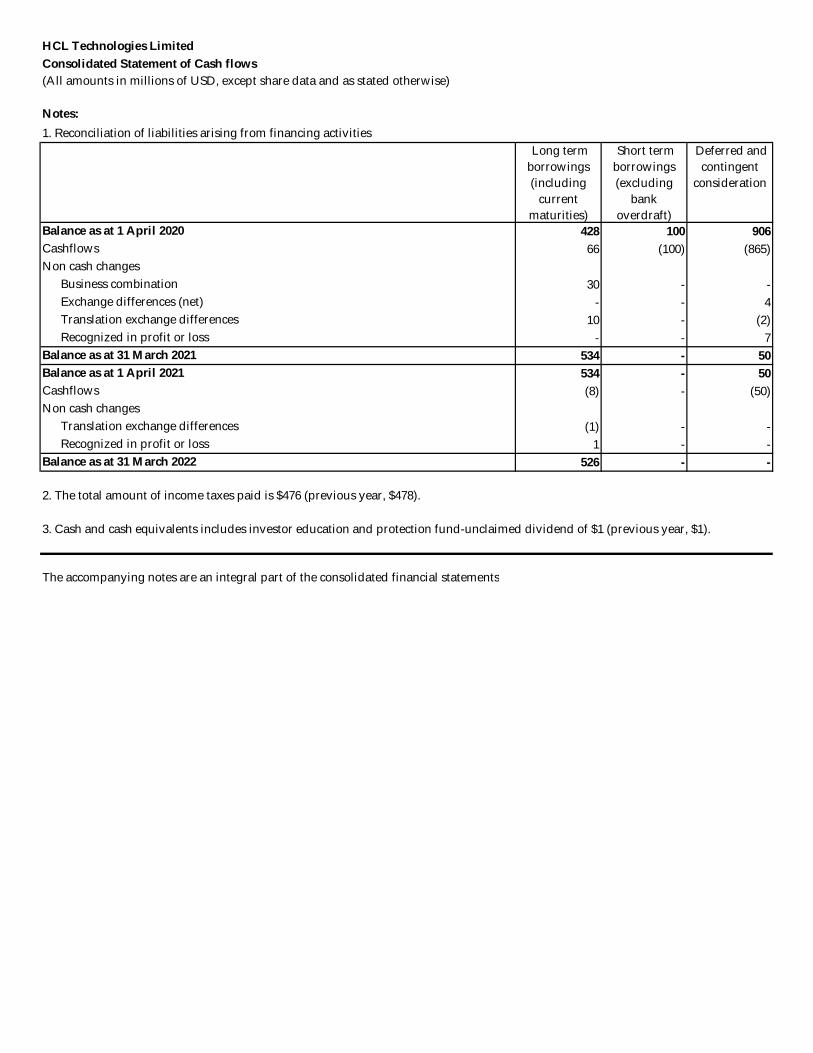
HCL Technologies Limited
Notes:1. Reconciliation of liabilities arising from financing activities
Long term borrowings (including
current maturities)
Short term borrowings(excluding
bank overdraft)
Deferred and contingent
consideration
Balance as at 1 April 2020 428 100 906 Cashflows 66 (100) (865)
Non cash changesBusiness combination 30 - - Exchange differences (net) - - 4 Translation exchange differences 10 - (2)Recognized in profit or loss - - 7
Balance as at 31 March 2021 534 - 50 Balance as at 1 April 2021 534 - 50
Cashflows (8) - (50)Non cash changes
Translation exchange differences (1) - - Recognized in profit or loss 1 - -
Balance as at 31 March 2022 526 - -
2. The total amount of income taxes paid is $476 (previous year, $478).
The accompanying notes are an integral part of the consolidated financial statements
3. Cash and cash equivalents includes investor education and protection fund-unclaimed dividend of $1 (previous year, $1).
Consolidated Statement of Cash flows(All amounts in millions of USD, except share data and as stated otherwise)
HCL Technologies Limited Notes to consolidated financial statements for the year ended 31 March 2022
(All amounts in millions of USD, except share data and as stated otherwise)
ORGANIZATION AND NATURE OF OPERATIONS HCL Technologies Limited (hereinafter referred to as “the Company” or “the Parent Company”) and its subsidiaries (hereinafter collectively referred to as “the Group”) are primarily engaged in providing a range of IT and business services, engineering and R&D services and products & platforms. The Company was incorporated under the provisions of the Companies Act applicable in India in November 1991, having its registered office at 806, Siddharth, 96, Nehru Place, New Delhi- 110019. The Group leverages its global technology workforce and intellectual properties to deliver solutions across following verticals - Financial Services, Manufacturing, Life Sciences & Healthcare, Public Services, Retail & CPG, Technology & Services and Telecom, Media, Publishing and Entertainment. The consolidated financial statements for the year ended 31 March 2022 were approved and authorized for issue by the Board of Directors on 21 April 2022.
1. SUMMARY OF SIGNIFICANT ACCOUNTING POLICIES (a) Basis of preparation
These consolidated financial statements of the Group have been prepared in accordance with International Financial Reporting Standards (IFRS) as issued by the International Accounting Standards Board (IASB). These consolidated financial statements, being the Group’s first IFRS financial statements, are covered by IFRS 1, “First-time Adoption of International Financial Reporting Standards”. An explanation of the effect of the transition on the Group’s equity and profit in accordance with the consolidated financial statements as per Indian Accounting Standards prescribed under section 133 of the Companies Act, 2013 (Ind AS) (“Previous GAAP”) to IFRS is provided in Note 4. These consolidated financial statements have been prepared under the historical cost convention on an accrual and going concern basis, except for the following assets and liabilities which have been measured at fair value:
a) Derivative financial instruments, b) Certain financial assets and liabilities (refer accounting policy regarding financial instruments), c) Defined benefit plans
The preparation of these consolidated financial statements has not resulted in changes to the Group’s accounting policies as compared to the most recent annual consolidated financial statements prepared under Previous GAAP. Accounting policies have been applied consistently to all years presented in the consolidated financial statements including the preparation of the IFRS opening balance sheet as at 1 April 2020 (refer note 4) (‘Transition date’) for the purpose of transition to IFRS and as required by IFRS 1. These accounting policies have also been applied consistently for all entities in the Group considered for consolidation. All assets and liabilities have been classified as current and non-current as per the Group’s normal operating cycle of 12 months. The statement of cash flows has been prepared under indirect method. The Group uses the US Dollars (‘$’) as its reporting currency. All amounts are presented in millions rounded to whole number and amounts less than 0.50 million are presented as “-”.
(b) Basis of Consolidation The consolidated financial statements comprise the financial statements of HCL Technologies Limited, the Parent Company, and its subsidiaries. Consolidation of a subsidiary begins when the Group obtains control over the subsidiary and ceases when the Group loses control of the subsidiary.
HCL Technologies Limited Notes to consolidated financial statements for the year ended 31 March 2022
(All amounts in millions of USD, except share data and as stated otherwise)
The Group controls an investee if and only if the Group has:
a) Power over the investee (i.e. existing rights that give it the current ability to direct the relevant activities of the investee),
b) Exposure, or rights, to variable returns from its involvement with the investee, and c) The ability to use its power over the investee to affect its returns.
Generally, there is a presumption that a majority of voting rights result in control. To support this presumption and when the Group has less than a majority of the voting or similar rights of an investee, the Group considers all relevant facts and circumstances in assessing whether it has power over an investee, including:
a) The contractual arrangement with the other vote holders of the investee b) Rights arising from other contractual arrangements c) The Group’s voting rights and potential voting rights
The Group re-assesses whether or not it controls an investee if facts and circumstances indicate that there are changes to one or more of the three elements of control. The financial statements of the subsidiaries in the Group are added on a line-by-line basis and inter-company balances and transactions including unrealized gain/loss from such transactions, are eliminated upon consolidation. The consolidated financial statements are prepared by applying uniform accounting policies in use by the Group. An associate is an entity over which the Group has significant influence, but not control or joint control over financial and operating policies. Investments in associates are accounted for using the equity method of accounting, after initially being recognized at cost. The aggregate of the Group’s share of profit or loss of an associate is shown on the face of the consolidated statement of profit or loss.
(c) Use of estimates and judgements The preparation of consolidated financial statements in conformity with IFRS requires the management to make estimates and judgements that affect the reported amounts of assets, liabilities, revenue, expenses and other comprehensive income (OCI) that are reported and disclosed in the consolidated financial statements and accompanying notes. These estimates are based on the management’s best knowledge of current events, historical experience, actions that the Group may undertake in the future and on various other assumptions that are believed to be reasonable under the circumstances. Actual results could differ from those estimates. Changes in estimates are reflected in the consolidated financial statements in the year in which the changes are made. Significant estimates and assumptions are used for, but not limited to,
i. Accounting for costs expected to be incurred to complete performance under fixed price projects and determination of stand-alone selling prices for each distinct performance obligation in contracts involving multiple performance obligations, refer note 1(g)
ii. Allowance for uncollectible accounts receivables, refer note 1(t)(i) iii. Fair value of the consideration transferred (including contingent consideration) and fair value of the assets
acquired and liabilities assumed, measured on a provisional basis in case of business combination, refer note 1(d)
iv. Recognition of income and deferred taxes, refer note 1(i) and note 3.17 v. Key actuarial assumptions for measurement of future obligations under employee benefit plans, refer note
1(r) and note 3.22 vi. Estimated forfeitures in share-based compensation expense, refer note 1(s)
vii. Useful lives of property, plant and equipment, refer note 1(j) viii. Lives of intangible assets, refer note 1(k)
ix. Key assumptions used for impairment of goodwill, refer note 1(p) and note 3.2 x. Identification of leases and measurement of lease liabilities and right of use assets, refer note 1(n)
xi. Provisions and contingent liabilities, refer note 1(q) and note 3.25
HCL Technologies Limited Notes to consolidated financial statements for the year ended 31 March 2022
(All amounts in millions of USD, except share data and as stated otherwise)
In view of pandemic relating to COVID -19, the Group has considered and taken into account internal and external information and has performed sensitivity analysis based on current estimates in assessing the recoverability of receivables, goodwill, intangible assets, other assets, impact on revenues and costs, impact on leases and effectiveness of its hedging relationships, including but not limited to the assessment of liquidity and going concern assumption and believes that the impact of COVID-19 is not material to these consolidated financial statements. However, the actual impact of COVID-19 on the Group's consolidated financial statements may differ from that estimated and the Group will continue to closely monitor any material changes to future economic conditions. (d) Business combinations and goodwill In accordance with the provisions of IFRS 1 related to first time adoption of IFRS, the Group has elected to apply IFRS accounting for business combinations prospectively from the transition date. As such, Previous GAAP balances relating to business combinations entered into before that date, including goodwill, have been carried forward (please refer note 4). Business combinations are accounted for using the acquisition method. The cost of an acquisition is the aggregate of the consideration transferred measured at fair value at the acquisition date and the amount of any non-controlling interest in the acquiree. For each business combination, the Group measures the non-controlling interest in the acquiree at fair value. Acquisition related costs are expensed as incurred. Any contingent consideration to be transferred by the acquirer is recognized at fair value at the acquisition date. Contingent consideration classified as financial liability is measured at fair value with changes in fair value recognized in the statement of profit or loss. Goodwill is initially measured at cost, being the excess of the aggregate of the consideration transferred and the amount recognized for non-controlling interest, and any previous interest held, over the net identifiable assets acquired and liabilities assumed. If the fair value of the net assets acquired is in excess of the aggregate consideration transferred, the excess is recognized in the statement of profit or loss as bargain purchase gain after reassessing the fair values of the net assets.
(e) Foreign currency and translation The Group’s consolidated financial statements are presented in US Dollars ($) to facilitate the evaluation and comparison of Group’s performance and financial position globally and the Parent Company’s functional currency is Indian Rupee (INR). For each entity, the Group determines the functional currency, and items included in the financial statements of each entity are measured using that functional currency. The Group uses the direct method of consolidation and on disposal of a foreign operation the gain or loss that is reclassified to the statement of profit or loss reflects the amount that arises from using this method. Transactions in foreign currencies are initially recorded by the Group’s entities at their respective functional currency spot rates at the date of the transaction. Foreign currency denominated monetary assets and liabilities are translated to the relevant functional currency at exchange rates in effect at the balance sheet date. Exchange differences arising on settlement or translation of monetary items are recognized in the statement of profit or loss. Non-monetary assets and non-monetary liabilities denominated in a foreign currency and measured at historical cost are translated at the exchange rate prevalent at the date of initial transaction. Non-monetary assets and non-monetary liabilities denominated in a foreign currency and measured at fair value are translated at the exchange rate prevalent at the date when the fair value was determined. Transaction gains or losses realized upon settlement of foreign currency transactions are included in determining net profit for the year. Revenue, expenses and cash-flow items denominated in foreign currencies are translated into the relevant functional currencies using the exchange rate in effect on the date of the transaction.
HCL Technologies Limited Notes to consolidated financial statements for the year ended 31 March 2022
(All amounts in millions of USD, except share data and as stated otherwise)
The translation of foreign operations from respective functional currency into USD (the reporting currency) for assets and liabilities is performed using the exchange rates in effect at the balance sheet date, and for revenue, expenses and cash flows is performed using an appropriate daily weighted average exchange rate for the respective years. The exchange differences arising on translation for consolidation are reported as a component of ‘other comprehensive income (loss)’. On disposal of a foreign operation, the component of OCI relating to that particular foreign operation is recognized in the statement of profit or loss. In accordance with the provisions of IFRS 1 related to first time adoption of IFRS, the Group has elected to set the foreign currency translation reserve at zero as on 1 April 2020 (please refer note 4).
(f) Fair value measurement The Group records certain financial assets and liabilities at fair value on a recurring basis. The Group determines fair values based on the price it would receive to sell an asset or pay to transfer a liability in an orderly transaction between market participants at the measurement date in the principal or most advantageous market for that asset or liability. The Group holds certain fixed income securities, equity securities and derivatives, which must be measured using the guidance for fair value hierarchy and related valuation methodologies. The guidance specifies a hierarchy of valuation techniques based on whether the inputs to each measurement are observable or unobservable. Observable inputs reflect market data obtained from independent sources, while unobservable inputs reflect the Group’s assumptions about current market conditions. The fair value hierarchy also requires an entity to maximize the use of observable inputs and minimize the use of unobservable inputs when measuring fair value. The prescribed fair value hierarchy and related valuation methodologies are as follows: Level 1 - Quoted inputs that reflect quoted prices (unadjusted) for identical assets or liabilities in active markets. Level 2 - Quoted prices for similar instruments in active markets, quoted prices for identical or similar instruments in markets that are not active and model-derived valuations, in which all significant inputs are directly or indirectly observable in active markets. Level 3 - Valuations derived from valuation techniques, in which one or more significant inputs are unobservable inputs which are supported by little or no market activity. In accordance with IFRS 13, assets and liabilities at fair value are measured based on the following valuation techniques:
a) Market approach – Prices and other relevant information generated by market transactions involving identical or comparable assets or liabilities.
b) Income approach – Converting the future amounts based on market expectations to its present value using the discounting method.
c) Cost approach – Replacement cost method. Certain assets are measured at fair value on a non-recurring basis. These assets consist primarily of non-financial assets such as goodwill and intangible assets. Goodwill and intangible assets recognized in business combinations are measured at fair value initially and subsequently when there is an indicator of impairment, the impairment is recognized. A fair value measurement of a non-financial asset takes into account a market participant’s ability to generate economic benefits by using the asset in its highest and best use or by selling it to another market participant who would use the asset in its highest and best use.
HCL Technologies Limited Notes to consolidated financial statements for the year ended 31 March 2022
(All amounts in millions of USD, except share data and as stated otherwise)
(g) Revenue recognition Contracts involving provision of services and material Revenue is recognized when, or as, control of a promised service or good transfers to a customer, in an amount that reflects the consideration to which the Group expects to be entitled in exchange for transferring those products or services. To recognize revenues, the following five step approach is applied: (1) identify the contract with a customer, (2) identify the performance obligations in the contract, (3) determine the transaction price, (4) allocate the transaction price to the performance obligations in the contract, and (5) recognize revenues when a performance obligation is satisfied. A contract is accounted when it is legally enforceable through executory contracts, approval and commitment from all parties, the rights of the parties are identified, payment terms are defined, the contract has commercial substance and collectability of consideration is probable. Time-and-material / Volume based / Transaction based contracts Revenue with respect to time-and-material, volume based and transaction based contracts is recognized as the related services are performed through efforts expended, volume serviced transactions are processed etc. that correspond with value transferred to customer till date which is related to the right to invoice for services performed. Fixed Price contracts Revenue related to fixed price contracts where performance obligations and control are satisfied over a period of time like technology integration, complex network building contracts, system implementations and application development are recognized based on progress towards completion of the performance obligation using a cost-to-cost measure of progress (i.e., percentage-of-completion (POC) method of accounting). Revenue is recognized based on the costs incurred to date as a percentage of the total estimated costs to fulfill the contract. Any revision in cost to complete would result in increase or decrease in revenue and such changes are recorded in the period in which they are identified. Provisions for estimated losses, if any, on contracts-in-progress are recorded in the period in which such losses become probable based on the current contract estimates. Contract losses are determined to be the amount by which the estimated incremental cost to complete exceeds the estimated future revenues that will be generated by the contract and are included in cost of revenues. Revenue related to other fixed price contracts providing maintenance and support services, are recognized based on the right to invoice for services performed for contracts in which the invoicing is representative of the value being delivered. If invoicing is not consistent with value delivered, revenues are recognized as the service is performed based on the cost to cost method described above. In arrangements involving sharing of customer revenues, revenue is recognized when the right to receive is established. Revenue from product sales are shown net of applicable taxes, discounts and allowances. Revenue related to product with installation services that are critical to the product is recognized when installation of product at customer site is completed and accepted by the customer. If the revenue for a delivered item is not recognized for non-receipt of acceptance from the customer, the cost of the delivered item continues to be in inventory. Proprietary Software Products Revenue from distinct proprietary perpetual license software is recognized at a point in time at the inception of the arrangement when control transfers to the client. Revenue from proprietary term license software is recognized at a point in time for the committed term of the contract. In case of renewals of proprietary term licenses with existing customers, revenue from term license is recognized at a point in time when the renewal is agreed on signing of contracts. Revenue from support and subscription (S&S) is recognized over the contract term on a straight-line basis as the Company is providing a service of standing ready to provide support, when-and-if needed, and is providing unspecified software upgrades on a when-and-if available basis over the contract term. In case software are bundled with support and subscription either for perpetual or term based license, such support and subscription contracts
HCL Technologies Limited Notes to consolidated financial statements for the year ended 31 March 2022
(All amounts in millions of USD, except share data and as stated otherwise)
are generally priced as a percentage of the net fees paid by the customer to purchase the license and are generally recognized as revenues ratably over the contractual period that the support services are provided. Revenue from these proprietary software products is classified under sale of services. Multiple performance obligation When a sales arrangement contains multiple performance obligation, such as services, hardware and licensed IPs (software) or combinations of each of them, revenue for each element is based on a five step approach as defined above. To the extent a contract includes multiple promised deliverables, judgment is applied to determine whether promised deliverables are capable of being distinct and are distinct in the context of the contract. If these criteria are not met, the promised deliverables are accounted for as a combined performance obligation. For arrangements with multiple distinct performance obligations or series of distinct performance obligations, consideration is allocated among the performance obligations based on their relative standalone selling price. Standalone selling price is the price at which the Group would sell a promised good or service separately to the customer. When not directly observable, we estimate standalone selling price by using the expected cost plus a margin approach. We establish a standalone selling price range for our deliverables, which is reassessed on a periodic basis or when facts and circumstances change. If the arrangement contains obligations related to License of Intellectual property (Software) or Lease deliverable, the arrangement consideration allocated to the Software deliverables, lease deliverable as a group is then allocated to each software obligation and lease deliverable. Revenue recognition for delivered elements is limited to the amount that is not contingent on the future delivery of products or services, future performance obligations or subject to customer-specified return or refund privileges. Revenue from certain activities in transition services in outsourcing arrangements are not capable of being distinct or represent separate performance obligation. Revenues relating to such transition activities are classified as Contract liabilities and subsequently recognized over the period of the arrangement. Direct and incremental costs in relation to such transition activities which are expected to be recoverable under the contract and generate or enhance resources of the Company that will be used in satisfying the performance obligation in the future are considered as contract fulfillment costs classified as Deferred contract cost and recognized over the period of arrangement. Certain upfront non-recurring incremental contract acquisition costs and other upfront fee paid to customer are deferred and classified as Deferred contract cost and amortized to revenue or cost, usually on a straight line basis, over the term of the contract unless revenues are earned and obligations are fulfilled in a different pattern. The undiscounted future cash flows from the arrangement are periodically estimated and compared with the unamortized costs. If the unamortized costs exceed the undiscounted cash flow, a loss is recognized. In instances when revenue is derived from sales of third-party vendor services, material or licenses, revenue is recorded on a gross basis when the Group is a principal to the transaction and net of costs when the Group is acting as an agent between the customer and the vendor. Several factors are considered to determine whether the Group is a principal or an agent, most notably being group controls the goods or service before it is transferred to customer, latitude in deciding the price being charged to customer. Revenue is recognized net of discounts and allowances, value-added and service taxes, and includes reimbursement of out-of-pocket expenses, with the corresponding out-of-pocket expenses included in cost of revenues. Volume discounts, or any other form of variable consideration is estimated using either the sum of probability weighted amounts in a range of possible consideration amounts (expected value), or the single most likely amount in a range of possible consideration amounts (most likely amount), depending on which method better predicts the amount of consideration realizable. Transaction price includes variable consideration only to the extent it is probable that a significant reversal of revenues recognized will not occur when the uncertainty associated with the variable consideration is resolved. Our estimates of variable consideration and determination of whether to include estimated amounts in the transaction price may involve judgment and are based largely on an assessment of our anticipated performance and all information that is reasonably available to us.
HCL Technologies Limited Notes to consolidated financial statements for the year ended 31 March 2022
(All amounts in millions of USD, except share data and as stated otherwise)
Revenue recognized but not billed to customers is classified either as contract assets or unbilled receivables in the consolidated balance sheet. Contract assets primarily relate to unbilled amounts on those contracts utilizing the cost to cost method of revenue recognition and right to consideration is not unconditional. Contract assets are recognized where there is excess of revenue over the billings. Unbilled receivables represent contracts where right to consideration is unconditional (i.e. only the passage of time is required before the payment is due). A contract liability arises when there is excess billing over the revenue recognized. Revenue from sales-type leases is recognized when risk of loss has been transferred to the client and there are no unfulfilled obligations that affect the final acceptance of the arrangement by the client. Interest attributable to sales-type leases and direct financing leases included therein is recognized on an accrual basis using the effective interest method and is recognized as other income. Interest income Interest income for all financial instruments measured at amortized cost is recorded using the effective interest rate (EIR). EIR is the rate that exactly discounts the estimated future cash payments or receipts over the expected life of the financial instrument or a shorter period, where appropriate, to the gross carrying amount of the financial asset or to the amortized cost of a financial liability. When calculating the EIR, the Group estimates the expected cash flows by considering all the contractual terms of the financial instrument but does not consider the expected credit losses. Interest income is included in other income in the statement of profit or loss.
(h) Cost recognition Costs and expenses are recognised when incurred and have been classified according to their primary functions in the following categories: Cost of revenue These costs primarily include employee compensation including stock based compensation of personnel engaged in providing services, travel expenses, outsourcing costs, cost of hardware and software licenses, facility expenses, communication expenses and any other directly attributable expenses. Research and development expenses These costs primarily include employee compensation including stock based compensation for personnel engaged in research and development activities, travel expenses, communication expenses and facility expenses for these employees. Selling, general and administrative expenses These costs primarily include employee compensation including stock based compensation for management, sales, marketing and enabling personnel, travel expenses, advertising, business promotion expenses, bad debts and advances written off, allowance for doubtful trade receivables and advances, facility expenses for these employees.
(i) Income taxes Income tax expense comprises current and deferred income tax. Income tax expense is recognized in the statement of profit or loss except to the extent that it relates to items recognized directly in equity, in which case it is recognized in equity. Current income tax for current and prior periods is recognized at the amount expected to be paid to or recovered from the tax authorities, using the tax rates and tax laws that have been enacted or substantively enacted by the balance sheet date. Provision for income tax includes the impact of provisions established for uncertain income tax positions.
HCL Technologies Limited Notes to consolidated financial statements for the year ended 31 March 2022
(All amounts in millions of USD, except share data and as stated otherwise)
Deferred income tax assets and liabilities recognized for all temporary differences arising between the tax bases of assets and liabilities and their carrying amounts in the financial statements. Deferred income tax assets and liabilities are recognized for those temporary differences which originate during the tax holiday period and are reversed after the tax holiday period. For this purpose, reversal of timing differences is determined using first-in-first-out method. Deferred tax assets are reviewed at each reporting date and are reduced to the extent that it is no longer probable that the related tax benefit will be realized. Deferred income tax assets and liabilities are measured using tax rates and tax laws that have been enacted or substantively enacted by the balance sheet date and are expected to apply to taxable income in the years in which those temporary differences are expected to be recovered or settled. Deferred tax assets and deferred tax liabilities are offset, if a legally enforceable right exists to set off current tax assets against current tax liabilities and the deferred taxes relate to the same taxable entity and the same taxation authority. The effect of changes in tax rates on deferred income tax assets and liabilities is recognized as income or expense in the year that includes the enactment or the substantive enactment date. A deferred income tax asset is recognized to the extent that it is probable that future taxable profit will be available against which the deductible temporary differences and tax losses can be utilized. Deferred income taxes are not provided on the undistributed earnings of subsidiaries and branches where it is expected that the earnings of the subsidiary or branch will not be distributed in the foreseeable future. Tax benefits acquired as part of a business combination, but not satisfying the criteria for separate recognition at that date, are recognized subsequently if new information about facts and circumstances change. The adjustment is either treated as a reduction in goodwill (as long as it does not exceed goodwill) if it was incurred during the measurement period or recognized in the statement of profit or loss. In some tax jurisdictions, the amount of tax deductions on share based payments to employees are different from the related cumulative remuneration expenses. If the amount of the tax deduction (or estimated future tax deduction) exceeds the amount of the related cumulative remuneration expense, such excess amount of tax deduction and the associated tax benefit is recognized directly in retained earnings.
(j) Property, plant and equipment
Property, plant and equipment are stated at cost less accumulated depreciation and impairment losses, if any. Cost comprises the purchase price and directly attributable cost of bringing the asset to its working condition for its intended use. Any trade discounts and rebates are deducted in arriving at the purchase price. The Group identifies and determines separate useful lives for each major component of the property, plant and equipment, if they have a useful life that is materially different from that of the asset as a whole. Expenses on existing property, plant and equipment, including day-to-day repairs, maintenance expenditure and cost of replacing parts, are charged to the statement of profit or loss for the year during which such expenses are incurred. Gains or losses arising from derecognition of assets are measured as the difference between the net disposal proceeds and the carrying amount of the asset and are recognized in the statement of profit or loss when the asset is derecognized. Property, plant and equipment under construction and cost of assets not ready for use at the year-end are disclosed as capital work- in- progress. Depreciation on property, plant and equipment is provided on the straight-line method over their estimated useful lives, as determined by the management. Depreciation is charged on a pro-rata basis for assets purchased/sold during the year.
HCL Technologies Limited Notes to consolidated financial statements for the year ended 31 March 2022
(All amounts in millions of USD, except share data and as stated otherwise)
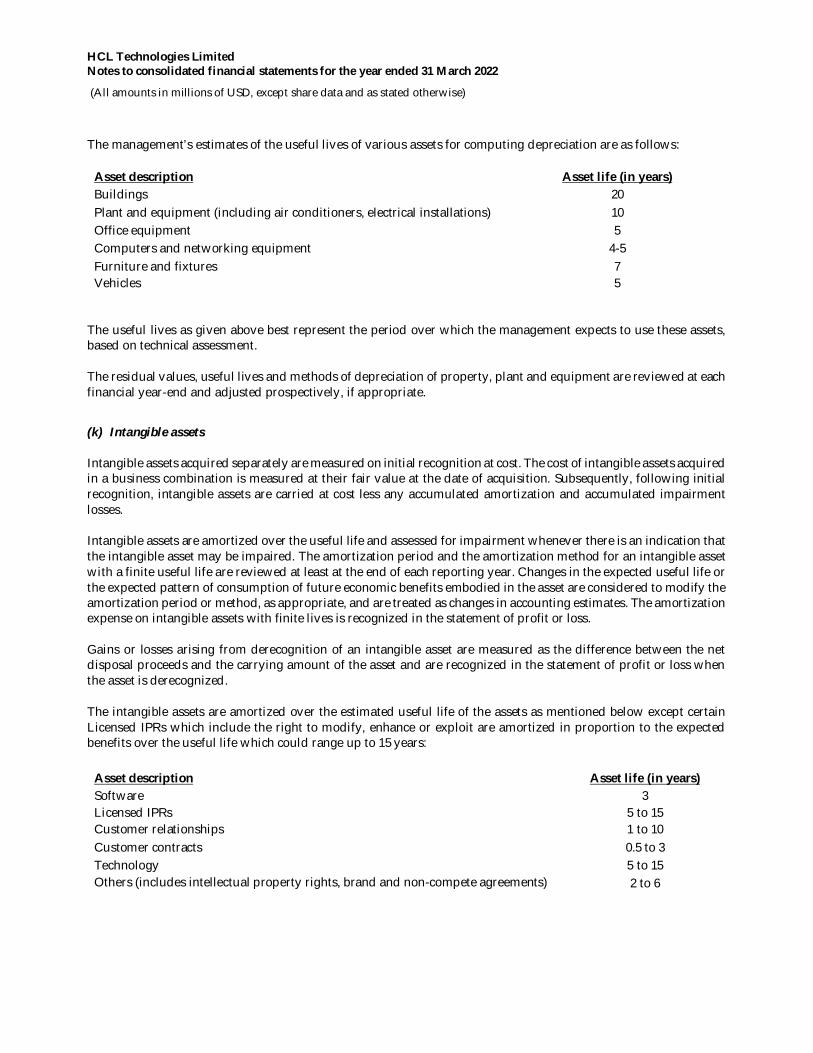
The management’s estimates of the useful lives of various assets for computing depreciation are as follows:
Asset description Asset life (in years) Buildings 20 Plant and equipment (including air conditioners, electrical installations) 10 Office equipment 5 Computers and networking equipment 4-5 Furniture and fixtures 7 Vehicles 5
The useful lives as given above best represent the period over which the management expects to use these assets, based on technical assessment. The residual values, useful lives and methods of depreciation of property, plant and equipment are reviewed at each financial year-end and adjusted prospectively, if appropriate.
(k) Intangible assets Intangible assets acquired separately are measured on initial recognition at cost. The cost of intangible assets acquired in a business combination is measured at their fair value at the date of acquisition. Subsequently, following initial recognition, intangible assets are carried at cost less any accumulated amortization and accumulated impairment losses. Intangible assets are amortized over the useful life and assessed for impairment whenever there is an indication that the intangible asset may be impaired. The amortization period and the amortization method for an intangible asset with a finite useful life are reviewed at least at the end of each reporting year. Changes in the expected useful life or the expected pattern of consumption of future economic benefits embodied in the asset are considered to modify the amortization period or method, as appropriate, and are treated as changes in accounting estimates. The amortization expense on intangible assets with finite lives is recognized in the statement of profit or loss. Gains or losses arising from derecognition of an intangible asset are measured as the difference between the net disposal proceeds and the carrying amount of the asset and are recognized in the statement of profit or loss when the asset is derecognized. The intangible assets are amortized over the estimated useful life of the assets as mentioned below except certain Licensed IPRs which include the right to modify, enhance or exploit are amortized in proportion to the expected benefits over the useful life which could range up to 15 years:
Asset description Asset life (in years) Software Licensed IPRs Customer relationships
3 5 to 15 1 to 10
Customer contracts 0.5 to 3 Technology 5 to 15 Others (includes intellectual property rights, brand and non-compete agreements) 2 to 6
HCL Technologies Limited Notes to consolidated financial statements for the year ended 31 March 2022
(All amounts in millions of USD, except share data and as stated otherwise)
(l) Research and development costs Research costs are expensed as incurred. Development expenditure, on an individual project, is recognized as an intangible asset when the Group can demonstrate: The technical feasibility of completing the intangible asset so that it will be available for use or sale Its intention to complete and its ability and intention to use or sell the asset How the asset will generate future economic benefits The availability of resources to complete the asset The ability to measure reliably the expenditure during development Subsequently, following initial recognition of the development expenditure as an asset, the cost model is applied requiring the asset to be carried at cost less any accumulated amortization and accumulated impairment losses. Amortization of the asset begins when development is complete and the asset is available for use. It is amortized over the period of expected future benefit. Amortization expense is recognized in the statement of profit or loss. During the period of development, the asset is tested for impairment annually.
(m) Borrowing costs Borrowing costs directly attributable to the acquisition, construction or production of an asset that necessarily takes a substantial period of time to get ready for its intended use are capitalized as part of the cost of the asset. All other borrowing costs are expensed in the period in which they occur. Borrowing costs consist of interest and other costs that an entity incurs in connection with the borrowing of funds.
(n) Leases A lease is a contract that contains right to control the use of an identified asset for a period of time in exchange for consideration. Group as a lessee Group is lessee in case of leasehold land, office space, accommodation for its employees & IT equipment. These leases are evaluated to determine whether it contains lease based on principles for the recognition, measurement, presentation and disclosure of leases for both lessees and lessors as defined in IFRS 16. Right-of-use asset represents the Group’s right to control the underlying assets under lease and the lease liability is the obligation to make the lease payments related to the underlying asset under lease. Right-of-use asset is measured initially based on the lease liability adjusted for any initial direct costs, prepaid rent, and lease incentives. Right-of-use asset is depreciated based on straight line method over the lease term or useful life of right-of-use asset, whichever is less. Subsequently, right-of-use asset is measured at cost less any accumulated depreciation, accumulated impairment losses, if any and adjusted for any remeasurement of lease liability. The lease liability is measured at the lease commencement date and determined using the present value of the minimum lease payments not yet paid and the Group’s incremental borrowing rate, which approximates the rate at which the Group would borrow, in the country where the lease was executed. The Group has used a single discount rate for a portfolio of leases with reasonably similar characteristics. The lease payment comprises fixed payment less any lease incentives, variable lease payment that depends on an index or a rate, exercise price of a purchase option if the Group is reasonably certain to exercise the option and payment of penalties for terminating the lease, if the lease term reflects the Group exercising an option to terminate the lease. Lease liability is subsequently measured by increase the carrying amount to reflect interest on the lease liability, reducing the carrying amount to reflect the lease payment made and remeasuring the carrying amount to reflect any reassessment or modification, if any.
HCL Technologies Limited Notes to consolidated financial statements for the year ended 31 March 2022
(All amounts in millions of USD, except share data and as stated otherwise)
The Group has elected to not recognize leases with a lease term of 12 months or less in the consolidated balance sheet, including those acquired in a business combination, and lease costs for those short-term leases are recognized on a straight-line basis over the lease term in the consolidated statement of profit or loss. For all asset classes, the Group has elected the lessee practical expedient to combine lease and non-lease components and account for the combined unit as a single lease component in case there is no separate payment defined under the contract. Group as a lessor Leases in which the Group does not transfer substantially all the risks and benefits of ownership of the asset are classified as operating leases. Initial direct costs incurred in negotiating an operating lease are added to the carrying amount of the leased asset and recognized over the lease term on the same basis as rental income. Contingent rents are recognized as revenue in the year in which they are earned or contingency is resolved. Leases in which the Group transfers substantially all the risk and benefits of ownership of the asset are classified as finance leases. Assets given under finance lease are recognized as a receivables at an amount equal to the present value of lease receivables. After initial recognition, the Group apportions lease rentals between the principal repayment and interest income so as to achieve a constant periodic rate of return on the net investment outstanding in respect of the finance leases. The interest income is recognized in the consolidated statement of profit or loss. Initial direct costs such as legal cost, brokerage cost etc. are recognized immediately in the statement of profit or loss. When arrangements include multiple performance obligations, the Group allocates the consideration in the contract between the lease components and the non-lease components on a relative standalone selling price basis.
(o) Inventories
Stock-in-trade, stores and spares are valued at the lower of the cost or net realizable value. Cost includes cost of purchase and other costs incurred in bringing the inventories to their present location and condition. Net realizable value is the estimated selling price in the ordinary course of business, less estimated costs of completion and estimated costs necessary to make the sale. Cost of stock-in-trade procured for specific projects is assigned by identifying individual costs of each item. Cost of stock-in-trade, that are interchangeable and not specific to any project and cost of stores and spare parts are determined using the weighted average cost formula.
(p) Impairment of non-financial assets Goodwill
Goodwill is tested annually on March 31, for impairment, or sooner whenever there is an indication that goodwill may be impaired, relying on a number of factors including operating results, business plans and future cash flows. For the purpose of impairment testing, goodwill acquired in a business combination is allocated to the Group’s cash generating units (CGU) expected to benefit from the synergies arising from the business combination. A CGU is the smallest identifiable group of assets that generates cash inflows that are largely independent of the cash inflows from other assets or group of assets. Impairment occurs when the carrying amount of a CGU including the goodwill, exceeds the estimated recoverable amount of the CGU. The recoverable amount of a CGU is the higher of its fair value less cost to sell and its value-in-use. Value-in-use is the present value of future cash flows expected to be derived from the CGU. Total impairment loss of a CGU is allocated first to reduce the carrying amount of goodwill allocated to the CGU and then to the other assets of the CGU, pro-rata on the basis of the carrying amount of each asset in the CGU. An impairment loss on goodwill recognized in the statement of profit or loss is not reversed in the subsequent period.
HCL Technologies Limited Notes to consolidated financial statements for the year ended 31 March 2022
(All amounts in millions of USD, except share data and as stated otherwise)
Intangible assets and property, plant and equipment Intangible assets and property, plant and equipment are evaluated for recoverability whenever events or changes in circumstances indicate that their carrying amounts may not be recoverable. For the purpose of impairment testing, the recoverable amount (i.e. the higher of the fair value less cost to sell and the value-in-use) is determined on an individual asset basis unless the asset does not generate cash flows that are largely independent of those from other assets. In such cases, the recoverable amount is determined for the CGU to which the asset belongs. If such assets are considered to be impaired, the impairment to be recognized in the statement of profit or loss is measured by the amount by which the carrying value of the asset exceeds the estimated recoverable amount of the asset.
(q) Provisions and contingent liabilities A provision is recognized if, as a result of a past event, the Group has a present legal or constructive obligation that can be estimated reliably, and it is probable that an outflow of resources embodying economic benefits will be required to settle the obligation. If the effect of the time value of money is material, provisions are determined by discounting the expected future cash flows. The Group uses significant judgement to disclose contingent liabilities. Contingent liabilities are disclosed when there is a possible obligation arising from past events, the existence of which will be confirmed only by the occurrence or non-occurrence of one or more uncertain future events not wholly within the control of the Group or a present obligation that arises from past events where it is either not probable that an outflow of resources will be required to settle the obligation or a reliable estimate of the amount cannot be made. Contingent assets are neither recognized nor disclosed in the financial statements.
(r) Retirement and other employee benefits
i. Provident fund: Employees of the Company and its subsidiaries in India receive benefits under the provident
fund, a defined benefit plan. The employee and employer each make monthly contributions to the plan. A portion of the contribution is made to the provident fund trust managed by the Group or Government administered provident fund; while the balance contribution is made to the Government administered pension fund, a define contribution plan. For the contribution made by the Company and its subsidiaries in India to the provident fund trust managed by the Group, the Company has an obligation to fund any shortfall on the yield of the Trust’s investments over the administered interest rates. The liability is actuarially determined (using the projected unit credit method) at the end of the year. The funds contributed to the Trust are invested in specific securities as mandated by law and generally consist of federal and state government bonds, debt instruments of government-owned corporations and, equity other eligible market securities.
ii. In respect of superannuation, a defined contribution plan for applicable employees, the Company contributes to a scheme administered on its behalf by appointed fund managers and such contributions for each year of service rendered by the employees are charged to the statement of profit or loss. The Company has no further obligations to the superannuation plan beyond its contributions.
iii. Gratuity liability: The Company and its subsidiaries in India provide for gratuity, a defined benefit plan (the
“Gratuity Plan”) covering eligible employees. The Gratuity Plan provides a lump sum payment to vested employees at retirement, death, incapacitation or termination of employment, of an amount based on the respective employee’s base salary and the tenure of employment (subject to a maximum of $- (INR 2 million) per employee). The liability is actuarially determined (using the projected unit credit method) at the end of each year. Actuarial gains/losses are recognized immediately in the balance sheet with a corresponding debit or credit to other comprehensive income in the year in which they occur.
HCL Technologies Limited Notes to consolidated financial statements for the year ended 31 March 2022
(All amounts in millions of USD, except share data and as stated otherwise)
In respect to certain employees in India, the Company contributes towards gratuity liabilities to the Gratuity Fund Trust. Trustees of the Company administer contributions made to the Trust and contributions are invested in a scheme with Life Insurance Corporation of India as permitted by law.
iv. Compensated absences: The employees of the Group are entitled to compensated absences which are both
accumulating and non-accumulating in nature. The employees can carry forward up to the specified portion of the unutilized accumulated compensated absences and utilize it in future periods or receive cash at retirement or termination of employment. The expected cost of accumulating compensated absences is determined by actuarial valuation (using the projected unit credit method) based on the additional amount expected to be paid as a result of the unused entitlement that has accumulated at the balance sheet date. The expense on non-accumulating compensated absences is recognized in the statement of profit or loss in the year in which the absences occur. Actuarial gains/losses are immediately taken to the statement of profit or loss and are not deferred.
v. State Plan: The contribution to State Plans in India, a defined contribution plan namely Employee State Insurance Fund is charged to the statement of profit or loss as and when employees render related services.
vi. Contributions to other defined contribution plans in subsidiaries outside India are recognized as expense when employees have rendered services entitling them to such benefits.
vii. In certain subsidiaries outside India, the Group provide retirement benefit pension plans in accordance with the local laws. The liability is actuarially determined (using the projected unit credit method) at the end of each year.
(s) Equity settled share based compensation Share-based compensation represents the cost related to share-based awards granted to employees. The Company measures share-based compensation cost at grant date, based on the estimated fair value of the award and recognizes the cost on a straight line basis (net of estimated forfeitures) over the employee's requisite service period for an award with only service condition and for an award with both service and performance condition on a straight line basis over the requisite service period for each separately vesting portion of the award, as if award was in substance, multiple awards. The Company estimates the fair value of stock options using option pricing model. The cost is recorded under the head employee benefit expense in the consolidated statement of profit or loss with corresponding increase in “Share Based Payment Reserve”.
(t) Financial Instruments A financial instrument is a contract that gives rise to a financial asset of one entity and a financial liability or equity instrument of another entity. i. Financial assets
All financial assets are recognized initially at fair value. Transaction costs that are directly attributable to the acquisition of financial assets (other than financial assets at fair value through profit or loss) are added to the fair value measured on initial recognition of financial asset. Purchase and sale of financial assets are accounted for at trade date.
Cash and cash equivalents Cash and cash equivalents in the balance sheet comprise cash in banks and short-term deposits and investments with an original maturity of three months or less, which are subject to an insignificant risk of changes in value. For the purposes of the cash flow statement, cash and cash equivalents are considered net of outstanding bank overdrafts that are repayable on demand and are considered part of the Group’s cash management system. In the consolidated balance sheet, bank overdrafts are presented under borrowings within current liabilities.
HCL Technologies Limited Notes to consolidated financial statements for the year ended 31 March 2022
(All amounts in millions of USD, except share data and as stated otherwise)
Financial assets at amortized cost A financial asset is measured at the amortized cost if both the following conditions are met: a) The asset is held within a business model whose objective is to hold assets for collecting contractual cash
flows, and b) Contractual terms of the asset give rise on specified dates to cash flows that are solely payments of principal
and interest (SPPI) on the principal amount outstanding. After initial measurement, such financial assets are subsequently measured at amortized cost using the effective interest rate (EIR) method. Amortized cost is calculated by taking into account any discount or premium on acquisition and fees or costs that are an integral part of the EIR. The EIR amortization is included in other income in the statement of profit or loss. The losses arising from impairment are recognized in the statement of profit or loss. This category includes cash and bank balances, loans, unbilled receivables, trade and other receivables. Financial assets at Fair Value through Other Comprehensive Income (OCI) A financial asset is classified and measured at fair value through OCI if both of the following criteria are met:
i. The objective of the business model is achieved both by collecting contractual cash flows and selling the financial assets, and
ii. The asset’s contractual cash flows represent solely payments of principal and interest.
Financial asset included within the OCI category are measured initially as well as at each reporting date at fair value. Fair value movements are recognized in OCI. Interest income is recognized in statement of profit or loss for debt instruments. On derecognition of the asset, cumulative gain or loss previously recognized in OCI is reclassified from OCI to statement of profit or loss.
Financial assets at Fair Value through Profit or Loss Any financial asset, which does not meet the criteria for categorization at amortized cost or at fair value through other comprehensive income, is classified at fair value through profit or loss. Financial assets included at the fair value through profit or loss category are measured at fair value with all changes recognized in the statement of profit or loss. Equity investments All equity instruments are initially measured at fair value and are subsequently re-measured with all changes recognized in the statement of profit or loss. In limited circumstances, investments, for which sufficient, more recent information to measure fair value is not available cost represents the best estimate of fair value within that range. Derecognition of financial assets A financial asset is primarily derecognized when the rights to receive cash flows from the asset have expired, or the Group has transferred its rights to receive cash flows from the asset.
Impairment of financial assets The Group recognizes loss allowances using the expected credit loss (ECL) model for the financial assets which are not fair valued through profit or loss. Lifetime ECL allowance is recognized for trade receivables with no significant financing component. For all other financial assets, expected credit losses are measured at an amount equal to the 12-month ECL, unless there has been a significant increase in credit risk from initial recognition in which case they are measured at lifetime ECL. The amount of expected credit losses (or reversal) that is required to adjust the loss allowance at the reporting date is recognized in statement of profit or loss.
ii. Financial liabilities
All financial liabilities are recognized initially at fair value and, in the case of loans and borrowings and payables, net of directly attributable transaction costs.
The subsequent measurement of financial liabilities depends on their classification, as described below:
HCL Technologies Limited Notes to consolidated financial statements for the year ended 31 March 2022
(All amounts in millions of USD, except share data and as stated otherwise)
Financial liabilities at fair value through profit or loss Financial liabilities designated upon initial recognition at fair value through profit or loss are designated as such at the initial date of recognition, and only if the criteria in IFRS 9 are satisfied. Changes in fair value of such liability are recognized in the statement of profit or loss. Financial liabilities at amortized cost The Group’s financial liabilities at amortized cost, are initially recognized at net of transaction costs and includes trade payables, borrowings including bank overdrafts and other payables.
After initial recognition, financial liabilities are subsequently measured at amortized cost using the effective interest rate (EIR) method except for deferred consideration recognized in a business combination which is subsequently measured at fair value through profit or loss. Gains and losses are recognized in the statement of profit or loss when the liabilities are derecognized as well as through the EIR amortization process. Amortized cost is calculated by taking into account any discount or premium on acquisition and fees or costs that are an integral part of the EIR. The EIR amortization is included as finance costs in the statement of profit or loss.
Derecognition A financial liability is derecognized when the obligation under the liability is discharged or cancelled or expires.
iii. Derivative financial instruments and hedge accounting
Foreign exchange forward contracts and options are purchased to mitigate the risk of changes in foreign exchange rates associated with forecast transactions denominated in certain foreign currencies and interest rate swaps are entered to mitigate interest rate fluctuation risk on indebtedness.
The Group recognizes all derivatives as assets or liabilities measured at their fair value. Changes in fair value for derivatives not designated in a hedge accounting relationship are marked to market at each reporting date and the related gains (losses) are recognized in the statement of profit or loss as ‘foreign exchange gains (losses)’ and ‘finance costs’ as applicable.
The foreign exchange forward contracts, options and interest rate swaps in respect of forecasted transactions which meet the hedging criteria are designated as cash flow hedges. Changes in the fair value of derivatives (net of tax) that are designated as effective cash flow hedges are deferred and recorded in the hedging reserve account as a component of accumulated ‘other comprehensive income (loss)’ until the hedged transaction occurs and are then recognized in the statement of profit or loss. The ineffective portion of hedging derivatives is immediately recognized in other income (expenses) in the statement of profit or loss. In respect of derivatives designated as hedges, the Group formally documents all relationships between hedging instruments and hedged items, as well as its risk management objective and strategy for undertaking various hedge transactions. The Group also formally assesses both at the inception of the hedge and on an ongoing basis, whether each derivative is highly effective in offsetting changes in fair values or cash flows of the hedged item. The Group determines the existence of an economic relationship between the hedging instrument and hedged item based on the currency, amount and timing of their respective cash flows. Hedge accounting is discontinued prospectively from the last testing date when (1) it is determined that the derivative financial instrument is no longer effective in offsetting changes in the fair value or cash flows of the underlying exposure being hedged; (2) the derivative financial instrument matures or is sold, terminated or exercised; or (3) it is determined that designating the derivative financial instrument as a hedge is no longer appropriate. When hedge accounting is discontinued the deferred gains or losses on the cash flow hedge remain in ‘other comprehensive income (loss)’ until the forecast transaction occurs. Any further change in the fair value of the derivative financial instrument is recognized in current year earnings.
HCL Technologies Limited Notes to consolidated financial statements for the year ended 31 March 2022
(All amounts in millions of USD, except share data and as stated otherwise)
Offsetting of financial instruments
Financial assets and financial liabilities are offset and the net amount is reported in the consolidated balance sheet if there is a currently enforceable legal right to offset the recognized amounts and there is an intention to settle on a net basis to realize the assets and settle the liabilities simultaneously.
(u) Dividend
Final dividend proposed by the Board of Directors is recognized upon approval by the shareholders who have the right to decrease but not increase the amount of dividend recommended by the Board of Directors. Interim dividends are recognized on declaration by the Board of Directors. Final and interim dividend excludes dividend on treasury shares.
(v) Earnings per share (EPS) Basic EPS amounts are computed by dividing the net profit attributable to the equity holders of the Parent Company by the weighted average number of equity shares outstanding during the year adjusted for treasury shares held. Diluted EPS amounts are computed by dividing the net profit attributable to the equity holders of the Parent Company by the weighted average number of equity shares considered for deriving basic earnings per share and also the weighted average number of equity shares that could have been issued upon conversion of all dilutive potential equity shares. The diluted potential equity shares are adjusted for the proceeds receivable had the shares been actually issued at fair value (i.e. the average market value of the outstanding shares). Performance based stock unit awards are included in dilutive potential shares when they become contingently issuable and have a dilutive impact and are excluded when they are not contingently issuable. Dilutive potential equity shares are deemed converted as at the beginning of the year, unless issued at a later date. Dilutive potential equity shares are determined independently for each year presented. The number of shares and potentially dilutive equity shares are adjusted retrospectively for all periods presented for bonus shares.
(w) Nature and purpose of reserves
Treasury share reserve The Company’s equity shares held by a trust, which is consolidated as a part of the Group, are classified as Treasury shares. Treasury shares are carried at acquisition cost and presented as a deduction from total equity as “Treasury share reserve”. As and when treasury shares are transferred to employees on exercise after satisfaction of the vesting conditions, the amount received is recognized as an increase in equity, and the balance lying in “Treasury share reserve” is transferred to “Securities premium”. Securities premium Securities premium is used to record the premium on issue of shares. The reserve can be utilized only for limited purposes such as issuance of bonus shares and buyback of shares in accordance with the provisions of the Companies Act, 2013 in India. Capital redemption reserve The Group recognizes cancellation of the Group’s own equity instruments to capital redemption reserve. Share based payment reserve The share based payment reserve is recognized over the vesting period at the grant date fair value of units issued to employees of the Group under the Company’s restricted stock unit plan.
HCL Technologies Limited Notes to consolidated financial statements for the year ended 31 March 2022
(All amounts in millions of USD, except share data and as stated otherwise)
Special economic zone re-investment reserve The Company has created special economic zone (SEZ) re-investment reserve out of profits of the eligible SEZ Units in terms of the specific provisions of Section 10AA(1) of the Income Tax Act, 1961 (“the Act”) in India. The said reserve needs to be utilized by the Company for acquiring plant and machinery for the purpose of its business in terms of Section 10AA(2) of the Act for availing tax benefit. Further, during the year ended 31 March 2022, utilization also includes additional acquisition of plant and machinery in the business of the Company which was not considered as utilization earlier due to an uncertain tax position which has been settled. Remeasurement of defined benefit plans The Group recognizes actuarial gains/losses on defined benefit plans in the balance sheet with a corresponding debit or credit to other comprehensive income in the period in which they occur. Foreign currency translation reserve Exchange differences arising on translation of the foreign operations are recognized in other comprehensive income as described in the accounting policy and accumulated in a separate reserve within equity. The cumulative amount is reclassified to profit or loss when the net investment is disposed-off. Cash flow hedging reserve For hedging foreign currency and interest rate risk, the Group uses foreign currency forward, option contracts and interest rate swaps. To the extent these hedges are effective, the change in fair value of the hedging instrument is recognized in the cash flow hedging reserve. Amounts recognized in the cash flow hedging reserve is reclassified to the statement of profit or loss when the hedged item affects profit or loss. Debt instruments through other comprehensive income The Group recognizes changes in the fair value of debt instruments held with business objective of collect and sell in other comprehensive income. The Group transfers amounts from this reserve to the statement of profit or loss when the debt instrument is sold.
(x) Recently issued accounting pronouncements
Onerous Contracts – Cost of Fulfilling a Contract (Amendment to IAS 37)
In May 2020, the IASB issued Amendments to IAS 37 “Provisions, Contingent Liabilities and Contingent Assets”, clarifying that the ‘costs of fulfilling a contract’ comprise both the incremental costs and allocation of other direct costs. The amendments are effective for the fiscal year beginning April 01, 2022 including interim periods within those fiscal years. The Group does not expect the adoption of this update to have a material impact on its consolidated financial statements. Classification of liabilities as current or non-current (Amendments to IAS 1)
In January 2020, the IASB issued final amendments in IAS 1, which clarifies that classification of liabilities as current or non-current should be based on rights that are in existence at the end of the reporting period to defer settlement by at least twelve months. The classification is unaffected by expectations about whether an entity will exercise its right to defer settlement of a liability through any other asset or services. The amendments are effective for the fiscal year beginning April 01, 2023 including interim periods within those fiscal years and are to be applied retrospectively. The Group is currently in the process of evaluating the impact that adoption of this standard will have on its consolidated financial statements. Disclosure of Accounting Policies (Amendments to IAS 1 and IFRS Practice Statement 2)
In February 2021, IASB issued 'Disclosure of Accounting Policies (Amendments to IAS 1 and IFRS Practice Statement 2)' which intends to assist in deciding which accounting policies to disclose in the financial statements. The amendments to IAS 1 require entities to disclose their material accounting policies rather than their significant accounting policies. The amendments to IFRS Practice Statement 2 provide guidance on how to apply the concept of materiality to accounting policy disclosures. The amendments are effective for the fiscal year beginning April 01, 2023 including interim periods within those fiscal years and are to be applied retrospectively.
HCL Technologies Limited Notes to consolidated financial statements for the year ended 31 March 2022
(All amounts in millions of USD, except share data and as stated otherwise)
The Group is currently in the process of evaluating the impact that adoption of this standard will have on its consolidated financial statements. Definition of Accounting Estimate (Amendments to IAS 8)
In February 2021, IASB issued 'Definition of Accounting Estimates (Amendments to IAS 8)' to help entities to distinguish between accounting policies and accounting estimates. The definition of a change in accounting estimates has been replaced with a definition of accounting estimates. Under the new definition, accounting estimates are “monetary amounts in financial statements that are subject to measurement uncertainty”. Entities develop accounting estimates if accounting policies require items in financial statements to be measured in a way that involves measurement uncertainty. The amendments are effective for the fiscal year beginning April 01, 2023 including interim periods within those fiscal years and are to be applied retrospectively. The Group is currently in the process of evaluating the impact that adoption of this standard will have on its consolidated financial statements.
Deferred Tax Related to Assets and Liabilities Arising from a Single Transaction (Amendments to IAS 12 Income Taxes)
In May 2021, IASB issued 'targeted amendments to IAS 12’, to specify how to account for deferred tax on transactions such as leases. The amendments clarify that lease transactions give rise to equal and offsetting temporary differences and financial statements should reflect the future tax impacts of these transactions through recognizing deferred tax. The amendments are effective for the fiscal year beginning April 01, 2023 including interim periods within those fiscal years. The Group is currently in the process of evaluating the impact that adoption of this standard will have on its consolidated financial statements.
2. ACQUISITIONS a) Acquisitions in the current year
i. Acquisition of non-controlling interest in Actian Corporation
In July 2018, the Group and Sumeru Equity Partners (SEP) had acquired Actian Corporation through a joint venture company in which the Group and SEP had 80.4% and 19.6% stake respectively. On 29 December, 2021, as per the terms of the joint venture agreement, the Group acquired the balance 19.6% stake held by SEP for a cash consideration of $100. The total cash consideration of $100 has been settled against financial liability of $68 and non controlling interest of $14 and balance $18 has been recognized against retained earnings.
ii. Acquisition of gbs - Gesellschaft für Banksysteme GmbH (GBS) In January 2022, the Group through a wholly owned subsidiary acquired 51% shares of GBS for a total purchase consideration of $- (EUR 99 thousand). This strategic acquisition will add an edge to Group’s existing capabilities to accelerate digital transformation and further enhance HCL’s scale in Germany. Purchase consideration of $- (EUR 99 thousand) has been preliminarily allocated to cash and cash equivalent of $5, net liabilities of $5, and non-controlling interest of $- (EUR 99 thousand).
b) Acquisitions in the previous year
i. Acquisition of Cisco SON Product
On 29 May 2020, the Group had signed a definitive agreement to acquire Cisco Self-Optimizing Network (SON) products and associated business from Cisco System, Inc., a California based Company for a consideration of $50.
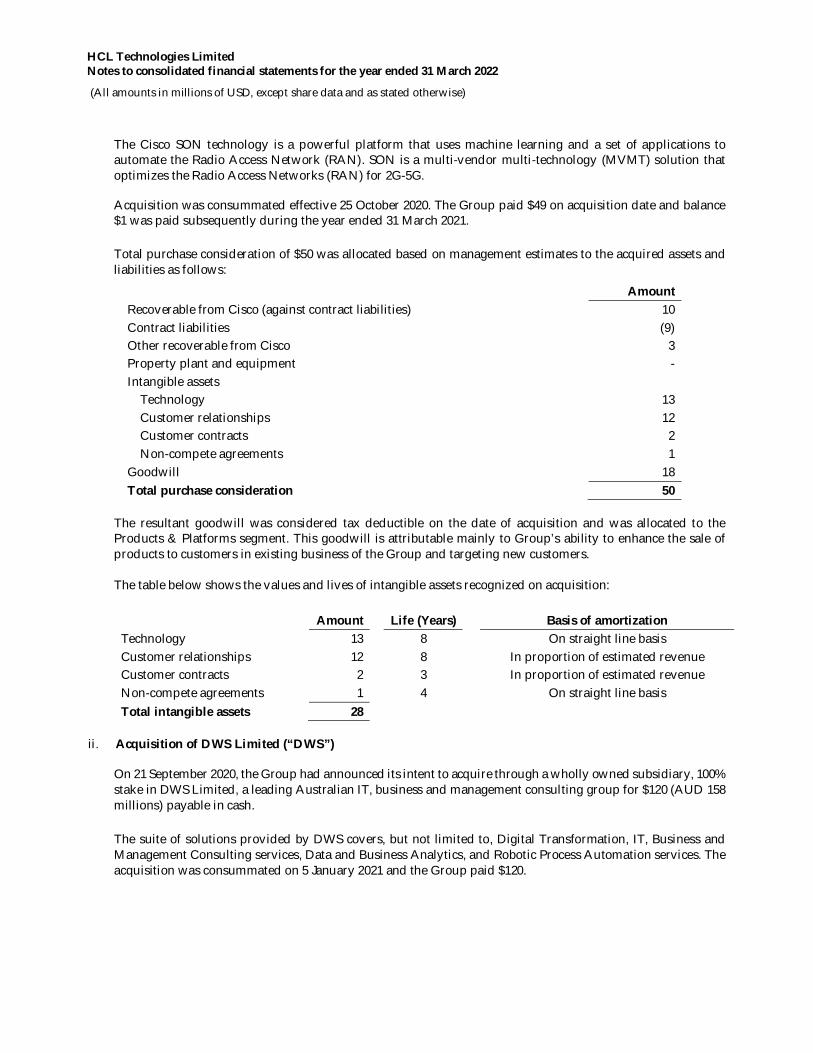
HCL Technologies Limited Notes to consolidated financial statements for the year ended 31 March 2022
(All amounts in millions of USD, except share data and as stated otherwise)
The Cisco SON technology is a powerful platform that uses machine learning and a set of applications to automate the Radio Access Network (RAN). SON is a multi-vendor multi-technology (MVMT) solution that optimizes the Radio Access Networks (RAN) for 2G-5G. Acquisition was consummated effective 25 October 2020. The Group paid $49 on acquisition date and balance $1 was paid subsequently during the year ended 31 March 2021.
Total purchase consideration of $50 was allocated based on management estimates to the acquired assets and liabilities as follows:
Amount Recoverable from Cisco (against contract liabilities) 10 Contract liabilities (9) Other recoverable from Cisco 3 Property plant and equipment - Intangible assets Technology 13 Customer relationships 12 Customer contracts 2 Non-compete agreements 1 Goodwill 18 Total purchase consideration 50
The resultant goodwill was considered tax deductible on the date of acquisition and was allocated to the Products & Platforms segment. This goodwill is attributable mainly to Group’s ability to enhance the sale of products to customers in existing business of the Group and targeting new customers. The table below shows the values and lives of intangible assets recognized on acquisition:
Amount Life (Years) Basis of amortization Technology 13 8 On straight line basis Customer relationships 12 8 In proportion of estimated revenue Customer contracts 2 3 In proportion of estimated revenue Non-compete agreements 1 4 On straight line basis Total intangible assets 28
ii. Acquisition of DWS Limited (“DWS”)
On 21 September 2020, the Group had announced its intent to acquire through a wholly owned subsidiary, 100% stake in DWS Limited, a leading Australian IT, business and management consulting group for $120 (AUD 158 millions) payable in cash.
The suite of solutions provided by DWS covers, but not limited to, Digital Transformation, IT, Business and Management Consulting services, Data and Business Analytics, and Robotic Process Automation services. The acquisition was consummated on 5 January 2021 and the Group paid $120.
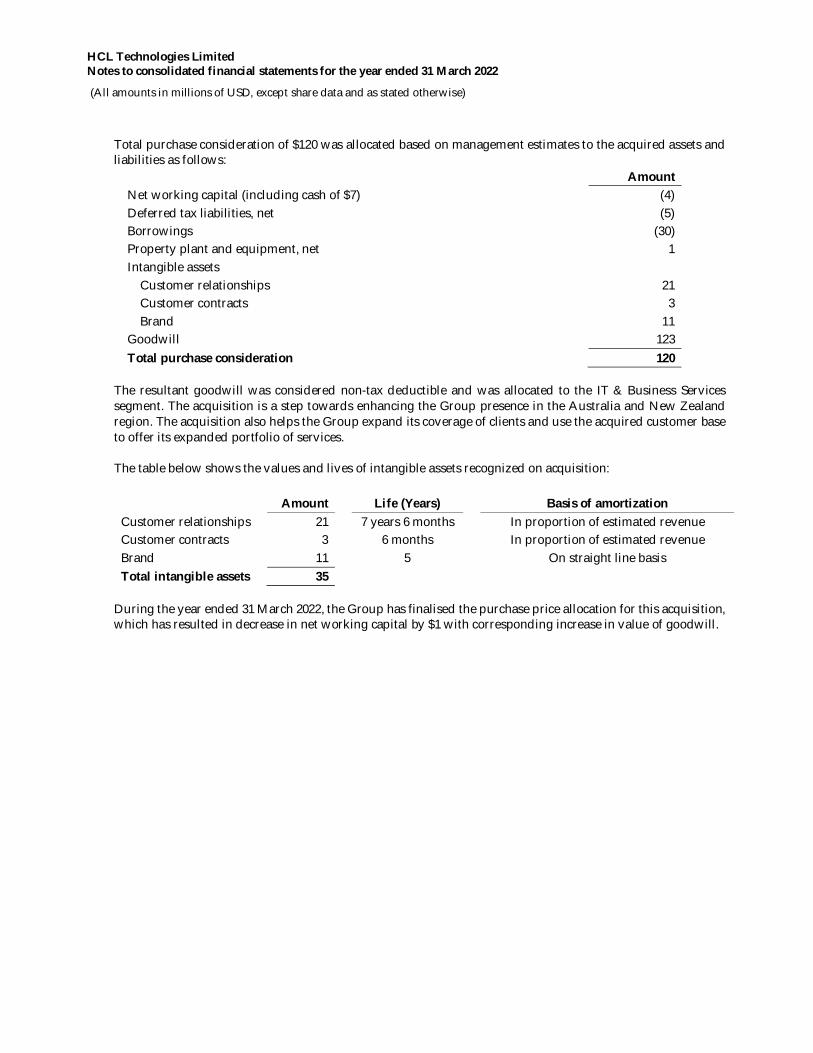
HCL Technologies Limited Notes to consolidated financial statements for the year ended 31 March 2022
(All amounts in millions of USD, except share data and as stated otherwise)
Total purchase consideration of $120 was allocated based on management estimates to the acquired assets and liabilities as follows:
Amount Net working capital (including cash of $7) (4) Deferred tax liabilities, net (5) Borrowings (30) Property plant and equipment, net 1 Intangible assets Customer relationships 21 Customer contracts 3 Brand 11 Goodwill 123 Total purchase consideration 120
The resultant goodwill was considered non-tax deductible and was allocated to the IT & Business Services segment. The acquisition is a step towards enhancing the Group presence in the Australia and New Zealand region. The acquisition also helps the Group expand its coverage of clients and use the acquired customer base to offer its expanded portfolio of services. The table below shows the values and lives of intangible assets recognized on acquisition:
Amount Life (Years) Basis of amortization Customer relationships 21 7 years 6 months In proportion of estimated revenue Customer contracts 3 6 months In proportion of estimated revenue Brand 11 5 On straight line basis Total intangible assets 35
During the year ended 31 March 2022, the Group has finalised the purchase price allocation for this acquisition, which has resulted in decrease in net working capital by $1 with corresponding increase in value of goodwill.
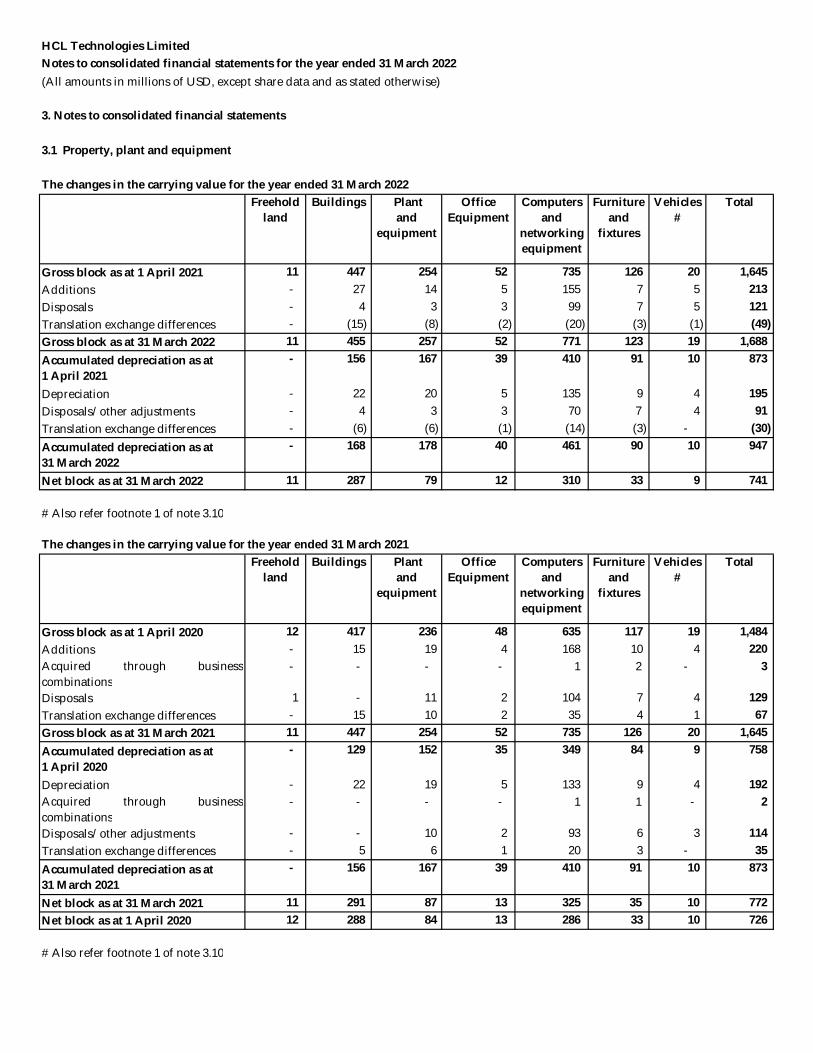
HCL Technologies LimitedNotes to consolidated financial statements for the year ended 31 March 2022
Freeholdland
Buildings Plantand
equipment
Office Equipment
Computers and
networkingequipment
Furniture and
fixtures
Vehicles#
Total
Gross block as at 1 April 2021 11 447 254 52 735 126 20 1,645 Additions - 27 14 5 155 7 5 213 Disposals - 4 3 3 99 7 5 121 Translation exchange differences - (15) (8) (2) (20) (3) (1) (49) Gross block as at 31 March 2022 11 455 257 52 771 123 19 1,688 Accumulated depreciation as at 1 April 2021
- 156 167 39 410 91 10 873
Depreciation - 22 20 5 135 9 4 195 Disposals/other adjustments - 4 3 3 70 7 4 91 Translation exchange differences - (6) (6) (1) (14) (3) - (30) Accumulated depreciation as at 31 March 2022
- 168 178 40 461 90 10 947
Net block as at 31 March 2022 11 287 79 12 310 33 9 741
# Also refer footnote 1 of note 3.10
Freeholdland
Buildings Plantand
equipment
Office Equipment
Computers and
networkingequipment
Furniture and
fixtures
Vehicles#
Total
Gross block as at 1 April 2020 12 417 236 48 635 117 19 1,484 Additions - 15 19 4 168 10 4 220 Acquired through businesscombinations
- - - - 1 2 - 3
Disposals 1 - 11 2 104 7 4 129 Translation exchange differences - 15 10 2 35 4 1 67 Gross block as at 31 March 2021 11 447 254 52 735 126 20 1,645 Accumulated depreciation as at 1 April 2020
- 129 152 35 349 84 9 758
Depreciation - 22 19 5 133 9 4 192 Acquired through businesscombinations
- - - - 1 1 - 2
Disposals/other adjustments - - 10 2 93 6 3 114 Translation exchange differences - 5 6 1 20 3 - 35 Accumulated depreciation as at 31 March 2021
- 156 167 39 410 91 10 873
Net block as at 31 March 2021 11 291 87 13 325 35 10 772 Net block as at 1 April 2020 12 288 84 13 286 33 10 726
# Also refer footnote 1 of note 3.10
The changes in the carrying value for the year ended 31 March 2021
(All amounts in millions of USD, except share data and as stated otherwise)
3. Notes to consolidated financial statements
3.1 Property, plant and equipment
The changes in the carrying value for the year ended 31 March 2022
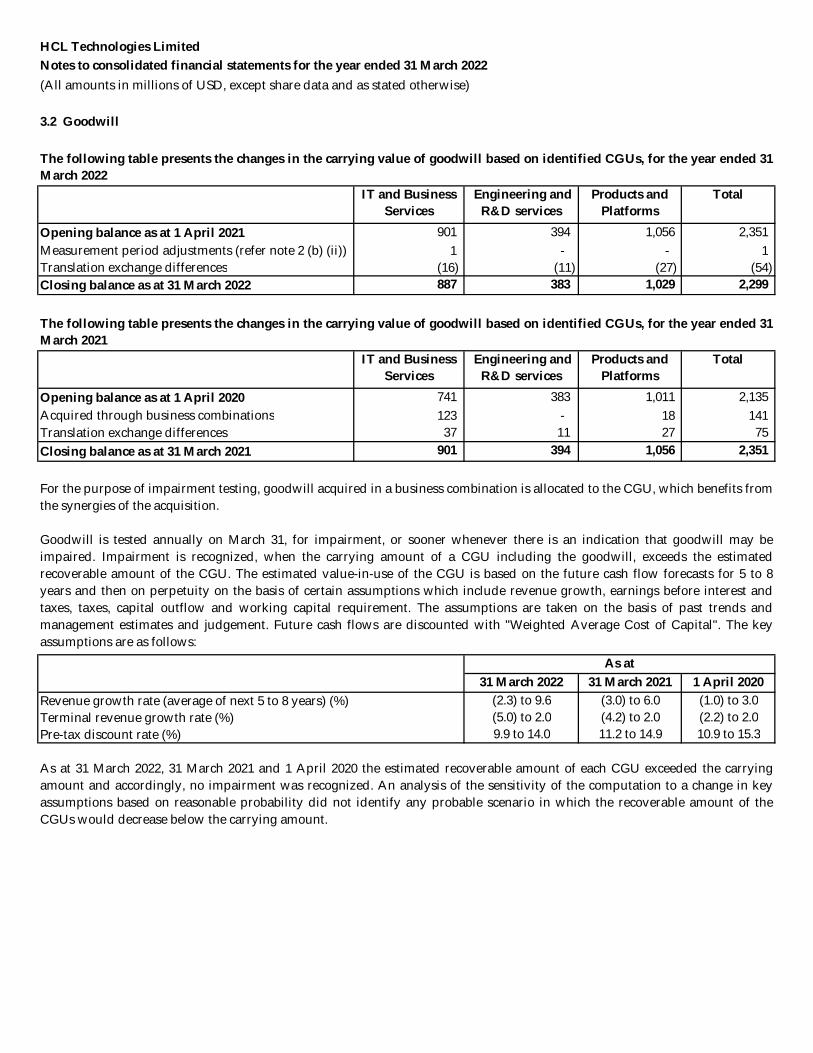
HCL Technologies LimitedNotes to consolidated financial statements for the year ended 31 March 2022
3.2 Goodwill
IT and Business Services
Engineering and R&D services
Products and Platforms
Total
Opening balance as at 1 April 2021 901 394 1,056 2,351 Measurement period adjustments (refer note 2 (b) (ii)) 1 - - 1 Translation exchange differences (16) (11) (27) (54) Closing balance as at 31 March 2022 887 383 1,029 2,299
IT and Business Services
Engineering and R&D services
Products and Platforms
Total
Opening balance as at 1 April 2020 741 383 1,011 2,135 Acquired through business combinations 123 - 18 141 Translation exchange differences 37 11 27 75 Closing balance as at 31 March 2021 901 394 1,056 2,351
31 March 2022 31 March 2021 1 April 2020(2.3) to 9.6 (3.0) to 6.0 (1.0) to 3.0
Terminal revenue growth rate (%) (5.0) to 2.0 (4.2) to 2.0 (2.2) to 2.0Pre-tax discount rate (%) 9.9 to 14.0 11.2 to 14.9 10.9 to 15.3
As at 31 March 2022, 31 March 2021 and 1 April 2020 the estimated recoverable amount of each CGU exceeded the carryingamount and accordingly, no impairment was recognized. An analysis of the sensitivity of the computation to a change in keyassumptions based on reasonable probability did not identify any probable scenario in which the recoverable amount of theCGUs would decrease below the carrying amount.
(All amounts in millions of USD, except share data and as stated otherwise)
For the purpose of impairment testing, goodwill acquired in a business combination is allocated to the CGU, which benefits fromthe synergies of the acquisition.
Goodwill is tested annually on March 31, for impairment, or sooner whenever there is an indication that goodwill may beimpaired. Impairment is recognized, when the carrying amount of a CGU including the goodwill, exceeds the estimatedrecoverable amount of the CGU. The estimated value-in-use of the CGU is based on the future cash flow forecasts for 5 to 8years and then on perpetuity on the basis of certain assumptions which include revenue growth, earnings before interest andtaxes, taxes, capital outflow and working capital requirement. The assumptions are taken on the basis of past trends andmanagement estimates and judgement. Future cash flows are discounted with "Weighted Average Cost of Capital". The keyassumptions are as follows:
The following table presents the changes in the carrying value of goodwill based on identified CGUs, for the year ended 31March 2022
The following table presents the changes in the carrying value of goodwill based on identified CGUs, for the year ended 31March 2021
As at
Revenue growth rate (average of next 5 to 8 years) (%)
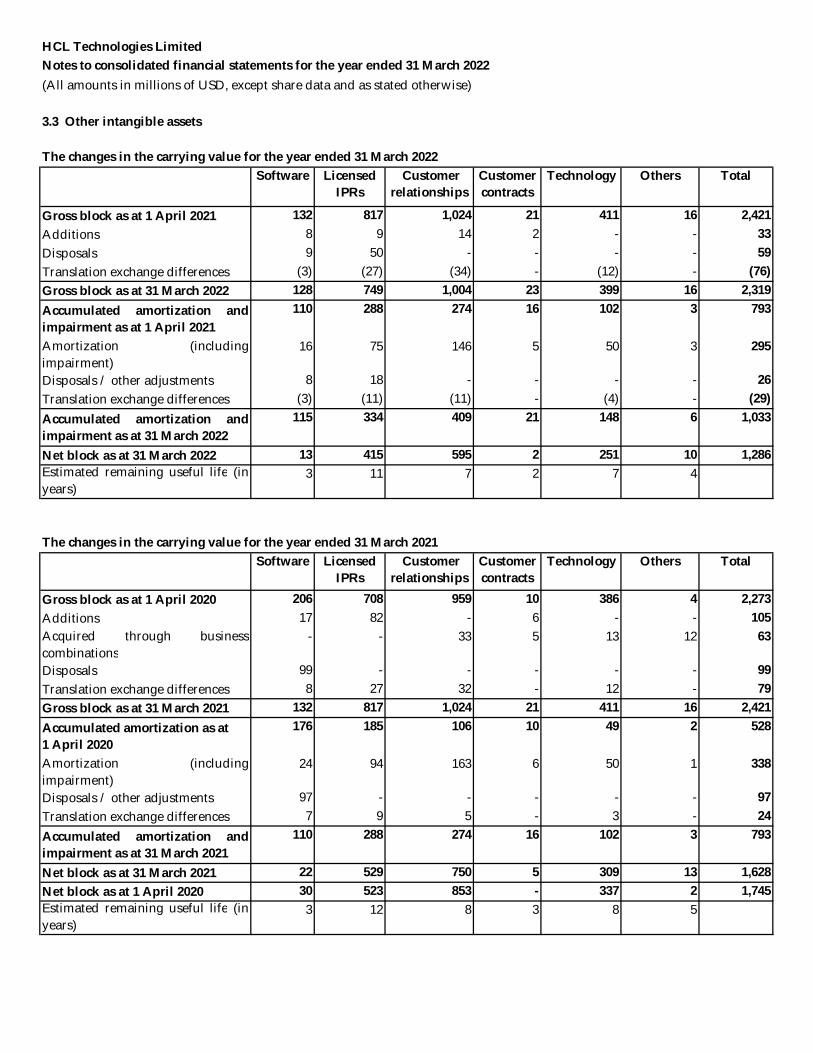
HCL Technologies LimitedNotes to consolidated financial statements for the year ended 31 March 2022
3.3 Other intangible assets
Software LicensedIPRs
Customer relationships
Customer contracts
Technology Others Total
Gross block as at 1 April 2021 132 817 1,024 21 411 16 2,421 Additions 8 9 14 2 - - 33 Disposals 9 50 - - - - 59 Translation exchange differences (3) (27) (34) - (12) - (76)Gross block as at 31 March 2022 128 749 1,004 23 399 16 2,319 Accumulated amortization andimpairment as at 1 April 2021
110 288 274 16 102 3 793
Amortization (includingimpairment)
16 75 146 5 50 3 295
Disposals / other adjustments 8 18 - - - - 26 Translation exchange differences (3) (11) (11) - (4) - (29)Accumulated amortization andimpairment as at 31 March 2022
115 334 409 21 148 6 1,033
Net block as at 31 March 2022 13 415 595 2 251 10 1,286 Estimated remaining useful life (inyears)
3 11 7 2 7 4
Software LicensedIPRs
Customer relationships
Customer contracts
Technology Others Total
Gross block as at 1 April 2020 206 708 959 10 386 4 2,273 Additions 17 82 - 6 - - 105 Acquired through businesscombinations
- - 33 5 13 12 63
Disposals 99 - - - - - 99 Translation exchange differences 8 27 32 - 12 - 79 Gross block as at 31 March 2021 132 817 1,024 21 411 16 2,421 Accumulated amortization as at 1 April 2020
176 185 106 10 49 2 528
Amortization (includingimpairment)
24 94 163 6 50 1 338
Disposals / other adjustments 97 - - - - - 97 Translation exchange differences 7 9 5 - 3 - 24 Accumulated amortization andimpairment as at 31 March 2021
110 288 274 16 102 3 793
Net block as at 31 March 2021 22 529 750 5 309 13 1,628 Net block as at 1 April 2020 30 523 853 - 337 2 1,745 Estimated remaining useful life (inyears)
3 12 8 3 8 5
The changes in the carrying value for the year ended 31 March 2022
The changes in the carrying value for the year ended 31 March 2021
(All amounts in millions of USD, except share data and as stated otherwise)
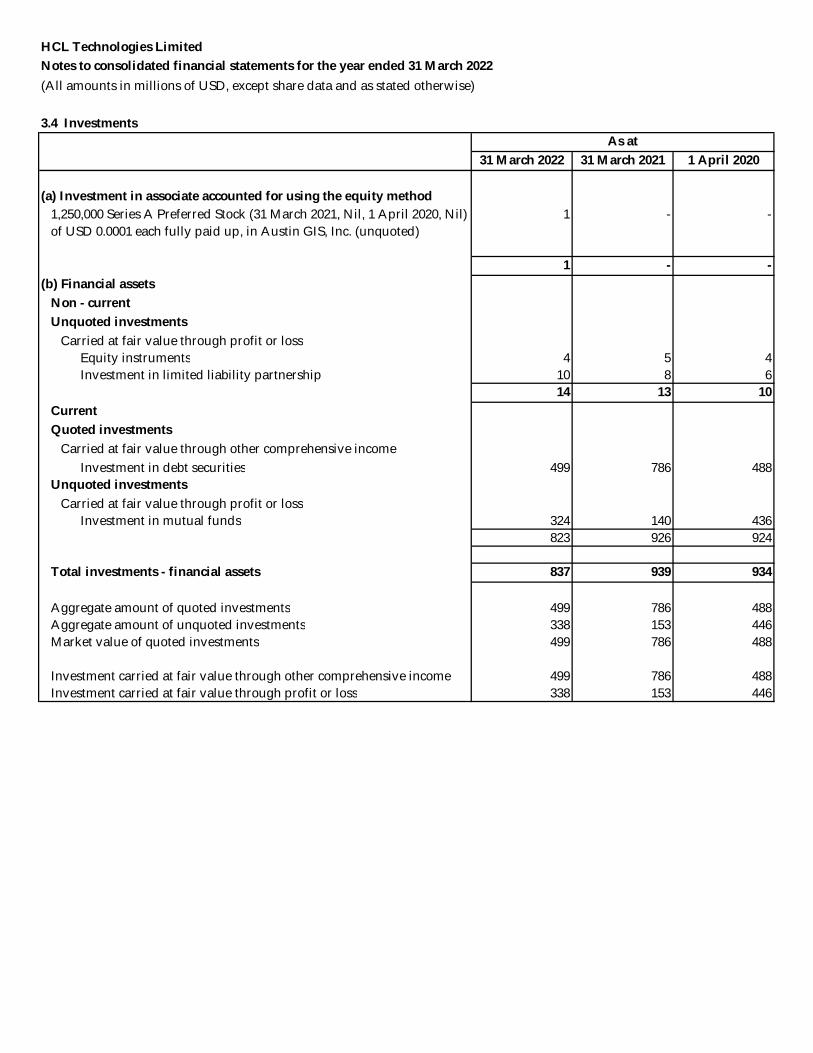
HCL Technologies LimitedNotes to consolidated financial statements for the year ended 31 March 2022(All amounts in millions of USD, except share data and as stated otherwise)
3.4 Investments
31 March 2022 31 March 2021 1 April 2020
(a) Investment in associate accounted for using the equity method1,250,000 Series A Preferred Stock (31 March 2021, Nil, 1 April 2020, Nil) of USD 0.0001 each fully paid up, in Austin GIS, Inc. (unquoted)
1 - -
1 - - (b) Financial assets
Non - currentUnquoted investments
Carried at fair value through profit or lossEquity instruments 4 5 4 Investment in limited liability partnership 10 8 6
14 13 10 CurrentQuoted investments
Carried at fair value through other comprehensive incomeInvestment in debt securities 499 786 488
Unquoted investmentsCarried at fair value through profit or loss
Investment in mutual funds 324 140 436 823 926 924
Total investments - financial assets 837 939 934
Aggregate amount of quoted investments 499 786 488 Aggregate amount of unquoted investments 338 153 446 Market value of quoted investments 499 786 488
Investment carried at fair value through other comprehensive income 499 786 488 Investment carried at fair value through profit or loss 338 153 446
As at
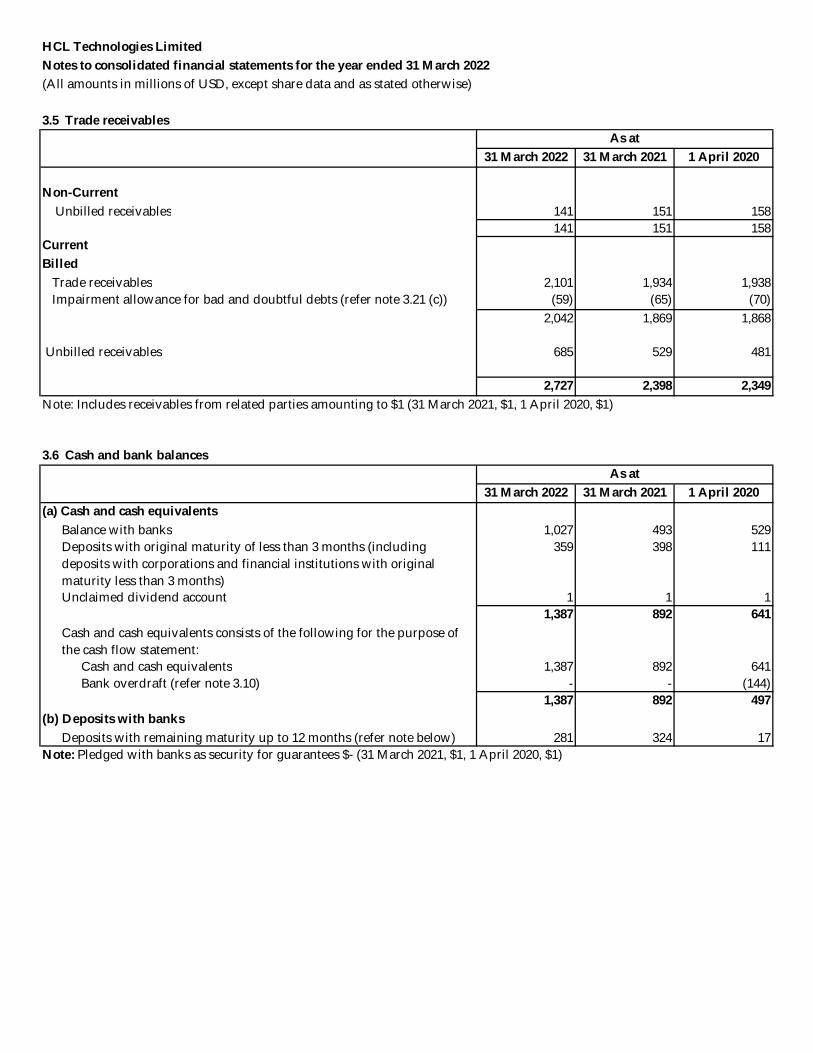
HCL Technologies LimitedNotes to consolidated financial statements for the year ended 31 March 2022(All amounts in millions of USD, except share data and as stated otherwise)
3.5 Trade receivables
31 March 2022 31 March 2021 1 April 2020
Non-Current Unbilled receivables 141 151 158
141 151 158 CurrentBilled
Trade receivables 2,101 1,934 1,938 Impairment allowance for bad and doubtful debts (refer note 3.21 (c)) (59) (65) (70)
2,042 1,869 1,868
Unbilled receivables 685 529 481
2,727 2,398 2,349
3.6 Cash and bank balances
31 March 2022 31 March 2021 1 April 2020(a) Cash and cash equivalents Balance with banks 1,027 493 529
Deposits with original maturity of less than 3 months (including deposits with corporations and financial institutions with original maturity less than 3 months)
359 398 111
Unclaimed dividend account 1 1 1 1,387 892 641
Cash and cash equivalents consists of the following for the purpose of the cash flow statement: Cash and cash equivalents 1,387 892 641 Bank overdraft (refer note 3.10) - - (144)
1,387 892 497 (b) Deposits with banks
Deposits with remaining maturity up to 12 months (refer note below) 281 324 17 Note: Pledged with banks as security for guarantees $- (31 March 2021, $1, 1 April 2020, $1)
As at
As at
Note: Includes receivables from related parties amounting to $1 (31 March 2021, $1, 1 April 2020, $1)
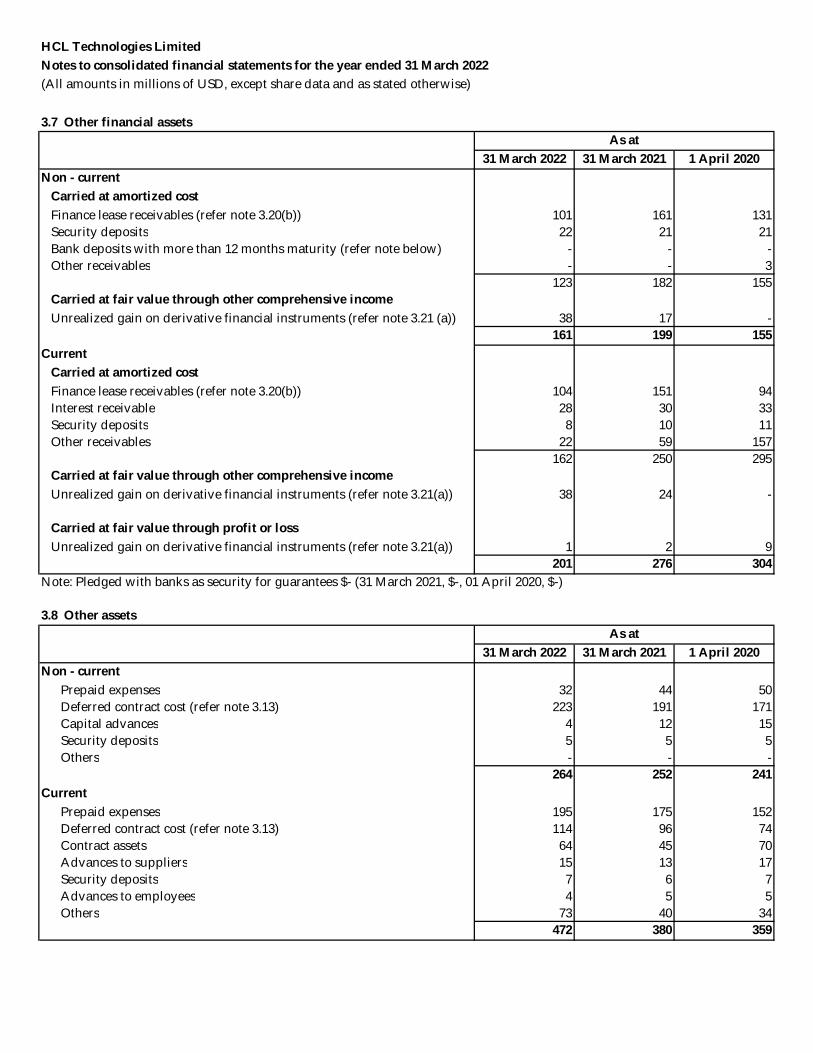
HCL Technologies LimitedNotes to consolidated financial statements for the year ended 31 March 2022(All amounts in millions of USD, except share data and as stated otherwise)
3.7 Other financial assets
31 March 2022 31 March 2021 1 April 2020Non - current
Carried at amortized costFinance lease receivables (refer note 3.20(b)) 101 161 131 Security deposits 22 21 21 Bank deposits with more than 12 months maturity (refer note below) - - - Other receivables - - 3
123 182 155 Carried at fair value through other comprehensive incomeUnrealized gain on derivative financial instruments (refer note 3.21 (a)) 38 17 -
161 199 155 Current
Carried at amortized costFinance lease receivables (refer note 3.20(b)) 104 151 94 Interest receivable 28 30 33 Security deposits 8 10 11 Other receivables 22 59 157
162 250 295 Carried at fair value through other comprehensive incomeUnrealized gain on derivative financial instruments (refer note 3.21(a)) 38 24 -
Carried at fair value through profit or lossUnrealized gain on derivative financial instruments (refer note 3.21(a)) 1 2 9
201 276 304 Note: Pledged with banks as security for guarantees $- (31 March 2021, $-, 01 April 2020, $-)
3.8 Other assets
31 March 2022 31 March 2021 1 April 2020Non - current
Prepaid expenses 32 44 50 Deferred contract cost (refer note 3.13) 223 191 171 Capital advances 4 12 15 Security deposits 5 5 5 Others - - -
264 252 241 Current
Prepaid expenses 195 175 152 Deferred contract cost (refer note 3.13) 114 96 74 Contract assets 64 45 70 Advances to suppliers 15 13 17 Security deposits 7 6 7 Advances to employees 4 5 5 Others 73 40 34
472 380 359
As at
As at
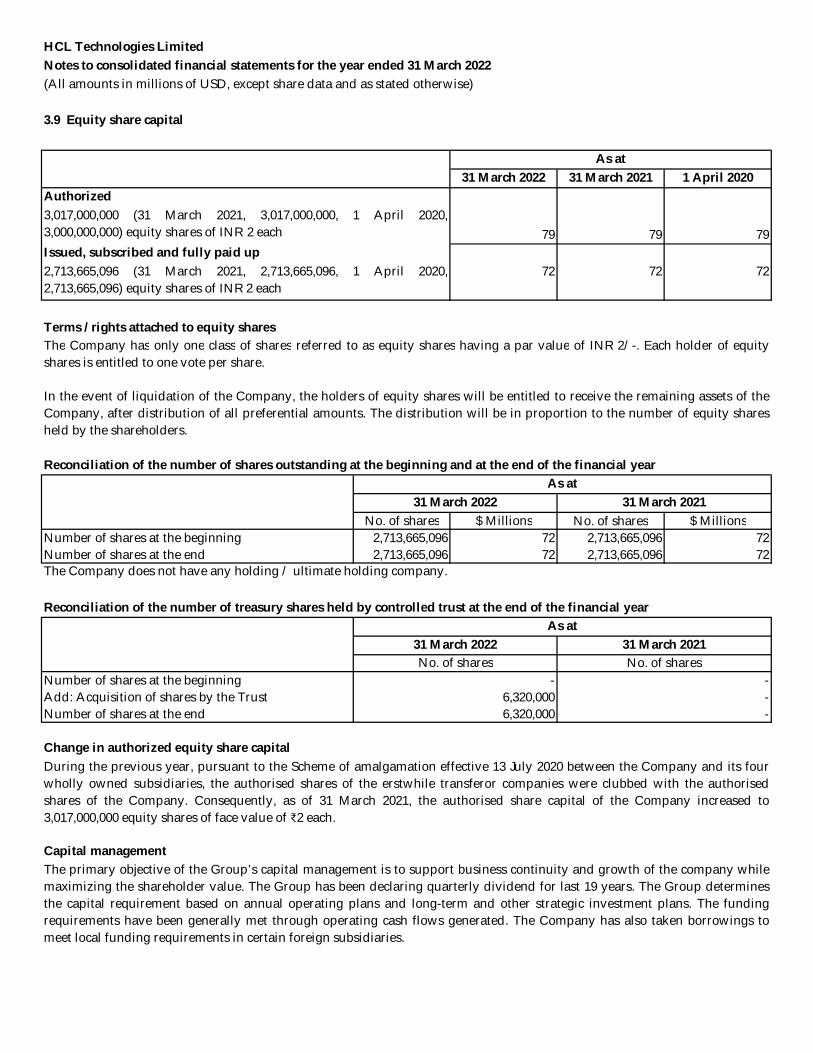
HCL Technologies LimitedNotes to consolidated financial statements for the year ended 31 March 2022(All amounts in millions of USD, except share data and as stated otherwise)
3.9 Equity share capital
31 March 2022 31 March 2021 1 April 2020Authorized
79 79 79 Issued, subscribed and fully paid up
72 72 72
Terms / rights attached to equity shares
Reconciliation of the number of shares outstanding at the beginning and at the end of the financial year
No. of shares $ Millions No. of shares $ MillionsNumber of shares at the beginning 2,713,665,096 72 2,713,665,096 72 Number of shares at the end 2,713,665,096 72 2,713,665,096 72
Reconciliation of the number of treasury shares held by controlled trust at the end of the financial year
Number of shares at the beginningAdd: Acquisition of shares by the TrustNumber of shares at the end
Change in authorized equity share capital
Capital management
As at
3,017,000,000 (31 March 2021, 3,017,000,000, 1 April 2020,3,000,000,000) equity shares of INR 2 each
2,713,665,096 (31 March 2021, 2,713,665,096, 1 April 2020,2,713,665,096) equity shares of INR 2 each
During the previous year, pursuant to the Scheme of amalgamation effective 13 July 2020 between the Company and its fourwholly owned subsidiaries, the authorised shares of the erstwhile transferor companies were clubbed with the authorisedshares of the Company. Consequently, as of 31 March 2021, the authorised share capital of the Company increased to3,017,000,000 equity shares of face value of ₹2 each.
The Company has only one class of shares referred to as equity shares having a par value of INR 2/-. Each holder of equityshares is entitled to one vote per share.
In the event of liquidation of the Company, the holders of equity shares will be entitled to receive the remaining assets of theCompany, after distribution of all preferential amounts. The distribution will be in proportion to the number of equity sharesheld by the shareholders.
As at31 March 2022 31 March 2021
The primary objective of the Group’s capital management is to support business continuity and growth of the company whilemaximizing the shareholder value. The Group has been declaring quarterly dividend for last 19 years. The Group determinesthe capital requirement based on annual operating plans and long-term and other strategic investment plans. The fundingrequirements have been generally met through operating cash flows generated. The Company has also taken borrowings tomeet local funding requirements in certain foreign subsidiaries.
31 March 2021As at
The Company does not have any holding / ultimate holding company.
31 March 2022
No. of shares
6,320,000 -
6,320,000
- - -
No. of shares
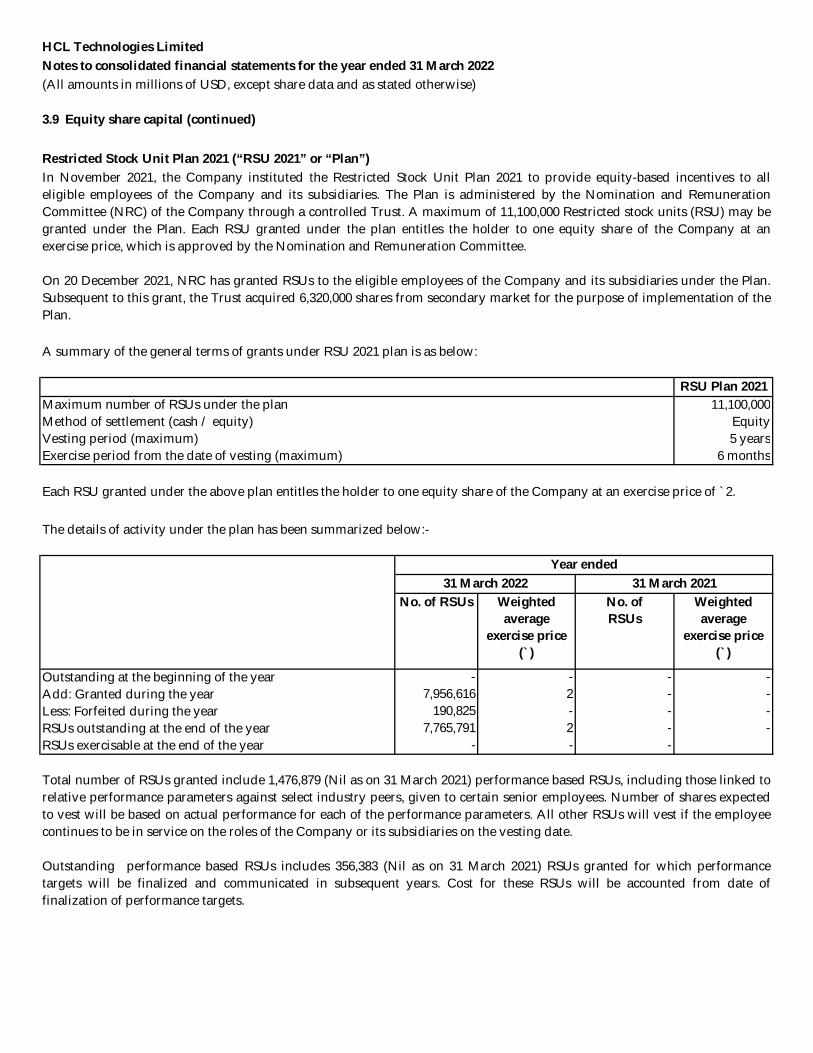
HCL Technologies LimitedNotes to consolidated financial statements for the year ended 31 March 2022(All amounts in millions of USD, except share data and as stated otherwise)
Restricted Stock Unit Plan 2021 (“RSU 2021” or “Plan”)
A summary of the general terms of grants under RSU 2021 plan is as below:
RSU Plan 202111,100,000
Equity5 years
6 months
The details of activity under the plan has been summarized below:-
No. of RSUs Weighted average
exercise price (`)
No. of RSUs
Weighted average
exercise price (`)
Outstanding at the beginning of the year - - - - Add: Granted during the year 7,956,616 2 - - Less: Forfeited during the year 190,825 - - - RSUs outstanding at the end of the year 7,765,791 2 - - RSUs exercisable at the end of the year - - -
In November 2021, the Company instituted the Restricted Stock Unit Plan 2021 to provide equity-based incentives to alleligible employees of the Company and its subsidiaries. The Plan is administered by the Nomination and RemunerationCommittee (NRC) of the Company through a controlled Trust. A maximum of 11,100,000 Restricted stock units (RSU) may begranted under the Plan. Each RSU granted under the plan entitles the holder to one equity share of the Company at anexercise price, which is approved by the Nomination and Remuneration Committee.
On 20 December 2021, NRC has granted RSUs to the eligible employees of the Company and its subsidiaries under the Plan.Subsequent to this grant, the Trust acquired 6,320,000 shares from secondary market for the purpose of implementation of thePlan.
Maximum number of RSUs under the planMethod of settlement (cash / equity)
Total number of RSUs granted include 1,476,879 (Nil as on 31 March 2021) performance based RSUs, including those linked torelative performance parameters against select industry peers, given to certain senior employees. Number of shares expectedto vest will be based on actual performance for each of the performance parameters. All other RSUs will vest if the employeecontinues to be in service on the roles of the Company or its subsidiaries on the vesting date.
Outstanding performance based RSUs includes 356,383 (Nil as on 31 March 2021) RSUs granted for which performancetargets will be finalized and communicated in subsequent years. Cost for these RSUs will be accounted from date offinalization of performance targets.
3.9 Equity share capital (continued)
Exercise period from the date of vesting (maximum)
Each RSU granted under the above plan entitles the holder to one equity share of the Company at an exercise price of `2.
Year ended31 March 2022 31 March 2021
Vesting period (maximum)
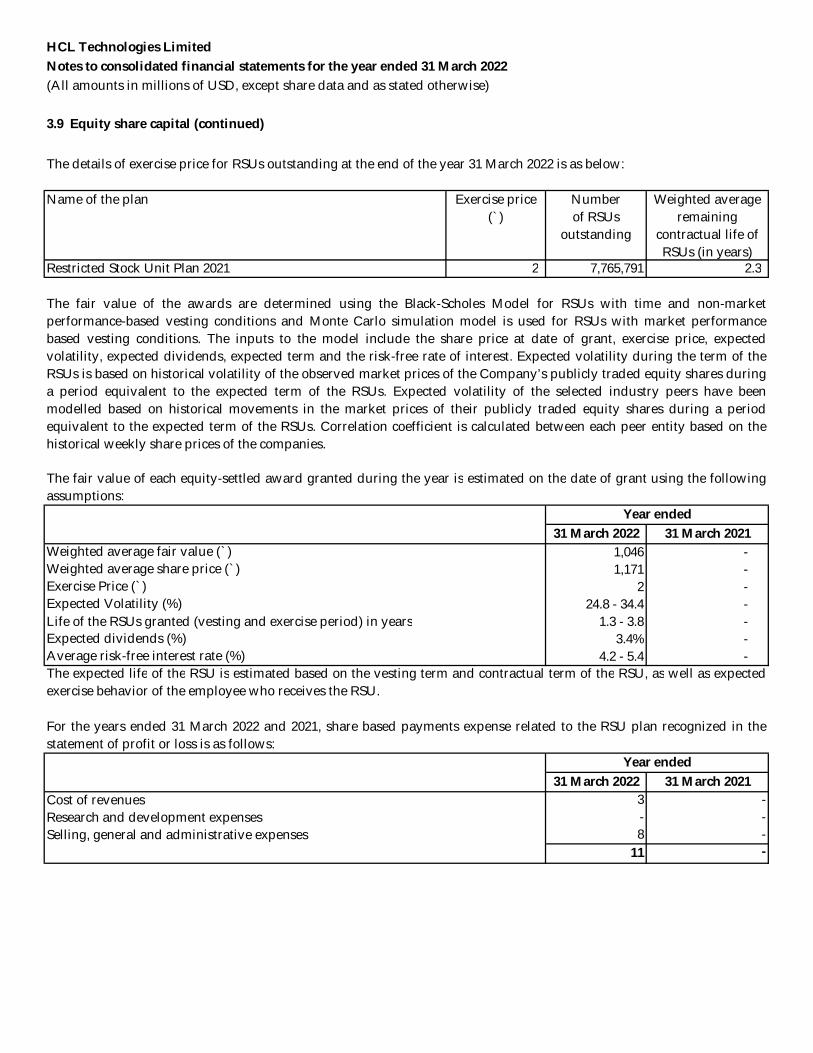
HCL Technologies LimitedNotes to consolidated financial statements for the year ended 31 March 2022(All amounts in millions of USD, except share data and as stated otherwise)
The details of exercise price for RSUs outstanding at the end of the year 31 March 2022 is as below:
Exercise price (`)
Numberof RSUs
outstanding
Weighted averageremaining
contractual life of RSUs (in years)
2 7,765,791 2.3
31 March 2022 31 March 2021Weighted average fair value (`) 1,046 - Weighted average share price (`) 1,171 - Exercise Price (`) 2 - Expected Volatility (%) 24.8 - 34.4 - Life of the RSUs granted (vesting and exercise period) in years 1.3 - 3.8 - Expected dividends (%) 3.4% - Average risk-free interest rate (%) 4.2 - 5.4 -
31 March 2022 31 March 2021 3 - - -
8 - 11 -
For the years ended 31 March 2022 and 2021, share based payments expense related to the RSU plan recognized in thestatement of profit or loss is as follows:
The expected life of the RSU is estimated based on the vesting term and contractual term of the RSU, as well as expectedexercise behavior of the employee who receives the RSU.
3.9 Equity share capital (continued)
Name of the plan
Restricted Stock Unit Plan 2021
The fair value of the awards are determined using the Black-Scholes Model for RSUs with time and non-marketperformance-based vesting conditions and Monte Carlo simulation model is used for RSUs with market performancebased vesting conditions. The inputs to the model include the share price at date of grant, exercise price, expectedvolatility, expected dividends, expected term and the risk-free rate of interest. Expected volatility during the term of theRSUs is based on historical volatility of the observed market prices of the Company’s publicly traded equity shares duringa period equivalent to the expected term of the RSUs. Expected volatility of the selected industry peers have beenmodelled based on historical movements in the market prices of their publicly traded equity shares during a periodequivalent to the expected term of the RSUs. Correlation coefficient is calculated between each peer entity based on thehistorical weekly share prices of the companies.
The fair value of each equity-settled award granted during the year is estimated on the date of grant using the followingassumptions:
Year ended
Research and development expensesCost of revenues
Selling, general and administrative expenses
Year ended
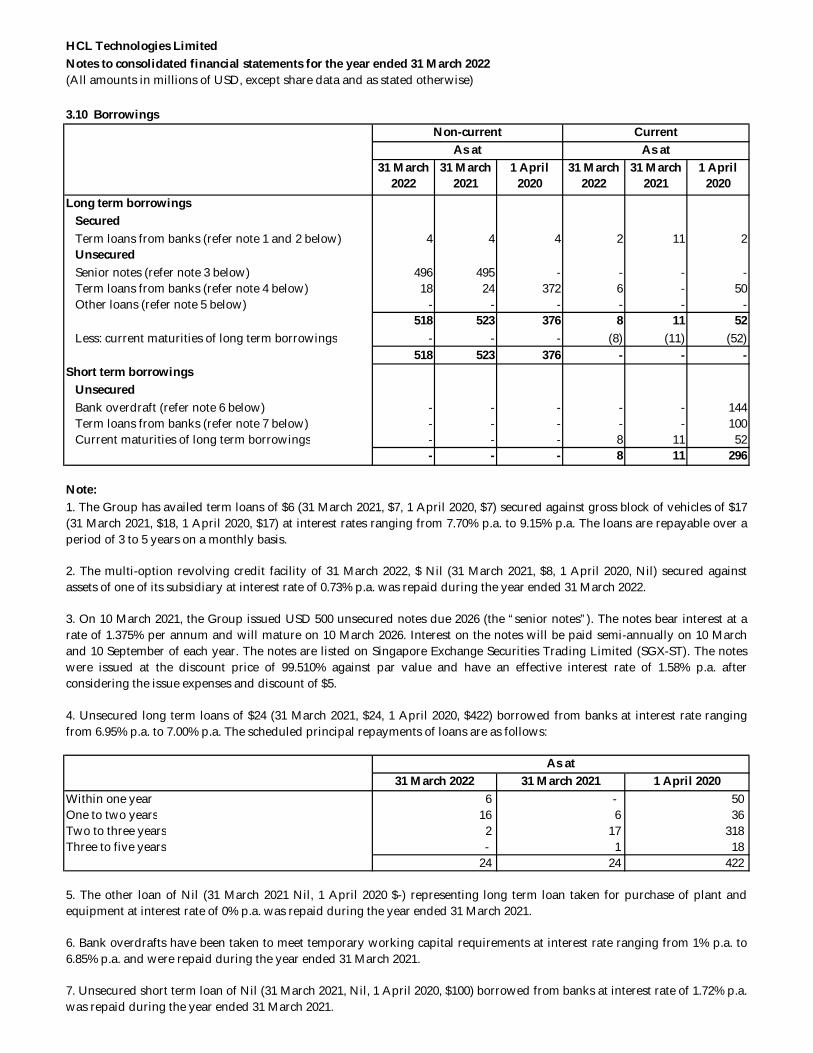
HCL Technologies LimitedNotes to consolidated financial statements for the year ended 31 March 2022
3.10 Borrowings
31 March 2022
31 March 2021
1 April 2020
31 March 2022
31 March 2021
1 April 2020
Long term borrowingsSecuredTerm loans from banks (refer note 1 and 2 below) 4 4 4 2 11 2 UnsecuredSenior notes (refer note 3 below) 496 495 - - - - Term loans from banks (refer note 4 below) 18 24 372 6 - 50 Other loans (refer note 5 below) - - - - - -
518 523 376 8 11 52 Less: current maturities of long term borrowings - - - (8) (11) (52)
518 523 376 - - - Short term borrowings
UnsecuredBank overdraft (refer note 6 below) - - - - - 144 Term loans from banks (refer note 7 below) - - - - - 100 Current maturities of long term borrowings - - - 8 11 52
- - - 8 11 296
Note:
Within one yearOne to two yearsTwo to three yearsThree to five years
422
17 6 - 50
36 318
4. Unsecured long term loans of $24 (31 March 2021, $24, 1 April 2020, $422) borrowed from banks at interest rate rangingfrom 6.95% p.a. to 7.00% p.a. The scheduled principal repayments of loans are as follows:
5. The other loan of Nil (31 March 2021 Nil, 1 April 2020 $-) representing long term loan taken for purchase of plant andequipment at interest rate of 0% p.a. was repaid during the year ended 31 March 2021.
6. Bank overdrafts have been taken to meet temporary working capital requirements at interest rate ranging from 1% p.a. to6.85% p.a. and were repaid during the year ended 31 March 2021.
7. Unsecured short term loan of Nil (31 March 2021, Nil, 1 April 2020, $100) borrowed from banks at interest rate of 1.72% p.a.was repaid during the year ended 31 March 2021.
31 March 2022 31 March 2021 1 April 2020As at
6 16 2 - 24 24
1 18
1. The Group has availed term loans of $6 (31 March 2021, $7, 1 April 2020, $7) secured against gross block of vehicles of $17(31 March 2021, $18, 1 April 2020, $17) at interest rates ranging from 7.70% p.a. to 9.15% p.a. The loans are repayable over aperiod of 3 to 5 years on a monthly basis.
2. The multi-option revolving credit facility of 31 March 2022, $ Nil (31 March 2021, $8, 1 April 2020, Nil) secured againstassets of one of its subsidiary at interest rate of 0.73% p.a. was repaid during the year ended 31 March 2022.
(All amounts in millions of USD, except share data and as stated otherwise)
3. On 10 March 2021, the Group issued USD 500 unsecured notes due 2026 (the “senior notes”). The notes bear interest at arate of 1.375% per annum and will mature on 10 March 2026. Interest on the notes will be paid semi-annually on 10 Marchand 10 September of each year. The notes are listed on Singapore Exchange Securities Trading Limited (SGX-ST). The noteswere issued at the discount price of 99.510% against par value and have an effective interest rate of 1.58% p.a. afterconsidering the issue expenses and discount of $5.
Non-current CurrentAs at As at
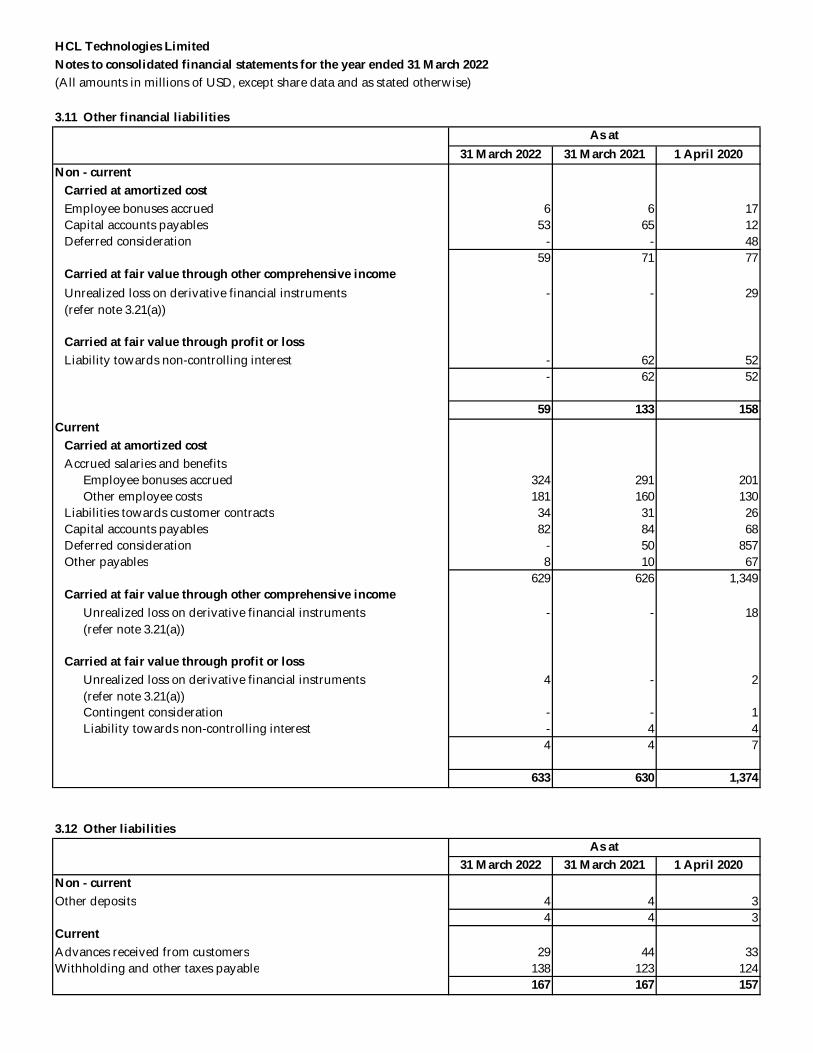
HCL Technologies LimitedNotes to consolidated financial statements for the year ended 31 March 2022(All amounts in millions of USD, except share data and as stated otherwise)
3.11 Other financial liabilities
31 March 2022 31 March 2021 1 April 2020Non - current
Carried at amortized costEmployee bonuses accrued 6 6 17 Capital accounts payables 53 65 12 Deferred consideration - - 48
59 71 77 Carried at fair value through other comprehensive incomeUnrealized loss on derivative financial instruments (refer note 3.21(a))
- - 29
Carried at fair value through profit or lossLiability towards non-controlling interest - 62 52
- 62 52
59 133 158 Current
Carried at amortized costAccrued salaries and benefits
Employee bonuses accrued 324 291 201 Other employee costs 181 160 130
Liabilities towards customer contracts 34 31 26 Capital accounts payables 82 84 68 Deferred consideration - 50 857 Other payables 8 10 67
629 626 1,349 Carried at fair value through other comprehensive income
Unrealized loss on derivative financial instruments (refer note 3.21(a))
- - 18
Carried at fair value through profit or lossUnrealized loss on derivative financial instruments (refer note 3.21(a))
4 - 2
Contingent consideration - - 1 Liability towards non-controlling interest - 4 4
4 4 7
633 630 1,374
3.12 Other liabilities
31 March 2022 31 March 2021 1 April 2020Non - currentOther deposits 4 4 3
4 4 3 CurrentAdvances received from customers 29 44 33 Withholding and other taxes payable 138 123 124
167 167 157
As at
As at
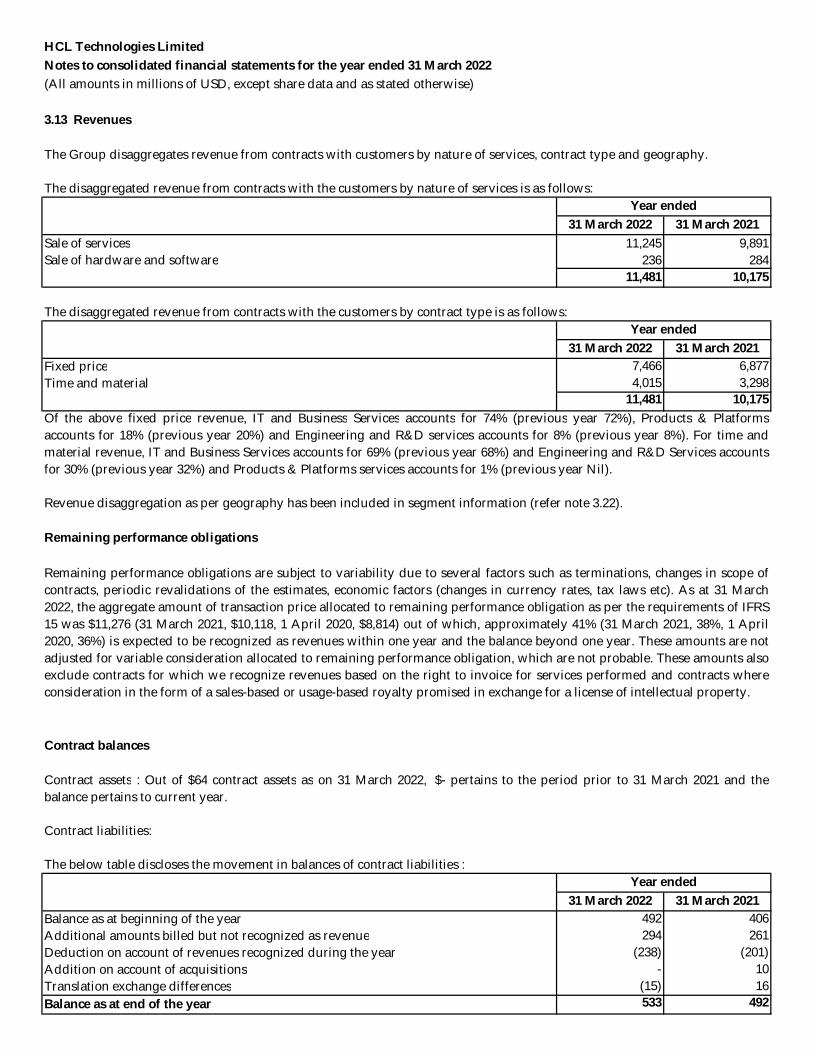
HCL Technologies LimitedNotes to consolidated financial statements for the year ended 31 March 2022(All amounts in millions of USD, except share data and as stated otherwise)
3.13 Revenues
The Group disaggregates revenue from contracts with customers by nature of services, contract type and geography.
The disaggregated revenue from contracts with the customers by nature of services is as follows:
31 March 2022 31 March 2021Sale of services 11,245 9,891 Sale of hardware and software 236 284
11,481 10,175
31 March 2022 31 March 2021Fixed price 7,466 6,877 Time and material 4,015 3,298
11,481 10,175
Revenue disaggregation as per geography has been included in segment information (refer note 3.22).
Remaining performance obligations
Contract balances
The below table discloses the movement in balances of contract liabilities :
31 March 2022 31 March 2021Balance as at beginning of the year 492 406 Additional amounts billed but not recognized as revenue 294 261 Deduction on account of revenues recognized during the year (238) (201)Addition on account of acquisitions - 10 Translation exchange differences (15) 16 Balance as at end of the year 533 492
Contract liabilities:
Year ended
Year ended
The disaggregated revenue from contracts with the customers by contract type is as follows:Year ended
Contract assets : Out of $64 contract assets as on 31 March 2022, $- pertains to the period prior to 31 March 2021 and thebalance pertains to current year.
Of the above fixed price revenue, IT and Business Services accounts for 74% (previous year 72%), Products & Platformsaccounts for 18% (previous year 20%) and Engineering and R&D services accounts for 8% (previous year 8%). For time andmaterial revenue, IT and Business Services accounts for 69% (previous year 68%) and Engineering and R&D Services accountsfor 30% (previous year 32%) and Products & Platforms services accounts for 1% (previous year Nil).
Remaining performance obligations are subject to variability due to several factors such as terminations, changes in scope ofcontracts, periodic revalidations of the estimates, economic factors (changes in currency rates, tax laws etc). As at 31 March2022, the aggregate amount of transaction price allocated to remaining performance obligation as per the requirements of IFRS15 was $11,276 (31 March 2021, $10,118, 1 April 2020, $8,814) out of which, approximately 41% (31 March 2021, 38%, 1 April2020, 36%) is expected to be recognized as revenues within one year and the balance beyond one year. These amounts are notadjusted for variable consideration allocated to remaining performance obligation, which are not probable. These amounts alsoexclude contracts for which we recognize revenues based on the right to invoice for services performed and contracts whereconsideration in the form of a sales-based or usage-based royalty promised in exchange for a license of intellectual property.
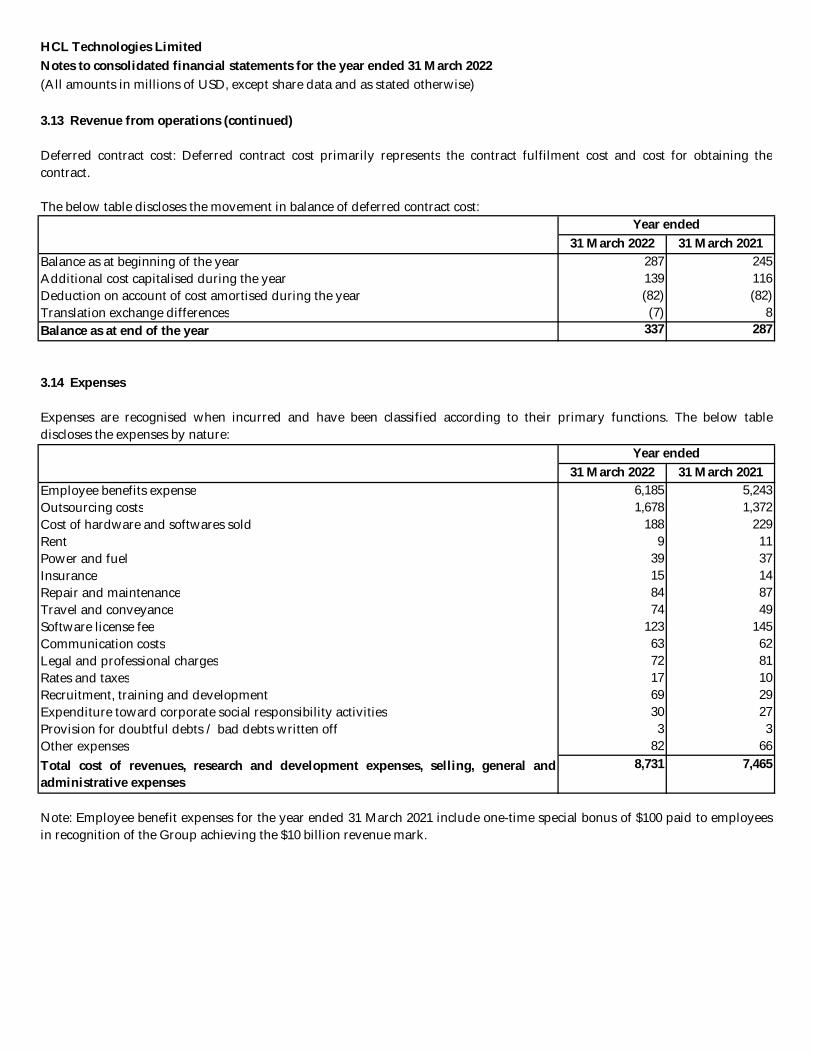
HCL Technologies LimitedNotes to consolidated financial statements for the year ended 31 March 2022(All amounts in millions of USD, except share data and as stated otherwise)
3.13 Revenue from operations (continued)
The below table discloses the movement in balance of deferred contract cost:
31 March 2022 31 March 2021Balance as at beginning of the year 287 245 Additional cost capitalised during the year 139 116 Deduction on account of cost amortised during the year (82) (82)Translation exchange differences (7) 8 Balance as at end of the year 337 287
3.14 Expenses
31 March 2022 31 March 2021Employee benefits expense 6,185 5,243 Outsourcing costs 1,678 1,372 Cost of hardware and softwares sold 188 229 Rent 9 11 Power and fuel 39 37 Insurance 15 14 Repair and maintenance 84 87 Travel and conveyance 74 49 Software license fee 123 145 Communication costs 63 62 Legal and professional charges 72 81 Rates and taxes 17 10 Recruitment, training and development 69 29 Expenditure toward corporate social responsibility activities 30 27 Provision for doubtful debts / bad debts written off 3 3 Other expenses 82 66
8,731 7,465
Note: Employee benefit expenses for the year ended 31 March 2021 include one-time special bonus of $100 paid to employeesin recognition of the Group achieving the $10 billion revenue mark.
Year ended
Total cost of revenues, research and development expenses, selling, general andadministrative expenses
Deferred contract cost: Deferred contract cost primarily represents the contract fulfilment cost and cost for obtaining thecontract.
Year ended
Expenses are recognised when incurred and have been classified according to their primary functions. The below tablediscloses the expenses by nature:
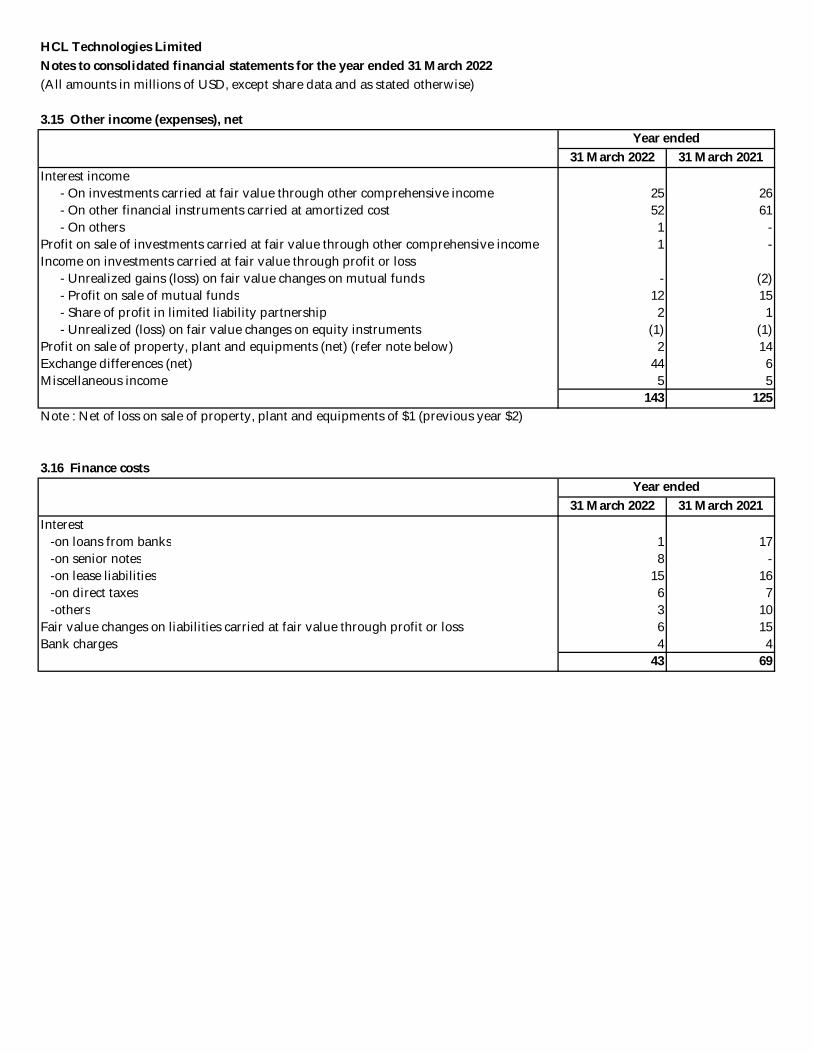
HCL Technologies LimitedNotes to consolidated financial statements for the year ended 31 March 2022(All amounts in millions of USD, except share data and as stated otherwise)
3.15 Other income (expenses), net
31 March 2022 31 March 2021Interest income
25 26 52 61 1 - 1 -
- (2)- Profit on sale of mutual funds 12 15 - Share of profit in limited liability partnership 2 1
(1) (1) 2 14
Exchange differences (net) 44 6 Miscellaneous income 5 5
143 125
3.16 Finance costs
31 March 2022 31 March 2021Interest
-on loans from banks 1 17 -on senior notes 8 - -on lease liabilities 15 16 -on direct taxes 6 7 -others 3 10
Fair value changes on liabilities carried at fair value through profit or loss 6 15 Bank charges 4 4
43 69
Year ended
- Unrealized gains (loss) on fair value changes on mutual funds
- Unrealized (loss) on fair value changes on equity instrumentsProfit on sale of property, plant and equipments (net) (refer note below)
Income on investments carried at fair value through profit or loss
Note : Net of loss on sale of property, plant and equipments of $1 (previous year $2)
Profit on sale of investments carried at fair value through other comprehensive income
Year ended
- On investments carried at fair value through other comprehensive income- On other financial instruments carried at amortized cost- On others
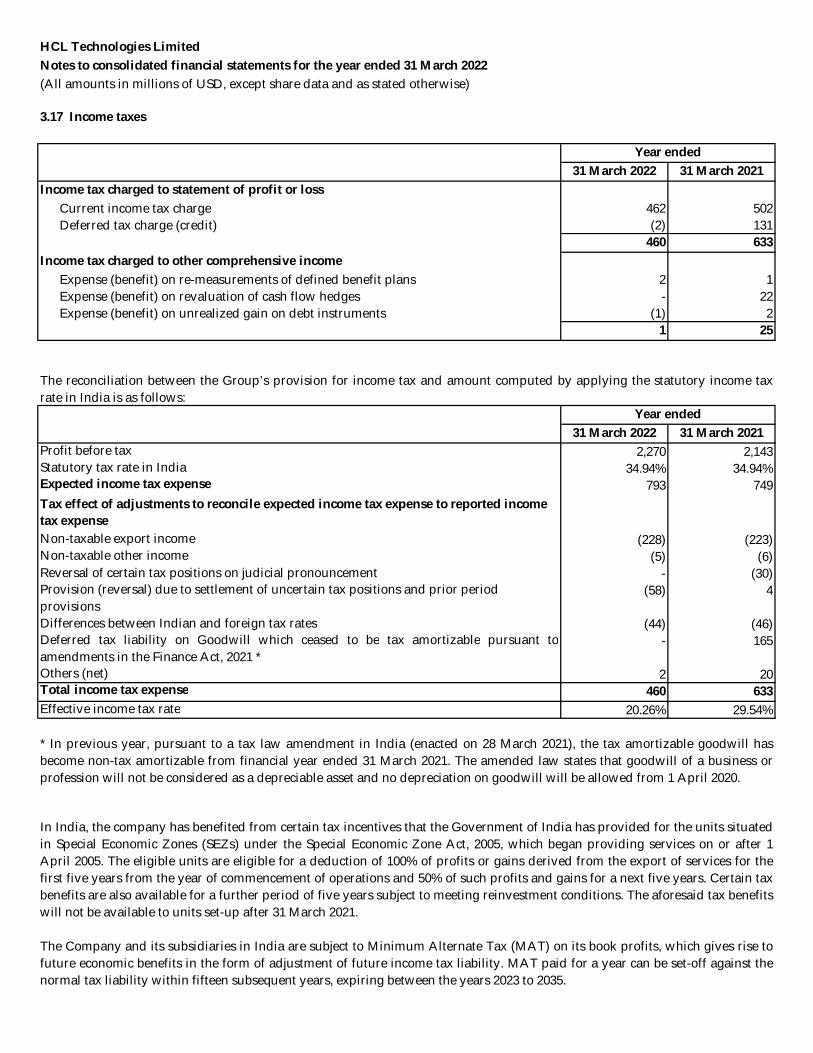
HCL Technologies LimitedNotes to consolidated financial statements for the year ended 31 March 2022(All amounts in millions of USD, except share data and as stated otherwise)
3.17 Income taxes
31 March 2022 31 March 2021Income tax charged to statement of profit or loss
Current income tax charge 462 502 Deferred tax charge (credit) (2) 131
460 633 Income tax charged to other comprehensive income
Expense (benefit) on re-measurements of defined benefit plans 2 1 Expense (benefit) on revaluation of cash flow hedges - 22 Expense (benefit) on unrealized gain on debt instruments (1) 2
1 25
31 March 2022 31 March 2021Profit before tax 2,270 2,143 Statutory tax rate in India 34.94% 34.94%Expected income tax expense 793 749
Non-taxable export income (228) (223)Non-taxable other income (5) (6)Reversal of certain tax positions on judicial pronouncement - (30)
(58) 4
Differences between Indian and foreign tax rates (44) (46) - 165
Others (net) 2 20 Total income tax expense 460 633 Effective income tax rate 20.26% 29.54%
Year ended
The reconciliation between the Group’s provision for income tax and amount computed by applying the statutory income taxrate in India is as follows:
Year ended
In India, the company has benefited from certain tax incentives that the Government of India has provided for the units situatedin Special Economic Zones (SEZs) under the Special Economic Zone Act, 2005, which began providing services on or after 1April 2005. The eligible units are eligible for a deduction of 100% of profits or gains derived from the export of services for thefirst five years from the year of commencement of operations and 50% of such profits and gains for a next five years. Certain taxbenefits are also available for a further period of five years subject to meeting reinvestment conditions. The aforesaid tax benefitswill not be available to units set-up after 31 March 2021.
The Company and its subsidiaries in India are subject to Minimum Alternate Tax (MAT) on its book profits, which gives rise tofuture economic benefits in the form of adjustment of future income tax liability. MAT paid for a year can be set-off against thenormal tax liability within fifteen subsequent years, expiring between the years 2023 to 2035.
* In previous year, pursuant to a tax law amendment in India (enacted on 28 March 2021), the tax amortizable goodwill hasbecome non-tax amortizable from financial year ended 31 March 2021. The amended law states that goodwill of a business orprofession will not be considered as a depreciable asset and no depreciation on goodwill will be allowed from 1 April 2020.
Deferred tax liability on Goodwill which ceased to be tax amortizable pursuant toamendments in the Finance Act, 2021 *
Tax effect of adjustments to reconcile expected income tax expense to reported income tax expense
Provision (reversal) due to settlement of uncertain tax positions and prior period provisions
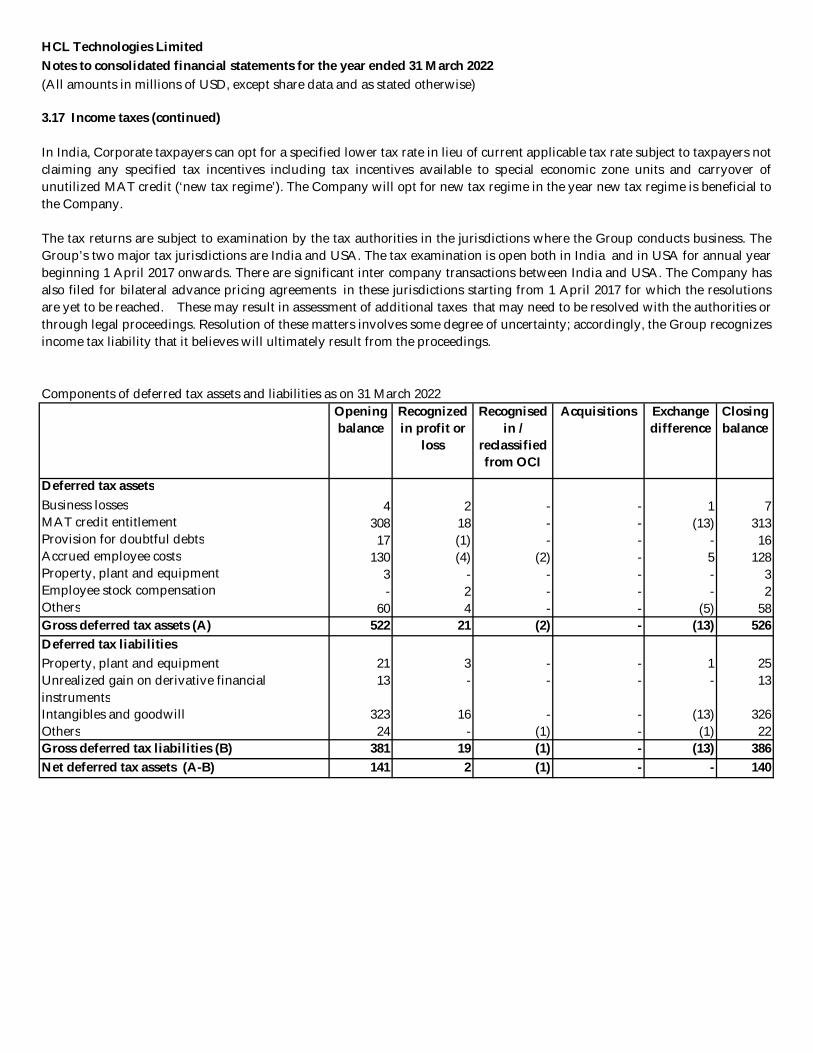
HCL Technologies LimitedNotes to consolidated financial statements for the year ended 31 March 2022(All amounts in millions of USD, except share data and as stated otherwise)
3.17 Income taxes (continued)
Opening balance
Recognized in profit or
loss
Recognised in /
reclassified from OCI
Acquisitions Exchangedifference
Closing balance
Deferred tax assetsBusiness losses 4 2 - - 1 7 MAT credit entitlement 308 18 - - (13) 313 Provision for doubtful debts 17 (1) - - - 16 Accrued employee costs 130 (4) (2) - 5 128 Property, plant and equipment 3 - - - - 3 Employee stock compensation - 2 - - - 2 Others 60 4 - - (5) 58 Gross deferred tax assets (A) 522 21 (2) - (13) 526 Deferred tax liabilitiesProperty, plant and equipment 21 3 - - 1 25 Unrealized gain on derivative financial instruments
13 - - - - 13
Intangibles and goodwill 323 16 - - (13) 326 Others 24 - (1) - (1) 22 Gross deferred tax liabilities (B) 381 19 (1) - (13) 386 Net deferred tax assets (A-B) 141 2 (1) - - 140
In India, Corporate taxpayers can opt for a specified lower tax rate in lieu of current applicable tax rate subject to taxpayers notclaiming any specified tax incentives including tax incentives available to special economic zone units and carryover ofunutilized MAT credit (‘new tax regime’). The Company will opt for new tax regime in the year new tax regime is beneficial tothe Company.
The tax returns are subject to examination by the tax authorities in the jurisdictions where the Group conducts business. TheGroup’s two major tax jurisdictions are India and USA. The tax examination is open both in India and in USA for annual yearbeginning 1 April 2017 onwards. There are significant inter company transactions between India and USA. The Company hasalso filed for bilateral advance pricing agreements in these jurisdictions starting from 1 April 2017 for which the resolutionsare yet to be reached. These may result in assessment of additional taxes that may need to be resolved with the authorities orthrough legal proceedings. Resolution of these matters involves some degree of uncertainty; accordingly, the Group recognizesincome tax liability that it believes will ultimately result from the proceedings.
Components of deferred tax assets and liabilities as on 31 March 2022
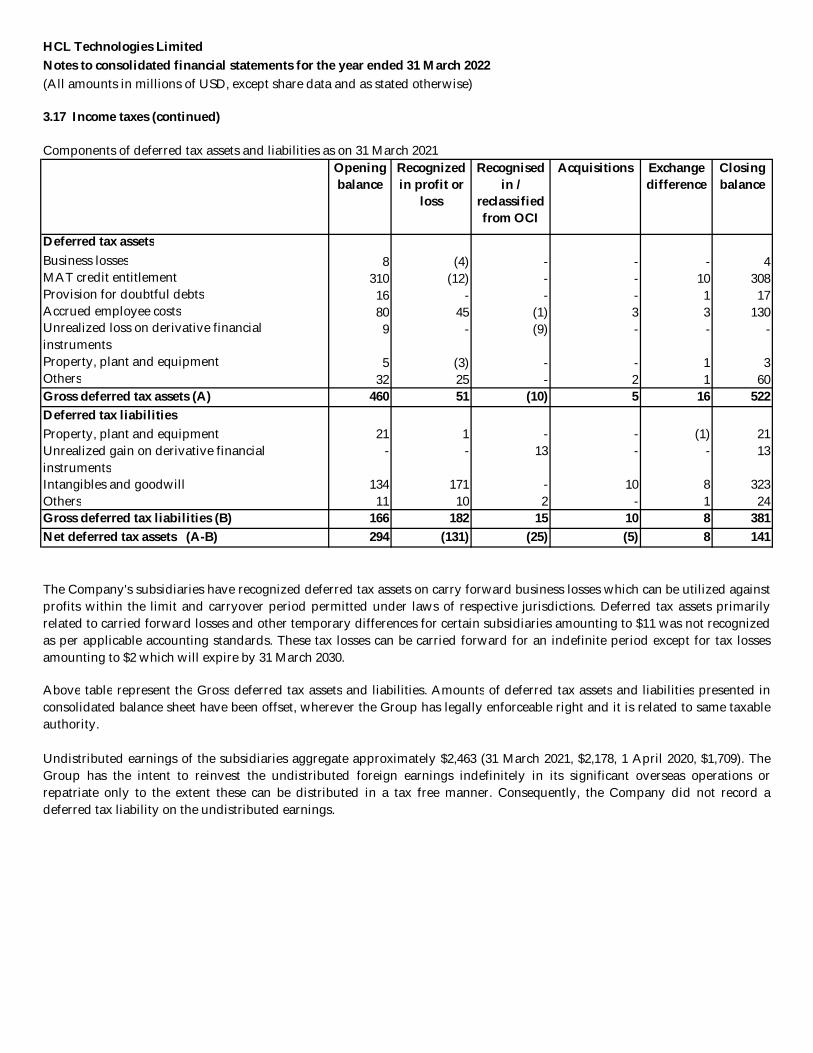
HCL Technologies LimitedNotes to consolidated financial statements for the year ended 31 March 2022(All amounts in millions of USD, except share data and as stated otherwise)
3.17 Income taxes (continued)
Opening balance
Recognized in profit or
loss
Recognised in /
reclassified from OCI
Acquisitions Exchangedifference
Closing balance
Deferred tax assetsBusiness losses 8 (4) - - - 4 MAT credit entitlement 310 (12) - - 10 308 Provision for doubtful debts 16 - - - 1 17 Accrued employee costs 80 45 (1) 3 3 130 Unrealized loss on derivative financial instruments
9 - (9) - - -
Property, plant and equipment 5 (3) - - 1 3 Others 32 25 - 2 1 60 Gross deferred tax assets (A) 460 51 (10) 5 16 522 Deferred tax liabilitiesProperty, plant and equipment 21 1 - - (1) 21 Unrealized gain on derivative financial instruments
- - 13 - - 13
Intangibles and goodwill 134 171 - 10 8 323 Others 11 10 2 - 1 24 Gross deferred tax liabilities (B) 166 182 15 10 8 381 Net deferred tax assets (A-B) 294 (131) (25) (5) 8 141
Undistributed earnings of the subsidiaries aggregate approximately $2,463 (31 March 2021, $2,178, 1 April 2020, $1,709). TheGroup has the intent to reinvest the undistributed foreign earnings indefinitely in its significant overseas operations orrepatriate only to the extent these can be distributed in a tax free manner. Consequently, the Company did not record adeferred tax liability on the undistributed earnings.
Components of deferred tax assets and liabilities as on 31 March 2021
The Company's subsidiaries have recognized deferred tax assets on carry forward business losses which can be utilized againstprofits within the limit and carryover period permitted under laws of respective jurisdictions. Deferred tax assets primarilyrelated to carried forward losses and other temporary differences for certain subsidiaries amounting to $11 was not recognizedas per applicable accounting standards. These tax losses can be carried forward for an indefinite period except for tax lossesamounting to $2 which will expire by 31 March 2030.
Above table represent the Gross deferred tax assets and liabilities. Amounts of deferred tax assets and liabilities presented inconsolidated balance sheet have been offset, wherever the Group has legally enforceable right and it is related to same taxableauthority.
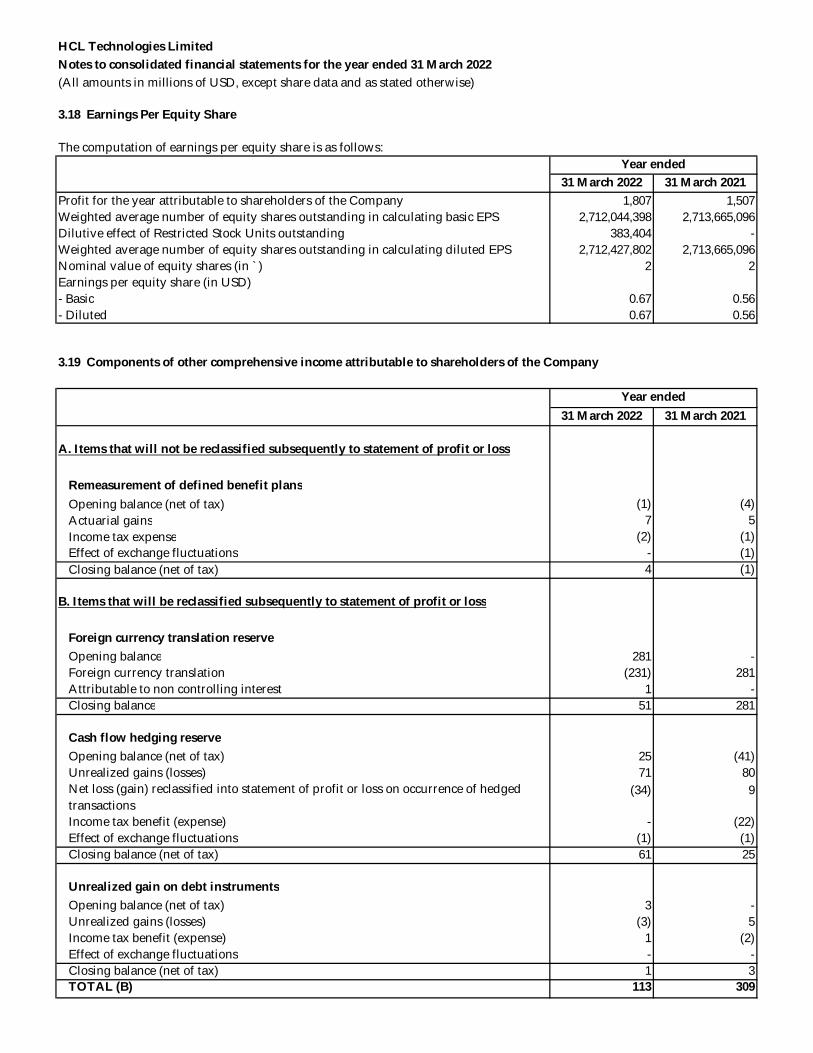
HCL Technologies LimitedNotes to consolidated financial statements for the year ended 31 March 2022(All amounts in millions of USD, except share data and as stated otherwise)
3.18 Earnings Per Equity Share
The computation of earnings per equity share is as follows:
31 March 2022 31 March 2021Profit for the year attributable to shareholders of the Company 1,807 1,507 Weighted average number of equity shares outstanding in calculating basic EPS 2,712,044,398 2,713,665,096 Dilutive effect of Restricted Stock Units outstanding 383,404 - Weighted average number of equity shares outstanding in calculating diluted EPS 2,712,427,802 2,713,665,096 Nominal value of equity shares (in `) 2 2 Earnings per equity share (in USD)- Basic 0.67 0.56 - Diluted 0.67 0.56
31 March 2022 31 March 2021
A. Items that will not be reclassified subsequently to statement of profit or loss
Remeasurement of defined benefit plansOpening balance (net of tax) (1) (4)Actuarial gains 7 5 Income tax expense (2) (1)Effect of exchange fluctuations - (1)Closing balance (net of tax) 4 (1)
B. Items that will be reclassified subsequently to statement of profit or loss
Foreign currency translation reserveOpening balance 281 - Foreign currency translation (231) 281 Attributable to non controlling interest 1 - Closing balance 51 281
Cash flow hedging reserveOpening balance (net of tax) 25 (41)Unrealized gains (losses) 71 80 Net loss (gain) reclassified into statement of profit or loss on occurrence of hedged transactions
(34) 9
Income tax benefit (expense) - (22)Effect of exchange fluctuations (1) (1)Closing balance (net of tax) 61 25
Unrealized gain on debt instrumentsOpening balance (net of tax) 3 - Unrealized gains (losses) (3) 5 Income tax benefit (expense) 1 (2)Effect of exchange fluctuations - - Closing balance (net of tax) 1 3 TOTAL (B) 113 309
Year ended
3.19 Components of other comprehensive income attributable to shareholders of the Company
Year ended
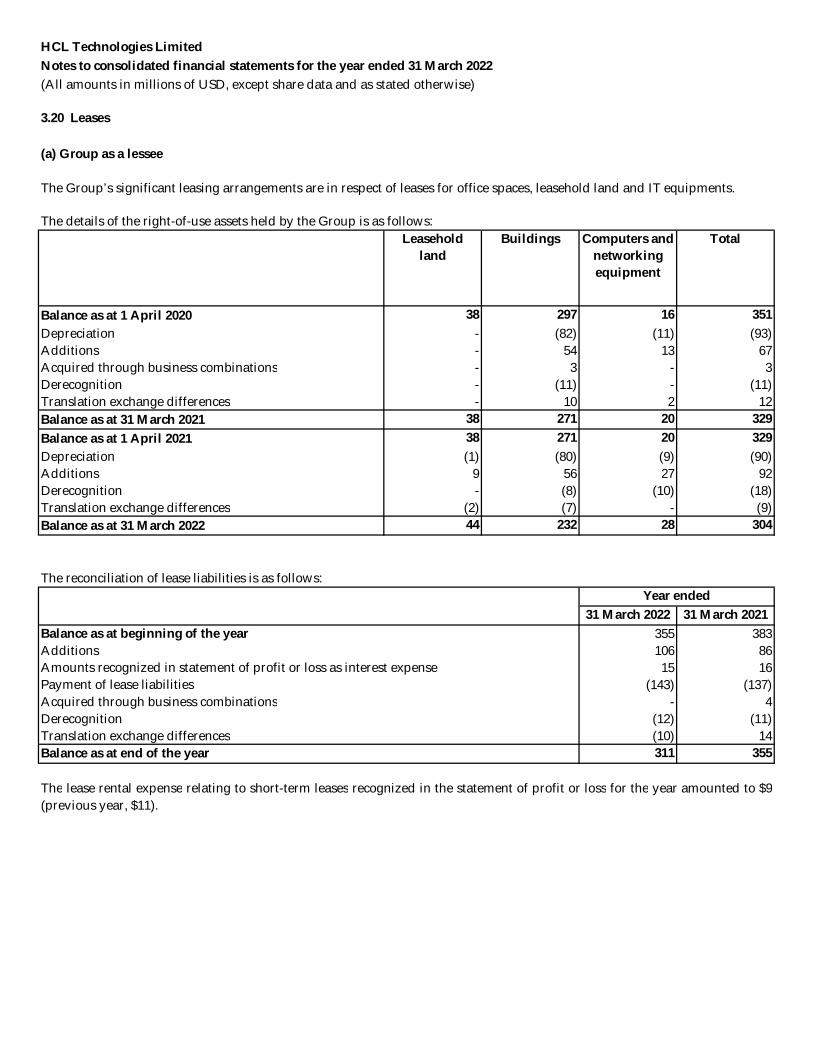
HCL Technologies LimitedNotes to consolidated financial statements for the year ended 31 March 2022(All amounts in millions of USD, except share data and as stated otherwise)
3.20 Leases
(a) Group as a lessee
The details of the right-of-use assets held by the Group is as follows:
Balance as at 1 April 2020 38 297 16 351 Depreciation - (82) (11) (93)Additions - 54 13 67 Acquired through business combinations - 3 - 3 Derecognition - (11) - (11)Translation exchange differences - 10 2 12 Balance as at 31 March 2021 38 271 20 329 Balance as at 1 April 2021 38 271 20 329 Depreciation (1) (80) (9) (90)Additions 9 56 27 92 Derecognition - (8) (10) (18)Translation exchange differences (2) (7) - (9)Balance as at 31 March 2022 44 232 28 304
The reconciliation of lease liabilities is as follows:
31 March 2022 31 March 2021Balance as at beginning of the year 355 383 Additions 106 86 Amounts recognized in statement of profit or loss as interest expense 15 16 Payment of lease liabilities (143) (137)Acquired through business combinations - 4 Derecognition (12) (11)Translation exchange differences (10) 14 Balance as at end of the year 311 355
The lease rental expense relating to short-term leases recognized in the statement of profit or loss for the year amounted to $9(previous year, $11).
The Group’s significant leasing arrangements are in respect of leases for office spaces, leasehold land and IT equipments.
Leaseholdland
Buildings Computers andnetworkingequipment
Total
Year ended
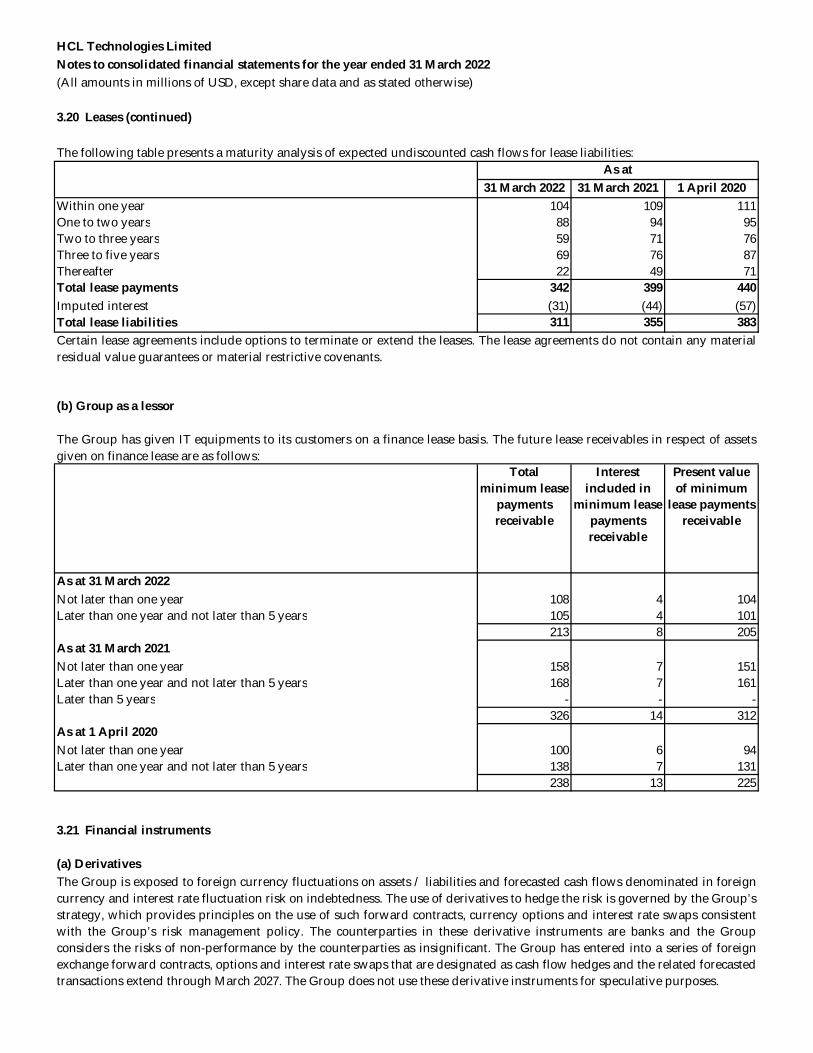
HCL Technologies LimitedNotes to consolidated financial statements for the year ended 31 March 2022(All amounts in millions of USD, except share data and as stated otherwise)
3.20 Leases (continued)
31 March 2022 31 March 2021 1 April 2020Within one year 104 109 111 One to two years 88 94 95 Two to three years 59 71 76 Three to five years 69 76 87 Thereafter 22 49 71 Total lease payments 342 399 440 Imputed interest (31) (44) (57)Total lease liabilities 311 355 383
(b) Group as a lessor
Total minimum lease
payments receivable
Interest included in
minimum lease payments receivable
Present value of minimum
lease payments receivable
As at 31 March 2022Not later than one year 108 4 104 Later than one year and not later than 5 years 105 4 101
213 8 205 As at 31 March 2021Not later than one year 158 7 151 Later than one year and not later than 5 years 168 7 161 Later than 5 years - - -
326 14 312 As at 1 April 2020Not later than one year 100 6 94 Later than one year and not later than 5 years 138 7 131
238 13 225
3.21 Financial instruments
(a) Derivatives
The following table presents a maturity analysis of expected undiscounted cash flows for lease liabilities:As at
The Group is exposed to foreign currency fluctuations on assets / liabilities and forecasted cash flows denominated in foreigncurrency and interest rate fluctuation risk on indebtedness. The use of derivatives to hedge the risk is governed by the Group’sstrategy, which provides principles on the use of such forward contracts, currency options and interest rate swaps consistentwith the Group’s risk management policy. The counterparties in these derivative instruments are banks and the Groupconsiders the risks of non-performance by the counterparties as insignificant. The Group has entered into a series of foreignexchange forward contracts, options and interest rate swaps that are designated as cash flow hedges and the related forecastedtransactions extend through March 2027. The Group does not use these derivative instruments for speculative purposes.
The Group has given IT equipments to its customers on a finance lease basis. The future lease receivables in respect of assetsgiven on finance lease are as follows:
Certain lease agreements include options to terminate or extend the leases. The lease agreements do not contain any materialresidual value guarantees or material restrictive covenants.
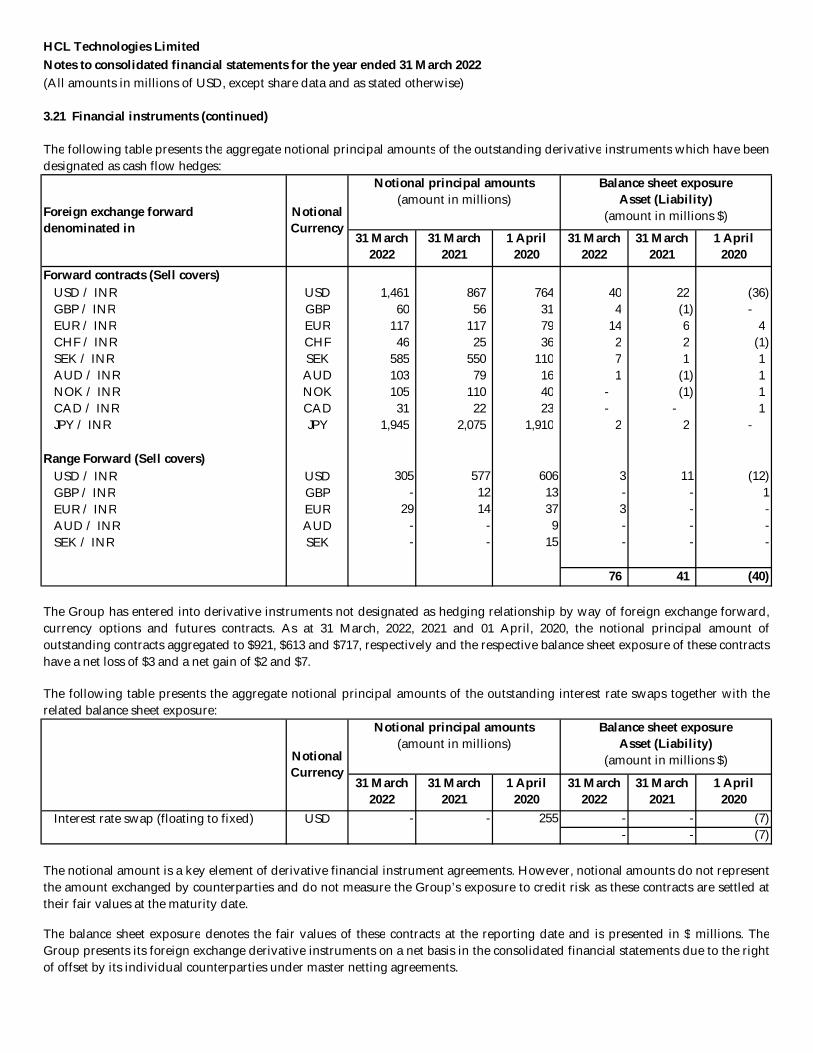
HCL Technologies LimitedNotes to consolidated financial statements for the year ended 31 March 2022(All amounts in millions of USD, except share data and as stated otherwise)
3.21 Financial instruments (continued)
31 March2022
31 March2021
1 April2020
31 March2022
31 March2021
1 April2020
Forward contracts (Sell covers)USD / INR USD 1,461 867 764 40 22 (36) GBP / INR GBP 60 56 31 4 (1) - EUR / INR EUR 117 117 79 14 6 4 CHF / INR CHF 46 25 36 2 2 (1) SEK / INR SEK 585 550 110 7 1 1 AUD / INR AUD 103 79 16 1 (1) 1 NOK / INR NOK 105 110 40 - (1) 1 CAD / INR CAD 31 22 23 - - 1 JPY / INR JPY 1,945 2,075 1,910 2 2 -
Range Forward (Sell covers)USD / INR USD 305 577 606 3 11 (12)GBP / INR GBP - 12 13 - - 1 EUR / INR EUR 29 14 37 3 - - AUD / INR AUD - - 9 - - - SEK / INR SEK - - 15 - - -
76 41 (40)
31 March2022
31 March2021
1 April2020
31 March2022
31 March2021
1 April2020
Interest rate swap (floating to fixed) USD - - 255 - - (7) - - (7)
The following table presents the aggregate notional principal amounts of the outstanding derivative instruments which have beendesignated as cash flow hedges:
Notional principal amounts(amount in millions)
Balance sheet exposureAsset (Liability)
(amount in millions $)NotionalCurrency
Foreign exchange forwarddenominated in
The notional amount is a key element of derivative financial instrument agreements. However, notional amounts do not representthe amount exchanged by counterparties and do not measure the Group’s exposure to credit risk as these contracts are settled attheir fair values at the maturity date.
The balance sheet exposure denotes the fair values of these contracts at the reporting date and is presented in $ millions. TheGroup presents its foreign exchange derivative instruments on a net basis in the consolidated financial statements due to the rightof offset by its individual counterparties under master netting agreements.
The Group has entered into derivative instruments not designated as hedging relationship by way of foreign exchange forward,currency options and futures contracts. As at 31 March, 2022, 2021 and 01 April, 2020, the notional principal amount ofoutstanding contracts aggregated to $921, $613 and $717, respectively and the respective balance sheet exposure of these contractshave a net loss of $3 and a net gain of $2 and $7.
The following table presents the aggregate notional principal amounts of the outstanding interest rate swaps together with therelated balance sheet exposure:
NotionalCurrency
Notional principal amounts(amount in millions)
Balance sheet exposureAsset (Liability)
(amount in millions $)
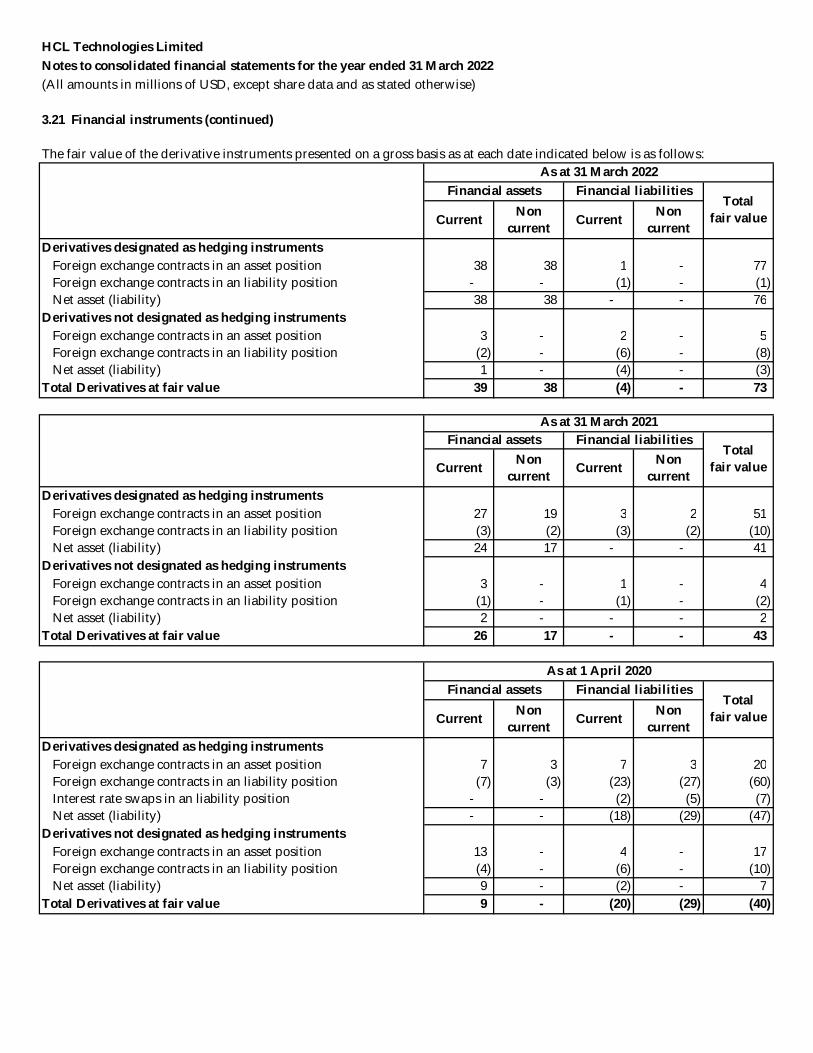
HCL Technologies LimitedNotes to consolidated financial statements for the year ended 31 March 2022(All amounts in millions of USD, except share data and as stated otherwise)
3.21 Financial instruments (continued)
Current Non current Current Non
currentDerivatives designated as hedging instruments
Foreign exchange contracts in an asset position 38 38 1 - 77 Foreign exchange contracts in an liability position - - (1) - (1) Net asset (liability) 38 38 - - 76
Derivatives not designated as hedging instrumentsForeign exchange contracts in an asset position 3 - 2 - 5 Foreign exchange contracts in an liability position (2) - (6) - (8) Net asset (liability) 1 - (4) - (3)
Total Derivatives at fair value 39 38 (4) - 73
Current Non current Current Non
currentDerivatives designated as hedging instruments
Foreign exchange contracts in an asset position 27 19 3 2 51 Foreign exchange contracts in an liability position (3) (2) (3) (2) (10) Net asset (liability) 24 17 - - 41
Derivatives not designated as hedging instrumentsForeign exchange contracts in an asset position 3 - 1 - 4 Foreign exchange contracts in an liability position (1) - (1) - (2) Net asset (liability) 2 - - - 2
Total Derivatives at fair value 26 17 - - 43
Current Noncurrent Current Non
currentDerivatives designated as hedging instruments
Foreign exchange contracts in an asset position 7 3 7 3 20 Foreign exchange contracts in an liability position (7) (3) (23) (27) (60) Interest rate swaps in an liability position - - (2) (5) (7) Net asset (liability) - - (18) (29) (47)
Derivatives not designated as hedging instrumentsForeign exchange contracts in an asset position 13 - 4 - 17 Foreign exchange contracts in an liability position (4) - (6) - (10) Net asset (liability) 9 - (2) - 7
Total Derivatives at fair value 9 - (20) (29) (40)
The fair value of the derivative instruments presented on a gross basis as at each date indicated below is as follows:
Financial assets Financial liabilitiesAs at 31 March 2022
Totalfair value
As at 31 March 2021Financial assets Financial liabilities
Totalfair value
Financial assets Financial liabilitiesTotal
fair value
As at 1 April 2020
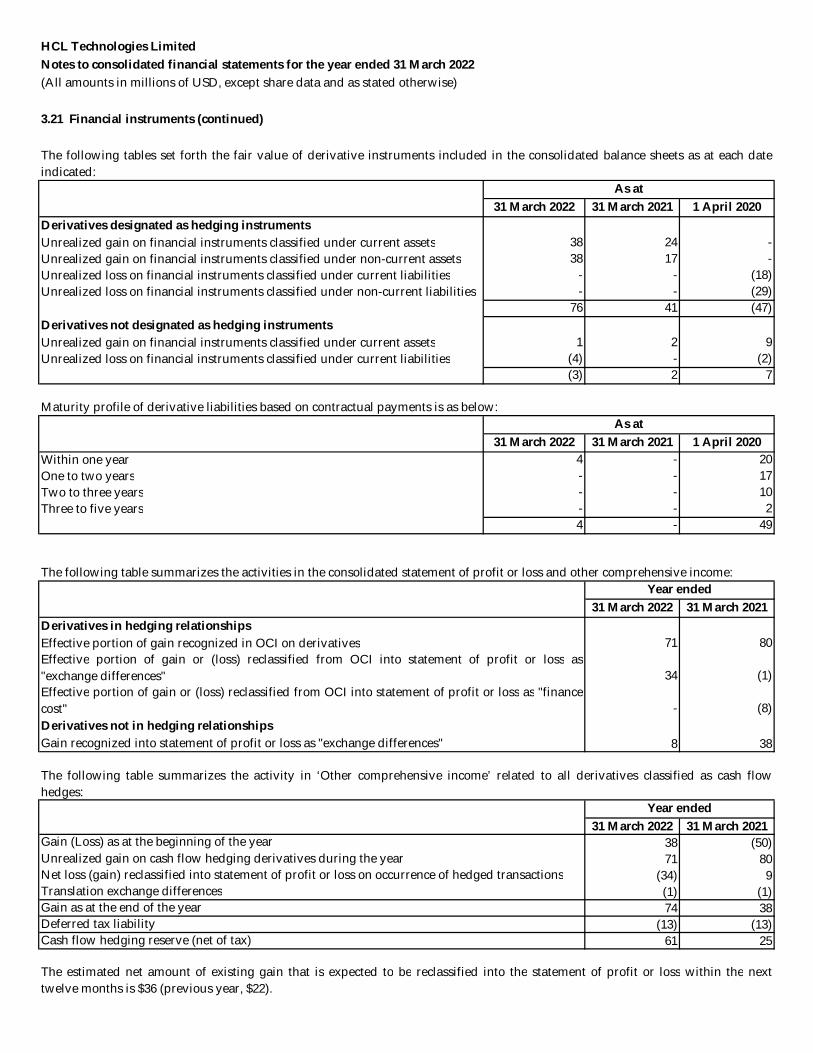
HCL Technologies LimitedNotes to consolidated financial statements for the year ended 31 March 2022(All amounts in millions of USD, except share data and as stated otherwise)
3.21 Financial instruments (continued)
31 March 2022 31 March 2021 1 April 2020Derivatives designated as hedging instrumentsUnrealized gain on financial instruments classified under current assets 38 24 - Unrealized gain on financial instruments classified under non-current assets 38 17 - Unrealized loss on financial instruments classified under current liabilities - - (18)Unrealized loss on financial instruments classified under non-current liabilities - - (29)
76 41 (47)Derivatives not designated as hedging instrumentsUnrealized gain on financial instruments classified under current assets 1 2 9 Unrealized loss on financial instruments classified under current liabilities (4) - (2)
(3) 2 7
Maturity profile of derivative liabilities based on contractual payments is as below:
31 March 2022 31 March 2021 1 April 2020Within one year 4 - 20 One to two years - - 17 Two to three years - - 10 Three to five years - - 2
4 - 49
The following table summarizes the activities in the consolidated statement of profit or loss and other comprehensive income:
31 March 2022 31 March 2021Derivatives in hedging relationshipsEffective portion of gain recognized in OCI on derivatives 71 80
34 (1)
- (8)Derivatives not in hedging relationshipsGain recognized into statement of profit or loss as "exchange differences" 8 38
31 March 2022 31 March 2021Gain (Loss) as at the beginning of the year 38 (50)Unrealized gain on cash flow hedging derivatives during the year 71 80 Net loss (gain) reclassified into statement of profit or loss on occurrence of hedged transactions (34) 9 Translation exchange differences (1) (1)
74 38 (13) (13) 61 25
As at
The following tables set forth the fair value of derivative instruments included in the consolidated balance sheets as at each dateindicated:
As at
Cash flow hedging reserve (net of tax)
The estimated net amount of existing gain that is expected to be reclassified into the statement of profit or loss within the nexttwelve months is $36 (previous year, $22).
Year ended
The following table summarizes the activity in ‘Other comprehensive income’ related to all derivatives classified as cash flowhedges:
Year ended
Gain as at the end of the yearDeferred tax liability
Effective portion of gain or (loss) reclassified from OCI into statement of profit or loss as"exchange differences"Effective portion of gain or (loss) reclassified from OCI into statement of profit or loss as "financecost"
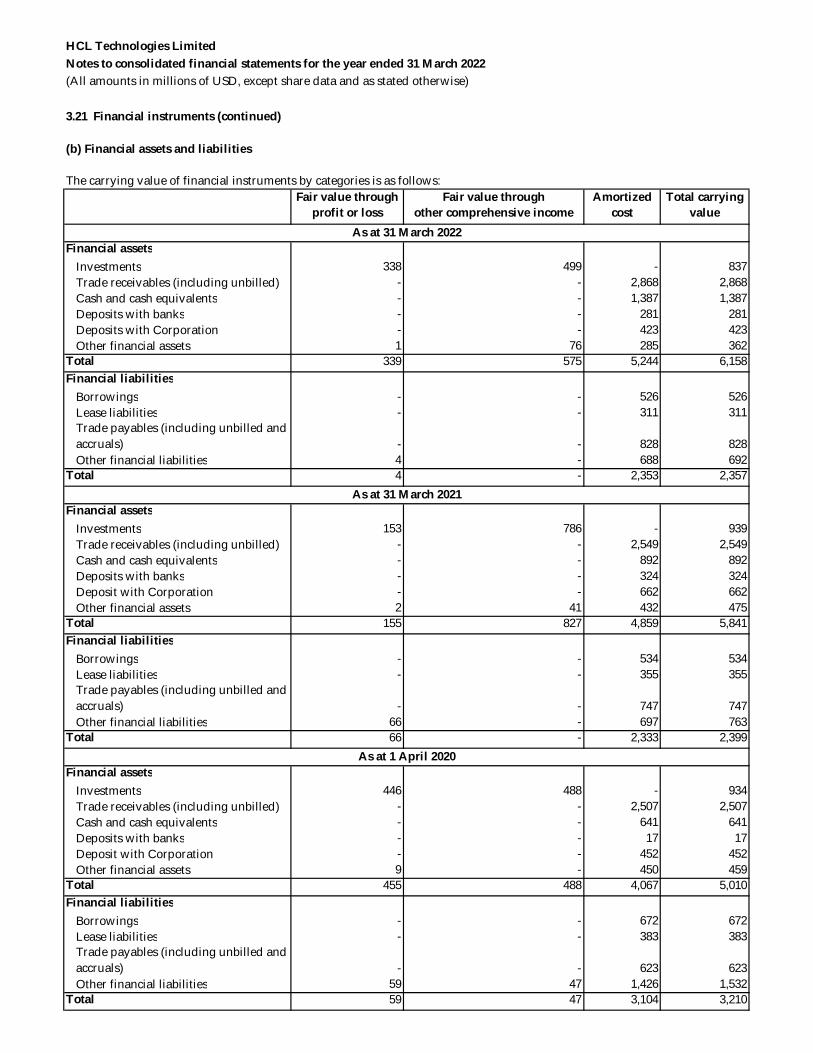
HCL Technologies LimitedNotes to consolidated financial statements for the year ended 31 March 2022(All amounts in millions of USD, except share data and as stated otherwise)
3.21 Financial instruments (continued)
(b) Financial assets and liabilities
The carrying value of financial instruments by categories is as follows:Fair value through
profit or lossFair value through
other comprehensive incomeAmortized
costTotal carrying
value
Financial assetsInvestments 338 499 - 837 Trade receivables (including unbilled) - - 2,868 2,868 Cash and cash equivalents - - 1,387 1,387 Deposits with banks - - 281 281 Deposits with Corporation - - 423 423 Other financial assets 1 76 285 362
Total 339 575 5,244 6,158 Financial liabilities
Borrowings - - 526 526 Lease liabilities - - 311 311 Trade payables (including unbilled and accruals) - - 828 828 Other financial liabilities 4 - 688 692
Total 4 - 2,353 2,357
Financial assetsInvestments 153 786 - 939 Trade receivables (including unbilled) - - 2,549 2,549 Cash and cash equivalents - - 892 892 Deposits with banks - - 324 324 Deposit with Corporation - - 662 662 Other financial assets 2 41 432 475
Total 155 827 4,859 5,841 Financial liabilities
Borrowings - - 534 534 Lease liabilities - - 355 355 Trade payables (including unbilled and accruals) - - 747 747 Other financial liabilities 66 - 697 763
Total 66 - 2,333 2,399
Financial assetsInvestments 446 488 - 934 Trade receivables (including unbilled) - - 2,507 2,507 Cash and cash equivalents - - 641 641 Deposits with banks - - 17 17 Deposit with Corporation - - 452 452 Other financial assets 9 - 450 459
Total 455 488 4,067 5,010 Financial liabilities
Borrowings - - 672 672 Lease liabilities - - 383 383 Trade payables (including unbilled and accruals) - - 623 623 Other financial liabilities 59 47 1,426 1,532
Total 59 47 3,104 3,210
As at 31 March 2022
As at 31 March 2021
As at 1 April 2020
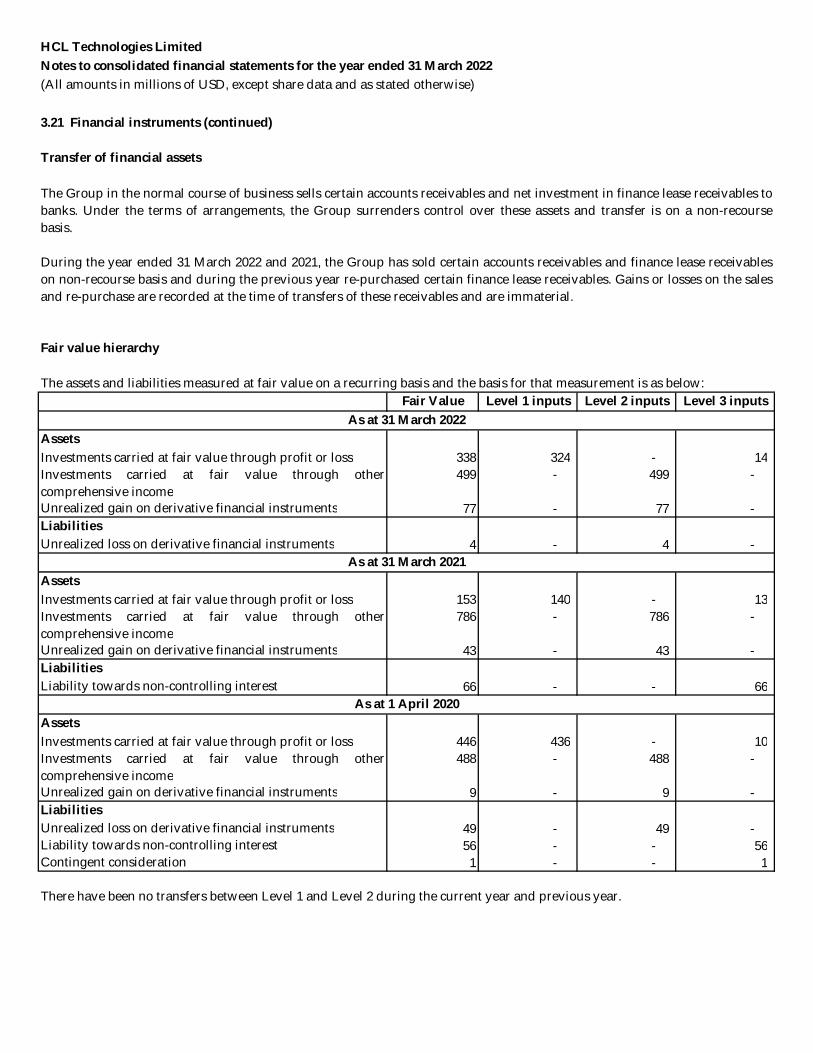
HCL Technologies LimitedNotes to consolidated financial statements for the year ended 31 March 2022(All amounts in millions of USD, except share data and as stated otherwise)
3.21 Financial instruments (continued)
Transfer of financial assets
Fair value hierarchy
Fair Value Level 1 inputs Level 2 inputs Level 3 inputs
AssetsInvestments carried at fair value through profit or loss 338 324 - 14 Investments carried at fair value through othercomprehensive income
499 - 499 -
Unrealized gain on derivative financial instruments 77 - 77 - LiabilitiesUnrealized loss on derivative financial instruments 4 - 4 -
AssetsInvestments carried at fair value through profit or loss 153 140 - 13 Investments carried at fair value through othercomprehensive income
786 - 786 -
Unrealized gain on derivative financial instruments 43 - 43 - LiabilitiesLiability towards non-controlling interest 66 - - 66
AssetsInvestments carried at fair value through profit or loss 446 436 - 10 Investments carried at fair value through othercomprehensive income
488 - 488 -
Unrealized gain on derivative financial instruments 9 - 9 - LiabilitiesUnrealized loss on derivative financial instruments 49 - 49 - Liability towards non-controlling interest 56 - - 56 Contingent consideration 1 - - 1
There have been no transfers between Level 1 and Level 2 during the current year and previous year.
The Group in the normal course of business sells certain accounts receivables and net investment in finance lease receivables tobanks. Under the terms of arrangements, the Group surrenders control over these assets and transfer is on a non-recoursebasis.
During the year ended 31 March 2022 and 2021, the Group has sold certain accounts receivables and finance lease receivableson non-recourse basis and during the previous year re-purchased certain finance lease receivables. Gains or losses on the salesand re-purchase are recorded at the time of transfers of these receivables and are immaterial.
The assets and liabilities measured at fair value on a recurring basis and the basis for that measurement is as below:
As at 31 March 2022
As at 31 March 2021
As at 1 April 2020
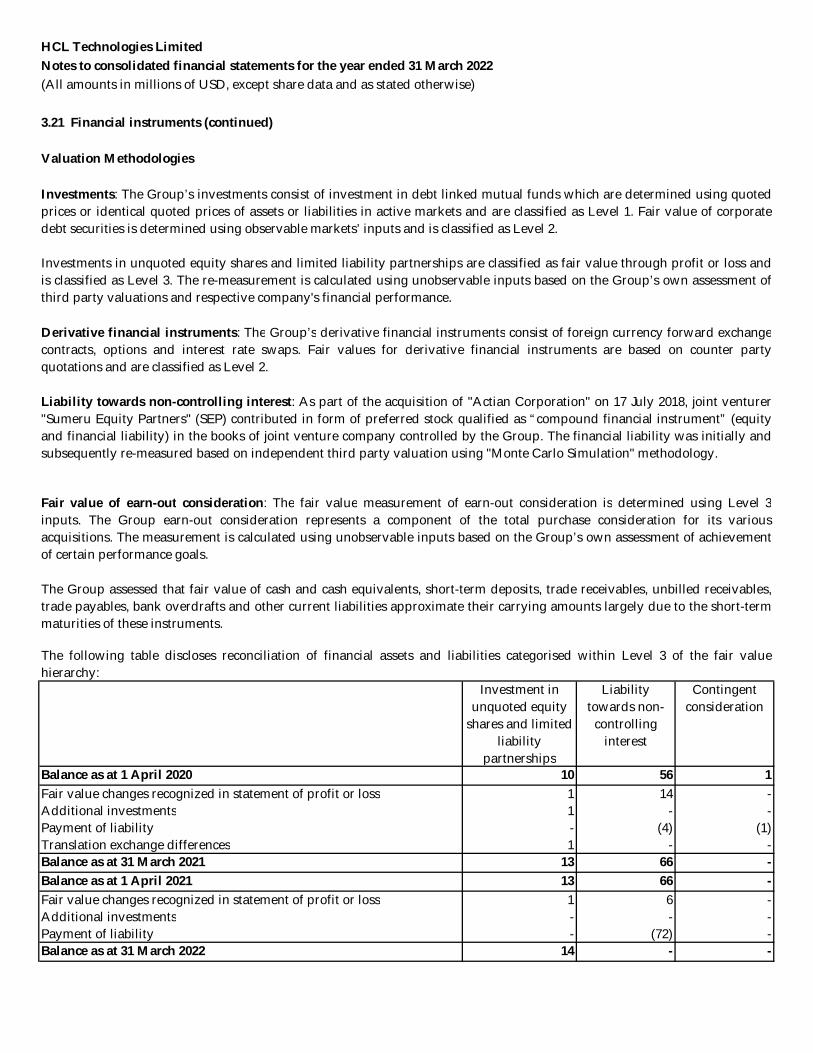
HCL Technologies LimitedNotes to consolidated financial statements for the year ended 31 March 2022(All amounts in millions of USD, except share data and as stated otherwise)
3.21 Financial instruments (continued)
Valuation Methodologies
Investment in unquoted equity
shares and limited liability
partnerships
Liability towards non-
controlling interest
Contingent consideration
Balance as at 1 April 2020 10 56 1 Fair value changes recognized in statement of profit or loss 1 14 - Additional investments 1 - - Payment of liability - (4) (1)Translation exchange differences 1 - - Balance as at 31 March 2021 13 66 - Balance as at 1 April 2021 13 66 - Fair value changes recognized in statement of profit or loss 1 6 - Additional investments - - - Payment of liability - (72) - Balance as at 31 March 2022 14 - -
The following table discloses reconciliation of financial assets and liabilities categorised within Level 3 of the fair valuehierarchy:
The Group assessed that fair value of cash and cash equivalents, short-term deposits, trade receivables, unbilled receivables,trade payables, bank overdrafts and other current liabilities approximate their carrying amounts largely due to the short-termmaturities of these instruments.
Investments: The Group’s investments consist of investment in debt linked mutual funds which are determined using quotedprices or identical quoted prices of assets or liabilities in active markets and are classified as Level 1. Fair value of corporatedebt securities is determined using observable markets’ inputs and is classified as Level 2.
Investments in unquoted equity shares and limited liability partnerships are classified as fair value through profit or loss andis classified as Level 3. The re-measurement is calculated using unobservable inputs based on the Group’s own assessment ofthird party valuations and respective company's financial performance.
Derivative financial instruments: The Group’s derivative financial instruments consist of foreign currency forward exchangecontracts, options and interest rate swaps. Fair values for derivative financial instruments are based on counter partyquotations and are classified as Level 2.
Fair value of earn-out consideration: The fair value measurement of earn-out consideration is determined using Level 3inputs. The Group earn-out consideration represents a component of the total purchase consideration for its variousacquisitions. The measurement is calculated using unobservable inputs based on the Group’s own assessment of achievementof certain performance goals.
Liability towards non-controlling interest: As part of the acquisition of "Actian Corporation" on 17 July 2018, joint venturer"Sumeru Equity Partners" (SEP) contributed in form of preferred stock qualified as “compound financial instrument” (equityand financial liability) in the books of joint venture company controlled by the Group. The financial liability was initially andsubsequently re-measured based on independent third party valuation using "Monte Carlo Simulation" methodology.
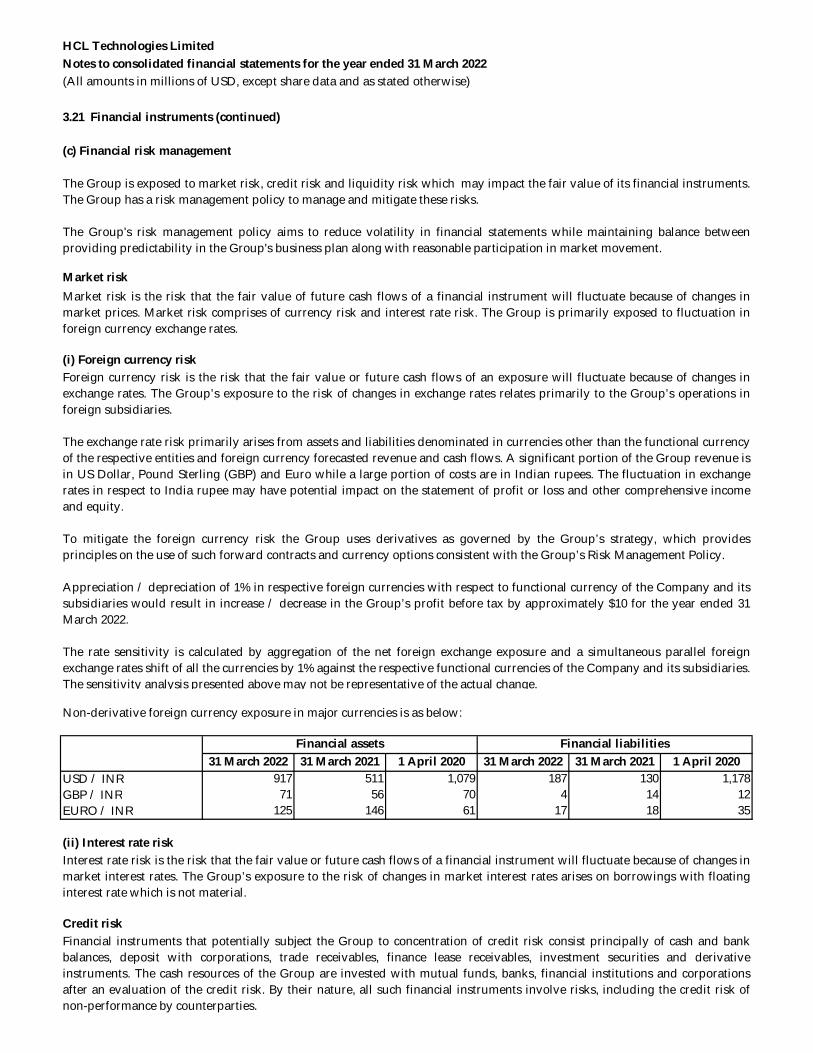
HCL Technologies LimitedNotes to consolidated financial statements for the year ended 31 March 2022(All amounts in millions of USD, except share data and as stated otherwise)
3.21 Financial instruments (continued)
(c) Financial risk management
Market risk
(i) Foreign currency risk
31 March 2022 31 March 2021 1 April 2020 31 March 2022 31 March 2021 1 April 2020USD / INR 917 511 1,079 187 130 1,178 GBP / INR 71 56 70 4 14 12 EURO / INR 125 146 61 17 18 35
(ii) Interest rate risk
Credit risk
The Group is exposed to market risk, credit risk and liquidity risk which may impact the fair value of its financial instruments.The Group has a risk management policy to manage and mitigate these risks.
The Group's risk management policy aims to reduce volatility in financial statements while maintaining balance betweenproviding predictability in the Group's business plan along with reasonable participation in market movement.
Market risk is the risk that the fair value of future cash flows of a financial instrument will fluctuate because of changes inmarket prices. Market risk comprises of currency risk and interest rate risk. The Group is primarily exposed to fluctuation inforeign currency exchange rates.
Foreign currency risk is the risk that the fair value or future cash flows of an exposure will fluctuate because of changes inexchange rates. The Group’s exposure to the risk of changes in exchange rates relates primarily to the Group’s operations inforeign subsidiaries.
The exchange rate risk primarily arises from assets and liabilities denominated in currencies other than the functional currencyof the respective entities and foreign currency forecasted revenue and cash flows. A significant portion of the Group revenue isin US Dollar, Pound Sterling (GBP) and Euro while a large portion of costs are in Indian rupees. The fluctuation in exchangerates in respect to India rupee may have potential impact on the statement of profit or loss and other comprehensive incomeand equity.
To mitigate the foreign currency risk the Group uses derivatives as governed by the Group’s strategy, which providesprinciples on the use of such forward contracts and currency options consistent with the Group’s Risk Management Policy.
Appreciation / depreciation of 1% in respective foreign currencies with respect to functional currency of the Company and itssubsidiaries would result in increase / decrease in the Group’s profit before tax by approximately $10 for the year ended 31March 2022.
The rate sensitivity is calculated by aggregation of the net foreign exchange exposure and a simultaneous parallel foreignexchange rates shift of all the currencies by 1% against the respective functional currencies of the Company and its subsidiaries.The sensitivity analysis presented above may not be representative of the actual change.
Non-derivative foreign currency exposure in major currencies is as below:
Financial liabilitiesFinancial assets
Financial instruments that potentially subject the Group to concentration of credit risk consist principally of cash and bankbalances, deposit with corporations, trade receivables, finance lease receivables, investment securities and derivativeinstruments. The cash resources of the Group are invested with mutual funds, banks, financial institutions and corporationsafter an evaluation of the credit risk. By their nature, all such financial instruments involve risks, including the credit risk ofnon-performance by counterparties.
Interest rate risk is the risk that the fair value or future cash flows of a financial instrument will fluctuate because of changes inmarket interest rates. The Group’s exposure to the risk of changes in market interest rates arises on borrowings with floatinginterest rate which is not material.
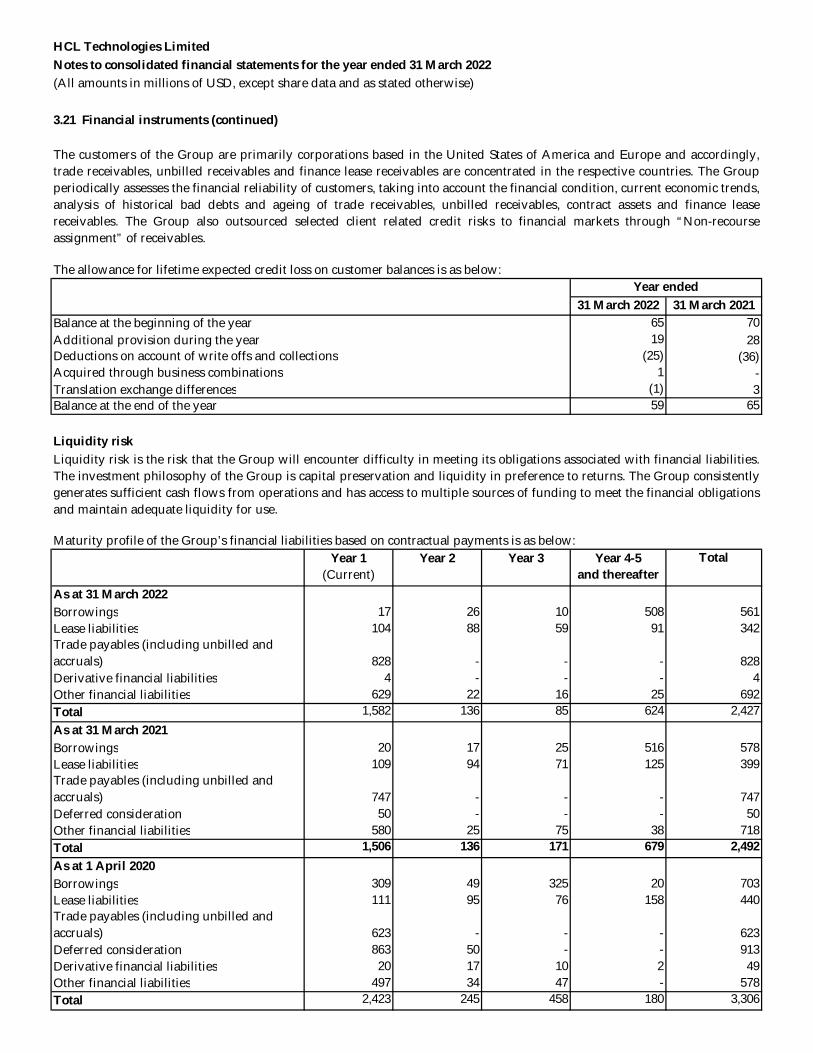
HCL Technologies LimitedNotes to consolidated financial statements for the year ended 31 March 2022(All amounts in millions of USD, except share data and as stated otherwise)
3.21 Financial instruments (continued)
The allowance for lifetime expected credit loss on customer balances is as below:
31 March 2022 31 March 2021Balance at the beginning of the year 65 70 Additional provision during the year 19 28 Deductions on account of write offs and collections (25) (36)Acquired through business combinations 1 - Translation exchange differences (1) 3 Balance at the end of the year 59 65
Liquidity risk
Year 1(Current)
Year 2 Year 3 Year 4-5and thereafter
Total
As at 31 March 2022Borrowings 17 26 10 508 561 Lease liabilities 104 88 59 91 342 Trade payables (including unbilled and accruals) 828 - - - 828 Derivative financial liabilities 4 - - - 4 Other financial liabilities 629 22 16 25 692 Total 1,582 136 85 624 2,427 As at 31 March 2021Borrowings 20 17 25 516 578 Lease liabilities 109 94 71 125 399 Trade payables (including unbilled and accruals) 747 - - - 747 Deferred consideration 50 - - - 50 Other financial liabilities 580 25 75 38 718 Total 1,506 136 171 679 2,492 As at 1 April 2020Borrowings 309 49 325 20 703 Lease liabilities 111 95 76 158 440 Trade payables (including unbilled and accruals) 623 - - - 623 Deferred consideration 863 50 - - 913 Derivative financial liabilities 20 17 10 2 49 Other financial liabilities 497 34 47 - 578 Total 2,423 245 458 180 3,306
Year ended
Liquidity risk is the risk that the Group will encounter difficulty in meeting its obligations associated with financial liabilities.The investment philosophy of the Group is capital preservation and liquidity in preference to returns. The Group consistentlygenerates sufficient cash flows from operations and has access to multiple sources of funding to meet the financial obligationsand maintain adequate liquidity for use.
Maturity profile of the Group’s financial liabilities based on contractual payments is as below:
The customers of the Group are primarily corporations based in the United States of America and Europe and accordingly,trade receivables, unbilled receivables and finance lease receivables are concentrated in the respective countries. The Groupperiodically assesses the financial reliability of customers, taking into account the financial condition, current economic trends,analysis of historical bad debts and ageing of trade receivables, unbilled receivables, contract assets and finance leasereceivables. The Group also outsourced selected client related credit risks to financial markets through “Non-recourseassignment” of receivables.
HCL Technologies LimitedNotes to consolidated financial statements for the year ended 31 March 2022(All amounts in millions of USD, except share data and as stated otherwise)
3.21 Financial instruments (continued)
Offsetting of financial instruments
3.22 Segment Reporting
Segment revenue is directly attributable to the segment and segment expenses have been allocated to various segments on thebasis of specific identification and wherever allocable, are apportioned to the segment on an appropriate basis. However,segment revenue does not include other income. Segment expenses do not include finance cost, exchange differences and taxexpense. Inter segment revenue primarily relates to software sourced internally from Products & Platforms segment by othersegments for providing services to end customers.
b) Segment assets and liabilitiesAssets and liabilities are not identified to any reportable segments, since these are used interchangeably across segments andconsequently, the management believes that it is not practicable or meaningful to provide segment disclosures relating to totalassets and liabilities.
a) Segment revenue and expenses
Under cash pooling arrangements with banks outside India, the contractual terms of arrangements preclude individual bankaccounts within the arrangement from being considered separate units of account. Accordingly, the balances of all such bankaccounts subject to the arrangements are presented on net basis. The impact of such netting on bank balances and bankoverdraft is $25 (31 March 2021, $55, 1 April 2020, $90).
Operating segments are defined as components of an enterprise for which discrete financial information is available andwhose results are reviewed regularly by the chief operating decision maker (CODM), for allocation of resources and assessingperformance.
The group has organized itself into the following segments:
IT and Business Services provide a comprehensive portfolio of IT & Business Services (Application, Infrastructure and DigitalProcess Operations) and Digital transformation services enabled by Digital and Analytics, IoTWoRKs, Cloud native andCybersecurity solutions including products developed within these businesses.
Engineering and R&D Services provides comprehensive engineering services and solutions across software, embedded,mechanical, VLSI and platform engineering that support the end to end lifecycle of products – both hardware and softwareacross diverse industries including products developed within this business.
Products & Platforms includes standalone product businesses that provide modernized software products to global clients fortheir technology and industry specific requirements.
Segment accounting policiesThe accounting principles used in the preparation of the financial statements are consistently applied to record revenue andexpenditure in individual segments and are as set out in note 1 to the financial statements on significant accounting policies.The accounting policies in relation to segment accounting are as under:
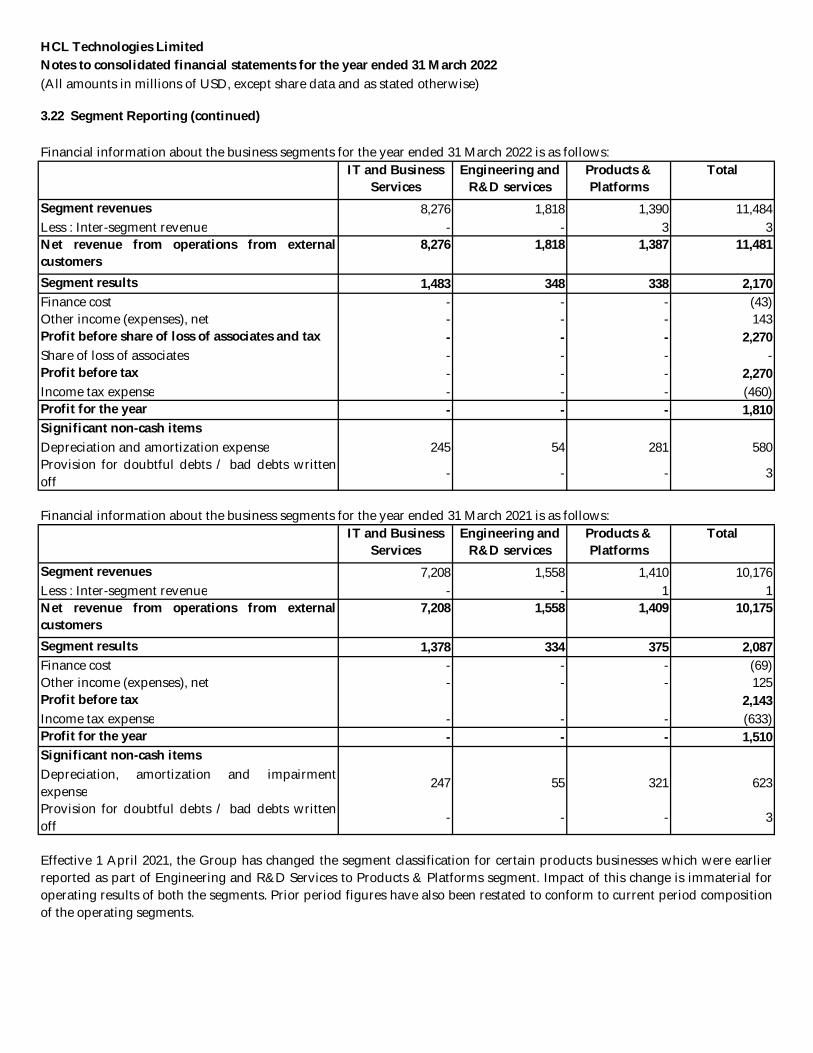
HCL Technologies LimitedNotes to consolidated financial statements for the year ended 31 March 2022(All amounts in millions of USD, except share data and as stated otherwise)
3.22 Segment Reporting (continued)
IT and Business Services
Engineering and R&D services
Products & Platforms
Total
Segment revenues 8,276 1,818 1,390 11,484 Less : Inter-segment revenue - - 3 3 Net revenue from operations from externalcustomers
8,276 1,818 1,387 11,481
Segment results 1,483 348 338 2,170 Finance cost - - - (43)Other income (expenses), net - - - 143 Profit before share of loss of associates and tax - - - 2,270 Share of loss of associates - - - - Profit before tax - - - 2,270 Income tax expense - - - (460)Profit for the year - - - 1,810 Significant non-cash itemsDepreciation and amortization expense 245 54 281 580 Provision for doubtful debts / bad debts writtenoff
- - - 3
IT and Business Services
Engineering and R&D services
Products & Platforms
Total
Segment revenues 7,208 1,558 1,410 10,176 Less : Inter-segment revenue - - 1 1 Net revenue from operations from externalcustomers
7,208 1,558 1,409 10,175
Segment results 1,378 334 375 2,087 Finance cost - - - (69)Other income (expenses), net - - - 125 Profit before tax 2,143 Income tax expense - - - (633)Profit for the year - - - 1,510 Significant non-cash itemsDepreciation, amortization and impairmentexpense
247 55 321 623
Provision for doubtful debts / bad debts writtenoff
- - - 3
Financial information about the business segments for the year ended 31 March 2022 is as follows:
Financial information about the business segments for the year ended 31 March 2021 is as follows:
Effective 1 April 2021, the Group has changed the segment classification for certain products businesses which were earlierreported as part of Engineering and R&D Services to Products & Platforms segment. Impact of this change is immaterial foroperating results of both the segments. Prior period figures have also been restated to conform to current period compositionof the operating segments.
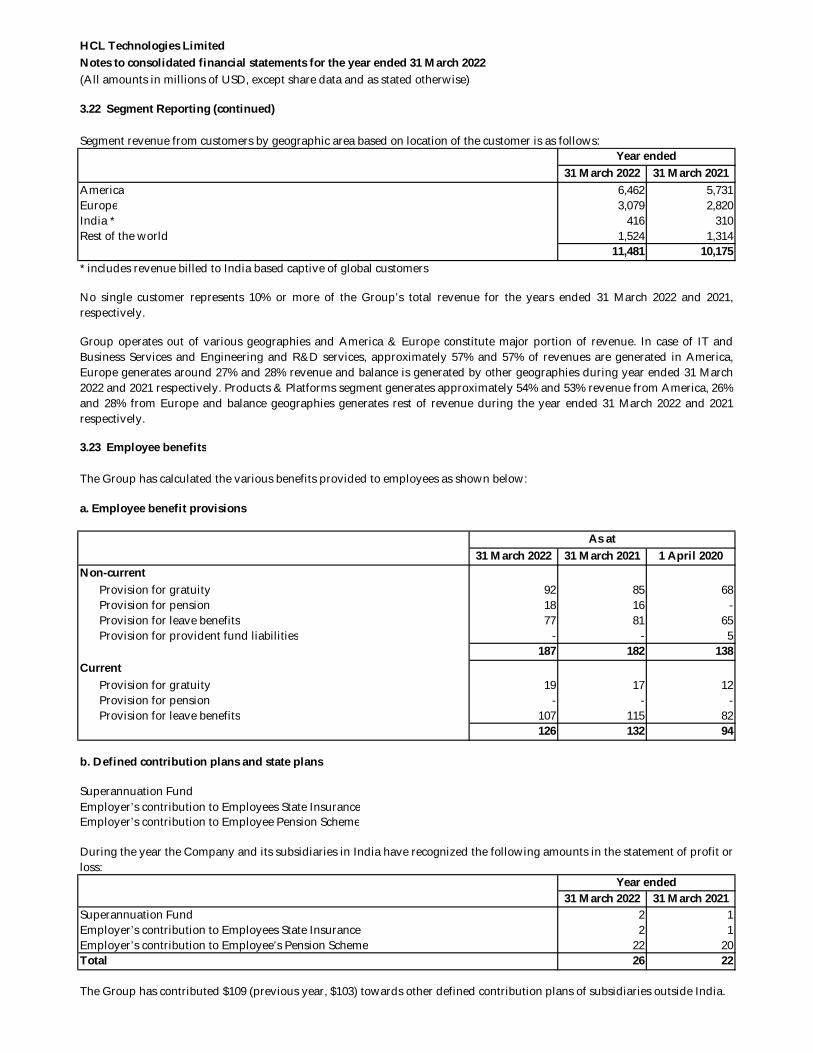
HCL Technologies LimitedNotes to consolidated financial statements for the year ended 31 March 2022(All amounts in millions of USD, except share data and as stated otherwise)
3.22 Segment Reporting (continued)
31 March 2022 31 March 2021America 6,462 5,731 Europe 3,079 2,820 India * 416 310 Rest of the world 1,524 1,314
11,481 10,175 * includes revenue billed to India based captive of global customers
3.23 Employee benefits
The Group has calculated the various benefits provided to employees as shown below:
a. Employee benefit provisions
31 March 2022 31 March 2021 1 April 2020Non-current
Provision for gratuity 92 85 68 Provision for pension 18 16 - Provision for leave benefits 77 81 65 Provision for provident fund liabilities - - 5
187 182 138 Current
Provision for gratuity 19 17 12 Provision for pension - - - Provision for leave benefits 107 115 82
126 132 94
b. Defined contribution plans and state plans
Superannuation FundEmployer’s contribution to Employees State InsuranceEmployer’s contribution to Employee Pension Scheme
31 March 2022 31 March 2021Superannuation Fund 2 1 Employer’s contribution to Employees State Insurance 2 1 Employer’s contribution to Employee’s Pension Scheme 22 20 Total 26 22
Segment revenue from customers by geographic area based on location of the customer is as follows:Year ended
No single customer represents 10% or more of the Group’s total revenue for the years ended 31 March 2022 and 2021,respectively.
During the year the Company and its subsidiaries in India have recognized the following amounts in the statement of profit orloss:
Year ended
The Group has contributed $109 (previous year, $103) towards other defined contribution plans of subsidiaries outside India.
Group operates out of various geographies and America & Europe constitute major portion of revenue. In case of IT andBusiness Services and Engineering and R&D services, approximately 57% and 57% of revenues are generated in America,Europe generates around 27% and 28% revenue and balance is generated by other geographies during year ended 31 March2022 and 2021 respectively. Products & Platforms segment generates approximately 54% and 53% revenue from America, 26%and 28% from Europe and balance geographies generates rest of revenue during the year ended 31 March 2022 and 2021respectively.
As at
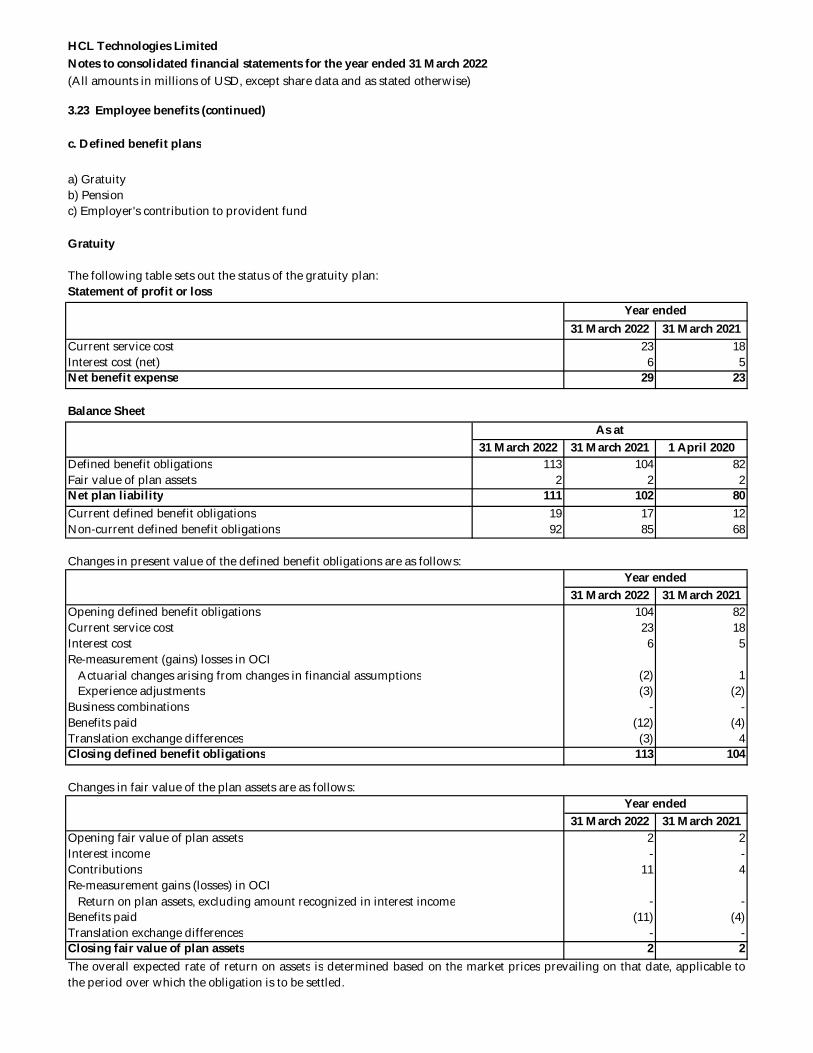
HCL Technologies LimitedNotes to consolidated financial statements for the year ended 31 March 2022(All amounts in millions of USD, except share data and as stated otherwise)
3.23 Employee benefits (continued)
c. Defined benefit plans
a) Gratuity b) Pensionc) Employer's contribution to provident fund
Statement of profit or loss
31 March 2022 31 March 2021Current service cost 23 18 Interest cost (net) 6 5 Net benefit expense 29 23
Balance Sheet
31 March 2022 31 March 2021 1 April 2020Defined benefit obligations 113 104 82 Fair value of plan assets 2 2 2 Net plan liability 111 102 80 Current defined benefit obligations 19 17 12 Non-current defined benefit obligations 92 85 68
31 March 2022 31 March 2021Opening defined benefit obligations 104 82 Current service cost 23 18 Interest cost 6 5 Re-measurement (gains) losses in OCI
Actuarial changes arising from changes in financial assumptions (2) 1 Experience adjustments (3) (2)
Business combinations - - Benefits paid (12) (4)Translation exchange differences (3) 4 Closing defined benefit obligations 113 104
Changes in fair value of the plan assets are as follows:
31 March 2022 31 March 2021Opening fair value of plan assets 2 2 Interest income - - Contributions 11 4 Re-measurement gains (losses) in OCI
Return on plan assets, excluding amount recognized in interest income - - Benefits paid (11) (4)Translation exchange differences - - Closing fair value of plan assets 2 2
Gratuity
The following table sets out the status of the gratuity plan:
Year ended
Year ended
The overall expected rate of return on assets is determined based on the market prices prevailing on that date, applicable tothe period over which the obligation is to be settled.
Year endedChanges in present value of the defined benefit obligations are as follows:
As at
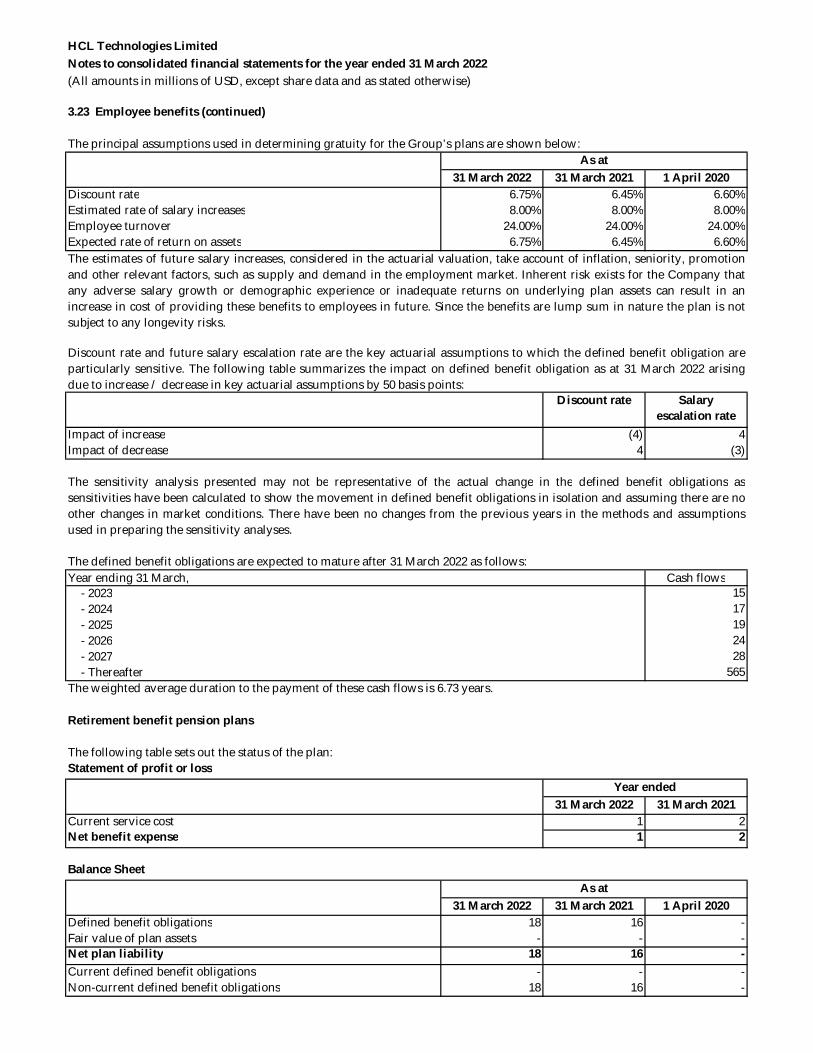
HCL Technologies LimitedNotes to consolidated financial statements for the year ended 31 March 2022(All amounts in millions of USD, except share data and as stated otherwise)
3.23 Employee benefits (continued)
The principal assumptions used in determining gratuity for the Group’s plans are shown below:
31 March 2022 31 March 2021 1 April 2020Discount rate 6.75% 6.45% 6.60%Estimated rate of salary increases 8.00% 8.00% 8.00%Employee turnover 24.00% 24.00% 24.00%Expected rate of return on assets 6.75% 6.45% 6.60%
Discount rate Salary escalation rate
Impact of increase (4) 4 Impact of decrease 4 (3)
Year ending 31 March, Cash flows - 2023 15 - 2024 17 - 2025 19 - 2026 24 - 2027 28 - Thereafter 565
The weighted average duration to the payment of these cash flows is 6.73 years.
Statement of profit or loss
31 March 2022 31 March 2021Current service cost 1 2 Net benefit expense 1 2
Balance Sheet
31 March 2022 31 March 2021 1 April 2020Defined benefit obligations 18 16 - Fair value of plan assets - - - Net plan liability 18 16 - Current defined benefit obligations - - - Non-current defined benefit obligations 18 16 -
As at
The estimates of future salary increases, considered in the actuarial valuation, take account of inflation, seniority, promotionand other relevant factors, such as supply and demand in the employment market. Inherent risk exists for the Company thatany adverse salary growth or demographic experience or inadequate returns on underlying plan assets can result in anincrease in cost of providing these benefits to employees in future. Since the benefits are lump sum in nature the plan is notsubject to any longevity risks.
As at
Discount rate and future salary escalation rate are the key actuarial assumptions to which the defined benefit obligation areparticularly sensitive. The following table summarizes the impact on defined benefit obligation as at 31 March 2022 arisingdue to increase / decrease in key actuarial assumptions by 50 basis points:
The sensitivity analysis presented may not be representative of the actual change in the defined benefit obligations assensitivities have been calculated to show the movement in defined benefit obligations in isolation and assuming there are noother changes in market conditions. There have been no changes from the previous years in the methods and assumptionsused in preparing the sensitivity analyses.
The defined benefit obligations are expected to mature after 31 March 2022 as follows:
Retirement benefit pension plans
The following table sets out the status of the plan:
Year ended
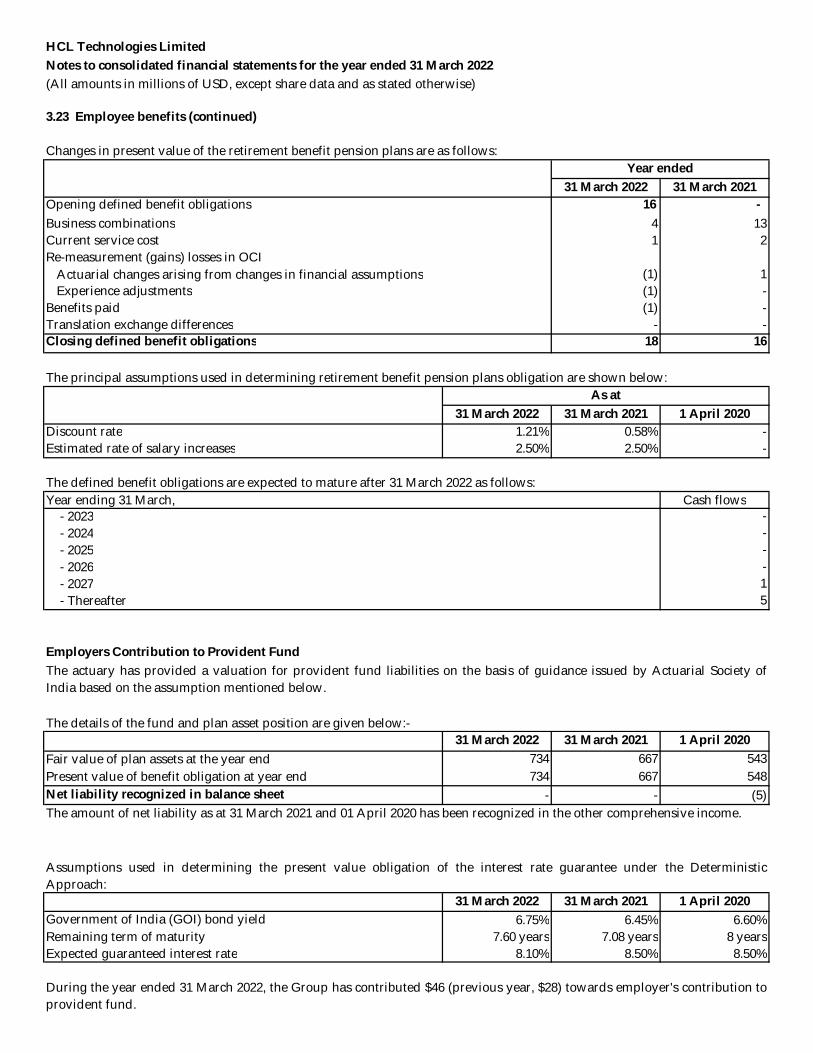
HCL Technologies LimitedNotes to consolidated financial statements for the year ended 31 March 2022(All amounts in millions of USD, except share data and as stated otherwise)
3.23 Employee benefits (continued)
31 March 2022 31 March 2021Opening defined benefit obligations 16 - Business combinations 4 13 Current service cost 1 2 Re-measurement (gains) losses in OCI
Actuarial changes arising from changes in financial assumptions (1) 1 Experience adjustments (1) -
Benefits paid (1) - Translation exchange differences - - Closing defined benefit obligations 18 16
The principal assumptions used in determining retirement benefit pension plans obligation are shown below:
31 March 2022 31 March 2021 1 April 2020Discount rate 1.21% 0.58% - Estimated rate of salary increases 2.50% 2.50% -
Year ending 31 March, Cash flows - 2023 - - 2024 - - 2025 - - 2026 - - 2027 1 - Thereafter 5
Employers Contribution to Provident Fund
31 March 2022 31 March 2021 1 April 2020Fair value of plan assets at the year end 734 667 543
734 667 548 Net liability recognized in balance sheet - - (5)
31 March 2022 31 March 2021 1 April 2020Government of India (GOI) bond yield 6.75% 6.45% 6.60%Remaining term of maturity 7.60 years 7.08 years 8 yearsExpected guaranteed interest rate 8.10% 8.50% 8.50%
Changes in present value of the retirement benefit pension plans are as follows:Year ended
The defined benefit obligations are expected to mature after 31 March 2022 as follows:
As at
Present value of benefit obligation at year end
Assumptions used in determining the present value obligation of the interest rate guarantee under the DeterministicApproach:
During the year ended 31 March 2022, the Group has contributed $46 (previous year, $28) towards employer's contribution toprovident fund.
The actuary has provided a valuation for provident fund liabilities on the basis of guidance issued by Actuarial Society ofIndia based on the assumption mentioned below.
The details of the fund and plan asset position are given below:-
The amount of net liability as at 31 March 2021 and 01 April 2020 has been recognized in the other comprehensive income.
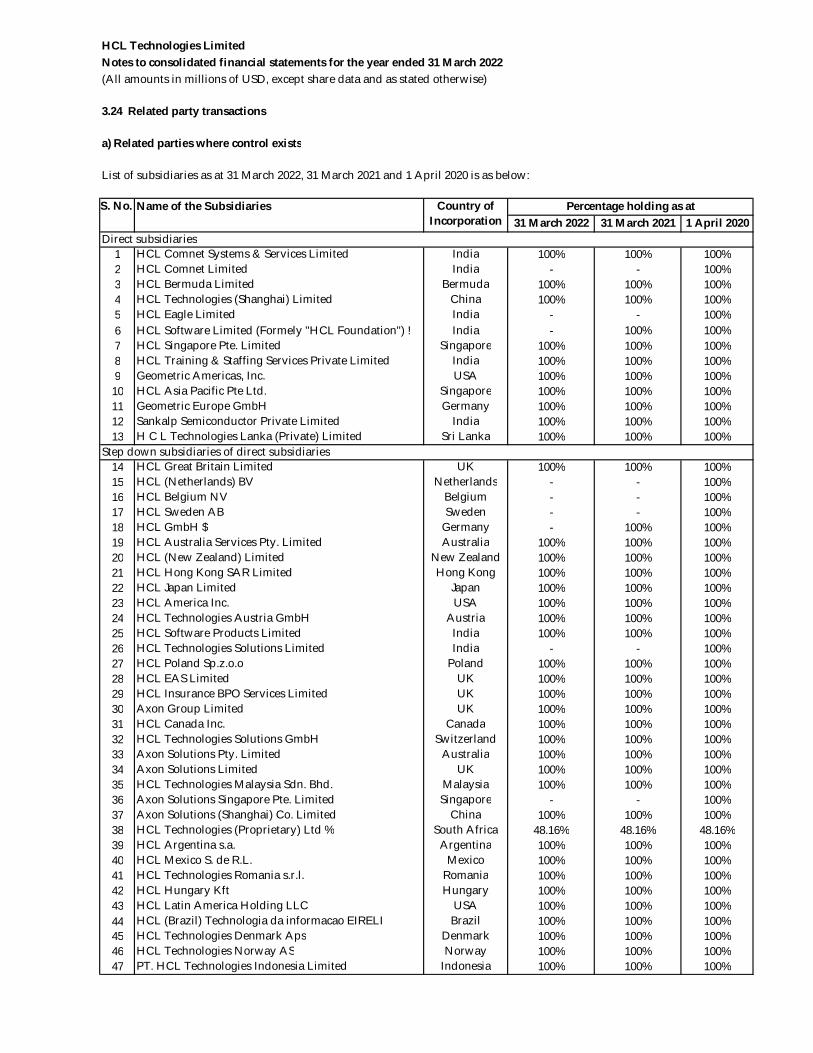
HCL Technologies LimitedNotes to consolidated financial statements for the year ended 31 March 2022(All amounts in millions of USD, except share data and as stated otherwise)
3.24 Related party transactions
a) Related parties where control exists
List of subsidiaries as at 31 March 2022, 31 March 2021 and 1 April 2020 is as below:
S. No. Name of the Subsidiaries31 March 2022 31 March 2021 1 April 2020
Direct subsidiaries1 HCL Comnet Systems & Services Limited India 100% 100% 100%2 HCL Comnet Limited India - - 100%3 HCL Bermuda Limited Bermuda 100% 100% 100%4 HCL Technologies (Shanghai) Limited China 100% 100% 100%5 HCL Eagle Limited India - - 100%6 HCL Software Limited (Formely "HCL Foundation") ! India - 100% 100%7 HCL Singapore Pte. Limited Singapore 100% 100% 100%8 HCL Training & Staffing Services Private Limited India 100% 100% 100%9 Geometric Americas, Inc. USA 100% 100% 100%
10 HCL Asia Pacific Pte Ltd. Singapore 100% 100% 100%11 Geometric Europe GmbH Germany 100% 100% 100%12 Sankalp Semiconductor Private Limited India 100% 100% 100%13 H C L Technologies Lanka (Private) Limited Sri Lanka 100% 100% 100%
Step down subsidiaries of direct subsidiaries14 HCL Great Britain Limited UK 100% 100% 100%15 HCL (Netherlands) BV Netherlands - - 100%16 HCL Belgium NV Belgium - - 100%17 HCL Sweden AB Sweden - - 100%18 HCL GmbH $ Germany - 100% 100%19 HCL Australia Services Pty. Limited Australia 100% 100% 100%20 HCL (New Zealand) Limited New Zealand 100% 100% 100%21 HCL Hong Kong SAR Limited Hong Kong 100% 100% 100%22 HCL Japan Limited Japan 100% 100% 100%23 HCL America Inc. USA 100% 100% 100%24 HCL Technologies Austria GmbH Austria 100% 100% 100%25 HCL Software Products Limited India 100% 100% 100%26 HCL Technologies Solutions Limited India - - 100%27 HCL Poland Sp.z.o.o Poland 100% 100% 100%28 HCL EAS Limited UK 100% 100% 100%29 HCL Insurance BPO Services Limited UK 100% 100% 100%30 Axon Group Limited UK 100% 100% 100%31 HCL Canada Inc. Canada 100% 100% 100%32 HCL Technologies Solutions GmbH Switzerland 100% 100% 100%33 Axon Solutions Pty. Limited Australia 100% 100% 100%34 Axon Solutions Limited UK 100% 100% 100%35 HCL Technologies Malaysia Sdn. Bhd. Malaysia 100% 100% 100%36 Axon Solutions Singapore Pte. Limited Singapore - - 100%37 Axon Solutions (Shanghai) Co. Limited China 100% 100% 100%38 HCL Technologies (Proprietary) Ltd % South Africa 48.16% 48.16% 48.16%39 HCL Argentina s.a. Argentina 100% 100% 100%40 HCL Mexico S. de R.L. Mexico 100% 100% 100%41 HCL Technologies Romania s.r.l. Romania 100% 100% 100%42 HCL Hungary Kft Hungary 100% 100% 100%43 HCL Latin America Holding LLC USA 100% 100% 100%44 HCL (Brazil) Technologia da informacao EIRELI Brazil 100% 100% 100%45 HCL Technologies Denmark Aps Denmark 100% 100% 100%46 HCL Technologies Norway AS Norway 100% 100% 100%47 PT. HCL Technologies Indonesia Limited Indonesia 100% 100% 100%
Country of Incorporation
Percentage holding as at
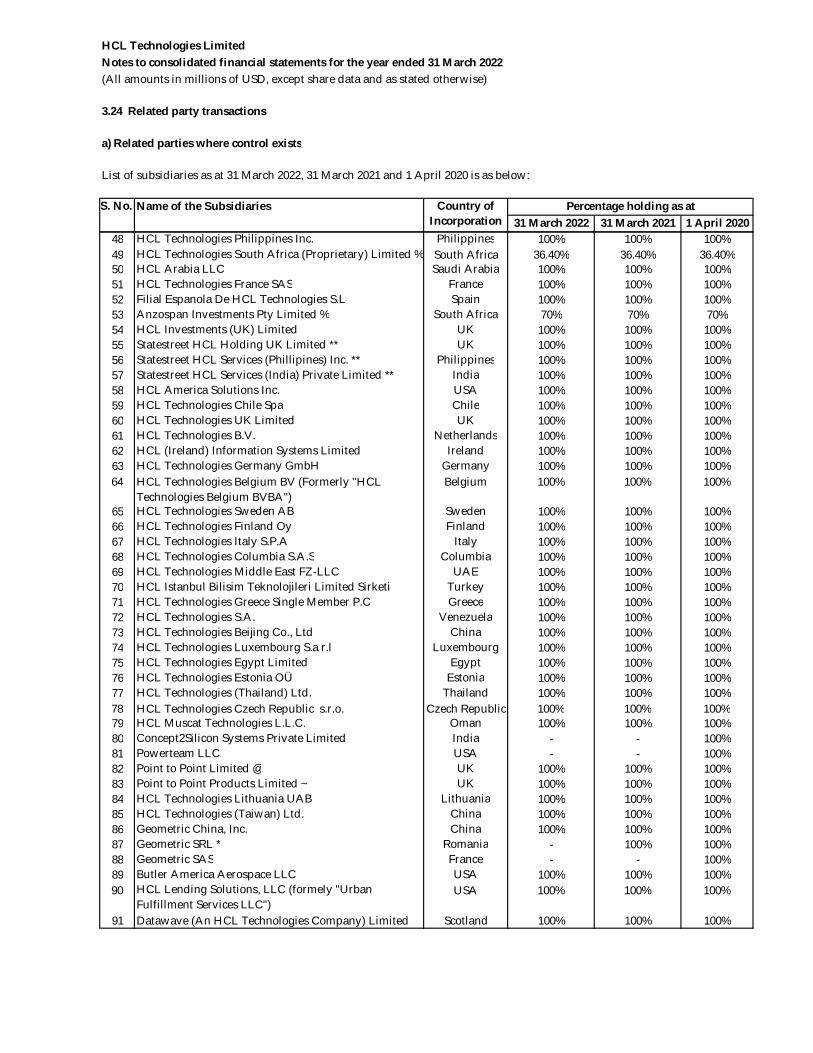
HCL Technologies LimitedNotes to consolidated financial statements for the year ended 31 March 2022(All amounts in millions of USD, except share data and as stated otherwise)
3.24 Related party transactions
a) Related parties where control exists
List of subsidiaries as at 31 March 2022, 31 March 2021 and 1 April 2020 is as below:
S. No. Name of the Subsidiaries31 March 2022 31 March 2021 1 April 2020
Country of Incorporation
Percentage holding as at
48 HCL Technologies Philippines Inc. Philippines 100% 100% 100%49 HCL Technologies South Africa (Proprietary) Limited % South Africa 36.40% 36.40% 36.40%50 HCL Arabia LLC Saudi Arabia 100% 100% 100%51 HCL Technologies France SAS France 100% 100% 100%52 Filial Espanola De HCL Technologies S.L Spain 100% 100% 100%53 Anzospan Investments Pty Limited % South Africa 70% 70% 70%54 HCL Investments (UK) Limited UK 100% 100% 100%55 Statestreet HCL Holding UK Limited ** UK 100% 100% 100%56 Statestreet HCL Services (Phillipines) Inc. ** Philippines 100% 100% 100%57 Statestreet HCL Services (India) Private Limited ** India 100% 100% 100%58 HCL America Solutions Inc. USA 100% 100% 100%59 HCL Technologies Chile Spa Chile 100% 100% 100%60 HCL Technologies UK Limited UK 100% 100% 100%61 HCL Technologies B.V. Netherlands 100% 100% 100%62 HCL (Ireland) Information Systems Limited Ireland 100% 100% 100%63 HCL Technologies Germany GmbH Germany 100% 100% 100%64 HCL Technologies Belgium BV (Formerly "HCL
Technologies Belgium BVBA")Belgium 100% 100% 100%
65 HCL Technologies Sweden AB Sweden 100% 100% 100%66 HCL Technologies Finland Oy Finland 100% 100% 100%67 HCL Technologies Italy S.P.A Italy 100% 100% 100%68 HCL Technologies Columbia S.A.S Columbia 100% 100% 100%69 HCL Technologies Middle East FZ-LLC UAE 100% 100% 100%70 HCL Istanbul Bilisim Teknolojileri Limited Sirketi Turkey 100% 100% 100%71 HCL Technologies Greece Single Member P.C Greece 100% 100% 100%72 HCL Technologies S.A. Venezuela 100% 100% 100%73 HCL Technologies Beijing Co., Ltd China 100% 100% 100%74 HCL Technologies Luxembourg S.a r.l Luxembourg 100% 100% 100%75 HCL Technologies Egypt Limited Egypt 100% 100% 100%76 HCL Technologies Estonia OÜ Estonia 100% 100% 100%77 HCL Technologies (Thailand) Ltd. Thailand 100% 100% 100%78 HCL Technologies Czech Republic s.r.o. Czech Republic 100% 100% 100%79 HCL Muscat Technologies L.L.C. Oman 100% 100% 100%80 Concept2Silicon Systems Private Limited India - - 100%81 Powerteam LLC USA - - 100%82 Point to Point Limited @ UK 100% 100% 100%83 Point to Point Products Limited ~ UK 100% 100% 100%84 HCL Technologies Lithuania UAB Lithuania 100% 100% 100%85 HCL Technologies (Taiwan) Ltd. China 100% 100% 100%86 Geometric China, Inc. China 100% 100% 100%87 Geometric SRL * Romania - 100% 100%88 Geometric SAS France - - 100%89 Butler America Aerospace LLC USA 100% 100% 100%90 HCL Lending Solutions, LLC (formely "Urban
Fulfillment Services LLC")USA 100% 100% 100%
91 Datawave (An HCL Technologies Company) Limited Scotland 100% 100% 100%
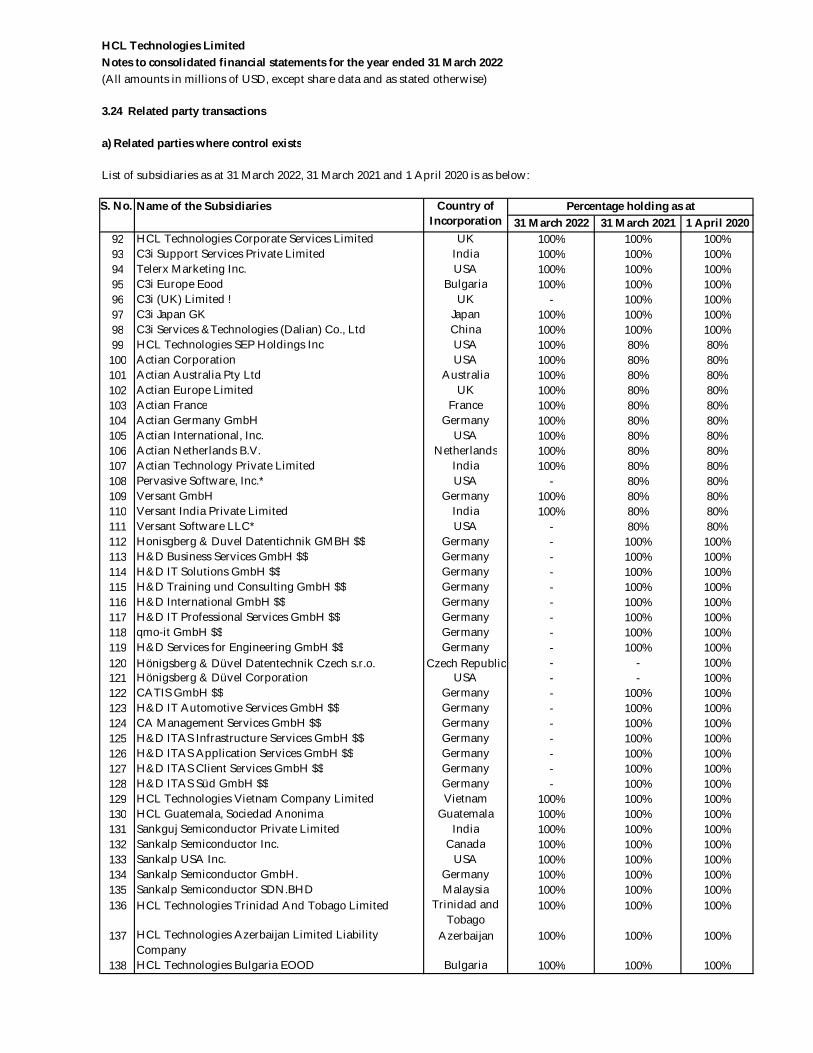
HCL Technologies LimitedNotes to consolidated financial statements for the year ended 31 March 2022(All amounts in millions of USD, except share data and as stated otherwise)
3.24 Related party transactions
a) Related parties where control exists
List of subsidiaries as at 31 March 2022, 31 March 2021 and 1 April 2020 is as below:
S. No. Name of the Subsidiaries31 March 2022 31 March 2021 1 April 2020
Country of Incorporation
Percentage holding as at
92 HCL Technologies Corporate Services Limited UK 100% 100% 100%93 C3i Support Services Private Limited India 100% 100% 100%94 Telerx Marketing Inc. USA 100% 100% 100%95 C3i Europe Eood Bulgaria 100% 100% 100%96 C3i (UK) Limited ! UK - 100% 100%97 C3i Japan GK Japan 100% 100% 100%98 C3i Services &Technologies (Dalian) Co., Ltd China 100% 100% 100%99 HCL Technologies SEP Holdings Inc USA 100% 80% 80%
100 Actian Corporation USA 100% 80% 80%101 Actian Australia Pty Ltd Australia 100% 80% 80%102 Actian Europe Limited UK 100% 80% 80%103 Actian France France 100% 80% 80%104 Actian Germany GmbH Germany 100% 80% 80%105 Actian International, Inc. USA 100% 80% 80%106 Actian Netherlands B.V. Netherlands 100% 80% 80%107 Actian Technology Private Limited India 100% 80% 80%108 Pervasive Software, Inc.* USA - 80% 80%109 Versant GmbH Germany 100% 80% 80%110 Versant India Private Limited India 100% 80% 80%111 Versant Software LLC* USA - 80% 80%112 Honisgberg & Duvel Datentichnik GMBH $$ Germany - 100% 100%113 H&D Business Services GmbH $$ Germany - 100% 100%114 H&D IT Solutions GmbH $$ Germany - 100% 100%115 H&D Training und Consulting GmbH $$ Germany - 100% 100%116 H&D International GmbH $$ Germany - 100% 100%117 H&D IT Professional Services GmbH $$ Germany - 100% 100%118 qmo-it GmbH $$ Germany - 100% 100%119 H&D Services for Engineering GmbH $$ Germany - 100% 100%120 Hönigsberg & Düvel Datentechnik Czech s.r.o. Czech Republic - - 100%121 Hönigsberg & Düvel Corporation USA - - 100%122 CATIS GmbH $$ Germany - 100% 100%123 H&D IT Automotive Services GmbH $$ Germany - 100% 100%124 CA Management Services GmbH $$ Germany - 100% 100%125 H&D ITAS Infrastructure Services GmbH $$ Germany - 100% 100%126 H&D ITAS Application Services GmbH $$ Germany - 100% 100%127 H&D ITAS Client Services GmbH $$ Germany - 100% 100%128 H&D ITAS Süd GmbH $$ Germany - 100% 100%129 HCL Technologies Vietnam Company Limited Vietnam 100% 100% 100%130 HCL Guatemala, Sociedad Anonima Guatemala 100% 100% 100%131 Sankguj Semiconductor Private Limited India 100% 100% 100%132 Sankalp Semiconductor Inc. Canada 100% 100% 100%133 Sankalp USA Inc. USA 100% 100% 100%134 Sankalp Semiconductor GmbH. Germany 100% 100% 100%135 Sankalp Semiconductor SDN.BHD Malaysia 100% 100% 100%136 HCL Technologies Trinidad And Tobago Limited Trinidad and
Tobago100% 100% 100%
137 HCL Technologies Azerbaijan Limited Liability Company
Azerbaijan 100% 100% 100%
138 HCL Technologies Bulgaria EOOD Bulgaria 100% 100% 100%
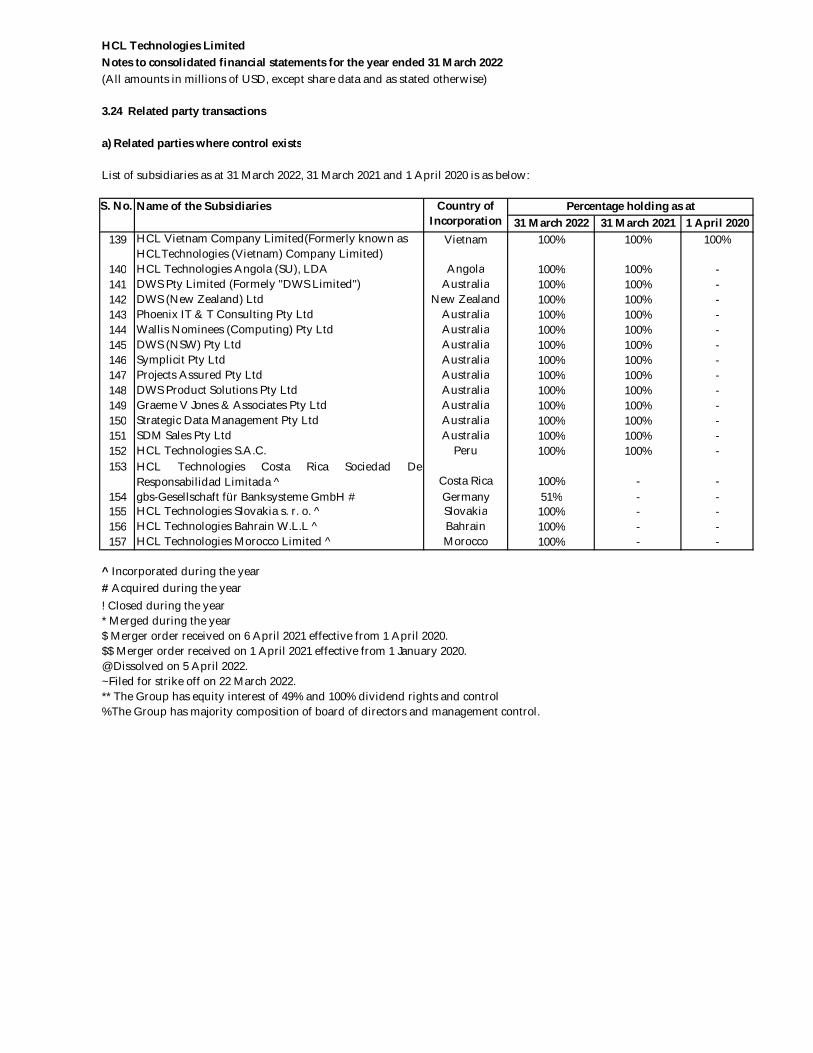
HCL Technologies LimitedNotes to consolidated financial statements for the year ended 31 March 2022(All amounts in millions of USD, except share data and as stated otherwise)
3.24 Related party transactions
a) Related parties where control exists
List of subsidiaries as at 31 March 2022, 31 March 2021 and 1 April 2020 is as below:
S. No. Name of the Subsidiaries31 March 2022 31 March 2021 1 April 2020
Country of Incorporation
Percentage holding as at
139 HCL Vietnam Company Limited(Formerly known as HCLTechnologies (Vietnam) Company Limited)
Vietnam 100% 100% 100%
140 HCL Technologies Angola (SU), LDA Angola 100% 100% -141 DWS Pty Limited (Formely "DWS Limited") Australia 100% 100% -142 DWS (New Zealand) Ltd New Zealand 100% 100% -143 Phoenix IT & T Consulting Pty Ltd Australia 100% 100% -144 Wallis Nominees (Computing) Pty Ltd Australia 100% 100% -145 DWS (NSW) Pty Ltd Australia 100% 100% -146 Symplicit Pty Ltd Australia 100% 100% -147 Projects Assured Pty Ltd Australia 100% 100% -148 DWS Product Solutions Pty Ltd Australia 100% 100% -149 Graeme V Jones & Associates Pty Ltd Australia 100% 100% -150 Strategic Data Management Pty Ltd Australia 100% 100% -151 SDM Sales Pty Ltd Australia 100% 100% -152 HCL Technologies S.A.C. Peru 100% 100% -153 HCL Technologies Costa Rica Sociedad De
Responsabilidad Limitada ^ Costa Rica 100% - -154 gbs-Gesellschaft für Banksysteme GmbH # Germany 51% - -155 HCL Technologies Slovakia s. r. o. ^ Slovakia 100% - -156 HCL Technologies Bahrain W.L.L ^ Bahrain 100% - -157 HCL Technologies Morocco Limited ^ Morocco 100% - -
^ Incorporated during the year# Acquired during the year! Closed during the year* Merged during the year$ Merger order received on 6 April 2021 effective from 1 April 2020.$$ Merger order received on 1 April 2021 effective from 1 January 2020.@ Dissolved on 5 April 2022.~Filed for strike off on 22 March 2022.** The Group has equity interest of 49% and 100% dividend rights and control%The Group has majority composition of board of directors and management control.
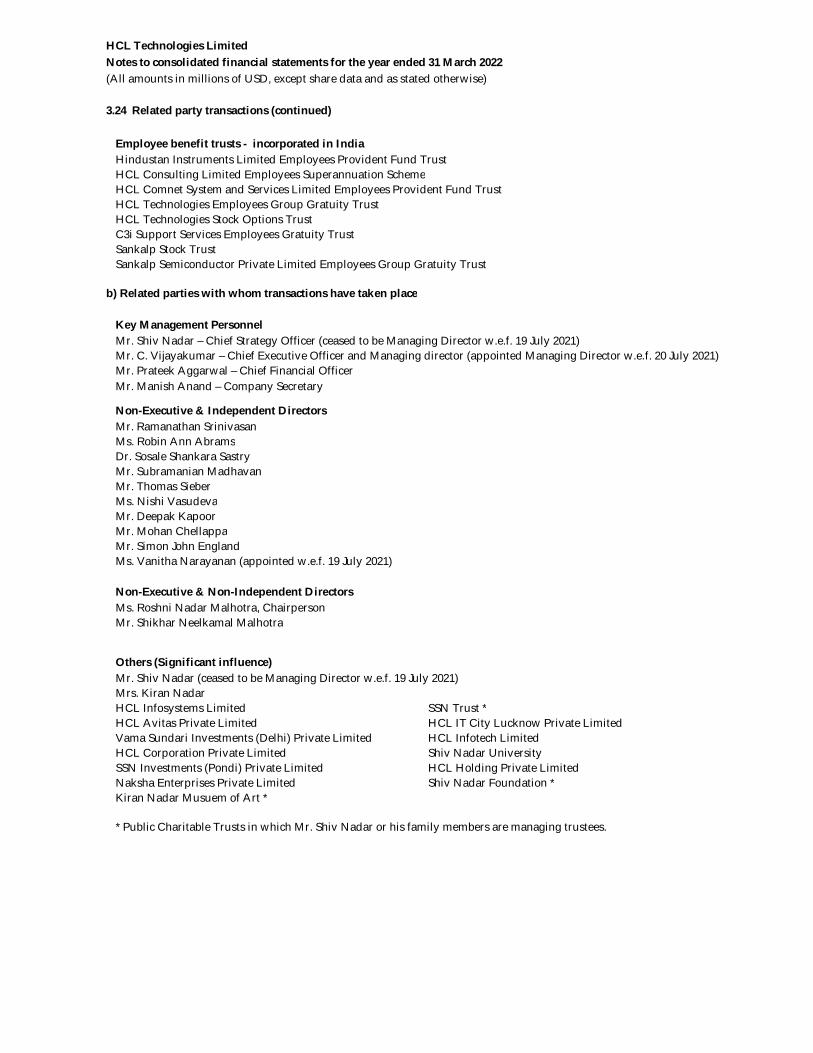
HCL Technologies LimitedNotes to consolidated financial statements for the year ended 31 March 2022(All amounts in millions of USD, except share data and as stated otherwise)
3.24 Related party transactions (continued)
Employee benefit trusts - incorporated in IndiaHindustan Instruments Limited Employees Provident Fund TrustHCL Consulting Limited Employees Superannuation SchemeHCL Comnet System and Services Limited Employees Provident Fund TrustHCL Technologies Employees Group Gratuity TrustHCL Technologies Stock Options TrustC3i Support Services Employees Gratuity TrustSankalp Stock TrustSankalp Semiconductor Private Limited Employees Group Gratuity Trust
b) Related parties with whom transactions have taken place
Key Management PersonnelMr. Shiv Nadar – Chief Strategy Officer (ceased to be Managing Director w.e.f. 19 July 2021)
Mr. Prateek Aggarwal – Chief Financial OfficerMr. Manish Anand – Company Secretary
Non-Executive & Independent DirectorsMr. Ramanathan SrinivasanMs. Robin Ann AbramsDr. Sosale Shankara SastryMr. Subramanian MadhavanMr. Thomas SieberMs. Nishi VasudevaMr. Deepak KapoorMr. Mohan ChellappaMr. Simon John EnglandMs. Vanitha Narayanan (appointed w.e.f. 19 July 2021)
Non-Executive & Non-Independent DirectorsMs. Roshni Nadar Malhotra, ChairpersonMr. Shikhar Neelkamal Malhotra
Others (Significant influence)Mr. Shiv Nadar (ceased to be Managing Director w.e.f. 19 July 2021)Mrs. Kiran NadarHCL Infosystems Limited SSN Trust *HCL Avitas Private Limited HCL IT City Lucknow Private LimitedVama Sundari Investments (Delhi) Private Limited HCL Infotech LimitedHCL Corporation Private Limited Shiv Nadar UniversitySSN Investments (Pondi) Private Limited HCL Holding Private LimitedNaksha Enterprises Private Limited Shiv Nadar Foundation *Kiran Nadar Musuem of Art *
* Public Charitable Trusts in which Mr. Shiv Nadar or his family members are managing trustees.
Mr. C. Vijayakumar – Chief Executive Officer and Managing director (appointed Managing Director w.e.f. 20 July 2021)
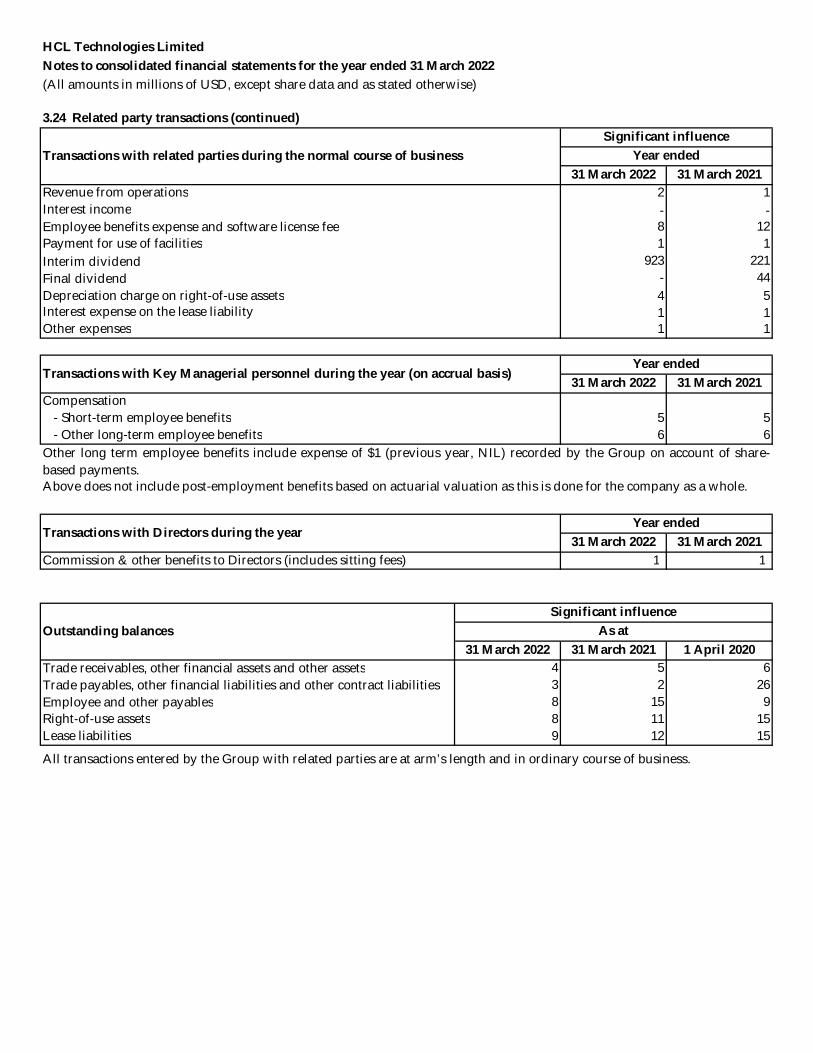
HCL Technologies LimitedNotes to consolidated financial statements for the year ended 31 March 2022(All amounts in millions of USD, except share data and as stated otherwise)
3.24 Related party transactions (continued)
31 March 2022 31 March 2021Revenue from operations 2 1 Interest income - - Employee benefits expense and software license fee 8 12 Payment for use of facilities 1 1 Interim dividend 923 221 Final dividend - 44 Depreciation charge on right-of-use assets 4 5 Interest expense on the lease liability 1 1 Other expenses 1 1
31 March 2022 31 March 2021Compensation
- Short-term employee benefits 5 5 - Other long-term employee benefits 6 6
Above does not include post-employment benefits based on actuarial valuation as this is done for the company as a whole.
31 March 2022 31 March 20211 1
31 March 2022 31 March 2021 1 April 2020Trade receivables, other financial assets and other assets 4 5 6 Trade payables, other financial liabilities and other contract liabilities 3 2 26 Employee and other payables 8 15 9 Right-of-use assets 8 11 15 Lease liabilities 9 12 15
Year endedSignificant influence
Year endedTransactions with Key Managerial personnel during the year (on accrual basis)
Transactions with related parties during the normal course of business
All transactions entered by the Group with related parties are at arm’s length and in ordinary course of business.
Commission & other benefits to Directors (includes sitting fees)
Other long term employee benefits include expense of $1 (previous year, NIL) recorded by the Group on account of share-based payments.
Transactions with Directors during the yearYear ended
Outstanding balances As atSignificant influence
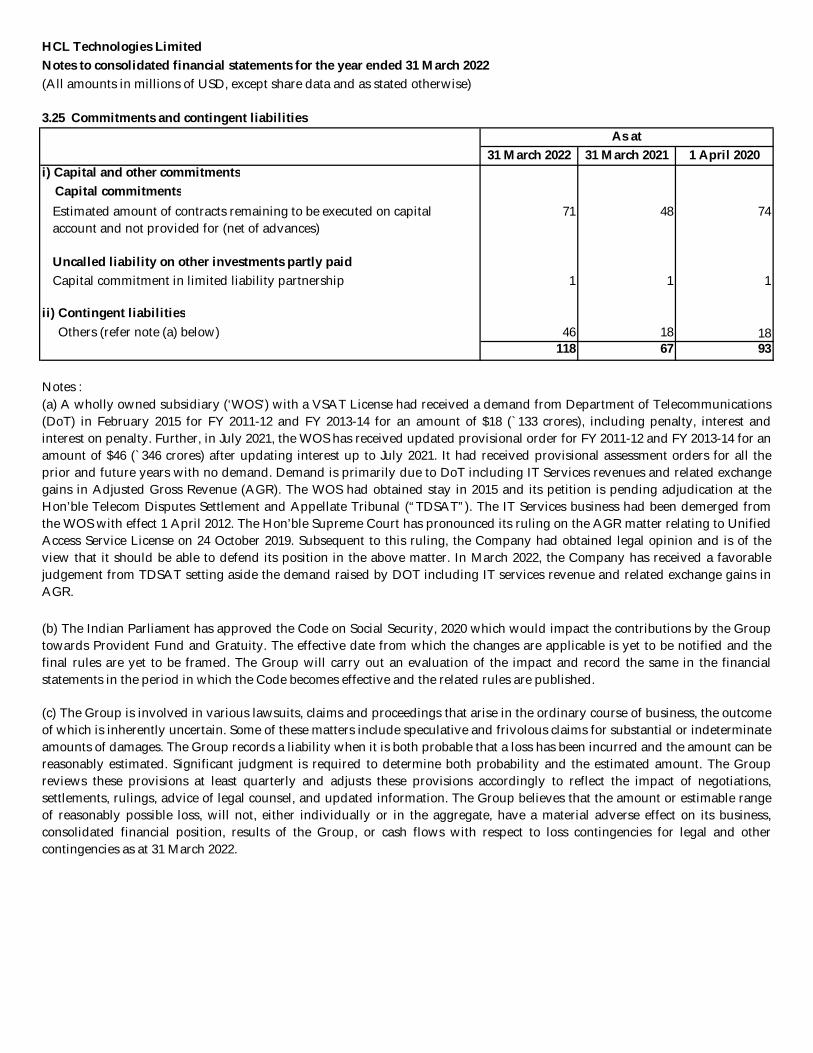
HCL Technologies LimitedNotes to consolidated financial statements for the year ended 31 March 2022(All amounts in millions of USD, except share data and as stated otherwise)
3.25 Commitments and contingent liabilities
31 March 2022 31 March 2021 1 April 2020i) Capital and other commitments Capital commitments
Estimated amount of contracts remaining to be executed on capital account and not provided for (net of advances)
71 48 74
Uncalled liability on other investments partly paidCapital commitment in limited liability partnership 1 1 1
ii) Contingent liabilities Others (refer note (a) below) 46 18 18
118 67 93
Notes :
As at
(c) The Group is involved in various lawsuits, claims and proceedings that arise in the ordinary course of business, the outcomeof which is inherently uncertain. Some of these matters include speculative and frivolous claims for substantial or indeterminateamounts of damages. The Group records a liability when it is both probable that a loss has been incurred and the amount can bereasonably estimated. Significant judgment is required to determine both probability and the estimated amount. The Groupreviews these provisions at least quarterly and adjusts these provisions accordingly to reflect the impact of negotiations,settlements, rulings, advice of legal counsel, and updated information. The Group believes that the amount or estimable rangeof reasonably possible loss, will not, either individually or in the aggregate, have a material adverse effect on its business,consolidated financial position, results of the Group, or cash flows with respect to loss contingencies for legal and othercontingencies as at 31 March 2022.
(a) A wholly owned subsidiary (‘WOS’) with a VSAT License had received a demand from Department of Telecommunications(DoT) in February 2015 for FY 2011-12 and FY 2013-14 for an amount of $18 (`133 crores), including penalty, interest andinterest on penalty. Further, in July 2021, the WOS has received updated provisional order for FY 2011-12 and FY 2013-14 for anamount of $46 (`346 crores) after updating interest up to July 2021. It had received provisional assessment orders for all theprior and future years with no demand. Demand is primarily due to DoT including IT Services revenues and related exchangegains in Adjusted Gross Revenue (AGR). The WOS had obtained stay in 2015 and its petition is pending adjudication at theHon’ble Telecom Disputes Settlement and Appellate Tribunal (“TDSAT”). The IT Services business had been demerged fromthe WOS with effect 1 April 2012. The Hon’ble Supreme Court has pronounced its ruling on the AGR matter relating to UnifiedAccess Service License on 24 October 2019. Subsequent to this ruling, the Company had obtained legal opinion and is of theview that it should be able to defend its position in the above matter. In March 2022, the Company has received a favorablejudgement from TDSAT setting aside the demand raised by DOT including IT services revenue and related exchange gains inAGR.
(b) The Indian Parliament has approved the Code on Social Security, 2020 which would impact the contributions by the Grouptowards Provident Fund and Gratuity. The effective date from which the changes are applicable is yet to be notified and thefinal rules are yet to be framed. The Group will carry out an evaluation of the impact and record the same in the financialstatements in the period in which the Code becomes effective and the related rules are published.
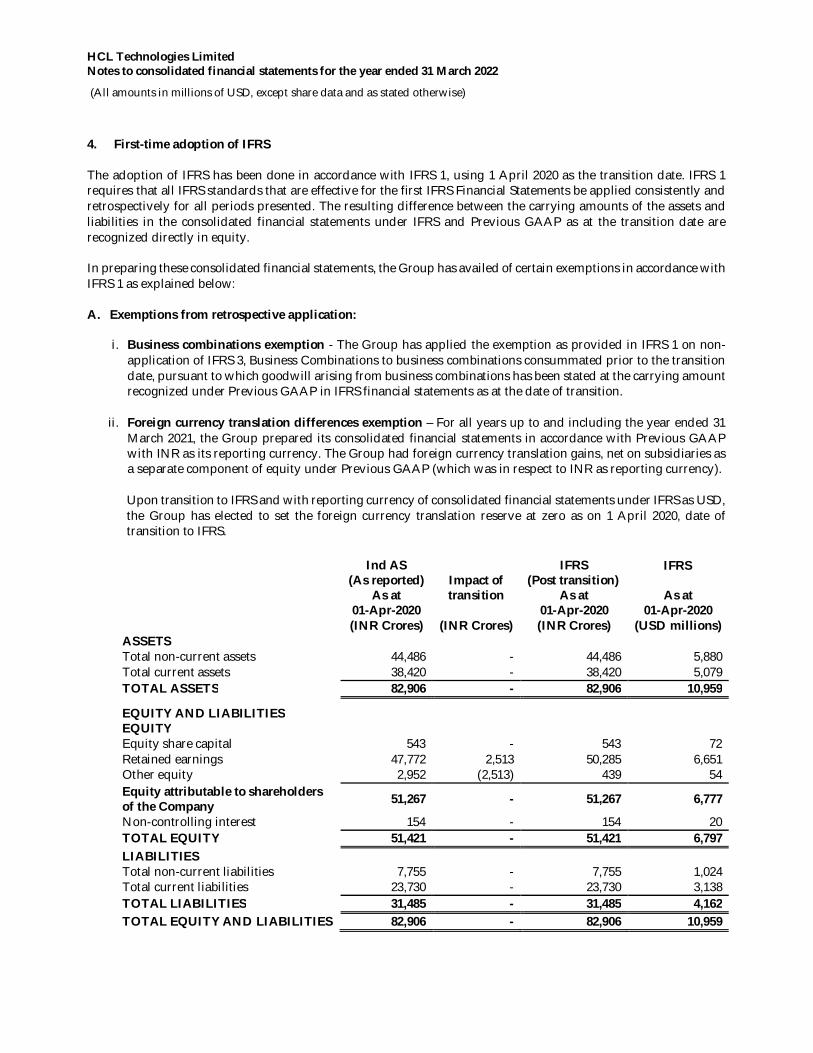
HCL Technologies Limited Notes to consolidated financial statements for the year ended 31 March 2022
(All amounts in millions of USD, except share data and as stated otherwise)
4. First-time adoption of IFRS The adoption of IFRS has been done in accordance with IFRS 1, using 1 April 2020 as the transition date. IFRS 1 requires that all IFRS standards that are effective for the first IFRS Financial Statements be applied consistently and retrospectively for all periods presented. The resulting difference between the carrying amounts of the assets and liabilities in the consolidated financial statements under IFRS and Previous GAAP as at the transition date are recognized directly in equity. In preparing these consolidated financial statements, the Group has availed of certain exemptions in accordance with IFRS 1 as explained below: A. Exemptions from retrospective application:
i. Business combinations exemption - The Group has applied the exemption as provided in IFRS 1 on non-application of IFRS 3, Business Combinations to business combinations consummated prior to the transition date, pursuant to which goodwill arising from business combinations has been stated at the carrying amount recognized under Previous GAAP in IFRS financial statements as at the date of transition.
ii. Foreign currency translation differences exemption – For all years up to and including the year ended 31
March 2021, the Group prepared its consolidated financial statements in accordance with Previous GAAP with INR as its reporting currency. The Group had foreign currency translation gains, net on subsidiaries as a separate component of equity under Previous GAAP (which was in respect to INR as reporting currency). Upon transition to IFRS and with reporting currency of consolidated financial statements under IFRS as USD, the Group has elected to set the foreign currency translation reserve at zero as on 1 April 2020, date of transition to IFRS.
Ind AS
(As reported) Impact of transition
IFRS (Post transition)
IFRS
As at As at As at 01-Apr-2020 01-Apr-2020 01-Apr-2020 (INR Crores) (INR Crores) (INR Crores) (USD millions)
ASSETS
Total non-current assets 44,486 - 44,486 5,880 Total current assets 38,420 - 38,420 5,079 TOTAL ASSETS 82,906 - 82,906 10,959 EQUITY AND LIABILITIES
EQUITY
Equity share capital 543 - 543 72 Retained earnings 47,772 2,513 50,285 6,651 Other equity 2,952 (2,513) 439 54 Equity attributable to shareholders of the Company 51,267 - 51,267 6,777
Non-controlling interest 154 - 154 20 TOTAL EQUITY 51,421 - 51,421 6,797 LIABILITIES
Total non-current liabilities 7,755 - 7,755 1,024 Total current liabilities 23,730 - 23,730 3,138 TOTAL LIABILITIES 31,485 - 31,485 4,162 TOTAL EQUITY AND LIABILITIES 82,906 - 82,906 10,959
HCL Technologies Limited Notes to consolidated financial statements for the year ended 31 March 2022
(All amounts in millions of USD, except share data and as stated otherwise)
B. Reconciliations:
The following reconciliations provide a quantification of the effect of the transition to IFRS from Previous GAAP in accordance with IFRS 1:
i. Equity as at 1 April 2020 (Transition date) and as at 31 March 2021
The transition from Previous GAAP to IFRS had no impact on the equity of the Group.
ii. Consolidated Statement of Profit or Loss and Consolidated Statement of Profit or Loss and other comprehensive income for the year ended 31 March 2021 The transition from Previous GAAP to IFRS had no impact on the consolidated statement of profit or loss and consolidated statement of profit or loss and other comprehensive income.
iii. Consolidated Statement of Cash Flows for the year ended 31 March 2021
The transition from Previous GAAP to IFRS had no impact on the consolidated statement of cash flows.
5. Subsequent events
(a) The Board of Directors at its meeting held on 21 April 2022 has declared an interim dividend of `18 per share.
(b) On 14 January 2022, the Group through a wholly owned subsidiary has signed a definitive agreement to acquire 100% shareholding of Starschema, a leading provider of data engineering services, based in Budapest, Hungary for a consideration of $43 payable in cash. Starschema provides consulting, technology and managed services in data engineering to Global 2000 companies in the U.S. and Europe. The strategic acquisition will bolster HCL’s capability in digital engineering -- driven by data engineering -- and increase its presence in Central and Eastern Europe. The acquisition was consummated on 2 April 2022.