HCL Technologies (HCLTEC) - ICICIdirect
14
October 24, 2016 ICICI Securities Ltd | Retail Equity Research Result Update Surprise reiteration of guidance… • HCL Tech reported a good set of Q2FY17 numbers with dollar revenue growth in line with our estimates while EBIT margins were above our estimates • Dollar revenues grew 1.9% QoQ to $1,722million, in line with our 2.0% growth and $1,725 million estimate • Revenues in rupees grew 1.6% QoQ to | 11,519 crore, in line with | 11,551 crore estimate (average rupee realised 67.08 vs. 66.96 assumed) • At 20.1%, EBIT margins declined only 50 bps QoQ on account of partial wage hike above our 100 bps decline and 19.6% estimate • PAT of | 2,014 crore was above our | 1,977 crore estimate led by the margin beat • The company announced an interim dividend of | 6/share Reiterates its revenue growth guidance of 12-14% in CC… HCL Tech’s dollar revenues grew robustly 1.9% QoQ to $1,722 million. Constant currency (CC) revenue grew 2.8% QoQ vs. 6.0% in the previous quarter. HCL Tech continues to perform well in its core segment i.e. IMS (40.3% of revenues), which grew 4.4% QoQ on top of 16.5% QoQ growth in Q1FY17. On the other hand, application services (37.8% of revenues) grew 1.4% sequentially while BPO business recovered after two quarters with 2.1% QoQ growth. Going ahead, the management maintained its revenue growth guidance of 12-14% in CC terms translating into 11.0%- 13.0% in dollar terms (based on September end rates). However, FY17E guidance does not include Butler and Geometric acquisition. Acquires Butler America Aerospace, extended IP partnership HCL Tech acquired Butler America Aerospace, a provider of engineering and design services to US aerospace and defence customers. US$85 million is to be paid in cash for transaction while the deal is expected to be EPS accretive. Butler America aerospace had US$85.4 million in revenue (CY15) with 12.5% EBIT margin. It has 900 highly skilled engineers with seven design centres in US and caters to marquee list of clients in aerospace & defence. Acquisition may bolster HCL’s enginnering and R&D services (17.8% of revenues) and provide access to clients with large R&D spend. HCL also “extended” its IP partnership with IBM to cover API/web service enablement for mainframes where it would be investing ~US$55 million. It could garner US$5 million in revenue by FY17E and ~US$15 million in revenue over the period of partnership. Margin better than expectations; reiterates its margin guidance… At 20.1%, EBIT margins declined only 50 bps QoQ above our 19.6% estimate. Margins declined mainly on account of a partial wage hike impact (80 bps in Q2). As per management, wage hike would impact margins by 70 bps, 10 bps in Q3FY17, Q4FY17, respectively. Overall, the management reiterated its guidance for 19.5-20.5% margins in FY17E. Guidance provides visibility, maintain BUY… HCL Tech maintained its guidance for FY17E, providing visibility on revenue growth and margin. We expect HCLT to report revenue, PAT CAGR of 12%, 7% in FY15-18E with average 20.1% EBIT margins during FY16-18E compared to 24%, 41% in FY10-15, respectively, with 18.8% margins led by order book conversion and steady execution. We maintain our BUY recommendation with a target price of | 950 (15x FY18 EPS). Rating matrix Rating : Buy Target : | 950 Target Period : 12 months Potential Upside : 14% What’s Changed? Target Unchanged EPS FY17E Changed from | 57.2 to | 58.3 EPS FY18E Changed from | 63.2 to | 63.8 Rating Unchanged Quarterly Performance Q2FY17 Q2FY16 YoY (%) Q1FY17 QoQ (%) Revenue 11,519 10,341 11.4 11,336 1.6 EBIT 2,318 2,072 11.9 2,333 (0.7) EBIT (%) 20.1 20.0 9 bps 20.6 -46 bps PAT 2,014 1,920 4.9 2,047 (1.6) Key Financials | Crore FY15 FY16 FY17E FY18E Net Sales 37,061 30,781 47,900 53,443 EBITDA 8,069 6,148 9,697 10,662 Net Profit 7,317 5,643 8,230 9,014 EPS (|) 51.8 40.0 58.3 63.8 Valuation summary FY15 FY16 FY17E FY18E P/E 16.0 20.8 14.2 13.0 Target P/E 18.4 23.9 16.4 15.0 EV / EBITDA 12.6 16.6 9.8 8.6 P/BV 4.8 4.3 3.7 3.2 RoNW (%) 30.2 20.7 25.9 24.6 RoCE (%) 35.3 23.5 31.0 29.9 Stock data Particular Amount Market Capitalization (| Crore) 117,171.0 Total Debt (March-15) (| Crore) 523.4 Cash (March-15) (| Crore) 9,786.2 EV (| Crore) 101,270.0 52 week H/L 986 / 707 Equity capital 282.1 Face value | 2 Price performance (%) 1M 3M 6M 12M TCS 5.0 4.5 (4.3) (2.8) Infosys 2.5 11.2 3.3 10.2 Wipro 3.4 (0.4) (7.1) (10.6) HCL Tech (0.5) (1.7) (15.3) (10.8) Research Analyst Deepak Purswani, CFA [email protected] Tushar Wavhal [email protected] Deepti Tayal [email protected] HCL Technologies (HCLTEC) | 830
-
Upload
khangminh22 -
Category
Documents
-
view
2 -
download
0
Transcript of HCL Technologies (HCLTEC) - ICICIdirect

October 24, 2016
ICICI Securities Ltd | Retail Equity Research
Result Update
Surprise reiteration of guidance… • HCL Tech reported a good set of Q2FY17 numbers with dollar
revenue growth in line with our estimates while EBIT margins were above our estimates
• Dollar revenues grew 1.9% QoQ to $1,722million, in line with our 2.0% growth and $1,725 million estimate
• Revenues in rupees grew 1.6% QoQ to | 11,519 crore, in line with | 11,551 crore estimate (average rupee realised 67.08 vs. 66.96 assumed)
• At 20.1%, EBIT margins declined only 50 bps QoQ on account of partial wage hike above our 100 bps decline and 19.6% estimate
• PAT of | 2,014 crore was above our | 1,977 crore estimate led by the margin beat
• The company announced an interim dividend of | 6/share Reiterates its revenue growth guidance of 12-14% in CC… HCL Tech’s dollar revenues grew robustly 1.9% QoQ to $1,722 million. Constant currency (CC) revenue grew 2.8% QoQ vs. 6.0% in the previous quarter. HCL Tech continues to perform well in its core segment i.e. IMS (40.3% of revenues), which grew 4.4% QoQ on top of 16.5% QoQ growth in Q1FY17. On the other hand, application services (37.8% of revenues) grew 1.4% sequentially while BPO business recovered after two quarters with 2.1% QoQ growth. Going ahead, the management maintained its revenue growth guidance of 12-14% in CC terms translating into 11.0%-13.0% in dollar terms (based on September end rates). However, FY17E guidance does not include Butler and Geometric acquisition. Acquires Butler America Aerospace, extended IP partnership HCL Tech acquired Butler America Aerospace, a provider of engineering and design services to US aerospace and defence customers. US$85 million is to be paid in cash for transaction while the deal is expected to be EPS accretive. Butler America aerospace had US$85.4 million in revenue (CY15) with 12.5% EBIT margin. It has 900 highly skilled engineers with seven design centres in US and caters to marquee list of clients in aerospace & defence. Acquisition may bolster HCL’s enginnering and R&D services (17.8% of revenues) and provide access to clients with large R&D spend. HCL also “extended” its IP partnership with IBM to cover API/web service enablement for mainframes where it would be investing ~US$55 million. It could garner US$5 million in revenue by FY17E and ~US$15 million in revenue over the period of partnership. Margin better than expectations; reiterates its margin guidance… At 20.1%, EBIT margins declined only 50 bps QoQ above our 19.6% estimate. Margins declined mainly on account of a partial wage hike impact (80 bps in Q2). As per management, wage hike would impact margins by 70 bps, 10 bps in Q3FY17, Q4FY17, respectively. Overall, the management reiterated its guidance for 19.5-20.5% margins in FY17E. Guidance provides visibility, maintain BUY… HCL Tech maintained its guidance for FY17E, providing visibility on revenue growth and margin. We expect HCLT to report revenue, PAT CAGR of 12%, 7% in FY15-18E with average 20.1% EBIT margins during FY16-18E compared to 24%, 41% in FY10-15, respectively, with 18.8% margins led by order book conversion and steady execution. We maintain our BUY recommendation with a target price of | 950 (15x FY18 EPS).
Rating matrix Rating : BuyTarget : | 950Target Period : 12 monthsPotential Upside : 14%
What’s Changed?
Target UnchangedEPS FY17E Changed from | 57.2 to | 58.3EPS FY18E Changed from | 63.2 to | 63.8Rating Unchanged
Quarterly Performance
Q2FY17 Q2FY16 YoY (%) Q1FY17 QoQ (%)Revenue 11,519 10,341 11.4 11,336 1.6 EBIT 2,318 2,072 11.9 2,333 (0.7) EBIT (%) 20.1 20.0 9 bps 20.6 -46 bpsPAT 2,014 1,920 4.9 2,047 (1.6)
Key Financials | Crore FY15 FY16 FY17E FY18ENet Sales 37,061 30,781 47,900 53,443 EBITDA 8,069 6,148 9,697 10,662 Net Profit 7,317 5,643 8,230 9,014 EPS (|) 51.8 40.0 58.3 63.8
Valuation summary
FY15 FY16 FY17E FY18EP/E 16.0 20.8 14.2 13.0 Target P/E 18.4 23.9 16.4 15.0 EV / EBITDA 12.6 16.6 9.8 8.6 P/BV 4.8 4.3 3.7 3.2 RoNW (%) 30.2 20.7 25.9 24.6 RoCE (%) 35.3 23.5 31.0 29.9
Stock data Particular AmountMarket Capitalization (| Crore) 117,171.0
Total Debt (March-15) (| Crore) 523.4 Cash (March-15) (| Crore) 9,786.2
EV (| Crore) 101,270.0 52 week H/L 986 / 707
Equity capital 282.1 Face value | 2
Price performance (%)
1M 3M 6M 12M
TCS 5.0 4.5 (4.3) (2.8) Infosys 2.5 11.2 3.3 10.2 Wipro 3.4 (0.4) (7.1) (10.6) HCL Tech (0.5) (1.7) (15.3) (10.8)
Research Analyst
Deepak Purswani, CFA [email protected] Tushar Wavhal [email protected] Deepti Tayal [email protected]
HCL Technologies (HCLTEC) | 830
ICICI Securities Ltd | Retail Equity Research Page 2
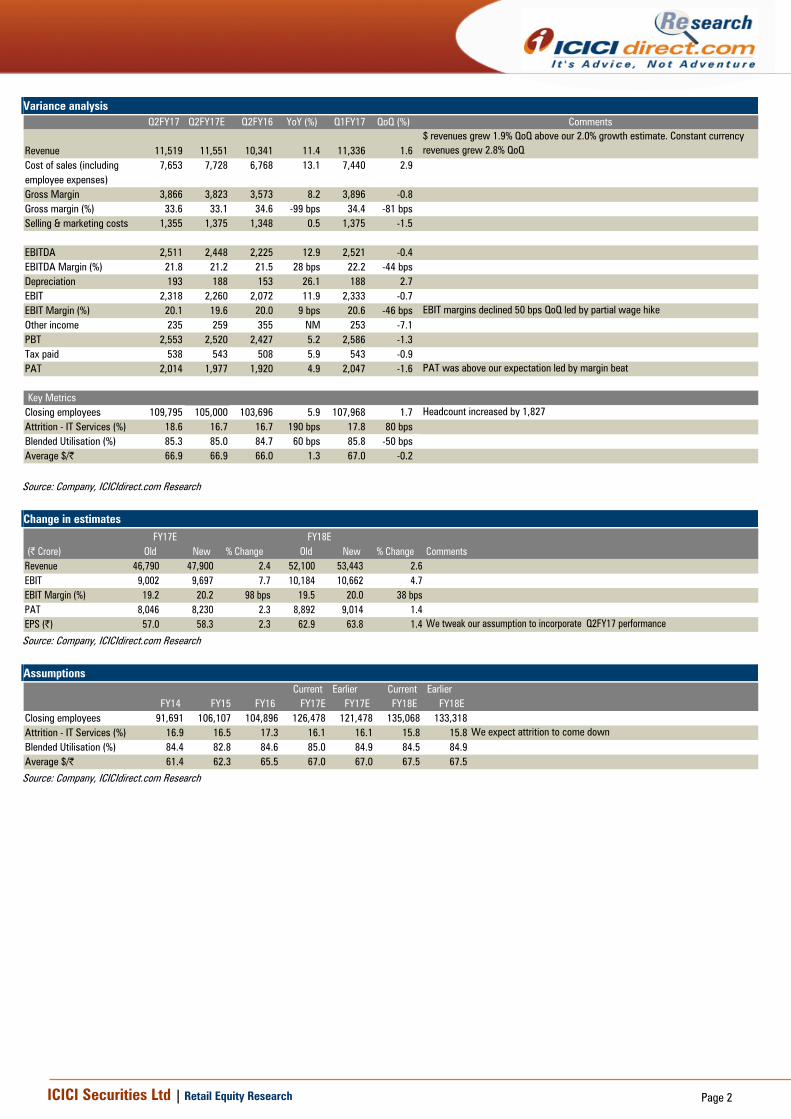
Variance analysis Q2FY17 Q2FY17E Q2FY16 YoY (%) Q1FY17 QoQ (%) Comments
Revenue 11,519 11,551 10,341 11.4 11,336 1.6$ revenues grew 1.9% QoQ above our 2.0% growth estimate. Constant currency revenues grew 2.8% QoQ
Cost of sales (including 7,653 7,728 6,768 13.1 7,440 2.9employee expenses)Gross Margin 3,866 3,823 3,573 8.2 3,896 -0.8Gross margin (%) 33.6 33.1 34.6 -99 bps 34.4 -81 bpsSelling & marketing costs 1,355 1,375 1,348 0.5 1,375 -1.5
EBITDA 2,511 2,448 2,225 12.9 2,521 -0.4EBITDA Margin (%) 21.8 21.2 21.5 28 bps 22.2 -44 bpsDepreciation 193 188 153 26.1 188 2.7EBIT 2,318 2,260 2,072 11.9 2,333 -0.7EBIT Margin (%) 20.1 19.6 20.0 9 bps 20.6 -46 bps EBIT margins declined 50 bps QoQ led by partial wage hike Other income 235 259 355 NM 253 -7.1PBT 2,553 2,520 2,427 5.2 2,586 -1.3Tax paid 538 543 508 5.9 543 -0.9PAT 2,014 1,977 1,920 4.9 2,047 -1.6 PAT was above our expectation led by margin beat
Key MetricsClosing employees 109,795 105,000 103,696 5.9 107,968 1.7 Headcount increased by 1,827Attrition - IT Services (%) 18.6 16.7 16.7 190 bps 17.8 80 bpsBlended Utilisation (%) 85.3 85.0 84.7 60 bps 85.8 -50 bpsAverage $/| 66.9 66.9 66.0 1.3 67.0 -0.2
Source: Company, ICICIdirect.com Research Change in estimates
(| Crore) Old New % Change Old New % Change CommentsRevenue 46,790 47,900 2.4 52,100 53,443 2.6EBIT 9,002 9,697 7.7 10,184 10,662 4.7EBIT Margin (%) 19.2 20.2 98 bps 19.5 20.0 38 bpsPAT 8,046 8,230 2.3 8,892 9,014 1.4EPS (|) 57.0 58.3 2.3 62.9 63.8 1.4 We tweak our assumption to incorporate Q2FY17 performance
FY17E FY18E
Source: Company, ICICIdirect.com Research Assumptions
Current Earlier Current EarlierFY14 FY15 FY16 FY17E FY17E FY18E FY18E
Closing employees 91,691 106,107 104,896 126,478 121,478 135,068 133,318Attrition - IT Services (%) 16.9 16.5 17.3 16.1 16.1 15.8 15.8 We expect attrition to come downBlended Utilisation (%) 84.4 82.8 84.6 85.0 84.9 84.5 84.9Average $/| 61.4 62.3 65.5 67.0 67.0 67.5 67.5
Source: Company, ICICIdirect.com Research

ICICI Securities Ltd | Retail Equity Research Page 3
Conference call highlights…
• C Vijaykumar has been elevated from chief operating officer to President & CEO. Anant Gupta has resigned to pursue his personal interest outside HCL. C Vijaykumar would continue to be based in the US
• The management expects FY17 revenues to grow in the range of 12.0-14.0% in constant currency terms based on FY16 (April-March) exchange rates. Based on the September rate, revenue is expected to grow 11-13% in dollar terms
• The FY17 guidance does not include revenues from Geometric and Butler America Aerospace acquisition due to uncertainty of the closure of transaction and extended IP partnership with IBM
• It has extended the IP strategic partnership with IBM to cover API/web service enablement for mainframes, where HCL tech would be investing ~US$55 million and expects only US$5-6 million in revenue by FY17E and US$15 million annual revenue run rate in coming years
• HCL Tech Expects ~ $30-40 million revenue from IP partnership and US$160 million from the Volvo acquisition
• In terms of operating profit (EBIT) guidance, HCL it is expected to be maintained at 19.5-20.5% despite the wage hike impact in Q3 (-70 bps) and Q4 (-10 bps)
• HCL has signed 12 large transformational deals during the quarter with a deal pipeline higher than Q1FY17E

ICICI Securities Ltd | Retail Equity Research Page 4
Company Analysis Broad based growth across segments… In constant currency, among geographies, America led the growth (up 5.5% QoQ) while Europe declined (down 2.1% QoQ). European revenues declined mainly due to one-time project closure during the quarter and on account of high growth in Q1FY17 (~17% QoQ growth). The management also alluded that European BFSI exposure is balanced despite Deutsche Bank being the key client. Among services, infrastructure led the growth with 4.4% QoQ, engineering and R&D services (+2.3% QoQ) and business services recovered with 2.1% QoQ growth. Among verticals, growth was driven by lifesciences & healthcare (+8.2% QoQ) followed by retail & CPG (7.7% QoQ), telecom (+6.1% QoQ) and financial services (+5.6% QoQ) while manufacturing (-0.9% QoQ) and public services (-3.7% QoQ) were weak. The manufacturing vertical was impacted by large hi-tech client that reduced some spend and one engineering client that is witnessing structural offshoring. The management guided that a large number of IMS clients have less penetration among application clients and vice-versa that could be mined accordingly to demonstrate better revenue growth in coming years. Clients contributing $1 million+ increased by 12… Revenues from top 11-20 customers grew 4.9% QoQ vs. 1.4% in Q1. Top 6-10 customer revenues grew at a slower pace at 0.5% QoQ vs. 2.6% QoQ in Q1. Top five accounts slowed down (grew 1.1% QoQ vs. 8.9% in Q1). Client mining was okay. Transition of one client took place in $100 million+ bucket, 12 in $1-5 million, two to $40-50 million while there was a reduction of two clients in $10-20 million. It added one client in $30-40 million. Exhibit 1: Clients contributing $1 million+ remains flat QoQ
332397 428 429
476 486 494 482 482 482 494
0
100
200
300
400
500
600
FY11
FY12
FY13
FY14
FY15
Q1FY
16
Q2FY
16
Q3FY
16
FY16
Q1FY
17
Q2FY
17
Clients contributing $1 million+
Source: Company, ICICIdirect.com Research

ICICI Securities Ltd | Retail Equity Research Page 5
Exhibit 2: HCL growth vs. Nasscom guidance
31.1
17.110.2
13.0 13.0 13.0 11.012.9 14.4
11.1
-21.1
10.7
18.7
16.5
-30
-20
-10
0
10
20
30
40
FY11 FY12 FY13 FY14 FY15 FY16 FY17E
%Growth, YoY NASSCOM guidance (mid-point)
Source: Company, ICICIdirect.com Research
Exhibit 3: Dollar revenues may grow at 9% CAGR during FY15-18E
35454152
5952
1545 1566 1587
46994686
5359
1691 1722
71497917
6.5
31.1
17.112.9
14.4 11.1 7.8 5.0
10.0 11.5
10.7
0
1800
3600
5400
7200
9000
FY11
FY12
FY13
FY14
FY15
Q1FY
16
Q2FY
16
Q3FY
16
FY16
Q1FY
17
Q2FY
17
FY17
E
FY18
E
$ m
illio
n
05101520253035404550
%
Dollar revenue Growth, YoY
Source: Company, ICICIdirect.com Research
Margin guidance maintained @ 19.5-20.5% … At 20.1%, EBIT margins declined only 50 bps QoQ due to partial wage hike (80 bps impact) and were above our 100 bps decline and 19.6% estimate. For FY17, the management expects the operating margin (EBIT) to be in the range of 19.5-20.5%, as guided in Q1. Wage hike would impact margins by 70 bps in Q3FY17E and 10 bps in Q4FY17E. We expect EBIT margins to be 20.2%/19.9% in FY17E/FY18E.

ICICI Securities Ltd | Retail Equity Research Page 6
Exhibit 4: EBIT margins decline 50 bps QoQ despite wage hike impact
14.016.5
19.7
24.121.8
20.6 20.0 20.8 20.0 20.6 20.1 20.2 20.0
10
14
18
22
26
30
FY11
FY12
FY13
FY14
FY15
Q1FY
16
Q2FY
16
Q3FY
16
FY16
Q1FY
17
Q2FY
17
FY17
E
FY18
E
%EBIT margin
Source: Company, ICICIdirect.com Research
Attrition remains a concern… Q2FY17 IT services attrition rose 80 bps QoQ and 230 bps YoY to 18.6% vs. increase of 50 bps QoQ in Q1 and continues to be at elevated levels. Quarterly attrition in business services increased 130 bps QoQ to 7.4% vs. 6.1% in Q1. Utilisation declined 50 bps QoQ to 85.3% vs. an increase of 20 bps QoQ in Q1. Exhibit 5: Attrition rises 80 bps QoQ; continues to be at elevated levels
16.9
14.9 14.9
16.9 16.5 16.3 16.717.3 17.3
17.818.6
16.1 15.8
10
12
14
16
18
20
FY11
FY12
FY13
FY14
FY15
Q1FY
16
Q2FY
16
Q3FY
16
FY16
Q1FY
17
Q2FY
17
FY17
E
FY18
E
%
Attrition
Source: Company, ICICIdirect.com Research

ICICI Securities Ltd | Retail Equity Research Page 7
Exhibit 6: Utilisation declined 50 bps QoQ
79.1
81.082.5
84.4
82.883.6
84.785.6
84.685.8 85.3 85.0 84.5
75
78
81
84
87
90
FY11
FY12
FY13
FY14
FY15
Q1FY
16
Q2FY
16
Q3FY
16
FY16
Q1FY
17
Q2FY
17
FY17
E
FY18
E
%Utilisation (ex-trainees)
Source: Company, ICICIdirect.com Research

ICICI Securities Ltd | Retail Equity Research Page 8
Annual report key takeaways
• HCL Tech chose “Partner To The 21st Century Enterprise” as the theme of the annual report, with the view that 21st Century Enterprise creates user-centric business models for consumers, partners and employees that drive an engaged experience through empathy, simplicity and value. According to the company, successful 21st century enterprises will be experience-centric, service-centric, agile and lean, ecosystem-driven and outcome-based
• HCL’s engineering and R&D services is the largest Indian
engineering service provider (ESP) and has helped more than 300 organisations develop and launch market-leading products and services across market segments, delivering ~ $50 billion in revenues for its customers. At present, the company works with more than 50 of the top 100 R&D spenders in the globe
• In March, 2016, the company acquired the IT divisions of Volvo IT
AB (Volvo IT), a subsidiary of AB Volvo, the holding company of the Volvo Group, providing IT services to the Volvo group as well as non- Volvo group customers worth | 895.52 crore, which was paid on March 31, 2016. The company has made payment of | 1,183 crore as purchase consideration for all the acquisitions done during the year
• Goodwill on consolidation increased to | 5921.4 crore, 22% of
Networth (FY15: | 4793.3 crore) on account of acquisitions made during the year
• Following the Companies Act, 2013, the company now has its
financial year ending on 31st March from earlier 30th June
• Due to change in financial year end, the figures of FY16 are not comparable to FY15 figures. Operating cash flow registered a decline of 31.5% YoY to | 3,797 crore. FCF declined 15.4% to | 5,703.4 crore while OCF/EBITDA declined to 58.0% from 65.4% in FY15
• HCLT paid a dividend (including dividend distribution tax) of | 16
per share in FY16 with dividend payout ratio of ~48% as compared to its peers Infosys 49.7% and TCS ~42%
• Regarding the remuneration of key managerial personnel in FY16,
Shiv Nadar (Chairman & Chief Strategy Officer) received | 12.60 crore, Anant Gupta (CEO & MD) received | 38.19 crore while Anil Chanana (CFO) received | 4.66 crore. The percentage increase in the median remuneration of employees in the financial year 2016 was 6.8%

ICICI Securities Ltd | Retail Equity Research Page 9
Outlook and valuation HCL Tech reported a good set of Q2FY17 numbers. Dollar revenue growth was in line with our estimates while EBIT margins were above our estimates. Growth in constant currency was driven by America among geographies, infrastructure and engineering and R&D among services, retail & CPG, financial services among verticals. HCL Tech maintained it guidance for FY17E, providing visibility on revenue growth and margin. Furthermore, the stock is currently trading at attractive valuation of 13.2x FY18E along with attractive dividend yield (~3%). We expect HCLT to report revenue, PAT CAGR of 12%, 7% during FY15-18E with average 20.1% EBIT margins in FY16-18E compared to 24%, 41% in FY10-15, respectively, with 18.8% margins led by order book conversion and steady execution. We maintain BUY recommendation with a revised target price of | 950 (15x FY18 EPS). Exhibit 7: One year forward rolling PE
0
200
400
600
800
1000
1200
Oct-0
7
Apr-0
8
Oct-0
8
Apr-0
9
Oct-0
9
Apr-1
0
Oct-1
0
Apr-1
1
Oct-1
1
Apr-1
2
Oct-1
2
Apr-1
3
Oct-1
3
Apr-1
4
Oct-1
4
Apr-1
5
Oct-1
5
Apr-1
6
Oct-1
6
|
Price 20 16 12 8 4
Source: Company, ICICIdirect.com Research
Exhibit 8: Valuation
Sales Growth EPS Growth PE EV/EBITDA RoNW RoCE (| cr) (%) (|) (%) (x) (x) (%) (%)
FY15 37,061 12.6 51.8 15.0 16.0 12.6 30.2 35.3 FY16 30,781 (16.9) 40.0 (22.9) 20.8 16.6 20.7 23.5 FY17E 47,900 55.6 58.3 46.0 14.2 9.8 25.9 31.0 FY18E 53,443 11.6 63.8 9.3 13.0 8.6 24.6 29.9
Source: Company, ICICIdirect.com Research

ICICI Securities Ltd | Retail Equity Research Page 10
Recommendation History vs. Consensus
200
500
800
1,100
1,400
1,700
2,000
Oct-16Aug-16May-16Mar-16Dec-15Oct-15Jul-15May-15Mar-15Dec-14Oct-14
(|)
60.0
65.0
70.0
75.0
80.0
85.0
(%)
Price Idirect target Consensus Target Mean % Consensus with BUY
Source: Bloomberg, Company, ICICIdirect.com Research Key events Date EventOct-13 The company reports 3.5% dollar revenue growth with 280 bps margin expansion led by continued momentum in IMS business
Jan-14 HCL Tech reports 4% sequential growth helped by demand uptick in core software business after being sluggish for last five quarters
Oct-14 Reports soft dollar revenue growth led by slower-than-expected growth in IMS business.
Jan-15 Reports best ever 6.2% constant currency growth in last 16 quarters led by broad based growth. HCL also announces bonus share issue of 1:1
Mar-15 HCL Tech shares trade ex-bonus post 19/03/15. Shiv Nadar Foundation sells its entire 0.79% stake in the company to support its philanthropic activities
Aug-15 Reports mixed set of Q4FY15 earnings as growth was above our estimates but margins were below. Constant currency revenues grew 2.9% QoQ
Sep-15 Guides for weak revenue growth in Q1FY16 in its pre-quarter earning briefing note led by client specific issues in ADM contract and revenue recognition delay in IMS
Oct-15 Reports soft Q1FY16 earnings. Dollar revenue growth in line with our estimates with adjusted EBIT margins better
Aug-16 CCI cleared the HCL-Geometric all equity swap deal worth $260-270 million
Sep-16 Won a contract to provide application management services for Western Australia leading energy provider, Synergy
Sep-16 Company added into 15 year partnership with IBM for automation and development
Oct-16According to media sources, HCL is the only Indian IT player among the six IT service providers shortlisted by the British Broadcasting Corporation (BBC) for a infrastructure management services (IMS) contract worth $300 million
Source: Company, ICICIdirect.com Research Top 10 Shareholders Shareholding Pattern Rank Name Latest Filing Date % O/S Position (m) Change (m)1 Vamasundari Investments (Delhi) Pvt. Ltd. 30-Jun-16 42.5% 600.1 0.02 HCL Holdings Pvt. Ltd. 30-Jun-16 17.0% 239.1 0.03 ICICI Prudential Asset Management Co. Ltd. 31-Aug-16 1.3% 18.1 -3.94 Lazard Asset Management, L.L.C. 30-Sep-16 1.2% 16.6 0.05 Artisan Partners Limited Partnership 30-Jun-16 1.1% 15.6 15.66 BlackRock Institutional Trust Company, N.A. 30-Sep-16 1.1% 15.4 0.27 The Vanguard Group, Inc. 31-Aug-16 1.1% 15.2 0.28 Reliance Nippon Life Asset Management Limited 31-Aug-16 1.0% 14.4 -0.39 HSBC Global Asset Management (Hong Kong) Limited 30-Nov-15 0.9% 13.3 -0.210 HCL Corporation, Ltd. 21-Oct-15 0.9% 12.4 -0.2
(in %) Mar-16 Jun-16 Sep-16Promoter 60.38 60.36 60.36Public 39.62 39.64 39.64Others 0.00 0.00 0.00Total 100.00 100.00 100.00
Source: Reuters, ICICIdirect.com Research Recent Activity
Investor name Value Shares Investor name Value SharesArtisan Partners Limited Partnership 168.98m 15.61m Vontobel Asset Management, Inc. -47.44m -4.08mNordea Funds Oy 34.66m 3.20m ICICI Prudential Asset Management Co. Ltd. -44.89m -3.86mInvesco Hong Kong Limited 8.69m 0.80m Fidelity Management & Research Company -16.63m -1.43mFranklin Advisers, Inc. 4.87m 0.45m Baillie Gifford & Co. -13.82m -1.28mUnigestion 3.46m 0.32m Principal Global Investors (Equity) -13.33m -1.18m
Buys Sells
Source: Reuters, ICICIdirect.com Research

ICICI Securities Ltd | Retail Equity Research Page 11
.
Financial summary
Profit and loss statement | Crore (Year-end June) FY15 FY16 FY17E FY18E
Total operating Income 37,061 30,781 47,900 53,443
Growth (%) 12.6 (16.9) 55.6 11.6
Direct costs 22,823 19,969 31,375 35,059
S,G&A expenses 5,406 4,271 5,796 6,573
Other expenses - - - -
Total Operating Expenditure 28,229 24,240 37,171 41,632
EBITDA 8,473 6,541 10,730 11,811
Growth (%) (2.2) (22.8) 64.0 10.1
Depreciation 404 393 958 1,069
Amortisation - - 75 80
Other Income 975 756 787 894
PBT 9,044 6,904 10,484 11,556
Forex adjustments - - - -
Total Tax 1,815 1,364 2,254 2,542
PAT 7,317 5,643 8,230 9,014
Growth (%) 14.9 (22.9) 45.8 9.5
EPS (|) 51.8 40.0 58.3 63.8
Source: Company, ICICIdirect.com Research
Cash flow statement | Crore (Year-end June) FY15 FY16 FY17E FY18E
PBT 9,044 6,904 10,484 11,556
Depreciation & Amortisation 404 393 1,033 1,149
(Inc)/dec in Current Assets (2,446) (1,604) (2,805) (2,267)
Inc/(dec) in CL and Provisions 1,258 148 1,729 1,397
Taxes paid (1,774) (1,400) (2,254) (2,542)
CF from operating activities 5,539 3,797 7,399 8,398
(Inc)/dec in Investments (796) (248) 787 894
(Inc)/dec in Fixed Assets (1,202) (724) (1,198) (1,336)
CF from investing activities (2,014) (2,154) (411) (442)
Issue/(Buy back) of Equity 10 1 - -
Inc/(dec) in loan funds 199 481 (69) (69)
Dividend paid & dividend tax (2,824) (2,697) (3,776) (4,136)
Inc/(dec) in debentures (500) - - -
Others (51) (22) - -
CF from financing activities (3,140) (2,237) (3,845) (4,205)
Net Cash flow 385 (594) 3,143 3,752
Exchange difference (74) (20) - -
Opening Cash 1,027 1,338 9,285 12,429
Bank bal +unclaimed dvd. 8,448 8,562 8,562 8,562
Cash c/f to balance sheet 9,786 9,285 20,990 24,742
Source: Company, ICICIdirect.com Research
Balance sheet | Crore
(Year-end June) FY15 FY16 FY17E FY18E
Liabilities
Equity Capital 281 282 282 282
Reserve and Surplus 23,943 27,012 31,466 36,343
Total Shareholders funds 24,224 27,294 31,748 36,625
Long term borrowings 168 737 669 600
Other long term liabilities 825 841 907 961
Minority Interest / Others 82 312 312 312
Total Liabilities 25,300 29,184 33,635 38,498
Assets
Gross Block 13,125 15,198 16,396 17,732
Less: Acc Depreciation 4,850 5,243 6,276 7,425
Net Block 8,275 9,955 10,120 10,307
Capital WIP 552 606 606 606
Investments 107 321 321 321
Liquid investments 763 535 535 535
Inventory 158 264 309 344
Debtors 6,539 7,682 8,966 10,003
Loans and Advances -short 2,189 3,340 3,898 4,349
Other Current Assets 3,613 3,754 4,381 4,888
Cash 9,786 9,285 12,429 16,180
Total Current Assets 22,284 24,325 29,982 35,765
Short term borrowings 355 214 214 214
Trade payables 625 700 817 911
Current liabilities 7,231 7,442 8,686 9,691
Total Current Liabilities 8,964 9,246 10,791 12,040
Net Current Assets 13,320 15,080 19,192 23,726
Deferred tax assets 790 826 826 826
Application of Funds 25,300 29,184 33,635 38,498
Source: Company, ICICIdirect.com Research
Key ratios (Year-end June) FY15 FY16 FY17E FY18E
Per share data (|)
EPS 51.8 40.0 58.3 63.8
Cash EPS 54.7 42.7 65.7 71.9
BV 171.6 193.2 225.1 259.2
DPS 30.0 16.0 26.7 29.3
Cash Per Share 69.3 65.7 88.1 114.5
Operating Ratios (%)
EBIT Margin 21.8 20.0 20.2 20.0
PBT Margin 24.4 22.4 21.9 21.6
PAT Margin 19.7 18.3 17.2 16.9
Inventory days 2 3 2 2
Debtor days 64 91 68 68
Creditor days 6 8 6 6
Return Ratios (%)
RoE 30.2 20.7 25.9 24.6
RoCE 35.3 23.5 31.0 29.9
RoIC 71.5 40.0 59.2 61.8
Valuation Ratios (x)
P/E 16.0 20.8 14.2 13.0
EV / EBITDA 12.6 16.6 9.8 8.6
EV / Net Sales 2.9 3.5 2.2 1.9
Market Cap / Sales 3.2 3.8 2.4 2.2
Price to Book Value 4.8 4.3 3.7 3.2
Solvency Ratios
Debt/EBITDA 0.1 0.1 0.1 0.1
Debt / Equity 0.0 0.0 0.0 0.0
Current Ratio 1.3 1.5 1.5 1.5
Quick Ratio 1.3 1.5 1.5 1.5
Source: Company, ICICIdirect.com Research

ICICI Securities Ltd | Retail Equity Research Page 12
ICICIdirect.com coverage universe (IT) CMP M Cap EPS (|) P/E (x) RoCE (%)(|) TP(|) Rating (| Cr) FY16 FY17E FY18E FY16 FY17E FY18E FY16 FY17E FY18E FY16 FY17E FY18E FY16 FY17E FY18E
Cyient (INFENT) 510 540 Hold 5,742 29.0 33.8 39.0 17.6 15.1 13.1 11.9 9.7 8.2 20.3 20.8 21.8 17.1 17.7 18.1Eclerx (ECLSER) 1,620 1,412 Sell 6,679 87.9 90.5 100.9 18.4 17.9 16.0 12.6 11.9 10.4 42.7 38.0 36.2 33.5 29.6 28.1Firstsource (FIRSOU) 40 54 Buy 2,655 4.0 5.1 5.7 10.6 8.3 7.4 8.1 6.4 4.9 10.6 12.4 14.5 12.7 14.0 13.8HCL Tech (HCLTEC) 809 950 Buy 114,178 40.0 57.0 62.9 20.2 14.2 12.9 16.1 10.1 8.8 23.5 28.7 28.0 20.7 24.6 23.5Infosys (INFTEC) 1,038 1,175 Buy 237,237 59.0 62.3 69.1 17.6 16.7 15.0 11.9 10.5 9.1 30.2 29.0 28.9 21.8 20.7 20.6KPIT Tech (KPISYS) 140 150 Hold 2,786 14.1 12.9 14.3 9.9 10.8 9.8 6.0 7.0 6.0 23.7 19.6 19.6 20.4 16.2 15.6Mindtree (MINCON) 477 595 Hold 8,010 32.9 34.6 39.5 14.5 13.8 12.1 9.6 8.2 7.3 31.2 29.5 30.9 24.2 23.2 23.9NIIT Technologies (NIITEC) 411 450 Hold 2,495 45.8 37.6 45.2 8.9 9.2 9.1 4.4 4.3 3.8 28.6 26.0 25.8 17.6 13.1 14.3Persistent (PSYS) 690 690 Hold 5,122 37.2 40.0 47.0 18.3 17.0 14.5 11.2 9.3 7.4 27.9 27.3 28.1 21.2 20.4 20.7TCS (TCS) 2,400 2,600 Buy 470,088 123.2 132.2 144.7 19.1 17.8 16.2 15.1 13.6 12.2 41.2 36.8 34.1 33.1 29.5 27.2Tech Mahindra (TECMAH) 421 600 Buy 41,357 34.5 34.0 38.1 12.2 12.4 11.1 9.1 8.0 6.7 27.7 27.5 26.9 23.1 21.4 20.9Wipro (WIPRO) 479 560 Hold 118,027 36.1 33.7 37.5 13.3 14.2 12.8 8.6 8.7 7.1 20.7 18.3 17.9 17.9 15.4 14.6
RoE (%)Sector / Company
EV/EBITDA (x)
Company, ICICIdirect.com Research

ICICI Securities Ltd | Retail Equity Research Page 13
RATING RATIONALE ICICIdirect.com endeavours to provide objective opinions and recommendations. ICICIdirect.com assigns ratings to its stocks according to their notional target price vs. current market price and then categorises them as Strong Buy, Buy, Hold and Sell. The performance horizon is two years unless specified and the notional target price is defined as the analysts' valuation for a stock. Strong Buy: >15%/20% for large caps/midcaps, respectively, with high conviction; Buy: >10%/15% for large caps/midcaps, respectively; Hold: Up to +/-10%; Sell: -10% or more;
Pankaj Pandey Head – Research [email protected]
ICICIdirect.com Research Desk, ICICI Securities Limited, 1st Floor, Akruti Trade Centre, Road No 7, MIDC, Andheri (East) Mumbai – 400 093
ICICI Securities Ltd | Retail Equity Research Page 14
ANALYST CERTIFICATION We /I, Deepak Purswani, CFA MBA (Finance), Tushar Wavhal, MBA, Deepti Tayal, MBA, Research Analysts, authors and the names subscribed to this report, hereby certify that all of the views expressed in this research report accurately reflect our views about the subject issuer(s) or securities. We also certify that no part of our compensation was, is, or will be directly or indirectly related to the specific recommendation(s) or view(s) in this report.
Terms & conditions and other disclosures: ICICI Securities Limited is a Sebi registered Research Analyst having registration no. INH000000990. ICICI Securities Limited (ICICI Securities) is full-service, integrated investment banking and is, inter alia, engaged in the business of stock brokering and distribution of financial products. ICICI Securities is a wholly-owned subsidiary of ICICI Bank which is India’s largest private sector bank and has its various subsidiaries engaged in businesses of housing finance, asset management, life insurance, general insurance, venture capital fund management, etc. (“associates”), the details in respect of which are available on www.icicibank.com ICICI Securities is one of the leading merchant bankers/ underwriters of securities and participate in virtually all securities trading markets in India. We and our associates might have investment banking and other business relationship with a significant percentage of companies covered by our Investment Research Department. ICICI Securities generally prohibits its analysts, persons reporting to analysts and their relatives from maintaining a financial interest in the securities or derivatives of any companies that the analysts cover. The information and opinions in this report have been prepared by ICICI Securities and are subject to change without any notice. The report and information contained herein is strictly confidential and meant solely for the selected recipient and may not be altered in any way, transmitted to, copied or distributed, in part or in whole, to any other person or to the media or reproduced in any form, without prior written consent of ICICI Securities. While we would endeavour to update the information herein on a reasonable basis, ICICI Securities is under no obligation to update or keep the information current. Also, there may be regulatory, compliance or other reasons that may prevent ICICI Securities from doing so. Non-rated securities indicate that rating on a particular security has been suspended temporarily and such suspension is in compliance with applicable regulations and/or ICICI Securities policies, in circumstances where ICICI Securities might be acting in an advisory capacity to this company, or in certain other circumstances. This report is based on information obtained from public sources and sources believed to be reliable, but no independent verification has been made nor is its accuracy or completeness guaranteed. This report and information herein is solely for informational purpose and shall not be used or considered as an offer document or solicitation of offer to buy or sell or subscribe for securities or other financial instruments. Though disseminated to all the customers simultaneously, not all customers may receive this report at the same time. ICICI Securities will not treat recipients as customers by virtue of their receiving this report. Nothing in this report constitutes investment, legal, accounting and tax advice or a representation that any investment or strategy is suitable or appropriate to your specific circumstances. The securities discussed and opinions expressed in this report may not be suitable for all investors, who must make their own investment decisions, based on their own investment objectives, financial positions and needs of specific recipient. This may not be taken in substitution for the exercise of independent judgment by any recipient. The recipient should independently evaluate the investment risks. The value and return on investment may vary because of changes in interest rates, foreign exchange rates or any other reason. ICICI Securities accepts no liabilities whatsoever for any loss or damage of any kind arising out of the use of this report. Past performance is not necessarily a guide to future performance. Investors are advised to see Risk Disclosure Document to understand the risks associated before investing in the securities markets. Actual results may differ materially from those set forth in projections. Forward-looking statements are not predictions and may be subject to change without notice. ICICI Securities or its associates might have managed or co-managed public offering of securities for the subject company or might have been mandated by the subject company for any other assignment in the past twelve months. ICICI Securities or its associates might have received any compensation from the companies mentioned in the report during the period preceding twelve months from the date of this report for services in respect of managing or co-managing public offerings, corporate finance, investment banking or merchant banking, brokerage services or other advisory service in a merger or specific transaction. ICICI Securities or its associates might have received any compensation for products or services other than investment banking or merchant banking or brokerage services from the companies mentioned in the report in the past twelve months. ICICI Securities encourages independence in research report preparation and strives to minimize conflict in preparation of research report. ICICI Securities or its analysts did not receive any compensation or other benefits from the companies mentioned in the report or third party in connection with preparation of the research report. Accordingly, neither ICICI Securities nor Research Analysts have any material conflict of interest at the time of publication of this report. It is confirmed that Deepak Purswani, CFA MBA (Finance), Tushar Wavhal, MBA, Deepti Tayal, MBA, Research Analysts of this report have not received any compensation from the companies mentioned in the report in the preceding twelve months. Compensation of our Research Analysts is not based on any specific merchant banking, investment banking or brokerage service transactions. ICICI Securities or its subsidiaries collectively or Research Analysts do not own 1% or more of the equity securities of the Company mentioned in the report as of the last day of the month preceding the publication of the research report. Since associates of ICICI Securities are engaged in various financial service businesses, they might have financial interests or beneficial ownership in various companies including the subject company/companies mentioned in this report. It is confirmed that Deepak Purswani, CFA MBA (Finance), Tushar Wavhal, MBA, Deepti Tayal, MBA, Research Analysts do not serve as an officer, director or employee of the companies mentioned in the report. ICICI Securities may have issued other reports that are inconsistent with and reach different conclusion from the information presented in this report. Neither the Research Analysts nor ICICI Securities have been engaged in market making activity for the companies mentioned in the report. We submit that no material disciplinary action has been taken on ICICI Securities by any Regulatory Authority impacting Equity Research Analysis activities. This report is not directed or intended for distribution to, or use by, any person or entity who is a citizen or resident of or located in any locality, state, country or other jurisdiction, where such distribution, publication, availability or use would be contrary to law, regulation or which would subject ICICI Securities and affiliates to any registration or licensing requirement within such jurisdiction. The securities described herein may or may not be eligible for sale in all jurisdictions or to certain category of investors. Persons in whose possession this document may come are required to inform themselves of and to observe such restriction.


![Simultaneous HCl and Hg Control-Final [Compatibility Mode]](https://static.fdokumen.com/doc/165x107/6337d8c99e5ed58fcb099e56/simultaneous-hcl-and-hg-control-final-compatibility-mode.jpg)