INTEGRATED REPORT AND FINANCIAL STATEMENTS
244
INTEGRATED REPORT AND FINANCIAL STATEMENTS
-
Upload
khangminh22 -
Category
Documents
-
view
3 -
download
0
Transcript of INTEGRATED REPORT AND FINANCIAL STATEMENTS

I N T E G R A T E D R E P O R T A N DF I N A N C I A L S T A T E M E N T S

22
EQUITY GROUP HOLDING PLC AND SUBSIDIARIES INTERGRATED REPORT & FINANCIAL STATEMENTS / FOR THE YEAR ENDED 31 DECEMBER 2019
A key aspect of our business conduct is to regularly provide our stakeholders with information on Equity
Group Holdings Plc (“Equity”, “Equity Group” or “Group”). We prepare various reports in this respect aimed at
addressing stakeholder information requirements and ensuring that we remain transparent and accountable. As
an ethical and responsible financial services provider, our reports provide a mechanism for ongoing deliberations
and engagements with various stakeholders. It is this willingness to be above board and open that drives our
publication of an annual integrated report. Primarily, we use the Integrated Report to respond or demonstrate to
our financial capital providers, how we create and share value on a sustainable basis.
This report showcases our ongoing progress and performance, consistent with our overarching intent to produce
sustainable value for our stakeholders and best in class customer experience and satisfaction. It is the summary
of our strategies, our business, products and services and particularly the way we generate and distribute value
in the short, medium and long term.
This report covers the financial year from 1st January 2019 to 31st December 2019. The financial information
presented is prepared in line with the International Financial Reporting Standards (IFRS) while non-financial
information is presented in accordance with the International Integrated Reporting Council’s (IIRC) guidelines
provided in the International Integrated Reporting Framework.
How to read this report
Our Integrated Report provides information that enables Equity Group stakeholders to make an informed
assessment of our ability to create sustainable value. The aim of this Integrated Report is to clearly and concisely
tell the story of Equity, who we are, what we do, and how we create value. This report documents our strategy,
opportunities and risks, our business model and governance, and our performance against our strategic
objectives in a way that gives stakeholders a holistic view of Equity Group and our future prospects.
Our relevance as a Group today
and in the future, and our ability
to create long-term value is
interrelated and fundamentally
dependent on the forms of capital
available to us (inputs), how we
use these capitals (value-adding
activities), our impact on them
and the value we deliver (outputs
and outcomes).
The Capital
Value creation is the consequence
of how we apply and leverage
our capitals to deliver financial
performance (outcomes) and
value (outcomes and outputs) for
stakeholders while making trade-
offs. Our value creation process is
embedded in our purpose and is
described as part of our business
model and integrated into the way
we think and make decisions.
Defining Values
We apply the principle of
materiality in assessing which
information is to be included
in our Integrated Report. This
report focuses particularly on
those issues, opportunities
and challenges that impact
materially on Equity Group and
its ability to be a sustainable
business that consistently
delivers value to shareholders,
prospective investors and our
key stakeholders. Our material
matters influence our Group’s
strategy and inform the content in
this report.
Materiality & Material Matter
ABOUT THIS REPORT

3
EQUITY GROUP HOLDINGS PLC AND SUBSIDIARIES INTEGRATED REPORT AND FINANCIAL STATEMENTS FOR THE YEAR ENDED 31 DECEMBER 2019
TABLE OF CONTENTS
WHO WE ARE5 - 6 ABOUT US
7 - 8 GROUP STRUCTURE
9 - 10 BUSINESS VALIDATION
11 - 15 NOTICE OF THE 16TH AGM
OUR BUSINESS34 OUR STRATEGY
35 VALUE CREATION MODEL
36 - 37 STAKEHOLDERS
37 - 40 MATERIAL ISSUES
BUSINESS PERFORMANCE42 - 43 OPERATING ENVIRONMENT
44 - 45 BUSINESS HIGHLIGHTS 2019
46 - 51 SUBSIDIARY PERFORMANCE 2019
52 - 56 PERFORMANCE AGAINST OUR FOCUS AREAS
OUR CAPITALS58 FINANCIAL CAPITAL
59 - 60 HUMAN CAPITAL
61 - 63 INTELLECTUAL CAPITAL
63 - 66 MANUFACTURED CAPITAL
66 - 74 SOCIAL & RELATIONSHIP CAPITAL
75 NATURAL CAPITAL
76 – 80 SUSTAINABLE DEVELOPMENT GOALS (SDGs)
OPERATING ENVIRONMENT17 OPERATING ENVIRONMENT
KEY GROUP HIGHLIGHTS
18 - 21 MESSAGE FROM THE GROUP CHAIRMAN
22 - 27 CHIEF EXECUTIVE OFFICER’S STATEMENT
28 - 29 EQUITY GROUP BOARD STATEMENT ON THE COVID-19 PANDEMIC
30 - 31 GROUP BOARD OF DIRECTORS
32 GROUP EXECUTIVE MANAGEMENT
CONTROL ENVIRONMENT82 GROUP INTEGRATED RISK MANAGEMENT POLICY
82 - 83 REGULATORY LANDSCAPE
84 BUSINESS ENVIRONMENT
RISK APPETITE
84 – 87 PERFORMANCE OVERVIEW OF PRINCIPAL RISKS
CORPORATE GOVERNANCE89 - 90 BOARD OPERATIONS & CONTROL
90 STAKEHOLDER RELATIONS
90 - 91 ETHICS & SOCIAL RESPONSIBILITY
92 COMPLIANCE WITH LAWS AND REGULATIONS
TRANSPARENCY & DISCLOSURE
92 - 93 DIRECTORS’ REMUNERATION REPORT
94 EQUITY GROUP HOLDINGS PLC BOARD MEMBERS
95 THE GROUP BOARD
95 - 97 BOARD COMMITTEES
97 MANAGEMENT COMMITTEES
98 COMPANY SECRETARY MANDATE AND ROLE
BOARD CHANGES
98 - 99 BOARD EVALUATION
99 TRAINING
INDEPENDENCE OF THE CHAIRMAN
MEMBERSHIP ASSOCIATIONS
REPRESENTATION OF RETAIL SHAREHOLDERS
100 PARTICULARS OF SHAREHOLDING
101 THE LARGEST SHAREHOLDERS OF
EQUITY GROUP HOLDINGS PLC
102 STATEMENT OF THE RESPONSIBILITY OF DIRECTORS
FINANCIALS 2019105 GROUP AND COMPANY INFORMATION
106 - 107 DIRECTORS’ REPORT
108 –110 DIRECTORS’ REMUNERATION REPORT
111 STATEMENT OF DIRECTORS’ RESPONSIBILITIES
112 - 115 INDEPENDENT AUDITOR’S REPORT
FINANCIAL STATEMENTS116 CONSOLIDATED STATEMENT OF PROFIT OR LOSS
117 CONSOLIDATED STATEMENT OF COMPREHENSIVE INCOME
118 COMPANY STATEMENT OF PROFIT OR LOSS AND OTHER COMPREHENSIVE INCOME
119 CONSOLIDATED STATEMENT OF FINANCIAL POSITION
120 COMPANY STATEMENT OF FINANCIAL POSITION
121 - 122 CONSOLIDATED STATEMENT OF CHANGES IN EQUITY
123 COMPANY STATEMENT OF CHANGES IN EQUITY
124 CONSOLIDATED STATEMENT OF CASH FLOWS
125 COMPANY STATEMENT OF CASH FLOWS
127 - 224 NOTES
DIRECTOR PROFILES225- 233 CONSOLIDATED BOARD OF DIRECTORS’ PROFILES
234- 237 GROUP EXECUTIVE MANAGEMENT PROFILES

4
EQUITY GROUP HOLDINGS PLC AND SUBSIDIARIES INTEGRATED REPORT AND FINANCIAL STATEMENTS FOR THE YEAR ENDED 31 DECEMBER 2019
WHO WE ARE

5
EQUITY GROUP HOLDINGS PLC AND SUBSIDIARIES INTEGRATED REPORT AND FINANCIAL STATEMENTS FOR THE YEAR ENDED 31 DECEMBER 2019
Our inceptive intention to transform lives, give dignity
and expand opportunities for wealth creation of our
people remains true today, over 35 years later. We are
committed to improving the wellbeing of the people
of Africa. We are positive about Africa and our history
attests to the resilience and determination that has
seen our people attain remarkable feats. Dedication to
our purpose and our people continues to be our driving
force. We are the largest financial services provider by
customer numbers in the Eastern and Central Africa
region with Shs 673.7 Billion in total assets and are
present in 7 countries – Kenya, Uganda, South Sudan,
Tanzania, Rwanda, the Democratic Republic of the
Congo (DRC) and a representative office in Ethiopia (the
“regions”).
We are strategic in our intent of building on our legacy
as a pioneer and disruptor of traditional banking
approaches by enabling accessibility and financial
inclusion for the citizens of these regions. We continue
to consider varied ways in which we can enhance
the availability of financial services and provide our
people with relevant products that enable them to
maximize their opportunities. We are executing the
“Equity 3.0” strategy, which is aimed at leveraging on
technology and innovation to achieve convergence of
financial products and services, seamless integration
of channels, enhanced customer experiences and
disciplined operational controls.
In line with our intention to be a leading Pan-African
financial services provider, we are undertaking a
transformation process that will position us better
to capitalize on opportunities through technology,
demographic changes and regional expansion. We
are reengineering our business to ensure that it
is adaptable to future trends and prospects. We
have recently rebranded, in tune with our long term
aspirations, so as to resonate with our wide spectrum
of cross generational customers and stakeholders. But
more importantly, our rebrand goes beyond the visual
aspects to incorporate our intent to offer an enhanced
customer experience and value and be a catalyst for
wealth creation on the continent.
As a key driver of development in our region, we
want to operate in the sectors where we can have the
greatest impact on society, while being profitable.
We have earmarked agriculture, which is the largest
contributor to Gross Domestic Product (GDP) in the
economies where we operate, as a key sector for us
through financing and promotion of agribusiness.
Small and Medium Enterprises (SMEs) account for
90% of businesses in Africa. This scale justifies our
critical interest in enhancing this sector through
financial products and solutions as well as non-
financial enhancements such as financial literacy
and entrepreneurship trainings. Through the Equity
Group Foundation (EGF), we are a leading player in
innovative social payment solutions that are humane
and offer dignity to beneficiaries. Our flagship social
programs on youth and education, Wings to Fly and
Equity Leaders Program are highly acclaimed for their
transformational impact.
In 2019 and beyond, we have positioned ourselves to
take advantage of the opportunities associated with
Kenya becoming the hub for financial services in the
region. This will be achieved by offering differentiated,
high quality offerings driven by segmentation and
cross-selling initiatives and responsiveness to the
needs of the customers across the different segments.
Through a business model that is anchored on access,
convenience and affordability, we have evolved into a
regional financial services provider with more than
14.3 million customers, making us one of the largest
banks in Africa in terms of customer base.
We believe that true progress is only possible if we
are connected to people and, for this reason, placing
our customers at the centre of everything we do is of
utmost importance. We are cognizant of the fact that
this is going to be one of the main challenges for our
sector in the coming years, the ability to build a digital
bank that continues to be, in all aspects, personal and
intimately connected to the customer. We continue to
be the listening and caring partner that we have always
been. To understand the needs and dreams of our
customers; to offer solutions that best suit them and
help them achieve their goals.
ABOUT US

6
EQUITY GROUP HOLDINGS PLC AND SUBSIDIARIES INTEGRATED REPORT AND FINANCIAL STATEMENTS FOR THE YEAR ENDED 31 DECEMBER 2019
ABOUT US (continued)
OUR PHILOSOPHIES
Professionalism
Integrity
Creativity & Innovation
Teamwork
Unity of Purpose
Respect and Dignity for the Customer
Effective Corporate Governance
Purpose
Transforming lives, giving dignity and expanding opportunities for wealth creation
Vision
To be the champion of the socio-economic prosperity of the people of Africa
Mission
We offer integrated financial services that socially and economically empower consumers,
businesses, enterprises and communities
Positioning Statement
Equity provides Inclusive Financial Services that transform livelihoods, give dignity and
expand opportunities
Tagline
Your Listening, Caring Partner
Motto
Growing Together in Trust

Fin
serv
e A
fric
a
Eq
uit
y B
ank
Co
ng
o S
.A.
Eq
uit
y B
ank
Rw
and
a P
LC
Cap
ital
Rai
sin
g
& I
nve
stm
ent
Str
ateg
y &
In
vest
or
Rel
atio
ns
Co
mm
un
icat
ion
s &
Co
rpo
rate
A
ffai
rs
Bu
sin
ess
Tra
nsi
tio
n,
Cu
sto
mer
E
xper
ien
ce &
In
no
vati
on
Lea
der
ship
&
Go
vern
ance
Eq
uit
y B
ank
(Ken
ya)
Lim
ited
Eq
uit
y B
ank
(Tan
zan
ia)
Lim
ited
Eq
uit
y B
ank
Ug
and
a Li
mit
ed
Eq
uit
y B
ank
S. S
ud
an L
imit
ed
Ban
kin
g S
ub
sid
iari
es
Str
uct
ure
d E
nti
ty
Cyb
er &
Fra
ud
Ris
k
IT a
nd
MIS
Ris
k
Co
mp
lian
ce
Ris
k S
up
po
rt
We
carr
y ou
t ou
r op
erat
ions
with
in E
aste
rn a
nd C
entr
al A
fric
a, w
ith u
nits
str
ateg
ical
ly l
ocat
ed in
Ken
ya, U
gand
a, T
anza
nia,
Sou
th S
udan
, Rw
anda
and
Dem
ocra
tic R
epub
lic o
f th
e
Con
go. W
e al
so h
ave
a R
epre
sent
ativ
e O
ffice
in A
ddis
Aba
ba, E
thio
pia.
Our
reg
iona
l pre
senc
e cr
eate
s im
port
ant s
yner
gies
, par
ticul
arly
in th
e fin
anci
ng o
f tra
de a
nd c
olla
bora
tion.
Our
obje
ctiv
e is
to b
e re
cogn
ized
as
the
pref
erre
d A
fric
an fi
nanc
ial s
ervi
ces
prov
ider
, thu
s be
com
ing
a be
nchm
ark
in th
e re
gion
. Eac
h of
our
sub
sidi
arie
s ha
s it
s ow
n B
oard
of D
irec
tors
com
plia
nt w
ith lo
cal r
egul
atio
ns.
GR
OU
P S
TRU
CTU
RE
7
8
EQUITY GROUP HOLDINGS PLC AND SUBSIDIARIES INTEGRATED REPORT AND FINANCIAL STATEMENTS FOR THE YEAR ENDED 31 DECEMBER 2019
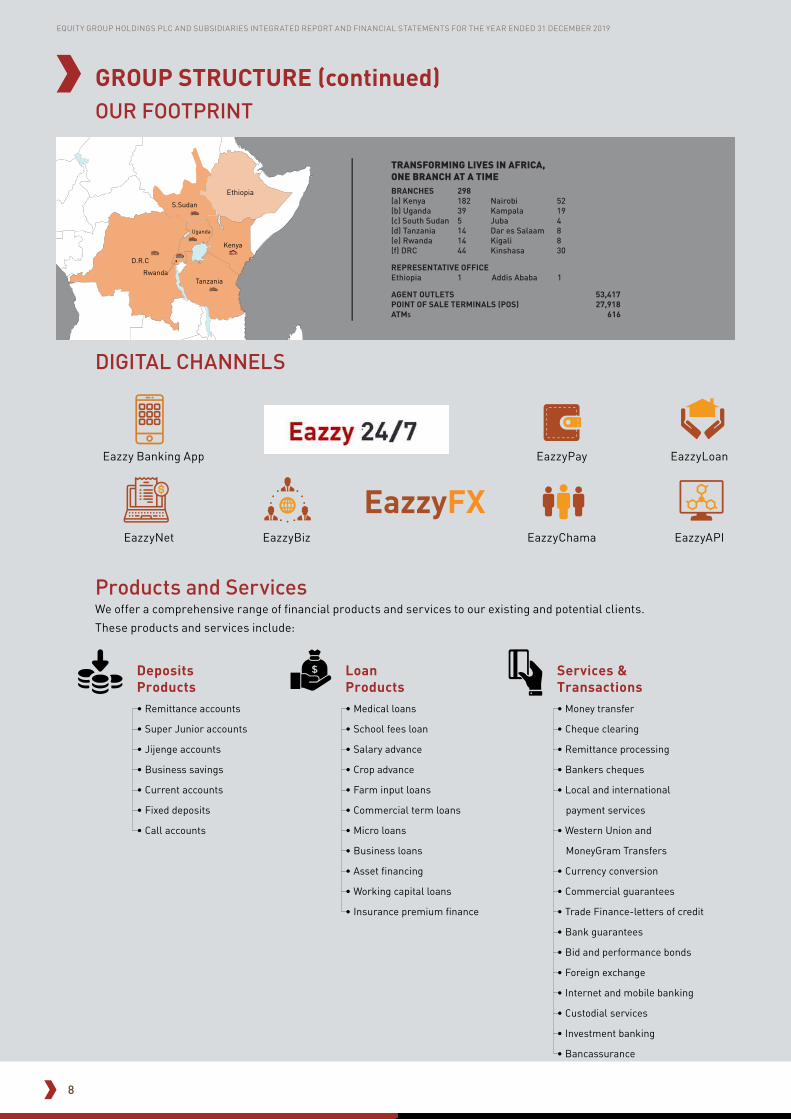
TRANSFORMING LIVES IN AFRICA, ONE BRANCH AT A TIMEBRANCHES 298(a) Kenya 182 Nairobi 52(b) Uganda 39 Kampala 19(c) South Sudan 5 Juba 4 (d) Tanzania 14 Dar es Salaam 8(e) Rwanda 14 Kigali 8(f) DRC 44 Kinshasa 30
REPRESENTATIVE OFFICEEthiopia 1 Addis Ababa 1
AGENT OUTLETS 53,417POINT OF SALE TERMINALS (POS) 27,918ATMS 616
Deposits Products• Remittance accounts
• Super Junior accounts
• Jijenge accounts
• Business savings
• Current accounts
• Fixed deposits
• Call accounts
Loan Products• Medical loans
• School fees loan
• Salary advance
• Crop advance
• Farm input loans
• Commercial term loans
• Micro loans
• Business loans
• Asset financing
• Working capital loans
• Insurance premium finance
Services & Transactions• Money transfer
• Cheque clearing
• Remittance processing
• Bankers cheques
• Local and international
payment services
• Western Union and
MoneyGram Transfers
• Currency conversion
• Commercial guarantees
• Trade Finance-letters of credit
• Bank guarantees
• Bid and performance bonds
• Foreign exchange
• Internet and mobile banking
• Custodial services
• Investment banking
• Bancassurance
GROUP STRUCTURE (continued)
Products and ServicesWe offer a comprehensive range of financial products and services to our existing and potential clients.
These products and services include:
DIGITAL CHANNELS
OUR FOOTPRINT
Eazzy Banking App EazzyPay
EazzyChamaEazzyNet
EazzyLoan
EazzyAPIEazzyBiz

9
EQUITY GROUP HOLDINGS PLC AND SUBSIDIARIES INTEGRATED REPORT AND FINANCIAL STATEMENTS FOR THE YEAR ENDED 31 DECEMBER 2019
2019
• Position 15 globally on Return on Assets
• Position 75 globally on Soundness (Capital Assets Ratio)
• Position 32 globally on Profits on Capital
• Position 844 globally largest Bank
• EABC Chairman’s Award - Overall Best Regional Company, 2018
• Best East African Company - CSR, 2018
• Best East African Company - Financial services, 2018 (1st Runner up)
Dr. James Mwangi, Managing Director and CEO Equity Group named to the 3rd Annual 2019 Bloomberg 50 list
Africa’s SME Bank of the Year, 2018 & 2019
Africa’s Best Digital Bank, 2019
Equity Bank Credit Rating
• National Rating: Aa1-
• Global Rating: B1
• Rating Outlook: Stable
• Socially Responsible Bank in Africa, 2019
• African Bank of the Year, 2018
• African Banker of the Year, 2018 (Equity Group Managing Director & CEO, Dr. James Mwangi)
• Best Retail Bank in Africa, 2017
• Best Overall Winner – 1st Runner Up
• Most Innovative Bank – Winner
• Bank Case Study; Financing Informal Sector – Winner
• Client Case study; Financing Commercial Clients – Winner
• Bank Case Study; Promoting Gender Inclusivity – 1st Runner Up
• Bank Case Study; Operations – 2nd Runner Up
• Client Case Study; Financing Small and Medium Enterprises – 2nd Runner Up
• Best in Sustainable Finance – 2nd Runner Up
• Bank of the Year- Kenya
• Bank of the Year - Uganda
• Bank of the Year- South Sudan
Top Acquirer 2019 Award
Equity Bank has been recognised for the last 12 years since 2007 as the Top Banking Superbrand in Kenya and in East Africa in 2008 and 2009.
BUSINESS VALIDATION

10
EQUITY GROUP HOLDINGS PLC AND SUBSIDIARIES INTEGRATED REPORT AND FINANCIAL STATEMENTS FOR THE YEAR ENDED 31 DECEMBER 2019
• Overall Best Bank in Kenya 2019 - 8 years Running
• Best Bank in Tier 1
• Best Bank in Sustainable CSR – 3 years Running
• The Most Customer - Centric Bank – 2 years Running
• Bank with the Lowest Charge for Individuals – 3 Years Running
Franchise Segmentation Awards• Best Bank in SME Banking
• Best Bank in Retail Banking – 1st Runner Up
• Best Bank in Agency Banking – 5 Years Running
• Best Bank in Mobile Banking – 2 Years Running
• Best Bank in Digital Banking
• Best Bank in Internet Banking – 2 Years Running
• Best Commercial Bank in Micro-Finance- 5 Years Running
• Best Bank in Corporate Banking
Product Awards• Best Bank in Product Marketing – 2 Years Running
• Best Bank in Mortgage Finance - 1st Runner Up ( 2 Years Running)
• Best Bank in Agriculture and Livestock Financing
• Best Bank in Trade Financing – 1st Runner Up (2 Years Running)
Leadership AwardChief Executive Officer of the Year – Dr. James Mwangi, CEO and MD Equity Group Holdings Plc (3 Years Running)
Local Content Prize - for Equity’s role in financing SMEs in Democratic Republic of Congo
Digital, Mobile and Online Banking Award - Equity Bank Congo S.A
Best Agency Bank in Tanzania - 2018
BUSINESS VALIDATION (continued)
Brent Malahay (centre), Equity Group Director of Strategy, Strategic Partnerships and Investor Relations, receives awards on behalf of Equity Bank at the Financial Times Banker’s Bank of the Year Awards 2019. The Bank won 3 awards namely; Bank of the Year - Kenya, Bank of the Year - Uganda and Bank of the Year - South Sudan
Managing Director of Equity Bank Congo, Celestin Muntuabu, speaking during an award ceremony where His Excellency the President of the Democratic Republic of Congo, Felix-Antoine Tshisekedi (right) presented him with the prestigious “Makutano Local Content” prize awarded to Equity Bank for its role in financing of Congolese SMEs.

11
EQUITY GROUP HOLDINGS PLC AND SUBSIDIARIES INTEGRATED REPORT AND FINANCIAL STATEMENTS FOR THE YEAR ENDED 31 DECEMBER 2019
Notice is hereby given to Shareholders that, in accordance with the provisions of section 280 of the Companies, Act,
2015 and pursuant to a Court Order issued by the High Court of Kenya in Miscellaneous Application No. E680 of 2020 on
Wednesday 29th April 2020, the Sixteenth Annual General Meeting (AGM) of Equity Group Holdings PLC (“the Company”)
will be held via electronic communication on Tuesday, 30th June, 2020 at 10.00 am for the purpose of considering and, if
thought fit, passing the resolutions set out below.
Due to the ongoing Government restrictions on public gatherings, Shareholders will not be able to attend the AGM in
person but will be able to register for, access information pertaining to the proposed resolutions, follow the meeting
in the manner detailed below and vote electronically or by proxy. Shareholders may ask questions in advance of the
meeting, as detailed below.
Resolutions numbers 2 (i), (iii) to (vi) and 3 (b) (i) and (ii) will be proposed as ordinary resolutions and resolution 3 (a) (i) will
be proposed as a special resolution.
AGENDA
1. CONSTITUTION OF THE MEETING
The Company Secretary to read the notice convening the meeting and determine if a quorum is present.
2. ORDINARY BUSINESS
i. Consideration of the Audited Financial Statements for the financial year ended 31st December, 2019
To receive, consider and if thought fit, adopt the Audited Financial Statements and Directors’ Remuneration Report
for the year ended 31st December, 2019, together with the Chairman’s, Directors’ and Auditors’ reports thereon,
noting that subsequent to the approval by the Directors of the audited financial statements for the financial year
ended 31st December, 2019, the Directors withdrew the proposal to declare a dividend as communicated in the
Public Notice by the Company dated 26th May, 2020 and reflected in the unaudited financial statements of the
Company for the period ended 31st March, 2020.
ii. Dividend
To note that the Directors do not recommend payment of a dividend for the financial year ended 31st December,
2019.
iii. Remuneration of Directors
To approve the remuneration of the Directors for the year ended 31st December, 2019.
iv. Election of Directors
a) To approve the appointment of Mrs. Evelyn Rutagwenda, who in accordance with Article 100 of the Company’s
Articles of Association, retires from office by rotation and being eligible, offers herself for re-election;
b) To approve the appointment of Mr. Christopher Newson, subject to obtaining regulatory approvals, and who having
been appointed by the Board on 4th March, 2020 in accordance with Article 101 of the Company’s Articles of
Association, offers himself for appointment;
c) To note the retirement of Mr. David Ansell, a Director who having attained the age of seventy years retires in
accordance with the terms of paragraph 2.5 of the Capital Markets Code of Corporate Governance Practices for
Issuers of Securities to the Public 2015 and who although eligible, does not offer himself for re-election; and
d) To note the retirement of Mr. Deepak Malik, a Director retiring from office by rotation in accordance with Article
100 of the Company’s Articles of Association and who, although eligible, does not offer himself for re-election.
NOTICE OF THE SIXTEENTH ANNUAL GENERAL MEETING

12
EQUITY GROUP HOLDINGS PLC AND SUBSIDIARIES INTEGRATED REPORT AND FINANCIAL STATEMENTS FOR THE YEAR ENDED 31 DECEMBER 2019
NOTICE OF THE SIXTEENTH ANNUAL GENERAL MEETING (continued)
v. In accordance with the provisions of section 769 of the Companies Act, 2015, to approve the election of the following
Directors, being members of the Board Audit Committee to continue to serve as members of the said Committee:
a. Mrs. Evelyn Rutagwenda;
b. Mr. Vijay Gidoomal;
c. Dr. Helen Gichohi; and
d. Dr. Edward Odundo.
vi. To pass an ordinary resolution pursuant to section 721 of the Companies Act, 2015 to appoint
PricewaterhouseCoopers (PwC) as auditors of the Company taking note that the auditors have expressed their
willingness to continue in office and to authorize the Directors to fix their remuneration.
3. SPECIAL BUSINESS
a. SPECIAL RESOLUTIONS
i. To amend Article 54 of the Articles of Association of the Company and create a new Article 54A of the Articles of
Association of the Company to allow for simultaneous attendance and participation by electronic means for General
Meetings including Annual General Meetings and Extraordinary General Meetings.
Pursuant to section 22 of the Companies Act, 2015 the text of the special resolution is set out below:
Amendment of Article 54 of the Articles of Association of the Company
“THAT, by way of special resolution Article 54 of the Articles of Association of the Company be and is hereby amended by including the following words immediately at the end of the first sentence and before the full stop “provided that the shareholders may participate in General Meetings electronically in accordance with the provisions of Article 54A”
Insertion of a new Article 54A of the Articles of Association of the Company immediately after Article 54 of the
Articles of Association of the Company
“Article 54A - ELECTRONIC PARTICIPATION IN GENERAL MEETINGS
i. The Directors may decide that the Members shall be able to participate in a general meeting by use of electronic
means, including that they may exercise their rights as shareholders electronically.
ii. In the case of any general meeting, the Directors may make arrangements for simultaneous attendance and
participation by electronic means allowing Members and proxies not present together at the same place to
attend, participate and vote at the meeting. The arrangements for simultaneous attendance and participation at
any place at which Members and proxies are participating, using electronic means may include arrangements
for controlling or regulating the level of attendance at any particular venue provided that such arrangements
shall operate so that all Members and proxies wishing to attend the meeting are able to attend at one or other
of the venues, including venues chosen by such Members and proxies individually and provided further that
such Members and Proxies may participate via electronic means from any other place as long as they are able
to attend and vote from the place at which they are participating via electronic means.
iii. The Members or proxies at the place or places at which persons are participating via electronic means shall be
counted in the quorum for, and be entitled to vote at, the general meeting in question, and that meeting shall
be duly constituted and its proceedings valid if the Chairman is satisfied that adequate facilities are available
throughout the meeting to ensure that the Members or proxies attending at the place or places at which
persons are participating via electronic means are able to:
(a) participate in the business for which the meeting has been convened; and

13
EQUITY GROUP HOLDINGS PLC AND SUBSIDIARIES INTEGRATED REPORT AND FINANCIAL STATEMENTS FOR THE YEAR ENDED 31 DECEMBER 2019
(b) hear all persons who speak (whether through the use of microphones, loud speakers, computer, audio-
visual communication equipment, telephones or otherwise, whether in use when these Articles are
adopted or developed subsequently) in the place at which persons are participating and any other place
at which persons are participating via electronic means”.
b. ORDINARY RESOLUTIONS
Acquisition of Banque Commerciale du Congo (BCDC)
i. To approve, confirm and ratify, the purchase by the Company of 625,354 ordinary shares in the capital of Banque
Commerciale du Congo (BCDC) (comprising 66.53% of the share capital of BCDC, and inclusive of dividends declared
after 1st January, 2019 in respect of the financial year ending on 31st December, 2019 i.e. a cum-dividend price per
share of USD 167.9 per share) from Mr. George Arthur Forrest for a cash consideration of US Dollars one hundred and
five million (USD 105 million) (the BCDC Acquisition).
Incorporation of a non-operating insurance holding company and a subsidiary for purposes of conducting insurance
business in Kenya
ii. Approving, subject to obtaining the requisite regulatory approvals, the Company setting up a non-operating insurance
holding company to serve as a holding company for insurance business (the Holding Company) and a subsidiary
in Kenya (the Subsidiary) to conduct and undertake long term insurance business in Kenya and putting in place all
the necessary structures, commercial arrangements and any ancillary arrangements relating to the undertaking of
long term insurance business in Kenya including the Company providing Kenya Shillings Four Hundred Million (Shs
400,000,000) as share capital for the Subsidiary as required under the Insurance Act (Chapter 487, Laws of Kenya).
A circular providing Shareholders with detailed information of the proposed incorporation of the Holding Company and
the Subsidiary and the BCDC Acquisition is available on the Company’s website at https://equitygroupholdings.com/
investorrelations/
4. ANY OTHER BUSINESS
To transact any other business that may legally be transacted at an annual general meeting, of which notice will have
been duly received.
BY ORDER OF THE BOARD
Christine Akinyi Browne
Company Secretary
P.O. BOX 75104-00200
NAIROBI.
5th June, 2020
NOTES
1) In view of the ongoing Coronavirus 2019 (Covid-19) pandemic and the related public health regulations and directives
passed by the Government of Kenya precluding among other things, public gatherings, it is impracticable for the
Company to hold a physical general meeting in the manner prescribed in its Articles of Association.
2) On 29th April, 2020, the High Court of Kenya in Miscellaneous Application No. E680 of 2020, made under the Section 280
of the Companies Act, 2015 (the Companies Act) issued an order granting special dispensation to any company listed on
the Nairobi Securities Exchange to convene and conduct a virtual general meeting subject to receipt of a “No Objection”
from the Capital Markets Authority (CMA).
NOTICE OF THE SIXTEENTH ANNUAL GENERAL MEETING (continued)

14
EQUITY GROUP HOLDINGS PLC AND SUBSIDIARIES INTEGRATED REPORT AND FINANCIAL STATEMENTS FOR THE YEAR ENDED 31 DECEMBER 2019
NOTICE OF THE SIXTEENTH ANNUAL GENERAL MEETING (continued)3) The Company has convened and is conducting this virtual annual general meeting following receipt of a “No Objection”
from the CMA.
4) Registration for the annual general meeting shall open on Friday, 5th June, 2020 at 9.00 am and will close on Friday,
26th June, 2020 at 5.00 pm Shareholders will not be able to register after Friday, 26th June, 2020 at 5.00 pm
5) Any Shareholder wishing to participate in the meeting should register for the annual general meeting by dialling
*483*807# on their Safaricom, Airtel or Telkom mobile telephone lines or *482# on their Equitel mobile telephone
lines and following the various prompts regarding the registration process. In order to complete the registration
process, Shareholders will need to have their ID/Passport Numbers which were used to purchase their shares and/or
their CDSC Account Number available. For assistance, Shareholders should dial the following helpline number: 0709
170000 from 9.00 am to 3.00 pm on a working day.
6) Any Shareholder domiciled outside of Kenya and wishing to participate in the meeting should send an email to Image
Registrars via [email protected] providing their details i.e. Name, Passport/ID Numbers, their CDSC Account
Number and Mobile telephone number requesting to be registered. Image Registrars shall register the Shareholder
and send them an email notification once registered.
7) A notification (email and SMS) shall be sent to shareholders domiciled outside Kenya who have registered for the
meeting as well as to all Shareholders 1 hour before the AGM notifying them about the AGM. This notification will
also include the link to stream the proceedings. For voting, the Shareholder will receive a verification Code via the
Mobile telephone number provided. The link shared to stream the meeting contains a voting tab. Once the shareholder
selects to vote, he/she shall key in the code received via SMS and proceed to follow the prompts.
8) In accordance with Section 283(2) (c) of the Companies Act, 2015, the following documents may be viewed on the
Company’s website https://equitygroupholdings.com/investor-relations/: (i) a copy of this Notice; (ii) the Company’s
Audited Financial Statements for the financial year ended 31st December, 2019; (iii) A copy of the High Court Order in
Miscellaneous Application No. E680 of 2020; (iv) Public Notice dated 26th May, 2020 on Non-Declaration of Dividend
for the 2019 Financial Year; (v) the profile of Mr. Christopher Newson, the new Director to be appointed in accordance
with Article 100 of the Company’s Articles of Association; and (vi) A Shareholders’ circular in support of the Ordinary
Resolutions proposed in paragraphs 3 (b) (i) & (ii) (the Documents).
A copy of the Share Purchase Agreement (the SPA) relating to the Ordinary Resolution proposed in paragraph 3 (b) (i)
may be inspected by Shareholders:
a. By appointment at the Company’s Head office situated at Equity Centre, 9th Floor, Hospital Road, Upper Hill,
Nairobi from 5th June, 2020 to Friday 26th June, 2020 between 9.00 am and 4.00 pm (excluding weekends/
Sundays and public holidays). Due to measures introduced through ministerial directives and the rules regarding
social distancing, all appointments must be arranged with the Company Secretary at least 48 hours in advance of
the proposed date and time for inspection provided the request for appointment has to be received on or before
5.00 pm on 24th June, 2020. To arrange an inspection time, Shareholders should send an email to the following
address [email protected], providing their full details (full names, Kenyan national
identity card/Passport Number/CDSC Account Number) and outlining their request to physically inspect the
SPA including the date and time they wish to avail themselves for the inspection, it being understood that due to
social distancing requirements the Company may not be able to provide access on the date and time proposed
in which case the Company Secretary will propose another suitable date and/or time.
As the SPA remains a confidential document any Shareholder wishing to inspect the same will be required
to confirm that they will maintain confidentiality by way of entry into of a non-disclosure agreement with the
Company prior to accessing the SPA.
15
EQUITY GROUP HOLDINGS PLC AND SUBSIDIARIES INTEGRATED REPORT AND FINANCIAL STATEMENTS FOR THE YEAR ENDED 31 DECEMBER 2019
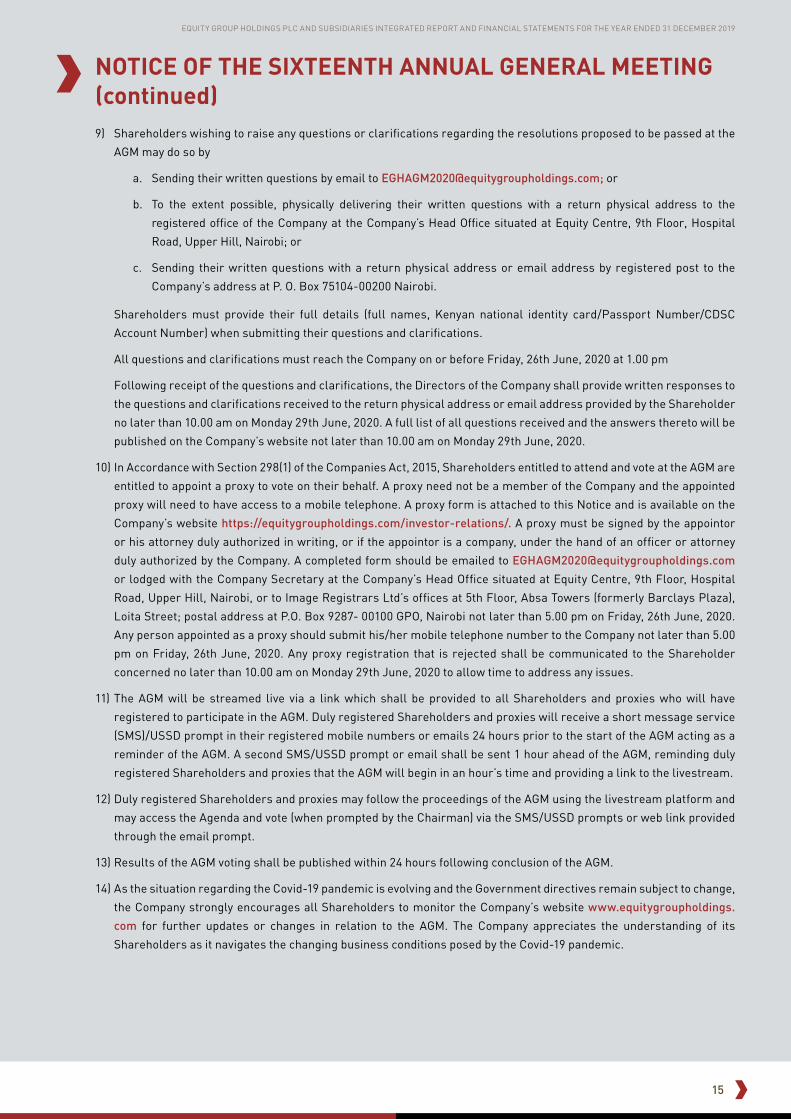
NOTICE OF THE SIXTEENTH ANNUAL GENERAL MEETING (continued)9) Shareholders wishing to raise any questions or clarifications regarding the resolutions proposed to be passed at the
AGM may do so by
a. Sending their written questions by email to [email protected]; or
b. To the extent possible, physically delivering their written questions with a return physical address to the
registered office of the Company at the Company’s Head Office situated at Equity Centre, 9th Floor, Hospital
Road, Upper Hill, Nairobi; or
c. Sending their written questions with a return physical address or email address by registered post to the
Company’s address at P. O. Box 75104-00200 Nairobi.
Shareholders must provide their full details (full names, Kenyan national identity card/Passport Number/CDSC
Account Number) when submitting their questions and clarifications.
All questions and clarifications must reach the Company on or before Friday, 26th June, 2020 at 1.00 pm
Following receipt of the questions and clarifications, the Directors of the Company shall provide written responses to
the questions and clarifications received to the return physical address or email address provided by the Shareholder
no later than 10.00 am on Monday 29th June, 2020. A full list of all questions received and the answers thereto will be
published on the Company’s website not later than 10.00 am on Monday 29th June, 2020.
10) In Accordance with Section 298(1) of the Companies Act, 2015, Shareholders entitled to attend and vote at the AGM are
entitled to appoint a proxy to vote on their behalf. A proxy need not be a member of the Company and the appointed
proxy will need to have access to a mobile telephone. A proxy form is attached to this Notice and is available on the
Company’s website https://equitygroupholdings.com/investor-relations/. A proxy must be signed by the appointor
or his attorney duly authorized in writing, or if the appointor is a company, under the hand of an officer or attorney
duly authorized by the Company. A completed form should be emailed to [email protected]
or lodged with the Company Secretary at the Company’s Head Office situated at Equity Centre, 9th Floor, Hospital
Road, Upper Hill, Nairobi, or to Image Registrars Ltd’s offices at 5th Floor, Absa Towers (formerly Barclays Plaza),
Loita Street; postal address at P.O. Box 9287- 00100 GPO, Nairobi not later than 5.00 pm on Friday, 26th June, 2020.
Any person appointed as a proxy should submit his/her mobile telephone number to the Company not later than 5.00
pm on Friday, 26th June, 2020. Any proxy registration that is rejected shall be communicated to the Shareholder
concerned no later than 10.00 am on Monday 29th June, 2020 to allow time to address any issues.
11) The AGM will be streamed live via a link which shall be provided to all Shareholders and proxies who will have
registered to participate in the AGM. Duly registered Shareholders and proxies will receive a short message service
(SMS)/USSD prompt in their registered mobile numbers or emails 24 hours prior to the start of the AGM acting as a
reminder of the AGM. A second SMS/USSD prompt or email shall be sent 1 hour ahead of the AGM, reminding duly
registered Shareholders and proxies that the AGM will begin in an hour’s time and providing a link to the livestream.
12) Duly registered Shareholders and proxies may follow the proceedings of the AGM using the livestream platform and
may access the Agenda and vote (when prompted by the Chairman) via the SMS/USSD prompts or web link provided
through the email prompt.
13) Results of the AGM voting shall be published within 24 hours following conclusion of the AGM.
14) As the situation regarding the Covid-19 pandemic is evolving and the Government directives remain subject to change,
the Company strongly encourages all Shareholders to monitor the Company’s website www.equitygroupholdings.
com for further updates or changes in relation to the AGM. The Company appreciates the understanding of its
Shareholders as it navigates the changing business conditions posed by the Covid-19 pandemic.

16
EQUITY GROUP HOLDINGS PLC AND SUBSIDIARIES INTEGRATED REPORT AND FINANCIAL STATEMENTS FOR THE YEAR ENDED 31 DECEMBER 2019
OPERATING ENVIRONMENT
17
EQUITY GROUP HOLDINGS PLC AND SUBSIDIARIES INTEGRATED REPORT AND FINANCIAL STATEMENTS FOR THE YEAR ENDED 31 DECEMBER 2019
OPERATING ENVIRONMENT
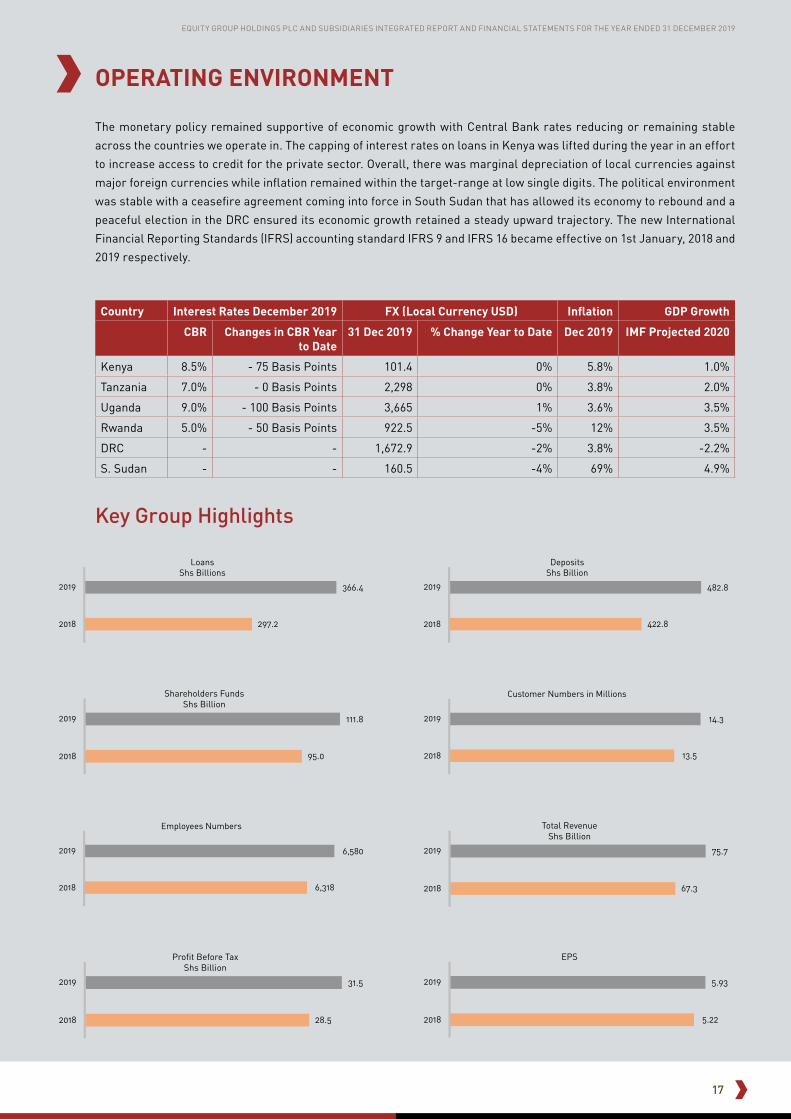
The monetary policy remained supportive of economic growth with Central Bank rates reducing or remaining stable
across the countries we operate in. The capping of interest rates on loans in Kenya was lifted during the year in an effort
to increase access to credit for the private sector. Overall, there was marginal depreciation of local currencies against
major foreign currencies while inflation remained within the target-range at low single digits. The political environment
was stable with a ceasefire agreement coming into force in South Sudan that has allowed its economy to rebound and a
peaceful election in the DRC ensured its economic growth retained a steady upward trajectory. The new International
Financial Reporting Standards (IFRS) accounting standard IFRS 9 and IFRS 16 became effective on 1st January, 2018 and
2019 respectively.
Country Interest Rates December 2019 FX (Local Currency USD) Inflation GDP Growth
CBR Changes in CBR Year to Date
31 Dec 2019 % Change Year to Date Dec 2019 IMF Projected 2020
Kenya 8.5% - 75 Basis Points 101.4 0% 5.8% 1.0%
Tanzania 7.0% - 0 Basis Points 2,298 0% 3.8% 2.0%
Uganda 9.0% - 100 Basis Points 3,665 1% 3.6% 3.5%
Rwanda 5.0% - 50 Basis Points 922.5 -5% 12% 3.5%
DRC - - 1,672.9 -2% 3.8% -2.2%
S. Sudan - - 160.5 -4% 69% 4.9%
Key Group Highlights
28.52018
2019 31.5
Profit Before Tax Shs Billion
67.32018
2019 75.7
Total Revenue Shs Billion
5.222018
2019 5.93
EPS
297.22018
2019 366.4
Loans Shs Billions
422.82018
2019 482.8
Deposits Shs Billion
95.02018
2019 111.8
Shareholders Funds Shs Billion
13.5 2018
2019 14.3
Customer Numbers in Millions
6,318 2018
2019 6,580
Employees Numbers

18
EQUITY GROUP HOLDINGS PLC AND SUBSIDIARIES INTEGRATED REPORT AND FINANCIAL STATEMENTS FOR THE YEAR ENDED 31 DECEMBER 2019
35 years of transforming lives2019 marked 35 years of operations for Equity Group. I was
privileged to preside over the celebrations that marked this
outstanding 35 years of creating value for our stakeholders
by transforming lives and livelihoods. It also marked the
retirement of our Founding Chairman, Dr. Peter Munga
under whose able guidance, oversight and exceptional
stewardship the Group has grown from its nascent
beginnings as a building society in rural Kenya into a
flourishing regional brand with more than 14 million
customers and underlying balance sheet of nearly
Shs 700 Billion. As a Board, we are clearly indebted
to the unwavering dedication and commitment of the
founding members and have the distinctive privilege
of overseeing the transition of oversight from
these founders. This change has been remarkably
successful proving the resilience and growth of the
Bank and its strong governance structures.
The year was also significant as we took time to reflect
on our journey over the past 35 years and envision the
future. We took time to revisit our corporate philosophies,
purpose, vision, mission, and values and align them with our
new impetus to not only enable people to improve their lives
but more importantly to create wealth. We are pleased that these
rallying statements remain credible and relevant for our future
endeavors and resonate with our key stakeholders – customers,
communities, regulators, and employees. These reflections also
encouraged us to rebrand as we position the Group better for the
future while celebrating the past. The result is a new brand that
communicates our resolve focusing on simplicity, boldness, and
confidence.
MESSAGE FROM THE GROUP CHAIRMANDavid Ansell Non-Executive Chairman,
Board of Directors
Equity Group Holdings Plc

19
EQUITY GROUP HOLDINGS PLC AND SUBSIDIARIES INTEGRATED REPORT AND FINANCIAL STATEMENTS FOR THE YEAR ENDED 31 DECEMBER 2019
Transformation and RebrandingRebranding entrenches our underlying organizational
culture which remains constant, driven by the values
of professionalism, integrity, creativity, teamwork,
unity of purpose, respect and dignity, and effective
governance. We continue to strengthen this culture
to support business and drive organizational
performance. We are committed to transforming the
lives of ordinary citizens in the countries where we
operate by providing relevant and impactful products
and services. Notably, we are an all-inclusive financial
services group with a client base that transcends the
entire social spectrum from high net worth and large
corporates to ordinary citizens and micro enterprises,
whom we serve with equal diligence and dedication.
Rebranding is the visual representation of our strategy
that focuses on business transformation to align and
remain relevant to a fast-changing external context.
Increasingly, our markets and clients are quite diverse
requiring different approaches and channels.
Our growth strategy is focused on increasing our
footprint, deepening, and widening our reach in
our markets. Acquisitions, as one of our expansion
strategies provides us with a deep and rapid market
entry advantage as we benefit from the skills, expertise,
knowledge, experience, and brand identity of the
institutions we acquire. We intend to pursue a systemic
position in each country we operate in by being among
the top five banks in each market. Subject to relevant
approvals, our acquisition of Banque Commerciale du
Congo (BCDC) in the Democratic Republic of the Congo
(DRC) will strengthen our position in the region as
we also seek to deepen and widen our reach. We are
optimistic that 2020 will culminate with closure of this
deal and will enable a further realization of our growth
aspirations.
Members of the Board cut the 35 year celebratory cake with Central Bank of Kenya Deputy Governor Sheila M’Mbijiwe (3rd right)
SustainabilityWe run a triple bottom line business anchored on an
economic and social engine focused on delivering
financial value, social value, and environmental
sustainability. Our economic engine continues to gain
momentum with above average growth of both balance
sheet and return on investment.
Our social engine, the Equity Group Foundation (EGF),
continues to scale the impact and significance of our
purpose driven social initiatives. The impacts of our
innovative social programs have redefined corporate
philanthropy and brought out the role that businesses
can play in building a more equitable and sustainable
world. In 2019, the Group made a bold commitment to
plant 35 million trees in Kenya over the next five years.
We recognize that deforestation is a major challenge
in Kenya, and we intend to take our place in society
through planting trees, enabling communities to
benefit from the vast ecosystem services ensuing from
adequate tree coverage.
In the course of the year, we were privileged to
commence a partnership with Mastercard Foundation
and the Government of Kenya to address youth
unemployment through the Young Africa Works
Program. The Young Africa Works initiative by
Mastercard Foundation aims to enable 50 million
young people in Africa, especially young women, to
secure employment that is dignified and fulfilling by
2050. It also seeks to enable entrepreneurs and small
enterprises to expand their businesses through access
to financial services. The Young Africa Works Kenya
program seeks to create 5 million jobs in Kenya by 2024
through empowering young people to have the skills
employers require to attain employment or establish
/expand their businesses. The project will especially
address the capacity of young persons and women
to have the competencies to engage in productive
activities and business. The Bank has committed Shs
420 Billion for business start-up and expansion under
this program.
Proposed Insurance BusinessThe Board proposes to venture into an Insurance
Business that provides an opportunity for EGH to
leverage on its existing Bancassurance operations
that are currently the largest in Kenya, (which include
its 36,000 agents and 180 branches) to market and
distribute insurance products and provide a one-stop
shop for offering both financial and insurance products
which we believe will further provide confidence and
stability for our customers during this COVID-19 crisis.
MESSAGE FROM THE GROUP CHAIRMAN (continued)

20
EQUITY GROUP HOLDINGS PLC AND SUBSIDIARIES INTEGRATED REPORT AND FINANCIAL STATEMENTS FOR THE YEAR ENDED 31 DECEMBER 2019
The Board of EGH expects that the Insurance Business
could result in the following benefits for the Group:
• Enhancing Micro, Small and Medium Enterprise
business by broadening and deepening the Group’s
relationships across ecosystems.
• Enabling the Group to deliver its mission of providing
access to competitive, integrated financial services
that socially and economically empower consumers,
businesses and communities whilst also delivering
significant value to its stakeholders.
• Ability for the Group to leverage its existing platforms
to upsell to existing customers and increase revenue
per customer which could ultimately lead to improved
return on shareholders’ funds.
• Expanded scale of Group operations in Kenya which
helps diversify the Group’s sources of revenues and
profits.
The Board
The Equity Group Board and Executive Management team
pose with the new logo unveiled at the Head Office.
In 2019, Mr. Gerald Warui was appointed Equity Bank
(Kenya) Limited Managing Director. We also welcome
other non-executive Directors who joined in the course
of the year including Mrs. Jane Ngige and Mr. Erastus
J.O. Mwencha (Equity Bank (Kenya) Limited), Mr Steven
Mutabazi (Equity Bank Rwanda PLC), Mr. Dino Stengel
and Professor Honest Ngowi (Equity Bank (Tanzania)
Limited).
I would also like to take this opportunity to thank the
Directors who retired in the year including Dr. Peter
Munga and Mr. Dennis Aluanga (Equity Group Holdings
Plc), Dr. Julius Muia (Equity Bank (Kenya) Limited) and
(Equity Investment Bank Limited), Dr. Mark Schwiete
(Equity Bank Congo S.A), Ms. Joanna Bichsel (Equity
Bank Rwanda PLC), Mr. Bhartesh Shah (Equity Bank
(Kenya) Limited, Equity Bank Congo S.A), Mr. Julius
Kayoboke (Equity Bank Rwanda PLC) and wish them
well in their endeavors.
We also opted to strengthen the holding structure
allowing the Group structure to pursue diverse
business lines beyond the banking business. We want
to be more than a Bank, delivering value to customers
through one brand that transcends banking. We have
the right balance in the Board composition and diversity
in terms of skills, experience, and gender. We pay
close attention to the mix of talents of our Directors,
constantly seeking diversity and change over time
to ensure that we remain relevant and can fulfil our
governance role in the most effective way.
Non declaration of dividend for the financial year ended 31st December 2019During the release of Equity Group Holdings Plc’s (the
Company) financial results for the year ended 31st
December, 2019 on 19th March, 2020, it was announced
that the Board of Directors of the Company (the Board)
had resolved to recommend to the shareholders of the
Company for their approval at the upcoming Annual
General Meeting, the payment of a first and final
dividend of Shs 2.50 for each ordinary share of Shs 0.50
for the year ended 31st December, 2019, (the Proposed
Dividend Recommendation).
The Board has subsequently considered the events
that have taken place and in particular the effects of
the COVID-19 pandemic to the world, Africa, and the
Kenyan economy. After careful consideration, the
Board has resolved to withdraw the Proposed Dividend
Recommendation and instead has recommended to the
shareholders that no dividend is paid for the financial
MESSAGE FROM THE GROUP CHAIRMAN (continued)Proposed Insurance Business (continued)
21
EQUITY GROUP HOLDINGS PLC AND SUBSIDIARIES INTEGRATED REPORT AND FINANCIAL STATEMENTS FOR THE YEAR ENDED 31 DECEMBER 2019
year ended 31st December, 2019.
With unprecedented uncertainty, the Board wishes to
exercise financial prudence in order to conserve cash
to enable the Company to respond appropriately in
terms of supporting its customers through the crisis
and directing cash resources to potential opportunities
that may arise as economies in which Equity Group
Holdings operates begin to recover.
Looking ForwardWe are optimistic about Africa with its dynamic young
generation, immense energy, entrepreneurial spirit,
and enormous opportunity. With our clear strategy
and approach to transforming the business, our strong
track record of delivery, our customer focused values
and the dedication and commitment of our employees,
we have all the components to succeed in our Africa
growth strategy and to create a legacy institution in
which the continent can take pride.
In view of the COVID-19 pandemic, its uncertainty and
impact on the economy, businesses, and societies
in the regions we operate in, we have revised our
performance outlook. We are cognizant of the efforts
being undertaken by governments to address the
pandemic and applaud this commitment to protecting
lives. Consequently, both the pandemic and the
mitigation measures will have far reaching effects on
the wider economy affecting businesses, societies,
and individuals. We are therefore expecting to be
affected by the economic slowdown and have taken a
cautious outlook on business performance in 2020. As
part of our Business Continuity Plan (BCP), we intend
to continue our strong financial and social support of
our customers across the region in order to help them
preserve their businesses, their capital and not only to
survive and recover, but also to thrive.
The Board remains grateful to Dr. James Mwangi, for
his unwavering passionate and visionary leadership
of the management team. His positive and hands-
on leadership has inspired employees to pursue the
ideals of Equity. The management team comprises
high caliber individuals who showcase mastery and
continue to serve with diligence and excellence. I am
also grateful to the entire staff of Equity who work
tirelessly to deliver on our brand promise and our
strategic intentions. Our regulators and investors are a
key pillar for our performance, and we are grateful for
their support and counsel.
RetirementAs you may have noticed from the Notice of the AGM,
I shall be retiring at the AGM and shall not be seeking
re-election. I have enjoyed working with the Board
and management of the Group and subsidiaries to
deliver on the mission and vision of the organization
and I am very proud of what we have achieved together.
May I take this opportunity to welcome my successor,
Professor Isaac Muthure Macharia. I wish him every
success as he assumes the Chairmanship of the Group
and I am confident that through his able leadership, the
Company will scale even higher heights.
David Ansell
Non-Executive Chairman
Board of Directors
Equity Group Holdings Plc
MESSAGE FROM THE GROUP CHAIRMAN (continued)Non declaration of dividend for the financial year ended 31st December 2019 (continued)

22
EQUITY GROUP HOLDINGS PLC AND SUBSIDIARIES INTEGRATED REPORT AND FINANCIAL STATEMENTS FOR THE YEAR ENDED 31 DECEMBER 2019
CHIEF EXECUTIVE OFFICER’S STATEMENT Dr. James Mwangi, CBS Group Managing Director & CEO
Equity Group Holdings Plc
2019 was a favorable year as we continued to witness
validation of our Group strategy through consistent returns
and strong performance in our core strategic indicators.
The external environment was challenging with subdued
economic activity in Kenya and mixed conditions in most of
the other regional countries in which Equity has operations.
Demographic and technology changes have continued to
play out in markets resulting in an expansion of client
preferences and needs, calling for innovation, agility and
improved understanding of the customer.
Our performance was particularly impressive with
marked growth in our customer base, revenue and
balance sheet. Our loan book in Kenya had significant
growth of 23% and an increase in customer deposits
of 14%. Attendant to this, our asset quality with NPLs
at 9% remains significantly lower than the market’s
double-digit average of 12%. This underscores
our disciplined approach to lending coupled
with proactive client relationship management
practices.
Our strategic focus on enhancing non-funded
income to strengthen the quality of our earnings
continued to display good results increasing
to 40% above the banking sector’s average
of 37%. Overall, the Group Profit Before Tax
(PBT) increased by 11% to Shs 31.5 Billion.
Return on Equity (ROE) was 22% with
Uganda and Rwanda posting ROE above cost
of capital, an indication that the regional
expansion strategy is beginning to pay off.
We also achieved rapid growth in Rwanda
and DRC with 12% and 38% increase in
assets respectively.
23
EQUITY GROUP HOLDINGS PLC AND SUBSIDIARIES INTEGRATED REPORT AND FINANCIAL STATEMENTS FOR THE YEAR ENDED 31 DECEMBER 2019
Regional banking subsidiaries and local non-banking
subsidiaries accounted for 28% of overall Group
revenues and continues to drive initiatives to increase
their overall contribution. Increasingly, we are seeing
evidence that the Group is becoming a systemic
financial services provider in the region.
Global relationships with key lenders remained strong
and we closed the year with Shs 56.7 Billion of long-
term global debt, enabling us to lengthen maturity
of our funding. This has given us the impetus to
consolidate our focus on Micro, Small and Medium
Enterprises (MSMEs), resulting in 65% of the loan book
being credit to MSMEs. In recognition of the challenging
environment, the Group adopted a conservative
approach by enhancing provisions by Shs 4 Billion
increasing the cost of risk to 1.3% and ensuring that the
effects of the external context are adequately covered.
35 years of transforming lives
We marked 35 years of operation in 2019, underscoring
the impressive journey that we have undertaken from
our inceptive years as a small building society in 1984
to the leading commercial bank in the region today. In
celebrating this momentous occasion, we took time
for introspection as we reflected on the different
milestones we have achieved and the vast impact we
have made on the lives of ordinary people. We are
humbled by the immense boldness that characterizes
our offerings as we innovated on the long held
traditional approaches to banking. It is important to
remind ourselves of the approach that has enabled us
to build an outstanding financial institution over the
last 35 years. Our brand was built on democratization
of the banking sector by removing barriers to accessing
financial services and empowering individuals to attain
their aspirations through appropriate products and
services.
We developed an intuitive capacity to innovate relevant
and impactful services for our clients based on their
economic realities, livelihood activities and expressed
needs. This intuitive ability has greatly rewarded
us as we have created opportunities for our clients
by removing barriers and delivering products and
services that are fit for their businesses and personal
aspirations, while attaining the pivotal position in the
Kenyan and regional commercial banking sector.
Significantly, we note with fulfilment that our purpose,
vision and mission remain just as relevant today
as they were when we embarked on democratizing
banking by broadening access and deepening inclusion
for all. We have taken time to reflect on these inceptive
philosophies that first stirred our passion, debated
their relevance in a fast-changing world that is
markedly different from the early 1990’s and concluded
that they continue to reflect our overarching ambitions
and intentions.
Most importantly, they remain relevant in a world that is
highly digitized, with a younger and more sophisticated
demographic and where we aim to grow our regional
footprint across diverse nations and cultures in Africa.
Business transformation
We embarked on a brand refresh in 2019, as part of
our business transformation process, culminating
in the launch of our new brand identity. This was a
significant change for us bearing in mind that our
brand identity held great significance and affinity
especially with the founding client base. Yet, after
careful introspection and counsel, we chose to pursue
a brand change exercise underpinned by a number of
key considerations. We took note of the fact that our
external context is changing rapidly driven by two key
factors, technology, and demographics. For several
decades, the banking sector’s business model had
been relatively unchanged hinged on brick and mortar
branches and client facing services. This has changed
radically in the last few years with technology enabled
channels becoming the main means by which clients
interact with financial products and services.
For Equity, 97% of our client transactions are
now conducted outside the branches. In terms of
demographics, we are now offering services to a
cross generational clientele including our founding
customers and those of a younger generation. This
wide generational spectrum presents challenges
and opportunities in terms of delivering relevant
products and preferences of channels. While our
legacy customers prefer to use branches and engage
directly with the bank through people facing functions,
the younger generation is interested in convenient
channels that empower them to conduct their own
affairs anywhere, anytime.
Today, we are engaged with a large and growing
demographic that wants to consume banking in a
different way and views financial services, not from
a utilitarian perspective but from an experiential and
value perspective. Further still, we are pursuing a
CHIEF EXECUTIVE OFFICER’S STATEMENT (continued)

24
EQUITY GROUP HOLDINGS PLC AND SUBSIDIARIES INTEGRATED REPORT AND FINANCIAL STATEMENTS FOR THE YEAR ENDED 31 DECEMBER 2019
deepening and widening of scale and saturation in
the seven markets in Eastern Africa we operate in
– Kenya, Tanzania, Rwanda, Uganda, South Sudan
and the Democratic Republic of Congo and Ethiopia
(representative office). In many of these countries our
legacy or brand identity is known but with much room
to grow.
Our brand needs to resonate emotionally with clients
in these countries and in the region while retaining the
Bank’s original intent encompassed in our purpose,
vision, and mission statements. Our new brand identity
speaks to our intention to retain the best of our heritage
brand while amplifying and introducing new elements
that are attractive to the cross generational nature
of our customer base. It also provides us with the
ability to resonate with our diverse regional clientele.
The simplified identity is particularly important since
it signals our intent to be relevant to our clients
depending on their needs, irrespective of their age,
gender, locality, economic activity or relationship with
us. It enables us to broaden our propositions to diverse
customer segments anchored on our core philosophies
and values with a value proposition of being more than
a bank, but a catalyst for daily lifestyle of our people.
We are able to deliver traditional banking services
and other financial services to these clients without
being constrained. This expands the ability of the
brand to express itself and remain relevant to diverse
demographics and regions. The brand identity change
is underpinned by a clear intent to transform the
Equity brand to a customer experience driven financial
services provider, based on the philosophy of one Equity
brand and one customer view. These philosophies
underscore our aim to offer seamless and similar
services cross-generationally and across countries
and regions irrespective of the channel, service or
product being offered to the client.
The transformation is pre-eminently about improving
client experience and ensuring that clients receive
the same services through our one brand proposition.
Our intent is that the brand will be relevant in a virtual
world, agile, while reflecting simplicity and boldness.
Digitization
We want to be a truly digital bank internally and when
serving our customers externally. Over the past
two years, we have made extensive investments in
technology to ensure we deliver on our digitization
agenda. In return, our digital channels have become
the primary way in which customers interact with
us. 97% of all cash-based transactions and 93% of
all disbursed loans are conducted on Equity’s self-
service digital platforms primarily on mobile phones.
The benefits of digitization are becoming increasingly
evident.
Our Eazzy suite of products and services continue to
offer customers our banking services through digital
channels covering an extensive array of transactions
and products. Thousands of individuals use these
channels on a daily basis attesting to improved
accessibility and convenience. Our payment platforms
– Jenga payment and Jenga API – have grown in
popularity and usage as they enable SMEs to automate
their back end and focus on delivering value added
products and services for our clients. We had over 80
businesses using these channels by December 2019
with 181,000 transactions valued at Shs 1.9 Billion.
Equitel, Equity’s mobile platform, continues to be
the leading multi-channel money product in Kenya
offering customers the convenience, accessibility, and
ease of transacting through a variety of bank channels
including ATMS, online banking, bank branches, agents
etc. It also provides a distinctive agile and secure
mobile channel that seamlessly integrates banking and
other financial products and services while providing
value-add telco products and services. Our mobile
and internet transactions grew by 15% to 595 million
transactions, up from 517 million in 2018. Digitization
is therefore a key strategic agenda for us.
We remain committed to innovations that improve
convenience and benefits for customers through
cutting edge financial solutions that are relevant
to customers in our region and delivered through
advanced digital channels. Internally, technology
will enable us to make better decisions, improve
efficiency, reduce costs and become more adaptable to
changes in the workplace. Overall, we are clear that
the workplace and marketplace of the future will be
anchored on technology.
CHIEF EXECUTIVE OFFICER’S STATEMENT (continued)
Business transformation (continued)

25
EQUITY GROUP HOLDINGS PLC AND SUBSIDIARIES INTEGRATED REPORT AND FINANCIAL STATEMENTS FOR THE YEAR ENDED 31 DECEMBER 2019
CHIEF EXECUTIVE OFFICER’S STATEMENT (continued)
Regional expansion
Regional growth is a key element of our strategic intent.
In 2019, we entered into a share purchase agreement
with George Arthur Forrest, to purchase 66.53% of the
shares held by Mr. Forrest in Banque Commerciale
du Congo (BCDC), a public limited company (Société
Anonyme - S.A.) licensed by the Banque Central du
Congo in the Democratic Republic of Congo (DRC).
Following completion of the transaction, the BCDC
business will eventually be amalgamated with that of
EGH’s existing banking subsidiary in DRC, Equity Bank
Congo S.A. (EBC).
Dr. James Mwangi, Equity Group MD & CEO (right) and Mr. George Forrest, (centre) majority shareholder of BCDC together with Prof. Isaac Macharia, Non-Executive Vice Chairman of Equity Group Holdings Pc (2nd right), Pierre Chevalier, BCDC Board Member and Yves Cuypers, BCDC MD, pose after signing the share purchase agreement in London UK.
The Agreement is subject to regulatory approvals
from amongst others, the Central Bank of Kenya,
Banque Centrale du Congo, the Common Markets for
Eastern and Southern Africa (COMESA) Competition
Commission and board approvals of BCDC and EGH. We
also set up a Commercial Representative Office in Addis
Ababa, Ethiopia as the Bank prepares to commence
operations. The Bank appointed Hassan Maalim as the
Head of the Commercial Representative Office which
is based at Kazanchis - Addis Ababa, Ethiopia and
became fully operational in July 2019. With the addition
of Ethiopia, the Bank will soon have operations in a
regional market with a combined population of nearly
500 million people, including Kenya, Uganda, Tanzania,
Rwanda, South Sudan and DRC.
Equity Group Foundation
Our social engine continues to play a pivotal role in
delivering programs for the benefit of society. In 2019,
the Government of Kenya and various development
organizations partnered with EGF to reach 1.3 million
families with social safety net payments. Our products
have been impactful in delivering solutions for our
partners in their support to vulnerable populations
with the highest levels of integrity and humanness
while maintaining their dignity. In addition, we provided
2.2 million women and youth with financial literacy
programs that de-risked them through capacity
building, making them eligible for credit facilities.
Agriculture is a mainstay of the work of the Foundation.
As of 2019, our program that aims to transform
subsistence farming into an agribusiness had reached
over 638,000 farmers and included a component that
links small agribusiness with other players within their
value chains. Environmental sustainability initiatives
also produced growth including 122,524 households
receiving clean energy equipment – solar panels and
clean cooking stoves - and 1.08 million trees being
planted. This not only has a positive impact on the
environment but also offers results for health benefits.
Overall, we have committed to plant 35 million trees
in Kenya over the next five years. Wings to Fly, the
shared prosperity initiative that is the flagship of
EGF’s educational and leadership pillar in partnership
with Mastercard Foundation continued to provide
scholarships to financially disadvantaged students.
In 2019, we received additional funding from the
Government of Kenya and the World Bank, a testament
of their confidence in the program, enabling us to
increase the number of recipients from 18,000 to
36,000. The global scholarship component of this
scholarship program has now benefited 554 talented
and exceptional young scholars with the opportunity to
study in world class global universities. Interactions
with our customers have revealed that the biggest
credit risk is driven by the health status of the client.
In this regard, we launched a medical insurance
product to enable client’s access to medical care when
required.
We also continued to set up a network of medical
clinics in collaboration with our scholarship recipients
who have studied medicine. These clinics known
as Equity Afia provide high quality medical care at
affordable rates. As at the end of 2019, EGF had opened
11 Equity Afia clinics reaching 62,083 patients with
154,137 cumulative patient visits.
26
EQUITY GROUP HOLDINGS PLC AND SUBSIDIARIES INTEGRATED REPORT AND FINANCIAL STATEMENTS FOR THE YEAR ENDED 31 DECEMBER 2019
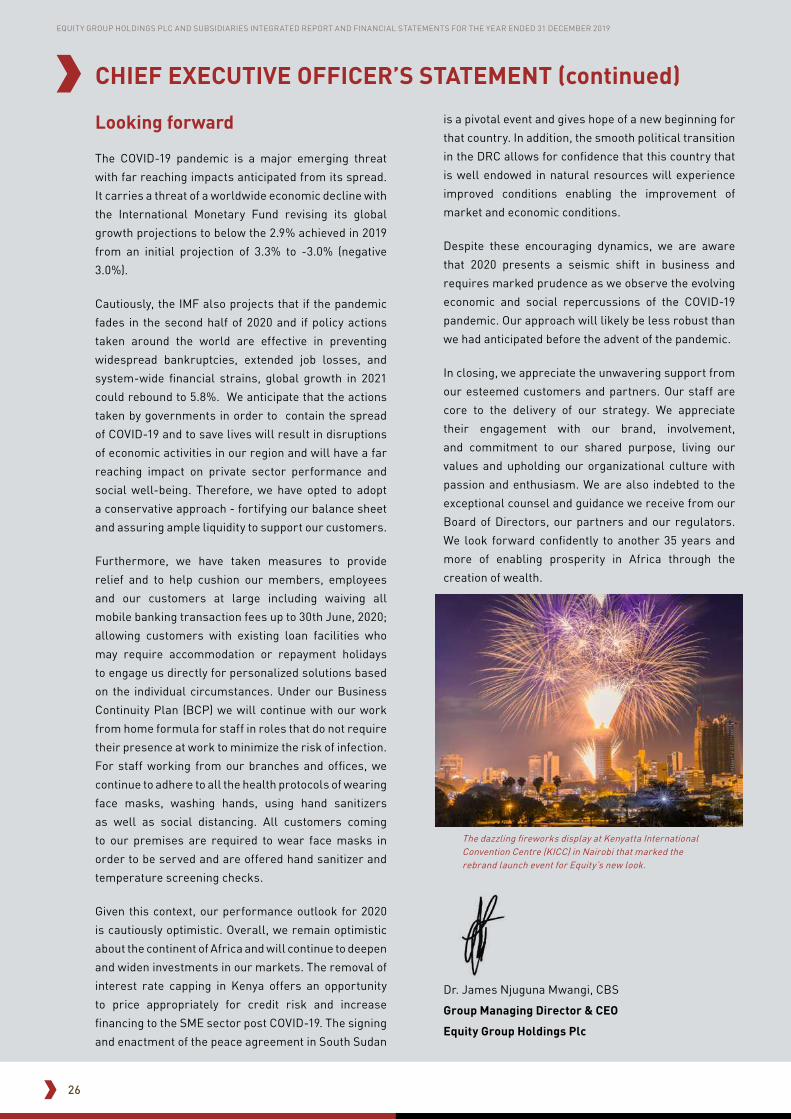
Looking forward
The COVID-19 pandemic is a major emerging threat
with far reaching impacts anticipated from its spread.
It carries a threat of a worldwide economic decline with
the International Monetary Fund revising its global
growth projections to below the 2.9% achieved in 2019
from an initial projection of 3.3% to -3.0% (negative
3.0%).
Cautiously, the IMF also projects that if the pandemic
fades in the second half of 2020 and if policy actions
taken around the world are effective in preventing
widespread bankruptcies, extended job losses, and
system-wide financial strains, global growth in 2021
could rebound to 5.8%. We anticipate that the actions
taken by governments in order to contain the spread
of COVID-19 and to save lives will result in disruptions
of economic activities in our region and will have a far
reaching impact on private sector performance and
social well-being. Therefore, we have opted to adopt
a conservative approach - fortifying our balance sheet
and assuring ample liquidity to support our customers.
Furthermore, we have taken measures to provide
relief and to help cushion our members, employees
and our customers at large including waiving all
mobile banking transaction fees up to 30th June, 2020;
allowing customers with existing loan facilities who
may require accommodation or repayment holidays
to engage us directly for personalized solutions based
on the individual circumstances. Under our Business
Continuity Plan (BCP) we will continue with our work
from home formula for staff in roles that do not require
their presence at work to minimize the risk of infection.
For staff working from our branches and offices, we
continue to adhere to all the health protocols of wearing
face masks, washing hands, using hand sanitizers
as well as social distancing. All customers coming
to our premises are required to wear face masks in
order to be served and are offered hand sanitizer and
temperature screening checks.
Given this context, our performance outlook for 2020
is cautiously optimistic. Overall, we remain optimistic
about the continent of Africa and will continue to deepen
and widen investments in our markets. The removal of
interest rate capping in Kenya offers an opportunity
to price appropriately for credit risk and increase
financing to the SME sector post COVID-19. The signing
and enactment of the peace agreement in South Sudan
is a pivotal event and gives hope of a new beginning for
that country. In addition, the smooth political transition
in the DRC allows for confidence that this country that
is well endowed in natural resources will experience
improved conditions enabling the improvement of
market and economic conditions.
Despite these encouraging dynamics, we are aware
that 2020 presents a seismic shift in business and
requires marked prudence as we observe the evolving
economic and social repercussions of the COVID-19
pandemic. Our approach will likely be less robust than
we had anticipated before the advent of the pandemic.
In closing, we appreciate the unwavering support from
our esteemed customers and partners. Our staff are
core to the delivery of our strategy. We appreciate
their engagement with our brand, involvement,
and commitment to our shared purpose, living our
values and upholding our organizational culture with
passion and enthusiasm. We are also indebted to the
exceptional counsel and guidance we receive from our
Board of Directors, our partners and our regulators.
We look forward confidently to another 35 years and
more of enabling prosperity in Africa through the
creation of wealth.
The dazzling fireworks display at Kenyatta International Convention Centre (KICC) in Nairobi that marked the rebrand launch event for Equity’s new look.
Dr. James Njuguna Mwangi, CBS
Group Managing Director & CEO
Equity Group Holdings Plc
CHIEF EXECUTIVE OFFICER’S STATEMENT (continued)
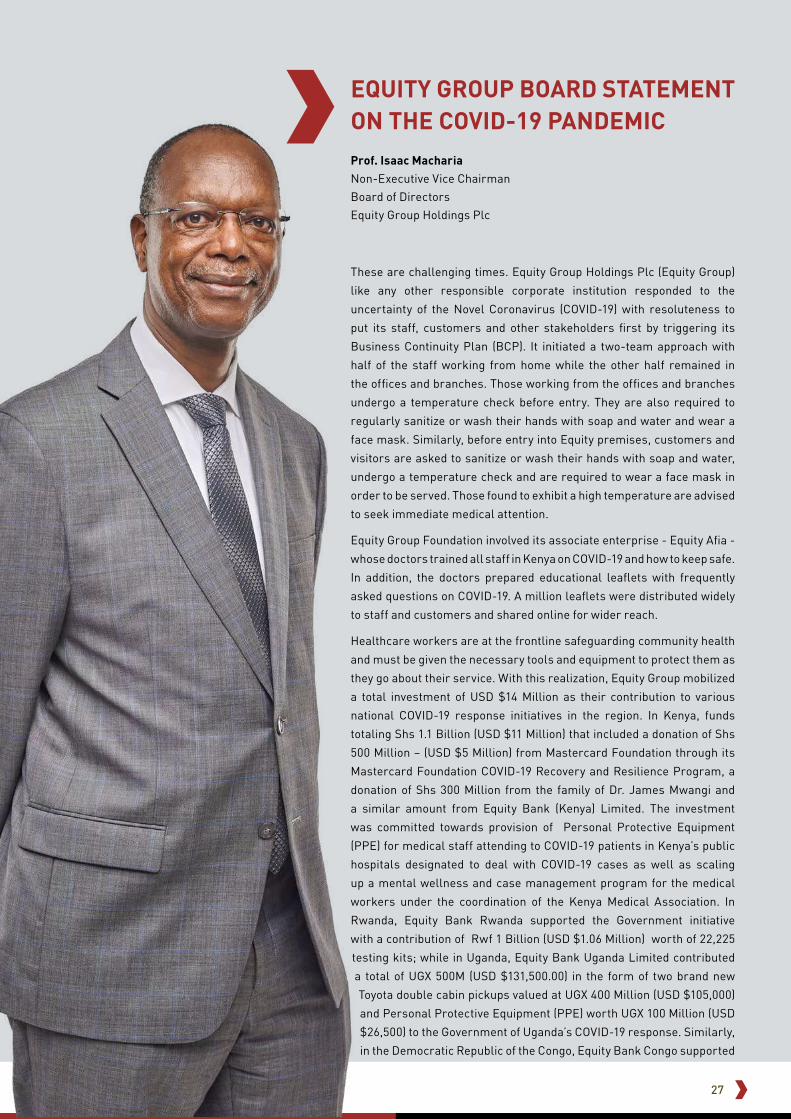
27
EQUITY GROUP HOLDINGS PLC AND SUBSIDIARIES INTEGRATED REPORT AND FINANCIAL STATEMENTS FOR THE YEAR ENDED 31 DECEMBER 2019
EQUITY GROUP BOARD STATEMENT ON THE COVID-19 PANDEMIC
These are challenging times. Equity Group Holdings Plc (Equity Group)
like any other responsible corporate institution responded to the
uncertainty of the Novel Coronavirus (COVID-19) with resoluteness to
put its staff, customers and other stakeholders first by triggering its
Business Continuity Plan (BCP). It initiated a two-team approach with
half of the staff working from home while the other half remained in
the offices and branches. Those working from the offices and branches
undergo a temperature check before entry. They are also required to
regularly sanitize or wash their hands with soap and water and wear a
face mask. Similarly, before entry into Equity premises, customers and
visitors are asked to sanitize or wash their hands with soap and water,
undergo a temperature check and are required to wear a face mask in
order to be served. Those found to exhibit a high temperature are advised
to seek immediate medical attention.
Equity Group Foundation involved its associate enterprise - Equity Afia -
whose doctors trained all staff in Kenya on COVID-19 and how to keep safe.
In addition, the doctors prepared educational leaflets with frequently
asked questions on COVID-19. A million leaflets were distributed widely
to staff and customers and shared online for wider reach.
Healthcare workers are at the frontline safeguarding community health
and must be given the necessary tools and equipment to protect them as
they go about their service. With this realization, Equity Group mobilized
a total investment of USD $14 Million as their contribution to various
national COVID-19 response initiatives in the region. In Kenya, funds
totaling Shs 1.1 Billion (USD $11 Million) that included a donation of Shs
500 Million – (USD $5 Million) from Mastercard Foundation through its
Mastercard Foundation COVID-19 Recovery and Resilience Program, a
donation of Shs 300 Million from the family of Dr. James Mwangi and
a similar amount from Equity Bank (Kenya) Limited. The investment
was committed towards provision of Personal Protective Equipment
(PPE) for medical staff attending to COVID-19 patients in Kenya’s public
hospitals designated to deal with COVID-19 cases as well as scaling
up a mental wellness and case management program for the medical
workers under the coordination of the Kenya Medical Association. In
Rwanda, Equity Bank Rwanda supported the Government initiative
with a contribution of Rwf 1 Billion (USD $1.06 Million) worth of 22,225
testing kits; while in Uganda, Equity Bank Uganda Limited contributed
a total of UGX 500M (USD $131,500.00) in the form of two brand new
Toyota double cabin pickups valued at UGX 400 Million (USD $105,000)
and Personal Protective Equipment (PPE) worth UGX 100 Million (USD
$26,500) to the Government of Uganda’s COVID-19 response. Similarly,
in the Democratic Republic of the Congo, Equity Bank Congo supported
Prof. Isaac MachariaNon-Executive Vice Chairman
Board of Directors
Equity Group Holdings Plc

28
EQUITY GROUP HOLDINGS PLC AND SUBSIDIARIES INTEGRATED REPORT AND FINANCIAL STATEMENTS FOR THE YEAR ENDED 31 DECEMBER 2019
EQUITY GROUP BOARD STATEMENT ON THE COVID-19 PANDEMIC (continued)
the Government’s response initiative with Congolese
Franc 1.9 Billion (USD $1 Million) towards the purchase
of PPEs.
Regarding our customers and business, the Equity
Group Board has evaluated the economic impact on
its own business and the businesses of our customers
during the lockdown. The Board of Directors,
in evaluating the global landscape, has further
acknowledged that the global supply chains and
much of the manufacturing sector has been severely
affected because of the lock down. The global aviation
business is at a standstill, the hotel industry has
been significantly affected while economies such as
the USA (United States of America) and Europe have
registered massive job losses. As of 2nd June, 2020,
the International Labour Organization stated that 190
million people were out of work due to COVID-19. The
situation has affected large business ecosystems and
industries such as travel, tourism, manufacturing,
trade and commerce, construction, oil and gas as well
as agriculture and education.
In East Africa, the Board of Equity Group has recognized
that more than 1 million people are reported to have
lost their jobs, nearly 40% of tenants had challenges
paying their rents for the month of April 2020, and the
informal sector (80% of employment) has stagnated.
Power consumption and demand is reported to have
fallen by 14%, reflecting the slowdown in business.
In view of these circumstances, Equity Group has
adopted an offensive and defensive approach to
protect and ensure the continuity of business for its
customers, staff and the Bank. On the defensive,
the Group has taken a personalized approach in
restructuring customer loans to help them navigate
through the COVID-19 pandemic that has evolved into a
socio-economic crisis.
Equity Group is supporting its clients and customers
to survive, recover and thrive when the COVID-19
pandemic ends. Clients who can demonstrate the
impact of COVID-19 on their businesses and the
soundness of their business model in the `New
Normal’ receive a reprieve through loan rescheduling
and refinancing with up to an additional three years
of repayment. The restructuring approach takes into
consideration regulatory and reporting requirements.
On the offensive approach, the Group is working
with its customers to expand their opportunities in
the health sector by financing them to manufacture
health requirements such as face masks and Personal
Protective Equipment (PPEs), preferably locally,
while helping to create regional supply chains. In
addition, the Group will support creation of a medical
ecosystem in the region specializing in research and
manufacturing of tropical medicine with a logistical
value chain to ensure efficient supply across the
region and beyond. In Kenya, EGF in partnership with
the Covid-19 Emergency Response Fund Board has
partnered with Kenya Association of Manufacturers
(KAM) and McKinsey and Company to train over 95 local
manufacturers on how to meet global health standards
in the production of PPEs and how to develop efficient
and sufficient supply chains for medical equipment in
the region. The initiative will give local manufacturers
the opportunity to excel as major exporters of trusted,
quality supplies within the African continent. In
Uganda, Equity Bank has partnered with Dei Group Ltd,

29
EQUITY GROUP HOLDINGS PLC AND SUBSIDIARIES INTEGRATED REPORT AND FINANCIAL STATEMENTS FOR THE YEAR ENDED 31 DECEMBER 2019
EQUITY GROUP BOARD STATEMENT ON THE COVID-19 PANDEMIC (continued)
a pharmaceutical company, to finance its expansion of
a pharmaceutical, biotech and research plant in order
to scale their capacity to manufacture and deliver
critical and effective drug solutions and to achieve their
goal of becoming the largest drug manufacturing plant
in Africa.
In line with its strategic mission, Equity Group will
support food and agriculture to enhance production,
processing, distribution, and export opportunities.
The Group will support innovation in ICT and other
initiatives to digitize the economy. The offensive
approach is anticipated to support economic recovery
and create new growth and employment opportunities.
To protect customers and staff, Equity Group has
massively invested to support contactless payments
and a working from home environment. Equity’s Point
of Sale terminals are now Near Field enabled (NFC)
and are Tap and Go. The Equity USSD mobile banking
channel has been revamped for ease of use while the
Equity Banking App has been upgraded for a smoother
user experience. The EazzyNet, EazzyPay, EazzyBiz
and EazzyFX suite of internet banking products have
been reviewed to ease customer’s user journey in
enabling the Equity banking experience to be “what you
do” instead of “where you go”. In addition, all mobile
transaction costs have been waived until 30th June,
2020.
The Group will play to its capital strength, balance sheet
agility and liquidity to support a long-term strategy
and walk with its customers through the COVID-19
crisis. The Group is optimistic that every client has a
chance to turn the crisis into an opportunity to survive,
recover and thrive. As part of Equity’s relationship
management, the Group is keeping a close connection
with customers and is advising them to exercise caution
in their decisions in order to preserve their business
capital during this period of uncertainty in order to sail
through the crisis.
In addition to working with its customers, the Group
has forged alliances with Kenya Association of
Manufactures (KAM), the Kenya National Chamber of
Commerce and Industries (KNCCI) as well as the Kenya
Micro and Small Enterprises Authority (MSEA). The
alliance, with support from the Mastercard Foundation
is aimed at synergizing and working together to
mitigate the adverse effects of the current economic
slowdown, providing capacity and resilience building to
preserve and create 5 million jobs.
Through Equity’s social arm, Equity Group Foundation
(EGF), with financial support from Mastercard
Foundation, the Group has provided solar-powered
devices to 13,790 Wings to Fly and Elimu secondary
school scholars. The scholars have been presented
with a device that contains a radio, a solar lamp and
a mobile charging unit which will enable the scholars
to continue their academic lessons currently being
delivered through the Government owned radio and
TV stations in Kenya. The secondary school scholars
as well as those sponsored in various technical and
vocational education and training (TVET) programs,
who are also sponsored through EGF’s Education
and Leadership pillar will receive a monthly stipend
for three months to cushion their families during the
lockdown period.
At this time, we are aware that the pandemic has
presented a period of great volatility due to an
unexpected and a very fast changing external
environment of unknown duration. During such a
crisis, critical decisions will have to be made as events
unfold to address immediate challenges. For now, the
ultimate impact the crisis will have on our customers,
partners and overall business in 2020 and beyond is
still not yet known. What we do know is that we are
striving to support our customers and stakeholders
with every capability and tool at our disposal. Our
current report does not take the impact of these issues
into account as the pandemic continues to evolve.
Consequently, since it is too early to determine the
full extent of the pandemic, from a health perspective
and an economic perspective we will continue to
execute Equity’s Business Continuity Plan, and we will
continuously update our stakeholders of any material
developments.
Signed
Prof. Isaac Macharia
Non-Executive Vice Chairman
Board of Directors
Equity Group Holdings Plc

30
EQUITY GROUP HOLDINGS PLC AND SUBSIDIARIES INTEGRATED REPORT AND FINANCIAL STATEMENTS FOR THE YEAR ENDED 31 DECEMBER 2019
30
Mary WamaeGroup Executive Director
David AnsellNon-Executive
Chairman
Edward OdundoNon-Executive Director
GROUP BOARD OF DIRECTORSWe have an extensively skilled and vastly-experienced Board charged with the governance and oversight functions
aimed at achieving our strategic goals and delivering value to all our stakeholders.
Profiles of the Directors are available on pages 225 to 233

31
EQUITY GROUP HOLDINGS PLC AND SUBSIDIARIES INTEGRATED REPORT AND FINANCIAL STATEMENTS FOR THE YEAR ENDED 31 DECEMBER 2019
GROUP BOARD OF DIRECTORS (continued)
Evelyn RutagwendaNon-Executive Director
James MwangiGroup Managing Director
and Chief Executive Officer
Vijay GidoomalNon-Executive Director
Deepak MalikNon-Executive Director
Helen Gichohi Non-Executive Director
Isaac Macharia Non-E xecutive V ice
Chairman
Profiles of the Directors are available on pages 225 to 233
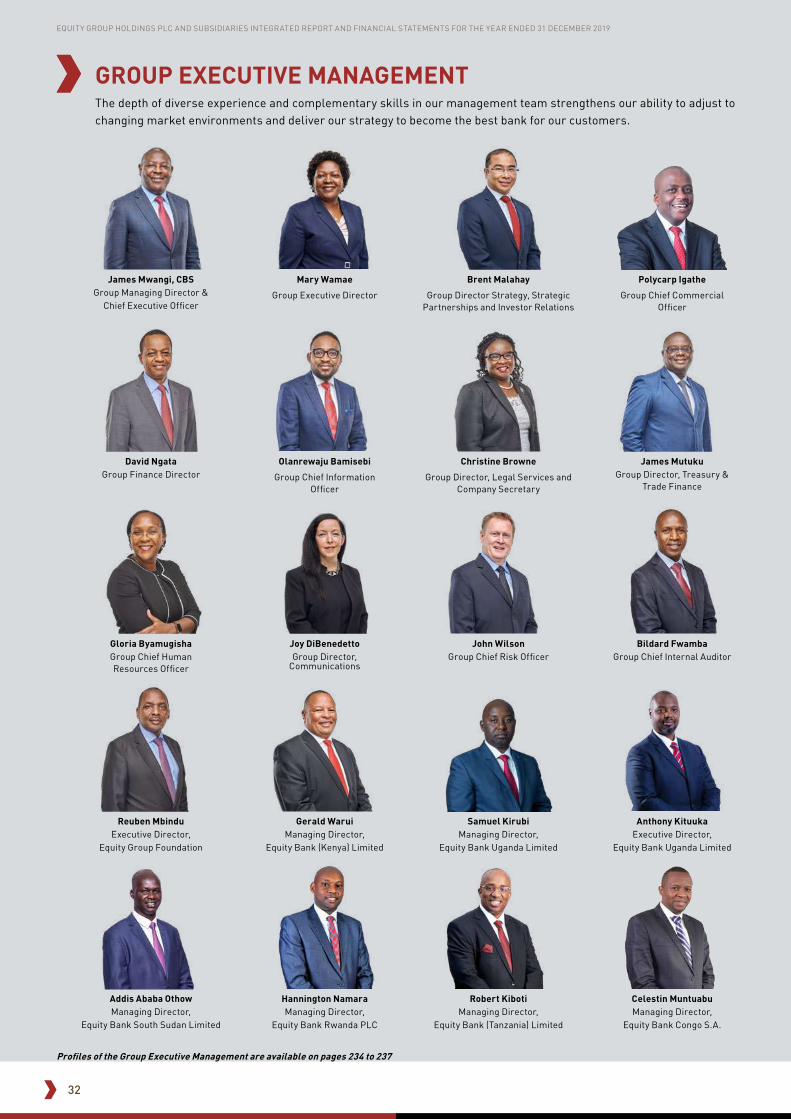
32
EQUITY GROUP HOLDINGS PLC AND SUBSIDIARIES INTEGRATED REPORT AND FINANCIAL STATEMENTS FOR THE YEAR ENDED 31 DECEMBER 2019
The depth of diverse experience and complementary skills in our management team strengthens our ability to adjust to changing market environments and deliver our strategy to become the best bank for our customers.
GROUP EXECUTIVE MANAGEMENT
Profiles of the Group Executive Management are available on pages 234 to 237
James Mwangi, CBSGroup Managing Director &
Chief Executive Officer
Mary Wamae
Group Executive Director
Brent Malahay
Group Director Strategy, Strategic Partnerships and Investor Relations
Christine Browne
Group Director, Legal Services and Company Secretary
David NgataGroup Finance Director
Joy DiBenedettoGroup Director,
Communications
Gerald WaruiManaging Director,
Equity Bank (Kenya) Limited
Gloria Byamugisha Group Chief Human Resources Officer
Robert KibotiManaging Director,
Equity Bank (Tanzania) Limited
Celestin MuntuabuManaging Director,
Equity Bank Congo S.A.
Addis Ababa OthowManaging Director,
Equity Bank South Sudan Limited
Hannington NamaraManaging Director,
Equity Bank Rwanda PLC
Samuel KirubiManaging Director,
Equity Bank Uganda Limited
Reuben MbinduExecutive Director,
Equity Group Foundation
Anthony KituukaExecutive Director,
Equity Bank Uganda Limited
Olanrewaju Bamisebi
Group Chief Information Officer
Bildard FwambaGroup Chief Internal Auditor
John Wilson Group Chief Risk Officer
James MutukuGroup Director, Treasury &
Trade Finance
Polycarp Igathe
Group Chief Commercial Officer

33
EQUITY GROUP HOLDINGS PLC AND SUBSIDIARIES INTEGRATED REPORT AND FINANCIAL STATEMENTS FOR THE YEAR ENDED 31 DECEMBER 2019
OUR BUSINESS
34
EQUITY GROUP HOLDINGS PLC AND SUBSIDIARIES INTEGRATED REPORT AND FINANCIAL STATEMENTS FOR THE YEAR ENDED 31 DECEMBER 2019
OUR STRATEGYTo realise our vision, the Equity Group strategy outlines
three objectives to guide our execution and measure
performance:
1. Leveraging on technology and innovation by
disrupting our self-virtualization and digitizing our
services and processes.
2. Convergence of various financial products and
services for focused strategic delivery and scaling
of the brand visibility and loyalty. This will be done
by increasing access and enhancing customer
experience.
3. Exercise strict operational control that will involve
redesigning the operating model to enhance
efficiency and high performance.
In order to deliver on these three objectives and
maintain our growth trajectory, we will leverage on
four things.
1. We have developed numerous 3rd party
infrastructures to foster growth and scale up our
operations without increasing our cost structure.
» The agency network that has more than
53,417 agents with a 10% growth in the
number of transactions.
» Our investment in Equitel which is now
the 2nd largest money transfer system
in Kenya and handled Shs 623 Billion in
2019.
» Our merchant network which now
has 27,918 POS merchants and 48,790
EazzyPay merchants on board.
2. Execution of digital banking through an enhanced
offering on our different digital platforms such as
EazzyNet, Eazzy API, EazzyBiz, Eazzy App, Eazzy
Diaspora, EazzyChama, EazzyPay, EazzyLoan
and Equitel. We have in place, best in class
security capabilities that will ensure protection of
customer transactions and information in this age
of cybercrime.
3. Regional diversification which allows for
diversified income streams through the
contribution of the various subsidiaries, spreading
of our business risks and expansion into different
sectors of the economies of these regions.
4. Efficiency through continuous improvement
and innovation that will allow us to maintain a
low cost to income ratio and thereby improve
our profitability. We have invested heavily in
technology and projects which will allow us to
harness efficiencies going forward. Through our
digitization agenda and third party infrastructure
we are moving away from a direct fixed cost
operating model to a low and variable cost model
as facilitated by mobile and agency banking.
Focus areas for 2019In light of the changing business environment, we
realigned our focus and business model into 8 facets,
as follows:
OUR BUSINESS
Non-funded income growth;
Treasury operations;
Regional and business diversification;
Strengthening liquidity and balance sheet agility;
01
02
03
04Asset quality;
Innovation and digitization;
Efficiencies and cost optimization; and
Impact investment and social brand development.
05
06
07
08

35
EQUITY GROUP HOLDINGS PLC AND SUBSIDIARIES INTEGRATED REPORT AND FINANCIAL STATEMENTS FOR THE YEAR ENDED 31 DECEMBER 2019
VALUE CREATION MODELOur vision is to be the leading bank in sustainable
performance and customer satisfaction and our
commitment leads us to serve as an agent of
transformation of society. We work for great causes,
such as financial inclusion and literacy, economic
development, enterprise development, education,
health, energy and agriculture. We continuously seek
the common good, contributing to the development of
the regions we operate in.
1. CAPITALS
All organizations depend on inputs (or capitals) for
their success. We use a wide range of inputs that are
related to raise finance and manage our customers’
funds. By allocating capital to our businesses, we
provide differentiation, create value and share it with
our stakeholders, while also increasing our own
capitals. We present below a brief description of the
capitals that are most relevant to our business model.
Financial capital
Financial capital is composed of the financial resources
available and allocated to Equity, our own or third
parties’ in the form of products and services provided
to our customers, such as: loan operations, financial
investments, deposits and funding, investments and
other operations that generate fees and commissions.
Human capital
This is composed of our employees and their skills and
experiences, as well as their motivations to innovate
and develop better products and services, in an ethical
and responsible way, by means of their capabilities for
management, leadership and cooperation.
Intellectual capital
This is composed of the reputation obtained by our
brand, by technical knowledge and intellectual
property and by the ability to develop new technologies,
products and services for the sustainability of the
business.
Manufactured capital
This is composed of the equipment and physical
installations, such as branches, ATMs, platforms,
applications and systems that are used by the
organization in the provision of products and services.
Social and relationship capital
This is mainly composed of ethical and transparent
relationships with our customers, shareholders,
investors, suppliers, regulatory agencies, government
and society. This also includes the ability to share
value with our stakeholders to enhance individual and
collective well-being.
Natural capital
These are the renewable and non-renewable
environmental resources, consumed or affected by our
businesses, for the prosperity of the organization. We
are particularly talking about water, soil, ores, forests
and biodiversity.
2. BUSINESS MANAGEMENT
Management is responsible for the efficient allocation
of the capitals to our activities and operations,
focused on the creation of shared value over time. Our
Governance and Risk Management Framework has
tools and internal policies that help us in the control
of risks, identification of opportunities, and definition
of strategies and assessment of the performance of
the businesses. Efficient management allows us to
offer products and services that are more suited to the
needs of our customers.
3. PRODUCTS AND SERVICES
By means of portfolios and commercial agreements,
we offer a wide range of financial products and services
to a diversified base of customers, locally and abroad,
which are offered via our physical and digital channels.
We highlight below the main financial products and
services offered to our customers:
• Savings and current accounts;
• Loans and financing;
• Cards;
• Investment;
• Brokerage;
• Wealth management;
• Telecommunications; and
• Insurance.
4. RESULTS
For us, to create value is to obtain sustainable results in
an ethical and responsible way that meets the needs of
our stakeholders. This is how we seek to create shared
value, achieve the established targets and encourage
the development of people, society and the countries in
which we operate.
OUR BUSINESS (continued)

36
EQUITY GROUP HOLDINGS PLC AND SUBSIDIARIES INTEGRATED REPORT AND FINANCIAL STATEMENTS FOR THE YEAR ENDED 31 DECEMBER 2019
STAKEHOLDERSThis section of the report describes our stakeholders’
needs, our pledge to our stakeholders and our strategy
and purpose. Our pledge is to create lasting stakeholder
value and to make a sustainable contribution to society.
To achieve this, we listen closely to our different
stakeholders. In a world that is defined by constantly
changing trends, we want to understand what matters
most to our stakeholders now and how their needs
will change going forward. We do this by engaging in
dialogue with our stakeholders.
Shareholders and Investors
These are the initial providers of financial capital
and we disclose to them relevant information to
make informed investment decisions as well as seek
their perspectives on our financial performance and
strategy.
Key concerns
The key concerns raised by shareholders related to
credit risks in light of the introduction of interest rate
capping and IFRS 9. They were also concerned about
business growth prospects in a challenging operating
environment, including management’s decision to
allocate capital in different countries as we look to
grow and have a presence in 15 countries by 2025. A
greater number of shareholders are interested in how
we are embedding sustainability considerations into
our business practices.
Value we create
• Delivering value to our shareholders by increasing
net asset value, dividends, share price and
earnings.
• Continuous engagement to ensure full disclosure
and open communication so as to inform their
investment decisions.
Customers
Customers remain the largest source of our deposits,
which enable us to fund lending activities. Gaining
more customers results in greater revenue growth
and this can only be achieved by providing superior
customer experience. On the other hand, sustainable
banking practices and world-class governance and risk
management ensure we maintain the trust customers
have in us.
Key concerns
They desire banking to become simpler, more intuitive
and time-efficient.
Providing excellent customer service and getting it
right for customers the first time and security for their
money and information.
Value we create
• Safeguarding deposits, investments and wealth,
while growing returns.
• Providing credit that enables wealth creation,
economic development and job creation.
• Facilitating transactions that are the backbone of
economic value exchange.
• Enabling financial inclusion by providing access to
affordable products to the previously unbanked.
• Providing financial education and advice.
• Developing innovative solutions that meet our
customers’ specific needs.
Employees
Our staff are key to making Equity a great place to bank
and work. Motivated and skilled staff, together with
efficient and value-creating solutions, services and
operations offer value to our customers. Staff as part
of society, contribute materially to the communities in
which they live and work.
Key concerns
They want to grow as the business grows, open doors
for career progression, opportunities to contribute to
society and a work environment that is friendly, safe
and conducive for work life balance.
Value we create
• Employing citizens in the jurisdictions in which we
operate.
• Rewarding staff for the value they add.
• Creating job opportunities as we grow.
• Developing our staff to further their careers and
improve our services and products.
• Transforming into an inclusive society through
employment equity and gender equality.
• Motivating and energising our workforce.
OUR BUSINESS (continued)

37
EQUITY GROUP HOLDINGS PLC AND SUBSIDIARIES INTEGRATED REPORT AND FINANCIAL STATEMENTS FOR THE YEAR ENDED 31 DECEMBER 2019
STAKEHOLDERS (continued)Society
We engage with our different communities so as to
better understand the role we can play to address the
needs of the societies we operate in. It is society that
grants us the license to operate and as such, we must
be ever conscious of its interests.
Key concerns
The public is demanding that banks exert greater
influence on their customers and employees to act
responsibly in environmental, social and governance
matters.
Value we create
• Embracing sustainable banking practices and
regulatory compliance that enable a safe and
stable banking system and a thriving society.
• Playing a meaningful part in the broader society
as a procurer of goods and services, making
a difference through our corporate social
investment activities and positively transforming
economies and society through our activities and
our lending.
Regulators and Policy Makers
We purpose to be a good corporate citizen and a long-
term participant in our markets by providing input to
and implementing public policies. We are regulated
by a wide spectrum of regulators due to our regional
footprint.
Key concerns
Regulation for the banking industry continues to be
around key areas such as cyber security, business and
professional conduct, corporate governance, financial
reporting and financial crime.
Value we create
• Complying to set rules and regulations to ensure a
stable financial sector.
• Collaboration with regulators to deepen financial
inclusion.
• Contributing meaningfully to government
budgets through our own corporate taxes, staff
paying personal taxes and participation in buying
government and public sector bonds.
MATERIAL ISSUESThese are the factors, which in our view, could materially impact our ability to serve our customers, deliver our strategy
and determine the nature of relationships we have. We also look at the actions we are taking to mitigate the inherent
risks. The careful analysis of these matters informs the strategic approach adopted by the Board and the choices senior
management make in running the Bank.
The risks and their impact How we are responding
Competition
and industry
disruption
Meeting customer needs with innovative solutions
and superior experiences is critical to maintaining
high-quality relationships with our customers.
As customer expectations continue to evolve,
competitors are finding alternative ways to deliver
financial services, and emerging technologies
present new sources of competitive advantage.
A failure to recognise and adapt to changing
competitive forces in a timely manner could erode
our earnings and our market position over the
long term.
• We actively monitor changes in customer
preferences, products, technologies and
distribution channels and continuously improve
customer experiences with market leading
innovation.
• We invest in people and key areas of technology
capability that are critical to our value
proposition to customers, including cyber-
security, digital channels, data and analytics.
• We are investing in emerging technologies
to ensure that the way we operate and the
solutions we provide to our customers are
industry leading.
• We invest in staff productivity to optimise our
cost base and continue to remain competitive
for our customers.
OUR BUSINESS (continued)

38
EQUITY GROUP HOLDINGS PLC AND SUBSIDIARIES INTEGRATED REPORT AND FINANCIAL STATEMENTS FOR THE YEAR ENDED 31 DECEMBER 2019
The risks and their impact How we are responding
Business
resilience
The resilience and continuity of our operations
is critical to providing our customers with the
products, services and experiences that they
expect.
Events driven by our external environment,
including cyber attacks, political instability,
unfavourable business conditions, global
pandemics and adverse weather conditions can
significantly disrupt the systems and processes
that enable us to serve and protect our customers.
Such disruptions can affect our trusted
relationships with customers, our reputation, and
our operating costs.
• We monitor the health of all systems and
perform contingency planning for disruptions
to critical systems and processes.
• We are implementing a number of process
and system simplification initiatives through
investments in agile capability, automation and
systems resilience.
• We are investing in our technology, processes
and people capabilities to mitigate the impact
of cyber-security risks on our businesses and
customers.
• Group policies and standards on supplier
governance, selection and management and on
outsourcing/offshoring are applied to mitigate
the risk and impact of third-party disruptions.
• We are improving partnership arrangements to
drive greater alignment between our business
and technology partners to ensure we remain
agile in the face of change.
People
capability
Our people are critical to the success of our
strategy and ensuring we are able to continuously
find better ways to operate and meet customer
needs.
A shortage of key skills, a failure to help our
people continuously update their capabilities, the
emergence of new technologies and/or a fall in our
attractiveness relative to other leading employers,
could impact our ability to deliver on our strategy
and vision.
• We are investing in our value proposition as
an employer, through new ways of working,
competitive benefits and a focus on culture and
diversity.
• We focus on developing and retaining our
people, including senior management,
through targeted training programs and skills
upgrading.
• We are creating flexible and innovative
workspaces to enable stronger collaboration
and foster an innovative culture.
• We are building partnerships with leading
universities to further develop top talent and
are investing in community awareness of
potential future skills shortages.
• We are assessing how new technologies will
impact the future workforce for the regional
economies and our businesses. We are building
these changes into our long-term people
development and capability roadmaps.
OUR BUSINESS (continued)MATERIAL ISSUES (continued)

39
EQUITY GROUP HOLDINGS PLC AND SUBSIDIARIES INTEGRATED REPORT AND FINANCIAL STATEMENTS FOR THE YEAR ENDED 31 DECEMBER 2019
The risks and their impact How we are responding
Regulatory
and policy
environment
Regulatory compliance and involvement in evolving
policy discussions are critical to how we continue
to run our business and interact with customers.
The banking industry remains subject to ongoing
regulatory and policy changes. If we are unable
to foresee, advocate for, plan for, and adapt to
regulatory change, this could negatively impact
our ability to serve customers and/or our earnings.
• We allocate a material proportion of our
investment budget to regulatory compliance
and risk prevention initiatives and engage with
policy makers and communities to advocate for
appropriate regulatory reform.
• We maintain constructive and proactive
relationships with key regulators.
Data and
information
management
As one of the region’s largest financial institution,
we manage a significant volume of sensitive
customer data and value the trusted relationship
we have with our customers.
As technology continues to evolve, the threat of
cyber-attacks is becoming more sophisticated and
greater numbers of third-parties seek to access
our customers’ data and remove it from the safety
of our systems and firewalls.
A failure to ensure this information is kept safe
and used in a way that regulators and customers
expect, may significantly impact relationships with
these stakeholders and the broader community.
• We have, and continue to invest significantly
in our data, analytics and cyber-security
capabilities to better meet evolving customer
needs and expectations, and to reduce the
potential for data breaches.
• We actively engage with regulators to ensure
that there is appropriate governance in place
and that evolution in regulation appropriately
balances the value of giving customers control
of their data, with our duty to protect customer
privacy and security.
• We continuously invest in IT system security
and identity and access management controls
to secure the confidentiality, integrity and
availability of our data.
• Our people undergo mandatory training
modules to ensure they understand the
importance of data security and their
obligations in relation to the data they have
access to.
OUR BUSINESS (continued)MATERIAL ISSUES (continued)

40
EQUITY GROUP HOLDINGS PLC AND SUBSIDIARIES INTEGRATED REPORT AND FINANCIAL STATEMENTS FOR THE YEAR ENDED 31 DECEMBER 2019
The risks and their impact How we are responding
Reputation Our reputation is of critical importance to us and
is directly related to how we run our businesses,
make decisions and communicate with customers
and the communities in which we operate.
A negative shift in any stakeholder’s perception of
the Group may materially undermine our ability
to advocate for positive outcomes that align to
our vision and values, and our ability to drive
long-term performance. It may also affect the
cost and availability of funding necessary for the
sustainable management of our business.
• We actively focus on improving the transparency
of our business decisions and engage with our
customers, employees and the communities in
which we operate to understand their concerns
and balance their needs.
• We have embedded our organizational culture
which communicates what we expect of our
people in applying our vision and values as a
guide for business management and decision-
making.
• We continue to drive deeper engagement with
customers, government and industry groups to
ensure we deliver better and consistently fair
outcomes and remediate issues when we are
made aware of them.
• We engage with external rating agencies
to assist them in forming an opinion on our
general creditworthiness, with mechanisms to
adjust business settings as appropriate.
Social and
environmental
footprint
We actively consider the social and environmental
impact of our activities and are committed to
operating sustainably and making a positive
contribution beyond our core businesses.
We consider social and environment issues to be
significant long-term drivers of both financial and
non-financial value. We appreciate the potential
impact they have on our relationships with
different stakeholders.
• Under our Foundation programs and initiatives,
we take a long-term view to ensure that we
conduct business in a sustainable and efficient
way, and appropriately use our influence to
enhance social and environmental outcomes.
• We have implemented frameworks for
considering Environmental, Social and
Governance (ESG) issues in assessing our
relationships with customers and suppliers.
OUR BUSINESS (continued)MATERIAL ISSUES (continued)

41
EQUITY GROUP HOLDINGS PLC AND SUBSIDIARIES INTEGRATED REPORT AND FINANCIAL STATEMENTS FOR THE YEAR ENDED 31 DECEMBER 2019
BUSINESS PERFORMANCE
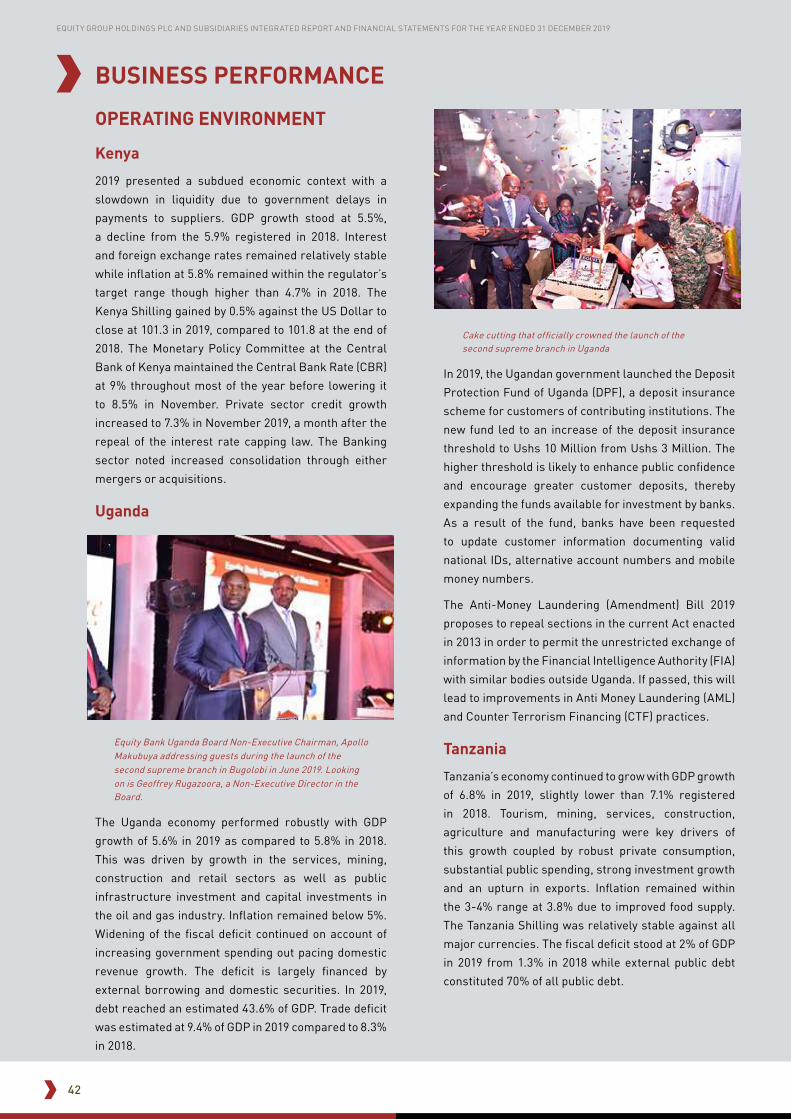
42
EQUITY GROUP HOLDINGS PLC AND SUBSIDIARIES INTEGRATED REPORT AND FINANCIAL STATEMENTS FOR THE YEAR ENDED 31 DECEMBER 2019
BUSINESS PERFORMANCE
OPERATING ENVIRONMENT
Kenya
2019 presented a subdued economic context with a
slowdown in liquidity due to government delays in
payments to suppliers. GDP growth stood at 5.5%,
a decline from the 5.9% registered in 2018. Interest
and foreign exchange rates remained relatively stable
while inflation at 5.8% remained within the regulator’s
target range though higher than 4.7% in 2018. The
Kenya Shilling gained by 0.5% against the US Dollar to
close at 101.3 in 2019, compared to 101.8 at the end of
2018. The Monetary Policy Committee at the Central
Bank of Kenya maintained the Central Bank Rate (CBR)
at 9% throughout most of the year before lowering it
to 8.5% in November. Private sector credit growth
increased to 7.3% in November 2019, a month after the
repeal of the interest rate capping law. The Banking
sector noted increased consolidation through either
mergers or acquisitions.
Uganda
Equity Bank Uganda Board Non-Executive Chairman, Apollo Makubuya addressing guests during the launch of the second supreme branch in Bugolobi in June 2019. Looking on is Geoffrey Rugazoora, a Non-Executive Director in the Board.
The Uganda economy performed robustly with GDP
growth of 5.6% in 2019 as compared to 5.8% in 2018.
This was driven by growth in the services, mining,
construction and retail sectors as well as public
infrastructure investment and capital investments in
the oil and gas industry. Inflation remained below 5%.
Widening of the fiscal deficit continued on account of
increasing government spending out pacing domestic
revenue growth. The deficit is largely financed by
external borrowing and domestic securities. In 2019,
debt reached an estimated 43.6% of GDP. Trade deficit
was estimated at 9.4% of GDP in 2019 compared to 8.3%
in 2018.
Cake cutting that officially crowned the launch of the second supreme branch in Uganda
In 2019, the Ugandan government launched the Deposit
Protection Fund of Uganda (DPF), a deposit insurance
scheme for customers of contributing institutions. The
new fund led to an increase of the deposit insurance
threshold to Ushs 10 Million from Ushs 3 Million. The
higher threshold is likely to enhance public confidence
and encourage greater customer deposits, thereby
expanding the funds available for investment by banks.
As a result of the fund, banks have been requested
to update customer information documenting valid
national IDs, alternative account numbers and mobile
money numbers.
The Anti-Money Laundering (Amendment) Bill 2019
proposes to repeal sections in the current Act enacted
in 2013 in order to permit the unrestricted exchange of
information by the Financial Intelligence Authority (FIA)
with similar bodies outside Uganda. If passed, this will
lead to improvements in Anti Money Laundering (AML)
and Counter Terrorism Financing (CTF) practices.
Tanzania
Tanzania’s economy continued to grow with GDP growth
of 6.8% in 2019, slightly lower than 7.1% registered
in 2018. Tourism, mining, services, construction,
agriculture and manufacturing were key drivers of
this growth coupled by robust private consumption,
substantial public spending, strong investment growth
and an upturn in exports. Inflation remained within
the 3-4% range at 3.8% due to improved food supply.
The Tanzania Shilling was relatively stable against all
major currencies. The fiscal deficit stood at 2% of GDP
in 2019 from 1.3% in 2018 while external public debt
constituted 70% of all public debt.

43
EQUITY GROUP HOLDINGS PLC AND SUBSIDIARIES INTEGRATED REPORT AND FINANCIAL STATEMENTS FOR THE YEAR ENDED 31 DECEMBER 2019
OPERATING ENVIRONMENT (continued)The Bank of Tanzania (Financial Consumer Protection)
Regulations 2019 through Government Notice No. 884
published on 22nd November, 2019 came into force
on 27th November, 2019. The Regulations provide for
financial consumer protection and designates the
responsibilities of Boards of Directors and Senior
Management of operating banks and financial service
providers. It requires institutions to deploy sound
governance, internal control systems, policies,
procedures and for submission of reports to the
Central Bank in this respect.
South Sudan
South Sudan’s economy rebounded in 2019, with
growth estimated at 5.8% as compared to 0.5% in 2018.
The rebound was attributed to increased oil supply
following the reopening of oil fields and resumption of
production. Inflation increased to 69% from 40.1% in
the previous year. The current account deficit widened
to 6.4% of GDP in 2019 from 4.5% in 2018. Oil exports—
crude oil accounts for more than 95% of exports—are
expected to fund the current account deficit and boost
foreign reserves.
Rwanda
Equity Bank Rwanda MD, Hannington Namara demonstrates how to scan a QR Code when using EazzyPay to pay for bills, goods or services during a media briefing. The functionality is available on the bank’s EazzyBanking App.
Rwanda’s economy continued to perform well with
GDP growth of 10.9% in 2019, higher than the regional
average. Growth was mainly in services, industry and
particularly construction as well as public investment
in basic services and infrastructure. Inflation moved up
to 12% in 2019, driven by increased domestic demand.
Since inflation was above the 5% target, the National
Bank of Rwanda reduced the monetary policy rate by
50 basis points to 5% in May 2019, stimulating bank
lending to the private sector. Domestic credit to the
private sector increased by 0.9 percentage points to
21.1% of GDP in 2019.
A packed crowd during a roadshow to mark the launch of Eazzy Banking suite of products in Rwanda
Fiscal deficit increased by 1.9 percentage points to 6.2%
of GDP. Government securities largely financed the
deficit. Public and publicly guaranteed debt increased
to 50.3% of GDP in 2019. The trade deficit widened by
3.5 percentage points to 11.3% increasing the current
account deficit by 1.5 percentage points to 9.2% of GDP.
The exchange rate depreciated against the dollar by
5.0% in 2019 due to the growing trade deficit.
Democratic Republic of Congo (DRC)
GDP grew at 4.6% in 2019, declining from 5.8% in
2018 due to a slowdown in the extractives sector,
the economy’s main driver and a fall in international
commodity prices particularly copper and cobalt prices.
Growth was hinged on domestic demand, particularly
private investment and public consumption. Inflation
declined to 3.9% in the year from a high of 9.1% in 2018.
The fiscal deficit was 0.4% while the current account
deficit was 2.6% of GDP, financed primarily by direct
foreign investment.
BUSINESS PERFORMANCE (continued)
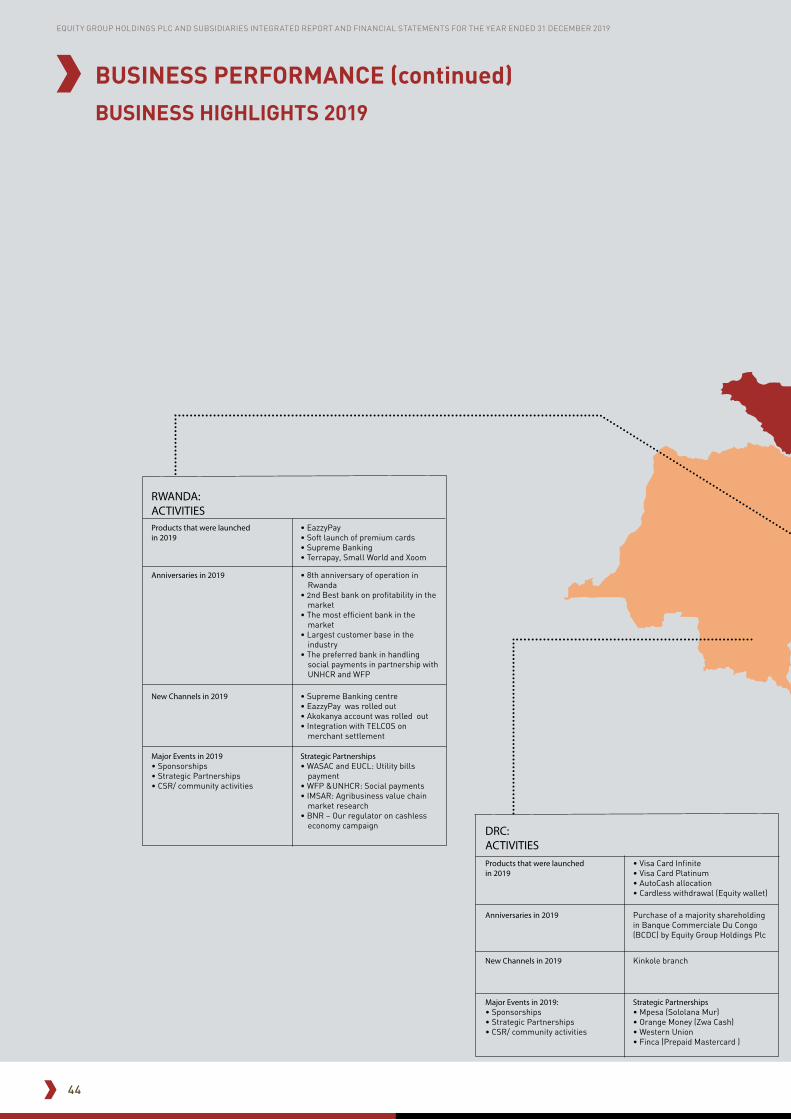
44
EQUITY GROUP HOLDINGS PLC AND SUBSIDIARIES INTEGRATED REPORT AND FINANCIAL STATEMENTS FOR THE YEAR ENDED 31 DECEMBER 2019
Products that were launched in 2019
• Visa Card Infinite • Visa Card Platinum • AutoCash allocation • Cardless withdrawal (Equity wallet)
Anniversaries in 2019 Purchase of a majority shareholding in Banque Commerciale Du Congo (BCDC) by Equity Group Holdings Plc
New Channels in 2019 Kinkole branch
Major Events in 2019:• Sponsorships• Strategic Partnerships• CSR/ community activities
Strategic Partnerships• Mpesa (Sololana Mur)• Orange Money (Zwa Cash)• Western Union• Finca (Prepaid Mastercard )
DRC: ACTIVITIES
Products that were launched in 2019
• EazzyPay• Soft launch of premium cards• Supreme Banking• Terrapay, Small World and Xoom
Anniversaries in 2019 • 8th anniversary of operation in Rwanda
• 2nd Best bank on profitability in the market
• The most efficient bank in the market
• Largest customer base in the industry
• The preferred bank in handling social payments in partnership with UNHCR and WFP
New Channels in 2019 • Supreme Banking centre• EazzyPay was rolled out• Akokanya account was rolled out• Integration with TELCOS on
merchant settlement
Major Events in 2019• Sponsorships• Strategic Partnerships• CSR/ community activities
Strategic Partnerships• WASAC and EUCL: Utility bills
payment• WFP &UNHCR: Social payments• IMSAR: Agribusiness value chain
market research• BNR – Our regulator on cashless
economy campaign
RWANDA: ACTIVITIES
Products that were launched in 2019
• Agency banking• Mastercard acceptance• Cash drop and Cash distribution
Anniversaries in 2019 • 10th anniversary of operation in South Sudan (1st July 2019)
New Channels in 2019 Rollout of Agents: 32
Major Events in 2019• Sponsorships• Strategic Partnerships• CSR/ community activities
Strategic Partnerships• EBSSL/Japanese Embassy public
Lectures at University of Juba• UNDP partnership on the SDGs• Youth Summit in Arusha• Trained 300 local traders on
entrepreneurship skills• UNMISS Rwandan Contingents -
construction of primary schools in Kapuripayam, Juba
• Alongside Embassy of Japan supported “Doing business in South Sudan” initiative
• Partnered with UNDP in support of the UN SDGs on Elimination of hunger through support of Agricultural master plan
SOUTH SUDAN: ACTIVITIES
Products that were launched in 2019
• Simba Debit Card• SATF project in partnership with
Mastercard• Expansion of agency network
Anniversaries in 2019 -
New branch, agency, digital platforms etc. opened/ rolled out in 2019Enrolled 837 new Equity Agents
(Wakala)
Major Events in 2019• Sponsorships• Strategic Partnerships• CSR/ community activities
Strategic Partnerships:• Strengthening of Bank support and
partnership with the Government through the Ministry of Home Affairs (Handed over desktop computers)
• Saba Saba International Trade Fair Exhibition, partnering with TanTrade which works under the Ministry of Trade and Industries
• Nane Nane Agricultural Trade Fair- partnering with the Ministry of Agriculture, Livestock and Fisheries
• Simba Sports Club Fans Debit Card - partnering with one of the most successful football clubs in Tanzania
TANZANIA: ACTIVITIES
Products that were launched in 2019
• Equity Agri-Business Loans• Equity Agri-Micro Loans
Anniversaries in 2019 Launch of the second Supreme Branch in Bugolobi
New Channels in 2019 • The bank set up an in-country data center
• Branches opened including Iganga, Masaka, Kasese, Soroti
Major Events in 2019• Sponsorships• Strategic Partnerships• CSR/ community activities
Strategic Partnerships:• Equity Bank partners with GOAL
Uganda to empower Ugandan youth through financial inclusion
• Equity Bank - NU-TEC FS (Northern Uganda transforming the economy through climate smart agriculture) Partnership
UGANDA: ACTIVITIES
BUSINESS PERFORMANCE (continued)
BUSINESS HIGHLIGHTS 2019

45
EQUITY GROUP HOLDINGS PLC AND SUBSIDIARIES INTEGRATED REPORT AND FINANCIAL STATEMENTS FOR THE YEAR ENDED 31 DECEMBER 2019
Products that were launched in 2019
• Visa Card Infinite • Visa Card Platinum • AutoCash allocation • Cardless withdrawal (Equity wallet)
Anniversaries in 2019 Purchase of a majority shareholding in Banque Commerciale Du Congo (BCDC) by Equity Group Holdings Plc
New Channels in 2019 Kinkole branch
Major Events in 2019:• Sponsorships• Strategic Partnerships• CSR/ community activities
Strategic Partnerships• Mpesa (Sololana Mur)• Orange Money (Zwa Cash)• Western Union• Finca (Prepaid Mastercard )
DRC: ACTIVITIES
Products that were launched in 2019
• EazzyPay• Soft launch of premium cards• Supreme Banking• Terrapay, Small World and Xoom
Anniversaries in 2019 • 8th anniversary of operation in Rwanda
• 2nd Best bank on profitability in the market
• The most efficient bank in the market
• Largest customer base in the industry
• The preferred bank in handling social payments in partnership with UNHCR and WFP
New Channels in 2019 • Supreme Banking centre• EazzyPay was rolled out• Akokanya account was rolled out• Integration with TELCOS on
merchant settlement
Major Events in 2019• Sponsorships• Strategic Partnerships• CSR/ community activities
Strategic Partnerships• WASAC and EUCL: Utility bills
payment• WFP &UNHCR: Social payments• IMSAR: Agribusiness value chain
market research• BNR – Our regulator on cashless
economy campaign
RWANDA: ACTIVITIES
Products that were launched in 2019
• Agency banking• Mastercard acceptance• Cash drop and Cash distribution
Anniversaries in 2019 • 10th anniversary of operation in South Sudan (1st July 2019)
New Channels in 2019 Rollout of Agents: 32
Major Events in 2019• Sponsorships• Strategic Partnerships• CSR/ community activities
Strategic Partnerships• EBSSL/Japanese Embassy public
Lectures at University of Juba• UNDP partnership on the SDGs• Youth Summit in Arusha• Trained 300 local traders on
entrepreneurship skills• UNMISS Rwandan Contingents -
construction of primary schools in Kapuripayam, Juba
• Alongside Embassy of Japan supported “Doing business in South Sudan” initiative
• Partnered with UNDP in support of the UN SDGs on Elimination of hunger through support of Agricultural master plan
SOUTH SUDAN: ACTIVITIES
Products that were launched in 2019
• Simba Debit Card• SATF project in partnership with
Mastercard• Expansion of agency network
Anniversaries in 2019 -
New branch, agency, digital platforms etc. opened/ rolled out in 2019Enrolled 837 new Equity Agents
(Wakala)
Major Events in 2019• Sponsorships• Strategic Partnerships• CSR/ community activities
Strategic Partnerships:• Strengthening of Bank support and
partnership with the Government through the Ministry of Home Affairs (Handed over desktop computers)
• Saba Saba International Trade Fair Exhibition, partnering with TanTrade which works under the Ministry of Trade and Industries
• Nane Nane Agricultural Trade Fair- partnering with the Ministry of Agriculture, Livestock and Fisheries
• Simba Sports Club Fans Debit Card - partnering with one of the most successful football clubs in Tanzania
TANZANIA: ACTIVITIES
Products that were launched in 2019
• Equity Agri-Business Loans• Equity Agri-Micro Loans
Anniversaries in 2019 Launch of the second Supreme Branch in Bugolobi
New Channels in 2019 • The bank set up an in-country data center
• Branches opened including Iganga, Masaka, Kasese, Soroti
Major Events in 2019• Sponsorships• Strategic Partnerships• CSR/ community activities
Strategic Partnerships:• Equity Bank partners with GOAL
Uganda to empower Ugandan youth through financial inclusion
• Equity Bank - NU-TEC FS (Northern Uganda transforming the economy through climate smart agriculture) Partnership
UGANDA: ACTIVITIES
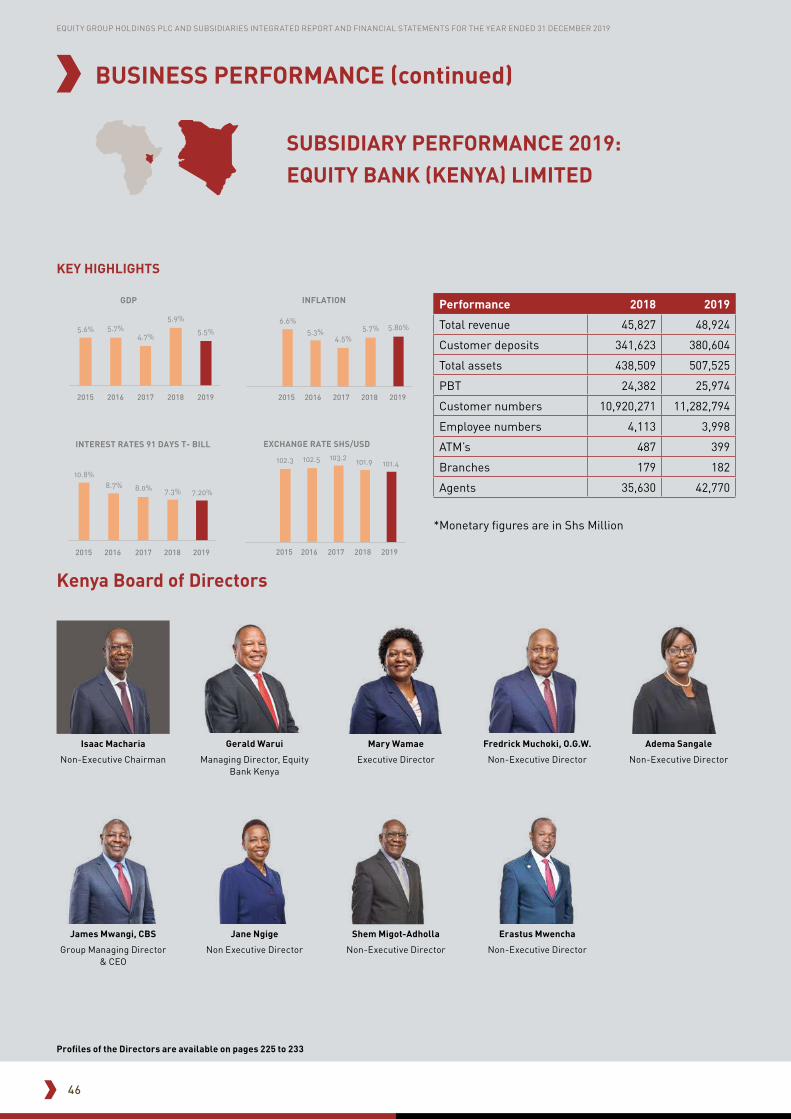
46
EQUITY GROUP HOLDINGS PLC AND SUBSIDIARIES INTEGRATED REPORT AND FINANCIAL STATEMENTS FOR THE YEAR ENDED 31 DECEMBER 2019
BUSINESS PERFORMANCE (continued)
Performance 2018 2019
Total revenue 45,827 48,924
Customer deposits 341,623 380,604
Total assets 438,509 507,525
PBT 24,382 25,974
Customer numbers 10,920,271 11,282,794
Employee numbers 4,113 3,998
ATM’s 487 399
Branches 179 182
Agents 35,630 42,770
*Monetary figures are in Shs Million
SUBSIDIARY PERFORMANCE 2019: EQUITY BANK (KENYA) LIMITED
5.6% 5.7%4.7%
5.9%
5.5%
GDP
2015 2016 2017 2018 2019
10.8%8.7% 8.0% 7.3% 7.20%
2015 2016 2017 2018 2019
INTEREST RATES 91 DAYS T- BILL
6.6%5.3%
4.5%5.7% 5.80%
INFLATION
2015 2016 2017 2018 2019
102.3 102.5 103.2 101.9 101.4
EXCHANGE RATE SHS/USD
2015 2016 2017 2018 2019
KEY HIGHLIGHTS
Kenya Board of Directors
Isaac Macharia
Non-Executive Chairman
Adema Sangale
Non-Executive Director
Mary Wamae
Executive Director
Fredrick Muchoki, O.G.W.
Non-Executive Director
Shem Migot-Adholla
Non-Executive Director
Erastus Mwencha
Non-Executive Director
James Mwangi, CBS
Group Managing Director & CEO
Jane Ngige
Non Executive Director
Profiles of the Directors are available on pages 225 to 233
Gerald Warui
Managing Director, Equity Bank Kenya
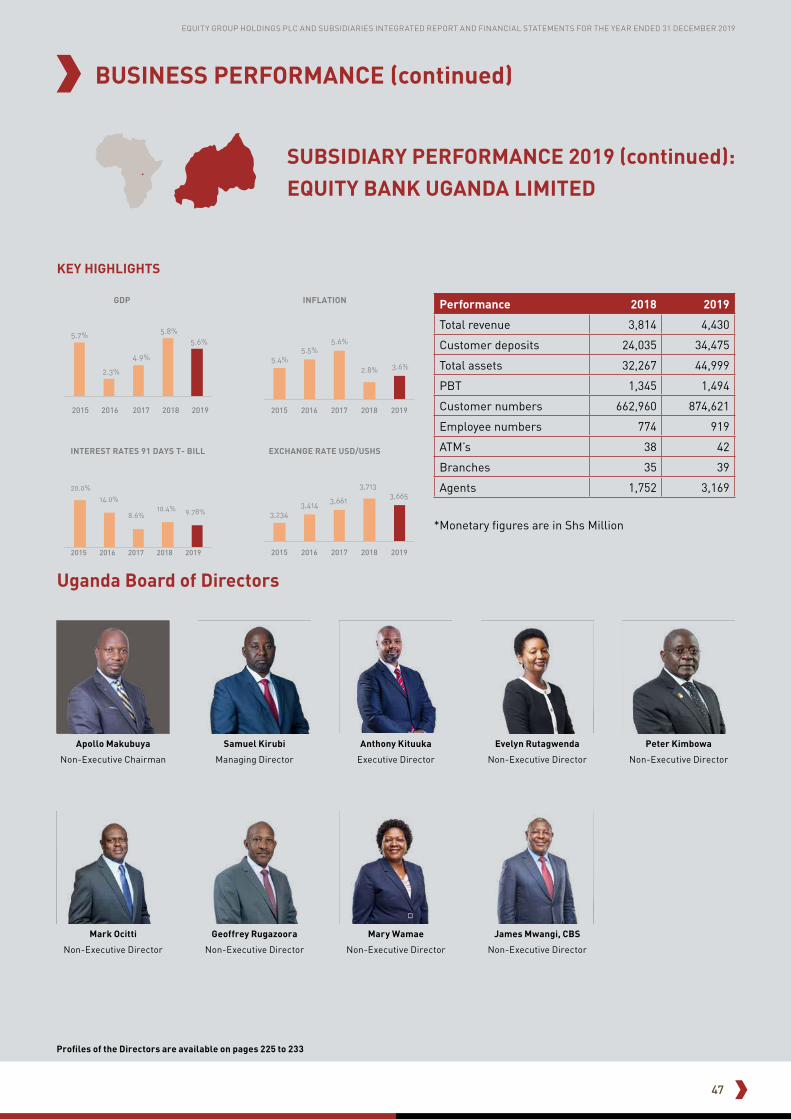
47
EQUITY GROUP HOLDINGS PLC AND SUBSIDIARIES INTEGRATED REPORT AND FINANCIAL STATEMENTS FOR THE YEAR ENDED 31 DECEMBER 2019
Performance 2018 2019
Total revenue 3,814 4,430
Customer deposits 24,035 34,475
Total assets 32,267 44,999
PBT 1,345 1,494
Customer numbers 662,960 874,621
Employee numbers 774 919
ATM’s 38 42
Branches 35 39
Agents 1,752 3,169
*Monetary figures are in Shs Million
5.7%
2.3%
4.9%
5.8%5.6%
2015 2016 2017 2018 2019
GDP
3,2343,414 3,661
3,713 3,665
EXCHANGE RATE USD/USHS
2015 2016 2017 2018 2019
5.4%5.5%
5.6%
2.8% 3.6%
INFLATION
2015 2016 2017 2018 2019
20.0%
14.0%
8.6%10.4% 9.78%
INTEREST RATES 91 DAYS T- BILL
2015 2016 2017 2018 2019
SUBSIDIARY PERFORMANCE 2019 (continued): EQUITY BANK UGANDA LIMITED
KEY HIGHLIGHTS
Apollo Makubuya
Non-Executive Chairman
Anthony Kituuka
Executive Director
Peter Kimbowa
Non-Executive Director
Samuel Kirubi
Managing Director
Evelyn Rutagwenda
Non-Executive Director
James Mwangi, CBS
Non-Executive Director
Mark Ocitti
Non-Executive Director
Geoffrey Rugazoora
Non-Executive Director
Mary Wamae
Non-Executive Director
Profiles of the Directors are available on pages 225 to 233
Uganda Board of Directors
BUSINESS PERFORMANCE (continued)

48
EQUITY GROUP HOLDINGS PLC AND SUBSIDIARIES INTEGRATED REPORT AND FINANCIAL STATEMENTS FOR THE YEAR ENDED 31 DECEMBER 2019
Performance 2018 2019
Total revenue 980 1,730
Customer deposits 5,251 5,193
Total assets 8,560 8, 754
PBT 241 606
Customer numbers 153,984 159,250
Employee numbers 75 69
ATM’s 15 14
Branches 5 5
Agents - 32
*Monetary figures are in Shs Million
-13.9%
-5.2%
0.5%
5.80%
2015 2016 2017 2018 2019
GDP
16.6089.90
127.90
154.30160.50
EXCHANGE RATE USD/SSP
2015 2016 2017 2018 2019
109.9%
379.9%
187.7%
40.1%69.00%
INFLATION
2015 2016 2017 2018 2019
7.0%
15.0%
22.0%
INTEREST RATES 91 DAYS T- BILL
2015 2016 2017 2018 2019
SUBSIDIARY PERFORMANCE 2019 (continued): EQUITY BANK SOUTH SUDAN LIMITED
KEY HIGHLIGHTS
Shem Migot-Adholla
Non-Executive Chairman
Addis Ababa Othow
Managing Director
Mary James Ajith
Non-Executive Director
Kenyi Spencer
Non-Executive Director
Allan Waititu
Non-Executive Director
Alternate to James Mwangi
Mary Wamae
Non-Executive Director
James Mwangi, CBS
Non-Executive Director
Profiles of the Directors are available on pages 225 to 233
South Sudan Board of Directors
BUSINESS PERFORMANCE (continued)
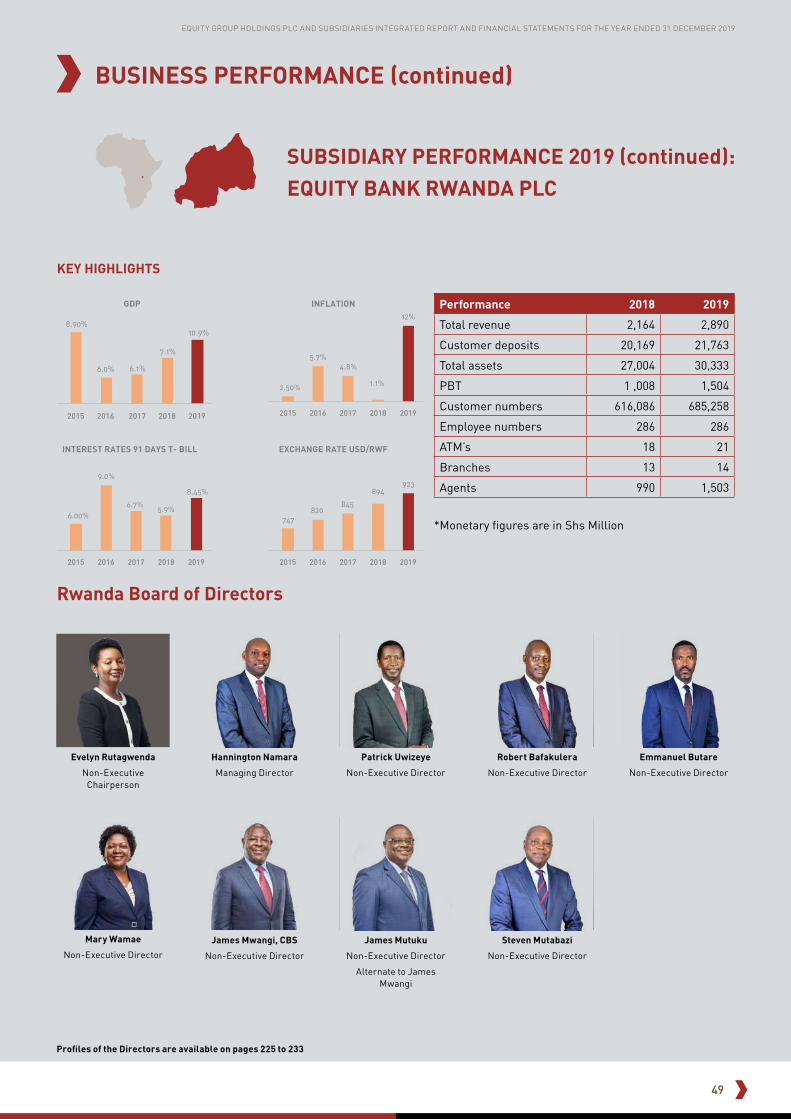
49
EQUITY GROUP HOLDINGS PLC AND SUBSIDIARIES INTEGRATED REPORT AND FINANCIAL STATEMENTS FOR THE YEAR ENDED 31 DECEMBER 2019
BUSINESS PERFORMANCE (continued)
Performance 2018 2019
Total revenue 2,164 2,890
Customer deposits 20,169 21,763
Total assets 27,004 30,333
PBT 1 ,008 1,504
Customer numbers 616,086 685,258
Employee numbers 286 286
ATM’s 18 21
Branches 13 14
Agents 990 1,503
*Monetary figures are in Shs Million
SUBSIDIARY PERFORMANCE 2019 (continued): EQUITY BANK RWANDA PLC
6.0%
8.90%
6.1%
7.1%
10.9%
2015 2016 2017 2018 2019
747820
845
894923
EXCHANGE RATE USD/RWF
2015 2016 2017 2018 2019
2.50%
5.7%4.8%
1.1%
12%
INFLATION
2015 2016 2017 2018 2019
6.00%
9.0%
6.7%5.9%
8.45%
INTEREST RATES 91 DAYS T- BILL
2015 2016 2017 2018 2019
GDP
KEY HIGHLIGHTS
Robert Bafakulera
Non-Executive Director
Hannington Namara
Managing Director
Patrick Uwizeye
Non-Executive Director
Emmanuel Butare
Non-Executive Director
James Mutuku
Non-Executive Director
Alternate to James Mwangi
Steven Mutabazi
Non-Executive Director
James Mwangi, CBS
Non-Executive Director
Profiles of the Directors are available on pages 225 to 233
Rwanda Board of Directors
Evelyn Rutagwenda
Non-Executive Chairperson
Mary Wamae
Non-Executive Director

50
EQUITY GROUP HOLDINGS PLC AND SUBSIDIARIES INTEGRATED REPORT AND FINANCIAL STATEMENTS FOR THE YEAR ENDED 31 DECEMBER 2019
BUSINESS PERFORMANCE (continued)
Performance 2018 2019
Total revenue 894 1,223
Customer deposits 16,284 15,908
Total assets 24,544 23,857
PBT (559.0) (411.2)
Customer numbers 506,078 469,312
Employee numbers 374 387
ATM’s 22 21
Branches 15 14
Agents 2,051 2,888
*Monetary figures are in Shs million
GDP
2.50%
5.7%
4.8%3.8% 3.8%
INFLATION
2015 2016 2017 2018 2019
9.20%
7.1%
4.0%
8.0%
4.30%
INTEREST RATES 91 DAYS T- BILL
2015 2016 2017 2018 2019 2015 2016 2017 2018 2019
2,149 2,173 2,230 2,298 2,298
0
500
1000
1500
2000
2500
EXCHANGE RATE -USD/TSHS
7.00%7.00%6.80%
7.1%6.8%
2015 2016 2017 2018 2019
SUBSIDIARY PERFORMANCE 2019 (continued): EQUITY BANK (TANZANIA) LIMITED
KEY HIGHLIGHTS
Raymond Mbilinyi
Non-Executive Chairman
Ahmed Ame
Non-Executive Director
Robert Kiboti
Managing Director
Godfrey Simbeye
Non-Executive Director
Dino Stengel
Non-Executive Director
Reuben Mbindu
Non-Executive Director
Alternate to James Mwangi
Honest Ngowi
Non-Executive Director
James Mwangi, CBS
Non-Executive Director
Mary Wamae
Non-Executive Director
Profiles of the Directors are available on pages 225 to 233
Tanzania Board of Directors

51
EQUITY GROUP HOLDINGS PLC AND SUBSIDIARIES INTEGRATED REPORT AND FINANCIAL STATEMENTS FOR THE YEAR ENDED 31 DECEMBER 2019
BUSINESS PERFORMANCE (continued)
Performance 2018 2019
Total revenue 5,258 5,949
Customer deposits 43,753 64,080
Total assets 57,965 80,076
PBT 1,358 1,644
Customer numbers 600,971 666,603
Employee numbers 445 651
ATM’s 114 119
Branches 43 44
Agents 2,212 3,055
*Monetary figures are in Shs million
GDP
2.70%
6.90%
3.50%
5.8%
4.63%
2015 2016 2017 2018 2019
INFLATION EXCHANGE RATE-USD/CDF
9251,165 1,595 1,625
1,673
2015 2016 2017 2018 2019
0.74%
31.1%
59.8%
9.1%3.91%
2015 2016 2017 2018 2019
SUBSIDIARY PERFORMANCE 2019 (continued): EQUITY BANK CONGO S.A.
KEY HIGHLIGHTS
Profiles of the Directors are available on pages 225 to 233
DRC Board of Directors
Wolfgang Bertelsmeier
Non-Executive Chairman
Celestin Muntuabu
Managing Director
Jean- Claude Tshipama
Non-Executive Director
Nestor Ankiba
Non-Executive Director
James Mutuku
Non-Executive Director
James Mwangi, CBS
Non-Executive Director
Mary Wamae
Non-Executive Director

52
EQUITY GROUP HOLDINGS PLC AND SUBSIDIARIES INTEGRATED REPORT AND FINANCIAL STATEMENTS FOR THE YEAR ENDED 31 DECEMBER 2019
1. Grow non-funded income
Growth of non-funded income is a foundational aspect
of our strategy to diversify our revenue streams,
improve our income mix and enhance the quality of
earnings. This income stream is vital because it is more
sustainable and predominantly involves a variable
cost component. Key non-funded income sources
include bank charges, transaction fees, monthly
account charges, mobile banking fees among others.
Alternative channels such as self-service channels
and agency account for 97% of all transactions. Non-
funded income for the year was Shs 29.9 Billion, a 19%
growth compared to 2018 and constituted 40% of total
revenue.
Mobile banking transactions grew by 15% year on year
to 595 Million transactions in 2019, from 517 Million
transactions in 2018. Mobile banking offers a wide
variety of transactions enabling customers to facilitate
diverse types of payments, thus resonating with our
customers’ journeys and financial needs. We continue
to expand the pool of partners and providers on this
platform to increase the breadth of products and
services that are availed to our customers.
Our merchant and card business performed well
with merchant commissions rising by 13% to Shs 2.3
Billion. We remain the leading issuer and acquirer
in the market with 3.5 million cards issued to date.
We partner with several leading card and payment
solution providers including American Express, Visa,
MasterCard, PayPal, Google, China Union Pay, SWIFT,
JCB, VFX (Equity Direct) and Diners Club.
Trade finance revenues hit Shs 1.2 Billion in 2019. Our
trade solutions facilitate trade in goods and services
locally and internationally by financing business
operations, liquidity and risk mitigation related to trade.
We have seen growth in sectors such as real estate,
logistics, export/import and regional trade which
continued to perform well despite the challenging
economic environment.
Agency banking also performed strongly in the year
driven by both the expansion of our network and
the number and volume of transactions now being
processed through this channel. Agency revenue
went up by 18% to Shs 1.1 Billion compared to Shs 910
Million in the same period last year. Foreign exchange
(FX) income also grew due to the increased demand for
major foreign currencies from traders importing both
raw and finished goods for the regional markets. FX
income grew by 9% to Shs 3.6 Billion in the year.
Diaspora banking offers financial solutions to
individuals working and living abroad. Leveraging
on technology, our local offerings and expertise are
availed to a global setting. Through EazzyNet - online
banking, Equity Direct, Eazzy Banking App, Eazzy
API, EazzyChama and several partnerships with
global remittance service providers, we have grown
the number of accounts opened and increased our
portfolio of services offered from simple banking and
remittances to investment solutions, insurance and
credit facilities. Diaspora remittances increased by
27% to Shs 142 Billion and income generated grew by
7% to Shs 851 Million.
2. Treasury operations
Treasury has increasingly become a strategic business
partner across all areas of the business, adding
value to the operating divisions of the company.
While traditional treasury functions are concerned
with balancing and managing the daily cash flow and
liquidity of funds within the bank, we have leveraged
on technology to extend this mandate to generating
returns based on excess liquidity. By working closer
with other business units, we continued to explore
and capitalise on areas of collaboration, investment
and cross sell by offering a full suite of services to
customers who require treasury products. Interest
income from trading in government securities has
been the biggest driver of growth under this pillar.
BUSINESS PERFORMANCE (continued)PERFORMANCE AGAINST OUR FOCUS AREAS
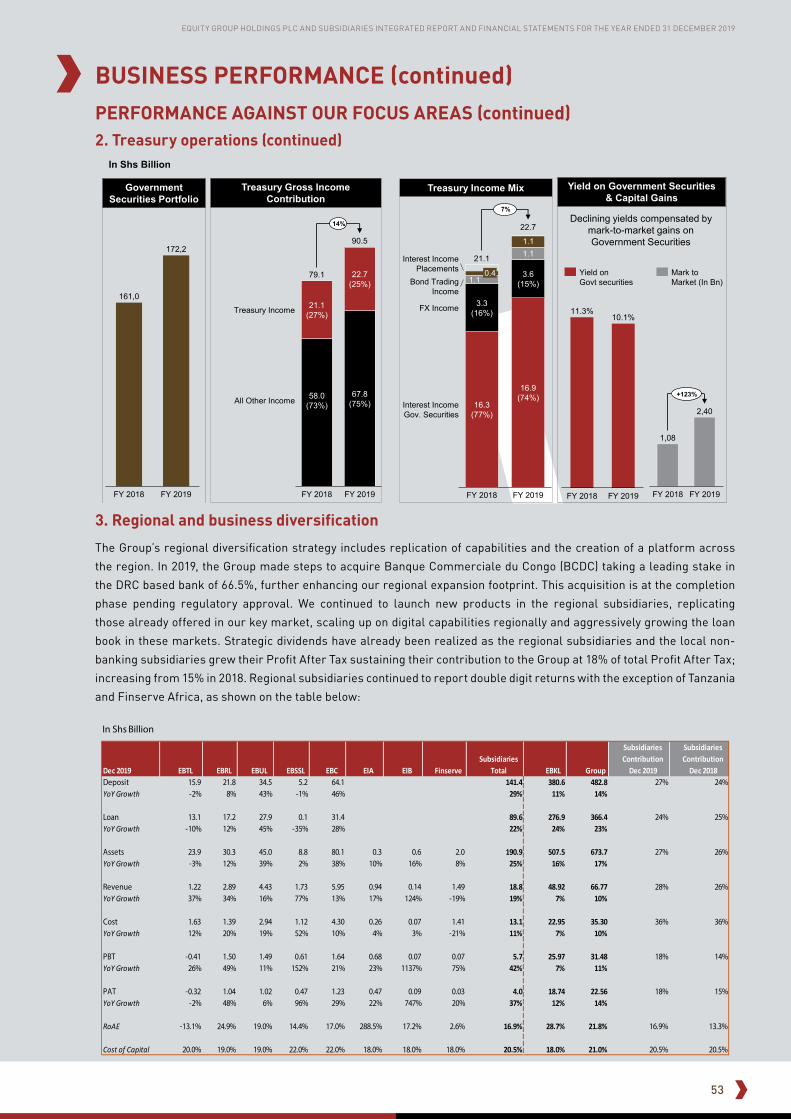
53
EQUITY GROUP HOLDINGS PLC AND SUBSIDIARIES INTEGRATED REPORT AND FINANCIAL STATEMENTS FOR THE YEAR ENDED 31 DECEMBER 2019
FY 2018 FY 2019
10.1%11.3%
Yield on Government Securities & Capital Gains
90.5
21.1(27%)
58.0(73%)
FY 2018
22.7(25%)
Treasury Income
67.8(75%)
FY 2019
All Other Income
79.1
14%
Treasury Gross Income Contribution
Government Securities Portfolio
In Shs Billion
161,0
172,2
FY 2018 FY 2019
Treasury Income Mix
1.1
1.1
3.6(15%)
FY 2018 FY 2019
3.3(16%)
16.3(77%)
16.9(74%)
Interest IncomeGov. Securities
Interest IncomePlacements
Bond TradingIncome
FX Income
21.1
22.7
1.1
7%
1,08
2,40
FY 2018 FY 2019
+123%
Mark to Market (In Bn)
Yield on Govt securities
Declining yields compensated by mark-to-market gains on Government Securities
0.4
BUSINESS PERFORMANCE (continued)PERFORMANCE AGAINST OUR FOCUS AREAS (continued)2. Treasury operations (continued)
3. Regional and business diversification
The Group’s regional diversification strategy includes replication of capabilities and the creation of a platform across
the region. In 2019, the Group made steps to acquire Banque Commerciale du Congo (BCDC) taking a leading stake in
the DRC based bank of 66.5%, further enhancing our regional expansion footprint. This acquisition is at the completion
phase pending regulatory approval. We continued to launch new products in the regional subsidiaries, replicating
those already offered in our key market, scaling up on digital capabilities regionally and aggressively growing the loan
book in these markets. Strategic dividends have already been realized as the regional subsidiaries and the local non-
banking subsidiaries grew their Profit After Tax sustaining their contribution to the Group at 18% of total Profit After Tax;
increasing from 15% in 2018. Regional subsidiaries continued to report double digit returns with the exception of Tanzania
and Finserve Africa, as shown on the table below:
Dec 2019 EBTL EBRL EBUL EBSSL EBC EIA EIB FinserveSubsidiaries
Total EBKL Group
Subsidiaries Contribution
Dec 2019
Subsidiaries Contribution
Dec 2018Deposit 15.9 21.8 34.5 5.2 64.1 141.4 380.6 482.8 27% 24%YoY Growth -2% 8% 43% -1% 46% 29% 11% 14%
Loan 13.1 17.2 27.9 0.1 31.4 89.6 276.9 366.4 24% 25%YoY Growth -10% 12% 45% -35% 28% 22% 24% 23%
Assets 23.9 30.3 45.0 8.8 80.1 0.3 0.6 2.0 190.9 507.5 673.7 27% 26%YoY Growth -3% 12% 39% 2% 38% 10% 16% 8% 25% 16% 17%
Revenue 1.22 2.89 4.43 1.73 5.95 0.94 0.14 1.49 18.8 48.92 66.77 28% 26%YoY Growth 37% 34% 16% 77% 13% 17% 124% -19% 19% 7% 10%
Cost 1.63 1.39 2.94 1.12 4.30 0.26 0.07 1.41 13.1 22.95 35.30 36% 36%YoY Growth 12% 20% 19% 52% 10% 4% 3% -21% 11% 7% 10%
PBT -0.41 1.50 1.49 0.61 1.64 0.68 0.07 0.07 5.7 25.97 31.48 18% 14%YoY Growth 26% 49% 11% 152% 21% 23% 1137% 75% 42% 7% 11%
PAT -0.32 1.04 1.02 0.47 1.23 0.47 0.09 0.03 4.0 18.74 22.56 18% 15%YoY Growth -2% 48% 6% 96% 29% 22% 747% 20% 37% 12% 14%
RoAE -13.1% 24.9% 19.0% 14.4% 17.0% 288.5% 17.2% 2.6% 16.9% 28.7% 21.8% 16.9% 13.3%
Cost of Capital 20.0% 19.0% 19.0% 22.0% 22.0% 18.0% 18.0% 18.0% 20.5% 18.0% 21.0% 20.5% 20.5%
In Shs Billion
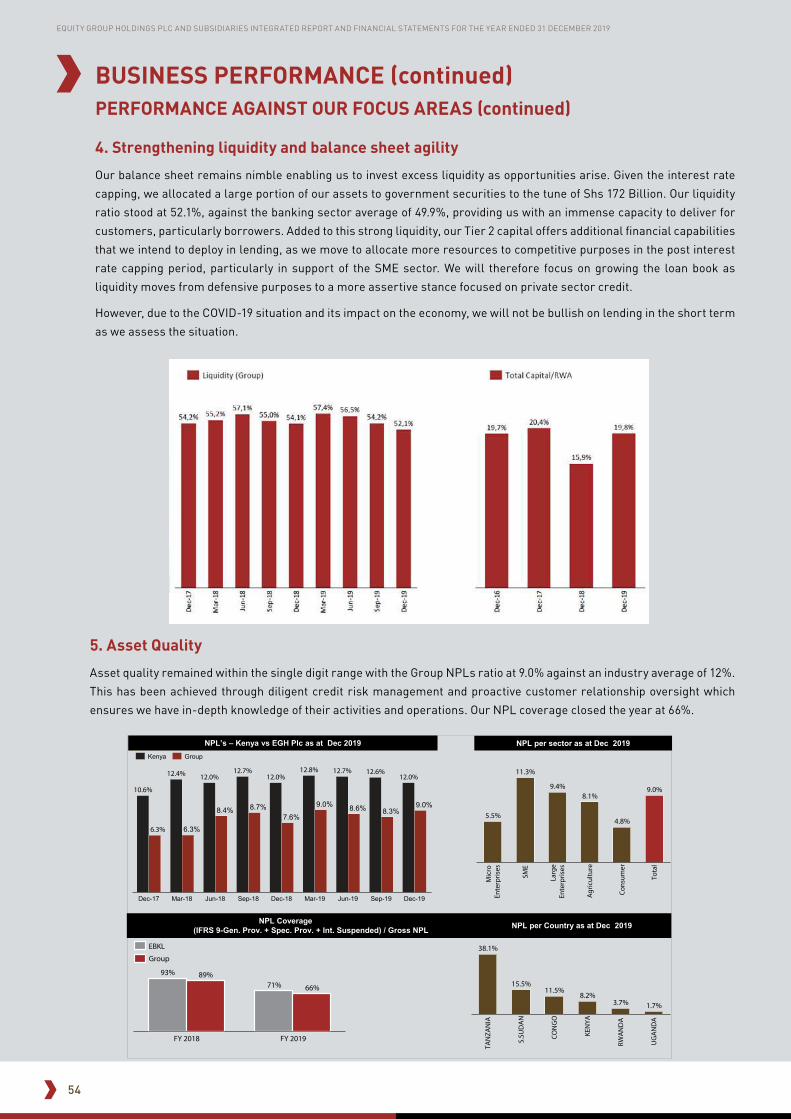
54
EQUITY GROUP HOLDINGS PLC AND SUBSIDIARIES INTEGRATED REPORT AND FINANCIAL STATEMENTS FOR THE YEAR ENDED 31 DECEMBER 2019
5. Asset Quality
Asset quality remained within the single digit range with the Group NPLs ratio at 9.0% against an industry average of 12%.
This has been achieved through diligent credit risk management and proactive customer relationship oversight which
ensures we have in-depth knowledge of their activities and operations. Our NPL coverage closed the year at 66%.
BUSINESS PERFORMANCE (continued)PERFORMANCE AGAINST OUR FOCUS AREAS (continued)
4. Strengthening liquidity and balance sheet agility
Our balance sheet remains nimble enabling us to invest excess liquidity as opportunities arise. Given the interest rate
capping, we allocated a large portion of our assets to government securities to the tune of Shs 172 Billion. Our liquidity
ratio stood at 52.1%, against the banking sector average of 49.9%, providing us with an immense capacity to deliver for
customers, particularly borrowers. Added to this strong liquidity, our Tier 2 capital offers additional financial capabilities
that we intend to deploy in lending, as we move to allocate more resources to competitive purposes in the post interest
rate capping period, particularly in support of the SME sector. We will therefore focus on growing the loan book as
liquidity moves from defensive purposes to a more assertive stance focused on private sector credit.
However, due to the COVID-19 situation and its impact on the economy, we will not be bullish on lending in the short term
as we assess the situation.
v NPL per sector as at Dec 2019NPL’s – Kenya vs EGH Plc as at Dec 2019
NPL Coverage (IFRS 9-Gen. Prov. + Spec. Prov. + Int. Suspended) / Gross NPL NPL per Country as at Dec 2019
10.6%
12.4% 12.0%12.7%
12.0%12.8% 12.7% 12.6%
12.0%
6.3% 6.3%
8.4% 8.7%7.6%
9.0% 8.6% 8.3%9.0%
Sep-18Jun-18Dec-17 Mar-19 Sep-19Mar-18 Jun-19Dec-18 Dec-19
Kenya Group
5.5%
11.3%
9.4%8.1%
4.8%
9.0%
Agr
icul
ture
Larg
eEn
terp
rises
Mic
roEn
terp
rises
SME
Cons
umer
Tota
l
71%
FY 2019FY 2018
93% 89%
66%
EBKL
Group38.1%
15.5%11.5%
8.2%3.7% 1.7%
KEN
YA
TAN
ZAN
IA
S.SU
DA
N
RWA
ND
A
CON
GO
UG
AN
DA
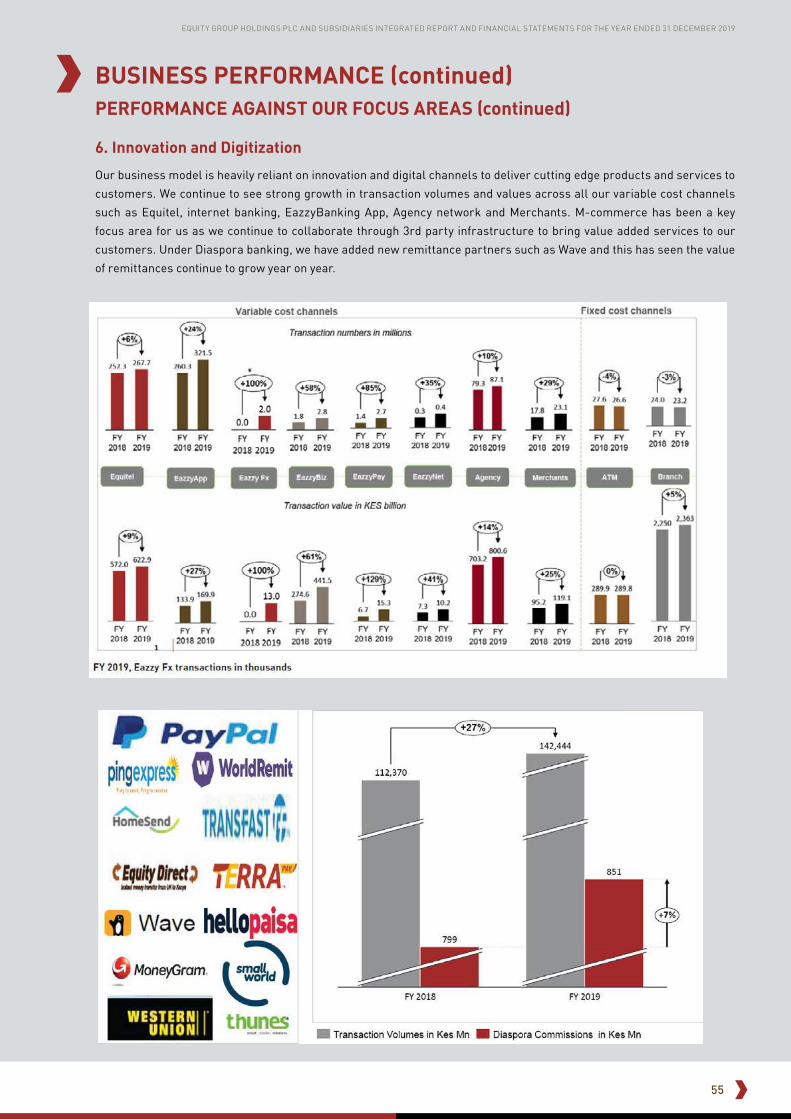
55
EQUITY GROUP HOLDINGS PLC AND SUBSIDIARIES INTEGRATED REPORT AND FINANCIAL STATEMENTS FOR THE YEAR ENDED 31 DECEMBER 2019
BUSINESS PERFORMANCE (continued)PERFORMANCE AGAINST OUR FOCUS AREAS (continued)
6. Innovation and Digitization
Our business model is heavily reliant on innovation and digital channels to deliver cutting edge products and services to
customers. We continue to see strong growth in transaction volumes and values across all our variable cost channels
such as Equitel, internet banking, EazzyBanking App, Agency network and Merchants. M-commerce has been a key
focus area for us as we continue to collaborate through 3rd party infrastructure to bring value added services to our
customers. Under Diaspora banking, we have added new remittance partners such as Wave and this has seen the value
of remittances continue to grow year on year.
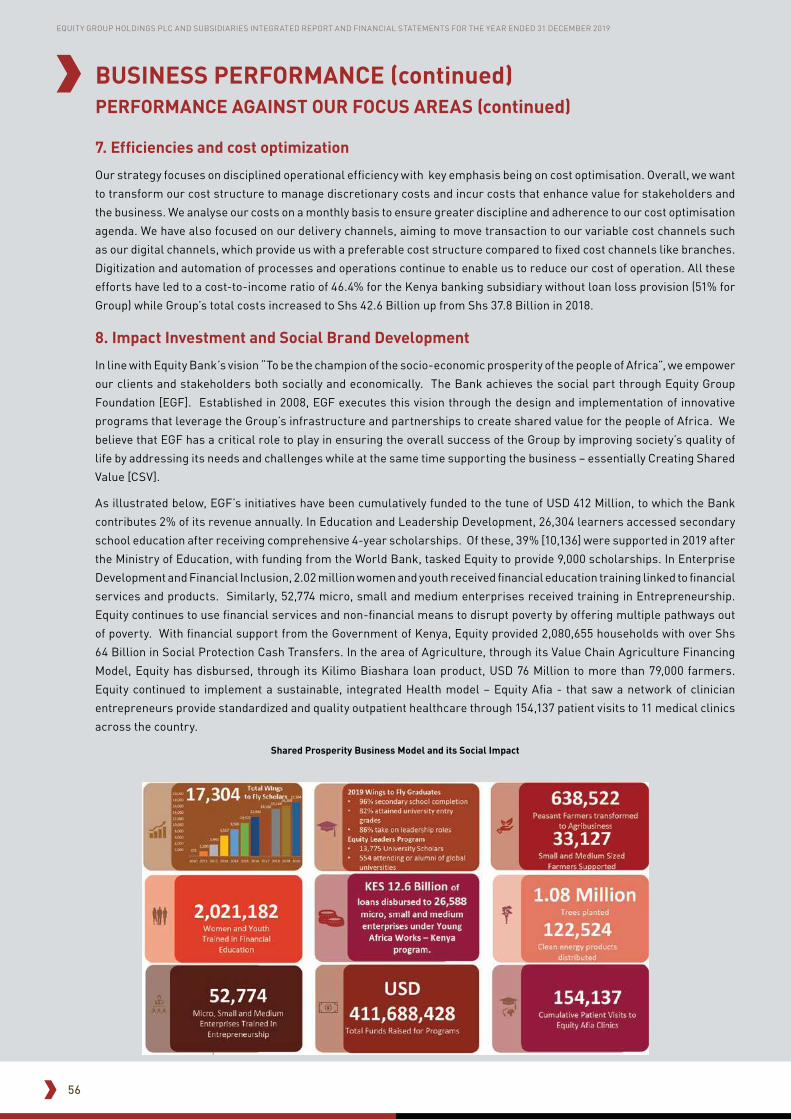
56
EQUITY GROUP HOLDINGS PLC AND SUBSIDIARIES INTEGRATED REPORT AND FINANCIAL STATEMENTS FOR THE YEAR ENDED 31 DECEMBER 2019
7. Efficiencies and cost optimization
Our strategy focuses on disciplined operational efficiency with key emphasis being on cost optimisation. Overall, we want
to transform our cost structure to manage discretionary costs and incur costs that enhance value for stakeholders and
the business. We analyse our costs on a monthly basis to ensure greater discipline and adherence to our cost optimisation
agenda. We have also focused on our delivery channels, aiming to move transaction to our variable cost channels such
as our digital channels, which provide us with a preferable cost structure compared to fixed cost channels like branches.
Digitization and automation of processes and operations continue to enable us to reduce our cost of operation. All these
efforts have led to a cost-to-income ratio of 46.4% for the Kenya banking subsidiary without loan loss provision (51% for
Group) while Group’s total costs increased to Shs 42.6 Billion up from Shs 37.8 Billion in 2018.
8. Impact Investment and Social Brand Development
In line with Equity Bank’s vision “To be the champion of the socio-economic prosperity of the people of Africa”, we empower
our clients and stakeholders both socially and economically. The Bank achieves the social part through Equity Group
Foundation [EGF]. Established in 2008, EGF executes this vision through the design and implementation of innovative
programs that leverage the Group’s infrastructure and partnerships to create shared value for the people of Africa. We
believe that EGF has a critical role to play in ensuring the overall success of the Group by improving society’s quality of
life by addressing its needs and challenges while at the same time supporting the business – essentially Creating Shared
Value [CSV].
As illustrated below, EGF’s initiatives have been cumulatively funded to the tune of USD 412 Million, to which the Bank
contributes 2% of its revenue annually. In Education and Leadership Development, 26,304 learners accessed secondary
school education after receiving comprehensive 4-year scholarships. Of these, 39% [10,136] were supported in 2019 after
the Ministry of Education, with funding from the World Bank, tasked Equity to provide 9,000 scholarships. In Enterprise
Development and Financial Inclusion, 2.02 million women and youth received financial education training linked to financial
services and products. Similarly, 52,774 micro, small and medium enterprises received training in Entrepreneurship.
Equity continues to use financial services and non-financial means to disrupt poverty by offering multiple pathways out
of poverty. With financial support from the Government of Kenya, Equity provided 2,080,655 households with over Shs
64 Billion in Social Protection Cash Transfers. In the area of Agriculture, through its Value Chain Agriculture Financing
Model, Equity has disbursed, through its Kilimo Biashara loan product, USD 76 Million to more than 79,000 farmers.
Equity continued to implement a sustainable, integrated Health model – Equity Afia - that saw a network of clinician
entrepreneurs provide standardized and quality outpatient healthcare through 154,137 patient visits to 11 medical clinics
across the country.
BUSINESS PERFORMANCE (continued)PERFORMANCE AGAINST OUR FOCUS AREAS (continued)
Shared Prosperity Business Model and its Social Impact

57
EQUITY GROUP HOLDINGS PLC AND SUBSIDIARIES INTEGRATED REPORT AND FINANCIAL STATEMENTS FOR THE YEAR ENDED 31 DECEMBER 2019
OUR CAPITALS

58
EQUITY GROUP HOLDINGS PLC AND SUBSIDIARIES INTEGRATED REPORT AND FINANCIAL STATEMENTS FOR THE YEAR ENDED 31 DECEMBER 2019
FINANCIAL CAPITALEquity Group has a diversified source of financial capital comprising shareholders’ funds, debt investors and retained
earnings. Our financial capital is made up of paid up and assigned capital (Shs 1.9 Billion), share premium (Shs 16.1 Billion),
retained earnings (Shs 99.2 Billion) and minority interest of Shs 1.1 Billion as at 31st December, 2019. While ensuring the
cost of funds is at the most reasonable rates, we deploy our financial strength to sustain our business, leverage growth,
achieve sustainable returns and create value for our stakeholders as we also manage our operating costs with utmost
rigor ensuring financial capital is deployed in productive avenues. We are committed to obtaining funds from diversified
sources and to utilizing them in the most effective and prudent manner as we seek to generate sustainable value.
Our approach to financial management is underpinned by prudence. We are concerned with how we raise, control,
administer and deploy our finances catering for risks, costs and control while seeking to be profitable. Capital allocation
is governed by a comprehensive capital allocation strategy framework through the Internal Capital Adequacy Assessment
Process (ICAAP) that provides for the approaches and procedures that ensure we have adequate capital resources with
due attention to all material risks and capital adequacy requirements. This approach also provides stewardship for our
cost optimisation measures as we diligently oversee the utilisation of financial resources in the Bank’s operations.
Capital allocation focuses on supporting value creation and ensuring high returns on deployed financial capital. Due
to our strong liquidity, with a liquidity ratio of 52.1%, our balance sheet is agile and able to adapt to opportunities and
changes in our external context, enabling us to respond appropriately to borrowers and investment prospects when
these arise. Customer deposits grew by 14% to Shs 482.8 Billion on account of improved services that enhanced customer
experience as well as convenience offered by our digital channels.
OUR CAPITALS
Mar
-18
Sep
-19
Dec
-17
48.4%
Jun-
18
Sep
-18
Dec
-18
Mar
-19
Jun-
19
Dec
-19
54.8%
43.8%
50.6%56.0%
45.8%
59.4%
48.0%
57.7% 57.9%
48.6%
61.3%
51.4%
61.6% 54.7%59.1%
50.8% 49.9%
Liquidity (Kenya)Banking Sector (Kenya)
Dec-19Dec-17Dec-16 Dec-18
15.9%
20.4%19.7% 19.8%
Total Capital/RWA
We continue to maintain a prudent and conservative stance in the management of our loan book by increasing our
provisions in tune with the challenging external context. Asset quality remained healthy and well above the banking
sector’s average. Our NPLs for the year stood at 9.0% compared to an industry average of 12% in the same period. Our
performance in this regard is anchored on proactive and exceptional knowledge of our customers which enables us to de-
risk these clients while we anticipate potential challenges and mitigate them from the onset. In addition, we have robust
risk management measures and robust credit underwriting policies that underlie our approach to lending.
Our capital allocation approach remained focused on prudent and optimal allocation to areas of our business that boost
value creation for not only our shareholders but all other stakeholders we partner with. In 2019, the Group made the
decision to increase capital allocation to our operations in the DRC in response to improved growth prospects being
realised by the Bank’s subsidiary. The Group will continue enhancing its balance sheet such that it remains nimble and
agile to adapt to any changes in the operating environment as enabled by strong liquidity and improved asset quality. We
will continue to invest in our Brand as we strengthen the brand transformation process, an integral part of our business
transformation strategy as well as digitization and innovation for increased operational efficiency that will result in lower
cost to income ratios.

59
EQUITY GROUP HOLDINGS PLC AND SUBSIDIARIES INTEGRATED REPORT AND FINANCIAL STATEMENTS FOR THE YEAR ENDED 31 DECEMBER 2019
OUR CAPITALS (continued)
HUMAN CAPITAL The key agenda for the people function in 2019 was
on enhancing the productivity of staff. We took time
to listen to our employees and clarify expectations
especially as regards career growth, remuneration
and rewards. We also took up a review of the Group
capabilities to enhance governance and leadership
as we position the Bank to pursue our strategy
on digitization and more pertinently support to
the SME sector. This review was accompanied by
capacity building in response to identified gaps. We
gave emphasis to communication of the business
transformation initiatives and their implications for
staff, especially the need for skills required in a digital
world and reskilling for customer centric delivery
models.
Overall, we want to reinforce a culture of high
performance underpinned by ethical conduct and
personal responsibility for performance. We anchor
this on capacity development to ensure skills gaps
are addressed and employees are equipped to
accomplish their assignments. Further, our brand
change is anchored on improved customer experience
as we transform into a future fit organization that is
empowered by purpose and focused on delivering
for our stakeholders. We are therefore committed
to ensuring that our staff are in tune with the brand
expectations making them a key component of our new
image and overall business transformation.
Culture alignment
The business transformation journey requires the
requisite culture to deliver on our strategic intentions.
Culture alignment is therefore a key component of
the investment we are making in our teams. In 2018,
we placed emphasis on induction into our corporate
philosophy to enhance appreciation for the overarching
purpose of the Group. In 2019, we enhanced this
engagement by enabling the staff appreciate our
direction and vision. All staff in our Kenya operations
were inducted in these overarching intentions enabling
them to understand the Group’s predominant agenda.
In addition, we placed emphasis on the need to adopt
new ways of doing things as we seek for our teams to
provide holistic solutions to customers. Our teams will
need to be more adept at delivering for our customers
from a one stop shop basis, thus demanding that
employees have a wide array of skills and knowledge.
Individual employees will have to be able to deliver
a broad cross section of services and products to
customers, rather than being narrow and specialised.
On a broader basis, we are changing the structure
of the Group and determining capacity gaps on the
delivery of our new structure. We want to build systems
that will deliver for our customers with convenience
and excellence. This calls for upskilling of our staff
and encouragement of continuous learning in a bid to
enhance knowledge retention.
To improve employee appreciation of the business
transformation and particularly the brand
transformation, we held several town hall sessions
with employees. These were staff briefing and
information sessions providing two-way discussions
on the brand and changes to the model and structure
of the Group. These meetings enable employees
to understand the business reengineering process
and the key skills and expertise required to drive
our transformation. In 2020, we will embark on
retraining and skills development to complement the
brand change. More foundationally, these meetings
also served as an opportunity to discuss the culture
expected of employees as we transform the brand,
ensuring that this transformation is not superficial but
anchored on real changes in customer experience.
Staff retention
Our market context is extremely competitive, making
staff retention challenging. We have therefore sought to
address this by offering competitive remuneration and
benefits, career growth and a workplace that enthuses
with passion and energy for our corporate purpose.
We have addressed the key man risk phenomenon by
identifying individuals whom we may promote to key
positions thus easing replacement of staff on exit. We
have also developed an adequate talent pipeline to
provide for employees at all levels.
Our staff retention remains within market levels at 10%
turnover rate. We consider this staff turnover rate as
healthy providing us with the opportunity to refresh
our teams without excessive interruption in our ability
to operate and create value for our stakeholders. We
remain committed to providing our staff with the best in
class opportunities and an enriching work experience.

60
EQUITY GROUP HOLDINGS PLC AND SUBSIDIARIES INTEGRATED REPORT AND FINANCIAL STATEMENTS FOR THE YEAR ENDED 31 DECEMBER 2019
Employee wellness
An Equity staff wins a race during the 2019 Interbank Games.
Equity Bank Kenya Managing Director Gerald Warui (left) hoists the 2019 Interbank Games Overall Winners trophy as Cabinet Secretary for Sports, Culture and Heritage Amb. (Dr.) Amina Mohammed looks on. Equity emerged the overall winners of the 35th edition of the Interbank Games in the same year the bank was celebrating 35 years since it began operation in 1984.
Equity female staff led by Group Executive Director, Mary Wamae (4th left) and Director - Credit, Elizabeth Gathai (2nd left) during celebrations to mark International Women’s Day in 2019. Equity has always championed the concept of equal opportunity at the work place.
Equity employees take part in an archery contest as part of a team building exercise.
Diversity and inclusion
We are committed to a diverse and inclusive workplace
that provides broad representation based on local and
international demographics. We are pleased to note
that our top management showcases a mix of local
and international talent, a fact that is replicated on our
Board. We view diversity as important as it provides us
with a wider range of perspectives and ideas, inherent
in well diversified and inclusive groups.
As a business that has championed inclusion in the
marketplace, we take great pride in driving inclusion in
the workplace. We provide equal opportunities for all
our employees and empower them with the required
tools and skills. The Group currently enjoys a rich
diversity base in terms of age, gender, nationality, race
and profession.
Leadership
It is stated that all things rise or fall on the basis of
leadership. We therefore take leadership seriously
and invest in equipping our staff with key leadership
skills as a critical requirement for delivering on their
tasks. We place extra emphasis on those tasked with
leadership positions as we require them to model
sound leadership through interpersonal and soft skills,
and technical knowledge. We completed the Harvard
ManageMentor program for 250 managers. Following
that lead, we are developing inhouse leadership
development modules to ensure we offer continuous
development to our leaders, providing them with the
knowledge and skills to direct the Bank.
Dr. James Mwangi was named in the Bloomberg list of 50 people who defined the year 2019 globally.
OUR CAPITALS (continued)
HUMAN CAPITAL (continued)
*Ratio of Male to Female staff at Equity is
56%:44%

61
EQUITY GROUP HOLDINGS PLC AND SUBSIDIARIES INTEGRATED REPORT AND FINANCIAL STATEMENTS FOR THE YEAR ENDED 31 DECEMBER 2019
INTELLECTUAL CAPITALIntellectual capital refers to the Bank’s intangible
assets and can broadly be defined as the collection
of all informational resources Equity has at its
disposal that can be used to drive profits, gain new
customers, create new products or otherwise improve
the business. It is the sum of employee expertise,
organizational processes, and other intangibles that
contribute to our bottom line. Aspects of intangible
value include technical knowledge, the value relating
to relationships, reputation and brand, intellectual
property, proprietary practices and capacity for
innovation.
At Equity, our intellectual capital includes highly
talented human capital, cutting-edge technological
innovations and digital channels, intricately designed
systems and processes and our heritage brand that
resonates with over 14 million customers in Africa and
beyond. This intellectual capital is invaluable since it
creates our most important societal value, namely,
trust. We therefore place great emphasis in protecting
our intellectual capital and strategically enhancing it.
Brand protection and enhancement
Our Brand is at the core of our Bank. It defines who we
are, what we do and why we do it. As an institution, we
exist to transform lives and livelihoods, empowering
people to create wealth as we champion the socio-
economic prosperity of Africa. Over the past 35 years,
with the vital support of our stakeholders, we have
diligently grown our brand equity and affinity into a
trusted heritage brand. Our brand assets are easily
recognizable especially in our traditional markets and
we make every effort to ensure that our stakeholders
experience of our brand is commensurate with their
expectations and our service commitments.
Technology has opened up digital spaces such as
the internet and mobile channels that allow us to be
more readily available with services and support.
Conversely, technology has also unlocked avenues of
fraud and deception. These avenues make it possible
for people to attempt to hijack or duplicate our brand
assets with the aim to defraud our customers or
tarnish our reputation. To avoid being hit by these
criminal activities, it is imperative that we harness
innovations that allow us to constantly monitor them.
This monitoring gives us real time awareness of
breaches and prevention of attacks on our brand when
they occur. We also provide customers and the public
with information to prevent them being defrauded by
fraudulent persons seeking to capitalize on our brand.
The new look Equity ATMs
One of the Bank’s branches sporting the new logo
OUR CAPITALS (continued)

62
EQUITY GROUP HOLDINGS PLC AND SUBSIDIARIES INTEGRATED REPORT AND FINANCIAL STATEMENTS FOR THE YEAR ENDED 31 DECEMBER 2019
INTELLECTUAL CAPITAL (continued)In 2019, we undertook a rebranding exercise that
involved retaining the best of our legacy brand while
projecting for a virtual world in which the client
demographic is much younger, more exposed and
focused on their experience of banking. Our new
brand identity is simple and bold, reflecting our intent
to simplify solutions for our clients and be audacious
in our aspirations. This new brand is supported by
an inhouse culture program, which seeks to enable
employees to deliver on our brand promise, ensuring
that the client experience matches the commitments
espoused by the new brand identity. Market sentiment
to our brand change has been particularly positive both
with our traditional customers and newer clients. It has
received good traction in our regional markets where
we are introducing the new brand identity.
Technology and innovation
Technology is a key driver of performance in the Bank
since it enables us to deliver services to our customers.
As our customers have chosen to engage with us
predominantly through our digital channels, technology
has become the key component of our operations aimed
at ensuring our digital channels are always available,
cutting edge and offering seamless services. We are
constantly upgrading and improving our technology
including in-house iterations to address ever evolving
customer requirements and expectations. Our overall
objective is to enhance customer experience by
providing best in class technology solutions.
To support our regional expansion, we are replicating
capabilities across our regional subsidiaries to enable
the Group to offer the same level of service across
different markets. Our core technology across markets
is similar, to enable congruence in operations and
ease of compatibility over the entire Group. However,
we also develop country specific capabilities based
on products or services within different countries
avoiding replicating irrelevant solutions in specific
entities. In 2019, our IT teams conducted over 200
different projects across the Group focusing on
running, building and assurance. Key issues covered in
these projects include technology availability, stability
and optimization, digital transformation and regulatory
assurance. Additionally, in the year, efforts were made
to ensure that recurring challenges are resolved once
and for all.
Technology is also a key driver in our efficiency and
cost optimization strategy. From a client perspective,
technology enables us to offer services at a much lower
cost. In addition, this lower cost enables customers to
engage in multiple transactions as they benefit from
lower charges than would occur with brick and mortar
services. For the Bank, technology enables employees
to be more efficient and productive. A key approach
here is to reduce those things that don’t add value and
focus on those that do, an approach that is made easier
and more convenient through technology.
A key part of our technology agenda is to develop
innovative solutions for customers. Technological
innovations are a key capability of the Group. Previously
handled by Finserve Africa, it is now anchored in
the IT team, and singularly seeks to develop new or
improved products or processes to enhance customer
experience.
Cyber Security
Microsoft estimates that by 2020, there will be 4 billion
people online, 50 billion devices connected to the
internet and data volumes will be 50 times greater
than they were in 2016, increasing the risks of cyber-
attacks. In July 2019, the Communications Authority of
Kenya revealed that organizations were hit with about
11.2 million cyber threats, a 10.1 percent increase in
the number of incidences, in the first three months of
2019 when compared to the previous quarter.
As an innovative and trusted institution, cyber-attacks
are a looming threat and risk to our organization and
our customers. While we offer our customers digital
channels and options to seamlessly blend with their
lifestyles, we understand that there are also increased
risks that come with this level of convenience. These
cyber-attacks threaten multiple aspects of our
intellectual capital including financial fraud, system
shutdown, reputational damage and costs escalations.
OUR CAPITALS (continued)

63
EQUITY GROUP HOLDINGS PLC AND SUBSIDIARIES INTEGRATED REPORT AND FINANCIAL STATEMENTS FOR THE YEAR ENDED 31 DECEMBER 2019
INTELLECTUAL CAPITAL (continued)
Cyber Security (continued)
Hence, cyber security has become an essential part of
the work we do at Equity. As we develop innovations,
we work with a talented team that focuses on any and
every possible cyber risk we may face. The objective of
our security team is to project potential scenarios, thus
determining and identifying any loopholes before the
release of a product or channel and working to address
them. In order to accomplish a high level of cyber
security, we observe monitoring tools and solutions
and seek updated innovations that decrease cyber
risks. For instance, we utilize email gateway solutions
that protect the data and information that exists within
our systems and networks. We install web application
firewalls that filter, monitor and block unwanted and
insecure traffic towards our channels.
Customer protection
To protect our customers and offer them a better
customer experience, we have improved on our
customer identification process in order to safeguard
their identity and provide a higher level of convenience
at any of our touchpoints. To achieve this, we have
incorporated biometric technology as part of our
upgraded systems. Biometric technology provides
numerous benefits in the world of banking and finance.
First and foremost, from a security perspective,
biometric technology is the strongest form of
authentication that prevents banking information from
being compromised by unauthorized personnel.
With the ability to identify customers within seconds,
it reduces many possible instances of fraud across
customer accounts and mobile channels, with the
added advantage of extreme convenience, especially
within branches. Internally, biometrics offer protection
against insider fraud as financial institutions can
secure employee authentication and accountability,
establishing concrete audit trails of processes and
transactions. With even greater advances, biometric
technology can further secure online banking and give
faster and more accurate customer service.
MANUFACTURED CAPITALManufactured capital consists of equipment,
physical facilities and digital channels such as ATMs,
applications and operational systems that are made
available by the organization for use and offer of
products and services. Our equipment and facilities
primarily provide comfort, convenience and security to
our customers and employees. We invest constantly to
improve our infrastructure, which is essential for the
efficacy and efficiency of our business model.
We have created a wide array of channels through which
we deliver our services coupled by a large distribution
network both locally and internationally. Our channels
continue to experience growth in the volume of
transactions conducted and the customer numbers. A
summary of our channels and client numbers indicates
a flourishing business. Equity Bank is no longer a place
you go to, but rather something you do. The volume of
banking transactions carried out through internet and
mobile phone continued to grow significantly in 2019.
As a rule, we do not replicate products and services
that we offer in other countries we operate in, we just
replicate the capabilities. The products we offer in the
different markets are always reflective of the specific
environment. For example, in DRC where there is only
7% penetration of banking services, mobile banking
offers the best access channel. Once the market is
ready for something new, we deliver it seamlessly
because we operate on a shared platform.
96,239Number of Online
banking users:
1,709,875Number of
Equitel customers:
1,689,713
Number of EazzyBanking App downloads:
298
Number of branches across the region:
196,266Number of active
users on EazzyApp:
53,417Number of Agents:
616Number of ATMs across the region
OUR CAPITALS (continued)
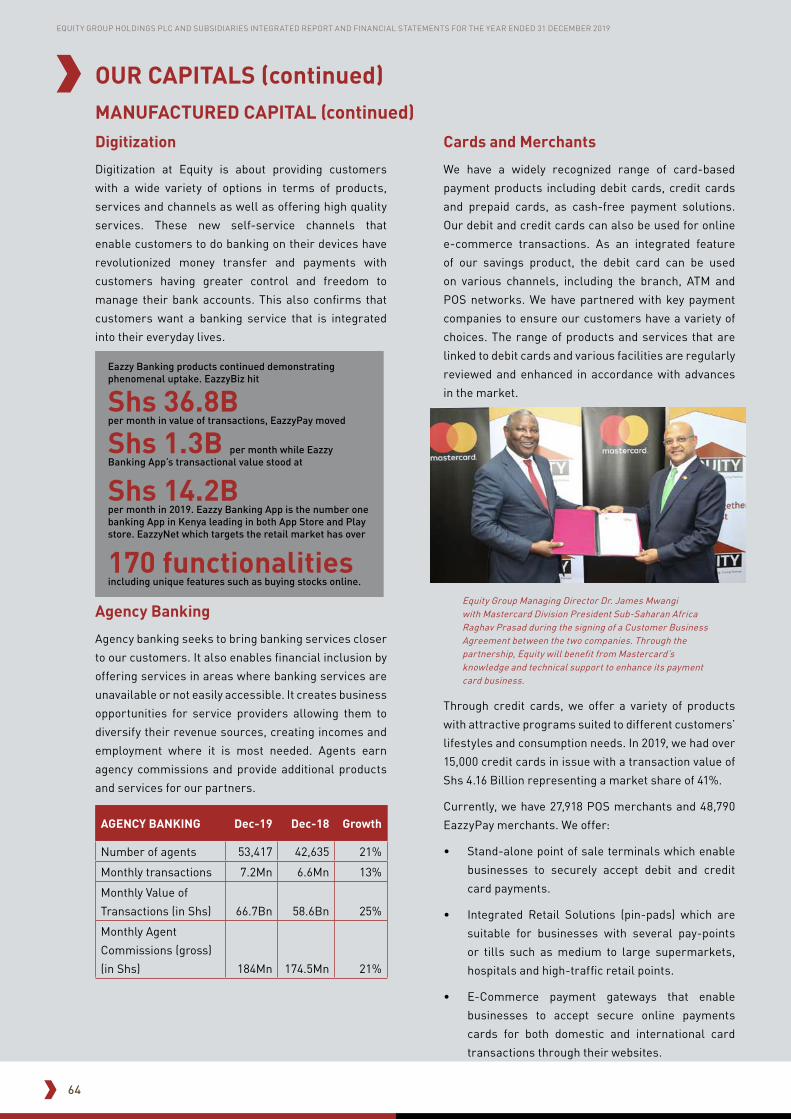
64
EQUITY GROUP HOLDINGS PLC AND SUBSIDIARIES INTEGRATED REPORT AND FINANCIAL STATEMENTS FOR THE YEAR ENDED 31 DECEMBER 2019
Digitization
Digitization at Equity is about providing customers
with a wide variety of options in terms of products,
services and channels as well as offering high quality
services. These new self-service channels that
enable customers to do banking on their devices have
revolutionized money transfer and payments with
customers having greater control and freedom to
manage their bank accounts. This also confirms that
customers want a banking service that is integrated
into their everyday lives.
Agency Banking
Agency banking seeks to bring banking services closer
to our customers. It also enables financial inclusion by
offering services in areas where banking services are
unavailable or not easily accessible. It creates business
opportunities for service providers allowing them to
diversify their revenue sources, creating incomes and
employment where it is most needed. Agents earn
agency commissions and provide additional products
and services for our partners.
AGENCY BANKING Dec-19 Dec-18 Growth
Number of agents 53,417 42,635 21%
Monthly transactions 7.2Mn 6.6Mn 13%
Monthly Value of
Transactions (in Shs) 66.7Bn 58.6Bn 25%
Monthly Agent
Commissions (gross)
(in Shs) 184Mn 174.5Mn 21%
Cards and Merchants
We have a widely recognized range of card-based
payment products including debit cards, credit cards
and prepaid cards, as cash-free payment solutions.
Our debit and credit cards can also be used for online
e-commerce transactions. As an integrated feature
of our savings product, the debit card can be used
on various channels, including the branch, ATM and
POS networks. We have partnered with key payment
companies to ensure our customers have a variety of
choices. The range of products and services that are
linked to debit cards and various facilities are regularly
reviewed and enhanced in accordance with advances
in the market.
Equity Group Managing Director Dr. James Mwangi with Mastercard Division President Sub-Saharan Africa Raghav Prasad during the signing of a Customer Business Agreement between the two companies. Through the partnership, Equity will benefit from Mastercard’s knowledge and technical support to enhance its payment card business.
Through credit cards, we offer a variety of products
with attractive programs suited to different customers’
lifestyles and consumption needs. In 2019, we had over
15,000 credit cards in issue with a transaction value of
Shs 4.16 Billion representing a market share of 41%.
Currently, we have 27,918 POS merchants and 48,790
EazzyPay merchants. We offer:
• Stand-alone point of sale terminals which enable
businesses to securely accept debit and credit
card payments.
• Integrated Retail Solutions (pin-pads) which are
suitable for businesses with several pay-points
or tills such as medium to large supermarkets,
hospitals and high-traffic retail points.
• E-Commerce payment gateways that enable
businesses to accept secure online payments
cards for both domestic and international card
transactions through their websites.
Eazzy Banking products continued demonstrating phenomenal uptake. EazzyBiz hit
Shs 36.8B per month in value of transactions, EazzyPay moved
Shs 1.3B per month while Eazzy Banking App’s transactional value stood at
Shs 14.2B per month in 2019. Eazzy Banking App is the number one banking App in Kenya leading in both App Store and Play store. EazzyNet which targets the retail market has over
170 functionalities including unique features such as buying stocks online.
MANUFACTURED CAPITAL (continued)
OUR CAPITALS (continued)

65
EQUITY GROUP HOLDINGS PLC AND SUBSIDIARIES INTEGRATED REPORT AND FINANCIAL STATEMENTS FOR THE YEAR ENDED 31 DECEMBER 2019
MANUFACTURED CAPITAL (continued)
1,5762,043
119,058
95,015
FY 2018
2,309
FY 2017
69,322
FY 2019
+30%+13%
+37%
+25%
Transaction Volumes in millionsCommissions in millions
▪ Equity is leading in Acquiring and Issuing
▪ Best in class payment channelservices work well with merchants
During the year under review, Merchant turnovers totalled Shs 119.1 Billion, a 25% growth from the previous year’s Shs
95.0 Billion. Merchant commissions closed at Shs 2.3 Billion up by 13% from Shs 2.04 Billion the previous year. The
number of merchant transactions stood at 23.1 million, a growth of 30% from 17.8 million transactions recorded in 2018.
Our acquiring market share stands at 44% as at end of 2019.
The total transaction value for debit and prepaid cards totalled Shs 243.9 Billion for both inbound and outbound
transactions while Issuing Interchange income was Shs 158.7 Million with ATM transaction commissions at Shs 1.62
Billion.
Diaspora Banking
Diaspora banking offers a wide range of services to suit the banking needs of our target clientele that ranges from banking
services for individuals and groups, card products, mobile and online banking, credit facilities, investment solutions and
insurance products. We have diaspora customers in well over 20 countries globally and we have segmented ourselves
based on five different regions that are overseen by a specialised team who have expertise and experience in the needs
of our customers based on their location.
We have partnered with globally recognized remittance partners and we seek to partner with even more, as technology
evolves, and new service providers emerge and take the forefront in money transfer. We leverage heavily on online and
mobile banking using world class solutions such as EazzyNet and Eazzy Banking App, that allow customers to access
their accounts from anywhere in the world as long as they have an internet connection.
OUR CAPITALS (continued)

66
EQUITY GROUP HOLDINGS PLC AND SUBSIDIARIES INTEGRATED REPORT AND FINANCIAL STATEMENTS FOR THE YEAR ENDED 31 DECEMBER 2019
MANUFACTURED CAPITAL (continued)
799
851
FY 2019FY 2018
112,370
142,444
+7%
+27%
Diaspora Transaction Volumes (Shs M)
Diaspora Commissions (Shs M)
SOCIAL & RELATIONSHIP CAPITALThis is composed of ethical and transparent
relationships with our customers, shareholders,
investors, suppliers, regulatory bodies, government
and society. It also includes the skill of sharing value
with our stakeholders to improve individual and
collective welfare. Our Creating Shared Value [CSV]
strategy relates to social development initiatives,
such as Education and Leadership Development,
Enterprise Development and Financial Inclusion,
Food and Agriculture, Health, as well as Energy and
Environment; which are delivered to all communities in
which we have operations. We also work together with
various levels of government to improve public policy
models in the countries where we operate.
Equity Group Foundation
Equity Group Foundation’s (EGF) mission is to
champion the transformation of lives and livelihoods
through the design and implementation of innovating
programs that leverage the Group’s infrastructure and
partnerships to create shared value for the people of
Africa. Established in 2008 as the Group’s social arm, the
Foundation continues to avail economic opportunities,
capacity, tools and technologies that enable individuals
and businesses to increase productivity, resilience and
share in socio-economic growth in the face of poverty
and other threats. Recognizing the diverse nature of
Africa’s socio-economic needs, EGF responds to the
continuum of issues that challenge socio-economic
advancement, especially for low-income individuals
and families, by working to create change.
Creating Shared Value
Creating Shared Value [CSV] is fundamental to the
mission of the Foundation. We believe that EGF has
a critical role to play in ensuring the overall success
of the Group by improving society’s quality of life by
addressing its needs and challenges while at the same
time supporting the business.
EGF’s CSV priorities are those areas of greatest
intersection between the business and society, and
where it can create the most value and make the most
difference. These include:
• Education and Leadership Development: EGF
increases access to and transition through secondary
and tertiary education and provides leadership
skills enhancement and career development in
order to break the cycle of poverty and develop the
next generation of leaders. By developing the next
generation of leaders, Equity creates shared value
by addressing the skills constraints that exist in
the labour market required to grow the business.
In essence, Equity takes a proactive approach to
supporting academically gifted but vulnerable future
leaders through its secondary school scholarship
programs – Wings to Fly and Elimu – and the Equity
Leaders Program that offers paid internships as
well as its Technical and Vocational Educational and
Training (TVET) programs.
OUR CAPITALS (continued)

67
EQUITY GROUP HOLDINGS PLC AND SUBSIDIARIES INTEGRATED REPORT AND FINANCIAL STATEMENTS FOR THE YEAR ENDED 31 DECEMBER 2019
SOCIAL & RELATIONSHIP CAPITAL (continued)
OUR CAPITALS (continued)
• Food and Agriculture: More than 60% of the
population of sub-Saharan Africa are smallholder
farmers, and about 23% of Sub-Saharan Africa’s
GDP comes from agriculture. Yet, Africa’s full
agricultural potential remains untapped. EGF helps
create jobs, improve market access, and expand
agricultural production by working in partnership
with small and medium-sized farmers to increase
their production capabilities, business acumen and
access to technology and financial services.
• Health: In Kenya, like many parts of sub-Saharan
Africa, levels of public expenditure are insufficient
to link the general population to quality preventive
and curative care. EGF increases access to
comprehensive health financing and private sector-
led, affordable, high quality and standardized health
services for poor and middle-income families.
• Enterprise Development and Financial Inclusion:
Micro, Small and Medium Enterprises [MSMEs] play
a significant role in the economy, particularly, in
developing countries. MSMEs create a considerable
proportion of employment for low-income groups
and a means of livelihood for marginalized persons.
EGF stimulates job creation and economic growth by
providing entrepreneurs with advice, mentorship and
entrepreneurship training. EGF promotes innovation
through the uptake of new ideas, solutions, and
technologies to achieve greater impact and scale for
all its work. Additionally, EGF extends Equity Bank’s
efforts to expand access to financial services to the
bottom of the pyramid, helping low-income people
to lift themselves out of poverty. EGF also improves
financial capability and individual and household
financial security by connecting women, youth and
communities to expert financial literacy training.
• Energy and Environment: In Africa, over 600 million
people live without electricity and use solid biomass,
often in open fires, for their cooking and heating
needs. In Kenya, the Clean Cooking Sector Study
2019, estimates that 21,000 people die every year due
to illnesses associated with household air pollution.
EGF promotes the use of Renewable Energy and
Energy Efficiency aimed at transitioning households,
institutions and industries from polluting
technologies and fuels to more efficient technologies
that are environmentally friendly and cost effective.
EGF also promotes the conservation and smart
use of natural resources by expanding forest cover
through tree planting, improving water security as
well as promoting climate smart agriculture. These
interventions are aimed at reversing environmental
degradation, combat climate change through
mitigation and adaptation, improve people’s health
outcomes and save costs. EGF’s intervention is
not only aimed at strengthening environmental
sustainability and stewarding natural resources for
future generations, but also improving the lives and
livelihoods of African people through clean energy
transitions.
• Social Protection: Governments as well as the
private sector have the primary responsibility of
affording social protection to all citizens. Many
countries, including those in East Africa have used
a variety of instruments, programs, policies and
funding mechanisms to achieve this goal. EGF is
committed to reduce social and economic risk and
vulnerability, and to alleviate extreme poverty and
deprivation through cash transfer programs.
Equity Bank Kenya MD, Gerald Warui, speaking at the closing ceremony of the 2019 Clean Cooking Forum held in Nairobi. Equity is a key player in the clean energy sector financing manufacturers, retailers, distributors and individuals in the clean energy value chain.

68
EQUITY GROUP HOLDINGS PLC AND SUBSIDIARIES INTEGRATED REPORT AND FINANCIAL STATEMENTS FOR THE YEAR ENDED 31 DECEMBER 2019
OUR CAPITALS (continued)
• Innovation: Fundamentally, EGF recognizes
innovation as a central means to launch, nurture, and
scale up Africa’s next generation of commercially
successful enterprises. EGF seeks to ingrain a
culture of innovation across all the sectors in
which we work, and ultimately to sustain the rapid
development of entrepreneurs working in all sectors
of Africa’s growing economy. EGF is currently
exploring and finalizing partnerships with several
leading universities, corporations and multilateral
development and civil society organizations to
establish business incubation facilities. Incubators
will support prototyping, research and development,
and offer access to business mentorship, expert
advisory services, training and knowledge resources.
The space will also offer important networking
opportunities to improve collaboration among
entrepreneurs and to support investor matching to
help entrepreneurs secure necessary equity and
debt financing.
Strategic Focus for Improved Impact
In 2019, EGF continued to implement its company
and community needs-based strategy to achieve the
following outcomes:
1. Building Resilience: Increase adaptive capacity and
ability to reduce [manage] risks.
• Increase the uptake of insurance to cushion against shocks and coping strategies.
• Improve access to financial and other services.
• Improve access to high quality and standardized health care.
2. Enhancing Prosperity: Improve financial literacy
and inclusion.
• Enhance positive banking behaviours.
• Improve financial and entrepreneurship management.
• Improve livelihoods and reduce vulnerability.
3. Equity and Inclusion: Enhance access to
educational and professional opportunities.
• Provide opportunities for secondary and tertiary education to bright disadvantaged students.
• Enhance knowledge and employability skills.
4. Testing and Scaling-up: Spur utilization and
adoption of innovation that supports inclusive socio-
economic gains.
• Facilitate the adoption of new technologies and tools to support socio-economic growth.
• Increase the capacity for innovation.
5. Enabling policies and institutions: Strengthen
the systemic capacity for effective execution and
delivery of programs.
• Improved and inclusive policy design and implementation capacity.
• Foster a conducive policy and institutional environment.
6. Partnering for Impact: Strengthen inclusive,
diverse and balanced engagement of partners for
collective action.
• Improved coordination, partnerships and alliances within and across sectors.
Specifically, efforts to improve and create bigger
impact are articulated in EGF’s Creating Shared
Value Strategy: (2017 - 2021). It articulates how the
Foundation can play an integral part in the long-
term business success for Equity Group while
creating value for society. Our key commitments and
performance for 2019 are indicated in the table below:
SOCIAL & RELATIONSHIP CAPITAL (continued)

69
EQUITY GROUP HOLDINGS PLC AND SUBSIDIARIES INTEGRATED REPORT AND FINANCIAL STATEMENTS FOR THE YEAR ENDED 31 DECEMBER 2019
Our 2019 commitments and performance
Pillar Program 2019 Cumulative
Education and
Leadership
Development
Secondary School Scholarships – Wings to Fly & Elimu 10,136 26,304
Wings to Fly scholars qualified to join university 1,519 9,581
Equity Leaders Program Global Scholars 51 514
Equity Leaders Program Interns 537 5,968
Technical and Vocational Education Training Scholars 278 3,033
Food and Agriculture Medium Sized farmers 1,836 33,127
Smallholder farmers - 638,522
Health Equity Afia out-patient clinics 6 11
Clients reached through Equity Afia 22,141 62,083
Client visits to Equity Afia 62,083 154,137
Enterprise
Development and
Financial Inclusion
Micro, Small and Medium Enterprises trained 7,074 52,774
Financial Inclusion 303,480 2,008,359
MSMEs receiving disbursements under Young Africa
Works- Kenya Program 26,588 26,588
Value of disbursements under Young Africa Works- Kenya
Program Shs 12.6 Billion Shs 12.6 Billion
Energy and
EnvironmentClean Energy products distributed 24,212 122,524
Social Protection Number of Households reached with Social Protection
Programs 214,734 2.08 Million
Value of Disbursements via Cash Transfers Shs 19 Billion Shs 64 Billion
Education & Leadership Development
EGF’s performance indicators provide a focus for measuring and reporting Creating Shared Value. This section provides
a performance summary of our strategic program pillars.
The goal of the Equity Education and Leadership Development pillar is to develop and inspire a generation of young
leaders to support the social transformation and economic growth of their communities, countries and beyond.
In its 11th year, the Wings to Fly program, selected 1,136 students to commence Form 1 in 2020. This brought the total
to 17,304 beneficiaries who have accessed secondary education through comprehensive scholarships coupled with
mentorship and psychosocial support. The program continued to record impressive performance with a 97% completion
rate, 82% of the graduates securing university admission and 86% of all students holding leadership positions.
OUR CAPITALS (continued)SOCIAL & RELATIONSHIP CAPITAL (continued)

70
EQUITY GROUP HOLDINGS PLC AND SUBSIDIARIES INTEGRATED REPORT AND FINANCIAL STATEMENTS FOR THE YEAR ENDED 31 DECEMBER 2019
Following the success of the Wings to Fly program, the
Government of Kenya appointed Equity to implement
the flagship Elimu Scholarship Program. The program
is supported by the World Bank and will run until 2024
and targets 18,000 beneficiaries in 110 sub-counties
and 15 urban centres with informal settlements. Under
this program, Equity in 2019 successfully selected the
first cohort of 9,000 secondary school scholarship
beneficiaries to commence Form 1 in 2020 and the
remaining 9,000 will be selected at the end of 2020.
Through the Transitions Program, 3,033 Wings to Fly
alumni accessed technical skills training in various
Technical and Vocational Education and Training (TVET)
institutions across the country. The aim of this program
is to equip the scholars with technical skills that
increase their employability as well as opportunities to
venture into entrepreneurship.
In our Paid Internship Program, that is fully sponsored
by the Group, 5,968 top performing secondary school
graduates accessed leadership training, coaching
and mentorship prior to proceeding to university. The
scholars are selected from top performing students
countrywide as well as Wings to Fly alumni who
score Grade A in the Kenya Certificate of Secondary
Education (KCSE) Examinations.
At the close of 2019, our College Counselling program
had supported 554 scholars to gain admission and
scholarships to study in leading global institutions
across 25 countries. These scholars have an
opportunity to gain world-class education and
exposure which in turn will influence better socio-
economic outcomes for their communities and the
country at large.
OUR CAPITALS (continued)SOCIAL & RELATIONSHIP CAPITAL (continued)
2010 2011 2012 2013 2014 2015 2016 2017 2018 2019 2020
20,000
18,000
16,000
14,000
12,000
10,000
8,000
6,000
4, 000
2,000
0
172
1,500
3,643
6,557
8,569
10,572
12,488
14,168
15,16816,168
17,304
Cumilative Wings to Fly Scholarship
9071,154
2,495
2,748
3,153
3,758
4,490
5,060
5,4315,968
7,000
6,000
5,000
4,000
3,000
2,000
1,000
0
Cumilative ELP Paid Internships
2010 2011 2012 2013 2014 2015 2016 2017 2018 2019
From left seated: Prof. Isaac Macharia, Equity Bank Kenya Board Chairman; Dr. James Mwangi, Equity Group MD & CEO and Equity Group Foundation Executive Chairman; Prof. George Magoha, Cabinet Secretary Ministry of Education; Benjamin Graedler, Senior Programme Manager at KfW; Dr. Belio Kipsang’, Permanent Secretary Ministry of Education and Dr. Beth Waweru, Equity Group Foundation Associate Director- Education, during the 2020 Wings to Fly Commissioning ceremony.

71
EQUITY GROUP HOLDINGS PLC AND SUBSIDIARIES INTEGRATED REPORT AND FINANCIAL STATEMENTS FOR THE YEAR ENDED 31 DECEMBER 2019
Enterprise Development & Financial Inclusion
EGF stimulates job creation and economic
growth by providing micro, small and medium
entrepreneurs (MSMEs) with advice, mentorship and
entrepreneurship training. Under the Entrepreneurship
program, 52,774 micro, small and medium size
enterprises have been trained. To date, USD 65 Million
(Shs 6.6 Billion) has been accessed in loans by these
MSMEs. Equity Group through Equity Bank Kenya and
EGF is currently implementing a five-year program
called Young Africa Works Kenya, in partnership with
the MasterCard Foundation. The program seeks to
catalyse creation of 810,000 jobs in Kenya by facilitating
150,000 MSMEs access finance, grow their capital
and improve their business models. Thus far, 32,958
MSMEs have been trained in various components of
entrepreneurship, digitization and financial education
since program inception. Additionally, 26,588 MSMEs
have received Shs 12.6 Billion in loan disbursements
under this program.
Equity Bank Kenya MD, Gerald Warui, takes President Uhuru Kenyatta through some of the Bank’s products that support SMEs. This was during the Inua Biashara launch event, an intiative of Kenya Bankers Association. The President was accompanied by Central Bank Governor, Dr. Patrick Njoroge and other senior members of government
EGF improves financial capability and individual and
household financial security by connecting people
at the bottom of the pyramid to expert financial
education training as well as expanding access to
financial services and products. To date, EGF has
trained 2,021,182 Kenyan MSMEs, women and youths in
financial education. EGF has scaled up the program to
neighboring countries. In Tanzania under the Fanikisha
Plus project, EGF has trained 42,827 while in Uganda,
another 10,266 individuals have been trained under
the SACCO Project. In Rwanda, Fanikisha project has
trained 550 women and youth in financial inclusion and
education.
Health
EGF implements the Equity Afia program to increase
the health status of Kenyans by increasing access to
and utilization of quality healthcare and affordable,
private health insurance. Equity Afia’s objectives
include:
1. Provide affordable, high-quality, preventative and
primary health services across Kenya;
2. Increase health literacy and favorable attitudes
about health insurance among Kenyans; and
3. Increase the uptake of comprehensive and
affordable private health insurance.
Key activities include:
• Identify and provide training and technical support
to a network of health entrepreneurs;
• Assist health entrepreneurs in accessing financing
to launch/improve health facilities using a high
volume/ low margin [HV/LM] hub and spoke model;
• Lead outreach programs to increase the public’s
knowledge of and attitude toward health insurance
and overall health literacy;
• Develop and launch health savings accounts,
mobile phone applications and social marketing
activities to support outreach;
• Perform data collection and analysis to inform
insurance scheme design; engage private sector
insurers to underwrite new schemes; and
• Support health facilities in adopting capitation and
bundled care payment models.
As at the end of 2019, EGF had opened 11 Equity Afia
health clinics out of a targeted 1,000 clinics reaching
62,083 patients with 154,137 cumulative patient visits
in 2019, with out-patient care services.
Director of Medical Services at the National Police Service, Dr. John Kibosia (in glasses) together with the General Manager of Equity Afia, Gilbert Muriithi (second left) and Reuben Mbindu (left), Executive Director at Equity Group Foundation during the opening ceremony of Equity Afia clinic in Embakasi.
OUR CAPITALS (continued)SOCIAL & RELATIONSHIP CAPITAL (continued)

72
EQUITY GROUP HOLDINGS PLC AND SUBSIDIARIES INTEGRATED REPORT AND FINANCIAL STATEMENTS FOR THE YEAR ENDED 31 DECEMBER 2019
Food and Agriculture
A farmer, who is also a customer of Equity Bank, tends to her crop at her banana farm
Agriculture is the key economic activity in the countries
where we operate and the mainstay for community
livelihoods. Our work in agriculture seeks to enable
farmers to increase their production capabilities,
inculcate business acumen in their farming activities,
thus viewing farming as business and not subsistence
and access technology and financial services to
improve their performance. EGF also assists farmers
with improved market access and expansion of
agricultural production. Thus far, the program has
supported 638,522 small-scale farmers who have
been transformed to agribusiness entrepreneurs
with 33,127 of them being medium - sized farmers.
At the close of 2019, Shs 7.6 Billion in loans had been
disbursed to 79,000 women in agribusiness.
Energy and Environment
Energy is a key component in household, institutional
and industrial operations. Clean and sustainable
energy has emerged as a focal point globally due
to mounting pressure to reduce carbon emissions,
preserve resources and reduce operational costs by
increasing access to Renewable Energy and Energy
Efficiency. Access to affordable and suitable clean
energy for all is the focus of SDG No. 7. Utilization of
conventional energy sources such as biomass and
fossil-based fuels leads to deterioration in people’s
health and productivity whilst having undesired and
sometimes non-reversible damage to the environment.
Despite the availability of cleaner and more efficient
energy solutions, majority of households, communities
and institutions lack knowledge on such solutions or
cannot access or afford to invest in them. Access to
electricity grids and the cost of connecting and staying
connected to the grid in many countries in Africa,
remains a big inhibitor in ensuring every household
has electricity.
Continued use of wood and charcoal as primary sources
of fuel has had devastating effects on the environment
through deforestation, greenhouse gas emissions and
health. The prices of kerosene and charcoal as well as
wood fuel have been on an upward trajectory increasing
the cost of energy for institutions and households that
rely on solid biomass for cooking and heating needs.
EGF seeks to address this challenge by increasing
awareness of the benefits of clean energy for cooking,
lighting and heating for both domestic and industrial
use. We facilitate access to clean energy through
affordable financing to purchase innovative clean
energy technologies that directly improve people’s
health, incomes and the environment. Tapping into the
power of the sun, water, wind and biofuels to provide
lighting, heating, electronic charging and running of
industrial machines are practical solutions that make
a real difference in how communities and businesses
sustain themselves. Industries and households can re-
allocate funds saved from the adoption of renewable
energy technologies to other basic needs such as
education, sustenance, healthcare and investment
which enhances livelihoods.
Eric Naivasha, Equity Group Foundation Associate Director - Energy and Environment, explains how the bank uses its infrastructure of over 180 branches and over 40,000 bank agents to distribute and ease access to clean cooking options for Kenyans.
OUR CAPITALS (continued)SOCIAL & RELATIONSHIP CAPITAL (continued)

73
EQUITY GROUP HOLDINGS PLC AND SUBSIDIARIES INTEGRATED REPORT AND FINANCIAL STATEMENTS FOR THE YEAR ENDED 31 DECEMBER 2019
Key Highlights:
Programs:
• EcoMoto program that allows households to access
clean energy products such as LPG, improved biomass
stoves and solar home systems.
• Climate Smart Agriculture which includes solar water
pumping, solar irrigation systems, bio-digesters for
biogas production and bio-slurry application.
• Energy efficiency solutions for households, industries
and institutions through interventions such as solar
water heating, retrofits and replacement of polluting
fuels used by industries with cleaner and environmentally
friendly alternatives.
• Support for clean biomass fuels production such as
briquettes and pellets.
• Distribution of clean energy products to households
by leveraging of the Bank’s network of branches and
agents.
• Tree planting as part of greening the environment and
combating climate change.
• Water efficiency through promotion of water harvesting
and storage, water purification and recycling.
To reach scale and create more impact at the household
level, we have created an energy loan that is available in
digital form through the phone and established a robust
distribution network of high-quality renewable energy
products throughout the country. The clean energy
programs will enable us to reduce greenhouse gas
emissions by 5 million metric tons by 2023.
Social Protection
In partnership with Governments, Humanitarian and
Development agencies, Equity provides inclusive financial
services to thousands of marginalized and vulnerable
households living in Kenya, Uganda, Rwanda and South
Sudan through Cash Transfer Programs.
The programs are delivered through Equity Bank’s vast
distribution network (Branches, Agents, Merchants, ATMs).
The Bank leverages innovative delivery models to co-create
enrolment and payment solutions for Elderly Persons,
Orphans, Persons with Severe Disabilities, Persons living
in Arid and Semi-Arid Lands (ASALs), Internally Displaced
Persons, Refugees and other Vulnerable Persons.
Key Partnerships include:
1. GoK: Ministry of Labour and Social Protection, Ministry of
Devolution and Arid Semi-Arid Lands (ASALs) - National
drought Management Authority, Ministry of Agriculture,
Livestock and Fisheries.
2. International Organizations: Department for
International Development (DFID), The World Bank,
Australian Agency for International Development
(AusAID), Financial Sector Deepening (FSD)- Kenya, The
United Nations High Commission for Refugees (UNHCR),
United Nations Children Fund (UNICEF) and the World
Food Programme (WFP).
Financial inclusion enables beneficiaries to be in charge
of their own spending and savings through fully-fledged
Bank Accounts and Biometric Smart Cards, a model
that enhances convenience, security, accessibility and
efficiency as well as accountability and preserves their
dignity. With the cards, beneficiaries can access their cash
allocations and use the card to purchase goods and access
services.
Over 122,000 households reached with renewable energy products impacting over 475,000 individuals.
Over Shs 536 Million worth of charcoal and kerosene saved through clean cook stoves and solar home systems.
108,000 metrics tons of CO2 reduced. Over Shs 546 Million in household savings by switching to clean energy.
Over Shs 617 Million worth of clean energy products distributed.
1.08 million trees planted and over 22,000 trees saved through clean energy transition.
122,000Households
108,000 546M
536M
617M 1.08M
OUR CAPITALS (continued)SOCIAL & RELATIONSHIP CAPITAL (continued)

74
EQUITY GROUP HOLDINGS PLC AND SUBSIDIARIES INTEGRATED REPORT AND FINANCIAL STATEMENTS FOR THE YEAR ENDED 31 DECEMBER 2019
Social payments have demonstrated a cost-effective way
of transferring cash to the most vulnerable and exposed
demographics, promoted socio-economic integration
and increased self-reliance. Adoption of cash transfer as
a mode of delivery for humanitarian aid fosters financial
inclusion leading to more sustainable socio-economic
development. Additionally, cash offers choice, dignity and
facilitates financial independence.
Beneficiaries are taken through financial literacy training
to equip them with the knowledge, skills and attitudes
required to adopt good management practices and
behaviors for earning, spending, saving, borrowing and
investing. Participants in these training programs are
equipped with information and tools that enable them to
make informed financial choices and the confidence to
access financial services. This helps them work towards
their financial goals, empower them with the tools
necessary to access finance and become more bankable,
and ultimately transform their lives and livelihoods.
With our regional reach of 298 branches and over 50,000
agents, the Bank offers convenient means of access to
funds for registered beneficiaries.
• 2.08 million reached with Social Protection Programs
• Shs 64 Billion Disbursement via Cash Transfer
Innovation
Equity is committed to fostering innovation that leads to
new ideas, solutions and technologies that increase impact
and scale.
Equitel - My Life
• Equity’s mobile channel Equitel has been an important
entry into the mobile banking space and value-added
services.
• My Life is the unique mobile channel made available
to EGF to deliver free or zero-rated relevant content
aligned with EGF programs.
Wings to Fly Learning
Wings to Fly Learning is an innovative project to bring the
best of digital learning to students in East Africa in order
to support better academic performance and employment
using appropriate, accessible and affordable technologies.
Digital Angels
The Digital Angels program will create opportunities for
young people to obtain a full range of digital skills, literacy
and qualifications in partnership with both global and local
technology organizations.
Wings to Fly beneficiaries with internet enabled mobile devices
2,500,000
2,000,000
1,500,000
1,000, 000
500,000
0
24,837 40,802 59,134
120,398196,258
530,741538,950
657,408724,961
1,865,921
2,080,655
Cumulative B ene�ciaries Reached with S o cial Protec tion
192.7 732.51,747.0
3,590.75,425.3
10,510.5
16,784.0
24,696.8
34,305.4
44,906.3
63,956.5
70,000.0
60,000.0
50,000.0
40,000.0
30,000.0
20,000.0
10,000.0
0.0
Cumulative S o cial Protec tion D isbursement (Shs. mn’)
2009 2010 2011 2012 2013 2014 2015 2016 2017 2018 2019
2009 2010 2011 2012 2013 2014 2015 2016 2017 2018 2019
OUR CAPITALS (continued)SOCIAL & RELATIONSHIP CAPITAL (continued)
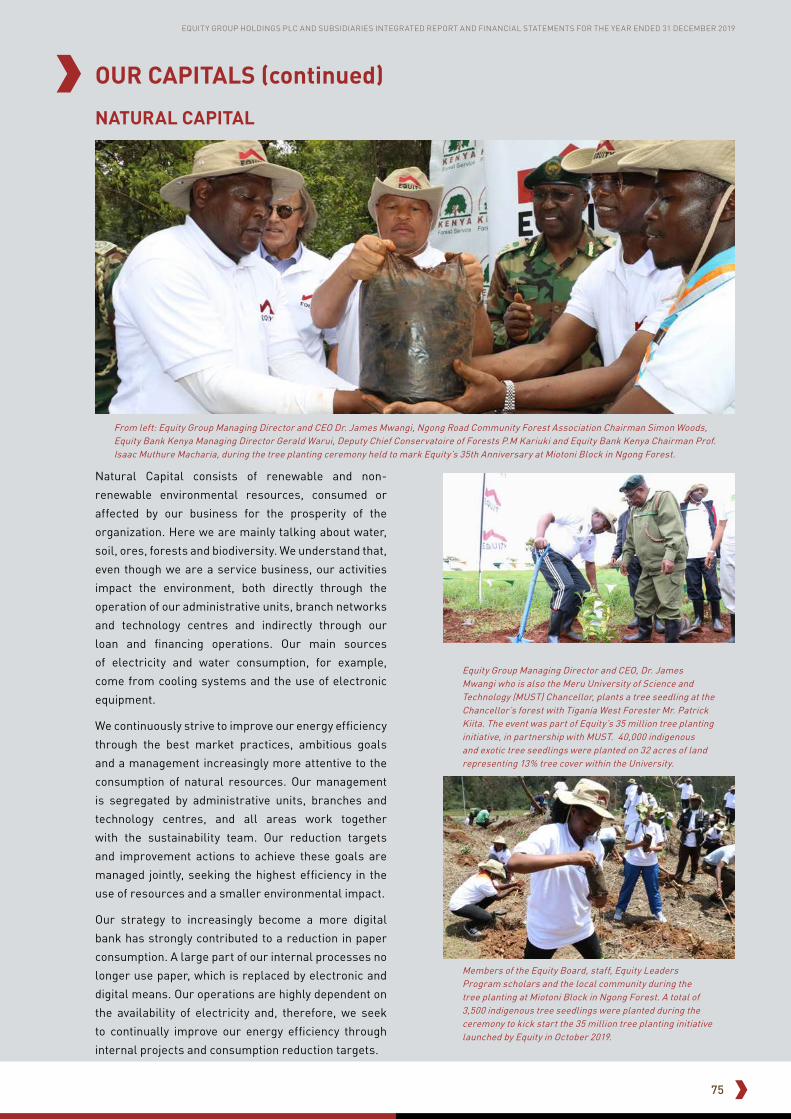
75
EQUITY GROUP HOLDINGS PLC AND SUBSIDIARIES INTEGRATED REPORT AND FINANCIAL STATEMENTS FOR THE YEAR ENDED 31 DECEMBER 2019
Natural Capital consists of renewable and non-
renewable environmental resources, consumed or
affected by our business for the prosperity of the
organization. Here we are mainly talking about water,
soil, ores, forests and biodiversity. We understand that,
even though we are a service business, our activities
impact the environment, both directly through the
operation of our administrative units, branch networks
and technology centres and indirectly through our
loan and financing operations. Our main sources
of electricity and water consumption, for example,
come from cooling systems and the use of electronic
equipment.
We continuously strive to improve our energy efficiency
through the best market practices, ambitious goals
and a management increasingly more attentive to the
consumption of natural resources. Our management
is segregated by administrative units, branches and
technology centres, and all areas work together
with the sustainability team. Our reduction targets
and improvement actions to achieve these goals are
managed jointly, seeking the highest efficiency in the
use of resources and a smaller environmental impact.
Our strategy to increasingly become a more digital
bank has strongly contributed to a reduction in paper
consumption. A large part of our internal processes no
longer use paper, which is replaced by electronic and
digital means. Our operations are highly dependent on
the availability of electricity and, therefore, we seek
to continually improve our energy efficiency through
internal projects and consumption reduction targets.
Equity Group Managing Director and CEO, Dr. James Mwangi who is also the Meru University of Science and Technology (MUST) Chancellor, plants a tree seedling at the Chancellor’s forest with Tigania West Forester Mr. Patrick Kiita. The event was part of Equity’s 35 million tree planting initiative, in partnership with MUST. 40,000 indigenous and exotic tree seedlings were planted on 32 acres of land representing 13% tree cover within the University.
Members of the Equity Board, staff, Equity Leaders Program scholars and the local community during the tree planting at Miotoni Block in Ngong Forest. A total of 3,500 indigenous tree seedlings were planted during the ceremony to kick start the 35 million tree planting initiative launched by Equity in October 2019.
OUR CAPITALS (continued)
NATURAL CAPITAL
From left: Equity Group Managing Director and CEO Dr. James Mwangi, Ngong Road Community Forest Association Chairman Simon Woods, Equity Bank Kenya Managing Director Gerald Warui, Deputy Chief Conservatoire of Forests P.M Kariuki and Equity Bank Kenya Chairman Prof. Isaac Muthure Macharia, during the tree planting ceremony held to mark Equity’s 35th Anniversary at Miotoni Block in Ngong Forest.

76
EQUITY GROUP HOLDINGS PLC AND SUBSIDIARIES INTEGRATED REPORT AND FINANCIAL STATEMENTS FOR THE YEAR ENDED 31 DECEMBER 2019
Equity Group’s Creating Shared Value (CSV) approach mirrors the Sustainable Development Goals (SDGs). From inception,
we set out to address societal challenges by offering inclusive, customer-focused financial services that socially and
economically empower our clients and other stakeholders. We recognize finance as a major catalyst enabling individuals
and communities to transform their lives when relevant and appropriate and offered through accessible channels. By
removing barriers to finance, we have empowered society to access financial services thus meet their financial needs
and pursue their aspirations.
In addition, our social investments including training on financial literacy, support for education, health, energy,
environment and social protection; facilitation of economic empowerment, enterprise development and innovation
and financing of key sectors such as agriculture and Small and Medium enterprises, are all aimed at empowering our
communities and addressing key enablers to social and economic progress.
The Addis Ababa Action Agenda of 2015 recognized the importance of an expanded role of the private sector in achieving
the Sustainable Development Goals (SDGs). We are committed to all 17 Sustainable Development Goals but seek to make
substantive impact on those goals that are strongly aligned to our business and social investments. Our contribution to
the SDGs in 2019 is provided in the ensuing table.
SUSTAINABLE DEVELOPMENT GOALS (SDGs)
SDG SDG Target Result
End poverty in all its forms
everywhere.
1.3 - Implement nationally appropriate
social protection systems and
measures for all, including floors, and
by 2030 achieve substantial coverage of
the poor and the vulnerable.
» 2.1 million beneficiaries (cumulative) reached with
social protection support (1.2 million in 2019).
» Shs 64 Billion cumulative disbursements issued
(Shs 2 Billion in 2019).
End hunger, achieve food security
and improved nutrition, and promote
sustainable agriculture
2.3- By 2030, double the agricultural
productivity and incomes of small-scale
food producers.
2.4- By 2030, ensure sustainable food
production systems and implement
resilient agricultural practices.
» Shs 7.6 Billion disbursed through Value Chain
Agriculture Financing Model under Kilimo
Biashara loan product.
» 79,000 farmers financed.
» 40,000 smallholder farmers supported through
the Kenya Cereals Enhancement Program (in
partnership with IFAD).
» 33,127 small and medium scale farmers
supported to increase agriculture production
and incomes (in partnership with Embassy of the
Kingdom of Netherlands and Norwegian Agency
for Development (Norad).
» Provision of Weather and Index Based Livestock
Insurance to Farmers.
OUR CAPITALS (continued)

77
EQUITY GROUP HOLDINGS PLC AND SUBSIDIARIES INTEGRATED REPORT AND FINANCIAL STATEMENTS FOR THE YEAR ENDED 31 DECEMBER 2019
SUSTAINABLE DEVELOPMENT GOALS (SDGs) (continued)
SDG SDG Target Result
Ensure healthy lives and promote
wellbeing for all at all ages
3.8-Achieve universal health coverage,
including financial risk protection,
access to quality essential health-care
services and access to safe, effective,
quality and affordable essential
medicines and vaccines for all.
3.C -Substantially increase health
financing and the recruitment,
development, training and retention
of the health workforce in developing
countries, especially in least developed
countries.
» Established 11 Equity Afia health clinics.
» 154,137 patient visits in 2019.
» 62,083 clients reached through Equity Afia
outpatient services.
» Provision of Medical Insurance by Equity Insurance
Agency Limited.
Ensure inclusive and equitable quality
education and promote lifelong
learning opportunities for all
4.1- By 2030, ensure that all girls
and boys complete free, equitable
and quality primary and secondary
education.
4.3- By 2030, ensure equal access for
all women and men to affordable and
quality technical, vocational and tertiary
education, including university.
4.4- By 2030, substantially increase
the number of youth and adults who
have relevant skills, including technical
and vocational skills, for employment,
decent jobs and entrepreneurship.
4.6- By 2030, ensure that all youth and
a substantial proportion of adults, both
men and women, achieve literacy and
numeracy.
» 26,304 scholarships offered through the Equity
Group Foundation.
» 17,304 beneficiaries benefit from secondary
education reached through Wings to Fly. » 9,000 scholarship beneficiaries under the Elimu
Scholarship Program (in partnership with GoK and
the World Bank).
» 3,033 Wings to Fly alumni benefit from technical
skills training through Technical and Vocational
Education and Training (TVET) institutions.
» 5,968 top performing secondary school graduates
have accessed leadership training, coaching
and mentoring through Equity Paid Internship
Program.
» 554 scholars gain admission and scholarships
to study in leading global institutions across 25
countries through College Counselling program.
Achieve gender equality and empower
all women and girls
5.A- Undertake reforms to give women
equal rights to economic resources, as
well as access to ownership and control
over land and other forms of property,
financial services, inheritance and
natural resources, in accordance with
national laws.
» 2.1 million women and youth in Kenya provided
with financial literacy skills.
» USD 51.1 Million (Shs 5.2 Billion) issued through
Fanikisha Women suite of loan products.
OUR CAPITALS (continued)

78
EQUITY GROUP HOLDINGS PLC AND SUBSIDIARIES INTEGRATED REPORT AND FINANCIAL STATEMENTS FOR THE YEAR ENDED 31 DECEMBER 2019
SUSTAINABLE DEVELOPMENT GOALS (SDGs) (continued)
SDG SDG Target Result
Ensure availability and sustainable
management of water and sanitation
for all
6.1- By 2030, achieve universal and
equitable access to safe and affordable
drinking water for all.
6.6 - By 2020, protect and restore
water-related ecosystems, including
mountains, forests, wetlands, rivers,
aquifers and lakes.
» 1.08 million trees planted across Kenya.
» Equity continued to finance water and sanitation
infrastructure including but not limited to water
storage tanks, biogas digesters and modern
toilets.
Ensure access to affordable, reliable,
sustainable and modern energy for all
7.1- By 2030, ensure universal access to
affordable, reliable and modern energy
services.
» Estimated 475,000 individuals provided with
122,524 clean energy products such as solar and
clean cook stoves.
Promote sustained, inclusive and
sustainable economic growth, full and
productive employment, and decent
work for all
8.3 -Promote development-oriented
policies that support productive
activities, decent job creation,
entrepreneurship, creativity and
innovation, and encourage the
formalization and growth of micro-,
small and medium-sized enterprises,
including through access to financial
services.
» 52,774 micro, small and medium size
entrepreneurs have been trained.
» Targeting 150,000 MSMEs to create 810,000 jobs
under the Young Africa Works program.
Build resilient infrastructure,
promote inclusive and sustainable
industrialisation, and foster innovation
9.3 - Increase the access of small-scale
industrial and other enterprises, in
particular in developing countries, to
financial services, including affordable
credit, and their integration into value
chains and markets.
9.b - Support domestic technology
development, research and innovation
in developing countries.
» 97% of transactions transacted on digital
channels.
OUR CAPITALS (continued)

79
EQUITY GROUP HOLDINGS PLC AND SUBSIDIARIES INTEGRATED REPORT AND FINANCIAL STATEMENTS FOR THE YEAR ENDED 31 DECEMBER 2019
SDG SDG Target Result
Reduce inequality within and among
countries
10.1 - By 2030, progressively achieve
and sustain income growth of the
bottom 40 per cent of the population at
a rate higher than the national average.
10.2 - By 2030, empower and promote
the social, economic and political
inclusion of all, irrespective of age, sex,
disability, race, ethnicity, origin, religion
or economic or other status.
10.3 - Ensure equal opportunity and
reduce inequalities of outcome.
» 3,033 youth supported to access technical and
vocational skills.
Make cities and human settlements
inclusive, safe, resilient and
sustainable
11.1 - By 2030, ensure access for all to
adequate, safe and affordable housing
and basic services and upgrade slums.
» Equity works with Government to improve living
conditions through the provision of microfinance
loans for sustainable mortgages/real estate sector
as well support the provision of prepaid card
solutions for urban mass transport.
Ensure sustainable consumption and
production patterns
12.6 - Encourage companies, especially
large and transnational companies,
to adopt sustainable practices and to
integrate sustainability information into
their reporting cycle.
» Equity has adopted ICT to reduce energy use as
well as material consumption through its Tier 4
Green Data Centre.
Take urgent action to combat climate
change and its impacts.
» Equity, in addition to other environment and
energy initiatives, supports productive uses of
energy (PUE) in areas such as water pumping for
drip irrigation and cattle drinking, aeration for
aquacultures, refrigeration and poultry lighting.
Other areas of interest are pest control and
electric fencing. The impacts of solar electricity on
agricultural activities are increased productivity
(including higher yields, lower losses and faster
production) and improved natural resource
management.
SUSTAINABLE DEVELOPMENT GOALS (SDGs) (continued)
OUR CAPITALS (continued)
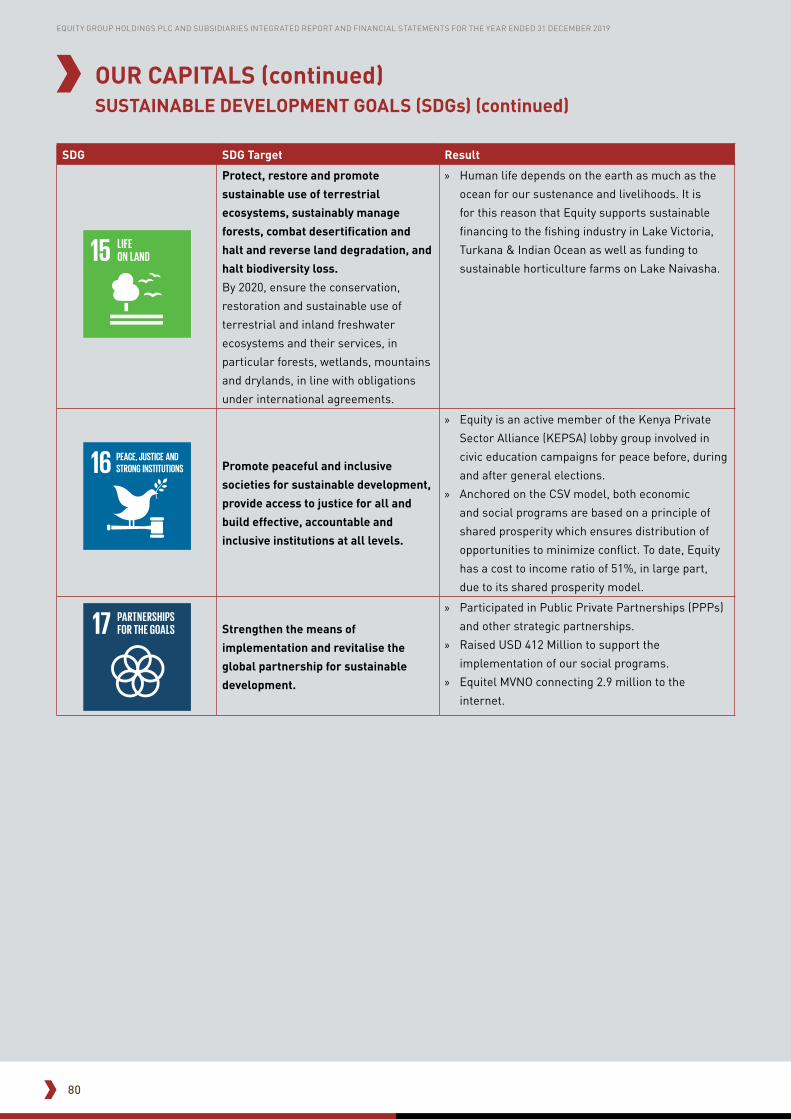
80
EQUITY GROUP HOLDINGS PLC AND SUBSIDIARIES INTEGRATED REPORT AND FINANCIAL STATEMENTS FOR THE YEAR ENDED 31 DECEMBER 2019
SDG SDG Target Result
Protect, restore and promote
sustainable use of terrestrial
ecosystems, sustainably manage
forests, combat desertification and
halt and reverse land degradation, and
halt biodiversity loss.
By 2020, ensure the conservation,
restoration and sustainable use of
terrestrial and inland freshwater
ecosystems and their services, in
particular forests, wetlands, mountains
and drylands, in line with obligations
under international agreements.
» Human life depends on the earth as much as the
ocean for our sustenance and livelihoods. It is
for this reason that Equity supports sustainable
financing to the fishing industry in Lake Victoria,
Turkana & Indian Ocean as well as funding to
sustainable horticulture farms on Lake Naivasha.
Promote peaceful and inclusive
societies for sustainable development,
provide access to justice for all and
build effective, accountable and
inclusive institutions at all levels.
» Equity is an active member of the Kenya Private
Sector Alliance (KEPSA) lobby group involved in
civic education campaigns for peace before, during
and after general elections.
» Anchored on the CSV model, both economic
and social programs are based on a principle of
shared prosperity which ensures distribution of
opportunities to minimize conflict. To date, Equity
has a cost to income ratio of 51%, in large part,
due to its shared prosperity model.
Strengthen the means of
implementation and revitalise the
global partnership for sustainable
development.
» Participated in Public Private Partnerships (PPPs)
and other strategic partnerships.
» Raised USD 412 Million to support the
implementation of our social programs.
» Equitel MVNO connecting 2.9 million to the
internet.
SUSTAINABLE DEVELOPMENT GOALS (SDGs) (continued)
OUR CAPITALS (continued)

81
EQUITY GROUP HOLDINGS PLC AND SUBSIDIARIES INTEGRATED REPORT AND FINANCIAL STATEMENTS FOR THE YEAR ENDED 31 DECEMBER 2019
CONTROL ENVIRONMENT

82
EQUITY GROUP HOLDINGS PLC AND SUBSIDIARIES INTEGRATED REPORT AND FINANCIAL STATEMENTS FOR THE YEAR ENDED 31 DECEMBER 2019
The Group Integrated Risk Management Policy outlines
the risk management framework, risk appetite
setting framework, risk evaluation and reporting, and
harmonises risk policies across the Group.
The Group has developed a risk intelligent culture, to
help it achieve the following strategic objectives:
1. Limiting potential losses;
2. Improving profitability;
3. Supporting growth;
4. Increasing quality of strategic and operational
decisions; and
5. Improving stakeholder management.
Assurance is guaranteed through the risk department,
internal audit, compliance and enforcement teams,
external audit by PwC, Central Bank Inspection, Capital
Markets Authority and Nairobi Securities Exchange
reviews and Cross Border Supervisory Colleges as
well as credit rating agencies’ reviews.
Risk Governance Structure
For effective risk management, the Group has
developed a risk governance structure that defines
the roles and responsibilities of the Board, the chief
risk officer and risk management function, as well as
the independent assessment of the risk governance
framework. The governance structure sets out an
integrated and coherent list of sound practices that
establish supervisory expectations for the role and
responsibilities of the Board as well as the stature,
resources, authority and independence of the risk
management and internal audit functions, including
Board reporting. The governance structure is
designed to protect against the erosion of prudent risk
management culture and practices even in the face of
challenging business and economic environments.
Risk Review
In line with the Equity 3.0 strategy, the Group continues
to leverage on technology and innovation to transform
banking from “somewhere you go to something you
do”. This is characterized by including segmentation
for focused strategic delivery, seamless integration of
channels to improve experience and convergence of
financial products and services.
The digitization of the Group’s banking activities has
made client access to banking services seamless and
the banking experience effortless. The Bank remains
the first in Kenya to receive Payment Card Industry-
Data Security Standard (PCI-DSS) certification.
In executing its strategy, the Group is faced with
economic, financial and other types of risk. These risks
are interdependent and require a holistic approach to
risk management. The key highlights within the year
were as follows:
REGULATORY LANDSCAPE
IT Risk and Information Security
As the Group’s strategic initiatives under Equity 3.0
strategy are undertaken, the IT risk and information
security landscape has been changing. Focus on
technology by the industry players has altered existing
information supply chains, created data types and
data models and expanded IT infrastructure risk
and security perimeter. Emerging risks around IT
programme and change execution and IT operational
resilience have joined cybercrime, data security and
third party management as being the most pressing IT
risks identified over the recent past.
The Group is currently coming up with an internal
policy to ensure compliance with the Data Protection
Act, 2019 that came into effect in November 2019.
The Group continues to be vigilant of the emerging IT
Risk threat landscape by continuously implementing
the IT Risk Management Policy and Information
Security Management Framework Policy as well as the
IT governance structure for effective risk control.
Impairment of Financial Instruments
The Group in 2018 implemented a Financial
Instruments Policy adopting the IFRS 9 International
Financial Reporting Standard that provides guidance
on the recognition, classification and measurement
of financial instruments. Full adoption of the standard
has led to an increase in provisioning that has
impacted the capital position of the Group. Equity
Bank Kenya is observing the 5-year CBK transitional
IFRS-9 arrangement issued to allow banks to be fully
compliant without significant disruption to their capital
CONTROL ENVIRONMENTGROUP INTEGRATED RISK MANAGEMENT POLICY

83
EQUITY GROUP HOLDINGS PLC AND SUBSIDIARIES INTEGRATED REPORT AND FINANCIAL STATEMENTS FOR THE YEAR ENDED 31 DECEMBER 2019
CONTROL ENVIRONMENT (continued)REGULATORY LANDSCAPE (continued)
base and business models. Equity Bank Tanzania
was also granted a three-year forbearance on capital
ratios from 31st December, 2018 to ensure compliance
with the standard without eroding capital. The Group
continues to engage KPMG as well as leverage on
internal resources in order to be fully compliant with
the standard.
AML/CTF Programs
As a key player in the financial system, the Group is
alive to the fact that it is imperative upon it to adhere to
local and international obligations in the management
of money laundering, financing of terrorism and
sanctions risks. Subsequently, the Group has a robust
Anti-Money Laundering and Counter-Terrorism
Financing Program (AML/CTF) which aims to identify,
manage and mitigate the money laundering and
terrorism financing risks faced by the Group.
Though AML/CTF falls under the umbrella of
Compliance function, the AML/CTF program is given
special focus due to considerable reputational risk
that this component holds. The program is divided into
three distinct components: Customer acceptance and
identification program, robust automated information
technology solutions as well as reporting and record
keeping.
In addition, the program is supported by four
pillars to enable proper execution and compliance:
an independent reporting officer, risk awareness
programs, independent assurance and internal
policies and procedures. The Board has the oversight
responsibility in ensuring that AML/CTF programs
are carried in strict adherence to applicable laws,
regulations, statutes and internal controls.
There is an approved Anti-Money Laundering Policy
for the Group and subsidiaries, which are reviewed
annually. There exists a structured AML training
program which is taken by all staff upon induction.
Subsequent trainings to agents and staff are done
to ensure they remain updated. The responsibility
to manage AML/CTF risks rests upon all staff from
both our business and support units to protect the
Group’s assets, the interests of our customers and
shareholders.
Internal Capital Adequacy Assessment Process (ICAAP)
Internal Capital Adequacy Assessment Process
(ICAAP) is a process to estimate capital requirements
through an enterprise-wide quasi-quantitative
methodology as part of a detailed risk-based business
and capital planning process. It is a formal process
through which a bank identifies, measures, aggregates
and monitors material risks to ultimately build a risk
profile that becomes a basis for capital allocation.
ICAAP documents are reviewed by CBK through
Supervisory Review Process (SREP) to ensure that
banks understand the risk that they take or might be
exposed to.
The Group has an approved ICAAP policy in line with
the ICAAP Guidance Note issued in 2016 by the CBK.
In 2018, the 5-year ICAAP plan for the Group and the
Bank was prepared and submitted before April as per
the guidance note. The Group shall continue to assess
its capital requirements on a regular basis.
Self-Regulation Standards
The Group is aware of its responsibility on ensuring
it carries out its business in a sustainable manner.
Considering this it adopted an Environmental and
Social Risk framework that seeks to ensure compliance
with IFC exclusion list requirements and Performance
Standards by committing itself against conducting
or funding any business, which may culminate in the
deterioration or degradation of the environment.
Sustainable finance initiatives by Kenya Bankers
Association reinforce the Group’s thinking towards
undertaking its business sustainably. Internally, the
Group has a ‘Speak-Up’ policy intended to encourage
staff to provide both positive and negative feedback
without fear of retaliation. The Group continues
dispensing its CSV activities in the society by
championing economic, social and environmental
changes through the Equity Group Foundation.
84
EQUITY GROUP HOLDINGS PLC AND SUBSIDIARIES INTEGRATED REPORT AND FINANCIAL STATEMENTS FOR THE YEAR ENDED 31 DECEMBER 2019
CONTROL ENVIRONMENT (continued)BUSINESS ENVIRONMENT
Liquidity Risk
The Group constantly reviews the business
environment against its strategic objectives. Liquidity
management remained a key focus in 2019 and shall
be monitored closely on a forward-looking basis. The
Group’s subsidiaries, particularly the banking entities,
had to constantly monitor their liquidity profiles
on a regular basis. This also involved relooking at
the adequacy of their liquidity contingency plans.
The Group maintained adequate liquidity buffers.
Notwithstanding, the Group regularly monitored
the results of 3-day liquidity stress tests to assess
resilience in case of bank runs.
Credit Risk
The banking industry performance improved in 2019.
Private sector credit grew by 7.3% in the 12 months to
November 2019. In November 2019, the interest rate
cap was repealed paving the way for Equity Bank Kenya
to progress implementation efforts of a risk-based
pricing framework for new credit disbursements in
consultation with the CBK. The Group continued to
leverage on its early warning framework and early
collection recoveries strategy to maintain a relatively
low Portfolio at Risk (PaR) compared to the industry.
RISK APPETITE The Group has a risk appetite for various types of
businesses and various forms of risks. It’s the policy
of the Group, however, to set a more conservative
appetite where a regulatory ratio or best practice is
given. Examples:
• Credit risk – Ratio of non-performing assets,
Concentration of assets per product, sector,
currency, counterparty etc.
• Market risk – Leverage ratios, return on assets,
liquidity, value at risk, durations of investment
securities etc.
Stress Testing
The primary objective of stress testing is to assess
the impact of “exceptional but plausible” bank specific
or macro-economic variables on crucial elements of
business sustenance such as liquidity, profitability
and capital adequacy, to ensure that the bank can
withstand such shocks and mitigating management
action is taken, preventing business failure.
The stress testing activity goes through the following
process:
1. Identification of stress components involving the
different types of material risks and stress factors;
2. Identification of methodology for application of
stress;
3. Estimation of the impact of stressed conditions on
the profitability, asset quality and capital adequacy;
4. Identification of remedial plans/ actions; and
5. Reporting of the stress test results and identified
remedial plans to the Board and regulators.
PERFORMANCE OVERVIEW OF PRINCIPAL RISKS
Credit Risk
The Group’s credit management framework is defined
by the Group’s Integrated Risk Management Policy
and customized in Credit Risk Policies by each of the
Banking Subsidiaries. Credit risk is generally evaluated
in terms of Portfolio at Risk (PaR) and concentration.
The year 2019 was characterized by downward PaR
trends in the Banking industry backed by increased
repayments and enhanced recovery efforts by banks.
To closely monitor the associated risks;
• The Group has set PaR targets at product level.
• PaR trends are monitored on a monthly basis and
drivers and possible solutions discussed in Credit
Risk and ALCO Committees.
• Evaluation of credit risk is conducted at customer,
product and sector level.
• The Group employs a proactive approach to credit
risk management by gathering market trends that
inform customer, product or sector credit outlooks.
• The credit book growth strategies are aligned to
expectation in the macro-economic environment.
• Underwriting risks are closely managed through
credit committees that start from the branch level to
the Board.
• For large credit exposures, the Corporate Strategic
and Advisory Committee (COSAC) provides strategic
guidance in the underwriting process to ensure
consistency with the overall Group strategy.

85
EQUITY GROUP HOLDINGS PLC AND SUBSIDIARIES INTEGRATED REPORT AND FINANCIAL STATEMENTS FOR THE YEAR ENDED 31 DECEMBER 2019
PERFORMANCE OVERVIEW OF PRINCIPAL RISKS (continued)
Credit Risk (continued)
The Group continues to leverage on technology in
delivery of credit products. Credit scores have been
done for the Group’s retail customers. Comprehensive
model validation is done on a quarterly basis to
confirm suitability of the model. The qualitative
validation involves evaluation of the effectiveness of
the governance model and consistency with the overall
Group strategy. The quantitative validation involves
assessment of model efficiency, discriminatory power,
predictive power, model stability and concentration.
The Group has embarked on automation of micro
and SME products to enhance efficiency and service
delivery.
As the Group seeks to deliver on its financial inclusion
objective, investment in solutions and systems to
enhance data quality and breadth will continue. This
is expected to improve prediction of probability of
default, loss given default and recovery rates for both
the existing and potential customers.
Market Risk
The Group’s market risk management is defined in
the Group’s Integrated Risk Management Policy and
customized through Market Risk Policies by various
subsidiaries. The policies define the risk appetite and
risk metrics for the Group. Market risk is monitored
through the following:
1. Return on assets – This reflects how well assets
are managed. The Group’s return on assets has
remained largely within target.
2. Liquidity – The Group ensures compliance with
liquidity ratios as stipulated by regulators and
regularly compares its liquidity position against
international standards as provided by Basel III.
3. Efficiency – This is evaluated in several ratios, key
one being interest rate spread. Interest rate spread
decomposition is intended to indicate how stable
the spread is, based on the components.
4. Stop loss limits – Ensure that trade does not
proceed if losses being realised exceed the set
limits.
5. Trader limits – Ensure that the Group traders do
not take excessive risks that would expose the
Group.
6. Risk measures - The Group measures the
sensitivity to changes on interest rates using the
PV01 measure. Market risk is also tracked using
Value at risk measure (defined as the maximum
amount of loss of the portfolio measured at certain
level of confidence).
Operational & Compliance Risks
The Group operational risk management gets authority
from the Group’s Integrated Risk Management Policy.
This is customized through Operational Risk Policy by
different subsidiaries. The subsidiary Operational Risk
Management policies were reviewed in 2019 defining
governance structures, operational risk department/
unit, roles and responsibilities and operational risk
appetite.
The operational risk and compliance departments
have built capacity to carry out their mandate covering:
Compliance, agency, fraud, systems and products,
business process management, AML/CTF and
business continuity planning.
The Group operational risk management involves
measurement and analysis tools such as:
i. Key Risk Indicators
ii. Risk Controls Self Assessments tools and
frameworks
iii. Risk library
iv. Scenario analysis covering external research,
trends of internal losses or subjective scenario
analysis
v. Stress Testing
vi. Business Process Mapping
vii. Capital Computation Framework
viii. Linkage of tools to decision making and controls
ix. Robust and reliable MIS
Compliance department has developed comprehensive
compliance tool kits guided by existing policies, laws
and regulations for compliance assessments. Risk-
based compliance programs have been developed
to ensure identification of significant rules, policies
and regulations where weak enforcement or non-
compliance would threaten the Group’s assets. The
Group has zero tolerance to regulatory breaches.
CONTROL ENVIRONMENT (continued)

86
EQUITY GROUP HOLDINGS PLC AND SUBSIDIARIES INTEGRATED REPORT AND FINANCIAL STATEMENTS FOR THE YEAR ENDED 31 DECEMBER 2019
Operational & Compliance Risks (continued)
The Group also maintains Business Continuity Planning
and Data Recovery (BCP-DR) Policies. These policies
incorporate:
• Business impact analyses
• Recovery strategies
• Periodic testing
• Communication, training and awareness programs
• Crisis management programs
The BCP-DR policy and processes involve identification
of:
1. Critical business operations
2. Key internal and external dependencies
3. Appropriate resilience levels
4. Plausible disruptive scenarios are assessed for their
financial, operational and reputational impact on a
continuous basis
Risk Culture
Whereas there is the tangible appreciation of tools
to help in the identification, assessment, setting of
appetites, mitigation and monitoring (the ‘what’ of
risk management), we recognize that “the how” of
risk management contributes towards success or
otherwise of risk management initiatives. The Group’s
risk culture, “the set of individual and corporate
values, attitudes, competencies and behaviours
that determine our commitment to and style of risk
management” provides reference against which our
conduct is evaluated.
The Group’s risk culture is founded on four pillars,
namely:
Transparency;
1. Level of insight (knowledge of the risks)
2. Tolerance (how much risk to be taken on account of
control effectiveness)
3. Communication (purposeful and deliberate sharing
of risk events)
Acknowledgement
i. Confidence, that we are vulnerable and risks can
crystallize
ii. Challenge, of behaviours not consistent with
those ascribed
iii. Openness, as regards experiences of control
failures / weaknesses
Respect
i. Adherence to rules; following laid down
procedures
ii. Coordination; acknowledging that controls are
not self-standing
Response
1. Calling for speedy response
2. Diligence in response, to ensure that weaknesses
are effectively addressed.
3. The aim is to achieve a “strong risk-culture” through
creating awareness and competency of the risks
around us and driving the goal of consistency in how
we react to them. This emphasizes on;
i. Setting the “Tone at the Top”, using the Board
and senior management to walk the talk on risk
management
ii. Data mining and analysis; use of data to inform
on progress or otherwise
iii. Compensation and reward; honouring good risk
behaviour and discouraging / punishing the
opposite
iv. Communication; deliberate sharing of lessons
learnt to shape values and behaviours.
To enhance the Group’s risk culture, risk culture
policies that define the frameworks of achieving
socio-economic transformation of the people of Africa
have been developed. These include the Group’s
Corporate Responsibility Policy that articulates our
role as a responsible corporate citizen. The Social
and Environmental Risk Management framework sets
the Group’s approach in achieving triple bottom lines
targets.
The Consumer Protection Policy provides customers
with a sense of goodwill and comfort in the Group’s
character and integrity as a corporate citizen. It enables
the Group to comply with regulatory Guidelines on
Consumer Protection and the Consumer Protection Act
and in extension cushion the Group from legal risks,
reputational risks and liquidity risks among others.
CONTROL ENVIRONMENT (continued)PERFORMANCE OVERVIEW OF PRINCIPAL RISKS (continued)

87
EQUITY GROUP HOLDINGS PLC AND SUBSIDIARIES INTEGRATED REPORT AND FINANCIAL STATEMENTS FOR THE YEAR ENDED 31 DECEMBER 2019
Future Risk Priorities
The Group’s operating environment continues to
experience changes that increase the downside risk in
the short term. The regulatory landscape has become
more dynamic with the regulators seeking to improve
resilience of the banking institutions. International
standards on accounting and risk management
have set the benchmark higher not only in corporate
governance, but also systems and processes that
enhance performance and improve stability.
Increased automation of services and products under
an environment where cyber threats are on the rise
will continue to define the Group’s priority in risk
management. The Group will constantly test its IT
operational resilience against the best practices in
data security, cyber risks and effective third party risk
management.
Cross border operations have been on the rise
occasioned by the Group’s regional operations. While
commodity prices are expected to remain stable in
2020, pandemic risks (Coronavirus), geopolitics (USA
– China tariff war), terrorism and civil wars continue
to suppress the would-be rosy outlook in global trade.
Enhancing sovereign and country risk management will
remain a top agenda for the business moving forward.
While regional inflation expectations are largely within
central bank target ranges, the Group acknowledges
susceptibility of regional prices to external events. Top
on the list is currency depreciation. The US Federal
Reserve Bank has signalled no plans to cut interest
rates in 2020 which will ensure stability of regional
currencies. Any significant rise in the cost of crude
oil is likely to impact on the regional countries import
bill and thus the current account balance and their
currencies as well as domestic inflation. The Group
will continue to enhance its market risk management
practice and frameworks to guarantee balance sheet
agility.
CONTROL ENVIRONMENT (continued)PERFORMANCE OVERVIEW OF PRINCIPAL RISKS (continued)

88
EQUITY GROUP HOLDINGS PLC AND SUBSIDIARIES INTEGRATED REPORT AND FINANCIAL STATEMENTS FOR THE YEAR ENDED 31 DECEMBER 2019
CORPORATE GOVERNANCE

89
EQUITY GROUP HOLDINGS PLC AND SUBSIDIARIES INTEGRATED REPORT AND FINANCIAL STATEMENTS FOR THE YEAR ENDED 31 DECEMBER 2019
“Corporate governance continues to advance, with the focus currently being on environmental, social and governance (ESG) factors and the role of corporates in their attainment. The Code emphasizes the need for boards to adopt an ESG lens in guiding performance thereby promoting sustainable practices.”
(2019 Capital Market Authority Report on the state of
Corporate Governance of issuers of securities to the
Public in Kenya – Former Capital Markets Authority
CEO- Mr. Paul Murithi Muthaura, MBS).
The Group has diversity in its board and hence it has
ensured that the board is well equipped to the new
advancement in Corporate Governance in respect
to environmental, social and governance (ESG). The
Group has ensured its product offerings are aligned
with the global best practices on ESG.
Corporate Governance is the backbone to any
organization’s strategy and success. It provides a
framework within which corporate objectives are
set and performance monitored, as well as providing
assurance to investors that they will receive a return
on their investment. Governance has proven from
time immemorial to be paramount to the success of
any institution. Good corporate governance is critical
in the banking industry because with good corporate
governance, financial fraud that could lead to financial
distress and bankruptcy is avoided.
The Group has complied with all the aspects of the 2015
CMA Code of Corporate Governance as highlighted
under the following broad topics:
• Board operations and control;
• Rights of shareholders;
• Stakeholder Relations;
• Ethics and social responsibility;
• Accountability, risk management and internal
control; and
• Transparency and disclosure.
BOARD OPERATIONS & CONTROL Principle on appointment, composition, size and
qualifications of Board members.
The Governance, Nominations and Compensation
Committee proposes new nominees for appointment to
the Board. In making the proposals for appointment, the
Committee ensures diversity in the Board composition,
as well as ensuring a balance of executive and non-
executive Directors, with the majority being non-
executive and at least one-third of the total number
of Board members being Independent non-executive
Directors. The Group avails information relating to
those nominated for Board positions to shareholders,
to ensure only credible persons who can add value to
the Group’s business are elected to the Board. The
principles for board appointments are outlined below:
a) Diversity
The Group is committed to having a great ‘mix’ of
qualified individuals appointed to the Board, as
diversity is not only a strength but also provides
great competitive edge. Diversity is observed through
differentiation in the age of Directors, their gender,
professional qualifications, as well as their nationality.
Additionally, there is diversity in terms of the highest
education (academic) level achieved; with 3 members
of the Group Board having received presidential
awards, 3 hold honorary doctorates, 2 hold PhDs, 4
hold Master’s Degrees and the rest hold Bachelor’s
degrees. Many are members of professional bodies.
b) Principle on structure of the Board
To ensure effectiveness and value addition to the
Group, the Group always has a minimum of at-
least 7 Directors and a maximum of 12 Directors.
Additionally, the Board has established Committees,
with written terms of reference, to provide guidance
on broad functions of the Group such as audit, risk
management, remuneration, finance, investment and
governance. The Board ensures that the Committees
are appropriately constituted with members who
have the necessary skills and expertise to handle the
responsibilities allocated to them.
c) Principle on the functions of the Board
To enhance accountability to its shareholders, the
Group has ensured that:
• It has distinguished the roles reserved for the Board
and those delegated to the Management;
CORPORATE GOVERNANCE

90
EQUITY GROUP HOLDINGS PLC AND SUBSIDIARIES INTEGRATED REPORT AND FINANCIAL STATEMENTS FOR THE YEAR ENDED 31 DECEMBER 2019
CORPORATE GOVERNANCE (continued)
• The functions of the Chairperson and the Chief
Executive Officer are not exercised by the same
individual;
• The Chairperson of the Board is a non-executive
director;
• It is assisted by a qualified and competent company
secretary of good standing with the Institute of
Certified Public Secretaries of Kenya (ICPSK);
• The Group’s strategies are sustainable;
• It has clearly identified the Directors’ fiduciary
duties; and
• It has established a Conflict of Interest Policy.
d) Principle on Board independence
The Group Board assesses the independence of Board
members on an annual basis, to ensure that the
Board always benefits from independent and objective
judgment.
e) Principle on age limit for Board members
The Group has prescribed 70 years as the age limit for
its Directors. Any Director who has reached the age
of 70 years resigns from the office of Director at the
following Annual General Meeting and Shareholders
are informed of such resignation at each Annual
General Meeting. If any Director wishes to continue
serving in the office of Director, he/she must seek the
approval of the Shareholders at an Annual General
Meeting.
f) Principle on Board tools
The Group has formulated a Code of Ethics and Conduct,
which has been cascaded down to all employees, as
well as established a Board Charter, to guide in the
activities of the Board. The Code and the Charter are
reviewed from time to time and have been disclosed in
the Group’s website.
Further, the Board develops a work plan and an
evaluation toolkit annually, to ensure effectiveness.
g) Principle on governance and legal audit
The Group in 2019 has been implementing the Audit
recommendations of the 2018 Governance Audit
proactively. The Group has also, after lodging an
application with the Capital Markets Authority (CMA),
become eligible for the two (2) year cycle of conducting
governance audits and will conduct the next governance
audit in 2020.
h) Principle on insider dealings/ trading
In line with the Group’s continuing listing obligations,
the Group prohibits insider trading, as it enables
persons who have access to non-public information to
potentially profit or avoid loss unfairly. The Group has
developed and enforced an insider trading and market
abuse policy. In the year 2019, there were no known
insider dealings.
Rights of Shareholders The Group Board recognizes, respects and protects
the rights of shareholders through:
• Availing information on the Group’s performance
through distribution of integrated reports annually,
as well as convening investor briefings on a quarterly
basis;
• Disseminating information concerning the date,
location and agenda of the Annual General Meeting
(AGM) at least 21 calendar days before the AGM;
• Ensuring that every shareholder has a right to
participate and vote at the AGM;
• Ensuring equitable treatment of all holders of the
same class of issued shares;
• Ensuring that institutional investors hold meetings
with the Management, to discuss the Group’s
performance; and
• Engaging the media on dissemination of important
Group information.
STAKEHOLDER RELATIONS The Board has identified at least 9 categories of
stakeholders as follows: depositors, development
partners, employees, financiers, government,
regulators, shareholders, suppliers and the wider
community. Before making its decisions, the Board
takes into account the interests of all stakeholders
and ensures that engagement with stakeholders is
deliberate and planned and that communication is
always transparent and effective.
ETHICS & SOCIAL RESPONSIBILITY The Group’s Board has identified the following four
ethical values, which underpin good corporate
governance, to guide all its deliberations, decisions
and actions:
BOARD OPERATIONS & CONTROL (continued)

91
EQUITY GROUP HOLDINGS PLC AND SUBSIDIARIES INTEGRATED REPORT AND FINANCIAL STATEMENTS FOR THE YEAR ENDED 31 DECEMBER 2019
• Responsibility: The Board assumes responsibility
for the assets and actions of the Group and is willing
to take corrective actions to keep the Group on a
strategic path that is ethical and sustainable;
• Accountability: The Board justifies its decisions and
actions to Shareholders and other Stakeholders;
• Fairness: The Board ensures that it considers
the legitimate interests and expectations of all
Stakeholders; and
• Transparency: The Board discloses information
in a manner that enables Stakeholders to make an
informed analysis of the Group’s performance and
sustainability.
The Board has developed the Code of Ethics and
Conduct to ensure that its business is conducted
according to the highest ethical standards and in
compliance with all the applicable laws and regulations
governing the banking industry. The provisions of the
Code apply to all Directors and the Board ensures that
all the Directors, Senior Management and staff adhere
to it.
Additionally, the Board has put in place a Speak Up
Policy to encourage feedback towards improving the
Group’s procedures in line with market developments,
organisation’s strategies and business process
optimization. The Policy enables stakeholders to
speak up on their experiences, observations and
opinions on products, service delivery, expectations
and challenges, as well as encouraging employees and
other relevant stakeholders to report any perceived act
of impropriety without fear of retaliation.
The Board has established the Social and
Environmental Risk Management Policy and the Social
and Environmental Management System for Credit
Exposures to ensure that its activities lead to good
corporate citizenship. Additionally, the Group observes:
• IFC exclusion list in credit activities;
• NEMA Regulations;
• Code of Ethics for businesses in Kenya; and
• Sustainable banking initiatives by Kenya Bankers
Association.
Division of Role of Chairperson and Chief Executive Officer
The Chairperson
The Chairperson of the Board is an Independent
Non-Executive Director. The Chairperson leads and
manages the work of the Board and ensures that
decisions are taken on a sound and well-informed
basis. The Chairperson provides leadership to the
Board and is responsible for the Board’s effective
overall functioning.
The Chairperson also ensures:
a. The smooth functioning of the Board, the governance
structure and instils a positive culture in the Board;
b. Guidelines and procedures are in place to govern the
Board’s operation and conduct;
c. All relevant issues are on the agenda for Board
meetings and all Directors are able to participate
fully in the Board’s activities;
d. The Board debates strategic and critical issues; and
e. The Board receives the necessary information on a
timely basis from the management.
The Chief Executive Officer
The Chief Executive Officer is wholly responsible to
the Board for the day to day running of the Group. The
collective responsibility of the Group’s management is
vested in the Chief Executive Officer and bears ultimate
responsibility for all management functions.
The Chief Executive Officer undertakes the following
key responsibilities:
a. Ensures that the policies spelt out by the Board in the
Group’s overall corporate strategy of the institution
are implemented;
b. Identifies and recommends to the Board competent
officers to manage the operations of the Group;
c. Establishes and maintains efficient and adequate
internal control systems;
d. Ensures that the Board is frequently and adequately
appraised about the operations of the Group;
e. Co-ordinates the operations of the various
departments within the Bank; and
f. Designs and implements the necessary management
information systems in order to facilitate efficient and effective communication within the Bank.
CORPORATE GOVERNANCE (continued)ETHICS & SOCIAL RESPONSIBILITY (continued)

92
EQUITY GROUP HOLDINGS PLC AND SUBSIDIARIES INTEGRATED REPORT AND FINANCIAL STATEMENTS FOR THE YEAR ENDED 31 DECEMBER 2019
The Group is licensed by Central Bank of Kenya as a
non-operating holding company listed on the Main
Investment Market Segment of the Nairobi Securities
Exchange (the Exchange) and as such, is bound by and
complies with:
• The Capital Markets Act and all subsidiary
legislation made thereunder;
• The NSE rules and guidelines issued by the Capital
Markets Authority (the Authority), the Exchange and
any requirements, decisions, or directions given by
the Authority and the Exchange;
• The Banking Act and all prudential guidelines and
directions given by the Central Bank of Kenya and
other regional regulators;
• The Companies Act 2015, its regulations and
amendments thereto; and
• All other applicable laws and regulations governing
the various lines of businesses it is engaged in.
TRANSPARENCY & DISCLOSURE
Policy on Conflict of Interest
The Group’s Board has established a Conflict of
Interest Policy, in recognition that excessive activities,
gratuities and access to information may lead to actual
or potential conflicts of interest between the interests
of the Group and those of its relevant persons. The
Policy identifies the activities which may compete or
conflict with the Group’s interests and outlines the
steps to manage conflict of interest, should it arise.
Policy on IT
The Group’s Board has developed various IT policies,
so as to enable the Group to realise its digitization
agenda. The policies provide in-depth coverage
and guidance on IT-related matters such as: SLA
management, project management, branch server
room management, business partnerships, database
procedures, incident management, invoice processing,
quality assurance, security procedures and software
design, development and testing.
Policy on Procurement
The Group’s Board has developed a Group Procurement
Policy, so as to:
• Promote best practices, transparency and
professionalism in all acquisition processes within
the Equity Group fraternity;
• Ensure that suppliers of goods and services are
subjected to a competitive tendering process in
order to achieve quality, price competitiveness and
reliability;
• Ensure that all expenditure is in accordance with
prior approved budget and procurement plan; and
• Ensure compliance with applicable regulations and
legislations.
DIRECTORS’ REMUNERATION REPORT The Board reviews and recommends the remuneration
structure of Directors annually, subject to
Shareholder’s approval. Directors’ remuneration is
linked to performance but is competitively structured
to attract and retain the best talent to effectively
develop the Group’s business.
Executive Directors
The Executive Directors’ remuneration package
comprises core fixed elements (base salary, pension
and other benefits). Executive Directors are eligible
to participate in the Group’s bonus scheme which is
anchored on achievement of key business performance
indicators but are not entitled to earn fees or sitting
allowances.
CORPORATE GOVERNANCE (continued)COMPLIANCE WITH LAWS AND REGULATIONS

93
EQUITY GROUP HOLDINGS PLC AND SUBSIDIARIES INTEGRATED REPORT AND FINANCIAL STATEMENTS FOR THE YEAR ENDED 31 DECEMBER 2019
Non-Executive Directors
Non-Executive Directors are appointed for a renewable
term of 3 years, subject to regulatory approval and
shareholder ratification. They are obligated to act
reasonably, in good faith and in the best interests of the
Group and its Shareholders. Non-Executive Directors
are vested with the following key responsibilities:
a. To constructively challenge and contribute to the
development of strategy and extend the business of
the Group;
b. To monitor the performance of Management in
meeting agreed goals and objectives and monitor the
reporting of performance; and
c. To ensure that financial information is accurate,
and that financial controls and systems of risk
management are robust and defensible.
Non-Executive Directors are entitled to sitting
allowances for attending Board and Committee
meetings, as well as an out of station per diem for
attending to Group’s business outside their usual place
of business. Non-Executive Directors do not earn a
salary and they do not participate in the Group’s bonus
schemes nor the Group’s pension plan.
Upon retirement or termination, Non-Executive
Directors are entitled to any accrued but unpaid
Director’s fees or reasonably incurred expenses but
not to any other compensation.
Insurance
The Group provides Directors’ and Officers’ Liability
Insurance for all Directors of the Group during the
entire duration of their tenure.
Share Options
There are currently no share options issued by
the Group to the Executive and the Non-Executive
Directors. Particulars of compensation of directors
and key personnel are disclosed to the public in the
audited financial statements under Note 28.
See remuneration report on pages 108 - 110.
Governance, Legal and Compliance Audits will
henceforth from 2018 and be conducted by the Group
bi-annually (after every two years). The Group,
Governance, Legal and Compliance Audit report was
first undertaken in 2018 and is available in the Equity
Group Holdings Plc and Subsidiaries integrated report
and financial statements for the year ended 31st
December, 2018.
DIRECTORS’ REMUNERATION REPORT (continued)
CORPORATE GOVERNANCE (continued)

94
EQUITY GROUP HOLDINGS PLC AND SUBSIDIARIES INTEGRATED REPORT AND FINANCIAL STATEMENTS FOR THE YEAR ENDED 31 DECEMBER 2019
Equity Group Holdings Plc Board members
Name Expertise Executive/
Independent
Non-Executive
Independent
Gender Meeting
Attendance
Nationality
Mr. David
Ansell
Management of financial
institutions, strategic planning and
business development
Non-Executive
Chairman
Independent Male 3/5 Kenyan
Prof. Isaac
Macharia
Medical, strategic planning,
leadership and business
development
Non-Executive
Vice Chairman
Independent Male 5/5 Kenyan
Dr. James
Mwangi
Banking and financial experience,
leadership and management of
financial institutions
Group Managing
Director &
Chief Executive
Officer
Non-
independent
Male 5/5 Kenyan
Mr. Deepak
Malik
Accounting, banking, financial
investment experience, leadership
and management of financial
institutions
Non-Executive
Director
Non-
Independent
Male 4/5 Indian
Mrs. Evelyn
Rutagwenda
Accounting, auditing, leadership
and management
Non-Executive
Director
Independent Female 5/5 Rwandese
Dr. Edward
Odundo
Strategic Management &
Marketing. Finance &
Accounting, pension and tax
Non-Executive
Director
Independent Male 5/5 Kenyan
Dr. Helen
Gichohi
Leadership and international
management of social impact and
transformational programs
Non-Executive
Director
Independent Female 5/5 Kenyan
Mr. Vijay
Gidoomal
Finance, operations, strategic
planning and business development
Non-Executive
Director
Independent Male 5/5 Kenyan
Mrs. Mary
Wamae
Legal, company secretarial,
strategic planning, leadership and
business development
Executive Non-
Independent
Female 5/5 Kenyan
CORPORATE GOVERNANCE (continued)
95
EQUITY GROUP HOLDINGS PLC AND SUBSIDIARIES INTEGRATED REPORT AND FINANCIAL STATEMENTS FOR THE YEAR ENDED 31 DECEMBER 2019
The Board meetings were held on a quarterly basis in
the month of March, April, July and November. There
was 1 ad hoc meeting in August. The Committee
meetings on the other hand were held on a quarterly
basis in March, April, July and November.
The key areas of focus during the Board meetings are
as follows:
• Review of the macro-economic environment and
developments in the banking industry;
• Review of financial and management performance
and approval of accounts;
• Review of compliance with Anti-Money Laundering/
Combating the Financing of Terrorism Regulations;
• Review of Board Evaluation Report;
• Review of the Subsidiaries’ Performance;
• Review of preliminary Inspection Report; and
• Review proposed strategic investments.
BOARD COMMITTEES
The Group Board has established Board Committees
in each of the Subsidiaries, governed by charters and
aligned to the Group’s delivery of its vision and mission.
The secretary to each Board Committee is the head of
the relevant function within the Group and Company.
The Group Board has four significant committees
which supports it in discharging its responsibilities.
These are: The Audit Committee, Governance,
Nominations and Compensation Committee, Strategy
and Investments Committee, Risk & Assets and
Liabilities Management Committee (ALCO).
NB: The member constitution of the March committee
meetings was different from that of April, July and
November. Some members did not therefore attend all
meetings because they had not yet been appointed to
their respective committees.
The Group Audit Committee
The Group Audit Committee is appointed by the Board
and is responsible for providing independent oversight
on:
• The integrity of the financial statements of the Group;
• The effectiveness of the Group’s financial reporting,
internal control and risk management systems;
• The effectiveness of the Group internal audit
function; and
• The external auditors’ qualifications, independence
and performance.
The Committee is currently composed of 4 Independent
and Non-Executive Directors, 1 of whom is a Certified
Public Accountant. The following is the current
membership and attendance to the Committee
meetings:
Mrs. Evelyn Rutagwenda Chairperson (4/4)
Dr. Edward Odundo Member (3/4)
Dr. Helen Gichohi Member (3/4)
Mr. Vijay Gidoomal Member (4/4)
The key areas of focus for the meetings was as follows:
• Review of the External Audit Plan for the year ending
31st December 2019;
• Consideration and recommendation of financial
statements;
• Status of issues raised in previous Internal Audit
Reports, Management Letters and Central Bank
Onsite Examination Reports;
• Significant internal audit findings and coverage of
audit plans;
• Consideration and approval of the Group Internal
Audit Plan; and
• Consideration and recommendation of the Board
Audit Committee Charter.
Governance, Nominations and Compensation Committee
The Committee derives its mandate from the Board
and its purpose is to:
• Recommend to the Board the remuneration packages
offered to its Executive Directors, including bonuses,
deferred awards and long-term incentive awards,
pension rights and any compensation arrangements,
taking account of the Group’s compensation and risk
framework and appraisal structures;
• Recommend general staff remuneration and human
resource related practices;
CORPORATE GOVERNANCE (continued)THE GROUP BOARD

96
EQUITY GROUP HOLDINGS PLC AND SUBSIDIARIES INTEGRATED REPORT AND FINANCIAL STATEMENTS FOR THE YEAR ENDED 31 DECEMBER 2019
• Periodically review the completeness and effectiveness
of the Group’s corporate governance initiatives and
policies; and
• Regularly reviewing the required mix of skills and
experience, so as to determine the effectiveness of the
Board and making recommendations to the Board for
new appointments.
The Committee is composed of 7 members, three of
whom are Independent Non-Executive Directors. All
Committee members have extensive experience in
business management in key positions and have adequate
understanding of the impact of compensation practices
on the Group’s risk profile. The following is the current
membership and attendance to the Committee meetings:
Prof. Isaac Macharia Chairman (4/4)
Mrs. Evelyn Rutagwenda Member (4/4)
Dr. James Mwangi Member (3/4)
Mrs. Mary Wamae Member (3/4)
Dr. Edward Odundo Member (3/4)
Dr. Helen Gichohi Member (3/4)
Mr. Deepak Malik Member (4/4
The key areas of focus for the meetings was as follows:
• Review and recommend appointment of new board directors for nomination;
• Responsible for Board Evaluation;
• Guide HR Strategy; and
• Guide on Compensation and Remuneration of staff &
Board directors.
Strategy & Investment Committee
The Strategy and Investments Committee derives its
authority from the Board, and it considers the various
strategic options available to the Group and makes
recommendations to the Board regarding the development
of the Group’s long-term strategic plans.
The Strategy and Investments Committee, in conjunction
with the Group’s Senior Management is responsible for:
• Regularly reviewing, discussing and suggesting
revisions to the Group’s vision and mission;
• Establishing procedural guidelines with the
Senior Management for the development of the
Group’s corporate and investments strategy and its
implementation and clearly identifying the goals and
expectations for the Group’s strategic planning process;
• Providing ongoing critical evaluation of, and
accountability for performance within, the corporate
and investments strategy, financial limits and operating
objectives approved by the Board;
• Understanding, identifying and discussing key issues,
assumptions, risks and opportunities that impinge upon
the development and implementation of appropriate
corporate and investments strategies; and
• Ensuring Group-wide risk discussion and management
are key components of the strategic planning process,
including consideration of risk and opportunities relating
to the economy, the environment, ethics, finance,
leadership, operations, politics, reputation, strategy,
competition, technology and other types.
The Committee comprises eight members, six of whom are
Non-Executive, with four being Independent.
The current membership of the Committee together with
attendance is as follows:
Mr. Deepak Malik Chairman (4/4)
Dr. James Mwangi Member (4/4)
Dr. Helen Gichohi Member (4/4)
Mr. Vijay Gidoomal Member (4/4)
Prof. Isaac Macharia Member (3/4)
Dr. Edward Odundo Member (3/4)
Mrs. Mary Wamae Member (3/4)
Mrs. Evelyn Rutagwenda Member (3/4)
The key areas of focus for the meetings was as follows:
• Proposal on Employee Share Ownership Plan;
• Discussion on culture and brand;
• General funding needs;
• Proposal on expansion;
• Impact of IFRS9, and
• Strategic initiatives and investments
Risk & Assets and Liabilities Management Committee
The Risk & Assets and Liabilities Management Committee
derives its authority from the Board and is responsible for:
• Reviewing and assessing the quality, reliability and integrity of risk management;
• Ensuring that the Group risk policies and strategies are
effectively managed;
BOARD COMMITTEES (continued)Governance, Nominations and Compensation Committee (continued)
CORPORATE GOVERNANCE (continued)

97
EQUITY GROUP HOLDINGS PLC AND SUBSIDIARIES INTEGRATED REPORT AND FINANCIAL STATEMENTS FOR THE YEAR ENDED 31 DECEMBER 2019
BOARD COMMITTEES (continued)Risk & Assets and Liabilities Management Committee (continued)• Ensuring the optimisation of the Group’s assets and
liabilities;
• Ensuring compliance with statutory and legal
requirements and Group’s policies and procedures;
and
• Reviewing on an annual basis the effectiveness of the
Group’s risk management practices.
The Committee consists of six members, four of whom
are Non-Executive, with three being Independent. The
current membership of the Committee together with
attendance is as follows:
Mr. Vijay Gidoomal Chairman (3/4)
Dr. James Mwangi Member (4/4)
Mr. Deepak Malik Member (4/4)
Mrs. Evelyn Rutagwenda Member (3/4)
Dr. Edward Odundo Member (3/4)
Mrs. Mary Wamae Member (3/4)
The key areas of focus for the meetings was as follows:
• The review of leading risk issues as defined in the
Group Risk Management Policy;
• Enterprise Information, Risk and Security;
» Cyber security strategy
» Review of Business Continuity Management
Strategy
• Global and Regional Macro-Economic Outlook
Review;
• Review of Internal Capital Adequacy Assessment
Process; and
• Review of compliance with AML/CTF Laws,
Regulations and Standards.
MANAGEMENT COMMITTEES
The Group has established the following Management
Committees:
Management Credit Risk Committee
The Management Credit Risk Committee is vested with
the following responsibilities:
• To periodically monitor concentrations in credit
portfolio and assess efficacy of thresholds and
action plans in case of threshold breach in the Group;
• To review and monitor the credit portfolio quality;
• To review credit vintages; and
• To ensure implementation and adherence to credit
policies.
Management Risk & ALCO Committee
The responsibilities of the Management Risk & ALCO
Committee are as follows:
• To recommend the risk philosophy, strategy and
policies to the Board;
• To monitor and ensure optimal composition of assets
and liabilities within the Group;
• To monitor the liquidity positions for the banking
and non-banking subsidiaries against regulatory
requirements, as well as conduct stress tests;
• To ensure effective management of a high-quality
loan portfolio; and
• To review and ensure that the Group’s capital
adequacy is within the regulatory requirements.
Compliance & Operational Risk Committee
The Compliance & Operational Risk Committee is
vested with the following responsibilities:
• To ensure implementation of operational policies;
• To monitor compliance with internal policies and
procedures and the regulatory environment;
• To review operation risk management tools,
procedures, methodologies, as well as to understand
and discuss emerging trends in operational risk
profile;
• To review and ensure effective implementation of a
robust Business Continuity and Disaster Recovery
framework; and
• To review and discuss operational risk appetite,
trends and composition of operational risk loss
data, risk control self-assessment results, key risk
indicator breaches and risk library maintenance and
usage.
Corporate Governance (continued)
98
EQUITY GROUP HOLDINGS PLC AND SUBSIDIARIES INTEGRATED REPORT AND FINANCIAL STATEMENTS FOR THE YEAR ENDED 31 DECEMBER 2019
COMPANY SECRETARY MANDATE AND ROLE
The Company Secretary is appointed by the Directors
for such term, at such remuneration and upon such
conditions as they may think fit; and any Company
Secretary so appointed may be removed by them.
The Company Secretary is an integral senior officer of
the Company, with many varied roles such as:
• Providing dedicated support for the Board and is a
point of reference and support for all Directors;
• Regularly reviewing, along with the Chairperson,
the Board and the Group’s governance processes,
with a view to ensuring that they are fit for purpose
and recommending or developing initiatives to
strengthen the governance of the Group;
• Monitoring and putting in place procedures which
allow for compliance with the Constitution, all the
applicable regulatory and legal requirements,
national and international standards, as well as the
Memorandum and Articles of Association of the
Company and all internal policies;
• Maintaining and updating all statutory registers,
ensuring that any filing with the Registrar of
Companies is done on time and coordinating the
publication and distribution of the Group’s Integrated
Report and Financial Statements as well as interim
statements;
• Handling all matters affecting shareholding, queries
and requests from shareholders, as well as capital
issues and restructuring; and
• Roles relating to conduct of Board and annual general
meetings and compliance with continuous listing
obligations including disclosures transparency and
managing relations with investors and regulators.
BOARD CHANGES
The following changes occurred in the Group Board
and subsidiary Company Boards:
Appointments to the Board • Mr. Gerald Warui was appointed as the Managing
Director of Equity Bank (Kenya) Limited;
• Mrs. Jane Ngige was appointed to the Board of
Equity Bank (Kenya) Limited;
• Mr. Erastus J.O. Mwencha was appointed to the
Board of Equity Bank (Kenya) Limited;
• Mr. Dino Stengel and Professor Honest Ngowi were
appointed to the Board of Equity Bank (Tanzania)
Limited;
• Mr. Steven Mutabazi was appointed to the Board of
Equity Bank Rwanda PLC.
Retirements from the Board
• Dr. Julius Muia retired from the Boards of Equity
Bank (Kenya) Limited and Equity Investment Bank
Limited;
• Mr. Polycarp Igathe retired as Managing Director,
Equity Bank (Kenya) Limited;
• Ms. Joanna Bichsel retired from the Board of Equity
Bank Rwanda PLC;
• Dr. Mark Schwiete retired from the Board of Equity
Bank Congo S.A.;
• Mr. Bhartesh Shah retired from the Boards of Equity
Bank Congo S.A. and Equity Bank (Kenya) Limited;
and
• Dr. Peter Kahara Munga and Mr. Dennis Aluanga
retired from the Group Board;
• Mr. Julius Kayoboke retired from the Board of Equity
Bank Rwanda PLC.
Appointment of Board Chairperson
• Mr. David Ansell was appointed as the Chairman of
the Group and retired from all subsidiary boards.
BOARD EVALUATION Board evaluation is performed on an annual basis
for each of the banking subsidiaries in the Group,
as required by the Central Bank of Kenya, regional
regulators and the Capital Markets Authority. For the
financial year 2019, Board evaluation was conducted
by an independent consultant, whereby evaluation
was performed on the Chairman of the Board, Board
members including the CEO, Board Committees and
Company Secretary by means of one on one interviews,
as well as questionnaires. The Board evaluation
questionnaire focused on the following key areas:
• Board Structure;
• Board Composition;
• Board Role and Responsibilities;
• Key Board Functions and Processes;
• Board Information;
• Board Meetings;
• Board Relationships;
Corporate Governance (continued)
99
EQUITY GROUP HOLDINGS PLC AND SUBSIDIARIES INTEGRATED REPORT AND FINANCIAL STATEMENTS FOR THE YEAR ENDED 31 DECEMBER 2019
• Board Development; and
• Overall Performance and Contribution.
The resultant reports were filed with the regulators as
required.
TRAINING
Training of Directors is undertaken to ensure that
Directors keep abreast with modern management
trends, as well as familiarise themselves with changes
in legislation. Some of the training programs provided
to Directors in 2019 were as follows:
• Financial Risk Management;
• International Financial Reporting Standards 9 (IFRS
9);
• Environmental and Social Risk Management;
• Anti-Money Laundering Laws & Regulations (AML);
• Blockchain; and
• New Directors underwent extensive induction.
This is in accordance with the Group Code that states that
on appointment to the Board and to Board Committees,
all Directors will receive a comprehensive induction
on their individual requirements (where applicable) in
order to become as effective as possible in their role
within the shortest practicable time.
The induction process is intended to achieve the
following:
• Build an understanding of the nature of the Group, its
business and the markets in which it operates;
• Build a link with the Group’s staff;
• Build an understanding of the Group’s main
relationships; and
• Ensure an understanding of the role of a Director
and the framework within which the Board operates.
INDEPENDENCE OF THE CHAIRMAN
To ensure independence, the Group has appointed
a Non-Executive Chairman. Additionally, the
Chairperson does not act as the chairperson of more
than 2 public listed companies at any one time in order
to ensure effective participation in the Board.
MEMBERSHIP ASSOCIATIONS
The Group and the Bank are also members of the
following network associations and forums:
1. Association of Microfinance Institutions (AMFI);
2. Kenya Bankers Association (KBA);
3. Women’s World Banking (WWB);
4. Global Network for Banking Innovation (GNBI);
5. Small Business Banking Network (SBBillion);
6. Micro Finance Network (MFN);
7. Global Agenda Council on Emerging
Multinationals 2010;
8. World Economic Forum;
9. Clinton Global Initiative;
10. African Leadership Network (ALN);
11. UN Economic and Social Council;
12. G8 New Alliance for Food Security & Nutrition;
13. Agenda Council on New Models of Economic
Thinking of the World Economic Forum;
14. Aspen Network of Development Entrepreneurs
(ANDE);
15. Invest in Africa (IIA);
16. Kenya Healthcare Federation; and
17. East Africa Humanitarian Private Partnership
Platform.
18. Tent Partnership for Refugees; and
19. Smart Communities Coalition.
REPRESENTATION OF RETAIL SHAREHOLDERS
The Group employs diverse channels and mechanisms
to communicate and disseminate information to its
various stakeholders, including shareholders. These
channels and mechanisms include collection of
investor feedback and communication via the investor
relations function, financial information on the Group
is available on the Group’s website and latest results
are provided on a quarterly basis across a number
of national publications. In addition, interaction with
senior management is also afforded at the Group’s
results presentations. Lastly, shareholders have
access to senior management during the Annual
General Meeting and at any other time on request.
CORPORATE GOVERNANCE (continued)BOARD EVALUATION (continued)

100
EQUITY GROUP HOLDINGS PLC AND SUBSIDIARIES INTEGRATED REPORT AND FINANCIAL STATEMENTS FOR THE YEAR ENDED 31 DECEMBER 2019
PARTICULARS OF SHAREHOLDING
The Group complies with the provisions of the Capital Markets Act and all the Rules, Regulations and Guidelines made
there under. Monthly reports are made to the Capital Markets Authority (CMA) and the Nairobi Securities Exchange (NSE)
on the particulars of the shareholders as required by the law.
The top ten largest shareholders as at 31st December 2019 were:
SHAREHOLDERS NAME NUMBER OF SHARES % OF SHAREHOLDING
ARISE B.V. 452,581,275 11.99
JAMES NJUGUNA MWANGI 127,809,180 3.38
BRITISH-AMERICAN INVESTMENTS COMPANY KENYA LIMITED 118,890,750 3.15
EQUITY BANK EMPLOYEE SHARE OWNERSHIP PLAN 108,855,100 2.88
STANBIC NOMINEES LTD A/C OWNERSHIP PLAN 108,516,255 2.87
FORTRESS HIGHLANDS LIMITED 101,010,000 2.67
EQUITY NOMINEES LIMITED A/C 00104 94,444,584 2.50
AIB NOMINEE A/C SOLIDUS HOLDINGS LTD 90,114,910 2.38
MAEWA HOLDINGS LTD 64,371,200 1.70
EQUITY NOMINEES LIMITED A/C 00161 64,142,900 1.69
OTHER SHAREHOLDERS 2,442,938,648 64.73
TOTAL 3,773,674,802 100%
EGH Plc Director Shareholding as at 31st December 2019
DIRECTOR NO. OF SHARES OWNERSHIP %
(100%)
Mr. David Ansell Nil Nil
Dr. James Mwangi 127,809,180 3.38
Prof. Isaac Macharia 346,950 0.0092
Dr. Helen Gichohi 13,200 0.0003
Mrs. Evelyn Rutagwenda Nil Nil
Mr. Vijay Gidoomal Nil Nil
Mr. Deepak Malik Nil Nil
Mrs. Mary Wamae Nil Nil
Dr. Edward Odundo Nil Nil
By virtue of his shareholding and units in British American Investments Company (Kenya) Limited and Employee Share Ownership Plan (ESOP) respectively, Dr. James Mwangi’s total direct and indirect shareholding is 4.38%.
The following is the shareholding structure as at 31st December 2019
SHAREHOLDING NO. OF SHAREHOLDERS NO. OF SHARES % SHARES HELD
1 to 500 9,988 2,401,518 0.06
501 - 5,000 10,914 20,105,297 0.53
5,001 - 10,000 1,700 13,038,705 0.34
10,001 - 100,000 2,149 62,577,537 1.65
100,001 - 1,000,000 527 190,556,594 5.04
1,000,001 and above 334 3,484,995,151 92.35
Total: 25,612 3,773,674,802 100
CORPORATE GOVERNANCE (continued)

101
EQUITY GROUP HOLDINGS PLC AND SUBSIDIARIES INTEGRATED REPORT AND FINANCIAL STATEMENTS FOR THE YEAR ENDED 31 DECEMBER 2019
THE LARGEST SHAREHOLDERS OF EQUITY GROUP HOLDINGS PLC
1. ARISE B.V
Arise is a leading African investment company that
partners with sustainable, locally owned Financial
Services Providers (FSPs) in Sub-Saharan Africa. The
company was founded by four cornerstone investors
namely Rabobank, Norfund, NorFinance and FMO and
manages assets in excess of USD 950 million and is
operational in 9 countries.
Their vision is to contribute to the economic growth in
Africa and the prosperity of its people by increasing
financial inclusion and employment, strengthening
rural development and reducing poverty alleviation.
Arise takes and manages minority stakes in Sub-
Saharan African FSPs with the core aim of building
strong and stable institutions that will serve retail,
Small and Medium Enterprises (SMEs), the rural
sector and clients who have not previously had access
to financial services.
The company supports the growth and development
of FSPs through providing among others technical
assistance and management services in the field of
banking development, governance, management,
marketing, innovation, compliance and risk
management. Arise aims to increase the availability of
financial services to SMES and provide a platform for
people in Sub-Saharan Africa to empower themselves
by opening bank accounts and taking loans; in turn
building a better life for their families.
a. Rabobank
Rabobank is a Dutch cooperative bank that was
founded by farmers in the late 19th century. In
the Netherlands, Rabobank is an all-finance
bank with a strong local presence, providing a
variety of products and services to individuals
and companies. Rabobank serves in excess of 7.4
million clients in the Netherlands.
b. Norfund
Norfund, the Norwegian Investment Fund
for Developing Countries, was established by
the Norwegian Parliament in 1997. Norfund’s
objective is to contribute to reducing global poverty
through contributing to the growth of sustainable
commercial enterprises in developing countries.
It offers equity, venture capital and other loans
to companies in selected countries and business
areas where the private sector lacks sufficient
capital to grow and develop viable businesses.
c. FMO
FMO is the Dutch development bank. As a leading
impact investor, FMO supports sustainable
private sector growth in developing countries
and emerging markets by investing in ambitious
projects and entrepreneurs. FMO believes that
a strong private sector leads to economic and
social development and has a proven track-record
of empowering people to employ their skills and
improve their quality of life.
2. BRITAM HOLDINGS LIMITED
Britam is a leading diversified financial services group,
listed on the Nairobi Securities Exchange. The group
has interests across the Eastern and Southern Africa
region, with operations in Kenya, Uganda, Tanzania,
Rwanda, South Sudan, Mozambique and Malawi.
Britam offers a wide range of financial products
and services which include Asset Management, Life
Assurance, Retirement Planning, General Insurance,
Health Insurance, Banking and Property. These
financial solutions enable our customers to create and
protect their wealth and lives every step of the way.
CORPORATE GOVERNANCE (continued)

102
EQUITY GROUP HOLDINGS PLC AND SUBSIDIARIES INTEGRATED REPORT AND FINANCIAL STATEMENTS FOR THE YEAR ENDED 31 DECEMBER 2019
Directors have a statutory duty to promote the success
of the Company for the benefit of its stakeholders. In
promoting the success of the Company, Directors must
have due regard to the long term consequences of
their decisions, the legitimate interests of employees,
the need to foster effective business relationships
with suppliers, customers and others, the impact of
the Company’s operations on the community and the
environment, and the desire to maintain a reputation
for high standards of business conduct.
The Board is committed to ensuring that the Company
is in compliance with the laws, regulations and
standards applicable to it. The Board ensures high
standards and practices in Corporate Governance
and more specifically the principles, practices and
recommendations set out under the Code of Corporate
Governance for Issuers of Securities in Kenya (“the
Code”) as well as the Companies Act, 2015 (“the Act”)
are adhered to.
The Board has established internal procedures and
monitoring systems to promote compliance with
applicable laws, regulations and standards. The
Board is also supported by duly qualified legal and
compliance professionals to guide and focus the
Company’s compliance efforts.
In this regard, the Group during the period under review
has been implementing the recommendations of the
2018 Governance Audit. The Capital Markets Authority
(CMA) undertook extensive stakeholder consultation
to consider the frequency, cycle, cost and scope of
governance audits as a result of which CMA advised
all Issuers of a revision in the cycle of governance
audits to at least once every two years with the option
of CMA increasing or decreasing this frequency on a
risk-based approach. Consequently, CMA approved
the Group’s request to adopt the 2-year cycle. The next
governance audit is therefore scheduled to commence
in 2020.
STATEMENT OF THE RESPONSIBILITY OF DIRECTORS
CORPORATE GOVERNANCE (continued)

103
EQUITY GROUP HOLDINGS PLC AND SUBSIDIARIES INTEGRATED REPORT AND FINANCIAL STATEMENTS FOR THE YEAR ENDED 31 DECEMBER 2019
FINANCIALS 2019

104
EQUITY GROUP HOLDINGS PLC AND SUBSIDIARIES INTEGRATED REPORT AND FINANCIAL STATEMENTS FOR THE YEAR ENDED 31 DECEMBER 2019
C O N T E N T S
Group and Company information
Directors’ report
Directors’ remuneration report
Statement of Directors’ responsibilities
Independent auditor’s report
FINANCIAL STATEMENTS:
Consolidated statement of profit or loss
Consolidated statement of comprehensive income
Company statement of profit or loss and other
comprehensive income
Consolidated statement of financial position
Company statement of financial position
Consolidated statement of changes in equity
Company statement of changes in equity
Consolidated statement of cash flows
Company statement of cash flows
Notes
105
106 - 107
108 - 110
111
112 - 115
116
117
118
119
120
121 - 122
123
124
125
127 - 224

105
EQUITY GROUP HOLDINGS PLC AND SUBSIDIARIES INTEGRATED REPORT AND FINANCIAL STATEMENTS FOR THE YEAR ENDED 31 DECEMBER 2019
REGISTERED OFFICE
9th Floor, Equity Centre
Hospital Road, Upper Hill
P.O. Box 75104 - 00200
Nairobi, Kenya
LAWYERS
Anjarwalla & Khanna (A&K)
ALN House, Eldama Ravine Close,
Off Eldama Ravine Road, Westlands
P.O. Box 200 - 00606
Nairobi, Kenya
Dentons Hamilton Harrison & Mathews
ICEA Building
Kenyatta Avenue
P.O. Box 30333 - 00100
Nairobi, Kenya
Dengtiel A. Kuur
South Sudan Associated Advocates
Chamber of Commerce Complex
Summer Palace Business Hotel Close
Juba, South Sudan
Mr. Frank Karemera
F K Advocates
KG 599 ST 50, Remera-Kigali
Plot No.574 besides RCN Justice & Democratie Office
P. O. Box 6936
Kigali, Rwanda
Maitre Jean Bosco Rusanganwa
Avocat au Barreau du Rwanda
P.O. Box 1890 Avenue de la Justice
Kigali, Rwanda
Mark & Associates Attorneys
NIC Life House
1st Floor, Wing C
Sokoine Drive/Ohio Street
P.O. Box 8211
Dar es Salaam, Tanzania
A.F. Mpanga Advocates
9th Floor North Wing Workers House
1 Pilkington Road
P.O. Box 1520
Kampala, Uganda
Cabinet Kalongo Mbikayi
Apartment 14 B, New Presidential Galleries
Kinshasa, Democratic Republic of Congo
BANKERS
Central Bank of Kenya
P.O. Box 60000 - 00200
Nairobi, Kenya
Equity Bank (Kenya) Limited
P.O. Box 75104 - 00200
Nairobi, Kenya
National Bank of Rwanda
P.O. Box 531
Kigali, Rwanda
Bank of South Sudan (BOSS)
P.O. Box 136
Juba, South Sudan
Bank of Tanzania
P.O. Box 2939
Dar es Salaam, Tanzania
Central Bank of Congo
P.O. Box 2627
Kinshasa, Democratic Republic of Congo
Bank of Uganda
P.O. Box 7120
Kampala, Uganda
AUDITOR
PricewaterhouseCoopers LLP
PwC Tower
Waiyaki Way/Chiromo Road, Westlands
P.O. Box 43963 - 00100
Nairobi, Kenya
COMPANY SECRETARY
Christine Browne
CPS Registration No. 1485
9th Floor, Equity Centre
P.O. Box 75104 - 00200
Nairobi, Kenya
GROUP AND COMPANY INFORMATION

106
EQUITY GROUP HOLDINGS PLC AND SUBSIDIARIES INTEGRATED REPORT AND FINANCIAL STATEMENTS FOR THE YEAR ENDED 31 DECEMBER 2019
The Directors present their report together with the
audited financial statements for the year ended 31
December 2019, in accordance with section 22 of the
Banking Act (Cap 488) Laws of Kenya and section 653
of the Companies Act, 2015, which discloses the state
of affairs of the Company and its subsidiary companies.
PRINCIPAL ACTIVITIES
The principal activities of Equity Group Holdings Plc are:
a. To carry on the business of a non-operating holding
company as defined under the Banking Act;
b. To employ the funds of the Group in the development
and expansion of the business of the Group and all or
any of its Subsidiaries; and
c. To co-ordinate the administration of and to provide
advisory, administrative, management and other
services in connection with the activities of its
Subsidiaries.
A detailed business review, including an overview of the
Group’s macro-economic environment and principal
risks and challenges facing the Group is included in the
Integrated Report on pages 42 - 56.
RESULTS AND RECOMMENDED DIVIDEND
Profit for year of Shs 22,561 Million (2018: Shs 19,824
Million) has been added to retained earnings. The
Directors recommend the approval of a dividend of Shs
2.50 per share amounting to Shs 9,434 Million (2018:
Shs 2.00 per share amounting to Shs 7,547 Million).
DIRECTORS
The Directors who served during the year and to the
date of this report were:
Dr. James Njuguna Mwangi*
(Group Chief Executive Officer & Managing Director)
David Ansell**
(Appointed Chairman on 30 April 2019)
Helen Gichohi
Dr. Peter Munga
(Retired as Chairman on 30 April 2019)
Dennis Aluanga
(Retired on 30 April 2019)
Evelyn Rutagwenda***
Deepak Malik****
Prof. Isaac Macharia
(Vice Chairman)
Vijay Gidoomal
Mary Wangari Wamae*
Dr. Edward Odundo
* Executive Director
** American and Kenyan
*** Rwandese
**** Indian
Article 100 of the Memorandum and Articles of
Association of the Company provides for retirement of
Directors by rotation. Clause 2.5 of the Capital Markets
Code of Corporate Governance Practices for Issuers of
Securities to the Public 2015 provides for retirement of
Directors on attaining the age of seventy years.
A. Mrs. Evelyn Rutagwenda retires from office by
rotation in accordance with Article 100 of the
Company’s Articles of Association and offers
herself for re-election;
B. Mr. Christopher Newson appointed by the Board as
a new Director on 4th March 2020, offers himself
for appointment in accordance with Article 101 of
the Company’s Articles of Association, subject to
regulatory approvals.
C. Mr. David Ansell, a Director, having attained the age
of seventy years retires in terms of Clause 2.5 of
the Capital Markets Code of Corporate Governance
Practices for Issuers of Securities to the Public
2015 and does not offer himself for re-election;
D. Mr. Deepak Malik retires from office by rotation
in accordance with Article 100 of the Company’s
Articles of Association and does not offer himself
for re-election.
DIRECTORS’ REPORT

107
EQUITY GROUP HOLDINGS PLC AND SUBSIDIARIES INTEGRATED REPORT AND FINANCIAL STATEMENTS FOR THE YEAR ENDED 31 DECEMBER 2019
STATEMENT AS TO DISCLOSURE TO THE GROUP’S AUDITOR
With respect to each Director at the time this report was
approved:
a. There is, so far as each Director is aware, no relevant
audit information of which the Group’s auditor is
unaware; and
b. The Director had taken all steps that ought to have
been taken as a Director so as to be aware of any
relevant audit information and to establish that the
Group’s auditor is aware of that information.
TERMS OF APPOINTMENT OF THE AUDITOR
PricewaterhouseCoopers LLP continues in office in
accordance with the Company’s Articles of Association
and Section 721 of the Companies Act, 2015.
By order of the Board
CHRISTINE BROWNE
SECRETARY
19th March 2020
DIRECTORS’ REPORT (continued)

108
EQUITY GROUP HOLDINGS PLC AND SUBSIDIARIES INTEGRATED REPORT AND FINANCIAL STATEMENTS FOR THE YEAR ENDED 31 DECEMBER 2019
Information not subject to auditThe Board reviews and recommends the remuneration
structure of Directors annually, subject to Shareholder’s
approval. Directors’ remuneration is linked to
performance and is competitively structured to attract
and retain the best talent to effectively develop the
Group’s business.
Executive DirectorsThe Executive Directors remuneration package
comprises core fixed elements (base salary, pension
and other benefits). Executive Directors are eligible
to participate in the Group’s bonus scheme which is
anchored on achievement of key business performance
indicators, but are not entitled to earn fees or other
allowances.
Non-Executive DirectorsNon-Executive Directors are appointed for a renewable
term of 3 years, subject to regulatory approval and
shareholder ratification. They are obligated to act
reasonably, in good faith and in the best interests of the
Group and its shareholders. Non-Executive Directors
are vested with the following key responsibilities:
a. To constructively challenge and contribute to the
development of strategy and extend the business of
the Group;
b. To monitor the performance of management in
meeting agreed goals and objectives, and monitor the
reporting of performance; and
c. To ensure that the financial information is accurate
and that financial controls and systems of risk
management are robust and defensible.
Non-Executive Directors are entitled to fees for
attending Board and Committee meetings, as well
as an out of station per diem for attending to Group’s
business outside their usual place of business. Non-
Executive Directors do not earn a salary and they do
not participate in the Group’s bonus schemes nor the
Group’s pension plan.
Upon retirement or termination, Non-Executive
Directors are entitled to any accrued but unpaid
Director’s fees or reasonably incurred expenses but not
to any other compensation.
InsuranceThe Group provides Directors’ and Officers’ Liability
Insurance for all Directors of the Group during the
entire duration of their tenure.
Share OptionsThere are currently no share options issued by the
Group to the Executive and the Non-Executive Directors.
Particulars of compensation of Directors and key
personnel are disclosed in Note 28.
DIRECTORS’ REMUNERATION REPORT

Aud
ited
info
rmat
ion
The
follo
win
g ta
ble
show
s a
sing
le fi
gure
rem
uner
atio
n fo
r th
e Ch
airm
an, N
on-E
xecu
tive
Dir
ecto
rs (
NED
s) a
nd E
xecu
tive
Dir
ecto
rs in
res
pect
of
qual
ifyin
g se
rvic
es f
or t
he y
ear
ende
d 31
Dec
embe
r 20
19 to
geth
er w
ith th
e co
mpa
rativ
e fig
ures
for
2018
. The
agg
rega
te D
irec
tors
’ em
olum
ents
are
sho
wn
on N
ote
28 (e
).
Sala
ryFe
esP
ensi
onB
onus
Oth
er a
llow
ance
sEs
tim
ated
val
ue fo
r
non-
cash
ben
efit
s
Tota
l
Yea
r en
ded
31 D
ecem
ber
2019
Shs’
000
Shs’
000
Shs’
000
Shs’
000
Shs’
000
Shs’
000
Shs’
000
Dr.
Jam
es M
wan
gi*
56,7
34-
2-
3,75
64,
702
65,1
94
Mrs
. Mar
y W
amae
*38
,972
-2,
081
--
-41
,053
Dr.
Pet
er M
unga
**-
52,5
02-
--
-52
,502
Mr.
Dee
pak
Mal
ik-
2,23
9-
--
-2,
239
Mr.
Dav
id A
nsel
l-
5,10
9-
--
-5,
109
Mrs
. Eve
lyn
Rut
agw
enda
-3,
660
--
--
3,66
0
Mr.
Vija
y G
idoo
mal
-3,
261
--
--
3,26
1
Pro
f. Is
aac
Mac
hari
a-
2,64
2-
--
-2,
642
Dr.
Hel
en G
icho
hi-
2,75
2-
--
-2,
752
Dr.
Edw
ard
Odu
ndo
-4,
270
--
--
4,27
0
95,7
0676
,435
2,08
3-
3,75
64,
702
182,
682
*Exe
cutiv
e D
irec
tors
: Exe
cutiv
e D
irec
tors
are
not
ent
itled
to
rece
ive
fees
or
allo
wan
ces
for
atte
ndin
g m
eetin
gs o
f th
e Co
mpa
ny’s
Boa
rd a
nd t
hose
of
any
subs
idia
ry C
ompa
ny o
f w
hich
the
y
may
be
a D
irec
tor.
** T
he fe
es r
ecei
ved
by D
r. P
eter
Mun
ga in
clud
e a
one-
off g
ratu
ity o
f Shs
50
mill
ion
in c
onsi
dera
tion
of h
is le
ngth
of s
ervi
ce, c
omm
itmen
t and
ded
icat
ion
to th
e G
roup
spa
nnin
g ov
er 3
5 ye
ars.
DIR
ECTO
RS’
REM
UN
ERAT
ION
REP
OR
T (c
onti
nued
)
EQ
UIT
Y G
RO
UP
HO
LD
ING
S P
LC A
ND
SU
BS
IDIA
RIE
S IN
TEG
RAT
ED
RE
PO
RT
AN
D F
INA
NC
IAL
STA
TEM
EN
TS/ F
OR
TH
E YE
AR
EN
DE
D 3
1 D
EC
EM
BE
R 2
019
109

Aud
ited
info
rmat
ion
(con
tinu
ed)
Sala
ryFe
esP
ensi
onB
onus
Oth
er a
llow
ance
sTo
tal
Yea
r en
ded
31 D
ecem
ber
2018
Shs’
000
Shs’
000
Shs’
000
Shs’
000
Shs’
000
Shs’
000
Dr.
Jam
es M
wan
gi*
56,7
34
--
-3,
744
60,4
78
Mrs
. Mar
y W
amae
*35
,212
-
1,76
0-
-36
,972
Dr.
Pet
er M
unga
-7,
417
--
-7,
417
Mr.
Dee
pak
Mal
ik-
2,42
5-
--
2,42
5
Mr.
Dav
id A
nsel
l-
1,82
5-
--
1,82
5
Mrs
. Eve
lyn
Rut
agw
enda
-5,
263
--
-5,
263
Mr.
Vija
y G
idoo
mal
-2,
124
--
-2,
124
Pro
f. Is
aac
Mac
hari
a-
2,32
8-
--
2,32
8
Mr.
Den
nis
Alu
anga
-1,
114
--
-1,
114
Dr.
Hel
en G
icho
hi-
2,02
2-
--
2,02
2
91,9
4624
,518
1,76
0-
3,74
412
1,96
8
On
beha
lf o
f the
Boa
rd
Mar
y W
amae
Sign
atur
e:
DIR
ECTO
RS’
REM
UN
ERAT
ION
REP
OR
T (c
onti
nued
)
EQ
UIT
Y G
RO
UP
HO
LD
ING
S P
LC A
ND
SU
BS
IDIA
RIE
S IN
TEG
RAT
ED
RE
PO
RT
AN
D F
INA
NC
IAL
STA
TEM
EN
TS/ F
OR
TH
E YE
AR
EN
DE
D 3
1 D
EC
EM
BE
R 2
019
110

111
EQUITY GROUP HOLDINGS PLC AND SUBSIDIARIES INTEGRATED REPORT AND FINANCIAL STATEMENTS FOR THE YEAR ENDED 31 DECEMBER 2019
The Kenyan Companies Act, 2015 requires the Directors
to prepare financial statements for each financial year
that give a true and fair view of the financial position
of the Group and of the Company as at the end of the
financial year and of their profit or loss for that year. The
Directors are responsible for ensuring that the Group
and Company keeps proper accounting records that
are sufficient to show and explain the transactions of
the Group and the Company; disclose with reasonable
accuracy at any time the financial position of the Group
and the Company; and that enables them to prepare
financial statements of the Group and of the Company
that comply with prescribed financial reporting
standards and the requirements of the Kenyan
Companies Act, 2015. They are also responsible for
safeguarding the assets of the Group and the Company,
and for taking reasonable steps for the prevention and
detection of fraud and other irregularities.
The Directors accept responsibility for the preparation
and presentation of these financial statements in
accordance with International Financial Reporting
Standards and in the manner required by the Kenyan
Companies Act, 2015. They also accept responsibility
for:
i. Designing, implementing and maintaining such
internal control as they determine necessary to
enable the presentation of financial statements
that are free from material misstatement,
whether due to fraud or error;
ii. Selecting suitable accounting policies and
applying them consistently; and
iii. Making accounting estimates and judgements
that are reasonable in the circumstances.
Having made an assessment of the Group’s and
Company’s ability to continue as a going concern, the
Directors are not aware of any material uncertainties
related to events or conditions that may cast doubt upon
the Group’s and Company’s ability to continue as a going
concern.
The Directors acknowledge that the independent audit
of the financial statements does not relieve them of
their responsibilities.
Approved by the Board of Directors on 19 March 2020
and signed on its behalf by:
Dr. James Mwangi
Group CEO & Managing Director
Mary Wamae
Group Executive Director
STATEMENT OF DIRECTORS’ RESPONSIBILITIES
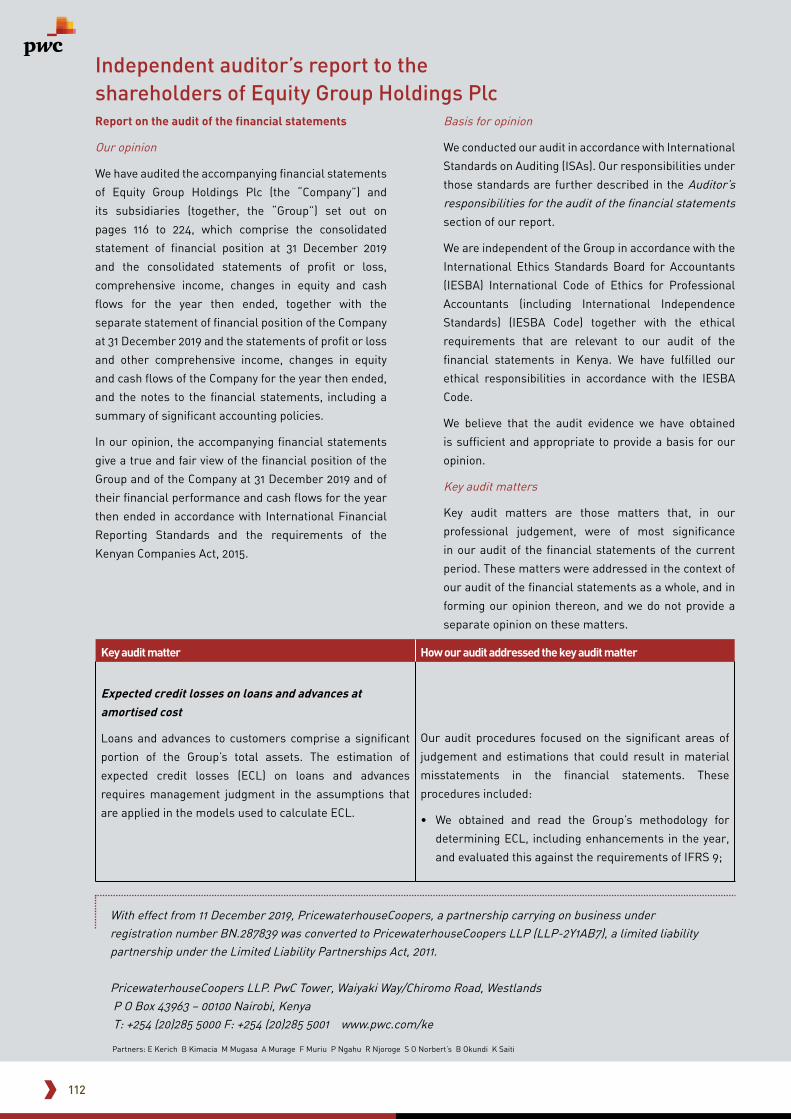
112
Report on the audit of the financial statements
Our opinion
We have audited the accompanying financial statements
of Equity Group Holdings Plc (the “Company”) and
its subsidiaries (together, the “Group”) set out on
pages 116 to 224, which comprise the consolidated
statement of financial position at 31 December 2019
and the consolidated statements of profit or loss,
comprehensive income, changes in equity and cash
flows for the year then ended, together with the
separate statement of financial position of the Company
at 31 December 2019 and the statements of profit or loss
and other comprehensive income, changes in equity
and cash flows of the Company for the year then ended,
and the notes to the financial statements, including a
summary of significant accounting policies.
In our opinion, the accompanying financial statements
give a true and fair view of the financial position of the
Group and of the Company at 31 December 2019 and of
their financial performance and cash flows for the year
then ended in accordance with International Financial
Reporting Standards and the requirements of the
Kenyan Companies Act, 2015.
Basis for opinion
We conducted our audit in accordance with International
Standards on Auditing (ISAs). Our responsibilities under
those standards are further described in the Auditor’s responsibilities for the audit of the financial statements section of our report.
We are independent of the Group in accordance with the
International Ethics Standards Board for Accountants
(IESBA) International Code of Ethics for Professional
Accountants (including International Independence
Standards) (IESBA Code) together with the ethical
requirements that are relevant to our audit of the
financial statements in Kenya. We have fulfilled our
ethical responsibilities in accordance with the IESBA
Code.
We believe that the audit evidence we have obtained
is sufficient and appropriate to provide a basis for our
opinion.
Key audit matters
Key audit matters are those matters that, in our
professional judgement, were of most significance
in our audit of the financial statements of the current
period. These matters were addressed in the context of
our audit of the financial statements as a whole, and in
forming our opinion thereon, and we do not provide a
separate opinion on these matters.
Key audit matter How our audit addressed the key audit matter
Expected credit losses on loans and advances at amortised cost
Loans and advances to customers comprise a significant
portion of the Group’s total assets. The estimation of
expected credit losses (ECL) on loans and advances
requires management judgment in the assumptions that
are applied in the models used to calculate ECL.
Our audit procedures focused on the significant areas of
judgement and estimations that could result in material
misstatements in the financial statements. These
procedures included:
• We obtained and read the Group’s methodology for
determining ECL, including enhancements in the year,
and evaluated this against the requirements of IFRS 9;
With effect from 11 December 2019, PricewaterhouseCoopers, a partnership carrying on business under registration number BN.287839 was converted to PricewaterhouseCoopers LLP (LLP-2Y1AB7), a limited liability partnership under the Limited Liability Partnerships Act, 2011.
PricewaterhouseCoopers LLP. PwC Tower, Waiyaki Way/Chiromo Road, Westlands P O Box 43963 – 00100 Nairobi, Kenya T: +254 (20)285 5000 F: +254 (20)285 5001 www.pwc.com/ke
Partners: E Kerich B Kimacia M Mugasa A Murage F Muriu P Ngahu R Njoroge S O Norbert’s B Okundi K Saiti
Independent auditor’s report to the shareholders of Equity Group Holdings Plc

113
Key audit matters (continued)
Key audit matter How our audit addressed the key audit matter
The policies for estimating ECL are explained in notes 2 (i),
3 (a) and 4 (b) of the financial statements.
The key areas where significant judgement has been
exercised and therefore, an increased level of audit focus
applied, include:
• The assumptions applied in deriving the probabilities of
default (PDs), loss given default (LGD) and exposures at
default (EAD) for the various segments;
• The judgments made to determine the staging of facilities
in line with IFRS 9. In particular, the identification
of Significant Increase in Credit Risk (“SICR”) and
Default requires consideration of quantitative and
qualitative criteria. This is a key area of judgement as
this determines whether a 12-month or lifetime PD
is used. Specific assumptions have been applied by
management in determining the staging, PD and LGD
for certain segments of the loan book;
• The relevance of forward-looking information used in
the models; and
• For Equity Bank Kenya Limited (EBKL), the top 50 loans
and advances are individually assessed by the Board
Credit Committee (BCC). Judgement is exercised in the
consideration of quantitative and qualitative factors, and
the mapping of these loans to external ratings.
Due to the significant impact of management judgments
applied in calculating the ECL, we designated this as a key
audit matter in our audit.
• We tested how the Group extracts ‘days past due (DPD)’
applied in classifying the loan book into the three
stages required by IFRS 9. For a sample of loans, we
recalculated the DPD applied in the model and agreed
these to the DPD as per the Group’s IT system and the
respective customer files;
• We obtained an understanding of the basis used to
determine the probabilities of default. We tested the
completeness and accuracy of the historical data used
in derivation of PDs and LGDs, and re-calculated the
same on a sample basis;
• For LGD, we tested the assumptions on the timing of the
cash flows based on empirical evidence. In addition, for
secured facilities, we agreed the collateral values used
in the ECL model to external valuer reports;
• We tested, on a sample basis, the reasonableness of
EAD for both on and off-balance sheet exposures;
• For forward-looking assumptions used in the ECL
calculations, we corroborated the assumptions using
publicly available information;
• For the EBKL top 50 loans and advances, we discussed
with management and reviewed the appropriateness of
their assessment and mapping to external ratings; and
• We assessed whether the disclosures in the financial
statements on the key judgements and assumptions
were adequate.
Valuation of loan note measured at fair value
As described in Notes 3 (b) and 20 (d) of the financial statements,
the Group holds a loan note which is measured at fair value. The
loan note was issued to the Group in 2017 following the restructure
of facilities to a customer (original borrower company).
To determine the fair value of the loan note, management use a
complex discounted cash flow (DCF) model. Significant judgement
was exercised in:
• The selection of the DCF valuation approach and
consideration of alternative modelling approaches; and
• The assumptions applied in deriving the model inputs
which include the projected cash flows of the original
borrower company, the weighted average cost of capital
(WACC) of the original borrower company and the growth
rate assumptions.
Changes in the valuation approach and the underlying assumptions
could result in material variations in the carrying amount of the
asset at year-end.
We performed the following procedures:
• In conjunction with our valuation experts, we assessed
the appropriateness of the modelling approach used by
management;
• We verified the key valuation inputs and assessed
the reasonableness of key assumptions used in
estimating the value of the loan note. We also tested the
mathematical accuracy of the model computation;
• We tested the reasonableness of the fair values
using sensitivity analysis based on the most critical
assumptions as disclosed under note 20 (d) of the
financial statements; and
• We assessed the adequacy of the disclosure of the
key valuation assumptions in terms of International
Financial Reporting Standards (IFRS) requirements.
Independent auditor’s report to the shareholders of Equity Group Holdings Plc (continued)

114
Other information
The other information comprises Group and Company
information, Directors’ report, Directors’ remuneration
report and Statement of Directors’ responsibilities
which we obtained prior to the date of this auditor’s
report, and the rest of the other information in the
Integrated Report which are expected to be made
available to us after that date, but does not include the
financial statements and our auditor’s report thereon.
The Directors are responsible for the other information.
Our opinion on the financial statements does not cover
the other information and we do not and will not express
any form of assurance conclusion thereon.
In connection with our audit of the financial statements,
our responsibility is to read the other information
identified above and, in doing so, consider whether the
other information is materially inconsistent with the
financial statements or our knowledge obtained in the
audit, or otherwise appears to be materially misstated.
If, based on the work we have performed on the other
information we have received prior to the date of this
auditor’s report we conclude that there is a material
misstatement of this other information, we are required
to report that fact. We have nothing to report in this
regard.
When we read the rest of the other information in
the Integrated Report and we conclude that there is
a material misstatement therein, we are required
to communicate the matter to those charged with
governance.
Responsibilities of the Directors for the financial statements
The Directors are responsible for the preparation of
financial statements that give a true and fair view in
accordance with International Financial Reporting
Standards and the requirements of the Kenyan
Companies Act, 2015, and for such internal control as
the Directors determine is necessary to enable the
preparation of financial statements that are free from
material misstatement, whether due to fraud or error.
In preparing the financial statements, the Directors are
responsible for assessing the Group’s and Company’s
ability to continue as a going concern, disclosing,
as applicable, matters related to going concern and
using the going concern basis of accounting unless
the Directors either intend to liquidate the Group or
Company to cease operations, or have no realistic
alternative but to do so.
Auditor’s responsibilities for the audit of the financial statements
Our objectives are to obtain reasonable assurance
about whether the financial statements as a whole
are free from material misstatement, whether due to
fraud or error, and to issue an auditor’s report that
includes our opinion. Reasonable assurance is a high
level of assurance, but is not a guarantee that an audit
conducted in accordance with ISAs will always detect a
material misstatement when it exists. Misstatements
can arise from fraud or error and are considered
material if, individually or in the aggregate, they could
reasonably be expected to influence the economic
decisions of users taken on the basis of these financial
statements.
As part of an audit in accordance with ISAs, we exercise
professional judgement and maintain professional
scepticism throughout the audit. We also:
• Identify and assess the risks of material
misstatement of the financial statements, whether
due to fraud or error, design and perform audit
procedures responsive to those risks, and obtain
audit evidence that is sufficient and appropriate
to provide a basis for our opinion. The risk of not
detecting a material misstatement resulting from
fraud is higher than for one resulting from error,
as fraud may involve collusion, forgery, intentional
omissions, misrepresentations, or the override of
internal control.
• Obtain an understanding of internal control relevant
to the audit in order to design audit procedures that
are appropriate in the circumstances, but not for the
purpose of expressing an opinion on the effectiveness
of the Group’s and Company’s internal control.
Independent auditor’s report to the shareholders of Equity Group Holdings Plc

115
Auditor’s responsibilities for the audit of the financial statements (continued)
• Evaluate the appropriateness of accounting policies
used and the reasonableness of accounting estimates
and related disclosures made by the Directors.
• Conclude on the appropriateness of the Directors’ use
of the going concern basis of accounting and, based
on the audit evidence obtained, whether a material
uncertainty exists related to events or conditions
that may cast significant doubt on the Group’s and
Company’s ability to continue as a going concern. If
we conclude that a material uncertainty exists, we
are required to draw attention in our auditor’s report
to the related disclosures in the financial statements
or, if such disclosures are inadequate, to modify
our opinion. Our conclusions are based on the audit
evidence obtained up to the date of our auditor’s
report. However, future events or conditions may
cause the Group or Company to cease to continue as
a going concern.
• Evaluate the overall presentation, structure and
content of the financial statements, including the
disclosures, and whether the financial statements
represent the underlying transactions and events in
a manner that achieves fair presentation.
• Obtain sufficient appropriate audit evidence
regarding the financial information of the entities
or business activities within the Group to express
an opinion on the Group’s financial statements. We
are responsible for the direction, supervision and
performance of the Group audit. We remain solely
responsible for our audit opinion.
We communicate with the Directors regarding, among
other matters, the planned scope and timing of the audit
and significant audit findings, including any significant
deficiencies in internal control that we identify during
our audit.
We also provide the Directors with a statement that
we have complied with relevant ethical requirements
regarding independence, and to communicate with
them all relationships and other matters that may
reasonably be thought to bear on our independence,
and where applicable, related safeguards.
From the matters communicated with the Directors, we
determine those matters that were of most significance
in the audit of the financial statements of the current
period and are therefore the key audit matters. We
describe these matters in our auditor’s report unless
law or regulation precludes public disclosure about the
matter or when, in extremely rare circumstances, we
determine that a matter should not be communicated in
our report because the adverse consequences of doing
so would reasonably be expected to outweigh the public
interest benefits of such communication.
Report on other matters prescribed by the Kenyan
Companies Act, 2015
Report of the Directors
In our opinion the information given in the Directors’
report on pages 106 to 107 is consistent with the financial
statements.
Directors’ remuneration report
In our opinion the auditable part of the Directors’
remuneration report on pages 108 to 110 has been
properly prepared in accordance with the Kenyan
Companies Act, 2015.
Certified Public Accountants
Nairobi
20 March 2020
FCPA Richard Njoroge, Practising certificate P/1244
Signing partner responsible for the independent audit
Independent auditor’s report to the shareholders of Equity Group Holdings Plc (continued)

116
EQUITY GROUP HOLDINGS PLC AND SUBSIDIARIES INTEGRATED REPORT AND FINANCIAL STATEMENTS FOR THE YEAR ENDED 31 DECEMBER 2019
2019 2018
Notes Shs’ millions Shs’ millions
Interest income 6 59,723 53,230
Interest expense 6 (14,740) (11,808)
Net interest income 44,983 41,422
Fee and commission income 7 (a) 20,857 18,264
Fee and commission expense 7 (b) (3,687) (2,993)
Net fee and commission income 17,170 15,271
Net foreign exchange income 8 3,493 3,822
Other operating income 9 5,585 2,998
Fair value loss on loan note at FVTPL 20 (d) (1,000) -
Credit impairment losses 11 (3,458) (2,936)
4,620 3,884
Net operating income 66,773 60,577
Employee benefits 12 (12,952) (11,544)
Operating lease expenses 13 (425) (2,257)
Depreciation and amortisation 10 (6,021) (4,441)
Other operating expenses 16 (15,142) (13,632)
Loss on net monetary position 35 (755) (240)
Operating expenses (35,295) (32,114)
Profit before income tax 31,478 28,463
Income tax expense 18 (8,917) (8,639)
Profit for the year 22,561 19,824
Profit attributable to:
Owners of the parent 22,386 19,691
Non-controlling interest 175 133
22,561 19,824
Earnings per share (basic and diluted) (Shs) 29 5.93 5.22
CONSOLIDATED STATEMENT OF PROFIT OR LOSS

117
EQUITY GROUP HOLDINGS PLC AND SUBSIDIARIES INTEGRATED REPORT AND FINANCIAL STATEMENTS FOR THE YEAR ENDED 31 DECEMBER 2019
2019 2018
Notes Shs’ millions Shs’ millions
Profit for the year 22,561 19,824
Other comprehensive income:
Items that will be reclassified to profit or loss:
Fair value gains/ (losses) on investments in financial
instruments measured at FVOCI 21 3,757 (944)
Deferred income tax 23 (1,127) 310
2,630 (634)
Exchange differences on translation of foreign operations (824) (1,035)
Other comprehensive income for the year 1,806 (1,669)
Total comprehensive income for the year, net of tax 24,367 18,155
Total comprehensive income attributable to:
Owners of the parent 24,192 18,022
Non-controlling interest 175 133
24,367 18,155
CONSOLIDATED STATEMENT OF COMPREHENSIVE INCOME

118
EQUITY GROUP HOLDINGS PLC AND SUBSIDIARIES INTEGRATED REPORT AND FINANCIAL STATEMENTS FOR THE YEAR ENDED 31 DECEMBER 2019
COMPANY STATEMENT OF PROFIT OR LOSS AND OTHER COMPREHENSIVE INCOME
2019 2018
Notes Shs’ millions Shs’ millions
Interest income 6 182 212
Dividend income 28 (h) 12,500 10,450
Other operating income 9 59 44
Operating income 12,741 10,706
Credit impairment losses 11 (1) (35)
Employee benefits 12 (87) (55)
Operating lease expenses 13 (2) -
Other operating expenses 16 (321) (51)
Operating expenses (411) (141)
Profit before income tax 12,330 10,565
Income tax expense 18 (67) (18)
Profit for the year 12,263 10,547
Other comprehensive income for the year - -
Total comprehensive income for the year 12,263 10,547

119
EQUITY GROUP HOLDINGS PLC AND SUBSIDIARIES INTEGRATED REPORT AND FINANCIAL STATEMENTS AT 31 DECEMBER 2019
CONSOLIDATED STATEMENT OF FINANCIAL POSITION
2019 2018
Notes Shs’ millions Shs’ millions
Assets
Cash, deposits and balances due from financial institutions 19 (a) 86,434 74,619
Derivative financial assets 33 472 225
Investment securities 21 172,208 160,952
Due from related parties 28 (f) 19 24
Current income tax 18 152 632
Loans and advances to customers 20 366,440 297,227
Other assets 22 12,745 12,395
Property and equipment 14 (a) 11,031 10,276
Right-of-use assets 14 (c) 7,342 -
Intangible assets 15 10,347 10,466
Deferred income tax 23 6,492 6,117
Prepaid leases 14 (b) - 451
Total assets 673,682 573,384
Liabilities
Deposits from customers 24 482,752 422,758
Borrowed funds 26 56,714 45,101
Other liabilities 25 12,865 10,343
Lease liabilities 14 (c) 7,496 -
Current income tax 18 1,928 185
Deferred income tax 23 150 40
Total liabilities 561,905 478,427
Equity
Share capital 27 (a) 1,887 1,887
Share premium 27 (b) 16,063 16,063
Retained earnings 99,150 85,034
FVOCI reserve 27 (c) 2,514 (116)
Loan loss reserve 27 (d) 739 16
Foreign currency translation reserve 27 (f) (9,521) (8,697)
Other reserves 27 (e) (113) (113)
Equity attributable to owners of the Company 110,719 94,074
Non-controlling interests 1,058 883
Total equity 111,777 94,957
Total equity and liabilities 673,682 573,384
The financial statements on pages 116 to 224 were approved for issue by the Board of Directors on 19 March 2020 and signed
on its behalf by:
Dr. James Mwangi Mary Wamae
Group CEO & Managing Director Group Executive Director

120
EQUITY GROUP HOLDINGS PLC AND SUBSIDIARIES INTEGRATED REPORT AND FINANCIAL STATEMENTS AT 31 DECEMBER 2019
COMPANY STATEMENT OF FINANCIAL POSITION
2019 2018
Notes Shs’ millions Shs’ millions
Assets
Cash, deposits and balances due from financial institutions 19 12,694 7,675
Due from related parties 28(f) 61 95
Other assets 22 159 236
Current income tax 18 37 11
Property and equipment 14(a) 12 -
Investments in subsidiary companies 17(a) 66,786 66,786
Deferred income tax 23 85 83
Total assets 79,834 74,886
Liabilities
Due to related parties 28(g) 619 422
Other liabilities 25 38 3
Total liabilities 657 425
Equity
Share capital 27(a) 1,887 1,887
Share premium 27(b) 16,063 16,063
Retained earnings 61,227 56,511
Total equity 79,177 74,461
Total equity and liabilities 79,834 74,886
The financial statements on pages 116 to 224 were approved for issue by the Board of Directors on 19 March 2020 and signed on its behalf by:
Dr. James Mwangi Mary Wamae
Group CEO & Managing Director Group Executive Director

Att
ribu
tabl
e to
ow
ners
of t
he p
aren
t
Not
esSh
are
capi
tal
Shar
e pr
emiu
mR
etai
ned
earn
ings
Loan
loss
re
serv
eFV
OC
I re
serv
e
Fore
ign
curr
ency
tr
ansl
atio
n re
serv
e
Oth
er
rese
rves
Tota
lN
on-
cont
roll
ing
inte
rest
s
Tota
l eq
uity
Shs’
m
illio
nsSh
s’
mill
ions
Shs’
m
illio
nsSh
s’
mill
ions
Shs’
m
illio
nsSh
s’
mill
ions
Shs’
m
illio
nsSh
s’
mill
ions
Shs’
m
illio
nsSh
s’
mill
ions
Year
end
ed 3
1 D
ecem
ber
2019
At s
tart
of y
ear
1,88
716
,063
85,0
3416
(116
)(8
,697
)(1
13)
94,0
7488
394
,957
Tota
l com
preh
ensi
ve in
com
e:
Pro
fit fo
r th
e ye
ar-
-22
,386
--
--
22,3
8617
522
,561
Oth
er c
ompr
ehen
sive
inco
me
--
--
2,63
0(8
24)
-1,
806
-1,
806
--
22,3
86-
2,63
0(8
24)
-24
,192
175
24,3
67
Loan
loss
res
erve
tran
sfer
s-
-(7
23)
723
--
--
--
Fina
l 201
8 di
vide
nd d
ecla
red
and
paid
27 (g
)-
-(7
,547
)-
--
-(7
,547
)-
(7,5
47)
At e
nd o
f yea
r1,
887
16,0
6399
,150
739
2,51
4(9
,521
)(1
13)
110,
719
1,05
811
1,77
7
EQ
UIT
Y G
RO
UP
HO
LD
ING
S P
LC A
ND
SU
BS
IDIA
RIE
S IN
TEG
RAT
ED
RE
PO
RT
AN
D F
INA
NC
IAL
STA
TEM
EN
TS/ F
OR
TH
E YE
AR
EN
DE
D 3
1 D
EC
EM
BE
R 2
019
121
CO
NSO
LID
ATED
STA
TEM
ENT
OF
CH
AN
GES
IN E
QU
ITY
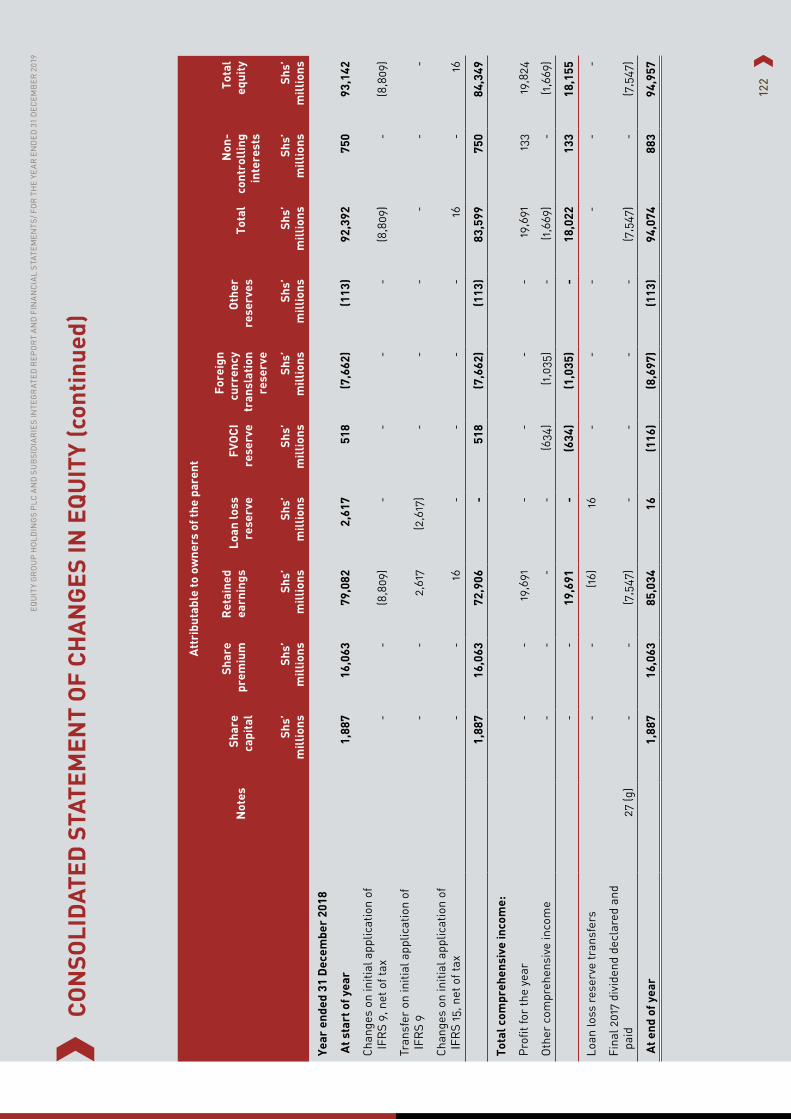
Att
ribu
tabl
e to
ow
ners
of t
he p
aren
t
Not
esSh
are
capi
tal
Shar
e pr
emiu
mR
etai
ned
earn
ings
Loan
loss
re
serv
eFV
OC
I re
serv
e
Fore
ign
curr
ency
tr
ansl
atio
n re
serv
e
Oth
er
rese
rves
Tota
lN
on-
cont
roll
ing
inte
rest
s
Tota
l eq
uity
Shs’
m
illio
nsSh
s’
mill
ions
Shs’
m
illio
nsSh
s’
mill
ions
Shs’
m
illio
nsSh
s’
mill
ions
Shs’
m
illio
nsSh
s’
mill
ions
Shs’
m
illio
nsSh
s’
mill
ions
Year
end
ed 3
1 D
ecem
ber
2018
At s
tart
of y
ear
1,88
716
,063
79,0
822,
617
518
(7,6
62)
(113
)92
,392
750
93,1
42
Chan
ges
on in
itial
app
licat
ion
of
IFR
S 9,
net
of t
ax-
-(8
,809
)-
--
-(8
,809
)-
(8,8
09)
Tran
sfer
on
initi
al a
pplic
atio
n of
IF
RS
9-
-2,
617
(2,6
17)
--
--
--
Chan
ges
on in
itial
app
licat
ion
of
IFR
S 15
, net
of t
ax-
-16
--
--
16-
16
1,88
716
,063
72,9
06-
518
(7,6
62)
(113
)83
,599
750
84,3
49
Tota
l com
preh
ensi
ve in
com
e:
Pro
fit fo
r th
e ye
ar-
-19
,691
--
--
19,6
9113
319
,824
Oth
er c
ompr
ehen
sive
inco
me
--
--
(634
)(1
,035
)-
(1,6
69)
-(1
,669
)
--
19,6
91-
(634
)(1
,035
)-
18,0
2213
318
,155
Loan
loss
res
erve
tran
sfer
s-
-(1
6)16
--
--
--
Fina
l 201
7 di
vide
nd d
ecla
red
and
paid
27 (g
)-
-(7
,547
)-
--
-(7
,547
)-
(7,5
47)
At e
nd o
f yea
r1,
887
16,0
6385
,034
16(1
16)
(8,6
97)
(113
)94
,074
883
94,9
57
EQ
UIT
Y G
RO
UP
HO
LD
ING
S P
LC A
ND
SU
BS
IDIA
RIE
S IN
TEG
RAT
ED
RE
PO
RT
AN
D F
INA
NC
IAL
STA
TEM
EN
TS/ F
OR
TH
E YE
AR
EN
DE
D 3
1 D
EC
EM
BE
R 2
019
122
CO
NSO
LID
ATED
STA
TEM
ENT
OF
CH
AN
GES
IN E
QU
ITY
(con
tinu
ed)

123
EQUITY GROUP HOLDINGS PLC AND SUBSIDIARIES INTEGRATED REPORT AND FINANCIAL STATEMENTS FOR THE YEAR ENDED 31 DECEMBER 2019
COMPANY STATEMENT OF CHANGES IN EQUITY
Share capitalShare
premium
Retained
earningsTotal equity
Shs’ millions Shs’ millions Shs’ millions Shs’ millions
Year ended 31 December 2019
At start of year 1,887 16,063 56,511 74,461
Total comprehensive income:
Profit for the year - - 12,263 12,263
Dividends (Note 27(g)):
Final 2018 dividend declared and paid - - (7,547) (7,547)
At end of year 1,887 16,063 61,227 79,177
Year ended 31 December 2018
At start of year 1,887 16,063 53,513 71,463
Changes on initial application of IFRS 9, net of tax - - (2) (2)
Total comprehensive income:
Profit for the year - - 10,547 10,547
Dividends (Note 27(g)):
Final 2017 dividend declared and paid - - (7,547) (7,547)
At end of year 1,887 16,063 56,511 74,461
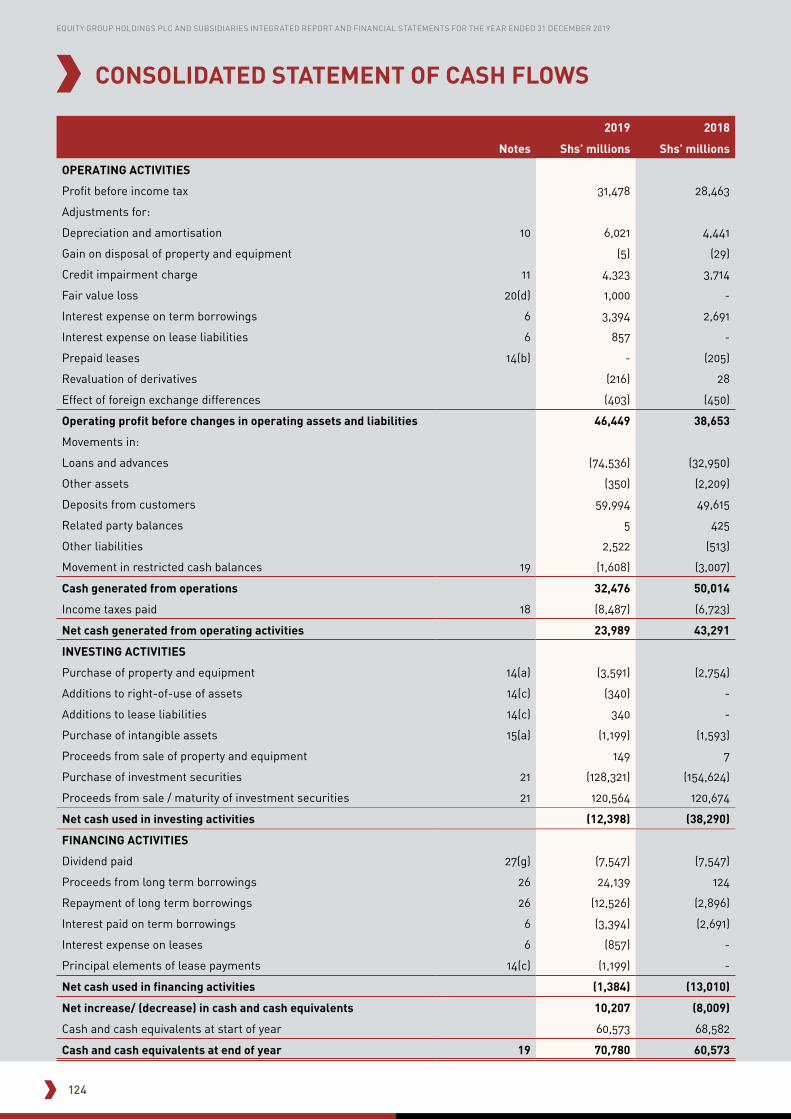
124
EQUITY GROUP HOLDINGS PLC AND SUBSIDIARIES INTEGRATED REPORT AND FINANCIAL STATEMENTS FOR THE YEAR ENDED 31 DECEMBER 2019
2019 2018
Notes Shs’ millions Shs’ millions
OPERATING ACTIVITIES
Profit before income tax 31,478 28,463
Adjustments for:
Depreciation and amortisation 10 6,021 4,441
Gain on disposal of property and equipment (5) (29)
Credit impairment charge 11 4,323 3,714
Fair value loss 20(d) 1,000 -
Interest expense on term borrowings 6 3,394 2,691
Interest expense on lease liabilities 6 857 -
Prepaid leases 14(b) - (205)
Revaluation of derivatives (216) 28
Effect of foreign exchange differences (403) (450)
Operating profit before changes in operating assets and liabilities 46,449 38,653
Movements in:
Loans and advances (74,536) (32,950)
Other assets (350) (2,209)
Deposits from customers 59,994 49,615
Related party balances 5 425
Other liabilities 2,522 (513)
Movement in restricted cash balances 19 (1,608) (3,007)
Cash generated from operations 32,476 50,014
Income taxes paid 18 (8,487) (6,723)
Net cash generated from operating activities 23,989 43,291
INVESTING ACTIVITIES
Purchase of property and equipment 14(a) (3,591) (2,754)
Additions to right-of-use of assets 14(c) (340) -
Additions to lease liabilities 14(c) 340 -
Purchase of intangible assets 15(a) (1,199) (1,593)
Proceeds from sale of property and equipment 149 7
Purchase of investment securities 21 (128,321) (154,624)
Proceeds from sale / maturity of investment securities 21 120,564 120,674
Net cash used in investing activities (12,398) (38,290)
FINANCING ACTIVITIES
Dividend paid 27(g) (7,547) (7,547)
Proceeds from long term borrowings 26 24,139 124
Repayment of long term borrowings 26 (12,526) (2,896)
Interest paid on term borrowings 6 (3,394) (2,691)
Interest expense on leases 6 (857) -
Principal elements of lease payments 14(c) (1,199) -
Net cash used in financing activities (1,384) (13,010)
Net increase/ (decrease) in cash and cash equivalents 10,207 (8,009)
Cash and cash equivalents at start of year 60,573 68,582
Cash and cash equivalents at end of year 19 70,780 60,573
CONSOLIDATED STATEMENT OF CASH FLOWS

125
EQUITY GROUP HOLDINGS PLC AND SUBSIDIARIES INTEGRATED REPORT AND FINANCIAL STATEMENTS FOR THE YEAR ENDED 31 DECEMBER 2019
2019 2018
Notes Shs’ millions Shs’ millions
OPERATING ACTIVITIES
Profit before income tax 12,330 10,565
Adjustments for:
Dividend received (12,500) (10,450)
Credit impairment loss charge 11 1 35
Operating (loss)/ profit before changes in operating assets and liabilities (169) 150
Other assets 76 (271)
Related party balances 231 (2,029)
Other liabilities 35 (256)
Cash generated from/(used in) operations 173 (2,406)
Income taxes paid 18 (95) (115)
Net cash from operating activities 78 (2,521)
INVESTING ACTIVITIES
Dividend received 12,500 10,450
Purchase of property and equipment (12) -
Net cash from investing activities 12,488 10,450
FINANCING ACTIVITIES
Dividend paid 27(g) (7,547) (7,547)
Additional capital injected into subsidiaries - (1,025)
Net cash used in financing activities (7,547) (8,572)
Net increase/(decrease) in cash and cash equivalents 5,019 (643)
Cash and cash equivalents at start of year 7,675 8,318
Cash and cash equivalents at end of year 19 12,694 7,675
COMPANY STATEMENT OF CASH FLOWS

126
EQUITY GROUP HOLDINGS PLC AND SUBSIDIARIES INTEGRATED REPORT AND FINANCIAL STATEMENTS FOR THE YEAR ENDED 31 DECEMBER 2019
NOTES
127
EQUITY GROUP HOLDINGS PLC AND SUBSIDIARIES INTEGRATED REPORT AND FINANCIAL STATEMENTS FOR THE YEAR ENDED 31 DECEMBER 2019
NOTES
1.Corporate informationEquity Group Holdings Plc (the “Company”) is incorporated
under the Kenyan Companies Act, 2015 and is domiciled in
Kenya. The Company is licensed under the Kenyan Banking
Act (Chapter 488). The Company has subsidiaries in Kenya,
Uganda, South Sudan, Rwanda, Tanzania and Democratic
Republic of Congo and a representative office in Ethiopia.
Its shares are listed on the Nairobi Securities Exchange,
Uganda Securities Exchange and Rwanda Stock Exchange.
2.Significant accounting policiesThe principal accounting policies applied in the preparation of
these financial statements are set out below. These policies
have been consistently applied to all years presented, unless
otherwise stated.
(a) Basis of preparation
The financial statements have been prepared in accordance
with International Financial Reporting Standards (“IFRS”).
The measurement basis applied is the historical cost basis,
except for fair value through other comprehensive income
investments, derivatives and loan notes at fair value through
profit or loss which have been measured at fair value.
The preparation of financial statements in conformity with
IFRS requires the use of certain critical accounting estimates.
It also requires the Directors to exercise judgement in the
process of applying the Group’s accounting policies. The
areas involving a higher degree of judgement or complexity,
or where assumptions and estimates are significant to the
financial statements, are disclosed in Note 3.
Changes in accounting policy and disclosures
(i) New and amended standards adopted by the Group and
Company
The following standards and amendments have been applied
by the Group for the first time for the financial year beginning
1 January 2019:
IFRS 16 – Leases
IFRS 16 ‘Leases’ replaces IAS 17 ‘Leases’ along with
three Interpretations (IFRIC 4 ‘Determining whether
an Arrangement contains a Lease’, SIC 15 ‘Operating
Leases-Incentives’ and SIC 27 ‘Evaluating the Substance
of Transactions Involving the Legal Form of a Lease’). The
adoption of this new Standard has resulted in the Group
recognising a right-of-use asset and related lease liability in
connection with all former operating leases except for those
identified as low-value or having a remaining lease term of
less than 12 months from the date of initial application.
The New Standard has been applied using the modified
retrospective approach with no effect on the retained
earnings. Prior periods have not been restated. For
contracts in place at the date of initial application, the Group
has elected to apply the definition of a lease from IAS 17 and
IFRIC 4 and has not applied IFRS 16 to arrangements that
were previously not identified as lease under IAS 17 and
IFRIC 4.
At this date, the Group has also elected to measure the
right-of-use assets at an amount equal to the lease liability
adjusted for any prepaid or accrued lease payments that
existed at the date of transition plus provision for restoration
costs.
On adoption of IFRS 16, the group recognised lease liabilities
in relation to leases which had previously been classified as
‘operating leases’ under the principles of IAS 17 Leases.
These liabilities were measured at the present value of the
remaining lease payments, discounted using the lessee’s
incremental borrowing rate as of 1 January 2019.

128
EQUITY GROUP HOLDINGS PLC AND SUBSIDIARIES INTEGRATED REPORT AND FINANCIAL STATEMENTS FOR THE YEAR ENDED 31 DECEMBER 2019
NOTES (continued)
2.Significant accounting policies (continued)(a) Basis of preparation (continued)
Changes in accounting policy and disclosures (continued)
(i) New and amended standards adopted by the Group and Company (continued)
IFRS 16 – Leases (continued)
a. Practical expedients applied
The Group applied the following practical expedients when applying IFRS 16 to leases previously classified as operating leases
under IAS 17:
• Apply a single discount rate to a portfolio of leases with reasonably similar characteristics;
• Exclude initial direct costs from the measurement of right-of-use assets at the date of initial application for leases
where the right-of-use asset was determined as if IFRS 16 had been applied since the commencement date;
• Reliance on previous assessments on whether leases are onerous as opposed to preparing an impairment review under
IAS 36 as at the date of initial application; and
• Applied the exemption not to recognise right-of-use assets and liabilities for leases with less than 12 months of lease
term remaining as of the date of initial application or those identified as low value.
On transition to IFRS 16, the weighted average incremental borrowing rates applied to lease liabilities recognised under IFRS
16 were as shown below;
Local CCY US$
EBKL 13% -
EBUL 10% 4.5%
EBTL 15% 7%
EBRL 8% -
EBCL - 13.9%
EBSSL - 1.5%
b. Measurement of lease liabilities
Shs’ millions
Operating lease commitments disclosed as at 31 December 2018 11,128
Discounted using the lessee’s incremental borrowing rate of at the date of initial application (2,773)
Lease liability recognised as at 1 January 2019 8,355
Of which are:
Current lease liabilities 1,288
Non-current lease liabilities 7,067
8,355
c. Measurement of right of use
The associated right-of-use assets for property leases were measured on a retrospective basis as if the new rules had always
been applied. Other right-of use assets were measured at the amount equal to the lease liability, adjusted by the amount of any
prepaid or accrued lease payments relating to that lease recognised in the balance sheet as at 31 December 2018.
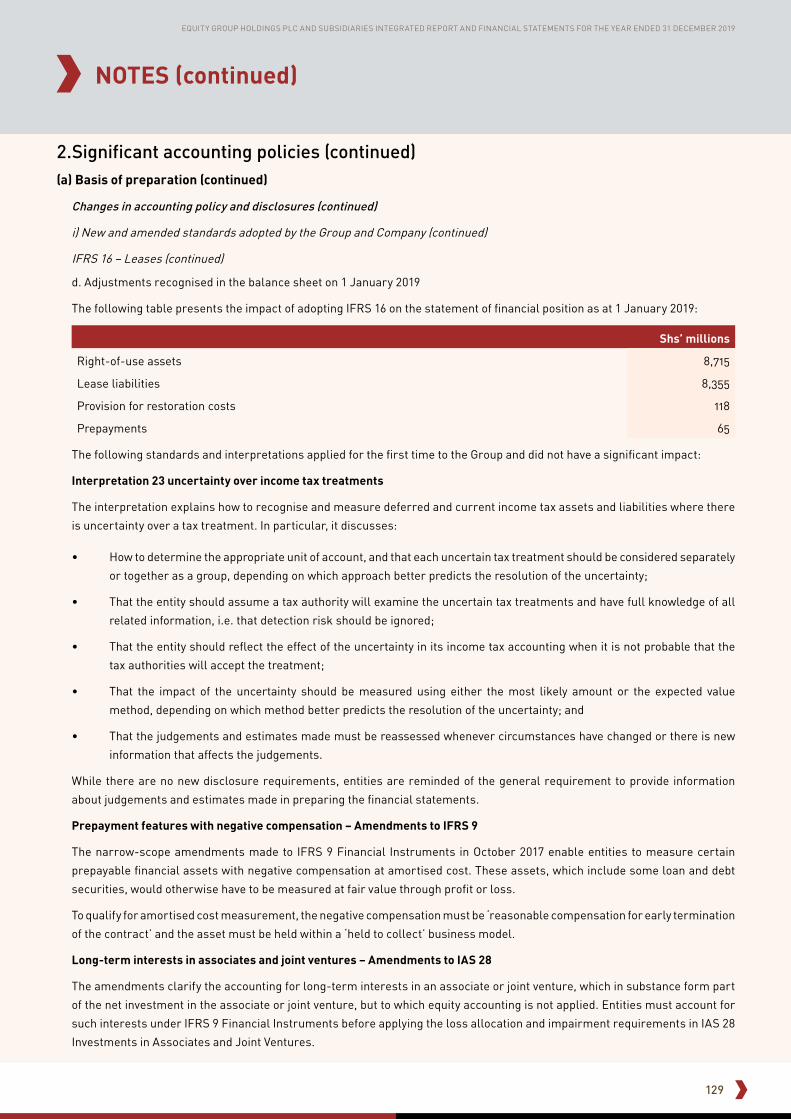
129
EQUITY GROUP HOLDINGS PLC AND SUBSIDIARIES INTEGRATED REPORT AND FINANCIAL STATEMENTS FOR THE YEAR ENDED 31 DECEMBER 2019
2.Significant accounting policies (continued)(a) Basis of preparation (continued)
Changes in accounting policy and disclosures (continued)
i) New and amended standards adopted by the Group and Company (continued)
IFRS 16 – Leases (continued)
d. Adjustments recognised in the balance sheet on 1 January 2019
The following table presents the impact of adopting IFRS 16 on the statement of financial position as at 1 January 2019:
Shs’ millions
Right-of-use assets 8,715
Lease liabilities 8,355
Provision for restoration costs 118
Prepayments 65
The following standards and interpretations applied for the first time to the Group and did not have a significant impact:
Interpretation 23 uncertainty over income tax treatments
The interpretation explains how to recognise and measure deferred and current income tax assets and liabilities where there
is uncertainty over a tax treatment. In particular, it discusses:
• How to determine the appropriate unit of account, and that each uncertain tax treatment should be considered separately
or together as a group, depending on which approach better predicts the resolution of the uncertainty;
• That the entity should assume a tax authority will examine the uncertain tax treatments and have full knowledge of all
related information, i.e. that detection risk should be ignored;
• That the entity should reflect the effect of the uncertainty in its income tax accounting when it is not probable that the
tax authorities will accept the treatment;
• That the impact of the uncertainty should be measured using either the most likely amount or the expected value
method, depending on which method better predicts the resolution of the uncertainty; and
• That the judgements and estimates made must be reassessed whenever circumstances have changed or there is new
information that affects the judgements.
While there are no new disclosure requirements, entities are reminded of the general requirement to provide information
about judgements and estimates made in preparing the financial statements.
Prepayment features with negative compensation – Amendments to IFRS 9
The narrow-scope amendments made to IFRS 9 Financial Instruments in October 2017 enable entities to measure certain
prepayable financial assets with negative compensation at amortised cost. These assets, which include some loan and debt
securities, would otherwise have to be measured at fair value through profit or loss.
To qualify for amortised cost measurement, the negative compensation must be ‘reasonable compensation for early termination
of the contract’ and the asset must be held within a ‘held to collect’ business model.
Long-term interests in associates and joint ventures – Amendments to IAS 28
The amendments clarify the accounting for long-term interests in an associate or joint venture, which in substance form part
of the net investment in the associate or joint venture, but to which equity accounting is not applied. Entities must account for
such interests under IFRS 9 Financial Instruments before applying the loss allocation and impairment requirements in IAS 28
Investments in Associates and Joint Ventures.
NOTES (continued)

130
EQUITY GROUP HOLDINGS PLC AND SUBSIDIARIES INTEGRATED REPORT AND FINANCIAL STATEMENTS FOR THE YEAR ENDED 31 DECEMBER 2019
NOTES (continued)
2.Significant accounting policies (continued)
(a) Basis of preparation (continued)
Changes in accounting policy and disclosures (continued)
i) New and amended standards adopted by the Group and Company (continued)
Annual improvements to IFRS Standards 2015 – 2017 Cycle
The following improvements were finalised in December
2017:
• IFRS 3 Business Combinations – clarified that
obtaining control of a business that is a joint operation
is a business combination achieved in stages.
• IFRS 11 Joint Arrangements – clarified that the party
obtaining joint control of a business that is a joint
operation should not remeasure its previously held
interest in the joint operation.
• IAS 12 Disclosure of Interests in Other Entities
– clarified that the income tax consequences of
dividends on financial instruments classified as
equity should be recognised according to where
the past transactions or events that generated
distributable profits were recognised.
• IAS 23 Borrowing Costs – clarified that, if a specific
borrowing remains outstanding after the related
qualifying asset is ready for its intended use or sale,
it becomes part of general borrowings.
Plan amendment, curtailment or settlement –
Amendments to IAS 19
The amendments to IAS 19 Employee Benefits clarify
the accounting for defined benefit plan amendments,
curtailments and settlements. They confirm that entities
must:
• Calculate the current service cost and net interest
for the remainder of the reporting period after a plan
amendment, curtailment or settlement by using the
updated assumptions from the date of the change.
• Recognise any reduction in a surplus immediately
in profit or loss, either as part of past service cost
or as a gain or loss on settlement. In other words,
a reduction in a surplus must be recognised in
profit or loss even if that surplus was not previously
recognised because of the impact of the asset ceiling.
• Separately recognise any changes in the asset ceiling
through other comprehensive income.
(ii) New standards and interpretations not yet adopted
Certain new accounting standards and interpretations have
been published that are not mandatory for 31 December
2019 reporting periods and have not been early adopted by
the Group and Company. These standards are not expected
to have a material impact on the Group and Company in
the current or future reporting periods and on foreseeable
future transactions.
(b) Business combinations and goodwill
Business combinations are accounted for using the
acquisition method. The cost of an acquisition is measured
as the aggregate of the consideration transferred including
acquisition cost, measured at acquisition date fair value and
the amount of any non-controlling interest in the acquiree.
For each business combination, the Group elects whether
to measure the non-controlling interest in the acquiree at
fair value or at the proportionate share of the acquiree’s
identifiable net assets. Acquisition related costs are
expensed as incurred and included in operating expenses.
When the Group acquires a business, it assesses the financial
assets and liabilities assumed for appropriate classification
and designation in accordance with the contractual terms,
economic circumstances and pertinent conditions as at the
acquisition date.
Goodwill is initially measured at cost, being the excess of the
aggregate of the consideration transferred and the amount
recognised for non-controlling interests and any previous
interest held over the net identifiable assets acquired and
liabilities assumed. If the fair value of the net assets acquired
is in excess of the aggregate consideration transferred, the
Group re-assesses whether it has correctly identified all of
the assets acquired and all of the liabilities assumed and
reviews the procedures used to measure the amounts to be
recognised at the acquisition date. If the reassessment still
results in an excess of the fair value of net assets acquired
over the aggregate consideration transferred, then the gain
is recognised in profit or loss.
131
EQUITY GROUP HOLDINGS PLC AND SUBSIDIARIES INTEGRATED REPORT AND FINANCIAL STATEMENTS FOR THE YEAR ENDED 31 DECEMBER 2019
2.Significant accounting policies (continued)
(b) Business combinations and goodwill (continued)
After initial recognition, goodwill is measured at cost less
any accumulated impairment losses. For the purpose
of impairment testing, goodwill acquired in a business
combination is, from the acquisition date, allocated to each
of the Group’s cash generating units that are expected to
benefit from the combination, irrespective of whether other
assets or liabilities of the acquiree are assigned to those
units.
In the Company’s financial statements, investments in
subsidiaries are accounted for at cost less accumulated
impairment losses.
(c) Foreign currency translation
Items included in the financial statements of each of the
Group’s entities are measured using the currency of the
primary economic environment in which the entity operates
(the “Functional Currency”). The consolidated financial
statements are presented in Kenya Shillings, which is the
Company’s functional and presentation currency.
(i) Transactions and balances
Transactions in foreign currencies are initially recorded by
the group entities at their respective Functional Currency
prevailing at the date of the transaction. Monetary assets
and liabilities denominated in foreign currencies are
translated into the Functional Currency at the spot rate of
exchange at the reporting date. All differences arising from
non-trading activities are taken to other operating income
in profit or loss. Non-monetary items that are measured in
terms of historical cost in a foreign currency are translated
using the spot exchange rates as at the dates of recognition.
(ii) Group companies
On consolidation, the assets and liabilities in foreign
operations whose functional currencies are not the
currency of a hyperinflationary currency are translated
into Kenya Shillings at the spot rate of exchange prevailing
at the reporting date and their statements of profit or loss
and other comprehensive income are translated at average
rates.
The exchange differences arising on the translation are
recognised in other comprehensive income. On disposal of
a foreign operation, the component of other comprehensive
income relating to that particular foreign operation is
recognised in profit or loss.
(iii) Hyperinflationary economies
The Group considers an economy to be hyperinflationary
if the cumulative inflation rate over three years is
approaching, or exceeds, 100%. The financial statements of
a subsidiary whose functional currency is the currency of a
hyperinflationary economy are restated from historical cost
into the measuring unit current at the end of the reporting
period by applying a general price index.
The corresponding figures for the previous period and
any information in respect of earlier periods is also stated
in terms of the measuring unit current at the end of the
reporting period. The restatement is based on conversion
factors derived from Consumer Price Indices (CPI) (refer to
note 35).
For the purpose of consolidation, the results and financial
position of a subsidiary whose functional currency is the
currency of a hyperinflationary economy are translated into
Kenya Shillings at the spot rate of exchange prevailing at the
reporting date. However, the comparative amounts are those
that were presented in the prior year financial statements.
(d) Recognition of interest income, dividend and interest
expense
Revenue is recognised as control is passed, either over time
or at a point in time. The Group recognises revenue over time
after each performance obligation is fulfilled.
Interest income and expense are recognised in profit or loss
on the Effective Interest Rate (EIR) method. Interest income
and expense presented in the statement of profit or loss
include:
NOTES (continued)

132
EQUITY GROUP HOLDINGS PLC AND SUBSIDIARIES INTEGRATED REPORT AND FINANCIAL STATEMENTS FOR THE YEAR ENDED 31 DECEMBER 2019
2.Significant accounting policies (continued)
(d) Recognition of interest income, dividend and interest
expense (continued)
• Interest on financial assets and liabilities measured
at amortised cost and debt instruments classified
as FVOCI, calculated using the effective interest rate
(EIR). The calculation takes into account all of the
contractual terms of the financial instrument (for
example, prepayment options) and includes any fees
or incremental costs that are directly attributable to
the instrument and are an integral part of the EIR, but
not future credit losses. When the recorded value of a
financial asset or a group of similar financial assets has
been reduced by an impairment loss, interest income
continues to be recognised using the rate of interest
used to discount the future cash flows for the purpose
of measuring the impairment loss.
• Dividend income is recognised when the Company’s
right to receive that payment is established.
(e) Fee and commission income and expense
Fees and commissions charged for services provided or
received by the Group are recognised as the services are
provided or received, for example on completion of an
underlying transaction.
(f) Net foreign exchange income
Net foreign exchange income arises from both the sale
and purchase of investment securities, margins which are
achieved through market-making and customer business
and from changes in fair value caused by movements in
interest and exchange rates and other market variables.
Gains or losses on assets or liabilities are included in profit
or loss under net foreign exchange income.
(g) Leases
(i) Determination
The determination of whether an arrangement is, or contains,
a lease is based on the substance of the arrangement and
requires an assessment of whether the fulfilment of the
arrangement is dependent on the use of a specific asset or
assets and the arrangement conveys a right to use the asset.
(ii) Group as a lessee
The Group leases various offices and are typically made
for fixed periods of 6 months to 10 years but may have
extension options. The Group allocates the consideration in
the contract to the lease and non-lease components based
on their relative stand-alone prices. However, for leases of
real estate for which the group is a lessee, it has elected not
to separate lease and non-lease components and instead
accounts for these as a single lease component. Lease
terms are negotiated on an individual basis and contain a
wide range of different terms and conditions.
The lease agreements do not impose any covenants other
than the security interests in the leased assets that are held
by the lessor. Leased assets may not be used as security
for borrowing purposes. From 1 January 2019, leases are
recognised as a right-of-use asset and a corresponding
liability at the date at which the leased asset is available for
use by the Group.
Assets and liabilities arising from a lease are initially
measured on a present value basis. Lease liabilities include
the net present value of the following lease payments:
• Fixed payments (including in-substance fixed
payments), less any lease incentives receivable.
• Variable lease payment that are based on an index or a
rate, initially measured using the index or rate as at the
commencement date.
• Amounts expected to be payable by the Group under
residual value guarantees.
• The exercise price of a purchase option if the Group is
reasonably certain to exercise that option, and
• Payments of penalties for terminating the lease, if the
lease term reflects the Group exercising that option.
The lease payments are discounted using the interest rate
implicit in the lease. If that rate cannot be readily determined,
which is generally the case for leases in the Group, the
lessee’s incremental borrowing rate is used, being the rate
that the individual lessee would have to pay to borrow the
funds necessary to obtain an asset of similar value to the
right-of-use asset in a similar economic environment with
similar terms, security and conditions.
NOTES (continued)

133
EQUITY GROUP HOLDINGS PLC AND SUBSIDIARIES INTEGRATED REPORT AND FINANCIAL STATEMENTS FOR THE YEAR ENDED 31 DECEMBER 2019
2.Significant accounting policies (continued)
(g) Leases (continued)
(ii) Group as a lessee (continued)
To determine the incremental borrowing rate, the Group:
• Where possible, uses recent third-party financing received by the individual lessee as a starting point, adjusted to reflect changes in financing conditions since third party financing was received;
• Uses a build-up approach that starts with a risk-free interest rate adjusted for credit risk for leases held by Group, which does not have recent third party financing; and
• Makes adjustments specific to the lease.
Lease payments are allocated between principal and
finance cost. The finance cost is charged to profit or loss
over the lease period so as to produce a constant periodic
rate of interest on the remaining balance of the liability for
each period.
Right-of-use assets are measured at cost comprising the
following:
• The amount of the initial measurement of lease liability;
• Any lease payments made at or before the commencement date less any lease incentives received;
• Any initial direct costs; and
• Restoration costs.
Right-of-use assets are generally depreciated over the
shorter of the asset’s useful life and the lease term on
a straight-line basis. If the Group is reasonably certain
to exercise a purchase option, the right-of-use asset
is depreciated over the underlying asset’s useful life.
Payments associated with short-term leases of equipment
and vehicles and all leases of low-value assets are
recognised on a straight-line basis as an expense in profit
or loss. Short-term leases are leases with a lease term of
12 months or less. Low-value assets comprise IT equipment
and small items of office furniture.
Extension and termination options are included in a number
of property and equipment leases across the Group. These
are used to maximise operational flexibility in terms of
managing the assets used in the Group’s operations. The
majority of extension and termination options held are
exercisable only by the Group and not by the respective
lessor.
The Group’s accounting policy for leases under which the
Group was lessee was, up to 31 December 2018, as follows:
Leases which do not transfer to the Group substantially all
the risks and benefits incidental to ownership of the leased
items are operating leases. Operating lease payments are
recognised as an expense in profit or loss on a straight-
line basis over the lease term. Contingent rent payable
is recognised as an expense in the period in which it is
incurred. Prepaid operating leases are accounted for as an
asset using the straight-line method of amortisation over
the period of the lease.
Lease incentives received are recognised as an integral part
of the total lease expense, over the term of the lease. When
an operating lease is terminated before the lease period has
expired, any payment required to be made to the lessor by
way of penalty is recognised as an expense in the period in
which termination takes place.
(h) Income tax
The income tax expense for the period comprises current
and deferred income tax. Tax is recognised in profit or loss,
except to the extent that it relates to items recognised in
other comprehensive income or directly in equity. In this
case, the tax is also recognised in other comprehensive
income or directly in equity respectively.
(i) Current income tax
The current income tax charge is calculated on the basis
of the tax enacted or substantively enacted at the reporting
date. The Directors periodically evaluate positions taken in
tax returns with respect to situations in which applicable
tax regulation is subject to interpretation. It establishes
provisions where appropriate on the basis of amounts
expected to be paid to the tax authorities.
(ii) Deferred income tax
Deferred income tax is recognised, using the liability
method, on temporary differences arising between the tax
bases of assets and liabilities and their carrying amounts
in the financial statements. However, deferred income tax
is not accounted for if it arises from initial recognition of
an asset or liability in a transaction other than a business
combination that at the time of the transaction affects
neither accounting nor taxable profit or loss. Deferred
income tax is determined using tax rates (and laws) that
have been enacted or substantively enacted at the reporting
date and are expected to apply when the related deferred
income tax asset is realised or the deferred income tax
liability is settled.
NOTES (continued)

134
EQUITY GROUP HOLDINGS PLC AND SUBSIDIARIES INTEGRATED REPORT AND FINANCIAL STATEMENTS FOR THE YEAR ENDED 31 DECEMBER 2019
2.Significant accounting policies (continued)
(h) Income tax (continued)
(ii) Deferred income tax (continued)
Deferred income tax assets are recognised only to the extent
that it is probable that future taxable profits will be available
against which the temporary differences can be utilised.
Deferred income tax assets and liabilities are offset when
there is a legally enforceable right to offset current tax
assets against current tax liabilities and when the deferred
income tax assets and liabilities relate to income taxes
levied by the same taxation authority on either the same
taxable entity or different taxable entities where there is an
intention to settle the balances on a net basis.
(i) Financial assets and liabilities
(i) Classification and subsequent measurement
Financial assets
Except for trade receivables that do not have a significant
financing component, at initial recognition, the Group
measures a financial asset or financial liability at its fair
value plus or minus, in the case of a financial asset or
financial liability not at fair value through profit or loss,
transaction costs that are directly attributable to the
acquisition or issuance of the financial asset or financial
liability. Trade receivables that do not have a significant
financing component are measured at their transaction
price.
The Group classifies its financial assets into three
principal classification categories based on the cash
flow characteristics of the asset and the business model
assessment:
• Measured at amortised cost;
• FVOCI; and
• FVTPL.
Amortised cost
A financial asset is measured at amortised cost if it meets
both of the following conditions and is not designated as at
FVTPL:
• It is held within a business model whose objective is
to hold assets to collect contractual cash flows; and
• Its contractual terms give rise on specified dates to
cash flows that are solely payments of principal and
interest (SPPI) on the principal amount outstanding.
The Group recognises cash, deposits and balances due
from financial institutions including items in the course of
collection, amounts due from related parties, loans and
advances to customers, certain investment securities, and
other assets at amortised cost.
Fair Value through Other Comprehensive Income (FVOCI) – Debt
A financial asset which is a debt instrument is measured at
FVOCI only if it meets both of the following conditions and is
not designated as at FVTPL:
• It is held within a business model whose objective is
achieved by both collecting contractual cash flows
and selling financial assets; and
• Its contractual terms give rise on specified dates to
cash flows that are solely payments of principal and
interest on the principal amount outstanding.
The Group classifies certain investments it has in
government securities at FVOCI.
Fair Value through Other Comprehensive Income (FVOCI) – Equity
On initial recognition of an equity investment that is not
held for trading, the Group may irrevocably elect to present
subsequent changes in fair value in OCI. This election is
made on an investment-by investment basis. The Group
currently has no equity investments held at FVOCI.
Fair Value through Profit or Loss (FVTPL)
All financial assets not classified as measured at amortised
cost or FVOCI as described above are measured at FVTPL.
In addition, on initial recognition the Group may irrevocably
designate a financial asset that otherwise meets the
requirements to be measured at amortised cost or at FVOCI
as at FVTPL if doing so eliminates or significantly reduces an
accounting mismatch that would otherwise arise.
NOTES (continued)

135
EQUITY GROUP HOLDINGS PLC AND SUBSIDIARIES INTEGRATED REPORT AND FINANCIAL STATEMENTS FOR THE YEAR ENDED 31 DECEMBER 2019
2.Significant accounting policies (continued)
(i) Financial assets and liabilities (continued)
(i) Classification and subsequent measurement (continued)
Financial assets (continued)
Fair Value through Profit or Loss (FVTPL) (continued)
The Group classifies derivative financial assets and loan
notes at FVTPL.
A financial asset is classified into one of these categories
on initial recognition. Under IFRS 9, derivatives embedded
in contracts where the host is a financial asset in the scope
of IFRS 9 are not separated. Instead, the hybrid financial
instrument as a whole is assessed for classification.
Assessment whether contractual cash flows are Solely Payments of Principal and Interest (SPPI)
To determine whether a financial asset should be classified
as measured at amortised cost or FVOCI, an entity assesses
whether the cash flows from the financial asset represent,
on specified dates, solely payments of principal and interest
on the principal amount outstanding - i.e. the SPPI criterion.
A financial asset that does not meet the SPPI criterion is
always measured at FVTPL, unless it is an equity instrument
for which an entity may apply the OCI election.
For the purposes of this assessment, ‘principal’ is defined as
the fair value of the financial asset on initial recognition. The
definition of principal reflects the economics of the financial
asset from the perspective of the current holder. This means
that an entity assesses the asset’s contractual cash flow
characteristics by comparing the contractual cash flows to
the amount that it actually invested.
‘Interest’ is defined as consideration for the time value
of money, for the credit risk associated with the principal
amount outstanding during a particular period of time and
for other basic lending risks and costs (e.g. liquidity risk and
administrative costs), as well as a profit margin.
In assessing whether the contractual cash flows are solely
payments of principal and interest, the Group considered
the contractual terms of its financial assets.
The Group, through the Credit, Finance and Treasury
departments will from time to time review the contractual
terms of existing instruments and also review contractual
terms of new products the Group develops or invests in going
forward. This includes assessing whether the financial asset
contained a contractual term that could change the timing
or amount of contractual cash flows such that it would not
meet this condition.
In making the assessment, the Group shall consider:
• Contingent events that would change the amount and
timing of cash flows;
• Leverage features;
• Prepayment and extension terms;
• Terms that limit the Group’s claim to cash flows
from specified assets – e.g. non-recourse asset
arrangements; and
• Features that modify consideration for the time value
of money – e.g. periodic reset of interest rates.
Contractual features that introduce exposure to risks or
volatility in the contractual cash flows that is unrelated to a
basic lending arrangement, such as exposure to changes in
equity prices or commodity prices, give rise to contractual
cash flows that do not meet the SPPI criterion.
The prevailing rates are generally based on a regulator’s
rate and include a discretionary spread (Margin). In these
cases, the Group will assess whether the discretionary
feature is consistent with the SPPI criterion by considering a
number of factors, including whether:
• The borrowers are able to prepay the loans without
significant penalties;
• The market competition ensures that interest rates
are consistent between banks; and
• Any regulatory or customer protection framework is
in place that requires banks to treat customers fairly.
Interest rate on loans made by other banking subsidiaries
within the Group are based on the prevailing market rates
depending on the specific country of operation.
NOTES (continued)
136
EQUITY GROUP HOLDINGS PLC AND SUBSIDIARIES INTEGRATED REPORT AND FINANCIAL STATEMENTS FOR THE YEAR ENDED 31 DECEMBER 2019
2.Significant accounting policies (continued)
(i) Financial assets and liabilities (continued)
(i) Classification and subsequent measurement (continued)
Financial assets (continued)
Assessment whether contractual cash flows are Solely Payments of Principal and Interest (SPPI) (continued)
Some of the Group’s loans may contain prepayment features.
A prepayment feature is consistent with the SPPI criterion
if the prepayment amount substantially represents unpaid
amounts of principal and interest on the principal amount
outstanding, which may include reasonable compensation
for early termination of the contract.
In addition, a prepayment feature is treated as consistent
with this criterion if a financial asset is acquired or
originated at a premium or discount to its contractual par
amount, the prepayment amount substantially represents
the contractual par amount plus accrued (but unpaid)
contractual interest (which may also include reasonable
compensation for early termination), and the fair value of
the prepayment feature is insignificant on initial recognition.
De minimis
A contractual cash flow characteristic may not affect the
classification of a financial asset if it could have only a de
minimis effect on the financial asset’s contractual cash
flows. To make this determination, the Group considers the
possible effect of the contractual cash flow characteristic in
each reporting period and cumulatively over the life of the
financial asset.
Business model assessment
The Group makes an assessment of the objective of the
business model in which a financial asset is held at a portfolio
level because this best reflects the way the business is
managed and information is provided to management. The
information considered includes:
• The stated policies and objectives for the portfolio
and the operation of those policies in practice,
including whether management’s strategy focuses on
earning contractual interest revenue, maintaining a
particular interest rate profile, matching the duration
of the financial assets to the duration of the liabilities
that are funding those assets or realising cash flows
through the sale of assets;
• How the performance of the portfolio is evaluated
and reported to the Group’s management;
• The risks that affect the performance of the business
model (and the financial assets held within that
business model) and how those risks are managed;
• How managers of the business are compensated –
e.g. whether compensation is based on the fair value
of the assets managed or the contractual cash flows
collected; and
• The frequency, volume and timing of sales in prior
periods, the reasons for such sales and expectations
about future sales activity. However, information
about sales activity is not considered in isolation, but
as part of an overall assessment of how the Group’s
stated objective for managing the financial assets is
achieved and how cash flows are realised
Financial assets that are held for trading and those that are
managed and whose performance is evaluated on a fair
value basis will be measured at FVTPL because they are
neither held to collect contractual cash flows nor held both
to collect contractual cash flows and to sell financial assets.
The table below summarises the key features of each type of
business model and the resultant measurement category:
NOTES (continued)

137
EQUITY GROUP HOLDINGS PLC AND SUBSIDIARIES INTEGRATED REPORT AND FINANCIAL STATEMENTS FOR THE YEAR ENDED 31 DECEMBER 2019
2.Significant accounting policies (continued)(i) Financial assets and liabilities (continued)
(i) Classification and subsequent measurement (continued)
Financial assets (continued)
Business model assessment (continued)
BUSINESS MODEL KEY FEATURES CATEGORY
Held to collect The objective of the business model is to hold assets to collect
contractual cash flows.
• Sales are incidental to the objective of the model.
• This model typically involves the lowest level of sales in
comparison with other business models (in frequency and
volume).
Amortised
cost (1)
Both held to collect and for sale Both collecting contractual cash flows and sales are integral to
achieving the objective of the business model.
This model typically has more sales (in frequency and volume)
than the held-to-collect business model.
FVOCI (1)
Other business models, including:
• Trading,
• Managing assets on a fair value basis and
• Maximising cash flows through sale
• The business model is neither held-to-collect nor held to
collect and for sale.
• The collection of contractual cash flows is incidental to the
objective of the model.
FVTPL (2)
Notes
1. Subject to meeting the SPPI criterion.
2. The SPPI criterion is irrelevant - i.e. assets in all business models are measured at FVTPL.
Financial liabilities
The Group classifies all financial liabilities as subsequently measured at amortised cost, except for financial liabilities at fair
value through profit or loss. Such liabilities, including derivatives that are liabilities, shall be subsequently measured at fair
value. Deposits from customers, borrowed funds and other liabilities are also classified at amortised cost.
Reclassification
The Group only reclassifies financial assets when management changes the business model for managing the financial
assets. In that instance all affected financial assets are reclassified. Such changes are expected to be very infrequent, and are
determined by the Group’s senior management as a result of external or internal changes.
Derecognition and contract modification
The Group derecognises a financial asset when the contractual rights to the cash flows from the financial asset expire, or
when it transfers the rights to receive the contractual cash flows on the financial asset in a transaction in which substantially
all the risks and rewards of ownership of the financial asset are transferred. Any interest in transferred financial assets that
is created or retained by the Group is recognised as a separate asset or liability. However, when the modification of a financial
instrument not measured at FVTPL does not result in derecognition, the Group has recalculated the gross carrying amount
of the financial asset (or the amortised cost of the financial liability) by discounting the modified contractual cash flows at the
original effective interest rate and recognise any resulting adjustment as a modification gain or loss in profit or loss.
NOTES (continued)

138
EQUITY GROUP HOLDINGS PLC AND SUBSIDIARIES INTEGRATED REPORT AND FINANCIAL STATEMENTS FOR THE YEAR ENDED 31 DECEMBER 2019
2.Significant accounting policies (continued)
(i) Financial assets and liabilities (continued)
(i) Classification and subsequent measurement (continued)
Derecognition and contract modification (continued)
The Group derecognises a financial liability when its
contractual obligations are discharged or cancelled or
expire. The Group enters into transactions whereby it
transfers assets recognised on its statement of financial
position, but retains either all or substantially all of the
risks and rewards of the transferred assets or a portion
of them. If all or substantially all risks and rewards are
retained, then the transferred assets are not derecognised
from the statement of financial position. Transfers of assets
with retention of all or substantially all risks and rewards
include, for example, securities lending and repurchase
transactions.
Write-off
The Group writes off financial assets, in whole or part,
when it has exhausted all practical recovery efforts and has
concluded there is no reasonable expectation of recovery.
Indicators that there is no reasonable expectation of
recovery include:
• Ceasing enforcement activity
• Where the Group’s recovery method is foreclosing on
collateral and the value of the collateral is such that
there is no reasonable expectation of recovering in
full.
Offsetting
Financial assets and liabilities are offset and the net amount
presented in the statement of financial position when, and
only when, the Group has a legal right to set off the amounts
and it intends either to settle them on a net basis or to realise
the asset and settle the liability simultaneously. Income and
expenses are presented on a net basis only when permitted
under IFRS, or for gains and losses arising from a group of
similar transactions such as in the Group’s trading activity.
Interest income recognition
According to IFRS 9 paragraph 5.4.1 interest revenue shall
be calculated by using the effective interest method. This
shall be calculated by applying the effective interest rate to
the gross carrying amount of a financial asset except for:
• Purchased or originated credit-impaired financial
assets. For those financial assets, the entity shall
apply the credit-adjusted effective interest rate to
the amortised cost of the financial asset from initial
recognition.
• Financial assets that are not purchased or originated
credit-impaired financial assets but subsequently
have become credit-impaired financial assets. For
those financial assets, the entity shall apply the
effective interest rate to the amortised cost of the
financial asset in subsequent reporting periods.
According to IFRS 9 paragraph 5.4.2 an entity that, in a
reporting period, calculates interest revenue by applying
the effective interest method to the amortised cost of a
financial asset in accordance with paragraph 5.4.1(b) (see
(b) above), shall, in subsequent reporting periods, calculate
the interest revenue by applying the effective interest rate to
the gross carrying amount if the credit risk on the financial
instrument improves so that the financial asset is no longer
credit-impaired and the improvement can be related
objectively to an event occurring after the requirements in
paragraph 5.4.1(b) were applied (such as an improvement in
the borrower’s credit rating). In the context of the Central
Bank regulations, credit impaired accounts would refer
to the substandard, doubtful and loss risk classifications,
and interest on these accounts is calculated on the gross
carrying amount and not recognised in profit or loss but
rather suspended in the statement of financial position.
Assets that are credit-impaired on initial recognition
According to IFRS 9 (7A.8.340) Purchased or Originated
Credit Impaired (POCI) assets are assets that are credit-
impaired on initial recognition. An asset is credit-impaired
if one or more events have occurred that have a detrimental
impact on the estimated future cash flows of the asset. The
following are examples of such events:
• Significant financial difficulty of the issuer or the
borrower;
• A breach of contract - e.g. a default or past-due event;
NOTES (continued)

139
EQUITY GROUP HOLDINGS PLC AND SUBSIDIARIES INTEGRATED REPORT AND FINANCIAL STATEMENTS FOR THE YEAR ENDED 31 DECEMBER 2019
2.Significant accounting policies (continued)
(i) Financial assets and liabilities (continued)
(i) Classification and subsequent measurement (continued)
Assets that are credit-impaired on initial recognition
(continued)
• A lender having granted a concession to the borrower
- for economic or contractual reasons relating to the
borrower’s financial difficulty - that the lender would
not otherwise consider;
• It becoming probable that the borrower will enter
bankruptcy or other financial reorganisation;
• The disappearance of an active market for that
financial asset because of financial difficulties; or
• The purchase of a financial asset at a deep discount
that reflects the incurred credit losses.
It may not be possible to identify a single discrete event
that caused the asset to be credit-impaired. Instead, the
combined effect of several events may cause financial
assets to become credit-impaired.
Measurement on initial recognition
On initial recognition, POCI assets do not carry an impairment
allowance. Instead, lifetime ECLs are incorporated into the
calculation of the effective interest rate.
Subsequent measurement
The ECLs for POCI assets are always measured at an amount
equal to lifetime ECLs. However, the amount recognised as
a loss allowance for these assets is not the total amount
of lifetime ECLs, but instead the changes in lifetime ECLs
since initial recognition of the asset. Favourable changes in
lifetime ECLs are recognised as an impairment gain, even
if the favourable changes are more than the amount, if any,
previously recognised in profit or loss as impairment losses.
Modifications
When the contractual cash flows of a POCI asset are modified
and the modification does not result in derecognition, the
calculation of the modification gain or loss is the difference
between:
• the gross carrying amount of the asset before the
modification; and
• the recalculated gross carrying amount
The recalculated gross carrying amount is the present value
of the estimated future cash payments or receipts through
the expected life of the modified financial asset discounted
using the credit-adjusted effective interest rate before the
modification
(ii) Impairment – financial assets, loan commitments and financial guarantee contracts
The impairment model applies to the following financial
instruments that are not measured at FVTPL:
• Financial assets that are debt instruments – this
applies to the Group’s loans and advances to
customers, Investment in Government securities
measured at amortised cost and FVOCI, balances due
to group companies and other assets;
• Lease and trade receivables – this applies to the
Group’s finance lease and trade receivables; and
• Loan commitments and financial guarantee contracts
issued (previously, impairment was measured
under IAS 37 Provisions, Contingent Liabilities and
Contingent Assets) - this applies to the Group’s off
balance sheet exposures where credit intervention is
not required for the counterparty to access the credit
facility.
No impairment loss is recognised on equity investments and
financial assets measured at FVPL.
The Group recognises loss allowance at an amount equal to
either 12-month ECLs or lifetime ECLs. Lifetime ECLs are
the ECLs that result from all possible default events over the
expected life of a financial instrument, whereas 12-month
ECLs are the portion of ECLs that result from default events
that are possible within the 12 months after the reporting
date.
The Group has recognised loss allowances at an amount
equal to lifetime ECLs, except in the following cases, for
which the amount recognised will be 12-month ECLs:
NOTES (continued)

140
EQUITY GROUP HOLDINGS PLC AND SUBSIDIARIES INTEGRATED REPORT AND FINANCIAL STATEMENTS FOR THE YEAR ENDED 31 DECEMBER 2019
2.Significant accounting policies (continued)
(i) Financial assets and liabilities (continued)
(ii) Impairment – financial assets, loan commitments and financial guarantee contracts (continued)
• Debt investment securities that are determined to
have low credit risk at the reporting date. The Group
has considered a debt security to have low credit risk
when its credit risk rating is equivalent to the globally
understood definition of ‘investment-grade’ and
investments in Government securities; and
• Other financial instruments (other than trade and
lease receivables) for which credit risk has not
increased significantly since initial recognition.
Loss allowances for trade and lease receivables will
always be measured at an amount equal to lifetime ECLs.
The impairment requirements of IFRS 9 are complex
and require management judgement, estimates and
assumptions, particularly in the following areas, which are
discussed in detail below:
• Assessing whether the credit risk of an instrument
has increased significantly since initial recognition;
and
• Incorporating forward-looking information into the
measurement of ECLs.
Measurement of expected credit losses
ECLs are a probability-weighted estimate of credit losses
and have been measured as follows:
• Financial assets that are not credit-impaired at the
reporting date: the present value of all cash shortfalls
– i.e. the difference between the cash flows due to the
entity in accordance with the contract and the cash
flows that the Group expects to receive;
• Financial assets that are credit-impaired at the
reporting date: the difference between the gross
carrying amount and the present value of estimated
future cash flows;
• Undrawn loan commitments: the present value of
the difference between the contractual cash flows
that are due to the Group if the commitment is drawn
down and the cash flows that the Group expects to
receive; and
• Financial guarantee contracts: the present value of
the expected payments to reimburse the holder less
any amounts that the Group expects to recover.
An asset is credit-impaired if one or more events have
occurred that have a detrimental impact on the estimated
future cash flows of the asset. The following are examples
of such events:
• Significant financial difficulty of the issuer or the
borrower;
• A breach of contract - e.g. a default or past-due event;
• A lender having granted a concession to the borrower
- for economic or contractual reasons relating to the
borrower’s financial difficulty - that the lender would
not otherwise consider;
• It becoming probable that the borrower will enter
bankruptcy or other financial reorganisation;
• The disappearance of an active market for that
financial asset because of financial difficulties; or
• The purchase of a financial asset at a deep discount
that reflects the incurred credit losses.
For purposes of IFRS 9 there will generally be no difference
between credit impaired and non-performing financial
loans as defined by the regulator.
Expected credit losses
Expected credit losses are computed as a product of the
Probability of Default (PD), Loss Given Default (LGD) and
the Exposure at Default (EAD).
ECL = PD x LGD x EAD
NOTES (continued)

141
EQUITY GROUP HOLDINGS PLC AND SUBSIDIARIES INTEGRATED REPORT AND FINANCIAL STATEMENTS FOR THE YEAR ENDED 31 DECEMBER 2019
2.Significant accounting policies (continued)(i) Financial assets and liabilities (continued)
(ii) Impairment – financial assets, loan commitments and financial guarantee contracts (continued)
Expected credit losses (continued)
In applying the IFRS 9 impairment requirements, an entity needs to follow one of the approaches below:
• The general approach
• The simplified approach
The simplified approach is applied for trade receivables or contract assets resulting from transactions in the scope of IFRS 15
Revenue from customer contracts or lease receivables resulting from transactions in the scope of IAS 17 Leases. The Group
has therefore applied the general approach.
The General Approach
Under the general approach, at each reporting date, an entity recognises a loss allowance based on either 12-month ECLs or
lifetime ECLs, depending on whether there has been a significant increase in credit risk on the financial instrument since initial
recognition.
The changes in the loss allowance balance are recognised in profit or loss as an impairment gain or loss. Essentially, an entity
must make the following assessment at each reporting date:
Stage 1 - For credit exposures where there have not been significant increases in credit risk since initial recognition, an entity is
required to provide for 12-month ECLs, i.e., the portion of lifetime ECLs that represent the ECLs that result from default events
that are possible within the 12-months after the reporting date (12-month ECL as per formula below).
ECL12m = PD12m x LGD12m x EAD12m x D12m
Stage 2 - For credit exposures where there have been significant increases in credit risk since initial recognition on an individual
or collective basis, a loss allowance is required for lifetime (LT) ECLs, i.e., ECLs that result from all possible default events over
the expected life of a financial instrument (ECL LT as per formula below).
ECL LT = LT∑T=1 PDt x LGDt x EADt x Dt
Stage 3 – For credit exposures that are credit impaired and in default. Similar to stage 2 assets a loss allowance is required for
lifetime ECLs. However the probability of default for these assets is presumed to be 100% less any determined recovery and
cure rate.
The table below shows the link between the regulator risk classifications and the IFRS 9 stage allocation for assets for Equity
Bank Kenya Limited.
CBK PG/04 Guidelines Days past due Stage allocation
Normal 0-30 1
Watch 31-90 2
Substandard 91-180 3
Doubtful 181 - 365 3
Loss Over 365 or considered uncollectible 3
NOTES (continued)

142
EQUITY GROUP HOLDINGS PLC AND SUBSIDIARIES INTEGRATED REPORT AND FINANCIAL STATEMENTS FOR THE YEAR ENDED 31 DECEMBER 2019
2.Significant accounting policies (continued)(i) Financial assets and liabilities (continued)
(ii) Impairment – financial assets, loan commitments and financial guarantee contracts (continued)
Definition of default
The Group will consider a financial asset to be in default
when:
• The borrower is unlikely to pay their credit obligations
to the Group in full, without recourse by the Group to
actions such as realising security (if any is held); or
• The borrower is more than 90 days past due on any
material credit obligation to the Group. This will be
consistent with the rebuttable criteria set out by IFRS
9 and existing practice of the Group; or
• If it meets the definition of the local regulator of
default, if in the future the local regulator prescribe
the criteria of default for IFRS 9 purposes.
This definition is largely consistent with the regulator
definition that will be used for regulatory purposes. In
assessing whether a borrower is in default, the Group will
consider indicators that are:
• Significant financial difficulty of the issuer or the
borrower;
• A breach of contract - e.g. a default or past-due event;
• A lender having granted a concession to the borrower
- for economic or contractual reasons relating to the
borrower’s financial difficulty - that the lender would
not otherwise consider;
• It becoming probable that the borrower will enter
bankruptcy or other financial reorganisation;
• The disappearance of an active market for that
financial asset because of financial difficulties; or
• The purchase of a financial asset at a deep discount
that reflects the incurred credit losses.
Inputs into the assessment of whether a financial instrument
is in default and their significance may vary over time
to reflect changes in circumstances. The Group has not
rebutted the 90 Days Past Due (DPD) rule for identifying
defaults.
Significant increase in credit risk (SICR)
The Group in determining whether the credit risk (i.e.
risk of default) on a financial instrument has increased
significantly since initial recognition considered reasonable
and supportable information that is relevant and available
without undue cost or effort, including both quantitative and
qualitative information and analysis based on the Group’s
historical experience, expert credit assessment and
forward-looking information.
The Group identifies a significant increase in credit risk
where
• Exposures have a regulatory risk rating of ‘WATCH’;
• An exposure is greater than 30 days past due – this is in
line with the IFRS 9 30 DPD rebuttable presumption;
• An exposure has been restructured in the past due to
credit risk related factors or which was NPL and is now
regular (subject to the regulatory cooling off period);or
• By comparing an exposures:
- credit risk quality at the date of reporting; with
- the credit risk quality on initial recognition of the
exposure.
The assessment of significant deterioration is key in
establishing the point of switching between the requirement
to measure an allowance based on 12-month expected
credit losses and one that is based on lifetime expected
credit losses.
NOTES (continued)

143
EQUITY GROUP HOLDINGS PLC AND SUBSIDIARIES INTEGRATED REPORT AND FINANCIAL STATEMENTS FOR THE YEAR ENDED 31 DECEMBER 2019
2.Significant accounting policies (continued)
(i) Financial assets and liabilities (continued)
(ii) Impairment – financial assets, loan commitments and financial guarantee contracts (continued)
Credit risk classification
The Group allocates each exposure to a credit risk
classification based on the regulatory requirements of the
regulator which requires the prediction of the risk of default
and applying experienced credit judgement. The Group
shall use these classifications in identifying significant
increases in credit risk under IFRS 9. The risk classifications
are defined using the regulator’s guidance, days past due,
management assessment, qualitative and quantitative
factors that are indicative of the risk of default.
These factors may vary depending on the nature of the
exposure and the type of borrower. The Group shall undertake
a thorough credit appraisal process and determine the
credit quality of each exposure on initial recognition based
on available information about the borrower. Exposures will
be subject to ongoing monitoring, which may result in an
exposure being moved to a different credit risk classification.
Determining whether credit risk has increased significantly
The Group has established a framework that incorporates
both quantitative and qualitative information to determine
whether the credit risk on a particular financial instrument
has increased significantly since initial recognition. The
framework has been aligned with the Group’s internal credit
risk management process. The criteria for determining
whether credit risk has increased significantly varies by
portfolio and will include a backstop based on delinquency
(30 DPD presumption).
Quantitative factors
The Group deems the credit risk of a particular exposure to
have increased significantly since initial recognition based
on a loan being in arrears for a period of 31 to 90 days in
accordance with IFRS 9 paragraph 5.5.11. The Group has
developed an internal rating model going forward and
movement in rating grades between the reporting period
and initial recognition date/ the date of initial application of
IFRS 9 of the loan will form the basis of significant increase
in credit risk.
Qualitative factors
In certain instances, using its expert credit judgement
and, where possible, relevant historical experience, the
Group may determine that an exposure has undergone a
significant increase in credit risk if particular qualitative
factors indicate so and those indicators may not be fully
captured by its quantitative analysis on a timely basis. The
management view and judgement has included the following
assessments:
• Classification of exposures by any other Banks and
Financial institutions or local Credit Reference
Bureau (CRB);
• Unavailable/inadequate financial information/
financial statements;
• Qualified report by external auditors;
• Significant contingent liabilities;
• Loss of key staff in the organization;
• Increase in operational risk and higher occurrence of
fraudulent activities;
• Continued delay and non-cooperation by the borrower
in providing key relevant documentation;
• Deterioration in credit worthiness due to factors
other than those listed above.
As a backstop, and as required by IFRS 9, the Group will
presumptively consider that a significant increase in credit
risk occurs no later than when an asset is more than 30
days past due. The Group will determine days past due by
counting the number of days since the earliest elapsed due
date in respect of which full payment has not been received.
NOTES (continued)

144
EQUITY GROUP HOLDINGS PLC AND SUBSIDIARIES INTEGRATED REPORT AND FINANCIAL STATEMENTS FOR THE YEAR ENDED 31 DECEMBER 2019
2.Significant accounting policies (continued)
(i) Financial assets and liabilities (continued)
(ii) Impairment – financial assets, loan commitments and financial guarantee contracts (continued)
SICR at transition to IFRS 9
Under IFRS 9, assessment of SICR requires comparison of
default risk at the reporting date with the risk at origination
or initial recognition of the asset. However the standard also
states that if the Group cannot measure default risk at initial
recognition for SICR purposes without undue cost or effort,
then it should recognize lifetime ECL on that instrument.
The Group at transition has used past due information to
determine whether there have been significant increases in
credit risk since initial recognition.
Backward transitions
Backward transitions define the criteria for moving a
financial asset back from Stage 2 to Stage 1 or Stage 3 to
Stage 2. The Group applies the considerations of the central
bank prudential guidelines to determine whether a financial
asset should be upgraded from Stage 3 to Stage 2 and then
Stage 1. Where an account in Stage 3 is regularised (i.e. all
past due principal and interest is repaid in full) it may be
upgraded to Stage 2 subject to observation of the cooling off
period as defined by prudential guidelines. A facility which
meets the above condition and has been classified as Stage
2 may be reclassified to Stage 1 if a sustained record of
performance is maintained for a period of six (6) months.
Modified financial assets
The contractual terms of a loan may be modified for a
number of reasons, including changing market conditions,
customer retention and other factors not related to a
current or potential credit deterioration of the customer.
An existing loan whose terms have been modified may be
derecognised and the renegotiated loan recognised as a new
loan at fair value. Under IFRS 9, when the terms of a financial
asset are modified and the modification does not result in
derecognition, the determination of whether the asset’s
credit risk has increased significantly reflects comparison
of the borrower’s initial credit risk assessment and the
current assessment at the point of modification.
Restructuring
The Group renegotiates loans to customers in financial
difficulties (referred to as ‘restructuring’) to maximise
collection opportunities and minimise the risk of default.
Under the Group’s restructuring policy, loan restructuring
is granted on a selective basis if the debtor is currently in
default on its debt or if there is a high risk of default, there
is evidence that the debtor made all reasonable efforts to
pay under the original contractual terms and the debtor is
expected to be able to meet the revised terms. The revised
terms usually include extending the maturity, changing the
timing of interest payments and amending the terms of loan
covenants. The Group’s Credit Committee regularly reviews
reports on restructuring activities.
Generally, restructuring is a qualitative indicator of default
and credit impairment and expectations of restructuring are
relevant to assessing whether there is a significant increase
in credit risk. Following restructuring, a customer needs to
demonstrate consistently good payment behaviour over a
period of time before the exposure is no longer considered
to be in default/credit-impaired or the PD is considered
to have decreased such that the loss allowance reverts to
being measured at an amount equal to 12-month ECLs.
The Group applies the requirements of the Central Bank
prudential guidelines where an account in Doubtful or Sub-
standard category (Stage 3) will be upgraded to Watch if
principal and interest payments are fully regularised at the
point of restructure, the account is re-classified to Watch
(Stage 2) and observed for six (6) months. Where the account
continues to perform appropriately for an additional six (6)
months the account is upgraded to normal and the Group
reverts to measuring 12-month ECLs. Where the account
is restructured with the customer having not regularized
overdue principal and interest, the account shall remain in
Substandard for six (6) months or if in Doubtful category,
twelve (12) months for observation. If the restructured
account performs as per the new contract during the
observation period, the account can be then upgraded to
Watch (stage 2) and observed for another six (6) months
where it can be further upgraded to Normal (stage 1) if good
performance is sustained.
NOTES (continued)

145
EQUITY GROUP HOLDINGS PLC AND SUBSIDIARIES INTEGRATED REPORT AND FINANCIAL STATEMENTS FOR THE YEAR ENDED 31 DECEMBER 2019
2.Significant accounting policies (continued)
(i) Financial assets and liabilities (continued)
(ii) Impairment – financial assets, loan commitments and financial guarantee contracts (continued)
Restructuring (continued)
The date of renegotiation is consequently considered to be
the date of initial recognition for impairment calculation
purposes, including for determining whether a significant
increase in credit risk has occurred. However, the Group
also assesses whether the new financial asset recognised is
deemed to be credit-impaired at initial recognition, especially
in circumstances where the renegotiation was driven by the
debtor being unable to make the originally agreed payments.
Differences in the carrying amount are also recognised in
profit or loss as a gain or loss on derecognition.
If the terms are not substantially different, the renegotiation
or modification does not result in derecognition, and the
Group recalculates the gross carrying amount based on
the revised cash flows of the financial asset and recognises
a modification gain or loss in profit or loss. The new gross
carrying amount is recalculated by discounting the modified
cash flows at the original EIR.
ECL model
Segmentation
In order to determine the ECL by modelling the PD, LGD and
EAD for different loan accounts, the Group has segmented
the loan book into five segments namely Corporate, SME,
Mortgage, Unsecured and Eazzy (short term mobile loans).
The PDs are determined at segment level, LGD at customer
or segment level (based on collateral and collections
respectively) and EAD at account level. Where a borrower
has been in several segments historically the Group uses
the borrower’s current segmentation. In addition to the
on-balance sheet facilities, the Group considered treasury
products (investment securities and placements with other
banking institutions) and the off balance sheet facilities
offered by the Group such as guarantees, letters of credit,
overdrafts and credit cards where an exposure is present.
The EAD for these facilities is based on whether there is a
commitment by the Group to fund a customer and the rate
of conversion of such facilities (Credit Conversion Factor –
CCF).
Risk parameters in measurement of ECLs
The key inputs into the measurement of ECLs are likely to
be the term structures of the following variables:
• PD;
• Loss Given Default (LGD); and
• Exposure at Default (EAD).
These parameters has been derived from internally
developed statistical models and other historical data that
leverage regulatory models. They have been adjusted to
reflect forward-looking information as described below.
Probability of default
Probability of Default (“PD”) refers to the likelihood of a
default occurring and is a measure of the risk of default.
In order to calculate IFRS 9 PD, there is a need to develop
a PD term structure for calculating ECL (forward looking
and lifetime PDs). PD estimates for loans and advances
are estimates at a certain date, which has been calculated
based on statistical migration matrices that model the
chance of an exposure transitioning to default over time and
has been assessed at portfolio level for portfolios of assets
that have similar characteristics. PDs have been estimated
based on the theory of Markov Chain process. The method
requires information regarding transitions among credit
states. Credit states are defined by rating classes. The
Group reviews and updates the portfolio PDs on an annual
basis.
The Group has drawn yearly transition matrix of ratings to
compute a value or transaction based PD over the one year
horizon for the past 3-5 years. The Group has built data to
5 years and update every year thereafter for new data. The
PDs are approved by the relevant Board committees for
them to take effect. Transition probabilities are determined
from the actually observed number of transitions over the
observed period of time. These PDs have been classified as
per stage 1 and 2 which is driven by the central bank risk
classifications, management view and DPD. This rating
migration captures the movement of obligors into default at
yearly intervals.
NOTES (continued)
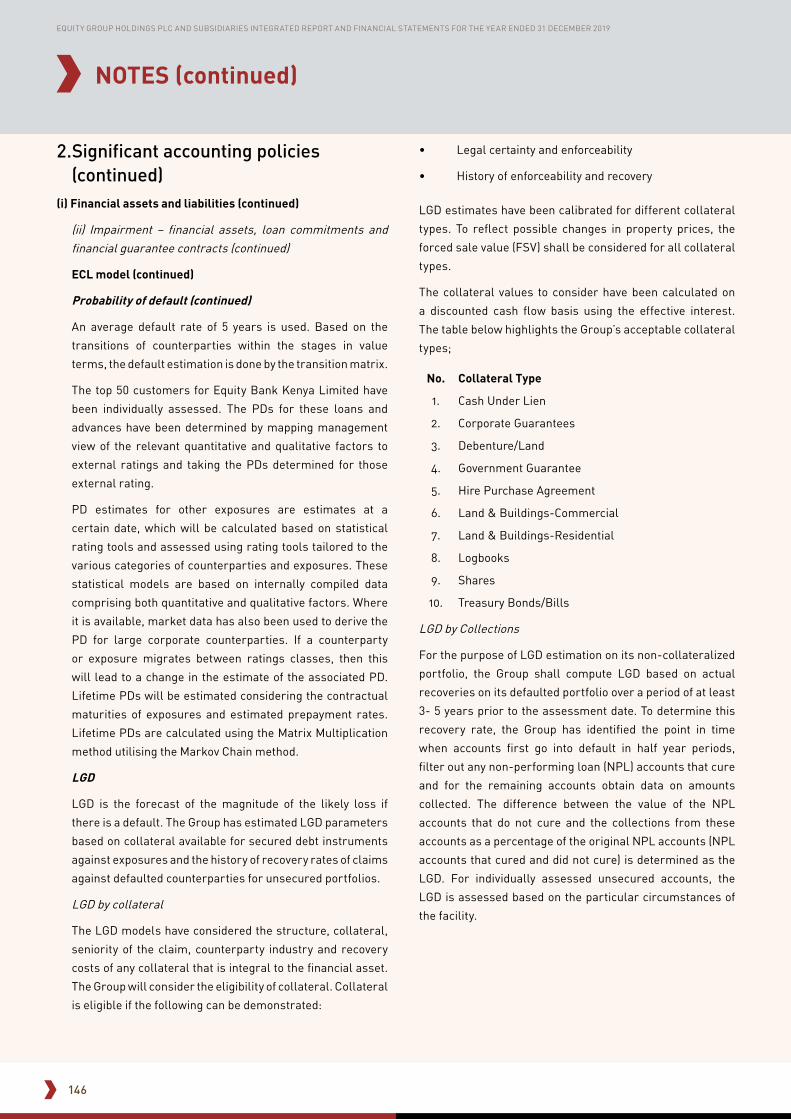
146
EQUITY GROUP HOLDINGS PLC AND SUBSIDIARIES INTEGRATED REPORT AND FINANCIAL STATEMENTS FOR THE YEAR ENDED 31 DECEMBER 2019
2.Significant accounting policies (continued)
(i) Financial assets and liabilities (continued)
(ii) Impairment – financial assets, loan commitments and financial guarantee contracts (continued)
ECL model (continued)
Probability of default (continued)
An average default rate of 5 years is used. Based on the
transitions of counterparties within the stages in value
terms, the default estimation is done by the transition matrix.
The top 50 customers for Equity Bank Kenya Limited have
been individually assessed. The PDs for these loans and
advances have been determined by mapping management
view of the relevant quantitative and qualitative factors to
external ratings and taking the PDs determined for those
external rating.
PD estimates for other exposures are estimates at a
certain date, which will be calculated based on statistical
rating tools and assessed using rating tools tailored to the
various categories of counterparties and exposures. These
statistical models are based on internally compiled data
comprising both quantitative and qualitative factors. Where
it is available, market data has also been used to derive the
PD for large corporate counterparties. If a counterparty
or exposure migrates between ratings classes, then this
will lead to a change in the estimate of the associated PD.
Lifetime PDs will be estimated considering the contractual
maturities of exposures and estimated prepayment rates.
Lifetime PDs are calculated using the Matrix Multiplication
method utilising the Markov Chain method.
LGD
LGD is the forecast of the magnitude of the likely loss if
there is a default. The Group has estimated LGD parameters
based on collateral available for secured debt instruments
against exposures and the history of recovery rates of claims
against defaulted counterparties for unsecured portfolios.
LGD by collateral
The LGD models have considered the structure, collateral,
seniority of the claim, counterparty industry and recovery
costs of any collateral that is integral to the financial asset.
The Group will consider the eligibility of collateral. Collateral
is eligible if the following can be demonstrated:
• Legal certainty and enforceability
• History of enforceability and recovery
LGD estimates have been calibrated for different collateral
types. To reflect possible changes in property prices, the
forced sale value (FSV) shall be considered for all collateral
types.
The collateral values to consider have been calculated on
a discounted cash flow basis using the effective interest.
The table below highlights the Group’s acceptable collateral
types;
No. Collateral Type
1. Cash Under Lien
2. Corporate Guarantees
3. Debenture/Land
4. Government Guarantee
5. Hire Purchase Agreement
6. Land & Buildings-Commercial
7. Land & Buildings-Residential
8. Logbooks
9. Shares
10. Treasury Bonds/Bills
LGD by Collections
For the purpose of LGD estimation on its non-collateralized
portfolio, the Group shall compute LGD based on actual
recoveries on its defaulted portfolio over a period of at least
3- 5 years prior to the assessment date. To determine this
recovery rate, the Group has identified the point in time
when accounts first go into default in half year periods,
filter out any non-performing loan (NPL) accounts that cure
and for the remaining accounts obtain data on amounts
collected. The difference between the value of the NPL
accounts that do not cure and the collections from these
accounts as a percentage of the original NPL accounts (NPL
accounts that cured and did not cure) is determined as the
LGD. For individually assessed unsecured accounts, the
LGD is assessed based on the particular circumstances of
the facility.
NOTES (continued)

147
EQUITY GROUP HOLDINGS PLC AND SUBSIDIARIES INTEGRATED REPORT AND FINANCIAL STATEMENTS FOR THE YEAR ENDED 31 DECEMBER 2019
2.Significant accounting policies (continued)
(i) Financial assets and liabilities (continued)
(ii) Impairment – financial assets, loan commitments and financial guarantee contracts (continued)
Exposure at default (EAD)
EAD represents the expected exposure in the event of a
default. The Group has derived the EAD from the current
exposure to the counterparty and potential changes to
the current amount allowed under the contract, including
amortisation, and prepayments. The EAD of a financial asset
is measured as:
EAD = Outstanding exposure + (CCF*undrawn portion)
For lending commitments and financial guarantees, the
EAD has considered the amount drawn, as well as potential
future amounts that may be drawn or repaid under the
contract, which will be estimated based on behavioural
study of historical patterns and forward-looking forecasts.
For revolving off-balance sheet positions, the CCF to be
applied to the undrawn commitments have been derived
from a behavioural study of historical patterns. In the case
of undrawn commitments (i.e. undrawn portions of the
Group’s commitments for off-balance sheet items), if the
terms of the contract clearly state that the commitment is
unconditionally cancellable for any reason, the committed
amounts for such arrangements has not be considered as
EAD.
Term of loan in calculating Lifetime ECL and determining the EAD
As described previously in this document, and subject to
using a maximum of a 12-month PD for financial assets for
which credit risk has not significantly increased, the Group
will measure ECLs considering the risk of default over the
maximum contractual period (including any borrower’s
extension options) over which it is exposed to credit risk,
even if, for risk management purposes, the Group will
consider a longer period. The maximum contractual period
extends to the date at which the Group has the right to require
repayment of an advance or terminate a loan commitment
or guarantee. For overdrafts, guarantee facilities and other
revolving facilities that include both a loan and an undrawn
commitment component, the Group will measure ECLs over
a period of one year unless the expected life of the exposure
can be reasonably determined.
Forward-looking information
Under IFRS 9, the Group has incorporated forward-looking
information in its measurement of ECLs. The Group has
formulated a ‘base case’ view of the future direction of
relevant economic variables and a representative range of
other possible forecast scenarios based on advice from the
Group’s Executive Risk Committees (ALCO & CORC) and
economic experts and consideration of a variety of external
actual and forecast information. This process will involve
developing two or more additional economic scenarios
and considering the relative probabilities of each outcome.
External information may include economic data and
forecasts published by governmental bodies and monetary
authorities in East Africa, supranational organisations such
as the World Bank and the International Monetary Fund and
selected private sector and academic forecasters. The base
case represents a most-likely outcome and be aligned with
information used by the Group for other purposes, such as
strategic planning and budgeting. The other scenarios will
represent more optimistic and more pessimistic outcomes.
The Group has identified and documented key drivers of
credit risk and credit losses for each portfolio of financial
instruments and, using an analysis of historical data, has
estimated relationships between macro-economic variables
and credit risk and credit losses. These key drivers include,
among others, inflation rates, GDP forecasts, balance of
trade, unemployment rates and interest rates. Predicted
relationships between the key indicators and default and
loss rates on various portfolios of financial assets shall
be developed based on analysing historical data over the
previous 5 years. The economic scenarios used have been
approved by the Group’s Credit and Risk Committees.
NOTES (continued)

148
EQUITY GROUP HOLDINGS PLC AND SUBSIDIARIES INTEGRATED REPORT AND FINANCIAL STATEMENTS FOR THE YEAR ENDED 31 DECEMBER 2019
2.Significant accounting policies (continued)
(i) Financial assets and liabilities (continued)
(iii) Fair value measurement
The Group measures financial instruments such as
derivatives, loan Notes (continued) at FVTPL and FVOCI
investment securities at fair value at each reporting date.
Fair value of financial instruments is the price that would
be received to sell an asset or paid to transfer a liability in
an orderly transaction between market participants at the
measurement date.
The fair value measurement is based on the presumption
that the transaction to sell the asset or transfer the liability
takes place either:
• In the principal market for the asset or liability; or
• In the absence of a principal market, in the most
advantageous market for the asset or liability.
The principal or the most advantageous market must be
accessible by the Group.
The fair value of an asset or a liability is measured using
the assumptions that market participants would use
when pricing the asset or liability, assuming that market
participants act in their economic best interest.
The Group uses valuation techniques that are appropriate in
the circumstances and for which sufficient data is available
to measure fair value, maximising the use of relevant
observable inputs and minimising the use of unobservable
inputs.
All assets and liabilities for which fair value is measured
or disclosed in the financial statements are categorised
within the fair value hierarchy, described as follows, based
on the lowest level input that is significant to the fair value
measurement as a whole:
• Level 1 - Quoted (unadjusted) market prices in active
markets for identical assets or liabilities.
• Level 2 - Valuation techniques for which the lowest
level input that is significant to the fair value
measurement is directly or indirectly observable.
• Level 3 - Valuation techniques for which the lowest
level input that is significant to the fair value
measurement is unobservable.
For assets and liabilities that are recognised in the financial
statements at fair value on a recurring basis, the Group
determines whether transfers have occurred between
levels in the hierarchy by re-assessing categorisation
(based on the lowest level input that is significant to the fair
value measurement as a whole) at the end of each reporting
period.
The determination of fair values of financial assets and
financial liabilities is based on quoted market prices or
dealer price quotations for financial instruments traded in
active markets at the reporting date without any deduction
for transaction costs.
Gains or losses on valuation of FVOCI are recognised in
other comprehensive income.
For all other financial instruments not traded in an active
market, the fair value is determined by using appropriate
valuation techniques. Valuation techniques include the
discounted cash flow method, comparison to similar
instruments for which market observable prices exist,
options pricing models, credit models and other relevant
valuation models.
For the purpose of fair value disclosures, the Group has
determined classes of assets and liabilities on the basis of
the nature, characteristics and risks of the asset or liability
and the level of the fair value hierarchy, as explained above.
NOTES (continued)

149
EQUITY GROUP HOLDINGS PLC AND SUBSIDIARIES INTEGRATED REPORT AND FINANCIAL STATEMENTS FOR THE YEAR ENDED 31 DECEMBER 2019
2.Significant accounting policies (continued)(i) Financial assets and liabilities (continued)
(iii) Fair value measurement (continued)The table below shows the various asset classes.
Category
(as defined by IFRS 9)
Class (as determined by the Group) Subclasses
Financial assets Financial assets at fair
value through profit or loss
(FVTPL)
Financial assets held for trading Derivative financial assets
Financial assets designated at fair
value through profit or loss
Loan note at FVTPL
Amortised cost Deposits and balances due from financial institutions
Due from Group companies
Loans and advances to customers Loans to
individuals
(Agriculture
and
consumer)
Term loans
Mobile loans
Credit cards
Mortgages
Loans to
micro, SME
and large
enterprises
Term loans
Overdrafts
Others
Settlement and clearing accounts
Cash balances with central banks
Other assets
Financial assets at fair
value through other
comprehensive income
(FVOCI)
Investment securities
Financial liabilities Financial liabilities at
amortised cost
Financial liabilities at amortised cost
Deposits from customers
Other liabilities
Borrowed funds
Due to Group companies
Off-balance sheet
financial instruments
Loan commitments
Guarantees, acceptances and other financial liabilities
Fair-value related disclosures for financial instruments that are measured at fair value or where fair values are disclosed,
are summarised in note 5 to the financial statements.
NOTES (continued)

150
EQUITY GROUP HOLDINGS PLC AND SUBSIDIARIES INTEGRATED REPORT AND FINANCIAL STATEMENTS FOR THE YEAR ENDED 31 DECEMBER 2019
2.Significant accounting policies (continued)
(j) Cash and cash equivalents
Cash and cash equivalents include notes and coins on hand
and bank balances held with central banks in the countries
in which the Group operates and highly liquid financial
assets with original maturities of less than three months,
which are subject to insignificant risk of changes in their fair
value, and are used by the Group in the management of its
short-term commitments.
Cash and cash equivalents are classified and carried at
amortised cost in the statement of financial position.
For the purpose of the statement of cash flows, cash and
cash equivalents comprise cash and balances with banks,
unrestricted balances with central banks in the countries in
which the Group operates and money market placements.
(k) Property and equipment
(i) Recognition and measurement
Items of property and equipment are initially measured at
cost. Cost includes expenditures that are directly attributable
to the acquisition of the asset. The cost includes any other
costs directly attributable to bringing the asset to a working
condition for its intended use and the present value of the
estimated costs of dismantling and removing the items and
restoring the site on which they are located. Purchased
software that is integral to the functionality of the related
equipment is capitalised as part of that equipment.
After initial recognition, property and equipment are
measured at cost less accumulated depreciation and
impairment losses.
(ii) Subsequent costs
The cost of replacing part of an item of property or
equipment is recognised in the carrying amount of the item
if it is probable that the future economic benefits embodied
within the part will flow to the Group and its cost can be
measured reliably. The costs of the day-to-day servicing of
property and equipment are recognised in profit or loss as
they are incurred.
(ii) Depreciation
Depreciation is recognised in profit or loss on a straight-
line basis over the estimated useful lives of each part of an
item of property and equipment in order to write down the
carrying amount over its useful life to its residual value.
Freehold land is not depreciated.
The annual rates of depreciation (2.5% - 33.3%) in use are
as follows:
Buildings 2.5%
Motor vehicles and Village cell banking vans 25%
Office equipment, furniture and fittings 12.5%
Computer hardware 33.3%
ATM machines, core banking hardware 20%
Leasehold improvements are written off over their estimated
useful lives or the lease period, whichever is shorter.
The assets’ residual values, useful lives and methods of
depreciation are reassessed at each financial year-end
and adjusted prospectively, as a change in an estimate, if
appropriate.
Property and equipment is derecognised on disposal or
when no future economic benefits are expected from its use.
An item of property and equipment is derecognised on
disposal or when no future economic benefits are expected
from its use. Any gain or loss arising on derecognition of
the asset (calculated as the difference between the net
disposal proceeds and the carrying amount of the asset) is
recognised in other operating income in profit or loss in the
year the asset is derecognised.
(l) Intangible assets
The Group’s intangible assets include the value of computer
software. Costs associated with maintaining software
programmes are recognised as an expense as incurred.
Development costs that are directly attributable to the design
and testing of identifiable and unique software products
controlled by the Group are recognised as intangible assets
when the following criteria are met:
• It is technically feasible to complete the software so
that it will be available for use;
• Management intends to complete the software and
use or sell it;
• There is an ability to use or sell the software;
• It can be demonstrated how the software will
generate probable future economic benefits;
NOTES (continued)

151
EQUITY GROUP HOLDINGS PLC AND SUBSIDIARIES INTEGRATED REPORT AND FINANCIAL STATEMENTS FOR THE YEAR ENDED 31 DECEMBER 2019
NOTES (continued)
2.Significant accounting policies (continued)
(l) Intangible assets (continued)
• Adequate technical, financial and other resources
to complete the development and to use or sell the
software are available; and
• The expenditure attributable to the software during
its development can be reliably measured.
Directly attributable costs that are capitalised as part of the
software include employee costs and an appropriate portion
of relevant overheads. Capitalised development costs are
recorded as intangible assets and amortised from the point
at which the asset is ready for use.
Following initial recognition, intangible assets are carried
at cost less any accumulated amortisation and any
accumulated impairment losses.
The useful lives of intangible assets are assessed to be
finite or indefinite. Intangible assets with finite lives are
amortised over the useful lives. The amortisation period and
the amortisation method for an intangible asset with a finite
useful life are reviewed at least at each financial year-end.
Changes in the expected useful life or the expected pattern
of consumption of future economic benefits embodied in
the asset are accounted for by changing the amortisation
period or method, as appropriate, and treated as changes
in accounting estimates. The amortisation expense on
intangible assets with finite lives is recognised in profit or
loss in the expense category consistent with the function of
the intangible asset. The intangible assets have a maximum
useful life of ten years.
(m) Impairment of non-financial assets
The carrying amounts of the Group’s non-financial assets
are reviewed at each reporting date to determine whether
there is any indication that an asset may be impaired. If any
such indication exists, then the asset’s recoverable amount
is estimated.
An asset’s recoverable amount is the higher of an asset’s
or cash-generating unit’s (CGU’s) fair value less costs of
disposal and its value in use.
The recoverable amount is determined for an individual
asset, unless the asset does not generate cash inflows that
are largely independent of those from other assets or group
of assets. Where the carrying amount of an asset or CGU
exceeds its recoverable amount, the asset is considered
impaired and is written down to its recoverable amount. In
assessing value in use, the estimated future cash flows are
discounted to their present value using a pre-tax discount
rate that reflects current market assessments of the
time value of money and the risks specific to the asset. In
determining fair value less costs of disposal, an appropriate
valuation model is used. Impairment losses are recognised
in profit or loss in expense categories consistent with the
function of the impaired asset.
A previously recognised impairment loss is reversed only
if there has been a change in the assumptions used to
determine the asset’s recoverable amount since the last
impairment loss was recognised. The reversal is limited so
that the carrying amount of the asset does not exceed its
recoverable amount, or the carrying amount that would
have been determined, net of depreciation or amortisation,
had no impairment loss been recognised for the asset in
prior years. Such reversal is recognised in profit or loss.
(n) Provisions
Provisions are recognised when the Group and Company
have a present obligation (legal or constructive) as a result of
a past event, and it is probable that an outflow of resources
embodying economic benefits will be required to settle the
obligation and a reliable estimate can be made of the amount
of the obligation. The expense relating to any provision is
presented in profit or loss net of any reimbursement.
(o) Employee benefits
(i) Defined contribution plans
The Group contributes to statutory defined contribution
pension schemes (the National Social Security Fund
(NSSF)), for Kenya, Tanzania, Uganda and Democratic
Republic of Congo employees. The Group also contributes
to the Rwanda Social Security Fund for Rwanda employees
and to a private pension fund for employees in South Sudan.

152
EQUITY GROUP HOLDINGS PLC AND SUBSIDIARIES INTEGRATED REPORT AND FINANCIAL STATEMENTS FOR THE YEAR ENDED 31 DECEMBER 2019
2.Significant accounting policies (continued)
(o) Employee benefits (continued)
(i) Defined contribution plans (continued)
A defined contribution plan is a pension plan under which
the Group pays fixed contributions into a separate entity. The
Group has no legal or constructive obligations to pay further
contributions if the funds do not hold sufficient assets to pay
all employees the benefits relating to employee service in
the current and prior periods. The assets of the schemes
are held in a separate trustee administered funds, which are
funded by contributions from both the Group and employees.
The Group contributions to both the defined contribution
schemes are charged to the statement of comprehensive
income in the year to which they relate.
(ii) Short-term benefits
Short-term employee benefit obligations are measured
on an undiscounted basis and are expensed as the related
service is provided. A provision is recognised for the amount
expected to be paid under short-term cash bonus and leave
if the group has a present obligation to pay this amount as
a result of past service provided by the employee and the
obligation can be estimated reliably.
(p) Segmental reporting
Operating segments are reported in a manner consistent
with the internal reporting provided to the chief operating
decision-maker. The chief operating decision-maker who
is responsible for allocating resources and assessing the
performance of the operating segments has been identified
as the Group Strategy and Investment Committee that
makes strategic decisions.
All transactions between business segments are conducted
on an arm’s length basis, with intra-segment revenue and
costs being eliminated in head office. Income and expenses
directly associated with each segment are included in
determining business segment performance.
(q) Earnings per share
The Group presents basic and diluted earnings per share
(EPS) for its ordinary shares. Basic EPS is calculated by
dividing the profit attributable to ordinary shareholders
of the Group by the weighted average number of ordinary
shares outstanding during the year.
(r) Dividends
Dividends are recognised as a liability and deducted from
equity in the year in which they are declared when they
are approved by the Company’ Shareholders. Proposed
dividends are disclosed as part of Note 27 (g).
(s) Deposits from customers
Deposits from customers are recognized and accounted for
on receipt basis as liabilities. Interest expense is accrued on
the deposits on a daily basis.
(t) Work in progress
Work-in-progress includes assets paid for but are not
yet ready for the intended use and include software,
computers and equipment. These are not depreciated and
are capitalized when they get in the location and condition
necessary for them to be capable of operating in the manner
intended by management.
(u) Fiduciary assets
The Group entities provide trust and other fiduciary services
that result in the holding or investing of assets on behalf
of its clients. Assets held in a fiduciary capacity, unless
recognition criteria are met, are not reported in the financial
statements, as they are not assets of the Group (note 34).
(v) Derivative financial assets and liabilities
The Group enters into derivatives (currency forwards and
swaps) for trading purposes. At their inception, derivatives
often involve only a mutual exchange of promises with little
or no transfer of consideration.
The Group may take positions with the expectation of
profiting from favourable movement in prices, rates or
indices. The Group’s exposure under derivative contracts
is closely monitored as part of the overall management of
its market risk. Derivatives are recorded at fair value and
carried as assets when their fair value is positive and as
liabilities when their fair value is negative. Changes in the
fair value of derivatives are included in net trading income.
The Group uses the following derivative instruments:
NOTES (continued)
153
EQUITY GROUP HOLDINGS PLC AND SUBSIDIARIES INTEGRATED REPORT AND FINANCIAL STATEMENTS FOR THE YEAR ENDED 31 DECEMBER 2019
2.Significant accounting policies (continued)
(v) Derivative financial assets and liabilities (continued)
Currency forwards
Forward contracts are contractual agreements to buy or
sell a specified financial instrument at a specific price and
date in the future. Forwards are customised contracts
transacted in the over–the–counter market. The Group has
credit exposure to the counterparties of forward contracts.
Forward contracts are settled gross and result in market
risk exposure.
Currency swaps
Swaps are contractual agreements between two parties
to exchange streams of payments over time based on
specified notional amounts, in relation to movements in a
specified underlying index such as a foreign currency rate.
In a currency swap, the Group pays a specified amount in
one currency and receives a specified amount in another
currency.
Currency spots
Spot contracts are contractual agreements between two
parties to exchange streams with immediate settlement
(payment and delivery) on the spot date, which is normally
two business days after the trade date.
(w) Comparatives
Except otherwise required, all amounts are reported or
disclosed with comparative information. Where necessary,
comparative figures have been adjusted to conform to
changes in presentation in the current year.
(x) Financial guarantee contracts and loan commitments
Financial guarantee contracts are contracts that require the
issuer to make specified payments to reimburse the holder
for a loss it incurs because a specified debtor fails to make
payments when due, in accordance with the terms of a debt
instrument. Such financial guarantees are given to banks,
financial institutions, and others on behalf of customers to
secure loans, overdrafts, and other banking facilities.
Financial guarantees contracts are initially measured at fair
value and subsequently measured at the higher of:
• The amount of loss allowance and;
• The premium received on initial recognition less
recognition in accordance with the principles of IFRS
15.
Loan commitments provided by the Group are measured as
the amount of the loss allowance. The Group has not provided
any commitment to provide loans at a below-market interest
rate, or that can be settled net in cash or by delivering or
issuing another financial instrument.
For loan commitments and financial guarantee contracts,
the loss allowance is recognised as a provision. However, for
contracts that include both a loan and undrawn commitment
and the Group cannot separately identify the expected credit
losses on the undrawn commitment component from those
on the loan component, the expected credit losses on the
undrawn commitment are recognised together with the
loss allowance for the loan. To the extent that the combined
expected credit losses exceed the gross carrying amount
of the loan, the expected credit losses are recognised as a
provision.
NOTES (continued)

154
EQUITY GROUP HOLDINGS PLC AND SUBSIDIARIES INTEGRATED REPORT AND FINANCIAL STATEMENTS FOR THE YEAR ENDED 31 DECEMBER 2019
3.Critical accounting estimates and judgementsEstimates and judgements are continually evaluated and
are based on historical experience and other factors,
including experience of future events that are believed to be
reasonable under the circumstances.
Critical accounting estimates and assumptions
The Group makes estimates and assumptions concerning
the future. The resulting accounting estimates will, by
definition, seldom equal the related actual results. The
estimates and assumptions that have a significant risk of
causing a material adjustment to the carrying amounts
of assets and liabilities within the next financial year are
addressed below.
(a) Measurement of expected credit loss allowance
The measurement of expected credit loss allowance for
financial assets measured at amortised cost and FVOCI is an
area that requires the use of complex models and significant
assumptions about future economic conditions and credit
behaviour (e.g. the likelihood of customers defaulting and
the resulting losses).
A number of significant judgements are also required in
applying the accounting requirements for measuring ECL,
such as:
• Determining the criteria for significant increase in
credit risk;
• Choosing appropriate models and assumptions for
the measurement of ECL;
• Establishing the number and relative weightings for
a forward-looking scenarios for each type of product
/ market and associated ECL;
• Establishing groups of similar assets for the purposes
of measuring ECL; and
• Determining LGDs of individually assessed loan
accounts.
The expected credit loss allowance on loans and advances is
disclosed in more detail in Notes 11 and 20 (b).
(b) Valuation of loan note held at fair value
As per IFRS 13, where the Group measures a financial
instrument at fair value, the fair value should represent the
price that would be received to sell an asset in an orderly
transaction in the principal (or most advantageous) market
between market participants at the measurement date.
Fair value is a market-based measurement, which uses
the assumptions that market participants would use when
pricing an asset or liability under current market conditions.
The Group hold a loan note that contains an embedded
derivative and has therefore been measured at fair value
through profit or loss. Fair value is composed of two key
cashflow components, being the interest receivable on the
mandatorily convertible component of the loan note and
proceeds from sale of underlying shares upon whose sale
the principal debt amount will be realised. Any shortfall
from the above cashflow streams is covered, albeit partially,
by a government guarantee.
To determine the value of the shares, the Group uses a
complex discounted cash flow (DCF) valuation model that
incorporates inputs including the projected cash flows of the
borrower company, the weighted average cost of capital and
growth rate assumptions. The selection and application of
this model and the related inputs is judgmental.
(c) Accounting for leases under IFRS 16
i) Determining the lease term
In determining the lease term, management considers all
facts and circumstances that create an economic incentive
to exercise an extension option, or not exercise a termination
option. Extension options (or periods after termination
options) are only included in the lease term if the lease is
reasonably certain to be extended (or not terminated).
For leases of branches and office premised, the following
factors are normally the most relevant:
• If there are significant penalties to terminate (or not
extend), the Group is typically reasonably certain to
extend (or not terminate).
NOTES (continued)
155
EQUITY GROUP HOLDINGS PLC AND SUBSIDIARIES INTEGRATED REPORT AND FINANCIAL STATEMENTS FOR THE YEAR ENDED 31 DECEMBER 2019
3.Critical accounting estimates and judgements (continued)(c) Accounting for leases under IFRS 16 (continued)
i) Determining the lease term (continued)
• If any leasehold improvements are expected to have
a significant remaining value, the Group is typically
reasonably certain to extend (or not terminate).
• Otherwise, the Group considers other factors
including historical lease durations and the costs and
business disruption required to replace the leased
asset.
Most extension options in offices leases have not been
included in the lease liability, because the Group could
replace the assets without significant cost or business
disruption.
The lease term is reassessed if an option is actually exercised
(or not exercised) or the Group becomes obliged to exercise
(or not exercise) it. The assessment of reasonable certainty
is only revised if a significant event or a significant change in
circumstances occurs, which affects this assessment, and
that is within the control of the lessee.
ii) Incremental borrowing rate
The lease payments are discounted using the interest rate
implicit in the lease. If that rate cannot be readily determined,
which is generally the case for leases in the Group, the
lessee’s incremental borrowing rate is used, being the rate
that the individual lessee would have to pay to borrow the
funds necessary to obtain an asset of similar value to the
right-of-use asset in a similar economic environment with
similar terms, security and conditions.
The incremental borrowing rate is determined on the
commencement date of the lease. As a result, it will
incorporate the impact of significant economic events and
other changes in circumstances arising between lease
inception and commencement.
Judgement may be needed to estimate an incremental
borrowing rate in the context of a right-of-use asset,
especially when the value of the underlying asset differs
significantly from the value of the right-of-use asset.
4.Financial risk management(a) Introduction and overview
The Group and Company have exposure to the following
risks from its financial instruments:
• Credit risk
• Liquidity risk
• Market risk
• Capital risk
This note presents information about the Group’s and
Company’s exposure to each of the above risks, the Group’s
objectives, policies and processes for measuring and
managing risk, and the Group’s management of capital.
There were no changes in the risk and capital management
policies during the current financial year.
Risk management framework
The Board of Directors has overall responsibility for the
establishment and oversight of the group’s risk management
framework. The Board has established the Board Risk
Management Committee, which is responsible for
developing and monitoring Group risk management policies
in their specified areas. All Board committees have both
executive and non-executive members and report regularly
to the Board of Directors on their activities. The Group’s
risk management policies are established to identify and
analyse the risks faced by the Group, to set appropriate risk
limits and controls, and to monitor risks and adherence to
limits. Risk management policies and systems are reviewed
regularly to reflect changes in market conditions, products
and services offered. The Group, through its training and
management standards and procedures, aims to develop a
disciplined and constructive control environment, in which
all employees understand their roles and obligations.
NOTES (continued)

156
EQUITY GROUP HOLDINGS PLC AND SUBSIDIARIES INTEGRATED REPORT AND FINANCIAL STATEMENTS FOR THE YEAR ENDED 31 DECEMBER 2019
4.Financial risk management (continued)
(a) Introduction and overview (continued)
Risk management framework (continued)
The Risk Management Committee is responsible for
monitoring compliance with the Group’s risk management
policies and procedures, and for reviewing the adequacy
of the risk management framework in relation to the risks
faced by the Group. The Board Risk Management Committee
is assisted in these functions by Risk Management
Department. Internal Audit undertakes both regular and ad-
hoc reviews of risk management controls and procedures,
the results of which are reported to the Board Risk
Management Committee.
(b) Credit risk
Credit risk is the risk of financial loss to the Group if a
customer or counterparty to a financial instrument fails to
meet its contractual obligations, and arises principally from
the Group’s loans and advances to customers and other
banks, and investment securities. For risk management
reporting purposes, the Group considers and consolidates
all elements of credit risk exposure.
Management of credit risk
The Board of Directors has delegated responsibility for the
management of credit risk to Group management through
the Chief Executive Officer. Management has delegated this
responsibility to head office and branch credit committees
as prescribed in the Group’s credit charter. A separate
Group Credit Committee, reporting to the Chief Executive
Officer, is responsible for oversight of the Group’s credit
risk, including:
• Formulating credit policies in consultation with business
units, covering collateral requirements, credit assessment,
risk grading and reporting, documentary and legal
procedures, and compliance with regulatory and statutory
requirements.
• Establishing the authorisation structure for the approval
and renewal of credit facilities. Authorisation limits are
allocated to head office and branch credit committees as
stipulated in the Group’s Credit Charter.
• Reviewing and assessing credit risk - The Group Credit
Committee assesses all credit exposures in excess of
designated limits, prior to facilities being committed to
customers by the branch concerned. Renewals and reviews
of facilities are subject to the same review process.
• Limiting concentrations of exposure to counterparties,
geographies and industries (for loans and advances) and by
issuer, credit rating band, market liquidity and country (for
investment securities).
• Developing and maintaining the Group’s risk grading in
order to categorise exposures according to the degree of
risk of financial loss faced and to focus management on
the attendant risks. The risk grading system is used in
determining where impairment provisions may be required
against specific credit exposures. The current risk grading
framework consists of five grades reflecting varying degrees
of risk of default and the availability of collateral or other
credit risk mitigation. The responsibility for setting risk
grades lies with the final approving executive / committee
as appropriate. Risk grades are subject to regular reviews
by Group’s credit risk department.
• Reviewing compliance of business units with agreed
exposure limits, including those for selected industries,
country risk and product types. Regular reports are
provided to Group Credit department on the credit quality of
local portfolios and appropriate corrective action is taken.
• Providing advice, guidance and specialist skills to branches
to promote best practice throughout the Group in the
management of credit risk.
Each branch is required to implement Group credit policies
and procedures, with credit approval authorities delegated
from the Group Credit committee. Each branch has a credit
risk manager who reports on all credit related matters to
local management who report to Group management and the
Group Credit Committee. Each business unit is responsible
for the quality and performance of its credit portfolio and for
monitoring and controlling all credit risks in its portfolios,
including those subject to central approval.
Regular audits of branches and Group credit processes are
undertaken by Internal Audit.
NOTES (continued)

157
EQUITY GROUP HOLDINGS PLC AND SUBSIDIARIES INTEGRATED REPORT AND FINANCIAL STATEMENTS FOR THE YEAR ENDED 31 DECEMBER 2019
NOTES (continued)
4.Financial risk management (continued)(b) Credit risk (continued)
Management of credit risk (continued)
The maximum exposure to credit risk for the components of the statement of financial position at 31 December is their
carrying amount as illustrated in the tables below:
Group 2019 2018
Note Shs’ millions % Shs’ millions %
Credit exposures
On – balance sheet items
Balances and deposits due from financial institutions* 19 62,134 10% 54,742 10%
Derivative financial assets 33 472 0% 225 0%
Investment securities 21 172,208 28% 160,952 31%
Due from related parties 28 (f) 19 0% 24 0%
Loans and advances to customers at amortised cost 20(a) 362,373 60% 292,136 56%
Loans and advances to customers at FVTPL 20(d) 4,067 1% 5,091 1%
Other assets** 22 8,358 1% 8,966 2%
609,631 522,136
Off-balance sheet items
Guarantees and standby letters of credit 30 53,325 44,171
Letters of credit, acceptances and other credits 30 33,283 29,114
86,608 73,285
696,239 595,421
Company
Credit exposures
On – balance sheet items
Balances and deposits due from financial institutions 19 12,694 98% 7,675 96%
Due from related parties 28 (f) 61 1% 95 1%
Other assets 22 159 1% 236 3%
12,914 8,006
*Balances and deposits due from financial institutions excludes cash at hand as disclosed under Note 19 (a) as this does not
pose a credit risk.
The credit risk on balances and deposits due from financial institutions, investment securities and derivative financial assets
is limited as the counterparties are all recognised financial institutions with good reputation.
**Other assets are made up of settlement and clearing accounts, refundable deposits and other receivable balances. The
balances are settled no more than 12 months after the reporting date. All the balances are non-interest bearing.
None of the other assets and balances due from related parties are past due or impaired. Management has established a
related entity risk management framework including mandatory credit checks with counter parties.
Letters of credit, acceptances, guarantees and performance bonds are issued by the Group, on behalf of customers, to
guarantee performance by customers to third parties. The Group will only be required to meet these obligations in the event
of default by the customers.

158
EQUITY GROUP HOLDINGS PLC AND SUBSIDIARIES INTEGRATED REPORT AND FINANCIAL STATEMENTS FOR THE YEAR ENDED 31 DECEMBER 2019
4.Financial risk management (continued)(b) Credit risk (continued)
Exposure to credit risk
2019
Stage 1 Stage 2 Stage 3 Total
12 month ECL Lifetime ECL Lifetime ECL
Amortised cost Shs’ millions Shs’ millions Shs’ millions Shs’ millions
Individually and collectively impaired
Grade 3: Substandard - - 11,080 11,080
Grade 4: Doubtful - - 14,962 14,962
Grade 5: Loss - - 8,667 8,667
Gross amount - - 34,709 34,709
Provision for impairment losses - - (14,033) (14,033)
Carrying amount - - 20,676 20,676
Individually and collectively impaired
Grade 1: Normal 313,002 - - 313,002
Grade 2: Watch - 37,397 - 37,397
Gross amount 313,002 37,397 - 350,399
Provision for impairment losses (4,773) (3,929) - (8,702)
Carrying amount 308,229 33,468 - 341,697
Total carrying amount 362,373
Fair value through profit or loss
Loans note 5,067
Fair value loss (1,000)
4,067
Total carrying amount 366,440
NOTES (continued)

159
EQUITY GROUP HOLDINGS PLC AND SUBSIDIARIES INTEGRATED REPORT AND FINANCIAL STATEMENTS FOR THE YEAR ENDED 31 DECEMBER 2019
4.Financial risk management (continued)(b) Credit risk (continued)
Exposure to credit risk (continued)
2018
Stage 1 Stage 2 Stage 3 Total
12 month ECL Lifetime ECL Lifetime ECL
Amortised cost Shs’ millions Shs’ millions Shs’ millions Shs’ millions
Individually and collectively impaired
Grade 3: Substandard - - 8,152 8,152
Grade 4: Doubtful - - 11,718 11,718
Grade 5: Loss - - 3,006 3,006
Gross amount - - 22,876 22,876
Provision for impairment losses - - (9,452) (9,452)
Carrying amount - - 13,424 13,424
Individually and collectively impaired
Grade 1: Normal 251,105 - - 251,105
Grade 2: Watch - 37,638 - 37,638
Gross amount 251,105 37,638 - 288,743
Provision for impairment losses (2,992) (7,039) - (10,031)
Carrying amount 248,113 30,599 - 278,712
Total carrying amount 292,136
Fair value through profit or loss
Loans note 5,091
Fair value loss (1,000)
Total carrying amount 297,227
Grade 1 and Grade 2 represent loans and advances that are not impaired. Grade 3, Grade 4 and Grade 5 refer to loans and
advances that have been impaired in line with the Group’s credit policy and internal model. These represent the loans and
advances that the Group cannot collect according to contractual terms of the loan agreements.
Impaired loans
Impaired loans are loans which the Group determines that it is probable that it will be unable to collect all principal and interest
due according to the contractual terms of the loan agreements.
Past due but not impaired loans
These are loans where contractual interest or principal payments are past due but the Group believes that impairment is not
appropriate on the basis of the stage of collection of amounts owed to the Group.
NOTES (continued)

160
EQUITY GROUP HOLDINGS PLC AND SUBSIDIARIES INTEGRATED REPORT AND FINANCIAL STATEMENTS FOR THE YEAR ENDED 31 DECEMBER 2019
4.Financial risk management (continued)(b) Credit risk (continued)
Allowances for impairment
The loss allowance recognised in the period is impacted by a variety of factors as follows:
- Transfers between Stages 1, 2 and 3 reflective of significant increases (or decreases) of credit risk or loans and advances
becoming credit impaired in the period, and the consequent “step up” or “step down” between 12-month and lifetime ECL;
- Allowance for new financial instruments recognised during the period, as well as releases for financial instruments de-
recognised in the period;
- Impact on the measurement of ECL due to changes in PDs, EADs and LGDs in the period, arising from regular refreshing of
inputs to models;
- Impacts on the measurement of ECL due to changes made to models and assumptions; and
- Discount unwind within ECL due to the passage of time, as ECL is measured on a present value basis.
Write-off policy
The Group writes off a loan balance when the credit department determines that the loans are uncollectible. This determination
is reached after considering information such as the occurrence of significant changes in the borrower’s financial position
such that the borrower can no longer pay the obligation or that proceeds from collateral have failed to cover the entire facility
outstanding. For smaller balance standardised loans, write-off decisions are generally based on a product specific past due
default history.
Collateral on loans and advances
The Group routinely obtains collateral and security to mitigate credit risk. The Group ensures that any collateral held is
sufficiently liquid, legally effective, enforceable and regularly reassessed.
Before attaching value to collateral, the business holding approved collateral must ensure that they are legally perfected
devoid of any encumbrances. Security structures and legal covenants are subject to regular review, to ensure that they remain
fit for purpose and remain consistent with accepted local market practice.
The principal collateral types held by the Group for loans and advances are:
• Mortgages over residential properties.
• Charges over business assets such as premises, inventory and accounts receivable.
• Charges over financial instruments such as debt securities and equities.
Valuation of collateral taken is within agreed parameters. The valuation is performed on origination, periodically in line with
the Group policy and in the course of enforcement actions. Collateral for impaired loans is reviewed regularly to ensure that it
is still enforceable and that the impairment allowance remains appropriate given the current valuation.
NOTES (continued)

161
EQUITY GROUP HOLDINGS PLC AND SUBSIDIARIES INTEGRATED REPORT AND FINANCIAL STATEMENTS FOR THE YEAR ENDED 31 DECEMBER 2019
4.Financial risk management (continued)(b) Credit risk (continued)
Collateral on loans and advances (continued)
The Group has considered all relevant factors, including local market conditions and practices, before any collateral is realized.
The collateral held by the Group against loans and advances is as below;
Group
2019 2018
Shs’ millions Shs’ millions
Property 443,573 359,528
Equities 127 117
Other 152,537 41,242
Total 596,237 400,887
*Other includes log books, cash cover, debentures and Directors’ guarantees.
The Group monitors concentration of credit risk by sector. The credit risk concentrations are controlled wherever they are
identified in particular, to individual counterparties and groups of borrowers, countries, and to industry segments. An analysis
of concentrations of credit risk at the reporting date is shown below:
Group
2019 2018
Shs’ millions Shs’ millions
Concentration by sector
Loans and advances at amortised cost
Small and medium enterprises 229,232 188,518
Consumer 87,383 71,211
Large enterprises 46,575 35,585
Micro enterprises 11,396 9,196
Agriculture 10,522 7,109
Total 385,108 311,619
NOTES (continued)

162
EQUITY GROUP HOLDINGS PLC AND SUBSIDIARIES INTEGRATED REPORT AND FINANCIAL STATEMENTS FOR THE YEAR ENDED 31 DECEMBER 2019
4.Financial risk management (continued)
(c) Liquidity risk
The definition of liquidity risk is the risk that the Group is
unable to meet its obligations as they fall due as a result
of a sudden, and potentially protracted, increase in net
cash outflows. Such outflows would deplete available cash
resources for customer lending, trading activities and
investments. These outflows could be principally through
customer withdrawals, wholesale counterparties removing
financing, collateral posting requirements or loan draw-
downs. This risk is inherent in all banking operations and
can be affected by a range of Group-specific and market-
wide events which can result in: – an inability to support
normal business activity; and – a failure to meet liquidity
regulatory requirements.
During periods of market dislocation, the Group’s ability
to manage liquidity requirements may be impacted by a
reduction in the availability of wholesale term funding as
well as an increase in the cost of raising wholesale funds.
Asset sales, balance sheet reductions and the increasing
costs of raising funding will affect the earnings of the Group.
In illiquid markets, the Group may decide to hold assets
rather than securitising, syndicating or disposing of them.
This could affect the Group’s ability to originate new loans
or support other customer transactions as both capital and
liquidity are consumed by existing or legacy assets.
The efficient management of liquidity is essential to the
Group in retaining the confidence of the financial markets
and ensuring that the business is sustainable. Liquidity risk
is managed through the Liquidity Risk Framework, which is
designed to meet the following objectives:
• Maintain liquidity resources that are sufficient in
amount and quality and a funding profile that is
appropriate to meet the liquidity risk framework as
expressed by the Board;
• Maintain market confidence in the Group;
• Set limits to control liquidity risk within and across
lines of business;
• Accurately price liquidity costs, benefits and risks
and incorporate those into product pricing and
performance measurement;
• Set early warning indicators to identify immediately
the emergence of increased liquidity risk or
vulnerabilities including events that would impair
access to liquidity resources;
• Project fully over an appropriate set of time horizons
cash flows arising from assets, liabilities and off-
balance sheet items; and
• Maintain a contingency funding plan (“CFP”) that is
comprehensive and proportionate to the nature, scale
and complexity of the business and that is regularly
tested to ensure that it is operationally robust.
Management of liquidity risk
The Group’s approach to managing liquidity is to ensure, as
far as possible, that it will always have sufficient liquidity
to meet its liabilities when due, under both normal and
stressed conditions, without incurring unacceptable losses
or risking damage to the Group’s reputation.
To limit this risk, management has arranged for diversified
funding sources in addition to its core deposit base, and
adopted a policy of managing assets with liquidity in mind
and monitoring future cash flows and liquidity on a daily
basis. The Group has developed internal control processes
and contingency plans for managing liquidity risk.
This incorporates an assessment of expected cash flows and
the availability of high grade collateral which could be used
to secure additional funding if required. The Group maintains
a portfolio of highly marketable and diverse assets that are
assumed to be easily liquidated in the event of an unforeseen
interruption in cash flow. The Group also has lines of credit
that it can access to meet liquidity needs.
In accordance with the Group’s policy, the liquidity position
is assessed under a variety of scenarios, giving due
consideration to stress factors relating to both the market
in general and specifically to the Group. Net liquid assets
consist of cash, short–term bank deposits and liquid debt
securities available for immediate sale, less deposit for
banks and borrowings due to mature within the next month.
NOTES (continued)

163
EQUITY GROUP HOLDINGS PLC AND SUBSIDIARIES INTEGRATED REPORT AND FINANCIAL STATEMENTS FOR THE YEAR ENDED 31 DECEMBER 2019
4.Financial risk management (continued)(c) Liquidity risk (continued)
Management of liquidity risk (continued)
The Group stresses the importance of current accounts and savings accounts as sources of funds to finance lending to
customers. They are monitored using the advances to deposit ratio, which compares loans and advances to customers as a
percentage of core customer current and savings accounts, together with term funding with a remaining term to maturity in
excess of one year.
Treasury maintains a portfolio of short-term liquid assets, largely made up of short-term liquid investment securities, loans
and advances to banks and other inter-bank facilities, to ensure that sufficient liquidity is maintained within the Group as a
whole. The daily liquidity position is monitored and regular liquidity stress testing is conducted under a variety of scenarios
covering both normal and more severe market conditions. All liquidity policies and procedures are subject to review and
approval by Board Risk Management Committee.
Exposure to liquidity risk
The key measure used by the Group for managing liquidity risk is the ratio of net liquid assets to deposits from customers.
Details of the reported Group ratios of net liquid assets to deposits at the reporting date and during the reporting period were
as follows:
Kenya Uganda South Sudan Rwanda Tanzania DRC
At 31 December 2019
At 31 December 55% 30% 136% 381% 49% 162%
Average for the year 59% 27% 144% 210% 50% 183%
Maximum for the year 62% 38% 163% 365% 57% 194%
Minimum for the year 55% 20% 133% 125% 40% 161%
Minimum statutory requirement 20% 20% 20% 100% 20% 100%
At 31 December 2018
At 31 December 58% 38% 134% 110% 43% 187%
Average for the year 58% 34% 136% 157% 37% 156%
Maximum for the year 60% 44% 166% 281% 43% 187%
Minimum for the year 54% 27% 125% 108% 31% 142%
Minimum statutory requirement 20% 20% 20% 100% 20% 100%
NOTES (continued)

164
EQUITY GROUP HOLDINGS PLC AND SUBSIDIARIES INTEGRATED REPORT AND FINANCIAL STATEMENTS FOR THE YEAR ENDED 31 DECEMBER 2019
4.Financial risk management (continued) (c) Liquidity risk (continued)
Analysis of financial assets and liabilities by remaining contractual maturities
The table below summarises the maturity profile of the undiscounted cash flows of the Group’s financial assets and liabilities
as at 31 December.
Group 2019 Less than 3 months
3-6 months 6-12 months
1-5 years More than 5 years
Totals
Shs’ millions
Shs’ millions
Shs’ millions
Shs’ millions
Shs’ millions
Shs’ millions
Financial assets
Balances and deposits due from financial institutions 86,434 - - - - 86,434
Loans and advances to customers 52,875 18,173 41,047 209,486 173,980 495,561
Investment securities 31,835 15,421 11,102 61,350 120,426 240,134
Amounts due from related parties 19 - - - - 19
Derivative financial assets 472 - - - - 472
Other assets 8,358 - - - - 8,358
Total financial assets 179,993 33,594 52,149 270,836 294,406 830,978
Financial liabilities
Deposits from customers 188,284 26,831 41,328 265,673 1,808 523,924
Borrowed funds 6,862 627 7,588 22,676 23,097 60,850
Other liabilities 12,865 - - - - 12,865
Lease liabilities 515 468 968 6,312 1,037 9,300
Total financial liabilities 208,526 27,926 49,884 294,661 25,942 606,939
Liquidity gap at 31 December 2019 (28,533) 5,668 2,265 (23,825) 268,464 224,039
0 - 3 months 3-6 months 6-12 months 1-5 years Totals
Shs’ millions Shs’ millions Shs’ millions Shs’ millions Shs’ millions
Off-balance sheet items
Guarantees and standby letters of credit 10,736 8,687 12,273 21,629 53,325
Letters of credit, acceptances and other documentary credits 6,028 17,361 8,567 1,327 33,283
Capital commitments - - 578 - 578
Loans approved but not disbursed 9,853 2,982 4,200 3,597 20,632
Total commitments and guarantees 26,617 29,030 25,618 26,553 107,818
NOTES (continued)

165
EQUITY GROUP HOLDINGS PLC AND SUBSIDIARIES INTEGRATED REPORT AND FINANCIAL STATEMENTS FOR THE YEAR ENDED 31 DECEMBER 2019
4.Financial risk management (continued) (c) Liquidity risk (continued)
Group 2018 Less than 3 months
3-6 months 6-12 months 1-5 years More than 5 years
Totals
Shs’ millions
Shs’ millions
Shs’ millions
Shs’ millions
Shs’ millions
Shs’ millions
Financial assets
Balances and deposits due from financial institutions 75,852 - - - - 75,852
Loans and advances to customers 48,434 14,405 29,914 185,346 150,571 428,670
Investment securities 25,578 16,495 43,612 81,307 72,496 239,488
Amounts due from related parties 24 - - - - 24
Derivative financial assets 225 - - - - 225
Other assets 8,358 - - - - 8,358
Total financial assets 158,471 30,900 73,526 266,653 223,067 752,617
Financial liabilities
Deposits from customers 194,759 21,985 29,408 207,911 39 454,102
Borrowed funds 8,217 1,119 8,308 29,068 4,474 51,186
Other liabilities 10,343 - - - - 10,343
Total financial liabilities 213,319 23,104 37,716 236,979 4,513 515,631
Liquidity gap at 31 December 2018 (54,848) 7,796 35,810 29,674 218,554 236,986
0 - 3 months
3-6 months 6-12 months 1-5 years Totals
Shs’ millions
Shs’ millions
Shs’ millions
Shs’ millions
Shs’ millions
Off-balance sheet items
Guarantees and standby letters of credit 7,523 8,889 10,221 17,538 44,171
Letters of credit, acceptances and other documentary credits 13,941 8,720 6,442 11 29,114
Capital commitments 73 - 245 - 318
Loans approved but not disbursed 3,692 4,253 2,418 1,661 12,024
Total commitments and guarantees 25,229 21,862 19,326 19,210 85,627
NOTES (continued)
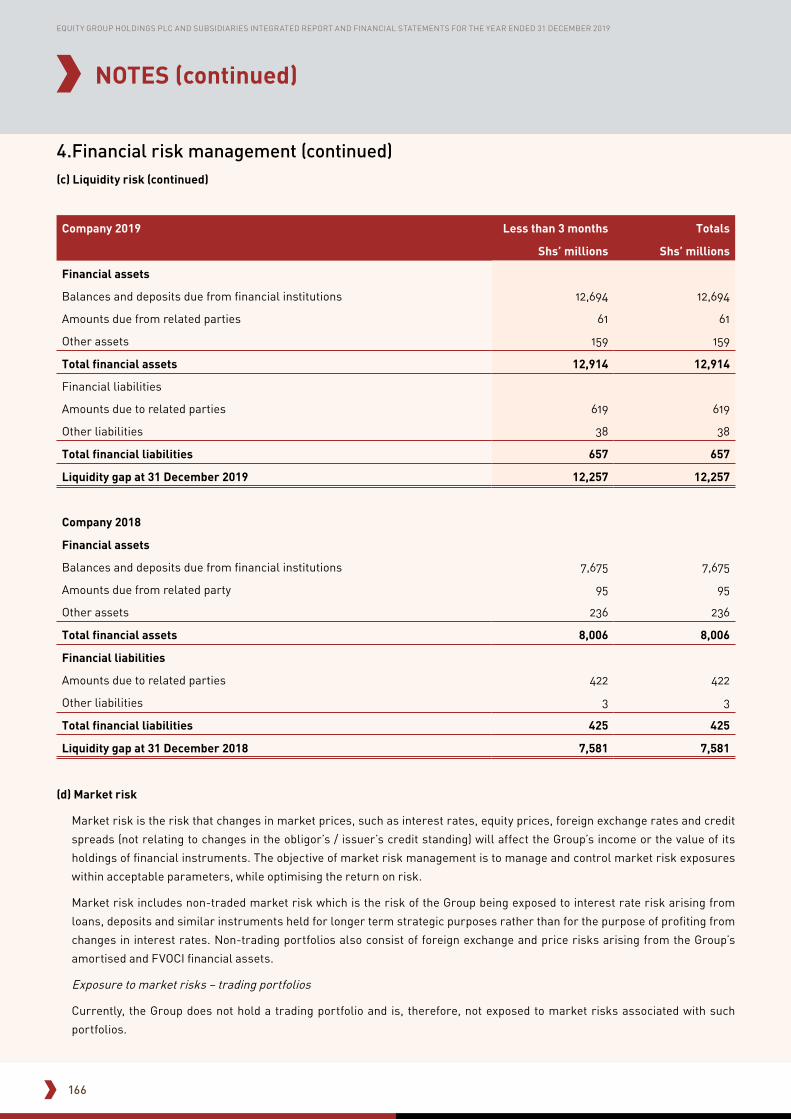
166
EQUITY GROUP HOLDINGS PLC AND SUBSIDIARIES INTEGRATED REPORT AND FINANCIAL STATEMENTS FOR THE YEAR ENDED 31 DECEMBER 2019
4.Financial risk management (continued) (c) Liquidity risk (continued)
Company 2019 Less than 3 months Totals
Shs’ millions Shs’ millions
Financial assets
Balances and deposits due from financial institutions 12,694 12,694
Amounts due from related parties 61 61
Other assets 159 159
Total financial assets 12,914 12,914
Financial liabilities
Amounts due to related parties 619 619
Other liabilities 38 38
Total financial liabilities 657 657
Liquidity gap at 31 December 2019 12,257 12,257
Company 2018
Financial assets
Balances and deposits due from financial institutions 7,675 7,675
Amounts due from related party 95 95
Other assets 236 236
Total financial assets 8,006 8,006
Financial liabilities
Amounts due to related parties 422 422
Other liabilities 3 3
Total financial liabilities 425 425
Liquidity gap at 31 December 2018 7,581 7,581
(d) Market risk
Market risk is the risk that changes in market prices, such as interest rates, equity prices, foreign exchange rates and credit
spreads (not relating to changes in the obligor’s / issuer’s credit standing) will affect the Group’s income or the value of its
holdings of financial instruments. The objective of market risk management is to manage and control market risk exposures
within acceptable parameters, while optimising the return on risk.
Market risk includes non-traded market risk which is the risk of the Group being exposed to interest rate risk arising from
loans, deposits and similar instruments held for longer term strategic purposes rather than for the purpose of profiting from
changes in interest rates. Non-trading portfolios also consist of foreign exchange and price risks arising from the Group’s
amortised and FVOCI financial assets.
Exposure to market risks – trading portfolios
Currently, the Group does not hold a trading portfolio and is, therefore, not exposed to market risks associated with such
portfolios.
NOTES (continued)

167
EQUITY GROUP HOLDINGS PLC AND SUBSIDIARIES INTEGRATED REPORT AND FINANCIAL STATEMENTS FOR THE YEAR ENDED 31 DECEMBER 2019
4.Financial risk management (continued) (d) Market risk (continued)
Management of market risk
The objective of market risk measurement is to manage
and control market risk exposures within acceptable limits
while optimising the return on risk. The Group’s Treasury
is responsible for the development of detailed market risk
management policies and for day-to-day implementation of
those policies.
Furthermore it includes the protection and enhancement of
the statement of financial position and statement of profit
or loss and other comprehensive income and facilitating
business growth within a controlled and transparent risk
management framework.
All foreign exchange risk within the Group is managed by
the Treasury department. Accordingly, the foreign exchange
position is treated as part of the Group’s trading portfolios
for risk management purposes (refer to Note 33).
Overall authority for market risk management is vested
in the Board Risk Management Committee. The Finance
and Treasury departments in collaboration with the
Risk Management department are responsible for the
development of detailed market risk management policies
(subject to review and approval by Board Risk Management
Committee) and for the day-to-day review of their
implementation.
Market risk measurement techniques
(i) Value at risk
The Group applies a ‘value at risk’ (VAR) methodology to
its foreign currency trading to estimate the market risk of
positions held and the maximum losses expected, based
upon a number of assumptions for various changes in
market conditions. The Board sets limits on the value of risk
that may be accepted for each banking subsidiary, which are
monitored on a daily basis by the Treasury department of
each banking subsidiary.
VAR is a statistically based estimate of the potential loss on
the current portfolio from adverse market movements. It
expresses the ‘maximum’ amount the banking subsidiary
might lose, but only to a certain level of confidence (95%).
There is therefore a specified statistical probability (5%) that
actual loss could be greater than the VAR estimate.
The VAR model assumes a certain ‘holding period’ until
positions can be closed (1 day). It also assumes that market
moves occurring over this holding period will follow a similar
pattern to those that have occurred over 1-day periods in the
past. The Group’s assessment of past movements is based
on data for the past five years. The use of this approach does
not prevent losses outside of these limits in the event of
more significant market movements.
VAR constitutes an integral part of the Group’s market risk
control regime. VAR limits are established by the Board
annually for all trading portfolio operations and allocated to
business units. Actual exposure against limits is reviewed
daily by the Treasury department of each banking subsidiary
and centrally by Group Treasury.
(ii) Stress tests
The Group applies a ‘stress test’ methodology to its non-
trading book. Interest rate risk in the non-trading book is
measured through the use of interest rate repricing gap
analysis. Stress tests provide an indication of the potential
size of losses that could arise in extreme conditions. The
results of the stress tests are reviewed by heads of business
unit and by the Board. The stress testing is tailored to the
business and typically uses scenario analysis.
Interest rate risk
The principal risk to which non-trading portfolios are
exposed is the risk of loss from fluctuations in the future
cash flows or fair values of financial instruments because
of a change in market interest rates. Interest rate risk is
managed principally through monitoring interest rate gaps
and by having pre-approved limits for repricing bands. The
Board Risk Management Committee is the monitoring body
for compliance with these limits and is assisted by Treasury
Back Office and Finance Department in the day-to-day
monitoring activities, while Risk Management Department
carries out regular reviews. A summary of the Group’s
interest rate gap position on non-trading portfolios is as
follows:
NOTES (continued)

168
EQUITY GROUP HOLDINGS PLC AND SUBSIDIARIES INTEGRATED REPORT AND FINANCIAL STATEMENTS FOR THE YEAR ENDED 31 DECEMBER 2019
4.Financial risk management (continued)(d) Market risk (continued)
Interest rate risk (continued)
Financial assets and liabilities subject to interest rate fluctuations.
Included in the table below are financial assets and financial liabilities at carrying amount categorised by earlier of contractual
repricing or maturity date.
Carrying amount
Non-interest bearing
Less than 3 months
3-6 months
6-12months
1-5 years
More than 5 years
31 December 2019 Shs’ millions
Shs’ millions Shs’ millions
Shs’ millions
Shs’ millions
Shs’ millions
Shs’ millions
AssetsBalances and deposits due from financial institutions 86,434 50,230 36,204 - - - -Loans and advances to customers 366,440 - 366,440 - - - -Investment securities 172,208 70 30,578 13,811 6,432 33,028 88,289
625,082 50,300 433,222 13,811 6,432 33,028 88,289LiabilitiesDeposits from customers 482,752 363,980 27,955 24,301 40,537 25,439 540Borrowed funds 56,714 - 5,833 546 7,158 25,676 17,501
Lease liabilities 7,496 - 416 377 780 5,087 836546,962 363,980 34,204 25,224 48,475 56,202 18,877
Interest rate sensitivity gap 78,120 (313,680) 399,018 (11,413) (42,043) (23,174) 69,412
Carrying amount
Non-interest bearing
Less than 3 months
3-6 months
6-12months
1-5 years
More than 5 years
31 December 2018 Shs’ millions
Shs’ millions Shs’ millions
Shs’ millions
Shs’ millions
Shs’ millions
Shs’ millions
AssetsBalances and deposits due from financial institutions 74,619 36,242 38,377 - - - -Loans and advances to customers 297,227 - 297,227 - - - -Investment securities 160,952 - 23,736 13,860 39,422 29,659 54,275
532,798 36,242 359,340 13,860 39,422 29,659 54,275LiabilitiesDeposits from customers 422,758 282,230 42,247 40,126 33,871 24,277 7Borrowed funds 45,101 - 6,036 1,017 8,418 27,384 2,246
467,859 282,230 48,283 41,143 42,289 51,661 2,253Interest rate sensitivity gap 64,939 (245,988) 311,057 (27,283) (2,867) (22,002) 52,022
NOTES (continued)

169
EQUITY GROUP HOLDINGS PLC AND SUBSIDIARIES INTEGRATED REPORT AND FINANCIAL STATEMENTS FOR THE YEAR ENDED 31 DECEMBER 2019
4.Financial risk management (continued)(d) Market risk (continued)
Interest rate risk (continued)
The Group closely monitors interest rate movements and seeks to limit its exposure by managing the interest rate and maturity
structure of assets and liabilities carried on the statement of financial position. Assets and Liabilities Committee (ALCO)
monitors compliance with the set interest rate gaps.
Company interest rate risk
Carrying amount Less than 3 Months
31 December 2019 Shs’ millions Shs’ millions
Assets
Cash and cash equivalents 12,694 12,694
Interest rate sensitivity gap at 31 December 2019 12,694 12,694
31 December 2018
Assets
Cash and cash equivalents 7,675 7,675
7,675 7,675
During the year, a 5% increase / decrease (2018: 5%) of the annual interest rate would have the following effect on profit or loss
and equity:
Group Company Group Company
Sensitivity impact on
profit or loss
impact on
profit or loss
impact on
equity
impact on
equity
Shs’ millions Shs’ millions Shs’ millions Shs’ millions
2019 +/-5% +/-2,242 +/-2 +/-1,570 +/-1
2018 +/-5% +/-2,071 +/-2 +/-1,450 +/-1
Exposure to other market risks – non-trading portfolios
Credit spread risk (not relating to changes in the obligor / issuer’s credit standing) on debt securities held by Treasury and price
risk is subject to regular monitoring by Board Risk Management Committee. Currently, the exposure to other market risks on
non-trading portfolio is not significant in relation to the overall results and financial position of the Group.
Foreign currency exposure – Group
Currency risk is the risk that the fair value or future cash flows of a financial instrument will fluctuate due to changes in
foreign exchange rates. The Board of Directors has set limits on foreign currency positions. The foreign currency positions are
monitored on daily basis and strategies used to ensure that positions are maintained within the established limits.
NOTES (continued)

170
EQUITY GROUP HOLDINGS PLC AND SUBSIDIARIES INTEGRATED REPORT AND FINANCIAL STATEMENTS FOR THE YEAR ENDED 31 DECEMBER 2019
NOTES (continued)
4.Financial risk management (continued)(d) Market risks (continued)
Foreign currency exposure – Group (continued)
The amounts below summarize the foreign currency exposure position as at 31 December.
US$ GBP Euro ZAR Others Total
Shs’ millions Shs’ millions Shs’ millions Shs’ millions Shs’ millions Shs’ millions
31 December 2019
Cash and cash equivalents 39,034 506 2,431 52 539 42,562
Loans and advances to customers 137,245 35 320 - - 137,600
Investment securities 16,514 - - - 3,473 19,987
Other assets 1,995 - 683 - - 2,678
Total assets 194,788 541 3,434 52 4,012 202,827
Customer deposits 116,858 499 2,839 1 31 120,228
Borrowed funds 53,534 - - - 27 53,561
Other liabilities 12,882 2 39 59 8 12,990
Total liabilities 183,274 501 2,878 60 66 186,779
Net financial position 11,514 40 556 (8) 3,946 16,048
31 December 2018
Cash and cash equivalents 24,250 455 1,521 39 48 26,313
Loans and advances to customers 106,204 39 192 - - 106,435
Investment securities 14,337 - - - 5,328 19,665
Other assets 1,710 - 119 10 217 2,056
Total assets 146,501 494 1,832 49 5,593 154,469
Customer deposits 94,844 486 2,312 4 40 97,686
Borrowed funds 38,378 - - - 58 38,436
Other liabilities 5,922 2 136 24 12 6,096
Total liabilities 139,144 488 2,448 28 110 142,218
Net financial position 7,357 6 (616) 21 5,483 12,251
Effect on profit before income tax Effect on equity
Shs’ millions Shs’ millions
Changes in EUR
2019 +/-2% +/-23 +/-16
2018 +/-7% +/-43 +/-30
Changes in US$
2019 +/-1% +/-9 +/-6
2018 +/-2% +/-147 +/-103
Changes in GBP
2019 +/-3% +/-1 +/-1
2018 +/-8% +/-1 +/-1

171
EQUITY GROUP HOLDINGS PLC AND SUBSIDIARIES INTEGRATED REPORT AND FINANCIAL STATEMENTS FOR THE YEAR ENDED 31 DECEMBER 2019
NOTES (continued)
4.Financial risk management (continued)
(d) Market risks (continued)
Foreign currency exposure – Group (continued)
The analysis calculates the effect of a reasonably possible
movement of the currency rate against other currencies
profit or loss and equity. A negative amount in the table
reflects a potential net reduction in profit or equity, while a
positive amount reflects a net potential increase.
The Company did not have significant foreign currency
denominated assets or liabilities as at 31 December 2019.
(e) Capital management
Capital risk is the risk that the Group is unable to maintain
adequate levels of capital which could lead to an inability
to support business activity or to meet regulatory
requirements. Changes to credit ratings, could result in
increased costs or reduced capacity to raise funding.
The primary objectives of the Group’s capital management
policy are to ensure that the Group complies with externally
imposed capital requirements and maintains strong credit
ratings and healthy capital ratios in order to support its
business and to maximise shareholder value. This is done by
the Board of Directors. The Group Board manages its capital
structure and makes adjustments to it according to changes
in economic conditions and the risk characteristics of its
activities. In order to maintain or adjust the capital structure,
the Group Board may adjust the amount of dividend payment
to shareholders, return capital to shareholders or issue
capital securities. Primary objectives and core practices
are:
• Provide a viable and sustainable business offering
by maintaining adequate capital to cover the Group’s
current and forecast business needs and associated
risks;
• Meet minimum regulatory requirements;
• Ensure the Group maintains adequate capital to
withstand the impact of the risks that may arise
under the stressed conditions;
• Perform internal and regulatory stress tests;
• Maintain capital buffers over regulatory minimum;
• Develop contingency plans for severe (stress
management actions) to support the Group’s and
Company’s growth and strategic options; and
• Maintain a capital plan on a short-term and medium
term basis aligned with strategic objectives.
We adopt a forward-looking, risk based approach to capital
risk management. Capital demand and supply is actively
managed taking into account the regulatory, economic and
commercial environment in which the Group operates.
The Group’s policy is to maintain a strong capital base so
as to maintain investor, creditor and market confidence
and to sustain future development of the business. The
impact of the level of capital on shareholders’ return is also
recognised, and the Group and the Company recognises the
need to maintain a balance between the higher returns that
might be possible with greater gearing and the advantages
and security afforded by a sound capital position.
The Group has complied with all externally imposed capital
requirements throughout the year except for Equity Bank
Tanzania Limited (EBTL). The Group Board of Directors
has approved measures to restore EBTL’s capital above
regulatory minimum.

172
EQUITY GROUP HOLDINGS PLC AND SUBSIDIARIES INTEGRATED REPORT AND FINANCIAL STATEMENTS FOR THE YEAR ENDED 31 DECEMBER 2019
4.Financial risk management (continued)(e) Capital management (continued)
The regulatory capital position at 31 December was as follows:
Shs ‘millions
EBKL EBCL EBTL EBUL EBRL EBSSL
31 December 2019
Risk Weighted Assets 475,760 46,258 20,766 39,515 18,943 732
Core Capital 63,434 7,273 887 5,592 4,055 2,000
Total Capital 83,704 7,273 910 5,592 4,055 2,000
Core capital / TRWA 13.3% 15.7% 4.3% 14.2% 21.4% 273.2%
Statutory minimum 10.5% 6.0% 12.5% 10.0% 10.0% 8.0%
Excess 2.8% 9.7% (8.2%) 4.2% 11.4% 265.3%
Total capital / TRWA 17.6% 15.7% 4.4% 14.2% 21.4% 273.2%
Statutory minimum 14.5% 10.0% 14.5% 12.0% 15.0% 12.0%
Excess 3.1% 5.7% (10.1%) 2.2% 6.4% 261.2%
Core capital / deposits 16.7% 11.4% 5.6% 16.2% 18.6% 38.5%
Statutory minimum 10.5% 8.0% 8.0% 10.0% 8.0% 8.0%
Excess 6.2% 3.4% (2.4%) 6.2% 10.6% 30.5%
31 December 2018
Risk Weighted Assets 400,289 26,462 20,805 25,284 17,952 766
Core Capital 55,864 6,111 2,217 4,615 3,390 2,984
Total Capital 55,864 6,111 2,795 4,615 3,390 2,984
Core capital / TRWA 15.3% 23.1% 10.7% 18.3% 18.9% 389.6%
Statutory minimum 10.5% 8.0% 12.5% 10.5% 10.5% 10.5%
Excess 4.8% 15.1% (1.8%) 7.8% 8.4% 379.1%
Total capital / TRWA 15.3% 23.1% 13.4% 18.3% 18.9% 389.6%
Statutory minimum 14.5% 10.0% 14.5% 14.5% 14.5% 14.5%
Excess 0.8% 13.1% (1.1%) 3.8% 4.4% 375.1%
Core capital / deposits 17.9% 14.0% 13.6% 19.2% 16.8% 56.8%
Statutory minimum 10.5% 8.0% 8.0% 8.0% 8.0% 8.0%
Excess 7.4% 6.0% 5.6% 11.2% 8.8% 48.8%
NOTES (continued)

173
EQUITY GROUP HOLDINGS PLC AND SUBSIDIARIES INTEGRATED REPORT AND FINANCIAL STATEMENTS FOR THE YEAR ENDED 31 DECEMBER 2019
4.Financial risk management (continued)(e)Capital management (continued)
Group
2019 2018
Shs’ Millions Shs’ Millions
Total risk-weighted assets 601,744 493,817
Capital ratios
Total regulatory capital expressed as a percentage of total risk-weighted assets 20.5% 19.1%
Total tier 1 capital expressed as a percentage of risk-weighted Assets 17.0% 19.1%
5.Financial assets and liabilities The fair value of financial instruments is included at the price that would be received to sell an asset or paid to transfer a liability
in an orderly transaction between market participants at the measurement date, or in its absence, the most advantageous
market to which the Group has access at that date. The fair value of a liability reflects its non-performance risk. The fair value
of cash and cash equivalents, loans and advances, customer deposits and borrowed funds are evaluated by the Group based on
parameters such as interest rates, specific country factors and individual creditworthiness of the customer. The valuation is
performed on a discounted cash flow basis. Based on this evaluation, allowances are taken to account for the expected losses
of the receivables.
Valuation methods and assumptions
The following methods and assumptions were used to estimate the fair values. The fair values of the quoted notes and bonds
are based on price quotations at the reporting date. The fair values of loans and advances, borrowings and other financial
liabilities, are estimated by discounting future cash flows using rates currently available for debt on similar terms, credit risk
and remaining maturities.
Valuation technique Significant observable input Range (Weighted
average)
Level 2
FVOCI investment securities Fair value at closing rate Quoted yields 7%-13.5%
Amortised cost investment securities Fair value at closing rate Quoted yields 9.5%-12.5%
Level 3
Currency swaps and forwards Forward pricing model Interest curve 2%-4%
Loans note at FVTPL Discounted cash flows Growth rate assumption 0 - 4%
Long-term debt equity ratio in
determining WACC
57:43
Financial liabilities
Deposits from customers-fixed
deposits
Discounted cash flow Fixed rate and fixed time period 5%-9%
Borrowed funds Discounted cash flow Expected cashflows 4%-6%
The fair values of remaining FVOCI financial assets are derived from quoted market prices in active markets. There have been
no transfers between Level 1 and Level 2 during the year ended 31 December 2019 (2018: Nil).
The table below shows certain financial assets and financial liabilities that have been measured at either fair value, or for which
fair value has been disclosed in the financial statements, analysed by the level of valuation method.
NOTES (continued)

174
EQUITY GROUP HOLDINGS PLC AND SUBSIDIARIES INTEGRATED REPORT AND FINANCIAL STATEMENTS FOR THE YEAR ENDED 31 DECEMBER 2019
NOTES (continued)
5.Financial assets and liabilities (continued)Fair value measurement hierachy (continued)
Group Level 1 Level 2 Level 3 Total
At 31 December 2019 Shs’ millions Shs’ millions Shs’ millions Shs’ millions
Financial assets fair value disclosures:
Investment securities – FVOCI - 150,128 - 150,128
Loan note at FVTPL - - 4,067 4,067
Derivative financial assets - 472 - 472
Investment securities - FVTPL - 507 - 507
Total financial assets at fair value - 151,107 4,067 155,174
At 31 December 2018
Financial assets fair value disclosures
FVOCI investment securities - 142,435 - 142,435
Derivative financial assets - 255 - 255
Loan note at FVTPL - - 5,091 5,091
Total financial assets at fair value - 142,690 5,091 147,781
The movement in the loan note at FVTPL is attributable to fair value changes.
The following summarises the carrying amount of those assets and liabilities not held at fair value. Except for amortised cost
investment securities, the carrying amount of assets and liabilities held at amortised cost is considered to approximate their
fair value where they have short tenor or, for long term facilities, earn/accrue interest at market rate.
Group Carrying
amount
Fair value Level 1 Level 2 Level 3
At 31 December 2019 Shs’
millions
Shs’
millions
Shs’
millions
Shs’
millions
Shs’
millions
Cash balances and deposits in financial institutions 86,434 86,434 - - 86,434
Investment securities – Amortised cost 21,573 19,811 - 19,811 -
Loans and advances at amortised cost 362,373 362,373 - - 362,373
Due from related parties 19 19 - - 19
Other assets 8,358 8,358 - - 8,358
Total financial assets 478,757 476,995 - 19,811 457,184
Deposits from customers 482,752 482,752 - - 482,752
Borrowed funds 56,714 56,714 - - 56,714
Lease liabilities 7,496 7,496 - - 7,496
Other liabilities 12,865 12,865 - - 12,865
Total liabilities 559,827 559,827 - - 559,827

175
EQUITY GROUP HOLDINGS PLC AND SUBSIDIARIES INTEGRATED REPORT AND FINANCIAL STATEMENTS FOR THE YEAR ENDED 31 DECEMBER 2019
5.Financial assets and liabilitiesFair value measurement hierarchy (continued)
Group Carrying amount
Fair value Level 1 Level 2 Level 3
At 31 December 2018 Shs’ millions
Shs’ millions
Shs’ millions
Shs’ millions
Shs’ millions
Balances and deposits due from financial institutions 74,619 74,619 - - 74,619
Investment securities – Amortised cost 16,469 16,469 - 16,469 -
Loans and advances at amortised cost 292,136 292,136 - - 292,136
Due from related parties 24 24 - - 24
Other assets 9,157 9,157 - - 9,157
Total financial assets 394,453 392,405 - 16,469 375,936
Deposits from customers 422,758 422,758 - - 422,758
Borrowed funds 45,101 45,101 - - 45,101
Other liabilities 10,343 10,343 - - 10,343
Total liabilities 478,202 478,202 - - 478,202
Company Carrying amount
Fair value Level 1 Level 2 Level 3
At 31 December 2019 Shs’ millions
Shs’ millions
Shs’ millions
Shs’ millions
Shs’ millions
Cash balances and deposits in financial institutions 12,694 12,694 - - 12,694
Due from related parties 61 61 - - 61
Other assets 159 159 - - 159
Total financial assets 12,914 12,914 - - 12,914
Due to related parties 619 619 - - 619
Other liabilities 38 38 - - 38
Total liabilities 657 657 - - 657
Company Carrying amount
Fair value Level 1 Level 2 Level 3
At 31 December 2018 Shs’ millions
Shs’ millions
Shs’ millions
Shs’ millions
Shs’ millions
Cash balances and deposits in financial institutions 7,675 7,675 - - 7,675
Due from related parties 95 95 - - 95
Other assets 236 236 - - 236
Total financial assets 8,006 8,006 - - 8,006
Due to related parties 422 422 - - 422
Other liabilities 3 3 - - 3
Total liabilities 425 425 - - 425
NOTES (continued)

176
EQUITY GROUP HOLDINGS PLC AND SUBSIDIARIES INTEGRATED REPORT AND FINANCIAL STATEMENTS FOR THE YEAR ENDED 31 DECEMBER 2019
6.Interest income
Group Company
2019 2018 2019 2018
Shs’ millions Shs’ millions Shs’ millions Shs’ millions
Interest income
Loans and advances to customers 41,648 36,503 - -
Cash and cash equivalents 1,181 431 182 212
Investment securities at amortised cost 10,218 10,400 - -
Investment securities at FVOCI 6,676 5,896 - -
59,723 53,230 182 212
Interest expense
Deposits from banks (120) (557) - -
Deposits from customers (10,369) (8,560) - -
Borrowed funds (Note 26) (3,394) (2,691) - -
Lease liabilities (Note 14) (857) - - -
(14,740) (11,808) - -
Net interest income 44,983 41,422 182 212
7.Net fee and commission income(a) Fee and commission income
Group
2019 2018
Shs’ millions Shs’ millions
Service fees and commission 15,129 13,053
Credit related fees 5,597 5,117
Custodial fee income 131 94
20,857 18,264
(b) Fee and commission expense
Fee and commission expense (3,687) (2,993)
Net fee and commission income 17,170 15,271
8.Net foreign exchange income
Group
2019 2018
Shs’ millions Shs’ millions
Net foreign exchange gain 3,493 3,822
NOTES (continued)
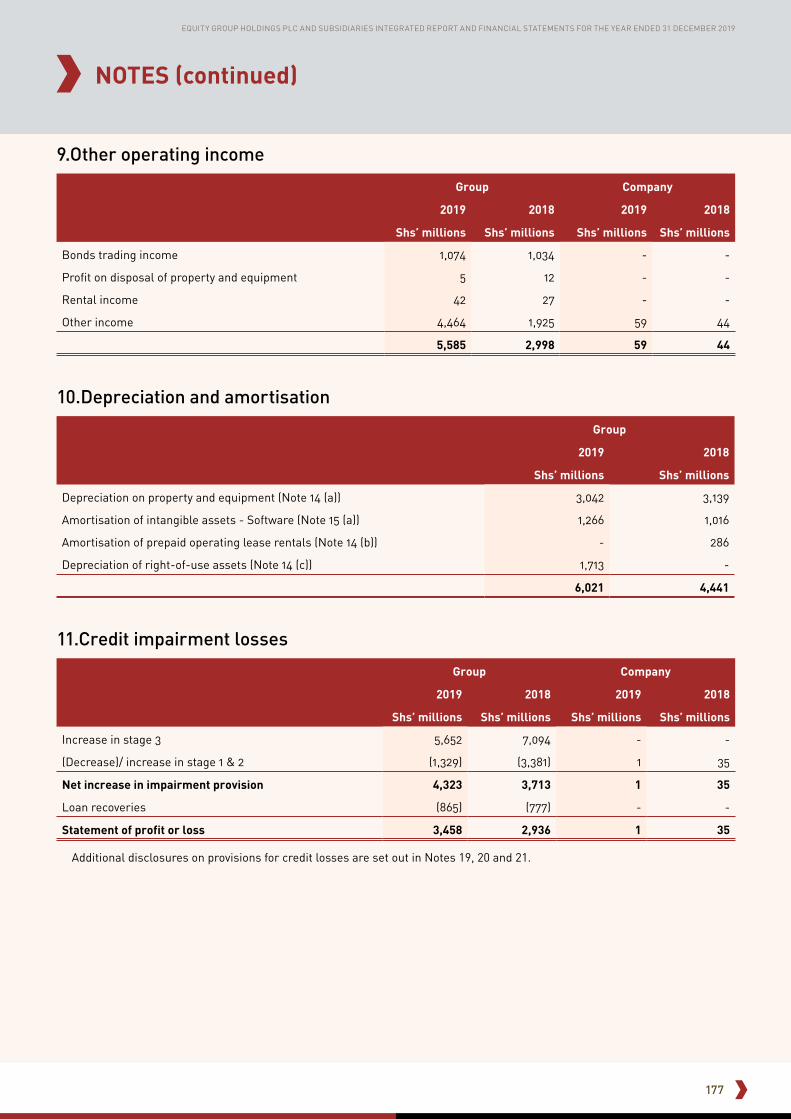
177
EQUITY GROUP HOLDINGS PLC AND SUBSIDIARIES INTEGRATED REPORT AND FINANCIAL STATEMENTS FOR THE YEAR ENDED 31 DECEMBER 2019
9.Other operating income
Group Company
2019 2018 2019 2018
Shs’ millions Shs’ millions Shs’ millions Shs’ millions
Bonds trading income 1,074 1,034 - -
Profit on disposal of property and equipment 5 12 - -
Rental income 42 27 - -
Other income 4,464 1,925 59 44
5,585 2,998 59 44
10.Depreciation and amortisation
Group
2019 2018
Shs’ millions Shs’ millions
Depreciation on property and equipment (Note 14 (a)) 3,042 3,139
Amortisation of intangible assets - Software (Note 15 (a)) 1,266 1,016
Amortisation of prepaid operating lease rentals (Note 14 (b)) - 286
Depreciation of right-of-use assets (Note 14 (c)) 1,713 -
6,021 4,441
11.Credit impairment losses
Group Company
2019 2018 2019 2018
Shs’ millions Shs’ millions Shs’ millions Shs’ millions
Increase in stage 3 5,652 7,094 - -
(Decrease)/ increase in stage 1 & 2 (1,329) (3,381) 1 35
Net increase in impairment provision 4,323 3,713 1 35
Loan recoveries (865) (777) - -
Statement of profit or loss 3,458 2,936 1 35
Additional disclosures on provisions for credit losses are set out in Notes 19, 20 and 21.
NOTES (continued)

178
EQUITY GROUP HOLDINGS PLC AND SUBSIDIARIES INTEGRATED REPORT AND FINANCIAL STATEMENTS FOR THE YEAR ENDED 31 DECEMBER 2019
12.Employee benefits
Group Company
2019 2018 2019 2018
Shs’ millions Shs’ millions Shs’ millions Shs’ millions
Salaries and other staff costs 12,306 11,057 87 55
Contributions to defined contribution plans 646 487 - -
12,952 11,544 87 55
The average number of staff in the Group for the year was 6,580 (2018: 6,318).
13.Operating lease expenses
Group Company
2019 2018 2019 2018
Shs’ millions Shs’ millions Shs’ millions Shs’ millions
Operating lease rentals 425 2,257 2 -
The Group leases a number of branch and office premises under operating leases. The leases typically run for a year up to
ten years, with an option to renew the lease after that date. Lease payments are increased accordingly to reflect market lease
rentals as detailed in Note 30. From 1 January 2019, the Group has recognised right-of-use assets for these leases as per IFRS
16, except for short-term and low-value leases.
14.(a) Property and equipment – Company
2019 2018
Shs’ millions Shs’ millions
Furniture and fittings
Additions during the year 12 -
Depreciation charge for the year* - -
At the end of the year 12 -
*The depreciation charge of Shs 354,000 when converted to Shs millions is less than 1 million and has not been presented
above.
NOTES (continued)

14.(a
) Pro
pert
y an
d eq
uipm
ent –
Gro
up
Free
hold
land
&
bui
ldin
gsLe
aseh
old
impr
ovem
ents
Mot
or
vehi
cles
Eq
uipm
ent,
fu
rnit
ure
&
fitt
ings
Com
pute
rsVi
llag
e ce
ll
bank
ing
van
sW
ork-
in-
pro-
gres
sTo
tal
Shs’
mill
ions
Shs’
mill
ions
Shs’
mill
ions
Shs’
mill
ions
Shs’
mill
ions
Shs’
mill
ions
Shs’
mill
ions
Shs’
mill
ions
31 D
ecem
ber
2019
Cos
t
At s
tart
of y
ear
1,57
311
,604
487
7,51
113
,940
103
294
35,5
12
Tran
slat
ion
diff
eren
ces
1631
9(3
)(2
8)(2
1)-
(22)
261
Add
ition
s14
476
135
624
1,03
3-
1,30
93,
591
Tran
sfer
s-
59-
-15
1-
(210
)-
Dis
posa
ls-
(745
)(5
2)(1
,077
)(3
42)
--
(2,2
16)
At e
nd o
f yea
r1,
603
11,7
1356
77,
030
14,7
6110
31,
371
37,1
48
Acc
umul
ated
dep
reci
atio
n
At s
tart
of y
ear
82
8,04
2-
4,
822
11
,825
103
-25
,236
Tran
slat
ion
diff
eren
ces
3(6
2)(2
)(2
1)(7
)-
-(8
9)
Char
ge fo
r th
e ye
ar33
956
6380
41,
186
--
3,04
2
Tran
sfer
s-
13-
(13)
--
--
Dis
posa
ls-
(744
)(5
2)(9
72)
(304
)-
-(2
,072
)
At e
nd o
f yea
r11
88,
205
371
4,62
012
,700
103
1,37
126
,117
Net
boo
k va
lue
at e
nd o
f yea
r1,
485
3,50
819
62,
410
2,06
1-
1,37
111
,031
EQ
UIT
Y G
RO
UP
HO
LD
ING
S P
LC A
ND
SU
BS
IDIA
RIE
S IN
TEG
RAT
ED
RE
PO
RT
AN
D F
INA
NC
IAL
STA
TEM
EN
TS/ F
OR
TH
E YE
AR
EN
DE
D 3
1 D
EC
EM
BE
R 2
019
179
NO
TES
(con
tinu
ed)

EQ
UIT
Y G
RO
UP
HO
LD
ING
S P
LC A
ND
SU
BS
IDIA
RIE
S IN
TEG
RAT
ED
RE
PO
RT
AN
D F
INA
NC
IAL
STA
TEM
EN
TS/ F
OR
TH
E YE
AR
EN
DE
D 3
1 D
EC
EM
BE
R 2
019
14.(a
) Pro
pert
y an
d eq
uipm
ent –
Gro
up (c
ontin
ued)
Free
hold
land
&
bui
ldin
gsLe
aseh
old
impr
ovem
ents
Mot
or
vehi
cles
Eq
uipm
ent,
fu
rnit
ure
&
fitt
ings
Com
pute
rsVi
llag
e ce
ll
bank
ing
vans
W
ork-
in-
prog
ress
Tota
l
Shs’
mill
ions
Shs’
mill
ions
Shs’
mill
ions
Shs’
mill
ions
Shs’
mill
ions
Shs’
mill
ions
Shs’
mill
ions
Shs’
mill
ions
31 D
ecem
ber
2018
Cos
t
At s
tart
of y
ear
1,36
710
,732
469
7,16
513
,082
103
279
33,1
97
Tran
slat
ion
diff
eren
ces
9515
02
(87)
19-
(77)
102
Add
ition
s
1
31
717
50
661
978
-21
7
2,7
54
Tran
sfer
s
(13)
38
442
52
-
(1
23)
-
Dis
posa
ls
(7)
(33)
(3
8)
(2
70)
(191
)-
(
2)
(5
41)
At e
nd o
f yea
r1,
573
11,6
0448
77,
511
13,9
4010
329
435
,512
Acc
umul
ated
dep
reci
atio
n
At s
tart
of y
ear
115
6,94
526
74,
278
10,6
2410
3-
22,3
32
Tran
slat
ion
diff
eren
ces
(56)
202
7745
2-
-27
0
Char
ge fo
r th
e ye
ar26
923
56
747
1,3
87
--
3,13
9
Tran
sfer
s(3
)-
- (1
4)17
-
--
Dis
posa
ls-
(28)
(38)
(234
) (2
05)
--
(505
)
At e
nd o
f yea
r82
8,04
2 36
2
4,82
2
11,8
25
103
-25
,236
Net
boo
k va
lue
at e
nd o
f yea
r1,
491
3,56
212
52,
689
2,11
5-
294
10,2
76
180
NO
TES
(con
tinu
ed)

181
EQUITY GROUP HOLDINGS PLC AND SUBSIDIARIES INTEGRATED REPORT AND FINANCIAL STATEMENTS FOR THE YEAR ENDED 31 DECEMBER 2019
14.(b) Prepaid operating lease rentals
Group
2019 2018
Shs’ millions Shs’ millions
Cost
At start of year 1,121 1,278
Transfer to right-of-use assets (1,121) -
Translation differences - (362)
Additions - 205
At end of year - 1,121
Amortisation
At start of year 670 724
Transfer to right-of-use assets (670) -
Translation differences - (340)
Amortisation - 286
At end of year - 670
Net carrying amount at end of year - 451
14.(c) Right of use assets and lease liabilities(i) Right-of-use assets - Group
2019 2018
Shs’ millions Shs’ millions
At start of year 8,715 -
Additions 340 -
Depreciation (1,713) -
At end of year 7,342 -
Additions to the right-of-use assets during the 2019 financial year were Shs 340 Million.
(ii) Lease liabilities - Group
2019 2018
Shs’ millions Shs’ millions
Current 1,312 -
Non-current 6,184 -
7,496 -
NOTES (continued)

182
EQUITY GROUP HOLDINGS PLC AND SUBSIDIARIES INTEGRATED REPORT AND FINANCIAL STATEMENTS FOR THE YEAR ENDED 31 DECEMBER 2019
14.(c) Right of use assets and lease liabilities (continued)(ii) Lease liabilities – Group (continued)
2019 2018
Shs’ millions Shs’ millions
At start of year 8,355 -
Additions 340 -
Interest expense 857 -
Interest paid (857) -
Principal elements of lease payments (1,199) -
7,496 -
Amounts recognised in the statement of profit or loss - Group
Depreciation charge of right-of-use assets 1,713 -
Interest expense 857 -
2,570 -
The total cash outflow for leases was as follows:
Cash paid for amounts included in:
Financing cash flows from operating leases 1,199 -
15.(a) Software - Group
Software Work in progress Total
31 December 2019 Shs’ millions Shs’ millions Shs’ millions
Cost
At start of year 12,200 633 12,833
Translation differences (173) (13) (186)
Additions 679 520 1,199
Transfers 382 (382) -
Disposals (133) - (133)
At end of year 12,955 758 13,713
Amortisation
At start of year 5,470 - 5,470
Translation differences (143) - (143)
Amortisation 1,266 - 1,266
Disposal (124) - (124)
At end of year 6,469 - 6,469
Net book value at end of year 6,486 758 7,244
NOTES (continued)
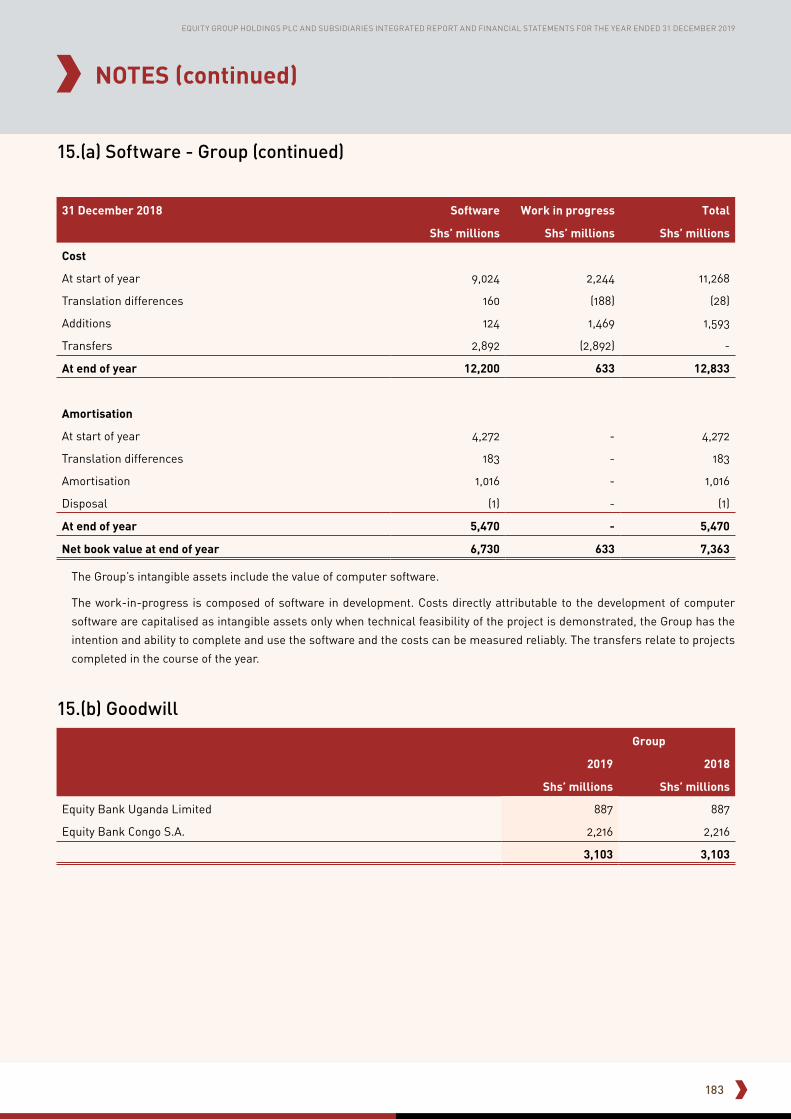
183
EQUITY GROUP HOLDINGS PLC AND SUBSIDIARIES INTEGRATED REPORT AND FINANCIAL STATEMENTS FOR THE YEAR ENDED 31 DECEMBER 2019
15.(a) Software - Group (continued)
31 December 2018 Software Work in progress Total
Shs’ millions Shs’ millions Shs’ millions
Cost
At start of year 9,024 2,244 11,268
Translation differences 160 (188) (28)
Additions 124 1,469 1,593
Transfers 2,892 (2,892) -
At end of year 12,200 633 12,833
Amortisation
At start of year 4,272 - 4,272
Translation differences 183 - 183
Amortisation 1,016 - 1,016
Disposal (1) - (1)
At end of year 5,470 - 5,470
Net book value at end of year 6,730 633 7,363
The Group’s intangible assets include the value of computer software.
The work-in-progress is composed of software in development. Costs directly attributable to the development of computer
software are capitalised as intangible assets only when technical feasibility of the project is demonstrated, the Group has the
intention and ability to complete and use the software and the costs can be measured reliably. The transfers relate to projects
completed in the course of the year.
15.(b) Goodwill
Group
2019 2018
Shs’ millions Shs’ millions
Equity Bank Uganda Limited 887 887
Equity Bank Congo S.A. 2,216 2,216
3,103 3,103
NOTES (continued)

184
EQUITY GROUP HOLDINGS PLC AND SUBSIDIARIES INTEGRATED REPORT AND FINANCIAL STATEMENTS FOR THE YEAR ENDED 31 DECEMBER 2019
NOTES (continued)
15.(b) Goodwill (continued)The goodwill of Shs 887 Million arose from the acquisition of Equity Bank Uganda Limited (formerly Uganda Microfinance
Limited) in April 2008, which was determined in accordance with IFRS 3. It represents the difference between the total purchase
consideration (including acquisition costs) paid to acquire 100% stake in Equity Bank Uganda Limited and the fair value of the
net tangible assets and the separable identifiable intangible assets.
On 30 September 2015, Equity Group Holdings Plc acquired 79% of the net assets of Equity Bank Congo S.A. The Group increased
its stake to 86% in 2016 following the acquisition of an additional 13%.
The goodwill arising from acquisition consists largely of the synergies and economies of scale expected from combining the
operations of Equity Group Holdings Plc and Equity Bank Congo S.A., as well as Equity Bank Uganda Limited.
Management carried out an impairment assessment in respect of goodwill at year end. Since the goodwill arose on purchase
of Equity Bank Uganda Limited and Equity Bank Congo S.A. as subsidiaries, the whole amount is allocated to the subsidiaries
which the Group considers as a cash generating unit (CGU). The table below shows the various variables used in management’s
impairment assessment:
Equity Bank Uganda Limited Equity Bank Congo S.A.
2019 2018 2019 2018
Shs’ millions Shs’ millions Shs’ millions Shs’ millions
Value in use 45,740 17,345 26,195 14,549
Projected Return on Assets (ROA) – 2019 11% 8% 9% 11%
Projected Return on Assets (ROA) – 2020 14% 14% 9% 11%
Projected growth in profit margins – 2019 21% 38% 17% 21%
Projected growth in profit margins – 2020 20% 23% 15% 19%
Projected growth in non-interest income – 2019 24% 45% 22% 20%
Projected growth in non-interest income - 2020 24% 45% 22% 20%
Weighted average cost of capital 18% 18% 23% 23%
Key assumptions used in value in use calculations and sensitivity to changes in assumptions:
• Budgeted EBITDA – Budgeted EBITDA has been based on past experience adjusted for efficiencies expected from
implementation of Group initiatives.
• Budgeted capital expenditure – The cash flow forecasts for capital expenditure are based on past experience and include
the ongoing capital expenditures. Capital expenditure includes cash outflows for purchase of property, equipment and
computer software.
• Long term growth rate is based on an annual growth rate in EBITDA estimated by management for each subsidiary.
• Pre-tax risk adjusted discount rate is generally based on the risk free rate of government securities in the respective
country adjusted for a risk premium to reflect the increased risk of investing in equities and the systemic risk of the
specific Group operating company.
• An assumed terminal value based on a historical performance of the CGUs and Pre-tax risk adjusted discount rate.
Sensitivity analysis
Management believes that no reasonably possible change in any of the above key assumptions would cause the carrying value
of any CGU to exceed its recoverable amount.

185
EQUITY GROUP HOLDINGS PLC AND SUBSIDIARIES INTEGRATED REPORT AND FINANCIAL STATEMENTS FOR THE YEAR ENDED 31 DECEMBER 2019
NOTES (continued)
16.Other operating expenses
Group Company
2019 2018 2019 2018
Shs’ millions Shs’ millions Shs’ millions Shs’ millions
Software licencing and other IT related costs 3,986 3,339 - -
Consultancy, legal and professional fees 2,117 1,709 263 -
Electricity, water and repairs and maintenance 1,198 1,292 - -
Travel and accommodation 1,115 859 21 -
Marketing, advertising and sponsorship 930 957 1 -
Publications, stationery and communications 861 700 28 -
Auditors’ remuneration 51 54 2 2
Other expenses 4,884 4,722 6 49
15,142 13,632 321 51
17.(a) Investment in subsidiary companies
Country of incorporation Shareholding 2019 2018
Shs’ millions Shs’ millions
Banking
Equity Bank (Kenya) Limited Kenya 100% 40,733 40,733
Equity Bank Congo S.A. DRC 86% 6,748 6,748
Equity Bank (South Sudan) Limited South Sudan 100% 5,712 5,712
Equity Bank Uganda Limited Uganda 100% 5,005 5,005
Equity Bank Tanzania Limited Tanzania 100% 3,839 3,839
Equity Bank (Rwanda) Limited Rwanda 100% 2,807 2,807
Telecommunication
Finserve Africa Africa Limited Kenya 100% 1,001 1,001
Investment banking
Equity Investment Bank Limited Kenya 100% 420 420
Insurance brokerage
Equity Insurance Agency Limited Kenya 100% 100 100
Consultancy
Equity Consulting Group Limited Kenya 100% 0.5 0.5
Equity Investment Services Limited Kenya 100% 420 420
Custodial services
Equity Nominees Limited Kenya 100% 0.1 0.1
Total 66,786 66,786
On 14 November 2018, additional capital of 226,000 new shares with a par value of TShs 100,000 was issued and paid by EGH
Plc to Equity Bank Tanzania Limited for a consideration of US$ 10 Million (Shs 1.025 Billion).
The Company has assessed impairment of the investment in subsidiaries using the Net Asset Value (NAV) and Discounted Cash
Flow (DCF) methods as appropriate and concluded there’s no impairment.

186
EQUITY GROUP HOLDINGS PLC AND SUBSIDIARIES INTEGRATED REPORT AND FINANCIAL STATEMENTS FOR THE YEAR ENDED 31 DECEMBER 2019
NOTES (continued)
17.(b) Non-controlling interests (NCI)Set out below is the summarised financial information of Equity Bank Congo S.A. which has non-controlling interest that is
material to the Group.
Group
2019 2018
Shs’ millions Shs’ millions
Summarised statement of financial position
Total assets 80,076 57,965
Total liabilities 72,294 51,269
Equity 7,782 6,696
Accumulated NCI 1,058 883
Summarised statement of comprehensive income
Operating income 5,949 5,258
Profit for the period 1,229 952
Other comprehensive income - -
Total comprehensive income 1,229 952
Profit allocated to NCI 175 133
Summarised statement of cash flows
Cash flows from operating activities 14,803 8,088
Cash flows to investing activities (4,042) (1,010)
Cash flows from financing activities 245 2,565
Net increase in cash and cash equivalents 11,006 9,643
17.(c) Interests in unconsolidated structured entityEquity Group Holdings Plc does not consolidate the results of Equity Group Foundation (the “Foundation”) which was incorporated
on 12 February 2008 under the Companies Act (Cap 486) as a company limited by guarantee. It is a charitable organization set up
to provide a platform to development partners, government, the private sector as well as local and international organizations
for the implementation of high impact development programs which include Wings to Fly Scholarship Program.
The programs of the Foundation are primarily funded by third party donors under donor agreements. The Group’s contributions
to the Foundation are in monetary terms but mainly in-kind in the form of utilising the Group’s extensive branch network and
staff in driving the achievement of the goals/activities of the Foundation in communities. On the basis that the donors provide
majority of the funding and direct the activities of the Foundation through the donor agreements, the Group does not control
the Foundation.

187
EQUITY GROUP HOLDINGS PLC AND SUBSIDIARIES INTEGRATED REPORT AND FINANCIAL STATEMENTS FOR THE YEAR ENDED 31 DECEMBER 2019
17.(c) Interests in unconsolidated structured entity (continued)
The table below summarises EGF’s source of funding:
2019 2018
Shs’ millions Shs’ millions
Donors 1,306 1,170
Equity Group Holdings Plc 102 123
Total donations income 1,408 1,293
The Group does not earn income from EGF and is not exposed to loss arising from its involvement with the Foundation.
Consistent with previous years, the Group will continue providing support to the Foundation primarily as regards the use of
the Group’s branch network and staff to carry out its program activities.
18.Income taxRecognised in profit or loss
Group Company
2019 2018 2019 2018
Shs’ millions Shs’ millions Shs’ millions Shs’ millions
Current income tax:
Current year charge 10,233 8,058 71 106
Prior year overstatement (228) (162) (2) (6)
Deferred income tax (Note 23):
Current year (credit)/charge (1,088) 743 (2) (82)
Income tax expense 8,917 8,639 67 18
NOTES (continued)

188
EQUITY GROUP HOLDINGS PLC AND SUBSIDIARIES INTEGRATED REPORT AND FINANCIAL STATEMENTS FOR THE YEAR ENDED 31 DECEMBER 2019
NOTES (continued)
18.Income tax (continued)Reconciliation of effective tax rate:
The tax on the Group’s and Company’s profit before income tax differs from the theoretical amount that would arise using the
statutory income tax rate as follows:
Group Company
2019 2018 2019 2018
Shs’ millions
Shs’ millions
Shs’ millions
Shs’ millions
Profit before income tax 31,478 28,463 12,330 10,565
Income tax using the enacted corporation tax rate 9,443 8,539 3,699 3,170
The effect of differential tax rate in South Sudan (20% (2018: 25%)) 61 12 - -
Prior year overstatement (228) (162) (2) (6)
Other differences (359) 250 (3,630) (3,146)
8,917 8,639 67 18
Current income tax liability/ (asset)
At start of year (447) (1,782) (11) 3
Charge for the year 10,233 8,058 71 107
Prior year overstatement (228) (162) (2) (6)
Translation differences 705 162 - -
Paid during the year (8,487) (6,723) (95) (115)
At end of year 1,776 (447) (37) (11)
Made up of:
Tax payable 1,928 185 - -
Tax recoverable (152) (632) (37) (11)
1,776 (447) (37) (11)

18.In
com
e ta
x (c
ontin
ued)
Ta
x ra
tes
are
as fo
llow
s:
Gro
upEG
H P
lcEB
KL
EBC
LEB
UL
EBR
LEI
AL
EBTL
EBSS
LO
ther
s*
2019
Shs’
m
illio
nsSh
s’
mill
ions
Shs’
m
illio
nsSh
s’
mill
ions
Shs’
m
illio
nsSh
s’
mill
ions
Shs’
m
illio
nsSh
s’
mill
ions
Shs’
m
illio
nsSh
s’
mill
ions
Pro
fit b
efor
e ta
x31
,478
12,3
3025
,974
1,64
41,
494
1,50
467
5(4
11)
606
161
Enac
ted
tax
rate
30%
30%
30%
30%
30%
30%
30%
30%
20%
30%
Inco
me
tax
usin
g th
e en
acte
d co
rpor
atio
n ta
x ra
te9,
443
3,69
97,
792
493
448
451
203
(123
)12
148
2018
Pro
fit b
efor
e ta
x28
,463
10,5
6524
,382
1,35
81,
345
1,00
854
7(5
59)
241
26
Enac
ted
tax
rate
30%
30%
30%
35%
30%
30%
30%
30%
25%
30%
Inco
me
tax
usin
g th
e en
acte
d co
rpor
atio
n ta
x ra
te8,
539
3,17
07,
315
475
404
302
164
(168
)60
8
EGH
Plc
– E
quity
Gro
up H
oldi
ngs
Plc
, EB
KL
– Eq
uity
Ban
k K
enya
Lim
ited,
EB
CL
– Eq
uity
Ban
k C
ongo
S.A
., EB
UL
– Eq
uity
Ban
k U
gand
a Li
mite
d, E
BR
L –
Equi
ty B
ank
Rw
anda
Plc
, EIA
L –
Equi
ty In
sura
nce
Age
ncy
Lim
ited,
EB
TL –
Equ
ity B
ank
Tanz
ania
Lim
ited,
EB
SSL
– Eq
uity
Ban
k So
uth
Suda
n Li
mite
d.
*Oth
ers
rela
te to
Equ
ity In
vest
men
t Ban
k Li
mite
d, F
inse
rve
Afr
ica
Afr
ica
Lim
ited,
Equ
ity N
omin
ees
Lim
ited,
Equ
ity In
vest
men
t Ser
vice
s Li
mite
d an
d Eq
uity
Con
sult
ing
Gro
up L
imite
d.
EQ
UIT
Y G
RO
UP
HO
LD
ING
S P
LC A
ND
SU
BS
IDIA
RIE
S IN
TEG
RAT
ED
RE
PO
RT
AN
D F
INA
NC
IAL
STA
TEM
EN
TS/ F
OR
TH
E YE
AR
EN
DE
D 3
1 D
EC
EM
BE
R 2
019
189
NO
TES
(con
tinu
ed)

190
EQUITY GROUP HOLDINGS PLC AND SUBSIDIARIES INTEGRATED REPORT AND FINANCIAL STATEMENTS FOR THE YEAR ENDED 31 DECEMBER 2019
NOTES (continued)
19.(a) Cash, deposits and balances due from financial institutionsFor the purpose of the statement of cash flows, cash and cash equivalents comprise the following at 31 December:
Group Company
2019 2018 2019 2018
Shs’ millions Shs’ millions Shs’ millions Shs’ millions
Cash in hand 24,300 19,877 12,697 7,675
Unrestricted balances with central banks 24,936 13,958 - -
Money market placements 15,040 20,649 - -
Cash balances with banks 6,663 6,289 - -
70,939 60,773 12,697 7,675
12-month ECL:
At 1 January/ Initial re-measurement (200) (242) - -
Re-measurement during the year 41 42 (3) -
(159) (200) (3) -
Included in cash and cash equivalents 70,780 60,573 12,694 7,675
Restricted balances with central banks 15,654 14,046 - -
Net carrying amount 86,434 74,619 12,694 7,675
Movement in restricted balances:
At start of year 14,046 11,039 - -
Movement during the year 1,608 3,007 - -
At end of year 15,654 14,046 - -
The restricted funds with the Central Banks in Kenya, Uganda, Tanzania, Rwanda, South Sudan and Democratic Republic of
Congo are not interest earning and are based on the value of deposits as adjusted by Central Banks’ requirements from time to
time. These funds (restricted balances with Central Banks) are not available for use by the Group in its day-to-day operations.
19.(b) Net debt reconciliationThis section sets out an analysis of net debt and the movements in net debt for each of the periods presented.
Group 2019 2018
Shs’ millions Shs’ millions
Cash and cash equivalents (Note 19(a)) 70,780 60,573
Liquid investments:
FVOCI and FVTPL investment securities (Note 21) 150,635 142,435
Borrowed funds - repayable within one year (Note 26) (13,537) (11,792)
Borrowed funds - repayable after one year (Note 26) (43,177) (33,309)
Net cash 164,701 157,907
Cash and liquid investments 221,415 203,008
Gross debt - fixed interest rates (11,070) (8,652)
Gross debt - variable interest rates (45,644) (36,449)
164,701 157,907

191
EQUITY GROUP HOLDINGS PLC AND SUBSIDIARIES INTEGRATED REPORT AND FINANCIAL STATEMENTS FOR THE YEAR ENDED 31 DECEMBER 2019
NOTES (continued)
20.Loans and advances to customers - Group
2019 2018
Shs’ millions Shs’ millions
Loans and advances at armotised cost 362,373 292,136
Loans and advances at fair value through profit or loss 4,067 5,091
366,440 297,227
a) Loans and advances at amortised cost
At 31 December 2019 Stage 1 Stage 2 Stage 3 Total
12 month ECL Lifetime ECL Lifetime ECL
Shs’ millions Shs’ millions Shs’ millions Shs’ millions
Gross loans and advances 313,002 37,397 34,709 385,108
Loss allowance (4,773) (3,929) (14,033) (22,735)
Net loans and advances 308,229 33,468 20,676 362,373
At 31 December 2018 Stage 1 Stage 2 Stage 3 Total
12 month ECL Lifetime ECL Lifetime ECL
Shs’ millions Shs’ millions Shs’ millions Shs’ millions
Gross loans and advances 251,105 37,638 22,876 311,619
Loss allowance (2,992) (7,039) (9,452) (19,483)
Net loans and advances 248,113 30,599 13,424 292,136
Gross Net
2019 2018 2019 2018
Shs’ millions Shs’ millions Shs’ millions Shs’ millions
Current portion 82,212 70,438 74,846 62,432
Non-current portion 302,896 241,181 287,527 229,704
385,108 311,619 362,373 292,136

192
EQUITY GROUP HOLDINGS PLC AND SUBSIDIARIES INTEGRATED REPORT AND FINANCIAL STATEMENTS FOR THE YEAR ENDED 31 DECEMBER 2019
20.Loans and advances to customers - Group (continued)(b) Impairment on financial assets
2019
Stage 1 Stage 2 Stage 3 Total
12 month ECL Lifetime ECL Lifetime ECL
Shs’ millions Shs’ millions Shs’ millions Shs’ millions
Loss allowance as at 1 January 2,992 7,039 9,452 19,483
Transfer to 12 months ECL 292 (233) (59) -
Transfer to lifetime ECL not credit impaired (66) 155 (89) -
Transfer to lifetime ECL credit impaired (154) (1,528) 1,682 -
Net remeasurement 967 (1,220) 4,046 3,793
Net financial assets originated 1,760 1,069 971 3,800
Financial assets derecognised (1,006) (1,166) (928) (3,100)
Translation differences (12) (187) 29 (170)
1,781 (3,110) 5,652 4,323
Write offs - - (1,071) (1,071)
Loss allowance as at 31 December 4,773 3,929 14,033 22,735
2018
Stage 1 Stage 2 Stage 3 Total
12 month ECL Lifetime ECL Lifetime ECL
Shs’ millions Shs’ millions Shs’ millions Shs’ millions
Loss allowance as at 1 January 2,513 10,900 6,170 19,583
Transfer to 12 months ECL 386 (228) (158) -
Transfer to lifetime ECL not credit impaired (132) 273 (141) -
Transfer to lifetime ECL credit impaired (63) (2,407) 2,470 -
Net remeasurement (504) (86) 2,640 2,050
Net financial assets originated 1,606 1,207 4,922 7,735
Financial assets derecognised (814) (2,619) (2,639) (6,072)
479 (3,859) 7,094 3,713
Write offs - (1) (3,812) (3,813)
Loss allowance as at 31 December 2,992 7,039 9,452 19,483
NOTES (continued)

193
EQUITY GROUP HOLDINGS PLC AND SUBSIDIARIES INTEGRATED REPORT AND FINANCIAL STATEMENTS FOR THE YEAR ENDED 31 DECEMBER 2019
20.Loans and advances to customers (continued)(b) Impairment on financial assets (continued)
2019
Stage 1 Stage 2 Stage 3 Total
12 month ECL Lifetime ECL Lifetime ECL
Shs’ millions Shs’ millions Shs’ millions Shs’ millions
Gross carrying amount as at 1 January 251,105 37,638 22,876 311,619
Transfer to 12 months ECL 3,957 (3,674) (283) -
Transfer to lifetime ECL not credit impaired (10,072) 10,779 (707) -
Transfer to lifetime ECL credit impaired (6,650) (9,656) 16,306 -
Net remeasurement (24,882) (3,870) 1,244 (27,508)
Net financial assets originated 181,169 10,232 2,033 193,434
Financial assets derecognised (74,846) (9,965) (6,783) (91,594)
Translation differences (6,779) 5,913 23 (843)
Loss allowance as at 31 December 313,002 37,397 34,709 385,108
2018
Stage 1 Stage 2 Stage 3 Total
12 month ECL Lifetime ECL Lifetime ECL
Shs’ millions Shs’ millions Shs’ millions Shs’ millions
Gross carrying amount as at 1 January 206,622 56,932 17,817 281,371
Transfer to 12 months ECL 4,701 (4,211) (490) -
Transfer to lifetime ECL not credit impaired (9,781) 9,861 (80) -
Transfer to lifetime ECL credit impaired (2,158) (4,049) 6,207 -
Net remeasurement (15,257) (5,134) 9,146 (11,245)
Net financial assets originated 138,311 9,742 1,045 149,098
Financial assets derecognised (69,849) (25,094) (10,641) (105,584)
Translation differences (1,484) (409) (128) (2,021)
Gross carrying amount as at 31 December 251,105 37,638 22,876 311,619
NOTES (continued)

EQ
UIT
Y G
RO
UP
HO
LD
ING
S P
LC A
ND
SU
BS
IDIA
RIE
S IN
TEG
RAT
ED
RE
PO
RT
AN
D F
INA
NC
IAL
STA
TEM
EN
TS/ F
OR
TH
E YE
AR
EN
DE
D 3
1 D
EC
EM
BE
R 2
019
194
NO
TES
(con
tinu
ed)
20.L
oans
and
adv
ance
s to
cus
tom
ers
(con
tinue
d)(c
)Mov
emen
ts p
er s
ecto
r -
Mor
tgag
e, C
orpo
rate
and
SM
E
Mor
tgag
e se
ctor
Cor
pora
te s
ecto
rSM
E se
ctor
Stag
e 1
Stag
e 2
Stag
e 3
Tota
lSt
age
1St
age
2St
age
3To
tal
Stag
e 1
Stag
e 2
Stag
e 3
Tota
l
31 D
ecem
ber
2019
12 m
onth
EC
LLi
feti
me
ECL
Life
tim
e EC
L12
mon
th
ECL
Life
tim
e EC
LLi
feti
me
ECL
12 m
onth
EC
LLi
feti
me
ECL
Life
tim
e EC
L
Shs’
m
illio
nsSh
s’
mill
ions
Shs’
m
illio
nsSh
s’
mill
ions
Shs’
m
illio
nsSh
s’
mill
ions
Shs’
m
illio
nsSh
s’
mill
ions
Shs’
m
illio
nsSh
s’
mill
ions
Shs’
m
illio
nsSh
s’
mill
ions
Gro
ss c
arry
ing
amou
nt a
s at
1 J
anua
ry38
,457
3,94
92,
478
44,8
8491
,654
27,4
673,
537
122,
658
43,6
104,
096
8,94
456
,650
Tran
sfer
to 1
2 m
onth
s EC
L94
9(8
26)
(123
)-
1,43
2(1
,432
)-
-74
3(6
50)
(93)
-
Tran
sfer
to L
ifetim
e EC
L no
t cre
dit i
mpa
ired
(1,7
88)
2,05
2(2
64)
-(5
,495
)5,
495
--
(1,4
28)
1,76
7(3
39)
-
Tran
sfer
to L
ifetim
e EC
L cr
edit
impa
ired
(1,1
58)
(694
)1,
852
-(2
,042
)(6
,952
)8,
994
-(1
,956
)(1
,399
)3,
355
-
Net
rem
easu
rem
ent
(5,8
59)
(544
)(1
49)
(6,5
52)
(3,0
40)
(2,0
33)
1,50
1(3
,572
)(6
,502
)(7
23)
379
(6,8
46)
Net
fina
ncia
l ass
ets
orig
inat
ed
20,0
1755
989
821
,474
63,7
766,
275
399
70,4
5025
,315
1,28
137
526
,971
Fina
ncia
l ass
ets
dere
cogn
ised
(4,9
94)
(856
)(6
75)
(6,5
25)
(19,
496)
(6,5
97)
(4,3
85)
(30,
478)
(12,
801)
(1,4
78)
(1,0
15)
(15,
294)
Tran
slat
ion
diff
eren
ces
917
541,
837
2,80
8(7
272)
5,88
15,
168
3,77
7(3
47)
(23)
(1,0
99)
(1,4
69)
Gro
ss c
arry
ing
amou
nt a
s at
31
Dec
embe
r46
,541
3,69
45,
854
56,0
8911
9,51
728
,104
15,2
1416
2,83
546
,634
2,87
110
,507
60,0
12
Loss
all
owan
ce a
s at
1 J
anua
ry15
240
295
01,
504
1,27
95,
479
1,80
28,
560
354
270
5,28
45,
908
Tran
sfer
to 1
2 m
onth
s EC
L57
(57)
--
63(6
3)-
-58
(35)
(23)
-
Tran
sfer
to L
ifetim
e EC
L no
t cre
dit i
mpa
ired
(7)
11(4
)-
(35)
35-
-(9
)39
(30)
-
Tran
sfer
to L
ifetim
e EC
L cr
edit
impa
ired
(5)
(33)
38-
(31)
(1,3
34)
1,36
5-
(30)
(101
)13
1-
Net
rem
easu
rem
ent o
f los
s al
low
ance
(58)
7034
035
21,
202
(1,1
48)
1,76
71,
821
(72)
(158
)81
658
6
Net
fina
ncia
l ass
ets
orig
inat
ed
8834
227
349
591
774
172
1,53
723
771
(80)
228

EQ
UIT
Y G
RO
UP
HO
LD
ING
S P
LC A
ND
SU
BS
IDIA
RIE
S IN
TEG
RAT
ED
RE
PO
RT
AN
D F
INA
NC
IAL
STA
TEM
EN
TS/ F
OR
TH
E YE
AR
EN
DE
D 3
1 D
EC
EM
BE
R 2
019
20.L
oans
and
adv
ance
s to
cus
tom
ers
(con
tinue
d)(c
) Mov
emen
ts p
er s
ecto
r –
- M
ortg
age,
Cor
pora
te a
nd S
ME
(con
tinu
ed)
Mor
tgag
e se
ctor
Cor
pora
te s
ecto
rSM
E se
ctor
Stag
e 1
Stag
e 2
Stag
e 3
Tota
lSt
age
1St
age
2St
age
3To
tal
Stag
e 1
Stag
e 2
Stag
e 3
Tota
l
31 D
ecem
ber
2019
12 m
onth
EC
LLi
feti
me
ECL
Life
tim
e EC
L12
mon
th
ECL
Life
tim
e EC
LLi
feti
me
ECL
12 m
onth
EC
LLi
feti
me
ECL
Life
tim
e EC
L
Shs’
m
illio
nsSh
s’
mill
ions
Shs’
m
illio
nsSh
s’
mill
ions
Shs’
m
illio
nsSh
s’
mill
ions
Shs’
m
illio
nsSh
s’
mill
ions
Shs’
m
illio
nsSh
s’
mill
ions
Shs’
m
illio
nsSh
s’
mill
ions
Fina
ncia
l ass
ets
dere
cogn
ised
(23)
(32)
(160
)(2
15)
(413
)(9
56)
(833
)(2
,202
)(1
24)
(79)
(74)
(277
)
Wri
te o
ffs
-
-
(167
)(1
67)
-
-
(178
)(1
78)
-
-
(162
)(1
62)
Tran
slat
ion
diff
eren
ces
16(1
83)
(31)
(198
)(9
)47
83,
485
3,95
421
158
(2,8
16)
(2,6
37)
Loss
all
owan
ce a
s at
31
Dec
embe
r22
021
21,
193
1,62
52,
647
3,26
57,
580
13,4
9243
516
53,
046
3,64
6
Net
loan
s an
d ad
vanc
es46
,321
3,48
24,
661
54,4
6411
6,87
024
,839
7,63
414
9,34
346
,199
2,70
67,
461
56,3
66
195
NO
TES
(con
tinu
ed)

20.L
oans
and
adv
ance
s to
cus
tom
ers
(con
tinue
d)(c
)Mov
emen
ts p
er s
ecto
r -
Uns
ecur
ed a
nd E
azzy
Uns
ecur
ed s
ecto
rEa
zzy
sect
or
Stag
e 1
Stag
e 2
Stag
e 3
Tota
lSt
age
1St
age
2St
age
3To
tal
31 D
ecem
ber
2019
12 m
onth
EC
LLi
feti
me
ECL
Life
tim
e EC
L12
mon
th E
CL
Life
tim
e EC
LLi
feti
me
ECL
Shs’
mill
ions
Shs’
mill
ions
Shs’
mill
ions
Shs’
mill
ions
Shs’
mill
ions
Shs’
mill
ions
Shs’
mill
ions
Shs’
mill
ions
Gro
ss c
arry
ing
amou
nt a
s at
1 J
anua
ry69
,385
1,95
37,
650
78,9
88 7
,999
1
73
267
8
,439
Tran
sfer
to 1
2 m
onth
s EC
L79
5(7
28)
(67)
- 3
8 (3
8) -
-
Tran
sfer
to L
ifetim
e EC
L no
t cre
dit i
mpa
ired
(1,2
56)
1,36
0(1
04)
- (1
05)
105
-
-
Tran
sfer
to L
ifetim
e EC
L cr
edit
impa
ired
(1,3
16)
(548
)1,
864
- (1
78)
(63)
241
-
Net
rem
easu
rem
ent
(8,7
52)
(501
)(4
05)
(9,6
58)
(729
) (6
9) (8
2) (8
80)
Net
fina
ncia
l ass
ets
orig
inat
ed
66,1
231,
790
153
68,0
66 5
,938
3
27
208
6
,473
Fina
ncia
l ass
ets
dere
cogn
ised
(30,
818)
(823
)(4
58)
(32,
099)
(6,7
37)
(211
) (2
50)
(7,1
98)
Tran
slat
ion
diff
eren
ces
(20)
(1)
(5,8
79)
(5,9
00)
(57)
2
(4)
(59)
Gro
ss c
arry
ing
amou
nt a
s at
31
Dec
embe
r94
,141
2,50
22,
754
99,3
796,
169
226
380
6,77
5
Loss
all
owan
ce a
s at
1 J
anua
ry1,
086
821
1,19
33,
100
121
6
7 2
23
411
Tran
sfer
to 1
2 m
onth
s EC
L11
2(7
6)(3
6)-
2
(2)
-
-
Tran
sfer
to L
ifetim
e EC
L no
t cre
dit i
mpa
ired
(12)
67(5
5)-
(3)
3
-
-
Tran
sfer
to L
ifetim
e EC
L cr
edit
impa
ired
(15)
(49)
64-
(73)
(11)
84
-
Net
rem
easu
rem
ent o
f los
s al
low
ance
(170
)14
1,02
887
2 6
5 2
9
5 1
62
Net
fina
ncia
l ass
ets
orig
inat
ed
698
162
365
1,22
5 1
46
28
287
4
61
EQ
UIT
Y G
RO
UP
HO
LD
ING
S P
LC A
ND
SU
BS
IDIA
RIE
S IN
TEG
RAT
ED
RE
PO
RT
AN
D F
INA
NC
IAL
STA
TEM
EN
TS/ F
OR
TH
E YE
AR
EN
DE
D 3
1 D
EC
EM
BE
R 2
019
196
NO
TES
(con
tinu
ed)

EQ
UIT
Y G
RO
UP
HO
LD
ING
S P
LC A
ND
SU
BS
IDIA
RIE
S IN
TEG
RAT
ED
RE
PO
RT
AN
D F
INA
NC
IAL
STA
TEM
EN
TS/ F
OR
TH
E YE
AR
EN
DE
D 3
1 D
EC
EM
BE
R 2
019
20.L
oans
and
adv
ance
s to
cus
tom
ers
(con
tinue
d)(c
) Mov
emen
ts p
er s
ecto
r -
Uns
ecur
ed a
nd E
azzy
(con
tinu
ed)
Uns
ecur
ed s
ecto
rU
nsec
ured
and
Eaz
zy
Stag
e 1
Stag
e 2
Stag
e 3
Tota
lSt
age
1St
age
2St
age
3To
tal
31 D
ecem
ber
2019
12 m
onth
EC
LLi
feti
me
ECL
Life
tim
e EC
L12
mon
th E
CL
Life
tim
e EC
LLi
feti
me
ECL
Shs’
mill
ions
Shs’
mill
ions
Shs’
mill
ions
Shs’
mill
ions
Shs’
mill
ions
Shs’
mill
ions
Shs’
mill
ions
Shs’
mill
ions
Fina
ncia
l ass
ets
dere
cogn
ised
(323
)(8
7)(1
74)
(584
) (1
23)
(12)
313
1
78
Wri
te o
ffs
-
-(6
4)(6
4) -
-
(5
00)
(500
)
Tran
slat
ion
diff
eren
ces
(66)
(585
) (8
18)
(1,4
69)
26
(55)
209
1
80
Loss
all
owan
ce a
s at
31
Dec
embe
r1,
310
267
1,50
33,
080
161
2
0 7
11
892
Net
loan
s an
d ad
vanc
es92
,831
2,23
51,
251
96,3
17 6
,008
2
06
(331
) 5
,883
197
NO
TES
(con
tinu
ed)
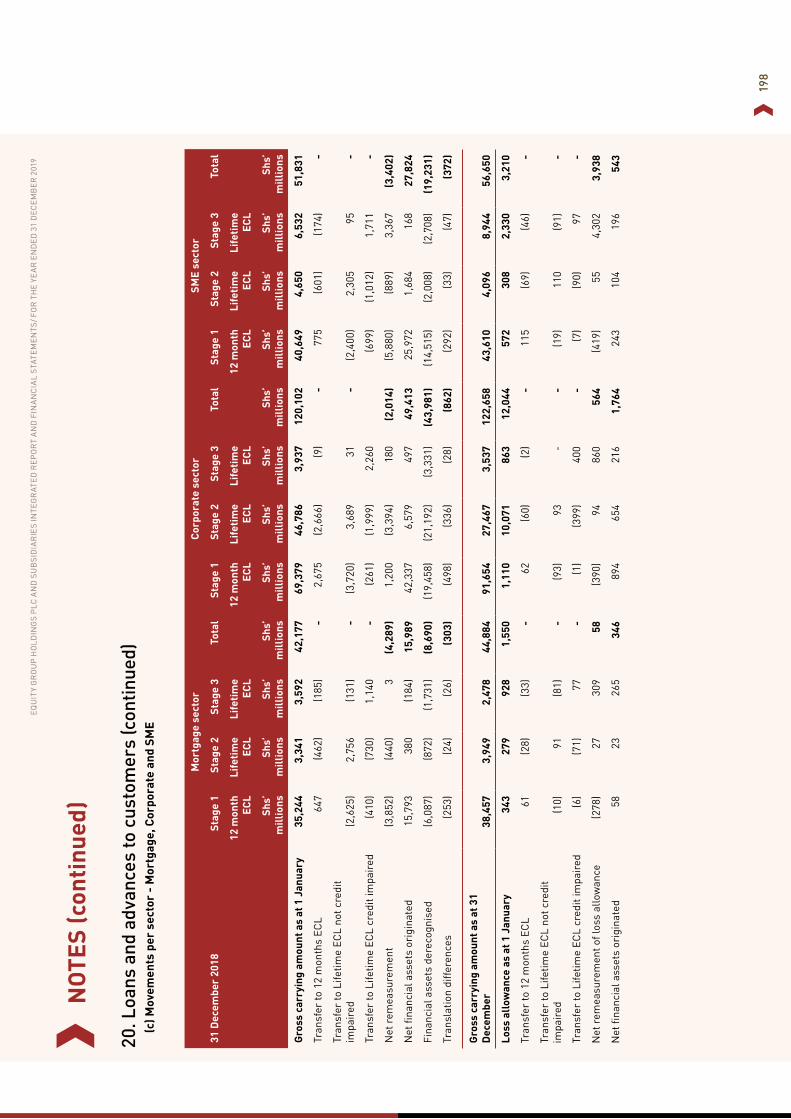
EQ
UIT
Y G
RO
UP
HO
LD
ING
S P
LC A
ND
SU
BS
IDIA
RIE
S IN
TEG
RAT
ED
RE
PO
RT
AN
D F
INA
NC
IAL
STA
TEM
EN
TS/ F
OR
TH
E YE
AR
EN
DE
D 3
1 D
EC
EM
BE
R 2
019
198
20. L
oans
and
adv
ance
s to
cus
tom
ers
(con
tinue
d)(c
) Mov
emen
ts p
er s
ecto
r -
Mor
tgag
e, C
orpo
rate
and
SM
E
Mor
tgag
e se
ctor
Cor
pora
te s
ecto
rSM
E se
ctor
31 D
ecem
ber
2018
Stag
e 1
Stag
e 2
Stag
e 3
Tota
lSt
age
1St
age
2St
age
3To
tal
Stag
e 1
Stag
e 2
Stag
e 3
Tota
l
12 m
onth
EC
LLi
feti
me
ECL
Life
tim
e EC
L12
mon
th
ECL
Life
tim
e EC
LLi
feti
me
ECL
12 m
onth
EC
LLi
feti
me
ECL
Life
tim
e EC
L
Shs’
m
illio
nsSh
s’
mill
ions
Shs’
m
illio
nsSh
s’
mill
ions
Shs’
m
illio
nsSh
s’
mill
ions
Shs’
m
illio
nsSh
s’
mill
ions
Shs’
m
illio
nsSh
s’
mill
ions
Shs’
m
illio
nsSh
s’
mill
ions
Gro
ss c
arry
ing
amou
nt a
s at
1 J
anua
ry35
,244
3,
341
3,59
2 42
,177
69
,379
46
,786
3,
937
120,
102
40,6
49
4,65
0 6,
532
51,8
31
Tran
sfer
to 1
2 m
onth
s EC
L64
7 (4
62)
(185
)-
2,67
5 (2
,666
)(9
) -
77
5 (6
01)
(174
)-
Tran
sfer
to L
ifetim
e EC
L no
t cre
dit
impa
ired
(2,6
25)
2,75
6 (1
31)
-(3
,720
)3,
689
31
-
(2,4
00)
2,30
5 95
-
Tran
sfer
to L
ifetim
e EC
L cr
edit
impa
ired
(410
)(7
30)
1,14
0 -
(261
)(1
,999
)2,
260
(699
)(1
,012
)1,
711
-
Net
rem
easu
rem
ent
(3,8
52)
(440
)3
(4,2
89)
1,20
0 (3
,394
)18
0 (2
,014
)(5
,880
)(8
89)
3,36
7 (3
,402
)
Net
fina
ncia
l ass
ets
orig
inat
ed
15,7
93
380
(184
)15
,989
42
,337
6,
579
497
49,4
13
25,9
72
1,68
4 16
8 27
,824
Fina
ncia
l ass
ets
dere
cogn
ised
(6,0
87)
(872
)(1
,731
)(8
,690
)(1
9,45
8)(2
1,19
2)(3
,331
)(4
3,98
1)(1
4,51
5)(2
,008
)(2
,708
)(1
9,23
1)
Tran
slat
ion
diff
eren
ces
(253
)(2
4)(2
6)(3
03)
(498
)(3
36)
(28)
(862
)(2
92)
(33)
(47)
(372
)
Gro
ss c
arry
ing
amou
nt a
s at
31
Dec
embe
r38
,457
3,
949
2,47
8 44
,884
91
,654
27
,467
3,
537
122,
658
43,6
10
4,09
6 8,
944
56,6
50
Loss
all
owan
ce a
s at
1 J
anua
ry34
327
992
81,
550
1,11
010
,071
863
12,0
4457
230
82,
330
3,21
0
Tran
sfer
to 1
2 m
onth
s EC
L61
(28)
(33)
-62
(60)
(2)
-11
5(6
9)(4
6)-
Tran
sfer
to L
ifetim
e EC
L no
t cre
dit
impa
ired
(10)
91(8
1)-
(93)
93-
-(1
9)11
0(9
1)-
Tran
sfer
to L
ifetim
e EC
L cr
edit
impa
ired
(6)
(71)
77-
(1)
(399
)40
0-
(7)
(90)
97-
Net
rem
easu
rem
ent o
f los
s al
low
ance
(278
)27
309
58(3
90)
9486
056
4(4
19)
554,
302
3,93
8
Net
fina
ncia
l ass
ets
orig
inat
ed
5823
265
346
894
654
216
1,76
424
310
419
654
3
NO
TES
(con
tinu
ed)
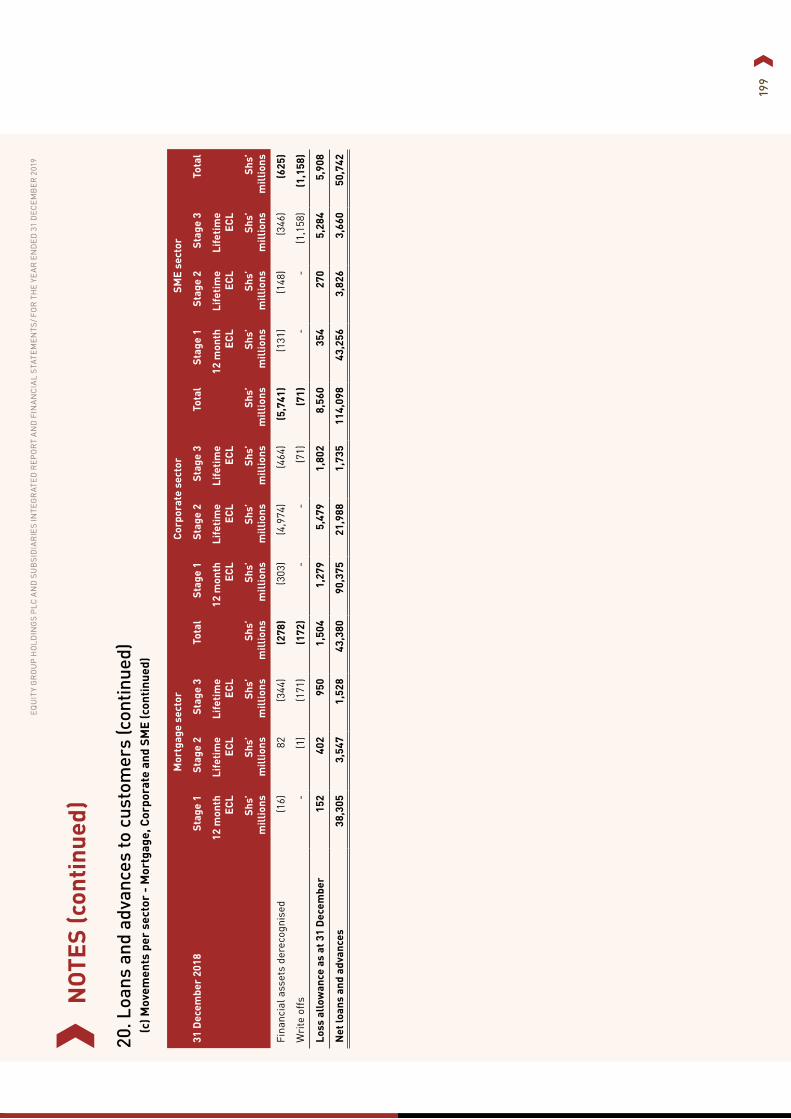
EQ
UIT
Y G
RO
UP
HO
LD
ING
S P
LC A
ND
SU
BS
IDIA
RIE
S IN
TEG
RAT
ED
RE
PO
RT
AN
D F
INA
NC
IAL
STA
TEM
EN
TS/ F
OR
TH
E YE
AR
EN
DE
D 3
1 D
EC
EM
BE
R 2
019
199
20. L
oans
and
adv
ance
s to
cus
tom
ers
(con
tinue
d)(c
) Mov
emen
ts p
er s
ecto
r -
Mor
tgag
e, C
orpo
rate
and
SM
E (c
onti
nued
)
Mor
tgag
e se
ctor
Cor
pora
te s
ecto
rSM
E se
ctor
31 D
ecem
ber
2018
Stag
e 1
Stag
e 2
Stag
e 3
Tota
lSt
age
1St
age
2St
age
3To
tal
Stag
e 1
Stag
e 2
Stag
e 3
Tota
l
12 m
onth
EC
LLi
feti
me
ECL
Life
tim
e EC
L12
mon
th
ECL
Life
tim
e EC
LLi
feti
me
ECL
12 m
onth
EC
LLi
feti
me
ECL
Life
tim
e EC
L
Shs’
m
illio
nsSh
s’
mill
ions
Shs’
m
illio
nsSh
s’
mill
ions
Shs’
m
illio
nsSh
s’
mill
ions
Shs’
m
illio
nsSh
s’
mill
ions
Shs’
m
illio
nsSh
s’
mill
ions
Shs’
m
illio
nsSh
s’
mill
ions
Fina
ncia
l ass
ets
dere
cogn
ised
(16)
82
(344
)(2
78)
(303
)(4
,974
)(4
64)
(5,7
41)
(131
)(1
48)
(346
)(6
25)
Wri
te o
ffs
-(1
)(1
71)
(172
)-
-(7
1)(7
1)-
-(1
,158
)(1
,158
)
Loss
all
owan
ce a
s at
31
Dec
embe
r 1
52
402
9
50
1,5
04
1,2
79
5,4
79
1,8
02
8,5
60
354
2
70
5,2
84
5,9
08
Net
loan
s an
d ad
vanc
es38
,305
3,54
71,
528
43,3
8090
,375
21,9
881,
735
114,
098
43,2
563,
826
3,66
050
,742
NO
TES
(con
tinu
ed)

20.L
oans
and
adv
ance
s to
cus
tom
ers
(con
tinue
d)(c
) Mov
emen
ts p
er s
ecto
r –
Uns
ecur
ed a
nd E
azzy
Uns
ecur
ed s
ecto
rEa
zzy
sect
or
Stag
e 1
Stag
e 2
Stag
e 3
Tota
lSt
age
1St
age
2St
age
3To
tal
31 D
ecem
ber
2018
12 m
onth
ECL
Life
tim
e
ECL
Life
tim
e
ECL
12 m
onth
ECL
Life
tim
e
ECL
Life
tim
e
ECL
Shs’
mill
ions
Shs’
mill
ions
Shs’
mill
ions
Shs’
mill
ions
Shs’
mill
ions
Shs’
mill
ions
Shs’
mill
ions
Shs’
mill
ions
Gro
ss c
arry
ing
amou
nt a
s at
1 J
anua
ry56
,006
2,
031
3,49
5 61
,532
5,
344
124
261
5,72
9
Tran
sfer
to 1
2 m
onth
s EC
L61
8 (4
96)
(122
)-
(14)
14
--
Tran
sfer
to L
ifetim
e EC
L no
t cre
dit i
mpa
ired
(985
)1,
111
(126
)-
(51)
- 51
-
Tran
sfer
to L
ifetim
e EC
L cr
edit
impa
ired
(787
)(2
97)
1,08
4 -
(1)
(11)
12
-
Net
rem
easu
rem
ent
(6,7
57)
(412
)5,
597
(1,5
72)
32
1 (1
)32
Net
fina
ncia
l ass
ets
orig
inat
ed
48,0
01
940
382
49,3
23
6,20
8 15
9 18
26,
549
Fina
ncia
l ass
ets
dere
cogn
ised
(26,
309)
(909
)(2
,635
)(2
9,85
3)(3
,480
)(1
13)
(236
)(3
,829
)
Tran
slat
ion
diff
eren
ces
(402
)(1
5)(2
5)(4
42)
(39)
(1)
(2)
(42)
Gro
ss c
arry
ing
amou
nt a
s at
31
Dec
embe
r69
,385
1,
953
7,65
078
,988
7,
999
173
267
8,43
9
Loss
all
owan
ce a
s at
1 J
anua
ry39
523
61,
925
2,55
693
612
422
3
Tran
sfer
to 1
2 m
onth
s EC
L14
9(7
0)(7
9)-
(1)
(1)
2
-
Tran
sfer
to L
ifetim
e EC
L no
t cre
dit i
mpa
ired
(11)
91(8
0)-
1
(112
) 1
11
-
Tran
sfer
to L
ifetim
e EC
L cr
edit
impa
ired
(11)
(44)
55-
(38)
(1
,803
) 1
,841
-
Net
rem
easu
rem
ent o
f los
s al
low
ance
171
501
1,43
72,
109
412
(7
63)
(4,2
68)
(4,6
19)
Net
fina
ncia
l ass
ets
orig
inat
ed
751
301
176
1,22
8(3
40)
125
4
,069
3,
854
EQ
UIT
Y G
RO
UP
HO
LD
ING
S P
LC A
ND
SU
BS
IDIA
RIE
S IN
TEG
RAT
ED
RE
PO
RT
AN
D F
INA
NC
IAL
STA
TEM
EN
TS/ F
OR
TH
E YE
AR
EN
DE
D 3
1 D
EC
EM
BE
R 2
019
200
NO
TES
(con
tinu
ed)
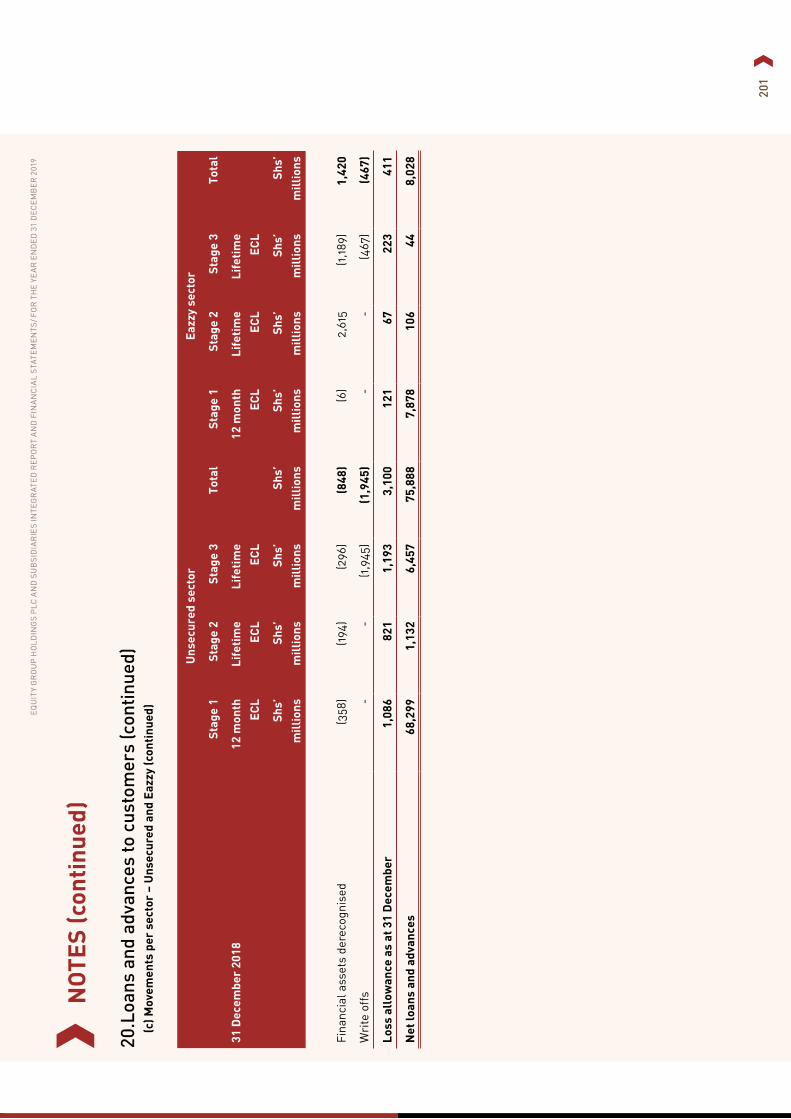
20.L
oans
and
adv
ance
s to
cus
tom
ers
(con
tinue
d)(c
) Mov
emen
ts p
er s
ecto
r –
Uns
ecur
ed a
nd E
azzy
(con
tinu
ed)
Uns
ecur
ed s
ecto
rEa
zzy
sect
or
Stag
e 1
Stag
e 2
Stag
e 3
Tota
lSt
age
1St
age
2St
age
3To
tal
31 D
ecem
ber
2018
12 m
onth
ECL
Life
tim
e
ECL
Life
tim
e
ECL
12 m
onth
ECL
Life
tim
e
ECL
Life
tim
e
ECL
Shs’
mill
ions
Shs’
mill
ions
Shs’
mill
ions
Shs’
mill
ions
Shs’
mill
ions
Shs’
mill
ions
Shs’
mill
ions
Shs’
mill
ions
Fina
ncia
l ass
ets
dere
cogn
ised
(358
)(1
94)
(296
)(8
48)
(6)
2,61
5 (1
,189
) 1,
420
Wri
te o
ffs
--
(1,9
45)
(1,9
45)
--
(467
)(4
67)
Loss
all
owan
ce a
s at
31
Dec
embe
r 1
,086
8
21
1,1
93
3,1
00
121
6
7 2
23
411
Net
loan
s an
d ad
vanc
es68
,299
1,13
26,
457
75,8
887,
878
106
448,
028
201
EQ
UIT
Y G
RO
UP
HO
LD
ING
S P
LC A
ND
SU
BS
IDIA
RIE
S IN
TEG
RAT
ED
RE
PO
RT
AN
D F
INA
NC
IAL
STA
TEM
EN
TS/ F
OR
TH
E YE
AR
EN
DE
D 3
1 D
EC
EM
BE
R 2
019
NO
TES
(con
tinu
ed)

202
EQUITY GROUP HOLDINGS PLC AND SUBSIDIARIES INTEGRATED REPORT AND FINANCIAL STATEMENTS FOR THE YEAR ENDED 31 DECEMBER 2019
NOTES (continued)
20.Loans and advances to customers (continued) (c) Movements per sector
The terms and conditions normally provided for the loans and advances to customers are as follows:
Retail loans – Retail loans are comprised of consumer loans, micro-enterprises and agriculture. These are interest bearing
facilities to retail customers. Collateral is required except for scheme loans to salaried customers. On average, the contractual
tenor is between 6 months and 5 years. These loans are charged processing fees.
Corporate loans - These are loans to small medium and large customers and they are all interest bearing. Collateral is a
requirement for all facilities. The contractual tenor is between 6 months and 10 years. These loans are charged processing fees.
Overdrafts - These are short-term facilities to customers with urgent need of cash. Collateral is required for all these facilities
and the tenor is 6 to 12 months. The only charge on these facilities is the overdrafts arrangement fee.
(d) Financial asset at fair value through profit or loss
Group
2019 2018
Shs’ millions Shs’ millions
Loan note 5,067 5,091
Fair value loss (1,000) -
Non-current 4,067 5,091
The financial asset at fair value through profit or loss relates to long term note issued to the Group in 2017 following a restructure
of facilities to a customer in the airline industry (original borrower company). The loan note earns a coupon rate of interest, is
partly guaranteed by the Government of Kenya and is secured by shares held by the issuer in the original borrower company.
The ultimate amount recoverable on the loan note will depend on the value realised when the underlying shares are disposed
of (including any upswing) and any guarantee called in the event of loss. The instrument is considered a loan instrument with
an embedded derivative and has therefore been classified as an asset at fair value through profit or loss.
The Group has used a discounted cash flow (DCF) model to compute the fair value of the instrument. The significant assumptions
applied in the DCF model include:
• The projected cash flows of the original borrower company - In arriving at free cash flows, management has used
projected earnings before interest, tax, depreciation and amortisation (EBITDA). The projections take into account past
performance and management view on measures being undertaken to turn around the performance of the original
borrower company;
• The weighted average cost of capital (WACC) of the original borrower company - WACC is the sum of the cost of debt and
the cost of equity. The cost of debt has been determined using the original borrower company’s current medium to long
term debt. In determining the cost of capital, management has assumed 60: 40 long term debt to equity ratio which is
consistent with the ratio for airlines in emerging markets and included a specific, judgmental risk premium. The WACC
is applied on the post-tax cash flows before adjusting for the original borrower company’s net debt; and
• The growth rate assumptions - Management has used the EBITDA growth rate achieved in the past. In addition, the
model includes the long-term US$ projected inflation rate in determining the original borrower company’s terminal
value.

203
EQUITY GROUP HOLDINGS PLC AND SUBSIDIARIES INTEGRATED REPORT AND FINANCIAL STATEMENTS FOR THE YEAR ENDED 31 DECEMBER 2019
NOTES (continued)
20.Loans and advances to customers (continued)
Sensitivity analysis
Changes in the above assumptions could affect the reported fair value of the loan note. We have summarized in the table below
the increases/decreases in fair value for each of the below factors while holding all other factors constant.
• A 5% change in the projected cash flows of the original borrower company (2018: 5%)
• A 5% change in the WACC of the original borrower company (2018: 5%)
• A 5% change in EBITDA growth rate assumption of the original borrower company (2018: 5%)
2019 2018
Increase Decrease Increase Decrease
Shs’ millions Shs’ millions Shs’ millions Shs’ millions
Projected cash flows: +/-5% 560 658 - 38
Change in WACC: +/-5% 628 642 - -
Change in EBITDA growth rate: +/-5% 48 145 - 746
In addition to the above, the value of the loan note would be impacted by qualitative, judgemental analysis of developments
at the original borrower company and in the airline industry, and the future actions of the Government of Kenya and other
shareholders.

204
EQUITY GROUP HOLDINGS PLC AND SUBSIDIARIES INTEGRATED REPORT AND FINANCIAL STATEMENTS FOR THE YEAR ENDED 31 DECEMBER 2019
21.Investment securities – Group
2019 2018
Shs’ millions Shs’ millions
Government securities at amortised cost
At start of year 18,527 20,532
Purchase of securities 5,638 2,778
Maturity of securities (2,526) (4,837)
Translation differences (55) 54
At end of year 21,584 18,527
12-month ECL:
At 1 January/ Initial re-measurement (10) (13)
Re-measurement during the year (1) 3
At 31 December (11) (10)
Net carrying amount 21,573 18,517
Government securities at FVOCI
At start of year 142,501 107,470
Purchase of investment securities 120,905 151,846
Sale / maturity of investment securities (116,674) (115,837)
Net gain / (loss) on fair valuation 3,757 (944)
Translation differences (297) (34)
At end of year 150,192 142,501
12-month ECL:
At 1 January/ Initial re-measurement (66) (48)
Re-measurement during the year 2 (18)
(64) (66)
Net carrying amount 150,128 142,435
FVTPL
At start of year - -
Purchase of investment securities 1,778 -
Sale of investment securities (1,364) -
Net gain on fair valuation 93 -
Net carrying amount 507 -
Total investment securities 172,208 160,952
Current 50,891 74,941
Non-current 121,317 86,011
Total 172,208 160,952
The weighted average effective interest rate on investment securities at 31 December 2019 was 10.34% (2018: 10.58%).
NOTES (continued)

205
EQUITY GROUP HOLDINGS PLC AND SUBSIDIARIES INTEGRATED REPORT AND FINANCIAL STATEMENTS FOR THE YEAR ENDED 31 DECEMBER 2019
22.Other assets
Group Company
2019 2018 2019 2018
Shs’ millions Shs’ millions Shs’ millions Shs’ millions
Settlement and clearing accounts 1,783 1,749 - -
Prepaid expenses 4,387 3,429 - -
Refundable deposits 584 548 - -
Sundry debtors 2,835 2,757 - -
Other assets 3,586 4,375 434 511
13,175 12,858 434 511
12 month ECL:
1 January / Initial re-measurement (463) (439) (275) (240)
Re-measurement during the year 33 (24) - (35)
(430) (463) (275) (275)
Net carrying amount 12,745 12,395 159 236
Other assets are settled no more than 12 months after the reporting date. All the balances are non-interest bearing.
NOTES (continued)

206
EQUITY GROUP HOLDINGS PLC AND SUBSIDIARIES INTEGRATED REPORT AND FINANCIAL STATEMENTS FOR THE YEAR ENDED 31 DECEMBER 2019
23.Deferred income tax The net deferred income tax movement computed at the enacted tax rates, is attributable to the following items:
Group At start of
year
Recognised in
profit or loss
Translation
differences
Recognised
in OCI
At end of Year
For the year ended 31 December 2019 Shs’ millions Shs’ millions Shs’ millions Shs’ millions Shs’ millions
Property, equipment and software 773 (80) 116 - 809
Loan impairment provision 5,593 395 216 - 6,204
Provision for accrued leave 99 (4) 2 - 97
Other temporary differences - 1,088 - - 1,088
Deferred income (497) (311) - - (808)
FVOCI reserves 109 - (30) (1,127) (1,048)
6,077 1,088 304 (1,127) 6,342
Company
Loan impairment provision 83 2 - - 85
Group At start of year IFRS 9 day 1adjustment
Recognisedin profit or
loss
Translationdifferences
Recognisedin OCI
At end of Year
For the year ended 31 December 2018 Shs’ millions Shs’ millions Shs’ millions Shs’ millions Shs’ millions Shs’ millions
Property, equipment and software 798 - (201) 176 - 773
Loan impairment provision 1,670 4,067 (66) (78) - 5,593
Provision for accrued leave 89 - 10 - - 99
Unrealised exchange losses 70 - - (70) - -
Deferred income - - (497) - - (497)
Tax losses 204 - 11 (215) - -
FVOCI reserves (189) - - (12) 310 109
2,642 4,067 (743) (199) 310 6,077
Company
Loan impairment provision - 1 82 - - 83
The deferred tax asset and deferred tax liability at Group level in the statement of financial position have been separated as
required by IAS 12, since they relate to different tax jurisdictions.
NOTES (continued)

207
EQUITY GROUP HOLDINGS PLC AND SUBSIDIARIES INTEGRATED REPORT AND FINANCIAL STATEMENTS FOR THE YEAR ENDED 31 DECEMBER 2019
23.Deferred income tax (continued)
Group Company
2019 2018 2019 2018
Shs’ millions Shs’ millions Shs’ millions Shs’ millions
The balance at 31 December is made up of:
Deferred income tax asset 6,492 6,117 85 83
Deferred income tax liability (150) (40) - -
6,342 6,077 85 83
The Group has concluded that the deferred income tax assets will be recoverable using the estimated future taxable income
based on the approved business plans and budgets for the Group. The Group is expected to continue generating taxable income.
24.Deposits from customers
Group
2019 2018
Shs’ millions Shs’ millions
Retail customers
Savings deposits 129,323 126,584
Current deposits 35,756 46,765
Term deposits 33,495 23,114
Transactional deposits 31,353 28,786
229,927 225,249
Corporate customers
Term deposits 102,764 116,691
Current deposits 116,404 58,011
Transactional deposits 24,973 19,628
Savings deposits 6,904 1,458
Margin on guarantees 1,780 1,721
252,825 197,509
482,752 422,758
Current 234,549 205,400
Non-current 248,203 217,358
Total 482,752 422,758
The weighted average effective interest rate on interest bearing customer deposits at 31 December 2019 was 8.79% (2018:
6.12%). The carrying value of customer deposits approximates their fair value.
NOTES (continued)

208
EQUITY GROUP HOLDINGS PLC AND SUBSIDIARIES INTEGRATED REPORT AND FINANCIAL STATEMENTS FOR THE YEAR ENDED 31 DECEMBER 2019
24.Deposits from customers (continued)The summary of terms and conditions for the various categories of deposits are below:
a. Term deposits - These are high interest-bearing accounts that are opened for a specific period of time at a fixed rate of
interest. Funds are fixed on the account for specified term periods of time. Interest is calculated daily and paid only on
maturity of the deposits. Interest rates are offered at competitive and attractive rates.
b. Current accounts - These are non-interest-bearing accounts that are due on demand. They are operated by both
individuals and institutions with the use of a cheque book. They are subject to transaction activity fees and/or monthly
maintenance charges.
c. Savings accounts - These are deposits accounts designed for the average income earner that enables one to save some
money and earn interest. The more one saves, the higher the interest. Interest on minimum monthly balances is paid
into the account bi-annually.
d. Transaction deposits - These are non-interest-bearing accounts that can be used directly as cash without withdrawal
limits or restrictions.
25.Other liabilities
Group Company
2019 2018 2019 2018
Shs’ millions Shs’ millions Shs’ millions Shs’ millions
Short term employee benefits 288 363 - -
Settlement and clearing accounts 3,387 3,160 - -
Accounts payable and sundry creditors 2,796 3,941 - -
Accrued expenses 2,993 1,945 38 3
Other 3,401 934 - -
12,865 10,343 38 3
NOTES (continued)

209
EQUITY GROUP HOLDINGS PLC AND SUBSIDIARIES INTEGRATED REPORT AND FINANCIAL STATEMENTS FOR THE YEAR ENDED 31 DECEMBER 2019
26.Borrowed funds
Group
2019 2018
Shs’ millions Shs’ millions
Equity Bank (Kenya) Limited (EBKL)
African Development Bank 10,723 13,875
International Finance Corporation (IFC) 17,403 10,417
ResponsAbility 2,559 4,130
European Investment Bank 358 1,568
KFW DEG 10,408 -
KFW (Ministry of Finance) - SIPMK 86 114
Inter-bank money market borrowings:
Equity Bank (Kenya) Limited (EBKL) 540 165
Equity Bank Rwanda Plc (EBRL) 3,052 2,539
Equity Bank Tanzania Limited (EBTL) - 665
Equity Bank Uganda Limited (EBUL) 68 1,293
Equity Bank Uganda Limited (EBUL)
European Investment Bank 1,855 1,039
Equity Bank Tanzania Limited (EBTL)
European Investment Bank 4,551 4,532
Equity Bank Congo S.A. (EBCL)
European Investment Bank 1,984 2,236
FPM, Democratic Republic of Congo (DRC) 328 488
BCDC 2,799 1,020
TMB - 1,020
56,714 45,101
Current 13,537 11,792
Non-current portion 43,177 33,309
56,714 45,101
Movement during the year:
At 1 January 45,101 47,873
Proceeds from borrowed funds 24,139 124
Repayment of borrowed funds (12,526) (2,896)
Interest charged on borrowed funds 3,394 2,691
Interest paid on borrowed funds (3,394) (2,691)
56,714 45,101
NOTES (continued)

EQ
UIT
Y G
RO
UP
HO
LD
ING
S P
LC A
ND
SU
BS
IDIA
RIE
S IN
TEG
RAT
ED
RE
PO
RT
AN
D F
INA
NC
IAL
STA
TEM
EN
TS/ F
OR
TH
E YE
AR
EN
DE
D 3
1 D
EC
EM
BE
R 2
019
26.B
orro
wed
fund
s (c
ontin
ued)
31 D
ecem
ber
2019
– G
roup
Lend
erTy
pe o
f loa
nLo
an b
alan
ceSe
curi
tyC
urre
ncy
Inte
rest
rat
eM
atur
ity
date
Fina
nce
cost
re
cogn
ised
in
the
year
Shs’
mill
ions
Shs’
mill
ions
Afr
ican
Dev
elop
men
t Ban
k, E
BK
LLo
ng te
rm lo
an10
,723
Dir
ecto
rs’ g
uara
ntee
USD
LIB
OR
+2.
85%
1 Fe
brua
ry 2
023
633
Inte
rnat
iona
l Fin
ance
Cor
pora
tion
(IFC)
, EB
KL
Med
ium
term
loan
7,04
9D
irec
tors
’ gua
rant
eeU
SDLI
BO
R +
3.15
%15
Mar
ch 2
023
457
Inte
rnat
iona
l Fin
ance
Cor
pora
tion
(IFC)
, EB
KL
Med
ium
term
loan
10,3
54D
irec
tors
’ gua
rant
eeU
SDLI
BO
R+
2.75
%15
Mar
ch 2
026
645
Res
pons
Abi
lity
Med
ium
term
loan
2,55
9D
irec
tors
’ gua
rant
eeU
SDLI
BO
R+
3.07
%31
Mar
ch 2
021
241
Euro
pean
Inve
stm
ent B
ank,
EB
KL
Med
ium
term
loan
358
Dir
ecto
rs’ g
uara
ntee
SHS
2.95
%15
Dec
embe
r 20
2061
KFW
DEG
Long
term
loan
10,4
08D
irec
tors
’ gua
rant
eeU
SDLI
BO
R+
3.3%
15 A
ugus
t 202
633
5
KFW
(Min
istr
y of
Fin
ance
) - S
IPM
KLo
ng te
rm lo
an86
Dir
ecto
rs’ g
uara
ntee
Shs
4.00
%30
Dec
embe
r 20
244
Mon
ey m
arke
t bor
row
ings
by
EBK
L Sh
ort t
erm
540
Dir
ecto
rs’ g
uara
ntee
SHS
Vari
ous
Less
than
3 m
onth
s 13
4
Mon
ey m
arke
t bor
row
ings
by
EBR
L Sh
ort t
erm
3,05
2D
irec
tors
’ gua
rant
eeR
WF
8%Le
ss th
an 3
mon
ths
216
Mon
ey m
arke
t bor
row
ings
by
EBU
L Sh
ort t
erm
68D
irec
tors
’ gua
rant
eeU
SHS
Bet
wee
n 3.
72%
to 1
0%Le
ss th
an 3
mon
ths
6
Euro
pean
Inve
stm
ent B
ank,
EB
UL
Med
ium
term
loan
1,85
5D
irec
tors
’ gua
rant
eeU
SHS
10.8
3%20
Apr
il 20
2020
5
Euro
pean
Inve
stm
ent B
ank,
EB
TLM
ediu
m te
rm lo
an4,
551
Dir
ecto
rs’ g
uara
ntee
USD
LIB
OR
+4.
5%20
Oct
ober
202
724
7
Euro
pean
Inve
stm
ent B
ank,
EB
CLM
ediu
m te
rm lo
an1,
984
Dir
ecto
rs’ g
uara
ntee
Bet
wee
n 4.
67 %
to
5.23
%20
Apr
il 20
2710
2
FPM
, EB
CLM
ediu
m te
rm lo
an32
8D
irec
tors
’ gua
rant
eeU
SD6.
0%16
Sep
tem
ber
2021
30
Mon
ey m
arke
t bor
row
ings
, EB
CLSh
ort t
erm
2,79
9D
irec
tors
’ gua
rant
eeU
SDB
etw
een
2.85
% to
3.
5%Le
ss th
an 3
mon
ths
78
56,7
143,
394
210
NO
TES
(con
tinu
ed)

26.B
orro
wed
fund
s (c
ontin
ued)
31 D
ecem
ber
2018
– G
roup
Lend
erTy
pe o
f loa
nLo
an b
alan
ceSe
curi
tyC
urre
ncy
Inte
rest
rat
eM
atur
ity
date
Fina
nce
cost
re
cogn
ised
in
the
year
Shs’
mill
ions
Shs’
mill
ions
Afr
ican
Dev
elop
men
t Ban
kLo
ng te
rm lo
an13
,875
Dir
ecto
rs’ g
uara
ntee
USD
LIB
OR
+2.
85%
1 Fe
brua
ry 2
023
727
Inte
rnat
iona
l Fin
ance
Cor
pora
tion
(IFC)
Med
ium
term
loan
10,4
17D
irec
tors
’ gua
rant
eeU
SDLI
BO
R +
3.15
%LI
BO
R+
2.75
%15
Mar
ch 2
023
15 M
arch
201
964
1
Res
pons
Abi
lity
Med
ium
term
loan
4,13
0D
irec
tors
’ gua
rant
eeU
SDLI
BO
R+
3.07
%23
Sep
tem
ber2
019
249
Euro
pean
Inve
stm
ent B
ank,
EB
KL
Med
ium
term
loan
568
Dir
ecto
rs’ g
uara
ntee
USD
LIB
OR
+2.
95%
17 N
ovem
ber
2020
27
Euro
pean
Inve
stm
ent B
ank,
EB
KL
Med
ium
term
loan
1,00
0D
irec
tors
’ gua
rant
eeSH
S6.
7%6.
85%
7.04
%
15 D
ecem
ber
2019
17 D
ecem
ber
2019
17 J
une
2019
112
KFW
Long
term
loan
-D
irec
tors
’ gua
rant
eeU
SDLI
BO
R+
3.3%
14 D
ecem
ber
2018
106
KFW
(Min
istr
y of
Fin
ance
) - S
IPM
KLo
ng te
rm lo
an11
4D
irec
tors
’ gua
rant
eeSH
S4.
00%
30 D
ecem
ber
2024
6
Mon
ey m
arke
t bor
row
ings
by
EBK
L Sh
ort t
erm
165
Dir
ecto
rs’ g
uara
ntee
SHS
6.85
%7.
04%
Less
than
3 m
onth
s18
2
Mon
ey m
arke
t bor
row
ings
by
EBR
L Sh
ort t
erm
2,53
9D
irec
tors
’ gua
rant
eeR
WF
8%Le
ss th
an 3
mon
ths
105
Mon
ey m
arke
t bor
row
ings
by
EBTL
Sh
ort t
erm
665
Dir
ecto
rs’ g
uara
ntee
TSH
SB
etw
een
2.5%
to 7
%Le
ss th
an 3
mon
ths
28
Mon
ey m
arke
t bor
row
ings
by
EBU
L Sh
ort t
erm
1,29
3D
irec
tors
’ gua
rant
eeU
SHS
Bet
wee
n 3.
72%
to 1
0%Le
ss th
an 3
mon
ths
84
Euro
pean
Inve
stm
ent B
ank,
EB
UL
Med
ium
term
loan
1,03
9D
irec
tors
’ gua
rant
eeU
SHS
10.8
3%15
Apr
il 20
1911
2
Euro
pean
Inve
stm
ent B
ank,
EB
TLM
ediu
m te
rm lo
an4,
532
Dir
ecto
rs’ g
uara
ntee
USD
LIB
OR
+4.
5%16
Jan
uary
201
916
2
Euro
pean
Inve
stm
ent B
ank,
EB
CLM
ediu
m te
rm lo
an2,
236
Dir
ecto
rs’ g
uara
ntee
USD
Bet
wee
n 4.
67 %
to
5.23
%Le
ss th
an 3
mon
ths
106
FPM
, EB
CLM
ediu
m te
rm lo
an48
8D
irec
tors
’ gua
rant
eeU
SD6.
0%16
Sep
tem
ber
2021
24 N
ovem
ber
2019
10 O
ctob
er 2
020
36
Mon
ey m
arke
t bor
row
ings
by
EBCL
Shor
t ter
m2,
040
Dir
ecto
rs’ g
uara
ntee
USD
Bet
wee
n 2.
85%
to 3
.5%
Less
than
3 m
onth
s8
45,1
012,
691
EQ
UIT
Y G
RO
UP
HO
LD
ING
S P
LC A
ND
SU
BS
IDIA
RIE
S IN
TEG
RAT
ED
RE
PO
RT
AN
D F
INA
NC
IAL
STA
TEM
EN
TS/ F
OR
TH
E YE
AR
EN
DE
D 3
1 D
EC
EM
BE
R 2
019
211
NO
TES
(con
tinu
ed)

212
EQUITY GROUP HOLDINGS PLC AND SUBSIDIARIES INTEGRATED REPORT AND FINANCIAL STATEMENTS FOR THE YEAR ENDED 31 DECEMBER 2019
NOTES (continued)
27.Share capital and reservesa) Share capital
Group Company
2019 2018 2019 2018
Shs’ millions Shs’ millions Shs’ millions Shs’ millions
Authorised - 4,114,196,688 (2018: 4,114,196,688) ordinary
shares of Shs 0.5 each 2,057 2,057 2,057 2,057
Issued and fully paid - 3,773,674,802 (2018:
3,773,674,802) ordinary shares of Shs 0.5 each 1,887 1,887 1,887 1,887
Group Company
2019 2018 2019 2018
Shs’ millions Shs’ millions Shs’ millions Shs’ millions
Movement in ordinary shares
At start and end of year (3,773,674,802) 3,774 3,774 3,774 3,774
In monetary terms:
At start and end of year 1,887 1,887 1,887 1,887
The shareholders of ordinary shares are entitled to receive dividends as declared from time to time and are entitled to one vote
per share at meetings of the Company.
(b) Share premium
Share premium arose from the issue of shares at a price higher than the par value of the shares.
(c) FVOCI reserve
The fair value through other comprehensive income (FVOCI) reserve is attributable to marking to market of investment
securities classified under the FVOCI category. All unrealised gains and losses are recognised in other comprehensive income
and credited to FVOCI reserve until the investment is derecognised at which time the cumulative gain or loss is recognised in
profit or loss, or the investment is determined to be impaired, when the cumulative loss is reclassified from the FVOCI reserve
to profit or loss.
(d) Loan loss reserve
The loan loss reserve represents excess of the loans and advances impairment provision determined in accordance with the
Central Banks’ of Kenya, Rwanda and Uganda prudential guidelines compared with the requirements of IFRS 9 - Financial
instruments: Recognition and measurement. This amount is not available for distribution.
(e) Other reserves
The other reserves represent pre-acquisition reserves from Equity Bank Uganda Limited. This amount is not available for
distribution.
(f) Foreign currency translation reserve
The foreign exchange translation reserve represents translation of the financial statements of the subsidiaries from Uganda
Shillings, South Sudan Pounds, Tanzania Shillings, Rwanda Franc and US Dollars for Equity Bank Congo S.A. to Kenya Shillings.
This amount is not available for distribution.

213
EQUITY GROUP HOLDINGS PLC AND SUBSIDIARIES INTEGRATED REPORT AND FINANCIAL STATEMENTS FOR THE YEAR ENDED 31 DECEMBER 2019
NOTES (continued)
27.Share capital and reserves (continued)(g) Dividends
The following dividends were declared and/or paid by the Company.
Cash dividends on ordinary shares declared and paid:
Group Company
2019 2018 2019 2018
Shs’ millions Shs’ millions Shs’ millions Shs’ millions
Final dividend declared and paid in 2019 Shs 2:00 per share
(2018: Shs 2.00) 7,547 7,547 7,547 7,547
Proposed dividends on ordinary shares
Group Company
2019 2018 2019 2018
Shs’ millions Shs’ millions Shs’ millions Shs’ millions
Final dividend for 2019; Shs 2.50 per share (2018: Shs 2.00) 9,434 7,547 9,434 7,547
Proposed dividends on ordinary shares are subject to approval at the annual general meeting and are not recognised as a
liability as at 31st December.
There is no income tax consequence arising from the retention or distribution of the retained earnings during the year (2018:
Nil).
28.Related parties and related party transactionsKey management personnel are those individuals who have the authority and responsibility for planning and exercising power
to directly or indirectly control the activities of the Group (including subsidiaries) and its employees. The Group considers the
Board of Directors, executive and non-executive Directors, to be key management personnel for the purposes of IAS 24 - related
party disclosures.
The Group enters into transactions, arrangements and agreements involving Directors, senior management and their related
concerns in the ordinary course of business.
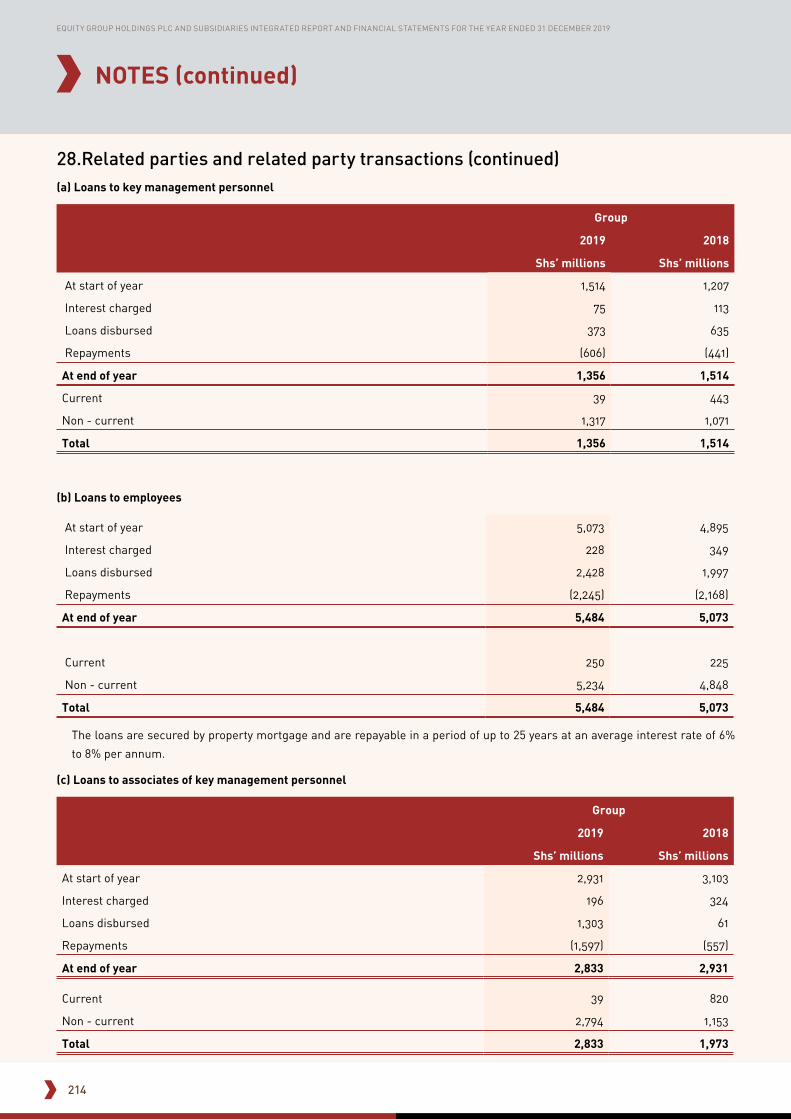
214
EQUITY GROUP HOLDINGS PLC AND SUBSIDIARIES INTEGRATED REPORT AND FINANCIAL STATEMENTS FOR THE YEAR ENDED 31 DECEMBER 2019
28.Related parties and related party transactions (continued)(a) Loans to key management personnel
Group
2019 2018
Shs’ millions Shs’ millions
At start of year 1,514 1,207
Interest charged 75 113
Loans disbursed 373 635
Repayments (606) (441)
At end of year 1,356 1,514
Current 39 443
Non - current 1,317 1,071
Total 1,356 1,514
(b) Loans to employees
At start of year 5,073 4,895
Interest charged 228 349
Loans disbursed 2,428 1,997
Repayments (2,245) (2,168)
At end of year 5,484 5,073
Current 250 225
Non - current 5,234 4,848
Total 5,484 5,073
The loans are secured by property mortgage and are repayable in a period of up to 25 years at an average interest rate of 6%
to 8% per annum.
(c) Loans to associates of key management personnel
Group
2019 2018
Shs’ millions Shs’ millions
At start of year 2,931 3,103
Interest charged 196 324
Loans disbursed 1,303 61
Repayments (1,597) (557)
At end of year 2,833 2,931
Current 39 820
Non - current 2,794 1,153
Total 2,833 1,973
NOTES (continued)

215
EQUITY GROUP HOLDINGS PLC AND SUBSIDIARIES INTEGRATED REPORT AND FINANCIAL STATEMENTS FOR THE YEAR ENDED 31 DECEMBER 2019
28.Related parties and related party transactions (continued)(c) Loans to associates of key management personnel (continued)
These are loans to associates of executive and non-executive Directors. The total amount of loans and advances granted was in
ordinary course of business. There were no provisions for doubtful debts related to the amount of outstanding balances and no
expense was recognised during the year in respect of bad or doubtful debts due from related parties.
(d) Key management personnel compensation
Group
2019 2018
Shs’ millions Shs’ millions
Remuneration to executive Directors:
Company* 106 97
Group** 646 441
Remuneration to key management 3,054 2,562
3,806 3,100
* Remuneration to the executive Directors of the parent Company, Equity Group Holdings Plc
** Remuneration to the executive Directors of the subsidiary companies in the Group.
Group
2019 2018
Shs’ millions Shs’ millions
Remuneration to key management:
Salaries and short term benefits 2,896 2,431
Pension 158 131
3,054 2,562
(e) Directors’ emoluments
Group Company
2019 2018 2019 2018
Shs’ millions Shs’ millions Shs’ millions Shs’ millions
Directors of EGH Plc
As executives 106 97 - -
Fees for non-executive Directors 76 25 76 25
182 122 76 25
Directors of subsidiaries who are not Directors of EGH Plc
As executives 646 441 - -
Fees for non-executive Directors 540 538 - -
1,186 979 - -
NOTES (continued)

216
EQUITY GROUP HOLDINGS PLC AND SUBSIDIARIES INTEGRATED REPORT AND FINANCIAL STATEMENTS FOR THE YEAR ENDED 31 DECEMBER 2019
28.Related parties and related party transactions (continued)(e) Directors’ emoluments (continued)
In addition to their salaries, the Group also contributes to a post-employment defined contribution plan and the national social
security fund for Kenya, Tanzania, Uganda and Democratic Republic of Congo employees. The Group also contributes to the
Rwanda Social Security Fund for Rwanda employees and to a private pension fund for employees in South Sudan.
Related parties are only the subsidiary companies in addition to Equity Group Foundation, which is a related party by virtue
of common directorship. Transactions with related parties are carried out in the normal course of business. The outstanding
balances as at year-end are unsecured and interest free and settlement occurs in cash. There have been no guarantees provided
or received for any related party payables or receivables. For the year ended 31 December 2019, the Group has not recorded any
impairment loss on receivables relating to the amounts owed by related parties (2018: Nil). This assessment is undertaken each
financial year through examining the financial position of the related party and the market in which the related party operates.
(f) Amounts due from related parties
Group Company
2019 2018 2019 2018
Shs’ millions Shs’ millions Shs’ millions Shs’ millions
Equity Group Foundation 19 24 - -
Equity Bank Congo S.A. - - 21 15
Equity Investment Bank Limited - - 40 80
19 24 61 95
(g) Amounts due to related parties
Company
2019 2018
Shs’ millions Shs’ millions
Equity Bank (Kenya) Limited 199 2
Equity Investment Services Limited 420 420
619 422
(h) Dividends received from subsidiaries
Equity Bank (Kenya) Limited 12,000 10,000
Equity Insurance Agency Limited 500 450
12,500 10,450
NOTES (continued)

217
EQUITY GROUP HOLDINGS PLC AND SUBSIDIARIES INTEGRATED REPORT AND FINANCIAL STATEMENTS FOR THE YEAR ENDED 31 DECEMBER 2019
29.Earnings per share The calculation of basic earnings per share for the Group at 31 December 2019 is based on the profit attributable to ordinary
shareholders of Shs 22,561 Million (2018: Shs 19,824 million) and the weighted average number of ordinary shares outstanding
of 3,774 Million (2018: 3,774 Million).
Group
2019 2018
Shs’ millions Shs’ millions
Profit for the year attributable to equity shareholders 22,386 19,691
Number of shares: (in millions)
Issued and weighted average number of ordinary shares at start and end of year: 3,773,674,802 (2018: 3,773,674,802))
3,774 3,774
Basic and diluted earnings per share (in Kenya Shillings) 5.93 5.22
30.Off-balance sheet contingencies and commitmentsGroup
In the ordinary course of business, the Group conducts business involving guarantees, acceptances and performance bonds.
These facilities are offset by corresponding obligations of third parties. At the year end, the contingencies were as follows:
2019 2018 2019 2018
Shs’ millions Shs’ millions Shs’ millions Shs’ millions
Guarantees and standby letters of credit 53,325 44,171 - -
Letters of credit, acceptances and other documentary credits 33,388 29,114 - -
86,713 73,285 - -
Commitments contracted for at the reporting date but not recognised in the financial statements are as follows:
Group
2019 2018
Shs’ millions Shs’ millions
Capital commitments 578 318
Loans approved but not disbursed 20,632 12,024
21,210 12,342
NOTES (continued)

218
EQUITY GROUP HOLDINGS PLC AND SUBSIDIARIES INTEGRATED REPORT AND FINANCIAL STATEMENTS FOR THE YEAR ENDED 31 DECEMBER 2019
30.Off-balance sheet contingencies and commitments (continued)The table below shows the contractual expiry by maturity of the Group’s contingent liabilities and commitments. Each undrawn
loan commitment is included in the time band containing the earliest date it can be drawn down.
Group – 2019 0 - 3 months 3 - 6 months 6 - 12 months
1 - 5 Years Total
Shs’ millions Shs’ millions Shs’ millions Shs’ millions Shs’ millions
Guarantees and standby letters of credit 10,736 8,687 12,273 21,629 53,325
Letters of credit, acceptances and other documentary credits 6,028 17,361 8,567 1,327 33,283
Capital commitments - - 578 - 578
Loans approved but not disbursed 9,853 2,982 4,200 3,597 20,632
Total commitments and guarantees 26,617 29,030 25,618 26,553 107,818
Group - 2018
Guarantees and standby letters of credit 7,523 8,889 10,221 17,538 44,171
Letters of credit, acceptances and other documentary credits 13,941 8,720 6,442 11 29,114
Capital commitments 73 - 245 - 318
Loans approved but not disbursed 3,692 4,253 2,418 1,661 12,024
Total commitments and guarantees 25,229 21,862 19,326 19,210 85,627
Group leases
The Group has entered into commercial property leases on a number of branches and office premises under operating leases.
These non-cancellable leases have remaining terms of between one and 10 years. All leases include a clause that enables
upward revision of the rental charges on an agreed basis according to prevailing market conditions. Some of the leases have
extension options. From 1 January 2019, the Group has recognised right-of-use assets for these leases, except for short-term
and low-value leases. Future minimum rentals payable under non-cancellable operating leases as at 31 December 2018 are
as follows:
2019 2018
Shs’ millions Shs’ millions
Within one year - 2,089
After one year but not more than five years - 7,620
More than five years - 1,419
- 11,128
Contingent liabilities - Litigation
The Group has established protocol for dealing with such legal claims. Once professional advice has been obtained and the
amount of damages reasonably estimated, the Group makes provisions to account for any adverse effects which the claim may
have on its financial standing.
Contingent tax liabilities
The Group has unresolved tax disputes with the Kenya Revenue Authority currently pending at the Tax Appeals Tribunal. Based
on professional advice received, the Directors are of the opinion that no significant loss will arise from these matters.
NOTES (continued)

219
EQUITY GROUP HOLDINGS PLC AND SUBSIDIARIES INTEGRATED REPORT AND FINANCIAL STATEMENTS FOR THE YEAR ENDED 31 DECEMBER 2019
31.Retirement Benefit Obligations The Group contributes to statutory defined contribution pension schemes (the National Social Security Fund (NSSF)), for Kenya,
Tanzania, Uganda and Democratic Republic of Congo employees. The Group also contributes to the Rwanda Social Security
Fund for Rwanda employees and to a private pension fund for employees in South Sudan.
Group
2019 2018
Shs’ millions Shs’ millions
National Social Security Fund 93 91
Pension Scheme 430 412
523 503
32.Segment informationA segment is a distinguishable component of the Group that is engaged either in providing products or services (business
segment), or in providing products or services within a particular economic environment (geographical segment), which is
subject to risks and rewards that are different from those of other segments.
(i) Business segments
The Group provides financial services to individuals, small and medium sized enterprises and large enterprises in each of
the banking subsidiaries. For management purposes, the results of each business unit (entity) is reviewed separately for the
purpose of making decisions. Distinct significant business segments are only considered for loans and advances as presented
below:
Group Consumer Micro enterprises
Agriculture Small and medium enterprises
Large enterprises*
Total
Shs’ millions Shs’ millions Shs’ millions Shs’ millions Shs’ millions Shs’ millions
Gross Loans and advances
31 December 2019 87,383 11,396 10,522 229,232 51,642 390,175
31 December 2018 71,211 9,196 7,109 188,518 40,676 316,710
*The segment information above includes the loan note carried at fair value disclosed in note 4 (b) and note 20.
The three customer facing lines of businesses include:
Consumer – This segment targets salaried customers or customers receiving other regular remittances like pension. Facilities
granted under this segment are for the purposes of empowering such customers to meet their most immediate personal needs
or personal development.
Small and Medium Enterprises (SME’s) – These are customers with small and medium enterprises. The facilities granted
under this segment are for purposes of meeting working capital needs, property development or acquisition of assets.
Corporate – This segment comprises large enterprises. The facilities granted under this segment are designed for purposes
of meeting working capital needs, large scale development, property acquisition, large investments and acquisition of assets.
NOTES (continued)
220
EQUITY GROUP HOLDINGS PLC AND SUBSIDIARIES INTEGRATED REPORT AND FINANCIAL STATEMENTS FOR THE YEAR ENDED 31 DECEMBER 2019
NOTES (continued)
32.Segment information (continued)(i) Business segments (continued)
The products the Group offers its customers include:
Equi loan - a credit facility granted to employees of reputable
organizations that the Group has an MOU with. The facility is
administered through a check off system from the employer
where loan deductions are remitted to the Group for loan
instalment due.
Vijana loan - meant to cater for the youth majority of whom
have business ideas but lack conventional collaterals, the
Group set aside some funds to support this clientele. The
lending is done through Group methodology.
Fanikisha loan - loan products tailored for women clients.
They have a characteristic of flexibility on collaterals since
majority of women don’t have formal collaterals yet have
good business ideas.
Farm input - facilities granted to customers in the
agricultural sector of the economy for inputs and working
capital needs.
Mortgage loan - facilities granted to customers in pursuit
of housing needs. The mortgages are advanced for both
residential and commercial purposes. This is available to
both salaried and business clients.
Asset finance loan - granted to our customers for purchase
of both movable and immovable assets. Majority of the
customers are in business.
Trade finance - products for customers in business and
facilitates purchase of goods and services and subsequent
payments thereof. Various products are extended under
trade finance including Bid bonds, LCs and Guarantees
among others.
Development loan - a facility granted to customers in the
construction to finance the project in terms of materials
and other overheads. Majority of customers accessing this
product are predominantly in SME and Corporate sectors.
Business loan - credit facilities granted to business
customers for working capital needs. Biashara Imara -
working capital facility provided to micro clients with no
conventional collateral.
It is not practicable to segregate revenues from external
customers for each product and service as the information
is not available and the cost to develop it would be excessive.
There are no other distinct significant business segments
within each entity to necessitate detailed disclosures.
(ii) Operating segments
The Group operates in six geographical markets that
is Kenya, Uganda, South Sudan, Rwanda, Tanzania and
Democratic Republic of Congo. The table below shows the
distribution of the Group’s total assets, net interest income,
total operating income, total expenses and profit before
income tax.

221
EQUITY GROUP HOLDINGS PLC AND SUBSIDIARIES INTEGRATED REPORT AND FINANCIAL STATEMENTS FOR THE YEAR ENDED 31 DECEMBER 2019
32.Segment information (continued)(ii) Operating segments
Kenya Uganda South Sudan
Rwanda Tanzania DRC Total
Shs’ millions
Shs’ millions
Shs’ millions
Shs’ millions
Shs’ millions
Shs’ millions
Shs’ millions
At 31 December 2019
Total assets 485,663 44,999 8,754 30,333 23,857 80,076 673,682
Total liabilities 397,668 39,027 5,487 25,750 21,679 72,294 561,905
Net interest income 34,727 3,398 10 2,242 996 3,610 44,983
Total operating income 51,551 4,430 1,730 2,890 1,223 5,949 67,773
Depreciation and amortization 4,125 534 171 228 352 611 6,021
Total expenses including impairment of financial assets 22,910 2,937 1,126 1,345 1,634 4,305 34,257
Profit before income tax 26,641 1,494 606 1,504 (411) 1,644 31,478
Additions to property and equipment 2,457 692 11 136 113 182 3,591
Additions to intangible assets 539 1 - 5 11 643 1,199
At 31 December 2018
Total assets 423,044 32,267 8,560 27,004 24,544 57,965 573,384
Total liabilities 349,187 27,513 5,338 23,222 21,898 51,269 478,427
Net interest income 32,059 2,551 37 1,655 1,402 3,418 41,422
Total operating income 47,467 3,814 980 2,164 894 5,258 60,577
Depreciation and amortization 3,276 252 117 213 134 449 4,441
Total expenses including impairment of financial assets 26,214 2,479 752 1,522 2,674 5,180 38,821
Profit before income tax 25,070 1,345 241 1,008 (559) 1,358 28,463
Additions to property and equipment 1,444 778 4 88 49 391 2,754
Additions to intangible assets 1,531 15 - 13 20 14 1,593
Interest income is reported net as management primarily relies on net interest revenue as a performance measure, not the
gross income and expense. No revenue from transactions with a single external customer or counter party amounted to 10% or
more of the Group’s total revenue in 2019 or 2018. The Group’s operating segments are reported based on financial information
provided to the Strategy and Investment Committee which is the key management committee and represents the decision
making organ.
NOTES (continued)

222
EQUITY GROUP HOLDINGS PLC AND SUBSIDIARIES INTEGRATED REPORT AND FINANCIAL STATEMENTS FOR THE YEAR ENDED 31 DECEMBER 2019
33.Derivative financial assets and liabilitiesThe table below shows the fair values of currency forwards and swaps recorded as assets or liabilities together with their
notional amounts. The notional amount, recorded gross, is the amount of a currency forward or swap’s underlying off balance
sheet asset / liability and is the basis upon which changes in the fair values of currency forwards and swaps are measured. The
notional amounts indicate the volume of transactions outstanding at the year-end and are indicative of neither the market risk
nor the credit risk.
Notional amount
asset
Notional amount liability
Fair value of asset
Fair value of liability
Notional amount
asset
Notional amount liability
Fair value of asset
Fair value of liability
2019 2018
Shs’ millions
Shs’ millions
Shs’ millions
Shs’ millions
Shs’ millions
Shs’ millions
Shs’ millions
Shs’ millions
Forward exchange contracts 28,586 28,589 28,586 28,150 5,084 5,084 5,082 5,032
Swaps 3,819 3,790 3,819 3,783 10,982 10,982 11,164 10,989
Spot 2,980 2,980 2,980 2,980 1,038 1,038 1,102 1,102
35,387 35,359 35,385 34,913 17,104 17,104 17,348 17,123
The Group has netting agreements in place with counterparties to manage the associated credit risks. These netting agreements
and similar arrangements generally enable the counterparties to off-set liabilities against available assets received in the
ordinary course of business and / or in the event of the counterparty’s default. The offsetting right is a legal right to settle, or
otherwise eliminate all or a portion of an amount due by applying an amount receivable from the same counterparty against it,
thus reducing credit exposure.
The table below summarises the currency forwards and swaps subject to offsetting and enforceable netting agreements whose
net amounts are presented in other assets.
2019 2018
Fair value of asset
Fair value of liability
Net amount presented
Fair value of asset
Fair value of liability
Net amount presented
Shs’ millions Shs’ millions Shs’ millions Shs’ millions Shs’ millions Shs’ millions
Forward exchange contracts 28,586 28,150 436 5,082 5,032 50
Swaps 3,819 3,783 36 11,164 10,989 175
Spot 2,980 2,980 - 1,102 1,102 -
35,385 34,913 472 17,348 17,123 225
34.Fiduciary activitiesThe Group provides custody, trustee, corporate administration, investment management and advisory services to third parties,
which involve the Group making allocation and purchase and sale decisions in relation to a wide range of financial instruments.
These financial instruments comprise deposits with financial institutions, government securities and quoted and unquoted
securities, among others. Those assets that are held in a fiduciary capacity are not included in these financial statements.
Some of these arrangements involve the Group accepting targets for benchmark levels of returns for the assets under the
Group’s care. These services give rise to the risk that the Bank will be accused of maladministration or under-performance.
The Group’s custodial services department holds assets on behalf of customers with a value of Shs 120.833 Billion (2018 – Shs
142.844 Billion). The income for the period for custodial services was Shs 126.050 Million (2018 - Shs 94.490 Million) while the
expenses amounted to Shs 47.564 Million (2018 - Shs 30.295 Million).
NOTES (continued)

223
EQUITY GROUP HOLDINGS PLC AND SUBSIDIARIES INTEGRATED REPORT AND FINANCIAL STATEMENTS FOR THE YEAR ENDED 31 DECEMBER 2019
35.Hyperinflation accounting With effect from 2016, the South Sudanese economy is considered to be hyperinflationary in accordance with the criteria in IAS
29. Accordingly, adjustments and reclassifications for the purposes of presentation of financial statements include restatements
in accordance with IAS 29, for changes in general purchasing power of the South Sudanese Pound.
The financial statements are based on historical cost approach. The standard requires that the financial statements prepared
in the currency of a hyperinflationary economy be stated in terms of measuring unit current at the reporting date.
On the application of IAS 29, the Group used conversion coefficients derived from the consumer price index (CPI) in the Republic
of South Sudan. CPIs and the corresponding conversion coefficients are presented below:
Year CPI Conversion coefficient
31 December 2019
2014 170 63
2015 357 30
2016 2,799 4
2017 4,502 2
2018 6,306 2
2019 10,657 1
31 December 2018
2014 170 37
2015 357 18
2016 2,799 2
2017 4,502 1.4
2018 6,306 1
NOTES (continued)

224
EQUITY GROUP HOLDINGS PLC AND SUBSIDIARIES INTEGRATED REPORT AND FINANCIAL STATEMENTS FOR THE YEAR ENDED 31 DECEMBER 2019
35.Hyperinflation accounting (continued)The application of IAS 29 resulted in an adjustment for the loss of purchasing power of the South Sudanese Pound recorded
in profit or loss. In the current year, Equity Bank South Sudan was holding excess of monetary assets over monetary liabilities
which resulted in a loss on the net monetary position. The movement is shown as below:
Group 2019 2018
Shs’ millions Shs’ millions
Monetary liabilities at 1 January 5,326 5,662
Increase in net monetary liabilities during the year 2,357 1,347
Monetary liabilities at 31 December 7,683 7,009
Restated monetary liabilities at 31 December (5,357) (5,338)
Gain on monetary liabilities (a) 2,326 1,671
Monetary assets at 1 January 8,176 8,853
Increase in net monetary assets during the year 3,296 1,240
Monetary assets at 31 December 11,472 10,093
Restated monetary assets at 31 December (8,391) (8,182)
Loss on monetary assets (b) 3,081 1,911
Net monetary position loss (a - b) (755) (240)
Monetary liabilities and assets at 1 January are based on opening CPI as of that date.
Monetary liabilities and assets at 31 December have been restated using the conversion coefficient of 2 (2018: 1.40).
See also Note 2 (c) (iii).
36.Events after the reporting period There have been no events after the reporting date that require adjustment to, or disclosure in, these financial statements.
––– 000 –––
NOTES (continued)

225
EQUITY GROUP HOLDINGS PLC AND SUBSIDIARIES INTEGRATED REPORT AND FINANCIAL STATEMENTS FOR THE YEAR ENDED 31 DECEMBER 2019
DAVID ANSELL
David holds a Bachelor’s degree in Mathematics from the University of North Carolina at Wilmington, a Bachelor’s degree in Finance from the Thunderbird Graduate School of International Management and an Advanced Management Degree (AMP) from the Wharton School of Business. He has served in various assignments at Citibank in the Emerging Markets, including 16 years in Africa as well as being appointed Managing Director and CEO of Ecobank Transnational Inc.
Boards: Non-Executive Chairman, Equity Group Holdings Plc.
PROF. ISAAC MACHARIA
Isaac holds a Master of Medicine in Otorhinolaryngology, Bachelor of Medicine and Bachelor of Surgery from the University of Nairobi and is a Fellow of the College of Surgeons of East, Central and Southern Africa (COSECSA). He is a Professor of ENT, Head and Neck Surgery at the University of Nairobi. Isaac is the East African regional advisor for CBM in Ear and Hearing Care as well as being the Regional Secretary for Africa and the Middle East for the International Federation of Otorhinolaryngological Societies (IFOS). He is a past President of the Pan African Federation of Otorhinolaryngological Societies (PAFOS) and is a member of The Starkey Hearing Foundation Global Initiative Advisory Board. Prof Macharia was the founder Chairman of the Allergy Society of Kenya and the Cochlear Implant Group of Kenya (CIGOK). He is Chairman of Savannah Informatics, Jadala Investments and Co-founder as well as Chairman, Otolaryngology Associates and Nairobi ENT Clinic.
Boards: Non-Executive Vice Chairman, Equity Group Holdings Plc; Non Executive Chairman, Equity Bank (Kenya) Limited
DR. JAMES MWANGI, CBS
James holds five honorary doctorate degrees in recognition of his positive impact to the Kenyan society. He holds a Bachelor of Commerce degree and is a Certified Public Accountant. He has been honoured thrice with National Presidential Awards: The First Class Chief of the Order of the Burning Spear (CBS), the Moran of the Burning Spear (MBS) and Head of State Commendation (HSC). On the global front, Dr. Mwangi won the G8 Global Vision Award, 2007. He was named among the Top 50 Emerging Market Business Leaders and the 20 most influential people in Africa in 2011; the World Entrepreneur of the Year by Ernst & Young in 2012; the Forbes Africa Person of the Year in 2012 and was recently named in the Bloomberg 50 list of people who defined 2019 globally.
On the regional front, he was also recognized as the Africa Investor Awards, CEO of the Year in 2009 and 2015; Innovation Leader of the Year in 2012; African Business Leader of the Year in 2013 and African Banker of the Year in 2010, 2011 and 2017 at the African Banker Awards. Dr. Mwangi was also named the Banker of the Year during the Banker Africa (East Africa) Awards in 2017 & 2018. Locally, he has received the Think Business CEO of the Year award for the last 3 years.
James has served on board and advisory roles at the Global Advisory Council for VISA Inc., the Clinton Global Initiative, The G8 New Alliance For Food Security And Nutrition, US President Barack Obama’s Initiative for Global Development, the G20 Advisory Board of Agriculture and Initiative for Global Development and The Global Agenda Council on New Economic Thinking of the World Economic Forum from 2003-2007. He served as the Founding Chair of Kenya’s Vision 2030 from inception in 2007 to 2019
He currently serves on several international bodies as an advisor and was recently appointed to the Nairobi Advisory Board of Columbia Global Centres. He is a Board member of the Economic Advisory Board of the International Finance Corporation (IFC), The Mastercard MEA Advisory Board, the Africa Leadership Academy in South Africa, the Global Alliance for Food Security and Nutrition and is the Chancellor of Meru University College of Science and Technology.
He is a guest lecturer at Stanford, Columbia, MIT, Harvard, IESE and Lagos Business School where Equity Bank Business Model is a case study.
Boards: Managing Director and CEO, Equity Group Holdings Plc; Non-Executive Director, Equity Bank (Kenya) Limited; Non-Executive Director, Equity Bank (Tanzania) Limited; Non-Executive Director in Equity Bank Rwanda PLC; Non-Executive Director, Equity Bank Congo S. A.; Non-Executive Director, Equity Bank Uganda Limited; Non-Executive Director, Equity Bank South Sudan Limited; Non-Executive Director, Finserve Africa; Non-Executive Director, Equity Investment Bank; Executive Chairman, Equity Group Foundation.
MARY WAMAE
Mary holds a Master’s degree in Leading Innovation and Change from York St. John University, UK, a Bachelor of Laws degree from the University of Nairobi and a Diploma in Law from the Kenya School of Law. She is a graduate of Advanced Management Programme (Strathmore - IESE Business School, Barcelona Spain) and Advanced Management Programme at Harvard Business School.
She is a Certified Public Secretary (Kenya) and member of The Institute of Certified Public Secretaries of Kenya (ICPSK), Law Society of Kenya, Women Corporate Directors and the Kenya Section of International Commission of Jurists. She is a graduate of Advanced Management Programme (Strathmore - IESE Business School, Barcelona Spain) and Advanced Management Programme at Harvard Business School. She is an Advocate of the High Court of Kenya and holds a Post Graduate Diploma in Gender and Development and has over 15 years’ experience in private legal practice.
Boards: Group Executive Director, Equity Group Holdings Plc; Executive Director, Equity Bank (Kenya) Limited; Non-Executive Director, Equity Bank (Tanzania) Limited; Non-Executive Director, Equity Bank Congo S.A.; Non-Executive Director in Equity Bank Rwanda PLC; Non-Executive Director, Equity Bank Uganda Limited; Non-Executive Director, Equity
CONSOLIDATED BOARD OF DIRECTORS’ PROFILES
226
EQUITY GROUP HOLDINGS PLC AND SUBSIDIARIES INTEGRATED REPORT AND FINANCIAL STATEMENTS FOR THE YEAR ENDED 31 DECEMBER 2019
Bank South Sudan Limited; Non-Executive Director, Finserve Africa; Non-Executive Director, Equity Investment Bank, Non-Executive Director, Equity Group Foundation.
EVELYN RUTAGWENDA
Evelyn holds a Bachelor of Commerce degree from Makerere University, Kampala. She is a Certified Public Accountant and member of the Institute of Certified Public Accountants of Rwanda (ICPAR). She previously worked as the Auditor General for the Republic of Rwanda; as the Secretary General of Uganda National Chamber of Commerce and Industry (UNCCI); consultant/project accountant for Decentralization Secretariat (Institutional Capacity Building Project); Ministry of Local Government, Uganda and also as Chief Auditor at UCA Auditing Services among others. Evelyn spearheaded the formation of the Institute of Certified Public Accountants of Rwanda (ICPAR) and subsequently served the Institute in various capacities including, Chairperson of the Interim Governing Council, Ex Officio and elected member of the Governing Council. In 2009, she received an ACCA Achievements Award for her outstanding contribution to developing the accountancy and finance profession. She is currently the Chair-MTN Rwanda and Crystal Telecom Limited Boards, Vice-Chair, Rwanda Development Board and previously served on the Board of Victoria Motors Rwanda from July 2013 to September 2019.
Boards: Non-Executive Director, Equity Group Holdings Plc; Non-Executive Chairperson, Equity Bank Rwanda PLC; Non-Executive Director, Equity Bank Uganda Limited.
VIJAY GIDOOMAL
Vijay qualified as a lawyer from Clifford Chance in the UK in 1992. He has worked in various capacities with Car & General and has seen the company grow regionally with representation in Kenya, Uganda, Tanzania, Rwanda, Burundi, Seychelles, Eritrea, Ethiopia, Djibouti and Somalia. He is an active member of the Young Presidents Association, its past Chairman (Kenya Chapter) and regional board member.
Boards: Non-Executive Director, Equity Group Holdings Plc; Non-Executive Chairman, Equity Investment Bank.
DR. HELEN GICHOHI, MBS, OGW
Helen holds a PhD. in Ecology from the University of Leicester in the UK, Master of Science degree in Biology of Conservation from the University of Nairobi and a BSc in Zoology from Kenyatta University respectively. Helen is currently serving as the part-time Ambassador for Conservation in Africa for Fauna and Flora International. She has held various positions including Managing Director of Equity Group Foundation, president of African Wildlife Foundation and Managing Director of African Conservation Center. She is a recipient of the Charlotte Wyman Trust’s Women in Conservation Program, the Order of Great Warrior and the Moran of the Order of the Burning Spear (MBS). She won the
Giai Environmental Award in 2012 at The WIFTs Foundation International Visionary Awards. Helen serves on the boards of Bamburi Cement Limited and OlPejeta Conservancy and previously served on the Africa Wildlife Foundation and Kenya Wildlife Service Boards. She also serves on the Advisory Board of the Stockholm based EAT Forum.
Boards: Non-Executive Director, Equity Group Holdings Plc.
DEEPAK MALIK
Deepak holds a Bachelor‘s Degree in Commerce and is a fellow member of the Institute of Chartered Accountants - India. He is the Chief Executive Officer of Arise and has extensive experience in the financial services sector on the African continent. Previous positions that he has held include being the CEO of the Development Bank of Zambia (DBZ) and serving as the Head of Department of Financial Institutions at Norfund. In addition, he has also held several senior executive positions at Zambia Consolidated Copper Mines Limited (ZCCM) and serves on various boards of financial institutions across Southern and Eastern Africa.
Boards: Non-Executive Director, Equity Group Holdings Plc.
DR. EDWARD ODUNDO PhD, MBS
Edward holds a PhD in Business Administration (Strategic Management) from The University of Nairobi, MBA degree in Strategic Management and Marketing and a BSc Degree in Finance and Accounting. He is also an alumnus of Harvard University, John F. Kennedy School of Government (HSB), London School of Economics (LSE) and holds membership in several professional bodies (FCPA, FCPS, FKIM, ICIFA). He is the former Chief Executive Officer of Retirement Benefits Authority (Kenya) and former Director, Nairobi Securities Exchange.
He is the Director, School of Pension and Retirement Studies (SPRS), Chairman of the Public Service Superannuation Scheme, Kenya (PSSS) and a lecturer at the University of Nairobi, School of Business as well as a Consultant in Pensions, Tax, Corporate Governance and Financial Services. He is a recipient of the Moran of the Order of The Burning Spear (MBS). He is a published author having authored a book titled ‘The Doctrine of Strategic Planning’.
Boards: Non-Executive Director, Equity Group Holdings Plc.
PROF. SHEM MIGOT-ADHOLLA
Shem holds a PhD in Sociology of Development and a Master of Arts in Sociology from University of California. He is a Special Graduate Student in Agricultural Economics from Michigan State University and holds a Bachelor of Arts degree from University of East Africa. He is a private consultant on agriculture and rural development, land policy reform and environmental issues based in Nairobi, Kenya. Previously he was the Lead Specialist on Land Policy and Administration
CONSOLIDATED BOARD OF DIRECTORS’ PROFILES (continued)

227
EQUITY GROUP HOLDINGS PLC AND SUBSIDIARIES INTEGRATED REPORT AND FINANCIAL STATEMENTS FOR THE YEAR ENDED 31 DECEMBER 2019
in the World Bank. He also served in the Government of Kenya (on secondment from the World Bank) as Permanent Secretary, Ministry of Agriculture and Rural Development. He served as an Associate Research Professor at the Institute for Development Studies (IDS), University of Nairobi and has numerous publications to his name focusing on land issues, pastoralism, farmers’ institutions and rural development. He has working experience in many African countries as well as Haiti, Kyrgyz Republic and several Asian countries. He is currently the Chairman of the Council of Kenyatta University and has also served as Chairman of Kibabii University, Chairman of Board of the Centre for Corporate Governance and was a Director of Housing Finance Company of Kenya Ltd and Vice-Chairman Board of Directors, Kenya Wildlife Service.
Boards: Non-Executive Chairman, Equity Bank South Sudan Limited; Non-Executive Director, Equity Bank (Kenya) Limited.
FREDRICK MUCHOKI, OGW
Fredrick is a businessman with vast commercial experience. He is the Managing Director of Continental Business Systems, Presta and Office Equipment Limited, Mugumo Coffee Ltd, Online Mobile Com. Ltd and Summerdale Inn Ltd.
Boards: Non-Executive Director, Equity Bank (Kenya) Limited.
ADEMA SANGALE
Adema graduated top of her class at USIU and went on to receive post-graduate degrees from some of the world’s top universities. As a Chevening Scholar, she obtained a Master of Business Administration from Oxford University, UK, and thereafter, a Master’s in Public Administration & Public Policy from Harvard Kennedy School of Government, US, as an Edward S. Mason Fellow.
She has worked mainly in the private sector for the past 23 years, starting out at Procter & Gamble East Africa where, at 27, she was the youngest regional CEO of a blue chip. She subsequently rose to senior leadership positions across Africa, Europe & North America. She has worked at UNEP as Chief of Brand and as a Senior Vice President Africa for a social impact organization. Most recently she worked in New York as a consultant with UN Women. She is currently the Managing Partner at C.Suite Africa, a management consultancy.
Adema has received several nominations and recognitions. In 2012, she was recognized as a New Generation Leader by the African Leadership Network and has been honored three times as “Top 40 Under 40” by Business Daily. In 2016, she was invited to the Paris-based Institut Choiseul’s as one of Africa’s top 100 emerging leaders. In 2018 she received the Distinguished Women’s Leadership award and has recently been featured in The Journeys of Women Trailblazers in Kenya, a publication of the Kenya Government.
She is passionate about Africa and sits on the Boards of several private and public sector organizations on the continent across various sectors.
Boards: Non-Executive Director, Equity Bank (Kenya) Limited.
JANE NGIGE
Jane holds a Food and Agriculture Biotechnology Master’s Degree: University of Reading - UK; a post-graduate certificate in International Food Laws: University of Michigan State-USA; Higher Diploma in Food Science and Technology; Kenya Polytechnic and Postgraduate Diploma: Food Processing, Quality Assurance & Marketing from the University of Wageningen.
Jane’s professional experience spans across the civil service, private sector, NGO’s as well as development agencies. She is the former Chief Executive of the Kenya Flower Council and the Kenya Horticulture Council over a period of 15 years in total. Prior to venturing into horticulture, Jane worked with the hospitality, food processing and manufacturing industries in several countries.
Boards: Non-Executive Director, Equity Bank (Kenya) Limited.
ERASTUS J.O MWENCHA, EGH
Erastus holds an MA in Economics from the University of York and a B.A. (Hons) in Economics from the University of Nairobi. He was decorated by the President of the Republic of Kenya with the highest State commendation, “Elder of the Order of the Golden Heart” (EGH), in recognition of his contribution to national and regional development. He is a recipient of several awards.
He is the Chairperson of the Africa Capacity Building Foundation (ACBF) and TradeMark East Africa. In January 2008, he was elected as Deputy Chairperson of the African Union Commission by the Heads of State and Governments of the 55 Member States of the African Union and was re-elected in July 2012. Previously, he served for 10 years as Secretary General for the 21 Member States of the Common Market for Eastern and Southern Africa (COMESA), the first Regional Economic Community to establish a Free Trade Area.
Prior to his regional and continental assignments, Erastus served in the Government of Kenya in various senior positions. He is also a member of several Boards including the Brenthurst Foundation, Trade Policy and Capacity Training Centre (TRAPCA) and Coalition for Dialogue on Africa (CoDA).
Boards: Non-Executive Director, Equity Bank (Kenya) Limited
CONSOLIDATED BOARD OF DIRECTORS’ PROFILES (continued)

228
EQUITY GROUP HOLDINGS PLC AND SUBSIDIARIES INTEGRATED REPORT AND FINANCIAL STATEMENTS FOR THE YEAR ENDED 31 DECEMBER 2019
JAMES MUTUKU
James holds a Bachelor of Arts in Economics and Sociology from Egerton University. He has over 20 years’ experience in Treasury business having worked as a treasury dealer for Co-operative Bank of Kenya, Head of Money Markets and Fixed Income at KCB Kenya and the East Africa Head of Asset Liability Management (ALM) for Standard Chartered Bank Kenya. Before joining Equity Bank, he was the immediate country Head of Financial Markets for Standard Chartered Bank Uganda, where he also doubled up as the Co-Head SCB Uganda Wholesale Bank. He brings a wealth of experience in balance sheet management, fixed income trading and general treasury management. He joined Equity Bank in 2016.
Boards: Non-Executive Director, Equity Bank Congo S. A.; Non-Executive Director (alternate to Dr. James Mwangi), Equity Bank Rwanda PLC.
RAYMOND MBILINYI
Raymond holds a BSc Engineering and an MBA (Marketing). He is a professional engineer, a certified project manager, transportation specialist and a professional marketer with over 20 years of experience in Africa. He has gained extensive experience in conducting a wide range of assignments in both public and private organizations. Prior to being appointed as Executive Secretary of TNBC, he was the Acting – Executive Director of Tanzania Investment Centre (TIC), First Project Director of Dar Rapid Transit (DART) at Dar es Salaam City Council, Network Development Manager – Retail of BP (T) Ltd and Vice President of World Investment Promotion Agencies Association (WAIPA). He is a Board Member in Swiss Port Tanzania PLC, Tanga Cement PLC, Tanzania Industries Licensing Board – BRELA and Tanzania Private Sector Foundation (TPSF). Raymond is also Vice Chairman of the National Hunting Block Allocation Advisory Committee under the Ministry of Natural Resources and Tourism.
Boards: Non-Executive Chairman, Equity Bank (Tanzania) Limited.
ROBERT KIBOTI
Robert holds a bachelor’s degree in Economics and Administration from Maharshi Dayanand University, India. He has attended several professional courses in banking and finance both locally and internationally. He has over 24 years’ experience in banking, where he has held various leadership positions. Before joining Equity Bank Tanzania, he was the General Manager in charge of Equity Supreme Centre. Prior to joining Equity Bank, he was in Industrial Development Bank, where he worked for 7 years in various capacities. Robert joined Equity Bank in May 2005.
Boards: Managing Director, Equity Bank (Tanzania) Limited.
PROF. AHMED AME
Ahmed holds a Doctor of Philosophy (PhD) in Business Administration from the University of Dar es Salaam; a Licentiate in Business Administration from UMEA University in Sweden; an MBA (with a bias in Production and Operations Management) from the University of Dar es Salaam and a B.A –Statistics (Hons) from the University of Dar es Salaam. He also holds a Statistical training Diploma, with specialization in computer programming and data processing from the International Statistical Education Centre in Calcutta, India. He is an Associate Professor in Business Administration at the University of Dar es Salaam Business School (UDBS). He has undertaken various research projects in the area of banking and is a member of various local and international committees.
Boards: Non-Executive Director, Equity Bank (Tanzania) Limited.
DINO STENGEL
Dino holds a Bachelor of Commerce Degree from Rhodes University. He joined Achelis in Bremen, Germany in 1997 and is currently the Managing Director of Achelis (Tanganyika) and shareholder of JohAchelis & Söhne. He has over 20 years of cross functional experience within the group in Eastern and Southern Africa. In Tanzania, he is an active executive committee member of the Young Presidents Organisation, has chaired the German Business Association and founded the European Union Business Group in 2012. He is also a member of various local and International committees.
Boards: Non-Executive Director, Equity Bank (Tanzania) Limited.
GODFREY SIMBEYE
Godfrey holds a Bachelor of Commerce and Accounting degree from the University of Dar es Salaam and is a qualified accountant (ACCA). He has a Master of Science degree in Information Systems Management and Technology from the University of Strathclyde in the UK. He has a strong background in Business and Financial Management and has more than 17 years of experience in consultancy and management of finance functions. He is currently the Executive Director of Tanzania Private Sector Foundation (TPSF). His day to day duties at TPSF for over 10 years have earned him a wealth of experience in Public Private Engagement and Dialogue (PPD’s) at local and international levels, private sector development, PPP projects and in advocacy for business environment reforms in Tanzania and in the EAC region.
Godfrey is also a member of the Boards of African Capacity Building Foundation (ACBF) based in Zimbabwe, Tanzania Investment Centre and African Trade Insurance (ATI) based in Nairobi.
Boards: Non-Executive Director, Equity Bank (Tanzania) Limited.
CONSOLIDATED BOARD OF DIRECTORS’ PROFILES (continued)

229
EQUITY GROUP HOLDINGS PLC AND SUBSIDIARIES INTEGRATED REPORT AND FINANCIAL STATEMENTS FOR THE YEAR ENDED 31 DECEMBER 2019
PROF. HONEST PROSPER NGOWI
Professor Ngowi holds a Phd in Economics from the Open University of Tanzania, a Master of Science in Economics and Business Administration from Agder University College, Norway, Advanced Diploma in Economic Planning from the Institute of Development Planning. He is an alumnus of the Norwegian School of Economics and Telemark University College, Norway.
He is Associate Professor of economics, researcher and consults in Economics and Business at Mzumbe University, Tanzania. He has written over 70 major works and published and lectured widely on various areas of economics and business. He is active in the academic, research and consultancy industry with broad international exposures and networks in over twenty countries.
He has been a member of several national and international professional associations and has served as a Director on several boards including the Economic and Social Research Foundation (ESRF), Envirocare, SWISSAID, Southern Agricultural Growth Corridor for Tanzania (SAGCOT), National Entrepreneurship Development Committee (under NEEC) and Stellenbosch University.
Professor Ngowi is the founder of Ngowi TV which is an online television channel dedicated to Economic, Business and Development perspectives. He is also a Partner of Think Global, an international consulting and research company based in Oslo Norway.
Boards: Non-Executive Director, Equity Bank (Tanzania) Limited
HANNINGTON NAMARA
Hannington is the Managing Director of Equity Bank Rwanda. He holds a degree in Business Administration (Finance option) from Makerere University Business School, a graduate of Advanced Management Programme from Strathmore Business School. He is a Fellow of the Africa Leadership Initiative-East Africa, a member of the Aspen Global Leadership Network. He has over 19 years of experience in banking and Private Sector Development extensive with knowledge and a track record in Strategic Leadership, Banking and Finance, Management and Communications. He has held various leadership positions while working with different reputable organisations in the past including TradeMark East Africa, Rwanda Private Sector Federation, Commercial Bank of Rwanda (BCR), Rwanda Investment Export Promotion Agency (RIEPA-now known as Rwanda Development Board). He holds several positions of responsibility in Boards of Corporates and Parastatals.
Boards: Managing Director, Equity Bank Rwanda PLC.
DR. PATRICK UWIZEYE
Patrick holds a degree of Doctor of Business Administration (DBA) from the Heriot-Watt University, UK, a Master of Science (MSc) in Strategic Planning from the same University, MBA in Financial Management from the University of Hull, UK and Masters in Communications Management (MCM) from Coventry University, UK. He is also a Certified Public Accountant (CPA) and a member of both Institutes of CPA Kenya and Rwanda; a Certified Member of the Institute of Risk Management (CMIRM), UK and Associate Member of Kenya Institute of Management. Patrick has over 28 years working experience in business management and worked for MTN Rwanda and AACC in Nairobi. Dr. Uwizeye is currently the President of the Institute of CPA Rwanda, and a board member of Pan Africa Federation of Accountants (PAFA). Patrick currently serves as the Managing Director of BPU Consulting Ltd, a company he founded more than six year ago.
Boards: Non-Executive Director, Equity Bank Rwanda PLC; Non-Executive Chairman, Finserve Africa.
ROBERT BAFAKULERA
Robert holds a Bachelor of Commerce degree from Makerere University, Uganda. He has served as Chairman in several investment and trading companies and has a wealth of experience in entrepreneurship and business. He is currently the Managing Director for Roba General Merchants Limited.
Boards: Non-Executive Director, Equity Bank Rwanda PLC.
EMMANUEL BUTARE
Emmanuel holds a Master’s Degree in Law from Ottawa University and a Bachelor of Laws degree from the National University of Rwanda. He also holds a Postgraduate Diploma in legal practice from the Institute of Legal Practice and Development (ILPD); A fellow from the London Institute of Chartered Arbitrators (FCIArb) and a Certificate in Global Arbitration from Hamline University of Law in conjunction with School of International Arbitration, Queen Mary University in London. He worked as an Assistant Lecturer at the Law School, a Training Coordinator in the Rwandan Judiciary and Principal State Attorney. He was part of the team that negotiated the launch of the Tripartite Free Trade Area negotiations between the EAC, COMESA and SADC. He served as Vice President, East African Law Society (EALS) and President of the Strategic Litigation Committee of the EALS. He is a member of the Kigali International Arbitration Centre Domestic Arbitrators and has handled several arbitrations. Robert is currently the Managing Partner and one of the founding Partners of MRB Attorneys.
Boards: Non-Executive Director, Equity Bank Rwanda PLC.
CONSOLIDATED BOARD OF DIRECTORS’ PROFILES (continued)

230
EQUITY GROUP HOLDINGS PLC AND SUBSIDIARIES INTEGRATED REPORT AND FINANCIAL STATEMENTS FOR THE YEAR ENDED 31 DECEMBER 2019
STEVEN MUTABAZI
Steve holds Master of Science in Engineering and Bachelor of Engineering degrees from Monash University, Melbourne, Australia. He has over 30 years’ experience in corporate governance, as an Executive Board Member of the two companies he founded and later as Chairman of Broadband Systems Corporation Ltd, KT Rwanda Networks Ltd, and the National Industrial Research and Development Agency as well as being a member of the Australian Institute of Company Directors.
Steve built his entrepreneurial business career in Australia and the Asia Pacific region. He founded and led two technology innovation companies for 20 years. He also held senior positions with Telstra Corporation (Australia) and Hewlett Packard Company.
In 2012, he joined the Rwanda Development Board, where for over 6 years, he led the Government’s effort to develop the country’s ICT sector. He led the establishment of the Government’s joint venture with KT Corporation for the rollout of 4G LTE covering 95% of the population by 2017 and developed Kigali Innovation City flagship initiative.
Boards: Non-Executive Director, Equity Bank Rwanda PLC
APOLLO MAKUBUYA
Apollo is a Senior Partner and Head of the Commercial Team of MMAKS Advocates, a position he has held since 2005. He joined MMAKS having been previously ass Managing Partner at Central Law Offices since 1999 and a Senior Law Lecturer at the Faculty of Law in Makerere University for 15 years.
Apollo is the Chairman of the Board of Equity Bank Uganda Ltd; Prudential Insurance Uganda Ltd; Ssanga Courts Ltd and a Cancer Charity known as ‘Art with a Cause’ based in Uganda.
A graduate of Makerere University (cum laude) and the University of Cambridge, Apollo has written the book: Protection, Patronage or Plunder? British Machinations and Uganda’s Struggle for Independence.
For over 25 years, Apollo has served in many senior positions in the Kingdom of Buganda including as its Attorney General and 3rd Deputy Katikkiro (Prime Minister). He is presently the Chief Palace adviser to Kabaka Ronald MuwendaMutebi II.
Boards: Non-Executive Chairman, Equity Bank Uganda Limited.
SAMUEL KIRUBI
Samuel holds a Master’s Degree in Business Administration (Finance) from Moi University and a Bachelor of Arts degree in Economics and Statistics from Egerton University. He is a graduate of Advanced Management Programme (Strathmore
IESE Business School, Barcelona Spain). He joined Equity Bank in 2001 and has gained vast experience in operations, marketing and customer service. Samuel previously served as the Chief Operations Officer in Equity Bank South Sudan and most recently as the Managing Director, Equity Bank Rwanda.
Boards: Managing Director, Equity Bank Uganda Limited.
ANTHONY KITUUKA
Anthony holds an MBA in Oil and Gas from Middlesex University, London and a Bachelor’s Degree in Statistics and Applied Economics from Makerere University, Uganda. He is a Fellow of the Association of Chartered Certified Accountants Certificate (FCCA) and has completed an Advanced Management Program from Strathmore, Lagos and IESE (Spain) Business Schools as well as several other executive leadership programs at Gordon Institute of Business and INSEAD. He has over 13 years banking experience and has previously worked with Kenya Commercial Bank (KCB) and Barclays Bank Uganda Limited. He joined Equity Bank in 2014 and was previously the Group Executive Director for Regional Subsidiaries.
Boards: Executive Director, Equity Bank Uganda Limited.
DR. PETER KIMBOWA
Peter is the team leader CEO Summit Uganda and is an Executive Coach, internationally certified trainer, speaker, consultant and author. He is a Board member in ESKOM (Uganda), in Baylor College of Medicine (Mulago and Texas) and in in Financial Sector Deepening Initiative of Executive Coaching Association for Africa. He is an adjunct faculty member Strathmore Business School, a founding member Association of Management Consultants of Uganda (AMCU) and Uganda Coaches and Mentors. He is a co-founder and Managing Partner at IFE – a Leadership and Management Development consulting firm and also an Associate of National Academy of Sciences as well as American Management Association. Peter is also the Board Chairman of the Transport Management Company (TMC).
Boards: Non-Executive Director, Equity Bank Uganda Limited.
GEOFFREY RUGAZOORA
Geoffrey holds a Bachelor of Science degree in Industrial Chemistry (Honours) of Makerere University Kampala and received postgraduate training in the fields of tribology, operations management, leadership and governance at Wits Business School Johannesburg, among other reputable higher institutions of learning. He has held various managerial positions within TOTAL Uganda, sat on various Boards including Uganda Airlines, is currently a member of the Board of Directors of Rushere Community Hospital and the Group Chief Executive Officer of MOGAS.
CONSOLIDATED BOARD OF DIRECTORS’ PROFILES (continued)

231
EQUITY GROUP HOLDINGS PLC AND SUBSIDIARIES INTEGRATED REPORT AND FINANCIAL STATEMENTS FOR THE YEAR ENDED 31 DECEMBER 2019
Boards: Non-Executive Director, Equity Bank Uganda Limited.
MARK OCITTI
Mark holds a Bachelor of Statistics degree from Makerere University in Uganda, an Advanced Management Program certificate from the London Business School and a Master in Business Administration degree from the Heriot-Watt University, Edinburgh, UK. He has over 26 years of operational and executive experience working in blue chip companies in Downstream Oil, Telecoms and FMCG sectors. He is currently the Managing Director of Serengeti Breweries Limited in Tanzania, a member of the East African Breweries group.
Boards: Non-Executive Director, Equity Bank Uganda Limited.
DR. ADDIS ABABA OTHOW
Addis holds a Bachelor of Science degree in Economics, a Master’s degree in Economic Development and a PhD degree in political economics from Al-Neelain University, Khartoum, Sudan. He also holds a Bachelor’s Degree in Finance and Accounting from Hanze University, Groningen, Netherlands, a PhD degree in Business Administration from Faculty of Business and Economics, Atlantic International University, USA and the Advanced Management Programme (AMP) from Strathmore University, Nairobi, Kenya.
He has a wide range of experience in banking, accounting, finance, and information systems. Prior to joining Equity Bank, he initially worked as a teaching assistant at Al Neelain University, Khartoum and was later appointed as a banking inspector, Central Bank of Sudan in 1997. He also worked as an assistant accountant/ auditor at Dubois & Co Chartered Accountants Amsterdam, The Netherlands, and a consultant at South Sudan Anti-Corruption Commission, a Part-time Lecturer at College of Social & Economics Studies, University of Juba and a Deputy Chairperson of the Board of Trustees of South Sudan Pensions Fund (SSPF). Dr. Othow has also worked as Head of Non-banking Division before he became the Head of Planning, Regulation and Licensing, Central Bank of South Sudan (BSS). He joined Equity Bank in February 2015.
Boards: Managing Director, Equity Bank South Sudan Limited.
DR. KENYI SPENCER
Kenyi holds a Professional Certificate in international trade from the International Trade Institute of Southern Africa (Affiliate of International Association of Trade Training Organization), a PhD in Environmental Economics from the University of Geneva in Switzerland, a Master’s degree in Environmental Management from the University of the Free State (Bloemfontein) in South Africa, a Post-graduate certificate in Practical Ecology from TechnischeUniversitat in Berlin, Germany and BSc. in Science and Applied Environmental Science from the National University of
Lesotho. He previously worked as a Deputy Director in KB Environment & Trade Consultancy in South Africa and has executed many assignments for the World Bank and the Republic of South Sudan (RSS). Kenyi is currently an Executive Chairman of Central Equatoria Vision 2040 Secretariat, Deputy Chairman of Central Equatoria Development Agency (CEDA) and a board member of the Juba Media Group and South Sudan Roads Authority. He is also the Chairman of the South Sudan Media Development Institute. He recently published a world acclaimed novel – “Twisted Gift”.
Boards: Non-Executive Director, Equity Bank South Sudan Limited.
MARY AJITH
Mary holds an LL.B. degree from EL-Neelian University, Khartoum, Sudan, Certificate in Law from LDC Uganda and a Post Graduate Diploma in Human Rights from the University of Juba. Mary has worked with various Gender and Child Related Organizations and holds a Certificate in Skill for Communicating with Children, Certificate in Gender and Development and an Advanced Certificate in Women, Peace and Security Council Resolution 1325. She serves on the board of the Ethicapl University, Juba and is a member of South Sudan Revenue Authority Board of Directors. She is currently the Head of Directororate of Legislation, Ministry of Justice and Constitutional Affairs for the Republic of South Sudan and holds certificates of Legislative drafting and Bills Scrutiny training with over 16 years’ experience.
Boards: Non-Executive Director, Equity Bank South Sudan.
ALLAN WAITITU
Allan holds a Bachelor’s Degree in Business Information Technology and is a graduate of Advanced Management Programme (Strathmore- IESE Business School, Barcelona Spain). He has a Master’s in Business Administration from Strathmore University Business School. He has over 30 years’ experience in Information Technology and banking having previously served as Equity Bank’s General Manager, Operations; Director, ICT and Innovations and Director, Special Projects. He is a member of the World Economic Forum (WEF) Global Future Council on the Future Humanitarian System 2019/2020. He is currently the Director, Operation, Equity Bank Kenya.
Boards: Non-Executive Director, Equity Bank South Sudan Limited.
CONSOLIDATED BOARD OF DIRECTORS’ PROFILES (continued)

232
EQUITY GROUP HOLDINGS PLC AND SUBSIDIARIES INTEGRATED REPORT AND FINANCIAL STATEMENTS FOR THE YEAR ENDED 31 DECEMBER 2019
WOLFGANG BERTELSMEIER
Wolfgang holds a degree in Business Administration from Frankfurt University. He also has a degree in Banking as well as executive education courses at Harvard Business School, INSEAD and Stanford University. He has worked in various capacities with Deutsche Bank, DEG, the World Bank and the IFC. He has also held various Board Directorships primarily in financial institutions in Europe, Asia and Africa, as well as infrastructure, agribusiness and hospitality companies in Africa.
Boards: Non-Executive Chairman, Equity Bank Congo S. A.
CÉLESTIN MUNTUABU
Célestin holds a Master’s degree in Business Administration and Management from the Protestant University in Congo. Besides his training in leadership, he also holds a degree in Banking Administration from ProCredit Academy – Germany. Prior to joining the banking sector, he worked with the International Training Center, a consulting cabinet specialized in the training of business executives in internal audit and strengthening of the systems of internal control for companies.
Célestin was a Permanent Secretary and Clerk Trainer at the International Training Center. He was Deputy CEO (2008-2014) in ProCredit Bank Congo. He was listed among the Top 100 Young African leaders by Choiseul for two consecutive years (2017 and 2018). Celestin is the current Chairman of the United Nations Global Compact DRC Network.
Boards: Managing Director, Equity Bank Congo S. A.
NESTOR ANKIBA YAR
Nestor holds a Bachelor’s degree in Business Administration from Kinshasa University in DRC, an MBA in Marketing Communications from Leicester University in UK and has attended Executive Leadership courses at INSEAD in France and Harvard Business School in the US. Nestor has held various positions with ExxonMobil and in the international development field, overseeing projects with NGOs (ACMS and ASF). In ExxonMobil, he served as Managing Director and Executive board member in countries such as Togo, Zambia, Zimbabwe, Cameroon, Chad, Equatorial Guinea and DRC. He also served as Assistant Lecturer at Kinshasa University and is the current Chairman of the National Refinery Company (SOCIR). He also provides consultancy services in Risk Management and Compliance.
Boards: Non-Executive Director, Equity Bank Congo S. A.
JEAN-CLAUDE TSHIPAMA
Jean-Claude holds an Executive Master’s in Business Administration (MBA) form McGill University and HEC-Montreal. He also has a Master’s degree in Economics from
the Protestant University in Congo. He has worked in various capacities with Celtel in the DRC, Digicel Group, Microsoft Corporation and Canal+ (a Pay TV company), Zympala. In his last assignment with EUTELSA, he headed EUTELSAT Broadband in Africa, ensuring that their broadband business is successfully deployed across Africa to connect the unconnected.
Boards: Non-Executive Director, Equity Bank Congo S. A.
JOANNA BICHSEL
Joanna holds a Bachelor’s degree in Computer Science with Honors from Queen’s University in Canada and has 20 years of experience as a professional in the technology industry across software engineering, product development, technology business management and technology leadership. She spent 11 years at Microsoft Corporation headquarters working as a software engineer, business leader and a senior leader of an international cybersecurity team. Joanna is the CEO and Founder of Kasha, an ecommerce company for women’s health operating in Kenya and Rwanda. Prior to founding Kasha, she was the Principal Technology Advisor for Global Development at the Bill & Melinda Gates Foundation focusing on technology strategy and investments across East and West Africa and South Asia.
Boards: Non-Executive Director, Finserve Africa.
ISIS NYONG’O MADISON
Isis holds a Master’s Degree in Business Administration from Harvard Business School and a Bachelor of Arts Degree in Human Biology from Stanford University. Isis Nyong’o Madison has made her mark scaling media and digital businesses across Africa. She’s passionate about advancing entrepreneurship given her background as both an experienced operator for African businesses of global companies and as a founder of her own enterprises. Isis is the founder of Kenya’s leading parenting platform, MumsVillage. Prior to this, she held leadership positions on the Africa teams for InMobi, Google and MTV Networks.
She has been shortlisted on the Forbes Top 20 Youngest Power Women in Africa. She is a Senior Advisor to the Albright Stonebridge Group and serves on the board of the Nairobi Securities Exchange (NSE). The World Economic Forum selected her as a Young Global Leader in 2012.
Boards: Non-Executive Director, Finserve Africa.
DR. JOSEPHINE WAPAKABULO
Josephine holds a PhD in Information Science focused on “big data” and published a book on the adoption of data-exchange standards and knowledge management technologies in Defense and Oil & Gas companies. She obtained her Global Executive MBA from INSEAD business school in France. She has over 20 years’ professional experience with a focus
CONSOLIDATED BOARD OF DIRECTORS’ PROFILES (continued)

233
EQUITY GROUP HOLDINGS PLC AND SUBSIDIARIES INTEGRATED REPORT AND FINANCIAL STATEMENTS FOR THE YEAR ENDED 31 DECEMBER 2019
on strategy development and implementation, quality and continuous improvement and engineering management in multinational companies, in Oil & Gas, Defence, Aerospace and IT consulting. She obtained her executive level experience in the UK, Germany, Australia, Ghana, Kenya and Uganda. Josephine is currently the founder and Managing Director of TIG Africa DMCC and was the first female CEO founder of a National Oil Company.
Boards: Non-Executive Director, Finserve Africa.
DAVID SOMEN
David holds an MBA from Harvard Business School and a BA in Law from Oxford University. After an early stint at McKinsey and Co, he has spent his career founding and leading cutting-edge technology firms across the world. He co-founded and served as CEO of LCR Telecom Group (sold to a NASDAQ listed company in 2000) and co-founded and was Deputy Chairman at AccessKenya, Kenya’s leading corporate internet service provider listed on the Nairobi Stock Exchange and sold to Dimension Data in 2013. He also co-founded and serves as Managing Director of Virtual IT one of the UK’s leading IT Managed Services Providers, and co-founded and serves as Executive Chairman of Eldama Technologies Limited one of Kenya’s leading IT Managed Services Providers. He also serves as a director of Serenity Spa, Kenya’s leading spa organisation, and serves as a Non – Executive Director of CIM Group, a leading listed financial services company in Mauritius.
Boards: Non-Executive Director, Finserve Africa.
BRENT MALAHAY
Brent holds a Master’s degree in Economics and a Bachelor’s degree in Commerce from the University of KwaZulu-Natal, South Africa. He has over 16 years’ experience in financial services with competencies ranging from commercial banking, credit ratings, investment banking and fund management. He has previously worked at Standard Bank, Fitch Ratings, J.P. Morgan and Investec Asset Management. Brent has worked at Equity Group since 2016.
Boards: Non-Executive Director, Finserve Africa.
REUBEN MBINDU
Reuben holds a BSc. in Computer Science from Germany and is a full member of the Institute of Human Resource Management in Kenya. He has over 31 years’ work experience, most of which has been in the banking sector as a human capital specialist. He joined Equity Bank in 2013 from Standard Chartered, where he had served at senior management levels in Human Resources for over 15 years. He has also worked in other sectors including public sector (UNEP), consultancy (Deloitte) and ICT (Siemens, Germany). He has also served in other senior positions including Head of Corporate Affairs - Standard Chartered, East Africa and Chairman of the Standard Chartered Nairobi Marathon. Reuben joined Equity Group as the Chief Officer, Human Capital and Administration and was additionally appointed to run operations of the Equity Group Foundation as Executive Director in 2018.
Boards: Executive Director, Equity Group Foundation; Non-Executive Director (alternate to Dr. James Mwangi), Equity Bank (Tanzania) Limited.
ZAINAB JAFFER
Zainab holds a Bachelor of Science Degree (Honours) in Management with Law from the London School of Economics and Political Science. She is a Director of MJ Group, a leading African port service provider based out of Kenya. She is also overseeing the implementation of the Social Economic Development Initiative for Kenya (SEDIK), which has been launched under the guidance of the Kenyan government to support Kenya’s Vision 2030. She serves as Director, Principal and/or Advisor to IFG Port Holdings, a New York based global investment firm. Zainab is also a Board Member of the Coast General Hospital and leads the Jaffer Foundation which focuses on health, education and water services in the Coastal region of Kenya.
Boards: Non-Executive Director, Equity Group Foundation.
CONSOLIDATED BOARD OF DIRECTORS’ PROFILES (continued)

234
EQUITY GROUP HOLDINGS PLC AND SUBSIDIARIES INTEGRATED REPORT AND FINANCIAL STATEMENTS FOR THE YEAR ENDED 31 DECEMBER 2019
DR. JAMES MWANGI, CBS Group Managing Director & Chief Executive Officer
James holds five honorary doctorate degrees in recognition of his positive impact to the Kenyan society. He holds a Bachelor of Commerce degree and is a Certified Public Accountant. He has been honoured thrice with National Presidential Awards: The First Class Chief of the Order of the Burning Spear (CBS), the Moran of the Burning Spear (MBS) and Head of State Commendation (HSC). On the global front, Dr. Mwangi won the G8 Global Vision Award, 2007. He was named among the Top 50 Emerging Market Business Leaders and the 20 most influential people in Africa in 2011; the World Entrepreneur of the Year by Ernst & Young in 2012; the Forbes Africa Person of the Year in 2012 and was recently named in the Bloomberg 50 list of people who defined 2019 globally.
On the regional front, he was also recognized as the Africa Investor Awards, CEO of the Year in 2009 and 2015; Innovation Leader of the Year in 2012; African Business Leader of the Year in 2013 and African Banker of the Year in 2010, 2011 and 2017 at the African Banker Awards. Dr. Mwangi was also named the Banker of the Year during the Banker Africa (East Africa) Awards in 2017 & 2018. Locally, he has received the Think Business CEO of the Year award for the last 3 years.
James has served on board and advisory roles at the Global Advisory Council for VISA Inc., The Clinton Global Initiative, The G8 New Alliance For Food Security And Nutrition, US President Barack Obama’s Initiative for Global Development, the G20 Advisory Board of Agriculture and Initiative for Global Development, and The Global Agenda Council on New Economic Thinking of the World Economic Forum from 2003-2007. He served as the Founding Chair of Kenya’s Vision 2030 from inception in 2007 to 2019
He currently serves on several international bodies as an advisor and was recently appointed to the Nairobi Advisory Board of Columbia Global Centres. He is a Board member of the Economic Advisory Board of the International Finance Corporation (IFC), The Mastercard MEA Advisory Board, the Africa Leadership Academy in South Africa, the Global Alliance for Food Security and Nutrition and is the Chancellor of Meru University College of Science and Technology.
He is a guest lecturer at Stanford, Columbia, MIT, Harvard, IESE and Lagos Business School where Equity Bank Business Model is a case study.
MARY WAMAE Group Executive Director
Mary holds a Master’s degree in Leading Innovation and Change from York St. John University, UK, a Bachelor of Laws degree from the University of Nairobi and a Diploma in Law from the Kenya School of Law. She is a Certified Public Secretary (Kenya) and member of The Institute of Certified Public Secretaries of Kenya (ICPSK), Law Society of Kenya, Women Corporate Directors and the Kenya Section of International Commission of Jurists. She is a
graduate of Advanced Management Programme (Strathmore - IESE Business School, Barcelona Spain) and Advanced Management Programme at Harvard Business School. She is an Advocate of the High Court of Kenya and holds a Post Graduate Diploma in Gender and Development. She has over 15 years’ experience in private legal practice.
BRENT MALAHAY Group Director, Strategy, Strategic Partnerships and Investor Relations
Brent holds a Master’s degree in Economics and a Bachelor’s degree in Commerce from the University of KwaZulu-Natal, South Africa. He has over 16 years’ experience in financial services with competencies ranging from commercial banking, credit ratings, investment banking and fund management. He has previously worked at Standard Bank, Fitch Ratings, J.P. Morgan and Investec Asset Management. Brent has worked at Equity Group since 2016.
DAVID NGATA Group Director, Finance
David holds a Bachelor of Commerce degree from the University of Nairobi and a Master’s of Science in Business Analytics from Carnegie Mellon University. He is a Certified Public Accountant and a member of Institute of Certified Public Accountants of Kenya. He has over 20 years global working experience in the financial services industry. Prior to joining Equity Bank in 2018, he worked at American Express, where he held various roles including leading the global internal audit data analytics practice. He has also specialized in the audit of banking institutions, leasing companies, investment banks and broker dealers with KPMG in New York and Kenya.
OLANREWAJU BAMISEBI Group Chief Information Officer
Lanre Bamisebi holds a Bachelor of Science in Accounting, Bachelor of Science (Honours) in Computing & Information Technology from the University of Derby, UK and Masters in Business Administration from Durham Business School, UK. He is currently undertaking a PhD in USIU, Nairobi-Kenya.
He is a seasoned IT professional with over 20 years in management experience. He has vast knowledge and has managed IT in 22 African countries. His work experience in the information systems sector spans across consulting, telcom, oil and gas, banking and fintech.
Before joining Equity, he worked in other capacities across the African region as follows; Chief Information Officer at Access Bank, Group Chief Information Officer at Diamond Bank and United Bank for Africa (UBA), Head of IT Projects at MTN Nigeria and Director, Finance & IT at Starcomms.
GROUP EXECUTIVE MANAGEMENT PROFILES
235
EQUITY GROUP HOLDINGS PLC AND SUBSIDIARIES INTEGRATED REPORT AND FINANCIAL STATEMENTS FOR THE YEAR ENDED 31 DECEMBER 2019
GLORIA BYAMUGISHA Group Chief Human Resources Officer
Gloria is a HR professional who holds a BBA in Business Administration and Management, an Msc. in Human Resource Management (PGD Award), an MBA in Finance and Administration and a Certificate in Strategic Business Analysis. She is an alumni of Uganda Martyrs University, the University of Bedfordshire, the University of Westminster and London Business School.
She is professionally certified in the following areas; job evaluation, leadership training, performance management, leadership psychometrics (PI) and change management. With over 19 years of experience in Human Resource Management, she has worked in the following industries; public sector, telecommunications and banking. Additionally, she has work experience in more than 10 countries.
JAMES MUTUKU Group Director, Treasury and Trade Finance
James holds a Bachelor of Arts in Economics and Sociology from Egerton University. He has over 20 years’ experience in Treasury business having worked as a treasury dealer for Co-operative Bank of Kenya, Head of Money Markets and Fixed Income at KCB Kenya and the East Africa Head of Asset Liability Management (ALM), for Standard Chartered Bank Kenya. Before joining Equity Bank, he was the immediate country Head of Financial Markets for Standard Chartered Bank Uganda, where he also doubled up as the Co-Head SCB Uganda Wholesale Bank. He brings a wealth of experience in balance sheet management, fixed income trading and general treasury management. He joined Equity Bank in 2016.
JOHN WILSON Group Chief Risk Officer
John is a graduate of the Swedish Military Academy and holds a Master of Arts in Economics from Uppsala University and a Master of Public Affairs from Woodrow Wilson School at Princeton University.
John began his career at McKinsey & Co in Europe and the former Soviet Union, focusing on manufacturing, transportation and infrastructure companies. He then joined the World Bank Private Sector Development Department working on privatization in Cameroon, Ghana, Malawi, Russia and Ukraine, and was thereafter seconded to the IFC Global Capital Markets Department. Returning to his native Sweden, John built the Export & Project Finance department at Swedbank, and then headed up Structured Finance, Equity Capital Markets, Investor Relations and Corporate Strategy including M&A. In 2006, he joined Kaupthing Bank as Head of Investment Banking and then returned to IFC in 2008.
Prior to joining Equity Group in August 2019 as Group Chief Operating Officer, John was a Manager in the financial sector in Sub-Saharan Africa for the International Finance Corporation, the private sector development arm of the World Bank Group. Before that, he was responsible for IFC’s
banking experts and risk management advisory services as global Head of Banking, and before that a Principal Banking Specialist covering sub-Saharan Africa, stationed in Nairobi since 2008.
POLYCARP IGATHEGroup Chief Commercial Officer
Polycarp holds a Bachelor of Arts degree in Economics and Sociology from the University of Nairobi and is a graduate of the Strathmore University’s Advanced Management Program (AMP) with IESE Business School in Spain.
Prior to his appointment, he was the Executive Vice President for Sales and Marketing in Africa at Vivo Energy. He has also successfully served in leading corporate entities as MD Equity Bank (Kenya) Limited, Regional MD East Africa of Tiger Brands International, MD of Haco Industries, Wines of the World and Vivo Energy. He has also held senior commercial roles as Sales and Marketing Manager at Coca-Cola SABCO, Africa Online and Marketing Manager at Kenya Breweries Ltd. He has served as Chairman, Kenya Association of Manufacturers (KAM); Chairman, Petroleum Institute of East Africa (PIEA); Director & Trustee, Kenya Private Sector Alliance (KEPSA) and Chair, Board of Management at BG Ngandu Girls High School.
Prior to joining Equity Bank in 2018 he served as the Deputy Governor in the Nairobi County Government. Polycarp is celebrated as a Warrior of the Marketing Society of Kenya (MSK), Savant of Marketing by Marketing Africa Magazine and a Savant of Policy Advocacy by the Kenya Association of Manufacturers (KAM).
CHRISTINE AKINYI BROWNE Group Director of Legal Services & Company Secretary
Christine is a Chevening alumnus who holds a Master of Laws from UCL - University of London. She is an accomplished legal practitioner and has previously worked at The World Bank and the Industrial Promotion Services (K) Limited (IPS). She joined the Group in 2014 after a six year stint as Principal Counsel at East African Development Bank. Prior to her current position, she was the General Manager for Legal, Corporate Banking, Equity Bank (Kenya) Ltd. Christine is a member of Law Society of Kenya, Institute of Certified Public Secretaries of Kenya and International Commission of Jurists, Kenya Section.
JOY DIBENEDETTO Group Director, Communications
Joy holds a Bachelor’s degree in Speech Pathology and Audiology from Marymount Manhattan College in New York City. She is an award-winning entrepreneurial communications professional; a veteran journalist and media executive whose focus has always been global. She is the Founder of the international content and information company -HUM: Human Unlimited Media, Inc. (AKA, HUMNEWS.COM) and has covered major international events – from the studio and in the field – as a storyteller, producer and diplomat for
GROUP EXECUTIVE MANAGEMENT PROFILES (continued)

236
EQUITY GROUP HOLDINGS PLC AND SUBSIDIARIES INTEGRATED REPORT AND FINANCIAL STATEMENTS FOR THE YEAR ENDED 31 DECEMBER 2019
more than 25 years. A founding partner in the C5 Collective, she has maximized the impact and brand awareness of social innovators, corporations, NGO’s, media, academia, and service organizations worldwide.
She is the Immediate Past President/CEO of the Nobel Peace Prize-nominated Friendship Force International (FFI); and was previously the global Vice President of Network Booking and Research for CNN Worldwide; starting her career in Corporate Finance with Turner Broadcasting. Her career squarely spans the media industry as well as humanitarian interests and always builds on the intersection of both for the greatest social impact.
BILDARD FWAMBA Group Chief Internal Auditor
Bildard holds a Bachelor of Commerce (Accounting) degree from Kenyatta University and is a Certified Public Accountant and a member of ICPAK. He has worked in the banking sector for 22 years, serving in various senior management capacities. He has extensive knowledge and experience in Financial Management, Risk Management, Internal Controls and Regulatory Oversight. He joined Equity Bank in 2004. Before his current role, Bildard served in various capacities in Equity Bank Kenya Limited including Compliance Manager, Head of Internal Audit, General Manager- Finance and General Manager- Internal Audit. He previously worked with Central Bank of Kenya and Britam.
GERALD WARUI Managing Director, Equity Bank (Kenya) Limited
Gerald holds an Executive Masters of Business Administration degree from Jomo Kenyatta University of Agriculture and Technology (JKUAT). He is a Certified Public Accountant CPA(K) and a graduate of Advanced Management Program from Strathmore- IESE Business School, Barcelona Spain and a career banker. Gerald has vast experience in operations and customer service. Prior to his current position, he served as the Director Operations. Before that, he served as the Director Human Resource and Customer Experience. He joined Equity Bank in 1998.
SAMUEL KIRUBI Managing Director, Equity Bank Uganda Limited
Samuel holds a Master’s Degree in Business Administration (Finance) from Moi University and a Bachelor of Arts degree in Economics and Statistics from Egerton University. He is a graduate of Advanced Management Programme (Strathmore IESE Business School, Barcelona Spain). He joined Equity Bank in 2001 and has gained vast experience in operations, marketing and customer service. Samuel previously served as the Chief Operations Officer in Equity Bank South Sudan and most recently as the Managing Director, Equity Bank Rwanda.
ANTHONY KITUUKA Executive Director, Equity Bank Uganda Limited
Anthony holds an MBA in Oil and Gas from Middlesex University, London and a Bachelor’s Degree in Statistics and Applied Economics from Makerere University, Uganda. He is a Fellow of the Association of Chartered Certified Accountants Certificate (FCCA) and has completed an Advanced Management Program from Strathmore, Lagos and IESE (Spain) Business Schools as well as several other executive leadership programs at Gordon Institute of Business and INSEAD. He has over 13 years banking experience and has previously worked with Kenya Commercial Bank (KCB) and Barclays Bank Uganda Limited. He joined Equity Bank in 2014 and was previously the Group Executive Director for Regional Subsidiaries.
DR. ADDIS ABABA OTHOW Managing Director, Equity Bank South Sudan Limited
Addis holds a Bachelor of Science degree in Economics, a Master’s degree in Economic Development and a PhD degree in political economics from Al-Neelain University, Khartoum, Sudan. He also holds a Bachelor’s Degree in Finance and Accounting from Hanze University, Groningen, Netherlands, a PhD degree in Business Administration from Faculty of Business and Economics, Atlantic International University, USA and the Advanced Management Programme(AMP) from Strathmore University, Nairobi, Kenya.
He has a wide range of experience in banking, accounting, finance, and information systems. Prior to joining Equity Bank, he initially worked as a teaching assistant at Al Neelain University, Khartoum and was later appointed as a banking inspector, Central Bank of Sudan in 1997. He also worked as an assistant accountant/ auditor at Dubois & Co Chartered Accountants Amsterdam, The Netherlands, and a consultant at South Sudan Anti-Corruption Commission, a Part-time Lecturer at College of Social & Economics Studies, University of Juba and a Deputy Chairperson of the Board of Trustees of South Sudan Pensions Fund (SSPF). Dr. Othow has also worked as Head of Non-banking Division before he gbecame the Head of Planning, Regulation and Licensing, Central Bank of South Sudan (BSS). He joined Equity Bank in February 2015.
HANNINGTON NAMARA Managing Director, Equity Bank Rwanda PLC
Hannington is the Managing Director of Equity Bank Rwanda. He holds a degree in Business Administration (Finance option) from Makerere University Business School. He is a graduate of Advanced Management Programme from Strathmore Business School. He is a Fellow of the Africa Leadership Initiative-East Africa, a member of the Aspen Global Leadership Network. He has over 19 years of experience in banking and Private Sector Development. He has extensive knowledge and track record in Strategic Leadership, Banking and Finance, Management and Communications. He has held various leadership positions while working with different reputable organisations in the past including TradeMark East Africa, Rwanda Private Sector Federation, Commercial Bank
GROUP EXECUTIVE MANAGEMENT PROFILES (continued)

237
EQUITY GROUP HOLDINGS PLC AND SUBSIDIARIES INTEGRATED REPORT AND FINANCIAL STATEMENTS FOR THE YEAR ENDED 31 DECEMBER 2019
GROUP EXECUTIVE MANAGEMENT PROFILES (continued)of Rwanda (BCR), Rwanda Investment Export Promotion Agency (RIEPA-now known as Rwanda Development Board). He holds several positions of responsibility in Boards of Corporates and Parastatals.
ROBERT KIBOTI Managing Director, Equity Bank (Tanzania) Limited
Robert holds a Bachelor’s Degree in Economics and Administration from Maharshi Dayanand University, India. He has attended several professional courses in banking and finance both locally and internationally. He has over 24 years’ experience in banking, where he has held various leadership positions. Before joining Equity Bank Tanzania, he was the General Manager in charge of Equity Bank Supreme Centre. Prior to joining Equity Bank, he was in Industrial Development Bank, where he worked for 7 years in various capacities. Robert joined Equity Bank in May 2005.
CÉLESTIN MUNTUABU Managing Director, Equity Bank Congo S.A.
Célestin holds a Master’s degree in Business Administration and Management from the Protestant University in Congo. Besides his training in leadership, he also holds a degree in Banking Administration from ProCredit Academy – Germany. Prior to joining the banking sector, he worked with the International Training Center, a consulting cabinet specialized in the training of business executives in internal audit and strengthening of the systems of internal control for companies.
Célestin was a Permanent Secretary and Clerk Trainer at the International Training Center. He was Deputy CEO (2008- 2014) in ProCredit Bank Congo. He was listed among the Top 100 Young African leaders by Choiseul for two consecutive years (2017 and 2018). Celestin is the current Chairman of the United Nations Global Compact DRC Network.
REUBEN MBINDU Executive Director, Equity Group Foundation
Reuben holds a BSc. in Computer Science from Germany and is a full member of the Institute of Human Resource Management in Kenya. He has over 31 years’ work experience, most of which has been in the banking sector as a human capital specialist. He joined Equity Bank in 2013 from Standard Chartered, where he had served at senior management levels in Human Resources for over 15 years. He has also worked in other sectors including public sector (UNEP), consultancy (Deloitte) and ICT (Siemens, Germany). He has also served in other senior positions including Head of Corporate Affairs - Standard Chartered, East Africa and Chairman of the Standard Chartered Nairobi Marathon. Reuben joined Equity Group as the Chief Officer, Human Capital and Administration and was additionally appointed to run operations of the Equity Group Foundation as Executive Director in 2018.
238
EQUITY GROUP HOLDINGS PLC AND SUBSIDIARIES INTEGRATED REPORT AND FINANCIAL STATEMENTS FOR THE YEAR ENDED 31 DECEMBER 2019
___________________________________________________________________________________________________
___________________________________________________________________________________________________
___________________________________________________________________________________________________
___________________________________________________________________________________________________
___________________________________________________________________________________________________
___________________________________________________________________________________________________
___________________________________________________________________________________________________
___________________________________________________________________________________________________
___________________________________________________________________________________________________
___________________________________________________________________________________________________
___________________________________________________________________________________________________
___________________________________________________________________________________________________
___________________________________________________________________________________________________
___________________________________________________________________________________________________
___________________________________________________________________________________________________
___________________________________________________________________________________________________
___________________________________________________________________________________________________
___________________________________________________________________________________________________
___________________________________________________________________________________________________
___________________________________________________________________________________________________
___________________________________________________________________________________________________
___________________________________________________________________________________________________
___________________________________________________________________________________________________
___________________________________________________________________________________________________
___________________________________________________________________________________________________
___________________________________________________________________________________________________
___________________________________________________________________________________________________
___________________________________________________________________________________________________
___________________________________________________________________________________________________
___________________________________________________________________________________________________
NOTES

239
EQUITY GROUP HOLDINGS PLC AND SUBSIDIARIES INTEGRATED REPORT AND FINANCIAL STATEMENTS FOR THE YEAR ENDED 31 DECEMBER 2019
THE SIXTEENTH ANNUAL GENERAL MEETING HELD VIA ELECTRONIC COMMUNICATION ON TUESDAY, 30TH JUNE, 2020PROXY FORM
I/We_______________________________________________________________________________________
___________________________________________________________________________________________
CDS A/C No __________________________________________________________________________________
Of (address) __________________________________________________________________________________
Telephone number _____________________________________________________________ and/or email address
___________________________________________________________________________________________
Being a Shareholder(s) of Equity Group Holdings Plc (“the Company”) hereby, appoint ______________________________
___________________________________________________________________________________________
Of (address) __________________________________________________________________________________
Telephone number ________________________________________________________________ and email address
___________________________________________________________________________________________
or, failing him, the duly appointed Chairman of the meeting to be my/our proxy, to vote on my/ our behalf at the virtual Annual
General Meeting of the Company to be held electronically and chaired from the Company’s Head Office situated at EQUITY
CENTRE, 9TH FLOOR, Hospital Road, Upper Hill, Nairobi on Tuesday, 30th June, 2020 at 10.00 am or at any adjournment thereof.
I/We direct my/our proxy to vote on the following resolutions as I/We have indicated by marking the appropriate box with an “X”.
If no indication is given, my/our proxy will vote or withhold his or her vote at his or her discretion and I/We authorize my/our proxy
to vote (or withhold his or her vote) as he or she thinks fit in relation to any other matter which is properly put before the Meeting.
Please clearly mark the box below to instruct your proxy how to vote;
RESOLUTIONS
ORDINARY BUSINESS
i. Consideration of the Audited Financial Statements for the financial year ended 31st December, 2019
To receive, consider and if thought fit, adopt the Audited Financial Statements and Directors’ Remuneration Report for the year
ended 31st December, 2019, together with the Chairman’s, Directors’ and Auditors’ reports thereon, noting that subsequent
to the approval by the Directors of the audited financial statements for the financial year ended 31st December, 2019, the
Directors withdrew the proposal to declare a dividend as communicated in the Public Notice by the Company dated 26th May,
2020 and reflected in the unaudited financial statements of the Company for the period ended 31st March, 2020.
For:
Against:
Withheld:
ii. Remuneration of Directors
To approve the remuneration of the Directors for the year ended 31st December, 2019.
For:
Against:
Withheld:

240
EQUITY GROUP HOLDINGS PLC AND SUBSIDIARIES INTEGRATED REPORT AND FINANCIAL STATEMENTS FOR THE YEAR ENDED 31 DECEMBER 2019
THE SIXTEENTH ANNUAL GENERAL MEETING HELD VIA ELECTRONIC COMMUNICATION ON TUESDAY, 30TH JUNE, 2020 (continued)
iii.Election of Directors
a.To approve the appointment of Mrs. Evelyn Rutagwenda, who in accordance with Article 100 of the Company’s Articles of
Association, retires from office by rotation and being eligible, offers herself for re-election;
b.To approve the appointment of Mr. Christopher Newson, subject to obtaining regulatory approvals, and who having been
appointed by the Board on 4th March, 2020 in accordance with Article 101 of the Company’s Articles of Association, offers
himself for appointment.
For:
Against:
Withheld:
iv. In accordance with the provisions of section 769 of the Companies Act, 2015, to approve the election of the following
Directors, being members of the Board Audit Committee to continue to serve as members of the said Committee:
a. Mrs. Evelyn Rutagwenda;
b. Mr. Vijay Gidoomal;
c. Dr. Helen Gichohi; and
d. Dr. Edward Odundo.
For:
Against:
Withheld:
v. To pass an ordinary resolution pursuant to section 721 of the Companies Act, 2015 to appoint PricewaterhouseCoopers (PwC)
as auditors of the Company taking note that the auditors have expressed their willingness to continue in office and to authorize
the Directors to fix their remuneration.
For:
Against:
Withheld:
1. SPECIAL BUSINESS
a. SPECIAL RESOLUTIONS
i. To amend Article 54 of the Articles of Association of the Company and create a new Article 54A of the Articles of Association
of the Company to allow for simultaneous attendance and participation by electronic means for General Meetings including
Annual General Meetings and Extraordinary General Meetings.
Pursuant to section 22 of the Companies Act, 2015 the text of the special resolution is set out below:
Amendment of Article 54 of the Articles of Association of the Company
“THAT, by way of special resolution Article 54 of the Articles of Association of the Company be and is hereby amended by including the following words immediately at the end of the first sentence and before the full stop “,provided that the shareholders may participate in General Meetings electronically in accordance with the provisions of Article 54A”
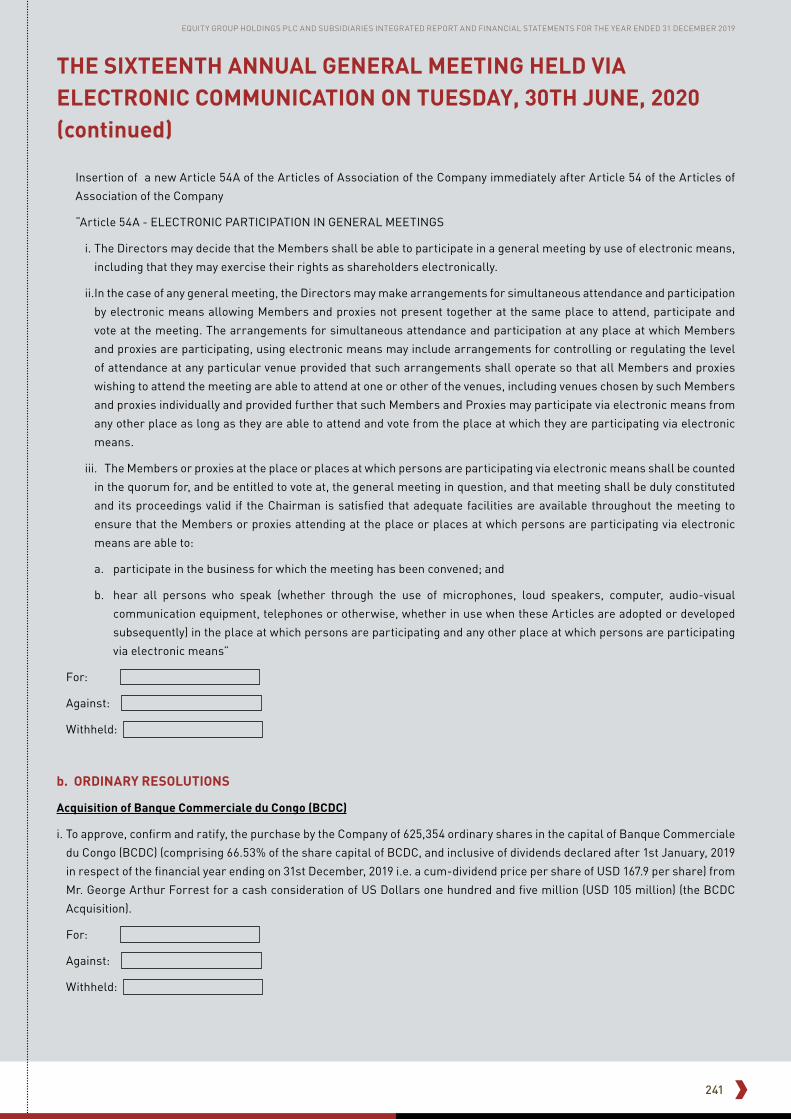
241
EQUITY GROUP HOLDINGS PLC AND SUBSIDIARIES INTEGRATED REPORT AND FINANCIAL STATEMENTS FOR THE YEAR ENDED 31 DECEMBER 2019
THE SIXTEENTH ANNUAL GENERAL MEETING HELD VIA ELECTRONIC COMMUNICATION ON TUESDAY, 30TH JUNE, 2020 (continued)
Insertion of a new Article 54A of the Articles of Association of the Company immediately after Article 54 of the Articles of
Association of the Company
“Article 54A - ELECTRONIC PARTICIPATION IN GENERAL MEETINGS
i. The Directors may decide that the Members shall be able to participate in a general meeting by use of electronic means,
including that they may exercise their rights as shareholders electronically.
ii. In the case of any general meeting, the Directors may make arrangements for simultaneous attendance and participation
by electronic means allowing Members and proxies not present together at the same place to attend, participate and
vote at the meeting. The arrangements for simultaneous attendance and participation at any place at which Members
and proxies are participating, using electronic means may include arrangements for controlling or regulating the level
of attendance at any particular venue provided that such arrangements shall operate so that all Members and proxies
wishing to attend the meeting are able to attend at one or other of the venues, including venues chosen by such Members
and proxies individually and provided further that such Members and Proxies may participate via electronic means from
any other place as long as they are able to attend and vote from the place at which they are participating via electronic
means.
iii. The Members or proxies at the place or places at which persons are participating via electronic means shall be counted
in the quorum for, and be entitled to vote at, the general meeting in question, and that meeting shall be duly constituted
and its proceedings valid if the Chairman is satisfied that adequate facilities are available throughout the meeting to
ensure that the Members or proxies attending at the place or places at which persons are participating via electronic
means are able to:
a. participate in the business for which the meeting has been convened; and
b. hear all persons who speak (whether through the use of microphones, loud speakers, computer, audio-visual
communication equipment, telephones or otherwise, whether in use when these Articles are adopted or developed
subsequently) in the place at which persons are participating and any other place at which persons are participating
via electronic means”
For:
Against:
Withheld:
b. ORDINARY RESOLUTIONS
Acquisition of Banque Commerciale du Congo (BCDC)
i. To approve, confirm and ratify, the purchase by the Company of 625,354 ordinary shares in the capital of Banque Commerciale
du Congo (BCDC) (comprising 66.53% of the share capital of BCDC, and inclusive of dividends declared after 1st January, 2019
in respect of the financial year ending on 31st December, 2019 i.e. a cum-dividend price per share of USD 167.9 per share) from
Mr. George Arthur Forrest for a cash consideration of US Dollars one hundred and five million (USD 105 million) (the BCDC
Acquisition).
For:
Against:
Withheld:

242
EQUITY GROUP HOLDINGS PLC AND SUBSIDIARIES INTEGRATED REPORT AND FINANCIAL STATEMENTS FOR THE YEAR ENDED 31 DECEMBER 2019
THE SIXTEENTH ANNUAL GENERAL MEETING HELD VIA ELECTRONIC COMMUNICATION ON TUESDAY, 30TH JUNE, 2020 (continued)
Incorporation of a non-operating insurance holding company and a subsidiary for purposes of conducting insurance business
in Kenya
i. Approving, subject to obtaining the requisite regulatory approvals, the Company setting up a non-operating insurance holding
company to serve as a holding company for insurance business (the Holding Company) and a subsidiary in Kenya (the Subsidiary)
to conduct and undertake long term insurance business in Kenya and putting in place all the necessary structures, commercial
arrangements and any ancillary arrangements relating to the undertaking of long term insurance business in Kenya including
the Company providing Kenya Shillings Four Hundred Million (Shs 400,000,000) as share capital for the insurance business as
required under the Insurance Act (Chapter 487, Laws of Kenya).
For:
Against:
Withheld:
As witness to my/our hands this________________________________________day of______________________________2020
Signature(s)____________________________________________________________________________________
This form is to be used *in favour of/*against/*withheld the resolution (*Strike out whichever is not desired)
NOTES:
1. As a member of the Company you are entitled to appoint a proxy or proxies to exercise all or any of your rights to attend, speak
and vote at a general meeting of the Company. You can only appoint a proxy using the procedures set out in these notes and in
the notes to the Annual General Meeting Notice.
2. Appointment of a proxy does not preclude you from attending the meeting and voting in person. If you have appointed a proxy and
attend the meeting in person and vote, your proxy appointment will automatically be terminated.
3. This proxy form should be completed and signed and sent or delivered by email to [email protected]
or lodged with and received by the Company Secretary at the Company’s Head Office situated at EQUITY CENTRE, 9TH FLOOR,
Hospital Road, Upper Hill, Nairobi, or to Image Registrars Ltd, offices, 5th Floor, Absa Towers (formerly Barclays Plaza), Loita
Street; postal address at P.O. Box 9287- 00100 GPO, Nairobi (consultant’s physical address) not later than 5.00 pm on Friday,
26th June, 2020, failing which it will be invalid.
4. A proxy form must be in writing and in case of an individual shall be signed by the Shareholder or by his attorney, and in the
case of a Company, the proxy must be either under the hand of an officer or attorney duly authorized by the Company.
5. Any person appointed as a proxy should submit his/her mobile telephone number to the Company not later than 5.00 pm on
Friday, 26th June, 2020. Any proxy registration that is rejected shall be communicated to the Shareholder concerned no later
than Monday, 29th June, 2020 to allow time to address any issues.

243
EQUITY GROUP HOLDINGS PLC AND SUBSIDIARIES INTEGRATED REPORT AND FINANCIAL STATEMENTS FOR THE YEAR ENDED 31 DECEMBER 2019
Brand consultant Martin Miruka with Adam Jones of Mastercard.
Central Bank deputy Governor Sheila M’Mbijjewe with Nyandarua Governor Francis Kimemia.
Gospel artiste Mercy Masika sings her heart out.
Equity Bank Kenya CEO James Mwangi.
Businessman Fred Muchoki with Treasury PS Julius Monzi.
Head of Anglican
Church of Kenya
Archbishop Jackson
ole Sapit.
Clique & Clicks Get Spotted
The cake-cutting was the apex of the pompous ceremony.
Former Equity Group chair Peter Munga (seated) receives a gift from his successor Isaac Macharia.
Scott the Violinist does his thing.Equity Group board members Evelyn Kamagaju and Edward Odundo.
Firework displays illuminate Nairobi’s skyline.
by Elly Gitau Fireworks display illuminated the city’s sky-
lines as Equity Group marked 35 years of doing business in Kenya with a major celebration event at the Kenyatta International Convention Centre in Nairobi on Wednesday. The company runs entities such as the Equity Bank and Fin-serve, a mobile virtual network operator that trades in Kenya under the name Equitel. The event also saw the unveiling of the company’s new logo. In attendance were Central Bank deputy Governor Sheila M’Mbijjewe, Equity Bank Kenya chief executive James Mwangi, Nyandarua Governor Francis Kimemia, Head of Anglican Church of Kenya Archbishop Jack-son ole Sapit and Treasury PS Julius Monzi.
PD/ JOHN OCHIENG
EQUITY HITS 35
Dagoretti North MP Simba Arati.
Friday, October 4, 2019 / pEoplE DAIlY 21
EQUITY CENTRE, 9TH FLOOR HOSPITAL ROAD, UPPER HILL, NAIROBITel : + 254 763 063000
Email: [email protected]
That when years turn our vision dim and gray, we shall still see beauty in the tired wrinkles of our faces and shall take comfort out of the fact and knowledge that when we were given the opportunity we did all we could to empower our people to exploit opportunities and realise their full potential on the road to
economic prosperity.
Our Inspiration