Sainsburys and Tecso Financial Analysis
43
I. Executive Summary The report is intended to assess the financial performance of two well-known companies in the retail sector of the United Kingdom. The two firms are Sainsbury’s and Tesco. This report shows the comparison between the two companies in 2011, 2012, and 2013. The analysis is established on the source of the ratio analysis, in which the profitability ratios, liquidity ratios, efficiency ratios, gearing ratios, cash flow ratios and Z-score analysis have been utilized. The profitability ratios are used to compare in the two companies, in terms of net profit margin, gross profit margin, return on equity and return on capital employed. It has been found that Sainsbury’s is performing better than Tesco. The liquidity ratios include the current ratio and quick ratio, during the analysis. It is shown that Tesco outperformed Sainsbury’s in term of transforming assets into cash and having sufficient short-term assets to cover immediate liabilities without selling inventory. The cash flow ratio includes the cash flow adequacy and quality of profits. This ratio suggests that Sainsbury’s was in a better position, in which the organization had more effective ability to meet its obligations and the Page 1 of 43
-
Upload
westengland -
Category
Documents
-
view
0 -
download
0
Transcript of Sainsburys and Tecso Financial Analysis

I.Executive Summary
The report is intended to assess the financial
performance of two well-known companies in the retail
sector of the United Kingdom. The two firms are
Sainsbury’s and Tesco. This report shows the comparison
between the two companies in 2011, 2012, and 2013. The
analysis is established on the source of the ratio
analysis, in which the profitability ratios, liquidity
ratios, efficiency ratios, gearing ratios, cash flow
ratios and Z-score analysis have been utilized.
The profitability ratios are used to compare in the two
companies, in terms of net profit margin, gross profit
margin, return on equity and return on capital employed.
It has been found that Sainsbury’s is performing better
than Tesco.
The liquidity ratios include the current ratio and quick
ratio, during the analysis. It is shown that Tesco
outperformed Sainsbury’s in term of transforming assets
into cash and having sufficient short-term assets to
cover immediate liabilities without selling inventory.
The cash flow ratio includes the cash flow adequacy and
quality of profits. This ratio suggests that Sainsbury’s
was in a better position, in which the organization had
more effective ability to meet its obligations and the
Page 1 of 43
capability to generate profit in form of cash, compared
to Tesco.
Regarding their Z score, Sainsbury’s had a better trend
that is not likely to bankrupt while Tesco had a trend
that is likely to go bankrupt. Therefore, the old and new
investors and shareholders have impressed with
Sainsbury’s other than Tesco.
Hence, it can be generalized that Sainsbury’s businesses
and operations were more effective and efficient than
Tesco’s, except liquidity analysis, in the last three
years.
Table of Content
Executive Summary…………………………………………………………………1
Introduction
Objective…………………………………………………………………..….3
Research Methodology……………………………………………………..3-4
Communication and Information Technology…………………………………….4
Finding – Analysis and Interpretation
Profitability Ratios………. ………………………………………………...4-7
Liquidity Ratios……………………………………………………………..7-9
Efficiency Ratios…………………………………………………………..9-11
Page 2 of 43
Gearing Ratios……………………………………………………………11-12
Cash Flow Analysis………………………………………………………12-14
Z-Score……………………………………………………………………14-15
Study Identified………………………………………………………………16
Usefulness……………………………………………………………………16
Conclusion and Recommendation…………………………………………………16
Reflection…………………………………………………………………………....17
References……………………………………………………………………….18-19
Appendices
Appendix 1……………………………………………………………….20-22
Appendix 2……………………………………………………………….23-27
Appendix 3……………………………………………………………….28-32
Page 3 of 43

II. Introduction
In United Kingdom, the retail sector is essential for thecountry economy, which has profound impacts on thecountry as a whole. According to ESRC (2013), 20% ofUnited Kingdom’s GDP is accounted by the retail sector.Particularly, Sainsbury’s and ASDA are the two ofrenowned companies in the retail sector. This reportdeals with the assessment of both companies’ performancesin the last three years based on ratio analysis.
To begin with, Sainsbury’s is one of the leading retailstores in the UK dealing with general goods andgroceries. Sainsbury’s was founded in 1869 by John JamesSainsbury and his wife, Mary Ann Sainsbury, in London.Since 1869, the company has been expanded to 523convenience stores and 583 supermarkets in the UK; moreimportantly, Sainsbury’s has employed around 157,000employees. The management team of Sainsbury’s is run bythree important people who are Mr. David Tyler, thechairman, Mr. Justin King, the CEO, and Mr. John Roger,the CFO (J Sainsbury’s PLC, 2014).
Besides Sainsbury’s, Tesco is a famous Britishmultinational retailer which also deals with generalmerchandise and groceries. Jack Cohen founded Tesco in1919. Tesco has been operating for almost 100 years, andit has expanded more branches domestically andinternationally. Regarding employment, Tesco hasrecruited almost 530,000 employees who are committed tothe provision of best shopping experience for theirconsumer and community as a whole (Tesco PLC, 2014).
Objectives
Page 4 of 43
This report purposes to have a comprehensive evaluationover the business performance and day-to-day operations;thus, the main objectives of this report are:
To assess how they can outperform distinctively oneanother.
To give recommendation for both companies to havepositive changes and attention in their food supplychain.
Research Methodology
This report will assess performances of the two companiesby using ratio analysis. To be able to conduct thisstudy, financial information, annual report, of bothcompanies will be utilized, extracted and calculated. Theoutcome of this report will be presented in poundscurrency.
Format of answer:
1. Profitability Ratios in percentage2. Liquidity Ratios3. Efficiency Ratios for inventory turnover (days), and
asset turnover (times)4. Gearing Ratios5. Cash Flow analysis6. Z Score analysis
III. Communication and Information Technology
The application Microsoft word and Microsoft excel arecrucial for this report. The compilation of this reportis done through Microsoft Word with the assist fromMicrosoft Excel. By using Microsoft Excel, it is verybeneficial for undertaking calculation and graph.
Page 5 of 43
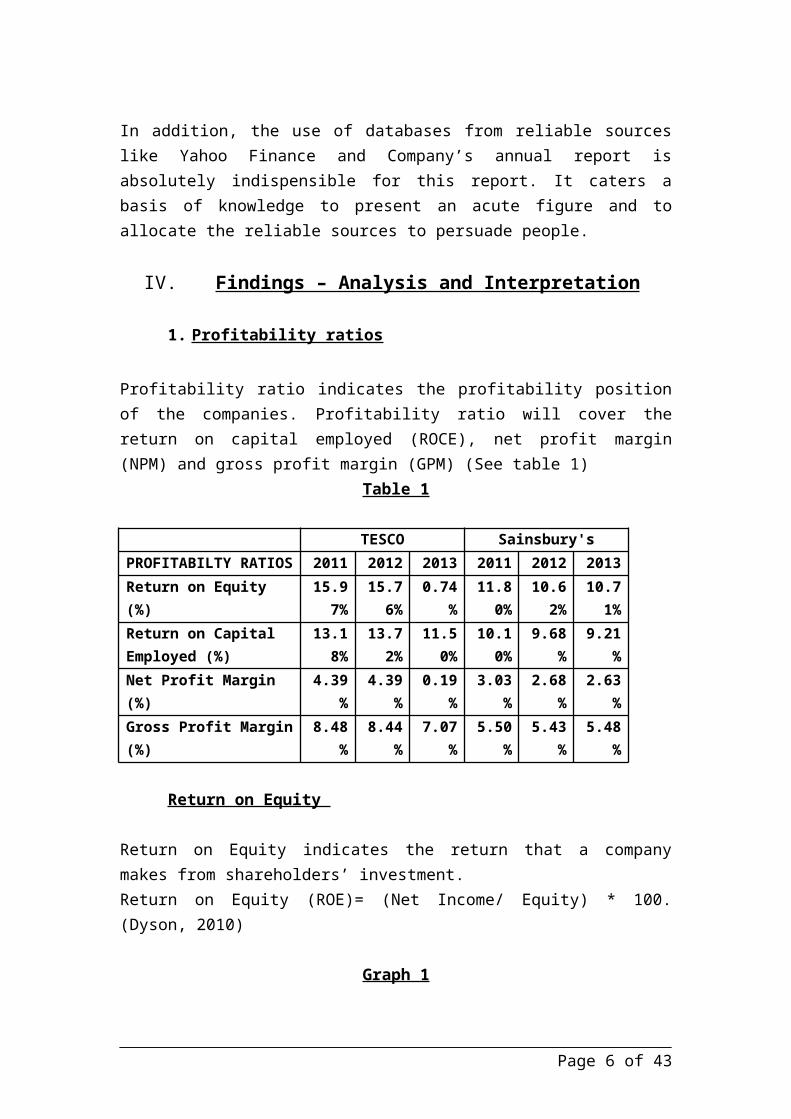
In addition, the use of databases from reliable sourceslike Yahoo Finance and Company’s annual report isabsolutely indispensible for this report. It caters abasis of knowledge to present an acute figure and toallocate the reliable sources to persuade people.
IV. Findings – Analysis and Interpretation
1. Profitability ratios
Profitability ratio indicates the profitability positionof the companies. Profitability ratio will cover thereturn on capital employed (ROCE), net profit margin(NPM) and gross profit margin (GPM) (See table 1)
Table 1
TESCO Sainsbury'sPROFITABILTY RATIOS 2011 2012 2013 2011 2012 2013Return on Equity (%)
15.97%
15.76%
0.74%
11.80%
10.62%
10.71%
Return on Capital Employed (%)
13.18%
13.72%
11.50%
10.10%
9.68%
9.21%
Net Profit Margin (%)
4.39%
4.39%
0.19%
3.03%
2.68%
2.63%
Gross Profit Margin(%)
8.48%
8.44%
7.07%
5.50%
5.43%
5.48%
Return on Equity
Return on Equity indicates the return that a companymakes from shareholders’ investment. Return on Equity (ROE)= (Net Income/ Equity) * 100.(Dyson, 2010)
Graph 1
Page 6 of 43

2011 2012 20130.00%5.00%10.00%15.00%20.00% ROE
The return on equity of Tesco for the last three yearsdecreased sharply; specifically, in 2013, the company ROEdropped significantly to below 1%. In addition, in 2013,Sainsbury’s was able to pick up a slight increase of itsreturn on equity compared to the decrease in 2011 and2012. By this, it can be implied that Tesco’sshareholders may have loss their confidence over theirinvestment, while shareholders of Sainsbury’s had moreconfidence over their investment.
Return on Capital Employed
Return on Capital Employed is used to indicate how wellan organization uses its long-term investments togenerate income. The ROCE ratio can help the company tosucceed its future profitability, so this can measure thecompany’s success or failure, which depends on its targetROCE that it has set (McLaney and Atrill, 2012)Return on Capital Employed= (PBIT/ Capital Employed) *100. (Dyson, 2010)
Graph 2
Page 7 of 43

Due tothe
greater market share, Tesco had a better performancecompared to Sainsbury’s in the last three year.Regardless the increase of Tesco’s ROCE in 2012, Tescowas seen not be able to stabilize its ROCE whileSainsbury’s performed equally well to alleviate itsprofit every year. Overall, it can be understood,Sainsbury’s was able to use its long-term investmentseffectively to generate more income compared to Tesco.
Net Profit Margin
Net profit margin measures how much out of every pound ofsales a company keeps earning which means that a 4%profit margin of company shows that company has a netincome of 0.04 pound. Net Profit Margin = (Net Income/Sale Revenue) * 100
Particularly, the below graph illustrates that Tesco’sprofit margin was higher than Sainsbury’s in 2011 and2012. However, between 2012 and 2013, there was asignificant plunge of Tesco’s profit margin from 4.39% to0.19%. In addition, Sainsbury’s profit margin haddeclined steadily from 2011 to 2013, respectively from3.03% to 2.63%. Thus, it can be understood thatSainsbury’s had a better performance in term of
Page 8 of 43
2011 2012 20130.00%2.00%4.00%6.00%8.00%
10.00%12.00%14.00%16.00%
ROCE
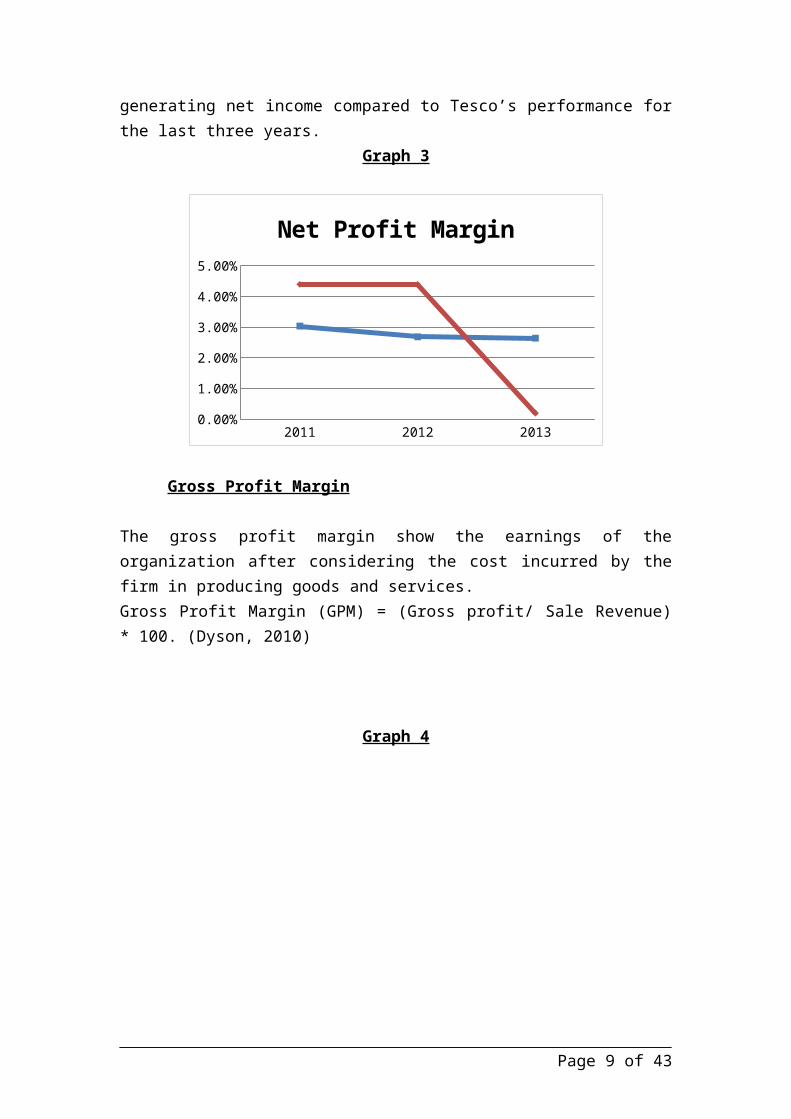
generating net income compared to Tesco’s performance forthe last three years.
Graph 3
2011 2012 20130.00%
1.00%
2.00%
3.00%
4.00%
5.00%
Net Profit Margin
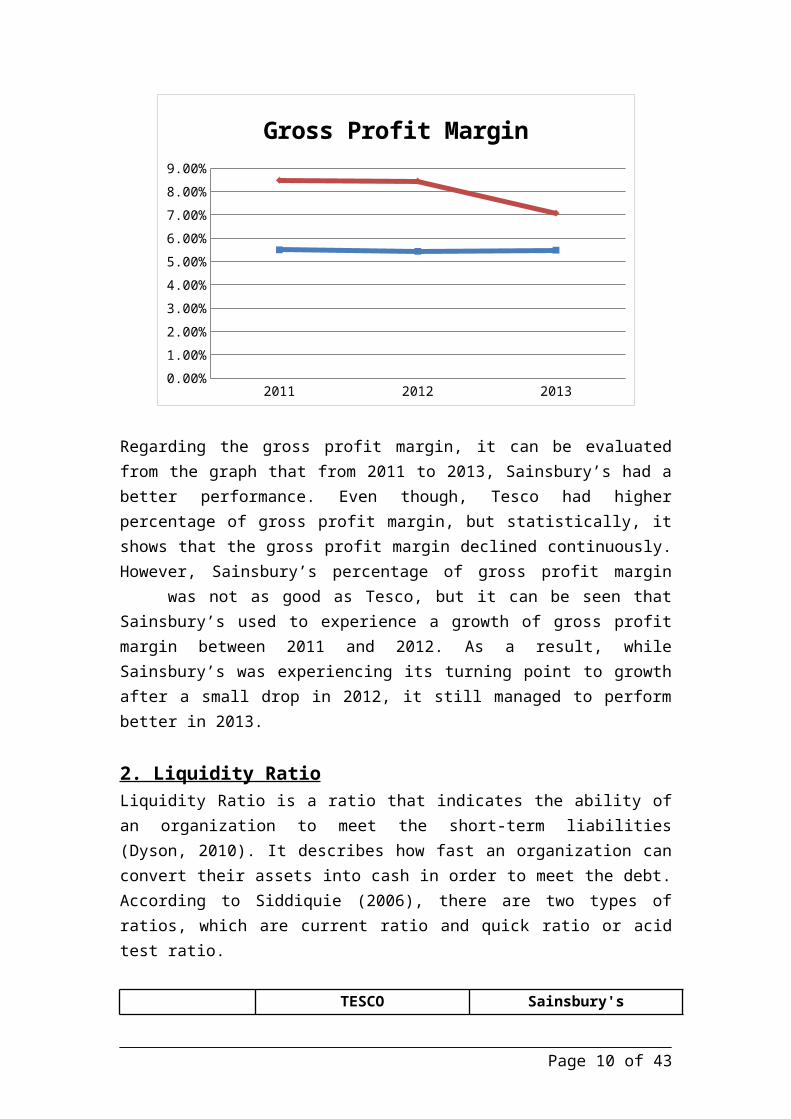
Gross Profit Margin
The gross profit margin show the earnings of theorganization after considering the cost incurred by thefirm in producing goods and services. Gross Profit Margin (GPM) = (Gross profit/ Sale Revenue)* 100. (Dyson, 2010)
Graph 4
Page 9 of 43
2011 2012 20130.00%1.00%2.00%3.00%4.00%5.00%6.00%7.00%8.00%9.00%
Gross Profit Margin
Regarding the gross profit margin, it can be evaluatedfrom the graph that from 2011 to 2013, Sainsbury’s had abetter performance. Even though, Tesco had higherpercentage of gross profit margin, but statistically, itshows that the gross profit margin declined continuously.However, Sainsbury’s percentage of gross profit margin
was not as good as Tesco, but it can be seen thatSainsbury’s used to experience a growth of gross profitmargin between 2011 and 2012. As a result, whileSainsbury’s was experiencing its turning point to growthafter a small drop in 2012, it still managed to performbetter in 2013.
2. Liquidity RatioLiquidity Ratio is a ratio that indicates the ability ofan organization to meet the short-term liabilities(Dyson, 2010). It describes how fast an organization canconvert their assets into cash in order to meet the debt.According to Siddiquie (2006), there are two types ofratios, which are current ratio and quick ratio or acidtest ratio.
TESCO Sainsbury's
Page 10 of 43
LIQUIDITY RATIOS 2011 2012 2013 2011 2012 2013
Current Ratio 64.51% 64.17% 65.66% 58.50% 64.80% 61.44%Acid/Quick Ratio 48.68% 45.48% 45.94% 30.90% 34.89% 29.76%
Table 2
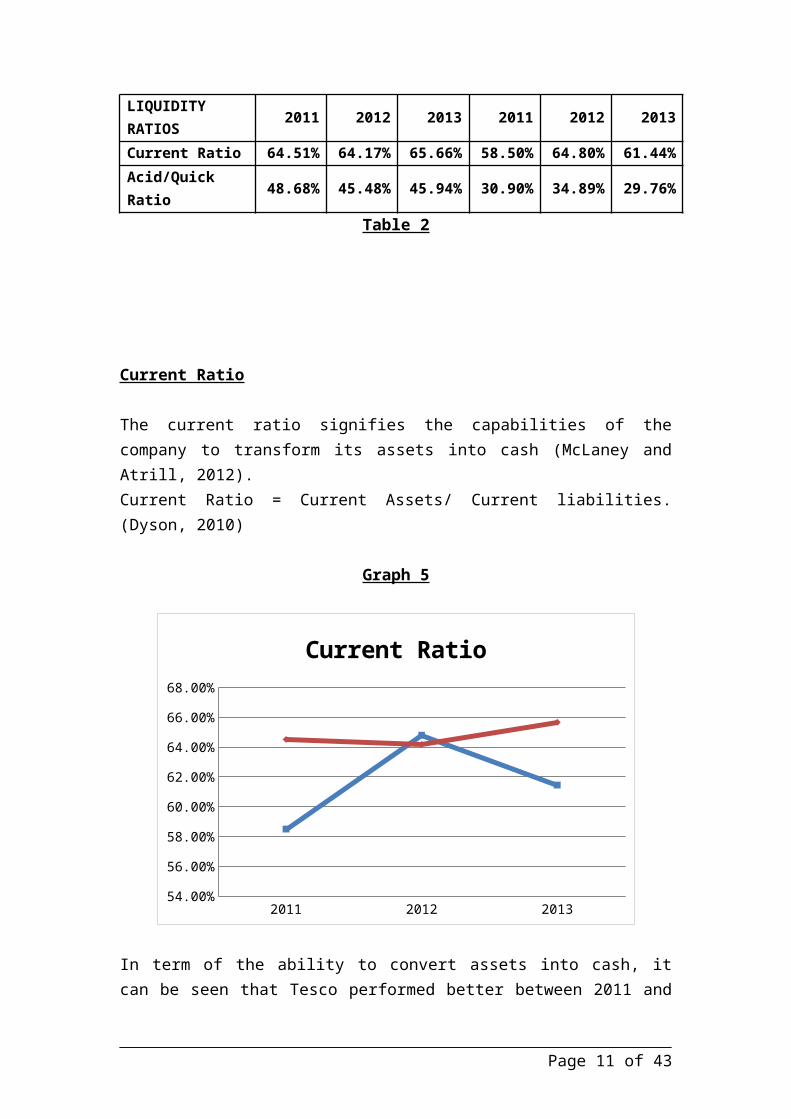
Current Ratio
The current ratio signifies the capabilities of thecompany to transform its assets into cash (McLaney andAtrill, 2012). Current Ratio = Current Assets/ Current liabilities.(Dyson, 2010)
Graph 5
2011 2012 201354.00%
56.00%
58.00%
60.00%
62.00%
64.00%
66.00%
68.00%
Current Ratio
In term of the ability to convert assets into cash, itcan be seen that Tesco performed better between 2011 and
Page 11 of 43
2012. In detail, Tesco had experienced a decrease inbetween 2011 and 2012; positively, the company was ableto increase its current ratio back in 2012 to 2013.However, for Sainsbury’s from 2011 to 2012, there was asharp increase of the company current ratio, whichsignifies how the ability of the company to transformerits asset into cash. Holistically, both companies’current ratio had experienced an increase for the lastyear. In nutshell, it can be understood that bothcompanies performed well in term of converting theirassets into cash, but Tesco was the outstanding one.
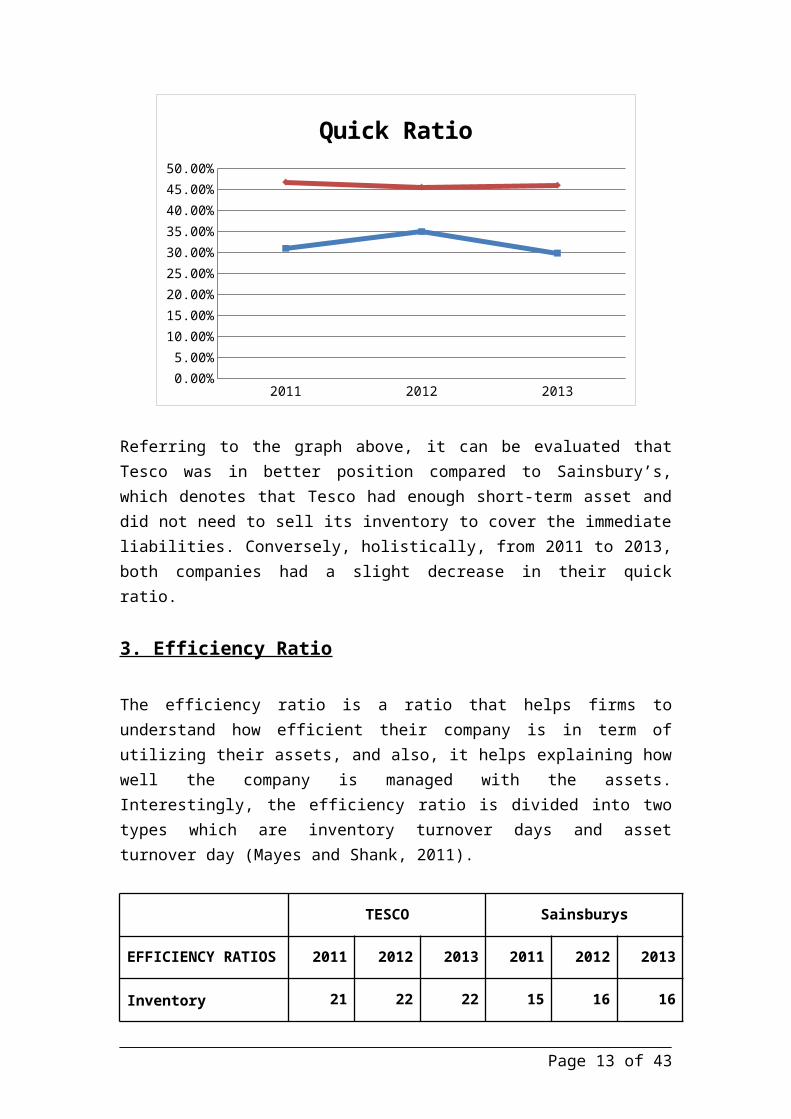
Acid Test Ratio
Acid test ratio or quick ratio is an indicator thatdefines whether a company has sufficient short-termassets to cover its immediate liabilities without sellinginventory.Acid test ratio = (Current assets – Inventories) /Current liabilities. (Dyson, 2010)
Graph 6
Page 12 of 43
2011 2012 20130.00%5.00%10.00%15.00%20.00%25.00%30.00%35.00%40.00%45.00%50.00%
Quick Ratio
Referring to the graph above, it can be evaluated thatTesco was in better position compared to Sainsbury’s,which denotes that Tesco had enough short-term asset anddid not need to sell its inventory to cover the immediateliabilities. Conversely, holistically, from 2011 to 2013,both companies had a slight decrease in their quickratio.
3. Efficiency Ratio
The efficiency ratio is a ratio that helps firms tounderstand how efficient their company is in term ofutilizing their assets, and also, it helps explaining howwell the company is managed with the assets.Interestingly, the efficiency ratio is divided into twotypes which are inventory turnover days and assetturnover day (Mayes and Shank, 2011).
TESCO Sainsburys
EFFICIENCY RATIOS 2011 2012 2013 2011 2012 2013
Inventory 21 22 22 15 16 16
Page 13 of 43

Turnover
Asset Turnover 1.28 1.26 1.29 1.85 1.81 1.84
Table 3
Inventory Turnover
The inventory turnover is measured by days, whichexplains the duration that needed to transform thecompany’s inventories into sales. In this regards, theless number of the days, the better performance of thefirm is.Inventory Turnover (days) = (Inventory / Cost of sales) *365 (Dyson, 2010)
Graph 7
2011 2012 20130
5
10
15
20
25
Inventory Turnover
In particular, the graph shows that in the last threeyears Sainsbury’s could be able to convert itsinventories into cash within only 15 to 16 days.Conversely, in the last three years, Tesco took longertime to transform its inventory into cash, which it took
Page 14 of 43
around 21 to 23 days. As a result, Sainsbury’s performedvery well on its inventory management which allowedSainsbury’s to be in a better position in term ofinventory management compared to Tesco.
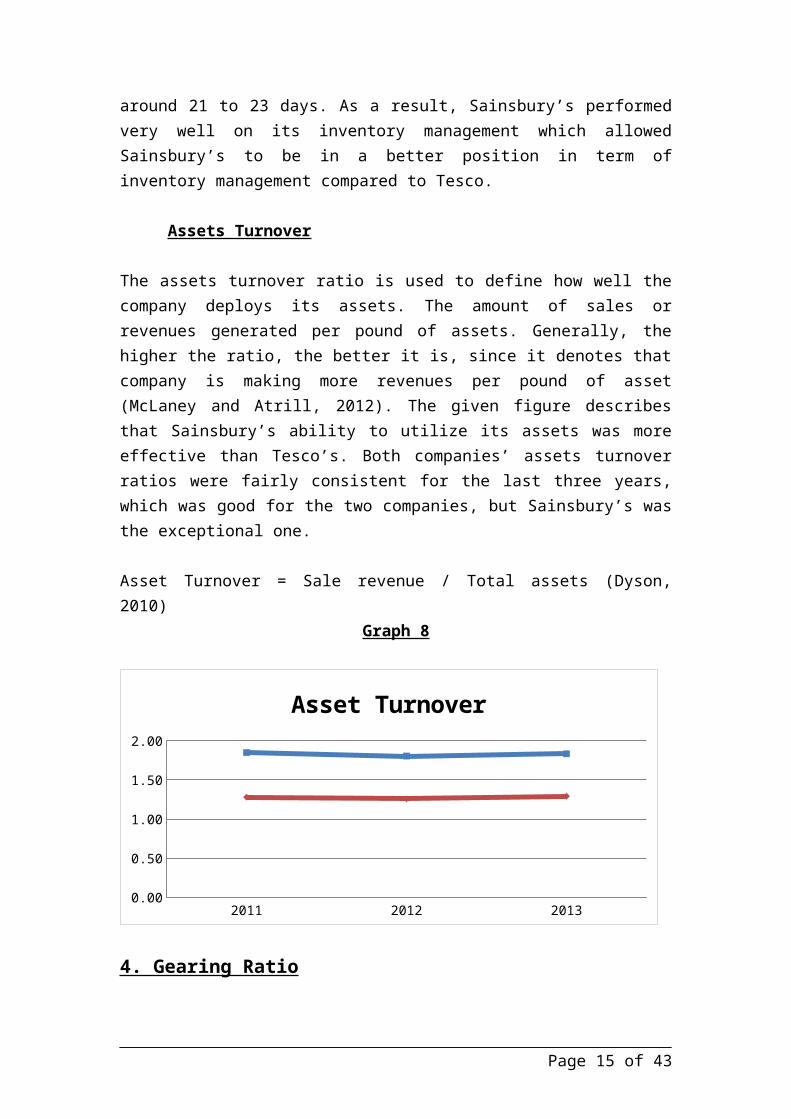
Assets Turnover
The assets turnover ratio is used to define how well thecompany deploys its assets. The amount of sales orrevenues generated per pound of assets. Generally, thehigher the ratio, the better it is, since it denotes thatcompany is making more revenues per pound of asset(McLaney and Atrill, 2012). The given figure describesthat Sainsbury’s ability to utilize its assets was moreeffective than Tesco’s. Both companies’ assets turnoverratios were fairly consistent for the last three years,which was good for the two companies, but Sainsbury’s wasthe exceptional one.
Asset Turnover = Sale revenue / Total assets (Dyson,2010)
Graph 8
2011 2012 20130.00
0.50
1.00
1.50
2.00
Asset Turnover
4. Gearing Ratio
Page 15 of 43

Gearing ratio is a financial ratio that measures thefinancial leverage, signifying the degree to which afirm's activities are funded by owner's funds versuscreditor's funds (McLaney and Atrill, 2012). In thiscase, the higher a company's degree of leverage, the morethe company is considered to be risky because the companymust continue to service its debt regardless of how badits sales are. In this context, there are two ratios isto be considered, the gearing ratio and the interestcover.
Table 4
TESCO Sainsbury'sGEARING RATIOS 2011 2012 2013 2011 2012 2013
Gearing ratio (%) 60% 57% 62% 52% 54% 53%
Interest cover 7.46 9.25 6.91 7.36 7.07 6.78
Gearing Ratio
Gearing Ration = Long term Debt + Preference Shares /Equity * 100 (Dyson, 2010)
Graph 9
In
term of gearing ratio, the graph shows that Sainsbury’shad lower percentage than Tesco in the last three years,which denotes that Tesco was considered to be more risky.Between 2011 and 2013, Tesco’s gearing ratio was higher
Page 16 of 43
2011 2012 201345%
50%55%60%65%
Gearing Ratio

than Sainsbury’s by almost 10%, which signified thatSainsbury’s was in a better position regarding thefinancial leverage.
Interest Cover
The interest cover measures the amount of availability ofoperating profit for covering interest payable (McLaneyand Atrill, 2012). Also, Mclaney and Atrill (2012) statedthat the lower level of operating profit coverage, thehigher the risk to lender and shareholder.Interest Cover = Operating profit / Interest Expense.(Dyson, 2010)
Graph 10
2011 2012 20130.001.002.003.004.005.006.007.008.009.0010.00
Interest Cover
According to the graph, it can be seen that Sainsbury’shad the lower rate of interest cover from years to yearscompared to Tesco. For Tesco, positively in 2012, therewas a significant remark that the company’s interestcover was around 2 times higher than 2011. Since Tescocould hardly main its interest cover rate, while
Page 17 of 43
Sainsbury’s could, Sainsbury’s is deem to be betterposition for last three years.
5. Cash Flow Analysis
The capability of an organization to meet the paymentobligations and other fixed expenses is called the cashflow ratio. Mainly, there are two important ratios to beestimated, the cash flow adequacy and quality of profits(Kieso, Weygandt and Warfield, 2011).
Table 5
TESCO Sainsbury'sCash Flow ratios 2011 2012 2013 2011 2012 2013Cash Flow Adequacy 0.24 0.23 0.15 0.29 0.34 0.17
Quality of Profits 1.22 1.16 0.92 1.00 1.20 1.11
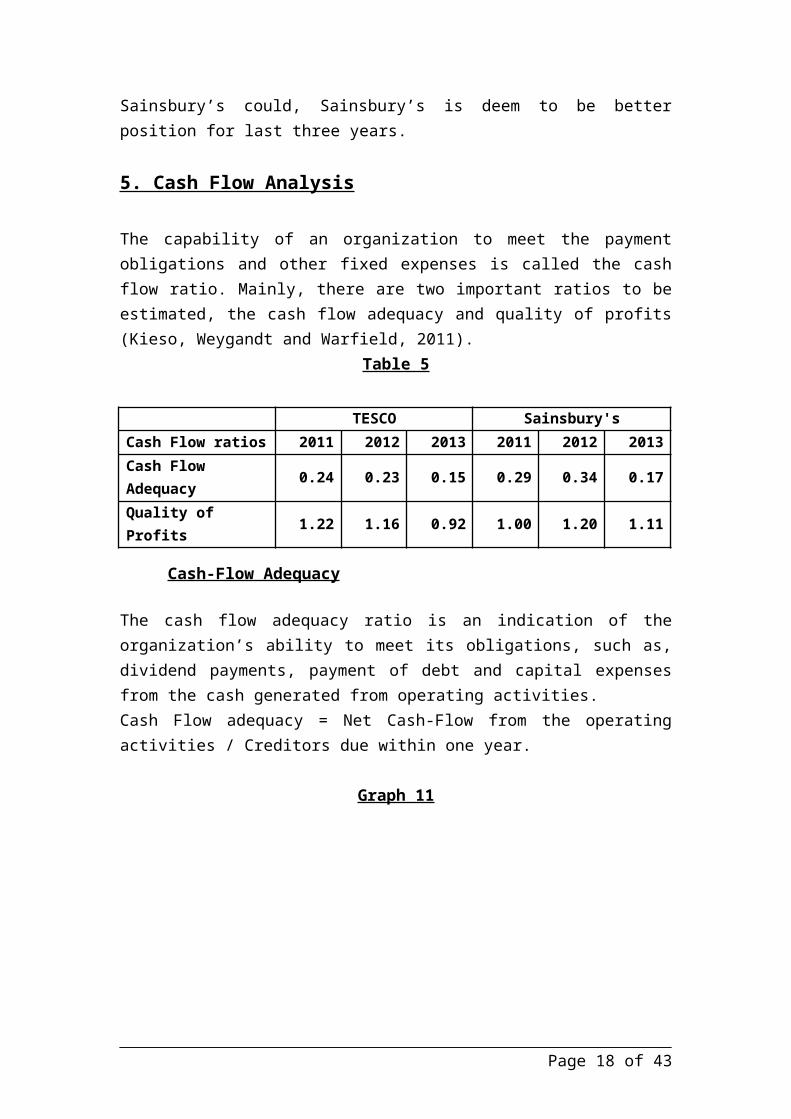
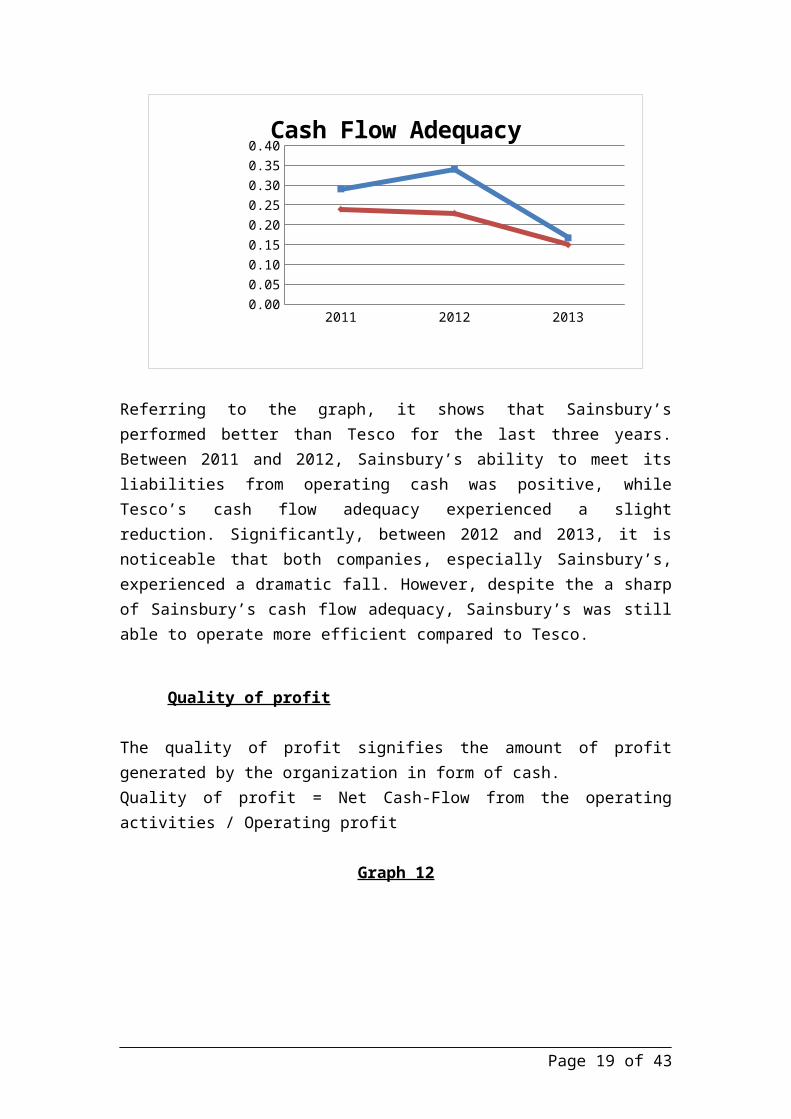
Cash-Flow Adequacy
The cash flow adequacy ratio is an indication of theorganization’s ability to meet its obligations, such as,dividend payments, payment of debt and capital expensesfrom the cash generated from operating activities. Cash Flow adequacy = Net Cash-Flow from the operatingactivities / Creditors due within one year.
Graph 11
Page 18 of 43
2011 2012 20130.000.050.100.150.200.250.300.350.40Cash Flow Adequacy
Referring to the graph, it shows that Sainsbury’sperformed better than Tesco for the last three years.Between 2011 and 2012, Sainsbury’s ability to meet itsliabilities from operating cash was positive, whileTesco’s cash flow adequacy experienced a slightreduction. Significantly, between 2012 and 2013, it isnoticeable that both companies, especially Sainsbury’s,experienced a dramatic fall. However, despite the a sharpof Sainsbury’s cash flow adequacy, Sainsbury’s was stillable to operate more efficient compared to Tesco.
Quality of profit
The quality of profit signifies the amount of profitgenerated by the organization in form of cash. Quality of profit = Net Cash-Flow from the operatingactivities / Operating profit
Graph 12
Page 19 of 43

2011 2012 20130.00
0.20
0.40
0.60
0.80
1.00
1.20
1.40
Quality of Profit
The above graph shows that over the last three years,Sainsbury’s performed better in term of increasing itsnet income while it could reduce its operating expense,tax and interest expense. From 2011 to 2013, Tesco’squality of profit declined gradually until gotoutperformed by Sainsbury’s in 2013. To recap, Tesco’squality of profit for the last three years wasoutperformed by Sainsbury’s efficiency of surging the netincome.
6. Z-Score Analysis
The Z-score utilizes financial ratios in order to decidethe chances of an organization to get bankrupt. Altmanrevived Z score in 2000, and he developed the model basedon five financial ratios (McLaney and Atrill, 2012).The five ratios are symbolized as X1, X2, X3, X4 and X5and are shown below:
X1 = (Current assets – Current liabilities) / TotalassetsThis compares the size of the company with the amount ofliquid assets.
Page 20 of 43

X2 = Retained earnings / Total assetsThis estimates the affect of earnings on the profit ofthe organization.
X3 = Profit before Interest and Tax / Total assetsThis evaluates the efficiency of the organizationregardless of its tax and interest.
X4 = (Market value of the shares X Number of shares) /Total liabilityThis signifies the instability in the equity.
X5 = Sales / Total assetsThis assesses the efficiency of firms regarding thegeneration of revenue.
The formula for Z score is Z-score = 0.717X1 + 0.847X2 + 3.107X3 + 0.420X4 + 0.998X5(Altman, 2000) cited in (Mclaney and Atrill, 2012).
According to Alman, cited in Mclaney and Atrill (2012),implies that the lower the Z-score, the higher is thechance of failure; particularly, a company whose score isbelow 1.23 tends to fail. Meanwhile, a company whose Zscore is greater than 4.41 tends not to fail.
Table 6
TESCO Sainsbury's
Z-Score 2011 2012 2013 2011 2012 2013
Z-score 1.63 1.61 1.58 2.29 2.25 2.28
Specifically, the graph below shows that Tesco’s Z-scoredecreased over for the last three years, which impliesthat the company has higher chance to go bankrupt eventhough the Z score did not go below 1.23. Sainsbury’s,
Page 21 of 43
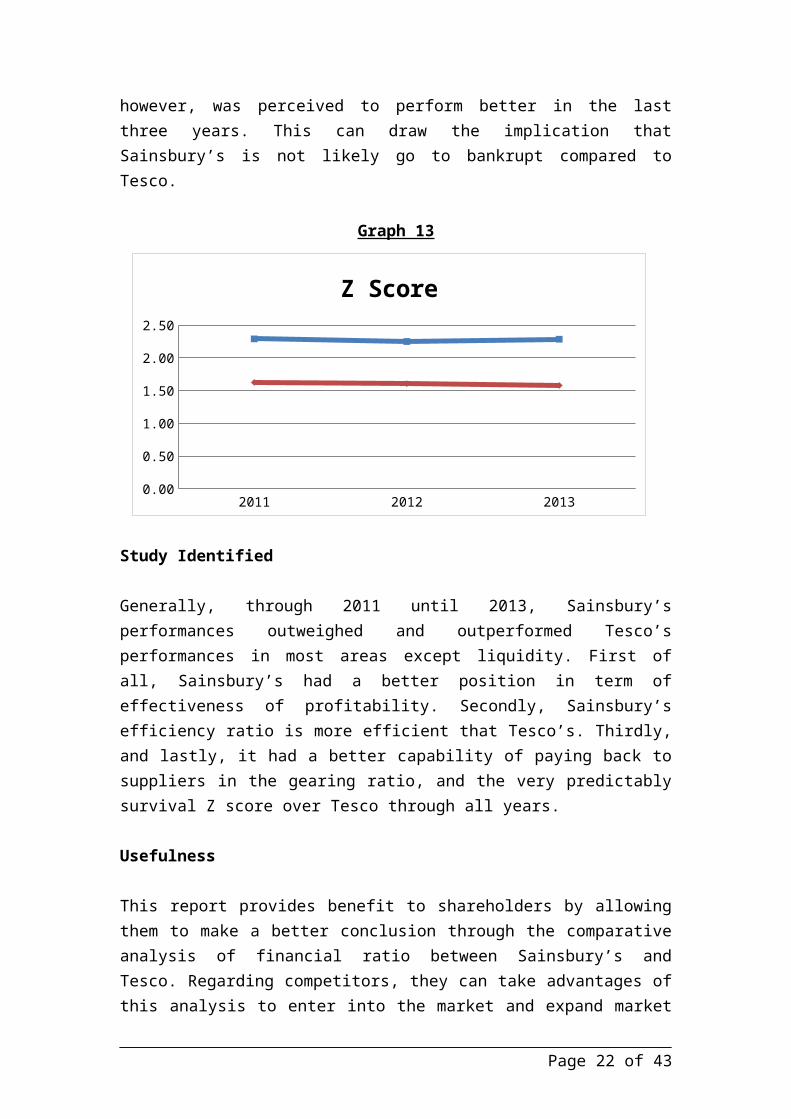
however, was perceived to perform better in the lastthree years. This can draw the implication thatSainsbury’s is not likely go to bankrupt compared toTesco.
Graph 13
Study Identified
Generally, through 2011 until 2013, Sainsbury’sperformances outweighed and outperformed Tesco’sperformances in most areas except liquidity. First ofall, Sainsbury’s had a better position in term ofeffectiveness of profitability. Secondly, Sainsbury’sefficiency ratio is more efficient that Tesco’s. Thirdly,and lastly, it had a better capability of paying back tosuppliers in the gearing ratio, and the very predictablysurvival Z score over Tesco through all years.
Usefulness
This report provides benefit to shareholders by allowingthem to make a better conclusion through the comparativeanalysis of financial ratio between Sainsbury’s andTesco. Regarding competitors, they can take advantages ofthis analysis to enter into the market and expand market
Page 22 of 43
2011 2012 20130.00
0.50
1.00
1.50
2.00
2.50
Z Score
share; yet, suppliers can pay more devotion to the riskof supply of its product to Tesco and Sainsbury’s. Also,the two companies can use the analysis to discovery thecritical grounds behind their loss and contributedfactors behind their growth. Last but not least,financial institutions can make an assessment whether ornot to grant loans to the companies.
V.Conclusion and Recommendation
To recapitulate, for the last three years, it can beevaluated that Sainsbury’s outperformed Tesco in 3 areasof ratios-profitability, efficiency and gearing ratio-andZ score, except liquidity ratio. To improve the liquidityratio, Sainsbury’s should liquid its cash moreeffectively in term of the ability of converting assetsinto cash and the ability to cover liabilities withoutselling inventories. Particularly, the company’s currentasset, current debt, and inventory have to be assessedand balanced. On the other hand, Tesco should pay moreattention on most of the aspects that had affected theratios and Z score, especially.
For further research, each company’s cost of sale that isnot cost effective and operative should be taken intoconsideration to define why the cost of sale is noteffective; hence, it provides fewer opportunities for newentrants.
Page 23 of 43
VI. Reflection
After having been through the whole terms, ManagingFinance is one of the interesting subjects that caught myattention the most. In the process of the course,personally, I found that it had several strengths andweaknesses, which need to be discussed.
To begin with, the vital strength of the course is thatit was very relevant to the main course I was taking. Inthis regards, the course provides very valuable lessonswhich are absolutely practical for students, particularlyme. Moreover, it helped showing how important financialmanagement is and how financial management affectscompanies around the world. Particularly, the coursehelped distinguishing concisely between financialaccounting and management accounting. Personally, I amvery satisfied with the outcomes of this course since itallows me to have obtained a lot of analytical andcritical skills regarding financial analysis.
On the other hand, I found that attendance issue andassessment method were the main weaknesses of thiscourse. Unlike the UK educational system, my country,Cambodia, educational system places attendance to befirst priority of the course, since attendance is one ofthe criteria that evaluates students’ assessment. Havingbeen brought up in that educational system, I feel thatattendance is very important to keep track of students.During the course, managing finance, attendance issue andassessment method were seemed to be related which causedproblems. In this regard, the assessment was based ononly one coursework which could be done by just onlystudying one chapter or two. By this means, some studentstook other classes of the course for granted after theyhad learnt the first one or two chapters of the course.Therefore, with problematic of both attendance issue and
Page 24 of 43

assessment method, I felt that it was quite discouragingand demotivating for students.
Besides, the strengths and weaknesses of the course, Iwould like to give a reflection toward the coursework.First of all, I deem the coursework to be veryanalytical, critical and especially practical. To me, thecoursework provides an in-depth analytical skill, whichis very practical for the working environment. Second ofall, particularly, when I tried to collect data and dothe calculation, it was a bit bewildering; but with thedetermination and efforts, I managed to complete thecalculation and analysis. At the mean time, MicrosoftExcel has helped facilitating me doing the coursework.
Last but not least, the course is considered to beabsolutely useful and practical for the real workingenvironment. I believe that in the future the module canbe even more effective by adding more extra sessions inassignment help as I have found most of the students hada hardship in doing the calculation, finding figures fromthe financial statements, and understanding eachfinancial term.
VII. References
Dyson, J.R. (2010) Accounting for Non-Accounting Students [online]. Harlow: Financial Times Prentice Hall. [Accessed 02 March 2014].
Economic and Social Research Council, (2014) ESRC Retail Sector Initiative 2013. Available from: http://www.esrc.ac.uk/funding-and-guidance/funding-opportunities/16967/retail-sector-initiative21-aug.aspx [Accessed 10 March 2014].
Page 25 of 43

J Sainsbury’s (2011) Annual Report and Financial Statements 2011 [Online]. J Sainsbury’s plc. Available from: http://www.jsainsbury.co.uk/media/171813/ar2011_report.pdf [Accessed 07 March 2014].
J Sainsbury’s (2012) Annual Report and Financial Statements 2012 [Online]. J Sainsbury’s plc. Available from: http://www.jsainsbury.co.uk/media/649393/j_sainsbury_ara_2012.pdf [Accessed 07 March 2014]
J Sainsbury’s (2013) Annual Report and Financial Statements 2013 [Online]. J Sainsbury’s plc. Available from: http://www.jsainsbury.co.uk/media/1616189/sainsburys_ara.pdf [Accessed 07 March 2014].
J Sainsbury PLC, (2014) History [online]. Available from:http://www.j-sainsbury.co.uk/about-us/sainsburys-story/ [Accessed 07 March 2014].
Kieso, J., Weygandt, J. and Warfield, T.D. (2011) Intermediate accounting [online]. New Jersey: John Wiley & Sons. [Accessed 10 March 2014].
McLaney, E.J. and Atrill, P. (2012) Accounting: An Introduction [online]. Harlow: Pearson. [Accessed 07 March 2014].
Mayes, T. and Shank, T. (2011) Financial analysis with Microsoft Excel. Connecticut: Cengage Learning.
Siddiqui, S.A. (2006) Managerial economics and financial analysis. New Delhi: New Age International
Tesco (2011) Annual Report 2011 [Online]. Tesco plc. Available from:
Page 26 of 43
http://www.tescoplc.com/media/417/tesco_annual_report_2011.pdf [Accessed 08 March 2014].
Tesco (2012) Annual Report 2012 [Online]. Tesco plc. Available from: http://www.tescoplc.com/files/pdf/reports/tesco_annual_report_2012.pdf [Accessed 08 March 2014].
Tesco (2013) Annual Report 2013 [Online]. Tesco plc. Available from: http://files.thegroup.net/library/tesco/annualreport2013/pdfs/tesco_annual_report_2013.pdf [Accessed 08 March 2013].
Tesco PLC, (2014) History [online]. Available from: http://www.Tescoplc.com/index.asp [Accessed 05 March 2014].
Yahoo Finance, (2013a) Tesco PLC (TSCO.L). Available from: http://finance.yahoo.com/q/hp?s=TSCO.L+Historical+Prices [Accessed 15 March 2014].
Yahoo Finance, (2013b) Tesco PLC (TSCO.L). Available from: http://finance.yahoo.com/q/is?s=TSCO.L+Income+Statement&annual [Accessed 15 March 2014].
Yahoo Finance, (2013c) Tesco PLC (TSCO.L). Available from: http://finance.yahoo.com/q/bs?s=TSCO.L+Balance+Sheet&annual [Accessed 15 March 2014].
Yahoo Finance, (2013d) Tesco PLC (TSCO.L). Available from: http://finance.yahoo.com/q/cf?s=TSCO.L+Cash+Flow&annual [Accessed 15 March 2014].
Page 27 of 43
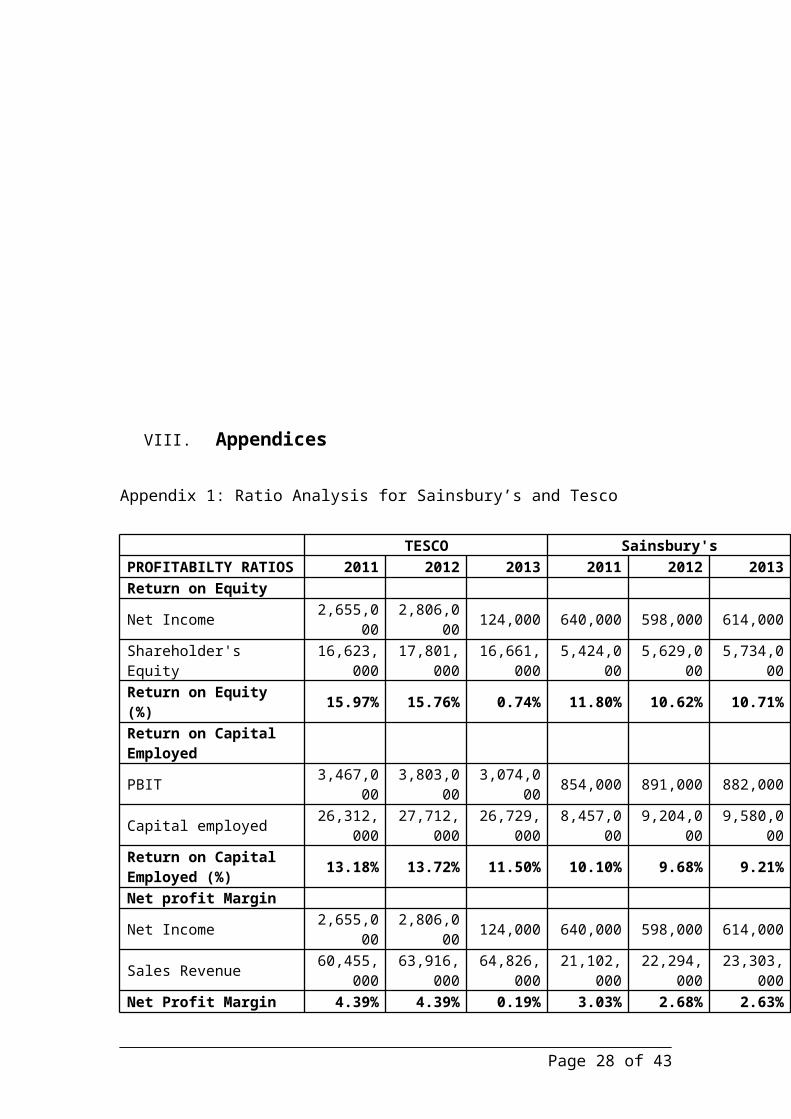
VIII. Appendices
Appendix 1: Ratio Analysis for Sainsbury’s and Tesco
TESCO Sainsbury'sPROFITABILTY RATIOS 2011 2012 2013 2011 2012 2013Return on Equity
Net Income 2,655,000
2,806,000 124,000 640,000 598,000 614,000
Shareholder's Equity
16,623,000
17,801,000
16,661,000
5,424,000
5,629,000
5,734,000
Return on Equity (%) 15.97% 15.76% 0.74% 11.80% 10.62% 10.71%
Return on Capital Employed
PBIT 3,467,000
3,803,000
3,074,000 854,000 891,000 882,000
Capital employed 26,312,000
27,712,000
26,729,000
8,457,000
9,204,000
9,580,000
Return on Capital Employed (%) 13.18% 13.72% 11.50% 10.10% 9.68% 9.21%
Net profit Margin
Net Income 2,655,000
2,806,000 124,000 640,000 598,000 614,000
Sales Revenue 60,455,000
63,916,000
64,826,000
21,102,000
22,294,000
23,303,000
Net Profit Margin 4.39% 4.39% 0.19% 3.03% 2.68% 2.63%
Page 28 of 43

(%)Gross Profit Margin
Gross Profit 5,125,000
5,397,000
4,089,000
1,160,000
1,211,000
1,277,000
Sales Revenue 60,455,000
63,916,000
64,826,000
21,102,000
22,294,000
23,303,000
Gross Profit Margin(%) 8.48% 8.44% 6.31% 5.50% 5.43% 5.48%
A.Profitability
TESCO Sainsbury'sLIQUIDITY RATIOS 2011 2012 2013 2011 2012 2013
Current ratioCurrent Assets 11,438,000 12,353,000 12,465,000 1,721,000 2,032,000 1,914,000
Current Liabilities 17,731,000 19,249,000 18,985,000 2,942,000 3,136,000 3,115,000
Current Ratio 64.51% 64.17% 65.66% 58.50% 64.80% 61.44%Acid/Quick RatioCurrent assets
11,438,000
12,353,000
12,465,000
1,721,000
2,032,000
1,914,000
Inventories 3,162,000 3,598,000 3,744,000 812,000 938,000 987,000Current Liabilities
17,731,000
19,249,000
18,985,000
2,942,000
3,136,000
3,115,000
Acid/Quick Ratio 0.47 0.45 0.46 0.31 0.35 0.30
B.Liquidity
C.Efficiency Ratio TESCO Sainsbury's
EFFICIENCY RATIOS 2011 2012 2013 2011 2012 2013
Inventory days
Inventory 3,162,000
3,598,000
3,744,000 812,000 938,000 987,000
Cost of sales 55,330,000
58,519,000
60,737,000
19,942,000
21,083,000
22,026,000
Inventory 21 22 22 15 16 16
Page 29 of 43
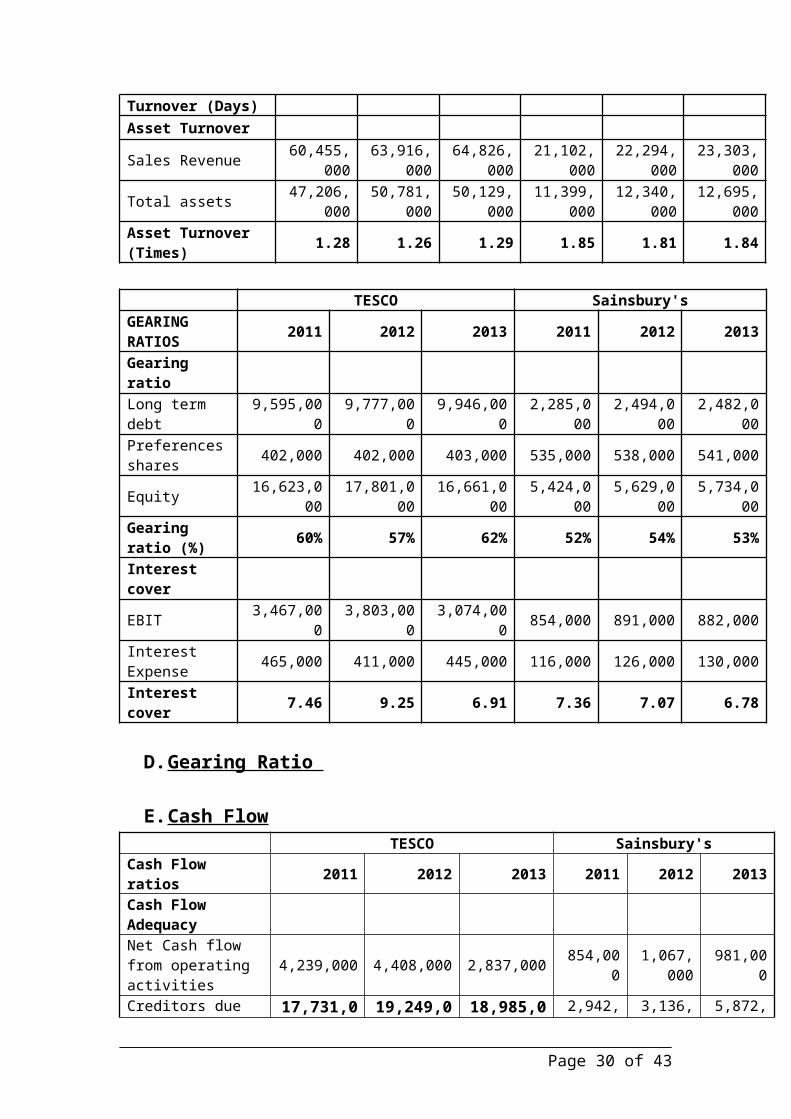
Turnover (Days)Asset Turnover
Sales Revenue 60,455,000
63,916,000
64,826,000
21,102,000
22,294,000
23,303,000
Total assets 47,206,000
50,781,000
50,129,000
11,399,000
12,340,000
12,695,000
Asset Turnover (Times) 1.28 1.26 1.29 1.85 1.81 1.84
TESCO Sainsbury'sGEARING RATIOS 2011 2012 2013 2011 2012 2013
Gearing ratioLong term debt
9,595,000
9,777,000
9,946,000
2,285,000
2,494,000
2,482,000
Preferencesshares 402,000 402,000 403,000 535,000 538,000 541,000
Equity 16,623,000
17,801,000
16,661,000
5,424,000
5,629,000
5,734,000
Gearing ratio (%) 60% 57% 62% 52% 54% 53%
Interest cover
EBIT 3,467,000
3,803,000
3,074,000 854,000 891,000 882,000
Interest Expense 465,000 411,000 445,000 116,000 126,000 130,000
Interest cover 7.46 9.25 6.91 7.36 7.07 6.78
D.Gearing Ratio
E.Cash Flow TESCO Sainsbury's
Cash Flow ratios 2011 2012 2013 2011 2012 2013
Cash Flow AdequacyNet Cash flow from operating activities
4,239,000 4,408,000 2,837,000 854,000
1,067,000
981,000
Creditors due 17,731,0 19,249,0 18,985,0 2,942, 3,136, 5,872,
Page 30 of 43

in one year 00 00 00 000 000 000Cash Flow Adequacy 0.24 0.23 0.15 0.29 0.34 0.17
Quality of ProfitsNet Cash flowfrom operating activities
4,239,000
4,408,000
2,837,000 854,000 1,067,00
0 981,000
Operating profit
3,467,000
3,803,000
3,074,000 854,000 891,000 882,000
Quality of Profits 1.22 1.16 0.92 1.00 1.20 1.11
F.Z- Score TESCO Sainsbury's
Z-Score 2,011 2,012 2,013 2,011 2,012 2,013 X1
CurrentAssets
12,039,000
12,863,000
13,096,000
1,721,000
2,032,000
1,914,000
CurrentLiabilities
17,731,000
19,249,000
18,985,000
2,942,000
3,136,000
3,115,000
Totalassets
47,206,000
50,781,000
50,129,000
11,399,000
12,340,000
12,695,000
X1 -0.12 -0.13 -0.12 -0.11 -0.09 -0.09 X2
Retainedearnings
11,171,000
12,164,000
10,535,000
3,374,000
3,715,000
4,060,000
Totalassets
47,206,000
50,781,000
50,129,000
11,399,000
12,340,000
12,695,000
X2 0.24 0.24 0.21 0.30 0.30 0.32 X3
OperatingProfit
3,467,000
3,803,000
3,074,000
851,000
887,000
887,000
Totalassets
47,206,000
50,781,000
50,129,000
11,399,000
12,340,000
12,695,000
X3 0.07 0.07 0.06 0.07 0.07 0.07 X4
Page 31 of 43
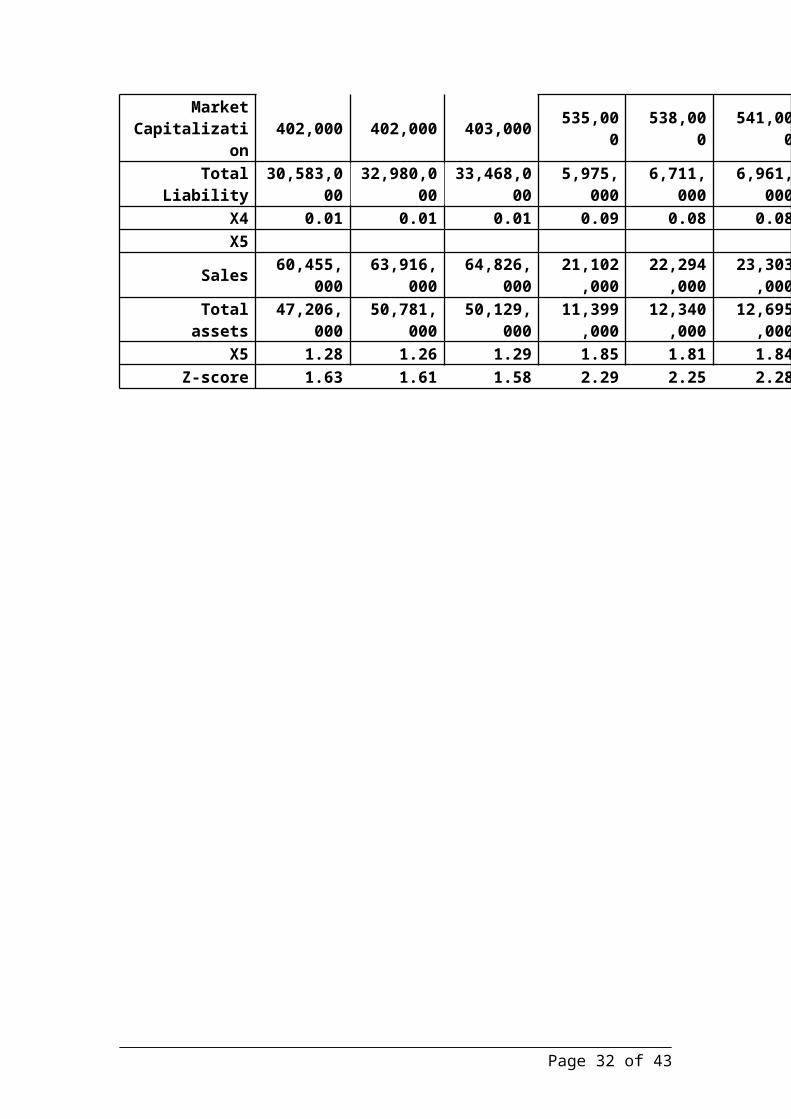
MarketCapitalizati
on 402,000 402,000 403,000 535,00
0 538,00
0 541,00
0
TotalLiability
30,583,000
32,980,000
33,468,000
5,975,000
6,711,000
6,961,000
X4 0.01 0.01 0.01 0.09 0.08 0.08 X5
Sales 60,455,000
63,916,000
64,826,000
21,102,000
22,294,000
23,303,000
Totalassets
47,206,000
50,781,000
50,129,000
11,399,000
12,340,000
12,695,000
X5 1.28 1.26 1.29 1.85 1.81 1.84 Z-score 1.63 1.61 1.58 2.29 2.25 2.28
Page 32 of 43

Appendix 2 : Financial statements of Tesco Plc from 2011 to 2013
Tesco Plc: Income Statement from 2011 to 2013
Page 33 of 43
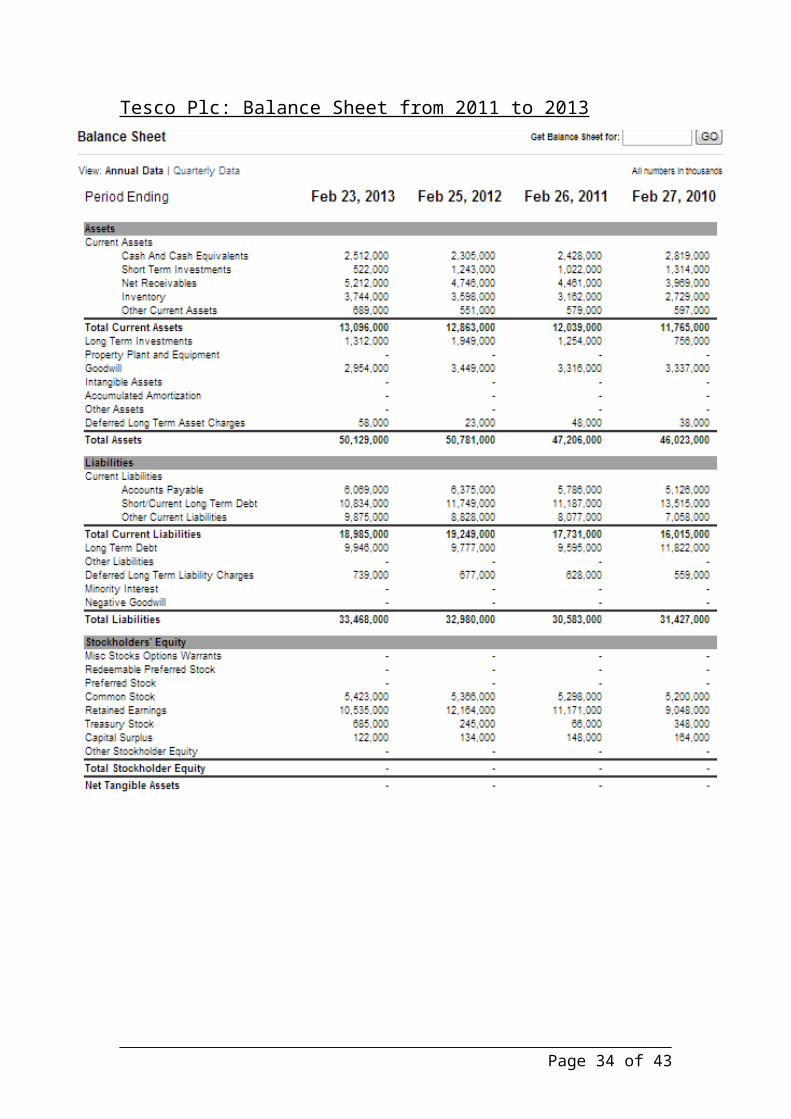
Tesco Plc: Balance Sheet from 2011 to 2013
Page 34 of 43

Tesco Plc: Cash Flow from 2011 to 2013
Page 35 of 43
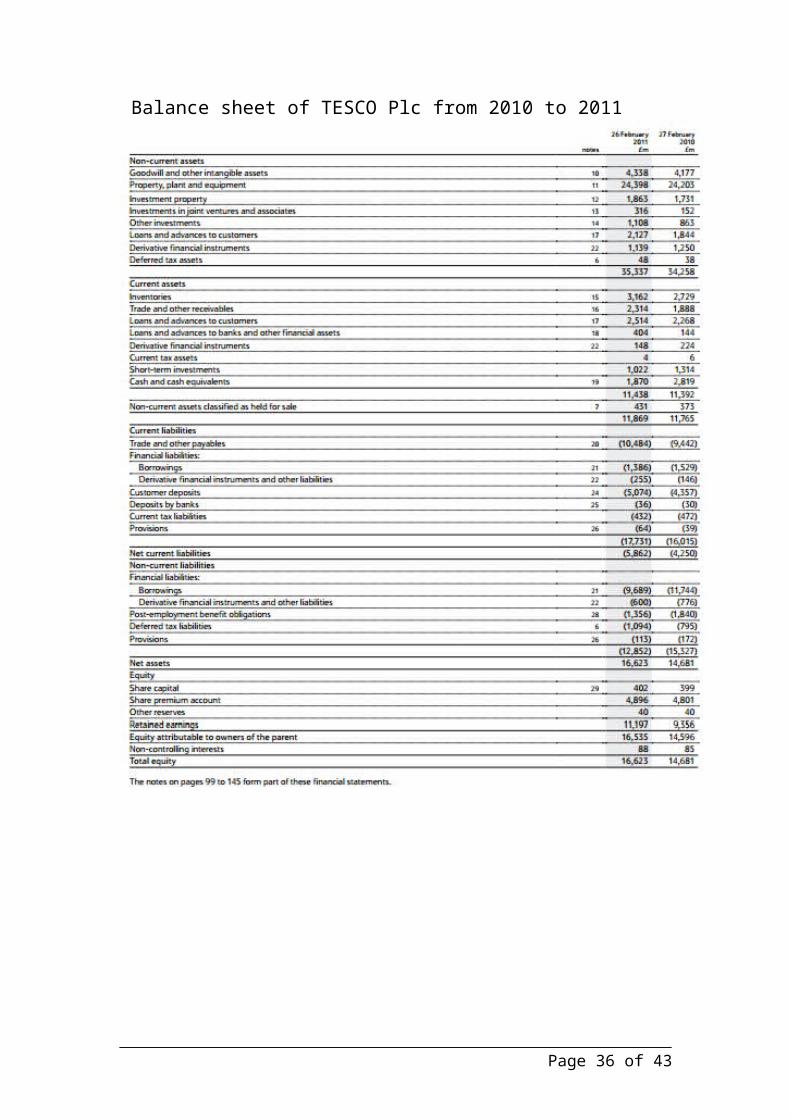
Balance sheet of TESCO Plc from 2010 to 2011
Page 36 of 43
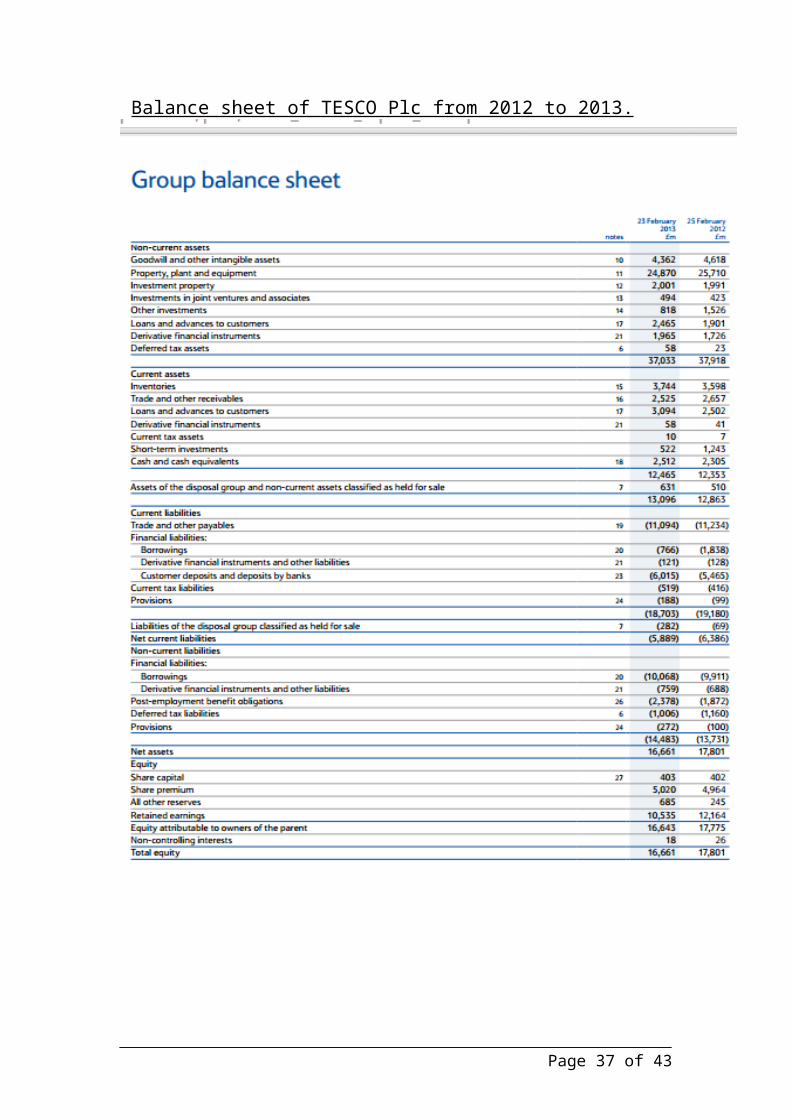
Balance sheet of TESCO Plc from 2012 to 2013.
Page 37 of 43
Appendix 3 : Financial statements of Sainsbury’s from 2011 to 2013
Balance Sheet of Sainsbury’s from 2011 to 2012
Page 38 of 43

Balance Sheet of Sainsbury’s from 2012 to 2013
Page 39 of 43
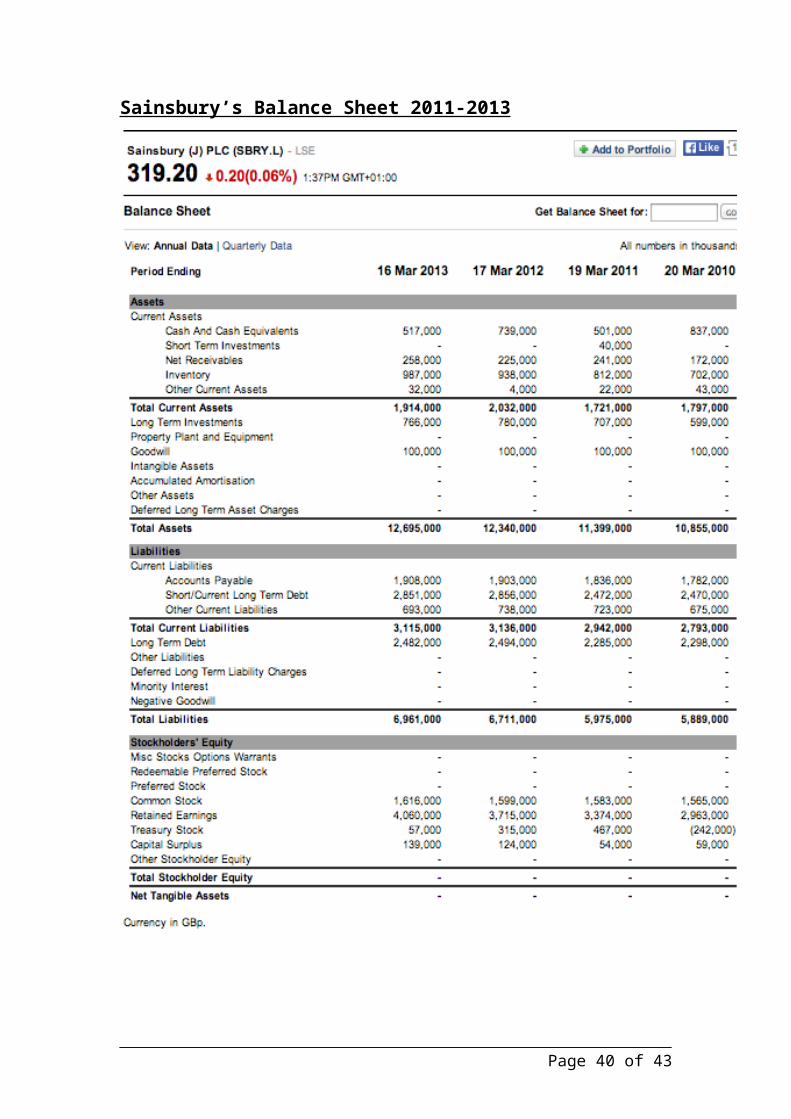
Sainsbury’s Balance Sheet 2011-2013
Page 40 of 43
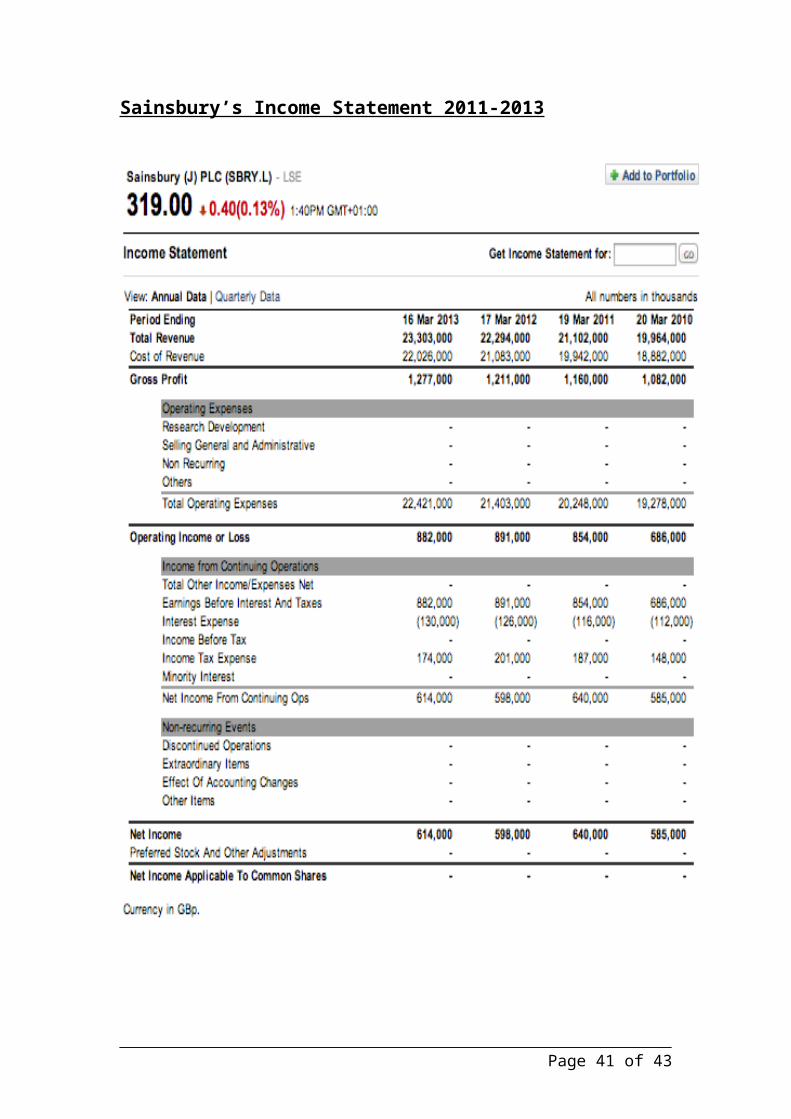
Sainsbury’s Income Statement 2011-2013
Page 41 of 43

Sainsbury’s Cash Flow 2011-2013
Page 42 of 43

Page 43 of 43