Financial Analysis & Comparison
21
Running head: FINANCIAL ANALYSIS & COMPARISON 1 Financial Analysis & Comparison May 30, 2014
-
Upload
coloradotech -
Category
Documents
-
view
1 -
download
0
Transcript of Financial Analysis & Comparison

Running head: FINANCIAL ANALYSIS & COMPARISON 1
Financial Analysis & Comparison
May 30, 2014

FINANCIAL ANALYSIS & COMPARISON 2
Financial Analysis & Comparison
The manufacturing company chosen to be betrayed in this
financial analysis is Ford Motors. Ford Motors Co. is a major
distributor of vehicles worldwide. They specialize in
manufacturing everything from small cars, trucks and luxury brand
vehicles. The annual report will be reviewed to help give incite
on how this company ranks in sales and comparisons to its
competitors. Annual reports are accounting reports that are
issued to reveal performance, assess the success or failures of
the facility and inform shareholder’s exactly how the corporation
is doing. The annual report for 2013 Ford Motors Co. ranked
number ten in global revenues after dropping a notch from the
previous year from nine. Research has shown that it has declined
from its 2008 position of eight, (CNN Money, 2014).
Links to Ford Motors’ Financial Documents
Balance Sheet-http://finance.yahoo.com/q/bs?
s=F+Balance+Sheet&annual and Income
Statement-http://finance.yahoo.com/q/is?
s=F+Income+Statement&annual, (Yahoo Finance, 2014). Full Annual

FINANCIAL ANALYSIS & COMPARISON 3
report http://corporate.ford.com/doc/916/251/ar2013- 2013%20Ford
%20Annual%20Report%20MR.pdf , (Ford Motor Company, 2013).

FINANCIAL ANALYSIS & COMPARISON 4

FINANCIAL ANALYSIS & COMPARISON 5

FINANCIAL ANALYSIS & COMPARISON 6
Determining Financial Ratios
Financial ratios are relationships between different
accounts from financial statements. These ratios serve as
performance indicators because the reveal relative values and
allow for comparisons across time. The purpose of financial
ratios is to inform corporate heads on the best direction to lead
the firm and to inform investors on how well the company is doing
financially. This gives interested parties a chance to locate and
correct problems for performance improvement.
Return on Assets
Return on assets or ROAs measures how much the firm has earned from the use of its
total assets. The equation is Ford’s ROA= Total Income Average Total
Assets
Total income represents all revenue a business earns before
paying expenses, (Keythman, 2014). Assets represent anything
owned or owed to the company. Calculations for Ford Motors Co
return on assets are 1.48%. This information was gathered from
the December 31, 2013 income statement divided by the total
assets on the balance sheet.

FINANCIAL ANALYSIS & COMPARISON 7
Return on Equity
Return on equity measures how much the firm earned as a
percentage of the investments
made by shareholders. Return on Equity can be figured by finding the shareholder's equity on the
balance sheet and is simply the difference between the total assets and total liabilities. The
equation is calculated Ford’s ROE= Profit (Net Income) Average Shareholders’
Equity
Return on equity is important because it helps a company
determine if they consume cash or create assets. Ford Motors ROE
was 27.12% on December 31, 2013. Quarterly reports for March 31,
2014 ranked ROE for the company at 29.59% which shows it has had
a significant drop from
FINANCIAL ANALYSIS & COMPARISON 8
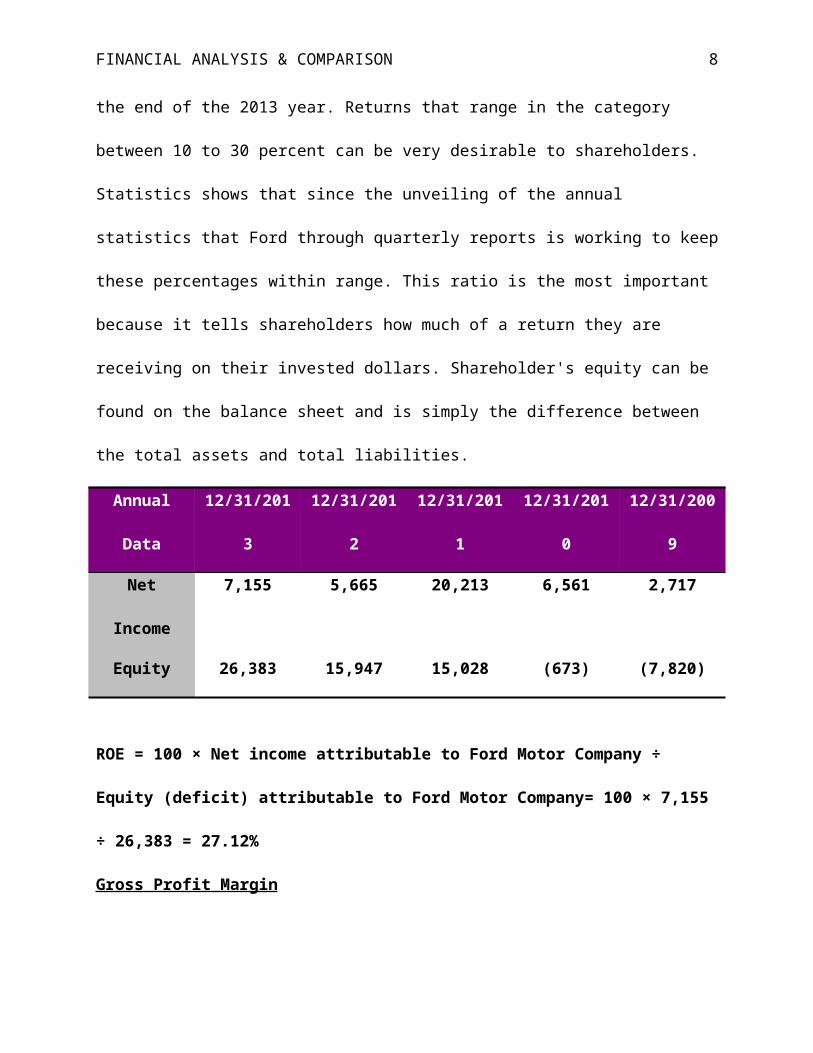
the end of the 2013 year. Returns that range in the category
between 10 to 30 percent can be very desirable to shareholders.
Statistics shows that since the unveiling of the annual
statistics that Ford through quarterly reports is working to keep
these percentages within range. This ratio is the most important
because it tells shareholders how much of a return they are
receiving on their invested dollars. Shareholder's equity can be
found on the balance sheet and is simply the difference between
the total assets and total liabilities.
Annual
Data
12/31/201
3
12/31/201
2
12/31/201
1
12/31/201
0
12/31/200
9
Net
Income
7,155 5,665 20,213 6,561 2,717
Equity 26,383 15,947 15,028 (673) (7,820)
ROE = 100 × Net income attributable to Ford Motor Company ÷
Equity (deficit) attributable to Ford Motor Company= 100 × 7,155
÷ 26,383 = 27.12%
Gross Profit Margin
FINANCIAL ANALYSIS & COMPARISON 9
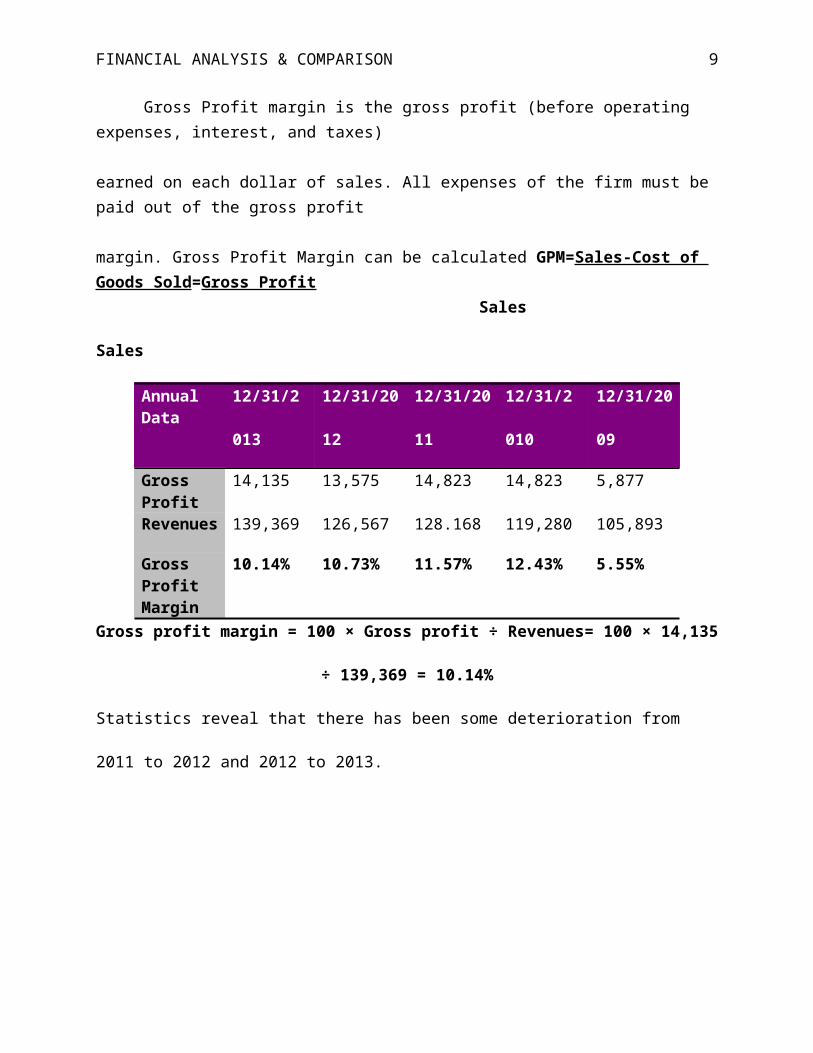
Gross Profit margin is the gross profit (before operating expenses, interest, and taxes)
earned on each dollar of sales. All expenses of the firm must be paid out of the gross profit
margin. Gross Profit Margin can be calculated GPM=Sales-Cost of Goods Sold=Gross Profit
Sales
Sales
AnnualData
12/31/2
013
12/31/20
12
12/31/20
11
12/31/2
010
12/31/20
09
Gross Profit
14,135 13,575 14,823 14,823 5,877
Revenues 139,369 126,567 128.168 119,280 105,893
Gross Profit Margin
10.14% 10.73% 11.57% 12.43% 5.55%
Gross profit margin = 100 × Gross profit ÷ Revenues= 100 × 14,135
÷ 139,369 = 10.14%
Statistics reveal that there has been some deterioration from
2011 to 2012 and 2012 to 2013.

FINANCIAL ANALYSIS & COMPARISON 10
Debt to Equity Ratio
Debt to Equity Ratio shows the relationship between the suppliers of credit and equity.
The ratio can be calculated by using the equation Debt-Equity Ratio= Total Liabilities
TotalEquity
AnnualData
12/31/2013
12/31/2012
12/31/2011
12/31/2010
12/31/2009
Debt/Payable1yr
1,257 1,386 1,033 2,049 2,095
LTD/Payable
1yr
14,426 12,870 12,061 17,028 32,321
TotalDebt
15,683 14,256 13,094 19,077 34,416
Equity(deficit)
26,383 15,947 15,028 (673) (7,820)
Debt to equity = Total debt ÷ Equity (deficit) attributable to Ford Motor Company
= 15,683 ÷ 26,383 = 0.59
Statistics reveal that there indeed was a decline from 2012 to 2013.
Debt Ratio
The debt ratio measures the proportion of assets financed by
the debt. The greater the total debt ratio, the more leveraged
and risky things can become for the firm. The key is to always

FINANCIAL ANALYSIS & COMPARISON 11
ensure that the total assets outweigh liabilities. Companies need
to be aware of their abilities to pay back long term debt and if
that debt will cloud or overwhelm the assets and profits that are
made. The Equation for measuring the debt ratio is
Total Debt Ratio=Total LiabilitiesAssets
AnnualData
12/31/2013
12/31/2012
12/31/2011
12/31/2010
12/31/2009
Liabilities
177,005 176,055 164,177 166,435 204,405
Assets 203,752 192,366 179,248 165,793 197,890TotalDebtRatio
0.869 0.915 0.914 1.004 1.032
Ford did manage in 2011 to drastically decrease their debt ratio from the all-time high they had
in 2009 but it has been steadily increasing from 2011 to 2013.

FINANCIAL ANALYSIS & COMPARISON 12
Current Ratio
Creditors are particularly interested in the widely reported
current ratio of businesses. Analyzing this ratio ensure the
firm’s ability to meet its short-term obligations. Assets can be
converted into cash within a year and the firm will be able to
pay current liabilities. This ratio in general helps to give an
effective measure of the firm’s liquidity. The goal is to ensure
a ratio of one but to ensure financial cushioning firms will want
to maintain well over that allotment. The Equation is Current
ratio = Current assets ÷ Current liabilities.
This ratio accounts for all inventories that the company
currently possesses.
AnnualData
12/31/2013
12/31/2012
12/31/2011
12/31/2010
12/31/2009
CurrentAssets
42,547 43,175 38,147 34,368 40,560
CurrentLiabiliti
es
37,003 35,228 32,825 34,516 37,037
CurrentRatio
1.15 1.23 1.16 1.00 1.10
Current ratio = Current assets ÷ Current liabilities= 42,457 ÷
37,003 = 1.15.

FINANCIAL ANALYSIS & COMPARISON 13
The five year table reveals that at one particular point
between 2011 the current ratio showed improved but has dropped
significantly from 2012-2013. Even though Ford has dropped this
ratio ensures that Ford has enough to cover liabilities.
Quick Ratio
Quick ratio is described a calculating the cash plus short-
term marketable investments plus receivables divided by the
current liabilities. It does not include all inventories as
current ratio requires. The equation for Quick ratio = (cash +
marketable securities + net receivables) / current liabilities.

FINANCIAL ANALYSIS & COMPARISON 14
AnnualData
12/31/2013
12/31/2012
12/31/2011
12/31/2010
12/31/2009
Cash &CashEquiv.
4,959 6,247 7,965 6,301 10,309
Marketable
Securities
20,157 18,178 14,984 14,207 15,169
Receivables, LessAllowance
s
5,641 5,361 4,219 3,992 3,708
TotalQuickAssets
30,757 29,786 27,168 24,500 29,186
CurrentLiabiliti
es
37,003 35,228 32,825 34,516 37,037
Ford’sQuickRatio
0.83 0.85 0.83 0.71 0.79
Quick ratio = Total quick assets ÷ Current liabilities= 30,757 ÷
37,003 = 0.83.
Ford’s quick ratio improved from 2011 to 2012 but then slightly
deteriorated from 2012 to 2013 not reaching 2011 level, (Stock
Analysis on the net, 2014).
Inventory Asset Turnover
Inventory Asset Turnover is the number of times the value of
inventory assets turns over in a period. The equation is IAT=Cost
of Goods Sold/Average Inventory.

FINANCIAL ANALYSIS & COMPARISON 15
AnnualData
12/31/2013
12/31/2012
12/31/2011
12/31/2010
12/31/2009
Cost ofSales
125,234 112,992 113,345 104,451 100,016
Inventories
7,708 7,362 5,901 5,917 5,450
FordTurnoverRate
16.25 15.35 19.21 17.65 18.35
Inventory turnover = Cost of sales ÷ Inventories= 125,234 ÷ 7,708
= 16.25
Data reveals there was gradual deterioration for Ford Motor Co.
in the Inventory turnover from 2011 to 2013.

FINANCIAL ANALYSIS & COMPARISON 16
Price Earnings Ratio
Price Earnings Ratio is where the market price per share is
divided by earnings per share and indicates how any times
earnings. This can include years’ worth of earnings the market is
paying for the stock. It can be calculated by PE=Market price of
Stock/Earnings per Share.
This ratio is considered to be a stock market ratio because it
can be calculated from data associated with the stock market
performance. The P/E ratio informs analyst just exactly how much
an investor in common stock pays per dollar of current earnings.
AnnualData
12/31/2013
12/31/2012
12/31/2011
12/31/2010
12/31/2009
# Sharesof Com.Stock
Outstanding
3,943,822,377
3,922,247,667
3,800,746,841
3,782,710,935
3,368,265,681
NetIncome to
Ford
7,155 5,665 20,213 6,561 2,717
Shareprice
1.81 1.44 5.32 1.73 0.81
FordMotor Co.
8.48 8.99 2.36 8.68 14.60
Shows slight increase but then decreased in 2012-2013.

FINANCIAL ANALYSIS & COMPARISON 17

FINANCIAL ANALYSIS & COMPARISON 18
Memo
To: Jackie Russell, CEO
From: Stephanie Moore, Financial Analyst
RE: Ford Financial Summary
Date: June 1, 2014
Ford Motor Company Executive Summary
As requested I am submitting to you a financial summary of afive year comparison for Ford Motor Company. Ford Motor Company is a two sector corporation that manufactures vehicles under the Ford and Lincoln Brand. The other sector offers financial services by financing products by means of automotive dealers. This sector also encompasses retail installment sale contracts for new and used vehicles, lease for new vehicles to retail customers, government entities, daily rental car companies, and fleet customers. Ford Motor Company also offers the option to comprise loans to dealers to finance the purchase of vehicle inventory, loans to dealers to finance working capital, and to purchase dealership real estate, (Yahoo Finance, 2014).
Horizontal Analysis
This analysis is intended to discuss findings from the balance and income sheet which revealed over the five year time span for Ford Motor Company. In that time span the average total assets is with an average of about -----% increase. Assetsshowed an increase/decrease with a rise in -------and then a gradual decline during 20--.

FINANCIAL ANALYSIS & COMPARISON 19
Vertical Analysis

FINANCIAL ANALYSIS & COMPARISON 20
References
CNN Money (2014). Fortune 500 Annual Reports of Ford Motors. Retrieved
from:
http://money.cnn.com/magazines/fortune/fortune500/2013/snapshots/
160.html
Ford Motor Company (2013). 2013 Annual Report. Retrieved from:
http://corporate.ford.com/doc/916/251/ar2013-013%20Ford
%20Annual%20Report%20MR.pdf
Keythaman B., (2014). How to Calculate Total Revenue on a Financial Statement.
Hearst
Newspaper LLC: Retrieved from
http://smallbusiness.chron.com/calculate-total-revenue-
financial-statement-52111.html
Stock Analysis on Net (2014). Liquidity Analysis. Retrieved from:
http://www.stock-analysis-on.net/NYSE/Company/Ford-Motor-
Co/Ratios/Liquidity
Yahoo Finance (2014). Ford Company’s Balance Sheet. Retrieved from:
http://finance.yahoo.com/q/bs?s=F+Balance+Sheet&annual
Yahoo Finance (2014). Ford Company’s Income Statement. Retrieved from:

FINANCIAL ANALYSIS & COMPARISON 21
http://finance.yahoo.com/q/is?s=F+Income+Statement&annual