Financial Statement Analysis of Financial Sector - (2016 - 2020)
235
FINANCIAL STATEMENTS ANALYSIS OF FINANCIAL SECTOR 2016-2020 Statistics and DWH Department State Bank Pakistan
-
Upload
khangminh22 -
Category
Documents
-
view
1 -
download
0
Transcript of Financial Statement Analysis of Financial Sector - (2016 - 2020)

FINANCIAL STATEMENTS ANALYSIS OF
FINANCIAL SECTOR
2016-2020
Statistics and DWH Department
State Bank Pakistan

Financial Statements Analysis of Financial Sector 2020
Vision and Mission Statements of State Bank of Pakistan
To be an independent and credible central bank that achieves monetary and financial stability and inclusive financial sector development for the long-term benefit of the people of Pakistan.
Vision
To promote monetary and financial stability and foster a sound and dynamic financial system, so as to achieve sustained and equitable economic growth and prosperity in Pakistan.
Mission

Financial Statements Analysis of Financial Sector 2020
Team Members
Atiya Yusuf Assistant Director [email protected]
Bushra Iqbal Assistant Director [email protected]
Faisal Altaf Deputy Director [email protected]
Mirza Kaleem ullah Joint Director [email protected]
Team Leader
Muhammad Asif Additional Director [email protected]

Financial Statements Analysis of Financial Sector 2020
State Bank of Pakistan or any of its constituents (the Bank) do not warrant, nor accept any responsibility or liability for the accuracy, timeliness or completeness of the content or for any loss which may arise out of use and/or reliance on the data and/or information contained herein. Every effort is made to ensure that the information and/or data provided herein is up to date and accurate. Please let us know if you find any errors in the publication.
Disclaimer
Comments and suggestions for further improvement in the publication are welcome. Please write to us at:
Feedback
The Director,Statistics and Data Warehouse Department, State Bank of Pakistan,I.I Chundrigar Road,Karachi.
Or drop us an email at:

Financial Statements Analysis of Financial Sector 2020
CONTENTS
Executive Summary--------------------------------------------------------------------------------------------------vi
Introduction--------------------------------------------------------------------------------------------------------------1 1.1 Methodology-----------------------------------------------------------------------------------------------------2 1.2 Concepts and Definitions--------------------------------------------------------------------------------------2 1.3 Performance Indicators---------------------------------------------------------------------------------------11
Review and Financial Analysis of:
Banks---------------------------------------------------------------------------------------------------------------------20 Development Finance Institutions (DFIs)------------------------------------------------------------------------62 Microfinance Banks (MFBs)---------------------------------------------------------------------------------------75 Leasing Companies---------------------------------------------------------------------------------------------------90 Investment Banks---------------------------------------------------------------------------------------------------101 Modaraba Companies----------------------------------------------------------------------------------------------110 Exchange Companies------------------------------------------------------------------------------------------------141 Insurance Companies----------------------------------------------------------------------------------------------170Other Sectors: Mutual Funds (Close Ended)-----------------------------------------------------------------------------------220 Venture Capital -------------------------------------------------------------------------------------------------------220
Appendix (List of Companies)-------------------------------------------------------------------------------------224 Explanatory Notes----------------------------------------------------------------------------------------------------228

Financial Statements Analysis of Financial Sector 2020
Executive Summary
Financial statements analysis of 165 companies from 10 sectors namely, (i) Banks
(ii) Development Finance Institutions (DFIs) (iii) Microfinance Banks (MFBs) (iv) Leasing companies (v) Investment Banks (vi) Modarabas (vii) Exchange companies (viii) Insurance companies (ix) Mutual
Funds and (x) Venture Capital are included in this publication for the period 2016-20.
Banking sector comprises local and foreign banks. Local banks include private sector, public sector and
specialized banks. The balance sheet size of the banking sector expanded in CY20. Total assets of the
banking sector grew from Rs 22,120.46 billion in CY19 to Rs 25,069.06 billion in CY20 showing an
increase of 13.33 percent. Total liabilities and equity (including others) witnessed increases of 13.29
percent and 13.80 percent respectively during the year. Growth of the banking sector was attributed to
an increase of 13.68 percent in the balance sheet size of local banks that hold 97.07 percent share of
banking sector balance sheet. Foreign banks comprising 2.93 percent share in total assets of banking
sector, recorded an increase of 2.87 percent during CY20. Profit before and after tax of banking sector
as a whole increased by Rs 94.63 billion or 29.61 percent and Rs 65.14 billion or 35.48 percent
respectively during the year CY20 over CY19.
DFIs exhibited an expansion in their balance sheet size during the period under review. Total assets
increased by 14.26 percent to reach Rs 435.87 billion in CY20 from Rs 381.47 billion during CY19.
Total liabilities increased by 17.78 percent or Rs 46.20 billion in CY20 over CY19. The shareholders’
equity (including others) posted a rise of 6.74 percent in CY20 when compared with CY19. Profit
before tax increased by 49.93 percent with an amount of Rs 5.17 billion and profit after tax increased by
39.75 percent or Rs 4.07 billion over the previous year.
Microfinance sector continued its positive stride during the year, with total assets increased by
31.65 percent to reach Rs 492.62 billion in CY20 from Rs 374.20 billion in CY19. Total liabilities
increased by Rs 114.74 billion or 35.06 percent while total equity (including others) increased by Rs
3.68 billion or 7.88 percent respectively in CY20 over CY19. Interest/mark up income of the
microfinance banks recorded an increase of Rs 9.31 billion in CY20 .i.e. an increase of 14.10 percent
over previous year. Interest/ mark up expense also increased by Rs 4.30 billion contributed to record an
increase in net interest income with an amount of Rs 5.01 billion in CY20. Loss before and after
taxation decreased by Rs 6.57 billion and Rs 6.32 billion respectively during the year.
Asset base of leasing sector was decreased by 9.79 percent during the FY20 from Rs 31.29 billion in
FY19 to Rs 28.23 billion in FY20. Total income of the sector posted an increase of 5.18 percent in
FY20 to reach at Rs 4.79 billion. Profit before tax and profit after tax is recorded as Rs 0.85 billion and
Rs 0.56 billion respectively in FY20 as compared to Rs 1.49 billion and Rs 1.05 billion in FY19.
Analysis reveals that balance sheet size of investment banks increased by 0.85 percent during FY20 as
compared to FY19. Total shareholders’ equity (including others) increased by 25.72 percent over the
previous year. A decrease of 13.91 percent is observed in total liabilities during FY20. Profit before tax
increased from Rs 0.15 billion in FY19 to Rs 0.24 billion in FY20.
.
vi

Financial Statements Analysis of Financial Sector 2020
Balance sheet size of modaraba companies decreased during FY20. Total assets, liabilities and total
equity (including others) decreased during FY20 when compared to FY19. Total assets decreased from
Rs 54.09 billion in FY19 to Rs 51.62 billion in FY20 showing a decrease of 4.56 percent during
current year over FY19. Total liabilities of modaraba companies decreased by 0.73 percent in FY20
when compared with the FY19. Profit before and after tax decreased by 82.09 percent and
78.60 percent respectively in FY20 over FY19.
Exchange Companies continued its upward stride in its balance sheet size. Total assets increased by
12.91 percent to stand at Rs 22.26 billion in CY20 as compared to Rs 19.72 billion in CY19.
Exchange companies, mainly deals with transfer of funds, cash and balances remained major
component of asset side, it’s share in total assets is recorded as 57.67 percent in CY20. Similarly, total
equity (including others) increased to Rs 16.79 billion in CY20 from Rs 15.75 billion in CY19,
recording YoY increase of 6.63 percent in CY20. Profit before and after taxation, both recorded
significant decreases of Rs 2.04 billion or 64.43 percent and Rs 1.55 billion or 69.06 percent
respectively in CY20 over CY19.
Assets of insurance sector expanded by 13.38 percent, with corresponding increases of 13.96 percent
in liabilities during CY20. The growth rate in assets was attained mainly due to increase of 14.01
percent in balance sheet size of life insurance, which contributed 83.74 percent share of insurance
sector in CY20. Takaful companies shared 2.09 percent of insurance sector in CY20, recorded an
increase of 18.27 percent in their total assets. Similarly, total equity (including others) of insurance
sector posted an increase of 6.95 percent in CY20 as compared to the previous year. This increment in
equity (including others) is mainly attributed due to increase of 4.17 percent in equity of non-life
insurance companies in CY20 over CY19, which contributed 75.41 percent share of overall insurance
sector in CY20. On account of earnings, insurance sector posted an increase of
13.94 percent and 20.36 percent in profit before tax and after tax respectively during CY20. Increment
in over-all profit before tax and after tax is mainly due to life insurance companies whose profit before
tax and after tax increased by 50.05 percent or Rs 4.04 billion and 59.18 percent or Rs 3.12 billion
respectively during the year CY20 over CY19. But non-life insurance posted a decline in profit before
during CY20 as compared to CY19.
There were two close ended companies in the mutual fund sector in the previous year but one
company (Golden Arrow Selected Stocks Fund Ltd.) shifted from close ended to open ended and
not being included in analysis of the publication this year. Data of this company is being aggregated in
position of over-all sector up to year 2019. To capture good comparative analysis, data of this
company is excluded from aggregate data for the analysis of FY20 which was part of mutual funds in
previous year. Balance sheet size of Tri-Star mutual fund reduced by Rs 1.58 million, showing a YoY
decline of 2.49 percent in total assets during FY20 over FY19. Total assets decreased from Rs
63.37 million in FY19 to Rs 61.79 million in FY20. Total equity (including others) decreased by
6.72 percent during FY20 when compared to FY19. Total liabilities of the fund increased by Rs 1.80
million in FY20 as compared to FY19. Gross income also increased with Rs 12.58 million during
FY20.
Balance sheet size of venture capital reduced by Rs 9.53 million or 24.12 percent during FY20 over
FY19. Total assets of venture capital decreased from Rs 39.52 million in FY19 to Rs 29.99 million in
FY20. Total liabilities also decreased from Rs 5.48 million in FY19 to Rs 4.90 million in FY20,
showing a decrease of 10.57 percent during FY20. Total equity (including others) recorded a YoY
decrease of 26.30 percent in FY20 over the previous year. Loss before tax increased by Rs
0.47 million or 19.02 percent in FY20 over FY19. Loss after tax recorded a decrease of Rs 0.38
million or 11.67 percent in FY20 when compared with FY19.
vii

Financial Statements Analysis of Financial Sector 2020
Introduction
Statistics and Data Warehouse Department strives hard to disseminate quality statistics. It not only produces
primary data but also provides secondary data with analysis to the various stakeholders including
researchers and policy makers. As the performance of financial sector reflects the financial health of an
economy, standard analytical tools are used to gauge the performance of this vital sector.
The analysis1 includes the following sectors:
➢ Banks ➢ Insurance Companies
➢➢ DFIs ➢ Exchange Companies
➢ Microfinance Banks ➢ Mutual Funds (close ended)
➢ Investment Banks ➢ Venture Capital
➢ Leasing Companies
➢ Modaraba Companies
Consolidation is provided at the beginning of each sector’s analysis. For banks, consolidation is at different
levels. At first level, overall consolidation of all banks including foreign banks is given. The information
and ratios relating to number of ordinary shares, dividend earning per share and breakup value per share
are not taken into consideration because foreign banks do not have such type of information. The level of
consolidation for banks is as follows:
➢ All Banks (overall)
• Local Banks
- Public Sector Banks
- Private Sector Banks
- Specialized Banks
• Foreign Banks
Similarly, consolidated analysis of insurance companies is also provided to reflect financial health of
Insurance Sector. The level of consolidation is as follows:
➢ Insurance Companies (overall)
• Life Insurance
• Non-Life Insurance
• Takaful
1Since each sector has peculiar business activities, therefore, for analysis separate set of variables was taken into consideration. Similarly, an
associated set of financial ratios has also been selected for each sector.
1

Financial Statements Analysis of Financial Sector 2020
1.1 Methodology Methodology used for analysis is ratio analysis because it is a powerful tool to analyze financial statements
of any company. Ratio analysis measures inter-relationship between various items of the financial
statements. Ratios are taken as guide lines for these are useful in evaluating a company’s financial position
and operation and making comparison with results in previous years or with others in the same industry.
The primary objective of ratio analysis is to point out areas requiring further investigation. Ratios are
calculated from the following financial statements and relevant notes to accounts:
• Balance Sheet
• Profit and Loss Account
• Statement of Changes in Equity
• Cash Flow Statement
Total equity is computed as the sum of ordinary share capital plus reserve & surplus plus un-appropriated
profit/loss while the revaluation, intangible assets etc. are clubbed together in ‘others’ of total equity
section. For foreign banks, the ordinary share capital is replaced by head office capital account. Since the
financial sector comprises variety of financial institutions having peculiar business activities, therefore,
variables used for analysis would be different for each sector.
1.2 Concepts and Definitions
Banks, Development Finance Institutions (DFIs) and Microfinance Banks (MFBs)
Following variables are used for analysis of banks, DFIs and MFBs:
Shareholders’ Equity
The sum of following items except “others” is considered for analysis:
• Ordinary Share Capital or Head Office Account (in case of foreign bank)
• Reserves
• Un-appropriated Profit/Loss
• Others
Liabilities
Bills Payables, borrowings and deposits being the major items contributing towards liabilities of
banks, DFIs and MFBs are taken for analysis, the remaining heads of liabilities are pooled under
‘others’:
• Bills Payables
• Borrowing from Financial Institutions
• Deposits and Other Accounts
• Others
2

Financial Statements Analysis of Financial Sector 2020
Assets
The following items are included in the analysis. The relevant information is taken from balance
sheet as well as respective notes to accounts.
• Cash and Balances with Treasury Banks • Advances –Non-Performing/Classified
• Balances with Other Banks • Provision Against Advances
• Lending to Financial Institutions • Advances Net of Provision
• Investment • Fixed Assets
• Gross Advances • Others
Profit and Loss Account
The following items are included for analysis. The relevant figures are obtained from profit and
loss accounts and notes to financial statements.
• Interest Earned • Non-Interest Income
• Interest Expensed • Non-Interest Expense
• Net Interest Income • Administrative Expenses
• Provision and Write-offs • Profit/Loss before Tax
• Net Interest Income after Provision • Profit/Loss after Tax
Other Items
• No. of Ordinary Shares
Outstanding shares at end of the period as shown in balance sheet.
• Cash Dividend
The amount of cash dividend is taken as the percentage declared during the period.
• Stock Dividend/Bonus Shares
The number of bonus shares declared is also taken as percentage amount
distributed during the period.
• Cash Generated from Operating Activities
The amount is taken from cash flow statement
• Commitment and Contingencies
This is an off balance sheet item. The detail is given in notes to accounts and the
sum of all kinds of commitments and contingencies is taken for analysis.
3

Financial Statements Analysis of Financial Sector 2020
Leasing Companies
Following variables are involved in the analysis of leasing companies:
Shareholders’ Equity
Shareholders’ equity includes share capital, reserves and un-appropriated profit/loss. Any other
item(s) mentioned in the balance sheet under shareholders’ equity is pooled under the head
‘others’.
Liabilities
Borrowings from financial institutions and deposits with financial institutions are the major items
contributing towards liabilities of leasing companies. For analysis, these two items are taken
separately while the remaining items of liabilities are pooled under ‘others’
Assets
Assets are classified into current and non-current. Major items of non-current assets are
mentioned below where remaining items of non-current assets are pooled under “others”
Non-Current Assets
• Term Deposit Certificates
• Net Finance-Investment
• Advances – Net
• Fixed Assets
• Others
Current Assets
Three main items are taken for analysis while the rest are pooled under ‘others’
• Cash and Balances with Central Bank
• Balances with Other Banks
• Placement with Other Banks
• Others
Profit and Loss Account
The amounts reported under the following heads are extracted from profit and loss accounts along
with relevant notes to accounts:
• Income from Operating Lease • Administrative Expenses
4

Financial Statements Analysis of Financial Sector 2020
• Income from Investment • Profit/Loss before Tax
• Income from Finances • Profit/Loss after Tax
• Other Income
Other Items
• No. of Ordinary Shares
The number of shares outstanding as on balance sheet date
• Cash Dividend
The amount of cash dividend is taken as percentage of the dividend declared during the
period.
• Stock Dividend
The number of bonus shares declared is also taken as percentage amount during the
period.
• Cash Generated from Operating Activities
The amount is taken from the cash flow statement.
Investment Banks
Following variables are used in the analysis of investment banks:
Shareholders’ Equity
The composition and explanation of shareholders’ equity is same as explained earlier.
Liabilities
The amount of current and non-current liabilities is taken from the balance sheet and the sum of
these two is the same as total liabilities of the company.
Assets
Current assets are classified into ‘cash and bank balances’ and ‘others’ while non-current
assets are divided into three heads i.e., long term investment, fixed assets, and others.
Current Assets Non-Current Assets
• Cash and Banks Balances • Long Term Investment
• Others • Fixed Assets
• Others
5

Financial Statements Analysis of Financial Sector 2020
Profit and Loss Account
The following items are taken for analysis. The relevant figures are taken from profit
and loss account and notes to financial statements.
• Gross Revenues
• Administrative and Operating Expenses
• Operating Profit
• Profit/Loss before Tax
• Profit/Loss after Tax
Other Items
These include:
• No. of Ordinary Shares
• Cash Dividend
• Stock Dividend
• Cash Generated from Operating Activities
Mutual Funds (Close Ended)
The analysis includes the following variables:
Shareholders’ Equity
The composition and explanation of shareholders’ equity is same as explained earlier.
Liabilities
As the financial activities of mutual funds are limited, the composition of liabilities is divided into
two heads as follows:
• Payable to Investment Adviser
• Others
Assets
The asset base of mutual fund is also not broad, therefore, for analysis it is limited to three items.
These are available in the company’s balance sheet and notes to financial statements.
• Cash and Banks Balances
• Investment
• Others
6

Financial Statements Analysis of Financial Sector 2020
Profit and Loss Account
The following items are taken into consideration for analysis. The relevant figures are obtained
from profit and loss account and notes to financial statements.
• Interest Income • Other Income
• Dividend Income • Remuneration to Management
Co-advisor
• Net Gain on Sale of Investment • Remuneration to Trustees/Custodian
• Net Unrealized Gain • Brokerage, Commission /Fee
• Income from Future
Transactions
• Administrative and General
Expenses
• Capital Gain • Other Expenses
Other Items
The information on the following is extracted from the balance sheet and relevant notes to financial
statements:
• No. of Ordinary Shares
• Cash Dividend
• Stock Dividend
• Cash Generated from Operating Activities
Modaraba Companies
Following variables are included in the analysis of modaraba companies:
Certificate Holders Equity
Modaraba company issues certificates instead of shares. Therefore the amount subscribed through
issuing certificates is termed as certificate capital. For analysis, certificate holders’ equity is the
sum of ‘certificate capital’, ‘reserves’, and un-appropriated profit/loss. Any other items under the
section of certificate holder’s equity are pooled under the head of ‘others’.
• Certificates Capital
• Reserves
• Un-appropriated Profit/Loss
• Others
Liabilities
These include current and non-current liabilities taken from the balance sheet.
7

Financial Statements Analysis of Financial Sector 2020
Assets
The current and non-current assets and their break up are taken from balance sheet. In case of
current assets the amount of cash and bank balances is taken separately while the remaining current
assets are pooled under “others”. Similarly, long term investment and fixed assets are taken
individually while the remaining non-current assets are pooled under “others”.
Current Assets Non-Current Assets
• Cash and Banks Balances • Long Term Investment
• Others • Fixed Assets
• Others
Profit and Loss Account
The following items are taken for analysis. The relevant figures are taken from profit and loss
account and notes to financial statements.
• Gross Revenues • Modaraba Company Management Fee
• Operating Expenses • Profit/Loss before Tax
• Operating Profit • Profit/Loss after Tax
Other Items These include:
• No. of certificates outstanding as mentioned in balance sheet.
• Cash Dividend
• Stock Dividend
• Cash Generated from Operating Activities
Exchange Companies
Following variables are included for analysis of exchange companies:
Shareholders’ Equity
• Share Capital
• Reserves
• Accumulated Profit/Loss
• Others
Liabilities
These include:
• Current Liabilities
• Non-current Liabilities
8

Financial Statements Analysis of Financial Sector 2020
Assets
These include:
Current Assets Non-Current Assets
• Cash and Banks Balances • Long Term Investment
• Others • Fixed Assets
• Others
Profit and Loss Account
The following items are taken from profit and loss account of the company:
• Revenues
• Admin and General Expenses
• Profit/Loss before Tax
• Profit/Loss after Tax
Other Items
The following items are extracted mainly from notes to accounts of the company:
• No. of Ordinary Shares
• Cash Dividend
• Stock Dividend
• Cash Generated from Operating Activities
Venture Capital
Following variables are included in the analysis of venture capital:
Shareholders’ Equity
The shareholders’ equity is the sum of share capital, reserve and un-appropriated profit/loss, while
the remaining items are pooled under ‘others’.
• Share Capital
• Reserves
• Un Appropriated Profit/Loss
• Others
Liabilities
These include current and non-current liabilities.
• Current Liabilities
• Non-Current Liabilities
Assets
The current and non-current assets include.
Current Assets Non-Current Assets
• Cash and Bank Balances • Investment
9

Financial Statements Analysis of Financial Sector 2020
• Investment • Venture Investment
• Others • Fixed Assets
• Others
Profit and Loss Account
The following items are included in the analysis.
• Income
• Administrative and Operating Expenses
• Operating Profit
• Profit/Loss Before Taxation
• Profit/Loss After Taxation
Other Items These include:
• No. of Ordinary Shares
• Cash Dividend
• Stock Dividend
• Cash Generated from Operating Activities
Insurance Companies
Following variables are involved in the analysis of Insurance Companies:
Shareholders’ Equity These include:
• Share Capital
• Reserves
• Un-appropriated Profit/Loss
• Others
Liabilities
These include:
• Balance in the Statutory Fund
• Outstanding Claims, Premiums Received in Advance, Amount
Due to Other Insurers
• Other Liabilities
Assets
These include:
• Cash and Balances with
Banks • Advances
• Deposit with Banks • Loans to employees
10

Financial Statements Analysis of Financial Sector 2020
• Investment in Securities
and Properties • Other Assets
Profit and Loss Account
These include:
• Interest/Investment Income • Net Claims
• Net Premium • Underwriting Profit
• Gross Premium • Profit before Tax
• Gross Claims • Profit after Tax
Other Items
These include:
• No. of Ordinary Shares
• Cash Dividend
• Stock Dividend
• Cash Generated from Operating Activities
1.3 Performance Indicators
Pakistan’s financial sector is an integration of institutions of diversified nature including Banks DFIs,
Leasing Companies, Modaraba Companies, Insurance Companies, Investment Banks, etc. Therefore, ratios
used to analyze these sectors may be different in some cases as different sectors have peculiar business
activities but some ratios are common to all sectors. Some important ratios and their explanations are given
below which may be read in combination with the analysis sheet of each sector separately.
Efficiency/Profitability Ratio
Spread Ratio
= Net Markup/Interest Income
Markup/Interest Earned∗ 100
It is the amount of Net Markup/Interest Income divided by Markup/Interest Earned . This ratio is
useful for Banks, DFIs and MFBs.
Net Interest Margin Ratio
= Total Interest Income – Total Interest Expense
Total Assets *100
This ratio indicates the earning capacity through core banking business by utilizing all assets. Banks
normally borrow from savers and lend to investors. It is the ratio between the difference of interest income
and interest expense to total assets. It is also useful for Banks, DFIs and MFBs.
Return on Assets (ROA)
ROA =Net Profit after Tax
Total Assets ∗ 100
This ratio expresses the capacity of earning profit by a bank on its total assets employed in the business. It
is calculated as percentage of net profit after tax to total assets. It is useful for whole financial sector.
11

Financial Statements Analysis of Financial Sector 2020
Return on Equity (ROE)
ROE =Net Profit after Tax
Total Shareholders′ Equity*100
Total Shareholders’ Equity (Pakistani Banks) = Share Capital + Reserves + Un-appropriated Profit (Loss)
Total Shareholders’ Equity (Foreign Banks) =H.O Capital Account + Reserves +Unremitted Profit
This ratio expresses the return on shareholders’ equity. ROE is a direct measure of returns to the
shareholders. It is calculated as a percentage of the net profit after tax to total Shareholders’ equity. It is
also useful for whole financial sector.
Non-Interest Income to Total Assets Ratio
=Total Non−Markup Income
Total Assets ∗ 100
Ratio on incomes earned other than mark-up e.g. capital gains, commission, fee to total assets etc. This ratio
expresses how much income is earned other than mark-up through other functions of the bank by employing
total assets. It is useful for Banks, DFIs and MFBs.
Interest Ratio
=Interest Paid
Interest Earned ∗ 100
This ratio expresses the payment of interest mainly to depositors. The lower the ratio, the less the company
is burdened by debt expenses. It is useful for Banks, DFIs and MFBs.
Administrative Expenses to Profit before Tax
=Administrative Expenses
Profit before Tax
This ratio expresses the relationship between administrative expenses and profit before tax. It is useful for
whole financial sector.
Net Interest Income after Provision to Total Assets
=Net Interest Income after Provision
Total Assets ∗ 100
This is the ratio between interests earned less provision to total assets. It is useful for Banks, DFIs and
MFBs.
Non-Interest Expenses to Total Income
=Non−interest expenses
Total income ∗ 100
The ratio expresses the percentage of non-interest expenses to total income which reflects efficiency of
management in applying the banks’ resources. It is useful for Banks, DFIs and MFBs.
12

Financial Statements Analysis of Financial Sector 2020
Administrative Expenses to Non-Interest Income
=Administrative Expenses
Non−Interest Income
This ratio expresses total administrative expenses to non-interest income. It is useful for Banks, DFIs and
MFBs.
Earnings per Share (EPS)
=Net Profit after Tax
No.of Ordinary Shares
EPS is the ratio between net profit after tax to number of shares outstanding at the end of the year as shown
in balance sheet and its relevant notes to accounts. It is useful for whole financial sector except for
Modaraba Companies where certificates are issued for raising capital.
Return on Capital Employed (ROCE)
=Profit before Tax
(Total Assets – Current Liabilities) *100
ROCE is a ratio that indicates the efficiency and profitability of a company’s capital investments. The
amount of capital employed is calculated by subtracting current liabilities from total assets. It is useful for
whole financial sector except for banks, DFIs, Insurance, mutual fund.
Return on Revenue (ROR)
=Net income
Revenue∗ 100
This is a measure of a company’s profitability, calculated as net income divided by revenue. This ratio is
useful for Leasing Company, Mutual Fund, etc.
Lease Ratio
=Lease Income
Total Income∗ 100
The core function of a leasing company is to earn profit from operating and financial lease. This ratio
expresses how much portion of total income is being generated through its core business. It is useful for
leasing company.
Operating Expense Ratio
=Operating Expense
Net Income*100
It is a measure of operating efficiency i.e., how well the management controls its expenses. Operating
expense ratio can be used to gauge the general health of the core or other businesses. It is useful for
Modaraba and Investment Banks.
13
Financial Statements Analysis of Financial Sector 2020
Gain Ratio
=Total Gains
Total Income∗ 100
A total gain comprises gain on sales of securities, gain on re-measurement, gain on disposal of long-term
investment, etc. It is useful for Mutual Fund.
Trading Income Ratio
=Gain on Sale of Investments
Total Income∗ 100
The core business of mutual fund is to gain from trading of shares and securities and the higher ratio reflects
that funds are being efficiently managed. Both figures are taken from the income statement. It is useful for
Mutual Fund.
Management Expenses Ratio
=Remuneration to Advisor
Total Expenses * 100
For mutual funds management expenses ratio is calculated by dividing remuneration to adviser by total
expenses.
Net Investment in Finance Lease to Total Assets
=Net Investment in Finance Lease
Total assets∗ 100
This ratio expresses the relationship of net investment in finance lease to total assets. This ratio is useful
for leasing companies.
Earning per Certificate
=Profit after Tax
No.of Certificates
The ratio between profits after tax to number of certificates is an important efficiency ratio because it
reflects how much amount is earned on each certificate. It is useful for Modaraba Companies.
Net Claims incurred Ratio
=Net Claims
Net Premium *100
This expresses the efficiency of insurance company and is calculated as the claim incurred on net premium.
Higher ratio indicates that the incurrence of claims is more than premium. It is useful for insurance
companies.
14

Financial Statements Analysis of Financial Sector 2020
Underwriting profit to Net profit
=Underwriting Profit
Net profit∗ 100
The ratio shows the percentage of underwriting profit as of net profit. Underwriting profit is net of
underwriting income and expenses of the cost of obtaining new policies. This ratio is useful for insurance
companies.
Investment Income to Net Premium
=Investment Income
Net Premium∗ 100
The ratio shows the relationship between investment income and net premium. This is one of the ratios used
to measure efficiency of an insurance company.
Liquidity Ratios
Cash and Balances with Banks to Total Assets
=Cash and Balances with Banks
Total Assets∗ 100
This ratio expresses the percentage of total assets available in the form of highly liquid assets.
Total Deposit and other Accounts to Total assets
=Total Deposit and other Accounts
Total assets ∗ 100
The ratio shows what percentage of total assets comprises total deposits and other accounts.
Investment and Total Assets
=Total Investment
Total Assets∗ 100
The ratio between Investment and total assets shows investment activity with reference to its total assets. It
indicates the portion of total assets used for investment in various venues. This ratio is useful for banks,
DFIs and insurance companies.
Advances and Total Assets
=Advances (Net)
Total Assets∗ 100
This ratio expresses the relationship of advances (net) to total assets. This ratio is useful for banks, DFIs
and MFBs.
15

Financial Statements Analysis of Financial Sector 2020
Total Liabilities to Total Assets
=Total liabilities
Total Assets∗ 100
The ratio shows the proportion of banks assets, which are financed through debt. This ratio is useful for
banks, DFIs and MFBs.
Gross Advances to Deposits
=Gross Advances
Deposits *100
The ratio expresses the percentage of gross advances to deposits and expresses the utilization of deposits in
the core business of a bank, i.e., intermediation. This ratio is useful for banks, DFIs and MFBs.
Gross advances to Borrowing and Deposits
=Gross Advances
(Borrowing +Deposits)∗ 100
The ratio expresses the percentage of gross advances to deposits and borrowings. This ratio shows activity
of a banking business as it reflects that advances are being made more/less than deposits. This ratio is useful
for banks, DFIs and MFBs.
Current Ratio
=Current Assets
Current Liabilities
This ratio shows how many times current assets cover current liabilities and the strength of the company to
pay immediate liabilities. This ratio is used for whole financial sector except for banks, DFIs and MFBs.
Long Term Investment to Total Assets
=Long term Total Investment
Total Assets∗ 100
The ratio between long-term investments to total assets shows investment activity with reference to its total
assets. It indicates the portion of total assets used to invest in different venues.
Assets Quality Ratios
Non-Performing Loans (NPLs) to Gross Advances
=NPLs
Gross Advances∗ 100
This ratio expresses the quality of loan portfolio of a bank. It shows the percentage of NPLs as gross
advances made by a bank and evaluates assets quality based on loan portfolio. This ratio is useful for banks,
DFIs and MFBs.
16

Financial Statements Analysis of Financial Sector 2020
Provision against NPLs and Gross Advances
=Provision against NPLs
Gross Advances∗ 100
The ratio between provisions against classified loans/advances to gross advances reflects the quality of
advances of banks, DFIs and MFBs.
NPLs to Equity Ratio
=NPLs
Total Shareholders’ equity ∗ 100
Where,
Total Shareholders’ Equity (Pakistani Banks) = Share Capital + Reserves + Un-appropriated Profit (Loss)
Total Shareholders’ Equity (Foreign Banks) =H.O Capital Account + Reserves +Unremitted Profit
The ratio between NPLs to shareholders’ equity indicates the exposure of the common shareholders to
NPLs. This ratio is useful for banks, DFIs and MFBs.
NPLs write-off to NPLs Provision Ratio
=NPLs write−off
NPLs Provision∗ 100
This ratio is calculated for banks, DFIs and MFBs.
NPLs Provision to NPLs Ratio
=Provision for NPLs
NPLs∗ 100
The ratio reflects what percentage of provision has been made against NPLs. This ratio is useful for Banks,
DFIs and MFBs.
Capital/Leverage Ratios
Capital Ratio
=Total Shareholders’ Equity
Total assets∗ 100
Where,
Total Shareholders’ Equity (Pakistani Banks) = Share Capital + Reserves + Un-appropriated Profit (Loss)
Total Shareholders’ Equity (Foreign Banks) =H.O Capital Account + Reserves +Unremitted Profit.
The ratio between shareholders’ equity and total assets expresses the percentage of equity in total assets.
Contingent Liabilities and Commitment to Shareholders’ Equity
=Contingent Liabilities 𝑎𝑛𝑑 Commitments
Shareholders’ Equity
17

Financial Statements Analysis of Financial Sector 2020
The ratio between contingent liabilities and commitments to shareholders’ equity expresses exposure of
contingent liabilities and commitments by banks.
Break-Up Value per Share
=Total Shareholders’ Equity
No.of Ordinary Shares
Break-up Value is net worth per share and is an important criterion to measure financial soundness of a
company. The break-up value is calculated for whole financial sector except in case of foreign banks and
Modaraba Companies.
Deposits to Equity Ratio
=Total Deposits
Total Shareholders′ Equity
The ratio shows the relationship between total deposits in a bank to the total shareholders’ equity.
Break-up Value per Certificate
=Modaraba Certificate Holders′ Equity
No.of Modaraba Certificates
Break-up value is net worth per certificate and is one of the important criteria to measure the financial
soundness of a company. This ratio is calculated for Modaraba Companies only.
Capital Ratio (Modaraba Company)
=Modaraba Certificate holders’ Equity
Total assets∗ 100
The ratio expresses the percentage of equity in total assets. It is calculated for Modaraba Companies only.
Cash Flow Ratios
Cash Flow to Profit after Tax
= Cash Generated from Operating Activities
Profit after Tax
The ratio expresses proportions of cash being spun off from ongoing operations. This ratio is useful for the
whole financial sector.
Cash flow to Current Liabilities Ratio
=Cash Generated from Operating Activities
Current Liabilities
The ratio reflects cash generation strength of a company to meet current liabilities. This ratio is calculated
for all sectors except investment banks, insurance companies, banks, DFIs and mutual funds.
18

Financial Statements Analysis of Financial Sector 2020
Review and Financial Analysis

Financial Statements Analysis of Financial Sector 2020
Banks
Performance at a Glance Banking sector comprises local and foreign
banks. Local banks include private sector,
public sector and specialized banks. The balance
sheet size of the banking sector expanded in
CY20. Total assets of the banking sector grew
from Rs 22,120.46 billion in CY19 to Rs
25,069.06 billion in CY20 showing an increase
of 13.33 percent. Total liabilities and equity
(including others) witnessed increases of 13.29
percent and 13.80 percent respectively during
the year. Growth of the banking sector was
attributed to an increase of 13.68 percent in the
balance sheet size of local banks that hold 97.07
percent share of banking sector balance sheet.
Foreign banks comprising 2.93 percent share in
total assets of banking sector, recorded an increase of 2.87 percent during CY20. Profit before and after
tax of banking sector as a whole increased by Rs 94.63 billion or 29.61 percent and Rs 65.14 billion or
35.48 percent respectively during the year CY20 over CY19.
Liabilities Total liabilities of the banking sector witnessed an
increase of 13.29 percent to touch Rs 23.17 trillion
in CY20 over Rs 20.45 trillion in CY19. Deposits
of banking industry with 79.85 percent share of
total liabilities in CY20 depicted a YoY growth of
15.50 percent during CY20 over CY19, increase
from Rs 16.02 trillion in CY19 to touch Rs 18.50
trillion in CY20. Liabilities of local banks and
foreign banks remained at Rs 22.52 trillion and Rs
0.66 trillion respectively in CY20. The liabilities of
local banks posted an increase of 13.69 percent or
Rs 2.71 trillion in CY20 over CY19 and foreign
banks witnessed a growth of 1.16 percent or Rs
7.54 billion increase in liabilities when compared
with the previous year.
Shareholders’ Equity The equity (including others) of all banks increased from Rs 1.67 trillion in CY19 to Rs 1.90 trillion in
CY20 witnessing an increase of Rs 229.81 billion or 13.80 percent. Total equity (including others) of
local banks comprising 95.92 percent equity share of banking sector witnessed an increase of 13.54
percent to reach at Rs 1.82 trillion in CY20. Share capital/Head office account of banking sector
witnessed an increase of 0.68 percent to touch Rs 449.01 billion in CY20. The share capital of foreign
banks recorded an increase of 4.01 percent to touch at Rs 45.08 billion in CY20. For all banks (local and
foreign), reserves increased by Rs 40.29 billion in CY20 as compared to CY19. Unappropriated profit of
0
2,000
4,000
6,000
8,000
10,000
12,000
14,000
16,000
18,000
20,000
Bills payable Borrowings
from
financial
institutions
Deposits and
other
accounts
Other/misc.
liabilities
bil
lion
Rs
Major Components of Liabilities
2019 2020
20

Financial Statements Analysis of Financial Sector 2020
banking industry touched Rs 670.56 billion in CY20 with an increase of Rs 150.63 billion or 28.97
percent over CY19.
Assets
Total assets of the banking sector increased from
Rs 22.12 trillion in CY19 to Rs 25.07 trillion in
CY20 registering an increase of 13.33 percent.
Investment of the banking sector was increased by
Rs 2.78 trillion or 30.79 percent. Gross advances
grew by 1.98 percent in CY20 as compared to
previous year. The analysis of components of total
assets reveals that lending to financial institutions
witnessed an increase of 10.11 percent in CY20,
increased from Rs 970.48 billion in CY19 to touch
Rs 1,068.61 billion in CY20. Increase in total assets
of the banking sector was mainly attributed to local
banks which comprised 97.07 percent of banking
sector’s assets. Local banks assets increased by Rs
2.93 trillion or 13.68 percent during CY19 over
CY18. Similarly, total assets of foreign banks witnessed an increase of Rs 20.51 billion or 2.87 percent in
CY20 when compared with CY19. Lending to financial institution of foreign banks made a contribution
of Rs 214.52 billion in CY20, with YoY decrease of Rs 8.74 billion over CY19. Lending to financial
institutions from local banks, was increased by Rs 118.68 billion or 16.14 percent in CY20. Gross
advances of banking sector increased by 1.98 percent in CY20 from Rs 8.90 trillion in CY19 to Rs 9.08
trillion in CY20. The analysis of advances reveals that Non-Performing Loans (NPL) increased by 7.61
percent or Rs 55.68 billion in CY20 over CY19 whereas, provisions against NPL also increased by 15.09
percent over the previous year. Advances net of provisions increased from Rs 8.30 trillion in CY19 to Rs
8.38 trillion in CY20 with an increase of 1.02 percent.
Profitability and Operating Efficiency In terms of profitability of banking sector, CY20 witnessed an increase both in profits before and after
taxation. Profit before taxation increased from Rs 319.54 billion in CY18 to Rs 414.17 billion in CY19
witnessing an increase of 29.61 percent in CY20 over CY19. Profit after taxation increased from Rs
183.59 billion in CY19 to Rs 248.73 billion in CY20. Increase in profitability of banking sector is
attributed to mainly local banks as its profit before taxation was increased by Rs 91.02 billion in CY20.
Foreign banks, recorded an increase of Rs 3.61 billion and Rs 2.78 billion in profit before and after
taxation respectively in CY20. Ratio statistics of the banking industry revealed that return on equity
(ROE) increased from 13.27 percent in CY18 to 16.99 percent in CY20 similarly return on assets (ROA)
also increased from 0.83 percent in CY19 to 1.07 percent in CY20. On the income side, Interest/mark-up
income of all banks during CY20 was around Rs 1.92 trillion as compared to Rs 1.85 trillion in CY19
witnessing an increase of Rs 64.48 billion or 3.48 percent in CY20 over CY19. On the other side,
interest/mark-up expenses were decreased by Rs 91.96 billion or 7.84 percent in CY20 over CY19. The
net interest/mark up income stood at Rs 836.29 billion in CY20, constituting a YoY growth of 23.01
percent with an increase of Rs 156.44 billion in CY20. Non-markup/interest income of banking sector
increased from Rs 202.01 billion during CY19 to Rs 237.89 billion in CY20, depicting an increase of
17.76 percent or Rs 35.89 billion.
0
2,000
4,000
6,000
8,000
10,000
12,000
14,000
Cash & Cash
Equivalent
Lending Investment Advances
Grossb
illi
on
Rs
Major Components of Assets
2019 2020
21

Financial Statements Analysis of Financial Sector 2020
Ratio of Administrative expenses to the profit before tax of the banking sector decreased from 1.54 in
CY19 to 1.14 in CY20. Mark up interest expenses were 56.13 percent of mark up interest income in
CY20 decreased from the previous year which was 63.32 percent. Deposits to total assets moved up from
72.43 percent in CY19 to 74.30 percent in CY20.
Provisions against NPLs to NPLs were recorded at 88.74 percent in CY20 for overall banking sector
comprising private, public, specialized and foreign banks.
319.54
183.59
414.17
248.73
0
50
100
150
200
250
300
350
400
450
Profit Before Taxation Profit After Taxation
bil
lion
s R
s
Profit and Loss Accounts
2019 2020
0.83%
13.27%
8.22%6.26%
1.07%
16.99%
7.78%
6.29%
0%
5%
10%
15%
20%
25%
30%
35%
ROA ROE NPL to
Gross
advances
Capital
Ratio
Performance Indicators
2019 2020
22

Financial Statement Analysis of Financial Sector 2020
2016 2017 2018 2019 2020Items
A.Total equity (A1 to A3) 1.Share capital/head office capital account 2.Reserves 3.Un appropriated profit 4.Others B.Total liabilities (B1 to B4) 1.Bills payable 2.Borrowings from financial institutions 3.Deposits and other accounts 4.Other/misc. liabilities C.Total assets (C1 to C4 + C8 to C10) 1.Cash and balances with treasury banks 2.Balances with other banks 3.Lending to financial institutions 4.Investments 5.Gross advances 6.Advances-non-performing/classified 7.Provision against advances 8.Advances net of provision (C5 - C7) 9.Fixed assets 10.Other/misc. assets D.Profit & loss account 1.Markup/interest earned 2.Markup/interest expenses 3.Net markup/interest income 4.Provisions and write-offs 5.Net markup/interest income after provisions 6.Non-markup/interest income 7.Non-markup/interest expenses 8.Administrative expenses 9.Profit/(loss) before taxation 10.Profit/(loss) after taxation E.Other items 1.Cash generated from operating activities 2.Commitments and contigencies F.Efficiency ratios/profitability ratios 1.Spread ratio (D3/D1) 2.Net markup/interest margin (D1-D2)/C 3.Return on equity (ROE) (D10/A) 4.Return on assets (ROA) (D10/C) 5.Non-markup/interest income to total assets (D6/C) 6.Net markup/interest income(after provisions) to total assets(D5/C) 7.Markup/interest expense to markup/interest income (D2/D1) 8.Admin. expesne to profit before tax. (D8/D9)(times) 9.Non-markup/interest expense to total income D7/(D1+D6) 10.Admin. expense to non-markup/interest income(D8/D6)(times) G.Liquidity ratios 1.Cash & cash equivalent to total assets (C1+C2)/C 2.Investment to total assets (C4/C) 3.Advances net of provisions to total assets (C8/C) 4.Deposits to total assets (B3/C) 5.Total liabilities to total assets (B/C) 6.Gross advances to deposits (C5/B3) 7.Gross advances to borrowing & deposits C5/(B2+B3) H.Assets quality ratios 1.Non-performing loans to gross advances (C6/C5) 2.Provision against NPLs to gross advances (C7/C5) 3.NPLs to total equity (C6/A) 4.NPLs write off to NPLs provision (D4/C7) 5.Provision against NPL to NPLs (C7/C6) I.Capital /leverage ratios 1.Capital ratio (A/C) 2.Commitments & contingencies to total equity (E2/A) (times) 3.Total deposit to total equity (B3/A) (times) J.Cash flow ratio 1.Cash generated from operating activities to profit after tax (E1/D10) (times)
1,175,498,718 1,149,807,067 1,261,395,703 1,383,706,620 1,577,651,475
534,612,611 413,014,554 432,521,958 445,984,289 449,006,837
304,936,372 341,413,315 388,513,190 417,791,143 458,084,578
335,949,735 395,379,198 440,360,555 519,931,188 670,560,060
174,822,622 238,908,131 193,599,547 281,889,801 317,751,482
14,539,437,305 17,151,321,267 18,587,376,827 20,454,859,062 23,173,656,646
211,162,200 264,242,205 290,266,630 233,127,774 306,229,767
1,928,723,371 3,091,646,420 3,028,011,600 2,974,983,362 3,153,253,160
11,764,688,240 12,930,256,100 14,295,218,772 16,021,241,977 18,504,835,539
634,863,494 865,176,542 973,879,825 1,225,505,949 1,209,338,180
15,889,758,645 18,540,036,464 20,042,372,077 22,120,455,483 25,069,059,602
1,186,502,771 1,295,237,258 1,578,417,094 1,986,366,071 2,007,563,324
158,026,748 150,155,990 151,400,809 215,636,891 271,412,445
542,138,720 580,383,714 898,973,651 970,479,084 1,068,610,922
7,512,974,884 8,684,912,973 8,005,224,324 9,025,623,894 11,804,264,958
5,997,009,849 7,045,906,738 8,563,285,299 8,903,222,149 9,079,701,591
552,131,134 595,011,025 648,764,870 732,123,076 787,802,557
512,292,695 531,592,658 564,399,933 607,487,637 699,130,123
5,484,717,154 6,514,314,080 7,998,885,366 8,295,734,512 8,380,571,468
296,878,467 369,102,820 420,325,292 554,466,659 585,816,114
708,519,901 945,929,629 989,145,541 1,072,148,372 950,820,371
934,072,694 991,557,513 1,157,982,242 1,853,396,430 1,917,875,768
453,676,143 500,547,007 617,087,228 1,173,638,378 1,081,674,275
480,396,551 491,010,506 540,895,014 679,758,052 836,201,493
7,335,018 42,719,477 33,463,894 61,347,485 130,770,132
473,061,533 448,291,029 507,431,120 618,523,916 705,431,361
200,231,724 197,915,100 190,754,806 202,006,234 237,892,504
363,532,224 390,564,403 440,161,416 500,877,411 529,154,836
356,619,079 384,308,753 435,173,394 492,847,705 518,008,584
309,738,983 255,641,725 258,009,420 319,539,390 414,169,029
187,913,637 152,523,602 158,971,799 183,589,266 248,731,474
648,976,716 803,696,156 357,141,058 1,407,779,117 2,974,291,873
6,877,353,419 9,753,857,454 11,920,301,899 12,164,474,494 11,236,809,078
51.43% 49.52% 46.71% 36.68% 43.60%
3.02% 2.65% 2.70% 3.07% 3.34%
15.99% 13.27% 12.60% 13.27% 15.77%
1.18% 0.82% 0.79% 0.83% 0.99%
1.26% 1.07% 0.95% 0.91% 0.95%
2.98% 2.42% 2.53% 2.80% 2.81%
48.57% 50.48% 53.29% 63.32% 56.40%
1.15 1.50 1.69 1.54 1.25
32.05% 32.84% 32.64% 24.37% 24.55%
1.78 1.94 2.28 2.44 2.18
8.46% 7.80% 8.63% 9.95% 9.09%
47.28% 46.84% 39.94% 40.80% 47.09%
34.52% 35.14% 39.91% 37.50% 33.43%
74.04% 69.74% 71.32% 72.43% 73.82%
91.50% 92.51% 92.74% 92.47% 92.44%
50.97% 54.49% 59.90% 55.57% 49.07%
43.79% 43.98% 49.43% 46.87% 41.92%
9.21% 8.44% 7.58% 8.22% 8.68%
8.54% 7.54% 6.59% 6.82% 7.70%
46.97% 51.75% 51.43% 52.91% 49.94%
1.43% 8.04% 5.93% 10.10% 18.70%
92.78% 89.34% 87.00% 82.98% 88.74%
7.40% 6.20% 6.29% 6.26% 6.29%
5.85 8.48 9.45 8.79 7.12
10.01 11.25 11.33 11.58 11.73
3.45 5.27 2.25 7.67 11.96
(Thousand Rupees)All Banks - Overall
23

Financial Statement Analysis of Financial Sector 2020
2016 2017 2018 2019 2020Items
A.Total equity (A1 to A3) 1.Share capital 2.Reserves 3.Un appropriated profit 4.Others B.Total liabilities(B1 to B4) 1.Bills payable 2.Borrowings from financial institutions 3.Deposits and other accounts 4.Other/misc. liabilities C.Total assets (C1 to C4 + C8 to C10) 1.Cash and balances with treasury banks 2.Balances with other banks 3.Lending to financial institutions 4.Investments 5.Gross advances 6.Advances-non-performing/classified 7.Provision against advances 8.Advances net of provision (C5-C7) 9.Fixed assets 10.Other/misc. assets D.Profit & loss account 1.Markup/interest earned 2.Markup/interest expensed 3.Net markup/interest income 4.Provisions and write-offs 5.Net markup/interest income after provisions 6.Non-markup/interest income 7.Non-markup/interest expenses 8.Administrative expenses 9.Profit/(loss) before taxation 10.Profit/(loss) after taxation E.Other items 1.No. of ordinary shares (000) 2.Cash dividend 3.Stock dividend/bonus shares 4.Cash generated from operating activities 5.Commitments and contigencies F.Efficiency ratios/profitability ratios 1.Spread (D3/D1) 2.Net markup/interest margin (D1-D2)/C 3.Return on equity (ROE) (D10/A) 4.Return on assets (ROA) (D10/C) 5.Non-markup/interest income to total assets (D6/C) 6.Net markup/interest income(after prov.) to total assets(D5/C) 7.Markup/interest expense to markup/interest income (D2/D1) 8.Admin. expense to profit before tax. (D8/D9) (times) 9.Non-markup/interest expense to total income D7/(D1+D6) 10.Admin. expense to non-markup/interest income (D8/D6) (times) 11.Earning per share (D10/E1) G.Liquidity ratios 1.Cash & cash equivalent to total assets (C1+C2)/C 2.Investment to total assets (C4/C) 3.Advances net of provisions to total assets (C8/C) 4.Deposits to total assets (B3/C) 5.Total liabilities to total assets (B/C) 6.Gross advances to deposits (C5/B3) 7.Gross advances to borrowing & deposit C5/(B2+B3) H.Assets quality ratios 1.Non-performing loan to gross advances (C6/C5) 2.Provisions against NPLs to gross advances (C7/C5) 3.NPLs to shareholders equity (C6/A) 4.NPLs write off to NPLs provisions (D4/C7) 5.Provision against NPL to NPLs (C7/C6) I.Capital /leverage ratios 1.Capital ratio (A/C) 2.Commitments & contingencies to total equity (E5/A) (times) 3.Break up value per share (A/E1) 4.Total deposit to total equity (B3/A) (times) J.Cash flow ratio 1.Cash generated from opration activities to profit after tax (E4/D10) (times)
1,147,953,319 1,107,089,379 1,204,974,934 1,319,568,911 1,499,805,690
516,623,156 383,079,258 388,989,747 402,638,435 403,924,505
304,767,668 341,250,276 388,351,647 417,629,600 457,923,028
326,562,495 382,759,845 427,633,540 499,300,876 637,958,157
174,797,023 239,157,002 194,211,124 281,660,524 318,254,607
14,174,226,026 16,626,697,362 17,977,392,506 19,803,965,557 22,515,227,515
204,717,489 256,847,735 283,441,542 225,929,524 301,356,428
1,739,940,551 2,771,631,693 2,654,974,324 2,609,848,451 2,808,261,038
11,617,595,874 12,761,095,463 14,102,529,712 15,776,060,970 18,230,456,018
611,972,112 837,122,471 936,446,928 1,192,126,612 1,175,154,031
15,496,976,368 17,972,943,742 19,376,578,564 21,405,194,992 24,333,287,812
1,164,124,326 1,258,583,107 1,523,973,740 1,926,783,431 1,947,872,626
152,602,602 146,793,891 146,337,876 187,701,262 241,712,888
501,486,040 410,809,207 656,695,752 735,414,371 854,091,104
7,236,170,337 8,391,785,863 7,755,364,879 8,738,308,860 11,459,692,968
5,961,454,568 7,002,365,569 8,482,769,104 8,809,058,603 9,004,510,315
549,167,872 592,115,871 645,924,725 729,351,539 785,324,965
509,322,140 528,606,577 561,256,798 604,415,276 696,306,720
5,452,132,428 6,473,758,992 7,921,512,306 8,204,643,327 8,308,203,595
295,317,904 367,484,945 418,791,691 552,496,817 583,783,528
695,142,731 923,727,737 953,902,320 1,059,846,924 937,931,103
916,558,858 963,523,344 1,120,409,164 1,781,737,381 1,849,579,848
441,925,090 482,728,497 593,684,307 1,127,396,501 1,037,644,524
474,633,768 480,794,847 526,724,857 654,340,880 811,935,324
7,433,099 42,703,374 33,376,993 61,341,033 130,713,791
467,200,669 438,091,473 493,347,864 593,113,196 681,221,533
193,348,184 192,740,470 183,332,482 194,985,284 227,483,970
359,118,941 385,433,044 433,312,952 493,811,389 523,509,746
352,302,537 379,374,087 428,615,084 486,305,045 512,947,251
301,407,862 245,398,898 243,367,394 294,173,742 385,195,757
182,854,815 146,335,485 149,959,233 168,876,152 231,237,531
50,877,996 37,598,233 38,189,275 53,543,316 39,504,377
710,655,701 792,951,644 344,386,888 1,341,824,715 2,907,625,838
5,487,162,409 8,180,143,732 10,342,260,101 10,609,850,403 9,620,191,051
51.78% 49.90% 47.01% 36.72% 43.90%
3.06% 2.68% 2.72% 3.06% 3.34%
15.93% 13.22% 12.45% 12.80% 15.42%
1.18% 0.81% 0.77% 0.79% 0.95%
1.25% 1.07% 0.95% 0.91% 0.93%
3.01% 2.44% 2.55% 2.77% 2.80%
48.22% 50.10% 52.99% 63.28% 56.10%
1.17 1.55 1.76 1.65 1.33
32.36% 33.33% 33.24% 24.98% 25.20%
1.82 1.97 2.34 2.49 2.25
3.59 3.89 3.93 3.15 5.85
8.50% 7.82% 8.62% 9.88% 9.00%
46.69% 46.69% 40.02% 40.82% 47.09%
35.18% 36.02% 40.88% 38.33% 34.14%
74.97% 71.00% 72.78% 73.70% 74.92%
91.46% 92.51% 92.78% 92.52% 92.53%
51.31% 54.87% 60.15% 55.84% 49.39%
44.63% 45.08% 50.62% 47.91% 42.80%
9.21% 8.46% 7.61% 8.28% 8.72%
8.54% 7.55% 6.62% 6.86% 7.73%
47.84% 53.48% 53.60% 55.27% 52.36%
1.46% 8.08% 5.95% 10.15% 18.77%
92.74% 89.27% 86.89% 82.87% 88.66%
7.41% 6.16% 6.22% 6.16% 6.16%
4.78 7.39 8.58 8.04 6.41
22.56 29.45 31.55 24.64 37.97
10.12 11.53 11.70 11.96 12.16
3.89 5.42 2.30 7.95 12.57
(Thousand Rupees)Local Banks - Overall
N/A N/A N/A N/A N/A
N/A N/A N/A N/A N/A
24

Financial Statement Analysis of Financial Sector 2020
2016 2017 2018 2019 2020Items
A.Total equity (A1 to A3) 1.Share capital 2.Reserves 3.Un appropriated profit 4.Others B.Total liabilities(B1 to B4) 1.Bills payable 2.Borrowings from financial institutions 3.Deposits and other accounts 4.Other/misc. liabilities C.Total assets (C1 to C4 + C8 to C10) 1.Cash and balances with treasury banks 2.Balances with other banks 3.Lending to financial institutions 4.Investments 5.Gross advances 6.Advances-non-performing/classified 7.Provision against advances 8.Advances net of provision (C5-C7) 9.Fixed assets 10.Other/misc. assets D.Profit & loss account 1.Markup/interest earned 2.Markup/interest expensed 3.Net markup/interest income 4.Provisions and write-offs 5.Net markup/interest income after provisions 6.Non-markup/interest income 7.Non-markup/interest expenses 8.Administrative expenses 9.Profit/(loss) before taxation 10.Profit/(loss) after taxation E.Other items 1.No. of ordinary shares (000) 2.Cash dividend 3.Stock dividend/bonus shares 4.Cash generated from operating activities 5.Commitments and contigencies F.Efficiency ratios/profitability ratios 1.Spread (D3/D1) 2.Net markup/interest margin (D1-D2)/C 3.Return on equity (ROE) (D10/A) 4.Return on assets (ROA) (D10/C) 5.Non-markup/interest income to total assets (D6/C) 6.Net markup/interest income(after prov.) to total assets(D5/C) 7.Markup/interest expense to markup/interest income (D2/D1) 8.Admin. expense to profit before tax. (D8/D9) (times) 9.Non-markup/interest expense to total income D7/(D1+D6) 10.Admin. expense to non-markup/interest income (D8/D6) (times) 11.Earning per share (D10/E1) G.Liquidity ratios 1.Cash & cash equivalent to total assets (C1+C2)/C 2.Investment to total assets (C4/C) 3.Advances net of provisions to total assets (C8/C) 4.Deposits to total assets (B3/C) 5.Total liabilities to total assets (B/C) 6.Gross advances to deposits (C5/B3) 7.Gross advances to borrowing & deposit C5/(B2+B3) H.Assets quality ratios 1.Non-performing loan to gross advances (C6/C5) 2.Provisions against NPLs to gross advances (C7/C5) 3.NPLs to shareholders equity (C6/A) 4.NPLs write off to NPLs provisions (D4/C7) 5.Provision against NPL to NPLs (C7/C6) I.Capital /leverage ratios 1.Capital ratio (A/C) 2.Commitments & contingencies to total equity (E5/A) (times) 3.Break up value per share (A/E1) 4.Total deposit to total equity (B3/A) (times) J.Cash flow ratio 1.Cash generated from opration activities to profit after tax (E4/D10) (times)
170,682,162 187,725,392 214,178,438 239,127,076 277,234,292
60,069,872 71,455,664 71,455,664 81,155,664 81,155,664
51,801,712 58,144,685 62,668,151 63,613,405 69,686,701
58,810,578 58,125,043 80,054,623 94,358,007 126,391,927
69,059,063 52,587,087 57,086,113 75,180,356 81,167,423
2,687,813,953 3,397,189,425 3,645,166,110 4,170,742,335 4,219,299,038
16,075,035 19,127,334 15,876,698 25,485,963 22,933,268
123,048,536 518,119,628 500,050,241 651,554,884 358,539,554
2,400,283,229 2,593,096,942 2,907,989,000 3,221,543,699 3,607,415,128
148,407,153 266,845,521 221,250,171 272,157,789 230,411,088
2,927,555,178 3,637,501,904 3,916,430,661 4,485,049,767 4,577,700,753
213,147,318 222,601,598 313,999,855 373,057,213 349,363,154
28,478,792 38,824,697 22,279,903 32,662,418 26,618,387
149,137,449 58,347,396 147,313,624 165,708,956 153,834,453
1,318,047,650 1,806,547,409 1,657,561,898 2,026,255,268 2,223,396,867
1,176,910,346 1,365,587,088 1,673,704,215 1,780,696,413 1,824,100,133
183,358,667 183,689,513 213,941,542 240,616,201 271,295,719
155,762,653 173,105,360 188,300,790 209,494,974 250,614,934
1,021,147,693 1,192,481,728 1,485,403,425 1,571,201,439 1,573,485,199
43,834,115 44,250,775 66,851,247 76,968,674 76,810,013
153,762,161 274,448,301 223,020,709 239,195,799 174,192,680
167,063,474 184,933,828 225,207,832 358,392,436 382,895,254
90,544,623 104,369,024 133,799,271 252,438,151 246,128,547
76,518,851 80,564,804 91,408,561 105,954,285 136,766,707
2,544,171 16,064,310 11,371,246 26,038,119 49,401,103
73,974,680 64,500,494 80,037,315 80,067,713 87,365,604
41,674,529 38,757,637 39,128,884 40,705,644 51,454,222
64,786,119 67,494,907 78,102,529 90,190,356 90,677,095
63,243,694 67,129,967 77,684,795 89,573,977 89,695,704
50,863,090 35,763,223 41,063,670 30,431,454 48,142,731
31,033,263 22,514,200 26,601,696 16,866,481 31,156,543
6,006,987 7,145,566 7,145,566 8,141,881 8,141,881
107,200,189 (138,545,992) 478,246,084 535,340,316 122,286,560
1,071,488,734 1,187,355,747 1,712,188,161 2,228,237,742 1,977,100,911
45.80% 43.56% 40.59% 29.56% 35.72%
2.61% 2.21% 2.33% 2.36% 2.99%
18.18% 11.99% 12.42% 7.05% 11.24%
1.06% 0.62% 0.68% 0.38% 0.68%
1.42% 1.07% 1.00% 0.91% 1.12%
2.53% 1.77% 2.04% 1.79% 1.91%
54.20% 56.44% 59.41% 70.44% 64.28%
1.24 1.88 1.89 2.94 1.86
31.04% 30.17% 29.55% 22.60% 20.88%
1.52 1.73 1.99 2.20 1.74
5.17 3.15 3.72 2.07 3.83
8.25% 7.19% 8.59% 9.05% 8.21%
45.02% 49.66% 42.32% 45.18% 48.57%
34.88% 32.78% 37.93% 35.03% 34.37%
81.99% 71.29% 74.25% 71.83% 78.80%
91.81% 93.39% 93.07% 92.99% 92.17%
49.03% 52.66% 57.56% 55.27% 50.57%
46.64% 43.89% 49.11% 45.98% 45.99%
15.58% 13.45% 12.78% 13.51% 14.87%
13.23% 12.68% 11.25% 11.76% 13.74%
107.43% 97.85% 99.89% 100.62% 97.86%
1.63% 9.28% 6.04% 12.43% 19.71%
84.95% 94.24% 88.02% 87.07% 92.38%
5.83% 5.16% 5.47% 5.33% 6.06%
6.28 6.32 7.99 9.32 7.13
28.41 26.27 29.97 29.37 34.05
14.06 13.81 13.58 13.47 13.01
3.45 -6.15 17.98 31.74 3.92
(Thousand Rupees)Public Sector Banks - Overall
N/A N/A N/A N/A N/A
N/A N/A N/A N/A N/A
25

Financial Statement Analysis of Financial Sector 2020
2016 2017 2018 2019 2020Items
A.Total equity (A1 to A3) 1.Share capital 2.Reserves 3.Un appropriated profit 4.Others B.Total liabilities(B1 to B4) 1.Bills payable 2.Borrowings from financial institutions 3.Deposits and other accounts 4.Other/misc. liabilities C.Total assets (C1 to C4 + C8 to C10) 1.Cash and balances with treasury banks 2.Balances with other banks 3.Lending to financial institutions 4.Investments 5.Gross advances 6.Advances-non-performing/classified 7.Provision against advances 8.Advances net of provision (C5-C7) 9.Fixed assets 10.Other/misc. assets D.Profit & loss account 1.Markup/interest earned 2.Markup/interest expensed 3.Net markup/interest income 4.Provisions and write-offs 5.Net markup/interest income after provisions 6.Non-markup/interest income 7.Non-markup/interest expenses 8.Administrative expenses 9.Profit/(loss) before taxation 10.Profit/(loss) after taxation E.Other items 1.No. of ordinary shares (000) 2.Cash dividend 3.Stock dividend/bonus shares 4.Cash generated from operating activities 5.Commitments and contigencies F.Efficiency ratios/profitability ratios 1.Spread (D3/D1) 2.Net markup/interest margin (D1-D2)/C 3.Return on equity (ROE) (D10/A) 4.Return on assets (ROA) (D10/C) 5.Non-markup/interest income to total assets (D6/C) 6.Net markup/interest income(after prov.) to total assets(D5/C) 7.Markup/interest expense to markup/interest income (D2/D1) 8.Admin. expense to profit before tax. (D8/D9) (times) 9.Non-markup/interest expense to total income D7/(D1+D6) 10.Admin. expense to non-markup/interest income (D8/D6) (times) 11.Earning per share (D10/E1) G.Liquidity ratios 1.Cash & cash equivalent to total assets (C1+C2)/C 2.Investment to total assets (C4/C) 3.Advances net of provisions to total assets (C8/C) 4.Deposits to total assets (B3/C) 5.Total liabilities to total assets (B/C) 6.Gross advances to deposits (C5/B3) 7.Gross advances to borrowing & deposit C5/(B2+B3) H.Assets quality ratios 1.Non-performing loan to gross advances (C6/C5) 2.Provisions against NPLs to gross advances (C7/C5) 3.NPLs to shareholders equity (C6/A) 4.NPLs write off to NPLs provisions (D4/C7) 5.Provision against NPL to NPLs (C7/C6) I.Capital /leverage ratios 1.Capital ratio (A/C) 2.Commitments & contingencies to total equity (E5/A) (times) 3.Break up value per share (A/E1) 4.Total deposit to total equity (B3/A) (times) J.Cash flow ratio 1.Cash generated from opration activities to profit after tax (E4/D10) (times)
3,337,855 3,606,375 3,606,375 3,606,375 3,606,375
3,494,113 3,994,113 3,994,113 3,994,113 3,994,113
307,717 307,717 307,717 307,717 307,717
(463,975) (695,455) (695,455) (695,455) (695,455)
142,667 126,336 126,336 126,336 126,336
15,040,042 21,096,220 21,096,220 21,096,220 21,096,220
214,155 530,291 530,291 530,291 530,291
743,909 3,903,832 3,903,832 3,903,832 3,903,832
13,708,791 16,259,737 16,259,737 16,259,737 16,259,737
373,187 402,360 402,360 402,360 402,360
18,520,564 24,828,931 24,828,931 24,828,931 24,828,931
1,081,532 1,438,429 1,438,429 1,438,429 1,438,429
112,042 62,606 62,606 62,606 62,606
100,000 0 0 0 0
8,032,819 13,587,722 13,587,722 13,587,722 13,587,722
9,478,671 10,129,162 10,129,162 10,129,162 10,129,162
1,963,210 1,670,104 1,670,104 1,670,104 1,670,104
1,265,424 1,253,531 1,253,531 1,253,531 1,253,531
8,213,247 8,875,631 8,875,631 8,875,631 8,875,631
337,077 323,546 323,546 323,546 323,546
643,847 540,997 540,997 540,997 540,997
1,161,864 1,276,336 1,276,336 1,276,336 1,276,336
522,492 601,824 601,824 601,824 601,824
639,372 674,512 674,512 674,512 674,512
(17,667) 12,354 12,354 12,354 12,354
657,039 662,158 662,158 662,158 662,158
244,555 121,978 121,978 121,978 121,978
897,541 900,071 900,071 900,071 900,071
879,190 893,021 893,021 893,021 893,021
4,053 (115,935) (115,935) (115,935) (115,935)
11,322 (238,038) (238,038) (238,038) (238,038)
349,411 399,411 399,411 399,411 399,411
0.00% 0.00% 0.00% 0.00% 0.00%
0.00% 0.00% 0.00% 0.00% 0.00%
(3,732,382) 5,391,892 5,391,892 5,391,892 5,391,892
2,273,166 1,255,963 1,255,963 1,255,963 1,255,963
55.03% 52.85% 52.85% 52.85% 52.85%
3.45% 2.72% 2.72% 2.72% 2.72%
0.34% -6.60% -6.60% -6.60% -6.60%
0.06% -0.96% -0.96% -0.96% -0.96%
1.32% 0.49% 0.49% 0.49% 0.49%
3.55% 2.67% 2.67% 2.67% 2.67%
44.97% 47.15% 47.15% 47.15% 47.15%
216.92 -7.70 -7.70 -7.70 -7.70
63.82% 64.37% 64.37% 64.37% 64.37%
3.60 7.32 7.32 7.32 7.32
0.03 -0.60 -0.60 -0.60 -0.60
6.44% 6.05% 6.05% 6.05% 6.05%
43.37% 54.73% 54.73% 54.73% 54.73%
44.35% 35.75% 35.75% 35.75% 35.75%
74.02% 65.49% 65.49% 65.49% 65.49%
81.21% 84.97% 84.97% 84.97% 84.97%
69.14% 62.30% 62.30% 62.30% 62.30%
65.58% 50.23% 50.23% 50.23% 50.23%
20.71% 16.49% 16.49% 16.49% 16.49%
13.35% 12.38% 12.38% 12.38% 12.38%
58.82% 46.31% 46.31% 46.31% 46.31%
-1.40% 0.99% 0.99% 0.99% 0.99%
64.46% 75.06% 75.06% 75.06% 75.06%
18.02% 14.52% 14.52% 14.52% 14.52%
0.68 0.35 0.35 0.35 0.35
9.55 9.03 9.03 9.03 9.03
4.11 4.51 4.51 4.51 4.51
-329.66 -22.65 -22.65 -22.65 -22.65
(Thousand Rupees)FIRST WOMEN BANK LTD.
26

Financial Statement Analysis of Financial Sector 2020
2016 2017 2018 2019 2020Items
A.Total equity (A1 to A3) 1.Share capital 2.Reserves 3.Un appropriated profit 4.Others B.Total liabilities(B1 to B4) 1.Bills payable 2.Borrowings from financial institutions 3.Deposits and other accounts 4.Other/misc. liabilities C.Total assets (C1 to C4 + C8 to C10) 1.Cash and balances with treasury banks 2.Balances with other banks 3.Lending to financial institutions 4.Investments 5.Gross advances 6.Advances-non-performing/classified 7.Provision against advances 8.Advances net of provision (C5-C7) 9.Fixed assets 10.Other/misc. assets D.Profit & loss account 1.Markup/interest earned 2.Markup/interest expensed 3.Net markup/interest income 4.Provisions and write-offs 5.Net markup/interest income after provisions 6.Non-markup/interest income 7.Non-markup/interest expenses 8.Administrative expenses 9.Profit/(loss) before taxation 10.Profit/(loss) after taxation E.Other items 1.No. of ordinary shares (000) 2.Cash dividend 3.Stock dividend/bonus shares 4.Cash generated from operating activities 5.Commitments and contigencies F.Efficiency ratios/profitability ratios 1.Spread (D3/D1) 2.Net markup/interest margin (D1-D2)/C 3.Return on equity (ROE) (D10/A) 4.Return on assets (ROA) (D10/C) 5.Non-markup/interest income to total assets (D6/C) 6.Net markup/interest income(after prov.) to total assets(D5/C) 7.Markup/interest expense to markup/interest income (D2/D1) 8.Admin. expense to profit before tax. (D8/D9) (times) 9.Non-markup/interest expense to total income D7/(D1+D6) 10.Admin. expense to non-markup/interest income (D8/D6) (times) 11.Earning per share (D10/E1) G.Liquidity ratios 1.Cash & cash equivalent to total assets (C1+C2)/C 2.Investment to total assets (C4/C) 3.Advances net of provisions to total assets (C8/C) 4.Deposits to total assets (B3/C) 5.Total liabilities to total assets (B/C) 6.Gross advances to deposits (C5/B3) 7.Gross advances to borrowing & deposit C5/(B2+B3) H.Assets quality ratios 1.Non-performing loan to gross advances (C6/C5) 2.Provisions against NPLs to gross advances (C7/C5) 3.NPLs to shareholders equity (C6/A) 4.NPLs write off to NPLs provisions (D4/C7) 5.Provision against NPL to NPLs (C7/C6) I.Capital /leverage ratios 1.Capital ratio (A/C) 2.Commitments & contingencies to total equity (E5/A) (times) 3.Break up value per share (A/E1) 4.Total deposit to total equity (B3/A) (times) J.Cash flow ratio 1.Cash generated from opration activities to profit after tax (E4/D10) (times)
120,014,623 125,692,679 146,882,410 162,369,773 193,859,398
21,275,131 21,275,131 21,275,131 21,275,131 21,275,131
46,800,341 50,356,895 53,274,402 52,308,742 56,562,933
51,939,151 54,060,653 72,332,877 88,785,900 116,021,334
56,718,153 49,689,402 59,986,125 70,244,060 73,699,344
1,832,122,164 2,329,938,887 2,591,697,653 2,891,775,037 2,740,968,239
10,187,250 13,195,054 9,944,178 19,867,424 16,795,186
44,863,930 360,105,674 392,739,396 471,757,352 138,539,005
1,657,312,093 1,727,102,019 2,011,385,201 2,198,049,281 2,418,966,479
119,758,891 229,536,140 177,628,878 202,100,980 166,667,569
2,008,854,940 2,505,320,968 2,798,566,188 3,124,388,870 3,008,526,981
160,172,561 160,089,619 247,518,270 292,513,379 249,259,590
13,828,477 26,403,906 12,202,020 13,220,807 14,227,355
121,709,399 26,916,113 106,391,667 144,140,344 126,804,675
897,130,749 1,295,719,550 1,284,319,388 1,439,160,062 1,463,398,076
781,475,768 856,937,772 1,059,480,147 1,151,315,050 1,159,873,747
119,416,000 120,798,000 133,360,000 148,751,717 171,294,133
114,086,313 117,165,789 133,473,143 143,175,966 176,619,220
667,389,455 739,771,983 926,007,004 1,008,139,084 983,254,527
32,016,837 32,210,079 53,859,883 54,303,565 54,413,493
116,607,462 224,209,718 168,267,956 172,911,629 117,169,265
114,402,671 123,072,600 149,968,712 239,477,316 257,811,015
59,578,235 68,819,721 89,302,482 167,570,039 153,655,908
54,824,436 54,252,879 60,666,230 71,907,277 104,155,107
(701,257) 1,191,944 11,300,373 14,250,275 30,895,938
55,525,693 53,060,935 49,365,857 57,657,002 73,259,169
29,966,606 31,065,870 36,248,936 36,199,485 36,076,908
48,351,084 48,527,537 55,931,412 65,853,120 63,111,930
46,943,418 48,224,847 55,687,359 65,705,029 62,796,623
37,141,215 35,599,268 29,683,381 28,003,367 46,224,147
22,752,285 23,027,987 20,015,122 15,809,811 30,558,919
2,127,513 2,127,513 2,127,513 2,127,513 2,127,513
0.75% 0.00% 0.00% 0.00% 0.00%
0.00% 0.00% 0.00% 0.00% 0.00%
45,349,026 (232,540,971) 597,385,382 292,999,644 (51,869,597)
847,438,860 967,675,924 1,410,038,651 1,953,896,161 1,675,254,109
47.92% 44.08% 40.45% 30.03% 40.40%
2.73% 2.17% 2.17% 2.30% 3.46%
18.96% 18.32% 13.63% 9.74% 15.76%
1.13% 0.92% 0.72% 0.51% 1.02%
1.49% 1.24% 1.30% 1.16% 1.20%
2.76% 2.12% 1.76% 1.85% 2.44%
52.08% 55.92% 59.55% 69.97% 59.60%
1.26 1.35 1.88 2.35 1.36
33.49% 31.48% 30.04% 23.89% 21.47%
1.57 1.55 1.54 1.82 1.74
10.69 10.82 9.41 7.43 14.36
8.66% 7.44% 9.28% 9.79% 8.76%
44.66% 51.72% 45.89% 46.06% 48.64%
33.22% 29.53% 33.09% 32.27% 32.68%
82.50% 68.94% 71.87% 70.35% 80.40%
91.20% 93.00% 92.61% 92.55% 91.11%
47.15% 49.62% 52.67% 52.38% 47.95%
45.91% 41.06% 44.07% 43.12% 45.35%
15.28% 14.10% 12.59% 12.92% 14.77%
14.60% 13.67% 12.60% 12.44% 15.23%
99.50% 96.11% 90.79% 91.61% 88.36%
-0.61% 1.02% 8.47% 9.95% 17.49%
95.54% 96.99% 100.08% 96.25% 103.11%
5.97% 5.02% 5.25% 5.20% 6.44%
7.06 7.70 9.60 12.03 8.64
56.41 59.08 69.04 76.32 91.12
13.81 13.74 13.69 13.54 12.48
1.99 -10.10 29.85 18.53 -1.70
(Thousand Rupees)NATIONAL BANK OF PAKISTAN
27

Financial Statement Analysis of Financial Sector 2020
2016 2017 2018 2019 2020Items
A.Total equity (A1 to A3)1.Share capital2.Reserves3.Un appropriated profit4.Others
B.Total liabilities(B1 to B4)1.Bills payable2.Borrowings from financial institutions3.Deposits and other accounts4.Other/misc. liabilities
C.Total assets (C1 to C4 + C8 to C10)1.Cash and balances with treasury banks2.Balances with other banks3.Lending to financial institutions4.Investments5.Gross advances6.Advances-non-performing/classified7.Provision against advances8.Advances net of provision (C5-C7)9.Fixed assets10.Other/misc. assets
D.Profit & loss account1.Markup/interest earned2.Markup/interest expensed3.Net markup/interest income4.Provisions and write-offs5.Net markup/interest income after provisions6.Non-markup/interest income7.Non-markup/interest expenses8.Administrative expenses9.Profit/(loss) before taxation10.Profit/(loss) after taxation
E.Other items1.No. of ordinary shares (000)2.Cash dividend3.Stock dividend/bonus shares4.Cash generated from operating activities5.Commitments and contigencies
F.Efficiency ratios/profitability ratios1.Spread (D3/D1)2.Net markup/interest margin (D1-D2)/C3.Return on equity (ROE) (D10/A)4.Return on assets (ROA) (D10/C)5.Non-markup/interest income to total assets (D6/C)6.Net markup/interest income(after prov.) to total assets(D5/C)7.Markup/interest expense to markup/interest income (D2/D1)8.Admin. expense to profit before tax. (D8/D9) (times)9.Non-markup/interest expense to total income D7/(D1+D6) 10.Admin. expense to non-markup/interest income (D8/D6) (times) 11.Earning per share (D10/E1)
G.Liquidity ratios1.Cash & cash equivalent to total assets (C1+C2)/C2.Investment to total assets (C4/C)3.Advances net of provisions to total assets (C8/C)
4.Deposits to total assets (B3/C)5.Total liabilities to total assets (B/C) 6.Gross advances to deposits (C5/B3) 7.Gross advances to borrowing & deposit C5/(B2+B3)
H.Assets quality ratios1.Non-performing loan to gross advances (C6/C5)2.Provisions against NPLs to gross advances (C7/C5)3.NPLs to shareholders equity (C6/A)4.NPLs write off to NPLs provisions (D4/C7) 5.Provision against NPL to NPLs (C7/C6)
I.Capital /leverage ratios1.Capital ratio (A/C)2.Commitments & contingencies to total equity (E5/A) (times)3.Break up value per share (A/E1)4.Total deposit to total equity (B3/A) (times)
J.Cash flow ratio1.Cash generated from opration activities to profit after tax (E4/D10) (times)
15,396,853 16,637,929 15,420,398 16,857,778 16,857,778
10,010,130 10,010,130 10,010,130 19,710,130 19,710,130
1,200,812 1,451,979 1,451,979 1,451,979 1,451,979
4,185,911 5,175,820 3,958,289 (4,304,331) (4,304,331)
134,032 (570,121) (4,181,968) 219,423 219,423
130,824,488 188,414,668 144,322,537 143,521,733 143,521,733
714,212 905,423 929,426 495,010 495,010
8,910,738 50,971,174 26,771,698 4,192,284 4,192,284
119,022,240 134,207,056 113,594,544 134,049,662 134,049,662
2,177,298 2,331,015 3,026,869 4,784,777 4,784,777
146,355,373 204,482,476 155,560,967 160,598,934 160,598,934
7,500,675 9,679,582 9,102,696 13,552,972 13,552,972
791,478 3,023,451 507,605 838,364 838,364
6,938,610 5,331,327 5,383,162 3,645,392 3,645,392
71,539,737 114,259,902 55,350,066 65,143,452 65,143,452
55,979,573 69,112,166 79,171,957 76,430,095 76,430,095
1,569,380 5,462,160 24,868,024 33,804,371 33,804,371
4,146,391 4,398,825 5,540,326 15,299,043 15,299,043
51,833,182 64,713,341 73,631,631 61,131,052 61,131,052
1,759,192 1,593,876 1,663,468 3,788,000 3,788,000
5,992,499 5,880,997 9,922,339 12,499,702 12,499,702
9,775,399 11,541,183 12,382,921 12,115,401 12,115,401
5,371,167 6,276,431 7,507,771 10,265,615 10,265,615
4,404,232 5,264,752 4,875,150 1,849,786 1,849,786
1,607,448 252,434 1,377,846 10,020,498 10,020,498
2,796,784 5,012,318 3,497,304 (8,170,712) (8,170,712)
3,495,950 1,327,696 (388,615) (667,912) (667,912)
3,864,804 4,157,580 4,527,421 4,922,552 4,922,552
3,864,279 4,148,159 4,439,505 4,902,734 4,902,734
2,427,930 2,182,434 (1,418,732) (13,761,176) (13,761,176)
1,390,826 1,255,835 (1,205,180) (8,259,860) (8,259,860)
1,001,013 1,001,013 1,001,013 1,971,013 1,971,013
0.00% 0.00% 0.00% 0.00% 0.00%
0.00% 0.00% 0.00% 0.00% 0.00%
3,340,734 48,301,254 (55,958,951) 2,657,581 2,657,581
90,783,568 62,704,482 125,579,844 26,124,258 26,124,258
45.05% 45.62% 39.37% 15.27% 15.27%
3.01% 2.57% 3.13% 1.15% 1.15%
9.03% 7.55% -7.82% -49.00% -49.00%
0.95% 0.61% -0.77% -5.14% -5.14%
2.39% 0.65% -0.25% -0.42% -0.42%
1.91% 2.45% 2.25% -5.09% -5.09%
54.95% 54.38% 60.63% 84.73% 84.73%
1.59 1.90 -3.13 -0.36 -0.36
29.12% 32.31% 37.75% 43.00% 43.00%
1.11 3.12 -11.42 -7.34 -7.34
1.39 1.25 -1.20 -4.19 -4.19
5.67% 6.21% 6.18% 8.96% 8.96%
48.88% 55.88% 35.58% 40.56% 40.56%
35.42% 31.65% 47.33% 38.06% 38.06%
81.32% 65.63% 73.02% 83.47% 83.47%
89.39% 92.14% 92.78% 89.37% 89.37%
47.03% 51.50% 69.70% 57.02% 57.02%
43.76% 37.32% 56.40% 55.29% 55.29%
2.80% 7.90% 31.41% 44.23% 44.23%
7.41% 6.36% 7.00% 20.02% 20.02%
10.19% 32.83% 161.27% 200.53% 200.53%
38.77% 5.74% 24.87% 65.50% 65.50%
264.21% 80.53% 22.28% 45.26% 45.26%
10.52% 8.14% 9.91% 10.50% 10.50%
5.90 3.77 8.14 1.55 1.55
15.38 16.62 15.40 8.55 8.55
7.73 8.07 7.37 7.95 7.95
2.40 38.46 46.43 -0.32 -0.32
(Thousand Rupees)SINDH BANK LTD.
28

Financial Statement Analysis of Financial Sector 2020
2016 2017 2018 2019 2020Items
A.Total equity (A1 to A3)1.Share capital2.Reserves3.Un appropriated profit4.Others
B.Total liabilities(B1 to B4)1.Bills payable2.Borrowings from financial institutions3.Deposits and other accounts4.Other/misc. liabilities
C.Total assets (C1 to C4 + C8 to C10)1.Cash and balances with treasury banks2.Balances with other banks3.Lending to financial institutions4.Investments5.Gross advances6.Advances-non-performing/classified7.Provision against advances8.Advances net of provision (C5-C7)9.Fixed assets10.Other/misc. assets
D.Profit & loss account1.Markup/interest earned2.Markup/interest expensed3.Net markup/interest income4.Provisions and write-offs5.Net markup/interest income after provisions6.Non-markup/interest income7.Non-markup/interest expenses8.Administrative expenses9.Profit/(loss) before taxation10.Profit/(loss) after taxation
E.Other items1.No. of ordinary shares (000)2.Cash dividend3.Stock dividend/bonus shares4.Cash generated from operating activities5.Commitments and contigencies
F.Efficiency ratios/profitability ratios1.Spread (D3/D1)2.Net markup/interest margin (D1-D2)/C3.Return on equity (ROE) (D10/A)4.Return on assets (ROA) (D10/C)5.Non-markup/interest income to total assets (D6/C)6.Net markup/interest income(after prov.) to total assets(D5/C)7.Markup/interest expense to markup/interest income (D2/D1)8.Admin. expense to profit before tax. (D8/D9) (times)9.Non-markup/interest expense to total income D7/(D1+D6) 10.Admin. expense to non-markup/interest income (D8/D6) (times) 11.Earning per share (D10/E1)
G.Liquidity ratios1.Cash & cash equivalent to total assets (C1+C2)/C2.Investment to total assets (C4/C)3.Advances net of provisions to total assets (C8/C)
4.Deposits to total assets (B3/C)5.Total liabilities to total assets (B/C) 6.Gross advances to deposits (C5/B3) 7.Gross advances to borrowing & deposit C5/(B2+B3)
H.Assets quality ratios1.Non-performing loan to gross advances (C6/C5)2.Provisions against NPLs to gross advances (C7/C5)3.NPLs to shareholders equity (C6/A)4.NPLs write off to NPLs provisions (D4/C7) 5.Provision against NPL to NPLs (C7/C6)
I.Capital /leverage ratios1.Capital ratio (A/C)2.Commitments & contingencies to total equity (E5/A) (times)3.Break up value per share (A/E1)4.Total deposit to total equity (B3/A) (times)
J.Cash flow ratio1.Cash generated from opration activities to profit after tax (E4/D10) (times)
14,685,246 14,943,251 13,809,276 14,982,023 16,604,589
10,002,524 10,002,524 10,002,524 10,002,524 10,002,524
2,192,169 2,550,263 2,643,483 2,904,691 3,335,048
2,490,553 2,390,464 1,163,269 2,074,808 3,267,017
1,457,298 454,868 (2,104,692) (780,670) 1,166,961
190,257,730 229,734,265 211,390,399 292,103,899 270,528,341
775,938 1,131,241 895,126 1,172,155 944,140
28,700,825 64,189,586 34,842,114 94,656,461 57,063,018
157,020,365 159,246,974 171,167,556 182,167,572 203,071,658
3,760,602 5,166,464 4,485,603 14,107,711 9,449,525
206,400,274 245,132,384 223,094,983 306,305,252 288,299,891
8,636,526 8,916,018 12,351,453 12,137,805 15,840,359
9,980,928 3,257,351 3,705,360 8,230,072 9,092,355
8,827,307 1,529,106 7,695,642 13,863,449 7,297,519
141,602,355 140,473,783 94,233,239 146,911,102 113,478,994
36,054,479 87,672,573 99,166,975 113,976,152 134,907,242
5,456,524 4,808,257 4,658,352 5,026,718 7,275,940
4,410,594 4,303,521 4,155,072 4,233,860 5,843,865
31,643,885 83,369,052 95,011,903 109,742,292 129,063,377
2,070,554 2,233,549 2,216,422 3,334,670 3,472,025
3,638,719 5,353,525 7,880,964 12,085,862 10,055,262
12,049,052 14,375,382 14,686,465 24,656,535 25,673,375
7,642,575 9,576,349 9,547,084 19,890,617 18,911,494
4,406,477 4,799,033 5,139,381 4,765,918 6,761,881
630,779 (123,201) (170,962) (21,092) 1,610,005
3,775,698 4,922,234 5,310,343 4,938,557 5,151,876
2,672,988 1,650,819 (526,345) 1,112,482 2,877,661
3,208,735 3,777,654 4,077,397 3,638,181 4,223,253
3,210,806 3,774,878 4,052,247 3,620,419 4,223,198
3,239,951 2,795,398 706,601 2,261,311 3,806,284
2,020,476 1,790,471 466,099 1,306,039 2,151,783
1,000,252 1,000,252 1,000,252 1,000,252 1,000,252
15.00% 15.00% 0.00% 5.00% 15.00%
0.00% 0.00% 0.00% 0.00% 5.00%
55,468,753 (3,663,312) (36,733,783) 55,553,621 (31,725,542)
22,485,665 20,941,435 29,505,219 51,736,720 60,716,676
36.57% 33.38% 34.99% 19.33% 26.34%
2.13% 1.96% 2.30% 1.56% 2.35%
13.76% 11.98% 3.38% 8.72% 12.96%
0.98% 0.73% 0.21% 0.43% 0.75%
1.30% 0.67% -0.24% 0.36% 1.00%
1.83% 2.01% 2.38% 1.61% 1.79%
63.43% 66.62% 65.01% 80.67% 73.66%
0.99 1.35 5.73 1.60 1.11
21.80% 23.57% 28.79% 14.12% 14.79%
1.20 2.29 -7.70 3.25 1.47
2.02 1.79 0.47 1.31 2.15
9.02% 4.97% 7.20% 6.65% 8.65%
68.61% 57.31% 42.24% 47.96% 39.36%
15.33% 34.01% 42.59% 35.83% 44.77%
76.08% 64.96% 76.72% 59.47% 70.44%
92.18% 93.72% 94.75% 95.36% 93.84%
22.96% 55.05% 57.94% 62.57% 66.43%
19.41% 39.24% 48.14% 41.17% 51.86%
15.13% 5.48% 4.70% 4.41% 5.39%
12.23% 4.91% 4.19% 3.71% 4.33%
37.16% 32.18% 33.73% 33.55% 43.82%
14.30% -2.86% -4.11% -0.50% 27.55%
80.83% 89.50% 89.20% 84.23% 80.32%
7.11% 6.10% 6.19% 4.89% 5.76%
1.53 1.40 2.14 3.45 3.66
14.68 14.94 13.81 14.98 16.60
10.69 10.66 12.40 12.16 12.23
27.45 -2.05 -78.81 42.54 -14.74
(Thousand Rupees)THE BANK OF KHYBER
29

Financial Statement Analysis of Financial Sector 2020
2016 2017 2018 2019 2020Items
A.Total equity (A1 to A3) 1.Share capital 2.Reserves 3.Un appropriated profit 4.Others B.Total liabilities(B1 to B4) 1.Bills payable 2.Borrowings from financial institutions 3.Deposits and other accounts 4.Other/misc. liabilities C.Total assets (C1 to C4 + C8 to C10) 1.Cash and balances with treasury banks 2.Balances with other banks 3.Lending to financial institutions 4.Investments 5.Gross advances 6.Advances-non-performing/classified 7.Provision against advances 8.Advances net of provision (C5-C7) 9.Fixed assets 10.Other/misc. assets D.Profit & loss account 1.Markup/interest earned 2.Markup/interest expensed 3.Net markup/interest income 4.Provisions and write-offs 5.Net markup/interest income after provisions 6.Non-markup/interest income 7.Non-markup/interest expenses 8.Administrative expenses 9.Profit/(loss) before taxation 10.Profit/(loss) after taxation E.Other items 1.No. of ordinary shares (000) 2.Cash dividend 3.Stock dividend/bonus shares 4.Cash generated from operating activities 5.Commitments and contigencies F.Efficiency ratios/profitability ratios 1.Spread (D3/D1) 2.Net markup/interest margin (D1-D2)/C 3.Return on equity (ROE) (D10/A) 4.Return on assets (ROA) (D10/C) 5.Non-markup/interest income to total assets (D6/C) 6.Net markup/interest income(after prov.) to total assets(D5/C) 7.Markup/interest expense to markup/interest income (D2/D1) 8.Admin. expense to profit before tax. (D8/D9) (times) 9.Non-markup/interest expense to total income D7/(D1+D6) 10.Admin. expense to non-markup/interest income (D8/D6) (times) 11.Earning per share (D10/E1) G.Liquidity ratios 1.Cash & cash equivalent to total assets (C1+C2)/C 2.Investment to total assets (C4/C) 3.Advances net of provisions to total assets (C8/C) 4.Deposits to total assets (B3/C) 5.Total liabilities to total assets (B/C) 6.Gross advances to deposits (C5/B3) 7.Gross advances to borrowing & deposit C5/(B2+B3) H.Assets quality ratios 1.Non-performing loan to gross advances (C6/C5) 2.Provisions against NPLs to gross advances (C7/C5) 3.NPLs to shareholders equity (C6/A) 4.NPLs write off to NPLs provisions (D4/C7) 5.Provision against NPL to NPLs (C7/C6) I.Capital /leverage ratios 1.Capital ratio (A/C) 2.Commitments & contingencies to total equity (E5/A) (times) 3.Break up value per share (A/E1) 4.Total deposit to total equity (B3/A) (times) J.Cash flow ratio 1.Cash generated from opration activities to profit after tax (E4/D10) (times)
17,247,585 26,845,158 34,459,979 41,311,127 46,306,152
15,287,974 26,173,766 26,173,766 26,173,766 26,173,766
1,300,673 3,477,831 4,990,570 6,640,276 8,029,024
658,938 (2,806,439) 3,295,643 8,497,085 12,103,362
10,606,913 2,886,602 3,260,312 5,371,207 5,955,359
519,569,529 628,005,385 676,659,301 822,245,446 1,043,184,505
4,183,480 3,365,325 3,577,677 3,421,083 4,168,641
39,829,134 38,949,362 41,793,201 77,044,955 154,841,415
453,219,740 556,281,156 595,581,962 691,017,447 835,067,592
22,337,175 29,409,542 35,706,461 50,761,961 49,106,857
547,424,027 657,737,145 714,379,592 868,927,780 1,095,446,016
35,756,024 42,477,950 43,589,007 53,414,628 69,271,804
3,765,867 6,077,383 5,802,312 10,310,569 2,397,707
11,562,133 24,570,850 27,843,153 4,059,771 16,086,867
199,741,990 242,506,452 210,071,483 361,452,930 567,788,623
293,921,855 341,735,415 425,755,974 428,845,954 442,759,887
54,953,553 50,950,992 49,385,062 51,363,291 57,251,171
31,853,931 45,983,694 43,878,718 45,532,574 51,599,275
262,067,924 295,751,721 381,877,256 383,313,380 391,160,612
7,650,455 7,889,725 8,787,928 15,218,893 14,812,949
26,879,634 38,463,064 36,408,453 41,157,609 33,927,454
29,674,488 34,668,327 46,893,398 80,866,848 86,019,127
17,430,154 19,094,699 26,840,110 54,110,056 62,693,706
12,244,334 15,573,628 20,053,288 26,756,792 23,325,421
1,024,868 14,730,779 (1,148,365) 1,776,084 6,862,308
11,219,466 842,849 21,201,653 24,980,708 16,463,113
5,294,430 4,591,274 3,672,930 3,939,611 13,045,587
8,463,955 10,132,065 12,666,228 14,876,432 17,519,289
8,346,001 10,089,062 12,612,663 14,452,774 16,880,128
8,049,941 (4,697,942) 12,208,355 14,043,887 11,989,411
4,858,354 (3,322,055) 7,563,693 8,248,529 6,943,739
1,528,797 2,617,377 2,617,377 2,643,692 2,643,692
0.00% 0.00% 0.00% 8.00% 10.00%
0.00% 0.00% 0.00% 0.00% 0.00%
6,774,058 43,965,145 (31,838,456) 178,737,578 197,832,226
108,507,475 134,777,943 145,808,484 195,224,640 213,749,905
41.26% 44.92% 42.76% 33.09% 27.12%
2.24% 2.37% 2.81% 3.08% 2.13%
28.17% -12.37% 21.95% 19.97% 15.00%
0.89% -0.51% 1.06% 0.95% 0.63%
0.97% 0.70% 0.51% 0.45% 1.19%
2.05% 0.13% 2.97% 2.87% 1.50%
58.74% 55.08% 57.24% 66.91% 72.88%
1.04 -2.15 1.03 1.03 1.41
24.20% 25.81% 25.05% 17.54% 17.68%
1.58 2.20 3.43 3.67 1.29
3.18 -1.27 2.89 3.12 2.63
7.22% 7.38% 6.91% 7.33% 6.54%
36.49% 36.87% 29.41% 41.60% 51.83%
47.87% 44.97% 53.46% 44.11% 35.71%
82.79% 84.57% 83.37% 79.53% 76.23%
94.91% 95.48% 94.72% 94.63% 95.23%
64.85% 61.43% 71.49% 62.06% 53.02%
59.61% 57.41% 66.80% 55.83% 44.73%
18.70% 14.91% 11.60% 11.98% 12.93%
10.84% 13.46% 10.31% 10.62% 11.65%
318.62% 189.80% 143.31% 124.33% 123.64%
3.22% 32.03% -2.62% 3.90% 13.30%
57.97% 90.25% 88.85% 88.65% 90.13%
3.15% 4.08% 4.82% 4.75% 4.23%
6.29 5.02 4.23 4.73 4.62
11.28 10.26 13.17 15.63 17.52
26.28 20.72 17.28 16.73 18.03
1.39 -13.23 -4.21 21.67 28.49
(Thousand Rupees)THE BANK OF PUNJAB
30

Financial Statement Analysis of Financial Sector 2020
2016 2017 2018 2019 2020Items
A.Total equity (A1 to A3) 1.Share capital 2.Reserves 3.Un appropriated profit 4.Others B.Total liabilities(B1 to B4) 1.Bills payable 2.Borrowings from financial institutions 3.Deposits and other accounts 4.Other/misc. liabilities C.Total assets (C1 to C4 + C8 to C10) 1.Cash and balances with treasury banks 2.Balances with other banks 3.Lending to financial institutions 4.Investments 5.Gross advances 6.Advances-non-performing/classified 7.Provision against advances 8.Advances net of provision (C5-C7) 9.Fixed assets 10.Other/misc. assets D.Profit & loss account 1.Markup/interest earned 2.Markup/interest expensed 3.Net markup/interest income 4.Provisions and write-offs 5.Net markup/interest income after provisions 6.Non-markup/interest income 7.Non-markup/interest expenses 8.Administrative expenses 9.Profit/(loss) before taxation 10.Profit/(loss) after taxation E.Other items 1.No. of ordinary shares (000) 2.Cash dividend 3.Stock dividend/bonus shares 4.Cash generated from operating activities 5.Commitments and contigencies F.Efficiency ratios/profitability ratios 1.Spread (D3/D1) 2.Net markup/interest margin (D1-D2)/C 3.Return on equity (ROE) (D10/A) 4.Return on assets (ROA) (D10/C) 5.Non-markup/interest income to total assets (D6/C) 6.Net markup/interest income(after prov.) to total assets(D5/C) 7.Markup/interest expense to markup/interest income (D2/D1) 8.Admin. expense to profit before tax. (D8/D9) (times) 9.Non-markup/interest expense to total income D7/(D1+D6) 10.Admin. expense to non-markup/interest income (D8/D6) (times) 11.Earning per share (D10/E1) G.Liquidity ratios 1.Cash & cash equivalent to total assets (C1+C2)/C 2.Investment to total assets (C4/C) 3.Advances net of provisions to total assets (C8/C) 4.Deposits to total assets (B3/C) 5.Total liabilities to total assets (B/C) 6.Gross advances to deposits (C5/B3) 7.Gross advances to borrowing & deposit C5/(B2+B3) H.Assets quality ratios 1.Non-performing loan to gross advances (C6/C5) 2.Provisions against NPLs to gross advances (C7/C5) 3.NPLs to shareholders equity (C6/A) 4.NPLs write off to NPLs provisions (D4/C7) 5.Provision against NPL to NPLs (C7/C6) I.Capital /leverage ratios 1.Capital ratio (A/C) 2.Commitments & contingencies to total equity (E5/A) (times) 3.Break up value per share (A/E1) 4.Total deposit to total equity (B3/A) (times) J.Cash flow ratio 1.Cash generated from opration activities to profit after tax (E4/D10) (times)
956,519,542 898,718,612 970,415,510 1,059,976,014 1,204,657,852
433,751,493 288,823,164 294,733,579 298,682,333 299,968,444
245,777,088 275,886,666 318,435,336 346,700,996 380,882,096
276,990,961 334,008,782 357,246,595 414,592,685 523,807,312
58,281,226 136,459,772 87,115,926 156,590,359 186,959,372
11,306,428,678 13,046,513,446 14,148,603,788 15,450,292,220 18,108,866,590
188,035,439 237,078,512 266,920,037 199,801,621 277,803,502
1,534,136,465 2,168,908,526 2,070,320,544 1,873,690,028 2,366,298,647
9,147,869,314 10,097,586,740 11,123,862,738 12,484,583,498 14,550,807,844
436,387,460 542,939,668 687,500,469 892,217,073 913,956,597
12,321,229,446 14,081,691,829 15,206,135,224 16,666,858,593 19,500,483,814
946,129,150 1,030,917,544 1,204,819,121 1,549,047,942 1,593,500,321
103,151,503 86,393,217 103,159,011 133,985,930 193,921,885
350,771,632 351,059,201 507,979,518 568,302,805 698,854,041
5,873,148,624 6,538,132,085 6,050,418,396 6,664,704,237 9,190,812,955
4,618,421,427 5,470,694,860 6,642,451,891 6,862,095,199 7,014,604,015
329,601,183 372,263,563 395,777,829 452,440,148 477,584,733
335,416,585 337,376,398 354,831,189 376,795,483 427,564,189
4,283,004,842 5,133,318,462 6,287,620,702 6,485,299,716 6,587,039,826
244,617,104 313,880,600 342,580,832 466,164,957 497,221,236
520,406,591 627,990,720 709,557,644 799,353,006 739,133,550
727,490,876 756,484,953 872,972,611 1,401,051,298 1,444,168,024
345,328,678 372,262,372 453,748,263 868,764,185 784,725,728
382,162,198 384,222,581 419,224,348 532,287,113 659,442,296
2,990,485 24,773,046 20,139,729 33,336,896 79,444,384
379,171,713 359,449,535 399,084,619 498,912,019 579,997,912
146,852,635 149,170,149 139,377,799 149,448,780 171,206,431
281,908,878 305,244,895 342,440,126 391,103,432 420,054,651
276,966,540 299,979,727 338,548,841 384,482,967 410,760,815
244,093,420 203,374,789 196,022,292 257,295,565 331,149,692
148,425,358 120,507,989 120,038,321 148,547,952 197,415,467
43,375,150 28,882,317 29,473,358 43,831,085 29,792,146
583,550,192 908,768,455 (155,494,355) 780,161,324 2,766,378,960
4,399,721,153 6,974,975,990 8,612,216,277 8,364,002,542 7,626,509,682
52.53% 50.79% 48.02% 37.99% 45.66%
3.10% 2.73% 2.76% 3.19% 3.38%
15.52% 13.41% 12.37% 14.01% 16.39%
1.20% 0.86% 0.79% 0.89% 1.01%
1.19% 1.06% 0.92% 0.90% 0.88%
3.08% 2.55% 2.62% 2.99% 2.97%
47.47% 49.21% 51.98% 62.01% 54.34%
1.13 1.48 1.73 1.49 1.24
32.24% 33.70% 33.83% 25.22% 26.00%
1.89 2.01 2.43 2.57 2.40
3.42 4.17 4.07 3.39 6.63
8.52% 7.93% 8.60% 10.10% 9.17%
47.67% 46.43% 39.79% 39.99% 47.13%
34.76% 36.45% 41.35% 38.91% 33.78%
74.24% 71.71% 73.15% 74.91% 74.62%
91.76% 92.65% 93.05% 92.70% 92.86%
50.49% 54.18% 59.71% 54.96% 48.21%
43.24% 44.60% 50.34% 47.79% 41.46%
7.14% 6.80% 5.96% 6.59% 6.81%
7.26% 6.17% 5.34% 5.49% 6.10%
34.46% 41.42% 40.78% 42.68% 39.64%
0.89% 7.34% 5.68% 8.85% 18.58%
101.76% 90.63% 89.65% 83.28% 89.53%
7.76% 6.38% 6.38% 6.36% 6.18%
4.60 7.76 8.87 7.89 6.33
22.05 31.12 32.93 24.18 40.44
9.56 11.24 11.46 11.78 12.08
3.93 7.54 -1.30 5.25 14.01
(Thousand Rupees)Private Sector Banks - Overall
N/A N/A N/A N/A N/A
N/A N/A N/A N/A N/A
31

Financial Statement Analysis of Financial Sector 2020
2016 2017 2018 2019 2020Items
A.Total equity (A1 to A3) 1.Share capital 2.Reserves 3.Un appropriated profit 4.Others B.Total liabilities(B1 to B4) 1.Bills payable 2.Borrowings from financial institutions 3.Deposits and other accounts 4.Other/misc. liabilities C.Total assets (C1 to C4 + C8 to C10) 1.Cash and balances with treasury banks 2.Balances with other banks 3.Lending to financial institutions 4.Investments 5.Gross advances 6.Advances-non-performing/classified 7.Provision against advances 8.Advances net of provision (C5-C7) 9.Fixed assets 10.Other/misc. assets D.Profit & loss account 1.Markup/interest earned 2.Markup/interest expensed 3.Net markup/interest income 4.Provisions and write-offs 5.Net markup/interest income after provisions 6.Non-markup/interest income 7.Non-markup/interest expenses 8.Administrative expenses 9.Profit/(loss) before taxation 10.Profit/(loss) after taxation E.Other items 1.No. of ordinary shares (000) 2.Cash dividend 3.Stock dividend/bonus shares 4.Cash generated from operating activities 5.Commitments and contigencies F.Efficiency ratios/profitability ratios 1.Spread (D3/D1) 2.Net markup/interest margin (D1-D2)/C 3.Return on equity (ROE) (D10/A) 4.Return on assets (ROA) (D10/C) 5.Non-markup/interest income to total assets (D6/C) 6.Net markup/interest income(after prov.) to total assets(D5/C) 7.Markup/interest expense to markup/interest income (D2/D1) 8.Admin. expense to profit before tax. (D8/D9) (times) 9.Non-markup/interest expense to total income D7/(D1+D6) 10.Admin. expense to non-markup/interest income (D8/D6) (times) 11.Earning per share (D10/E1) G.Liquidity ratios 1.Cash & cash equivalent to total assets (C1+C2)/C 2.Investment to total assets (C4/C) 3.Advances net of provisions to total assets (C8/C) 4.Deposits to total assets (B3/C) 5.Total liabilities to total assets (B/C) 6.Gross advances to deposits (C5/B3) 7.Gross advances to borrowing & deposit C5/(B2+B3) H.Assets quality ratios 1.Non-performing loan to gross advances (C6/C5) 2.Provisions against NPLs to gross advances (C7/C5) 3.NPLs to shareholders equity (C6/A) 4.NPLs write off to NPLs provisions (D4/C7) 5.Provision against NPL to NPLs (C7/C6) I.Capital /leverage ratios 1.Capital ratio (A/C) 2.Commitments & contingencies to total equity (E5/A) (times) 3.Break up value per share (A/E1) 4.Total deposit to total equity (B3/A) (times) J.Cash flow ratio 1.Cash generated from opration activities to profit after tax (E4/D10) (times)
10,984,841 10,590,487 10,351,871 11,546,024 12,305,943
13,106,862 13,106,862 13,106,862 14,500,490 14,500,490
159,348 159,348 159,348 179,384 332,231
(2,281,369) (2,675,723) (2,914,339) (3,133,850) (2,526,778)
404,662 171,734 353,212 1,185,540 723,509
117,322,553 111,890,172 118,107,956 149,250,662 179,784,170
3,909,415 3,658,120 3,697,477 3,223,721 3,696,482
3,223,109 3,209,400 3,836,022 4,278,132 5,722,336
103,320,059 96,622,925 99,915,011 129,654,288 159,363,727
6,869,970 8,399,727 10,659,446 12,094,521 11,001,625
128,712,056 122,652,393 128,813,039 161,982,226 192,813,622
18,725,350 8,915,585 14,934,799 26,319,937 15,773,612
984,125 2,932,165 854,171 2,850,550 10,177,095
2,692,703 5,095,411 0 14,598,633 2,748,221
24,601,518 19,393,486 21,345,325 24,194,885 57,117,232
71,090,188 75,492,269 79,771,998 81,290,324 97,355,367
7,146,027 7,651,332 7,020,606 9,250,329 9,512,008
4,304,922 4,289,213 4,760,022 5,846,612 7,076,323
66,785,266 71,203,056 75,011,976 75,443,712 90,279,044
2,617,734 2,361,576 2,310,578 4,877,578 4,396,282
12,305,360 12,751,114 14,356,190 13,696,931 12,322,136
5,158,073 6,717,570 8,031,610 12,923,326 14,052,494
2,794,910 3,077,721 3,814,832 7,912,215 7,676,157
2,363,163 3,639,849 4,216,778 5,011,111 6,376,337
(164,250) 185,354 770,029 1,190,441 1,207,948
2,527,413 3,454,495 3,446,749 3,820,670 5,168,389
874,200 967,796 1,096,768 1,430,203 1,885,749
3,502,361 4,953,364 4,788,529 5,243,303 5,515,734
3,414,381 4,929,047 4,782,531 5,214,659 5,393,641
(100,748) (531,073) (245,012) 7,570 1,538,404
(155,527) (389,438) (253,728) (191,686) 764,233
1,310,686 1,310,686 1,310,686 1,373,963 1,373,963
0.00% 0.00% 0.00% 0.00% 0.00%
0.00% 0.00% 0.00% 0.00% 0.00%
9,232,119 (13,868,634) 4,867,484 15,539,994 31,126,959
22,992,868 57,812,684 78,807,206 42,405,292 51,520,742
45.81% 54.18% 52.50% 38.78% 45.38%
1.84% 2.97% 3.27% 3.09% 3.31%
-1.42% -3.68% -2.45% -1.66% 6.21%
-0.12% -0.32% -0.20% -0.12% 0.40%
0.68% 0.79% 0.85% 0.88% 0.98%
1.96% 2.82% 2.68% 2.36% 2.68%
54.19% 45.82% 47.50% 61.22% 54.62%
-33.89 -9.28 -19.52 688.86 3.51
58.06% 64.45% 52.46% 36.53% 34.61%
3.91 5.09 4.36 3.65 2.86
-0.12 -0.30 -0.19 -0.14 0.56
15.31% 9.66% 12.26% 18.01% 13.46%
19.11% 15.81% 16.57% 14.94% 29.62%
51.89% 58.05% 58.23% 46.58% 46.82%
80.27% 78.78% 77.57% 80.04% 82.65%
91.15% 91.23% 91.69% 92.14% 93.24%
68.81% 78.13% 79.84% 62.70% 61.09%
66.72% 75.62% 76.89% 60.70% 58.97%
10.05% 10.14% 8.80% 11.38% 9.77%
6.06% 5.68% 5.97% 7.19% 7.27%
65.05% 72.25% 67.82% 80.12% 77.30%
-3.82% 4.32% 16.18% 20.36% 17.07%
60.24% 56.06% 67.80% 63.20% 74.39%
8.53% 8.63% 8.04% 7.13% 6.38%
2.09 5.46 7.61 3.67 4.19
8.38 8.08 7.90 8.40 8.96
9.41 9.12 9.65 11.23 12.95
-59.36 35.61 -19.18 -81.07 40.73
(Thousand Rupees)ALBARAKA BANK (PAKISTAN) LTD.
32

Financial Statement Analysis of Financial Sector 2020
2016 2017 2018 2019 2020Items
A.Total equity (A1 to A3) 1.Share capital 2.Reserves 3.Un appropriated profit 4.Others B.Total liabilities(B1 to B4) 1.Bills payable 2.Borrowings from financial institutions 3.Deposits and other accounts 4.Other/misc. liabilities C.Total assets (C1 to C4 + C8 to C10) 1.Cash and balances with treasury banks 2.Balances with other banks 3.Lending to financial institutions 4.Investments 5.Gross advances 6.Advances-non-performing/classified 7.Provision against advances 8.Advances net of provision (C5-C7) 9.Fixed assets 10.Other/misc. assets D.Profit & loss account 1.Markup/interest earned 2.Markup/interest expensed 3.Net markup/interest income 4.Provisions and write-offs 5.Net markup/interest income after provisions 6.Non-markup/interest income 7.Non-markup/interest expenses 8.Administrative expenses 9.Profit/(loss) before taxation 10.Profit/(loss) after taxation E.Other items 1.No. of ordinary shares (000) 2.Cash dividend 3.Stock dividend/bonus shares 4.Cash generated from operating activities 5.Commitments and contigencies F.Efficiency ratios/profitability ratios 1.Spread (D3/D1) 2.Net markup/interest margin (D1-D2)/C 3.Return on equity (ROE) (D10/A) 4.Return on assets (ROA) (D10/C) 5.Non-markup/interest income to total assets (D6/C) 6.Net markup/interest income(after prov.) to total assets(D5/C) 7.Markup/interest expense to markup/interest income (D2/D1) 8.Admin. expense to profit before tax. (D8/D9) (times) 9.Non-markup/interest expense to total income D7/(D1+D6) 10.Admin. expense to non-markup/interest income (D8/D6) (times) 11.Earning per share (D10/E1) G.Liquidity ratios 1.Cash & cash equivalent to total assets (C1+C2)/C 2.Investment to total assets (C4/C) 3.Advances net of provisions to total assets (C8/C) 4.Deposits to total assets (B3/C) 5.Total liabilities to total assets (B/C) 6.Gross advances to deposits (C5/B3) 7.Gross advances to borrowing & deposit C5/(B2+B3) H.Assets quality ratios 1.Non-performing loan to gross advances (C6/C5) 2.Provisions against NPLs to gross advances (C7/C5) 3.NPLs to shareholders equity (C6/A) 4.NPLs write off to NPLs provisions (D4/C7) 5.Provision against NPL to NPLs (C7/C6) I.Capital /leverage ratios 1.Capital ratio (A/C) 2.Commitments & contingencies to total equity (E5/A) (times) 3.Break up value per share (A/E1) 4.Total deposit to total equity (B3/A) (times) J.Cash flow ratio 1.Cash generated from opration activities to profit after tax (E4/D10) (times)
74,474,468 78,643,302 84,227,659 89,542,175 102,722,446
11,450,739 11,450,739 11,450,739 11,450,739 11,450,739
16,533,485 17,980,116 20,276,515 22,270,225 24,277,184
46,490,244 49,212,447 52,500,405 55,821,211 66,994,523
26,199,360 28,073,051 23,077,174 25,808,658 28,837,661
968,271,920 1,142,949,305 1,243,294,076 1,365,770,419 1,458,897,908
9,848,795 7,835,467 7,752,959 7,878,626 9,622,020
126,368,875 223,556,383 225,882,986 266,448,386 193,928,086
805,110,834 883,740,709 984,475,183 1,049,043,032 1,216,678,254
26,943,416 27,816,746 25,182,948 42,400,375 38,669,548
1,068,945,748 1,249,665,658 1,350,598,909 1,481,121,252 1,590,458,015
73,203,717 85,367,385 99,188,414 119,943,828 128,391,896
679,923 648,765 2,575,055 602,582 7,236,502
10,512,752 8,694,399 53,780,195 13,606,921 17,996,123
589,864,548 698,082,066 671,228,285 757,956,993 829,621,110
348,346,063 388,751,651 453,866,549 500,168,300 510,173,744
20,431,609 18,051,749 16,064,641 15,853,918 14,160,659
18,783,872 16,713,937 15,549,365 15,152,419 13,741,988
329,562,191 372,037,714 438,317,184 485,015,881 496,431,756
31,765,903 46,867,935 52,127,591 62,114,648 73,529,440
33,356,714 37,967,394 33,382,185 41,880,399 37,251,188
64,592,588 65,708,757 73,274,161 122,637,434 110,546,934
31,345,347 34,130,494 41,158,720 81,129,964 62,126,061
33,247,241 31,578,263 32,115,441 41,507,470 48,420,873
(260,453) (2,526,148) (1,089,688) 546,658 843,550
33,507,694 34,104,411 33,205,129 40,960,812 47,577,323
11,210,491 8,712,261 11,289,440 10,891,180 12,542,230
20,886,967 21,937,977 23,478,142 27,610,353 30,604,153
20,295,643 21,423,547 24,519,149 28,184,528 29,874,463
23,831,218 20,878,695 21,016,427 24,241,639 29,515,400
14,427,050 12,733,636 12,880,518 14,112,911 18,029,457
1,145,074 1,145,074 1,145,074 1,145,074 1,145,074
0.73% 0.01% 0.01% 80.00% 80.00%
0.00% 0.00% 0.00% 0.00% 0.00%
63,803,312 119,789,804 33,679,500 98,946,324 123,396,444
189,683,417 235,905,181 379,526,640 465,219,340 349,537,722
51.47% 48.06% 43.83% 33.85% 43.80%
3.11% 2.53% 2.38% 2.80% 3.04%
19.37% 16.19% 15.29% 15.76% 17.55%
1.35% 1.02% 0.95% 0.95% 1.13%
1.05% 0.70% 0.84% 0.74% 0.79%
3.13% 2.73% 2.46% 2.77% 2.99%
48.53% 51.94% 56.17% 66.15% 56.20%
0.85 1.03 1.17 1.16 1.01
27.55% 29.48% 27.76% 20.68% 24.86%
1.81 2.46 2.17 2.59 2.38
12.60 11.12 11.25 12.32 15.75
6.91% 6.88% 7.53% 8.14% 8.53%
55.18% 55.86% 49.70% 51.17% 52.16%
30.83% 29.77% 32.45% 32.75% 31.21%
75.32% 70.72% 72.89% 70.83% 76.50%
90.58% 91.46% 92.06% 92.21% 91.73%
43.27% 43.99% 46.10% 47.68% 41.93%
37.40% 35.11% 37.50% 38.02% 36.17%
5.87% 4.64% 3.54% 3.17% 2.78%
5.39% 4.30% 3.43% 3.03% 2.69%
27.43% 22.95% 19.07% 17.71% 13.79%
-1.39% -15.11% -7.01% 3.61% 6.14%
91.94% 92.59% 96.79% 95.58% 97.04%
6.97% 6.29% 6.24% 6.05% 6.46%
2.55 3.00 4.51 5.20 3.40
65.04 68.68 73.56 78.20 89.71
10.81 11.24 11.69 11.72 11.84
4.42 9.41 2.61 7.01 6.84
(Thousand Rupees)ALLIED BANK LTD.
33

Financial Statement Analysis of Financial Sector 2020
2016 2017 2018 2019 2020Items
A.Total equity (A1 to A3) 1.Share capital 2.Reserves 3.Un appropriated profit 4.Others B.Total liabilities(B1 to B4) 1.Bills payable 2.Borrowings from financial institutions 3.Deposits and other accounts 4.Other/misc. liabilities C.Total assets (C1 to C4 + C8 to C10) 1.Cash and balances with treasury banks 2.Balances with other banks 3.Lending to financial institutions 4.Investments 5.Gross advances 6.Advances-non-performing/classified 7.Provision against advances 8.Advances net of provision (C5-C7) 9.Fixed assets 10.Other/misc. assets D.Profit & loss account 1.Markup/interest earned 2.Markup/interest expensed 3.Net markup/interest income 4.Provisions and write-offs 5.Net markup/interest income after provisions 6.Non-markup/interest income 7.Non-markup/interest expenses 8.Administrative expenses 9.Profit/(loss) before taxation 10.Profit/(loss) after taxation E.Other items 1.No. of ordinary shares (000) 2.Cash dividend 3.Stock dividend/bonus shares 4.Cash generated from operating activities 5.Commitments and contigencies F.Efficiency ratios/profitability ratios 1.Spread (D3/D1) 2.Net markup/interest margin (D1-D2)/C 3.Return on equity (ROE) (D10/A) 4.Return on assets (ROA) (D10/C) 5.Non-markup/interest income to total assets (D6/C) 6.Net markup/interest income(after prov.) to total assets(D5/C) 7.Markup/interest expense to markup/interest income (D2/D1) 8.Admin. expense to profit before tax. (D8/D9) (times) 9.Non-markup/interest expense to total income D7/(D1+D6) 10.Admin. expense to non-markup/interest income (D8/D6) (times) 11.Earning per share (D10/E1) G.Liquidity ratios 1.Cash & cash equivalent to total assets (C1+C2)/C 2.Investment to total assets (C4/C) 3.Advances net of provisions to total assets (C8/C) 4.Deposits to total assets (B3/C) 5.Total liabilities to total assets (B/C) 6.Gross advances to deposits (C5/B3) 7.Gross advances to borrowing & deposit C5/(B2+B3) H.Assets quality ratios 1.Non-performing loan to gross advances (C6/C5) 2.Provisions against NPLs to gross advances (C7/C5) 3.NPLs to shareholders equity (C6/A) 4.NPLs write off to NPLs provisions (D4/C7) 5.Provision against NPL to NPLs (C7/C6) I.Capital /leverage ratios 1.Capital ratio (A/C) 2.Commitments & contingencies to total equity (E5/A) (times) 3.Break up value per share (A/E1) 4.Total deposit to total equity (B3/A) (times) J.Cash flow ratio 1.Cash generated from opration activities to profit after tax (E4/D10) (times)
25,249,836 27,293,237 31,859,710 37,955,418 46,908,566
12,602,602 12,602,602 12,602,602 12,602,602 12,602,602
8,670,686 11,840,757 15,543,179 19,366,260 25,632,015
3,976,548 2,849,878 3,713,929 5,986,556 8,673,949
7,327,114 5,142,254 1,649,197 4,300,426 7,637,784
590,291,749 630,255,904 673,023,135 790,952,162 937,970,712
8,579,809 10,769,262 15,512,880 15,768,947 12,629,996
89,261,788 71,587,311 52,702,323 51,187,681 84,163,669
472,811,335 525,808,308 573,635,856 679,299,486 791,186,883
19,638,817 22,091,023 31,172,076 44,696,048 49,990,164
622,868,699 662,691,395 706,532,042 833,208,006 992,517,062
42,568,141 44,239,325 49,187,645 63,039,290 73,651,718
5,845,748 3,193,835 4,093,402 7,886,702 7,719,615
6,836,584 2,250,000 0 20,405,972 0
295,846,254 314,956,748 260,233,987 305,435,633 449,687,240
262,123,256 284,339,670 369,258,971 398,548,811 421,819,890
28,534,630 26,753,027 26,657,086 28,133,973 28,410,810
26,959,334 25,646,584 26,151,824 25,634,948 26,446,050
235,163,922 258,693,086 343,107,147 372,913,863 395,373,840
10,132,940 9,885,958 12,791,827 19,696,568 21,213,709
26,475,110 29,472,443 37,118,034 43,829,978 44,870,940
35,408,195 36,267,220 43,669,883 71,704,373 77,321,906
20,496,757 20,071,965 25,059,925 49,568,569 47,059,096
14,911,438 16,195,255 18,609,958 22,135,804 30,262,810
(658,824) (1,330,390) 1,460,575 773,275 1,974,747
15,570,262 17,525,645 17,149,383 21,362,529 28,288,063
7,210,473 6,108,354 5,621,593 7,404,193 9,693,808
14,303,787 15,142,197 15,891,521 18,377,451 20,214,626
14,078,992 14,948,796 16,240,514 18,235,387 20,123,495
8,476,948 8,491,802 6,879,455 10,389,271 17,767,245
5,220,635 5,267,887 4,431,278 7,017,022 10,800,375
1,260,260 1,260,260 1,260,260 1,260,260 1,260,260
0.15% 0.10% 0.10% 15.00% 30.00%
0.00% 0.00% 0.00% 0.00% 0.00%
42,479,240 26,130,753 (43,591,408) 69,138,318 147,085,265
374,682,255 948,100,639 1,080,428,257 503,698,039 633,563,381
42.11% 44.66% 42.62% 30.87% 39.14%
2.39% 2.44% 2.63% 2.66% 3.05%
20.68% 19.30% 13.91% 18.49% 23.02%
0.84% 0.79% 0.63% 0.84% 1.09%
1.16% 0.92% 0.80% 0.89% 0.98%
2.50% 2.64% 2.43% 2.56% 2.85%
57.89% 55.34% 57.38% 69.13% 60.86%
1.66 1.76 2.36 1.76 1.13
33.56% 35.73% 32.24% 23.23% 23.23%
1.95 2.45 2.89 2.46 2.08
4.14 4.18 3.52 5.57 8.57
7.77% 7.16% 7.54% 8.51% 8.20%
47.50% 47.53% 36.83% 36.66% 45.31%
37.75% 39.04% 48.56% 44.76% 39.84%
75.91% 79.34% 81.19% 81.53% 79.72%
94.77% 95.11% 95.26% 94.93% 94.50%
55.44% 54.08% 64.37% 58.67% 53.31%
46.64% 47.60% 58.96% 54.56% 48.19%
10.89% 9.41% 7.22% 7.06% 6.74%
10.28% 9.02% 7.08% 6.43% 6.27%
113.01% 98.02% 83.67% 74.12% 60.57%
-2.44% -5.19% 5.58% 3.02% 7.47%
94.48% 95.86% 98.10% 91.12% 93.08%
4.05% 4.12% 4.51% 4.56% 4.73%
14.84 34.74 33.91 13.27 13.51
20.04 21.66 25.28 30.12 37.22
18.73 19.27 18.01 17.90 16.87
8.14 4.96 -9.84 9.85 13.62
(Thousand Rupees)ASKARI BANK LTD.
34

Financial Statement Analysis of Financial Sector 2020
2016 2017 2018 2019 2020Items
A.Total equity (A1 to A3) 1.Share capital 2.Reserves 3.Un appropriated profit 4.Others B.Total liabilities(B1 to B4) 1.Bills payable 2.Borrowings from financial institutions 3.Deposits and other accounts 4.Other/misc. liabilities C.Total assets (C1 to C4 + C8 to C10) 1.Cash and balances with treasury banks 2.Balances with other banks 3.Lending to financial institutions 4.Investments 5.Gross advances 6.Advances-non-performing/classified 7.Provision against advances 8.Advances net of provision (C5-C7) 9.Fixed assets 10.Other/misc. assets D.Profit & loss account 1.Markup/interest earned 2.Markup/interest expensed 3.Net markup/interest income 4.Provisions and write-offs 5.Net markup/interest income after provisions 6.Non-markup/interest income 7.Non-markup/interest expenses 8.Administrative expenses 9.Profit/(loss) before taxation 10.Profit/(loss) after taxation E.Other items 1.No. of ordinary shares (000) 2.Cash dividend 3.Stock dividend/bonus shares 4.Cash generated from operating activities 5.Commitments and contigencies F.Efficiency ratios/profitability ratios 1.Spread (D3/D1) 2.Net markup/interest margin (D1-D2)/C 3.Return on equity (ROE) (D10/A) 4.Return on assets (ROA) (D10/C) 5.Non-markup/interest income to total assets (D6/C) 6.Net markup/interest income(after prov.) to total assets(D5/C) 7.Markup/interest expense to markup/interest income (D2/D1) 8.Admin. expense to profit before tax. (D8/D9) (times) 9.Non-markup/interest expense to total income D7/(D1+D6) 10.Admin. expense to non-markup/interest income (D8/D6) (times) 11.Earning per share (D10/E1) G.Liquidity ratios 1.Cash & cash equivalent to total assets (C1+C2)/C 2.Investment to total assets (C4/C) 3.Advances net of provisions to total assets (C8/C) 4.Deposits to total assets (B3/C) 5.Total liabilities to total assets (B/C) 6.Gross advances to deposits (C5/B3) 7.Gross advances to borrowing & deposit C5/(B2+B3) H.Assets quality ratios 1.Non-performing loan to gross advances (C6/C5) 2.Provisions against NPLs to gross advances (C7/C5) 3.NPLs to shareholders equity (C6/A) 4.NPLs write off to NPLs provisions (D4/C7) 5.Provision against NPL to NPLs (C7/C6) I.Capital /leverage ratios 1.Capital ratio (A/C) 2.Commitments & contingencies to total equity (E5/A) (times) 3.Break up value per share (A/E1) 4.Total deposit to total equity (B3/A) (times) J.Cash flow ratio 1.Cash generated from opration activities to profit after tax (E4/D10) (times)
35,672,945 40,408,589 46,283,478 55,489,294 69,569,892
11,114,254 11,114,254 11,114,254 11,114,254 11,114,254
11,899,426 12,981,379 14,757,530 16,467,282 18,431,277
12,659,265 16,312,956 20,411,694 27,907,758 40,024,361
6,840,799 5,467,293 3,268,202 6,013,816 10,286,484
725,504,673 898,257,898 998,687,323 1,237,179,001 1,442,234,951
13,872,057 19,663,349 20,603,682 20,131,529 31,013,221
93,717,345 133,499,876 119,038,358 228,745,034 211,599,405
584,171,954 692,576,176 796,900,525 903,739,926 1,099,686,361
33,743,317 52,518,497 62,144,758 84,562,512 99,935,964
768,018,417 944,133,780 1,048,239,003 1,298,682,111 1,522,091,327
50,600,041 60,096,155 74,432,172 113,838,791 105,935,947
2,866,455 4,691,917 7,989,939 9,523,969 19,662,515
0 0 0 1,857,575 2,175,301
405,027,569 476,125,054 414,605,406 586,140,504 764,943,506
269,267,267 347,465,571 485,944,757 498,260,168 522,894,419
5,715,466 5,288,599 5,235,392 7,257,916 7,381,473
7,827,169 7,632,660 7,730,179 9,590,721 12,642,787
261,440,098 339,832,911 478,214,578 488,669,447 510,251,632
18,776,218 22,482,946 26,183,149 36,562,508 43,967,993
29,308,036 40,904,797 46,813,759 62,089,317 75,154,433
47,804,368 50,309,377 60,733,138 105,601,725 125,272,587
23,132,808 24,386,577 29,839,393 64,415,666 67,652,611
24,671,560 25,922,800 30,893,745 41,186,059 57,619,976
(638,049) 48,539 247,177 3,394,995 4,543,429
25,309,609 25,874,261 30,646,568 37,791,064 53,076,547
5,052,248 8,118,438 7,117,233 9,480,871 10,272,850
17,197,870 20,102,289 23,500,134 28,260,940 34,768,333
17,728,349 19,860,573 23,202,083 27,719,281 34,039,945
13,163,987 13,890,410 14,263,667 19,010,995 28,581,064
8,119,229 8,501,034 8,417,656 11,168,736 17,811,536
1,111,425 1,111,425 1,111,425 1,111,425 1,111,425
0.35% 0.30% 0.25% 35.00% 45.00%
0.00% 0.00% 0.00% 0.00% 0.00%
64,252,144 85,203,789 (36,256,163) 217,873,335 190,835,323
272,251,603 590,059,388 686,530,960 432,637,373 446,071,046
51.61% 51.53% 50.87% 39.00% 46.00%
3.21% 2.75% 2.95% 3.17% 3.79%
22.76% 21.04% 18.19% 20.13% 25.60%
1.06% 0.90% 0.80% 0.86% 1.17%
0.66% 0.86% 0.68% 0.73% 0.67%
3.30% 2.74% 2.92% 2.91% 3.49%
48.39% 48.47% 49.13% 61.00% 54.00%
1.35 1.43 1.63 1.46 1.19
32.54% 34.41% 34.64% 24.56% 25.65%
3.51 2.45 3.26 2.92 3.31
7.31 7.65 7.57 10.05 16.03
6.96% 6.86% 7.86% 9.50% 8.25%
52.74% 50.43% 39.55% 45.13% 50.26%
34.04% 35.99% 45.62% 37.63% 33.52%
76.06% 73.36% 76.02% 69.59% 72.25%
94.46% 95.14% 95.27% 95.26% 94.75%
46.09% 50.17% 60.98% 55.13% 47.55%
39.72% 42.06% 53.05% 44.00% 39.88%
2.12% 1.52% 1.08% 1.46% 1.41%
2.91% 2.20% 1.59% 1.92% 2.42%
16.02% 13.09% 11.31% 13.08% 10.61%
-8.15% 0.64% 3.20% 35.40% 35.94%
136.95% 144.32% 147.65% 132.14% 171.28%
4.64% 4.28% 4.42% 4.27% 4.57%
7.63 14.60 14.83 7.80 6.41
32.10 36.36 41.64 49.93 62.60
16.38 17.14 17.22 16.29 15.81
7.91 10.02 -4.31 19.51 10.71
(Thousand Rupees)BANK AL-HABIB LTD.
35

Financial Statement Analysis of Financial Sector 2020
2016 2017 2018 2019 2020Items
A.Total equity (A1 to A3) 1.Share capital 2.Reserves 3.Un appropriated profit 4.Others B.Total liabilities(B1 to B4) 1.Bills payable 2.Borrowings from financial institutions 3.Deposits and other accounts 4.Other/misc. liabilities C.Total assets (C1 to C4 + C8 to C10) 1.Cash and balances with treasury banks 2.Balances with other banks 3.Lending to financial institutions 4.Investments 5.Gross advances 6.Advances-non-performing/classified 7.Provision against advances 8.Advances net of provision (C5-C7) 9.Fixed assets 10.Other/misc. assets D.Profit & loss account 1.Markup/interest earned 2.Markup/interest expensed 3.Net markup/interest income 4.Provisions and write-offs 5.Net markup/interest income after provisions 6.Non-markup/interest income 7.Non-markup/interest expenses 8.Administrative expenses 9.Profit/(loss) before taxation 10.Profit/(loss) after taxation E.Other items 1.No. of ordinary shares (000) 2.Cash dividend 3.Stock dividend/bonus shares 4.Cash generated from operating activities 5.Commitments and contigencies F.Efficiency ratios/profitability ratios 1.Spread (D3/D1) 2.Net markup/interest margin (D1-D2)/C 3.Return on equity (ROE) (D10/A) 4.Return on assets (ROA) (D10/C) 5.Non-markup/interest income to total assets (D6/C) 6.Net markup/interest income(after prov.) to total assets(D5/C) 7.Markup/interest expense to markup/interest income (D2/D1) 8.Admin. expense to profit before tax. (D8/D9) (times) 9.Non-markup/interest expense to total income D7/(D1+D6) 10.Admin. expense to non-markup/interest income (D8/D6) (times) 11.Earning per share (D10/E1) G.Liquidity ratios 1.Cash & cash equivalent to total assets (C1+C2)/C 2.Investment to total assets (C4/C) 3.Advances net of provisions to total assets (C8/C) 4.Deposits to total assets (B3/C) 5.Total liabilities to total assets (B/C) 6.Gross advances to deposits (C5/B3) 7.Gross advances to borrowing & deposit C5/(B2+B3) H.Assets quality ratios 1.Non-performing loan to gross advances (C6/C5) 2.Provisions against NPLs to gross advances (C7/C5) 3.NPLs to shareholders equity (C6/A) 4.NPLs write off to NPLs provisions (D4/C7) 5.Provision against NPL to NPLs (C7/C6) I.Capital /leverage ratios 1.Capital ratio (A/C) 2.Commitments & contingencies to total equity (E5/A) (times) 3.Break up value per share (A/E1) 4.Total deposit to total equity (B3/A) (times) J.Cash flow ratio 1.Cash generated from opration activities to profit after tax (E4/D10) (times)
49,155,049 58,514,493 68,263,925 76,660,572 80,508,482
15,952,076 16,075,720 17,743,629 17,771,651 17,771,651
15,895,652 18,156,669 23,050,754 26,046,019 27,680,022
17,307,321 24,282,104 27,469,542 32,842,902 35,056,809
10,969,713 7,285,248 7,382,950 11,367,004 10,508,837
869,520,982 933,028,198 930,570,968 977,283,569 1,293,856,230
19,091,201 20,882,970 35,988,225 17,169,059 22,571,122
178,311,035 207,193,686 123,738,241 102,842,330 314,960,186
634,740,043 644,984,967 702,895,280 782,284,196 881,767,082
37,378,703 59,966,575 67,949,222 74,987,984 74,557,840
929,645,744 998,827,939 1,006,217,843 1,065,311,145 1,384,873,549
74,071,384 70,381,435 82,407,700 100,731,873 99,348,197
9,373,123 3,753,954 3,874,955 4,709,968 6,234,299
30,149,029 48,895,828 62,172,287 71,434,895 77,305,535
389,092,637 400,733,286 277,660,403 299,098,115 547,089,932
395,863,309 417,181,932 518,393,165 529,970,947 600,899,372
19,019,000 17,579,000 18,822,000 22,417,228 25,859,580
17,142,960 16,526,508 16,756,713 18,734,998 23,583,425
378,720,349 400,655,424 501,636,452 511,235,949 577,315,947
16,476,271 16,155,727 18,272,215 29,087,028 30,976,236
31,762,951 58,252,285 60,193,831 49,013,317 46,603,403
57,144,032 56,175,501 59,318,342 92,519,053 92,615,890
28,152,734 27,199,316 27,727,287 47,623,373 47,911,316
28,991,298 28,976,185 31,591,055 44,895,680 44,704,574
1,183,272 (616,430) 588,383 3,028,585 7,589,269
27,808,026 29,592,615 31,002,672 41,828,897 37,115,305
8,907,328 9,076,079 10,200,358 10,357,355 12,794,862
23,692,195 24,963,529 24,365,275 29,842,609 32,031,845
23,683,609 24,671,927 23,966,756 29,065,738 31,442,922
13,023,159 13,705,165 16,837,755 22,381,841 17,878,322
7,899,908 8,166,232 10,150,268 12,695,517 10,474,910
1,595,208 1,607,572 1,774,363 1,777,165 1,777,165
0.00% 0.15% 0.25% 40.00% 40.00%
0.00% 0.00% 0.10% 0.00% 0.00%
(29,354,807) 30,307,388 (142,469,511) 80,947,532 204,045,683
344,601,108 1,105,453,540 1,368,422,518 534,640,976 461,867,331
50.73% 51.58% 53.26% 48.53% 48.27%
3.12% 2.90% 3.14% 4.21% 3.23%
16.07% 13.96% 14.87% 16.56% 13.01%
0.85% 0.82% 1.01% 1.19% 0.76%
0.96% 0.91% 1.01% 0.97% 0.92%
2.99% 2.96% 3.08% 3.93% 2.68%
49.27% 48.42% 46.74% 51.47% 51.73%
1.82 1.80 1.42 1.30 1.76
35.87% 38.26% 35.05% 29.01% 30.39%
2.66 2.72 2.35 2.81 2.46
4.95 5.08 5.72 7.14 5.89
8.98% 7.42% 8.57% 9.90% 7.62%
41.85% 40.12% 27.59% 28.08% 39.50%
40.74% 40.11% 49.85% 47.99% 41.69%
68.28% 64.57% 69.86% 73.43% 63.67%
93.53% 93.41% 92.48% 91.74% 93.43%
62.37% 64.68% 73.75% 67.75% 68.15%
48.69% 48.95% 62.71% 59.88% 50.21%
4.80% 4.21% 3.63% 4.23% 4.30%
4.33% 3.96% 3.23% 3.54% 3.92%
38.69% 30.04% 27.57% 29.24% 32.12%
6.90% -3.73% 3.51% 16.17% 32.18%
90.14% 94.01% 89.03% 83.57% 91.20%
5.29% 5.86% 6.78% 7.20% 5.81%
7.01 18.89 20.05 6.97 5.74
30.81 36.40 38.47 43.14 45.30
12.91 11.02 10.30 10.20 10.95
-3.72 3.71 -14.04 6.38 19.48
(Thousand Rupees)BANK ALFALAH LTD.
36

Financial Statement Analysis of Financial Sector 2020
2016 2017 2018 2019 2020Items
A.Total equity (A1 to A3) 1.Share capital 2.Reserves 3.Un appropriated profit 4.Others B.Total liabilities(B1 to B4) 1.Bills payable 2.Borrowings from financial institutions 3.Deposits and other accounts 4.Other/misc. liabilities C.Total assets (C1 to C4 + C8 to C10) 1.Cash and balances with treasury banks 2.Balances with other banks 3.Lending to financial institutions 4.Investments 5.Gross advances 6.Advances-non-performing/classified 7.Provision against advances 8.Advances net of provision (C5-C7) 9.Fixed assets 10.Other/misc. assets D.Profit & loss account 1.Markup/interest earned 2.Markup/interest expensed 3.Net markup/interest income 4.Provisions and write-offs 5.Net markup/interest income after provisions 6.Non-markup/interest income 7.Non-markup/interest expenses 8.Administrative expenses 9.Profit/(loss) before taxation 10.Profit/(loss) after taxation E.Other items 1.No. of ordinary shares (000) 2.Cash dividend 3.Stock dividend/bonus shares 4.Cash generated from operating activities 5.Commitments and contigencies F.Efficiency ratios/profitability ratios 1.Spread (D3/D1) 2.Net markup/interest margin (D1-D2)/C 3.Return on equity (ROE) (D10/A) 4.Return on assets (ROA) (D10/C) 5.Non-markup/interest income to total assets (D6/C) 6.Net markup/interest income(after prov.) to total assets(D5/C) 7.Markup/interest expense to markup/interest income (D2/D1) 8.Admin. expense to profit before tax. (D8/D9) (times) 9.Non-markup/interest expense to total income D7/(D1+D6) 10.Admin. expense to non-markup/interest income (D8/D6) (times) 11.Earning per share (D10/E1) G.Liquidity ratios 1.Cash & cash equivalent to total assets (C1+C2)/C 2.Investment to total assets (C4/C) 3.Advances net of provisions to total assets (C8/C) 4.Deposits to total assets (B3/C) 5.Total liabilities to total assets (B/C) 6.Gross advances to deposits (C5/B3) 7.Gross advances to borrowing & deposit C5/(B2+B3) H.Assets quality ratios 1.Non-performing loan to gross advances (C6/C5) 2.Provisions against NPLs to gross advances (C7/C5) 3.NPLs to shareholders equity (C6/A) 4.NPLs write off to NPLs provisions (D4/C7) 5.Provision against NPL to NPLs (C7/C6) I.Capital /leverage ratios 1.Capital ratio (A/C) 2.Commitments & contingencies to total equity (E5/A) (times) 3.Break up value per share (A/E1) 4.Total deposit to total equity (B3/A) (times) J.Cash flow ratio 1.Cash generated from opration activities to profit after tax (E4/D10) (times)
10,826,268 12,400,129 12,664,168 15,069,968 16,864,664
10,000,079 10,000,079 10,000,079 11,007,991 11,007,991
613,636 926,266 968,799 1,186,267 1,526,894
212,553 1,473,784 1,695,290 2,875,710 4,329,779
1,618,398 1,276,340 1,850,647 4,626,364 3,030,509
170,028,757 204,115,929 201,228,441 263,400,162 316,402,125
2,937,746 3,928,469 3,242,180 3,645,324 4,949,486
6,066,307 15,570,390 7,819,532 15,103,607 16,127,616
153,735,845 178,309,817 184,693,363 228,826,675 282,015,950
7,288,859 6,307,253 5,473,366 15,824,556 13,309,073
182,473,423 217,792,397 215,743,256 283,096,494 336,297,298
8,921,433 11,784,180 14,292,752 14,640,163 22,034,025
1,140,150 801,807 832,621 1,877,508 12,308,269
27,218,665 21,371,787 18,173,504 42,911,620 41,640,012
46,316,927 42,092,166 38,832,093 55,194,471 95,239,635
89,949,086 130,828,986 129,734,404 144,720,437 145,338,047
14,533,967 15,837,045 15,403,434 15,387,724 15,387,724
12,132,284 11,673,947 11,163,593 12,945,933 15,176,158
77,816,802 119,155,039 118,570,811 131,774,504 130,161,889
6,186,259 5,944,357 6,663,467 12,717,391 11,741,506
14,873,187 16,643,061 18,378,008 23,980,837 23,171,962
10,127,616 10,353,849 12,204,238 23,650,447 25,743,683
5,791,252 5,249,882 6,170,275 12,860,056 13,254,781
4,336,364 5,103,967 6,033,963 10,790,391 12,488,902
(2,029,926) (391,970) 36,835 2,798,657 2,601,023
6,366,290 5,495,937 5,997,128 7,991,734 9,887,879
637,612 964,695 1,264,012 1,633,184 1,635,435
6,160,145 6,303,270 6,858,572 7,793,580 8,763,867
6,142,395 6,281,537 6,795,997 7,721,165 8,578,042
843,757 157,362 402,568 1,831,338 2,759,447
452,300 1,563,149 212,664 1,087,338 1,703,135
1,000,008 1,000,008 1,000,008 1,100,799 1,100,799
0.00% 0.00% 0.00% 10.00% 0.00%
0.00% 0.00% 0.00% 0.00% 0.00%
9,354,153 118,864 190,873 17,027,070 60,476,352
27,184,209 23,041,302 23,134,769 26,652,078 22,001,304
42.82% 49.30% 49.44% 45.62% 48.51%
2.38% 2.34% 2.80% 3.81% 3.71%
4.18% 12.61% 1.68% 7.22% 10.10%
0.25% 0.72% 0.10% 0.38% 0.51%
0.35% 0.44% 0.59% 0.58% 0.49%
3.49% 2.52% 2.78% 2.82% 2.94%
57.18% 50.70% 50.56% 54.38% 51.49%
7.28 39.92 16.88 4.22 3.11
57.22% 55.69% 50.92% 30.82% 32.01%
9.63 6.51 5.38 4.73 5.25
0.45 1.56 0.21 0.99 1.55
5.51% 5.78% 7.01% 5.83% 10.21%
25.38% 19.33% 18.00% 19.50% 28.32%
42.65% 54.71% 54.96% 46.55% 38.70%
84.25% 81.87% 85.61% 80.83% 83.86%
93.18% 93.72% 93.27% 93.04% 94.08%
58.51% 73.37% 70.24% 63.24% 51.54%
56.29% 67.48% 67.39% 59.33% 48.75%
16.16% 12.11% 11.87% 10.63% 10.59%
13.49% 8.92% 8.60% 8.95% 10.44%
134.25% 127.72% 121.63% 102.11% 91.24%
-16.73% -3.36% 0.33% 21.62% 17.14%
83.48% 73.71% 72.47% 84.13% 98.63%
5.93% 5.69% 5.87% 5.32% 5.01%
2.51 1.86 1.83 1.77 1.30
10.83 12.40 12.66 13.69 15.32
14.20 14.38 14.58 15.18 16.72
20.68 0.08 0.90 15.66 35.51
(Thousand Rupees)BANKISLAMI PAKISTAN LTD.
37

Financial Statement Analysis of Financial Sector 2020
2016 2017 2018 2019 2020Items
A.Total equity (A1 to A3) 1.Share capital 2.Reserves 3.Un appropriated profit 4.Others B.Total liabilities(B1 to B4) 1.Bills payable 2.Borrowings from financial institutions 3.Deposits and other accounts 4.Other/misc. liabilities C.Total assets (C1 to C4 + C8 to C10) 1.Cash and balances with treasury banks 2.Balances with other banks 3.Lending to financial institutions 4.Investments 5.Gross advances 6.Advances-non-performing/classified 7.Provision against advances 8.Advances net of provision (C5-C7) 9.Fixed assets 10.Other/misc. assets D.Profit & loss account 1.Markup/interest earned 2.Markup/interest expensed 3.Net markup/interest income 4.Provisions and write-offs 5.Net markup/interest income after provisions 6.Non-markup/interest income 7.Non-markup/interest expenses 8.Administrative expenses 9.Profit/(loss) before taxation 10.Profit/(loss) after taxation E.Other items 1.No. of ordinary shares (000) 2.Cash dividend 3.Stock dividend/bonus shares 4.Cash generated from operating activities 5.Commitments and contigencies F.Efficiency ratios/profitability ratios 1.Spread (D3/D1) 2.Net markup/interest margin (D1-D2)/C 3.Return on equity (ROE) (D10/A) 4.Return on assets (ROA) (D10/C) 5.Non-markup/interest income to total assets (D6/C) 6.Net markup/interest income(after prov.) to total assets(D5/C) 7.Markup/interest expense to markup/interest income (D2/D1) 8.Admin. expense to profit before tax. (D8/D9) (times) 9.Non-markup/interest expense to total income D7/(D1+D6) 10.Admin. expense to non-markup/interest income (D8/D6) (times) 11.Earning per share (D10/E1) G.Liquidity ratios 1.Cash & cash equivalent to total assets (C1+C2)/C 2.Investment to total assets (C4/C) 3.Advances net of provisions to total assets (C8/C) 4.Deposits to total assets (B3/C) 5.Total liabilities to total assets (B/C) 6.Gross advances to deposits (C5/B3) 7.Gross advances to borrowing & deposit C5/(B2+B3) H.Assets quality ratios 1.Non-performing loan to gross advances (C6/C5) 2.Provisions against NPLs to gross advances (C7/C5) 3.NPLs to shareholders equity (C6/A) 4.NPLs write off to NPLs provisions (D4/C7) 5.Provision against NPL to NPLs (C7/C6) I.Capital /leverage ratios 1.Capital ratio (A/C) 2.Commitments & contingencies to total equity (E5/A) (times) 3.Break up value per share (A/E1) 4.Total deposit to total equity (B3/A) (times) J.Cash flow ratio 1.Cash generated from opration activities to profit after tax (E4/D10) (times)
12,046,524 15,054,436 17,570,841 20,897,410 23,798,353
10,225,567 11,652,288 11,652,288 11,652,288 11,652,288
404,694 725,101 1,226,954 1,896,073 2,474,851
1,416,263 2,677,047 4,691,599 7,349,049 9,671,214
60,811 (142,265) (820,667) 1,265,224 825,345
140,026,064 170,081,710 215,072,579 242,475,984 278,638,465
2,218,979 3,677,900 2,811,457 2,972,307 4,246,241
5,670,091 5,255,642 12,670,525 9,813,903 17,350,949
129,264,513 149,295,457 182,186,634 209,952,073 237,553,365
2,872,481 11,852,711 17,403,963 19,737,701 19,487,910
152,133,399 184,993,881 231,822,753 264,638,618 303,262,163
14,007,320 10,423,998 17,752,920 19,417,428 19,096,891
543,363 1,173,267 1,241,840 1,246,953 3,279,935
12,536,061 4,860,272 4,000,000 5,590,405 2,397,516
27,211,659 41,474,123 45,850,970 49,157,269 66,579,570
95,713,549 121,480,512 155,463,023 180,793,500 204,411,874
2,414,427 2,307,854 2,938,496 4,540,164 5,687,435
1,802,647 1,958,248 2,156,643 2,871,663 4,995,469
93,910,902 119,522,264 153,306,380 177,921,837 199,416,405
1,870,060 1,499,655 1,381,172 4,288,414 3,685,492
2,054,034 6,040,302 8,289,471 7,016,312 8,806,354
9,486,289 10,797,894 14,901,469 26,138,948 25,981,040
4,273,598 4,370,422 6,778,333 15,615,070 14,085,771
5,212,691 6,427,472 8,123,136 10,523,878 11,895,269
128,580 184,791 221,788 721,628 2,135,241
5,084,111 6,242,681 7,901,348 9,802,250 9,760,028
1,566,528 2,075,398 2,248,363 2,759,657 2,495,305
5,279,608 5,754,514 6,029,724 6,873,833 7,468,075
5,264,089 5,693,223 5,942,917 6,658,707 7,369,672
1,371,031 2,563,565 4,119,987 5,688,074 4,787,258
855,540 1,602,036 2,509,265 3,345,597 2,893,891
1,022,557 1,165,229 1,165,229 1,165,229 1,165,229
0.00% 0.00% 0.00% 0.00% 0.00%
0.00% 0.00% 0.00% 0.00% 0.00%
64,352 6,441,237 9,948,637 2,664,926 21,063,828
53,704,609 41,149,638 41,496,971 60,293,217 51,809,631
54.95% 59.53% 54.51% 40.26% 45.78%
3.43% 3.47% 3.50% 3.98% 3.92%
7.10% 10.64% 14.28% 16.01% 12.16%
0.56% 0.87% 1.08% 1.26% 0.95%
1.03% 1.12% 0.97% 1.04% 0.82%
3.34% 3.37% 3.41% 3.70% 3.22%
45.05% 40.47% 45.49% 59.74% 54.22%
3.84 2.22 1.44 1.17 1.54
47.77% 44.70% 35.16% 23.79% 26.23%
3.36 2.74 2.64 2.41 2.95
0.84 1.37 2.15 2.87 2.48
9.56% 6.27% 8.19% 7.81% 7.38%
17.89% 22.42% 19.78% 18.58% 21.95%
61.73% 64.61% 66.13% 67.23% 65.76%
84.97% 80.70% 78.59% 79.34% 78.33%
92.04% 91.94% 92.77% 91.63% 91.88%
74.04% 81.37% 85.33% 86.11% 86.05%
70.93% 78.60% 79.78% 82.27% 80.19%
2.52% 1.90% 1.89% 2.51% 2.78%
1.88% 1.61% 1.39% 1.59% 2.44%
20.04% 15.33% 16.72% 21.73% 23.90%
7.13% 9.44% 10.28% 25.13% 42.74%
74.66% 84.85% 73.39% 63.25% 87.83%
7.92% 8.14% 7.58% 7.90% 7.85%
4.46 2.73 2.36 2.89 2.18
11.78 12.92 15.08 17.93 20.42
10.73 9.92 10.37 10.05 9.98
0.08 4.02 3.96 0.80 7.28
(Thousand Rupees)DUBAI ISLAMIC BANK PAKISTAN LTD.
38

Financial Statement Analysis of Financial Sector 2020
2016 2017 2018 2019 2020Items
A.Total equity (A1 to A3) 1.Share capital 2.Reserves 3.Un appropriated profit 4.Others B.Total liabilities(B1 to B4) 1.Bills payable 2.Borrowings from financial institutions 3.Deposits and other accounts 4.Other/misc. liabilities C.Total assets (C1 to C4 + C8 to C10) 1.Cash and balances with treasury banks 2.Balances with other banks 3.Lending to financial institutions 4.Investments 5.Gross advances 6.Advances-non-performing/classified 7.Provision against advances 8.Advances net of provision (C5-C7) 9.Fixed assets 10.Other/misc. assets D.Profit & loss account 1.Markup/interest earned 2.Markup/interest expensed 3.Net markup/interest income 4.Provisions and write-offs 5.Net markup/interest income after provisions 6.Non-markup/interest income 7.Non-markup/interest expenses 8.Administrative expenses 9.Profit/(loss) before taxation 10.Profit/(loss) after taxation E.Other items 1.No. of ordinary shares (000) 2.Cash dividend 3.Stock dividend/bonus shares 4.Cash generated from operating activities 5.Commitments and contigencies F.Efficiency ratios/profitability ratios 1.Spread (D3/D1) 2.Net markup/interest margin (D1-D2)/C 3.Return on equity (ROE) (D10/A) 4.Return on assets (ROA) (D10/C) 5.Non-markup/interest income to total assets (D6/C) 6.Net markup/interest income(after prov.) to total assets(D5/C) 7.Markup/interest expense to markup/interest income (D2/D1) 8.Admin. expense to profit before tax. (D8/D9) (times) 9.Non-markup/interest expense to total income D7/(D1+D6) 10.Admin. expense to non-markup/interest income (D8/D6) (times) 11.Earning per share (D10/E1) G.Liquidity ratios 1.Cash & cash equivalent to total assets (C1+C2)/C 2.Investment to total assets (C4/C) 3.Advances net of provisions to total assets (C8/C) 4.Deposits to total assets (B3/C) 5.Total liabilities to total assets (B/C) 6.Gross advances to deposits (C5/B3) 7.Gross advances to borrowing & deposit C5/(B2+B3) H.Assets quality ratios 1.Non-performing loan to gross advances (C6/C5) 2.Provisions against NPLs to gross advances (C7/C5) 3.NPLs to shareholders equity (C6/A) 4.NPLs write off to NPLs provisions (D4/C7) 5.Provision against NPL to NPLs (C7/C6) I.Capital /leverage ratios 1.Capital ratio (A/C) 2.Commitments & contingencies to total equity (E5/A) (times) 3.Break up value per share (A/E1) 4.Total deposit to total equity (B3/A) (times) J.Cash flow ratio 1.Cash generated from opration activities to profit after tax (E4/D10) (times)
29,090,229 33,633,227 38,404,848 44,515,793 51,079,959
11,997,601 13,197,361 15,176,965 15,176,965 15,176,965
7,158,248 7,936,338 8,778,908 9,830,958 11,032,647
9,934,380 12,499,528 14,448,975 19,507,870 24,870,347
5,917,426 5,613,243 5,093,667 10,748,080 9,027,473
417,014,646 455,687,412 556,415,668 574,588,784 649,850,522
6,655,919 8,761,334 23,543,525 8,356,460 13,543,270
52,806,084 54,788,547 98,351,921 72,746,795 58,446,516
339,632,770 371,624,155 409,383,802 457,789,109 540,635,833
17,919,873 20,513,376 25,136,420 35,696,420 37,224,903
452,022,301 494,933,882 599,914,183 629,852,657 709,957,954
37,239,302 37,861,767 43,173,993 60,368,417 59,881,289
1,139,375 1,872,771 1,847,595 2,835,570 2,878,547
5,000,000 9,010,335 2,997,486 0 2,985,000
170,209,104 179,728,189 214,185,591 204,068,952 276,929,792
229,825,518 255,827,227 320,258,309 333,810,677 339,745,286
30,036,000 27,321,076 26,687,638 30,409,283 26,225,425
24,994,521 24,295,067 23,813,448 24,237,675 21,565,408
204,830,997 231,532,160 296,444,861 309,573,002 318,179,878
12,111,881 12,939,625 12,943,738 24,183,424 24,038,885
21,491,642 21,989,035 28,320,919 28,823,292 25,064,563
26,200,691 28,766,119 35,199,965 58,398,138 55,922,010
14,134,284 14,830,923 18,924,859 37,278,033 31,387,944
12,066,407 13,935,196 16,275,106 21,120,105 24,534,066
564,078 (491,802) (421,940) 765,998 2,254,301
11,502,329 14,426,998 16,697,046 20,354,107 22,279,765
6,954,458 5,639,264 6,259,953 7,170,465 8,231,043
11,776,100 12,774,086 14,755,290 17,332,882 19,740,451
11,660,533 12,607,943 14,492,257 17,067,653 19,401,299
6,658,637 7,292,176 8,201,709 10,191,690 10,770,357
4,301,772 4,529,650 4,837,183 6,040,632 6,510,505
1,199,760 1,319,736 1,517,697 1,517,697 1,517,697
0.00% 0.00% 0.00% 0.00% 0.00%
0.10% 0.15% 0.15% 0.00% 0.00%
(4,856,009) (16,825,604) 43,544,740 6,567,693 101,539,479
114,653,583 176,116,584 253,248,424 236,579,389 217,174,995
46.05% 48.44% 46.24% 36.17% 43.87%
2.67% 2.82% 2.71% 3.35% 3.46%
14.79% 13.47% 12.60% 13.57% 12.75%
0.95% 0.92% 0.81% 0.96% 0.92%
1.54% 1.14% 1.04% 1.14% 1.16%
2.54% 2.91% 2.78% 3.23% 3.14%
53.95% 51.56% 53.76% 63.83% 56.13%
1.75 1.73 1.77 1.67 1.80
35.52% 37.13% 35.59% 26.43% 30.77%
1.68 2.24 2.32 2.38 2.36
3.59 3.43 3.19 3.98 4.29
8.49% 8.03% 7.50% 10.03% 8.84%
37.66% 36.31% 35.70% 32.40% 39.01%
45.31% 46.78% 49.41% 49.15% 44.82%
75.14% 75.09% 68.24% 72.68% 76.15%
92.26% 92.07% 92.75% 91.23% 91.53%
67.67% 68.84% 78.23% 72.92% 62.84%
58.56% 60.00% 63.08% 62.92% 56.71%
13.07% 10.68% 8.33% 9.11% 7.72%
10.88% 9.50% 7.44% 7.26% 6.35%
103.25% 81.23% 69.49% 68.31% 51.34%
2.26% -2.02% -1.77% 3.16% 10.45%
83.22% 88.92% 89.23% 79.70% 82.23%
6.44% 6.80% 6.40% 7.07% 7.19%
3.94 5.24 6.59 5.31 4.25
24.25 25.48 25.30 29.33 33.66
11.68 11.05 10.66 10.28 10.58
-1.13 -3.71 9.00 1.09 15.60
(Thousand Rupees)FAYSAL BANK LTD.
39

Financial Statement Analysis of Financial Sector 2020
2016 2017 2018 2019 2020Items
A.Total equity (A1 to A3) 1.Share capital 2.Reserves 3.Un appropriated profit 4.Others B.Total liabilities(B1 to B4) 1.Bills payable 2.Borrowings from financial institutions 3.Deposits and other accounts 4.Other/misc. liabilities C.Total assets (C1 to C4 + C8 to C10) 1.Cash and balances with treasury banks 2.Balances with other banks 3.Lending to financial institutions 4.Investments 5.Gross advances 6.Advances-non-performing/classified 7.Provision against advances 8.Advances net of provision (C5-C7) 9.Fixed assets 10.Other/misc. assets D.Profit & loss account 1.Markup/interest earned 2.Markup/interest expensed 3.Net markup/interest income 4.Provisions and write-offs 5.Net markup/interest income after provisions 6.Non-markup/interest income 7.Non-markup/interest expenses 8.Administrative expenses 9.Profit/(loss) before taxation 10.Profit/(loss) after taxation E.Other items 1.No. of ordinary shares (000) 2.Cash dividend 3.Stock dividend/bonus shares 4.Cash generated from operating activities 5.Commitments and contigencies F.Efficiency ratios/profitability ratios 1.Spread (D3/D1) 2.Net markup/interest margin (D1-D2)/C 3.Return on equity (ROE) (D10/A) 4.Return on assets (ROA) (D10/C) 5.Non-markup/interest income to total assets (D6/C) 6.Net markup/interest income(after prov.) to total assets(D5/C) 7.Markup/interest expense to markup/interest income (D2/D1) 8.Admin. expense to profit before tax. (D8/D9) (times) 9.Non-markup/interest expense to total income D7/(D1+D6) 10.Admin. expense to non-markup/interest income (D8/D6) (times) 11.Earning per share (D10/E1) G.Liquidity ratios 1.Cash & cash equivalent to total assets (C1+C2)/C 2.Investment to total assets (C4/C) 3.Advances net of provisions to total assets (C8/C) 4.Deposits to total assets (B3/C) 5.Total liabilities to total assets (B/C) 6.Gross advances to deposits (C5/B3) 7.Gross advances to borrowing & deposit C5/(B2+B3) H.Assets quality ratios 1.Non-performing loan to gross advances (C6/C5) 2.Provisions against NPLs to gross advances (C7/C5) 3.NPLs to shareholders equity (C6/A) 4.NPLs write off to NPLs provisions (D4/C7) 5.Provision against NPL to NPLs (C7/C6) I.Capital /leverage ratios 1.Capital ratio (A/C) 2.Commitments & contingencies to total equity (E5/A) (times) 3.Break up value per share (A/E1) 4.Total deposit to total equity (B3/A) (times) J.Cash flow ratio 1.Cash generated from opration activities to profit after tax (E4/D10) (times)
158,457,896 151,423,488 164,486,591 176,611,091 206,971,909
14,668,525 14,668,525 14,668,525 14,668,525 14,668,525
47,146,362 49,519,342 57,935,252 57,274,159 63,040,638
96,643,009 87,235,621 91,882,814 104,668,407 129,262,746
23,609,084 21,215,598 14,562,465 24,810,855 35,752,856
2,223,017,060 2,401,311,157 2,700,445,803 2,852,311,807 3,400,986,955
31,108,762 33,617,261 42,325,254 29,534,303 46,122,344
333,987,106 395,486,210 518,896,397 382,071,512 540,095,253
1,793,370,392 1,899,511,435 2,020,007,979 2,301,899,086 2,669,490,716
64,550,800 72,696,251 119,216,173 138,806,906 145,278,642
2,405,084,040 2,573,950,243 2,879,494,859 3,053,733,753 3,643,711,720
219,788,876 230,256,066 266,610,256 337,241,623 347,988,749
32,742,891 28,777,991 26,095,330 32,139,733 38,422,719
33,926,110 33,900,345 51,277,336 45,303,199 30,154,193
1,304,722,761 1,335,791,470 1,341,030,709 1,351,961,513 1,912,237,993
772,645,840 864,237,563 1,082,130,756 1,142,770,428 1,193,887,162
68,621,823 67,037,629 71,564,479 72,408,326 75,450,605
60,513,286 63,548,585 66,276,830 69,751,759 76,566,202
712,132,554 800,688,978 1,015,853,926 1,073,018,669 1,117,320,960
30,792,535 56,920,682 65,235,710 75,541,769 84,350,518
70,978,313 87,614,711 113,391,592 138,527,247 113,236,588
137,807,927 142,510,065 157,168,449 246,424,529 257,776,834
58,490,216 64,879,843 81,152,453 151,798,914 135,725,021
79,317,711 77,630,222 76,015,996 94,625,615 122,051,813
666,163 23,804,767 4,639,834 2,529,752 10,223,853
78,651,548 53,825,455 71,376,162 92,095,863 111,827,960
25,859,057 30,952,803 16,444,513 18,759,275 25,742,954
52,264,566 57,290,362 67,971,554 83,756,425 84,576,430
50,917,849 56,227,736 70,327,028 82,709,202 83,151,607
52,246,039 27,487,896 19,849,121 27,098,713 52,994,484
31,820,219 7,730,547 11,789,157 15,064,189 31,523,682
1,466,853 1,466,853 1,466,853 1,466,852 1,466,852
1.40% 0.80% 0.43% 50.00% 42.50%
0.00% 0.00% 0.00% 0.00% 0.00%
172,844,211 82,547,166 122,049,832 (189,970,357) 715,245,919
583,558,529 560,986,894 715,787,631 997,893,257 988,232,024
57.56% 54.47% 48.37% 38.40% 47.35%
3.30% 3.02% 2.64% 3.10% 3.35%
20.08% 5.11% 7.17% 8.53% 15.23%
1.32% 0.30% 0.41% 0.49% 0.87%
1.08% 1.20% 0.57% 0.61% 0.71%
3.27% 2.09% 2.48% 3.02% 3.07%
42.44% 45.53% 51.63% 61.60% 52.65%
0.97 2.05 3.54 3.05 1.57
31.93% 33.03% 39.15% 31.58% 29.83%
1.97 1.82 4.28 4.41 3.23
21.69 5.27 8.04 10.27 21.49
10.50% 10.06% 10.17% 12.10% 10.60%
54.25% 51.90% 46.57% 44.27% 52.48%
29.61% 31.11% 35.28% 35.14% 30.66%
74.57% 73.80% 70.15% 75.38% 73.26%
92.43% 93.29% 93.78% 93.40% 93.34%
43.08% 45.50% 53.57% 49.64% 44.72%
36.32% 37.66% 42.62% 42.58% 37.20%
8.88% 7.76% 6.61% 6.34% 6.32%
7.83% 7.35% 6.12% 6.10% 6.41%
43.31% 44.27% 43.51% 41.00% 36.45%
1.10% 37.46% 7.00% 3.63% 13.35%
88.18% 94.80% 92.61% 96.33% 101.48%
6.59% 5.88% 5.71% 5.78% 5.68%
3.68 3.70 4.35 5.65 4.77
108.03 103.23 112.14 120.40 141.10
11.32 12.54 12.28 13.03 12.90
5.43 10.68 10.35 -12.61 22.69
(Thousand Rupees)HABIB BANK LTD.
40

Financial Statement Analysis of Financial Sector 2020
2016 2017 2018 2019 2020Items
A.Total equity (A1 to A3) 1.Share capital 2.Reserves 3.Un appropriated profit 4.Others B.Total liabilities(B1 to B4) 1.Bills payable 2.Borrowings from financial institutions 3.Deposits and other accounts 4.Other/misc. liabilities C.Total assets (C1 to C4 + C8 to C10) 1.Cash and balances with treasury banks 2.Balances with other banks 3.Lending to financial institutions 4.Investments 5.Gross advances 6.Advances-non-performing/classified 7.Provision against advances 8.Advances net of provision (C5-C7) 9.Fixed assets 10.Other/misc. assets D.Profit & loss account 1.Markup/interest earned 2.Markup/interest expensed 3.Net markup/interest income 4.Provisions and write-offs 5.Net markup/interest income after provisions 6.Non-markup/interest income 7.Non-markup/interest expenses 8.Administrative expenses 9.Profit/(loss) before taxation 10.Profit/(loss) after taxation E.Other items 1.No. of ordinary shares (000) 2.Cash dividend 3.Stock dividend/bonus shares 4.Cash generated from operating activities 5.Commitments and contigencies F.Efficiency ratios/profitability ratios 1.Spread (D3/D1) 2.Net markup/interest margin (D1-D2)/C 3.Return on equity (ROE) (D10/A) 4.Return on assets (ROA) (D10/C) 5.Non-markup/interest income to total assets (D6/C) 6.Net markup/interest income(after prov.) to total assets(D5/C) 7.Markup/interest expense to markup/interest income (D2/D1) 8.Admin. expense to profit before tax. (D8/D9) (times) 9.Non-markup/interest expense to total income D7/(D1+D6) 10.Admin. expense to non-markup/interest income (D8/D6) (times) 11.Earning per share (D10/E1) G.Liquidity ratios 1.Cash & cash equivalent to total assets (C1+C2)/C 2.Investment to total assets (C4/C) 3.Advances net of provisions to total assets (C8/C) 4.Deposits to total assets (B3/C) 5.Total liabilities to total assets (B/C) 6.Gross advances to deposits (C5/B3) 7.Gross advances to borrowing & deposit C5/(B2+B3) H.Assets quality ratios 1.Non-performing loan to gross advances (C6/C5) 2.Provisions against NPLs to gross advances (C7/C5) 3.NPLs to shareholders equity (C6/A) 4.NPLs write off to NPLs provisions (D4/C7) 5.Provision against NPL to NPLs (C7/C6) I.Capital /leverage ratios 1.Capital ratio (A/C) 2.Commitments & contingencies to total equity (E5/A) (times) 3.Break up value per share (A/E1) 4.Total deposit to total equity (B3/A) (times) J.Cash flow ratio 1.Cash generated from opration activities to profit after tax (E4/D10) (times)
37,165,329 39,556,557 42,575,612 47,122,590 54,483,404
10,478,315 10,478,315 10,478,315 10,478,315 10,478,315
13,933,875 15,035,676 16,267,793 17,584,517 19,986,241
12,753,139 14,042,566 15,829,504 19,059,758 24,018,848
2,505,121 941,698 (5,573,656) (2,885,060) 3,164,807
486,935,967 620,167,516 636,393,825 815,533,070 959,923,972
8,108,633 19,643,603 12,173,407 11,739,383 15,421,002
37,205,175 64,038,646 51,347,381 144,462,232 201,722,849
430,888,036 508,103,951 543,577,510 611,869,248 680,955,712
10,734,123 28,381,316 29,295,527 47,462,207 61,824,409
526,606,417 660,665,771 673,395,781 859,770,600 1,017,572,183
35,561,885 42,281,977 48,177,009 70,713,603 54,694,603
2,259,974 1,100,929 1,115,557 2,061,606 1,990,862
16,750,886 10,914,805 11,984,795 22,197,303 1,000,000
314,619,011 396,636,990 346,665,904 448,909,727 584,531,633
159,893,152 190,745,709 243,250,307 280,864,425 331,482,580
19,873,142 18,519,849 17,679,907 17,533,138 19,302,056
16,931,049 16,426,423 16,560,690 16,915,952 19,315,775
142,962,103 174,319,286 226,689,617 263,948,473 312,166,805
3,246,376 3,355,862 4,021,021 8,306,783 9,033,002
11,206,182 32,055,922 34,741,878 43,633,105 54,155,278
33,172,071 33,838,124 42,520,197 72,206,339 76,123,412
21,409,855 19,867,170 26,297,463 54,815,387 47,360,682
11,762,216 13,970,954 16,222,734 17,390,952 28,762,730
844,615 (112,662) 382,429 406,169 3,501,713
10,917,601 14,083,616 15,840,305 16,984,783 25,261,017
8,836,266 5,643,758 6,074,015 7,347,091 9,650,276
9,420,120 10,598,290 11,839,942 13,094,003 14,874,508
9,359,596 10,420,061 11,616,837 12,754,190 14,321,741
10,333,747 9,129,084 10,074,378 11,237,871 20,036,785
6,119,324 5,509,006 6,160,584 6,583,481 12,008,196
1,047,832 1,047,832 1,047,832 1,047,831 1,047,831
0.30% 0.30% 0.00% 25.00% 45.00%
0.00% 0.00% 0.00% 0.00% 0.00%
19,424,843 92,502,967 (31,608,724) 125,003,870 117,168,103
277,587,498 272,566,979 400,439,829 768,687,106 690,729,858
35.46% 41.29% 38.15% 24.09% 37.78%
2.23% 2.11% 2.41% 2.02% 2.83%
16.47% 13.93% 14.47% 13.97% 22.04%
1.16% 0.83% 0.91% 0.77% 1.18%
1.68% 0.85% 0.90% 0.85% 0.95%
2.07% 2.13% 2.35% 1.98% 2.48%
64.54% 58.71% 61.85% 75.91% 62.22%
0.91 1.14 1.15 1.13 0.71
22.42% 26.84% 24.36% 16.46% 17.34%
1.06 1.85 1.91 1.74 1.48
5.84 5.26 5.88 6.28 11.46
7.18% 6.57% 7.32% 8.46% 5.57%
59.74% 60.04% 51.48% 52.21% 57.44%
27.15% 26.39% 33.66% 30.70% 30.68%
81.82% 76.91% 80.72% 71.17% 66.92%
92.47% 93.87% 94.51% 94.85% 94.33%
37.11% 37.54% 44.75% 45.90% 48.68%
34.16% 33.34% 40.89% 37.14% 37.55%
12.43% 9.71% 7.27% 6.24% 5.82%
10.59% 8.61% 6.81% 6.02% 5.83%
53.47% 46.82% 41.53% 37.21% 35.43%
4.99% -0.69% 2.31% 2.40% 18.13%
85.20% 88.70% 93.67% 96.48% 100.07%
7.06% 5.99% 6.32% 5.48% 5.35%
7.47 6.89 9.41 16.31 12.68
35.47 37.75 40.63 44.97 52.00
11.59 12.84 12.77 12.98 12.50
3.17 16.79 -5.13 18.99 9.76
(Thousand Rupees)HABIB METROPOLITAN BANK LTD.
41

Financial Statement Analysis of Financial Sector 2020
2016 2017 2018 2019 2020Items
A.Total equity (A1 to A3) 1.Share capital 2.Reserves 3.Un appropriated profit 4.Others B.Total liabilities(B1 to B4) 1.Bills payable 2.Borrowings from financial institutions 3.Deposits and other accounts 4.Other/misc. liabilities C.Total assets (C1 to C4 + C8 to C10) 1.Cash and balances with treasury banks 2.Balances with other banks 3.Lending to financial institutions 4.Investments 5.Gross advances 6.Advances-non-performing/classified 7.Provision against advances 8.Advances net of provision (C5-C7) 9.Fixed assets 10.Other/misc. assets D.Profit & loss account 1.Markup/interest earned 2.Markup/interest expensed 3.Net markup/interest income 4.Provisions and write-offs 5.Net markup/interest income after provisions 6.Non-markup/interest income 7.Non-markup/interest expenses 8.Administrative expenses 9.Profit/(loss) before taxation 10.Profit/(loss) after taxation E.Other items 1.No. of ordinary shares (000) 2.Cash dividend 3.Stock dividend/bonus shares 4.Cash generated from operating activities 5.Commitments and contigencies F.Efficiency ratios/profitability ratios 1.Spread (D3/D1) 2.Net markup/interest margin (D1-D2)/C 3.Return on equity (ROE) (D10/A) 4.Return on assets (ROA) (D10/C) 5.Non-markup/interest income to total assets (D6/C) 6.Net markup/interest income(after prov.) to total assets(D5/C) 7.Markup/interest expense to markup/interest income (D2/D1) 8.Admin. expense to profit before tax. (D8/D9) (times) 9.Non-markup/interest expense to total income D7/(D1+D6) 10.Admin. expense to non-markup/interest income (D8/D6) (times) 11.Earning per share (D10/E1) G.Liquidity ratios 1.Cash & cash equivalent to total assets (C1+C2)/C 2.Investment to total assets (C4/C) 3.Advances net of provisions to total assets (C8/C) 4.Deposits to total assets (B3/C) 5.Total liabilities to total assets (B/C) 6.Gross advances to deposits (C5/B3) 7.Gross advances to borrowing & deposit C5/(B2+B3) H.Assets quality ratios 1.Non-performing loan to gross advances (C6/C5) 2.Provisions against NPLs to gross advances (C7/C5) 3.NPLs to shareholders equity (C6/A) 4.NPLs write off to NPLs provisions (D4/C7) 5.Provision against NPL to NPLs (C7/C6) I.Capital /leverage ratios 1.Capital ratio (A/C) 2.Commitments & contingencies to total equity (E5/A) (times) 3.Break up value per share (A/E1) 4.Total deposit to total equity (B3/A) (times) J.Cash flow ratio 1.Cash generated from opration activities to profit after tax (E4/D10) (times)
15,426,705 16,179,050 16,652,615 16,696,555 18,258,085
10,119,242 10,119,242 10,119,242 10,119,242 10,119,242
1,334,122 1,540,988 1,712,171 1,749,673 1,991,170
3,973,341 4,518,820 4,821,202 4,827,640 6,147,673
1,222,820 490,279 (1,035,589) 636,700 2,334,123
250,794,369 374,809,920 441,137,050 453,093,710 511,576,194
2,544,028 3,824,278 3,519,924 3,804,491 4,981,983
10,320,047 64,557,043 96,558,663 54,468,283 48,303,412
226,098,931 290,077,566 321,413,263 369,789,964 433,062,593
11,831,363 16,351,033 19,645,200 25,030,972 25,228,206
267,443,894 391,479,249 456,754,076 470,426,965 532,168,402
15,508,968 17,333,788 32,110,840 25,589,349 30,421,231
752,710 1,034,266 968,575 462,836 1,105,969
11,334,414 3,116,199 1,937,347 30,320,540 23,239,672
133,726,610 169,611,558 148,689,974 142,568,470 201,698,473
96,453,475 186,878,895 255,147,213 246,453,136 254,402,329
3,327,942 3,257,997 8,309,467 10,353,164 11,733,555
2,659,341 2,739,313 3,156,295 3,508,627 4,203,163
93,794,134 184,139,582 251,990,918 242,944,509 250,199,166
4,044,154 5,135,309 6,245,328 9,692,701 7,599,538
8,282,904 11,108,547 14,811,094 18,848,560 17,904,353
15,081,015 20,381,171 29,997,028 41,594,699 43,098,990
9,353,282 14,139,220 21,187,732 34,566,342 33,321,699
5,727,733 6,241,951 8,809,296 7,028,357 9,777,291
351,423 370,651 238,788 (91,930) 1,279,608
5,376,310 5,871,300 8,570,508 7,120,287 8,497,683
4,861,269 4,051,340 2,140,838 3,943,204 6,676,357
6,847,643 8,302,076 9,806,589 10,930,416 13,151,099
6,748,444 8,256,335 9,956,060 10,791,708 13,019,000
3,389,936 1,620,564 904,757 133,075 2,022,941
2,076,616 973,149 562,338 24,653 1,150,060
1,011,924 1,011,924 1,011,924 1,011,924 1,011,924
0.00% 0.00% 0.00% 0.00% 0.00%
0.00% 0.00% 0.00% 0.00% 0.00%
(16,770,865) 96,304,643 (37,763,483) (28,904,883) 95,087,932
78,923,028 99,457,652 104,806,746 121,676,295 124,042,426
37.98% 30.63% 29.37% 16.90% 22.69%
2.14% 1.59% 1.93% 1.49% 1.84%
13.46% 6.01% 3.38% 0.15% 6.30%
0.78% 0.25% 0.12% 0.01% 0.22%
1.82% 1.03% 0.47% 0.84% 1.25%
2.01% 1.50% 1.88% 1.51% 1.60%
62.02% 69.37% 70.63% 83.10% 77.31%
1.99 5.09 11.00 81.09 6.44
34.34% 33.98% 30.51% 24.00% 26.42%
1.39 2.04 4.65 2.74 1.95
2.05 0.96 0.56 0.02 1.14
6.08% 4.69% 7.24% 5.54% 5.92%
50.00% 43.33% 32.55% 30.31% 37.90%
35.07% 47.04% 55.17% 51.64% 47.02%
84.54% 74.10% 70.37% 78.61% 81.38%
93.77% 95.74% 96.58% 96.32% 96.13%
42.66% 64.42% 79.38% 66.65% 58.74%
40.80% 52.70% 61.04% 58.09% 52.85%
3.45% 1.74% 3.26% 4.20% 4.61%
2.76% 1.47% 1.24% 1.42% 1.65%
21.57% 20.14% 49.90% 62.01% 64.26%
13.21% 13.53% 7.57% -2.62% 30.44%
79.91% 84.08% 37.98% 33.89% 35.82%
5.77% 4.13% 3.65% 3.55% 3.43%
5.12 6.15 6.29 7.29 6.79
15.24 15.99 16.46 16.50 18.04
14.66 17.93 19.30 22.15 23.72
-8.08 98.96 -67.15 -1,172.47 82.68
(Thousand Rupees)JS BANK LTD.
42

Financial Statement Analysis of Financial Sector 2020
2016 2017 2018 2019 2020Items
A.Total equity (A1 to A3) 1.Share capital 2.Reserves 3.Un appropriated profit 4.Others B.Total liabilities(B1 to B4) 1.Bills payable 2.Borrowings from financial institutions 3.Deposits and other accounts 4.Other/misc. liabilities C.Total assets (C1 to C4 + C8 to C10) 1.Cash and balances with treasury banks 2.Balances with other banks 3.Lending to financial institutions 4.Investments 5.Gross advances 6.Advances-non-performing/classified 7.Provision against advances 8.Advances net of provision (C5-C7) 9.Fixed assets 10.Other/misc. assets D.Profit & loss account 1.Markup/interest earned 2.Markup/interest expensed 3.Net markup/interest income 4.Provisions and write-offs 5.Net markup/interest income after provisions 6.Non-markup/interest income 7.Non-markup/interest expenses 8.Administrative expenses 9.Profit/(loss) before taxation 10.Profit/(loss) after taxation E.Other items 1.No. of ordinary shares (000) 2.Cash dividend 3.Stock dividend/bonus shares 4.Cash generated from operating activities 5.Commitments and contigencies F.Efficiency ratios/profitability ratios 1.Spread (D3/D1) 2.Net markup/interest margin (D1-D2)/C 3.Return on equity (ROE) (D10/A) 4.Return on assets (ROA) (D10/C) 5.Non-markup/interest income to total assets (D6/C) 6.Net markup/interest income(after prov.) to total assets(D5/C) 7.Markup/interest expense to markup/interest income (D2/D1) 8.Admin. expense to profit before tax. (D8/D9) (times) 9.Non-markup/interest expense to total income D7/(D1+D6) 10.Admin. expense to non-markup/interest income (D8/D6) (times) 11.Earning per share (D10/E1) G.Liquidity ratios 1.Cash & cash equivalent to total assets (C1+C2)/C 2.Investment to total assets (C4/C) 3.Advances net of provisions to total assets (C8/C) 4.Deposits to total assets (B3/C) 5.Total liabilities to total assets (B/C) 6.Gross advances to deposits (C5/B3) 7.Gross advances to borrowing & deposit C5/(B2+B3) H.Assets quality ratios 1.Non-performing loan to gross advances (C6/C5) 2.Provisions against NPLs to gross advances (C7/C5) 3.NPLs to shareholders equity (C6/A) 4.NPLs write off to NPLs provisions (D4/C7) 5.Provision against NPL to NPLs (C7/C6) I.Capital /leverage ratios 1.Capital ratio (A/C) 2.Commitments & contingencies to total equity (E5/A) (times) 3.Break up value per share (A/E1) 4.Total deposit to total equity (B3/A) (times) J.Cash flow ratio 1.Cash generated from opration activities to profit after tax (E4/D10) (times)
117,946,240 136,493,130 139,530,625 145,219,342 162,381,537
11,130,307 11,850,600 11,850,600 11,850,600 11,850,600
53,346,861 70,866,473 74,147,981 77,591,253 80,696,335
53,469,072 53,776,057 53,532,044 55,777,489 69,834,602
23,680,385 17,073,207 9,747,104 23,695,441 27,720,418
930,738,565 1,189,671,554 1,348,852,332 1,346,237,232 1,567,360,515
12,843,552 22,680,667 15,699,280 11,821,698 23,980,692
74,515,383 133,069,556 216,018,886 89,505,892 164,001,533
781,429,823 968,482,635 1,049,037,615 1,144,763,259 1,289,502,304
61,949,807 65,438,696 68,096,551 100,146,383 89,875,986
1,072,365,190 1,343,237,891 1,498,130,061 1,515,152,015 1,757,462,470
74,222,347 106,072,084 103,174,597 132,704,797 122,180,839
4,343,841 4,579,275 11,878,975 12,542,239 24,030,328
2,809,752 4,398,114 35,106,241 1,090,058 17,139,453
555,928,553 656,963,632 749,368,738 748,764,502 1,015,869,448
367,814,547 515,057,855 546,791,549 540,037,216 513,550,202
21,688,250 48,752,620 48,955,548 49,424,259 51,189,047
19,697,930 45,702,006 43,210,226 43,358,342 50,608,415
348,116,617 469,355,849 503,581,323 496,678,874 462,941,787
32,066,098 39,169,606 41,069,761 58,271,245 58,027,904
54,877,982 62,699,331 53,950,426 65,100,300 57,272,711
67,400,294 74,090,972 83,318,994 138,291,896 136,075,705
23,586,203 31,428,759 37,304,844 78,675,682 64,741,214
43,814,091 42,662,213 46,014,150 59,616,214 71,334,491
653,651 1,045,019 (1,753,256) 2,483,534 7,313,166
43,160,440 41,617,194 47,767,406 57,132,680 64,021,325
16,174,707 18,117,954 17,198,126 16,678,953 18,135,787
23,260,457 28,720,940 32,901,914 33,709,321 33,908,157
22,073,702 27,957,811 32,090,793 32,670,918 32,645,782
36,074,690 31,014,208 32,063,618 40,102,312 48,248,955
21,890,896 22,458,901 21,359,578 23,976,839 29,037,301
1,113,031 1,185,060 1,185,060 1,185,060 1,185,060
1.60% 1.60% 1.60% 1.70% 2.00%
0.00% 0.00% 0.00% 0.00% 0.00%
21,592,869 121,009,773 143,220,700 48,192,341 285,808,110
304,692,756 448,135,100 584,434,305 851,146,770 714,038,383
65.01% 57.58% 55.23% 43.11% 52.42%
4.09% 3.18% 3.07% 3.93% 4.06%
18.56% 16.45% 15.31% 16.51% 17.88%
2.04% 1.67% 1.43% 1.58% 1.65%
1.51% 1.35% 1.15% 1.10% 1.03%
4.02% 3.10% 3.19% 3.77% 3.64%
34.99% 42.42% 44.77% 56.89% 47.58%
0.61 0.90 1.00 0.81 0.68
27.83% 31.15% 32.73% 21.75% 21.99%
1.36 1.54 1.87 1.96 1.80
19.67 18.95 18.02 20.23 24.50
7.33% 8.24% 7.68% 9.59% 8.32%
51.84% 48.91% 50.02% 49.42% 57.80%
32.46% 34.94% 33.61% 32.78% 26.34%
72.87% 72.10% 70.02% 75.55% 73.37%
86.79% 88.57% 90.04% 88.85% 89.18%
47.07% 53.18% 52.12% 47.17% 39.83%
42.97% 46.76% 43.22% 43.75% 35.33%
5.90% 9.47% 8.95% 9.15% 9.97%
5.36% 8.87% 7.90% 8.03% 9.85%
18.39% 35.72% 35.09% 34.03% 31.52%
3.32% 2.29% -4.06% 5.73% 14.45%
90.82% 93.74% 88.26% 87.73% 98.87%
11.00% 10.16% 9.31% 9.58% 9.24%
2.58 3.28 4.19 5.86 4.40
105.97 115.18 117.74 122.54 137.02
6.63 7.10 7.52 7.88 7.94
0.99 5.39 6.71 2.01 9.84
(Thousand Rupees)MCB BANK LTD.
43

Financial Statement Analysis of Financial Sector 2020
2016 2017 2018 2019 2020Items
A.Total equity (A1 to A3) 1.Share capital 2.Reserves 3.Un appropriated profit 4.Others B.Total liabilities(B1 to B4) 1.Bills payable 2.Borrowings from financial institutions 3.Deposits and other accounts 4.Other/misc. liabilities C.Total assets (C1 to C4 + C8 to C10) 1.Cash and balances with treasury banks 2.Balances with other banks 3.Lending to financial institutions 4.Investments 5.Gross advances 6.Advances-non-performing/classified 7.Provision against advances 8.Advances net of provision (C5-C7) 9.Fixed assets 10.Other/misc. assets D.Profit & loss account 1.Markup/interest earned 2.Markup/interest expensed 3.Net markup/interest income 4.Provisions and write-offs 5.Net markup/interest income after provisions 6.Non-markup/interest income 7.Non-markup/interest expenses 8.Administrative expenses 9.Profit/(loss) before taxation 10.Profit/(loss) after taxation E.Other items 1.No. of ordinary shares (000) 2.Cash dividend 3.Stock dividend/bonus shares 4.Cash generated from operating activities 5.Commitments and contigencies F.Efficiency ratios/profitability ratios 1.Spread (D3/D1) 2.Net markup/interest margin (D1-D2)/C 3.Return on equity (ROE) (D10/A) 4.Return on assets (ROA) (D10/C) 5.Non-markup/interest income to total assets (D6/C) 6.Net markup/interest income(after prov.) to total assets(D5/C) 7.Markup/interest expense to markup/interest income (D2/D1) 8.Admin. expense to profit before tax. (D8/D9) (times) 9.Non-markup/interest expense to total income D7/(D1+D6) 10.Admin. expense to non-markup/interest income (D8/D6) (times) 11.Earning per share (D10/E1) G.Liquidity ratios 1.Cash & cash equivalent to total assets (C1+C2)/C 2.Investment to total assets (C4/C) 3.Advances net of provisions to total assets (C8/C) 4.Deposits to total assets (B3/C) 5.Total liabilities to total assets (B/C) 6.Gross advances to deposits (C5/B3) 7.Gross advances to borrowing & deposit C5/(B2+B3) H.Assets quality ratios 1.Non-performing loan to gross advances (C6/C5) 2.Provisions against NPLs to gross advances (C7/C5) 3.NPLs to shareholders equity (C6/A) 4.NPLs write off to NPLs provisions (D4/C7) 5.Provision against NPL to NPLs (C7/C6) I.Capital /leverage ratios 1.Capital ratio (A/C) 2.Commitments & contingencies to total equity (E5/A) (times) 3.Break up value per share (A/E1) 4.Total deposit to total equity (B3/A) (times) J.Cash flow ratio 1.Cash generated from opration activities to profit after tax (E4/D10) (times)
10,094,531 9,832,379 9,937,242 10,044,475 10,254,456
10,000,000 10,000,000 11,200,000 11,550,000 11,550,000
26,444 26,444 26,444 26,444 68,107
68,087 (194,065) (1,289,202) (1,531,969) (1,363,651)
171,342 (201,600) 132,272 422,326 473,316
18,298,320 42,115,218 84,824,921 94,555,544 130,443,114
447,776 314,210 1,303,992 973,627 2,470,821
2,785,650 7,926,790 7,800,628 4,127,526 20,596,773
14,279,436 32,690,808 73,307,185 81,853,511 99,253,161
785,458 1,183,410 2,413,116 7,600,880 8,122,359
28,564,193 51,745,997 94,894,435 105,022,345 141,170,886
1,509,804 3,390,753 6,990,369 10,252,547 9,872,197
2,750,998 2,703,251 1,422,701 8,822,985 4,996,602
0 1,400,000 4,675,000 5,851,664 828,790
5,769,675 9,186,213 12,713,954 16,309,800 27,617,997
16,130,187 31,314,623 62,922,064 51,346,670 84,962,433
0 0 0 381,427 756,471
1,274 1,219 14,860 36,703 66,242
16,128,913 31,313,404 62,907,204 51,309,967 84,896,191
1,728,933 2,136,975 2,619,980 5,779,772 5,548,894
675,870 1,615,401 3,565,227 6,695,610 7,410,215
1,526,778 2,060,927 4,208,875 9,848,819 9,676,435
576,544 1,005,671 2,304,950 5,855,061 5,280,989
950,234 1,055,256 1,903,925 3,993,758 4,395,446
(94,137) (55) 895,646 199,814 15,270
1,044,371 1,055,311 1,008,279 3,793,944 4,380,176
259,164 439,010 399,262 343,319 678,153
1,189,562 1,845,248 3,087,754 4,503,022 4,665,250
1,187,266 1,845,119 3,083,172 4,478,636 4,654,830
113,973 (350,927) (1,680,213) (365,759) 393,079
79,917 (262,997) (1,095,982) (243,612) 208,316
1,000,000 1,000,000 1,120,000 15,193,939 1,155,000
0.00% 0.00% 0.00% 0.00% 0.00%
0.00% 0.00% 0.00% 0.00% 0.00%
3,434,946 6,130,427 (17,450,371) (17,450,371) 7,861,006
3,389,641 3,389,641 8,931,264 8,931,264 29,021,032
62.24% 51.20% 45.24% 40.55% 45.42%
3.33% 2.04% 2.01% 3.80% 3.11%
0.79% -2.67% -11.03% -2.43% 2.03%
0.28% -0.51% -1.15% -0.23% 0.15%
0.91% 0.85% 0.42% 0.33% 0.48%
3.66% 2.04% 1.06% 3.61% 3.10%
37.76% 48.80% 54.76% 59.45% 54.58%
10.42 -5.26 -1.83 -12.24 11.84
66.61% 73.81% 67.01% 44.18% 45.05%
4.58 4.20 7.72 13.05 6.86
0.08 -0.26 -0.98 -0.02 0.18
14.92% 11.78% 8.87% 18.16% 10.53%
20.20% 17.75% 13.40% 15.53% 19.56%
56.47% 60.51% 66.29% 48.86% 60.14%
49.99% 63.18% 77.25% 77.94% 70.31%
64.06% 81.39% 89.39% 90.03% 92.40%
112.96% 95.79% 85.83% 62.73% 85.60%
94.52% 77.10% 77.58% 59.72% 70.89%
0.00% 0.00% 0.00% 0.74% 0.89%
0.01% 0.00% 0.02% 0.07% 0.08%
0.00% 0.00% 0.00% 3.80% 7.38%
-7,389.09% -4.51% 6,027.23% 544.41% 23.05%
9.62% 8.76%
35.34% 19.00% 10.47% 9.56% 7.26%
0.34 0.34 0.90 0.89 2.83
10.09 9.83 8.87 0.66 8.88
1.41 3.32 7.38 8.15 9.68
42.98 -23.31 15.92 71.63 37.74
- - -
(Thousand Rupees)MCB ISLAMIC BANK LTD
44

Financial Statement Analysis of Financial Sector 2020
2016 2017 2018 2019 2020Items
A.Total equity (A1 to A3) 1.Share capital 2.Reserves 3.Un appropriated profit 4.Others B.Total liabilities(B1 to B4) 1.Bills payable 2.Borrowings from financial institutions 3.Deposits and other accounts 4.Other/misc. liabilities C.Total assets (C1 to C4 + C8 to C10) 1.Cash and balances with treasury banks 2.Balances with other banks 3.Lending to financial institutions 4.Investments 5.Gross advances 6.Advances-non-performing/classified 7.Provision against advances 8.Advances net of provision (C5-C7) 9.Fixed assets 10.Other/misc. assets D.Profit & loss account 1.Markup/interest earned 2.Markup/interest expensed 3.Net markup/interest income 4.Provisions and write-offs 5.Net markup/interest income after provisions 6.Non-markup/interest income 7.Non-markup/interest expenses 8.Administrative expenses 9.Profit/(loss) before taxation 10.Profit/(loss) after taxation E.Other items 1.No. of ordinary shares (000) 2.Cash dividend 3.Stock dividend/bonus shares 4.Cash generated from operating activities 5.Commitments and contigencies F.Efficiency ratios/profitability ratios 1.Spread (D3/D1) 2.Net markup/interest margin (D1-D2)/C 3.Return on equity (ROE) (D10/A) 4.Return on assets (ROA) (D10/C) 5.Non-markup/interest income to total assets (D6/C) 6.Net markup/interest income(after prov.) to total assets(D5/C) 7.Markup/interest expense to markup/interest income (D2/D1) 8.Admin. expense to profit before tax. (D8/D9) (times) 9.Non-markup/interest expense to total income D7/(D1+D6) 10.Admin. expense to non-markup/interest income (D8/D6) (times) 11.Earning per share (D10/E1) G.Liquidity ratios 1.Cash & cash equivalent to total assets (C1+C2)/C 2.Investment to total assets (C4/C) 3.Advances net of provisions to total assets (C8/C) 4.Deposits to total assets (B3/C) 5.Total liabilities to total assets (B/C) 6.Gross advances to deposits (C5/B3) 7.Gross advances to borrowing & deposit C5/(B2+B3) H.Assets quality ratios 1.Non-performing loan to gross advances (C6/C5) 2.Provisions against NPLs to gross advances (C7/C5) 3.NPLs to shareholders equity (C6/A) 4.NPLs write off to NPLs provisions (D4/C7) 5.Provision against NPL to NPLs (C7/C6) I.Capital /leverage ratios 1.Capital ratio (A/C) 2.Commitments & contingencies to total equity (E5/A) (times) 3.Break up value per share (A/E1) 4.Total deposit to total equity (B3/A) (times) J.Cash flow ratio 1.Cash generated from opration activities to profit after tax (E4/D10) (times)
28,149,073 34,338,420 40,378,938 49,614,577 63,592,974
10,027,379 10,629,022 11,691,924 12,861,116 14,147,228
9,699,685 13,368,809 15,161,249 18,207,664 20,424,225
8,422,009 10,340,589 13,525,765 18,545,797 29,021,521
2,324,545 738,973 (45,883) 9,400,835 5,562,292
631,581,836 753,730,607 897,582,350 1,062,242,842 1,452,404,197
13,756,970 17,175,035 23,750,543 17,186,807 26,494,006
32,005,501 36,813,295 36,407,811 42,047,390 94,500,640
559,397,881 667,180,865 785,476,944 932,579,114 1,254,430,534
26,421,484 32,561,412 51,947,052 70,429,531 76,979,017
662,055,454 788,808,000 937,915,405 1,121,258,254 1,521,559,463
56,036,849 64,556,170 65,022,041 92,193,361 136,242,495
12,021,351 4,895,816 8,255,187 15,372,233 19,445,879
129,115,165 147,229,221 184,814,600 223,689,325 342,068,799
130,156,297 119,238,246 123,742,867 225,646,162 434,208,340
319,616,864 428,833,530 522,263,763 506,512,576 531,587,615
6,847,000 6,606,000 6,985,000 8,995,719 14,933,473
8,086,594 8,804,442 9,699,241 12,737,230 19,055,685
311,530,270 420,029,088 512,564,522 493,775,346 512,531,930
8,053,136 11,362,868 13,129,126 23,284,415 23,568,351
15,142,386 21,496,591 30,387,062 47,297,412 53,493,669
30,761,376 36,426,932 48,624,458 94,270,461 106,589,059
12,872,844 15,683,700 20,456,948 47,731,080 41,740,168
17,888,532 20,743,232 28,167,510 46,539,381 64,848,891
(184,919) 1,283,326 1,168,051 4,186,430 8,210,297
18,073,451 19,459,906 26,999,459 42,352,951 56,638,594
5,657,319 7,624,282 7,462,503 9,320,186 10,071,889
14,787,934 16,832,178 19,669,556 25,522,458 29,774,741
14,680,291 16,579,977 19,290,136 24,830,659 28,808,560
8,942,836 10,252,010 14,792,406 26,150,679 36,935,742
5,561,611 6,312,767 8,962,200 15,232,074 22,165,606
1,002,738 1,062,902 1,169,192 1,286,112 1,286,112
0.30% 0.30% 0.35% 50.00% 60.00%
0.00% 0.00% 0.10% 10.00% 10.00%
(7,740,738) (3,148,928) 8,732,438 136,080,972 272,867,150
367,448,209 363,667,883 462,955,500 752,090,128 776,263,932
58.15% 56.94% 57.93% 49.37% 60.84%
2.70% 2.63% 3.00% 4.15% 4.26%
19.76% 18.38% 22.20% 30.70% 34.86%
0.84% 0.80% 0.96% 1.36% 1.46%
0.85% 0.97% 0.80% 0.83% 0.66%
2.73% 2.47% 2.88% 3.78% 3.72%
41.85% 43.06% 42.07% 50.63% 39.16%
1.64 1.62 1.30 0.95 0.78
40.61% 38.21% 35.07% 24.64% 25.52%
2.59 2.17 2.58 2.66 2.86
5.55 5.94 7.67 11.84 17.23
10.28% 8.80% 7.81% 9.59% 10.23%
19.66% 15.12% 13.19% 20.12% 28.54%
47.06% 53.25% 54.65% 44.04% 33.68%
84.49% 84.58% 83.75% 83.17% 82.44%
95.40% 95.55% 95.70% 94.74% 95.45%
57.14% 64.28% 66.49% 54.31% 42.38%
54.04% 60.91% 63.54% 51.97% 39.41%
2.14% 1.54% 1.34% 1.78% 2.81%
2.53% 2.05% 1.86% 2.51% 3.58%
24.32% 19.24% 17.30% 18.13% 23.48%
-2.29% 14.58% 12.04% 32.87% 43.09%
118.10% 133.28% 138.86% 141.59% 127.60%
4.25% 4.35% 4.31% 4.42% 4.18%
13.05 10.59 11.47 15.16 12.21
28.07 32.31 34.54 38.58 49.45
19.87 19.43 19.45 18.80 19.73
-1.39 -0.50 0.97 8.93 12.31
(Thousand Rupees)MEEZAN BANK LTD.
45

Financial Statement Analysis of Financial Sector 2020
2016 2017 2018 2019 2020Items
A.Total equity (A1 to A3) 1.Share capital 2.Reserves 3.Un appropriated profit 4.Others B.Total liabilities(B1 to B4) 1.Bills payable 2.Borrowings from financial institutions 3.Deposits and other accounts 4.Other/misc. liabilities C.Total assets (C1 to C4 + C8 to C10) 1.Cash and balances with treasury banks 2.Balances with other banks 3.Lending to financial institutions 4.Investments 5.Gross advances 6.Advances-non-performing/classified 7.Provision against advances 8.Advances net of provision (C5-C7) 9.Fixed assets 10.Other/misc. assets D.Profit & loss account 1.Markup/interest earned 2.Markup/interest expensed 3.Net markup/interest income 4.Provisions and write-offs 5.Net markup/interest income after provisions 6.Non-markup/interest income 7.Non-markup/interest expenses 8.Administrative expenses 9.Profit/(loss) before taxation 10.Profit/(loss) after taxation E.Other items 1.No. of ordinary shares (000) 2.Cash dividend 3.Stock dividend/bonus shares 4.Cash generated from operating activities 5.Commitments and contigencies F.Efficiency ratios/profitability ratios 1.Spread (D3/D1) 2.Net markup/interest margin (D1-D2)/C 3.Return on equity (ROE) (D10/A) 4.Return on assets (ROA) (D10/C) 5.Non-markup/interest income to total assets (D6/C) 6.Net markup/interest income(after prov.) to total assets(D5/C) 7.Markup/interest expense to markup/interest income (D2/D1) 8.Admin. expense to profit before tax. (D8/D9) (times) 9.Non-markup/interest expense to total income D7/(D1+D6) 10.Admin. expense to non-markup/interest income (D8/D6) (times) 11.Earning per share (D10/E1) G.Liquidity ratios 1.Cash & cash equivalent to total assets (C1+C2)/C 2.Investment to total assets (C4/C) 3.Advances net of provisions to total assets (C8/C) 4.Deposits to total assets (B3/C) 5.Total liabilities to total assets (B/C) 6.Gross advances to deposits (C5/B3) 7.Gross advances to borrowing & deposit C5/(B2+B3) H.Assets quality ratios 1.Non-performing loan to gross advances (C6/C5) 2.Provisions against NPLs to gross advances (C7/C5) 3.NPLs to shareholders equity (C6/A) 4.NPLs write off to NPLs provisions (D4/C7) 5.Provision against NPL to NPLs (C7/C6) I.Capital /leverage ratios 1.Capital ratio (A/C) 2.Commitments & contingencies to total equity (E5/A) (times) 3.Break up value per share (A/E1) 4.Total deposit to total equity (B3/A) (times) J.Cash flow ratio 1.Cash generated from opration activities to profit after tax (E4/D10) (times)
11,742,188 12,481,041 13,163,770 13,850,228 14,861,897
10,082,387 10,082,387 10,082,387 10,082,387 10,082,387
407,680 555,451 691,997 829,289 1,031,623
1,252,121 1,843,203 2,389,386 2,938,552 3,747,887
577,336 227,153 (380,015) 329,259 455,076
90,780,211 105,515,314 109,980,832 115,397,920 143,679,430
915,076 686,692 877,017 783,478 3,358,345
35,847,072 46,201,468 39,780,603 36,114,488 56,197,092
50,306,804 54,901,464 65,225,052 71,881,880 78,425,557
3,711,259 3,725,690 4,098,160 6,618,074 5,698,436
103,099,735 118,223,508 122,764,587 129,577,407 158,996,403
4,723,664 3,887,745 5,154,790 5,544,027 7,422,652
816,421 127,386 493,174 1,154,197 1,396,188
5,277,254 5,192,950 9,449,244 2,274,405 9,935,566
57,237,456 62,918,102 48,021,370 51,278,029 67,889,703
30,987,952 42,502,560 55,891,780 64,043,357 68,573,265
2,372,926 2,335,748 2,392,000 2,672,740 2,695,622
2,197,972 2,320,787 2,299,525 2,687,214 2,937,875
28,789,980 40,181,773 53,592,255 61,356,143 65,635,390
1,290,007 1,113,248 1,064,563 1,896,507 1,939,123
4,964,953 4,802,304 4,989,191 6,074,099 4,777,781
5,682,057 7,256,121 7,555,595 12,791,334 13,574,834
3,576,446 4,896,833 4,847,164 9,272,249 9,876,082
2,105,611 2,359,288 2,708,431 3,519,085 3,698,752
265,459 101,412 68,364 502,047 353,644
1,840,152 2,257,876 2,640,067 3,017,038 3,345,108
1,079,406 715,146 766,719 846,146 1,341,462
1,993,103 2,042,094 2,297,067 2,763,035 3,018,355
1,980,190 2,023,021 2,258,765 2,732,037 3,018,355
926,455 930,928 1,109,719 1,100,149 1,668,215
544,602 738,853 682,729 686,458 1,011,669
1,008,239 1,008,239 1,008,239 1,008,239 1,008,239
0.00% 0.00% 0.00% 0.00% 7.50%
0.00% 0.00% 0.00% 0.00% 0.00%
14,243,363 2,962,310 (16,691,215) 9,610,044 18,390,447
51,429,803 232,309,529 157,744,444 124,832,898 111,512,167
37.06% 32.51% 35.85% 27.51% 27.25%
2.04% 2.00% 2.21% 2.72% 2.33%
4.64% 5.92% 5.19% 4.96% 6.81%
0.53% 0.62% 0.56% 0.53% 0.64%
1.05% 0.60% 0.62% 0.65% 0.84%
1.78% 1.91% 2.15% 2.33% 2.10%
62.94% 67.49% 64.15% 72.49% 72.75%
2.14 2.17 2.04 2.48 1.81
29.48% 25.62% 27.60% 20.26% 20.24%
1.83 2.83 2.95 3.23 2.25
0.54 0.73 0.68 0.68 1.00
5.37% 3.40% 4.60% 5.17% 5.55%
55.52% 53.22% 39.12% 39.57% 42.70%
27.92% 33.99% 43.65% 47.35% 41.28%
48.79% 46.44% 53.13% 55.47% 49.33%
88.05% 89.25% 89.59% 89.06% 90.37%
61.60% 77.42% 85.69% 89.10% 87.44%
35.97% 42.04% 53.23% 59.30% 50.94%
7.66% 5.50% 4.28% 4.17% 3.93%
7.09% 5.46% 4.11% 4.20% 4.28%
20.21% 18.71% 18.17% 19.30% 18.14%
12.08% 4.37% 2.97% 18.68% 12.04%
92.63% 99.36% 96.13% 100.54% 108.99%
11.39% 10.56% 10.72% 10.69% 9.35%
4.38 18.61 11.98 9.01 7.50
11.65 12.38 13.06 13.74 14.74
4.28 4.40 4.95 5.19 5.28
26.15 4.01 -24.45 14.00 18.18
(Thousand Rupees)SAMBA BANK LTD.
46

Financial Statement Analysis of Financial Sector 2020
2016 2017 2018 2019 2020Items
A.Total equity (A1 to A3) 1.Share capital 2.Reserves 3.Un appropriated profit 4.Others B.Total liabilities(B1 to B4) 1.Bills payable 2.Borrowings from financial institutions 3.Deposits and other accounts 4.Other/misc. liabilities C.Total assets (C1 to C4 + C8 to C10) 1.Cash and balances with treasury banks 2.Balances with other banks 3.Lending to financial institutions 4.Investments 5.Gross advances 6.Advances-non-performing/classified 7.Provision against advances 8.Advances net of provision (C5-C7) 9.Fixed assets 10.Other/misc. assets D.Profit & loss account 1.Markup/interest earned 2.Markup/interest expensed 3.Net markup/interest income 4.Provisions and write-offs 5.Net markup/interest income after provisions 6.Non-markup/interest income 7.Non-markup/interest expenses 8.Administrative expenses 9.Profit/(loss) before taxation 10.Profit/(loss) after taxation E.Other items 1.No. of ordinary shares (000) 2.Cash dividend 3.Stock dividend/bonus shares 4.Cash generated from operating activities 5.Commitments and contigencies F.Efficiency ratios/profitability ratios 1.Spread (D3/D1) 2.Net markup/interest margin (D1-D2)/C 3.Return on equity (ROE) (D10/A) 4.Return on assets (ROA) (D10/C) 5.Non-markup/interest income to total assets (D6/C) 6.Net markup/interest income(after prov.) to total assets(D5/C) 7.Markup/interest expense to markup/interest income (D2/D1) 8.Admin. expense to profit before tax. (D8/D9) (times) 9.Non-markup/interest expense to total income D7/(D1+D6) 10.Admin. expense to non-markup/interest income (D8/D6) (times) 11.Earning per share (D10/E1) G.Liquidity ratios 1.Cash & cash equivalent to total assets (C1+C2)/C 2.Investment to total assets (C4/C) 3.Advances net of provisions to total assets (C8/C) 4.Deposits to total assets (B3/C) 5.Total liabilities to total assets (B/C) 6.Gross advances to deposits (C5/B3) 7.Gross advances to borrowing & deposit C5/(B2+B3) H.Assets quality ratios 1.Non-performing loan to gross advances (C6/C5) 2.Provisions against NPLs to gross advances (C7/C5) 3.NPLs to shareholders equity (C6/A) 4.NPLs write off to NPLs provisions (D4/C7) 5.Provision against NPL to NPLs (C7/C6) I.Capital /leverage ratios 1.Capital ratio (A/C) 2.Commitments & contingencies to total equity (E5/A) (times) 3.Break up value per share (A/E1) 4.Total deposit to total equity (B3/A) (times) J.Cash flow ratio 1.Cash generated from opration activities to profit after tax (E4/D10) (times)
66,568,833 13,128,623 14,454,954 10,515,377 10,515,377
77,998,099 23,431,374 23,431,374 23,431,374 23,431,374
327,845 554,903 820,890 820,890 820,890
(11,757,111) (10,857,654) (9,797,310) (13,736,887) (13,736,887)
(54,514,245) 52,723 (68,207) 256,510 256,510
122,979,234 153,673,186 159,290,039 194,916,193 194,916,193
3,996,044 3,192,981 2,866,568 2,483,658 2,483,658
30,195,702 35,582,000 18,051,854 31,973,231 31,973,231
86,787,423 110,277,807 132,664,084 148,853,513 148,853,513
2,000,065 4,620,398 5,707,533 11,605,791 11,605,791
135,033,822 166,854,532 173,676,786 205,688,080 205,688,080
7,370,962 8,413,176 8,871,567 11,838,682 11,838,682
87,748 218,420 309,994 1,168,163 1,168,163
706,572 8,620,649 12,612,156 18,101,837 18,101,837
37,488,482 38,266,735 28,924,993 36,245,350 36,245,350
69,312,185 90,137,784 103,566,168 112,236,882 112,236,882
5,820,000 5,820,000 6,675,000 34,729,083 34,729,083
4,509,557 4,287,069 5,212,166 6,861,935 6,861,935
64,802,628 85,850,715 98,354,002 105,374,947 105,374,947
4,101,219 4,176,746 3,981,271 5,910,389 5,910,389
20,476,211 21,308,091 20,622,803 27,048,712 27,048,712
9,959,053 11,670,271 15,596,213 16,697,901 16,697,901
5,609,691 6,184,217 8,990,735 15,081,744 15,081,744
4,349,362 5,486,054 6,605,478 1,616,157 1,616,157
(48,795) 553,737 1,268,673 2,432,830 2,432,830
4,398,157 4,932,317 5,336,805 (816,673) (816,673)
2,212,664 2,943,468 3,414,872 3,236,234 3,236,234
5,325,689 6,489,237 6,874,849 8,248,504 8,248,504
5,500,470 6,434,457 6,781,153 8,051,497 8,051,497
1,285,132 1,386,548 1,876,828 (5,828,943) (5,828,943)
738,553 1,135,288 1,329,933 (3,963,003) (3,963,003)
7,799,810 2,343,137 2,343,137 2,343,137 2,343,137
0.00% 0.00% 0.00% 0.00% 0.00%
0.00% 0.00% 0.00% 0.00% 0.00%
5,049,696 (4,586,816) (17,302,060) 21,646,943 21,646,943
35,894,373 36,055,464 47,353,704 39,699,828 39,699,828
43.67% 47.01% 42.35% 9.68% 9.68%
3.22% 3.29% 3.80% 0.79% 0.79%
1.11% 8.65% 9.20% -37.69% -37.69%
0.55% 0.68% 0.77% -1.93% -1.93%
1.64% 1.76% 1.97% 1.57% 1.57%
3.26% 2.96% 3.07% -0.40% -0.40%
56.33% 52.99% 57.65% 90.32% 90.32%
4.28 4.64 3.61 -1.38 -1.38
43.75% 44.41% 36.16% 41.38% 41.38%
2.49 2.19 1.99 2.49 2.49
0.09 0.48 0.57 -1.69 -1.69
5.52% 5.17% 5.29% 6.32% 6.32%
27.76% 22.93% 16.65% 17.62% 17.62%
47.99% 51.45% 56.63% 51.23% 51.23%
64.27% 66.09% 76.39% 72.37% 72.37%
91.07% 92.10% 91.72% 94.76% 94.76%
79.86% 81.74% 78.07% 75.40% 75.40%
59.25% 61.80% 68.72% 62.07% 62.07%
8.40% 6.46% 6.45% 30.94% 30.94%
6.51% 4.76% 5.03% 6.11% 6.11%
8.74% 44.33% 46.18% 330.27% 330.27%
-1.08% 12.92% 24.34% 35.45% 35.45%
77.48% 73.66% 78.08% 19.76% 19.76%
49.30% 7.87% 8.32% 5.11% 5.11%
0.54 2.75 3.28 3.78 3.78
8.53 5.60 6.17 4.49 4.49
1.30 8.40 9.18 14.16 14.16
6.84 -4.04 -13.01 -5.46 -5.46
(Thousand Rupees)SILKBANK LIMITED
47

Financial Statement Analysis of Financial Sector 2020
2016 2017 2018 2019 2020Items
A.Total equity (A1 to A3) 1.Share capital 2.Reserves 3.Un appropriated profit 4.Others B.Total liabilities(B1 to B4) 1.Bills payable 2.Borrowings from financial institutions 3.Deposits and other accounts 4.Other/misc. liabilities C.Total assets (C1 to C4 + C8 to C10) 1.Cash and balances with treasury banks 2.Balances with other banks 3.Lending to financial institutions 4.Investments 5.Gross advances 6.Advances-non-performing/classified 7.Provision against advances 8.Advances net of provision (C5-C7) 9.Fixed assets 10.Other/misc. assets D.Profit & loss account 1.Markup/interest earned 2.Markup/interest expensed 3.Net markup/interest income 4.Provisions and write-offs 5.Net markup/interest income after provisions 6.Non-markup/interest income 7.Non-markup/interest expenses 8.Administrative expenses 9.Profit/(loss) before taxation 10.Profit/(loss) after taxation E.Other items 1.No. of ordinary shares (000) 2.Cash dividend 3.Stock dividend/bonus shares 4.Cash generated from operating activities 5.Commitments and contigencies F.Efficiency ratios/profitability ratios 1.Spread (D3/D1) 2.Net markup/interest margin (D1-D2)/C 3.Return on equity (ROE) (D10/A) 4.Return on assets (ROA) (D10/C) 5.Non-markup/interest income to total assets (D6/C) 6.Net markup/interest income(after prov.) to total assets(D5/C) 7.Markup/interest expense to markup/interest income (D2/D1) 8.Admin. expense to profit before tax. (D8/D9) (times) 9.Non-markup/interest expense to total income D7/(D1+D6) 10.Admin. expense to non-markup/interest income (D8/D6) (times) 11.Earning per share (D10/E1) G.Liquidity ratios 1.Cash & cash equivalent to total assets (C1+C2)/C 2.Investment to total assets (C4/C) 3.Advances net of provisions to total assets (C8/C) 4.Deposits to total assets (B3/C) 5.Total liabilities to total assets (B/C) 6.Gross advances to deposits (C5/B3) 7.Gross advances to borrowing & deposit C5/(B2+B3) H.Assets quality ratios 1.Non-performing loan to gross advances (C6/C5) 2.Provisions against NPLs to gross advances (C7/C5) 3.NPLs to shareholders equity (C6/A) 4.NPLs write off to NPLs provisions (D4/C7) 5.Provision against NPL to NPLs (C7/C6) I.Capital /leverage ratios 1.Capital ratio (A/C) 2.Commitments & contingencies to total equity (E5/A) (times) 3.Break up value per share (A/E1) 4.Total deposit to total equity (B3/A) (times) J.Cash flow ratio 1.Cash generated from opration activities to profit after tax (E4/D10) (times)
14,841,725 14,872,229 13,676,500 18,320,140 19,686,035
11,024,636 11,024,636 11,024,636 11,024,636 11,024,636
1,423,829 1,752,494 2,109,227 2,490,432 2,970,486
2,393,260 2,095,099 542,637 4,805,072 5,690,913
3,447,502 3,632,370 4,312,374 1,893,455 3,471,003
263,515,862 306,714,696 364,508,914 422,327,187 462,188,185
4,163,509 4,895,447 3,993,525 3,960,957 6,707,581
38,905,078 64,584,236 81,962,917 95,705,109 87,020,539
209,893,582 227,304,100 262,378,761 302,082,985 345,498,768
10,553,693 9,930,913 16,173,711 20,578,136 22,961,297
281,805,089 325,219,295 382,497,788 442,540,782 485,345,223
18,278,840 19,431,256 26,019,679 33,961,308 29,963,954
822,689 1,151,015 1,179,612 2,074,533 4,268,063
5,521,875 6,502,687 3,921,270 1,202,243 8,956,086
117,883,960 117,428,516 146,645,533 177,056,116 249,955,671
133,753,036 172,772,430 194,831,205 212,515,914 172,692,643
10,419,420 10,244,669 11,357,132 10,902,508 10,785,406
8,447,271 8,479,515 8,356,022 7,614,601 8,148,124
125,305,765 164,292,915 186,475,183 204,901,313 164,544,519
4,936,122 6,464,678 6,238,673 8,328,905 11,910,925
9,055,838 9,948,228 12,017,838 15,016,364 15,746,005
17,524,408 18,504,526 21,599,792 38,790,413 42,228,185
10,680,270 12,032,444 14,646,799 30,864,247 31,572,929
6,844,138 6,472,082 6,952,993 7,926,166 10,655,256
24,407 77,503 (71,072) (588,899) 1,401,703
6,819,731 6,394,579 7,024,065 8,515,065 9,253,553
2,736,237 3,456,114 3,260,171 2,861,162 3,807,495
6,478,629 7,003,130 7,379,583 8,129,481 9,026,293
6,388,894 6,942,982 7,420,176 8,190,466 8,857,542
3,077,339 2,847,563 2,904,653 3,246,746 4,034,755
1,878,844 1,659,919 1,783,664 1,906,024 2,400,272
1,102,464 1,102,464 1,102,464 1,102,463 1,102,463
0.13% 0.75% 0.10% 10.00% 12.50%
0.00% 0.00% 0.00% 0.00% 0.00%
13,074,630 (5,929,785) 38,673,405 40,425,634 78,585,431
83,399,392 294,123,363 558,430,406 244,865,581 174,804,272
39.05% 34.98% 32.19% 20.43% 25.23%
2.43% 1.99% 1.82% 1.79% 2.20%
12.66% 11.16% 13.04% 10.40% 12.19%
0.67% 0.51% 0.47% 0.43% 0.49%
0.97% 1.06% 0.85% 0.65% 0.78%
2.42% 1.97% 1.84% 1.92% 1.91%
60.95% 65.02% 67.81% 79.57% 74.77%
2.08 2.44 2.55 2.52 2.20
31.98% 31.89% 29.68% 19.52% 19.61%
2.33 2.01 2.28 2.86 2.33
1.70 1.51 1.62 1.73 2.18
6.78% 6.33% 7.11% 8.14% 7.05%
41.83% 36.11% 38.34% 40.01% 51.50%
44.47% 50.52% 48.75% 46.30% 33.90%
74.48% 69.89% 68.60% 68.26% 71.19%
93.51% 94.31% 95.30% 95.43% 95.23%
63.72% 76.01% 74.26% 70.35% 49.98%
53.76% 59.19% 56.58% 53.42% 39.93%
7.79% 5.93% 5.83% 5.13% 6.25%
6.32% 4.91% 4.29% 3.58% 4.72%
70.20% 68.88% 83.04% 59.51% 54.79%
0.29% 0.91% -0.85% -7.73% 17.20%
81.07% 82.77% 73.58% 69.84% 75.55%
5.27% 4.57% 3.58% 4.14% 4.06%
5.62 19.78 40.83 13.37 8.88
13.46 13.49 12.41 16.62 17.86
14.14 15.28 19.18 16.49 17.55
6.96 -3.57 21.68 21.21 32.74
(Thousand Rupees)SONERI BANK LTD.
48

Financial Statement Analysis of Financial Sector 2020
2016 2017 2018 2019 2020Items
A.Total equity (A1 to A3) 1.Share capital 2.Reserves 3.Un appropriated profit 4.Others B.Total liabilities(B1 to B4) 1.Bills payable 2.Borrowings from financial institutions 3.Deposits and other accounts 4.Other/misc. liabilities C.Total assets (C1 to C4 + C8 to C10) 1.Cash and balances with treasury banks 2.Balances with other banks 3.Lending to financial institutions 4.Investments 5.Gross advances 6.Advances-non-performing/classified 7.Provision against advances 8.Advances net of provision (C5-C7) 9.Fixed assets 10.Other/misc. assets D.Profit & loss account 1.Markup/interest earned 2.Markup/interest expensed 3.Net markup/interest income 4.Provisions and write-offs 5.Net markup/interest income after provisions 6.Non-markup/interest income 7.Non-markup/interest expenses 8.Administrative expenses 9.Profit/(loss) before taxation 10.Profit/(loss) after taxation E.Other items 1.No. of ordinary shares (000) 2.Cash dividend 3.Stock dividend/bonus shares 4.Cash generated from operating activities 5.Commitments and contigencies F.Efficiency ratios/profitability ratios 1.Spread (D3/D1) 2.Net markup/interest margin (D1-D2)/C 3.Return on equity (ROE) (D10/A) 4.Return on assets (ROA) (D10/C) 5.Non-markup/interest income to total assets (D6/C) 6.Net markup/interest income(after prov.) to total assets(D5/C) 7.Markup/interest expense to markup/interest income (D2/D1) 8.Admin. expense to profit before tax. (D8/D9) (times) 9.Non-markup/interest expense to total income D7/(D1+D6) 10.Admin. expense to non-markup/interest income (D8/D6) (times) 11.Earning per share (D10/E1) G.Liquidity ratios 1.Cash & cash equivalent to total assets (C1+C2)/C 2.Investment to total assets (C4/C) 3.Advances net of provisions to total assets (C8/C) 4.Deposits to total assets (B3/C) 5.Total liabilities to total assets (B/C) 6.Gross advances to deposits (C5/B3) 7.Gross advances to borrowing & deposit C5/(B2+B3) H.Assets quality ratios 1.Non-performing loan to gross advances (C6/C5) 2.Provisions against NPLs to gross advances (C7/C5) 3.NPLs to shareholders equity (C6/A) 4.NPLs write off to NPLs provisions (D4/C7) 5.Provision against NPL to NPLs (C7/C6) I.Capital /leverage ratios 1.Capital ratio (A/C) 2.Commitments & contingencies to total equity (E5/A) (times) 3.Break up value per share (A/E1) 4.Total deposit to total equity (B3/A) (times) J.Cash flow ratio 1.Cash generated from opration activities to profit after tax (E4/D10) (times)
56,871,970 57,335,131 61,709,698 67,533,662 73,921,962
38,715,850 38,715,850 38,715,850 38,715,850 38,715,850
12,770,562 14,419,594 16,667,466 19,870,955 22,497,551
5,385,558 4,199,687 6,326,382 8,946,857 12,708,561
4,410,323 5,601,565 5,528,671 5,382,841 7,755,848
413,469,926 456,895,452 508,842,967 547,054,082 640,226,935
10,821,793 18,958,345 16,943,627 12,375,271 10,712,040
14,400,841 26,029,816 24,023,697 20,256,731 23,293,381
365,562,094 377,576,064 424,898,936 465,628,985 556,505,923
22,685,198 34,331,227 42,976,707 48,793,095 49,715,591
474,752,219 519,832,148 576,081,336 619,970,585 721,904,745
40,729,979 35,085,289 50,293,497 61,290,428 54,366,569
5,699,791 779,856 2,344,297 3,484,265 11,271,237
19,798,390 8,067,665 6,465,508 17,012,089 69,551,802
245,850,227 272,487,815 279,065,904 249,164,030 349,444,772
133,631,337 157,259,073 187,162,249 235,268,620 199,752,577
0 19,587,098 17,402,702 17,737,943 22,694,978
19,680,570 19,624,561 17,618,487 17,181,427 21,536,203
113,950,767 137,634,512 169,543,762 218,087,193 178,216,374
5,773,296 8,033,890 7,837,979 10,563,451 11,910,762
42,949,769 57,743,121 60,530,389 60,369,129 47,143,229
28,395,001 26,798,792 31,206,960 52,240,154 52,221,970
9,009,663 10,300,723 12,376,471 24,053,613 24,082,373
19,385,338 16,498,069 18,830,489 28,186,541 28,139,597
(1,140,898) 283,664 (1,218,457) (16,810) 4,940,714
20,526,236 16,214,405 20,048,946 28,203,351 23,198,883
7,162,775 8,981,850 9,687,692 10,889,774 12,800,206
12,344,145 11,743,130 11,290,065 11,893,922 12,382,609
11,964,196 11,456,760 10,886,745 11,128,663 11,878,809
15,344,866 13,453,125 18,446,573 27,199,203 23,616,480
9,617,785 8,245,162 11,239,360 16,017,447 13,132,982
3,871,585 3,871,585 3,871,585 3,871,585 3,871,585
20.00% 0.18% 0.23% 30.00% 27.50%
0.00% 0.00% 0.00% 0.00% 0.00%
39,063,346 22,803,463 19,955,900 (14,799,187) 94,101,844
271,501,653 419,438,146 422,981,202 642,533,356 571,520,390
68.27% 61.56% 60.34% 53.96% 53.88%
4.08% 3.17% 3.27% 4.55% 3.90%
16.91% 14.38% 18.21% 23.72% 17.77%
2.03% 1.59% 1.95% 2.58% 1.82%
1.51% 1.73% 1.68% 1.76% 1.77%
4.32% 3.12% 3.48% 4.55% 3.21%
31.73% 38.44% 39.66% 46.04% 46.12%
0.78 0.85 0.59 0.41 0.50
34.72% 32.82% 27.61% 18.84% 19.04%
1.67 1.28 1.12 1.02 0.93
2.48 2.13 2.90 4.14 3.39
9.78% 6.90% 9.14% 10.45% 9.09%
51.78% 52.42% 48.44% 40.19% 48.41%
24.00% 26.48% 29.43% 35.18% 24.69%
77.00% 72.63% 73.76% 75.11% 77.09%
87.09% 87.89% 88.33% 88.24% 88.69%
36.56% 41.65% 44.05% 50.53% 35.89%
35.17% 38.96% 41.69% 48.42% 34.45%
0.00% 12.46% 9.30% 7.54% 11.36%
14.73% 12.48% 9.41% 7.30% 10.78%
0.00% 34.16% 28.20% 26.27% 30.70%
-5.80% 1.45% -6.92% -0.10% 22.94%
100.19% 101.24% 96.86% 94.89%
11.98% 11.03% 10.71% 10.89% 10.24%
4.77 7.32 6.85 9.51 7.73
14.69 14.81 15.94 17.44 19.09
6.43 6.59 6.89 6.89 7.53
4.06 2.77 1.78 -0.92 7.17
-
(Thousand Rupees)STANDARD CHARTERED BANK (PAKISTAN) LTD.
49

Financial Statement Analysis of Financial Sector 2020
2016 2017 2018 2019 2020Items
A.Total equity (A1 to A3) 1.Share capital 2.Reserves 3.Un appropriated profit 4.Others B.Total liabilities(B1 to B4) 1.Bills payable 2.Borrowings from financial institutions 3.Deposits and other accounts 4.Other/misc. liabilities C.Total assets (C1 to C4 + C8 to C10) 1.Cash and balances with treasury banks 2.Balances with other banks 3.Lending to financial institutions 4.Investments 5.Gross advances 6.Advances-non-performing/classified 7.Provision against advances 8.Advances net of provision (C5-C7) 9.Fixed assets 10.Other/misc. assets D.Profit & loss account 1.Markup/interest earned 2.Markup/interest expensed 3.Net markup/interest income 4.Provisions and write-offs 5.Net markup/interest income after provisions 6.Non-markup/interest income 7.Non-markup/interest expenses 8.Administrative expenses 9.Profit/(loss) before taxation 10.Profit/(loss) after taxation E.Other items 1.No. of ordinary shares (000) 2.Cash dividend 3.Stock dividend/bonus shares 4.Cash generated from operating activities 5.Commitments and contigencies F.Efficiency ratios/profitability ratios 1.Spread (D3/D1) 2.Net markup/interest margin (D1-D2)/C 3.Return on equity (ROE) (D10/A) 4.Return on assets (ROA) (D10/C) 5.Non-markup/interest income to total assets (D6/C) 6.Net markup/interest income(after prov.) to total assets(D5/C) 7.Markup/interest expense to markup/interest income (D2/D1) 8.Admin. expense to profit before tax. (D8/D9) (times) 9.Non-markup/interest expense to total income D7/(D1+D6) 10.Admin. expense to non-markup/interest income (D8/D6) (times) 11.Earning per share (D10/E1) G.Liquidity ratios 1.Cash & cash equivalent to total assets (C1+C2)/C 2.Investment to total assets (C4/C) 3.Advances net of provisions to total assets (C8/C) 4.Deposits to total assets (B3/C) 5.Total liabilities to total assets (B/C) 6.Gross advances to deposits (C5/B3) 7.Gross advances to borrowing & deposit C5/(B2+B3) H.Assets quality ratios 1.Non-performing loan to gross advances (C6/C5) 2.Provisions against NPLs to gross advances (C7/C5) 3.NPLs to shareholders equity (C6/A) 4.NPLs write off to NPLs provisions (D4/C7) 5.Provision against NPL to NPLs (C7/C6) I.Capital /leverage ratios 1.Capital ratio (A/C) 2.Commitments & contingencies to total equity (E5/A) (times) 3.Break up value per share (A/E1) 4.Total deposit to total equity (B3/A) (times) J.Cash flow ratio 1.Cash generated from opration activities to profit after tax (E4/D10) (times)
10,559,950 9,539,583 9,539,583 9,539,583 9,539,583
17,786,663 26,381,510 26,381,510 26,381,510 26,381,510
2,288,488 (6,306,359) (6,306,359) (6,306,359) (6,306,359)
(9,515,201) (10,535,568) (10,535,568) (10,535,568) (10,535,568)
2,112,002 1,494,942 1,494,942 1,494,942 1,494,942
202,350,396 222,015,411 222,015,411 222,015,411 222,015,411
5,061,470 3,065,379 3,065,379 3,065,379 3,065,379
49,819,840 67,307,766 67,307,766 67,307,766 67,307,766
142,871,229 145,729,707 145,729,707 145,729,707 145,729,707
4,597,857 5,912,559 5,912,559 5,912,559 5,912,559
215,022,348 233,049,936 233,049,936 233,049,936 233,049,936
12,786,616 13,556,723 13,556,723 13,556,723 13,556,723
2,582,531 2,440,333 2,440,333 2,440,333 2,440,333
1,631,583 10,671,003 10,671,003 10,671,003 10,671,003
90,575,032 95,231,064 95,231,064 95,231,064 95,231,064
94,255,433 99,531,320 99,531,320 99,531,320 99,531,320
16,719,020 17,065,580 17,065,580 17,065,580 17,065,580
14,411,701 14,009,450 14,009,450 14,009,450 14,009,450
79,843,732 85,521,870 85,521,870 85,521,870 85,521,870
12,272,884 12,664,584 12,664,584 12,664,584 12,664,584
15,329,970 12,964,359 12,964,359 12,964,359 12,964,359
10,626,799 10,644,945 10,644,945 10,644,945 10,644,945
7,853,591 7,745,052 7,745,052 7,745,052 7,745,052
2,773,208 2,899,893 2,899,893 2,899,893 2,899,893
1,884,185 (146,070) (146,070) (146,070) (146,070)
889,023 3,045,963 3,045,963 3,045,963 3,045,963
3,127,394 2,419,997 2,419,997 2,419,997 2,419,997
5,934,128 6,228,728 6,228,728 6,228,728 6,228,728
5,817,604 6,069,011 6,069,011 6,069,011 6,069,011
(1,917,711) (762,768) (762,768) (762,768) (762,768)
(2,174,392) (1,146,439) (1,146,439) (1,146,439) (1,146,439)
1,778,666 2,638,151 2,638,151 2,638,151 2,638,151
0.00% 0.00% 0.00% 0.00% 0.00%
0.00% 0.00% 0.00% 0.00% 0.00%
12,495,069 7,416,783 7,416,783 7,416,783 7,416,783
107,826,940 117,856,006 117,856,006 117,856,006 117,856,006
26.10% 27.24% 27.24% 27.24% 27.24%
1.29% 1.24% 1.24% 1.24% 1.24%
-20.59% -12.02% -12.02% -12.02% -12.02%
-1.01% -0.49% -0.49% -0.49% -0.49%
1.45% 1.04% 1.04% 1.04% 1.04%
0.41% 1.31% 1.31% 1.31% 1.31%
73.90% 72.76% 72.76% 72.76% 72.76%
-3.03 -7.96 -7.96 -7.96 -7.96
43.14% 47.68% 47.68% 47.68% 47.68%
1.86 2.51 2.51 2.51 2.51
-1.22 -0.43 -0.43 -0.43 -0.43
7.15% 6.86% 6.86% 6.86% 6.86%
42.12% 40.86% 40.86% 40.86% 40.86%
37.13% 36.70% 36.70% 36.70% 36.70%
66.44% 62.53% 62.53% 62.53% 62.53%
94.11% 95.27% 95.27% 95.27% 95.27%
65.97% 68.30% 68.30% 68.30% 68.30%
48.92% 46.72% 46.72% 46.72% 46.72%
17.74% 17.15% 17.15% 17.15% 17.15%
15.29% 14.08% 14.08% 14.08% 14.08%
158.32% 178.89% 178.89% 178.89% 178.89%
13.07% -1.04% -1.04% -1.04% -1.04%
86.20% 82.09% 82.09% 82.09% 82.09%
4.91% 4.09% 4.09% 4.09% 4.09%
10.21 12.35 12.35 12.35 12.35
5.94 3.62 3.62 3.62 3.62
13.53 15.28 15.28 15.28 15.28
-5.75 -6.47 -6.47 -6.47 -6.47
(Thousand Rupees)SUMMIT BANK LTD.
50

Financial Statement Analysis of Financial Sector 2020
2016 2017 2018 2019 2020Items
A.Total equity (A1 to A3) 1.Share capital 2.Reserves 3.Un appropriated profit 4.Others B.Total liabilities(B1 to B4) 1.Bills payable 2.Borrowings from financial institutions 3.Deposits and other accounts 4.Other/misc. liabilities C.Total assets (C1 to C4 + C8 to C10) 1.Cash and balances with treasury banks 2.Balances with other banks 3.Lending to financial institutions 4.Investments 5.Gross advances 6.Advances-non-performing/classified 7.Provision against advances 8.Advances net of provision (C5-C7) 9.Fixed assets 10.Other/misc. assets D.Profit & loss account 1.Markup/interest earned 2.Markup/interest expensed 3.Net markup/interest income 4.Provisions and write-offs 5.Net markup/interest income after provisions 6.Non-markup/interest income 7.Non-markup/interest expenses 8.Administrative expenses 9.Profit/(loss) before taxation 10.Profit/(loss) after taxation E.Other items 1.No. of ordinary shares (000) 2.Cash dividend 3.Stock dividend/bonus shares 4.Cash generated from operating activities 5.Commitments and contigencies F.Efficiency ratios/profitability ratios 1.Spread (D3/D1) 2.Net markup/interest margin (D1-D2)/C 3.Return on equity (ROE) (D10/A) 4.Return on assets (ROA) (D10/C) 5.Non-markup/interest income to total assets (D6/C) 6.Net markup/interest income(after prov.) to total assets(D5/C) 7.Markup/interest expense to markup/interest income (D2/D1) 8.Admin. expense to profit before tax. (D8/D9) (times) 9.Non-markup/interest expense to total income D7/(D1+D6) 10.Admin. expense to non-markup/interest income (D8/D6) (times) 11.Earning per share (D10/E1) G.Liquidity ratios 1.Cash & cash equivalent to total assets (C1+C2)/C 2.Investment to total assets (C4/C) 3.Advances net of provisions to total assets (C8/C) 4.Deposits to total assets (B3/C) 5.Total liabilities to total assets (B/C) 6.Gross advances to deposits (C5/B3) 7.Gross advances to borrowing & deposit C5/(B2+B3) H.Assets quality ratios 1.Non-performing loan to gross advances (C6/C5) 2.Provisions against NPLs to gross advances (C7/C5) 3.NPLs to shareholders equity (C6/A) 4.NPLs write off to NPLs provisions (D4/C7) 5.Provision against NPL to NPLs (C7/C6) I.Capital /leverage ratios 1.Capital ratio (A/C) 2.Commitments & contingencies to total equity (E5/A) (times) 3.Break up value per share (A/E1) 4.Total deposit to total equity (B3/A) (times) J.Cash flow ratio 1.Cash generated from opration activities to profit after tax (E4/D10) (times)
116,942,573 127,001,081 134,682,882 143,231,740 156,432,328
12,241,798 12,241,798 12,241,798 12,241,798 12,241,797
40,454,505 43,846,877 54,439,238 59,319,611 62,274,068
64,246,270 70,912,406 68,001,846 71,670,331 81,916,463
34,844,288 32,305,966 16,587,066 25,837,143 27,640,579
1,448,845,529 1,873,626,887 1,738,329,198 1,723,706,479 1,865,510,406
24,519,507 29,847,743 27,249,136 22,926,596 29,733,813
201,549,619 512,650,465 268,124,033 154,484,000 128,987,415
1,167,123,963 1,272,787,824 1,366,060,048 1,467,063,461 1,640,211,901
55,652,440 58,340,855 76,895,981 79,232,422 66,577,277
1,600,632,390 2,032,933,934 1,889,599,146 1,892,775,362 2,049,583,313
131,506,861 157,582,687 183,467,358 235,861,767 250,838,052
14,920,994 19,516,198 23,345,698 20,729,005 13,888,765
25,710,707 10,867,531 33,941,546 20,183,118 19,959,132
806,531,246 1,091,786,626 786,375,326 840,322,652 1,128,674,494
550,636,310 670,055,700 776,272,341 702,951,491 609,307,008
44,566,984 52,246,691 68,561,721 76,985,726 83,623,743
40,525,386 42,696,864 60,335,610 67,117,274 79,027,512
510,110,924 627,358,836 715,936,731 635,834,217 530,279,496
33,579,026 45,208,373 45,799,099 52,396,877 51,207,703
78,272,632 80,613,683 100,733,388 87,447,726 54,735,671
98,219,214 107,205,820 113,198,299 153,676,364 152,003,210
41,176,686 50,781,440 56,964,028 91,901,868 77,044,038
57,042,528 56,424,380 56,234,271 61,774,496 74,959,172
1,478,866 2,449,810 12,853,640 8,219,792 16,768,148
55,563,662 53,974,570 43,380,631 53,554,704 58,191,024
23,608,642 22,162,142 25,011,371 21,676,331 17,094,339
33,156,708 36,218,256 43,425,338 40,989,166 41,092,893
31,903,598 35,349,864 38,826,761 40,208,862 40,060,602
46,015,596 39,918,456 24,966,664 34,241,869 34,192,470
27,730,112 25,179,647 15,226,095 19,133,774 20,898,783
1,224,180 1,224,180 1,224,180 1,224,180 1,224,180
1.30% 1.30% 0.11% 1.20% 1.20%
0.00% 0.00% 0.00% 0.00% 0.00%
130,776,564 253,458,855 (244,641,712) 134,204,343 172,629,959
727,624,808 949,350,377 1,118,899,495 1,391,664,349 1,055,243,212
58.08% 52.63% 49.68% 40.20% 49.31%
3.56% 2.78% 2.98% 3.26% 3.66%
23.71% 19.83% 11.31% 13.36% 13.36%
1.73% 1.24% 0.81% 1.01% 1.02%
1.47% 1.09% 1.32% 1.15% 0.83%
3.47% 2.66% 2.30% 2.83% 2.84%
41.92% 47.37% 50.32% 59.80% 50.69%
0.69 0.89 1.56 1.17 1.17
27.22% 28.00% 31.42% 23.38% 24.30%
1.35 1.60 1.55 1.85 2.34
22.65 20.57 12.44 15.63 17.07
9.15% 8.71% 10.94% 13.56% 12.92%
50.39% 53.70% 41.62% 44.40% 55.07%
31.87% 30.86% 37.89% 33.59% 25.87%
72.92% 62.61% 72.29% 77.51% 80.03%
90.52% 92.16% 91.99% 91.07% 91.02%
47.18% 52.64% 56.83% 47.92% 37.15%
40.23% 37.53% 47.50% 43.35% 34.44%
8.09% 7.80% 8.83% 10.95% 13.72%
7.36% 6.37% 7.77% 9.55% 12.97%
38.11% 41.14% 50.91% 53.75% 53.46%
3.65% 5.74% 21.30% 12.25% 21.22%
90.93% 81.72% 88.00% 87.18% 94.50%
7.31% 6.25% 7.13% 7.57% 7.63%
6.22 7.48 8.31 9.72 6.75
95.53 103.74 110.02 117.00 127.79
9.98 10.02 10.14 10.24 10.49
4.72 10.07 -16.07 7.01 8.26
(Thousand Rupees)UNITED BANK LTD.
51

Financial Statement Analysis of Financial Sector 2020
2016 2017 2018 2019 2020Items
A.Total equity (A1 to A3) 1.Share capital 2.Reserves 3.Un appropriated profit 4.Others B.Total liabilities(B1 to B4) 1.Bills payable 2.Borrowings from financial institutions 3.Deposits and other accounts 4.Other/misc. liabilities C.Total assets (C1 to C4 + C8 to C10) 1.Cash and balances with treasury banks 2.Balances with other banks 3.Lending to financial institutions 4.Investments 5.Gross advances 6.Advances-non-performing/classified 7.Provision against advances 8.Advances net of provision (C5-C7) 9.Fixed assets 10.Other/misc. assets D.Profit & loss account 1.Markup/interest earned 2.Markup/interest expensed 3.Net markup/interest income 4.Provisions and write-offs 5.Net markup/interest income after provisions 6.Non-markup/interest income 7.Non-markup/interest expenses 8.Administrative expenses 9.Profit/(loss) before taxation 10.Profit/(loss) after taxation E.Other items 1.No. of ordinary shares (000) 2.Cash dividend 3.Stock dividend/bonus shares 4.Cash generated from operating activities 5.Commitments and contigencies F.Efficiency ratios/profitability ratios 1.Spread (D3/D1) 2.Net markup/interest margin (D1-D2)/C 3.Return on equity (ROE) (D10/A) 4.Return on assets (ROA) (D10/C) 5.Non-markup/interest income to total assets (D6/C) 6.Net markup/interest income(after prov.) to total assets(D5/C) 7.Markup/interest expense to markup/interest income (D2/D1) 8.Admin. expense to profit before tax. (D8/D9) (times) 9.Non-markup/interest expense to total income D7/(D1+D6) 10.Admin. expense to non-markup/interest income (D8/D6) (times) 11.Earning per share (D10/E1) G.Liquidity ratios 1.Cash & cash equivalent to total assets (C1+C2)/C 2.Investment to total assets (C4/C) 3.Advances net of provisions to total assets (C8/C) 4.Deposits to total assets (B3/C) 5.Total liabilities to total assets (B/C) 6.Gross advances to deposits (C5/B3) 7.Gross advances to borrowing & deposit C5/(B2+B3) H.Assets quality ratios 1.Non-performing loan to gross advances (C6/C5) 2.Provisions against NPLs to gross advances (C7/C5) 3.NPLs to shareholders equity (C6/A) 4.NPLs write off to NPLs provisions (D4/C7) 5.Provision against NPL to NPLs (C7/C6) I.Capital /leverage ratios 1.Capital ratio (A/C) 2.Commitments & contingencies to total equity (E5/A) (times) 3.Break up value per share (A/E1) 4.Total deposit to total equity (B3/A) (times) J.Cash flow ratio 1.Cash generated from opration activities to profit after tax (E4/D10) (times)
20,751,615 20,645,375 20,380,986 20,465,821 17,913,546
22,801,791 22,800,430 22,800,504 22,800,438 22,800,397
7,188,868 7,218,925 7,248,160 7,315,199 7,354,231
(9,239,044) (9,373,980) (9,667,678) (9,649,816) (12,241,082)
47,456,734 50,110,143 50,009,085 49,889,809 50,127,812
179,983,395 182,994,491 183,622,608 182,931,002 187,061,887
607,015 641,889 644,807 641,940 619,658
82,755,550 84,603,539 84,603,539 84,603,539 83,422,837
69,443,331 70,411,781 70,677,974 69,933,773 72,233,046
27,177,499 27,337,282 27,696,288 27,751,750 30,786,346
248,191,744 253,750,009 254,012,679 253,286,632 255,103,245
4,847,858 5,063,965 5,154,764 4,678,276 5,009,151
20,972,307 21,575,977 20,898,962 21,052,914 21,172,616
1,576,959 1,402,610 1,402,610 1,402,610 1,402,610
44,974,063 47,106,369 47,384,585 47,349,355 45,483,146
166,122,795 166,083,621 166,612,998 166,266,991 165,806,167
36,208,022 36,162,795 36,205,354 36,295,190 36,444,513
18,142,902 18,124,819 18,124,819 18,124,819 18,127,597
147,979,893 147,958,802 148,488,179 148,142,172 147,678,570
6,866,685 9,353,570 9,359,612 9,363,186 9,752,279
20,973,979 21,288,716 21,323,967 21,298,119 24,604,873
22,004,508 22,104,563 22,228,721 22,293,647 22,516,570
6,051,789 6,097,101 6,136,773 6,194,165 6,790,249
15,952,719 16,007,462 16,091,948 16,099,482 15,726,321
1,898,443 1,866,018 1,866,018 1,966,018 1,868,304
14,054,276 14,141,444 14,225,930 14,133,464 13,858,017
4,821,020 4,812,684 4,825,799 4,830,860 4,823,317
12,423,944 12,693,242 12,770,297 12,517,601 12,778,000
12,092,303 12,264,393 12,381,448 12,248,101 12,490,732
6,451,352 6,260,886 6,281,432 6,446,723 5,903,334
3,396,194 3,313,296 3,319,216 3,461,719 2,665,521
1,495,859 1,570,350 1,570,351 1,570,350 1,570,350
19,905,320 22,729,181 21,635,159 26,323,075 18,960,318
15,952,522 17,811,995 17,855,663 17,610,119 16,580,458
72.50% 72.42% 72.39% 72.22% 69.84%
6.43% 6.31% 6.34% 6.36% 6.16%
16.37% 16.05% 16.29% 16.91% 14.88%
1.37% 1.31% 1.31% 1.37% 1.04%
1.94% 1.90% 1.90% 1.91% 1.89%
5.66% 5.57% 5.60% 5.58% 5.43%
27.50% 27.58% 27.61% 27.78% 30.16%
1.87 1.96 1.97 1.90 2.12
46.31% 47.16% 47.20% 46.15% 46.74%
2.51 2.55 2.57 2.54 2.59
2.27 2.11 2.11 2.20 1.70
10.40% 10.50% 10.26% 10.16% 10.26%
18.12% 18.56% 18.65% 18.69% 17.83%
59.62% 58.31% 58.46% 58.49% 57.89%
27.98% 27.75% 27.82% 27.61% 28.32%
72.52% 72.12% 72.29% 72.22% 73.33%
239.22% 235.87% 235.74% 237.75% 229.54%
109.15% 107.14% 107.30% 107.59% 106.52%
21.80% 21.77% 21.73% 21.83% 21.98%
10.92% 10.91% 10.88% 10.90% 10.93%
174.48% 175.16% 177.64% 177.35% 203.45%
10.46% 10.30% 10.30% 10.85% 10.31%
50.11% 50.12% 50.06% 49.94% 49.74%
8.36% 8.14% 8.02% 8.08% 7.02%
0.77 0.86 0.88 0.86 0.93
13.87 13.15 12.98 13.03 11.41
3.35 3.41 3.47 3.42 4.03
5.86 6.86 6.52 7.60 7.11
(Thousand Rupees)Specialized Banks - Overall
N/A N/A N/A N/A N/A
N/A N/A N/A N/A N/A
52

Financial Statement Analysis of Financial Sector 2020
2016 2017 2018 2019 2020Items
A.Total equity (A1 to A3) 1.Share capital 2.Reserves 3.Un appropriated profit 4.Others B.Total liabilities(B1 to B4) 1.Bills payable 2.Borrowings from financial institutions 3.Deposits and other accounts 4.Other/misc. liabilities C.Total assets (C1 to C4 + C8 to C10) 1.Cash and balances with treasury banks 2.Balances with other banks 3.Lending to financial institutions 4.Investments 5.Gross advances 6.Advances-non-performing/classified 7.Provision against advances 8.Advances net of provision (C5-C7) 9.Fixed assets 10.Other/misc. assets D.Profit & loss account 1.Markup/interest earned 2.Markup/interest expensed 3.Net markup/interest income 4.Provisions and write-offs 5.Net markup/interest income after provisions 6.Non-markup/interest income 7.Non-markup/interest expenses 8.Administrative expenses 9.Profit/(loss) before taxation 10.Profit/(loss) after taxation E.Other items 1.No. of ordinary shares (000) 2.Cash dividend 3.Stock dividend/bonus shares 4.Cash generated from operating activities 5.Commitments and contigencies F.Efficiency ratios/profitability ratios 1.Spread (D3/D1) 2.Net markup/interest margin (D1-D2)/C 3.Return on equity (ROE) (D10/A) 4.Return on assets (ROA) (D10/C) 5.Non-markup/interest income to total assets (D6/C) 6.Net markup/interest income(after prov.) to total assets(D5/C) 7.Markup/interest expense to markup/interest income (D2/D1) 8.Admin. expense to profit before tax. (D8/D9) (times) 9.Non-markup/interest expense to total income D7/(D1+D6) 10.Admin. expense to non-markup/interest income (D8/D6) (times) 11.Earning per share (D10/E1) G.Liquidity ratios 1.Cash & cash equivalent to total assets (C1+C2)/C 2.Investment to total assets (C4/C) 3.Advances net of provisions to total assets (C8/C) 4.Deposits to total assets (B3/C) 5.Total liabilities to total assets (B/C) 6.Gross advances to deposits (C5/B3) 7.Gross advances to borrowing & deposit C5/(B2+B3) H.Assets quality ratios 1.Non-performing loan to gross advances (C6/C5) 2.Provisions against NPLs to gross advances (C7/C5) 3.NPLs to shareholders equity (C6/A) 4.NPLs write off to NPLs provisions (D4/C7) 5.Provision against NPL to NPLs (C7/C6) I.Capital /leverage ratios 1.Capital ratio (A/C) 2.Commitments & contingencies to total equity (E5/A) (times) 3.Break up value per share (A/E1) 4.Total deposit to total equity (B3/A) (times) J.Cash flow ratio 1.Cash generated from opration activities to profit after tax (E4/D10) (times)
(26,102,344) (25,916,289) (25,916,289) (25,916,289) (25,916,289)
1 0 0 0 0
0 0 0 0 0
(26,102,345) (25,916,289) (25,916,289) (25,916,289) (25,916,289)
76,967 68,084 68,084 68,084 68,084
30,104,331 30,123,511 30,123,511 30,123,511 30,123,511
3,534 3,520 3,520 3,520 3,520
23,409,994 23,409,994 23,409,994 23,409,994 23,409,994
157,339 139,477 139,477 139,477 139,477
6,533,464 6,570,520 6,570,520 6,570,520 6,570,520
4,078,954 4,275,306 4,275,306 4,275,306 4,275,306
38,503 22,467 22,467 22,467 22,467
8,080 7,631 7,631 7,631 7,631
1,131,959 1,402,610 1,402,610 1,402,610 1,402,610
460,986 443,102 443,102 443,102 443,102
5,785,114 5,786,744 5,786,744 5,786,744 5,786,744
5,776,630 5,776,999 5,776,999 5,776,999 5,776,999
5,776,630 5,776,999 5,776,999 5,776,999 5,776,999
8,484 9,745 9,745 9,745 9,745
49,187 49,184 49,184 49,184 49,184
2,381,755 2,340,567 2,340,567 2,340,567 2,340,567
110,900 102,715 102,715 102,715 102,715
14,323 10,765 10,765 10,765 10,765
96,577 91,950 91,950 91,950 91,950
(22,376) (102,066) (102,066) (102,066) (102,066)
118,953 194,016 194,016 194,016 194,016
219,573 223,697 223,697 223,697 223,697
118,391 126,747 126,747 126,747 126,747
113,075 126,706 126,706 126,706 126,706
220,135 290,966 290,966 290,966 290,966
217,151 219,048 219,048 219,048 219,048
0 0 0 0 0
0.00% 0.00% 0.00% 0.00% 0.00%
0.00% 0.00% 0.00% 0.00% 0.00%
(211,853) (187,160) (187,160) (187,160) (187,160)
136,765 95,803 95,803 95,803 95,803
87.08% 89.52% 89.52% 89.52% 89.52%
2.37% 2.15% 2.15% 2.15% 2.15%
-0.83% -0.85% -0.85% -0.85% -0.85%
5.32% 5.12% 5.12% 5.12% 5.12%
5.38% 5.23% 5.23% 5.23% 5.23%
2.92% 4.54% 4.54% 4.54% 4.54%
12.92% 10.48% 10.48% 10.48% 10.48%
0.51 0.44 0.44 0.44 0.44
35.82% 38.83% 38.83% 38.83% 38.83%
0.51 0.57 0.57 0.57 0.57
1.14% 0.70% 0.70% 0.70% 0.70%
11.30% 10.36% 10.36% 10.36% 10.36%
0.21% 0.23% 0.23% 0.23% 0.23%
3.86% 3.26% 3.26% 3.26% 3.26%
738.04% 704.59% 704.59% 704.59% 704.59%
3,676.85% 4,148.89% 4,148.89% 4,148.89% 4,148.89%
24.55% 24.57% 24.57% 24.57% 24.57%
99.85% 99.83% 99.83% 99.83% 99.83%
99.85% 99.83% 99.83% 99.83% 99.83%
-22.13% -22.29% -22.29% -22.29% -22.29%
-0.39% -1.77% -1.77% -1.77% -1.77%
100.00% 100.00% 100.00% 100.00% 100.00%
-639.93% -606.19% -606.19% -606.19% -606.19%
-0.01 0.00 0.00 0.00 0.00
-0.01 -0.01 -0.01 -0.01 -0.01
-0.98 -0.85 -0.85 -0.85 -0.85
- - - - -
- - - - -
(Thousand Rupees)INDUSTRIAL DEVELOPMENT BANK LTD.
53

Financial Statement Analysis of Financial Sector 2020
2016 2017 2018 2019 2020Items
A.Total equity (A1 to A3)1.Share capital2.Reserves3.Un appropriated profit4.Others
B.Total liabilities(B1 to B4)1.Bills payable2.Borrowings from financial institutions3.Deposits and other accounts4.Other/misc. liabilities
C.Total assets (C1 to C4 + C8 to C10)1.Cash and balances with treasury banks2.Balances with other banks3.Lending to financial institutions4.Investments5.Gross advances6.Advances-non-performing/classified7.Provision against advances8.Advances net of provision (C5-C7)9.Fixed assets10.Other/misc. assets
D.Profit & loss account1.Markup/interest earned2.Markup/interest expensed3.Net markup/interest income4.Provisions and write-offs5.Net markup/interest income after provisions6.Non-markup/interest income7.Non-markup/interest expenses8.Administrative expenses9.Profit/(loss) before taxation10.Profit/(loss) after taxation
E.Other items1.No. of ordinary shares (000)2.Cash dividend3.Stock dividend/bonus shares4.Cash generated from operating activities5.Commitments and contigencies
F.Efficiency ratios/profitability ratios1.Spread (D3/D1)2.Net markup/interest margin (D1-D2)/C3.Return on equity (ROE) (D10/A)4.Return on assets (ROA) (D10/C)5.Non-markup/interest income to total assets (D6/C)6.Net markup/interest income(after prov.) to total assets(D5/C)7.Markup/interest expense to markup/interest income (D2/D1)8.Admin. expense to profit before tax. (D8/D9) (times)9.Non-markup/interest expense to total income D7/(D1+D6) 10.Admin. expense to non-markup/interest income (D8/D6) (times) 11.Earning per share (D10/E1)
G.Liquidity ratios1.Cash & cash equivalent to total assets (C1+C2)/C2.Investment to total assets (C4/C)3.Advances net of provisions to total assets (C8/C)
4.Deposits to total assets (B3/C)5.Total liabilities to total assets (B/C) 6.Gross advances to deposits (C5/B3) 7.Gross advances to borrowing & deposit C5/(B2+B3)
H.Assets quality ratios1.Non-performing loan to gross advances (C6/C5)2.Provisions against NPLs to gross advances (C7/C5)3.NPLs to shareholders equity (C6/A)4.NPLs write off to NPLs provisions (D4/C7) 5.Provision against NPL to NPLs (C7/C6)
I.Capital /leverage ratios1.Capital ratio (A/C)2.Commitments & contingencies to total equity (E5/A) (times)3.Break up value per share (A/E1)4.Total deposit to total equity (B3/A) (times)
J.Cash flow ratio1.Cash generated from opration activities to profit after tax (E4/D10) (times)
8,328 (406,365) (406,365) (406,365) (3,162,669)
2,392,507 2,392,507 2,392,507 2,392,507 2,392,507
206,526 206,526 206,526 206,526 206,526
(2,590,705) (3,005,398) (3,005,398) (3,005,398) (5,761,702)
12,320 (27,980) (27,980) (27,980) 2,586
9,357,567 11,429,439 11,429,439 11,429,439 13,101,170
95,443 92,554 92,554 92,554 99,986
3,460,326 5,308,315 5,308,315 5,308,315 4,127,613
5,228,716 5,343,655 5,343,655 5,343,655 7,602,262
573,082 684,915 684,915 684,915 1,271,309
9,378,215 10,995,094 10,995,094 10,995,094 9,941,087
560,802 435,791 435,791 435,791 668,727
4,226 11,321 11,321 11,321 2,123
445,000 0 0 0 0
4,869,535 6,911,314 6,911,314 6,911,314 5,828,353
8,028,712 7,744,049 7,744,049 7,744,049 6,771,662
5,418,812 5,396,984 5,396,984 5,396,984 5,373,260
5,256,992 5,238,540 5,238,540 5,238,540 5,241,318
2,771,720 2,505,509 2,505,509 2,505,509 1,530,344
101,141 63,122 63,122 63,122 472,184
625,791 1,068,037 1,068,037 1,068,037 1,439,356
615,070 649,278 649,278 649,278 738,948
441,204 520,408 520,408 520,408 1,008,663
173,866 128,870 128,870 128,870 (269,715)
(64,266) (16,807) (16,807) (16,807) (14,521)
238,132 145,677 145,677 145,677 (255,194)
47,270 24,738 24,738 24,738 14,934
742,220 891,422 891,422 891,422 906,858
740,332 840,252 840,252 840,252 837,299
(456,818) (721,007) (721,007) (721,007) (1,147,118)
(199,242) (294,022) (294,022) (294,022) (977,164)
239,251 239,251 239,251 239,251 239,251
0.00% 0.00% 0.00% 0.00% 0.00%
0.00% 0.00% 0.00% 0.00% 0.00%
508,200 1,990,780 1,990,780 6,707,231 (120,300)
4,846,806 6,730,038 6,730,038 6,730,038 5,701,081
28.27% 19.85% 19.85% 19.85% -36.50%
1.85% 1.17% 1.17% 1.17% -2.71%
-2,392.44% 72.35% 72.35% 72.35% 30.90%
-2.12% -2.67% -2.67% -2.67% -9.83%
0.50% 0.22% 0.22% 0.22% 0.15%
2.54% 1.32% 1.32% 1.32% -2.57%
71.73% 80.15% 80.15% 80.15% 136.50%
-1.62 -1.17 -1.17 -1.17 -0.73
112.06% 132.26% 132.26% 132.26% 120.29%
15.66 33.97 33.97 33.97 56.07
-0.83 -1.23 -1.23 -1.23 -4.08
6.02% 4.07% 4.07% 4.07% 6.75%
51.92% 62.86% 62.86% 62.86% 58.63%
29.55% 22.79% 22.79% 22.79% 15.39%
55.75% 48.60% 48.60% 48.60% 76.47%
99.78% 103.95% 103.95% 103.95% 131.79%
153.55% 144.92% 144.92% 144.92% 89.07%
92.40% 72.70% 72.70% 72.70% 57.73%
67.49% 69.69% 69.69% 69.69% 79.35%
65.48% 67.65% 67.65% 67.65% 77.40%
65,067.39% -1,328.11% -1,328.11% -1,328.11% -169.90%
-1.22% -0.32% -0.32% -0.32% -0.28%
97.01% 97.06% 97.06% 97.06% 97.54%
0.09% -3.70% -3.70% -3.70% -31.81%
581.99 -16.56 -16.56 -16.56 -1.80
0.03 -1.70 -1.70 -1.70 -13.22
627.85 -13.15 -13.15 -13.15 -2.40
-2.55 -6.77 -6.77 -22.81 0.12
(Thousand Rupees)SME BANK LTD.
54

Financial Statement Analysis of Financial Sector 2020
2016 2017 2018 2019 2020Items
A.Total equity (A1 to A3) 1.Share capital 2.Reserves 3.Un appropriated profit 4.Others B.Total liabilities(B1 to B4) 1.Bills payable 2.Borrowings from financial institutions 3.Deposits and other accounts 4.Other/misc. liabilities C.Total assets (C1 to C4 + C8 to C10) 1.Cash and balances with treasury banks 2.Balances with other banks 3.Lending to financial institutions 4.Investments 5.Gross advances 6.Advances-non-performing/classified 7.Provision against advances 8.Advances net of provision (C5-C7) 9.Fixed assets 10.Other/misc. assets D.Profit & loss account 1.Markup/interest earned 2.Markup/interest expensed 3.Net markup/interest income 4.Provisions and write-offs 5.Net markup/interest income after provisions 6.Non-markup/interest income 7.Non-markup/interest expenses 8.Administrative expenses 9.Profit/(loss) before taxation 10.Profit/(loss) after taxation E.Other items 1.No. of ordinary shares (000) 2.Cash dividend 3.Stock dividend/bonus shares 4.Cash generated from operating activities 5.Commitments and contigencies F.Efficiency ratios/profitability ratios 1.Spread (D3/D1) 2.Net markup/interest margin (D1-D2)/C 3.Return on equity (ROE) (D10/A) 4.Return on assets (ROA) (D10/C) 5.Non-markup/interest income to total assets (D6/C) 6.Net markup/interest income(after prov.) to total assets(D5/C) 7.Markup/interest expense to markup/interest income (D2/D1) 8.Admin. expense to profit before tax. (D8/D9) (times) 9.Non-markup/interest expense to total income D7/(D1+D6) 10.Admin. expense to non-markup/interest income (D8/D6) (times) 11.Earning per share (D10/E1) G.Liquidity ratios 1.Cash & cash equivalent to total assets (C1+C2)/C 2.Investment to total assets (C4/C) 3.Advances net of provisions to total assets (C8/C) 4.Deposits to total assets (B3/C) 5.Total liabilities to total assets (B/C) 6.Gross advances to deposits (C5/B3) 7.Gross advances to borrowing & deposit C5/(B2+B3) H.Assets quality ratios 1.Non-performing loan to gross advances (C6/C5) 2.Provisions against NPLs to gross advances (C7/C5) 3.NPLs to shareholders equity (C6/A) 4.NPLs write off to NPLs provisions (D4/C7) 5.Provision against NPL to NPLs (C7/C6) I.Capital /leverage ratios 1.Capital ratio (A/C) 2.Commitments & contingencies to total equity (E5/A) (times) 3.Break up value per share (A/E1) 4.Total deposit to total equity (B3/A) (times) J.Cash flow ratio 1.Cash generated from opration activities to profit after tax (E4/D10) (times)
6,989,035 7,111,433 6,847,044 6,931,879 7,135,908
7,886,842 7,885,482 7,885,556 7,885,490 7,885,449
682,816 712,873 742,108 809,147 848,179
(1,580,623) (1,486,922) (1,780,620) (1,762,758) (1,597,720)
4,783,944 7,486,536 7,385,478 7,266,202 7,473,639
7,400,612 8,320,656 8,948,773 8,257,167 10,716,321
14,807 52,584 55,502 52,635 22,921
0 0 0 0 0
4,186,617 5,057,990 5,324,183 4,579,982 4,620,648
3,199,188 3,210,082 3,569,088 3,624,550 6,072,752
19,173,591 22,918,625 23,181,295 22,455,248 25,325,868
770,803 1,127,957 1,218,756 742,268 840,207
885,556 1,482,580 805,565 959,517 1,088,417
0 0 0 0 0
2,525,001 2,633,412 2,911,628 2,876,398 2,093,150
11,040,810 11,284,669 11,814,046 11,468,039 11,979,602
2,270,105 2,246,337 2,288,896 2,378,732 2,551,779
1,606,271 1,606,271 1,606,271 1,606,271 1,606,271
9,434,539 9,678,398 10,207,775 9,861,768 10,373,331
4,645,212 7,170,119 7,176,161 7,179,735 7,159,766
912,480 826,159 861,410 835,562 3,770,997
1,647,117 1,721,149 1,845,307 1,910,233 2,043,486
140,781 110,447 150,119 207,511 315,340
1,506,336 1,610,702 1,695,188 1,702,722 1,728,146
194 0 0 100,000 0
1,506,142 1,610,702 1,695,188 1,602,722 1,728,146
132,477 142,549 155,664 160,725 162,986
1,496,634 1,608,374 1,685,429 1,432,733 1,677,696
1,389,835 1,448,374 1,565,429 1,432,082 1,677,666
141,985 144,877 165,423 330,714 213,436
103,948 113,933 119,853 262,356 149,300
4,364 78,855 78,856 78,855 78,855
0.00% 0.00% 0.00% 0.00% 0.00%
0.00% 0.00% 0.00% 0.00% 0.00%
(441,734) 874,854 (219,168) (247,703) (782,929)
204,137 221,340 265,008 19,464 18,760
91.45% 93.58% 91.86% 89.14% 84.57%
7.86% 7.03% 7.31% 7.58% 6.82%
1.49% 1.60% 1.75% 3.78% 2.09%
0.54% 0.50% 0.52% 1.17% 0.59%
0.69% 0.62% 0.67% 0.72% 0.64%
7.86% 7.03% 7.31% 7.14% 6.82%
8.55% 6.42% 8.14% 10.86% 15.43%
9.79 10.00 9.46 4.33 7.86
84.10% 86.30% 84.23% 69.18% 76.04%
10.49 10.16 10.06 8.91 10.29
23.82 1.44 1.52 3.33 1.89
8.64% 11.39% 8.73% 7.58% 7.62%
13.17% 11.49% 12.56% 12.81% 8.26%
49.21% 42.23% 44.03% 43.92% 40.96%
21.84% 22.07% 22.97% 20.40% 18.24%
38.60% 36.31% 38.60% 36.77% 42.31%
263.72% 223.11% 221.89% 250.39% 259.26%
263.72% 223.11% 221.89% 250.39% 259.26%
20.56% 19.91% 19.37% 20.74% 21.30%
14.55% 14.23% 13.60% 14.01% 13.41%
32.48% 31.59% 33.43% 34.32% 35.76%
0.01% 0.00% 0.00% 6.23% 0.00%
70.76% 71.51% 70.18% 67.53% 62.95%
36.45% 31.03% 29.54% 30.87% 28.18%
0.03 0.03 0.04 0.00 0.00
1,601.52 90.18 86.83 87.91 90.49
0.60 0.71 0.78 0.66 0.65
-4.25 7.68 -1.83 -0.94 -5.24
(Thousand Rupees)THE PUNJAB PROVINCIAL COOPERATIVE BANK LTD.
55

Financial Statement Analysis of Financial Sector 2020
2016 2017 2018 2019 2020Items
A.Total equity (A1 to A3) 1.Share capital 2.Reserves 3.Un appropriated profit 4.Others B.Total liabilities(B1 to B4) 1.Bills payable 2.Borrowings from financial institutions 3.Deposits and other accounts 4.Other/misc. liabilities C.Total assets (C1 to C4 + C8 to C10) 1.Cash and balances with treasury banks 2.Balances with other banks 3.Lending to financial institutions 4.Investments 5.Gross advances 6.Advances-non-performing/classified 7.Provision against advances 8.Advances net of provision (C5-C7) 9.Fixed assets 10.Other/misc. assets D.Profit & loss account 1.Markup/interest earned 2.Markup/interest expensed 3.Net markup/interest income 4.Provisions and write-offs 5.Net markup/interest income after provisions 6.Non-markup/interest income 7.Non-markup/interest expenses 8.Administrative expenses 9.Profit/(loss) before taxation 10.Profit/(loss) after taxation E.Other items 1.No. of ordinary shares (000) 2.Cash dividend 3.Stock dividend/bonus shares 4.Cash generated from operating activities 5.Commitments and contigencies F.Efficiency ratios/profitability ratios 1.Spread (D3/D1) 2.Net markup/interest margin (D1-D2)/C 3.Return on equity (ROE) (D10/A) 4.Return on assets (ROA) (D10/C) 5.Non-markup/interest income to total assets (D6/C) 6.Net markup/interest income(after prov.) to total assets(D5/C) 7.Markup/interest expense to markup/interest income (D2/D1) 8.Admin. expense to profit before tax. (D8/D9) (times) 9.Non-markup/interest expense to total income D7/(D1+D6) 10.Admin. expense to non-markup/interest income (D8/D6) (times) 11.Earning per share (D10/E1) G.Liquidity ratios 1.Cash & cash equivalent to total assets (C1+C2)/C 2.Investment to total assets (C4/C) 3.Advances net of provisions to total assets (C8/C) 4.Deposits to total assets (B3/C) 5.Total liabilities to total assets (B/C) 6.Gross advances to deposits (C5/B3) 7.Gross advances to borrowing & deposit C5/(B2+B3) H.Assets quality ratios 1.Non-performing loan to gross advances (C6/C5) 2.Provisions against NPLs to gross advances (C7/C5) 3.NPLs to shareholders equity (C6/A) 4.NPLs write off to NPLs provisions (D4/C7) 5.Provision against NPL to NPLs (C7/C6) I.Capital /leverage ratios 1.Capital ratio (A/C) 2.Commitments & contingencies to total equity (E5/A) (times) 3.Break up value per share (A/E1) 4.Total deposit to total equity (B3/A) (times) J.Cash flow ratio 1.Cash generated from opration activities to profit after tax (E4/D10) (times)
39,856,596 39,856,596 39,856,596 39,856,596 39,856,596
12,522,441 12,522,441 12,522,441 12,522,441 12,522,441
6,299,526 6,299,526 6,299,526 6,299,526 6,299,526
21,034,629 21,034,629 21,034,629 21,034,629 21,034,629
42,583,503 42,583,503 42,583,503 42,583,503 42,583,503
133,120,885 133,120,885 133,120,885 133,120,885 133,120,885
493,231 493,231 493,231 493,231 493,231
55,885,230 55,885,230 55,885,230 55,885,230 55,885,230
59,870,659 59,870,659 59,870,659 59,870,659 59,870,659
16,871,765 16,871,765 16,871,765 16,871,765 16,871,765
215,560,984 215,560,984 215,560,984 215,560,984 215,560,984
3,477,750 3,477,750 3,477,750 3,477,750 3,477,750
20,074,445 20,074,445 20,074,445 20,074,445 20,074,445
0 0 0 0 0
37,118,541 37,118,541 37,118,541 37,118,541 37,118,541
141,268,159 141,268,159 141,268,159 141,268,159 141,268,159
22,742,475 22,742,475 22,742,475 22,742,475 22,742,475
5,503,009 5,503,009 5,503,009 5,503,009 5,503,009
135,765,150 135,765,150 135,765,150 135,765,150 135,765,150
2,071,145 2,071,145 2,071,145 2,071,145 2,071,145
17,053,953 17,053,953 17,053,953 17,053,953 17,053,953
19,631,421 19,631,421 19,631,421 19,631,421 19,631,421
5,455,481 5,455,481 5,455,481 5,455,481 5,455,481
14,175,940 14,175,940 14,175,940 14,175,940 14,175,940
1,984,891 1,984,891 1,984,891 1,984,891 1,984,891
12,191,049 12,191,049 12,191,049 12,191,049 12,191,049
4,421,700 4,421,700 4,421,700 4,421,700 4,421,700
10,066,699 10,066,699 10,066,699 10,066,699 10,066,699
9,849,061 9,849,061 9,849,061 9,849,061 9,849,061
6,546,050 6,546,050 6,546,050 6,546,050 6,546,050
3,274,337 3,274,337 3,274,337 3,274,337 3,274,337
1,252,244 1,252,244 1,252,244 1,252,244 1,252,244
0.00% 0.00% 0.00% 0.00% 0.00%
0.00% 0.00% 0.00% 0.00% 0.00%
20,050,707 20,050,707 20,050,707 20,050,707 20,050,707
10,764,814 10,764,814 10,764,814 10,764,814 10,764,814
72.21% 72.21% 72.21% 72.21% 72.21%
6.58% 6.58% 6.58% 6.58% 6.58%
8.22% 8.22% 8.22% 8.22% 8.22%
1.52% 1.52% 1.52% 1.52% 1.52%
2.05% 2.05% 2.05% 2.05% 2.05%
5.66% 5.66% 5.66% 5.66% 5.66%
27.79% 27.79% 27.79% 27.79% 27.79%
1.50 1.50 1.50 1.50 1.50
41.85% 41.85% 41.85% 41.85% 41.85%
2.23 2.23 2.23 2.23 2.23
2.61 2.61 2.61 2.61 2.61
10.93% 10.93% 10.93% 10.93% 10.93%
17.22% 17.22% 17.22% 17.22% 17.22%
62.98% 62.98% 62.98% 62.98% 62.98%
27.77% 27.77% 27.77% 27.77% 27.77%
61.76% 61.76% 61.76% 61.76% 61.76%
235.96% 235.96% 235.96% 235.96% 235.96%
122.04% 122.04% 122.04% 122.04% 122.04%
16.10% 16.10% 16.10% 16.10% 16.10%
3.90% 3.90% 3.90% 3.90% 3.90%
57.06% 57.06% 57.06% 57.06% 57.06%
36.07% 36.07% 36.07% 36.07% 36.07%
24.20% 24.20% 24.20% 24.20% 24.20%
18.49% 18.49% 18.49% 18.49% 18.49%
0.27 0.27 0.27 0.27 0.27
31.83 31.83 31.83 31.83 31.83
1.50 1.50 1.50 1.50 1.50
6.12 6.12 6.12 6.12 6.12
(Thousand Rupees)ZARAI TARAQIATI BANK LTD. (ZTBL)
56

Financial Statement Analysis of Financial Sector 2020
2016 2017 2018 2019 2020Items
A.Total equity (A1 to A3) 1.Head office capital account 2.Reserves 3.Unremitted profit 4.Others B.Total liabilities (B1 to B4) 1.Bills payable 2.Borrowings from financial institutions 3.Deposits and other accounts 4.Other/misc. liabilities C.Total assets (C1 to C4 + C8 to C10) 1.Cash and balances with treasury banks 2.Balances with other banks 3.Lending to financial institutions 4.Investments 5.Gross advances 6.Advances-non-performing/classified 7.Provision against advances 8.Advances net of provision (C5-C7) 9.Fixed assets 10.Other/misc. assets D.Profit & loss account 1.Markup/interest earned 2.Markup/interest expenses 3.Net markup/interest income 4.Provisions and write-offs 5.Net markup/interest income after provisions 6.Non-markup/interest income 7.Non-markup/interest expenses 8.Administrative expenses 9.Profit/(loss) before taxation 10.Profit/(loss) after taxation E.Other items 1.Cash generated from operating activities 2.Commitments and contingencies F.Efficiency ratios/Profitability ratios 1.Spread (D3/D1) 2.Net markup/interest margin (D1-D2)/C 3.Return on equity (ROE) (D10/A) 4.Return on assets (ROA) (D10/C) 5.Non-markup/interest income to total assets (D6/C) 6.Net markup/Interest income (after prov.) to total assets(D5/C) 7.Markup/interest expense to markup/interest income (D2/D1) 8.Admin expense to profit before tax.(D8/D9) (times) 9.Non-markup/interest expense to total income D7/(D1+D6) 10.Admin. exp. to non-markup/interest income (D8/D6) (times) G.Liquidity ratios 1.Cash & cash equivalent to total assets (C1+C2)/C 2.Investment to total assets (C4/C) 3.Advances net of provision to total assets (C8/C) 4.Deposits to total assets ( B3/C) 5.Total liabilities to total assets (B/C) 6.Gross advances to deposit (C5/B3) 7.Gross advances to borrowing & deposit C5/(B2+B3) H.Assets quality ratios 1.Non-performing loan to gross advances (C6/C5) 2.Provision against NPLs to gross advances (C7/C5) 3.NPLs to total equity (C6/A) 4.NPLs write off to NPLs provision (D4/C7) 5.Provision against NPL to NPLs (C7/C6) I.Capital/leverage ratios 1.Capital ratio (A/C) 2.Commitments & contingencies to total equity (E2/A) (times) 3.Total deposit to total equity (B3/A) (times) J.Cash flow ratio 1.Cash generated from operating activities to profit after tax (E1/D10) (times)
27,545,399 42,717,688 56,420,769 64,137,709 77,845,785
17,989,455 29,935,296 43,532,211 43,345,854 45,082,332
168,704 163,039 161,543 161,543 161,550
9,387,240 12,619,353 12,727,015 20,630,312 32,601,903
25,599 (248,871) (611,577) 229,277 (503,125)
365,211,279 524,623,905 609,984,321 650,893,505 658,429,131
6,444,711 7,394,470 6,825,088 7,198,250 4,873,339
188,782,820 320,014,727 373,037,276 365,134,911 344,992,122
147,092,366 169,160,637 192,689,060 245,181,007 274,379,521
22,891,382 28,054,071 37,432,897 33,379,337 34,184,149
392,782,277 567,092,722 665,793,513 715,260,491 735,771,790
22,378,445 36,654,151 54,443,354 59,582,640 59,690,698
5,424,146 3,362,099 5,062,933 27,935,629 29,699,557
40,652,680 169,574,507 242,277,899 235,064,713 214,519,818
276,804,547 293,127,110 249,859,445 287,315,034 344,571,990
35,555,281 43,541,169 80,516,195 94,163,546 75,191,276
2,963,262 2,895,154 2,840,145 2,771,537 2,477,592
2,970,555 2,986,081 3,143,135 3,072,361 2,823,403
32,584,726 40,555,088 77,373,060 91,091,185 72,367,873
1,560,563 1,617,875 1,533,601 1,969,842 2,032,586
13,377,170 22,201,892 35,243,221 12,301,448 12,889,268
17,513,836 28,034,169 37,573,078 71,659,049 68,295,920
11,751,053 17,818,510 23,402,921 46,241,877 44,029,751
5,762,783 10,215,659 14,170,157 25,417,172 24,266,169
(98,081) 16,103 86,901 6,452 56,341
5,860,864 10,199,556 14,083,256 25,410,720 24,209,828
6,883,540 5,174,630 7,422,324 7,020,950 10,408,534
4,413,283 5,131,359 6,848,464 7,066,022 5,645,090
4,316,542 4,934,666 6,558,310 6,542,660 5,061,333
8,331,121 10,242,827 14,642,026 25,365,648 28,973,272
5,058,822 6,188,117 9,012,566 14,713,114 17,493,943
(61,678,985) 10,744,512 12,754,170 65,954,402 66,666,035
1,390,191,010 1,573,713,722 1,578,041,798 1,554,624,091 1,616,618,027
32.90% 36.44% 37.71% 35.47% 35.53%
1.47% 1.80% 2.13% 3.55% 3.30%
18.37% 14.49% 15.97% 22.94% 22.47%
1.29% 1.09% 1.35% 2.06% 2.38%
1.75% 0.91% 1.11% 0.98% 1.41%
1.49% 1.80% 2.12% 3.55% 3.29%
67.10% 63.56% 62.29% 64.53% 64.47%
0.52 0.48 0.45 0.26 0.17
18.09% 15.45% 15.22% 8.98% 7.17%
0.63 0.95 0.88 0.93 0.49
7.08% 7.06% 8.94% 12.24% 12.15%
70.47% 51.69% 37.53% 40.17% 46.83%
8.30% 7.15% 11.62% 12.74% 9.84%
37.45% 29.83% 28.94% 34.28% 37.29%
92.98% 92.51% 91.62% 91.00% 89.49%
24.17% 25.74% 41.79% 38.41% 27.40%
10.59% 8.90% 14.23% 15.43% 12.14%
8.33% 6.65% 3.53% 2.94% 3.30%
8.35% 6.86% 3.90% 3.26% 3.75%
10.76% 6.78% 5.03% 4.32% 3.18%
-3.30% 0.54% 2.76% 0.21% 2.00%
100.25% 103.14% 110.67% 110.85% 113.96%
7.01% 7.53% 8.47% 8.97% 10.58%
50.47 36.84 27.97 24.24 20.77
5.34 3.96 3.42 3.82 3.52
-12.19 1.74 1.42 4.48 3.81
(Thousand Rupees)Foreign Banks - Overall
57

Financial Statement Analysis of Financial Sector 2020
2017 2018 2019 2020Items
A.Total equity (A1 to A3) 1.Head office capital account 2.Reserves 3.Unremitted profit 4.Others B.Total liabilities (B1 to B4) 1.Bills payable 2.Borrowings from financial institutions 3.Deposits and other accounts 4.Other/misc. liabilities C.Total assets (C1 to C4 + C8 to C10) 1.Cash and balances with treasury banks 2.Balances with other banks 3.Lending to financial institutions 4.Investments 5.Gross advances 6.Advances-non-performing/classified 7.Provision against advances 8.Advances net of provision (C5-C7) 9.Fixed assets 10.Other/misc. assets D.Profit & loss account 1.Markup/interest earned 2.Markup/interest expenses 3.Net markup/interest income 4.Provisions and write-offs 5.Net markup/interest income after provisions 6.Non-markup/interest income 7.Non-markup/interest expenses 8.Administrative expenses 9.Profit/(loss) before taxation 10.Profit/(loss) after taxation E.Other items 1.Cash generated from operating activities 2.Commitments and contingencies F.Efficiency ratios/Profitability ratios 1.Spread (D3/D1) 2.Net markup/interest margin (D1-D2)/C 3.Return on equity (ROE) (D10/A) 4.Return on assets (ROA) (D10/C) 5.Non-markup/interest income to total assets (D6/C) 6.Net markup/Interest income (after prov.) to total assets(D5/C) 7.Markup/interest expense to markup/interest income (D2/D1) 8.Admin expense to profit before tax.(D8/D9) (times) 9.Non-markup/interest expense to total income D7/(D1+D6) 10.Admin. exp. to non-markup/interest income (D8/D6) (times) G.Liquidity ratios 1.Cash & cash equivalent to total assets (C1+C2)/C 2.Investment to total assets (C4/C) 3.Advances net of provision to total assets (C8/C) 4.Deposits to total assets ( B3/C) 5.Total liabilities to total assets (B/C) 6.Gross advances to deposit (C5/B3) 7.Gross advances to borrowing & deposit C5/(B2+B3) H.Assets quality ratios 1.Non-performing loan to gross advances (C6/C5) 2.Provision against NPLs to gross advances (C7/C5) 3.NPLs to total equity (C6/A) 4.NPLs write off to NPLs provision (D4/C7) 5.Provision against NPL to NPLs (C7/C6) I.Capital/leverage ratios 1.Capital ratio (A/C) 2.Commitments & contingencies to total equity (E2/A) (times) 3.Total deposit to total equity (B3/A) (times) J.Cash flow ratio 1.Cash generated from operating activities to profit after tax (E1/D10) (times)
5,520,860 6,943,095 6,913,414 6,986,827
5,520,860 6,943,095 7,742,380 7,991,720
0 0 0 0
0 0 (828,966) (1,004,893)
(211,200) (478,310) 0 (2,756)
721,492 8,299,459 19,601,497 7,381,697
0 0 0 0
0 0 800,000 0
0 7,227,913 17,009,371 5,874,230
721,492 1,071,546 1,792,126 1,507,467
6,031,152 14,764,244 26,514,911 14,365,767
5,521,360 7,238,142 8,466,816 8,477,398
285,720 10,726 13,740,673 546,688
0 276,244 2,477,562 239,752
0 6,569,934 0 3,974,343
0 133,900 834,590 0
0 0 0 0
0 0 0 0
0 133,900 834,590 0
195,879 232,280 522,666 554,804
28,193 303,018 472,604 572,782
0 369,276 789,169 324,328
0 345,662 786,419 298,090
0 23,614 2,750 26,238
0 0 0 0
0 23,614 2,750 26,238
(17,522) 12,969 98,540 463,589
193,678 561,245 630,307 764,289
193,678 561,245 630,307 764,289
(211,200) (524,662) (529,017) (274,462)
(211,200) (267,110) (348,887) (175,927)
482,099 6,686,824 8,072,921 (9,200,637)
739,274 13,864,479 38,644,804 36,907,187
6.39% 0.35% 8.09%
0.00% 0.16% 0.01% 0.18%
-3.83% -3.85% -5.05% -2.52%
-3.50% -1.81% -1.32% -1.22%
-0.29% 0.09% 0.37% 3.23%
0.00% 0.16% 0.01% 0.18%
93.61% 99.65% 91.91%
-0.92 -1.07 -1.19 -2.78
-1,105.34% 146.83% 71.00% 97.00%
-11.05 43.28 6.40 1.65
96.28% 49.10% 83.75% 62.82%
0.00% 44.50% 0.00% 27.67%
0.00% 0.91% 3.15% 0.00%
0.00% 48.96% 64.15% 40.89%
11.96% 56.21% 73.93% 51.38%
1.85% 4.91% 0.00%
1.85% 4.69% 0.00%
0.00% 0.00%
0.00% 0.00%
0.00% 0.00% 0.00% 0.00%
91.54% 47.03% 26.07% 48.64%
0.13 2.00 5.59 5.28
0.00 1.04 2.46 0.84
-2.28 -25.03 -23.14 52.30
-
-
--
- -- -
- - - -- - - -
(Thousand Rupees)Bank of China Limited
58
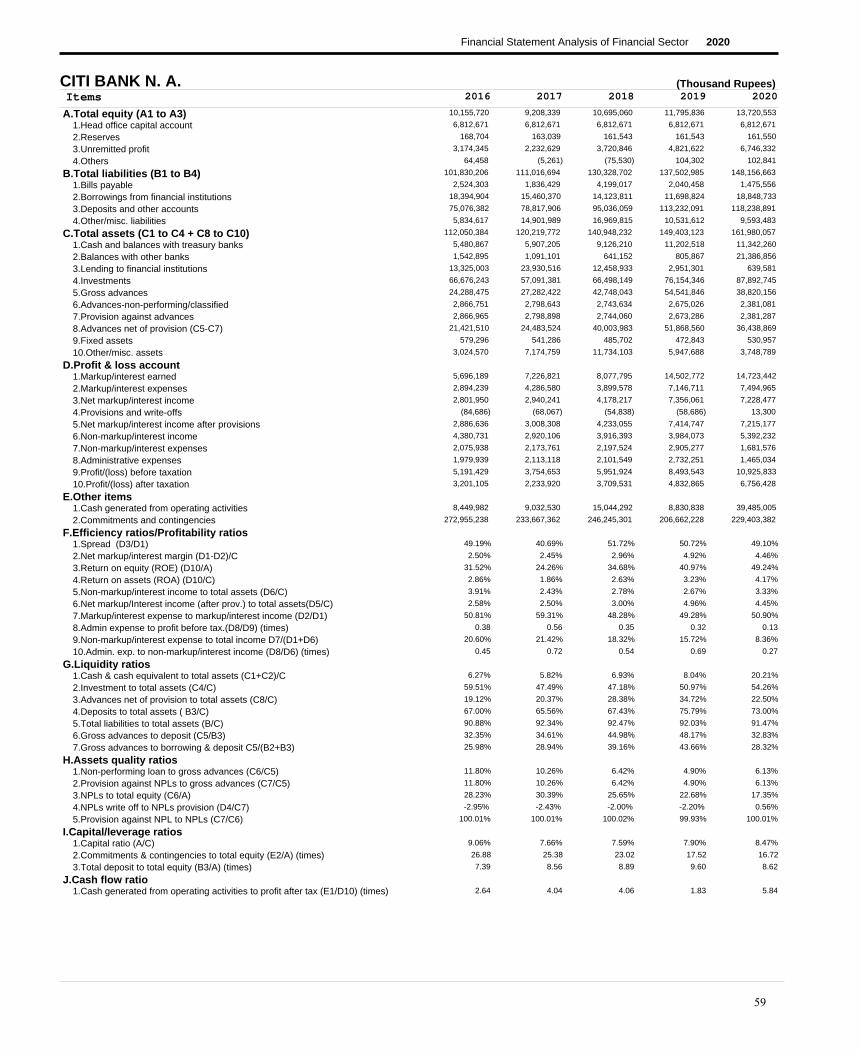
Financial Statement Analysis of Financial Sector 2020
2016 2017 2018 2019 2020Items
A.Total equity (A1 to A3)1.Head office capital account2.Reserves3.Unremitted profit4.Others
B.Total liabilities (B1 to B4)1.Bills payable2.Borrowings from financial institutions3.Deposits and other accounts4.Other/misc. liabilities
C.Total assets (C1 to C4 + C8 to C10)1.Cash and balances with treasury banks2.Balances with other banks3.Lending to financial institutions4.Investments5.Gross advances6.Advances-non-performing/classified7.Provision against advances8.Advances net of provision (C5-C7)9.Fixed assets10.Other/misc. assets
D.Profit & loss account1.Markup/interest earned2.Markup/interest expenses3.Net markup/interest income4.Provisions and write-offs5.Net markup/interest income after provisions6.Non-markup/interest income7.Non-markup/interest expenses8.Administrative expenses9.Profit/(loss) before taxation10.Profit/(loss) after taxation
E.Other items1.Cash generated from operating activities2.Commitments and contingencies
F.Efficiency ratios/Profitability ratios1.Spread (D3/D1)2.Net markup/interest margin (D1-D2)/C3.Return on equity (ROE) (D10/A)4.Return on assets (ROA) (D10/C)5.Non-markup/interest income to total assets (D6/C)6.Net markup/Interest income (after prov.) to total assets(D5/C)7.Markup/interest expense to markup/interest income (D2/D1)8.Admin expense to profit before tax.(D8/D9) (times)9.Non-markup/interest expense to total income D7/(D1+D6) 10.Admin. exp. to non-markup/interest income (D8/D6) (times)
G.Liquidity ratios1.Cash & cash equivalent to total assets (C1+C2)/C2.Investment to total assets (C4/C)3.Advances net of provision to total assets (C8/C) 4.Deposits to total assets ( B3/C) 5.Total liabilities to total assets (B/C) 6.Gross advances to deposit (C5/B3) 7.Gross advances to borrowing & deposit C5/(B2+B3)
H.Assets quality ratios1.Non-performing loan to gross advances (C6/C5)2.Provision against NPLs to gross advances (C7/C5)3.NPLs to total equity (C6/A)4.NPLs write off to NPLs provision (D4/C7) 5.Provision against NPL to NPLs (C7/C6)
I.Capital/leverage ratios1.Capital ratio (A/C)2.Commitments & contingencies to total equity (E2/A) (times)3.Total deposit to total equity (B3/A) (times)
J.Cash flow ratio1.Cash generated from operating activities to profit after tax (E1/D10) (times)
10,155,720 9,208,339 10,695,060 11,795,836 13,720,553
6,812,671 6,812,671 6,812,671 6,812,671 6,812,671
168,704 163,039 161,543 161,543 161,550
3,174,345 2,232,629 3,720,846 4,821,622 6,746,332
64,458 (5,261) (75,530) 104,302 102,841
101,830,206 111,016,694 130,328,702 137,502,985 148,156,663
2,524,303 1,836,429 4,199,017 2,040,458 1,475,556
18,394,904 15,460,370 14,123,811 11,698,824 18,848,733
75,076,382 78,817,906 95,036,059 113,232,091 118,238,891
5,834,617 14,901,989 16,969,815 10,531,612 9,593,483
112,050,384 120,219,772 140,948,232 149,403,123 161,980,057
5,480,867 5,907,205 9,126,210 11,202,518 11,342,260
1,542,895 1,091,101 641,152 805,867 21,386,856
13,325,003 23,930,516 12,458,933 2,951,301 639,581
66,676,243 57,091,381 66,498,149 76,154,346 87,892,745
24,288,475 27,282,422 42,748,043 54,541,846 38,820,156
2,866,751 2,798,643 2,743,634 2,675,026 2,381,081
2,866,965 2,798,898 2,744,060 2,673,286 2,381,287
21,421,510 24,483,524 40,003,983 51,868,560 36,438,869
579,296 541,286 485,702 472,843 530,957
3,024,570 7,174,759 11,734,103 5,947,688 3,748,789
5,696,189 7,226,821 8,077,795 14,502,772 14,723,442
2,894,239 4,286,580 3,899,578 7,146,711 7,494,965
2,801,950 2,940,241 4,178,217 7,356,061 7,228,477
(84,686) (68,067) (54,838) (58,686) 13,300
2,886,636 3,008,308 4,233,055 7,414,747 7,215,177
4,380,731 2,920,106 3,916,393 3,984,073 5,392,232
2,075,938 2,173,761 2,197,524 2,905,277 1,681,576
1,979,939 2,113,118 2,101,549 2,732,251 1,465,034
5,191,429 3,754,653 5,951,924 8,493,543 10,925,833
3,201,105 2,233,920 3,709,531 4,832,865 6,756,428
8,449,982 9,032,530 15,044,292 8,830,838 39,485,005
272,955,238 233,667,362 246,245,301 206,662,228 229,403,382
49.19% 40.69% 51.72% 50.72% 49.10%
2.50% 2.45% 2.96% 4.92% 4.46%
31.52% 24.26% 34.68% 40.97% 49.24%
2.86% 1.86% 2.63% 3.23% 4.17%
3.91% 2.43% 2.78% 2.67% 3.33%
2.58% 2.50% 3.00% 4.96% 4.45%
50.81% 59.31% 48.28% 49.28% 50.90%
0.38 0.56 0.35 0.32 0.13
20.60% 21.42% 18.32% 15.72% 8.36%
0.45 0.72 0.54 0.69 0.27
6.27% 5.82% 6.93% 8.04% 20.21%
59.51% 47.49% 47.18% 50.97% 54.26%
19.12% 20.37% 28.38% 34.72% 22.50%
67.00% 65.56% 67.43% 75.79% 73.00%
90.88% 92.34% 92.47% 92.03% 91.47%
32.35% 34.61% 44.98% 48.17% 32.83%
25.98% 28.94% 39.16% 43.66% 28.32%
11.80% 10.26% 6.42% 4.90% 6.13%
11.80% 10.26% 6.42% 4.90% 6.13%
28.23% 30.39% 25.65% 22.68% 17.35%
-2.95% -2.43% -2.00% -2.20% 0.56%
100.01% 100.01% 100.02% 99.93% 100.01%
9.06% 7.66% 7.59% 7.90% 8.47%
26.88 25.38 23.02 17.52 16.72
7.39 8.56 8.89 9.60 8.62
2.64 4.04 4.06 1.83 5.84
(Thousand Rupees)CITI BANK N. A.
59

Financial Statement Analysis of Financial Sector 2020
2016 2017 2018 2019 2020Items
A.Total equity (A1 to A3)1.Head office capital account2.Reserves3.Unremitted profit4.Others
B.Total liabilities (B1 to B4)1.Bills payable2.Borrowings from financial institutions3.Deposits and other accounts4.Other/misc. liabilities
C.Total assets (C1 to C4 + C8 to C10)1.Cash and balances with treasury banks2.Balances with other banks3.Lending to financial institutions4.Investments5.Gross advances6.Advances-non-performing/classified7.Provision against advances8.Advances net of provision (C5-C7)9.Fixed assets10.Other/misc. assets
D.Profit & loss account1.Markup/interest earned2.Markup/interest expenses3.Net markup/interest income4.Provisions and write-offs5.Net markup/interest income after provisions6.Non-markup/interest income7.Non-markup/interest expenses8.Administrative expenses9.Profit/(loss) before taxation10.Profit/(loss) after taxation
E.Other items1.Cash generated from operating activities2.Commitments and contingencies
F.Efficiency ratios/Profitability ratios1.Spread (D3/D1)2.Net markup/interest margin (D1-D2)/C3.Return on equity (ROE) (D10/A)4.Return on assets (ROA) (D10/C)5.Non-markup/interest income to total assets (D6/C)6.Net markup/Interest income (after prov.) to total assets(D5/C)7.Markup/interest expense to markup/interest income (D2/D1)8.Admin expense to profit before tax.(D8/D9) (times)9.Non-markup/interest expense to total income D7/(D1+D6) 10.Admin. exp. to non-markup/interest income (D8/D6) (times)
G.Liquidity ratios1.Cash & cash equivalent to total assets (C1+C2)/C2.Investment to total assets (C4/C)3.Advances net of provision to total assets (C8/C) 4.Deposits to total assets ( B3/C) 5.Total liabilities to total assets (B/C) 6.Gross advances to deposit (C5/B3) 7.Gross advances to borrowing & deposit C5/(B2+B3)
H.Assets quality ratios1.Non-performing loan to gross advances (C6/C5)2.Provision against NPLs to gross advances (C7/C5)3.NPLs to total equity (C6/A)4.NPLs write off to NPLs provision (D4/C7) 5.Provision against NPL to NPLs (C7/C6)
I.Capital/leverage ratios1.Capital ratio (A/C)2.Commitments & contingencies to total equity (E2/A) (times)3.Total deposit to total equity (B3/A) (times)
J.Cash flow ratio1.Cash generated from operating activities to profit after tax (E1/D10) (times)
5,537,870 6,952,864 7,596,820 7,268,081 8,221,348
3,544,827 4,238,906 5,091,000 5,563,663 6,302,781
0 0 0 0 0
1,993,043 2,713,958 2,505,820 1,704,418 1,918,567
0 0 0 0 0
18,955,701 27,346,693 27,794,406 26,676,305 36,099,261
2,976,253 932,787 1,314,231 1,032,458 972,657
27,509 15,755 2,871,553 1,394,029 241,047
14,092,145 23,212,445 20,100,376 20,473,611 30,965,106
1,859,794 3,185,706 3,508,246 3,776,207 3,920,451
24,493,571 34,299,557 35,391,226 33,944,386 44,320,609
4,993,782 5,995,920 6,961,709 7,558,956 8,645,015
136,459 396,881 220,159 118,681 5,268,843
14,630,311 19,707,230 19,150,856 15,132,302 26,209,833
0 0 0 0 0
3,318,334 5,813,996 6,354,270 9,330,260 2,610,408
96,511 96,511 96,511 96,511 96,511
103,590 104,718 104,509 104,509 104,509
3,214,744 5,709,278 6,249,761 9,225,751 2,505,899
291,553 271,894 214,924 345,355 242,064
1,226,722 2,218,354 2,593,817 1,563,341 1,448,955
1,049,008 1,221,952 1,738,883 2,801,020 2,647,085
345,527 463,007 768,616 1,063,657 1,237,236
703,481 758,945 970,267 1,737,363 1,409,849
(13,395) 1,705 (5,224) 0 0
716,876 757,240 975,491 1,737,363 1,409,849
1,036,326 1,389,908 964,928 614,739 1,550,945
1,014,080 1,004,966 1,326,771 1,215,005 1,438,655
1,014,095 980,403 1,310,838 1,189,950 1,407,591
739,122 1,142,182 613,648 1,137,097 1,522,139
419,526 712,223 365,621 652,214 905,537
(534,806) 622,010 552,465 1,600,850 6,212,555
60,496,027 33,040,643 42,939,864 27,897,681 48,268,043
67.06% 62.11% 55.80% 62.03% 53.26%
2.87% 2.21% 2.74% 5.12% 3.18%
7.58% 10.24% 4.81% 8.97% 11.01%
1.71% 2.08% 1.03% 1.92% 2.04%
4.23% 4.05% 2.73% 1.81% 3.50%
2.93% 2.21% 2.76% 5.12% 3.18%
32.94% 37.89% 44.20% 37.97% 46.74%
1.37 0.86 2.14 1.05 0.92
48.63% 38.48% 49.07% 35.57% 34.27%
0.98 0.71 1.36 1.94 0.91
20.95% 18.64% 20.29% 22.62% 31.39%
0.00% 0.00% 0.00% 0.00% 0.00%
13.12% 16.65% 17.66% 27.18% 5.65%
57.53% 67.68% 56.79% 60.32% 69.87%
77.39% 79.73% 78.53% 78.59% 81.45%
23.55% 25.05% 31.61% 45.57% 8.43%
23.50% 25.03% 27.66% 42.67% 8.37%
2.91% 1.66% 1.52% 1.03% 3.70%
3.12% 1.80% 1.64% 1.12% 4.00%
1.74% 1.39% 1.27% 1.33% 1.17%
-12.93% 1.63% -5.00% 0.00% 0.00%
107.33% 108.50% 108.29% 108.29% 108.29%
22.61% 20.27% 21.47% 21.41% 18.55%
10.92 4.75 5.65 3.84 5.87
2.54 3.34 2.65 2.82 3.77
-1.27 0.87 1.51 2.45 6.86
(Thousand Rupees)DEUTSCHE BANK AG
60

Financial Statement Analysis of Financial Sector 2020
2016 2017 2018 2019 2020Items
A.Total equity (A1 to A3)1.Head office capital account2.Reserves3.Unremitted profit4.Others
B.Total liabilities (B1 to B4)1.Bills payable2.Borrowings from financial institutions3.Deposits and other accounts4.Other/misc. liabilities
C.Total assets (C1 to C4 + C8 to C10)1.Cash and balances with treasury banks2.Balances with other banks3.Lending to financial institutions4.Investments5.Gross advances6.Advances-non-performing/classified7.Provision against advances8.Advances net of provision (C5-C7)9.Fixed assets10.Other/misc. assets
D.Profit & loss account1.Markup/interest earned2.Markup/interest expenses3.Net markup/interest income4.Provisions and write-offs5.Net markup/interest income after provisions6.Non-markup/interest income7.Non-markup/interest expenses8.Administrative expenses9.Profit/(loss) before taxation10.Profit/(loss) after taxation
E.Other items1.Cash generated from operating activities2.Commitments and contingencies
F.Efficiency ratios/Profitability ratios1.Spread (D3/D1)2.Net markup/interest margin (D1-D2)/C3.Return on equity (ROE) (D10/A)4.Return on assets (ROA) (D10/C)5.Non-markup/interest income to total assets (D6/C)6.Net markup/Interest income (after prov.) to total assets(D5/C)7.Markup/interest expense to markup/interest income (D2/D1)8.Admin expense to profit before tax.(D8/D9) (times)9.Non-markup/interest expense to total income D7/(D1+D6) 10.Admin. exp. to non-markup/interest income (D8/D6) (times)
G.Liquidity ratios1.Cash & cash equivalent to total assets (C1+C2)/C2.Investment to total assets (C4/C)3.Advances net of provision to total assets (C8/C) 4.Deposits to total assets ( B3/C) 5.Total liabilities to total assets (B/C) 6.Gross advances to deposit (C5/B3) 7.Gross advances to borrowing & deposit C5/(B2+B3)
H.Assets quality ratios1.Non-performing loan to gross advances (C6/C5)2.Provision against NPLs to gross advances (C7/C5)3.NPLs to total equity (C6/A)4.NPLs write off to NPLs provision (D4/C7) 5.Provision against NPL to NPLs (C7/C6)
I.Capital/leverage ratios1.Capital ratio (A/C)2.Commitments & contingencies to total equity (E2/A) (times)3.Total deposit to total equity (B3/A) (times)
J.Cash flow ratio1.Cash generated from operating activities to profit after tax (E1/D10) (times)
7,823,171 16,872,113 26,886,514 38,160,378 48,917,057
3,775,797 9,506,699 20,829,285 23,227,140 23,975,160
0 0 0 0 0
4,047,374 7,365,414 6,057,229 14,933,238 24,941,897
(38,542) (32,050) (57,530) 124,975 (603,210)
238,095,040 375,008,800 438,883,442 467,112,718 466,791,510
831,033 4,573,858 1,292,129 4,125,334 2,425,126
169,531,176 303,724,827 355,486,464 351,242,058 325,902,342
52,779,401 57,698,198 66,540,142 94,465,934 119,301,294
14,953,430 9,011,917 15,564,707 17,279,392 19,162,748
245,879,669 391,848,863 465,712,426 505,398,071 515,105,357
8,377,564 15,585,904 27,658,474 32,354,350 31,226,025
3,685,177 1,461,579 4,015,685 13,270,408 2,497,170
8,687,263 118,285,067 207,924,067 214,503,548 187,430,652
209,336,742 235,089,040 175,857,020 211,160,688 252,704,902
6,096,727 8,246,547 29,456,850 29,456,850 33,760,712
0 0 0 0 0
0 82,465 229,428 294,566 337,607
6,096,727 8,164,082 29,162,284 29,162,284 33,423,105
641,995 581,047 590,331 628,978 704,761
9,054,201 12,682,144 20,504,565 4,317,815 7,118,742
10,332,731 19,020,812 26,745,817 53,566,088 50,601,065
8,161,423 12,669,163 18,016,523 37,245,090 34,999,460
2,171,308 6,351,649 8,729,294 16,320,998 15,601,605
0 82,465 146,963 65,138 43,041
2,171,308 6,269,184 8,582,331 16,255,860 15,558,564
1,302,572 571,379 2,255,682 2,323,598 3,001,768
1,101,931 1,508,691 2,425,737 2,315,433 1,760,570
1,101,931 1,401,970 2,257,492 1,990,152 1,424,419
2,371,949 5,331,872 8,412,276 16,264,025 16,799,762
1,427,316 3,318,666 5,066,980 9,576,922 10,007,905
(69,615,225) 413,095 (9,272,112) 47,449,793 30,169,112
1,056,479,672 1,298,873,448 1,269,586,331 1,281,419,378 1,302,039,415
21.01% 33.39% 32.64% 30.47% 30.83%
0.88% 1.62% 1.87% 3.23% 3.03%
18.24% 19.67% 18.85% 25.10% 20.46%
0.58% 0.85% 1.09% 1.89% 1.94%
0.53% 0.15% 0.48% 0.46% 0.58%
0.88% 1.60% 1.84% 3.22% 3.02%
78.99% 66.61% 67.36% 69.53% 69.17%
0.46 0.26 0.27 0.12 0.08
9.47% 7.70% 8.36% 4.14% 3.28%
0.85 2.45 1.00 0.86 0.47
4.91% 4.35% 6.80% 9.03% 6.55%
85.14% 59.99% 37.76% 41.78% 49.06%
2.48% 2.08% 6.26% 5.77% 6.49%
21.47% 14.72% 14.29% 18.69% 23.16%
96.83% 95.70% 94.24% 92.42% 90.62%
11.55% 14.29% 44.27% 31.18% 28.30%
2.74% 2.28% 6.98% 6.61% 7.58%
0.00% 0.00% 0.00% 0.00% 0.00%
0.00% 1.00% 1.00% 1.00% 1.00%
0.00% 0.00% 0.00% 0.00% 0.00%
100.00% 64.09% 22.11% 12.75%
3.18% 4.31% 5.77% 7.55% 9.50%
135.04 76.98 47.22 33.58 26.62
6.75 3.42 2.47 2.48 2.44
-48.77 0.12 -1.83 4.95 3.01
-- - - - -
(Thousand Rupees)INDUSTRIAL AND COMMERCIAL BANK OF CHINA LTD.
61

Financial Statements Analysis of Financial Sector 2020
Development Finance Institutes (DFIs)
Performance at a Glance
DFIs exhibited an expansion in their balance sheet size during the period under review. Total assets
increased by 14.26 percent to reach Rs 435.87 billion in CY20 from Rs 381.47 billion during CY19. Total
liabilities increased by 17.78 percent or Rs 46.20 billion in CY20 over CY19. The shareholders’ equity
(including others) posted a rise of 6.74 percent in CY20 when compared with CY19. Profit before tax
increased by 49.93 percent with an amount of Rs 5.17 billion and profit after tax increased by 39.75
percent or Rs 4.07 billion over the previous year.
Shareholders’ Equity
Total Shareholders’ equity (including others)
increased from Rs 121.60 billion in CY19 to Rs
129.80 billion in CY20 witnessing a YoY increase
of Rs 8.20 billion or 6.74 percent. Share capital of
the sector increased by 2.35 percent during the
year. This increase is attributed to an increase of Rs
1.73 billion in share capital of Pak Libya holding
company Ltd during CY20. Reserves comprising
16.29 percent share of total equity (including
others) in CY20 increased by 8.44 percent with
amount of Rs 1.65 billion in CY20 as compared to
CY19. Unappropriated profit constitutes 23.56
percent share of total equity (including others); it
touched Rs 30.58 billion in CY20 indicating an
increase of Rs 7.21 billion or 30.86 percent over
CY19.
Liabilities
Total liabilities of DFIs increased by Rs 46.20
billion during CY20. It grew from Rs 259.87
billion in CY19 to touch Rs 306.07 billion in CY20
witnessing a YoY growth of 17.78 percent over the
previous year. Borrowings from financial
institutions increased by 13.35 percent to touch Rs
259.55 billion in CY20. It constitutes 84.80 percent
of total liabilities. Similarly, deposits (which
comprise term deposits and time deposits) were at
Rs 12.03 billion in CY19 and increased to Rs 27.44
billion in CY20 registering a YoY growth of
128.08 percent during CY20 when compared with
CY19.
6.74%
17.78%
14.26%
0%
2%
4%
6%
8%
10%
12%
14%
16%
18%
20%
0
50
100
150
200
250
300
350
400
450
500
S.H. Equity
(Including
Others)
Total Liabilities Total Assets
bil
lion
Rs
Components of Balance Sheet
CY 19 CY 20 Growth(RHS)
13.35%
128.08%
1.16%
0%
20%
40%
60%
80%
100%
120%
140%
0
50
100
150
200
250
300
Borrowings Deposits Others
bil
lion
Rs
Major Components of Liabilities
CY 19 CY 20 Growth(RHS)
62

Financial Statements Analysis of Financial Sector 2020
Assets
In CY20, total assets increased by Rs 54.39 billion or 14.26 percent when compared with the previous
year. The amount of investments comprises 65.71 percent share of total assets of DFIs during CY20,
increased from Rs 243.47 billion in CY19 to Rs 286.42 billion in CY20 showing a YoY growth of 17.64
percent during CY20 over CY19. Lending to financial institutions that were at Rs 16.88 billion in CY19
decreased to Rs 8.78 billion with a YoY decline of 48.00 percent in CY20 over CY19. Gross advances of
DFIs increased by 19.62 percent in CY20, from Rs 103.17 billion in CY19 to Rs 123.41 billion in CY20.
Advances net of provisions witnessing an increase of 20.93 percent over CY19 stood at Rs 111.16 billion
in CY20 from Rs 91.92 billion in CY19. NPLs to gross advances ratio decreased from 14.18 percent in
CY19 to 12.92 percent in CY20.
Profitability of DFIs
In terms of profitability, CY20 witnessed an increase in profits before tax and profit after tax. Profit
before tax increased from Rs 10.35 billion in CY19 to Rs 15.52 billion in CY20 witnessing an increase of
49.93 percent over the previous year. Similarly, profit after tax which were 10.24 billion in CY19 rise to
Rs 14.31 billion registered a YoY increase of 39.75 percent or Rs 4.07 billion during CY20.
-8.45%
-48.00%
17.64%
19.62%
-60%
-50%
-40%
-30%
-20%
-10%
0%
10%
20%
30%
0
50
100
150
200
250
300
350
Cash &
Cash
Equivalent
Lending Investment Advances
bil
lion
Rs
Major Components of Assets
CY 19 CY 20 Growth(RHS)
19.62%
9.00% 8.89%
20.93%
0%
5%
10%
15%
20%
25%
0
20
40
60
80
100
120
140
Adv. Gross NPL Provision Adv. Net
bil
lion
Rs
Major Components of Advances
CY 19 CY 20 Growth(RHS)
0
2
4
6
8
10
12
14
16
18
CY 19 CY 20
bil
lion
Rs
Profit and Loss Accounts
Profit Before Taxation Profit After Taxation
8.79%
1.77% 2.35%
11.27%
2.49% 2.47%
0%
5%
10%
15%
20%
25%
Spread Ratio ROE ROA
Profitability Ratios
CY 19 CY 20
63

Financial Statements Analysis of Financial Sector 2020
Return on assets (ROA) increased from 2.68 percent in CY19 to 3.28 percent in CY20. Return on equity
(ROE) increased from 8.79 percent in CY19 to 11.27 percent in CY20. Similarly, breakup value per share
of DFIs increased from Rs 18.31 per share in CY19 to Rs 19.44 per share in CY20. Earnings per share
also increased from Rs 1.61 per share in CY19 to Rs 2.19 per share in CY20 respectively.
64

Financial Statement Analysis of Financial Sector 2020
2016 2017 2018 2019 2020Items
A.Total equity (A1 to A3)1.Share capital2.Reserves3.Un appropriated profit4.Others
B.Total liabilities (B1 to B4)1.Bills payable2.Borrowings from financial institutions3.Deposits and other accounts4.Other/misc. liabilities
C.Total assets (C1 to C4 + C8 to C10)1.Cash and balances with treasury banks2.Balances with other banks3.Lending to financial institutions4.Investments5.Gross advances6.Advances-non-performing/classified7.Provisions against advances8.Advances net of provisions (C5-C7)9.Fixed assets10.Other/misc. assets
D.Profit & loss account1.Markup/interest earned2.markup/interest expensed3.Net markup/interest income4.Provisions and write-offs5.Net markup/interest income after provisions6.Non-markup/interest income7.Non-markup/interest expenses8.Administrative expenses9.Profit/(loss) before taxation10.Profit/(loss) after taxation
E.Other items1.No. of ordinary shares2.Cash dividend3.Stock dividend/bonus shares4.Cash generated from operating activities5.Commitments and contigencies
F.Efficiency ratios/profitability ratios1.Spread ratio (D3/D1)2.Net markup/interest margin (D1-D2)/C3.Return on equity (ROE) (D10/A)4.Return on assets (ROA) (D10/C)5.Non-markup/interest income to total assets (D6/C)6.Net markup/interest income(after provisions) to total assets(D5/C)7.Markup/interest expenses to markup/interest income (D2/D1)8.Admin. expenses to profit before tax. (D8/D9) (times)9.Non-markup/interest expenses to total income D7/(D1+D6) 10.Admin. expenses to non-markup/interest income (D8/D6) (times) 11.Earning per share (D10/E1)
G.Liquidity ratios1.Cash & cash equivalent to total assets (C1+C2)/C2.Investment to total assets (C4/C)3.Advances net of provisions to total assets (C8/C) 4.Deposits to total assets (B3/C) 5.Total liabilities to total assets (B/C) 6.Gross advances to deposits (C5/B3) 7.Gross advances to borrowing & deposits C5/(B2+B3)
H.Assets quality ratios1.Non-performing loan to gross advances (C6/C5)2.Provision against NPLs to gross advances (C7/C5)3.NPLs to total equity (C6/A)4.NPLs write off to NPLs provisions (D4/C7) 5.Provision against NPL to NPLs (C7/C6)
I.Capital /leverage ratios1.Capital ratio (A/C)2.Commitments & contingencies to total equity (E5/A) (times)3.Break up value per share (A/E1)4.Total deposits to total equity (B3/A) (times)
J.Cash flow ratio1.Cash generated from operating activities to profit after tax (E4/D10) (times)
95,377,055 98,862,416 105,411,853 116,474,804 127,060,590
65,373,180 65,373,180 69,031,686 73,611,924 75,341,924
13,065,586 14,441,602 15,774,031 19,494,561 21,139,608
16,938,289 19,047,634 20,606,136 23,368,319 30,579,058
4,921,545 1,922,242 1,147,389 5,126,662 2,738,379
108,090,134 126,649,489 132,855,436 259,871,200 306,068,374
0 0 0 0 0
87,161,808 100,537,356 111,444,365 228,987,297 259,554,478
10,934,356 17,115,314 11,643,692 12,032,735 27,443,924
9,993,970 8,996,819 9,767,379 18,851,168 19,069,972
208,388,734 227,434,147 239,414,678 381,472,666 435,867,343
2,794,115 557,440 593,251 3,721,416 3,040,855
7,983,035 5,342,179 5,243,330 6,136,079 5,983,791
8,404,877 12,757,465 16,497,798 16,880,746 8,777,773
109,646,206 121,392,618 122,612,890 243,469,413 286,424,920
79,567,113 87,607,034 92,740,109 103,166,959 123,405,378
15,867,588 15,632,931 13,939,088 14,626,925 15,944,070
11,938,938 10,767,881 10,290,554 11,243,621 12,243,387
67,628,175 76,839,153 82,449,555 91,923,338 111,161,991
3,695,149 3,562,151 4,249,696 4,701,778 4,714,821
8,237,177 6,983,141 7,768,158 14,639,896 15,763,192
12,260,966 13,355,279 14,030,538 27,895,855 36,943,246
6,025,406 6,408,005 6,764,810 17,251,194 23,744,769
6,235,560 6,947,274 7,265,728 10,644,661 13,198,477
(390,975) 923,358 247,591 1,666,404 2,425,079
6,626,535 6,023,916 7,018,137 8,978,257 10,773,398
7,464,778 5,011,556 5,132,457 6,733,310 10,847,199
4,755,437 3,999,176 4,667,011 5,376,292 6,130,423
4,588,913 3,802,001 4,476,354 5,152,476 5,816,146
9,364,645 8,310,268 7,440,412 10,351,971 15,520,309
6,750,145 5,958,170 5,298,194 10,242,096 14,313,679
5,937,558 5,937,558 6,303,409 6,361,593 6,534,593
872,488 (11,646,227) 784,094 114,230,958 35,904,884
27,529,283 32,935,290 40,738,338 59,958,134 46,602,977
50.86% 52.02% 51.79% 38.16% 35.73%
2.99% 3.05% 3.03% 2.79% 3.03%
7.08% 6.03% 5.03% 8.79% 11.27%
3.24% 2.62% 2.21% 2.68% 3.28%
3.58% 2.20% 2.14% 1.77% 2.49%
3.18% 2.65% 2.93% 2.35% 2.47%
49.14% 47.98% 48.21% 61.84% 64.27%
0.49 0.46 0.60 0.50 0.37
0.24 0.22 0.24 0.16 0.13
0.61 0.76 0.87 0.77 0.54
1.14 1.00 0.84 1.61 2.19
5.17% 2.59% 2.44% 2.58% 2.07%
52.62% 53.37% 51.21% 63.82% 65.71%
32.45% 33.79% 34.44% 24.10% 25.50%
5.25% 7.53% 4.86% 3.15% 6.30%
51.87% 55.69% 55.49% 68.12% 70.22%
727.68% 511.86% 796.48% 857.39% 449.66%
81.11% 74.46% 75.34% 42.80% 43.00%
19.94% 17.84% 15.03% 14.18% 12.92%
15.00% 12.29% 11.10% 10.90% 9.92%
16.64% 15.81% 13.22% 12.56% 12.55%
-3.27% 8.58% 2.41% 14.82% 19.81%
75.24% 68.88% 73.83% 76.87% 76.79%
45.77% 43.47% 44.03% 30.53% 29.15%
0.29 0.33 0.39 0.51 0.37
16.06 16.65 16.72 18.31 19.44
0.11 0.17 0.11 0.10 0.22
0.13 -1.95 0.15 11.15 2.51
(Thousand Rupees)DFIs - Overall
N/A N/A N/A N/A N/A
N/A N/A N/A N/A N/A
65

Financial Statement Analysis of Financial Sector 2020
2016 2017 2018 2019 2020Items
A.Total equity (A1 to A3)1.Share capital2.Reserves3.Un appropriated profit4.Others
B.Total liabilities (B1 to B4)1.Bills payable2.Borrowings from financial institutions3.Deposits and other accounts4.Other/misc. liabilities
C.Total assets (C1 to C4 + C8 to C10)1.Cash and balances with treasury banks2.Balances with other banks3.Lending to financial institutions4.Investments5.Gross advances6.Advances-non-performing/classified7.Provisions against advances8.Advances net of provisions (C5-C7)9.Fixed assets10.Other/misc. assets
D.Profit & loss account1.Markup/interest earned2.markup/interest expensed3.Net markup/interest income4.Provisions and write-offs5.Net markup/interest income after provisions6.Non-markup/interest income7.Non-markup/interest expenses8.Administrative expenses9.Profit/(loss) before taxation10.Profit/(loss) after taxation
E.Other items1.No. of ordinary shares2.Cash dividend3.Stock dividend/bonus shares4.Cash generated from operating activities5.Commitments and contigencies
F.Efficiency ratios/profitability ratios1.Spread ratio (D3/D1)2.Net markup/interest margin (D1-D2)/C3.Return on equity (ROE) (D10/A)4.Return on assets (ROA) (D10/C)5.Non-markup/interest income to total assets (D6/C)6.Net markup/interest income(after provisions) to total assets(D5/C)7.Markup/interest expenses to markup/interest income (D2/D1)8.Admin. expenses to profit before tax. (D8/D9) (times)9.Non-markup/interest expenses to total income D7/(D1+D6) 10.Admin. expenses to non-markup/interest income (D8/D6) (times) 11.Earning per share (D10/E1)
G.Liquidity ratios1.Cash & cash equivalent to total assets (C1+C2)/C2.Investment to total assets (C4/C)3.Advances net of provisions to total assets (C8/C) 4.Deposits to total assets (B3/C) 5.Total liabilities to total assets (B/C) 6.Gross advances to deposits (C5/B3) 7.Gross advances to borrowing & deposits C5/(B2+B3)
H.Assets quality ratios1.Non-performing loan to gross advances (C6/C5)2.Provision against NPLs to gross advances (C7/C5)3.NPLs to total equity (C6/A)4.NPLs write off to NPLs provisions (D4/C7) 5.Provision against NPL to NPLs (C7/C6)
I.Capital /leverage ratios1.Capital ratio (A/C)2.Commitments & contingencies to total equity (E5/A) (times)3.Break up value per share (A/E1)4.Total deposits to total equity (B3/A) (times)
J.Cash flow ratio1.Cash generated from operating activities to profit after tax (E4/D10) (times)
15,999,813 16,711,250 16,926,069 20,115,819 20,115,819
19,365,000 19,365,000 19,365,000 19,365,000 19,365,000
713,662 1,038,727 1,246,974 1,799,383 1,799,383
(4,078,849) (3,692,477) (3,685,905) (1,048,564) (1,048,564)
(1,686) 2,174 (20,844) (7,756) (7,756)
4,908,344 3,616,650 3,972,657 5,093,783 5,093,783
0 0 0 0 0
0 0 0 2,000,000 2,000,000
0 0 0 0 0
4,908,344 3,616,650 3,972,657 3,093,783 3,093,783
20,906,471 20,330,074 20,877,882 25,201,846 25,201,846
121,378 53,531 34,387 42,126 42,126
650,310 771,582 412,020 368,211 368,211
400,188 851,542 4,206,891 0 0
6,841,040 6,489,513 4,010,448 10,283,836 10,283,836
15,925,288 14,965,220 14,808,587 15,172,213 15,172,213
6,666,456 6,672,007 4,710,848 4,210,899 4,210,899
4,108,359 3,452,857 3,127,405 3,503,477 3,503,477
11,816,929 11,512,363 11,681,182 11,668,736 11,668,736
315,460 292,715 314,020 403,499 403,499
761,166 358,828 218,934 2,435,438 2,435,438
2,606,851 2,281,936 2,241,405 2,987,835 2,987,835
1,068,019 0 0 137,507 137,507
1,538,832 2,281,936 2,241,405 2,850,328 2,850,328
884,621 678,374 (348,193) 368,641 368,641
654,211 1,603,562 2,589,598 2,481,687 2,481,687
281,170 177,210 147,842 130,797 130,797
1,800,018 1,025,889 1,439,777 1,637,297 1,637,297
1,758,098 984,643 1,404,297 1,618,363 1,618,363
(835,867) 2,019,114 1,254,493 953,748 953,748
(865,950) 1,625,328 1,041,230 2,762,047 2,762,047
1,936,500 1,936,500 1,936,500 1,936,500 1,936,500
0.00% 0.00% 0.00% 0.00% 0.00%
0.00% 0.00% 0.00% 0.00% 0.00%
(249,705) (319,770) (2,788,782) 4,436,460 4,436,460
772,243 1,176,172 1,271,388 770,332 770,332
59.03% 100.00% 100.00% 95.40% 95.40%
7.36% 11.22% 10.74% 11.31% 11.31%
-5.41% 9.73% 6.15% 13.73% 13.73%
-4.14% 7.99% 4.99% 10.96% 10.96%
1.34% 0.87% 0.71% 0.52% 0.52%
3.13% 7.89% 12.40% 9.85% 9.85%
40.97% 0.00% 0.00% 4.60% 4.60%
-2.10 0.49 1.12 1.70 1.70
0.62 0.42 0.60 0.53 0.53
6.25 5.56 9.50 12.37 12.37
-0.45 0.84 0.54 1.43 1.43
3.69% 4.06% 2.14% 1.63% 1.63%
32.72% 31.92% 19.21% 40.81% 40.81%
56.52% 56.63% 55.95% 46.30% 46.30%
0.00% 0.00% 0.00% 0.00% 0.00%
23.48% 17.79% 19.03% 20.21% 20.21%
758.61% 758.61%
41.86% 44.58% 31.81% 27.75% 27.75%
25.80% 23.07% 21.12% 23.09% 23.09%
41.67% 39.93% 27.83% 20.93% 20.93%
21.53% 19.65% -11.13% 10.52% 10.52%
61.63% 51.75% 66.39% 83.20% 83.20%
76.53% 82.20% 81.07% 79.82% 79.82%
0.05 0.07 0.08 0.04 0.04
8.26 8.63 8.74 10.39 10.39
0.00 0.00 0.00 0.00 0.00
0.29 -0.20 -2.68 1.61 1.61
- - - - -- - -
(Thousand Rupees)HOUSE BUILDING FINANCE COMPANY LTD.
66

Financial Statement Analysis of Financial Sector 2020
2016 2017 2018 2019 2020Items
A.Total equity (A1 to A3)1.Share capital2.Reserves3.Un appropriated profit4.Others
B.Total liabilities (B1 to B4)1.Bills payable2.Borrowings from financial institutions3.Deposits and other accounts4.Other/misc. liabilities
C.Total assets (C1 to C4 + C8 to C10)1.Cash and balances with treasury banks2.Balances with other banks3.Lending to financial institutions4.Investments5.Gross advances6.Advances-non-performing/classified7.Provisions against advances8.Advances net of provisions (C5-C7)9.Fixed assets10.Other/misc. assets
D.Profit & loss account1.Markup/interest earned2.markup/interest expensed3.Net markup/interest income4.Provisions and write-offs5.Net markup/interest income after provisions6.Non-markup/interest income7.Non-markup/interest expenses8.Administrative expenses9.Profit/(loss) before taxation10.Profit/(loss) after taxation
E.Other items1.No. of ordinary shares2.Cash dividend3.Stock dividend/bonus shares4.Cash generated from operating activities5.Commitments and contigencies
F.Efficiency ratios/profitability ratios1.Spread ratio (D3/D1)2.Net markup/interest margin (D1-D2)/C3.Return on equity (ROE) (D10/A)4.Return on assets (ROA) (D10/C)5.Non-markup/interest income to total assets (D6/C)6.Net markup/interest income(after provisions) to total assets(D5/C)7.Markup/interest expenses to markup/interest income (D2/D1)8.Admin. expenses to profit before tax. (D8/D9) (times)9.Non-markup/interest expenses to total income D7/(D1+D6) 10.Admin. expenses to non-markup/interest income (D8/D6) (times) 11.Earning per share (D10/E1)
G.Liquidity ratios1.Cash & cash equivalent to total assets (C1+C2)/C2.Investment to total assets (C4/C)3.Advances net of provisions to total assets (C8/C) 4.Deposits to total assets (B3/C) 5.Total liabilities to total assets (B/C) 6.Gross advances to deposits (C5/B3) 7.Gross advances to borrowing & deposits C5/(B2+B3)
H.Assets quality ratios1.Non-performing loan to gross advances (C6/C5)2.Provision against NPLs to gross advances (C7/C5)3.NPLs to total equity (C6/A)4.NPLs write off to NPLs provisions (D4/C7) 5.Provision against NPL to NPLs (C7/C6)
I.Capital /leverage ratios1.Capital ratio (A/C)2.Commitments & contingencies to total equity (E5/A) (times)3.Break up value per share (A/E1)4.Total deposits to total equity (B3/A) (times)
J.Cash flow ratio1.Cash generated from operating activities to profit after tax (E4/D10) (times)
9,366,881 9,292,618 9,181,391 9,414,414 9,646,257
6,000,000 6,000,000 6,000,000 6,000,000 6,000,000
794,107 840,066 840,066 888,356 965,805
2,572,774 2,452,552 2,341,325 2,526,058 2,680,452
83,078 (37,286) (71,701) 56,305 16,001
9,148,512 8,430,333 9,415,747 12,003,870 11,627,546
0 0 0 0 0
6,549,981 6,370,738 7,915,859 10,842,781 10,223,036
2,079,728 1,814,001 1,221,724 775,323 923,702
518,803 245,594 278,164 385,766 480,808
18,598,471 17,685,665 18,525,437 21,474,589 21,289,804
64,205 37,870 73,144 46,383 54,919
432,783 91,727 60,653 83,751 74,589
0 970,000 105,000 150,000 0
11,842,973 11,044,299 11,259,928 14,664,301 13,651,952
6,282,232 5,507,178 7,195,696 6,648,924 7,716,614
1,168,338 958,250 1,712,086 1,822,853 2,081,878
857,881 854,246 971,770 1,259,215 1,551,571
5,424,351 4,652,932 6,223,926 5,389,709 6,165,043
176,982 198,003 193,242 230,023 219,821
657,177 690,834 609,544 910,422 1,123,480
1,243,694 1,045,117 907,417 1,967,277 1,960,461
533,274 387,358 472,607 1,024,210 956,826
710,420 657,759 434,810 943,067 1,003,635
(415,856) 66,591 257,163 177,153 190,666
1,126,276 591,168 177,647 765,914 812,969
53,242 128,510 101,236 (36,212) 70,717
318,427 351,464 267,425 335,235 377,402
318,148 296,323 267,421 322,425 363,707
861,091 368,214 11,458 394,467 506,284
603,291 229,795 (10,231) 241,452 387,245
600,000 600,000 600,000 600,000 600,000
0.00% 0.00% 0.00% 0.00% 0.00%
0.00% 0.00% 0.00% 0.00% 0.00%
(725,103) (213,566) 519,893 3,227,513 (876,884)
222,392 4,384,591 4,074,244 5,423,734 4,578,204
57.12% 62.94% 47.92% 47.94% 51.19%
3.82% 3.72% 2.35% 4.39% 4.71%
6.44% 2.47% -0.11% 2.56% 4.01%
3.24% 1.30% -0.06% 1.12% 1.82%
0.29% 0.73% 0.55% -0.17% 0.33%
6.06% 3.34% 0.96% 3.57% 3.82%
42.88% 37.06% 52.08% 52.06% 48.81%
0.37 0.80 23.34 0.82 0.72
0.25 0.30 0.27 0.17 0.19
5.98 2.31 2.64 -8.90 5.14
1.01 0.38 -0.02 0.40 0.65
2.67% 0.73% 0.72% 0.61% 0.61%
63.68% 62.45% 60.78% 68.29% 64.12%
29.17% 26.31% 33.60% 25.10% 28.96%
11.18% 10.26% 6.59% 3.61% 4.34%
49.19% 47.67% 50.83% 55.90% 54.62%
302.07% 303.59% 588.98% 857.57% 835.40%
72.80% 67.29% 78.75% 57.23% 69.23%
18.60% 17.40% 23.79% 27.42% 26.98%
13.66% 15.51% 13.50% 18.94% 20.11%
12.47% 10.31% 18.65% 19.36% 21.58%
-48.47% 7.80% 26.46% 14.07% 12.29%
73.43% 89.15% 56.76% 69.08% 74.53%
50.36% 52.54% 49.56% 43.84% 45.31%
0.02 0.47 0.44 0.58 0.47
15.61 15.49 15.30 15.69 16.08
0.22 0.20 0.13 0.08 0.10
-1.20 -0.93 -50.82 13.37 -2.26
(Thousand Rupees)PAIR INVESTMENT CO. LTD. (FORMERLY PAK-IRAN JOINT
67

Financial Statement Analysis of Financial Sector 2020
2016 2017 2018 2019 2020Items
A.Total equity (A1 to A3)1.Share capital2.Reserves3.Un appropriated profit4.Others
B.Total liabilities (B1 to B4)1.Bills payable2.Borrowings from financial institutions3.Deposits and other accounts4.Other/misc. liabilities
C.Total assets (C1 to C4 + C8 to C10)1.Cash and balances with treasury banks2.Balances with other banks3.Lending to financial institutions4.Investments5.Gross advances6.Advances-non-performing/classified7.Provisions against advances8.Advances net of provisions (C5-C7)9.Fixed assets10.Other/misc. assets
D.Profit & loss account1.Markup/interest earned2.markup/interest expensed3.Net markup/interest income4.Provisions and write-offs5.Net markup/interest income after provisions6.Non-markup/interest income7.Non-markup/interest expenses8.Administrative expenses9.Profit/(loss) before taxation10.Profit/(loss) after taxation
E.Other items1.No. of ordinary shares2.Cash dividend3.Stock dividend/bonus shares4.Cash generated from operating activities5.Commitments and contigencies
F.Efficiency ratios/profitability ratios1.Spread ratio (D3/D1)2.Net markup/interest margin (D1-D2)/C3.Return on equity (ROE) (D10/A)4.Return on assets (ROA) (D10/C)5.Non-markup/interest income to total assets (D6/C)6.Net markup/interest income(after provisions) to total assets(D5/C)7.Markup/interest expenses to markup/interest income (D2/D1)8.Admin. expenses to profit before tax. (D8/D9) (times)9.Non-markup/interest expenses to total income D7/(D1+D6) 10.Admin. expenses to non-markup/interest income (D8/D6) (times) 11.Earning per share (D10/E1)
G.Liquidity ratios1.Cash & cash equivalent to total assets (C1+C2)/C2.Investment to total assets (C4/C)3.Advances net of provisions to total assets (C8/C) 4.Deposits to total assets (B3/C) 5.Total liabilities to total assets (B/C) 6.Gross advances to deposits (C5/B3) 7.Gross advances to borrowing & deposits C5/(B2+B3)
H.Assets quality ratios1.Non-performing loan to gross advances (C6/C5)2.Provision against NPLs to gross advances (C7/C5)3.NPLs to total equity (C6/A)4.NPLs write off to NPLs provisions (D4/C7) 5.Provision against NPL to NPLs (C7/C6)
I.Capital /leverage ratios1.Capital ratio (A/C)2.Commitments & contingencies to total equity (E5/A) (times)3.Break up value per share (A/E1)4.Total deposits to total equity (B3/A) (times)
J.Cash flow ratio1.Cash generated from operating activities to profit after tax (E4/D10) (times)
10,490,617 10,657,968 10,633,697 10,700,292 11,125,495
6,000,000 6,000,000 6,000,000 6,000,000 6,000,000
1,257,721 1,351,812 1,406,995 1,480,107 1,723,782
3,232,896 3,306,156 3,226,702 3,220,185 3,401,713
(62,060) (201,744) (673,212) (150,898) (392,920)
23,962,040 19,413,049 38,832,642 47,224,073 29,520,838
0 0 0 0 0
20,492,898 13,976,083 36,890,373 45,152,000 27,763,412
2,913,487 4,751,164 725,403 620,000 830,000
555,655 685,802 1,216,866 1,452,073 927,426
34,390,597 29,869,273 48,793,127 57,773,467 40,253,413
322,004 137,609 161,339 129,571 168,090
1,936,970 74,549 46,355 163,909 422,121
498,065 2,420,909 0 4,500,000 507,800
16,657,665 7,678,634 26,116,936 31,816,997 17,482,949
14,232,032 19,056,899 20,639,421 19,165,404 19,557,328
451,407 953,997 592,529 595,472 983,888
236,090 289,074 309,684 394,034 423,442
13,995,942 18,767,825 20,329,737 18,771,370 19,133,886
25,160 19,732 16,450 140,297 119,389
954,791 770,015 2,122,310 2,251,323 2,419,178
1,590,722 1,461,566 2,506,962 5,041,574 3,680,678
1,083,660 908,144 1,787,629 4,307,293 2,912,988
507,062 553,422 719,333 734,281 767,690
97,111 178,164 96,393 (13,219) 33,970
409,951 375,258 622,940 747,500 733,720
1,236,657 588,456 221,870 42,656 687,694
314,084 292,798 341,311 331,965 387,991
293,714 278,554 330,373 325,524 366,237
1,332,524 670,916 503,499 458,191 1,033,423
961,658 470,456 275,914 365,562 718,373
600,000 600,000 600,000 600,000 600,000
300,000.00% 0.00% 0.00% 0.00% 0.00%
0.00% 0.00% 0.00% 0.00% 0.00%
1,551,225 (10,018,115) 18,540,404 5,158,121 (13,555,428)
16,071,984 7,944,552 7,999,852 12,048,155 12,224,995
31.88% 37.87% 28.69% 14.56% 20.86%
1.47% 1.85% 1.47% 1.27% 1.91%
9.17% 4.41% 2.59% 3.42% 6.46%
2.80% 1.58% 0.57% 0.63% 1.78%
3.60% 1.97% 0.45% 0.07% 1.71%
1.19% 1.26% 1.28% 1.29% 1.82%
68.12% 62.13% 71.31% 85.44% 79.14%
0.22 0.42 0.66 0.71 0.35
0.11 0.14 0.13 0.07 0.09
0.24 0.47 1.49 7.63 0.53
1.60 0.78 0.46 0.61 1.20
6.57% 0.71% 0.43% 0.51% 1.47%
48.44% 25.71% 53.53% 55.07% 43.43%
40.70% 62.83% 41.67% 32.49% 47.53%
8.47% 15.91% 1.49% 1.07% 2.06%
69.68% 64.99% 79.59% 81.74% 73.34%
488.49% 401.10% 2,845.24% 3,091.19% 2,356.30%
60.80% 101.76% 54.87% 41.87% 68.40%
3.17% 5.01% 2.87% 3.11% 5.03%
1.66% 1.52% 1.50% 2.06% 2.17%
4.30% 8.95% 5.57% 5.57% 8.84%
41.13% 61.63% 31.13% -3.35% 8.02%
52.30% 30.30% 52.26% 66.17% 43.04%
30.50% 35.68% 21.79% 18.52% 27.64%
1.53 0.75 0.75 1.13 1.10
17.48 17.76 17.72 17.83 18.54
0.28 0.45 0.07 0.06 0.07
1.61 -21.29 67.20 14.11 -18.87
(Thousand Rupees)PAK BRUNEI INVESTMENT CPOMPANY LTD.
68

Financial Statement Analysis of Financial Sector 2020
2016 2017 2018 2019 2020Items
A.Total equity (A1 to A3)1.Share capital2.Reserves3.Un appropriated profit4.Others
B.Total liabilities (B1 to B4)1.Bills payable2.Borrowings from financial institutions3.Deposits and other accounts4.Other/misc. liabilities
C.Total assets (C1 to C4 + C8 to C10)1.Cash and balances with treasury banks2.Balances with other banks3.Lending to financial institutions4.Investments5.Gross advances6.Advances-non-performing/classified7.Provisions against advances8.Advances net of provisions (C5-C7)9.Fixed assets10.Other/misc. assets
D.Profit & loss account1.Markup/interest earned2.markup/interest expensed3.Net markup/interest income4.Provisions and write-offs5.Net markup/interest income after provisions6.Non-markup/interest income7.Non-markup/interest expenses8.Administrative expenses9.Profit/(loss) before taxation10.Profit/(loss) after taxation
E.Other items1.No. of ordinary shares2.Cash dividend3.Stock dividend/bonus shares4.Cash generated from operating activities5.Commitments and contigencies
F.Efficiency ratios/profitability ratios1.Spread ratio (D3/D1)2.Net markup/interest margin (D1-D2)/C3.Return on equity (ROE) (D10/A)4.Return on assets (ROA) (D10/C)5.Non-markup/interest income to total assets (D6/C)6.Net markup/interest income(after provisions) to total assets(D5/C)7.Markup/interest expenses to markup/interest income (D2/D1)8.Admin. expenses to profit before tax. (D8/D9) (times)9.Non-markup/interest expenses to total income D7/(D1+D6) 10.Admin. expenses to non-markup/interest income (D8/D6) (times) 11.Earning per share (D10/E1)
G.Liquidity ratios1.Cash & cash equivalent to total assets (C1+C2)/C2.Investment to total assets (C4/C)3.Advances net of provisions to total assets (C8/C) 4.Deposits to total assets (B3/C) 5.Total liabilities to total assets (B/C) 6.Gross advances to deposits (C5/B3) 7.Gross advances to borrowing & deposits C5/(B2+B3)
H.Assets quality ratios1.Non-performing loan to gross advances (C6/C5)2.Provision against NPLs to gross advances (C7/C5)3.NPLs to total equity (C6/A)4.NPLs write off to NPLs provisions (D4/C7) 5.Provision against NPL to NPLs (C7/C6)
I.Capital /leverage ratios1.Capital ratio (A/C)2.Commitments & contingencies to total equity (E5/A) (times)3.Break up value per share (A/E1)4.Total deposits to total equity (B3/A) (times)
J.Cash flow ratio1.Cash generated from operating activities to profit after tax (E4/D10) (times)
14,000,932 14,668,324 15,278,259 16,627,260 17,399,062
9,116,400 9,116,400 9,116,400 9,696,638 9,696,638
977,365 1,110,843 1,232,830 1,394,487 1,548,848
3,907,167 4,441,081 4,929,029 5,536,135 6,153,576
125,152 246 83,041 4,752 83,193
8,392,156 9,752,396 4,400,934 16,768,180 13,926,790
0 0 0 0 0
8,196,455 9,576,860 4,180,683 16,119,293 12,902,914
0 0 0 0 512,400
195,701 175,536 220,251 648,887 511,476
22,518,240 24,420,966 19,762,234 33,400,192 31,409,045
2,080,940 26,530 62,586 3,176,193 2,223,117
3,086,523 2,168,945 1,553,209 878,418 35,230
2,647,918 0 0 0 1,149,985
7,734,253 13,848,109 9,976,199 19,241,496 15,657,891
6,545,526 8,373,636 8,163,493 10,032,791 12,354,740
383,164 313,164 397,439 592,313 668,201
505,706 473,644 543,305 741,590 804,642
6,039,820 7,899,992 7,620,188 9,291,201 11,550,098
177,302 174,362 187,585 277,680 233,858
751,484 303,028 362,467 535,204 558,866
990,161 1,622,936 1,244,514 2,486,988 3,204,977
293,493 669,157 162,160 774,010 1,765,752
696,668 953,779 1,082,354 1,712,978 1,439,225
(68,488) (70,749) 225,577 471,914 116,890
765,156 1,024,528 856,777 1,241,064 1,322,335
435,512 323,421 441,476 262,888 284,331
342,196 378,147 386,494 476,330 491,755
321,626 378,147 386,374 476,330 491,725
858,471 969,803 911,758 1,065,757 1,166,485
615,129 670,595 618,820 760,092 773,203
911,640 911,640 911,640 969,664 969,664
0.00% 0.00% 0.00% 0.00% 0.00%
0.00% 0.00% 0.00% 0.00% 0.00%
(1,195,012) 3,099,984 (4,735,499) 11,386,894 (5,573,105)
650,401 6,967,592 3,688,828 16,720,483 9,957,637
70.36% 58.77% 86.97% 68.88% 44.91%
3.09% 3.91% 5.48% 5.13% 4.58%
4.39% 4.57% 4.05% 4.57% 4.44%
2.73% 2.75% 3.13% 2.28% 2.46%
1.93% 1.32% 2.23% 0.79% 0.91%
3.40% 4.20% 4.34% 3.72% 4.21%
29.64% 41.23% 13.03% 31.12% 55.09%
0.37 0.39 0.42 0.45 0.42
0.24 0.19 0.23 0.17 0.14
0.74 1.17 0.88 1.81 1.73
0.67 0.74 0.68 0.78 0.80
22.95% 8.99% 8.18% 12.14% 7.19%
34.35% 56.71% 50.48% 57.61% 49.85%
26.82% 32.35% 38.56% 27.82% 36.77%
0.00% 0.00% 0.00% 0.00% 1.63%
37.27% 39.93% 22.27% 50.20% 44.34%
2,411.15%
79.86% 87.44% 195.27% 62.24% 92.09%
5.85% 3.74% 4.87% 5.90% 5.41%
7.73% 5.66% 6.66% 7.39% 6.51%
2.74% 2.13% 2.60% 3.56% 3.84%
-13.54% -14.94% 41.52% 63.64% 14.53%
131.98% 151.24% 136.70% 125.20% 120.42%
62.18% 60.06% 77.31% 49.78% 55.40%
0.05 0.48 0.24 1.01 0.57
15.36 16.09 16.76 17.15 17.94
0.00 0.00 0.00 0.00 0.03
-1.94 4.62 -7.65 14.98 -7.21
- - - -
(Thousand Rupees)PAK CHINA INVESTMENT CO. LTD.
69

Financial Statement Analysis of Financial Sector 2020
2016 2017 2018 2019 2020Items
A.Total equity (A1 to A3)1.Share capital2.Reserves3.Un appropriated profit4.Others
B.Total liabilities (B1 to B4)1.Bills payable2.Borrowings from financial institutions3.Deposits and other accounts4.Other/misc. liabilities
C.Total assets (C1 to C4 + C8 to C10)1.Cash and balances with treasury banks2.Balances with other banks3.Lending to financial institutions4.Investments5.Gross advances6.Advances-non-performing/classified7.Provisions against advances8.Advances net of provisions (C5-C7)9.Fixed assets10.Other/misc. assets
D.Profit & loss account1.Markup/interest earned2.markup/interest expensed3.Net markup/interest income4.Provisions and write-offs5.Net markup/interest income after provisions6.Non-markup/interest income7.Non-markup/interest expenses8.Administrative expenses9.Profit/(loss) before taxation10.Profit/(loss) after taxation
E.Other items1.No. of ordinary shares2.Cash dividend3.Stock dividend/bonus shares4.Cash generated from operating activities5.Commitments and contigencies
F.Efficiency ratios/profitability ratios1.Spread ratio (D3/D1)2.Net markup/interest margin (D1-D2)/C3.Return on equity (ROE) (D10/A)4.Return on assets (ROA) (D10/C)5.Non-markup/interest income to total assets (D6/C)6.Net markup/interest income(after provisions) to total assets(D5/C)7.Markup/interest expenses to markup/interest income (D2/D1)8.Admin. expenses to profit before tax. (D8/D9) (times)9.Non-markup/interest expenses to total income D7/(D1+D6) 10.Admin. expenses to non-markup/interest income (D8/D6) (times) 11.Earning per share (D10/E1)
G.Liquidity ratios1.Cash & cash equivalent to total assets (C1+C2)/C2.Investment to total assets (C4/C)3.Advances net of provisions to total assets (C8/C) 4.Deposits to total assets (B3/C) 5.Total liabilities to total assets (B/C) 6.Gross advances to deposits (C5/B3) 7.Gross advances to borrowing & deposits C5/(B2+B3)
H.Assets quality ratios1.Non-performing loan to gross advances (C6/C5)2.Provision against NPLs to gross advances (C7/C5)3.NPLs to total equity (C6/A)4.NPLs write off to NPLs provisions (D4/C7) 5.Provision against NPL to NPLs (C7/C6)
I.Capital /leverage ratios1.Capital ratio (A/C)2.Commitments & contingencies to total equity (E5/A) (times)3.Break up value per share (A/E1)4.Total deposits to total equity (B3/A) (times)
J.Cash flow ratio1.Cash generated from operating activities to profit after tax (E4/D10) (times)
22,822,320 24,128,148 26,382,006 30,703,347 36,242,415
6,000,000 6,000,000 6,000,000 10,000,000 10,000,000
6,876,320 7,431,389 8,193,002 9,543,420 10,812,156
9,946,000 10,696,759 12,189,004 11,159,927 15,430,259
1,865,000 679,262 167,303 2,831,306 1,474,807
4,254,092 4,321,754 3,427,917 32,246,120 69,108,420
0 0 0 0 0
2,661,764 2,562,007 1,371,474 28,953,243 62,152,972
3,650 2,500 35,000 0 2,820,000
1,588,678 1,757,247 2,021,443 3,292,877 4,135,448
28,941,412 29,129,164 29,977,226 65,780,773 106,825,642
61,995 61,148 60,901 54,209 137,120
16,691 18,730 9,690 23,762 14,095
2,632,880 2,476,726 1,071,204 1,218,271 0
21,206,169 22,922,841 25,815,300 56,341,132 90,458,932
5,860,141 4,319,273 3,770,041 7,705,430 15,581,415
1,546,078 1,197,298 1,113,743 1,092,317 1,065,341
1,437,645 1,152,703 1,071,860 1,050,828 1,324,568
4,422,496 3,166,570 2,698,181 6,654,602 14,256,847
201,875 196,533 217,382 217,148 298,012
399,306 286,616 104,568 1,271,649 1,660,636
1,027,732 740,818 928,003 2,118,683 6,664,984
244,012 104,125 66,290 767,945 4,574,374
783,720 636,693 861,713 1,350,738 2,090,610
(592) (63,965) 298,767 450,468 1,033,680
784,312 700,658 562,946 900,270 1,056,930
3,786,996 2,402,923 3,534,453 5,644,635 7,884,581
442,842 519,669 582,116 776,859 1,123,386
484,948 509,869 511,810 660,583 966,773
4,128,466 2,593,652 3,515,283 5,768,046 7,818,125
3,452,494 1,850,229 2,768,420 4,743,438 6,343,682
240 240 240 400 400
0.00% 0.00% 0.00% 0.00% 0.00%
0.00% 0.00% 0.00% 0.00% 0.00%
(4,898,617) 1,511,866 1,234,477 22,965,230 30,273,581
1,235,359 850,000 150,000 8,084,576 12,695,668
76.26% 85.94% 92.86% 63.75% 31.37%
2.71% 2.19% 2.87% 2.05% 1.96%
15.13% 7.67% 10.49% 15.45% 17.50%
11.93% 6.35% 9.24% 7.21% 5.94%
13.09% 8.25% 11.79% 8.58% 7.38%
2.71% 2.41% 1.88% 1.37% 0.99%
23.74% 14.06% 7.14% 36.25% 68.63%
0.12 0.20 0.15 0.11 0.12
0.09 0.17 0.13 0.10 0.08
0.13 0.21 0.14 0.12 0.12
14,385.39 7,709.29 11,535.08 11,858.60 15,859.21
0.27% 0.27% 0.24% 0.12% 0.14%
73.27% 78.69% 86.12% 85.65% 84.68%
15.28% 10.87% 9.00% 10.12% 13.35%
0.01% 0.01% 0.12% 0.00% 2.64%
14.70% 14.84% 11.44% 49.02% 64.69%
160,551.81% 172,770.92% 10,771.55% 552.53%
219.86% 168.43% 268.05% 26.61% 23.98%
26.38% 27.72% 29.54% 14.18% 6.84%
24.53% 26.69% 28.43% 13.64% 8.50%
6.77% 4.96% 4.22% 3.56% 2.94%
-0.04% -5.55% 27.87% 42.87% 78.04%
92.99% 96.28% 96.24% 96.20% 124.33%
78.86% 82.83% 88.01% 46.68% 33.93%
0.05 0.04 0.01 0.26 0.35
95,093.00 100,533.95 109,925.03 76,758.37 90,606.04
0.00 0.00 0.00 0.00 0.08
-1.42 0.82 0.45 4.84 4.77
-
(Thousand Rupees)PAK KUWAIT INVESTEMNT CO. (PVT.) LTD.
70

Financial Statement Analysis of Financial Sector 2020
2016 2017 2018 2019 2020Items
A.Total equity (A1 to A3)1.Share capital2.Reserves3.Un appropriated profit4.Others
B.Total liabilities (B1 to B4)1.Bills payable2.Borrowings from financial institutions3.Deposits and other accounts4.Other/misc. liabilities
C.Total assets (C1 to C4 + C8 to C10)1.Cash and balances with treasury banks2.Balances with other banks3.Lending to financial institutions4.Investments5.Gross advances6.Advances-non-performing/classified7.Provisions against advances8.Advances net of provisions (C5-C7)9.Fixed assets10.Other/misc. assets
D.Profit & loss account1.Markup/interest earned2.markup/interest expensed3.Net markup/interest income4.Provisions and write-offs5.Net markup/interest income after provisions6.Non-markup/interest income7.Non-markup/interest expenses8.Administrative expenses9.Profit/(loss) before taxation10.Profit/(loss) after taxation
E.Other items1.No. of ordinary shares2.Cash dividend3.Stock dividend/bonus shares4.Cash generated from operating activities5.Commitments and contigencies
F.Efficiency ratios/profitability ratios1.Spread ratio (D3/D1)2.Net markup/interest margin (D1-D2)/C3.Return on equity (ROE) (D10/A)4.Return on assets (ROA) (D10/C)5.Non-markup/interest income to total assets (D6/C)6.Net markup/interest income(after provisions) to total assets(D5/C)7.Markup/interest expenses to markup/interest income (D2/D1)8.Admin. expenses to profit before tax. (D8/D9) (times)9.Non-markup/interest expenses to total income D7/(D1+D6) 10.Admin. expenses to non-markup/interest income (D8/D6) (times) 11.Earning per share (D10/E1)
G.Liquidity ratios1.Cash & cash equivalent to total assets (C1+C2)/C2.Investment to total assets (C4/C)3.Advances net of provisions to total assets (C8/C) 4.Deposits to total assets (B3/C) 5.Total liabilities to total assets (B/C) 6.Gross advances to deposits (C5/B3) 7.Gross advances to borrowing & deposits C5/(B2+B3)
H.Assets quality ratios1.Non-performing loan to gross advances (C6/C5)2.Provision against NPLs to gross advances (C7/C5)3.NPLs to total equity (C6/A)4.NPLs write off to NPLs provisions (D4/C7) 5.Provision against NPL to NPLs (C7/C6)
I.Capital /leverage ratios1.Capital ratio (A/C)2.Commitments & contingencies to total equity (E5/A) (times)3.Break up value per share (A/E1)4.Total deposits to total equity (B3/A) (times)
J.Cash flow ratio1.Cash generated from operating activities to profit after tax (E4/D10) (times)
4,669,164 4,712,650 4,383,660 5,289,853 6,244,685
6,141,780 6,141,780 6,141,780 6,141,780 7,871,780
302,094 311,650 311,650 1,511,650 507,477
(1,774,710) (1,740,780) (2,069,770) (2,363,577) (2,134,572)
92,251 (157,735) (215,171) (36,336) (281,624)
14,134,026 14,608,015 16,259,548 23,844,340 31,047,398
0 0 0 0 0
13,391,904 14,367,132 15,352,993 21,914,147 26,391,955
463,117 39,000 643,575 1,551,020 4,042,892
279,005 201,883 262,980 379,173 612,551
18,895,441 19,162,930 20,428,037 29,097,857 37,010,459
20,420 28,328 22,985 32,474 63,155
72,705 83,494 54,665 134,554 82,159
950,000 4,000,000 1,950,000 2,800,000 3,400,000
13,183,821 9,700,440 11,832,050 19,019,915 24,912,515
4,355,087 5,137,036 5,873,295 6,027,598 7,123,939
1,637,100 1,980,900 1,591,672 1,565,728 1,511,939
1,517,564 1,543,952 1,522,985 1,502,447 1,449,930
2,837,523 3,593,084 4,350,310 4,525,151 5,674,009
87,697 80,458 62,361 90,345 99,777
1,743,275 1,677,126 2,155,666 2,495,418 2,778,844
1,179,031 1,016,924 1,428,129 1,928,804 3,208,957
865,788 752,303 1,168,533 1,852,255 2,496,438
313,243 264,621 259,596 76,549 712,519
(1,161,501) 64,650 127,220 (82,904) 180,294
1,474,744 199,971 132,376 159,453 532,225
118,497 318,349 78,389 25,277 503,599
561,422 434,194 471,407 461,557 575,854
409,099 404,423 429,461 446,192 559,329
1,031,819 84,126 (260,642) (276,827) 459,970
791,170 47,781 (322,959) (303,713) 304,135
614,178 614,178 614,178 614,178 787,178
0.00% 0.00% 0.00% 0.00% 0.00%
0.00% 0.00% 0.00% 0.00% 0.00%
3,857,195 (5,280,156) 4,988,077 6,232,973 6,226,987
2,195,876 2,200,081 1,447,467 3,559,678 1,909,092
26.57% 26.02% 18.18% 3.97% 22.20%
1.66% 1.38% 1.27% 0.26% 1.93%
16.94% 1.01% -7.37% -5.74% 4.87%
4.19% 0.25% -1.58% -1.04% 0.82%
0.63% 1.66% 0.38% 0.09% 1.36%
7.80% 1.04% 0.65% 0.55% 1.44%
73.43% 73.98% 81.82% 96.03% 77.80%
0.40 4.81 -1.65 -1.61 1.22
0.43 0.33 0.31 0.24 0.16
3.45 1.27 5.48 17.65 1.11
1.29 0.08 -0.53 -0.49 0.39
0.49% 0.58% 0.38% 0.57% 0.39%
69.77% 50.62% 57.92% 65.37% 67.31%
15.02% 18.75% 21.30% 15.55% 15.33%
2.45% 0.20% 3.15% 5.33% 10.92%
74.80% 76.23% 79.59% 81.95% 83.89%
940.39% 13,171.89% 912.60% 388.62% 176.21%
31.43% 35.66% 36.72% 25.69% 23.41%
37.59% 38.56% 27.10% 25.98% 21.22%
34.85% 30.06% 25.93% 24.93% 20.35%
35.06% 42.03% 36.31% 29.60% 24.21%
-76.54% 4.19% 8.35% -5.52% 12.43%
92.70% 77.94% 95.68% 95.96% 95.90%
24.71% 24.59% 21.46% 18.18% 16.87%
0.47 0.47 0.33 0.67 0.31
7.60 7.67 7.14 8.61 7.93
0.10 0.01 0.15 0.29 0.65
4.88 -110.51 -15.44 -20.52 20.47
(Thousand Rupees)PAK LIBYA HOLDING COMPANY LTD.
71

Financial Statement Analysis of Financial Sector 2020
2016 2017 2018 2019 2020Items
A.Total equity (A1 to A3)1.Share capital2.Reserves3.Un appropriated profit4.Others
B.Total liabilities (B1 to B4)1.Bills payable2.Borrowings from financial institutions3.Deposits and other accounts4.Other/misc. liabilities
C.Total assets (C1 to C4 + C8 to C10)1.Cash and balances with treasury banks2.Balances with other banks3.Lending to financial institutions4.Investments5.Gross advances6.Advances-non-performing/classified7.Provisions against advances8.Advances net of provisions (C5-C7)9.Fixed assets10.Other/misc. assets
D.Profit & loss account1.Markup/interest earned2.markup/interest expensed3.Net markup/interest income4.Provisions and write-offs5.Net markup/interest income after provisions6.Non-markup/interest income7.Non-markup/interest expenses8.Administrative expenses9.Profit/(loss) before taxation10.Profit/(loss) after taxation
E.Other items1.No. of ordinary shares2.Cash dividend3.Stock dividend/bonus shares4.Cash generated from operating activities5.Commitments and contigencies
F.Efficiency ratios/profitability ratios1.Spread ratio (D3/D1)2.Net markup/interest margin (D1-D2)/C3.Return on equity (ROE) (D10/A)4.Return on assets (ROA) (D10/C)5.Non-markup/interest income to total assets (D6/C)6.Net markup/interest income(after provisions) to total assets(D5/C)7.Markup/interest expenses to markup/interest income (D2/D1)8.Admin. expenses to profit before tax. (D8/D9) (times)9.Non-markup/interest expenses to total income D7/(D1+D6) 10.Admin. expenses to non-markup/interest income (D8/D6) (times) 11.Earning per share (D10/E1)
G.Liquidity ratios1.Cash & cash equivalent to total assets (C1+C2)/C2.Investment to total assets (C4/C)3.Advances net of provisions to total assets (C8/C) 4.Deposits to total assets (B3/C) 5.Total liabilities to total assets (B/C) 6.Gross advances to deposits (C5/B3) 7.Gross advances to borrowing & deposits C5/(B2+B3)
H.Assets quality ratios1.Non-performing loan to gross advances (C6/C5)2.Provision against NPLs to gross advances (C7/C5)3.NPLs to total equity (C6/A)4.NPLs write off to NPLs provisions (D4/C7) 5.Provision against NPL to NPLs (C7/C6)
I.Capital /leverage ratios1.Capital ratio (A/C)2.Commitments & contingencies to total equity (E5/A) (times)3.Break up value per share (A/E1)4.Total deposits to total equity (B3/A) (times)
J.Cash flow ratio1.Cash generated from operating activities to profit after tax (E4/D10) (times)
8,106,752 8,059,817 8,103,513 8,191,734 8,734,535
6,150,000 6,150,000 6,150,000 6,150,000 6,150,000
984,427 1,071,761 1,164,643 1,265,504 1,759,985
972,325 838,056 788,870 776,230 824,550
354,446 63,540 39,425 161,727 348,498
31,345,157 56,546,033 49,967,534 83,729,353 87,723,043
0 0 0 0 0
25,150,898 44,607,690 39,961,645 73,681,026 70,551,769
5,342,975 10,501,149 9,010,490 8,576,392 15,869,130
851,284 1,437,194 995,399 1,471,935 1,302,144
39,806,355 64,669,390 58,110,472 92,082,814 96,806,076
88,884 172,121 122,604 153,271 214,433
1,670,921 2,010,079 2,275,589 1,974,796 1,318,436
935,826 2,038,288 5,434,296 8,132,475 3,600,000
20,831,182 40,240,634 28,433,357 59,375,922 68,217,290
15,900,129 19,663,753 21,061,394 20,576,002 21,587,215
1,218,843 964,378 711,233 678,329 1,527,219
1,065,278 875,260 580,692 551,869 651,910
14,834,851 18,788,493 20,480,702 20,024,133 20,935,305
85,263 81,901 96,169 201,216 219,239
1,359,428 1,337,874 1,267,755 2,221,001 2,301,373
2,287,972 3,955,607 3,550,116 7,521,051 8,993,366
1,436,373 3,099,597 2,710,409 6,500,194 7,444,829
851,599 856,010 839,707 1,020,857 1,548,537
6,648 (168,313) (332,101) (34,136) 144,952
844,951 1,024,323 1,171,808 1,054,993 1,403,585
827,673 340,437 161,564 236,269 670,810
647,335 620,227 584,028 609,415 737,257
658,798 573,254 552,165 577,375 680,164
1,025,289 744,533 749,344 681,847 1,337,138
705,614 436,668 464,410 504,304 972,406
615,000 615,000 615,000 615,000 615,000
0.00% 0.00% 0.00% 0.00% 0.00%
0.00% 0.00% 0.00% 0.00% 0.00%
4,624,456 288,193 (10,063,973) 38,624,252 (40,873)
3,956,292 6,838,492 19,695,692 10,880,137 1,873,531
37.22% 21.64% 23.65% 13.57% 17.22%
2.14% 1.32% 1.45% 1.11% 1.60%
8.70% 5.42% 5.73% 6.16% 11.13%
1.77% 0.68% 0.80% 0.55% 1.00%
2.08% 0.53% 0.28% 0.26% 0.69%
2.12% 1.58% 2.02% 1.15% 1.45%
62.78% 78.36% 76.35% 86.43% 82.78%
0.64 0.77 0.74 0.85 0.51
0.21 0.14 0.16 0.08 0.08
0.80 1.68 3.42 2.44 1.01
1.15 0.71 0.76 0.82 1.58
4.42% 3.37% 4.13% 2.31% 1.58%
52.33% 62.23% 48.93% 64.48% 70.47%
37.27% 29.05% 35.24% 21.75% 21.63%
13.42% 16.24% 15.51% 9.31% 16.39%
78.74% 87.44% 85.99% 90.93% 90.62%
297.59% 187.25% 233.74% 239.91% 136.03%
52.14% 35.68% 43.01% 25.01% 24.98%
7.67% 4.90% 3.38% 3.30% 7.07%
6.70% 4.45% 2.76% 2.68% 3.02%
15.03% 11.97% 8.78% 8.28% 17.48%
0.62% -19.23% -57.19% -6.19% 22.23%
87.40% 90.76% 81.65% 81.36% 42.69%
20.37% 12.46% 13.95% 8.90% 9.02%
0.49 0.85 2.43 1.33 0.21
13.18 13.11 13.18 13.32 14.20
0.66 1.30 1.11 1.05 1.82
6.55 0.66 -21.67 76.59 -0.04
(Thousand Rupees)PAK OMAN INVESTMENT COMPANY LTD.
72

Financial Statement Analysis of Financial Sector 2020
2016 2017 2018 2019 2020Items
A.Total equity (A1 to A3)1.Share capital2.Reserves3.Un appropriated profit4.Others
B.Total liabilities (B1 to B4)1.Bills payable2.Borrowings from financial institutions3.Deposits and other accounts4.Other/misc. liabilities
C.Total assets (C1 to C4 + C8 to C10)1.Cash and balances with treasury banks2.Balances with other banks3.Lending to financial institutions4.Investments5.Gross advances6.Advances-non-performing/classified7.Provisions against advances8.Advances net of provisions (C5-C7)9.Fixed assets10.Other/misc. assets
D.Profit & loss account1.Markup/interest earned2.markup/interest expensed3.Net markup/interest income4.Provisions and write-offs5.Net markup/interest income after provisions6.Non-markup/interest income7.Non-markup/interest expenses8.Administrative expenses9.Profit/(loss) before taxation10.Profit/(loss) after taxation
E.Other items1.No. of ordinary shares2.Cash dividend3.Stock dividend/bonus shares4.Cash generated from operating activities5.Commitments and contigencies
F.Efficiency ratios/profitability ratios1.Spread ratio (D3/D1)2.Net markup/interest margin (D1-D2)/C3.Return on equity (ROE) (D10/A)4.Return on assets (ROA) (D10/C)5.Non-markup/interest income to total assets (D6/C)6.Net markup/interest income(after provisions) to total assets(D5/C)7.Markup/interest expenses to markup/interest income (D2/D1)8.Admin. expenses to profit before tax. (D8/D9) (times)9.Non-markup/interest expenses to total income D7/(D1+D6) 10.Admin. expenses to non-markup/interest income (D8/D6) (times) 11.Earning per share (D10/E1)
G.Liquidity ratios1.Cash & cash equivalent to total assets (C1+C2)/C2.Investment to total assets (C4/C)3.Advances net of provisions to total assets (C8/C) 4.Deposits to total assets (B3/C) 5.Total liabilities to total assets (B/C) 6.Gross advances to deposits (C5/B3) 7.Gross advances to borrowing & deposits C5/(B2+B3)
H.Assets quality ratios1.Non-performing loan to gross advances (C6/C5)2.Provision against NPLs to gross advances (C7/C5)3.NPLs to total equity (C6/A)4.NPLs write off to NPLs provisions (D4/C7) 5.Provision against NPL to NPLs (C7/C6)
I.Capital /leverage ratios1.Capital ratio (A/C)2.Commitments & contingencies to total equity (E5/A) (times)3.Break up value per share (A/E1)4.Total deposits to total equity (B3/A) (times)
J.Cash flow ratio1.Cash generated from operating activities to profit after tax (E4/D10) (times)
3,713,090 4,616,028 6,055,007
3,658,506 3,658,506 3,658,506
11,007 191,375 478,643
43,577 766,147 1,917,858
0 80,244 83,356
36,588 14,880,273 22,697,011
0 0 0
0 7,565,788 15,248,741
0 0 0
36,588 7,314,485 7,448,270
3,749,678 19,576,545 28,835,374
653 50,780 30,122
504,566 2,382,641 3,111,722
912,000 0 0
1,009,632 8,821,820 10,202,696
1,200,000 7,729,232 14,967,077
0 0 0
0 0 0
1,200,000 7,729,232 14,967,077
45,067 78,340 157,749
77,760 513,732 366,008
223,605 1,529,275 2,508,960
0 336,696 715,269
223,605 1,192,579 1,793,691
0 0 15,702
223,605 1,192,579 1,777,989
30 920 3,152
166,877 291,657 344,803
166,877 272,060 315,170
56,758 901,842 1,436,338
55,037 901,842 1,436,338
365,851 365,851 365,851
0.00% 0.00% 0.00%
0.00% 0.00% 0.00%
(2,058,405) 2,666,035 2,193,284
0 0 0
100.00% 77.98% 71.49%
5.96% 6.09% 6.22%
1.48% 19.54% 23.72%
1.47% 4.61% 4.98%
0.00% 0.00% 0.01%
5.96% 6.09% 6.17%
0.00% 22.02% 28.51%
2.94 0.30 0.22
0.75 0.19 0.14
5,562.57 295.72 99.99
0.15 2.47 3.93
13.47% 12.43% 10.90%
26.93% 45.06% 35.38%
32.00% 39.48% 51.91%
0.00% 0.00% 0.00%
0.98% 76.01% 78.71%
102.16% 98.15%
0.00% 0.00% 0.00%
0.00% 0.00% 0.00%
0.00% 0.00% 0.00%
99.02% 23.58% 21.00%
0.00 0.00 0.00
10.15 12.62 16.55
0.00 0.00 0.00
-37.40 2.96 1.53
- -- -- -- -- -- -- -- -- -- -- -- -- -- -- -- -- -- -- -- -- -
- -- -- -- -- -- -- -- -- -- -
- -- -- -- -- -
- -- -- -- -- -- -- -- -- -- -- -
- -- -- -- -- -- - - - -- - -
- -- -- -- - - - -- - - - -
- -- -- -- -
- -
(Thousand Rupees)PAKISTAN MORTGAGE REFINANCE COMPANY LTD.
73

Financial Statement Analysis of Financial Sector 2020
2016 2017 2018 2019 2020Items
A.Total equity (A1 to A3)1.Share capital2.Reserves3.Un appropriated profit4.Others
B.Total liabilities (B1 to B4)1.Bills payable2.Borrowings from financial institutions3.Deposits and other accounts4.Other/misc. liabilities
C.Total assets (C1 to C4 + C8 to C10)1.Cash and balances with treasury banks2.Balances with other banks3.Lending to financial institutions4.Investments5.Gross advances6.Advances-non-performing/classified7.Provisions against advances8.Advances net of provisions (C5-C7)9.Fixed assets10.Other/misc. assets
D.Profit & loss account1.Markup/interest earned2.markup/interest expensed3.Net markup/interest income4.Provisions and write-offs5.Net markup/interest income after provisions6.Non-markup/interest income7.Non-markup/interest expenses8.Administrative expenses9.Profit/(loss) before taxation10.Profit/(loss) after taxation
E.Other items1.No. of ordinary shares2.Cash dividend3.Stock dividend/bonus shares4.Cash generated from operating activities5.Commitments and contigencies
F.Efficiency ratios/profitability ratios1.Spread ratio (D3/D1)2.Net markup/interest margin (D1-D2)/C3.Return on equity (ROE) (D10/A)4.Return on assets (ROA) (D10/C)5.Non-markup/interest income to total assets (D6/C)6.Net markup/interest income(after provisions) to total assets(D5/C)7.Markup/interest expenses to markup/interest income (D2/D1)8.Admin. expenses to profit before tax. (D8/D9) (times)9.Non-markup/interest expenses to total income D7/(D1+D6) 10.Admin. expenses to non-markup/interest income (D8/D6) (times) 11.Earning per share (D10/E1)
G.Liquidity ratios1.Cash & cash equivalent to total assets (C1+C2)/C2.Investment to total assets (C4/C)3.Advances net of provisions to total assets (C8/C) 4.Deposits to total assets (B3/C) 5.Total liabilities to total assets (B/C) 6.Gross advances to deposits (C5/B3) 7.Gross advances to borrowing & deposits C5/(B2+B3)
H.Assets quality ratios1.Non-performing loan to gross advances (C6/C5)2.Provision against NPLs to gross advances (C7/C5)3.NPLs to total equity (C6/A)4.NPLs write off to NPLs provisions (D4/C7) 5.Provision against NPL to NPLs (C7/C6)
I.Capital /leverage ratios1.Capital ratio (A/C)2.Commitments & contingencies to total equity (E5/A) (times)3.Break up value per share (A/E1)4.Total deposits to total equity (B3/A) (times)
J.Cash flow ratio1.Cash generated from operating activities to profit after tax (E4/D10) (times)
9,920,576 10,631,641 10,810,168 10,816,057 11,497,315
6,600,000 6,600,000 6,600,000 6,600,000 6,600,000
1,159,890 1,285,354 1,366,864 1,420,279 1,543,529
2,160,686 2,746,287 2,843,304 2,795,778 3,353,786
2,465,364 1,573,785 1,838,548 2,187,318 1,414,824
11,945,807 9,961,259 6,541,869 24,081,208 35,323,545
0 0 0 0 0
10,717,908 9,076,846 5,771,338 22,759,019 32,319,679
131,399 7,500 7,500 510,000 2,445,800
1,096,500 876,913 763,031 812,189 558,066
24,331,747 22,166,685 19,190,585 37,084,583 48,235,684
34,289 40,303 54,652 36,409 107,773
116,132 123,073 326,583 126,037 557,228
340,000 0 2,818,407 80,000 119,988
11,349,103 9,468,148 4,159,040 23,903,994 35,556,859
10,466,678 10,584,039 10,028,182 10,109,365 9,344,837
2,796,202 2,592,937 3,109,538 4,069,014 3,894,705
2,210,415 2,126,145 2,162,853 2,240,161 2,533,847
8,256,263 8,457,894 7,865,329 7,869,204 6,810,990
2,625,410 2,518,447 3,117,420 3,063,230 2,963,477
1,610,550 1,558,820 849,154 2,005,709 2,119,369
1,334,803 1,230,375 1,000,387 2,314,368 3,733,028
500,787 487,321 397,182 1,551,084 2,740,786
834,016 743,054 603,205 763,284 992,242
267,082 238,606 (77,235) 328,487 340,284
566,934 504,448 680,440 434,797 651,958
725,031 732,250 445,597 426,080 611,518
329,113 376,788 427,576 455,977 454,678
344,482 376,788 427,576 453,624 454,678
962,852 859,910 698,461 404,900 808,798
486,739 627,318 407,553 267,072 616,250
660,000 660,000 660,000 660,000 660,000
0.00% 0.00% 0.00% 0.00% 0.00%
0.00% 0.00% 0.00% 0.00% 0.00%
(2,091,951) (714,663) (4,852,098) 19,533,480 12,820,862
2,424,736 2,573,810 2,410,867 2,471,039 2,593,518
62.48% 60.39% 60.30% 32.98% 26.58%
3.43% 3.35% 3.14% 2.06% 2.06%
4.91% 5.90% 3.77% 2.47% 5.36%
2.00% 2.83% 2.12% 0.72% 1.28%
2.98% 3.30% 2.32% 1.15% 1.27%
2.33% 2.28% 3.55% 1.17% 1.35%
37.52% 39.61% 39.70% 67.02% 73.42%
0.36 0.44 0.61 1.12 0.56
0.16 0.19 0.30 0.17 0.10
0.48 0.51 0.96 1.06 0.74
0.74 0.95 0.62 0.40 0.93
0.62% 0.74% 1.99% 0.44% 1.38%
46.64% 42.71% 21.67% 64.46% 73.71%
33.93% 38.16% 40.99% 21.22% 14.12%
0.54% 0.03% 0.04% 1.38% 5.07%
49.10% 44.94% 34.09% 64.94% 73.23%
7,965.57% 141,120.52% 133,709.09% 1,982.23% 382.08%
96.47% 116.51% 173.53% 43.45% 26.88%
26.72% 24.50% 31.01% 40.25% 41.68%
21.12% 20.09% 21.57% 22.16% 27.11%
28.19% 24.39% 28.76% 37.62% 33.87%
12.08% 11.22% -3.57% 14.66% 13.43%
79.05% 82.00% 69.56% 55.05% 65.06%
40.77% 47.96% 56.33% 29.17% 23.84%
0.24 0.24 0.22 0.23 0.23
15.03 16.11 16.38 16.39 17.42
0.01 0.00 0.00 0.05 0.21
-4.30 -1.14 -11.91 73.14 20.80
(Thousand Rupees)SAUDI PAK INDUSTRIAL & AGRI. INV CO. LTD.
74

Financial Statements Analysis of Financial Sector 2020
Microfinance Banks
Performance at a Glance Microfinance sector continued its positive stride during the year, with total assets increased by 31.65 percent to reach Rs 492.62 billion in CY20 from Rs 374.20 billion in CY19. Total liabilities increased by Rs 114.74 billion or 35.06 percent while total equity (including others) increased by Rs 3.68 billion or 7.88 percent respectively in CY20 over CY19. Interest/mark up income of the microfinance banks recorded an increase of Rs 9.31 billion in CY20 .i.e. an increase of 14.10 percent over previous year. Interest/ mark up expense also increased by Rs 4.30 billion contributed to record an increase in net interest income with an amount of Rs 5.01 billion in CY20. Loss before and after taxation decreased by Rs 6.57 billion and Rs 6.32 billion respectively during the year.
Shareholders’ Equity Total equity (including others) increased from Rs 46.74 billion in CY19 to Rs 50.42 billion in CY20 witnessing an increase of Rs 3.68 billion or YoY increase in growth of 7.88 percent. Share capital increased by 3.70 percent from Rs 29.35 billion in CY19 to Rs 30.43 billion in CY20. It is important to note that share capital which contributed 58.52 percent of equity in CY19, raised to 67.98 percent in CY20 due to decrease in total equity of the sector in during the year. Reserves comprising 58.76 percent share of total equity in CY20 increased by Rs 0.93 billion in CY20 over CY19 but unappropriated loss increased by Rs 7.40 billion.
Assets In CY20, total assets stood at Rs 492.62 billion, increased by 31.65 percent when compared to previous year. The analysis of components of total assets reveals that lending to financial institutions activities of MFBs increased during CY20 by Rs 4.31 billion and investments also expanded to almost its double during the year. The amount of investments increased from Rs 51.48 billion in CY19 to Rs 98.08 billion in CY20 showing an increase of Rs 46.61 billion or 90.54 percent. Lending to financial institutions increased to Rs 9.71 billion in CY20 from Rs 5.40 billion in CY19, depicting an increase of 79.86 percent or Rs 4.31 billion over the previous year. Gross advances of MFBs increased by Rs 24.92 billion in CY20, from Rs 214.74 billion in CY19 to stand at Rs 239.66 billion in CY20. Share of gross advances in total assets decreased to 48.65 percent in CY20 from 57.39 percent in CY19. The analysis of
0
100
200
300
400
500
600
Total Equity(including
Others)
Total Liabilities Total Assets
billi
on R
s
Components of Balance Sheet2019 2020
59.37
5.40
51.48
214.74
75.19
9.71
98.08
239.66
0
50
100
150
200
250
300
Cash & CashEquivalent
Lending Investment Advances
billi
on R
s
Major Components of Assets2019 2020
75

Financial Statements Analysis of Financial Sector 2020
components of advances reveals that Non-Performing Loans (NPL) and provisions against NPL in advances decreased significantly during CY20. NPL decreased by Rs 5.10 billion and dropped to Rs 8.06 billion in CY20 as compared to Rs 13.16 billion in CY19. Advances net of provisions with an increase of Rs 27.77 billion or 13.67 percent stood at Rs 230.87 billion in CY20 from Rs 203.10 billion in CY19. Provision against advances decreased from Rs 11.64 billion in CY19 to Rs 8.79 billion, showing YoY decline in growth by 24.47 percent during CY20.
Liabilities Total liabilities of MFBs increased by Rs 114.74 billion to touch Rs 442.20 billion in CY20 from Rs 327.46 billion in CY19. Borrowings from financial institutions increased from Rs 19.67 billion in CY19
to Rs 26.79 billion in CY20 registering an increase of 36.23 percent over the previous year. Deposits and other accounts remained the highest liability (84.35 percent share) in CY20 of microfinance banks. Amount of deposits of MFBs recorded a significant increase of Rs 107.06 billion to stand at Rs 373.00 billion in CY20 from Rs 265.94 billion in CY19, showing an increase of 40.26 percent over the previous Year. Profitability & Operating Efficiency Profit/ loss position before and after taxation improved for microfinance sector in Pakistan. Loss before taxation decreased from Rs 9.68 billion in CY19 to loss of Rs 3.10 billion in CY20 witnessing a decrease of 67.92 percent over CY19. Loss after taxation decreased from Rs 11.92 billion in CY19 to loss of Rs 5.60 billion in CY20, registering a decrease of Rs 6.32 billion. Efficiency ratios in terms of return on assets and equity deciphered downward behavior in CY20 as compared to CY19. Return on equity (ROE) improved from -23.77 percent to -12.51 percent in CY20 as compared to CY19. Similarly, return on assets (ROA) improved from -3.19 percent growth
19.67
265.94
41.8626.79
373.00
42.41
0
50
100
150
200
250
300
350
400
Borrowings Deposits Others
billi
on R
s
Major Components of Liabilities2019 2020
6.01% 6.06%
81.21% 84.35%
12.78% 9.59%
0%10%20%30%40%50%60%70%80%90%
100%
2019 2020
Share of Borrowings in Total LiablilitiesBorrowings Deposits Others
59.60%
-23.77%
-3.19% 6.13%
58.89%
-12.51%
-1.14%3.36%
-30%-20%-10%
0%10%20%30%40%50%60%70%
SpreadRatio
ROE ROA NPL togross
advances
Efficiency/ Profitability Ratios2019 2020
76

Financial Statements Analysis of Financial Sector 2020
in CY19 to -1.14 percent decline in CY20. Capital ratio i.e. total equity to overall assets moved down from 13.40 percent to 9.09 percent during the current year. Gross advances to deposits moved down from 80.75 percent in CY19 to 64.25 percent in CY20.
77

Financial Statement Analysis of Financial Sector 2020
2016 2017 2018 2019 2020Items
A.Total equity (A1 to A3)1.Share capital2.Reserves3.Un appropriated profit4.Others
B.Total liabilities(B1 to B4)1.Bills payable2.Borrowings from financial institutions3.Deposits and other accounts4.Other/misc. liabilities
C.Total assets (C1 to C4 + C8 to C10)1.Cash and balances with treasury banks2.Balances with other banks3.Lending to financial institutions4.Investments5.Gross advances6.Advances-non-performing/classified7.Provision against advances8.Advances net of provision (C5-C7)9.Fixed assets10.Other/misc. assets
D.Profit & loss account1.Markup/interest earned2.Markup/interest expensed3.Net markup/interest income4.Provisions and write-offs5.Net markup/interest income after provisions6.Non-markup/interest income7.Non-markup/interest expenses8.Administrative expenses9.Profit/(loss) before taxation10.Profit/(loss) after taxation
E.Other items1.No. of ordinary shares (000)2.Cash dividend3.Stock dividend/bonus shares4.Cash generated from operating activities5.Commitments and contigencies
F.Efficiency ratios/profitability ratios1.Spread (D3/D1)2.Net markup/interest margin (D1-D2)/C3.Return on equity (ROE) (D10/A)4.Return on assets (ROA) (D10/C)5.Non-markup/interest income to total assets (D6/C)6.Net markup/interest income(after prov.) to total assets(D5/C)7.Markup/interest expense to markup/interest income (D2/D1)8.Admin. expense to profit before tax. (D8/D9) (times)9.Non-markup/interest expense to total income D7/(D1+D6) 10.Admin. expense to non-markup/interest income (D8/D6) (times) 11.Earning per share (D10/E1)
G.Liquidity ratios1.Cash & cash equivalent to total assets (C1+C2)/C2.Investment to total assets (C4/C)3.Advances net of provisions to total assets (C8/C)
4.Deposits to total assets (B3/C)5.Total liabilities to total assets (B/C) 6.Gross advances to deposits (C5/B3) 7.Gross advances to borrowing & deposit C5/(B2+B3)
H.Assets quality ratios1.Non-performing loan to gross advances (C6/C5)2.Provisions against NPLs to gross advances (C7/C5)3.NPLs to shareholders equity (C6/A)4.NPLs write off to NPLs provisions (D4/C7) 5.Provision against NPL to NPLs (C7/C6)
I.Capital /leverage ratios1.Capital ratio (A/C)2.Commitments & contingencies to total equity (E5/A) (times)3.Break up value per share (A/E1)4.Total deposit to total equity (B3/A) (times)
J.Cash flow ratio1.Cash generated from opration activities to profit after tax (E4/D10) (times)
28,125,443 35,872,132 50,874,057 50,150,141 44,766,445
21,443,298 24,477,784 27,678,113 29,348,283 30,433,283
2,977,973 4,126,727 14,570,204 25,370,483 26,303,698
3,704,172 7,267,621 8,625,740 (4,568,625) (11,970,536)
(3,610,302) (3,463,477) (2,901,342) (3,412,483) 5,656,176
145,615,827 215,106,548 278,539,757 327,461,818 442,197,442
110,670 136,194 141,654 0 0
13,728,881 13,017,323 17,011,065 19,665,384 26,790,532
120,173,249 185,909,900 238,556,412 265,937,619 372,998,755
11,603,027 16,043,131 22,830,626 41,858,815 42,408,155
170,130,968 247,515,203 326,512,472 374,199,478 492,620,063
9,534,721 12,224,551 16,246,986 17,695,183 23,791,104
23,705,997 26,690,384 43,464,211 41,679,439 51,397,553
2,151,981 4,292,591 9,833,315 5,400,000 9,712,489
30,964,763 44,674,356 37,008,966 51,476,547 98,084,287
89,637,080 136,663,986 189,658,351 214,743,266 239,661,491
2,279,323 2,459,310 5,105,742 13,159,865 8,064,239
1,894,075 2,537,140 4,509,407 11,643,695 8,794,236
87,743,005 134,126,846 185,148,944 203,099,571 230,867,255
5,142,024 7,256,382 10,805,498 25,212,110 25,443,739
10,888,477 18,250,093 24,004,552 29,636,628 53,323,636
23,150,854 35,657,987 50,401,036 66,026,127 75,333,133
6,749,847 11,298,551 15,845,443 26,674,021 30,972,392
16,401,007 24,359,436 34,555,591 39,352,106 44,360,741
2,168,562 1,949,653 4,526,916 16,815,941 11,862,673
14,232,445 22,409,783 30,028,672 22,285,274 32,498,068
5,283,756 12,897,011 13,725,984 15,254,362 13,123,592
14,720,318 27,590,761 36,248,542 47,468,670 48,750,260
14,602,859 27,272,924 25,848,779 47,103,526 48,523,986
4,795,884 7,716,038 7,506,113 (9,678,143) (3,104,516)
3,180,677 5,292,818 3,892,955 (11,921,469) (5,602,310)
2,126,929 2,398,762 2,882,921 2,934,828 4,380,975
27,949,865 18,399,378 804,447 (849,550) 59,010,383
0 0 0 0 0
70.84% 68.31% 68.56% 59.60% 58.89%
9.64% 9.84% 10.58% 10.52% 9.01%
11.31% 14.75% 7.65% -23.77% -12.51%
1.87% 2.14% 1.19% -3.19% -1.14%
3.11% 5.21% 4.20% 4.08% 2.66%
8.37% 9.05% 9.20% 5.96% 6.60%
29.16% 31.69% 31.44% 40.40% 41.11%
3.04 3.53 3.44 -4.87 -15.63
51.77% 56.82% 56.53% 58.40% 55.11%
2.76 2.11 1.88 3.09 3.70
1.50 2.21 1.35 -4.06 -1.28
19.54% 15.72% 18.29% 15.87% 15.26%
18.20% 18.05% 11.33% 13.76% 19.91%
51.57% 54.19% 56.71% 54.28% 46.87%
70.64% 75.11% 73.06% 71.07% 75.72%
85.59% 86.91% 85.31% 87.51% 89.76%
74.59% 73.51% 79.50% 80.75% 64.25%
66.94% 68.70% 74.21% 75.19% 59.95%
2.54% 1.80% 2.69% 6.13% 3.36%
2.11% 1.86% 2.38% 5.42% 3.67%
8.10% 6.86% 10.04% 26.24% 18.01%
114.49% 76.84% 100.39% 144.42% 134.89%
83.10% 103.16% 88.32% 88.48% 109.05%
16.53% 14.49% 15.58% 13.40% 9.09%
0.00 0.00 0.00 0.00 0.00
13.22 14.95 17.65 17.09 10.22
4.27 5.18 4.69 5.30 8.33
8.79 3.48 0.21 0.07 -10.53
(Thousand Rupees)All Microfinance Banks - Overall
N/A N/A N/A N/A N/A
N/A N/A N/A N/A N/A
78
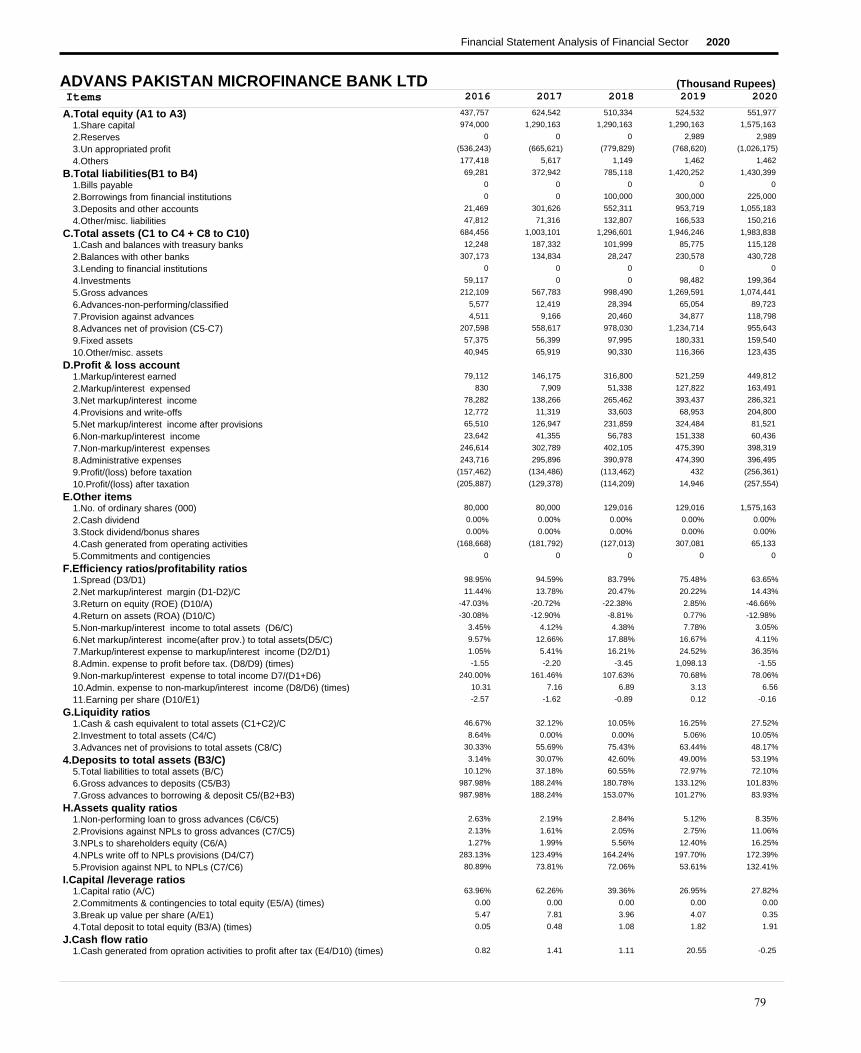
Financial Statement Analysis of Financial Sector 2020
2016 2017 2018 2019 2020Items
A.Total equity (A1 to A3)1.Share capital2.Reserves3.Un appropriated profit4.Others
B.Total liabilities(B1 to B4)1.Bills payable2.Borrowings from financial institutions3.Deposits and other accounts4.Other/misc. liabilities
C.Total assets (C1 to C4 + C8 to C10)1.Cash and balances with treasury banks2.Balances with other banks3.Lending to financial institutions4.Investments5.Gross advances6.Advances-non-performing/classified7.Provision against advances8.Advances net of provision (C5-C7)9.Fixed assets10.Other/misc. assets
D.Profit & loss account1.Markup/interest earned2.Markup/interest expensed3.Net markup/interest income4.Provisions and write-offs5.Net markup/interest income after provisions6.Non-markup/interest income7.Non-markup/interest expenses8.Administrative expenses9.Profit/(loss) before taxation10.Profit/(loss) after taxation
E.Other items1.No. of ordinary shares (000)2.Cash dividend3.Stock dividend/bonus shares4.Cash generated from operating activities5.Commitments and contigencies
F.Efficiency ratios/profitability ratios1.Spread (D3/D1)2.Net markup/interest margin (D1-D2)/C3.Return on equity (ROE) (D10/A)4.Return on assets (ROA) (D10/C)5.Non-markup/interest income to total assets (D6/C)6.Net markup/interest income(after prov.) to total assets(D5/C)7.Markup/interest expense to markup/interest income (D2/D1)8.Admin. expense to profit before tax. (D8/D9) (times)9.Non-markup/interest expense to total income D7/(D1+D6) 10.Admin. expense to non-markup/interest income (D8/D6) (times) 11.Earning per share (D10/E1)
G.Liquidity ratios1.Cash & cash equivalent to total assets (C1+C2)/C2.Investment to total assets (C4/C)3.Advances net of provisions to total assets (C8/C)
4.Deposits to total assets (B3/C)5.Total liabilities to total assets (B/C) 6.Gross advances to deposits (C5/B3) 7.Gross advances to borrowing & deposit C5/(B2+B3)
H.Assets quality ratios1.Non-performing loan to gross advances (C6/C5)2.Provisions against NPLs to gross advances (C7/C5)3.NPLs to shareholders equity (C6/A)4.NPLs write off to NPLs provisions (D4/C7) 5.Provision against NPL to NPLs (C7/C6)
I.Capital /leverage ratios1.Capital ratio (A/C)2.Commitments & contingencies to total equity (E5/A) (times)3.Break up value per share (A/E1)4.Total deposit to total equity (B3/A) (times)
J.Cash flow ratio1.Cash generated from opration activities to profit after tax (E4/D10) (times)
437,757 624,542 510,334 524,532 551,977
974,000 1,290,163 1,290,163 1,290,163 1,575,163
0 0 0 2,989 2,989
(536,243) (665,621) (779,829) (768,620) (1,026,175)
177,418 5,617 1,149 1,462 1,462
69,281 372,942 785,118 1,420,252 1,430,399
0 0 0 0 0
0 0 100,000 300,000 225,000
21,469 301,626 552,311 953,719 1,055,183
47,812 71,316 132,807 166,533 150,216
684,456 1,003,101 1,296,601 1,946,246 1,983,838
12,248 187,332 101,999 85,775 115,128
307,173 134,834 28,247 230,578 430,728
0 0 0 0 0
59,117 0 0 98,482 199,364
212,109 567,783 998,490 1,269,591 1,074,441
5,577 12,419 28,394 65,054 89,723
4,511 9,166 20,460 34,877 118,798
207,598 558,617 978,030 1,234,714 955,643
57,375 56,399 97,995 180,331 159,540
40,945 65,919 90,330 116,366 123,435
79,112 146,175 316,800 521,259 449,812
830 7,909 51,338 127,822 163,491
78,282 138,266 265,462 393,437 286,321
12,772 11,319 33,603 68,953 204,800
65,510 126,947 231,859 324,484 81,521
23,642 41,355 56,783 151,338 60,436
246,614 302,789 402,105 475,390 398,319
243,716 295,896 390,978 474,390 396,495
(157,462) (134,486) (113,462) 432 (256,361)
(205,887) (129,378) (114,209) 14,946 (257,554)
80,000 80,000 129,016 129,016 1,575,163
0.00% 0.00% 0.00% 0.00% 0.00%
0.00% 0.00% 0.00% 0.00% 0.00%
(168,668) (181,792) (127,013) 307,081 65,133
0 0 0 0 0
98.95% 94.59% 83.79% 75.48% 63.65%
11.44% 13.78% 20.47% 20.22% 14.43%
-47.03% -20.72% -22.38% 2.85% -46.66%
-30.08% -12.90% -8.81% 0.77% -12.98%
3.45% 4.12% 4.38% 7.78% 3.05%
9.57% 12.66% 17.88% 16.67% 4.11%
1.05% 5.41% 16.21% 24.52% 36.35%
-1.55 -2.20 -3.45 1,098.13 -1.55
240.00% 161.46% 107.63% 70.68% 78.06%
10.31 7.16 6.89 3.13 6.56
-2.57 -1.62 -0.89 0.12 -0.16
46.67% 32.12% 10.05% 16.25% 27.52%
8.64% 0.00% 0.00% 5.06% 10.05%
30.33% 55.69% 75.43% 63.44% 48.17%
3.14% 30.07% 42.60% 49.00% 53.19%
10.12% 37.18% 60.55% 72.97% 72.10%
987.98% 188.24% 180.78% 133.12% 101.83%
987.98% 188.24% 153.07% 101.27% 83.93%
2.63% 2.19% 2.84% 5.12% 8.35%
2.13% 1.61% 2.05% 2.75% 11.06%
1.27% 1.99% 5.56% 12.40% 16.25%
283.13% 123.49% 164.24% 197.70% 172.39%
80.89% 73.81% 72.06% 53.61% 132.41%
63.96% 62.26% 39.36% 26.95% 27.82%
0.00 0.00 0.00 0.00 0.00
5.47 7.81 3.96 4.07 0.35
0.05 0.48 1.08 1.82 1.91
0.82 1.41 1.11 20.55 -0.25
(Thousand Rupees)ADVANS PAKISTAN MICROFINANCE BANK LTD
79

Financial Statement Analysis of Financial Sector 2020
2016 2017 2018 2019 2020Items
A.Total equity (A1 to A3)1.Share capital2.Reserves3.Un appropriated profit4.Others
B.Total liabilities(B1 to B4)1.Bills payable2.Borrowings from financial institutions3.Deposits and other accounts4.Other/misc. liabilities
C.Total assets (C1 to C4 + C8 to C10)1.Cash and balances with treasury banks2.Balances with other banks3.Lending to financial institutions4.Investments5.Gross advances6.Advances-non-performing/classified7.Provision against advances8.Advances net of provision (C5-C7)9.Fixed assets10.Other/misc. assets
D.Profit & loss account1.Markup/interest earned2.Markup/interest expensed3.Net markup/interest income4.Provisions and write-offs5.Net markup/interest income after provisions6.Non-markup/interest income7.Non-markup/interest expenses8.Administrative expenses9.Profit/(loss) before taxation10.Profit/(loss) after taxation
E.Other items1.No. of ordinary shares (000)2.Cash dividend3.Stock dividend/bonus shares4.Cash generated from operating activities5.Commitments and contigencies
F.Efficiency ratios/profitability ratios1.Spread (D3/D1)2.Net markup/interest margin (D1-D2)/C3.Return on equity (ROE) (D10/A)4.Return on assets (ROA) (D10/C)5.Non-markup/interest income to total assets (D6/C)6.Net markup/interest income(after prov.) to total assets(D5/C)7.Markup/interest expense to markup/interest income (D2/D1)8.Admin. expense to profit before tax. (D8/D9) (times)9.Non-markup/interest expense to total income D7/(D1+D6) 10.Admin. expense to non-markup/interest income (D8/D6) (times) 11.Earning per share (D10/E1)
G.Liquidity ratios1.Cash & cash equivalent to total assets (C1+C2)/C2.Investment to total assets (C4/C)3.Advances net of provisions to total assets (C8/C)
4.Deposits to total assets (B3/C)5.Total liabilities to total assets (B/C) 6.Gross advances to deposits (C5/B3) 7.Gross advances to borrowing & deposit C5/(B2+B3)
H.Assets quality ratios1.Non-performing loan to gross advances (C6/C5)2.Provisions against NPLs to gross advances (C7/C5)3.NPLs to shareholders equity (C6/A)4.NPLs write off to NPLs provisions (D4/C7) 5.Provision against NPL to NPLs (C7/C6)
I.Capital /leverage ratios1.Capital ratio (A/C)2.Commitments & contingencies to total equity (E5/A) (times)3.Break up value per share (A/E1)4.Total deposit to total equity (B3/A) (times)
J.Cash flow ratio1.Cash generated from opration activities to profit after tax (E4/D10) (times)
1,244,270 1,464,759 1,515,358 2,506,057 2,541,415
2,200,000 2,500,000 2,500,000 3,439,850 3,439,850
1,279 1,279 11,932 22,637 30,081
(957,009) (1,036,520) (996,574) (956,430) (928,516)
(537,071) (444,346) (41,612) (631,730) (282,168)
12,846,804 12,963,177 16,149,301 18,668,927 26,572,140
0 0 0 0 0
204,002 202,285 9,369 6,598 3,467
12,347,071 12,528,727 15,866,331 18,317,084 26,178,887
295,731 232,165 273,601 345,245 389,786
13,554,003 13,983,590 17,623,047 20,543,254 28,831,387
1,028,052 1,202,270 1,585,616 1,342,224 2,394,744
4,280,247 4,048,779 2,910,831 5,464,028 9,505,025
0 0 0 0 0
605,409 658,483 884,469 1,045,912 1,704,021
6,397,188 5,983,811 10,087,136 9,071,890 10,504,574
1,484,012 1,315,627 1,309,014 486,629 486,043
913,163 757,264 921,396 292,664 384,654
5,484,025 5,226,547 9,165,740 8,779,226 10,119,920
821,090 881,491 857,383 927,788 985,452
1,335,180 1,966,020 2,219,008 2,984,076 4,122,225
1,441,502 1,577,980 2,157,835 2,899,785 3,418,310
671,551 703,944 800,799 1,209,081 1,389,267
769,951 874,036 1,357,036 1,690,704 2,029,043
845,921 (131,198) (62,826) 292,876 70,399
(75,970) 1,005,234 1,419,863 1,397,828 1,958,644
112,898 115,062 276,284 489,255 177,129
1,134,506 1,308,599 1,595,647 1,797,738 2,077,906
1,107,253 1,308,599 1,595,647 1,795,186 2,069,031
(1,097,578) (188,302) 100,500 89,344 57,868
(735,524) (79,511) 53,261 53,525 37,219
220,000 250,000 250,000 343,985 343,985
0.00% 0.00% 0.00% 0.00% 0.00%
0.00% 0.00% 0.00% 0.00% 0.00%
3,593,023 (271,022) (679,158) 2,235,026 5,626,825
0 0 0 0 0
53.41% 55.39% 62.89% 58.30% 59.36%
5.68% 6.25% 7.70% 8.23% 7.04%
-59.11% -5.43% 3.51% 2.14% 1.46%
-5.43% -0.57% 0.30% 0.26% 0.13%
0.83% 0.82% 1.57% 2.38% 0.61%
-0.56% 7.19% 8.06% 6.80% 6.79%
46.59% 44.61% 37.11% 41.70% 40.64%
-1.01 -6.95 15.88 20.09 35.75
72.99% 77.29% 65.55% 53.05% 57.79%
9.81 11.37 5.78 3.67 11.68
-3.34 -0.32 0.21 0.16 0.11
39.16% 37.55% 25.51% 33.13% 41.27%
4.47% 4.71% 5.02% 5.09% 5.91%
40.46% 37.38% 52.01% 42.74% 35.10%
91.10% 89.60% 90.03% 89.16% 90.80%
94.78% 92.70% 91.64% 90.88% 92.16%
51.81% 47.76% 63.58% 49.53% 40.13%
50.97% 47.00% 63.54% 49.51% 40.12%
23.20% 21.99% 12.98% 5.36% 4.63%
14.27% 12.66% 9.13% 3.23% 3.66%
119.27% 89.82% 86.38% 19.42% 19.12%
92.64% -17.33% -6.82% 100.07% 18.30%
61.53% 57.56% 70.39% 60.14% 79.14%
9.18% 10.47% 8.60% 12.20% 8.81%
0.00 0.00 0.00 0.00 0.00
5.66 5.86 6.06 7.29 7.39
9.92 8.55 10.47 7.31 10.30
-4.88 3.41 -12.75 41.76 151.18
(Thousand Rupees)APNA MICROFINANCE BANK (formerly NETWORK MICROFI
80

Financial Statement Analysis of Financial Sector 2020
2016 2017 2018 2019 2020Items
A.Total equity (A1 to A3)1.Share capital2.Reserves3.Un appropriated profit4.Others
B.Total liabilities(B1 to B4)1.Bills payable2.Borrowings from financial institutions3.Deposits and other accounts4.Other/misc. liabilities
C.Total assets (C1 to C4 + C8 to C10)1.Cash and balances with treasury banks2.Balances with other banks3.Lending to financial institutions4.Investments5.Gross advances6.Advances-non-performing/classified7.Provision against advances8.Advances net of provision (C5-C7)9.Fixed assets10.Other/misc. assets
D.Profit & loss account1.Markup/interest earned2.Markup/interest expensed3.Net markup/interest income4.Provisions and write-offs5.Net markup/interest income after provisions6.Non-markup/interest income7.Non-markup/interest expenses8.Administrative expenses9.Profit/(loss) before taxation10.Profit/(loss) after taxation
E.Other items1.No. of ordinary shares (000)2.Cash dividend3.Stock dividend/bonus shares4.Cash generated from operating activities5.Commitments and contigencies
F.Efficiency ratios/profitability ratios1.Spread (D3/D1)2.Net markup/interest margin (D1-D2)/C3.Return on equity (ROE) (D10/A)4.Return on assets (ROA) (D10/C)5.Non-markup/interest income to total assets (D6/C)6.Net markup/interest income(after prov.) to total assets(D5/C)7.Markup/interest expense to markup/interest income (D2/D1)8.Admin. expense to profit before tax. (D8/D9) (times)9.Non-markup/interest expense to total income D7/(D1+D6) 10.Admin. expense to non-markup/interest income (D8/D6) (times) 11.Earning per share (D10/E1)
G.Liquidity ratios1.Cash & cash equivalent to total assets (C1+C2)/C2.Investment to total assets (C4/C)3.Advances net of provisions to total assets (C8/C)
4.Deposits to total assets (B3/C)5.Total liabilities to total assets (B/C) 6.Gross advances to deposits (C5/B3) 7.Gross advances to borrowing & deposit C5/(B2+B3)
H.Assets quality ratios1.Non-performing loan to gross advances (C6/C5)2.Provisions against NPLs to gross advances (C7/C5)3.NPLs to shareholders equity (C6/A)4.NPLs write off to NPLs provisions (D4/C7) 5.Provision against NPL to NPLs (C7/C6)
I.Capital /leverage ratios1.Capital ratio (A/C)2.Commitments & contingencies to total equity (E5/A) (times)3.Break up value per share (A/E1)4.Total deposit to total equity (B3/A) (times)
J.Cash flow ratio1.Cash generated from opration activities to profit after tax (E4/D10) (times)
6,458,395 7,267,668 7,968,028 8,600,545 9,065,874
6,348,887 6,348,887 6,348,887 6,348,887 6,348,887
195,022 365,982 557,278 687,949 868,881
(85,514) 552,799 1,061,863 1,563,709 1,848,106
(4,025,842) (3,984,436) (3,935,640) (3,882,238) (3,822,399)
13,185,412 21,858,654 28,247,372 32,593,582 34,607,406
14,625 81,872 61,356 0 0
1,350,002 1,668,982 3,318,501 4,752,853 4,710,504
11,069,656 19,183,926 23,741,812 23,911,342 26,082,761
751,129 923,874 1,125,703 3,929,387 3,814,141
15,617,965 25,141,886 32,279,760 37,311,889 39,850,881
809,675 976,429 1,639,249 1,595,527 1,572,075
1,248,485 1,556,695 2,489,462 1,642,665 2,849,103
0 0 0 0 0
1,885,329 5,209,160 3,827,477 6,244,459 6,448,872
10,209,128 15,110,644 20,868,935 22,480,016 21,550,510
114,977 224,155 392,188 1,055,090 739,183
126,864 247,303 288,406 441,212 304,401
10,082,264 14,863,341 20,580,529 22,038,804 21,246,109
920,847 1,220,666 1,748,345 3,131,121 2,444,958
671,365 1,315,595 1,994,698 2,659,313 5,289,764
2,986,050 4,808,929 6,531,286 8,312,159 8,628,539
647,593 1,256,381 1,828,404 2,997,774 3,038,759
2,338,457 3,552,548 4,702,881 5,314,385 5,589,780
219,211 406,595 434,916 1,089,594 1,228,373
2,119,246 3,145,953 4,267,965 4,224,791 4,361,407
549,776 693,478 801,885 954,484 845,440
1,681,427 2,461,178 3,489,903 4,167,707 3,824,200
1,669,761 2,437,692 3,453,480 4,102,037 3,761,043
987,595 1,378,254 1,579,947 1,011,568 1,382,647
630,896 854,798 956,480 653,352 904,663
634,889 634,889 750,000 634,889 634,889
0.00% 0.00% 0.00% 0.00% 0.00%
0.00% 0.00% 0.00% 0.00% 0.00%
2,371,848 1,870,197 620,034 (2,586,096) 7,501,237
0 0 0 0 0
78.31% 73.87% 72.01% 63.94% 64.78%
14.97% 14.13% 14.57% 14.24% 14.03%
9.77% 11.76% 12.00% 7.60% 9.98%
4.04% 3.40% 2.96% 1.75% 2.27%
3.52% 2.76% 2.48% 2.56% 2.12%
13.57% 12.51% 13.22% 11.32% 10.94%
21.69% 26.13% 27.99% 36.06% 35.22%
1.69 1.77 2.19 4.06 2.72
47.55% 44.73% 47.59% 44.98% 40.37%
3.04 3.52 4.31 4.30 4.45
0.99 1.35 1.28 1.03 1.42
13.18% 10.08% 12.79% 8.68% 11.09%
12.07% 20.72% 11.86% 16.74% 16.18%
64.56% 59.12% 63.76% 59.07% 53.31%
70.88% 76.30% 73.55% 64.09% 65.45%
84.42% 86.94% 87.51% 87.35% 86.84%
92.23% 78.77% 87.90% 94.01% 82.62%
82.20% 72.46% 77.12% 78.43% 69.98%
1.13% 1.48% 1.88% 4.69% 3.43%
1.24% 1.64% 1.38% 1.96% 1.41%
1.78% 3.08% 4.92% 12.27% 8.15%
172.79% 164.41% 150.80% 246.95% 403.54%
110.34% 110.33% 73.54% 41.82% 41.18%
41.35% 28.91% 24.68% 23.05% 22.75%
0.00 0.00 0.00 0.00 0.00
10.17 11.45 10.62 13.55 14.28
1.71 2.64 2.98 2.78 2.88
3.76 2.19 0.65 -3.96 8.29
(Thousand Rupees)FINCA MICROFINANCE BANK LIMITED
81

Financial Statement Analysis of Financial Sector 2020
2016 2017 2018 2019 2020Items
A.Total equity (A1 to A3)1.Share capital2.Reserves3.Un appropriated profit4.Others
B.Total liabilities(B1 to B4)1.Bills payable2.Borrowings from financial institutions3.Deposits and other accounts4.Other/misc. liabilities
C.Total assets (C1 to C4 + C8 to C10)1.Cash and balances with treasury banks2.Balances with other banks3.Lending to financial institutions4.Investments5.Gross advances6.Advances-non-performing/classified7.Provision against advances8.Advances net of provision (C5-C7)9.Fixed assets10.Other/misc. assets
D.Profit & loss account1.Markup/interest earned2.Markup/interest expensed3.Net markup/interest income4.Provisions and write-offs5.Net markup/interest income after provisions6.Non-markup/interest income7.Non-markup/interest expenses8.Administrative expenses9.Profit/(loss) before taxation10.Profit/(loss) after taxation
E.Other items1.No. of ordinary shares (000)2.Cash dividend3.Stock dividend/bonus shares4.Cash generated from operating activities5.Commitments and contigencies
F.Efficiency ratios/profitability ratios1.Spread (D3/D1)2.Net markup/interest margin (D1-D2)/C3.Return on equity (ROE) (D10/A)4.Return on assets (ROA) (D10/C)5.Non-markup/interest income to total assets (D6/C)6.Net markup/interest income(after prov.) to total assets(D5/C)7.Markup/interest expense to markup/interest income (D2/D1)8.Admin. expense to profit before tax. (D8/D9) (times)9.Non-markup/interest expense to total income D7/(D1+D6) 10.Admin. expense to non-markup/interest income (D8/D6) (times) 11.Earning per share (D10/E1)
G.Liquidity ratios1.Cash & cash equivalent to total assets (C1+C2)/C2.Investment to total assets (C4/C)3.Advances net of provisions to total assets (C8/C)
4.Deposits to total assets (B3/C)5.Total liabilities to total assets (B/C) 6.Gross advances to deposits (C5/B3) 7.Gross advances to borrowing & deposit C5/(B2+B3)
H.Assets quality ratios1.Non-performing loan to gross advances (C6/C5)2.Provisions against NPLs to gross advances (C7/C5)3.NPLs to shareholders equity (C6/A)4.NPLs write off to NPLs provisions (D4/C7) 5.Provision against NPL to NPLs (C7/C6)
I.Capital /leverage ratios1.Capital ratio (A/C)2.Commitments & contingencies to total equity (E5/A) (times)3.Break up value per share (A/E1)4.Total deposit to total equity (B3/A) (times)
J.Cash flow ratio1.Cash generated from opration activities to profit after tax (E4/D10) (times)
4,937,238 6,354,266 8,198,502 9,374,962 10,777,107
1,705,001 1,705,001 1,705,000 1,705,000 1,705,000
865,421 1,225,534 1,717,290 1,784,843 1,871,831
2,366,816 3,423,731 4,776,212 5,885,119 7,200,276
(141) 1,509 948 23,688 16,771
28,836,382 52,605,428 62,272,502 72,094,478 96,308,996
78,396 0 0 0 0
6,199,882 4,782,681 2,964,872 1,326,021 427,708
21,179,403 45,746,861 56,017,988 63,882,349 88,649,814
1,378,701 2,075,886 3,289,642 6,886,108 7,231,474
33,773,479 58,961,203 70,471,952 81,493,128 107,102,874
1,300,650 1,664,251 1,792,737 2,926,228 2,850,265
1,387,702 2,399,132 7,498,358 4,181,130 10,752,177
1,544,066 474,532 1,837,749 450,000 795,981
2,967,965 16,297,590 8,915,710 10,111,744 17,679,889
23,308,981 32,813,744 44,095,601 54,797,822 62,105,641
422,134 381,553 627,831 2,543,502 1,892,999
369,450 597,752 721,299 1,256,670 1,464,854
22,939,531 32,215,992 43,374,302 53,541,152 60,640,787
719,730 1,141,596 1,353,528 3,612,304 3,688,195
2,913,835 4,768,110 5,699,568 6,670,570 10,695,580
5,926,210 8,740,750 11,926,025 15,258,718 18,670,291
1,807,109 2,995,881 4,590,105 6,799,214 8,732,042
4,119,101 5,744,869 7,335,920 8,459,504 9,938,249
684,807 712,645 778,230 2,259,383 2,992,355
3,434,294 5,032,224 6,557,690 6,200,121 6,945,894
1,118,659 1,339,898 1,638,551 1,973,457 1,542,971
2,773,871 3,883,141 4,725,916 5,655,071 6,097,067
2,775,914 3,857,042 4,706,553 5,635,527 6,037,253
1,779,082 2,488,981 3,470,325 2,518,507 2,391,798
1,272,734 1,800,565 2,458,786 1,836,169 1,739,756
170,500 170,500 170,500 170,500 170,500
0.00% 0.00% 0.00% 0.00% 0.00%
0.00% 0.00% 0.00% 0.00% 0.00%
1,047,563 15,694,279 549,262 (797,139) 16,534,871
0 0 0 0
69.51% 65.73% 61.51% 55.44% 53.23%
12.20% 9.74% 10.41% 10.38% 9.28%
25.78% 28.34% 29.99% 19.59% 16.14%
3.77% 3.05% 3.49% 2.25% 1.62%
3.31% 2.27% 2.33% 2.42% 1.44%
10.17% 8.53% 9.31% 7.61% 6.49%
30.49% 34.27% 38.49% 44.56% 46.77%
1.56 1.55 1.36 2.24 2.52
39.37% 38.52% 34.84% 32.82% 30.16%
2.48 2.88 2.87 2.86 3.91
7.46 10.56 14.42 10.77 10.20
7.96% 6.89% 13.18% 8.72% 12.70%
8.79% 27.64% 12.65% 12.41% 16.51%
67.92% 54.64% 61.55% 65.70% 56.62%
62.71% 77.59% 79.49% 78.39% 82.77%
85.38% 89.22% 88.36% 88.47% 89.92%
110.05% 71.73% 78.72% 85.78% 70.06%
85.13% 64.94% 74.76% 84.03% 69.72%
1.81% 1.16% 1.42% 4.64% 3.05%
1.59% 1.82% 1.64% 2.29% 2.36%
8.55% 6.00% 7.66% 27.13% 17.57%
185.36% 119.22% 107.89% 179.79% 204.28%
87.52% 156.66% 114.89% 49.41% 77.38%
14.62% 10.78% 11.63% 11.50% 10.06%
0.00 0.00 0.00 0.00 0.00
28.96 37.27 48.09 54.99 63.21
4.29 7.20 6.83 6.81 8.23
0.82 8.72 0.22 -0.43 9.50
-
(Thousand Rupees)KHUSHHALIBANK LIMITED
82

Financial Statement Analysis of Financial Sector 2020
2016 2017 2018 2019 2020Items
A.Total equity (A1 to A3)1.Share capital2.Reserves3.Un appropriated profit4.Others
B.Total liabilities(B1 to B4)1.Bills payable2.Borrowings from financial institutions3.Deposits and other accounts4.Other/misc. liabilities
C.Total assets (C1 to C4 + C8 to C10)1.Cash and balances with treasury banks2.Balances with other banks3.Lending to financial institutions4.Investments5.Gross advances6.Advances-non-performing/classified7.Provision against advances8.Advances net of provision (C5-C7)9.Fixed assets10.Other/misc. assets
D.Profit & loss account1.Markup/interest earned2.Markup/interest expensed3.Net markup/interest income4.Provisions and write-offs5.Net markup/interest income after provisions6.Non-markup/interest income7.Non-markup/interest expenses8.Administrative expenses9.Profit/(loss) before taxation10.Profit/(loss) after taxation
E.Other items1.No. of ordinary shares (000)2.Cash dividend3.Stock dividend/bonus shares4.Cash generated from operating activities5.Commitments and contigencies
F.Efficiency ratios/profitability ratios1.Spread (D3/D1)2.Net markup/interest margin (D1-D2)/C3.Return on equity (ROE) (D10/A)4.Return on assets (ROA) (D10/C)5.Non-markup/interest income to total assets (D6/C)6.Net markup/interest income(after prov.) to total assets(D5/C)7.Markup/interest expense to markup/interest income (D2/D1)8.Admin. expense to profit before tax. (D8/D9) (times)9.Non-markup/interest expense to total income D7/(D1+D6) 10.Admin. expense to non-markup/interest income (D8/D6) (times) 11.Earning per share (D10/E1)
G.Liquidity ratios1.Cash & cash equivalent to total assets (C1+C2)/C2.Investment to total assets (C4/C)3.Advances net of provisions to total assets (C8/C)
4.Deposits to total assets (B3/C)5.Total liabilities to total assets (B/C) 6.Gross advances to deposits (C5/B3) 7.Gross advances to borrowing & deposit C5/(B2+B3)
H.Assets quality ratios1.Non-performing loan to gross advances (C6/C5)2.Provisions against NPLs to gross advances (C7/C5)3.NPLs to shareholders equity (C6/A)4.NPLs write off to NPLs provisions (D4/C7) 5.Provision against NPL to NPLs (C7/C6)
I.Capital /leverage ratios1.Capital ratio (A/C)2.Commitments & contingencies to total equity (E5/A) (times)3.Break up value per share (A/E1)4.Total deposit to total equity (B3/A) (times)
J.Cash flow ratio1.Cash generated from opration activities to profit after tax (E4/D10) (times)
1,218,956 3,062,142 3,835,587 4,710,378 5,214,181
1,451,754 2,713,597 2,713,597 2,713,597 2,713,597
46,152 168,570 332,174 516,340 622,404
(278,950) 179,975 789,816 1,480,441 1,878,180
11,538 42,493 128,227 148,868 189,944
13,003,363 17,476,241 24,150,880 33,315,836 50,598,802
0 0 0 0 0
0 0 0 0 0
10,306,362 14,943,057 22,091,486 29,224,876 46,806,827
2,697,001 2,533,184 2,059,394 4,090,960 3,791,975
14,233,857 20,580,876 28,114,694 38,175,082 56,002,927
747,930 1,071,464 2,134,916 2,187,973 3,674,149
4,742,891 3,047,343 5,162,381 10,830,602 5,425,344
0 0 0 0 0
1,495,053 4,527,807 5,408,582 5,252,110 12,073,885
5,933,962 10,002,318 12,713,805 15,537,781 24,578,789
2,323 31,232 161,859 584,745 68,491
75,138 182,972 285,428 464,905 355,050
5,858,824 9,819,346 12,428,377 15,072,876 24,223,739
388,448 462,744 729,542 1,560,757 1,860,006
1,000,711 1,652,172 2,250,896 3,270,764 8,745,804
1,241,070 2,616,677 3,356,863 5,303,981 6,682,988
255,330 510,086 389,543 961,516 1,599,279
985,740 2,106,591 2,967,320 4,342,465 5,083,709
67,611 115,701 197,192 460,476 202,456
918,129 1,990,890 2,770,127 3,881,989 4,881,253
599,661 541,249 513,589 158,991 (105,592)
1,182,955 1,651,540 2,062,915 2,775,288 4,029,139
1,179,326 1,648,857 2,058,286 2,767,197 4,027,461
334,835 880,599 1,220,801 1,265,693 746,522
230,758 612,089 818,021 920,833 530,318
145,175 271,360 271,359 271,360 271,360
0.00% 0.00% 0.00% 0.00% 0.00%
0.00% 0.00% 0.00% 0.00% 0.00%
4,410,284 632,583 4,363,261 6,270,512 3,618,762
0 0
79.43% 80.51% 88.40% 81.87% 76.07%
6.93% 10.24% 10.55% 11.38% 9.08%
18.93% 19.99% 21.33% 19.55% 10.17%
1.62% 2.97% 2.91% 2.41% 0.95%
4.21% 2.63% 1.83% 0.42% -0.19%
6.45% 9.67% 9.85% 10.17% 8.72%
20.57% 19.49% 11.60% 18.13% 23.93%
3.52 1.87 1.69 2.19 5.39
64.27% 52.30% 53.30% 50.80% 61.26%
1.97 3.05 4.01 17.40 -38.14
1.59 2.26 3.01 3.39 1.95
38.58% 20.01% 25.96% 34.10% 16.25%
10.50% 22.00% 19.24% 13.76% 21.56%
41.16% 47.71% 44.21% 39.48% 43.25%
72.41% 72.61% 78.58% 76.55% 83.58%
91.36% 84.91% 85.90% 87.27% 90.35%
57.58% 66.94% 57.55% 53.17% 52.51%
57.58% 66.94% 57.55% 53.17% 52.51%
0.04% 0.31% 1.27% 3.76% 0.28%
1.27% 1.83% 2.25% 2.99% 1.44%
0.19% 1.02% 4.22% 12.41% 1.31%
89.98% 63.23% 69.09% 99.05% 57.02%
3,234.52% 585.85% 176.34% 79.51% 518.39%
8.56% 14.88% 13.64% 12.34% 9.31%
0.00 0.00 0.00 0.00 0.00
8.40 11.28 14.13 17.36 19.21
8.46 4.88 5.76 6.20 8.98
19.11 1.03 5.33 6.81 6.82
- - -
(Thousand Rupees)MOBILINK MICROFINANCE BANK LTD.
83

Financial Statement Analysis of Financial Sector 2020
2016 2017 2018 2019 2020Items
A.Total equity (A1 to A3)1.Share capital2.Reserves3.Un appropriated profit4.Others
B.Total liabilities(B1 to B4)1.Bills payable2.Borrowings from financial institutions3.Deposits and other accounts4.Other/misc. liabilities
C.Total assets (C1 to C4 + C8 to C10)1.Cash and balances with treasury banks2.Balances with other banks3.Lending to financial institutions4.Investments5.Gross advances6.Advances-non-performing/classified7.Provision against advances8.Advances net of provision (C5-C7)9.Fixed assets10.Other/misc. assets
D.Profit & loss account1.Markup/interest earned2.Markup/interest expensed3.Net markup/interest income4.Provisions and write-offs5.Net markup/interest income after provisions6.Non-markup/interest income7.Non-markup/interest expenses8.Administrative expenses9.Profit/(loss) before taxation10.Profit/(loss) after taxation
E.Other items1.No. of ordinary shares (000)2.Cash dividend3.Stock dividend/bonus shares4.Cash generated from operating activities5.Commitments and contigencies
F.Efficiency ratios/profitability ratios1.Spread (D3/D1)2.Net markup/interest margin (D1-D2)/C3.Return on equity (ROE) (D10/A)4.Return on assets (ROA) (D10/C)5.Non-markup/interest income to total assets (D6/C)6.Net markup/interest income(after prov.) to total assets(D5/C)7.Markup/interest expense to markup/interest income (D2/D1)8.Admin. expense to profit before tax. (D8/D9) (times)9.Non-markup/interest expense to total income D7/(D1+D6) 10.Admin. expense to non-markup/interest income (D8/D6) (times) 11.Earning per share (D10/E1)
G.Liquidity ratios1.Cash & cash equivalent to total assets (C1+C2)/C2.Investment to total assets (C4/C)3.Advances net of provisions to total assets (C8/C)
4.Deposits to total assets (B3/C)5.Total liabilities to total assets (B/C) 6.Gross advances to deposits (C5/B3) 7.Gross advances to borrowing & deposit C5/(B2+B3)
H.Assets quality ratios1.Non-performing loan to gross advances (C6/C5)2.Provisions against NPLs to gross advances (C7/C5)3.NPLs to shareholders equity (C6/A)4.NPLs write off to NPLs provisions (D4/C7) 5.Provision against NPL to NPLs (C7/C6)
I.Capital /leverage ratios1.Capital ratio (A/C)2.Commitments & contingencies to total equity (E5/A) (times)3.Break up value per share (A/E1)4.Total deposit to total equity (B3/A) (times)
J.Cash flow ratio1.Cash generated from opration activities to profit after tax (E4/D10) (times)
3,106,336 3,869,522 4,417,174 4,485,770 5,243,905
1,498,372 1,498,372 1,498,372 1,498,372 1,498,372
357,739 522,034 640,217 657,079 815,767
1,250,225 1,849,116 2,278,585 2,330,319 2,929,766
97,393 144,388 190,583 201,862 266,550
23,248,698 29,575,599 33,742,828 35,317,638 47,650,706
0 0 0 0 0
4,677,175 3,293,888 4,531,800 3,764,297 3,395,944
16,922,084 23,671,820 26,263,175 26,650,662 39,284,549
1,649,439 2,609,891 2,947,853 4,902,679 4,970,213
26,452,427 33,589,509 38,350,585 40,005,271 53,161,161
1,199,469 1,642,950 1,120,908 1,483,412 2,867,959
4,067,413 5,223,370 3,699,044 3,967,374 4,933,304
0 0 2,522,202 0 1,494,681
6,109,061 2,696,483 3,458,697 1,590,418 8,637,899
13,271,040 20,934,194 23,777,633 27,768,761 29,289,840
48,060 69,041 646,269 450,401 1,242,292
144,309 228,385 466,511 398,149 1,357,418
13,126,731 20,705,809 23,311,122 27,370,612 27,932,422
353,177 533,617 1,008,607 2,023,314 1,673,856
1,596,576 2,787,280 3,230,005 3,570,141 5,621,040
3,221,206 4,976,177 6,331,528 7,523,998 8,852,245
1,239,768 2,038,967 2,226,359 3,401,597 3,928,775
1,981,438 2,937,210 4,105,168 4,122,401 4,923,470
155,329 387,510 1,154,856 1,845,041 1,741,368
1,826,109 2,549,700 2,950,312 2,277,360 3,182,102
693,344 871,122 833,261 1,165,091 1,076,871
1,558,954 2,315,149 2,885,022 3,355,069 3,114,720
1,558,766 2,313,916 2,881,731 3,353,705 3,096,753
960,499 1,105,674 898,550 87,382 1,144,253
684,787 821,474 590,916 84,310 793,435
149,837 149,837 149,837 149,837 149,837
0.00% 0.00% 0.00% 0.00% 0.00%
0.00% 0.00% 0.00% 0.00% 0.00%
3,062,825 2,556,227 (242,194) (2,946,370) 9,379,002
0 0 0 0 0
61.51% 59.03% 64.84% 54.79% 55.62%
7.49% 8.74% 10.70% 10.30% 9.26%
22.04% 21.23% 13.38% 1.88% 15.13%
2.59% 2.45% 1.54% 0.21% 1.49%
2.62% 2.59% 2.17% 2.91% 2.03%
6.90% 7.59% 7.69% 5.69% 5.99%
38.49% 40.97% 35.16% 45.21% 44.38%
1.62 2.09 3.21 38.38 2.71
39.82% 39.59% 40.27% 38.61% 31.37%
2.25 2.66 3.46 2.88 2.88
4.57 5.48 3.94 0.56 5.30
19.91% 20.44% 12.57% 13.63% 14.67%
23.09% 8.03% 9.02% 3.98% 16.25%
49.62% 61.64% 60.78% 68.42% 52.54%
63.97% 70.47% 68.48% 66.62% 73.90%
87.89% 88.05% 87.99% 88.28% 89.63%
78.42% 88.44% 90.54% 104.20% 74.56%
61.44% 77.63% 77.21% 91.30% 68.63%
0.36% 0.33% 2.72% 1.62% 4.24%
1.09% 1.09% 1.96% 1.43% 4.63%
1.55% 1.78% 14.63% 10.04% 23.69%
107.64% 169.67% 247.55% 463.40% 128.29%
300.27% 330.80% 72.19% 88.40% 109.27%
11.74% 11.52% 11.52% 11.21% 9.86%
0.00 0.00 0.00 0.00 0.00
20.73 25.82 29.48 29.94 35.00
5.45 6.12 5.95 5.94 7.49
4.47 3.11 -0.41 -34.95 11.82
(Thousand Rupees)NRSP MICROFINANCE BANK LTD.
84

Financial Statement Analysis of Financial Sector 2020
2016 2017 2018 2019 2020Items
A.Total equity (A1 to A3)1.Share capital2.Reserves3.Un appropriated profit4.Others
B.Total liabilities(B1 to B4)1.Bills payable2.Borrowings from financial institutions3.Deposits and other accounts4.Other/misc. liabilities
C.Total assets (C1 to C4 + C8 to C10)1.Cash and balances with treasury banks2.Balances with other banks3.Lending to financial institutions4.Investments5.Gross advances6.Advances-non-performing/classified7.Provision against advances8.Advances net of provision (C5-C7)9.Fixed assets10.Other/misc. assets
D.Profit & loss account1.Markup/interest earned2.Markup/interest expensed3.Net markup/interest income4.Provisions and write-offs5.Net markup/interest income after provisions6.Non-markup/interest income7.Non-markup/interest expenses8.Administrative expenses9.Profit/(loss) before taxation10.Profit/(loss) after taxation
E.Other items1.No. of ordinary shares (000)2.Cash dividend3.Stock dividend/bonus shares4.Cash generated from operating activities5.Commitments and contigencies
F.Efficiency ratios/profitability ratios1.Spread (D3/D1)2.Net markup/interest margin (D1-D2)/C3.Return on equity (ROE) (D10/A)4.Return on assets (ROA) (D10/C)5.Non-markup/interest income to total assets (D6/C)6.Net markup/interest income(after prov.) to total assets(D5/C)7.Markup/interest expense to markup/interest income (D2/D1)8.Admin. expense to profit before tax. (D8/D9) (times)9.Non-markup/interest expense to total income D7/(D1+D6) 10.Admin. expense to non-markup/interest income (D8/D6) (times) 11.Earning per share (D10/E1)
G.Liquidity ratios1.Cash & cash equivalent to total assets (C1+C2)/C2.Investment to total assets (C4/C)3.Advances net of provisions to total assets (C8/C)
4.Deposits to total assets (B3/C)5.Total liabilities to total assets (B/C) 6.Gross advances to deposits (C5/B3) 7.Gross advances to borrowing & deposit C5/(B2+B3)
H.Assets quality ratios1.Non-performing loan to gross advances (C6/C5)2.Provisions against NPLs to gross advances (C7/C5)3.NPLs to shareholders equity (C6/A)4.NPLs write off to NPLs provisions (D4/C7) 5.Provision against NPL to NPLs (C7/C6)
I.Capital /leverage ratios1.Capital ratio (A/C)2.Commitments & contingencies to total equity (E5/A) (times)3.Break up value per share (A/E1)4.Total deposit to total equity (B3/A) (times)
J.Cash flow ratio1.Cash generated from opration activities to profit after tax (E4/D10) (times)
1,069,551 2,253,153 2,307,421 2,304,245 2,125,059
1,151,820 2,308,300 2,308,300 2,308,300 2,308,300
8,363 14,275 26,320 32,059 32,059
(90,632) (69,422) (27,199) (36,114) (215,300)
2,792 57,635 58,915 61,037 62,017
188,154 80,902 123,211 2,269,675 2,259,243
0 0 0 0 0
0 0 0 1,982,284 1,982,284
148,895 9,033 6,784 6,701 6,701
39,259 71,869 116,427 280,690 270,258
1,260,497 2,391,690 2,489,547 4,634,957 4,446,319
7,997 4,177 3,751 3,622 3,431
28,527 320,086 491,356 1,197,269 1,290,197
184,700 450,000 0 0 0
516,913 797,010 630,622 1,258,490 181,262
439,275 703,493 1,257,189 1,996,421 2,539,991
21,960 24,818 103,716 172,445 195,611
10,797 15,367 48,548 93,494 70,619
428,478 688,126 1,208,641 1,902,927 2,469,372
32,960 30,958 52,318 132,483 170,058
60,922 101,333 102,859 140,166 331,999
176,541 243,495 439,075 782,767 749,580
4,977 9,391 49 124,290 188,139
171,564 234,104 439,026 658,477 561,441
18,560 24,299 89,138 225,418 246,877
153,004 209,805 349,887 433,059 314,564
42,998 47,045 69,162 116,280 190,973
181,233 213,106 318,476 496,789 744,502
181,647 21,306 318,702 488,563 740,168
14,770 43,744 100,572 52,550 (238,965)
6,486 29,562 60,227 28,693 (179,638)
115,182 230,830 230,830 230,830 230,830
0.00% 0.00% 0.00% 0.00% 0.00%
0.00% 0.00% 0.00% 0.00% 0.00%
438,558 (632,477) 30,440 (569,280) (942,408)
0 0 0 0 0
97.18% 96.14% 99.99% 84.12% 74.90%
13.61% 9.79% 17.63% 14.21% 12.63%
0.61% 1.31% 2.61% 1.25% -8.45%
0.51% 1.24% 2.42% 0.62% -4.04%
3.41% 1.97% 2.78% 2.51% 4.30%
12.14% 8.77% 14.05% 9.34% 7.07%
2.82% 3.86% 0.01% 15.88% 25.10%
12.30 0.49 3.17 9.30 -3.10
82.55% 73.35% 62.66% 55.26% 79.16%
4.22 0.45 4.61 4.20 3.88
0.06 0.13 0.26 0.12 -0.78
2.90% 13.56% 19.89% 25.91% 29.09%
41.01% 33.32% 25.33% 27.15% 4.08%
33.99% 28.77% 48.55% 41.06% 55.54%
11.81% 0.38% 0.27% 0.14% 0.15%
14.93% 3.38% 4.95% 48.97% 50.81%
295.02% 7,788.03% 18,531.68% 29,792.88% 37,904.66%
295.02% 7,788.03% 18,531.68% 100.37% 127.70%
5.00% 3.53% 8.25% 8.64% 7.70%
2.46% 2.18% 3.86% 4.68% 2.78%
2.05% 1.10% 4.49% 7.48% 9.20%
171.90% 158.12% 183.61% 241.10% 349.59%
49.17% 61.92% 46.81% 54.22% 36.10%
84.85% 94.21% 92.68% 49.71% 47.79%
0.00 0.00 0.00 0.00 0.00
9.29 9.76 10.00 9.98 9.21
0.14 0.00 0.00 0.00 0.00
67.62 -21.39 0.51 -19.84 5.25
(Thousand Rupees)PAK OMAN MICROFINANCE BANK LIMITED
85

Financial Statement Analysis of Financial Sector 2020
2016 2017 2018 2019 2020Items
A.Total equity (A1 to A3)1.Share capital2.Reserves3.Un appropriated profit4.Others
B.Total liabilities(B1 to B4)1.Bills payable2.Borrowings from financial institutions3.Deposits and other accounts4.Other/misc. liabilities
C.Total assets (C1 to C4 + C8 to C10)1.Cash and balances with treasury banks2.Balances with other banks3.Lending to financial institutions4.Investments5.Gross advances6.Advances-non-performing/classified7.Provision against advances8.Advances net of provision (C5-C7)9.Fixed assets10.Other/misc. assets
D.Profit & loss account1.Markup/interest earned2.Markup/interest expensed3.Net markup/interest income4.Provisions and write-offs5.Net markup/interest income after provisions6.Non-markup/interest income7.Non-markup/interest expenses8.Administrative expenses9.Profit/(loss) before taxation10.Profit/(loss) after taxation
E.Other items1.No. of ordinary shares (000)2.Cash dividend3.Stock dividend/bonus shares4.Cash generated from operating activities5.Commitments and contigencies
F.Efficiency ratios/profitability ratios1.Spread (D3/D1)2.Net markup/interest margin (D1-D2)/C3.Return on equity (ROE) (D10/A)4.Return on assets (ROA) (D10/C)5.Non-markup/interest income to total assets (D6/C)6.Net markup/interest income(after prov.) to total assets(D5/C)7.Markup/interest expense to markup/interest income (D2/D1)8.Admin. expense to profit before tax. (D8/D9) (times)9.Non-markup/interest expense to total income D7/(D1+D6) 10.Admin. expense to non-markup/interest income (D8/D6) (times) 11.Earning per share (D10/E1)
G.Liquidity ratios1.Cash & cash equivalent to total assets (C1+C2)/C2.Investment to total assets (C4/C)3.Advances net of provisions to total assets (C8/C)
4.Deposits to total assets (B3/C)5.Total liabilities to total assets (B/C) 6.Gross advances to deposits (C5/B3) 7.Gross advances to borrowing & deposit C5/(B2+B3)
H.Assets quality ratios1.Non-performing loan to gross advances (C6/C5)2.Provisions against NPLs to gross advances (C7/C5)3.NPLs to shareholders equity (C6/A)4.NPLs write off to NPLs provisions (D4/C7) 5.Provision against NPL to NPLs (C7/C6)
I.Capital /leverage ratios1.Capital ratio (A/C)2.Commitments & contingencies to total equity (E5/A) (times)3.Break up value per share (A/E1)4.Total deposit to total equity (B3/A) (times)
J.Cash flow ratio1.Cash generated from opration activities to profit after tax (E4/D10) (times)
776,290 796,929 833,108 882,604 933,109
750,000 750,000 750,000 750,000 750,000
5,535 9,880 17,496 27,931 38,563
20,755 37,049 65,612 104,673 144,546
1,384 2,470 4,374 6,983 9,641
3,019 4,507 165,971 1,017,905 956,489
0 0 0 0 0
0 0 76,523 800,000 750,000
1,139 1,373 77,769 126,447 139,340
1,880 3,134 11,679 91,458 67,149
780,693 803,906 1,003,453 1,907,492 1,899,239
517 1,005 13,416 13,650 19,256
581,438 423,921 255,910 332,486 478,301
100,000 0 0 0 0
0 0 100,000 619,095 687,933
69,351 341,807 589,666 864,362 559,995
0 0 2,405 16,509 5,320
694 3,418 6,564 14,388 6,189
68,657 338,389 583,102 849,974 553,806
7,400 9,013 14,345 52,779 52,134
22,681 31,578 36,680 39,508 107,809
60,809 119,668 207,309 347,011 362,142
0 5 5,014 71,057 79,617
60,809 119,663 202,295 275,954 282,525
694 3,195 4,597 13,425 14,116
60,115 116,468 197,697 262,529 268,409
16 10 0 0 0
39,390 85,525 145,735 193,871 198,285
39,390 85,525 114,938 193,871 197,884
20,741 30,954 51,962 68,658 70,124
12,461 21,725 38,084 52,170 52,684
75,000 75,000 75,000 75,000 75,000
0.00% 0.00% 0.00% 0.00% 0.00%
0.00% 0.00% 0.00% 0.00% 0.00%
(67,944) (253,586) (47,290) (121,250) 280,975
0 0 0 0 0
100.00% 100.00% 97.58% 79.52% 78.01%
7.79% 14.89% 20.16% 14.47% 14.88%
1.61% 2.73% 4.57% 5.91% 5.65%
1.60% 2.70% 3.80% 2.74% 2.77%
0.00% 0.00% 0.00% 0.00% 0.00%
7.70% 14.49% 19.70% 13.76% 14.13%
0.00% 0.00% 2.42% 20.48% 21.99%
1.90 2.76 2.21 2.82 2.82
64.76% 71.46% 70.30% 55.87% 54.75%
2,461.88 8,552.50
0.17 0.29 0.51 0.70 0.70
74.54% 52.86% 26.84% 18.15% 26.20%
0.00% 0.00% 9.97% 32.46% 36.22%
8.79% 42.09% 58.11% 44.56% 29.16%
0.15% 0.17% 7.75% 6.63% 7.34%
0.39% 0.56% 16.54% 53.36% 50.36%
6,088.76% 24,894.90% 758.23% 683.58% 401.89%
6,088.76% 24,894.90% 382.18% 93.30% 62.97%
0.00% 0.00% 0.41% 1.91% 0.95%
1.00% 1.00% 1.11% 1.66% 1.11%
0.00% 0.00% 0.29% 1.87% 0.57%
100.00% 93.48% 70.03% 93.31% 228.08%
272.93% 87.15% 116.33%
99.44% 99.13% 83.02% 46.27% 49.13%
0.00 0.00 0.00 0.00 0.00
10.35 10.63 11.11 11.77 12.44
0.00 0.00 0.09 0.14 0.15
-5.45 -11.67 -1.24 -2.32 5.33
- - -
- -
(Thousand Rupees)SINDH MICROFINANCE BANK
86

Financial Statement Analysis of Financial Sector 2020
2016 2017 2018 2019 2020Items
A.Total equity (A1 to A3)1.Share capital2.Reserves3.Un appropriated profit4.Others
B.Total liabilities(B1 to B4)1.Bills payable2.Borrowings from financial institutions3.Deposits and other accounts4.Other/misc. liabilities
C.Total assets (C1 to C4 + C8 to C10)1.Cash and balances with treasury banks2.Balances with other banks3.Lending to financial institutions4.Investments5.Gross advances6.Advances-non-performing/classified7.Provision against advances8.Advances net of provision (C5-C7)9.Fixed assets10.Other/misc. assets
D.Profit & loss account1.Markup/interest earned2.Markup/interest expensed3.Net markup/interest income4.Provisions and write-offs5.Net markup/interest income after provisions6.Non-markup/interest income7.Non-markup/interest expenses8.Administrative expenses9.Profit/(loss) before taxation10.Profit/(loss) after taxation
E.Other items1.No. of ordinary shares (000)2.Cash dividend3.Stock dividend/bonus shares4.Cash generated from operating activities5.Commitments and contigencies
F.Efficiency ratios/profitability ratios1.Spread (D3/D1)2.Net markup/interest margin (D1-D2)/C3.Return on equity (ROE) (D10/A)4.Return on assets (ROA) (D10/C)5.Non-markup/interest income to total assets (D6/C)6.Net markup/interest income(after prov.) to total assets(D5/C)7.Markup/interest expense to markup/interest income (D2/D1)8.Admin. expense to profit before tax. (D8/D9) (times)9.Non-markup/interest expense to total income D7/(D1+D6) 10.Admin. expense to non-markup/interest income (D8/D6) (times) 11.Earning per share (D10/E1)
G.Liquidity ratios1.Cash & cash equivalent to total assets (C1+C2)/C2.Investment to total assets (C4/C)3.Advances net of provisions to total assets (C8/C)
4.Deposits to total assets (B3/C)5.Total liabilities to total assets (B/C) 6.Gross advances to deposits (C5/B3) 7.Gross advances to borrowing & deposit C5/(B2+B3)
H.Assets quality ratios1.Non-performing loan to gross advances (C6/C5)2.Provisions against NPLs to gross advances (C7/C5)3.NPLs to shareholders equity (C6/A)4.NPLs write off to NPLs provisions (D4/C7) 5.Provision against NPL to NPLs (C7/C6)
I.Capital /leverage ratios1.Capital ratio (A/C)2.Commitments & contingencies to total equity (E5/A) (times)3.Break up value per share (A/E1)4.Total deposit to total equity (B3/A) (times)
J.Cash flow ratio1.Cash generated from opration activities to profit after tax (E4/D10) (times)
4,577,575 4,981,530 13,614,984 8,305,729 (2,311,141)
1,346,939 1,346,939 3,547,269 4,277,589 4,277,589
1,286,756 1,405,571 10,412,953 20,585,009 20,616,746
1,943,880 2,229,020 (345,238) (16,556,869) (27,205,476)
8,334 24,265 53,445 14,610 7,475,778
31,717,737 42,482,072 48,797,547 52,539,595 47,100,311
0 0 0 0 0
0 0 0 0 0
27,829,780 36,664,927 42,274,909 41,170,537 36,963,810
3,887,957 5,817,145 6,522,638 11,369,058 10,136,501
36,303,646 47,487,867 62,465,976 60,859,934 52,264,948
3,116,926 3,497,633 4,210,306 3,463,741 2,881,781
2,558,937 4,310,776 3,864,399 7,408,549 6,352,885
323,215 3,368,059 5,473,364 4,950,000 6,971,827
11,568,227 6,767,309 9,008,445 13,773,400 11,855,007
15,945,318 25,002,513 34,187,550 27,460,565 12,726,494
95,774 256,738 1,401,873 5,781,651 2,103,905
110,070 240,860 1,242,731 7,461,626 1,635,534
15,835,248 24,761,653 32,944,819 19,998,939 11,090,960
1,041,611 1,729,560 3,001,351 7,667,057 8,650,391
1,859,482 3,052,877 3,963,292 3,598,248 4,462,097
4,486,604 6,063,887 8,721,206 9,288,624 5,981,102
1,113,495 1,767,054 2,595,036 3,671,426 2,771,116
3,373,109 4,296,833 6,126,170 5,617,198 3,209,986
103,555 241,749 1,386,509 8,869,478 2,014,714
3,269,554 4,055,084 4,739,661 (3,503,171) 1,195,272
1,653,220 8,487,508 8,386,778 8,538,104 7,196,650
3,553,489 11,855,148 15,240,407 21,069,975 18,813,504
3,485,207 11,795,637 4,948,448 20,818,968 18,774,865
1,369,285 687,444 (2,113,968) (15,784,151) (10,421,582)
895,354 416,756 (2,515,738) (16,351,827) (10,703,951)
134,694 134,694 354,727 427,759 427,759
0.00% 0.00% 0.00% 0.00% 0.00%
0.00% 0.00% 0.00% 0.00% 0.00%
11,129,496 (1,954,717) (7,095,671) (615,487) (8,981,482)
0 0 0
75.18% 70.86% 70.24% 60.47% 53.67%
9.29% 9.05% 9.81% 9.23% 6.14%
19.56% 8.37% -18.48% -196.87% 463.15%
2.47% 0.88% -4.03% -26.87% -20.48%
4.55% 17.87% 13.43% 14.03% 13.77%
9.01% 8.54% 7.59% -5.76% 2.29%
24.82% 29.14% 29.76% 39.53% 46.33%
2.55 17.16 -2.34 -1.32 -1.80
57.88% 81.47% 89.08% 118.19% 142.77%
2.11 1.39 0.59 2.44 2.61
6.65 3.09 -7.09 -38.23 -25.02
15.63% 16.44% 12.93% 17.86% 17.67%
31.87% 14.25% 14.42% 22.63% 22.68%
43.62% 52.14% 52.74% 32.86% 21.22%
76.66% 77.21% 67.68% 67.65% 70.72%
87.37% 89.46% 78.12% 86.33% 90.12%
57.30% 68.19% 80.87% 66.70% 34.43%
57.30% 68.19% 80.87% 66.70% 34.43%
0.60% 1.03% 4.10% 21.05% 16.53%
0.69% 0.96% 3.64% 27.17% 12.85%
2.09% 5.15% 10.30% 69.61% -91.03%
94.08% 100.37% 111.57% 118.87% 123.18%
114.93% 93.82% 88.65% 129.06% 77.74%
12.61% 10.49% 21.80% 13.65% -4.42%
0.00 0.00 0.00 0.00 0.00
33.98 36.98 38.38 19.42 -5.40
6.08 7.36 3.11 4.96 -15.99
12.43 -4.69 2.82 0.04 0.84
- -
(Thousand Rupees)TELENOR MICROFINANCE BANK
87

Financial Statement Analysis of Financial Sector 2020
2016 2017 2018 2019 2020Items
A.Total equity (A1 to A3)1.Share capital2.Reserves3.Un appropriated profit4.Others
B.Total liabilities(B1 to B4)1.Bills payable2.Borrowings from financial institutions3.Deposits and other accounts4.Other/misc. liabilities
C.Total assets (C1 to C4 + C8 to C10)1.Cash and balances with treasury banks2.Balances with other banks3.Lending to financial institutions4.Investments5.Gross advances6.Advances-non-performing/classified7.Provision against advances8.Advances net of provision (C5-C7)9.Fixed assets10.Other/misc. assets
D.Profit & loss account1.Markup/interest earned2.Markup/interest expensed3.Net markup/interest income4.Provisions and write-offs5.Net markup/interest income after provisions6.Non-markup/interest income7.Non-markup/interest expenses8.Administrative expenses9.Profit/(loss) before taxation10.Profit/(loss) after taxation
E.Other items1.No. of ordinary shares (000)2.Cash dividend3.Stock dividend/bonus shares4.Cash generated from operating activities5.Commitments and contigencies
F.Efficiency ratios/profitability ratios1.Spread (D3/D1)2.Net markup/interest margin (D1-D2)/C3.Return on equity (ROE) (D10/A)4.Return on assets (ROA) (D10/C)5.Non-markup/interest income to total assets (D6/C)6.Net markup/interest income(after prov.) to total assets(D5/C)7.Markup/interest expense to markup/interest income (D2/D1)8.Admin. expense to profit before tax. (D8/D9) (times)9.Non-markup/interest expense to total income D7/(D1+D6) 10.Admin. expense to non-markup/interest income (D8/D6) (times) 11.Earning per share (D10/E1)
G.Liquidity ratios1.Cash & cash equivalent to total assets (C1+C2)/C2.Investment to total assets (C4/C)3.Advances net of provisions to total assets (C8/C)
4.Deposits to total assets (B3/C)5.Total liabilities to total assets (B/C) 6.Gross advances to deposits (C5/B3) 7.Gross advances to borrowing & deposit C5/(B2+B3)
H.Assets quality ratios1.Non-performing loan to gross advances (C6/C5)2.Provisions against NPLs to gross advances (C7/C5)3.NPLs to shareholders equity (C6/A)4.NPLs write off to NPLs provisions (D4/C7) 5.Provision against NPL to NPLs (C7/C6)
I.Capital /leverage ratios1.Capital ratio (A/C)2.Commitments & contingencies to total equity (E5/A) (times)3.Break up value per share (A/E1)4.Total deposit to total equity (B3/A) (times)
J.Cash flow ratio1.Cash generated from opration activities to profit after tax (E4/D10) (times)
3,151,958 3,792,879 4,884,044 5,427,375 6,028,805
2,730,811 2,730,811 2,730,811 2,730,811 2,730,811
189,569 326,723 675,629 824,003 993,501
231,578 735,345 1,477,604 1,872,561 2,304,493
678,546 712,670 619,283 620,057 659,536
13,047,727 21,435,139 32,121,953 41,184,589 69,674,746
0 0 0 0 0
297,820 0 0 0 2,021,434
12,237,466 20,887,192 31,129,077 38,403,643 61,726,243
512,441 547,947 992,876 2,780,946 5,927,069
16,878,231 25,940,688 37,625,280 47,232,021 76,363,087
840,523 1,204,886 2,186,701 2,875,826 4,252,199
2,111,977 2,638,550 6,036,912 3,404,932 7,472,280
0 0 0 0 0
4,627,558 5,934,139 2,807,140 4,512,898 14,541,655
8,273,926 14,554,966 23,857,102 31,613,750 43,411,854
58,873 95,284 214,267 1,106,004 1,204,801
90,698 160,298 302,658 677,483 1,783,656
8,183,228 14,394,668 23,554,444 30,936,267 41,628,198
496,359 724,983 1,187,584 2,819,654 2,841,735
618,586 1,043,462 1,852,499 2,682,444 5,627,020
2,480,263 3,719,299 6,047,176 8,521,507 11,404,245
580,886 856,648 1,682,653 3,467,735 4,740,019
1,899,377 2,862,651 4,364,523 5,053,772 6,664,226
15,612 91,586 250,988 852,841 1,567,350
1,883,765 2,771,065 4,113,535 4,200,931 5,096,876
170,561 302,185 509,209 767,930 875,694
1,565,782 2,065,998 3,112,150 4,267,700 5,157,462
1,559,937 2,061,717 3,112,150 4,267,675 5,157,438
488,544 1,007,252 1,510,594 701,161 815,108
316,259 685,772 1,000,070 532,712 574,599
273,081 273,081 273,081 273,081 273,081
0.00% 0.00% 0.00% 0.00% 0.00%
0.00% 0.00% 0.00% 0.00% 0.00%
(125,592) 2,217,887 1,546,005 134,941 13,716,123
0 0 0 0 0
76.58% 76.97% 72.17% 59.31% 58.44%
11.25% 11.04% 11.60% 10.70% 8.73%
10.03% 18.08% 20.48% 9.82% 9.53%
1.87% 2.64% 2.66% 1.13% 0.75%
1.01% 1.16% 1.35% 1.63% 1.15%
11.16% 10.68% 10.93% 8.89% 6.67%
23.42% 23.03% 27.83% 40.69% 41.56%
3.19 2.05 2.06 6.09 6.33
59.07% 51.37% 47.47% 45.94% 42.00%
9.15 6.82 6.11 5.56 5.89
1.16 2.51 3.66 1.95 2.10
17.49% 14.82% 21.86% 13.30% 15.35%
27.42% 22.88% 7.46% 9.55% 19.04%
48.48% 55.49% 62.60% 65.50% 54.51%
72.50% 80.52% 82.73% 81.31% 80.83%
77.31% 82.63% 85.37% 87.20% 91.24%
67.61% 69.68% 76.64% 82.32% 70.33%
66.01% 69.68% 76.64% 82.32% 68.10%
0.71% 0.65% 0.90% 3.50% 2.78%
1.10% 1.10% 1.27% 2.14% 4.11%
1.87% 2.51% 4.39% 20.38% 19.98%
17.21% 57.13% 82.93% 125.88% 87.87%
154.06% 168.23% 141.25% 61.26% 148.05%
18.67% 14.62% 12.98% 11.49% 7.89%
0.00 0.00 0.00 0.00 0.00
11.54 13.89 17.88 19.87 22.08
3.88 5.51 6.37 7.08 10.24
-0.40 3.23 1.55 0.25 23.87
(Thousand Rupees)THE FIRST MICROFINANCE BANK LIMITED
88

Financial Statement Analysis of Financial Sector 2020
2016 2017 2018 2019 2020Items
A.Total equity (A1 to A3)1.Share capital2.Reserves3.Un appropriated profit4.Others
B.Total liabilities(B1 to B4)1.Bills payable2.Borrowings from financial institutions3.Deposits and other accounts4.Other/misc. liabilities
C.Total assets (C1 to C4 + C8 to C10)1.Cash and balances with treasury banks2.Balances with other banks3.Lending to financial institutions4.Investments5.Gross advances6.Advances-non-performing/classified7.Provision against advances8.Advances net of provision (C5-C7)9.Fixed assets10.Other/misc. assets
D.Profit & loss account1.Markup/interest earned2.Markup/interest expensed3.Net markup/interest income4.Provisions and write-offs5.Net markup/interest income after provisions6.Non-markup/interest income7.Non-markup/interest expenses8.Administrative expenses9.Profit/(loss) before taxation10.Profit/(loss) after taxation
E.Other items1.No. of ordinary shares (000)2.Cash dividend3.Stock dividend/bonus shares4.Cash generated from operating activities5.Commitments and contigencies
F.Efficiency ratios/profitability ratios1.Spread (D3/D1)2.Net markup/interest margin (D1-D2)/C3.Return on equity (ROE) (D10/A)4.Return on assets (ROA) (D10/C)5.Non-markup/interest income to total assets (D6/C)6.Net markup/interest income(after prov.) to total assets(D5/C)7.Markup/interest expense to markup/interest income (D2/D1)8.Admin. expense to profit before tax. (D8/D9) (times)9.Non-markup/interest expense to total income D7/(D1+D6) 10.Admin. expense to non-markup/interest income (D8/D6) (times) 11.Earning per share (D10/E1)
G.Liquidity ratios1.Cash & cash equivalent to total assets (C1+C2)/C2.Investment to total assets (C4/C)3.Advances net of provisions to total assets (C8/C)
4.Deposits to total assets (B3/C)5.Total liabilities to total assets (B/C) 6.Gross advances to deposits (C5/B3) 7.Gross advances to borrowing & deposit C5/(B2+B3)
H.Assets quality ratios1.Non-performing loan to gross advances (C6/C5)2.Provisions against NPLs to gross advances (C7/C5)3.NPLs to shareholders equity (C6/A)4.NPLs write off to NPLs provisions (D4/C7) 5.Provision against NPL to NPLs (C7/C6)
I.Capital /leverage ratios1.Capital ratio (A/C)2.Commitments & contingencies to total equity (E5/A) (times)3.Break up value per share (A/E1)4.Total deposit to total equity (B3/A) (times)
J.Cash flow ratio1.Cash generated from opration activities to profit after tax (E4/D10) (times)
1,147,117 1,404,742 2,789,517 3,027,944 4,596,154
1,285,714 1,285,714 2,285,714 2,285,714 3,085,714
22,137 86,879 178,915 229,644 410,876
(160,734) 32,149 324,888 512,586 1,099,564
(24,653) (25,742) 18,986 22,918 1,079,044
9,469,250 16,251,887 31,983,074 37,039,341 65,038,204
17,649 54,322 80,298 0 0
1,000,000 3,069,487 6,010,000 6,733,331 13,274,191
8,109,924 11,971,358 20,534,770 23,290,259 46,104,640
341,677 1,156,720 5,358,006 7,015,751 5,659,373
10,591,714 17,630,887 34,791,577 40,090,204 70,713,402
470,734 772,154 1,457,387 1,717,205 3,160,117
2,391,207 2,586,898 11,027,311 3,019,826 1,908,209
0 0 0 0 450,000
1,130,131 1,786,375 1,967,824 6,969,539 24,074,500
5,576,802 10,648,713 17,225,244 21,882,307 31,319,362
25,633 48,443 217,926 897,835 35,871
48,381 94,355 205,406 508,227 1,313,063
5,528,421 10,554,358 17,019,838 21,374,080 30,006,299
303,027 465,355 754,500 3,104,522 2,917,414
768,194 1,465,747 2,564,717 3,905,032 8,196,863
1,051,487 2,644,950 4,365,933 7,266,318 10,133,879
428,308 1,152,285 1,676,143 3,842,509 4,341,888
623,179 1,492,665 2,689,790 3,423,809 5,791,991
44,490 86,252 259,713 838,456 1,579,865
578,689 1,406,413 2,430,076 2,585,353 4,212,126
318,981 458,099 640,482 939,432 1,263,020
802,097 1,448,588 2,270,266 3,214,072 4,295,156
801,942 1,446,737 2,267,866 3,206,407 4,265,595
95,573 415,924 800,292 310,713 1,204,072
72,353 258,966 547,057 253,648 906,159
128,571 128,571 228,571 228,571 228,571
0.00% 0.00% 0.00% 0.00% 0.00%
0.00% 0.00% 0.00% 0.00% 0.00%
2,258,472 (1,278,201) 1,886,771 (2,161,488) 12,211,345
0 0
59.27% 56.43% 61.61% 47.12% 57.15%
5.88% 8.47% 7.73% 8.54% 8.19%
6.31% 18.44% 19.61% 8.38% 19.72%
0.68% 1.47% 1.57% 0.63% 1.28%
3.01% 2.60% 1.84% 2.34% 1.79%
5.46% 7.98% 6.98% 6.45% 5.96%
40.73% 43.57% 38.39% 52.88% 42.85%
8.39 3.48 2.83 10.32 3.54
58.53% 46.68% 45.35% 39.17% 37.69%
2.51 3.16 3.54 3.41 3.38
0.56 2.01 2.39 1.11 3.96
27.02% 19.05% 35.88% 11.82% 7.17%
10.67% 10.13% 5.66% 17.38% 34.05%
52.20% 59.86% 48.92% 53.31% 42.43%
76.57% 67.90% 59.02% 58.09% 65.20%
89.40% 92.18% 91.93% 92.39% 91.97%
68.77% 88.95% 83.88% 93.95% 67.93%
61.22% 70.80% 64.89% 72.88% 52.74%
0.46% 0.45% 1.27% 4.10% 0.11%
0.87% 0.89% 1.19% 2.32% 4.19%
2.23% 3.45% 7.81% 29.65% 0.78%
91.96% 91.41% 126.44% 164.98% 120.32%
188.74% 194.78% 94.25% 56.61% 3,660.51%
10.83% 7.97% 8.02% 7.55% 6.50%
0.00 0.00 0.00 0.00 0.00
8.92 10.93 12.20 13.25 20.11
7.07 8.52 7.36 7.69 10.03
31.21 -4.94 3.45 -8.52 13.48
- - -
(Thousand Rupees)U MICROFINANCE BANK LTD.
89

Financial Statements Analysis of Financial Sector 2020
90
Leasing Companies
Performance at a Glance Asset base of leasing sector was decreased by 9.79 percent during the FY20 from Rs 31.29 billion in FY19 to Rs 28.23 billion in FY20. Total income of the sector posted an increase of 5.18 percent in FY20 to reach at Rs 4.79 billion. Profit before tax and profit after tax is recorded as Rs 0.85 billion and Rs 0.56 billion respectively in FY20 as compared to Rs 1.49 billion and Rs 1.05 billion in FY19.
Shareholders’ Equity The shareholders’ equity (including others) of leasing sector increased by 0.73 percent in FY20 from Rs
8.76 billion in FY19 to Rs 8.82 billion in FY20. Share capital remained unchanged at Rs 3.98 billion in
FY20. Reserves were increased by 81.02 percent in FY20 over FY19 to stand at Rs 7.19 billion in FY20
from Rs 3.97 billion in FY19. Unappropriate profit, however, posted a decreas of Rs 3.16 billion in FY20
when compared with FY19.
Liabilities Total liabilities decreased from Rs 22.53 billion in FY19 to Rs 19.40 billion in FY20 reflecting a decrease
of 13.88 percent or Rs 3.13 billion. Non-current liabilities comprise borrowings from financial and other
institutions, deposit on finance lease and other miscellaneous liabilities recorded a YoY decrease of 17.78
percent during FY20. A decrease of 27.91 percent or Rs 1.79 billion is observed in borrowing from
financial and other institutions in FY20 declined from Rs 6.40 billion in FY19 to Rs 4.61 billion in FY20.
Deposit on finance lease decreased from Rs 3.71 billion in FY19 to Rs 3.46 billion in FY20, showing a
YoY decline of 6.87 percent in FY20.
Current liabilities were recorded at Rs 9.83 billion in FY20 dropped from Rs 10.89 billion in FY19
showing a decrease of 9.71 percent. Non-current liaibilities and current liabilities constitute 49.32 percent
and 50.68 percent shares respectively of overall liabilities of the leasing sector during FY20.
8.76
3.98 3.97
8.82
3.98
7.19
-50%
-30%
-10%
10%
30%
50%
70%
90%
0
1
2
3
4
5
6
7
8
9
10
Total Equity
including others
Share Capital Reserves
bil
lion
Rs
Shareholder's Equity
FY 19 FY 20 Growth (RHS)
11.6410.89
9.57 9.83
-30%
-25%
-20%
-15%
-10%
-5%
0%
5%
10%
0
2
4
6
8
10
12
14
Non-Current Liabilities Current Liabilities
Composition of Total Liabilities
FY 19 FY 20 Growth (RHS)b
illi
on
Rs

Financial Statements Analysis of Financial Sector 2020
Assets
Total assets of leasing sector decreased to Rs 28. 23 billion in FY20 against Rs 31.29 billion in FY19,
showing a decrease of 9.79 percent or Rs 3.06 billion. Non-current assets constitute 51.07 percent share of
total assets in FY20, has decreased with 11.09 percent decline in growth during FY20. Net investment in
finance lease recorded a decrease of 23.83 percent during FY20. Fixed assets however, posted an
increase during FY20 increased by Rs 0.48 billion while other/miscellaneous assets also increase by 3.02
percent in FY20 over the previous year.
Current assets were decreased by 8.39 percent (Rs 1.26 billion) to reach Rs 13.81 billion during FY20.
Current assets constituted 48.93 percent share of total assets in FY20. Cash and cash equivalents
comprises 9.40 percent share of overall current assets in FY20, touched Rs 1.30 billion in FY20 from Rs
0.75 billion in FY19, recorded YoY growth of 72.25 percent in FY20.
Profitability and Operating Efficiency The leasing sector recorded an deciphered amount
of Rs 4.79 billion for total income/revenue during
FY20. Income from lease activities increased in
FY20 as compared to FY19, increase from Rs 3.10
billion in FY19 to touch Rs 3.22 billion in FY20.
Income from investment also increased by 18.36
percent in FY20 over the previous year.
Administrative expenses were at Rs 1.40 billion in
FY19 decreased to Rs 1.33 billion in FY20.
Profitability of Leasing companies detoriated
during the year FY20 as compared to previous year
instead of 5.18 percent increase in total income as
compare to last year. Profit before tax is recorded
as Rs 0.85 billion in FY20 which is 43.08 percent
or Rs 0.64 billion lower than FY19. Similarly,
profit after tax dropped to Rs 0.56 billion during FY20, which were at Rs 1.05 billion in FY19 facing a
YoY decline of 46.34 percent over the pervious year.
16.21
10.12
1.60
4.50
14.42
7.71
2.07
4.64
-30%
-20%
-10%
0%
10%
20%
30%
40%
0
2
4
6
8
10
12
14
16
18
NCA NIFL FA MISC
bil
lion
Rs
Composition of Non Current Assets
FY 19 FY 20 Growth (RHS)15.08
0.75
14.3213.81
1.30
12.51
-20%
-10%
0%
10%
20%
30%
40%
50%
60%
70%
80%
0
2
4
6
8
10
12
14
16
Current Assets Cash & Cash
Eqv.
OCA
bil
lon
Rs
Current Assets
FY 19 FY 20 Growth (RHS)
12.17%
7.31%
3.35%
23.04%
6.48%4.61%
1.99%
11.75%
0%
5%
10%
15%
20%
25%
30%
ROE ROCE ROA ROR
Profitability Ratios
FY 19 FY 20
91

Financial Statements Analysis of Financial Sector 2020
92
Consequently, return on equity decreased from 12.17 percent in FY 19 to 6.48 percent in FY20. Similarly,
the returns on assets decreased from 3.35 percent in FY20 to 1.99 percent in current year. Return on
revenues moved down from 23.04 percent in FY19 to 11.75 percent in the current year.

Financial Statement Analysis of Financial Sector 2020
2016 2017 2018 2019 2020Items
A.Total equity (A1 to A3)1.Share capital2.Reserves3.Un appropriated profit/loss4.Others
B.Total liabilities (B1+ B2)1.Non-current liabilities (a + b + c)
a.Borrowings from financial and other institutionsb.Deposit on finance leasec.Other/misc. liabilities
2.Current liabilitiesC.Total assets (C1 + C2)
1.Non-current assets (a + b + c)a.Net investment in finance leaseb.Fixed assetsc.Other/misc. assets
2.Current assets (e + f)a.Cash and balances with treasury banksb.Placement with other banksc.Term deposits certificated.Other money market placementse.Cash & cash equivalent (a + b + c + d)f.Other/misc. current assets
D.Profit & loss account1.Income from finance lease2.Income from operating lease3.Income from lease (D1 + D2)4.Income from investments5.Other income6.Total income/revenue (D3 to D5)7.Administrative expenses8.Profit/(loss) before taxation9.Profit/(loss) after taxation
E.Other items1.No. of ordinary shares (000)2.Cash dividend3.Stock dividend4.Cash generated from operating activities
F.Efficiency ratios/profitability ratios1.Return on equity (ROE) (D9/A) 2.Return on capital employed (ROCE) (D8/(C-B2))3.Return on assets (ROA) (D9/C)4.Return on revenue (ROR) (D9/D6) 5.Lease income to total income (D3/D6)6.Administrative expenses to profit before tax. (D7/D9) (times)7.Earning per share (D9/E1)
G.Liquidity ratios1.Cash & cash equivalent to total assets (C2e/C)2.Net investment in finance lease to total assets (C1a/C)3.Current assets to current liabilities (C2/B2) (times)4.Total liabilities to total assets (B/C) (times)
H.Capital /leverage ratios1.Capital ratio (A/C)2.Break up value per share (A/E1)
I.Cash flow ratio1.Cash generated from operating activities to profit after tax. (E4/D9) (times)2.Cash generated from operating activities to current liabilities (E4/B2) (times)
5,542,829 5,756,130 7,852,561 8,614,789 8,678,817
3,634,811 3,634,811 3,706,107 3,984,532 3,984,532
2,419,843 2,469,903 4,036,125 3,973,633 7,193,090
(511,825) (348,584) 110,329 656,624 (2,498,805)
137,969 135,346 146,883 145,167 144,850
27,065,289 26,082,959 23,960,230 22,528,737 19,401,704
14,128,361 12,880,261 11,146,762 11,637,889 9,568,459
6,340,528 6,872,928 5,889,090 6,395,297 4,610,100
6,755,018 4,885,143 4,031,104 3,713,770 3,458,513
1,032,815 1,122,190 1,226,568 1,528,822 1,499,846
12,936,928 13,202,698 12,813,468 10,890,848 9,833,245
32,746,087 31,974,435 31,959,674 31,288,693 28,225,371
16,203,595 16,393,964 16,136,966 16,213,628 14,415,283
9,340,737 9,650,137 10,461,699 10,115,837 7,705,291
2,317,866 1,845,039 1,752,488 1,596,672 2,072,776
4,544,992 4,898,788 3,922,779 4,501,119 4,637,216
16,542,492 15,580,471 15,822,708 15,075,065 13,810,088
1,594 3,164 2,530 2,767 2,047
608,627 631,755 537,116 206,389 345,315
1,326,712 985,808 842,377 481,388 897,085
10,000 9,291 63,291 63,291 54,000
1,946,933 1,630,018 1,445,314 753,835 1,298,447
14,595,559 13,950,453 14,377,394 14,321,230 12,511,641
2,598,527 2,684,917 2,762,686 3,103,661 3,221,845
596,899 539,312 387,214 300,367 238,012
3,195,426 3,224,229 3,149,900 3,404,028 3,459,857
514,631 548,591 638,679 790,651 935,780
784,324 591,281 1,144,722 356,656 391,605
4,494,381 4,364,101 4,933,301 4,551,335 4,787,242
1,144,413 1,239,765 1,294,379 1,403,272 1,328,907
906,900 1,164,787 1,857,447 1,491,048 848,678
665,685 816,261 1,430,372 1,048,634 562,725
303,157 303,157 1,563,198 338,129 345,632
(1,192,567) 872,793 (413,458) 2,595,976 5,808,991
12.01% 14.18% 18.22% 12.17% 6.48%
4.58% 6.21% 9.70% 7.31% 4.61%
2.03% 2.55% 4.48% 3.35% 1.99%
14.81% 18.70% 28.99% 23.04% 11.75%
71.10% 73.88% 63.85% 74.79% 72.27%
1.72 1.52 0.90 1.34 2.36
2.20 2.69 0.92 3.10 1.63
5.95% 5.10% 4.52% 2.41% 4.60%
28.52% 30.18% 32.73% 32.33% 27.30%
1.28 1.18 1.23 1.38 1.40
0.83 0.82 0.75 0.72 0.69
16.93% 18.00% 24.57% 27.53% 30.75%
18.28 18.99 5.02 25.48 25.11
-1.79 1.07 -0.29 2.48 10.32
-0.09 0.07 -0.03 0.24 0.59
(Thousand Rupees)Leasing Companies - Overall
N/A N/A N/A N/A N/A
N/A N/A N/A N/A N/A
93

Financial Statement Analysis of Financial Sector 2020
2016 2017 2018 2019 2020Items
A.Total equity (A1 to A3)1.Share capital2.Reserves3.Un appropriated profit/loss4.Others
B.Total liabilities (B1+ B2)1.Non-current liabilities (a + b + c)
a.Borrowings from financial and other institutionsb.Deposit on finance leasec.Other/misc. liabilities
2.Current liabilitiesC.Total assets (C1 + C2)
1.Non-current assets (a + b + c)a.Net investment in finance leaseb.Fixed assetsc.Other/misc. assets
2.Current assets (e + f)a.Cash and balances with treasury banksb.Placement with other banksc.Term deposits certificated.Other money market placementse.Cash & cash equivalent (a + b + c + d)f.Other/misc. current assets
D.Profit & loss account1.Income from finance lease2.Income from operating lease3.Income from lease (D1 + D2)4.Income from investments5.Other income6.Total income/revenue (D3 to D5)7.Administrative expenses8.Profit/(loss) before taxation9.Profit/(loss) after taxation
E.Other items1.No. of ordinary shares (000)2.Cash dividend3.Stock dividend4.Cash generated from operating activities
F.Efficiency ratios/profitability ratios1.Return on equity (ROE) (D9/A) 2.Return on capital employed (ROCE) (D8/(C-B2))3.Return on assets (ROA) (D9/C)4.Return on revenue (ROR) (D9/D6) 5.Lease income to total income (D3/D6)6.Administrative expenses to profit before tax. (D7/D9) (times)7.Earning per share (D9/E1)
G.Liquidity ratios1.Cash & cash equivalent to total assets (C2e/C)2.Net investment in finance lease to total assets (C1a/C)3.Current assets to current liabilities (C2/B2) (times)4.Total liabilities to total assets (B/C) (times)
H.Capital /leverage ratios1.Capital ratio (A/C)2.Break up value per share (A/E1)
I.Cash flow ratio1.Cash generated from operating activities to profit after tax. (E4/D9) (times)2.Cash generated from operating activities to current liabilities (E4/B2) (times)
168,034 189,070 222,863 243,011 251,678
107,444 107,444 107,444 107,444 107,444
31,812 36,019 42,777 46,807 48,541
28,778 45,607 72,642 88,760 95,693
0 0 0 0 0
97,721 164,818 184,509 138,423 94,073
44,613 109,809 117,205 77,860 74,459
0 0 0 0 0
0 0 0 0 0
44,613 109,809 117,205 77,860 74,459
53,108 55,009 67,304 60,563 19,614
265,755 353,888 407,372 381,434 345,751
196,882 153,513 294,578 235,071 174,531
0 0 0 0 0
175,277 131,593 268,819 217,715 160,799
21,605 21,920 25,759 17,356 13,732
68,873 200,375 112,794 146,363 171,220
19 735 726 800 27
245 0 0 0 324
0 0 0 0 0
0 9,291 9,291 9,291 0
264 10,026 10,017 10,091 351
68,609 190,349 102,777 136,272 170,869
0 0 0 0 0
51,260 52,507 64,460 58,647 40,875
51,260 52,507 64,460 58,647 40,875
0 0 0 0 0
1,381 0 0 0 0
52,641 52,507 64,460 58,647 40,875
9,294 12,166 8,234 16,627 17,311
32,309 31,819 40,760 27,379 12,199
19,884 21,036 33,794 20,147 8,667
10,744 10,744 10,744 10,744 10,744
0.00% 0.00% 0.00% 0.00% 0.00%
0.00% 0.00% 0.00% 0.00% 0.00%
77,993 (112,924) 117,513 7,622 (17,764)
11.83% 11.13% 15.16% 8.29% 3.44%
15.19% 10.65% 11.99% 8.53% 3.74%
7.48% 5.94% 8.30% 5.28% 2.51%
37.77% 40.06% 52.43% 34.35% 21.20%
97.38% 100.00% 100.00% 100.00% 100.00%
0.47 0.58 0.24 0.83 2.00
1.85 1.96 3.15 1.88 0.81
0.10% 2.83% 2.46% 2.65% 0.10%
0.00% 0.00% 0.00% 0.00% 0.00%
1.30 3.64 1.68 2.42 8.73
0.37 0.47 0.45 0.36 0.27
63.23% 53.43% 54.71% 63.71% 72.79%
15.64 17.60 20.74 22.62 23.42
3.92 -5.37 3.48 0.38 -2.05
1.47 -2.05 1.75 0.13 -0.91
(Thousand Rupees)Capital Assets Leasing Corporation Ltd.
94

Financial Statement Analysis of Financial Sector 2020
2016 2017 2018 2019 2020Items
A.Total equity (A1 to A3)1.Share capital2.Reserves3.Un appropriated profit/loss4.Others
B.Total liabilities (B1+ B2)1.Non-current liabilities (a + b + c)
a.Borrowings from financial and other institutionsb.Deposit on finance leasec.Other/misc. liabilities
2.Current liabilitiesC.Total assets (C1 + C2)
1.Non-current assets (a + b + c)a.Net investment in finance leaseb.Fixed assetsc.Other/misc. assets
2.Current assets (e + f)a.Cash and balances with treasury banksb.Placement with other banksc.Term deposits certificated.Other money market placementse.Cash & cash equivalent (a + b + c + d)f.Other/misc. current assets
D.Profit & loss account1.Income from finance lease2.Income from operating lease3.Income from lease (D1 + D2)4.Income from investments5.Other income6.Total income/revenue (D3 to D5)7.Administrative expenses8.Profit/(loss) before taxation9.Profit/(loss) after taxation
E.Other items1.No. of ordinary shares (000)2.Cash dividend3.Stock dividend4.Cash generated from operating activities
F.Efficiency ratios/profitability ratios1.Return on equity (ROE) (D9/A) 2.Return on capital employed (ROCE) (D8/(C-B2))3.Return on assets (ROA) (D9/C)4.Return on revenue (ROR) (D9/D6) 5.Lease income to total income (D3/D6)6.Administrative expenses to profit before tax. (D7/D9) (times)7.Earning per share (D9/E1)
G.Liquidity ratios1.Cash & cash equivalent to total assets (C2e/C)2.Net investment in finance lease to total assets (C1a/C)3.Current assets to current liabilities (C2/B2) (times)4.Total liabilities to total assets (B/C) (times)
H.Capital /leverage ratios1.Capital ratio (A/C)2.Break up value per share (A/E1)
I.Cash flow ratio1.Cash generated from operating activities to profit after tax. (E4/D9) (times)2.Cash generated from operating activities to current liabilities (E4/B2) (times)
74,626 73,768 69,363 67,467 63,743
215,000 215,000 215,000 215,000 215,000
59,256 59,257 59,257 59,257 59,257
(199,630) (200,489) (204,894) (206,790) (210,514)
0 0 0 0 0
173,407 194,717 202,723 225,027 233,801
28,253 40,446 40,975 41,529 40,432
0 0 0 0 0
26,883 39,022 39,224 39,364 36,836
1,370 1,424 1,751 2,165 3,596
145,154 154,271 161,748 183,498 193,369
248,033 268,485 272,086 292,494 297,544
56,976 80,584 85,128 94,099 90,677
54,320 78,572 83,635 92,486 87,741
2,126 1,732 1,431 1,142 2,313
530 280 62 471 623
191,057 187,901 186,958 198,395 206,867
14 869 274 103 141
4,231 2,160 4,021 10,368 16,955
0 0 0 0 0
0 0 0 0 0
4,245 3,029 4,295 10,471 17,096
186,812 184,872 182,663 187,924 189,771
9,712 10,069 9,403 14,045 17,038
0 0 0 0 0
9,712 10,069 9,403 14,045 17,038
0 0 0 0 0
510 841 490 883 1,875
10,222 10,910 9,893 14,928 18,913
11,431 11,215 11,988 12,360 13,295
176 (425) (2,689) (1,194) (2,947)
(714) (904) (4,378) (1,858) (3,871)
21,500 21,500 21,500 21,500 21,500
0.00% 0.00% 0.00% 0.00% 0.00%
0.00% 0.00% 0.00% 0.00% 0.00%
1,404 (6,397) (5,557) (861) 2,004
-0.96% -1.23% -6.31% -2.75% -6.07%
0.17% -0.37% -2.44% -1.10% -2.83%
-0.29% -0.34% -1.61% -0.64% -1.30%
-6.98% -8.29% -44.25% -12.45% -20.47%
95.01% 92.29% 95.05% 94.08% 90.09%
-16.01 -12.41 -2.74 -6.65 -3.43
-0.03 -0.04 -0.20 -0.09 -0.18
1.71% 1.13% 1.58% 3.58% 5.75%
21.90% 29.26% 30.74% 31.62% 29.49%
1.32 1.22 1.16 1.08 1.07
0.70 0.73 0.75 0.77 0.79
30.09% 27.48% 25.49% 23.07% 21.42%
3.47 3.43 3.23 3.14 2.96
-1.97 7.08 1.27 0.46 -0.52
0.01 -0.04 -0.03 0.00 0.01
(Thousand Rupees)Grays Leasing Ltd.
95

Financial Statement Analysis of Financial Sector 2020
2016 2017 2018 2019 2020Items
A.Total equity (A1 to A3)1.Share capital2.Reserves3.Un appropriated profit/loss4.Others
B.Total liabilities (B1+ B2)1.Non-current liabilities (a + b + c)
a.Borrowings from financial and other institutionsb.Deposit on finance leasec.Other/misc. liabilities
2.Current liabilitiesC.Total assets (C1 + C2)
1.Non-current assets (a + b + c)a.Net investment in finance leaseb.Fixed assetsc.Other/misc. assets
2.Current assets (e + f)a.Cash and balances with treasury banksb.Placement with other banksc.Term deposits certificated.Other money market placementse.Cash & cash equivalent (a + b + c + d)f.Other/misc. current assets
D.Profit & loss account1.Income from finance lease2.Income from operating lease3.Income from lease (D1 + D2)4.Income from investments5.Other income6.Total income/revenue (D3 to D5)7.Administrative expenses8.Profit/(loss) before taxation9.Profit/(loss) after taxation
E.Other items1.No. of ordinary shares (000)2.Cash dividend3.Stock dividend4.Cash generated from operating activities
F.Efficiency ratios/profitability ratios1.Return on equity (ROE) (D9/A) 2.Return on capital employed (ROCE) (D8/(C-B2))3.Return on assets (ROA) (D9/C)4.Return on revenue (ROR) (D9/D6) 5.Lease income to total income (D3/D6)6.Administrative expenses to profit before tax. (D7/D9) (times)7.Earning per share (D9/E1)
G.Liquidity ratios1.Cash & cash equivalent to total assets (C2e/C)2.Net investment in finance lease to total assets (C1a/C)3.Current assets to current liabilities (C2/B2) (times)4.Total liabilities to total assets (B/C) (times)
H.Capital /leverage ratios1.Capital ratio (A/C)2.Break up value per share (A/E1)
I.Cash flow ratio1.Cash generated from operating activities to profit after tax. (E4/D9) (times)2.Cash generated from operating activities to current liabilities (E4/B2) (times)
4,176,712 4,466,445 7,248,879 8,013,089 8,233,737
820,828 820,828 1,392,124 1,670,549 1,670,549
1,709,738 1,746,175 3,428,393 3,347,643 6,563,188
1,646,146 1,899,442 2,428,362 2,994,897 0
0 0 0 0 0
22,723,381 21,629,162 19,449,875 17,977,715 14,765,067
12,773,058 11,522,921 9,725,035 9,994,560 8,012,609
6,147,989 6,707,294 5,796,540 6,310,419 4,579,592
5,888,173 4,000,333 3,225,369 2,819,697 2,629,733
736,896 815,294 703,126 864,444 803,284
9,950,323 10,106,241 9,724,840 7,983,155 6,752,458
26,900,093 26,095,607 26,698,754 25,990,804 22,998,804
13,163,271 13,237,772 13,183,153 13,224,725 11,766,274
7,416,054 7,516,682 8,594,074 8,134,614 5,983,750
1,765,367 1,532,753 1,324,351 1,209,139 1,747,587
3,981,850 4,188,337 3,264,728 3,880,972 4,034,937
13,736,822 12,857,835 13,515,601 12,766,079 11,232,530
1,309 1,309 1,408 1,715 1,744
332,278 340,575 498,407 172,599 206,167
1,218,977 913,882 772,588 394,439 803,340
0 0 0 0 0
1,552,564 1,255,766 1,272,403 568,753 1,011,251
12,184,258 11,602,069 12,243,198 12,197,326 10,221,279
2,324,490 2,416,994 2,531,120 2,840,178 2,932,739
534,394 474,221 312,867 232,274 189,215
2,858,884 2,891,215 2,843,987 3,072,452 3,121,954
506,881 543,065 633,584 783,769 926,231
704,671 596,663 994,388 323,625 388,062
4,070,436 4,030,943 4,471,959 4,179,846 4,436,247
856,540 966,310 1,094,162 1,188,177 1,135,781
976,669 1,158,010 1,719,754 1,447,799 973,511
759,978 841,244 1,379,623 1,022,517 702,221
82,083 82,083 1,392,124 167,055 167,055
45.00% 30.00% 30.00% 0.38% 32.50%
0.00% 0.00% 0.20% 0.00% 0.05%
(1,535,641) 942,200 (327,330) 2,626,956 5,627,906
18.20% 18.83% 19.03% 12.76% 8.53%
5.76% 7.24% 10.13% 8.04% 5.99%
2.83% 3.22% 5.17% 3.93% 3.05%
18.67% 20.87% 30.85% 24.46% 15.83%
70.24% 71.73% 63.60% 73.51% 70.37%
1.13 1.15 0.79 1.16 1.62
9.26 10.25 0.99 6.12 4.20
5.77% 4.81% 4.77% 2.19% 4.40%
27.57% 28.80% 32.19% 31.30% 26.02%
1.38 1.27 1.39 1.60 1.66
0.84 0.83 0.73 0.69 0.64
15.53% 17.12% 27.15% 30.83% 35.80%
50.88 54.41 5.21 47.97 49.29
-2.02 1.12 -0.24 2.57 8.01
-0.15 0.09 -0.03 0.33 0.83
(Thousand Rupees)Orix Leasing Pakistan Ltd.
96

Financial Statement Analysis of Financial Sector 2020
2016 2017 2018 2019 2020Items
A.Total equity (A1 to A3)1.Share capital2.Reserves3.Un appropriated profit/loss4.Others
B.Total liabilities (B1+ B2)1.Non-current liabilities (a + b + c)
a.Borrowings from financial and other institutionsb.Deposit on finance leasec.Other/misc. liabilities
2.Current liabilitiesC.Total assets (C1 + C2)
1.Non-current assets (a + b + c)a.Net investment in finance leaseb.Fixed assetsc.Other/misc. assets
2.Current assets (e + f)a.Cash and balances with treasury banksb.Placement with other banksc.Term deposits certificated.Other money market placementse.Cash & cash equivalent (a + b + c + d)f.Other/misc. current assets
D.Profit & loss account1.Income from finance lease2.Income from operating lease3.Income from lease (D1 + D2)4.Income from investments5.Other income6.Total income/revenue (D3 to D5)7.Administrative expenses8.Profit/(loss) before taxation9.Profit/(loss) after taxation
E.Other items1.No. of ordinary shares (000)2.Cash dividend3.Stock dividend4.Cash generated from operating activities
F.Efficiency ratios/profitability ratios1.Return on equity (ROE) (D9/A) 2.Return on capital employed (ROCE) (D8/(C-B2))3.Return on assets (ROA) (D9/C)4.Return on revenue (ROR) (D9/D6) 5.Lease income to total income (D3/D6)6.Administrative expenses to profit before tax. (D7/D9) (times)7.Earning per share (D9/E1)
G.Liquidity ratios1.Cash & cash equivalent to total assets (C2e/C)2.Net investment in finance lease to total assets (C1a/C)3.Current assets to current liabilities (C2/B2) (times)4.Total liabilities to total assets (B/C) (times)
H.Capital /leverage ratios1.Capital ratio (A/C)2.Break up value per share (A/E1)
I.Cash flow ratio1.Cash generated from operating activities to profit after tax. (E4/D9) (times)2.Cash generated from operating activities to current liabilities (E4/B2) (times)
546,896 583,374 633,716 666,382 657,251
253,698 253,698 253,698 253,698 253,698
74,148 83,563 97,437 110,313 112,491
219,050 246,113 282,581 302,371 291,062
81,700 92,583 93,320 92,264 92,363
1,222,579 1,475,305 1,821,782 1,903,146 1,977,717
657,223 755,443 986,793 1,286,555 1,262,394
0 20,833 4,167 29,167 12,500
482,845 545,858 587,231 691,164 647,766
174,378 188,752 395,395 566,224 602,128
565,356 719,862 834,989 616,591 715,323
1,851,175 2,151,262 2,548,818 2,661,792 2,727,331
1,276,529 1,534,005 1,703,375 1,836,676 1,630,932
1,039,543 1,315,938 1,495,119 1,651,541 1,446,648
209,486 56,606 40,724 21,187 22,064
27,500 161,461 167,532 163,948 162,220
574,646 617,257 845,443 825,116 1,096,399
1 0 0 0 0
44,295 63,565 15,601 16,410 114,805
16,259 39,300 40,387 57,433 64,508
0 0 0 0 0
60,555 102,865 55,988 73,843 179,313
514,091 514,392 789,455 751,273 917,086
142,476 153,030 178,155 218,862 245,567
0 0 0 0 0
142,476 153,030 178,155 218,862 245,567
5,960 5,522 5,090 6,882 9,542
3,236 13,659 17,135 18,147 10,335
151,672 172,211 200,380 243,891 265,444
72,290 76,481 72,584 78,833 68,015
51,186 65,501 80,602 71,185 21,619
40,714 47,076 69,368 64,378 10,894
25,370 25,370 25,370 25,370 25,370
0.05% 7.50% 12.50% 7.50% 2.50%
0.00% 0.00% 0.00% 0.00% 0.00%
10,719 (123,264) (182,134) (35,217) 200,131
7.44% 8.07% 10.95% 9.66% 1.66%
3.98% 4.58% 4.70% 3.48% 1.07%
2.20% 2.19% 2.72% 2.42% 0.40%
26.84% 27.34% 34.62% 26.40% 4.10%
93.94% 88.86% 88.91% 89.74% 92.51%
1.78 1.62 1.05 1.22 6.24
1.60 1.86 2.73 2.54 0.43
3.27% 4.78% 2.20% 2.77% 6.57%
56.16% 61.17% 58.66% 62.05% 53.04%
1.02 0.86 1.01 1.34 1.53
0.66 0.69 0.71 0.71 0.73
29.54% 27.12% 24.86% 25.04% 24.10%
21.56 22.99 24.98 26.27 25.91
0.26 -2.62 -2.63 -0.55 18.37
0.02 -0.17 -0.22 -0.06 0.28
(Thousand Rupees)Pak-Gulf Leasing Co. Ltd.
97

Financial Statement Analysis of Financial Sector 2020
2016 2017 2018 2019 2020Items
A.Total equity (A1 to A3)1.Share capital2.Reserves3.Un appropriated profit/loss4.Others
B.Total liabilities (B1+ B2)1.Non-current liabilities (a + b + c)
a.Borrowings from financial and other institutionsb.Deposit on finance leasec.Other/misc. liabilities
2.Current liabilitiesC.Total assets (C1 + C2)
1.Non-current assets (a + b + c)a.Net investment in finance leaseb.Fixed assetsc.Other/misc. assets
2.Current assets (e + f)a.Cash and balances with treasury banksb.Placement with other banksc.Term deposits certificated.Other money market placementse.Cash & cash equivalent (a + b + c + d)f.Other/misc. current assets
D.Profit & loss account1.Income from finance lease2.Income from operating lease3.Income from lease (D1 + D2)4.Income from investments5.Other income6.Total income/revenue (D3 to D5)7.Administrative expenses8.Profit/(loss) before taxation9.Profit/(loss) after taxation
E.Other items1.No. of ordinary shares (000)2.Cash dividend3.Stock dividend4.Cash generated from operating activities
F.Efficiency ratios/profitability ratios1.Return on equity (ROE) (D9/A) 2.Return on capital employed (ROCE) (D8/(C-B2))3.Return on assets (ROA) (D9/C)4.Return on revenue (ROR) (D9/D6) 5.Lease income to total income (D3/D6)6.Administrative expenses to profit before tax. (D7/D9) (times)7.Earning per share (D9/E1)
G.Liquidity ratios1.Cash & cash equivalent to total assets (C2e/C)2.Net investment in finance lease to total assets (C1a/C)3.Current assets to current liabilities (C2/B2) (times)4.Total liabilities to total assets (B/C) (times)
H.Capital /leverage ratios1.Capital ratio (A/C)2.Break up value per share (A/E1)
I.Cash flow ratio1.Cash generated from operating activities to profit after tax. (E4/D9) (times)2.Cash generated from operating activities to current liabilities (E4/B2) (times)
156,955 133,250 111,682 77,108 19,560
320,000 320,000 320,000 320,000 320,000
48,466 48,466 48,466 48,466 48,466
(211,511) (235,216) (256,784) (291,358) (348,906)
0 0 0 0 0
346,812 344,394 397,318 404,612 386,058
204,737 177,555 188,291 181,674 160,557
0 0 0 0 0
199,584 170,644 179,200 163,545 144,178
5,153 6,911 9,091 18,129 16,379
142,075 166,839 209,027 222,938 225,501
503,767 477,644 509,000 481,720 405,618
421,607 361,068 344,622 313,587 247,405
342,510 289,283 273,330 237,196 187,152
8,648 6,500 5,076 16,563 11,674
70,449 65,285 66,216 59,828 48,579
82,160 116,576 164,378 168,133 158,213
79 88 88 72 66
2,441 1,815 6,042 715 1,560
0 0 0 0 0
0 0 0 0 0
2,520 1,903 6,130 787 1,626
79,640 114,673 158,248 167,346 156,587
32,531 26,671 31,160 26,466 21,583
0 0 0 0 0
32,531 26,671 31,160 26,466 21,583
1,790 4 5 0 7
3,094 687 286 111 365
37,415 27,362 31,451 26,577 21,955
38,111 40,548 43,642 44,234 43,682
(13,057) (22,177) (21,011) (35,385) (57,353)
(13,382) (22,510) (21,361) (35,694) (57,677)
32,000 32,000 32,000 32,000 32,000
0.00% 0.00% 0.00% 0.00% 0.00%
0.00% 0.00% 0.00% 0.00% 0.00%
16,425 (6,462) (27,055) (1,834) 297
-8.53% -16.89% -19.13% -46.29% -294.87%
-3.61% -7.14% -7.00% -13.67% -31.84%
-2.66% -4.71% -4.20% -7.41% -14.22%
-35.77% -82.27% -67.92% -134.30% -262.71%
86.95% 97.47% 99.07% 99.58% 98.31%
-2.85 -1.80 -2.04 -1.24 -0.76
-0.42 -0.70 -0.67 -1.12 -1.80
0.50% 0.40% 1.20% 0.16% 0.40%
67.99% 60.56% 53.70% 49.24% 46.14%
0.58 0.70 0.79 0.75 0.70
0.69 0.72 0.78 0.84 0.95
31.16% 27.90% 21.94% 16.01% 4.82%
4.90 4.16 3.49 2.41 0.61
-1.23 0.29 1.27 0.05 -0.01
0.12 -0.04 -0.13 -0.01 0.00
(Thousand Rupees)SME Leasing Ltd.
98

Financial Statement Analysis of Financial Sector 2020
2016 2017 2018 2019 2020Items
A.Total equity (A1 to A3)1.Share capital2.Reserves3.Un appropriated profit/loss4.Others
B.Total liabilities (B1+ B2)1.Non-current liabilities (a + b + c)
a.Borrowings from financial and other institutionsb.Deposit on finance leasec.Other/misc. liabilities
2.Current liabilitiesC.Total assets (C1 + C2)
1.Non-current assets (a + b + c)a.Net investment in finance leaseb.Fixed assetsc.Other/misc. assets
2.Current assets (e + f)a.Cash and balances with treasury banksb.Placement with other banksc.Term deposits certificated.Other money market placementse.Cash & cash equivalent (a + b + c + d)f.Other/misc. current assets
D.Profit & loss account1.Income from finance lease2.Income from operating lease3.Income from lease (D1 + D2)4.Income from investments5.Other income6.Total income/revenue (D3 to D5)7.Administrative expenses8.Profit/(loss) before taxation9.Profit/(loss) after taxation
E.Other items1.No. of ordinary shares (000)2.Cash dividend3.Stock dividend4.Cash generated from operating activities
F.Efficiency ratios/profitability ratios1.Return on equity (ROE) (D9/A) 2.Return on capital employed (ROCE) (D8/(C-B2))3.Return on assets (ROA) (D9/C)4.Return on revenue (ROR) (D9/D6) 5.Lease income to total income (D3/D6)6.Administrative expenses to profit before tax. (D7/D9) (times)7.Earning per share (D9/E1)
G.Liquidity ratios1.Cash & cash equivalent to total assets (C2e/C)2.Net investment in finance lease to total assets (C1a/C)3.Current assets to current liabilities (C2/B2) (times)4.Total liabilities to total assets (B/C) (times)
H.Capital /leverage ratios1.Capital ratio (A/C)2.Break up value per share (A/E1)
I.Cash flow ratio1.Cash generated from operating activities to profit after tax. (E4/D9) (times)2.Cash generated from operating activities to current liabilities (E4/B2) (times)
(556,764) (634,245) (556,382) (548,442) (600,593)
979,813 979,813 979,813 979,813 979,813
177,928 177,928 177,928 179,280 179,280
(1,714,505) (1,791,986) (1,714,123) (1,707,535) (1,759,686)
25,764 15,864 31,218 31,905 32,835
1,544,668 1,344,575 1,362,929 1,340,211 1,389,590
74,155 0 0 0 0
0 0 0 0 0
3,750 0 0 0 0
70,405 0 0 0 0
1,470,513 1,344,575 1,362,929 1,340,211 1,389,590
1,013,668 726,194 837,765 823,674 821,832
115,033 67,465 108,791 110,348 108,976
8,752 0 0 0 0
64,673 32,119 45,135 66,630 66,677
41,608 35,346 63,656 43,718 42,299
898,635 658,729 728,974 713,326 712,856
88 79 3 47 39
3,335 8,308 9,736 6,013 4,940
88,407 29,557 29,402 29,516 29,237
0 0 0 0 0
91,830 37,944 39,141 35,576 34,216
806,805 620,785 689,833 677,750 678,640
16,195 5,760 9,052 4,021 4,918
2,556 2,132 693 0 0
18,751 7,892 9,745 4,021 4,918
0 0 0 0 0
42,134 5,535 2,238 31,985 4,104
60,885 13,427 11,983 36,006 9,022
59,868 43,232 39,433 48,032 39,721
(190,826) (68,755) (52,263) 6,130 (54,272)
(192,928) (69,309) (52,674) 6,757 (53,430)
45,160 45,160 45,160 45,160 45,160
0.00% 0.00% 0.00% 0.00% 0.00%
0.00% 0.00% 0.00% 0.00% 0.00%
34,965 (11,473) (580) 2,336 (3,864)
34.65% 10.93% 9.47% -1.23% 8.90%
41.77% 11.12% 9.95% -1.19% 9.56%
-19.03% -9.54% -6.29% 0.82% -6.50%
-316.87% -516.19% -439.57% 18.77% -592.22%
30.80% 58.78% 81.32% 11.17% 54.51%
-0.31 -0.62 -0.75 7.11 -0.74
-4.27 -1.53 -1.17 0.15 -1.18
9.06% 5.23% 4.67% 4.32% 4.16%
0.86% 0.00% 0.00% 0.00% 0.00%
0.61 0.49 0.53 0.53 0.51
1.52 1.85 1.63 1.63 1.69
-54.93% -87.34% -66.41% -66.58% -73.08%
-12.33 -14.04 -12.32 -12.14 -13.30
-0.18 0.17 0.01 0.35 0.07
0.02 -0.01 0.00 0.00 0.00
(Thousand Rupees)Saudi Pak Leasing Co. Ltd.
99

Financial Statement Analysis of Financial Sector 2020
2016 2017 2018 2019 2020Items
A.Total equity (A1 to A3)1.Share capital2.Reserves3.Un appropriated profit/loss4.Others
B.Total liabilities (B1+ B2)1.Non-current liabilities (a + b + c)
a.Borrowings from financial and other institutionsb.Deposit on finance leasec.Other/misc. liabilities
2.Current liabilitiesC.Total assets (C1 + C2)
1.Non-current assets (a + b + c)a.Net investment in finance leaseb.Fixed assetsc.Other/misc. assets
2.Current assets (e + f)a.Cash and balances with treasury banksb.Placement with other banksc.Term deposits certificated.Other money market placementse.Cash & cash equivalent (a + b + c + d)f.Other/misc. current assets
D.Profit & loss account1.Income from finance lease2.Income from operating lease3.Income from lease (D1 + D2)4.Income from investments5.Other income6.Total income/revenue (D3 to D5)7.Administrative expenses8.Profit/(loss) before taxation9.Profit/(loss) after taxation
E.Other items1.No. of ordinary shares (000)2.Cash dividend3.Stock dividend4.Cash generated from operating activities
F.Efficiency ratios/profitability ratios1.Return on equity (ROE) (D9/A) 2.Return on capital employed (ROCE) (D8/(C-B2))3.Return on assets (ROA) (D9/C)4.Return on revenue (ROR) (D9/D6) 5.Lease income to total income (D3/D6)6.Administrative expenses to profit before tax. (D7/D9) (times)7.Earning per share (D9/E1)
G.Liquidity ratios1.Cash & cash equivalent to total assets (C2e/C)2.Net investment in finance lease to total assets (C1a/C)3.Current assets to current liabilities (C2/B2) (times)4.Total liabilities to total assets (B/C) (times)
H.Capital /leverage ratios1.Capital ratio (A/C)2.Break up value per share (A/E1)
I.Cash flow ratio1.Cash generated from operating activities to profit after tax. (E4/D9) (times)2.Cash generated from operating activities to current liabilities (E4/B2) (times)
124,594 92,692 122,440 96,174 53,441
438,028 438,028 438,028 438,028 438,028
181,867 181,867 181,867 181,867 181,867
(495,301) (527,203) (497,455) (523,721) (566,454)
29,699 26,093 22,345 20,998 19,652
660,808 634,075 541,094 539,603 555,398
217,631 145,396 88,463 55,711 18,008
192,539 144,801 88,383 55,711 18,008
25,092 595 80 0 0
0 0 0 0 0
443,177 488,679 452,631 483,892 537,390
815,101 752,860 685,879 656,775 628,491
504,806 491,066 417,319 399,122 396,488
46,734 16,838 15,541 0 0
82,189 73,636 66,952 64,296 61,662
375,883 400,592 334,826 334,826 334,826
310,295 261,794 268,560 257,653 232,003
39 39 31 30 30
10,578 4,108 3,309 284 564
0 0 0 0 0
10,000 0 54,000 54,000 54,000
20,617 4,147 57,340 54,314 54,594
289,678 257,647 211,220 203,339 177,409
2,596 1,866 3,796 89 0
8,689 10,452 9,194 9,446 7,922
11,285 12,318 12,990 9,535 7,922
0 0 0 0 0
19,724 (35,678) 130,185 (18,095) (13,136)
31,009 (23,360) 143,175 (8,560) (5,214)
38,991 31,925 24,336 15,009 11,102
(10,232) (59,861) 92,294 (24,866) (44,079)
15,378 (37,127) 26,000 (27,613) (44,079)
36,300 36,300 36,300 36,300 43,803
0.00% 0.00% 0.00% 0.00% 0.00%
0.00% 0.00% 0.00% 0.00% 0.00%
14,216 3,761 11,685 (3,026) 281
12.34% -40.05% 21.23% -28.71% -82.48%
-2.75% -22.66% 39.57% -14.38% -48.38%
1.89% -4.93% 3.79% -4.20% -7.01%
49.59% 158.93% 18.16% 322.58% 845.40%
36.39% -52.73% 9.07% -111.39% -151.94%
2.54 -0.86 0.94 -0.54 -0.25
0.42 -1.02 0.72 -0.76 -1.01
2.53% 0.55% 8.36% 8.27% 8.69%
5.73% 2.24% 2.27% 0.00% 0.00%
0.70 0.54 0.59 0.53 0.43
0.81 0.84 0.79 0.82 0.88
15.29% 12.31% 17.85% 14.64% 8.50%
3.43 2.55 3.37 2.65 1.22
0.92 -0.10 0.45 0.11 -0.01
0.03 0.01 0.03 -0.01 0.00
(Thousand Rupees)Security Leasing Corporation Ltd.
100

Financial Statements Analysis of Financial Sector 2020
Investment Banks
Performance at a Glance
Analysis reveals that balance sheet size of investment banks increased by 0.85 percent during
FY20 as compared to FY19. Total shareholders’ equity (including others) increased by 25.72
percent over the previous year. A decrease of 13.91 percent is observed in total liabilities during
FY20. Profit before tax increased from Rs 0.15 billion in FY19 to Rs
0.2 billion in FY20.
Shareholders’ Equity
Total Shareholders’ equity (including
others) increased to Rs 4.68 billion in
FY20 from Rs 3.72 billion in FY19
witnessing a YoY increase of 25.72 percent.
Similarly, a rise of 0.87 percent is observed
in reserves during FY20 when compared
with FY19. Others in shareholders’ equity
is composed of surplus on revaluation of
fixed assets, surplus/deficit on revaluation
of available for sale investments etc. were
at Rs 2.61 billion during FY19, increased
with YoY growth of 1.17 percent to reach
at Rs 2.64 billion during FY20.
Assets
Total assets increased from Rs 9.99
billion in FY19 to Rs 10.08 billion in
FY20, of which total current assets
stood at Rs 5.11 billion in FY19 reduced
to Rs 4.38 billion in FY20, showing a
decline of 14.26 percent. Cash and bank
balances stood at Rs 0.34 billion in
FY20, reflected a decrease of 53.31
percent over FY19. Other current assets
stood at Rs 4.04 billion in FY20,
showed a decrease of 7.77 percent over
FY19. Total non-current assets reached
to Rs 5.69 billion in FY20 with an
increase of 16.71 percent over FY19.
Fixed assets and long term investments
which constitute 17.74 percent and 70.08 percent
share in non-current assets respectively during FY20, showed a respective increase of 9.74
percent and 24.01 percent during FY20 over FY19. On the other hand other non-current
assets showed a decrease of 6.36 percent during FY20 when compare with FY19.
1.09
0.83
2.84
0.730.92
3.22
0.0
0.5
1.0
1.5
2.0
2.5
3.0
3.5
Cash & Bank Bal. Fixed Assets Long Trem Invt.
bil
lio
n R
s
Components of Assets FY19 FY20
0.85
-13.91
25.72
-20
-15
-10
-5
0
5
10
15
20
25
30
0
2
4
6
8
10
12
Assets Liabilities Equity (Inc.
Others)
per
cen
t
bil
lio
n R
s
Components of Balance SheetFY19 FY20 Growth (RHS)
101

Financial Statements Analysis of Financial Sector 2020
Liabilities
Total liabilities witnessed a decline of
13.91 percent from Rs 6.27 billion in FY19
to Rs 5.40 billion in FY20. Share
composition of current and non-current
liabilities to total liabilities were 85.00
percent and 15.00 percent respectively in
FY20 as against their respective share of
77.22 percent and 22.78 percent in FY19.
Current liabilities witnessed a decrease 5.23
percent during FY20 to reach Rs 4.59
billion and non-current liabilities also
showed a decrease of 43.32 percent in FY20
to touch Rs 0.81 billion.
Profitability and Operating Efficiency
Gross revenue and operating profit increased during the year with a YoY increase of 14.17 percent
and 210.70 percent respectively in FY20 over FY19. Profit before tax(P/LBT) was at Rs 0.15
billion in FY19 increased to Rs 0.24 billion in FY20. Profit after tax(P/LAT) of the sector was Rs -
0.03 billion in FY19 now comes’ up with a profit after tax of Rs 0.12 billion in FY20. Return on
equity (ROE), which was -2.45 percent in FY19 increased to 5.67 percent in FY20, Return on
capital employed (ROCE) increased to 4.34 percent in FY20 from 3.00 percent in FY19. Return on
assets (ROA) and Return on Revenue (ROR) also remained in the positive zone during FY20.
77.2285.00
22.7815.00
0
20
40
60
80
100
120
FY19 FY20
per
cen
t
Percent Share of Liabilities
Current Liabilities Non-Current Liabilities
0.44
0.08
0.15
(0.03)
0.50
0.25 0.24
0.12
(0.10)
-
0.10
0.20
0.30
0.40
0.50
0.60
Gross
revenue
Operating
profit
P/LBT P/LAT
bil
lio
n R
s
Profit and Loss Accounts FY19 FY20
-2.45
3.00
-0.27
-6.22
5.67 4.34
1.15
23.08
-10
-5
0
5
10
15
20
25
ROE ROCE ROA ROR
per
cen
t
Profitability Ratios FY19 FY20
102
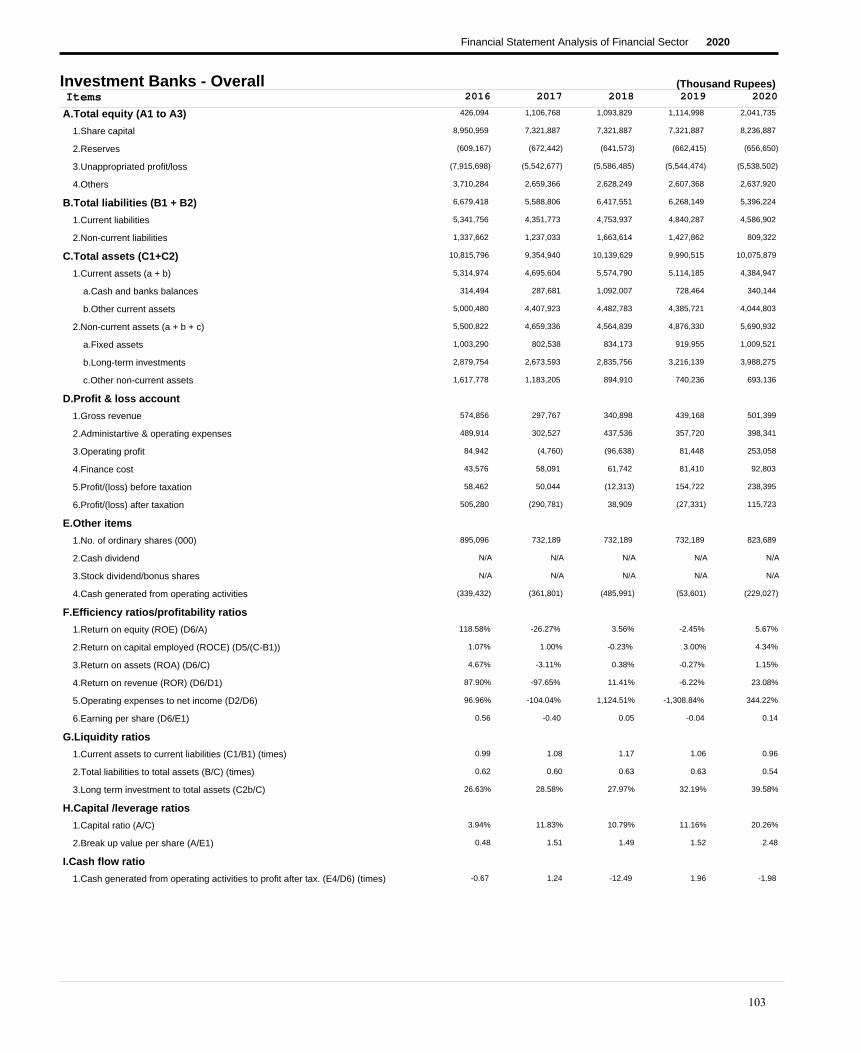
Financial Statement Analysis of Financial Sector 2020
2016 2017 2018 2019 2020Items
A.Total equity (A1 to A3)
1.Share capital
2.Reserves
3.Unappropriated profit/loss
4.Others
B.Total liabilities (B1 + B2)
1.Current liabilities
2.Non-current liabilities
C.Total assets (C1+C2)
1.Current assets (a + b)
a.Cash and banks balances
b.Other current assets
2.Non-current assets (a + b + c)
a.Fixed assets
b.Long-term investments
c.Other non-current assets
D.Profit & loss account
1.Gross revenue
2.Administartive & operating expenses
3.Operating profit
4.Finance cost
5.Profit/(loss) before taxation
6.Profit/(loss) after taxation
E.Other items
1.No. of ordinary shares (000)
2.Cash dividend
3.Stock dividend/bonus shares
4.Cash generated from operating activities
F.Efficiency ratios/profitability ratios
1.Return on equity (ROE) (D6/A)
2.Return on capital employed (ROCE) (D5/(C-B1))
3.Return on assets (ROA) (D6/C)
4.Return on revenue (ROR) (D6/D1)
5.Operating expenses to net income (D2/D6)
6.Earning per share (D6/E1)
G.Liquidity ratios
1.Current assets to current liabilities (C1/B1) (times)
2.Total liabilities to total assets (B/C) (times)
3.Long term investment to total assets (C2b/C)
H.Capital /leverage ratios
1.Capital ratio (A/C)
2.Break up value per share (A/E1)
I.Cash flow ratio
1.Cash generated from operating activities to profit after tax. (E4/D6) (times)
426,094 1,106,768 1,093,829 1,114,998 2,041,735
8,950,959 7,321,887 7,321,887 7,321,887 8,236,887
(609,167) (672,442) (641,573) (662,415) (656,650)
(7,915,698) (5,542,677) (5,586,485) (5,544,474) (5,538,502)
3,710,284 2,659,366 2,628,249 2,607,368 2,637,920
6,679,418 5,588,806 6,417,551 6,268,149 5,396,224
5,341,756 4,351,773 4,753,937 4,840,287 4,586,902
1,337,662 1,237,033 1,663,614 1,427,862 809,322
10,815,796 9,354,940 10,139,629 9,990,515 10,075,879
5,314,974 4,695,604 5,574,790 5,114,185 4,384,947
314,494 287,681 1,092,007 728,464 340,144
5,000,480 4,407,923 4,482,783 4,385,721 4,044,803
5,500,822 4,659,336 4,564,839 4,876,330 5,690,932
1,003,290 802,538 834,173 919,955 1,009,521
2,879,754 2,673,593 2,835,756 3,216,139 3,988,275
1,617,778 1,183,205 894,910 740,236 693,136
574,856 297,767 340,898 439,168 501,399
489,914 302,527 437,536 357,720 398,341
84,942 (4,760) (96,638) 81,448 253,058
43,576 58,091 61,742 81,410 92,803
58,462 50,044 (12,313) 154,722 238,395
505,280 (290,781) 38,909 (27,331) 115,723
895,096 732,189 732,189 732,189 823,689
(339,432) (361,801) (485,991) (53,601) (229,027)
118.58% -26.27% 3.56% -2.45% 5.67%
1.07% 1.00% -0.23% 3.00% 4.34%
4.67% -3.11% 0.38% -0.27% 1.15%
87.90% -97.65% 11.41% -6.22% 23.08%
96.96% -104.04% 1,124.51% -1,308.84% 344.22%
0.56 -0.40 0.05 -0.04 0.14
0.99 1.08 1.17 1.06 0.96
0.62 0.60 0.63 0.63 0.54
26.63% 28.58% 27.97% 32.19% 39.58%
3.94% 11.83% 10.79% 11.16% 20.26%
0.48 1.51 1.49 1.52 2.48
-0.67 1.24 -12.49 1.96 -1.98
(Thousand Rupees)Investment Banks - Overall
N/A N/A N/A N/A N/A
N/A N/A N/A N/A N/A
103

Financial Statement Analysis of Financial Sector 2020
2016 2017 2018 2019 2020Items
A.Total equity (A1 to A3)
1.Share capital
2.Reserves
3.Unappropriated profit/loss
4.Others
B.Total liabilities (B1 + B2)
1.Current liabilities
2.Non-current liabilities
C.Total assets (C1+C2)
1.Current assets (a + b)
a.Cash and banks balances
b.Other current assets
2.Non-current assets (a + b + c)
a.Fixed assets
b.Long-term investments
c.Other non-current assets
D.Profit & loss account
1.Gross revenue
2.Administartive & operating expenses
3.Operating profit
4.Finance cost
5.Profit/(loss) before taxation
6.Profit/(loss) after taxation
E.Other items
1.No. of ordinary shares (000)
2.Cash dividend
3.Stock dividend/bonus shares
4.Cash generated from operating activities
F.Efficiency ratios/profitability ratios
1.Return on equity (ROE) (D6/A)
2.Return on capital employed (ROCE) (D5/(C-B1))
3.Return on assets (ROA) (D6/C)
4.Return on revenue (ROR) (D6/D1)
5.Operating expenses to net income (D2/D6)
6.Earning per share (D6/E1)
G.Liquidity ratios
1.Current assets to current liabilities (C1/B1) (times)
2.Total liabilities to total assets (B/C) (times)
3.Long term investment to total assets (C2b/C)
H.Capital /leverage ratios
1.Capital ratio (A/C)
2.Break up value per share (A/E1)
I.Cash flow ratio
1.Cash generated from operating activities to profit after tax. (E4/D6) (times)
351,598 233,418 80,058 30,759 901,668
441,000 441,000 441,000 441,000 1,356,000
158,497 158,497 158,497 158,497 159,747
(247,899) (366,079) (519,439) (568,738) (614,079)
21,473 20,695 19,942 18,945 17,997
879,911 733,835 1,419,940 1,385,321 456,681
599,375 515,653 650,940 651,854 343,828
280,536 218,182 769,000 733,467 112,853
1,252,982 987,948 1,519,940 1,435,025 1,376,346
485,045 404,282 1,221,108 933,529 709,710
4,010 8,143 756,000 578,486 286,662
481,035 396,139 465,108 355,043 423,048
767,937 583,666 298,832 501,496 666,636
96,045 85,892 102,898 120,460 194,528
275,780 175,004 216 184,911 260,572
396,112 322,770 195,718 196,125 211,536
100,169 35,565 31,809 112,796 147,438
105,026 61,514 206,529 122,257 163,727
(4,857) (25,949) (174,720) (9,461) 133,711
113 30 52 136 4,523
(123,213) (94,333) (233,161) (49,508) (28,215)
(127,769) (119,269) (154,409) (50,296) (29,910)
44,100 44,100 44,100 44,100 135,600
0.00% 0.00% 0.00% 0.00% 0.00%
0.00% 0.00% 0.00% 0.00% 0.00%
(22,872) (194,758) (228,993) (215,531) (261,340)
-36.34% -51.10% -192.87% -163.52% -3.32%
-18.85% -19.97% -26.83% -6.32% -2.73%
-10.20% -12.07% -10.16% -3.50% -2.17%
-127.55% -335.35% -485.43% -44.59% -20.29%
-82.20% -51.58% -133.75% -243.07% -547.40%
-2.90 -2.70 -3.50 -1.14 -0.22
0.81 0.78 1.88 1.43 2.06
0.70 0.74 0.93 0.97 0.33
22.01% 17.71% 0.01% 12.89% 18.93%
28.06% 23.63% 5.27% 2.14% 65.51%
7.97 5.29 1.82 0.70 6.65
0.18 1.63 1.48 4.29 8.74
(Thousand Rupees)Escorts Investment Bank Ltd.
104

Financial Statement Analysis of Financial Sector 2020
2016 2017 2018 2019 2020Items
A.Total equity (A1 to A3)
1.Share capital
2.Reserves
3.Unappropriated profit/loss
4.Others
B.Total liabilities (B1 + B2)
1.Current liabilities
2.Non-current liabilities
C.Total assets (C1+C2)
1.Current assets (a + b)
a.Cash and banks balances
b.Other current assets
2.Non-current assets (a + b + c)
a.Fixed assets
b.Long-term investments
c.Other non-current assets
D.Profit & loss account
1.Gross revenue
2.Administartive & operating expenses
3.Operating profit
4.Finance cost
5.Profit/(loss) before taxation
6.Profit/(loss) after taxation
E.Other items
1.No. of ordinary shares (000)
2.Cash dividend
3.Stock dividend/bonus shares
4.Cash generated from operating activities
F.Efficiency ratios/profitability ratios
1.Return on equity (ROE) (D6/A)
2.Return on capital employed (ROCE) (D5/(C-B1))
3.Return on assets (ROA) (D6/C)
4.Return on revenue (ROR) (D6/D1)
5.Operating expenses to net income (D2/D6)
6.Earning per share (D6/E1)
G.Liquidity ratios
1.Current assets to current liabilities (C1/B1) (times)
2.Total liabilities to total assets (B/C) (times)
3.Long term investment to total assets (C2b/C)
H.Capital /leverage ratios
1.Capital ratio (A/C)
2.Break up value per share (A/E1)
I.Cash flow ratio
1.Cash generated from operating activities to profit after tax. (E4/D6) (times)
716,955 723,948 733,093 742,830 745,027
650,000 650,000 650,000 650,000 650,000
131,318 132,745 134,583 0 0
(64,363) (58,797) (51,490) 92,830 95,027
(10,524) (8,021) (10,843) (24,237) (6,237)
305,817 439,381 605,113 666,708 928,395
111,099 245,740 477,349 600,374 852,626
194,718 193,641 127,764 66,334 75,769
1,012,248 1,155,308 1,327,363 1,385,301 1,667,185
801,906 882,614 855,967 751,510 333,671
16,276 219,306 209,076 36,263 27,606
785,630 663,308 646,891 715,247 306,065
210,342 272,694 471,396 633,791 1,333,514
3,393 2,742 5,856 4,500 23,098
85,853 70,946 391,878 553,569 1,239,821
121,096 199,006 73,662 75,722 70,595
99,018 79,945 102,649 116,844 154,763
43,214 46,552 41,157 44,872 61,559
55,804 33,393 61,492 71,972 93,204
3,153 25,851 44,924 52,213 57,771
65,203 11,720 15,802 15,203 37,810
43,864 7,132 9,190 9,517 28,703
65,000 65,000 65,000 65,000 65,000
0.00% 0.00% 0.00% 3.00% 0.00%
0.00% 0.00% 0.00% 0.00% 0.00%
(44,126) 76,539 516 46,651 62,500
6.12% 0.99% 1.25% 1.28% 3.85%
7.24% 1.29% 1.86% 1.94% 4.64%
4.33% 0.62% 0.69% 0.69% 1.72%
44.30% 8.92% 8.95% 8.15% 18.55%
98.52% 652.72% 447.85% 471.49% 214.47%
0.67 0.11 0.14 0.15 0.44
7.22 3.59 1.79 1.25 0.39
0.30 0.38 0.46 0.48 0.56
8.48% 6.14% 29.52% 39.96% 74.37%
70.83% 62.66% 55.23% 53.62% 44.69%
11.03 11.14 11.28 11.43 11.46
-1.01 10.73 0.06 4.90 2.18
(Thousand Rupees)First Credit and Investment Bank
105

Financial Statement Analysis of Financial Sector 2020
2016 2017 2018 2019 2020Items
A.Total equity (A1 to A3)
1.Share capital
2.Reserves
3.Unappropriated profit/loss
4.Others
B.Total liabilities (B1 + B2)
1.Current liabilities
2.Non-current liabilities
C.Total assets (C1+C2)
1.Current assets (a + b)
a.Cash and banks balances
b.Other current assets
2.Non-current assets (a + b + c)
a.Fixed assets
b.Long-term investments
c.Other non-current assets
D.Profit & loss account
1.Gross revenue
2.Administartive & operating expenses
3.Operating profit
4.Finance cost
5.Profit/(loss) before taxation
6.Profit/(loss) after taxation
E.Other items
1.No. of ordinary shares (000)
2.Cash dividend
3.Stock dividend/bonus shares
4.Cash generated from operating activities
F.Efficiency ratios/profitability ratios
1.Return on equity (ROE) (D6/A)
2.Return on capital employed (ROCE) (D5/(C-B1))
3.Return on assets (ROA) (D6/C)
4.Return on revenue (ROR) (D6/D1)
5.Operating expenses to net income (D2/D6)
6.Earning per share (D6/E1)
G.Liquidity ratios
1.Current assets to current liabilities (C1/B1) (times)
2.Total liabilities to total assets (B/C) (times)
3.Long term investment to total assets (C2b/C)
H.Capital /leverage ratios
1.Capital ratio (A/C)
2.Break up value per share (A/E1)
I.Cash flow ratio
1.Cash generated from operating activities to profit after tax. (E4/D6) (times)
685,594 400,955 503,101 532,437 468,801
1,483,900 1,483,900 1,483,900 1,483,900 1,483,900
435,100 435,100 455,426 455,842 455,842
(1,233,406) (1,518,045) (1,436,225) (1,407,305) (1,470,941)
(9,531) 8,498 (4,602) (7,127) 6,373
667,597 649,155 532,628 473,627 466,570
667,597 523,415 463,488 384,367 395,401
0 125,740 69,140 89,260 71,169
1,343,660 1,058,608 1,031,127 998,937 941,744
393,083 441,293 397,957 390,218 386,652
6,102 4,084 90,515 74,343 1,040
386,981 437,209 307,442 315,875 385,612
950,577 617,315 633,170 608,719 555,092
2,530 1,714 1,223 1,006 3,404
201,431 230,250 214,719 204,464 226,166
746,616 385,351 417,228 403,249 325,522
35,122 31,877 16,236 17,065 9,702
41,056 39,216 37,466 33,416 28,064
(5,934) (7,339) (21,230) (16,351) (18,362)
19,443 8 3 6,906 8,694
22,471 11,721 103,475 39,138 11,126
500,269 (284,639) 101,626 29,336 (63,409)
148,390 148,390 148,390 148,390 148,390
0.00% 0.00% 0.00% 0.00% 0.00%
0.00% 0.00% 0.00% 0.00% 0.00%
(6,843) (11,305) 20,036 (22,979) (20,645)
72.97% -70.99% 20.20% 5.51% -13.53%
3.32% 2.19% 18.23% 6.37% 2.04%
37.23% -26.89% 9.86% 2.94% -6.73%
1,424.38% -892.93% 625.93% 171.91% -653.57%
8.21% -13.78% 36.87% 113.91% -44.26%
3.37 -1.92 0.68 0.20 -0.43
0.59 0.84 0.86 1.02 0.98
0.50 0.61 0.52 0.47 0.50
14.99% 21.75% 20.82% 20.47% 24.02%
51.02% 37.88% 48.79% 53.30% 49.78%
4.62 2.70 3.39 3.59 3.16
-0.01 0.04 0.20 -0.78 0.33
(Thousand Rupees)First Dawood Investment Bank Ltd.
106

Financial Statement Analysis of Financial Sector 2020
2016 2017 2018 2019 2020Items
A.Total equity (A1 to A3)
1.Share capital
2.Reserves
3.Unappropriated profit/loss
4.Others
B.Total liabilities (B1 + B2)
1.Current liabilities
2.Non-current liabilities
C.Total assets (C1+C2)
1.Current assets (a + b)
a.Cash and banks balances
b.Other current assets
2.Non-current assets (a + b + c)
a.Fixed assets
b.Long-term investments
c.Other non-current assets
D.Profit & loss account
1.Gross revenue
2.Administartive & operating expenses
3.Operating profit
4.Finance cost
5.Profit/(loss) before taxation
6.Profit/(loss) after taxation
E.Other items
1.No. of ordinary shares (000)
2.Cash dividend
3.Stock dividend/bonus shares
4.Cash generated from operating activities
F.Efficiency ratios/profitability ratios
1.Return on equity (ROE) (D6/A)
2.Return on capital employed (ROCE) (D5/(C-B1))
3.Return on assets (ROA) (D6/C)
4.Return on revenue (ROR) (D6/D1)
5.Operating expenses to net income (D2/D6)
6.Earning per share (D6/E1)
G.Liquidity ratios
1.Current assets to current liabilities (C1/B1) (times)
2.Total liabilities to total assets (B/C) (times)
3.Long term investment to total assets (C2b/C)
H.Capital /leverage ratios
1.Capital ratio (A/C)
2.Break up value per share (A/E1)
I.Cash flow ratio
1.Cash generated from operating activities to profit after tax. (E4/D6) (times)
236,868 255,076 267,216 256,274 291,450
2,848,669 2,848,669 2,848,669 2,848,669 2,848,669
(1,900,433) (1,878,673) (1,873,413) (1,767,989) (1,778,936)
(711,368) (714,920) (708,040) (824,406) (778,283)
6,673 0 0 0 0
874,559 831,479 791,496 693,824 676,941
512,331 471,150 615,479 495,144 466,551
362,228 360,329 176,017 198,680 210,390
1,118,100 1,086,555 1,058,712 950,098 968,391
587,107 524,273 520,189 536,436 547,519
3,219 14,714 10,161 24,746 10,950
583,888 509,559 510,028 511,690 536,569
530,993 562,282 538,523 413,662 420,872
147,147 135,471 116,783 72,106 68,845
167,304 189,460 235,164 301,168 289,689
216,542 237,351 186,576 40,388 62,338
58,775 35,400 60,004 62,537 91,467
30,998 33,192 31,521 35,546 23,072
27,777 2,208 28,483 26,991 68,395
16,092 28,510 7,501 21,586 21,246
39,191 (9,205) 9,206 36,531 68,888
40,257 (9,400) 8,601 (116,366) 46,123
284,867 284,867 284,867 284,867 284,867
0.00% 0.00% 0.00% 0.00% 0.00%
0.00% 0.00% 0.00% 0.00% 0.00%
17,903 42,460 51,011 33,224 21,862
17.00% -3.69% 3.22% -45.41% 15.83%
6.47% -1.50% 2.08% 8.03% 13.73%
3.60% -0.87% 0.81% -12.25% 4.76%
68.49% -26.55% 14.33% -186.08% 50.43%
77.00% -353.11% 366.48% -30.55% 50.02%
0.14 -0.03 0.03 -0.41 0.16
1.15 1.11 0.85 1.08 1.17
0.78 0.77 0.75 0.73 0.70
14.96% 17.44% 22.21% 31.70% 29.91%
21.18% 23.48% 25.24% 26.97% 30.10%
0.83 0.90 0.94 0.90 1.02
0.44 -4.52 5.93 -0.29 0.47
(Thousand Rupees)Invest Capital Investment Bank Ltd.
107

Financial Statement Analysis of Financial Sector 2020
2016 2017 2018 2019 2020Items
A.Total equity (A1 to A3)
1.Share capital
2.Reserves
3.Unappropriated profit/loss
4.Others
B.Total liabilities (B1 + B2)
1.Current liabilities
2.Non-current liabilities
C.Total assets (C1+C2)
1.Current assets (a + b)
a.Cash and banks balances
b.Other current assets
2.Non-current assets (a + b + c)
a.Fixed assets
b.Long-term investments
c.Other non-current assets
D.Profit & loss account
1.Gross revenue
2.Administartive & operating expenses
3.Operating profit
4.Finance cost
5.Profit/(loss) before taxation
6.Profit/(loss) after taxation
E.Other items
1.No. of ordinary shares (000)
2.Cash dividend
3.Stock dividend/bonus shares
4.Cash generated from operating activities
F.Efficiency ratios/profitability ratios
1.Return on equity (ROE) (D6/A)
2.Return on capital employed (ROCE) (D5/(C-B1))
3.Return on assets (ROA) (D6/C)
4.Return on revenue (ROR) (D6/D1)
5.Operating expenses to net income (D2/D6)
6.Earning per share (D6/E1)
G.Liquidity ratios
1.Current assets to current liabilities (C1/B1) (times)
2.Total liabilities to total assets (B/C) (times)
3.Long term investment to total assets (C2b/C)
H.Capital /leverage ratios
1.Capital ratio (A/C)
2.Break up value per share (A/E1)
I.Cash flow ratio
1.Cash generated from operating activities to profit after tax. (E4/D6) (times)
522,821 579,360 596,350 638,687 720,778
514,336 514,336 514,336 514,336 514,336
147,316 159,452 162,897 170,798 186,260
(138,831) (94,428) (80,883) (46,447) 20,182
76,924 18,407 3,965 0 0
36,236 72,594 206,012 186,307 5,275
36,236 72,594 23,460 185,327 5,275
0 0 182,552 980 0
635,981 670,361 806,327 824,994 726,053
471,464 593,570 729,997 652,920 557,823
21,421 34,842 19,663 8,034 7,294
450,043 558,728 710,334 644,886 550,529
164,517 76,791 76,330 172,074 168,230
16,449 16,843 47,537 162,007 159,770
112,186 35,906 21,752 0 0
35,882 24,042 7,041 10,067 8,460
52,138 58,272 73,492 73,218 41,321
39,593 32,251 31,061 31,827 32,117
12,545 26,021 42,431 41,391 9,204
1,245 3,123 8,693 0 0
11,301 71,513 33,737 54,730 90,158
8,808 58,484 16,990 43,567 77,305
51,434 51,434 51,434 51,434 51,434
0.00% 0.00% 0.00% 0.00% 0.00%
0.00% 0.00% 0.00% 0.00% 0.00%
(65,593) (60,070) (113,894) 319,701 183,263
1.68% 10.09% 2.85% 6.82% 10.73%
1.88% 11.96% 4.31% 8.56% 12.51%
1.38% 8.72% 2.11% 5.28% 10.65%
16.89% 100.36% 23.12% 59.50% 187.08%
449.51% 55.14% 182.82% 73.05% 41.55%
0.17 1.14 0.33 0.85 1.50
13.01 8.18 31.12 3.52 105.75
0.06 0.11 0.26 0.23 0.01
17.64% 5.36% 2.70% 0.00% 0.00%
82.21% 86.43% 73.96% 77.42% 99.27%
10.16 11.26 11.59 12.42 14.01
-7.45 -1.03 -6.70 7.34 2.37
(Thousand Rupees)Security Investment Bank Ltd.
108

Financial Statement Analysis of Financial Sector 2020
2016 2017 2018 2019 2020Items
A.Total equity (A1 to A3)
1.Share capital
2.Reserves
3.Unappropriated profit/loss
4.Others
B.Total liabilities (B1 + B2)
1.Current liabilities
2.Non-current liabilities
C.Total assets (C1+C2)
1.Current assets (a + b)
a.Cash and banks balances
b.Other current assets
2.Non-current assets (a + b + c)
a.Fixed assets
b.Long-term investments
c.Other non-current assets
D.Profit & loss account
1.Gross revenue
2.Administartive & operating expenses
3.Operating profit
4.Finance cost
5.Profit/(loss) before taxation
6.Profit/(loss) after taxation
E.Other items
1.No. of ordinary shares (000)
2.Cash dividend
3.Stock dividend/bonus shares
4.Cash generated from operating activities
F.Efficiency ratios/profitability ratios
1.Return on equity (ROE) (D6/A)
2.Return on capital employed (ROCE) (D5/(C-B1))
3.Return on assets (ROA) (D6/C)
4.Return on revenue (ROR) (D6/D1)
5.Operating expenses to net income (D2/D6)
6.Earning per share (D6/E1)
G.Liquidity ratios
1.Current assets to current liabilities (C1/B1) (times)
2.Total liabilities to total assets (B/C) (times)
3.Long term investment to total assets (C2b/C)
H.Capital /leverage ratios
1.Capital ratio (A/C)
2.Break up value per share (A/E1)
I.Cash flow ratio
1.Cash generated from operating activities to profit after tax. (E4/D6) (times)
(1,643,538) (1,085,989) (1,085,989) (1,085,989) (1,085,989)
892,029 1,383,982 1,383,982 1,383,982 1,383,982
300,344 320,437 320,437 320,437 320,437
(2,835,911) (2,790,408) (2,790,408) (2,790,408) (2,790,408)
2,974,065 2,619,787 2,619,787 2,619,787 2,619,787
3,024,843 2,862,362 2,862,362 2,862,362 2,862,362
2,760,663 2,523,221 2,523,221 2,523,221 2,523,221
264,180 339,141 339,141 339,141 339,141
4,355,370 4,396,160 4,396,160 4,396,160 4,396,160
1,675,867 1,849,572 1,849,572 1,849,572 1,849,572
17,615 6,592 6,592 6,592 6,592
1,658,252 1,842,980 1,842,980 1,842,980 1,842,980
2,679,503 2,546,588 2,546,588 2,546,588 2,546,588
694,991 559,876 559,876 559,876 559,876
1,974,860 1,972,027 1,972,027 1,972,027 1,972,027
9,652 14,685 14,685 14,685 14,685
75,179 56,708 56,708 56,708 56,708
76,848 89,802 89,802 89,802 89,802
(1,669) (33,094) (33,094) (33,094) (33,094)
2,677 569 569 569 569
20,473 58,628 58,628 58,628 58,628
20,280 56,911 56,911 56,911 56,911
89,203 138,398 138,398 138,398 138,398
0.00% 0.00% 0.00% 0.00% 0.00%
0.00% 0.00% 0.00% 0.00% 0.00%
(287,197) (214,667) (214,667) (214,667) (214,667)
-1.23% -5.24% -5.24% -5.24% -5.24%
1.28% 3.13% 3.13% 3.13% 3.13%
0.47% 1.29% 1.29% 1.29% 1.29%
26.98% 100.36% 100.36% 100.36% 100.36%
378.93% 157.79% 157.79% 157.79% 157.79%
0.23 0.41 0.41 0.41 0.41
0.61 0.73 0.73 0.73 0.73
0.69 0.65 0.65 0.65 0.65
45.34% 44.86% 44.86% 44.86% 44.86%
-37.74% -24.70% -24.70% -24.70% -24.70%
-18.42 -7.85 -7.85 -7.85 -7.85
-14.16 -3.77 -3.77 -3.77 -3.77
(Thousand Rupees)Trust Investment Bank Ltd.
109

Financial Statements Analysis of Financial Sector 2020
Modaraba Companies
Performance at a Glance Balance sheet size of modaraba companies
decreased during FY20. Total assets,
liabilities and total equity (including others)
decreased during FY20 when compared to
FY19. Total assets decreased from Rs 54.09
billion in FY19 to Rs 51.62 billion in FY20
showing a decrease of 4.56 percent during
current year over FY19. Total liabilities of
modaraba companies decreased by 0.73
percent in FY20 when compared with the
FY19. Profit before and after tax decreased
by 82.09 percent and 78.60 percent
respectively in FY20 over FY19.
Shareholders’ Equity Capital certificate of modaraba companies, which constituted 74.02 percent share of total equity
(including others) in FY20, increased with YoY growth of 0.21 percent in FY20. Reserves during
FY20 showed YoY growth of 7.50 percent as it increased from Rs 9.79 billion to Rs 10.53 billion
in FY20. The un-appropraite profit/loss showed a significant decrease of 71.59 percent during
FY20 as compared with FY19.Other part of share holder’s equity also showed YoY growth of
12.74 percent during FY20 when compared with FY19.
Liabilities The current liabilities during FY20 reached
at Rs 28.00 billion from Rs 27.58 billion in
previous year which showed 1.51 percent
YoY increase in current liabilities during
FY20. Share of current liabilities is 85.51
percent of total liabilities in FY20. Non-
current liabilities decreased from Rs 5.40
billion to Rs 4.75 billion and showed 12.17
percent decline during FY20 when
compared with FY19. The overall position
of total liabilities of modarba companies
stood at Rs 32.75 billion in FY20, showing
YoY decrease of 0.73 percent or Rs 0.24
billion in FY20.
Assets Non-current assets decreased during the FY20 as fixed assets and other non-current assets reached
at Rs 21.99 billion and Rs 0.98 billion in FY20 from Rs 24.13 billion and Rs 1.08 billion in FY19,
showing YoY decrease of 8.85 percent and 9.13 percent during FY20. Current assets which
constitute 37.07 percent of total assets in FY20 and decreased by 1.35 percent during FY20. Cash
and bank balances increased by 65.35 percent to reach at Rs 3.55 billion in FY20 from Rs 2.15
billion in FY19.
27.58 28.00
5.40 4.75
24
25
26
27
28
29
30
31
32
33
34
FY19 FY20
bil
lio
n R
s
Current and Non Current Liabilities
Current liabilities Non-current liabilities
-10.55%
-0.73%
-4.56%
-12%
-10%
-8%
-6%
-4%
-2%
0%
0
10
20
30
40
50
60
Total Equity
incl. other
Total Liabilities Total Assets
bil
lio
n R
s
Components of Balance Sheets
FY19 FY20 Growth (RHS)
110

Financial Statements Analysis of Financial Sector 2020
Profitability and Operating Efficiency Gross revenue of modaraba companies decreased from Rs 9.19 billion in FY19 to Rs 9.10 billion
in FY20 recording decrease of 0.96 percent. Operating expenses showed increase of 1.09 percent
in FY20 over FY19 as it reached at Rs 6.26 billion in FY20 from Rs 6.20 billion in FY19. Due to
an increase in operating expenses, operating profit of modaraba companies decreased from Rs 2.99
billion in FY19 to Rs 2.83 billion in FY20 witnessing a decrease of 5.20 percent. Profit before tax
showed decline of 82.09 percent during FY20 as compared to FY19. Similarly, profit after tax also
showed the decline of 78.60 percent.
Return on assets (ROA), return on equity (ROE) and Return on capital employed (ROCE)
witnessed a decrease in FY20 over FY19. ROA decreased from -2.36 percent in FY19 to –4.42
percent in FY20. ROE decrease from -6.64 percent in FY19 to -13.61 percent in FY20. ROCE also
decrease from -4.67 percent in FY19 to -9.54 percent in FY20 over FY19. Breakup value per
certificate marginally decreased from Rs 12.86 per certificate in FY19 to Rs 11.19 per certificate
in FY20.
9.19
6.20
2.99
9.10
6.26
2.83
0
1
2
3
4
5
6
7
8
9
10
Gross Rev Operating Exp Operating Profit
bil
lio
n R
s
Profit and Loss Accounts
FY19 FY20
-6.64%
-4.67%
-2.36%
-13.61%
-9.54%
-4.42%
-16%
-14%
-12%
-10%
-8%
-6%
-4%
-2%
0%
ROE ROCE ROA
Profitability Ratios
FY19
FY20
111

Financial Statement Analysis of Financial Sector 2020
2016 2017 2018 2019 2020Items
A.Total equity (A1 to A3)
1.Certificate capital
2.Reserves
3.Unappropriated profit
4.Others
B.Total liabilities (B1 + B2)
1.Current liabilities
2.Non-current liabilities
C.Total assets (C1+C2)
1.Current assets (a + b)
a.Cash and banks balances
b.Other current assets
2.Non-current assets (a + b + c)
a.Fixed assets
b.Long-term investments
c.Other non-current assets
D.Profit & loss account
1.Gross revenue(loss)
2.Operating expenses
3.Operating profit
4.Modaraba co's management fees
5.Profit/(loss) before taxation
6.Profit/(loss) after taxation
E.Other items
1.No. of certificates (000)
2.Cash dividend
3.Stock dividend/bonus shares
4.Cash generated from operating activities
F.Efficiency ratios/profitability ratios
1.Return on equity (ROE) (D6/A)
2.Return on capital employed (ROCE) (D5/(C-B1))
3.Return on assets (ROA) (D6/C)
4.Return on revenue (D6/D1)
5.Operating expenses to net income (D2/D6)
6.Management expenses (D4/D2)
7.Earning Per Certificate (D6/E1)
G.Liquidity Ratios
1.Current assets to current liabilities (C1/B1) (times)
2.Total liabilities to total assets (B/C) (times)
3.Long term investment to total assets (C2b/C)
H.Capital /leverage ratios
1.Capital ratio (A/C)
2.Break up value per certificate (A/E1)
I.Cash flow ratio
1.Cash generated from operating activities to profit after tax. (E4/D6) (times)
2.Cash generated from operating activities to current liabilities (E4/B1) (times)
19,233,293 20,432,293 21,583,101 19,227,512 16,762,476
12,522,724 12,522,725 13,915,885 13,942,271 13,971,297
8,538,181 9,362,933 9,658,563 9,794,821 10,528,993
(1,827,612) (1,453,365) (1,991,347) (4,509,580) (7,737,814)
1,450,667 1,640,585 1,662,063 1,874,316 2,113,069
16,417,753 22,225,190 29,434,720 32,987,067 32,746,178
11,285,548 16,436,205 23,725,486 27,584,203 28,000,704
5,132,205 5,788,985 5,709,234 5,402,864 4,745,474
37,101,713 44,298,068 52,679,884 54,088,895 51,621,723
11,798,518 13,910,025 18,299,717 19,395,105 19,133,635
2,539,833 2,321,138 2,895,698 2,145,686 3,547,877
9,258,685 11,588,887 15,404,019 17,249,419 15,585,758
25,303,195 30,388,043 34,380,167 34,693,790 32,488,088
19,103,584 22,781,198 24,867,264 24,126,316 21,991,704
5,335,080 6,485,463 8,240,857 9,486,815 9,514,337
864,531 1,121,382 1,272,046 1,080,659 982,047
7,981,846 8,827,313 9,512,351 9,185,845 9,097,898
3,149,469 3,489,089 4,854,040 6,196,425 6,264,030
4,832,377 5,338,224 4,658,311 2,989,420 2,833,868
92,275 122,189 105,238 111,749 118,863
1,217,423 1,615,794 860,535 (1,237,621) (2,253,523)
1,182,879 1,574,011 761,620 (1,277,507) (2,281,620)
1,353,072 1,353,073 1,492,389 1,495,027 1,497,930
1,204,103 (464,306) (1,840,545) (1,829,100) 2,082,671
6.15% 7.70% 3.53% -6.64% -13.61%
4.72% 5.80% 2.97% -4.67% -9.54%
3.19% 3.55% 1.45% -2.36% -4.42%
14.82% 17.83% 8.01% -13.91% -25.08%
266.25% 221.67% 637.33% -485.04% -274.54%
2.93% 3.50% 2.17% 1.80% 1.90%
0.87 1.16 0.51 -0.85 -1.52
1.05 0.85 0.77 0.70 0.68
0.44 0.50 0.56 0.61 0.63
14.38% 14.64% 15.64% 17.54% 18.43%
51.84% 46.12% 40.97% 35.55% 32.47%
14.21 15.10 14.46 12.86 11.19
1.02 -0.29 -2.42 1.43 -0.91
0.11 -0.03 -0.08 -0.07 0.07
(Thousand Rupees)Modaraba Companies - Overall
N/A N/A N/A N/A N/A
N/A N/A N/A N/A N/A
112

Financial Statement Analysis of Financial Sector 2020
2016 2017 2018 2019 2020Items
A.Total equity (A1 to A3)
1.Certificate capital
2.Reserves
3.Unappropriated profit
4.Others
B.Total liabilities (B1 + B2)
1.Current liabilities
2.Non-current liabilities
C.Total assets (C1+C2)
1.Current assets (a + b)
a.Cash and banks balances
b.Other current assets
2.Non-current assets (a + b + c)
a.Fixed assets
b.Long-term investments
c.Other non-current assets
D.Profit & loss account
1.Gross revenue(loss)
2.Operating expenses
3.Operating profit
4.Modaraba co's management fees
5.Profit/(loss) before taxation
6.Profit/(loss) after taxation
E.Other items
1.No. of certificates (000)
2.Cash dividend
3.Stock dividend/bonus shares
4.Cash generated from operating activities
F.Efficiency ratios/profitability ratios
1.Return on equity (ROE) (D6/A)
2.Return on capital employed (ROCE) (D5/(C-B1))
3.Return on assets (ROA) (D6/C)
4.Return on revenue (D6/D1)
5.Operating expenses to net income (D2/D6)
6.Management expenses (D4/D2)
7.Earning Per Certificate (D6/E1)
G.Liquidity Ratios
1.Current assets to current liabilities (C1/B1) (times)
2.Total liabilities to total assets (B/C) (times)
3.Long term investment to total assets (C2b/C)
H.Capital /leverage ratios
1.Capital ratio (A/C)
2.Break up value per certificate (A/E1)
I.Cash flow ratio
1.Cash generated from operating activities to profit after tax. (E4/D6) (times)
2.Cash generated from operating activities to current liabilities (E4/B1) (times)
3,248,960 3,525,379 4,077,825 4,077,825 4,096,005
1,755,000 1,755,000 2,200,000 2,200,000 2,200,000
1,282,359 1,463,127 1,614,386 1,614,386 1,685,840
211,601 307,252 263,439 263,439 210,165
1,133,213 1,133,212 1,255,713 1,255,713 1,255,713
2,829,177 3,702,362 3,495,499 3,495,499 3,282,564
1,630,503 1,533,372 1,981,382 1,981,382 1,584,490
1,198,674 2,168,990 1,514,117 1,514,117 1,698,074
7,211,350 8,360,953 8,829,037 8,829,037 8,634,282
1,039,238 1,666,889 2,182,660 2,182,660 2,253,685
57,353 307,439 50,644 50,644 92,916
981,885 1,359,450 2,132,016 2,132,016 2,160,769
6,172,112 6,694,064 6,646,377 6,646,377 6,380,597
6,146,674 6,687,244 6,646,327 6,646,327 6,380,547
0 0 0 0 0
25,438 6,820 50 50 50
2,686,893 3,116,267 3,821,667 3,821,667 3,431,380
2,088,419 2,277,015 2,907,074 2,907,074 2,562,176
598,474 839,252 914,593 914,593 869,204
9,978 10,000 10,000 10,000 10,000
294,349 457,859 382,854 382,854 227,521
294,349 457,859 382,854 382,854 227,521
175,500 175,500 220,000 220,000 220,000
10.00% 15.00% 0.10% 0.10% 0.08%
0.00% 0.00% 0.00% 0.00% 0.00%
925,250 831,305 1,169,246 1,169,246 958,690
9.06% 12.99% 9.39% 9.39% 5.55%
5.27% 6.71% 5.59% 5.59% 3.23%
4.08% 5.48% 4.34% 4.34% 2.64%
10.95% 14.69% 10.02% 10.02% 6.63%
709.50% 497.32% 759.32% 759.32% 1,126.13%
0.48% 0.44% 0.34% 0.34% 0.39%
1.68 2.61 1.74 1.74 1.03
0.64 1.09 1.10 1.10 1.42
0.39 0.44 0.40 0.40 0.38
0.00% 0.00% 0.00% 0.00% 0.00%
45.05% 42.16% 46.19% 46.19% 47.44%
18.51 20.09 18.54 18.54 18.62
3.14 1.82 3.05 3.05 4.21
0.57 0.54 0.59 0.59 0.61
(Thousand Rupees)Allied Rental Modaraba
113

Financial Statement Analysis of Financial Sector 2020
2016 2017 2018 2019 2020Items
A.Total equity (A1 to A3)
1.Certificate capital
2.Reserves
3.Unappropriated profit
4.Others
B.Total liabilities (B1 + B2)
1.Current liabilities
2.Non-current liabilities
C.Total assets (C1+C2)
1.Current assets (a + b)
a.Cash and banks balances
b.Other current assets
2.Non-current assets (a + b + c)
a.Fixed assets
b.Long-term investments
c.Other non-current assets
D.Profit & loss account
1.Gross revenue(loss)
2.Operating expenses
3.Operating profit
4.Modaraba co's management fees
5.Profit/(loss) before taxation
6.Profit/(loss) after taxation
E.Other items
1.No. of certificates (000)
2.Cash dividend
3.Stock dividend/bonus shares
4.Cash generated from operating activities
F.Efficiency ratios/profitability ratios
1.Return on equity (ROE) (D6/A)
2.Return on capital employed (ROCE) (D5/(C-B1))
3.Return on assets (ROA) (D6/C)
4.Return on revenue (D6/D1)
5.Operating expenses to net income (D2/D6)
6.Management expenses (D4/D2)
7.Earning Per Certificate (D6/E1)
G.Liquidity Ratios
1.Current assets to current liabilities (C1/B1) (times)
2.Total liabilities to total assets (B/C) (times)
3.Long term investment to total assets (C2b/C)
H.Capital /leverage ratios
1.Capital ratio (A/C)
2.Break up value per certificate (A/E1)
I.Cash flow ratio
1.Cash generated from operating activities to profit after tax. (E4/D6) (times)
2.Cash generated from operating activities to current liabilities (E4/B1) (times)
1,028,443 1,160,141 1,221,374 1,184,758 1,199,498
1,000,000 1,000,000 1,000,000 1,000,000 1,000,000
5,689 36,568 73,315 95,592 116,121
22,754 123,573 148,059 89,166 83,377
0 0 0 0 0
14,608 42,568 61,719 49,574 44,193
14,608 42,568 61,719 49,574 36,912
0 0 0 0 7,281
1,043,051 1,202,709 1,283,093 1,234,332 1,243,691
974,281 625,019 769,077 807,975 912,920
933,525 252,808 298,946 164,135 259,909
40,756 372,211 470,131 643,840 653,011
68,770 577,690 514,016 426,357 330,771
14 3,507 2,830 8,025 4,265
0 18,000 48,879 0 0
68,756 556,183 462,307 418,332 326,506
61,924 208,215 263,315 185,381 176,325
5,704 30,576 51,921 57,154 58,138
56,220 177,639 211,394 128,227 118,187
3,276 17,762 21,137 12,814 11,808
28,443 154,398 183,734 111,383 102,646
28,443 154,398 183,734 111,383 102,646
100,000 100,000 100,000 100,000 100,000
2.27% 12.25% 14.80% 8.90% 8.00%
0.00% 0.00% 0.00% 0.00% 0.00%
(66,460) (560,453) 64,886 21,223 184,773
2.77% 13.31% 15.04% 9.40% 8.56%
2.77% 13.31% 15.04% 9.40% 8.51%
2.73% 12.84% 14.32% 9.02% 8.25%
45.93% 74.15% 69.78% 60.08% 58.21%
20.05% 19.80% 28.26% 51.31% 56.64%
57.43% 58.09% 40.71% 22.42% 20.31%
0.28 1.54 1.84 1.11 1.03
66.70 14.68 12.46 16.30 24.73
0.01 0.04 0.05 0.04 0.04
0.00% 1.50% 3.81% 0.00% 0.00%
98.60% 96.46% 95.19% 95.98% 96.45%
10.28 11.60 12.21 11.85 11.99
-2.34 -3.63 0.35 0.19 1.80
-4.55 -13.17 1.05 0.43 5.01
(Thousand Rupees)Awwal Modaraba
114

Financial Statement Analysis of Financial Sector 2020
2016 2017 2018 2019 2020Items
A.Total equity (A1 to A3)
1.Certificate capital
2.Reserves
3.Unappropriated profit
4.Others
B.Total liabilities (B1 + B2)
1.Current liabilities
2.Non-current liabilities
C.Total assets (C1+C2)
1.Current assets (a + b)
a.Cash and banks balances
b.Other current assets
2.Non-current assets (a + b + c)
a.Fixed assets
b.Long-term investments
c.Other non-current assets
D.Profit & loss account
1.Gross revenue(loss)
2.Operating expenses
3.Operating profit
4.Modaraba co's management fees
5.Profit/(loss) before taxation
6.Profit/(loss) after taxation
E.Other items
1.No. of certificates (000)
2.Cash dividend
3.Stock dividend/bonus shares
4.Cash generated from operating activities
F.Efficiency ratios/profitability ratios
1.Return on equity (ROE) (D6/A)
2.Return on capital employed (ROCE) (D5/(C-B1))
3.Return on assets (ROA) (D6/C)
4.Return on revenue (D6/D1)
5.Operating expenses to net income (D2/D6)
6.Management expenses (D4/D2)
7.Earning Per Certificate (D6/E1)
G.Liquidity Ratios
1.Current assets to current liabilities (C1/B1) (times)
2.Total liabilities to total assets (B/C) (times)
3.Long term investment to total assets (C2b/C)
H.Capital /leverage ratios
1.Capital ratio (A/C)
2.Break up value per certificate (A/E1)
I.Cash flow ratio
1.Cash generated from operating activities to profit after tax. (E4/D6) (times)
2.Cash generated from operating activities to current liabilities (E4/B1) (times)
123,742 134,738 130,939 134,855 137,511
75,152 75,152 75,152 75,152 75,152
37,586 45,527 47,385 47,385 48,713
11,004 14,059 8,402 12,318 13,646
30,099 18,999 2,285 (11,626) (10,980)
4,436 5,215 6,883 3,087 4,873
4,436 5,215 6,883 3,087 4,873
0 0 0 0 0
158,277 158,952 140,107 126,316 131,404
158,189 158,872 140,029 30,627 28,290
29,156 6,900 24,943 12,875 24,738
129,033 151,972 115,086 17,752 3,552
88 80 78 95,689 103,114
48 40 38 32 27
0 0 0 0 0
40 40 40 95,657 103,087
17,762 24,223 12,435 5,089 10,867
5,582 6,194 7,460 6,743 6,282
12,180 18,029 4,975 (1,654) 4,585
1,218 1,803 497 0 518
10,743 15,901 4,388 (1,654) 3,985
10,225 15,880 3,717 (2,929) 2,657
7,515 7,515 7,515 7,515 7,515
6.50% 10.00% 0.00% 0.00% 0.00%
0.00% 0.00% 0.00% 0.00% 0.00%
2,984 (6,690) 8,109 (11,641) 7,780
8.26% 11.79% 2.84% -2.17% 1.93%
6.98% 10.34% 3.29% -1.34% 3.15%
6.46% 9.99% 2.65% -2.32% 2.02%
57.57% 65.56% 29.89% -57.56% 24.45%
54.59% 39.01% 200.70% -230.22% 236.43%
21.82% 29.11% 6.66% 0.00% 8.25%
1.36 2.11 0.49 -0.39 0.35
35.66 30.46 20.34 9.92 5.81
0.03 0.03 0.05 0.02 0.04
0.00% 0.00% 0.00% 0.00% 0.00%
78.18% 84.77% 93.46% 106.76% 104.65%
16.47 17.93 17.42 17.94 18.30
0.29 -0.42 2.18 3.97 2.93
0.67 -1.28 1.18 -3.77 1.60
(Thousand Rupees)B.F. Modaraba
115
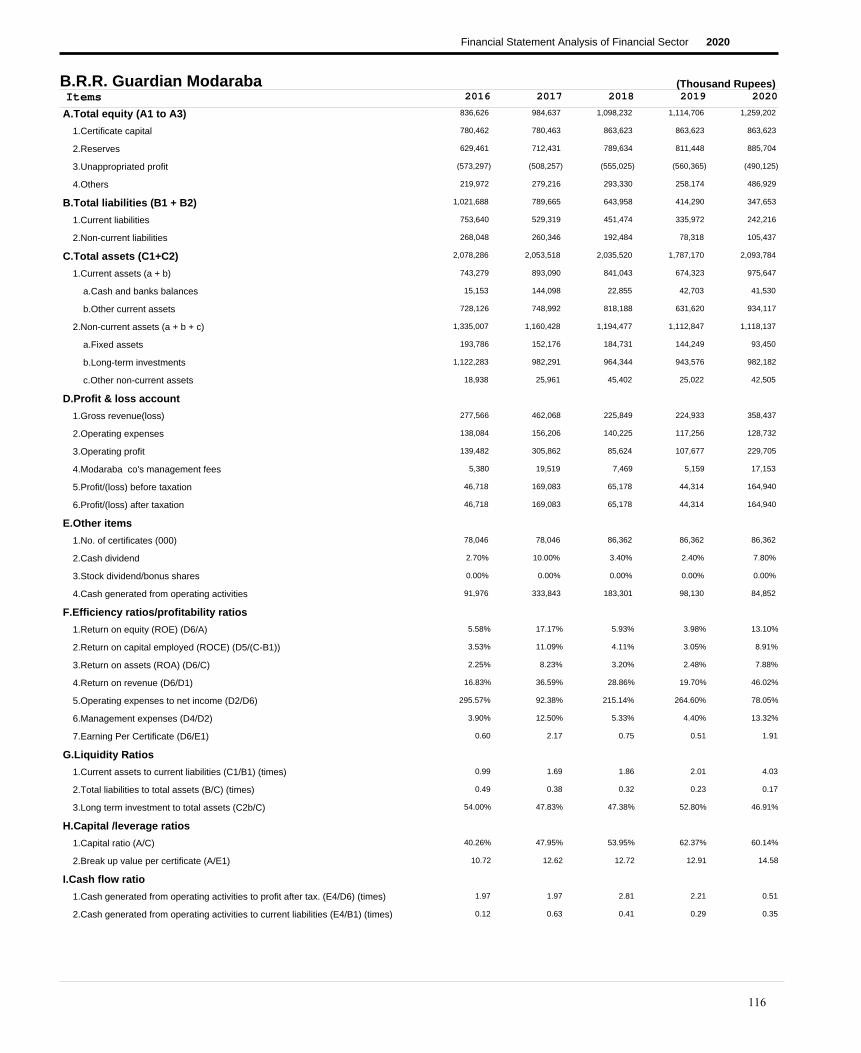
Financial Statement Analysis of Financial Sector 2020
2016 2017 2018 2019 2020Items
A.Total equity (A1 to A3)
1.Certificate capital
2.Reserves
3.Unappropriated profit
4.Others
B.Total liabilities (B1 + B2)
1.Current liabilities
2.Non-current liabilities
C.Total assets (C1+C2)
1.Current assets (a + b)
a.Cash and banks balances
b.Other current assets
2.Non-current assets (a + b + c)
a.Fixed assets
b.Long-term investments
c.Other non-current assets
D.Profit & loss account
1.Gross revenue(loss)
2.Operating expenses
3.Operating profit
4.Modaraba co's management fees
5.Profit/(loss) before taxation
6.Profit/(loss) after taxation
E.Other items
1.No. of certificates (000)
2.Cash dividend
3.Stock dividend/bonus shares
4.Cash generated from operating activities
F.Efficiency ratios/profitability ratios
1.Return on equity (ROE) (D6/A)
2.Return on capital employed (ROCE) (D5/(C-B1))
3.Return on assets (ROA) (D6/C)
4.Return on revenue (D6/D1)
5.Operating expenses to net income (D2/D6)
6.Management expenses (D4/D2)
7.Earning Per Certificate (D6/E1)
G.Liquidity Ratios
1.Current assets to current liabilities (C1/B1) (times)
2.Total liabilities to total assets (B/C) (times)
3.Long term investment to total assets (C2b/C)
H.Capital /leverage ratios
1.Capital ratio (A/C)
2.Break up value per certificate (A/E1)
I.Cash flow ratio
1.Cash generated from operating activities to profit after tax. (E4/D6) (times)
2.Cash generated from operating activities to current liabilities (E4/B1) (times)
836,626 984,637 1,098,232 1,114,706 1,259,202
780,462 780,463 863,623 863,623 863,623
629,461 712,431 789,634 811,448 885,704
(573,297) (508,257) (555,025) (560,365) (490,125)
219,972 279,216 293,330 258,174 486,929
1,021,688 789,665 643,958 414,290 347,653
753,640 529,319 451,474 335,972 242,216
268,048 260,346 192,484 78,318 105,437
2,078,286 2,053,518 2,035,520 1,787,170 2,093,784
743,279 893,090 841,043 674,323 975,647
15,153 144,098 22,855 42,703 41,530
728,126 748,992 818,188 631,620 934,117
1,335,007 1,160,428 1,194,477 1,112,847 1,118,137
193,786 152,176 184,731 144,249 93,450
1,122,283 982,291 964,344 943,576 982,182
18,938 25,961 45,402 25,022 42,505
277,566 462,068 225,849 224,933 358,437
138,084 156,206 140,225 117,256 128,732
139,482 305,862 85,624 107,677 229,705
5,380 19,519 7,469 5,159 17,153
46,718 169,083 65,178 44,314 164,940
46,718 169,083 65,178 44,314 164,940
78,046 78,046 86,362 86,362 86,362
2.70% 10.00% 3.40% 2.40% 7.80%
0.00% 0.00% 0.00% 0.00% 0.00%
91,976 333,843 183,301 98,130 84,852
5.58% 17.17% 5.93% 3.98% 13.10%
3.53% 11.09% 4.11% 3.05% 8.91%
2.25% 8.23% 3.20% 2.48% 7.88%
16.83% 36.59% 28.86% 19.70% 46.02%
295.57% 92.38% 215.14% 264.60% 78.05%
3.90% 12.50% 5.33% 4.40% 13.32%
0.60 2.17 0.75 0.51 1.91
0.99 1.69 1.86 2.01 4.03
0.49 0.38 0.32 0.23 0.17
54.00% 47.83% 47.38% 52.80% 46.91%
40.26% 47.95% 53.95% 62.37% 60.14%
10.72 12.62 12.72 12.91 14.58
1.97 1.97 2.81 2.21 0.51
0.12 0.63 0.41 0.29 0.35
(Thousand Rupees)B.R.R. Guardian Modaraba
116

Financial Statement Analysis of Financial Sector 2020
2016 2017 2018 2019 2020Items
A.Total equity (A1 to A3)
1.Certificate capital
2.Reserves
3.Unappropriated profit
4.Others
B.Total liabilities (B1 + B2)
1.Current liabilities
2.Non-current liabilities
C.Total assets (C1+C2)
1.Current assets (a + b)
a.Cash and banks balances
b.Other current assets
2.Non-current assets (a + b + c)
a.Fixed assets
b.Long-term investments
c.Other non-current assets
D.Profit & loss account
1.Gross revenue(loss)
2.Operating expenses
3.Operating profit
4.Modaraba co's management fees
5.Profit/(loss) before taxation
6.Profit/(loss) after taxation
E.Other items
1.No. of certificates (000)
2.Cash dividend
3.Stock dividend/bonus shares
4.Cash generated from operating activities
F.Efficiency ratios/profitability ratios
1.Return on equity (ROE) (D6/A)
2.Return on capital employed (ROCE) (D5/(C-B1))
3.Return on assets (ROA) (D6/C)
4.Return on revenue (D6/D1)
5.Operating expenses to net income (D2/D6)
6.Management expenses (D4/D2)
7.Earning Per Certificate (D6/E1)
G.Liquidity Ratios
1.Current assets to current liabilities (C1/B1) (times)
2.Total liabilities to total assets (B/C) (times)
3.Long term investment to total assets (C2b/C)
H.Capital /leverage ratios
1.Capital ratio (A/C)
2.Break up value per certificate (A/E1)
I.Cash flow ratio
1.Cash generated from operating activities to profit after tax. (E4/D6) (times)
2.Cash generated from operating activities to current liabilities (E4/B1) (times)
294,720 297,766 267,101 252,049 253,494
210,000 210,000 210,000 210,000 210,000
97,480 98,086 97,836 97,836 97,836
(12,760) (10,320) (40,735) (55,787) (54,342)
(2,494) (5,230) (2,688) (7,409) (5,371)
64,712 58,925 51,968 44,319 21,183
33,338 24,949 23,185 32,239 13,274
31,374 33,976 28,783 12,080 7,909
356,938 351,461 316,381 288,959 269,306
107,331 125,964 134,543 163,224 189,227
24,207 11,483 24,281 33,849 9,175
83,124 114,481 110,262 129,375 180,052
249,607 225,497 181,838 125,735 80,079
147,176 147,412 103,531 48,155 9,809
39,834 30,536 27,162 24,824 22,323
62,597 47,549 51,145 52,756 47,947
23,437 39,366 24,921 25,582 30,430
25,473 25,575 29,408 28,418 30,499
(2,036) 13,791 (4,487) (2,836) (69)
13 329 0 0 0
118 3,028 (25,010) (14,117) (196,563)
118 3,028 (25,010) (14,117) (196,563)
21,000 21,000 21,000 21,000 21,000
0.00% 1.20% 0.00% 0.00% 0.00%
0.00% 0.00% 0.00% 0.00% 0.00%
116,981 39,547 34,809 2,647 57,717
0.04% 1.02% -9.36% -5.60% -77.54%
0.04% 0.93% -8.53% -5.50% -76.77%
0.03% 0.86% -7.91% -4.89% -72.99%
0.50% 7.69% -100.36% -55.18% -645.95%
21,587.29% 844.62% -117.58% -201.30% -15.52%
0.05% 1.29% 0.00% 0.00% 0.00%
0.01 0.14 -1.19 -0.67 -9.36
3.22 5.05 5.80 5.06 14.26
0.18 0.17 0.16 0.15 0.08
11.16% 8.69% 8.59% 8.59% 8.29%
82.57% 84.72% 84.42% 87.23% 94.13%
14.03 14.18 12.72 12.00 12.07
991.36 13.06 -1.39 -0.19 -0.29
3.51 1.59 1.50 0.08 4.35
(Thousand Rupees)First Al-Noor Modaraba
117

Financial Statement Analysis of Financial Sector 2020
2016 2017 2018 2019 2020Items
A.Total equity (A1 to A3)
1.Certificate capital
2.Reserves
3.Unappropriated profit
4.Others
B.Total liabilities (B1 + B2)
1.Current liabilities
2.Non-current liabilities
C.Total assets (C1+C2)
1.Current assets (a + b)
a.Cash and banks balances
b.Other current assets
2.Non-current assets (a + b + c)
a.Fixed assets
b.Long-term investments
c.Other non-current assets
D.Profit & loss account
1.Gross revenue(loss)
2.Operating expenses
3.Operating profit
4.Modaraba co's management fees
5.Profit/(loss) before taxation
6.Profit/(loss) after taxation
E.Other items
1.No. of certificates (000)
2.Cash dividend
3.Stock dividend/bonus shares
4.Cash generated from operating activities
F.Efficiency ratios/profitability ratios
1.Return on equity (ROE) (D6/A)
2.Return on capital employed (ROCE) (D5/(C-B1))
3.Return on assets (ROA) (D6/C)
4.Return on revenue (D6/D1)
5.Operating expenses to net income (D2/D6)
6.Management expenses (D4/D2)
7.Earning Per Certificate (D6/E1)
G.Liquidity Ratios
1.Current assets to current liabilities (C1/B1) (times)
2.Total liabilities to total assets (B/C) (times)
3.Long term investment to total assets (C2b/C)
H.Capital /leverage ratios
1.Capital ratio (A/C)
2.Break up value per certificate (A/E1)
I.Cash flow ratio
1.Cash generated from operating activities to profit after tax. (E4/D6) (times)
2.Cash generated from operating activities to current liabilities (E4/B1) (times)
130,451 124,940 127,945 113,248 106,905
113,400 113,400 113,400 113,400 113,400
17,051 31,622 30,770 23,611 22,035
0 (20,082) (16,225) (23,763) (28,530)
0 0 0 0 0
51,331 61,072 62,875 69,022 74,192
17,310 15,139 15,936 14,863 17,453
34,021 45,933 46,939 54,159 56,739
181,782 186,012 190,820 182,270 181,097
96,729 77,144 48,934 36,662 46,385
21,691 23,090 14,239 6,623 19,171
75,038 54,054 34,695 30,039 27,214
85,053 108,868 141,886 145,608 134,712
85,053 108,868 141,886 145,608 134,712
0 0 0 0 0
0 0 0 0 0
49,772 52,203 69,305 41,778 38,367
23,080 26,921 35,268 17,296 15,224
26,692 25,282 34,037 24,482 23,143
0 0 524 0 0
(2,640) (2,353) 4,719 (3,890) (5,064)
(3,024) (2,767) 4,719 (4,371) (5,272)
11,340 11,340 11,340 11,340 11,340
0.00% 0.00% 0.03% 0.00% 0.00%
0.00% 0.00% 0.00% 0.00% 0.00%
4,673 (211) (6,691) (7,591) 13,163
-2.32% -2.21% 3.69% -3.86% -4.93%
-1.61% -1.38% 2.70% -2.32% -3.09%
-1.66% -1.49% 2.47% -2.40% -2.91%
-6.08% -5.30% 6.81% -10.46% -13.74%
-763.23% -972.93% 747.36% -395.70% -288.77%
0.00% 0.00% 1.49% 0.00% 0.00%
-0.27 -0.24 0.42 -0.39 -0.46
5.59 5.10 3.07 2.47 2.66
0.28 0.33 0.33 0.38 0.41
0.00% 0.00% 0.00% 0.00% 0.00%
71.76% 67.17% 67.05% 62.13% 59.03%
11.50 11.02 11.28 9.99 9.43
-1.55 0.08 -1.42 1.74 -2.50
0.27 -0.01 -0.42 -0.51 0.75
(Thousand Rupees)First Elite Capital Modaraba
118

Financial Statement Analysis of Financial Sector 2020
2016 2017 2018 2019 2020Items
A.Total equity (A1 to A3)
1.Certificate capital
2.Reserves
3.Unappropriated profit
4.Others
B.Total liabilities (B1 + B2)
1.Current liabilities
2.Non-current liabilities
C.Total assets (C1+C2)
1.Current assets (a + b)
a.Cash and banks balances
b.Other current assets
2.Non-current assets (a + b + c)
a.Fixed assets
b.Long-term investments
c.Other non-current assets
D.Profit & loss account
1.Gross revenue(loss)
2.Operating expenses
3.Operating profit
4.Modaraba co's management fees
5.Profit/(loss) before taxation
6.Profit/(loss) after taxation
E.Other items
1.No. of certificates (000)
2.Cash dividend
3.Stock dividend/bonus shares
4.Cash generated from operating activities
F.Efficiency ratios/profitability ratios
1.Return on equity (ROE) (D6/A)
2.Return on capital employed (ROCE) (D5/(C-B1))
3.Return on assets (ROA) (D6/C)
4.Return on revenue (D6/D1)
5.Operating expenses to net income (D2/D6)
6.Management expenses (D4/D2)
7.Earning Per Certificate (D6/E1)
G.Liquidity Ratios
1.Current assets to current liabilities (C1/B1) (times)
2.Total liabilities to total assets (B/C) (times)
3.Long term investment to total assets (C2b/C)
H.Capital /leverage ratios
1.Capital ratio (A/C)
2.Break up value per certificate (A/E1)
I.Cash flow ratio
1.Cash generated from operating activities to profit after tax. (E4/D6) (times)
2.Cash generated from operating activities to current liabilities (E4/B1) (times)
625,724 656,684 613,925 594,310 592,849
524,400 524,400 524,400 524,400 524,400
126,611 162,307 126,650 123,347 117,485
(25,287) (30,023) (37,125) (53,437) (49,036)
0 0 0 0 0
38,720 94,455 45,971 42,146 43,842
35,585 91,391 41,725 37,694 39,091
3,135 3,064 4,246 4,452 4,751
664,444 751,139 659,896 636,456 636,691
299,525 329,836 254,704 230,071 242,455
10,790 41,395 11,626 4,383 90,758
288,735 288,441 243,078 225,688 151,697
364,919 421,303 405,192 406,385 394,236
33,529 17,114 6,340 7,654 6,436
327,630 399,929 394,592 394,471 383,540
3,760 4,260 4,260 4,260 4,260
30,364 79,495 17,138 18,207 16,457
21,401 33,409 21,420 23,104 22,549
8,963 46,086 (4,282) (4,897) (6,092)
0 4,890 0 0 0
9,092 42,513 (4,193) (3,304) (5,861)
9,092 42,513 (4,193) (3,304) (5,861)
52,440 52,440 52,440 52,440 52,440
1.30% 6.00% 0.00% 0.00% 0.00%
0.00% 0.00% 0.00% 0.00% 0.00%
(5,295) (97,759) (71,682) (12,921) 81,320
1.45% 6.47% -0.68% -0.56% -0.99%
1.45% 6.44% -0.68% -0.55% -0.98%
1.37% 5.66% -0.64% -0.52% -0.92%
29.94% 53.48% -24.47% -18.15% -35.61%
235.38% 78.59% -510.85% -699.27% -384.73%
0.00% 14.64% 0.00% 0.00% 0.00%
0.17 0.81 -0.08 -0.06 -0.11
8.42 3.61 6.10 6.10 6.20
0.06 0.13 0.07 0.07 0.07
49.31% 53.24% 59.80% 61.98% 60.24%
94.17% 87.43% 93.03% 93.38% 93.11%
11.93 12.52 11.71 11.33 11.31
-0.58 -2.30 17.10 3.91 -13.87
-0.15 -1.07 -1.72 -0.34 2.08
(Thousand Rupees)First Equity Modaraba
119

Financial Statement Analysis of Financial Sector 2020
2016 2017 2018 2019 2020Items
A.Total equity (A1 to A3)
1.Certificate capital
2.Reserves
3.Unappropriated profit
4.Others
B.Total liabilities (B1 + B2)
1.Current liabilities
2.Non-current liabilities
C.Total assets (C1+C2)
1.Current assets (a + b)
a.Cash and banks balances
b.Other current assets
2.Non-current assets (a + b + c)
a.Fixed assets
b.Long-term investments
c.Other non-current assets
D.Profit & loss account
1.Gross revenue(loss)
2.Operating expenses
3.Operating profit
4.Modaraba co's management fees
5.Profit/(loss) before taxation
6.Profit/(loss) after taxation
E.Other items
1.No. of certificates (000)
2.Cash dividend
3.Stock dividend/bonus shares
4.Cash generated from operating activities
F.Efficiency ratios/profitability ratios
1.Return on equity (ROE) (D6/A)
2.Return on capital employed (ROCE) (D5/(C-B1))
3.Return on assets (ROA) (D6/C)
4.Return on revenue (D6/D1)
5.Operating expenses to net income (D2/D6)
6.Management expenses (D4/D2)
7.Earning Per Certificate (D6/E1)
G.Liquidity Ratios
1.Current assets to current liabilities (C1/B1) (times)
2.Total liabilities to total assets (B/C) (times)
3.Long term investment to total assets (C2b/C)
H.Capital /leverage ratios
1.Capital ratio (A/C)
2.Break up value per certificate (A/E1)
I.Cash flow ratio
1.Cash generated from operating activities to profit after tax. (E4/D6) (times)
2.Cash generated from operating activities to current liabilities (E4/B1) (times)
331,808 323,661 357,022 341,003 336,350
264,138 264,138 264,138 264,138 264,138
67,670 79,378 94,390 76,865 72,212
0 (19,855) (1,506) 0
0 0 0 0 0
25,215 25,764 42,012 41,249 41,638
22,621 23,489 23,058 22,764 21,575
2,594 2,275 18,954 18,485 20,063
357,023 349,425 399,034 382,252 377,988
110,457 107,814 93,515 89,598 88,909
127 24 10,041 3,417 1,423
110,330 107,790 83,474 86,181 87,486
246,566 241,611 305,519 292,654 289,079
233,526 228,581 301,753 288,405 284,510
5,750 5,750 0 0 0
7,290 7,280 3,766 4,249 4,569
5,353 3,573 50,534 27,293 24,402
14,371 10,138 12,344 13,153 15,530
(9,018) (6,565) 38,190 14,140 8,872
0 0 (3,707) (154) 0
(9,743) (8,147) 33,362 1,386 (4,653)
(9,743) (8,147) 33,362 1,150 (4,653)
26,414 26,414 26,414 26,414 26,414
0.00% 0.00% 0.07% 0.00% 0.00%
0.00% 0.00% 0.00% 0.00% 0.00%
(1,215) (175) 36,252 20,749 21,037
-2.94% -2.52% 9.34% 0.34% -1.38%
-2.91% -2.50% 8.87% 0.39% -1.31%
-2.73% -2.33% 8.36% 0.30% -1.23%
-182.01% -228.02% 66.02% 4.21% -19.07%
-147.50% -124.44% 37.00% 1,143.74% -333.76%
0.00% 0.00% -30.03% -1.17% 0.00%
-0.37 -0.31 1.26 0.04 -0.18
4.88 4.59 4.06 3.94 4.12
0.07 0.07 0.11 0.11 0.11
1.61% 1.65% 0.00% 0.00% 0.00%
92.94% 92.63% 89.47% 89.21% 88.98%
12.56 12.25 13.52 12.91 12.73
0.12 0.02 1.09 18.04 -4.52
-0.05 -0.01 1.57 0.91 0.98
-
(Thousand Rupees)First Fidelity Leasing Modaraba
120

Financial Statement Analysis of Financial Sector 2020
2016 2017 2018 2019 2020Items
A.Total equity (A1 to A3)
1.Certificate capital
2.Reserves
3.Unappropriated profit
4.Others
B.Total liabilities (B1 + B2)
1.Current liabilities
2.Non-current liabilities
C.Total assets (C1+C2)
1.Current assets (a + b)
a.Cash and banks balances
b.Other current assets
2.Non-current assets (a + b + c)
a.Fixed assets
b.Long-term investments
c.Other non-current assets
D.Profit & loss account
1.Gross revenue(loss)
2.Operating expenses
3.Operating profit
4.Modaraba co's management fees
5.Profit/(loss) before taxation
6.Profit/(loss) after taxation
E.Other items
1.No. of certificates (000)
2.Cash dividend
3.Stock dividend/bonus shares
4.Cash generated from operating activities
F.Efficiency ratios/profitability ratios
1.Return on equity (ROE) (D6/A)
2.Return on capital employed (ROCE) (D5/(C-B1))
3.Return on assets (ROA) (D6/C)
4.Return on revenue (D6/D1)
5.Operating expenses to net income (D2/D6)
6.Management expenses (D4/D2)
7.Earning Per Certificate (D6/E1)
G.Liquidity Ratios
1.Current assets to current liabilities (C1/B1) (times)
2.Total liabilities to total assets (B/C) (times)
3.Long term investment to total assets (C2b/C)
H.Capital /leverage ratios
1.Capital ratio (A/C)
2.Break up value per certificate (A/E1)
I.Cash flow ratio
1.Cash generated from operating activities to profit after tax. (E4/D6) (times)
2.Cash generated from operating activities to current liabilities (E4/B1) (times)
3,262,248 3,354,268 3,442,258 3,511,722 3,546,684
1,008,000 1,008,000 1,008,000 1,008,000 1,008,000
2,254,248 2,107,012 2,121,490 2,137,474 2,153,308
0 239,256 312,768 366,248 385,376
53,807 117,635 117,878 124,880 86,870
3,844,695 4,894,748 6,719,120 7,487,422 6,279,503
3,540,634 4,652,980 6,303,092 7,185,648 6,025,448
304,061 241,768 416,028 301,774 254,055
7,160,750 8,366,651 10,279,256 11,124,024 9,913,057
2,613,505 3,259,093 3,994,811 3,849,499 3,839,710
248,143 192,260 320,869 50,625 168,610
2,365,362 3,066,833 3,673,942 3,798,874 3,671,100
4,547,245 5,107,558 6,284,445 7,274,525 6,073,347
2,734,122 2,453,304 2,933,273 2,783,498 1,789,279
1,812,457 2,653,338 3,349,956 4,489,820 4,282,849
666 916 1,216 1,207 1,219
475,518 539,840 585,788 913,677 1,209,205
81,979 89,311 100,936 126,031 146,728
393,539 450,529 484,852 787,646 1,062,477
34,356 35,041 33,311 36,777 36,431
298,303 304,601 289,561 319,685 316,683
298,303 294,517 289,561 319,685 316,683
201,600 201,600 201,600 201,600 201,600
20.00% 20.00% 25.00% 28.00% 28.00%
0.00% 0.00% 0.00% 0.00% 0.00%
(671,971) (628,958) (1,260,030) (929,637) 1,212,388
9.14% 8.78% 8.41% 9.10% 8.93%
8.24% 8.20% 7.28% 8.12% 8.15%
4.17% 3.52% 2.82% 2.87% 3.19%
62.73% 54.56% 49.43% 34.99% 26.19%
27.48% 30.32% 34.86% 39.42% 46.33%
41.91% 39.23% 33.00% 29.18% 24.83%
1.48 1.46 1.44 1.59 1.57
0.74 0.70 0.63 0.54 0.64
0.54 0.59 0.65 0.67 0.63
25.31% 31.71% 32.59% 40.36% 43.20%
45.56% 40.09% 33.49% 31.57% 35.78%
16.18 16.64 17.07 17.42 17.59
-2.25 -2.14 -4.35 -2.91 3.83
-0.19 -0.14 -0.20 -0.13 0.20
(Thousand Rupees)First Habib Modaraba
121

Financial Statement Analysis of Financial Sector 2020
2016 2017 2018 2019 2020Items
A.Total equity (A1 to A3)
1.Certificate capital
2.Reserves
3.Unappropriated profit
4.Others
B.Total liabilities (B1 + B2)
1.Current liabilities
2.Non-current liabilities
C.Total assets (C1+C2)
1.Current assets (a + b)
a.Cash and banks balances
b.Other current assets
2.Non-current assets (a + b + c)
a.Fixed assets
b.Long-term investments
c.Other non-current assets
D.Profit & loss account
1.Gross revenue(loss)
2.Operating expenses
3.Operating profit
4.Modaraba co's management fees
5.Profit/(loss) before taxation
6.Profit/(loss) after taxation
E.Other items
1.No. of certificates (000)
2.Cash dividend
3.Stock dividend/bonus shares
4.Cash generated from operating activities
F.Efficiency ratios/profitability ratios
1.Return on equity (ROE) (D6/A)
2.Return on capital employed (ROCE) (D5/(C-B1))
3.Return on assets (ROA) (D6/C)
4.Return on revenue (D6/D1)
5.Operating expenses to net income (D2/D6)
6.Management expenses (D4/D2)
7.Earning Per Certificate (D6/E1)
G.Liquidity Ratios
1.Current assets to current liabilities (C1/B1) (times)
2.Total liabilities to total assets (B/C) (times)
3.Long term investment to total assets (C2b/C)
H.Capital /leverage ratios
1.Capital ratio (A/C)
2.Break up value per certificate (A/E1)
I.Cash flow ratio
1.Cash generated from operating activities to profit after tax. (E4/D6) (times)
2.Cash generated from operating activities to current liabilities (E4/B1) (times)
140,172 137,472 134,861 139,163 161,259
30,000 30,000 30,000 30,000 30,000
71,399 73,065 85,285 94,143 104,678
38,773 34,407 19,576 15,020 26,581
0 0 0 0 0
199,770 233,306 280,229 202,066 203,746
180,340 212,043 255,192 171,869 166,173
19,430 21,263 25,037 30,197 37,573
339,942 370,778 415,090 341,229 365,005
325,367 357,050 402,121 331,110 358,107
61,301 7,427 14,070 11,347 18,971
264,066 349,623 388,051 319,763 339,136
14,575 13,728 12,969 10,119 6,898
14,459 13,347 12,478 9,628 6,413
0 0 0 0 0
116 381 491 491 485
827,864 734,216 897,590 705,649 555,117
46,822 54,444 62,522 64,826 63,026
781,042 679,772 835,068 640,823 492,091
2,063 2,346 2,564 8,101 7,303
80,885 65,031 73,105 58,569 56,646
42,017 33,299 30,551 25,310 35,115
3,000 3,000 3,000 3,000 3,000
120.00% 100.00% 56.67% 50.00% 75.00%
0.00% 0.00% 0.00% 0.00% 0.00%
79,070 (46,929) (48,400) 94,569 (10,501)
29.98% 24.22% 22.65% 18.19% 21.78%
50.68% 40.97% 45.72% 34.58% 28.49%
12.36% 8.98% 7.36% 7.42% 9.62%
5.08% 4.54% 3.40% 3.59% 6.33%
111.44% 163.50% 204.65% 256.13% 179.48%
4.41% 4.31% 4.10% 12.50% 11.59%
14.01 11.10 10.18 8.44 11.71
1.80 1.68 1.58 1.93 2.16
0.59 0.63 0.68 0.59 0.56
0.00% 0.00% 0.00% 0.00% 0.00%
41.23% 37.08% 32.49% 40.78% 44.18%
46.72 45.82 44.95 46.39 53.75
1.88 -1.41 -1.58 3.74 -0.30
0.44 -0.22 -0.19 0.55 -0.06
(Thousand Rupees)First Imrooz Modaraba
122

Financial Statement Analysis of Financial Sector 2020
2016 2017 2018 2019 2020Items
A.Total equity (A1 to A3)
1.Certificate capital
2.Reserves
3.Unappropriated profit
4.Others
B.Total liabilities (B1 + B2)
1.Current liabilities
2.Non-current liabilities
C.Total assets (C1+C2)
1.Current assets (a + b)
a.Cash and banks balances
b.Other current assets
2.Non-current assets (a + b + c)
a.Fixed assets
b.Long-term investments
c.Other non-current assets
D.Profit & loss account
1.Gross revenue(loss)
2.Operating expenses
3.Operating profit
4.Modaraba co's management fees
5.Profit/(loss) before taxation
6.Profit/(loss) after taxation
E.Other items
1.No. of certificates (000)
2.Cash dividend
3.Stock dividend/bonus shares
4.Cash generated from operating activities
F.Efficiency ratios/profitability ratios
1.Return on equity (ROE) (D6/A)
2.Return on capital employed (ROCE) (D5/(C-B1))
3.Return on assets (ROA) (D6/C)
4.Return on revenue (D6/D1)
5.Operating expenses to net income (D2/D6)
6.Management expenses (D4/D2)
7.Earning Per Certificate (D6/E1)
G.Liquidity Ratios
1.Current assets to current liabilities (C1/B1) (times)
2.Total liabilities to total assets (B/C) (times)
3.Long term investment to total assets (C2b/C)
H.Capital /leverage ratios
1.Capital ratio (A/C)
2.Break up value per certificate (A/E1)
I.Cash flow ratio
1.Cash generated from operating activities to profit after tax. (E4/D6) (times)
2.Cash generated from operating activities to current liabilities (E4/B1) (times)
87,693 16,333 8,144 (29,200) (63,161)
250,000 250,000 250,000 250,000 250,000
43,955 43,955 43,955 43,955 43,955
(206,262) (277,622) (285,811) (323,155) (357,116)
0 0 0 0 0
753,612 492,145 347,922 325,179 302,113
604,048 429,546 342,714 322,054 302,113
149,564 62,599 5,208 3,125 0
841,305 508,478 356,066 295,979 238,952
292,401 246,152 219,842 205,954 199,288
14,743 49,708 51,654 11,329 22,655
277,658 196,444 168,188 194,625 176,633
548,904 262,326 136,224 90,025 39,664
466,286 247,452 124,919 83,940 39,624
36,150 3,377 8,858 5,894 0
46,468 11,497 2,447 191 40
314,369 179,801 67,895 18,221 14,685
16,130 15,175 15,551 15,137 14,910
298,239 164,626 52,344 3,084 (225)
0 0 0 0 0
(53,832) (71,360) (8,189) (35,716) (34,072)
(53,832) (71,360) (8,189) (35,716) (34,072)
25,000 25,000 25,000 25,000 25,000
0.00% 0.00% 0.00% 0.00% 0.00%
0.00% 0.00% 0.00% 0.00% 0.00%
(18,416) 198,034 41,583 (5,704) 17,180
-61.39% -436.91% -100.55% 122.32% 53.94%
-22.69% -90.41% -61.33% 136.97% 53.94%
-6.40% -14.03% -2.30% -12.07% -14.26%
-17.12% -39.69% -12.06% -196.02% -232.02%
-29.96% -21.27% -189.90% -42.38% -43.76%
0.00% 0.00% 0.00% 0.00% 0.00%
-2.15 -2.85 -0.33 -1.43 -1.36
0.48 0.57 0.64 0.64 0.66
0.90 0.97 0.98 1.10 1.26
4.30% 0.66% 2.49% 1.99% 0.00%
10.42% 3.21% 2.29% -9.87% -26.43%
3.51 0.65 0.33 -1.17 -2.53
0.34 -2.78 -5.08 0.16 -0.50
-0.03 0.46 0.12 -0.02 0.06
(Thousand Rupees)First National Bank Modaraba
123

Financial Statement Analysis of Financial Sector 2020
2016 2017 2018 2019 2020Items
A.Total equity (A1 to A3)
1.Certificate capital
2.Reserves
3.Unappropriated profit
4.Others
B.Total liabilities (B1 + B2)
1.Current liabilities
2.Non-current liabilities
C.Total assets (C1+C2)
1.Current assets (a + b)
a.Cash and banks balances
b.Other current assets
2.Non-current assets (a + b + c)
a.Fixed assets
b.Long-term investments
c.Other non-current assets
D.Profit & loss account
1.Gross revenue(loss)
2.Operating expenses
3.Operating profit
4.Modaraba co's management fees
5.Profit/(loss) before taxation
6.Profit/(loss) after taxation
E.Other items
1.No. of certificates (000)
2.Cash dividend
3.Stock dividend/bonus shares
4.Cash generated from operating activities
F.Efficiency ratios/profitability ratios
1.Return on equity (ROE) (D6/A)
2.Return on capital employed (ROCE) (D5/(C-B1))
3.Return on assets (ROA) (D6/C)
4.Return on revenue (D6/D1)
5.Operating expenses to net income (D2/D6)
6.Management expenses (D4/D2)
7.Earning Per Certificate (D6/E1)
G.Liquidity Ratios
1.Current assets to current liabilities (C1/B1) (times)
2.Total liabilities to total assets (B/C) (times)
3.Long term investment to total assets (C2b/C)
H.Capital /leverage ratios
1.Capital ratio (A/C)
2.Break up value per certificate (A/E1)
I.Cash flow ratio
1.Cash generated from operating activities to profit after tax. (E4/D6) (times)
2.Cash generated from operating activities to current liabilities (E4/B1) (times)
59,811 62,481 62,563 66,196 68,041
125,400 125,400 125,400 125,400 125,400
25,068 25,602 26,045 26,148 26,517
(90,657) (88,521) (88,882) (85,352) (83,876)
0 0 0 (4,875) (4,875)
7,621 7,579 12,914 11,319 9,822
6,006 5,964 6,725 8,525 9,622
1,615 1,615 6,189 2,794 200
67,432 70,060 75,477 72,640 72,988
54,559 43,092 40,555 43,130 61,755
42,483 16,158 15,591 19,005 42,267
12,076 26,934 24,964 24,125 19,488
12,873 26,968 34,922 29,510 11,233
5,476 4,879 21,273 9,728 4,051
0 0 0 0 0
7,397 22,089 13,649 19,782 7,182
4,923 7,908 10,187 13,379 10,911
4,500 3,569 4,291 7,127 6,582
423 4,339 5,896 6,252 4,329
20 267 221 151 0
201 2,671 2,213 1,211 1,938
201 2,671 2,213 514 1,845
12,540 12,540 12,540 12,540 12,540
0.00% 1.70% 1.40% 0.00% 0.00%
0.00% 0.00% 0.00% 0.00% 0.00%
(1,772) (25,617) 20,914 (3,094) 19,767
0.34% 4.27% 3.54% 0.78% 2.71%
0.33% 4.17% 3.22% 1.89% 3.06%
0.30% 3.81% 2.93% 0.71% 2.53%
4.08% 33.78% 21.72% 3.84% 16.91%
2,238.81% 133.62% 193.90% 1,386.58% 356.75%
0.44% 7.48% 5.15% 2.12% 0.00%
0.02 0.21 0.18 0.04 0.15
9.08 7.23 6.03 5.06 6.42
0.11 0.11 0.17 0.16 0.13
0.00% 0.00% 0.00% 0.00% 0.00%
88.70% 89.18% 82.89% 91.13% 93.22%
4.77 4.98 4.99 5.28 5.43
-8.82 -9.59 9.45 -6.02 10.71
-0.30 -4.30 3.11 -0.36 2.05
(Thousand Rupees)First Pak Modaraba
124

Financial Statement Analysis of Financial Sector 2020
2016 2017 2018 2019 2020Items
A.Total equity (A1 to A3)
1.Certificate capital
2.Reserves
3.Unappropriated profit
4.Others
B.Total liabilities (B1 + B2)
1.Current liabilities
2.Non-current liabilities
C.Total assets (C1+C2)
1.Current assets (a + b)
a.Cash and banks balances
b.Other current assets
2.Non-current assets (a + b + c)
a.Fixed assets
b.Long-term investments
c.Other non-current assets
D.Profit & loss account
1.Gross revenue(loss)
2.Operating expenses
3.Operating profit
4.Modaraba co's management fees
5.Profit/(loss) before taxation
6.Profit/(loss) after taxation
E.Other items
1.No. of certificates (000)
2.Cash dividend
3.Stock dividend/bonus shares
4.Cash generated from operating activities
F.Efficiency ratios/profitability ratios
1.Return on equity (ROE) (D6/A)
2.Return on capital employed (ROCE) (D5/(C-B1))
3.Return on assets (ROA) (D6/C)
4.Return on revenue (D6/D1)
5.Operating expenses to net income (D2/D6)
6.Management expenses (D4/D2)
7.Earning Per Certificate (D6/E1)
G.Liquidity Ratios
1.Current assets to current liabilities (C1/B1) (times)
2.Total liabilities to total assets (B/C) (times)
3.Long term investment to total assets (C2b/C)
H.Capital /leverage ratios
1.Capital ratio (A/C)
2.Break up value per certificate (A/E1)
I.Cash flow ratio
1.Cash generated from operating activities to profit after tax. (E4/D6) (times)
2.Cash generated from operating activities to current liabilities (E4/B1) (times)
215,768 212,607 213,141 215,574 208,283
137,884 137,884 137,884 137,884 137,884
42,733 44,169 47,387 49,804 51,104
35,151 30,554 27,870 27,886 19,295
0 0 0 0 0
294,678 253,253 231,075 247,950 238,992
92,160 66,712 103,055 118,274 107,858
202,518 186,541 128,020 129,676 131,134
510,446 465,860 444,216 463,524 447,275
396,628 348,041 316,176 350,099 349,138
45,581 54,066 25,579 20,003 75,852
351,047 293,975 290,597 330,096 273,286
113,818 117,819 128,040 113,425 98,137
34,152 24,617 24,787 18,753 17,349
0 0 0 0 0
79,666 93,202 103,253 94,672 80,788
145,624 202,191 257,140 219,160 185,688
113,775 180,827 234,425 191,480 163,510
31,849 21,364 22,715 27,680 22,178
1,694 933 1,485 1,571 845
13,912 7,180 11,061 12,085 6,497
13,912 7,180 10,865 12,085 6,497
13,788 13,788 13,788 13,788 13,788
7.50% 7.00% 7.00% 10.00% 3.50%
0.00% 0.00% 0.00% 0.00% 0.00%
(51,426) 33,085 3,889 8,899 76,384
6.45% 3.38% 5.10% 5.61% 3.12%
3.33% 1.80% 3.24% 3.50% 1.91%
2.73% 1.54% 2.45% 2.61% 1.45%
9.55% 3.55% 4.23% 5.51% 3.50%
817.82% 2,518.48% 2,157.62% 1,584.44% 2,516.70%
1.49% 0.52% 0.63% 0.82% 0.52%
1.01 0.52 0.79 0.88 0.47
4.30 5.22 3.07 2.96 3.24
0.58 0.54 0.52 0.53 0.53
0.00% 0.00% 0.00% 0.00% 0.00%
42.27% 45.64% 47.98% 46.51% 46.57%
15.65 15.42 15.46 15.63 15.11
-3.70 4.61 0.36 0.74 11.76
-0.56 0.50 0.04 0.08 0.71
(Thousand Rupees)First Paramount Modaraba
125

Financial Statement Analysis of Financial Sector 2020
2016 2017 2018 2019 2020Items
A.Total equity (A1 to A3)
1.Certificate capital
2.Reserves
3.Unappropriated profit
4.Others
B.Total liabilities (B1 + B2)
1.Current liabilities
2.Non-current liabilities
C.Total assets (C1+C2)
1.Current assets (a + b)
a.Cash and banks balances
b.Other current assets
2.Non-current assets (a + b + c)
a.Fixed assets
b.Long-term investments
c.Other non-current assets
D.Profit & loss account
1.Gross revenue(loss)
2.Operating expenses
3.Operating profit
4.Modaraba co's management fees
5.Profit/(loss) before taxation
6.Profit/(loss) after taxation
E.Other items
1.No. of certificates (000)
2.Cash dividend
3.Stock dividend/bonus shares
4.Cash generated from operating activities
F.Efficiency ratios/profitability ratios
1.Return on equity (ROE) (D6/A)
2.Return on capital employed (ROCE) (D5/(C-B1))
3.Return on assets (ROA) (D6/C)
4.Return on revenue (D6/D1)
5.Operating expenses to net income (D2/D6)
6.Management expenses (D4/D2)
7.Earning Per Certificate (D6/E1)
G.Liquidity Ratios
1.Current assets to current liabilities (C1/B1) (times)
2.Total liabilities to total assets (B/C) (times)
3.Long term investment to total assets (C2b/C)
H.Capital /leverage ratios
1.Capital ratio (A/C)
2.Break up value per certificate (A/E1)
I.Cash flow ratio
1.Cash generated from operating activities to profit after tax. (E4/D6) (times)
2.Cash generated from operating activities to current liabilities (E4/B1) (times)
454,488 453,968 423,066 425,973 420,571
872,177 872,177 872,177 872,177 872,177
148,247 151,283 151,283 151,747 151,747
(565,936) (569,492) (600,394) (597,951) (603,353)
(2,097) (1,808) (1,868) (2,417) (2,417)
59,696 62,799 73,505 69,847 59,186
50,115 51,522 52,951 51,769 58,866
9,581 11,277 20,554 18,078 320
512,087 514,959 494,703 493,403 477,340
357,991 273,587 215,299 258,657 344,901
241,497 95,328 45,039 96,877 248,180
116,494 178,259 170,260 161,780 96,721
154,096 241,372 279,404 234,746 132,439
109,310 78,031 91,378 64,149 21,512
35,328 63,684 62,124 55,747 56,547
9,458 99,657 125,902 114,850 54,380
52,631 54,388 59,982 70,535 69,357
26,002 26,742 23,173 32,540 31,893
26,629 27,646 36,809 37,995 37,464
2,082 1,518 0 461 0
20,816 15,179 (19,564) 3,900 (3,705)
20,816 15,179 (19,564) 2,322 (5,402)
87,218 87,218 87,218 87,218 87,218
1.80% 1.30% 0.00% 0.00% 0.00%
0.00% 0.00% 0.00% 0.00% 0.00%
(1,762) (122,847) (2,919) 52,068 137,944
4.58% 3.34% -4.62% 0.55% -1.28%
4.51% 3.28% -4.43% 0.88% -0.89%
4.06% 2.95% -3.95% 0.47% -1.13%
39.55% 27.91% -32.62% 3.29% -7.79%
124.91% 176.18% -118.45% 1,401.38% -590.39%
8.01% 5.68% 0.00% 1.42% 0.00%
0.24 0.17 -0.22 0.03 -0.06
7.14 5.31 4.07 5.00 5.86
0.12 0.12 0.15 0.14 0.12
6.90% 12.37% 12.56% 11.30% 11.85%
88.75% 88.16% 85.52% 86.33% 88.11%
5.21 5.20 4.85 4.88 4.82
-0.08 -8.09 0.15 22.42 -25.54
-0.04 -2.38 -0.06 1.01 2.34
(Thousand Rupees)First Prudential Modaraba
126

Financial Statement Analysis of Financial Sector 2020
2016 2017 2018 2019 2020Items
A.Total equity (A1 to A3)
1.Certificate capital
2.Reserves
3.Unappropriated profit
4.Others
B.Total liabilities (B1 + B2)
1.Current liabilities
2.Non-current liabilities
C.Total assets (C1+C2)
1.Current assets (a + b)
a.Cash and banks balances
b.Other current assets
2.Non-current assets (a + b + c)
a.Fixed assets
b.Long-term investments
c.Other non-current assets
D.Profit & loss account
1.Gross revenue(loss)
2.Operating expenses
3.Operating profit
4.Modaraba co's management fees
5.Profit/(loss) before taxation
6.Profit/(loss) after taxation
E.Other items
1.No. of certificates (000)
2.Cash dividend
3.Stock dividend/bonus shares
4.Cash generated from operating activities
F.Efficiency ratios/profitability ratios
1.Return on equity (ROE) (D6/A)
2.Return on capital employed (ROCE) (D5/(C-B1))
3.Return on assets (ROA) (D6/C)
4.Return on revenue (D6/D1)
5.Operating expenses to net income (D2/D6)
6.Management expenses (D4/D2)
7.Earning Per Certificate (D6/E1)
G.Liquidity Ratios
1.Current assets to current liabilities (C1/B1) (times)
2.Total liabilities to total assets (B/C) (times)
3.Long term investment to total assets (C2b/C)
H.Capital /leverage ratios
1.Capital ratio (A/C)
2.Break up value per certificate (A/E1)
I.Cash flow ratio
1.Cash generated from operating activities to profit after tax. (E4/D6) (times)
2.Cash generated from operating activities to current liabilities (E4/B1) (times)
181,733 191,650 203,394 192,610 137,299
340,200 340,200 340,200 340,200 340,200
204,120 209,697 215,447 216,693 216,693
(362,587) (358,247) (352,253) (364,283) (419,594)
0 0 0 0 0
1,245,629 1,682,169 1,789,466 1,936,987 1,946,675
281,985 574,487 571,996 661,135 1,232,390
963,644 1,107,682 1,217,470 1,275,852 714,285
1,427,362 1,873,819 1,992,860 2,129,597 2,083,974
839,608 1,081,453 1,165,798 1,229,635 1,192,619
30,065 41,753 47,169 43,025 25,103
809,543 1,039,700 1,118,629 1,186,610 1,167,516
587,754 792,366 827,062 899,962 891,355
218,350 181,418 228,228 367,049 513,017
310,447 554,186 536,307 468,310 313,735
58,957 56,762 62,527 64,603 64,603
139,483 173,639 139,413 187,430 198,084
22,077 29,374 35,351 39,202 38,374
117,406 144,265 104,062 148,228 159,710
1,716 2,672 3,079 0 0
21,162 24,048 27,713 6,688 (55,311)
27,533 27,885 28,754 6,225 (55,311)
34,020 34,020 34,020 34,020 34,020
5.00% 5.00% 0.05% 0.00% 0.00%
0.00% 0.00% 0.00% 0.00% 0.00%
42,174 37,491 (36,914) (62,398) (10,544)
15.15% 14.55% 14.14% 3.23% -40.29%
1.85% 1.85% 1.95% 0.46% -6.50%
1.93% 1.49% 1.44% 0.29% -2.65%
19.74% 16.06% 20.63% 3.32% -27.92%
80.18% 105.34% 122.94% 629.75% -69.38%
7.77% 9.10% 8.71% 0.00% 0.00%
0.81 0.82 0.85 0.18 -1.63
2.98 1.88 2.04 1.86 0.97
0.87 0.90 0.90 0.91 0.93
21.75% 29.58% 26.91% 21.99% 15.05%
12.73% 10.23% 10.21% 9.04% 6.59%
5.34 5.63 5.98 5.66 4.04
1.53 1.34 -1.28 -10.02 0.19
0.15 0.07 -0.06 -0.09 -0.01
(Thousand Rupees)First Punjab Modaraba
127

Financial Statement Analysis of Financial Sector 2020
2016 2017 2018 2019 2020Items
A.Total equity (A1 to A3)
1.Certificate capital
2.Reserves
3.Unappropriated profit
4.Others
B.Total liabilities (B1 + B2)
1.Current liabilities
2.Non-current liabilities
C.Total assets (C1+C2)
1.Current assets (a + b)
a.Cash and banks balances
b.Other current assets
2.Non-current assets (a + b + c)
a.Fixed assets
b.Long-term investments
c.Other non-current assets
D.Profit & loss account
1.Gross revenue(loss)
2.Operating expenses
3.Operating profit
4.Modaraba co's management fees
5.Profit/(loss) before taxation
6.Profit/(loss) after taxation
E.Other items
1.No. of certificates (000)
2.Cash dividend
3.Stock dividend/bonus shares
4.Cash generated from operating activities
F.Efficiency ratios/profitability ratios
1.Return on equity (ROE) (D6/A)
2.Return on capital employed (ROCE) (D5/(C-B1))
3.Return on assets (ROA) (D6/C)
4.Return on revenue (D6/D1)
5.Operating expenses to net income (D2/D6)
6.Management expenses (D4/D2)
7.Earning Per Certificate (D6/E1)
G.Liquidity Ratios
1.Current assets to current liabilities (C1/B1) (times)
2.Total liabilities to total assets (B/C) (times)
3.Long term investment to total assets (C2b/C)
H.Capital /leverage ratios
1.Capital ratio (A/C)
2.Break up value per certificate (A/E1)
I.Cash flow ratio
1.Cash generated from operating activities to profit after tax. (E4/D6) (times)
2.Cash generated from operating activities to current liabilities (E4/B1) (times)
4,431,064 4,514,382 4,041,602 1,655,366 (1,391,736)
1,956,000 1,956,000 1,956,000 1,956,000 1,956,000
2,383,598 2,464,811 2,464,811 2,464,811 2,464,811
91,466 93,571 (379,209) (2,765,445) (5,812,547)
29,753 28,371 26,989 387,476 385,359
730,183 4,324,551 8,150,774 11,132,852 12,557,803
617,334 4,268,125 8,150,774 11,123,580 12,494,020
112,849 56,426 0 9,272 63,783
5,191,000 8,867,304 12,219,365 13,175,694 11,551,426
1,382,380 2,015,512 3,767,288 4,481,876 3,011,539
200,209 147,628 589,898 99,596 169,137
1,182,171 1,867,884 3,177,390 4,382,280 2,842,402
3,808,620 6,851,792 8,452,077 8,693,818 8,539,887
3,780,937 6,827,550 8,436,604 8,682,886 8,418,377
0 0 0 0 0
27,683 24,242 15,473 10,932 121,510
366,140 348,867 49,409 (955,231) (836,920)
168,253 149,213 342,816 1,117,527 1,604,052
197,887 199,654 (293,407) (2,072,758) (2,440,972)
0 0 0 0 0
244,358 204,577 (357,120) (2,391,792) (3,048,041)
244,358 204,577 (357,120) (2,391,792) (3,049,219)
195,600 195,600 195,600 195,600 195,600
6.27% 5.98% 0.00% 0.00% 0.00%
0.00% 0.00% 0.00% 0.00% 0.00%
265,255 (346,864) (1,519,086) (2,929,040) (852,422)
5.51% 4.53% -8.84% -144.49% 219.09%
5.34% 4.45% -8.78% -116.55% 323.37%
4.71% 2.31% -2.92% -18.15% -26.40%
66.74% 58.64% -722.78% 250.39% 364.34%
68.86% 72.94% -95.99% -46.72% -52.61%
0.00% 0.00% 0.00% 0.00% 0.00%
1.25 1.05 -1.83 -12.23 -15.59
2.24 0.47 0.46 0.40 0.24
0.14 0.49 0.67 0.84 1.09
0.00% 0.00% 0.00% 0.00% 0.00%
85.36% 50.91% 33.08% 12.56% -12.05%
22.65 23.08 20.66 8.46 -7.12
1.09 -1.70 4.25 1.22 0.28
0.43 -0.08 -0.19 -0.26 -0.07
(Thousand Rupees)First Treet Manufacturing Modaraba
128

Financial Statement Analysis of Financial Sector 2020
2016 2017 2018 2019 2020Items
A.Total equity (A1 to A3)
1.Certificate capital
2.Reserves
3.Unappropriated profit
4.Others
B.Total liabilities (B1 + B2)
1.Current liabilities
2.Non-current liabilities
C.Total assets (C1+C2)
1.Current assets (a + b)
a.Cash and banks balances
b.Other current assets
2.Non-current assets (a + b + c)
a.Fixed assets
b.Long-term investments
c.Other non-current assets
D.Profit & loss account
1.Gross revenue(loss)
2.Operating expenses
3.Operating profit
4.Modaraba co's management fees
5.Profit/(loss) before taxation
6.Profit/(loss) after taxation
E.Other items
1.No. of certificates (000)
2.Cash dividend
3.Stock dividend/bonus shares
4.Cash generated from operating activities
F.Efficiency ratios/profitability ratios
1.Return on equity (ROE) (D6/A)
2.Return on capital employed (ROCE) (D5/(C-B1))
3.Return on assets (ROA) (D6/C)
4.Return on revenue (D6/D1)
5.Operating expenses to net income (D2/D6)
6.Management expenses (D4/D2)
7.Earning Per Certificate (D6/E1)
G.Liquidity Ratios
1.Current assets to current liabilities (C1/B1) (times)
2.Total liabilities to total assets (B/C) (times)
3.Long term investment to total assets (C2b/C)
H.Capital /leverage ratios
1.Capital ratio (A/C)
2.Break up value per certificate (A/E1)
I.Cash flow ratio
1.Cash generated from operating activities to profit after tax. (E4/D6) (times)
2.Cash generated from operating activities to current liabilities (E4/B1) (times)
204,502 200,337 202,656 180,116 182,390
211,631 211,631 211,631 211,631 211,631
30,053 31,744 31,744 31,744 31,744
(37,182) (43,038) (40,719) (63,259) (60,985)
(8,168) (822) (1,430) (2,208) (1,914)
19,601 12,538 11,355 15,186 13,705
19,601 12,538 11,355 15,081 13,370
0 0 0 105 335
215,935 212,053 212,581 193,094 194,181
8,585 5,454 21,450 36,146 50,858
139 141 231 6,509 1,543
8,446 5,313 21,219 29,637 49,315
207,350 206,599 191,131 156,948 143,323
1,709 139,264 1,322 59,978 54,186
72,720 67,276 189,750 96,911 89,078
132,921 59 59 59 59
4,708 6,942 18,000 19,943 26,755
607 2,659 15,711 40,374 24,696
4,101 4,283 2,289 (20,431) 2,059
0 385 0 0 256
4,134 3,412 2,320 (20,425) 2,274
4,134 2,004 2,320 (20,425) 2,274
21,163 21,163 21,163 21,163 21,163
0.00% 0.00% 0.01% 0.00% 0.00%
0.00% 0.00% 0.00% 0.00% 0.00%
132,687 22 (1,347) (12,974) (7,177)
2.02% 1.00% 1.14% -11.34% 1.25%
2.11% 1.71% 1.15% -11.47% 1.26%
1.91% 0.95% 1.09% -10.58% 1.17%
87.81% 28.87% 12.89% -102.42% 8.50%
14.68% 132.68% 677.20% -197.67% 1,086.02%
0.00% 14.48% 0.00% 0.00% 1.04%
0.20 0.09 0.11 -0.97 0.11
0.44 0.43 1.89 2.40 3.80
0.09 0.06 0.05 0.08 0.07
33.68% 31.73% 89.26% 50.19% 45.87%
94.71% 94.47% 95.33% 93.28% 93.93%
9.66 9.47 9.58 8.51 8.62
32.10 0.01 -0.58 0.64 -3.16
6.77 0.00 -0.12 -0.86 -0.54
(Thousand Rupees)First Tri-Star Modaraba
129

Financial Statement Analysis of Financial Sector 2020
2016 2017 2018 2019 2020Items
A.Total equity (A1 to A3)
1.Certificate capital
2.Reserves
3.Unappropriated profit
4.Others
B.Total liabilities (B1 + B2)
1.Current liabilities
2.Non-current liabilities
C.Total assets (C1+C2)
1.Current assets (a + b)
a.Cash and banks balances
b.Other current assets
2.Non-current assets (a + b + c)
a.Fixed assets
b.Long-term investments
c.Other non-current assets
D.Profit & loss account
1.Gross revenue(loss)
2.Operating expenses
3.Operating profit
4.Modaraba co's management fees
5.Profit/(loss) before taxation
6.Profit/(loss) after taxation
E.Other items
1.No. of certificates (000)
2.Cash dividend
3.Stock dividend/bonus shares
4.Cash generated from operating activities
F.Efficiency ratios/profitability ratios
1.Return on equity (ROE) (D6/A)
2.Return on capital employed (ROCE) (D5/(C-B1))
3.Return on assets (ROA) (D6/C)
4.Return on revenue (D6/D1)
5.Operating expenses to net income (D2/D6)
6.Management expenses (D4/D2)
7.Earning Per Certificate (D6/E1)
G.Liquidity Ratios
1.Current assets to current liabilities (C1/B1) (times)
2.Total liabilities to total assets (B/C) (times)
3.Long term investment to total assets (C2b/C)
H.Capital /leverage ratios
1.Capital ratio (A/C)
2.Break up value per certificate (A/E1)
I.Cash flow ratio
1.Cash generated from operating activities to profit after tax. (E4/D6) (times)
2.Cash generated from operating activities to current liabilities (E4/B1) (times)
547,503 553,646 515,276 461,855 459,791
263,866 263,866 263,866 290,252 319,278
252,531 259,037 259,037 232,651 203,626
31,106 30,743 (7,627) (61,048) (63,113)
95,524 167,142 70,814 (24,432) 22,715
237,346 136,394 108,237 54,515 50,036
99,625 117,173 97,927 43,422 42,978
137,721 19,221 10,310 11,093 7,058
880,373 857,182 694,327 491,938 532,542
256,853 203,309 207,015 80,810 96,634
148,389 91,589 55,860 25,817 67,001
108,464 111,720 151,155 54,993 29,633
623,520 653,873 487,312 411,128 435,908
398,292 312,720 249,576 127,536 107,047
224,351 300,972 202,366 242,765 285,545
877 40,181 35,370 40,827 43,316
175,138 225,162 75,612 34,464 38,296
48,159 53,302 22,570 44,000 41,000
126,979 171,860 53,042 (9,536) (2,704)
3,950 4,029 0 0 0
34,334 32,530 47,770 (15,356) (2,800)
34,334 32,530 (7,232) (15,739) (2,800)
26,387 26,387 26,387 29,025 31,928
10.00% 11.00% 0.00% 0.00% 0.00%
0.00% 0.00% 0.10% 0.10% 0.10%
71,424 101,168 (32,457) (10,563) 28,915
6.27% 5.88% -1.40% -3.41% -0.61%
4.40% 4.40% 8.01% -3.42% -0.57%
3.90% 3.79% -1.04% -3.20% -0.53%
19.60% 14.45% -9.56% -45.67% -7.31%
140.27% 163.85% -312.09% -279.56% -1,464.29%
8.20% 7.56% 0.00% 0.00% 0.00%
1.30 1.23 -0.27 -0.54 -0.09
2.58 1.74 2.11 1.86 2.25
0.27 0.16 0.16 0.11 0.09
25.48% 35.11% 29.15% 49.35% 53.62%
62.19% 64.59% 74.21% 93.88% 86.34%
20.75 20.98 19.53 15.91 14.40
2.08 3.11 4.49 0.67 -10.33
0.72 0.86 -0.33 -0.24 0.67
(Thousand Rupees)First UDL Modaraba
130

Financial Statement Analysis of Financial Sector 2020
2018 2019 2020Items
A.Total equity (A1 to A3)
1.Certificate capital
2.Reserves
3.Unappropriated profit
4.Others
B.Total liabilities (B1 + B2)
1.Current liabilities
2.Non-current liabilities
C.Total assets (C1+C2)
1.Current assets (a + b)
a.Cash and banks balances
b.Other current assets
2.Non-current assets (a + b + c)
a.Fixed assets
b.Long-term investments
c.Other non-current assets
D.Profit & loss account
1.Gross revenue(loss)
2.Operating expenses
3.Operating profit
4.Modaraba co's management fees
5.Profit/(loss) before taxation
6.Profit/(loss) after taxation
E.Other items
1.No. of certificates (000)
2.Cash dividend
3.Stock dividend/bonus shares
4.Cash generated from operating activities
F.Efficiency ratios/profitability ratios
1.Return on equity (ROE) (D6/A)
2.Return on capital employed (ROCE) (D5/(C-B1))
3.Return on assets (ROA) (D6/C)
4.Return on revenue (D6/D1)
5.Operating expenses to net income (D2/D6)
6.Management expenses (D4/D2)
7.Earning Per Certificate (D6/E1)
G.Liquidity Ratios
1.Current assets to current liabilities (C1/B1) (times)
2.Total liabilities to total assets (B/C) (times)
3.Long term investment to total assets (C2b/C)
H.Capital /leverage ratios
1.Capital ratio (A/C)
2.Break up value per certificate (A/E1)
I.Cash flow ratio
1.Cash generated from operating activities to profit after tax. (E4/D6) (times)
2.Cash generated from operating activities to current liabilities (E4/B1) (times)
304,012 312,107 335,440
300,000 300,000 300,000
802 3,021 9,338
3,210 9,086 26,102
0 0 0
978 7,311 10,477
978 7,311 10,477
0 0 0
304,990 319,418 345,917
90,626 147,069 206,823
33,525 32,276 34,523
57,101 114,793 172,300
214,364 172,349 139,094
5,104 4,524 3,390
8,442 131,054 130,453
200,818 36,771 5,251
12,657 29,394 50,714
6,607 15,273 15,709
6,050 14,121 35,005
0 0 3,223
4,012 11,095 28,014
4,012 11,095 28,014
30,000 30,000 30,000
1.00% 3.00% 7.00%
0.00% 0.00% 0.00%
(209,019) 1,300 (5,451)
1.32% 3.55% 8.35%
1.32% 3.55% 8.35%
1.32% 3.47% 8.10%
31.70% 37.75% 55.24%
164.68% 137.66% 56.08%
0.00% 0.00% 20.52%
0.13 0.37 0.93
92.66 20.12 19.74
0.00 0.02 0.03
2.77% 41.03% 37.71%
99.68% 97.71% 96.97%
10.13 10.40 11.18
-52.10 0.12 -0.19
-213.72 0.18 -0.52
(Thousand Rupees)Habib Metro Modaraba
131

Financial Statement Analysis of Financial Sector 2020
2016 2017 2018 2019 2020Items
A.Total equity (A1 to A3)
1.Certificate capital
2.Reserves
3.Unappropriated profit
4.Others
B.Total liabilities (B1 + B2)
1.Current liabilities
2.Non-current liabilities
C.Total assets (C1+C2)
1.Current assets (a + b)
a.Cash and banks balances
b.Other current assets
2.Non-current assets (a + b + c)
a.Fixed assets
b.Long-term investments
c.Other non-current assets
D.Profit & loss account
1.Gross revenue(loss)
2.Operating expenses
3.Operating profit
4.Modaraba co's management fees
5.Profit/(loss) before taxation
6.Profit/(loss) after taxation
E.Other items
1.No. of certificates (000)
2.Cash dividend
3.Stock dividend/bonus shares
4.Cash generated from operating activities
F.Efficiency ratios/profitability ratios
1.Return on equity (ROE) (D6/A)
2.Return on capital employed (ROCE) (D5/(C-B1))
3.Return on assets (ROA) (D6/C)
4.Return on revenue (D6/D1)
5.Operating expenses to net income (D2/D6)
6.Management expenses (D4/D2)
7.Earning Per Certificate (D6/E1)
G.Liquidity Ratios
1.Current assets to current liabilities (C1/B1) (times)
2.Total liabilities to total assets (B/C) (times)
3.Long term investment to total assets (C2b/C)
H.Capital /leverage ratios
1.Capital ratio (A/C)
2.Break up value per certificate (A/E1)
I.Cash flow ratio
1.Cash generated from operating activities to profit after tax. (E4/D6) (times)
2.Cash generated from operating activities to current liabilities (E4/B1) (times)
178,832 182,865 189,280 190,966 192,324
201,875 201,875 216,875 216,875 216,875
46,686 49,799 48,386 46,306 47,931
(69,729) (68,809) (75,981) (72,215) (72,482)
0 0 0 0 0
45,433 45,486 34,942 38,768 36,736
35,386 35,722 24,787 28,757 33,064
10,047 9,764 10,155 10,011 3,672
224,265 228,351 224,222 229,734 229,060
88,554 85,669 104,646 99,656 92,352
20,702 13,917 23,504 32,048 44,159
67,852 71,752 81,142 67,608 48,193
135,711 142,682 119,576 130,078 136,708
36,507 44,854 42,982 40,196 29,377
82,084 77,084 72,084 67,084 62,084
17,120 20,744 4,510 22,798 45,247
43,915 47,400 35,689 36,675 27,324
22,154 24,436 22,010 18,648 16,466
21,761 22,964 13,679 18,027 10,858
1,093 1,112 5 523 445
9,840 11,209 43 5,231 4,448
9,840 10,008 43 4,708 4,003
20,188 20,188 21,688 21,688 21,688
3.51% 3.57% 0.00% 1.60% 1.30%
0.00% 0.00% 0.00% 0.00% 0.00%
37,143 (7,638) 27,686 18,991 10,071
5.50% 5.47% 0.02% 2.47% 2.08%
5.21% 5.82% 0.02% 2.60% 2.27%
4.39% 4.38% 0.02% 2.05% 1.75%
22.41% 21.11% 0.12% 12.84% 14.65%
225.14% 244.16% 51,186.05% 396.09% 411.34%
4.93% 4.55% 0.02% 2.80% 2.70%
0.49 0.50 0.00 0.22 0.18
2.50 2.40 4.22 3.47 2.79
0.20 0.20 0.16 0.17 0.16
36.60% 33.76% 32.15% 29.20% 27.10%
79.74% 80.08% 84.42% 83.12% 83.96%
8.86 9.06 8.73 8.81 8.87
3.77 -0.76 643.86 4.03 2.52
1.05 -0.21 1.12 0.66 0.30
(Thousand Rupees)IBL Modaraba
132

Financial Statement Analysis of Financial Sector 2020
2016 2017 2018 2019 2020Items
A.Total equity (A1 to A3)
1.Certificate capital
2.Reserves
3.Unappropriated profit
4.Others
B.Total liabilities (B1 + B2)
1.Current liabilities
2.Non-current liabilities
C.Total assets (C1+C2)
1.Current assets (a + b)
a.Cash and banks balances
b.Other current assets
2.Non-current assets (a + b + c)
a.Fixed assets
b.Long-term investments
c.Other non-current assets
D.Profit & loss account
1.Gross revenue(loss)
2.Operating expenses
3.Operating profit
4.Modaraba co's management fees
5.Profit/(loss) before taxation
6.Profit/(loss) after taxation
E.Other items
1.No. of certificates (000)
2.Cash dividend
3.Stock dividend/bonus shares
4.Cash generated from operating activities
F.Efficiency ratios/profitability ratios
1.Return on equity (ROE) (D6/A)
2.Return on capital employed (ROCE) (D5/(C-B1))
3.Return on assets (ROA) (D6/C)
4.Return on revenue (D6/D1)
5.Operating expenses to net income (D2/D6)
6.Management expenses (D4/D2)
7.Earning Per Certificate (D6/E1)
G.Liquidity Ratios
1.Current assets to current liabilities (C1/B1) (times)
2.Total liabilities to total assets (B/C) (times)
3.Long term investment to total assets (C2b/C)
H.Capital /leverage ratios
1.Capital ratio (A/C)
2.Break up value per certificate (A/E1)
I.Cash flow ratio
1.Cash generated from operating activities to profit after tax. (E4/D6) (times)
2.Cash generated from operating activities to current liabilities (E4/B1) (times)
487,994 490,416 373,908 339,669 237,360
480,665 480,665 480,665 480,665 480,665
82,591 83,505 83,505 83,505 83,505
(75,262) (73,754) (190,262) (224,501) (326,810)
(98,961) (98,960) (98,960) (98,960) (98,960)
512,212 208,251 100,650 29,875 16,007
295,207 137,637 79,115 23,005 12,237
217,005 70,614 21,535 6,870 3,770
901,245 599,707 375,598 270,584 154,407
591,030 488,336 277,741 236,436 141,820
48,705 22,604 30,948 51,147 71,872
542,325 465,732 246,793 185,289 69,948
310,215 111,371 97,857 34,148 12,587
68,653 52,056 35,660 14,796 5,125
0 0 0 0 0
241,562 59,315 62,197 19,352 7,462
141,519 85,127 46,011 18,189 3,491
73,669 56,723 51,303 35,746 28,689
67,850 28,404 (5,292) (17,557) (25,198)
824 457 0 0 0
8,245 4,570 (114,209) (34,240) (102,921)
8,245 4,570 (114,209) (34,240) (102,921)
48,067 48,067 48,067 48,067 48,067
0.80% 0.70% 0.00% 0.00% 0.00%
0.00% 0.00% 0.00% 0.00% 0.00%
50,279 242,412 98,825 74,388 33,292
1.69% 0.93% -30.54% -10.08% -43.36%
1.36% 0.99% -38.52% -13.83% -72.39%
0.91% 0.76% -30.41% -12.65% -66.66%
5.83% 5.37% -248.22% -188.25% -2,948.18%
893.50% 1,241.20% -44.92% -104.40% -27.87%
1.12% 0.81% 0.00% 0.00% 0.00%
0.17 0.10 -2.38 -0.71 -2.14
2.00 3.55 3.51 10.28 11.59
0.57 0.35 0.27 0.11 0.10
0.00% 0.00% 0.00% 0.00% 0.00%
54.15% 81.78% 99.55% 125.53% 153.72%
10.15 10.20 7.78 7.07 4.94
6.10 53.04 -0.87 -2.17 -0.32
0.17 1.76 1.25 3.23 2.72
(Thousand Rupees)KASB Modaraba
133

Financial Statement Analysis of Financial Sector 2020
2016 2017 2018 2019 2020Items
A.Total equity (A1 to A3)
1.Certificate capital
2.Reserves
3.Unappropriated profit
4.Others
B.Total liabilities (B1 + B2)
1.Current liabilities
2.Non-current liabilities
C.Total assets (C1+C2)
1.Current assets (a + b)
a.Cash and banks balances
b.Other current assets
2.Non-current assets (a + b + c)
a.Fixed assets
b.Long-term investments
c.Other non-current assets
D.Profit & loss account
1.Gross revenue(loss)
2.Operating expenses
3.Operating profit
4.Modaraba co's management fees
5.Profit/(loss) before taxation
6.Profit/(loss) after taxation
E.Other items
1.No. of certificates (000)
2.Cash dividend
3.Stock dividend/bonus shares
4.Cash generated from operating activities
F.Efficiency ratios/profitability ratios
1.Return on equity (ROE) (D6/A)
2.Return on capital employed (ROCE) (D5/(C-B1))
3.Return on assets (ROA) (D6/C)
4.Return on revenue (D6/D1)
5.Operating expenses to net income (D2/D6)
6.Management expenses (D4/D2)
7.Earning Per Certificate (D6/E1)
G.Liquidity Ratios
1.Current assets to current liabilities (C1/B1) (times)
2.Total liabilities to total assets (B/C) (times)
3.Long term investment to total assets (C2b/C)
H.Capital /leverage ratios
1.Capital ratio (A/C)
2.Break up value per certificate (A/E1)
I.Cash flow ratio
1.Cash generated from operating activities to profit after tax. (E4/D6) (times)
2.Cash generated from operating activities to current liabilities (E4/B1) (times)
159,540 162,377 168,478 233,300 248,759
184,239 184,239 184,239 184,239 184,239
58,459 59,764 62,082 130,208 133,929
(83,158) (81,626) (77,843) (81,147) (69,409)
0 0 0 0 0
59,800 33,907 27,132 27,786 23,556
33,158 26,318 26,897 27,686 23,456
26,642 7,589 235 100 100
219,340 196,284 195,610 261,086 272,315
44,833 66,402 101,048 103,209 123,008
5,936 19,591 47,176 49,182 64,480
38,897 46,811 53,872 54,027 58,528
174,507 129,882 94,562 157,877 149,307
174,507 124,550 84,160 76,040 72,859
0 0 0 70,604 72,090
0 5,332 10,402 11,233 4,358
54,389 55,272 54,992 34,891 24,862
13,912 10,117 10,516 7,763 6,738
40,477 45,155 44,476 27,128 18,124
0 0 0 0 0
5,267 7,263 12,708 8,780 19,291
4,681 6,522 11,594 7,965 18,607
18,424 18,424 18,424 18,424 18,424
2.00% 2.80% 5.00% 1.60% 7.00%
0.00% 0.00% 0.00% 0.00% 0.00%
41,505 26,590 29,194 13,409 8,402
2.93% 4.02% 6.88% 3.41% 7.48%
2.83% 4.27% 7.53% 3.76% 7.75%
2.13% 3.32% 5.93% 3.05% 6.83%
8.61% 11.80% 21.08% 22.83% 74.84%
297.20% 155.12% 90.70% 97.46% 36.21%
0.00% 0.00% 0.00% 0.00% 0.00%
0.25 0.35 0.63 0.43 1.01
1.35 2.52 3.76 3.73 5.24
0.27 0.17 0.14 0.11 0.09
0.00% 0.00% 0.00% 27.04% 26.47%
72.74% 82.73% 86.13% 89.36% 91.35%
8.66 8.81 9.14 12.66 13.50
8.87 4.08 2.52 1.68 0.45
1.25 1.01 1.09 0.48 0.36
(Thousand Rupees)Modaraba Al-Mali
134

Financial Statement Analysis of Financial Sector 2020
2017 2018 2019 2020Items
A.Total equity (A1 to A3)
1.Certificate capital
2.Reserves
3.Unappropriated profit
4.Others
B.Total liabilities (B1 + B2)
1.Current liabilities
2.Non-current liabilities
C.Total assets (C1+C2)
1.Current assets (a + b)
a.Cash and banks balances
b.Other current assets
2.Non-current assets (a + b + c)
a.Fixed assets
b.Long-term investments
c.Other non-current assets
D.Profit & loss account
1.Gross revenue(loss)
2.Operating expenses
3.Operating profit
4.Modaraba co's management fees
5.Profit/(loss) before taxation
6.Profit/(loss) after taxation
E.Other items
1.No. of certificates (000)
2.Cash dividend
3.Stock dividend/bonus shares
4.Cash generated from operating activities
F.Efficiency ratios/profitability ratios
1.Return on equity (ROE) (D6/A)
2.Return on capital employed (ROCE) (D5/(C-B1))
3.Return on assets (ROA) (D6/C)
4.Return on revenue (D6/D1)
5.Operating expenses to net income (D2/D6)
6.Management expenses (D4/D2)
7.Earning Per Certificate (D6/E1)
G.Liquidity Ratios
1.Current assets to current liabilities (C1/B1) (times)
2.Total liabilities to total assets (B/C) (times)
3.Long term investment to total assets (C2b/C)
H.Capital /leverage ratios
1.Capital ratio (A/C)
2.Break up value per certificate (A/E1)
I.Cash flow ratio
1.Cash generated from operating activities to profit after tax. (E4/D6) (times)
2.Cash generated from operating activities to current liabilities (E4/B1) (times)
821,501 872,486 827,790
750,000 750,000 750,000
14,300 34,847 49,999
57,201 87,639 27,791
0 0 0
640,734 734,902 849,365
229,484 443,652 383,962
411,250 291,250 465,403
1,462,235 1,607,388 1,677,155
293,407 394,584 474,057
46,122 38,866 18,843
247,285 355,718 455,214
1,168,828 1,212,804 1,203,098
1,124,556 1,196,151 1,198,400
0 0 0
44,272 16,653 4,698
610,618 1,274,761 1,161,060
470,253 1,030,009 944,379
140,365 244,752 216,681
8,226 11,819 3,486
71,501 102,735 30,305
71,501 102,735 30,305
75,000 75,000 75,000
6.90% 10.00% 1.80%
0.00% 0.00% 0.00%
88,444 230,971 200,465
8.70% 11.77% 3.66%
5.80% 8.83% 2.34%
4.89% 6.39% 1.81%
11.71% 8.06% 2.61%
657.69% 1,002.59% 3,116.25%
1.75% 1.15% 0.37%
0.95 1.37 0.40
1.28 0.89 1.23
0.44 0.46 0.51
0.00% 0.00% 0.00%
56.18% 54.28% 49.36%
10.95 11.63 11.04
1.24 2.25 6.61
0.39 0.52 0.52
-
-
-
-
-
-
-
-
-
-
-
-
-
-
-
-
-
-
-
-
-
-
-
-
-
-
-
-
-
-
-
-
-
-
-
-
-
-
-
-
(Thousand Rupees)Orient Rental Modaraba
135

Financial Statement Analysis of Financial Sector 2020
2016 2017 2018 2019 2020Items
A.Total equity (A1 to A3)
1.Certificate capital
2.Reserves
3.Unappropriated profit
4.Others
B.Total liabilities (B1 + B2)
1.Current liabilities
2.Non-current liabilities
C.Total assets (C1+C2)
1.Current assets (a + b)
a.Cash and banks balances
b.Other current assets
2.Non-current assets (a + b + c)
a.Fixed assets
b.Long-term investments
c.Other non-current assets
D.Profit & loss account
1.Gross revenue(loss)
2.Operating expenses
3.Operating profit
4.Modaraba co's management fees
5.Profit/(loss) before taxation
6.Profit/(loss) after taxation
E.Other items
1.No. of certificates (000)
2.Cash dividend
3.Stock dividend/bonus shares
4.Cash generated from operating activities
F.Efficiency ratios/profitability ratios
1.Return on equity (ROE) (D6/A)
2.Return on capital employed (ROCE) (D5/(C-B1))
3.Return on assets (ROA) (D6/C)
4.Return on revenue (D6/D1)
5.Operating expenses to net income (D2/D6)
6.Management expenses (D4/D2)
7.Earning Per Certificate (D6/E1)
G.Liquidity Ratios
1.Current assets to current liabilities (C1/B1) (times)
2.Total liabilities to total assets (B/C) (times)
3.Long term investment to total assets (C2b/C)
H.Capital /leverage ratios
1.Capital ratio (A/C)
2.Break up value per certificate (A/E1)
I.Cash flow ratio
1.Cash generated from operating activities to profit after tax. (E4/D6) (times)
2.Cash generated from operating activities to current liabilities (E4/B1) (times)
1,176,182 1,150,119 1,147,880 1,160,475 1,174,473
453,835 453,835 453,835 453,835 453,835
534,143 540,555 546,570 552,873 559,246
188,204 155,729 147,475 153,767 161,392
0 0 0 0 0
4,122,954 4,812,172 5,805,557 5,805,538 6,071,894
2,825,897 3,467,564 4,206,170 4,206,665 4,936,903
1,297,057 1,344,608 1,599,387 1,598,873 1,134,991
5,299,136 5,962,291 6,953,437 6,966,013 7,246,367
591,358 590,809 1,173,942 1,789,621 2,362,837
266,802 367,303 409,085 432,293 1,038,077
324,556 223,506 764,857 1,357,328 1,324,760
4,707,778 5,371,482 5,779,495 5,176,392 4,883,530
3,678,230 4,475,895 3,850,100 3,147,995 2,637,732
1,029,548 895,587 1,929,395 2,028,397 2,245,798
0 0 0 0 0
1,848,281 1,890,890 1,953,231 2,026,748 2,014,775
106,551 130,365 139,705 152,951 175,713
1,741,730 1,760,525 1,813,526 1,873,797 1,839,062
19,939 13,596 13,839 14,501 14,663
173,123 128,241 120,297 126,057 127,458
173,123 128,241 120,297 126,057 127,458
45,384 45,384 45,384 45,384 45,384
34.00% 27.00% 25.00% 25.00% 25.00%
0.00% 0.00% 0.00% 0.00% 0.00%
201,044 (341,089) (915,419) 157,871 272,389
14.72% 11.15% 10.48% 10.86% 10.85%
7.00% 5.14% 4.38% 4.57% 5.52%
3.27% 2.15% 1.73% 1.81% 1.76%
9.37% 6.78% 6.16% 6.22% 6.33%
61.55% 101.66% 116.13% 121.33% 137.86%
18.71% 10.43% 9.91% 9.48% 8.34%
3.81 2.83 2.65 2.78 2.81
0.21 0.17 0.28 0.43 0.48
0.78 0.81 0.83 0.83 0.84
19.43% 15.02% 27.75% 29.12% 30.99%
22.20% 19.29% 16.51% 16.66% 16.21%
25.92 25.34 25.29 25.57 25.88
1.16 -2.66 -7.61 1.25 2.14
0.07 -0.10 -0.22 0.04 0.06
(Thousand Rupees)Orix Modaraba
136

Financial Statement Analysis of Financial Sector 2020
2016 2017 2018 2019 2020Items
A.Total equity (A1 to A3)
1.Certificate capital
2.Reserves
3.Unappropriated profit
4.Others
B.Total liabilities (B1 + B2)
1.Current liabilities
2.Non-current liabilities
C.Total assets (C1+C2)
1.Current assets (a + b)
a.Cash and banks balances
b.Other current assets
2.Non-current assets (a + b + c)
a.Fixed assets
b.Long-term investments
c.Other non-current assets
D.Profit & loss account
1.Gross revenue(loss)
2.Operating expenses
3.Operating profit
4.Modaraba co's management fees
5.Profit/(loss) before taxation
6.Profit/(loss) after taxation
E.Other items
1.No. of certificates (000)
2.Cash dividend
3.Stock dividend/bonus shares
4.Cash generated from operating activities
F.Efficiency ratios/profitability ratios
1.Return on equity (ROE) (D6/A)
2.Return on capital employed (ROCE) (D5/(C-B1))
3.Return on assets (ROA) (D6/C)
4.Return on revenue (D6/D1)
5.Operating expenses to net income (D2/D6)
6.Management expenses (D4/D2)
7.Earning Per Certificate (D6/E1)
G.Liquidity Ratios
1.Current assets to current liabilities (C1/B1) (times)
2.Total liabilities to total assets (B/C) (times)
3.Long term investment to total assets (C2b/C)
H.Capital /leverage ratios
1.Capital ratio (A/C)
2.Break up value per certificate (A/E1)
I.Cash flow ratio
1.Cash generated from operating activities to profit after tax. (E4/D6) (times)
2.Cash generated from operating activities to current liabilities (E4/B1) (times)
74,013 78,594 81,222 86,061 88,124
100,000 100,000 100,000 100,000 100,000
16,345 17,261 17,787 18,755 19,863
(42,332) (38,667) (36,565) (32,694) (31,739)
0 0 0 0 0
66,640 80,212 44,310 34,510 43,833
22,935 30,370 33,983 29,951 39,907
43,705 49,842 10,327 4,559 3,926
140,653 158,806 125,532 120,571 131,957
29,215 50,597 55,958 55,175 37,203
3,035 6,459 6,169 14,206 4,536
26,180 44,138 49,789 40,969 32,667
111,438 108,209 69,574 65,396 94,754
106,305 98,940 41,414 21,176 48,851
3,300 6,768 27,238 41,321 44,454
1,833 2,501 922 2,899 1,449
26,307 31,398 29,950 25,061 34,558
23,626 29,803 27,454 21,130 29,062
2,681 1,595 2,496 3,931 5,496
0 530 338 558 0
(55,737) 4,600 2,936 4,854 5,543
(56,296) 4,581 2,628 4,839 5,543
10,000 10,000 10,000 10,000 10,000
0.00% 0.00% 0.00% 3.48% 4.04%
0.00% 0.00% 0.00% 0.00% 0.00%
28,932 13,534 28,520 31,366 27,635
-76.06% 5.83% 3.24% 5.62% 6.29%
-47.35% 3.58% 3.21% 5.36% 6.02%
-40.02% 2.88% 2.09% 4.01% 4.20%
-214.00% 14.59% 8.77% 19.31% 16.04%
-41.97% 650.58% 1,044.67% 436.66% 524.30%
0.00% 1.78% 1.23% 2.64% 0.00%
-5.63 0.46 0.26 0.48 0.55
1.27 1.67 1.65 1.84 0.93
0.47 0.51 0.35 0.29 0.33
2.35% 4.26% 21.70% 34.27% 33.69%
52.62% 49.49% 64.70% 71.38% 66.78%
7.40 7.86 8.12 8.61 8.81
-0.51 2.95 10.85 6.48 4.99
1.26 0.45 0.84 1.05 0.69
(Thousand Rupees)Popular Islamic Modaraba
137

Financial Statement Analysis of Financial Sector 2020
2016 2017 2018 2019 2020Items
A.Total equity (A1 to A3)
1.Certificate capital
2.Reserves
3.Unappropriated profit
4.Others
B.Total liabilities (B1 + B2)
1.Current liabilities
2.Non-current liabilities
C.Total assets (C1+C2)
1.Current assets (a + b)
a.Cash and banks balances
b.Other current assets
2.Non-current assets (a + b + c)
a.Fixed assets
b.Long-term investments
c.Other non-current assets
D.Profit & loss account
1.Gross revenue(loss)
2.Operating expenses
3.Operating profit
4.Modaraba co's management fees
5.Profit/(loss) before taxation
6.Profit/(loss) after taxation
E.Other items
1.No. of certificates (000)
2.Cash dividend
3.Stock dividend/bonus shares
4.Cash generated from operating activities
F.Efficiency ratios/profitability ratios
1.Return on equity (ROE) (D6/A)
2.Return on capital employed (ROCE) (D5/(C-B1))
3.Return on assets (ROA) (D6/C)
4.Return on revenue (D6/D1)
5.Operating expenses to net income (D2/D6)
6.Management expenses (D4/D2)
7.Earning Per Certificate (D6/E1)
G.Liquidity Ratios
1.Current assets to current liabilities (C1/B1) (times)
2.Total liabilities to total assets (B/C) (times)
3.Long term investment to total assets (C2b/C)
H.Capital /leverage ratios
1.Capital ratio (A/C)
2.Break up value per certificate (A/E1)
I.Cash flow ratio
1.Cash generated from operating activities to profit after tax. (E4/D6) (times)
2.Cash generated from operating activities to current liabilities (E4/B1) (times)
473,135 983,671 1,015,786 1,063,046 1,609,974
450,000 450,000 450,000 450,000 450,000
23,135 511,324 527,034 551,380 1,094,533
0 22,347 38,752 61,666 65,441
0
42,290 44,923 553,643 576,226 96,196
9,605 25,345 553,467 576,218 96,195
32,685 19,578 176 8 1
515,425 1,028,594 1,569,429 1,639,272 1,706,170
77,776 468,491 1,096,696 1,218,411 1,177,338
40,446 370,776 670,733 788,633 883,708
37,330 97,715 425,963 429,778 293,630
437,649 560,103 472,733 420,861 528,832
212,436 140,455 65,481 13,783 11,165
224,349 419,108 407,036 407,078 513,999
864 540 216 0 3,668
85,493 132,576 88,789 125,017 188,072
17,233 24,124 28,872 32,114 39,223
68,260 108,452 59,917 92,903 148,849
2,389 3,024 6,024 9,335 12,411
20,743 26,287 52,365 81,153 107,885
20,743 26,287 52,365 81,153 107,885
45,000 45,000 45,000 45,000 45,000
3.50% 4.50% 7.50% 0.00% 0.00%
0.00% 0.00% 0.00% 0.00% 0.00%
(59,759) (164,652) 441,544 158,168 (502,766)
4.38% 2.67% 5.16% 7.63% 6.70%
4.10% 2.62% 5.15% 7.63% 6.70%
4.02% 2.56% 3.34% 4.95% 6.32%
24.26% 19.83% 58.98% 64.91% 57.36%
83.08% 91.77% 55.14% 39.57% 36.36%
13.86% 12.54% 20.86% 29.07% 31.64%
0.46 0.58 1.16 1.80 2.40
8.10 18.48 1.98 2.11 12.24
0.08 0.04 0.35 0.35 0.06
43.53% 40.75% 25.94% 24.83% 30.13%
91.80% 95.63% 64.72% 64.85% 94.36%
10.51 21.86 22.57 23.62 35.78
-2.88 -6.26 8.43 1.95 -4.66
-6.22 -6.50 0.80 0.27 -5.23
- - - -
(Thousand Rupees)Sindh Modaraba
138

Financial Statement Analysis of Financial Sector 2020
2016 2017 2018 2019 2020Items
A.Total equity (A1 to A3)
1.Certificate capital
2.Reserves
3.Unappropriated profit
4.Others
B.Total liabilities (B1 + B2)
1.Current liabilities
2.Non-current liabilities
C.Total assets (C1+C2)
1.Current assets (a + b)
a.Cash and banks balances
b.Other current assets
2.Non-current assets (a + b + c)
a.Fixed assets
b.Long-term investments
c.Other non-current assets
D.Profit & loss account
1.Gross revenue(loss)
2.Operating expenses
3.Operating profit
4.Modaraba co's management fees
5.Profit/(loss) before taxation
6.Profit/(loss) after taxation
E.Other items
1.No. of certificates (000)
2.Cash dividend
3.Stock dividend/bonus shares
4.Cash generated from operating activities
F.Efficiency ratios/profitability ratios
1.Return on equity (ROE) (D6/A)
2.Return on capital employed (ROCE) (D5/(C-B1))
3.Return on assets (ROA) (D6/C)
4.Return on revenue (D6/D1)
5.Operating expenses to net income (D2/D6)
6.Management expenses (D4/D2)
7.Earning Per Certificate (D6/E1)
G.Liquidity Ratios
1.Current assets to current liabilities (C1/B1) (times)
2.Total liabilities to total assets (B/C) (times)
3.Long term investment to total assets (C2b/C)
H.Capital /leverage ratios
1.Capital ratio (A/C)
2.Break up value per certificate (A/E1)
I.Cash flow ratio
1.Cash generated from operating activities to profit after tax. (E4/D6) (times)
2.Cash generated from operating activities to current liabilities (E4/B1) (times)
310,165 315,168 306,002 303,871 306,866
298,000 298,000 298,000 298,000 298,000
76,163 78,782 78,508 75,547 77,781
(63,998) (61,614) (70,506) (69,676) (68,915)
0 0 0 0 0
86,007 74,765 71,333 67,398 50,638
48,581 45,800 49,823 40,102 26,024
37,426 28,965 21,510 27,296 24,614
396,172 389,933 377,335 371,269 357,504
207,552 220,782 237,430 213,457 220,395
11,920 15,997 4,162 4,057 8,093
195,632 204,785 233,268 209,400 212,302
188,620 169,151 139,905 157,812 137,109
134,687 133,572 106,229 115,840 100,041
8,849 7,577 12,324 18,959 29,660
45,084 28,002 21,352 23,013 7,408
84,709 84,725 32,018 33,607 34,824
28,589 29,576 27,584 29,699 30,504
56,120 55,149 4,434 3,908 4,320
1,448 1,573 226 133 321
13,030 14,155 2,034 1,198 2,665
13,030 14,155 1,923 1,037 1,732
29,800 29,800 29,800 29,800 29,800
3.00% 3.50% 0.00% 0.00% 0.00%
0.00% 0.00% 0.00% 0.00% 0.00%
25,495 9,532 (6,853) 5,435 20,329
4.20% 4.49% 0.63% 0.34% 0.56%
3.75% 4.11% 0.62% 0.36% 0.80%
3.29% 3.63% 0.51% 0.28% 0.48%
15.38% 16.71% 6.01% 3.09% 4.97%
219.41% 208.94% 1,434.43% 2,863.93% 1,761.20%
5.06% 5.32% 0.82% 0.45% 1.05%
0.44 0.48 0.06 0.03 0.06
4.27 4.82 4.77 5.32 8.47
0.22 0.19 0.19 0.18 0.14
2.23% 1.94% 3.27% 5.11% 8.30%
78.29% 80.83% 81.10% 81.85% 85.84%
10.41 10.58 10.27 10.20 10.30
1.96 0.67 -3.56 5.24 11.74
0.52 0.21 -0.14 0.14 0.78
(Thousand Rupees)Trust Modaraba
139

Financial Statement Analysis of Financial Sector 2020
2016 2017 2018 2019 2020Items
A.Total equity (A1 to A3)
1.Certificate capital
2.Reserves
3.Unappropriated profit
4.Others
B.Total liabilities (B1 + B2)
1.Current liabilities
2.Non-current liabilities
C.Total assets (C1+C2)
1.Current assets (a + b)
a.Cash and banks balances
b.Other current assets
2.Non-current assets (a + b + c)
a.Fixed assets
b.Long-term investments
c.Other non-current assets
D.Profit & loss account
1.Gross revenue(loss)
2.Operating expenses
3.Operating profit
4.Modaraba co's management fees
5.Profit/(loss) before taxation
6.Profit/(loss) after taxation
E.Other items
1.No. of certificates (000)
2.Cash dividend
3.Stock dividend/bonus shares
4.Cash generated from operating activities
F.Efficiency ratios/profitability ratios
1.Return on equity (ROE) (D6/A)
2.Return on capital employed (ROCE) (D5/(C-B1))
3.Return on assets (ROA) (D6/C)
4.Return on revenue (D6/D1)
5.Operating expenses to net income (D2/D6)
6.Management expenses (D4/D2)
7.Earning Per Certificate (D6/E1)
G.Liquidity Ratios
1.Current assets to current liabilities (C1/B1) (times)
2.Total liabilities to total assets (B/C) (times)
3.Long term investment to total assets (C2b/C)
H.Capital /leverage ratios
1.Capital ratio (A/C)
2.Break up value per certificate (A/E1)
I.Cash flow ratio
1.Cash generated from operating activities to profit after tax. (E4/D6) (times)
2.Cash generated from operating activities to current liabilities (E4/B1) (times)
42,943 38,761 33,708 33,402 30,131
236,400 236,400 236,400 236,400 236,400
(41,261) (41,261) (41,261) (41,261) (41,261)
(152,196) (156,378) (161,431) (161,737) (165,008)
0 0 0 0 0
9,104 13,103 19,959 22,244 25,757
3,818 1,900 19,639 21,924 25,757
5,286 11,203 320 320 0
52,047 51,864 53,667 55,646 55,888
51,429 51,432 53,363 55,431 55,735
17 791 739 216 647
51,412 50,641 52,624 55,215 55,088
618 432 304 215 153
618 432 304 215 153
0 0 0 0 0
0 0 0 0 0
500 2,038 2,216 4,345 375
6,198 6,219 7,270 4,650 3,646
(5,698) (4,181) (5,054) (305) (3,271)
0 0 0 0 0
(5,698) (4,181) (5,054) (305) (3,271)
(5,698) (4,181) (5,054) (305) (3,271)
23,640 23,640 23,640 23,640 23,640
0.00% 0.00% 0.00% 0.00% 0.00%
0.00% 0.00% 0.00% 0.00% 0.00%
(55,870) (5,143) (6,930) (2,967) (2,961)
-13.27% -10.79% -14.99% -0.91% -10.86%
-11.81% -8.37% -14.85% -0.90% -10.86%
-10.95% -8.06% -9.42% -0.55% -5.85%
-1,139.60% -205.15% -228.07% -7.02% -872.27%
-108.78% -148.74% -143.85% -1,524.59% -111.46%
0.00% 0.00% 0.00% 0.00% 0.00%
-0.24 -0.18 -0.21 -0.01 -0.14
13.47 27.07 2.72 2.53 2.16
0.17 0.25 0.37 0.40 0.46
0.00% 0.00% 0.00% 0.00% 0.00%
82.51% 74.74% 62.81% 60.03% 53.91%
1.82 1.64 1.43 1.41 1.27
9.81 1.23 1.37 9.73 0.91
-14.63 -2.71 -0.35 -0.14 -0.11
(Thousand Rupees)Unicap Modaraba
140

Financial Statements Analysis of Financial Sector 2020
Exchange Companies
Performance at a Glance
Exchange Companies continued it’s upward
stride in its balance sheet size. Total assets
increased by 12.91 percent to stand at Rs
22.26 billion in CY20 as compared to Rs
19.72 billion in CY19. Exchange
companies, mainly deals with transfer of
funds, cash and balances remained major
component of asset side, its share in total
assets is recorded as 57.67 percent in CY20.
Similarly, total equity (including others)
increased to Rs 16.79 billion in CY20 from
Rs 15.75 billion in CY19, recording YoY
increase of 6.63 percent in CY20. Profit
before and after taxation, both recorded significant decreases of Rs 2.04 billion or 64.43 percent
and Rs 1.55 billion or 69.06 percent respectively in CY20 over CY19.
Shareholders’ Equity Total equity (including others) increased from Rs 15.75 billion in CY19 to Rs 16.79 billion in
CY20 reflecting YoY increase of 6.63 percent in CY20 over CY19. Share capital consist of
80.93 percent share of total equity in CY20 increased with YoY growth of 7.83 percent and
touched Rs 13.59 billion in CY20 from Rs 12.60 billion in CY19. Reserves of exchange
companies however, decreased to Rs 0.07 billion in CY20 from Rs 0.09 billion in CY19.
Accumulated profit showed an increament of 2.33 percent to touch Rs 3.12 billion in CY20
over CY19.
Laibilities
The current liabilities during CY20 remained approximately same at Rs 3.39 billion from Rs
3.37 billion in previous year. On the other hand, non-current liabilities grew exponentially and
reached at Rs 2.08 billion in CY20 from Rs 0.60 billion in CY19, showing a significant YoY
growth of 246.28 percent during CY20. This shows that the overall position of total liabilities of
exchange companies jumped to Rs 5.47 billion in CY20, representing YoY growth of 37.79
percent during the period.
15.75
3.97
19.72
16.79
5.47
22.26
0%
5%
10%
15%
20%
25%
30%
35%
40%
0
5
10
15
20
25
Total Equity
incl. others
Total Liabilities Total Assets
Gro
wth
%
bil
lion
Rs
Components of Balance Sheet
CY19 CY20 Growth% (RHS)
12.60
3.05
0.10
13.59
3.12
0.08
-20%
-15%
-10%
-5%
0%
5%
10%
0
2
4
6
8
10
12
14
16
Share capital Accumulated
profit (loss)
Reserves &
Others
per
cen
t
bil
lion
Rs
Components of Share Holder's Equity
CY19 CY20 Growth% (RHS)
3.37
0.60
3.39
2.08
-20%
30%
80%
130%
180%
230%
280%
0
1
1
2
2
3
3
4
4
Current liabilities Non-current liabilities
per
cen
t
bil
lion
Rs
Current and Non-Current Liabilities
CY19 CY20 Growth% (RHS)
141

Financial Statements Analysis of Financial Sector 2020
Assets Total assets of the exchange companies
witnessed a YoY growth of 12.91 percent in
CY20 to reach to Rs 22.26 billion in CY20
from Rs 19.72 billion in CY19. Current
assets with a share of 73.18 percent of total
asset of exchange companies, remain the
major component in CY20 grew by 0.31
billion or 1.95 percent in current year when
compared with previous year. Cash and bank
balances increased with a YoY growth of
7.48 percent to reach Rs 12.84 billion in
CY20 from Rs 11.95 in CY19. However,
share of cash and bank balances in total
assets of exchange companies faced a decline
in CY20, decreased from 60.58 percent in
CY19 and dropped to 57.67 percent in CY20.
Non-current assets witnessed a growth of 59.79 percent in CY20 over CY19 and touched to Rs
5.97 billion in current year from Rs 3.74 billion in previous year.
Profitability Profitability of exchange companies deteriorated during the year CY20. Gross revenue declined
to Rs 8.19 billion in CY20, from Rs 10.69 billion in CY19 showing a decline of 23.43 percent in
CY20 over CY19. Administrative and general expenses decreased to 7.06 billion in CY20 from
Rs 7.52 billion in CY19. Profit before taxation dropped from Rs 3.17 billion in CY19 to Rs 1.13
billion in CY20 facing a YoY decrease of 64.43 percent in CY20. Similarly, profit after taxation
decreased to Rs 0.69 billion in CY20 from Rs 2.24 billion in CY19, posting a YoY fall of 69.06
percent..
Return on Capital Employed (ROCE) decreased from 19.39 percent in CY19 to 5.98 percent in
CY20. The Return on Equity (ROE) and Return on Assets (ROA) deciphered to deteriorated
performance of exchange companies on account of profitability as ROE decreased from 14.24
percent to 4.13 percent and ROA dropped from 11.37 percent to 3.11 percent respectively in
CY20 over CY19. Breakup value per share of exchange companies decreased from Rs 22.48 in
CY19 to Rs 22.37 in CY20.
3.17
2.24
1.13
0.69
0.0
0.5
1.0
1.5
2.0
2.5
3.0
3.5
Profit before taxation Profit after taxation
bil
lion
Rs
Profitability CY19 CY20
11.37%
19.39%
14.24%
3.11%
5.98%
4.13%
0.00
0.05
0.10
0.15
0.20
0.25
ROA ROCE ROE
percen
t
Key Financial Ratios CY19 CY20
…
4.04
1.29
2.44
12.84
3.45
2.19
3.78
-40%
-20%
0%
20%
40%
60%
80%
0
2
4
6
8
10
12
14
Cash &
bb
Other C
Assets
Fixed
assets
Other NC
Assets
Gro
wth
%
bil
lion
Rs
Current Assets
Components of Assets
CY19 CY20 Growth% (RHS)
Non Current
142
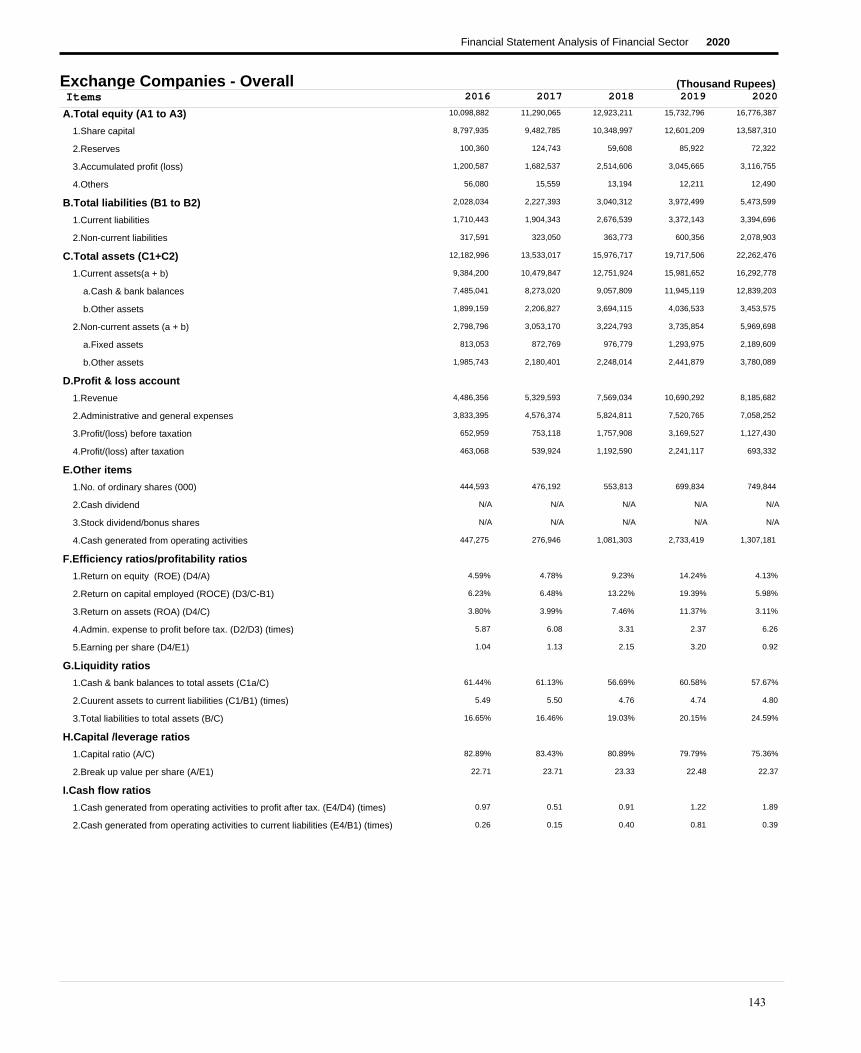
Financial Statement Analysis of Financial Sector 2020
2016 2017 2018 2019 2020Items
A.Total equity (A1 to A3)
1.Share capital
2.Reserves
3.Accumulated profit (loss)
4.Others
B.Total liabilities (B1 to B2)
1.Current liabilities
2.Non-current liabilities
C.Total assets (C1+C2)
1.Current assets(a + b)
a.Cash & bank balances
b.Other assets
2.Non-current assets (a + b)
a.Fixed assets
b.Other assets
D.Profit & loss account
1.Revenue
2.Administrative and general expenses
3.Profit/(loss) before taxation
4.Profit/(loss) after taxation
E.Other items
1.No. of ordinary shares (000)
2.Cash dividend
3.Stock dividend/bonus shares
4.Cash generated from operating activities
F.Efficiency ratios/profitability ratios
1.Return on equity (ROE) (D4/A)
2.Return on capital employed (ROCE) (D3/C-B1)
3.Return on assets (ROA) (D4/C)
4.Admin. expense to profit before tax. (D2/D3) (times)
5.Earning per share (D4/E1)
G.Liquidity ratios
1.Cash & bank balances to total assets (C1a/C)
2.Cuurent assets to current liabilities (C1/B1) (times)
3.Total liabilities to total assets (B/C)
H.Capital /leverage ratios
1.Capital ratio (A/C)
2.Break up value per share (A/E1)
I.Cash flow ratios
1.Cash generated from operating activities to profit after tax. (E4/D4) (times)
2.Cash generated from operating activities to current liabilities (E4/B1) (times)
10,098,882 11,290,065 12,923,211 15,732,796 16,776,387
8,797,935 9,482,785 10,348,997 12,601,209 13,587,310
100,360 124,743 59,608 85,922 72,322
1,200,587 1,682,537 2,514,606 3,045,665 3,116,755
56,080 15,559 13,194 12,211 12,490
2,028,034 2,227,393 3,040,312 3,972,499 5,473,599
1,710,443 1,904,343 2,676,539 3,372,143 3,394,696
317,591 323,050 363,773 600,356 2,078,903
12,182,996 13,533,017 15,976,717 19,717,506 22,262,476
9,384,200 10,479,847 12,751,924 15,981,652 16,292,778
7,485,041 8,273,020 9,057,809 11,945,119 12,839,203
1,899,159 2,206,827 3,694,115 4,036,533 3,453,575
2,798,796 3,053,170 3,224,793 3,735,854 5,969,698
813,053 872,769 976,779 1,293,975 2,189,609
1,985,743 2,180,401 2,248,014 2,441,879 3,780,089
4,486,356 5,329,593 7,569,034 10,690,292 8,185,682
3,833,395 4,576,374 5,824,811 7,520,765 7,058,252
652,959 753,118 1,757,908 3,169,527 1,127,430
463,068 539,924 1,192,590 2,241,117 693,332
444,593 476,192 553,813 699,834 749,844
447,275 276,946 1,081,303 2,733,419 1,307,181
4.59% 4.78% 9.23% 14.24% 4.13%
6.23% 6.48% 13.22% 19.39% 5.98%
3.80% 3.99% 7.46% 11.37% 3.11%
5.87 6.08 3.31 2.37 6.26
1.04 1.13 2.15 3.20 0.92
61.44% 61.13% 56.69% 60.58% 57.67%
5.49 5.50 4.76 4.74 4.80
16.65% 16.46% 19.03% 20.15% 24.59%
82.89% 83.43% 80.89% 79.79% 75.36%
22.71 23.71 23.33 22.48 22.37
0.97 0.51 0.91 1.22 1.89
0.26 0.15 0.40 0.81 0.39
(Thousand Rupees)Exchange Companies - Overall
N/A N/A N/A N/A N/A
N/A N/A N/A N/A N/A
143

Financial Statement Analysis of Financial Sector 2020
2016 2017 2018 2019 2020Items
A.Total equity (A1 to A3)
1.Share capital
2.Reserves
3.Accumulated profit (loss)
4.Others
B.Total liabilities (B1 to B2)
1.Current liabilities
2.Non-current liabilities
C.Total assets (C1+C2)
1.Current assets(a + b)
a.Cash & bank balances
b.Other assets
2.Non-current assets (a + b)
a.Fixed assets
b.Other assets
D.Profit & loss account
1.Revenue
2.Administrative and general expenses
3.Profit/(loss) before taxation
4.Profit/(loss) after taxation
E.Other items
1.No. of ordinary shares (000)
2.Cash dividend
3.Stock dividend/bonus shares
4.Cash generated from operating activities
F.Efficiency ratios/profitability ratios
1.Return on equity (ROE) (D4/A)
2.Return on capital employed (ROCE) (D3/C-B1)
3.Return on assets (ROA) (D4/C)
4.Admin. expense to profit before tax. (D2/D3) (times)
5.Earning per share (D4/E1)
G.Liquidity ratios
1.Cash & bank balances to total assets (C1a/C)
2.Cuurent assets to current liabilities (C1/B1) (times)
3.Total liabilities to total assets (B/C)
H.Capital /leverage ratios
1.Capital ratio (A/C)
2.Break up value per share (A/E1)
I.Cash flow ratios
1.Cash generated from operating activities to profit after tax. (E4/D4) (times)
2.Cash generated from operating activities to current liabilities (E4/B1) (times)
398,106 408,501 437,722 493,253 422,875
365,000 395,000 412,000 457,000 457,000
0 0 0 0 0
33,106 13,501 25,722 36,253 (34,125)
0 0 0 0 0
230,693 205,831 292,839 342,390 325,662
224,435 199,812 286,225 335,753 319,559
6,258 6,019 6,614 6,637 6,103
628,799 614,332 730,561 835,643 748,537
446,530 406,333 506,854 600,903 526,066
290,011 319,289 359,035 455,023 449,252
156,519 87,044 147,819 145,880 76,814
182,269 207,999 223,707 234,740 222,471
69,237 80,365 91,128 91,699 81,153
113,032 127,634 132,579 143,041 141,318
224,952 298,122 382,982 473,914 313,004
191,327 279,865 346,196 422,688 379,221
33,625 18,257 36,786 51,226 (66,217)
21,540 13,395 25,721 35,531 (70,378)
36,500 39,500 41,200 45,700 45,700
0.00% 0.00% 0.00% 0.00% 0.00%
0.00% 0.00% 0.00% 0.00% 0.00%
(8,812) 70,368 65,262 102,353 (5,758)
5.41% 3.28% 5.88% 7.20% -16.64%
8.32% 4.40% 8.28% 10.25% -15.44%
3.43% 2.18% 3.52% 4.25% -9.40%
5.69 15.33 9.41 8.25 -5.73
0.59 0.34 0.62 0.78 -1.54
46.12% 51.97% 49.15% 54.45% 60.02%
1.99 2.03 1.77 1.79 1.65
36.69% 33.50% 40.08% 40.97% 43.51%
63.31% 66.50% 59.92% 59.03% 56.49%
10.91 10.34 10.62 10.79 9.25
-0.41 5.25 2.54 2.88 0.08
-0.04 0.35 0.23 0.30 -0.02
(Thousand Rupees)AA Exchange Co. (Pvt) Ltd.
144

Financial Statement Analysis of Financial Sector 2020
2016 2017 2018 2019 2020Items
A.Total equity (A1 to A3)
1.Share capital
2.Reserves
3.Accumulated profit (loss)
4.Others
B.Total liabilities (B1 to B2)
1.Current liabilities
2.Non-current liabilities
C.Total assets (C1+C2)
1.Current assets(a + b)
a.Cash & bank balances
b.Other assets
2.Non-current assets (a + b)
a.Fixed assets
b.Other assets
D.Profit & loss account
1.Revenue
2.Administrative and general expenses
3.Profit/(loss) before taxation
4.Profit/(loss) after taxation
E.Other items
1.No. of ordinary shares (000)
2.Cash dividend
3.Stock dividend/bonus shares
4.Cash generated from operating activities
F.Efficiency ratios/profitability ratios
1.Return on equity (ROE) (D4/A)
2.Return on capital employed (ROCE) (D3/C-B1)
3.Return on assets (ROA) (D4/C)
4.Admin. expense to profit before tax. (D2/D3) (times)
5.Earning per share (D4/E1)
G.Liquidity ratios
1.Cash & bank balances to total assets (C1a/C)
2.Cuurent assets to current liabilities (C1/B1) (times)
3.Total liabilities to total assets (B/C)
H.Capital /leverage ratios
1.Capital ratio (A/C)
2.Break up value per share (A/E1)
I.Cash flow ratios
1.Cash generated from operating activities to profit after tax. (E4/D4) (times)
2.Cash generated from operating activities to current liabilities (E4/B1) (times)
209,213 210,058 211,055 212,631 213,865
200,000 200,000 200,000 200,000 200,000
0 0 0 0 0
9,213 10,058 11,055 12,631 13,865
3,430 3,309 3,194 2,961 2,740
7,369 6,556 5,427 4,190 4,058
2,147 1,358 677 691 1,334
5,222 5,198 4,750 3,499 2,724
220,012 219,923 219,676 219,782 220,663
195,772 197,128 198,381 199,864 202,012
173,977 173,334 177,409 128,110 179,924
21,795 23,794 20,972 71,754 22,088
24,240 22,795 21,295 19,918 18,651
24,240 22,795 21,295 19,918 18,651
0 0 0 0 0
25,095 28,419 28,500 46,429 37,210
24,098 27,059 27,566 45,759 36,535
997 1,360 934 670 675
1,386 725 882 1,343 1,013
200 200 200 200 200
0.00% 0.00% 0.00% 0.00% 0.00%
0.00% 0.00% 0.00% 0.00% 0.00%
2,433 23 4,074 (298) 2,813
0.66% 0.35% 0.42% 0.63% 0.47%
0.46% 0.62% 0.43% 0.31% 0.31%
0.63% 0.33% 0.40% 0.61% 0.46%
24.17 19.90 29.51 68.30 54.13
6.93 3.63 4.41 6.72 5.07
79.08% 78.82% 80.76% 58.29% 81.54%
91.18 145.16 293.03 289.24 151.43
3.35% 2.98% 2.47% 1.91% 1.84%
95.09% 95.51% 96.08% 96.75% 96.92%
1,046.07 1,050.29 1,055.28 1,063.16 1,069.33
1.76 0.03 4.62 -0.22 2.78
1.13 0.02 6.02 -0.43 2.11
(Thousand Rupees)Al-Hameed Int. Money Ex (Pvt) Ltd.
145
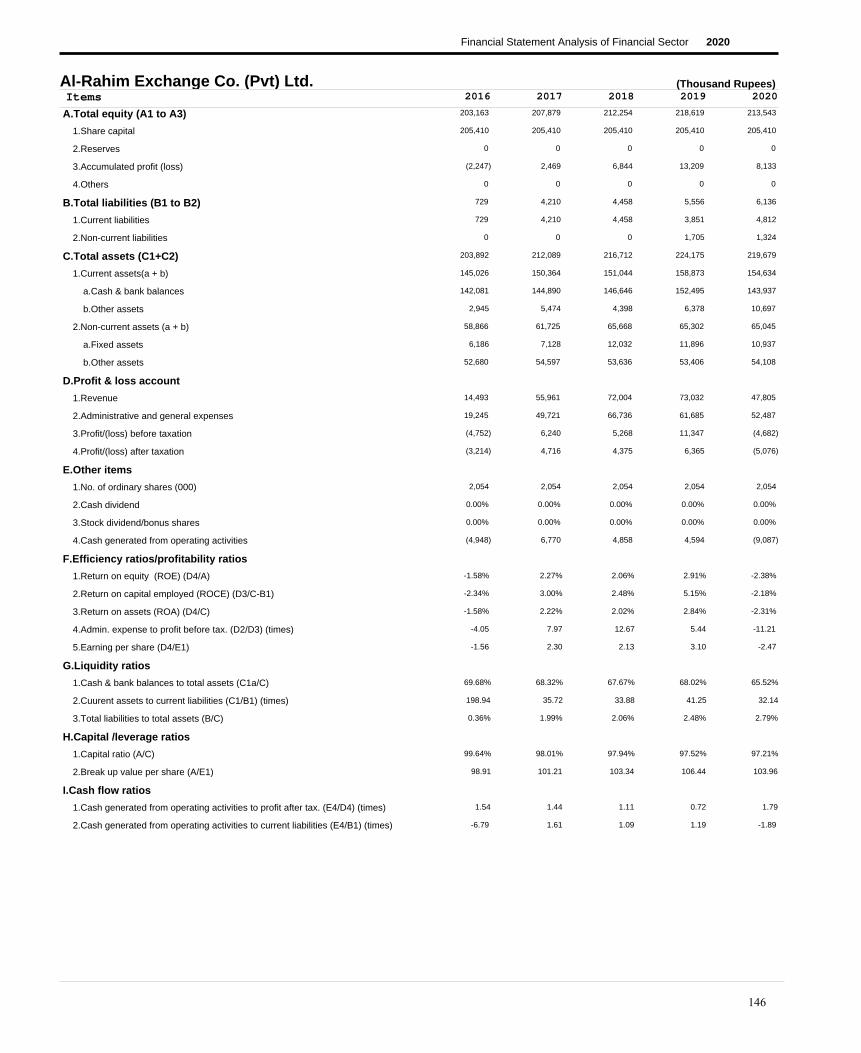
Financial Statement Analysis of Financial Sector 2020
2016 2017 2018 2019 2020Items
A.Total equity (A1 to A3)
1.Share capital
2.Reserves
3.Accumulated profit (loss)
4.Others
B.Total liabilities (B1 to B2)
1.Current liabilities
2.Non-current liabilities
C.Total assets (C1+C2)
1.Current assets(a + b)
a.Cash & bank balances
b.Other assets
2.Non-current assets (a + b)
a.Fixed assets
b.Other assets
D.Profit & loss account
1.Revenue
2.Administrative and general expenses
3.Profit/(loss) before taxation
4.Profit/(loss) after taxation
E.Other items
1.No. of ordinary shares (000)
2.Cash dividend
3.Stock dividend/bonus shares
4.Cash generated from operating activities
F.Efficiency ratios/profitability ratios
1.Return on equity (ROE) (D4/A)
2.Return on capital employed (ROCE) (D3/C-B1)
3.Return on assets (ROA) (D4/C)
4.Admin. expense to profit before tax. (D2/D3) (times)
5.Earning per share (D4/E1)
G.Liquidity ratios
1.Cash & bank balances to total assets (C1a/C)
2.Cuurent assets to current liabilities (C1/B1) (times)
3.Total liabilities to total assets (B/C)
H.Capital /leverage ratios
1.Capital ratio (A/C)
2.Break up value per share (A/E1)
I.Cash flow ratios
1.Cash generated from operating activities to profit after tax. (E4/D4) (times)
2.Cash generated from operating activities to current liabilities (E4/B1) (times)
203,163 207,879 212,254 218,619 213,543
205,410 205,410 205,410 205,410 205,410
0 0 0 0 0
(2,247) 2,469 6,844 13,209 8,133
0 0 0 0 0
729 4,210 4,458 5,556 6,136
729 4,210 4,458 3,851 4,812
0 0 0 1,705 1,324
203,892 212,089 216,712 224,175 219,679
145,026 150,364 151,044 158,873 154,634
142,081 144,890 146,646 152,495 143,937
2,945 5,474 4,398 6,378 10,697
58,866 61,725 65,668 65,302 65,045
6,186 7,128 12,032 11,896 10,937
52,680 54,597 53,636 53,406 54,108
14,493 55,961 72,004 73,032 47,805
19,245 49,721 66,736 61,685 52,487
(4,752) 6,240 5,268 11,347 (4,682)
(3,214) 4,716 4,375 6,365 (5,076)
2,054 2,054 2,054 2,054 2,054
0.00% 0.00% 0.00% 0.00% 0.00%
0.00% 0.00% 0.00% 0.00% 0.00%
(4,948) 6,770 4,858 4,594 (9,087)
-1.58% 2.27% 2.06% 2.91% -2.38%
-2.34% 3.00% 2.48% 5.15% -2.18%
-1.58% 2.22% 2.02% 2.84% -2.31%
-4.05 7.97 12.67 5.44 -11.21
-1.56 2.30 2.13 3.10 -2.47
69.68% 68.32% 67.67% 68.02% 65.52%
198.94 35.72 33.88 41.25 32.14
0.36% 1.99% 2.06% 2.48% 2.79%
99.64% 98.01% 97.94% 97.52% 97.21%
98.91 101.21 103.34 106.44 103.96
1.54 1.44 1.11 0.72 1.79
-6.79 1.61 1.09 1.19 -1.89
(Thousand Rupees)Al-Rahim Exchange Co. (Pvt) Ltd.
146

Financial Statement Analysis of Financial Sector 2020
2016 2017 2018 2019 2020Items
A.Total equity (A1 to A3)
1.Share capital
2.Reserves
3.Accumulated profit (loss)
4.Others
B.Total liabilities (B1 to B2)
1.Current liabilities
2.Non-current liabilities
C.Total assets (C1+C2)
1.Current assets(a + b)
a.Cash & bank balances
b.Other assets
2.Non-current assets (a + b)
a.Fixed assets
b.Other assets
D.Profit & loss account
1.Revenue
2.Administrative and general expenses
3.Profit/(loss) before taxation
4.Profit/(loss) after taxation
E.Other items
1.No. of ordinary shares (000)
2.Cash dividend
3.Stock dividend/bonus shares
4.Cash generated from operating activities
F.Efficiency ratios/profitability ratios
1.Return on equity (ROE) (D4/A)
2.Return on capital employed (ROCE) (D3/C-B1)
3.Return on assets (ROA) (D4/C)
4.Admin. expense to profit before tax. (D2/D3) (times)
5.Earning per share (D4/E1)
G.Liquidity ratios
1.Cash & bank balances to total assets (C1a/C)
2.Cuurent assets to current liabilities (C1/B1) (times)
3.Total liabilities to total assets (B/C)
H.Capital /leverage ratios
1.Capital ratio (A/C)
2.Break up value per share (A/E1)
I.Cash flow ratios
1.Cash generated from operating activities to profit after tax. (E4/D4) (times)
2.Cash generated from operating activities to current liabilities (E4/B1) (times)
200,005 177,252 262,656 339,864 371,749
200,000 200,000 300,000 350,000 350,000
0 0 0 0 0
5 (22,748) (37,344) (10,136) 21,749
0 0 0 0 0
6,935 2,704 3,700 8,067 11,064
6,935 2,704 3,700 8,067 10,826
0 0 0 0 238
206,940 179,956 266,356 347,931 382,813
149,677 123,225 186,786 256,594 288,460
142,365 23,171 84,910 152,845 279,737
7,312 100,054 101,876 103,749 8,723
57,263 56,731 79,570 91,337 94,353
4,722 3,311 2,263 2,786 4,114
52,541 53,420 77,307 88,551 90,239
69,065 40,149 26,531 70,860 82,291
65,871 62,241 41,071 42,600 43,254
3,194 (22,092) (14,540) 28,260 39,037
1,927 (22,752) (14,596) 27,208 31,885
20,000 20,000 30,000 35,000 35,000
0.00% 0.00% 0.00% 0.00% 0.00%
0.00% 0.00% 0.00% 0.00% 0.00%
(4,187) (119,462) (14,327) 26,888 125,217
0.96% -12.84% -5.56% 8.01% 8.58%
1.60% -12.46% -5.54% 8.32% 10.49%
0.93% -12.64% -5.48% 7.82% 8.33%
20.62 -2.82 -2.82 1.51 1.11
0.10 -1.14 -0.49 0.78 0.91
68.80% 12.88% 31.88% 43.93% 73.07%
21.58 45.57 50.48 31.81 26.65
3.35% 1.50% 1.39% 2.32% 2.89%
96.65% 98.50% 98.61% 97.68% 97.11%
10.00 8.86 8.76 9.71 10.62
-2.17 5.25 0.98 0.99 3.93
-0.60 -44.18 -3.87 3.33 11.57
(Thousand Rupees)Al-Sahara Exchange Co. (Pvt) Ltd.
147

Financial Statement Analysis of Financial Sector 2020
2016 2017 2018 2019 2020Items
A.Total equity (A1 to A3)
1.Share capital
2.Reserves
3.Accumulated profit (loss)
4.Others
B.Total liabilities (B1 to B2)
1.Current liabilities
2.Non-current liabilities
C.Total assets (C1+C2)
1.Current assets(a + b)
a.Cash & bank balances
b.Other assets
2.Non-current assets (a + b)
a.Fixed assets
b.Other assets
D.Profit & loss account
1.Revenue
2.Administrative and general expenses
3.Profit/(loss) before taxation
4.Profit/(loss) after taxation
E.Other items
1.No. of ordinary shares (000)
2.Cash dividend
3.Stock dividend/bonus shares
4.Cash generated from operating activities
F.Efficiency ratios/profitability ratios
1.Return on equity (ROE) (D4/A)
2.Return on capital employed (ROCE) (D3/C-B1)
3.Return on assets (ROA) (D4/C)
4.Admin. expense to profit before tax. (D2/D3) (times)
5.Earning per share (D4/E1)
G.Liquidity ratios
1.Cash & bank balances to total assets (C1a/C)
2.Cuurent assets to current liabilities (C1/B1) (times)
3.Total liabilities to total assets (B/C)
H.Capital /leverage ratios
1.Capital ratio (A/C)
2.Break up value per share (A/E1)
I.Cash flow ratios
1.Cash generated from operating activities to profit after tax. (E4/D4) (times)
2.Cash generated from operating activities to current liabilities (E4/B1) (times)
200,022 194,104 205,851 419,302 369,789
200,500 200,500 206,500 415,100 415,100
0 0 0 0 0
(478) (6,396) (649) 4,202 (45,311)
0 0 0 0 0
19,108 18,699 34,895 188,533 83,629
16,572 15,812 30,324 180,360 63,211
2,536 2,887 4,571 8,173 20,418
219,130 212,803 240,746 607,835 453,418
159,113 146,579 160,048 452,741 263,332
147,981 135,156 142,082 333,510 229,219
11,132 11,423 17,966 119,231 34,113
60,017 66,224 80,698 155,094 190,086
7,564 10,961 20,217 42,234 55,946
52,453 55,263 60,481 112,860 134,140
40,997 32,106 70,336 466,740 169,075
34,099 37,506 62,087 237,521 219,317
6,897 (5,400) 8,249 229,219 (50,242)
5,922 (5,918) 5,746 163,451 (49,512)
20,050 20,050 20,650 41,510 41,510
0.00% 0.00% 0.00% 0.00% 0.00%
0.00% 0.00% 0.00% 0.00% 0.00%
3,595 7,862 12,669 171,928 (59,748)
2.96% -3.05% 2.79% 38.98% -13.39%
3.40% -2.74% 3.92% 53.62% -12.88%
2.70% -2.78% 2.39% 26.89% -10.92%
4.94 -6.95 7.53 1.04 -4.37
0.30 -0.30 0.28 3.94 -1.19
67.53% 63.51% 59.02% 54.87% 50.55%
9.60 9.27 5.28 2.51 4.17
8.72% 8.79% 14.49% 31.02% 18.44%
91.28% 91.21% 85.51% 68.98% 81.56%
9.98 9.68 9.97 10.10 8.91
0.61 -1.33 2.20 1.05 1.21
0.22 0.50 0.42 0.95 -0.95
(Thousand Rupees)D. D Exchange Co. (Pvt) Ltd.
148

Financial Statement Analysis of Financial Sector 2020
2016 2017 2018 2019 2020Items
A.Total equity (A1 to A3)
1.Share capital
2.Reserves
3.Accumulated profit (loss)
4.Others
B.Total liabilities (B1 to B2)
1.Current liabilities
2.Non-current liabilities
C.Total assets (C1+C2)
1.Current assets(a + b)
a.Cash & bank balances
b.Other assets
2.Non-current assets (a + b)
a.Fixed assets
b.Other assets
D.Profit & loss account
1.Revenue
2.Administrative and general expenses
3.Profit/(loss) before taxation
4.Profit/(loss) after taxation
E.Other items
1.No. of ordinary shares (000)
2.Cash dividend
3.Stock dividend/bonus shares
4.Cash generated from operating activities
F.Efficiency ratios/profitability ratios
1.Return on equity (ROE) (D4/A)
2.Return on capital employed (ROCE) (D3/C-B1)
3.Return on assets (ROA) (D4/C)
4.Admin. expense to profit before tax. (D2/D3) (times)
5.Earning per share (D4/E1)
G.Liquidity ratios
1.Cash & bank balances to total assets (C1a/C)
2.Cuurent assets to current liabilities (C1/B1) (times)
3.Total liabilities to total assets (B/C)
H.Capital /leverage ratios
1.Capital ratio (A/C)
2.Break up value per share (A/E1)
I.Cash flow ratios
1.Cash generated from operating activities to profit after tax. (E4/D4) (times)
2.Cash generated from operating activities to current liabilities (E4/B1) (times)
789,784 826,521 872,708 921,572 955,831
700,000 700,000 700,000 800,000 800,000
0 0 0 0 0
89,784 126,521 172,708 121,572 155,831
0 0 0 0 0
34,209 39,374 30,587 29,847 28,301
31,722 36,887 28,100 29,847 28,301
2,487 2,487 2,487 0 0
823,993 865,895 903,295 951,419 984,132
557,062 602,173 636,940 664,177 700,049
548,572 583,004 604,738 613,466 645,744
8,490 19,169 32,202 50,711 54,305
266,931 263,722 266,355 287,242 284,083
75,083 70,053 68,122 67,204 66,026
191,848 193,669 198,233 220,038 218,057
296,986 353,935 403,759 496,600 519,023
255,395 300,686 337,785 407,474 469,688
41,591 53,249 65,974 89,126 49,335
28,282 36,736 46,187 48,864 34,258
7,000 7,000 7,000 8,000 8,000
0.00% 0.00% 0.00% 0.00% 0.00%
0.00% 0.00% 0.00% 0.00% 0.00%
38,755 46,276 38,694 43,663 44,535
3.58% 4.44% 5.29% 5.30% 3.58%
5.25% 6.42% 7.54% 9.67% 5.16%
3.43% 4.24% 5.11% 5.14% 3.48%
6.14 5.65 5.12 4.57 9.52
4.04 5.25 6.60 6.11 4.28
66.57% 67.33% 66.95% 64.48% 65.62%
17.56 16.32 22.67 22.25 24.74
4.15% 4.55% 3.39% 3.14% 2.88%
95.85% 95.45% 96.61% 96.86% 97.12%
112.83 118.07 124.67 115.20 119.48
1.37 1.26 0.84 0.89 1.30
1.22 1.25 1.38 1.46 1.57
(Thousand Rupees)Dollar East Exchange Co. (Pvt) Ltd.
149

Financial Statement Analysis of Financial Sector 2020
2016 2017 2018 2019 2020Items
A.Total equity (A1 to A3)
1.Share capital
2.Reserves
3.Accumulated profit (loss)
4.Others
B.Total liabilities (B1 to B2)
1.Current liabilities
2.Non-current liabilities
C.Total assets (C1+C2)
1.Current assets(a + b)
a.Cash & bank balances
b.Other assets
2.Non-current assets (a + b)
a.Fixed assets
b.Other assets
D.Profit & loss account
1.Revenue
2.Administrative and general expenses
3.Profit/(loss) before taxation
4.Profit/(loss) after taxation
E.Other items
1.No. of ordinary shares (000)
2.Cash dividend
3.Stock dividend/bonus shares
4.Cash generated from operating activities
F.Efficiency ratios/profitability ratios
1.Return on equity (ROE) (D4/A)
2.Return on capital employed (ROCE) (D3/C-B1)
3.Return on assets (ROA) (D4/C)
4.Admin. expense to profit before tax. (D2/D3) (times)
5.Earning per share (D4/E1)
G.Liquidity ratios
1.Cash & bank balances to total assets (C1a/C)
2.Cuurent assets to current liabilities (C1/B1) (times)
3.Total liabilities to total assets (B/C)
H.Capital /leverage ratios
1.Capital ratio (A/C)
2.Break up value per share (A/E1)
I.Cash flow ratios
1.Cash generated from operating activities to profit after tax. (E4/D4) (times)
2.Cash generated from operating activities to current liabilities (E4/B1) (times)
202,003 264,120 313,354 362,712 453,376
200,000 250,000 275,000 336,312 440,000
0 0 0 0 0
2,003 14,120 38,354 26,400 13,376
0 0 0 0 0
26,048 24,880 39,401 55,436 67,751
11,788 11,620 28,141 44,176 58,491
14,260 13,260 11,260 11,260 9,260
228,051 289,000 352,755 418,148 521,127
157,911 200,583 258,899 301,742 377,899
132,859 183,627 216,380 248,407 228,722
25,052 16,956 42,519 53,335 149,177
70,140 88,417 93,856 116,406 143,228
15,043 16,654 18,094 25,581 24,516
55,097 71,763 75,762 90,825 118,712
65,286 87,054 134,879 197,140 153,041
46,455 65,912 103,704 162,849 138,782
18,831 21,142 31,175 34,291 14,259
15,630 12,118 24,195 24,358 10,664
20,000 25,000 27,500 33,631 44,000
0.00% 0.00% 0.00% 0.00% 0.00%
0.00% 0.00% 0.00% 0.00% 0.00%
14,426 22,846 18,725 34,533 (66,939)
7.74% 4.59% 7.72% 6.72% 2.35%
8.71% 7.62% 9.60% 9.17% 3.08%
6.85% 4.19% 6.86% 5.83% 2.05%
2.47 3.12 3.33 4.75 9.73
0.78 0.48 0.88 0.72 0.24
58.26% 63.54% 61.34% 59.41% 43.89%
13.40 17.26 9.20 6.83 6.46
11.42% 8.61% 11.17% 13.26% 13.00%
88.58% 91.39% 88.83% 86.74% 87.00%
10.10 10.56 11.39 10.78 10.30
0.92 1.89 0.77 1.42 -6.28
1.22 1.97 0.67 0.78 -1.14
(Thousand Rupees)Fairdeal Exchange Co. (Pvt) Ltd.
150

Financial Statement Analysis of Financial Sector 2020
2016 2017 2018 2019 2020Items
A.Total equity (A1 to A3)
1.Share capital
2.Reserves
3.Accumulated profit (loss)
4.Others
B.Total liabilities (B1 to B2)
1.Current liabilities
2.Non-current liabilities
C.Total assets (C1+C2)
1.Current assets(a + b)
a.Cash & bank balances
b.Other assets
2.Non-current assets (a + b)
a.Fixed assets
b.Other assets
D.Profit & loss account
1.Revenue
2.Administrative and general expenses
3.Profit/(loss) before taxation
4.Profit/(loss) after taxation
E.Other items
1.No. of ordinary shares (000)
2.Cash dividend
3.Stock dividend/bonus shares
4.Cash generated from operating activities
F.Efficiency ratios/profitability ratios
1.Return on equity (ROE) (D4/A)
2.Return on capital employed (ROCE) (D3/C-B1)
3.Return on assets (ROA) (D4/C)
4.Admin. expense to profit before tax. (D2/D3) (times)
5.Earning per share (D4/E1)
G.Liquidity ratios
1.Cash & bank balances to total assets (C1a/C)
2.Cuurent assets to current liabilities (C1/B1) (times)
3.Total liabilities to total assets (B/C)
H.Capital /leverage ratios
1.Capital ratio (A/C)
2.Break up value per share (A/E1)
I.Cash flow ratios
1.Cash generated from operating activities to profit after tax. (E4/D4) (times)
2.Cash generated from operating activities to current liabilities (E4/B1) (times)
208,736 206,142 215,962 239,782 234,739
210,000 210,000 210,000 210,000 210,000
0 0 0 0 0
(1,264) (3,858) 5,962 29,782 24,739
0 0 0 0 0
2,023 2,239 5,569 15,174 39,799
2,023 2,239 5,569 11,051 8,451
0 0 0 4,123 31,348
210,759 208,381 221,531 254,956 274,538
152,781 150,538 166,656 138,849 184,253
136,236 142,927 157,502 120,926 116,804
16,545 7,611 9,154 17,923 67,449
57,978 57,843 54,875 116,107 90,285
4,818 4,183 3,715 66,107 35,814
53,160 53,660 51,160 50,000 54,471
77,788 72,438 91,596 135,489 110,286
70,501 74,308 77,568 101,859 110,758
7,287 (1,870) 14,028 33,630 (472)
6,509 (2,594) 9,820 23,820 (5,043)
21,000 21,000 21,000 21,000 21,000
0.00% 0.00% 0.00% 0.00% 0.00%
0.00% 0.00% 0.00% 0.00% 0.00%
7,561 5,404 11,766 24,574 (5,034)
3.12% -1.26% 4.55% 9.93% -2.15%
3.49% -0.91% 6.50% 13.79% -0.18%
3.09% -1.24% 4.43% 9.34% -1.84%
9.67 -39.74 5.53 3.03 -234.66
0.31 -0.12 0.47 1.13 -0.24
64.64% 68.59% 71.10% 47.43% 42.55%
75.52 67.23 29.93 12.56 21.80
0.96% 1.07% 2.51% 5.95% 14.50%
99.04% 98.93% 97.49% 94.05% 85.50%
9.94 9.82 10.28 11.42 11.18
1.16 -2.08 1.20 1.03 1.00
3.74 2.41 2.11 2.22 -0.60
(Thousand Rupees)Glaxy Exchange Co. (Pvt) Ltd.
151

Financial Statement Analysis of Financial Sector 2020
2016 2017 2018 2019 2020Items
A.Total equity (A1 to A3)
1.Share capital
2.Reserves
3.Accumulated profit (loss)
4.Others
B.Total liabilities (B1 to B2)
1.Current liabilities
2.Non-current liabilities
C.Total assets (C1+C2)
1.Current assets(a + b)
a.Cash & bank balances
b.Other assets
2.Non-current assets (a + b)
a.Fixed assets
b.Other assets
D.Profit & loss account
1.Revenue
2.Administrative and general expenses
3.Profit/(loss) before taxation
4.Profit/(loss) after taxation
E.Other items
1.No. of ordinary shares (000)
2.Cash dividend
3.Stock dividend/bonus shares
4.Cash generated from operating activities
F.Efficiency ratios/profitability ratios
1.Return on equity (ROE) (D4/A)
2.Return on capital employed (ROCE) (D3/C-B1)
3.Return on assets (ROA) (D4/C)
4.Admin. expense to profit before tax. (D2/D3) (times)
5.Earning per share (D4/E1)
G.Liquidity ratios
1.Cash & bank balances to total assets (C1a/C)
2.Cuurent assets to current liabilities (C1/B1) (times)
3.Total liabilities to total assets (B/C)
H.Capital /leverage ratios
1.Capital ratio (A/C)
2.Break up value per share (A/E1)
I.Cash flow ratios
1.Cash generated from operating activities to profit after tax. (E4/D4) (times)
2.Cash generated from operating activities to current liabilities (E4/B1) (times)
492,950 507,963 560,941 632,565 671,043
400,000 400,000 400,000 500,000 500,000
10,900 10,900 10,900 0 0
82,050 97,063 150,041 132,565 171,043
0 0 0 0 0
49,114 49,388 86,929 191,818 191,261
37,110 37,159 62,614 90,525 53,374
12,004 12,229 24,315 101,293 137,887
542,064 557,351 647,870 824,383 862,304
419,572 435,631 619,722 786,070 774,482
374,100 389,577 467,897 455,516 468,483
45,472 46,054 151,825 330,554 305,999
122,492 121,720 28,148 38,313 87,822
20,990 19,983 23,681 32,145 23,886
101,502 101,737 4,467 6,168 63,936
100,896 108,330 200,977 226,500 210,538
85,421 87,819 125,138 131,327 147,119
15,474 20,511 75,839 95,173 63,419
9,900 15,013 52,978 71,623 38,478
400 400 400 500 500
0.00% 0.00% 0.00% 0.00% 0.00%
0.00% 0.00% 0.00% 0.00% 0.00%
15,937 17,252 85,402 22,619 71,910
2.01% 2.96% 9.44% 11.32% 5.73%
3.06% 3.94% 12.96% 12.97% 7.84%
1.83% 2.69% 8.18% 8.69% 4.46%
5.52 4.28 1.65 1.38 2.32
24.75 37.53 132.45 143.25 76.96
69.01% 69.90% 72.22% 55.26% 54.33%
11.31 11.72 9.90 8.68 14.51
9.06% 8.86% 13.42% 23.27% 22.18%
90.94% 91.14% 86.58% 76.73% 77.82%
1,232.38 1,269.91 1,402.35 1,265.13 1,342.09
1.61 1.15 1.61 0.32 1.87
0.43 0.46 1.36 0.25 1.35
(Thousand Rupees)H & H Exchange Co. (Pvt) Ltd.
152

Financial Statement Analysis of Financial Sector 2020
2016 2017 2018 2019 2020Items
A.Total equity (A1 to A3)
1.Share capital
2.Reserves
3.Accumulated profit (loss)
4.Others
B.Total liabilities (B1 to B2)
1.Current liabilities
2.Non-current liabilities
C.Total assets (C1+C2)
1.Current assets(a + b)
a.Cash & bank balances
b.Other assets
2.Non-current assets (a + b)
a.Fixed assets
b.Other assets
D.Profit & loss account
1.Revenue
2.Administrative and general expenses
3.Profit/(loss) before taxation
4.Profit/(loss) after taxation
E.Other items
1.No. of ordinary shares (000)
2.Cash dividend
3.Stock dividend/bonus shares
4.Cash generated from operating activities
F.Efficiency ratios/profitability ratios
1.Return on equity (ROE) (D4/A)
2.Return on capital employed (ROCE) (D3/C-B1)
3.Return on assets (ROA) (D4/C)
4.Admin. expense to profit before tax. (D2/D3) (times)
5.Earning per share (D4/E1)
G.Liquidity ratios
1.Cash & bank balances to total assets (C1a/C)
2.Cuurent assets to current liabilities (C1/B1) (times)
3.Total liabilities to total assets (B/C)
H.Capital /leverage ratios
1.Capital ratio (A/C)
2.Break up value per share (A/E1)
I.Cash flow ratios
1.Cash generated from operating activities to profit after tax. (E4/D4) (times)
2.Cash generated from operating activities to current liabilities (E4/B1) (times)
785,952 859,697 1,073,105 1,458,045 1,642,888
400,000 400,000 400,000 700,000 700,000
0 0 0 0 0
385,952 459,697 673,105 758,045 942,888
0 0 0 0 0
26,019 39,708 63,800 71,816 151,373
26,019 39,708 63,800 71,816 79,818
0 0 0 0 71,555
811,971 899,405 1,136,905 1,529,861 1,794,261
696,714 871,478 1,005,591 1,383,102 1,635,250
646,566 665,271 536,563 1,128,483 1,423,689
50,148 206,207 469,028 254,619 211,561
115,257 27,927 131,314 146,759 159,011
14,417 25,949 24,919 38,212 144,769
100,840 1,978 106,395 108,547 14,242
243,106 255,391 496,404 816,042 615,199
122,729 150,665 201,267 261,444 356,083
120,377 104,726 305,078 554,598 259,116
80,479 73,745 213,408 384,940 184,843
40,000 40,000 40,000 70,000 70,000
0.00% 0.00% 0.00% 0.00% 0.00%
0.00% 0.00% 0.00% 0.00% 0.00%
204,446 25,933 (125,680) 603,362 399,310
10.24% 8.58% 19.89% 26.40% 11.25%
15.32% 12.18% 28.43% 38.04% 15.11%
9.91% 8.20% 18.77% 25.16% 10.30%
1.02 1.44 0.66 0.47 1.37
2.01 1.84 5.34 5.50 2.64
79.63% 73.97% 47.20% 73.76% 79.35%
26.78 21.95 15.76 19.26 20.49
3.20% 4.41% 5.61% 4.69% 8.44%
96.80% 95.59% 94.39% 95.31% 91.56%
19.65 21.49 26.83 20.83 23.47
2.54 0.35 -0.59 1.57 2.16
7.86 0.65 -1.97 8.40 5.00
(Thousand Rupees)HBL Currency Exchange (Pvt) Ltd.
153
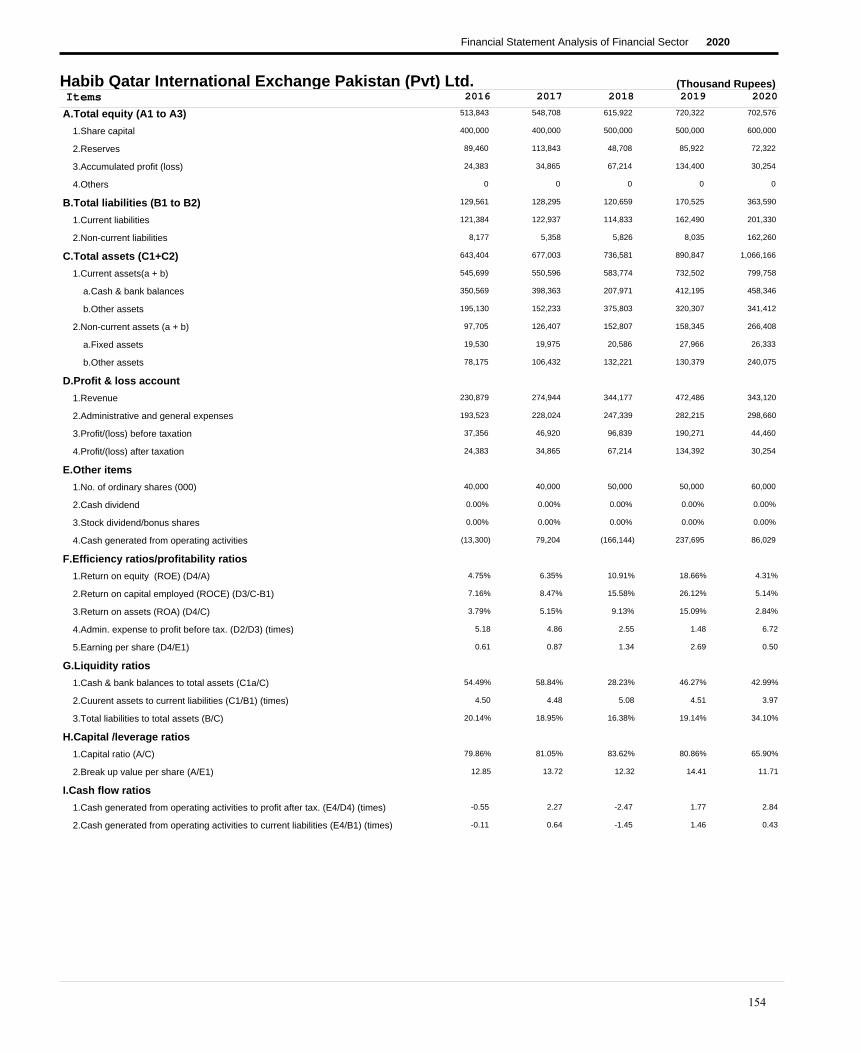
Financial Statement Analysis of Financial Sector 2020
2016 2017 2018 2019 2020Items
A.Total equity (A1 to A3)
1.Share capital
2.Reserves
3.Accumulated profit (loss)
4.Others
B.Total liabilities (B1 to B2)
1.Current liabilities
2.Non-current liabilities
C.Total assets (C1+C2)
1.Current assets(a + b)
a.Cash & bank balances
b.Other assets
2.Non-current assets (a + b)
a.Fixed assets
b.Other assets
D.Profit & loss account
1.Revenue
2.Administrative and general expenses
3.Profit/(loss) before taxation
4.Profit/(loss) after taxation
E.Other items
1.No. of ordinary shares (000)
2.Cash dividend
3.Stock dividend/bonus shares
4.Cash generated from operating activities
F.Efficiency ratios/profitability ratios
1.Return on equity (ROE) (D4/A)
2.Return on capital employed (ROCE) (D3/C-B1)
3.Return on assets (ROA) (D4/C)
4.Admin. expense to profit before tax. (D2/D3) (times)
5.Earning per share (D4/E1)
G.Liquidity ratios
1.Cash & bank balances to total assets (C1a/C)
2.Cuurent assets to current liabilities (C1/B1) (times)
3.Total liabilities to total assets (B/C)
H.Capital /leverage ratios
1.Capital ratio (A/C)
2.Break up value per share (A/E1)
I.Cash flow ratios
1.Cash generated from operating activities to profit after tax. (E4/D4) (times)
2.Cash generated from operating activities to current liabilities (E4/B1) (times)
513,843 548,708 615,922 720,322 702,576
400,000 400,000 500,000 500,000 600,000
89,460 113,843 48,708 85,922 72,322
24,383 34,865 67,214 134,400 30,254
0 0 0 0 0
129,561 128,295 120,659 170,525 363,590
121,384 122,937 114,833 162,490 201,330
8,177 5,358 5,826 8,035 162,260
643,404 677,003 736,581 890,847 1,066,166
545,699 550,596 583,774 732,502 799,758
350,569 398,363 207,971 412,195 458,346
195,130 152,233 375,803 320,307 341,412
97,705 126,407 152,807 158,345 266,408
19,530 19,975 20,586 27,966 26,333
78,175 106,432 132,221 130,379 240,075
230,879 274,944 344,177 472,486 343,120
193,523 228,024 247,339 282,215 298,660
37,356 46,920 96,839 190,271 44,460
24,383 34,865 67,214 134,392 30,254
40,000 40,000 50,000 50,000 60,000
0.00% 0.00% 0.00% 0.00% 0.00%
0.00% 0.00% 0.00% 0.00% 0.00%
(13,300) 79,204 (166,144) 237,695 86,029
4.75% 6.35% 10.91% 18.66% 4.31%
7.16% 8.47% 15.58% 26.12% 5.14%
3.79% 5.15% 9.13% 15.09% 2.84%
5.18 4.86 2.55 1.48 6.72
0.61 0.87 1.34 2.69 0.50
54.49% 58.84% 28.23% 46.27% 42.99%
4.50 4.48 5.08 4.51 3.97
20.14% 18.95% 16.38% 19.14% 34.10%
79.86% 81.05% 83.62% 80.86% 65.90%
12.85 13.72 12.32 14.41 11.71
-0.55 2.27 -2.47 1.77 2.84
-0.11 0.64 -1.45 1.46 0.43
(Thousand Rupees)Habib Qatar International Exchange Pakistan (Pvt) Ltd.
154

Financial Statement Analysis of Financial Sector 2020
2016 2017 2018 2019 2020Items
A.Total equity (A1 to A3)
1.Share capital
2.Reserves
3.Accumulated profit (loss)
4.Others
B.Total liabilities (B1 to B2)
1.Current liabilities
2.Non-current liabilities
C.Total assets (C1+C2)
1.Current assets(a + b)
a.Cash & bank balances
b.Other assets
2.Non-current assets (a + b)
a.Fixed assets
b.Other assets
D.Profit & loss account
1.Revenue
2.Administrative and general expenses
3.Profit/(loss) before taxation
4.Profit/(loss) after taxation
E.Other items
1.No. of ordinary shares (000)
2.Cash dividend
3.Stock dividend/bonus shares
4.Cash generated from operating activities
F.Efficiency ratios/profitability ratios
1.Return on equity (ROE) (D4/A)
2.Return on capital employed (ROCE) (D3/C-B1)
3.Return on assets (ROA) (D4/C)
4.Admin. expense to profit before tax. (D2/D3) (times)
5.Earning per share (D4/E1)
G.Liquidity ratios
1.Cash & bank balances to total assets (C1a/C)
2.Cuurent assets to current liabilities (C1/B1) (times)
3.Total liabilities to total assets (B/C)
H.Capital /leverage ratios
1.Capital ratio (A/C)
2.Break up value per share (A/E1)
I.Cash flow ratios
1.Cash generated from operating activities to profit after tax. (E4/D4) (times)
2.Cash generated from operating activities to current liabilities (E4/B1) (times)
177,184 413,478 596,572 806,319 799,496
235,000 400,000 537,500 600,000 700,000
0 0 0 0 0
(57,816) 13,478 59,072 206,319 99,496
43,750 3,750 3,000 2,250 2,250
20,193 37,931 204,163 348,010 1,326,698
11,009 16,120 165,369 231,763 456,821
9,184 21,811 38,794 116,247 869,877
241,127 455,159 803,735 1,156,579 2,128,444
139,956 286,134 610,425 993,743 1,017,049
101,201 199,306 503,873 552,349 856,624
38,755 86,828 106,552 441,394 160,425
101,171 169,025 193,310 162,836 1,111,395
22,381 29,875 51,771 123,207 882,488
78,790 139,150 141,539 39,629 228,907
128,460 226,877 494,123 917,762 826,445
106,726 155,524 412,538 715,694 828,745
21,734 71,353 81,585 202,068 (2,300)
18,040 71,293 45,593 147,247 (6,309)
23,500 40,000 53,750 60,000 70,000
0.00% 0.00% 0.00% 0.00% 0.00%
0.00% 0.00% 0.00% 0.00% 0.00%
4,917 22,002 244,761 64,383 387,460
10.18% 17.24% 7.64% 18.26% -0.79%
9.44% 16.25% 12.78% 21.85% -0.14%
7.48% 15.66% 5.67% 12.73% -0.30%
4.91 2.18 5.06 3.54 -360.32
0.77 1.78 0.85 2.45 -0.09
41.97% 43.79% 62.69% 47.76% 40.25%
12.71 17.75 3.69 4.29 2.23
8.37% 8.33% 25.40% 30.09% 62.33%
73.48% 90.84% 74.22% 69.72% 37.56%
7.54 10.34 11.10 13.44 11.42
0.27 0.31 5.37 0.44 -61.41
0.45 1.36 1.48 0.28 0.85
(Thousand Rupees)Link International Exchange Co. (Pvt) Ltd.
155

Financial Statement Analysis of Financial Sector 2020
2016 2017 2018 2019 2020Items
A.Total equity (A1 to A3)
1.Share capital
2.Reserves
3.Accumulated profit (loss)
4.Others
B.Total liabilities (B1 to B2)
1.Current liabilities
2.Non-current liabilities
C.Total assets (C1+C2)
1.Current assets(a + b)
a.Cash & bank balances
b.Other assets
2.Non-current assets (a + b)
a.Fixed assets
b.Other assets
D.Profit & loss account
1.Revenue
2.Administrative and general expenses
3.Profit/(loss) before taxation
4.Profit/(loss) after taxation
E.Other items
1.No. of ordinary shares (000)
2.Cash dividend
3.Stock dividend/bonus shares
4.Cash generated from operating activities
F.Efficiency ratios/profitability ratios
1.Return on equity (ROE) (D4/A)
2.Return on capital employed (ROCE) (D3/C-B1)
3.Return on assets (ROA) (D4/C)
4.Admin. expense to profit before tax. (D2/D3) (times)
5.Earning per share (D4/E1)
G.Liquidity ratios
1.Cash & bank balances to total assets (C1a/C)
2.Cuurent assets to current liabilities (C1/B1) (times)
3.Total liabilities to total assets (B/C)
H.Capital /leverage ratios
1.Capital ratio (A/C)
2.Break up value per share (A/E1)
I.Cash flow ratios
1.Cash generated from operating activities to profit after tax. (E4/D4) (times)
2.Cash generated from operating activities to current liabilities (E4/B1) (times)
370,716 586,255 609,321 662,169 731,903
300,000 500,000 500,000 500,000 500,000
0 0 0 0 0
70,716 86,255 109,321 162,169 231,903
0 0 0 0 0
159,560 35,741 189,370 255,719 285,521
158,594 35,341 188,973 253,069 280,613
966 400 397 2,650 4,908
530,276 621,996 798,691 917,888 1,017,424
440,083 530,979 704,366 891,475 994,319
426,350 523,764 538,456 886,293 992,501
13,733 7,215 165,910 5,182 1,818
90,193 91,017 94,325 26,413 23,105
12,565 13,539 16,948 21,593 18,259
77,628 77,478 77,377 4,820 4,846
98,540 107,814 131,199 187,774 209,800
80,785 86,590 98,033 114,444 110,493
17,755 21,224 33,166 73,330 99,307
12,102 15,539 23,066 52,848 69,734
300 500 500 500 500
0.00% 0.00% 0.00% 0.00% 0.00%
0.00% 0.00% 0.00% 0.00% 0.00%
138,598 (103,883) 15,123 279,788 101,467
3.26% 2.65% 3.79% 7.98% 9.53%
4.78% 3.62% 5.44% 11.03% 13.48%
2.28% 2.50% 2.89% 5.76% 6.85%
4.55 4.08 2.96 1.56 1.11
40.34 31.08 46.13 105.70 139.47
80.40% 84.21% 67.42% 96.56% 97.55%
2.77 15.02 3.73 3.52 3.54
30.09% 5.75% 23.71% 27.86% 28.06%
69.91% 94.25% 76.29% 72.14% 71.94%
1,235.72 1,172.51 1,218.64 1,324.34 1,463.81
11.45 -6.69 0.66 5.29 1.46
0.87 -2.94 0.08 1.11 0.36
(Thousand Rupees)Money Link Exchange Co. (Pvt) Ltd.
156

Financial Statement Analysis of Financial Sector 2020
2016 2017 2018 2019 2020Items
A.Total equity (A1 to A3)
1.Share capital
2.Reserves
3.Accumulated profit (loss)
4.Others
B.Total liabilities (B1 to B2)
1.Current liabilities
2.Non-current liabilities
C.Total assets (C1+C2)
1.Current assets(a + b)
a.Cash & bank balances
b.Other assets
2.Non-current assets (a + b)
a.Fixed assets
b.Other assets
D.Profit & loss account
1.Revenue
2.Administrative and general expenses
3.Profit/(loss) before taxation
4.Profit/(loss) after taxation
E.Other items
1.No. of ordinary shares (000)
2.Cash dividend
3.Stock dividend/bonus shares
4.Cash generated from operating activities
F.Efficiency ratios/profitability ratios
1.Return on equity (ROE) (D4/A)
2.Return on capital employed (ROCE) (D3/C-B1)
3.Return on assets (ROA) (D4/C)
4.Admin. expense to profit before tax. (D2/D3) (times)
5.Earning per share (D4/E1)
G.Liquidity ratios
1.Cash & bank balances to total assets (C1a/C)
2.Cuurent assets to current liabilities (C1/B1) (times)
3.Total liabilities to total assets (B/C)
H.Capital /leverage ratios
1.Capital ratio (A/C)
2.Break up value per share (A/E1)
I.Cash flow ratios
1.Cash generated from operating activities to profit after tax. (E4/D4) (times)
2.Cash generated from operating activities to current liabilities (E4/B1) (times)
812,568 864,620 1,006,832 1,117,583 1,221,923
556,875 556,875 857,587 857,587 1,000,000
0 0 0 0 0
255,693 307,745 149,245 259,996 221,923
0 0 0 0 0
24,021 12,345 18,995 59,129 89,793
13,223 1,824 5,790 17,941 36,479
10,798 10,521 13,205 41,188 53,314
836,589 876,965 1,025,827 1,176,712 1,311,716
813,770 862,229 864,281 1,107,938 966,298
403,358 457,650 521,305 975,128 914,230
410,412 404,579 342,976 132,810 52,068
22,819 14,736 161,546 68,774 345,418
19,623 11,820 12,432 22,052 21,303
3,196 2,916 149,114 46,722 324,115
185,828 195,276 337,899 323,086 332,117
122,910 124,259 141,122 164,925 193,070
62,917 71,017 196,777 158,161 139,047
44,781 52,052 142,213 110,751 104,339
55,688 55,688 85,759 85,759 100,000
0.00% 0.00% 0.00% 0.00% 0.00%
0.00% 0.00% 0.00% 0.00% 0.00%
(108,418) (32,513) 124,107 332,519 143,570
5.51% 6.02% 14.12% 9.91% 8.54%
7.64% 8.11% 19.29% 13.65% 10.90%
5.35% 5.94% 13.86% 9.41% 7.95%
1.95 1.75 0.72 1.04 1.39
0.80 0.93 1.66 1.29 1.04
48.21% 52.19% 50.82% 82.87% 69.70%
61.54 472.71 149.27 61.75 26.49
2.87% 1.41% 1.85% 5.02% 6.85%
97.13% 98.59% 98.15% 94.98% 93.15%
14.59 15.53 11.74 13.03 12.22
-2.42 -0.62 0.87 3.00 1.38
-8.20 -17.83 21.43 18.53 3.94
(Thousand Rupees)NBP Exchange Co. Ltd.
157

Financial Statement Analysis of Financial Sector 2020
2016 2017 2018 2019 2020Items
A.Total equity (A1 to A3)
1.Share capital
2.Reserves
3.Accumulated profit (loss)
4.Others
B.Total liabilities (B1 to B2)
1.Current liabilities
2.Non-current liabilities
C.Total assets (C1+C2)
1.Current assets(a + b)
a.Cash & bank balances
b.Other assets
2.Non-current assets (a + b)
a.Fixed assets
b.Other assets
D.Profit & loss account
1.Revenue
2.Administrative and general expenses
3.Profit/(loss) before taxation
4.Profit/(loss) after taxation
E.Other items
1.No. of ordinary shares (000)
2.Cash dividend
3.Stock dividend/bonus shares
4.Cash generated from operating activities
F.Efficiency ratios/profitability ratios
1.Return on equity (ROE) (D4/A)
2.Return on capital employed (ROCE) (D3/C-B1)
3.Return on assets (ROA) (D4/C)
4.Admin. expense to profit before tax. (D2/D3) (times)
5.Earning per share (D4/E1)
G.Liquidity ratios
1.Cash & bank balances to total assets (C1a/C)
2.Cuurent assets to current liabilities (C1/B1) (times)
3.Total liabilities to total assets (B/C)
H.Capital /leverage ratios
1.Capital ratio (A/C)
2.Break up value per share (A/E1)
I.Cash flow ratios
1.Cash generated from operating activities to profit after tax. (E4/D4) (times)
2.Cash generated from operating activities to current liabilities (E4/B1) (times)
213,784 209,453 208,728 189,872 203,555
210,000 210,000 210,000 210,000 210,000
0 0 0 0 0
3,784 (547) (1,272) (20,128) (6,445)
1,900 1,500 1,500 1,500 1,500
5,785 9,302 10,068 39,466 9,738
5,199 8,524 9,165 38,449 8,625
586 778 903 1,017 1,113
221,469 220,255 220,296 230,838 214,793
157,901 155,942 157,783 168,594 153,040
156,842 152,930 155,670 166,807 151,813
1,059 3,012 2,113 1,787 1,227
63,568 64,313 62,513 62,244 61,753
3,739 3,703 3,210 2,867 2,500
59,829 60,610 59,303 59,377 59,253
47,928 30,700 36,685 52,767 39,044
24,859 34,132 36,962 44,004 49,870
23,069 (3,532) (277) 8,763 (10,826)
19,147 (4,331) (724) (18,856) (11,395)
2,100 2,100 2,100 2,100 2,100
0.00% 0.00% 0.00% 0.00% 0.00%
0.00% 0.00% 0.00% 0.00% 0.00%
2,573 (2,108) 1,544 11,382 (15,032)
8.96% -2.07% -0.35% -9.93% -5.60%
10.67% -1.67% -0.13% 4.55% -5.25%
8.65% -1.97% -0.33% -8.17% -5.31%
1.08 -9.66 -133.44 5.02 -4.61
9.12 -2.06 -0.34 -8.98 -5.43
70.82% 69.43% 70.66% 72.26% 70.68%
30.37 18.29 17.22 4.38 17.74
2.61% 4.22% 4.57% 17.10% 4.53%
96.53% 95.10% 94.75% 82.25% 94.77%
101.80 99.74 99.39 90.42 96.93
0.13 0.49 -2.13 -0.60 1.32
0.49 -0.25 0.17 0.30 -1.74
(Thousand Rupees)Noble Exchange International (Pvt) Ltd.
158

Financial Statement Analysis of Financial Sector 2020
2016 2017 2018 2019 2020Items
A.Total equity (A1 to A3)
1.Share capital
2.Reserves
3.Accumulated profit (loss)
4.Others
B.Total liabilities (B1 to B2)
1.Current liabilities
2.Non-current liabilities
C.Total assets (C1+C2)
1.Current assets(a + b)
a.Cash & bank balances
b.Other assets
2.Non-current assets (a + b)
a.Fixed assets
b.Other assets
D.Profit & loss account
1.Revenue
2.Administrative and general expenses
3.Profit/(loss) before taxation
4.Profit/(loss) after taxation
E.Other items
1.No. of ordinary shares (000)
2.Cash dividend
3.Stock dividend/bonus shares
4.Cash generated from operating activities
F.Efficiency ratios/profitability ratios
1.Return on equity (ROE) (D4/A)
2.Return on capital employed (ROCE) (D3/C-B1)
3.Return on assets (ROA) (D4/C)
4.Admin. expense to profit before tax. (D2/D3) (times)
5.Earning per share (D4/E1)
G.Liquidity ratios
1.Cash & bank balances to total assets (C1a/C)
2.Cuurent assets to current liabilities (C1/B1) (times)
3.Total liabilities to total assets (B/C)
H.Capital /leverage ratios
1.Capital ratio (A/C)
2.Break up value per share (A/E1)
I.Cash flow ratios
1.Cash generated from operating activities to profit after tax. (E4/D4) (times)
2.Cash generated from operating activities to current liabilities (E4/B1) (times)
235,010 236,337 237,247 214,341 200,096
250,000 250,000 250,000 250,000 250,000
0 0 0 0 0
(14,990) (13,663) (12,753) (35,659) (49,904)
0 0 0 0 0
6,519 8,819 7,470 9,237 9,576
5,072 4,868 5,237 5,306 9,576
1,447 3,951 2,233 3,931 0
241,529 245,156 244,717 223,578 209,672
93,232 94,691 90,497 66,098 58,898
57,258 45,126 47,479 22,722 40,223
35,974 49,565 43,018 43,376 18,675
148,297 150,465 154,220 157,480 150,774
73,269 70,306 73,479 77,948 68,198
75,028 80,159 80,741 79,532 82,576
128,343 141,292 144,983 92,586 77,773
119,705 138,307 141,894 114,334 90,854
8,638 2,985 3,089 (21,748) (13,081)
7,170 1,327 909 (22,906) (14,244)
2,500 2,500 2,500 2,500 2,500
0.00% 0.00% 0.00% 0.00% 0.00%
0.00% 0.00% 0.00% 0.00% 0.00%
24,208 (8,754) 10,920 (17,878) 18,098
3.05% 0.56% 0.38% -10.69% -7.12%
3.65% 1.24% 1.29% -9.96% -6.54%
2.97% 0.54% 0.37% -10.25% -6.79%
13.86 46.33 45.94 -5.26 -6.95
2.87 0.53 0.36 -9.16 -5.70
23.71% 18.41% 19.40% 10.16% 19.18%
18.38 19.45 17.28 12.46 6.15
2.70% 3.60% 3.05% 4.13% 4.57%
97.30% 96.40% 96.95% 95.87% 95.43%
94.00 94.53 94.90 85.74 80.04
3.38 -6.60 12.01 0.78 -1.27
4.77 -1.80 2.09 -3.37 1.89
(Thousand Rupees)P B S Exchange (Pvt) Ltd.
159

Financial Statement Analysis of Financial Sector 2020
2016 2017 2018 2019 2020Items
A.Total equity (A1 to A3)
1.Share capital
2.Reserves
3.Accumulated profit (loss)
4.Others
B.Total liabilities (B1 to B2)
1.Current liabilities
2.Non-current liabilities
C.Total assets (C1+C2)
1.Current assets(a + b)
a.Cash & bank balances
b.Other assets
2.Non-current assets (a + b)
a.Fixed assets
b.Other assets
D.Profit & loss account
1.Revenue
2.Administrative and general expenses
3.Profit/(loss) before taxation
4.Profit/(loss) after taxation
E.Other items
1.No. of ordinary shares (000)
2.Cash dividend
3.Stock dividend/bonus shares
4.Cash generated from operating activities
F.Efficiency ratios/profitability ratios
1.Return on equity (ROE) (D4/A)
2.Return on capital employed (ROCE) (D3/C-B1)
3.Return on assets (ROA) (D4/C)
4.Admin. expense to profit before tax. (D2/D3) (times)
5.Earning per share (D4/E1)
G.Liquidity ratios
1.Cash & bank balances to total assets (C1a/C)
2.Cuurent assets to current liabilities (C1/B1) (times)
3.Total liabilities to total assets (B/C)
H.Capital /leverage ratios
1.Capital ratio (A/C)
2.Break up value per share (A/E1)
I.Cash flow ratios
1.Cash generated from operating activities to profit after tax. (E4/D4) (times)
2.Cash generated from operating activities to current liabilities (E4/B1) (times)
819,037 829,184 832,126 885,904 771,052
800,000 800,000 800,000 800,000 800,000
0 0 0 0 0
19,037 29,184 32,126 85,904 (28,948)
0 0 0 0 0
572,629 644,211 651,844 655,658 832,631
466,596 516,671 499,776 484,293 597,185
106,033 127,540 152,068 171,365 235,446
1,391,666 1,473,395 1,483,970 1,541,562 1,603,683
1,199,511 1,278,702 1,347,711 1,401,239 1,275,372
869,963 1,151,268 846,239 764,935 937,739
329,548 127,434 501,472 636,304 337,633
192,155 194,693 136,259 140,323 328,311
80,246 77,913 133,696 139,221 131,789
111,909 116,780 2,563 1,102 196,522
977,842 1,042,629 1,208,596 1,462,800 757,832
954,327 1,012,961 1,145,950 1,371,386 880,072
23,515 29,668 62,646 91,414 (122,240)
9,201 10,147 6,570 53,777 (131,383)
8,000 8,000 8,000 8,000 8,000
0.00% 0.00% 0.00% 0.00% 0.00%
0.00% 0.00% 0.00% 0.00% 0.00%
126,136 210,773 (154,293) (53,883) 30,973
1.12% 1.22% 0.79% 6.07% -17.04%
2.54% 3.10% 6.37% 8.65% -12.15%
0.66% 0.69% 0.44% 3.49% -8.19%
40.58 34.14 18.29 15.00 -7.20
1.15 1.27 0.82 6.72 -16.42
62.51% 78.14% 57.03% 49.62% 58.47%
2.57 2.47 2.70 2.89 2.14
41.15% 43.72% 43.93% 42.53% 51.92%
58.85% 56.28% 56.07% 57.47% 48.08%
102.38 103.65 104.02 110.74 96.38
13.71 20.77 -23.48 -1.00 -0.24
0.27 0.41 -0.31 -0.11 0.05
(Thousand Rupees)Pakistan Currency Exchange Co. (Pvt) Ltd.
160

Financial Statement Analysis of Financial Sector 2020
2016 2017 2018 2019 2020Items
A.Total equity (A1 to A3)
1.Share capital
2.Reserves
3.Accumulated profit (loss)
4.Others
B.Total liabilities (B1 to B2)
1.Current liabilities
2.Non-current liabilities
C.Total assets (C1+C2)
1.Current assets(a + b)
a.Cash & bank balances
b.Other assets
2.Non-current assets (a + b)
a.Fixed assets
b.Other assets
D.Profit & loss account
1.Revenue
2.Administrative and general expenses
3.Profit/(loss) before taxation
4.Profit/(loss) after taxation
E.Other items
1.No. of ordinary shares (000)
2.Cash dividend
3.Stock dividend/bonus shares
4.Cash generated from operating activities
F.Efficiency ratios/profitability ratios
1.Return on equity (ROE) (D4/A)
2.Return on capital employed (ROCE) (D3/C-B1)
3.Return on assets (ROA) (D4/C)
4.Admin. expense to profit before tax. (D2/D3) (times)
5.Earning per share (D4/E1)
G.Liquidity ratios
1.Cash & bank balances to total assets (C1a/C)
2.Cuurent assets to current liabilities (C1/B1) (times)
3.Total liabilities to total assets (B/C)
H.Capital /leverage ratios
1.Capital ratio (A/C)
2.Break up value per share (A/E1)
I.Cash flow ratios
1.Cash generated from operating activities to profit after tax. (E4/D4) (times)
2.Cash generated from operating activities to current liabilities (E4/B1) (times)
527,182 586,249 649,896 750,994 779,288
435,000 435,000 435,000 649,800 649,800
0 0 0 0 0
92,182 151,249 214,896 101,194 129,488
0 0 0 0 0
171,832 288,451 202,203 95,770 81,103
75,169 213,073 148,930 45,532 52,646
96,663 75,378 53,273 50,238 28,457
699,014 874,700 852,099 846,764 860,391
539,010 686,982 672,523 631,963 599,354
450,620 234,104 322,953 274,700 237,759
88,390 452,878 349,570 357,263 361,595
160,004 187,718 179,576 214,801 261,037
69,872 73,527 66,523 71,301 65,376
90,132 114,191 113,053 143,500 195,661
195,758 204,756 264,164 330,249 162,064
146,213 137,480 182,475 241,271 127,613
49,545 67,276 81,689 88,978 34,451
47,012 59,066 63,647 101,098 28,294
43,500 43,500 43,500 64,980 64,980
0.00% 0.00% 0.00% 0.00% 0.00%
0.00% 0.00% 0.00% 0.00% 0.00%
99,950 (159,739) 124,422 (16,371) 43,920
8.92% 10.08% 9.79% 13.46% 3.63%
7.94% 10.17% 11.62% 11.11% 4.27%
6.73% 6.75% 7.47% 11.94% 3.29%
2.95 2.04 2.23 2.71 3.70
1.08 1.36 1.46 1.56 0.44
64.47% 26.76% 37.90% 32.44% 27.63%
7.17 3.22 4.52 13.88 11.38
24.58% 32.98% 23.73% 11.31% 9.43%
75.42% 67.02% 76.27% 88.69% 90.57%
12.12 13.48 14.94 11.56 11.99
2.13 -2.70 1.95 -0.16 1.55
1.33 -0.75 0.84 -0.36 0.83
(Thousand Rupees)Paracha International Exchange (Pvt) Ltd.
161

Financial Statement Analysis of Financial Sector 2020
2016 2017 2018 2019 2020Items
A.Total equity (A1 to A3)
1.Share capital
2.Reserves
3.Accumulated profit (loss)
4.Others
B.Total liabilities (B1 to B2)
1.Current liabilities
2.Non-current liabilities
C.Total assets (C1+C2)
1.Current assets(a + b)
a.Cash & bank balances
b.Other assets
2.Non-current assets (a + b)
a.Fixed assets
b.Other assets
D.Profit & loss account
1.Revenue
2.Administrative and general expenses
3.Profit/(loss) before taxation
4.Profit/(loss) after taxation
E.Other items
1.No. of ordinary shares (000)
2.Cash dividend
3.Stock dividend/bonus shares
4.Cash generated from operating activities
F.Efficiency ratios/profitability ratios
1.Return on equity (ROE) (D4/A)
2.Return on capital employed (ROCE) (D3/C-B1)
3.Return on assets (ROA) (D4/C)
4.Admin. expense to profit before tax. (D2/D3) (times)
5.Earning per share (D4/E1)
G.Liquidity ratios
1.Cash & bank balances to total assets (C1a/C)
2.Cuurent assets to current liabilities (C1/B1) (times)
3.Total liabilities to total assets (B/C)
H.Capital /leverage ratios
1.Capital ratio (A/C)
2.Break up value per share (A/E1)
I.Cash flow ratios
1.Cash generated from operating activities to profit after tax. (E4/D4) (times)
2.Cash generated from operating activities to current liabilities (E4/B1) (times)
193,556 206,141 218,857 340,980 332,036
200,000 200,000 200,000 300,000 300,000
0 0 0 0 0
(6,444) 6,141 18,857 40,980 32,036
0 0 0 0 0
22,521 21,370 32,482 57,721 221,820
15,097 14,989 24,154 43,061 122,055
7,424 6,381 8,328 14,660 99,765
216,077 227,511 251,339 398,701 553,856
138,991 145,538 168,813 254,297 305,976
114,617 124,898 125,848 167,103 182,481
24,374 20,640 42,965 87,194 123,495
77,086 81,973 82,526 144,404 247,880
12,558 16,096 18,156 52,514 144,473
64,528 65,877 64,370 91,890 103,407
63,475 83,050 130,744 173,582 148,838
61,824 70,855 111,700 141,619 161,041
1,652 12,195 19,044 31,963 (12,203)
1,660 10,296 12,685 22,400 (8,889)
200 200 200 300 300
0.00% 0.00% 0.00% 0.00% 0.00%
0.00% 0.00% 0.00% 0.00% 0.00%
(2,777) 14,696 3,418 7,071 29,154
0.86% 4.99% 5.80% 6.57% -2.68%
0.82% 5.74% 8.38% 8.99% -2.83%
0.77% 4.53% 5.05% 5.62% -1.60%
37.42 5.81 5.87 4.43 -13.20
8.30 51.48 63.43 74.67 -29.63
53.04% 54.90% 50.07% 41.91% 32.95%
9.21 9.71 6.99 5.91 2.51
10.42% 9.39% 12.92% 14.48% 40.05%
89.58% 90.61% 87.08% 85.52% 59.95%
967.78 1,030.71 1,094.29 1,136.60 1,106.79
-1.67 1.43 0.27 0.32 -3.28
-0.18 0.98 0.14 0.16 0.24
(Thousand Rupees)Paragon Exchange (Pvt) Ltd.
162

Financial Statement Analysis of Financial Sector 2020
2016 2017 2018 2019 2020Items
A.Total equity (A1 to A3)
1.Share capital
2.Reserves
3.Accumulated profit (loss)
4.Others
B.Total liabilities (B1 to B2)
1.Current liabilities
2.Non-current liabilities
C.Total assets (C1+C2)
1.Current assets(a + b)
a.Cash & bank balances
b.Other assets
2.Non-current assets (a + b)
a.Fixed assets
b.Other assets
D.Profit & loss account
1.Revenue
2.Administrative and general expenses
3.Profit/(loss) before taxation
4.Profit/(loss) after taxation
E.Other items
1.No. of ordinary shares (000)
2.Cash dividend
3.Stock dividend/bonus shares
4.Cash generated from operating activities
F.Efficiency ratios/profitability ratios
1.Return on equity (ROE) (D4/A)
2.Return on capital employed (ROCE) (D3/C-B1)
3.Return on assets (ROA) (D4/C)
4.Admin. expense to profit before tax. (D2/D3) (times)
5.Earning per share (D4/E1)
G.Liquidity ratios
1.Cash & bank balances to total assets (C1a/C)
2.Cuurent assets to current liabilities (C1/B1) (times)
3.Total liabilities to total assets (B/C)
H.Capital /leverage ratios
1.Capital ratio (A/C)
2.Break up value per share (A/E1)
I.Cash flow ratios
1.Cash generated from operating activities to profit after tax. (E4/D4) (times)
2.Cash generated from operating activities to current liabilities (E4/B1) (times)
746,692 872,776 1,004,261 1,186,484 1,491,845
650,000 700,000 700,000 1,000,000 1,400,000
0 0 0 0 0
96,692 172,776 304,261 186,484 91,845
0 0 0 0 0
121,005 241,997 219,390 428,836 414,743
117,097 241,522 219,390 428,836 307,212
3,908 475 0 0 107,531
867,697 1,114,773 1,223,651 1,615,320 1,906,588
613,496 837,581 1,076,065 1,182,894 1,238,009
426,795 670,323 599,466 825,989 824,915
186,701 167,258 476,599 356,905 413,094
254,201 277,192 147,586 432,426 668,579
111,762 112,072 109,940 124,263 118,435
142,439 165,120 37,646 308,163 550,144
399,341 500,014 668,215 830,065 657,962
345,726 394,465 480,764 583,242 530,621
53,615 105,549 187,451 246,823 127,341
37,881 76,086 131,485 182,223 90,361
6,500 7,000 7,000 10,000 14,000
0.00% 0.00% 0.00% 0.00% 0.00%
0.00% 0.00% 0.00% 0.00% 0.00%
(13,517) 79,168 74,816 159,950 115,866
5.07% 8.72% 13.09% 15.36% 6.06%
7.14% 12.09% 18.67% 20.80% 7.96%
4.37% 6.83% 10.75% 11.28% 4.74%
6.45 3.74 2.56 2.36 4.17
5.83 10.87 18.78 18.22 6.45
49.19% 60.13% 48.99% 51.13% 43.27%
5.24 3.47 4.90 2.76 4.03
13.95% 21.71% 17.93% 26.55% 21.75%
86.05% 78.29% 82.07% 73.45% 78.25%
114.88 124.68 143.47 118.65 106.56
-0.36 1.04 0.57 0.88 1.28
-0.12 0.33 0.34 0.37 0.38
(Thousand Rupees)Ravi Exchange Co. (Pvt) Ltd.
163

Financial Statement Analysis of Financial Sector 2020
2016 2017 2018 2019 2020Items
A.Total equity (A1 to A3)
1.Share capital
2.Reserves
3.Accumulated profit (loss)
4.Others
B.Total liabilities (B1 to B2)
1.Current liabilities
2.Non-current liabilities
C.Total assets (C1+C2)
1.Current assets(a + b)
a.Cash & bank balances
b.Other assets
2.Non-current assets (a + b)
a.Fixed assets
b.Other assets
D.Profit & loss account
1.Revenue
2.Administrative and general expenses
3.Profit/(loss) before taxation
4.Profit/(loss) after taxation
E.Other items
1.No. of ordinary shares (000)
2.Cash dividend
3.Stock dividend/bonus shares
4.Cash generated from operating activities
F.Efficiency ratios/profitability ratios
1.Return on equity (ROE) (D4/A)
2.Return on capital employed (ROCE) (D3/C-B1)
3.Return on assets (ROA) (D4/C)
4.Admin. expense to profit before tax. (D2/D3) (times)
5.Earning per share (D4/E1)
G.Liquidity ratios
1.Cash & bank balances to total assets (C1a/C)
2.Cuurent assets to current liabilities (C1/B1) (times)
3.Total liabilities to total assets (B/C)
H.Capital /leverage ratios
1.Capital ratio (A/C)
2.Break up value per share (A/E1)
I.Cash flow ratios
1.Cash generated from operating activities to profit after tax. (E4/D4) (times)
2.Cash generated from operating activities to current liabilities (E4/B1) (times)
202,010 201,381 201,975 223,259 240,478
200,000 200,000 200,000 200,000 200,000
0 0 0 0 0
2,010 1,381 1,975 23,259 40,478
0 0 0 0 0
133 149 499 496 443
133 149 499 496 443
0 0 0 0 0
202,143 201,530 202,474 223,755 240,921
150,970 149,786 147,156 168,947 181,721
149,135 146,875 146,367 168,531 180,735
1,835 2,911 789 416 986
51,173 51,744 55,318 54,808 59,200
846 1,396 4,254 3,855 8,373
50,327 50,348 51,064 50,953 50,827
18,316 16,787 23,011 47,674 45,157
12,937 13,354 14,492 17,571 20,905
5,379 3,433 12,262 30,103 24,252
3,650 2,371 8,595 21,284 17,219
20,000 20,000 20,000 20,000 20,000
0.00% 0.00% 0.00% 0.00% 0.00%
0.00% 0.00% 0.00% 0.00% 0.00%
451 (1,327) 8,153 18,496 13,126
1.81% 1.18% 4.26% 9.53% 7.16%
2.66% 1.70% 6.07% 13.48% 10.08%
1.81% 1.18% 4.24% 9.51% 7.15%
2.41 3.89 1.18 0.58 0.86
0.18 0.12 0.43 1.06 0.86
73.78% 72.88% 72.29% 75.32% 75.02%
1,135.11 1,005.28 294.90 340.62 410.21
0.07% 0.07% 0.25% 0.22% 0.18%
99.93% 99.93% 99.75% 99.78% 99.82%
10.10 10.07 10.10 11.16 12.02
0.12 -0.56 0.95 0.87 0.76
3.39 -8.91 16.34 37.29 29.63
(Thousand Rupees)Riaz Exchange Co. (Pvt) Ltd.
164

Financial Statement Analysis of Financial Sector 2020
2016 2017 2018 2019 2020Items
A.Total equity (A1 to A3)
1.Share capital
2.Reserves
3.Accumulated profit (loss)
4.Others
B.Total liabilities (B1 to B2)
1.Current liabilities
2.Non-current liabilities
C.Total assets (C1+C2)
1.Current assets(a + b)
a.Cash & bank balances
b.Other assets
2.Non-current assets (a + b)
a.Fixed assets
b.Other assets
D.Profit & loss account
1.Revenue
2.Administrative and general expenses
3.Profit/(loss) before taxation
4.Profit/(loss) after taxation
E.Other items
1.No. of ordinary shares (000)
2.Cash dividend
3.Stock dividend/bonus shares
4.Cash generated from operating activities
F.Efficiency ratios/profitability ratios
1.Return on equity (ROE) (D4/A)
2.Return on capital employed (ROCE) (D3/C-B1)
3.Return on assets (ROA) (D4/C)
4.Admin. expense to profit before tax. (D2/D3) (times)
5.Earning per share (D4/E1)
G.Liquidity ratios
1.Cash & bank balances to total assets (C1a/C)
2.Cuurent assets to current liabilities (C1/B1) (times)
3.Total liabilities to total assets (B/C)
H.Capital /leverage ratios
1.Capital ratio (A/C)
2.Break up value per share (A/E1)
I.Cash flow ratios
1.Cash generated from operating activities to profit after tax. (E4/D4) (times)
2.Cash generated from operating activities to current liabilities (E4/B1) (times)
371,607 438,651 660,642 852,080 1,063,103
350,000 400,000 450,000 650,000 650,000
0 0 0 0 0
21,607 38,651 210,642 202,080 413,103
0 0 0 0 0
31,103 46,497 113,376 130,643 203,803
11,124 30,278 94,567 100,226 144,928
19,979 16,219 18,809 30,417 58,875
402,710 485,148 774,018 982,723 1,266,906
300,205 361,028 613,117 769,250 992,567
273,830 336,023 567,411 701,326 959,651
26,375 25,005 45,706 67,924 32,916
102,505 124,120 160,901 213,473 274,339
6,161 7,018 15,759 17,070 66,832
96,344 117,102 145,142 196,403 207,507
108,891 132,122 413,129 532,247 665,855
93,305 104,993 167,100 266,506 371,817
15,586 27,128 246,029 265,741 294,038
13,149 17,044 171,992 191,437 211,024
3,500 4,000 4,500 6,500 6,500
0.00% 0.00% 0.00% 0.00% 0.00%
0.00% 0.00% 0.00% 0.00% 0.00%
4,516 38,592 218,433 177,622 298,868
3.54% 3.89% 26.03% 22.47% 19.85%
3.98% 5.96% 36.21% 30.11% 26.21%
3.27% 3.51% 22.22% 19.48% 16.66%
5.99 3.87 0.68 1.00 1.26
3.76 4.26 38.22 29.45 32.47
68.00% 69.26% 73.31% 71.37% 75.75%
26.99 11.92 6.48 7.68 6.85
7.72% 9.58% 14.65% 13.29% 16.09%
92.28% 90.42% 85.35% 86.71% 83.91%
106.17 109.66 146.81 131.09 163.55
0.34 2.26 1.27 0.93 1.42
0.41 1.27 2.31 1.77 2.06
(Thousand Rupees)Royal International Exchange Co. (Pvt) Ltd.
165

Financial Statement Analysis of Financial Sector 2020
2016 2017 2018 2019 2020Items
A.Total equity (A1 to A3)
1.Share capital
2.Reserves
3.Accumulated profit (loss)
4.Others
B.Total liabilities (B1 to B2)
1.Current liabilities
2.Non-current liabilities
C.Total assets (C1+C2)
1.Current assets(a + b)
a.Cash & bank balances
b.Other assets
2.Non-current assets (a + b)
a.Fixed assets
b.Other assets
D.Profit & loss account
1.Revenue
2.Administrative and general expenses
3.Profit/(loss) before taxation
4.Profit/(loss) after taxation
E.Other items
1.No. of ordinary shares (000)
2.Cash dividend
3.Stock dividend/bonus shares
4.Cash generated from operating activities
F.Efficiency ratios/profitability ratios
1.Return on equity (ROE) (D4/A)
2.Return on capital employed (ROCE) (D3/C-B1)
3.Return on assets (ROA) (D4/C)
4.Admin. expense to profit before tax. (D2/D3) (times)
5.Earning per share (D4/E1)
G.Liquidity ratios
1.Cash & bank balances to total assets (C1a/C)
2.Cuurent assets to current liabilities (C1/B1) (times)
3.Total liabilities to total assets (B/C)
H.Capital /leverage ratios
1.Capital ratio (A/C)
2.Break up value per share (A/E1)
I.Cash flow ratios
1.Cash generated from operating activities to profit after tax. (E4/D4) (times)
2.Cash generated from operating activities to current liabilities (E4/B1) (times)
202,259 255,465 315,866 398,015 440,039
200,000 250,000 300,000 360,000 400,000
0 0 0 0 0
2,259 5,465 15,866 38,015 40,039
2,000 2,000 1,000 1,000 1,000
10,008 25,313 33,194 50,904 112,028
7,118 19,903 24,819 37,913 99,296
2,890 5,410 8,375 12,991 12,732
214,267 282,778 350,060 449,919 553,067
100,467 148,285 199,376 261,181 356,737
91,385 134,043 189,422 199,174 340,635
9,082 14,242 9,954 62,007 16,102
113,800 134,493 150,684 188,738 196,330
41,430 47,747 47,832 65,218 62,458
72,370 86,746 102,852 123,520 133,872
93,097 116,539 180,139 256,483 236,145
90,170 110,700 160,878 224,390 230,578
2,927 5,839 19,261 32,093 5,567
1,991 3,206 10,401 22,148 2,025
2,000 2,500 3,000 3,600 4,000
0.00% 0.00% 0.00% 0.00% 0.00%
0.00% 0.00% 0.00% 0.00% 0.00%
2,378 17,507 27,076 (50,538) 116,796
0.98% 1.25% 3.29% 5.56% 0.46%
1.41% 2.22% 5.92% 7.79% 1.23%
0.93% 1.13% 2.97% 4.92% 0.37%
30.81 18.96 8.35 6.99 41.42
1.00 1.28 3.47 6.15 0.51
42.65% 47.40% 54.11% 44.27% 61.59%
14.11 7.45 8.03 6.89 3.59
4.67% 8.95% 9.48% 11.31% 20.26%
94.40% 90.34% 90.23% 88.46% 79.56%
101.13 102.19 105.29 110.56 110.01
1.19 5.46 2.60 -2.28 57.68
0.33 0.88 1.09 -1.33 1.18
(Thousand Rupees)Sadiq Exchange Co. (Pvt) Ltd.
166

Financial Statement Analysis of Financial Sector 2020
2016 2017 2018 2019 2020Items
A.Total equity (A1 to A3)
1.Share capital
2.Reserves
3.Accumulated profit (loss)
4.Others
B.Total liabilities (B1 to B2)
1.Current liabilities
2.Non-current liabilities
C.Total assets (C1+C2)
1.Current assets(a + b)
a.Cash & bank balances
b.Other assets
2.Non-current assets (a + b)
a.Fixed assets
b.Other assets
D.Profit & loss account
1.Revenue
2.Administrative and general expenses
3.Profit/(loss) before taxation
4.Profit/(loss) after taxation
E.Other items
1.No. of ordinary shares (000)
2.Cash dividend
3.Stock dividend/bonus shares
4.Cash generated from operating activities
F.Efficiency ratios/profitability ratios
1.Return on equity (ROE) (D4/A)
2.Return on capital employed (ROCE) (D3/C-B1)
3.Return on assets (ROA) (D4/C)
4.Admin. expense to profit before tax. (D2/D3) (times)
5.Earning per share (D4/E1)
G.Liquidity ratios
1.Cash & bank balances to total assets (C1a/C)
2.Cuurent assets to current liabilities (C1/B1) (times)
3.Total liabilities to total assets (B/C)
H.Capital /leverage ratios
1.Capital ratio (A/C)
2.Break up value per share (A/E1)
I.Cash flow ratios
1.Cash generated from operating activities to profit after tax. (E4/D4) (times)
2.Cash generated from operating activities to current liabilities (E4/B1) (times)
266,452 303,677 319,204 378,066 414,918
260,150 300,000 300,000 300,000 400,000
0 0 0 0 0
6,302 3,677 19,204 78,066 14,918
5,000 5,000 4,500 4,500 5,000
21,312 13,365 71,759 70,089 105,791
21,312 13,365 71,759 70,089 105,791
0 0 0 0 0
292,764 322,042 395,463 452,655 525,709
217,517 226,134 294,704 336,886 386,594
206,963 218,755 220,977 309,268 287,398
10,554 7,379 73,727 27,618 99,196
75,247 95,908 100,759 115,769 139,115
7,142 15,412 13,404 24,388 23,698
68,105 80,496 87,355 91,381 115,417
51,543 73,782 134,405 222,763 169,282
48,993 75,816 112,202 114,873 148,164
2,550 (2,034) 22,203 107,890 21,118
1,612 (2,625) 15,526 77,862 14,852
2,602 3,000 3,000 3,000 4,000
0.00% 0.00% 0.00% 0.00% 0.00%
0.00% 0.00% 0.00% 0.00% 0.00%
(7,698) (10,152) 10,556 127,600 (16,138)
0.60% -0.86% 4.86% 20.59% 3.58%
0.94% -0.66% 6.86% 28.20% 5.03%
0.55% -0.82% 3.93% 17.20% 2.83%
19.21 -37.27 5.05 1.06 7.02
0.62 -0.88 5.18 25.95 3.71
70.69% 67.93% 55.88% 68.32% 54.67%
10.21 16.92 4.11 4.81 3.65
7.28% 4.15% 18.15% 15.48% 20.12%
91.01% 94.30% 80.72% 83.52% 78.93%
102.42 101.23 106.40 126.02 103.73
-4.78 3.87 0.68 1.64 -1.09
-0.36 -0.76 0.15 1.82 -0.15
(Thousand Rupees)Sky Exchange Co. (Pvt) Ltd.
167

Financial Statement Analysis of Financial Sector 2020
2016 2017 2018 2019 2020Items
A.Total equity (A1 to A3)
1.Share capital
2.Reserves
3.Accumulated profit (loss)
4.Others
B.Total liabilities (B1 to B2)
1.Current liabilities
2.Non-current liabilities
C.Total assets (C1+C2)
1.Current assets(a + b)
a.Cash & bank balances
b.Other assets
2.Non-current assets (a + b)
a.Fixed assets
b.Other assets
D.Profit & loss account
1.Revenue
2.Administrative and general expenses
3.Profit/(loss) before taxation
4.Profit/(loss) after taxation
E.Other items
1.No. of ordinary shares (000)
2.Cash dividend
3.Stock dividend/bonus shares
4.Cash generated from operating activities
F.Efficiency ratios/profitability ratios
1.Return on equity (ROE) (D4/A)
2.Return on capital employed (ROCE) (D3/C-B1)
3.Return on assets (ROA) (D4/C)
4.Admin. expense to profit before tax. (D2/D3) (times)
5.Earning per share (D4/E1)
G.Liquidity ratios
1.Cash & bank balances to total assets (C1a/C)
2.Cuurent assets to current liabilities (C1/B1) (times)
3.Total liabilities to total assets (B/C)
H.Capital /leverage ratios
1.Capital ratio (A/C)
2.Break up value per share (A/E1)
I.Cash flow ratios
1.Cash generated from operating activities to profit after tax. (E4/D4) (times)
2.Cash generated from operating activities to current liabilities (E4/B1) (times)
437,004 553,353 661,842 953,332 1,063,373
350,000 400,000 400,000 600,000 600,000
0 0 0 0 0
87,004 153,353 261,842 353,332 463,373
0 0 0 0 0
326,484 316,868 585,319 649,772 427,180
321,984 312,868 581,319 644,522 270,007
4,500 4,000 4,000 5,250 157,173
763,488 870,221 1,247,161 1,603,104 1,490,553
623,777 652,376 1,019,363 1,463,833 1,204,459
442,432 491,213 868,366 1,137,332 960,859
181,345 161,163 150,997 326,501 243,600
139,711 217,845 227,798 139,271 286,094
84,813 101,646 91,998 103,415 65,665
54,898 116,199 135,800 35,856 220,429
550,845 808,106 1,047,054 1,500,270 1,050,539
477,649 712,839 900,612 1,087,847 878,439
73,196 95,267 146,442 412,423 172,100
46,430 66,348 108,489 291,490 110,041
35,000 40,000 40,000 60,000 60,000
0.00% 0.00% 0.00% 0.00% 0.00%
0.00% 0.00% 0.00% 0.00% 0.00%
(87,045) 47,255 410,045 367,691 (291,041)
10.62% 11.99% 16.39% 30.58% 10.35%
16.58% 17.09% 21.99% 43.02% 14.10%
6.08% 7.62% 8.70% 18.18% 7.38%
6.53 7.48 6.15 2.64 5.10
1.33 1.66 2.71 4.86 1.83
57.95% 56.45% 69.63% 70.95% 64.46%
1.94 2.09 1.75 2.27 4.46
42.76% 36.41% 46.93% 40.53% 28.66%
57.24% 63.59% 53.07% 59.47% 71.34%
12.49 13.83 16.55 15.89 17.72
-1.87 0.71 3.78 1.26 -2.64
-0.27 0.15 0.71 0.57 -1.08
(Thousand Rupees)Wall Street Exchange Co. (Pvt) Ltd.
168

Financial Statement Analysis of Financial Sector 2020
2016 2017 2018 2019 2020Items
A.Total equity (A1 to A3)
1.Share capital
2.Reserves
3.Accumulated profit (loss)
4.Others
B.Total liabilities (B1 to B2)
1.Current liabilities
2.Non-current liabilities
C.Total assets (C1+C2)
1.Current assets(a + b)
a.Cash & bank balances
b.Other assets
2.Non-current assets (a + b)
a.Fixed assets
b.Other assets
D.Profit & loss account
1.Revenue
2.Administrative and general expenses
3.Profit/(loss) before taxation
4.Profit/(loss) after taxation
E.Other items
1.No. of ordinary shares (000)
2.Cash dividend
3.Stock dividend/bonus shares
4.Cash generated from operating activities
F.Efficiency ratios/profitability ratios
1.Return on equity (ROE) (D4/A)
2.Return on capital employed (ROCE) (D3/C-B1)
3.Return on assets (ROA) (D4/C)
4.Admin. expense to profit before tax. (D2/D3) (times)
5.Earning per share (D4/E1)
G.Liquidity ratios
1.Cash & bank balances to total assets (C1a/C)
2.Cuurent assets to current liabilities (C1/B1) (times)
3.Total liabilities to total assets (B/C)
H.Capital /leverage ratios
1.Capital ratio (A/C)
2.Break up value per share (A/E1)
I.Cash flow ratios
1.Cash generated from operating activities to profit after tax. (E4/D4) (times)
2.Cash generated from operating activities to current liabilities (E4/B1) (times)
320,044 322,100 418,312 754,731 771,008
320,000 320,000 400,000 650,000 650,000
0 0 0 0 0
44 2,100 18,312 104,731 121,008
0 0 0 0 0
3,121 3,150 11,916 37,697 80,107
852 402 8,351 32,020 73,512
2,269 2,748 3,565 5,677 6,595
323,165 325,250 430,228 792,428 851,115
229,457 228,832 311,049 607,897 656,190
228,975 228,133 302,844 592,486 347,783
482 699 8,205 15,411 308,407
93,708 96,418 119,179 184,531 194,925
4,816 9,342 11,325 19,315 17,617
88,892 87,076 107,854 165,216 177,308
48,606 43,000 102,543 284,952 206,237
38,602 40,293 81,632 161,238 184,066
10,004 2,707 20,911 123,714 22,171
6,498 2,056 16,213 86,419 16,277
32,000 32,000 40,000 65,000 65,000
0.00% 0.00% 0.00% 0.00% 0.00%
0.00% 0.00% 0.00% 0.00% 0.00%
7,097 2,953 26,923 53,676 (253,154)
2.03% 0.64% 3.88% 11.45% 2.11%
3.10% 0.83% 4.96% 16.27% 2.85%
2.01% 0.63% 3.77% 10.91% 1.91%
3.86 14.88 3.90 1.30 8.30
0.20 0.06 0.41 1.33 0.25
70.85% 70.14% 70.39% 74.77% 40.86%
269.32 569.23 37.25 18.98 8.93
0.97% 0.97% 2.77% 4.76% 9.41%
99.03% 99.03% 97.23% 95.24% 90.59%
10.00 10.07 10.46 11.61 11.86
1.09 1.44 1.66 0.62 -15.55
8.33 7.35 3.22 1.68 -3.44
(Thousand Rupees)ZeeQue Exchange Co. (Pvt) Ltd.
169

Financial Statements Analysis of Financial Sector 2020
Insurance Companies
Performance at a Glance Assets of insurance sector expanded by 13.38 percent, with corresponding increases of 13.96 percent in liabilities during CY20. The growth rate in assets was attained mainly due to increase of 14.01 percent in balance sheet size of life insurance, which contributed 83.74 percent share of insurance sector in CY20. Takaful companies shared 2.09 percent of insurance sector in CY20, recorded an increase of 18.27 percent in their total assets. Similarly, total equity (including others) of insurance sector posted an increase of 6.95 percent in CY20 as compared to the previous year. This increment in equity (including others) is mainly attributed due to increase of 4.17 percent in equity of non-life insurance companies in CY20 over CY19, which contributed 75.41 percent share of overall insurance sector in CY20. On account of earnings, insurance sector posted an increase of 13.94 percent and 20.36 percent in profit before tax and after tax respectively during CY20. Increment in over-all profit before tax and after tax is mainly due to life insurance companies whose profit before tax and after tax increased by 50.05 percent or Rs 4.04 billion and 59.18 percent or Rs 3.12 billion respectively during the year CY20 over CY19. But, non-life insurance posted a decline in profit before tax during CY20 as compared to CY19.
Shareholders’ Equity Total equity (including others) of insurance sector increased to Rs 151.21 billion in CY20 from Rs 141.38 billion in CY19. The reason behind this increment in equity is the increase in equity (including others) of non-life insurance companies’ that shared 75.41 percent of the overall equity and increased by 4.17 percent during the year. Whereas, life insurance and takaful companies also posted YoY increase of 17.14 percent and 10.79 percent respectively in their equity during the year CY20, contributing 22.15 percent and 2.43 percent shares respectively of total equity of insurance sector in CY20. The share capital of all insurance companies, comprising 30.87 percent of total equity (including others), increased by 4.10 percent in CY20 as compared to CY19. Reserves, comprises of 31.44 percent of total equity (including others) also increased during the year and reached to Rs 47.55 billion from Rs 45.96 billion in CY19, posted an increment of 3.44 percent in CY20. Similarly, un-appropriated profit of insurance companies posted an increase of 8.21 percent in CY20 to reach Rs 49.72 billion.
22.15
88.95 83.74
75.41
8.99 14.172.43
2.06 2.09
Total Equity(including others)
Liabilities Assets
Category-wise % Share in overall Balance Sheet
Life Insurance Non-Life Insurance Takaful
4.10% 3.44%
8.21%
56.65%
0%
10%
20%
30%
40%
50%
60%
0
10
20
30
40
50
60
ShareCapital
Reserves Un App.Profit/loss
Others
billi
on R
s
Components of Shareholders' Equity
CY19 CY20 Growth(RHS)
170

Financial Statements Analysis of Financial Sector 2020
Assets Total assets reached Rs 1,938.41 billion in CY20, with an increase of 13.38 percent over CY19. Total investment including securities and properties (IV) reached at Rs 1,471.86 billion increased by 17.24 percent in CY20, which hold 75.93 percent share of overall assets and remained the largest component. However, Cash and Balances with banks (C&B), reflected a decrease of 26.09 percent over the previous year. Total assets of life insurance grew by 14.01 percent in CY20 and reached at 1,623.16 billion in CY19 from Rs 1,423.75 billion in CY20. Similarly, total assets of non-Life insurance also increased from Rs 251.62 billion in CY19 to Rs 274.67 billion in CY20, reflecting an increase of 9.16 percent during current year.
Liabilities Total liabilities (TL) of insurance sector stood at Rs 1,787.20 billion in CY20 increased by 13.96 percent from Rs 1,568.29 billion in CY19. Balances of statutory funds (BSF) with an increase of 22.41 percent reached to Rs 5.75 billion in CY20 as compared from Rs 4.69 billion in CY19. Total Liabilities of life insurance companies, which comprises of 88.95 percent share of total liabilities, increase by 13.96 percent in CY20 over CY19. Similarly, total liabilities of non-life insurance and takaful companies also posted and increase during the year CY20 when compared with previous year. Outstanding claims, advances, premium due to other insurance (OC) contributed 73.40 percent share of total liabilities related to insurance sector, of which 66.11 percent share belongs to life insurance sector and posted YoY increase of 13.72 percent in CY20.
Profitability and Operating Efficiency The main source of revenue of insurance sector is premium. The gross premium for year CY19 was Rs 348.52 billion, increased by 4.07 percent to reach Rs 334.88 billion in CY20. Similarly, net premium posted an increase during the year from Rs 276.39 billion in CY19 to Rs 284.27 billion in CY20, showing a YoY growth of 2.85 percent. Investment income witnessed upward trend in CY20 and reached at Rs 125.84 billion from Rs
-26.09%
17.24% 13.38%
-30%
-25%
-20%
-15%
-10%
-5%
0%
5%
10%
15%
20%
0
500
1000
1500
2000
2500
C&B IV TA
billi
on R
s
Components of AssetsCY19 CY20 Growth(RHS)
13.96%
13.49%
15.19%
13%
13%
14%
14%
15%
15%
16%
0200400600800
100012001400160018002000
TL Outst. Claims Misc Liab
Components of Liabilitiesbi
llion
Rs
CY19 CY20 Growth(RHS)
112.62
191.67
125.84
202.9911.74%
5.90%
0%
2%
4%
6%
8%
10%
12%
14%
0
50
100
150
200
250
Investment Income Underwriting Profit
billi
on R
s
Non Core Income of Insurance CompaniesCY19 CY20 Growth(RHS)
171

Financial Statements Analysis of Financial Sector 2020
112.62 billion in CY19. Under-writing profit stood at Rs 202.99 billion in CY19, showed a YoY growth
of 5.90 percent to reach Rs 191.67 billion in CY20. Profit before and after taxation increased to reach at
Rs 27.81 billion and Rs 19.78 billion respectively in CY20.
Return on Equity (ROE) increased to 13.74 percent during CY20 from 12.01 percent in CY19. Similarly,
Return on Assets (ROA) increased to 1.02 percent in CY20 from 0.96 percent in CY19. Earnings per
Share (EPS) was at Rs 3.95 in CY19, increased to Rs 4.58 per share in CY20. Breakup value increased
from Rs 32.89 per share in CY19 to Rs 33.36 per share in CY20.
12.01%
0.96%
13.74%
1.02%
0%
2%
4%
6%
8%
10%
12%
14%
16%
ROE ROA
Profitability RatiosCY19 CY20
3.95
32.89
4.58
33.36
0
5
10
15
20
25
30
35
40
EPS BPS
Rs
per
Sh
are
Valuation per Share
CY19 CY20
172

Financial Statement Analysis of Financial Sector 2020
2016 2017 2018 2019 2020Items
A.Total equity (A1 to A3)
1.Share capital
2.Reserves
3.Un appropriated profit
4.Others
B.Total liabilities (B1 to B3)
1.Balance of statutory funds
2.Outstanding claims, adv., prem., due to other insurers
3.Other/misc. liabilities
C.Total assets (C1 to C5)
1.Cash and balances with banks
2.Advances to policy holders & employees
3.Investments in securities & properties
4.Other/misc. assets
5.Fixed assets
D.Profit & loss account
1.Investment income
2.Gross premium
3.Net premium
4.Gross claims
5.Net claims
6.Underwriting profit
7.Profit/(loss) before taxation
8.Profit/(loss) after taxation
E.Other items
1.No. of ordinary shares (000)
2.Cash dividend
3.Stock dividend/bonus shares
4.Cash generated from operating activities
F.Efficiency ratios/profitability ratios
1.Return on equity (ROE) (D8/A)
2.Return on assets (ROA) (D8/C)
3.Earning per share (D8/E1) (rs. per share)
4.Net Claims Incurred Ratio (D5/D3)
5.Underwriting profit to profit after tax. (D6/D8)
6.Investment income to net premium (D1/D3)
G.Liquidity ratios
1.Cash & bank balances to total assets (C1/C)
2. Investment to total assets (C3/C)
H.Capital /leverage ratios
1.Capital ratio (A/C)
2.Break up value per share (A/E1) (Rs. per share)
I.Cash flow ratio
1.Cash generated from operating activities to profit after tax. (E4/D8)
141,568,770 129,950,204 128,030,323 136,747,390 143,944,075
36,976,693 39,749,821 42,413,174 44,833,163 46,673,453
60,054,752 46,958,455 42,528,115 45,963,863 47,547,199
44,537,325 43,241,928 43,089,034 45,950,364 49,723,423
3,081,149 2,540,735 2,987,832 4,637,585 7,264,669
1,110,447,058 1,225,439,547 1,362,206,683 1,568,285,673 1,787,198,113
2,483,637 3,049,994 3,729,090 4,694,192 5,746,254
817,638,151 903,257,105 1,005,449,676 1,155,893,250 1,311,833,023
290,325,270 319,132,448 353,027,917 407,698,231 469,618,836
1,255,096,976 1,357,930,485 1,493,224,837 1,709,670,648 1,938,406,857
59,415,788 71,256,363 64,555,370 123,024,871 90,927,160
63,618,947 1,473,970 1,461,503 1,560,367 1,598,210
987,763,353 1,050,144,107 1,140,652,790 1,255,473,272 1,471,863,041
132,125,744 219,021,356 266,651,515 305,262,121 350,197,389
12,173,144 16,034,689 19,903,659 24,350,017 23,821,057
13,081,117 151,099,605 89,164,522 112,620,172 125,844,414
263,980,909 296,000,886 320,226,207 334,879,279 348,518,562
215,186,530 253,144,482 271,354,020 276,393,560 284,269,003
115,385,078 126,986,594 140,846,003 161,626,753 178,491,306
95,585,828 110,648,433 122,753,371 142,993,408 158,284,405
66,867,482 132,116,281 157,284,546 191,674,556 202,988,064
25,385,000 24,774,981 21,571,801 24,410,994 27,813,477
17,882,004 16,253,752 13,920,509 16,429,661 19,775,310
3,427,669 3,704,982 3,988,255 4,158,254 4,315,283
48,533,912 58,599,314 59,319,142 39,928,359 54,405,728
12.63% 12.51% 10.87% 12.01% 13.74%
1.42% 1.20% 0.93% 0.96% 1.02%
5.22 4.39 3.49 3.95 4.58
44.42% 43.71% 45.24% 51.74% 55.68%
373.94% 812.84% 1,129.88% 1,166.64% 1,026.47%
6.08% 59.69% 32.86% 40.75% 44.27%
4.73% 5.25% 4.32% 7.20% 4.69%
78.70% 77.33% 76.39% 73.43% 75.93%
11.28% 9.57% 8.57% 8.00% 7.43%
41.30 35.07 32.10 32.89 33.36
271.41% 360.53% 426.13% 243.03% 275.12%
(Thousand Rupees)Insurance Companies - Overall
N/A N/A N/A N/A N/A
N/A N/A N/A N/A N/A
173

Financial Statement Analysis of Financial Sector 2020
2016 2017 2018 2019 2020Items
A.Total equity (A1 to A3)
1.Share capital
2.Reserves
3.Un appropriated profit
4.Others
B.Total liabilities (B1 to B3)
1.Balance of statutory funds
2.Outstanding claims, adv., prem., due to other insurers
3.Other/misc. liabilities
C.Total assets (C1 to C5)
1.Cash and balances with banks
2.Advances to policy holders & employees
3.Investments in securities & properties
4.Other/misc. assets
5.Fixed assets
D.Profit & loss account
1.Investment income
2.Gross premium
3.Net premium
4.Gross claims
5.Net claims
6.Underwriting profit
7.Profit/(loss) before taxation
8.Profit/(loss) after taxation
E.Other items
1.No. of ordinary shares (000)
2.Cash dividend
3.Stock dividend/bonus shares
4.Cash generated from operating activities
F.Efficiency ratios/profitability ratios
1.Return on equity (ROE) (D8/A)
2.Return on assets (ROA) (D8/C)
3.Earning per share (D8/E1) (rs. per share)
4.Net Claims Incurred Ratio (D5/D3)
5.Underwriting profit to profit after tax. (D6/D8)
6.Investment income to net premium (D1/D3)
G.Liquidity ratios
1.Cash & bank balances to total assets (C1/C)
2. Investment to total assets (C3/C)
H.Capital /leverage ratios
1.Capital ratio (A/C)
2.Break up value per share (A/E1) (Rs. per share)
I.Cash flow ratio
1.Cash generated from operating activities to profit after tax. (E4/D8)
20,317,550 22,775,844 24,300,725 26,809,866 29,431,524
7,463,402 7,716,193 8,836,193 10,936,193 11,940,524
3,651,823 4,595,669 5,668,163 5,031,160 5,299,068
9,202,325 10,463,982 9,796,369 10,842,513 12,191,932
1,763,210 986,443 1,160,028 1,785,168 4,064,071
982,491,224 1,086,290,787 1,215,178,583 1,395,158,246 1,589,669,077
0 0 0 0 0
734,067,498 810,201,764 907,798,518 1,038,950,237 1,181,485,642
248,423,726 276,089,023 307,380,065 356,208,009 408,183,435
1,004,571,984 1,110,053,074 1,240,639,336 1,423,753,280 1,623,164,672
41,256,688 51,651,624 48,084,537 109,538,381 77,220,128
63,424,098 1,073,893 1,132,405 1,143,045 1,099,856
840,384,565 915,619,874 1,006,352,403 1,106,210,493 1,308,624,155
55,946,440 135,412,822 177,650,853 198,344,818 228,074,036
3,560,193 6,294,861 7,419,138 8,516,543 8,146,497
1,347,762 73,365,231 81,016,135 101,566,506 115,015,759
171,780,969 198,954,987 213,553,842 212,993,597 223,308,603
169,155,733 196,532,135 210,747,319 210,015,107 219,615,590
73,590,010 83,304,800 93,529,365 109,425,243 127,199,609
71,720,064 81,004,135 91,405,646 107,159,858 123,356,798
60,014,111 127,894,046 151,658,988 187,069,703 198,515,654
7,911,523 9,963,044 8,032,874 8,069,574 12,108,377
5,283,415 6,498,998 5,305,010 5,264,038 8,379,504
476,340 501,619 568,619 706,619 780,052
42,357,258 54,803,340 53,226,173 34,414,091 48,733,026
26.00% 28.53% 21.83% 19.63% 28.47%
0.53% 0.59% 0.43% 0.37% 0.52%
11.09 12.96 9.33 7.45 10.74
42.40% 41.22% 43.37% 51.02% 56.17%
1,135.90% 1,967.90% 2,858.79% 3,553.73% 2,369.06%
0.80% 37.33% 38.44% 48.36% 52.37%
4.11% 4.65% 3.88% 7.69% 4.76%
83.66% 82.48% 81.12% 77.70% 80.62%
2.02% 2.05% 1.96% 1.88% 1.81%
42.65 45.40 42.74 37.94 37.73
801.70% 843.26% 1,003.32% 653.76% 581.57%
(Thousand Rupees)Life Insurance Corporations - Overall
N/A N/A N/A N/A N/A
N/A N/A N/A N/A N/A
174

Financial Statement Analysis of Financial Sector 2020
2016 2017 2018 2019 2020Items
A.Total equity (A1 to A3)
1.Share capital
2.Reserves
3.Un appropriated profit
4.Others
B.Total liabilities (B1 to B3)
1.Balance of statutory funds
2.Outstanding claims, adv., prem., due to other insurers
3.Other/misc. liabilities
C.Total assets (C1 to C5)
1.Cash and balances with banks
2.Advances to policy holders & employees
3.Investments in securities & properties
4.Other/misc. assets
5.Fixed assets
D.Profit & loss account
1.Investment income
2.Gross premium
3.Net premium
4.Gross claims
5.Net claims
6.Underwriting profit
7.Profit/(loss) before taxation
8.Profit/(loss) after taxation
E.Other items
1.No. of ordinary shares (000)
2.Cash dividend
3.Stock dividend/bonus shares
4.Cash generated from operating activities
F.Efficiency ratios/profitability ratios
1.Return on equity (ROE) (D8/A)
2.Return on assets (ROA) (D8/C)
3.Earning per share (D8/E1) (rs. per share)
4.Net Claims Incurred Ratio (D5/D3)
5.Underwriting profit to profit after tax. (D6/D8)
6.Investment income to net premium (D1/D3)
G.Liquidity ratios
1.Cash & bank balances to total assets (C1/C)
2. Investment to total assets (C3/C)
H.Capital /leverage ratios
1.Capital ratio (A/C)
2.Break up value per share (A/E1) (Rs. per share)
I.Cash flow ratio
1.Cash generated from operating activities to profit after tax. (E4/D8)
1,241,425 1,059,301 1,126,817 1,322,823 1,490,254
935,494 935,494 935,494 935,494 935,494
233,009 69,450 139,035 367,674 526,415
72,922 54,357 52,288 19,655 28,345
25,162 4,639 (3,928) (3,532) 361
22,246,310 28,393,488 32,789,403 39,057,153 49,348,801
0 0 0 0 0
481,280 642,625 1,391,835 1,130,250 1,620,976
21,765,030 27,750,863 31,397,568 37,926,903 47,727,825
23,512,897 29,457,428 33,912,292 40,376,444 50,839,416
1,677,912 1,351,635 3,311,653 7,260,559 9,955,052
28,624 40,086 45,367 64,058 33,090
20,133,136 27,348,232 29,638,487 31,954,538 39,402,518
1,547,339 503,693 749,148 533,314 1,283,364
125,886 213,782 167,637 563,975 165,392
23,632 146,016 1,585,556 2,539,618 2,586,859
11,301,714 13,766,086 13,247,254 12,969,421 17,100,887
10,913,432 13,294,151 12,711,254 12,386,150 16,536,920
3,480,937 4,826,323 6,827,889 7,065,482 7,452,420
3,151,648 4,400,308 6,304,344 6,723,882 6,838,631
6,428,487 12,921,738 13,045,429 15,895,867 20,822,093
1,962 (242,152) 72,563 281,181 310,192
1,178 (169,749) (56,088) 217,106 191,014
93,549 93,549 93,549 93,549 93,549
0.00% 0.00% 0.00% 0.00% 0.00%
0.00% 0.00% 0.00% 0.00% 0.00%
4,335,391 6,884,690 4,059,752 2,865,383 5,650,284
0.09% -16.02% -4.98% 16.41% 12.82%
0.01% -0.58% -0.17% 0.54% 0.38%
0.01 -1.81 -0.60 2.32 2.04
28.88% 33.10% 49.60% 54.29% 41.35%
545,711.97% -7,612.26% -23,258.86% 7,321.71% 10,900.82%
0.22% 1.10% 12.47% 20.50% 15.64%
7.14% 4.59% 9.77% 17.98% 19.58%
85.63% 92.84% 87.40% 79.14% 77.50%
5.28% 3.60% 3.32% 3.28% 2.93%
13.27 11.32 12.05 14.14 15.93
368,029.80% -4,055.81% -7,238.18% 1,319.81% 2,958.05%
(Thousand Rupees)Adamjee Life Assurance Co. Ltd.
175

Financial Statement Analysis of Financial Sector 2020
2016 2017 2018 2019 2020Items
A.Total equity (A1 to A3)
1.Share capital
2.Reserves
3.Un appropriated profit
4.Others
B.Total liabilities (B1 to B3)
1.Balance of statutory funds
2.Outstanding claims, adv., prem., due to other insurers
3.Other/misc. liabilities
C.Total assets (C1 to C5)
1.Cash and balances with banks
2.Advances to policy holders & employees
3.Investments in securities & properties
4.Other/misc. assets
5.Fixed assets
D.Profit & loss account
1.Investment income
2.Gross premium
3.Net premium
4.Gross claims
5.Net claims
6.Underwriting profit
7.Profit/(loss) before taxation
8.Profit/(loss) after taxation
E.Other items
1.No. of ordinary shares (000)
2.Cash dividend
3.Stock dividend/bonus shares
4.Cash generated from operating activities
F.Efficiency ratios/profitability ratios
1.Return on equity (ROE) (D8/A)
2.Return on assets (ROA) (D8/C)
3.Earning per share (D8/E1) (rs. per share)
4.Net Claims Incurred Ratio (D5/D3)
5.Underwriting profit to profit after tax. (D6/D8)
6.Investment income to net premium (D1/D3)
G.Liquidity ratios
1.Cash & bank balances to total assets (C1/C)
2. Investment to total assets (C3/C)
H.Capital /leverage ratios
1.Capital ratio (A/C)
2.Break up value per share (A/E1) (Rs. per share)
I.Cash flow ratio
1.Cash generated from operating activities to profit after tax. (E4/D8)
194,282 158,620 545,627 283,247 448,496
601,720 601,720 1,101,720 1,101,720 1,501,720
(320,764) (355,735) (452,235) (732,058) (970,982)
(86,674) (87,365) (103,858) (86,415) (82,242)
282 100,238 257 800 2,373
281,990 268,109 297,489 485,861 599,303
0 0 0 0 0
83,362 77,910 108,263 37,492 73,155
198,628 190,199 189,226 448,369 526,148
476,554 526,967 843,373 769,908 1,050,172
65,960 55,225 73,881 112,844 86,503
10,671 10,859 9,804 520 546
359,808 423,767 714,005 510,611 822,950
20,824 19,987 40,300 102,911 108,374
19,291 17,129 5,383 43,022 31,799
16,373 23,833 29,631 88,124 56,671
24,856 19,211 43,849 301,961 449,264
20,081 16,758 25,661 219,535 281,371
50,399 39,556 64,040 176,873 328,175
49,516 37,332 50,083 82,127 126,702
(59,824) 42,380 58,472 295,972 350,140
(4,751) (35,073) (112,738) (262,370) (238,354)
(4,917) (35,662) (112,993) (262,880) (238,801)
60,172 60,172 110,172 110,172 150,172
0.01% 0.00% 0.00% 0.00% 0.00%
0.00% 0.00% 0.00% 0.00% 0.00%
(109,938) (71,636) (118,998) (193,514) (185,626)
-2.53% -22.48% -20.71% -92.81% -53.24%
-1.03% -6.77% -13.40% -34.14% -22.74%
-0.08 -0.59 -1.03 -2.39 -1.59
246.58% 222.77% 195.17% 37.41% 45.03%
1,216.68% -118.84% -51.75% -112.59% -146.62%
81.53% 142.22% 115.47% 40.14% 20.14%
13.84% 10.48% 8.76% 14.66% 8.24%
75.50% 80.42% 84.66% 66.32% 78.36%
40.77% 30.10% 64.70% 36.79% 42.71%
3.23 2.64 4.95 2.57 2.99
2,235.88% 200.87% 105.31% 73.61% 77.73%
(Thousand Rupees)Askari Life Insurance Co. Ltd.(Formally East West Life Assur
176

Financial Statement Analysis of Financial Sector 2020
2016 2017 2018 2019 2020Items
A.Total equity (A1 to A3)
1.Share capital
2.Reserves
3.Un appropriated profit
4.Others
B.Total liabilities (B1 to B3)
1.Balance of statutory funds
2.Outstanding claims, adv., prem., due to other insurers
3.Other/misc. liabilities
C.Total assets (C1 to C5)
1.Cash and balances with banks
2.Advances to policy holders & employees
3.Investments in securities & properties
4.Other/misc. assets
5.Fixed assets
D.Profit & loss account
1.Investment income
2.Gross premium
3.Net premium
4.Gross claims
5.Net claims
6.Underwriting profit
7.Profit/(loss) before taxation
8.Profit/(loss) after taxation
E.Other items
1.No. of ordinary shares (000)
2.Cash dividend
3.Stock dividend/bonus shares
4.Cash generated from operating activities
F.Efficiency ratios/profitability ratios
1.Return on equity (ROE) (D8/A)
2.Return on assets (ROA) (D8/C)
3.Earning per share (D8/E1) (rs. per share)
4.Net Claims Incurred Ratio (D5/D3)
5.Underwriting profit to profit after tax. (D6/D8)
6.Investment income to net premium (D1/D3)
G.Liquidity ratios
1.Cash & bank balances to total assets (C1/C)
2. Investment to total assets (C3/C)
H.Capital /leverage ratios
1.Capital ratio (A/C)
2.Break up value per share (A/E1) (Rs. per share)
I.Cash flow ratio
1.Cash generated from operating activities to profit after tax. (E4/D8)
5,535,588 5,870,550 5,882,690 5,856,954 6,136,778
1,000,000 1,000,000 1,000,000 1,000,000 1,000,000
1,650,000 1,900,000 2,150,000 2,000,000 2,000,000
2,885,588 2,970,550 2,732,690 2,856,954 3,136,778
582,271 92,121 75,713 50,986 38,311
100,496,875 103,582,513 110,806,208 123,381,699 148,304,847
0 0 0 0 0
2,416,546 2,840,305 2,545,802 3,942,890 4,972,058
98,080,329 100,742,208 108,260,406 119,438,809 143,332,789
106,614,734 109,545,184 116,764,611 129,289,639 154,479,936
3,037,489 6,057,913 4,786,362 5,713,548 5,335,091
91,912 105,386 136,737 82,799 87,012
99,021,099 97,959,122 105,820,637 116,065,289 142,432,034
2,309,842 3,213,921 3,562,210 4,897,609 4,143,701
2,154,392 2,208,842 2,458,665 2,530,394 2,482,098
410,697 6,411,124 6,942,391 11,589,124 11,468,634
24,676,452 31,420,835 30,790,407 31,750,084 32,545,748
23,861,851 30,813,133 30,164,268 31,141,634 31,653,339
18,351,861 14,828,672 13,589,766 16,115,441 18,587,039
17,764,439 14,237,934 13,094,451 15,677,433 17,860,692
3,261,031 27,157,046 30,372,245 38,061,925 52,550,827
2,798,096 2,794,241 2,282,937 2,354,173 2,527,233
1,872,896 1,909,962 1,546,303 1,549,264 1,784,150
100,000 100,000 100,000 100,000 100,000
150.00% 150.00% 1.50% 150.00% 150.00%
0.00% 0.00% 0.00% 0.00% 0.00%
212,450 7,299,968 7,835,807 7,849,700 5,819,758
33.83% 32.53% 26.29% 26.45% 29.07%
1.76% 1.74% 1.32% 1.20% 1.15%
18.73 19.10 15.46 15.49 17.84
74.45% 46.21% 43.41% 50.34% 56.43%
174.12% 1,421.86% 1,964.18% 2,456.77% 2,945.43%
1.72% 20.81% 23.02% 37.21% 36.23%
2.85% 5.53% 4.10% 4.42% 3.45%
92.88% 89.42% 90.63% 89.77% 92.20%
5.19% 5.36% 5.04% 4.53% 3.97%
55.36 58.71 58.83 58.57 61.37
11.34% 382.20% 506.74% 506.67% 326.19%
(Thousand Rupees)EFU Life Assurance Co. Ltd.
177

Financial Statement Analysis of Financial Sector 2020
2016 2017 2018 2019 2020Items
A.Total equity (A1 to A3)
1.Share capital
2.Reserves
3.Un appropriated profit
4.Others
B.Total liabilities (B1 to B3)
1.Balance of statutory funds
2.Outstanding claims, adv., prem., due to other insurers
3.Other/misc. liabilities
C.Total assets (C1 to C5)
1.Cash and balances with banks
2.Advances to policy holders & employees
3.Investments in securities & properties
4.Other/misc. assets
5.Fixed assets
D.Profit & loss account
1.Investment income
2.Gross premium
3.Net premium
4.Gross claims
5.Net claims
6.Underwriting profit
7.Profit/(loss) before taxation
8.Profit/(loss) after taxation
E.Other items
1.No. of ordinary shares (000)
2.Cash dividend
3.Stock dividend/bonus shares
4.Cash generated from operating activities
F.Efficiency ratios/profitability ratios
1.Return on equity (ROE) (D8/A)
2.Return on assets (ROA) (D8/C)
3.Earning per share (D8/E1) (rs. per share)
4.Net Claims Incurred Ratio (D5/D3)
5.Underwriting profit to profit after tax. (D6/D8)
6.Investment income to net premium (D1/D3)
G.Liquidity ratios
1.Cash & bank balances to total assets (C1/C)
2. Investment to total assets (C3/C)
H.Capital /leverage ratios
1.Capital ratio (A/C)
2.Break up value per share (A/E1) (Rs. per share)
I.Cash flow ratio
1.Cash generated from operating activities to profit after tax. (E4/D8)
1,496,342 1,569,055 1,402,094 2,232,970 2,134,397
605,000 705,672 705,672 1,705,672 1,705,672
77,899 173,456 71,065 (148,245) (641,955)
813,443 689,927 625,357 675,543 1,070,680
108,208 (24,767) (48,240) 7,743 2,331
17,943,342 18,484,007 17,296,523 17,903,386 19,731,014
0 0 0 0 0
423,213 336,799 351,275 511,927 916,886
17,520,129 18,147,208 16,945,248 17,391,459 18,814,128
19,547,892 20,028,295 18,650,377 20,144,099 21,867,742
610,880 746,277 768,762 110,462 363,263
0 0 0 0 0
17,671,547 17,771,814 15,681,832 17,350,938 19,017,906
1,181,180 1,382,315 1,645,575 2,040,361 1,755,610
84,285 127,889 554,208 642,338 730,963
106,863 1,072,504 1,077,634 1,551,163 1,644,301
7,584,067 5,617,388 4,793,561 4,814,857 6,160,785
7,436,242 5,488,472 4,656,321 4,656,663 5,949,885
3,213,429 4,392,221 5,154,003 4,883,118 4,416,919
3,186,980 4,318,736 5,122,635 4,770,078 4,295,989
3,813,915 453,138 5,730,089 6,315,977 1,966,733
135,539 225,975 (134,076) (245,797) (135,987)
94,890 157,771 (94,703) (176,718) (95,725)
60,500 70,567 70,567 170,567 170,567
15.00% 10.00% 0.00% 0.00% 0.00%
20.00% 16.00% 0.00% 0.00% 0.00%
2,965,665 (411,053) (1,990,349) (1,607,511) (95,965)
6.34% 10.06% -6.75% -7.91% -4.48%
0.49% 0.79% -0.51% -0.88% -0.44%
1.57 2.24 -1.34 -1.04 -0.56
42.86% 78.69% 110.01% 102.44% 72.20%
4,019.30% 287.21% -6,050.59% -3,574.04% -2,054.57%
1.44% 19.54% 23.14% 33.31% 27.64%
3.13% 3.73% 4.12% 0.55% 1.66%
90.40% 88.73% 84.08% 86.13% 86.97%
7.65% 7.83% 7.52% 11.08% 9.76%
24.73 22.23 19.87 13.09 12.51
3,125.37% -260.54% 2,101.67% 909.65% 100.25%
(Thousand Rupees)IGI Life Insurance Limited (Formerly American Life Insuranc
178

Financial Statement Analysis of Financial Sector 2020
2016 2017 2018 2019 2020Items
A.Total equity (A1 to A3)
1.Share capital
2.Reserves
3.Un appropriated profit
4.Others
B.Total liabilities (B1 to B3)
1.Balance of statutory funds
2.Outstanding claims, adv., prem., due to other insurers
3.Other/misc. liabilities
C.Total assets (C1 to C5)
1.Cash and balances with banks
2.Advances to policy holders & employees
3.Investments in securities & properties
4.Other/misc. assets
5.Fixed assets
D.Profit & loss account
1.Investment income
2.Gross premium
3.Net premium
4.Gross claims
5.Net claims
6.Underwriting profit
7.Profit/(loss) before taxation
8.Profit/(loss) after taxation
E.Other items
1.No. of ordinary shares (000)
2.Cash dividend
3.Stock dividend/bonus shares
4.Cash generated from operating activities
F.Efficiency ratios/profitability ratios
1.Return on equity (ROE) (D8/A)
2.Return on assets (ROA) (D8/C)
3.Earning per share (D8/E1) (rs. per share)
4.Net Claims Incurred Ratio (D5/D3)
5.Underwriting profit to profit after tax. (D6/D8)
6.Investment income to net premium (D1/D3)
G.Liquidity ratios
1.Cash & bank balances to total assets (C1/C)
2. Investment to total assets (C3/C)
H.Capital /leverage ratios
1.Capital ratio (A/C)
2.Break up value per share (A/E1) (Rs. per share)
I.Cash flow ratio
1.Cash generated from operating activities to profit after tax. (E4/D8)
7,120,394 9,301,632 10,363,161 11,233,535 12,794,822
721,188 793,307 793,307 793,307 872,638
1,825,862 2,501,455 3,153,255 3,436,746 4,080,865
4,573,344 6,006,870 6,416,599 7,003,482 7,841,319
544,802 15,090 (21,492) 172,026 77,384
95,131,570 111,196,179 129,284,345 161,954,962 177,549,917
0 0 0 0 0
1,774,327 2,465,214 4,084,760 5,265,177 6,797,869
93,357,243 108,730,965 125,199,585 156,689,785 170,752,048
102,796,766 120,512,901 139,626,014 173,360,523 190,422,123
4,404,061 4,893,175 5,673,359 4,094,997 4,943,260
9,152 18,909 24,792 42,631 29,387
94,253,985 110,010,655 112,519,463 158,843,190 175,769,348
3,394,977 2,331,502 18,082,299 6,593,765 5,812,754
734,591 3,258,660 3,326,101 3,785,940 3,867,374
463,311 5,959,850 7,564,517 12,591,769 12,024,816
38,003,577 46,816,891 51,887,073 49,627,409 46,507,123
36,988,234 45,905,895 50,670,972 48,396,019 45,207,696
10,268,591 14,015,203 17,294,771 23,629,644 30,662,188
9,473,846 12,969,716 16,315,729 22,471,614 28,825,518
23,009,185 42,091,302 48,996,245 68,766,251 57,137,348
3,151,604 5,135,506 3,448,674 3,416,367 4,070,024
2,107,898 3,261,837 2,430,331 2,224,227 2,884,381
72,119 79,331 79,331 79,331 87,264
145.00% 175.00% 175.00% 165.00% 165.00%
10.00% 0.00% 0.00% 10.00% 0.00%
18,136,828 22,157,759 22,499,257 13,027,353 6,807,490
29.60% 35.07% 23.45% 19.80% 22.54%
2.05% 2.71% 1.74% 1.28% 1.51%
29.23 41.12 30.64 28.04 33.05
25.61% 28.25% 32.20% 46.43% 63.76%
1,091.57% 1,290.42% 2,016.03% 3,091.69% 1,980.92%
1.25% 12.98% 14.93% 26.02% 26.60%
4.28% 4.06% 4.06% 2.36% 2.60%
91.69% 91.29% 80.59% 91.63% 92.31%
6.93% 7.72% 7.42% 6.48% 6.72%
98.73 117.25 130.63 141.60 146.62
860.42% 679.30% 925.77% 585.70% 236.01%
(Thousand Rupees)Jubilee Life Insurance Co. Ltd.
179

Financial Statement Analysis of Financial Sector 2020
2016 2017 2018 2019 2020Items
A.Total equity (A1 to A3)
1.Share capital
2.Reserves
3.Un appropriated profit
4.Others
B.Total liabilities (B1 to B3)
1.Balance of statutory funds
2.Outstanding claims, adv., prem., due to other insurers
3.Other/misc. liabilities
C.Total assets (C1 to C5)
1.Cash and balances with banks
2.Advances to policy holders & employees
3.Investments in securities & properties
4.Other/misc. assets
5.Fixed assets
D.Profit & loss account
1.Investment income
2.Gross premium
3.Net premium
4.Gross claims
5.Net claims
6.Underwriting profit
7.Profit/(loss) before taxation
8.Profit/(loss) after taxation
E.Other items
1.No. of ordinary shares (000)
2.Cash dividend
3.Stock dividend/bonus shares
4.Cash generated from operating activities
F.Efficiency ratios/profitability ratios
1.Return on equity (ROE) (D8/A)
2.Return on assets (ROA) (D8/C)
3.Earning per share (D8/E1) (rs. per share)
4.Net Claims Incurred Ratio (D5/D3)
5.Underwriting profit to profit after tax. (D6/D8)
6.Investment income to net premium (D1/D3)
G.Liquidity ratios
1.Cash & bank balances to total assets (C1/C)
2. Investment to total assets (C3/C)
H.Capital /leverage ratios
1.Capital ratio (A/C)
2.Break up value per share (A/E1) (Rs. per share)
I.Cash flow ratio
1.Cash generated from operating activities to profit after tax. (E4/D8)
4,398,078 4,576,958 4,720,658 5,591,925 6,365,221
3,000,000 3,000,000 3,500,000 4,300,000 4,600,000
185,817 307,043 507,043 7,043 304,725
1,212,261 1,269,915 713,615 1,284,882 1,460,496
502,485 779,122 1,157,718 1,557,145 3,943,311
746,289,576 824,105,800 924,352,798 1,051,687,035 1,193,074,111
0 0 0 0 0
728,855,421 803,781,784 899,221,629 1,027,823,887 1,166,687,540
17,434,155 20,324,016 25,131,169 23,863,148 26,386,571
751,190,139 829,461,880 930,231,174 1,058,836,105 1,203,382,643
31,348,623 38,452,099 33,298,315 91,859,786 56,184,733
63,283,739 898,653 915,705 953,037 949,821
608,801,177 661,915,969 741,775,462 781,259,434 930,911,392
47,347,590 127,758,291 153,360,269 183,843,613 214,485,881
409,010 436,868 881,423 920,235 850,816
317,517 59,738,227 63,800,988 73,184,367 87,207,086
90,074,024 101,044,743 112,356,501 112,776,755 119,414,632
89,820,969 100,760,717 112,123,490 112,572,322 119,034,540
38,070,144 45,117,374 50,329,972 57,143,001 64,886,618
37,938,986 44,954,658 50,249,480 57,048,764 64,688,426
23,606,112 44,954,658 53,040,337 57,048,764 64,688,426
1,830,460 2,256,129 2,675,420 2,796,846 5,926,610
1,212,261 1,546,552 1,792,210 1,984,303 4,206,342
30,000 30,000 35,000 43,000 46,000
0.00% 0.00% 0.00% 0.00% 0.00%
0.00% 0.00% 0.00% 0.00% 0.00%
17,029,114 19,024,872 21,068,067 12,635,718 30,894,807
27.56% 33.79% 37.97% 35.49% 66.08%
0.16% 0.19% 0.19% 0.19% 0.35%
40.41 51.55 51.21 46.15 91.44
42.24% 44.62% 44.82% 50.68% 54.34%
1,947.28% 2,906.77% 2,959.49% 2,875.00% 1,537.88%
0.35% 59.29% 56.90% 65.01% 73.26%
4.17% 4.64% 3.58% 8.68% 4.67%
81.04% 79.80% 79.74% 73.78% 77.36%
0.59% 0.55% 0.51% 0.53% 0.53%
146.60 152.57 134.88 130.04 138.37
1,404.74% 1,230.15% 1,175.54% 636.78% 734.48%
(Thousand Rupees)State Life Insurance Corporation Ltd.
180

Financial Statement Analysis of Financial Sector 2020
2016 2017 2018 2019 2020Items
A.Total equity (A1 to A3)
1.Share capital
2.Reserves
3.Un appropriated profit
4.Others
B.Total liabilities (B1 to B3)
1.Balance of statutory funds
2.Outstanding claims, adv., prem., due to other insurers
3.Other/misc. liabilities
C.Total assets (C1 to C5)
1.Cash and balances with banks
2.Advances to policy holders & employees
3.Investments in securities & properties
4.Other/misc. assets
5.Fixed assets
D.Profit & loss account
1.Investment income
2.Gross premium
3.Net premium
4.Gross claims
5.Net claims
6.Underwriting profit
7.Profit/(loss) before taxation
8.Profit/(loss) after taxation
E.Other items
1.No. of ordinary shares (000)
2.Cash dividend
3.Stock dividend/bonus shares
4.Cash generated from operating activities
F.Efficiency ratios/profitability ratios
1.Return on equity (ROE) (D8/A)
2.Return on assets (ROA) (D8/C)
3.Earning per share (D8/E1) (rs. per share)
4.Net Claims Incurred Ratio (D5/D3)
5.Underwriting profit to profit after tax. (D6/D8)
6.Investment income to net premium (D1/D3)
G.Liquidity ratios
1.Cash & bank balances to total assets (C1/C)
2. Investment to total assets (C3/C)
H.Capital /leverage ratios
1.Capital ratio (A/C)
2.Break up value per share (A/E1) (Rs. per share)
I.Cash flow ratio
1.Cash generated from operating activities to profit after tax. (E4/D8)
331,441 239,728 259,678 288,412 61,556
600,000 680,000 800,000 1,100,000 1,325,000
0 0 100,000 100,000 0
(268,559) (440,272) (640,322) (911,588) (1,263,444)
0 20,000 0 0 0
101,561 260,691 351,817 688,150 1,061,084
0 0 0 0 0
33,349 57,127 94,954 238,614 417,158
68,212 203,564 256,863 449,536 643,926
433,002 520,419 611,495 976,562 1,122,640
111,763 95,300 172,205 386,185 352,226
0 0 0 0 0
143,813 190,315 202,517 226,493 268,007
144,688 203,113 211,052 333,245 484,352
32,738 31,691 25,721 30,639 18,055
9,369 13,677 15,418 22,341 27,392
116,279 269,833 435,197 753,110 1,130,164
114,924 253,009 395,353 642,784 951,839
154,649 85,451 268,924 411,684 866,250
154,649 85,451 268,924 385,960 720,840
(44,795) 273,784 416,171 684,947 1,000,087
(1,387) (171,582) (199,906) (270,826) (351,341)
(791) (171,713) (200,050) (271,264) (351,857)
60,000 68,000 80,000 110,000 132,500
0.00% 0.00% 20.00% 0.00% 0.00%
0.00% 10.00% 13.00% 0.00% 0.00%
(212,252) (81,260) (127,363) (163,038) (157,722)
-0.24% -71.63% -77.04% -94.05% -571.60%
-0.18% -33.00% -32.71% -27.78% -31.34%
-0.01 -2.53 -2.50 -2.47 -2.66
134.57% 33.77% 68.02% 60.05% 75.73%
5,663.08% -159.44% -208.03% -252.50% -284.23%
8.15% 5.41% 3.90% 3.48% 2.88%
25.81% 18.31% 28.16% 39.55% 31.37%
33.21% 36.57% 33.12% 23.19% 23.87%
76.54% 46.06% 42.47% 29.53% 5.48%
5.52 3.53 3.25 2.62 0.46
26,833.38% 47.32% 63.67% 60.10% 44.83%
(Thousand Rupees)TPL Life Insurance Ltd.
181

Financial Statement Analysis of Financial Sector 2020
2016 2017 2018 2019 2020Items
A.Total equity (A1 to A3)
1.Share capital
2.Reserves
3.Un appropriated profit
4.Others
B.Total liabilities (B1 to B3)
1.Balance of statutory funds
2.Outstanding claims, adv., prem., due to other insurers
3.Other/misc. liabilities
C.Total assets (C1 to C5)
1.Cash and balances with banks
2.Advances to policy holders & employees
3.Investments in securities & properties
4.Other/misc. assets
5.Fixed assets
D.Profit & loss account
1.Investment income
2.Gross premium
3.Net premium
4.Gross claims
5.Net claims
6.Underwriting profit
7.Profit/(loss) before taxation
8.Profit/(loss) after taxation
E.Other items
1.No. of ordinary shares (000)
2.Cash dividend
3.Stock dividend/bonus shares
4.Cash generated from operating activities
F.Efficiency ratios/profitability ratios
1.Return on equity (ROE) (D8/A)
2.Return on assets (ROA) (D8/C)
3.Earning per share (D8/E1) (rs. per share)
4.Net Claims Incurred Ratio (D5/D3)
5.Underwriting profit to profit after tax. (D6/D8)
6.Investment income to net premium (D1/D3)
G.Liquidity ratios
1.Cash & bank balances to total assets (C1/C)
2. Investment to total assets (C3/C)
H.Capital /leverage ratios
1.Capital ratio (A/C)
2.Break up value per share (A/E1) (Rs. per share)
I.Cash flow ratio
1.Cash generated from operating activities to profit after tax. (E4/D8)
119,316,422 104,870,920 101,078,385 107,416,226 111,743,237
26,831,319 29,029,522 29,947,642 30,717,631 31,553,590
56,677,703 42,633,905 37,275,306 41,045,472 42,360,287
35,807,400 33,207,493 33,855,437 35,653,123 37,829,360
990,973 1,143,730 1,178,163 2,050,932 2,288,516
108,483,195 116,763,839 121,257,979 142,147,965 160,642,565
0 0 0 0 0
81,971,884 91,337,499 95,763,177 114,973,645 127,703,993
26,511,311 25,426,340 25,494,802 27,174,320 32,938,572
228,790,590 222,778,489 223,514,527 251,615,123 274,674,318
13,991,080 14,951,513 13,020,287 8,719,187 9,741,151
192,160 386,373 321,100 401,172 486,749
133,260,378 117,289,578 112,388,063 124,879,396 132,349,919
73,082,427 80,800,345 85,767,815 102,711,551 117,372,605
8,264,545 9,350,680 12,017,262 14,903,817 14,723,894
11,648,142 76,883,522 6,836,801 8,697,859 9,154,170
82,126,307 86,622,267 95,801,723 110,229,702 113,206,627
43,497,059 47,706,158 52,068,153 56,962,843 55,023,602
38,237,079 38,925,970 42,550,938 46,504,659 44,764,083
22,311,119 25,669,600 27,097,523 30,532,748 28,983,897
6,868,594 4,200,129 5,614,102 4,618,765 4,433,728
17,722,977 15,067,435 13,866,638 16,154,646 15,372,985
12,912,099 10,071,634 9,007,760 11,041,451 11,132,489
2,683,132 2,902,952 3,056,702 3,133,701 3,217,296
3,764,882 768,644 3,567,268 4,028,251 3,986,099
10.82% 9.60% 8.91% 10.28% 9.96%
5.64% 4.52% 4.03% 4.39% 4.05%
4.81 3.47 2.95 3.52 3.46
51.29% 53.81% 52.04% 53.60% 52.68%
53.20% 41.70% 62.33% 41.83% 39.83%
26.78% 161.16% 13.13% 15.27% 16.64%
6.12% 6.71% 5.83% 3.47% 3.55%
58.25% 52.65% 50.28% 49.63% 48.18%
52.15% 47.07% 45.22% 42.69% 40.68%
44.47 36.13 33.07 34.28 34.73
29.16% 7.63% 39.60% 36.48% 35.81%
(Thousand Rupees)Non-Life Insurance Corporations - Overall
N/A N/A N/A N/A N/A
N/A N/A N/A N/A N/A
182

Financial Statement Analysis of Financial Sector 2020
2016 2017 2018 2019 2020Items
A.Total equity (A1 to A3)
1.Share capital
2.Reserves
3.Un appropriated profit
4.Others
B.Total liabilities (B1 to B3)
1.Balance of statutory funds
2.Outstanding claims, adv., prem., due to other insurers
3.Other/misc. liabilities
C.Total assets (C1 to C5)
1.Cash and balances with banks
2.Advances to policy holders & employees
3.Investments in securities & properties
4.Other/misc. assets
5.Fixed assets
D.Profit & loss account
1.Investment income
2.Gross premium
3.Net premium
4.Gross claims
5.Net claims
6.Underwriting profit
7.Profit/(loss) before taxation
8.Profit/(loss) after taxation
E.Other items
1.No. of ordinary shares (000)
2.Cash dividend
3.Stock dividend/bonus shares
4.Cash generated from operating activities
F.Efficiency ratios/profitability ratios
1.Return on equity (ROE) (D8/A)
2.Return on assets (ROA) (D8/C)
3.Earning per share (D8/E1) (rs. per share)
4.Net Claims Incurred Ratio (D5/D3)
5.Underwriting profit to profit after tax. (D6/D8)
6.Investment income to net premium (D1/D3)
G.Liquidity ratios
1.Cash & bank balances to total assets (C1/C)
2. Investment to total assets (C3/C)
H.Capital /leverage ratios
1.Capital ratio (A/C)
2.Break up value per share (A/E1) (Rs. per share)
I.Cash flow ratio
1.Cash generated from operating activities to profit after tax. (E4/D8)
21,871,855 20,364,465 19,663,358 21,380,492 22,234,859
3,500,000 3,500,000 3,500,000 3,500,000 3,500,000
6,278,086 5,000,501 3,784,200 4,555,491 4,486,946
12,093,769 11,863,964 12,379,158 13,325,001 14,247,913
0 0 0 0 0
23,767,842 27,023,072 28,181,736 28,157,770 27,285,290
0 0 0 0 0
18,713,108 22,383,450 23,680,578 23,773,861 20,036,850
5,054,734 4,639,622 4,501,158 4,383,909 7,248,440
45,639,697 47,387,537 47,845,094 49,538,262 49,520,149
3,811,171 2,278,614 2,211,444 1,176,685 1,312,044
18,369 147,024 103,455 201,496 282,387
24,337,225 23,749,454 24,114,124 26,289,568 26,997,649
16,223,192 18,580,304 17,822,573 17,569,456 16,371,963
1,249,740 2,632,141 3,593,498 4,301,057 4,556,106
3,502,042 1,493,778 1,284,656 1,372,373 1,092,506
16,270,031 18,521,851 20,387,059 22,507,035 18,279,110
9,615,381 11,534,999 13,805,781 15,433,989 13,294,626
10,609,406 10,632,888 13,905,284 14,686,699 11,973,346
6,210,499 7,433,828 8,385,752 9,876,537 7,986,856
1,077,987 556,779 815,905 653,622 375,700
4,053,636 2,120,906 2,173,500 2,532,994 1,910,186
3,492,944 1,221,228 1,239,000 1,812,975 1,875,506
350,000 350,000 350,000 350,000 350,000
40.00% 25.00% 25.00% 25.00% 25.00%
0.00% 0.00% 0.00% 0.00% 0.00%
222,446 1,060,014 1,892,177 (93,353) 647,787
15.97% 6.00% 6.30% 8.48% 8.43%
7.65% 2.58% 2.59% 3.66% 3.79%
9.98 3.49 3.54 5.18 5.36
64.59% 64.45% 60.74% 63.99% 60.08%
30.86% 45.59% 65.85% 36.05% 20.03%
36.42% 12.95% 9.31% 8.89% 8.22%
8.35% 4.81% 4.62% 2.38% 2.65%
53.32% 50.12% 50.40% 53.07% 54.52%
47.92% 42.97% 41.10% 43.16% 44.90%
62.49 58.18 56.18 61.09 63.53
6.37% 86.80% 152.72% -5.15% 34.54%
(Thousand Rupees)Adamjee Insurance Co. Ltd.
183

Financial Statement Analysis of Financial Sector 2020
2016 2017 2018 2019 2020Items
A.Total equity (A1 to A3)
1.Share capital
2.Reserves
3.Un appropriated profit
4.Others
B.Total liabilities (B1 to B3)
1.Balance of statutory funds
2.Outstanding claims, adv., prem., due to other insurers
3.Other/misc. liabilities
C.Total assets (C1 to C5)
1.Cash and balances with banks
2.Advances to policy holders & employees
3.Investments in securities & properties
4.Other/misc. assets
5.Fixed assets
D.Profit & loss account
1.Investment income
2.Gross premium
3.Net premium
4.Gross claims
5.Net claims
6.Underwriting profit
7.Profit/(loss) before taxation
8.Profit/(loss) after taxation
E.Other items
1.No. of ordinary shares (000)
2.Cash dividend
3.Stock dividend/bonus shares
4.Cash generated from operating activities
F.Efficiency ratios/profitability ratios
1.Return on equity (ROE) (D8/A)
2.Return on assets (ROA) (D8/C)
3.Earning per share (D8/E1) (rs. per share)
4.Net Claims Incurred Ratio (D5/D3)
5.Underwriting profit to profit after tax. (D6/D8)
6.Investment income to net premium (D1/D3)
G.Liquidity ratios
1.Cash & bank balances to total assets (C1/C)
2. Investment to total assets (C3/C)
H.Capital /leverage ratios
1.Capital ratio (A/C)
2.Break up value per share (A/E1) (Rs. per share)
I.Cash flow ratio
1.Cash generated from operating activities to profit after tax. (E4/D8)
985,184 1,054,417 1,066,866 1,312,385 1,312,385
500,000 500,000 500,000 500,000 500,000
203,541 152,332 100,604 184,396 184,396
281,643 402,085 466,262 627,989 627,989
0 0 0 0 0
1,875,401 2,096,066 2,120,005 2,711,377 2,711,377
0 0 0 0 0
1,498,541 1,649,111 1,609,041 1,939,432 1,939,432
376,860 446,955 510,964 771,945 771,945
2,860,585 3,150,483 3,186,871 4,023,762 4,023,762
374,766 765,259 592,898 328,906 328,906
4,114 3,419 4,996 4,509 4,509
798,107 574,442 1,016,096 1,541,459 1,541,459
1,500,068 1,614,801 1,390,698 1,967,330 1,967,330
183,530 192,562 182,183 181,558 181,558
96,509 48,856 36,932 110,855 110,855
1,924,317 2,082,005 2,338,699 2,666,478 2,666,478
916,586 1,043,222 1,302,298 1,583,734 1,583,734
861,774 711,734 1,168,455 921,704 921,704
493,076 470,630 617,966 658,573 658,573
86,168 100,692 24,197 81,791 81,791
194,975 176,895 95,188 253,053 253,053
129,374 123,040 65,767 159,344 159,344
50,000 50,000 50,000 50,000 50,000
0.00% 0.00% 0.00% 0.00% 0.00%
0.00% 0.00% 0.00% 0.00% 0.00%
79,782 163,110 257,785 64,612 64,612
13.13% 11.67% 6.16% 12.14% 12.14%
4.52% 3.91% 2.06% 3.96% 3.96%
2.59 2.46 1.32 3.19 3.19
53.79% 45.11% 47.45% 41.58% 41.58%
66.60% 81.84% 36.79% 51.33% 51.33%
10.53% 4.68% 2.84% 7.00% 7.00%
13.10% 24.29% 18.60% 8.17% 8.17%
27.90% 18.23% 31.88% 38.31% 38.31%
34.44% 33.47% 33.48% 32.62% 32.62%
19.70 21.09 21.34 26.25 26.25
61.67% 132.57% 391.97% 40.55% 40.55%
(Thousand Rupees)Alflah Insurance Co. Ltd.
184

Financial Statement Analysis of Financial Sector 2020
2016 2017 2018 2019 2020Items
A.Total equity (A1 to A3)
1.Share capital
2.Reserves
3.Un appropriated profit
4.Others
B.Total liabilities (B1 to B3)
1.Balance of statutory funds
2.Outstanding claims, adv., prem., due to other insurers
3.Other/misc. liabilities
C.Total assets (C1 to C5)
1.Cash and balances with banks
2.Advances to policy holders & employees
3.Investments in securities & properties
4.Other/misc. assets
5.Fixed assets
D.Profit & loss account
1.Investment income
2.Gross premium
3.Net premium
4.Gross claims
5.Net claims
6.Underwriting profit
7.Profit/(loss) before taxation
8.Profit/(loss) after taxation
E.Other items
1.No. of ordinary shares (000)
2.Cash dividend
3.Stock dividend/bonus shares
4.Cash generated from operating activities
F.Efficiency ratios/profitability ratios
1.Return on equity (ROE) (D8/A)
2.Return on assets (ROA) (D8/C)
3.Earning per share (D8/E1) (rs. per share)
4.Net Claims Incurred Ratio (D5/D3)
5.Underwriting profit to profit after tax. (D6/D8)
6.Investment income to net premium (D1/D3)
G.Liquidity ratios
1.Cash & bank balances to total assets (C1/C)
2. Investment to total assets (C3/C)
H.Capital /leverage ratios
1.Capital ratio (A/C)
2.Break up value per share (A/E1) (Rs. per share)
I.Cash flow ratio
1.Cash generated from operating activities to profit after tax. (E4/D8)
664,856 581,408 561,442 446,645 590,886
500,000 500,000 500,000 500,000 500,000
33,787 (9,773) (11,752) 3,432 (452)
131,069 91,181 73,194 (56,787) 91,338
0 0 0 0 0
1,110,622 1,239,580 1,253,455 1,294,517 1,327,741
0 0 0 0 0
923,764 1,049,803 1,066,964 1,056,629 1,133,862
186,858 189,777 186,491 237,888 193,879
1,775,478 1,820,988 1,814,897 1,741,162 1,918,627
91,398 39,549 122,911 30,422 88,060
1,387 10,882 8,628 0 0
888,660 759,479 695,971 594,177 814,816
752,822 954,636 934,167 1,017,586 936,829
41,211 56,442 53,220 98,977 78,922
111,148 44,449 20,931 64,705 97,503
2,004,643 1,947,030 2,026,447 2,382,505 2,360,612
1,286,460 1,227,527 1,335,397 1,615,665 1,464,581
1,470,078 1,443,373 1,694,426 2,178,924 1,750,989
1,027,222 936,425 1,069,395 1,493,619 1,097,409
145,578 132,905 101,299 (136,487) 71,977
216,577 121,740 76,947 (54,495) 179,391
150,670 84,244 57,013 (79,981) 148,125
50,000 50,000 50,000 50,000 50,000
0.00% 0.00% 0.00% 0.00% 0.00%
0.00% 0.00% 0.00% 0.00% 0.00%
(9,129) 26,334 72,977 (185,927) 234,126
22.66% 14.49% 10.15% -17.91% 25.07%
8.49% 4.63% 3.14% -4.59% 7.72%
3.01 1.68 1.14 -1.60 2.96
79.85% 76.29% 80.08% 92.45% 74.93%
96.62% 157.76% 177.68% 170.65% 48.59%
8.64% 3.62% 1.57% 4.00% 6.66%
5.15% 2.17% 6.77% 1.75% 4.59%
50.05% 41.71% 38.35% 34.13% 42.47%
37.45% 31.93% 30.94% 25.65% 30.80%
13.30 11.63 11.23 8.93 11.82
-6.06% 31.26% 128.00% 232.46% 158.06%
(Thousand Rupees)Allianz EFU Health Insurance Co. Ltd.
185

Financial Statement Analysis of Financial Sector 2020
2016 2017 2018 2019 2020Items
A.Total equity (A1 to A3)
1.Share capital
2.Reserves
3.Un appropriated profit
4.Others
B.Total liabilities (B1 to B3)
1.Balance of statutory funds
2.Outstanding claims, adv., prem., due to other insurers
3.Other/misc. liabilities
C.Total assets (C1 to C5)
1.Cash and balances with banks
2.Advances to policy holders & employees
3.Investments in securities & properties
4.Other/misc. assets
5.Fixed assets
D.Profit & loss account
1.Investment income
2.Gross premium
3.Net premium
4.Gross claims
5.Net claims
6.Underwriting profit
7.Profit/(loss) before taxation
8.Profit/(loss) after taxation
E.Other items
1.No. of ordinary shares (000)
2.Cash dividend
3.Stock dividend/bonus shares
4.Cash generated from operating activities
F.Efficiency ratios/profitability ratios
1.Return on equity (ROE) (D8/A)
2.Return on assets (ROA) (D8/C)
3.Earning per share (D8/E1) (rs. per share)
4.Net Claims Incurred Ratio (D5/D3)
5.Underwriting profit to profit after tax. (D6/D8)
6.Investment income to net premium (D1/D3)
G.Liquidity ratios
1.Cash & bank balances to total assets (C1/C)
2. Investment to total assets (C3/C)
H.Capital /leverage ratios
1.Capital ratio (A/C)
2.Break up value per share (A/E1) (Rs. per share)
I.Cash flow ratio
1.Cash generated from operating activities to profit after tax. (E4/D8)
702,578 741,053 705,602 705,526 700,118
403,600 500,000 500,000 500,000 500,000
92,844 95,005 108,890 105,743 97,537
206,134 146,048 96,712 99,783 102,581
0 0 0 0 0
493,790 670,093 510,467 406,448 382,809
0 0 0 0 0
396,088 590,450 423,339 305,282 302,121
97,702 79,643 87,128 101,166 80,688
1,196,368 1,411,146 1,216,069 1,111,974 1,082,927
22,320 133,048 31,399 141,980 46,387
0 0 0 0 0
829,497 779,013 808,033 654,194 754,630
337,186 493,864 372,771 292,665 265,847
7,365 5,221 3,866 23,135 16,063
78,203 53,760 43,777 43,277 59,882
151,448 106,277 83,474 114,854 97,043
79,946 79,917 47,419 60,197 70,318
60,567 111,868 158,075 103,037 35,420
47,719 89,344 46,024 2,696 44,550
(73,177) (123,106) (97,527) (56,046) (57,895)
(19,057) (67,595) (53,466) 5,743 2,971
(15,475) (59,846) (49,628) 3,596 1,835
40,360 50,000 50,000 50,000 50,000
0.00% 0.00% 0.00% 0.00% 0.00%
0.00% 0.00% 0.00% 0.00% 0.00%
(35,352) (110,640) (134,613) (80,106) (45,499)
-2.20% -8.08% -7.03% 0.51% 0.26%
-1.29% -4.24% -4.08% 0.32% 0.17%
-0.38 -1.20 -0.99 0.07 0.04
59.69% 111.80% 97.06% 4.48% 63.36%
472.87% 205.70% 196.52% -1,558.57% -3,155.04%
97.82% 67.27% 92.32% 71.89% 85.16%
1.87% 9.43% 2.58% 12.77% 4.28%
69.33% 55.20% 66.45% 58.83% 69.68%
58.73% 52.51% 58.02% 63.45% 64.65%
17.41 14.82 14.11 14.11 14.00
228.45% 184.87% 271.24% -2,227.64% -2,479.51%
(Thousand Rupees)Alpha Insurance Co. Ltd.
186

Financial Statement Analysis of Financial Sector 2020
2016 2017 2018 2019 2020Items
A.Total equity (A1 to A3)
1.Share capital
2.Reserves
3.Un appropriated profit
4.Others
B.Total liabilities (B1 to B3)
1.Balance of statutory funds
2.Outstanding claims, adv., prem., due to other insurers
3.Other/misc. liabilities
C.Total assets (C1 to C5)
1.Cash and balances with banks
2.Advances to policy holders & employees
3.Investments in securities & properties
4.Other/misc. assets
5.Fixed assets
D.Profit & loss account
1.Investment income
2.Gross premium
3.Net premium
4.Gross claims
5.Net claims
6.Underwriting profit
7.Profit/(loss) before taxation
8.Profit/(loss) after taxation
E.Other items
1.No. of ordinary shares (000)
2.Cash dividend
3.Stock dividend/bonus shares
4.Cash generated from operating activities
F.Efficiency ratios/profitability ratios
1.Return on equity (ROE) (D8/A)
2.Return on assets (ROA) (D8/C)
3.Earning per share (D8/E1) (rs. per share)
4.Net Claims Incurred Ratio (D5/D3)
5.Underwriting profit to profit after tax. (D6/D8)
6.Investment income to net premium (D1/D3)
G.Liquidity ratios
1.Cash & bank balances to total assets (C1/C)
2. Investment to total assets (C3/C)
H.Capital /leverage ratios
1.Capital ratio (A/C)
2.Break up value per share (A/E1) (Rs. per share)
I.Cash flow ratio
1.Cash generated from operating activities to profit after tax. (E4/D8)
543,829 620,624 977,566 963,586 984,887
450,000 450,000 603,374 603,374 603,374
2,500 2,500 199,126 199,126 199,126
91,329 168,124 175,066 161,086 182,387
91,060 463 (20) 0 0
404,352 515,237 486,456 640,394 751,726
0 0 0 0 0
333,689 453,659 415,047 410,224 516,620
70,663 61,578 71,409 230,170 235,106
1,039,241 1,136,324 1,464,002 1,603,980 1,736,613
116,140 243,196 316,248 202,790 116,685
0 0 0 0 0
317,284 312,437 498,372 573,991 613,235
355,541 481,409 568,193 634,607 845,358
250,276 99,282 81,189 192,592 161,335
51,676 (30,084) 10,778 52,855 110,631
540,234 659,319 521,370 523,656 607,062
420,122 527,728 480,215 437,893 471,450
124,004 188,544 194,584 170,907 238,051
95,338 179,238 136,965 131,677 145,131
15,393 (17,495) (19,528) (67,990) (25,571)
73,955 84,669 15,457 606 87,623
71,098 76,795 20,315 2,321 41,301
45,000 45,000 60,337 60,337 60,337
0.00% 0.00% 0.00% 0.00% 10.00%
25.00% 0.00% 0.00% 0.00% 10.00%
(17,826) 207 (97,980) (60,195) (159,457)
13.07% 12.37% 2.08% 0.24% 4.19%
6.84% 6.76% 1.39% 0.14% 2.38%
1.58 1.71 0.34 0.04 0.68
22.69% 33.96% 28.52% 30.07% 30.78%
21.65% -22.78% -96.13% -2,929.34% -61.91%
12.30% -5.70% 2.24% 12.07% 23.47%
11.18% 21.40% 21.60% 12.64% 6.72%
30.53% 27.50% 34.04% 35.79% 35.31%
52.33% 54.62% 66.77% 60.07% 56.71%
12.09 13.79 16.20 15.97 16.32
-25.07% 0.27% -482.30% -2,593.49% -386.09%
(Thousand Rupees)Asia Insurance Co. Ltd.
187

Financial Statement Analysis of Financial Sector 2020
2016 2017 2018 2019 2020Items
A.Total equity (A1 to A3)
1.Share capital
2.Reserves
3.Un appropriated profit
4.Others
B.Total liabilities (B1 to B3)
1.Balance of statutory funds
2.Outstanding claims, adv., prem., due to other insurers
3.Other/misc. liabilities
C.Total assets (C1 to C5)
1.Cash and balances with banks
2.Advances to policy holders & employees
3.Investments in securities & properties
4.Other/misc. assets
5.Fixed assets
D.Profit & loss account
1.Investment income
2.Gross premium
3.Net premium
4.Gross claims
5.Net claims
6.Underwriting profit
7.Profit/(loss) before taxation
8.Profit/(loss) after taxation
E.Other items
1.No. of ordinary shares (000)
2.Cash dividend
3.Stock dividend/bonus shares
4.Cash generated from operating activities
F.Efficiency ratios/profitability ratios
1.Return on equity (ROE) (D8/A)
2.Return on assets (ROA) (D8/C)
3.Earning per share (D8/E1) (rs. per share)
4.Net Claims Incurred Ratio (D5/D3)
5.Underwriting profit to profit after tax. (D6/D8)
6.Investment income to net premium (D1/D3)
G.Liquidity ratios
1.Cash & bank balances to total assets (C1/C)
2. Investment to total assets (C3/C)
H.Capital /leverage ratios
1.Capital ratio (A/C)
2.Break up value per share (A/E1) (Rs. per share)
I.Cash flow ratio
1.Cash generated from operating activities to profit after tax. (E4/D8)
1,404,244 1,484,286 1,686,721 1,966,379 2,181,933
543,681 625,234 625,234 719,019 719,019
210,233 165,157 173,699 191,500 194,186
650,330 693,895 887,788 1,055,860 1,268,728
0 0 0 0 0
2,341,406 3,026,843 3,171,038 3,465,019 3,686,321
0 0 0 0 0
1,942,797 2,555,292 2,642,691 2,880,506 3,015,515
398,609 471,551 528,347 584,513 670,806
3,745,650 4,511,129 4,857,759 5,431,398 5,868,254
151,902 191,755 147,175 342,237 231,797
1,344 801 13,095 2,973 3,085
1,524,532 1,606,820 1,873,721 2,257,338 2,590,093
1,934,140 2,591,353 2,594,862 2,542,940 2,659,528
133,732 120,400 228,906 285,910 383,751
122,238 87,829 70,701 201,389 265,754
2,249,946 2,583,234 2,885,080 3,029,070 2,955,255
1,255,230 1,356,189 1,811,751 2,016,249 1,860,234
1,045,253 1,005,118 1,407,006 1,613,090 1,484,248
644,502 622,365 1,069,485 1,250,767 1,116,735
369,211 252,431 272,577 217,839 231,906
320,516 364,497 420,847 509,464 559,999
236,805 253,690 295,767 361,838 395,158
54,368 62,523 62,523 71,902 71,902
10.00% 25.00% 15.00% 25.00% 27.50%
15.00% 0.00% 15.00% 0.00% 0.00%
123,594 257,472 364,137 575,132 206,117
16.86% 17.09% 17.54% 18.40% 18.11%
6.32% 5.62% 6.09% 6.66% 6.73%
4.36 4.06 4.73 5.03 5.50
51.35% 45.89% 59.03% 62.03% 60.03%
155.91% 99.50% 92.16% 60.20% 58.69%
9.74% 6.48% 3.90% 9.99% 14.29%
4.06% 4.25% 3.03% 6.30% 3.95%
40.70% 35.62% 38.57% 41.56% 44.14%
37.49% 32.90% 34.72% 36.20% 37.18%
25.83 23.74 26.98 27.35 30.35
52.19% 101.49% 123.12% 158.95% 52.16%
(Thousand Rupees)Askari General Insurance Co. Ltd.
188

Financial Statement Analysis of Financial Sector 2020
2016 2017 2018 2019 2020Items
A.Total equity (A1 to A3)
1.Share capital
2.Reserves
3.Un appropriated profit
4.Others
B.Total liabilities (B1 to B3)
1.Balance of statutory funds
2.Outstanding claims, adv., prem., due to other insurers
3.Other/misc. liabilities
C.Total assets (C1 to C5)
1.Cash and balances with banks
2.Advances to policy holders & employees
3.Investments in securities & properties
4.Other/misc. assets
5.Fixed assets
D.Profit & loss account
1.Investment income
2.Gross premium
3.Net premium
4.Gross claims
5.Net claims
6.Underwriting profit
7.Profit/(loss) before taxation
8.Profit/(loss) after taxation
E.Other items
1.No. of ordinary shares (000)
2.Cash dividend
3.Stock dividend/bonus shares
4.Cash generated from operating activities
F.Efficiency ratios/profitability ratios
1.Return on equity (ROE) (D8/A)
2.Return on assets (ROA) (D8/C)
3.Earning per share (D8/E1) (rs. per share)
4.Net Claims Incurred Ratio (D5/D3)
5.Underwriting profit to profit after tax. (D6/D8)
6.Investment income to net premium (D1/D3)
G.Liquidity ratios
1.Cash & bank balances to total assets (C1/C)
2. Investment to total assets (C3/C)
H.Capital /leverage ratios
1.Capital ratio (A/C)
2.Break up value per share (A/E1) (Rs. per share)
I.Cash flow ratio
1.Cash generated from operating activities to profit after tax. (E4/D8)
4,727,324 4,047,043 3,460,876 3,706,740 4,775,227
701,614 701,614 701,614 771,775 848,953
3,406,850 2,685,644 2,104,563 2,313,255 3,277,641
618,860 659,785 654,699 621,710 648,633
0 0 0 0 0
3,347,497 2,715,078 3,204,851 3,327,380 4,886,518
0 0 0 0 0
1,710,330 1,521,055 2,297,663 2,218,434 3,257,821
1,637,167 1,194,023 907,188 1,108,946 1,628,697
8,074,821 6,762,121 6,665,727 7,034,120 9,661,745
250,436 702,252 1,327,987 650,207 882,778
97 37 0 0 0
6,437,759 4,933,697 3,712,647 4,775,442 6,229,415
1,327,319 1,037,057 1,543,013 1,487,815 2,389,763
59,210 89,078 82,080 120,656 159,789
458,140 321,547 230,857 224,805 239,702
2,333,644 2,379,272 2,849,455 2,911,830 3,046,399
1,044,230 1,274,543 1,473,915 1,455,416 1,405,342
684,382 689,134 893,127 1,008,501 794,917
268,889 432,519 488,305 468,715 449,595
484,203 578,495 684,323 596,751 599,520
916,846 988,847 989,029 895,241 907,775
618,174 663,987 665,568 623,256 645,427
70,161 70,161 70,161 77,178 84,895
65.00% 65.00% 70.00% 70.00% 70.00%
0.00% 0.00% 10.00% 10.00% 0.00%
300,395 363,836 725,505 534,734 635,396
13.08% 16.41% 19.23% 16.81% 13.52%
7.66% 9.82% 9.98% 8.86% 6.68%
8.81 9.46 9.49 8.08 7.60
25.75% 33.94% 33.13% 32.20% 31.99%
78.33% 87.12% 102.82% 95.75% 92.89%
43.87% 25.23% 15.66% 15.45% 17.06%
3.10% 10.39% 19.92% 9.24% 9.14%
79.73% 72.96% 55.70% 67.89% 64.48%
58.54% 59.85% 51.92% 52.70% 49.42%
67.38 57.68 49.33 48.03 56.25
48.59% 54.80% 109.01% 85.80% 98.45%
(Thousand Rupees)Atlas Insurance Co. Ltd.
189
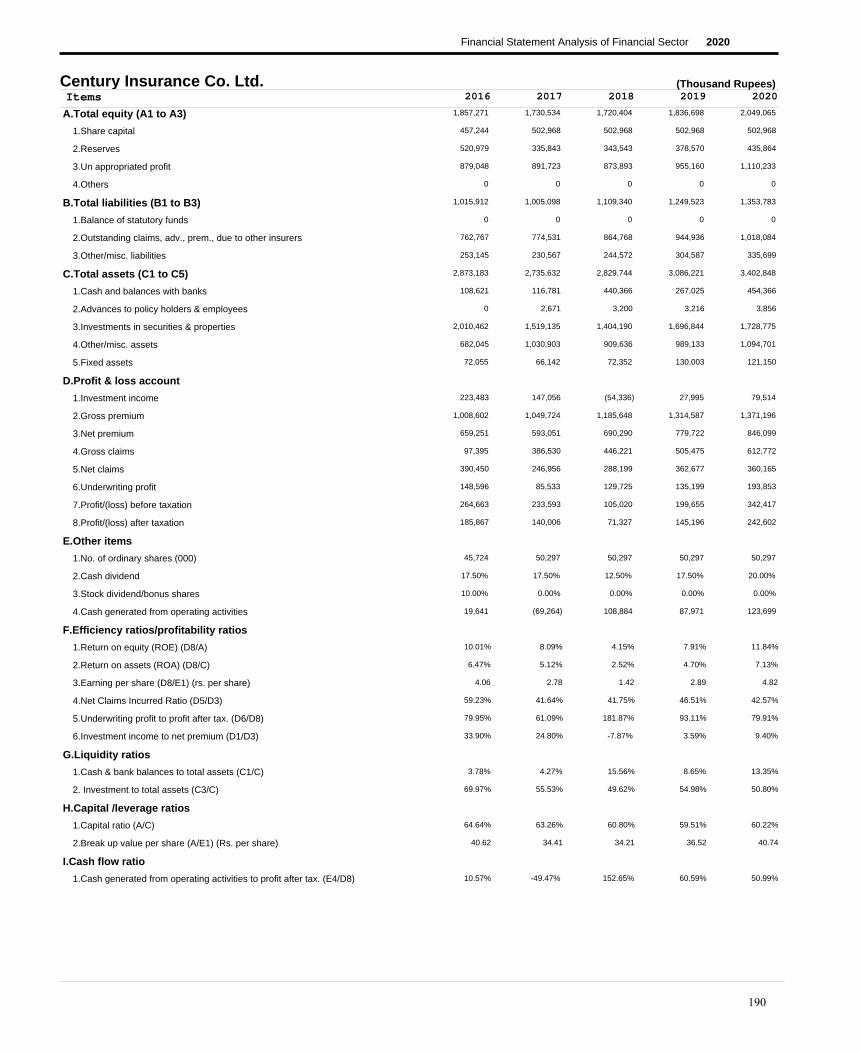
Financial Statement Analysis of Financial Sector 2020
2016 2017 2018 2019 2020Items
A.Total equity (A1 to A3)
1.Share capital
2.Reserves
3.Un appropriated profit
4.Others
B.Total liabilities (B1 to B3)
1.Balance of statutory funds
2.Outstanding claims, adv., prem., due to other insurers
3.Other/misc. liabilities
C.Total assets (C1 to C5)
1.Cash and balances with banks
2.Advances to policy holders & employees
3.Investments in securities & properties
4.Other/misc. assets
5.Fixed assets
D.Profit & loss account
1.Investment income
2.Gross premium
3.Net premium
4.Gross claims
5.Net claims
6.Underwriting profit
7.Profit/(loss) before taxation
8.Profit/(loss) after taxation
E.Other items
1.No. of ordinary shares (000)
2.Cash dividend
3.Stock dividend/bonus shares
4.Cash generated from operating activities
F.Efficiency ratios/profitability ratios
1.Return on equity (ROE) (D8/A)
2.Return on assets (ROA) (D8/C)
3.Earning per share (D8/E1) (rs. per share)
4.Net Claims Incurred Ratio (D5/D3)
5.Underwriting profit to profit after tax. (D6/D8)
6.Investment income to net premium (D1/D3)
G.Liquidity ratios
1.Cash & bank balances to total assets (C1/C)
2. Investment to total assets (C3/C)
H.Capital /leverage ratios
1.Capital ratio (A/C)
2.Break up value per share (A/E1) (Rs. per share)
I.Cash flow ratio
1.Cash generated from operating activities to profit after tax. (E4/D8)
1,857,271 1,730,534 1,720,404 1,836,698 2,049,065
457,244 502,968 502,968 502,968 502,968
520,979 335,843 343,543 378,570 435,864
879,048 891,723 873,893 955,160 1,110,233
0 0 0 0 0
1,015,912 1,005,098 1,109,340 1,249,523 1,353,783
0 0 0 0 0
762,767 774,531 864,768 944,936 1,018,084
253,145 230,567 244,572 304,587 335,699
2,873,183 2,735,632 2,829,744 3,086,221 3,402,848
108,621 116,781 440,366 267,025 454,366
0 2,671 3,200 3,216 3,856
2,010,462 1,519,135 1,404,190 1,696,844 1,728,775
682,045 1,030,903 909,636 989,133 1,094,701
72,055 66,142 72,352 130,003 121,150
223,483 147,056 (54,336) 27,995 79,514
1,008,602 1,049,724 1,185,648 1,314,587 1,371,196
659,251 593,051 690,290 779,722 846,099
97,395 386,530 446,221 505,475 612,772
390,450 246,956 288,199 362,677 360,165
148,596 85,533 129,725 135,199 193,853
264,663 233,593 105,020 199,655 342,417
185,867 140,006 71,327 145,196 242,602
45,724 50,297 50,297 50,297 50,297
17.50% 17.50% 12.50% 17.50% 20.00%
10.00% 0.00% 0.00% 0.00% 0.00%
19,641 (69,264) 108,884 87,971 123,699
10.01% 8.09% 4.15% 7.91% 11.84%
6.47% 5.12% 2.52% 4.70% 7.13%
4.06 2.78 1.42 2.89 4.82
59.23% 41.64% 41.75% 46.51% 42.57%
79.95% 61.09% 181.87% 93.11% 79.91%
33.90% 24.80% -7.87% 3.59% 9.40%
3.78% 4.27% 15.56% 8.65% 13.35%
69.97% 55.53% 49.62% 54.98% 50.80%
64.64% 63.26% 60.80% 59.51% 60.22%
40.62 34.41 34.21 36.52 40.74
10.57% -49.47% 152.65% 60.59% 50.99%
(Thousand Rupees)Century Insurance Co. Ltd.
190

Financial Statement Analysis of Financial Sector 2020
2016 2017 2018 2019 2020Items
A.Total equity (A1 to A3)
1.Share capital
2.Reserves
3.Un appropriated profit
4.Others
B.Total liabilities (B1 to B3)
1.Balance of statutory funds
2.Outstanding claims, adv., prem., due to other insurers
3.Other/misc. liabilities
C.Total assets (C1 to C5)
1.Cash and balances with banks
2.Advances to policy holders & employees
3.Investments in securities & properties
4.Other/misc. assets
5.Fixed assets
D.Profit & loss account
1.Investment income
2.Gross premium
3.Net premium
4.Gross claims
5.Net claims
6.Underwriting profit
7.Profit/(loss) before taxation
8.Profit/(loss) after taxation
E.Other items
1.No. of ordinary shares (000)
2.Cash dividend
3.Stock dividend/bonus shares
4.Cash generated from operating activities
F.Efficiency ratios/profitability ratios
1.Return on equity (ROE) (D8/A)
2.Return on assets (ROA) (D8/C)
3.Earning per share (D8/E1) (rs. per share)
4.Net Claims Incurred Ratio (D5/D3)
5.Underwriting profit to profit after tax. (D6/D8)
6.Investment income to net premium (D1/D3)
G.Liquidity ratios
1.Cash & bank balances to total assets (C1/C)
2. Investment to total assets (C3/C)
H.Capital /leverage ratios
1.Capital ratio (A/C)
2.Break up value per share (A/E1) (Rs. per share)
I.Cash flow ratio
1.Cash generated from operating activities to profit after tax. (E4/D8)
469,198 565,891 610,008 673,804 764,864
400,000 500,000 500,000 500,000 500,000
69,198 5,272 8,742 11,444 15,320
0 60,619 101,266 162,360 249,544
0 0 0 0 0
813,613 602,697 405,391 557,065 772,043
0 0 0 0 0
755,819 421,769 360,123 495,976 700,428
57,794 180,928 45,268 61,089 71,615
1,282,811 1,168,588 1,015,399 1,230,869 1,536,907
437,543 38,199 38,220 33,506 70,836
0 0 0 0 0
53,945 642,810 516,600 632,310 742,513
775,486 473,071 442,636 532,866 678,482
15,837 14,508 17,943 32,187 45,076
25,582 26,630 33,970 58,251 60,258
392,561 528,230 437,343 604,750 870,179
121,362 108,066 125,783 168,173 209,284
705,585 232,467 158,119 51,441 35,911
21,468 11,040 26,687 33,010 24,767
6,048 32,737 24,819 30,036 75,120
27,932 56,789 59,987 87,473 127,675
16,815 42,425 41,472 61,810 88,815
40,000 50,000 50,000 50,000 50,000
0.00% 0.00% 0.00% 0.00% 0.00%
0.00% 0.00% 0.00% 0.00% 0.00%
(197,192) 117,353 (154,220) 68,356 105,485
3.58% 7.50% 6.80% 9.17% 11.61%
1.31% 3.63% 4.08% 5.02% 5.78%
0.42 0.85 0.83 1.24 1.78
17.69% 10.22% 21.22% 19.63% 11.83%
35.97% 77.16% 59.85% 48.59% 84.58%
21.08% 24.64% 27.01% 34.64% 28.79%
34.11% 3.27% 3.76% 2.72% 4.61%
4.21% 55.01% 50.88% 51.37% 48.31%
36.58% 48.43% 60.08% 54.74% 49.77%
11.73 11.32 12.20 13.48 15.30
-1,172.71% 276.61% -371.87% 110.59% 118.77%
(Thousand Rupees)Chubb Insurance Pakistan Ltd
191

Financial Statement Analysis of Financial Sector 2020
2016 2017 2018 2019 2020Items
A.Total equity (A1 to A3)
1.Share capital
2.Reserves
3.Un appropriated profit
4.Others
B.Total liabilities (B1 to B3)
1.Balance of statutory funds
2.Outstanding claims, adv., prem., due to other insurers
3.Other/misc. liabilities
C.Total assets (C1 to C5)
1.Cash and balances with banks
2.Advances to policy holders & employees
3.Investments in securities & properties
4.Other/misc. assets
5.Fixed assets
D.Profit & loss account
1.Investment income
2.Gross premium
3.Net premium
4.Gross claims
5.Net claims
6.Underwriting profit
7.Profit/(loss) before taxation
8.Profit/(loss) after taxation
E.Other items
1.No. of ordinary shares (000)
2.Cash dividend
3.Stock dividend/bonus shares
4.Cash generated from operating activities
F.Efficiency ratios/profitability ratios
1.Return on equity (ROE) (D8/A)
2.Return on assets (ROA) (D8/C)
3.Earning per share (D8/E1) (rs. per share)
4.Net Claims Incurred Ratio (D5/D3)
5.Underwriting profit to profit after tax. (D6/D8)
6.Investment income to net premium (D1/D3)
G.Liquidity ratios
1.Cash & bank balances to total assets (C1/C)
2. Investment to total assets (C3/C)
H.Capital /leverage ratios
1.Capital ratio (A/C)
2.Break up value per share (A/E1) (Rs. per share)
I.Cash flow ratio
1.Cash generated from operating activities to profit after tax. (E4/D8)
942,828 939,265 1,126,807 1,173,762 1,228,948
826,833 826,833 1,076,950 1,076,950 1,076,950
105,103 28,372 28,895 26,716 27,321
10,892 84,060 20,962 70,096 124,677
(199,650) 50,363 (199,650) (199,650) (199,650)
366,658 253,385 252,436 280,659 303,772
0 0 0 0 0
167,726 166,833 110,801 116,701 109,518
198,932 86,552 141,635 163,958 194,254
1,109,836 1,243,013 1,179,593 1,254,771 1,333,070
58,368 57,571 73,139 73,887 10,065
23 215 0 0 0
188,474 241,152 165,578 167,162 241,776
841,159 919,620 919,523 997,323 1,066,362
21,812 24,455 21,353 16,399 14,867
6,906 103,712 307 3,675 2,097
190,288 113,280 114,618 115,988 105,071
206,346 109,614 111,270 110,851 112,642
57,072 35,915 23,194 13,955 7,447
55,418 37,283 17,453 13,955 7,447
52,364 (95,046) (89,181) 2,097 19,864
25,622 40,021 (49,237) 63,585 66,165
23,557 73,167 (63,097) 49,133 54,582
82,683 82,683 107,695 107,695 107,695
0.00% 0.00% 0.00% 0.00% 0.00%
0.00% 0.00% 0.00% 0.00% 0.00%
20,644 (330,573) (6,829) 2,882 12,335
2.50% 7.79% -5.60% 4.19% 4.44%
2.12% 5.89% -5.35% 3.92% 4.09%
0.28 0.88 -0.59 0.46 0.51
26.86% 34.01% 15.69% 12.59% 6.61%
222.29% -129.90% 141.34% 4.27% 36.39%
3.35% 94.62% 0.28% 3.32% 1.86%
5.26% 4.63% 6.20% 5.89% 0.76%
16.98% 19.40% 14.04% 13.32% 18.14%
84.95% 75.56% 95.53% 93.54% 92.19%
11.40 11.36 10.46 10.90 11.41
87.63% -451.81% 10.82% 5.87% 22.60%
(Thousand Rupees)Crescent Star Insurance Ltd.
192

Financial Statement Analysis of Financial Sector 2020
2016 2017 2018 2019 2020Items
A.Total equity (A1 to A3)
1.Share capital
2.Reserves
3.Un appropriated profit
4.Others
B.Total liabilities (B1 to B3)
1.Balance of statutory funds
2.Outstanding claims, adv., prem., due to other insurers
3.Other/misc. liabilities
C.Total assets (C1 to C5)
1.Cash and balances with banks
2.Advances to policy holders & employees
3.Investments in securities & properties
4.Other/misc. assets
5.Fixed assets
D.Profit & loss account
1.Investment income
2.Gross premium
3.Net premium
4.Gross claims
5.Net claims
6.Underwriting profit
7.Profit/(loss) before taxation
8.Profit/(loss) after taxation
E.Other items
1.No. of ordinary shares (000)
2.Cash dividend
3.Stock dividend/bonus shares
4.Cash generated from operating activities
F.Efficiency ratios/profitability ratios
1.Return on equity (ROE) (D8/A)
2.Return on assets (ROA) (D8/C)
3.Earning per share (D8/E1) (rs. per share)
4.Net Claims Incurred Ratio (D5/D3)
5.Underwriting profit to profit after tax. (D6/D8)
6.Investment income to net premium (D1/D3)
G.Liquidity ratios
1.Cash & bank balances to total assets (C1/C)
2. Investment to total assets (C3/C)
H.Capital /leverage ratios
1.Capital ratio (A/C)
2.Break up value per share (A/E1) (Rs. per share)
I.Cash flow ratio
1.Cash generated from operating activities to profit after tax. (E4/D8)
21,083,909 20,841,285 19,298,455 19,296,071 19,578,865
2,000,000 2,000,000 2,000,000 2,000,000 2,000,000
15,443,591 15,638,968 14,522,985 15,765,886 16,183,550
3,640,318 3,202,317 2,775,470 1,530,185 1,395,315
0 0 859,097 1,000,414 1,013,365
20,259,141 22,812,819 22,711,571 25,402,761 25,220,106
0 0 0 0 0
16,392,852 19,092,528 18,920,486 21,553,489 21,126,091
3,866,289 3,720,291 3,791,085 3,849,272 4,094,015
41,343,050 43,654,104 42,869,123 45,699,246 45,812,336
1,867,466 1,594,759 1,266,562 1,191,688 1,328,500
2,258 3,665 5,245 4,772 5,102
26,260,086 28,223,784 25,482,899 25,881,160 27,253,859
12,065,821 12,542,873 13,498,769 15,654,195 14,406,022
1,147,419 1,289,023 2,615,648 2,967,431 2,818,853
1,009,428 1,512,280 1,612,336 2,262,228 2,185,430
16,099,993 18,837,706 18,780,177 19,774,236 20,241,229
7,242,821 7,614,588 7,562,349 7,459,570 8,616,759
4,347,275 5,067,420 4,956,502 4,897,302 5,232,548
2,694,098 2,975,071 3,088,870 3,548,905 4,359,123
1,789,019 1,632,428 1,306,804 505,115 738,889
3,781,284 3,661,586 3,262,364 3,827,335 3,453,394
2,392,442 2,500,330 2,171,273 2,608,580 2,370,823
200,000 200,000 200,000 200,000 200,000
100.00% 100.00% 100.00% 90.00% 100.00%
0.00% 0.00% 0.00% 0.00% 0.00%
826,235 3,096,396 20,052 863,825 1,401,732
11.35% 12.00% 11.25% 13.52% 12.11%
5.79% 5.73% 5.06% 5.71% 5.18%
11.96 12.50 10.86 13.04 11.85
37.20% 39.07% 40.85% 47.58% 50.59%
74.78% 65.29% 60.19% 19.36% 31.17%
13.94% 19.86% 21.32% 30.33% 25.36%
4.52% 3.65% 2.95% 2.61% 2.90%
63.52% 64.65% 59.44% 56.63% 59.49%
51.00% 47.74% 45.02% 42.22% 42.74%
105.42 104.21 96.49 96.48 97.89
34.54% 123.84% 0.92% 33.11% 59.12%
(Thousand Rupees)E.F.U.General Insurance Co. Ltd.
193

Financial Statement Analysis of Financial Sector 2020
2016 2017 2018 2019 2020Items
A.Total equity (A1 to A3)
1.Share capital
2.Reserves
3.Un appropriated profit
4.Others
B.Total liabilities (B1 to B3)
1.Balance of statutory funds
2.Outstanding claims, adv., prem., due to other insurers
3.Other/misc. liabilities
C.Total assets (C1 to C5)
1.Cash and balances with banks
2.Advances to policy holders & employees
3.Investments in securities & properties
4.Other/misc. assets
5.Fixed assets
D.Profit & loss account
1.Investment income
2.Gross premium
3.Net premium
4.Gross claims
5.Net claims
6.Underwriting profit
7.Profit/(loss) before taxation
8.Profit/(loss) after taxation
E.Other items
1.No. of ordinary shares (000)
2.Cash dividend
3.Stock dividend/bonus shares
4.Cash generated from operating activities
F.Efficiency ratios/profitability ratios
1.Return on equity (ROE) (D8/A)
2.Return on assets (ROA) (D8/C)
3.Earning per share (D8/E1) (rs. per share)
4.Net Claims Incurred Ratio (D5/D3)
5.Underwriting profit to profit after tax. (D6/D8)
6.Investment income to net premium (D1/D3)
G.Liquidity ratios
1.Cash & bank balances to total assets (C1/C)
2. Investment to total assets (C3/C)
H.Capital /leverage ratios
1.Capital ratio (A/C)
2.Break up value per share (A/E1) (Rs. per share)
I.Cash flow ratio
1.Cash generated from operating activities to profit after tax. (E4/D8)
990,000 1,049,518 1,123,839 1,425,302 1,648,766
508,151 609,782 762,227 1,029,007 1,183,358
197,788 191,119 133,048 136,330 368,419
284,061 248,617 228,564 259,965 96,989
0 0 0 0 0
1,349,337 1,639,854 1,834,242 2,214,907 2,312,511
0 0 0 0 0
1,123,822 1,434,054 1,603,088 1,902,447 1,955,380
225,515 205,800 231,154 312,460 357,131
2,339,337 2,689,372 2,958,081 3,640,209 3,961,277
11,663 14,892 35,777 28,403 26,722
0 0 0 0 0
1,123,383 1,236,661 1,123,750 1,287,658 1,509,419
1,078,214 1,320,336 1,641,834 2,176,815 2,295,394
126,077 117,483 156,720 147,333 129,742
187,510 (47,436) (9,220) 23,354 84,025
2,066,836 2,531,428 3,107,161 3,246,178 3,468,545
981,285 1,054,707 1,459,230 1,467,313 1,852,506
603,924 850,977 912,411 983,422 1,081,697
469,034 469,917 633,992 642,479 817,827
181,258 228,395 270,799 284,742 330,776
297,013 88,795 146,116 235,023 297,399
282,147 66,187 132,392 183,846 231,375
50,815 60,978 76,223 102,901 118,336
12.50% 0.00% 0.00% 0.00% 0.00%
12.50% 20.00% 25.00% 20.00% 15.00%
49,250 166,099 33,558 (50,997) 159,112
28.50% 6.31% 11.78% 12.90% 14.03%
12.06% 2.46% 4.48% 5.05% 5.84%
5.55 1.09 1.74 1.79 1.96
47.80% 44.55% 43.45% 43.79% 44.15%
64.24% 345.08% 204.54% 154.88% 142.96%
19.11% -4.50% -0.63% 1.59% 4.54%
0.50% 0.55% 1.21% 0.78% 0.67%
48.02% 45.98% 37.99% 35.37% 38.10%
42.32% 39.02% 37.99% 39.15% 41.62%
19.48 17.21 14.74 13.85 13.93
17.46% 250.95% 25.35% -27.74% 68.77%
(Thousand Rupees)East West Insurance Co. Ltd.
194

Financial Statement Analysis of Financial Sector 2020
2016 2017 2018 2019 2020Items
A.Total equity (A1 to A3)
1.Share capital
2.Reserves
3.Un appropriated profit
4.Others
B.Total liabilities (B1 to B3)
1.Balance of statutory funds
2.Outstanding claims, adv., prem., due to other insurers
3.Other/misc. liabilities
C.Total assets (C1 to C5)
1.Cash and balances with banks
2.Advances to policy holders & employees
3.Investments in securities & properties
4.Other/misc. assets
5.Fixed assets
D.Profit & loss account
1.Investment income
2.Gross premium
3.Net premium
4.Gross claims
5.Net claims
6.Underwriting profit
7.Profit/(loss) before taxation
8.Profit/(loss) after taxation
E.Other items
1.No. of ordinary shares (000)
2.Cash dividend
3.Stock dividend/bonus shares
4.Cash generated from operating activities
F.Efficiency ratios/profitability ratios
1.Return on equity (ROE) (D8/A)
2.Return on assets (ROA) (D8/C)
3.Earning per share (D8/E1) (rs. per share)
4.Net Claims Incurred Ratio (D5/D3)
5.Underwriting profit to profit after tax. (D6/D8)
6.Investment income to net premium (D1/D3)
G.Liquidity ratios
1.Cash & bank balances to total assets (C1/C)
2. Investment to total assets (C3/C)
H.Capital /leverage ratios
1.Capital ratio (A/C)
2.Break up value per share (A/E1) (Rs. per share)
I.Cash flow ratio
1.Cash generated from operating activities to profit after tax. (E4/D8)
519,310 556,139 544,226 544,226 544,226
400,000 500,000 500,000 500,000 500,000
97,483 81,522 81,547 81,547 81,547
21,827 (25,383) (37,321) (37,321) (37,321)
0 0 0 0 0
87,731 77,879 72,490 72,490 72,490
0 0 0 0 0
13,047 34,660 12,615 12,615 12,615
74,684 43,219 59,875 59,875 59,875
607,041 634,018 616,716 616,716 616,716
64,603 5,307 15,729 15,729 15,729
451 541 536 536 536
531,429 602,499 577,286 577,286 577,286
6,664 22,449 20,600 20,600 20,600
3,894 3,222 2,565 2,565 2,565
105,549 (22,703) 13,976 13,976 13,976
4,561 3,980 2,231 2,231 2,231
673 1,874 502 502 502
322 13,861 8,825 8,825 8,825
1,407 1,814 (3,424) (3,424) (3,424)
(10,652) (21,283) (24,037) (24,037) (24,037)
113,344 (46,722) (11,381) (11,381) (11,381)
100,490 (47,210) (11,938) (11,938) (11,938)
40,000 50,000 50,000 50,000 50,000
0.00% 0.00% 0.00% 0.00% 0.00%
0.00% 0.00% 0.00% 0.00% 0.00%
(11,159) (53,802) (39,165) (39,165) (39,165)
19.35% -8.49% -2.19% -2.19% -2.19%
16.55% -7.45% -1.94% -1.94% -1.94%
2.51 -0.94 -0.24 -0.24 -0.24
209.06% 96.80% -682.07% -682.07% -682.07%
-10.60% 45.08% 201.35% 201.35% 201.35%
15,683.36% -1,211.47% 2,784.06% 2,784.06% 2,784.06%
10.64% 0.84% 2.55% 2.55% 2.55%
87.54% 95.03% 93.61% 93.61% 93.61%
85.55% 87.72% 88.25% 88.25% 88.25%
12.98 11.12 10.88 10.88 10.88
-11.10% 113.96% 328.07% 328.07% 328.07%
(Thousand Rupees)Excel Insurance Co. Ltd.
195

Financial Statement Analysis of Financial Sector 2020
2016 2017 2018 2019 2020Items
A.Total equity (A1 to A3)
1.Share capital
2.Reserves
3.Un appropriated profit
4.Others
B.Total liabilities (B1 to B3)
1.Balance of statutory funds
2.Outstanding claims, adv., prem., due to other insurers
3.Other/misc. liabilities
C.Total assets (C1 to C5)
1.Cash and balances with banks
2.Advances to policy holders & employees
3.Investments in securities & properties
4.Other/misc. assets
5.Fixed assets
D.Profit & loss account
1.Investment income
2.Gross premium
3.Net premium
4.Gross claims
5.Net claims
6.Underwriting profit
7.Profit/(loss) before taxation
8.Profit/(loss) after taxation
E.Other items
1.No. of ordinary shares (000)
2.Cash dividend
3.Stock dividend/bonus shares
4.Cash generated from operating activities
F.Efficiency ratios/profitability ratios
1.Return on equity (ROE) (D8/A)
2.Return on assets (ROA) (D8/C)
3.Earning per share (D8/E1) (rs. per share)
4.Net Claims Incurred Ratio (D5/D3)
5.Underwriting profit to profit after tax. (D6/D8)
6.Investment income to net premium (D1/D3)
G.Liquidity ratios
1.Cash & bank balances to total assets (C1/C)
2. Investment to total assets (C3/C)
H.Capital /leverage ratios
1.Capital ratio (A/C)
2.Break up value per share (A/E1) (Rs. per share)
I.Cash flow ratio
1.Cash generated from operating activities to profit after tax. (E4/D8)
1,099,648 985,080 994,172 974,903 975,386
619,374 619,374 619,374 619,374 619,374
264,122 264,122 264,122 264,122 264,122
216,152 101,584 110,676 91,407 91,890
636,930 450,547 344,387 274,278 324,862
1,928,914 1,840,432 1,943,844 2,391,486 2,717,628
0 0 0 0 0
1,289,917 1,384,577 1,475,688 1,657,378 1,974,614
638,997 455,855 468,156 734,108 743,014
3,665,492 3,276,059 3,282,403 3,640,667 4,017,876
148,016 166,460 102,396 121,116 179,541
62,084 64,831 58,298 57,320 63,212
1,724,594 1,277,273 1,200,619 1,265,566 1,315,548
1,705,163 1,742,210 1,807,571 2,028,745 2,272,205
25,635 25,285 113,519 167,920 187,370
238,626 215,224 196,665 94,810 94,145
1,400,881 1,163,365 1,327,024 1,620,051 1,658,449
544,701 555,977 532,062 755,586 738,670
757,385 810,710 722,774 944,415 936,857
281,560 373,716 312,495 417,753 355,903
71,014 16,196 46,611 101,298 121,207
285,110 162,735 157,916 97,227 89,037
191,708 109,956 105,310 70,087 61,663
61,937 61,937 123,875 123,875 123,875
35.00% 15.00% 15.00% 10.00% 10.00%
0.00% 0.00% 0.00% 0.00% 0.00%
(111,458) (157,547) (61,996) 147,699 114,108
17.43% 11.16% 10.59% 7.19% 6.32%
5.23% 3.36% 3.21% 1.93% 1.53%
3.10 1.78 0.85 0.57 0.50
51.69% 67.22% 58.73% 55.29% 48.18%
37.04% 14.73% 44.26% 144.53% 196.56%
43.81% 38.71% 36.96% 12.55% 12.75%
4.04% 5.08% 3.12% 3.33% 4.47%
47.05% 38.99% 36.58% 34.76% 32.74%
30.00% 30.07% 30.29% 26.78% 24.28%
17.75 15.90 8.03 7.87 7.87
-58.14% -143.28% -58.87% 210.74% 185.05%
(Thousand Rupees)Habib Insurance Co. Ltd.
196

Financial Statement Analysis of Financial Sector 2020
2016 2017 2018 2019 2020Items
A.Total equity (A1 to A3)
1.Share capital
2.Reserves
3.Un appropriated profit
4.Others
B.Total liabilities (B1 to B3)
1.Balance of statutory funds
2.Outstanding claims, adv., prem., due to other insurers
3.Other/misc. liabilities
C.Total assets (C1 to C5)
1.Cash and balances with banks
2.Advances to policy holders & employees
3.Investments in securities & properties
4.Other/misc. assets
5.Fixed assets
D.Profit & loss account
1.Investment income
2.Gross premium
3.Net premium
4.Gross claims
5.Net claims
6.Underwriting profit
7.Profit/(loss) before taxation
8.Profit/(loss) after taxation
E.Other items
1.No. of ordinary shares (000)
2.Cash dividend
3.Stock dividend/bonus shares
4.Cash generated from operating activities
F.Efficiency ratios/profitability ratios
1.Return on equity (ROE) (D8/A)
2.Return on assets (ROA) (D8/C)
3.Earning per share (D8/E1) (rs. per share)
4.Net Claims Incurred Ratio (D5/D3)
5.Underwriting profit to profit after tax. (D6/D8)
6.Investment income to net premium (D1/D3)
G.Liquidity ratios
1.Cash & bank balances to total assets (C1/C)
2. Investment to total assets (C3/C)
H.Capital /leverage ratios
1.Capital ratio (A/C)
2.Break up value per share (A/E1) (Rs. per share)
I.Cash flow ratio
1.Cash generated from operating activities to profit after tax. (E4/D8)
12,260,735 1,760,581 2,382,947 2,462,112 2,446,797
1,226,895 1,501,000 1,918,384 1,918,384 1,918,384
8,102,711 0 0 0 0
2,931,129 259,581 464,563 543,728 528,413
0 417,384 0 313,309 333,025
2,389,891 3,676,898 4,629,684 6,153,198 7,678,412
0 0 0 0 0
1,698,799 2,760,150 3,542,175 4,708,787 6,144,946
691,092 916,748 1,087,509 1,444,411 1,533,466
14,650,626 5,854,863 7,012,631 8,928,619 10,458,234
367,174 1,507,742 477,161 133,110 231,606
0 0 0 0 0
12,515,647 1,584,784 2,921,883 3,528,471 3,286,454
1,547,062 2,482,517 3,294,274 4,408,128 6,059,142
220,743 279,820 319,313 858,910 881,032
1,445,480 63,685 134,816 465,848 344,294
2,343,705 2,901,560 4,417,930 5,177,105 5,476,591
1,121,949 1,645,140 2,236,397 2,396,793 2,320,744
1,074,221 1,195,945 1,620,722 1,617,607 2,181,572
586,425 933,244 1,142,716 1,203,473 1,096,802
256,411 208,758 251,591 233,123 299,684
1,531,753 248,798 530,567 806,897 685,556
1,293,046 173,879 373,335 573,157 486,460
122,690 150,100 191,838 191,838 191,838
60.00% 40.00% 60.00% 30.00% 0.00%
0.00% 0.00% 15.00% 0.00% 0.00%
24,479 473,635 263,180 452,031 (22,090)
10.55% 9.88% 15.67% 23.28% 19.88%
8.83% 2.97% 5.32% 6.42% 4.65%
10.54 1.16 1.95 2.99 2.54
52.27% 56.73% 51.10% 50.21% 47.26%
19.83% 120.06% 67.39% 40.67% 61.61%
128.84% 3.87% 6.03% 19.44% 14.84%
2.51% 25.75% 6.80% 1.49% 2.21%
85.43% 27.07% 41.67% 39.52% 31.42%
83.69% 30.07% 33.98% 27.58% 23.40%
99.93 11.73 12.42 12.83 12.75
1.89% 272.39% 70.49% 78.87% -4.54%
(Thousand Rupees)IGI General Insurance Ltd.
197

Financial Statement Analysis of Financial Sector 2020
2016 2017 2018 2019 2020Items
A.Total equity (A1 to A3)
1.Share capital
2.Reserves
3.Un appropriated profit
4.Others
B.Total liabilities (B1 to B3)
1.Balance of statutory funds
2.Outstanding claims, adv., prem., due to other insurers
3.Other/misc. liabilities
C.Total assets (C1 to C5)
1.Cash and balances with banks
2.Advances to policy holders & employees
3.Investments in securities & properties
4.Other/misc. assets
5.Fixed assets
D.Profit & loss account
1.Investment income
2.Gross premium
3.Net premium
4.Gross claims
5.Net claims
6.Underwriting profit
7.Profit/(loss) before taxation
8.Profit/(loss) after taxation
E.Other items
1.No. of ordinary shares (000)
2.Cash dividend
3.Stock dividend/bonus shares
4.Cash generated from operating activities
F.Efficiency ratios/profitability ratios
1.Return on equity (ROE) (D8/A)
2.Return on assets (ROA) (D8/C)
3.Earning per share (D8/E1) (rs. per share)
4.Net Claims Incurred Ratio (D5/D3)
5.Underwriting profit to profit after tax. (D6/D8)
6.Investment income to net premium (D1/D3)
G.Liquidity ratios
1.Cash & bank balances to total assets (C1/C)
2. Investment to total assets (C3/C)
H.Capital /leverage ratios
1.Capital ratio (A/C)
2.Break up value per share (A/E1) (Rs. per share)
I.Cash flow ratio
1.Cash generated from operating activities to profit after tax. (E4/D8)
8,773,381 8,312,970 7,908,055 8,712,061 9,547,009
1,569,100 1,804,465 1,804,465 1,804,465 1,984,912
6,015,807 5,443,506 5,038,172 5,721,041 5,941,897
1,188,474 1,064,999 1,065,418 1,186,555 1,620,200
0 0 0 0 0
11,742,817 11,384,594 13,405,097 13,376,863 13,747,961
0 0 0 0 0
7,612,863 7,652,698 8,091,371 9,875,266 10,550,427
4,129,954 3,731,896 5,313,726 3,501,597 3,197,534
20,516,198 19,697,564 21,313,152 22,088,924 23,294,970
1,504,687 1,893,276 1,669,039 1,148,951 965,862
203 775 809 1,256 726
13,492,673 11,998,979 12,184,797 13,849,904 15,176,812
5,331,625 5,605,938 7,216,515 6,846,271 6,954,108
187,010 198,596 241,992 242,542 197,462
1,111,438 879,213 1,019,544 949,909 1,709,685
7,850,500 7,694,212 9,161,366 9,375,269 9,109,975
4,170,928 4,610,717 4,922,929 5,279,188 4,959,025
3,846,186 3,273,427 3,996,825 3,489,678 3,649,795
2,030,292 2,450,107 2,691,068 2,827,884 3,058,182
472,979 408,689 211,727 372,326 23,946
1,854,125 1,664,304 1,631,278 1,725,016 2,113,708
1,179,431 1,116,985 1,066,305 1,224,285 1,532,738
156,910 180,447 180,447 180,447 198,491
35.00% 40.00% 40.00% 30.00% 35.00%
15.00% 0.00% 0.00% 10.00% 0.00%
228,511 (373,650) 422,174 417,293 (87,619)
13.44% 13.44% 13.48% 14.05% 16.05%
5.75% 5.67% 5.00% 5.54% 6.58%
7.52 6.19 5.91 6.78 7.72
48.68% 53.14% 54.66% 53.57% 61.67%
40.10% 36.59% 19.86% 30.41% 1.56%
26.65% 19.07% 20.71% 17.99% 34.48%
7.33% 9.61% 7.83% 5.20% 4.15%
65.77% 60.92% 57.17% 62.70% 65.15%
42.76% 42.20% 37.10% 39.44% 40.98%
55.91 46.07 43.82 48.28 48.10
19.37% -33.45% 39.59% 34.08% -5.72%
(Thousand Rupees)Jubilee General Insurance Co. Ltd.
198

Financial Statement Analysis of Financial Sector 2020
2016 2017 2018 2019 2020Items
A.Total equity (A1 to A3)
1.Share capital
2.Reserves
3.Un appropriated profit
4.Others
B.Total liabilities (B1 to B3)
1.Balance of statutory funds
2.Outstanding claims, adv., prem., due to other insurers
3.Other/misc. liabilities
C.Total assets (C1 to C5)
1.Cash and balances with banks
2.Advances to policy holders & employees
3.Investments in securities & properties
4.Other/misc. assets
5.Fixed assets
D.Profit & loss account
1.Investment income
2.Gross premium
3.Net premium
4.Gross claims
5.Net claims
6.Underwriting profit
7.Profit/(loss) before taxation
8.Profit/(loss) after taxation
E.Other items
1.No. of ordinary shares (000)
2.Cash dividend
3.Stock dividend/bonus shares
4.Cash generated from operating activities
F.Efficiency ratios/profitability ratios
1.Return on equity (ROE) (D8/A)
2.Return on assets (ROA) (D8/C)
3.Earning per share (D8/E1) (rs. per share)
4.Net Claims Incurred Ratio (D5/D3)
5.Underwriting profit to profit after tax. (D6/D8)
6.Investment income to net premium (D1/D3)
G.Liquidity ratios
1.Cash & bank balances to total assets (C1/C)
2. Investment to total assets (C3/C)
H.Capital /leverage ratios
1.Capital ratio (A/C)
2.Break up value per share (A/E1) (Rs. per share)
I.Cash flow ratio
1.Cash generated from operating activities to profit after tax. (E4/D8)
769,882 708,318 509,400 509,400 509,400
769,882 708,318 509,400 509,400 509,400
0 0 0 0 0
0 0 0 0 0
0 0 0 0 0
1,531,601 407,867 26,345 26,345 26,345
0 0 0 0 0
1,281,278 261,712 13,693 13,693 13,693
250,323 146,155 12,652 12,652 12,652
2,301,483 1,116,185 535,745 535,745 535,745
92,091 19,311 4,465 4,465 4,465
0 0 0 0 0
1,237,871 764,923 332,765 332,765 332,765
949,070 321,950 198,515 198,515 198,515
22,451 10,001 0 0 0
182,260 67,610 34,113 34,113 34,113
643,954 (31,173) (74) (74) (74)
102,477 1,236 1 1 1
879,744 579,798 32,655 32,655 32,655
39,885 7,908 (6,036) (6,036) (6,036)
205,124 53,776 5,777 5,777 5,777
289,834 (19,823) (48,493) (48,493) (48,493)
222,699 (63,157) (198,918) (198,918) (198,918)
76,988 70,832 50,940 50,940 50,940
0.00% 0.00% 0.00% 0.00% 0.00%
0.00% 0.00% 0.00% 0.00% 0.00%
(17,008) (619,283) (493,730) (493,730) (493,730)
28.93% -8.92% -39.05% -39.05% -39.05%
9.68% -5.66% -37.13% -37.13% -37.13%
2.89 -0.89 -3.90 -3.90 -3.90
38.92% 639.81% -603,600.00% -603,600.00% -603,600.00%
92.11% -85.15% -2.90% -2.90% -2.90%
177.85% 5,470.06% 3,411,300.00% 3,411,300.00% 3,411,300.00%
4.00% 1.73% 0.83% 0.83% 0.83%
53.79% 68.53% 62.11% 62.11% 62.11%
33.45% 63.46% 95.08% 95.08% 95.08%
10.00 10.00 10.00 10.00 10.00
-7.64% 980.55% 248.21% 248.21% 248.21%
(Thousand Rupees)New Hampshire Insurance Co. Ltd.
199

Financial Statement Analysis of Financial Sector 2020
2016 2017 2018 2019 2020Items
A.Total equity (A1 to A3)
1.Share capital
2.Reserves
3.Un appropriated profit
4.Others
B.Total liabilities (B1 to B3)
1.Balance of statutory funds
2.Outstanding claims, adv., prem., due to other insurers
3.Other/misc. liabilities
C.Total assets (C1 to C5)
1.Cash and balances with banks
2.Advances to policy holders & employees
3.Investments in securities & properties
4.Other/misc. assets
5.Fixed assets
D.Profit & loss account
1.Investment income
2.Gross premium
3.Net premium
4.Gross claims
5.Net claims
6.Underwriting profit
7.Profit/(loss) before taxation
8.Profit/(loss) after taxation
E.Other items
1.No. of ordinary shares (000)
2.Cash dividend
3.Stock dividend/bonus shares
4.Cash generated from operating activities
F.Efficiency ratios/profitability ratios
1.Return on equity (ROE) (D8/A)
2.Return on assets (ROA) (D8/C)
3.Earning per share (D8/E1) (rs. per share)
4.Net Claims Incurred Ratio (D5/D3)
5.Underwriting profit to profit after tax. (D6/D8)
6.Investment income to net premium (D1/D3)
G.Liquidity ratios
1.Cash & bank balances to total assets (C1/C)
2. Investment to total assets (C3/C)
H.Capital /leverage ratios
1.Capital ratio (A/C)
2.Break up value per share (A/E1) (Rs. per share)
I.Cash flow ratio
1.Cash generated from operating activities to profit after tax. (E4/D8)
12,316,190 10,049,686 9,407,899 9,828,798 9,828,798
3,000,000 3,000,000 3,000,000 3,000,000 3,000,000
6,475,923 3,802,484 3,763,561 3,711,061 3,711,061
2,840,267 3,247,202 2,644,338 3,117,737 3,117,737
0 0 0 0 0
13,667,382 13,933,343 15,051,338 26,007,168 26,007,168
0 0 0 0 0
10,473,160 10,662,003 11,812,827 21,974,820 21,974,820
3,194,222 3,271,340 3,238,511 4,032,348 4,032,348
25,983,572 23,983,029 24,459,237 35,835,966 35,835,966
2,240,002 2,517,094 2,602,484 815,679 815,679
72,950 122,414 93,361 91,398 91,398
13,406,985 9,252,478 8,661,980 10,969,290 10,969,290
10,224,709 12,054,472 13,058,655 23,892,328 23,892,328
38,926 36,571 42,757 67,271 67,271
961,157 3,325,868 690,970 1,008,309 1,008,309
8,806,654 8,035,591 10,734,456 17,655,482 17,655,482
5,801,848 5,006,374 5,463,586 6,905,155 6,905,155
3,417,460 4,919,822 2,999,830 6,154,840 6,154,840
3,335,560 3,937,974 2,989,582 4,258,866 4,258,866
544,733 (676,897) 582,820 501,365 501,365
1,426,948 2,875,829 1,729,747 2,189,249 2,189,249
974,263 2,226,336 1,228,047 1,484,283 1,484,283
300,000 300,000 300,000 300,000 300,000
30.00% 35.00% 20.00% 20.00% 20.00%
0.00% 0.00% 0.00% 0.00% 0.00%
(445,414) (3,318,402) 544,367 531,001 531,001
7.91% 22.15% 13.05% 15.10% 15.10%
3.75% 9.28% 5.02% 4.14% 4.14%
3.25 7.42 4.09 4.95 4.95
57.49% 78.66% 54.72% 61.68% 61.68%
55.91% -30.40% 47.46% 33.78% 33.78%
16.57% 66.43% 12.65% 14.60% 14.60%
8.62% 10.50% 10.64% 2.28% 2.28%
51.60% 38.58% 35.41% 30.61% 30.61%
47.40% 41.90% 38.46% 27.43% 27.43%
41.05 33.50 31.36 32.76 32.76
-45.72% -149.05% 44.33% 35.77% 35.77%
(Thousand Rupees)Pakistan Reinsurance Co. Ltd.
200

Financial Statement Analysis of Financial Sector 2020
2016 2017 2018 2019 2020Items
A.Total equity (A1 to A3)
1.Share capital
2.Reserves
3.Un appropriated profit
4.Others
B.Total liabilities (B1 to B3)
1.Balance of statutory funds
2.Outstanding claims, adv., prem., due to other insurers
3.Other/misc. liabilities
C.Total assets (C1 to C5)
1.Cash and balances with banks
2.Advances to policy holders & employees
3.Investments in securities & properties
4.Other/misc. assets
5.Fixed assets
D.Profit & loss account
1.Investment income
2.Gross premium
3.Net premium
4.Gross claims
5.Net claims
6.Underwriting profit
7.Profit/(loss) before taxation
8.Profit/(loss) after taxation
E.Other items
1.No. of ordinary shares (000)
2.Cash dividend
3.Stock dividend/bonus shares
4.Cash generated from operating activities
F.Efficiency ratios/profitability ratios
1.Return on equity (ROE) (D8/A)
2.Return on assets (ROA) (D8/C)
3.Earning per share (D8/E1) (rs. per share)
4.Net Claims Incurred Ratio (D5/D3)
5.Underwriting profit to profit after tax. (D6/D8)
6.Investment income to net premium (D1/D3)
G.Liquidity ratios
1.Cash & bank balances to total assets (C1/C)
2. Investment to total assets (C3/C)
H.Capital /leverage ratios
1.Capital ratio (A/C)
2.Break up value per share (A/E1) (Rs. per share)
I.Cash flow ratio
1.Cash generated from operating activities to profit after tax. (E4/D8)
38,211 (4,020) (15,819) (17,994) (18,006)
350,000 350,000 350,000 350,000 350,000
0 0 0 0 0
(311,789) (354,020) (365,819) (367,994) (368,006)
0 0 0 0 0
297,691 72,624 82,830 88,812 93,607
0 0 0 0 0
248,404 0 0 0 0
49,287 72,624 82,830 88,812 93,607
335,902 68,604 67,011 70,818 75,601
496 780 335 116 157
0 0 0 0 0
36,387 38,208 40,339 44,384 48,306
285,631 28,919 26,305 26,307 27,137
13,388 697 32 11 1
848 2,353 2,347 4,515 4,751
(15,375) (511) 0 0 0
76,310 44,643 0 0 0
80,887 104,157 0 0 0
225 48,447 0 0 0
24,998 (10,795) (10,929) (5,954) (4,548)
(24,367) (41,647) (8,914) (1,705) (12)
(24,881) (42,231) (11,799) 2,175 (12)
35,000 35,000 35,000 35,000 35,000
0.00% 0.00% 0.00% 0.00% 0.00%
0.00% 0.00% 0.00% 0.00% 0.00%
(49,157) (9,147) (763) (712) (863)
-65.11% 1,050.52% 74.59% -12.09% 0.07%
-7.41% -61.56% -17.61% 3.07% -0.02%
-0.71 -1.21 -0.34 0.06 0.00
0.29% 108.52%
-100.47% 25.56% 92.63% -273.75% 37,900.00%
1.11% 5.27%
0.15% 1.14% 0.50% 0.16% 0.21%
10.83% 55.69% 60.20% 62.67% 63.90%
11.38% -5.86% -23.61% -25.41% -23.82%
1.09 -0.11 -0.45 -0.51 -0.51
197.57% 21.66% 6.47% -32.74% 7,191.67%
- - -
- - -
(Thousand Rupees)PICIC Insurance Ltd.
201

Financial Statement Analysis of Financial Sector 2020
2016 2017 2018 2019 2020Items
A.Total equity (A1 to A3)
1.Share capital
2.Reserves
3.Un appropriated profit
4.Others
B.Total liabilities (B1 to B3)
1.Balance of statutory funds
2.Outstanding claims, adv., prem., due to other insurers
3.Other/misc. liabilities
C.Total assets (C1 to C5)
1.Cash and balances with banks
2.Advances to policy holders & employees
3.Investments in securities & properties
4.Other/misc. assets
5.Fixed assets
D.Profit & loss account
1.Investment income
2.Gross premium
3.Net premium
4.Gross claims
5.Net claims
6.Underwriting profit
7.Profit/(loss) before taxation
8.Profit/(loss) after taxation
E.Other items
1.No. of ordinary shares (000)
2.Cash dividend
3.Stock dividend/bonus shares
4.Cash generated from operating activities
F.Efficiency ratios/profitability ratios
1.Return on equity (ROE) (D8/A)
2.Return on assets (ROA) (D8/C)
3.Earning per share (D8/E1) (rs. per share)
4.Net Claims Incurred Ratio (D5/D3)
5.Underwriting profit to profit after tax. (D6/D8)
6.Investment income to net premium (D1/D3)
G.Liquidity ratios
1.Cash & bank balances to total assets (C1/C)
2. Investment to total assets (C3/C)
H.Capital /leverage ratios
1.Capital ratio (A/C)
2.Break up value per share (A/E1) (Rs. per share)
I.Cash flow ratio
1.Cash generated from operating activities to profit after tax. (E4/D8)
1,630,514 1,186,516 1,212,639 1,157,023 1,336,909
417,893 505,650 505,650 505,650 505,650
1,390,776 1,167,630 1,148,897 1,332,439 1,629,308
(178,155) (486,764) (441,908) (681,066) (798,049)
0 0 0 0 0
2,503,080 2,412,641 1,951,094 1,800,277 1,912,371
0 0 0 0 0
2,004,178 1,899,618 1,513,046 1,378,006 1,527,484
498,902 513,023 438,048 422,271 384,887
4,133,594 3,599,157 3,163,733 2,957,300 3,249,280
417,714 149,275 72,840 95,196 37,590
0 2,329 4,473 6,279 4,521
1,309,416 1,361,527 1,278,034 1,253,929 1,537,742
2,123,959 1,822,565 1,571,664 1,366,688 1,445,714
282,505 263,461 236,722 235,208 223,713
258,537 27,265 42,937 (135,584) 22,366
1,115,119 849,108 535,976 501,364 532,726
623,366 517,834 290,308 223,329 195,194
539,846 645,561 516,573 339,646 194,701
628,312 527,112 57,811 88,086 112,290
(432,243) (407,282) (35,758) (223,824) (182,908)
(325,134) (302,008) 53,390 (274,655) (110,036)
(330,709) (315,977) 44,822 (239,761) (117,112)
41,789 50,565 50,565 50,565 50,565
0.00% 0.00% 0.00% 0.00% 0.00%
10.00% 10.00% 0.00% 0.00% 0.00%
(84,077) (397,849) (281,178) (83,985) (121,787)
-20.28% -26.63% 3.70% -20.72% -8.76%
-8.00% -8.78% 1.42% -8.11% -3.60%
-7.91 -6.25 0.89 -4.74 -2.32
100.79% 101.79% 19.91% 39.44% 57.53%
130.70% 128.90% -79.78% 93.35% 156.18%
41.47% 5.27% 14.79% -60.71% 11.46%
10.11% 4.15% 2.30% 3.22% 1.16%
31.68% 37.83% 40.40% 42.40% 47.33%
39.45% 32.97% 38.33% 39.12% 41.14%
39.02 23.47 23.98 22.88 26.44
25.42% 125.91% -627.32% 35.03% 103.99%
(Thousand Rupees)Premier Insurance Ltd.
202

Financial Statement Analysis of Financial Sector 2020
2016 2017 2018 2019 2020Items
A.Total equity (A1 to A3)
1.Share capital
2.Reserves
3.Un appropriated profit
4.Others
B.Total liabilities (B1 to B3)
1.Balance of statutory funds
2.Outstanding claims, adv., prem., due to other insurers
3.Other/misc. liabilities
C.Total assets (C1 to C5)
1.Cash and balances with banks
2.Advances to policy holders & employees
3.Investments in securities & properties
4.Other/misc. assets
5.Fixed assets
D.Profit & loss account
1.Investment income
2.Gross premium
3.Net premium
4.Gross claims
5.Net claims
6.Underwriting profit
7.Profit/(loss) before taxation
8.Profit/(loss) after taxation
E.Other items
1.No. of ordinary shares (000)
2.Cash dividend
3.Stock dividend/bonus shares
4.Cash generated from operating activities
F.Efficiency ratios/profitability ratios
1.Return on equity (ROE) (D8/A)
2.Return on assets (ROA) (D8/C)
3.Earning per share (D8/E1) (rs. per share)
4.Net Claims Incurred Ratio (D5/D3)
5.Underwriting profit to profit after tax. (D6/D8)
6.Investment income to net premium (D1/D3)
G.Liquidity ratios
1.Cash & bank balances to total assets (C1/C)
2. Investment to total assets (C3/C)
H.Capital /leverage ratios
1.Capital ratio (A/C)
2.Break up value per share (A/E1) (Rs. per share)
I.Cash flow ratio
1.Cash generated from operating activities to profit after tax. (E4/D8)
119,311 117,981 116,827 114,764 113,483
161,500 161,500 161,500 161,500 161,500
(42,189) (43,519) (44,673) (46,736) (48,017)
0 0 0 0 0
0 0 0 0 0
4,467 4,719 5,457 7,647 9,798
0 0 0 0 0
0 0 0 0 0
4,467 4,719 5,457 7,647 9,798
123,778 122,700 122,284 122,411 123,281
154 156 43 21 624
0 0 0 0 0
116,333 115,312 115,047 115,145 115,419
6,773 6,772 6,780 6,881 6,917
518 460 414 364 321
0 3 458 307 292
0 0 0 0 0
0 0 0 0 0
0 0 0 0 0
0 0 0 0 0
0 0 0 0 0
(158) (673) (815) (1,783) (1,754)
(158) (673) (815) (1,783) (1,754)
16,150 16,150 16,150 16,150 16,150
0.00% 0.00% 0.00% 0.00% 0.00%
0.00% 0.00% 0.00% 0.00% 0.00%
(120) (189) (1,158) (2,016) (1,954)
-0.13% -0.57% -0.70% -1.55% -1.55%
-0.13% -0.55% -0.67% -1.46% -1.42%
-0.01 -0.04 -0.05 -0.11 -0.11
0.00% 0.00% 0.00% 0.00% 0.00%
0.12% 0.13% 0.04% 0.02% 0.51%
93.99% 93.98% 94.08% 94.06% 93.62%
96.39% 96.15% 95.54% 93.75% 92.05%
7.39 7.31 7.23 7.11 7.03
75.95% 28.08% 142.09% 113.07% 111.40%
- - - - -
- - - - -
(Thousand Rupees)Progressive Insurance Co. Ltd.
203

Financial Statement Analysis of Financial Sector 2020
2016 2017 2018 2019 2020Items
A.Total equity (A1 to A3)
1.Share capital
2.Reserves
3.Un appropriated profit
4.Others
B.Total liabilities (B1 to B3)
1.Balance of statutory funds
2.Outstanding claims, adv., prem., due to other insurers
3.Other/misc. liabilities
C.Total assets (C1 to C5)
1.Cash and balances with banks
2.Advances to policy holders & employees
3.Investments in securities & properties
4.Other/misc. assets
5.Fixed assets
D.Profit & loss account
1.Investment income
2.Gross premium
3.Net premium
4.Gross claims
5.Net claims
6.Underwriting profit
7.Profit/(loss) before taxation
8.Profit/(loss) after taxation
E.Other items
1.No. of ordinary shares (000)
2.Cash dividend
3.Stock dividend/bonus shares
4.Cash generated from operating activities
F.Efficiency ratios/profitability ratios
1.Return on equity (ROE) (D8/A)
2.Return on assets (ROA) (D8/C)
3.Earning per share (D8/E1) (rs. per share)
4.Net Claims Incurred Ratio (D5/D3)
5.Underwriting profit to profit after tax. (D6/D8)
6.Investment income to net premium (D1/D3)
G.Liquidity ratios
1.Cash & bank balances to total assets (C1/C)
2. Investment to total assets (C3/C)
H.Capital /leverage ratios
1.Capital ratio (A/C)
2.Break up value per share (A/E1) (Rs. per share)
I.Cash flow ratio
1.Cash generated from operating activities to profit after tax. (E4/D8)
868,880 804,569 853,566 924,777 993,273
510,375 561,413 561,413 561,413 561,413
220,000 250,000 250,000 250,000 250,000
138,505 (6,844) 42,153 113,364 181,860
8,088 (5,635) 2,359 8,752 4,362
951,418 992,187 802,729 661,957 716,339
0 0 0 0 0
819,278 842,668 667,402 568,397 640,084
132,140 149,519 135,327 93,560 76,255
1,828,386 1,791,121 1,658,654 1,595,486 1,713,974
120,239 160,185 144,372 131,228 111,310
998 1,336 990 1,059 930
795,291 704,219 711,108 777,312 813,517
824,787 844,361 709,303 602,857 718,007
87,071 81,020 92,881 83,030 70,210
99,009 (40,072) 46,673 92,725 83,543
1,201,840 1,155,402 878,686 622,401 569,073
359,415 357,654 348,241 347,798 319,478
267,349 228,649 207,784 320,478 194,450
101,720 88,157 87,174 87,205 76,425
64,289 67,082 48,624 40,821 29,010
115,540 (17,595) 60,121 96,404 83,576
100,690 (38,792) 48,997 71,211 68,495
51,038 56,141 56,141 56,141 56,141
5.00% 0.00% 0.00% 0.00% 0.00%
10.00% 0.00% 0.00% 0.00% 7.50%
102,288 38,113 (44,425) (44,957) (62,243)
11.59% -4.82% 5.74% 7.70% 6.90%
5.51% -2.17% 2.95% 4.46% 4.00%
1.97 -0.69 0.87 1.27 1.22
28.30% 24.65% 25.03% 25.07% 23.92%
63.85% -172.93% 99.24% 57.32% 42.35%
27.55% -11.20% 13.40% 26.66% 26.15%
6.58% 8.94% 8.70% 8.22% 6.49%
43.50% 39.32% 42.87% 48.72% 47.46%
47.52% 44.92% 51.46% 57.96% 57.95%
17.02 14.33 15.20 16.47 17.69
101.59% -98.25% -90.67% -63.13% -90.87%
(Thousand Rupees)Reliance Insurance Co. Ltd.
204

Financial Statement Analysis of Financial Sector 2020
2016 2017 2018 2019 2020Items
A.Total equity (A1 to A3)
1.Share capital
2.Reserves
3.Un appropriated profit
4.Others
B.Total liabilities (B1 to B3)
1.Balance of statutory funds
2.Outstanding claims, adv., prem., due to other insurers
3.Other/misc. liabilities
C.Total assets (C1 to C5)
1.Cash and balances with banks
2.Advances to policy holders & employees
3.Investments in securities & properties
4.Other/misc. assets
5.Fixed assets
D.Profit & loss account
1.Investment income
2.Gross premium
3.Net premium
4.Gross claims
5.Net claims
6.Underwriting profit
7.Profit/(loss) before taxation
8.Profit/(loss) after taxation
E.Other items
1.No. of ordinary shares (000)
2.Cash dividend
3.Stock dividend/bonus shares
4.Cash generated from operating activities
F.Efficiency ratios/profitability ratios
1.Return on equity (ROE) (D8/A)
2.Return on assets (ROA) (D8/C)
3.Earning per share (D8/E1) (rs. per share)
4.Net Claims Incurred Ratio (D5/D3)
5.Underwriting profit to profit after tax. (D6/D8)
6.Investment income to net premium (D1/D3)
G.Liquidity ratios
1.Cash & bank balances to total assets (C1/C)
2. Investment to total assets (C3/C)
H.Capital /leverage ratios
1.Capital ratio (A/C)
2.Break up value per share (A/E1) (Rs. per share)
I.Cash flow ratio
1.Cash generated from operating activities to profit after tax. (E4/D8)
432,261 523,313 496,912 698,839 724,276
410,000 500,000 500,000 500,000 575,000
(293) (418) (383) 131,992 127,082
22,554 23,731 (2,705) 66,847 22,194
0 0 0 0 0
603,734 654,671 726,921 700,394 699,421
0 0 0 0 0
416,582 492,510 491,144 474,279 485,506
187,152 162,161 235,777 226,115 213,915
1,035,995 1,177,984 1,223,833 1,399,233 1,423,697
80,185 43,843 27,489 32,114 47,661
1,529 1,350 362 884 1,779
156,290 232,194 235,612 393,950 375,699
700,355 803,152 851,475 869,412 901,033
97,636 97,445 108,895 102,873 97,525
12,712 14,265 16,656 17,564 17,368
678,082 700,999 580,692 739,496 718,719
529,290 561,908 471,131 579,151 534,135
183,212 176,121 168,985 207,374 250,101
215,099 198,926 151,680 136,597 149,251
51,026 40,474 12,109 32,653 12,523
64,710 48,456 12,967 52,266 44,615
36,788 44,152 18,932 66,835 33,306
41,000 50,000 50,000 50,000 57,500
0.00% 0.00% 0.00% 0.00% 0.00%
0.00% 0.00% 0.00% 0.00% 0.00%
54,297 19,464 (10,037) (42,581) 1,964
8.51% 8.44% 3.81% 9.56% 4.60%
3.55% 3.75% 1.55% 4.78% 2.34%
0.90 0.88 0.38 1.34 0.58
40.64% 35.40% 32.19% 23.59% 27.94%
138.70% 91.67% 63.96% 48.86% 37.60%
2.40% 2.54% 3.54% 3.03% 3.25%
7.74% 3.72% 2.25% 2.30% 3.35%
15.09% 19.71% 19.25% 28.15% 26.39%
41.72% 44.42% 40.60% 49.94% 50.87%
10.54 10.47 9.94 13.98 12.60
147.59% 44.08% -53.02% -63.71% 5.90%
(Thousand Rupees)SPI Insurance Company Ltd.
205

Financial Statement Analysis of Financial Sector 2020
2016 2017 2018 2019 2020Items
A.Total equity (A1 to A3)
1.Share capital
2.Reserves
3.Un appropriated profit
4.Others
B.Total liabilities (B1 to B3)
1.Balance of statutory funds
2.Outstanding claims, adv., prem., due to other insurers
3.Other/misc. liabilities
C.Total assets (C1 to C5)
1.Cash and balances with banks
2.Advances to policy holders & employees
3.Investments in securities & properties
4.Other/misc. assets
5.Fixed assets
D.Profit & loss account
1.Investment income
2.Gross premium
3.Net premium
4.Gross claims
5.Net claims
6.Underwriting profit
7.Profit/(loss) before taxation
8.Profit/(loss) after taxation
E.Other items
1.No. of ordinary shares (000)
2.Cash dividend
3.Stock dividend/bonus shares
4.Cash generated from operating activities
F.Efficiency ratios/profitability ratios
1.Return on equity (ROE) (D8/A)
2.Return on assets (ROA) (D8/C)
3.Earning per share (D8/E1) (rs. per share)
4.Net Claims Incurred Ratio (D5/D3)
5.Underwriting profit to profit after tax. (D6/D8)
6.Investment income to net premium (D1/D3)
G.Liquidity ratios
1.Cash & bank balances to total assets (C1/C)
2. Investment to total assets (C3/C)
H.Capital /leverage ratios
1.Capital ratio (A/C)
2.Break up value per share (A/E1) (Rs. per share)
I.Cash flow ratio
1.Cash generated from operating activities to profit after tax. (E4/D8)
14,927,269 15,394,267 13,870,414 14,917,643 14,410,562
680,625 680,625 680,625 680,625 680,625
5,366,032 5,349,517 3,313,257 3,742,464 2,867,792
8,880,612 9,364,125 9,876,532 10,494,554 10,862,145
0 0 0 0 0
5,300,261 5,847,503 5,126,269 6,902,683 20,121,635
0 0 0 0 0
2,630,325 3,177,226 3,328,994 4,513,580 15,487,591
2,669,936 2,670,277 1,797,275 2,389,103 4,634,044
20,227,530 21,241,770 18,996,683 21,820,326 34,532,197
386,533 644,546 233,108 268,560 697,927
0 1,014 931 1,010 693
16,839,825 17,093,520 14,472,903 16,717,987 17,051,384
2,893,712 3,385,442 4,165,579 4,683,393 16,621,866
107,460 117,248 124,162 149,376 160,327
1,016,532 1,082,586 995,081 1,037,215 724,489
2,087,139 2,013,428 2,495,889 3,121,741 8,798,985
445,682 502,533 599,589 695,996 815,915
2,411,044 410,321 470,470 437,968 573,265
74,704 94,441 83,195 110,472 111,478
270,660 197,766 294,297 302,407 368,744
1,186,279 1,278,118 1,291,835 1,353,963 1,008,011
799,580 824,723 853,828 959,383 707,054
68,063 68,063 68,063 68,063 68,063
0.00% 0.00% 0.00% 0.00% 0.00%
0.00% 0.00% 0.00% 0.00% 0.00%
186,093 (92,506) (643,098) 756,763 (51,561)
5.36% 5.36% 6.16% 6.43% 4.91%
3.95% 3.88% 4.49% 4.40% 2.05%
11.75 12.12 12.54 14.10 10.39
16.76% 18.79% 13.88% 15.87% 13.66%
33.85% 23.98% 34.47% 31.52% 52.15%
228.08% 215.43% 165.96% 149.03% 88.79%
1.91% 3.03% 1.23% 1.23% 2.02%
83.25% 80.47% 76.19% 76.62% 49.38%
73.80% 72.47% 73.01% 68.37% 41.73%
219.32 226.18 203.79 219.18 211.73
23.27% -11.22% -75.32% 78.88% -7.29%
(Thousand Rupees)Security General Insurance Co. Ltd.
206

Financial Statement Analysis of Financial Sector 2020
2016 2017 2018 2019 2020Items
A.Total equity (A1 to A3)
1.Share capital
2.Reserves
3.Un appropriated profit
4.Others
B.Total liabilities (B1 to B3)
1.Balance of statutory funds
2.Outstanding claims, adv., prem., due to other insurers
3.Other/misc. liabilities
C.Total assets (C1 to C5)
1.Cash and balances with banks
2.Advances to policy holders & employees
3.Investments in securities & properties
4.Other/misc. assets
5.Fixed assets
D.Profit & loss account
1.Investment income
2.Gross premium
3.Net premium
4.Gross claims
5.Net claims
6.Underwriting profit
7.Profit/(loss) before taxation
8.Profit/(loss) after taxation
E.Other items
1.No. of ordinary shares (000)
2.Cash dividend
3.Stock dividend/bonus shares
4.Cash generated from operating activities
F.Efficiency ratios/profitability ratios
1.Return on equity (ROE) (D8/A)
2.Return on assets (ROA) (D8/C)
3.Earning per share (D8/E1) (rs. per share)
4.Net Claims Incurred Ratio (D5/D3)
5.Underwriting profit to profit after tax. (D6/D8)
6.Investment income to net premium (D1/D3)
G.Liquidity ratios
1.Cash & bank balances to total assets (C1/C)
2. Investment to total assets (C3/C)
H.Capital /leverage ratios
1.Capital ratio (A/C)
2.Break up value per share (A/E1) (Rs. per share)
I.Cash flow ratio
1.Cash generated from operating activities to profit after tax. (E4/D8)
658,578 1,281,479 1,479,356 1,818,745 2,202,310
500,000 1,000,000 1,000,000 1,000,000 1,000,000
2,527 553 0 13,563 76,732
156,051 280,926 479,356 805,182 1,125,578
0 0 0 0 0
2,330,843 2,197,131 2,380,651 2,821,567 2,535,311
0 0 0 0 0
2,308,280 2,159,021 2,326,613 2,774,850 2,456,375
22,563 38,110 54,038 46,717 78,936
2,989,421 3,478,610 3,860,007 4,640,312 4,737,621
69,809 52,347 53,916 66,870 110,728
1,113 372 0 0 0
2,477,801 2,995,299 3,107,017 3,296,226 3,566,363
414,612 406,487 679,774 1,247,110 1,029,639
26,086 24,105 19,300 30,106 30,891
63,241 181,554 258,479 360,060 385,108
2,408,854 1,759,779 426,427 895,899 488,546
640,425 1,618,930 358,775 377,973 254,168
37,099 795,401 110,220 234,297 71,434
516,012 763,598 801,910 205,448 66,798
31,460 (9,066) 5,981 55,990 54,306
82,574 178,318 278,825 458,495 451,165
56,707 124,876 198,429 325,827 320,395
50,000 100,000 100,000 100,000 100,000
0.00% 0.00% 0.00% 0.00% 0.00%
0.00% 0.00% 0.00% 0.00% 0.00%
1,944,181 (152,345) (153,790) (162,022) (169,642)
8.61% 9.74% 13.41% 17.91% 14.55%
1.90% 3.59% 5.14% 7.02% 6.76%
1.13 1.25 1.98 3.26 3.20
80.57% 47.17% 223.51% 54.36% 26.28%
55.48% -7.26% 3.01% 17.18% 16.95%
9.87% 11.21% 72.04% 95.26% 151.52%
2.34% 1.50% 1.40% 1.44% 2.34%
82.89% 86.11% 80.49% 71.03% 75.28%
22.03% 36.84% 38.33% 39.19% 46.49%
13.17 12.81 14.79 18.19 22.02
3,428.47% -122.00% -77.50% -49.73% -52.95%
(Thousand Rupees)Sindh Insurance Limited
207

Financial Statement Analysis of Financial Sector 2020
2016 2017 2018 2019 2020Items
A.Total equity (A1 to A3)
1.Share capital
2.Reserves
3.Un appropriated profit
4.Others
B.Total liabilities (B1 to B3)
1.Balance of statutory funds
2.Outstanding claims, adv., prem., due to other insurers
3.Other/misc. liabilities
C.Total assets (C1 to C5)
1.Cash and balances with banks
2.Advances to policy holders & employees
3.Investments in securities & properties
4.Other/misc. assets
5.Fixed assets
D.Profit & loss account
1.Investment income
2.Gross premium
3.Net premium
4.Gross claims
5.Net claims
6.Underwriting profit
7.Profit/(loss) before taxation
8.Profit/(loss) after taxation
E.Other items
1.No. of ordinary shares (000)
2.Cash dividend
3.Stock dividend/bonus shares
4.Cash generated from operating activities
F.Efficiency ratios/profitability ratios
1.Return on equity (ROE) (D8/A)
2.Return on assets (ROA) (D8/C)
3.Earning per share (D8/E1) (rs. per share)
4.Net Claims Incurred Ratio (D5/D3)
5.Underwriting profit to profit after tax. (D6/D8)
6.Investment income to net premium (D1/D3)
G.Liquidity ratios
1.Cash & bank balances to total assets (C1/C)
2. Investment to total assets (C3/C)
H.Capital /leverage ratios
1.Capital ratio (A/C)
2.Break up value per share (A/E1) (Rs. per share)
I.Cash flow ratio
1.Cash generated from operating activities to profit after tax. (E4/D8)
401,595 495,393 574,376 621,112 655,818
450,000 600,000 600,000 600,000 600,000
31,416 31,042 31,367 33,103 32,200
(79,821) (135,649) (56,991) (11,991) 23,618
0 0 0 0 0
364,231 420,966 468,588 553,096 438,159
0 0 0 0 0
301,195 304,126 332,052 323,464 298,587
63,036 116,840 136,536 229,632 139,572
765,826 916,359 1,042,964 1,174,208 1,093,977
22,406 86,081 21,238 23,319 14,686
3 3 3 0 0
488,568 554,855 615,665 694,132 738,259
208,535 263,204 394,993 374,439 319,015
46,314 12,216 11,065 82,318 22,017
17,158 29,143 33,037 61,065 56,538
339,503 342,923 416,939 350,295 244,386
264,558 299,586 366,914 295,190 229,055
134,655 99,554 102,816 153,382 117,600
74,312 80,412 84,889 99,575 66,080
86,838 95,516 110,080 67,272 49,927
42,781 73,948 98,638 80,256 45,933
40,136 63,490 78,658 60,000 35,609
45,000 60,000 60,000 60,000 60,000
0.00% 0.00% 2.50% 0.00% 0.00%
0.00% 0.00% 0.00% 0.00% 0.00%
27,439 16,795 326 14,533 (21,808)
9.99% 12.82% 13.69% 9.66% 5.43%
5.24% 6.93% 7.54% 5.11% 3.26%
0.89 1.06 1.31 1.00 0.59
28.09% 26.84% 23.14% 33.73% 28.85%
216.36% 150.44% 139.95% 112.12% 140.21%
6.49% 9.73% 9.00% 20.69% 24.68%
2.93% 9.39% 2.04% 1.99% 1.34%
63.80% 60.55% 59.03% 59.11% 67.48%
52.44% 54.06% 55.07% 52.90% 59.95%
8.92 8.26 9.57 10.35 10.93
68.37% 26.45% 0.41% 24.22% -61.24%
(Thousand Rupees)Shaheen Insurance Co. Ltd.
208
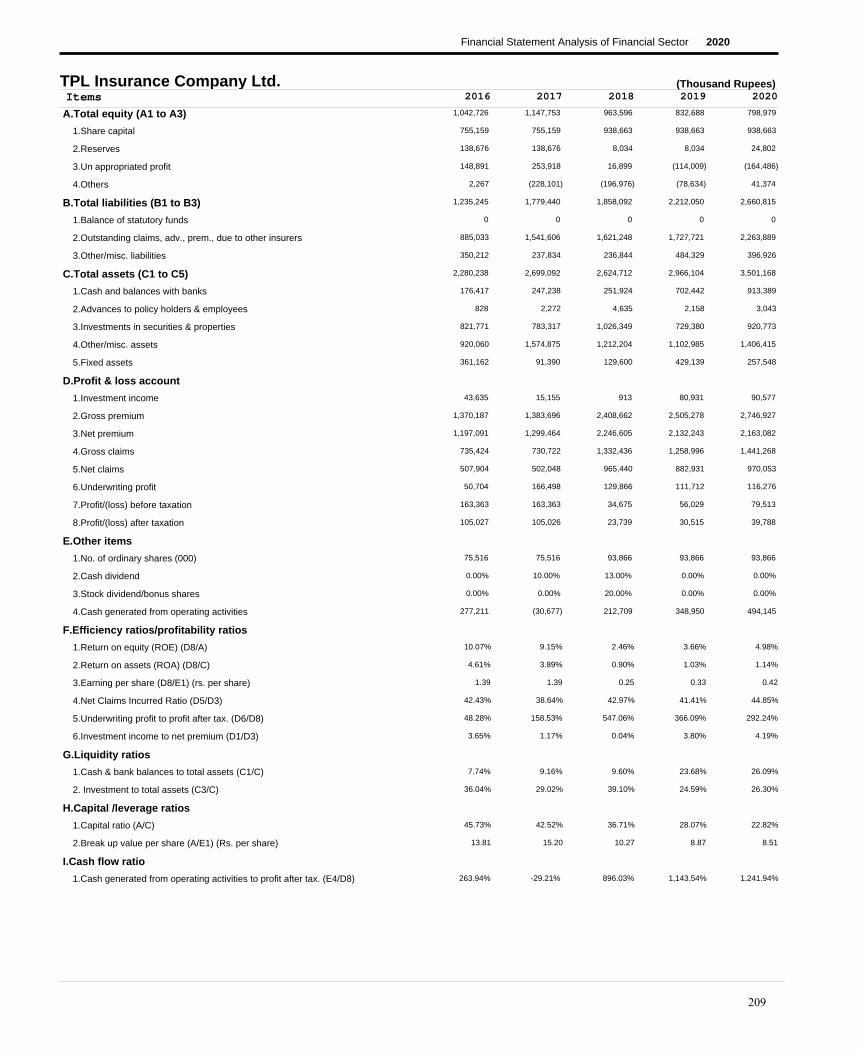
Financial Statement Analysis of Financial Sector 2020
2016 2017 2018 2019 2020Items
A.Total equity (A1 to A3)
1.Share capital
2.Reserves
3.Un appropriated profit
4.Others
B.Total liabilities (B1 to B3)
1.Balance of statutory funds
2.Outstanding claims, adv., prem., due to other insurers
3.Other/misc. liabilities
C.Total assets (C1 to C5)
1.Cash and balances with banks
2.Advances to policy holders & employees
3.Investments in securities & properties
4.Other/misc. assets
5.Fixed assets
D.Profit & loss account
1.Investment income
2.Gross premium
3.Net premium
4.Gross claims
5.Net claims
6.Underwriting profit
7.Profit/(loss) before taxation
8.Profit/(loss) after taxation
E.Other items
1.No. of ordinary shares (000)
2.Cash dividend
3.Stock dividend/bonus shares
4.Cash generated from operating activities
F.Efficiency ratios/profitability ratios
1.Return on equity (ROE) (D8/A)
2.Return on assets (ROA) (D8/C)
3.Earning per share (D8/E1) (rs. per share)
4.Net Claims Incurred Ratio (D5/D3)
5.Underwriting profit to profit after tax. (D6/D8)
6.Investment income to net premium (D1/D3)
G.Liquidity ratios
1.Cash & bank balances to total assets (C1/C)
2. Investment to total assets (C3/C)
H.Capital /leverage ratios
1.Capital ratio (A/C)
2.Break up value per share (A/E1) (Rs. per share)
I.Cash flow ratio
1.Cash generated from operating activities to profit after tax. (E4/D8)
1,042,726 1,147,753 963,596 832,688 798,979
755,159 755,159 938,663 938,663 938,663
138,676 138,676 8,034 8,034 24,802
148,891 253,918 16,899 (114,009) (164,486)
2,267 (228,101) (196,976) (78,634) 41,374
1,235,245 1,779,440 1,858,092 2,212,050 2,660,815
0 0 0 0 0
885,033 1,541,606 1,621,248 1,727,721 2,263,889
350,212 237,834 236,844 484,329 396,926
2,280,238 2,699,092 2,624,712 2,966,104 3,501,168
176,417 247,238 251,924 702,442 913,389
828 2,272 4,635 2,158 3,043
821,771 783,317 1,026,349 729,380 920,773
920,060 1,574,875 1,212,204 1,102,985 1,406,415
361,162 91,390 129,600 429,139 257,548
43,635 15,155 913 80,931 90,577
1,370,187 1,383,696 2,408,662 2,505,278 2,746,927
1,197,091 1,299,464 2,246,605 2,132,243 2,163,082
735,424 730,722 1,332,436 1,258,996 1,441,268
507,904 502,048 965,440 882,931 970,053
50,704 166,498 129,866 111,712 116,276
163,363 163,363 34,675 56,029 79,513
105,027 105,026 23,739 30,515 39,788
75,516 75,516 93,866 93,866 93,866
0.00% 10.00% 13.00% 0.00% 0.00%
0.00% 0.00% 20.00% 0.00% 0.00%
277,211 (30,677) 212,709 348,950 494,145
10.07% 9.15% 2.46% 3.66% 4.98%
4.61% 3.89% 0.90% 1.03% 1.14%
1.39 1.39 0.25 0.33 0.42
42.43% 38.64% 42.97% 41.41% 44.85%
48.28% 158.53% 547.06% 366.09% 292.24%
3.65% 1.17% 0.04% 3.80% 4.19%
7.74% 9.16% 9.60% 23.68% 26.09%
36.04% 29.02% 39.10% 24.59% 26.30%
45.73% 42.52% 36.71% 28.07% 22.82%
13.81 15.20 10.27 8.87 8.51
263.94% -29.21% 896.03% 1,143.54% 1,241.94%
(Thousand Rupees)TPL Insurance Company Ltd.
209

Financial Statement Analysis of Financial Sector 2020
2016 2017 2018 2019 2020Items
A.Total equity (A1 to A3)
1.Share capital
2.Reserves
3.Un appropriated profit
4.Others
B.Total liabilities (B1 to B3)
1.Balance of statutory funds
2.Outstanding claims, adv., prem., due to other insurers
3.Other/misc. liabilities
C.Total assets (C1 to C5)
1.Cash and balances with banks
2.Advances to policy holders & employees
3.Investments in securities & properties
4.Other/misc. assets
5.Fixed assets
D.Profit & loss account
1.Investment income
2.Gross premium
3.Net premium
4.Gross claims
5.Net claims
6.Underwriting profit
7.Profit/(loss) before taxation
8.Profit/(loss) after taxation
E.Other items
1.No. of ordinary shares (000)
2.Cash dividend
3.Stock dividend/bonus shares
4.Cash generated from operating activities
F.Efficiency ratios/profitability ratios
1.Return on equity (ROE) (D8/A)
2.Return on assets (ROA) (D8/C)
3.Earning per share (D8/E1) (rs. per share)
4.Net Claims Incurred Ratio (D5/D3)
5.Underwriting profit to profit after tax. (D6/D8)
6.Investment income to net premium (D1/D3)
G.Liquidity ratios
1.Cash & bank balances to total assets (C1/C)
2. Investment to total assets (C3/C)
H.Capital /leverage ratios
1.Capital ratio (A/C)
2.Break up value per share (A/E1) (Rs. per share)
I.Cash flow ratio
1.Cash generated from operating activities to profit after tax. (E4/D8)
2,305,324 2,239,520 2,317,125 2,325,302 2,325,302
500,000 500,020 500,032 500,032 500,032
1,795,943 1,731,154 1,808,500 1,815,246 1,815,246
9,381 8,346 8,593 10,024 10,024
0 0 0 0 0
70,315 44,754 48,640 59,911 59,911
0 0 0 0 0
5,253 7,311 15,168 20,158 20,158
65,062 37,443 33,472 39,753 39,753
2,375,639 2,284,274 2,365,765 2,385,213 2,385,213
11,813 10,355 7,341 13,218 13,218
0 0 0 0 0
161,930 74,148 58,370 70,643 70,643
3,578 3,790 8,605 12,716 12,716
2,198,318 2,195,981 2,291,449 2,288,636 2,288,636
5,585 3,496 3,071 2,604 2,604
5,813 8,743 16,780 33,351 33,351
5,328 6,309 10,530 23,464 23,464
181 623 833 845 845
130 618 787 768 768
(2,153) (4,199) (5,257) 5,936 5,936
433 (1,543) (4,040) 6,000 6,000
421 (1,035) 248 1,908 1,908
50,000 50,002 50,003 50,003 50,003
0.00% 0.00% 0.00% 0.00% 0.00%
0.00% 0.00% 0.00% 0.00% 0.00%
(11,665) (9,646) (11,549) (1,666) (1,666)
0.02% -0.05% 0.01% 0.08% 0.08%
0.02% -0.05% 0.01% 0.08% 0.08%
0.01 -0.02 0.00 0.04 0.04
2.44% 9.80% 7.47% 3.27% 3.27%
-511.40% 405.70% -2,119.76% 311.11% 311.11%
104.82% 55.41% 29.16% 11.10% 11.10%
0.50% 0.45% 0.31% 0.55% 0.55%
6.82% 3.25% 2.47% 2.96% 2.96%
97.04% 98.04% 97.94% 97.49% 97.49%
46.11 44.79 46.34 46.50 46.50
-2,770.78% 931.98% -4,656.85% -87.32% -87.32%
(Thousand Rupees)The Cooperative Insurance Society of Pakistan Ltd.
210

Financial Statement Analysis of Financial Sector 2020
2016 2017 2018 2019 2020Items
A.Total equity (A1 to A3)
1.Share capital
2.Reserves
3.Un appropriated profit
4.Others
B.Total liabilities (B1 to B3)
1.Balance of statutory funds
2.Outstanding claims, adv., prem., due to other insurers
3.Other/misc. liabilities
C.Total assets (C1 to C5)
1.Cash and balances with banks
2.Advances to policy holders & employees
3.Investments in securities & properties
4.Other/misc. assets
5.Fixed assets
D.Profit & loss account
1.Investment income
2.Gross premium
3.Net premium
4.Gross claims
5.Net claims
6.Underwriting profit
7.Profit/(loss) before taxation
8.Profit/(loss) after taxation
E.Other items
1.No. of ordinary shares (000)
2.Cash dividend
3.Stock dividend/bonus shares
4.Cash generated from operating activities
F.Efficiency ratios/profitability ratios
1.Return on equity (ROE) (D8/A)
2.Return on assets (ROA) (D8/C)
3.Earning per share (D8/E1) (rs. per share)
4.Net Claims Incurred Ratio (D5/D3)
5.Underwriting profit to profit after tax. (D6/D8)
6.Investment income to net premium (D1/D3)
G.Liquidity ratios
1.Cash & bank balances to total assets (C1/C)
2. Investment to total assets (C3/C)
H.Capital /leverage ratios
1.Capital ratio (A/C)
2.Break up value per share (A/E1) (Rs. per share)
I.Cash flow ratio
1.Cash generated from operating activities to profit after tax. (E4/D8)
567,347 609,917 490,374 470,758 429,301
400,013 464,015 464,015 464,015 464,015
114,987 51,942 52,184 51,983 51,495
52,347 93,960 (25,825) (45,240) (86,209)
9,799 7,941 6,348 6,233 5,412
372,932 300,320 140,417 72,398 72,807
0 0 0 0 0
331,999 119,017 82,682 42,712 42,712
40,933 181,303 57,735 29,686 30,095
950,078 918,178 637,139 549,389 507,520
8,430 28,751 22,564 6,379 2,908
4,479 4,369 4,290 4,265 51
395,420 446,422 334,702 313,914 300,531
420,007 323,347 172,108 123,022 108,252
121,742 115,289 103,475 101,809 95,778
14,452 12,015 8,427 3,334 4,904
352,440 201,098 0 0 0
250,957 287,600 (5,151) (17,975) 0
82,660 885 10 0 0
84,856 4,142 (6,757) (41,200) 0
70,658 100,382 (96,649) (11,728) (22,513)
43,913 60,217 (128,619) (46,908) 41,791
32,932 40,241 (121,377) (19,530) 41,791
40,001 46,402 46,402 46,402 46,402
0.00% 0.00% 0.00% 0.00% 0.00%
16.00% 0.00% 0.00% 0.00% 0.00%
133,758 (114,682) (13,083) (36,397) (13,877)
5.80% 6.60% -24.75% -4.15% 9.73%
3.47% 4.38% -19.05% -3.55% 8.23%
0.82 0.87 -2.62 -0.42 0.90
33.81% 1.44% 131.18% 229.21%
214.56% 249.45% 79.63% 60.05% -53.87%
5.76% 4.18% -163.60% -18.55%
0.89% 3.13% 3.54% 1.16% 0.57%
41.62% 48.62% 52.53% 57.14% 59.22%
59.72% 66.43% 76.96% 85.69% 84.59%
14.18 13.14 10.57 10.15 9.25
406.16% -284.99% 10.78% 186.36% -33.21%
-
-
(Thousand Rupees)The Pakistan General Insurance Co. Ltd.
211

Financial Statement Analysis of Financial Sector 2020
2016 2017 2018 2019 2020Items
A.Total equity (A1 to A3)
1.Share capital
2.Reserves
3.Un appropriated profit
4.Others
B.Total liabilities (B1 to B3)
1.Balance of statutory funds
2.Outstanding claims, adv., prem., due to other insurers
3.Other/misc. liabilities
C.Total assets (C1 to C5)
1.Cash and balances with banks
2.Advances to policy holders & employees
3.Investments in securities & properties
4.Other/misc. assets
5.Fixed assets
D.Profit & loss account
1.Investment income
2.Gross premium
3.Net premium
4.Gross claims
5.Net claims
6.Underwriting profit
7.Profit/(loss) before taxation
8.Profit/(loss) after taxation
E.Other items
1.No. of ordinary shares (000)
2.Cash dividend
3.Stock dividend/bonus shares
4.Cash generated from operating activities
F.Efficiency ratios/profitability ratios
1.Return on equity (ROE) (D8/A)
2.Return on assets (ROA) (D8/C)
3.Earning per share (D8/E1) (rs. per share)
4.Net Claims Incurred Ratio (D5/D3)
5.Underwriting profit to profit after tax. (D6/D8)
6.Investment income to net premium (D1/D3)
G.Liquidity ratios
1.Cash & bank balances to total assets (C1/C)
2. Investment to total assets (C3/C)
H.Capital /leverage ratios
1.Capital ratio (A/C)
2.Break up value per share (A/E1) (Rs. per share)
I.Cash flow ratio
1.Cash generated from operating activities to profit after tax. (E4/D8)
2,588,324 2,641,767 3,043,496 3,437,546 3,754,097
1,803,200 2,001,552 2,261,754 2,601,017 2,950,000
105,234 46,491 58,204 49,899 52,846
679,890 593,724 723,538 786,630 751,251
81,942 81,106 80,314 434,296 380,300
2,829,246 3,488,446 3,771,655 4,311,221 5,726,347
0 0 0 0 0
2,427,434 3,074,639 3,343,732 3,643,893 4,943,057
401,812 413,807 427,923 667,328 783,290
5,499,512 6,211,319 6,895,465 8,183,063 9,860,744
365,488 490,059 542,589 266,126 457,297
17,395 13,968 11,161 14,897 17,787
592,375 1,304,100 1,764,790 2,303,885 2,562,709
3,676,106 3,587,908 3,798,768 4,349,906 5,610,998
848,148 815,284 778,157 1,248,249 1,211,953
73,106 67,204,706 8,365 67,101 57,171
3,781,741 4,163,546 4,227,348 4,310,794 4,920,602
2,473,432 2,678,708 2,574,381 2,541,595 1,868,698
1,585,320 2,152,056 2,396,774 2,141,759 2,132,161
934,519 1,287,193 1,305,274 1,153,501 438,671
509,741 221,312 323,246 351,574 451,682
357,960 487,345 562,701 609,114 534,400
278,448 292,284 389,223 401,591 414,555
180,320 200,155 226,175 260,102 295,000
10.00% 0.00% 0.00% 0.00% 0.00%
11.00% 13.00% 15.00% 13.42% 0.00%
344,236 703,060 780,578 369,330 575,099
10.76% 11.06% 12.79% 11.68% 11.04%
5.06% 4.71% 5.64% 4.91% 4.20%
1.54 1.46 1.72 1.54 1.41
37.78% 48.05% 50.70% 45.38% 23.47%
183.07% 75.72% 83.05% 87.55% 108.96%
2.96% 2,508.85% 0.32% 2.64% 3.06%
6.65% 7.89% 7.87% 3.25% 4.64%
10.77% 21.00% 25.59% 28.15% 25.99%
47.06% 42.53% 44.14% 42.01% 38.07%
14.35 13.20 13.46 13.22 12.73
123.63% 240.54% 200.55% 91.97% 138.73%
(Thousand Rupees)The United Insurance Co. of Pakistan Ltd.
212

Financial Statement Analysis of Financial Sector 2020
2016 2017 2018 2019 2020Items
A.Total equity (A1 to A3)
1.Share capital
2.Reserves
3.Un appropriated profit
4.Others
B.Total liabilities (B1 to B3)
1.Balance of statutory funds
2.Outstanding claims, adv., prem., due to other insurers
3.Other/misc. liabilities
C.Total assets (C1 to C5)
1.Cash and balances with banks
2.Advances to policy holders & employees
3.Investments in securities & properties
4.Other/misc. assets
5.Fixed assets
D.Profit & loss account
1.Investment income
2.Gross premium
3.Net premium
4.Gross claims
5.Net claims
6.Underwriting profit
7.Profit/(loss) before taxation
8.Profit/(loss) after taxation
E.Other items
1.No. of ordinary shares (000)
2.Cash dividend
3.Stock dividend/bonus shares
4.Cash generated from operating activities
F.Efficiency ratios/profitability ratios
1.Return on equity (ROE) (D8/A)
2.Return on assets (ROA) (D8/C)
3.Earning per share (D8/E1) (rs. per share)
4.Net Claims Incurred Ratio (D5/D3)
5.Underwriting profit to profit after tax. (D6/D8)
6.Investment income to net premium (D1/D3)
G.Liquidity ratios
1.Cash & bank balances to total assets (C1/C)
2. Investment to total assets (C3/C)
H.Capital /leverage ratios
1.Capital ratio (A/C)
2.Break up value per share (A/E1) (Rs. per share)
I.Cash flow ratio
1.Cash generated from operating activities to profit after tax. (E4/D8)
382,590 509,959 525,805 530,180 444,235
416,180 500,000 500,000 500,000 500,000
28,720 28,599 13,824 13,824 13,824
(62,310) (18,640) 11,981 16,356 (69,589)
260,537 269,662 282,304 291,934 385,466
161,062 141,063 118,818 131,728 155,807
0 0 0 0 0
123,104 111,340 88,539 116,340 139,251
37,958 29,723 30,279 15,388 16,556
804,189 920,684 926,927 953,842 985,508
5,916 90,165 26,464 46,376 9,332
134 168 4 22 125
341,747 391,788 464,741 466,512 505,729
282,561 258,104 244,199 249,020 281,856
173,831 180,459 191,519 191,912 188,466
31,382 (4,914) (11,973) 13,634 9,754
35,979 28,324 63,549 139,149 140,986
25,546 12,183 33,184 68,115 67,199
22,448 11,508 17,560 4,827 50,430
(8,604) 9,017 2,366 (19,576) 35,774
(23,151) (39,329) (38,912) 7,287 (62,386)
71,246 45,423 19,497 4,421 (109,479)
69,407 41,452 15,989 2,335 (87,845)
41,618 50,000 50,000 50,000 50,000
0.00% 0.00% 0.00% 0.00% 0.00%
0.00% 0.00% 0.00% 0.00% 0.00%
(58,070) (17,147) (27,449) 15,860 (44,817)
18.14% 8.13% 3.04% 0.44% -19.77%
8.63% 4.50% 1.72% 0.24% -8.91%
1.67 0.83 0.32 0.05 -1.76
-33.68% 74.01% 7.13% -28.74% 53.24%
-33.36% -94.88% -243.37% 312.08% 71.02%
122.85% -40.33% -36.08% 20.02% 14.52%
0.74% 9.79% 2.86% 4.86% 0.95%
42.50% 42.55% 50.14% 48.91% 51.32%
47.57% 55.39% 56.73% 55.58% 45.08%
9.19 10.20 10.52 10.60 8.88
-83.67% -41.37% -171.67% 679.23% 51.02%
(Thousand Rupees)The Universal Insurance Co. Ltd.
213

Financial Statement Analysis of Financial Sector 2020
2016 2017 2018 2019 2020Items
A.Total equity (A1 to A3)
1.Share capital
2.Reserves
3.Un appropriated profit
4.Others
B.Total liabilities (B1 to B3)
1.Balance of statutory funds
2.Outstanding claims, adv., prem., due to other insurers
3.Other/misc. liabilities
C.Total assets (C1 to C5)
1.Cash and balances with banks
2.Advances to policy holders & employees
3.Investments in securities & properties
4.Other/misc. assets
5.Fixed assets
D.Profit & loss account
1.Investment income
2.Gross premium
3.Net premium
4.Gross claims
5.Net claims
6.Underwriting profit
7.Profit/(loss) before taxation
8.Profit/(loss) after taxation
E.Other items
1.No. of ordinary shares (000)
2.Cash dividend
3.Stock dividend/bonus shares
4.Cash generated from operating activities
F.Efficiency ratios/profitability ratios
1.Return on equity (ROE) (D8/A)
2.Return on assets (ROA) (D8/C)
3.Earning per share (D8/E1) (rs. per share)
4.Net Claims Incurred Ratio (D5/D3)
5.Underwriting profit to profit after tax. (D6/D8)
6.Investment income to net premium (D1/D3)
G.Liquidity ratios
1.Cash & bank balances to total assets (C1/C)
2. Investment to total assets (C3/C)
H.Capital /leverage ratios
1.Capital ratio (A/C)
2.Break up value per share (A/E1) (Rs. per share)
I.Cash flow ratio
1.Cash generated from operating activities to profit after tax. (E4/D8)
992,086 1,150,759 1,401,075 1,665,953 1,670,279
800,000 800,000 800,000 800,000 800,000
4,784 (880) (7,850) 1 (1,504)
187,302 351,639 608,925 865,952 871,783
0 0 0 0 0
2,544,528 3,066,304 3,406,032 4,088,854 4,196,236
0 0 0 0 0
2,270,383 2,650,013 3,009,599 3,549,769 3,616,462
274,145 416,291 396,433 539,085 579,774
3,536,614 4,217,063 4,807,107 5,754,807 5,866,515
30,495 86,049 140,664 360,436 214,296
1,868 1,384 2,628 3,122 3,009
777,456 863,694 872,075 827,412 1,067,051
2,644,230 3,181,421 3,691,253 4,439,497 4,508,563
82,565 84,515 100,487 124,340 73,596
73,992 44,115 60,557 79,661 102,026
2,334,187 2,760,841 3,391,311 3,988,703 4,041,493
872,903 1,012,177 1,412,471 1,769,967 1,841,542
1,387,641 1,293,601 1,927,442 2,022,610 2,604,234
452,947 419,969 568,260 646,815 1,127,838
236,694 320,967 378,703 448,098 53,807
196,283 247,371 364,991 448,557 93,538
136,596 166,996 259,576 307,875 67,130
80,000 80,000 80,000 80,000 80,000
0.00% 0.00% 0.00% 0.00% 0.00%
0.00% 0.00% 0.00% 0.00% 0.00%
(160,010) 116,066 43,922 155,088 17,159
13.77% 14.51% 18.53% 18.48% 4.02%
3.86% 3.96% 5.40% 5.35% 1.14%
1.71 2.09 3.24 3.85 0.84
51.89% 41.49% 40.23% 36.54% 61.24%
173.28% 192.20% 145.89% 145.55% 80.15%
8.48% 4.36% 4.29% 4.50% 5.54%
0.86% 2.04% 2.93% 6.26% 3.65%
21.98% 20.48% 18.14% 14.38% 18.19%
28.05% 27.29% 29.15% 28.95% 28.47%
12.40 14.38 17.51 20.82 20.88
-117.14% 69.50% 16.92% 50.37% 25.56%
(Thousand Rupees)UBL Insurers Ltd.
214

Financial Statement Analysis of Financial Sector 2020
2016 2017 2018 2019 2020Items
A.Total equity (A1 to A3)
1.Share capital
2.Reserves
3.Un appropriated profit
4.Others
B.Total liabilities (B1 to B3)
1.Balance of statutory funds
2.Outstanding claims, adv., prem., due to other insurers
3.Other/misc. liabilities
C.Total assets (C1 to C5)
1.Cash and balances with banks
2.Advances to policy holders & employees
3.Investments in securities & properties
4.Other/misc. assets
5.Fixed assets
D.Profit & loss account
1.Investment income
2.Gross premium
3.Net premium
4.Gross claims
5.Net claims
6.Underwriting profit
7.Profit/(loss) before taxation
8.Profit/(loss) after taxation
E.Other items
1.No. of ordinary shares (000)
2.Cash dividend
3.Stock dividend/bonus shares
4.Cash generated from operating activities
F.Efficiency ratios/profitability ratios
1.Return on equity (ROE) (D8/A)
2.Return on assets (ROA) (D8/C)
3.Earning per share (D8/E1) (rs. per share)
4.Net Claims Incurred Ratio (D5/D3)
5.Underwriting profit to profit after tax. (D6/D8)
6.Investment income to net premium (D1/D3)
G.Liquidity ratios
1.Cash & bank balances to total assets (C1/C)
2. Investment to total assets (C3/C)
H.Capital /leverage ratios
1.Capital ratio (A/C)
2.Break up value per share (A/E1) (Rs. per share)
I.Cash flow ratio
1.Cash generated from operating activities to profit after tax. (E4/D8)
1,934,798 2,303,440 2,651,213 2,521,298 2,769,314
2,681,972 3,004,106 3,629,339 3,179,339 3,179,339
(274,774) (271,119) (415,354) (112,769) (112,156)
(472,400) (429,547) (562,772) (545,272) (297,869)
326,966 410,562 649,641 801,485 912,082
19,472,639 22,384,921 25,770,121 30,979,462 36,886,471
2,483,637 3,049,994 3,729,090 4,694,192 5,746,254
1,598,769 1,717,842 1,887,981 1,969,368 2,643,388
15,390,233 17,617,085 20,153,050 24,315,902 28,496,829
21,734,402 25,098,922 29,070,974 34,302,245 40,567,867
4,168,020 4,653,226 3,450,546 4,767,303 3,965,881
2,689 13,704 7,998 16,150 11,605
14,118,410 17,234,655 21,912,324 24,383,383 30,888,967
3,096,877 2,808,189 3,232,847 4,205,752 4,750,748
348,406 389,148 467,259 929,657 950,666
85,213 850,852 1,311,586 2,355,807 1,674,485
10,073,633 10,423,632 10,870,642 11,655,980 12,003,332
2,533,738 8,906,189 8,538,548 9,415,610 9,629,811
3,557,989 4,755,824 4,765,700 5,696,851 6,527,614
1,554,645 3,974,698 4,250,202 5,300,802 5,943,710
(15,223) 22,106 11,456 (13,912) 38,682
(249,500) (255,498) (327,711) 186,774 332,115
(313,510) (316,880) (392,261) 124,172 263,317
268,197 300,411 362,934 317,934 317,934
2,411,772 3,027,330 2,525,701 1,486,017 1,686,603
-16.20% -13.76% -14.80% 4.92% 9.51%
-1.44% -1.26% -1.35% 0.36% 0.65%
-1.17 -1.05 -1.08 0.39 0.83
61.36% 44.63% 49.78% 56.30% 61.72%
4.86% -6.98% -2.92% -11.20% 14.69%
3.36% 9.55% 15.36% 25.02% 17.39%
19.18% 18.54% 11.87% 13.90% 9.78%
64.96% 68.67% 75.38% 71.08% 76.14%
8.90% 9.18% 9.12% 7.35% 6.83%
7.21 7.67 7.30 7.93 8.71
-769.28% -955.36% -643.88% 1,196.74% 640.52%
(Thousand Rupees)Takaful Companies - Overall
N/A N/A N/A N/A N/A
N/A N/A N/A N/A N/A
215

Financial Statement Analysis of Financial Sector 2020
2016 2017 2018 2019 2020Items
A.Total equity (A1 to A3)
1.Share capital
2.Reserves
3.Un appropriated profit
4.Others
B.Total liabilities (B1 to B3)
1.Balance of statutory funds
2.Outstanding claims, adv., prem., due to other insurers
3.Other/misc. liabilities
C.Total assets (C1 to C5)
1.Cash and balances with banks
2.Advances to policy holders & employees
3.Investments in securities & properties
4.Other/misc. assets
5.Fixed assets
D.Profit & loss account
1.Investment income
2.Gross premium
3.Net premium
4.Gross claims
5.Net claims
6.Underwriting profit
7.Profit/(loss) before taxation
8.Profit/(loss) after taxation
E.Other items
1.No. of ordinary shares (000)
2.Cash dividend
3.Stock dividend/bonus shares
4.Cash generated from operating activities
F.Efficiency ratios/profitability ratios
1.Return on equity (ROE) (D8/A)
2.Return on assets (ROA) (D8/C)
3.Earning per share (D8/E1) (rs. per share)
4.Net Claims Incurred Ratio (D5/D3)
5.Underwriting profit to profit after tax. (D6/D8)
6.Investment income to net premium (D1/D3)
G.Liquidity ratios
1.Cash & bank balances to total assets (C1/C)
2. Investment to total assets (C3/C)
H.Capital /leverage ratios
1.Capital ratio (A/C)
2.Break up value per share (A/E1) (Rs. per share)
I.Cash flow ratio
1.Cash generated from operating activities to profit after tax. (E4/D8)
381,226 376,406 385,837 416,022 491,558
750,000 750,000 750,000 750,000 750,000
0 0 0 0 0
(368,774) (373,594) (364,163) (333,978) (258,442)
(6,225) (6,206) (6,115) (1,902) (127)
2,662,801 3,219,223 3,909,882 5,099,714 6,331,817
2,483,637 3,049,994 3,729,090 4,694,192 5,746,254
105,198 94,161 90,217 137,668 149,860
73,966 75,068 90,575 267,854 435,703
3,037,802 3,589,423 4,289,604 5,513,834 6,823,248
1,694,600 1,774,653 239,176 409,626 569,297
2,689 0 0 0 0
950,310 1,520,922 3,713,756 4,536,961 5,399,337
352,722 261,542 301,475 395,632 651,706
37,481 32,306 35,197 171,615 202,908
21,662 27,020 175,460 371,554 352,486
1,178,417 1,313,292 1,471,410 1,636,064 1,834,213
558,450 489,681 554,853 1,038,043 1,140,147
68,180 45,881 75,707 291,383 539,073
31,841 33,305 56,604 274,572 480,306
0 0 0 0 0
2,957 7,218 21,343 50,784 88,586
(15,034) (4,820) 9,430 30,185 75,536
75,000 75,000 75,000 75,000 75,000
0.00% 0.00% 0.00% 0.00% 0.00%
0.00% 0.00% 0.00% 0.00% 0.00%
388,381 706,681 643,452 704,365 641,118
-3.94% -1.28% 2.44% 7.26% 15.37%
-0.49% -0.13% 0.22% 0.55% 1.11%
-0.20 -0.06 0.13 0.40 1.01
5.70% 6.80% 10.20% 26.45% 42.13%
0.00% 0.00% 0.00% 0.00% 0.00%
3.88% 5.52% 31.62% 35.79% 30.92%
55.78% 49.44% 5.58% 7.43% 8.34%
31.28% 42.37% 86.58% 82.28% 79.13%
12.55% 10.49% 8.99% 7.55% 7.20%
5.08 5.02 5.14 5.55 6.55
-2,583.35% -14,661.43% 6,823.46% 2,333.49% 848.76%
(Thousand Rupees)Dawood Family Takaful Ltd.
216

Financial Statement Analysis of Financial Sector 2020
2016 2017 2018 2019 2020Items
A.Total equity (A1 to A3)
1.Share capital
2.Reserves
3.Un appropriated profit
4.Others
B.Total liabilities (B1 to B3)
1.Balance of statutory funds
2.Outstanding claims, adv., prem., due to other insurers
3.Other/misc. liabilities
C.Total assets (C1 to C5)
1.Cash and balances with banks
2.Advances to policy holders & employees
3.Investments in securities & properties
4.Other/misc. assets
5.Fixed assets
D.Profit & loss account
1.Investment income
2.Gross premium
3.Net premium
4.Gross claims
5.Net claims
6.Underwriting profit
7.Profit/(loss) before taxation
8.Profit/(loss) after taxation
E.Other items
1.No. of ordinary shares (000)
2.Cash dividend
3.Stock dividend/bonus shares
4.Cash generated from operating activities
F.Efficiency ratios/profitability ratios
1.Return on equity (ROE) (D8/A)
2.Return on assets (ROA) (D8/C)
3.Earning per share (D8/E1) (rs. per share)
4.Net Claims Incurred Ratio (D5/D3)
5.Underwriting profit to profit after tax. (D6/D8)
6.Investment income to net premium (D1/D3)
G.Liquidity ratios
1.Cash & bank balances to total assets (C1/C)
2. Investment to total assets (C3/C)
H.Capital /leverage ratios
1.Capital ratio (A/C)
2.Break up value per share (A/E1) (Rs. per share)
I.Cash flow ratio
1.Cash generated from operating activities to profit after tax. (E4/D8)
785,152 1,136,605 1,468,048 1,308,131 1,457,665
710,629 994,880 1,307,124 1,307,124 1,307,124
0 24,872 0 0 0
74,523 116,853 160,924 1,007 150,541
450,738 542,170 672,949 758,986 785,805
15,170,971 17,369,021 19,754,899 23,773,588 27,886,318
0 0 0 0 0
543,289 546,941 706,681 692,467 1,013,923
14,627,682 16,822,080 19,048,218 23,081,121 26,872,395
16,406,861 19,047,796 21,895,896 25,840,705 30,129,788
2,264,456 2,642,171 2,794,808 4,085,607 2,936,455
0 11,838 5,240 13,313 9,266
12,412,046 14,993,209 17,334,836 18,894,945 24,286,883
1,526,167 1,138,870 1,430,499 2,231,803 2,327,354
204,192 261,708 330,513 615,037 569,830
49,056 802,265 1,120,448 1,908,640 1,247,733
7,493,979 8,263,052 7,816,618 8,287,057 7,961,475
1,315,378 7,907,340 7,443,140 7,861,433 7,557,834
2,559,883 3,618,580 3,839,479 4,704,790 4,860,221
896,060 3,426,066 3,635,486 4,458,036 4,575,931
0 0 0 0 0
165,816 173,375 154,761 84,070 208,122
122,607 126,060 107,458 55,241 163,563
71,063 99,488 130,712 130,712 130,712
0.00% 0.00% 0.00% 0.00% 0.00%
0.00% 0.00% 0.00% 0.00% 0.00%
2,276,857 2,485,094 1,873,844 757,453 868,024
15.62% 11.09% 7.32% 4.22% 11.22%
0.75% 0.66% 0.49% 0.21% 0.54%
1.73 1.27 0.82 0.42 1.25
68.12% 43.33% 48.84% 56.71% 60.55%
0.00% 0.00% 0.00% 0.00% 0.00%
3.73% 10.15% 15.05% 24.28% 16.51%
13.80% 13.87% 12.76% 15.81% 9.75%
75.65% 78.71% 79.17% 73.12% 80.61%
4.79% 5.97% 6.70% 5.06% 4.84%
11.05 11.42 11.23 10.01 11.15
1,857.04% 1,971.36% 1,743.79% 1,371.18% 530.70%
(Thousand Rupees)Pak Qatar Family Takaful Ltd.
217

Financial Statement Analysis of Financial Sector 2020
2016 2017 2018 2019 2020Items
A.Total equity (A1 to A3)
1.Share capital
2.Reserves
3.Un appropriated profit
4.Others
B.Total liabilities (B1 to B3)
1.Balance of statutory funds
2.Outstanding claims, adv., prem., due to other insurers
3.Other/misc. liabilities
C.Total assets (C1 to C5)
1.Cash and balances with banks
2.Advances to policy holders & employees
3.Investments in securities & properties
4.Other/misc. assets
5.Fixed assets
D.Profit & loss account
1.Investment income
2.Gross premium
3.Net premium
4.Gross claims
5.Net claims
6.Underwriting profit
7.Profit/(loss) before taxation
8.Profit/(loss) after taxation
E.Other items
1.No. of ordinary shares (000)
2.Cash dividend
3.Stock dividend/bonus shares
4.Cash generated from operating activities
F.Efficiency ratios/profitability ratios
1.Return on equity (ROE) (D8/A)
2.Return on assets (ROA) (D8/C)
3.Earning per share (D8/E1) (rs. per share)
4.Net Claims Incurred Ratio (D5/D3)
5.Underwriting profit to profit after tax. (D6/D8)
6.Investment income to net premium (D1/D3)
G.Liquidity ratios
1.Cash & bank balances to total assets (C1/C)
2. Investment to total assets (C3/C)
H.Capital /leverage ratios
1.Capital ratio (A/C)
2.Break up value per share (A/E1) (Rs. per share)
I.Cash flow ratio
1.Cash generated from operating activities to profit after tax. (E4/D8)
525,962 551,830 438,593 442,686 462,361
471,343 509,226 509,226 509,226 509,226
11,700 (3,358) (7,589) 220 833
42,919 45,962 (63,044) (66,760) (47,698)
(102,369) (119,362) 3,792 16,835 42,868
771,221 1,076,725 1,016,787 1,057,307 924,171
0 0 0 0 0
409,634 502,328 424,254 471,846 452,319
361,587 574,397 592,533 585,461 471,852
1,194,814 1,509,193 1,459,172 1,516,828 1,429,400
58,951 84,521 203,267 247,233 173,684
0 663 1,510 2,837 2,339
346,554 368,353 310,233 350,277 531,147
708,655 984,444 875,119 817,675 639,550
80,654 71,212 69,043 98,806 82,680
2,019 789 7,359 5,346 7,943
652,736 168,462 677,714 701,046 601,934
217,849 168,463 192,481 203,080 186,039
383,836 593,375 388,108 360,868 277,083
249,205 211,234 231,632 251,637 197,069
3,575 6,359 5,381 (7,680) 14,905
3,799 6,244 18,668 29,474 17,011
2,014 3,043 12,345 21,746 19,062
47,134 50,923 50,923 50,923 50,923
0.00% 0.00% 0.00% 0.00% 0.00%
0.00% 0.00% 0.00% 0.00% 0.00%
(75,829) 36,227 63,421 49,443 48,740
0.38% 0.55% 2.81% 4.91% 4.12%
0.17% 0.20% 0.85% 1.43% 1.33%
0.04 0.06 0.24 0.43 0.37
114.39% 125.39% 120.34% 123.91% 105.93%
177.51% 208.97% 43.59% -35.32% 78.19%
0.93% 0.47% 3.82% 2.63% 4.27%
4.93% 5.60% 13.93% 16.30% 12.15%
29.00% 24.41% 21.26% 23.09% 37.16%
44.02% 36.56% 30.06% 29.18% 32.35%
11.16 10.84 8.61 8.69 9.08
-3,765.09% 1,190.50% 513.74% 227.37% 255.69%
(Thousand Rupees)Pak Qatar General Takaful Ltd.
218

Financial Statement Analysis of Financial Sector 2020
2016 2017 2018 2019 2020Items
A.Total equity (A1 to A3)
1.Share capital
2.Reserves
3.Un appropriated profit
4.Others
B.Total liabilities (B1 to B3)
1.Balance of statutory funds
2.Outstanding claims, adv., prem., due to other insurers
3.Other/misc. liabilities
C.Total assets (C1 to C5)
1.Cash and balances with banks
2.Advances to policy holders & employees
3.Investments in securities & properties
4.Other/misc. assets
5.Fixed assets
D.Profit & loss account
1.Investment income
2.Gross premium
3.Net premium
4.Gross claims
5.Net claims
6.Underwriting profit
7.Profit/(loss) before taxation
8.Profit/(loss) after taxation
E.Other items
1.No. of ordinary shares (000)
2.Cash dividend
3.Stock dividend/bonus shares
4.Cash generated from operating activities
F.Efficiency ratios/profitability ratios
1.Return on equity (ROE) (D8/A)
2.Return on assets (ROA) (D8/C)
3.Earning per share (D8/E1) (rs. per share)
4.Net Claims Incurred Ratio (D5/D3)
5.Underwriting profit to profit after tax. (D6/D8)
6.Investment income to net premium (D1/D3)
G.Liquidity ratios
1.Cash & bank balances to total assets (C1/C)
2. Investment to total assets (C3/C)
H.Capital /leverage ratios
1.Capital ratio (A/C)
2.Break up value per share (A/E1) (Rs. per share)
I.Cash flow ratio
1.Cash generated from operating activities to profit after tax. (E4/D8)
216,033 212,174 332,310 354,459 357,730
300,000 300,000 612,989 612,989 612,989
1,663 (4,496) (119,628) (112,989) (112,989)
(85,630) (83,330) (161,051) (145,541) (142,270)
(15,678) (6,540) (21,485) 27,566 83,536
421,022 273,328 641,929 1,048,853 1,744,165
0 0 0 0 0
177,421 211,185 303,602 667,387 1,027,286
243,601 62,143 338,327 381,466 716,879
621,377 478,962 952,754 1,430,878 2,185,431
25,023 26,891 88,305 24,837 286,445
0 1,203 1,248 0 0
355,532 298,203 499,531 601,200 671,600
233,400 147,400 349,821 760,642 1,132,138
7,422 5,265 13,849 44,199 95,248
11,853 20,155 7,696 70,267 66,323
219,457 149,782 375,856 1,031,813 1,605,710
239,063 137,707 145,076 313,054 745,791
163,254 115,152 79,570 339,810 851,237
128,690 55,244 77,631 316,557 690,404
(23,001) 11,544 1,872 (6,232) 23,777
24,092 3,829 (76,319) 22,446 18,396
21,198 3,132 (77,199) 17,000 5,156
30,000 30,000 61,299 61,299 61,299
0.00% 0.00% 0.00% 0.00% 0.00%
0.00% 0.00% 0.00% 0.00% 0.00%
(43,488) (66,523) 79,133 (25,244) 128,721
9.81% 1.48% -23.23% 4.80% 1.44%
3.41% 0.65% -8.10% 1.19% 0.24%
0.71 0.10 -1.26 0.28 0.08
53.83% 40.12% 53.51% 101.12% 92.57%
-108.51% 368.58% -2.42% -36.66% 461.15%
4.96% 14.64% 5.30% 22.45% 8.89%
4.03% 5.61% 9.27% 1.74% 13.11%
57.22% 62.26% 52.43% 42.02% 30.73%
34.77% 44.30% 34.88% 24.77% 16.37%
7.20 7.07 5.42 5.78 5.84
-205.15% -2,123.98% -102.51% -148.49% 2,496.53%
(Thousand Rupees)Salaam Takaful Limited (Formerly Takaful Pakistan limited)
219

Financial Statements Analysis of Financial Sector 2020
Other Sectors
Mutual Funds (Close Ended)
There were two close ended companies in
the mutual fund sector in the previous year
but one company (Golden Arrow Selected
Stocks Fund Ltd.) shifted from close ended
to open ended and not being included in
analysis of the publication this year. Data of
this company is being aggregated in position
of over-all sector up to year 2019. To
capture good comparative analysis, data of
this company is excluded from aggregate
data for the analysis of FY20 which was
part of mutual funds in previous year.
Balance sheet size of Tri-Star mutual fund
reduced by Rs 1.58 million, showing a YoY
decline of 2.49 percent in total assets during
FY20 over FY19. Total assets decreased from Rs 63.37 million in FY19 to Rs 61.79 million in
FY20. Total equity (including others) decreased by 6.72 percent during FY20 when compared to
FY19. Total liabilities of the fund increased by Rs 1.80 million in FY20 as compared to FY19.
Gross income also increased with Rs 12.58 million during FY20.
Venture Capital
Balance sheet size of AKD Capital Ltd.
reduced by Rs 9.53 million or 24.12 percent
during FY20 over FY19. Total assets of
AKD Capital Ltd. decreased from Rs 39.52
million in FY19 to Rs 29.99 million in FY20.
Total liabilities also decreased from Rs 5.48
million in FY19 to Rs 4.90 million in FY20,
showing a decrease of 10.57 percent during
FY20. Total equity (including others)
recorded a YoY decrease of 26.30 percent in
FY20 over the previous year. Loss before tax
increased by Rs 0.47 million or 19.02
percent in FY20 over FY19. Loss after tax
recorded a decrease of Rs 0.38 million or
11.67 percent in FY20 when compared with
FY19.
-6.72
13.87
-2.49
-10
-5
0
5
10
15
0
10
20
30
40
50
60
70
Total Equity
including other
Total Liabilities Total Assets
per
cen
t
mil
lio
n R
s
Mutual Funds: Components of Balance Sheet
FY 19 FY 20 Growth(RHS)
-26.30%
-10.57%
-24.12%
-30
-25
-20
-15
-10
-5
0
0
5
10
15
20
25
30
35
40
45
50
Equity (Inc.
Others)
Liabilities Assets
per
cen
t
mil
lio
n R
s
Venture Capital: Components of Balance Sheet
FY 19 FY 20 Growth(RHS)
220

Financial Statement Analysis of Financial Sector 2020
2016 2017 2018 2019 2020Items
A.Total equity (A1 to A3)
1.Certificate holders equity
2.Reserves
3.Unappropriated profit/loss
4.Others
B.Total liabilities (B1 + B2)
1.Payable to investment advisor
2.Others
C.Total assets (C1 to C3)
1.Cash & bank balances
2.Investments
3.Others
D.Profit & loss account
1.Income (a to g)
a.Markup/interest income
b.Dividend income
c.Income from future transactions
d.Net gain on sale of investments
e.Net unrealized gain/(loss) on investment
f.Capital gain
g.Other income
E.Total expense (E1 to E5)
1.Remuneration to management co-advisor
2.Remuneration to trustees/custodians
3.Brokerage-commission /fee
4.Administrative and general expenses
5.Other
F.Net income for the year (D1-E)
G.Other items
1.No. of units (000)
2.Cash dividend
3.Stock dividend/bonus shares
4.Cash generated from operating activities
H.Efficiency ratios/profitability ratios
1.Gain ratio (D1c to D1g)/D1
2.Trading income (D1c/D1)
3.Return on revenue (ROR) (F/D1)
4.Return on assets (ROA) (F/C)
5.Management expenses (E1/E)
6.Net assets value per share (A1/G1)
7.Earning per share (F/G1)
I.Liquidity ratios
1.Cash & cash equivalent to total assets (C1/C)
2.Total liabilities to total assets (B/C)
J.Capital /leverage ratios
Shareholders equity to total assets (A1/C)
K.Cash flow ratio
Cash generated from operating activities to net income (G4/F) (time)
85,224 75,292 59,018 55,957
50,000 50,000 50,000 50,000
0 0 0 0
35,224 25,292 9,018 5,957
(5,940) (8,562) (8,658) (8,982)
9,130 10,478 13,010 14,814
5,127 6,322 8,264 9,447
4,003 4,156 4,746 5,367
88,414 77,208 63,370 61,789
41 42 92 33
88,166 76,943 63,054 61,527
207 223 224 229
21,778 (7,810) (13,736) (1,157)
0 0 0 0
72 35 57 45
0 0 0 0
0 0 0 0
0 0 0 0
21,706 (7,845) (13,793) (1,202)
0 0 0 0
2,498 2,361 2,538 1,904
1,497 1,449 1,267 1,034
93 75 109 125
0 0 0 0
430 649 997 611
478 188 165 134
19,280 (10,171) (16,274) (3,061)
5,000 5,000 5,000 5,000
0.00% 0.00% 0.00% 0.00%
0.00% 0.00% 0.00% 0.00%
584 785 3 (98)
99.67% 100.45% 100.41% 103.89%
0.00% 0.00% 0.00% 0.00%
88.53% 130.23% 118.48% 264.56%
21.81% -13.17% -25.68% -4.95%
59.93% 61.37% 49.92% 54.31%
10.00 10.00 10.00 10.00
3.86 -2.03 -3.25 -0.61
0.05% 0.05% 0.15% 0.05%
10.33% 13.57% 20.53% 23.98%
56.55% 64.76% 78.90% 80.92%
0.03 -0.08 0.00 0.03
-
-
-
-
-
-
-
-
-
-
-
-
-
-
-
-
-
-
-
-
-
-
-
-
-
-
-
-
-
-
-
-
-
-
-
-
-
-
-
-
-
-
(Thousand Rupees)Tri-Star Mutual Fund Ltd.
221

Financial Statement Analysis of Financial Sector 2020
2016 2017 2018 2019 2020Items
A.Total equity (A1 to A3)
1.Share capital
2.Revenue reserve
3.Unappropriated profit/loss
4.Others
B.Total liabilities (B1 + B2)
1.Current liabilities
2.Non-current liabilities
C.Total assets (C1+C2)
1.Current assets (a + b)
a.Cash & bank balances
b.Others
2.Non-current assets (a + b)
a.Venture investment
b.Others
D.Profit & loss account
1.Revenue
2.Admin. & operating expense
3.Financial charges
4.Profit/(loss) before taxation
5.Profit/(loss) after taxation
E.Other items
1.No. of ordinary shares (000)
2.Cash dividend
3.Stock dividend/bonus shares
4.Cash generated from operating activities
F.Efficiency ratios/profitability ratios
1.Return on equity (ROE) (D5/A)
2.Return on capital employed (ROCE) (D5/C-B1)
3.Return on assets (ROA) (D5/C)
4.Return on revenue (ROR) (D5/D1)
5.Admin. expense to revenue (D2/D1)
6.Earning per share (D5/E1)
G.Liquidity ratios
1.Cash & bank balances to total assets (C1a/C)
2.Current assets to current liabilities (C1/B1) (times)
3.Total liabilities to total assets (B/C) (times)
H.Capital /leverage ratios
1.Capital ratio (A/C)
2.Break up value per share (A/E1)
I.Cash flow ratio
1.Cash generated from operating activities to profit after tax. (E4/D5) (times)
2.Cash generated from operating activities to current liabilities (E4/B1) (times)
18,653 18,276 18,890 14,389 11,521
25,073 25,072 25,073 25,073 25,073
752 752 752 752 752
(7,172) (7,548) (6,935) (11,436) (14,304)
15,697 22,759 20,609 19,655 13,571
4,824 5,226 3,876 5,479 4,900
4,488 4,928 3,693 5,220 4,900
336 298 183 259 0
39,174 46,261 43,375 39,523 29,992
36,711 44,178 41,532 11,002 7,739
2,769 1,605 5,335 1,396 161
33,942 42,573 36,197 9,606 7,578
2,463 2,083 1,843 28,521 22,253
2,244 1,965 98 26,925 20,840
219 118 1,745 1,596 1,413
8,000 3,500 5,940 5,043 2,729
3,125 2,657 4,537 7,493 5,656
32 23 16 10 3
4,844 764 1,387 (2,460) (2,928)
1,292 799 1,202 (3,247) (2,868)
2,507 2,507 2,507 2,507 2,507
0.00% 0.05% 0.05% 0.05% 0.00%
0.00% 0.00% 0.00% 0.00% 0.00%
3,718 (78) 2,285 (4,167) (1,234)
6.93% 4.37% 6.36% -22.57% -24.89%
3.72% 1.93% 3.03% -9.47% -11.43%
3.30% 1.73% 2.77% -8.22% -9.56%
16.15% 22.83% 20.24% -64.39% -105.09%
39.06% 75.91% 76.38% 148.58% 207.26%
0.52 0.32 0.48 -1.30 -1.14
7.07% 3.47% 12.30% 3.53% 0.54%
8.18 8.96 11.25 2.11 1.58
0.12 0.11 0.09 0.14 0.16
47.62% 39.51% 43.55% 36.41% 38.41%
7.44 7.29 7.53 5.74 4.59
2.88 -0.10 1.90 1.28 0.43
0.83 -0.02 0.62 -0.80 -0.25
(Thousand Rupees)AKD Capital Ltd.
222

Appendix

Financial Statements Analysis of Financial Sector 2020
Appendix
Companies Covered in the Financial Statements Analysis
As on 31st December 2020
Total Companies (165)
Sr.
No. Company
Page
No.
Sr.
No. Company
Page
No.
Banks (33) 17 Soneri Bank Ltd. 48
A. Public Sector Banks (5) 18 Standard Chartered Bank (Pakistan) Ltd. 49
1 First Women Bank Ltd. 26 19 Summit Bank Ltd. 50
2 National Bank of Pakistan 27 20 United Bank Ltd. 51
3 Sindh Bank Ltd. 28 C. Specialized Banks (4)
4 The Bank of Khyber 29 1 Industrial Development Bank Ltd. 53
5 The Bank of Punjab 30 2 SME Bank Ltd. 54
B. Private Sector Banks (20) 3 The Punjab Provincial Cooperative Bank Ltd. 55
1 Albaraka Bank (Pakistan) Ltd. 32 4 Zarai Taraqiati Bank Ltd. (ZTBL) 56
2 Allied Bank Ltd. 33 D. Foreign Banks (4)
3 Askari Bank Ltd. 34 1 Bank of China Ltd. 58
4 Bank Al-Habib Ltd. 35 2 Citi Bank N.A. 59
5 Bank Alfalah Ltd. 36 3 Deutsche Bank AG 60
6 Bankislami Pakistan Ltd. 37 4 Industrial & Commercial Bank of China Ltd. 61
7 Dubai Islamic Bank Pakistan Ltd. 38 Development Finance Institutions (9)
8 Faysal Bank Ltd. 39 1 House Building Finance Company Ltd. 66
9 Habib Bank Ltd. 40 2 Pair Investment Company Ltd. 67
10 Habib Metropolitan Bank Ltd. 41 3 Pak Brunei Investment Company Ltd. 68
11 JS Bank Ltd. 42 4 Pak China Investment Company Ltd. 69
12 MCB Bank Ltd. 43 5 Pak Kuwait Investment Co. (Pvt.) Ltd. 70
13 MCB Islamic Ltd. 44 6 Pak Libya Holding Company Ltd. 71
14 Meezan Bank Ltd. 45 7 Pak Oman Investment Company Ltd. 72
15 Samba Bank Ltd 46 8 Pakistan Mortgage Refinance Company Ltd. 73
16 Silkbank Limited 47 9 Saudi Pak Industrial & Agri. Inv. Co. Ltd. 74
224

Financial Statements Analysis of Financial Sector 2020
Sr.
No. Company
Page
No.
Sr.
No. Company Page No.
Microfinance Banks (11)4 Invest Capital Investment Bank Ltd. 107
5 Security Investment Bank Ltd. 108
1 Advans Pakistan Microfinance Bank Ltd. 79 6 Trust Investment Bank Ltd. 109
2 Apna Microfinance Bank Ltd. 80
Modaraba Companies (28)*3 FINCA Microfinance Bank Ltd. 81
4 Khushhali Microfinance Bank Ltd. 82 1 Allied Rental Modaraba 113
5 Mobilink Microfinance Bank Ltd. 83 2 Awwal Modarba 114
6 NRSP Microfinance Bank Ltd. 84 3 B.F. Modaraba 115
7 Pak Oman Microfinance Bank Ltd. 85 4 B.R.R. Guardian Modaraba 116
8 SINDH Microfinance Bank Ltd. 86 5 First Al-Noor Modaraba 117
9 Telenor Microfinance Bank Ltd. 87 6 First Elite Capital Modaraba 118
10 The First Microfinance Bank Ltd. 88 7 First Equity Modaraba 119
11 U Microfinance Bank Ltd. 89 8 First Fidelity Leasing Modaraba 120
Leasing Companies (7)*9 First Habib Modaraba 121
10 First Imrooz Modaraba 122
1 Capital Assets Leasing Corp. Ltd. 94 11 First National Bank Modaraba 123
2 Grays Leasing Ltd. 95 12 First Pak Modaraba 124
3 Orix Leasing Pakistan Ltd. 96 13 First Paramount Modaraba 125
4 Pak-Gulf Leasing Company Ltd. 97 14 First Prudential Modaraba 126
5 SME Leasing Ltd. 98 15 First Punjab Modaraba 127
6 Saudi Pak Leasing Co. Ltd. 99 16 First Treet Manufacturing Modaraba 128
7 Security Leasing Corporation Ltd. 100 17 First Tri-Star Modaraba 129
Investment Banks (6)*18 First UDL Modaraba 130
19 Habib Metro Modaraba 131
1 Escorts Investment Bank Ltd. 104 20 IBL Modaraba 132
2 First Credit and Investment Bank 105 21 KASB Modaraba 133
3 First Dawood Investment Bank Ltd. 106 22 Modaraba Al-Mali 134
225

Financial Statements Analysis of Financial Sector 2020
Sr.
No. Company
Page
No.
Sr.
No. Company
Page
No.
23 Orient Rental Modaraba 135 20 Ravi Exchange Company (Pvt.) Ltd. 163
24 Orix Modaraba 136 21 Riaz Exchange Co. (Pvt.) Ltd. 164
25 Popular Islamic Modaraba 137 22 Royal International Exchange Co. (Pvt.) Ltd. 165
26 Sindh Modaraba 138 23 Sadiq Exchange Co. Ltd 166
27 Trust Modaraba 139 24 Sky Exchange Company (Pvt.) Ltd. 167
28 Unicap Modaraba 140 25 Wall Street Exchange Company (Pvt.) Ltd. 168
Exchange Companies (26)*26 ZeeQue Exchange Co.(Pvt.) Ltd. 169
Insurance Companies (43)1 AA Exchange Company (Pvt.) Ltd. 144
2 Al-Hameed Int. Money Exchange (Pvt.) Ltd. 145 A. Life Insurance Companies (7)
3 Al-Rahim Exchange Company (Pvt.) Ltd. 146 1 Adamjee Life Assurance Company Ltd. 175
4 Al-Sahara Exchange Company (Pvt.) Ltd. 147 2 Askari Life Insurance Co. (Formerly East
West Life Assurance Company Ltd.) 176
5 D. D Exchange Company (Pvt.) Ltd. 148 3 EFU Life Assurance Company Ltd. 177
6 Dollar East Exchange Company (Pvt.) Ltd. 149 4 IGI Life Insurance Ltd. 178
7 Fairdeal Exchange Company (Pvt.) Ltd. 150 5 Jubilee Life Insurance Company Ltd. 179
8 Glaxy Exchange Company (Pvt.) Ltd. 151 6 State Life Insurance Corporation Ltd. 180
9 H & H Exchange Company (Pvt.) Ltd. 152 7 TPL Life Insurance Ltd. 181
10 HBL Currency Exchange (Pvt.) Ltd. 153
B. Non-Life Insurance Companies (32) 11
Habib Qatar International Exchange Pakistan
(Pvt.) Ltd 154
12 Link International Exchange Co. Ltd. 155 1 Adamjee Insurance Company Ltd. 183
13 Money Link Exchange Co. (Pvt.) Ltd. 156 2 Alfalah Insurance Company Ltd. 184
14 NBP Exchange Company Ltd. 157 3 Allianz EFU Health Insurance Co. Ltd. 185
15 Noble Exchange International Co. (Pvt.) Ltd 158 4 Alpha Insurance Company Ltd. 186
16 P B S Exchange (Pvt.) Ltd. 159 5 Asia Insurance Company Ltd. 187
17 Pakistan Currency Exchange Co. (Pvt.) Ltd. 160 6 Askari General Insurance Company Ltd. 188
18 Paracha International Exchange (Pvt.) Ltd. 161 7 Atlas Insurance Company Ltd. 189
19 Paragon Exchange (Pvt.) Ltd. 162 8 Century Insurance Company Ltd. 190
226

Financial Statements Analysis of Financial Sector 2020
Sr.
No. Company
Page
No.
Sr.
No. Company
Page
No.
9 Chubb Insurance Pakistan Ltd. 191 27 TPL Insurance Company Ltd 209
10 Crescent Star Insurance Ltd 192 28 The Cooperative Insurance Society of Pakistan
Ltd. 210
11 E.F.U. General Insurance Company Ltd. 193 29 The Pakistan General Insurance Company Ltd. 211
12 East West Insurance Company Ltd. 194 30 The United Insurance Company of Pakistan Ltd. 212
13 Excel Insurance Company Ltd. 195 31 The Universal Insurance Company Ltd. 213
14 Habib Insurance Company Ltd. 196 32 UBL Insurers Ltd. 214
15 IGI General Insurance Ltd. 197
C. Takaful Companies (4) 16 Jubilee General Insurance Company Ltd. 198
17 New Hampshire Insurance Company Ltd. 199 1 Dawood Family Takaful Ltd. 216
18 Pakistan Reinsurance Company Ltd 200 2 Pak Qatar Family Takaful Ltd. 217
19 PICIC Insurance Ltd. 201 3 Pak Qatar General Takaful Ltd. 218
20 Premier Insurance Ltd. 202 4 Salaam Takaful Ltd. (Formerly Takaful
Pakistan Ltd.) 219
21 Progressive Insurance Company ltd. 203
Mutual Fund Companies (1)*22 Reliance Insurance Company Ltd. 204
23 SPI Insurance Company Ltd. 205 1 Tri-Star Mutual Fund 221
24 Security General Insurance Company Ltd. 206
Venture Capital (1)*25 Sindh Insurance 207
26 Shaheen Insurance Company Ltd. 208 1 AKD Capital Ltd. 222
* Fiscal year
227

Financial Statements Analysis of Financial Sector 2020
Explanatory Notes:
• In the analysis, consolidated financial statement of a company is used to cover full potential of the parent company as well as stand-alone postions are also used where required.
• Data revisions in the preceding years are due to restated balance sheets by respective institutions plus error & omissions, if any.
• Respective closings of different sectors/companies are mentioned in the appendix.
• Data of non-responding existing companies are repeated for 3 years before their removal from analysis in the publication.
• Sector-wise coverage is based on the available financial statements of companies.
• Reclassification in sectors and renaming may happen during the year, which would be reflected in the next year’s publication.
• Repeated data of any company is replaced with the actual one upon receipt of its annual report in that year’s publication.
• The symbol ‘-‘appearing in the analytical tables stands for Not applicable or Not available.
• Minor differences may occur in calculation due to rounding off at different stages of data processing.
• In this edition of the publication, House Building Finance Company Ltd. is classified under DFIs. Previously, it was covered in Housing Finance sector.
228