REPORT ON ECONOMIC AND FINANCIAL ANALYSIS - 4Q20
213
Table of Contents 3 Report on Economic and Financial Analysis 4Q20
-
Upload
khangminh22 -
Category
Documents
-
view
0 -
download
0
Transcript of REPORT ON ECONOMIC AND FINANCIAL ANALYSIS - 4Q20

Table of Contents
3
Report on
Economic and
Financial Analysis
4Q20


Table of Contents
3
1 - Managerial Analysis of Results 5
COVID-19 Pandemic 6
4Q20 highlights 7
Press Release 8
Main Information 9
Summarized Analysis of Recurring Income 10
Net Interest Income 12
Loan Portfolio 13
Expenses with Expanded ALL 17
Loan Indicators 18
Main Funding Sources 20
Income from Insurance 21
Revenue and Operating Income from Insurance 22
Insurance Activity, Technical Provisions and Indicators 23
Insurance – Income by Segments 24
Dynamics of the Insurance Business 26
Fee and Commission Income 27
Operating Expenses 28
Profit Reconciliation 30
Basel Ratio and Indicators 31
Guidance and Economic Perspectives 32
2 - Additional Information 33
100% Client 34
Digital Channels/ BIA 35
next 36
Ágora 37
Launches/Highlights 38
Service Network 39
Service Points and Clients 40
Market Share 41
Return to Shareholders 42
Additional Information 43
COVID-19 Pandemic 49
Selected Information - History 52
Consolidated Balance Sheet – Bradesco 53
Consolidated Balance Sheet – Insurance 54
Analytical Breakdown of Statement of Income 55
3 - Independent Auditor’s Report 57
Independent Reasonable Assurance Report on the process of compilation and
presentation on the Consolidated Supplementary Accounting information included
within the Economic and Financial Analysis Report
58
4 - Consolidated Financial Statements 61

4
Some numbers included in this Report have been subjected to rounding adjustments.
As a result, some amounts indicated as total amounts in some charts may not be the arithmetic sum of the preceding numbers.
Percentage variations not presented in the framework of this report, are related, in their majority, to the low value balances
compared with the other periods presented.

COVID-19 Pandemic
6
Managerial Analysis
of Results

COVID-19 Pandemic
6
Contributing towards overcoming the crisis
Bradesco, due to the serious scenario of the pandemic caused by COVID-19, which brought several adverse repercussions on the
lives of individuals and business, continue to actively contribute to support its clients and employees and intensify its commitment
to society. In spite of this adverse scenario, some lessons were incorporated into our operations, for example, the way we relate with
our clients and suppliers as well as the intensification of home office in the Organization. With these advances and through the
Collective Bargaining Agreement with the Banking Trade Union Movement at national level, Bradesco was the first of the large banks
to assume the commitment to adopt remote working after the pandemic.
It is important to emphasize that our actions have always taken into consideration the guidelines of the Ministry of Health.
Bradesco’s Crisis Committee, formed by the CEO, all the Vice-presidents and the CRO (Chief Risk Officer), continues to evaluate the
pandemic scenario and reports to the Board of Directors the assessment on the evolution of the pandemic and their reflection on
our operations and society. In addition, we have a Risk Commission, which plays an important role in verifying the various points and
scope of these measures in the Organization. The Business Continuity Plan (“BCP”) was engaged, we have intensified the
internal/external actions, we adopted the rotation of employees of the branch network and, over the period of the pandemic,
opportunities to optimize were identified due to the migration to remote work, prevailing a mindset geared to the digital
environment in a consistent and timely manner with the objective of minimizing the impacts involved.
More information about the actions that are helping the country overcome the crisis carried out by Bradesco is available in the
Additional Information section of this report.
Supporting and assisting our clients
We are in full operational capability to perform administrative (Back Office) functions as well as commercial teams/branch network
functions to serve our clients, following all the safety procedures given by the Ministry of Health by highlighting the use of masks,
the availability of alcohol gel for employees and clients and the adoption of a minimum distance between clients in the environment
of the branches.
Furthermore, with the commitment to guarantee more security and convenience for our clients, we created new credit alternatives
on our App, Internet Banking and Net Empresa (Company), prioritizing: extension of the installments on loans and financing,
extension of the term, loan unification, financial reorganization, payroll financing, new features with conditions of grace period and
more favorable term, in addition to emergency lines offerings of working capital for micro, small and medium-sized enterprises
through programs with government subsidies.
Bradesco’s objective at that moment of crisis was to relieve the strain on clients so that they could fulfill conditions to rearrange
their accounts in a sustainable way over time.
Extended Operations
As of 4Q20, we started disclosing the accounting balance of operations, net of amortization for better visualization of the extended
loans portfolio. The portfolio of R$48 billion in Dec20 has the following components: up-to-date – R$41.4 billion, in arrears – R$2.9
billion and in grace period – R$3.8 billion (50% settled in Jan21).
R$48 billion
accounting balance net of
amortizations
Credit profile of clients who
have requested an extension
92%
were up-to-date clients who showed no delay in the 12 months prior to the
pandemic
94%
rated
AA to C
70% with real
collateral
13 years average time of
relationship
* Delay index over 30 days calculated on the basis of the balance of the Bacen Portfolio.
For more information on our actions related to the coronavirus, please visit: www.bradesco.com.br/coronavirus
IMPORTANT: there is information available on the modalities of emergency actions on the institutional website
(banco.bradesco/aguentefirme), keep in mind that they are subject to credit analysis and other conditions of products
19.6
11.2
8.7
4.2
4.2 0.1
Balance by Product
Real Estate FinancingWorking CapitalVehiclesPersonal LoansBNDES / RuralPayroll-deductible Loans / Cards
Dec20
R$ billion
13.2 13.3 10.5
42.8 42.0 37.5
56.0 55.3
48.0
0.0% 0.2% 0.6%
June20 Sept20 Dec20
R$ billion
MultipurposeWholesaleIn arrears (over 30 days) *
R$ 0.2 bi R$ 1.1 bi R$ 2.9 bi

4Q20 highlights
7
Recurring Net Income
in the quarter
in 12 months (4Q20 x 4Q19)
Quarterly ROAE
in the quarter
in 12 months (4Q20 x 4Q19)
of
in the operating expenses
during the year (disregarding the provision for the adverse economic
scenario of the Insurance Group)
12 – month ER
(12M20 x 12M19)
Expanded Loan Portfolio in 12 months
in the quarter
Expanded ALL
in the quarter
in 12 months (4Q20 x 4Q19)
Coverage ratio over 90 days Delinquency ratio over 90 days
in 12 months
in 12 months
in the quarter
in the quarter

Press Release
8
Analysis of the 4Q20 Income
We closed the last quarter of the year with a Recurring Net Income of R$6.8 billion, a growth of 35% compared
to the previous quarter and 2% in the annual comparison (4Q20 vs. 4Q19). The quarterly ROAE returned to the
levels observed before the COVID-19 pandemic, reaching 20% in the fourth quarter.
Our expanded loan portfolio continues to evolve, growing 3% in the quarter and 10% in the annual comparison.
It is important to note the strong growth acceleration in individuals from 7% in the quarter and 12% in the year,
driven mainly by the products of payroll-deductible loans and real estate financing. In companies, the emphasis
is on the growth in the SMEs portfolio, which evolved 7% in the quarter and 19% in the year. In this quarter, we
completed the acquisition of BAC Florida Bank (BAC) and we have now consolidated it in our financial
statements. BAC has a portfolio of R$8.6 billion.
Our Basel I Ratio grew 90 bps, remaining at 13.8%.
We have finalized the extension of loans in the fourth quarter. As a consequence, the balance of operations
with a grace period closed the quarter with only R$3.8 billion, of which 50% were settled in January. In
December, the extension portfolio, net of amortizations totaled R$48 billion, of which R$41 billion or 86% of the
balance of these operations had already returned to normal payment and only R$2.9 billion were in arrears.
The Expanded ALL was of R$4.6 billion, presenting a reduction of 18% in comparison to the previous quarter,
even considering the increase of expenses with the impairment of financial assets, which was impacted by the
case of a specific client, in the amount of R$1 billion. Disregarding this effect, the total expenses would be a
reduction of 36% in comparison to the previous quarter and 10% in comparison to 4Q19.
It is also worth noting the increase of our coverage ratio over 90 days that reached 403% in December,
demonstrating our high level of provisioning and the reduction of the delinquency indicator overdue for more
than 90 days, which showed a decline in all segments.
The net interest income reached R$16.7 billion, with a growth of 9% in the quarter and 8% compared to the
same period of the previous year, reflecting the good performance of the market portion. The client portion
increased 3.3% in the quarter.
At the end of 2020, we made restructuring adjustments that resulted in the closure of 400 branches in the
quarter (1,083 branches in the year).
Such actions linked to the strong cost control enabled a reduction of R$3.2 billion or 6.6% in our operating
expenses, contributing to an annual improvement in our operating efficiency. It is worth noting that our accrued
ER for 12 months reached 46.3%, an improvement of 2.7 p.p., the best index of our historical series.
Fee and commission income, we had a strong growth of 7% in comparison with the previous quarter, driven,
largely, by the gradual recovery of the economic activity, observed in the last months of 2020, and by the
growth of our business.
In relation to Insurance activities, our operating income for the quarter was impacted mainly by the behavior of
the economic-financial index, which affected the correction of the technical provisions, in addition to the
reduction of the billing and the increase in the claims ratio, which was driven by the gradual resumption of the
elective procedures and indemnifiable events due to the repressed demand during the period of social
isolation. As a positive aspect, it is important to note the improvement of the financial income, with a growth of
43% in the quarter.
71.1 73.7
81.2
71.273.7
28.9 26.3
18.8
28.8
26.3
6,645 5,031
6,801
25,887
19,458
4Q19 3Q20 4Q20 12M19 12M20
Banking Activities % Insurance Activities %
R$ million
Recurring Net Income48.3 47.6 44.6
49.046.3
4Q19 3Q20 4Q20 12M19 12M20
%
ER
21.2
15.2
20.0 20.6
14.8
4Q19 3Q20 4Q20 12M19 12M20
%
ROAE
Main Information
9
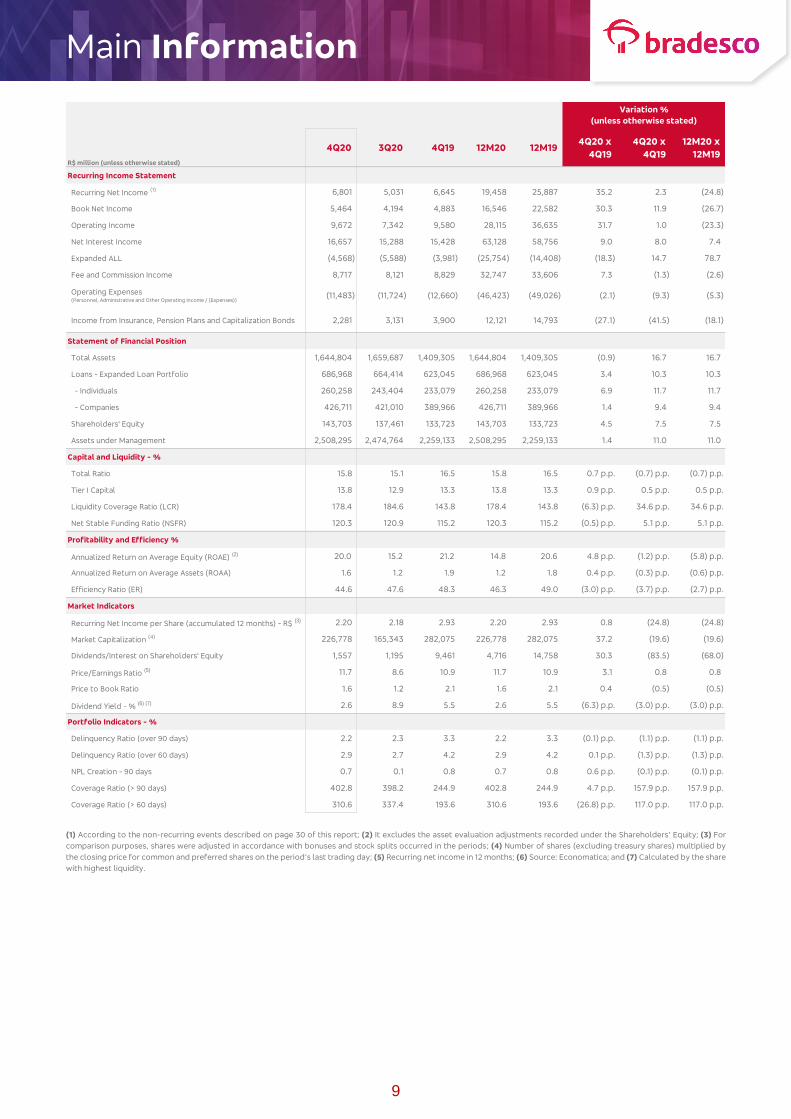
(1) According to the non-recurring events described on page 30 of this report; (2) It excludes the asset evaluation adjustments recorded under the Shareholders’ Equity; (3) For
comparison purposes, shares were adjusted in accordance with bonuses and stock splits occurred in the periods; (4) Number of shares (excluding treasury shares) multiplied by
the closing price for common and preferred shares on the period’s last trading day; (5) Recurring net income in 12 months; (6) Source: Economatica; and (7) Calculated by the share
with highest liquidity.
R$ million (unless otherwise stated)
Recurring Income Statement
Recurring Net Income (1) 6,801 5,031 6,645 19,458 25,887 35.2 2.3 (24.8)
Book Net Income 5,464 4,194 4,883 16,546 22,582 30.3 11.9 (26.7)
Operating Income 9,672 7,342 9,580 28,115 36,635 31.7 1.0 (23.3)
Net Interest Income 16,657 15,288 15,428 63,128 58,756 9.0 8.0 7.4
Expanded ALL (4,568) (5,588) (3,981) (25,754) (14,408) (18.3) 14.7 78.7
Fee and Commission Income 8,717 8,121 8,829 32,747 33,606 7.3 (1.3) (2.6)
Operating Expenses(Personnel, Administrative and Other Operating Income / (Expenses))
(11,483) (11,724) (12,660) (46,423) (49,026) (2.1) (9.3) (5.3)
Income from Insurance, Pension Plans and Capitalization Bonds 2,281 3,131 3,900 12,121 14,793 (27.1) (41.5) (18.1)
Statement of Financial Position
Total Assets 1,644,804 1,659,687 1,409,305 1,644,804 1,409,305 (0.9) 16.7 16.7
Loans - Expanded Loan Portfolio 686,968 664,414 623,045 686,968 623,045 3.4 10.3 10.3
- Individuals 260,258 243,404 233,079 260,258 233,079 6.9 11.7 11.7
- Companies 426,711 421,010 389,966 426,711 389,966 1.4 9.4 9.4
Shareholders' Equity 143,703 137,461 133,723 143,703 133,723 4.5 7.5 7.5
Assets under Management 2,508,295 2,474,764 2,259,133 2,508,295 2,259,133 1.4 11.0 11.0
Capital and Liquidity - %
Total Ratio 15.8 15.1 16.5 15.8 16.5 0.7 p.p. (0.7) p.p. (0.7) p.p.
Tier I Capital 13.8 12.9 13.3 13.8 13.3 0.9 p.p. 0.5 p.p. 0.5 p.p.
Liquidity Coverage Ratio (LCR) 178.4 184.6 143.8 178.4 143.8 (6.3) p.p. 34.6 p.p. 34.6 p.p.
Net Stable Funding Ratio (NSFR) 120.3 120.9 115.2 120.3 115.2 (0.5) p.p. 5.1 p.p. 5.1 p.p.
Profitability and Efficiency %
Annualized Return on Average Equity (ROAE) (2) 20.0 15.2 21.2 14.8 20.6 4.8 p.p. (1.2) p.p. (5.8) p.p.
Annualized Return on Average Assets (ROAA) 1.6 1.2 1.9 1.2 1.8 0.4 p.p. (0.3) p.p. (0.6) p.p.
Efficiency Ratio (ER) 44.6 47.6 48.3 46.3 49.0 (3.0) p.p. (3.7) p.p. (2.7) p.p.
Market Indicators
Recurring Net Income per Share (accumulated 12 months) - R$ (3) 2.20 2.18 2.93 2.20 2.93 0.8 (24.8) (24.8)
Market Capitalization (4) 226,778 165,343 282,075 226,778 282,075 37.2 (19.6) (19.6)
Dividends/Interest on Shareholders' Equity 1,557 1,195 9,461 4,716 14,758 30.3 (83.5) (68.0)
Price/Earnings Ratio (5) 11.7 8.6 10.9 11.7 10.9 3.1 0.8 0.8
Price to Book Ratio 1.6 1.2 2.1 1.6 2.1 0.4 (0.5) (0.5)
Dividend Yield - % (6) (7) 2.6 8.9 5.5 2.6 5.5 (6.3) p.p. (3.0) p.p. (3.0) p.p.
Portfolio Indicators - %
Delinquency Ratio (over 90 days) 2.2 2.3 3.3 2.2 3.3 (0.1) p.p. (1.1) p.p. (1.1) p.p.
Delinquency Ratio (over 60 days) 2.9 2.7 4.2 2.9 4.2 0.1 p.p. (1.3) p.p. (1.3) p.p.
NPL Creation - 90 days 0.7 0.1 0.8 0.7 0.8 0.6 p.p. (0.1) p.p. (0.1) p.p.
Coverage Ratio (> 90 days) 402.8 398.2 244.9 402.8 244.9 4.7 p.p. 157.9 p.p. 157.9 p.p.
Coverage Ratio (> 60 days) 310.6 337.4 193.6 310.6 193.6 (26.8) p.p. 117.0 p.p. 117.0 p.p.
Variation %
(unless otherwise stated)
4Q20 4Q19 12M1912M20 x
12M1912M20
4Q20 x
4Q19
4Q20 x
4Q193Q20

Summarized Analysis of Recurring Income
10
Recurring Income Statement
(1) During 2020, provisions were made for the adverse economic scenario in the sum of R$1,259 million in the Insurance
Group, which were classified as non-technical provisions in the line of Other Income/ Operating Expenses. In 4Q20, part
of these expenses was reversed (R$632 million) and there was a new constitution of provision, in the same value, for
long-term provision of Bradesco Saúde, classified as technical provisions. This event has not produced any impact on
the income of the 4Q20;
(2) Disregarding the constitution/reversal of provision for the adverse economic scenario performed during 2020 in the
Insurance Group, the reduction of our operating expenses would be of R$3.2 billion in the year or 6.6%; and
(3) According to the non-recurring events described on page 30 of this report.
R$ million
Net Interest Income 16,657 15,288 15,428 63,128 58,756 9.0 8.0 7.4
- Client Portion 13,219 12,794 12,983 52,140 49,631 3.3 1.8 5.1
- Market Portion 3,438 2,494 2,445 10,988 9,125 37.9 40.6 20.4
Expanded ALL (4,568) (5,588) (3,981) (25,754) (14,408) (18.3) 14.7 78.7
Gross Income from Financial Intermediation 12,089 9,700 11,447 37,374 44,348 24.6 5.6 (15.7)
Income from Insurance, Pension Plans and Capitalization
Bonds (1) 2,281 3,131 3,900 12,121 14,793 (27.1) (41.5) (18.1)
Fee and Commission Income 8,717 8,121 8,829 32,747 33,606 7.3 (1.3) (2.6)
Operating Expenses (2) (11,483) (11,724) (12,660) (46,423) (49,026) (2.1) (9.3) (5.3)
Personnel Expenses (5,134) (4,900) (5,468) (20,188) (21,767) 4.8 (6.1) (7.3)
Other Administrative Expenses (5,364) (5,035) (5,811) (20,447) (21,407) 6.5 (7.7) (4.5)
Other Operating Income / (Expenses) (1) (985) (1,789) (1,381) (5,788) (5,852) (44.9) (28.7) (1.1)
Tax Expenses (1,979) (1,917) (2,029) (7,819) (7,383) 3.2 (2.5) 5.9
Equity in the earnings (losses) of unconsolidated and jointly
controlled subsidiaries47 31 93 115 297 51.6 (49.5) (61.3)
Operating Income 9,672 7,342 9,580 28,115 36,635 31.7 1.0 (23.3)
Non-Operating Income (79) 16 (22) (77) 32 - - -
Single Allowance - Collective Agreement - (170) - (170) - - - -
Income Tax / Social Contribution (2,717) (2,108) (2,861) (8,171) (10,568) 28.9 (5.0) (22.7)
Non-controlling interests in subsidiaries (75) (49) (52) (239) (212) 53.1 44.2 12.7
Recurring Net Income (3) 6,801 5,031 6,645 19,458 25,887 35.2 2.3 (24.8)
Variation %
12M20 x
12M19
4Q20 x
4Q1912M20 12M19
4Q20 x
3Q204Q20 4Q193Q20

Summarized Analysis of Recurring Income
11
Income, Returns and Efficiency
In 4Q20, our recurring net income reached the sum of
R$6,801 million, showing a great evolution in comparison to
the previous quarter (+35.2%). Our quarterly Return on
Average Equity (ROAE) reached 20.0%, returning to the
same levels observed in 2019, the period that preceded the
COVID-19 pandemic. The operating income for the quarter
showed an excellent performance, reflecting the higher
revenues with the net interest income and fee and
commission, as well as the reduction of ALL expenses, which
showed a drop of 18.3% in the quarter, without impacting
our high level of provisioning, observed through our
coverage ratio for loans overdue for more than 90 days,
which reached the high mark of 403% in December 2020. In
the comparison with 4Q19, our good performance in terms
of the net income and operating income, derives from the
strong increase in the net interest income and the reduction
in our operating expenses, reflecting a strong cost control.
In the 4Q20, both the quarterly ER and the accrued for 12
months showed an improvement in performance in all the
comparative periods, reflection of actions by the
Management to maintain a strong cost control, mainly
related to the reduction of operating expenses, which
showed a reduction of R$3.2 billion in 2020 (disregarding
the constitution of a provision for the adverse economic
scenario of the Insurance Group), in addition to the
growth of revenues with the net interest income, even
with the lowest spreads. The risk-adjusted ER, both
regarding the quarterly and the accrued for 12 months,
also improved in comparison with the 3Q20, due to the
reduction of ALL expenses in the quarter as mentioned
before.
69.4 70.9 71.6 71.2 71.1
69.1 64.9
73.7
81.2
30.629.1
28.4 28.8 28.9
30.9 35.1
26.3
18.85,830
6,238 6,462 6,542 6,645
3,753 3,873
5,031
6,801
4Q18 1Q19 2Q 3Q 4Q 1Q20 2Q 3Q 4Q
Banking Activities % Participation Insurance Activities %
R$ million
Recurring Net Income
20.0
15.2
11.9 11.7
21.2
20.2
20.6 20.5 19.7
14.8
12.9 11.8 11.7
20.6
20.5
20.6 20.5
19.0
4Q3Q2Q1Q204Q3Q2Q1Q194Q18
ROAE - Quartely ROAE - Accrued
ROAE Quarterly and Accrued
%
50.4 48.6 49.2 49.9 48.3 49.344.0 47.6 44.6
49.6 49.5 49.4 49.5 49.0 49.1 47.8 47.2 46.3
65.2
64.5 64.2 63.9
63.4 66.7 70.5
72.2 72.065.6
63.5 63.3 63.3
63.5
77.4 78.1
70.262.4
4Q18 1Q19 2Q 3Q 4Q 1Q20 2Q 3Q 4Q
Quarterly ER12-month ER12-month risk-adjusted ERQuartely risk-adjusted ER
%
ER / Risk-Adjusted ER
Net Interest Income
12
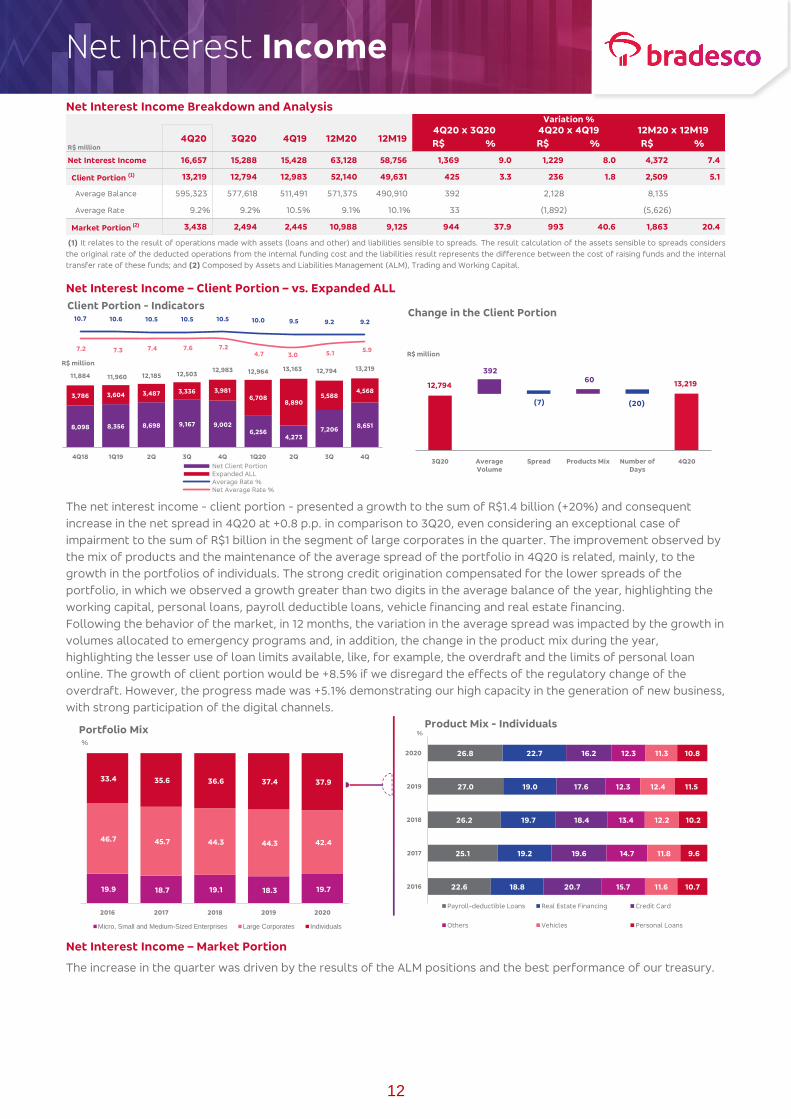
Net Interest Income Breakdown and Analysis
(1) It relates to the result of operations made with assets (loans and other) and liabilities sensible to spreads. The result calculation of the assets sensible to spreads considers
the original rate of the deducted operations from the internal funding cost and the liabilities result represents the difference between the cost of raising funds and the internal
transfer rate of these funds; and (2) Composed by Assets and Liabilities Management (ALM), Trading and Working Capital.
Net Interest Income – Client Portion – vs. Expanded ALL
The net interest income - client portion - presented a growth to the sum of R$1.4 billion (+20%) and consequent
increase in the net spread in 4Q20 at +0.8 p.p. in comparison to 3Q20, even considering an exceptional case of
impairment to the sum of R$1 billion in the segment of large corporates in the quarter. The improvement observed by
the mix of products and the maintenance of the average spread of the portfolio in 4Q20 is related, mainly, to the
growth in the portfolios of individuals. The strong credit origination compensated for the lower spreads of the
portfolio, in which we observed a growth greater than two digits in the average balance of the year, highlighting the
working capital, personal loans, payroll deductible loans, vehicle financing and real estate financing.
Following the behavior of the market, in 12 months, the variation in the average spread was impacted by the growth in
volumes allocated to emergency programs and, in addition, the change in the product mix during the year,
highlighting the lesser use of loan limits available, like, for example, the overdraft and the limits of personal loan
online. The growth of client portion would be +8.5% if we disregard the effects of the regulatory change of the
overdraft. However, the progress made was +5.1% demonstrating our high capacity in the generation of new business,
with strong participation of the digital channels.
Net Interest Income – Market Portion
The increase in the quarter was driven by the results of the ALM positions and the best performance of our treasury.
R$ million R$ % R$ % R$ %
Net Interest Income 16,657 15,288 15,428 63,128 58,756 1,369 9.0 1,229 8.0 4,372 7.4
Client Portion (1) 13,219 12,794 12,983 52,140 49,631 425 3.3 236 1.8 2,509 5.1
Average Balance 595,323 577,618 511,491 571,375 490,910 392 2,128 8,135
Average Rate 9.2% 9.2% 10.5% 9.1% 10.1% 33 (1,892) (5,626)
Market Portion (2) 3,438 2,494 2,445 10,988 9,125 944 37.9 993 40.6 1,863 20.4
Variation %
3Q20 12M194Q204Q20 x 3Q20 4Q20 x 4Q19 12M20 x 12M19
4Q19 12M20
19.9 18.7 19.1 18.3 19.7
46.7 45.7 44.3 44.3 42.4
33.4 35.6 36.6 37.4 37.9
2016 2017 2018 2019 2020
Micro, Small and Medium-Sized Enterprises Large Corporates Individuals
Portfolio Mix%
12,794
(20)
13,219
392
(7)
60
3Q20 Average
Volume
Spread Products Mix Number of
Days
4Q20
R$ million
Change in the Client Portion
22.6
25.1
26.2
27.0
26.8
18.8
19.2
19.7
19.0
22.7
20.7
19.6
18.4
17.6
16.2
15.7
14.7
13.4
12.3
12.3
11.6
11.8
12.2
12.4
11.3
10.7
9.6
10.2
11.5
10.8
2016
2017
2018
2019
2020
Payroll-deductible Loans Real Estate Financing Credit Card
Others Vehicles Personal Loans
Product Mix - Individuals
8,098 8,356 8,698 9,167 9,002 6,256
4,273 7,206
8,651
3,786 3,604 3,487 3,336 3,981 6,708
8,890 5,588
4,568
11,884 11,960 12,185 12,503 12,983 12,964 13,163 12,794 13,219
10.7 10.6 10.5 10.5 10.5 10.0 9.5 9.2 9.2
7.2 7.3 7.4 7.6 7.2 4.7 3.0 5.1
5.9
4Q18 1Q19 2Q 3Q 4Q 1Q20 2Q 3Q 4Q
Net Client PortionExpanded ALLAverage Rate %Net Average Rate %
R$ million
Client Portion - Indicators
%
Loan Portfolio
13
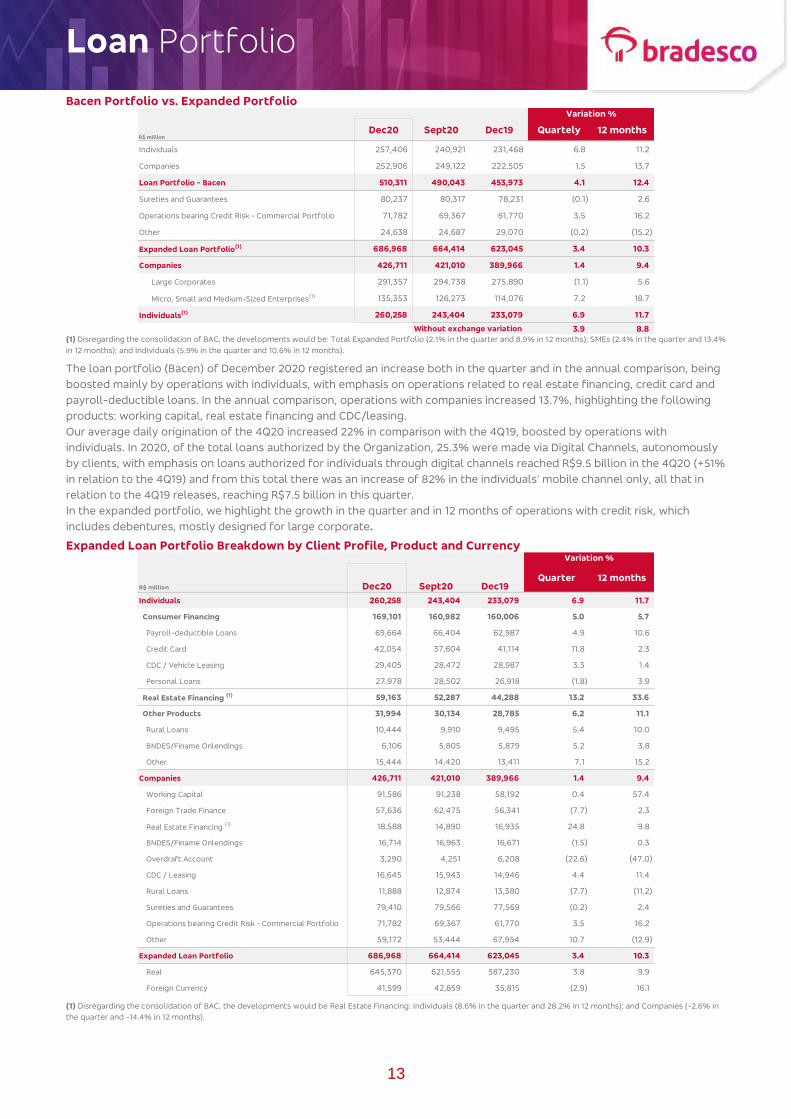
Bacen Portfolio vs. Expanded Portfolio
(1) Disregarding the consolidation of BAC, the developments would be: Total Expanded Portfolio (2.1% in the quarter and 8.9% in 12 months); SMEs (2.4% in the quarter and 13.4%
in 12 months); and Individuals (5.9% in the quarter and 10.6% in 12 months).
The loan portfolio (Bacen) of December 2020 registered an increase both in the quarter and in the annual comparison, being
boosted mainly by operations with individuals, with emphasis on operations related to real estate financing, credit card and
payroll-deductible loans. In the annual comparison, operations with companies increased 13.7%, highlighting the following
products: working capital, real estate financing and CDC/leasing.
Our average daily origination of the 4Q20 increased 22% in comparison with the 4Q19, boosted by operations with
individuals. In 2020, of the total loans authorized by the Organization, 25.3% were made via Digital Channels, autonomously
by clients, with emphasis on loans authorized for individuals through digital channels reached R$9.5 billion in the 4Q20 (+51%
in relation to the 4Q19) and from this total there was an increase of 82% in the individuals’ mobile channel only, all that in
relation to the 4Q19 releases, reaching R$7.5 billion in this quarter.
In the expanded portfolio, we highlight the growth in the quarter and in 12 months of operations with credit risk, which
includes debentures, mostly designed for large corporate.
Expanded Loan Portfolio Breakdown by Client Profile, Product and Currency
(1) Disregarding the consolidation of BAC, the developments would be Real Estate Financing: Individuals (8.6% in the quarter and 28.2% in 12 months); and Companies (-2.6% in
the quarter and -14.4% in 12 months).
R$ million
Individuals 257,406 240,921 231,468 6.8 11.2
Companies 252,906 249,122 222,505 1.5 13.7
Loan Portfolio - Bacen 510,311 490,043 453,973 4.1 12.4
Sureties and Guarantees 80,237 80,317 78,231 (0.1) 2.6
Operations bearing Credit Risk - Commercial Portfolio 71,782 69,367 61,770 3.5 16.2
Other 24,638 24,687 29,070 (0.2) (15.2)
Expanded Loan Portfolio(1) 686,968 664,414 623,045 3.4 10.3
Companies 426,711 421,010 389,966 1.4 9.4
Large Corporates 291,357 294,738 275,890 (1.1) 5.6
Micro, Small and Medium-Sized Enterprises(1) 135,353 126,273 114,076 7.2 18.7
Individuals(1) 260,258 243,404 233,079 6.9 11.7
Without exchange variation 3.9 8.8
Variation %
Dec20 Sept20 12 monthsDec19 Quartely
R$ million
Individuals 260,258 243,404 233,079 6.9 11.7
Consumer Financing 169,101 160,982 160,006 5.0 5.7
Payroll-deductible Loans 69,664 66,404 62,987 4.9 10.6
Credit Card 42,054 37,604 41,114 11.8 2.3
CDC / Vehicle Leasing 29,405 28,472 28,987 3.3 1.4
Personal Loans 27,978 28,502 26,918 (1.8) 3.9
Real Estate Financing (1) 59,163 52,287 44,288 13.2 33.6
Other Products 31,994 30,134 28,785 6.2 11.1
Rural Loans 10,444 9,910 9,495 5.4 10.0
BNDES/Finame Onlendings 6,106 5,805 5,879 5.2 3.8
Other 15,444 14,420 13,411 7.1 15.2
Companies 426,711 421,010 389,966 1.4 9.4
Working Capital 91,586 91,238 58,192 0.4 57.4
Foreign Trade Finance 57,636 62,475 56,341 (7.7) 2.3
Real Estate Financing (1) 18,588 14,890 16,935 24.8 9.8
BNDES/Finame Onlendings 16,714 16,963 16,671 (1.5) 0.3
Overdraft Account 3,290 4,251 6,208 (22.6) (47.0)
CDC / Leasing 16,645 15,943 14,946 4.4 11.4
Rural Loans 11,888 12,874 13,380 (7.7) (11.2)
Sureties and Guarantees 79,410 79,566 77,569 (0.2) 2.4
Operations bearing Credit Risk - Commercial Portfolio 71,782 69,367 61,770 3.5 16.2
Other 59,172 53,444 67,954 10.7 (12.9)
Expanded Loan Portfolio 686,968 664,414 623,045 3.4 10.3
Real 645,370 621,555 587,230 3.8 9.9
Foreign Currency 41,599 42,859 35,815 (2.9) 16.1
Sept20
Variation %
Quarter 12 monthsDec20 Dec19

Loan Portfolio
14
Real Estate Financing
Profile of the Individual Portfolio
Payroll-Deductible Loans
38,284 39,759 41,282 42,931 44,288 46,173 49,049 52,287 59,163
23,000 21,537 20,565 19,900 16,935 15,768 15,485 14,890 18,588
61,284 61,296 61,847 62,830 61,222 61,941 64,534 67,177
77,751
Dec18 Mar19 June Sept Dec Mar20 June Sept Dec
Individuals Companies
R$ million
Portfolio
2,910 2,812 3,231 3,675 3,273 3,562 4,253
5,462 6,899 1,317 926
1,452 1,183 1,312 954 535
860
2,021
4,227 3,738
4,683 4,858 4,585 4,516 4,788
6,322
8,920
4Q18 1Q19 2Q 3Q 4Q 1Q20 2Q 3Q 4Q
Borrower Builder
R$ million
Origination
10,866 10,301 11,487 12,624 11,315 12,022 14,544 16,884 21,879
6,050 5,137 4,949 7,340
6,843 5,070 1,601
3,876
9,364
16,916 15,438 16,436
19,964 18,158 17,092 16,145
20,760
31,243
4Q18 1Q19 2Q 3Q 4Q 1Q20 2Q 3Q 4Q
Borrower Builder
R$ million
Units Financed
50,932 53,505 57,318 60,258 62,987
65,320 65,448 66,404 69,664
71.9 71.2 70.6 69.7 70.1 68.8 69.2 70.0 71.3
Dec18 Mar19 June Sept Dec Mar20 June Sept Dec
Network of Branches %
Correspondent / Other Channels %
As a % of total Personal Loans
77.1 77.9 78.6 79.6 80.9 81.6
22.9 22.1 21.4 20.4 19.1 18.4
83.1
16.9
84.5
R$ million
74.8
25.2
%
Portfolio
15.5
59.3% R$309
Thousand
R$521
Thousand 49.3%
Average Property
Valuation
Average
Funding
Loan to
Value
Loan to Value
(Stock)
Average term: 318 Months
Except Loan to Value (Stock), R$ Production Dec20.
15.9%
Total
19.8%
14.9%
13.3%
Social Security National
Institute (INSS)
Private sector
Public sector
Dec20
Market Share
48.3 46.7 47.5
6.0 6.0 5.2
45.7 47.3 47.3
Dec18 Dec19 Dec20
Public Sector
Private Sector
Social Security National Institute (INSS)/Dataprev
%
Distribution of the Portfolio by Sector

Loan Portfolio
15
Vehicle Financing
Origination
The origination of vehicle financing presents indicators
with higher levels than the pre-pandemic period. The
significant growth of 30.9% in the average monthly
production in 4Q20 was influenced by the
flexibilization of the quarantine as a result of COVID-
19, allowing the resumption of activities in the majority
of dealers/sales correspondents, with the exemption
of IOF in vehicle operations, which acted as drivers for
sales.
Expanded Loan Portfolio Concentration – By Economic Sector
Diversified loan portfolio
and with low concentration
in sectors of higher risk
Sectors most exposed to the impacts of the current crisis
0.6% 0.2% Leisure and tourism Airline companies
24,247 25,164 26,547 28,005 29,516 30,003 28,793 28,956 29,876
12,564 13,062 13,979 15,255
16,444 17,084 16,576 16,830 17,422 36,811 38,226
40,52743,260
45,960 47,087 45,369 45,786 47,298
Dec Mar19 June Sept Dec Mar20 June Sept Dec
Individuals Companies
R$ million
Portfolio
85.8 89.4
91.8
1.6
1.9 1.5
12.6 8.7
6.7
Dec18 Dec19 Dec20
CDC Portfolio Leasing Portfolio Finame Portfolio
%
Distribution of the Portfolio by Product
R$ million
Economic Sector
Public Sector 15,772 2.3 16,037 2.4 15,867 2.5
Oil, derivatives and aggregate activities 11,312 1.6 11,957 1.8 10,318 1.7
Production and distribution of electricity 3,504 0.5 3,180 0.5 4,714 0.8
Other sectors 956 0.1 900 0.1 835 0.1
Private Sector 671,196 97.7 648,376 97.6 607,178 97.5
Companies 410,938 59.8 404,973 61.0 374,099 60.0
Real estate and construction activities 31,107 4.5 33,644 5.1 33,443 5.4
Retail 43,994 6.4 40,614 6.1 40,498 6.5
Transportation and concession 35,032 5.1 34,531 5.2 32,118 5.2
Services 43,569 6.3 37,349 5.6 36,329 5.8
Wholesale 23,759 3.5 21,695 3.3 19,897 3.2
Automotive 19,917 2.9 24,430 3.7 17,568 2.8
Food products 17,970 2.6 16,106 2.4 13,497 2.2
Other sectors 195,590 28.5 196,604 29.6 180,749 29.0
Individuals 260,258 37.9 243,404 36.6 233,079 37.4
Total 686,968 100.0 664,414 100.0 623,045 100.0
Dec20 % Dec19 %Sept20 %
43 months
R$38 thousand
R$1.5
billion 38%
Average
Inflows(1)
Average
Term(1) Average
Ticket(1)
Average Monthly
Production (1)
(1) R$ Production Oct20 – Dec20
Loan Portfolio
16
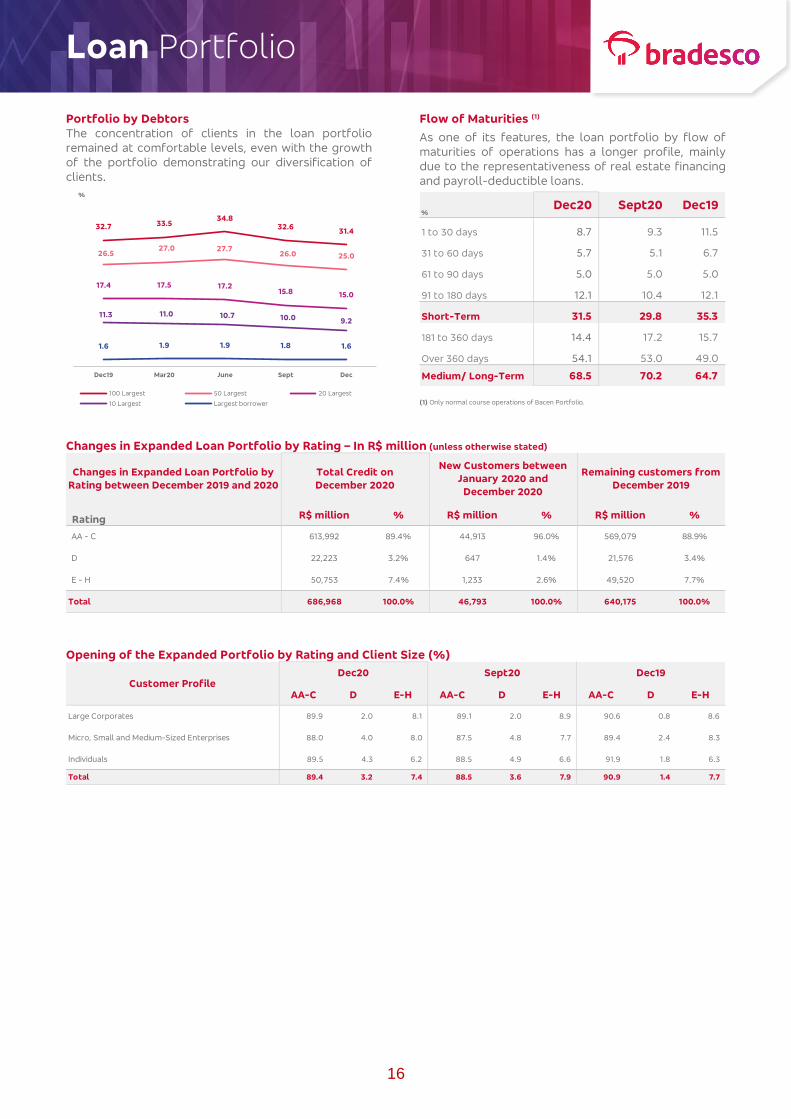
Portfolio by Debtors
The concentration of clients in the loan portfolio
remained at comfortable levels, even with the growth
of the portfolio demonstrating our diversification of
clients.
Flow of Maturities (1)
As one of its features, the loan portfolio by flow of
maturities of operations has a longer profile, mainly
due to the representativeness of real estate financing
and payroll-deductible loans.
(1) Only normal course operations of Bacen Portfolio.
Changes in Expanded Loan Portfolio by Rating – In R$ million (unless otherwise stated)
Opening of the Expanded Portfolio by Rating and Client Size (%)
32.7 33.534.8
32.631.4
26.527.0 27.7
26.0 25.0
17.4 17.5 17.215.8 15.0
11.3 11.0 10.7 10.0 9.2
1.6 1.9 1.9 1.8 1.6
Dec19 Mar20 June Sept Dec
100 Largest 50 Largest 20 Largest
10 Largest Largest borrower
%
%
1 to 30 days 8.7 9.3 11.5
31 to 60 days 5.7 5.1 6.7
61 to 90 days 5.0 5.0 5.0
91 to 180 days 12.1 10.4 12.1
Short-Term 31.5 29.8 35.3
181 to 360 days 14.4 17.2 15.7
Over 360 days 54.1 53.0 49.0
Medium/ Long-Term 68.5 70.2 64.7
Dec20 Sept20 Dec19
Rating R$ million % R$ million % R$ million %
AA - C 613,992 89.4% 44,913 96.0% 569,079 88.9%
D 22,223 3.2% 647 1.4% 21,576 3.4%
E - H 50,753 7.4% 1,233 2.6% 49,520 7.7%
Total 686,968 100.0% 46,793 100.0% 640,175 100.0%
Total Credit on
December 2020
New Customers between
January 2020 and
December 2020
Remaining customers from
December 2019
Changes in Expanded Loan Portfolio by
Rating between December 2019 and 2020
AA-C D E-H AA-C D E-H AA-C D E-H
Large Corporates 89.9 2.0 8.1 89.1 2.0 8.9 90.6 0.8 8.6
Micro, Small and Medium-Sized Enterprises 88.0 4.0 8.0 87.5 4.8 7.7 89.4 2.4 8.3
Individuals 89.5 4.3 6.2 88.5 4.9 6.6 91.9 1.8 6.3
Total 89.4 3.2 7.4 88.5 3.6 7.9 90.9 1.4 7.7
Customer ProfileDec20 Sept20 Dec19

Expenses with Expanded ALL
17
(1) It includes the result with BNDU, provision for sureties and guarantees and others.
This quarter, the total expenses with Expanded ALL reached
the lowest level in 2020, even considering the increase of
expenses with impairment of financial assets, impacted by a
specific client, getting close to the levels observed in 2019,
the period that preceded the COVID-19 pandemic. If we
disregard the effect of the specific case, to the sum of R$1
billion, the expenses with Expanded ALL would have a
reduction of 36.1% in comparison to 3Q20 and 10.4% in
comparison to 4Q19. Furthermore, we continue evolving in
our loan operations, whose expanded portfolio grew 10%
(+12% in operations aimed at individuals and +9% in
operations with companies) in 12 months, a development
that impacted the ALL expenses due to the minimum
reserves required by the Central Bank of Brazil, and yet, we
remain with a good level of provisioning for loans overdue
for more than 90 days, which reached the high mark of
403% in December 2020 and all segments showed a
reduction in the delinquency ratio for 90 days in the 12-
months comparative.
In 4Q20, our internal studies, which are based on statistical models that capture historical information and forecasts
and reflect our expectation of expected losses in different economic scenarios, as well as the experience of the
Management, indicated that there was no need to strengthen our provisions related to the adverse economic scenario
once the provisions made in the previous quarters (3Q20 - R$2.6 billion, 2Q20 – R$3.8 billion and 1Q20 – R$2.7 billion)
prepared the Bank for a scenario of increased delinquency in 2021, which should return to the historical levels that
preceded the pandemic.
It is worth mentioning that the ratio between the ALL expenses and the expanded portfolio registered 2.7% this
quarter.
R$ million
4Q20 3Q20 4Q19 12M20 12M19 4Q20 x
3Q20
4Q20 x
4Q19
12M20 x
12M19
Expanded ALL (4,568) (5,588) (3,981) (25,754) (14,408) (18.3) 14.7 78.7
ALL Expenses (4,066) (5,626) (4,622) (25,796) (19,785) (27.7) (12.0) 30.4
Income from Credit Recovery 1,588 1,828 1,542 5,940 7,975 (13.1) 3.0 (25.5)
Impairment of Financial Assets (1,442) (571) (130) (2,659) (316) - - -
Granted Discounts / Other (1) (648) (1,219) (771) (3,239) (2,282) (46.8) (16.0) 41.9
Variation %
3,786 3,604 3,487 3,336
3,981
6,708
8,890
5,588
4,568
2.8 2.6 2.4 2.2 2.6 4.1
5.4
3.4 2.7
4Q18 1Q19 2Q 3Q 4Q 1Q20 2Q 3Q 4Q
Expanded ALL (Expense)
Impairment (Specifc Client)
Expanded ALL (Expense) / Expanded Loan Portfolio (Annualized)
%
R$ million
Expanded ALL/ Expanded Loan Operations

Loan Indicators
18
Delinquency ratios
The reduction of the indicator over 90 days remains related to the effects of the actions implemented during 2020 to
provide liquidity to clients seeking a readjustment of their cash flows during the current scenario, in addition to the
extensions granted in previous quarters and the process of renegotiation, which demonstrated great effectiveness, thus
allowing a consistent reduction of our portfolios in arrears in view of the write-offs made. Among the main measures, we
highlight the flexibility of deadlines and rates, diversification of channels for purchase and development of digital
journeys, making them more intuitive for the client to reorganize their commitments. Credit and Recovery policies
experience a new paradigm of analytics, deploying new algorithms supported by transactional data and with “in real
time” decision, allowing a prompt reaction to the abrupt change in credit worthiness of clients imposed by the pandemic.
In December 2020, it is possible to observe the beginning of the return to the historical levels of the indicator from 15 to
90 days, due to the normalization of the usual policies for concession and management of the loan portfolio, in addition
to all the methodological and technical improvement of the processes of concession.
Loan Assignments
In the 4Q20, active loan assignments were made (without the retention of risks and benefits) in the Large Corporate
segment, for companies which were in arrears for more than 180 days, in the nominal value of R$160 million. The gross
sale value of these portfolios was R$69 million.
.
4.4 4.3 4.3 4.3 4.4
4.84.5
3.43.1
4.2 4.2 4.14.3
3.7
4.5
3.1
1.9 1.9
3.53.3 3.2
3.6
3.3
3.7
3.0 2.32.2
1.5
1.0 0.8
1.9
0.8
1.2
0.50.7 0.7
Dec18 Mar19 June Sept Dec Mar20 June Sept Dec
%
Individuals
Micro, Small and Medium-Sized Enterprises
Total
Large Corporates
Over 90 days
4.8
5.3 5.2
4.8 4.8
5.6
3.6 3.4
4.04.3
4.5
4.0
3.5
4.2
4.8
2.6 2.6
3.0
3.53.8 3.9
3.5 3.6
4.2
2.4 2.3
2.8
0.9 0.9
1.5
1.1
0.7
1.1
0.30.1 0.2
Dec18 Mar19 June Sept Dec Mar20 June Sept Dec
Individuals
Micro, Small and Medium-Sized Enterprises
Total
Large Corporates
%
15 to 90 days
1.8 1.8 1.8 1.9
1.4
1.8
1.3
0.6 0.8
1.41.3 1.3
1.6
1.3
1.5
1.2 0.80.8
0.6
0.2 0.2
1.0
0.10.2 0.2
--
Dec18 Mar19 June Sept Dec Mar20 June Sept Dec
%
Micro, Small and Medium-Sized Enterprises Total Large Corporates
Over 90 days without 100% provisioned operations

Loan Indicators
19
Coverage Ratios and Allowance
Our coverage ratios (60 e 90 days) remain at high levels and reached 311% and 403%, respectively. We emphasize
that the coverage ratio over 90 days, excluding operations 100% provisioned, demonstrates that we are at quite
comfortable levels of provisioning. The balance of our provision reached R$45.3 billion in December 2020, and our
level of provisioning in relation to the portfolio represents 8.9%. In December 2020, our overdue operations over 60
days increased 9.7% compared to September 2020.
NPL Creation | 90 days vs. Write-offs
Regarding loan portfolio, total NPL Creation reached 0.7% in the 4Q20, returning to the levels observed in the pre-
crisis periods. The increase in relation to the previous quarter reflects the normalization of the usual policies for
concession and management of the loan portfolio, in addition to the methodological and technical improvement of
the processes of concession.
(1) It refers to expenses with ALL, based on Resolution No. 2,682/99.
4.2 4.0 3.9 4.1 3.8 4.2 3.2 2.7 2.8
8.6 8.8 8.6 8.2 8.1 8.5 9.0 9.2 8.9
245.3 269.2 267.2
225.5 244.9 227.9
299.5
398.2 402.8
201.6 220.2 209.3 188.5 193.6 184.2
249.8
337.4 310.6
124.9 125.6 122.3 115.6 119.6 121.4 123.8 120.6 117.6
474.0
548.0 517.0
392.0
481.0
425.0
602.0
994.0 955.0
Dec18 Mar19 June Sept Dec Mar20 June Sept Dec
E-H Non-Performing Loans
Total Provision - in relation to the portfolio
Coverage Ratio over 90 Days
Coverage Ratio over 60 Days
Coverage Ratio over 90 Days + Renegociation
Coverage Ratio over 90 Days - excluding operations 100% provisioned
%
Coverage Ratio
14,100 13,661 13,912 14,835 14,491 16,560 12,905 11,145 12,044
14,081 16,428 16,049 14,407 15,404 14,541 18,290 23,378 22,775
6,903 6,899 6,899 6,899 6,901
9,365 12,014 10,370 10,519 35,084
36,987 36,860 36,142 36,796 40,466
43,209 44,894 45,339
Dec18 Mar19 June Sept Dec Mar20 June Sept Dec
Specific Generic Complementary
R$ million
Provision and Overdue Portfolio
17,403 16,798 17,611 19,171 19,008
21,972
17,296
13,304 14,597
14,302 13,739 13,795 16,024 15,026
17,759 14,428
11,276 11,255
Dec18 Mar19 June Sept Dec Mar20 June Sept Dec
Loan Portfolio Overdue for over 60 Days (B) Loan Portfolio Overdue for over 90 Days (C)
Portfolio in Arrears
R$ million
4,478 3,826
4,532
5,819
3,672
6,982
2,195
684
3,674 4,495
6,292
4,349 4,522 4,622
7,359
8,745
5,626
4,066
100 164 96 78 126 105
398
823
111
4Q18 1Q19 2Q 3Q 4Q 1Q20 2Q 3Q 4Q
Gross ALL Expenses (1) /NPL Creation - 90 days
NPL Creation - 90 days Gross ALL Expenses (1) Gross ALL Expenses /NPL Creation - 90 days
%
R$ million
627 18 334
1,489
(431)
934
(269)249 473
1,266 1,233 1,356
1,362
856
2,074
85146
922
2,585
2,575
2,843
2,969
3,248
3,974
2,379 289
2,279
4,478
3,826
4,532
5,819
3,672
6,982
2,195
684
3,674
4Q18 1Q19 2Q 3Q 4Q 1Q20 2Q 3Q 4Q
Large Corporates Micro, Small and Medium-Sized Enterprises Individuals
R$ million
NPL Creation
672 530 587 215 870
279 633 34 513
1,344 1,332 1,322 1,026
1,234
1,103
1,677
1,152 759
2,634 2,527 2,567
2,350
2,566
2,868
3,216
2,651 2,422
4,650 4,389 4,476
3,591
4,670 4,250
5,526
3,837 3,694
4Q18 1Q19 2Q 3Q 4Q 1Q20 2Q 3Q 4Q
Large Corporates Micro, Small and Medium-Sized Enterprises Individuals
Write-offs
R$ million

Main Funding Sources
20
Funds Raised and Managed
(1) It does not consider debentures.
Loans vs. Funding In order to evaluate loan operations in relation to funding, we deducted from the total client funding the amount
committed to reserve requirements at Bacen, the amount of funds available within the customer service network and
we added the funds from domestic and foreign lines of credit that finance the demand for loans. We show low
dependency on interbank deposits and foreign lines of credit, given its capacity to obtain funding from clients
effectively. This is a result of significant capillarity, the broad diversity of products offered and the market’s
confidence in the Bradesco brand and the important presence in the client’s sector.
(1) It considers: Demand Deposits, Miscellaneous Floating, Saving Deposits, Time Deposits, Debentures (with collateral of repurchase operations operations) and Funds from
Financial Bills (considers Mortgage Bonds, Letters of Credit for Agribusiness, Financial Bills and Structured Operations Certificate).
Demand Deposits 55,600 50,640 40,701 9.8 36.6
Savings Deposits 136,698 129,670 114,178 5.4 19.7
Time Deposits + Debentures 370,061 354,112 217,073 4.5 70.5
Borrowing and Onlending 49,808 53,896 53,966 (7.6) (7.7)
Funds from Issuance of Securities 145,017 154,003 170,743 (5.8) (15.1)
Subordinated Debts 15,875 16,833 12,606 (5.7) 25.9
Eligible Debt Capital Instruments 37,371 37,274 36,708 0.3 1.8
Subtotal 810,430 796,428 645,975 1.8 25.5
Securities Sold Under Agreements to Repurchase (1) 250,746 272,717 213,122 (8.1) 17.7
Interbank Deposits 837 1,043 549 (19.8) 52.5
Working Capital (Own/Managed) 118,924 113,637 107,703 4.7 10.4
Foreign Exchange Portfolio 18,758 34,439 15,489 (45.5) 21.1
Payment of Taxes and Other Contributions 707 4,784 712 (85.2) (0.7)
Technical provisions for insurance, pension plans and capitalization bonds 284,606 279,186 274,765 1.9 3.6
Funds raised 1,485,008 1,502,234 1,258,315 (1.1) 18.0
Investment Funds and Managed Portfolios 1,023,287 972,530 1,000,818 5.2 2.2
Total Assets under Management 2,508,295 2,474,764 2,259,133 1.4 11.0
Variation %
R$ millionDec19 Quarter 12 monthsDec20 Sept20
Funding vs. Investments
Demand Deposits + Sundry Floating 56,307 55,424 41,413 1.6 36.0
Savings Deposits 136,698 129,670 114,178 5.4 19.7
Time Deposits + Debentures 370,061 354,112 217,073 4.5 70.5
Funds from Financial Bills 134,356 142,007 167,367 (5.4) (19.7)
Customer Funds (1) 697,422 681,213 540,031 2.4 29.1
(-) Reserve Requirements (83,758) (81,310) (90,622) 3.0 (7.6)
(-) Available Funds (Brazil) (18,019) (19,180) (15,156) (6.1) 18.9
Customer Funds Net of Reserve Requirements 595,645 580,723 434,253 2.6 37.2
Borrowing and Onlending 49,808 53,896 53,966 (7.6) (7.7)
Other (Securities Abroad + Subordinated Debt + Other Borrowers - Cards) 87,431 86,617 74,286 0.9 17.7
Total Funding (A) 732,885 721,236 562,505 1.6 30.3
Expanded Loan Portfolio (Excluding Sureties and Guarantees) (B) 606,732 584,097 544,814 3.9 11.4
B / A 82.8% 81.0% 96.9% 1.8 p.p. (14.1) p.p.
Dec19Dec20R$ million
Sept20
Variation %
Quarter 12 months

Income from Insurance
21
Consolidated Statement of Income and Selected Property Data
(1) During 2020, provisions were made for the adverse economic scenario in the sum of R$1,259 million, which were classified as non-technical provisions in the line of Other
Income/Operating Expenses. In 4Q20, part of these expenses was reversed (R$632 million) and there was a new constitution of long-term technical provisions in the Bradesco
Saúde, in the same amount, without any effect on the net income; and (2) In December 2020, the shareholders’ equity of regulated companies (insurance, pension plans and
capitalization bonds) totaled R$22,750 million.
Net Income and ROAE
The net income performance in the comparative of 4Q19 was impacted mainly by the behavior of the economic-
financial ratios, which affected the financial income and correction of technical provisions, in addition to the increase
in the claims ratio, which was driven by the gradual resumption of the elective procedures and indemnifiable events
due to the period of social isolation.
RS million
Income Statement
Premiums Earned from Insurance, Pension Plan
Contribution and Capitalization Bond Income(1) 10,544 11,416 12,020 43,687 45,650 (7.6) (12.3) (4.3)
Retained Claims (7,824) (7,237) (7,308) (27,717) (27,731) 8.1 7.1 (0.0)
Capitalization Bond Draws and Redemptions (1,065) (1,261) (1,479) (4,709) (5,677) (15.6) (28.0) (17.1)
Selling Expenses (818) (795) (887) (3,170) (3,306) 2.8 (7.8) (4.1)
Financial Results 1,443 1,009 1,553 4,030 5,856 43.0 (7.1) (31.2)
Income from Insurance, Pension Plans and
Capitalization Bonds2,281 3,131 3,900 12,121 14,793 (27.1) (41.5) (18.1)
Fee and Commission Income 461 490 493 1,876 2,028 (5.9) (6.6) (7.5)
Personnel Expenses (347) (381) (503) (1,499) (1,821) (8.9) (31.0) (17.7)
Other Administrative Expenses (352) (355) (373) (1,426) (1,482) (1.1) (5.7) (3.8)
Others (1) 144 (582) (261) (2,303) (1,278) (124.7) (155.1) 80.1
Operating Income 2,188 2,302 3,256 8,769 12,240 (5.0) (32.8) (28.4)
Non-Operating Income / Income Tax / Social
Contribution / Non-controlling interests in subsidiaries(912) (977) (1,337) (3,649) (4,789) (6.7) (31.8) (23.8)
Recurring Net Income 1,276 1,325 1,919 5,120 7,451 (3.8) (33.5) (31.3)
Selected Asset Data
Total Assets 339,480 331,844 325,885 339,480 325,885 2.3 4.2 4.2
Securities 319,711 312,819 306,876 319,711 306,876 2.2 4.2 4.2
Technical Provisions 284,606 279,186 274,765 284,606 274,765 1.9 3.6 3.6
Shareholder's Equity (2) 37,792 40,293 38,614 37,792 38,614 (6.2) (2.1) (2.1)
Variation %
4Q20 4Q1912M20 x
12M1912M20 12M19
4Q20 x
4Q193Q20
4Q20 x
3Q20
101 142 163 155 156 125 78 105 92
323 340 326 271 269
182 359 232 301
355 398
514 549 465
40
341 349 241
1,003 934
830 910 1,029
811
583 639 642
1,782 1,814 1,833 1,885 1,919
1,158
1,361 1,325 1,276
22.3 23.4 23.7 24.1 24.2
13.4 15.5 14.9 14.3
4Q18 1Q19 2Q 3Q 4Q 1Q20 2Q 3Q 4Q
Life and Pension Plans Property & Casualty and Others Health Capitalization Bonds ROAE
R$ million
%
‘
14.3% ROAE
1,276
18,161 Revenues Net Income Information
4Q20 -3.8% in the quarter
-33.5% in 12 month
-9.8% in the quarter
-13.7% in 12 month
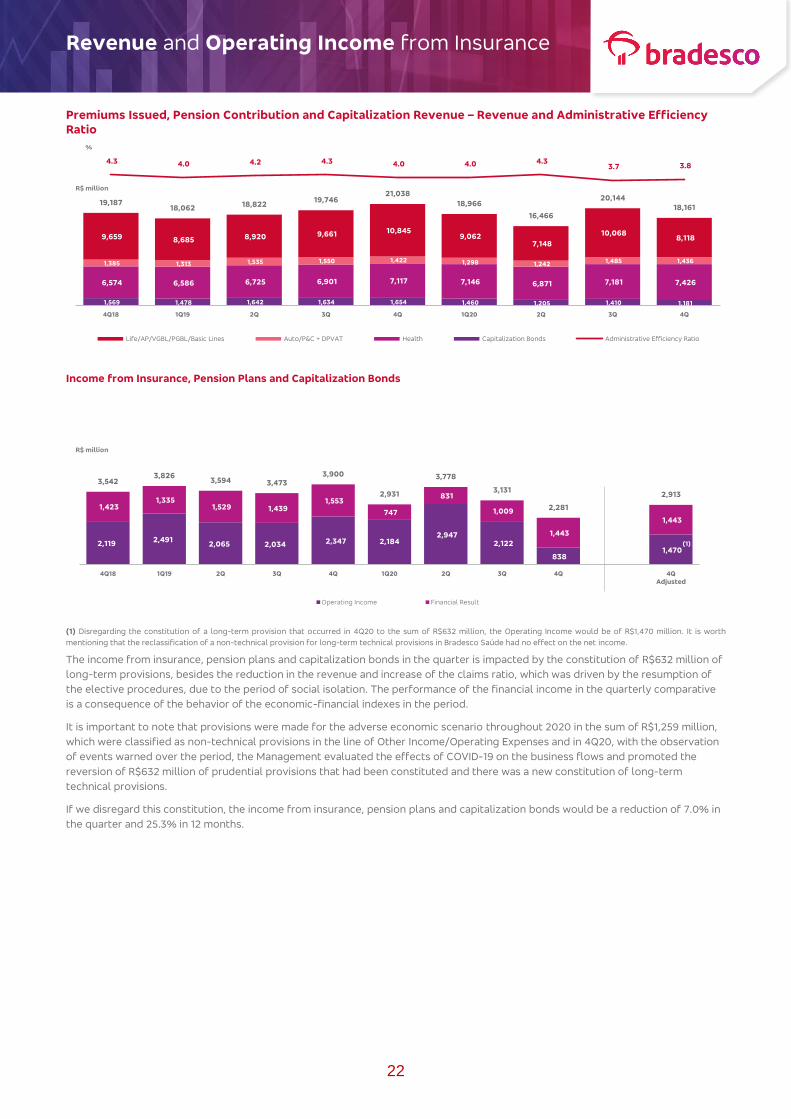
Revenue and Operating Income from Insurance
22
Premiums Issued, Pension Contribution and Capitalization Revenue – Revenue and Administrative Efficiency
Ratio
Income from Insurance, Pension Plans and Capitalization Bonds
(1) Disregarding the constitution of a long-term provision that occurred in 4Q20 to the sum of R$632 million, the Operating Income would be of R$1,470 million. It is worth
mentioning that the reclassification of a non-technical provision for long-term technical provisions in Bradesco Saúde had no effect on the net income.
The income from insurance, pension plans and capitalization bonds in the quarter is impacted by the constitution of R$632 million of
long-term provisions, besides the reduction in the revenue and increase of the claims ratio, which was driven by the resumption of
the elective procedures, due to the period of social isolation. The performance of the financial income in the quarterly comparative
is a consequence of the behavior of the economic-financial indexes in the period.
It is important to note that provisions were made for the adverse economic scenario throughout 2020 in the sum of R$1,259 million,
which were classified as non-technical provisions in the line of Other Income/Operating Expenses and in 4Q20, with the observation
of events warned over the period, the Management evaluated the effects of COVID-19 on the business flows and promoted the
reversion of R$632 million of prudential provisions that had been constituted and there was a new constitution of long-term
technical provisions.
If we disregard this constitution, the income from insurance, pension plans and capitalization bonds would be a reduction of 7.0% in
the quarter and 25.3% in 12 months.
1,569 1,478 1,642 1,634 1,654 1,460 1,205 1,410 1,181
6,574 6,586 6,725 6,901 7,117 7,146 6,871 7,181 7,426
1,385 1,313 1,535 1,550 1,422 1,298 1,242 1,485 1,436
9,659 8,685 8,920 9,661 10,845 9,062
7,148
10,068 8,118
19,18718,062 18,822
19,74621,038
18,966
16,466
20,14418,161
4.3 4.0 4.2 4.3 4.0 4.0 4.3 3.7 3.8
4Q18 1Q19 2Q 3Q 4Q 1Q20 2Q 3Q 4Q
Life/AP/VGBL/PGBL/Basic Lines Auto/P&C + DPVAT Health Capitalization Bonds Administrative Efficiency Ratio
R$ million
%
2,119 2,491 2,065 2,034 2,347 2,184
2,947 2,122
838 1,470
1,423 1,335
1,529 1,439 1,553
747
831
1,009
1,443
1,443
3,5423,826
3,594 3,4733,900
2,931
3,778
3,131
2,281
2,913
4Q18 1Q19 2Q 3Q 4Q 1Q20 2Q 3Q 4Q 4Q
Adjusted
Operating Income Financial Result
R$ million
(1)

Insurance Activity, Technical Provisions and Indicators
23
Technical Provisions
The technical provisions of the Insurance
Group totaled R$284.6 billion in December
2020, representing an increase of 3.6% in
relation to December 2019 and 1.9% regarding
the previous quarter, reflecting mainly the
higher provisions in the “Life and Pension” and
“Health” lines. It is worth noting that in 4Q20
there was the constitution of long-term
provisions of Bradesco Saúde.
Performance Ratios
The evolution of the combined ratio is due
largely to the increase in the claims ratio in the
quarter, mainly in the “Health” line.
The total claims ratio reached 83.7% in the
4Q20, an increase of 9.0 p.p. in comparison to
the previous quarter and of 9.5 p.p. in
comparison to the same period in the previous
year, reflecting the gradual resumption of the
elective procedures and indemnifiable events,
caused by the repressed demand during the
period of social isolation. It is important to note
that the claims ratio was impacted by the effect
of reclassifying the non-technical provision for
long-term technical provisions in Bradesco
Saúde.
The total expense ratio reached 8.6%, an
increase of 0.8 p.p. in comparison to the
previous quarter and of 0.3 p.p. in comparison
to the same period of the previous year.
258,755 261,106 265,241 269,675 274,765 272,257 274,861 279,186 284,606
234,661 236,888 240,388 244,312 249,240 246,298 250,168 253,240
257,746
10,392 10,378 10,756 11,014 11,132 11,727 11,325 12,390
13,638
8,187 8,336 8,538 8,699 8,838 8,854 8,755 8,815 8,571
4,608 4,567 4,665 4,791 4,753 4,541 4,391 4,531 4,650
Dec18 Mar19 June Sept Dec Mar20 June Sept Dec
Total Reserves Pension Plans and Life / VGBLHealth Capitalization BondsAuto/P&C
R$ million
Technical Provisions
93.8 92.6
98.0 99.1 98.2
95.4 82.0
96.7
108.9
99.8 98.4
95.5 97.195.3
96.9
92.0
95.6
100.0
54.450.4
55.7 54.6 56.153.5
61.866.8 67.4
80.8 80.384.5 84.4 84.2 83.6
74.5
86.0
95.5
4Q18 1Q19 2Q 3Q 4Q 1Q20 2Q 3Q 4Q
Health Auto/P&C Life Total
%
Combined Ratio
23.525.3
29.5
30.3
33.9 31.8
39.045.8
41.131.2
33.3
28.5
34.8
31.1 29.733.3 32.3
44.8
61.9 59.2 59.2 58.8 59.3 57.9
49.356.3
58.1
70.4 68.572.5 74.2 74.2 72.9
62.4
74.7
83.784.0 81.186.7 87.9 86.1 84.2
70.0
84.6
97.4
4Q18 1Q19 2Q 3Q 4Q 1Q20 2Q 3Q 4Q
Life/AP Property & CasualtyAuto/Optional Third-Party Liability TotalHealth
%
Claims Ratio
4.6 4.6 4.6 4.5 4.8 4.4 5.1 4.5 5.5
8.3 8.2 8.3 8.2 8.3 8.0 8.5 7.8 8.6
16.7 16.7 17.2 16.8 17.1 16.7 17.7 17.0 16.7
17.3 17.1 17.6 18.0 20.3
20.4
18.0 18.3 17.8
21.1 21.3 21.0 21.3 20.8
20.0
22.5
19.7 20.8
4Q18 1Q19 2Q 3Q 4Q 1Q20 2Q 3Q 4Q
Health TotalAuto/Optional Third-Party Liability Life/APProperty & Casualty
%
Expense Ratio

Insurance – Income by Segments
24
Life and Pension Plans
(1) Life/VGBL/PGBL/Traditional.
In relation to the 4Q19, net income is influenced by the
decrease in revenues and the increase in the claims
ratio in the “Life” line, impacted by the indemnifiable
events associated with the pandemic and the drop in
financial income, due to the behavior of the economic-
financial index, especially the IGPM, which impacted
the performance of the financial applications and the
updating of technical provisions. There was also a
reduction of the fees and commission income, which
was offset by the improvement in administrative
expenses.
In comparison with the 3Q20, the growth of net
income was driven by the improvement of the claims
ratio and the increase in financial income, offset by the
reduction in revenues and the drop in fee and
commission income.
Policyholders and Participants in Life and Personal
Accidents and in Pension Plans
Health
Note: Bradesco Saúde, Mediservice, Bradesco Saúde Operadora de Planos and
Odontoprev are considered for comparison purposes.
The net income growth in the 4Q20, in comparison
with the 3Q20 and the 4Q19, especially reflects the
increase in revenues and the improvement in financial
income due to the behavior of the economic-financial
index. This net income growth was partially offset by
the increase in the claims ratio, which was driven by
the gradual resumption of elective procedures, caused by the repressed demand of the period of
social isolation.
Number of Bradesco Saúde and Mediservice
Policyholders
9,659 8,685 8,920
9,661 10,845
9,062
7,148
10,068
8,118
1,003 934 830 910 1,029 811
583 639 642
4Q18 1Q19 2Q 3Q 4Q 1Q20 2Q 3Q 4Q
R$ million
Premium and Contribution Income (1) Net Income
32,647 34,157 33,138 32,203 33,149 33,117 32,377 32,022 31,876
Dec18 Mar19 June Sept Dec Mar20 June Sept Dec
In thousand
Number of Life and Personal Accidents
Policyholders
2,957 2,961 2,947 2,942 2,937 2,912 2,893 2,882 2,873
Dec18 Mar19 June Sept Dec Mar20 June Sept Dec
In thousand
Number of Pension and VGBL Participants
6,574 6,586 6,725 6,901 7,117 7,146 6,871 7,181 7,426
323 340 326 271 269 182 359
232 301
4Q18 1Q19 2Q 3Q 4Q 1Q20 2Q 3Q 4Q
R$ million
Net Written Premiums Net Income
3,482 3,438 3,447 3,473 3,532 3,511 3,492 3,536 3,531
143 141 139 136 134 132 130 128 127
7,218 7,176 7,181 7,208 7,340 7,164 6,983 6,950 7,155
10,843 10,755 10,767 10,817 11,006 10,807 10,605 10,614 10,813
Dec18 Mar19 June Sept Dec Mar20 June Sept Dec
In thousand
Company Health Plans Individual Health Plans Odontologic
Insurance – Income by Segments
25
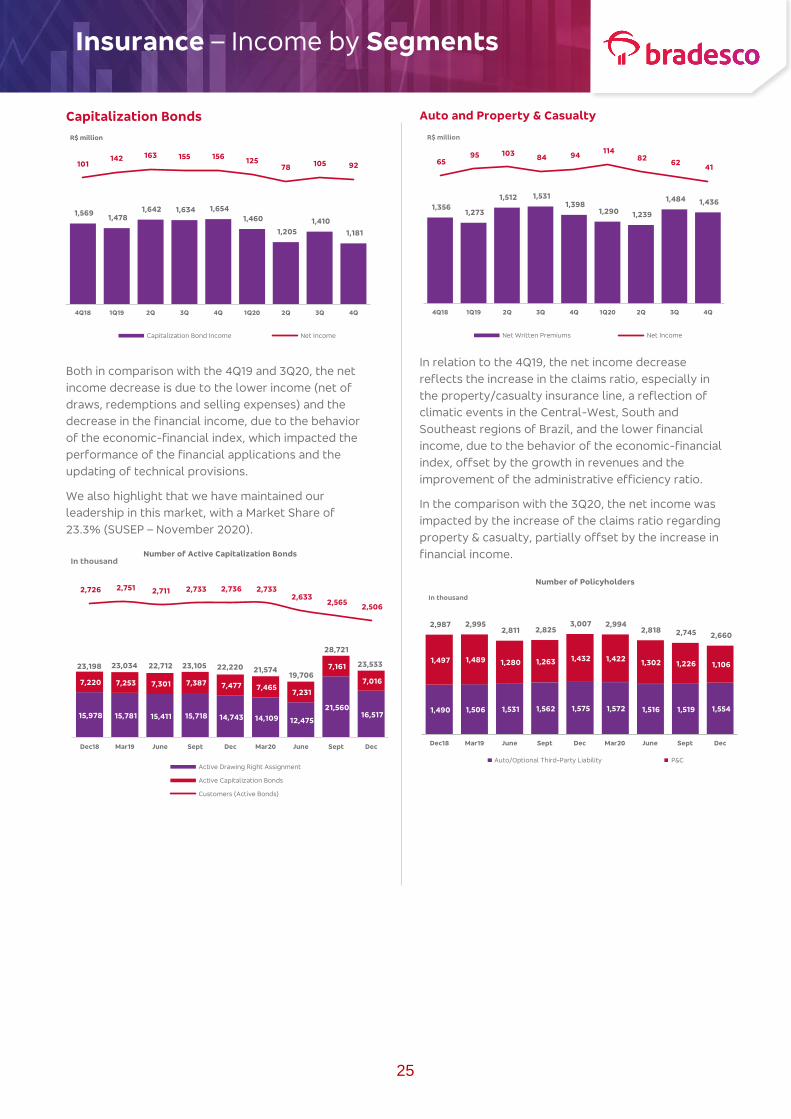
Capitalization Bonds
Both in comparison with the 4Q19 and 3Q20, the net
income decrease is due to the lower income (net of
draws, redemptions and selling expenses) and the
decrease in the financial income, due to the behavior
of the economic-financial index, which impacted the
performance of the financial applications and the
updating of technical provisions.
We also highlight that we have maintained our
leadership in this market, with a Market Share of
23.3% (SUSEP – November 2020).
Auto and Property & Casualty
In relation to the 4Q19, the net income decrease
reflects the increase in the claims ratio, especially in
the property/casualty insurance line, a reflection of
climatic events in the Central-West, South and
Southeast regions of Brazil, and the lower financial
income, due to the behavior of the economic-financial
index, offset by the growth in revenues and the
improvement of the administrative efficiency ratio.
In the comparison with the 3Q20, the net income was
impacted by the increase of the claims ratio regarding
property & casualty, partially offset by the increase in
financial income.
1,569 1,478
1,642 1,634 1,654
1,460
1,205
1,410
1,181
101142 163 155 156
12578 105 92
4Q18 1Q19 2Q 3Q 4Q 1Q20 2Q 3Q 4Q
R$ million
Capitalization Bond Income Net Income
15,978 15,781 15,411 15,718 14,743 14,109 12,475
21,560 16,517
7,220 7,253 7,301 7,387 7,477 7,465 7,231
7,161
7,016
2,726 2,751 2,711 2,733 2,736 2,733 2,633
2,565 2,506
Dec18 Mar19 June Sept Dec Mar20 June Sept Dec
In thousandNumber of Active Capitalization Bonds
Active Drawing Right Assignment
Active Capitalization Bonds
Customers (Active Bonds)
23,533 23,198 23,034 22,712 23,105 22,220 21,574 19,706
28,721
1,356 1,273
1,512 1,531 1,398
1,290 1,239
1,484 1,436
65 95 103
84 94 114
82 62
41
4Q18 1Q19 2Q 3Q 4Q 1Q20 2Q 3Q 4Q
R$ million
Net Written Premiums Net Income
1,490 1,506 1,531 1,562 1,575 1,572 1,516 1,519 1,554
1,497 1,489 1,280 1,263 1,432 1,422 1,302 1,226 1,106
2,987 2,995 2,811 2,825
3,007 2,994 2,818 2,745 2,660
Dec18 Mar19 June Sept Dec Mar20 June Sept Dec
Number of Policyholders
In thousand
Auto/Optional Third-Party Liability P&C

Dynamics of the Insurance Business
26
After the moderate recovery of the activity levels due to the reopening of sectors of the economy enabled by the cooling of the
health crisis, the 4Q20 was marked by the arrival of the second wave of the COVID-19 pandemic, which added uncertainty to the
economic scenario.
In 4Q20, in comparison to both the 4Q19 and the consolidated in the year, the pandemic negatively impacted the performance of the
Insurance Group, causing drops of 13.7% and 9.8% in the revenue, and 33.5% and 31.3% in the net income, respectively.
Despite the adverse situation, when compared to 4Q19, the technical reserves grew by 3.6%, to R$285 billion, and the financial
assets evolved 4.2%, reaching R$320 billion. Now the heading of Other Administrative Expenses reported a reduction of 5.7% and
3.8% when compared to the year-to-date, favoring the Administrative Efficiency Ratio of the Group, which remained stable at a level
of 3.8%. The value paid in compensation and benefits totaled R$33 billion, corresponding to a daily average of around R$130 million,
remaining stable with respect to the amount recorded in 2019.
With the evolution of the events warned over the period, part of the estimate recorded initially in relation to the distinctive scenario
caused by the COVID-19 was used to update the assumptions of the long-term provisions of the health line. This fact has not
produced any direct impact on the income of the quarter. The Management continues evaluating the dynamics of the events related
to the pandemic, considering the recent increase in the number of cases and uncertainties of its effects and duration.
In this scenario, Grupo Bradesco Seguros focused its strategy on the coverage of new risks, more flexible deadlines, agility in the
recruitment, more dynamic and consultative brokerage and, mainly, the investment in technology and innovation.
The company expanded and improved its digital marketing channels, whose sales grew 52% in 2020, in comparison with the
previous year, reaching the mark of R$1 billion, with an increase of 15% in the number of items distributed.
Currently, 11 products are marketed 100% online by the Bradesco Seguros app, which has already registered 6.3 million downloads.
In addition, 90% of Health reimbursements and 81% of claims of Auto insurance were completed by digital processing (58% and
43%, respectively, by the self-service system) and more than 200 thousand proposals of Private Pension plans have been validated
by the Bradesco App.
To expedite the support to its beneficiaries, Bradesco Saúde developed solutions like the Coronavirus Portal, complete repository of
information during the pandemic, and the “Digital Health”, a tele-medicine system available 24h, which surpassed the mark of 70
thousand appointments in 2020.
The company also expanded its line of regional plans, launching the Effective Campinas, Paraíba, Ceará, Piauí, Potiguar and Gaúcho
plans. In total, the product is available in 13 states and in the Federal District, totaling around 70 thousand beneficiaries. In 4Q20, the
São Paulo+ and Rio+ plans were launched, broadening the scope of these Effective plans.
In December, the Meu Doutor Novamed Clinics (My Doctor) completed five years in operation, totaling more than 530 thousand
appointments at its 19 units in the country, including the in-company clinics. The units of Curitiba (PR), São Bernardo do Campo (SP),
Botafogo and Centro (RJ) were opened in 2020.
In the segment of Pension Plans, Bradesco Vida e Previdência developed new options for products in the grid of individual and
corporate plans, seeking to meet client demand for greater diversity of pension funds and adjust the portfolio to the reality of the
market. On another front, it expanded the digital channels and applications available to managers for online sales, including the tool
for mobile and electronic signature by biometrics. In Life Insurance, the company implanted the claims report, the acceptance of
proposals for Bradesco account holders and the full range of information on products of the segment in the digital environment.
Now in Auto Insurance and P&C, Bradesco Auto/RE adopted the spread payment of the premium in the individual policies with
maturity, both for renewal as well as for new contracts, as well as the self-inspection in the acquisition of all products. The company
also improved the coverages for commercial activities at home and business insurance to consider protection of remote work and
strengthened the multichannel concept, adding new features to the applications Assistência Dia & Noite (Night & Day Assistance) and
Bradesco Corretor (Broker).
With regard to the brokers, the Insurance Group, although operating in the home office regime since the beginning of the pandemic,
strengthened the contact with these professionals, offering all the necessary support by means of channels like the Business Portal
and the BS Corretor App (Broker). The Group had the support of UniBrad - Bradesco University and of UniverSeg - Universe of
Insurance, intensifying training and promoting live streams with themes such as training in the virtual environment and new paths to
offer insurance.

Fee and Commission Income
27
The growth observed in practically all lines in the 4Q20 especially
reflects the gradual resumption of economic activity and the growth of
our business. Below are some highlights that influenced the results
from fee and commission income in the periods:
Card Income The evolution in the quarter is due to recovery of the
economy, in addition to the higher volume of business at the end of each
year, observed in the increase of the volume traded, as well as in the
change of the profile of purchases made, since revenues from operations
with cards in this period, in general, are higher in the establishments that
remained open during the restrictions period due to the COVID-19.
Checking Account The positive variation observed in all comparative
periods reflects the constant evolution of the client base during the year
of 2020, which increased 2.2 million in 12 months, and the higher turnover.
It is worth highlighting the strengthening in the management of the
service portfolio through a continuous process of improvement and
expansion of the variety of products, which we seek to offer in an
assertive way to clients.
Asset Management Variations observed in the periods are derived from
the review of the asset management fees aiming to adapt them to the new
standards of interest rate (Selic) and the redemptions observed in the
asset industry, with emphasis on the fixed income assets referenced by
the DI, which concentrate the liquidity reserves of both families and
companies, in addition to the lower number of working days. It is worth
highlighting the increase in the volume of funds and managed portfolios
of 5.2% in the quarter and 2.2% in 12 months.
Loan Operations The increase in comparison with the 3Q20 was driven by
the increase in the volume of loan origination, reflecting the gradual
recovery of the economy.
Consortium Management The good performance observed in the quarter
is a reflection of the strong presence of Bradesco Consórcios in its
branches of activity, maintaining its position as the leader in the market. It
is worth highlighting sales to individuals originated on mobile digital
channels and Internet Banking, which totaled R$390.9 million in 2020,
operating in market niches, such as agribusiness and real estate. We also
highlight sales in digital channels to companies, with revenue of R$443.8
million. With a comprehensive portfolio of products to meet all market
segments, 201,477 clients were included with letters of credit paid in 2020,
reaching the sum of R$8.7 billion.
Custody and Brokerage Services The positive variation in the periods is
related to the higher volumes traded in the stock exchange with emphasis
on the performance obtained in transactions carried out through Ágora
Corretora.
Underwriting/ Financial Advisory Services Here, revenues performance
is related to the volatility of the capital market activity combined with our
ability to capture business opportunities.
As of %
4Q20 3Q20 4Q19 12M20 12M194Q20 x
3Q20
4Q20 x
4Q19
12M20 x
12M194Q20
Card Income 2,983 2,530 2,906 10,565 11,288 17.9 2.6 (6.4) 34.2
Checking Account 2,072 1,955 1,980 7,928 7,706 6.0 4.6 2.9 23.8
Asset Management 815 872 968 3,414 3,835 (6.5) (15.8) (11.0) 9.3
Loans Operations 685 610 807 2,673 3,054 12.3 (15.1) (12.5) 7.9
Collections and Payments 665 668 653 2,613 2,575 (0.4) 1.8 1.5 7.6
Consortium Management 511 481 513 1,921 1,921 6.2 (0.4) - 5.9
Custody and Brokerage Services 328 321 307 1,298 1,139 2.2 6.8 14.0 3.8
Underwriting / Financial Advisory Services 344 383 434 1,151 1,015 (10.2) (20.7) 13.4 3.9
Other 314 301 261 1,184 1,073 4.3 20.3 10.3 3.6
Total 8,717 8,121 8,829 32,747 33,606 7.3 (1.3) (2.6) 100.0
Business Days 63 65 64 251 253 (2) (1) (2)
Variation %
R$ million
50,495 49,064 49,998 51,921 54,862 53,803
40,990 45,846
52,175
4Q18 1Q19 2Q 3Q 4Q 1Q20 2Q 3Q 4Q
Volume Traded - Credit Cards
R$ million
28.3 28.8 29.2 29.6 30.1 30.7 31.3 31.9 32.3
4Q18 1Q19 2Q 3Q 4Q 1Q20 2Q 3Q 4Q
Checking Account Holders In million
940.5 954.4 971.1995.5 1,000.8
915.5940.4
972.5
1,023.3
4Q18 1Q19 2Q 3Q 4Q 1Q20 2Q 3Q 4Q
Investments Funds and Managed Portfolios
R$ billion
57 59 63 69 71 71 70 73 71
257 260 261 267 266 252 244 243 235
1,190 1,209 1,215 1,266 1,280 1,262 1,236 1,232 1,222
1,504 1,528 1,539 1,601 1,617 1,585 1,550 1,548 1,528
4Q18 1Q19 2Q 3Q 4Q 1Q20 2Q 3Q 4Q
Number of Outstanding Consortium Quotas
Trucks Real Estate Auto
In million
1,623 1,654 1,775 1,803 1,855
1,590 1,718 1,768
1,949
4Q18 1Q19 2Q 3Q 4Q 1Q20 2Q 3Q 4Q
Assets under Custody
in billion

Operating Expenses
28
(1) It should be noted that provisions were made for the adverse economic scenario throughout 2020 in the sum of R$1,259 million in the Insurance Group, which were classified
as non-technical provisions in the line of Other Income/Operating Expenses. In 4Q20, part of these expenses was reversed (R$632 million) and there was a new constitution of
provision in the same value for long-term provisions of Bradesco Saúde, classified as technical provisions. This event has not produced any impact on the income of the 4Q20.
R$ million
Personnel Expenses
Structural 4,159 4,285 4,289 16,931 16,871 (2.9) (3.0) 0.4
Payroll/Social Charges 2,981 3,100 3,046 12,182 12,042 (3.8) (2.1) 1.2
Benefits 1,178 1,185 1,243 4,749 4,829 (0.6) (5.2) (1.7)
Non-Structural 975 615 1,179 3,257 4,896 58.5 (17.3) (33.5)
Management and Employee Profit Sharing 756 412 708 2,398 2,865 83.5 6.8 (16.3)
Provision for Labor Claims 129 152 325 577 1,490 (15.1) (60.3) (61.3)
Training 27 11 49 93 200 145.5 (44.9) (53.5)
Termination Costs 63 40 97 189 341 57.5 (35.1) (44.6)
Total - Personnel Expenses 5,134 4,900 5,468 20,188 21,767 4.8 (6.1) (7.3)
Administrative Expenses
Outsourced Services 1,418 1,298 1,406 5,204 5,086 9.2 0.9 2.3
Depreciation and Amortization 836 815 781 3,249 3,040 2.6 7.0 6.9
Data Processing 680 607 692 2,429 2,553 12.0 (1.7) (4.9)
Advertising and Marketing 398 291 558 1,249 1,573 36.8 (28.7) (20.6)
Communication 362 381 452 1,507 1,791 (5.0) (19.9) (15.9)
Asset Maintenance 357 349 360 1,375 1,316 2.3 (0.8) 4.5
Rent 323 336 329 1,344 1,299 (3.9) (1.8) 3.5
Financial System Services 284 256 273 1,050 1,065 10.9 4.0 (1.4)
Transportation 155 167 208 673 807 (7.2) (25.5) (16.6)
Security and Surveillance 151 176 190 698 745 (14.2) (20.5) (6.3)
Utilities (Water, Electricity and Gas) 91 80 112 374 445 13.8 (18.8) (16.0)
Materials 42 34 55 153 204 23.5 (23.6) (25.0)
Travel 8 6 105 82 315 33.3 (92.4) (74.0)
Other 259 239 290 1,060 1,168 8.4 (10.7) (9.2)
Total - Administrative Expenses 5,364 5,035 5,811 20,447 21,407 6.5 (7.7) (4.5)
Total Expenses Administrative + Personnel 10,498 9,935 11,279 40,635 43,174 5.7 (6.9) (5.9)
Other Operating Expenses Net of Revenue
Expenses with Marketing of Cards 521 405 643 1,983 2,285 28.6 (19.0) (13.2)
Civil and Tax Contingencies 366 264 143 860 942 38.6 155.9 (8.7)
Claims 129 122 116 447 469 5.4 11.2 (4.8)
Provision related to the adverse economic scenario (1) (632) 151 - 627 - - - -
Other 601 847 479 1,871 2,156 (29.0) 25.5 (13.2)
Total - Operating Expenses Net of Revenue 985 1,789 1,381 5,788 5,852 (44.9) (28.7) (1.1)
Total Operating Expenses 11,483 11,724 12,660 46,423 49,026 (2.1) (9.3) (5.3)
12M204Q20 3Q20
Variation %
12M194Q20 x
3Q20
4Q20 x
4Q19
12M20 x
12M194Q19
The operating expenses were reduced by 5.3%
in the annual comparison (12M20 vs. 12M19).
Disregarding the provision for the adverse economic scenario of the Insurance
Group, the savings would be of R$3.2 billion or 6.6%.

Operating Expenses
29
Personnel Expenses In the comparison with the
previous year (12M19), a drop of 7.3% or R$1.6
billion, resulted mainly from the reduction of the
workforce, lower expenses with provision for
labor claims and management and employee
profit sharing. It is worth noting that the effect of
the collective labor convention was 1.5% in 2020.
Regarding the comparison with the 3Q20, the
variations presented in the structural portion are
due to the reduction of the workforce, offset, in
part, by the effects of the collective bargaining
agreement. In the non-structural portion, the
increase in the quarterly comparative is justified
by higher variable expenses (management and
employee profit sharing), due to the increase of
the income.
Administrative Expenses The actions of the
Management to maintain a strict cost control and
to improve operational efficiency remain
reflecting on the performance of administrative
expenses. Compared to the previous year
periods, the expenses decreased 7.7% in
comparison with the 4Q19 and 4.5% in relation to
12M19. It is noteworthy that the inflation in 12
months measured by the IPCA and the IGP-M was
4.5% and 23.1%, respectively. In the quarterly
comparative, the increase of expenses is
concentrated on variable expenses and costs
related to the volume of business, in addition to
higher advertising and marketing expenses,
which justify the seasonal growth of expenses in
relation to the 3Q20.
(1) It includes business units – they are Banking Service Points (PAs) dedicated
exclusively to the relationship, financial consulting and offer of products and services
to Clients. For such, the digital channels, ATMs and banking correspondents have an
essential role.
Other Operating Expenses, Net of Income The reduction in the quarter is a reflection of the reversion of
part of the provision were made during the year 2020, for the adverse economic scenario of the Insurance
Group, to the sum of R$632 million, offset by higher costs with the constitution of civil provisions and
marketing of cards, the latter arising from the seasonal effect at the end of each year.
98,605
99,156
99,198
99,272
97,329
97,234
96,787
95,934
89,575
Dec18
Mar19
June
Sept
Dec
Mar20
June
Sept
Dec
Number of Employees
4,723
4,761
4,783
4,775
4,928
4,988
5,177
5,384
5,445
4,617
4,594
4,581
4,567
4,478
4,400
4,167
3,795
3,395
Dec18
Mar19
June
Sept
Dec
Mar20
June
Sept
Dec
PAEs and Pas (1) Branches
Branches and PAEs/PAs

Profit Reconciliation
30
Main non-recurring events that affected the net income in the periods:
(1) In 2020, it is composed of civil provisions and, in 2019, of civil and labor provisions;
(2) It refers to the ratings downgrade and the improvement of the measurement criteria of provision for
guarantees – sureties and guarantees;
(3) In 2020, it includes impairment of goodwill, intangible assets and systems/hardware and, in 2019, it is
mainly composed of impairment of investment, assets related to the acquisition in the provision of
financial services (payroll) and systems/hardware; and
(4) Related to restructuring, mainly, in the branch network.
R$ million4Q20 3Q20 4Q19 12M20 12M19
Recurring Net Income 6,801 5,031 6,645 19,458 25,887
Non-Recurring Events (1,337) (837) (1,762) (2,912) (3,305)
- Tax Credit - - 6,403 - 6,403
- Contingent Liabilities (1) (353) - (3,373) (353) (3,524)
- Expanded (ALL) (2) - - (2,468) - (2,468)
- Impairment of Non-Financial Assets (3) (574) - (1,080) (574) (1,080)
- Provision for Restructuring (4) (57) (483) - (540) -
- Goodwill Amortization (Gross) (354) (354) (426) (1,446) (1,545)
- Voluntary Severance Program 2019 - PDV - - (818) - (1,091)
Book Net Income 5,464 4,194 4,883 16,546 22,582
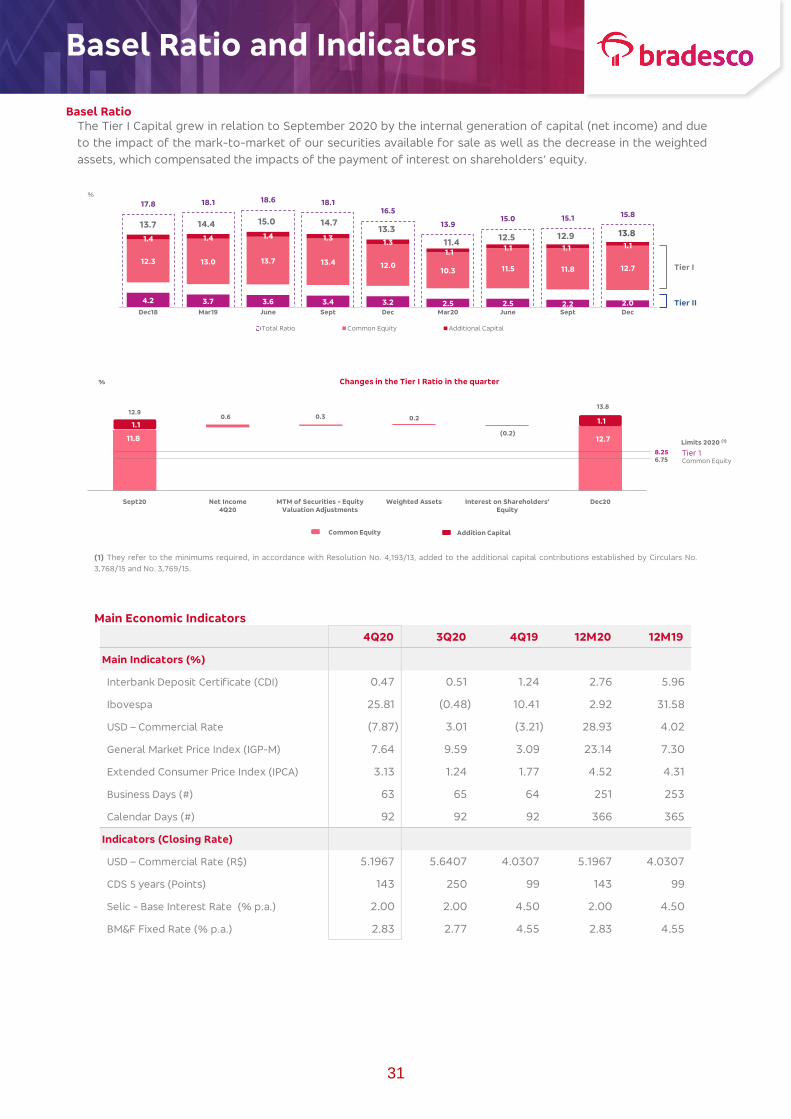
Basel Ratio and Indicators
31
Basel Ratio
The Tier I Capital grew in relation to September 2020 by the internal generation of capital (net income) and due
to the impact of the mark-to-market of our securities available for sale as well as the decrease in the weighted
assets, which compensated the impacts of the payment of interest on shareholders’ equity.
(1) They refer to the minimums required, in accordance with Resolution No. 4,193/13, added to the additional capital contributions established by Circulars No.
3,768/15 and No. 3,769/15.
Main Economic Indicators
17.8 18.1 18.6 18.116.5
13.915.0 15.1 15.8
4.2 3.7 3.6 3.4 3.2 2.5 2.5 2.2 2.0
12.3 13.0 13.7 13.4 12.010.3 11.5 11.8 12.7
1.4 1.4 1.4 1.31.3
1.11.1 1.1 1.1
Dec18 Mar19 June Sept Dec Mar20 June Sept Dec
Total Ratio Common Equity Additional Capital
13.7 14.4 15.0 14.713.3
11.412.5 12.9 13.8
%
Tier I
Tier II
12.9 13.8
0.6 0.3 0.2
(0.2)
Sept20 Net Income
4Q20
MTM of Securities - Equity
Valuation Adjustments
Weighted Assets Interest on Shareholders'
Equity
Dec20
1.1
11.8
1.1
Common Equity Addition Capital
Limits 2020 (1)
Common Equity
8.256.75
Tier 1
12.7
% Changes in the Tier I Ratio in the quarter
4Q20 3Q20 4Q19 12M20 12M19
Main Indicators (%)
Interbank Deposit Certificate (CDI) 0.47 0.51 1.24 2.76 5.96
Ibovespa 25.81 (0.48) 10.41 2.92 31.58
USD – Commercial Rate (7.87) 3.01 (3.21) 28.93 4.02
General Market Price Index (IGP-M) 7.64 9.59 3.09 23.14 7.30
Extended Consumer Price Index (IPCA) 3.13 1.24 1.77 4.52 4.31
Business Days (#) 63 65 64 251 253
Calendar Days (#) 92 92 92 366 365
Indicators (Closing Rate)
USD – Commercial Rate (R$) 5.1967 5.6407 4.0307 5.1967 4.0307
CDS 5 years (Points) 143 250 99 143 99
Selic - Base Interest Rate (% p.a.) 2.00 2.00 4.50 2.00 4.50
BM&F Fixed Rate (% p.a.) 2.83 2.77 4.55 2.83 4.55
13,4%

Guidance and Economic Perspectives
32
This Economic and Financial Analysis Report contains forward-looking statements related to our business. Such statements are based on Management’s
current expectations, estimates and projections concerning future events and financial trends that may affect our business. However, the forward-
looking statements are not guarantees of future performance and involve risks and uncertainties that may be beyond our control. In addition, certain
forward-looking statements, such as the guidance, for example, are based on assumptions, which, depending on future events, may not prove to be
accurate. Thus, the actual results may differ significantly from the plans, objectives, expectations, forecasts and intentions expressed or implied in such
forward-looking statements. The factors that can modify the actual results include changes in business and economic conditions, changes in interest
rates, inflation, loss of the ability to capture deposits, and loss of clients or of income, among others.
Guidance 2021
Bradesco’s Projections
Realized
20202021
Expanded Loan Portfolio 10.3% 9% to 13%
Client Portion 5.1% 2% to 6%
Fee and Commission Income -2.6% 1% to 5%
Operating Expenses(Personnel + Administrative Expenses + Other Operating Expenses, Net of Income)
-5.3% -5% to -1%
Income from Insurance, Pension Plans and
Capitalization Bonds(It includes the financial income of the operation)
-18.1% 2% to 6%
Expanded ALL - R$ billion R$ 25.8 R$ 14.0 to R$ 17.0
% 2021 2022 2023
USD - Commercial Rate (year-end) - R$ 5.00 5.07 5.15
Extended Consumer Price Index (IPCA) 3.50 3.50 3.25
General Market Price Index (IGP-M) 6.16 4.10 3.80
Selic (year-end) 4.00 5.25 5.25
Gross Domestic Product (PIB) 3.60 3.00 3.00

1
Informações
Adicionais
Additional
Information

100% Client
34
The client is at the center of all our activities and is the reason for our existence. We continue meeting their
needs and preferences, aware of the purpose of each profile, identifying their moment of life and seeking to
understand their plans so we are part of their achievements.
Our strategy is based on enchanting our clients, bringing an attractive value proposal suited to their needs so we
can merit their admiration and confidence. Over 77 years, we have improved the way we interact and provide
services, always reinforcing that those who work here should know how to act in the relationship with clients.
The client is at the center of our strategy and we have made several actions to enhance the knowledge through
the use of data intelligence, complete solutions for business and journeys of excellence, developing ways to get
to know the client, their moment in life and interaction with the Organization. In this way, we enable
contextualized offers, in accordance with their profile, providing pleasant and agile moments when they contact
the Bank.
Our behavior and mentality are digital so we can be simple, agile, flexible, connected and innovative. In a context
of great digital transformation, we want to make the banking experience even more convenient, modern, fast and
safe for the client – drivers present in the day-to-day operations.
We seek to maximize value from the client's perspective through the culture focused on continuous improvement
and efficiency. The expense management was highlighted, contributing with actions and projects aimed at
optimizing the use of channels and reducing the cost of providing services without losing quality.
Having people who work here as one of the main pillars, we seek to enhance their essential competencies in order
to make our corporate strategy feasible. By means of an organizational culture based on ethics, transparency and
respect for others, we have invested in an innovative, challenging, inclusive and diverse environment.
In 2020, we reviewed the corporate strategies of customer relationship, creating
initiatives aimed at meeting their expectations in line with their life cycle in order to provide and increase their
level of satisfaction by the excellence achieved during their entire relationship with our Organization.
In this sense, we highlight two important initiatives:
o Structuring of the Corporate Program called 100% Client, making use of the best market practices, which
aim to organize our business model to ensure that the client is always at the center of attention.
o Creation of the position of Chief Customer Officer (CCO) to ensure that the policy of customer
satisfaction is increasingly effective inside the Organization.
Initiatives
Transformation of the Business Model - 100% Client Program
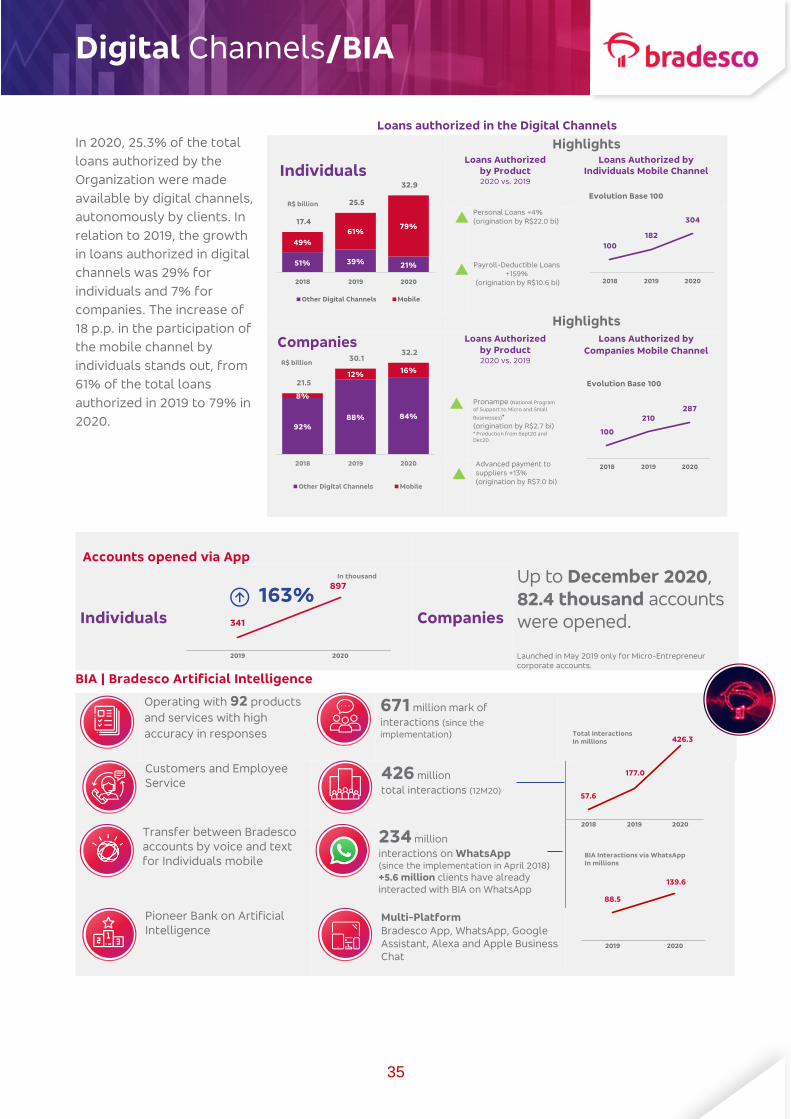
Digital Channels/BIA
35
In 2020, 25.3% of the total
loans authorized by the
Organization were made
available by digital channels,
autonomously by clients. In
relation to 2019, the growth
in loans authorized in digital
channels was 29% for
individuals and 7% for
companies. The increase of
18 p.p. in the participation of
the mobile channel by
individuals stands out, from
61% of the total loans
authorized in 2019 to 79% in
2020.
BIA | Bradesco Artificial Intelligence
Loans authorized in the Digital Channels Highlights
Loans Authorized
by Product 2020 vs. 2019
Loans Authorized by
Individuals Mobile Channel
Personal Loans +4%
(origination by R$22.0 bi)
Payroll-Deductible Loans +159%
(origination by R$10.6 bi)
Highlights
Loans Authorized
by Product 2020 vs. 2019
Loans Authorized by
Companies Mobile Channel
Pronampe (National Program
of Support to Micro and Small
Businesses)*
(origination by R$2.7 bi) * Production from Sept20 and
Dec20.
Advanced payment to
suppliers +13% (origination by R$7.0 bi)
Accounts opened via App
Individuals
Companies
Up to December 2020,
82.4 thousand accounts
were opened.
Launched in May 2019 only for Micro-Entrepreneur corporate accounts.
Operating with 92 products
and services with high
accuracy in responses
671 million mark of
interactions (since the
implementation)
Customers and Employee
Service
426 million
total interactions (12M20)
Transfer between Bradesco
accounts by voice and text
for Individuals mobile
234 million
interactions on WhatsApp (since the implementation in April 2018)
+5.6 million clients have already
interacted with BIA on WhatsApp
Pioneer Bank on Artificial
Intelligence
Multi-Platform
Bradesco App, WhatsApp, Google
Assistant, Alexa and Apple Business
Chat
51% 39% 21%
49%
61%79%
17.4
25.5
32.9
2018 2019 2020
Other Digital Channels Mobile
R$ billion
92%88% 84%
8%
12%16%
21.5
30.1 32.2
2018 2019 2020
Other Digital Channels Mobile
R$ billion
341
897
2019 2020
163%In thousand
Individuals
Companies
57.6
177.0
426.3
2018 2019 2020
Total InteractionsIn millions
88.5
139.6
2019 2020
BIA Interactions via WhatsAppIn millions
100
182
304
2018 2019 2020
Evolution Base 100
100
210287
2018 2019 2020
Evolution Base 100
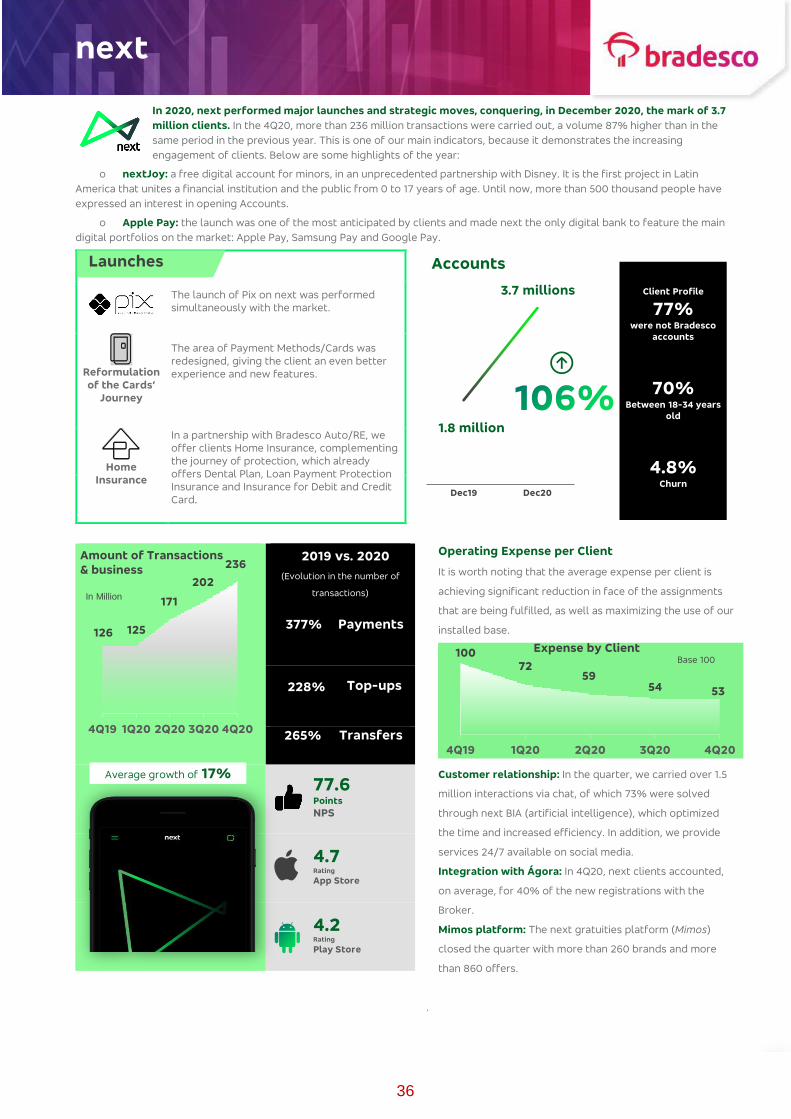
next
36
In 2020, next performed major launches and strategic moves, conquering, in December 2020, the mark of 3.7
million clients. In the 4Q20, more than 236 million transactions were carried out, a volume 87% higher than in the
same period in the previous year. This is one of our main indicators, because it demonstrates the increasing
engagement of clients. Below are some highlights of the year:
o nextJoy: a free digital account for minors, in an unprecedented partnership with Disney. It is the first project in Latin
America that unites a financial institution and the public from 0 to 17 years of age. Until now, more than 500 thousand people have
expressed an interest in opening Accounts.
o Apple Pay: the launch was one of the most anticipated by clients and made next the only digital bank to feature the main
digital portfolios on the market: Apple Pay, Samsung Pay and Google Pay.
The launch of Pix on next was performed
simultaneously with the market.
Reformulation
of the Cards’
Journey
The area of Payment Methods/Cards was
redesigned, giving the client an even better
experience and new features.
Home
Insurance
In a partnership with Bradesco Auto/RE, we
offer clients Home Insurance, complementing
the journey of protection, which already
offers Dental Plan, Loan Payment Protection
Insurance and Insurance for Debit and Credit
Card.
(Evolution in the number of
transactions)
Payments
Top-ups
Transfers
77.6 Points NPS
4.7 Rating
App Store
4.2 Rating
Play Store
Operating Expense per Client
It is worth noting that the average expense per client is
achieving significant reduction in face of the assignments
that are being fulfilled, as well as maximizing the use of our
installed base.
Customer relationship: In the quarter, we carried over 1.5
million interactions via chat, of which 73% were solved
through next BIA (artificial intelligence), which optimized
the time and increased efficiency. In addition, we provide
services 24/7 available on social media.
Integration with Ágora: In 4Q20, next clients accounted,
on average, for 40% of the new registrations with the
Broker.
Mimos platform: The next gratuities platform (Mimos)
closed the quarter with more than 260 brands and more
than 860 offers.
..
1.8 million
3.7 millions
Dec19 Dec20
Accounts
Client Profile
77%were not Bradesco
accounts
70%Between 18-34 years
old
4.8%Churn
126 125
171
202
236
4Q19 1Q20 2Q20 3Q20 4Q20
In Million
Amount of Transactions
& business
10072
5954 53
4Q19 1Q20 2Q20 3Q20 4Q20
Base 100Expense by Client
Average growth of 17%
2019 vs. 2020
377%
265%
228%
Launches
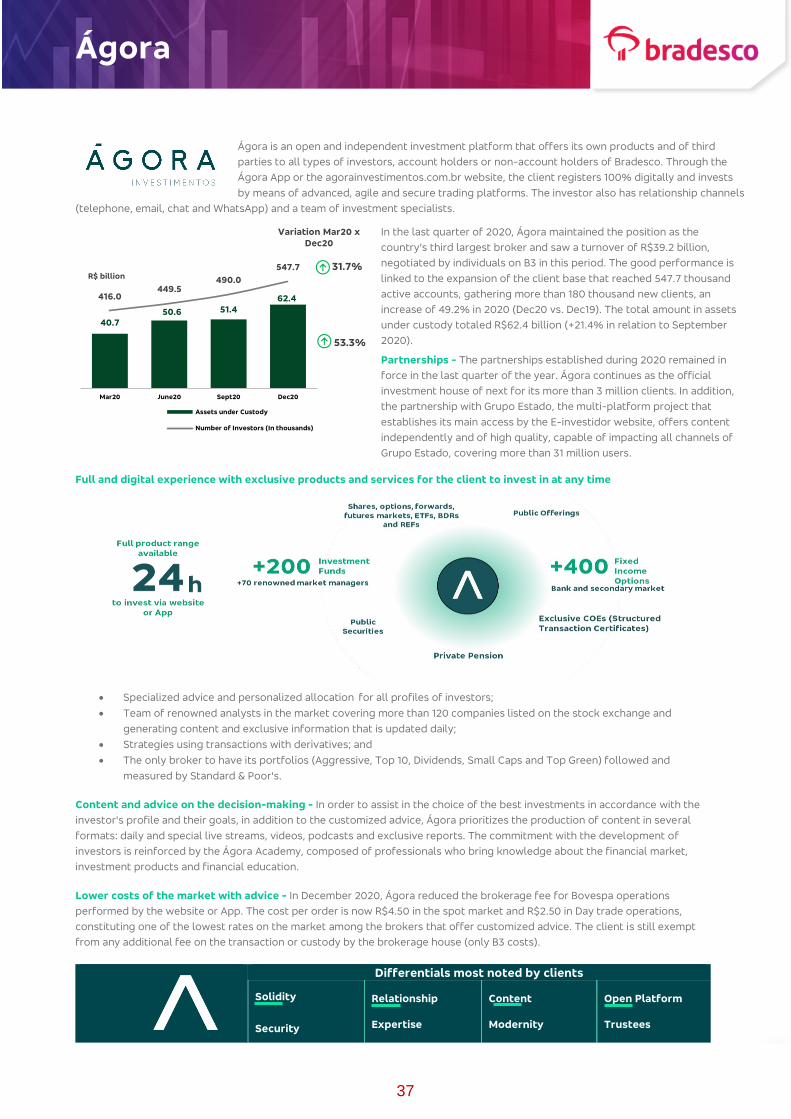
Ágora
37
Ágora is an open and independent investment platform that offers its own products and of third
parties to all types of investors, account holders or non-account holders of Bradesco. Through the
Ágora App or the agorainvestimentos.com.br website, the client registers 100% digitally and invests
by means of advanced, agile and secure trading platforms. The investor also has relationship channels
(telephone, email, chat and WhatsApp) and a team of investment specialists.
In the last quarter of 2020, Ágora maintained the position as the
country's third largest broker and saw a turnover of R$39.2 billion,
negotiated by individuals on B3 in this period. The good performance is
linked to the expansion of the client base that reached 547.7 thousand
active accounts, gathering more than 180 thousand new clients, an
increase of 49.2% in 2020 (Dec20 vs. Dec19). The total amount in assets
under custody totaled R$62.4 billion (+21.4% in relation to September
2020).
Partnerships - The partnerships established during 2020 remained in
force in the last quarter of the year. Ágora continues as the official
investment house of next for its more than 3 million clients. In addition,
the partnership with Grupo Estado, the multi-platform project that
establishes its main access by the E-investidor website, offers content
independently and of high quality, capable of impacting all channels of
Grupo Estado, covering more than 31 million users.
Full and digital experience with exclusive products and services for the client to invest in at any time
Specialized advice and personalized allocation for all profiles of investors;
Team of renowned analysts in the market covering more than 120 companies listed on the stock exchange and
generating content and exclusive information that is updated daily;
Strategies using transactions with derivatives; and
The only broker to have its portfolios (Aggressive, Top 10, Dividends, Small Caps and Top Green) followed and
measured by Standard & Poor's.
Content and advice on the decision-making - In order to assist in the choice of the best investments in accordance with the
investor's profile and their goals, in addition to the customized advice, Ágora prioritizes the production of content in several
formats: daily and special live streams, videos, podcasts and exclusive reports. The commitment with the development of
investors is reinforced by the Ágora Academy, composed of professionals who bring knowledge about the financial market,
investment products and financial education.
Lower costs of the market with advice - In December 2020, Ágora reduced the brokerage fee for Bovespa operations
performed by the website or App. The cost per order is now R$4.50 in the spot market and R$2.50 in Day trade operations,
constituting one of the lowest rates on the market among the brokers that offer customized advice. The client is still exempt
from any additional fee on the transaction or custody by the brokerage house (only B3 costs).
Differentials most noted by clients
Solidity
Security
Relationship
Expertise
Content
Modernity
Open Platform
Trustees
40.750.6 51.4
62.4416.0449.5
490.0
547.7
Mar20 June20 Sept20 Dec20
R$ billion
Assets under Custody
Number of Investors (In thousands)
53.3%
Variation Mar20 x
Dec20
31.7%

Launches/Highlights
38
Bitz, Bradesco’s digital wallet - Officially launched to the market in September 2020, Bitz is a digital wallet that
has a free payment account in which the balance yields 100% of the CDI. The application has features such as:
pay and receive by mobile, free TEDs, mobile top-up, debit card and virtual card to make purchases on the
internet and on the most commonly used applications in the country. In addition, all purchases with the Bitz card
generate cashback to clients as a way of encouraging the recurrence of the payment method. As a startup, Bitz
will operate with the dexterity required to advance in its category.
Acquisitions made - In October, with only one month of its launch, Bitz made its first acquisition, which was the
startup Dindin App. Already in December, it made its second purchase, the company 4Ward, with the objective of
acquiring technical know-how. The teams of technology and products were integrated, constituting a team of
experts in the category of digital wallets and payment Apps in a short time.
Growth driven by actions and promotions - The activations were the great engines of growth of the base,
which was three times the expectation projected for 2020. Performance Marketing Campaigns, press (PR) and
promotions are responsible for this result. The category of digital wallets and payment accounts runs on a retail
dynamic, in which both the acquisitions of clients as well as the incentive regarding the frequency of use are
motivated by differentials such as cashback and bonus in the account, besides benefits like the generation of the
bank payment slip using the App, transfers without any charge and payments with the QR code on Cielo card
machines. In the fourth quarter of the year, we had two main promotions: “NovemBitz”, during the month of
Black Friday, and “Bitz Noel”.
Growth of the base, improvements on the App, gain in scale, new partnerships, cases of use and growth of the
distribution via Bradesco channels will be the focus in 2021.
Bradesco concluded the acquisition of BAC Florida Bank and its subsidiaries on October 30, 2020. With 46 years
of expertise in banking, BAC Florida is headquartered in Coral Gables, Miami, USA, and has approximately 10
thousand clients.
BAC will offer a complete platform of banking products and services and of investments in the United States, a
differential in relation to our main competitors. The model of customer service will be unique and will have a
team of specialists in Miami to meet with exclusivity Brazilian clients in Portuguese. All of this with a smooth
digital experience.
BAC will continue to develop the existing lines of business like Private Banking & Wealth Management, Real
Estate Financing, Corporate & Institutional Banking and Commercial & Personal Digital Banking and, at the same
time, it will explore the whole potential of synergy between client bases.
In November 2020, Bradesco launched Pix, an innovative payment method created by the Central Bank of Brazil,
which allows payments, transfers and receipts at any time of the day, every day of the year, even on weekends
and holidays, crediting the beneficiary’s account in a few seconds. Pix can be performed from a current account,
savings account or payment account. The transactions are carried out by informing only the Pix key registered
(CPF/CNPJ, mobile, e-mail or random key) or scan of the QR Code for payment. Everything happens online,
through digital channels.
We were the first bank to add a loan offer linked to the Pix journey, where the offer is contextualized.
Bradesco reaffirms its commitment to innovate and encourage the market of payments.
ESG Issuance of Security linked to ESG criteria (Climate Financial Bill): In December 2020, Bradesco issued its first
green security. The sum of R$1.2 billion will fund projects and assets that support the transition toward a less
carbon-intensive economy.

Service Network
39
We are a Bank present throughout Brazil and operating in strategic locations abroad. With a wide and constantly
updated Service Network, we provide a modern structure, offering practical services in all segments we operate. At the
end of the quarter, our Network was comprised of 79,870 points.
Bradesco Varejo
The Bradesco Varejo service network comprises 3,049 branches, 3,915 service points, 822 electronic service points
and 708 business units, in addition to 39,100 Bradesco Expresso (banking correspondent) units, structures
dedicated to conducting business and for customer relationship, with the offer of a broad portfolio of products
and services.
In addition, we offer Digital Channels and thousands of self-service machines, providing full autonomy to clients
to carry out banking transactions conveniently and securely.
Even in a challenging year like 2020, we continued advancing in the offer of products and services and through
the implementation of digital journeys, we improved our customer (individuals and companies) experience, and
strengthened the financial guidance as a pillar of banking inclusion throughout the country.
Bradesco Prime
Bradesco Prime is the segment for high-income individuals, operating throughout Brazil. It has a wide network of
branches and platforms of service to its clients, including to those with a digital and investor profile. Clients rely
on the model of full relationship, with specialists in investments and relationship managers who act in a dedicated
manner, with a focus on their individual needs and offering personalized and effective financial planning.
Bradesco Private Bank
Bradesco Private Bank offers exclusivity and works side by side with clients to conserve and manage family wealth
across generations, underscoring the increase of its international value proposition with the acquisition of BAC
Florida Bank and its subsidiaries.
Designing innovative solutions to meet the ambitions and the individual needs of each of our clients, we have a
complete structure of Wealth Management involving liquid and illiquid assets, the best vehicles and investment
structures for the perpetuation of the family’s estate.
Clients have access to a complete, open and differentiated investments platform, locally and internationally, in
addition to exclusive funds, always counting on an experienced team of managers, economists, advisors, in
addition to all of our business solutions including Investment Bank, Loan, Insurance, Broker, Pension, among
others.
Currently, Bradesco Private Bank has 14 offices located in: São Paulo, Rio de Janeiro, Belo Horizonte, Blumenau,
Campinas, Curitiba, Fortaleza, Goiânia, Manaus, Porto Alegre, Recife, Ribeirão Preto and Salvador, thus ensuring
nation-wide presence, in addition to a foreign unit in Luxembourg.
Bradesco Corporate
The Bradesco Corporate segment is responsible for serving business groups and focused on both large and
medium-sized enterprises. With its offices located in the main financial centers and with a value proposal based on
proximity and relationship, it offers customized services with a global reach and has a highly skilled team to fulfill
clients’ needs through a wide portfolio of products, structured solutions and financial services.
Wholesale has been investing in major changes in customer experience and in the journey of managers, which has
been omnichannel and has been using systems like SalesForce and Tableau. In the half, we remodeled our
functional structure, eliminating hierarchical levels and addressing the challenge of “span of control” – achieving
this without losing sales reps, but gaining productivity and efficiency. We also eliminated two levels, highlighted
by the end of regional managers in the Corporate segments, and we also merged the Institutional segment with
the multinationals segment.
In addition to the four Corporate units, there are a number of divisions within these areas that observe concepts of
size, sectorial and geographical aspects, among others. The four Corporate units are: Large Corporate; Corporate;
Multi and Institutional; and Corporate One, which includes Middle Market.
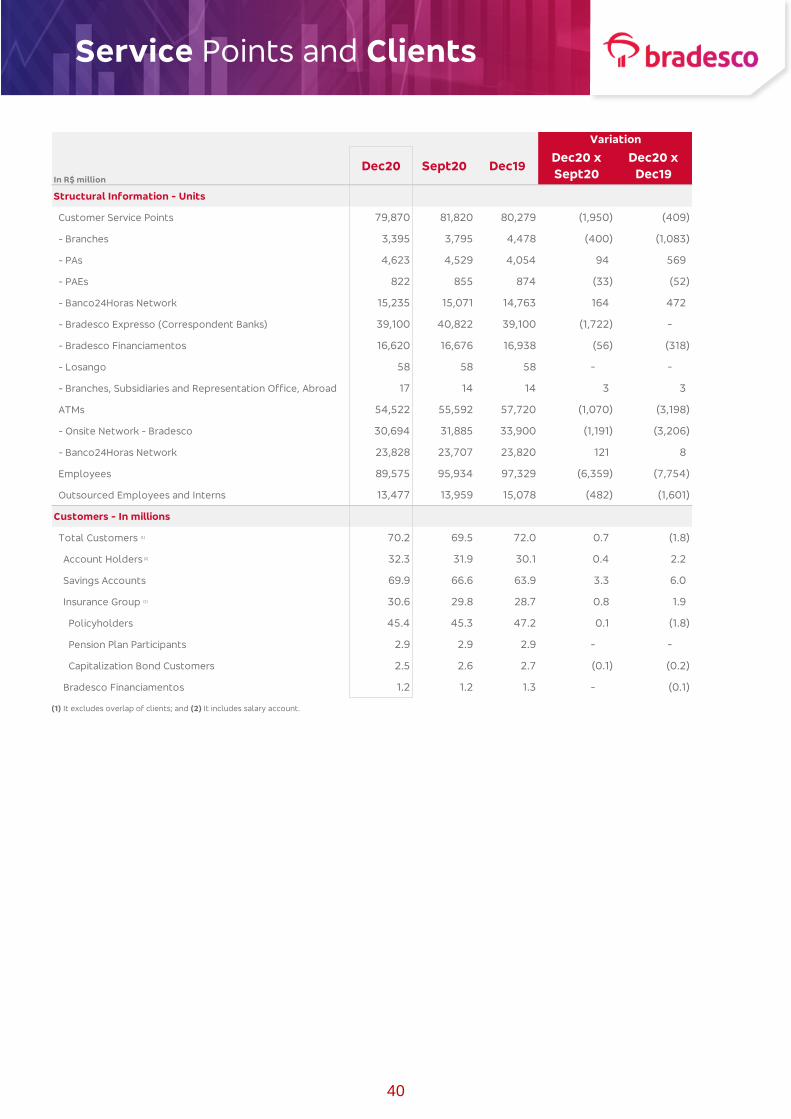
Service Points and Clients
40
(1) It excludes overlap of clients; and (2) It includes salary account.
In R$ million
Structural Information - Units
Customer Service Points 79,870 81,820 80,279 (1,950) (409)
- Branches 3,395 3,795 4,478 (400) (1,083)
- PAs 4,623 4,529 4,054 94 569
- PAEs 822 855 874 (33) (52)
- Banco24Horas Network 15,235 15,071 14,763 164 472
- Bradesco Expresso (Correspondent Banks) 39,100 40,822 39,100 (1,722) -
- Bradesco Financiamentos 16,620 16,676 16,938 (56) (318)
- Losango 58 58 58 - -
- Branches, Subsidiaries and Representation Office, Abroad 17 14 14 3 3
ATMs 54,522 55,592 57,720 (1,070) (3,198)
- Onsite Network - Bradesco 30,694 31,885 33,900 (1,191) (3,206)
- Banco24Horas Network 23,828 23,707 23,820 121 8
Employees 89,575 95,934 97,329 (6,359) (7,754)
Outsourced Employees and Interns 13,477 13,959 15,078 (482) (1,601)
Customers - In millions
Total Customers (1) 70.2 69.5 72.0 0.7 (1.8)
Account Holders (2) 32.3 31.9 30.1 0.4 2.2
Savings Accounts 69.9 66.6 63.9 3.3 6.0
Insurance Group (1) 30.6 29.8 28.7 0.8 1.9
Policyholders 45.4 45.3 47.2 0.1 (1.8)
Pension Plan Participants 2.9 2.9 2.9 - -
Capitalization Bond Customers 2.5 2.6 2.7 (0.1) (0.2)
Bradesco Financiamentos 1.2 1.2 1.3 - (0.1)
Dec20 x
Sept20Dec19Dec20 Sept20
Variation
Dec20 x
Dec19
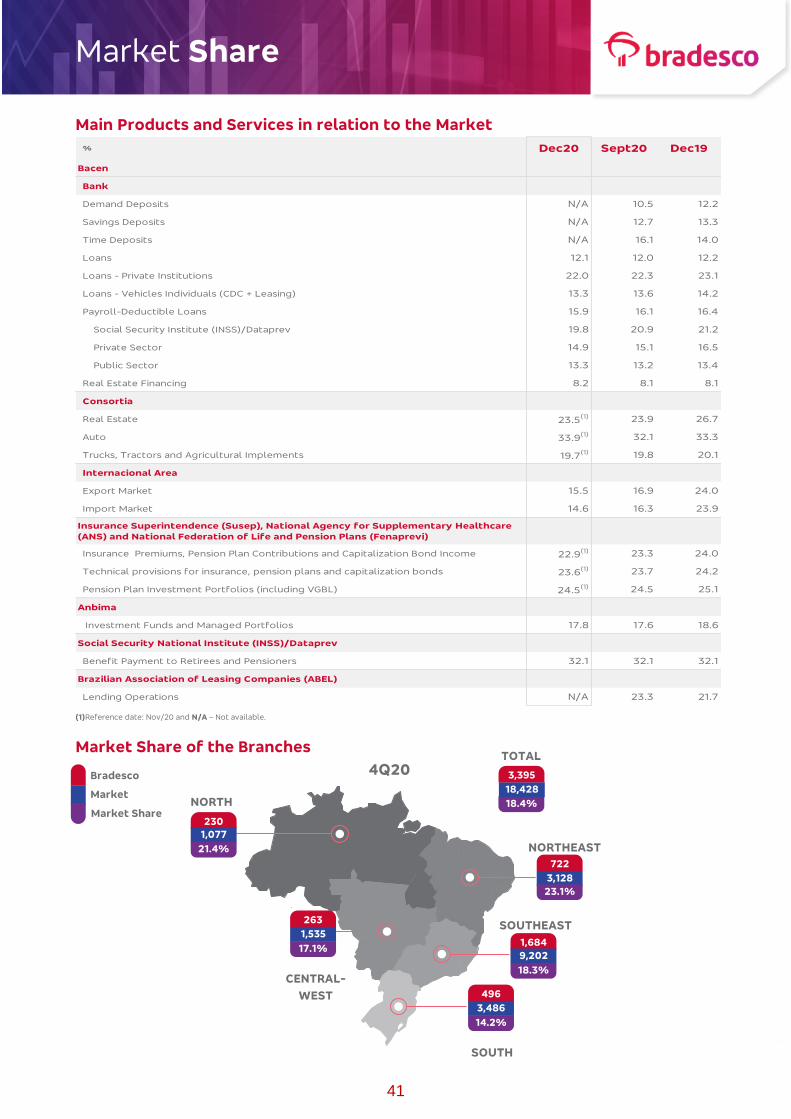
Market Share
41
Main Products and Services in relation to the Market
(1)Reference date: Nov/20 and N/A – Not available.
Market Share of the Branches
% Dec20 Sept20 Dec19
Bacen
Bank
Demand Deposits N/A 10.5 12.2
Savings Deposits N/A 12.7 13.3
Time Deposits N/A 16.1 14.0
Loans 12.1 12.0 12.2
Loans - Private Institutions 22.0 22.3 23.1
Loans - Vehicles Individuals (CDC + Leasing) 13.3 13.6 14.2
Payroll-Deductible Loans 15.9 16.1 16.4
Social Security Institute (INSS)/Dataprev 19.8 20.9 21.2
Private Sector 14.9 15.1 16.5
Public Sector 13.3 13.2 13.4
Real Estate Financing 8.2 8.1 8.1
Consortia
Real Estate 23.5(1) 23.9 26.7
Auto 33.9(1) 32.1 33.3
Trucks, Tractors and Agricultural Implements 19.7(1) 19.8 20.1
Internacional Area
Export Market 15.5 16.9 24.0
Import Market 14.6 16.3 23.9
Insurance Superintendence (Susep), National Agency for Supplementary Healthcare
(ANS) and National Federation of Life and Pension Plans (Fenaprevi)
Insurance Premiums, Pension Plan Contributions and Capitalization Bond Income 22.9(1) 23.3 24.0
Technical provisions for insurance, pension plans and capitalization bonds 23.6(1) 23.7 24.2
Pension Plan Investment Portfolios (including VGBL) 24.5(1) 24.5 25.1
Anbima
Investment Funds and Managed Portfolios 17.8 17.6 18.6
Social Security National Institute (INSS)/Dataprev
Benefit Payment to Retirees and Pensioners 32.1 32.1 32.1
Brazilian Association of Leasing Companies (ABEL)
Lending Operations N/A 23.3 21.7
23,9%
Bradesco
Market
Market Share
4Q20
230
1,077
21.4%
263
1,535
17.1%
722
3,128
23.1%
1,684
9,202
18.3%
496
3,486
14.2%
18.4%
18,428
3,395
TOTAL
NORTHEAST
NORTH
CENTRAL-
WEST
SOUTHEAST
SOUTH

Return to Shareholders
42
Main Indicators
Price/Income Ratio(1) It indicates the possible number of years in which the
investor would recover the capital invested, based on the
closing prices of common and preferred shares.
Price to Book Ratio
It indicates how many times by which Bradesco’s market
capitalization exceeds its shareholders’ equity.
Dividend Yield(2)(3) - %
The ratio between share price and dividends and/or interest
on shareholders’ equity paid to shareholders in the last 12
months, which indicates the return on investment represented by the profit sharing.
(1) Recurring net income in 12 months; (2) Source: Economatica; and (3) Calculated by the share with highest
liquidity.
Recommendation of Market Analysts –
Preferred Shares – BBDC4
Market Capitalization
226.8 R$ billion
Payout / Dividends and Interest on Shareholders’ Equity
(1) In 12M19, it considers R$8 billion extraordinary dividends paid on October 23, 2019; and (2) Calculated on the basis of the book net income after adjustment on legal reserves.
Note.: As defined in Resolution No. 4,820/20 of the Central Bank of Brazil, the payout for 2020 was limited
to 30% of the net income.
Trading Daily Average Volume
(1) BBD “Preferred Shares” and BBDO “Common Shares” (as of March 2012); and (2) BBDC3 “Common Shares”
and BBDC4 “Preferred Shares”.
Appreciation of Preferred Shares - BBDC4
Bradesco Share Performance(1)
(1) Adjusted for corporate events in the periods.
11.3 11.9 11.9 10.4 10.9
6.88.4 8.6
11.7
Dec18 Mar19 June Sept Dec Mar20 June Sept Dec
2.0 2.1 2.1 1.9
2.1
1.2 1.3 1.2 1.6
Dec18 Mar19 June Sept Dec Mar20 June Sept Dec
3.0 2.7 2.6 3.0
5.5
10.0 9.2 8.9
2.6
4Q18 1Q19 2Q 3Q 4Q 1Q20 2Q 3Q 4Q
3,369 3,740 3,895 4,078 5,055
6,035 6,976 7,204 7,299
15,863
5,548
32% 32% 32% 32% 32% 32%41% 44% 34%
69%
30%
12M10 12M11 12M12 12M13 12M14 12M15 12M16 12M17 12M18 12M19 12M20
Dividends/Interest on Shareholders' Equity (1) - Gross Net Payout (2) - 12 months
R$ million
315 312 278 239 296 327 352 330 406 489 497
155 193 233 292 326 320 352 354
522
734
1,089
470 505 511 531 622 647
704 684
928
1,223
1,586
2010 2011 2012 2013 2014 2015 2016 2017 2018 2019 2020
NYSE (1) B3 (2)
R$ million
BBDC4 Ibovespa
Base 100 324
174
In R$
Book Value per Common and Preferred Share 16.26 15.56 15.13 4.5 7.5
Last Trading Day Price – Common Shares 24.20 18.02 30.97 34.3 (21.9)
Last Trading Day Price – Preferred Shares 27.14 19.41 32.88 39.8 (17.5)
Dec20 Sept20 Dec19Dec20 x
Sept20
Dec20 x
Dec19
Variation %
2010 2011 2012 2013 2014 2015 2016 2017 2018 2019 2020

Additional Information
43
Ratings
(1) In December 2020, there was a change in country ceilings methodology in foreign and local currency, resulting in a rating upgrade of the long-term deposit rating in
foreign currency on a global scale, changing from "Ba3" to "Ba2. .
Risk Management
We control corporate risk management in an
integrated and independent manner, preserving and
valuing the Board’s decisions, developing and
implementing methodologies, models and
measurement and control tools. We also provide the
dissemination of the risk culture to all the
employees at every level of the Organization, from
business areas to the Board of Directors.
Our risk and capital management structures have
policies, standards and procedures, ensuring that
our Organization maintains control that is
compatible with the nature of its operations and the
complexity of its products and services, activities,
processes and systems, as well as the extent of its
exposure to risk. They also comprise various
committees, commissions and departments that
support the Board of Directors, the Chief Executive
Officer, the Chief Risk Officer and the Board of
Executive Officers of the Organization in decision-
making.
The most notable amongst these are: the Integrated
Risk Management and Capital Allocation Committee,
which aims to advise the Board of Directors on the
fulfillment of its duties related to the management
policy and to the risk exposure limits policy as well
as assure within our scope the fulfillment of the
processes, policies, related rules, and regulations
and laws applicable to our Organization; and the Risk
Committee, whose main purpose is to assess the
structure of our risk management and occasionally
propose improvements. Both advise the Board of
Directors on the performance of its duties in
management and control of risks, capital, internal
controls and compliance.
Detailed information regarding risk management
process, regulatory capital as well as our risk
exposures, can be found in the Risk Management
Report – Pillar 3, available on the Investor Relations
website (bradescori.com.br – Notice to the Market –
Risk Management).
Viability Support
Long-term Short-term Long-term Short-term
BB B AAA(bra) F1+(bra)
Long-term Short-term Long-term Short-term Long-term Short-term Long-term Short-term Long-term Short-term
Ba1 NP Ba1 NP Ba2 NP Ba2 NP Aa1.br BR-1
Long-term Short-term Long-term Short-term Long-term Short-term
BB- B BB- B brAAA brA-1
Fitch Ratings
International Scale National Scale
Domestic CurrencyDomestic Currency Foreign Currency
Short-term
B
Moody´s Investors Service (1)
Global Scale National Scale
BBbb 4
Long-term
National ScaleForeign Currency Domestic Currency Issuer Credit Rating
Domestic Currency Counterparty Foreign Currency Counterparty Deposits - Domestic Currency Foreign Currency Deposit Domestic Currency
Austin Rating
Long-term Short-term
brAAA brA-1+
S&P Global
Global Scale - Issuer Credit Rating National Scale

Additional Information
44
Capital Management
We have a department responsible for Capital
Management, subordinated to the Controllership
Department, which acts jointly with the Integrated
Risk Control Department, associated companies, business areas and supporting areas.
Additionally, this governance comprises
Commissions and Committees that assist the Board
of Directors and the Board of Executive Officers in the decision-making process.
The Capital Management structure, through
adequate capital sufficiency planning, aims to
provide conditions for capital monitoring and
control, contributing to the achievement of goals set
in the strategic objectives of the Organization.
With the implementation of the Capital Management
structure, an Internal Capital Adequacy Assessment
Process (ICAAP) was established, containing the
capital plan, which is used to assess its sufficiency,
considering the base and stress scenarios in a
prospective vision to identify actions of capital to be adopted for the respective scenarios.
The process of developing this capital plan
considers threats and opportunities, market share
and development goals, requirement projections
based on risks, as well as capital held by our
Organization. These projections are established for a
minimal period of three years and are constantly
monitored and controlled by the Capital Management area.
We have a Recovery Plan that contains actions of
capital and liquidity in compliance with Resolution No. 4,502/16.
Information on capital adequacy and sufficiency as
well as the instruments mentioned represent
fundamental tools in the management and support of the decision-making process.
Additional information on the Capital Management
structure is available in the Risk Management Report
– Pillar 3, and in the Integrated Report and Recovery
Plan (No. 4,502/16), available on the Investor Relations website at bradescori.com.br.
The table below shows the historical composition of the Regulatory Capital, of the Risk Weighted Assets and of
the Basel Ratio.
R$ million
Calculation Basis
Regulatory Capital 135,724 131,903 131,612 120,212 125,275 134,334 130,808 123,412 117,940
Tier I 118,282 112,575 109,692 98,451 100,832 108,818 105,448 98,370 90,322
Common Equity 108,982 103,153 100,328 89,172 91,272 99,031 95,843 88,944 81,090
Shareholders' Equity 143,703 137,461 135,134 129,548 133,723 138,313 133,636 126,674 121,121
Non-controlling/Other 164 184 427 199 106 230 163 152 170
Phase-in arrangements provided for Resolution No 4,192/13 (34,885) (34,492) (35,232) (40,575) (42,558) (39,512) (37,956) (37,883) (40,200)
Additional Capital 9,300 9,422 9,363 9,278 9,560 9,787 9,605 9,427 9,232
Tier II 17,442 19,328 21,920 21,761 24,444 25,516 25,359 25,042 27,618
Subordinated Debt (according to Resolution No. 4,192/13) 16,274 18,049 20,665 20,559 21,324 22,280 22,363 21,988 22,417
Subordinated Debt (before Resolution No 4,192/13) 1,168 1,279 1,255 1,202 3,119 3,236 2,996 3,054 5,201
Risk-Weighted Assets (RWA) 858,693 870,814 875,011 863,208 759,051 740,183 701,776 682,635 661,616
Credit Risk 779,589 787,660 786,300 781,319 680,908 659,401 632,615 612,394 598,058
Operational Risk 64,414 64,414 63,720 63,720 64,572 64,572 57,494 57,494 53,151
Market Risk 14,691 18,740 24,990 18,169 13,571 16,210 11,668 12,747 10,407
Total Ratio 15.8% 15.1% 15.0% 13.9% 16.5% 18.1% 18.6% 18.1% 17.8%
Tier I Capital 13.8% 12.9% 12.5% 11.4% 13.3% 14.7% 15.0% 14.4% 13.7%
Common Equity 12.7% 11.8% 11.5% 10.3% 12.0% 13.4% 13.7% 13.0% 12.3%
Additional Capital 1.1% 1.1% 1.1% 1.1% 1.3% 1.3% 1.4% 1.4% 1.4%
Tier II Capital 2.0% 2.2% 2.5% 2.5% 3.2% 3.4% 3.6% 3.7% 4.2%
Subordinated Debt (according to Resolution No. 4,192/13) 1.9% 2.1% 2.4% 2.4% 2.8% 3.0% 3.2% 3.2% 3.4%
Subordinated Debt (before Resolution No 4,192/13) 0.1% 0.1% 0.1% 0.1% 0.4% 0.4% 0.4% 0.4% 0.8%
Basel III
Sept20 June20 Mar20 Sept19 June19Dec19
Prudential Conglomerate
Mar19 Dec18Dec20
Additional Information
45
Minimum Capital Required – Grupo Bradesco Seguros
For companies regulated by SUSEP, the CNSP
Resolution No. 321/15 and subsequent amendments
set out that corporations should have an adjusted
shareholders’ equity (ASE) equal to or higher than
the minimum capital required (MCR). MCR is
equivalent to the base capital or the risk capital,
whichever is higher. According to CNSP Resolution
No. 343/16, the ASE is valued economically, and
should be calculated based on book shareholders’
equity or net assets, considering the accounting
adjustments and adjustments associated with
changes in economic values. For companies
regulated by the ANS, Normative Resolution No.
209/09 and subsequent amendments establish that
corporations should have adjusted shareholders’
equity (ASE) equal to or higher than the Regulatory
Capital (RC). The RC is equivalent to the highest
value between the base capital and the solvency
margin, except for corporations that have opted for
the early adoption of the risk-based capital (RBC),
whose RC is equivalent to the highest value between
the base capital, the solvency margin and the RBC.
The capital adjustment and management process is
continuously monitored and aims to ensure that
Grupo Bradesco Seguros keeps a solid capital base
to support the development of activities and cope
with the risks in any market situation, in compliance
with regulatory requirements and/or Corporate
Governance principles.
Companies must permanently maintain capital
compatible with the risks for their activities and
operations, according to the characteristics of each
company belonging to Grupo Bradesco Seguros,
represented by adequate capital levels. Grupo
Bradesco Seguros permanently observes the limits
required by the respective regulatory entities. The
Minimum Capital Required in November 2020
amounted to R$12.5 billion.
Compliance, Ethics and Integrity
The Compliance, Ethics and Integrity Programs
include our managers, employees, interns,
apprentices, suppliers, business partners and
correspondents in Brazil, subsidiaries and companies
that are part of our Organization, eliciting our
standards of conduct and ethics principles to guide
them in their interactions and daily decisions,
legitimizing our established policies and internal
rules.
The programs are supported in the commitment of
Senior Management, as well as codes, policies,
standards, procedures, training programs for
professionals and controls and seek to mitigate risks
and to promptly detect any actions considered as
violations of the Code of Ethical Conduct and/or
operations and situations with indications of links to
illegal activities, aimed at the adoption of
appropriate measures and actions. These control
mechanisms are subject to constant evaluation and
improvement in accordance with current and
applicable laws and regulations, following the best
market practices.
For matters relating to Compliance, Ethics and
Integrity, the Board of Directors and/or the Board of
Executive Officers are advised mainly by the Audit,
Integrity and Ethical Conduct Committee as well as
the Integrated Risk Management and Capital
Allocation Committee.

Additional Information
46
Investor Relations area – IR
The market relations area is responsible for
disseminating the information regarding the financial
economic performance of the Organization, as well
as its governance structure, policies and practices.
All this information is available on the
bradescori.com.br website, among them, the
Economic and Financial Analysis Report, which
provides an accurate analysis about the corporate
accounting, and Bradesco’s Integrated Report –
Complementary Version available in June 2020, in
which, following the best practices of corporate
governance and in a process of continuous evolution
in the provision of information with transparency,
shows a more comprehensive view of the
Organization as well as its strategies, highlights of
the year and other relevant information.
In order to increase stakeholders’ knowledge related
to the Bank’s information, institutional videos with
messages from the Organization’s Executives,
company presentations, calendar of events,
regulatory forms, our strategic positioning and our
operational management to face the COVID-19
pandemic and their effects on the economy and on
Brazilian society as a whole, among other corporate
information are available on the IR website.
Additionally, the market relations area has been
working completely remotely and maintaining a
constant dialog with the market. In the fourth
quarter of 2020, we interacted with 545 national and
international investors of 454 funds through
conference calls and we also took part in 46 online
international conferences, totaling 55 meetings, with
the presence of 172 investors from 135 institutional
funds.
On November 10, 2020, we held the Bradesco Day
for the first time in a virtual way, with the
participation of our Board of Directors and
Executives. The event was broadcasted live in
Portuguese, English and Libras (Brazilian sign
language) and the replay is available on our Investor
Relations website.
Corporate Governance
The Shareholders’ Meeting is the highest body of our
governance. In this meeting, the members of the
Board of Directors are elected for a single two-year
term of office. It is composed by nine members,
three of which are independent and responsible for
establishing the corporate strategy and reviewing
the business plans and policies, in addition to
supervising and monitoring the strategies assigned
to the Statutory Board of Executive Officers. The
positions of Chairman of the Board of Directors and
Chief Executive Officer, under the Company’s
Bylaws, are not cumulative.
Assisted by a Governance Department, the Body
ordinarily meets 6 times a year, and extraordinarily
when the interests of the company so require. With
its own Charter, the Board also has a Manual and an
Annual Calendar of Meetings set by its Chairman.
During 2020, in all, 75 meetings were held.
Bradesco has also seven Committees reporting to
the Board, the statutory ones, which are the Audit
and Remuneration committees; and the non-
statutory ones, which are the Integrity and Ethical
Conduct, Risks, Integrated Risk Management and
Capital Allocation; Sustainability and Diversity, and
Succession and Appointment committees. Various
executive committees assist in the activities of the
Board of Executive Officers, all regulated by their
own charters.
In the role of Supervisory Body of the acts of the
managers, and with permanent performance since
2015, we have the Fiscal Council, also elected by the
shareholders and with a single term of one year. It is
composed of five effective members and their
respective alternates – two of them are elected by
minority shareholders.
Besides the Fiscal Council, we are submitted to an
Audit Committee and an Internal Audit, both of
which report to the Board of Directors.
Our Organization is listed in Tier 1 of Corporate
Governance of B3 – Brazilian Exchange & OTC, and
our practices attest to the commitment with the
generation of value for shareholders, employees and
society. Further information on corporate
governance is available on the Investor Relations
website (bradescori.com.br – Corporate Governance
Section).

Additional Information
47
Social Actions
Fundação Bradesco
With a broad social and educational program in place
for 64 years, Fundação Bradesco operates 40 own
schools across Brazil. In 2020, R$680 million
benefited 46,321 students in their Schools, in Basic
Education (from Kindergarten to Secondary
Education and Vocational and Technical Education at
Secondary Level), Education for Young People and
Adults and Initial and Continuing Training focused on
employment and income generation. In addition to a
guaranteed free and quality education, students
enrolled in the Basic Education system, numbering
over 41 thousand, will also receive uniforms, school
supplies, meals, medical and dental assistance. With
regard to the distance learning system (EaD),
1,890,592 students through the e-learning portal
“Escola Virtual” (Virtual School) concluded at least
one of the various courses offered in the program,
and another 7,470 students benefited from projects
and initiatives carried out in partnership with the
Educa+Ação as well as from courses and educational
and information technology lectures.
Sustainability
Sustainability is among the strategic drivers of the
Organization, as we understand that the
management of environmental, social and
governance (“ESG” or “ASG”, in the acronym in
Portuguese) issues is fundamental to our survival
and growth in a context that is increasingly dynamic
and challenging. As we seek to generate shared and
long-term value for investors, employees, suppliers,
clients and the society, we also contribute to the
sustainable development of the country.
Governance: The main decisions and direction of the
strategy are conducted by the Sustainability and
Diversity Committee, which meets quarterly and has
Directors and Executive Officers, including the CEO.
The Committee is advised by the Sustainability
Committee, composed by officers and managers
from different areas. Strategy: Our sustainability
strategy is structured in six pillars: Sustainable
Business: The goal is to expand the supply of
solutions that promote a more inclusive society and
support clients in the transition to a more
sustainable economy; Climate Change: To ensure
that our businesses are prepared for the challenges
of climate change through improvements in business
management and transparency in relation to
climate-related impacts on the Organization;
Customer Relationships: We aim to serve the client
with excellence based on the understanding of their
needs in order to contribute to the achievement of
their goals; Diversity: Bradesco seeks to welcome
and promote diversity among its employees and
clients, aiming to attract and retain talents, expand
the access to career opportunities and adequately
serve an increasing range of client profiles;
Innovation: Ambition to address our strength of
innovation, already present in the DNA and in the
practices of Bradesco, toward sustainability with the
promotion of positive changes in the business and in
the relationship with clients; and Private Social
Investment: As one of the largest private donors in
Brazil, we seek to maximize the positive impacts
generated from Bradesco’s social investment.
Voluntary Commitments: We establish dialogs with
various stakeholders and adhere to initiatives and
voluntary commitments, such as Global Compact
Initiatives, Sustainable Development Goals (SDGs),
Equator Principles, Principles for Responsible
Investment (PRI), Principles for Sustainable Insurance
(PSI), Principles for Responsible Banking (PRB),
Women’s Empowerment Principles (WEPs), Task
force on Climate-related Financial Disclosures
(TCFD), Investors for the Climate (IPC), among
others.
Climate Strategy and Governance: Our
Governance for Climate Change involves
operational, executive and strategic levels with the
participation of the Board of Directors. Our strategy
for the subject involves four fronts: (i) to reduce and
mitigate the greenhouse gas emissions generated by
our operations and manage the exposure of our
structures to climate-related risks; (ii) to integrate
the risk assessment and climate-related
opportunities in the management of business; (iii) to
offer financial solutions that promote the lowest
generation of carbon and climate resilience; and (iv)
to promote the engagement and awareness on the
theme with stakeholders.
Eco-efficiency Management: We are running the
third Cycle of the Bradesco’s Eco-efficiency Master
Plan (2019-2021), which sets goals and projects to
reduce the consumption of resources, such as water
and energy, and the generation of waste and
greenhouse gas emissions. Part of their goals
(energy consumption, inland fleet and air fleet) are
aligned to the levels of ambition envisaged in the

Additional Information
48
Paris Agreement to limit global warming in up to 2°C,
in accordance with the sector-level tools indicated
by the Science-based Targets Initiative (SBTi).
Carbon offset in operations: We also committed to
offset 100% of greenhouse gas emissions (carbon
equivalents) generated by the Organization's
operations from 2019 onwards, being the first major
Brazilian bank to fulfill such a level of carbon offset.
This means, for example, neutralizing the carbon
generated from carrying money and bank notes, to
transporting all employees.
Renewable energy: In 2020, we committed to
having 100% of the operations of Bradesco supplied
by renewable energy. With the implementation of
this initiative, we started 2021 as one of the first
major financial institutions in the world to complete
this transition.
Partnership for Carbon Accounting Financials
(PCAF): Bradesco was the first bank to join the PCAF,
an international collaboration between financial
institutions to develop a methodology to measure
and disclose the carbon emissions generated by the
activities funded and invested by the institutions.
Plano Amazônia (Amazon Plan): Bradesco, Itaú and
Santander, in an unprecedented initiative, joined
forces to launch an integrated plan with 10 concrete
measures to foster the sustainable development of
the Amazon. Initiatives in the areas of sustainable
cultures, bioeconomics, land regularization and
meatpacking sector were prioritized in 2020 and are
being developed by the banks.
Coalizão Brasil Clima, Florestas e Agricultura
(Brazil Climate, Forests and Agriculture
Coalition): Bradesco became a signatory of the
Coalition with the goal of participating with other
companies and organizations of civil society in the
promotion of policies and actions that boost Brazil
towards a sustainable, low-carbon and inclusive
economy.
Issuance of Security linked to ESG criteria: In
December, Bradesco issued its first ESG security,
with a sum of R$1.2 billion. The resources will be
used to fund projects that contribute towards the
transition to a less carbon-intensive economy in
areas of renewable energy, energy and operating
efficiency, clean transport and sustainable buildings.
The security follows international references of
management for financial instruments with bias of
sustainability and has an independent opinion. The
disbursements and positive impacts generated will
be monitored and published annually by the bank.
Performance: Maintaining the trajectory of
evolution of the ESG performance, Bradesco was
recognized with the fifth overall position among the
banks listed in the Dow Jones Sustainability Index
2021 – becoming the Brazilian bank with the best
performance in the index. We also reached the
concept of “A-” (leadership) in climate management
in the evaluation of the CDP and we received an
upgrade to the AA rating in the MSCI Sustainability
Index.
Transparency and Disclosure: In the last year, we
advanced in the reporting of our ESG performance,
highlighting the alignment with the guidelines of the
SASB (Sustainability Accounting Standards Board)
and advances in response to the recommendations
of the TCFD. For more information, please visit our
Investor Relations website (bradescori.com.br).

COVID-19 Pandemic
49
The Organization is contributing actively to overcome this pandemic, taking care of employees and clients as well as intensifying the
commitment with society. In this section, we present a series of actions taken to combat the pandemic.
Maintaining the health and well-being of our employees
Information content about COVID-
19 with guidance on hygiene and
health care through media and
Bradesco Saúde booklet
Communication about care with
physical and mental health in
various formats: email marketing,
mobile messaging, content on the
corporate portal, advisory
material in the dependencies
(posters and banners) and internal
newsletters
Immediate leave for risk groups,
trainees and apprentices (for an
indefinite term)
Flexible hours
Alternation of teams
Anticipation of the 13th salary
Anticipation of the internal flu
vaccination campaign
Exclusive Center of Bradesco
Saúde for remote medical care
available to employees and family
members in cases of the COVID-19
Free serological examination
(partnership with Fleury for
serological testing in company
and in laboratory units to all the
employees of the Organization)
Free supply of cloth masks and
face shield
Viva Bem (Living Well) Program:
Exclusive Coronavirus content on
the corporate portal
(announcements, guidelines,
videos and step by step) and
protocol of monitoring and
clarification of doubts by health
professionals offered to
employees and family members
with symptoms of the COVID-19
Support, advice and coaching from
HR psychologists to support
employees and their family
members in emotional issues
related to social isolation and the
current scenario of the pandemic
Provision of the self-cleaning kit
(additional cleaning kit for
sanitation)
Increase of the spacing in the work
environment
Vem Pra Pista online: to encourage
the transformation of health
through physical activity and
provide quality of life to employees
and dependents, we offer free
lessons online
Compliance with Decree No. 20 of
the Ministry of Finance/Special
Secretariat for Social Security and
Labor on measures to be observed
aiming at the prevention, control
and mitigation of the risks of
transmission of the COVID-19 in
work
Video with Dr. Talita Almeida,
occupational health doctor and
manager of the Bradesco Well
Being and Quality of Life Program
interviewing doctors David Uip
(Infectologist) and Ricardo Amaral
(Psychiatrist). On the agenda:
details about care and prevention
of the COVID-19, in addition to the
emotional impacts related to social
isolation
Digital booklet to raise awareness
regarding prevention on holidays
and end-of-year celebrations. We
share tips on health care, through
email marketing and a booklet
available on the Corporate Portal
Intensification of Home Office
83% of the associated
companies
and staff
27% of the
Branch staff
on a rotation basis
Closer than ever, even
from a distance
Daily and transparent communication
with our greatest strength: People.
Disclosure of videos of Executives with
incentives to the approximation of teams and
reports about the positioning of the
Organization.
Health and Well-Being Care and Information
Security: internal campaigns and media with
guidelines on the use of VPN and best working
practices at home.
LIVE OFFICE Bradesco: videos of employees
sharing home office experiences.
Bradesco Family Live Stream: unprecedented
and important moment to strengthen the
relationship between the employees and the
Chairman of the Board and CEO.
Corporate University (UNIBRAD): New
options of digital content of free access to
employees on the external platform.
English online for all employees and interns.
Pop ups on business computers: reinforcing
the healthy life style for employees.
Podcasts: about care with physical and mental
health.
COVID-19 Pandemic
50
Governance, Policies and Risks
We have adjusted the Bradesco policies and governance for the time in which we are living in.
Credit Policy – In relation to our credit policies, our main focus remains on supporting our clients with the appropriate
assessment of risks. We have mapped our exposures to sectors and businesses with greater fragility and we have maintained a
constant line of communication with businesses through our relationship teams. We have kept the teams of credit recovery
100% active, focused on seeking solutions for clients who require them. We have incorporated the new risk variables of the
current scenario into our credit models in order to properly assess the situation.
Capital and Liquidity – Our ability to support clients is related to the maintenance of our strength. We remain with a solid
capital base and adequate and robust liquidity margin to meet the needs of clients, as well as business sustainability. In
addition, the measures implemented by the Central Bank of Brazil in 2020 (especially in the second and third quarters) favored
even more the solvency of capital and liquidity of the system. We use, in the normal course of our operations, funds resulting
from these measures, including originating loan operations in higher volumes than those provided by the Central Bank of Brazil.
Governance of Risks – We have constantly monitored and adjusted the operational and risk appetite limits by promoting the
review and prompt adaptation of the scenarios to the current context. In addition to our internal monitoring activities, a refined
and well-structured monitoring of relevant suppliers of the Organization was established to ensure that the continuity strategies
adopted by the companies correspond to the needs of our processes, maintaining our deliveries to clients.
Supporting and assisting our clients
Individuals Companies
SMALL AND MEDIUM-SIZED ENTERPRISES LARGE CORPORATE
Extension up to 90 days of
payment of installments of
loans and financing for clients
up-to-date or in arrears in up to
59 days, with the interest rate
of the original contract
maintained
Unification of the lines of
personal loan into a new
contract, with a grace period of
up to 90 days for the first
installment and term of up to 6
years, which may release an
additional value
Financial Reorganization credit
that allows the client to
negotiate the loans and account
limits in a single operation,
facilitating the control of the
budget. Grace period of up to
90 days for the payment of the
first installment and term of up
to 6 years
New resources with special
conditions in personal and
payroll-deducted loans with a
grace period of up to 90 days to
start paying
Real Estate Financing
Extension up to 60 days of
payment of installments of
real estate financing for clients
up-to-date with the interest
rate of the original contract
maintained
Payroll financing through the Emergency
Employment Support Program (PESE), with 6 months
for maturity of the first installment, term of 30
months for payment with interest rates of 0.31% p.m.
Payroll financing (Bradesco funding) with 6
months for maturity of the first installment, term of
30 months for payment with interest rates of 0.65%
p.m.
PRONAMPE (National Program for the Support of
Micro and Small Businesses) is a line of emergency
credit (through the guarantee of the FGO –
Operations Guarantee Fund), to strengthen small
businesses and to maintain jobs. SELIC rate +1.25%
p.a. (floating rate) and term of 36 months with grace
period of 6 months and term of 30 months for
payment
Working Capital GIF – Guaranteed Investment Fund,
managed by the BNDES (PEAC – Emergency Credit
Access Program) with grace period from 6 to 12
months for the payment of the first installment and
term from 24 to 60 months
Extension up to 120 days of payment of
installments of loans and financing for clients up-
to-date or in arrears in up to 59 days with the
interest rate of the original contract maintained
after the recalculation of installments
Financial Reorganization allows the reorganization
of loans, financing and account limits in a single
operation, facilitating the control of the budget with
grace period of up to 90 days for the payment of the
first installment and term of up to 72 months
Unification of Loans allows the combination of
Working Capital (without guarantee or with a surety
guarantee), Giro Empresarial (Corporate Working
Capital) and Giro Fácil (Easy Working Capital) paid on
time or overdue in up to 59 days, including a grace
period of up to 90 days for the payment of the first
installment and term of up to 72 months
New Resources: Working Capital with a grace period
of up to 180 days for the payment of the first
installment and term of up to 72 months
Payroll financing
(Bradesco funding) with 6
months for maturity of the
first installment, term of
30 months for payment
with interest rates from
0.55% p.m.
Extension up to 120 days
of payment of
installments of loans and
financing for clients up-to-
date or in arrears in up to
59 days with the interest
rate of the original
contract maintained after
the recalculation of
installments
IMPORTANT: on the
institutional website
(banco.bradesco/aguentefirme)
information is available on the
modalities of emergency
actions, keep in mind that they
are subject to the credit
analysis and to other
conditions of products
COVID-19 Pandemic
51
Service Channels – agility, flexibility and efficiency
Our digital channels have a fundamental role in serving our clients in this time of crisis. We observed an
expansion in the number of clients using these digital channels to perform their banking activities and a
significant increase in transactions using internet banking and mobile.
Agility in the Implementation – We were quite agile in implementing the measures approved by the
Government. Since March 30, 2020, the service channels have been adapted to capture the requests of
extensions of contracts. In addition, the new payroll financing was made available to clients on the first
working day after the official regulations of the product by the Central Bank of Brazil, with pre-
approved limit for loans made through the Net Empresa channel, with financing in 36 months. Bradesco
was chosen as a facilitating agent of the payment of the Emergency Aid Program – the program is a benefit granted by the Federal
Government, processed by Caixa Econômica Federal, in order to financially protect informal workers, individual micro-
entrepreneurs (MEI), self-employed and the unemployed during the coronavirus pandemic. We also changed the rules of spread
payment and renegotiation of debts of the corporate credit card, facilitating the budget of companies.
Intensification of the Communication – We strengthen communication with our clients by sending SMS and Messages via App
about the availability and the use of digital channels, as well as new features and products available.
We created a dedicated responsive page to disclose information of assistance, like the new opening hours, and to provide smoother
journeys for the extension of loans without the need for people to go to the branch. Through the banco.bradesco/coronavirus
website, it is possible to obtain information, extend loans and start the journey of installation and activation of the Bradesco App.
The extension of loans, in particular, can also be accessed once log in is made to the area of the account on Bradesco App. In
addition, we made the deadlines and conditions flexible in credit lines, renegotiation of debts and credit card to assist our clients in
this moment of pandemic. You can find this on the banco.bradesco/aguentefirme website.
Remote Branches – We enabled 36 thousand account managers equipped and ready to conduct business and transactions,
offering advice to clients via audio or video conference by monitoring of clients’ financial life as well as supporting them with credit
and lengthening of debt maturity.
Branches – Our branches are working in all locations where it is permitted, with differentiated opening hours to elderly and
high-risk group, with the teams working in shifts. We have intensified the cleansing and strengthened the access control to
maintain distance between the people.
Commitment to Society
The following are the actions that we performed for the
benefit of society.
Social Donations:
In a moment of concern and challenges to
overcome the pandemic of the novel coronavirus,
we offered assistance, in partnership with other
banks, for the acquisition and donation of 5
million kits for quick tests application, 30 CT
scanners, 30 PCR machines for real-time
diagnosis and 15 million masks to directly assist
the Ministry of Health and State Health
Departments.
We also cooperated in strategic partnerships with
companies and organizations in the health area
by making other donations, among them:
o Donation of 26 thousand tests that were
primarily directed to health care professionals
made in cooperation with other companies;
o Reform, acquisition of equipment and
acclimatization of ICU beds in hospital and
Santa Casa;
o Support to scientists of the Escola Politécnica
da Universidade de São Paulo (Polytechnic
School/USP) in the production of low-cost
ventilators;
o 150 thousand basic food baskets to meet
municipal communities;
o Activation of ICU beds of the Hospital
Universitário Clementino Fraga Filho (HUCCF);
o Construction of the Field Hospital in Leblon –
Rio de Janeiro (RJ) and Salvador (BA);
o Acquisition of tests for the COVID-19
(reimbursement to Fleury for direct costs of
25,900 diagnostic exams);
o Adoption of ICU beds in a hospital ward of the
Hospital das Clínicas (HCFMSUP) intended for
Hematological-oncology patients; and
o Support to the plant adequacy project for
vaccine production (COVID-19 and others)
inside Instituto Butantan.
Other Actions:
Bradesco has formed a consortium with eight
other banks associated with Febraban to ensure
the acquisition of 4,800 ventilators by the
Ministry of Health.
For more information on our actions related to the
coronavirus, please visit:
www.bradesco.com.br/coronavirus
98% of the
transactions are made through Digital
Channels
89% are
concentrated on Mobile
and the Internet

Selected Information - History
52
(1) For comparison purposes, shares were adjusted in accordance with bonuses and stock splits occurred in the periods; (2) It excludes the asset evaluation adjustments recorded under the Shareholders’ Equity; (3) Year-to-Date Recurring Net Income; (4) It excludes additional reserve; (5) In the last 12 months; (6) ER calculation = (Personnel
Expenses + Administrative Expenses + Other Operating Expenses, net of Income) / (Net Interest Income + Fee and commission income + Income from Insurance + Equity in
the income of Affiliated Companies + Tax Expenses); and (7) Number of shares (excluding treasury shares) x closing price for common and preferred shares on the last trading
day of the period.
In R$ million (unless otherwise stated)
Income Statement for the Period
Recurring Net Income 6,801 5,031 3,873 3,753 6,645 6,542 6,462 6,238 5,830
Net Interest Income 16,657 15,288 16,684 14,499 15,428 14,773 14,468 14,087 14,774
Clients Portion 13,219 12,794 13,163 12,964 12,983 12,503 12,185 11,960 11,884
Net Clients Portion of Expanded ALL 8,651 7,206 4,273 6,256 9,002 9,167 8,698 8,356 8,098
Expanded ALL (4,568) (5,588) (8,890) (6,708) (3,981) (3,336) (3,487) (3,604) (3,786)
Fee and Commission Income 8,717 8,121 7,626 8,283 8,829 8,423 8,280 8,074 8,434
Administrative and Personnel Expenses (11,483) (11,724) (11,459) (11,757) (12,660) (12,434) (12,123) (11,809) (10,619)
Income from Insurance, Pension Plans and Capitalization Bonds 2,281 3,131 3,778 2,931 3,900 3,473 3,594 3,826 3,542
Statement of Financial Position
Total Assets 1,644,804 1,659,687 1,571,407 1,486,358 1,409,305 1,404,664 1,412,294 1,388,429 1,386,010
Securities 693,467 683,060 669,338 656,719 657,504 649,080 650,112 630,310 658,501
Expanded Loans Portfolio 686,968 664,414 661,115 655,094 623,044 594,817 575,302 559,820 542,741
- Individuals 260,258 243,404 236,004 239,214 233,079 222,036 210,103 200,198 193,835
- Companies 426,711 421,010 425,111 415,880 389,966 372,781 365,198 359,622 348,905
Allowance for Loan Losses (ALL) (45,339) (44,894) (43,209) (40,466) (36,796) (36,142) (36,860) (36,987) (35,084)
Total Deposits 551,353 526,540 495,873 402,205 368,948 338,911 332,074 326,674 342,879
Shareholders' Equity 143,703 137,461 135,134 129,548 133,723 138,313 133,636 126,674 121,121
Assets under Management 2,508,295 2,474,764 2,364,472 2,252,994 2,259,133 2,255,680 2,231,331 2,205,050 2,181,893
Performance Indicators (%)
Recurring Net Income per Share (in 12 month) - R$ (1) 2.20 2.18 2.36 2.65 2.93 2.84 2.72 2.57 2.44
Book Value per Common and Preferred Share - R$ (1) 16.26 15.56 15.29 14.66 15.13 15.65 15.12 14.34 13.71
Recurring Net Income per Share 0.77 0.57 0.44 0.42 0.75 0.81 0.80 0.78 0.73
Dividends/Interest on Shareholders' Equity – Common Share (net of tax) 0.17 0.13 0.10 0.11 1.02 0.21 0.21 0.21 0.18
Dividends/Interest on Shareholders' Equity – Preferred Share (net of tax) 0.19 0.14 0.11 0.12 1.12 0.23 0.23 0.23 0.22
Annualized Return on Average Equity(2)(3) 14.8 12.9 11.8 11.7 20.6 20.5 20.6 20.5 19.0
Annualized Return on Average Assets (3) 1.2 1.1 1.0 1.0 1.8 1.8 1.8 1.8 1.6
Fixed Asset Ratio 30.1 33.1 32.6 35.5 38.3 33.7 34.4 35.3 36.3
Combined Ratio - Insurance (4) 95.5 86.0 74.5 83.6 84.2 84.4 84.5 80.3 80.8
Efficiency Ratio (ER) (5) (6) 46.3 47.2 47.8 49.1 49.0 49.5 49.4 49.5 49.6
Coverage Ratio (Fee and Commission Income/Administrative and Personnel Expenses) (5) 80.6 79.3 77.8 77.9 77.8 78.1 79.3 80.4 81.0
Market Capitalization - R$ million (7) 226,778 165,343 175,191 158,941 282,075 261,708 285,870 270,349 242,606
Loan Portfolio Quality (Bacen) - R$ million (unless otherwise stated)
ALL / Loan Portfolio (%) 8.9 9.2 9.0 8.5 8.1 8.2 8.6 8.8 8.6
Non-performing Loans (> 60 days / Loan Portfolio) (%) 2.9 2.7 3.6 4.6 4.2 4.3 4.1 4.0 4.3
AA - C Rated Loans / Loans (%) 88.7 87.9 89.7 90.3 90.4 90.1 89.6 89.3 89.5
D-rated Loans / Loans (%) 3.6 4.2 2.5 1.8 1.8 2.0 2.5 2.5 2.3
E-H rated Loans / Loans (%) 7.7 7.9 7.8 7.8 7.8 7.9 9.5 9.5 8.2
D-rated loans 18,434 20,361 11,745 8,817 7,997 8,841 9,239 9,169 9,413
Provision for D-rated loans 4,901 5,386 2,812 2,194 1,947 1,978 1,426 1,414 1,468
Provision / D-rated loans (%) 26.6 26.5 23.9 24.9 24.3 22.4 15.4 15.4 15.6
D-H rated Non-Performing Loans 17,355 15,716 18,394 23,845 20,337 20,946 19,711 19,535 19,815
Total Provision / D-H-rated Non-performing Loans (%) 261.2 285.7 234.9 169.7 180.9 172.5 187.0 189.3 177.1
E-H Rated Loans 39,336 38,926 37,410 37,387 35,318 34,900 35,455 35,589 33,636
Provision for E-H rated loans 32,492 32,211 32,533 30,419 29,133 28,983 32,547 32,759 30,894
Provision / E-H rated loans (%) 82.6 82.8 87.0 81.4 82.5 83.0 91.8 92.0 91.8
E-H rated Non-Performing Loans 14,125 12,993 15,541 20,070 17,294 18,257 16,772 16,772 17,228
Total Provision / E-H-rated Non-performing Loans (%) 321.0 345.5 278.0 201.6 212.8 198.0 219.8 220.5 203.6
Delinquency Ratio (> 90 days / Loan Portfolio) (%) 2.2 2.3 3.0 3.7 3.3 3.6 3.2 3.3 3.5
Coverage Ratio (> 90 days) (%) 402.8 398.2 299.5 227.9 244.9 225.5 267.2 269.2 245.3
Coverage Ratio (> 60 days) (%) 310.6 337.4 249.8 184.2 193.6 188.5 209.3 220.2 201.6
2Q20 1Q20 4Q194Q20 3Q20 3Q19 2Q19 1Q19 4Q18
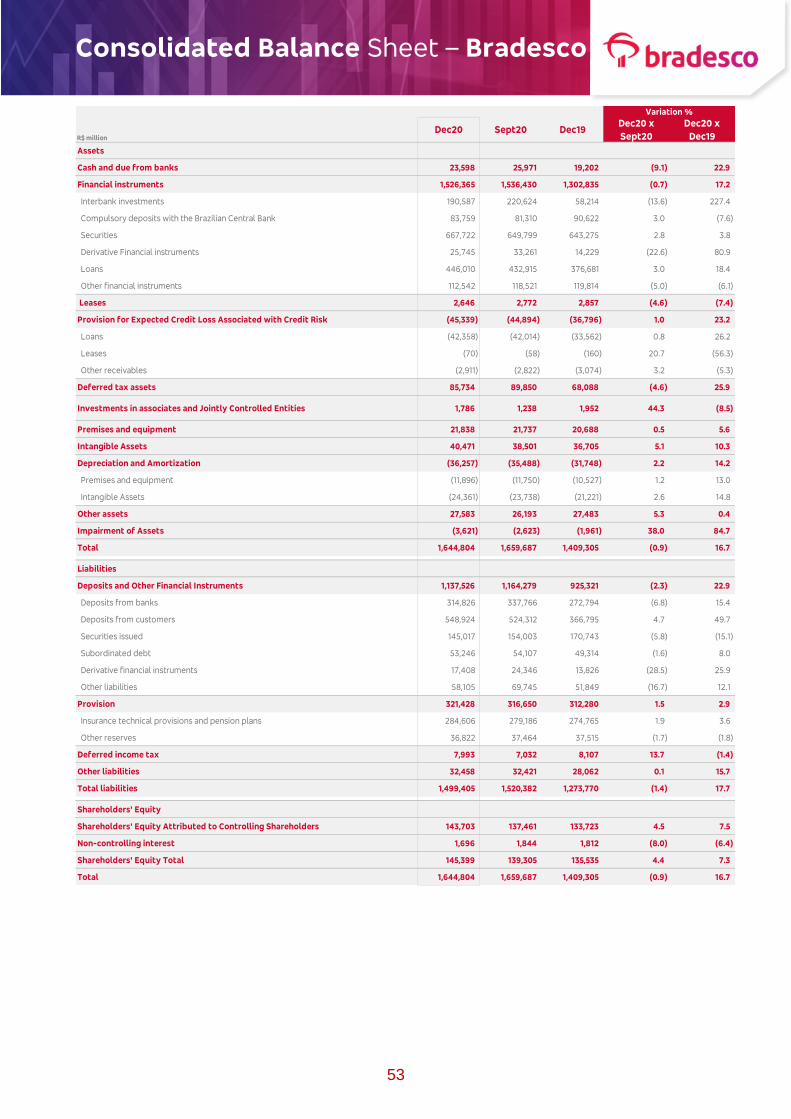
Consolidated Balance Sheet – Bradesco
53
Assets
Cash and due from banks 23,598 25,971 19,202 (9.1) 22.9
Financial instruments 1,526,365 1,536,430 1,302,835 (0.7) 17.2
Interbank investments 190,587 220,624 58,214 (13.6) 227.4
Compulsory deposits with the Brazilian Central Bank 83,759 81,310 90,622 3.0 (7.6)
Securities 667,722 649,799 643,275 2.8 3.8
Derivative Financial instruments 25,745 33,261 14,229 (22.6) 80.9
Loans 446,010 432,915 376,681 3.0 18.4
Other financial instruments 112,542 118,521 119,814 (5.0) (6.1)
Leases 2,646 2,772 2,857 (4.6) (7.4)
Provision for Expected Credit Loss Associated with Credit Risk (45,339) (44,894) (36,796) 1.0 23.2
Loans (42,358) (42,014) (33,562) 0.8 26.2
Leases (70) (58) (160) 20.7 (56.3)
Other receivables (2,911) (2,822) (3,074) 3.2 (5.3)
Deferred tax assets 85,734 89,850 68,088 (4.6) 25.9
Investments in associates and Jointly Controlled Entities 1,786 1,238 1,952 44.3 (8.5)
Premises and equipment 21,838 21,737 20,688 0.5 5.6
Intangible Assets 40,471 38,501 36,705 5.1 10.3
Depreciation and Amortization (36,257) (35,488) (31,748) 2.2 14.2
Premises and equipment (11,896) (11,750) (10,527) 1.2 13.0
Intangible Assets (24,361) (23,738) (21,221) 2.6 14.8
Other assets 27,583 26,193 27,483 5.3 0.4
Impairment of Assets (3,621) (2,623) (1,961) 38.0 84.7
Total 1,644,804 1,659,687 1,409,305 (0.9) 16.7
Liabilities
Deposits and Other Financial Instruments 1,137,526 1,164,279 925,321 (2.3) 22.9
Deposits from banks 314,826 337,766 272,794 (6.8) 15.4
Deposits from customers 548,924 524,312 366,795 4.7 49.7
Securities issued 145,017 154,003 170,743 (5.8) (15.1)
Subordinated debt 53,246 54,107 49,314 (1.6) 8.0
Derivative financial instruments 17,408 24,346 13,826 (28.5) 25.9
Other liabilities 58,105 69,745 51,849 (16.7) 12.1
Provision 321,428 316,650 312,280 1.5 2.9
Insurance technical provisions and pension plans 284,606 279,186 274,765 1.9 3.6
Other reserves 36,822 37,464 37,515 (1.7) (1.8)
Deferred income tax 7,993 7,032 8,107 13.7 (1.4)
Other liabilities 32,458 32,421 28,062 0.1 15.7
Total liabilities 1,499,405 1,520,382 1,273,770 (1.4) 17.7
Shareholders' Equity
Shareholders' Equity Attributed to Controlling Shareholders 143,703 137,461 133,723 4.5 7.5
Non-controlling interest 1,696 1,844 1,812 (8.0) (6.4)
Shareholders' Equity Total 145,399 139,305 135,535 4.4 7.3
Total 1,644,804 1,659,687 1,409,305 (0.9) 16.7
R$ millionSept20
Variation %
Dec20 x
Sept20
Dec20 x
Dec19Dec19Dec20
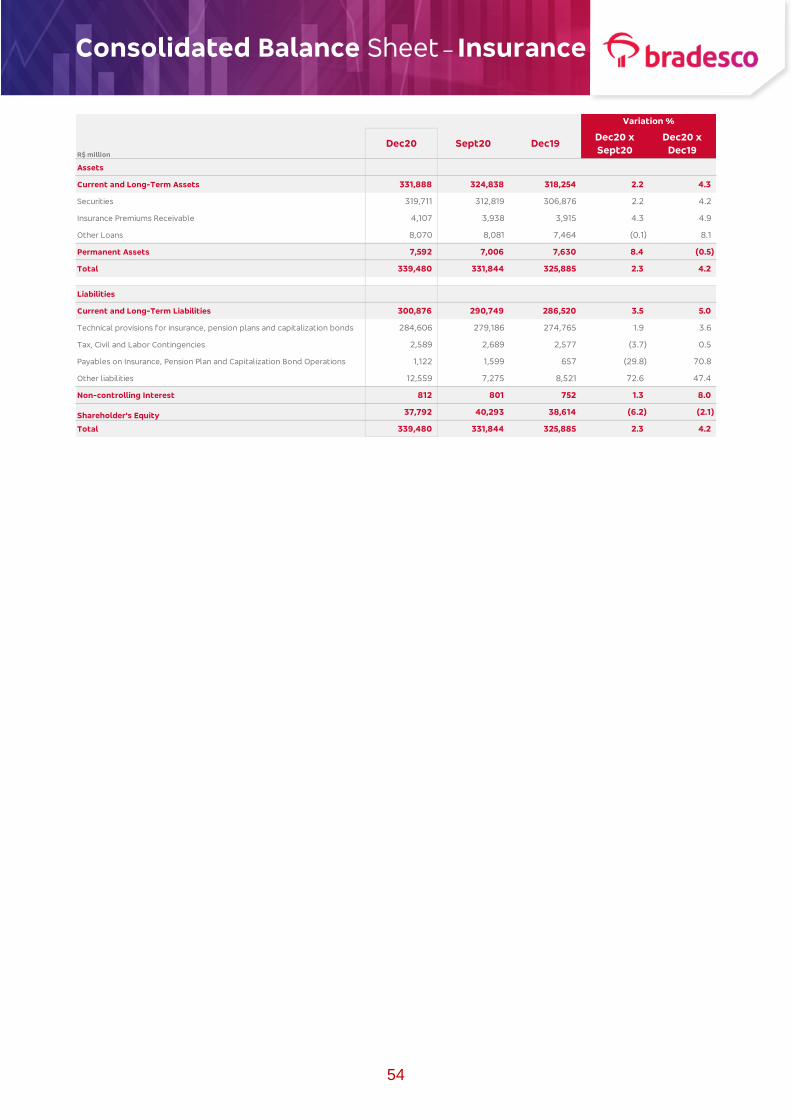
Consolidated Balance Sheet – Insurance
54
R$ million
Assets
Current and Long-Term Assets 331,888 324,838 318,254 2.2 4.3
Securities 319,711 312,819 306,876 2.2 4.2
Insurance Premiums Receivable 4,107 3,938 3,915 4.3 4.9
Other Loans 8,070 8,081 7,464 (0.1) 8.1
Permanent Assets 7,592 7,006 7,630 8.4 (0.5)
Total 339,480 331,844 325,885 2.3 4.2
Liabilities
Current and Long-Term Liabilities 300,876 290,749 286,520 3.5 5.0
Technical provisions for insurance, pension plans and capitalization bonds 284,606 279,186 274,765 1.9 3.6
Tax, Civil and Labor Contingencies 2,589 2,689 2,577 (3.7) 0.5
Payables on Insurance, Pension Plan and Capitalization Bond Operations 1,122 1,599 657 (29.8) 70.8
Other liabilities 12,559 7,275 8,521 72.6 47.4
Non-controlling Interest 812 801 752 1.3 8.0
Shareholder's Equity 37,792 40,293 38,614 (6.2) (2.1)
Total 339,480 331,844 325,885 2.3 4.2
Sept20
Variation %
Dec20Dec20 x
Sept20Dec19
Dec20 x
Dec19
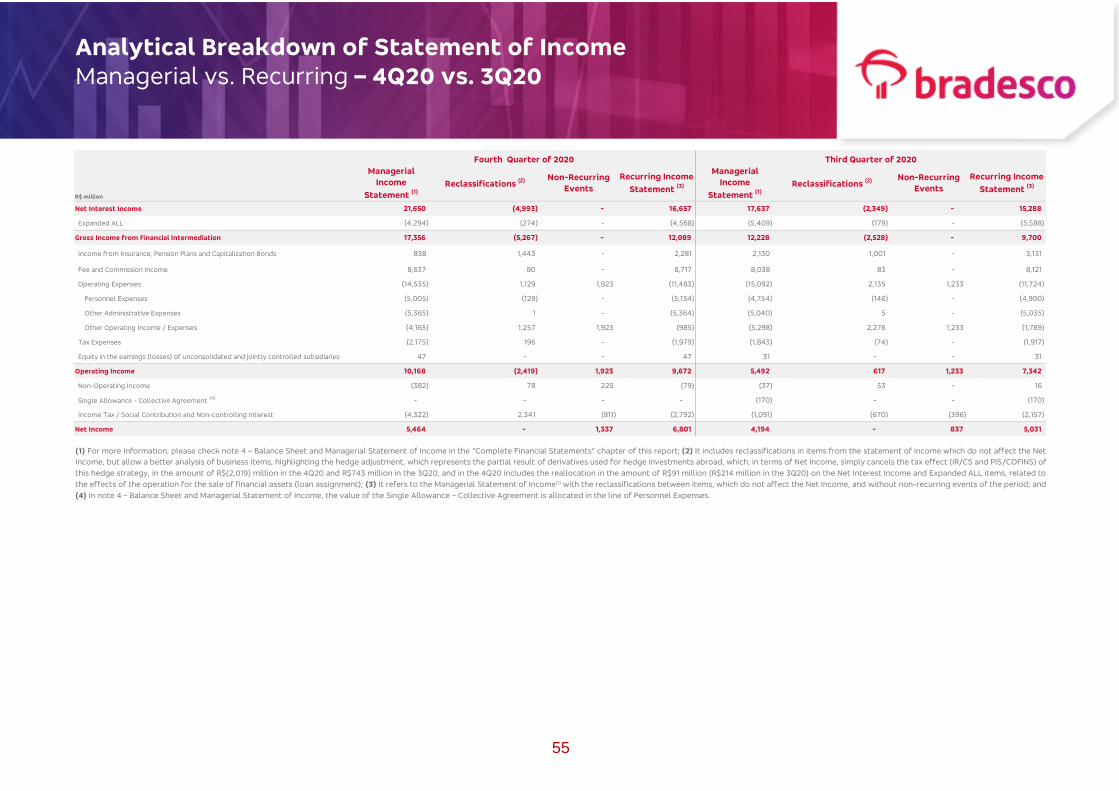
Analytical Breakdown of Statement of Income
Managerial vs. Recurring – 4Q20 vs. 3Q20
55
(1) For more information, please check note 4 – Balance Sheet and Managerial Statement of Income in the “Complete Financial Statements” chapter of this report; (2) It includes reclassifications in items from the statement of income which do not affect the Net
Income, but allow a better analysis of business items, highlighting the hedge adjustment, which represents the partial result of derivatives used for hedge investments abroad, which, in terms of Net Income, simply cancels the tax effect (IR/CS and PIS/COFINS) of
this hedge strategy, in the amount of R$(2,019) million in the 4Q20 and R$743 million in the 3Q20; and in the 4Q20 includes the reallocation in the amount of R$91 million (R$214 million in the 3Q20) on the Net Interest Income and Expanded ALL items, related to
the effects of the operation for the sale of financial assets (loan assignment); (3) It refers to the Managerial Statement of Income(1) with the reclassifications between items, which do not affect the Net Income, and without non-recurring events of the period; and
(4) In note 4 – Balance Sheet and Managerial Statement of Income, the value of the Single Allowance – Collective Agreement is allocated in the line of Personnel Expenses.
Net Interest Income 21,650 (4,993) - 16,657 17,637 (2,349) - 15,288
Expanded ALL (4,294) (274) - (4,568) (5,409) (179) - (5,588)
Gross Income from Financial Intermediation 17,356 (5,267) - 12,089 12,228 (2,528) - 9,700
Income from Insurance, Pension Plans and Capitalization Bonds 838 1,443 - 2,281 2,130 1,001 - 3,131
Fee and Commission Income 8,637 80 - 8,717 8,038 83 - 8,121
Operating Expenses (14,535) 1,129 1,923 (11,483) (15,092) 2,135 1,233 (11,724)
Personnel Expenses (5,005) (129) - (5,134) (4,754) (146) - (4,900)
Other Administrative Expenses (5,365) 1 - (5,364) (5,040) 5 - (5,035)
Other Operating Income / Expenses (4,165) 1,257 1,923 (985) (5,298) 2,276 1,233 (1,789)
Tax Expenses (2,175) 196 - (1,979) (1,843) (74) - (1,917)
Equity in the earnings (losses) of unconsolidated and jointly controlled subsidiaries 47 - - 47 31 - - 31
Operating Income 10,168 (2,419) 1,923 9,672 5,492 617 1,233 7,342
Non-Operating Income (382) 78 225 (79) (37) 53 - 16
Single Allowance - Collective Agreement (4) - - - - (170) - - (170)
Income Tax / Social Contribution and Non-controlling Interest (4,322) 2,341 (811) (2,792) (1,091) (670) (396) (2,157)
Net Income 5,464 - 1,337 6,801 4,194 - 837 5,031
Managerial
Income
Statement (1)
Reclassifications (2) Non-Recurring
Events
Recurring Income
Statement (3)
Managerial
Income
Statement (1)
Reclassifications (2) Non-Recurring
Events
Recurring Income
Statement (3)
R$ million
Fourth Quarter of 2020 Third Quarter of 2020
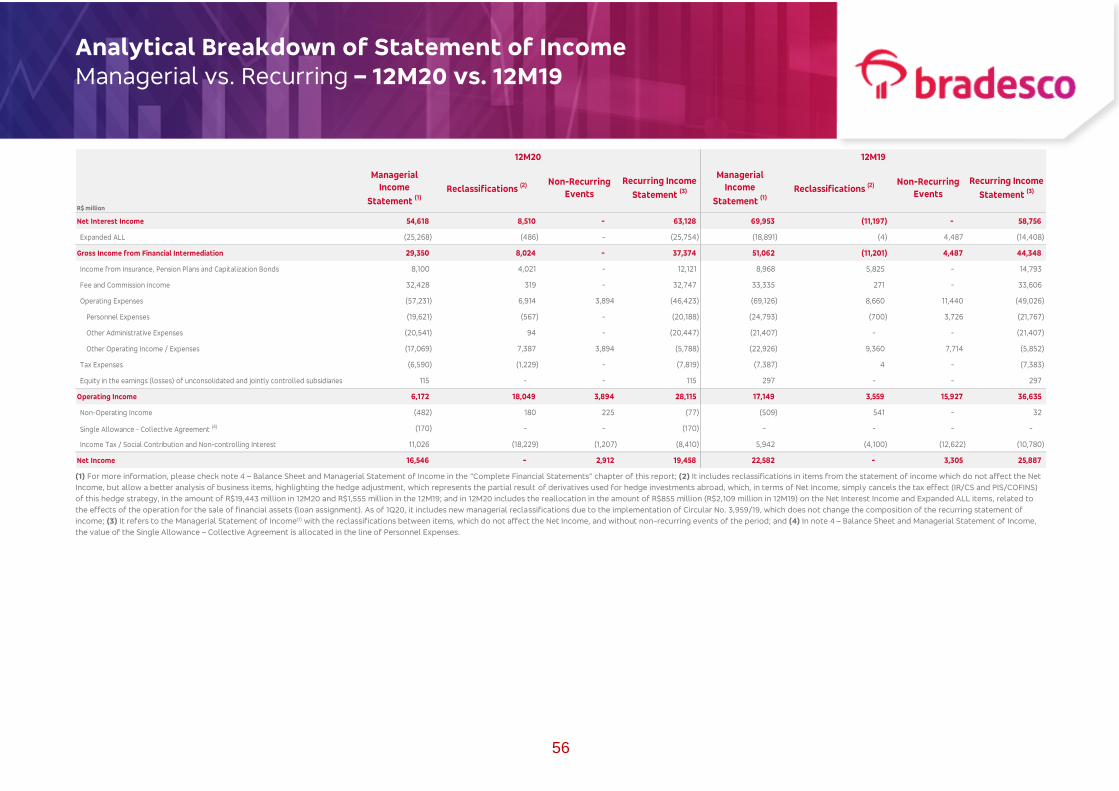
Analytical Breakdown of Statement of Income
Managerial vs. Recurring – 12M20 vs. 12M19
56
(1) For more information, please check note 4 – Balance Sheet and Managerial Statement of Income in the “Complete Financial Statements” chapter of this report; (2) It includes reclassifications in items from the statement of income which do not affect the Net
Income, but allow a better analysis of business items, highlighting the hedge adjustment, which represents the partial result of derivatives used for hedge investments abroad, which, in terms of Net Income, simply cancels the tax effect (IR/CS and PIS/COFINS)
of this hedge strategy, in the amount of R$19,443 million in 12M20 and R$1,555 million in the 12M19; and in 12M20 includes the reallocation in the amount of R$855 million (R$2,109 million in 12M19) on the Net Interest Income and Expanded ALL items, related to
the effects of the operation for the sale of financial assets (loan assignment). As of 1Q20, it includes new managerial reclassifications due to the implementation of Circular No. 3,959/19, which does not change the composition of the recurring statement of
income; (3) It refers to the Managerial Statement of Income(1) with the reclassifications between items, which do not affect the Net Income, and without non-recurring events of the period; and (4) In note 4 – Balance Sheet and Managerial Statement of Income,
the value of the Single Allowance – Collective Agreement is allocated in the line of Personnel Expenses.
Net Interest Income 54,618 8,510 - 63,128 69,953 (11,197) - 58,756
Expanded ALL (25,268) (486) - (25,754) (18,891) (4) 4,487 (14,408)
Gross Income from Financial Intermediation 29,350 8,024 - 37,374 51,062 (11,201) 4,487 44,348
Income from Insurance, Pension Plans and Capitalization Bonds 8,100 4,021 - 12,121 8,968 5,825 - 14,793
Fee and Commission Income 32,428 319 - 32,747 33,335 271 - 33,606
Operating Expenses (57,231) 6,914 3,894 (46,423) (69,126) 8,660 11,440 (49,026)
Personnel Expenses (19,621) (567) - (20,188) (24,793) (700) 3,726 (21,767)
Other Administrative Expenses (20,541) 94 - (20,447) (21,407) - - (21,407)
Other Operating Income / Expenses (17,069) 7,387 3,894 (5,788) (22,926) 9,360 7,714 (5,852)
Tax Expenses (6,590) (1,229) - (7,819) (7,387) 4 - (7,383)
Equity in the earnings (losses) of unconsolidated and jointly controlled subsidiaries 115 - - 115 297 - - 297
Operating Income 6,172 18,049 3,894 28,115 17,149 3,559 15,927 36,635
Non-Operating Income (482) 180 225 (77) (509) 541 - 32
Single Allowance - Collective Agreement (4) (170) - - (170) - - - -
Income Tax / Social Contribution and Non-controlling Interest 11,026 (18,229) (1,207) (8,410) 5,942 (4,100) (12,622) (10,780)
Net Income 16,546 - 2,912 19,458 22,582 - 3,305 25,887
Non-Recurring
Events
Recurring Income
Statement (3)
R$ million
12M20 12M19
Managerial
Income
Statement (1)
Reclassifications (2) Non-Recurring
Events
Recurring Income
Statement (3)
Managerial
Income
Statement (1)
Reclassifications (2)

Independent Auditor’s Report
58
Independent Auditor’s
Report

Independent Auditor’s Report
58
Independent Reasonable Assurance Report on the process of compilation and presentation on the Consolidated Supplementary Accounting information included within the Economic and Financial Analysis Report To Shareholders and the Board of Directors of Banco Bradesco S.A. Osasco – SP We were engaged by Banco Bradesco S.A. ("Bradesco") to report on the process of compilation and presentation of the consolidated supplementary financial information of Banco Bradesco for the year ended December 31, 2020, in the form of reasonable assurance conclusion based on our work, described in this report, the process of compilation and presentation of the consolidated supplementary accounting information included in the Report on Economic and Financial Analysis is presented, in all material respects, in accordance with the information mentioned in the paragraph "Criteria for the preparation of consolidated supplementary accounting information" paragraph. Responsibilities of the Management of Bradesco Management of Bradesco is responsible for the process of compilation and adequately presenting the consolidated supplementary accounting information included within the Economic and Financial Analysis Report based on the criteria for the preparation of the supplementary accounting information described below, and for other information contained within this report, as well as the design, implementation and maintenance of internal controls that management determined as necessary to allow for such information that is free from material misstatement, whether due to fraud or error. Independent Auditor´s Responsibility Our responsibility is to review the process of compilation of the consolidated supplementary accounting information included within the Economic and Financial Analysis Report prepared by Bradesco and to report thereon in the form of a reasonable assurance conclusion based on the evidence obtained. We conducted our engagement in accordance with the NBC TO 3000 - Assurance Engagement Other than Audit and Review (ISAE 3000). That standard requires that we comply with ethical requirements, including independence requirements, and plan and perform our procedures to obtain a reasonable assurance about whether we did not become aware of any fact that could lead us to believe that the process of compilation and presentation of the consolidated supplementary accounting information included within the Economic and Financial Analysis Report are not in accordance, in all material respects, to the information referred to in the “Criteria for preparing the supplementary accounting information” paragraph. The procedures selected were based on our understanding of the process of compilation and presentation of the consolidated supplementary accounting information included within the Economic and Financial Analysis Report, as well as other circumstances of our work and our consideration of other areas that may contain material misstatements, regardless of whether they are caused by fraud or error. However, such procedures do not include investigation or detection of fraud or error.

Independent Auditor’s Report
59
Independent Reasonable Assurance Report on the process of compilation and presentation on the Consolidated Supplementary Accounting information included within the Economic and Financial Analysis Report In making those risk assessments, we have considered internal controls relevant related to the process of compilation and presentation of the consolidated supplementary accounting information in order to design assurance procedures that are appropriate in the circumstances, but not for the purposes of expressing a conclusion as to the effectiveness of Bradesco’s internal control over the process of compilation and presentation of the consolidated supplementary accounting information. Our engagement also includes the assessment of the reasonableness of the consolidated supplementary accounting information, the appropriateness of the criteria applied by Bradesco in the compilation of such information included in the consolidated supplementary accounting information and the procedures and estimates used by Bradesco in the overall presentation of the consolidated supplementary accounting information. The reasonable assurance level is less than an audit.
Our conclusion does not contemplate aspects related to any prospective information contained within the Economic and Financial Analysis Report, nor offers any guarantee if the assumptions used by Management to provide a reasonable basis for the projections presented. Therefore, our report does not offer any type of assurance on the scope of future information (such as goals, expectations and ambitions) and descriptive information that is subject to subjective assessment.
Criteria for preparing the consolidated supplementary accounting information The consolidated supplementary accounting information disclosed in the Report on Economic and Financial Analysis for the year ended December 31, 2020 were compiled by the Management of Bradesco, based on the information contained in the consolidated financial statements as of December 31, 2020 and the accounting information adjusted to criteria described in Note 4 of such consolidated financial statements, in order to facilitate additional analyzes, without, however, being part of the consolidated financial statements disclosed on that date.
Conclusion Our conclusion has been formed on the basis of and is limited to the matters outlined in this report. We believe that the evidence we have obtained is sufficient and appropriate to provide a basis for our conclusion. In our opinion, the consolidated supplementary accounting information included within the Economic and Financial Analysis Information Report were compiled, in all material respects, in accordance with the information referred to in the “Criteria for preparing the consolidated supplementary accounting information” paragraph.
Osasco, February 03, 2021
KPMG Auditores Independentes
CRC SP-028567/F
Original report in Portuguese signed by
André Dala Pola Accountant CRC 1SP214007/O-2

60
(This page has been left blank intentionally).

Demonstrações Contábeis Consolidadas, Relatório dos Auditores Independentes, Resumo do Relatório do Comitê de Auditoria e Parecer do Conselho Fiscal
Relatório da Administração
59
tr1)144’
Consolidated
Financial Statements
2020

62
Dear shareholders,
2020 was a year like no other. Marked by the COVID-19 pandemic, which put us to the test, it became
one of the most challenging moments in our history. The adversities of the period provided opportunities that
have, once again, made us reinvent ourselves under the gaze of innovation and evolution.
However, we have preserved our tradition of serving our clients well, strengthening the brand and
renewing our vocation of partnership, I would even say more than that, of a relationship of trust with
Brazilians, the entrepreneurs and Brazil. Together, we seek to overcome challenges in the most difficult
moments.
The world is no longer the same, but with resilience and dedication, we will contribute to the building
of a much better future.
We ended the year grateful and hopeful towards the one that is beginning: a 2021 full of possibilities
and dreams. From here on, we will begin a new journey.
May the world shine once again!
I invite everyone to see the summary of our results during the year.
Enjoy the reading!
Cidade de Deus, February 3, 2021
Luiz Carlos Trabuco Cappi
Chairman of the Board of Directors

63
Dear shareholders,
We hereby present the Consolidated Financial Statements of Banco Bradesco S.A. related to the period ended on December 31, 2020, in accordance with the accounting practices used in Brazil and applicable to institutions authorized to operate by the Central Bank of Brazil. 1. Economic comment
The second half of 2020 was a period of recovery for the Brazilian economy. This process, highlighted in indicators related to production, demand, trust and generation of jobs has been consistent, reflecting the adoption of stimuli. In some cases, recent data has pointed to levels even higher than those observed before the pandemic. At the same time, expectations for 2021 remain quite favorable, with the beginning of vaccination in the country and the resumption of the agenda of structural reforms.
The National Financial System continues working effectively and sustainably expanding the credit, both for families and for businesses, helping them to overcome the difficulties caused by the pandemic. The maintenance of the government expenses ceiling and public debt and the signaling, on the part of the authorities, of declining trajectories of government debt should actively contribute towards the gradual process of normalization of the monetary policy that is expected. In the environment returning to normality in the global economy, Brazil tends to be benefited by the reduced aversion to risk.
In the global scenario, the economic activity in the major economies has also recovered, despite the recent upsurge of the pandemic in some developed countries. This process of resumption should continue on course, favored by the beginning of the vaccination in several regions, political transition in the USA and by the continued expansion of the Chinese economy.
2. Highlights of the year
Issuance of the First Financial Bill with Sustainability Criteria: The security issued in December 2020 followed the Framework of Climate Finance and raised R$1.2 billion to finance assets that support the transition toward a less carbon-intensive economy;
BAC Florida Bank: All regulatory authorizations were obtained for the acquisition, by Bradesco, of 100% of the share capital of BAC. The contract for the Purchase of Shares for acquisition of BAC Florida Bank, BAC Florida Investments Corp. and BAC Global Advisors, was signed in May 2019;
BITZ Serviços Financeiros S.A.: Start of operations of the new company of the Bradesco Organization, which operates in the Brazilian market of Digital Wallets and Payment Accounts. Through BITZ, clients can store money, make payments – including via QR Code, cash transfers, top-ups, receipts and online purchases. Thus, Bradesco now has an even more complete portfolio and reaffirms its commitment to digital presence;
Bradesco has joined the Partnership for Carbon Accounting Financials – PCAF, an international collaboration between banks, investors and fund managers with a focus on developing methodologies for measuring and disclosing carbon emissions generated by the activities funded by institutions. With this, we have become the first Brazilian bank to take part in the initiative; and
Fifth global position in the Dow Jones Sustainability Index: Bradesco has achieved the best performance among Brazilian banks present in the index and reached the fifth position among the more than 250 banks evaluated globally.

64
3. Results for the year
In 2020, we recorded a book net income of R$16.5 billion, equivalent to R$1.78 per common share and R$1.96 per preferred share, with an annualized return on average equity of 12.5%. The annualized return on average total assets was 1.1%.
In terms of Interest on Shareholders’ Equity, in gross values, we directed R$5.5 billion to the shareholders, paid on a monthly, intermediary and supplementary basis. Thus, R$0.66 (R$0.56 net of withheld Income Tax), were assigned, which include the additional 10% for each preferred share regarding the common shares, and R$0.60 (R$0.51 net of withheld Income Tax) for each common share. In 2020, we recorded a gross payout of 35.3% of the fiscal year book income (30.0% net of withheld Income Tax).
Over the year, taxes and contributions, including pensions, paid or provisioned, reached R$23,505 billion, of which 39.9% is related to taxes withheld and collected from third parties, and 60.1% calculated based
on the activities developed by the Bradesco Organization.
It is worth highlighting that the income in the period was particularly impacted by higher expenses with ALL, a reflection of the provision related to the adverse economic scenario and made during 2020, in the amount of R$9.1 billion (R$2.6 billion for the 3Q20, R$3.8 billion for the 2Q20 and R$2.7 billion for the 1Q20). At the end of December 2020, the total provision for the adverse economic scenario reached R$11.4 billion, emphasizing that our level of provisioning is based on statistical models that capture historical and prospective information, and in the experience of Management, reflecting our expectation of losses in different economic scenarios.
Capital, reserves and subordinated debt
We highlight that at the closing of the year:
R$79.1 billion totaled the paid Capital Stock;
R$59.4 billion totaled the Equity Reserves; and
R$143.7 billion was the Shareholders’ Equity with a growth of 7.5% in comparison to the same period of the previous year. The book value per share was R$16.26.
At the end of 2020, the fair value of Bradesco reached R$226.8 billion, which is equivalent to 1.6 times the Shareholders’ Equity, a reduction of 19.6% in comparison with 2019.
In December 2020, the Basel Ratio reached 15.8%, which is higher than the minimum of 10.25% regulated by Resolution No. 4,193/13 of the National Monetary Council, according to the Basel Committee. Regarding the Regulatory Capital, the fixed asset ratio reached 30.1% in the Prudential Consolidated, falling under the maximum limit of 50.0% stipulated by the Central Bank of Brazil.
Subordinated debt amounted to R$53.2 billion (R$14.3 billion abroad and R$38.9 billion in Brazil) at the end of the fiscal year, of which R$26.7 billion were considered eligible as regulatory capital and included the Regulatory Capital.
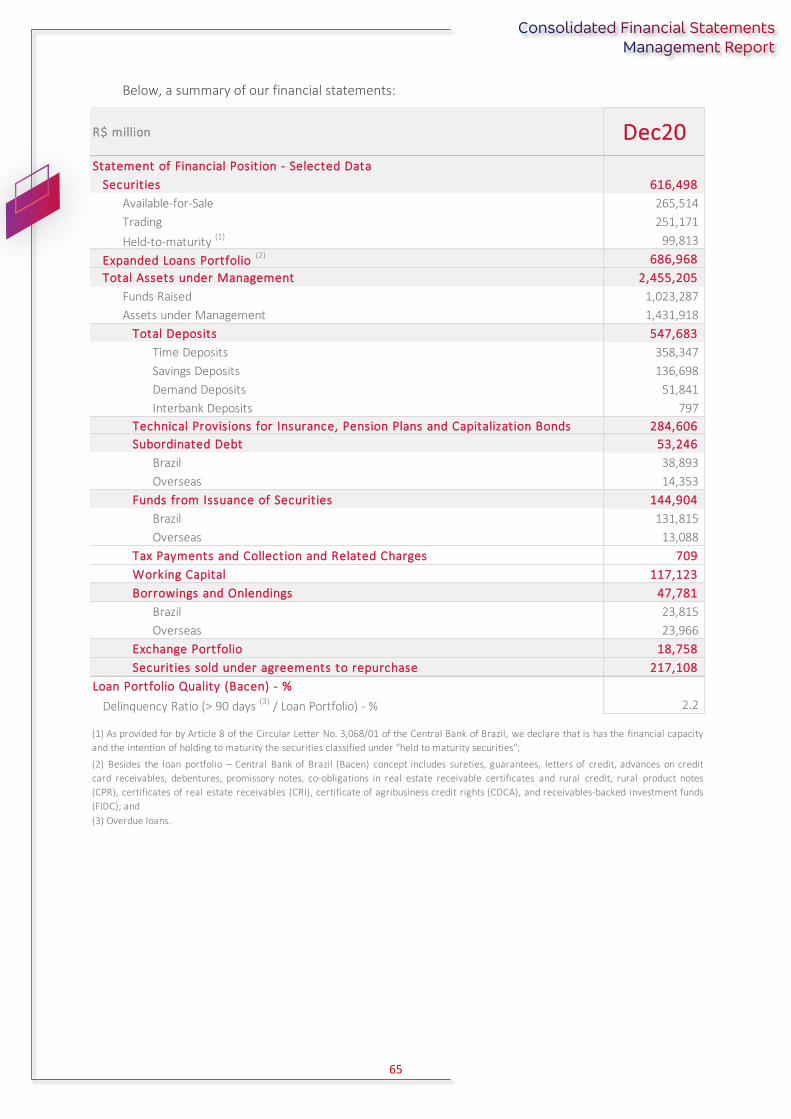
65
Below, a summary of our financial statements:
Statement of Financial Position - Selected Data
Securities 616,498
Available-for-Sale 265,514
Trading 251,171
Held-to-maturity (1) 99,813
Expanded Loans Portfolio (2) 686,968
Total Assets under Management 2,455,205
Funds Raised 1,023,287
Assets under Management 1,431,918
Total Deposits 547,683
Time Deposits 358,347
Savings Deposits 136,698
Demand Deposits 51,841
Interbank Deposits 797
Technical Provisions for Insurance, Pension Plans and Capitalization Bonds 284,606
Subordinated Debt 53,246
Brazil 38,893
Overseas 14,353
Funds from Issuance of Securities 144,904
Brazil 131,815
Overseas 13,088
Tax Payments and Collection and Related Charges 709
Working Capital 117,123
Borrowings and Onlendings 47,781
Brazil 23,815
Overseas 23,966
Exchange Portfolio 18,758
Securities sold under agreements to repurchase 217,108
Loan Portfolio Quality (Bacen) - %
Delinquency Ratio (> 90 days (3) / Loan Portfolio) - % 2.2
(1) As provided for by Article 8 of the Circular Letter No. 3,068/01 of the Central Bank of Brazil, we declare that is has the financial capacity
and the intention of holding to maturity the securities classified under "held to maturity securities";
(2) Besides the loan portfolio – Central Bank of Brazil (Bacen) concept includes sureties, guarantees, letters of credit, advances on credit
card receivables, debentures, promissory notes, co-obligations in real estate receivable certificates and rural credit, rural product notes
(CPR), certificates of real estate receivables (CRI), certificate of agribusiness credit rights (CDCA), and receivables-backed investment funds
(FIDC); and
R$ million
(3) Overdue loans.
Dec20

66
Capital Management
Composed by Commissions and Committees, we have the structure of capital management, which advises the Board of Executive Officers and the Board of Directors in the decisions that need to be made. The sufficiency assessment of capital is conducted in order to ensure that the Organization maintains adequate levels of capital to support and assist the development of its activities and to address the risks incurred, taking into account the strategic defined objectives. It adopts a forward-looking vision, which aims to anticipate possible changes in regulatory and market conditions.
4. Strategic Focus
Our strategy is based on delighting our clients, bringing an attractive value proposal suited to their needs so we can merit their admiration and confidence. Thus, in 2020, we reviewed our corporate strategy to align, even more, the actions in a single direction: meeting the expectations of people’s lives in accordance with their life cycle, increasing the satisfaction by means of experiences of excellence during their entire relationship with the Bank.
From this reflection, we based our strategy on four pillars that guide our trajectory toward continuity: client; efficiency; people; and sustainability.
The client is at the center of our strategy and we have made several actions to enhance the knowledge through the use of data intelligence, complete solutions for business and journeys of excellence, developing ways to get to know the client, their moment of life and interaction with the Organization. In this way, we enable contextualized offers in accordance with their profile, providing pleasant and agile moments when they contact the Bank.
Our behavior and mentality are digital so we can be simple, agile, flexible, innovative and connected. In a context of great digital transformation, we want to make the banking experience even more convenient, modern, fast and safe for the client – drivers present in the day-to-day operations.
We seek to maximize value from the client’s perspective through the culture focused on continuous improvement and efficiency. The expenses management was highlighted, contributing with actions and projects aimed at optimizing the use of channels and reducing the cost of providing services, without losing quality.
Our focus is to be relevant to our clients, shareholders, employees, partners and society, generating value for all target audiences. We are committed to growing in a diversified and sustainable manner through the best balance between risk and return and a robust capital structure and liquidity. We reiterate, with our commitments in facing Diversity, our belief in the transformative potential of people, respecting individuality and plurality. Inclusion and financial education are also important drivers, because through them we impact the lives of thousands of people. In addition, we are committed to issues related to Sustainability in order to contribute to the sustainable development of society.
Having the people who work here as one of the main pillars, we seek to enhance their essential competencies in order to make our corporate strategy feasible. By means of an organizational culture based on ethics, transparency and respect for others, we have invested in an innovative, challenging, inclusive and diverse environment. Also, we want to be a company desired by high-performance professionals, where they intend to build their present and future.
67
5. Sustainability for Bradesco
The Bradesco’s corporate mission expresses the commitment to sustainable development, which is one of the drivers in conducting our business, recognizing the management of environmental, social and governance – ESG (ASG in Portuguese) aspects as essential for the growth and continuity of the business, enabling the generation of shared and long-term value for shareholders, employees, suppliers, clients and society.
Our Sustainability Strategy is based on six pillars: Sustainable Business, Climate Change, Customer Relationship, Diversity, Innovation and Private Social Investment. In addition, our work is aligned with the Sustainable Development Goals (SDGs) of the UN.
We highlight the major advancements and achievements obtained in 2020:
• We have employed individual efforts and alliances with other companies to combat the COVID-19, supporting actions that go from the production and availability of masks to the construction of field hospitals;
• We, Bradesco, joined Itaú and Santander in an unprecedented way to develop the Amazon Plan, a set of 10 measures with a focus on promoting environmental conservation and the development of bioeconomics in the biome, the investment in sustainable infrastructure and the guarantee of basic rights of the Amazonian population;
• For the 16th time, we are featured in the portfolio of Corporate Sustainability Index (ISE) of B3;
• We received an upgrade from A to AA in the ESG MSCI Sustainability Index Rating and our performance was evaluated above the market average by the major ESG rating agencies like the FTSE4Good, ISS ESG Corporate Rating, and Sustainalytics ESG Ratings, among others;
• In climate management, one of the pillars of our strategy, we attained the category of leadership (A-) in the evaluation of the CDP; and
• We consume exclusively renewable energy sources and neutralize greenhouse gas emissions, direct and indirectly, arising from operational activities.
We are committed to advancing on this journey with the continuous improvement of our practices and contribution to industry and multi-industry initiatives. In addition to the various voluntary commitments in which we participated, in 2020 we entered the Brazil Climate, Forests and Agriculture Coalition, the Partnership for Carbon Accounting Financials (PCAF) and the Investors for the Climate (IPC).
You can follow this trend on the bradescori.com.br and bradescosustentabilidade.com.br websites.
6. Clients
The client is at the center of all our activities and is the reason for our existence. Over the 77 years, we have improved the way we interact and provide services, always reinforcing that those who work here should know how to act in the customer relationship. We continue meeting their needs and preferences, aware of the purpose of each profile, identifying their moment in life and seeking to understand their plans so we become part of their achievements.
We can serve all profiles of clients with the same level of excellence to meet the highest number of people, thereby fulfilling our goals of access democratization to banking products and services, encouraging financial inclusion, social mobility and entrepreneurship. Having the scale and diversification as differentials in the business model, these values extend to non-account holders because we recognize their importance and their potential to expand our business.
By offering flexibility and convenience in all areas in which we operate, we segmented the structure for both individuals and companies, ensuring a quality journey.
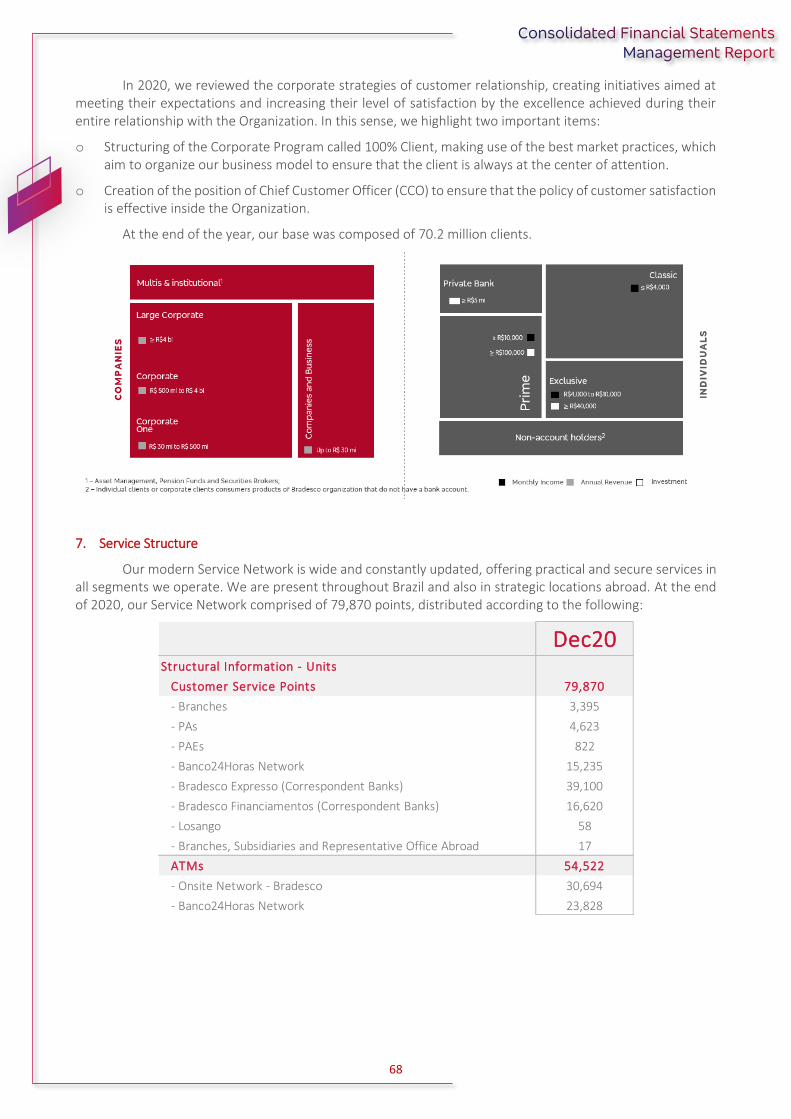
68
In 2020, we reviewed the corporate strategies of customer relationship, creating initiatives aimed at
meeting their expectations and increasing their level of satisfaction by the excellence achieved during their entire relationship with the Organization. In this sense, we highlight two important items:
o Structuring of the Corporate Program called 100% Client, making use of the best market practices, which aim to organize our business model to ensure that the client is always at the center of attention.
o Creation of the position of Chief Customer Officer (CCO) to ensure that the policy of customer satisfaction is effective inside the Organization.
At the end of the year, our base was composed of 70.2 million clients.
7. Service Structure
Our modern Service Network is wide and constantly updated, offering practical and secure services in all segments we operate. We are present throughout Brazil and also in strategic locations abroad. At the end of 2020, our Service Network comprised of 79,870 points, distributed according to the following:
Structural Information - Units
Customer Service Points 79,870
- Branches 3,395
- PAs 4,623
- PAEs 822
- Banco24Horas Network 15,235
- Bradesco Expresso (Correspondent Banks) 39,100
- Bradesco Financiamentos (Correspondent Banks) 16,620
- Losango 58
- Branches, Subsidiaries and Representative Office Abroad 17
ATMs 54,522
- Onsite Network - Bradesco 30,694
- Banco24Horas Network 23,828
Dec20

69
Accessibility
Since 1998, when we were pioneers in providing several accessibility solutions, products and services to the clients with disabilities, we remain evolving, developing and using means to bring more and more autonomy and financial independence to them.
Attentive to our values and mission, which include the access and inclusion democratization, among the actions we perform, we highlight Virtual Mouse, Virtual Vision, Tutoring in Brazilian Sign Language (Libras), Braille Kit, Enlarged Font, WebLibras, and, once more, we innovated by providing withdrawal in Libras assisted by the Iris – Digital Brazilian Sign Language Interpreter of Bradesco. The latter provides quality and assertive services to the public with hearing disabilities, expanding their relationship with the Bank. The employees provide the initial services and connect clients to the digital interpreter.
Digital Channels
We know that providing a modern and broad physical structure is not enough, so aiming at convenience, practicality and security for clients, we offer various products and services at any place and time through Digital Channels – Internet Banking, mobile App, ATM, Social Networks and Fone Fácil. Currently, they represent 98% of all transactions carried out, being 89% of them online and via mobile services.
Digital Platforms
We have eight large Digital Platforms serving clients of the Retail (Exclusive) and Prime segments, invited or that have requested migration for the units because of their relationship profile. We serve 367,000 thousand clients, being 362,000 thousand clients in Retail (Exclusive) and 105,000 thousand clients in Prime. We also have the Digital Branch Bradesco Private Bank, serving 4,848 clients in this segment.
International Area
We operate in the foreign exchange market, export, import, financial transfers and foreign trade financing.
We act in the main regions of Brazil through 12 specialized operational units and 18 service points located in the Corporate segment. Abroad, we have 3 Branches, 12 Subsidiaries and 2 Representative Offices in addition to an extensive corresponding bank network.
Recently we completed the acquisition of BAC Florida Bank and its subsidiaries to offer a complete platform of banking products and services and of investments, now also in the United States.
We closed the year occupying a prominent position in the Export, Import and Trade Finance rankings.
New York
Grand Cayman
London Banco Bradesco Europa
Buenos Aires Banco Bradesco Argentina S.A.U.
Luxembourg Banco Bradesco Europa S.A.
Bradesco North America LLC
Bradesco Securities, Inc.
London Bradesco Securities UK Limited
Bradesco Securities Hong Kong Limited
Bradesco Trade Services Limited
Grand Cayman Cidade Capital Markets Ltd.
Jalisco Bradescard México Sociedad de Responsabilidad Limitada
BAC Florida Bank
BAC Florida Investments
BAC Global Advisors
Miami Banco Bradesco S.A.
Hong Kong Banco Bradesco S.A.
Overseas Network
Branches
Banco Bradesco S.A.
Representative Office
Subsidiaries
New York
Hong Kong
Florida

70
next, our digital bank
Since its launch in 2017, next grew at an accelerated pace, becoming a related company in September 2020, which gives it greater autonomy for the implementation of models that a fintech needs, in addition to making strategic moves in the search for exponential and sustainable growth. With the DNA of Bradesco’s innovation, safety and soundness, it provides digital experiences to more than 3.7 million clients. It is a 100% digital bank, which operates based on the concepts of user experience, intelligent journeys and sophisticated algorithms, offering the best features, anticipating actions and suggesting assertive options for each client.
It has a complete portfolio of unlimited free services, such as transfers, credit card, financial management, withdrawals through ATMs of Bradesco and Banco24horas Network, digital wallets, journey of protection with insurance offers, among others. It is also a major hub in connection with non-financial services, where, through “Mimos”, it provides discounts and special benefits to clients on more than 260 brands and 860 offers by several partners.
We highlight some product releases during the year: integration with Apple Pay, making next the only
digital bank to feature the main digital wallets on the market; nextJoy – a free digital account for minors, in an
unprecedented partnership with Disney, promoting financial education; and Integration with Ágora delivering
more than 300 investment options to clients. And in partnership with Bradesco Auto/RE, we offer clients Home
Insurance, complementing the journey of Protection, which already offers Dental Plan, Loan Payment
Protection Insurance and Insurance for Debit and Credit Card.
8. Main products and services
Insurance
Grupo Bradesco Seguros, leader in the Brazilian and Latin America market, works to provide the best service to policyholders. With a solid path, it contributes consistently to the consolidated results of the Organization and represents us in offering multiple products for personal, family and business protection in various circumstances and several segments, such as Auto, Life, Health Plan, Dental, Capitalization Bonds, Private Pension Plans and Property and Casualty Insurances, which include Home and Property Insurance for individuals and companies.
Also, by means of the association between Bradesco Seguros and Swiss Re Corporate Solutions Brasil Seguros S.A., we maintain our presence in the insurance segment of large risks, P&C – Property and Casualty and of transport, aimed at medium and large-sized corporate clients of the most diverse segments.
A modern structure is available to more than 30.6 million policyholders and clients, formed by web and mobile channels, call centers, own dependencies with business teams, Bradesco Branches and an active brokers network, ensuring presence in all regions of the Country.
Grupo Bradesco Seguros Indicators
Recurring Net Income 5,120
Annualized Return on Average Equity (ROAE) - % 14.3%
Shareholders' Equity 37,792
Total Assets 339,480
Free Investments and the Cover of Technical Provisions. 319,711
Technical Provisions for Insurance, Pension Plans and Capitalization Bonds 284,606
Revenue from Insurance Premiums, Pension Contributions and Revenue from
Capitalization.73,737
Indemnities, Draws and Redemptions Paid 61,350
Dec20R$ million

71
Cards We have the most complete means of payment solutions line in Brazil and work with main cards like
Elo, Visa, Mastercard and American Express. We also offer Private Label cards in partnership with important companies. Through our subsidiary Bradescard México, one of the main financial institutions serving the Mexican market, we work as one of the largest issuers of credit cards with exclusivity in store chains that are leaders in that country, like the C&A store chain.
Also, we are well positioned with relevant market participations such as Cielo and through Elopar – an investment holding company which investments include Alelo (benefit, pre-paid cards and money card), Livelo (coalition loyalty program), as well as participations in Elo Serviços (brand), Banco CBSS (credit card issuance and other financial products) and Veloe (mobility and tolls company).
R$192.8 billion in card transactions in the year.
R$6.8 billion in Fee and Commission Income. Loan Operations
Our capillarity allows us to offer loans and direct financing or through strategic partnerships with various business chains, keeping the focus on improving the clients’ experience and assessing their real needs. We expanded and diversified offers in the distribution channels, especially in the digital media, supplemented by the Branch Network and Banking Correspondents. We are in full operational capability and the policy we have guides management’s actions and is constantly updated and consistent with the economic reality.
We highlighted some of the lines:
Agribusiness: we are featured among the biggest financiers in the niche, with offers and solutions for the development of production, keeping in accordance with the main manufacturers of agricultural tools of the Country;
Onlendings: leader in BNDES – Banco Nacional de Desenvolvimento Econômico e Social (National Bank for Social and Economic Development) onlendings;
Real Estate Financing: one of the most important in this market, maintaining the commitment in meeting the demands of the sector, financing both the construction industry and the acquisition of real estate by the final borrowers; and
For companies: working capital items, advances on receivables and financing of goods focused on small and medium-sized enterprises. With Bradesco Corporate, leader in assets of the Brazilian market for large and medium-sized enterprises, we offer complete solutions for different needs and business sectors.
Balance of the main portfolios in the year:
R$687.0 billion on loan operations in the expanded concept, which includes sureties, guarantees, letters of credit, anticipation of credit card receivables, debentures, promissory notes, co-obligations in real estate receivable certificates and rural credit, rural product notes (CPR), certificates of real estate receivables (CRI), certificate of agribusiness credit rights (CDCA) and receivables-backed investment funds (FIDC);
R$45.2 billion was the consolidated balance of the allowance for loan losses, considering a complementary provision of R$10.5 billion, constituted considering our provisioning model, which is based on statistical models that capture historical and forward-looking information, and Management’s experience in order to reflect our expectation of losses in different economic scenarios;
R$169.1 billion in operations intended to consumer financing – that comprises almost 65% of loan operations to individuals –, including the amount of R$69.7 billion in Payroll-Deductible Loans with 9.3 million active contracts;
R$77.8 billion was the balance in the Real Estate Financing portfolio, whereby R$59.2 billion was intended for individuals and R$18.6 billion for companies, totaling 337,519 units financed;
R$22.3 billion in applications on agribusiness; and
R$22.8 billion amounted to the balance of onlending portfolios, with 123,379 contracts.

72
Loan recovery
In 2020, we further strengthened our loan recovery actions, seeking to decrease the delinquency ratios and, at the same time, maintain the relationship with our clients.
With the constant update of statistical models and analytical strategies, we segmented the delinquent clients according to levels of risk and propensity to pay, maximizing return in the recovery.
The investment in technology keeps expanding our communication channels, allowing operation through Digital means, Network of Branches, Call Centers and Friendly and Judicial Collection Offices. Also, specialized regional teams tailor their operations on the most significant cases, fulfilling the cycle with our Committees and Recovery Commissions.
R$5.9 billion in loans were recovered in the year.
Consortia
Bradesco Consórcios (consortia) offers a complete product and service portfolio to account holders as well as to non-account holders. With an integrated platform for the marketing of solutions in synergy with the Branches and Digital Platforms, Bradesco Consórcios ensures our market leadership.
R$20.0 billion in revenues in the twelve months of the year, totaling R$80.2 billion up to 2020.
R$1.9 billion in Fee and Commission Income.
1,5 million active quotas, totaling 464.8 thousand new quotas sold in the year.
Investment Bank
By advising clients in primary and secondary issuing of shares, merger transactions, purchase and sale of assets, structuring and distributing debt instruments, structured corporate finance operations and projects under the modality of Project Finance, Banco Bradesco BBI operates as the Investment Bank of the Organization.
With a highly qualified research team, the Global Markets area, responsible for the securities and the institutional customer relationship, covers varied sectors and publicly-held companies in São Paulo, Buenos Aires, Mexico, New York, London and Hong Kong.
R$ 333.1 billion was the amount recorded for 200 investment banking transactions in 2020.
Asset Management
BRAM – Bradesco Asset Management, one of the market leaders companies, is our representative in the offer of complete solutions in asset management and investments portfolios for all the client profiles that we serve. It acts in multiple segments, including many from Banco Bradesco, in addition to Institutional Investors in Brazil and Abroad, and various Family Offices, ensuring excellence in service quality.
R$611.0 billion in investment funds and managed portfolios under its management accrued in the year.
Ágora Investimentos
After a revitalization, Ágora – Investment House demonstrates our agility and flexibility in the era of innovation by becoming an open and independent investment platform for both individuals and companies, including non-account holders.
Registration is 100% digital and clients have access to a complete portfolio of investments for all profiles, as well as a curated selection of the best products in the market with options of equity, futures markets, Tesouro Direto (Government Treasury Bonds), Structured Operations Certificate (COE), funds, and public and private securities of fixed income. They also have specialized advice and exclusive content prepared by renowned market analysts.
Available via website or Ágora App, the platform has an advanced, agile, modern and intuitive trading, 24 hours a day, providing a different experience, so that clients have all the comfort and security when investing.
73
Broker
Bradesco Corretora, through Bradesco BBI, exclusively serves institutional clients with coverage of analysis of companies and sectors. Through Bradesco Securities units, it operates in the North American, European and Chinese markets, mediating shares and ADRs – American Depositary Receipts, as well as distributing public and private securities for investors.
Complete Investment Platform
With complete investment management services, clients can rely on an investment specialist team providing advice on the demands of banking products, investment funds, capital market products, broker and private pension, in addition to rely on the services of the Bradesco’s Branch Network Managers. Suggested portfolios, which combine a diversity of financial products and which are established monthly based on the domestic and international market perspectives, are also available to clients.
The pillars which support the values of our Platform are:
Specialized consultancy, whose role is to generate value to the client through a complete offer of products and investment solutions to meet the needs of our investor clients, account holders and non-account holders, according to their age, equity and profile, through different service channels;
Product portfolio and recommended portfolios in an open platform that allows access to any product of the market regardless of the originator and issuer, as well as curatorship of investments, which will recommend the best combination of products in view of the objectives and client profiles; and
Leading edge digital trading platforms that allow quick, easy and complete access to clients.
Miscellaneous solutions
Capital Market
Regarding the capital market, we provide a broad range of solutions and services through a modern infrastructure and specialized professionals, with emphasis on Fiduciary Management for Funds, Investment Clubs and Managed Portfolios; Qualified Custody of Securities for Investors and Issuers; and Bookkeeping of Securities and Depositary (Escrow Account – Trustee). Among the services provided, we highlight our representativity in the provision of Qualified Custody services (Global).
Some of our results:
Fiduciary Management for Funds, Investment Clubs and Managed Portfolios
R$1.0 trillion attributable to equity holders of the Banco Bradesco and BEM – Distribuidora de Títulos e Valores Mobiliários in Investment Funds, Portfolios and Investment Clubs.
Qualified Custody of Securities for Investors and Issuers
R$1.9 trillion in assets under client custody;
R$2.8 trillion in assets under controllership; and
R$244.2 billion in market value, related to 31 ADR (American Depositary Receipts) programs and 4 GDR (Global Depositary Receipts) programs.
Bookkeeping of Securities and Depositary
245 member companies of the Bradesco Book-Entry Stock System, with 9.6 million shareholders;
449 companies with 730 issues in the Bradesco’s Book-Entry Debentures System, with a market value of R$650.5 billion;
1,039 investment funds in the Bradesco Book-Entry Quotas System, with a value of R$96.4 billion; and
33 Brazilian Depositary Receipts (BDR) programs managed, with a market value of R$1.8 billion.

74
Depositary (Escrow Account- Trustee)
24,606 contracts, with a financial volume of R$15.1 billion.
Cash Management
We offer a broad portfolio of products and services, solidity, security, tailored solutions and integration of systemic platforms in order to facilitate the financial management of Companies, Utilities and Public Agencies for the management of accounts receivable and payable and collection of taxes and fees.
Our Global Cash Management area structures solutions for international companies that operate in the Brazilian market and national companies that operate abroad, maintaining partnership with 53 international banks and access to the SWIFT network, supporting the opening of accounts for companies recommended by banking partners.
1.3 billion receipts processed by means of Cobrança Bradesco (Collection), Custody of Checks, Identified Deposit and OCT – Ordem de Crédito por Teleprocessamento (Tele-processed Credit Order).
1.2 billion transactions carried out by the payment systems for companies, which include the payments of the main commitments of the company’s accounts payable (suppliers, wages, taxes, and utility bills).
195.4 million documents collected in federal, state, municipal taxes and other contributions.
367.2 million documents received from electric, water, gas and telephone bills, of which 58.3 million of them settled by Direct Debit from Checking and Savings Accounts, a system that provides comprehensive convenience to the client.
139.1 million benefit payments to retirees and pensioners of the INSS.
91.6 million in Payroll Processing from the public and private sectors.
Public Authorities
Exclusive platforms serve the Public Sector throughout the national territory with Business Managers trained to offer products, services and solutions with quality and safety to the Executive, Legislative and Judicial Powers, federal, state and municipal authorities, as well as Municipalities, Public Foundations, Public and Mixed Capital Companies and the Armed and Auxiliary Forces. Every month, more than 11.6 million retirees and pensioners of the INSS receive their benefits in Bradesco, which gives it the position of highest payer among all the banks in the Country.
We have 9 Specialized Platforms to assist Governments, Capitals, Courts, Chambers, Public Prosecutors, Public Defenders and the largest municipalities according to the Brazilian GDP. We also have 35 Platforms that serve other City Halls and Bodies.
9. Technology and Innovation
In recent months, we tried to further intensify the partnership with our clients through our capacity to offer customized solutions contextualized to their day-to-day needs. The answer to coping with the pandemic is increasingly based on technology, digitalization and the omnichannel strategy of banking activities.
We are improving the customer experience with our loan products with the use of algorithms and advanced analytics, mapping their needs in real time to respond with the best product, limit and price, considering the conditions and context of each profile. We have made more than 60 deliveries related to refinancing, extending payments in installments, renegotiations and purchases in the channels focused on the emergency loan during the pandemic, as well as the launch of new products and development of journeys. This quarter, we highlight the recommendation of the redistribution of limits on revolving loan products, where the client can also adhere to new products in the channels and increase limits according to their need.
For greater convenience and self-service, we offer a variety of solutions, like, for example, the App, where clients can obtain the statement of their real estate financing and see the evolution of the contract. We have enabled the adequacy of limits on Internet Banking, allowing self-management for the payment of bank payment slips, adjusting the value to the extent of their possibilities on the channel itself or on mobile. In

75
Bradesco Seguros, for auto products, we created the digital kit for digital policies and endorsements, transforming the physical documents into digital released on the channels Portal de Negócios (Business Portal), Insured website, Broker App, Client App and e-mail; expanded the list of products of private pensions offered on the Bradesco App, with new purchases and contributions, in addition to new features for maintenance, like options to change the payment date and to receive the scanned documents. The acceptance for Capitalization became 100% digital, where, after the offer of the account manager, the confirmation can be made by the Bradesco App and Net Empresa and we also enabled the digital signature for the purchase of Health products.
We incremented the transactional and conversational skills of BIA, guiding, by WhatsApp, transactions on the Home Broker and helping clients who are beginning to operate on the Stock Exchange with clarifications on the purchase and sale of shares, scheduling of orders, subscription of shares and consultation/stop-limit orders. In addition, to better understand the needs of the client and to give accurate answers, we developed short-term memory for BIA and voice interpretation to understand the intention of clients. Since the launch, there have been 671 million interactions, with an increase in the amount of per-user interactions, which demonstrates its growing role as advisor.
Acting on the transformation of financial intermediation and of payments, we prepared in advance and we are moving forward with PIX (Instant Payment System). Until December, more than 14.6 million keys were registered. In addition to all the advantages that this new system offers for being instantaneous and simple to use, we added value by offering the possibility of loan contracting on PIX, in case of insufficient balance to transfer, with ideal solutions for the client to resolve everything online. Another initiative to highlight was the partnership for the launch of Disney+ in Brazil, in which we offered a simple and fluid journey for activation of the streaming with preferential offerings through the participating credit cards and had three plans available in accordance with the card modality chosen for payment and with a multichannel offer on Internet Banking, mobile for individuals, Cards App and next.
Recently, we were recognized as the Bank of the Year in Brazil by LatinFinance, which highlights the institutions that have achieved the best performance in 2020, evaluating the service provided to its clients and how they sailed in a global health crisis, with highlights for the initiatives in innovation. The inovabra habitat, our space for co-collaborative innovation, was among the 25 global companies in the ‘Open Innovation Challengers’ organized by the Global Corporate Startup Stars Award, which highlights the most active companies in open innovation encouraging best practices in collaboration with a corporate startup. In addition, 9 startup inhabitants (CoBlue, GETMORE, Smarkets, CleanCloud, Implanta IT, Digitalk, Guiando, Oficina de Valor, Jobecam and SVA Tech) were considered among the most attractive to the corporate market in 2020, according to the ranking 100 Open Startups.
10. Human Resources
We recognize in people one of the most important pillars that support the Organization as well as one of the reasons for our success. Therefore, the model of Human Capital Management is based on excellence, respect, transparency and continuous investment for the development and improvement of employees. We provide them and the other associates an ethical, healthy and safe environment, seeking to inspire, support and cooperate in the construction and recognition of their personal beliefs and values, sharing of knowledge and appreciation of the human being without any kind of discrimination.
By means of career growth opportunities, challenges and constant recognitions, training and development, compensation and differentiated benefits, valuing diversity and balance between work and family life, we keep our teams motivated and in constant harmony with the market. Our teams are composed of people able and willing to offer a highly qualified public service to all.
We believe in health as a vector of transformation in people’s lives. That is why a culture based on prevention and promotion of healthy habits and behaviors prevails in the Organization. Our wellness Viva Bem (Living Well) program, structured into three major pillars – balance, healthy and movement, provides the necessary support and care for the employees in all the stages of their journey, in the personal and professional aspects. Because of these practices, we received in 2020 the National Quality of Life Award – PNQV, with the Gold and Excellence in Management certifications.

76
This culture of health and well-being, allied to safety measures and technological support, has
contributed relevantly for us to structure and adopt contingency measures to cope with the COVID-19. Since the beginning, among other protection measures, we implemented an extensive program of remote working, resulting in a large part of the workforce from departments and offices working from their homes. For employees from Branches, the strategy was a weekly rotation of teams. At the end of the week, Branches undergo deep cleansing, ensuring everyone’s safety.
The learning with remote working has allowed us, through the Collective Bargaining Agreement with the Banking Trade Union Movement at national level, to be the first of the large banks to assume the commitment to adopt remote working after the pandemic.
During the year, due to the unfolding of the COVID-19, our vaccination campaign against H1N1 influenza was restructured to assist employees and their families with the care required. We applied the vaccine in open spaces, respecting the distancing and avoiding the agglomeration of people, in addition to the direct care provided in accredited clinics across Brazil. 83,065 people were vaccinated. In addition, we offer free tests for the detection of the COVID-19 to all our employees and interns.
Employees and their families continue to have the necessary protection, including psychological support to ensure tranquility during and after the crisis, after all, respect for people is an integral part of our corporate culture.
In addition to health care, education and promotion of diversity, that gained prominence in 2020, Unibrad - Corporate University of Bradesco, highlighted the interest and importance of distance learning courses, especially during the pandemic. In this period, more than 50 courses migrated to an online/virtual environment.
In relation to the actions of inclusion and diversity, due to the pandemic, we expanded our range by means of virtual events, with emphasis to Bradesco Women, in the form of live streams, with interviews about the challenges faced by women. Events with themes related to diversity also had our sponsorship and participation, like the Conferência Afro Presença (Afro Presence Conference), idealized by the Ministry of Public Labor Prosecution and organized by the UN Global Compact, the Virada da Consciência, one of the largest and most important events of the Country for the promotion of racial equality, and the Jornadas da Diversidade Racial 2020 (2020 Journeys of Racial Diversity), workshop on diversity and of ethnic-racial inclusion. We participated in the Black Tek Fest 2020, fair of technological experiences, innovation, afro-entrepreneurship and business and we promoted the event “EU SOMO”, an initiative of the Disability Affinity Group – Somar.
Unibrad launched the course “Inclusion and Career of the LGBTI+ Community in the Labor Market”, a learning and awareness tool to create a positive and safe environment, introducing concepts of diversity, inclusion, LGBTI+ universe and prejudice, among others.
Through these initiatives, in accordance with a study conducted by FIA, we were recognized as the “Most Incredible in Diversity and Inclusion” company of 2020, a fact that highlights the ongoing commitment with the quality of our people management practices.
Health care, flexibility, respect and productivity encouragement marked the year of the Organization,
which, at the end of the year, had 89,575 employees, of which 78,613 of Bradesco and 10,962 of Associated
Companies. Among those hired and interns, we had 13,477 people.
77
11. The Value of the Brand
The strength of the Bradesco brand is recognized in the most important awards of the market. At the beginning of 2020, the Bank figured at the top of the ranking of the Most Valuable Brand in Latin America, produced by research firm Kantar with the WPP Group. In a publication of the “Meio e Mensagem” newspaper, it was also among the top 3 Most Valuable Brazilian Brands 2020.
Marketing
Under the motto “Experience the Future with Bradesco”, the first campaign of the year brought to the screens the classic cartoon of the Sixties, The Jetsons, featuring the innovative services of the financial institution.
With the pandemic, the whole campaign planning was reviewed and adapted to the context. Thus, the communication was marked by more empathetic campaigns that carried relevant information for the moment and showed how we stand beside the population. We streamed a series of three films about how people reinvented themselves during the pandemic: the first brought the message on relearning in view of a new routine of social distancing, with the signature “It will pass”; the second recognized and encouraged entrepreneurs to demonstrate resilience under the command “Hold tight!”; and the third ad was a tribute sensitized to various categories that could not stay at home, among which the employees of the Bank branches.
In June, we started producing all audiovisual projects in a form accessible to people with visual and hearing impairment, in line with our aim of promoting inclusion. All the advertising films now have translated versions in Libras (Brazilian Sign Language) and subtitles, in addition to audio description, in an exclusive playlist on Bradesco’s channel on YouTube. In this way, we democratized even more the access of this public to the contents of our brand.
Once more, the Father’s Day campaign was highlighted by emotion. The film showed values and the example that a father can be for his children. The main characters were a real life father and daughter. The campaign was also highlighted by the choice of a cast 100% composed by black artists.
In September, the characters of the Jetsons returned to the screens with the message “For the challenges of the present, try the future with Bradesco”. The family of the future, who also adapted to the pandemic and appeared wearing masks and hand sanitizer, showed how the Bank was helping people adapt to the new reality with technologies, such as the artificial intelligence BIA, use of videoconferencing for clarification of doubts with the manager and contactless payments.
In the year in which the financial industry welcomed PIX, a product to make transfers and payments, Bradesco brought the world surfing champion Gabriel Medina to show the convenience offered by the service in a playful and didactic way.
Now at the end of the year, the campaign “In 2021, shine once again” presented the third film in the trilogy of fireflies, which reached more than 245 million views on YouTube, becoming the brand content with the highest viewing on the platform in the year. In the narrative, they helped to rescue the hope and brightness inside of each person to overcome difficult moments, bringing a look of hope for the coming year.
2020 was marked by difficulties in carrying out major sporting and cultural events. Even so, Bradesco confirmed its belief that these pillars are important instruments for the transformation and enrichment of a society. With this, we announced the extension of the master sponsorship to the Confederação Brasileira de Judo (CBJ - Brazilian Judo Confederation), the Confederação Brasileira de Rugby (CBRu - Brazilian Rugby Confederation) and the Confederação Brasileira de Vela (CBVela - Brazilian Sailing Confederation). The bond between the Bank and the entities – that would have ended at the end of 2020 – will continue until December 2021.
As a traditional supporter of Brazilian culture, we also maintained most of the sponsorships, even though the live events were postponed to 2021. Institutions such as MAM, MASP and Pinacoteca, which historically have had the support of the Bank, were able to promote remarkable exhibitions in the resumption of cultural activities, such as “Secrets”, by OsGemeos, and “Degas and the stories of dance”.

78
Teatro Bradesco (Theater), after theaters were closed during the most critical period of the pandemic,
debuted a new modality of attraction in 2020 and initiated an online program with diversity of content. Each month, artists, musicians and lecturers head several partnerships in unique and unprecedented formats. In all, there were 107 live streams, which reached more than 4 million people.
We launched in October, the Bradesco Cultura (Cultura), a digital platform that brings content related to cultural initiatives with the sponsorship of the institution. To visit, please access cultura.bradesco/.
November was marked by the end of the Bravoz project – Encontros Bradesco de Vozes Brasileiras (Bradesco Meetings of Brazilian Voices), a platform created with the aim of promoting national black artists in their vision of art and business and, thus, developing a culture of black awareness in society.
In 2020, Bradesco Women, the events platform whose objective is to support discussions around the strengthening of women and sharing visions of contemporary women with successful personal and professional trajectories, was also adapted to the digital format. During the year, there were 8 live streams, with participation of prominent names on the agenda of gender equity, totaling nearly 1 million views.
Bradesco Shares
Bradesco’s Shares, with a high level of liquidity, represented 5.3% of the Bovespa Index at the end of 2020. They are also traded abroad, on the New York Stock Exchange, by means of ADR – American Depositary Receipt – Level 2, and on the Stock Exchange of Madrid, Spain, through DRs, which integrate the Latibex Index.
Including the reinvestment of dividends, the appreciation in 2020 of preferred shares (BBDC4) was 15.2% and of common shares (BBDC3) was 19.7%.
As minimum mandatory dividends, shareholders are entitled to 30% of the net income, in addition to the Tag Along of 100% for the common shares and 80% for the preferred shares. Also, granted to the preferred shares are dividends 10% higher than those given to the common shares.
Bradesco’s securities also took part in other important indexes, such as the Special Tag-Along Stock Index (ITAG), the Special Corporate Governance Stock Index (IGC), the Brazil Indexes (IBrX50 and IBr100). Bradesco’s presence in these indexes strengthens our constant search for the adoption of good practices of corporate governance, economic efficiency, environmental ethics and responsibility.
R$271.120 billion was the amount negotiated in Bradesco’s Shares on B3 during the year, composed of 1,397 billion of common shares and 10,535 billion of preferred shares.
US$24.785 billion were negotiated as ADRs in the North American market (New York Stock Exchange – NYSE), equivalent to 5,464 million of common shares and 5,372 billion of preferred shares.
EUR499.111 thousand were negotiated as DRs in the European market (Latibex), equivalent to 141,359 thousand of preferred shares.
12. Corporate Governance
The Shareholders’ Meeting is the highest body of our governance. In this meeting, the members of the Board of Directors are elected for a single two-year term of office. It is composed by nine members, three of which are independent and responsible for establishing the corporate strategy and reviewing the business plans and policies, in addition to supervising and monitoring the strategies assigned to the Statutory Board of Executive Officers. The positions of Chairman of the Board of Directors and Chief Executive Officer, under the Company’s Bylaws, are not cumulative.
Assisted by a Governance Department, the Body ordinarily meets 6 times a year, and extraordinarily when the interests of the company so require. With its own Charter, the Board also has a Manual and an Annual Calendar of Meetings set by its Chairman. During 2020, in all, 75 meetings were held.
Bradesco has also seven Committees reporting to the Board, the statutory ones, which are the Audit and Remuneration committees; and the non-statutory ones, which are the Integrity and Ethical Conduct, Risks, Integrated Risk Management and Capital Allocation; Sustainability and Diversity, and Succession and
79
Appointment committees. Various executive committees assist in the activities of the Board of Executive Officers, all regulated by their own charters.
In the role of Supervisory Body of the acts of the managers, and with permanent performance since 2015, we have the Fiscal Council, also elected by the shareholders and with a single term of one year. It is composed of five effective members and their respective alternates – two of them are elected by minority shareholders.
Besides the Fiscal Council, we are submitted to an Audit Committee and an Internal Audit, both of which report to the Board of Directors.
Our Organization is listed in Tier 1 of Corporate Governance of B3 – Brazilian Exchange & OTC, and our practices attest to the commitment with the generation of value for shareholders, employees and society. Further information on corporate governance is available on the Investor Relations website (bradescori.com.br – Corporate Governance Section).
Internal Audit
The Audit and General Inspectorate Department is responsible for internal audit among other services. In an independent way, this department evaluates processes in order to mitigate the risks and ensure the effectiveness of the internal controls in compliance with the policies, guidelines, standards, internal and external regulations. The methodology and execution of works from the area are certified by the Institute of Internal Auditors of Brazil, which considers in its premises the technical recommendations of the Institute of Internal Auditors (IIA).
Ombudsman
Continuously, we have invested and we are dedicated in internal processes and human capital so that our values are, in fact, practiced and reflect directly in the relationship with our clients and users.
Ouvidoria Bradesco (Bradesco Ombudsman), which was created in 2005, two years before the obligation of Resolution No. 3,477 of the National Monetary Council, has the purpose of transforming the client’s voice into an instrument capable of directing the Organization’s strategy, improving products and services to offer the best experience in accordance with the guidelines of the Central Bank of Brazil and of the Securities & Exchange Commission – CVM.
The strategy is based on maintaining strong and active governance in the Organization, promoting discussions in multi-departmental groups about causes of complaints and, thus, boosting the implementation of projects and improvements focused on customer experience. In addition, we have tools of artificial intelligence and algorithms able to predict and map profiles, enabling a preventive process in certain cases.
At all levels of the Organization, employees and associates trained to represent the client, work to resolve numerous situations with engagement, efficiency and transparent dialog. The conclusion of the demands is offered swiftly and with quality by means of a model in constant evolution, where the area receives, handles and finalizes the requests with autonomy, using approved limits for resolution that enable a process that is much more efficient, having as priority the resolution of the claim received in less time. Our satisfaction survey reveals that the client perceives this delivery of value as an essential requirement.
Transparency and Disclosure of Information
All information regarding the performance of Bradesco, as well as its governance structure, policies and practices, are easily and readily available on the website banco.bradesco/ri. Among them, the Economic and Financial Analysis Report, which provides an accurate analysis about the corporate accounting and Bradesco’s Integrated Report, shows a more comprehensive view of the Organization as well as its strategies, highlights of the year and other relevant information.
In order to increase stakeholders’ knowledge related to Bradesco’s information, institutional videos with messages from the Organization’s Executives, company presentations, calendar of events, regulatory forms, among other corporate information are available on the website.
Even at a distance, we continued our dialog with the market, carrying out 693 events with the participation of more than 2,400 investors throughout the year.
80
In November, we promoted for the first time in a virtual manner Bradesco Day, with the presence of
the Board of Executive Officers. The event was broadcasted live, in Portuguese, English and Libras (the Brazilian Sign Language) on the LinkedIn platform, with 4.7 thousand spectators, and on Stream, 2.6 thousand accesses. To watch the replay of the event, visit our IR website.
13. Credit Policy and Risk Governance
We have adjusted the Bradesco’s policies and governance for the time in which we are living in.
In relation to our credit policies, the main focus remains in supporting our clients with the appropriate assessment of the risks taken. We have mapped our exposures to sectors and companies with greater fragility and we have maintained a constant line of communication with businesses through our relationship teams. We have kept the credit recovery teams 100% active and focused on seeking solutions for clients who need them. We have incorporated into our models of credit the new risk variables of the current scenario in order to properly assess the situation.
Our ability to support clients is related to the maintenance of our strength. We sustain both a solid capital base and an adequate and robust liquidity margin to meet the needs of clients, as well as business sustainability. In addition, the measures implemented by the Central Bank of Brazil in 2020 (mainly those implemented in the second and third quarters) favor even more the solvency of capital and liquidity of the system. We use, in the normal course of our operations, funds resulting from these measures, including originating loan operations in higher volumes than those provided by the Central Bank of Brazil.
We have constantly monitored and adjusted the operational and risk appetite limits by promoting the review and prompt adaptation to the current context. In addition to our internal monitoring activities, a refined and well-structured monitoring of relevant suppliers of the Organization was established to ensure that the continuity strategies adopted by the companies, in fact, correspond to the needs of our processes, maintaining our deliveries to clients.
14. Integrated Risk Control
The Bradesco Organization has extensive operations in all segments of the market, and, like any large institution, is exposed to various risks. Thus, risk management is strategically highly important due to the increasing complexity and variety of the products and services and, also, the globalization of our business. We constantly adopt mechanisms of identification and monitoring, making it possible to anticipate the development and implementation of actions to minimize any adverse impacts.
The corporate risk control management occurs in an integrated and independent manner, preserving and valuing the Board’s decisions, generating and carrying out methodologies, models and measurement and risk control tools. Adverse impacts may result from multiple factors and are reduced through the framework of risks and a sound governance structure, which involves the Integrated Risk Management and Capital Allocation Committee that is subordinate to the Board of Directors.
Among the list of risks, we highlight: Credit, Market, Operational, Subscription, Liquidity, Socio-environmental, Strategy, Reputation, Model, Contagion, Compliance, and Cyber. In an attempt to precipitate or reduce effects, in case they occur, we seek to identify and monitor any emerging risks, among them, issues related to global growth, international geopolitical issues and the economic and fiscal situation of Brazil. We also consider the risks posed by climate change and by technological innovation in financial services.
Independent Validation of Models
In order to identify, mitigate and control the risks inherent to the models, which can lead to adverse consequences, there is an independent validation process conducted by a specialized team, which evaluates all aspects thoroughly, challenging the methodology, the assumptions adopted, the data used and the use and robustness of the environment in which they are deployed. Various models are used as support instruments for decision, structuring of issues and risk and capital management. Among them we have internal ones, standardized ones and those developed by third parties (bureaus, pricers, rating agencies), supported by

81
economic, statistical, and financial theories, mechanisms of machine learning and expert knowledge. Any weaknesses detected are converted into notes, whose action plans are monitored until their solution. Results are reported to the managers themselves, to the Internal Audit, to the Executive Committees of the Bradesco Organization and, in certain cases, to the Regulatory Bodies.
15. Compliance and Ethics
Covering the entire Bradesco Organization, the Compliance and Integrity Programs, the standards that affirm our values and govern the daily interactions and decisions, are also extended to suppliers, service providers and subsidiaries, eliciting the high standards of conduct and ethics principles that we have.
These principles are supported by policies, standards and training programs for professionals by aggregating excellence in procedures and controls and seeking prevention, identification, mitigation and monitoring of any actions considered as violations of the Code of Ethical Conduct, and/or operations and situations with indications of links to illegal activities, aimed at the adoption of appropriate actions.
The control methodologies and procedures are objects of evaluation and constant improvement in accordance with current and applicable laws and regulations, as well as with the best market practices, supported by the Organization’s Board of Directors.
16. Social Investments
Fundação Bradesco
Constituted in 1956, Fundação Bradesco, the main social sustainability action at the Organization, runs the largest private social and educational program in the Country. The Foundation is based on the belief that education is the path to promote equal opportunities and personal and collective achievement, as well as a means to build a society that is more worthy, fair and productive. There are 40 schools primarily located in regions of accentuated educational deprivation in all Brazilian states and Federal District.
In 2020, it provided formal education of quality to 46,321 students in Basic Education, Youth and Adults Education and Initial and Continuing Education. In Distance Learning (EaD), it has benefited 1,890,592 students, who have completed at least one of the various courses offered, in addition to 7,470 people in projects and actions in partnership.
The students of Basic Education, more than 41,000 in the period, also receive uniforms, school materials, food and medical and dental care free of charge.
At the end of the fiscal year, R$680.3 million were invested, whereby R$118.6 million destined to investments in infrastructure and educational technology. The estimated budget for 2021 is R$799.0 million, destined to:
a) 83,064 students in Basic Education – Kindergarten to Secondary Education and Technical Education at Secondary Level –, Youth and Adults Education and Initial and Continuing Education focused on the creation of jobs;
b) 3.5 million students that are expected to complete at least one of the courses offered in their program in the EaD – Distance Learning modality, by means of their e-learning portal “Escol@ Virtual” (Virtual School); and
c) 7,000 beneficiaries in projects and actions in partnerships, such as educational and information technology courses and lectures.
In the last ten years, R$7.6 billion, in restated values, was the amount of the resources invested by Fundação Bradesco to defray the cost of its activities.

82
Bradesco Esportes (Sports)
With more than 30 years of existence, the Programa Bradesco Esportes e Educação (Bradesco Sports and Education Program) encourages sport as an activity to support the development of children and young people, favoring the promotion of health and the enhancement of talents through the teaching of female volleyball and basketball in all the schools of Fundação Bradesco, municipal sports centers, public and private schools and in its Center of Sports Development, all in Osasco – SP. Annually, approximately 1.1 thousand girls are trained. Participants also receive civic education instruction and those at Specialist Centers are offered health insurance, transportation, food, an allowance and other benefits.
17. Ratings
18. Recognitions
Certifications
The Management System is an essential tool to achieve the desired results and operational excellency, seeking the continuous improvement, providing the operation and management of our structure in an organized way.
We have highlighted the following certifications of the Bradesco Organization:
Corporate Social Responsibility, own normative standard, audited by an independent certification body; Occupational Health and Safety Management System – OHSAS 18001; Environmental Management – ISO 14001 (Administrative buildings: Paulista/Itapeva, Cidade de Deus, Núcleo Alphaville, Núcleo Vila Leopoldina, Campinas, BH Comércio, Santa Cecília, Alpha Building, Port Corporate, Bradesco Cartões, Nova Central and Internacional Plaza); Bradesco Environmental Management excellence seal, internal normative standard, audited by an independent certification body (679 Greater São Paulo’s branches); Greenhouse Gas Emissions Management – ISO 14064; Data Protection and Privacy – GoodPriv@cy; Controls Assurance Reports in the Service Provider Organization (international standard) – ISAE 3402; Quality Management – ISO 9001 (DITI/IT Security, IT Center and Logical Safety – Bradesco Seguros, RJ); Information Security Management – ISO 27001 (DITI/IT Security, IT Center – Infrastructure, Operation, Storage and Losango –, and other facilities in Cidade de Deus - SP, Alphaville - SP and Curitiba - PR, and Logical Security sector – Bradesco Seguros, RJ); and IT Service Management – ISO 20000.
Awards and Rankings
Bradesco was recognized as Bank of the Year in Brazil 2020 by LatinFinance, which highlighted the financial institutions in Latin America and the Caribbean that demonstrated excellence in retail, trade and investment services;
Bradesco was the winning Bank in the categories of Investment Managers and Banks in General in the Real Estate Survey 2020, a research conducted by the Euromoney magazine, which selects the best managers in the real estate sector in several countries;
Viability Support
Long-term Short-term Long-term Short-term
BB B AAA(bra) F1+(bra)
Long-term Short-term Long-term Short-term Long-term Short-term Long-term Short-term Long-term Short-term
Ba1 NP Ba1 NP Ba2 NP Ba3 NP Aa1.br BR-1
Long-term Short-term Long-term Short-term Long-term Short-term
BB- B BB- B brAAA brA-1
(1) In December 2020, there was a change in country ceilings methodology in foreign and local currency, resulting in a rating upgrade of
the long-term deposit rating in foreign currency from ‘Ba3’ to ‘Ba2’.
Long-term Short-term
brAAA brA-1+
National ScaleForeign Currency
Global Scale - Issuer Credit Rating National Scale
Domestic Currency Issuer Credit Rating
Foreign Currency Counterparty Deposits - Domestic Currency Foreign Currency Deposit Domestic Currency
S&P Global Austin Rating
Domestic Currency Counterparty
Moody´s Investors Service (1)
Global Scale National Scale
Long-term Short-term
BB B4bb
Domestic Currency
Fitch Ratings
International Scale National Scale
Domestic Currency Foreign Currency

83
The Bradesco Organization was recognized in the Award Yes to Racial Equality 2020 as the best company in the financial sector in the Racial Commitment Categories and Advertising Highlight. The survey was organized by the Consulting Firm Great Place to Work – GPTW and by Instituto Identidades do Brasil – ID_BR;
Bradesco was the financial institution more thoroughly evaluated in racial inclusion in the first edition of the Corporate Racial Inclusion Index (IIRE), a groundbreaking study conducted with the participation of Zumbi Data, Research Institute of the Zumbi dos Palmares University;
Bradesco is the only Brazilian bank among the 25 Open Innovation Challengers of Corporate Startup Stars Awards 2020, an award that recognizes the most active companies in open innovation initiatives by the International Consulting Firm Mind The Bridge in partnership with the International Chamber of Commerce – ICC;
In the fourth edition of the Finanças Mais Award, sponsored by O Estado de S. Paulo newspaper and Austing Rating, Bradesco was the biggest winner, coming first in four categories: Best Retail Bank; Leasing; Capitalization; and Life and Pension;
Conquest of the Award for “Leaders of Brazil 2020” in the category of Special Tribute for launching the plan for the sustainable development of the Amazon, granted by LIDE - Business Leaders Group;
Bradesco was recognized for its digital strategy and efforts in the protection and security of the journeys of our clients in the award-winning “Innovation in Digital Banking Awards 2020” from The Banker magazine, a division of the Financial Times British newspaper, featured in the categories “Most Innovative in Digital Banking in Latin America” and cybersecurity;
Bradesco was featured in Guia Exame Diversidade 2020 as one of the companies of the financial sector with the best practices of diversity and inclusion in the Country. The study, conducted by Instituto Ethos and the Exame magazine, recognizes the best practices adopted by Brazilian companies on issues of gender equality, racial equality, inclusion of people with disabilities and promotion of LGBTI+ rights;
Also, for the second time, Bradesco was elected as one of the Best Companies for Women to Work, according to a survey of the Great Place to Work consulting firm – GPTW, which evaluates companies that adopt policies and practices in favor of gender equality and empowerment of women in the employment market;
Conquest of the Ouvidorias Brasil Award 2020 in the category of Best Cases of Ombudsmanship and Reach of Customer Service promoted by Abrarec - Brazilian Association of Company-Client Relations;
Bradesco is one of the 20 large companies that integrate the ranking Incredible Places to Work 2020 and also came first in the Most Incredible Category in Diversity and Inclusion, an initiative of UOL and Fundação Instituto de Administração FIA;
The Bradesco Organization was the winner of the 16th Banking Report Award for Digital Transformation in the categories Efficiency, Financial Inclusion, Financial Innovation Personality and Payment Solution Companies conducted by Catarino Brasileiro;
Conquest of the Euromoney Cash Management Survey 2020 Award as the Best Bank of Cash Management in Brazil in the categories of Market Leader and Best Service, awarded by the British magazine Euromoney;
Bradesco was recognized with the Gold Certification and Trophy of Excellence in Management in the 2020 edition of the National Award for Quality of Life – PNQV, promoted by the Brazilian Association of Quality of Life – ABQV;
Bradesco was the winner in the category of Best Commercial Banks in the Empresas Mais 2020 Award of the newspaper O Estado de S. Paulo in partnership with Fundação Instituto de Administração – FIA and Austin Rating. Also, Bradesco Capitalização came first in Financial Services – Capitalization and Bradesco Saúde (Health) was among the top three in Financial Services – Insurer;

84
Bradesco is the largest business group of private capital in the Country among the 200 largest groups in Brazil from different segments, according to a study published by Valor Grandes Grupos (large groups), an annual publication of Valor Econômico;
Bradesco and Ágora were highlighted in the Whow! Award for Innovation 2020 promoted by Grupo Padrão in the categories of Banks and Investment Platforms, respectively;
Private Bank was featured in the Leaders League ranking as Leading in the category Advisors Wealth Management Brazil;
BRAM was considered the best pension fund manager of the Country, featured in several categories of Guia Valor/FGV Fundos de Previdência (Pension Funds) 2020;
According to Guia Exame – Where to invest in 2020, BRAM was considered the “Best manager of Investment Funds for Retail” for the second consecutive year;
For the fifth consecutive time, BRAM was elected the management company with the largest number of funds awarded by Revista Investidor Institucional. There are 36 Funds classified as Excellent in the ranking The Best Funds for Institutional Entities; and
Losango also figured, for the eighth year in a row, in the Best Companies to Work for in Rio de Janeiro Award, promoted by consultancy Great Pleace to Work – GPTW, in the category Large Company.
19. Independent Audit
In compliance with CVM Instruction No. 381/03, Bradesco Organization hired services provided by KPMG Auditores Independentes in 2020 that were not related to the external audit at a level lower than 5% of the total fees related to external audit services. Other services provided by the External Audit were: i) due diligence; (ii) assurance reports; and iii) reports on previously agreed procedures. The amount of signings totaled approximately R$3.4 million, which represents approximately 7.79% of the total fees of audits of financial statements prepared in 2020 in the Bradesco Organization. The Bank’s policy is in line with the principles of preserving the auditors’ independence, which is based on generally accepted international criteria, i.e.: the auditors should not audit their own work, perform management functions for their clients or promote their clients’ interests. It is noteworthy that any eventual services not related to the external audit are submitted prior to the authorization of the Audit Committee.
20. Acknowledgments
Even with the adversities, uncertainties and changes caused by the pandemic in 2020, we succeeded in looking at the moment with calm balance and sense of urgency in order to find opportunities. The conquests achieved during the year strengthen our productive work during our 77 years, in an environment that has not always been favorable, and consolidate the positions gained by the Organization in various segments of the national financial market. They reflect, in particular, the success of the efforts focused on supporting Brazilians and contribute towards the development of the country. By the results obtained, we appreciate the support and trust of our shareholders and clients as well as the efficient and diligent work of our employees and other associates. The world is no longer the same, but with resilience and dedication we will make use of the opportunity to build, together, a much better future.
Cidade de Deus, February 3, 2021
Board of Directors and Board of Executive Officers

85
Note On December 31,
2020 On December 31,
2019
Assets
Cash and due from banks 5 23,845,061 18,988,662
Financial instruments 1,472,837,923 1,253,843,679
- Interbank investments 6 191,147,208 58,612,208
- Compulsory deposits with the Brazilian Central Bank 7 83,757,533 90,622,338
- Securities 8 616,497,887 595,027,816
- Derivative financial instruments 9 24,815,393 14,511,190
- Loans 10 445,665,923 376,053,905
- Other financial instruments 11 110,953,979 119,016,222
Leases 10 2,646,438 2,857,515
Expected credit loss associated with credit risk (45,202,191) (36,640,425)
- Loans (42,233,636) (33,416,838)
- Leases (70,468) (160,382)
- Other receivables (2,898,087) (3,063,205)
Deferred tax assets 36 85,049,769 67,400,235
Investments in associates and jointly controlled entities 12 7,046,710 7,143,094
Premises and equipment, net 13 20,923,269 19,836,467
Intangible assets 14 34,395,581 31,702,554
Depreciation and amortization (33,578,011) (29,480,869)
- Premises and equipment (11,433,018) (10,029,291)
- Intangible assets (22,144,993) (19,451,578)
Other assets 15 26,752,701 26,308,106
Impairment of Assets Accumulated (3,678,206) (2,819,950)
Total assets 1,591,039,044 1,359,139,068
The accompanying Notes are an integral part of these Consolidated Financial Statements.

86
Note On December 31,
2020 On December 31,
2019
Liabilities Deposits and other financial liabilities 1,088,438,954 880,530,186
- Deposits from banks 16 267,280,167 227,819,610
- Deposits from customers 17 545,292,743 366,227,541
- Securities issued 18 144,903,825 170,727,563
- Subordinated debts 19 53,246,232 49,313,508
- Derivative financial instruments 9 18,697,682 14,244,083
- Other financial liabilities 20 59,018,305 52,197,881
Provisions 320,285,406 311,149,271
- Insurance technical provisions and pension plans 21 284,606,330 274,764,876
- Other reserves 21 35,679,076 36,384,395
Deferred income tax assets 36 7,951,848 8,070,398
Other liabilities 23 29,900,955 24,956,201
Total liabilities 1,446,577,163 1,224,706,056
Shareholders’ equity
Capital 79,100,000 75,100,000
Treasury shares (440,514) (440,514)
Capital reserves 11,441 11,441
Profit reserves 59,405,815 52,407,209
Other comprehensive income 5,625,898 6,645,085
Equity attributable to shareholders of the parent 24 143,702,640 133,723,221
Non-controlling interest 25 759,241 709,791
Total equity 144,461,881 134,433,012
Total equity and liabilities 1,591,039,044 1,359,139,068
The accompanying Notes are an integral part of these Consolidated Financial Statements.

87
Note
R$ thousand
2nd semester Accrued on December 31
2020 2020 2019
Revenue from financial intermediation 52,768,271 99,814,859 116,292,083
- Loans 37,597,492 74,638,143 75,866,596
- Leases 68,310 155,864 259,682
- Securities and interbank investments 9 10,907,546 26,882,782 27,605,074
- Net gain or (loss) from derivative financial instruments 9 (109,316) (12,825,359) (859,708)
- Financial income from insurance, pension plans and capitalization bonds 9 3,517,108 5,161,816 8,095,597
- Revenue from financial intermediation – foreign exchange income 11 213,948 4,723,329 2,413,090
- Reserve requirement 7 745,197 2,023,319 4,327,390
- Sale or transfer of financial assets (172,014) (945,035) (1,415,638)
Expenses from financial intermediation (12,312,896) (43,171,092) (44,522,845)
- Retail and professional market funding 20 (10,101,600) (25,672,243) (37,853,791)
- Borrowing and on-lending 16 (2,211,296) (17,498,849) (6,669,054)
Net revenue from financial intermediation 40,455,375 56,643,767 71,769,238
Expected Credit Loss Associated with Credit Risk expense (9,677,365) (25,164,015) (18,720,532)
- Loans (9,014,220) (24,723,332) (16,552,840)
- Leases 36,277 83,986 (34,911)
- Other receivables (699,422) (524,669) (2,132,781)
Gross income from financial intermediation 30,778,010 31,479,752 53,048,706
Net other operating income (expenses) (15,576,284) (25,922,137) (36,349,288)
- Fee and commission income 26 9,176,241 18,015,095 18,803,014
- Income from banking fees 4,149,747 8,216,814 8,148,191
- Other income from insurance, pension plans and capitalization bonds 21 2,967,635 8,098,742 8,962,125
- Personnel expenses 27 (9,606,681) (19,160,600) (21,399,973)
- Other administrative expenses 28 (9,772,394) (19,315,658) (20,236,215)
- Tax expenses 29 (3,716,311) (6,048,903) (6,858,230)
- Share of profit (loss) of unconsolidated and jointly controlled companies 12 529,790 749,312 1,203,531
- Other operating income 30 2,688,955 6,014,379 6,502,811
- Other operating expenses 31 (10,308,953) (19,938,454) (22,031,567)
- Provision (expenses)/reversals (1,684,313) (2,552,864) (9,442,975)
- Labor (372,485) (663,547) (3,382,750)
- Tax 235,150 256,489 227,244
- Civil (1,397,283) (1,609,720) (4,330,466)
- Others (149,695) (536,086) (1,957,003)
Operating profit/(loss) 15,201,726 5,557,615 16,699,418
Non-operating income/(expense) 32 (406,739) (466,267) (520,078)
Income/(loss) before income taxes and non-controlling interests 14,794,987 5,091,348 16,179,340
Income taxes 36 (5,038,928) 11,652,328 6,554,360
Non-controlling interests in subsidiaries (97,623) (197,099) (151,085)
Net income 9,658,436 16,546,577 22,582,615
Net income attributable to shareholders:
Shareholders of the parent 9,658,436 16,546,577 22,582,615
Non-controlling interest 97,623 197,099 151,085
Basic and diluted earnings per share based on the weighted average number of shares (expressed in R$ per share):
- Earnings per common share 1.04 1.78 2.43
- Earnings per preferred share 1.15 1.96 2.68
The accompanying Notes are an integral part of these Consolidated Financial Statements.

88
R$ thousand
2nd semester Accrued on December 31
2020 2020 2019
Net income for the period 9,658,436 16,546,577 22,582,615
Non-controlling interest 97,623 197,099 151,085
Net income for the period attributable to shareholders 9,756,059 16,743,676 22,733,700
Items that can subsequently be reclassified to profit or loss 2,171,271 (994,916) 6,084,412
Securities available for sale 1,887,768 (942,992) 5,912,636
- Own 1,869,851 (768,741) 5,963,230
- Associates and jointly controlled entities 17,917 (174,251) (50,594)
Cash flow hedge 133,922 (184,591) 150,256
Hedge of investment abroad 31,584 (103,196) (52,347)
Exchange differences on translations of foreign operations 117,997 235,863 73,867
Items that can not be reclassified to the Consolidated Income Statement (22,303) (24,271) (200,899)
Actuarial valuation (22,303) (24,271) (200,899)
Total other comprehensive income 2,148,968 (1,019,187) 5,883,513
Comprehensive income for the period 11,905,027 15,724,489 28,617,213
Attributable to shareholders:
Shareholders of the parent 11,807,404 15,527,390 28,466,128
Non-controlling interest 97,623 197,099 151,085

89
Capital
Capital reserves
Profit reserves Other comprehensive
income
Treasury shares
Retained earnings
Total Share
premium Legal Statutory
Balance on December 31, 2018 67,100,000 11,441 8,494,263 45,194,107 761,572 (440,514) - 121,120,869
Capital increase with reserves 8,000,000 - - (8,000,000) - - - - Asset valuation adjustments (1) - - - - 5,883,513 - - 5,883,513 Net income - - - - - - 22,582,615 22,582,615 Allocations: - Reserves - - 1,129,131 13,589,708 - - (14,718,839) - - Interest on Shareholders’ Equity Paid and/or provisioned - - - - - - (7,372,858) (7,372,858) - Provisioned dividends - - - (8,000,000) - - (490,918) (8,490,918)
Balance on December 31, 2019 75,100,000 11,441 9,623,394 42,783,815 6,645,085 (440,514) - 133,723,221
Balance on December 31, 2019 75,100,000 11,441 9,623,394 42,783,815 6,645,085 (440,514) - 133,723,221
Capital increase with reserves 4,000,000 - - (4,000,000) - - - - Asset valuation adjustments (1) - - - - (1,019,187) - - (1,019,187) Net income - - - - - - 16,546,577 16,546,577 Allocations: - Reserves - - 827,328 10,171,278 - - (10,998,606) - - Interest on Shareholders’ Equity Paid and/or provisioned - - - - - - (5,547,971) (5,547,971)
Balance on December 31, 2020 79,100,000 11,441 10,450,722 48,955,093 5,625,898 (440,514) - 143,702,640
Balance on June 30, 2020 79,100,000 11,441 9,967,801 43,017,995 3,476,929 (440,514) - 135,133,652
Asset valuation adjustments (1) - - - - 2,148,969 - - 2,148,969 Net income - - - - - - 9,658,436 9,658,436 Allocations: - Reserves - - 482,921 5,937,098 - - (6,420,019) - - Interest on Shareholders’ Equity Paid and/or provisioned - - - - - - (3,238,417) (3,238,417)
Balance on December 31, 2020 79,100,000 11,441 10,450,722 48,955,093 5,625,898 (440,514) - 143,702,640 (1) Includes the effects of exchange rate variations related to the conversion of investments abroad.
The accompanying Notes are an integral part of these Consolidated Financial Statements.

90
Description 2nd semester % 2020 % 2019 %
1 – Revenue 51,174,247 178.0 94,974,631 300.8 111,016,407 243.0
1.1) Financial intermediation 52,768,271 183.6 99,814,859 316.1 116,292,083 254.5
1.2) Fees and commissions 13,325,988 46.4 26,231,909 83.1 26,951,205 59.0
1.3) Allowance for loan losses (9,677,365) (33.7) (25,164,015) (79.7) (18,720,532) (41.0)
1.4) Other (5,242,647) (18.2) (5,908,122) (18.7) (13,506,349) (29.6)
2 – Financial intermediation expenses (12,312,896) (42.8) (43,171,092) (136.7) (44,522,845) (97.5)
3 – Inputs acquired from third parties (7,564,040) (26.3) (14,927,234) (47.3) (16,061,050) (35.2)
Outsourced services (2,566,707) (8.9) (4,948,258) (15.7) (4,995,465) (10.9)
Data processing (1,093,885) (3.8) (2,150,048) (6.8) (2,145,226) (4.7)
Communication (656,587) (2.3) (1,333,127) (4.2) (1,570,224) (3.4)
Asset maintenance (666,329) (2.3) (1,299,441) (4.1) (1,231,596) (2.7)
Financial system services (574,242) (2.0) (1,119,697) (3.5) (1,135,964) (2.5)
Advertising and marketing (589,929) (2.1) (1,052,083) (3.3) (1,300,468) (2.8)
Security and surveillance (327,380) (1.1) (698,206) (2.2) (744,036) (1.6)
Transport (313,296) (1.1) (651,238) (2.1) (773,208) (1.7)
Material, water, electricity and gas (238,734) (0.8) (512,427) (1.6) (631,975) (1.4)
Travel (12,958) - (77,433) (0.2) (302,170) (0.7)
Other (523,993) (1.8) (1,085,276) (3.4) (1,230,718) (2.7)
4 – Gross added value (1-2-3) 31,297,311 108.9 36,876,305 116.8 50,432,512 110.4
5 – Depreciation and amortization (3,082,766) (10.7) (6,052,304) (19.2) (5,948,634) (13.0)
6 – Net added value produced by the entity (4-5) 28,214,545 98.2 30,824,001 97.6 44,483,878 97.4
7 – Added value received through transfer 529,790 1.8 749,312 2.4 1,203,531 2.6
Share of profit (loss) of unconsolidated and jointly controlled companies 529,790 1.8 749,312 2.4 1,203,531 2.6
8 – Added value to distribute (6+7) 28,744,335 100.0 31,573,313 100 45,687,409 100
9 – Added value distributed 28,744,335 100.0 31,573,313 100.0 45,687,409 100.0
9.1) Personnel 8,426,804 29.3 16,732,063 53.0 18,985,475 41.6
Salaries 4,659,603 16.2 9,475,900 30.0 10,024,710 21.9
Benefits 2,317,253 8.1 4,659,876 14.8 5,911,496 12.9
Government Severance Indemnity Fund for Employees (FGTS) 581,304 2.0 975,480 3.1 1,055,693 2.3
Other 868,644 3.0 1,620,807 5.1 1,993,576 4.4
9.2) Tax, fees and contributions 9,935,116 34.6 (3,174,888) (10.1) 2,718,368 5.9
Federal 9,290,395 32.3 (4,489,734) (14.2) 1,287,339 2.8
State 6,973 - 10,057 - 15,898 -
Municipal 637,748 2.2 1,304,789 4.1 1,415,131 3.1
9.3) Remuneration for providers of capital 626,356 2.2 1,272,462 4.0 1,249,866 2.7
Rental 621,222 2.2 1,266,517 4.0 1,248,221 2.7
Asset leases 5,134 - 5,945 - 1,645 -
9.4) Added Value distributed to shareholders 9,756,059 33.9 16,743,676 53.0 22,733,700 49.8
Interest on Shareholders’ Equity/Dividends paid and/or provisioned 3,238,417 11.3 5,547,971 17.6 7,863,776 17.2
Retained earnings 6,420,019 22.3 10,998,606 34.8 14,718,839 32.2
Non-controlling interests in retained earnings 97,623 0.3 197,099 0.6 151,085 0.3
The accompanying Notes are an integral part of these Consolidated Financial Statements.

91
2nd semester 2020 2019
Cash flow from operating activities:
Net Income/(Loss) before income taxes and non-controlling interests 14,794,987 5,091,348 16,179,340
Adjustments for: 13,476,453 31,694,560 31,275,637
Effect of changes in exchange rates in cash and cash equivalents (430,913) (2,452,395) (752,829)
Allowance for loan losses expense 9,677,365 25,164,015 18,720,532
Accumulated depreciation and amortization 3,082,766 6,052,304 5,948,634
Constitution Impairment losses of assets 2,949,692 3,455,419 3,782,335
Expenses with civil, labor and tax provisions 2,221,785 3,822,270 9,244,967
Expenses with adjustment for inflation and interest on technical provisions for insurance, pension plans and capitalization bonds 9,276,135 18,344,005 16,930,146
Share of profit (loss) of unconsolidated and jointly controlled companies (529,790) (749,312) (1,203,531)
(Gain)/loss on sale of investments (29,829) (29,829) 48,927
Loss on sale of fixed assets 96,088 139,411 17,937
Loss on sale of foreclosed assets 105,893 130,024 277,763
Foreign exchange variation of assets and liabilities overseas/Other (12,942,739) (22,181,352) (21,739,244)
Net income before taxes after adjustments 28,271,440 36,785,908 47,454,977
(Increase)/Decrease in interbank investments (8,431,650) (8,449,903) (2,099,604)
(Increase)/Decrease in reserve requirement - Central Bank (2,808,329) 6,864,805 (3,025,422)
(Increase)/Decrease in trading securities and derivative financial instruments (24,934,693) (20,961,833) (6,012,586)
(Increase)/Decrease in loans and leases (22,855,487) (77,242,194) (52,922,210)
(Increase)/Decrease in Deferred income tax assets 1,090,221 (444,423) 1,092,995
(Increase)/decrease in other assets (384,748) (517,375) (2,189,895)
(Increase)/Decrease in Other financial instruments 12,422,439 12,249,584 (22,516,613)
Increase/(Decrease) in Deposits and other financial instruments 62,319,379 211,754,843 13,511,412
Increase/(Decrease) in Deferred income tax liabilities (1,578,522) (5,671,333) (3,941,580)
Increase/(Decrease) in Provisions (2,294,801) (12,986,176) (3,014,904)
Increase/(decrease) in other liabilities 973,136 7,514,788 5,155,399
Income tax and social contribution paid (1,923,162) (5,715,233) (8,433,279)
Net cash provided by/(used in) operating activities 39,865,223 143,181,458 (36,941,310)
Cash flow from investing activities:
Maturity of and interest on held-to-maturity securities 16,078,290 47,309,978 6,158,550
Sale of/maturity of and interest on available-for-sale securities 33,046,049 79,947,150 135,733,126
Proceeds from sale of foreclosed assets 369,279 559,661 613,246
Sale of investments 81,132 130,249 17,961
Sale of premises and equipment 411,609 795,560 816,907
Acquisition of subsidiaries, net of cash and cash equivalents, paid (3,173,403) (3,173,403) -
Purchases of available-for-sale securities (36,427,068) (84,691,092) (137,586,141)
Purchases of held-to-maturity securities - (18,491,475) (7,951)
Investment acquisitions (491,438) (491,438) -
Purchase of premises and equipment (859,932) (1,795,410) (2,629,435)
Intangible asset acquisitions (1,314,484) (2,472,210) (2,739,763)
Dividends and interest on shareholders’ equity received 35,078 292,244 716,581
Net cash provided by/(used in) investing activities 7,755,112 17,919,814 1,093,081
Cash flow from financing activities: -
Securities issued 29,128,521 61,833,816 84,982,152
Settlement and interest payments of funds from issuance of securities (47,018,117) (93,179,856) (71,781,695)
Issuance of subordinated debt 688,186 688,186 -
Settlement and interest payments of subordinated debts (1,274,856) (2,374,538) (8,593,243)
Dividends and interest on shareholders’ equity paid (716,502) (1,432,130) (17,751,148)
Non-controlling interest (94,242) (147,649) (106,803)
Net cash provided by/(used in) financing activities (19,287,010) (34,612,171) (13,250,737)
Net increase/(decrease) in cash and cash equivalents 28,333,325 126,489,101 (49,098,966)
Cash and cash equivalents - at the beginning of the period 162,056,751 61,879,493 110,225,630
Effect of changes in exchange rates in cash and cash equivalents 430,913 2,452,395 752,829
Cash and cash equivalents - at the end of the period 190,820,989 190,820,989 61,879,493
Net increase/(decrease) in cash and cash equivalents 28,333,325 126,489,101 (49,098,966)
The accompanying Notes are an integral part of these Consolidated Financial Statements.

92
The accompanying Notes are an integral part of these Consolidated Financial Statements are distributed as follow:
Page
1) OPERATIONS 93
2) PRESENTATION OF THE CONSOLIDATED FINANCIAL STATEMENTS 93
3) SIGNIFICANT ACCOUNTING PRACTICES 95
4) MANAGERIAL STATEMENTS OF FINANCIAL POSITION AND INCOME BY OPERATING SEGMENT 109
5) CASH AND CASH EQUIVALENTS 114
6) INTERBANK INVESTMENTS 115
7) COMPULSORY DEPOSITS WITH THE BRAZILIAN CENTRAL BANK 116
8) SECURITIES 117
9) DERIVATIVE FINANCIAL INSTRUMENTS 123
10) LOANS AND OTHER CREDIT EXPOSURES 130
11) OTHER FINANCIAL INSTRUMENTS 141
12) INVESTMENTS IN ASSOCIATES AND JOINTLY CONTROLLED ENTITIES 142
13) PREMISES AND EQUIPMENT 144
14) INTANGIBLE ASSETS 144
15) OTHER ASSETS 145
16) DEPOSITS FROM BANKS 146
17) DEPOSITS FROM CUSTOMERS 148
18) SECURITIES ISSUED 148
19) SUBORDINATED DEBT 149
20) OTHER FINANCIAL LIABILITIES 150
21) PROVISIONS 151
22) PROVISIONS, CONTINGENT ASSETS AND LIABILITIES AND LEGAL OBLIGATIONS – TAX AND SOCIAL SECURITY 154
23) OTHER LIABILITIES 159
24) SHAREHOLDERS’ EQUITY (PARENT COMPANY) 159
25) NON-CONTROLLING INTERESTS IN SUBSIDIARIES 160
26) FEE AND COMMISSION INCOME 161
27) PAYROLL AND RELATED BENEFITS 161
28) OTHER ADMINISTRATIVE EXPENSES 161
29) TAX EXPENSES 162
30) OTHER OPERATING INCOME 162
31) OTHER OPERATING EXPENSES 162
32) NON-OPERATING INCOME (LOSS) 162
33) RELATED-PARTY TRANSACTIONS 163
34) RISK AND CAPITAL MANAGEMENT 166
35) EMPLOYEE BENEFITS 175
36) INCOME TAXES 178
37) OTHER INFORMATION 181

93
1) OPERATIONS
Banco Bradesco S.A. (Bradesco or Organization) is a private-sector publicly traded company and universal bank, its headquarters is located in Cidade de Deus, s/n, in the city of Osasco, State of São Paulo, Brazil. Bradesco, through its commercial, foreign exchange, consumer financing and housing loan portfolios, carries out all the types of banking activities for which it has authorization. Bradesco is involved in a number of other activities, either directly or indirectly, through its subsidiaries, specifically leases, investment banking, brokerage, consortium management, credit cards, real estate projects, insurance, pension plans and capitalization bonds. All these activities are undertaken by the various companies in the Bradesco Organization (Organization), working together in an integrated manner in the market.
2) PRESENTATION OF THE CONSOLIDATED FINANCIAL STATEMENTS
Bradesco’s consolidated financial statements include the financial statements for Bradesco, its foreign branches and subsidiaries, in Brazil and overseas and SPEs (Special Purpose Entities) and investment funds of which the Organization's companies are the main beneficiaries or holders of the principal obligations, as established by Technical Pronouncement CPC 36 (R3) - Consolidated Financial Statements, under the item "Control". These statements were prepared in accordance with accounting practices adopted in Brazil applicable to institutions authorized to operate by the Central Bank of Brazil (Bacen), which includes the guidelines issued by Laws No. 4,595 / 64 (Law on the National Financial System) and No. 6,404 / 76 (Brazilian Corporate Law), including the changes introduced by Laws 11,638 / 07 and 11,941 / 09, for accounting for operations, the rules and instructions of the National Monetary Council (CMN) and the Central Bank of Brazil (Bacen ), in addition to the rules of the Securities Commission (CVM) of the National Private Insurance Council (CNSP), the Superintendency of Private Insurance (Susep) and the National Supplementary Health Agency (ANS), when not in conflict with the rules applicable to Financial Institution. The financial statements of the lease companies included in the consolidated financial statements were prepared using the financial method, under which leased assets are not recognized and the lease receivables are recognized at present value in the Leases line item. In addition, the changes arising from CMN Resolution No. 4,720/19 and Bacen Resolution No. 2/20 were included in Bradesco's consolidated financial statements. The main objective of these standards is to bring similarity with the guidelines for the presentation of financial statements in accordance with International Financial Reporting Standards (IFRS). The main changes implemented were: statement of financial position accounts are presented in order of liquidity and enforceability; the statement of financial position balances for the period are presented in comparison with the end of the immediate previous fiscal year and the remaining statements are compared with the same periods of the previous fiscal year for which they were presented; inclusion of information on recurring and non-recurring results; and the inclusion of the Statement of Comprehensive Income. The changes implemented by the new standards did not impact Net Income or Shareholders’ Equity. Management states that it has disclosed all relevant information in the consolidated financial statements of Bradesco and that the accounting practices have been applied in a consistent manner in all period presented. For the preparation of these consolidated financial statements, the intercompany transactions, balances of equity accounts, revenue, expenses and unrealized profits were eliminated and net income and shareholders’ equity attributable to the non-controlling interests were accounted for in a separate line. Goodwill on the acquisition of investments in associates, subsidiaries or jointly controlled companies is presented in the intangible assets lines (Note 14a). The foreign exchange variation from foreign branches and investments is presented in the income statement accounts used for changes in the value of derivative financial instrument and expenses for borrowings and on-lendings. These effects are offset by the results obtained by the financial instruments used to protect the effects of the exchange variation produced by our investments abroad.

94
The financial statements include estimates and assumptions, which are reviewed at least annually, such as: the calculation of estimated loan losses; fair value estimates of certain financial instruments; civil, tax and labor provisions; impairment losses of securities classified as available-for-sale and held-to-maturity securities and non-financial assets; the calculation of technical provisions for insurance, pension plans and capitalization bonds; and the determination of the useful life of specific assets. In the first half of 2020, there was a review of assumptions for certain assets due to the current economic scenario impacted by the pandemic caused by Covid-19. Actual results may differ from those based on estimates and assumptions. Bradesco’s consolidated financial statements were approved by the Board of Directors on February 03, 2021. Below are the significant directly and indirectly owned companies and investment funds included in the consolidated financial statements:
Activity
Equity interest
On December 31, 2020
On December 31, 2019
Financial Sector – Brazil
Ágora Corretora de Títulos e Valores Mobiliários S.A. Brokerage 100.00% 100.00%
Banco Bradescard S.A. Cards 100.00% 100.00%
Banco Bradesco BBI S.A. (1) Investment bank 100.00% 99.96%
Banco Bradesco BERJ S.A. Banking 100.00% 100.00%
Banco Bradesco Financiamentos S.A. Banking 100.00% 100.00%
Banco Losango S.A. Banking 100.00% 100.00%
Bradesco Administradora de Consórcios Ltda. Consortium management 100.00% 100.00%
Bradesco Leasing S.A. Arrendamento Mercantil Leases 100.00% 100.00%
Bradesco-Kirton Corretora de Câmbio S.A. Exchange Broker 99.97% 99.97%
Bradesco S.A. Corretora de Títulos e Valores Mobiliários Brokerage 100.00% 100.00%
BRAM - Bradesco Asset Management S.A. DTVM Asset management 100.00% 100.00%
Kirton Bank S.A. Banking 100.00% 100.00%
Tempo Serviços Ltda. Services 100.00% 100.00%
Financial Sector – Overseas
Banco Bradesco Argentina S.A.U. (2) Banking 100.00% 100.00%
Banco Bradesco Europa S.A. (2) Banking 100.00% 100.00%
Banco Bradesco S.A. Grand Cayman Branch (2) (3) Banking 100.00% 100.00%
Banco Bradesco S.A. New York Branch (2) Banking 100.00% 100.00%
Bradesco Securities, Inc. (2) Brokerage 100.00% 100.00%
Bradesco Securities, UK. Limited (2) Brokerage 100.00% 100.00%
Bradesco Securities, Hong Kong Limited (2) Brokerage 100.00% 100.00%
Cidade Capital Markets Ltd. (2) Banking 100.00% 100.00%
Bradescard México, sociedad de Responsabilidad Limitada (4) Cards 100.00% 100.00%
Bac Florida Bank (5) Banking 100.00% 0.00%
Insurance, Pension Plan and Capitalization Bond Sector - In Brazil
Atlântica Companhia de Seguros Insurance 100.00% 100.00%
Bradesco Auto/RE Companhia de Seguros Insurance 100.00% 100.00%
Bradesco Capitalização S.A. Capitalization bonds 100.00% 100.00%
Bradesco Saúde S.A. Insurance/health 100.00% 100.00%
Bradesco Seguros S.A. Insurance 99.96% 99.96%
Bradesco Vida e Previdência S.A. Pension plan/Insurance 100.00% 100.00%
Odontoprev S.A. (6) Dental care 50.01% 50.01%
Insurance - Overseas
Bradesco Argentina de Seguros S.A. (2) (6) Insurance 99.98% 99.98%
Other Activities - Brazil
Andorra Holdings S.A. Holding 100.00% 100.00%
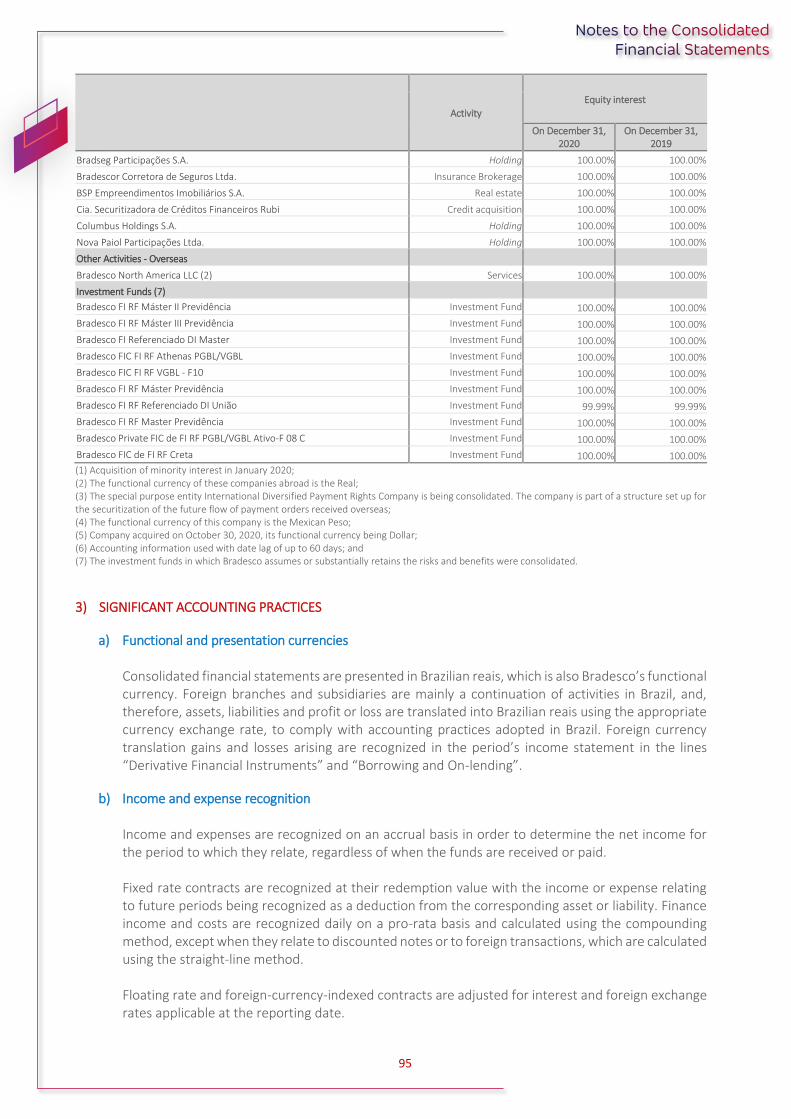
95
Activity
Equity interest
On December 31, 2020
On December 31, 2019
Bradseg Participações S.A. Holding 100.00% 100.00%
Bradescor Corretora de Seguros Ltda. Insurance Brokerage 100.00% 100.00%
BSP Empreendimentos Imobiliários S.A. Real estate 100.00% 100.00%
Cia. Securitizadora de Créditos Financeiros Rubi Credit acquisition 100.00% 100.00%
Columbus Holdings S.A. Holding 100.00% 100.00%
Nova Paiol Participações Ltda. Holding 100.00% 100.00%
Other Activities - Overseas
Bradesco North America LLC (2) Services 100.00% 100.00%
Investment Funds (7)
Bradesco FI RF Máster II Previdência Investment Fund 100.00% 100.00%
Bradesco FI RF Máster III Previdência Investment Fund 100.00% 100.00%
Bradesco FI Referenciado DI Master Investment Fund 100.00% 100.00%
Bradesco FIC FI RF Athenas PGBL/VGBL Investment Fund 100.00% 100.00%
Bradesco FIC FI RF VGBL - F10 Investment Fund 100.00% 100.00%
Bradesco FI RF Máster Previdência Investment Fund 100.00% 100.00%
Bradesco FI RF Referenciado DI União Investment Fund 99.99% 99.99%
Bradesco FI RF Master Previdência Investment Fund 100.00% 100.00%
Bradesco Private FIC de FI RF PGBL/VGBL Ativo-F 08 C Investment Fund 100.00% 100.00%
Bradesco FIC de FI RF Creta Investment Fund 100.00% 100.00%
(1) Acquisition of minority interest in January 2020; (2) The functional currency of these companies abroad is the Real; (3) The special purpose entity International Diversified Payment Rights Company is being consolidated. The company is part of a structure set up for the securitization of the future flow of payment orders received overseas; (4) The functional currency of this company is the Mexican Peso; (5) Company acquired on October 30, 2020, its functional currency being Dollar; (6) Accounting information used with date lag of up to 60 days; and (7) The investment funds in which Bradesco assumes or substantially retains the risks and benefits were consolidated.
3) SIGNIFICANT ACCOUNTING PRACTICES
a) Functional and presentation currencies Consolidated financial statements are presented in Brazilian reais, which is also Bradesco’s functional currency. Foreign branches and subsidiaries are mainly a continuation of activities in Brazil, and, therefore, assets, liabilities and profit or loss are translated into Brazilian reais using the appropriate currency exchange rate, to comply with accounting practices adopted in Brazil. Foreign currency translation gains and losses arising are recognized in the period’s income statement in the lines “Derivative Financial Instruments” and “Borrowing and On-lending”.
b) Income and expense recognition Income and expenses are recognized on an accrual basis in order to determine the net income for the period to which they relate, regardless of when the funds are received or paid. Fixed rate contracts are recognized at their redemption value with the income or expense relating to future periods being recognized as a deduction from the corresponding asset or liability. Finance income and costs are recognized daily on a pro-rata basis and calculated using the compounding method, except when they relate to discounted notes or to foreign transactions, which are calculated using the straight-line method. Floating rate and foreign-currency-indexed contracts are adjusted for interest and foreign exchange rates applicable at the reporting date.
96
Insurance and coinsurance premiums, net of premiums paid for coinsurance and related commissions, are recognized upon the issue of the related policies/certificates/endorsements and invoices, or upon the beginning of the exposure to risk in cases in which the risk begins before the policy issuance, and is recognized on a straight-line basis over the policies’ effective period through the upfront recognition and subsequent reversal through the income statement of the unearned premium reserve and the deferred acquisition costs. Revenues from premiums and the corresponding deferred acquisition costs, relating to existing risk for which no policy has been issued, are recognized in the income statement at the beginning of the risk exposure, based on estimated figures. The health insurance premiums are recognized in the net written premiums earned or provision for unearned premiums/considerations (PPCNG), according to the period of coverage of contracts in force on the reporting date. Reinsurance operations are recognized based on the premium and claims information provided, which is subject to the analysis of the re-insurers. The deductions of reinsurance premiums granted are consistent with the recognition of the corresponding insurance premium and/or terms of the reinsurance contract. The acquisition costs related to the insurance commission are deferred and appropriated to the income in proportion to the recognition of the premium earned. Agency fees are deferred and recognized in the income statement on a straight-line basis over a period of 24 months for health insurance operations, and 12 months for other operations. Pension plan contributions and life insurance premiums with survival coverage are recognized in the income statement as they are received. Management fee income is appropriated to the income on an accrual basis, according to contractually established rates. Revenue from capitalization bonds is recognized in the month in which they are issued, according to the types of collection, which may be in monthly payments or in a single payment. Each security has a nominal value, which is indexed to the Reference Rate (TR), plus interest rates defined in the plan. The corresponding technical provisions are recorded simultaneously with the recognition of revenue. The revenues arising from unclaimed and expired capitalization bonds (securities and non-redeemed draws) are recognized after the prescription period, that is, until November 2003, up to 20 years and five years after this date as established by law. The expenses related to commercialization of capitalization bonds are classified as “Acquisition Costs” and are recognized in the income statement as incurred.
c) Cash and cash equivalents Cash and cash equivalents include: funds available in currency, investments in gold, securities sold under agreements to repurchase and interest-earning deposits in other banks, maturing in 90 days or less, from the time of the acquisition, which are exposed to insignificant risk of change in fair value. These funds are used by Bradesco to manage its short-term commitments. Cash and cash equivalents detailed balances are presented in Note 5.

97
d) Financial instruments
i. Interbank investments
Interbank deposits are stated at cost, plus income earned up to the end of the reporting period, net of any devaluation allowance, if applicable.
The breakdown, terms and proceeds relating to interbank investments are presented in Note 6.
ii. Securities – Classification
Trading securities – securities acquired for the purpose of being actively and frequently traded. They are recognized at cost, plus income earned and adjusted to fair value with changes recognized in the income statement for the period;
Available-for-sale securities – securities that are not specifically intended for trading purposes or to be held to maturity. They are recognized at cost, plus income earned, which is recognized in profit or loss in the period and adjusted to fair value with changes recognized in shareholders’ equity, net of tax, which will be transferred to the income statement only when effectively realized; and
Held-to-maturity securities – securities for which there is positive intent and financial capacity to hold to maturity. They are recognized at cost, plus income earned recognized in the income statement for the period.
Securities classified as trading and available-for-sale, as well as derivative financial instruments, are recognized in the consolidated statement of financial position at their fair value. Fair value is generally based on quoted market prices or quotations for assets or liabilities with similar characteristics. If market prices are not available, fair values are based on traders’ quotations, pricing models, discounted cash flows or similar techniques to determine the fair value and may require judgment or significant estimates by Management. Classification, breakdown and segmentation of securities are presented in Note 8.
iii. Impairment of Financial Assets The balances of the securities classified in the securities available for sale and securities held to maturity categories are reviewed to determine whether there is any indication of impairment loss - Impairment. When a loss is verified, we recognize an expense in the income for the year. This occurs when the book value of the asset exceeds its recoverable value. In order to calculate the recoverable amount, the estimate of loss is made by models using observed data or by judgment based on the experience of our Organization. The composition of the Impairment for Securities is presented in Note 8d.
iv. Derivative financial instruments (assets and liabilities)
Derivative financial instruments are designed to meet the Company´s own needs to manage Bradesco´s global exposure, as well to meet customer requests, in order to manage its positions.
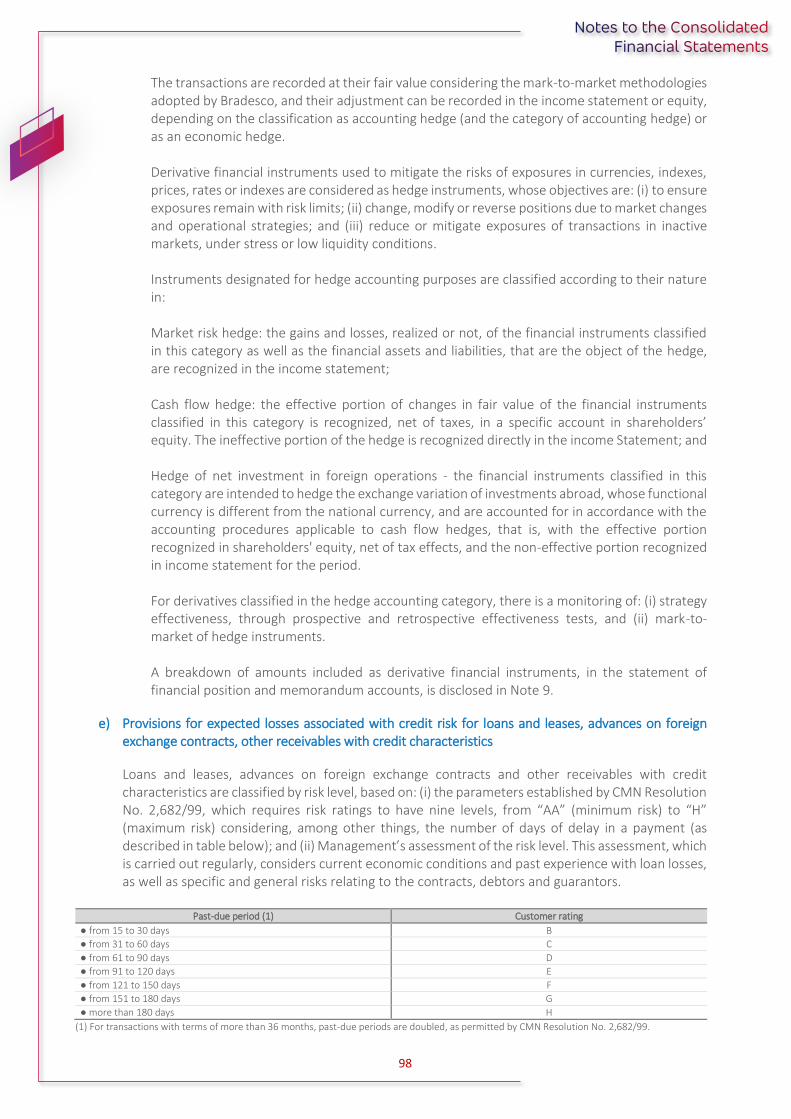
98
The transactions are recorded at their fair value considering the mark-to-market methodologies adopted by Bradesco, and their adjustment can be recorded in the income statement or equity, depending on the classification as accounting hedge (and the category of accounting hedge) or as an economic hedge. Derivative financial instruments used to mitigate the risks of exposures in currencies, indexes, prices, rates or indexes are considered as hedge instruments, whose objectives are: (i) to ensure exposures remain with risk limits; (ii) change, modify or reverse positions due to market changes and operational strategies; and (iii) reduce or mitigate exposures of transactions in inactive markets, under stress or low liquidity conditions. Instruments designated for hedge accounting purposes are classified according to their nature in: Market risk hedge: the gains and losses, realized or not, of the financial instruments classified in this category as well as the financial assets and liabilities, that are the object of the hedge, are recognized in the income statement; Cash flow hedge: the effective portion of changes in fair value of the financial instruments classified in this category is recognized, net of taxes, in a specific account in shareholders’ equity. The ineffective portion of the hedge is recognized directly in the income Statement; and Hedge of net investment in foreign operations - the financial instruments classified in this category are intended to hedge the exchange variation of investments abroad, whose functional currency is different from the national currency, and are accounted for in accordance with the accounting procedures applicable to cash flow hedges, that is, with the effective portion recognized in shareholders' equity, net of tax effects, and the non-effective portion recognized in income statement for the period. For derivatives classified in the hedge accounting category, there is a monitoring of: (i) strategy effectiveness, through prospective and retrospective effectiveness tests, and (ii) mark-to-market of hedge instruments. A breakdown of amounts included as derivative financial instruments, in the statement of financial position and memorandum accounts, is disclosed in Note 9.
e) Provisions for expected losses associated with credit risk for loans and leases, advances on foreign exchange contracts, other receivables with credit characteristics
Loans and leases, advances on foreign exchange contracts and other receivables with credit characteristics are classified by risk level, based on: (i) the parameters established by CMN Resolution No. 2,682/99, which requires risk ratings to have nine levels, from “AA” (minimum risk) to “H” (maximum risk) considering, among other things, the number of days of delay in a payment (as described in table below); and (ii) Management’s assessment of the risk level. This assessment, which is carried out regularly, considers current economic conditions and past experience with loan losses, as well as specific and general risks relating to the contracts, debtors and guarantors.
Past-due period (1) Customer rating
● from 15 to 30 days B
● from 31 to 60 days C
● from 61 to 90 days D
● from 91 to 120 days E
● from 121 to 150 days F
● from 151 to 180 days G
● more than 180 days H
(1) For transactions with terms of more than 36 months, past-due periods are doubled, as permitted by CMN Resolution No. 2,682/99.

99
Interest and inflation adjustments on past-due transactions are only recognized in the Income Statement up to the 59th day that they are past due. As from the 60th day, they are recognized in memorandum accounts and are only recognized in the Income Statement when received. H-rated past-due transactions remain at this level for six months, after which they are written-off against the existing allowance and controlled in memorandum accounts for at least five years. Renegotiated loans are maintained at least at the same rating in which they were classified on the date of renegotiation. As permitted by Resolution No. 4,803/20 issued by CMN, amended by Resolution No. 4,855/20, loans renegotiated in the period from March 1 to December 31, 2020 may be maintained at the same level as they were classified on February 29, 2020, except: (a) operations with a delay of 15 days or more on February 29, 2020; and (b) transactions with evidence of the counterparty's inability to honor the obligation under the new conditions agreed. Considering the provisions of the CMN Resolution No. 4,846/20, in operations in the scope of the Emergency Employment Support Program (PESE) the provision is being calculated only on the portion of loan whose risk is assumed by the Organization. Renegotiations of loans that had already been written-off against the allowance and that were recognized in memorandum accounts, are rated as level “H” and any possible gains derived from their renegotiation are recognized only when they are effectively received. When there is a significant repayment on the loan or when new material facts justify a change in the level of risk, the loan may be reclassified to a lower risk category. The provision for expected losses associated with credit risk are calculated in an amount sufficient to cover probable losses and are in accordance with the rules and instructions of CMN and Bacen, associated with the assessments carried out by Management in determining credit risks. The classification of all loans to the same economic client or group is defined as the one that presents the highest risk. In exceptional cases, different ratings for a particular loan are accepted according to the nature, value, purpose of the loan and characteristics of the guarantees. Type, values, terms, levels of risk, concentration, economic sector of client’s activity, renegotiation and income from loans, as well as the breakdown of expenses and Statement of Financial Position accounts for the allowance for loan losses are presented in Note 10.
f) Income tax and social contribution
Deferred tax assets, calculated on income tax losses, social contribution losses and temporary differences, are recognized in “Deferred tax assets” and the deferred tax liabilities on tax differences in lease asset depreciation (applicable only for income tax), fair value adjustments on securities, inflation adjustment of judicial deposits, among others, are recognized in “Deferred taxes”. Deferred tax assets on temporary differences are realized when the difference between the accounting treatment and the income tax treatment reverses. Deferred tax assets on carried forward income tax and social contribution losses are realizable when taxable income is generated, up to the 30% limit of the taxable profit for the period. Deferred tax assets are recognized based on current expectations of realization considering technical studies and analyses carried out by Management.

100
The provision for income tax (IRPJ) is calculated at 15% of taxable income plus a 10% surcharge. For financial companies, for companies considered as such and for the insurance industry, social contribution (CSLL) was calculated until August 2015, considering the rate of 15%. For the period between September 2015 and December 2018, the rate was changed to 20%, according to Law No. 13,169/15 and the rate returned to 15% again as from January 2019. In November 2019, Constitutional Amendment No. 103 was enacted, which establishes in Article 32, the increase in the social contribution rate on the net profit of “Banks” from 15% to 20%, effective from March 2020. For the other companies, the social contribution is calculated considering the rate of 9%. Provisions were recognized for income tax and social contribution in accordance with specific applicable legislation. The breakdown of income tax and social contribution, showing the calculations, the origin and expected use of deferred tax assets, as well as unrecognized deferred tax assets, is presented in Note 36.
g) Investments in associates and Jointly Controlled Entities Investments in unconsolidated companies, where Bradesco has significant influence over the investee or holds at least 20% of the voting rights, and jointly controlled companies, are accounted for using the equity method. The composition of unconsolidated and jointly controlled companies are disclosed in Note 12.
h) Premises and equipment Corresponds to rights relating to tangible assets intended to maintain activities or exercised for that purpose. Premises and equipment are stated at acquisition cost, net of accumulated depreciation, calculated by the straight-line method based on the assets’ estimated economic useful life, using the following rates: real estate – 4% per annum; installations, furniture, equipment for use, security systems and communications – 10% per annum; transport systems – 10% to 20% per annum; and data processing systems – 20% to 40% per annum, and adjusted for impairment, when applicable. The breakdown of asset costs and their corresponding depreciation, as well as the unrecognized surplus value for real estate and the fixed asset ratios, is disclosed in Note 13.
i) Intangible assets
Corresponds to acquired rights that have as object intangible assets intended for the maintenance of the entity or exercised for this purpose:
Acquisition of rights to provide banking services: they are recognized and amortized over the period in which the asset will directly and indirectly contribute to future cash flows and adjusted for impairment, where applicable;
Software: stated at cost less amortization calculated on a straight-line basis over the estimated useful life (20% p.a.), from the date it is available for use and adjusted for impairment, where applicable. Internal software development costs are recognized as an intangible asset when it is possible to show the intent and ability to complete and use the software, as well as to reliably measure costs directly attributable to the intangible asset. These costs are amortized during the software’s estimated useful life, considering the expected future economic benefits; and

101
Goodwill on acquisition of investments: constituted by the difference between the acquisition cost and the equity value of the shares and amortized over the estimated time in which the asset should contribute, directly or indirectly, to the future cash flow.
Intangible assets and the movement in these balances by class are presented in Note 14.
j) Other assets
Other assets include taxes to be offset relating to income tax and social contribution credits from previous years and prepayments made but not yet utilized in the current period. Also classified in this group are prepaid expenses that represent the application of funds in advance payments, whose rights to benefits or provision of services will occur in future periods, being recorded in the income statement on an accrual basis are classified as other assets. Incurred costs relating to assets that will generate revenue in subsequent periods are recognized in the Income Statement according to the terms and the amount of expected benefits and directly recognized in the Income Statement when the corresponding assets or rights are no longer part of the institution’s assets or when future benefits are no longer expected. Assets not for own use are those received as payment in kind and those that were in use and were deactivated, destined for sale. They are recorded at the lower of the market value and the book value and adjusted through a provision, when applicable. The composition of Other Assets is presented in Note 15.
k) Provisions for Impairment of Assets
Assets, which are subject to amortization or depreciation, are reviewed to verify impairment whenever events or changes in circumstances indicate that the carrying amount may not be recoverable. An impairment loss is recognized based on the excess the carrying amount of the asset or the cash generating unit (CGU) over its estimated recoverable amount. The recoverable amount of an asset or CGU is the greater of its fair value, less costs to sell, and its value in use. For the purpose of impairment testing, the assets that cannot be tested individually are grouped together into the smallest group of assets that generates cash inflows from continuing use that are largely independent of the cash inflows of other assets or CGUs. Subject to a ceiling of the operating segments, for the purpose of goodwill impairment testing, CGUs to which goodwill has been allocated are aggregated so that the level at which impairment testing is performed reflects the lowest level at which goodwill is monitored for internal reporting purposes. When assessing the value in use, projections of future results based on business and budget plans are used, and the estimated future cash flows are discounted to their present value using a discount rate before taxes, that reflects the current market conditions of the time value of money and the specific risks of the asset or CGU. The Organization’s corporate assets do not generate separate cash flows and are utilized by more than one CGU. Corporate assets are allocated to CGUs on a reasonable and consistent basis and tested for impairment as part of the testing of the CGU to which the corporate asset is allocated. Impairment losses are recognized in the consolidated Income Statement. Impairment losses recognized in respect of CGUs are allocated first to reduce the carrying amount of any goodwill

102
allocated to the CGU (or group of CGUs) and then to reduce the carrying amount of the other assets in the CGU (or group of CGUs) on a pro rata basis.
l) Deposits and other financial liabilities
i. Securities sold under agreements to repurchase, borrowing and on-lending, deposits from customers, securities issued and subordinated debt
They are measured at cost plus, when applicable, accrued interest recognized on a pro rata basis with the exception of securities sold under agreements to repurchase with no restricions on resale which are measured at fair value. The composition of these accounts is shown in Notes 16, 17, 18 and 19.
ii. Funding expenses Expenses related to funding transactions involving the issuance of securities reduce the corresponding liability and are recognized in profit or loss over the term of the transaction, according to Notes 16e.
m) Provisions
i. Technical provisions relating to insurance, pension plans and capitalization bonds
Damage, health and group insurance lines, except life insurance with survival coverage (VGBL):
- The unearned premium reserve (PPNG) is calculated on a daily pro-rata basis, using premiums net of coinsurance, including amounts ceded through reinsurance, and is comprised of the portion corresponding to the remaining period of coverage, except for health insurance. The portion of these reserves corresponding to the estimate for risks in effect but not yet contracted is designated ‘PPNG-RVNE’;
- The unearned premium/payments reserve (PPCNG) is calculated on a daily pro-rata basis based on the portion of health insurance premiums corresponding to the remaining period of coverage, of the currently effective contracts;
- The mathematical reserve for unvested benefits (PMBaC) is calculated as the difference between the current value of future benefits and the current value of future contributions, on obligations already assumed by Bradesco;
- For health insurance, the Mathematical Reserve for Benefits to be Granted (PMBaC) uses a discount rate of 3.6% (3.9% on December 31, 2019) per annum. It considers the payment of premiums until the death of the insured and, from this moment, the costs related to the coverage of dependents who remain in the plan for five further years without payment of premiums;
- For health insurance, the mathematical reserve of benefits granted (PMBC) is constituted by the obligations arising from the contractual clauses of remittance of installments, regarding the coverage of health assistance and by the premiums paid by insured participating in the Bradesco Saúde Insurance Plan - "GBS Plan" considering a discount rate of 3.6% (3.9% on December 31, 2019) per annum;
- The reserve for events incurred but not reported (PEONA) is calculated from the final estimate of claims already incurred and still not reported, based on the run-off triangles, monthly that consider the historical development of claims advised in the last 12 months for health insurance and last 18 months for dental care to establish a future projection per period of occurrence;

103
- For health insurance, the reserve for events incurred but not reported in SUS (PEONA-SUS) is calculated from the estimate of the amount of events/claims originating in the Unified Health System (SUS), which have occurred and which have not been forwarned. The amount is calculated and reported monthly on the institutional website of the National Supplementary Health Agency (ANS), its form of accounting being supported by the Normative Resolution No. 442/18 in force;
- For Vehicle insurance, and other Casualty insurance, the IBNR (reserve for incurred but not
reported claims) and IBNER (reserve for events incurred but not reported) provisions are recorded, the purpose of which is to guarantee the payment of claims incurred, but which the Insurer is not yet aware of for lack of notice, and also cover variations in estimated amounts to pay those already notified;
- For life insurance, the provision of ‘incurred but not reported claims (IBNR) is calculated based on semi-annual run-off triangles, which consider the historical development of claims paid and outstanding in the prior 10 half-year periods, to establish a future projection per period of occurrence. A residual tail study is carried out to project the claims notified after 10 half-year periods of the occurrence date;
- The reserve for unsettled claims (PSL), for health insurance, considers all claim notifications
received up to the end of the reporting period, and includes all claims in litigation and related costs, updated monetarily;
- The reserve for unsettled claims (PSL) for life insurance considers the expected amounts to be
settled from all claims notices received up to the reporting date. The provision covers administrative and judicial claims indexed to inflation and with interest in the event of judicial claims;
- For non-life insurance, the reserve for unsettled claims (PSL) is determined based on the
indemnity payment estimates, considering all administrative and judicial claims notified up to the reporting date, restated monetarily and with interest in case of judicial claims, net of the expected payments to be received;
- The technical surplus reserve (PET) corresponds to the difference between the expected value and the observed value for events occurred in the period for policies with technical surplus;
- The Allocated loss adjustment expenses reserve (ALAE) for life insurance is recognized to cover expenses related to estimated claims and benefits for pre-funded pension plans, the reserve covers claims incurred. For plans structured under a full-capitalization pension system, the reserve is made to cover the expected expenses related to incurred claims/benefits and also to claims/benefits to be incurred;
- For damage insurance, the allocated loss adjustment expenses reserve (ALAE) is calculated on
a monthly basis to cover the expenses related to indemnity payment, and it covers the expenses allocated individually to each claim, as well as expenses related to claims that have not been itemized, that is, those at the level of the portfolio;
- The reserve for redemptions and other amounts to be settled (PVR) comprises figures related to redemptions to settle, premium refunds owed and portability (transfer-outs) requested but not yet transferred to the recipient insurer;
- The supplementary provision for coverage (PCC) for damage insurance shall be recorded when
there is an insufficiency in the technical provisions, as calculated in the Liability Adequacy Test
104
(LAT), pursuant to the determinations specified in the regulations in force. As at the reporting date, no supplementary provision for coverage was recognized;
- The supplementary provision for coverage (PCC) for life insurance, refers to the amount
necessary to complement technical provisions, as calculated in the liability adequacy test (LAT). The LAT, which is prepared semiannually using statistical and actuarial methods based on realistic assumptions as account the biometric table BR-EMS of both genders, adjusted as per longevity development criteria in compliance with the last versions disclosed (improvement), claims, administrative and operating expenses and forward interest rate curves (ETTJ – prepared by Fenaprevi) free from risk as authorized by SUSEP. The improvement rate is calculated from automatic updates of the biometric table, considering the expected increase in future life expectancy. The LAT result must be offset by the amount of the difference between the market value and the book value of the collateralized securities of technical provisions classified as “held to maturity”, as required by SUSEP Circular No. 517/15 and subsequent changes; and
- Other technical provisions are recognized for the individual health portfolio to address the
differences between the expected present value of future premiums and the expected present value of indemnities and related expenses, using an annual discount rate of 3.6% (3.9% on December 31, 2019) per annum.
Pension plans and life insurance with survival coverage (VGBL):
- The unearned premium reserve (PPNG) is calculated on a daily prorated basis using net contributions, and is comprised of the portion corresponding to the remaining period of coverage. The portion of these reserves corresponding to the estimate for risks covered but not yet issued is designated PPNG-RVNE;
- The mathematical reserve for unvested benefits (PMBaC) is recognized for participants of pension plans and life insurance with survival coverage who have not yet received any benefit. In defined benefit pension plans, the reserve represents the difference between the present value of future benefits and the present value of future contributions, corresponding to obligations in the form of retirement, disability, pension and annuity plans. For defined contribution plans, it represents the value of participant contributions, net of costs and other contractual charges, plus income from investment in specially constituted investment funds (FIEs);
- The reserve for redemptions and other amounts to be settled (PVR) comprises figures related to redemptions to settle, premium refunds owed and portability (transfer-outs) requested but not yet transferred to the recipient insurer;
- The mathematical reserve for vested benefits (PMBC), calculated using actuarial estimates based on the relevant data of the plan participants, is recognized for participants already receiving benefits and corresponds to the present value of future obligations related to the payment of those on-going benefits;
- The supplementary provision for coverage (PCC) refers to the amount necessary to complement technical provisions, as calculated in the liability adequacy test (LAT). The liability adequacy test (LAT), which is prepared semi-annually using statistical and actuarial methods based on certain assumptions as account the biometric table BR-EMS of both genders, adjusted as per longevity development criteria in compliance with the last versions disclosed (improvement), claims, administrative and operating expenses, persistence rates and forward interest rate curves (ETTJ - prepared by Fenaprevi) free from risk and authorized by SUSEP. The improvement rate is calculated from automatic updates of the biometric table,
105
considering the expected increase in future life expectancy. The adequacy test result must be offset by the portion corresponding to the difference between the fair value and the book value of the linked securities as collateral for technical provisions classified as "held to maturity", as required by SUSEP Circular No. 517/15 and subsequent changes;
- The Allocated loss adjustment expenses reserve (ALAE) for life insurance is recognized to cover
expenses related to estimated claims and benefits for pre-funded pension plans, the reserve covers claims incurred. For plans structured under a full-capitalization pension system, the reserve is made to cover the expected expenses related to incurred claims/benefits and also to claims/benefits to be incurred;
- The reserve for financial surplus (PEF) corresponds to the financial income exceeding the minimum assured profitability, transferred to contracts with a financial surplus participation clause;
- The provision for claims incurred but not reported (IBNR) is calculated based on semi-annual
run-off triangles, which consider the historical development of claims paid and outstanding in the last 16 half-year periods for the creation of a new future projection by period of occurrence.
- The reserve for unsettled claims (PSL) considers the expected values to be settled from all loss
notices received up to the end of the reporting period. The provision covers administrative and judicial claims and is adjusted for inflation and with interest in the case of judicial claims; and
- The financial charges credited to technical provisions, and the recording and/or reversal of the
financial surplus, are classified as financial expenses, and are presented under “Financial income from insurance, pension plans and capitalization bonds”.
Capitalization bonds:
- The mathematical reserve for capitalization bond (PMC) is recognized for each active or suspended capitalization bond over the term set forth in the general conditions of the plan, and is calculated using the capitalization percentage, applicable to each of the payments made, plus the monthly accrual calculated using the inflation index and the interest rate established in the plan until the bond is redeemed or canceled;
- The reserve for redemption (PR) comprises the values of matured and early terminated capitalization bonds and is calculated by updating the balance of bonds whose terms have expired or canceled using the inflation index until the holder receives the redemption payment;
- The reserve for draws to be made (PSR) is constituted for each active security and is calculated for the prize draws funded which have not yet occurred, in accordance with the parameters of the plan. The calculation methodology consists of the projection of the expected present value of the expenses of future prize draws less the projection of the present value of the expected future receipts from the capitalization bonds;
- The reserve for draws payable (PSP) consists of the value of unpaid prize draw amounts, adjusted for inflation for the period between the date of the drawing and its effective settlement; and
- The reserve for administrative expense (PDA) is recognized to cover the cost for maintaining capitalization bonds. For the calculation, the present value of the expected future
106
administrative expenses is projected and compared to present value of the projected loading fees on future installments of the bonds.
Technical provisions shown by account, product and segment, as well as amounts and details of plan assets covering these technical provisions, are shown in Note 21.
i. Provisions, contingent assets and liabilities and legal obligations – tax and social security
Provisions, contingent assets and liabilities, and legal obligations, as defined below, are recognized, measured and disclosed in accordance with the criteria set out in CPC 25 – Provisions, contingent liabilities and contingent assets, approved by CMN Resolution No. 3,823/09 and CVM Resolution No. 594/09 and according to Circular Letter No. 3,429/10, which are:
Contingent Assets: these are not recognized in the financial statements, except to the extent that there are real guarantees or favorable judicial decisions, to which no further appeals are applicable, and it is considered virtually certain that cash inflows will flow to Bradesco. Contingent assets with a chance of probable success are disclosed in the notes to the financial statements;
Provisions: these are recognized taking into consideration the opinion of legal counsel, the nature of the lawsuits, similarity with previous lawsuits, complexity and positioning of the courts, whenever the Organization has a present obligation (legal or constructive) as a result of a past event, it is probable that an outflow of resources will be required to settle the obligation and when the amount can be reliably measured;
Contingent Liabilities: according to CPC 25, the term “contingent” is used for liabilities that are not recognized because their existence will only be confirmed by the occurrence of one or more uncertain future events beyond Management’s control. Contingent liabilities do not meet the criteria for recognition because they are considered as possible losses and should only be disclosed in the notes when relevant. Obligations deemed remote are not recognized as a provision nor disclosed; and
Legal Obligations: Provision for Tax Risks: results from judicial proceedings in which Bradesco is contesting the applicability of tax laws on the grounds of legality or constitutionality, which, regardless of the assessment of the probability of success, are fully provided for in the financial statements.
Details on lawsuits, as well as segregation and changes in amounts recognized, by type, are presented in Note 22.
n) Employee benefits
The recognition, measurement and disclosure of employee benefits are made in accordance with the criteria established by CPC 33 (R1) - Employee Benefits, approved by CMN Resolution No. 4,424/15.
Defined Contribution Plans
Bradesco and its subsidiaries sponsor supplementary pension plans for their employees and Management. Contributions for these pension plans are recognized as expenses in the Income Statement when they are incurred. Once the contributions are paid, the Organization, in the capacity of employer, has no obligation to make any additional payment.

107
Defined Benefit Plans
The Organization’s net obligation, in relation to the defined benefit plans, arises exclusively from institutions acquired and the plans are calculated separately for each plan, estimating the defined future benefit that the employees they will be entitled to post-employment leave when they leave the Organization or when they retire. Bradesco’s net obligation for defined benefit plans is calculated on the basis of an estimate of the value of future benefits that employees receive in return for services rendered in the current and prior periods. This value is discounted to its present value and is presented net of the fair value of any assets of the plan. The calculation of the obligation of the defined benefit plan is performed annually by a qualified actuary using the projected unit credit method as required by the accounting standard. Remeasurement of the net obligation comprise: actuarial gains and losses; the difference between the return on plan assets and the net interest recognized on the defined benefit liability and any change in the effect of the asset ceiling (excluding interest), and is recognized in other comprehensive income. The net interest and other costs related to the defined benefit plans are recognized in the Income Statement. Details on employee benefits are presented in Note 35.
o) Subsequent events These refer to events occurring between the reporting date and the date the financial statements are authorized to be issued.
They comprise the following: Events resulting in adjustments: events relating to conditions already existing at the end of the
reporting period; and
Events not resulting in adjustments: events relating to conditions not existing at the end of the reporting period.
Subsequent events, if any, are described in Note 37 and are disclosed in accordance with the criteria established by CPC 24 - Subsequent Events, approved by CMN Resolution No. 3,973/11.
p) Recurring and non-recurring income
Non-recurring income is the income that is related to the atypical activities of the institution and is not expected to occur with frequency in future years. The recurring revenue corresponds to typical activities of the institution and has the predictability of occurring frequently in future years. The recurring and non-recurring revenues are presented in note 37b.
q) Investment Acquisition
The accounting entry is made at the acquisition cost, broken down into: I - equity value at the time of acquisition; and II - goodwill or negative goodwill on the acquisition of the investment, which is the difference between the acquisition cost and the equity value of the shares.

108
The goodwill or negative goodwill must be evidenced by documentation supporting the bookkeeping and broken down into: I - market value of assets of the associate or subsidiary's assets higher or lower than the cost recorded in the accounting; II - profitability value of the associate or subsidiary, based on the forecast of future results; and III - goodwill, intangibles and other economic reasons. The details of investment acquisitions are presented in Note 37g.
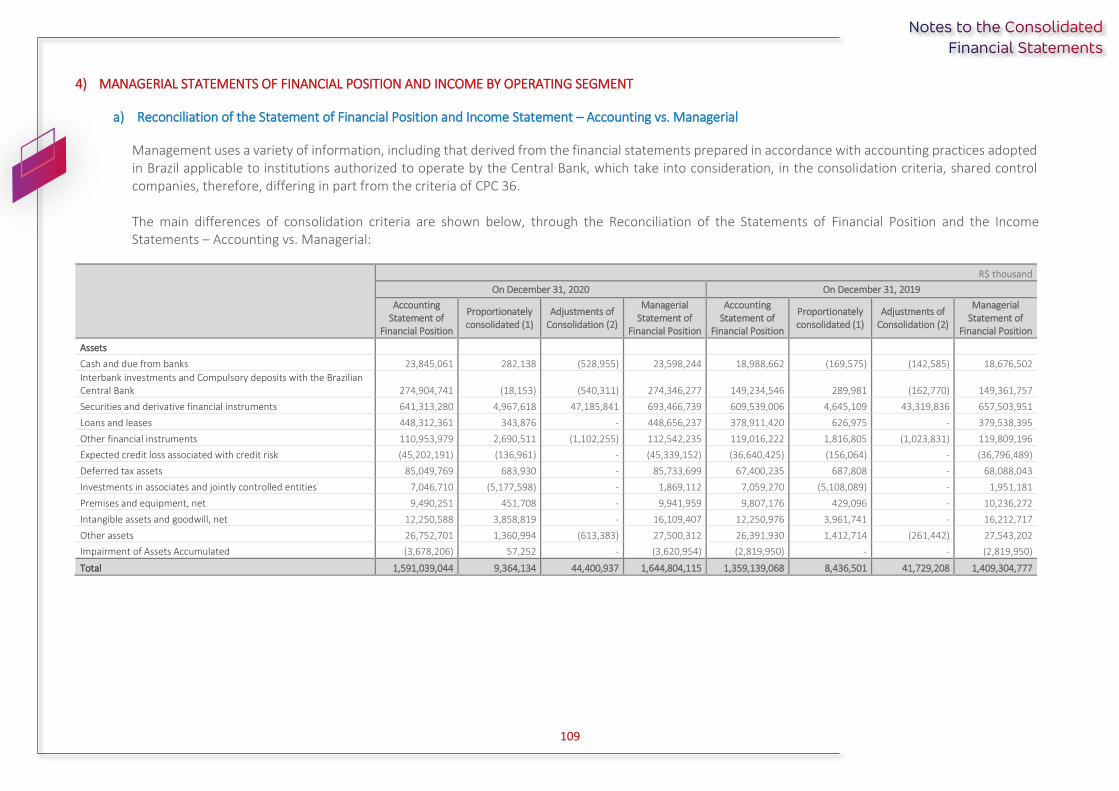
109
4) MANAGERIAL STATEMENTS OF FINANCIAL POSITION AND INCOME BY OPERATING SEGMENT
a) Reconciliation of the Statement of Financial Position and Income Statement – Accounting vs. Managerial
Management uses a variety of information, including that derived from the financial statements prepared in accordance with accounting practices adopted in Brazil applicable to institutions authorized to operate by the Central Bank, which take into consideration, in the consolidation criteria, shared control companies, therefore, differing in part from the criteria of CPC 36. The main differences of consolidation criteria are shown below, through the Reconciliation of the Statements of Financial Position and the Income Statements – Accounting vs. Managerial:
R$ thousand
On December 31, 2020 On December 31, 2019
Accounting Statement of
Financial Position
Proportionately consolidated (1)
Adjustments of Consolidation (2)
Managerial Statement of
Financial Position
Accounting Statement of
Financial Position
Proportionately consolidated (1)
Adjustments of Consolidation (2)
Managerial Statement of
Financial Position
Assets
Cash and due from banks 23,845,061 282,138 (528,955) 23,598,244 18,988,662 (169,575) (142,585) 18,676,502
Interbank investments and Compulsory deposits with the Brazilian Central Bank 274,904,741 (18,153) (540,311) 274,346,277 149,234,546 289,981 (162,770) 149,361,757
Securities and derivative financial instruments 641,313,280 4,967,618 47,185,841 693,466,739 609,539,006 4,645,109 43,319,836 657,503,951
Loans and leases 448,312,361 343,876 - 448,656,237 378,911,420 626,975 - 379,538,395
Other financial instruments 110,953,979 2,690,511 (1,102,255) 112,542,235 119,016,222 1,816,805 (1,023,831) 119,809,196
Expected credit loss associated with credit risk (45,202,191) (136,961) - (45,339,152) (36,640,425) (156,064) - (36,796,489)
Deferred tax assets 85,049,769 683,930 - 85,733,699 67,400,235 687,808 - 68,088,043
Investments in associates and jointly controlled entities 7,046,710 (5,177,598) - 1,869,112 7,059,270 (5,108,089) - 1,951,181
Premises and equipment, net 9,490,251 451,708 - 9,941,959 9,807,176 429,096 - 10,236,272
Intangible assets and goodwill, net 12,250,588 3,858,819 - 16,109,407 12,250,976 3,961,741 - 16,212,717
Other assets 26,752,701 1,360,994 (613,383) 27,500,312 26,391,930 1,412,714 (261,442) 27,543,202
Impairment of Assets Accumulated (3,678,206) 57,252 - (3,620,954) (2,819,950) - - (2,819,950)
Total 1,591,039,044 9,364,134 44,400,937 1,644,804,115 1,359,139,068 8,436,501 41,729,208 1,409,304,777

110
R$ thousand
On December 31, 2020 On December 31, 2019
Accounting Statement of
Financial Position
Proportionately consolidated (1)
Adjustments of Consolidation (2)
Managerial Statement of
Financial Position
Accounting Statement of
Financial Position
Proportionately consolidated (1)
Adjustments of Consolidation (2)
Managerial Statement of
Financial Position
Liabilities
Deposits from banks 267,280,167 2,093,170 45,452,379 314,825,716 227,819,610 1,239,740 43,735,051 272,794,401
Deposits from customers 545,292,743 (1,008,573) 4,639,653 548,923,823 366,227,541 (1,253,780) 1,821,336 366,795,097
Securities issued 144,903,825 - 112,717 145,016,542 170,727,563 15,294 - 170,742,857
Subordinated debt 53,246,232 - - 53,246,232 49,313,508 - - 49,313,508
Derivative financial instruments 18,697,682 - (1,290,146) 17,407,536 14,244,083 (12,419) (406,029) 13,825,635
Other financial liabilities 59,018,305 1,371 (915,170) 58,104,506 52,197,881 (246,192) (102,801) 51,848,888
Provisions 320,285,406 1,166,708 (23,891) 321,428,223 311,149,271 1,142,977 (12,812) 312,279,436
Deferred income tax assets 7,951,848 40,778 - 7,992,626 8,070,398 36,790 - 8,107,188
Other liabilities 29,900,955 6,134,396 (3,574,605) 32,460,746 24,956,201 6,411,461 (3,305,537) 28,062,125
Non-controlling interest 759,241 936,284 - 1,695,525 709,791 1,102,630 - 1,812,421
Shareholders’ equity 143,702,640 - - 143,702,640 133,723,221 - - 133,723,221
Total 1,591,039,044 9,364,134 44,400,937 1,644,804,115 1,359,139,068 8,436,501 41,729,208 1,409,304,777
R$ thousand
2nd semester of 2020
Accounting Income Statement
Proportionately consolidated (1)
Adjustments of Consolidation (2)
Managerial Income Statement
Revenue from financial intermediation 52,768,271 211,119 (2,875,952) 50,103,438
Expenses from financial intermediation (12,312,896) (21,195) 1,518,249 (10,815,842)
Financial margin 40,455,375 189,924 (1,357,703) 39,287,596
Expected Credit Loss Associated with Credit Risk expense (9,677,365) (25,992) - (9,703,357)
Gross income from financial intermediation 30,778,010 163,932 (1,357,703) 29,584,239
Other income from insurance, pension plans and capitalization bonds 2,967,635 - - 2,967,635
Fee and commission income and income from banking fees 13,325,988 2,249,575 1,099,128 16,674,691
Personnel expenses (9,606,681) (323,149) - (9,929,830)
Other administrative expenses (9,772,394) (748,325) 116,769 (10,403,950)
Tax expenses (3,716,311) (301,909) - (4,018,220)
Share of profit (loss) of unconsolidated and jointly controlled companies 529,790 (452,009) - 77,781
Other operating income / expenses (9,304,311) (302,072) 141,806 (9,464,577)
Operating profit/(loss) 15,201,726 286,043 - 15,487,769
Non-operating income/(expense) (406,739) (10,250) - (416,989)
IT/SC (Income Tax/Soc. Contrib.) and non-controlling interests (5,136,551) (275,793) - (5,412,344)
Net income 9,658,436 - - 9,658,436
(1) Refers to the effects of the consolidation adjustments arising from the undertakings consolidated proportionally (Grupo Cielo, Grupo Elopar, etc.) for managerial purposes; and (2) Primarily relates to reversal of the consolidation of the exclusive funds.

111
R$ thousand
Accrued on December 31
2020 2019
Accounting Income
Statement
Proportionately consolidated (1)
Adjustments of Consolidation (2)
Managerial Income
Statement
Accounting Income
Statement
Proportionately consolidated (1)
Adjustments of Consolidation (2)
Managerial Income
Statement
Revenue from financial intermediation 99,814,859 484,720 (3,521,128) 96,778,451 116,292,083 818,428 (125,364) 116,985,147
Expenses from financial intermediation (43,171,092) (40,645) 1,051,877 (42,159,860) (44,522,845) (104,508) (2,404,402) (47,031,755)
Financial margin 56,643,767 444,075 (2,469,251) 54,618,591 71,769,238 713,920 (2,529,766) 69,953,392
Expected Credit Loss Associated with Credit Risk expense (25,164,015) (104,072) - (25,268,087) (18,720,532) (170,961) - (18,891,493)
Gross income from financial intermediation 31,479,752 340,003 (2,469,251) 29,350,504 53,048,706 542,959 (2,529,766) 51,061,899
Other income from insurance, pension plans and capitalization bonds 8,098,742 - - 8,098,742 8,962,125 6,840 - 8,968,965
Fee and commission income and income from banking fees 26,231,909 4,031,391 2,164,111 32,427,411 26,951,205 4,128,937 2,254,425 33,334,567
Personnel expenses (19,160,600) (631,755) - (19,792,355) (21,399,973) (710,807) - (22,110,780)
Other administrative expenses (19,315,658) (1,442,189) 218,055 (20,539,792) (20,236,215) (1,419,119) 249,173 (21,406,161)
Tax expenses (6,048,903) (541,474) - (6,590,377) (6,858,230) (528,090) - (7,386,320)
Share of profit (loss) of unconsolidated and jointly controlled companies 749,312 (634,424) - 114,888 1,203,531 (906,399) - 297,132
Other operating income / expenses (16,476,939) (678,421) 87,085 (17,068,275) (24,971,731) (663,471) 26,168 (25,609,034)
Operating profit/(loss) 5,557,615 443,131 - 6,000,746 16,699,418 450,850 - 17,150,268
Non-operating income/(expense) (466,267) (14,306) - (480,573) (520,078) 9,583 - (510,495)
IT/SC (Income Tax/Soc. Contrib.) and non-controlling interests 11,455,229 (428,825) - 11,026,404 6,403,275 (460,433) - 5,942,842
Net income 16,546,577 - - 16,546,577 22,582,615 - - 22,582,615
(1) Refers to the effects of the consolidation adjustments arising from the undertakings consolidated proportionally (Grupo Cielo, Grupo Elopar, etc.) for managerial purposes; and (2) Primarily relates to reversal of the consolidation of the exclusive funds.
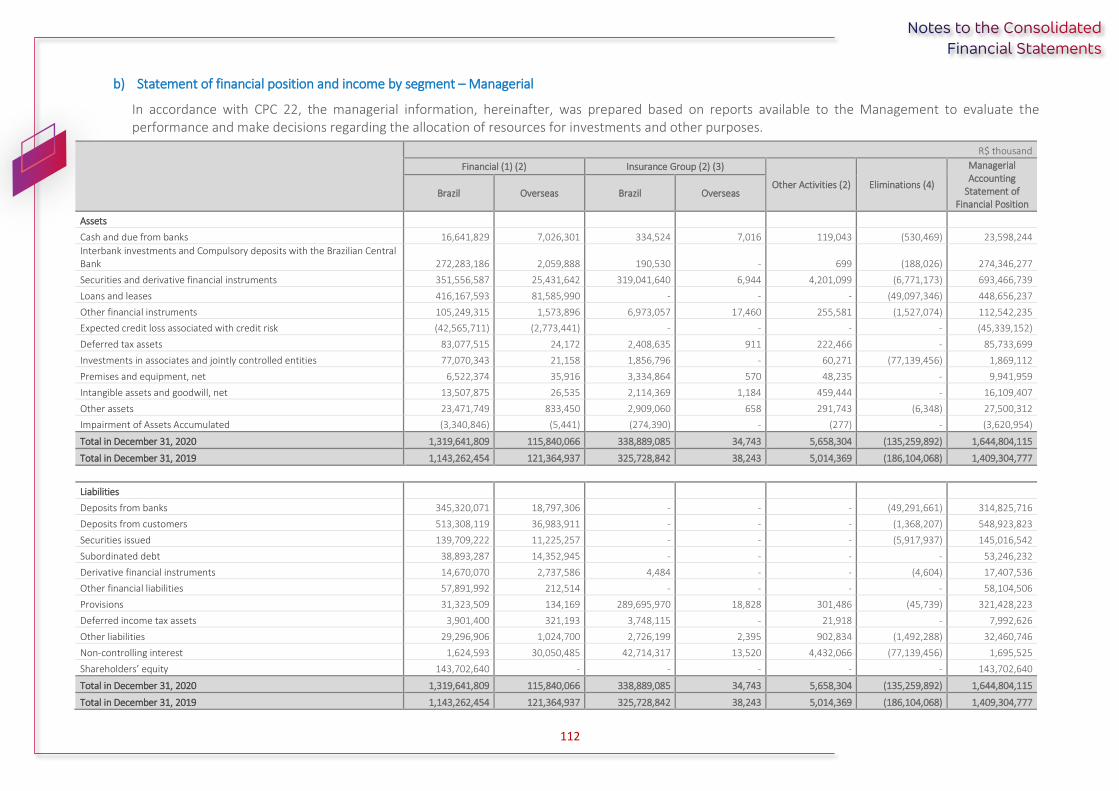
112
b) Statement of financial position and income by segment – Managerial
In accordance with CPC 22, the managerial information, hereinafter, was prepared based on reports available to the Management to evaluate the performance and make decisions regarding the allocation of resources for investments and other purposes.
R$ thousand
Financial (1) (2) Insurance Group (2) (3)
Other Activities (2) Eliminations (4)
Managerial Accounting
Statement of Financial Position
Brazil Overseas Brazil Overseas
Assets
Cash and due from banks 16,641,829 7,026,301 334,524 7,016 119,043 (530,469) 23,598,244
Interbank investments and Compulsory deposits with the Brazilian Central Bank 272,283,186 2,059,888 190,530 - 699 (188,026) 274,346,277
Securities and derivative financial instruments 351,556,587 25,431,642 319,041,640 6,944 4,201,099 (6,771,173) 693,466,739
Loans and leases 416,167,593 81,585,990 - - - (49,097,346) 448,656,237
Other financial instruments 105,249,315 1,573,896 6,973,057 17,460 255,581 (1,527,074) 112,542,235
Expected credit loss associated with credit risk (42,565,711) (2,773,441) - - - - (45,339,152)
Deferred tax assets 83,077,515 24,172 2,408,635 911 222,466 - 85,733,699
Investments in associates and jointly controlled entities 77,070,343 21,158 1,856,796 - 60,271 (77,139,456) 1,869,112
Premises and equipment, net 6,522,374 35,916 3,334,864 570 48,235 - 9,941,959
Intangible assets and goodwill, net 13,507,875 26,535 2,114,369 1,184 459,444 - 16,109,407
Other assets 23,471,749 833,450 2,909,060 658 291,743 (6,348) 27,500,312
Impairment of Assets Accumulated (3,340,846) (5,441) (274,390) - (277) - (3,620,954)
Total in December 31, 2020 1,319,641,809 115,840,066 338,889,085 34,743 5,658,304 (135,259,892) 1,644,804,115
Total in December 31, 2019 1,143,262,454 121,364,937 325,728,842 38,243 5,014,369 (186,104,068) 1,409,304,777
Liabilities
Deposits from banks 345,320,071 18,797,306 - - - (49,291,661) 314,825,716
Deposits from customers 513,308,119 36,983,911 - - - (1,368,207) 548,923,823
Securities issued 139,709,222 11,225,257 - - - (5,917,937) 145,016,542
Subordinated debt 38,893,287 14,352,945 - - - - 53,246,232
Derivative financial instruments 14,670,070 2,737,586 4,484 - - (4,604) 17,407,536
Other financial liabilities 57,891,992 212,514 - - - - 58,104,506
Provisions 31,323,509 134,169 289,695,970 18,828 301,486 (45,739) 321,428,223
Deferred income tax assets 3,901,400 321,193 3,748,115 - 21,918 - 7,992,626
Other liabilities 29,296,906 1,024,700 2,726,199 2,395 902,834 (1,492,288) 32,460,746
Non-controlling interest 1,624,593 30,050,485 42,714,317 13,520 4,432,066 (77,139,456) 1,695,525
Shareholders’ equity 143,702,640 - - - - - 143,702,640
Total in December 31, 2020 1,319,641,809 115,840,066 338,889,085 34,743 5,658,304 (135,259,892) 1,644,804,115
Total in December 31, 2019 1,143,262,454 121,364,937 325,728,842 38,243 5,014,369 (186,104,068) 1,409,304,777

113
R$ thousand
Financial (1) (2) Insurance Group (2) (3) Other Activities (2) Eliminations (4)
Managerial Income Statement Brazil Overseas Brazil Overseas
Revenue from financial intermediation 36,818,287 1,918,187 11,794,780 992 40,992 (469,800) 50,103,438
Expenses from financial intermediation (1,250,604) (766,328) (9,276,135) - (432) 477,657 (10,815,842)
Financial margin 35,567,683 1,151,859 2,518,645 992 40,560 7,857 39,287,596
Expected Credit Loss Associated with Credit Risk expense (8,959,550) (743,807) - - - - (9,703,357)
Gross income from financial intermediation 26,608,133 408,052 2,518,645 992 40,560 7,857 29,584,239
Other income from insurance, pension plans and capitalization bonds - - 2,947,139 8,706 - 11,790 2,967,635
Fee and commission income and income from banking fees 15,455,631 151,259 950,483 - 313,053 (195,735) 16,674,691
Personnel expenses (8,707,053) (156,179) (949,518) (697) (116,445) 62 (9,929,830)
Other administrative expenses (9,635,756) (160,303) (802,599) (7,906) (218,377) 420,991 (10,403,950)
Tax expenses (3,444,876) (6,933) (523,918) (31) (42,462) - (4,018,220)
Share of profit (loss) of unconsolidated and jointly controlled companies 4,314 - 59,530 - 13,937 - 77,781
Other operating income / expenses (9,428,557) (83,061) 226,065 (1,908) 67,849 (244,965) (9,464,577)
Operating profit/(loss) 10,851,836 152,835 4,425,827 (844) 58,115 - 15,487,769
Non-operating income/(expense) (250,294) 3,568 (171,331) - 1,068 - (416,989)
IT/SC (Income Tax/Soc. Contrib.) and non-controlling interests (3,532,133) (98,892) (1,746,249) 461 (35,531) - (5,412,344)
Net income in the 2nd semester of 2020 7,069,409 57,511 2,508,247 (383) 23,652 - 9,658,436
(1) The Financial segment is comprised of financial institutions, holding companies which are mainly responsible for managing financial resources, and credit card, consortium and asset management companies; (2) The asset, liability, income and expense balances between Brazilian companies from the same segment and between overseas companies from the same segment are eliminated; (3) The Insurance Group segment comprises insurance, pension plan and capitalization bond companies; and (4) Refers to amounts eliminated between segments, as well as among operations carried out between Brazil and overseas companies within the same segment.
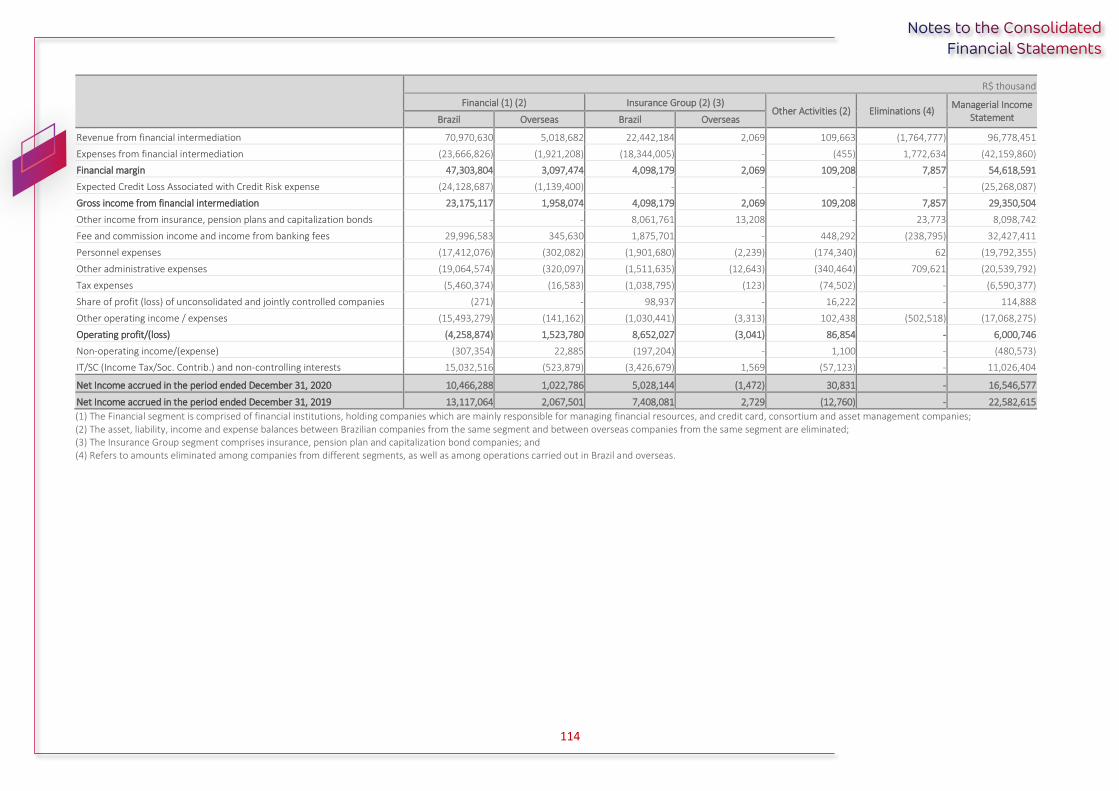
114
R$ thousand
Financial (1) (2) Insurance Group (2) (3) Other Activities (2) Eliminations (4)
Managerial Income Statement Brazil Overseas Brazil Overseas
Revenue from financial intermediation 70,970,630 5,018,682 22,442,184 2,069 109,663 (1,764,777) 96,778,451
Expenses from financial intermediation (23,666,826) (1,921,208) (18,344,005) - (455) 1,772,634 (42,159,860)
Financial margin 47,303,804 3,097,474 4,098,179 2,069 109,208 7,857 54,618,591
Expected Credit Loss Associated with Credit Risk expense (24,128,687) (1,139,400) - - - - (25,268,087)
Gross income from financial intermediation 23,175,117 1,958,074 4,098,179 2,069 109,208 7,857 29,350,504
Other income from insurance, pension plans and capitalization bonds - - 8,061,761 13,208 - 23,773 8,098,742
Fee and commission income and income from banking fees 29,996,583 345,630 1,875,701 - 448,292 (238,795) 32,427,411
Personnel expenses (17,412,076) (302,082) (1,901,680) (2,239) (174,340) 62 (19,792,355)
Other administrative expenses (19,064,574) (320,097) (1,511,635) (12,643) (340,464) 709,621 (20,539,792)
Tax expenses (5,460,374) (16,583) (1,038,795) (123) (74,502) - (6,590,377)
Share of profit (loss) of unconsolidated and jointly controlled companies (271) - 98,937 - 16,222 - 114,888
Other operating income / expenses (15,493,279) (141,162) (1,030,441) (3,313) 102,438 (502,518) (17,068,275)
Operating profit/(loss) (4,258,874) 1,523,780 8,652,027 (3,041) 86,854 - 6,000,746
Non-operating income/(expense) (307,354) 22,885 (197,204) - 1,100 - (480,573)
IT/SC (Income Tax/Soc. Contrib.) and non-controlling interests 15,032,516 (523,879) (3,426,679) 1,569 (57,123) - 11,026,404
Net Income accrued in the period ended December 31, 2020 10,466,288 1,022,786 5,028,144 (1,472) 30,831 - 16,546,577
Net Income accrued in the period ended December 31, 2019 13,117,064 2,067,501 7,408,081 2,729 (12,760) - 22,582,615
(1) The Financial segment is comprised of financial institutions, holding companies which are mainly responsible for managing financial resources, and credit card, consortium and asset management companies; (2) The asset, liability, income and expense balances between Brazilian companies from the same segment and between overseas companies from the same segment are eliminated; (3) The Insurance Group segment comprises insurance, pension plan and capitalization bond companies; and (4) Refers to amounts eliminated among companies from different segments, as well as among operations carried out in Brazil and overseas.
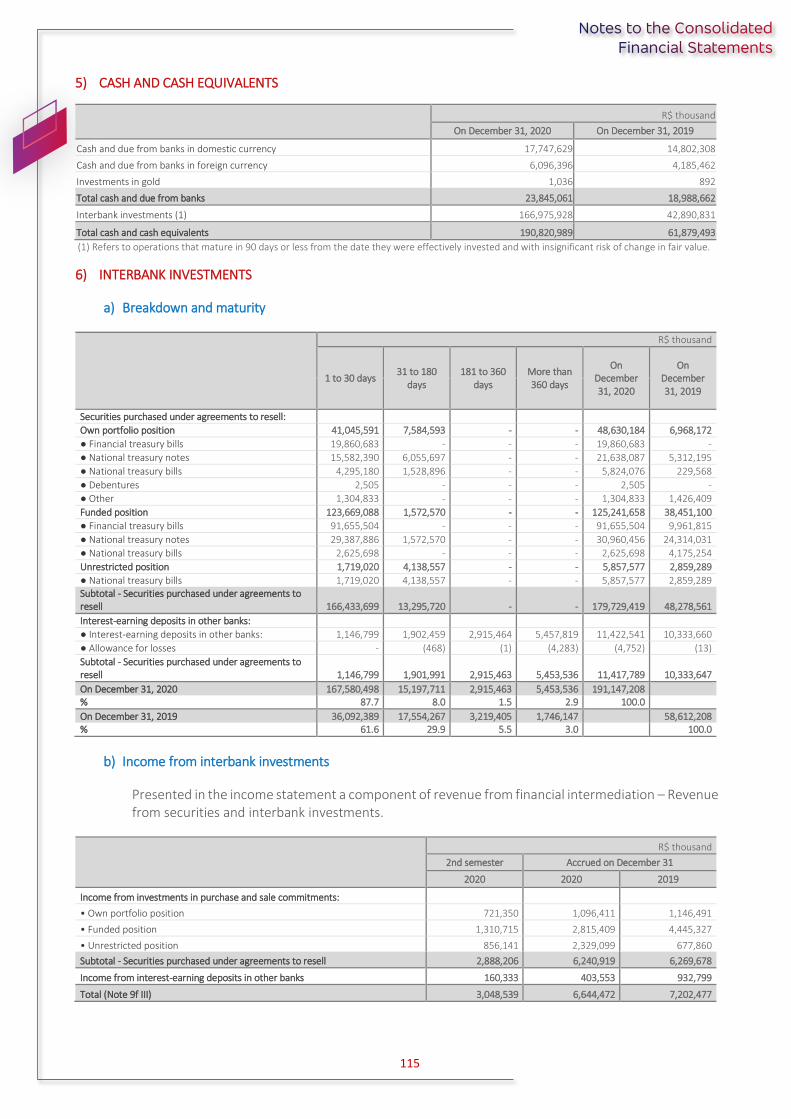
115
5) CASH AND CASH EQUIVALENTS
R$ thousand
On December 31, 2020 On December 31, 2019
Cash and due from banks in domestic currency 17,747,629 14,802,308
Cash and due from banks in foreign currency 6,096,396 4,185,462
Investments in gold 1,036 892
Total cash and due from banks 23,845,061 18,988,662
Interbank investments (1) 166,975,928 42,890,831
Total cash and cash equivalents 190,820,989 61,879,493
(1) Refers to operations that mature in 90 days or less from the date they were effectively invested and with insignificant risk of change in fair value.
6) INTERBANK INVESTMENTS
a) Breakdown and maturity
R$ thousand
1 to 30 days 31 to 180
days 181 to 360
days More than 360 days
On December 31, 2020
On December 31, 2019
Securities purchased under agreements to resell:
Own portfolio position 41,045,591 7,584,593 - - 48,630,184 6,968,172
● Financial treasury bills 19,860,683 - - - 19,860,683 -
● National treasury notes 15,582,390 6,055,697 - - 21,638,087 5,312,195
● National treasury bills 4,295,180 1,528,896 - - 5,824,076 229,568
● Debentures 2,505 - - - 2,505 -
● Other 1,304,833 - - - 1,304,833 1,426,409
Funded position 123,669,088 1,572,570 - - 125,241,658 38,451,100
● Financial treasury bills 91,655,504 - - - 91,655,504 9,961,815
● National treasury notes 29,387,886 1,572,570 - - 30,960,456 24,314,031
● National treasury bills 2,625,698 - - - 2,625,698 4,175,254
Unrestricted position 1,719,020 4,138,557 - - 5,857,577 2,859,289
● National treasury bills 1,719,020 4,138,557 - - 5,857,577 2,859,289 Subtotal - Securities purchased under agreements to resell 166,433,699 13,295,720 - - 179,729,419 48,278,561
Interest-earning deposits in other banks:
● Interest-earning deposits in other banks: 1,146,799 1,902,459 2,915,464 5,457,819 11,422,541 10,333,660
● Allowance for losses - (468) (1) (4,283) (4,752) (13)
Subtotal - Securities purchased under agreements to resell 1,146,799 1,901,991 2,915,463 5,453,536 11,417,789 10,333,647
On December 31, 2020 167,580,498 15,197,711 2,915,463 5,453,536 191,147,208 % 87.7 8.0 1.5 2.9 100.0
On December 31, 2019 36,092,389 17,554,267 3,219,405 1,746,147 58,612,208 % 61.6 29.9 5.5 3.0 100.0
b) Income from interbank investments
Presented in the income statement a component of revenue from financial intermediation – Revenue from securities and interbank investments.
R$ thousand
2nd semester Accrued on December 31
2020 2020 2019
Income from investments in purchase and sale commitments:
• Own portfolio position 721,350 1,096,411 1,146,491
• Funded position 1,310,715 2,815,409 4,445,327
• Unrestricted position 856,141 2,329,099 677,860
Subtotal - Securities purchased under agreements to resell 2,888,206 6,240,919 6,269,678
Income from interest-earning deposits in other banks 160,333 403,553 932,799
Total (Note 9f III) 3,048,539 6,644,472 7,202,477

116
7) COMPULSORY DEPOSITS WITH THE BRAZILIAN CENTRAL BANK
a) Reserve requirement
R$ thousand
Remuneration On December 31,
2020 On December 31,
2019
Compulsory deposit – demand deposits not remunerated 9,857,922 7,042,022
Compulsory deposit – savings deposits savings index 19,524,472 22,619,432
Compulsory deposit – time deposits Selic rate 54,375,139 60,960,884
Total 83,757,533 90,622,338
For more information on compulsory deposits, see Note 37.
b) Revenue from reserve requirement
R$ thousand
2nd semester Accrued on December 31
2020 2020 2019
Reserve requirement – Bacen (Compulsory deposit) 742,828 2,017,605 4,304,874
Reserve requirement – SFH (1) 2,369 5,714 22,516
Total 745,197 2,023,319 4,327,390
(1) Deposits requirement to SFH (Housing Finance System) are recorded under the caption “Other assets”.

117
8) SECURITIES
Information related to securities as follows:
a) Summary of the consolidated classification of securities by operating segment and issuer
R$ thousand
Financial
Insurance Group
Other Activities On December 31, 2020 % On December 31, 2019 % Insurance and Capitalization bonds
Pension plans (5)
Trading securities 54,360,035 12,746,109 184,057,518 7,634 251,171,296 40.7 236,060,067 39.7
- Government securities 47,338,471 8,888,857 161,009,201 7,634 217,244,163 35.2 201,299,359 33.8
- Corporate securities 7,021,564 3,857,252 23,048,317 - 33,927,133 5.5 34,760,708 5.9
Available-for-sale securities (2) 209,014,910 32,103,494 24,386,290 8,807 265,513,501 43.1 261,892,475 44.0
- Government securities 112,158,529 23,092,267 24,320,051 8,187 159,579,034 25.9 169,268,728 28.4
- Corporate securities 96,856,381 9,011,227 66,239 620 105,934,467 17.2 92,623,747 15.6
Held-to-maturity securities (2) 65,269,589 5,854,417 28,689,084 - 99,813,090 16.2 97,075,274 16.3
- Government securities 58,367,248 5,854,417 28,689,084 - 92,910,749 15.1 88,687,050 14.9
- Corporate securities 6,902,341 - - - 6,902,341 1.1 8,388,224 1.4
Total 328,644,534 50,704,020 237,132,892 16,441 616,497,887 100.0 595,027,816 100.0
- Government securities 217,864,248 37,835,541 214,018,336 15,821 469,733,946 76.2 459,255,137 77.2
- Corporate securities 110,780,286 12,868,479 23,114,556 620 146,763,941 23.8 135,772,679 22.8
Total 328,644,534 50,704,020 237,132,892 16,441 616,497,887 100.0 595,027,816 100.0

118
b) Consolidated classification by category, maturity and operating segment
I) Trading securities
Securities
R$ thousand
On December 31, 2020 On December 31, 2019
1 to 30 days 31 to 180 days 181 to 360
days More than 360 days
Fair/book value (3) (4)
Amortized cost
Fair Value Adjustment
Fair/book value (3) (4)
Fair Value Adjustment
- Financial 14,102,692 7,585,404 5,640,591 27,031,348 54,360,035 54,301,327 58,708 39,707,244 93,192
Financial treasury bills - 375,460 4,091,617 9,571,434 14,038,511 14,067,552 (29,041) 16,943,056 1,741
National treasury notes 10,178,352 356,385 - 12,283,069 22,817,806 22,574,774 243,032 7,552,980 363,105
Financial bills - - 135,888 106,637 242,525 292,087 (49,562) 499,332 (4,117)
Debentures - 300 177 833,593 834,070 1,038,018 (203,948) 798,746 (187,722)
National treasury bills - 5,891,458 1,389,188 1,902,347 9,182,993 9,166,195 16,798 7,992,245 15,809
Brazilian foreign debt securities 5 - - 725,510 725,515 701,201 24,314 47,308 41
Other 3,924,335 961,801 23,721 1,608,758 6,518,615 6,461,500 57,115 5,873,577 (95,665)
- Insurance companies and capitalization bonds 3,276,735 302,906 5,247,556 3,918,912 12,746,109 12,742,157 3,952 12,467,053 14,518
Financial treasury bills - 157,181 5,229,950 3,136,364 8,523,495 8,531,804 (8,309) 7,802,486 5,481
Financial bills 329 33,550 13,889 105,525 153,293 153,372 (79) 122,133 (11)
Other 3,276,406 112,175 3,717 677,023 4,069,321 4,056,981 12,340 4,542,434 9,048
- Pension plans 8,105,721 11,604,133 9,638,725 154,708,939 184,057,518 183,333,235 724,283 183,840,242 2,512,671
Financial treasury bills - 7,251,838 8,442,367 109,314,997 125,009,202 125,388,284 (379,082) 118,902,401 15,660
National treasury notes 12,503 222,329 - 27,225,012 27,459,844 26,499,936 959,908 29,841,115 1,772,594
National treasury bills - 392,245 61,709 8,086,201 8,540,155 8,475,196 64,959 11,283,357 725,110
Financial bills 329 2,957,349 357,106 4,065,026 7,379,810 7,367,961 11,849 12,896,236 1,815
Debentures 2,574 286,013 307,584 5,180,290 5,776,461 5,707,930 68,531 3,903,215 (3,819)
Other 8,090,315 494,359 469,959 837,413 9,892,046 9,893,928 (1,882) 7,013,918 1,311
- Other activities - 2,743 1,667 3,224 7,634 7,639 (5) 45,528 (1)
Financial treasury bills - 2,743 1,667 3,224 7,634 7,639 (5) 7,433 (1)
Other - - - - - - - 38,095 -
Total 25,485,148 19,495,186 20,528,539 185,662,423 251,171,296 250,384,358 786,938 236,060,067 2,620,380
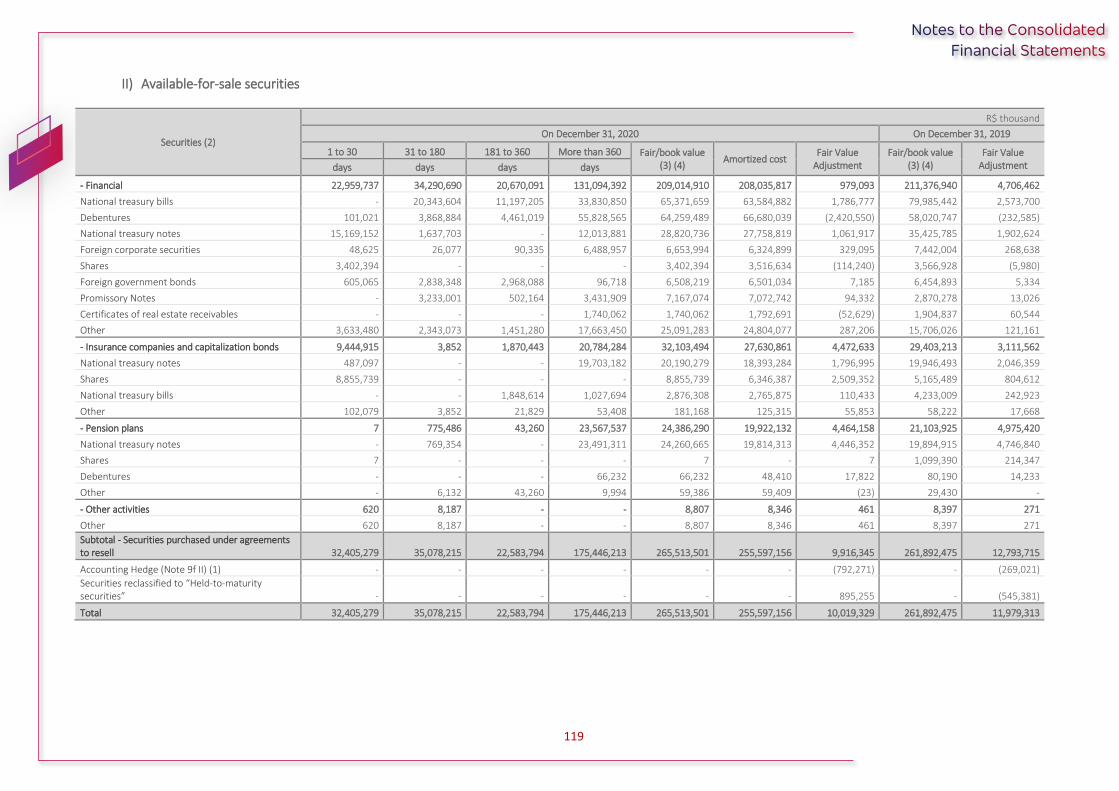
119
II) Available-for-sale securities
Securities (2)
R$ thousand
On December 31, 2020 On December 31, 2019
1 to 30 31 to 180 181 to 360 More than 360 Fair/book value (3) (4)
Amortized cost Fair Value
Adjustment Fair/book value
(3) (4) Fair Value
Adjustment days days days days
- Financial 22,959,737 34,290,690 20,670,091 131,094,392 209,014,910 208,035,817 979,093 211,376,940 4,706,462
National treasury bills - 20,343,604 11,197,205 33,830,850 65,371,659 63,584,882 1,786,777 79,985,442 2,573,700
Debentures 101,021 3,868,884 4,461,019 55,828,565 64,259,489 66,680,039 (2,420,550) 58,020,747 (232,585)
National treasury notes 15,169,152 1,637,703 - 12,013,881 28,820,736 27,758,819 1,061,917 35,425,785 1,902,624
Foreign corporate securities 48,625 26,077 90,335 6,488,957 6,653,994 6,324,899 329,095 7,442,004 268,638
Shares 3,402,394 - - - 3,402,394 3,516,634 (114,240) 3,566,928 (5,980)
Foreign government bonds 605,065 2,838,348 2,968,088 96,718 6,508,219 6,501,034 7,185 6,454,893 5,334
Promissory Notes - 3,233,001 502,164 3,431,909 7,167,074 7,072,742 94,332 2,870,278 13,026
Certificates of real estate receivables - - - 1,740,062 1,740,062 1,792,691 (52,629) 1,904,837 60,544
Other 3,633,480 2,343,073 1,451,280 17,663,450 25,091,283 24,804,077 287,206 15,706,026 121,161
- Insurance companies and capitalization bonds 9,444,915 3,852 1,870,443 20,784,284 32,103,494 27,630,861 4,472,633 29,403,213 3,111,562
National treasury notes 487,097 - - 19,703,182 20,190,279 18,393,284 1,796,995 19,946,493 2,046,359
Shares 8,855,739 - - - 8,855,739 6,346,387 2,509,352 5,165,489 804,612
National treasury bills - - 1,848,614 1,027,694 2,876,308 2,765,875 110,433 4,233,009 242,923
Other 102,079 3,852 21,829 53,408 181,168 125,315 55,853 58,222 17,668
- Pension plans 7 775,486 43,260 23,567,537 24,386,290 19,922,132 4,464,158 21,103,925 4,975,420
National treasury notes - 769,354 - 23,491,311 24,260,665 19,814,313 4,446,352 19,894,915 4,746,840
Shares 7 - - - 7 - 7 1,099,390 214,347
Debentures - - - 66,232 66,232 48,410 17,822 80,190 14,233
Other - 6,132 43,260 9,994 59,386 59,409 (23) 29,430 -
- Other activities 620 8,187 - - 8,807 8,346 461 8,397 271
Other 620 8,187 - - 8,807 8,346 461 8,397 271
Subtotal - Securities purchased under agreements to resell 32,405,279 35,078,215 22,583,794 175,446,213 265,513,501 255,597,156 9,916,345 261,892,475 12,793,715
Accounting Hedge (Note 9f II) (1) - - - - - - (792,271) - (269,021)
Securities reclassified to “Held-to-maturity securities” - - - - - - 895,255 - (545,381)
Total 32,405,279 35,078,215 22,583,794 175,446,213 265,513,501 255,597,156 10,019,329 261,892,475 11,979,313

120
III) Held-to-maturity securities
Securities (2)
R$ thousand
On December 31, 2020 On December 31, 2019
1 to 30 31 to 180 181 to 360 More than 360 Amortized cost (3)
Fair value (4) Gain (loss) not accounted for
Amortized cost (3)
Gain (loss) not accounted for days days days days
- Financial 99 80,473 10,696,212 54,492,805 65,269,589 67,184,763 1,915,174 67,096,679 2,464,037
National treasury bills - - 10,665,733 29,524,038 40,189,771 41,440,835 1,251,064 57,884,427 1,848,510
Certificates of real estate receivables - - 3,284 6,700,118 6,703,402 6,790,623 87,221 8,388,224 489,378
National treasury notes 99 778 676 18,123,723 18,125,276 18,696,822 571,546 820,887 126,149
Other - 79,695 26,519 144,926 251,140 256,483 5,343 3,141 -
- Insurance companies and capitalization bonds - 5,940 - 5,848,477 5,854,417 7,293,327 1,438,910 5,598,491 1,721,486
National treasury notes - 5,940 - 5,848,477 5,854,417 7,293,327 1,438,910 5,598,491 1,721,486
- Pension plans - 11,542,576 - 17,146,508 28,689,084 35,252,383 6,563,299 24,380,104 7,579,996
National treasury notes - 11,542,576 - 17,146,508 28,689,084 35,252,383 6,563,299 24,380,104 7,579,996
Total 99 11,628,989 10,696,212 77,487,790 99,813,090 109,730,473 9,917,383 97,075,274 11,765,519
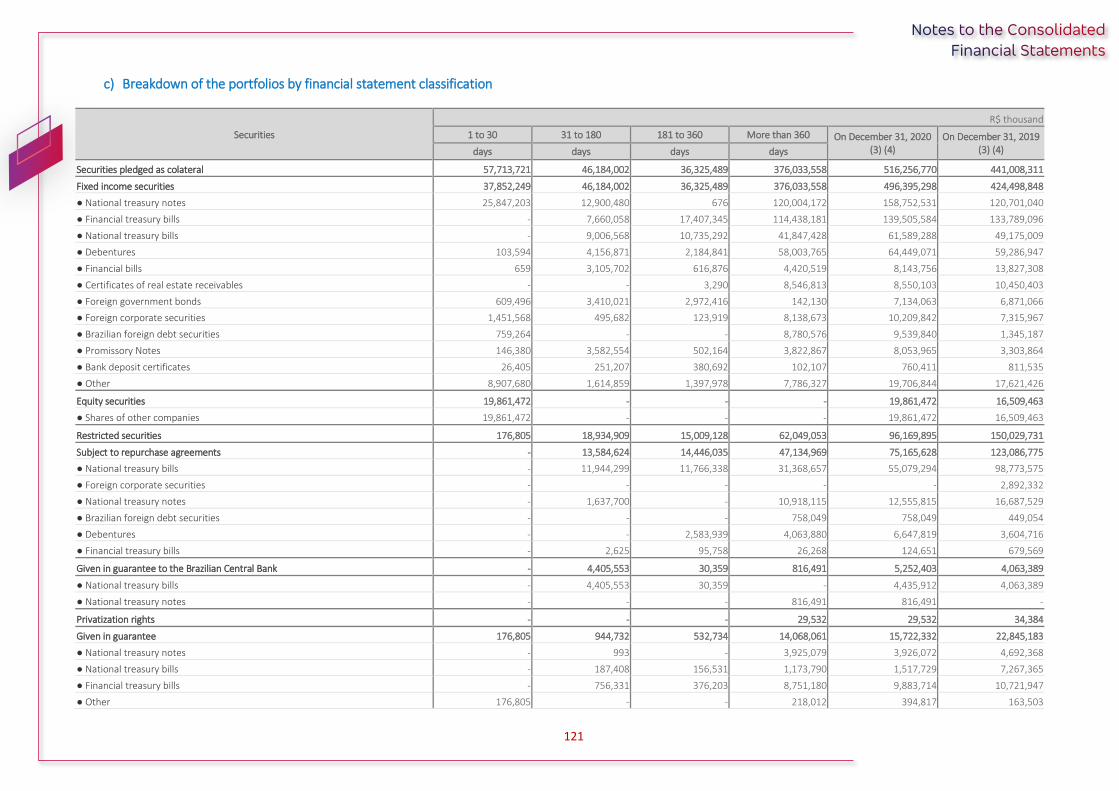
121
c) Breakdown of the portfolios by financial statement classification
Securities
R$ thousand
1 to 30 31 to 180 181 to 360 More than 360 On December 31, 2020 (3) (4)
On December 31, 2019 (3) (4) days days days days
Securities pledged as colateral 57,713,721 46,184,002 36,325,489 376,033,558 516,256,770 441,008,311
Fixed income securities 37,852,249 46,184,002 36,325,489 376,033,558 496,395,298 424,498,848
● National treasury notes 25,847,203 12,900,480 676 120,004,172 158,752,531 120,701,040
● Financial treasury bills - 7,660,058 17,407,345 114,438,181 139,505,584 133,789,096
● National treasury bills - 9,006,568 10,735,292 41,847,428 61,589,288 49,175,009
● Debentures 103,594 4,156,871 2,184,841 58,003,765 64,449,071 59,286,947
● Financial bills 659 3,105,702 616,876 4,420,519 8,143,756 13,827,308
● Certificates of real estate receivables - - 3,290 8,546,813 8,550,103 10,450,403
● Foreign government bonds 609,496 3,410,021 2,972,416 142,130 7,134,063 6,871,066
● Foreign corporate securities 1,451,568 495,682 123,919 8,138,673 10,209,842 7,315,967
● Brazilian foreign debt securities 759,264 - - 8,780,576 9,539,840 1,345,187
● Promissory Notes 146,380 3,582,554 502,164 3,822,867 8,053,965 3,303,864
● Bank deposit certificates 26,405 251,207 380,692 102,107 760,411 811,535
● Other 8,907,680 1,614,859 1,397,978 7,786,327 19,706,844 17,621,426
Equity securities 19,861,472 - - - 19,861,472 16,509,463
● Shares of other companies 19,861,472 - - - 19,861,472 16,509,463
Restricted securities 176,805 18,934,909 15,009,128 62,049,053 96,169,895 150,029,731
Subject to repurchase agreements - 13,584,624 14,446,035 47,134,969 75,165,628 123,086,775
● National treasury bills - 11,944,299 11,766,338 31,368,657 55,079,294 98,773,575
● Foreign corporate securities - - - - - 2,892,332
● National treasury notes - 1,637,700 - 10,918,115 12,555,815 16,687,529
● Brazilian foreign debt securities - - - 758,049 758,049 449,054
● Debentures - - 2,583,939 4,063,880 6,647,819 3,604,716
● Financial treasury bills - 2,625 95,758 26,268 124,651 679,569
Given in guarantee to the Brazilian Central Bank - 4,405,553 30,359 816,491 5,252,403 4,063,389
● National treasury bills - 4,405,553 30,359 - 4,435,912 4,063,389
● National treasury notes - - - 816,491 816,491 -
Privatization rights - - - 29,532 29,532 34,384
Given in guarantee 176,805 944,732 532,734 14,068,061 15,722,332 22,845,183
● National treasury notes - 993 - 3,925,079 3,926,072 4,692,368
● National treasury bills - 187,408 156,531 1,173,790 1,517,729 7,267,365
● Financial treasury bills - 756,331 376,203 8,751,180 9,883,714 10,721,947
● Other 176,805 - - 218,012 394,817 163,503
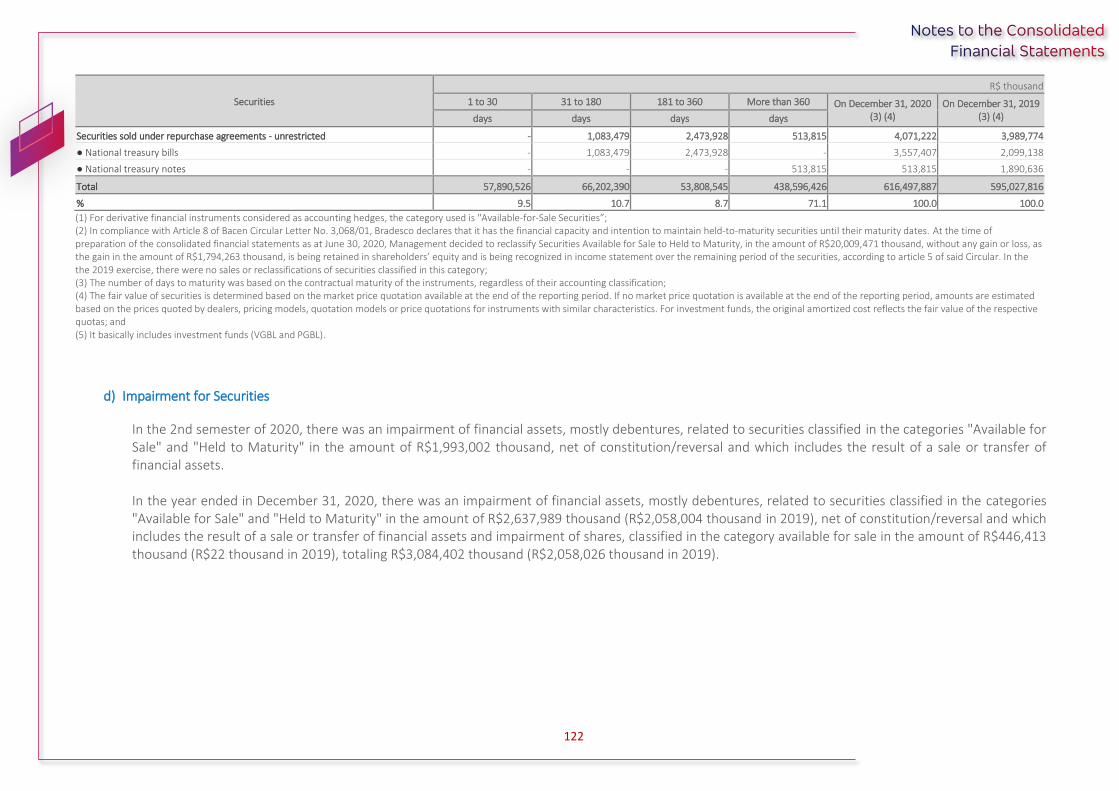
122
Securities
R$ thousand
1 to 30 31 to 180 181 to 360 More than 360 On December 31, 2020 (3) (4)
On December 31, 2019 (3) (4) days days days days
Securities sold under repurchase agreements - unrestricted - 1,083,479 2,473,928 513,815 4,071,222 3,989,774
● National treasury bills - 1,083,479 2,473,928 - 3,557,407 2,099,138
● National treasury notes - - - 513,815 513,815 1,890,636
Total 57,890,526 66,202,390 53,808,545 438,596,426 616,497,887 595,027,816
% 9.5 10.7 8.7 71.1 100.0 100.0
(1) For derivative financial instruments considered as accounting hedges, the category used is "Available-for-Sale Securities”; (2) In compliance with Article 8 of Bacen Circular Letter No. 3,068/01, Bradesco declares that it has the financial capacity and intention to maintain held-to-maturity securities until their maturity dates. At the time of preparation of the consolidated financial statements as at June 30, 2020, Management decided to reclassify Securities Available for Sale to Held to Maturity, in the amount of R$20,009,471 thousand, without any gain or loss, as the gain in the amount of R$1,794,263 thousand, is being retained in shareholders’ equity and is being recognized in income statement over the remaining period of the securities, according to article 5 of said Circular. In the the 2019 exercise, there were no sales or reclassifications of securities classified in this category; (3) The number of days to maturity was based on the contractual maturity of the instruments, regardless of their accounting classification; (4) The fair value of securities is determined based on the market price quotation available at the end of the reporting period. If no market price quotation is available at the end of the reporting period, amounts are estimated based on the prices quoted by dealers, pricing models, quotation models or price quotations for instruments with similar characteristics. For investment funds, the original amortized cost reflects the fair value of the respective quotas; and (5) It basically includes investment funds (VGBL and PGBL).
d) Impairment for Securities
In the 2nd semester of 2020, there was an impairment of financial assets, mostly debentures, related to securities classified in the categories "Available for Sale" and "Held to Maturity" in the amount of R$1,993,002 thousand, net of constitution/reversal and which includes the result of a sale or transfer of financial assets. In the year ended in December 31, 2020, there was an impairment of financial assets, mostly debentures, related to securities classified in the categories "Available for Sale" and "Held to Maturity" in the amount of R$2,637,989 thousand (R$2,058,004 thousand in 2019), net of constitution/reversal and which includes the result of a sale or transfer of financial assets and impairment of shares, classified in the category available for sale in the amount of R$446,413 thousand (R$22 thousand in 2019), totaling R$3,084,402 thousand (R$2,058,026 thousand in 2019).

123
9) DERIVATIVE FINANCIAL INSTRUMENTS
Bradesco carries out transactions involving derivative financial instruments, which are recognized in the statement of financial position, to meet its own needs in managing its global exposure, as well as to meet its customer’s requests, in order to manage their exposure. These operations involve a range of derivatives, including interest rate swaps, currency swaps, futures and options. Bradesco’s risk management policy is based on the utilization of derivative financial instruments mainly to mitigate the risks from operations carried out by the Bank and its subsidiaries. Securities classified as trading and available-for-sale, as well as derivative financial instruments, are recognized in the consolidated statement of financial position at their fair value. Fair value is generally based on quoted market prices or quotations for assets or liabilities with similar characteristics. Should market prices not be available, fair values are based on dealer quotations, pricing models, discounted cash flows or similar techniques for which the determination of fair value may require judgment or significant estimates by Management. Quoted market prices are used to determine the fair value of derivative financial instruments. The fair value of swaps is determined by using discounted cash flow modeling techniques that use yield curves, reflecting adequate risk factors. The information to build yield curves is mainly obtained from Securities, Commodities and Futures Exchange (B3), and the domestic and international secondary market. These yield curves are used to determine the fair value of currency swaps, interest rate and other risk factor swaps. The fair value of forward and futures contracts is also determined based on market price quotations for derivatives traded on an exchange or using methodologies similar to those outlined for swaps. The fair values of credit derivative instruments are determined based on market price quotation or prices received from specialized entities. The fair value of options is determined based on mathematical models, such as Black & Scholes, using yield curves, implied volatilities and the fair value of corresponding assets. Current market prices are used to calculate volatility. To estimate the fair value of the over-the-counter (OTC) financial derivative instruments, the credit quality of each counterparty is also taken into account, based on an expected loss for each derivative portfolio (Credit valuation adjustment). Bradesco’s derivative financial instruments in Brazil primarily consist of swaps and futures and are registered at B3. Foreign derivative financial instruments refer to swap, forward, options, credit and futures operations and primarily out at the stock exchanges in Chicago and New York, as well as the over-the-counter (OTC) markets. Macro strategy are defined for the Trading (proprietary) and Banking portfolios. Trading Portfolio transactions, including derivatives, look for gains from directional movements in prices and/or rates, arbitrage, hedge and market-maker strategies that may be fully or partially settled before the originally stipulated maturity date. The Banking Portfolio focuses on commercial transactions and their hedges. Portfolio risk is controlled using information consolidated by risk factor; effective portfolio risk management requires joint use of derivatives with other instruments, including stocks and bonds. The Financial Statements include a Risk Management and Capital Note on the main risk-control metrics and the risk management structure’s key aspects. This Note complements the Securities and Derivatives Note and shows these instruments' exposures under various views, as well as derivatives' revenues and expenses.

124
a) Amount of derivative financial instruments recognized by index
R$ thousand
Total in December 31, 2020 Total in December 31, 2019
Nominal value Net amount
value (3)
Original amortized
cost
Mark-to-market
adjustment Fair value Nominal value
Net amount value (3)
Original amortized
cost
Mark-to-market
adjustment Fair value
Futures contracts -
Purchase commitments: 84,467,021 24,535 - 24,535 140,426,077 20,290 - 20,290
- Interbank market 40,651,059 - 10,050 - 10,050 108,149,874 - 12,659 - 12,659
- Foreign currency 39,875,542 - 10,832 - 10,832 30,351,663 - 5,560 - 5,560
- Other 3,940,420 2,807,910 3,653 - 3,653 1,924,540 777,414 2,071 - 2,071
Sale commitments: 316,512,537 (19,366) - (19,366) 231,911,105 (23,676) - (23,676)
- Interbank market (1) 263,958,439 223,307,380 (15,899) - (15,899) 153,544,202 45,394,328 (18,640) - (18,640)
- Foreign currency (2) 51,421,588 11,546,046 (1,371) - (1,371) 77,219,777 46,868,114 (1,840) - (1,840)
- Other 1,132,510 - (2,096) - (2,096) 1,147,126 - (3,196) - (3,196)
Option contracts -
Purchase commitments: 326,423,643 2,456,611 895,667 3,352,278 145,317,995 1,489,325 310,565 1,799,890
- Interbank market 311,472,364 - 1,504,181 193,326 1,697,507 130,179,263 - 617,942 153,980 771,922
- Foreign currency 13,878,682 - 854,484 701,089 1,555,573 14,233,062 1,019,989 808,235 131,756 939,991
- Other 1,072,597 282,563 97,946 1,252 99,198 905,670 - 63,148 24,829 87,977
Sale commitments: 331,145,703 (2,520,903) (589,180) (3,110,083) 253,288,998 (1,519,642) (12,609) (1,532,251)
- Interbank market 314,999,693 3,527,329 (1,640,039) (194,670) (1,834,709) 238,999,513 108,820,250 (891,953) (130,183) (1,022,136)
- Foreign currency 15,355,976 1,477,294 (619,545) (363,298) (982,843) 13,213,073 - (545,433) 124,936 (420,497)
- Other 790,034 - (261,319) (31,212) (292,531) 1,076,412 170,742 (82,256) (7,362) (89,618)
Forward contracts -
Purchase commitments: 76,011,205 4,696,246 14,818 4,711,064 16,258,721 1,428,434 1,328 1,429,762
- Interbank market 246,269 246,269 1,859 14,818 16,677 232,706 232,706 1,859 1,328 3,187
- Foreign currency 70,345,084 48,576,798 (453) - (453) 13,794,259 - (251,175) - (251,175)
- Other 5,419,852 4,451,509 4,694,840 - 4,694,840 2,231,756 1,563,753 1,677,750 - 1,677,750
Sale commitments: 22,736,629 (132,076) (4,678) (136,754) 15,834,563 125,532 (2,167) 123,365
- Foreign currency (2) 21,768,286 - (82,681) - (82,681) 15,166,560 1,372,301 107,747 - 107,747
- Other 968,343 - (49,395) (4,678) (54,073) 668,003 - 17,785 (2,167) 15,618
Swap contracts -
Assets (long position): 66,137,265 11,195,415 3,591,785 14,787,200 70,032,236 9,668,531 987,011 10,655,542
- Interbank market 4,095,567 - 106,827 215,527 322,354 7,703,103 3,424,228 118,969 85,416 204,385
- Fixed rate 33,427,359 19,386,846 4,160,018 26,030 4,186,048 38,714,923 19,364,909 8,253,671 (515,320) 7,738,351
- Foreign currency 24,369,039 1,177,263 6,169,577 3,051,417 9,220,994 19,746,372 - 1,032,687 1,066,491 2,099,178
- IGPM 636,581 - 432,390 22,676 455,066 670,554 - 124,132 118,554 242,686

125
R$ thousand
Total in December 31, 2020 Total in December 31, 2019
Nominal value Net amount
value (3)
Original amortized
cost
Mark-to-market
adjustment Fair value Nominal value
Net amount value (3)
Original amortized
cost
Mark-to-market
adjustment Fair value
- Other 3,608,719 - 326,603 276,135 602,738 3,197,284 - 139,072 231,870 370,942
Liabilities (unrestricted position): 50,475,079 (10,838,073) (2,653,090) (13,491,163) 52,232,961 (9,044,701) (3,161,114) (12,205,815)
- Interbank market 7,350,385 3,254,818 (103,984) (27,012) (130,996) 4,278,875 - (179,169) 76,722 (102,447)
- Fixed rate 14,040,513 - (2,431,630) (1,448,120) (3,879,750) 19,350,014 - (5,547,009) (2,015,586) (7,562,595)
- Foreign currency 23,191,776 - (7,119,016) (801,099) (7,920,115) 21,483,368 1,736,996 (2,750,465) (605,694) (3,356,159)
- IGPM 836,307 199,726 (536,192) (48,393) (584,585) 893,000 222,446 (167,300) (170,755) (338,055)
- Other 5,056,098 1,447,379 (647,251) (328,466) (975,717) 6,227,704 3,030,420 (400,758) (445,801) (846,559)
Total 1,273,909,082 4,862,389 1,255,322 6,117,711 925,302,656 2,144,093 (1,876,986) 267,107
Derivatives include operations maturing in D+1. (1) Includes: (i) accounting cash flow hedges to protect DI-indexed (interbank interest rate) funding totaling R$128,431,775 thousand (R$76,405,734 thousand in December 31, 2019); and (ii) accounting cash flow hedges to protect DI-indexed investments totaling R$12,942,667 thousand (R$21,015,183 thousand in December 31, 2019) (Note 9f II); (2) Includes specific hedges to protect assets and liabilities, arising from foreign investments. Investments abroad totaling the amount of R$29,678,043 thousand (R$64,376,717 thousand in December 31, 2019), contemplating the capital reduction carried out In the six month period ended June 30, 2020, in the amount of R$59,546,684 thousand; and (3) Reflects the net balance between the Asset and Liability position.
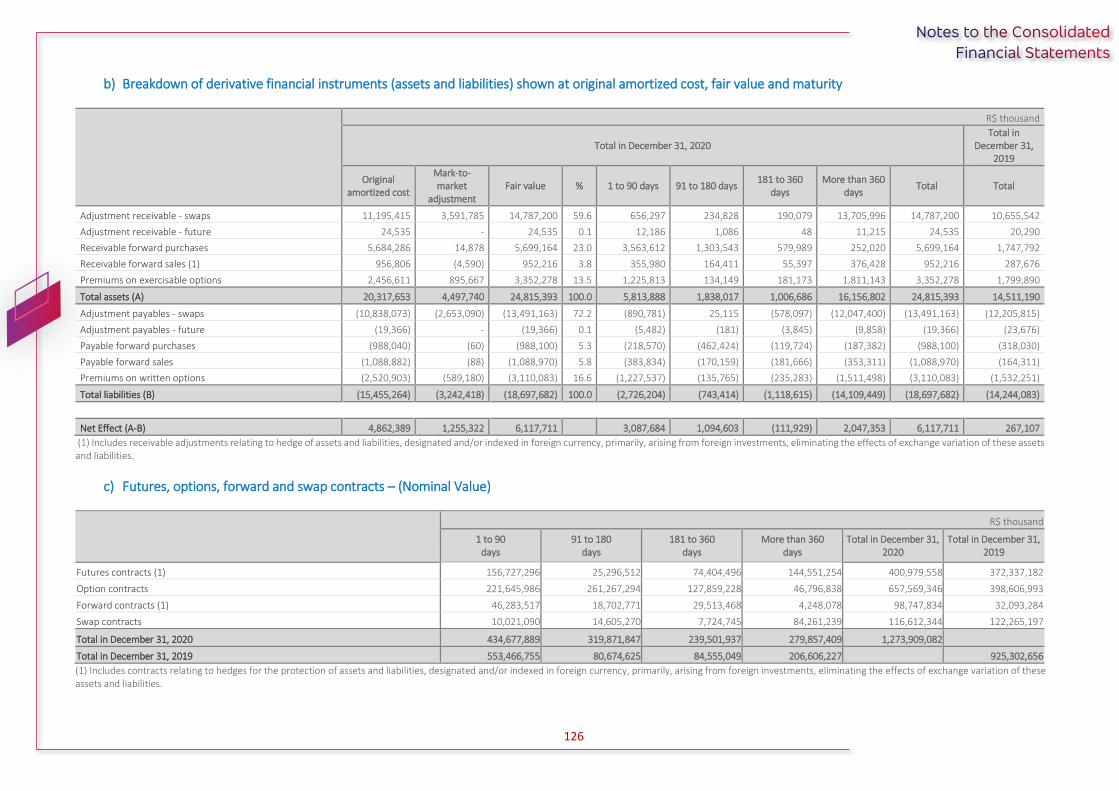
126
b) Breakdown of derivative financial instruments (assets and liabilities) shown at original amortized cost, fair value and maturity
R$ thousand
Total in December 31, 2020 Total in
December 31, 2019
Original amortized cost
Mark-to-market
adjustment Fair value % 1 to 90 days 91 to 180 days
181 to 360 days
More than 360 days
Total Total
Adjustment receivable - swaps 11,195,415 3,591,785 14,787,200 59.6 656,297 234,828 190,079 13,705,996 14,787,200 10,655,542
Adjustment receivable - future 24,535 - 24,535 0.1 12,186 1,086 48 11,215 24,535 20,290
Receivable forward purchases 5,684,286 14,878 5,699,164 23.0 3,563,612 1,303,543 579,989 252,020 5,699,164 1,747,792
Receivable forward sales (1) 956,806 (4,590) 952,216 3.8 355,980 164,411 55,397 376,428 952,216 287,676
Premiums on exercisable options 2,456,611 895,667 3,352,278 13.5 1,225,813 134,149 181,173 1,811,143 3,352,278 1,799,890
Total assets (A) 20,317,653 4,497,740 24,815,393 100.0 5,813,888 1,838,017 1,006,686 16,156,802 24,815,393 14,511,190
Adjustment payables - swaps (10,838,073) (2,653,090) (13,491,163) 72.2 (890,781) 25,115 (578,097) (12,047,400) (13,491,163) (12,205,815)
Adjustment payables - future (19,366) - (19,366) 0.1 (5,482) (181) (3,845) (9,858) (19,366) (23,676)
Payable forward purchases (988,040) (60) (988,100) 5.3 (218,570) (462,424) (119,724) (187,382) (988,100) (318,030)
Payable forward sales (1,088,882) (88) (1,088,970) 5.8 (383,834) (170,159) (181,666) (353,311) (1,088,970) (164,311)
Premiums on written options (2,520,903) (589,180) (3,110,083) 16.6 (1,227,537) (135,765) (235,283) (1,511,498) (3,110,083) (1,532,251)
Total liabilities (B) (15,455,264) (3,242,418) (18,697,682) 100.0 (2,726,204) (743,414) (1,118,615) (14,109,449) (18,697,682) (14,244,083)
Net Effect (A-B) 4,862,389 1,255,322 6,117,711 3,087,684 1,094,603 (111,929) 2,047,353 6,117,711 267,107
(1) Includes receivable adjustments relating to hedge of assets and liabilities, designated and/or indexed in foreign currency, primarily, arising from foreign investments, eliminating the effects of exchange variation of these assets and liabilities.
c) Futures, options, forward and swap contracts – (Nominal Value)
R$ thousand
1 to 90 days
91 to 180 days
181 to 360 days
More than 360 days
Total in December 31, 2020
Total in December 31, 2019
Futures contracts (1) 156,727,296 25,296,512 74,404,496 144,551,254 400,979,558 372,337,182
Option contracts 221,645,986 261,267,294 127,859,228 46,796,838 657,569,346 398,606,993
Forward contracts (1) 46,283,517 18,702,771 29,513,468 4,248,078 98,747,834 32,093,284
Swap contracts 10,021,090 14,605,270 7,724,745 84,261,239 116,612,344 122,265,197
Total in December 31, 2020 434,677,889 319,871,847 239,501,937 279,857,409 1,273,909,082
Total in December 31, 2019 553,466,755 80,674,625 84,555,049 206,606,227 925,302,656
(1) Includes contracts relating to hedges for the protection of assets and liabilities, designated and/or indexed in foreign currency, primarily, arising from foreign investments, eliminating the effects of exchange variation of these assets and liabilities.

127
d) Types of margin offered in guarantee of derivative financial instruments, primarily futures contracts
R$ thousand
On December 31, 2020 On December 31, 2019
Government securities
National treasury bills - 4,620,246
National treasury notes 4,368,766 5,270,514
Total 4,368,766 9,890,760
e) Revenues and expenses, net
R$ thousand
2nd semester Accrued on December 31
2020 2020 2019
Swap contracts 2,951,385 4,250,553 (303,446)
Forward contracts (1) (6,759,693) (7,597,574) 739,273
Option contracts 3,074,760 3,797,555 282,465
Futures contracts (1) 703,914 (19,638,556) (1,915,884)
Foreign exchange variation of assets and liabilities overseas (79,682) 6,362,663 337,884
Total (Note 9 III) (109,316) (12,825,359) (859,708)
(1) Includes the gain (loss) and the respective adjustment to the market capitalization of the hedge for protection of the assets and liabilities, designated and/or indexed in foreign currency, primarily, arising from foreign investments.
f) Nominal values of derivative financial instruments, by trading location and counterparty
R$ thousand
Total in December 31, 2020
Total in December 31, 2019
B3 (stock exchange) 1,034,782,001 739,773,021
B3 (over-the-counter) 203,170,377 143,904,600
- Financial Institutions 44,352,093 62,540,939
- Companies 158,472,894 80,946,338
- Individuals 345,390 417,323
Overseas (stock exchange) (1) 15,256,532 18,292,330
Overseas (over-the-counter) (1) 20,700,172 23,332,705
Total 1,273,909,082 925,302,656
(1) Comprised of operations carried out on the Chicago and New York Stock Exchanges and over-the-counter markets.
I) Credit Default Swaps (CDS)
In general, these represent bilateral agreements in which one of the parties purchases protection
against the credit risk of a certain financial instrument (the risk is transferred). The selling
counterparty receives remuneration that is usually paid linearly over the term of the agreement.
In the case of a default, the purchasing counterparty will receive a payment to offset the loss incurred
on the financial instrument. In this case, the selling counterparty usually receives the underlying
asset of the agreement in exchange for the payment.
R$ thousand
Total in December 31, 2020
Total in December 31, 2019
Risk received in credit Swaps: 3,872,939 3,894,982
- Debt securities issued by companies 1,024,244 791,045
- Bonds of the Brazilian public debt 2,580,026 3,056,778
- Bonds of foreign public debt 268,669 47,159
Risk transferred in credit Swaps: (1,304,372) (1,108,443)
- Brazilian public debt derivatives (332,589) (181,382)
- Foreign public debt derivatives (971,783) (927,061)
Total net credit risk value 2,568,567 2,786,539
Effect on Shareholders' Equity 105,226 84,382
Remuneration on the counterparty receiving the risk (26,462) (11,945)
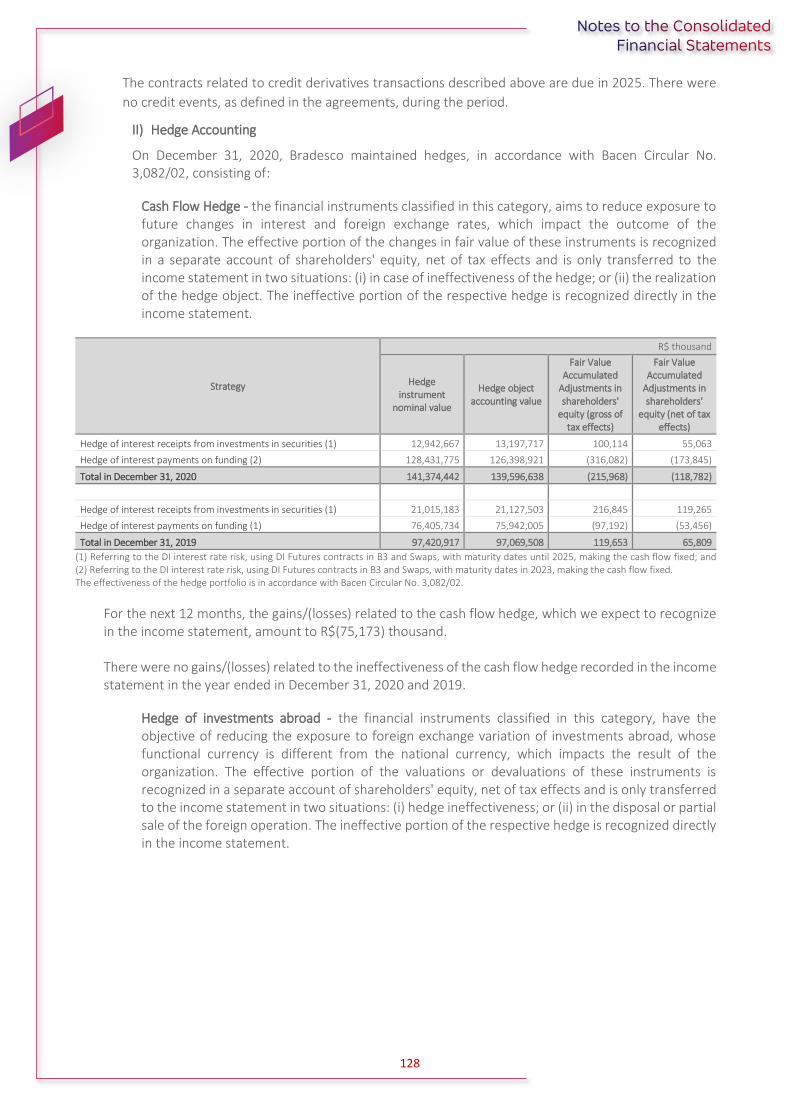
128
The contracts related to credit derivatives transactions described above are due in 2025. There were
no credit events, as defined in the agreements, during the period.
II) Hedge Accounting
On December 31, 2020, Bradesco maintained hedges, in accordance with Bacen Circular No. 3,082/02, consisting of:
Cash Flow Hedge - the financial instruments classified in this category, aims to reduce exposure to future changes in interest and foreign exchange rates, which impact the outcome of the organization. The effective portion of the changes in fair value of these instruments is recognized in a separate account of shareholders' equity, net of tax effects and is only transferred to the income statement in two situations: (i) in case of ineffectiveness of the hedge; or (ii) the realization of the hedge object. The ineffective portion of the respective hedge is recognized directly in the income statement.
Strategy
R$ thousand
Hedge instrument
nominal value
Hedge object accounting value
Fair Value Accumulated
Adjustments in shareholders'
equity (gross of tax effects)
Fair Value Accumulated
Adjustments in shareholders'
equity (net of tax effects)
Hedge of interest receipts from investments in securities (1) 12,942,667 13,197,717 100,114 55,063
Hedge of interest payments on funding (2) 128,431,775 126,398,921 (316,082) (173,845)
Total in December 31, 2020 141,374,442 139,596,638 (215,968) (118,782)
Hedge of interest receipts from investments in securities (1) 21,015,183 21,127,503 216,845 119,265
Hedge of interest payments on funding (1) 76,405,734 75,942,005 (97,192) (53,456)
Total in December 31, 2019 97,420,917 97,069,508 119,653 65,809
(1) Referring to the DI interest rate risk, using DI Futures contracts in B3 and Swaps, with maturity dates until 2025, making the cash flow fixed; and (2) Referring to the DI interest rate risk, using DI Futures contracts in B3 and Swaps, with maturity dates in 2023, making the cash flow fixed. The effectiveness of the hedge portfolio is in accordance with Bacen Circular No. 3,082/02.
For the next 12 months, the gains/(losses) related to the cash flow hedge, which we expect to recognize in the income statement, amount to R$(75,173) thousand. There were no gains/(losses) related to the ineffectiveness of the cash flow hedge recorded in the income statement in the year ended in December 31, 2020 and 2019.
Hedge of investments abroad - the financial instruments classified in this category, have the objective of reducing the exposure to foreign exchange variation of investments abroad, whose functional currency is different from the national currency, which impacts the result of the organization. The effective portion of the valuations or devaluations of these instruments is recognized in a separate account of shareholders' equity, net of tax effects and is only transferred to the income statement in two situations: (i) hedge ineffectiveness; or (ii) in the disposal or partial sale of the foreign operation. The ineffective portion of the respective hedge is recognized directly in the income statement.

129
Strategy
R$ thousand
Hedge instrument
nominal value
Hedge object accounting value
Fair Value Accumulated
Adjustments in shareholders'
equity (gross of tax effects)
Fair Value Accumulated
Adjustments in shareholders'
equity (net of tax effects)
Hedge of exchange variation on future cash flows (1) 4,839,546 2,570,621 (576,303) (316,967)
Total in December 31, 2020 4,839,546 2,570,621 (576,303) (316,967)
*
Hedge of exchange variation on future cash flows (1) 1,919,177 925,820 (388,674) (213,771)
Total in December 31, 2019 1,919,177 925,820 (388,674) (213,771)
(1) Whose functional currency is different from the real, using Forward and Dollar Futures contracts, with the object of hedging the foreign investment referenced to MXN (Mexican Peso) and USD (United States Dollar). The effectiveness of the hedge portfolio is in accordance with Bacen Circular No. 3,082/02.
For the next 12 months, the gains/(losses) related to the hedge of investments abroad (specifically the over-hedge made to cover tax effects), which we expect to recognize in the result, amount to R$307 thousand. The gains/(losses) related to the hedge of investments abroad, recorded in income accounts, in the second half of 2020, was R$ 2,161 thousand and in the year ended in December 31, 2020, was R$(12,697) thousand (R$(15,750) thousand in 2019).
III) Revenue from financial intermediation from securities, insurance, pension plans and capitalization bonds, and derivative financial instruments
R$ thousand
2nd semester Accrued on December 31
2020 2020 2019
Fixed income securities (1) 8,473,492 21,803,879 20,859,572
Interbank investments (Note 6b) 3,048,539 6,644,472 7,202,477
Equity securities (2) (614,485) (1,565,569) (456,975)
Subtotal - Securities purchased under agreements to resell 10,907,546 26,882,782 27,605,074
Financial income from insurance, pension plans and capitalization bonds (2) (3) 3,517,108 5,161,816 8,095,597
Net gain or (loss) from derivative financial instruments (Note 16e) (109,316) (12,825,359) (859,708)
Total 14,315,338 19,219,239 34,840,963
(1) In the year ended December 31, 2020, there were losses due to impairment of financial assets (mostly debentures), in the amount of R$1,960,911 thousand (R$2,058,004 thousand in 2019) and in the second half of 2020, in the amount of R$1,902,875 thousand, net of constitution/reversal. Including the result from a sale or transfer of financial assets, we would have an impairment of R$2,637,989 thousand in the year; (2) In the year ended December 31, 2020, there were losses by impairment of shares in the amount of R$446,413 thousand (R$22 thousand in 2019). There were no losses due to stock impaiment in the second half of 2020; and (3) In the year ended December 31, 2020, comprises financial income from insurance, pension plan and capitalization in the amount of R$23,505,822 thousand (R$25,025,743 thousand in 2019) and Expenses for updating and interest on technical provisions insurance, pension plan and capitalization in the amount of R$(18,344,005) thousand (R$(16,930,146) thousand in 2019). In the second half of 2020, it comprises financial income from insurance, private pension and capitalization in the amount of R$12,793,244 thousand and Expenses for updating and interest on technical provisions for insurance, private pension and capitalization in the amount of R$(9,276,135) thousand (Note 16e).

130
10) LOANS AND OTHER CREDIT EXPOSURES
Information relating to loans, including advances on foreign exchange contracts, leases and other receivables with credit characteristics is shown below:
a) By type and maturity
R$ thousand
Performing loans
1 to 30 days 31 to 60 days 61 to 90 days 91 to 180 days 181 to 360 days More than 360
days
Total in December 31,
2020 (A) % (4)
Total in December 31,
2019 (A) % (4)
Discounted trade receivables and loans (1) 16,504,243 12,772,842 12,468,716 28,768,209 35,244,281 123,168,178 228,926,469 39.7 185,347,428 36.1
Financing and on-lending 4,216,608 4,779,498 5,781,063 18,526,671 20,569,550 121,649,239 175,522,629 30.4 144,416,003 28.0
Agricultural and agribusiness loans 497,285 568,703 788,290 2,949,000 6,972,491 8,020,863 19,796,632 3.4 20,392,848 4.0
Subtotal - Securities purchased under agreements to resell
21,218,136 18,121,043 19,038,069 50,243,880 62,786,322 252,838,280 424,245,730 73.5 350,156,279 68.1
Leases 95,928 102,608 88,890 249,759 458,425 1,617,083 2,612,693 0.5 2,726,858 0.5
Advances on foreign exchange contracts (2) 601,388 1,295,796 1,025,335 3,370,463 1,172,258 66,682 7,531,922 1.3 15,684,618 3.0
Subtotal - Securities purchased under agreements to resell
21,915,452 19,519,447 20,152,294 53,864,102 64,417,005 254,522,045 434,390,345 75.3 368,567,755 71.6
Other receivables (3) 23,217,020 10,763,536 6,272,571 8,223,875 4,326,526 347,978 53,151,506 9.2 57,312,929 11.1
Credit portfolio 45,132,472 30,282,983 26,424,865 62,087,977 68,743,531 254,870,023 487,541,851 84.5 425,880,684 82.7
Acquisition of credit card receivables 4,290,459 1,408,216 881,802 1,216,901 552,080 - 8,349,458 1.4 9,485,622 1.8
Subtotal - Securities purchased under agreements to resell
49,422,931 31,691,199 27,306,667 63,304,878 69,295,611 254,870,023 495,891,309 85.9 435,366,306 84.5
Sureties and guarantees 641,880 905,295 1,289,829 6,470,156 13,457,806 57,471,636 80,236,602 13.9 78,231,145 15.2
Guarantee given on rural loans assigned - - - - 9,281 40,054 49,335 - 60,757 -
Letters of credit for imports 56,059 196,516 109,864 178,379 42,204 473,591 1,056,613 0.2 1,411,197 0.3
Confirmed exports loans 3,765 4,915 - - 1,354 - 10,034 - 20,227 -
Total - Memorandum accounts 701,704 1,106,726 1,399,693 6,648,535 13,510,645 57,985,281 81,352,584 14.1 79,723,326 15.5
Total on December 31, 2020 50,124,635 32,797,925 28,706,360 69,953,413 82,806,256 312,855,304 577,243,893 100.0
Total on December 31, 2019 58,848,500 34,555,194 25,618,740 62,116,622 81,107,695 252,842,881 515,089,632 100.0

131
R$ thousand
Non-performing loans
Past-due installments
1 to 30 days 31 to 60 days 61 to 90 days 91 to 180 days 181 to 540 days Total in December
31, 2020 (B) % (4)
Total in December 31, 2019 (B)
% (4)
Discounted trade receivables and loans (1) 892,874 768,506 596,139 1,635,686 2,908,381 6,801,586 83.3 9,311,845 81.4
Financing and on-lending 273,498 168,637 78,344 161,282 185,535 867,296 10.6 975,701 8.5
Agricultural and agribusiness loans 109,429 22,688 22,181 28,388 20,196 202,882 2.5 165,321 1.4
Subtotal - Securities purchased under agreements to resell
1,275,801 959,831 696,664 1,825,356 3,114,112 7,871,764 96.4 10,452,867 91.3
Leases 1,149 652 915 698 464 3,878 - 25,473 0.2
Advances on foreign exchange contracts (2) 1,793 4,608 69,071 34 - 75,506 0.9 372,646 3.3
Subtotal - Securities purchased under agreements to resell
1,278,743 965,091 766,650 1,826,088 3,114,576 7,951,148 97.3 10,850,986 94.8
Other receivables (3) 38,091 11,461 12,391 62,110 93,808 217,861 2.7 591,315 5.2
Total on December 31, 2020 1,316,834 976,552 779,041 1,888,198 3,208,384 8,169,009 100.0
Total on December 31, 2019 1,350,061 1,407,886 1,684,557 2,786,452 4,213,345 11,442,301 100.0
R$ thousand
Non-performing loans
Installments not yet due
1 to 30 days 31 to 60 days 61 to 90 days 91 to 180 days 181 to 360 days More than 360
days Total in December
31, 2020 (C) % (4)
Total in December 31, 2019 (C)
% (4)
Discounted trade receivables and loans (1)
537,132 493,402 446,619 1,087,087 1,801,118 5,659,835 10,025,193 73.6 10,382,566 66.4
Financing and on-lending 141,599 135,357 123,673 344,070 574,408 2,140,610 3,459,717 25.4 4,991,524 32.0
Agricultural and agribusiness loans
231 633 1,522 5,167 18,327 37,639 63,519 0.5 70,669 0.5
Subtotal - Securities purchased under agreements to resell
678,962 629,392 571,814 1,436,324 2,393,853 7,838,084 13,548,429 99.5 15,444,759 98.9
Leases 1,141 1,120 1,054 3,118 7,324 16,110 29,867 0.2 105,184 0.7
Subtotal - Securities purchased under agreements to resell
680,103 630,512 572,868 1,439,442 2,401,177 7,854,194 13,578,296 99.7 15,549,943 99.6
Other receivables (3) 3,026 2,649 2,434 6,226 8,705 20,815 43,855 0.3 68,746 0.4
Total on December 31, 2020 683,129 633,161 575,302 1,445,668 2,409,882 7,875,009 13,622,151 100.0
Total on December 31, 2019 911,472 790,742 760,240 1,790,461 2,936,967 8,428,807 15,618,689 100.0

132
R$ thousand
Total
Total in December 31, 2020 (A+B+C)
% (4) Total in December 31, 2019
(A+B+C) % (4)
Discounted trade receivables and loans (1) 245,753,248 41.1 205,041,839 37.9
Financing and on-lending 179,849,642 30.0 150,383,228 27.7
Agricultural and agribusiness loans 20,063,033 3.3 20,628,838 3.8
Subtotal - Securities purchased under agreements to resell 445,665,923 74.4 376,053,905 69.4
Leases 2,646,438 0.4 2,857,515 0.5
Advances on foreign exchange contracts (2) 7,607,428 1.3 16,057,264 3.0
Subtotal - Securities purchased under agreements to resell 455,919,789 76.1 394,968,684 72.9
Other receivables (3) 53,413,222 8.9 57,972,990 10.7
Credit portfolio 509,333,011 85.0 452,941,674 83.6
Acquisition of credit card receivables 8,349,458 1.4 9,485,622 1.7
Subtotal - Securities purchased under agreements to resell 517,682,469 86.4 462,427,296 85.3
Sureties and guarantees 80,236,602 13.4 78,231,145 14.4
Guarantee given on rural loans assigned 49,335 - 60,757 -
Letters of credit for imports 1,056,613 0.2 1,411,197 0.3
Confirmed exports loans 10,034 - 20,227 -
Total - Memorandum accounts 81,352,584 13.6 79,723,326 14.7
Total on December 31, 2020 599,035,053 100.0
Total on December 31, 2019 542,150,622 100.0
(1) Including credit card loans of R$9,922,375 thousand (R$13,499,626 thousand in December, 2019); (2) Advances on foreign exchange contracts are presented in the statement of financial position as a deduction from “Other financial liabilities”; (3) The item “Other Receivables” comprises receivables on sureties and guarantees honored, receivables on sale of assets, securities and credits receivable, income receivable from foreign exchange contracts and export contracts and credit card receivables (cash and installment purchases at merchants) totaling R$34,605,794 thousand (R$33,977,701 thousand in December, 2019); and (4) Percentage of each type in relation to the total loan portfolio, including sureties and guarantee, loan assignment and acquisition of receivables, co-obligations in rural loan assignments, credits opened for importation and confirmed export credits.

133
b) Modalities and levels of risk - credit portfolio and sureties and guarantees
R$ thousand
Levels of risk
AA A B C D E F G H Total in
December 31, 2020
% (1) Total in
December 31, 2019
% (1)
Discounted trade receivables and loans 24,764,655 60,421,441 74,904,019 39,717,259 13,875,244 5,184,754 5,975,067 2,952,062 17,958,747 245,753,248 41.7 205,041,839 38.7
Financing and on-lending 103,688,312 32,700,928 22,841,574 12,064,510 2,792,407 1,593,427 1,776,318 966,966 1,425,200 179,849,642 30.5 150,383,228 28.3
Agricultural and agribusiness loans 5,453,419 8,452,416 4,571,416 1,243,393 189,886 44,056 18,988 8,175 81,284 20,063,033 3.4 20,628,838 3.9
Subtotal - Securities purchased under agreements to resell 133,906,386 101,574,785 102,317,009 53,025,162 16,857,537 6,822,237 7,770,373 3,927,203 19,465,231 445,665,923 75.6 376,053,905 70.9
Leases 503,270 862,399 1,167,888 29,120 20,177 11,599 4,867 16,184 30,934 2,646,438 0.4 2,857,515 0.5
Advances on foreign exchange contracts (2) 2,159,828 1,371,247 2,180,450 1,635,582 14,684 40,547 162 27,683 177,245 7,607,428 1.3 16,057,264 3.0
Subtotal - Securities purchased under agreements to resell 136,569,484 103,808,431 105,665,347 54,689,864 16,892,398 6,874,383 7,775,402 3,971,070 19,673,410 455,919,789 77.3 394,968,684 74.4
Other receivables 13,904,410 16,123,413 10,445,535 10,578,735 1,449,767 174,159 58,063 59,154 619,986 53,413,222 9.1 57,972,990 10.9
Subtotal - Securities purchased under agreements to resell 150,473,894 119,931,844 116,110,882 65,268,599 18,342,165 7,048,542 7,833,465 4,030,224 20,293,396 509,333,011 86.4 452,941,674 85.3
Sureties and guarantees (3) 68,999,012 2,520,861 1,795,771 208,432 3,840,356 2,872,170 - - - 80,236,602 13.6 78,231,145 14.7
Total on December 31, 2020 219,472,906 122,452,705 117,906,653 65,477,031 22,182,521 9,920,712 7,833,465 4,030,224 20,293,396 589,569,613 100.0
% 37.2 20.8 20.0 11.1 3.8 1.7 1.3 0.7 3.4 100.0
Total on December 31, 2019 207,680,850 175,101,164 51,022,462 47,809,000 12,380,302 10,162,975 4,138,121 4,033,250 18,844,695 531,172,819 100.0
% 39.1 33.0 9.6 9.0 2.3 1.9 0.8 0.8 3.5 100.0
(1) Percentage of each type in relation to the total loan portfolio, excluding loan assignments, acquisition of receivables and co-obligation in rural loan assignments; (2) Advances on foreign exchange contracts are presented in the statement of financial position as a deduction from “Other financial liabilities”; and (3) The provision for losses, associated to the financial guarantees provided, is being assessed as provided by CMN Resolution No. 4,512/16, for more information on the methodology used, see Note 19c.

134
c) Composition of credit portfolio by risk level and delay situation
I) Levels of risk
R$ thousand
Levels of risk
Non-performing loans (3)
AA A B C D E F G H Total in
December 31, 2020
% (1) Total in
December 31, 2019
% (1)
Installments not yet due - - 1,570,681 1,954,430 2,527,731 1,452,605 831,970 801,124 4,483,610 13,622,151 100.0 15,618,689 100.0
1 to 30 - - 81,605 118,731 127,964 69,748 38,689 36,841 209,551 683,129 5.0 911,472 5.8
31 to 60 - - 75,937 105,705 116,878 65,046 38,435 37,561 193,599 633,161 4.6 790,742 5.1
61 to 90 - - 64,194 87,120 101,755 57,142 32,435 30,816 201,840 575,302 4.2 760,240 4.9
91 to 180 - - 152,439 214,292 270,344 159,774 93,001 95,030 460,788 1,445,668 10.6 1,790,461 11.5
181 to 360 - - 240,648 354,473 454,973 269,204 152,385 148,157 790,042 2,409,882 17.7 2,936,967 18.8
More than 360 - - 955,858 1,074,109 1,455,817 831,691 477,025 452,719 2,627,790 7,875,009 57.9 8,428,807 53.9
Past-due installments (2) - - 451,766 567,118 689,980 599,714 503,178 469,765 4,887,488 8,169,009 100.0 11,442,301 100.0
1 to 14 - - 6,785 37,649 45,150 22,754 13,434 13,141 221,799 360,712 4.4 297,885 2.6
15 to 30 - - 383,271 181,900 132,750 63,309 26,215 23,945 144,732 956,122 11.7 1,052,176 9.2
31 to 60 - - 61,710 307,164 185,217 81,635 44,784 55,315 240,727 976,552 12.0 1,407,886 12.3
61 to 90 - - - 14,842 289,828 92,902 43,293 35,540 302,636 779,041 9.5 1,684,557 14.6
91 to 180 - - - 25,563 37,035 325,358 356,634 318,045 825,563 1,888,198 23.1 2,786,452 24.4
181 to 360 - - - - - 13,756 18,818 23,779 3,081,138 3,137,491 38.4 4,149,757 36.3
More than 360 - - - - - - - - 70,893 70,893 0.9 63,588 0.6
Subtotal - Securities purchased under agreements to resell
- - 2,022,447 2,521,548 3,217,711 2,052,319 1,335,148 1,270,889 9,371,098 21,791,160 27,060,990
Specific provision - - 20,225 75,647 321,771 615,696 667,574 889,623 9,371,098 11,961,634 14,384,380
(1) Percentage of maturities by installment; (2) For transactions with terms of more than 36 months, past-due periods are doubled, as permitted by Resolution No. 2,682/99; and (3) For contracts with installments past-due for more than 14 days or which have been restructured or where the borrower is bankrupt or in judicial recovery.

135
R$ thousand
Levels of risk
Performing loans (2)
AA A B C D E F G H Total in
December 31, 2020
% (1) Total in
December 31, 2019
% (1)
Installments not yet due 150,343,571 119,650,498 114,028,517 62,571,474 15,014,964 4,966,173 6,476,945 2,746,630 10,788,555 486,587,327 99.8 424,171,930 99.6
1 to 30 9,120,121 14,851,714 8,471,219 8,384,757 1,566,835 713,043 318,695 100,133 651,431 44,177,948 9.1 50,993,845 12.0
31 to 60 7,889,013 8,247,580 6,928,640 5,421,991 929,151 190,010 105,349 62,643 508,606 30,282,983 6.2 32,649,225 7.7
61 to 90 7,164,799 7,476,250 5,331,452 5,079,668 744,232 179,776 138,836 60,873 248,979 26,424,865 5.4 23,927,453 5.6
91 to 180 19,808,197 18,374,044 12,031,318 7,898,212 1,444,336 426,948 774,673 245,122 1,085,127 62,087,977 12.7 52,933,226 12.4
181 to 360 19,168,482 16,301,912 17,585,622 10,228,268 2,738,417 675,805 459,438 370,003 1,215,584 68,743,531 14.1 67,145,117 15.8
More than 360 87,192,959 54,398,998 63,680,266 25,558,578 7,591,993 2,780,591 4,679,954 1,907,856 7,078,828 254,870,023 52.3 196,523,064 46.1
Past due up to 14 days 130,323 281,346 59,918 175,577 109,490 30,050 21,372 12,705 133,743 954,524 0.2 1,708,754 0.4
Subtotal - Securities purchased under agreements to resell
150,473,894 119,931,844 114,088,435 62,747,051 15,124,454 4,996,223 6,498,317 2,759,335 10,922,298 487,541,851 100.0 425,880,684 100.0
Generic provision - 599,659 1,140,884 1,882,411 1,512,445 1,498,867 3,249,158 1,931,534 10,922,298 22,737,256 15,371,677
Total on December 31, 2020 150,473,894 119,931,844 116,110,882 65,268,599 18,342,165 7,048,542 7,833,465 4,030,224 20,293,396 509,333,011
Existing provision - 728,056 1,409,023 5,803,040 4,885,649 3,405,380 4,763,946 3,913,701 20,293,396 45,202,191
Minimum required provision - 599,659 1,161,109 1,958,058 1,834,216 2,114,563 3,916,732 2,821,157 20,293,396 34,698,890
Supplementary provision - 128,397 247,914 3,844,982 3,051,433 1,290,817 847,214 1,092,544 - 10,503,301
Total on December 31, 2019 142,004,361 170,724,534 49,362,931 47,715,155 7,976,342 8,142,285 4,138,121 4,033,250 18,844,695 452,941,674
Existing provision - 974,264 579,340 4,157,469 1,944,607 3,577,874 2,605,846 3,956,330 18,844,695 36,640,425
Minimum required provision - 853,623 493,630 1,431,454 797,634 2,442,686 2,069,060 2,823,275 18,844,695 29,756,057
Supplementary provision - 120,641 85,710 2,726,015 1,146,973 1,135,188 536,786 1,133,055 - 6,884,368
(1) Percentage of maturities by installment; and (2) Transactions past-due for less than 15 days and which have not been restructured and where the borrower is not bankrupt or in judicial recovery.

136
II) Breakdown of credit portfolio
Level of risk
R$ thousand
Portfolio balance
Non-performing loans
Performing loans Total % (1) % Accrued on
December 31, 2020 (2)
% Accrued on December 31, 2019
(2) Installments past due Installments not yet
due Total - non-performing
loans
AA - - - 150,473,894 150,473,894 29.6 29.6 31.3
A - - - 119,931,844 119,931,844 23.5 53.1 69.0
B 451,766 1,570,681 2,022,447 114,088,435 116,110,882 22.8 75.9 79.9
C 567,118 1,954,430 2,521,548 62,747,051 65,268,599 12.8 88.7 90.4
Subtotal - Securities purchased under agreements to resell
1,018,884 3,525,111 4,543,995 447,241,224 451,785,219 88.7
D 689,980 2,527,731 3,217,711 15,124,454 18,342,165 3.6 92.3 92.2
E 599,714 1,452,605 2,052,319 4,996,223 7,048,542 1.4 93.7 94.0
F 503,178 831,970 1,335,148 6,498,317 7,833,465 1.5 95.2 94.9
G 469,765 801,124 1,270,889 2,759,335 4,030,224 0.8 96.0 95.8
H 4,887,488 4,483,610 9,371,098 10,922,298 20,293,396 4.0 100.0 100.0
Subtotal - Securities purchased under agreements to resell
7,150,125 10,097,040 17,247,165 40,300,627 57,547,792 11.3
Total on December 31, 2020 8,169,009 13,622,151 21,791,160 487,541,851 509,333,011 100.0
% 1.6 2.7 4.3 95.7 100.0
Total on December 31, 2019 11,442,301 15,618,689 27,060,990 425,880,684 452,941,674
% 2.5 3.4 5.9 94.1 100.0
(1) Percentage of level of risk in relation to the total portfolio; and (2) Cumulative percentage of level of risk in relation to the total portfolio.
III) Credit portfolio by days past due
Exposure - Loans
R$ thousand
On time Past-due until 14
days Past-due 15 to 60
days Past-due 61 to 90
days Past-due 91 to 180
days Past-due 181 to 360
days Past-due more than
360 Total
Total in December 31, 2020 473,967,655 9,877,889 11,034,801 3,327,229 4,869,964 6,005,697 249,776 509,333,011
Total in December 31, 2019 411,041,549 10,852,711 12,193,598 3,964,721 6,411,037 8,350,437 127,621 452,941,674

137
IV) Emergency Employment Support Program (PESE)
Considering the provisions of the CMN Resolution No. 4,846/20, we demonstrate below the operations
relating to the Emergency Employment Support Program (PESE) classified by level of risk and
accompanied by the amount of the provision made for each level of risk:
R$ thousand
Rating Assets Provision
AA 14,144 -
A 93,650 70
B 272,091 408
C 977,458 14,330
D 113,968 5,127
E 6,991 524
F 2,227 234
G 1,348 202
H 5,188 778
Total 1,487,065 21,673
d) Concentration of loans
R$ thousand
On December 31, 2020
% (1) On December 31,
2019 % (1)
Largest borrower 10,661,873 2.1 8,870,762 2.0
10 largest borrowers 38,638,446 7.6 35,177,697 7.8
20 largest borrowers 56,123,996 11.0 51,718,848 11.4
50 largest borrowers 80,415,643 15.8 76,286,455 16.8
100 largest borrowers 98,516,270 19.3 92,082,076 20.3
(1) Percentage on total portfolio (as defined by Bacen).
e) Credit portfolio by economic sector
R$ thousand
On December 31, 2020
% On December 31,
2019 %
Public sector 11,810,973 2.3 8,899,863 2.0
Oil, derivatives and aggregate activities 10,661,873 2.1 8,870,762 2.0
Production and distribution of electricity 1,074,867 0.2 3,032 -
Other industries 74,233 - 26,069 -
Private sector 497,522,038 97.7 444,041,811 98.0
Companies 241,092,358 47.4 213,605,332 47.2
Real estate and construction activities 20,092,249 3.9 21,695,592 4.8
Retail 36,498,461 7.2 35,521,621 7.8
Services 30,108,475 5.9 20,136,089 4.4
Transportation and concession 23,662,184 4.6 20,807,687 4.6
Automotive 15,625,309 3.1 12,723,830 2.8
Food products 13,378,255 2.6 11,067,069 2.4
Wholesale 16,479,704 3.2 14,327,816 3.2
Production and distribution of electricity 6,979,203 1.4 2,868,563 0.6
Iron and steel industry 10,036,586 2.0 9,022,956 2.0
Sugar and alcohol 6,878,558 1.4 6,191,961 1.4
Holding 2,971,345 0.6 2,940,207 0.6
Capital goods 3,408,997 0.7 3,197,561 0.7
Pulp and paper 3,589,015 0.7 2,331,950 0.5
Chemical 5,510,960 1.1 4,787,210 1.1
Cooperative 3,829,556 0.8 2,843,482 0.6
Financial 3,062,861 0.6 1,904,654 0.4
Leisure and tourism 4,011,957 0.8 3,401,206 0.8
Textiles 2,481,493 0.5 2,380,689 0.5
Agriculture 1,631,959 0.3 1,833,734 0.4
Oil, derivatives and aggregate activities 2,177,060 0.4 1,715,630 0.4
Other industries 28,678,171 5.6 31,905,825 7.0
Individuals 256,429,680 50.3 230,436,479 50.9
Total 509,333,011 100.0 452,941,674 100.0

138
f) Changes in the renegotiated portfolio
R$ thousand
2020 2019
Opening balance on exercise 19,030,657 17,143,212
Amount renegotiated 34,683,660 20,283,735
Amount received/Others (1) (19,448,835) (13,363,684)
Write-offs (4,508,342) (5,032,606)
Closing balance on December 31 29,757,140 19,030,657
Allowance for loan losses expense 18,311,603 12,724,216
Percentage on renegotiated portfolio 61.5% 66.9%
(1) Includes the settlement of renegotiated contracts through new transactions.
g) Income from loans and leases
R$ thousand
2nd semester Accrued on December 31
2020 2020 2019
Discounted trade receivables and loans 25,394,373 50,784,550 49,990,246
Financing and on-lending 8,061,594 16,427,918 16,505,080
Agricultural and agribusiness loans 734,008 1,506,278 1,462,374
Subtotal - Securities purchased under agreements to resell 34,189,975 68,718,746 67,957,700
Recovery of credits charged-off as losses 3,407,517 5,919,397 7,908,896
Subtotal - Securities purchased under agreements to resell 37,597,492 74,638,143 75,866,596
Leases, net of expenses 68,310 155,864 259,682
Total 37,665,802 74,794,007 76,126,278
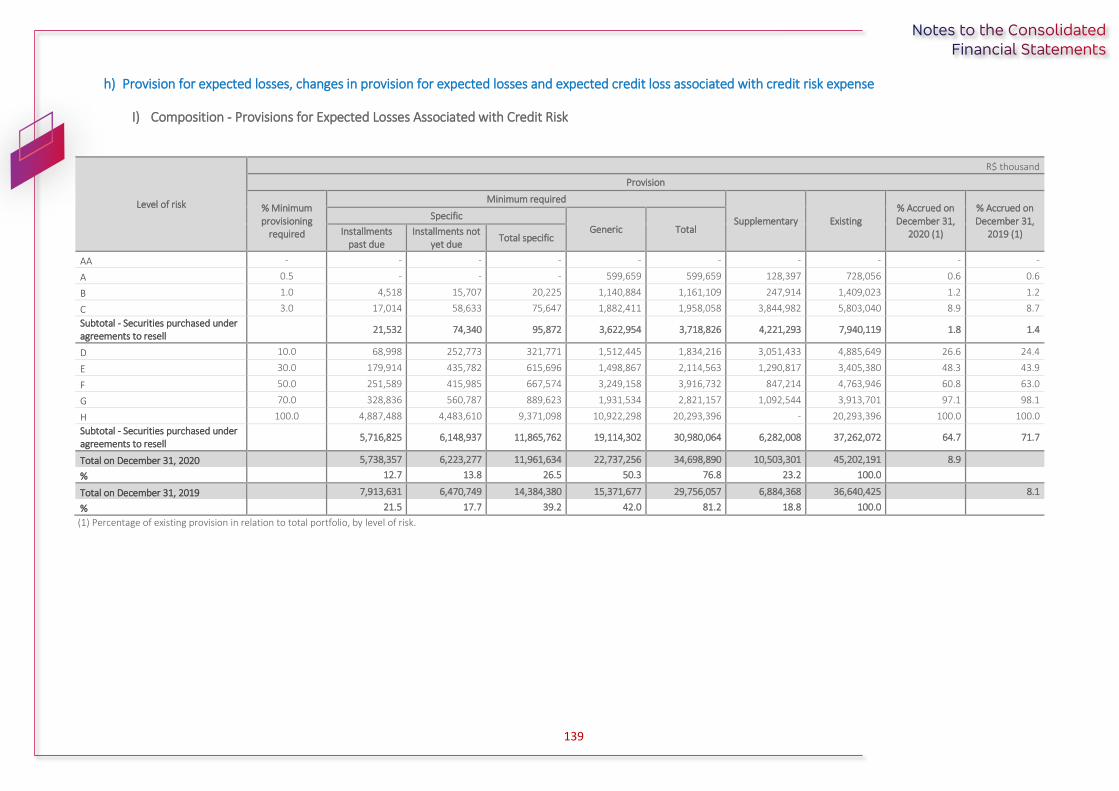
139
h) Provision for expected losses, changes in provision for expected losses and expected credit loss associated with credit risk expense
I) Composition - Provisions for Expected Losses Associated with Credit Risk
Level of risk
R$ thousand
Provision
% Minimum provisioning
required
Minimum required
Supplementary Existing % Accrued on December 31,
2020 (1)
% Accrued on December 31,
2019 (1)
Specific
Generic Total Installments past due
Installments not yet due
Total specific
AA - - - - - - - - - -
A 0.5 - - - 599,659 599,659 128,397 728,056 0.6 0.6
B 1.0 4,518 15,707 20,225 1,140,884 1,161,109 247,914 1,409,023 1.2 1.2
C 3.0 17,014 58,633 75,647 1,882,411 1,958,058 3,844,982 5,803,040 8.9 8.7
Subtotal - Securities purchased under agreements to resell
21,532 74,340 95,872 3,622,954 3,718,826 4,221,293 7,940,119 1.8 1.4
D 10.0 68,998 252,773 321,771 1,512,445 1,834,216 3,051,433 4,885,649 26.6 24.4
E 30.0 179,914 435,782 615,696 1,498,867 2,114,563 1,290,817 3,405,380 48.3 43.9
F 50.0 251,589 415,985 667,574 3,249,158 3,916,732 847,214 4,763,946 60.8 63.0
G 70.0 328,836 560,787 889,623 1,931,534 2,821,157 1,092,544 3,913,701 97.1 98.1
H 100.0 4,887,488 4,483,610 9,371,098 10,922,298 20,293,396 - 20,293,396 100.0 100.0
Subtotal - Securities purchased under agreements to resell
5,716,825 6,148,937 11,865,762 19,114,302 30,980,064 6,282,008 37,262,072 64.7 71.7
Total on December 31, 2020 5,738,357 6,223,277 11,961,634 22,737,256 34,698,890 10,503,301 45,202,191 8.9
% 12.7 13.8 26.5 50.3 76.8 23.2 100.0
Total on December 31, 2019 7,913,631 6,470,749 14,384,380 15,371,677 29,756,057 6,884,368 36,640,425 8.1
% 21.5 17.7 39.2 42.0 81.2 18.8 100.0
(1) Percentage of existing provision in relation to total portfolio, by level of risk.
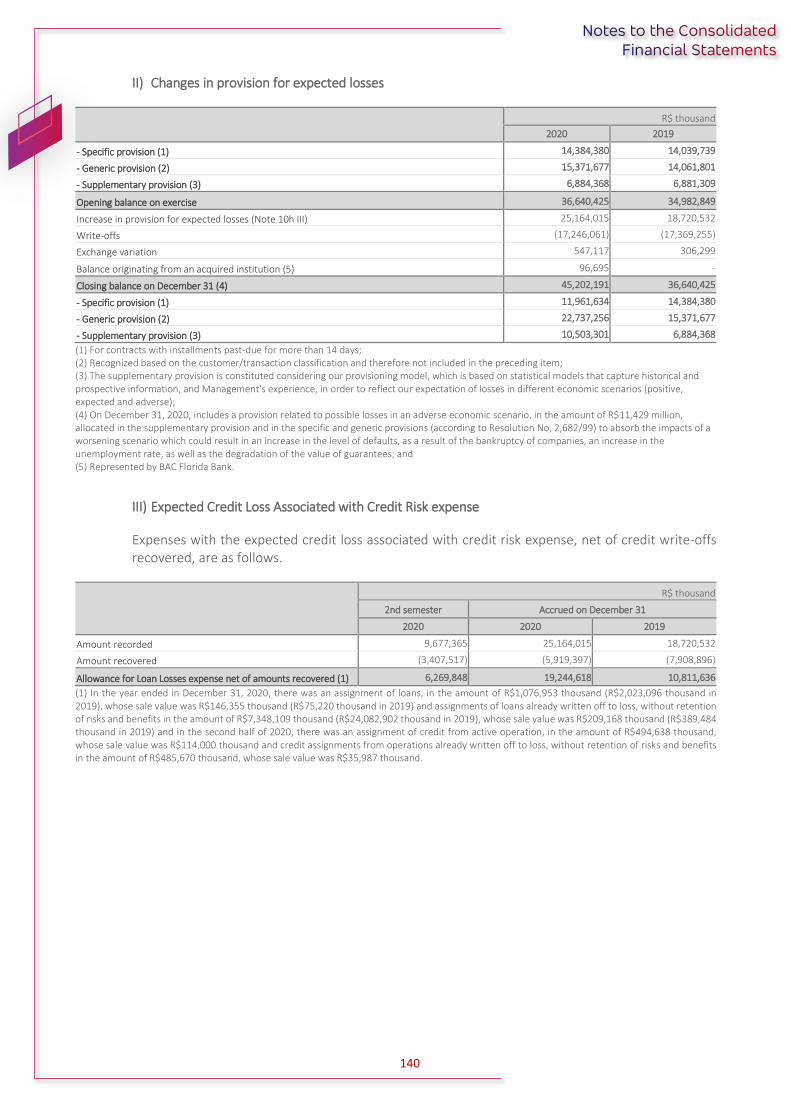
140
II) Changes in provision for expected losses
R$ thousand
2020 2019
- Specific provision (1) 14,384,380 14,039,739
- Generic provision (2) 15,371,677 14,061,801
- Supplementary provision (3) 6,884,368 6,881,309
Opening balance on exercise 36,640,425 34,982,849
Increase in provision for expected losses (Note 10h III) 25,164,015 18,720,532
Write-offs (17,246,061) (17,369,255)
Exchange variation 547,117 306,299
Balance originating from an acquired institution (5) 96,695 -
Closing balance on December 31 (4) 45,202,191 36,640,425
- Specific provision (1) 11,961,634 14,384,380
- Generic provision (2) 22,737,256 15,371,677
- Supplementary provision (3) 10,503,301 6,884,368
(1) For contracts with installments past-due for more than 14 days; (2) Recognized based on the customer/transaction classification and therefore not included in the preceding item; (3) The supplementary provision is constituted considering our provisioning model, which is based on statistical models that capture historical and prospective information, and Management's experience, in order to reflect our expectation of losses in different economic scenarios (positive, expected and adverse); (4) On December 31, 2020, includes a provision related to possible losses in an adverse economic scenario, in the amount of R$11,429 million, allocated in the supplementary provision and in the specific and generic provisions (according to Resolution No, 2,682/99) to absorb the impacts of a worsening scenario which could result in an increase in the level of defaults, as a result of the bankruptcy of companies, an increase in the unemployment rate, as well as the degradation of the value of guarantees; and (5) Represented by BAC Florida Bank.
III) Expected Credit Loss Associated with Credit Risk expense
Expenses with the expected credit loss associated with credit risk expense, net of credit write-offs recovered, are as follows.
R$ thousand
2nd semester Accrued on December 31
2020 2020 2019
Amount recorded 9,677,365 25,164,015 18,720,532
Amount recovered (3,407,517) (5,919,397) (7,908,896)
Allowance for Loan Losses expense net of amounts recovered (1) 6,269,848 19,244,618 10,811,636
(1) In the year ended in December 31, 2020, there was an assignment of loans, in the amount of R$1,076,953 thousand (R$2,023,096 thousand in 2019), whose sale value was R$146,355 thousand (R$75,220 thousand in 2019) and assignments of loans already written off to loss, without retention of risks and benefits in the amount of R$7,348,109 thousand (R$24,082,902 thousand in 2019), whose sale value was R$209,168 thousand (R$389,484 thousand in 2019) and in the second half of 2020, there was an assignment of credit from active operation, in the amount of R$494,638 thousand, whose sale value was R$114,000 thousand and credit assignments from operations already written off to loss, without retention of risks and benefits in the amount of R$485,670 thousand, whose sale value was R$35,987 thousand.

141
11) OTHER FINANCIAL INSTRUMENTS
Sundry
R$ thousand
On December 31, 2020 On December 31, 2019
Foreign exchange portfolio (a) 25,944,605 31,215,701
Credit card operations 34,605,794 33,977,701
Trade and credit receivables 19,107,790 23,039,948
Debtors for escrow deposits 18,489,500 18,695,102
Securities trading 6,111,610 4,659,791
Receivable insurance premiums 4,456,175 4,125,110
Receivables 1,300,355 1,630,039
Payments to be reimbursed 619,754 769,689
Receivables on sureties and guarantees honored 146,158 685,042
Other investments 48,441 48,916
Receivables from sale of assets 123,797 169,183
Total 110,953,979 119,016,222
a) Foreign exchange portfolio
Balances
R$ thousand
On December 31, 2020 On December 31, 2019
Assets – other financial instruments
Exchange purchases pending settlement 17,464,744 23,782,652
Foreign exchange and forward documents in foreign currencies 2,589 19,091
Exchange sale receivables 8,823,836 7,394,485
(-) Advances in domestic currency received (536,195) (243,847)
Income receivable on advances granted 189,631 263,320
Total 25,944,605 31,215,701
Liability - Other financial instruments
Exchange sales pending settlement 9,396,397 7,793,350
Exchange purchase payables 16,968,588 23,751,316
(-) Advances on foreign exchange contracts (7,607,428) (16,057,264)
Other 74 1,368
Total 18,757,631 15,488,770
Net foreign exchange portfolio 7,186,974 15,726,931
Memorandum accounts:
- Loans available for import 1,056,613 1,411,197
- Confirmed exports loans 10,034 20,227
Foreign exchange results
Net foreign exchange income for presentation purposes
R$ thousand
2nd semester Accrued on December 31
2020 2020 2019
Revenue from financial intermediation – foreign exchange income 213,948 4,723,329 2,413,090
Adjustments:
- Income on foreign currency financing (1) 50,396 366,561 196,201
- Income on export financing (1) 674,458 1,624,902 1,754,736
- Expenses of liabilities with foreign bankers (2) (Note 16d) (239,093) (5,122,684) (2,018,481)
- Funding expenses (3) (642,205) (1,590,872) (1,750,418)
- Other (4) 677,290 1,842,708 527,123
Total adjustments 520,846 (2,879,385) (1,290,839)
Net foreign exchange income 734,794 1,843,944 1,122,251
(1) Recognized in “Income from loans”; (2) Related to funds for financing of advances on foreign exchange contracts and import financing, recognized in “Borrowing and on-lending expenses”; (3) Refer to funding expenses, the resources of which were invested in foreign exchange operations; and (4) Primarily includes the exchange rate variations of amounts invested in foreign currency.
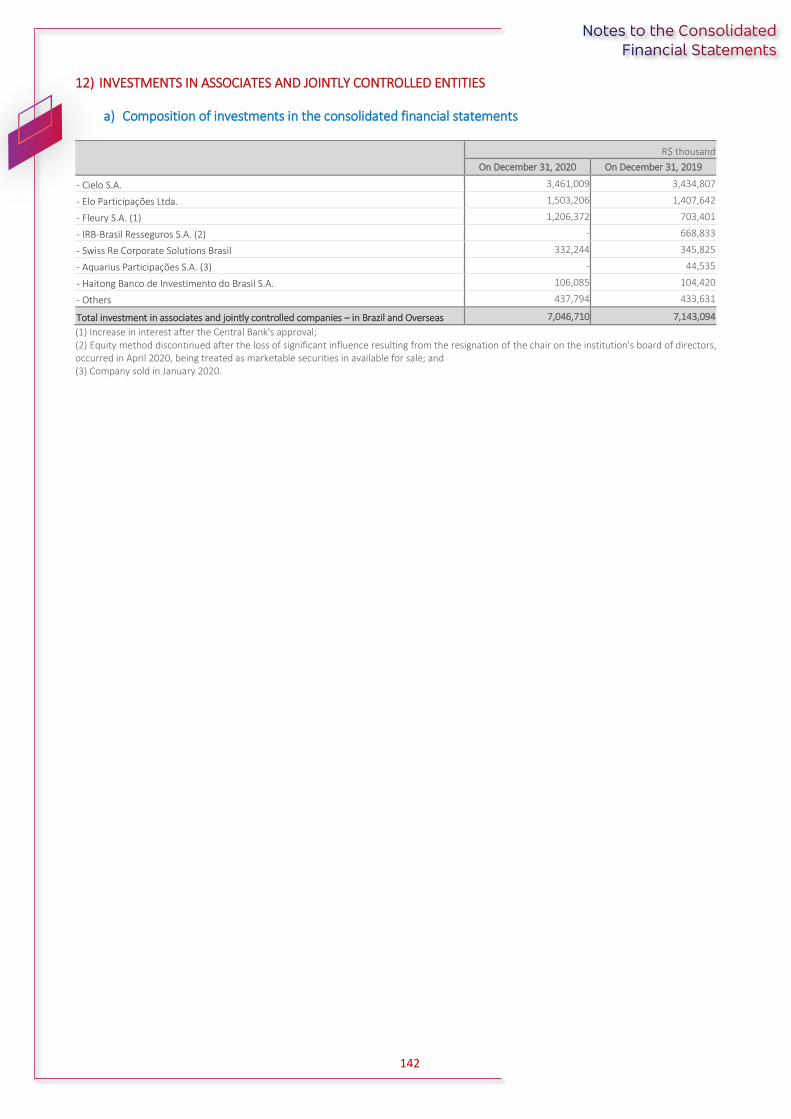
142
12) INVESTMENTS IN ASSOCIATES AND JOINTLY CONTROLLED ENTITIES
a) Composition of investments in the consolidated financial statements
R$ thousand
On December 31, 2020 On December 31, 2019
- Cielo S.A. 3,461,009 3,434,807
- Elo Participações Ltda. 1,503,206 1,407,642
- Fleury S.A. (1) 1,206,372 703,401
- IRB-Brasil Resseguros S.A. (2) - 668,833
- Swiss Re Corporate Solutions Brasil 332,244 345,825
- Aquarius Participações S.A. (3) - 44,535
- Haitong Banco de Investimento do Brasil S.A. 106,085 104,420
- Others 437,794 433,631
Total investment in associates and jointly controlled companies – in Brazil and Overseas 7,046,710 7,143,094
(1) Increase in interest after the Central Bank's approval; (2) Equity method discontinued after the loss of significant influence resulting from the resignation of the chair on the institution's board of directors, occurred in April 2020, being treated as marketable securities in available for sale; and (3) Company sold in January 2020.

143
b) The income/expense from the equity method accounting of investments was recognized in the income statement, under “Share of profit (loss) of unconsolidated and jointly controlled companies”, and are demonstrated below:
Companies
R$ thousand
Capital Shareholders’
equity adjusted
Number of shares held (in thousands)
Number of shares held (in
thousands)
Equity interest consolidated
on capital stock
Adjusted income in the
2nd semester of 2020
Adjusted income accumulated on December 31
Equity accounting
adjustments in the 2nd
semester of 2020 (1)
Equity accounting adjustments accrued on december 31 (1)
Ordinary (ON)
Preferential (PN)
2020 2019 2020 2019
- Elo Participações Ltda. (2) 1,052,000 3,005,811 - - 526,105 50.01% 585,137 866,659 627,369 292,627 433,416 313,747
- Aquarius Participações S.A. (3) - - - - - - - - 24,806 - - 12,155
- Haitong Banco de Investimento do Brasil S.A.
420,000 530,425 12,734 12,734 - 20.00% 15,590 21,920 19,120 3,118 4,384 3,824
- Others (4) - - - - - - - - - 234,045 311,512 873,805
Share of profit (loss) of unconsolidated and jointly controlled companies
529,790 749,312 1,203,531
(1) The adjustment considers income periodically calculated by the companies and includes equity variations recognized by the investees not recognized in profit or loss, as well as alignment of accounting practice adjustments, where applicable; (2) Investment in jointly controlled companies; (3) Company sold in January 2020; and (4) Includes, primarily, the adjustments resulting from the assessment by the equity method in public companies (Cielo S.A., Fleury S.A. and IRB-Brasil Resseguros S.A. until March 2020).

144
13) PREMISES AND EQUIPMENT
R$ thousand
Annual depreciation
rate Cost Depreciation
Impairment of Assets
Accumulated
Cost net of depreciation
On December 31, 2020
On December 31, 2019
Property and equipment:
- Buildings 4% 2,741,142 (920,984) (3,690) 1,816,468 1,793,859
- Land - 832,497 - 30,983 863,480 809,814
Facilities, furniture and premises and equipment (1) 10% 6,107,268 (3,413,499) (70,718) 2,623,051 3,525,331
Security and communication systems 10% 388,588 (236,324) - 152,264 153,852
Data processing systems 20 to 40% 10,137,875 (6,780,155) - 3,357,720 3,189,338
Transportation systems (1) 10 to 20% 196,434 (82,056) (1,363) 113,015 127,984
Fixed Assets in course - 519,465 - - 519,465 131,394
Total in December 31, 2020 20,923,269 (11,433,018) (44,788) 9,445,463
Total in December 31, 2019 9,731,572
(1) In 2020, an impairment reversal was recorded in the amount of R$30,983 thousand and an impairment was recorded in the "Other Operating
Expenses" account in the amount of R$20,677 thousand (In 2019, an impairment was recorded in the "Other Operating Expenses" item - R$25,471
thousand).
The fixed assets to shareholders’ equity ratio is 30.1% when only considering companies and payment
institutions within the economic group (the “Prudential Conglomerate”), where the maximum limit is 50.0%
as required by Resolution No. 2,669/99.
14) INTANGIBLE ASSETS
a) Goodwill
The goodwill recognized from investment acquisitions totaled, on December 31, 2020, R$4,874,282 thousand (R$4,864,316 thousand in 2019), net of accumulated amortization, as applicable, of which: (i) R$1,370,638 thousand (R$985,628 thousand in 2019)recognized in ‘Permanent Assets – Investments’ arose from the acquisition of shares of associates and jointly controlled companies (Cielo/Fleury/Swiss Re); and (ii) R$3,503,644 thousand (R$3,878,688 thousand in 2019)arose from the acquisition of shares of subsidiaries, relating to the future profitability/client portfolio/fair value, which is amortized in up to twenty years, recognized in Fixed Assets – Intangible Assets.
In the second half of 2020, goodwill was amortized totaling R$848,272 thousand and in the year ended in December 31, 2020, R$1,661,414 (R$1,710,013 thousand in 2019) (Note 31).
b) Intangible assets
Acquired intangible assets consist of:
R$ thousand
Rate of Amortization
(1) Cost Amortization
Cost net of amortization
On December 31, 2020
On December 31, 2019
Anticipation for acquisition of right to provide financial services (2) Contract 8,044,445 (3,892,832) 4,151,613 5,007,663
Software (2) 20% 12,349,481 (8,361,168) 3,988,313 3,335,831
Goodwill (3) Up to 20% 13,560,888 (9,500,830) 4,060,058 3,877,665
Other Contract 440,767 (390,163) 50,604 29,817
Total in December 31, 2020 34,395,581 (22,144,993) 12,250,588
Total in December 31, 2019 31,702,554 (19,451,578) 12,250,976
(1) Intangible assets are amortized over an estimated period of economic benefit, composed of: (i) Software and Other recorded under “Other Administrative Expenses”; and (ii) Acquisition of Payroll and Goodwill in “Other Operating Expenses”; (2) On December 31, 2020, there were impairment losses in: (i) Acquisition of the right to provide financial services, in the amount of R$320,726 thousand (R$519,749 thousand in 2019); (ii) Software R$258,998 (R$196,553 thousand in 2019); and (iii) Goodwill R$478,677 (R$255,301 thousand in 2019); and (3) On December 31, 2020, primarily composed of goodwill on the acquisition of equity interest in BAC Florida Bank - R$1,706,513 thousand, Odonto System – R$143,223 thousand (R$182,587 thousand in 2019), Bradescard Mexico - R$12,796 thousand (R$14,143 thousand in 2019), Bradesco BBI – R$69,026 thousand (R$84,337 thousand in 2019), Kirton Bank - R$1,421,663 thousand (R$2,901,667 thousand in 2019) and RCB Investimentos - R$141,023 thousand (R$183,275 thousand in 2019).

145
c) Changes in intangible assets by type
R$ thousand
On December 31, 2019
Additions / (reductions)
Amortization for the period
On December 31, 2020
Acquisition of financial services rights 5,007,663 470,321 (1,326,371) 4,151,613
Software 3,335,831 1,373,474 (720,992) 3,988,313
Goodwill – Future profitability 2,154,236 1,843,807 (981,786) 3,016,257
Goodwill – Based on intangible assets and other reasons 1,159,525 - (586,209) 573,316
Goodwill – Difference in fair value of assets/liabilities 563,904 - (93,419) 470,485
Other 29,817 309,095 (288,308) 50,604
Total in December 31, 2020 12,250,976 3,996,697 (3,997,085) 12,250,588
Total in December 31, 2019 13,895,351 2,496,370 (4,140,745) 12,250,976
15) OTHER ASSETS
R$ thousand
On December 31, 2020 On December 31, 2019
Prepaid taxes 15,330,420 15,685,801
Other assets and values (a) 5,358,150 5,678,155
Other debtors 3,437,752 3,182,805
Interbank and interdepartmental accounts 669,474 480,833
Specific receivables 105,410 67,499
Other 1,851,495 1,213,013
Total 26,752,701 26,308,106
a) Other Assets and Values
I) Foreclosed assets/other
R$ thousand
Cost Impairment of
Assets Accumulated
Cost net of provision
On December 31, 2020
On December 31, 2019
Real estate 2,665,553 (1,669,986) 995,567 1,133,524
Vehicles and similar 554,567 (348,496) 206,071 223,775
Inventories/warehouse 13,243 - 13,243 12,113
Machinery and equipment 6,219 (4,732) 1,487 362
Other 11,588 (11,548) 40 42
Total in December 31, 2020 3,251,170 (2,034,762) 1,216,408
Total in December 31, 2019 3,302,130 (1,932,314) 1,369,816
II) Prepaid expenses
R$ thousand
On December 31, 2020 On December 31, 2019
Deferred insurance acquisition costs (1) 1,070,033 1,045,711
Commission on the placement of loans and financing (2) 66,835 544,828
Advertising and marketing expenses (3) 404,145 244,346
Other (4) 565,967 541,140
Total 2,106,980 2,376,025
(1) Commissions paid to brokers and representatives on sale of insurance, pension plans and capitalization bond products; (2) Commissions paid to storeowners, car dealers and correspondent banks – payroll-deductible loans; (3) Prepaid expenses of future advertising and marketing campaigns on media; and (4) It includes, primarily: (i) anticipation of commissions concerning the operational agreement to offer credit cards and other products; and (ii) card issue costs.

146
16) DEPOSITS FROM BANKS
R$ thousand
1 to 30 days 31 to 180 days 181 to 360 days More than 360
days On December
31, 2020 On December
31, 2019
Demand deposits - Financial Institutions
1,593,170 - - - 1,593,170 1,606,077
Interbank deposits 152,478 124,053 520,440 245 797,216 369,983
Securities sold under agreements to repurchase (a)
215,010,248 561,529 10,993 1,525,583 217,108,353 174,100,023
Borrowings (b) 2,870,597 15,074,570 6,021,303 - 23,966,470 29,272,183
Onlending (c) 1,841,255 2,559,667 3,391,905 16,022,131 23,814,958 22,471,344
Total of deposits from banks 221,467,748 18,319,819 9,944,641 17,547,959 267,280,167 227,819,610
a) Securities sold under agreements to repurchase
R$ thousand
1 to 30 days 31 to 180
days 181 to 360
days More than 360 days
On December 31, 2020
On December 31, 2019
Securities pledged as colateral 79,538,354 144,995 10,993 1,525,583 81,219,925 127,901,823
● Government securities 68,487,086 141,617 102 - 68,628,805 116,745,432
● Debentures 7,043,808 3,378 - 12,512 7,059,698 3,559,618
● Foreign 4,007,460 - 10,891 1,513,071 5,531,422 7,596,773
Securities received as colateral (1) 124,979,740 404,072 - - 125,383,812 38,490,609
Right to sell or repledged the collateral (1) 10,492,154 12,462 - - 10,504,616 7,707,591
Total on December 31, 2020 215,010,248 561,529 10,993 1,525,583 217,108,353
% 99.0 0.3 - 0.7 100.0
Total on December 31, 2019 170,357,416 1,574,108 293,817 1,874,682 174,100,023
% 97.8 0.9 0.2 1.1 100.0
(1) Represented by government securities.
b) Borrowing
R$ thousand
1 to 30 days 31 to 180
days 181 to 360
days More than 360 days
On December 31, 2020
On December 31, 2019
Overseas 2,870,597 15,074,570 6,021,303 - 23,966,470 29,272,183
Total on December 31, 2020 2,870,597 15,074,570 6,021,303 - 23,966,470
% 12.0 62.9 25.1 - 100.0
Total on December 31, 2019 2,054,437 17,530,278 7,812,938 1,874,530 29,272,183
% 7.0 59.9 26.7 6.4 100.0
c) On-lending (1)
R$ thousand
1 to 30 days 31 to 180 days 181 to 360
days More than 360 days
On December 31, 2020
On December 31, 2019
In Brazil 1,841,255 2,559,667 3,391,905 16,022,131 23,814,958 22,471,344
- FINAME 256,730 1,470,656 1,828,989 7,423,334 10,979,709 12,092,907
- BNDES 1,583,901 1,089,011 1,450,538 8,597,381 12,720,831 10,240,069
- National Treasury - - 112,354 - 112,354 136,901
- Other institutions 624 - 24 1,416 2,064 1,467
Total on December 31, 2020 1,841,255 2,559,667 3,391,905 16,022,131 23,814,958
% 7.7 10.8 14.2 67.3 100.0
Total on December 31, 2019 723,873 2,694,394 3,288,118 15,764,959 22,471,344
% 3.2 12.0 14.6 70.2 100.0
(1) Onlendings consist of funds borrowed for local onlending, in which we borrow from Brazilian governmental agencies and entities to make loans to
Brazilian entities for investments in facilities, equipment and farming, among others.

147
d) Borrowing and on-lending expenses
R$ thousand
2nd semester Accrued on December 31
2020 2020 2019
Borrowing:
- In Brazil 1,982,268 1,994,411 629,183
- Overseas (2,081,723) 24,856,729 4,507,431
- Exchange variation from other assets and liabilities overseas 1,327,056 (15,965,826) (1,999,358)
Subtotal borrowing 1,227,601 10,885,314 3,137,256
On-lending in Brazil:
- BNDES 398,481 691,812 746,680
- FINAME 343,856 794,332 761,889
- National Treasury 2,261 4,702 4,654
- Other institutions 3 5 94
On-lending overseas:
Payables to foreign bankers (Note 11a) 239,094 5,122,684 2,018,481
Subtotal on-lending 983,695 6,613,535 3,531,798
Total 2,211,296 17,498,849 6,669,054
e) Cost for market funding and inflation and interest adjustments of technical provisions for insurance, pension plans and capitalization bonds
R$ thousand
2nd semester Accrued on December 31
2020 2020 2019
Savings deposits 1,301,347 3,049,149 4,568,663
Time deposits 2,471,846 5,634,342 7,694,570
Securities sold under agreements to repurchase 3,179,638 8,217,902 11,571,365
Securities issued (Note 18a) 1,729,501 5,576,416 9,541,792
Subordinated debts (Note 19b) 1,061,332 2,403,327 3,708,924
Other funding expenses 357,936 791,107 768,477
Subtotal - Securities purchased under agreements to resell 10,101,600 25,672,243 37,853,791
Cost for inflation and interest adjustment of technical provisions of insurance, pension plans and capitalization bonds
9,276,135 18,344,005 16,930,146
Total 19,377,735 44,016,248 54,783,937
(1) Comprises the balance of Financial income from insurance, pension plans and capitalization bonds (Note 9f III).
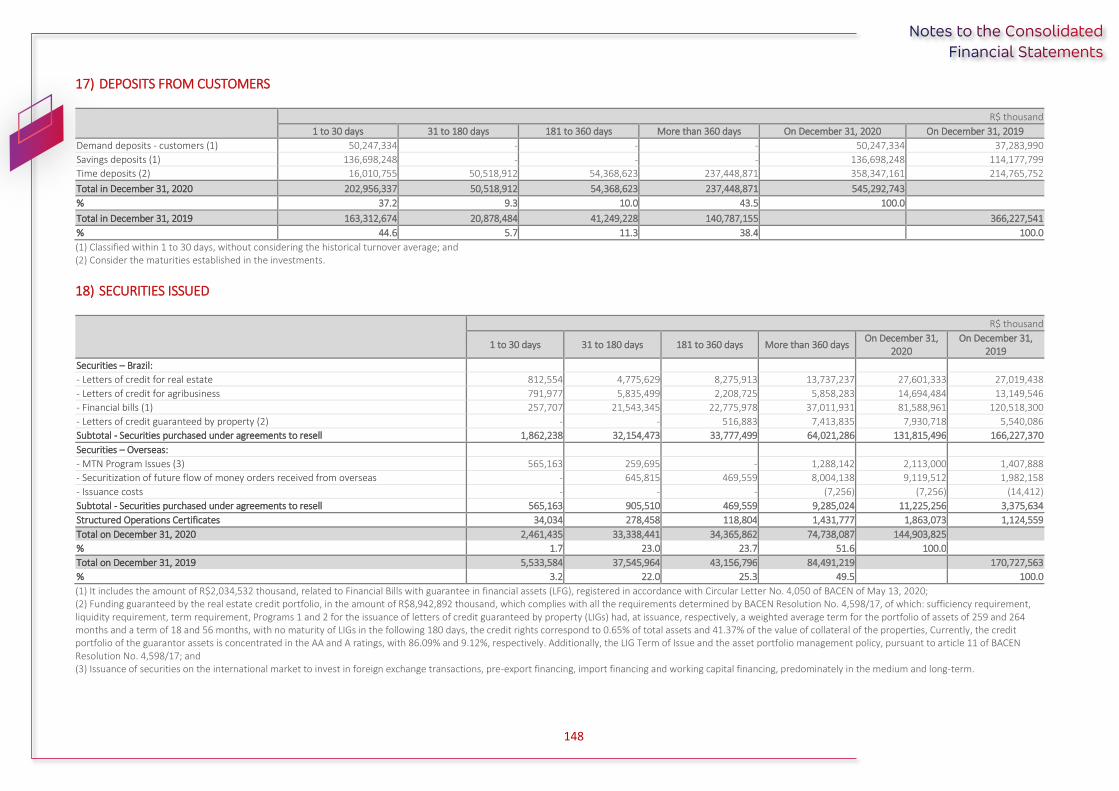
148
17) DEPOSITS FROM CUSTOMERS
R$ thousand
1 to 30 days 31 to 180 days 181 to 360 days More than 360 days On December 31, 2020 On December 31, 2019
Demand deposits - customers (1) 50,247,334 - - - 50,247,334 37,283,990
Savings deposits (1) 136,698,248 - - - 136,698,248 114,177,799
Time deposits (2) 16,010,755 50,518,912 54,368,623 237,448,871 358,347,161 214,765,752
Total in December 31, 2020 202,956,337 50,518,912 54,368,623 237,448,871 545,292,743
% 37.2 9.3 10.0 43.5 100.0
Total in December 31, 2019 163,312,674 20,878,484 41,249,228 140,787,155 366,227,541
% 44.6 5.7 11.3 38.4 100.0
(1) Classified within 1 to 30 days, without considering the historical turnover average; and (2) Consider the maturities established in the investments.
18) SECURITIES ISSUED
R$ thousand
1 to 30 days 31 to 180 days 181 to 360 days More than 360 days On December 31,
2020 On December 31,
2019
Securities – Brazil:
- Letters of credit for real estate 812,554 4,775,629 8,275,913 13,737,237 27,601,333 27,019,438
- Letters of credit for agribusiness 791,977 5,835,499 2,208,725 5,858,283 14,694,484 13,149,546
- Financial bills (1) 257,707 21,543,345 22,775,978 37,011,931 81,588,961 120,518,300
- Letters of credit guaranteed by property (2) - - 516,883 7,413,835 7,930,718 5,540,086
Subtotal - Securities purchased under agreements to resell 1,862,238 32,154,473 33,777,499 64,021,286 131,815,496 166,227,370
Securities – Overseas:
- MTN Program Issues (3) 565,163 259,695 - 1,288,142 2,113,000 1,407,888
- Securitization of future flow of money orders received from overseas - 645,815 469,559 8,004,138 9,119,512 1,982,158
- Issuance costs - - - (7,256) (7,256) (14,412)
Subtotal - Securities purchased under agreements to resell 565,163 905,510 469,559 9,285,024 11,225,256 3,375,634
Structured Operations Certificates 34,034 278,458 118,804 1,431,777 1,863,073 1,124,559
Total on December 31, 2020 2,461,435 33,338,441 34,365,862 74,738,087 144,903,825
% 1.7 23.0 23.7 51.6 100.0
Total on December 31, 2019 5,533,584 37,545,964 43,156,796 84,491,219 170,727,563
% 3.2 22.0 25.3 49.5 100.0
(1) It includes the amount of R$2,034,532 thousand, related to Financial Bills with guarantee in financial assets (LFG), registered in accordance with Circular Letter No. 4,050 of BACEN of May 13, 2020; (2) Funding guaranteed by the real estate credit portfolio, in the amount of R$8,942,892 thousand, which complies with all the requirements determined by BACEN Resolution No. 4,598/17, of which: sufficiency requirement, liquidity requirement, term requirement, Programs 1 and 2 for the issuance of letters of credit guaranteed by property (LIGs) had, at issuance, respectively, a weighted average term for the portfolio of assets of 259 and 264 months and a term of 18 and 56 months, with no maturity of LIGs in the following 180 days, the credit rights correspond to 0.65% of total assets and 41.37% of the value of collateral of the properties, Currently, the credit portfolio of the guarantor assets is concentrated in the AA and A ratings, with 86.09% and 9.12%, respectively. Additionally, the LIG Term of Issue and the asset portfolio management policy, pursuant to article 11 of BACEN Resolution No. 4,598/17; and (3) Issuance of securities on the international market to invest in foreign exchange transactions, pre-export financing, import financing and working capital financing, predominately in the medium and long-term.

149
a) Movement of funds from securities issued
R$ thousand
2020 2019
Opening balance on exercise 170,727,563 147,720,730
Issuance 61,833,816 84,982,152
Interest 5,576,416 9,541,792
Settlement and interest payments (93,179,856) (71,781,695)
Exchange variation (54,114) 264,584
Closing balance on December 31 144,903,825 170,727,563
19) SUBORDINATED DEBT
a) Composition by maturity
R$ thousand
Original term in years
Nominal amount On December 31,
2020 On December 31,
2019
In Brazil
Financial bills:
2020 7 - - 3,288
2022 7 4,305,011 6,662,957 6,426,671
2023 7 1,347,452 2,011,986 1,958,936
2024 7 67,450 93,765 87,316
2025 7 5,425,906 6,126,601 5,943,283
2027 7 401,060 403,352 -
2020 8 - - 64,624
2021 8 1,236 2,565 2,364
2023 8 1,699,346 2,798,899 2,671,282
2024 8 136,695 196,932 186,376
2025 8 6,193,653 6,340,117 6,424,128
2026 8 694,800 783,605 952,807
2028 8 55,437 55,702 -
2021 9 7,000 15,460 14,999
2024 9 4,924 9,347 8,375
2025 9 370,344 507,771 525,232
2027 9 89,700 104,782 159,920
2021 10 19,200 56,608 49,621
2022 10 54,143 128,910 118,117
2023 10 688,064 1,318,725 1,225,020
2025 10 284,137 596,797 518,242
2026 10 196,196 329,699 523,687
2027 10 256,243 338,894 319,582
2028 10 248,300 308,959 282,192
2030 10 134,500 139,596 -
2026 11 3,400 5,477 5,009
2027 11 47,046 65,771 62,776
2028 11 74,764 100,369 91,899
Perpetual 9,290,255 9,389,642 9,559,967
Subtotal in Brazil 38,893,288 38,185,713
Overseas:
2021 11 8,314,720 8,539,366 6,619,620
2022 11 5,716,370 5,822,747 4,512,729
Issuance costs on funding (9,169) (4,554)
Subtotal overseas 14,352,944 11,127,795
Total (1) (2) 53,246,232 49,313,508
(1) It includes the amount of R$26,741,610 thousand (R$34,003,704 thousand in December, 2019), refers to subordinated debts recognized as
“Eligible Debt Capital Instruments” for regulatory capital purpose – see note 34b; and
(2) The information on results is presented on Note 16e, cost for market funding and inflation and interest adjustments of technical provisions for insurance, pension plans and capitalization bonds.
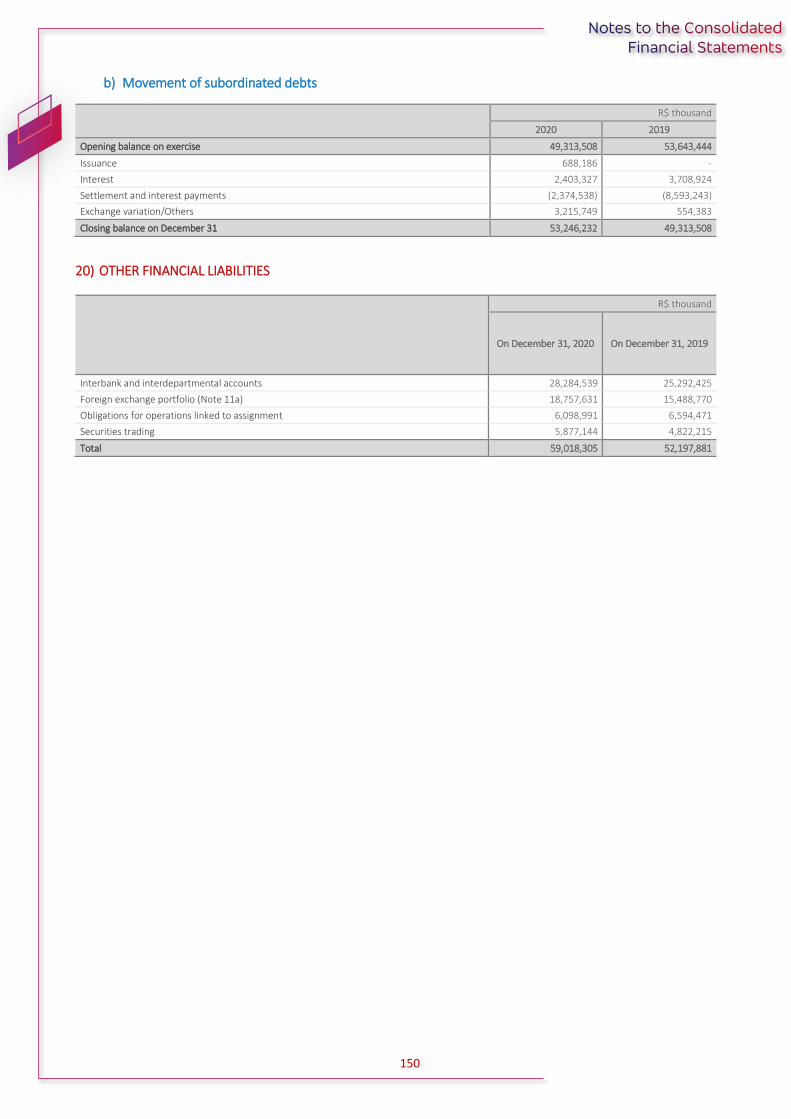
150
b) Movement of subordinated debts
R$ thousand
2020 2019
Opening balance on exercise 49,313,508 53,643,444
Issuance 688,186 -
Interest 2,403,327 3,708,924
Settlement and interest payments (2,374,538) (8,593,243)
Exchange variation/Others 3,215,749 554,383
Closing balance on December 31 53,246,232 49,313,508
20) OTHER FINANCIAL LIABILITIES
R$ thousand
On December 31, 2020 On December 31, 2019
Interbank and interdepartmental accounts 28,284,539 25,292,425
Foreign exchange portfolio (Note 11a) 18,757,631 15,488,770
Obligations for operations linked to assignment 6,098,991 6,594,471
Securities trading 5,877,144 4,822,215
Total 59,018,305 52,197,881

151
21) PROVISIONS
a) Insurance, Pension Plans and Capitalization Bonds
I) Technical provisions by account
R$ thousand
Insurance (1) Life and pension plans (2) Capitalization bonds Total
On December 31, 2020
On December 31, 2019
On December 31, 2020
On December 31, 2019
On December 31, 2020
On December 31, 2019
On December 31, 2020
On December 31, 2019
Current and long-term liabilities
Mathematical reserve for unvested benefits (PMBAC) 1,225,279 1,462,699 237,436,250 230,996,998 - - 238,661,529 232,459,697
Mathematical reserve for vested benefits (PMBC) 612,835 410,410 10,403,722 8,895,571 - - 11,016,557 9,305,981
Mathematical reserve for capitalization bonds (PMC) - - - - 7,430,426 7,747,565 7,430,426 7,747,565
Reserve for claims incurred but not reported (IBNR) 4,040,072 3,710,734 945,744 883,283 - - 4,985,816 4,594,017
Unearned premium reserve 4,381,913 4,472,988 1,719,098 1,024,185 - - 6,101,011 5,497,173
Reserve for unsettled claims (PSL) 4,893,477 4,584,475 1,677,216 1,381,709 - - 6,570,693 5,966,184
Reserve for financial surplus (PET) - - 783,786 622,703 - - 783,786 622,703
Reserve for draws (PSR) and Reserve for redemptions (PR) - - - - 1,053,215 999,888 1,053,215 999,888
Other reserves 3,136,012 2,045,713 4,780,007 5,435,638 87,278 90,317 8,003,297 7,571,668
Total technical provisions 18,289,588 16,687,019 257,745,823 249,240,087 8,570,919 8,837,770 284,606,330 274,764,876

152
II) Guarantees for technical provisions – minimum and actual values
R$ thousand
Insurance Life and pension plans Capitalization bonds Total
On December 31,
2020 On December 31,
2019 On December 31,
2020 On December 31,
2019 On December 31,
2020 On December 31,
2019 On December 31,
2020 On December 31,
2019
Total technical provisions 18,289,588 16,687,019 257,745,823 249,240,087 8,570,919 8,837,770 284,606,330 274,764,876
(+) Monetary effect on the preparation of LAT (3) - - 2,700,356 2,071,111 - - 2,700,356 2,071,111
(-) Commercialization surcharge – extended warranty - (10,051) - - - - - (10,051)
(-) Portion corresponding to contracted reinsurance (21,617) (110,759) (13,114) (11,713) - - (34,731) (122,472)
(-) Premiums receivables (1,502,349) (1,166,691) - - - - (1,502,349) (1,166,691)
(-) Unearned premium reserve – Health and dental insurance (4) (1,656,290) (1,527,337) - - - - (1,656,290) (1,527,337)
(-) Provisions from DPVAT agreements - (558,021) - - - - - (558,021)
Technical provisions to be covered 15,109,332 13,314,160 260,433,065 251,299,485 8,570,919 8,837,770 284,113,316 273,451,415
Investment fund quotas (VGBL and PGBL) - - 211,617,915 210,044,616 - - 211,617,915 210,044,616
Investment fund quotas (excluding VGBL and PGBL) 4,367,527 4,477,721 29,465,654 27,689,439 785,435 1,401,076 34,618,616 33,568,236
Government securities 13,470,796 11,326,945 29,871,219 24,422,182 8,652,529 8,131,854 51,994,544 43,880,981
Private securities 34,580 34,403 79,114 138,043 - - 113,694 172,446
Total assets held to guarantee technical provisions 17,872,903 15,839,069 271,033,902 262,294,280 9,437,964 9,532,930 298,344,769 287,666,279
(1) “Other reserves” - Insurance includes the Provision for Insufficient Premiums (PIP) of R$3,044,169 thousand and the Reserve for Related Expenses of R$78,673 thousand; (2) “Other reserves” - Life and Pension Plan mainly includes the “Reserve for redemption and other amounts to be settled” in the amount of R$2,822,392 thousand, “Reserve for related expenses” of R$633,768 thousand and "Other technical provisions" of R$1,305,127 thousand; (3) The result of the liability adequacy test, carried out for the base date of December 31, 2020, presented a total shortfall of R$2,700,356 thousand that was fully offset by the portion corresponding to the difference between the market value and the value accounting of securities linked to guarantee of technical provisions classified in the category “held to maturity”, as required by Circular SUSEP No. 517/15 and subsequent amendments. As a result, there was no need to recognize a supplementary provision for coverage on the base date. According to Electronic Circular Letter No. 4/2019/SUSEP/DIR4/CGMOP, the Term Structure of Interest Rates (ETTJ) methodology would be reviewed by SUSEP during 2020, including, among others, the revision of the extrapolation methodology (“ Ultimate Forward Rate ”- UFR) and revision of the IGPM curve (given the low liquidity of available assets). Until SUSEP's assessment is completed, it determined the disclosure of the quantitative impact on Shareholders' Equity and Income if the ETTJ prepared by SUSEP was used. The insufficiency of TAP, if determined considering the ETTJ prepared by SUSEP, on December 31, 2020, would be R$2,836,943 thousand, which would also be fully offset by the portion corresponding to the difference between the market value and the book value of the securities linked to guarantee of technical provisions classified in the category “held to maturity”. Additionally, the impact on the result and Shareholders' Equity, originated from the Provision for Related Expenses (PDR), if the ETTJ prepared by SUSEP is used, would be R$13,877 thousand, net of taxes; and (4) Deduction set forth in Article 4 of ANS Normative Resolution No. 392/15.

153
III) Insurance, pension plan contribution and capitalization bond retained premiums
R$ thousand
2nd semester Accrued on December 31
2020 2020 2019
Written premiums 21,828,995 42,469,074 41,870,927
Pension plan contributions (including VGBL) 13,930,251 26,118,492 29,518,768
Capitalization bond income 2,591,485 5,257,125 6,407,861
Granted coinsurance premiums (31,541) (66,647) (50,429)
Refunded premiums (14,424) (41,070) (78,938)
Net written premiums earned 38,304,766 73,736,974 77,668,189
Reinsurance premiums paid (56,278) (69,347) (68,919)
Insurance, pension plan and capitalization bond retained premiums 38,248,488 73,667,627 77,599,270
Changes in technical provisions for insurance, pension plans and capitalization bonds (16,298,169) (29,980,091) (31,883,730)
Capitalization bond prize draws and redemptions (2,326,350) (4,709,311) (5,676,964)
Retained claims (15,054,676) (27,717,828) (27,796,354)
Insurance, pension plan and capitalization expenses (1,601,658) (3,161,655) (3,280,097)
Other income from insurance, pension plans and capitalization bonds 2,967,635 8,098,742 8,962,125
b) Other reserves
R$ thousand
On December 31, 2020 On December 31, 2019
Provision for contingencies (Note 22) 24,254,031 24,421,945
Provision for Financial guarantees provided (I) 2,219,444 1,972,008
Other 9,205,601 9,990,442
Total 35,679,076 36,384,395
I) Financial guarantees
Financial guarantees provided are contracts requiring the Organization to make specific payments to the holder of the financial guarantee for a loss it will incur when a specific debtor fails to make the payment under the terms of the debt instrument. The provision for financial guarantees provided is formed based on the best estimate of the non-recoverable amount of the guarantee, if such disbursement is likely. The provisioning parameters are established based on the internal credit risk management models. In the case of retail operations, quantitative models are adopted, while in wholesale the combination of quantitative models with individualized analyzes is adopted.
R$ thousand
On December 31, 2020 On December 31, 2019
Guaranteed Values
Provisions Guaranteed
Values Provisions
Sureties and guarantees in judicial and administrative proceedings of a fiscal nature 36,166,993 (856,200) 37,696,763 (848,477)
Bank sureties 43,056,285 (1,353,020) 39,593,792 (1,099,140)
Others 1,013,324 (10,224) 940,590 (24,391)
Total 80,236,602 (2,219,444) 78,231,145 (1,972,008)

154
22) PROVISIONS, CONTINGENT ASSETS AND LIABILITIES AND LEGAL OBLIGATIONS – TAX AND SOCIAL SECURITY
a) Contingent assets
Contingent assets are not recognized in the consolidated financial statements. However, there are ongoing proceedings where the chance of success is considered probable, such as: a) Social Integration Program (PIS), Bradesco has made a claim to offset PIS against Gross Operating Income, paid under Decree-Laws No. 2,445/88 and No. 2,449/88, regarding the payment that exceeded the amount due under Supplementary Law No. 07/70 (PIS Repique); and b) other taxes, the legality and/or constitutionality of which is being challenged, where the decision may lead to reimbursement of amounts paid.
b) Provisions classified as probable losses and legal obligations – tax and social security
The Organization is a party to a number of labor, civil and tax lawsuits, arising from the normal course of business. Management recognized provisions where, based on their opinion and that of their legal counsel, the nature of the lawsuit, similarity to previous lawsuits, complexity and the courts standing, the loss is deemed probable. Management considers that the provision is sufficient to cover the future losses generated by the respective lawsuits. Provisions related to legal obligations are maintained until the conclusion of the lawsuit, represented by judicial decisions with no further appeals or due to the statute of limitation.
I - Labor claims
These are claims brought by former employees and outsourced employees seeking indemnifications, most significantly for unpaid “overtime”, pursuant to Article 224 of the Consolidation of Labor Laws (CLT). Considering that labor lawsuits have similar characteristics, the provision is recognized considering the following factors, among others: date of receipt of the proceedings (before or after the labor reform of November 2017), the average calculated value of payments made for labor complaints settled in the past 12 months before and after the labor reform, and inflation adjustment on the average calculated values. Overtime is monitored by using electronic time cards and paid regularly during the employment contract, so that the claims filed by Bradesco’s former employees do not represent individually relevant amounts.
II - Civil claims
These are claims for pain and suffering and property damages, related to banking products and services, the inclusion of information about debtors in the credit restriction registry and the replacement of inflation adjustments excluded as a result of government economic plans. These lawsuits are individually controlled using a computer-based system and provisioned whenever the loss is deemed as probable, considering the opinion of the legal advisors, the nature of the lawsuits, similarity with previous lawsuits, complexity and positioning of the courts. Most of these lawsuits involve the Special Civil Court (JEC), in which the claims are limited to 40 minimum wages. In relation to the legal claims that are pleading alleged differences in the adjustment of inflation on savings account balances and due to the implementation of economic plans that were part of the federal government’s economic policy to reduce inflation in the 80s and 90s, Bradesco, despite complying with the law and regulation in force at the time, has provisioned certain proceedings, taking

155
into consideration the claims in which they were mentioned and the perspective of loss of each demand, in view of the decisions and subjects still under analysis in the Superior Court of Justice (STJ), such as, for example, the application of default interest in executions arising from Public Civil Actions, interest payments and succession. In December 2017, with the mediation of the Attorney’s General Office (AGU), the entities representing the bank and the savings accounts, entered into an agreement related to litigation of economic plans, with the purpose of closing these claims, in which conditions and schedule were established for savings accounts holders to accede to the agreement. This agreement was approved by the Federal Supreme Court (STF) on March 1, 2018. On March 11, 2020, the signatory entities signed an amendment extending the collective agreement for a period of 5 (five) years, the Federal Supreme Court approved the extension of the agreement for 30 months, an opportunity in which it will evaluate the results and may extend it for another 30 months. As this is a voluntary agreement, Bradesco is unable to predict how many savings account holders will choose to accept the settlement offer. It is important to note that Bradesco understands that the provisioning was made to cover the eligible proceedings to the related agreement. The proceedings that are not in the scope of the agreement, including those related to merged banks are individually assessed based on the procedural stage they are in. Note that, regarding disputes relating to economic plans, the Federal Supreme Court (STF) suspended the prosecution of all lawsuits at the cognizance stage, until the Court issues a final decision on the right under litigation.
III - Provision for tax risks
The Organization has been discussing judicially the legality and constitutionality of certain taxes and contributions in court, for which provisions have been recognized in full, although there is a good chance of a favorable outcome, based on the opinion of Management and their legal counsel. The processing of these provisions for cases for which the risk of loss is deemed as probable and legal obligations is regularly monitored in the legal court. During or after the conclusion of each case, a favorable outcome may arise for the Organization, resulting in the reversal of the related provisions. The main cases are:
- PIS and Cofins - R$2,702,641 thousand (R$2,632,829 thousand on December 31, 2019): claims to
calculate and collect contributions to PIS and Cofins only on the sale of goods/rendering of services (billing), excluding financial income from the calculation base;
- Pension Contributions – R$1,785,787 thousand (R$1,799,047 thousand on December 31, 2019):
official notifications related to the pension contributions made to private pension plans, considered by the authorities to be employee compensation subject to the incidence of mandatory pension contributions and to an isolated fine for not withholding IRRF on such financial contributions;
- IRPJ/CSLL on losses of credits – R$1,262,225 thousand (R$1,264,448 thousand on December 31,
2019): we are requesting to deduct from income tax and social contributions payable (IRPJ and CSLL, respectively) amounts of actual and definite loan losses related to unconditional discounts granted during collections, regardless of compliance with the terms and conditions provided for in Articles 9 to 14 of Law No. 9,430/96 that only apply to temporary losses;
- IRPJ/CSLL on MTM - R$635,802 thousand (R$626,341 thousand on December 31, 2019):
assessment received in December 2018 challenging the deduction of certain mark-to-market gains from securities in the calculation of IRPJ and CSLL in 2007;
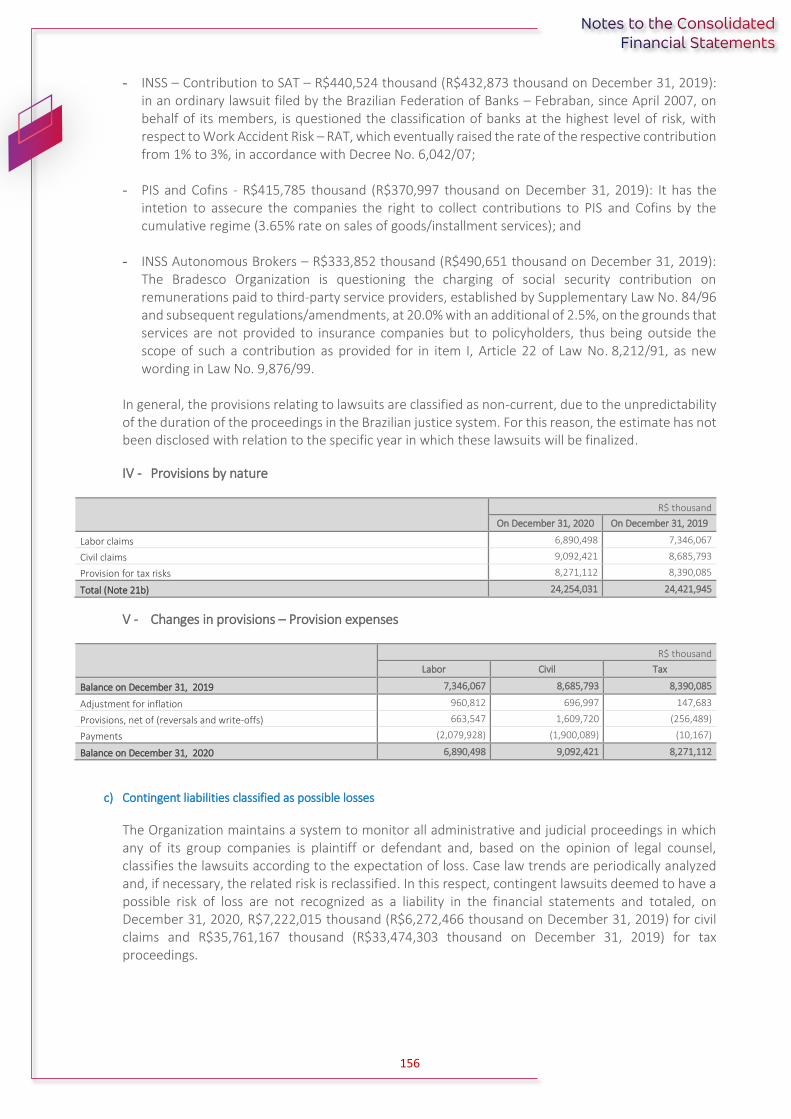
156
- INSS – Contribution to SAT – R$440,524 thousand (R$432,873 thousand on December 31, 2019): in an ordinary lawsuit filed by the Brazilian Federation of Banks – Febraban, since April 2007, on behalf of its members, is questioned the classification of banks at the highest level of risk, with respect to Work Accident Risk – RAT, which eventually raised the rate of the respective contribution from 1% to 3%, in accordance with Decree No. 6,042/07;
- PIS and Cofins - R$415,785 thousand (R$370,997 thousand on December 31, 2019): It has the
intetion to assecure the companies the right to collect contributions to PIS and Cofins by the cumulative regime (3.65% rate on sales of goods/installment services); and
- INSS Autonomous Brokers – R$333,852 thousand (R$490,651 thousand on December 31, 2019):
The Bradesco Organization is questioning the charging of social security contribution on remunerations paid to third-party service providers, established by Supplementary Law No. 84/96 and subsequent regulations/amendments, at 20.0% with an additional of 2.5%, on the grounds that services are not provided to insurance companies but to policyholders, thus being outside the scope of such a contribution as provided for in item I, Article 22 of Law No. 8,212/91, as new wording in Law No. 9,876/99.
In general, the provisions relating to lawsuits are classified as non-current, due to the unpredictability of the duration of the proceedings in the Brazilian justice system. For this reason, the estimate has not been disclosed with relation to the specific year in which these lawsuits will be finalized.
IV - Provisions by nature
R$ thousand
On December 31, 2020 On December 31, 2019
Labor claims 6,890,498 7,346,067
Civil claims 9,092,421 8,685,793
Provision for tax risks 8,271,112 8,390,085
Total (Note 21b) 24,254,031 24,421,945
V - Changes in provisions – Provision expenses
R$ thousand
Labor Civil Tax
Balance on December 31, 2019 7,346,067 8,685,793 8,390,085
Adjustment for inflation 960,812 696,997 147,683
Provisions, net of (reversals and write-offs) 663,547 1,609,720 (256,489)
Payments (2,079,928) (1,900,089) (10,167)
Balance on December 31, 2020 6,890,498 9,092,421 8,271,112
c) Contingent liabilities classified as possible losses
The Organization maintains a system to monitor all administrative and judicial proceedings in which any of its group companies is plaintiff or defendant and, based on the opinion of legal counsel, classifies the lawsuits according to the expectation of loss. Case law trends are periodically analyzed and, if necessary, the related risk is reclassified. In this respect, contingent lawsuits deemed to have a possible risk of loss are not recognized as a liability in the financial statements and totaled, on December 31, 2020, R$7,222,015 thousand (R$6,272,466 thousand on December 31, 2019) for civil claims and R$35,761,167 thousand (R$33,474,303 thousand on December 31, 2019) for tax proceedings.

157
The main tax proceedings with this classification are:
- IRPJ and CSLL deficiency note – 2013 to 2015 – R$9,431,944 thousand (R$9,216,012 thousand on December 31, 2019): due to the disallowance of interest expenses (CDI), related to certain investments and deposits between the companies of the Organization;
- IRPJ and CSLL – 2006 to 2017 – R$7,251,952 thousand (R$7,169,765 thousand on December 31, 2019), relating to goodwill amortization being disallowed on the acquisition of investments;
- COFINS – 1999 to 2005 – R$5,354,315 thousand (R$5,172,183 thousand on December 31, 2019): Fines and disallowances of Cofins loan compensations, released after a favorable decision in a judicial proceeding, where the unconstitutionality of the expansion of the intended calculation base was discussed for revenues other than those from billing (Law No. 9,718/98);
- Leasing companies’ Tax on Services of any Nature (ISSQN), R$2,485,745 thousand (R$2,537,997 thousand on December 31, 2019) which relates to the municipal tax demands from municipalities other than those in which the company is located and where, under law, tax is collected;
- Social Security Contribution Taxes – 2014 to 2016 – R$2,079,650 thousand (R$1,268,227
thousand on December 31, 2019): related to food and meal allowance made available to employees, according to the Worker's Food Program – PAT, through card and not "in natura";
- PIS and COFINS notifications and disallowances of compensations – R$1,444,586 thousand (R$1,490,269 thousand on December 31, 2019): related to the unconstitutional extension of the basis of calculation intended for other income other than the billing (Law No. 9,718/98), from acquired companies;
- IRPJ and CSLL deficiency note – 2000 to 2014 – R$848,605 thousand (R$1,187,411 thousand on December 31, 2019): relating to disallowance of exclusions and expenses, differences in depreciation expenses, insufficient depreciation expenses, expenses with depreciation of leased assets, operating expenses and income and disallowance of tax loss compensation;
- IRPJ and CSLL deficiency note – 2005 to 2013 – R$834,272 thousand (R$925,806 thousand on
December 31, 2019): relating to disallowance of expenses with credit losses;
- IRPJ and CSLL deficiency note – 2008 to 2013 – R$649,441 thousand (R$608,860 thousand on December 31, 2019): relating to profit of subsidiaries based overseas; and
- PLR - Profit Sharing - Base years from 2009 to 2011 - R$463,501 thousand (R$401,417 thousand in December 31, 2019): assessments for the social security contribution on amounts paid to employees as profit sharing, for alleged failure to comply with the rules contained in Law No. 10,101/00.

158
d) Other matters
Due to the so-called “Operação Zelotes” (“Zealots Operation”), which investigates the alleged improper performance of members of CARF – Administrative Council of Tax Appeals, a criminal proceeding against two former members of Bradesco’s Board of Executive Officers was opened in 2016 and received by the 10th Federal Court of Judicial Section of the Federal District. The investigation phase of the process was already completed, and is currently waiting for the decision of the first-degree court. The Company's Management conducted an internal evaluation of records and documents related to the matter and found no evidence of any illegal conduct practiced by its former representatives, Bradesco provided all of the information to the authorities and competent regulatory bodies, both in Brazil and abroad. As a result of the news about the Operação Zelotes, a Class Action was filed against Bradesco and members of its Board of Executive Officers before the District Court of New York (“Court”), on June 3, 2016, based on Sections 10 (b) and 20 (a) of the Securities Exchange Act of 1934. On July 1, 2019, Bradesco and the Lead Plaintiff made an agreement (“Agreement”) to terminate the Class Action, with the payment of US$14,5 million by Bradesco. The Agreement was finally approved by the Court on November 18, 2019 and the case was closed in relation to Bradesco and to the members of its Executive Board of Directors. The Agreement made does not represent the recognition of guilt or admission of liability by Bradesco, but its intent is to avoid uncertainties, costs and onus related to the progression of the Class Action. Also, as a result of Operação Zelotes, the Corregedoria Geral do Ministério da Fazenda (General Internal Affairs of the Ministry of Finance) promoted an investigative administrative procedure to verify the need for the establishment of an Administrative Accountability Process ("PAR"). The filing decision of the related procedure was published in Section 2 of the Diário Oficial da União (Federal Official Gazette) on February 3, 2020. The decision given by the Official of the Ministry of Economy accepted in full the Final Report of the Processing Committee, the Opinion of the National Treasury Attorney General's Office and the Joint Order of the General Coordination of Management and Administration, and of the Leadership of the Advisory and Judgment Division, which confirmed, expressly recognizing, the lack of evidence that Bradesco had promised, offered or given, directly or indirectly, an unfair advantage to public agents involved in the related operation, in accordance with the provisions laid down in Article 5, section I, of Law No. 12,846, of 2013.

159
23) OTHER LIABILITIES
R$ thousand
On December 31, 2020 On December 31, 2019
Sundry creditors 5,289,505 5,043,721
Payment of taxes and other contributions 708,886 711,891
Credit card operations 3,337,346 3,612,779
Taxes and contributions payable 3,853,700 4,771,950
Liabilities for acquisition of assets and rights 1,582,134 1,493,329
Social and statutory 3,747,682 933,002
Obligations for quotas of investment funds 2,929,138 1,804,294
Other 8,452,564 6,585,235
Total 29,900,955 24,956,201
24) SHAREHOLDERS’ EQUITY (PARENT COMPANY)
a) Capital stock in number of shares
Fully subscribed and paid-in capital stock comprises non-par, registered, book-entry shares.
On December 31, 2020
On December 31, 2019
Common 4,435,106,575 4,031,915,068
Preferred 4,435,106,111 4,031,914,646
Subtotal - Securities purchased under agreements to resell 8,870,212,686 8,063,829,714
Treasury (common shares) (7,307,259) (6,642,963)
Treasury (preferred shares) (27,378,542) (24,889,584)
Total outstanding shares 8,835,526,885 8,032,297,167
b) Transactions of capital stock involving quantities of shares
Common Preferred Total
Number of outstanding shares as at December 31, 2019 4,025,272,105 4,007,025,062 8,032,297,167
Increase of capital stock with issuing of shares – bonus of 10% (1) 403,191,507 403,191,465 806,382,972
Increase of shares in treasury – bonus of 10% (664,296) (2,488,958) (3,153,254)
Number of outstanding shares as at December 31, 2020 4,427,799,316 4,407,727,569 8,835,526,885
(1) It benefited the shareholders registered in the records of Bradesco on April 13, 2020.
In the Special Shareholders’ Meeting of March 10, 2020, the approval was proposed by the Board of Directors to increase the capital stock by R$4,000,000 thousand, increasing it from R$75,100,000 thousand to R$79,100,000 thousand, with a bonus in shares, through the capitalization of part of the balance of the account “Profit Reserves - Statutory Reserve”, in compliance with the provisions in Article 169 of Law No. 6,404/76, by issuing 806,382,972 new nominative-book entry shares, with no nominal value, whereby 403,191,507 are common and 403,191,465 are preferred shares, which will be allocated free-of-charge to the shareholders as bonus, to the ratio of 1 new share for every 10 shares of the same type that they own on the base date, and was approved by the Bacen on March 30, 2020.
c) Interest on Shareholders’ Equity/dividends Bradesco’s capital remuneration policy aims to distribute interest on shareholders’ equity at the maximum amount calculated under current legislation, and this is included, net of Withholding Income Tax (IRRF), in the calculation for mandatory dividends for the year under the Company’s Bylaws.

160
At the Board of Directors’ meeting of December 16, 2020, the proposal of the Board of Executive Officers for payment to the shareholders of interest on own capital was approved, for 2020, to the sum of R$3,502,000 thousand, of which R$0.377521225 would be paid per common share and R$0.415273347 per preferred share, whose payment was made on January 7, 2021. Interest on shareholders’ equity/dividends for the year ended in December 31, 2020 is calculated as follows:
R$ thousand % (1)
Net income for the period 16,546,577
(-) Legal reserve 827,328
Adjusted calculation basis 15,719,249
Monthly, intermediaries and supplementary interest on shareholders’ equity (gross), paid and/or provisioned 5,547,971
Withholding income tax on interest on shareholders' equity (832,196)
Interest on Shareholders’ Equity (net) accumulated in December 31, 2020 4,715,775 30.00
Interest on shareholders' equity (net) and total dividends accumulated in December 31, 2019 14,757,847 68.79
(1) Percentage of interest on shareholders’ equity/dividends after adjustments. The total percentage of net distribution in 2019 considers the payment of extraordinary dividends in the amount of R$8 billion, which occurred on October 23, 2019, using part of the balance of the account “Profit Reserve - Statutory.
Interest on shareholders’ equity/dividends were paid or recognized in provisions, as follows:
Description
R$ thousand
Per share (gross) Gross amount paid
Withholding Income Tax (IRRF) (15%)
Net amount paid Common Preferred
Monthly interest on shareholders’ equity paid 0.206998 0.227698 1,672,858 250,929 1,421,929
Intermediary interest on shareholders’ equity paid 0.172536 0.189790 1,455,000 218,250 1,236,750
Supplementary interest on shareholders´ equity paid 0.503380 0.553718 4,245,000 636,750 3,608,250
Extraordinary dividends paid 0.948654 1.043520 8,000,000 - 8,000,000
Supplementary dividends paid 0.058214 0.064035 490,918 - 490,918
Total accrued on December 31, 2019 1.889782 2.078761 15,863,776 1,105,929 14,757,847
Monthly interest on shareholders’ equity paid 0.206998 0.227698 1,861,951 279,293 1,582,658
Supplementary interest on shareholders´ equity paid (1) 0.377521 0.415273 3,502,000 525,300 2,976,700
Supplementary interest on shareholders’ equity provisioned 0.019838 0.021821 184,020 27,603 156,417
Total accrued on December 31, 2020 0.604357 0.664792 5,547,971 832,196 4,715,775
(1) Paid on January 7, 2021.
d) Treasury shares As of December 31, 2020, Bradesco held in treasury 7,307,259 common shares and 27,378,542 preferred shares for a total amount of R$440,514 thousand. The minimum, average and maximum cost per common share is R$19,34, R$24,55 and R$27,14, and per preferred share is R$19,37, R$26,98 and R$33,12, respectively. The fair value was R$24,20 per common share and R$27,14 per preferred share on December 31, 2020.
25) NON-CONTROLLING INTERESTS IN SUBSIDIARIES As of December 31, 2020, the balance of minority interests in subsidiaries was R$759,241 thousand (R$709,791 thousand on December 31, 2019), after the total acquisition of minority interest in Banco Bradesco BBI, in January 2020 The balance of minority interest in subsidiaries is now basically represented by Odontoprev.
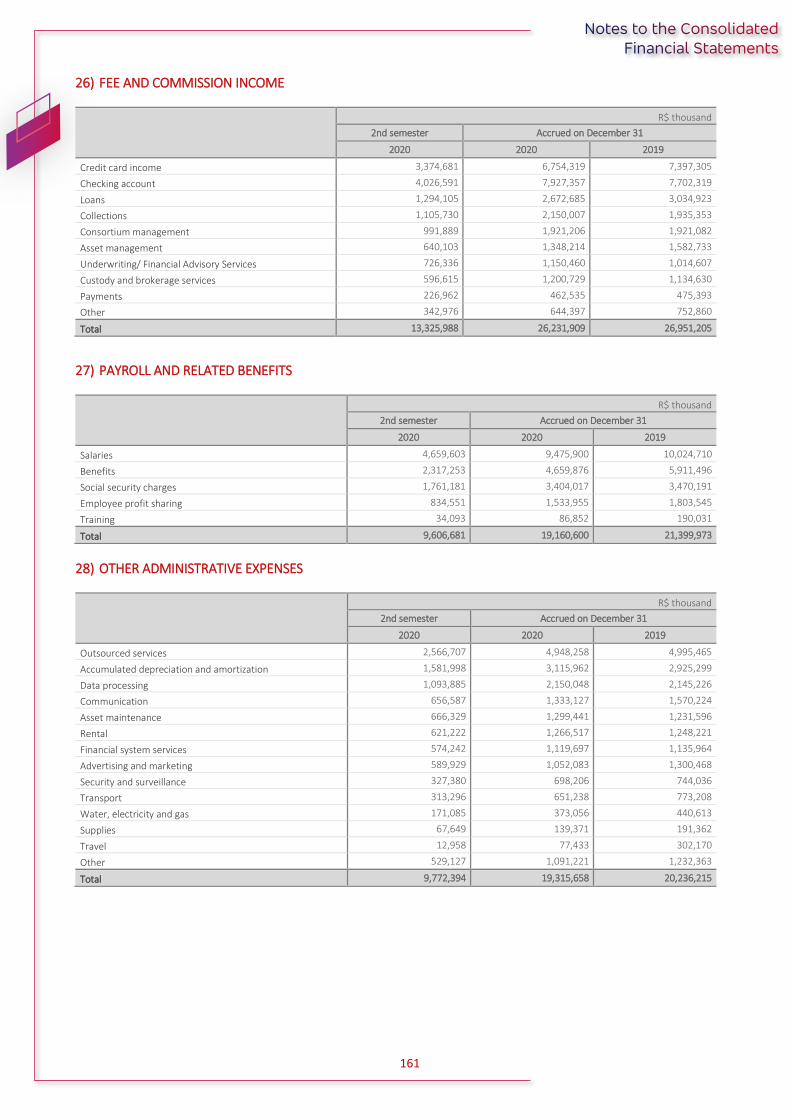
161
26) FEE AND COMMISSION INCOME
R$ thousand
2nd semester Accrued on December 31
2020 2020 2019
Credit card income 3,374,681 6,754,319 7,397,305
Checking account 4,026,591 7,927,357 7,702,319
Loans 1,294,105 2,672,685 3,034,923
Collections 1,105,730 2,150,007 1,935,353
Consortium management 991,889 1,921,206 1,921,082
Asset management 640,103 1,348,214 1,582,733
Underwriting/ Financial Advisory Services 726,336 1,150,460 1,014,607
Custody and brokerage services 596,615 1,200,729 1,134,630
Payments 226,962 462,535 475,393
Other 342,976 644,397 752,860
Total 13,325,988 26,231,909 26,951,205
27) PAYROLL AND RELATED BENEFITS
R$ thousand
2nd semester Accrued on December 31
2020 2020 2019
Salaries 4,659,603 9,475,900 10,024,710
Benefits 2,317,253 4,659,876 5,911,496
Social security charges 1,761,181 3,404,017 3,470,191
Employee profit sharing 834,551 1,533,955 1,803,545
Training 34,093 86,852 190,031
Total 9,606,681 19,160,600 21,399,973
28) OTHER ADMINISTRATIVE EXPENSES
R$ thousand
2nd semester Accrued on December 31
2020 2020 2019
Outsourced services 2,566,707 4,948,258 4,995,465
Accumulated depreciation and amortization 1,581,998 3,115,962 2,925,299
Data processing 1,093,885 2,150,048 2,145,226
Communication 656,587 1,333,127 1,570,224
Asset maintenance 666,329 1,299,441 1,231,596
Rental 621,222 1,266,517 1,248,221
Financial system services 574,242 1,119,697 1,135,964
Advertising and marketing 589,929 1,052,083 1,300,468
Security and surveillance 327,380 698,206 744,036
Transport 313,296 651,238 773,208
Water, electricity and gas 171,085 373,056 440,613
Supplies 67,649 139,371 191,362
Travel 12,958 77,433 302,170
Other 529,127 1,091,221 1,232,363
Total 9,772,394 19,315,658 20,236,215
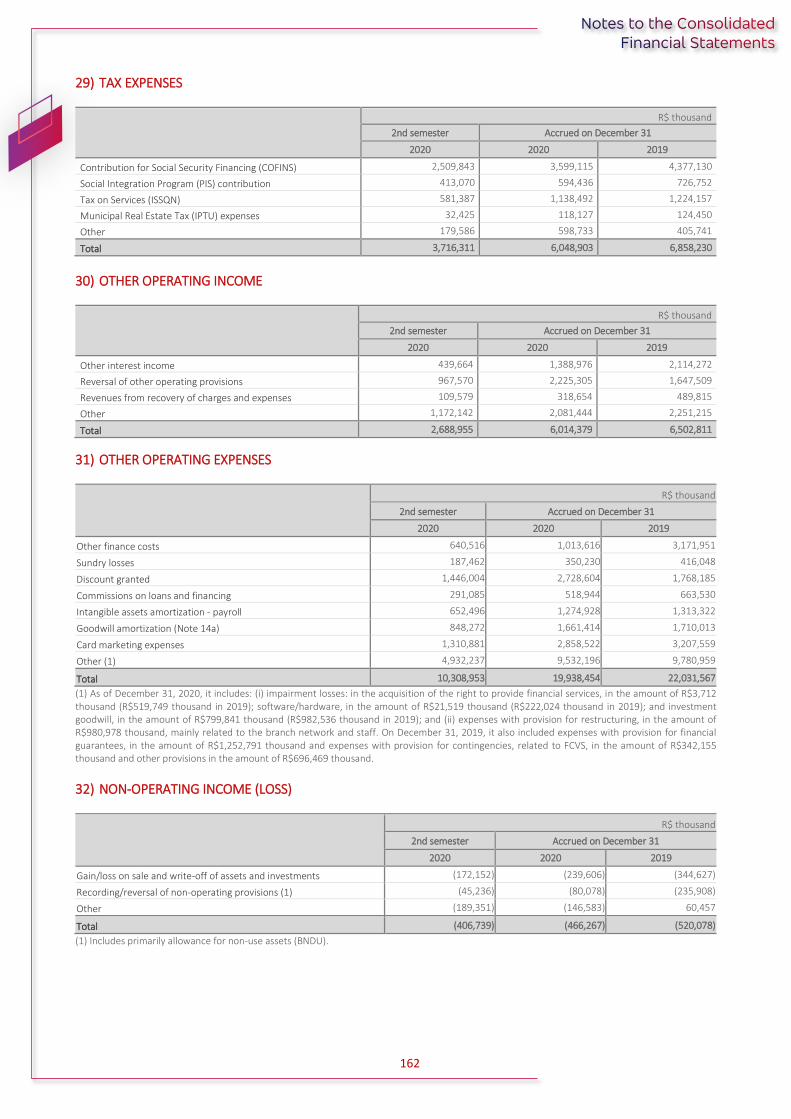
162
29) TAX EXPENSES
R$ thousand
2nd semester Accrued on December 31
2020 2020 2019
Contribution for Social Security Financing (COFINS) 2,509,843 3,599,115 4,377,130
Social Integration Program (PIS) contribution 413,070 594,436 726,752
Tax on Services (ISSQN) 581,387 1,138,492 1,224,157
Municipal Real Estate Tax (IPTU) expenses 32,425 118,127 124,450
Other 179,586 598,733 405,741
Total 3,716,311 6,048,903 6,858,230
30) OTHER OPERATING INCOME
R$ thousand
2nd semester Accrued on December 31
2020 2020 2019
Other interest income 439,664 1,388,976 2,114,272
Reversal of other operating provisions 967,570 2,225,305 1,647,509
Revenues from recovery of charges and expenses 109,579 318,654 489,815
Other 1,172,142 2,081,444 2,251,215
Total 2,688,955 6,014,379 6,502,811
31) OTHER OPERATING EXPENSES
R$ thousand
2nd semester Accrued on December 31
2020 2020 2019
Other finance costs 640,516 1,013,616 3,171,951
Sundry losses 187,462 350,230 416,048
Discount granted 1,446,004 2,728,604 1,768,185
Commissions on loans and financing 291,085 518,944 663,530
Intangible assets amortization - payroll 652,496 1,274,928 1,313,322
Goodwill amortization (Note 14a) 848,272 1,661,414 1,710,013
Card marketing expenses 1,310,881 2,858,522 3,207,559
Other (1) 4,932,237 9,532,196 9,780,959
Total 10,308,953 19,938,454 22,031,567
(1) As of December 31, 2020, it includes: (i) impairment losses: in the acquisition of the right to provide financial services, in the amount of R$3,712 thousand (R$519,749 thousand in 2019); software/hardware, in the amount of R$21,519 thousand (R$222,024 thousand in 2019); and investment goodwill, in the amount of R$799,841 thousand (R$982,536 thousand in 2019); and (ii) expenses with provision for restructuring, in the amount of R$980,978 thousand, mainly related to the branch network and staff. On December 31, 2019, it also included expenses with provision for financial guarantees, in the amount of R$1,252,791 thousand and expenses with provision for contingencies, related to FCVS, in the amount of R$342,155 thousand and other provisions in the amount of R$696,469 thousand.
32) NON-OPERATING INCOME (LOSS)
R$ thousand
2nd semester Accrued on December 31
2020 2020 2019
Gain/loss on sale and write-off of assets and investments (172,152) (239,606) (344,627)
Recording/reversal of non-operating provisions (1) (45,236) (80,078) (235,908)
Other (189,351) (146,583) 60,457
Total (406,739) (466,267) (520,078)
(1) Includes primarily allowance for non-use assets (BNDU).

163
33) RELATED-PARTY TRANSACTIONS
a) Related-party transactions (direct and indirect) are carried out according to CMN Resolution No. 4,636/18 and CVM Resolution No. 642/10. The Organization has a Transaction Policy with related parts disclosed on the Investor Relations website. The transactions are carried out under conditions and at rates consistent with those entered into with third parties at that time. The transactions are as follows:
R$ thousand
Shareholders of the parent (1) Associates and Jointly controlled
companies (2) Key Management Personnel (3) Total
On December 31, 2020
On December 31, 2019
On December 31, 2020
On December 31, 2019
On December 31, 2020
On December 31, 2019
On December 31, 2020
On December 31, 2019
Assets
Interbank investments - - 186,504 577,906 - - 186,504 577,906
Securities and derivative financial instruments 62,326 20,721 649,932 287,849 - - 712,258 308,570
Loans and other assets 16 9 334,746 109,766 119,659 88,750 454,421 198,525
Liabilities
Demand deposits/Savings accounts 164,651 109,767 22,515 39,191 17,685 20,428 204,851 169,386
Time deposits 1,289,430 1,802,883 595,078 2,838,567 126,130 373,047 2,010,638 5,014,497
Securities sold under agreements to repurchase 675,893 225,064 60,246 304,008 - - 736,139 529,072
Funds from issuance of securities and subordinated debts 11,480,275 13,697,802 - - 702,417 891,211 12,182,692 14,589,013
Derivative financial instruments 32,219 - - 7,264 - - 32,219 7,264
Interest on own capital and dividends payable 1,195,928 217,765 - - - - 1,195,928 217,765
Other liabilities - - 10,808,025 11,665,639 18,594 6,735 10,826,619 11,672,374

164
2nd semester of 2020 - R$ thousand
Shareholders of the parent (1)
Associates and Jointly controlled companies (2)
Key Management Personnel (3)
Total
Income from financial intermediation (15,508) 38,520 - 23,012
Financial intermediation expenses (177,219) (18,914) (26,912) (223,045)
Income from services provided 47 70,230 72 70,349
Other expenses net of other operating revenues 30,586 (916,461) 171,329 (714,546)
(1) Cidade de Deus Cia. Coml. de Participações, Fundação Bradesco, NCF Participações S.A., BBD Participações S.A. and Nova Cidade de Deus Participações S.A.; (2) Companies listed in Note 12; and (3) Members of the Board of Directors and the Board of Executive Officers.
Accrued on December 31 - R$ thousand
Shareholders of the parent (1) Associates and Jointly controlled
companies (2) Key Management Personnel (3) Total
2020 2019 2020 2019 2020 2019 2020 2019
Income from financial intermediation 40,506 4,871 62,121 65,625 - - 102,627 70,496
Financial intermediation expenses (488,882) (862,808) (243,875) (72,133) (45,003) (58,353) (777,760) (993,294)
Income from services provided 109 105 98,556 342,793 119 359 98,784 343,257
Other expenses net of other operating revenues 58,434 54,471 (1,644,088) (1,899,818) 89,582 288,187 (1,496,072) (1,557,160)
(1) Cidade de Deus Cia. Coml. de Participações, Fundação Bradesco, NCF Participações S.A., BBD Participações S.A. and Nova Cidade de Deus Participações S.A.; (2) Companies listed in Note 12; and (3) Members of the Board of Directors and the Board of Executive Officers.

165
b) Remuneration of Key Management Personnel Each year, the Annual Shareholders’ Meeting approves:
The annual total amount of Management compensation, set forth at the Board of Directors Meetings, to be paid to board members and members of the Board of Executive Officers, as determined by the Company’s Bylaws; and
The amount allocated to finance Management pension plans, within the Employee and Management pension plan of the Bradesco Organization.
For 2020, the maximum amount of R$871,589 thousand was determined for the remuneration of the Directors, and part of this refers to the social security contribution to the INSS, which is an obligation of the Organization, and R$515,650 thousand to cover supplementary pension plan defined contributions. The current policy on Management compensation sets forth that 50% of net variable compensation, if any, must be allocated to the acquisition of preferred class b shares issued by BBD Participações S.A. and/or preferred shares issued by Banco Bradesco S.A., which vest in three equal, annual and successive installments, the first of which is in the year following the payment date. This procedure complies with CMN Resolution No. 3,921/10, which sets forth a management compensation policy for financial institutions.
Short and medium term remuneration to Managers
R$ thousand
2nd semester Accrued on December 31
2020 2020 2019
Remuneration and Social Security Contribution to the INSS 224,001 534,696 852,862
Total 224,001 534,696 852,862
Post-employment benefits
R$ thousand
2nd semester Accrued on December 31
2020 2020 2019
Defined contribution supplementary pension plans 295,348 513,082 468,079
Total 295,348 513,082 468,079
Bradesco does not offer its Key Management Personnel long-term benefits related to severance pay or share-based compensation, pursuant to CPC 10 – Share-Based Payment, approved by CMN Resolution No. 3,989/11.
Shareholding Together, members of the Board of Directors and Board of Executive Officers had the following shareholding in Bradesco:
Direct shareholding On December 31, 2020 On December 31, 2019
● Common shares 0.53% 0.55%
● Preferred shares 0.91% 1.04%
● Total shares (1) 0.72% 0.79%
(1) On December 31, 2020, direct and indirect shareholding of the members of Bradesco’s Board of Directors and Board of Executive Officers amounted to 2.65% of common shares, 0.95% of preferred shares and 1.80% of all shares (2.48% of common shares, 1.07% of preferred shares and 1.78% of all shares on December 31, 2019).

166
34) RISK AND CAPITAL MANAGEMENT
a) Risk Management
Bradesco carries out a corporate risk control in an integrated and independent manner, preserving and giving value to a collective decision-making environment, developing and implementing methodologies, models and tools for measurement and control. It promotes the dissemination of the risk culture to all employees, at all hierarchical levels, from the business areas to the Board of Directors. The risk management and capital structures have policies, rules and procedures, ensuring that the Organization maintains controls compatible with the nature of its operations, the complexity of its products and services, activities, processes, systems and the size of its exposure to risks. These structures are also composed of various committees, commissions and departments that subsidize the Board of Directors, the Chief Executive Officer, the Chief Risk Officer (CRO) and the Executive Board of the Organization in decision making, including:
Integrated Risk Management and Capital Allocation Committee, whose purpose is to advise the Board of Directors in the performance of its duties related to the management policies and limits of exposure to risks and ensure within the scope of the Organization compliance with the related processes, policies, related standards and compliance with regulations and legislation applicable to the Organization; and
Risk Committee, whose main objective is to evaluate the Organization's risk management framework and, eventually, to propose improvements.
Both advise the Board of Directors in the performance of its duties in the management and control of risks, capital, internal controls and compliance. Detailed information on risk management process, reference equity and also Bradesco's risks exposures may be found in Risk Management Report – Pillar 3, available on the Investors Relations website Bradesco RI.
b) Capital Management
The Basel Ratio is part of the set of indicators monitored and evaluated in the process of Capital Management, and is intended to measure the sufficiency of capital in relation to the exposure to risks. The table below shows the composition of the Reference Equity and of the Risk Weighted Assets, according to the standards of Bacen. During the period, Bradesco has fulfilled all the minimum regulatory requirements.
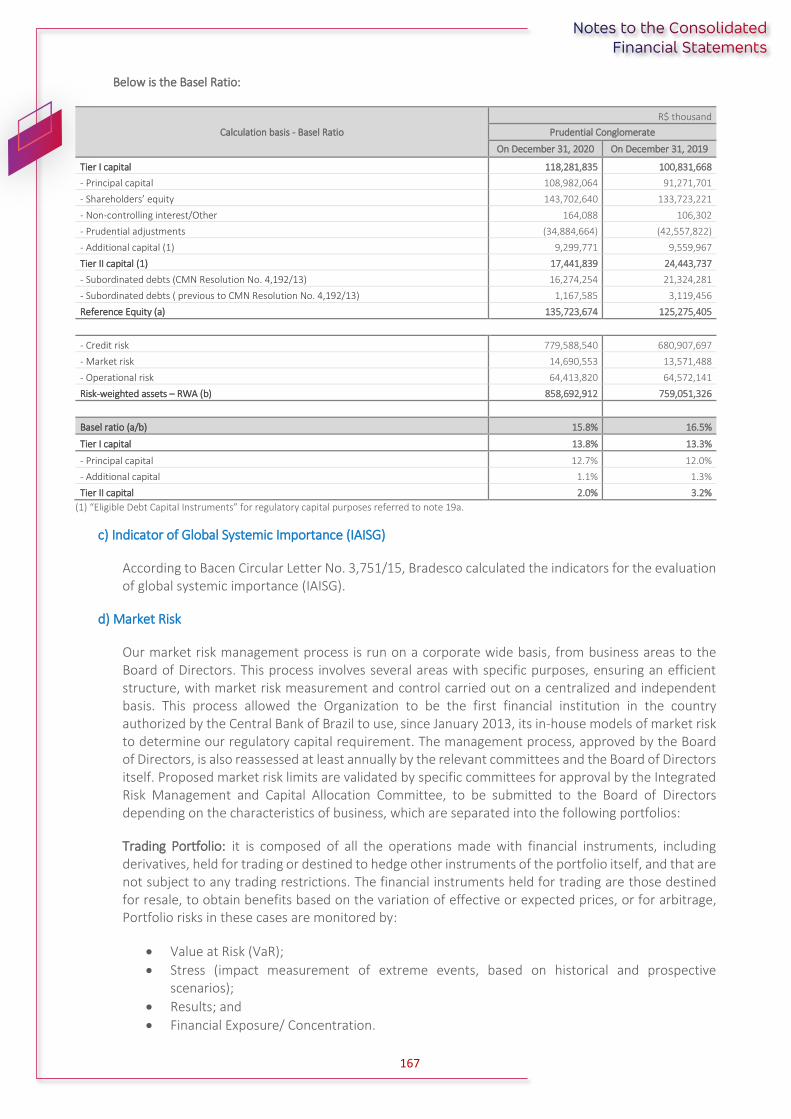
167
Below is the Basel Ratio:
Calculation basis - Basel Ratio
R$ thousand
Prudential Conglomerate
On December 31, 2020 On December 31, 2019
Tier I capital 118,281,835 100,831,668
- Principal capital 108,982,064 91,271,701
- Shareholders’ equity 143,702,640 133,723,221
- Non-controlling interest/Other 164,088 106,302
- Prudential adjustments (34,884,664) (42,557,822)
- Additional capital (1) 9,299,771 9,559,967
Tier II capital (1) 17,441,839 24,443,737
- Subordinated debts (CMN Resolution No. 4,192/13) 16,274,254 21,324,281
- Subordinated debts ( previous to CMN Resolution No. 4,192/13) 1,167,585 3,119,456
Reference Equity (a) 135,723,674 125,275,405
- Credit risk 779,588,540 680,907,697
- Market risk 14,690,553 13,571,488
- Operational risk 64,413,820 64,572,141
Risk-weighted assets – RWA (b) 858,692,912 759,051,326
Basel ratio (a/b) 15.8% 16.5%
Tier I capital 13.8% 13.3%
- Principal capital 12.7% 12.0%
- Additional capital 1.1% 1.3%
Tier II capital 2.0% 3.2%
(1) “Eligible Debt Capital Instruments” for regulatory capital purposes referred to note 19a.
c) Indicator of Global Systemic Importance (IAISG)
According to Bacen Circular Letter No. 3,751/15, Bradesco calculated the indicators for the evaluation of global systemic importance (IAISG).
d) Market Risk
Our market risk management process is run on a corporate wide basis, from business areas to the Board of Directors. This process involves several areas with specific purposes, ensuring an efficient structure, with market risk measurement and control carried out on a centralized and independent basis. This process allowed the Organization to be the first financial institution in the country authorized by the Central Bank of Brazil to use, since January 2013, its in-house models of market risk to determine our regulatory capital requirement. The management process, approved by the Board of Directors, is also reassessed at least annually by the relevant committees and the Board of Directors itself. Proposed market risk limits are validated by specific committees for approval by the Integrated Risk Management and Capital Allocation Committee, to be submitted to the Board of Directors depending on the characteristics of business, which are separated into the following portfolios:
Trading Portfolio: it is composed of all the operations made with financial instruments, including derivatives, held for trading or destined to hedge other instruments of the portfolio itself, and that are not subject to any trading restrictions. The financial instruments held for trading are those destined for resale, to obtain benefits based on the variation of effective or expected prices, or for arbitrage, Portfolio risks in these cases are monitored by:
Value at Risk (VaR);
Stress (impact measurement of extreme events, based on historical and prospective scenarios);
Results; and
Financial Exposure/ Concentration.

168
Banking Portfolio: composed of financial instruments not classified in the Trading Portfolio, originating from other business of the Organization and their respective hedges. Portfolio risks in these cases are monitored by:
Change in economic value due to changes in interest rates – ∆EVE (Economic Value of Equity); and
Change in net interest income due to changes in interest rates – ∆NII (Net Interest Income).
VaR Internal Model - Trading Portfolio
Below is the 1-day VaR:
Risk factors R$ thousand
On December 31, 2020 On December 31, 2019
Fixed rates 5,014 1,614
IGPM/IPCA 3,645 2,774
Exchange coupon 342 415
Foreign currency 4,704 5,327
Equities 2,422 707
Sovereign/Eurobonds and Treasuries 7,477 3,834
Other 154 2,122
Correlation/diversification effect (11,551) (6,820)
VaR (Value at Risk) 12,207 9,973
Amounts net of tax effects.
Sensitivity analysis - CVM Instruction No. 475/08
Sensitivity analysis of the Organization’s financial exposures (Trading and Banking Portfolio) were carried out based on scenarios prepared at the respective dates, always considering market data at the time and scenarios that would adversely affect our positions, according to the examples below:
Scenario 1: Based on market information (B3, Anbima, etc.), stresses were applied for 1 basis point on the interest rate and 1.0% variation on prices, For example: for a Real/US dollar exchange rate of R$5.18 a scenario of R$5.23 was used, while for a 1-year fixed interest rate of 2.86%, a 2.87% scenario was applied;
Scenario 2: 25.0% stresses were determined based on market information. For example: for a Real/US dollar exchange rate of R$5.18 a scenario of R$6.47 was used, while for a 1-year fixed interest rate of 2.86%, a 3.57% scenario was applied. The scenarios for other risk factors also accounted for 25.0% stresses in the respective curves or prices; and
Scenario 3: 50.0% stresses were determined based on market information. For example: for a Real/US dollar exchange rate of R$5.18 a scenario of R$7.77 was used, while for a 1-year fixed interest rate of 2.86%, a 4.29% scenario was applied. The scenarios for other risk factors also account for 50.0% stresses in the respective curves or prices.
The results presented reveal the impacts for each scenario in a static position of the portfolio. The dynamism of the market and portfolios means that these positions change continuously and do not necessarily reflect the position demonstrated here. In addition, the Organization has a continuous market risk management process, which is always searching for ways to mitigate the associated risks, according to the strategy determined by Senior Management. Therefore, where there are indicators of deterioration in certain positions, proactive measures are taken to minimize any potential negative impact and maximize the risk/return ratio for the Organization.

169
I - Sensitivity Analysis – Trading Portfolio
R$ thousand
Trading Portfolio (1)
On December 31, 2020 On December 31, 2019
Scenarios Scenarios
1 2 3 1 2 3
Interest rate in Reais Exposure subject to variations in fixed interest rates and interest rate coupons (105) (11,776) (23,317) (97) (14,128) (27,256)
Price indexes Exposure subject to variations in price index coupon rates (1,788) (41,702) (84,093) (904) (29,440) (56,245)
Exchange coupon Exposure subject to variations in foreign currency coupon rates (32) (3,256) (6,485) (10) (689) (1,373)
Foreign currency Exposure subject to exchange rate variations (1,597) (39,926) (79,852) (2,772) (74,695) (149,390)
Equities Exposure subject to variation in stock prices (354) (8,856) (17,712) (228) (5,710) (11,420)
Sovereign/Eurobonds and Treasuries
Exposure subject to variations in the interest rate of securities traded on the international market (167) (11,955) (23,430) (699) (29,099) (56,736)
Other Exposure not classified in other definitions - (41) (82) - (26) (52)
Total excluding correlation of risk factors (4,043) (117,512) (234,971) (4,710) (153,787) (302,472)
Total including correlation of risk factors (2,647) (73,605) (147,689) (2,617) (72,476) (145,411)
(1) Amounts net of tax effects.

170
Presented below are the impacts of the financial exposures (fair value) also considering the Banking Portfolio (composed of operations not classified in the Trading Portfolio, originating from other business of the Organization and their respective hedges).
II - Sensitivity Analysis – Trading and Banking Portfolios
R$ thousand
Trading and Banking Portfolios (1)
On December 31, 2020 On December 31, 2019
Scenarios Scenarios
1 2 3 1 2 3
Interest rate in Reais Exposure subject to variations in fixed interest rates and interest rate coupons (12,180) (1,553,493) (2,974,461) (14,670) (1,895,973) (3,775,039)
Price indexes Exposure subject to variations in price index coupon rates (27,143) (2,227,123) (4,031,341) (16,840) (1,312,832) (2,397,962)
Exchange coupon Exposure subject to variations in foreign currency coupon rates (2,277) (71,852) (141,860) (1,035) (71,631) (139,560)
Foreign currency Exposure subject to exchange rate variations (2,202) (65,746) (131,493) (3,136) (71,103) (142,206)
Equities Exposure subject to variation in stock prices (43,353) (1,083,824) (2,167,648) (28,808) (720,192) (1,440,384)
Sovereign/Eurobonds and Treasuries
Exposure subject to variations in the interest rate of securities traded on the international market (1,339) (14,019) (27,608) (1,399) (52,962) (104,190)
Other Exposure not classified in other definitions (30) (748) (1,496) (66) (1,660) (3,320)
Total excluding correlation of risk factors (88,524) (5,016,805) (9,475,907) (65,954) (4,126,353) (8,002,661)
Total including correlation of risk factors (73,350) (4,168,903) (7,883,903) (42,209) (3,038,149) (5,919,579)
(1) Amounts net of tax effects.

171
e) Social and environmental risk
The social and environmental risk is represented by potential damages that an economic activity can cause to society and to the environment. The social and environmental risks associated with financial institutions are mostly indirect and stem from business relationships, including those with the supply chain and with customers, through financing and investment activities. The social and environmental risk management process includes a governance structure, comprised of committees, policies, standards and procedures, which work to ensure the risks are identified, measured, mitigated, monitored and reported. This process complies with Resolution No. 4,327/14 of the Central Bank and observes the principles of relevance and proportionality, which is necessary in view of the complexity of the financial products and the profile of Organization’s activities. The Organization seeks to constantly incorporate and improve the criteria for managing the social and environmental risk arising from business relations with customers, through loan and financing operations, guarantees, suppliers and investments, which comprise the scope of analysis reflected in the Organization’s Social and Environmental Risk Standard. The Organization has made several commitments related to environmental and social aspects, such as the Carbon Disclosure Project (CDP), the Principles for Responsible Investment (PRI), the Business Charter for Human Rights and Promotion of Decent Work (Ethos), the United Nations Environment Program (UNEP-FI), the Global Compact, among others. Moreover, the Organization has been a signatory of the Equator Principles since 2004, and among the requirements evaluated are as follows: the working conditions, impacts to the community and the environment of projects financed by the Organization, pursuant to the Brazilian legislation and the standards and guidelines of the International Finance Corporation (IFC), besides the World Bank Group's Health, Safety and Environment Guidelines. During the credit granting process, transactions under Equator Principles undergo a social and environmental risk analysis. In the year ended in December 31, 2020 and 2019, there was no hiring of Advisory Service or contracting of Financing Project Finance or Corporate Loans to projects classified under the criteria of the Equator Principles III.

172
f) Below is the statement of financial position by currency and maturity
I – The statement of financial position by currency
R$ thousand
On December 31, 2020 On December 31,
2019
Balance Local currency Foreign currency
(1) (2) Foreign currency
(1) (2)
Assets
Cash and due from banks 23,845,061 15,520,772 8,324,289 4,553,120
Financial instruments 1,472,837,923 1,384,153,775 88,684,148 79,914,310
- Interbank investments 191,147,208 189,148,979 1,998,229 2,758,183
- Compulsory deposits with the Brazilian Central Bank 83,757,533 83,695,875 61,658 46,662
- Securities 616,497,887 583,570,361 32,927,526 22,242,979
- Derivative financial instruments 24,815,393 24,114,775 700,618 594,548
- Loans 445,665,923 411,725,906 33,940,017 30,162,221
- Other financial instruments 110,953,979 91,897,879 19,056,100 24,109,717
Leases 2,646,438 2,646,438 - -
Expected credit loss associated with credit risk (45,202,191) (42,428,750) (2,773,441) (1,505,929)
- Loans (42,233,636) (39,460,209) (2,773,427) (1,505,929)
- Leases (70,468) (70,468) - -
- Other receivables (2,898,087) (2,898,073) (14) -
Deferred tax assets 85,049,769 85,024,687 25,082 9,338
Investments in associates and jointly controlled entities 7,046,710 7,046,710 - -
Premises and equipment, net 20,923,269 20,745,153 178,116 112,141
Intangible assets 34,395,581 34,217,277 178,304 135,856
Depreciation and amortization (33,578,011) (33,285,788) (292,223) (196,903)
- Premises and equipment (11,433,018) (11,291,388) (141,630) (82,203)
- Intangible assets (22,144,993) (21,994,400) (150,593) (114,700)
Other assets 26,752,701 25,915,420 837,281 1,238,262
Impairment of Assets Accumulated (3,678,206) (3,672,765) (5,441) -
Total assets 1,591,039,044 1,495,882,929 95,156,115 84,260,195
Liabilities
Deposits and other financial liabilities 1,088,438,954 981,332,235 107,106,719 82,023,034
- Deposits from banks 267,280,167 237,234,930 30,045,237 37,397,409
- Deposits from customers 545,292,743 512,147,767 33,144,976 18,091,293
- Securities issued 144,903,825 133,678,568 11,225,257 3,375,635
- Subordinated debts 53,246,232 38,893,286 14,352,946 11,127,795
- Derivative financial instruments 18,697,682 14,141,288 4,556,394 1,457,142
- Other financial liabilities 59,018,305 45,236,396 13,781,909 10,573,760
Provisions 320,285,406 320,132,264 153,142 106,905
- Technical provision for insurance, pension plans and capitalization bonds 284,606,330 284,592,671 13,659 14,689
- Other reserves 35,679,076 35,539,593 139,483 92,216
Deferred income tax assets 7,951,848 7,630,655 321,193 157,751
Other liabilities 29,900,955 28,863,596 1,037,359 430,951
Total liabilities 1,446,577,163 1,337,958,750 108,618,413 82,718,641
Shareholders’ equity
Equity attributable to shareholders of the parent 143,702,640 143,702,640 - -
Non-controlling interest 759,241 759,241 - -
Total Shareholders’ equity 144,461,881 144,461,881 - -
Total Liability and Shareholders’ equity 1,591,039,044 1,482,420,631 108,618,413 82,718,641
Net position of assets and liabilities (13,462,298) 1,541,554
Net position of derivatives (2) (4,216,783) (65,993,860)
Other net off-balance-sheet accounts (3) 3,144,242 (4,208)
Net foreign exchange position (passive) (4) (14,534,839) (64,456,514)
(1) Amounts originally recognized and/or indexed mainly in US$; (2) Excluding operations maturing in D+1, to be settled at the rate on the last day of the month; (3) Other commitments recorded in off-balance-sheet accounts; and (4) Assets, liabilities and results of foreign investments and dependencies are translated into Brazilian reais at the local currency exchange rates, and the effects resulting from the conversion process, which totaled R$22,393,984 thousand in the year ended in December 31, 2020 (R$2,375,463 thousand in 2019), were recorded in the result. These effects were off-set by the results obtained by the financial instruments used to hedge the effects of the exchange variation produced by our investments abroad. For investments abroad that have a functional currency different from the real, the effects of the conversion are recorded in other comprehensive income as Asset Valuation Adjustments.
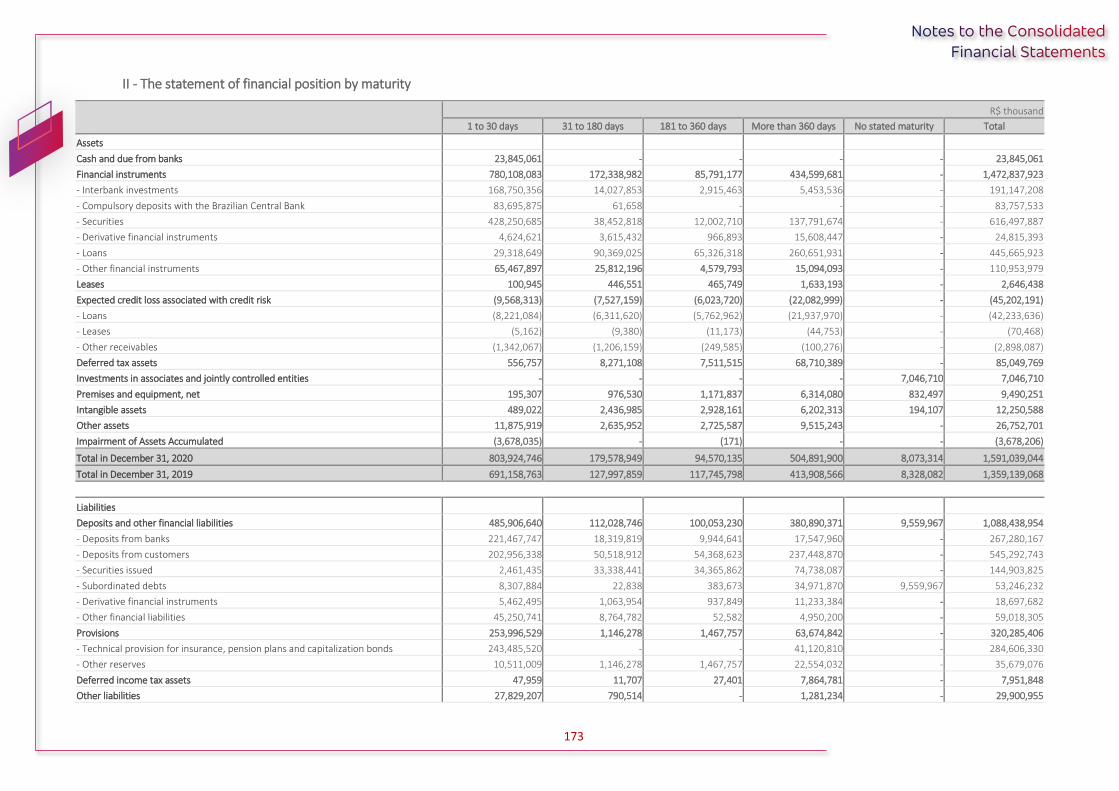
173
II - The statement of financial position by maturity
R$ thousand
1 to 30 days 31 to 180 days 181 to 360 days More than 360 days No stated maturity Total
Assets
Cash and due from banks 23,845,061 - - - - 23,845,061
Financial instruments 780,108,083 172,338,982 85,791,177 434,599,681 - 1,472,837,923
- Interbank investments 168,750,356 14,027,853 2,915,463 5,453,536 - 191,147,208
- Compulsory deposits with the Brazilian Central Bank 83,695,875 61,658 - - - 83,757,533
- Securities 428,250,685 38,452,818 12,002,710 137,791,674 - 616,497,887
- Derivative financial instruments 4,624,621 3,615,432 966,893 15,608,447 - 24,815,393
- Loans 29,318,649 90,369,025 65,326,318 260,651,931 - 445,665,923
- Other financial instruments 65,467,897 25,812,196 4,579,793 15,094,093 - 110,953,979
Leases 100,945 446,551 465,749 1,633,193 - 2,646,438
Expected credit loss associated with credit risk (9,568,313) (7,527,159) (6,023,720) (22,082,999) - (45,202,191)
- Loans (8,221,084) (6,311,620) (5,762,962) (21,937,970) - (42,233,636)
- Leases (5,162) (9,380) (11,173) (44,753) - (70,468)
- Other receivables (1,342,067) (1,206,159) (249,585) (100,276) - (2,898,087)
Deferred tax assets 556,757 8,271,108 7,511,515 68,710,389 - 85,049,769
Investments in associates and jointly controlled entities - - - - 7,046,710 7,046,710
Premises and equipment, net 195,307 976,530 1,171,837 6,314,080 832,497 9,490,251
Intangible assets 489,022 2,436,985 2,928,161 6,202,313 194,107 12,250,588
Other assets 11,875,919 2,635,952 2,725,587 9,515,243 - 26,752,701
Impairment of Assets Accumulated (3,678,035) - (171) - - (3,678,206)
Total in December 31, 2020 803,924,746 179,578,949 94,570,135 504,891,900 8,073,314 1,591,039,044
Total in December 31, 2019 691,158,763 127,997,859 117,745,798 413,908,566 8,328,082 1,359,139,068
Liabilities
Deposits and other financial liabilities 485,906,640 112,028,746 100,053,230 380,890,371 9,559,967 1,088,438,954
- Deposits from banks 221,467,747 18,319,819 9,944,641 17,547,960 - 267,280,167
- Deposits from customers 202,956,338 50,518,912 54,368,623 237,448,870 - 545,292,743
- Securities issued 2,461,435 33,338,441 34,365,862 74,738,087 - 144,903,825
- Subordinated debts 8,307,884 22,838 383,673 34,971,870 9,559,967 53,246,232
- Derivative financial instruments 5,462,495 1,063,954 937,849 11,233,384 - 18,697,682
- Other financial liabilities 45,250,741 8,764,782 52,582 4,950,200 - 59,018,305
Provisions 253,996,529 1,146,278 1,467,757 63,674,842 - 320,285,406
- Technical provision for insurance, pension plans and capitalization bonds 243,485,520 - - 41,120,810 - 284,606,330
- Other reserves 10,511,009 1,146,278 1,467,757 22,554,032 - 35,679,076
Deferred income tax assets 47,959 11,707 27,401 7,864,781 - 7,951,848
Other liabilities 27,829,207 790,514 - 1,281,234 - 29,900,955

174
R$ thousand
1 to 30 days 31 to 180 days 181 to 360 days More than 360 days No stated maturity Total
Shareholders’ equity
Equity attributable to shareholders of the parent - - - - 143,702,640 143,702,640
Non-controlling interest - - - - 759,241 759,241
Total Shareholders’ equity - - - - 144,461,881 144,461,881
Total in December 31, 2020 767,780,335 113,977,245 101,548,388 453,711,228 154,021,848 1,591,039,044
Total in December 31, 2019 663,802,650 87,327,618 99,186,006 364,829,815 143,992,979 1,359,139,068
Net assets accumulated on December 31, 2020 36,144,411 101,746,115 94,767,862 145,948,534
Net assets accumulated on December 31, 2019 27,356,113 68,026,354 86,586,146 135,664,897
(1) Repurchase agreements are classified according to the maturity of the transactions;
(2) Investments in investment funds are classified as 1 to 30 days; and
(3) Demand and savings deposits and technical provisions for insurance, pension plans and capitalization bonds comprising “VGBL” and “PGBL” products are classified as 1 to 30 days, without considering average historical turnover.

175
35) EMPLOYEE BENEFITS
Bradesco and its subsidiaries sponsor a private defined contribution pension for employees and managers, that allows financial resources to be accumulated by participants throughout their careers by means of employee and employer contributions and invested in an Exclusive Investment Fund (FIE). The plan is managed by Bradesco Vida e Previdência S.A. and BRAM – Bradesco Asset Management S.A. DTVM is responsible for the financial management of the FIEs funds. The supplementary pension plan counts on contributions from employees and managers of Bradesco and its subsidiaries equivalent to at least 4% of the salary by employees and, 5% of the salary, plus the percentage allocated to covers of risk benefits (invalidity and death) by the company. Actuarial obligations of the defined contribution plan are fully covered by the plan assets of the corresponding FIE. In addition to the plan, in 2001, participants who chose to migrate from the defined benefit plan are guaranteed a proportional deferred benefit, corresponding to their accumulated rights in that plan. For the active participants, retirees and pensioners of the defined benefit plan, now closed to new members, the present value of the actuarial obligations of the plan is fully covered by guarantee assets. Following the merger of Banco Alvorada S.A. (successor from the spin-off of Banco Baneb S.A.) into Kirton Bank S.A. Banco Múltiplo, on April 30, 2019, Kirton Bank S.A. Banco Múltiplo maintains variable contribution and defined benefit retirement plans, through Fundação Baneb de Seguridade Social – Bases related to the former employees of Baneb. Banco Bradesco S.A. sponsors both variable benefit and defined contribution retirement plans, through Caixa de Assistência e Aposentadoria dos Funcionários do Banco do Estado do Maranhão (Capof), to employees originating from Banco BEM S.A. Banco Bradesco S.A. sponsors a defined benefit plan through Caixa de Previdência Privada Bec – Cabec for employees of Banco do Estado do Ceará S.A. Kirton Bank S.A. Banco Múltiplo, Bradesco Capitalização S.A., Kirton Corretora de Seguros S.A., Bradesco-Kirton Corretora de Câmbio S.A. and Bradesco Seguros S.A. sponsor a defined benefit plan called APABA for employees originating from Banco Bamerindus do Brasil S.A., and Kirton Administração de Serviços para Fundos de Pensão Ltda. sponsors for its employees a defined contribution plan, known as the Kirton Prev Benefits Plan (Plano de Benefícios Kirton Prev), both managed by MultiBRA – Pension Fund. Banco Losango S.A. Banco Múltiplo, Kirton Bank S.A. Banco Múltiplo and Credival – Participações, Administração e Assessoria Ltda. sponsor three pension plans for its employees, which are: Losango I Benefits Plan – Basic Part, a defined benefit plan, Losango I – Supplementary Part and PREVMAIS Losango Plan, the last two in the form of variable contribution, all managed by MultiBRA – Settlor – Multiple Fund. Banco Bradesco S.A. also took on the obligations of Kirton Bank S.A. Banco Múltiplo with regard to Life Insurance, Health Insurance Plans, and Retirement Compensation for employees coming from Banco Bamerindus do Brasil S.A., as well as complementing Retirement and Health Plan of employees from Lloyds. In accordance with CPC 33 (R1) - Employee Benefits, approved by CMN Resolution No. 4,424/15, Bradesco and its subsidiaries, as sponsors of these plans, considering the economic and actuarial study, have calculated their actuarial commitments using real interest rate and recognize in their financial statements the obligation due. The resources guaranteeing the pension plans are invested in accordance with the relevant legislation (public and private securities, shares of listed companies and properties). Below are the main assumptions used by the independent actuary in the actuarial assessment of our plans, based on CPC 33 (R1):

176
Risk factors On December 31
2020 2019
Nominal discount rate 3.25% - 7.26% p.a. 6.45% - 7.45% p.a.
Nominal rate of future salary increases 3.25% p.a. 3.8% p.a.
Nominal growth rate of social security benefits and plans 3.25% p.a. 3.8% p.a.
Initial rate of growth of medical costs 7.38% - 8.41% p.a. 7.95% - 8.99% p.a.
Inflation rate 3.25% p.a. 3.8% p.a.
Biometric table of overall mortality AT 2000 and BR-SEM AT 2000 and BR-SEM
Biometric table of entering disability Per plan Per plan
Expected turnover rate - -
Probability of entering retirement 100% in the 1ª
eligibility to a benefit by the plan
100% in the 1ª eligibility to a benefit
by the plan
Considering the above assumptions, in accordance with CPC 33 (R1), the present value of the actuarial obligations of the benefit plans and of its assets to cover these obligations, is represented below:
R$ thousand
Retirement Benefits Other post-employment benefits
Accrued on December 31 Accrued on December 31
2020 2019 2020 2019
(i) Projected benefit obligations:
At the beginning of the year 3,065,146 2,530,590 917,870 669,093
Cost of current service 546 179 - -
Interest cost 212,033 224,508 66,772 60,185
Participant’s contribution 556 819 - -
Actuarial gain/(loss) (1) 123,504 516,333 13,671 224,683
Past service cost - plan changes - (3,920) - -
Early elimination of obligations - - - (1,613)
Benefit paid (219,657) (203,363) (31,883) (34,478)
At the end of the year 3,182,128 3,065,146 966,430 917,870
(ii) Plan assets at fair value:
At the beginning of the year 2,716,865 2,363,009 - -
Expected earnings 187,531 209,252 - -
Actuarial gain/(loss) (1) 59,071 332,368 - -
Contributions received:
Employer 15,150 14,763 - -
Employees 556 819 - -
Benefit paid (219,428) (203,346) - -
At the end of the year 2,759,745 2,716,865 - -
(iii) Changes in the unrecoverable surplus:
At the beginning of the year 36,155 54,025 - -
Interest on the irrecoverable surplus 2,736 4,981 - -
Change in irrecoverable surplus (1) (38,581) (22,851) - -
At the end of the year 310 36,155 - -
(iv) Financed position:
Plans in deficit (2) 422,693 384,436 966,430 917,870
Net balance 422,693 384,436 966,430 917,870
(1) In the year ended December 31, 2020, the remeasurement effects recognized in Shareholders' Equity, in Other Comprehensive Income totaled R$21,593 thousand (R$212,188 thousand in 2019), net of tax effects; and (2) Bradesco and its subsidiaries, as sponsors of said plans, considering an economic and actuarial study, calculated their actuarial commitments and recognize in their financial statements the actuarial obligation due.

177
The net cost/(benefit) of the pension plans, recognized in the income statement, include the following components:
R$ - thousand
Accrued on December 31
2020 2019
Projected benefit obligations:
Cost of service 546 (2,689)
Cost of interest on actuarial obligations 278,805 282,997
Expected earnings from the assets of the plan (187,531) (208,122)
Interest on irrecoverable surplus 2,736 4,981
Net cost/(benefit) of the pension plans 94,556 77,167
Maturity profile of the present value of the obligations of the benefit plans defined for the next years:
R$ thousand
Retirement Benefits Other post-employment
benefits
Weighted average duration (years) 10.07 12.84
2021 229,641 44,375
2022 234,469 46,487
2023 239,025 49,937
2024 243,650 53,408
2025 247,303 57,139
After 2026 1,279,375 337,370
Contributions to defined-benefit plans are expected to total R$24,820 thousand in 2021. The long-term rate of return on plan assets is based on the following:
- Medium- to long-term expectations of the asset managers; and - Public and private securities, a significant portion of the investments portfolio of our subsidiaries, the profitability of which is higher than inflation plus interest, with short to long-term maturities.
The resources guaranteeing the pension plans are invested in accordance with the relevant legislation (public and private securities, shares of listed companies and properties) and the weighted-average allocation of the pension plan's assets by category is as follows:
On December 31
Assets of the Alvorada Plan
Assets of the Bradesco Plan
Assets of the Kirton Plan Assets of the Losango
Plan
2020 2019 2020 2019 2020 2019 2020 2019
Asset categories
Equities - - 3.8% 9.6% - - - 18.5%
Fixed income 91.3% 93.5% 91.9% 86.6% 100.0% 100.0% 100.0% 78.9%
Real estate 5.6% 5.3% 2.6% 1.9% - - - -
Other 3.1% 1.2% 1.7% 1.9% - - - 2.6%
Total 100.0% 100.0% 100.0% 100.0% 100.0% 100.0% 100.0% 100.0%
The table below, of the sensitivity analysis of benefit plan obligations, shows the impact on actuarial exposure (8.5% - 10.0% p.a.) by means of the amendment in the premise regarding the discount rate and medical inflation by 1 p.p.:
Rate Discount rate/Medical
inflation rate Sensitivity Analysis Effect on actuarial liabilities
Effect on the present value of the obligations
Discount rate 6.87% - 8.26% Increase of 1 p.p. reduction (393,887)
Discount rate 4.87% - 6.26% Decrease of 1 p.p. increase 470,116
Medical Inflation 8.38% - 9.41% Increase of 1 p.p. increase 113,797
Medical Inflation 6.38% - 7.41% Decrease of 1 p.p. reduction (95,008)

178
Bradesco, in its offices abroad, provides pension plans for its employees and managers, in accordance with the standards established by the local authorities, which allows the accrual of financial resources during the professional career of the participant. Total expenses with contributions made in the second half of 2020 were R$474,842 thousand and in the year ended in December 31, 2020, were R$959,220 thousand (R$997,446 thousand in 2019). In addition to this benefit, Bradesco and its subsidiaries offer their employees and administrators other benefits, including: health insurance, dental assistance, life and personal accident insurance and professional training, the amount of which, including the aforementioned contributions, totaled, in the second half of 2020, the amount of R$2,351,346 thousand and in the year ended in December 31, 2020, the amount of R$4,746,728 thousand (R$6,101,527 thousand in 2019).
36) INCOME TAXES
a) Calculation of income taxes (company income tax IRPJ and social contribution charges CSLL)
R$ thousand
2nd semester Accrued on December 31
2020 2020 2019
Income before income tax and social contribution 14,794,987 5,091,348 16,179,340
Total burden of income tax and social contribution at the current rates (Note 3f) (6,657,744) (2,291,107) (6,471,736)
Effect on the tax calculation:
Equity investment in unconsolidated and jointly controlled companies 238,405 337,190 481,412
Net non-deductible expenses of non-taxable income 41,529 8,203 673,882
Interest on shareholders’ equity (paid and payable) 1,457,288 2,496,587 2,949,143
Other amounts (1) (118,406) 11,101,455 8,921,659
Income tax and social contribution for the period (5,038,928) 11,652,328 6,554,360
(1) Primarily, includes: (i) the exchange rate variation of assets and liabilities, derived from investments abroad in the amount of R$10,047,819 thousand, (R$934,897 thousand in 2019) and in the second half of 2020 in the amount of R$(633,033) thousand; (ii) the equalization of the effective rate of non-bank financial companies and insurance companies, starting in 2020, and of non-financial companies, in relation to that shown; and (iii) incentive deductions.
b) Breakdown of income tax and social contribution in the income statement
R$ thousand
2nd semester Accrued on December 31
2020 2020 2019
Current taxes:
Income tax and social contribution payable (1,816,454) (5,111,044) (7,162,259)
Deferred taxes:
Constitution/realization in the period on temporary additions and exclusions 2,214,340 6,036,325 12,513,293
Use of opening balances of:
Social contribution loss (38,310) (63,150) (107,984)
Income tax loss (47,760) (79,842) (186,773)
Constitution in the period on:
Social contribution loss (2,384,856) 4,813,120 1,174,988
Income tax loss (2,965,888) 6,056,919 323,095
Total deferred tax expense (3,222,474) 16,763,372 13,716,619
Income tax and social contribution for the period (5,038,928) 11,652,328 6,554,360

179
c) Deferred income tax and social contribution
R$ thousand
Balance on December 31,
2019
Amount recorded
Realized / Decrease
Balance on December 31,
2020
Allowance for loan losses expense 38,567,812 11,625,279 (5,425,774) 44,767,317
Civil provisions 3,793,953 806,406 (633,569) 3,966,790
Tax provisions 3,420,711 112,598 (136,840) 3,396,469
Labor provisions 3,248,186 884,106 (1,071,655) 3,060,637
Impairment of securities and investments 2,789,316 1,607,701 (646,514) 3,750,503
Provision for devaluation of foreclosed assets 833,163 224,592 (205,754) 852,001
Mark-to-market adjustment of trading securities and derivatives 1,346,668 633,811 (989,410) 991,069
Amortization of goodwill 410,537 27,448 (92,865) 345,120
Other 5,081,557 3,291,389 (3,119,354) 5,253,592
Total deductible taxes on temporary differences 59,491,903 19,213,330 (12,321,735) 66,383,498
Income tax and social contribution losses in Brazil and overseas 7,882,821 10,870,039 (142,992) 18,609,868
Subtotal - Securities purchased under agreements to resell 67,374,724 30,083,369 (12,464,727) 84,993,366
Adjustment to fair value of available-for-sale securities 25,511 42,554 (11,662) 56,403
Total deferred tax assets (Note 3f) 67,400,235 30,125,923 (12,476,389) 85,049,769
Deferred tax liabilities (Note 36e) 8,070,398 2,586,204 (2,704,754) 7,951,848
Deferred tax assets, net of deferred tax liabilities 59,329,837 27,539,719 (9,771,635) 77,097,921
- Percentage of net deferred tax assets on capital (Note 34b) 47.4% 56.8%
- Percentage of net deferred tax assets over total assets 4.4% 4.8%
The accounting record of the deferred tax assets was made using the rates applicable to the period projected for its realization and is based on the projection of future results and on a technical analysis. On December 31, 2020, no deferred tax assets were constituted, substantially, on temporary differences, in the amount of R$12,194 thousand (R$12,094 thousand as of December 31, 2019), which will be recorded upon the effective perspectives of realization, according to the technical study and analyses made by the Board and by the Standards of Bacen.
d) Expected realization of deferred tax assets on temporary differences, tax loss and negative basis of social contribution
R$ thousand
Temporary differences Carry-forward tax losses
Total Income tax
Social contribution
Income tax Social
contribution
2021 8,890,775 6,960,088 207,207 167,457 16,225,527
2022 8,461,275 6,688,997 177,515 144,305 15,472,092
2023 8,276,632 6,459,720 252,134 203,715 15,192,201
2024 7,303,505 5,794,571 207,162 184,877 13,490,115
2025 3,355,111 2,489,062 1,607,787 1,294,024 8,745,984
2026 807,775 641,310 2,060,938 1,716,355 5,226,378
2027 136,553 107,875 2,285,541 1,896,055 4,426,024
2028 5,694 4,555 2,214,619 1,828,733 4,053,601
2029 - - 836,633 1,324,811 2,161,444
Total 37,237,320 29,146,178 9,849,536 8,760,332 84,993,366
The projected realization of deferred tax assets is an estimate and it is not directly related to the expected accounting income. On December 31, 2020, the present value of deferred tax assets, calculated based on the average funding rate, net of tax effects, amounts to R$80,653,629 thousand (R$64,484,151 thousand on December 31, 2019), of which: R$63,973,290 thousand (R$57,223,800 thousand on December 31, 2019) of temporary differences; and R$16,680,339 thousand (R$7,260,351 thousand on December 31, 2019) to tax losses and negative basis of social contribution.

180
e) Deferred tax liabilities
R$ thousand
Balance on December 31,
2019
Amount recorded
Realized/Decrease Balance on
December 31, 2020
Fair value adjustment to securities and derivative financial instruments 8,732 890,275 (8,732) 890,275
Difference in depreciation 237,400 15,080 (19,632) 232,848
Judicial deposit 2,154,003 113,429 (82,569) 2,184,863
Other 904,499 58,016 (110,597) 851,918
Total deferred liabilities on temporary exclusions 3,304,634 1,076,800 (221,530) 4,159,904
Adjustment to fair value of available-for-sale securities 4,765,764 1,509,404 (2,483,224) 3,791,944
Total deferred tax expense (Note 36c) 8,070,398 2,586,204 (2,704,754) 7,951,848

181
37) OTHER INFORMATION
a) Fair value of financial assets and liabilities
Carrying amounts and the fair values of the financial assets and liabilities:
R$ thousand
On December 31, 2020 On December 31, 2019
Book value Fair Value Book value Fair Value
Assets
Interbank investments 191,147,208 191,196,047 58,612,208 58,619,668
Compulsory deposits with the Brazilian Central Bank 83,757,533 83,757,533 90,622,338 90,622,338
Securities:
- Trading securities 251,171,296 251,171,296 236,060,067 236,060,067
- Available-for-sale securities 265,513,501 265,513,501 261,892,475 261,892,475
- Held-to-maturity securities 99,813,090 109,730,473 97,075,274 108,840,793
Derivative financial instruments 24,815,393 24,815,393 14,511,190 14,511,190
Loans (1) 509,333,011 513,945,753 452,941,674 458,060,210
Other financial instruments 57,540,757 57,540,757 61,043,232 61,043,232
Liabilities
Deposits from banks 267,280,167 267,240,795 227,819,610 227,880,097
Deposits from customers 545,292,743 545,341,621 366,227,541 366,023,073
Securities issued 144,903,825 143,988,723 170,727,563 169,488,129
Subordinated debt 53,246,232 54,192,090 49,313,508 50,108,020
Derivative financial instruments 18,697,682 18,697,682 14,244,083 14,244,083
Other financial liabilities 51,410,877 51,410,877 36,140,617 36,140,617
(1) Includes advances on foreign exchange contracts, leasing operations and other credits with credit granting characteristics.
For financial instruments that are measured at fair value, the disclosure of the measurements is required according to the following hierarchical levels of fair value:
Level 1 Quoted prices in active markets for identical assets or liabilities. Level 1 assets and liabilities include debt and equity securities and derivative contracts that are traded in an active market, as well as Brazilian government securities that are highly liquid and are actively traded in over-the-counter markets.
Level 2 Valuation uses observable inputs other than Level 1 prices, such as quoted prices for similar assets or liabilities; quoted prices in markets that are not active; or other inputs that are observable or can be corroborated by observable market data for substantially the full term of the assets or liabilities. Level 2 assets and liabilities include derivative contracts whose value is determined using a pricing model with inputs that are observable in the market or can be derived principally from or corroborated by observable market data, including but not limited to yield curves, interest rates, volatilities, equity or debt prices and foreign exchange rates.
Level 3 Valuation uses unobservable inputs that are supported by little or no market activity and that are significant to the fair value of the assets or liabilities. Level 3 assets and liabilities normally include financial instruments whose value is determined using pricing models, discounted cash flow

182
methodologies, or similar techniques, as well as instruments for which the determination of fair value requires significant Management judgment or estimation. This category generally includes certain corporate and bank debt securities and certain derivative contracts. The main unobservable inputs used in the determination of the fair value are the credit spreads that vary between 2% and 9%. To fair value securities which have no consistent, regulatory updated, public price source, Bradesco uses models defined by the mark-to-market Commission and documented in the mark-to-mark manual for each security type. Through the use of methods and both mathematical and financial models which capture the effects and variations in the prices of marked-to-market assets, or similar instruments, Bradesco is able to ascertain in a clear and consistent manner the determination of fair value of its Level 3 assets and liabilities. The table below present the composition of the securities and derivative financial instruments measured at fair value, classified using the hierarchical levels:
R$ thousand
On December 31, 2020 On December 31, 2019
Level 1 Level 2 Level 3 Fair Value Level 1 Level 2 Level 3 Fair Value
Trading securities 231,598,361 19,253,501 319,434 251,171,296 211,402,154 23,950,518 707,395 236,060,067
Financial treasury bills 147,578,842 - - 147,578,842 143,655,376 - - 143,655,376
National treasury notes 44,279,165 6,345,101 - 50,624,266 33,056,039 4,848,858 - 37,904,897
Financial bills - 7,775,628 - 7,775,628 - 13,517,702 - 13,517,702
National treasury bills 17,741,893 - - 17,741,893 19,275,602 - - 19,275,602
Debentures 3,747,299 2,951,834 174,753 6,873,886 378,019 4,097,158 287,713 4,762,890
Brazilian foreign debt securities
725,515 - - 725,515 47,308 - - 47,308
Other 17,525,647 2,180,938 144,681 19,851,266 14,989,810 1,486,800 419,682 16,896,292
Derivatives 71,281 6,273,607 (227,177) 6,117,711 55,054 239,700 (27,647) 267,107
Derivative financial instruments (assets)
138,708 24,657,390 19,295 24,815,393 107,388 14,392,323 11,479 14,511,190
Derivative financial instruments (liabilities)
(67,427) (18,383,783) (246,472) (18,697,682) (52,334) (14,152,623) (39,126) (14,244,083)
Available-for-sale securities 186,660,906 68,307,132 10,545,463 265,513,501 188,560,977 60,934,527 12,396,971 261,892,475
National treasury notes 73,271,680 - - 73,271,680 75,267,193 - - 75,267,193
Debentures 6,354,515 48,446,791 9,577,824 64,379,130 2,461,345 45,033,391 10,636,268 58,131,004
National treasury bills 68,247,967 - - 68,247,967 84,218,450 - - 84,218,450
Shares 11,153,243 1,104,155 1,362 12,258,760 7,192,221 2,638,655 1,362 9,832,238
Foreign government bonds 6,508,218 - - 6,508,218 6,454,894 - - 6,454,894
Foreign corporate securities
6,653,994 - - 6,653,994 7,442,003 - - 7,442,003
Promissory Notes - 7,167,074 - 7,167,074 - 2,368,766 501,512 2,870,278
Certificates of real estate receivables
- 1,620,938 119,124 1,740,062 - 1,522,256 382,581 1,904,837
Other 14,471,289 9,968,174 847,153 25,286,616 5,524,871 9,371,459 875,248 15,771,578
Total 418,330,548 93,834,240 10,637,720 522,802,508 400,018,185 85,124,745 13,076,719 498,219,649
Public 370,447,630 6,345,101 30,466 376,823,197 365,684,094 4,848,858 35,135 370,568,087
Private 47,882,918 87,489,139 10,607,254 145,979,311 34,334,091 80,275,887 13,041,584 127,651,562
Derivative Assets and Liabilities The Organization’s derivative positions are determined using quantitative models that require the use of multiple inputs including interest rates, prices and indexes to generate continuous yield or pricing curves and volatility factors. The majority of market inputs are observable and can be mainly obtained from B3 and the secondary market. Exchange traded derivatives valued using quoted prices are classified within Level 1 of the valuation hierarchy. However, few classes of derivative contracts are listed on an exchange; those are classified as Level 2 or Level 3.
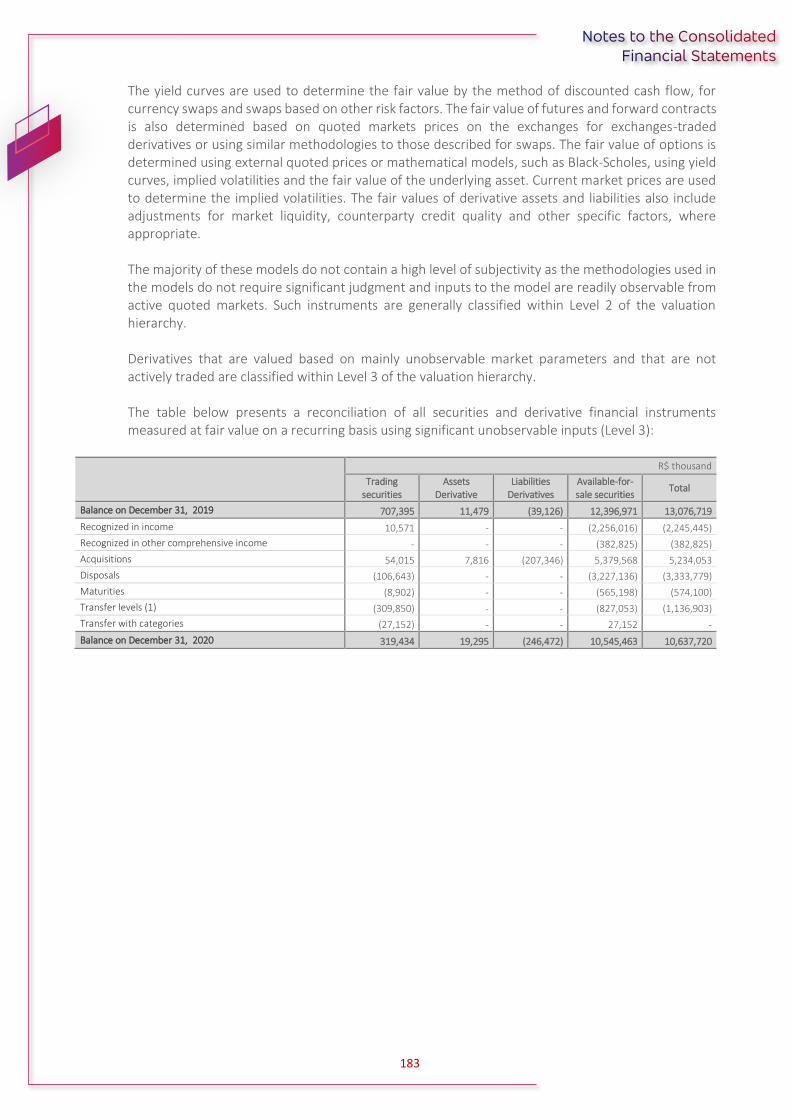
183
The yield curves are used to determine the fair value by the method of discounted cash flow, for currency swaps and swaps based on other risk factors. The fair value of futures and forward contracts is also determined based on quoted markets prices on the exchanges for exchanges-traded derivatives or using similar methodologies to those described for swaps. The fair value of options is determined using external quoted prices or mathematical models, such as Black-Scholes, using yield curves, implied volatilities and the fair value of the underlying asset. Current market prices are used to determine the implied volatilities. The fair values of derivative assets and liabilities also include adjustments for market liquidity, counterparty credit quality and other specific factors, where appropriate. The majority of these models do not contain a high level of subjectivity as the methodologies used in the models do not require significant judgment and inputs to the model are readily observable from active quoted markets. Such instruments are generally classified within Level 2 of the valuation hierarchy. Derivatives that are valued based on mainly unobservable market parameters and that are not actively traded are classified within Level 3 of the valuation hierarchy. The table below presents a reconciliation of all securities and derivative financial instruments measured at fair value on a recurring basis using significant unobservable inputs (Level 3):
R$ thousand
Trading securities
Assets Derivative
Liabilities Derivatives
Available-for-sale securities
Total
Balance on December 31, 2019 707,395 11,479 (39,126) 12,396,971 13,076,719
Recognized in income 10,571 - - (2,256,016) (2,245,445)
Recognized in other comprehensive income - - - (382,825) (382,825)
Acquisitions 54,015 7,816 (207,346) 5,379,568 5,234,053
Disposals (106,643) - - (3,227,136) (3,333,779)
Maturities (8,902) - - (565,198) (574,100)
Transfer levels (1) (309,850) - - (827,053) (1,136,903)
Transfer with categories (27,152) - - 27,152 -
Balance on December 31, 2020 319,434 19,295 (246,472) 10,545,463 10,637,720

184
Sensitivity analysis for financial assets classified as Level 3 (unobservable inputs):
Scenarios
R$ thousand
On December 31, 2020 On December 31, 2019
Impact on income
Impact on shareholders’
equity
Impact on income
Impact on shareholders’
equity
Interest rate in Reais
1 (25) (177) (16) (282)
2 (3,672) (29,423) (2,263) (45,522)
3 (6,971) (59,072) (4,407) (82,962)
Price indexes
1 (4) - (10) -
2 (83) - (383) -
3 (165) - (761) -
Exchange coupon
1 - - - (6)
2 - (8) - (354)
3 - (17) - (701)
Foreign currency
1 - (22) - (523)
2 - (608) - (13,069)
3 - (1,216) - (26,138)
Equities
1 (671) (7) (1,836) (8)
2 (15,373) (187) (45,889) (204)
3 (33,542) (375) (91,778) (409)
The sensitivity analyses were carried out based on the scenarios prepared for the respective dates, always taking into consideration market inputs available at the time and scenarios that would adversely impact our positions, in accordance with the scenarios below:
Scenario 1: Based on market information (B3, Anbima, etc.), stresses were applied for 1 basis point on the interest rate and 1.0% variation on prices. For example: for a Real/US dollar exchange rate of R$5.18, a scenario of R$5.23 was applied, while for a 1-year fixed interest rate of 2.86%, a scenario of 2.87% was applied; Scenario 2: 25.0% stresses were determined based on market information. For example: for a Real/US dollar exchange rate of R$5.18, a scenario of R$6.47 was applied, while for a 1-year fixed interest rate of 2.86%, a 3.57% scenario was applied. The scenarios for other risk factors also accounted for 25% stresses in the respective curves or prices; and Scenario 3: 50.0% stresses were determined based on market information. For example: for a Real/US dollar quote of R$5.18 a scenario of R$7.77 was applied, while for a 1-year fixed interest rate of 2.86%, a 4.29% scenario was applied. The scenarios for other risk factors also accounted for 50% stresses in the respective curves or prices.
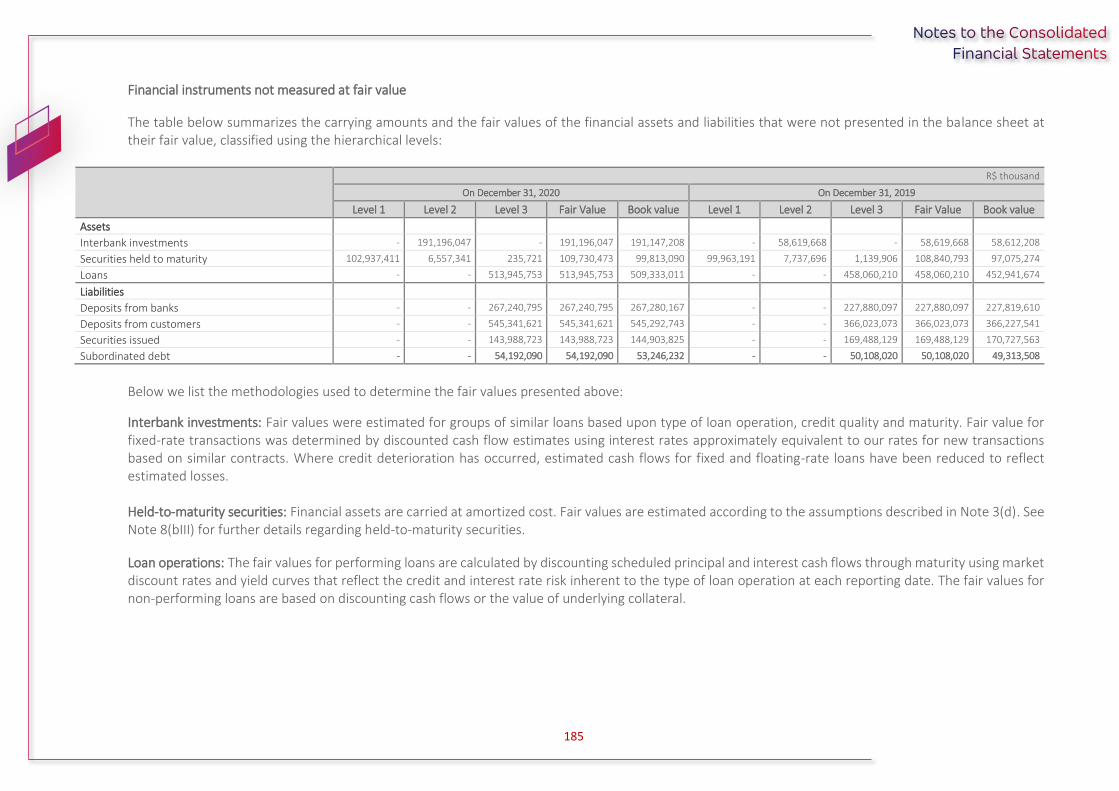
185
Financial instruments not measured at fair value
The table below summarizes the carrying amounts and the fair values of the financial assets and liabilities that were not presented in the balance sheet at their fair value, classified using the hierarchical levels:
R$ thousand
On December 31, 2020 On December 31, 2019
Level 1 Level 2 Level 3 Fair Value Book value Level 1 Level 2 Level 3 Fair Value Book value
Assets
Interbank investments - 191,196,047 - 191,196,047 191,147,208 - 58,619,668 - 58,619,668 58,612,208
Securities held to maturity 102,937,411 6,557,341 235,721 109,730,473 99,813,090 99,963,191 7,737,696 1,139,906 108,840,793 97,075,274
Loans - - 513,945,753 513,945,753 509,333,011 - - 458,060,210 458,060,210 452,941,674
Liabilities
Deposits from banks - - 267,240,795 267,240,795 267,280,167 - - 227,880,097 227,880,097 227,819,610
Deposits from customers - - 545,341,621 545,341,621 545,292,743 - - 366,023,073 366,023,073 366,227,541
Securities issued - - 143,988,723 143,988,723 144,903,825 - - 169,488,129 169,488,129 170,727,563
Subordinated debt - - 54,192,090 54,192,090 53,246,232 - - 50,108,020 50,108,020 49,313,508
Below we list the methodologies used to determine the fair values presented above:
Interbank investments: Fair values were estimated for groups of similar loans based upon type of loan operation, credit quality and maturity. Fair value for fixed-rate transactions was determined by discounted cash flow estimates using interest rates approximately equivalent to our rates for new transactions based on similar contracts. Where credit deterioration has occurred, estimated cash flows for fixed and floating-rate loans have been reduced to reflect estimated losses. Held-to-maturity securities: Financial assets are carried at amortized cost. Fair values are estimated according to the assumptions described in Note 3(d). See Note 8(bIII) for further details regarding held-to-maturity securities.
Loan operations: The fair values for performing loans are calculated by discounting scheduled principal and interest cash flows through maturity using market discount rates and yield curves that reflect the credit and interest rate risk inherent to the type of loan operation at each reporting date. The fair values for non-performing loans are based on discounting cash flows or the value of underlying collateral.

186
The non-performing loans were allocated into each loan category for purposes of calculating the fair-value disclosure. Assumptions regarding cash flows and discount rates are based on available market information and specific borrower information.
Deposits from banks and clients: The fair value of fixed-rate deposits with stated maturities was calculated using the contractual cash flows discounted with current market rates for instruments with similar maturities and terms. For floating-rate deposits, the carrying amount was considered to approximate fair value.
Funds from securities issued: The carrying values of funds from securities issued approximate the fair values of these instruments. Subordinated debt: Fair values for subordinated debts were estimated using a discounted cash flow calculation that applies interest rates available in the market for similar maturities and terms.
b) Recurring and non-recurring income
According to BCB Resolution no. 2/2020 (Article 34) and Bradesco Organization's policy for evaluating
and measuring non-recurring events, we present below the recurring and non-recurring results for
the periods:
Our accounting result in 2020 was R$16,546 million, the recurring result was R$19,458 million and
the non-recurring result was R$(2,912) million net of taxes, which is not expected to occur in future
years, below we detail:
Non-recurring events 2020: i. Provision for Restructuring R$(540) million: Process of restructuring
part of the businesses (resizing in the branch and department network) of Bradesco Organization; ii.
Impairment of Non-Financial Assets - R$(574) million: payroll, goodwill, systems and hardware; iii.
Contingent Liabilities - R$(353) million: civil lawsuits with relevant and atypical individual values that
we do not expect to happen in the next two years; and iv. Amortization of Goodwill - R$(1,446) million:
Amortization of goodwill due to expected future profitability, related to the atypical acquisition for
the Organization's businesses considering the history of other acquisitions of the Organization, where
we do not expect to have these effects beyond the next two years.
Our accounting result in 2019 was R$22,582 million, the recurring result was R$25,887 million and
the non-recurring result was R$(3,305) million, net of taxes. The non-recurring result for 2019 was
determined according to the criteria established by Management in its process of preparing the
Economic and Financial Analysis Report and is not expected to occur in future years, which we list
below:
Non-recurring events 2019: i. Voluntary Severance Program 2019 – (“PDV”) - R$(1,091) million:
Adjustment of the structure of branches and departments; ii. Impairment of Non-Financial Assets -
R$(1,080) million: Payroll, goodwill, systems and hardware; iii. Tax Credit - R$6,403 million: Increase
in the CSLL rate of banks from 15% to 20% on temporary differences and negative basis, established
in Constitutional Amendment No. 103/19; iv. Contingent Liabilities - R$(3,524) million: atypical
constitution of civil, labor provisions, for FCVS and for pension funds; v. Provision for guarantees and
other provisions - R$(2,468) million: provision for guarantees - sureties and guarantees and other
atypical provisions; saw. Amortization of Goodwill - R$(1,545) million: Amortization of goodwill for
expected future profitability, related to the atypical acquisition considering the history of other
acquisitions of the Organization.

187
c) Investment funds and portfolios The Organization manages investment funds and portfolios with net assets which, on December 31, 2020, amounted to R$1,023,287,047 thousand (R$1,000,818,236 thousand on December 31, 2019).
d) Consortium funds
R$ thousand
On December 31, 2020 On December 31, 2019
Monthly estimate of funds receivable from consortium members 639,242 670,865
Contributions payable by the group 35,489,135 35,317,947
Consortium members - assets to be included 31,182,122 31,268,865
Credits available to consortium members 7,069,000 6,251,300 b)
In units
On December 31, 2020 On December 31, 2019
Number of groups managed 3,436 3,537
Quantity of assets pending delivery 144,368 119,223
Quantity of total delivered assets 2,211,946 1,937,381
Quantity of total active consortium members 1,529,142 1,616,675
Quantity of total dropouts and cancellations 1,457,884 1,347,640
Default rate 3.38% 3.79%
In units
2nd semester Accrued on December 31, 2020
2020 2020 2019
Quantity of assets delivered in the period 107,627 199,544 230,237
Quantity of active consortium members in the period 149,496 217,741 189,539
Quantity of dropouts and cancellations in the period 143,989 208,867 204,443
e) In 2020, there were changes in the rules of compulsory collection as follows:
Description Previous Rule Current Rule
Resources from
Savings Deposits
Circular No. 3,975 of January 8, 2020 Regarding compulsory deposits required: - Rate of 20% on the basis of calculation determined; - Period of Transactions: Beginning on Monday of the second week following the period of calculation and ending on Friday of the same week.
Circular No. 4,033 of June 24, 2020 It amends Circular No. 3,975 to establish deduction on the chargeability of the compulsory collection from the operations below: - Balance of loan operations for financing of the working capital; - Balance of investments in Term Deposits with Special Guarantee (DPGE); - Period: Operations contracted and the investments made from June 22, 2020 to December 31, 2020; and - Limited to 30% of the chargeability of the compulsory collections.
Circular No. 3,975 of January 8, 2020 Art. 5 A - Deductions will apply to required payments related to loan operations for financing working capital for companies whose annual revenues are up to R$50 million, and the balances of investments in DPGE (Term Deposits with Special Guarantee) from institutions that do not pertain to the conglomerate itself.
Circular No. 4,035 of July 1, 2020 It amended Circular No. 3,975, including deductions on the collectability of the balance of interbank transfers made by cooperative banks to individual cooperatives that belong to this loan cooperative system in order to grant loan operations for financing working capital for companies with annual sales of up to R$50 million, excluding refinancing.
Time Deposits
Circular No. 3,916 of November 22, 2018 Regarding compulsory deposits required:
Circular No. 3,997 of April 6, 2020

188
- Rate of 17% on the basis of calculation determined; - Rate of 25% on the basis of calculation determined from the calculation period beginning on November 30, 2020 until December 4, 2020; - Period of Transactions: Beginning on Monday of the second week following the period of calculation and ending on Friday of the same week.
It amends Circular No. 3,916 and establishes deductions on the chargeability of the compulsory collection from the operations below: - 15% of the debit balance of funding granted by the Emergency Employment Support Program, MP No. 944 of April 3, 2020; Circular No. 4,001 of April 13, 2020 It amends Circular No. 3,916 and establishes deductions on the chargeability of the compulsory collection from the operations below: - Balance of Financial Bills of own issue repurchased by the issuing financial institution; - Limited to 15% of the chargeability of the compulsory collection.
Circular No. 3,993, of March 23, 2020 (Revoked) It amends Circular No. 3,916 Art. 4 - The chargeability of the compulsory collection is established by applying the following rates on the basis of calculation provisioned in Art. 3: I - 17% until the period of calculation, which starts on November 23, 2020 and ends on November 27, 2020; and II - 25% from the calculation period which starts on November 30, 2020 and ends on December 4, 2020.
BCB Resolution No. 21, of October 2, 2020
It amends Circular No. 3,916 "Art. 4 - The chargeability of the
compulsory collection is established by applying the
following rates on the basis of calculation provisioned in Art.
3:
I - 17% until the period of calculation which starts on March 15, 2021 and ends on March 19, 2021; and II - 20% from the calculation period which starts on March 22, 2021 and ends on March 26, 2021.
f) Since March 11, 2020 the World Health Organization (WHO) declared COVID-19, which originated in China at the end of 2019 and spread throughout the world, a pandemic resulting in a significant increase in the restrictions of national and international travel, downtime for many businesses and services in virtually all countries, government orders of social isolation to slow the spread of the virus, among other restrictions, generating an environment of strong financial volatility and increasing uncertainties, in addition to social, economic and employment instability. The COVID-19 pandemic has brought great challenges and uncertainties to the whole world, being considered the largest pandemic ever seen, according to the WHO. The crisis caused as a result of the pandemic can be observed from the beginning of March 2020 generating certain negative impacts on the Brazilian economy, such as (i) higher risk aversion, with pressures on the exchange rate; (ii) greater difficulties in foreign trade; and (iii) increase in the uncertainties of economic agents.
In order to mitigate the impacts of this crisis, governments and central banks around the world have intervened in the economy of their countries and have adopted unconventional measures, like the closing of non-essential economic activity and actions of monetary stimulus, with the practice of zero interest in addition to fiscal expansion. In Brazil, various measures have been adopted, including some directly impacting the liquidity of the financial markets, the credit markets, monetary and fiscal policy and exchange rates. In this context, in addition to the various measures taken by the Monetary Policy Committee (COPOM) and the Central Bank of Brazil, such as reducing the interest rate in August, 2020, to 2.0%, the National Monetary Council and the Federal Government approved, in extraordinary meetings, measures to help the Brazilian economy tackle the adverse effects caused by the virus, especially by means of:
March 16, 2020 Resolution No. 4,783/20, which reduced the minimum capital requirements, in
order to enhance the lending capacity of banks;
March 18, 2020 Resolution No. 4,784/20, which exempts banks from deducting from their capital,
the tax effects of transactions to hedge foreign currency for their participation in investments
189
abroad, one of the mechanisms used by banks to protect themselves against exchange rate
variations;
March 19, 2020 Circular No. 3,991/20, which temporarily removed the requirement for advance
notification of the amendment of the opening hours and compliance with the mandatory and
uninterrupted hours in the case of multiple banks, like ours;
March 23, 2020 Circular No. 3,993/20, which reduced the rate of compulsory deposits with the
Central Bank on time deposits, from 25% to 17%, and enhanced the rules for the Short-term
Liquidity Indicator (Liquidity Coverage Ratio – "LCR"). The aim of these measures is an
improvement of the liquidity conditions of the National Financial System;
March 23, 2020 Resolution No. 4,786/20, which aims to ensure the maintenance of adequate
levels of liquidity in the National Financial System, allowing the Central Bank of Brazil to grant loans
by means of the Special Temporary Liquidity Line ("LTEL"), regulated by Circular No. 3,994/20;
March 26, 2020 CMN Resolution No. 4,791/20 amends the Resolution No. 4,782 of March 16,
2020, which, in view of any potential impacts from COVID-19 on the economy, establishes
temporary criteria for characterizing the restructuring of loan operations for a determined period
of time in order to manage credit risk;
April 2, 2020 – Resolution No. 4,795/20, which authorizes the Central Bank of Brazil to grant loan
operations by means of a Temporary Special Line of Liquidity for the acquisition of a Financial
Letter of Credit with guarantee in financial assets or securities (LTEL-LFG);
April 6, 2020 – Circular No. 3,997/20 amends Circular No. 3,916, of November 22, 2018, which
defines and consolidates the rules of the compulsory deposits on term deposits, to establish
deduction of the chargeability of the compulsory collection of the financing granted in the scope
of the Emergency Employment Support Program, instituted by Provisional Measure No. 944, of
April 3, 2020;
April 9, 2020 Resolution No. 4,803/20, amended by Resolution No. 4,855/20, which adjusts the
criteria for the measurement of the provision for doubtful receivables from the renegotiated
operations by financial institutions and others authorized by the Central Bank of Brazil, due to the
COVID-19 pandemic. With this Resolution, the reclassification of the renegotiated operations
between March 1 and December 31, 2020 is permitted at the same level they were classified on
February 29, 2020;
April 13, 2020 – Circular No. 4,001/20 amends Circular No. 3,916, of November 22, 2018, which
defines and consolidates the rules of the compulsory deposits on term deposits, to establish
deduction of the chargeability of the compulsory collection from the portion of acquisition of
Financial Letters of Credit of own issue on the secondary Market;
May 25, 2020 – Resolution No. 4,820/20, which establishes, for a fixed term, prohibitions on the
payment of dividends and interest on shareholders’ equity, the increase in the remuneration of
the Management, the repurchasing of shares and the reduction of share capital, to be observed
by financial institutions and other institutions authorized to operate by the Central Bank of Brazil,
considering the potential effects of the pandemic of the coronavirus (COVID-19) on the National
Financial System;
June 23, 2020 – Circular No. 4,030/20 amends Circular No. 3,809, of August 25, 2016, which
establishes the procedures for the recognition of hedging instruments in the calculation of the
portion of the risk weighted assets (RWA) relating to exposure to credit risk subject to the
calculation of capital requirements through standardized approach (RWACPAD), which is
regulated by Resolution No. 4,193, of March 1, 2013;
June 24, 2020 – Circular No. 4,033/20 amends Circular No. 3,975, of January 8, 2020, instituting
the compulsory collection on resources of savings deposits, to establish deductions of the
chargeability of balance of loan operations for the financing of working capital and balance of
investments in Term Deposits with Special Guarantee (DPGE) of institutions not belonging to the
same conglomerate;
190
July 28, 2020 Law No. 14,031, which converts Provisional Measure No. 930, addresses the tax
treatment of foreign exchange gains or losses for an investment made by financial institutions and
other institutions authorized to operate by the Central Bank of Brazil in an affiliate, subsidiary,
branch or agency located abroad; amends Law No. 12,865 of October 9, 2013, which sets
provisions, among other matters, on payment arrangements and payment institutions that are
part of the Brazilian Payment System, and Law No. 12,249 of June 11, 2010, which sets provisions,
among other matters, on Financial Notes; as well as establishing other provisions;
July 30, 2020 CMN Resolution No. 4,843/20 extends emergency measures introduced by
Resolution No. 4,810 of April 30, 2020, which apply to procedures related to the concession,
control and oversight of rural loan operations resulting from the social distance measures adopted
to mitigate the impacts of the pandemic brought on by COVID-19;
July 30, 2020 CMN Resolution No. 4,840/20 modifies the maturity period for installment payments
of rural loan operations by borrowers whose activities were affected by the social distancing
measures associated with the COVID-19 pandemic, which is addressed in Section 22 (Defrayal and
investment operations hindered because of the social distancing measures adopted to mitigate
the impacts of the COVID-19 pandemic – Resolution No. 4,801/2020) of Chapter 18 (Renegotiation
of Debts from Rural Loan Operations) in the Manual de Crédito Rural – MCR (Rural Loan Manual);
and amends the time-line to enact an emergency situation or state of public calamity in
municipalities affected by drought for the purposes of renegotiating rural loan operations
addressed in Section 23 (Operations that incurred losses due to drought in municipalities declaring
a state of emergency or public calamity - Resolution No. 4,802/2020) of Chapter 18 (Renegotiation
of Debts Originating from Rural Loan Operations) from the MCR;
September 24, 2020 CMN Resolution No. 4,856/20, of September 24, 2020, amends the Resolution
No. 4,782 of March 16, 2020, which, in view of any potential impacts from COVID-19 on the
economy, establishes temporary criteria for characterizing the restructuring of loan operations for
a determined period of time in order to manage credit risk;
September 24, 2020 CMN Resolution No. 4,855/20, which regulates the criteria for the
measurement of allowance for loan losses of operations carried out within the scope of programs
instituted that are geared towards addressing the effects of the COVID-19 pandemic on the
economy; and
December 23, 2020 – CMN Resolution No. 4,885/20 amends the Resolution No. 4,820 of May 29,
2020, which establishes, for a fixed term, prohibitions on the payment of dividends and interest
on own capital, the increase in the remuneration of the Management, the repurchasing of shares
and the reduction of share capital to be observed by financial institutions and other institutions
authorized to operate by the Central Bank of Brazil, considering the potential effects of the
pandemic of the coronavirus (COVID-19) on the National Financial System.
In addition to the measures mentioned above, the Executive and Legislative Powers acted to approve
bills that minimize the repercussion of COVID-19, including proposing the temporary suspension of
taxes (such as the relaxation of the IOF on loans and the deferral of payment of PIS/COFINS) and
granting tax benefits to the sectors of the economy/workers most affected.
However, projections estimate that Brazil will face an economic downturn in 2020 with all the
ramifications in terms of business. Most of our operations occur in the domestic market and,
consequently, our result is significantly impacted by the local macroeconomic conditions.
We cannot control, and nor can we predict what measures or policies the government may adopt in
response to the current or future economic situation in Brazil, nor how the intervention or government
policies will affect the Brazilian economy and how they will affect our operations. Below we highlight
the main items of our statement of financial position which may potentially be impacted:
191
Financial instruments: whose market value may vary significantly given the price volatility of these assets, especially those issued by private companies that have a higher credit risk;
Loans: which we expect an increase in our level of arrears in the payment of loans, including loans that were renegotiated and extended in the context of the crisis, to the extent that the economic situation will deteriorate further, as well as facing significant challenges to take possession and realize the collateral resulting from guarantees related to loans in default;
Deferred tax assets: whose recoverability depends on future taxable profits, which may be affected depending on the consequences of the pandemic event if it extends over a long period of time;
Intangible assets: may have their recoverable amount impacted on the basis of the changes caused by the crisis to their main assumptions of realization, such as the rates of returns initially expected;
Funding: volatility, as well as uncertainties in credit and capital markets, generally reduces liquidity, which could result in an increase in the cost of funds for financial institutions, which may impact our ability to replace, appropriately and at reasonable costs, obligations that are maturing and/or the access to new resources to execute our growth strategy;
Technical provisions of insurance and pension resources: that depending on the evolution of the crisis can be impacted negatively given the possible increase in the level of claims, mainly in the "life" segment and a higher frequency of claims from "health" policyholders with the increased use of hospitals, furthermore, we may experience higher demand for early redemptions by pension plan participants, which would impact our revenues through a reduction in the management fees we charge; and
Civil and labor provisions: the number of labor lawsuits may increase as a result of third party suppliers that go bankrupt as Bradesco may be considered co-responsible in these lawsuits. It is also possible that we could experience a greater volume of civil processes, mainly involving reviews and contract renewals.
Our activities are operating at full capacity, since the beginning of the pandemic, and our actions have
taken into account the guidelines of the Ministry of Health. We have established a crisis committee
which is formed by the CEO, all the Vice-presidents and by the CRO (Chief Risk Officer), which meets
daily and reports periodically, to the Board of Directors, evaluations on the evolution of COVID-19 and
their reflections on the operations. In addition, we have a Risk Committee, which plays an important
role in verifying the various points and scope of these actions in the Organization. We lauched the
Business Continuity Plan (BCP) and in late March 2020, we intensified the internal/external actions, in
a consistent and timely manner, with the objective of minimizing the impacts involved, which we
highlight include:
giving leave to employees at-risk groups for an indefinite period of time;
increasing the number of employees working from home, with approximately 90% of our employees from the headquarters and offices and 50% of the branch employees working from home;
definition of the accompanying protocol, together with health professionals, for employees and family members who have symptoms of COVID-19;
intensification of the communication with our branches, providing guidance to our customers and employees about the prevention measures and the remote means of customer service;
making Covid-19 tests available to all employees for free; and
anticipation of the flu vaccine for all employees and dependents.
One of the main objectives of our risk management structure is to monitor the allocation of capital
and liquidity, aiming to maintain the levels of risk in accordance with the limits established and, in
addition, monitor the economic scenarios actively (national and international), as well as the evolution
of the COVID-19 pandemic and will make every effort to maintain the fullness of our operations, the
services to the population, and the stability of the national financial system.

192
We offer emergency lines of credit to companies, such as funds for financing of payrolls, as well as the
extension of the installments of loan operations to individuals for which the amounts in question, up
to the date of approval of these financial statements, were imaterial.
The measurements of the future financial and economic impacts related to the pandemic will continue to be assessed, although, they possess a certain level of uncertainty and depend on the development of the pandemic, since its duration or deterioration cannot yet be predicted, which could continue adversely affecting the global and local economy for an indefinite period of time, which negatively affects the results of financial institutions and, consequently, the performance of our operations.
g) Banco Bradesco communicated to the market, on May 6, 2019, the execution of the share purchase agreement with the controlling shareholders of BAC Florida Bank (“BAC Florida”), a bank that has offered various financial services in the United States for 46 years States, with emphasis on non-resident high-income individuals. The acquisition will cost approximately US$500 million. On September 10, 2019, the Central Bank authorized Bradesco to: (i) participate in up to 100% of the capital of BAC Florida Bank and its subsidiaries - the securities brokerage BAC Florida Investments Corp. and non-financial corporations BAC Global Advisors Inc., 5551 Luckett Road, Inc. and Representaciones Administrativas Internacionales S.A., the latter located in Guatemala and the others located in the USA. On October 8, 2020, all regulatory authorizations were obtained for the acquisition, by Bradesco, of 100% of the share capital of BAC Florida. With the end of the acquisition, on October 30, 2020, Bradesco: assumes the operations of BAC Florida, with the objective of expanding the offer of investments
in the USA to its high-income clients (Prime) and of the Private Bank, in addition to other banking services, such as checking account, credit card, and real estate financing; and
will have the opportunity to expand business related to corporate and institutional clients.
We present below the composition of the values of acquisition of BAC Florida and its subsidiaries and
goodwill in the acquisition of shares:
R$ thousand
Payment to BAC Florida 3,105,557
Payment Commission and Insurance 44,851
Total cost of acquisition 3,150,408
Shareholders’ equity acquired 1,398,083
Adjustments of shareholders of the parent (1) (13,033)
Shareholders’ equity adjusted 1,385,050
Goodwill on the acquisition of shares 1,765,358
(1) Adjustment of Provisions for expected losses associated with credit risk in accordance with Resolution No. 2,682/99.
Bradesco hired a specialized and independent company for the elaboration of the study of the
purchase price allocation ("PPA") for the initial allocation of the fair value of the assets acquired and
liabilities assumed by Bac Florida. Due to the complexity of operations and their relevance, the final
allocation may undergo changes and enhancements until the termination of the study, which is
estimated up to 12 months from the date of the respective acquisition.
We presented the main balances of the balance sheet on October 30, 2020, reference date for the
acquisition:

193
R$ thousand
BAC Florida Bank
Assets
Cash and due from banks 4,366,118
Financial instruments 10,468,202
- Securities and derivative financial instruments 1,209,024
- Loans 9,256,159
- Other financial instruments 3,019
Expected credit loss associated with credit risk (96,764)
- Loans (96,764)
Investments in Associates and Subsidiaries 56,863
Premises and Equipment 36,188
Depreciation Premises and Equipment (24,085)
Impairment of Assets Accumulated (5,970)
Other assets 347,742
Total Assets 15,148,294
Liabilities
Deposits and other financial liabilities 13,603,913
- Deposits from customers 12,952,310
- Securities issued 642,661
- Other financial liabilities 8,942
Other liabilities 136,713
Shareholders’ equity 1,407,668
Total 15,148,294
h) On January 15, 2020, Banco Bradesco announced that it sold the entire shareholding held in Chain Serviços e Contact Center S,A, (“Chain”) to Almaviva do Brasil Telemarketing e Informática S.A..
i) On January 27, 2020, Bradesco issued US$1,6 billion of senior notes in the international market, composed of two tranches of US$800 million, maturing in January 2023 and January 2025, with remuneration at fixed interest rates of 2.85% and 3.20% p.a., respectively.
j) On October 1, 2020, Cielo announced to the market that it signed a contract for the sale of all of its shares in Companhia Brasileira de Gestão de Serviços (“Orizon”), which represent 40.95% of Orizon's share capital, to Bradseg Participações SA for the amount of R$128,992 thousand. As shown in note 2, Bradseg Participações S.A. is 100% consolidated in these consolidated financial statements. The closing of the Transaction is subject to compliance with certain precedent conditions, including approval by the Central Bank of Brazil and the Administrative Council for Economic Defense – CADE.
k) On July 29, 2020, Law No. 14,031 was sanctioned, amending, from the fiscal year of 2021, the tax treatment incident on the exchange rate variation of the portion with risk coverage (hedge) of the value of the investment made by financial institutions and other institutions, authorized to operate by the Central Bank of Brazil, in a subsidiary, associated company, branch, branch office or branch domiciled abroad, registered in accordance with the regime of competence, which should be computed in determining the real income and on the base of the Social Contribution on Net Income (CSLL) of the investing legal entity, domiciled in Brazil, in the ratio of: (i) 50%, in 2021; and 100%, from the fiscal year of 2022.

194
Base Date January 19, 2021 Board of Directors Chairman Luiz Carlos Trabuco Cappi Vice Chairman Carlos Alberto Rodrigues Guilherme Members Denise Aguiar Alvarez Milton Matsumoto Alexandre da Silva Glüher Maurício Machado de Minas Samuel Monteiro dos Santos Junior - Independent Member Walter Luis Bernardes Albertoni - Independent Member * Paulo Roberto Simões da Cunha - Independent Member Board of Executive Officers Executive Officers Chief Executive Officer Octavio de Lazari Junior Executive Vice-Presidents Marcelo de Araújo Noronha André Rodrigues Cano Cassiano Ricardo Scarpelli Eurico Ramos Fabri Managing Officers Moacir Nachbar Junior Renato Ejnisman Walkiria Schirrmeister Marchetti Guilherme Muller Leal Rogério Pedro Câmara João Carlos Gomes da Silva Bruno D´Avila Melo Boetger Glaucimar Peticov José Ramos Rocha Neto Deputy Officers Antonio José da Barbara Edson Marcelo Moreto José Sérgio Bordin Leandro de Miranda Araujo Roberto de Jesus Paris Edilson Wiggers Department Officers Ademir Aparecido Correa Junior André Bernardino da Cruz Filho André Ferreira Gomes Antonio Carlos Melhado Antonio Daissuke Tokuriki Carlos Wagner Firetti Clayton Camacho Edilson Dias dos Reis Fernando Antônio Tenório Fernando Freiberger Fernando Honorato Barbosa José Augusto Ramalho Miranda José Gomes Fernandes Julio Cardoso Paixão Klayton Tomaz dos Santos Layette Lamartine Azevedo Júnior Leandro José Diniz Manoel Guedes de Araujo Neto Marcelo Santos Dall’Occo Marcio Henrique Araujo Parizotto Marcos Aparecido Galende Marlos Francisco de Souza Araujo Mauricio Gomes Maciel Oswaldo Tadeu Fernandes Paulo Eduardo Waack Roberto Medeiros Paula Officers *Adelmo Romero Perez Junior André David Marques Alexandre Cesar Pinheiro Quercia Alexandre Panico André Luis Duarte de Oliveira Carlos Alberto Alástico Carlos Henrique Villela Pedras Carlos Leibowicz *Carolina Salomão Fera Edmir José Domingues Francisco José Pereira Terra Jefferson Ricardo Romon José Leandro Borges Juliano Ribeiro Marcílio
Júlio Cesar Joaquim *Marcos Valério Tescarolo *Mateus Pagotto Yoshida Nairo José Martinelli Vidal Júnior Nilton Pereira dos Santos Junior Renata Geiser Mantarro Roberto França Romero Gomes de Albuquerque Rubia Becker Ruy Celso Rosa Filho Vasco Azevedo Regional Officers Alberto do Nascimento Lemos Altair Luiz Guarda Altair Naumann Amadeu Emilio Suter Neto André Vital Simoni Wanderley César Cabús Berenguer Silvany Deborah D’Avila Pereira Campani Santana Delvair Fidêncio de Lima Hebercley Magno dos Santos Lima José Flávio Ferreira Clemente José Roberto Guzela Marcos Daniel Boll Nelson Veiga Neto Paulo Roberto Andrade de Aguiar Rogerio Huffenbaecher Telma Maria dos Santos Calura Committees Subordinated to the Board of Directors Statutory Committees Audit Committee Alexandre da Silva Glüher - Coordinator Paulo Roberto Simões da Cunha – Financial Specialist Paulo Ricardo Satyro Bianchini José Luis Elias *Amaro Luiz de Oliveira Gomes Remuneration Committee Luiz Carlos Trabuco Cappi – Coordinator Carlos Alberto Rodrigues Guilherme Milton Matsumoto Fabio Augusto Iwasaki (Non-Manager) Non-Statutory Committees Ethics Integrity and Conduct Committee Carlos Alberto Rodrigues Guilherme - Coordinator Milton Matsumoto Alexandre da Silva Glüher Maurício Machado de Minas Octavio de Lazari Junior Marcelo de Araújo Noronha André Rodrigues Cano Moacir Nachbar Junior Glaucimar Peticov Clayton Camacho Edilson Wiggers Renata Geiser Mantarro Nairo José Martinelli Vidal Júnior Ivan Luiz Gonjito Junior Integrated Risk Management and Capital Allocation Committee André Rodrigues Cano – Coordinator Octavio de Lazari Junior Marcelo de Araújo Noronha Cassiano Ricardo Scarpelli Eurico Ramos Fabri Moacir Nachbar Junior Marlos Francisco de Souza Araujo Ivan Luiz Gonjito Junior Risk Committee Maurício Machado de Minas - Coordinator Carlos Alberto Rodrigues Guilherme André Rodrigues Cano Succession Planning and Nomination Committee Luiz Carlos Trabuco Cappi - Coordinator Carlos Alberto Rodrigues Guilherme Milton Matsumoto Octavio de Lazari Junior André Rodrigues Cano Glaucimar Peticov Sustainability and Diversity Committee André Rodrigues Cano - Coordinator Luiz Carlos Trabuco Cappi Carlos Alberto Rodrigues Guilherme
Milton Matsumoto Alexandre da Silva Glüher Maurício Machado de Minas Walter Luis Bernardes Albertoni Octavio de Lazari Junior Marcelo de Araújo Noronha Cassiano Ricardo Scarpelli Eurico Ramos Fabri Moacir Nachbar Junior Walkiria Schirrmeister Marchetti Glaucimar Peticov Edson Marcelo Moreto Leandro de Miranda Araujo Oswaldo Tadeu Fernandes Committee Subordinated to the Chief Executive Officer Disclosure Executive Committee Leandro de Miranda Araujo - Coordinator Octavio de Lazari Junior Marcelo de Araújo Noronha André Rodrigues Cano Cassiano Ricardo Scarpelli Eurico Ramos Fabri Moacir Nachbar Junior Antonio José da Barbara Carlos Wagner Firetti Marcelo Santos Dall’Occo Marcos Aparecido Galende Marlos Francisco de Souza Araujo Oswaldo Tadeu Fernandes Antonio Campanha Junior Ivan Luiz Gonjito Junior Fiscal Council Sitting Members Ariovaldo Pereira – Coordinator Cristiana Pereira Domingos Aparecido Maia José Maria Soares Nunes Ivanyra Maura de Medeiros Correia Deputy Members João Batista de Moraes Nilson Pinhal Renaud Roberto Teixeira Genival Francisco da Silva Reginaldo Ferreira Alexandre Ombudsman Department Nairo José Martinelli Vidal Júnior - Ombudsman
General Accounting Department Marcelo Santos Dall’Occo
Accountant – CRC 1SP160641/O-4
* Pending homologation by Bacen and possession

195
To Board of Directors and Shareholders of Banco Bradesco S,A, Osasco - SP Opinion We have audited the consolidated financial statements of Banco Bradesco S.A. (“Bradesco”), which comprise
the consolidated balance sheet as of December 31, 2020 and the respective consolidated income
statements, statements of comprehensive income, changes in shareholders’ equity and cash flows for the
six-month period and year then ended, as well as the related explanatory notes, including a summary of the
main accounting policies.
In our opinion, the accompanying consolidated financial statements present fairly, in all material respects,
the consolidated financial position of Banco Bradesco S.A. as of December 31, 2020, the consolidated
performance of its operations and its respective consolidated cash flows, for the six-month period and year
then ended, in accordance with the accounting practices adopted in Brazil applicable to institutions
authorized to operate by the Central Bank of Brazil.
Basis for opinion We conducted our audit in accordance with Brazilian and International Standards on Auditing (ISAs). Our
responsibilities under those standards, are further described in the “The Auditors’ responsibilities for the
audit of the consolidated financial statements” section of our report. We are independent of Bradesco and
its subsidiaries, in accordance with the ethical requirements established in the Accountant´s Professional
Ethics Code and the professional standards issued by the Federal Accounting Council, and we have fulfilled our
other ethical responsibilities in accordance with these requirements. We believe that the audit evidence we
have obtained is sufficient and appropriate to provide a basis for our opinion.
Key Audit Matters Key audit matters are those that, in our professional judgment, were of most significance in our audit of the
current year. These matters were treated in the context of our audit of the consolidated financial statements
as a whole, and in forming our opinion thereon, and, we do not express a separate opinion on these matters.
Evaluation of the measurement of the allowance for loan losses As disclosed in notes 3e and 10, Bradesco recorded a provision of R$ 45,202,191 thousand for allowance for loan losses (which comprise loans, leasing, advances on foreign exchange contracts and other receivables with credit characteristics) as of December 31, 2020. To determine the allowance for loan losses, Bradesco classifies credit operations in nine risk levels ("ratings"), taking into account factors and assumptions of customers and operations, such as economic and financial situation, indebtedness level, economic sector, collateral characteristics, late payments and other factors and assumptions provided for in CMN Resolution No. 2,682/99, with “AA” being the minimum risk and “H” being the maximum risk, applying the respective loss percentages established in such Resolution for each risk level. Additionally, Bradesco complements its estimates (supplementary provision) through internal evaluation based on statistical models that capture historical and prospective information, in order to reflect its expected losses in different economic scenarios (positive, expected and adverse). We consider the measurement of the allowance for loan losses as a key audit matter, due to the significant judgment, accentuated by the effects of the current economic situation resulting from the Covid-19 pandemic,

196
involved in the assessment of the assumptions used in the classification of loans operations and in determining the supplementary provision. How our audit approached this matter The primary procedures we performed to address the matter significant to our audit is summarized below. We tested the design and operational effectiveness of certain internal controls related to the processes of (i) development, approval and application of internal methodologies for assessing risk levels ("ratings") of clients that support the classification of operations; (ii) the definition, approval and application of the main assumptions used in assigning the ratings, including those related to the individual review of the credit risk analysis and the governance established for the respective approval. Additionally, for individually assessed clients, we analyze, based on sampling (by statistical criteria and specific items), the data that support the definition and review of customer ratings by Bradesco, such as the loan proposal, financial and registration information, restructuring operational and / or financial, guarantees and judicial reorganization plan, verifying the adherence of this rating assignment in relation to Bradesco's internal policies. For massively assessed clients, we tested the allocation of provisioning percentages according to the internal methodologies for assessing the risk levels of each client. We also evaluated the methodologies and assumptions used to determine the supplementary provision, which include Bradesco's assessment of the impacts generated by the Covid-19 pandemic, such as increased delinquency in certain sectors, increase in the unemployment rate, among others. We analyzed, by statistical sampling, the arithmetic calculation of the allowance for loan losses, considering the assessment of compliance with the requirements established by CMN Resolution No. 2,682/99, as minimum ratings in relation to days past due, assigning the worst rating for the same economic group and maintenance of the previous rating for cases of renegotiation / loan recovery. We also evaluated the disclosures made in the consolidated financial statements. Based on the evidence obtained through the procedures summarized above, we consider the measurement of the allowance for loan losses adequate, in the context of the consolidated financial statements taken as a whole for the six-month period and year ended December 31, 2020. Evaluation of the measurement of securities of private issuers As mentioned in notes 3d, 8 and 37a to the consolidated financial statements, the amount of securities of private issuers is R$ 146,763,941 thousand, which includes securities measured at market value, whose prices or market parameters are not observable (levels 2 and 3 of the fair value hierarchy). The determination of the market values of securities of private issuers, whose prices or market parameters are not observable, is subject to a greater level of uncertainty, as Bradesco makes significant judgments in determining the methods and assumptions used, such as interest rates and credit spreads. The securities of private issuers classified in the categories “Available for sale” and “Held to maturity” are also evaluated for indications of evidence of impairment, which also involves a high level of judgment in their determination considering the methodologies and assumptions used, such as assessing credit risk and guarantees. We consider the measurement of market value and the evaluation of indicative of impairment of securities of private issuers as a significant matter for our audit, due to the degree of judgment, accentuated by the current economic scenario of pandemic due to the Covid-19, involved in determining the methods and assumptions used. How our audit approached this matter The primary procedures we performed to address the matter significant to our audit is summarized below. We tested the design and operational effectiveness of certain internal controls related to the processes of (i) defining, approving and applying the models used to measure the market value of securities of private issuers;

197
(ii) capture of relevant data to measure the market value; (iii) evaluation of adherence to the calculations of the market value of certain financial instruments by independent department; (iv) definition and application of the assumptions used in the evaluation of the indicative of impairment of the securities of private issuers, such as the credit risk of the counterparty and the evaluation of guarantees. For a statistical sample of securities of private issuers, whose parameters for measuring market value are not observable, we evaluated, with the involvement of our pricing professionals of financial instruments with knowledge and experience in the sector, the models developed by Bradesco for the determination of market values, through the use of independent parameters. Additionally, based on sampling (by statistical criteria and specific items), we evaluate the assumptions considered in the analysis of the credit spread used in the pricing of certain financial instruments of private issuers, as well as those considered in the evaluation of the indicative and in the measurement of impairment, including the possible effects linked to the new pandemic scenario due to Covid-19, such as the increase in defaults in certain sectors, increase in the unemployment rate, among others. Our procedures also included the assessment of the disclosures made by Bradesco in the consolidated financial statements. Based on the evidence obtained through the procedures summarized above, we consider adequate the measurement of securities of private issuers, in the context of the consolidated financial statements taken as a whole for the six-month period and year ended December 31, 2020. Evaluation of the measurement of provisions and the disclosure of contingent liabilities - Tax, civil and labor As described in notes 3m and 22, Bradesco is defendant in lawsuits of tax, civil and labor nature, related to the normal course of its activities, with the respective provisions recorded in the consolidated financial statements in the amounts of R$ 8,271,112 thousand, R$ 9,092,421 thousand and R$ 6,890,498 thousand, respectively. For certain tax and civil lawsuits, such as those related to the legality and constitutionality of certain taxes, indemnity for moral and property damage, relating to banking products and services, insertion of information about debtors in the credit restrictions register, monetary correction adjustments of the balances savings accounts due to the implementation of economic plans by the Federal Government, and some other specific civil actions, it took significant judgment to determine the likelihood of loss and estimate the amount involved. For labor lawsuits, Bradesco used a model, based on data from similar lawsuits closed, segregating the lawsuits in relation to the entry date versus the date of implementation of the labor reform (Nov/2017), calculating the average loss for each group of lawsuits. We consider the measurement of provisions and the disclosure of contingent liabilities as a key audit matter. How our audit approached this matter The primary procedures we performed to address the matter significant to our audit is summarized below. We tested the design and operational effectiveness of certain internal controls related to the evaluation and measurement of the provisions and disclosures of contingent liabilities, including controls related to (i) the evaluation of information received from external and internal legal advisors on tax, civil and labor lawsuits; and (ii) evaluation of the models and assumptions used to measure the provision and contingent labor liabilities. For certain civil and tax lawsuits, we analyze the recognized provisions and the amounts disclosed, considering the assessment of internal and external legal advisors, as well as historical data and information/jurisprudence related to the lawsuits in question and other similar processes. We involved our tax professionals with knowledge and experience in the sector who assisted us in the assessment of certain tax processes in relation to technical merits and the supporting documentation for Bradesco's assessment of the likelihood and

198
estimate of loss. We involve our legal professionals with knowledge and experience in the sector who have helped us in the assessment of the likelihood of loss in certain specific civil cases. We obtained and evaluated the letters received directly from Bradesco's external legal advisors for tax lawsuits, which included an assessment of the likelihood of loss and an estimate of the amount of the loss, as well as assessments of the likelihood of loss and risk measurement received from internal legal advisors, for certain civil processes. We compared these assessments and estimates with those used by Bradesco and assessed the adequacy of the disclosures related to civil and tax contingencies in relation to these matters. For labor claims, the main procedures comprised: (i) evaluation of the model used by Bradesco, through the analysis of different simulated scenarios, comparing with the results obtained by the Bradesco model; (ii) analysis of the segregations used in the models, by the nature of the processes, including the time of entry (pre or post labor reform) and the author's characteristics (ex-employees or third parties); (iii) test on the mathematical precision of the calculations made by Bradesco to determine the provision for labor claims based on the loss history of the last years in similar cases. We also evaluated, for civil and labor claims, the sufficiency of the provision through the history of disbursement in relation to the respective provision amounts, intensifying the analyzes in relation to the understanding of specific cases that have diverged from the average of historical disbursements. Based on the evidence obtained through the procedures summarized above, we consider the measurement of provisions and the disclosure of tax, civil and labor contingent liabilities adequate, in the context of the consolidated financial statements taken as a whole for the six-month period and year ended on December 31, 2020. Assessment of the recoverability of deferred tax assets arising from carry-forward tax losses The consolidated financial statements include assets related to deferred tax assets arising from carry-forward tax losses in the amount of R$ 85,049,769 thousand (notes 3f and 36c) whose realization is based on estimates of future profitability. These projections are based on the business plans and budgets prepared by Bradesco, and require the adoption of a series of assumptions related to future events and conditions. Changes in certain assumptions about the future, such as interest rates, foreign exchange rates and applicable tax rates, could have a significant impact on projections and, consequently, on the recoverability of deferred tax assets arising from carry-forward tax losses. We consider the assessment of the recoverability of deferred tax assets arising from carry-forward tax losses as a key audit matter due to the degree of judgment necessary to evaluate the projections of future taxable profits and the main underlying key assumptions, especially accentuated of possible effects on the economic situation resulting from the Covid-19 pandemic. How our audit approached this matter The primary procedures we performed to address the matter significant to our audit is summarized below: We tested the design and operational effectiveness of certain internal controls over the Bradesco process to assess the recoverability of deferred tax assets arising from carry forward tax losses, including controls related to the development and approval of key assumptions for the budget and the final projections of taxable profits by Bradesco. We involved corporate finance professionals with knowledge and experience in the sector who assisted us on the assessment of assumptions, including growth rates for the main business lines, future interest rates, foreign exchange rates and applicable tax rates underlying Bradesco's projections of future taxable profits, including the possible effects on its projections of future taxable profits linked to the current economic situation resulting from the Covid-19 pandemic.
199
In addition, we tested the mathematical calculations included in the technical study of realization of the respective deferred tax assets and the disclosures made by Bradesco in the consolidated financial statements. Based on the evidence obtained through the procedures summarized above, we consider adequate the assessment of recoverability of deferred tax assets arising from carry forward tax losses in the context of the consolidated financial statements taken as a whole for the six-month period and year ended on December 31, 2020. Evaluation of the impairment testing of intangible assets As mentioned in notes 3i, 3k and 14, the consolidated financial statements include intangible assets, which comprise goodwill on the acquisition of investments in the amount of R$ 4,874,282 thousand and other intangible assets in the amount of R$ 4,151,613 thousand. Bradesco performs impairment tests at least annually or when there are events or circumstances that indicate that the book value may not be recoverable. As part of the impairment test of these assets, Bradesco estimated recoverable amounts of the relevant “CGU” Cash Generating Units and investments based on the present value of future cash flows. Future cash flow projections consider business plans and budgets and require a series of business and economic assumptions. We consider the evaluation of the impairment testing of intangible assets as a key audit matter, due to the high degree of subjectivity, especially accentuated by the current social and economic scenario resulting from the pandemic state due to Covid-19, in determining significant assumptions, including the growth rates for different businesses, revenue and expense flows, and the discount rates used. How our audit approached this matter The primary procedures we performed to address the matter significant to our audit is summarized below. We tested the design and operational effectiveness of certain internal controls over Bradesco's analysis of the impairment testing of intangible assets, including controls related to (i) review of the budget process; (ii) the development, review and approval of the key assumptions used in the analysis, such as growth rates and discount rates; and (iii) independent review of the calculation methodology to perform the impairment test. We involve our corporate finance professionals with knowledge and experience in the sector who assisted us in: (i) evaluating the assumptions used, such as growth rates used for different businesses, estimated revenue and expense flows, comparing them with information obtained from internal and external sources, including the possible effects on the premises generated by the current social and economic scenario resulting from the pandemic state due to Covid-19; (ii) evaluation of the discount rates used in the impairment test, comparing them with the discount rate ranges that were developed independently, using public market data available to comparable entities; (iii) evaluation of the adherence of the revised projections in relation to the realized cash flows; and (iv) evaluation of the mathematical precision of certain stages of the calculation of the present value. Our procedures also included the assessment of the disclosures made by Bradesco in the consolidated financial statements in relation to this matter. Based on the evidence obtained through the procedures summarized above, we consider the evaluation of the impairment testing of intangible assets adequate in the context of the consolidated financial statements taken as a whole for the six-month period and year ended December 31, 2020. Evaluation of the measurement of technical insurance and pension provisions As mentioned in notes 3m and 21a, Bradesco recorded technical provisions related to insurance and private pension contracts in the amount of R$ 276,035,411 thousand.

200
To measure the liability adequacy test and certain technical provisions, Bradesco uses actuarial techniques and methods that involve judgment in determining methodologies and assumptions that include, among others, expectation of claims, longevity, persistence, inflation of medical costs and discount rates. We consider the assessment of the measurement of the liability adequacy test and the technical provisions of insurance and private pension contracts as a key audit matter given the subjectivity and judgment, especially accentuated by the current social and economic scenario resulting from the pandemic state due to the Covid-19, necessary to evaluate the related methods and key assumptions. How our audit approached this matter The primary procedures we performed to address the matter significant to our audit is summarized below. We tested the design and operational effectiveness of certain internal controls related to the measurement processes of the liability adequacy test and technical provisions, related to (i) development and approval of actuarial methodologies and significant assumptions; and (ii) the approval and review of calculations. We involve actuarial professionals with knowledge and experience in the sector who have assisted us: (i) in the evaluation of methodologies and assumptions, such as claims expectation, longevity, persistence, inflation of medical costs and discount rates used in the measurement of technical provisions and the liability adequacy test, by comparison with practices used by the market and Bradesco's historical information, as well as assessing the possible impacts generated by the Covid-19 pandemic on such assumptions; (ii) to test, based on sampling and using a specific tool, the mathematical accuracy of technical provisions and the liability adequacy test; (iii) in determining, based on sampling and using a specific tool, an independent estimate of certain technical provisions, including the use of independent assumptions and generally accepted actuarial techniques; and (iv) in the assessment of claims projections made by Bradesco, by comparing historical estimates with subsequent payments made. Based on the evidence obtained through the procedures summarized above, we consider adequate the measurement of the liability adequacy test and the technical provisions for insurance and pension plans, in the context of the consolidated financial statements taken as a whole for the six-month period and year ended December 31, 2020. Application controls and general information technology controls Bradesco's technology environment has processes for managing access and changes in systems and applications, for developing new programs, besides automated controls and/or controls with automated components in the several relevant processes. In order to maintain its operations, Bradesco provides its employees with access to systems and applications, taking into account the duties performed by them and within its organizational structure. The controls to authorize, monitor, restrict and/or revoke the respective accesses to this environment aim to assure that the accesses and information updates are appropriately performed and by the appropriate professionals, to mitigate the potential risk of fraud or error arising from inappropriate access or change in a system or information, and to ensure the integrity of financial information and accounting records. We consider this area as significant for our audit due to Bradesco's high dependence on its technology systems, the high volume of transactions processed daily, and the importance of access controls and change management in its systems and applications to plan the nature, timing and extent of our audit procedures. How our audit approached this matter The primary procedures we performed to address the matter significant to our audit is summarized below.

201
With the assistance of our information technology professionals with experience and knowledge in the sector, we performed the following procedures:
(i) We tested the design and operational effectiveness of certain key access controls, such as authorizing new users, revoking disconnected users and reviewing active users;
(ii) We carry out tests, based on sampling, since we plan to rely on specific information, on information
extracted from certain systems, considered relevant for the purposes of preparing the consolidated financial statements;
(iii) In areas where, in our judgment, there is a high dependence on information technology, our tests
also included the assessment of password policies, security settings and controls on developments and changes in systems and applications;
(iv) When we identify key internal controls for the financial reporting process and other relevant
processes that are fully automated or with any component dependent on systems and applications, we test the design and operational effectiveness of these controls.
The evidence obtained through the procedures summarized above allowed us to consider application controls and general information technology controls to plan the nature, timing and extent of our audit procedures in the context of the consolidated financial statements taken as whole for the six-month period and year ended December 31, 2020. Other matters
Statement of added value The consolidated statement of added value for the six-month period and year ended December 31, 2020,
prepared under the responsibility of Bradesco's management, and presented as supplementary information
in relation to the accounting practices adopted in Brazil applicable to institutions authorized to operate by
the Central Bank of Brazil, was subjected to audit procedures performed in conjunction with the audit of
Bradesco's financial statements. For the purposes of forming our opinion, we assess whether these
statements are reconciled with the financial statements and accounting records, as applicable, and if their
form and content are in accordance with the criteria set forth in Technical Pronouncement CPC 09 -
Statement of Value Added. In our opinion, these consolidated statements of value added have been properly
prepared, in all material respects, in accordance with the criteria set forth in this Technical Pronouncement
and are consistent with the consolidated financial statements taken as a whole.
Individual financial statements Bradesco prepared a complete set of individual financial statements of Banco Bradesco S.A. for the six-month
period and year ended December 31, 2020 in accordance with accounting practices adopted in Brazil
applicable to institutions authorized to operate by the Central Bank of Brazil that were presented separately,
over which we issued a separate independent audit report, without any modification, dated February 03,
2021.
Other information that accompany the consolidated financial statements and the auditor report Bradesco’s management is responsible for the other information. The other information comprises the
Management´s Report.

202
Our opinion on the consolidated financial statements does not cover other information, and we do not
express any form of assurance conclusion thereon.
In connection with our audit of the consolidated financial statements, our responsibility is to read the other
information and, and, in doing so, consider whether the other information is materially inconsistent with the
consolidated financial statements or with our knowledge obtained in the audit, or otherwise appears to be
materially misstated. If, based on the work we have performed, we conclude that there is a material
misstatement of this other information, we are required to report that fact. We have nothing to report in
this regard.
Responsibilities of management and those in charge with governance for the consolidated financial statements Management is responsible for the preparation and fair presentation of the consolidated financial
statements in accordance with the accounting practices adopted in Brazil, applicable to institutions
authorized to operate by the Central Bank of Brazil, and the internal controls as management determines is
necessary to enable the preparation of consolidated financial statements that are free from material
misstatement whether due to fraud or error.
In preparing the consolidated financial statements, management is responsible for assessing Bradesco’s
ability to continue as going concern, disclosing, as applicable, matters related to going concern and using the
going concern basis of accounting, unless management either intends to liquidate Bradesco and its
subsidiaries or to cease operations, or there has no realistic alternative but to do so.
Those charged with governance are those responsible for overseeing Bradesco´s financial reporting process.
Auditors’ responsibilities for the audit of the consolidated financial statements Our objectives are to obtain reasonable assurance about whether the consolidated financial statements as a
whole are free from material misstatement, whether due to fraud or error, and to issue an auditor´s report
that includes our opinion. Reasonable assurance is a high level of assurance, but is not a guarantee that an
audit conducted in accordance with the Brazilian and International Standards on Auditing will always detect
a material misstatement when it exists. Misstatements can arise from fraud or error and are considered
material if, individually or in aggregate, they could reasonably be expected to influence the economic decisions
of users taken on the basis of these financial statements.
As part of an audit in accordance with the Brazilian and International Standards on Auditing, we exercise
professional judgment, and maintain professional skepticism throughout the audit. We also:
Identify and assess the risks of material misstatement of the consolidated financial statements, whether due to fraud or error, design and performed audit procedures responsive to those risks, and obtained audit evidence that is sufficient and appropriate to provide a basis for our opinion. The risk of not detecting material misstatement resulting from fraud is higher than for the one resulting from error, as fraud may involve collusion, forgery, intentional omission or misrepresentations, or the override of internal controls.
Obtain an understanding of internal control relevant to the audit to design audit procedures that are appropriate in the circumstances, but not for the purpose of expressing an opinion on the effectiveness of Bradesco and its subsidiaries internal control.

203
Evaluate the appropriateness of the accounting policies used and the reasonableness of accounting estimates and related disclosures made by Bradesco.
Conclude on the appropriateness of management’s use of the going concern basis of accounting, and, based on the audit evidence obtained, whether material uncertainty exists related to events or conditions that may cast significant doubt on Bradesco’s ability to continue as going concern. If we conclude that a material uncertainty exists, we are required to draw attention in our auditor’s report to the related disclosures in the consolidated financial statements, or if such disclosures are inadequate to modify our opinion. Our conclusions are based on the audit evidences obtained up to the date of our auditor’s report. However, future events or conditions may cause Bradesco and its subsidiaries to cease to continue as a going concern.
Evaluate the overall presentation, structure and content of the consolidated financial statements, including the disclosures and whether the consolidated financial statements represent the underlying transactions and events in a manner that achieves fair presentation.
Obtain sufficient appropriate audit evidence regarding the financial information of the entities or business activities within the Group to express an opinion on the consolidated financial statements. We are responsible for the direction, supervision and performance of group audit. We remain solely responsible for our audit opinion.
We communicate with those charged with governance regarding, among other matters, the planned scope
and timing and significant audit findings, including any significant deficiencies in internal control that we
identify during our audit.
We also provided those charged with governance with a statement that we have complied with the relevant
ethical requirements regarding independence, and communicate with them all relationships and other
matters that may reasonably be though to bear our independence, and where applicable, related safeguards.
From the matters communicated with those charged with governance, we determined those matters that
were of most significance in the audit of the consolidated financial statements of the current year, and are
therefore the key audit matters. We describe these matters in our auditor’s report, unless law or regulation
precludes public disclosure about the matters, or when, in extremely rare circumstances, we determine a
matter should not be communicated in our report because the adverse consequences of doing so would
reasonably be expected to outweigh the public interest benefit of such communication.
Osasco, February 03, 2021
KPMG Auditores Independentes
CRC 2SP-028567/F SP
Original report in Portuguese signed by
André Dala Pola
Accountant CRC 1SP214007/O-2
204
To the Board of Directors of the
BRADESCO ORGANIZATION
PRESENTATION The Statutory Audit Committee is a Body of a permanent nature, linked directly to the Board of Directors of
the Bradesco Organization, governed by Resolution No. 3,198/2004, of the National Monetary Council (CMN),
and other applicable regulations, among which is Law No. 6,404/76 – Lei das S/A (Corporation Law) and the
Sarbanes-Oxley Act for Companies registered in the U.S. Securities and Exchange Commission and listed on
the New York Stock Exchange, with its own Internal Regulation, available on the website
www.bradesco.com.br/ri, Corporate Governance area. Currently, the Audit Committee is composed of two (2)
Board Members and two (2) other Members. All the members meet the independence criteria set out in the
current legislation.
The Committee has the purpose of advising the Board of Directors on the exercise of its duties, acting primarily
regarding (i) the quality, transparency and integrity of the Individual and Consolidated Financial Statements;
(ii) the effectiveness of internal controls to mitigate the risks in relevant processes; and (iii) the assurance of
the independence and quality of the work of Independent and Internal Audits.
It is the responsibility of the Management and of the Independent Audit to ensure that the individual or
consolidated financial statements of the Bradesco Organization are complete and accurate, and are presented
in accordance with the practices adopted in Brazil issued by the Accounting Pronouncements Committee (CPC)
and with the International Financial Reporting Standards (IFRS) issued by the International Accounting
Standards Board (IASB).
DUTIES AND RESPONSIBILITIES
Management of Banco Bradesco and its Affiliated Companies
The Management is responsible: (i) for the definition and implementation of processes and procedures in
order to collect data for the preparation of the Financial Statements, in compliance with the corporate
legislation, with the accounting practices adopted in Brazil, in addition to those issued by the International
Accounting Standards Board (IASB), of normative acts relevant to the Securities and Exchange Commission
(CVM) and, due to Banco Bradesco being listed on the New York Stock Exchange, of the standards established
by the Securities and Exchange Commission (SEC) and by the Sarbanes-Oxley Act (SOx); (ii) for preparing and
ensuring the integrity of Financial Statements, managing risks, maintaining an effective system of internal
controls and ensuring compliance with the activities in accordance with the legal rules and regulations; and
(iii) for processes, policies and internal control procedures to ensure the safeguarding of assets, the timely
recognition of liabilities and the elimination or reduction in acceptable levels of risk factors.
Internal Audit
Area directly subordinated to the Board of Directors. It responds by conducting periodic assignments focused
on the main risks, wide and independently evaluating the actions of management of these risks and the
adequacy of internal controls and governance, contemplating the areas and activities that have risks that are
more sensitive to the operations and strategy of the Bradesco Organization.
In accordance with the existing regulations, the Audit Committee and the Board of Directors are responsible
for approving the Charter, the Work Plan and the Annual Report on the Activities of the Internal Audit.
205
Independent Audit
KPMG Auditores Independentes (KPMG) is responsible for the audit of the annual Financial Statements
published and for the revision of the Quarterly Information (ITRs) filed with the CVM, issuing reports that
reflect the results of their verifications and present their independent opinion regarding the reliability of the
Financial Statements in relation to the practices adopted in Brazil, issued by the Accounting Pronouncements
Committee (CPC) and with the International Financial Reporting Standards (IFRS) issued by the International
Accounting Standards Board (IASB), besides the adherence to the standards of the CVM, precepts of the
Brazilian corporation law and North American regulations applicable to Banco Bradesco.
Risk Monitoring – Internal Controls
The Integrated Risk Control Department (DCIR), linked to the Vice-Presidency of Risks, is responsible for
strengthening the corporate vision of risks through the identification, assessment, monitoring and
management of risks in conjunction with the various areas and companies of the Bradesco Organization.
The stated strategic management comprises the System of Internal Controls in the Bradesco Organization,
activities exercised by the Independent Unit of the commercial areas. During the year of 2020, we followed up
the work focused on the evaluation of the adherence of the System of Internal Controls and in the
identification, monitoring and management of the more relevant risks to which the Organization is exposed.
Compliance
The Compliance, Conduct and Ethics Department (DCCE) is responsible for supporting the Board of Directors,
the Audit Committee and the Board of Executive Officers in conducting a Corporate Conduct Program
(Compliance), which consists in the compliance with the internal and external laws and regulations, aligned
with the Organization’s strategy and its social surroundings.
It is also responsible for establishing standards and subsidizing the Areas in compliance with the issues related
to integrity, conflict of interests, ethics, and corporate/competitive/anti-corruption conducts.
Customer Call Center (SAC)
The monitoring of the performance of the Organization against the Rankings of Complaints is of competence
of the Ombudsmen of Banco Bradesco and the Grupo Bradesco Seguros, reporting the main events,
contributing with changes to the practices and routines to meet the expectations of clients and users.
To ensure the outcome and to stimulate the continuous improvement of processes, products and services,
the Ombudsmen interact with the Dependencies and Affiliated Companies, in addition to interacting with the
Regulatory Agencies and those of Consumer Rights and Protection.
The Audit Committee holds semiannual meetings with the Ombudsman Area (Bradesco and Grupo Bradesco
Seguros).
SUMMARY OF ACTIVITIES – YEAR OF 2020
The current and potential effects of the COVID-19 pandemic are difficult to assess and predict. In this sense,
we consider as important information (i) The direct and indirect effects on the Operating Income; (ii) Risks and
Uncertainties about the potential impact of the COVID-19 in the future, taking into account how recent events
may impact estimates and judgments relating to current and future accounting information; (iii) The potential

206
impact on the Operating Income, Liquidity and Capital Resources; and (iv) Procedures for the Audit Completion
or Review Procedures and other lines of controls impacted by the COVID-19 pandemic.
The Committee has participated in 218 meetings, especially those with the Board of Directors, Fiscal Council,
with executives from the Areas of Business, Information Technology, Internal Control, Compliance and Risk
Management, with the Internal and Independent Audit, and with the Central Bank of Brazil (Bacen).
In the scope of Continuing Education, the members of the Committee participated in congresses, seminars
and refresher and technical/professional development courses.
From the second half of March 2020, due to the recognition by the Federal Government of the COVID-19
pandemic in national territory, the Bradesco Organization decided to maintain an important number of
employees in the process of Home Office, in order to preserve the health of the people and maintain the
continuity of essential activities.
In this context, the Audit Committee planned to hold meetings with areas responsible for accounting, fiscal
and tax processes, as well as in the monitoring by the second and third Lines of Defense, in the scope of the
approach of Risks and Internal Controls. It also received Management Reports on the “Daily Monitoring of
Loan Operations and Delinquency”, “Portfolios - Trading and Banking”, “Liquidity” and “Limits”.
The Committee recognizes that the relevant and impacting issues, in particular the monitoring of Financial
Statements, were informed and discussed with the Management, safeguarding the criteria and procedures
adopted previously. Finally, the meetings were duly formalized in Minutes, and thus were presented:

207
The Work Plan of the Audit Committee, for the year of 2020, had as its focus the main processes and products
inherent to the Business of the Bradesco Organization. Among the aspects considered most relevant, we
highlight:
Allowance for Loan Losses: impairment – loan and advance portfolio, including guarantees, sureties
and debentures, with an emphasis on the Expectations of Future Losses in Mass-market and
Corporate Debt portfolios;
Fair value of Financial Instruments: measuring the fair value of derivative instruments, available-
for-sale securities and trading, safeguarding the criteria adopted for the valuation of the securities;
Provisions and Contingent Liabilities: integrity of the database, criteria adopted for the accounting
provisions and their respective sufficiency;
Recoverable Value of Assets – Tax Credits: with achievement supported by assumptions and
estimates of future profitability based on the business plan and budget prepared by the
Management;
Technical Provisions from Insurance, Pension Plans and Capitalization Bonds: premises in adherence
to the Actuarial Technical Notes and Pledged Assets (linked to bonds and securities);
Customer Relationship: regulatory compliance in meeting the customer service standards
(Customer Service – SAC/Ombudsman), Prevention of Money Laundering (PLD) and the
Concentration Agreement – Administrative Council for Economic Defense (CADE), Central Bank of
Brazil (Bacen), and the Protection and Consumer Rights Program (Procon) –commitment signed at
the time of acquisition of HSBC;
Management of Loan Portfolios: evolution of different loan portfolios in the face of the economic
framework impacted by the COVID-19 pandemic, renewals, recoveries and concession of new
credits;
Compliance: effectiveness of structures responsible for ensuring compliance with the laws, rules
and regulations applicable to the business;
Prevention of Money Laundering and Terrorism Financing: continuous improvement in the
management of the Prevention of Money Laundering process based on the results of the regular
inspections of the Internal and External Bodies, in the best practices of management
(methodologies, tools and people), allowing the work of Corporate Security to be conducted with
a centralized view of analysis and clearance considering the higher risk financial transactions
occurring in the Business deals and in current accounts;
Internal Control System: effective action of the first three lines of defense as to the responsibility
of each one in the improvement of the controls adopted, aiming to mitigate the risks inherent to
the business processes;
Access Management - Information Security: the Audit Committee kept the subject under focus
through meetings with the Board of Directors, managing departments and KPMG itself in order to
monitor the effectiveness of the implementation of security procedures for access to information.

208
General and applications controls of information technology: change management, security (logical
and physical), computing operation and registry, analysis and resolution of incidents and problems;
Cyber Security Process: continuous follow-up of security measures, mitigating the associated risks;
and
Technology Innovation: Open Banking, Startups, Fintechs, among others.
Internal Audit
To allow the effective and appropriate monitoring of the activities performed by the Internal Audit, in
adherence to the regulations in force, the Audit Committee received information of the highlights of the work
carried out, by means of reports and executive overviews, and periodic meetings were also part of the work
of the Committee with the Internal Audit.
Upon acknowledgement of the focal points and recommendations, the Audit Committee has followed the
remedial measures taken by the Management with the areas audited.
Annually, the function of Internal Audit is submitted to a process of technical evaluation conducted by the
Audit Committee, whose results are discussed with the Board of the Internal Audit. This practice of evaluation
is one of the important items in the maintenance of the Quality Certification Program of the Institute of
Internal Auditors (IIA), which envisages the continuous improvement of the management of the processes in
this Area and in the adoption of best practices (methodologies, tools and management).
The Internal Audit has responded adequately to the demands of the Audit Committee and to the needs and
requirements of the Organization and the Regulatory Agencies.
Independent Audit
With respect to the audits of the Financial Statements of Banco Bradesco and Affiliated Companies performed
in the year of 2020, conducted by KPMG Auditores Independentes (KPMG), the teams responsible for the
assignment presented the results and main conclusions to the Audit Committee in a timely manner.
The highlight is the procedure of this Committee, upon acknowledging the relevant aspects involving the
evaluation of the accounting systems and internal controls, drawn up in connection with the audits of the
Financial Statements, to monitor the implementation of the respective recommendations for the
improvement of processes, systems and risk mitigation.
The Audit Committee has evaluated the proposals presented by KPMG to perform “Other Services”, whereas
conflicts of interest, risk of loss of independence or objectivity were not identified.
Based on the planning submitted by the Independent Auditors, in subsequent discussions about the results of
the assignments and the formal process of “Technical Evaluation of the Independent Audit”, the Committee
considers that the assignments were adequate to the business of the Organization.
Monitoring: Risks, Internal Controls and Compliance

209
In the meetings in the year of 2020 with the Area responsible for the Integrated Risk Control (DCIR) and other
correlated departments of the Bradesco Organization, issues regarding the Matrix of Corporate Risks were
dealt with.
For the Market Risks and Liquidity, the Audit Committee, through the weekly reports received, monitors the
results of the Trading Portfolio and the limits established by governance for the corresponding Value at Risk
(VARs), Liquidity Coverage Ratio (LCR) and Minimum Liquidity Reserve (RML) – Securities Brokers and Grupo
Bradesco Seguros. The main exposures in currencies, indexes and assets are also reported to the Audit
Committee, including the Banking Portfolio with the correspondent Economic Value of Equity (∆EVE).
For the Credit Risks, the Committee met with the Areas of Integrated Risk Control, Credit Recovery and Loan
in a monthly basis in order to assess the evolution of the main Loan Portfolios, delinquency levels by
individuals, companies and their respective segments, as well as by modalities and sectors of the economy. In
these meetings, verifications were made as to the sufficiency of provision, concentration levels and
approaches for credit recovery with an emphasis on the Expectations of Future Losses in Mass-market
portfolios and movement of the Corporate Debt Ratings.
The Audit Committee monitored the work of the Integrated Risk Control Department (DCIR) in the evaluation
of adherence to the Internal Control System and in the identification, monitoring, and management of the
more relevant risks.
Extensive follow-up of the activities and results of the assignments of the Compliance, Conduct and Ethics
Department (DCCE).
The evaluations were completed at the time of the meetings with the various business and control areas, with
the Independent and Internal Audits, in the monitoring of the main processes, and Management’s
commitment to act to mitigate risks, and in the continuous improvement of the associated internal controls.
Assumptions that allowed the Audit Committee to recognize that the activities carried out in the context of Risks,
Compliance and of Corporate Internal Control System are properly routed, considering the size and complexity
of the Organization and record as positive, the efforts that have been made to guarantee the efficiency of its
operations, of information that generate the financial reports, as well as the compliance with internal and
external standards to which the transactions are subjected.
Customer Call Center (SAC)
In the meetings of the Ombudsman Area (Bradesco and Grupo Bradesco Seguros) with the Audit Committee,
specific situations of complaints via the various Whistle Blowing Channels available were addressed. Details
presented regarding the current standardized and practiced procedures in disagreement to such guidelines,
with a record of actions sent to Business managers involved with the theme of rectifying such anomalies, which
allow, corporately, the improvement of processes and the acculturation of Areas in the marketing of Products
and Services of the Bradesco Organization.
Financial Statements of Banco Bradesco and Affiliated Companies
Via WebEx and Microsoft Teams, the Committee met with the General Accounting (CG), Controllership, Grupo
Bradesco Seguros, Integrated Risk Control (DCIR), Internal Audit (IGL) and Independent Audit (KPMG) to assess
the Financial Statements of the year of 2020, the occasion in which the aspects of preparation of Balance
Sheets and Individual and Consolidated Balance Sheets, the Explanatory Notes and the Financial Reports
published were verified.
210
The accounting practices adopted were also examined in accordance with the regulations in Brazil, including
those issued by the responsible supervisory authorities – Central Bank of Brazil (Bacen), Superintendence of
Private Insurance (SUSEP), Securities and Exchange Commission (CVM) and National Supplementary Health
Agency (ANS). The Committee reviewed the procedures for the preparation and disclosure of the consolidated
financial statements prepared in accordance with standards issued by the International Accounting Standards
Board (IASB).
Before the disclosure of the Quarterly Information (ITRs) and the Balance Sheet of December 31, 2020, the
Committee met with KPMG to assess the aspects of independence of auditors and the control environment in
generating the figures for disclosure.
By recommendation of the Audit Committee, the main joint-stock companies in the Bradesco Conglomerate
and the Grupo Bradesco Seguros in their Consolidated, published their Financial Statements together with the
Audit Reports, including the Key Audit Matters (PAAs).
The Audit Committee held a quarterly meeting with the Board of Directors, and a semiannual meeting with
the Fiscal Council, in which it presented the results of the work of its activities.
CONCLUSION
Based on the work, evaluations, reviews, and discussions mentioned above, and taking into account the
context and scope of its duties, regardless of the need for behavioral changes and processes arising from the
COVID-19 pandemic, the Audit Committee on recognizing that all the relevant issues that they were presented
with are adequately disclosed in the Financial Statements and Financial Reports for the Balance Sheet ended on
December 31, 2020, accompanied by the Report of the Independent Auditors issued with no exceptions,
recommends to the Board of Directors the approval of the mentioned Financial Statements.
Cidade de Deus, Osasco, SP, February 2, 2021
AUDIT COMMITTEE
ALEXANDRE DA SILVA GLÜHER
(Coordinator)
PAULO ROBERTO S. DA CUNHA
(Financial Specialist)
PAULO RICARDO S. BIANCHINI
(Member)
JOSÉ LUIS ELIAS
(Member)

211
The Fiscal Council’s members, in the exercise of their legal and statutory attributes,
have examined the Management Report and the Financial Statements of Banco Bradesco S.A. (Bradesco),
related to the fiscal year ended on December 31, 2020 and, based on: (i) the Independent Auditors’ Report on
that date; (ii) the meetings with Independent Auditors; (iii) the reports of the Bradesco’s Audit Committee; (iv)
the document analysis and, substantially, the information received; and (v) the regular meetings with
managers of Bradesco’s various areas, came to the conclusion that the stated documents examined properly
reflect the assets, financial status and activities developed by Bradesco during the fiscal year ended on
December 31, 2020, supporting the Audit Committee’s opinion that the internal control is appropriate to the
size and complexity of the business, which is structured around internal and external regulations and
supported by systems that allow for financial reports, aiming to ensure operating efficiency.
In view of the report, the Fiscal Council’s members are of the opinion that the stated
documents examined are ready to be reviewed by the shareholders at the next Bradesco’s Annual
Shareholders’ Meeting.
Cidade de Deus, Osasco, SP, February 3, 2021
Ariovaldo Pereira
Domingos Aparecido Maia
José Maria Soares Nunes
Ivanyra Maura de Medeiros Correia
Cristiana Pereira
For further information, please contact:
Leandro Miranda
Executive Deputy Officer and Investor Relations Officer
Carlos Wagner Firetti
Market Relations Department
Phone: (11) 2194-0922
Cidade de Deus, s/n - Prédio Vermelho – 3rd floor
Osasco-SP
Brazil
banco.bradesco/ri