Impact of Energy Crisis on Economic Growth of Pakistan - CORE
Upload
khangminh22Category
view
3download
0
March 31, 2005
Document of the World BankR
eport N
o. 2
9373-PA
KPakistan
Punjab
Econom
ic Rep
ort
Report No. 29373-PAK
PakistanPunjab Economic Report
Towards a Medium-Term Development Strategy
����������������������� Poverty Reduction and Economic Management Unit South Asia Region
�������������������������������������������������������������������������������������������Government of the Punjab
Pub
lic D
iscl
osur
e A
utho
rized
Pub
lic D
iscl
osur
e A
utho
rized
Pub
lic D
iscl
osur
e A
utho
rized
Pub
lic D
iscl
osur
e A
utho
rized
Pub
lic D
iscl
osur
e A
utho
rized
Pub
lic D
iscl
osur
e A
utho
rized
Pub
lic D
iscl
osur
e A
utho
rized
Pub
lic D
iscl
osur
e A
utho
rized


TABLE OF CONTENTS
EXECUTIVE SUMMARY ........................................................................................................... 7
CHAPTER 1: THE CHALLENGE AND THE ISSUES .......................................................... 15 1. 1 CHARACTERISTICS OF INCOME ........................................................................................... 15 1.2 THE POVERTY CHALLENGE ................................................................................................. 18 1.3 CHARACTERISTICS OF THE LABOR FORCE .......................................................................... 20
CHAPTER 2: PROMOTING JOB-CREATION IN THE NON-FARM SECTOR .............. 24 2.1 DEVISING A GROWTH STRATEGY FOR SMALL AND MEDIUM ENTERPRISES ....................... 24
2.3 STIMULATING FASTER GROWTH IN THE CONSTRUCTION SECTOR ..................................... 35 2.4 IMPROVING THE SYSTEM OF LAND-TITLING IN THE PUNJAB .............................................. 37
2.6 TOWARDS BETTER STRATEGIES TO ACCELERATE GROWTH OF THE SERVICES SECTOR .... 43
CHAPTER 3: ACCELERATING GROWTH IN THE AGRICULTURE SECTOR ........... 43
1.4 THE EMPLOYMENT AND GROWTH CHALLENGE ................................................................. 21
2.2 IMPROVING THE BUSINESS ENVIRONMENT FOR FIRMS ....................................................... 28
2.5 PROMOTING THE DEVELOPMENT OF CITIES AS GROWTH ENGINES .................................... 39
3.1 RECENT SECTOR PERFORMANCE AND PRIORITIES FOR PUBLIC POLICY ............................. 43 3.2 RAISING THE LEVEL AND EFFICACY OF PUBLIC EXPENDITURES ........................................ 46 3.3 AGRICULTURAL PRICES AND OUTPUT MARKETS ............................................................... 48 3.4 MODERNIZING WHOLESALE MARKETS ................................................................................ 5 1 3.5 FACTOR MARKETS FOR LAND AND WATER: ....................................................................... 54 3.6 UPGRADING THE AGRICULTURE INNOVATION SYSTEM: .................................................... 58
CHAPTER 4: IMPROVING SERVICE DELIVERY AND SOCIAL OUTCOMES ............ 63 4.1 THE STATE OF EDUCATION AND HEALTH IN THE PUNJAB .................................................. 63 4.2 THE ROLE OF PUBLIC SERVICES ........................................................................................... 66 4.3 ACCOUNTABILITY OF POLICYMAKERS AND PROVIDERS: ................................................... 73 4.4 THE ROLE OF THE PROVINCIAL GOVERNMENT UNDER DECENTRALIZATION ..................... 81 4.5 BETTER INFORMATION IS CRITICAL .................................................................................... 85
CHAPTER 5: IMPROVING PROVINCIAL FINANCES FOR DEVELOPMENT ............. 89
5.1 A FISCAL PROBLEM OF A DIFFERENT K~ND ........................................................................ 90 5.2 ADDRESSING THE PROBLEM ................................................................................................ 95 5.3 MOVING FORWARD ........................................................................................................... 101
APPENDIX: A NOTE ON ESTIMATION OF PROVINCIAL GDP: 1990/91-2001/02 .... 105
REFERENCES ........................................................................................................................... 115 STATISTICAL APPENDIX ..................................................................................................... 117
3


LIST OF FIGURES AND TABLES
T.4BLE 1.1: GROWTH RATE OF REAL GDP: PUNJAB AND PAKISTAN: 1991/92 - 2001/02 ..................................... 16 TABLE 1.2: POVERTY TRENDS: ALL-PAKISTAN AND PUSJAB: 1983/84 - 2001/02 .................................................. 18 TABLE 1.3: EXPENDITURE AND URBANIZATION IN PUNJAB, BY DECILE: 2001 /02 .................... TABLE 1.4: POVERTY AND VULNERABILITY IN PUNJAB: 2001/02 ..................... TABLE 1.5: POVERTY HEADCOUNT RATE: REGIONS OF PUNJAB: 1998/99 - 2001 /02 TABLE 1.6: EMPLOYMENT BY GENDER AND PUBLIC/PRIVATE: 2001/02 .................................................................. 20 TABLE 1.7: EMPLOYMENT BY SECTOR, GENDER, AND SIZE OF FIRM: 2001 /o TABLE 1.8: EMPLOYMENT IN PUNJAB BY hhJOR INDUSTRY DIVISION: 1993/
TABLE 1.10: SIZE OF THE CIVILIAN LABOR FORCE IN THE PUNJAB: 1984/85 - 2001/02 TABLE 1.9: CHANGE IN MEDIAN EARNINGS: PUNJAB AND PAKISTAN: 1993/ ................................. 21
TABLE 2.1: COMPOSITION OF THE EMPLOYED LABOR FORCE IN THE PUNJAB: 1984/85 . 2001/02 ................... 24
TABLE 3.1: AGIIICULTUIW, EXPENDITURES IN PROVINCIAL AGGDP: 1990/91 . 2001/02 ................................ 47
TABLE 4.1: SELECTED EDUCATION INDICATORS FOR PUNJAB AND PAI<ISTAN: 2001 /02 ...................................... 63 TABLE 4.2: hhRGINAL EFFECTS ON THE PROBABILITY OF ATTENDING SCHOOL FORAGES 6-14: 1999/00 .... 67 TABLE 4.3: EDUCATIONAL ENROLLMENTS IN PUNJAB BY CONSUMPTION GROUP: 2001/02 ................................ 69 TABLE 4.4: DETERMINANTS OF HEALTH STATUS IN PhI<ISTAN: 1990/91 .................................................................. 71
TABLE 5.1: PUNJAB FISCAL ACCOUNTS: 19941’95 . 2003/04 ............. 89 TABLE 5.2: PUNJAB PROVINCIAL EXPENDITURE . OBJECT CLASSIFICATION: 1999/00 . 2002/03 ...................... 92 TABLE 5.3: ACCUMULATION OF PROVINCIAL PROVIDENT FUND LIABILITIES: TABLE 5.4: PUNJAB MID-TE~M FISCAL FRAMEWON<: 2002/03-2005/06 1’ ....... TABLE 5.5: PROVINCIAL CURRENT EXPENDITURES: 2003/04 - 2006/07 .................................................................. 98 TABLE 5.6: MAIN COMPONENTS OF THE PUNJAB GOVERNMENT’S DEBT: 1971/72 - 2002/03 TABLE 5.7: COST AND COMPOSITION OF THE PUNJAB’S OUTSTANDING DEBT: JUNE 2003 .................................. 99
FIGURE 1.1: COMPOSITION OF GROSS DOMESTIC PRODUCT IN 2001/02: PUNJAB AND PAKISTAN ..................... 16 FIGURE 1.2: GROWTH-INCIDENCE CURVE FOR PUNJAB: 1984/85 TO 2001/02 ........................................................ 17 FIGURE 1.3: UNEMPLOYMENT IN THE PUNJAB: 1984/85 - 2001/02 ........................................................................... 22
FIGURE 2.1: INVESTMENT OBSTACLES FACED BY FORMAL FIILMS . THE PUNJAB vs . OTHER PROVINCES .......... 28 FIGURE 2.2: INVESTMENT OBSTACLES IN THE PUNJAB - FORMAL v s . INFORMAL F I ~ ~ ~ s ....................................... 29 FIGURE 2.3: SOURCES OF WORKING CAPITAL FOR FOR~~AL FIIWS IN THE PUNJAB ............................................... 30
FIGURE 3.1: PUBLIC EXPENDITURES ON AGRICULTURE: PUNJAB v s . OTHER COUNTRIES: 2000 ......................... 46 FIGURE 3.2. REAL TRANSPORT AND HANDLING COSTS FOR WHEAT IN PUNJAB: 1996/97 - 2002/03 ............... 49 FIGURE 3.3: IRRIGATION DEPARTMENT REVENUES AND EXPENDITURES: 1970/71 - 2001 /02 .......................... 56
FIGURE 4.1: GROSS ENROLLMENT RATES BY PROVINCE: 1995/96 . 2001/02 ...
FIGURE 4.3: hfORTALITY RATES OF CHILDREN UNDER 2 M I S . BY HOUSEHOLD FIGURE 4.2: ENROLLMENT RATES IN THE PUNJAB BY INCOME, GENDER. AID
....................... 65 FIGURE 4.4: FORMATION OF PRIVATE SCHOOLS IN PUNJAB: 1970 - 2000 FIGURE 4.5:PERCENT OF HOUSEHOLDSWHO USUALLYUSE GOVERNMENT HEALTH FACILITIES ...................... 72 FIGURE 4.6: RELATIONSHIPS OF ACCOUNTABILITY IN SERVICE DELIVERY .............................................................. 73 FIGURE 4.7: FRAMEWORK FOR POLICY. PLANNING &BUDGETING IN THE PUNJAB 80 FIGURE 4.8: RELATIONSHIPS OF ACCOUNTABILITY IN DECENTRALIZED SETTINGS ................................................ 82
FIGURE 5.1: TRENDS IN PROVINCIAL PENSION PAYhlENTS: 1990/91 . 2003/04 ..................................................... 94 FIGURE 5.2: PROVINCIAL OWN REVENUE: 1994/95 . 2003/04 ................................................................................... 96
5

PREFACE AND ACKNOWLEDGEMENTS
This r e p o r t i s a joint p roduc t o f a team from the Governmen t o f the Punjab, the World Bank,
the Asian Deve lopmen t B a n k (ADB), and the Depar tment fo r In ternat ional Deve lopmen t (DFID) o f the G o v e r n m e n t o f the U n i t e d K i n g d o m . In December 2003, the Punjab Ch ie f Minister
consti tuted a counterpart team o f government officials, who were closely i nvo l ved in the report's
preparation. This team was headed by Mr. J a h a n p I G a n Tareen, Advisor to the Ch ie f Mln is ter
Punjab, a n d Mr. Suleman Ghani, Chai rman o f the Planning and Deve lopmen t Board, and inc luded
the Secretaries o f Finance, Planning, Communicat ion & Works, Education, Health, Irrigation,
Industries, a n d Agr icu l ture Departments, and the Punjab Resource Management Program Of f ice.
T h e repo r t was prepared by Salman Zaid~, I a a l i d Ikram, and H a n i d M u k h t a r in the Pover ty
Reduct ion a n d E c o n o m i c Management (PREM) unit o f the World Bank's South Asia Region, under
the guidance o f Manuela Ferro, L e a d Economist , I jaz Nabi , Sector Manager, and John Wall, Country D i rec to r . T h e - t e a m from the Asian Deve lopmen t B a n k compr ised N a v e d H a m i d , Safiya Af tab, and
Jacob Gu l lman . T h e DFID team inc luded Jackie Charlton, H a r o o n Sharif, a n d M a r k Poston. T h e
peer reviewers were Deepak Ahluwalia, Ron H o o d , and Fa r rukh I q b a l (World Bank), and Paul
Heytens a n d Rainer H a r t e l (ADB).
T h e repo r t draws upon contr ibutions from Rasmus He l tbe rg (poverty, employment), Shaheen
M a l i k (provincial GDP estimates), Shahid Karda r (construction, l a n d titling, city strategy, and
deregulation), D e r e k Byerlee, M u b a r i k Ali, Lit-e Ersado, and Asad A l e e m (agriculture), M a r k D u t z
and Anton Dobronogov (investment c h a t e ) , Soraya G o g a (city strategy), Jef f H a m m e r (service
delivery), I<ai Kaiser and I G a l i d Rashid (local government revenue potential), N i c k M a n n i n g and
Zah id Hasnain (devolution), Jacob G u l l m a n (background i n f o r m a t i o n a n d overview), and Tim Wdliamson, Masroo r Ahmad , and Samantha Smith (devolut ion and service delivery in the Punjab).
M u h a m m a d Shafiq, Nasreen Shah Kazmi , The lma Rutledge, and Shahnaz Rana p rov ided invaluable
assistance in handl ing a l l logistical arrangements for the mission, and with processing the repor t .
T h e repo r t team benef i ted greatly from collaborative work with the Governmen t o f the Punjab
counterpart team during three preparation m i s s i o n s (December 2003, February and M a y 2004). T h e
counterpart team coord inated a l l government inputs, a n d p r o v i d e d comments, feedback, and
guidance to the study team at al l stages of the analysis a n d repo r t preparation, and helped facllitate
interaction with other l ine departments. W e are grateful to SMEDA staf f for generously mak ing
available to the team various recent sector studles and reports. Finally, w e would also l ike to thank
other experts who shared their insights in the course o f preparation o f t h i s report, especially Kaiser
Bengali, A k m a l Hussain, a n d A.R. Kema l .
6


EXECUTIVE SUMMARY
1. T h e objective o f the repo r t i s to p rov ide an analytical and pol icy underp inn ing for the Punjab’s development strategy. Our starting point i s the Governmen t o f the Punjab’s enunciat ion o f the m a i n elements o f i t s economic strategy. This strategy will rest on f ive pdlars: (i) improving governance; (ii) reforming the fiscal and financial management system; (iii) creating a m o r e support ive environment for private sector-led growth; (iv) improving the delivery o f publ ic services; and (v) addressing the prov inc ia l economy’s vulnerabi l i ty to shocks.
2. Taken together, these elements add up t o a strategy that i s occupied not only with increasing output, but also encompasses i tems such as education, health, i m p r o v e d governance, a n d protect ion of the environment. T h e overr id ing concern i s t o provide a better l i f e for the province’s citizens.
3. In the short- to medmm-term, the p rov i s ion o f a better l i fe to the Punjab’s citizens depends essentially on two considerations. First, incomes must b e increased; second, the delivery o f publ ic services must b e improved.
4. In a marke t economy, incomes depend main ly upon product ive employment, i nc ludmg self- employment. Thus, the f i v s t imperative for the Governmen t o f the Punjab i s to expand the number o f jobs. How m a n y jobs will have to b e created? T h e labor force in 2001/02 was 27 d o n , of w h i c h an estimated 8.5 percent were unemployed. As a result o f the rap id growth o f the populat ion, the labor force in the nex t decade i s l ikely to grow at 3 percent pe r annum, w e l l above the 2.7 percent annual growth registered in the previous decade. I f the objective o f the government i s t o m o v e s t e a d y towards “full employment,” which, as in other countries, m a y b e def ined as be ing consistent with unemployment of 5 percent because o f frictional, seasonal, and other such factors, then the Punjab will have to create about one d o n n e w employment opportunit ies ( includmg self- employment) a year.
5. How fast will the economy have to increase in order to create these jobs? In the decade untd 2001/02, an increase o f 1 percent in the estimated prov inc ia l gross domestic p r o d u c t (GDP) o f the Punjab was associated with an increase o f 0.55 percent in employment. I f the same relat ionship holds in the future, the GDP o f the Punjab wi l l ’have to grow at 6.2 percent a year in real terms. Since the government’s a i m i s presumably also to significantly reduce underemployment, a target GDP growth rate o f 7 percent a year would not b e unreasonable.
6. In order that the Government o f the Punjab attains i t s development objectives, a basic condition i s that the provincial GDP grow at 6-7 percent a year in real terms. This rate i s well above the 4.4 percent a year achieved during the past decade, and will require changes in the institutional and technological framework of the provincial economy.
7. W h a t adds t o the challenge i s that the space for act ion by the authorit ies to expand employment i s likely to b e constricted. W h i l e the agricultural sector will undoubtedly rema in very impor tan t during the nex t decade, i t i s debatable whether i t can p rov ide product ive full employment t o a substantial amoun t of additional labor. Moreover , for reasons o f efficiency, i t i s clear that the publ ic sector should n o t absorb m o r e labor. Thus the bulk o f the additional employment will have to be generated in the private non-farm sector.
7

8. In order to draw attention to the necessity o f structural change in the province’s economy, w e have treated issues in the development o f non-agricultural activities-such as diff iculties faced by small and m e d m m enterprises in manufactur ing and commerce, and the particular problems arising in the construction sector-before w e deal with those in agriculture. W e reiterate, however, that agriculture wdl cont inue to remain crucial as a source o f i ncome and employment and as a generator o f demand for the products of the other sectors; w e have consequently devoted considerable space t o ident i fy ing policies that would strengthen the performance o f the agricultural sector.
I. THE NON-FARM SECTOR:
9. T h e private sector employs almost nine-tenths o f the work fo rce o f the Punjab, so if increasing incomes and reducing pove r t y l ie at the heart of the government’s objectives, the m a i n impetus for growth must come from this sector. T h e Punjab private sector encompasses both agriculture and non-agriculture, and the repo r t includes specific recommendations in each o f these areas. T h e recommendations call both for reforms to inst i tut ions and for increases in allocations for investment.
Improving the business environment for firms
10. Stimulat ing growth a n d job creation in the non- fa rm sector will require significant improvements to the business environment. U n d e r this general rubric, the r e p o r t provides specific recommendations for actions that are within the con t ro l o f prov inc ia l government, such as those dealing with mul t ip le taxation, labor laws, and regulatory structures:
9 E h n a t e mu l t i p le / nuisance taxation that raise the cost o f p roduc t i on .
9 Address weaknesses in labor laws that force many enterprises to rema in small, and to h i re casual laborers to avoid adverse effects of outdated legislation.
Revamp other arcane regulatory legislation and structures, part icularly the prov inc ia l Boi ler Act, Building and Elect r ic i ty inspectors, and introduce comprehensive insurance through private parties as an alternative to ensure pub l i c safety.
9
Stimulating job-creation in the construction sector
11. Particular emphasis i s p a i d to the construction sector, w h i c h has a high mul t ip l ier effect on employment. T h e Federal Governmen t has recently taken a number o f steps to address one o f the biggest problems constraining this sector-the relatively undeveloped state of the housing fmance sector, given the dif f icult ies in enforcing foreclosure laws in the event o f a default. T h e Governmen t o f the Punjab can also p lay a n impor tan t ro le in addressing a n u m b e r o f other key legal, fiscal, and administrative barriers h inde r ing faster development o f the housing and const ruct ion sector:
9 Rationalize the stamp du ty on p roper t y related transactions.
9 Trim change-of-use charge for p roper t y classified “commercial” under z o n i n g regulations.
9 Rationalize development charges imposed by local water and sanitation agencies for change o f use o f proper ty from “residential” to “commercial.”
Impose a l and n o n - u t h z a t i o n fee or an id le land tax.
Promulgate a l a w abolishing the benaami holding o f property.
9
9
8

9
9
Revamp the R e n t Restr ict ion Ordinance.
N a r r o w the dif ferential in proper ty tax on renter and owner-occupied property.
Improving the system of land titling
12. L a n d i s a crit ical economic asset in any country, particularly so for a government seeking t o p r o m o t e the const ruct ion sector and provide secure p roper t y rights for the most valuable asset owned by households. In order to m o v e towards establishing a m o d e r n l and adrmnistration system, with a secure, accurate, and accessible system of registering and reco rd ing l and transactions, the repo r t recommends that the Governmen t o f the Punjab:
9 In i t ia te pilot projects in two districts o f the prov ince for comprehensive cadastral surveys and registration o f titles.
I n t roduce requirement for compulsory registration o f al l documents related to property, i nc ludmg sale agreements, declaration o f g i f ts , p o w e r o f attorney.
In i t ia te the process o f conversion o f presumptive titles into exclusive titles.
9
9
Promoting the development of cities as growth engines
13. An impor tan t source o f sustained economic expansion for the prov ince cou ld b e the development o f cities, supported by indust ry clusters, as growth engines. In addi t ion to the million- plus cities o f Lahore, Faisalabad, Rawalpindi, Mul tan, and Gujranwala a n d their ad jo in ing areas, the Punjab has 10 other cities with over two hundred thousand residents, w h i c h cou ld potential ly se rve as mini growth-engines for the regional and prov inc ia l economy. In some impor tan t respects, Sialkot has m e t these condt ions, a n d i t s experience i s used as an i l lustrat ion in the report. Ideally, 1-2 pilot cities that display strong potent ia l with respect to the following four dimensions should b e identi f ied for “competit ive partnership” init iatives:
9 an organized private sector with entrepreneurs wilhng and able to p rov ide leadership;
9 strong local government support with pol i t ical will amongst topmost officials;
9 a sponsor with strong c red ibh ty with both private sector and government;
9 instruments such as logistical faciltties and seed funds to start the init iative.
11. PROMOTING GROWTH IN AGRICULTURE:
14. Agr icu l ture i s a m a j o r cont r ibutor to Punjab’s economy, accounting for roughly 28 percent o f i t s
output a n d providmg direct employment to over 40 percent o f the work force. W h i l e total employment in agriculture has stagnated during the past decade, m o r e eff icient uuhzat ion o f the Punjab’s pub l i c resources and abundant natural endowments, in combinat ion with measures to p r o m o t e agricultural &versif ication away from cereal crops to other m o r e labor-intensive activities, can help u n l o c k this sector’s tremendous employment-generation potential.
Raising the level and efficacy ofpublic expenditures
15. Al locat ion o f pub l i c resources to and within the sector i s one o f the ma jo r ways that the Governmen t o f the Pun jab can inf luence growth and employment generation in agriculture. In order
9

t o reverse the decline in total publ ic expendtures in agriculture as we l l as i m p r o v e the composi t ion o f publ ic s p e n d n g in this sector, the repo r t recommends that the prov inc ia l government should:
9
9
Increase publ ic investment, particularly on irrigation, water management, and research.
Reduce the share o f establishment costs ou t o f current expendtures for agricultural support services, as an impor tan t step towards rationalizing publ ic spendng.
Privatize commercial activities, l ivestock breeding farms and veterinary services, and focus instead on pedigree registration systems, capacity building and strengthening o f private breeder associations, and con t ro l o f l ivestock dsease epidemics.
I m p r o v e cost recovery, especially through greater cost recovery for canal maintenance in conjunct ion with devolut ion to water user associations.
9
9
Rationalizing the wheat procurement and storage policy
16. In recent years, even the sum tota l o f expendtures by the Depar tmen t of Agr icu l ture in the Punjab have been overshadowed by the subsidy p rov ided by the prov inc ia l government to one crop-wheat. T h e stated i n ten t i on o f the government’s in tervent ion in the wheat market i s to address deficiencies in pr ivate markets, but a consistent po l icy has yet to b e developed. W h i l e there may b e just i f icat ion for interventions to mit igate the adverse effects o f undue v o l a t h t y in the price of wheat, the repo r t notes that i t i s impor tan t for the prov inc ia l government to:
Clearly establish the objectives a n d targets for in tervent ion in wheat markets by laying out a f ramework f o r in tervent ion that defines a tolerable level o f pr ice variablltty, min imizes fiscal outlays, minimizes dstortions to long-run market equi l ibr ium prices, maximizes private sector part icipation and competit ive markets, and ensures that the poorest are the m a j o r beneficiaries o f fiscal expenditures.
I m p l e m e n t the foregoing po l i cy in the short-term by explor ing compet i t ive tendering o f procurement and storage by the private sector, sett ing the marg in for p rocu remen t and issue prices to cover full costs, and developing mechanisms for targeting subsides to the most vulnerable groups.
Deve lop a po l icy for pub l i c i nvo l vemen t in wheat markets over the longer t e r m only in extreme situations.
Modernizing wholesale markets
17. An eff icient market ing system i s a prerequisite for agricultural &versification, as i t allows farmers t o m o v e away from produc t ion o f cereals and other relatively low-value crops to those that command the highest re tu rn in the marke t place. Wholesale markets in part icular p lay a cri t ical ro le in this regard, as they help connect ru ra l p roduc t i on areas to u rban consumpt ion centers. Despi te the importance o f agriculture in the economy o f the Punjab, development o f wholesale markets has not kept pace with the needs o f the province. M a r k e t infrastructure tends to b e biased towards ma jo r crops rather than livestock, fruits, vegetables, a n d other such high-value crops, the market i n fo rma t ion system i s poorly developed, a n d the adrmnistrative structure to regulate output markets i s highly bureaucratic a n d lacks effective pr ivate sector part icipation. T h e G o v e m m e n t o f the Punjab can take a number o f steps to address these shortcomings:
10

I m p l e m e n t the p lanned r e f o r m of market regulations through amending the 1938 Marke t Commi t tee A c t to encourage private sector part icipation and investment to modern ize markets.
I m p r o v e the market i n fo rma t ion system through revamping the district-level marke t i n fo rma t ion system, a n d develop i n fo rma t ion packages t o p romote export of hor t icu l tura l products.
Deve lop in col laboration with the private sector, crit ical infrastructure such as refrigerator bogies, c o l d storage facilities at ma jo r airports, and state-of-the-art laboratories for f o o d safety testing.
Establ ish minimum grades and standards fo r al l agricultural r a w a n d processed products for the domes tic market, a im ing to have the equivalence o f WTO-recognized Codex Alimentaritts standards for expor t markets.
I nves t in capacity building for food testing, and invo lve producers and exporters in implement ing food safety management systems.
Improving functioning ofland and water markets
18. Wel l - funct ion ing input markets for land and water also have a very impor tan t ro le to play in encouraging the m o v e towards m o r e efficient, equitable, and compet i t ive farms. To this end:
9 An effective l and record ing system would p r o m o t e the smooth transfer o f titles a n d an efficient l and market. L a n d taxes based on the size o f the l and holdings should b e set to reflect product iv i ty potential, and discourage underuthzat ion o f l and on large holdings.
I m p r o v e d water-use efficiency requires better maintenance, r e h a b h a t i o n , a n d modern izat ion of the i r r igat ion a n d drainage system. Increased pub l i c investment i s needed even to maintain current efficiency levels.
T h e gap between water supply and demand d persist unless there i s a m o v e towards higher water product iv i ty through substitution towards high value water eff icient crops such as fruits and vegetables.
Sustainable water use requires an integrated approach to the use o f surface a n d groundwater along with appropriate p r i c ing mechanisms that ref lect the scarcity o f water.
9
9
9
Benefiting from innovation
19. Finally, a strong agricultural i nnova t ion system i s crit ical to modern i z ing agriculture, as a large par t o f future product iv i ty gains, qual i ty enhancement, a n d diversif icat ion must b e p rov ided through generation, adaptation, a n d dissemination o f n e w technologies a n d in fo rma t ion . T h e repor t recommends that a comprehensive approach b e taken by the prov inc ia l government to tackle the key pol icy re forms needed to modern ize the agricultural i nnova t ion system in the Punjab:
9 Establ ish a compet i t ive fund to support high priority research, providing operating costs t o research by al location on a compet i t ive basis through a small high quali ty apex research board.
I m p r o v e the enabl ing env i ronment for private and publ ic sector i nnova t ion by lobbying the Federal government to urgently approve p lan t varietal p ro tec t i on (PVP) laws a n d appropriate bio-safety regulations.
9
11

9 D e v e l o p a h u m a n resource and incentive f ramework for quality research through merit-based recruitment, abol ish promotions based solely on available posts, and instead develop a career service stream based o n well-defined promotion criteria that stresses qualif ications and accomplishments.
D e f i n e the ro le o f the prov inc ia l extension staff within a decentralized system, especially focusing on h u m a n resources development and knowledge sharing among districts.
9
111. IMPROVING PUBLIC SERVICE DELIVERY:
20. T h e second aspect o f providing a better l i fe for the Punjab’s citizens i s i m p r o v e d delivery o f publ ic services. Pr imary education i s better and health status i s worse in the Punjab relative to other provinces in Pakistan. However , both are s t d l worse than countries with the Punjab’s level o f income. Further, they have changed m o r e slowly than would b e expected g iven the rate o f economic growth in the province. T h e ro le o f publ ic services in determining social outcomes i s unclear, as there i s an astoundmg lack o f relevant i n fo rma t ion that would make this determination possible.
21, U n d e r the ongoing devolut ion initiative, local govemment nazimeen are now the pr inc ipa l policymakers with regard to m a n y key economic and social services. In order for local elected officials to discharge their n e w responsibhties effectively, they need to understand, act upon, and b e accountable to, the desires o f the public-particularly poo re r people. Bet ter i n f o r m a t i o n i s thus crit ical to both better po l icy decisions as we l l as better accountabil ity. T h e publ ic should know w h a t it i s enti t led to receive and what i t i s actually receiving relative to government policies and relative t o other communit ies. For their part, local governments need to know the effects o f po l i cy on the ult imate goals. This requires i n fo rma t ion on inputs in a form that can b e matched to outcomes.
22. T h e ro le o f the prov inc ia l government does not disappear with decentralization but needs m o r e clarity to avoid over lapping and ambiguous responsibhties. For example, the prov inc ia l government i s essential for part icular functions, such as those with cross-border or large-scale effects. Further, the prov inc ia l government has a very impor tan t ro le to play in help ing to i m p r o v e the accountabil ity of local governments to their clients by generating a n d publ ic iz ing i n f o r m a t i o n to facllitate both learning across districts and accountabil ity to electorates.
9 A t t e n t i o n to better health a n d education outcomes, not j u s t better in ternal processes of government offices, i s needed for i m p r o v e d service delivery. Prov iders in the publ ic sector should b e h e l d accountable for i m p r o v e d outcomes.
G i v e n a large a n d growing pr ivate sector in both health a n d education, pub l i c po l icy must complement rather than substitute for the private sector. I n f o r m a t i o n needs to b e collected on outcomes-enrollment rates or educated children, heal th status a n d coverage o f safe water-for the who le populat ion, not j u s t those using publ ic facilities.
As local governments experiment with alternative strategies for delivery o f economic and social services, i t i s i m p o r t a n t to monitor these various n e w init iatives, a n d evaluate carefully wha t works and wha t doesn’t.
9
9
12

Iv. IMPROVING PROVINCIAL FINANCES FOR DEVELOPMENT:
23. To achieve i t s employment, growth, and service delivery goals, the Governmen t o f the Punjab d need to significantly i m p r o v e the state o f i t s publ ic finances. On the face of it, the prov inc ia l government’s aggregate fiscal position appears t o b e reasonably satisfactory, with fiscal deficits during the 1990s averaging less than 1 percent o f prov inc ia l GDP, lower than those typically run by sub-national governments in other federal systems across the world. However , in order to achieve i t s
ambit ious development goals, the prov inc ia l government d need to mobdize addit ional revenues to finance the cost o f providmg high-quali ty economic and social services, and deepen budgetary and financial re forms to enhance the effectiveness o f existing expenditures. Unless suitable measures are taken to address this potential problem, liabdities arising employees’ fu ture pension payments m a y pose a ma jo r f inancial p r o b l e m for the prov inc ia l government.
24. T h e repo r t includes recommendations on several promising sources to increase own-revenues, as well as various steps needed to strengthen prov inc ia l tax administration. Establ ishing prov inc ia l finances on a f l rmer footing in turn d help create the addit ional fiscal space needed to improve publ ic infrastructure and service delivery in the province. T h e process o f using a medium-term budget f ramework in t roduced by the Governmen t o f the Punjab in i t s 2003/04 budget should b e expanded to gradually cover al l prov inc ia l expenditures. A key element in deepening this process will be to do away with the b i furcat ion o f the budget into development and recurrent components.
T h e agricultural i ncome tax’s structure and administrat ion should b e i m p r o v e d by using cropped rather than cult ivated area as the taxable unit, lower ing tax threshold on irr igated farms, and reducing tax avoidance by prohibiting benaami transactions.
T h e u rban immovab le p roper t y tax should b e i m p r o v e d by reducing the dif ferential in assessment rates for renter vs . owner-occupied properties a n d rat ional izing remain ing exemptions. T a x data-bases should b e updated using better census and survey techniques so that al l properties are enumerated a n d their rental value proper ly assessed.
T h e government should consider promulgat ing a prov inc ia l fiscal respons ib f i t y l a w on the pattern of the Federal Government , as we l l as improve financial accounting a n d report ing.
T h e prov inc ia l government’s p l a n to streamline and modern ize the tax administrat ion machinery by merg ing the prov inc ia l B o a r d of Revenue a n d Excise and Taxa t ion depar tment should b e pursued with full vigor.
v. IMPLEMENTATION CHALLENGES AND FURTHER WORK O N T H E STRATEGY
25. Several recommendations presented in the repo r t are not necessarily new; indeed some have been well-researched a n d known for m a n y years. Nevertheless, because o f a variety o f pol i t ical- economy and other inst i tu t ional constraints, they have not been acted upon earlier. T h e present prov inc ia l government has demonstrated i t s wil l ingness to embark upon a comprehensive p rog ram o f economic and structural re fo rms to i m p r o v e the quality o f l i f e of i t s people. I t has prepared a Pover ty Reduct ion Strategy Paper outlining the m a i n objectives o f i t s development strategy, and has init iated ambitious reforms o f p rov inc ia l finances and the education sector with financial and technical assistance from development partners. During the past f e w years the Federal Governmen t has undertaken extensive re fo rms to he lp correct macroeconomic a n d fiscal imbalances, and i s now increasingly focusing i t s efforts to address m o r e deep-seated structural issues a n d constraints
13

imped ing faster economic growth. T h e prevaihng economic situation in Pakistan thus provides the prov inc ia l government with a part icularly favorable env i ronment in w h i c h to augment i t s ongoing r e f o r m effort.
26. In translating i t s good intentions i n t o reality, an impor tan t challenge for the prov inc ia l government wdl b e to tackle the capacity and inst i tut ional constraints that have h indered earlier efforts. In a d l t i o n to strengthening the existing system o f financing, over the m e d i u m t e r m the prov inc ia l authorit ies must develop other innovative methods to br idge the l ikely shortfal l between i t s investment needs a n d resources. With the growing emphasis on decentralization, i t i s inevitable that there wdl b e changes in the scope and manner o f managing the prov inc ia l economy. In addit ion to i t s present role, the Punjab government will become increasingly i n v o l v e d in the type of economic management that can best b e described as “macroeconomic”. W e understand, o f course, that macroeconomic management for a prov ince l f f e r s in significant respects from that for the country as a whole. T h e prov inc ia l government i s not the p r i m e m o v e r in a n u m b e r of key areas of macroeconomic policy, such as tax po l icy and interest rates. Nevertheless, the prov inc ia l authorities must s d l monitor the impac t o f central government policies on the prov inc ia l economy. Moreover, the coordination o f policies with the central government can b e m o r e effective i f the effects of central government policies on the prov inc ia l economy can b e described in a quantitative manner.
27. A sine qua non for managing the economy on these expanded lines i s the development o f a suitable database a n d o f institutions that prov ide the required analytic expertise. In this report, we recommend the compi la t ion o f a database that would cover the m a i n indicators, such as the prov inc ia l GDP, investment, savings, flows o f credit, employment, industr ial product ion, and so on. I t d also require reliable i n f o r m a t i o n o n the in formal sector, w h i c h prov ides so m u c h o f the employment to the Punjab’s l abo r force, and on the impac t o f economic policies, both central and provincial, o n the S M E sector. T h e government should also strengthen the capabiltties o f the Planning and D e v e l o p m e n t Depar tment , the Finance Depar tment , a n d p rov ide greater analytic support to al l other departments, either by developing in-house capacity, or by strengthening external research institutions such as the Pun jab Economic Research Inst i tute.
28. Another ma jo r area in w h i c h i n fo rma t ion must b e collected a n d a p r o g r a m o f work developed relates to city clusters. A strategy must b e formulated whereby the m a n y large a n d m e d i u m cities in the Punjab can b e developed into growth-poles, and not for economic reasons alone. An u rban strategy for the Punjab should a i m at the development o f several “livable” cities, w h i c h in a d d t i o n to economic p o s s i b h i e s offered substantial opportunit ies fo r social a n d cultural growth. This would b e in the spirit o f decentralization and local empowerment, and would also prevent a situation arising in w h i c h Lahore became the overwhelming, if not the sole, magnet for popu la t i on migrat ion while the other u rban centers withered.
29. To sum, considerable addit ional work d need to b e done in order to operationalize the government’s vision for the Punjab. T h e present repo r t should therefore b e regarded as a contr ibut ion to work in progress that will b e cont inued in the c o m i n g months. I t i s in tended to b e an input into the process o f deliberations undertaken by the prov inc ia l government team to decide the appropriate sequencing of the recommended measures under i t s r e f o r m program. T h e repor t team stands ready to p r o v i d e whatever a d l t i o n a l technical assistance m a y b e needed by the provincial government for this purpose.
14

CHAPTER 1: THE CHALLENGE AND THE I S S U E S
1.1. T h e Governmen t o f the Punjab has indicated the m a i n elements of i t s economic strategy. This strategy rests o n f ive pillars: (i) improving governance; (ii) strengthening fiscal and financial structures; (iii) creating a more support ive env i ronment for private sector-led growth; (iv) re fo rm ing the delivery o f pub l i c services; and (v) addressing the prov inc ia l economy’s vu lne rabh ty to shocks. Taken together, these elements add up t o a strategy that i s occupied not only with increases in output, but also encompasses i tems such as education, health, i m p r o v e d governance, and protect ion o f the environment. T h e overr id ing concern i s to p rov ide a better l i f e for the province’s citizens.
1.2. This repor t offers a f i r s t cu t at operationalizing the strategy. I t identif ies what the Governmen t o f the Pun jab needs to do, pr imar i ly in a relatively short-term, and wha t actions i t needs to start in order to b e completed in the medium-term.
1.3. In the short- to medium-term, the p rov i s ion of a better l i f e to the Punjab’s citizens depends essentially on two considerations. First, incomes must b e increased; second, the delivery o f publ ic services must b e improved.
1.1 CHARACTERISTICS OF INCOME
1.4. T h e f i r s t pa r t o f this repor t concentrates on issues connected with the increasing of incomes. In a marke t economy, incomes main ly depend on product ive employment . T h e latter depends upon the demand for labor, w h i c h in turn i s generated by economic growth. Hence, the h g h e s t priority for the government of the Punjab in implement ing i t s strategy i s to increase the rate o f growth o f the prov inc ia l gross domestic p roduc t (GDP).
1.5. An of f ic ia l estimate o f the GDP of the Punjab does not exist. In order to devise any meaningfu l policy, i t i s necessary to have quantitative data. T h e repo r t recommends that the Punjab Bureau o f Statistics should give high priority to construction o f a reliable series o f prov inc ia l accounts, and should carry this o u t in coordination with the Federal Bu reau o f Statistics. Moreover, since pol icy-making requires avai labhty of data on a t imely basis, i t would b e impor tan t t o ident i fy a s e t o f intermediate i n d c a t o r s correlated with various sub-sectors o f the economy that can help track progress in these sectors. For instance, if data on indicators such as fe r thze r use, electricity consumpt ion by indust r ia l consumers, and cement are found to b e highly correlated with agriculture, manufactur ing and construction activity, etc., these can p rov ide good proxies for trends in various key sub-sectors o f the prov inc ia l economy.
1.6. As an i n t e r i m measure, the World B a n k has constructed a rough series o f prov inc ia l GDP fo l l ow ing the nat ional est imation methodology wherever data are available in disaggregated form. Since in fo rma t ion i s not available for a l l sub-sectors, regional allocators have been applied in these instances to estimate the prov inc ia l economy’s contr ibut ion to gross national output. These prov inc ia l GDP estimates and a short description o f the methodology are presented in the report’s statistical appendix. W e must, however, emphasize the approximate nature o f our calculations and stress that they should b e used as b r o a d indlcations o f trends rather than as precise estimates for a given year.
15

1.7. With a to ta l populat ion o f about 7 4 d o n in 1998-well over h a l f o f the national total-and an estimated prov inc ia l GDP that accounts fo r about 57 percent that o f Pakistan overall, clearly factors that affect the economy o f the Punjab have a bearing on the country as a whole.
Figure 1.1: Composition o f Gross Domestic Product in 2001/02: Punjab and Pakistan
1.8. As dust rated in Figure 1.1, agriculture constitutes a slightly larger share o f the Punjab’s economy than o f Pahs tan as a whole, whi le industry contributes a somewhat l ower share than the overal l national average. T h e services, w h i c h now constitutes over h a l f the aggregate GDP, has been the fastest growmg o f the Punjab’s economy during the 1990s, regs te r ing an average growth rate o f roughly 5 percent pe r a n n u m (Table 1.1).
Table 1.1: Growth Rate of Real GDP: Punjab and Pakistan: 1991/92 - 2001/02 (Percent per annum)
n~ I * * & _ _*-
Punjab Rest of Pakistan Year Agriculture Industry Services GDP Pakistan Overall
1991 /92 1992/93 1993/94 1994/95 1995/96 1996/97 1997/98 1998/99 1999/00 2000/01 2001/02 2002/03 Average
11.5 -6.9 3.6 11.7 6.3 -0.6 6.3 1.5 7.4 -2.1 2.2 3.6
7.4 5.5 4.4 2.4 8.6 0.4 4.2 5.9 2.3 3.4 5.5 4.6
8.5 4.9 4.5 5.3 5.2 4.0 3.1 5.0 4.9 4.2 4.8 5.3
9.2 1.4 4.2 6.4 6.3 1.8 4.3 4.2 5.0 2.2 4.3 4.7
(1991-2002) 3.6 4.5 5.0 4.5
5.6 7.6 2.9 2.1 4.5 4.4 3.3 5.1 7.0 6.6 1.6 1.7 2.5 3.5 4.2 4.2 2.5 3.9 2.2 2.2 2.2 3.4 5.6 5.1
4.1 3*’ ~ x
1.9. Between 1991/92 and 2002/03, the prov inc ia l GDP o f the Pun jab increased in real terms at about 4.5 percent a year, faster t han the 3.7 percent annual growth recorded in the rest o f the country. G iven that popu la t i on growth in the Pun jab was in the ne ighborhood o f 2.4 percent a year, the pe r capita i ncome in the p rov ince increased annually at about 2.1 percent during t h i s period. This w o u l d b e the average rate o f growth; obviously, for m a n y indwiduals the increase would have been
1 6

l ess than the average. Moreover , since the average rate was so low, i t means that m a n y individuals must have suffered a negative rate o f growth-they w o u l d have become increasingly poorer. T h e low rate o f growth o f pe r capita incomes for an extended period i s the root cause o f the increase in the incidence o f pove r t y in the Punjab.
1.10. T h e failure o f the economy o f the Punjab to grow suff iciently fast as to reduce pover ty in a meaningfu l way can b e determined through another approach. Two factors determine changes in pover ty outcomes: the economic growth rate, and changes in inequality. Ravalhon and Chen (2003) have comb ined these two factors into a measure o f pro-poor growth. T h e graphical representation o f the p ro -poor growth measure-often referred to as growth-incidence curves-shows how m u c h o f economic growth accrues to each cenule (or one-hundredth) o f the populat ion. Figure 1.2 illustrates this calculation for the Punjab between 1984/85 and 2001/02.
Figure 1.2: Growth-Incidence Curve for Punjab: 1984/85 to 2001/02
-1 I
0' l d 2d 30 4 d 5 d 60 70 80 90 I I I
Percentiles
Note: The figures show the change (in percent per year) in average real per capita expenditure by centile. The all-Pakistan consumer price index was used to deflate expenditures. A downward-sloping curve means that households in the lower end of the income distribution have gained more/lost less in percentage terms as compared to others. The horizontal line shows the mean percentile growth rate. Source: Staff estimates based on data from various HIES/PIHS.
1.11. Long- te rm growth in household real pe r capita expenditures has been positive, but modest; the mean g r o w t h rate across a l l centdes was only 0.25 percent p e r year. Growth appears to have been pro-poor, with the bottom e n d o f the i ncome distribution registering above-average expenditure growth o f a round 0.3-0.4 percent p e r year. By contrast, the r ichest 10 percent seems to have experienced decl ining living standards, although i t i s possible that changes in sampling and non- sampling errors over t h i s long p e r i o d m a y make comparisons at the very top end o f the i ncome dstribution d f f i c u l t . W h a t i s evident from Figure 1.2 i s that, wh i l e changes in the quality played a posit ive role, the sluggsh growth rates in household incomes over this long p e r i o d were the m a i n problem hinder ing pove r t y alleviation. Dec l i n ing inequali ty he lped lift the very bottom end o f the i ncome distribution a l i t t le faster t han the rest, but incomes of everybody, inc lud ing the poor, increased at a very modes t rate over this long period.
17

1.2 THE POVERTY CHALLENGE
1.12. I t may b e useful to describe briefly the contours of the challenge that i s to be met. The long- term evolution o f poverty in the Punjab follows that o f all-Pakistan: poverty declined rapidly during the 1980s and early 1990s, and then increased somewhat untd 2001/02. (Table 1.2). Between 1993/94 and 2001/02, the slowdown in economic growth and worsening macroeconomic conditions in Pakistan translated into rising poverty. By 2001/02, pove r t y in Punjab h a d increased to 34.1 percent; however, the recent r i se in pover ty has been smaller than in other provinces o f Pakistan, and recent years show a substantial decline in inequality. T h e Gini coeff icient o f household per capita expendture for the Punjab now stands at 0.28 (comparable Sr i Lanka, India, and Bangladesh). W h i l e GDP growth in Pakistan has p i cked up somewhat in recent years, the impact this may have had on reducing poverty cannot be ascertained because
Long-Term Poverty Trends: All-Pakistan and Punjab 1
20 1984185 1987188 1990191 1993194 1998199 2001102' 1
1 +AII.Pakintan ... e... Punjab 1
household survey data beyond 2001/02 are not yet available.
Table 1.2: Poverty Trends: All-Pakistan and Punjab: 1983/84 - 2001/02 (Percent of population)
1983/84 1987/88 1990/91 1993/94 1998/99 2001/02*
All-Pakis tan Punjab
46.0 37.4 34.0 28.6 32.6 37.3 48.5 40.4 35.9 28.2 32.4 34.1
Rural: All-Pahstan 49 3 40 2 36 9 33 4 35 9 41.6 Punjab 50 5 42 1 38 5 31 9 34 7 37 0
Urban: All-Pakistan 38 2 30 7 28 0 17.2 24 2 26 4 Punlab 43 6 35 6 29 4 18 4 26 5 27 0
ta f f es tmates based on vario IES and PIIHS Estmates for 2001/02 are prehinary
1.13. The incidence of pove r t y i s much higher in rural Punjab compared with urban areas. T h e very poorest tend to reside in ru ra l areas: in the lowest 10 percent of Punjab's income distribution, only 21 percent o f the population i s urban, as compared to 48 percent o f the richest 10 percent o f the i ncome distribution (Table 1.3). This does not imply that one can be complacent about urban poverty. W h i l e the latter i s lower and fel l much faster in 1984/85-2001/02, in the las t few years o f the period urban pover t y in the Pun jab actually grew faster than rural poverty.
Table 1.3: Expenditure and Urbanization in Punjab, by Decile: 2001/02
Decile 1 2 3 4 5 6 7 8 9 10 Overall
Urbanization (%) 21.2 25.3 17.6 25.8 24.9 29.1 32.0 32.4 32.8 47.9 28.9
Expen&tures(Rs) 398 525 607 682 758 855 967 1,116 1,361 2,276 954
so
1 8

1.14. Nevertheless, even this decreasing inequality o f expenditures leaves large gaps in living standards. T h e poorest 10 percent o f Punjabis, for example, consume on average j u s t b e l o w Rs 400 pe r capita p e r month. Vulnerabhty , defined as prox imi ty to the pove r t y line, i s also quite high. Three-fourths o f the Punjab’s populat ion l i ves on less than 150 percent o f the pove r t y line, and 63 percent l ive on less than 125 percent o f the pover ty l ine (Table 1.4). These people are vulnerable to even quite small shocks to their income. Since incomes have f luctuated substantially over t i m e , al l the indv iduals in this group can b e considered to b e at risk o f experiencing pove r t y i f hit by a shock.
Table 1.4: Poverty and Vulnerability in Punjab: 2001/02 (Percent o f population)
Headcount poverty Be low 125 percent of B e l o w 150 percent of poverty line poverty line
Rural 37.0 Urban 27.0 Overall 34.1
64.5 60.6 63.4
77.7 73.1 76.3
1.15. Punjab has impor tan t regional l f f e r e n c e s in living standards. T h e r a n h n g o f living standards, poverty, and social indicators generally follows a Nor th -Sou th pat tern in Punjab: i ncome and non- income indicators o f welfare are better in the North, fo l lowed by Central Punjab, and worst in South Punjab; likewise, pove r t y i s lowest in the North and highest in the Sou th o f Punjab 1 Highest Class Completed by Region: 15-19 year-olds
(Table 1.5). N o r t h e r n Punjab i s m o r e urban, and i s characterized by m o r e extensive links to u rban n o n - f a r m labor markets; in contrast, f a rm ing predominates in Southern Punjab. A clear N o r t h - S o u t h r a n h n g i s encountered in m a n y i f not most social indicators: literacy, school enrollment, prevalence o f sanitation a n d toilet facilities, and vulnerabihty to income shocks. For example, using data from the
I 1
70 1
lo i
Northern Punjab
0 1 G r a d e O 1 2 3 4 5 6 7 8 9 I O 11
2001/02 PIHS, the above graph illustrates the exist ing regional imbalances in s c h o o h g . A strategy o f pover ty reduct ion must lay significant emphasis on rura l areas, a n d must incorporate a regional strategy that pays special a t tent ion to the southern districts o f the province.
Table 1.5: Poverty Headcount Rate: Regions o f Punjab: 1998/99 - 2001/02 (Percent of population)
1998/99 _ *
Punjab Regions Urban Rural Overall Urban Rural Overall
Northern Punjab 18.3 29.6 26.2 20.1 33.8 29.8 Central Punjab 25 2 32.1 29.9 24.6 35.3 31.8 Southern Punjab 36.1 40 6 39 7 38.7 40.8 40.4
All-Punjab 26.9 34.7 32.4 27.4 37.0 34.1
ource: 1 9 9 8 / 9 9 FBS (2002), 2001/02
19

1.16. T h e labor force o f the Punjab in 2002 was
labor force was rural, and 80 percent male. T h e 2001/02 L a b o r Force Survey indicates that self- employment accounts for 60 percent o f al l employment. T h e publ ic sector employs only around
u rban areas. However , the pub l i c sector plays an m p o r t a n t ro le as an employer for 18 percent o f u rban
estmated at about 27 d o n ; abou t 70 percent o f the
11 percent o f employed workers, slightly m o r e so in
Table 1.6: Employment by Gender and Public/Private: 2001/02 (Percent)
Composition o f the Punlab Labor Force
1 6 1 4 1%
25 1% 54 6%
nRura’Women nUrbanWomen
Men Women Both Sexes Sector Urban Rural Urban Rural Punjab Overall
Private Public
87.9 89.4 81.7 91.5 88.9 12.1 10.6 18.3 8.5 11.4
Source: S t a f f estimates based on t h e 2001/02 Labor F o r c e Survey
1.17. T h e m a j o r bu rden o f providmg employment t o the popu la t i on i s shouldered by the private sector. Moreover, the vast ma jo r i t y o f employees in the pr ivate sector work in m i c r o enterprises, i nc ludmg self-employment. T h e data suggest that 86 percent work in units employ ing less than five workers (Table 1.7). Since firms with less than 10 employees are normal ly regarded as “informal,” i t
i s clear that the l i ve l i hood o f the major i ty o f the populat ion depends overwhelmingly on the i n fo rma l sector, and pove r t y reduct ion will b e closely l i nked with improving the product iv i ty of this sector.
Table 1.7: Employment by Sector, Gender, and Size of Firm: 2001/02 (Percent)
x -
es Size of Firm Urban Rural Urban Rural Punjab Overall
Less than 5 employees 88.9 90 1 86.5 55.2 85.7 6-9 employees 7.2 5.1 8.4 16.6 7.3 10-20 employees 2.2 3.1 4.0 12.6 3.9 More than 20 employees 1.6 1.7 1.1 15.6 3.1
“ I ? - * tes based on t h e 2001/02 L a
1.18. O v e r the last decade there has been a significant structural change in employment. The share o f agriculture in total employment d ropped from 51 to 43 percent o f the l abo r force (Table 1.8). Industr ial categories that soaked up m o r e labor include manufactur ing (from 11 to 16 percent o f workers), trade (from 12 to 14 percent), and services (from 1 3 to almost 15 percent). However, two- thirds o f female workers s t d l work in agriculture, and are also significantly represented in services and publ ic administration, a n d in manufacturing.
20

Table 1.8: Employment in Punjab by Major Industry Division: 1993/94 - 2001/02 (Percent)
I "
1993/94 2001j02
Agriculture and Allied services 51.1 Manufacturing, Mining and Quarrying 11.3 Construction 6.5 Wholesale and Retail Trade 12.1
Community, Personal, and Social Services 13.2 Other 1.5
Transport, Storage, and Communication 4.5
42.8 15.7
6.0 14.1
5.4 14.8
1.2 _ " *
rious issues
1.19. Recent trends in real earnings in the Punjab are not reassuring. Real earnings started to decline in 1996 a n d hit b o t t o m in 2000. A f t e r a modes t recovery in 2001, real earnings again fel l back during the f i r s t h a l f of 2002, the latest pe r iod f o r w h i c h data are available. Overall, real earnings for m e n and w o m e n in salaried employment f e l l by 13 and 15 percent, respectively, between 1993/94 and 2001/02 (Table 1.9); however, the biggest decline in real terms impacted on casual wages in the private sector. These declines were significantly higher than those for the rest o f the country. T h e improvemen t of living standards wiU call for reversing this trend, i.e., i t w1u require the creation not only o f more, but also of better paid, jobs. This can only happen if product iv i ty increases throughout a number o f sectors and occupations.
Table 1.9: Change in Median Earnings: Punjab and Pakistan: 1993/94 - 2001/02 (Percent)
* " _ Region M e n Women
Punjab Nominal Rupee Earnings Real Earnings
Rest of Pakistan Nominal Rupee Earnings Real Earnings
Pakistan Overall Nominal Rupee Earnings Real Earnings
50.0 -13.2
67.5 -2.1
64.8 -8.4
50.0 -14.9
66.7 -7.6
38.7 -20.2
: Staff estlmates based on 1993/94 and 2001/02 Labor used to convert nominal into real earnings
1.4 THE EMPLOYMENT AND GROWTH CHALLENGE
1.20. Creation of product ive employment opportunit ies i s the key to accelerating i n c o m e growth in a m o d e r n market-oriented economy. T h e to ta l labor force in the Punjab has increased s t e a d y over the years; however, i t s growth rate during the 1990s was considerably higher than in the earlier decade. I t
i s estimated that between 1984/85 and 1993/94 the labor force grew at a rate o f abou t 2.4 percent pe r annum, whi le between 1993/94 a n d 2001/02 i t g rew by 2.7 percent a year (Table 1.10). Assuming that the labor force in the Pun jab grows at abou t 3 percent p e r a n n u m over the next decade, this gives a labor force in 2011/12 o f about 36 d o n . '
1 I t i s difficult to accurately project the growth o f the labor force because (a) i t appears that the demographic transition may have commenced in I'alustan with the growth rate o f the population finally slowing down; and @) with the extension of
21

Table 1.10: Size of the Civilian Labor Force in the Punjab: 1984/85 - 2001/02 (Million)
Number of Workers 1984/85 1992/93 1993/94 1999/00 2001/02
Punjab Rural, Urban
17.6 21.3 21.8 25.8 27.0 15.8 16.5 18.5 19.1 5.5 5.3 7.3 8.0
sou
1.21. Open unemployment, as measured by the Labor Force Surveys, has been on the r i s e during the past two decades, and was estimated to be about 8.5 percent in 2001/02, m o r e than twice the rate in 1984/85 (Figure 1.3). This represents an almost fou r - fo ld increase in number o f people unemployed, from about 0.6 d o n in 1983/84 to about 2.3 d o n in 2001/02. I f the government o f the Punjab aims to provide full employment, defmed to incorporate 5 percent unemployment for frictional and structural reasons? to this labor force, then 10 d o n additional employment opportunit ies (or roughly one d o n per year) will have to be created during this period. This rate of job creation, w h i c h includes self-employment, on the present employment base implies a growth o f employment o f about 3.4 percent a year.
Figure 1.3: Unemployment in the Punjab: 1984/85 - 2001/02 (Million and Percent o f labor force)
2.5
2.0
E .- j 1.0
0 5 3 0.5 e
0.0
9 0 1 8.0
7.0 1
0.0 1 1984-85 1992-93 1993-94 1999-00 2001-02
1.22. T h e elasticity o f employment with respect to economic growth measures the relationship between growth in the economy and growth in the labor force. Over the period 1993-2002, Punjab’s elasticity o f employment with respect to GDP growth has been est imated at 0.55 (that is, 10 percent economic growth translates into 5.5 percent employment growth). This est imate o f t h e employment
primary and secondary education undertaken by the Punjab government, one would expect longer stays by school-going age cohorts in educational institutions and hence delays in their entry into the labor force. However, since the previous rapid population growth has left behind a large and young population, future growth of the labor force will likely be more rapid than the population, and dso faster than the 2.7 percent growth registered between 1993/94 and 2001/02. 2 Lord Beveridge, who developed the full employment policy for the Labor Party in Britain, defined “full employment” as incorporating 3 percent unemployment in order to account for frictional, seasonal, and international factors. President Kennedy’s Council of Economic Advisers defined full employment as constituting 4 percent unemployment, the Ford administration accepted 4.9 percent unemployment as the benchmark for calculating ‘‘full employment GDP,” while President Carter’s Council raised this to 5.1 percent.
22

elasticity impl ies that for the required employment growth o f 3.4 percent, prov inc ia l GDP needs to g r o w by abou t 6.2 percent a year in real terms. Thus, in broad terms, one might define a necessary condition for the Government of the Punjab to attain i t s development strategy as the creation of about one million employment opportunities a year. With the existing institutional and technological setup in the Punjab, this i s likely to require an annual real growth of provincial GDP of around 6.2 percent a year, or 2 percentage points higher than that experienced during the 1990s.
1.23. T h e main impetus for higher growth and faster job creation in the Punjab d likely come from the n o n - f a r m sector in the coming years, a topic that i s taken up for m o r e detailed l s c u s s i o n in the nex t chapter. T h e natural resource, environmental, and social implications o f pursuing a high g r o w t h strategy are a l l impor tan t issues that mer i t serious consideration. However , since the under ly ing analytic work that i s needed to support this does not exist at present, these topics are not taken up fur ther in this report. Instead, m o r e in-depth fo l low-up work to t h i s end will b e required.
1.24. For instance, a high growth strategy for the Punjab will l ikely require substantial increases in energy availabihty, g iven that the industr ial and transport sectors account for the bulk o f total domestic energy consumption. Per capita energy use in Pahs tan in 2000 was estimated to b e 459 kg oil-equivalent, considerably lower than in countries with comparatively h igher levels o f income-for example, Indonesia (708 kg), China (905 kg), Malaysia (2,126 kg), a n d K o r e a (4,067 kg).3 Fur ther work d b e needed in the c o m i n g months to he lp assess the various fue l options that are available to the government and the private sector to mee t the higher energy requirements over the nex t decade or two. For example, an in-depth study for Thai land carr ied out by the World B a n k in 1993 in col laboration with the Na t iona l Energy Pol icy Of f ice examined the present status and possibilities of various possible fue l sources, and accordingly recommended a fue l strategy for the country.4
1.25. Similarly, w h e n devising a suitable high growth strategy for the province, i t would b e impor tan t t o also pay due attention to the environmental and social implications o f the various pol icy options under consideration. For example, increased domestic energy consumption, or rap id expansion of the transport and manufactur ing sub-sectors o f the economy, WLLl pose n e w challenges for the environment, such as in the abatement o f pollution, ameliorat ion o f congestion, etc. This in turn d require suitable po l icy a n d inst i tut ional responses by the prov inc ia l government.5
3 Source: World Development Indicators 2000, World Bank. 4 This study helped identify various options with regard to most appropriate fuels for Thailand, as well as where, at what cost, and under what conditions they should be obtained to best meet the country’s energy needs in different t i m e frames (for more detds, please see World Bank 1993). 5 For an illustration of the type of analysis and future work that would be needed in order to study the environmental implications of a high growth strategy, please see Thailand: Mitigating Polution and Congestion Impacts i n a High-Growth Economy (World Bank 1994).
23

CHAPTER 2: PROMOTING JOB-CREATION IN THE NON-FARM SECTOR
2.1. T h e private sector in the Punjab employs close to nine-tenths o f the total work force, so i f increasing incomes and reducing pove r t y are key a r m , then clearly the m a i n impetus for growth and job creation must come from this sector. T h e Punjab private sector encompasses both the of f - farm sector as w e l l as agriculture. Chapters 2 and 3 address the m a i n issues in both these sectors and present a number o f recommendations. Wh i le the total number o f workers employed in agriculture has vutual ly stagnated between 1993/94 and 2001/02, total employment ~n the industr ial and services sub-sectors has increased by 1.7 million and 2.3 d o n respectively (Table 2.1). This repor t therefore f i r s t examines the job-creation potential o f the non- fa rm sector o f the prov inc ia l economy.
Table 2 1: Composition of the Employed Labor Force in the Punjab: 1984/85 - 2001/02 (Million)
Employment 1984/85 1993/94 1999/00 2001/02
Agriculture 8.6 10 5 11 3 10 6
Services 5 1 6 3 81 8 6 Overall 17.2 20.6 23.6 24.7
_ x
Sector of Number of Workers
Industry 3 4 3 8 42 5.5
-~ orts, various issues
2.2. T h e non- fa rm sector includes manufacturing, construction, wholesale a n d retai l trade, transport, and other services (Table 2.1). In the Punjab in 2002/03, these sub-sectors combined contr ibuted we l l over two-thirds the to ta l prov inc ia l GDP. For the generation of employment, small and m e d i u m enterprises are particularly important-the bulk o f total employment i s in the i n fo rma l sector (i.e. own-account enterprises, or those that have less than 10 workers). In addi t ion to creating an env i ronment to spur product iv i ty a n d growth o f fo rma l firms, the challenge i s to help boost in fo rma l enterprises, both by easing their evolut ion to fo rma l firms and by increasing the dynamism o f the remain ing i n f o r m a l enterprises. This section summarizes recommendat ions on reducing unnecessary regulations, w h i c h have been a ma jo r factor in increasing the cost o f doing business and hence a ma jo r disincentive to investment a n d private sector growth. These recommendations apply to a wide range o f activities in dl f ferent non - fa rm sectors.
Table 2.1: Composition of Punjab's Non-Farm Sector GDP: 2001/02 (Percent o f total)
Manufacturing 22 1 Housing and Construcuon 12 9 "holesale and Retad Trade 21 8 Transport, Storage, and Communicauon 12 8 Pubhc Administrauon and Defense 8 4 Other 21 9
2.1 DEVISING A GROWTH STRATEGY FOR SMALL AND MEDIUM ENTERPRISES
2.3. There exists a m a r k e d d i cho tomy between economic participants in Pahstan's private sector. On one end o f the spectrum, f o r m a l large enterprises enjoy a high degree o f protection, get virtual ly al l the inst i tut ional pr ivate credt , use relatively m o d e r n technologies a n d management, make most of
24

the country’s pr ivate investment, deliver m o s t o f i t s private exports, and pay h g h e r salaries. On the other end, there exist the small, micro, and m e d m m industries (henceforth collectively referred t o as SMEs) that in m a n y cases are i n f o r m a l units, are financially constrained, turn out m u c h of the country’s pr ivate output, and account for most o f i t s pr ivate jobs. Y e t the country’s policies-for import protection, for taxation, for technology transfer, for access to finance, for infrastructure, for dealing with labor, and so on-are al l devised with the larger enterprises in mind. S d a r l y , access to policymakers a n d opportunit ies to inf luence the policymalclng process are far easier f o r large enterprises than the SMEs; indeed, the latter generally are unable to affect policymalclng at all.
Judging from international experience, Pakistan might represent a case where the potent ia l o f SMEs has not
2.4. T h e literature on the international experience o f economic growth lays out a ro le played by SMEs in structural t ransformat ion as a country moves f r o m low- income towards middle-income levels. T h e “stylized facts” are we l l known, and can b e rehearsed very brief ly.
Share o f Private Sector Employment by Size o f the Firm (2001-02)
2.5. With increasing economic development the share o f agriculture, both in output and employment, decreases in percentage terms. At the same time, manufactur ing a n d the services sector (the latter inc lud ing al l t radmg and r e t a h n g activities), expand and begin to predominate.
2.6. In the early stages o f structural transformation the m i c r o and the smaller enterprises dominate the industr ial sector. However , as incomes increase, the share o f m e d i u m a n d large firms expands. Studies i n d c a t e that the enlargement o f scale persists even after c o n t r o h n g for the variat ion in capital-labor ratios across industries. In the main, the expansion in scale results from the abil ity o f firms to explo i t economies o f scale and to m o v e down their learning curves. T h e “typical” behavior of SMEs in an economy’s industr ial structure i s thus that i t dominates (in percentage terms) at low levels o f development, peaks as the economy attains middle- income levels, a n d then declines with further development. T h e literature therefore concludes that SMEs play a v i t a l ro le in structural transformation (especially from low to midd le i ncome levels) in providing employment and output in the early and m idd le stages of the transformation, and perhaps also in fachtat ing the transformation.
been adequately exploited. T h e pr ivate sector in the Punjab provides close to nine-tenths o f to ta l employment. An o v e n v h e h n g share (86 percent) o f private sector employees works in units with less than 10 employees. Firms with less than 10 employees are
4% 3%
normal ly assumed to b e in formal . Thus the l ive l ihood o f the major i ty of the popu la t i on depends n L e s s t h a n 5 m e - 1 0 0 1 0 - 2 0 OMorethanZOworken
overwhelmingly on the small enterprises, particularly in the i n f o r m a l sector. Seen in this light, i t becomes clear that pove r t y reduc t i on i s l inked closely with improving the product iv i ty o f the i n fo rma l sector. Moreover , this sector i s l ikely to b e an i m p o r t a n t source o f employment growth, having an estimated elasticity o f employment with respect to output of 0.85 (GoP 2003).
2.8. A strategy for dealing with the SME sector must b e devised, but this strategy cannot b e simply to support the SME sector f o r i t s own sake. In tervent ions to support the sector i ncu r a cost, and
25

particularly in the case of a resource-constrained economy such as Pahstan’s, the costs and benefits o f providing such support must b e carefully weighed. In this report, the recommendations are based not on a phi losophic v i e w such as “small i s beautiful,” but rather on a pragmatic judgment that: (a) small and m e d i u m enterprises account for the bulk o f employment and hence any policies that might adversely affect their funct ion ing should be thoroughly examined; and @) m a n y existing policies- especially those regarding location, finance, and infrastructure-discriminate against S M E s and an effort must b e made to level the playing field. Thus the repo r t does not advocate favors for SMEs, but rather the remova l of biases against them. In highlighting the m a j o r bottlenecks confront ing SMEs, the repo r t pays particular attention t o wha t the SMEs themselves repo r t as ma jo r problems faced by them.
2.9. T h e f i r s t observation that must b e made i s that i n fo rma t ion on such a v i ta l sector i s quite inadequate. This includes the absence o f a u n i f o r m off icial definit ion. S M E D A defines S M E s as units employ ing between 10 and 100 fu l l - t ime staff; al l i n f o r m a l enterprises, irrespective o f business volume, are classified as micro-enterprises. In i t s n e w prudential regulations for S M E finance, the State B a n k o f Pakistan defines the upper threshold for SMEs as enterprises employ ing up to 250 employees and an annual business turnover o f up to Rs 300 d o n , wh i l e hav ing no lower threshold.6 T h e differences between these definit ions lead to very d i f ferent estimates of the number o f SMEs. A c c o r d m g to the S M E D A definit ion, about 80,000 S M E s and 2.2 d o n micro-enterprises were estimated to exist in 2003. T h e ADB reckons that i f an international ly m o r e c o m m o n def in i t ion were applied (for example, units employ ing five and m o r e staff), the to ta l n u m b e r o f S M E s cou ld come to m o r e than 250,000. Such w ide divergences cou ld lead to rather large errors in policy.
2.10. W e recommend, therefore, that the authorit ies in the Punjab undertake surveys o f SMEs, their funct ion ing and problems, at regular (preferably annual) intervals. Untd such t ime as a reasonably comprehensive database i s built up specifically for the Punjab, one i s compelled to supplement the province-specific i n f o r m a t i o n with the findings o f studies for a l l Pakistan, a n d from comparable situations in I n d i a and other international sources.
2.1 1. Surveys have consistently shown that credit-related problems act as binding constraints to S M E growth in Pahstan, particularly in the manufactur ing sector (for instance, see N a b i 1988). M o r e recent surveys sponsored by the Asian Deve lopmen t B a n k show that these constraints are not binding for large manufactur ing firms and, therefore, ref lect size-specific h t a t i o n s . Most S M E s operate through self-f inancing or retained earnings. T h e ADB surveys suggest that in Pakistan only about G percent o f f i xed investment finance f o r S M E s comes from development finance institutions and commercial banks (Ban and Cheema, 2003). T h e in i t ia l investment tends to b e self-financed, whi le operations are largely f inanced through retained earnings. This contrasts sharply with large firms, w h i c h can re ly quite heavily on commercial banks for both working capital and f i xed investment finance. E v e n within the set of SMEs, access to credit i s highly correlated with firm size.
2.12. T h e access dif f icult ies result from cumbersome procedures a n d excessive requirements o f collateral. T h e loan approval process can take anywhere from two to 10 months, a n d frequently requires the payment o f bribes in order to have the l oan processed. Access to credit i s also made d i f f icu l t because o f the State B a n k of Pahstan’s prudent ia l regulations that h u t the a b h t y o f banks t o l end to SMEs on an unsecured basis. W h a t compounds the problem, accordmg to S M E D A , i s that
6 The upper threshold for employment and the use o f business turnover are in line with international practice.

the financial institutions stipulate norms regarding collateral that are even m o r e stringent than required by the State Bank-financial institutions frequently require collateralization from S M E s o f up to 120-130 percent o f the loan value.
2.13. T h e Governmen t o f the Punjab may not b e able t o resolve these matters in the short run, because m a n y o f the solutions l ie outside i t s writ. However, the impor tance o f S M E s in the economic structure o f the prov ince and the f inancing diff iculties faced by t h e m must constantly b e brought to the attention o f financial institutions and the central f inancial authorities, and a strategy developed for dealing with the problems.’
2.14. H a v i n g to depend largely upon retained earnings, the growth o f S M E s in Pakistan becomes strongly t ied to fluctuations in retained earnings, which, in turn, are highly correlated, with macroeconomic fluctuations. T h e best macroeconomic env i ronment for small firms i s one o f sustained high growth. Thus, policies o f the Governmen t o f the Punjab to increase incomes will play a ma jo r role, because this i s l ikely to enlarge the demand for the products and services o f SMEs and hence stimulate an expansion o f the output from, and employment in, these enterprises.
2.15. The second most impor tan t constraint on small firms i s the infrastructure. In this area, power i s the immediate and most i m p o r t a n t constraint. Unfortunately, solutions to the p o w e r p rob lem are d i f f icu l t for small firms. Owning a n d running one’s o w n generation equipment i s prohibit ively expensive f o r most small firms, and cooperative solutions have also p r o v e d dt f f icu l t in practice because private generating companies are not al lowed distribution rights. Recent studies in I n d i a have suggested a variety o f second-best solutions, such as awarding dlstribution rights to private companies with at least 40 percent of shareholdtng by power consumers within the industr ial estate or cluster.
2.16. M a n y SMEs typically operate in clusters, with the geographical boundary delineating an “internal” market for al l kinds o f activities. T h e advantage in clustering results from the reduct ion in transport costs and from a somewhat easier access to credlt from i n f o r m a l sources, because in fo rma t ion about borrowers i s m o r e easily available within the cluster. Clustering also makes available a larger pool o f labor with expertise in the activities carried on within the cluster.
2.17. By and large, therefore, the advantages of clustering result from “external economies,” i.e., the benefits accrue pr imar i ly to the industry as a whole. Clustering does not necessarily lead to the expansion o f the scale o f enterprises; i t might simply result in a n expansion in the number of enterprises. Studies from India, Italy, L a t i n America, and elsewhere have suggested some necessary ingredents fo r the success o f a cluster-oriented approach to the development o f small enterprises. T h e necessary ingredlents invo lve: (a) an extension o f the clusters built a round associations and leaders f r o m the clusters; (b) improving access to finance v ia f inanc ing of cooperatives/associations; (c) developing regionally def ined a n d legally recognized collective brand-names; for example, in the Punjab, a particular type o f d e s c o u l d legally b e def ined as “Multani,” wh i l e in Sin& “Halla” would (legally and exclusively) designate a certain type o f l ightweight pottery. This brand-naming, supported by con t ro l o f t h e specifications, generally leads to i m p r o v e d and m o r e uniform quali ty and fetches higher prices.
7 A variety o f business support services will be provided to SMEs in the ADB-financed SME sector development program.
27

2.18. T h e system of trade protect ion also works against SMEs. A study by the Pahs tan Inst i tute o f Deve lopmen t Economics found that in some impor tant industries, such as textdes, leather and leather goods, SMEs received substantially lower effective rates o f protect ion than larger enterprises. Moreover, S M E s generally have to buy impor ted r a w materials, machinery and equipment f r o m commercial importers, w h i c h increases their costs compared with larger enterprises that benefi t f r o m exemptions a n d investment promotion privileges.
2.19. Studles have also found that in Pakistan the linkages between S M E s a n d larger enterprises are not very impor tant , and the subcontracting system i s poorly developed. O n e way o f encouraging these interl inks would b e to p r o m o t e clusters of enterprises o f d i f ferent sizes, a n d to reserve space for smaller units in al l industr ial estates.
2.2 IMPROVING THE BUSINESS ENVIRONMENT FOR FIRMS
2.20. T h e cost o f doing business for the private sector i s raised by requirements to comply with a wide range o f cumbersome rules a n d regulations. T h e transaction costs o f t ime-consuming fiscal and non-f iscal regulations are high. A compar ison o f the perceptions of fo rma l a n d i n f o r m a l enterprises helps to understand how impor tan t the obstacles to investment faced by grass-roots entrepreneurs are. Such a compar ison i s especially instruct ive in the Punjab. T h e responses o f a survey of 965 main ly manufactur ing businesses across 12 cities in Pakistan (henceforth re fer red to as W B - S M E D A survey) show that the Punjab scores better on a major i ty o f components of the investment c h a t e (13 out o f 17 constraints) than the rest o f the country (Figure 2.1).8
Figure 2.1: Investment Obstacles faced by Formal Firms - the Punjab vs. other Provinces
2.21. Although firms in the Punjab score slightly better on most constraints (and significantly better regarding access to land), the top barriers to investment are strilungly s d a r in the Punjab and the rest of the country: tax enforcement and tax levels, corruption, the cost of finance, and electricity. T h e findmg from the W B - S M E D A survey that the Punjab’s investment c h a t e i s on average slightly
8 The World Bank Group and the Small and Medium Enterprise Development Authority (SMEDA) of the Government of Pakistan carried out this survey jointly, with financial support from DFID.
28

better i s consistent with a related finding, namely that the prov inc ia l capital, Lahore, received the most favorable ratings overall among al l cities covered by the survey w h e n managers were asked to rank investment clunate in the cities other than the one in w h i c h their firm was located (World B a n k 2003). In 3 out o f the 4 cases where the Punjab scored worse than the rest o f the country, the d f fe rence was not significant (the marg in was less than 3 percentage points). T h e only constraint where the Punjab scored substantially worse than the rest o f the country was anticompetit ive and i n f o r m a l practices, with 24 percent o f f o rma l firms in the Punjab versus 18 percent in the rest o f the country repo r t i ng i t as a ma jo r constraint. This suggests that informali ty, and hence causes o f in formal i ty are l ikely to b e particularly impor tan t in the Punjab.
Figure 2.2: Investment Obstacles in the Punjab - Formal vs. Informal Firms
I
2.22. Figure 2.2 illustrates differences in perceptions o f the investment clunate by firms in the Punjab operating in the fo rma l a n d the i n f o r m a l sectors.9 T h e top constraints to investment for i n f o r m a l enterprises are access to finance, electricity, and availabihty o f slulled/educated workers.’” M a n y o f the differences between f o r m a l and i n f o r m a l enterprises can b e explained by differences in the under ly ing nature o f the fo rma l and in fo rma l sectors. ‘Since electricity, telecommunications, a n d transportat ion tend to b e m o r e f o r m a l than other sectors o f the economy and have denser networks in the m o r e developed regions o f any locality, a firm’s informal i ty typically makes i t m o r e d i f f icu l t to access these services, especially electricity. Corruption i s a significantly less severe constraint for i n f o r m a l firms because in fo rma l i t y helps t h e m avo id taxes a n d other regulations that tend to b e associated with m o r e corruption.
2.23. I n fo rma l i t y in the Punjab does not seem to b e dr iven by the “natural” barriers to entry that are due to specific types o f economic activity. Were i t so, one would expect that i n f o r m a l firms should operate in the sectors that are less skill-intensive. Y e t this does not seem to b e the case: the
9 The results are based on an informal sector investment climate survey conducted for the 2005 World Development Report, and comprising 255 micro and small enterprises (below 10 workers) in Lahore and adjoining areas. 10 Establishment of Punjab IndtlstrialEstate Development and Management Compay (PIEDMC) appears to be a step in the right direction for deviating some o f the bottlenecks faced by the industridsts in Punjab. Similarly, Punjab Small Indu&al Corporation (PSIC) has helped provide low cost finances to small and micro enterprises.
29

p r o p o r t i o n o f i n f o r m a l firms w h i c h have repor ted s k i l l s and education o f available workers as a ma jo r obstacle for investment i s four times higher than for fo rma l firms. T h e inabi l i ty o f i n fo rma l enterprises to g r o w and increase product iv i ty appears severely hampered by their inabihty to attract skil led and educated workers-driven n o doubt by the incl ination o f ski l led workers t o gravitate towards the higher pay ing jobs in the fo rma l sector, but also by a relative scarcity o f s u e d and educated workers. In contrast, high tax levels, tax enforcement, trade-related a n d labor regulations are significantly less binding on i n f o r m a l enterprises, primari ly because in fo rma l i t y allows t h e m to avoid their full impact. T h e top overal l barriers to investment in the Punjab, tax enforcement and tax levels, are clearly impedunents due to their impact o n the fo rma l firms-though under current practices they would b e expected to have equal impact o n remain ing enterprises as they make their transition to fo rma l status.
2.24. Policy uncertainty i s a m a j o r investment constraint for both fo rma l and i n f o r m a l firms in the Punjab. A s d a r l y high n u m b e r of both in fo rma l and fo rma l firms repor t po l i cy uncertainty as a ma jo r obstacle to investment (38 and 39 percent, respectively). T h e most probable source o f uncertainty for al l firms i s uneven enforcement of regulations and tax laws: 59 percent o f fo rma l and 42 percent o f i n f o r m a l firms disagreed with the statement that interpretat ions of regulations are consistent and predictable."
2.25. Regardng finance, better access and lower costs o f finance are missing benefits o f operating formal ly f o r m o s t firms in the Punjab. Wh i le cost o f finance cou ld b e expected to b e a greater p r o b l e m fo r i n f o r m a l firms, as they are less l ikely to have strong collateral a n d a long c r e d t history, cost o f finance i s one o f the most severe obstacles to investment for both fo rma l a n d i n f o r m a l f irms: roughly 40 percent o f both f o r m a l and i n f o r m a l firms repor t cost o f finance as a m a j o r constraint. Access to finance i s the most severe constraint for i n f o r m a l enterprises (50 percent), a n d only slightly less severe than cost o f finance for fo rma l firms (38 percent).
2.26. Small f o rma l firms are m o r e l ikely to suffer from inadequate finance than larger ones. Wh i le Pakistan has recently imp lemen ted a number o f successful f inancial sector reforms, access to and cost o f finance for small f o rma l firms remains a crit ical issue (World B a n k 2003). i3gh collateral requirements, cumbersome procedures, and high borrowing costs are a m o n g the key reasons why small businesses are particularly constrained by lack o f access to credit a n d high interest rates. As a result, they rely on b a n k finance less than larger establishments (Error! N o t a valid bookmark self- reference.). T h e lack o f external f inance means that firms m a y not b e able to take advantage o f investment opportunit ies in a t imely fashion. As smaller firms represent the great major i ty o f firms in the country and emp loy m o r e than 80 percent o f manufactur ing sector workers, these issues are o f ma jo r importance for the Punjab's economy.
2.27. M a n y fo rma l and i n f o r m a l firms in the Pun jab repo r t electricity-related problems as a ma jo r obstacle t o investment (39 percent and 49 percent, respectively). On average, a fo rma l firm experienced 18 power outages in 2001, causing estimated p r o d u c t i o n losses equal to over 5 percent o f the average firm's output. This i s a ma jo r country-wide constraint to investment: Pahstan-wide
11 The higher portion of formal fxms disagreeing with this statement i s probably due to the larger number of regulations relevant for these firms, which leads them to face unpredictable interpretations more frequently.
30

numbers are s d a r (15 outages p e r year and 5.4 percent o f p roduc t i on lost) a n d m u c h higher than in comparator As ian countries.12
Figure 2.3: Sources o f Working Capital for Formal Firms in the Punjab
other
informal sources
equiv
tade credit
banks, other fnancial nsltufons
rebined earnings
0 10 20 30 40 50 60 70 80
Share of wrking capital, YO
H Large 10 Smll
2.28. Accelerat ing investment and growth and creating employment opportunities, therefore, requires policy, legislative, procedural, and inst i tut ional re forms that d reduce the private sector's cost of doing business. Reducing the degree o f administrative regulat ion a n d strengthening the accountabdity o f pub l i c functionaries cou ld curb the opportunit ies for r e n t seehng and the potential for arbitrary exercise o f discretionary powers, and thus significantly l ower transaction costs fo r the private sector.
2.29. Most o f the issues that have a ma jo r bearing on i m p r o v e d incentives for investment and increased operational certainty (such as taxation matters; the availabdity, rel iabhty, and cost o f utht ies; access to credit; security and pol i t ical stabhty; po l icy predic tabhty ; a n d contract enforcement norms), arise from factors under the con t ro l o f the Federal Governmen t . Nevertheless, a strong and uni ted voice at the prov inc ia l level should b e instrumental in ensuring increased central government responsiveness to local problems-as w e argue below.
2.30. T a x Related Constraints: T h e private sector regards the p r o b l e m o f dealing with government revenue agencies, in part icular the Central B o a r d o f Revenue (CBR), a m a j o r constraint to i t s business operations a n d growth prospects. T h e taxation system in i t s present form raises the cost o f doing business, especially by providing opportunit ies to extract rents. Entrepreneurs perceive the diff iculties arising from frequent changes in tax legislation a n d accompanying rules, the uneven implementation of policies, the unpredictable interpretat ion a n d application o f laws and associated rulings, the complex i ty o f the documentat ion and other compliance requirements (especially sales tax refunds) and the inord inate discret ion enjoyed by government functionaries with l i t t le redress as far outweighing the costs of dealing with other government agencies a n d departments. For SMEs these costs can b e high, especially as the f i xed cost element o f compliance does not vary with fm size.
'2 In contrast to the 5.4 percent loss of production due to power outages reported in Palustan, the comparable estLmates for China and Bangladesh are 2 percent and 2.3 percent respecuvely.
33

2.31. Expor te rs face considerable hurdles in gett ing their sales tax r e f u n d a n d duty drawback applications processed in time. T h e departmental c e h g on the amoun t that a revenue circle can refund during a particular pe r iod further increases business costs. T h e case o f a textde exporter w h o claimed to have six employees on his payro l l j u s t for handling sales tax re funds/duty drawback claims illustrates the nature, and magnitude, o f the costs o f d e a h g with government revenue departments.
2.32. T h e G o v e r n m e n t o f the Punjab, as the administrator o f the largest prov inc ia l economy, should lobby the Federal Governmen t to facilitate the creation o f a private sector fr iendly business environment, In particular, i t should press for the rationalization o f tax legislation, the rules and procedures for implementation, and the streamlining o f the system o f sales tax refunds.
2.33. Inadeauate Infrastructure: Private manufactur ing activities are adversely affected by the lack o f reliable supply o f electricity, forc ing them to consider investment in alternative arrangements for power. However , even w h e n businesses are prepared to make such investments, they find their options severely circumscribed by the policies and demands o f uthty agencies. For example, w h e n a texule manufacturer requested WAPDA to disconnect him (since h e h a d decided to instal l a gas generator), h e was i n f o r m e d that his application would b e processed in three years. As a result, the manufacturer h a d the choice to either remain WAPDA's consumer or swi tch to the alternate source but continue to pay the f ixed l ine ren t for three years.
2.34. Following the creation o f electricity d is t r ibut ion companies (DISCOS) at the regional level, the Governmen t o f the Punjab-as in the case o f tax reform-can b e inst rumenta l in inf luencing the reliabil i ty o f service and the speed o f response o f local DISCOs.
2.35. Problems with Contract Enforcement : Pakistani manufacturers operate in a low t r u s t
environment. Surveys suggest that: (a) most SMEs are constrained to deal with a hand fu l o f stable suppliers and buyers,13 depending on long- term stable relationships with a small n u m b e r of clients, developed on the basis o f reciprocity, rather than on general t r u s t ; @) there i s lack o f t r u s t o f government; and (c) there i s h t e d fa i th in the fo rma l adjudication systems to settle disputes quickly and t o enforce contractual obligations in a predictable manner, result ing in the uneven reliance on long- term contracts. T h e decision to either re ly on i n f o r m a l mechanisms to enforce contracts or to carry out transactions only with those whose business ethics one t r u s t s segments markets, raises transaction cost o f organizing large-scale p roduc t i on and exchange, a n d discourages business development.
2.36. T h e pervasiveness o f the lack o f t r u s t owing to diff iculties in contract enforcement manifests i tse l f in m a n y ways, a n d i s one o f the m o r e binding constraints to the expansion o f businesses. For instance, manufacturers have, at times, h a d to resort to vert ical integration, p roduc ing intermediate goods, even w h e n they do not have any compet i t ive advantage, result ing in non-op t ima l deployment o f scarce resources. S d a r l y , retailers are known to have taken up manufactur ing to secure their supply lines.14 Moreover , businesses are less &ng to expand their operations fearing the high cost
13 See SME Center, at LUMS, SME survey. For a discussion o f subcontracting as a production arrangement in the context of Pakistan, see Nabi 1988. 14 The growth of the retail services sector i s also stunted by the low educational accomphshments o f the majority of traders/retailers. This not only limits their ability to expand their businesses, to hire and supervise qualified staff and to develop documented systems on operations but also makes them hesitant to elicit professional advice. There i s considerable information asymmetry between lawyers, accountants and other professionals and an entrepreneur with inadequate
3 2

o f comply ing with government rules and regulations, for example, to register or dissolve a company and mainta in prescribed records. There are also the additional costs o f ‘greater visibility’.
2.37. Almost al l o f the constraints ment ioned above are a funct ion o f poorly enforceable property rights and the lack o f a fair, eff icient and cost-effective judicial system. T h e t imely dispensation o f justice and compensation for of f ic ia l abuse o f powers would greatly ease the private sector’s diff iculties regarding revenue matters. S d a r l y , i f courts cou ld s p e e d y adjudicate disputes between two private parties or between a business and the government in a predictable manner, contract repudiat ion would no longer b e a low-cost option, and entrepreneurs would b e less reluctant t o enter i n t o long- term contractual arrangements.
Recommendations for Actions Within the Provincial Government’s Control 2.38. As described above, the prov inc ia l governments have l i t t le ro le in investment promotion and business development. However , there are other factors that either l ie within their doma in or can b e inf luenced by t h e m through adequate budgetary allocations. For instance, the prov inc ia l government can ease problems o f l a w a n d order and t imely provision o f justice by improving availabhty o f h u m a n and financial resources. O t h e r i m p e h e n t s to private sector act ivi ty emanate from regulatory uncertainty, concerning rules govern ing prov inc ia l enforcement o f federal legislation on labor and factory laws and specific prov inc ia l legislation and associated regulatory structures governing building, electricity, and boi ler inspections.
P Eliminate MuItxpIe/Nuisance Taxation: The prov inc ia l a n d local government tax structures have also raised the cost o f product ion. For instance, dif ferent levels o f government levy mul t ip le taxes on the same tax base, e.g., i ncome tax and general sales tax (GSq are lev ied at the federal level, professional tax by the prov inc ia l government on a wide array o f businesses (with an addit ional ‘bed tax’ in the case o f hotels), wh i l e loca l governments impose a professional fee. S d a r l y , there i s an entertainment tax levied by the prov inc ia l government and an entertainment fee by the district government, both o f w h i c h should ideally b e replaced by the GST (with revenue transferred to the relevant government on col lect ion basis). Alternately, at least the prov inc ia l level taxes should b e devolved to the local governments to avoid “double” taxation. Some o f these are less appropriate, nuisance taxes in l ieu o f GST a n d the loca l proper ty tax and impac t negatively on the c h a t e for investment. T h e prov inc ia l government levies an electricity duty15 a n d a service charge on the use o f generators by private businesses, even though the m a i n reason for instaUlng these i s to ensure uninterrupted supply o f electricity in the face of poor service p r o v i d e d by WAPDA.
P Address Remaining Weaknesses in Labor Laws: M a n y firms choose to rema in small rather than have to deal with the complex i ty of dealing with as m a n y as 27 di f ferent labor laws that are applicable o n fums registered in the f o r m a l sector. In order to get a round the rigidit ies o f labor laws that become applicable to units with 10 or m o r e workers, employers have resor ted to a combinat ion o f capital intensive p r o d u c t i o n processes, hiring o f contract l abo r and /o r fragmentation/legal
educational qualifications. Entrepreneurs with low levels of education attainment are more open to exploitation by professionals and government officials. This partly explains their distrust of formal systems, their desire to function outside the range of the government’s radar, and to keep businesses less documented and opaque. ‘ 5 O f 2.50 paisa for domestic and 1.50 paisa for industrial connections per unit of the electricity tar i f f covering energy charges, fEed charges, the additional fuel surcharge and the additional surcharge.
33

subdivision of p roduc t i on fachties into smaller enterprises.16 Firms prefer t o h i re casual and contract labor, largely to get around lay-of f restrictions, and outdated labor legislation that stipulates detailed procedures for the resolut ion o f disputes, causing uncertainty and raising the regulatory costs for businesses. An adverse outcome o f these developments i s that they have lowered the incentive o f the private sector to invest in upgrading o f s lu l l s , thereby affect ing product iv i ty a n d p r o f i t a b h t y of enterprises.
2.39. U n d e r l abo r related legs lat ion five levies are imposed, two o f which, the Workers Welfare Fund17 and the Workers Profit Part icipation Fund,'B are structured in such a manner that they are levied l ike taxes on profits and only paid by enterprises mak ing taxable profits. T h e other levies are the old-age benefit charge collected b y the Employees Old-age Benef i t Institution (EOBI) w h i c h i s a Federal G o v e r n m e n t levy at 5 percent of the wage o f a worker, a prov inc ia l ley7 for Social Security (at 7 percent o f the wage payable) to the Punjab Employees Social Security I n s t i t u t e and Educat ion Cess (a Federal levy but collected and retained at the prov inc ia l level), al l payable by the employer and collected through three separate agencies, two o f w h i c h are provincial ly based.
2.40. Despi te a number o f reforms that are under way, under the inst i tut ional arrangements currently in place, the workers do n o t benefi t to the full potent ia l o f the resources m o b h z e d f r o m labor related levies. For instance, workers cannot exercise the choice of whether to mainta in their pension (EOBI) account with the state-run EOBI managing the m o b h z e d funds or a private fund management company, w h i c h cou ld eam a higher re tu rn for them. S d a r l y , i t cou ld b e argued that 7 percent o f wages would buy better health care through pr ivate medica l insurance than available through the Social Security hospitals run by the prov inc ia l governments. L a b o r welfare schemes are also not beneficial for either stakeholder. On the one hand, these schemes dstort business incentives. On the other hand, f r o m the workers point o f view, returns are low or they encourage a shift in the employment structure towards contract labor.
2.41. L a b o r regulations, therefore, need to b e simplif ied, revised and al igned with current market realities, such as the existence o f contract labor and the requirements o f flexible labor markets operating within a globalized trade env i ronment (for implementat ion by a fewer number o f regulators) wh i l e labor levies need to b e consolidated for col lect ion by one organization for distr ibution a m o n g d i f ferent government agencies.
> Revamp Other Arcane Regulatoy Legislation and Structures: Some of the regulatory laws are completely outdated, out o f tune with technological developments, a n d beyond the technical competence of the enforcement machinery. In several instances, n e w products and instruments have become available that are bet ter replacements and m o r e effect ive mechanisms for achieving the objectives under ly ing the p romu lga t ion o f existing laws or inst i tu t ional and adrmnistrative arrangements for their enforcement. T h e prov inc ia l Boi ler A c t 1923, for example, requires Grade-1 1 Boi ler Inspectors recruited a n d trained to enforce a legislation that m a y have been relevant m o r e than 80 years ago, and are today expected to inspect a n d cert i fy boilers manufactured by multinationals.
16 One study of the surgcal instruments sector, Sector Strategy Report-Stlrgicd Instwments, SMEDA, 1999/2000, suggests that only 17 percent o f the firms operating in the sector were registered with the Labor Department. 17 Payable at 2 percent of taxable income and collected by the Income Tax authorities for transfer to the Workers Welfare Board. 18 Payable at 5 percent o f profits and distributed among the workers of the company up to a maximum of Rs. 3,000 per worker of the enterprise, with the undistributed balance being deposited in the Worker's Welfare Fund.
34

This regulatory funct ion can easily b e outsourced t o universities and private firms providmg engineering services that cou ld b e pre-qualif ied o n the basis o f well-drafted selection criteria.
2.42. S d a r l y , the government has Building and Electr ici ty Inspectors to ensure the safety and security o f private buildmgs used for publ ic purposes, for example, cinema houses a n d restaurants. Objectives underlying the regulatory functions per formed by these functionaries can b e better achieved i f such buildings are comprehensively insured through private insurance companies. E v e n in Palustan’s economy, where the entire range o f services on of fer are s t d l in the evolut ionary stages o f development, the private sector i s able to provide products and services to supplant/replace the present ro le o f the government’s regulatory apparatus. Through this inst rument the cinema owners can be spared the frequent v i s i t s o f these government employees, who would b e denied the opportunity for extor t ion on the basis o f regulatory functions mandated to them. Moreover, the security and safety of the pub l i c using these buildings would also b e assured, since the private insurance companies would ensure the p roper construction and maintenance of the property.
2.3 STIMULATING FASTER GROWTH IN THE CONSTRUCTION SECTOR
2.43. Construct ion has t h e potent ia l to b e one o f the most dynamic sectors o f Pahstan’s economy.’g However , the shortage o f housing units in the country i s estimated to s t d l b e a round 5 r rd ion units, indicating that this sector has considerable untapped g r o w t h potential. This i s especially so in the Punjab where the number o f housing units has increased by 2 percent pe r a n n u m between 1980 and 1998, as compared with 3 percent p.a. for other provinces. With popu la t i on growing at 2.5 percent per annum. (2.6 percent in other provinces), t h i s sluggish growth in n u m b e r o f housing units has l e d to increased c rowd ing o f houses in the Punjab (while in other provinces n u m b e r o f persons per housing unit have declined), despite somewhat faster growth in income.
2.44. T o t a l national investment in housing, at around Rs. 150-160 billion p e r annum, contributes less than one percent o f GDP. This i s due in large pa r t to the relatively undeveloped state o f housing finance. Historically, the state-owned Housing Buildmg Finance Corpo ra t i on has p rov ided the bulk o f housing finance. However , even at i t s peak, annual credit by fo rma l f inancial institutions has never exceeded 1.5 percent o f to ta l housing investment, compared to a round 25-50 percent in South East Asia and the U n i t e d States respectively.20 A culture o f d f u l default a long with procedural complications encountered by financial institutions in encashing collateral, part icularly o f immovable property, have deterred the private sector from ventur ing into housing finance activities. W h i l e high interest rates throughout the 1990s have also restrained the demand for c red t , p r e v a h n g interest rates are now at their lowest levels ever.
2.45. Wh i le addressing the biggest p r o b l e m constraining the development o f the housing finance sector-the df f icu l t ies in enforc ing foreclosure laws in the event o f a default-is largely outside the purv iew o f prov inc ia l governments, the Federal G o v e m m e n t has recently taken several impor tan t steps in this regard. T h e i m p r o v e d per formance o f Bank ing Tribunals, a long with enactment o f the 2001 Finance Institutions (Recovery o f Finances) Ord inance p rov ide some h o p e that the challenges o f foreclosure have been addressed effectively through strengthening o f the legal f ramework and the
19 Pakistan’s PRSP notes that the employment elasticity of this sector with respect to GDP growth i s more than twice that for the economy as a whole (overall GDP-employment elasticity: 0.41; construction sector 0.87). 20 Presentation by Conrad D’Souza of the Housing Development Finance Corporation Limited, India at a Housing Finance Seminar in Karachi, August 2003.
35

debt recovery procedures.21 T h e eventual development o f a secondary market in housing finance, leading to the i n t roduc t i on of tradable mortgage-backed instruments whereby p r imary lenders can securitize their mortgage holdings for re-sale to other investors, will give an addit ional fillip to this sector.
2.46. The Prov inc ia l Governmen t can also play an impor tan t ro le in addressing a number o f other key legal, fiscal, and administrative barriers hindering faster development of the housing and construction sector. These include:
Unrel iable Records of Rights due to Unclear L a n d Titles: T h e lack of adequate l and information, access, a n d retr ieval and veri f icat ion system results in poor quality, rel iabhty, and accuracy o f the records o f ownership rights. This dysfunctional nexus between land management and housing markets i s a m a j o r imped imen t to the development o f m o r e eff icient l a n d markets.
High Rates o f StamD D u t v and other Levies: In u rban areas o f the Punjab, the costs o f registering proper ty transfers include a 1 percent registration fee, a 5 percent prov inc ia l stamp duty on the value o f the p roper t y (compared to a nomina l transfer fee o f Rs.150 per sq . ya rd and no stamp duty in Islamabad, and 3 percent stamp duty in Sindh), not to m e n t i o n numerous other charges (professional charges, brokerage fees, cou r t fees, etc).
Outdated and Non-uniform Building and Z o n i n g Laws: M u l t i p l e agencies administer dif ferent zoning and building by-laws (e.g. those relat ing to heights o f buildings, ra t i o of floor to plot area, etc.) and building approval criteria within a city. For instance, in the case o f Lahore, these include the LDX, Cantonment Board, and Tehsi l Mun ic ipa l Administrat ions. These z o n i n g a n d buildmg by-laws need t o b e updated and made consistent across authorities within the province.
Excessive L a n d Reda t ion -Commerc ia l i za t i on Charpes: Some local government taxes and fees raise the cost o f investment for the construction sector. For instance, in the case o f change o f use of property, LDA levies a commercial izat ion fee o f 20 percent o f the value o f the plot, even in areas that have already been declared as commerc ia l zones.
L a c k o f Adeauate Penalties for N o n - U t h z a t i o n o f Land: T h e lack of adequate penalties to discourage speculative acquisit ion o f p roper t y means that even w h e n a l l associated infrastructure has been provided, co lon izat ion o f housing schemes proceeds at a slow pace. Not only i s the investment on roads, electricity, gas, water supply and sanitation systems, etc. under -u thzed as a result, but also the assets created deteriorate because o f long periods o f non-use. To discourage speculation and release land for development, the government should consider raising the n o n - u t h z a t i o n fees on vacant plots along with appropriate measures to address the issue o f benaami holding o f proper ty (thereby also m in im iz ing the p r o b l e m of unclear titles).22
21 The Ordinance dlows financial institutions to repossess property without recourse to courts, and has also been successfully tested in the courts in two recent cases. Nevertheless, foreclosure may continue to be an issue in the case of home lending, since social and cultural values would also come into play, which would perceive financial institutions as forcing defenseless poor households to surrender their only shelter. 22 Benaami literally means “no name”; a benaamz transaction means any transaction in which property i s transferred to one person for a consideration paid or provided by another. Benaumi holding of property allows individuals to obfuscate the identity of the true owner of the property, or to undermine effective implementation of landholding ceilings.
36

R e n t Restr ic t ion Legs la t i on and Disincentives to D e v e l o t i n c Renta l ProDertv: T h e excessive pro-tenant bias o f the 1959 U r b a n Ren t Restr ict ion Ordinance, under w h i c h a Contro l ler has the sole authority to determine the fair ren t for residential premises as we l l as w h e n evict ion o f tenants i s justified, discourages development of properties for rental purposes. O t h e r ma jo r factors that serve as disincentives for ren t i ng out proper ty include the high rate o f stamp du ty and registration fees (3 percent and 1 percent of value o f contract respectively), and that p roper t y tax on rental proper ty i s assessed at ten times the rate o n comparable owner-occupied properties, even though both may have the same access to pub l i c facilities and amenities [the current proper ty tax dif ferential i s m u c h higher than in Karach i (2:l) or Islamabad (same rate applied)].
2.47. Any potent ia l loss o f revenue from the reduct ion in proper ty tax rate o f ren ted properties i s l ikely to b e more than recovered from a reduction in evasion o f p roper t y tax on rented properties, increased development o f properties for rental purposes, and a slight rev is ion in the tax o f owner- occupied properties. In addition, disposal o f l and owned by government in p r i m e commercial locations and be ing used for less product ive purposes (or leased out to the private sector at nomina l rents), will he lp better exploit the potential o f this scarce asset, a n d thereby stimulate private construction activity, improve land utdlzation, and m o b h e revenues for a l l levels o f government.
Recommendations for Actions Within the Provincial Government’s Control 2.48. T h e Prov inc ia l Governmen t can help reduce the cost of investment in construction, and improve incentives for construction o f proper ty for renta l purposes through a n u m b e r of measures:
9 Rationalize the stamp duty on property related transactions
9 Prune change of use charges for property classified as ‘‘commercialy’ under zoning regulations
9 Rationalize development charges imposed by local water and sanitation agencies for change of use ofproperty from ‘kesidential” to ‘%ommercial”
9 Impose a land non-utilization fee or an idle land tax
9 Promulgate a law abolishing the benaami holding ofproperty
9 Revamp the Rent Restriction Ordinance.
9 Narrow the differentialin property tax on renter and owner-occupiedproperty
2.4 IMPROVING THE SYSTEM OF LAND-TITLING IN THE PUNJAB
2.49. L a n d i s a crit ical economic asset in any economy. A m o d e r n l a n d admmistrat ion system, with a secure, accurate, and accessible system o f registering and reco rd ing l a n d transactions, i s widely accepted as an impor tan t mechanism for empower ing the poor.
2.50. Current Svstem o f Record-of-Richts and Related Less la t i on : T h e records-of-r ights in land in Pakistan are o f the fiscal variety. T h e person shown on the records i s responsible for pay ing l and revenue or proper ty tax and i s presumed to b e the owner, unless i t can b e p r o v e d otherwise. However, the tit le to l a n d i s only incidental, as Pakistani l a w does not adrmt to the provision o f a
37

certificate from the government guaranteeing that the person ment ioned in the records-of-rights i s the true owner. In other words, entries in the records-of-rights can b e challenged in the courts o f law, as the registrar entering the transaction in off icial records only conf i rms the val idlty and accuracy o f the document, but does not prov ide any legally binding assurance o f tit le to the proper ty .
2.51. Excep t for cases specifically p rov ided for in the Registration A c t or the Transfer of Proper ty Act, registration o f l a n d i s optional. For instance, under Islamic Law, ora l declarations o f gift (even i f subsequently recorded on paper) do not have t o b e registered. Thus, the system o f l a w allows for perfect ly va l id titles (Le. in a legal sense) to be created without the transaction being recorded anywhere. Any search by a buyer in the Revenue Record sand the Registrar’s O f f i c e will not prov ide any clues to such a transaction hav ing taken place. On the other hand, courts have repeatedly con f i rmed that registered documents do n o t guarantee t i t le, but rather are o p e n to scrutiny and possible reject ion in courts.
2.52. T h e established system o f conveyancing visualizes that the buyer must investigate the seller’s t it le to the property-“let the buyer beware.” Wh i le the transferor i s ob l iged to g v e a good tit le to the transferee, the government i s under no obligation to prov ide a guarantee to title, i.e., it does not furnish any assurance on ownership. Despi te the exercise o f due caut ion the t i t le m a y s t i l l b e defective. For instance, wh i l e the buyer may have satisfied h imse l f of the authentici ty o f the transactions leading to the present transaction, i t i s just possible that some o f the documents of earlier transactions were defective on account o f forgery, lack o f consent, consent granted by a minor and hence not valid, etc.
2.53. Benefits o f State Guarantees o f T i t l e to ProDertv: Deve lop ing a system o f guaranteeing l and titles would not only confer great benefits to those h e c t l y i nvo l ved in l a n d transactions, but would likely also generate considerable economic externalities. I t would help free up precious court-t ime presently engaged in settl ing t i t l e disputes, enable implementat ion o f l a n d reforms, facditate credit availabilitv to small farmers who c o u l d use secure titles as collateral. boost tax revenues bv reducing the scope for evasion o f i n c o m e tax, and would also help reduce cost a n d t ime overruns in development projects involving land acquisition.
2.54. T h e impor tance of m o d e r n technology and the i n t roduc t i on o f a GIS are universally recognized as a way of enabling quick and eff icient reco rdmg o f tit le transfers. However , for the effect ive use o f new technologies greater consideration d have to b e g iven to inst i tut ional roles a n d responsibdities, development of h u m a n resources, work procedures and processes and appropriate, sustainable technology that has a well- defined development path. W h i l e sett ing up the system may init ial ly b e qui te costly, for
Box 1: Land Titling Systems in Other Countries
The Torrens System in Australia: U n d e r this system, t h e state cert i f ies t h e au thent ic i t y o f tit le. Apart from t h e main advantage t h a t it confers on t h e o w n e r a d e f i n i t i v e t i t le to t h e land, th is system great ly s imp l i f ies c o n v e y a n c i n g procedures, c i rcumvents t h e n e e d for cos t ly e x a m i n a t i o n o f records, a n d helps a v o i d p r o b l e m s created by g e n u i n e er ro rs a n d mistakes in t h e past. E x p e r i e n c e in several A u s t r a l i a n states has s h o w n tha t w h e n t h e cent ra l g o v e r n m e n t created a database o f al l parcels o f l a n d a n d the i r respect ive o w n e r s t h e y w e r e able to detec t m a n y m o r e leg i t imate taxpayers. O v e r 50 countr ies, i n c l u d i n g Kenya, Uganda, Sudan, M o r o c c o , T u n i s a n d Syria, have now a d o p t e d t h e T o r r e n s system. S ingapore has also swi tched to a system o f reg is t ra t ion o f t i t les r a t h e r t h a n deeds.
The English System: T h e L a n d T r a n s f e r A c t in E n g l a n d reyu i res a c o m p u l s o r y reg is t ra t ion o f t i t le to land. T h e registered h o l d e r i s regarded as t h e so le p r o p r i e t o r . T h e d i f fe rence o f t h e E n g l i s h sys tem from t h e T o r r e n s system i s that, e v e n though t h e f o r m e r i s m u c h simpler, t it les c a n b e cor rec ted in t h e event of f r a u d u n d e r t h e lat ter . In t h e T o r r e n s system t h e cour ts have l im i ted , i f any, j u r i s d i c t i o n o v e r t h e records o f tit les.
38

instance on account of indemni f icat ion losses, these costs would most l ikely b e recovered through increased tax revenues. In addition, supplementing the in i t ia l fund with registration charges, once transactions start get t ing recorded can min imize budgetary outlays.
Recommendations 2.55. W h i l e comprehensive cadastral surveys and registration of titles are admittedly costly affairs and d i f f icu l t to undertake, they l ikely o f fe r the only lasting solution to the problems discussed above. Those profiting from the present system d oppose an up-to-date, m o r e accessible, system fo r recordmg l a n d related in format ion, so preventing r e f o r m efforts from being st i f led by these vested interests d require commi tmen t and suppor t f r o m the highest level o f government.
2.56. T h e gove rnmen t cou ld init iate pilot projects in two districts o f the country. These projects will enable the ident i f icat ion o f the problems and diff iculties l ikely to b e encountered in setting up a system o f registrat ion o f titles. As a f i r s t step in the long term strategy to design and implement a system o f t i t le registrat ion there cou ld b e a requirement for the compulsory registration of al l documents w h i c h relate to property, inc lud ing sale agreements, declaration o f g i f t s , powers o f attorney. Any par ty claiming t i t le through adverse possession would b e required, within six months o f acquir ing such title, to register his claim. Bemzmi transactions would have to b e declared unlawfu l and the courts would have to refuse to recognize these. Any suit against any immovab le proper ty would also have to b e registered with the Registrar. Provision exists in the Registrat ion A c t for such registration. This would have to b e made compulsory. Simultaneously, the government cou ld init iate the process o f conversion o f presumpt ive titles into exclusive titles. D r a f t l i s t s cou ld b e prepared, that would b e open to publ ic inspect ion for a period o f G months or some such stipulated pe r iod during w h i c h any disputes or objections that are raised cou ld b e would b e settled. W h i l e the process may b e slow and painful, the long- term economic and social benefi ts that d result from establishment o f a m o d e r n system o f l a n d tiding are l ikely to b e immense.
2.5 PROMOTING THE DEVELOPMENT OF CITIES AS GROWTH ENGINES
2.57. A recent UN study estimates that by 2007, m o r e than h a l f the world's popu la t i on d live in u rban areas. Most of t h i s growth i s pro jected to come from smaller u r b a n centers that currently have fewer than half d o n residents. Governments in some developing countries are increasingly focusing on development o f cities-both smaller u rban centers a n d mega-cities, with recognit ion that these areas contr ibute s i p f i c a n t l y to GDP and employment, a n d t h u s p rov ide the best opportunity-to generate n e w employment opportunit ies and serve as growth engines for the economy. For instance, China now encourages ru ra l u rban migration, hav ing realized that this has had a posit ive effect on the economy. To support these cities in generating economic benefits for the country, governments-national, sub-national, and local-undertake a series o f actions aimed at supporting the city's comparative a n d competit ive advantages, ensuring that they p rov ide a sound local investment cl imate to businesses, and ensuring that i t prov ides adequate and needed infrastructure at appropriate locations. T h e approach i s demand based, responding to business needs and i s premised o n partnership between the publ ic and private sector.
2.58. With an overal l popu la t i on density m o r e than 3% times that o f the rest o f Pakistan, the Punjab i s uniquely placed to locate cities at the center o f i t s economic a n d development strategy. In addit ion to the don-p lus cities of Lahore, Faisalabad, Rawalpindi, Mu l tan , a n d Gujranwala and their adjoining areas, i t has 10 other cities with over two h u n d r e d thousand residents, w h i c h cou ld
39

potential ly serve as m in i -g rowth engines fo r the regional and prov inc ia l economy. Focus on these smaller u rban centers in addit ion to the mega-cities provides greater scope to explo i t local resource bases and comparative advantage, leading to the development o f a m o r e diversif ied and prosperous economic base overall. T h e example o f Sialkot (Box 2) offers an excellent m o d e l to spur other cities to pursue s d a r objectives through innovative schemes and proposals relevant to their regions and specializations.
2.59. T h e overal l approach would b e t o (i) ensure that the investment climate o f the city / city reg ion i s conducive to business needs (this could, for instance, mean ensuring we l l funct ion ing infrastructure, addressing excessive regulation, ensuring good govemance), a n d (ii) focusing on the needs o f key industr ial sectors o f the economy. This in turn would entai l designing and implement ing a collaborative work-p lan of m o r e focused and in-depth studies to examine the growth potential o f each reg ion based on the full spectrum o f potential private sector issues,23 and cult ivat ing and pursuing successful publ ic-private partnerships to help realize this latent potential, as government f inancing alone wdl b e insuff icient to meet the increased investment needs o f these regions.
2.60. Such “competitiveness partnership” initiatives, consultative mechanisms, or public-private p la t forms for r e f o r m should ideally b e init ial ly launched in 1-2 pilot cities, selected based on displaying the strongest potential with respect t o 4 dimensions: (1) a n organized private sector with some entrepreneurs witling and able to prov ide leadership; (2) strong government suppor t with poli t ical will ( including support from prov inc ia l officials dealing with matters l ike taxation, business registration, trunk infrastructure, water supply and sanitation, roads, a n d other such key local infrastructure); (3) a sponsor with strong credibil i ty with both private sector and government; and (4) instruments such as logistical facilities and seed funds for start ing the init iat ive untd fur ther funding becomes available.
2.61. T h e init ial focus should b e on po l i cy and regulatory issues that affect the entire private sector, where b r o a d consensus for r e f o r m exists, and where qu ick and visible wins are feasible, complemented by longer-term init iatives such as enhanced support for enterprise-based training. A carefully implemented media and communications strategy to enhance accountabdtty o f group members to b road social interests should buttress a well-defined outreach strategy in support o f an understandable and achievable vision statement.
23 K e y studies t h a t are l i k e l y to b e r e q u i r e d inc lude: (i) d e v e l o p m e n t o f basel ine i n f o r m a t i o n ; (ii) analysis of t h e e c o n o m i c po ten t ia l of t h e loca l areas a n d pr io r i t ies for g o v e r n m e n t support; (iii) analysis of bus iness needs within t h e area; a n d (iv) a thorough rev iew o f t h e e c o n o m i c services depar tments a n d t h e services they p r o v i d e . B a s e d on these studies a p r i o r i t i z a t i o n c o u l d b e under taken (i) of t h e e c o n o m i c services t h a t are required; a n d (ii) of business i n v e s t m e n t c l imate needs.
40

I Box 2: The Cluster Approach to Regional Development and Growth: The Example o f Sialkot
A key center for labor-intensive small-scale industrial enterprises, the Sialkot regional cluster i s poised for accelerated growth. A relatively small city with an estimated population o f approximately half a million, Sialkot i s nonetheless internationally renowned for its export-intensive manufacturing sectors, in particular its three relatively well-developed industrial clusters producing surgical instruments, sports goods, and leather garments. Annual exports from the region are now close to $700 d o n , contributing nearly 7% of Pakistan’s exports. The business community in Sialkot has successfully pursued a number of initiatives over the years:
Sambrial Drv Port: As early as 1986, ci ty residents collaborated to set up the Sialkot Dry Port Trust, the fust ever dry-port established in the private sector in Asia. The main objective of this venture was to provide customs clearance through a one-window operation at the city’s doorstep, thereby facilitating participation by exporters and importers. The number o f exporters subsequently increased substantially, enabling total exports to r i se rapidly. The total annual value of exports from the port has increased more than twenty-fold since its inception.
Citv Package: - Since excessive travel time and inconvenience was an important factor inhibiting potential clients and visitors, the private sector raised funds to build better approach roads to the city. An innovative financing plan was agreed with the Punjab Government, whereby the Chamber of Commerce raised Rs. 130 million through deducting 0.25 percent of export earnings at source. Whi le the government initially agreed to contribute Rs. 3 for every rupee raised, it eventually withdrew from the scheme after contributing Rs.lOO million. Several key roads were nonetheless reconstructed and expanded through the scheme, and drainage work undertaken, making a dramatic difference to the image o f Sialkot.
Other self-heln schemes and nartnershins: Road improvement work was undertaken in the Sialkot Industrial Estate in 2001/02 through a Rs. 5 million self-help scheme, which in turn was matched by a grant from the District Naz im and a contribution of Rs. 10 million from the city package in 2001-02. Similarly, when residents realized that the unplanned and uncontrolled growth o f tanneries in populated areas of the city posed serious a public health risk, the business community and the Provincial Environment Protection Agency set up the Sialkot Tanneries Zone, to which all tanneries would be relocated.
Sialkot International AirDort initiative: The private sector’s most ambitious undertaking to-date has been to initiate construction o f an international airport on a build-own-operate basis. Members of Sialkot International Airport Limited (SIAL) contributed 5 million each to raise a total of Rs. 800 d o n . In 2004, Rs. 200 million i s expected to be raised through soliciting smaller contributions from 200 additional members. Land acquisition for the project was financed through funds advanced from the government at favorable terms. Wh i le initial estimates of the cost of the project were Rs 1.7 billion, this could r ise to around Rs 2.5 billion. SIAL i s presently examining several options to meet the shortfall in funds through additional equity financing. In the meantime, construction work on a 3.6 km runway, equivalent in specification to that of Lahore International Airport, commenced in January 2003, and i s expected to be complete by July 2004 allowing cargo flights to commence. Passenger operations are expected to commence in April 2005.
Addressing Impediments to Growth: Whi le the business community in Sialkot has undertaken a number of commendable initiatives in the past few years, i t alone cannot tacMe all the bottlenecks constraining growth. By joining hands with the private sector in the following areas, the provincial government can work towards accelerated future development of this promising region:
P Devefop human capital: Worlung in partnership with the private sector, organizations such as the Technical and Vocational Training Authority (TEVTA) and the Punjab Vocational Training Council (PVTC) can play an important role in stimulating employment generation in this region by designing training courses that develop skilled manpower demanded by industry.
P Roads infrastructure: Additional, relatively modest, investments in infrastructure can play a key role in reducing the high logistical cost o f doing business, and help improve, and not merely expand, the competitiveness of this growth cluster. The private sector has identified a number of schemes where investment by the provincial government to improve access to a l l the major cities in the region, and from the new airport can provide swift returns.
> Shared service facifities: Better connectivity in turn will allow sharing of common service facilities (e.g. training facilities, common bonded warehouses for raw materials, testing facilities, etc.) by industries across the region. A case in point i s heat treatment and materials testing facilities, where the rudimentary public sector facilities that existed in the 1980s were found inadequate, and their use largely abandoned. These facilities need upgradmg, or better st i l l , the government can help set up a modern faciltty in the private sector.
k Administrah’veprocedures: Following the recent and ongoing local government reforms, some administrative confusion has arisen over the functional mandates of provincial and local government for maintenance of infrastructure. This needs to be addressed urgently, as i t i s perceived as a growing constraint to progress in improving access roads. The government can also focus its efforts on deregulation of systems and procedures to reduce the cost o f business.
Source: For more detds, please see background study: The ClusterApproach t o Regional Development and Gmwth: The Case ofSialkot
41

2.6 TOWARDS BETTER STRATEGIES T O ACCELERATE GROWTH OF THE SERVICES SECTOR
2.62. As n o t e d earlier, the non- fa rm sector accounts fo r the bulk o f prov inc ia l GDP in t h e Punjab. In particular, the services sub-sector-comprising wholesale and retai l trade, transport, storage, and communication, and pub l i c administrat ion and defense-contributes about one-half of prov inc ia l GDP, and employs about one- th i rd o f the total labor force. This chapter has inc luded a number o f recommendations on reducing unnecessary regulations w h i c h increase the cost of doing business, and hence act as a m a j o r disincentive t o investment and private sector growth. In addt ion, using survey data on perceptions o f the investment climate by firms in both the fo rma l and in fo rma l sectors, the r e p o r t has highl ighted how access to finance, infrastructure (electricity in particular), and avai labhty o f slulled workers act as bindmg constraints for firms operating in h f f e r e n t sectors.
2.63. Looking ahead, clearly m o r e in-depth work i s needed-moving b e y o n d t h i s fairly macro- analysis o f the over-arching constraints to faster growth-to analyze specific po l icy actions and interventions that cou ld he lp spur faster growth o f selected sub-sectors o f the prov inc ia l economy. This i s true not just o f those selected sub-sectors contr ibut ing a high share of to ta l GDP and employment (e.g. light engmeering, poultry, d a q , etc.), but also those that m a y b e relatively small at present, but nonetheless have considerable latent growth and employment potent ia l (e.g. i n fo rma t ion technology, education and health services, IT-enabled services, etc.). In this regard, whi le manufactur ing a n d construction-related sub-sectors have been the subject o f a number o f recent studies,24 very l i t t le attention has been d rec ted to-date towards better-understandmg constraints faced by firms in various services-related sub-sectors. In thinking abou t a fu ture p rog ram o f work to help operationalize the prov inc ia l government’s development vision, there i s an urgent need to strengthen the i n f o r m a t i o n base in this area.
24 For instance, see t h e recent studies b y SMEDA a n d o t h e r ins t i tu t ions ana lyz ing t h e growth p o t e n t i a l of var ious industrial sub-sectors, such as-for instance-poultry, dairy, electric fans, surgical goods, a u t o m o b i l e parts, electronics, m o l d s a n d dies, sugar, steel, m a r i n e fisheries, leather, ceramics, h a n d l o o m s a n d o t h e r s u c h texule-related sectors, etc.
42

CHAPTER 3: ACCELERATING GROWTH IN THE AGRICULTURE SECTOR
3.1. Agr icu l ture i s a ma jo r cont r ibutor to the Punjab’s economy, accounting for roughly 28 percent o f i t s output a n d providing employment t o over 40 percent o f the work force. T h e performance o f the sector i s therefore crucial to any strategy for generating higher incomes. W h i l e the agriculture sector in the Punjab has witnessed negligible growth in total employment during the 1990s (ref. Table 2.1), i t nonetheless has considerable latent employment-generation potential. Examin ing data from several South and East As ian countries, a recent study concludes that conver t ing one hectare o f r ice t o vegetable cult ivat ion for one season generates one year-round job (Ali a n d Abedul lah 2002), ind icat ing that increased agricultural &versif ication away from cereal crops to h igher value and m o r e labor-intensive activities-a central thrust o f this chapter-presents tremendous job-creation possibhties. This chapter reviews the recent performance o f the agriculture sector in the Punjab, and identif ies priori t ies for publ ic po l i cy to accelerate agricultural growth, enhance the sustainable use o f natural resources, and reduce ru ra l poverty.
3.1 RECENT SECTOR PERFORMANCE AND PRIORITIES FOR PUBLIC POLICY
3.2. O v e r the past 20 years, the agricultural sector has pe r fo rmed moderately well, growing at around 4-5 percent pe r a n n u m (higher than the average for Pakistan, South Asia, as w e l l as low- income countries overall). Since the Green Revolut ion in the 1960s, agricultural growth has largely come from adopt ion o f m o d e r n inputs, especially high yielding varieties, fer thzer a n d pesticides, comb ined with expansion o f irr igated water supplies. T h e adop t ion o f t h i s technology has reached high levels, with 80 percent o f l and irrigated, over 90 percent o f the area o f the ma jo r crops under m o d e r n varieties (sugar cane i s the exception), and fer thzer consumpt ion o f over 100 kg/ha. Between 1970-2003, input growth accounted for one-half of growth in output, whi le total factor product iv i ty (TFP) growth accounted for the remain ing half, with technical change, infrastructure, and education being the ma jo r drivers o f TFP growth (Ali and Byerlee, 2004). Loohng ahead, impor tan t considerations related to agriculture include:
Average Annual Growth (1991-2003)
1.0% 2.0% 4.0% 6.0%
Shares in Total Agriculture Value Added (2002103)
0 Livstk. BMin. Crp OForest. OMaj. Crp. mFishery
0 T h e Green Revo lu t i on strategy o f input intensif icat ion in a f e w ma jo r crops, pursued since the 1960s has to a large extent been exhausted with h t e d prospects of increasing l and area and water supplies, and rap id ly diminishing returns, and in some cases serious env i ronment and health implications to higher use o f external inputs, especially pesticides (Box 3).
Product iv i ty o f the sector i s low in terms o f efficiency o f use of resources a n d inputs, and the rate o f TFP growth at 1.5 percent has been lower than in other countries a n d regions experiencing r a p i d technological transformation, such as nor thwest I n d a , China, and Brazil.25
0
25 Comparable estimates o f TFP growth are 1.9 percent for the Ind ian Punjab 1970-95, 2.2 percent for China 1965-85, 1.9 percent in Taiwan 1951-80, and 1.7 percent in Brazi l in 1968-87.
43

Water has become the ma jo r h t i n g factor to further growth yet the product iv i ty of water used in agriculture has declined in the past three decades.
L a n d has been degraded by the use o f poor quality water and continuous cereal mono-cropping. Together, these factors have h e l d back the g rowth o f productivity-it i s estimated that in the absence o f resource degradation, product iv i ty growth in the Punjab would have been 42 percent higher than the actual growth during 1970-1990s.
Agr icu l tura l exports have largely been p rov ided by co t ton and rice, a n d only recently has the Punjab begun to explo i t the rapidly growing trade for high-value agricultural exports, despite a favorable ecology and geographic position.
G r o w i n g income inequali ty and stagnating pover ty levels have accompanied low agricultural growth. Par t o f the p r o b l e m has been a high and growing concentrat ion of l a n d with 2.5 percent o f large farmers (> 20 ha) owning one third o f the l and whi le small farmers with less than 2 h a o w n on ly 12 percent o f the l and although they account f o r h a l f o f the to ta l farm populat ion.
Box 3: Environmental and Health Problems o f Agricultural Intensification
The most serious agricultural pollution problem relates to the rapid increase in pesticide u s e f r o m less than 1000 t i n 1980 to 70,000 t in 2002-most of which i s used in the Punjab. Most pesticide i s insecticide and most of this i s applied to the cotton crop. The widespread use of generic and often dangerous pesticides on cotton has a number of potential health hazards, including contamination of workers who apply it (three quarters of producers use a back-pack sprayer without protective clothing), contamination of harvesters (all of whom are women), health hazards to plant workers, contamination of soil and groundwater used for drinking, and contamination of consumers of agricultural products. Economic costs of these negative health effects have been estimated at over one billion Rupees annually.
The sole reliance on pesticides to reduce pest losses has aggravated sustainability problems as pest populations change and develop resistance to commonly used pesticides. This was manifested in the recurring cotton crises of the past few years where pest losses sharply reduced the cotton harvest, threatening supplies to the domestic textile industry, causing estimated losses of Rupees 5.7 billion annually. The short run success in increasing cotton production over the past two decades has been translated into a major challenge to sustaining the industry. Despite the magnitude o f the environmental and health problems associated with high levels o f pesticide use, Pakistan i s a latecomer to the practice o f integrated pest management (IPM) and has been reactive rather than proactive in fighting pests.
3.3. Because o f i t s ro le in output, incomes, a n d employment, i t i s clear that agriculture will b e a priority sector in any strategy that the Punjab adopts to accelerate economic growth a n d to reduce poverty. However , i t i s also clear that past approaches wdl not work for the future.
3.4. First, markets for agricultural products are rapidly changing. No t only does the sector need to respond to rapidly changing domes t ic markets with urbanization and m o r e af f luent consumers, but also the Punjab with i t s i rr igated agriculture, favorable c h a t e and geographic position, has excellent prospects t o expand exports into high value and value-added products. With self-sufficiency in wheat and sugar, the growth strategy must shift increasingly towards f r u i t s a n d vegetables, value-added products, and l ivestock products, and to promoting the expor t orientat ion o f these products.
3.5. Second, with ever m o r e h t e d prospects for expandmg l a n d area a n d water supplies, growth strategies must increasingly re ly on i m p r o v e d management a n d knowledge to increase the productivi ty o f existing resources. Technological progress and inst i tu t ional r e f o r m i s central to better system-wide and location-specif ic management for enhanced input a n d resource use efficiency. Enhanced efficiency i s also essential for improving Pakistan’s compet i t ive position in world markets as i t adjusts to WTO rules.
44

Box 4: Crop Yields in the Pakistani Punjab, the Indian Punjab, and Egypt Despite the achievements noted, yields of most crops in Punjab are lower than international comparators (see below). 'Wheat and rice yields in Pakistan Punjab are less than half of what has been achieved in the comparable environment of Indian Punjab and Egypt. This not only suggests lack of appropriate technologies and inefficiency in using available technologies, but also indicates the enormous potentlal, which can be exploited without many additional resources.
Tons / hectare (Data for 2002) Crop Pakistani Punjab Indian Punjab Egypt Wheat 2 5 4 5 6 2 R m - f i n e (paddy) 2 5 Re-coarse (paddy) 3 3 5 3 9.4 Cotton @hum) 1 8 1 3 2 8 Sugarcane 45 1 65 2 90 9 Maze 2 1 2 7 7 7 Gram/chck peas 0 7 0 9 1.9 Rapeseed and mustard 1 0 1 2 Tomato 10 0 35 1 Potato 17 2 20 0 23 8
3.6. Third, sustainable agricultural growth depends on i m p r o v e d management o f l and and water resources to reduce natural resource degradation. This d require po l i t ica l commi tmen t at the highest level to mount a concerted e f fo r t across a wide range o f government departments, as we l l as close coord inat ion with federal agencies and local governments on a priority basis.
3.7. Finally, a m a j o r challenge i s to ensure that the poor, both small farmers and the landless, participate in future growth. T h e m o v e towards high-value products (which tend also to b e m o r e labor intensive) i s one w a y o f generating employment. Target ing pub l i c resources on poor regions, such as southern Punjab, and poore r farmers, can also help towards this end.
3.8. In terms o f specific commodities, these challenges suggest that the Punjab:
Cont inue to ensure a moderate growth in wheat production, but recognize that under current yields a n d world prices it does not have a comparative advantage in wheat exports
I m p r o v e competit iveness o f r ice and cotton, especially in v i e w o f the aggressive efforts by other countries in these markets. This applies especially to I n d a in Basmat i rice, and to most ma jo r producers in cotton, that have sharply reduced their p roduc t i on costs by adopt ing Bt cot ton.
Judiciously seek opportunit ies in import substitution, especially oilseeds for m o r e sustainable cropping systems, but only where they have a clear compet i t ive advantage.
D ive rs i f y p roduc t i on toward higher value hor t icu l tura l and l ivestock products to meet rapidly expanding domes tic demand and generate employment, a n d
E x p l o i t i t s excellent resource base and geographic advantage to tap into the rapidly expanding markets for high value products in Asia, the M i d d l e East, and other high income countries.
T h e Governmen t o f the Punjab, especially the Depar tmen t o f Agr icu l ture has already init iated many reforms to modern ize pub l i c services to the fu ture needs o f the sector. T h e efforts to develop partnerships with the pr ivate sector in agricultural marke t i ng a n d in promotion o f conservation idlage, are especially commendable.
45

3.2 RAISING THE LEVEL AND EFFICACY OF PUBLIC EXPENDITURES
3.9. A l l oca t i on o f publ ic expenditures to and within agriculture i s one o f the ma jo r ways that the government can inf luence growth and employment in the sector. Unfortunately, from the early 1990s to 2002, real to ta l expenditures on agriculture and irr igation declined by 4.4 percent annually (Table 3.1). In 2002, to ta l agriculture and irr igation expenditures comb ined accounted for only 2.1 percent o f agriculture GDP, fal l ing from 4.5 percent in 1991. These figures are very small in comparison to
other developing countries and regions (Figure 3.1). For instance, in 1998, agriculture expenditures as a percentage o f agriculture GDP was only about one quarter o f the Asian average o f 8 percent, and lower even than Nepal. Also contrasting to the steady decline in the Punjab, agricultural expenditures in developing countries as a who le grew at 3 percent during the 1990s (Fan and Rao, 2003).
Figure 3.1: Public Expenditures on Agriculture: Punjab vs. Other Countries: 2000
14 12
'ij 10 cln e n 8 6
2 0
n O a 4
3.10. I r r igat ion expenditures have declined m o r e rapidly than for agriculture. In fact m o r e funds are spent on wheat subsidies to consumers than on crop, l ivestock, forestry and fisheries combined, for producers. T h e federal con t r i bu t i on to agriculture and i r r igat ion has decl ined most rapidly, and made up only an estimated 8 percent o f spending in the Punjab in 2001, be fo re rising again in 2002. T h e largest decline in spending has been for development expendtures, w h i c h are now less than h a l f their level in 1991 (Table 3.1). Deve lopmen t expenditures are especially impor tan t in the i r r igat ion sector to ensure op t ima l exploitat ion o f water resources. Most agricultural expenditures are allocated for non-developmental activities, ma in l y for establishment charges such as salaries and wages. T h e Punjab Governmen t has made progress in recent years in increasing the rat io o f operating costs to salaries. For example, the ra t i o in c rop research has increased from 18 percent in 1996-97 t o 24 percent in 2003-04, a l though s t i l l b e l o w the 30 percent ra t io recommended for research. However , declining resources for O&M remain a p r o b l e m in irr igation.
3.11. T h e foregoing trends suggest that, despite the rhetoric, the status o f agriculture has declined within government priorit ies. Although the Governmen t o f the Pun jab has taken a number o f initiatives in recent years to use publ ic resources in agriculture m o r e efficiently, i t s t i l l has ma jo r opportunities for reallocating expenditures, privatizing, and devolut ion, w h i c h would enhance the impact on growth and pove r t y reduction. A n u m b e r of recommendations are o f fe red that would improve the efficacy o f pub l i c expenditures a n d m o v e the p rov ince closer towards the attainment o f i t s goals.
46

Table 3.1: Agricultural Expenditures in Provincial AgGDP: 1990/91- 2001/02 /l - L x x IX
Agriculture Irrigation Total Agric Exp. as Agr. exp. Estimated Total Develop Total Develop Total Develop Yo of Punjab as Oh of Federal as O/o
Rsm Rsm Rsm Rsm Rsm Rsm Budget AgGDPa of Agric Exp. 1990/91 5,414 1,123 8,535 2,634 13,949 3,757 15 1 4 5 15 1 1991/92 6,604 2,406 8,451 2,529 15,055 4,935 14 6 4 3 23 6 1992/93 6,403 1,927 6,700 1,449 13,103 3,376 14 0 3 9 17 2
1994/95 5,635 1,218 6,304 1,348 11,939 2,566 12 3 3 2 17 9 1995/96 5,529 1,121 7,877 1,396 13,406 2,517 12 3 3 4 18 3 1996/97 4,697 737 6,446 729 11,143 1,466 13 0 2 9 13 5 1997/98 4,877 851 5,226 1,492 10,103 2,343 11 7 2 4 14 1 1998/99 5,003 699 4,795 1,308 9,798 2,007 11 1 2 2 13 8 1999/00 4,615 514 4,506 1,201 9,121 1,715 8 9 1 9 11 3 2000/0l 4,502 395 3,975 970 8,477 1,365 9 1 1 8 8 2 2001/02 4,842 467 5,017 1,114 9,859 1,581 9 8 2 1 16.9
1993/94 5,595 1,243 4,996 643 10,591 1,886 12 7 3 1 20 9
Y ”
Growth Rate -2,.8 -13.8 -5.7 -5.9 -4.4 -9.2 ulture, 11 /ob R s Mhon a Includes
I
spending and district spending. Source: Pakistan Public Expenditure Management (World Bank, 2004)
> Increase public investment, particularly on irrigation, water management, and agricultural research: the Punjab’s long run objective must b e to increase agricultural O&M and development spendmg on core publ ic goods toward in temat ional levels. For example, publ ic investment in agricultural research in the Province ( includmg federal expenditures) i s 0.26 percent o f agricultural GDP, compared with an Asian average o f 0.5 percent a n d a n average for industrialized countries o f 2.6 percent. Likewise, development expendltures in the i r r igat ion sector are especially impor tant to ensure op t ima l exploitat ion o f water resources, one o f the most crit ical natural endowments o f the province.
> Privatize commercial activities, livestock breeding farms, and veterinaty services, and focus instead on core public goods: G i v e n the scarcity o f overal l pub l i c resources available, the f i rs t priority o f the prov inc ia l government should b e to ensure that the pub l i c sector i s only fundmg those activities that are clearly pub l i c goods, and to devolve other extraneous activities to the private sector. For example, the prov inc ia l L ivestock Depar tment currently spends Rs. 340 millton (i.e. over ha l f i t s budget) on i t s l ivestock breedmg farms, w h i c h i s clearly a pr ivate sector activity. T h e Depar tment should develop an act ion p lan to devolve t h i s act ivi ty to the pr ivate sector, and focus instead on activities such as pedgree registration systems, capacity buildmg a n d strengthening of private breeders associations to facditate the transition. Similarly, veterinary services p rov ided at the district level should also b e rap id ly privatized, and the publ ic sector should instead focus on contro l o f l ivestock disease epidemics.
> Reduce the share o f establishment costs out of current expenditures as an important step towards rationahzing public spending: Although some progress has been made, the share o f establishment costs out o f current expendttures fo r agricultural support services i s dlsproport ionably high. For instance, despite decl ining pub l i c investment on irrigation, the I r r i ga t i on Depar tmen t continues to employ a ve ry large staff, thereby using up significant prov inc ia l budgetary n o n - development resources.
> Improve cost recovely, especially through greater cost recovety for canal maintenance in conjunction with devolution to water user associations: T h e pub l i c sector needs to inst i tute better cost recovery a n d sharing schemes in the provision o f pub l i c services. In the Depar tmen t of
47

Irr igation, for example, cost recovery for canal maintenance s u l l averages only 25 percent, and there i s clearly a m a j o r oppor tun i t y t o save fiscal resources and i m p r o v e canal maintenance by full cost recovery in conjunct ion with devolut ion to Water User Associations. S d a r l y , f ield operations services in the Depar tmen t o f Agriculture (which account f o r one- th i rd o f i t s budget) should b e carefully scrut inized for potent ia l for cost recovery, and for privatization.
3.3 AGRICULTURAL PRICES AND OUTPUT MARKETS
3.12. Pr ice Pol icv and Whea t Subsidv: Historically, the Pakistan federal and prov inc ia l governments intervened heavily in p r o d u c t markets. T h e publ ic sector dominated market ing for ma jo r crops (especially wheat) from procurement and storage through publ ic corporations such as Pakistan Agr icu l tura l Supply a n d Services Corporat ion (PASSCO), and the prov inc ia l Food Departments. These policies also set output prices we l l be low border-parity prices, with the result that Pakistan h a d one o f the highest rates of “taxation” o f the agricultural sector in the world.26 Since the Punjab i s the ma jo r surplus province, these policies h a d greatest impac t on the agricultural sector o f that province.
3.13. O v e r the past decade, the government has taken ma jo r steps to liberalize markets and encourage private sector participation, so that wheat and sugarcane are the only ma jo r commodit ies where there i s significant state intervention. T h e Governmen t o f Pakistan remains concerned about price stabil ization for wheat and continues to announce a support price, w h i c h i s backed through publ ic procurement. Price po l i cy o f wheat i s also a ma jo r concern o f the Governmen t o f the Punjab, since wheat procurement and storage has significant fiscal implications for prov inc ia l expenditures, and in fact, the Governmen t o f the Punjab pays the bulk o f the wheat subsidy.
3.14. T h e stated i n ten t i on of the current po l icy i s to ensure food security, a n d address deficiencies in s t i l l developing private markets, and t o do so in ways that do not invo lve t radmg losses. T h e m o v e toward ‘cascading prices’ where procurement and issue prices are increased monthly after harvest to reflect storage charges, a l lowed the private sector m o r e space in the wheat market in 2002-03. But, government procurement o f wheat (50-60 percent o f marketed surplus) s t i l l far exceeds the amoun t required for the strategic reserve and subsidies for wheat procurement a n d distribution remain large. In addition, a consistent po l i cy i s lacking with the Governmen t o f the Punjab imp lemen t ing in 2004 i t s own pr ice premium, restr ict ing wheat movement across provinces, a n d aggressively compet ing with the private sector for p r o c ~ r e m e n t . ~ ~
3.15. In recent years wheat subsidies in the Punjab have exceeded to ta l expenditures by the Depar tmen t o f Agriculture. Subsidies for domestic wheat, w h i c h are almost entirely bo rne by the Governmen t o f the Punjab, ref lect the fact that the dif ference between the pr ice o f procurement and the issue pr ice to d s (currently 30 Rs per 40 kg) i s only about one third o f the total costs o f transport, storage, and handhng by PASSCO and the Punjab Food Corpo ra t i on (about Rs 2400 p e r ton, or nearly Rs 100 p e r 40kg).2* In par t t h i s reflects inefficiencies in pub l i c management, rather than a subsidy to consumers, since margins for private sector wheat t rad ing are significantly l ower (Salam and Muktar , 2003). Also alarming i s the r a p i d increase in real costs p e r ton p rocu red by the publ ic
26 Schiff and Valdes, 1992. 27 In fact, the Government of Punjab’s recent decision to add a premium to the announced federal procurement price, will have to be supported by a direct fiscal outlays estimated at Rs 700 m, without any clear rational. 28 Although PASSCO only receives a direct subsidy on imported wheat, it passes on full costs to the provincial food departments, which have to subsidize the difference between total costs and the dowed margin.
48

sector, with a doubl ing of costs incurred by PASSCO, and an even higher increase in the Punjab F o o d Depar tmen t (Figure 3.2).
Figure 3.2. Real Transport and Handling Costs for Wheat in Punjab: 1996/97 - 2002/03
3,000
2,500 0 9 2 c? 2.000 0
1.500
1,000 1996-97 1997-98 1998-99 1999-00 200041 200142 200243
9 3.16. There m a y b e just i f icat ion for interventions to manage pr ice r i sks of wheat in Pakistan, or at least, to mit igate their effects. High ins tabh ty in wheat prices m a y b e undesirable for promoting opt imal p roduc t i on decisions, especially in the absence of market-based risk management instruments. M o r e importantly, the poor are most vulnerable to sharp pr ice fluctuations, since wheat constitutes a large share of small farmers’ incomes and poor consumers’ expenditures.
Rationalizing the wheat procurement and storage policy
3.17. T h e federal and prov inc ia l governments need to define a consistent po l i cy for interventions in wheat markets that clearly articulates objectives and strategies. T h e G o v e r n m e n t o f the Punjab, since i t pays the ma jo r cost of the wheat subsidy, should lead t h i s e f for t .
3.18. T h e f i r s t issue i s to clearly establish the objectives and targets for in tervent ion in wheat markets. These should expl ici t ly lay out a f ramework for interventions that:
0
0
0
0
0
Def ines a tolerable level o f price var iabhty
Min imizes fiscal outlays, especially risks o f unexpected fiscal impacts
Min imizes dstortions to long-run market e q u h b r i u m prices,
Maximizes private sector part icipation and competit ive markets
Ensures that the poorest are the m a j o r beneficiaries of any fiscal expenditures.
3.19. In def in ing these objectives, i t should b e n o t e d that i t i s m u c h easier a n d cheaper to remove extreme price variat ion and conf ine movements to within a ‘tolerable band’, t han to fully s t a b h e prices. I t i s also m u c h cheaper and m o r e equitable to target subsidies, i f there are any, on the poorest groups that are most vulnerable to pr ice fluctuations.
3.20. Second, the government should recognize that there are a n u m b e r o f potent ia l instruments for realizing i t s objectives, each o f w h i c h raises several questions in implementat ion.
49

T h e current strategy of setting o f minimum support prices for producers a n d m a x i m u m release prices for consumers, enforced by government or government-contracted procurement. (How to set theses prices to m in im ize fiscal outlays, and maximize private sector roles? Use o f cascading prices, a n d spatially determined prices).
Holding o f a strategic reserve (by whom: publ ic sector or private sector, a n d what size? the potent ia l to use a tendering system for procurement o f the reserve through the private sector?)
Provisions o f incentives/subsidies t o the private sector to hold reserves a n d invest in storage capacity (how to do this without distort ing markets and ensuring minimum fiscal outlays?)
Use o f bo rde r pr ice bands and variable tariffs to protect against extreme movements in world prices (what criteria to set pr ice bands, h o w to comply with WTO rules?)
Strengthening o f commod i t y exchanges with forward contract markets (how to regulate and enforce contracts, issues o f standardization of grades, use o f warehouse receipt systems?)
Opera t i on in c o m m o d t y futures and options markets by both pub l i c a n d private traders (which markets and types of contacts, analytical capacity t o determine op t ima l hedging strategies?)
Strengthening of marke t i n fo rma t ion systems, and crop forecasting (potential to use satellite imagery and c r o p models to enhance precision o f pre-harvest c r o p estimates?)
Provision o f safety nets to the most vulnerable consumers a n d producers, such as food stamps, and vouchers for p roduc t i on inputs (how to target? How to avo id distorting markets?).
3.21. At this time, pub l i c po l icy in Palustan only uses the f i r s t two of these instruments, w h i c h severely limits i t s effectiveness in reaching the set o f objectives outhned above. In particular, the government maintains a ma jo r ro le for the publ ic sector in actual buying, storage and selling of wheat, rather than regulat ing and in f luencing the market in desirable direct ions for producer and consumer welfare. I t also leads to ineff iciency (high market ing margins), opportunit ies for rent seeking and-most o f all-a high fiscal outlay.
3.22. In the short term, the authorit ies should clarify their objectives for marke t intervention and critically evaluate two options to i m p r o v e performance. First, they should explore competit ive tendering o f procurement and storage to the private sector in order to m in im ize costs and enhance transparency. Second, they should set the marg in for procurement a n d issue prices to cover full costs, and develop mechanisms for targeting any subsidies to the poorest a n d most vulnerable groups.
3.23. Over the longer term, the government should explore a w ide r range o f alternatives, especially in light o f the apparent achievement o f self-sufficiency, and the need to diversify the agricultural sector. This will require considerable technical s k d l s a n d i n f o r m a t i o n for developing an appropriate strategy for wheat pr ice risk management. T h e Government of the Punjab in collaboration with the federal government needs to establish a high level task force to develop a new approach to stabilizing wheat prices within the above framework.29 This task force should b e backed by appropriate analytical capacity, both in mode l i ng wheat markets a n d in c rop forecasting based on crop models and sate lhe imagery.
29 This task force should go well beyond the 2001 task force to clarify objectives, and explore a wider set o f instruments as developed here.
50

3.4 MODERNIZING WHOLESALE MARKETS
3.24. Wholesale markets are a crit ical link in the market ing channel, connecting rura l p roduc t i on areas to u r b a n consumpt ion centers. T h e y break up large lots into smaller units to mee t the demands o f various buyers, contr ibute to the regularization o f supplies, he lp stabhze prices, and link to expor t demands. I m p r o v e d market operations ultimately reduce costs, i m p r o v e food quality and standards for domestic consumers, and help meet export requirements.
3.25. Publ ic sector dominat ion o f wholesale markets: Wholesale markets are control led and by departments through Marke t Committees set up at the district level. Currently fruit and vegetable markets are managed by Marke t Committees under the Agriculture Depar tment , food grain markets are contro l led b y the Food Department, and livestock markets and abattoirs are supervised by the L ivestock Depar tment . These departments set d i f ferent rules and regulations that create confus ion for producers a n d consumers. Recently, the Punjab government has opened a n e w Agricultural Marke t i ng Depar tmen t in order t o s t r e a m h e the procedures across the various types o f agricultural markets.
3.26. T h e administrative structure to regulate output markets in the Punjab i s highly bureaucratic and lacks effective private sector involvement. This generates inefficiencies and administrative anomalies. For example, in the case of f r u i t s and vegetables, commiss ion agents o f t e n charge a higher commiss ion or a d h o c charges from both sellers and buyers than they are legally allowed. In addition, the expansion o f agricultural market infrastructure i s insuff icient to mee t demand. T h e n e t revenues generated by the M a r k e t Committees are not suff icient to expand markets and modern ize i n fo rma t ion system, in l ine with the expansion of agricultural output a n d changing requirement of the agricultural sector.30 This adds congestion to already very c rowded markets. T h e current regulatory system assures the status quo and provides l i t t le incentive to i m p r o v e food quality and imp lemen t food safety standards, and discourages private investment in market infrastructure.
3.27. L a c k o f marke t infrastructure: In par t due to the above constraints, farmers are also not we l l connected with markets. A b o u t one third o f farmers in the prov ince are located m o r e than 15 km from any fruit and vegetable market, a n d eight percent have to travel m o r e than f ive km to reach a metal led road. T h e weak market infrastructure, congestion in markets, a n d poor post-harvest handllng, increases the in ternal transport costs a n d post-harvest losses and reduces the quality o f output. A recent estimate suggests that an average of 25 percent of fruit a n d vegetable p roduc t i on i s los t before i t reaches consumers, not inc lud ing loss in value due to deteriorat ion in quality.31 Therefore market ing i s considered a m a j o r cost o f doing business in the agricultural sector and an impor tan t impedunent to private sector investment in farming and agribusiness. T h e available market infrastructure i s also biased toward m a j o r crops, with inadequate attention to high-value crops and livestock. With changmg consumer demands, this strategy i s be ing revised to shift focus towards the development o f marke t chains for high-value products.
3.28. Poor market in format ion: T h e market i n f o r m a t i o n system i s poorly developed. Marke t Committees are responsible for the col lect ion and dissemination of domestic prices for d i f ferent commodit ies. But the col lect ion o f pr ice data i s unscienti f ic a n d the dissemination system i s p r im i t i ve (e.g., use o f chalk boards to post prices). As a result marke t supplies usually do not m a t c h demand,
30 In 2003, a totd of Rs. 260 miUion was generated against Rs. 200 mdlion salary and operating costs 31 SMEDA 2000.
51

and do not ref lect the quality demanded by consumers. Gluts and shortages in agricultural commod i t y supplies are c o m m o n and discourage long- term investment in the agricultural sector.
3.29. T h e poor infrastructure and inadequate i n fo rma t ion system lead to uncoord inated markets, result ing in high price difference for the same commodi ty across markets. For example, monthly average po ta to prices in Lahore can &verge as m u c h 162 percent from the p r e v a h g price in Hyderabad, a m u c h higher difference than can b e explained by the transportat ion and handl ing costs.
3.30. M s s e d o m o r t u n i t i e s for diversif ication: The Punjab has been a late entry into expor t markets for high value agricultural products. Recently, the Federal Governmen t has established the Pakistan Hor t icu l ture Deve lopmen t and E x p o r t B o a r d t o facilitate the hking of domestic p roduc t i on to international markets through marke t i n fo rma t ion and technology dissemination. E f f o r t s are be ing made to in t roduce Pahs tan i specialty fruits and vegetables abroad through trade fairs. However , m u c h m o r e needs to b e done in developing appropriate co ld storage f a c h t y in a n d around a q o r t s , and providing refrigerated bogies in Pakistan Railways to transport f r u i t s and vegetables from in land t o ports in order to mainta in quality.
3.31. Grades a n d standards as a m a i o r bottleneck: Although neither o f f ic ia l nor accredited, grades and standards for agricultural products are o f ten used in formal ly in Pakistan. For example, traders, assemblers, wholesalers, and consumers usually grade wheat based on size o f grain, presence o f insect damage, soil admixture/staining a n d discolored or diseased grains. However , g lobal and domestic forces have created a need for m o r e formalized and universally accepted standards. To respond to these demands, the federal government has set up the Palustan Standards and Quality C o n t r o l Authority (PSQCA) to defme output and input standards inc lud ing for food products. To encourage standards in c o t t o n p roduc t i on a n d processing, Pakistan Cotton Standards Inst i tu te (PCSI) was established in 2001. T h e inst i tute has def ined the acceptable standards for various grades o f lint, although i t s ro le in imp lemen t ing these standards remains controversial a m o n g various stakeholders.
3.32. These standards, however, are poorly defined or imp lemen ted leaving ample space for corrupt ion as well as distribution of poor quality and unsafe food. For example, 50-63 percent o f the milk distr ibuted in the country i s adulterated.32 With high pesticide application, pesticide residues on vegetables have crossed the tolerance h t for food safety. This situation not only results in hygienically p o o r food in domestic markets, but also restricts agricultural exports to low pr ice foreign markets. For example, in 2002, Pahs tan was the second largest exporter o f mangos in terms o f volume, but in fifth place in terms o f value. Likewise, the pr ice received for Pakistan Basmat i r ice in international markets has been l o w e r than for I n d i a n Basmati. Weak grades a n d standards, lack o f credible sanitary and phytosanitary (SPS) laboratories and trained manpower to test and implement food safety standards, a n d consumer ignorance are the m a i n constraints in improving grades and standards.
Reforming Wholesale Markets: Priorities for the Provincial Government 3.33. T h e present agricultural marke t i ng system i s a remnant of a n era w h e n self-sufficiency in cereals was the p r imary aim. As a result o f urbanization and changing expor t demands, the characteristics, roles a n d needs o f d i f ferent stakeholders in the marke t i ng system are changing. Consumers, b o t h domestic a n d foreign, are demanding greater emphasis not only on food quality,
‘
32 SMEDA 1999.
52

but also on food safety. Domes t i c and export markets can b e compromised i f food o f in fer ior quality or o f a hazardous nature i s p roduced and distributed. T h e market ing system also has to respond to a change from a focus on food-security to &versification.
9 Reform market regulations: Imp lemen t the planned rev is ion o f the M a r k e t Commit tee A c t to
encourage the greater invo lvement o f the private sector in market development. T h i s will bring n e w pr ivate investment to modern ize agricultural markets.
9 Improve the market information system: T h e Governmen t o f T h e Pun jab should revamp the district-level market i n fo rma t ion system, by upgrading the col lect ion a n d dissemination o f market prices on scientif ic basis, training the Marke t Commit tee staff in col lect ion o f price data, and developing an act ion p lan to electronically link al l markets in the p rov ince (Box 5). At the same time, the government should work with the Hor t i cu l tu re E x p o r t B o a r d and the private sector to develop an i n fo rma t ion system on international prices, qual i ty standards, port charges, trade procedures, and p roduc t i on and processing technologies of hor t icu l tura l products.
Box 5: “Silicon Mali”
Mali’s success in establishing a market information system earned it the t i t l e of “Silicon Mali” by Forbes Magazine in 2002. M&’s market information system (Observatoke des March& Agricoles) i s based on enumerators visiting 58 markets around Mali and recording the high and low prices for grains, crops, and livestock. They enter these on laptop computers and e-mail the information by FM radio waves al l solar-powered equipment to other regional offices where data are compiled and reports prepared for different types of producers.
The system built up over a decade has made Malian grain farmers more efficient, knowing when and where to sell, and for what price. With better information, the government can now rely on the private sector to shift surpluses to areas with shortages without resorting to foreign aid. Mali’s information system has become a model for the rest o f West Africa, where such countries as Niger and Burkina Faso are setting up similar systems that will be linked together. Soon, farmers will be able to do more selling across national boundaries.
Source: Sansoni, S. 2002: “Sdicon Mali.” Forbes Global, February 4. Cited in World Bank. 2004. Agriculture Investment Sourcebook. Washington, D.C.: World Bank.
9 Develop critical infrastructure: Establ ish co ld storage facilities at m a j o r airports, especially Lahore, ini t ial ly through pub l i c investment (or better, seek partnerships with private exporters) and operated to recover full cost. Later they can b e completely transferred to the private sector. I n i t i a l government investment on refrigerator bogies and c o l d storages at alrports will encourage the development o f c o l d storage chain for high value crops in the pr ivate sector at the vdlage and town levels, and boost the quali ty o f agricultural exports.
9 Establish a state o f the art laboratory for food safety testing: T h e development of a safe food industry, w h i c h can respond to consumers demand within a n d outside the country, requires publ ic investment in laboratories to test for virus contaminat ion a n d pesticide and nitrate residues. This laboratory, w h i c h has already been approved can b e established on full cost recovery basis. A priority d b e to develop capacity to eff iciently use the laboratory to efficiently serve the private sector.
9 Pilot traceability and risk mitigation: I n t roduce the preventive approach known as HACCP - Hazard Analysis a n d Cr i t ica l Control Point - to manage hazards associated with identi f ied stages within the c o m m o d q chain, such as f r u i t s and vegetables for export. HACCP i s increasingly becoming a requi rement for expor t in high value markets. To p r o v e that good practices are
53

adopted in agricultural production, traceabdity o f products from specific farmer’s f ield through the entire market chain, has become a necessary element in expor t markets. In i t ia l ly outlays for developing appropriate food safety management systems can b e quite high. In Bangladesh, for example, i n t roduc t i on o f HACCP f o r the shrimp industry costs the equivalent o f n ine percent o f annual sales for start up and 1.2 percent for recurrent operating costs. With a dynamic expor t industry, in i t ia l outlays are soon recuperated, as it promotes the effective handl ing and use o f r a w materials, as we l l as prevents excessive losses o f valuable natural resources. In time, small food enterprises can increase their markets and gain a step up the ladder to lucrative expor t markets (Nicolaides et al. 1997).
Build capacity in grades and standards: T h e most serious constraint on implement ing f o o d quality and safety standards i s h u m a n capacity. There i s an urgent need to invest in capacity building for food testing. I nvo l vemen t o f producers and exporters in implement ing food safety management systems can help to share some infrastructure and capacity building costs.
Priorities for dialogue with the Federal Government: Since there are a number o f areas where the p r imary decision mak ing responsibil i ty rests with the Federal Government , the Governmen t o f the Punjab needs to actively pursue a dialogue with it in the following areas:
Streamlining of laws to a l low the private sector to establish c o l d storage at m a j o r ports.
Legislat ion and capacity building t o strengthen commod i t y markets to reduce risk and access finance, through warehouse receipts system and fo rward contracts.
Streamlining o f laws and regulations for the punishment o f those supplying adulterated, unsafe, and substandard food products, in a way that reduces the discretionary powers o f food inspectors, yet improves the effectiveness o f enforcement. I nvo l vemen t of independent and credible testing laboratories in the food testing process would b e he lp fu l in this regard.
D e f i n i n g the minimum grades and standards for agricultural r a w and processed products for the domestic market, and a iming to have equivalence to the WTO recognized Codex Alunentarius standards for expor t markets. This requires developing a workable mechanism with the col laboration of growers, processors, a n d exporters for implementat ion of regulations that have already been developed, such as in cotton.
3.5 FACTOR MARKETS FOR LAND AND WATER:
3.34. Land: Ir r igated l and i s the most impor tan t product ive asset in ru ra l Punjab. L a n d distribution i s highly skewed-2.5 percent of farmers with over 20 h a own one- th i rd of the l and wh i l e small farmers with less than 2 h a own only 12 percent o f the land, a l though they account for h a l f the total f a r m populat ion. O v e r time, l a n d ownership in the Punjab has become m o r e concentrated with the Gini coefficient o f distribution worsening from 0.43 in 1972 to 0.56 in 2000.
3.35. Current l and markets p r o m o t e neither efficiency nor equity. First, l a n d markets are very thin because o f the high asset value o f l a n d in relat ion to use value, a n d the lack o f fmancial institutions in rura l areas to fachtate l and acquisit ion. Second, an effective l a n d marke t has failed to develop because o f legal impedunents to the sale a n d purchase o f l and such as the right o f shy% ( f i r s t purchase), excessive bureaucratic intervention, a n d lack of a transparent a n d eff icient l and
54

administrat ion system. Imper fect ions results f r o m an antiquated l and administrat ion and registration system, high transactions costs in land transfers, inheritance laws that encourage fragmentation, an outdated legal framework, and inabi l i ty t o enforce existing laws (such as tenancy rights). Third, three l and reforms since independence have generally failed to achieve their objectives, and have l e d t o increased ev ic t ion of tenants, reduced employment and increased pove r t y (World Bank, 2002). These imperfections slow the exit from agriculture o f ineff icient and very small farms that cannot prov ide a livelihood, reduce incentives for very large holdings to sell off underu thzed land, a n d p romote fragmentation rather than consolidation o f land holdings, result ing in sub-optimal mechanization and irr igation operations.
3.36. X n u m b e r o f measures cou ld improve funct ion ing o f l and markets and encourage the m o v e toward m o r e efficient, equitable, and competit ive farms. T h e m a j o r emphasis should b e on improving funct ion ing o f l and markets and p r o v i d m g incentives for large farmers with u n d e r u t h e d land t o sell land. Unambiguous laws and an effective l and record ing system would p r o m o t e the smoo th transfer o f titles and an eff icient l and market. T h e Punjab has already recognized the need to clarify p roper t y rights and to modern ize the l and registration and records system by in i t ia t ing a pilot p rog ram to computerize l a n d registration records. This p r o g r a m should b e carefully evaluated and scaled up accordingly, taking account o f successful experiences in other countries (e.g., Thailand).
3.37. L a n d taxes based on the size o f the l and holdmg cou ld b e set to ref lect product iv i ty potential and discourage underuul izat ion o f l and on large holdings. Reforms in other areas, such as reducing subsidies for i r r igat ion (so that large l and holders pay full O&M costs) a n d improving the efficiency o f financial markets to fachtate l and transactions, would also p r o m o t e market-based land consolidation a n d redistr ibution.
3.38. Water: Agr icu l ture presently uses about 95 percent o f a v d a b l e water resources and water has become the m a j o r limiting factor to further growth. I t i s therefore disquiet ing that the product iv i ty of water used in agriculture has decl ined in the past three decades.33 Ine f f i c i en t water management, inadequate maintenance funding, a d h o c bureaucratic and pol i t ica l influences, a n d lack o f economic incentives to use water eff iciently cause low product iv i ty o f water. Moreover , supply options are increasingly costly and approaching their physical h u t s , wh i l e managing demand (efficiency, productivity, pricing, water entitlements, etc.) has received too l i t t le attention.
3.39. Although there appears to b e significant scope for addit ional surface water resources development, this i s M t e d i f addit ional storage i s not developed. Among alternative supply options, groundwater development i s already nearing i t s practical hut, a n d water conservation m a y b e able t o add only about 5 percent to to ta l supply. Ground water tables are fal l ing because o f over-pumping. Existing laws place n o quanti tat ive h t s on groundwater wi thdrawal by ind iv idual users. T h e lack o f these h t s , coupled with tying l a n d rights with water rights, has serious equity implications, because it allows larger farmers with higher pumping capacity and deeper tube wells to have a disproportionate c la im over water than others.
3.40. T h e poor delivery of i r r igat ion and drainage services results p r imar i l y from deficiencies in the operation of the canal system, on w h i c h maintenance i s o f t e n deferred because of inadequate resources. Currently, abiunu (water charges) i s the pr inc ipa l means o f sharing a n d recovering 0&M
33 Ali and Byerlee, op. cit.
55

cost.34Abianu proceeds go directly to t h e Depar tment o f Finance, and there i s no du-ect link between recoveries and budget allocations for O&M and other system improvements. A cost-recovery gap has existed since 1970 because of the escalating cost o f O&M, the stagnation o f water rates and ineff icient assessment a n d col lect ion mechanisms (Figure 3.3).
Figure 3.3: Irrigation Department Revenues and Expenditures: 1970/71- 2001/02
6,000
5,000
4,000
v) [1:
6 3,000 .- - - 'E
2,000
1,000
0
3.41. T h e current regulatory f ramework impedes the development o f water markets and does not prov ide incentives for eff icient water use. Farmers or their organizations on a distributary or watercourse do not have a legal water entit lement or right-hence water markets that would help farmers decide on the best use o f their water and land do not function.
3.42. M o r e than 90 percent o f farmers with tube wells sell water, significantly improving access to water, particularly for small farmers, landless tenants and younger households who o f ten lack the resources (or land and water rights) to instal l their own tube well. However , water purchasers do not have full access rights to the water, and are frequently denied access w h e n water or energy supplies are scarce.
3.43. Water logging and salinity are the most serious outcome of inef f ic ient i r r igat ion and canal seepage caused by a poorly managed water d is t r ibut ion system and inappropriate i r r igat ion practices. In spite o f huge pub l i c investments in salinity con t ro l a n d reclamation, the problems o f sa l in i ty lsodx i ty have become m o r e acute in recent years, because o f poorly maintained drainage systems and increased tapping o f brackish groundwater for irr igation.
Recommendations:
9 Improved water-use efficiency requires better maintenance, rehabifitation, and modernization o f the irrigation and drainage systems. Equa l l y impor tan t are on - fa rm conservation measures such as precision l and leveling, zero tillage, b e d - f u r r o w irrigation, and other water conservation measures. Some of these practices have p r o v e n to b e effective in min im iz ing the impacts of recent drought years, a n d are being rap id ly adopted.
34 Farmers pay a share of the capital cost o f watercourse lining (up to 50yo) and land leveling ( S O 0 )
56

9 Even with po ten tial additional storage and plausible improvement in irrga tion efficiency, the gap between water suppIy and demand will persist unless there i s a move toward higher water productiviry through choice o f cropping patter-subs tituting high value and water eff icient crops such as vegetables and fruits for high water consuming crops (e.g. rice and sugarcane)-as well as increased crop productivi ty. For example, an increase in irr igated wheat yields f r o m a current level o f 2.8 t /ha to an average o f 5.0 t /ha (already achieved in Mexico, In&an Punjab and Egypt) would al low demand for wheat in 2025 to b e achieved with 30 percent less water.
9 Sustainable water use requires an integrated approach to the use o f surface and groundwater together with appropriate pricing mechanisms that reflect the scarcity o f the resource. Ef f i c ien t water markets, tradable water rights and physical infrastructure to transfer water and measure water flows are crit ical for farmers to maximize their incomes by allocating water according to i t s opt imal use (whether on their own fields or sales to or purchases from other farmers). I t i s therefore impor tan t to in t roduce the necessary legal and infrastructure arrangements to facditate movement toward f o r m a l water markets. A f i r s t step would b e to m o v e toward abiana based on the water vo lume actually supplied. This would require investments in flow measurement and meter ing devices and structures and a decentralized inst i tut ional set-up involving FOs and AWBs for assessment and collection.
9 Empowering FOs through a secure system o f water entitlements to manage water i s a crit ical pa r t o f the incentive f ramework needed to improve both water efficiency and productivi ty. The progress on wider inst i tut ional re forms has been slow due to lack of ownership by irr igation departments, insuff icient capacity and resistance to change, and ineffect ive monitoring and evaluation systems. In i t i a l findings from Sindh, where the responsibi l i ty for O&M and abiana assessment and col lect ion has been transferred to some 60 FOs, i s that both assessments and collections have substantially i m p r o v e d as compared with the pre-turnover years. T h e present use of khal and nehri panchayats as proxies for water course associations and FOs respectively cou ld p rove successful if I r r igat ion Management Transfer (IMT agreements clearly specify responsibll i t ies and functions between PIDA, the AWB and the FOs, and in particular, ensure the effective empowerment o f FOs. T h e G o v e r n m e n t o f the Punjab has indicated that it wdl make the necessary changes in the financial regulations to a l l ow FOs to retain their share of abiana to enable t h e m to finance the operation and maintenance activities at the minor and distr ibutary canal level for w h i c h they are responsible. T h e challenge for the Punjab i s to quickly develop a p r o g r a m o f FO mobil izat ion, training and capacity building to consolidate progress and deepen the pilot reforms.
9 To establish an active f o r m a l water market, rights to water use must be separated from land for alternative use. An eff icient marke t requires the prior existence o f an effect ive legal institution o f proper ty rights, establishing the in i t ia l resource endowments o f individuals. The re i s therefore a need to specify water wi thdrawal h t s by individuals in volumetr ic terms.
9 Finally, increasedpublic and private investment in the irrigation system i s needed to even maintain current efficiency levels. Curative measures WLLl b e needed to con t ro l a n d reverse the effects o f severe water loggmg a n d soil salinity. These inc lude lining o f canals in some saline ground water areas, improvemen t o f watercourses, i n t roduc t i on o f on - fa rm drainage a n d land-leveling, improvement o f existing and creation o f n e w drains i nc lud ing a trunk or spinal dra in in the upper and middle basin, and conjunct ive management o f canal water a n d groundwater. The re m a y also b e
57

opportunit ies for expansion o f the existing system, through small and m e d i u m schemes, that have a satisfactory benefi t-cost rat io. However , increased public investment requires sharp re-allocation o f current expenditures from non-development and establishment costs, a n d greatly enhanced cost recovery for O&M.
3.6 UPGRADING THE AGRICULTURE INNOVATION SYSTEM:
3.44. ii strong agricultural innovat ion system i s crit ical to modern iz ing agriculture, as a large pa r t of future product iv i ty gains, quality enhancement, and diversif ication must b e p rov ided through generation, adaptation and dissemination o f n e w technologies and in format ion. W h i l e a fairly extensive agricultural R&D system was se t up in Pakistan during the 1970s and 1980s, capacity o f the agriculture technology system has declined sharply in recent years (Box 6).
Box 6: Current Status o f the Agricultural Research System in Punjab
Declining canacitv in the research system: There i s general agreement that the capacity of the agricultural technology system has declined sharply in recent years. X funding shortfall i s only part o f the problem and reflects wider weaknesses in the system. Research i s managed through a highly centralized, bureaucratic and supply-driven approach. In addition, generally weak and unstable leadership has further undermined the credibility of these organizations. As a result, except in narrow areas such as crop breeding, research capacity i s weak in priority areas for future growth, such as land and water management, post-harvest management, social sciences and policy, horticulture and livestock, most o f which have a public good nature and require public funding.
Declining capacity reflects several weaknesses. First the framework of incentives for scientists i s especially weak in the provincial system. Within Punjab there are wide variations in the human resources policies, with institutes of the Palustan Atomic Energy Commission (PAEC) in Faisalabad having virtually all the critical elements of a strong human resource policy and incentive framework, to provincial research agencies where lack o f incentives and qualified staff seriously limit the effectiveness of research. For example, AARI scientists receive only about half of the package of benefits of PAEC scientists located in Faisalabad. Likewise only one post in AARI i s filed at the Grade 20 level (the Director General) versus 68 scientists in the University of Agriculture, Faisalabad.
The rate o f decline in research capacity i s also accelerating due to an aging complement of research scientists resulting from a hiring freeze lasting more than 10 years, and a “brain drain” as many o f the better scientists have left the system. Poor service rules relate to recruitment of qualified researchers, selection of research managers ( s t i l l on a seniority basis), career path for scientists, and provision of a stimulating working environment. Finally, the cumbersome approval processes at the provincial level for training outside the country, results in many missed opportunities for strengthening the human resource capacity.
Good research i s also being stifled by financial and bureaucratic restrictions and protocols. Most are imbedded in traditional bureaucratic ways of doing business, but are inconsistent with the functions and flexibility needed to effectively manage a modern research system. Even simple rules that are accepted in nearly all research organizations, such as the ability to retain earned income, are not in place in the provincial institutes. In large part these problems relate to the continued management of research as part of the provincial l ine ministries, according to normal civil service bureaucratic rules. Punjab i s one of the fewplaces in the world where research i s sti l l organized wirhin line ministries, and certainly by far the largest such system.
Highly fra-mented research system: Provincial research on crops and on-farm water i s separated within the Department of Agriculture, and research on livestock, fisheries, and forestry in different departments. At the same time, various university programs and federal research organizations carry out research in the province on all of these topics, without any institutional mechanisms for coordination and integration across the various agencies (i.e., between federal agencies, universities, and Provincial crop, livestock, irrigation and fisheries departments). This leads to a highly fragmented research agenda that does not address emerging issues in an integrated manner.
Lack o f an enabling environment for private sector R&D: The contribution of the private sector has expanded in the 1990’s with some notable examples of creating new industries such as spring maize in the Punjab, and providing hybrid seed of crops such as sunflowers. But private sector investment depends critically on an enabling policy environment of Plant Varietal Protection CpW) and Biosafety regulations, both of which have yet to be implemented in Pakistan. These regulations are also required under international treaties; PVP i s a minimum requirement of the TRIPS agreement of the W O , and the Biosafety regulations are required under the Cartagena Protocol o f the Convention on Biodiversity (CBD). The long delay (now approaching ten years) in approval ofBiosafetyguideIines means that Pakistan i s at least five years behind competing countries in the commercialization o f transgenic insect-resistant cotton which has provided a cost advantage of 20- 25% in countries as diverse as Mexico, China, USA and India, and resulted in substantial reduction in harmful pesticide use.
Source: For more details, please see background note: The P q a b Agn’cultm Innovation SyJtem.
58

3.45. W h i l e current spending on agricultural research i s very l 0 ~ , 3 5 i t i s impor tan t to no te that the i m m e d a t e issue at h a n d i s not to increase funding, but rather to better u a z e available resources. T h e Punjab must in t roduce a m o r e scientifically-based agricultural i nnova t ion system based o n interactions a m o n g a l l players, b o t h publ ic and private,-engaged in knowledge creation, those invo lved in i t s extension, as we l l as those engaged in i t s application at the f a r m level.
3.46. A comprehensive approach i s required on the pa r t o f the prov inc ia l government to tackle the key po l i cy re fo rms needed:
9 Establish a competitive fund to support high priority research: T h e fund cou ld p rov ide operating costs to research by allocation on a competit ive basis, using rigorous and transparent review procedures, to he lp ensure that high priority areas are funded., and would al low the GOP to tap the best scientif ic talent, whether in the GOP research agencies, agricultural universities, federal research agencies, or the private sector. I t cou ld even b e used to seek out and test the most promis ing innovat ions from abroad, especially in high value products. Imp lemen t ing this recommendat ion in turn requires three key actions:
Establ ish a small hishlv - . . Drofessional funding bodv: This apex research body or counci l would be responsible for liaising with stakeholders to set priori t ies for the fund, implement ing calls for proposals, setting up a rigorous and transparent peer rev iew a n d selection process, awarding contracts, a n d monitoring and evaluating funded projects.36 I t should b e small, but highly professional, with incentives and rules that can attract high quality staff.
Seek out sources of fundins: T h e prov inc ia l government should b e the f u s t source o f funding by allocating the funding i t currently provides in i t s budget to research institutes through the n e w apex funding body. W h i l e t h i s m a y mean that m u c h o f the current prov inc ia l research establishment that cou ld not compete successfully d not receive funds, this d help ensure that prov inc ia l research fundtng i s put to op t ima l use. O t h e r sources o f funding would b e the proposed USDAfund, and l ikely appropriat ions of funds under donor programs, such as the ADB agricultural adjustment loan.
Set Driorit ies for the Fund: T h e funlng agency would liaise with key stakeholders in the publ ic and private sectors to set key priori t ies for the fund, and would address emerging problems in c rop and l ivestock lseases and pests, innovat ions to stimulate diversif icat ion toward high value products, and solutions to the serious l and and water degradation issues.
9 Provide an enablingpolicy environment for both private and public sector innovation: An appropriate regulatory environment, in the form o f Plant Varietal Rights and Biosafety Rules, i s needed to fur ther stimulate pr ivate R&D. W h i l e these regulatory issues are under federal control, the GOP must remain actively engaged to keep m a x i m u m pressure on federal bodies to urgently approve PVP laws and appropriate Bio-safety regulations that d benef i t both pub l i c a n d private research. With PIP, the pub l i c system should b e encouraged to enter business agreements with the private sector, and stimulate the development o f local private R&D companies
3.5 Our estimates indicate that the provincial government spends only 0.15% o f Punjab AgGDP on agricultural research. Even adding estimates of research in universities and federal ins t i t u tes allocated to the Punjab, the total spending i s s u l l only 0.26% AgGDP (ie. less than half o f the average for Asia o f 0.5%, and less than 10% that for developed countries of 2.6O/’). 36 Although the Punjab Agricultural Research Board was constituted for this purpose in 1996 i t never served i t s role, in part because i t was not provided the appropriate business rules and flexibdity to operate, and it could not attract high quahty leadership and human resources.
59

9 Develop a human resource and incentive framework for quality research: T h e research system i s only as good as the quality o f i t s research leaders and scientists, a n d the incentive f ramework for st imulat ing innovation. An immediate priority i s to strengthen the h u m a n resource base o f the prov inc ia l system through (i) selection o,f dynamic research leaders appointed on merit, rather than seniority, (ii) a transparent and open system o f recruitment o f scientists based on merit, (iii) establishing a career service stream that allows qualif ied scientists to advance based on well- def ined p r o m o t i o n criteria not t ied to available posts, (iv) o v e r h a u h g and s tandardz ing the salary and benefits structure for scientists structures, (e.g., the NIAB model), a n d (v) immediate attention to suppor t ing post-graduate training abroad, especially in fields where there i s l i t t le capacity within Pakistan (e.g., biotechnology, some areas of natural resources management, economic policy).
9 Provide autonomy and functional ffexibiliity for effective research management: T h e dynamic nature o f research requires f lexibdity in the flow o f funds to enable research managers to reallocate between l ine i tems and budget codes. Likewise, linkages with farmers, extension agents, academia, and external agencies, a l l o f w h i c h are impor tan t f o r successful research, require that research managers have the authority to respond to opportunit ies for scientif ic exchanges o f in format ion, i ncome generation, specialized training and materials exchange, without hav ing to seek higher level approval, for wha t are everyday occurrences in a m o d e r n research system. Unul these issues are addressed, the impac t o f other efforts to improve the research system wdl b e h t e d .
3.47. T h e legal f ramework for research developed by the M i n i s t r y o f Science a n d Technology (Box 7), d if implemented by prov inc ia l research organizations, b e an impor tan t step in recognizing the unique requirements o f m o d e r n research systems, w h i c h differentiate i t from other publ ic sector functions. O v e r the long term, the Prov ince must put in place processes for comprehensive restructuring and modern izat ion within this n e w legal framework. This restructuring d require a large redundancy o f staff that are not suitably qualif ied for the n e w standards, a n d wdl result in a m u c h smaller but highly quali f ied publ ic ly funded system.
Box 7: N e w Legal Framework for S&T Organizations
The Ministry of S&T has developed a set of recommendations regarding the legal framework and administration measures to enhance the effectiveness o f R&D organizations in the country. These recommendations have been approved by Cabinet and are now being implemented through revisions of the Acts or Ordinances for R&D organizations to provide the necessary autonomy and powers to their BOG, following a standardized template. The most important provisions under the new framework are:
a)
b)
c)
d) e)
9 g)
Constitution of a small (less then 15 persons) BOG of individuals serving in their personal capacity, with an elected Chair. Open and transparent recruitment of the Chief Executive Office by the BOG for a futed term, against specified criteria. Empowerment of the BOG and CEO to approve rules and implement decisions with respect to human resources, financial budgets, foreign travel, contracting etc, without referral to the parent Ministry. Provision of establishment and non-establishment budget, with flexibllity within these categories. Encouragement of income generation and partnerships with the private sector, within a profit sharing formula, that includes incentives to staff Uniform service conditions, with open recruitment of staff on merit. Rigorous procedures for review of new projects and preparation of a business plan that clearly identifies expected products and end users
60

9 Improve coordination across research agencies and with technology transfer agents: T h e government should inst i tut ional ize a mechanism through w h i c h leaders/managers in the agriculture, l ivestock a n d fisheries research, extension, university and other key stakeholders can come together to identi fy opportunit ies for improving synergies and avoiding duplication of effort. T h e apex research body discussed above cou ld b e a vehicle for t h i s . Similar coordmat ion mechanisms should b e explored at the ago-ecological system to best link local stakeholders in the decision mak ing at the system level (e.g. ABAD for the Bar& O n - f a r m Water Management for rice-wheat; NUB for saline agriculture, Univers i ty o f Agriculture, Faisalabad, for m i x e d farming systems of central Punjab). Finally, the r o l e o f c o m m o d i t y groups that coordinate actions across agencies for ma jo r commodt ies should b e strengthened as a vehicle for setting long- term goals and priori t ies for the commod l t y in question (e.g., using a c o m m o d i t y chain approach that brings in ma jo r players from agro-processing and marketing, in order to address emerging market needs).
9 Promote a pro-active approach to improving effectiveness o f decentralized extension: The transfer of p roven technology adapted to local farmer condlt ions i s o f fundamental importance. T h e Punjab faces a m a j o r challenge in the r e f o r m o f the publ ic extension m o d e l to p r o m o t e high quality demand-driven services. A n e w extension pol icy needs to b e developed to address issues of decentralization, empowerment, accountability, and sustainable funding.
Prov inc ia l extension pol icv: T h e government should establish a po l i cy that clearly lays ou t i t s
roles and responsibihties in a decentralized system. These would inc lude technical support and human resources development, monitoring and evaluating overal l system performance, knowledge sharing among districts, a n d evaluation o f innovative extension approaches, whether publ ic or private, and identifying, piloting, and supporting scaling up of promising inst i tu t ional innovations.
AdaDtive research a n d t e c h n o l o m transfer grants: T h e compet i t ive fund above should establish a special window to fund innovative ideas for pilot testing and dissemination o f n e w technologies, especially for higher value products that d enhance diversif icat ion and growth in the sector, or address specific needs o f the poorest farmers. Grants would encourage partnerships between research agencies, technology delivery agencies, especially from the pr ivate or NGO sector, and farmers, especially organized groups o f farmers.
H u m a n resources development: T h e ma jo r ro le o f the Ex tens ion Wing under the provincial government i s t o p rov ide opportunit ies for continuous in service t ra in ing for distr ict extension staff. Given rap id changes in the agricultural sector, training programs d have to b e considerably revamped to meet the changing needs o f a market-oriented a n d diversif ied agriculture, such as post harvest handling, business a n d market ing sk t l l s , and s k d s in fach ta t i ng the emergence o f strong producer organizations.
61


CHAPTER 4: IMPROVING SERVICE DELIVERY AND SOCIAL OUTCOMES
I 80 -
1 5 - h
70 - 5 ~ 0 6 5 6 -
4.1. Increasing the opportunit ies t o earn higher incomes i s but one p a r t o f the prov inc ia l government's strategy for improving the l i f e o f i t s citizens. Together with higher incomes must go the better availabdity o f publ ic services, especially education, health, access to clean drinkmg water, and sanitation, to name but the most essential. T h e chapter discusses generic i ssues o f service delivery in a decentralized setting, summarizes some o f the reforms the Governmen t o f the Punjab i s currently considering ( including those being implemented under the Punjab Educat ion Sector R e f o r m Program (F'ESRP)), and make suggestions as to next steps in the r e f o r m process. Wh i le t h i s chapter discusses these issues in the context o f pr imary education and of health, the discussion i s applicable to many other services.
Table 4.1: Selected Education Indicators for Punjab and Pakistan: 2001/02 Puniab Overall
Indicator Urban Rural Overall Pakistan 1. Literacy Rate (Yo Population 10 Years and Above)
Male 71 51 57 Female 60 26 36 Overall 66 38 47
M a l e 57 44 47 Female 58 38 43 Overall 57 41 45
Male 13 19 17 Female 8 18 14
2. N e t Primary Enrolment Rate (YO)
3. Dropout Rate (% children 10-18 yrs. leaving school before completing primary level)
58 32 45
46 38 42
15 15
Overall 11 19 16 15 Source: 2001/02 PIIlS
4.1 THE S T A T E OF EDUCATION AND HEALTH IN THE PUNJAB
4.2. Table 4.1 presents enro l lment rates in the Punjab in comparison to the all-Pakistan average. In general, the Punjab has higher l i teracy a n d enrol lment rates than the rest of the country. Notably, the dif ferential between male a n d female l iteracy i s m u c h lower in the Pun jab than elsewhere-a factor that augurs we l l for the future, as d b e discussed. Not only i s the current level o f enrol lment higher in the Punjab but also the t rend in the past f e w years looks good. Figure 4.1 shows gross enrol lment rates for t h e provinces. A f t e r a p e r i o d o f stagnation that, in turn, fo l l owed some improvemen t early in the decade, the last couple o f years have seen enrol lments p i c k up. T h e rest o f the country, in fact, has seen a decrease in gross enro l lment rates from already low levels.
Figure 4.1: Gross Enrollment Rates by Province: 1995/96 - 2001/02
FP
Balochistan
1 5 0 I 1995196 1996197 I998199 2 0 0 1 102
63

4.3. However , in compar ison with other countries of the Punjab’s level o f i ncome as we l l as others in the region, enro l lment rates do not seem as impressive. N e t enro l lment in Bangladesh, for example, i s fully twenty percentage points higher than in the Punjab and Sr i Lanka has achieved virtual ly universal enrollments. T h e Punjab’s performance looks m u c h m o r e l i ke that o f the poorer states in N o r t h e r n I n d l a than either the southern states or the country as a whole.
M a l e
FCIlIdk
Nonh
C entrdl
4.4. Moreover , b e h i n d this picture o f overall improvement i s substantial variat ion between chi ldren f r o m d i f fer ing backgrounds. Figure 4.2 shows that enrollments are m u c h higher a m o n g high income groups than low, ten percentage points higher fo r boys than p l s and vastly d i f ferent between the N o r t h e r n and Southern regions o f the province.
Figure 4.2: Enrollment Rates in the Punjab by Income, Gender, and Region: 2001/02
Source: S t a f f est imates based on the 2001 /02 PIHS
4.5. D a t a on health status in the Punjab, as in Pahs tan as a whole, i s seriously deficient. D a t a on morta l i ty rates, for example, varies substantially across sources. Using h e c t survey questions in the Pakistan Demographic and H e a l t h Survey (PDHS), i n fan t mor ta l i ty was 104 p e r thousand in the Punjab compared to 94 nat ionwide in 1990-91. Using m o d e l based estimates, the P I H S shows in fan t mor ta l i ty in the p e r i o d 1990-95 as 110 p e r thousand in the Punjab a n d 105 nationwide. For 1993-98 the P I H S reports 100 a n d 96 p e r thousand in the Punjab and nationwide, respectively. O f f i c i a l data shows a decline from 127 to 82 nat ionwide for the pe r iod 1991 to 2001/2. D a t a can b e mustered, therefore, to make either the point that health status has stagnated almost completely in the 1990’s (deteriorating and then recovering) or that enormous progress has been made-enough, in fact, to b e on track to achieve the M d e n n i u m Deve lopmen t Goals. Discrepancies o f t h i s magnitude for the m o s t basic (and unambiguously defined) measure o f health status indicate the impossibility o f attr ibuting effects o f policy, or even o f hav ing a clear p ic ture o f reality.
4.6. Ignoring the quest ion o f the usefulness o f the data collected, one result c o m m o n to al l sources where the compar ison can b e made i s that the Punjab seems to have mor ta l i t y rates consistently a l i t t le higher than in the rest of the coun t ry and progress, i f any, a t abou t the same pace. As a relatively
6 4

r icher and, as n o t e d above, better educated province, t h i s difference i s a real puzzle. Both income and education are usually highly correlated with better health.
4.7. Indeed, using the 1990/1 P D H S data (the only source large enough to b e able to measure mortality-and even then only for Pakistan as a whole) F igure 4.3 shows that there are large differences in morta l i ty rates between r i c h and poor . Chi ldren from relatively poor f a d e s are almost twice as l ikely to die before their second birthday than those from bet ter -of f f a d e s . T h i s result i s consistent with those in most countries.
Figure 4.3: Mortality Rates of Children under 2 yrs, by Household ‘Wealth”: 1991 0 14
0 12
0.1
0.08
0.06
0 04
0.02
0 0 50 100 150 200 250
Note: The figure i s a non-parametric regression (a moving average) of mortality o f children under two by a measure o f living standards constructed as a weighted average of ownership o f consumer durables and housing quality. The measure i s more accurate at higher levels of “wealth” so defined. Source: Staff estimates based on the 1991 PDHS.
4.8. T h e interpretat ion that progress in improving health has been stagnant over the past decade i s reinforced by data on nutr i t ional status-measured by height for age (relative to a c o m m o n standard)-from a survey done by the In ternat ional Food Pol icy Research Inst i tu te in July 1986 - September 1989 and compared to a re-survey of the same f a d e s in 2001 by the Pakistan Rura l Househo ld Survey Q?RHS). In this comparison, there appeared to b e no improvemen t over the f i f teen year period, a deeply disturbing result. Oddly, on nutr i t ional status, the Punjab i s somewhat better than the rest o f the country, though, at 60 percent stunted (height for age be ing m o r e than two standard deviations l o w e r than norms) this i s not m u c h comfo r t . Exacerbating the mystery a round the accuracy o f the mor ta l i t y data, nut r i t ional status i s also usually highly correlated with other measures o f health.
4.9. As a result o f the very poor state o f data col lect ion on health, fur ther results need to b e treated with great skepticism. W h a t can b e confidently concluded, however, i s that if the causes of better health-in particular those causes that can b e in f luenced by policy-are ever to b e determined, i t will require substantially better measurement of the ult imate goal of a healthier publ ic, especially children. Further, data has only been collected in samples large enough to measure progress for large areas- provinces at best. I f data i s to b e used t o a id decision ma lung in a decentralized setting, m u c h larger and m o r e regular samples d need to b e collected. This point warrants cont inual repeti t ion.
65

4.2 THE ROLE OF PUBLIC SERVICES
4.10. This section asks two questions: First, what are the determinants o f levels and trends in school attendance and health status a n d how m u c h o f a ro le does publ ic po l icy play? Second, given the large (in health) and growing (in education) private sector, how should publ ic priori t ies b e set?
4.11. Determinants o f Dr iman i school attendance: Analyses in Pakistan as a w h o l e and in the Punjab o f fe r some obvious possibil i t ies o f determinants that are generally observed in other countries. Table 4.2 shows the national and Punjab specific results fo r rura l enrollments. Parents’ education i s a strong determinant o f enrollment, as are measures o f i ncome and wealth both o f the f a d e s (as represented by their own consumption) as we l l as o f the communit ies (as measured by overal l quality o f housing in villages). Interestingly, the gap between r i c h and p o o r i s somewhat higher (and significantly so) in the Punjab relative to the country as a whole.
4.12. Most impor tant , however, are the variables that can b e in f luenced by education policy. N o t surprisingly, p rox im i t y to a p r imary school i s an impor tan t determinant o f attendance, though considerably less so for the Pun jab than for the rest of the country. P r o x i m i t y to a secondary school i s also related to higher enrol lments in pr imary schools-an effect slightly h igher for the Punjab. This has been observed in several countries37 o f widely differing levels o f i ncome a n d i s o f ten interpreted to mean that parents see p r imary education not as an end in i tse l f b u t ’ a s a means o f obtaining secondary education-frequently required for employment in government service or the d t a r y . T h a t this should b e a stronger effect in the Punjab cou ld we l l b e related to the higher overall enrol lment rate i n l c a t i n g m o r e chi ldren whose parents m a y b e considering education beyond pr imary for them.
4.13. Unfortunately, there are very f e w other policy-related variables available for analysis. M a n y of the features o f schools that are o f t e n ident i f ied as being impor tan t for attract ing students are n o t o f ten measured in such a way as to b e able to use in this sort of analysis. Var ious measures of “quality”, either o f the infrastructure o f schools or the absentee rates, e f fo r t and dedication o f teachers are frequently men t ioned as impor tant . I t i s impossible to determine from available data sets w h i c h o f these alternatives m a y b e impor tan t and w h i c h not. Quality on some measures i s certainly an issue as recent s t u l e s have n o t e d that, of schools that are open at al l (in which, it must b e noted, the Punjab i s very m u c h bet ter t han the other provinces) the rate o f absences o f teachers in the Punjab i s somewhat h igher than in the rest of Pakistan-24 percent versus 19 percent.38
4.14. This s t d l leaves the quest ion o f to w h a t extent i s the i m p r o v e m e n t in enro l lment rates attributable to publ ic policy?39 O n e reason for some skepticism concern ing the public’s r o l e i s that the growth o f the pr ivate sector has been dramatic in recent years. F igure 4.4 shows the massive increase in the fo rma t ion o f pr ivate schools in the Punjab over the 1990’s. Also notable i s the balance between urban and ru ra l areas. T h e f e w schools that h a d been opened prior to the 1990’s h a d been pr imar i ly in u rban areas. Since then, private schools in ru ra l areas have been forming at almost
37 World Bank 1998,2002b. 38 World Bank 2002b. 39 I t i s hoped the PESRP will provide an opportunity to assess this impact. The various policies introduced under this program will be subject to rigorous third-party assessments and impact evaluations. The new dimensions o f public policy include introduction of incentives such as free textbooks in government primary schools, stipends for g x l s in selected low literacy districts, recruitment o f school-specific contract teachers, development o f partnership agreements between the province and the districts, and contracts and partnerships with the private and NGO sectors to improve service delivery.
66

exactly the same rate. However , according t o t h e 2000 private school census conducted by FBS, there i s h t e d growth o f private schools in districts in Southern Punjab-districts l ike Rajanpur, R a h i m Yar Khan , Lodhran, and D e r a Ghaz i Khan, w h i c h also have m u c h higher pove r t y levels and lower literacy rates compared to dst r ic ts in the rest o f the prov ince
Table 4.2: Marginal Effects on The Probability of Attending School for Ages 6-14: 1999/00 (Results from Probit Regressions)
" * 1 * " - * * *
Independent Variables All Pakistan Rural Punjab Rural Marginal Effect T-ratio Marginal Effect T-ratio
0 064 3 95 0 046 167 Quintile 2 Quintile 3 Quintile 4 Quintile 5
Rural Female * Age Age squared Mother's Education
Ever Attended School * Education>=Grade 6 * Education>=Grade 11 *
Ever Attended School * Education>=Grade 6 * Education>=Grade 11 *
Father's Education
Number of Children in Household Amount of agric. land owned:
Group 1 Group 2 Group 3
In PSU/Within 1 km. from PSU Primary School * Primary, Middle & Sec. School * Bus Station * Railway Station * Shop * Market Bank * Phone Post Office * Distr ict Capital *
Hospital/Dispensaq * Health Worker * Drainage Fackty * hfotorable Approach Road * Mostly Pucca Houses in PSU * >=50% of Households with Electricity *
*
*
I n PSU
0.154 0.196 0.244
-0.241 0.316 -0.016
0.249 0.116 0.238
0.145 0.143 0.115 0.010
-0.017 0.024 0.035
0.193 0.079
0.039 0.053
-0.007
-0.045 -0.031 0.030 -0.001 0.143
0.012 0.013 0.036 0.027 0.073
0.125
9.71 12.3 14.2
-24.1 18.9 -19.4
9.44 1.96 1.14
11.8 9.32 4.19 4.70
-1.17 1.33 1.53
11.4 5.89 -0.58 1.84 2.80 -2.23 -2.02 2.46 -0.09 3.77
1.00 1.19 3.07 1.52 6.39
9.07
0.193 0.213 0.273
-0.191 0.346 -0.018
0.221 0.135
0.138 0.185 0.092 0.016
-0.033 0.013 0.019
0.120 0.105 -0.008 0.87
0.007
0.057 -0.190 0.081
-0.033
-0.037
-0.005 -0.025 0.024 0.018 0.054
0.162
7.41 8.13 9.77
-11.4 11.91 -12.6
5.64 1.56
6.68 7.36 1.40 3.95
-1.31 0.43 0.44
3.45 4.89 -0.39 2.43
0.19 -1.42 2.65 -1.0 0.72
-0.22 -1.29 1.25 0.48 2.57
6.12
-0.60
mdependent, conunuous variable, for 0-1 vmables, it measures dscrete change m the probabkty for discrete change of vanable from 0 to 1 T-ratios pertam to underlymg Probit coefficients Specification for W-Palustan d u d e s dummy variables for every province (Punjab i s the reference state) Source: World Bank 2002b
67

. Figure 4.4: Formation of Private Schools in Punjab: 1970 - 2000 (Number)
6000
5000
4 0 0 0
3000
2 0 0 0
1 0 0 0
0 1 9 7 0 1 9 7 2 1 9 7 4 1 9 7 6 1 9 7 8 1 9 8 0 1 9 8 2 1 9 8 4 1 9 8 6 1 9 8 8 1 9 9 0 1 9 9 2 1 9 9 4 1 9 9 6 1 9 9 8 2 0 0 0
Y e a r o f Formation I
Note: 2001 incomplete: Source: Federal Bureau of Statistics: Pakistan Census of Private Schools
4.15. This t rend towards private education, whi le c o m m o n across the country, i s particularly strong in the Punjab where, according to the CIET study,40 55 percent o f chi ldren between the ages o f 5 and 9 are in government schools, an extremely low number for t h i s age group by international experience. T h e comparable n u m b e r for Pakistan as a who le i s 67 percent (implying rates in the other ma jo r provinces in the high 70’s given the Punjab’s large con t r i bu t i on to the average). In urban Punjab, only about h a l f o f chi ldren in pr imary education are in government schools. Compar ing the rap id growth of schools (and enrollments) in private schools, this leaves very l i t t le o f the overall increase in attendance attributable to the publ ic system.
4.16. Several factors m a y account for the rap id increase in private schools. O n e m a y b e an overall dissatisfaction with the publ ic system. T h e CIET study shows 53 percent of households satisfied with government education-virtually the same as the 55 percent nat ional average. Dissatisfact ion o f 47 percent cou ld we l l b e fuel ing the exodus. However , two other factors are related to the steady increase in female education over time. First, overal l demand for education should b e rising- parental education being a p r imary driver. Second, m o r e subtly, recent research41 has used the fact that proximity to schools i s also an impor tan t determinant o f attendance a n d that hav ing educated w o m e n in ru ra l areas increases the pool o f potent ia l teachers for the private schools to d raw upon. These w o m e n are a large f ract ion o f the private teaching force: over 70 percent in the Punjab in contrast to about 50 percent nationwide. So, on both the demand (increases due to educated mothers) and the supply (more potent ia l teachers), increases in female education generate a cont inu ing m o m e n t u m for education overal l and for private education in particular.
4.17. T h a t same research also puts into doubt some often-heard reasons for low enrollments. T h e vast major i ty o f private schools established in ru ra l Punjab-well over 90 percent-are coeducational. I t i s not a reluctance to send q l s to coeducational schools that has been standing in the way o f progress. Private schools must cater to the wishes o f the parents in order to attract business and therefore have a bet ter sense o f parents’ demand. Also interesting in that research is:
40 CIET, 2003. 41 Xndrabi e t d, 2002.
68

quality as measured by functional infrastructure (toilets, etc.) and maintenance i s also better than in publ ic schools
overall costs o f private schools (total cost of provision-not fees to students) i s slightly lower than in pub l i c schools-Rs. 1000 vs. Rs. 1200 per year, respectively.
T h e median monthly tuition at private schools in rura l Punjab are quite low at Rs. 51 (the lowest in Pakistan)
Parents appear to b e quite sensitive to various measures o f quali ty in that higher fees are associated with observable school characteristics such as better student-teacher ratios and better qualif ications o f teachers. T h i s indicates that parents can b e good “shoppers” for education and pay attention to quality.
4.18. Exactly how m a n y students enrol led in these schools h a d previously come from publ ic schools and how m a n y are n e w students are ha rd to determine but are cri t ical pieces o f in format ion. I f expansion or improvemen t o f the publ ic system simply reverses this process-extra publ ic investment will not translate into m o r e overal l enrol lment if i t simply returns students to the publ ic that had le f t for private education. T h e only advantage o f expanding the l ower pr ice (to students, not t o society as a whole) option o f publ ic education would b e i f the benefits would disproport ionately accrue to the poor.
4.19. Wh i le i t i s certainly the case that a higher fract ion o f chi ldren from bet ter -of f f a d e s attend private schools, private enro l lment h a d been increasing rapidly in both ru ra l areas and a m o n g poorer f a d e s . Table 4.3 shows that even a m o n g the poorest quintde, one- f i f ths of al l students are attending private p r imary schools, negating the popular misconcept ion that private schools in the Punjab cater only to the r ich.
Table 4.3: Educational Enrollments in Punjab by Consumption Group: 2001/02
Consumption Gross Share in Total in quintile enrollment rate government school government school Poorest 56 80 45
2 72 75 54 3 86 70 60 4 95 65 61
k c h e s t 105 58 61
4.20. I t i s impor tan t to know whether enro l lment expansion i s due to pr ivate or pub l i c schools. Planning needs to take into account the possibdq that n e w governmen t schools cou ld prov ide compet i t ion for private schools-not in i tse l f a b a d thing i f there are suff icient numbers o f students to attend both-but w h i c h cou ld simply displace private schools and lead to m u c h less n e t increase in enrol lment than would otherwise b e expected. O n e possibhty for ensuring complementari ty between publ ic and pr ivate schools systems i s to encourage partnership between them. Recognizing this, the prov inc ia l government has restructured the Punjab E d u c a t i o n Founda t ion i n t o an autonomous body as a vehicle to p r o m o t e a n d develop such partnerships. In addition, dif ferent models for strengthening School Counci ls (SC) are being implemented. In the f i r s t phase, PESRP has established a m o d e l for contract ing out services to NGOs worktng in col laborat ion with SCs, wh ich will be implemented in six districts. Current research i s p lanned to study this m o d e l (Box 8).
69

I Box 8: Studying Public-Private Partnerships in Education in the Punjab
Following the denationalization o f private schooling in 1979, there has been significant growth in private schools in Pakistan. However, relatively little analytic work, i f any, has been carried out to-date examining the causes and consequences of this phenomenon, largely due to the lack of reliable nationwide data on private schools. For instance, researches and policy-makers do not yet have a good understanding o f school-choice decisions by households (in particular relating to factors such as availability, quality, costs, role o f female teachers, etc. across different types of schools). In particular, no outcome variables are available related to learning achievements o f students in the private sector.
As part o f the ongoing collaboration between the provincial education authorities and the World Bank in the context of the Punjab Education Sector Reform Program (see Box 8), an extensive study on Public-Private Partnerships in the Education Sector i s being carried out to help fd this knowledge gap. Since public-private partnerships constitute an important element of the provincial government’s education reform program, the study a ims to deepen policy-makers’ understanding of the role of the private sector in education. Specifically the study will examine (i) the quality of education provided in private rural schools, both in absolute terms and relative to that o f public schools, (ii) the fee-structure charged in private schools and its relationship with school quality, (ii) the relevant market structure for (private) education, and the extent to which private schools compete with other (private or public) schools, (iv) factors that influence the school-choice decision of the household, and numerous other such important questions of policy interest. I t will be carried out in two main phases: (a) a careful evaluation o f school choice with regard to school quality using detailed data on household inputs and learning outcomes in schools, and @) a randomized intervention including both demand side and supply side incentives to evaluate the outcomes of potential policy changes.
The study concentrates on village units endowed both with public and private schools. 120 villages have been sampled from 3 districts (httock, Faisalabad, and Rahim Yar Khan), where fieldwork will be carried out. A list o f all households with children o f school-going age w d be compiled for al l selected villages, following which a household survey will be administered to selected households along with school surveys and tests o f children in the 4th grade in Mathematics, English and Urdu. In addition, test will also be administered to teachers to determine a measure of teacher quality. Tests and household surveys will be administered every s i x months, until a longitudinal data set comprising 3 rounds i s available for a panel o f interviewed households and children. The household data collected will be matched with detailed school-level information on fee structure, teacher qualifications, ownership structure, etc. Analysis o f these combined data will help yield valuable information on school choice and relative performance among schools in the same village. The results of this analysis w d then be used in discussions with various stakeholders to agree on a n appropriate intervention to be studied in the randomized experiments administered under the second phase o f the project.
Sources: For more details, see Das et al(2003)Improving ScboolQaafip in Pakistan: A Concqt N o t e , World Bank, Washington DC.
4.21. Inco rpo ra t i ng the pr ivate sector into the p lanning o f the pub l i c sector implies that i n fo rma t ion b e collected on the basis of the populat ion o f students and not just from the Depar tmen t o f Education’s in ternal management i n fo rma t ion systems. I t i s not suff icient to keep track o f chi ldren who happen to attend pub l i c schools. I t i s necessary to know the progress o f al l children. Wh i le the Punjab Educa t ion Management I n f o r m a t i o n System (EMIS) collects data for government schools on an annual basis, s d a r instruments for collecting i n fo rma t ion on private schools are not yet available. T h e prov inc ia l government i s considering conduct ing an annual pr ivate school census t o collect updated i n f o r m a t i o n on the total student populat ion on a regular basis.
4.22, Determinants o f heal th status and publ ic policy’s ro le in i t are even harder to assess than in education. This i s not only because o f the lack o f relevant i n f o r m a t i o n but also because health involves a m u c h m o r e complex combinat ion o f determin ing factors. Educa t ion requires a teacher and chi ldren in classrooms on a regular basis and some educational materials-most o f w h i c h are concerns o f the Ministry o f Educat ion. H e a l t h status, in contrast, i s determined by a large number o f factors that l ie outside o f the Ministry o f Heal th . I n f o r m a t i o n to correctly assess these various potential contr ibutors i s simply not available so the following discussion i s mere ly suggestive.
4.23. T h e P D H S i s the only source o f data that i s both large enough a n d b r o a d enough to attempt an explanation o f i n f a n t a n d ch i l d mortal i ty. Table 4.4 presents the basic results of a regression analysis based on data from the who le country. N o t e that there i s no i n f o r m a t i o n on the presence or absence o f publ ic health facilities in the same data set so a compar ison with other po l i cy options
70

cannot b e made. However , several very strong correlations do appear. First i s the effect o f mother’s education, fur ther emphasizing the benefits of expanding female education. Second, the impact o f “wealth” i s strong and reinforces the impl icat ion o f Figure 4.3 above.
Table 4.4: Determinants of Heal th status in Pakistan: 1990/91
Independent variable Coefficient (Standard Error) Wealth - 068 ( 028) Secondary/ higher education -.701 ( 189) Piped water - 249 ( 140) Flush toilet -.061 ( 125) Pit todet - 622 ( 129) rural - 099 (.113)
~
n an n that were not significant Source: Staff est lmates based on the 1990/91 PDHS
4.24. Finally, the impac t o f hav ing any sanitation fach ty at all, i s very strong on ch i l d survival, even stronger than source o f water. Sanitation habits are not directly addressable with infrastructure- related interventions42 but require behavioral change in f a d e s . Ach iev ing behavior change has impor tan t pub l i c good characteristics (health education-the dissemination of in fo rma t ion that i s not associated with a commercial p roduc t that would b e advertised) as w e l l as direct effects on other village members,43 that is , with large externalities. Further, infect ious l s e a s e a n d deaths from diarrhea among chi ldren are almost always m o r e concentrated a m o n g the poor than any other l s e a s e condition.44 Therefore, addressing the sanitation p r o b l e m has a strong c la im on pub l i c resources on b o t h equity a n d efficiency grounds.
4.25. W h a t o f the effect o f publ ic health care fachties? This i s h a r d to say. I t i s possible that better sanitation practices are brought about by contact with publ ic heal th fachties or that the other determinants are simply proxies for access to health care. This cannot b e direct ly tested. However, there i s reason to doubt the effect o f publ ic care. First, very f e w people, even a m o n g the poorest use publ ic health care fachties (Figure 4.5). T h e CIET study shows very low use o f pub l i c facilities and that “very vulnerable” households were not any m o r e l ikely to use t h e m than o the r households. Some o f t h i s i s due to fewer people who are “very vulnerable” be ing within 5 km of a publ ic facility. T h e current pattern o f publ ic subsidy, then, i s not pro-poor.
4.26. Second, overal l changes in mor ta l i t y (either the modest estimates from compar ing the PDHS to PIHS or the m o r e dramatic estimate using of f ic ia l records as the baseline) are consistent with changes in the other impor tan t determinants. O v e r the decade there has been increased coverage o f water and sanitation,45 increased female education and decreased ferul i ty (usually associated with lower morta l i ty since high risk mothers-very young, very old, those with largest numbers o f chi ldren and those that feel themselves to b e at high risk-tend to reduce ferul i ty f i r s t w h e n overal l rates decline). Together these cou ld account for the observed improvements. Finally, in I n l a and Bangladesh, where in format ion on access to pub l i c fachties i s available in the same type o f surveys, their presence i s not, generally, associated with lower mortal i ty. Perhaps the most comparable case i s the Ind ian state of Punjab. There analyses show no such relationship.
?* Water and Sanitation Program, South Asia Region, The World Bank. 43 Hughes and Dunleavy, 2000. 44 World Bank, 1998, 2002b. 45 World Bank 2002b.
71

Figure 4.5: Percent of Households who usually use Government Health Facilities
Sindh Baluchistan NWFP Punjab isiamabad Pakistan
Source: CIET 2003
4.27. w h y might sanitation work w h e n health care does not a n d w h a t does this mean for publ ic pol icy? Sanitation, as noted, i s characterized as hav ing large external benefits a n d disproportionately affects the poor. G i v e n the very large private sector in health care, the substitution possibhties with the publ ic sector are also potential ly substantial. In fact, analysis o f substitution in Paktstan as a whole shows that any increase in the cost o f attendmg publ ic facdities that would lead to a 10 percent reduction in publ ic facilities i s associated with an increase in the use of pr ivate facilities that amounts to 7 o f those 10 percentage points.46 T h e substitutabll ity seems high a n d therefore increases in publ ic facilities cou ld lead to m u c h lower-than-expected increases in n e t coverage o f health care uul izat ion due to reductions in pr ivate sector use.47
4.28. Simply not enough i s known about the contr ibutions o f d i f ferent policies on health status and they cannot b e determined with currently available data-in our case as old as 13 years. More, and timelier, i n fo rma t ion that can b e used by health planners and heal th care providers i s a top priority. Further, even m o r e than in education, the kinds o f i n fo rma t ion that need to b e collected must b e f r o m population-based surveys and not simply from fach ty based in fo rma t ion . Since so l i t t le of the sector i s covered by pub l i c fachties, the focus o f attention and data col lect ion should b e on wha t most people are really doing about their health and health care-information that cannot, even in principle, b e collected at pub l i c health centers.
‘6 Alderman and Gertler, 1989. 47 There i s substantial controversy over the “qudty” o f care in both public and private facdities. This i s a grossly under- researched topic given i t s importance. Recent evidence (Das and Hammer, 2004) seems to indicate that in urban India, poor people are treated by low quality providers in both public and private facilities (with public MBBS doctors a litt le, but not much, better than private providers without an MBBS) while richer people are treated by higher quality doctors in both the public and private sectors (the private being a little, but not much, better than the public). N o such study exists for Pakistan, le t alone the Punjab.
72

4.3 ACCOUNTABILITY OF POLICYMAKERS AND PROVIDERS:
4.29. T h e World Deve lopmen t Repor t 2004: “Making Services Work for Poor People” identi f ied the core factors i nvo l ved in mak ing sure that services do, in fact, work for poor people. These are a set o f “relationships o f accountabhty”, or, m o r e prosaically, m a k i n g sure that service providers feel commi t ted a n d have incentives to prov ide services effectively (Figure 4.6).
Figure 4.6: Relationships o f Accountability in Service Delivery
Services
Source: World Development Report 2004
4.30. T h e basic p o i n t i s that the goal i s t o improve services to clients, particularly poor clients, w h i c h serve their needs and preferences. People are concerned with outcomes. T h e y wan t educated children, clean and convenient water and better health (and attentive health care). T h e y do not care what managerial system gets i t to them. In a market for an ordinary good, people pay for i t directly, o f course, but in doing this they make sure that they are gett ing the type and quali ty that they want. They are closely monitoring the seller-it i s their m o n e y after all-and have impl ic i t ly or explicit ly the a b h t y to make sure the seller delivers. T h e y can compla in (an expl ici t sanction) or they can threaten not to re tu rn or to tell their friends (an imp l i c i t sanction). T h e seller has every reason to satisfy the w i s h e s o f the consumer since that i s how they earn their living. This i s a power fu l incentive. In the dlagram, i t i s one form o f the “short route” o f accountabil ity.
4.31. This fable i s relevant to basic services because even if services are p rov ided by the government, the same degree o f care on the part o f providers to satisfy the needs o f clients needs to b e maintained. However , this now takes two steps (the “long route” of accountabhty). First, the government must be aware and have the incentive to satis@ the desires o f the clients, particularly poorer clients. This relat ionship o f accountabhty i s “voice” in the diagram-more common ly k n o w n as pol i t ics. Service delivery should always b e seen as inherently polit ical. In democracies, i t i s the pol i t ic ians that usually respond to voters’ wishes, a n d they must pass on these wishes to the policy-makers.
4.32. Second, policymakers must be able to ensure that providers have the incentives to satis@ the needs o f clients. Pol icy makers need to b e able to monitor a n d induce prov ider organizations (such as the Ministr ies o f H e a l t h or Education) and, through them, f r o n t h e providers
7 3

such as teachers and doctors, to p e r f o r m their duties properly. High rates o f absenteeism are an ind icat ion that this i s not an easy task. This relationship o f accountabhty i s labeled “compact” in the diagram. “Voice” and “compact” together form the “long route” o f accountabhty. For the “long route” to work well, both pol icy makers and providers feel responsible to supply the same things that people demand. Providers in the publ ic sector must b e accountable to the pol icymakers who, in turn, must b e accountable to the public.
4.33. FinaII’ monitoring o f the performance o f providers i s o f ten d i f f icu l t to do through ordinary managerial supervision. S d a r l y , implement ing systems o f rewards a n d punishments for performance based on this monitoring i s not easy. Depend ing on their capacity, (and even r i c h and technologically advanced countries o f ten find this diff icult) governments might find that reliance on parents, patients or community organizations can be helpful in ensuring better performance-either as monitors or as direct demanders o f services. T h i s i s called “client power” in the diagram. This i s a second meaning o f the “short route”, Le. not re ly ing on the market (also a short route but only by default)-but as a deliberate po l icy init iat ive to take advantage o f local i n fo rma t ion and enforcement capacities.
4.34. These services are p rov ided by the state for good reason-market outcomes are not always sufficient. Poor people m a y not obta in education w i thou t state intervention, even i f i t i s in the long te rm interests o f the children. P r imary education, in particular, i s considered to have benefits to the commun i t y at large (externalities). In health there i s a wide range o f activities with di f fer ing degrees o f market failure-from the pu re pub l i c goods o f pest con t ro l for w h i c h there cannot b e a private market to con t ro l o f infect ious disease to relatively inexpensive curative care w h i c h i s close to a pu re private good. Publ ic sector priori t ies should balance the a b h t y o f markets to deliver particular services to the abil ity o f governments to deliver t h e m given problems that appear a long the “long route” o f accountabhty. T h e remainder o f this section examines ways in w h i c h each o f these relationships o f accountabhty can b e made to work better in the Pun jab and, for example, as i s already being done under the PESRP. T h e following section examines the appropriate ro le of the prov inc ia l government that will fur ther i m p r o v e these relationships in the devolved system.
4.35. Voice: Pol icy makers, in the devolved system the nazimeen, must believe that i m p r o v e d services serve their own interests. U n d e r the PESRP, al l district govemments have entered into terms o f partnership (see B o x 8) with the prov inc ia l government in a m a j o r e f fo r t to i m p r o v e education service delivery. In the course o f consultations for the r e f o r m program, a ma jo r i t y o f Zd la Nazimeen stressed the high priority they accorded t o improving education outcomes. There are several examples o f this, inc lud ing the Z i l la N a z i m and Union Naz imeen in Faisalabad who feel responsible fo r service delivery, a n d consider success to b e impor tan t for their po l i t ica l futures.48 In R a h i m Y a r K h a n as well, both heal th care provision a n d educational improvemen t are g iven high priority for the same reason-the N a z i m and counci lors believe that better services amoun t to good polit ics.
4.36. One major expected benef i t o f devolut ion was that local governments will both know m o r e about the specific needs of their constituents and b e m o r e l ikely to feel accountable to people. But devolution, by itself, does not ensure this d happen. I f polit icians in Faisalabad a n d R a h i m Y a r K h a n do, in fact, reap pol i t ica l benefi ts from an emphasis on i m p r o v e d service delivery, their experience i s l ikely to b e repeated. T h e devolut ion study indicates that N a z i m e e n do find that
48 World Bank 2004c
74

l istening to citizens i s m o r e impor tan t after devolution-certainly a p romis ing result. However , d e p e n l n g on local c o n l t i o n s and history, improved communicat ion m a y not b e the result, local polit icians m a y b e subject to pol i t ical capture by elites and services m a y not reach the poor. To counter this possibility, actions on the par t of the prov inc ia l government, as discussed below, and more open, publ ic, and i n f o r m e d debates o n issues are necessary.
Box 9: The Punjab Education Sector Reform Program
Following extensive consultations with students, parents, teachers, and local officials, including in-depth meetings with district education teams and NGOs, the Government of the Punjab has recently embarked upon an extensive reform program to enhance access and quality of education in the province. In 2004 the World Bank extended U S $ l O O million, the first of a series of three IDA adjustment credits, in support of this reform effort. The government’s medium-term reform program has three main pillars:
(11 PubIic finance reforms: The government has increased public expenditures on pro-poor services with a focus on education by increasing provincial public sector expenditures with conditional grants for district governments.
611 Devolution reforms: I n line with the ongoing devolution initiative, increased decision making authority on resource allocation has been passed on to district governments. The provincial government i s also developing an implementation framework that clarifies the roles of service providers and users and institutionalizes performance-based budgeting.
(iii) Education sector reforms: To improve education sector performance, the government i s taking measures to strengthen education accountability by establishing transparent criteria for teacher recruitment and deployment. These reforms support the effective use of School Councils (SCs) to strengthen parents and children’s participation in the process and to generate improvements in monitoring and evaluation of the education sector.
An integral part of the reforms i s the clarification of the respective roles of the various tiers of government under the decentralization program and the introduction of incentives for district governments to improve service delivery. These reforms are embodied in the Terms of Partnerships (TOP) agreement between the provincial and district governments, initiated for the fxst t ime in Pakistan. The TOP improves the transparency and efficiency in the financing and management of the education sector by clearly defining the responsibilities and obligations of districts, province and SCs in planning, implementing and monitoring the education system and use of funds. The TOP also provides financial and performance based incentives for districts to improve their education service delivery.
During the first year, all 34 districts received earmarked grants for education after signing the TOP. The size of the second and outer year grants i s based on need and i s also conditional on the attainment o f education performance outcomes and an increase in district expenditures on education agreed under the TOP. Finally, the TOP agreement also increases client participation in service delivery by requiring district and provincial governments to take a l l necessary administrative and financial actions to assure that the SCs are effective partners of the education system.
4.37. ComDact: Throughout South Asia problems such as absenteeism or discourteous behavior on the pa r t o f providers are common. In I n d i a and Bangladesh, for example, surprise vis i ts found that 42 percent and 35 percent o f medical providers and 25 percent and 18 percent o f teachers, respectively, were not at their assigned posts. S d a r (though less consistently measured) results appear to b e true for Pakistan. Further, the PIHS indicates that for u r b a n Punjab, 21 percent o f people avoid government health facilities due to discourteous treatment by the staff. Clearly, neither absenteeism nor l s c o u r t e s y was the i n ten t i on o f policymakers but reflects their diff iculties in ensuring appropriate per formance by f ront l ine providers. How to i m p r o v e the monitoring and administrative capacity o f po l i cy makers i s a high priority.
4.38. Reforms in improving the “compact” can vary substantially. U n d e r the PESRP, six district governments have entered tr ipart i te contract arrangements with NGOs l i ke the Na t iona l and the Punjab Rura l Support Programs to direct ly manage government p r imary schools in partnership with the SCs. This i s an interesting example o f using explici t contracts to engage the services o f either the non-prof i t or for-profit pr ivate providers. O n e advantage o f expl ici t contracts i s that accountabhty can b e m u c h stronger to the policy-maker. Instead o f government officials feel ing l ike they need to
75

make excuses for deficient performance, the explicit separation o f roles o f pol icy maker and prov ider allows the fo rmer to w a n t to find cases o f b a d performance in order to correct them.49 A second advantage i s that payments in contracts can b e made dependent on the actual performance of the provider, improving the effort put in to achieve these goals. T h e m o d e l be ing used in the Punjab i s based on a similar m o d e l developed f o r the health sector (and subsequently for schools as well) in R a h i m Y a r K h a n . A n o t h e r example i s in Bangladesh, where health educators were issued performance contracts to teach the use o f O r a l Rehydration Therapy to mothers. Bonuses were p a i d for the n u m b e r o f mothers who cou ld explain how to handle diarrhea (with ORT) as measured by independent evaluators-not p r o g r a m administrators or the providers themselves. This l e d to both an increase in mothers’ knowledge and, as a means to this end, m o r e use o f hands-on education techniques instead o f classroom learning. T h e change in teaching technique was not devised by p rog ram managers, i t was a result o f the teachers themselves wan t ing to make sure the i n fo rma t ion got across since this would increase their bonus.50
4.39. This sort o f contract may not always work. Ano the r ma jo r benef i t o f devolut ion i s potential ly that dif ferent districts can experiment with alternative methods o f dealing with their problems. Differences in local condit ions or attitudes may make the appropriate response vary in each case, or, on the other hand, a n experiment m a y b e successful in one distr ict and b e considered a m o d e l to emulate by others. Recognizing this, the Governmen t o f the Punjab has a l lowed for considerable diversity in the partnership models for SCs (Box lo), and some districts in the prov ince have already begun experimentation with alternative ways o f doing business. T h e CARE init iat ive in Lahore, for example, i s a way of using NGO’s as managers o f government schools (Box 10). As and w h e n such examples are successful, other distr ict governments take t h e m up with suitable modif icat ions as needed, with the v i e w to repl icat ing these successes within their respective jurisdxtions.
Box 10: Community Management Schools Models in the Punjab
Model A: 1. A selected NGO enters into an agreement with the district government to take over 400 schools in various union
councils. 2. The NGO now becomes responsible for the operation and management of these schools. 3. The NGO also forms SCs in line with the guidelines of the Education Department. 4. The capacity building of the council i s also the responsibility o f the NGO.
The PESRP pays for the field o f the NGO and also places a reasonable sum at the disposal of the Council which i t will spend on improvement of the school.
Model B: 1. A selected NGO enters into an agreement with the district government to form SCs in 400 schools in various union
councils. 2. The operation and management of these schools remain with the district governments. 3 . The NGO forms SCs in line with the guidelines of the Education Department, and carries out capacity building of
The PESRP pays for the fielding of the NGO and also places a reasonable sum at the disposal o f the Council which it will spend on improvement of the school.
Note: Five district governments have opted for Model A, while one has opted for Model B.
these councils.
-19 World Bank 2004b, p. 98 51) ibid, p.102
76

Box 11: NGO Management o f Public Schools: The CARE Initiative in Lahore
The Government o f Punjab launched a scheme in 1998 to improve management of government schools by encouraging NGOs with a proven track record in the education sector to “adopt” schools o f the Metropolitan Corporation Lahore (MCL). The charitable trust, Cooperation for the Advancement Rehabditation and Education (CARE) was amongst the fxst NGOs in Lahore to be approached with an initial offer to run ten schools. Since this initial pilot, CARE’s partnership with the Lahore city government has subsequently expanded to include the responsibility to rehabilitate, finance, and manage 165 MCL schools across the city, with 840 teachers and a total enrollment o f over 80,000 students.
When i t fust adopted the MCL schools, CARE was confronted with many challenges: in addition to the problems of staff shortages and teacher absenteeism, these schools were characterized by poor teaching methods, low student pass rates, high dropouts, and deteriorating infrastructure. The schools lacked basic amenities such as clean drinking water, latrines, blackboards, chalk, etc. To improve school infrastructure, CARE made major repairs as well as constructed additional classrooms, provided furniture, improved sanitary conditions by repairing and/or constructing toilets, set up functional laboratories for better understanding o f basic scientif ic concepts, as well as made a small library or book resource room in every school. CARE chose to work in close partnership with MCL head teachers and union leaders to uplift the standard of education in schools, despite the government staffs initial skepticism and suspicion. A CARE-hired teacher was appointed as an “Internal Coordinator” in each school to work in tandem with the MCL Head teacher to monitor the performance o f teachers. Weekly supervisions of schools were carried out by a volunteer “External Coordinator”, whose main role was to conduct quality checks to ensure regular attendance o f teachers and students, monitor performance of staff, ensure that copies were checked properly and tests were administered and recorded every month. In addition, CARE appointed an “Academic Coordinator” to streamline the curriculum and teaching practices to improve the standard of education in schools, and a Teacher Training Center was set up to equip teachers with modern teaching methodologes.
CARE’s guiding philosophy i s rooted in the belief that education i s the birth right of every child and should never be denied to anyone, as well as to combat the notion that the poor do not “want” or “value” education. In addition to running schools across Lahore, i t has also initiated a merit scholarship program for its outstanding students to finance their higher education. This program, which was started two years ago, covers the academic and in some cases, living expenditures o f 82 students enrolled in such prestigious institutions as King Edward Medical College, IOnnaird College and Government College. Finances for the N G O are generated from donations, with 98 percent of these coming from contributions within Pakistan.
Sources: CARE website: www.care.ory.pk, “Empowerment through Education” Asian Journal o f Management Cases, Volume 1 Number 1: Jan-June 2004. Pgs. 39-60, as well as various newspaper articles, reviews, and interviews.
4.40. Reforms o f the agreements between pol icy makers and providers can b e done within the publ ic sector as well. In R a h i m Y a r Khan , the distr ict experimented with a n alternative organization for the funct ion ing of the Basic H e a l t h Units (BHU). Instead o f keeping a Med ica l O f f i c e r (MO) responsible for a single BHU, each was given responsibdity for three BHUs, at a n enhanced salary of course, that they would visit each day in rotat ion. In addi t ion a revo lv ing drug fund was established that ensured a m o r e reliable supply o f pharmaceuticals. People would know w h e n the MO was to be present and were m o r e conf ident of being treated with adequate supplies. T h e use o f pub l i c BHUs increased dramatically over the f i r s t f ive months o f the experiment. I t i s too soon to say if this i s an unambiguous success or i f the greater use o f publ ic facilities translates into better health status o f the public. But the dramatic increase in use-more than doubling the monthly v i s i t s from 74,000 in June 2003 to an average o f 175,000 for each o f the following five months-is a n early marker o f success. Again, whether t h i s can b e adapted to other districts is, and should be, decided based on local conditions-experimentation that devolut ion allows.
4.41. Client Power: For good reasons the discussion o f “compact” used several examples from the health sector. Since m a n y o f the marke t failures in health are so severe, i t i s not possible to solve t h e m without a substantial gove rnmen t ro le a n d improving the “long route” o f accountabil ity i s necessary. There i s no alternative to the government providing (or contract ing with full payment for) pure publ ic goods. Similarly, ensuring that immunizat ions are complete does not require demand- dr iven f ixed facilities (that are o f t e n d i f f icu l t to manage) but i s not l ikely to b e accomplished without d r e c t publ ic invo lvement . W h e n i t comes to increasing client-power, however, there are m a n y m o r e possibilities in the education sector. W h i l e i t i s h a r d to attr ibute better heal th to a particular health
77

care episode, parents-even f i t e r a t e ones-can tell i f the teacher i s showing up to work on a regular basis or i f their chi ldren are learning anything. In fact, they are in a better position than government hierarchies to do SO.
4.42. Client p o w e r can improve services in several ways. In one sense the simplest i s to recruit clients as aides in monitoring the performance o f providers. By ensuring that complaints will b e heard and addressed, i n fo rma t ion from clients can b e used to improve services. In another sense, this i s not simple at a l l and requires a tradlt ion o f expecting services to func t i on proper ly and o f access to government ears. In the Punjab, only ten percent o f respondents in the CIET survey k n e w h o w to compla in abou t government health services. Increased devolut ion m a y make such lines o f communicat ion clearer but that remains to b e seen.
4.43. T h e second way to empower clients i s to prov ide t h e m with m o r e choice and compet i t ion among facilities. T h e growth o f the private sector in both health and education already shows that people have options to publ ic facilities i f they are dissatisfied. However , compet i t ion and choice can b e incorporated into government programs to improve efficiency o f service delivery. A particularly successful case i s the Female Secondary School Assistance Prog ram in Bangladesh. Here, money was deposited in b a n k accounts in the grls’.names and cou ld b e used to pay for any secondary school- government, NGO or for-profit-provided she stayed in school, mainta ined a passing grade and remained unmarried. Secondary school enrollments rose 10 percent pe r year-mostly due to female attendance-for the decade after the p rog ram started.51 M o r e interesting, m a n y o f the barriers that were thought to keep g i r l s away from school and that the pub l i c system h a d a very h a r d t ime overcoming-separate latrines for boys and g i r l s , m o r e female teachers-were solved very quickly once the schools h a d the incentive o f attracting m o r e g i r l s and their tuition money.
4.44. T h e Punjab government’s st ipend p rog ram for g i r l s enrol led in grades 6-8 i s designed to attract more g i r l s to schools, and i s be ing implemented in the 15 lowest-l iteracy districts in the province. I t
shares some of the features o f the Bangladesh program, but in i t s f i r s t phase lacks the dimension of encouraging compe t i t i on between publ ic and private schools.52 T h e s t ipend i s p a i d to f a d e s if they keep their 9 1 s in school (maintaining at least 80 percent attendance rate). But they do not have the choice o f where to send them. If the m a i n reason that g i r l s are not attending school i s because o f financial constraints such as cost o f transportation, the p r o g r a m might work.53 If, however, characteristics of schools such as female teachers or headmasters who make sure absenteeism i s kep t t o a minimum or any other d imension o f quality on w h i c h schools might compete, the lack of portabi l i ty o f the scholarship across schools h u t s the effectiveness i t would have on improving school performance. T h e government plans to subject t h i s p r o g r a m to a rigorous evaluation through a third-party to assess i t s impac t a n d effectiveness at increasing enrol lments. T h e f i r s t evaluation i s p lanned in December 2004, by w h i c h t ime the p rog ram will have been running for one year.
4.45. Compet i t i on i s not always an appropriate instrument, part icularly in sparsely populated areas (that cou ld sustain only one school, for example) or at p r imary level where long travel i s not acceptable. M o r e appropriate might b e the third way to empower clients: through participation, or,
51 World Bank 2004b, p. 69 52 Many o f these low-literacy districts are in Southern Punjab, where private schools have relatively limited coverage, particularly in rural areas and at the middle-school and secondary level. 53 Following disbursement of two quarterly installments, monitoring data shows encouraging results: between the f i r s t and second quarter, g i r l s ’ attendance was found to have gone up by 6 percent.
78

more direct management of facllities. There are many examples a round the world in w h c h giving parents m o r e authority-usually the authority to h i re and fire teachers-has dramatically improved performance o f schools. A celebrated example i s the EDUCO p r o g r a m in El Salvador in w h i c h the Ministry o f Educa t ion entered into explicit contracts with communit ies to run their schools. Ths inc luded hiring teachers and under tak ing regular inspections. Studies indlcate that each visit by the parent’s association increased test scores in both m a t h and reading.54
4.46. Closer to home, a recent study reports that Madhya Pradesh in I n d l a i s the state that has benefi ted most and early on from the national D is t r i c t Pr imary Educa t ion Project. O n c e again, a ma jo r difference was parent associations that could hit-e (at b e l o w of f ic ia l pay scales) and fue teachers. Absenteeism was found to b e m u c h lower and b o t h student enrol lments and attendance m u c h higher than in the con t ro l group.55
4.47. Prospects for this form o f client power in the Punjab are be ing developed by the provincial government through NGO contracting and strengthening o f SCs. In the past, school management committees in the Pun jab have shown m i x e d resul ts . Studies conducted during the nineties under the Social A c t i o n P rog ram demonstrated that SCs pe r fo rmed we l l w h e n there was a commi t ted head teacher along with grants for school improvements; however, a large n u m b e r of SCs were not very successful due to frequent reconsti tut ion o f membership and changes in government policies. There are exceptions: for instance, a recent study finds that SCs in Faisalabad are active throughout the district. T h e day-to-day running of schools i s under the responsibl l i ty o f the Committees, w h i c h are chaired by the School Headmaster and have 10 members in all. T h e y mee t monthly and approve expenditures on a monthly basis (e.g. equipment, repair and maintenance etc.). Contr ibut ions from the commun i t y can also he lp finance school costs. To help finance the non-salary recurrent costs, contr ibutions are col lected from pupils,56 and in the g i r l s ’ p r imary schoo l visited, private schooling in an evening shift generated funds that cont r ibuted t o paying bdls such as electricity. This school was in a peri-urban area, a n d the situation in a m o r e rural, less wealthy, env i ronment i s hkely t o b e far worse. I t i s clear that the relat ionship between staff and the local c o m m u n i t y i s crucial.57
4.48. Deve lop ing cl ient p o w e r through part icipatory means m a y take some t ime to take root in the Punjab. T h e recent CIET survey i n d c a t e d that just over 2 percent o f households nationwide h a d participated in any vo luntary group. A source o f concern i s that relatively we l l -o f f people were m o r e than twice as l ikely as others to have participated in such groups than those ident i f ied as “vulnerable”. This i s a concern since, should such vo luntary groups b e used as a basis for cit izen participation, i t r i sks services be ing less-well suited to the needs o f the poor. In the Punjab only 3 percent o f men and 1 percent o f w o m e n (identical to the national average) h a d even heard o f Cit izen Commun i t y Boards.
4.49. This perspective on improving service delivery depends on governmen t be ing as concerned, as focused and as knowledgeable abou t u l t imate outcomes of services, as are the people themselves. I t
requires the government to l isten to the needs o f the publ ic v ia ‘Lvoice’’, part icularly o f the poor. I t
also requires that prov iders (as organizations, such as h e ministr ies a n d as individuals) b e faced with
SJJimenez a n d Sawada, 1999. 5.5 Glinskaya a n d Jalan, 2003 56 In general, 1 Rupee p e r c h i l d i s col lected in classes 1-4 and in classes 5-12,2 Rupees are col lected per chi ld. 57 Williamson et al. 2004
79
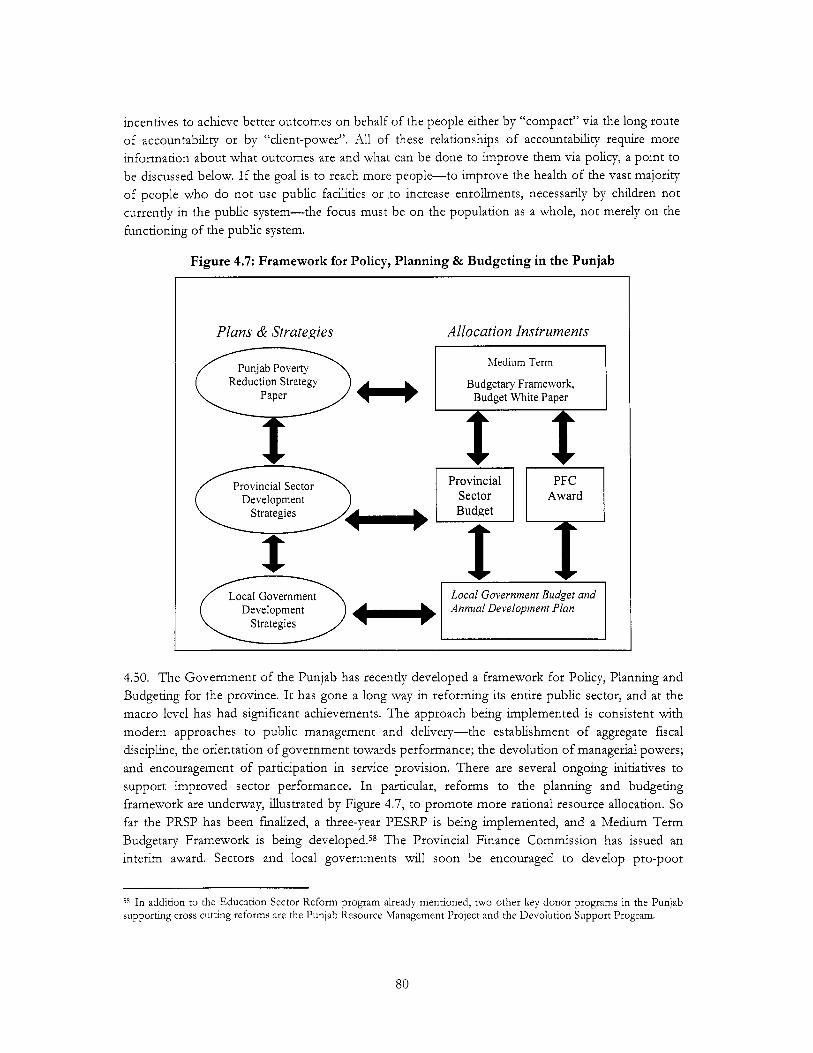
incentives to achieve better outcomes on behalf o f the people either by “compact” v ia the long rou te o f accountabiltty or by “client-power”. All o f these relationships o f accountabiltty require m o r e i n fo rma t ion abou t w h a t outcomes are and what can b e done to i m p r o v e t h e m v ia policy, a point to b e discussed below. I f the goal i s to reach m o r e people-to improve the health o f the vast major i ty o f people who do not use publ ic fachties or ,to increase enrollments, necessarily by chi ldren not currently in the publ ic system-the focus must b e on the populat ion as a whole, not merely on the funct ion ing o f the pub l i c system.
Figure 4.7: Framework for Policy, Planning & Budgeting in the Punjab
Plans & Strategies Allocation Instruments
Medium Term
Budgetary Framework, Budget White Paper
Reduction Strategy
Local Government Local Government Budget and Development Annual Development Plan
4.50. T h e Governmen t of the Punjab has recently developed a f ramework for Policy, P lanning and Budget ing for the province. I t has gone a long way in r e f o r m i n g i t s entire pub l i c sector, and at the macro level has h a d significant achievements. T h e approach be ing implemented i s consistent with m o d e r n approaches to publ ic management and delivery-the establishment of aggregate fiscal discipline, the orientat ion o f government towards performance; the devolut ion o f managerial powers; and encouragement of part icipation in service provision. There are several ongoing init iatives to support i m p r o v e d sector performance. In particular, re fo rms to the p lann ing and budget ing f ramework are underway, i l lustrated by Figure 4.7, to p r o m o t e m o r e rat ional resource allocation. So far the PRSP has been finalized, a three-year PESRP i s be ing implemented, a n d a M e d i u m T e r m Budgetary F ramework i s be ing developed.58 T h e Prov inc ia l Finance Commission has issued an interim award. Sectors and local governments wdl soon b e encouraged to develop p r o - p o o r
58 In addition to the Education Sector Reform program already mentioned, two other key donor programs in the Punjab supporting cross cutting reforms are the Punjab Resource Management Project and the Devolution Support Program.
80

strategies. In FY04, the prov inc ia l government has significantly increased i t s allocation to the education sector, and i s passing this on to the &strict governments as an earmarked grant.
4.51. H o w e v e r the challenge i s translating the good intentions, w h i c h are set out on paper, into reality. These are ambit ious a n d involve changing behavior that has been entrenched in the bureaucratic and pol i t ical establishment. T h e r e f o r m process described in Figure 4.7 i s a good step towards fixing the in ternal problems o f coordmating pol i t ical decisions with po l i cy choices, but improvemen t on the ground must also take into account the other relationships of accountabhty.
4.52. First, the reforms must engage rather than bypass the reality that engineering change in social service delivery will b e highly pol i t ica l at all levels-MNAs, W A S and Nazimeen. Reforms must a i m to channel the pol i t ica l agenda constructively towards enhancing services. T h a t is , they must continual ly b e aware of the need for “voice” in improving services. Second, wh i l e the in tent ion i s to make the process m o r e per formance oriented, concrete steps need to b e taken to measure performance. In both senses, the nex t challenge i s t o make the r e f o r m process m o r e outward l ook ing rather than inward.
4.4 THE ROLE OF THE PROVINCIAL GOVERNMENT UNDER DECENTRALIZATION.
As noted, service delivery does not necessarily improve with devolut ion pe r se. Since the devolut ion process in Pakistan i s s t i l l in i t s early stages, i t i s m u c h too early to make firm judgments about how we l l i t i s working. W h a t i s clear, however, i s that devolut ion i s a fait accompl i a n d m o r e decisions d be taken at the local level as devolut ion proceeds. This fact does not m e a n that the prov inc ia l government i s any less impor tan t t han i t has been, but i t does mean that i t s functions wiU change. T h e task i s t o make sure that the prov inc ia l government reinforces the relationships o f accountabhty discussed above as we l l as to make sure that certain functions that transcend local governments are adequately per formed. Ear ly i ndca t ions are that there are some ‘‘growing pains” in decentralization, that is, that roles between the levels o f government are n o t yet completely clear. I t can b e h o p e d that this lack o f clarity i s simply a natura l transit ion p e r i o d that would work i tse l f out in time. However , there are several considerations that might make the transition p e r i o d shorter. F igure 4.8 adapts F igure 4.6 t o make i t applicable to the current decentralized setting in Pakistan.
4.53. T h e discussion o f accountabhty in the previous section i s relevant to decentralization with three modif icat ions. First, there now two “voice” relations between people (particularly poor people) and government-to loca l leaders a n d to prov inc ia l (and to national, but that w e leave aside). There i s a presumpt ion that loca l po l i cy makers care m o r e about service quali ty because they are m u c h m o r e likely to b e h e l d responsible for i t than are prov inc ia l governments-a leve l that has many m o r e functions to p e r f o r m than health, education, and water supply. On the o the r hand, dependmg on the social structure at the loca l level, whether the voice o f poor people i s m o r e l ikely to b e heard at the local level rather than o the r citizens i s an empir ical matter a n d the p rov inc ia l government may take i t upon i t s e l f to b e a check on local elite capture.
8 1

t

Workers, for example, have m o r e than one kmd o f supervisor). Again, this m a y b e simply a matter for t ime to work out but the transit ion may b e sped up with focused intergovernmental discussion.
4.57. D i r e c t compacts are used by prov inc ia l governments in two modes. T h e f i rs t , and m o r e problematic, i s the use of vert ical programs whose planning, f inancing and operation are, to a greater or lesser extent, retained by the province. These are usually responsible for lack o f clarity o f responsibhty on the pa r t o f providers and run the risk o f subvert ing the democratic responsibhties and accountabhty o f councilors and nazimeen t o their constituents. T h e potent ia l benefits o f devolut ion depend on stronger accountabhty for budget priori t ies and service performance. Subject to a few, very h t e d areas, vert ical programs should b e examined with a very skeptical eye.
4.58. X second hnd o f compact that devolut ion has in t roduced i s the grant mechanism from prov ince to district. Generally speaking transfers need not, and, to the extent local governments protect their poo re r citizens, should not b e t ied t o specific services. However , i f the prov ince i s interested in improving particular services, pe r se, pa r t of the grant can b e made condi t ional on outcomes for i t s poo re r citizens. So, as a protective mechanism, particularly w h e n there i s doubt that loca l pol i t ical leaders are adequately representing the wishes o f their constituents, transfer formulae can incorporate performance criteria. In general, if the goal i s to improve living condit ions o f poor citizens these condit ions are l ikely to involve m o r e attention to communicable disease control, increased enrol lments in p r imary education, a n d m o r e extensive access to clean water. And al l o f these need m u c h better measurement if transfers are to b e made condi t ional on them. As n o t e d in B o x 8, the government has already begun to do so in the education sector.
4.59. Enhancing ‘Went power”: Finally, prov inc ia l government might experiment with policies that give purchasing power duectly into the hands o f clients. This does bypass nazimeen but in a way that increases overal l accountabhty to clients. O n e example i s the School Counc i l m o d e l under w h i c h NGOs are being contracted for school improvements. Ano the r example would b e the possible mod i f i ca t i on o f the middle-school g l s ’ stipend p r o g r a m based on i t s evaluation, a n d in a manner that would al low compet i t ion between d f f e r e n t hnds o f schools as in the comparable p rog ram in Bangladesh. O t h e r “voucher”-like mechanisms that a l low choice between government, NGO, or other private providers can b e experimented with in water and heal th care as w e l l but, as with any experiment, they should also b e subject to rigorous evaluation.
4.60. Beyond improving accountabhty, there are four specific areas in w h i c h prov inc ia l government can make a significant con t r i bu t i on t o service delivery by ove rcoming certain systematic problems in a devolved setting:
e ensuring that activities with substantial spillover effects across distr ict boundaries are proper ly handled
e providing services with large economies ofscale that would not b e eff iciently handled at distr ict level
improving the distribution of income across the p rov ince by disproport ionately augmenting the local revenue col lect ion of poore r districts
generating and disseminating a w ide variety o f types o f information.
83
4.61. Dis t r ic ts answering to their own constituents’ needs m a y not adequately consider spdlover effects from one district to another, and services may b e sub-optimally provided. M a n y o f these l ie outside the health, education and drinking water services. Watershed management, o f particular impor tan t to the prov ince of the “five rivers”, i s t h e most obvious example. H o w e v e r in health also, there are aspects o f the con t ro l o f infectious disease, particularly at border areas o f districts, w h i c h d o not respect po l i t ica l boundaries. Some o f these activities remain vertical programs. In general, vertical programs disrupt the budget ing processes o f district government. In the specific case o f infectious disease, however, there are good reasons for provincial and distr ict officers to work closely together and for the prov ince to b e able to support activities that benefi t m o r e than the distr ict alone.
4.62. Interestingly, some o f the vertical programs with the greatest potent ia l for dealing with such spillovers are not as completely devolved, that is, m o r e o f the expenditure i s delegated, than others with somewhat less o f a c la im for addressing such “external” effects. For example, whi le the Federal Governmen t supplies materials o f the malaria con t ro l program, employees are on the payro l l o f the districts. Similarly, tuberculosis, now handled through t h e “directly observed treatment system” has procurement o f materials a prov inc ia l responsibility, pr ior i t izat ion and supervision o f BHUs are a &strict responsibhty. T h e p rov inc ia l govemment should certainly m o n i t o r the effectiveness of each o f these (with the Ex tended Prog ram o f Immun iza t i on being somewhat m o r e of a “gray” area), even if i t does not d r e c t l y administer them.60
4.63. In contrast, the L a d y H e a l t h W o r k e r (LHW program remains a nat ional program-the only one fully funded by the federal government inc ludmg salaries p a i d through the prov inc ia l coor&nator. Prov inc ia l and distr ict coordinators undertake parallel supervision. T h e LHW program certainly has high potent ia l for improving health. Recent experience in I r a n seems to b e very positive.61 However , the types o f services i t provides (family planning, nutrition promot ion, immunizat ion (again, a “gray” area), and treatment o f diseases l ike respiratory infect ions and diarrhea) have fewer cross-district effects than other activities. Such anomalies as to who i s assigned responsibhty for w h a t p r o g r a m should b e w o r k e d out over time.
4.64. Scale economies for the set o f services w e are focusing on refer mostly to referral hospital based treatment a t levels that distr ict hospitals should n o t have to duplicate. Prov inc ia l health authorities should b e apprised, at least, of equipment purchases by distr ict hospitals that m a y b e m o r e efficiently handled at a tertiary fachty. T h e tertiary facihties, themselves, are most likely to b e either prov inc ia l fachties or pr ivate facilities funded by insurance that would have to b e regulated, if not prov ided direct ly at p rov ince (or even federal) level. H e a l t h insurance i s a n area o f sufficient complexity as to go we l l b e y o n d the scope o f this report.
4.65. A second area in w h i c h scale m a y favor an active prov inc ia l gove rnmen t i s in the choice o f curr iculum for p r imary a n d secondary schools. As argued elsewhere in this report, the growth o f high quality, high paying jobs prov ince-wide has been hampered by shortages o f workers with particular s l u l l s . N o t only do large firms r e p o r t poor h u m a n capital and s k i l l s as a n i m p o r t a n t constraint, but small and m e d i u m enterprises do as well. T h e prov inc ia l government m a y b e better placed than &strict staff t o confer prov ince-wide with potent ia l employers, or even internationally, in order t o ident i fy areas in w h i c h curr icula o f schools m a y b e made m o r e relevant.
60 World Bank 2004c. 61 I s lamic Repub l ic o f I ran : Primary I l e a l t h Care and t h e R u r a l Poor. Case study presented at t h e 2004 Shangha i conference.
8 4
4.66. Analogous to the p r o b l e m o f tertiary hospitals, the prov ince d need to b e invo lved with regulations relevant to university education. W e are not recommendmg publ ic expenditure for university education even at prov inc ia l level. Such spending i s universally regressive (benefits go t o students from f a d e s who are relatively wel l -o f f compared to average taxpayers) and the benefits are largely pr ivate with the possible exception o f basic research-very loosely, if at all, related to tuition. However , t he market for loans fo r higher education i s underdeveloped due to the absence o f collateral for h u m a n capital investments. Therefore the guarantee and the col lect ion o f student loans may b e a government, l ikely the prov inc ia l government, responsibil i ty. Slrmlarly, h e c t support for research outputs as we l l as general certif ication o f institutions have claims on publ ic money, again, m u c h m o r e appropriately financed at levels above the district.
4.67. Redis t r ibut ion o f i ncome from r i c h t o p o o r has a very h t e d scope within districts. In the Punjab, average incomes clearly fal l m o v i n g north to south. A balance must b e struck between use o f own revenues (which WLLl hkely b e m o r e closely watched by local officials) a n d support o f poorer districts by prov inc ia l government. As discussed, transfers from prov inc ia l to local governments can b e made condi t ional on local pol icy.
4.68. Bet ter i n fo rma t ion i s needed at every level of government. H e l p in' collecting and disseminating i n fo rma t ion might be the most effective way that prov inc ia l governments can improve service delivery. I n f o r m a t i o n provides an example o f spdlovers (experience in one distr ict can help p lanning in others) and of scale economies (certain kmds o f lessons can b e obtained only by compar ing experience across districts and o f redistribution), as poo re r districts m a y b e less inc l ined to take the longer-term perspective that acquisit ion o f i n fo rma t ion requires.
4.69. Further, ind iv idual districts m a y b e perfect ly happy to take credit for progress but less happy to admi t problems. So, i n fo rma t ion needs to b e collected by relatively disinterested thud parties. T h e prov ince can take this role. This leads duectly to the last topic.
4.5 BETTER INFORMATION IS CRITICAL
4.70. As has been raised repeatedly in this chapter, at the core o f al l attempts to improve services i s the need to generate and disseminate in format ion. All o f the relationships o f accountabil ity that d help lead to sustained improvements in service delivery require better information-particularly o n the ult imate outcomes o f services. I f government i s to p rov ide services that people w a n t and need, i t has to b e as focused on the u l t imate goals o f these services-better health, bet ter literacy-as people are themselves.
4.71. People themselves need m o r e i n fo rma t ion on wha t services they are enti t led to, what services they are getting, wha t services others in their &strict or in other &stricts are getting, and who i s deciding these issues. T h e y also need to know how the heal th a n d education outcomes in their districts compare to other districts. These are al l necessary to he lp t h e m b e aware o f and i n s i s t on the most effective services. For instance, a start has been made in the education sector, with a major education awareness campaign launched in the f i r s t phase using the print a n d electronic media to publicize the various dimensions o f the PESRP. In the n e x t phase, specific i n f o r m a t i o n campaigns wdl b e launched at the &strict level and below.
85

4.72. Pol icy makers need to know wha t the state o f health and educational status i s at a level o f government (district or below) for w h i c h someone can b e h e l d responsible. T h e y also need to k n o w w h i c h policies work-they need better analysis to help t h e m figure out w h i c h o f the policies they try actually translate into i m p r o v e d health and education outcomes. This means m o r e regular and systematic collection o f data on both inputs affected by pol icy and outcomes so that such analyses can b e conducted.
4.73. T h e f i r s t sections o f this chapter examined a few questions that available data might address. But the truth i s that these data are too aggregated in most cases, incomplete, outdated, and inadequate for answering most pol icy questions. T h e conclusions in those sections are only illustrative. Recent developments, such as the adopt ion o f the Mu l t i p le Ind icator Cluster (MICS) and the Core Wel fare Indicators Questionnaire (CWQ surveys, are encouraging. I t i s impor tan t that such surveys b e done regularly and with large enough samples that they can b e used at the district level. Repeated surveys are necessary in order to find causal relationships. O v e r time, they can also b e used as benchmarks f o r assessing improvements. Findmg out that health i s worse a n d enrollments lower in the southern, poorer, districts i s he lp fu l as a f i r s t step. But no pol icy maker i s really responsible for that. W h a t po l icy makers can b e responsible for i s changes in the health and education status o f their districts, whether p o o r or not, i f the impac t o f po l i cy can, in fact, b e discovered a long with other determinants.
4.74. In addition, for the sake o f both pol icy makers and f r o n t h e providers, m o r e rigorous experimentation and evaluation of policies in terms o f their ult imate impac t on outcomes should also b e a priority. M o n i t o r i n g and evaluation units in al l service oriented ministr ies need to b e created and i m p r o v e d to b e able to answer the fundamental question: ‘ “ h a t works?”. W h e n something i s found t o work, this in fo rma t ion can b e transmitted to all distr ict po l icy makers, who can then replicate it. W h e n someth ing i s found not to work-it should either b e analyzed to fmd out why i t did not work, or i t should b e dropped. I t i s o f t e n d f f i c u l t for governments to adrmt mistakes but, as a senior po l icy maker in the Punjab very aptly noted, correcting mistakes (‘is not admi t t i ng failure-it i s jus t changing strategy”.
4.75. Further, i n fo rma t ion must b e “outward loohng” as w e l l as “ inward loohng”. T h e latter can b e f o u n d by improving Management I n f o r m a t i o n Systems. T h e former requires data on the populat ion as a whole. In sectors such as health and education where the private sector i s large and growing and where (as in the case o f education) m a n y m a y not b e served at all, hav ing an accurate p ic ture o f the internal workings o f ministries i s not sufficient-what i s needed i s an accurate p ic ture o f how all people are living their lives: are their chi ldren in school? A r e they suf fer ing from avoidable health problems?
4.76. I t must b e n o t e d that the Depar tmen t of Educat ion in the Punjab has made very large and very rap id strides in improving the i n f o r m a t i o n base within the department with regards to the physical status o f government fachties, enro l lment levels, the attendance o f s taf f and students and the distribution o f needed supplies throughout the system. This has markedly i m p r o v e d the funct ion ing o f the department, and in t h i s regard the education sector in the Punjab prov ides a very good m o d e l f o r other provinces. W h a t remains, however, i s populat ion-based i n f o r m a t i o n that covers those who are n o t in school at al l or who are be ing served by the pr ivate sector (as i s presently be ing considered by the prov inc ia l government).
86

4.77. Finally, i n f o r m a t i o n co l lect ion i s an area in w h i c h the p rov inc ia l gove rnmen t must play a leading role. As m o r e responsibil i t ies of government are devolved to bst r ic ts , tehsils, a n d unions, there are oppor tun i t ies to learn from experience. There i s also a n e e d to m a k e sure that such i n f o r m a t i o n i s object ively col lected a n d analyzed. Both require a third par t y to col lect a n d analyze the informat ion-a very large, ve ry i m p o r t a n t r o l e for the prov inc ia l government .
4.78. V e r y l i t t le real progress will occur-in fact there will b e no way to determine if there has been progress a t all-until bet ter i n f o r m a t i o n i s brought to bear on improving services a n d the i r outcomes. So, wh i l e “ in format ion” i s the last section o f th is chapter, i t i s t he f i rst step that must b e taken by the G o v e r n m e n t o f the Punjab.
Box 12: International Lessons for Health Policy
This chapter has emphasized the need for developing Punjab-specific data to monitor progress and, eventually, determine appropriate policy based on a clear understanding of the causal factors o f health status. This i s a medium to long term perspective and the value of data collected will become more easily discernable over t ime. Collection should start as soon as possible. In the meantime, some direction for health policy are likely to be more successful than others based on international experience and the insights afforded by economic theory. These can serve as hypotheses to be tested as data accumulates or, alternatively, as a starting point for re-orienting policy. As far as allocating resources within the health ministry i s concerned, we can look at three broad categories of intervention. First i s the set o f core, population based, public health interventions such as sanitation, vector (pest) control, basic health education concerning hygiene or nutrition and immunization or other specific infectious disease interventions. Second i s the provision of primary health care - simple medical procedures. Third i s the provision of more expensive, hospital based care, preferably accessed via referral from cheaper-to-run facilities.
From the perspective of the field of public economics, there are three main criteria by which to judge these types of interventions. The first i s to increase efficiency - that is, to use government to do things that private markets can’t do adequately even in principle. This means identifying the most important “market failures” in the sector and making sure that public efforts - particularly public expenditure - address these problems. The second criteria for public policy i s to improve equity Government can be a means to improve social justice and transfer benefits to poor people. Different policies have differing effects on the relatively well-off and the poor and greater emphasis and resources can be given to the latter. The third criterion, not quite as standard in textbooks but an area emphasized in this chapter, i s the relative ease the public sector has in implementing different policies. I t i s important for government to be able to “make good” on the promises it makes to the people both for ensuring that public resources are not wasted and also to bolster confidence and credibility for government action.
The question for setting priorities becomes: how do the three main types of policies measure up on these three criteria?
Core public heafth: The two characteristic market failures in health are the large externalities associated with infectious disease and the exposure to financially catastrophic risk due to the absence o f insurance markets. Core public health interventions almost always directly attack infectious diseases. The health sector gives some of the only examples we have of “pure public goods”, that is, activities that cannot be sustained in a private market because their benefits cannot be limited to those who can pay for them. Whi le the private sector can be contracted to perform such activities by governments, they will not perform them without government intervention. Some forms of pest control - spraying for mosquitoes, control o f the rat or snai l populations that spread disease - are good examples. Health education for basic hygiene and nutrition are also examples. Other activities that have large externalities include tuberculosis control that can limit the spread of a dangerous infectious disease and of resistance to standard drug treatments, On efficiency grounds, therefore, core public health interventions rank highly.
On equity grounds as well, infectious disease control looks good. Whi le poor people suffer from almost everything to a greater extent than do the rich, the differential i s greatest for infectious disease. For example, in India the incidence of tuberculosis i s seven t i m e s greater for the poorest decile than for the richest. For malaria it i s four times greater while for cataracts (as an example of a chronic, non-infectious, i l lness) the differential i s only 30%. Any shift o f focus away from infectious disease to other health problems hurts the poor.
Finally, many o f the activities that fall under the category of “core public health” are, arguably, relatively easy to implement. Some of them are “one shot” interventions such as swamp drainage or only require periodic visits (say for immunization campaigns) rather than sustained presence of professionals in rural areas. On all three grounds, then, making sure that traditional public health activities are adequately funded i s a hlgh priority W h i l e there has been much talk of late of the “health transition” in which the disease pattern has shifted from infectious to chronic illnesses, it i s important to emphasize that for public expenditure, the priority remains - and will continue to remain for some t i m e in Pakistan -with core public health.
87

Box 12: International Lessons for Health Policy (continued)
Primary health care; I n contrast to core public health, maintaining a widespread network of simple curative care centers i s more problematic. The “market failure” often associated with routine curative care i s “asymmetric information’’, or, the fact that medical professionals know more about your i l lness than you do allows them to exploit this knowledge to their own advantage. The importance of this “supplier induced demand” i s contested in the literature. Its main manifestation would be over-use o f medical care - not often raised as an issue for rural areas (though in urban areas in South Asia generally, this may be something of a problem). I t should be remembered that there i s a very large private sector in health care - almost all of it in primary care (or for treatments that could be done at primary level). Public provision runs the risk o f displacing whatever private capacity does exist. In any case, the “efficiency” argument for primary health care i s not particularly strong.
On equity grounds, primary care may do better but this i s entirely an empirical question. International experience on who benefits from subsidies to primary health varies widely - sometimes with poor people benefiting more than others, sometimes with the benefits captured largely by the middle and upper classes. I t i s for this reason that more data needs to be collected in Punjab - there are no consistent lessons from other countries. Fortunately, this can be measured in one survey and one does not have to wait for the answer.
I t i s on implementation capacity that primary health care i s most vulnerable to criticism. Medical professionals - doctors especially but not h i t e d to them - have better earning opportunities in urban areas. Further, they are themselves usually urban born and bred and want the amenities (and educational opportunities for their children) afforded by cities. I n many countries i t i s difficult to fill posts in the more remote rural areas (for example, vacancy rates in Indonesia range from nearly zero in the desirable province of Bati to 60% in the remote area of West Papua). Even when positions are accepted, absentee rates from primary health centers are often very high. A recent study in Bangladesh found that the absentee rate among doctors as measured by surprise visits to facil i t ies were as high as 74% in rural areas (as opposed to a nation-wide average of 40%). This result has been replicated in many countries and has found to be very high in South Asia generally. Running primary health centers i s simply not an easy task.
On all three grounds, then, the argument for large amounts of public spending on primary health i s ambiguous and depends critically on country circumstances. Judged on the basis of neighboring countries, the case for Pakistan as a whole i s s t i l l ambiguous - the performance in India and Bangladesh would lead to pessimism. On the other hand, Iran has been very successful in implementing primary care through the use of female village health workers. Why I ran has been successful where India has not i s unclear and generalizations are hazardous. Punjab-specific analysis i s essential.
Nospitabbased care: I n contrast to primary health care which i s murky on all three criteria, and to core public health in which all arguments go the same way, hospital based care i s clear on each criteria but they argue in conflicting ways.
Without health insurance, a market that i s inadequate in many ways, and given the difficulty of running a public health insurance program (which tend to be difficult to administer for the same reasons that private programs fail), subsidized public hospitals may be the only recourse most people would have for protection against catastrophic (financially) illness. The efficiency argument for public hospitals can be very strong. On the other hand, while the data on the distribution of benefits for primary health care varies from country to country - hospital care i s almost everywhere utilized more by the well-off than the poor. To a large extent this i s due to the necessity of hospitals being in urban (or semi-urban) areas where the very poorest do not live in conjunction with procedures that do not keep people from using public hospitals (such as policies of free care). Therefore, public subsidies go disproportionately to the well-off. I t i s likely that running a public hospital i s easier than running a diffuse network o f primary care centers but this i s a matter of speculation or indirect inferences. Evidence from t h e state of Andhra Pradesh in India suggests that a major source of job satisfaction for medical professionals i s the ability to use their knowledge, confer with colleagues and have access to modern equipment. All of these are much more likely to be satisfied in hospitals and, in general, absentee studies confum that staf f show up for work more in hospitals than in smaller facilities.
88

CHAPTER 5: IMPROVING PROVINCIAL FINANCES FOR DEVELOPMENT
5.1. This repor t has p rov ided a n u m b e r o f recommendations to help accelerate g rowth and employment generation in the Punjab. Some of the recommended measures simply entai l stroke-of- the-pen changes in existing rules and regulations, and therefore d o not have any significant budgetary implications. However , others-for instance, the development o f city clusters-are l ikely to require substantial fiscal outlays over the m e d m m term. W h e n developing further the recommended p r o g r a m of work in such areas, the government should also strive to conduct a comprehensive costing exercise to ascertain the a d d t i o n a l f inancing that may b e required for these purposes. Wh i le substantial addit ional pub l i c investment wdl l ikely b e needed over the m e d m m term, the prov inc ia l government should also actively explore the possibil i ty o f pursuing innovat ive public-private init iatives (Box 13).
Table 5.1: Punjab Fiscal Accounts: 1994/95 - 2004/05
(Expresssed as percent of provincial GDP) lYY4/95 199996 1YY6/Y7 1997/Y8 1998/99 199Y/00 2000/01 2001/02 2002/03 2003/04 2 0 0 4 / 6 Actuals Actuals Actuals Actuals Actuals Actuals Actuals P.Actua1 P.Actual Revised Budget
T o t a l Kevenue (including Grants) 6.9 7.5 7. I 5.7 5.6 6.1 6. I 5.6 6.4 6.9 6.8 Federal tax assignments Provincial revenue Provincial taxes
Direct tuxes Urban immovable property tax Agriculture income tax Registration fee Land revenue (tax) Taxes on profes,trades and callings Others
Motor vehicle tax GIST on Services Stamp duties Other
lndirecr luxes
Non-Tax Revenue &Grants Local Government Revenue
Total Expenditure Current Expenditure General Administration Law & order Social services
Education Health Other Social Services
Economic Services Irrigation Other Economic Services
Community services Subsidies Interest payments Grants & Investments Unallocable
Development Expenditure
Fiscal Deficit
Financing Foreign loans Loans from the federal government
5.4 1.5 0.6 0 2 0 0 0 0 0 0 0 1 0 0 0 0 0 5 0 1 0 0 0 2 0 1 0.9 0.0
7.7 6.1 0 9 0 6 2 3 1 8 0 4 0 1 0 6 0 3 0 4 0 3 0 1 1 3 0 0 0 0
1.6
-0.8
0.8 0 3 0 2
6.0 1.5 0.6 0 2 0 0 0 0 0 0 0 1 0 0 0 0 0 5 0 1 0 0 0 2 0 2 0.9 0.0
7. Y 6.5 1 4 0 6 2 2 1 8 0 4 0 1 0 7 0 4 0 3 0 3 0 1 1 2 0 0 0 0
1.5
-0.4
0.4 0 3 0 1
5.9 1.2 0.7 0 2 0 1 0 0 0 0 0 1 0 0 0 0 0 5 0 1 0 0 0 2 0 2 0.6 0.0
6.7 5.7 1 0 0 5 2 0 1 6 0 3 0 1 0 7 0 4 0 3 0 2 0 1 1 1 0 0 0 0
0.9
0.4
-0.4 0 2 0 0
4.4 1.3 0.6 0 2 0 0 0 0 0 0 0 1 0 0 0 0 0 4 0 1 0 0 0 2 0 1 0.7 0.0
6.5 5.1 0 7 0 5 2 0 1 6 0 4 0 1 0 5 0 2 0 3 0 2 0 1 1 0 0 0 0 0
1.4
.0.8
0.8 0 4 0 0
4.1 1.5 0.6 0.2 0.0 0.1 0.0 0.1 0.0 0.0 0.4 0.1 0.0 0.2 0.1 0.9 0.0
6.3 5.0 0.8 0.5 1.8 1.4 0.3 0.1 0.5 0.2 0.3 0.2 0.2 0.9 0.0 0.0
1.3
-0.7
0.7 0.5 0.1
4.3 1.8 0.7 0.2 0.0 0.1 0.0 0.1 0.0 0.0 0.4 0.1 0.0 0.3 0.1 1.1 0.0
6.8 5.5 0.8 0.5 1.8 1.4 0.4 0.0 0.5 0.2 0.3 0.2 0.2 0.9 0.5 0.0
1.4
-0.8
0.8 0.5 0.1
4.6 1.6 0.7 0.2 0.0 0.0 0.0 0.1 0.0 0.0 0.5 0.1 0.1 0.2 0.1 0.9 0.0
6.3 5.3 0.9 0.5 1.8 1.4 0.4 0.0 0.5 0.2 0.3 0.2 0.2 0.9 0.4 0.0
1.0
-0.2
0.2 0.3 0.0
4.3 1.3 0.5 0.2 0.0 0.0 0.0 0.1 0.0 0.0 0.4 0.1 0.1 0.2 0.1 0.7 0.0
5. Y 5.0 0.7 0.5 1.8
0.4 0.0 0.5 0.2 0.3 0.2 0.1 0.8 0.3 0.0
1.0
-0.4
0.4 0.3 0.0
1.4
4.5 1.8 0.6 0.2 0.0 0.0 0.0 0.1 0.0 0.0 0.4 0.1 0.1 0.2 0.1 1.2 0.0
6.2 5.1 0.7 0.6 1.9 1.5 0.4 0.0 0.5 0.2 0.3 0.2 0.1 0.7 0.3 0.0
1.1
0.1
-0.1 0.3
-0.1
4.3 2.6 0.8 0.3 0.0 0.0 0.1 0.1 0.0 0.0 0.6 0.1 0.1 0.3 0. I 1.6 0.2
7.1 5.5 0.6 0.8 0.4 0.1 0.2 0.0 0.4 0.0 0.0 0.1 0.1 0.6 2.6 0.0
1.7
-0.3
0.3 0.9
-0 7
4.2 2.7 0.7 0 2 0 0 0 0 0 1 0 1 0 0 0 0 0 5 0 1 0 1 0 2 0 1 1.7 0.2
6.7 5.1 0 5 0 7 0 5 0 2 0 3 0 0 0 3 0 0 0 0 0 1 0 0 0 5 2 5 0 0
1.6
0.2
4.2 0 7
-0 5 0 1 - 0 4 0 0 - 0 4 Domestic borrowing &cash balances 0 3 0 0 -0 6 0 4 0 2 0 2 - 0 1
Source: Provincial Finance Accounts (varioub issues) and Budget documents (Various issues), and staf f estunates
89

Box 13: Innovative Public-Private Partnerships: The Bangalore Agenda Task Force Example
Bangalore, the capital of I<arnataka state in India, has become one of Asia’s fastest growing cities, with an estimated population of about 6 mdlion. I t recently underwent a rapid transformation from a quiet “pensioners’ city” to a fast paced cosmopolitan city with a booming IT industry, and the rapid growth of population and industry placed a big strain on the city’s infrastructure. The Bangalore Agenda Task Force (BATF), a unique experiment in private public partnership in urban governance, was set up in 1999 to help upgrade and modernize infrastructure, expand the city’s resource base, and help create a responsive, efficient, and proactive administrative framework for provision of public services. With the broad mandate to make Bangalore a world-class city by 2004-05 to strengthen its position as an engine of growth for the state’s economy, the BATF conducted a citizen’s poll early on to identify key issues facing the city’s residents. The citizen feedback was then used to identify priority areas for the task force. Among the top ten issues highlighted by the poll were garbage collection, road safety, and traffic. A major public drive was subsequently launched, and as a first step towards increased accountability and transparency, the “Bangalore Agenda” was unveiled in a series of presentations at public fora attended by the Chief Minister, representatives from government, the private sector, the media, and citizens of Bangalore.
Through public-private partnerships as well as application of a build-own-transfer (BOT) funding model, the BATF has undertaken several initiatives to upgrade the city’s infrastructure, including:
ImDroved Solid Waste Manacement: This project was undertaken through training o f health workers, providing upgraded equipment for door-to-door collection initiatives as well as monitoring the system for feedback. Pushcarts for waste collection were provided through donations from various local corporate houses, while local mobile phone providers helped set up the local help-line and infrastructure for the call center. Upgraded public sanitation facilities were provided through private donations channeled through the BATF.
Roads and Traffic Improvement: The rapid growth in traffic volumes in recent years placed an enormous strain on the city’s road network. In partnership with the local police and ci ty corporation, the BATF took on the task of augmenting road infrastructure, identified especially problematic bottlenecks, and accordingly developed a prioritized program of road improvement projects. Several key roads and junctions have subsequently been improved under this initiative.
Imnroved Urban Spaces: BATF helped design four different bus stand models with appropriate building materials and specifications, and developed a build-operate-transfer model for these shelters to serve as a revenue source for the city corporation. BATF has also been responsible for the Pay n’ Park scheme, the formulation o f the comprehensive Road Signage Manual, and road signage projects on a BOT basis, upgrading local parks, installation and maintenance of street furniture, and a number of other such initiatives to improve public areas.
Are city residents better of f since the BATF began operations? In response to the regular public poll on whether Bangalore was now better off, the proportion of citizens that gave a positive response has been rising steadily: 71 percent of those polled in July 2000 stated that there was an improvement; 74 percent in February 2001,81 percent in September 2001, and 94 percent in February 2003. Of these, the proportion indicating that the city has improved “a lot” has also been rising steadily, from 6 percent in 2001 to 28 percent in 2003, Particularly heartening i s the fact that residents from all backgrounds indicated they perceived improvements in the city to have taken place; in-fact a higher share of low-income residents indicated an improvement in the city as compared to their better-off counterparts.
.CorrrrP:ThiP hnu drawc hmvilv from the w=hsite, www hlrfnnvarrl cnm
5.2. V iewed solely from the perspective o f the overall fiscal balance, the Punjab’s finances appear t o b e in reasonably satisfactory: the prov inc ia l government’s fiscal def ic i t has stayed b e l o w 1 percent o f prov inc ia l GDP p e r year throughout the past decade. In 2002/03, the G o v e r n m e n t o f the Punjab in fact r a n a small budget surp lus (Table 5.1), and i t s fiscal si tuation i s somewhat better than other provinces in Pakistan. However , in order to achieve i t s ambit ious development goals, the provincial government will need to m o b h z e significantly higher resources to finance the cost o f provilng high quality economic and social services. This chapter presents recommendat ions on h o w the government can create the addit ional fiscal space i t needs over the m e l u m t e r m to achieve i t s development objectives.
5.1 A FISCAL PROBLEM OF A DIFFERENT KIND
5.3. In the sense o f fiscal sustainability, low levels o f fiscal deficits ref lect soundness o f provincial finances, but in a broader sense, low aggregate expen l tu res inhibit the government’s abil ity t o discharge i t s consti tut ional respons ibh ty to prov ide social a n d economic services o f acceptable quality t o i t s populat ion. T h e apparent improvemen t in the Punjab’s fiscal position has been achieved through tight e x p e n l t u r e controls; from 1995/96 - 2002/03, p rov inc ia l expenditures fel l from 7.9 percent t o only 6.2 percent o f p rov inc ia l GDP (Table 5.1). Thus in 2002/03, the Governmen t of the
90

Punjab spent less than US330 pe r capita on running the government, servicing i t s debt, paying food subsidies, providmg grants to local governments, and maintaining and developing prov inc ia l and local infrastructure a n d services. At about one- th i rd the average pe r capita spending by state governments in India, this amoun t i s obviously very l o w in relat ion to the vast functional responsibil l t ies o f the prov inc ia l government. Realizing this, the prov inc ia l government under the M e d i u m T e r m Budget F ramework (see below) i s mak ing an ef for t to enhance publ ic spendmg on high-pr ior i ty sectors and areas, especially o n development and non-salary O&M. I t s due to this reason that prov inc ia l expenditure increased to 7.1% o f prov inc ia l GDP in 2003/04.
5.4. As n o t e d earlier in the report, social and economic indicators in the Punjab are in general l ower than in other countries o f comparable i ncome levels, suggesting that not enough publ ic resources have been allocated for their improvement . T h e p r o b l e m of meager fiscal resources i s compounded by ineff icient u t h z a t i o n o f funds because o f long-standing inst i tut ional and structural weakness inherent in prov inc ia l finances. The Punjab, therefore, faces a fiscal problem, not in terms o f running unsustainably high fiscal deficits, but rather in terms o f running wha t m a y b e described as high “infrastructure deficits” caused by inadequate maintenance o f roads, water supply, and other infrastructure, high “social deficits” result ing from inadequate provision for operating and mainta in ing the quanti ty and quality o f education, health and other social services, and high “irrigation deficits” because o f inadequate drainage, and poor operations and maintenance o f i r r igat ion canals a n d channels.62
5.5. W h i l e the level o f spending by prov inc ia l governments in Pahs tan has been low hstorically, the current fiscal pressure has been precipitated by changes in t roduced under the 1997 NFC Award, exacerbated by rigidit ies and weaknesses in the prov inc ia l fiscal structure. This award resulted in an acute drop in prov inc ia l revenue because o f changes in the revenue-sharing formula and the composi t ion o f the divisible pool o f taxes, whereby the share o f provinces in m o r e buoyant federal taxes (e.g. i ncome tax a n d the Genera l Sales Tax) was reduced. W h i l e provinces were al lowed a share in cus tom duties as a compensatory measure, t a r i f f re forms have resulted in a r a p i d decline in revenue receipts under this head. As a result, even in n o m i n a l terms, federal revenue transfers to the Punjab in 1997/98 were 15 percent b e l o w those during the previous year, and have grown by only 7 percent pe r a n n u m during the past 5 years. This represents a marked slowdown from the 25 percent annual growth in federal tax transfers, or the 10 percent annual growth in prov inc ia l expendtures, during the 1991 NFC A w a r d period. In addition, based on excessively opt imis t ic project ions o f revenue transfers, the federal government discontinued Cash Deve lopmen t Loans to the provinces, w h i c h earlier f inanced a very large share o f the prov inc ia l development program.
5.6. Since the Constitution of Pahs tan restricts provinces to only borrowing from, or with the consent of, the federal government, the acute drop in revenue receipts forced the Punjab to curtai l expenditures. Unab le to reduce i t s wage bill or interest payments in the short-run, the prov inc ia l government appl ied expenditure cuts ma in l y to non-wage operations a n d maintenance expenditures (O&V and development spending. This adversely impacted the quali ty o f prov inc ia l infrastructure and services, and eroded the economy’s product ive capacity a n d potent ia l tax base. With the perception growing o f not gett ing value for their tax money, citizens have become progressively less w&ng t o pay taxes, aggravating the p r o b l e m o f insuf f ic ient funding for publ ic services. T h e
62 “ Infrastructure deficit” refers to fall in economic va lua t ion o f infrastructure a n d lower effectiveness of pub l ic services, “social deficits” to decline in h u m a n capital, a n d “ i r r igat ion deficits” to decline in value o f the i r r iga t ion system.
91

prov inc ia l government therefore appears to be stuck in a vicious cycle of low fiscal resources + l o w publ ic expenditures -+ low augmentation o f physical and human capital + low product iv i ty -+ low fiscal capacity -+ l o w fiscal resources.
5.7. T h e p r o b l e m of lower federal revenue transfer has been magni f ied by structural weaknesses in prov inc ia l finances. Despi te be ing the largest prov ince with significant opportunit ies for resource mobil izat ion, the Governmen t o f the Punjab remains heavily dependent on federal fiscal transfers, with own-revenues compr is ing only about 26 percent o f to ta l revenue receipts.63 This fiscal dependence on the federal government i s part ly an outcome o f skewed tax assignment, as the federal government controls a l l the m a j o r buoyant taxes, and part ly a result o f lack o f pol i t ica l d and weak prov inc ia l tax administration. T h e prov inc ia l government i s thus hostage to federal revenue col lect ion efforts, as any shortfal l in federal transfers reduces i t s a b h t y to execute i t s budget and pursue i t s development objectives. B i furcat ion o f taxation and expenditure responsibll i t ies between the federal and prov inc ia l governments also compromises accountabhty to tax payers. T h e prov inc ia l government, w h i c h does not have to raise taxes (or user charges) to p rov ide pub l i c services and infrastructure to i t s citizens, i s l ikely to b e less prudent about the quali ty o f i t s expenditures.
5.8. Public spending in the Punjab i s characterized by acute structural ngidit les and other weaknesses. T h e large provmcia l establishment implies that about 40-45 percent o f to ta l provincial expenditures go towards pay ing wages and pensions o f government employees (Table 5.2). Interest payments to service the province’s debt account for another 10-13 percent of to ta l spending. Since development expenditures account for about 15-20 percent o f to ta l prov inc ia l expenditures, the relatlvely high f ixed expenditures on wages, pension, and interest payments means that only meager amounts are available in the recurrent budget for essential non-salary 0&M expenditures.
Table 5.2: Punjab Provincial Expenditure - Object Classification: 1999/00 - 2002/03
Rs million Percent of Total Expenditure 1999/00 2000/01 2001/02 2002/03 Average 1999/00 2000/01 2001/02 2002/03 Actuals Actuals P. Actual P. Actual Growth Actuals Actuals P. Actual P. Actual
Total Expenditure 117,538 113,338 127,432 152,653 9.1 100.0 100.0 100.0 100.0 Current Expenditure 94,969 96,290 108,913 129,195 10.8 80.8 85.0 85.5 84.6 Wages and Pensions 46,046 52,057 57,023 62,176 10 5 39 2 45 9 44 7 40 7 Goods, Repaus and Mantenance 3,254 5,222 4,950 5,140 16 5 2 8 4 6 3 9 3 4 Interest Payments 14,743 15,667 15,605 15,317 1 3 12 5 13 8 12 2 10 0 Subsidies 3,500 4,000 2,505 3,000 -5 0 3 0 3 5 2 0 2 0 Grants (To local govts & others) 9,061 6,507 5,759 5,426 -157 7 7 5 7 4 5 3 6 Distr ict Level Non-Salary 0 0 6,522 7,380 _ _ 0 0 0 0 5 1 4 8 Others 18,365 12,837 16,550 30,757 18 8 15 6 11 3 13 0 20 1
Development Expenditure 22,569 17,048 18,518 23,457 1.3 19.2 15.0 14.5 15.4 Source: Finance Department, Government o f the Punlab
5.9. T h e p rob lem o f inadequate O&M i s exacerbated by over-extension o f pub l i c infrastructure (i.e., beyond the prov inc ia l fiscal resources to adequately fund it); lack o f fiscal transparency; a weak fiscal monitoring system w h i c h focuses solely on ensuring that expenditures are made as pe r the budgetary allocations; disregard a n d c i rcumvent ion o f i n t e m a l controls; poorly funct ion ing mechanisms o f financial accounting and report ing, leadmg to a weakening of f inancial accountabhty.
63 Even this understates the province’s dependence of federal revenue as included in provincial own revenue are the federal grants (which are classified as an item in provincial own non-tax revenue) and royalty on natural gas and oil, which i s collected and then transferred by the federal government and net hydel profits from WAPDA. Taking all this into account, share of provincially collected revenue in total drops to about 15 percent.
92

5.10. An t iqua ted and inappropriate budgetary procedures and practices that govern financial transactions o f the prov inc ia l government are also to blame for poor infrastructure maintenance and inadequate service delivery. These include, among others:
0 Incrementa l budgeting, w h i c h has little, or no, link with government policies. N o rev iew o f “permanent budget,” irrespective o f whether or not the activities ref lect government priorit ies, or are relevant for implement ing government policies. Full budget ing for sanctioned posts, regardless o f whether they are expected to b e f i l led during the budget period. Strict h t a t i o n s on re-appropriat ing budgetary funds from salary to non-salary heads (while the opposi te can b e done rather easily), even if savings are expected in the former. Structural and inst i tut ional bifurcation o f development a n d recurrent budgets, w h i c h blurs the link between establishment and adequately operate and mainta in publ ic facilities. Pro l i ferat ion of a large number of schemes in development programs, that leads to thin spreadmg of scarce development resources and causes long delays in complet ing them.
5.11. L o o k i n g ahead, beside the structural and procedural problems n o t e d above, the sustainabihty o f prov inc ia l finances in the Punjab i s under threat because o f two m a i n factors: (i) the rap id accumulation of deferred liabihties on the prov inc ia l Prov ident Fund (G.P. Fund), and (ii) a looming payment crisis on pensions o f employees.
5.12. Growing Liabilities on the Provident Fund: T h e G.P. Fund i s basically a contr ibutory ret irement scheme. Employees contr ibute t o i t through mandatory monthly deductions from their salaries, whi le the government contr ibut ion i s in the form of interest due on the accumulated employee contr ibutions. T h e receipts in the G.P Fund accrue into the Prov inc ia l Consolidated Fund, and are used to finance the prov inc ia l government’s fiscal deficit. As a result, very little, i f any, o f the G.P. Fund’s accumulated cash i s available in the prov inc ia l account. Disbursements on behal f of the G.P. Fund are made through the prov inc ia l budget and impose a heavy bu rden on prov inc ia l finances. Moreover , the disbursement from the G.P. Fund (i.e. on beha l f o f the G.P. Fund) has been increasing at a m u c h faster rate as compared with receipts (22.6 vs. 12.9 percent pe r annum), leadmg to the gap between receipts into a n d payments out o f the fund nar row ing rap id ly (Table 5.3).
Table 5.3: Accumulation of Provincial Provident Fund Liabilities: 1990/91- 2001/02 (Rs. million)
Opening Closing Interest Bonus on Composite Balance Receipts Payments Balance Rate(%) Interest (YO) Interest (9‘0)
1990/91 4,922.9 1,163.6 394.3 5,692.2 15.93 30.00 20.71 1991/92 5,6922 1,2505 481 9 1992/93 6,4608 1,4465 6585 1993/94 7,2488 1,5290 6308 1994/95 8,147 0 1,782 8 1,688 1 1995/96 8,241 7 1,2167 771 5 1996/97 8,6869 1,3086 241 1 1997/98 9,754 4 2,640 5 1,551 3 1998/99 10,843 6 3,314 8 2,405 1 1999/00 11,753 3 3,574 5 2,393 5 2000/01 12,934 3 3,502 6 2,914 0 2001/02 13,522 9 4,416 0 3,714 7 2002/03 14,224 2 5,567 6 4,416 0 2003/04 15,026 4 3,825 0 3,953 0 Source: Provincial budget documents
6,460 8 7,248 8 8,147 0 8,241 7 8,686 9
10,843 6 11,753 3 12,934 3 13,522 9 14,224 2 15,026 4 14,898 4
9,754 4
15.93 15.93 15.54 15.44 15.49 16.76 17.51 17.35 16.11 15.00 15.00 14.50 14.50
30.00 30.00 30.00 30.00 30.00 30.00 30.00 30.00 30.00
0.00 0.00 0.00 0.00
20.71 20.71 20.20 20.07 20.14 21.79 22.76 22.56 20.94 15.00 15.00 14.50 14.50
93

5.13. As a result, an increasingly small amoun t d b e available as f inancing to the prov inc ia l government. Governmen t project ions indicate that the disbursement from the G.P. Fund wdl exceed receipts by 2008/09. In the meantime, the deferred l iabdtty @e. the stock of the G.P. Fund) continues to grow at an exponential rate on account of the exceedingly high rate of interest levied. T h e situation, i f not effectively and immediately handled, i s potential ly explosive, and can jeopardze the prov inc ia l government's f inancial stability.
5.14. The Looming Pensions Problem: As i s the case with the Prov ident Fund, employees' pensions pose another potential f inancial p r o b l e m in the making. Pensions are un funded and are p a i d out o f the prov inc ia l budget. In Pakistan, government pensions are non-contr ibutory, and are based solely on def ined benefits. Moreover , the present pension scheme allows for upfront undiscounted commuta t i on o f a large portion o f accrued pension, mak ing i t very expensive for the prov inc ia l budget. Pension payments have been increasing at over 14 percent pe r annum, a n d grew to over 11 percent o f to ta l recurrent expenditures in 2001 /02 before subsequently tapering of f (Figure 5.1).
F igure 5.1: Trends in Provincial Pension Payments: 1990/91- 2004/05
12,00000 T T 1400
10,000 00
~ 8,000 00
l o i s 6,000 00
e
, P d?
4,000 00
2,000 00
5.15. With a large number o f government employees in the Punjab becoming eligible for pensions in the nex t 10-15 years,G4 keeping up with payment on pensions i s a source o f m a j o r concern for the financial managers o f the province. T h e Governmen t o f the Punjab i s currently imp lemen t ing an extensive p rog ram of fiscal a n d financial management re fo rms under the ADB- f i nanced Punjab Resource Management P rog ram (see Box 14), under w h i c h i t has init iated work on pension reform. X Working G r o u p has been set up to oversee a study of the government's contingent liabilities, fo l lowing w h i c h an A c t i o n P lan WLLl b e developed and imp lemen ted for capitalization o f the GP Fund, f inancing o f contingent l iabht ies o f agreed publ ic sector organizations. Finally, the Group i s also expected to develop a strategy for f inanc ing pension obligations.
6-1 Large-scale recruitments were made in the early 1990s to expanding social services under the Social Action Program. These s t a f f would be completing their 25 years in the next 10-15 years and would become eligible for pensions.
94
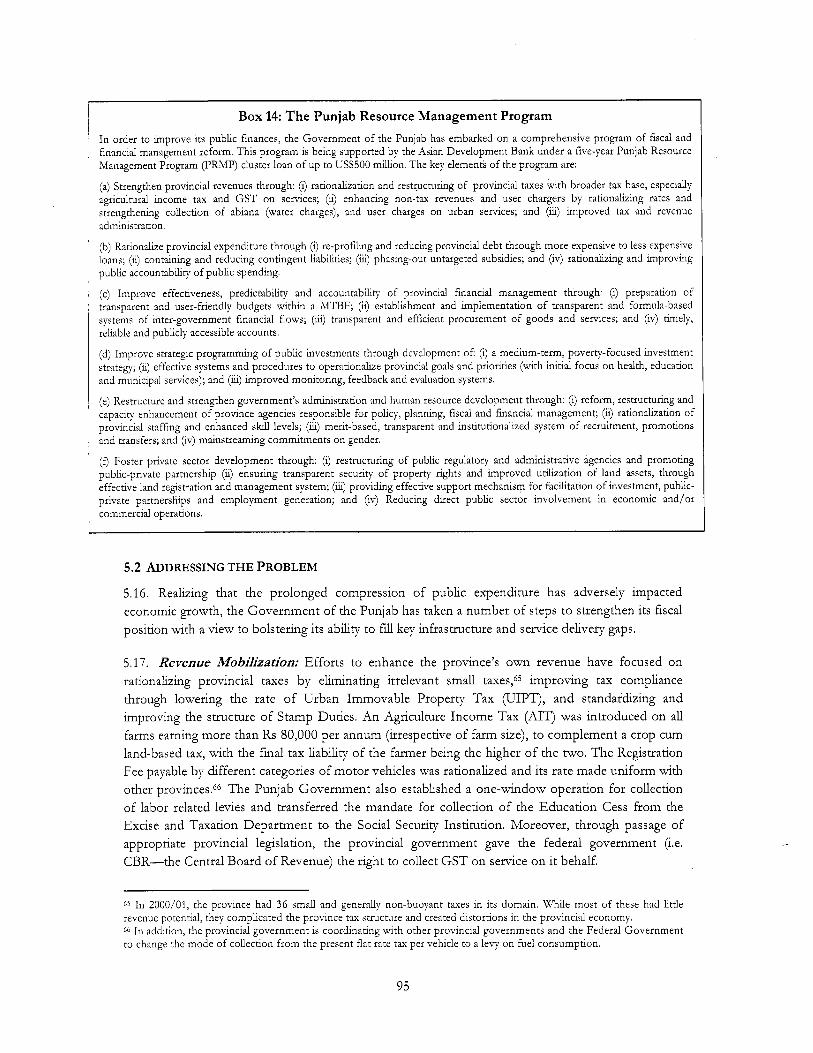
Box 14: The Punjab Resource Management Program
In order to improve its public finances, the Government of the Punjab has embarked on a comprehensive program of fiscal and financial management reform. This program i s being supported by the Asian Development Bank under a five-year Punjab Resource Management Program (l'FWP) cluster loan of up to US$500 million. The key elements of the program are:
(a) Strengthen provincial revenues through: (i) rationalization and restructuring o f provincial taxes with broader tax base, especially agricultural income tax and GST on services; (ii) enhancing non-tax revenues and user chargers by rationalizing rates and strengthening collection of abiana (water charges), and user charges on urban services; and (iii) improved tax and revenue administration.
@) Rationalize provincial expenditure through (i) re-profding and reducing provincial debt through more expensive to less expensive loans; (ii) containing and reducing contingent liabilities; (iii) phasing-out untargeted subsidies; and (iv) rationalizing and improving public accountability o f public spending.
(c) Improve effectiveness, predictability and accountability o f provincial financial management through: (i) preparation of transparent and user-friendly budgets within a MTBF; (ii) establishment and implementation of transparent and formula-based systems o f inter-government financial flows; (iii) transparent and efficient procurement of goods and services; and (iv) timely, reliable and publicly accessible accounts.
(d) Improve strategic programming of public investments through development oE (i) a medium-term, poverty-focused investment strategy; (ii) effective systems and procedures to operationalize provincial goals and priorities (with initial focus on health, education and municipal services); and (iii) improved monitoring, feedback and evaluation systems.
(e) Restructure and strengthen government's administration and human resource development through: (i) reform, restructuring and capacity enhancement of province agencies responsible for policy, planning, f iscal and financial management; (ii) rationahation o f provincial staffing and enhanced s k i l l levels; (iii) merit-based, transparent and institutionalized system of recruitment, promotions and transfers; and (iv) mainstreaming commitments on gender.
(9 Foster private sector development through: (i) restructuring of public regulatory and administrative agencies and promoting public-private partnership (ii) ensuring transparent security of property rights and improved utdization of land assets, through effective land registration and management system; (iii) providing effective support mechanism for facilitation of investment, public- private partnerships and employment generation; and (iv) Reducing direct public sector involvement in economic and/or commercial operations.
I I
5.2 ADDRESSING THE PROBLEM
5.16. Realizing that the p ro longed compression o f publ ic expenditure has adversely impacted economic growth, the G o v e r n m e n t o f the Punjab has taken a n u m b e r o f steps to strengthen i t s fiscal position with a v i e w to bols ter ing i t s abil ity to fdl key infrastructure and service delivery gaps.
5.17. Revenue Mobilization: Efforts to enhance the province's own revenue have focused o n rationalizing prov inc ia l taxes by e h n a t i n g irrelevant small taxes,65 improving tax compliance through lower ing the rate o f U r b a n I m m o v a b l e Property T a x (UIPT), a n d s tandardz ing and improving the structure o f Stamp Dut ies. An Agriculture I n c o m e T a x (AIT) was in t roduced on al l farms earning m o r e than Rs 80,000 per a n n u m (irrespective o f f a r m size), to comp lemen t a crop c u m land-based tax, with the f ina l tax l i a b h t y of the farmer be ing the h igher o f the two. T h e Registration Fee payable by d i f ferent categories o f motor vehicles was rat ional ized a n d i t s rate made uniform with other provinces.66 T h e Pun jab Governmen t also established a one-w indow operat ion for collection o f labor related levies a n d transferred the mandate for col lect ion o f the Educa t ion Cess from the Excise and Taxat ion D e p a r t m e n t to the Social Security Institution. Moreover , through passage o f appropriate prov inc ia l legislation, the prov inc ia l government gave the federal government (i.e. CBR-the Central B o a r d o f Revenue) the right to collect GST on service on i t behalf.
65 In 2000/01, the province had 36 small and generally non-buoyant taxes in its domain. Wh i le most o f these had little revenue potential, they complicated the province tax structure and created distortions in the provincial economy. 66 In addition, the provincial government i s coordinating with other provincial governments and the Federal Government to change the mode o f collection from the present flat rate tax per vehicle to a levy on fuel consumption.
95

Figure 5.2: Provincial Own Revenue: 1994/95 - 2004/05
2.50 3 '00 I
-YO o f Total Revenue 0.00
40 00
35 00
3 0 0 0 1 2 5 0 0 5 ~
2 0 0 0 ;; 1 5 0 0 % ~
0~
a
b
* 1000 ; 5 0 0 ~
0 00
5.18. As a result of these measures, prov inc ia l own-revenue receipts have increased from 1.5 percent o f prov inc ia l GDP in 1994/95 to 1.8 percent in 2002/03 (Table 5.1). Although commendable in their own rights, especially in v i e w o f the narrowness and lack o f buoyancy o f most revenue bases assigned to prov inc ia l governments, this increase by i tse l f has not been suff icient to overcome the impact o f decl ining federal transfers. However , there i s considerable room for mob i l i z i ng addit ional revenue from prov inc ia l revenue by improving the structure a n d administrat ion o f the relative broad- based taxes in the prov inc ia l domain.
5.19. Budgetary and FinanciaI Management Reforms: In order to enhance the effectiveness o f prov inc ia l expenditure, the prov ince has undertaken some serious budgetary and financial management re forms. For example, the Governmen t of the Punjab was the f i r s t one to present a performance budget. However , lack o f interest and capacity within the l i ne departments l e d t o shelving o f this init iat ive taken by the Finance Depar tment .
5.20. T h e M e d i u m - T e r m Budee t Framework: In 2003/04, the prov inc ia l government made i t s f i r s t attempt to prepare a M e d u m - T e r m Budget F ramework o. This three-year budget f ramework (2003/04-2005/06) constitutes an impor tan t component o f the prov inc ia l pove r t y reduct ion strategy. Under the MTBF, the Pun jab government has taken some i m p o r t a n t steps to strengthen i t s fiscal position, wh i l e a t the same t ime m a k m g substantial increases in allocations for high-priori ty expenditures. However , the MTBF process i s in a very early stage a n d considerable progress d b e needed in c o m i n g months a n d years t o fine-tune and strengthen this process.
5.21. T h e failure of the NFC to come to a consensus on the distribution o f federally collected taxes, represents a m a j o r blow to prov inc ia l finances. This implies that the revenue transfers to the provinces would continue to b e governed by the 1997 NFC Award; whereas each prov ince w o u l d have received significantly larger amoun t from the &visible pool if the last o f fer o f the federal government would have been accepted by a l l four provinces. Although compared with other provinces, the Punjab loses the least in terms o f transferable revenue, the loss i s nonetheless substantial. On the basis o f the 1997 NFC Award, the Pun jab wdl receive Rs 134 bilhon in revenue transfer from the federal government in 2004/05, w h i c h i s 1 3 percent h igher than last year. On the

other hand, in i t ia l estimates p o i n t to only a meager tax ef for t by the province. T h e province’s own tax revenue i s projected to increase by only 5 percent in 2004/05. However , the non- tax revenue i s projected to increase by 22 percent, leading t o a 13 percent increase in prov inc ia l own revenue.67 T h e overall prov inc ia l revenue receipts are projected t o increase by 13 percent.
2003/04 Projections (Annual percentage increase) Budget 2004/05 2005106 2006107 2006/08 2004/05 2005/06 2006/07 2006108
Table 5.4: Punjab Mid -Term Fiscal Framework 2003/04-2007/08 11
Average Growth
Revenue Receipts Federal Tax Transfers Provincial Revenue
Tax Revenue Non-Tax revenue
Grants Punjab Development Fund Local Government Revenue
13 I 13 2 12 2 12 8 II 4
40 0 I O 0
13 0 9 4
18 9
15 4 -44 4 -16 7 -28 6
rota1 Expenditure Current Expenditure Development Expenditure \1
Fiscal Balance (Percent of Provincial GDP)
Financing Net Domestic Borrowing Net Foreign Borrowing Cash Balance Utilization
18 7 18 1 18 6 20 7 164
40 1
I 9 0 9 2
48 9
-13 7 44 4 37 4
-25 5
Memo items: (as a ?4 of Provinc Education Expenditure Health Expenditure Pro-Poor Expenditure
burce: Finance Department.
1 5 3 347 I16 426 30 620 I5 773 14 847 2 300
0 000 4 000
159 695 129 195 30 500
-6 349 -0 3%
I O 108 -2 984 4 624 8 469
GDP) 18% 0 6%
I86 021 131 648 39 073 20 125 18 949 9 300 1000
5 000
204 366 I 3 9 772 64 594
-18 345 -0 7%
8 593 -13 106 I 5 600 6 099
2 0%
0 8%
224 784 256 508 290 067 169572 191 852 217091 43711 51 155 57375 22660 27734 31 284 21 052 23421 26091
0000 0000 0000
I 5 0 0 2500 3 500 10000 II 000 12100
236 508 269 171 304068 154570 168334 184195 81938 100837 119873
-11 725 -12663 -14001 -04% -04% -04%
3 765 6500 7 500 -13 600 -9000 -5000 13365 12000 10000
0 9% 0 9 % 09%1
21 3 2 0 8 13 1 2 8 8 2 7 6 1 1 9 2 7 6 12 6 2 7 6 II 1
304 3 ._ 5 0 0
2 5 0 1000
2 8 0 1 5 7 8 2 1 0 6
111 8 2 6 9
-15 0 -56 2 339 1 3 8 2374 -14 3 -280 -34 4
14 I 13 1 I 7 0 22 4 11 3
66 7 I O 0
I 3 8 8 9
23 1
72 7 -33 8 -10 2 -12 5
x w n m e n t o f the Punlab /1 Includes provincial government investments in pension funds and financial instruments
5.22. On the expenditure side, the 2004/05 budget (and the MTBF) presents a contrasting picture in terms o f current and development expenditures. On the current expenditure side, the MTBF reflects a continuation o f fiscal restraint that has been a hal lmark o f the prov inc ia l fiscal management over the last some years, as the overal l current expenditure in 2004/05 i s expected to increase at a rate o f a slightly above 10 percent.68 On the o the r hand, the prov inc ia l development p r o g r a m i s expected to
increase by as m u c h as over 29 percent over FY04’s level. T h e relatively modes t increases in current budget for the nex t three years therefore seem somewhat inconsistent with this sharp increase in development spending a n d i f not immediately corrected m a y exacerbate the p r o b l e m of inadequate O&M allocations.
5.23. Nevertheless, analysis o f recurrent expenditure allays, at least partly, the concern over inadequacy o f current budget. As the MTBF makes a strong at tempt to refocus prov inc ia l priori t ies and divert prov inc ia l resources towards pro-poor and social expenditures. T h e needs o f the priority
67 Under these projections, the provincial government will n o t meet the PRMP target o f a 10-15 percent increase in tax revenue. However, i t would achieve the target on 10-15 percent increase in overall revenue. 68 These estimates exclude the impact o f any possible salary increase.
97

sectors are fair ly w e l l accommodated by providmg large increases in the recurrent allocations for these sectors. For example, in order to cater for the backlog o f deferred O&M, the allocation for water supply a n d sanitation sector i s projected to increase by 6 times in F Y 0 5 . 6 9 S d a r l y , recurrent allocations for education and health sectors are to increase by 14 percent and 15 percent, respectively. Overall, the recurrent allocation for PRSP e x p e n l t u r e are projected to increase by 14.4 percent, whereas phasing out of wheat subsidy and savings in interest payments due t o early ret irement of federal debt (see below) imply a virtual stagnation in non-PRSP recurrent expenditure over the MTBF p e r i o d (Table 5.5).
Budget Budget Budget Budget Budget 2003/04 2004105 2005106 2006/07 2007/08
Table 5.5: Provincial Current Expenditures: 2003/04 - 2007/08
Annual Percentage Increase FY05 FY06 FY07 FY08 Average SECTORS
oads, Highways, Bridges 7,895
25,242 16,828
8,056 8,771
87,859 64,262 23,597 33,903
Current Development Water Supply & Sanitation \I Current Development Education Current Development Health Current Development Population Planning Current Development Social Security & Social Welfare Current Development Natural Calamities & other Disasters Current Development Irrigation Current Development Agriculture Current Development Industries (Including TEVTA) Current Development Rural Development Current Development Housing Sector Current Development Safety nets Current Development Access to Justice Programme Current Development Grand Total PRSP Current Development Others Current Development Total Expeniture Current Development Expenditure /2
\1 Excluding WASAs
1245 2123 752.7
1103 I 5525
30.2 25 8 5 6 7 45.9
10.7 32. I 13.6 11.0 16.2 17.1 12.3 36.1 19.0 12.3 29.3 25.2
25.2 10.7 11.0 9.0
11.0 11.0
21.6 10.7 32.9 15.8 10.7 30.2 17.1 13.9 26.9 17.4 11.0 21.6 13.3 11.0 14.6 12.3 12.3
11.0 11.0 9.0
18.1 11.7 29.2
2.1 1.8
10.0 15.1 9.6
3,508 1,346
490 857
42,023 36,047
5,976 13,790 12,930
860 746
0 746 551 536
16 23 23
0 9,623 5,796 3,826 3,421 2,684
737 0 0 0
2,284 429
1,855 777 648 129
2,090 2,090
0 16,405 15,777
628 99,180 80,043 19,137 60,515 49,152 11,363
159,695 129,195
1,462 0
1,462 959 829 130 36 36 0
21,354 8,857
12,497 6,331 4,256 2,074 3,647 2,613 1,034
12,975 4,575 8,400 1,378
465 912
3,259 3,259
0 28,016 27,368
648 251,145 150,704 100,441 34,822 33,491
1,331 285,967 184.195
10,956 11,479 5,891 5,588
54,717 45,353
9,364 20,122 12,866 7,256
746 0
746 706 606 IO0 27 27 0
11,862 6,535 5,327 4,080 3,140
940 2,273 1,768
506 8,012 3,346 4,667
947 340 606
2,3 00 2,300
0 20,511 20,Ol I
500 352,291 108,009 46,556 32,764 3 1,764
1,000 187,328 139,772
0.0
0.0 28.2 13.2
539.1 14.6 14.6
23.3 12.7 39.2 19.3 17.0 27.5 --
-- --
250.8 680.4 151.6 21.8
-47.5 370.1
10.1 10.1
25.0 26.8
-20.4 53.5 34.9
143.3 -45.9 -35.4 -91.2 17.3 8.2
--
-_
_*
6.407 7.112 17,529 13,245 6,539 6,706
68,543 52,156 16,387 25,680 14,796 10,884 1,231
0 1,231
782 673 109 29 29 0
16,244 7,189 9,056 4,958 3,454 1,503 2,880 2,121
759 9,547 3,714 5,833 1,075
378 697
2,645 2,645
0 22,758 22,213
545 193,554 122,3 14 71,240 33,356 32,256
1,100 226,910 154,570
21,035 14,567 7,258 7.3 10
77,558 57,893 19,664 29,485 16,424 13,061 1,342
0 1,342
866 747 1 I 9 33 33 0
18,394 7,979
10,4 14 5,563 3,834 1,729 3,303 2,354
949 11,122 4,122 7,000 1,256
419 837
2,936 2,936
0 25,250 24,656
594 219,822 135,769 84,053 33,775 32,565
1,210 253,597 168,334
18,230 -0.5 15,6731 743.7
10.0 60.0 15.4 11.0 20.0 25.3 15.0 75.0 27.6 15.0 50.0 65.0
65.0 10.7 11.0 9.0
11.0 11.0
36.9 10.0 70.0 21.5 10.0 60.0 26.7 20.0 50.0 19.2 11.0 25.0 13.6 11.0 15.0 15.0 15.0
11.0 11.0 9.0
27.1 13.2 53.0
1.8 1.5
10.0 21.1 10.6
11.0 20.0 10.0 11.0 9.0
13.2 11.0 20.0 14.8 11.0 20.0
9.0
9.0 10.7 11.0 9.0
11.0 11.0
13.2 11.0 15.0 12.2 11.0 15.0 14.7 11.0 25.0 16.5 11.0 20.0 16.8 11.0 20.0 11.0 11.0
11.0 11.0 9.0
13.6 11.0 18.0
1.3 1.0
10.0 11.8 8.9
11.0 20.0 15.5 11.0 20.0 13.3 11.0 20.0 15.0 11.0 20.0
9.0
9.0 10.7 11.0 9.0
11.0 11.0
16.1 11.0 20.0 13.8 11.0 20.0 10.4 11.0 9.0
16.7 11.0 20.0
9.7 11.0 9.0
11.0 11.0
11.0 11.0 9.0
14.2 11.0 19.5 3.1 2.8
10.0 12.8 9.4
30,5001 64,594 81,938 100,837 119,8731 Ill 8 26 9 23 1 18 9 22 9
\ 2 Includes provincial government’s investment in the pension funds and financial instruments.
69 An increase of 11 percent per annum i s projected for the subsequent two years o f MTBF.
98

5.24. In the 2004/05 broposed) development budget very large increase are proposed for roads (71 percent), water supply and sanitation (75 percent), education (34 percent), health (167 percent), i r r igat ion (46 percent), agriculture (67 percent) and housing and physical p lanning sectors (249 percent). In the education sector, the increase in development budget f o r m Rs 6 b i l l i on to Rs 8 blllton i s ma in l y to p rov ide funds for the streams o f the Punjab Educa t ion Sector R e f o r m Program.
Table 5.6: Main Components o f the Punjab Government’s Debt: 1971/72 - 2002/03
Rs million CDL Foreign Loans Total C D L Foreign Loans Total P G D P Total Revenue
1971/72 998 9 341 7 1,340 6 -- _ _ -- 3 1% 92 9% 1981/82 9,516 0 1,478 9 10,994 9 25 3% 15 8% 23 4% 6 5% 120 4% 1991/92 54,464 9 5,341 5 59,806 4 19 1% 13 7% 18 5% 9.9% 149 5% 2001/02 85,962 9 41,321 0 127,283 9 47% 22.7% 7 8 % 66% 1182% 2002/03 83,742 5 47 476 4 131 218 9 4 4% 24 4% 8 2% 5 5% 79.8%
68 ce: P
5.25. Overall, the M”Il3F indicates a significant improvemen t in the med ium- te rm fiscal outlook o f the Punjab. Moreover , the MTE3F makes a strong at tempt for reor ient ing government expendture priori t ies toward PRSP expendtures. This success o f prov inc ia l govemment efforts to reduce pover ty in the p rov ince wdl depend crit ically on the success o f the federal and prov inc ia l governments to mobdtze addit ional resources and create significant f iscal space through better debt and expenditure management, and to devise mechanisms to channel these addit ional resources to the distr ict governments, w h i c h have to incu r the bulk o f the pro-poor expenditures. Strong efforts will also b e needed to enhance the effectiveness o f pub l i c expenditures.
5.26. Provincial Debt Management Strategy: T h e debt bu rden of the Punjab government increased quite rap id ly during the decades o f the 1970s and 1980s (Table 5.6) because o f increased borrowing from the federal government in the form o f Cash Deve lopmen t Loans (CDL). In 1991/92, total outs tandmg debt of the Governmen t o f the Punjab peaked at 10 percent o f prov inc ia l GDP, or about 150 percent o f total prov inc ia l revenues.70 During the 1990s, foreign borrowing became an increasingly impor tan t source o f f inancing for the Punjab’s development program. W h i l e the bulk o f foreign deb t i s concessional, the grant componen t o f external assistance has generally been decl ining over the years. Moreover , the CDL, w h i c h consti tuted the bulk of the Punjab’s total outstanding debt in 2002/03, carries an average interest rate o f over 14.5 percent pe r a n n u m (Table 5.7). As a result, debt servicing now preempts a significant portion o f to ta l prov inc ia l fiscal resources.
Table 5.7: Cost and Composition o f the Punjab’s Outstanding Debt: June 2003
Rupee Loan Received from the Federal Government Counterpart Fund Rupee Loans Foreign Exchange Loans Punjab Loan 2008 General Provident Fund Accumulatlons Total so
Average Interest Rate
14.625 2.300 1090
17 500 14.500 8.568
Outs tanding Amount
68,449 34
68,684 76
16,613 153.856
* Percent of
Total 44 49% 0 02%
44 64% 0 05%
10 80% 100.00%
~~
70 As noted earlier, total revenues and expenditures in Punjab are quite low as a ratio o f provincial GDP, so in many respects debt as a share of total revenue rather than provincial GDP i s a better measure of the provincial government’s total indebtedness.
99

5.27. T h e prov inc ia l government’s debt management strategy, being suppor ted through the PRMP, has three m a i n components:
(i) S w a m i n 9 High Cost Loans With Low Cost Loans: Tak ing advantage o f the recent decline in market interest rates, the Punjab government intends to borrow funds from the domestic f inancial sector for early ret irement o f m o r e expensive CDL. However, i t i s unl ikely that the government would b e able t o borrow huge amounts needed to make a significant impac t on province’s budgetary posit ion. T h e other alternative i s that the government may try to raise loans through floating i t s own securities. In this case, government will have to of fer i t s securities for open subscript ion on terms and condit ions m o r e attractive to the publ ic than instruments presently available in the market. Hence bo r row ing from the international donors at concessional rates remains the most viable op t i on for the prov inc ia l government to ret ire i t s most expensive debt a n d create some fiscal space fo r enhancing high-priority expenditure. T h e Punjab Governmen t has entered into a l oan agreement with Asian Deve lopmen t B a n k for the Punjab Public Resource Management P rog ram (PPRMP) cluster loan o f up to U S $ 500 d o n for the pe r iod 2003/04 to 2007/08 a n d a US$ 100 d o n concessional budget support loan with the World B a n k f o r Educa t ion Sector Re fo rms - the Punjab Educat ion Sector Ad jus tmen t Credi t (PESAC). T h e f i r s t tranche o f PPRMF’ a n d proceeds of P E S A C were u d n e d to ret ire abou t Rs 11.4 bdlion o f federal government m o r e expensive loans on accelerated basis. This action alone would yield the prov inc ia l government an estimated annual savings o f about Rs 2 bdlion on i t s interest payments.
(ii) Privatizing Pub l i c Sector Entemrises and other ProDerties: Presently, fifty pub l i c properties, with an assessed value o f about Rs 3 billion, are expected to b e sold during 2003/04 by the Punjab Privatization Board. In addition, another 510 properties are with the D i s t r i c t Privatization Committees, with a to ta l assessed value o f Rs 1.2 bdlion. Thus the prov inc ia l government expects about Rs 4.2 billion in proceeds from privatization o f these properties. Moreover , the Punjab government anticipates generation o f substantial amounts through sale o f government l and that has been occupied illegally. T h e a m o u n t so generated, along with proceeds from policy-based IF1 loans, would help the Punjab government to ret ire Rs 15 bdlion o f i t s m o r e expensive CDL in FY05. This would bring a saving of Rs 1.7 bdhon during 2004/05. This fiscal space would b e ut ihzed for spending o n p r o - p o o r sectors.
(ii? Professional Management o f Prov ident Fund Pension Schemes: Rs. 15 bdlion o f the prov inc ia l government’s debt, or abou t 10 percent o f the total debt outstandmg, i s in the form of G. P. Fund accumulations, bearing an average c o m p o u n d interest rate o f 19.915 percent pe r annum (Table 5.7). In 2003/04, the estimated cost o f interest payment on the G.P. Fund liabi l i ty alone i s Rs 3.6 bi l l ion. T h e rate o f interest on the G.P. Fund i s exceedingly high a n d i s f inancially unsustainable. T h e high rate of interest and the un founded nature o f G.P Fund have the potent ia l o f becoming ma jo r financial concerns for the prov inc ia l government.
5.28. T h e Punjab government has consti tuted a committee to examine the f inancial viabi l i ty of the G. P. Fund and i t s pens ion schemes, and to suggest ways to conver t t h e m into professionally managed funds, so that the budgetary implications o f the G. P Fund a n d pensions can gradually b e phased out. S d a r l y , the gove rnmen t i s examin ing the possibi l i ty o f establishing a professionally managed provincial pension fund, w h i c h w o u l d b e capitalized from grants from the budget, and
100

through high yielding investments would, over the medium-term, try to reduce the bu rden o f pension payments on the prov inc ia l budget.
5.3 MOVING FORWARD
5.29. As men t ioned above, the Punjab government has init iated comprehensive reforms to enhance sustainability o f i t s finances through the ADB- f i nanced PRMP. In order to effectively tackle the long-standing problems (that were discussed above) and to create addit ional fiscal space for st imulat ing economic growth and effective delivery o f publ ic services, these reforms need to b e broadened and fully implemented.
5.30. On the revenue side, the prov ince expects t o get significantly higher revenues from federal transfers. The challenge for the prov inc ia l government will b e to avoid be ing complacent in terms of raising m o r e revenue from i t s own sources. Addi t ional revenue from federal govemment should b e complemented by higher revenue generation b y the prov inc ia l g o v e m m e n t to prov ide addit ional resources for essential O&M and development. Some suggestions to increase in prov inc ia l revenue are l isted below:
5.31. Agricultural income tax: T h e AIT has considerable untapped revenue potential. Addi t ional revenue cou ld b e collected from the tax through improved tax adrmnistration; restructuring the land- tax so as to b e col lected on c ropped area; lower ing the tax threshold from 12.5 acres to 7.5 acres on irr igated lands; m a k i n g the rate structure m o r e progressive; a n d discouraging sub-division o f l and for the purpose o f avoid ing tax by promulgat ing a legislation to prohibit benaami transactions. I t i s estimated that ma lung the above-mentioned changes would raise the revenue potent ia l o f AIT to Rs 6 bilhon.
5.32. Urban immoveable property tax: Although considerable progress has been made in restructuring the p roper t y tax, room s t i l l exist for further improvements, through (a) a reduct ion the differential in assessment o f owner-occupied and rented propert ies from 1 : l O to 1:5 in F Y 0 5 and to about 1:2 in the nex t 3 to 5 years would; @) a rev iew o f the remain ing exemptions, for example those available to propert ies o f ret i red government servants, and propert ies o w n e d by publ ic sector agencies/authorities and charitable institutions, with a v iew to e h n a t i n g or reducing their revenue and disincentive impac t (if these exemptions are to retained, i t i s appropriate to convert t h e m in terms o f rental value than on plot size); (c) an enhancement in the elasticity o f the tax by indexing proper ty values to changes in marke t rents;71 (d) an i m p r o v e d equity o f the present system such that properties on s d a r sized plots but in different ra t ing areas face the same tax structure; (e) revision in the structure so as to capture the element o f pzlgree (goodd) in assessment o f rental value of commercial properties; a n d ( f ) phase in a proper ty tax system based on capital values o f properties, with supporting legislative changes to prevent i t from being over turned by the courts. Finally, as the tax has been devolved to TMAs, whereas i t col lect ion has been devolved to the distr ict governments, it i s only appropriate to either discuss the above men t ioned changes with the T M s and encourage them t o adopt these changes and for the col lect ion o f the tax should b e devolved to TMAs, at least for those TMAs who have the capacity and will to collect the tax.
71 Present ly, v a l u a t i o n tables are to b e r e v i s e d every 5 years, but in p r a c t i c e take m u c h l o n g e r . T h i s p r o h i b i t s a steady regu la r increase in p r o p e r t y tax r e v e n u e (with m a r k e t rents).
101

5.33. Motor vehicle tax (MVT): The m o t o r vehicle tax i s quite an inconvenient tax. Moreover, the revenue f r o m the tax increases only with an increase in the number o f vehicles plying in the prov ince (or through increases in tax rates). The government may forceful ly pursue the idea o f conver t ing the tax into a f ixed levy on fuel consumption. This wdl not only reduce the inconvenience to the taxpayers, but would relate the tax to use o f vehicles and would enhance the revenue.
5.34. Stamp duties: There i s a need t o further rationalize and consolidate the number o f stamp duties (from the present structure o f hav ing m o r e than 100 serials). T h e tax cou ld b e made less inconvenient and i t s base m o r e buoyant b y convert ing the specific rate into a d va lorem rates. T h e prov inc ia l government m a y also consider negotiat ing the levying o f uniform rates o f stamp duties on financial documents. Since levy ing o f stamp duties and registration o f accompanying proper ty transfer documents are closely l i nked activities, there i s a need to strengthen the associated procedures and the inst i tut ional arrangements for i m p r o v i n g compliance and col lect ion efficiencies, inc lud ing the incorporat ion o f penalty provisions in the legislation/rules/ regulations.
5.35. Tax on professions and caIIings: T h e existing prov inc ia l f lat rate tax on professions and callings i s inelastic, with tax rules containing a number o f anomalies, w h i c h a l low taxpayers to evade and avoid the tax. I t m a y b e appropriate to levy this tax as a two-stage tax. First, as a license fee for locat ing business in the province, and, second, as a f ixed (ad valorem) rate tax l i nked to sales or turnover, preferably to be collected by the CBR. I t i s conservatively estimated that a n o m i n a l tax rate o f 0.5 percent would enable the Governmen t o f the Punjab to mob l l i ze at least Rs 2 bdhon p.a.
5.36. Provincial excises: Be ing levied only on a select number o f items, prov inc ia l excises have a very na r row base, w h i c h i s per forated and leakages from the tax are substantial. To plug these leakages the Punjab government should coordna te with the other prov inc ia l governments to
harmonize the taxation system with tax levied as a uniform rate tax across provinces.
5.37. User charges: There i s also a need to enhance and rationalize user charges, particularly for economic (especially abiana) and tertiary level social services, with a purpose to i m p r o v e cost recovery o f these services but keeping in v iew the equity aspects o f higher user charges.
5.38. Tax administration: To address the challenges in revenue m o b h a t i o n , the prov inc ia l tax adrmnistration will have to b e strengthened. T h e present thinlung o f the govemment to merge the revenue col lect ion functions o f B o a r d o f Revenue and the Excise and Taxat ion Depar tmen t into a single, m o d e r n and eff icient tax col lect ion author i ty (more or less o f the p a t t e m o f CBR) should b e pursued with full vigor. Besides, the prov inc ia l government m a y also consider u t h z i n g CBR and private sector in tax col lect ion wherever possible.
5.39. T h e measures proposed above have the potent ia l to significantly augment prov inc ia l revenue, w h i c h w o u l d supplement prov inc ia l measures to curtai l the government’s current expenditure (through reducing debt servicing a n d phasing out prov inc ia l subsides), and p rov ide the fiscal space that cou ld b e used for high-priority O&M a n d for accelerated development o f the province.
5.40. Unfortunately, the indications are that the effectiveness o f publ ic expend tu re has remained very low. Prepar ing and imp lemen t ing an MTBF would contr ibute significantly to improving expenditure efficiency through i m p r o v e d medmm- te rm planning; greater transparency o f fiscal resources that m a y b e available to d i f ferent departments a n d sectors; better al location of fiscal
102

resources towards government priorit ies; and through an i m p r o v e d m i x of wage and non-wage and development a n d O&M expenditures.
5.41. Expanding and Strengthening the MTBF: This entails accelerating the M’IBF process. T h e most appropriate rou te for doing so w o u l d b e t o expand the MTBF process to cover al l prov inc ia l expenditure. However , in the short-run, i t would b e appropriate to focus only on a h t e d number o f policies, programs, and projects in selected high-priori ty sectors to do detailed costing and projections (and preparing MTBF f o r the remaining sectors, departments a n d areas only on an aggregate basis). O n e key element o f deepening the MTBF r e f o r m i s to do away with the unwarranted b i furcat ion o f the prov inc ia l budget into development and recurrent components. As a f i r s t step, the prov inc ia l government should a im to present prov inc ia l expendtures (say in the W h i t e Paper) o n an aggregate sectoral basis.72 This would help department officials to think in terms of aggregate expenditure allocations rather than focusing on development a n d recurrent budgets separately, and cou ld contr ibute in the future to mak ing a consolidated sectoral budget.
5.42. In order to ensure soundness o f prov inc ia l finances and to i m p r o v e the quali ty of provincial fiscal management, the Punjab government may consider promulgating/enacting a Punjab Fiscal Responsibhty L a w on a pat tern s d a r to that o f the federal government. This will he lp in ensuring fiscal discipline, reducing prov inc ia l debt, and creating increased fiscal space for the high-priority expenditure o f the prov ince over the medium-run.
5.43. To i m p r o v e financial accounting and repor t ing in the province, the prov inc ia l government needs to own and imp lemen t a l l PIFRA-re la ted reforms, inc lud ing adopt ion o f the N e w Account ing M o d e l PAM) during 2004/05 a n d u p g r a d n g the capacity and terms to the DA0.73 As a f i r s t step in that h e c t i o n , the prov ince must agree with the federal government on the text o f the CGA O r d n a n c e and then notify the Ordnance . Moreover, the prov inc ia l gove rnmen t should review the financial rules to make these consistent with the n e w accounting m o d e l a n d init iate reconchat ion exercises in respect o f all on- a n d of f -budget prov inc ia l publ ic accounts to assess their financial position and possible cont ingent l iabht ies for the government.
5.44. To summarize, the Pun jab government has made a good start a n d has taken a number of measures t o strengthen i t s fiscal posit ion. Considerable deepening o f this r e f o r m process i s required (on the lines suggested above) to establish prov inc ia l finances on f u m e r footings and create additional fiscal space to address the past neglect o f prov inc ia l infrastructure a n d service delivery and f o r economic and social uplift o f the province. T h e prov ince i s ideally situated to undertake t h i s deepening and expansion o f fiscal and financial management re forms. I n a b h t y to take advantage o f this opportunity m a y result in perpetuating the vicious cycle of “low allocations + low economic and social development --+ low revenue generation --+ low allocations” from w h c h the Governmen t o f the Punjab i s trying h a r d to escape.
72 That is, present an expenditure table (in the White Paper) showing development, recurrent and total expenditure and allocation for each sector (Le. for each functional classification). 73 From BPS 17 to BPS 18/19.
103

104

APPENDIX A NOTE O N ESTIMATION OF PROVINCIAL GDP: 1990/91-2001/02
As in most other developing countries o f the world, in Pakistan too the calculation o f Gross Domes t i c P roduc t (GDP) contains some methodological weaknesses. Two of the most obvious shortcomings are the p e r i o d c i t y (the national accounts are compi led on annual basis only) and aggregate nature o f these accounts. Wh i le efforts are underway to prepare quarterly GDP and the Federal Bureau o f Statistics (FBS), w h i c h compiles the national accounts, m a y start presenting GDP o n a quarterly basis f r o m 2004/05, no of f ic ia l attempt has been made to-date in Pakistan t o estimate GDP at the prov inc ia l level. These shortcomings have hampered economic monitoring and regional p lanning in the country.
Unul 1971 Pakistan h a d a centralized system o f administration-the “one unit” system- under w h i c h no ds t i nc t i on was made between the various geographical and cultural entities within the r e g o n called West Pakistan, w h i c h later came to b e known post-1971 as Pakistan. Hence no need was felt to estimate Regional Accounts. In 1971 the “one unit” was b r o k e n into four separate administrative units or provinces, the Punjab, Sindh, NWFP and Balochistan. However , even under this n e w system relatively l i t t le au tonomy was given to the provinces, as m a j o r decision-makmg authority de-facto remained at the Federal level. Untd the early eighties, Pakistan’s GDP was estimated with the base year o f 1959/60. In the early 1980s, the base year was changed to 1980/81, w h i c h h a d cont inued ttU today.74
T h e construction o f prov inc ia l GDP series i s a large and complex undertaking, as disaggregated data are needed for a very large number o f province-specific variables. Moreover , the exercise i s also extremely t ime intensive, as a large vo lume o f data need to b e analyzed to derive consistent and robust estimates. G i v e n t ime constraints and data inadequacies, as an i n t e r i m measure, this repor t rel ied upon calculating the Punjab’s share in the nat ional value-added o f various economic sectors using some b r o a d “allocators’’, or na t i ona l -GDP appor t ion ing factors. Wherever data were available in a m o r e dsaggregated form, value-added in various sectors was estimated on a similar pattern to the methodology used by the Federal Bureau o f Statistics (FBS) to estimate nat ional GDP. However , such in fo rma t ion at the regional level was not available for al l sectors and activities. E v e n the national data that are publ ished by FBS are available with considerable t ime lag, and certain key surveys are also not conducted at regular intervals, thus leaving significant data gaps in the national series. W e must therefore emphasize the approximate nature o f our calculations, and stress that the derived prov inc ia l GDP estimates should only b e used as b r o a d indca t ions of trends rather than as precise estimates for a g iven year.
1. Methodology:
U n d e r the present exercise, prov inc ia l GDP has been estimated using a combinat ion o f the three tradit ional approaches-production, expendmre, or income. M o r e specifically, wherever detailed prov inc ia l data were available, for example, agriculture, mining and quarrying, manufacturing, and wholesale and retai l trade, sectoral value-added were estimated using the p roduc t i on approach. T h e expenditure approach was used to compu te value-added o f the construction, ownership o f dwellings, electricity and gas dstribution, and publ ic adrmnistration and defense sub-sectors, whereas a variant o f the i ncome approach was applied t o estimate value-added in the transport, storage, and
~~ ~
74 T h e FBS has recent ly f in ished u p d a t i n g t h e base year for GDP calculat ions to 2000/01; however , t h e estimates presented in this r e p o r t are based on t h e 1980/81 series, as disaggregated da ta from the n e w series i s not ye t available.
105
communication, banking and insurance, and services sub-sectors. In almost al l o f these instances, the d r e c t and indxec t methods were combined to compute sectoral value-added by appor t ion ing the national i ncome t o the prov ince using appropriate allocators. W h i l e these allocators were applied only where Isaggregated data at the prov inc ia l level were not available, clearly the present exercise represents a “second-best” approach to estimate sectoral value-added at the prov inc ia l level. In what follows below, w e p rov ide a b r i e f sector-by-sector description o f the me thodo logy and techniques used to estimate prov inc ia l GDP.
Aericulture: Value-added in agriculture in the Punjab has been estimated by applying prov inc ia l allocators to the national value-added estimate for this sub-sector. Overall, the computat ion o f value- added in crop agriculture i s based on 12 ma jo r crops and 5 m i n o r crops. T h e c rop output data for the Punjab and for Pakistan was obtained f r o m published sources.75 D u e to the non-availabil ity o f input costs o f agriculture, p roduc t i on allocators were used to estimate value-added for the crop sub- sector. T h e Punjab’s share o f total crop product ion in national output was assumed to remain the same as i t s share o f to ta l nat ional value-added. These output shares (allocators) were used to estimate value-added o f wheat, rice, cottonseed, sugarcane, maize, gram, barley, jawar, bajra, rapeseed & mustard, sesame seed a n d tobacco for ma jo r crops for the years 1990/91 to 2001/02. T h e simple addit ion o f the value-added of each crop represents the total value-added of m a j o r crops. S d a r l y , value-added o f minor crops was estimated using lentils (mash, moong, a n d masoor), potatoes and onions as the m a i n minor crops.
Livestock: T h e l ivestock sub-sector includes the value-added o f milk, meat, poultry, and eggs. T h e consumpt ion o f each o f these products in the Punjab vis-&vis nat ional consumpt ion was taken as the allocator to estimate prov inc ia l value-added. T h e consumpt ion share was compu ted o n the basis of p e r capita monthly consumpt ion of each p roduc t repo r ted in various issues of the Househo ld I n c o m e a n d E x p e n I t u r e Surveys (HIES) conducted by FBS. T h e data series was extended to non-HIES years using standard interpolat ing techniques. T h e share o f each p roduc t in total consumpt ion was obta ined by conver t ing per capita monthly consumpt ion into total annual consumpt ion for Pahs tan a n d the Punjab using estimated popu la t i on shares. T h e weight o f each product in total value-added was derived from the national accounts data.76 T h e weighted share of consumpt ion for each p r o d u c t was then added up and applied to nat ional value-added of livestock to get the Punjab l ivestock value-added.
Fishery: T h e p rov inc ia l value added in the fishery sector i s der ived from the national value- added in the sector by using the share o f Punjab in total fish produc t ion as weight.
Forestry: T h e m a j o r componen t of forestry i s t imber product ion. As the prices o f t imber were not available, the value added o f this sector was assumed to b e p ropor t i ona te to the revenue f r o m sale o f timber. In o the r words, the prov inc ia l value-added in the forestry sector was derived from the national (sectoral) value-added by using the share of revenue earned from the sale of t imber in Punjab to the national revenue as allocator.
75 The data are obtained from various issues of the Pakistan Statistical Yearbook, Agriculture Statistics of Pakistan, Punjab Development Statistics, Economic Survey, Agricultural Crops and Livestock Products - Long-Term Trends, and Support Price Policy Issues o f Major Crops. 76 FBS authorities on demand provided the data.
106

Manufacturing: T h e manufacturing sub-sector i s sub -dv ided into large-scale and small-scale manufacturing. Large-scale manufacturing includes units that employ 20 or m o r e workers on any w o r k i n g day during the year and use power, whi le the small-scale manufactur ing includes those units that emp loy 10-19 workers in any day o f the year.
Value-added in the Punjab large scale manufactur ing sub-sector i s estimated on the pattern o f national GDP calculations by FBS based on the Census o f Manufactur ing Industr ies data and the Quantum I n d e x o f Manufactur ing (QIM) estimates. T h e Punjab Bureau o f Statistics conducts monthly surveys o f industr ial p roduc t i on and employment in the p rov ince and estimate QIM based o n these data. T h e survey reports cover 2,121 industr ial units and 99 selected i tems across 47 large- scale manufactur ing industries. T h e methodology used to estimates the monthly index was to measure the percentage increase in the current month’s p roduc t i on of any i t e m from the average m o n t h l y p roduc t i on o f 1980/81. T h e weighted percentage increase was calculated with the assigned weights based on 1980/81 CMI data f o r each i tem.
T h e benchmark estimates (1990/91 and 1995/96) o f large scale manufactur ing value-added are derived on the basis o f the Punjab’s share o f value-added from the CMI for the census years. T h e C M I data has i t s deficiencies o f t ime lag, considerable non-response, under- repor t ing o f output value and over-report ing of input cost (supposedly due to fear of taxation), a n d under-coverage o f non- registered companies. However , despite these shortcomings the C M I data were used assuming that data problems in the Punjab were n o dif ferent t o those at the nat ional level. T h e benchmark data points obtained from the CMI were then interpolated for the years where the CMI was not conducted using the standard in terpolat ion methods and annual percentage increase in the Punjab QIM,77 wherever, appropriate.
T h e small scale value-added has been estimated based on the Census o f Small Househo ld Manufactur ing Industr ies (SHMI). T h e u rban and ru ra l value-added b reakdown for this sub-sector was only available in the 1996/97 census. T h e value-added in small-scale manufactur ing was derived by using the share o f the Punjab in national value-added in the small-scale industry (SHMI). This share was then applied to the national sectoral value-added.78
Mining: L i k e agriculture, livestock, and the manufactur ing sub-sectors, the mining sub-sector i s also estimated using the p roduc t i on approach. Mining consists o f three m a i n sub-sectors that account for 82 percent o f the total value-added o f this sub-sector: crude oil, natural gas, and coal. In addition, t h i s sub-sector includes twelve other minerals. T h e gross value o f each o f the four m a i n components (i.e. crude oil, natural gas, coal, and other minerals) was calculated from their respective constant prices in any one year for Pakistan and for the Punjab. Since input costs o f al l these products were not available at the regional level, the share o f the Punjab’s to ta l value o f minera l product ion with Pakistan’s value of minera l p roduc t i on was used as the allocator to estimate the Punjab’s value-added for this sector. T h e various sources used for this sub-sector include the Energy Year books o f various years for coal, gas, and crude oil p roduc t i on a n d their respective prices, and other minera l p roduc t i on data received from the Punjab Mining Depar tment .
77 The Punjab Bureau of Statistics bases the QIM on monthly surveys of industrial production and employment. 78 The Federal Bureau of Statistics has calculated a growth rate of 5.31% based on the small household manufacturing index (SHMI) at national level.
107

Construction: Ideally, value added for the construction sub-sector should b e calculated through the expenditure approach, as i s done by FBS at the national level. However , since the prov inc ia l expenditure data on construction was n o t available, the Punjab’s share o f construction workers was used, instead, to derive estimates fo r 1990/91 and 2002/03. T h e missing years were then interpolated to get the full series.79 T h e data on percentage distribution o f employment in construction industry in Pakistan and the Punjab were obtained from FBS’s L a b o r Force Surveys o f various years.
Electr ici tv and Gas: In the Electr ici ty and Gas sub-sector, value-added was estimated on the basis of electricity generation, electricity consumption, and natural gas consumption. T h e data were taken from various Energy Year Books (1996/97 to 2001/02) publ ished annually by the Hydroca rbon Deve lopmen t Inst i tu te o f Pakistan. D a t a were obtained for electricity generation for hydel and thermal electricity; these figures were mul t ip l ied with a single year (i.e. constant) price to get constant rupee value of electricity generation. T h e value o f electricity consumpt ion was then taken as a p r o x y for value o f electricity transmission and distribution. S d a r l y , the value of gas consumpt ion was taken as a p r o x y for the value o f gas dstribution. These three constant @.e. a t a single year price) values o f the three components were then added for both Pahs tan a n d the Punjab to get constant value generated in the sub-sector at the national and prov inc ia l level. Finally, the prov inc ia l value-added in electricity a n d gas was derived by applying to the nat ional value-added estimate the derived rat io o f the prov inc ia l value t o national value. Since, the data for the Punjab was not available before 1997/98, the base year’s share was assumed to b e in h e with earlier work on Regional Accounts o f Pahs tan carried out by Kaiser Bengali.80
T ranmor t . Storage. a n d Communicat ion: T h e transport and storage sub-sector consists o f six sub-sectors: r o a d transport, water transport, air wansport, communications, storage, a n d the railways. The share o f value-added o f the sub-sectors in the total was assumed to b e the same as in the total national value-added for this sub-sector. R o a d transport i s the biggest componen t in the Punjab, cont r ibut ing about two-thirds o f the to ta l value-added, whi le communicat ion a n d air transport earn about 14-16 percent and 13-14 percent respectively. Water transport i s not applicable in the Punjab while the other two sub-sectors have negligible contr ibut ion to total value-added in this sub-sector. In the r o a d transport sector, the Punjab’s share was assumed to b e equal to the Punjab’s share o f national consumpt ion o f pe t ro leum products. Na t iona l value-added in other sub-sectors was allocated to provinces on the basis o f their respective sub-sectoral shares in nat ional value-added f r o m Na t iona l Accoun t o f Pahs tan 1994/95 and prov inc ia l shares by using ratios obta ined from the earlier work done by Kaiser Bengali. Consumption o f Petro leum products for the Punjab and Pakistan were taken from Energy Year Books of various years.
Wholesale and Retai l Trade: E c o n o m i c activities in t h i s sub-sector inc lude wholesale and retai l trade, inc lud ing import and expor t o f goods, purchase and sale agents a n d brokers/auctioneering. Since this sub-sector i s closely connected with trad ing o f agriculture and manufactur ing products, the rat io o f prov inc ia l t o nat ional value-added was based upon the aggregated share o f these two sub- sectors. In other words, the Punjab’s value-added was derived from the aggregated value-added of agriculture and manufactur ing sectors o f the Punjab and Pahs tan by applying the prov inc ia l share (of
79 The data from Punjab mineral department was avatlable for the period 1993/94 to 2002/03; some estimates for Punjab’s production share have been used for the earlier years, however. 8‘) Regional Accounts of Pakistan by Kaiser Bengali, February 1997.
108

value-added in agriculture a n d manufacturing) to the national value-added in the wholesale and retail trade sub-sector.
Table 1: Share o f Punjab in the Wholesale and Trade Sector At constant factor cost o f 1980/81
Aggregate value added of Agriculture and Manufacturing Share (%)
(Mil Rs.) (Allocator) Pakistan Punjab
1990/91 191,650 109,362 57.1 1991/92 208,097 1992/93 205,141 1993194 215,277 1994/95 225,776 1995/96 244,848 1996197 244,961 1997198 258,341 1998199 265,550 1999100 276,864 2000101 281,149 2001102 286,892 2002/03 303,139
120,665 58.0 117,220 57.1 122,326 56.8 133,259 59.0 141,501 57.8 141,354 57.7 150,545 58.3 269,070 101.3 163,035 58.9 165,168 58.7 170,608 59.5 178,502 58.9
Finance and Insurance: Since wages and salaries account for a signif icant share, the i ncome approach i s probably the best one to apply to estimate to ta l value-added in this sub-sector. However, this approach cou ld not b e used, as province-wise data on factor incomes were not available. Instead, we assumed that the value-added o f the bankmg sub-sector cou ld b e approx imated by the rupee amount o f deposits h e l d by the bank ing system. The prov inc ia l to nat ional ra t io of these deposits was used to derive prov inc ia l value-added in this sub-sector. T h e State L i f e Insurance Corporat ion (SLIC) measures insurance activi ty across Pakistan. T h e data for zones in the Pun jab were compared with the country as a whole. T h e level o f activity in each zone was, however, k e p t constant. T h e prov inc ia l value-added o f State B a n k o f Pakistan (SBP) was derived from the prov inc ia l rat ios determined by the SBP employees’ compensat ion in al l four provinces and the sub-sector’s share in the national value-added from the N a t i o n a l Accounts of Pakistan (1 994/95).
Table 2: Finance and Insurance Value-Added at different level of activities in Punjab
Mil Rs. Bank
Years Deposits Insurance State Bank Total
1990/91 1991192 1992/93 1993/94 1994195 1995196 1996/97 1997/98 1998/99 1999/00 2000101 2001/02 2002/03
2965 3 147 3469 3633 3678 4950 5862 4256 5540 5407 6435 7019 7253
1063 1173 1263 1604 2020 2160 2212 1914 1955 1636 1578 1764 1798
3 4032 3 4323 1 4734
35 5272 47 5745
4 7114 3 8077 5 6175 4 7499 9 7052 9 8023
10 8793 9 9060
109

OwnershiD and Dwell ings: At national level, the value-added in this sub-sector i s measured by the ren t accruing from ownership o f dwellings (rented or self occupied). For the present exercise, the prov inc ia l value-added o f ownership and dwellings was derived from the prov inc ia l share o f rental expendtures obta ined from different publ ished issues o f the HIES. T h e value-added for non-survey years was interpolated. T h e house ren t expenditures were estimated from the monthly expenditure pe r household, house r e n t shares in total expenditures, and total number o f houses as pe r the HIES data. Table 3 presents some o f the key data that were used to calculate the Punjab's value-added share o f ownership and dwell ings.
Table 3: Estimation of House Rent Expenditures
Exuenditures (Mil Rsl Share(%) Years Pakistan Punjab (Allocator)
1990191 57,096 30,413 53.3 199 1\92 67,611 36,368 53.8 1992193 78,425 42,533 54.2 1993194 91,915 50,752 55.2 1994195 104,777 57,687 55.1 1995196 119,213 64,999 54.5 1996197 15638 1 84,613 54.0 1997198 174,354 95,945 55.0 1998199 196,445 106,967 54.5 1999100 200,078 107,758 53.9
2001102 207,208 112,682 54.4 2000101 205,843 108,365 52.6
Publ ic Admin i s t ra t i on and Defense: This value-added in the Publ ic Adrmnis t ra t ion and Defense sector comprise ma in l y o f wages and salaries o f pub l i c sector employees. T h e FBS computes value-added separately for the federal, each prov inc ia l and aggregated local government. T h e sectoral value added in Punjab was estimated by attr ibuting the federal a n d local governments value-added to Punjab on the basis o f populat ion share and adding i t to the FBS data on valued-added for the Punjab government.
Table 4 : Intermediate calculations for estimating Public Administration and Defense
Publi Gross C Gross
Punjab' Value- Public Admi Value- District Wages Non- Net Gross sshare Added Admin n Added
Federa NWF Baloch & Local & Wage Value Depreci Value (Allocat Punjab( (current (Cons Defla (consta Years I Punjab Sindh P istan Govts. Salaries Bill Added ation Added or) Current) ) tant) tor nt)
-----Mil Rs. ---_- (?A) Mil Rs 1990191 28830 17548 7754 4370 2594 1588 62684 6268 68953 3448 72400 55.0 39843.4 76519 31679 2.4 16495 1991/92 33975 19825 10235 5382 3327 1908 74651 7465 82117 4106 86222 53.5 46122.4 85472 32495 2.6 17535 1992193 39116 22799 11243 6052 4140 2177 85526 8553 94079 4704 98783 53.7 53038.7 94560 33295 2.8 18675 1993/94 44634 24461 13153 6509 4228 2380 95365 9537 104902 5245 110147 53.3 58698.6 105298 33759 3.1 18819 1994195 50310 30153 16678 8177 4895 2948 113161 11316 124477 6224 130701 53.1 69359 130701 34814 3.8 18475 1995196 60615 39700 18521 9813 6017 3139 137805 13781 151586 7579 159165 54.6 86949.6 159164 35917 4.4 19621 1996/97 66655 42705 19091 10602 5986 3231 148270 14827 163097 8155 171252 55.1 94295.7 171252 36712 4.7 20215 1997/98 72020 43285 21315 12363 6830 3435 159248 15925 175173 8759 183931 53.7 98796.8 183932 37459 4.9 20121 1998199 75123 50580 25749 13518 8069 3716 176755 17676 194431 9722 204152 53.6 109454 206997 38395 5.4 20302 1999100 106956 50336 28822 15990 9415 5484 217003 21700 238703 11935 250638 52.3 131164 249832 42003 5.9 22052 2000/01 113234 52624 33031 16085 10654 6062 ,231690 23169 254859 12743 267602 51.7 , 138426 263505 42486 6.2 22319 2001102 Y ~ ~ S v ~ ~ ~ 4 f h ~ s 5 ~ t ~ 7 ~ e r ~ 5 ~ ~ a ~ ~ ~ 0&!52&2$k PI%%% !2%%L &'"'&80 lb%%?%!5@ ec&rd3774
________________________________________--------Mil Rs ~ _ _ _ _ _ _ _ _ _ _ _ _ _ _ ~ _ _ _ _ _ _ _ _ _ _ _ _ _ _ _ _ _ _ _ _ _ _ _ _ _
gdei&ad&-PeeP f&7p~92@@9Il~% 15@4/9@Wd7&6refW d6-d lbmIt&a n a ~ n a l l ~ ~ ~ ~ ~ ~ a ~ ~ ~ ~ s i ~ a 1 3 4
110

an allocator the share o f current e x p e n l t u r e in the Punjab to aggregate prov inc ia l current expenditures.
Services: This sector comprises incomes of the private sector persons who are engaged in private education, medica l & health professions, and other household and commun i t y services. Prov inc ia l data for these categories were not available; the value-added o f Pun jab in this sector was therefore estimated on the basis o f the share o f the Punjab’s labor force in the overal l national labor force. T h e L a b o r Force data points were taken from various LFS publications, whi le the data for i n t e r m e l a t e years were interpolated to obta in a continuous series o f allocators, w h i c h were then applied to the national data series.
2. Trends in Regional Accounts
U n d e r the present effort, regional accounts were only prepared for the Punjab. However , this exercise cou ld in pr inc ip le b e replicated to derive estimates for other provinces also, assuming o f - course that the various data used for this purpose are also available for other provinces. T h e estimates obtained for the Punjab are reasonably robust and compatible with earlier work by Kaiser Bengali ci ted earlier. These results suggest that over the nineties, economic growth in the Punjab was somewhat faster than that in Pakistan as a whole. T h e Punjab’s economy g rew at an average annual rate o f 4.4 percent during 1990/91-2002/03. By contrast, the growth rate for Pakistan during the same pe r iod was about 4.1 percent p e r annum.
Table 5: Puniab Value Added of Maior CroDs Annual Growth rates
Percentage
Seed Sugarc Rape
seed & Total Wheat Rice Cotton ane Maize Gram Barley Jawar Bajra Mustard Seseame Tobbaco Punj.
1990191 1991192 1992193 1993194 1994195 1995196 1996197 1997198 1998199 1999100 2000101 2001102 2002103
9.3 -1.6 -3.0 15.1 -4.5 -1.1 12.1 -4.3 33.9 -1 1.6 -5.7 6.6 -
-2.2 36.0 3.4 -0.8 -1.7 -6.3 -6.8 -0.2 -2.5 42.0 4.3 17.5 -4.2 -30.5 -3.6 -7.0 -44.2 -6.5 10.4 1.6 -16.9 15.5 -1.6 -17.2 18.4 -20.8 22.4 9.0 26.5 -4.7 -2.3 -0.1 -7.1 -1.4 2.1 -4.1 5.9 15.3 17.0 7.0 50.4 17.1 10.1 12.4 24.5 8.1 -2.5 15.0 7.3 16.2 -6.1 22.6 24.9 4.5 -3.9 -3.0 8.6 7.1 -5.4 5.2 8.4 -18.8 -10.9 0.5 -12.4 -5.3 -0.4 -2.9 16.6 20.2 1.8 -7.8 -3.4 -3.8 34.2 -0.4 37.2 22.4 -0.5 7.0 2.0 -8.8 8.0 7.9 14.4-3.1 3.6 43.9 -10.9 -11.9 -0.1 -3.1 -2.3 -27.0 4.9 0.2 16.4 37.4 -16.1 2.2 -16.7 11.1 5.9 8.2 2.6 18.4 0.8 20.5 -4.6 -4.6 -2.9 -9.8 -29.2 -20.3 2.1 7.3 -26.8 47.7 -9.8 -7.8 2.1 -1.0 18.3 -1.4 -9.7 5 . 5 -2.1 0.1 0.9 35.3 4.2 0.0 13.5-9.7 4.4 20.6 76.1 2.3 -9.3 15.3 14.3 -75.5 1.2 3.6
Source: World Bank staflestimates
Aericulture: T h e Pun jab accounts for 57 percent o f the nat ional income, most o f w h i c h comes from the agriculture sector-27 percent value-added o f the Punjab’s GDP in 2002/03. Wheat, rice, cotton, and sugarcane are the m a j o r crops that bring in m o r e than 90 percent share o f the agriculture value-added. T h e value-added of the agriculture sub-sector in Pun jab has been unstable throughout the nineties due to droughts, c rop viruses etc. T o t a l value-added decl ined sharply in 1992/93, mainly o n account o f t h e virus attack that a f f i c t e d cotton; to ta l value-added o f seed c o t t o n decl ined by 30.5
111

percent during this year as al l other ma jo r crops (except for jawar, bajra, and sesame seeds) showed a decline. 1994/95 a n d 1997/98 were both exceptionally g o o d years for agriculture, w h e n the total value-added o f c rop sector increased by 12.8 percent and 11.5 percent respectively because o f bumper wheat, rice, a n d sugarcane crops. Overall, the Punjab’s agriculture sector grew by 3.6 percent per a n n u m between 1990/91 and 2002/03.
L i v e s t o c k T h e l ivestock sector of the Punjab accounts for 63 percent of national l ivestock
Table 6: Puniab Gross Value and Value Added of Minor Croos A t constant factor cost
Rs Million
Total V A Minor Mash Mung Masoor Potatoes Onion Punj. Crops
1990191 1991192 1992193 1993194 1994195 1995196 1996197 1997198 1998199 1999100 2000101 2001102
156 212 88 1,070 266 1,792 157 187 80 1,302 266 1,993 125 227 89 1,417 289 2,146 119 270 72 1,625 308 2,394 110 316 99 1,717 346 2,587 120 361 106 1,594 357 2,538 122 368 110 1,458 368 2,426 107 337 119 2,291 380 3,235 103 352 123 3,002 389 3,969 97 384 119 3,085 417 4,102 107 43 5 83 2,770 423 3,819 115 478 85 2,899 379 3,956
1 1,204 11,478 12,017 13,819 14,792 14,816 14,767 17,938 19,678 16,064 16,125 16,642
2002103 125 589 101 3,298 443 4,556 17,536 Source: World Bank staff estimates
value-added. A c c o r d m g to the HIES, the consumpt ion pat tern o f l ivestock products in the Punjab increased sharply from 1987/88 to 1992/93, w h i c h i s apparent from a higher value-added o f l ivestock in early 1990s. W e the l ivestock sector cont inued to grow from 1990/91 to 2002/03, i t s rate o f growth was a bit slower than in earlier years (7% to 10% from 1990/91 to 1996/97), and declined to 5.7 percent p e r annum.
Table 7 : Puniab Gross Value Added of Agriculture Sector Annual Percentape Growth
Percentape
Agricultu Agricultu Major Minor revalue re Value Crops Crops Added Livestock Fishery Forestery Added
1991192 17.5 2.4 14.2 7.3 5.1 -53.3 11.5
1993194 -4.1 15.0 0.4 10.0 40.1 -30.3 3.6 1994195 15.0 7.0 12.8 10.0 -14.8 31.4 11.7 1995196 5.2 0.2 3.9 10.0 7.4 65.1 6.3 1996197 -7.8 -0.3 -5.9 10.0 -6.0 -56.1 -0.6 1997198 7.9 21.5 11.5 -1.2 -8.6 -11.3 6.3 1998199 0.2 9.7 3.0 -1.2 7.7 30.3 1.5 1999100 20.5 -18.4 8.5 4.7 9.8 92.3 7.4 2000/01 -7.8 0.4 -5.9 4.7 -5.7 27.8 -2.1 2001102 0.0 3.2 0.8 4.7 -12.8 9.5 2.2 2002103 3.6 5.4 4.0 2.9 15.4 -6.8 3.6
1992193 -17.2 4.7 -12.8 7.3 -5.3 46.6 -6.9
112

Manufacturing: T h e contr ibut ion o f the manufacturing sector in the Punjab’s economy i s about 16 percent- the large-scale and small-scale manufacturing sub-sectors account fo r about 9.5 and 6.5 percent respectively. T h e large-scale sub-sector contracted substantially (-1.6 percent) in 1997 due both to drop in edible oils p roduc t i on as we l l as nil p roduc t i on repor ted by five d s be ing privatized. Although the average annual percentage increase stood at 5.2 percent during the 1990s and early 2000’s, al l t ime high g r o w t h rats o f 7.8 percent and 9.2 percent were recorded in 1998/99 and in 2001/02 (due main ly to higher sugar and co t ton yarn p roduc t i on by 53 percent and 7 percent respectively during this year). T h e average annual growth in small-scale manufactur ing remains 5.3 percent as has been estimated by Census o f Small Househo ld Manufactur ing Industries.
M i n i n s : On average, the mining sector experienced a decline in growth by 0.4 percent but. the yearly estimates show that the growth rate in 2002/03 has p i cked up to 9 percent; this has main ly been due to higher p roduc t i on o f coal, dolomite, bauxite, r o c k salt and shca sand in the Punjab.
Construction: T h e Punjab has experienced an overall average annual increase of 2.1 percent in the value-added in the construction sector between 1990/91 and 2001/03: about the same increase as in the national value-added (2.3 percent).
Electr ici tv and Gas: Electr ici ty and Gas sector i s a relatively smaller sector in the Punjab’s economy as compared to the national average. Sectoral value-added grew at an average rate o f 5 percent p e r a n n u m between 1990/91 and 2002/03. However , the Punjab consumes about 60 percent o f the total electricity and about 45 percent o f natural gas p roduced in Pahs tan overall. Although the share of the Punjab Electr ici ty and Gas value-added increased in 2000/01, the 12 percent decline in the Punjab’s value-added i s because the sectoral value-added declined nationally (by 17.4 percent) due to a significant increase in international oil prices-the m a i n input in thermal electricity generation. As electricity generation i s only a small activity in Punjab, the decrease in sectoral value-added in the Punjab was relatively less, causing the prov inc ia l share to increase.
TransDort. Storape. and Communicat ion: T h e Punjab’s value-added in this sector grew faster than that o f the nat ional value-added. T h e Punjab grew by 5.6 percent pe r a n n u m between 1990/91 and 2002/03, compared to 4.3 percent growth in Pahs tan overal l during this period.
Wholesale a n d Retai l Trade: Since the t radmg activities in the agriculture and manufactur ing sector are the m a i n driving force to the value-added o f wholesale a n d retai l trade, the growth should have the same trends as in agriculture and manufactur ing sectors. T h e growth in the Punjab’s value- added in this sector has been posit ive in the last twelve years except one year: in W97, the growth of agriculture and manufactur ing sectors was also negative. Overall, the sector in the Punjab g rew at 3.8 percent pe r a n n u m compared to 3.6 percent at the national level.
Finance and Insurance: This sector g rew significantly faster in the Punjab as compared to Pakistan overall. T h e sectoral growth o f 7 percent pe r a n n u m in the Punjab over the 1990/91 - 2002/03 pe r iod was due to faster growth in al l three components, as financial activities m o v e away from their tradit ional base in Karach i to Lahore a n d other u r b a n areas in the Punjab. This i s ref lected in a somewhat h igher deposit m o b f i z a t i o n in the prov ince vis-;-vis the country as a whole. T h e national growth in this sector between 1990/91 and 2002/03 was abou t 4.8 percent p e r annum.
113

OwnershiD a n d Dwe l l i ng : L i k e the Construct ion sector, value-added in t h e ownership o f dwel l ing sector g rew at abou t the same rate in both the Pun jab a n d Pakistan between 1990/91 and 2002/03 (5.6 percent as compared to 5.3 percent respectively in the two areas).
Publ ic Admin i s t ra t i on a n d Defense: With recru i tment b a n in place for most of this per iod, to ta l value-added in pub l i c admin is t ra t ion a n d defense g rew relatively s lowly at only 3.6 percent pe r a n n u m between 1990/91 a n d 2002/03. T h e sectoral growth rate in Pun jab was somewhat h igher the nat ional rate, leading to a marg ina l increase in the Punjab’s share in na t iona l value-added from 52.4 percent to 53.6 percent, largely because increase in the c iv i l services s taf f in t h e provinces.
Services: Based on calculated numbers on value-added in services sector i t i s apparent that the growth in services sector in t h e Pun jab has been qui te robust (6.5 percent p e r a n n u m between 1990/91 a n d 2002/03) w h i c h matches the nat ional trend. As a consequence, share o f the Pun jab in nat ional value-added in the services sector has remained m o r e or less constant a t abou t 62 percent.
114

REFERENCES
ACO 2000, Pakistan MouTa Statistics, Agricultural Census Organization (ACO), Statistics Division, Government o f Palustan, Gulberg 111, Lahore.
Alderman, Harold and Paul Gertler, The substitutabili0 ofPublic and Private Health Carefor the Treatment of Children in Pakistan Living Standards Measurement Study, Working Paper No. 57, World Bank, Washington, D.C. 1989.
Ali, Mubarik and Abedullah, Nutritional and Economic BenGts of Enhanced Vegetable Production and Consumption, Journal o f Crop Production, Vol. 6, No. ‘/z (#11/12), 2002, pp. 145-176. 2002.
Ali, Mubarik and D e r e k Byerlee, Productivip Growth and Resource Degradation in Pakistan’s Pzqab: A Decomposition Anabsis, Policy Research Worktng Paper No. 2480, World Bank, Washington D C , 2000.
Andrabi, Tahir, Jishnu Das, and A s h IUlwaja, The Rzse ofprivate Schooling in Pakistan: Catering t o the Urban Elite or Educating the Rural Poor?, “eo, 2002.
Bari, Faisal and Ali Cheema, Barriers to S M E Development “eo, Lahore Univers i ty o f Management Science, Lahore. Study financed by the Asian Development Bank, 2003.
CIET 2003. Communi0 Social Aud i t Report. National Reconstruction Bureau, Government o f Pakistan, Islamabad, 2003.
Das, Jishnu and Jeffrey Hammer, Strained Mery: The Qualig ofMedical Care in Delhi, Policy Research Working Paper 3228, T h e World Bank, Washington DC, February 2004.
Deininger, I<. 2001. “Land Policy and Admtnistration: Lessons Leamed and New Challenges for the Bank’s Development Agenda”, Draft “eo.
Deininger, I<., and P. Mpuga. “Land Markets in Uganda: Incidence, Impact, and Evolution over Time.” Policy Research Working Paper, The World Bank, Washington DC, 2003.
Fan, S. and N. Rao, Public Spending i n Developing Countries: Trends, Determination, and Impact, EPTD Discussion Paper No. 99, International Food Policy Research Inst i tute, Washington DC, 2003.
FAO, The Markets for Non-Traditional Agnictrltural Exports, Raw Mater ia l Tropical and Horticultural Products Services Commodties and Trade Division, FAO, Rome, Italy, 2003.
Faruqee R., and J. R. Coleman, Managing Price Rzsk in the Pakistan Wheat Market, World Bank Discussion Paper No. 334, The World Bank, 1996.
Glinskaya, E lena and Jyotsna Jalan, Improving Primary School Education in India: A n Impact Assessment of DPEP-Phase I, The World Bank, Washington D C and the Indian Statistical Inst i tute, New Delhi. Processed. 2003.
GoP 2002, Economic S u r q ofPakistan 2001-02, M i n i s t r y o f Finance, Govt. of Palustan, Islamabad.
GoP 2003, Accelerating Economic Gmwth and Redua’ng Pave%: The Road Ahead, Pover ty Reduction Strategy Paper, M i n i s t r y o f Finance, Government o f Pakistan, Islamabad.
Hughes and Dunleavy 2000, Indoor Pollution and Heal th : Why do babies and young children d ie in India?, ”eo, World Bank, Washington D.C.
Jimenez and Sawada 1999, Do CammunipManaged Schools Work? A n Evaluation of E l Salvador’s E D U C O Program, World Bank Economic Review, Volume 13, No. 3. Washington D.C.
115

Malik, S. J,, Agriczrltural Growth and Rural P o v e q in Pakistan: A Review $Evidence, Asian Development Bank, Country Office, Islamabad. 2003.
Nabi 1988, Entrepreneurs and Markets in Ear4 Industrialiyation: A case stuh from Pakistan, International Center for Economic Growth, ICs Press, San Francisco, California.
Nicolaides, L., R. Coker, P. Wareing and M. Nagler, Food Safe0 and the Developing World, Natura l Resources Ins t i tu te , The University o f Greenwich, 1997.
PERI 2001, Development Ranking $Disticts $Punjab, Punjab Economic Research Inst i tute, 2001.
Salam and Mukhtar. Count9 Paper on Pakistan, Agricultural Prices Commission, Government o f Pakistan, Islamabad. Paper prepared for the Workshop on Agribusiness: From Parastatals to Private Trade held at New Delhi, India, 15-16 December, 2003.
Schiff M. W., and A. Valdes, The Plundering afAgkculture in Developing Countries, T h e World Bank, Washington DC, 1992.
SMEDA 1999, Strategy Development in Milk Production and Distribution, Smal l and Medmm Enterprise Development Authority (SMEDA), D a q Division, Agriculture Sector, May 1999.
SMEDA 2000, HEXPO 2000 and Beyond, Small and Medium Enterprise Development Authority (SMEDA), Agriculture Sector, Lahore, Draf t Report, 2000.
LVdhamson, Tim, Masroor Ahmad, and Samantha Smith 2004, Devolution and Service Delivey in the Puyab: Strengthening Health, Education, Water, and Sanitation Services, Background paper prepared fro the Punjab Economic Report.
World Bank 1993, ThailandFuel Option Stu4 Report No. 11948-TH, World Bank, Washington DC.
World Bank 1994, Thailand Mitigating Pollution and Congestion Impacts in a Highgrowth Economy. Report No. 11770-TH, World Bank, Washington DC.
World Bank 2002a, Pakistan Development Polig Review: A New Dawn. Report No. 23916-PAI<, World Bank, Washington DC.
World Bank 2002b, Pakistan Povenj Assessment. P o v e q in Pakistan: Vulnerabilities, Soczal Gaps and Rural Dynamics, Report No. 24296-PAI<, World Bank, Washington DC.
World Bank 2003, Improving the Investment Climate in Pakistan (&eo) An inves tmen t c h a t e assessment prepared by the World Bank Group in collaboration with t h e Small and Medum Enterpr ise Development Authority (SMEDA), Washington D.C. 2003.
World Bank 2004a, Pakistan Public Expenditure Management. Accelerated Development of Water Resources and ImgatedAgnkulture. Volume 2. Report No. 25665-PIq World Bank, Washington DC.
World Bank 2004b, Making Services Work for Poor People, World Development Report 22004, World Bank, Washington DC.
World Bank 2004c, Devolution in Pakistan: Assessment and Recommendations for Action, World Bank, Washington DC.
116

STATISTICAL APPENDIX
117

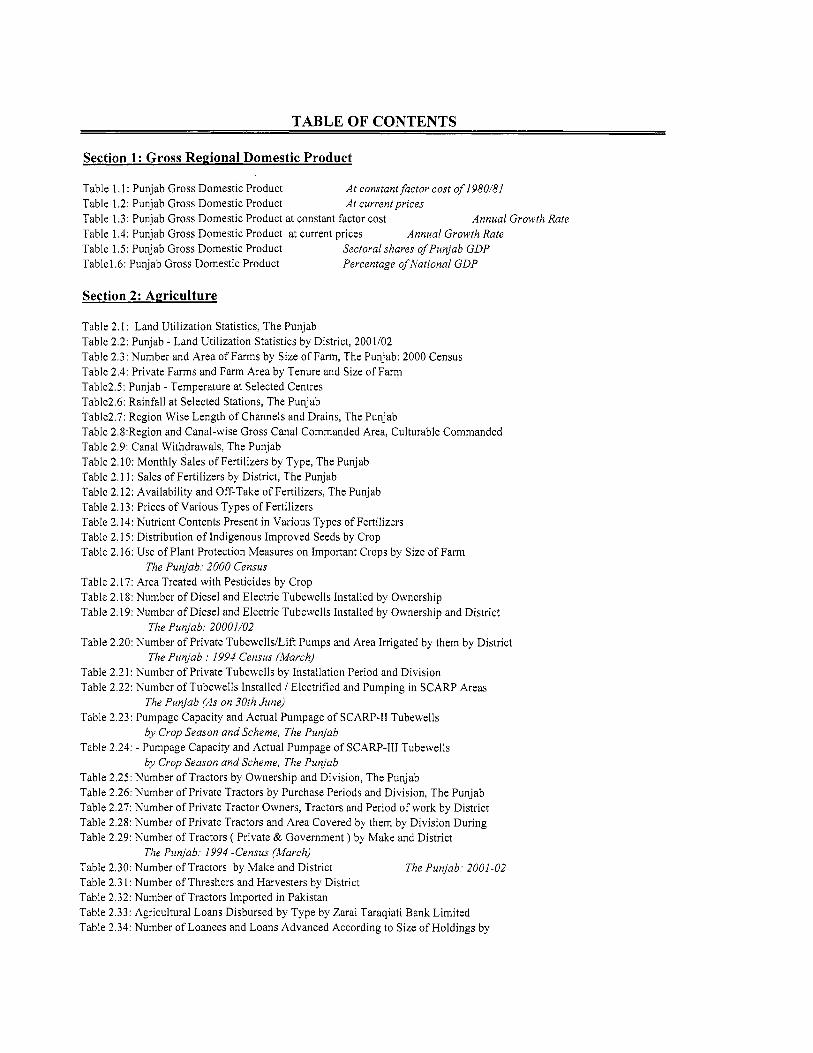
TABLE OF CONTENTS
Section 1: Gross Repional Domestic Product
Table 1.1 : Punjab Gross Domestic Product Table 1.2: Punjab Gross Domestic Product Table 1.3: Punjab Gross Domestic Product at constant factor cost Table 1.4: Punjab Gross Domestic Product at current prices Table 1.5: Punjab Gross Domestic Product Tablel.6: Punjab Gross Domestic Product
At constant factor cost of 1980/81 At current prices
Annual Growth Rate Annual Growth Rate
Sectoral shares ojPunjab GDP Percentage ojNationa1 GDP
Section 2: Apriculture
Table 2.1: Land Utilization Statistics, The Punjab Table 2.2: Punjab - Land Utilization Statistics by District, 2001/02 Table 2.3: Number and Area o f Farms by Size of Farm, The Punjab: 2000 Census Table 2.4: Private Farms and Farm Area by Tenure and Size of Farm Table2.5: Punjab - Temperature at Selected Centres Table2.6: Rainfall at Selected Stations, The Punjab Table2.7: Region Wise Length o f Channels and Drains, The Punjab Table 2.8:Region and Canal-wise Gross Canal Commanded Area, Culturable Commanded Table 2.9: Canal Withdrawals, The Punjab Table 2.10: Monthly Sales of Fertilizers by Type, The Punjab Table 2.1 1 : Sales o f Fertilizers by District, The Punjab Table 2.12: Availability and Off-Take of Fertilizers, The Punjab Table 2.13: Prices of Various Types of Fertilizers Table 2.14: Nutrient Contents Present in Various Types of Fertilizers Table 2.15: Distribution o f Indigenous Improved Seeds by Crop Table 2.16: Use o f Plant Protection Measures on Important Crops by Size o f Farm
Table 2.17: Area Treated with Pesticides by Crop Table 2.18: Number o f Diesel and Electric Tubewells Installed by Ownership Table 2.19: Number o f Diesel and Electric Tubewells Installed by Ownership and District
Table 2.20: Number o f Private Tubewells/Lift Pumps and Area Irrigated by them by District
Table 2.2 1 : Number o f Private Tubewells by Installation Period and Division Table 2.22: Number of Tubewells Installed / Electrified and Pumping in SCARP Areas
Table 2.23: Pumpage Capacity and Actual Pumpage of SCARP-I1 Tubewells
Table 2.24: - Pumpage Capacity and Actual Pumpage of SCARP-I11 Tubewells
Table 2.25: Number of Tractors by Ownership and Division, The Punjab Table 2.26: Number of Private Tractors by Purchase Periods and Division, The Punjab Table 2.27: Number of Private Tractor Owners, Tractors and Period of work by District Table 2.28: Number o f Private Tractors and Area Covered by them by Division During Table 2.29: Number o f Tractors ( Private & Government ) by Make and District
Table 2.30: Number of Tractors by Make and District Table 2.3 1 : Number of Threshers and Harvesters by District Table 2.32: Number of Tractors Imported in Pakistan Table 2.33: Agricultural Loans Disbursed by Type by Zarai Taraqiati Bank Limited Table 2.34: Number of Loanees and Loans Advanced According to Size of Holdings by
The Punjab: 2000 Census
The Punjab: 20001/02
The Punjab : 1994 Census (March)
The Punjab (As on 30th June)
by Crop Season and Scheme, The Punjab
by Crop Season and Scheme, The Punjab
The Punjab: 1994 -Census (March) The Punjab: 2001-02
TABLE OF CONTENTS
Table 2.35: Loans Disbursed by Purpose by Zarai Taraqiati Bank Limited
Table 2.36: Loans Advanced to Farmers by Commercial Banks in the Punjab Table 2.37: Agricultural Co-operative Societies, their Membership & Loans
Table 2.38: Area Sown, Irrigated and Un-Irrigated by Mode of Irrigation Table 2.39: Taccavi Loans Allocated, Disbursed and Recovered Table 2.40: Cropped Area by Crop, The Punjab: 2002-2003 Table 2.41: Number o f Mauzas and Cropped Area by District, The Punjab: 2002-2003 Table2.42: Area Sown, Irrigatied and Un- Irrigated by Mode o f Irrigation and District
Table 2.43: Area Sown-Total and Irrigated-under Important Crops Table 2.44: Area Sown under Major Crops by Mode o f Irrigation Table 2.45: Kharif and Rabi Acreage by Crop-Total and Irrigated Table 2.46: Kharif and Rabi Acreage Failed by Crop-Total and Irrigated, Table 2.47: Production o f Important Crops,Total & Irrigated Table 2.48: Per Hectare Yield o f Important Crops, Total and Irrigated Table 2.49: Area and Production o f Wheat and Rice by Variety Table 2.50: Area Sown-Total and Irrigated-Under Wheat by District Table 2.5 1 : Area * Sown Under Rice by District Table 2.52: Area* Sown Under Cotton by District Table 2.53: Area* Sown Under Sugarcane by District Table 2.54:Wheat Production-Total and Irrigated-by District Table 2.55: Rice (Cleaned) Production* by District
Table 2.56: Cotton Production* by District Table 2.57- Sugarcane Production* by District Table 2.58: Area and Production o f Various Oil Seeds Table 2.59: Area and Production o f Kharif Fruit,
Table 2.60: Area and Production o f Rabi Fruit, Table 2.61: Area and Production o f Kharif Vegetables, Table 2.62: Area and Production o f Rabi Vegetables Table 2.63: Area and Production o f Potato and Onion Table 2.64: Water Table Depths, Pakistan and The Punjab Table 2.65: Area and Production o f Pulses, Condiments and Fodder Table 2.66: Area and Production o f Important Crops Pakistan and The Punjab Table 2.67: Saline and Water-Logged Area by District, The Punjab: 2001-02
in The Punjab
Advanced/Recovered by Provincial Co-operative Bank, The Punjab
The Punjab: 2002-03
Section 3: Livestock
Table 3.1: Animals Slaughtered in Recognized and Un-Recognized Slaughter Houses by Type Table 3.2: Animals Slaughtered in Recognized and Un-recognized Slaughter Houses by Type and District, 2002-03 Table 3.3: Establishment o f Private Poultry Farms by District, The Punjab : 2002-2003 Table 3.4: Poultry Production Status in Private Sector, The Punjab Table 3.5: Performance o f Government Poultry Farms, The Punjab
Section 4: Mining
Table 4.1 : Minerals Production
Section 5: Manufacturing
Table 5.1: Performance O f Vegetable Ghee Industry

TABLE OF CONTENTS
Table 5.2: Performance o f Sugar Industry Table 5.3: Performance o f Beverages Industry Table 5.4: Performance o f Cigarettes Industry Table 5.5- Performance of Cotton Textile Industry Table 5.6: Performance of Jute Textile Industry Table 5.7: Performance of Woollen Textile Industry Table 5.8: Performance o f Leather Tanning Industry Table 5.9: Performance o f Footwear Industry Table 5.10: Performance o f Paper & Paper Board Industry Table 5.11: Performance o f Chemical Industry, The Punjab Table 5.12: Performance of Fertilizers Industry Table 5.13: Performance o f Cement Industry Table 5.14: Performance of Re-Rolled Steel Industry Table 5.15: Performance of Bicycle Industry Table 5.16: Performance of Diesel Engine Industry Table 5.17: Performance of Electric Fans Indutry Table 5.18: Performance o f Electric Motors Industry Table 5.19: Performance of Electric Transformers Industry Table 5.20: Performance of Tractor Industry Table No. 5.21 : Summary Statistics of Censuses of Manufacturing Industries Table 5.22: Summary Statistics of Census o f Manufacturing Industies by Major Industry Group, Table 5.23: Summary Statistics o f Census o f Manufacturing Industries by District, Table 5.24: Number o f Registered Factories by District Table 5.25: Number o f Registered Factories by Major Industry Group Table 5.26: Production o f Major Manufactured Items, Pakistan and The Punjab Table 5.27: Industry-wise Loans Disbursed by Pakistan Industrial Credit and Table 5.28: Industry-wise Loans Disbursed by the Industrial Development
Section 6: Pomlation
Table 6.1 : Population Census Table 6.2 : Area, Population, Percentage of Area and Population, Density Table 6.3: Area and Population by Tehsil, The Punjab: 1951, 1961, 1972
Table 6.4: Population by Tehsil and Area, The Punjab: 1981 and 1998 Censuses Table 6.5: Population by Tehsil and Sex, The Punjab: 1981and 1998 Censuses Table 6.6 : Population by Age group ( 15 Years and Above ) ,Marital Status and Sex, Table 6.7: Population by Religion and Area, The Punjab: 1998 Census Table 6.8: Disabled Population by Nature o f Disability and Sex Table 6.9: Population by Age-Group, The Punjab: 1998 Census Table 6.10: Population o f Major Cities / Towns
1981 and 1998 Censuses
Section 7: Provincial Finances
Table 7.1 : Punjab: Current Receipts Table 7.2: Punjab Current Transfer Table7. 3: Punjab Total (Current And Development) Expenditures Table 7.4: Punjab Current Expenditures Table 7.5: Punjab Development (Revenue And Capital) Excpenditures


V I
4 SI
'J I


a
0 .- +
Z C
s C
L 3 - U u d $ g $ .e c w

V E
9
t
J
a
8
2
w m m c a m * " 0 m" m" m-
m w m w m d b b b
w m -
m* m* m" m o o 0 0 0 -
m - 0 w r - m e b b
% ; F B - - 0 m" m" m"
c a w - m m w N, m m -

0 W
m P- - l-
2
vi vi m
m m m
- N
%
W 0 m
00
II?
vi w
m Q
3
C
5 '8
5 B e
m m m m W N P - I n
N I n
3
i
i
- 2 ' v ,
- 0 - 0 N N "
Lnbl-l- V i t -bb
- - v i m W N m w " N N

m - m - m e - - -


9 9 9 2 2 2
? e m m m m N - N
‘ ? ? ? 3 3 2
? Y ? 3 3 s
II“
r ? ? ? 2 2 2
o q ? ? 2 2 2
- “ ? 5 2 2
? ? ‘ ? - O N m m m
? “ ? 2 9 2
? ? ? 2 2 2
- ? r ? r 4 N b m m m
t ? “ 2 2 2
2.2 m m m
w r ? 9 2 2 2
2.2 m m m
9 9 ” 2 2 2
2 2 2 ? ? w m m m m m w
v m w 01” 2 2 2
r - 0 0 m m m m 2 2 2

'0.5 U
r - N W m o m m m N - m P - d N W u . 2 N o -
0100. "
C??X N
m - m w d m N - P - ' L " "
m m
0 . 2 2 z m m m -
m o o - o\ m 2 m
- t 9
m -" N" N"
d w m o m - w r - w m o w m w m w r - m
' " 9 w o o c a r 4
r - w r - w c o m d 0, w
0" N N r - m w m
o o w e m m m m v i m
L r - m N N
- N 0 0 0 0 . NO\ ' 099
- m
- r - m d d m w r - m
d m w 2 P - N
d d m m w o m 0 N N d
W ~ P - * o m N N
-" m m m 2 2 2
d m w " 0 . 2 2 2
r - c o m m m m 2 2 2
8 Z 2 0 0 0 " N

t - N ~ O d O m v ) O m 0 r - Q ' v ) m e. m N t- 2\0 d N
h
E 5

- m m Y 3J 0 .- a

” “ 0 0
. . . I . . b P P i
? o s ? b m b
o r ? ? - N -
“ ‘ ? o s b b b
m - ? P i P i N - ? - Pi“ m y ?
“ N “ 0 9 P i P i - in ; a
c = - Q
? C ? ? b m b
? ? ? 0 0 0
? ? “ 0 0 0
? ? ? - - - o s ? ? I--
? l o “ N
r ? ? ? - r ? o - - -
- ? ” 0 0 0
o r ? - ? o o z “ o r ? p ’ r - c e
“ b
-“ m m m e e e 2 2 2

Yr) s 0 0 N
N
0 0 N
8 c
m
0 0 N
s - N
0 0 N
8 c
m
0 0 N
s
N
0 0 N
e 3
- e s


a g " " $ $ 1 0 0 0 0 - 3 -
2 2 2 2 2 2 m m m m m m
0 0 0 0 2 2 t t
2 2 2 2 m m m m
0 0 0 0 m m m m ""
0 0 0 0 r - r - I . I . ""
2 - - - - - - - - - - P I - " " " " d d d d d d d d d d d
.

L
c
? 9 9 9 0 " 2 8
9 9 2 %

n
a n.
m e
Q,
d e u n 4 8
e
h
in
B I : v1 a 0
M FI e U
L 0 e 0
a i c1 v1
E .-
.- c1
n .- a 2 .. M
@J z
P - N ~ d b m m m w
m z m m w m m m
o w m F o r . d"
O N 0 w m m
m o o 0 " D D
N o m m t i o
N d N N
w w z
r - o m N w N N
m o w d" m o m
o r . - * * - m w m $" 2" 2"

v1 a
u 0 0 0 r 4
P 0 E
.. *-
a3 E E" i=1
a,
L
L 0 e, N
h P
a
iij
v1
E u U E m c, L 0
I $
s e 0
E 2
E 0
u w .- U
U
E
h
8
& U E 0
i 0
3 .. w 2 a, 5
,
3

1
I " v,
- 6 6 0 ' " s
I ' V I m m
v i - m o W " 6 W W 6 6
v , r - w t - - v i r n o m w a r - w
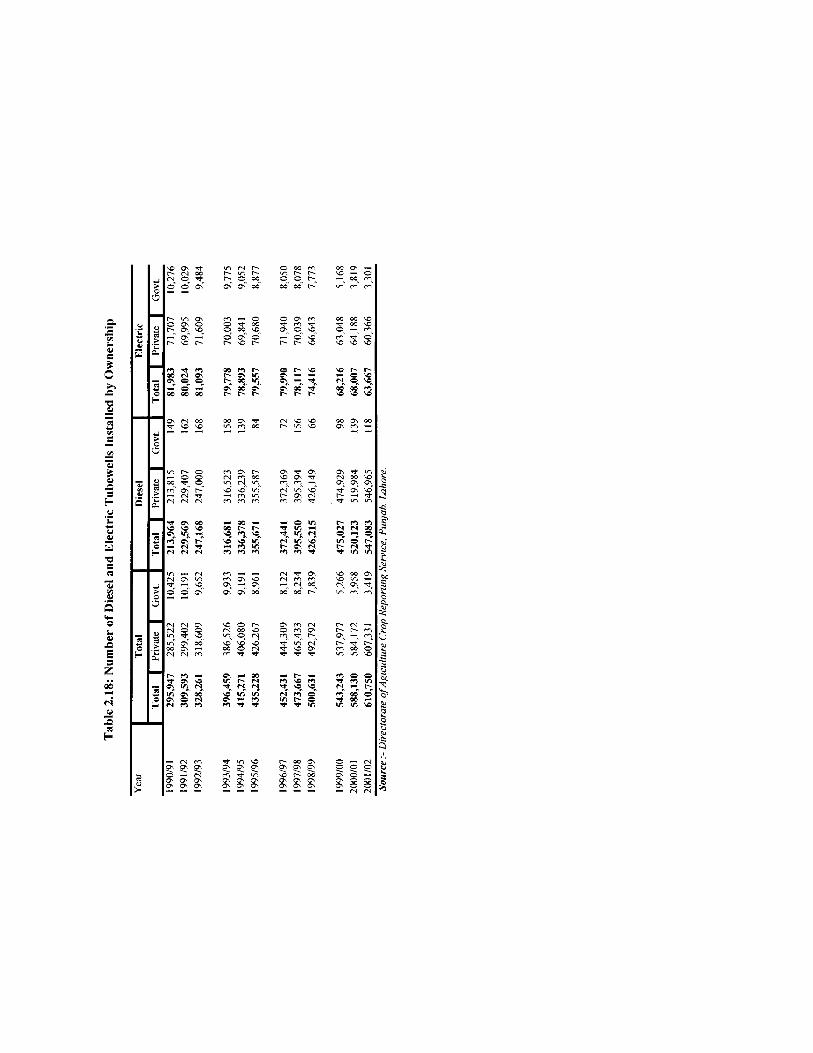

'I

Y u L Y v1
.-
.- A Y h P
$ 9 h P
L L 3
m z N N Z m m m
m o - N O vi N r - b Z O Q \
m w - m - f “ d

3
m - r - m z N
w - w w m -r N
2 0 ='- - N w

0 v, Y 8
PL rr
W c?
h \ > ?

3 h
h e 1 \

m r - a .
0 0 0 0 0 0 w w w w w w
" b m w r - -him e m w m a . m "a. e e e e e e 2 2 2 2 2 2
-" w m r - W F W
m w m r - 2 - " b " 0 w w r - m i o w
9 0 - - - c w r - w w w c

- - w - P - * m m m
m r - - m r - b ~ m m - r - r - z 2 2
0 ' 0 N 2 2 %
2" r - m " N
- Q I w m r - 0 0 c a m - 0 ' - a m m m
c Q c Q o \ m m 0 " N
0 0 0 ' 0 0" m ~ m
m - r - 2 2 =
m m r - 2 = z
0" m m m
m t - t - w w m - m m m m m
W N m m m m w m w b - 0 PI"
3" " r 3 3 -
m z m 0 0 w w w
m m m 0 0 w w w
bl
2 2 2 w w w
2 2 2 w w w
2 2 2 w w \ o
2 2 2 w w w
S P P w w w
2 2 2 3 3 % "" -- n- - . . 3 - 3 -- "" n- .. ..
3 3 "
" b
0'" e e e - ~ m
2 2 2

c o o m u w u
o s 0 w w w
s s s w w w
t - N m = 0 0
r - u m w r - 2
* w * I n t - M - 3 N
0 0 0 w w w
s s s w w w
- - * " N
2 2 2
- m m
0 - N 0 0 0 0 0 0 " N
B e e
2" c o t - #
W O N * a m N - 3
m m m 0 0 0 0 0 0 w w w
0 0 w c 2 2 2
N I - 0 m w m N N N
- m - 0 0 0 0 0 0 w w w
m m m 0 0 0 0 0 0 w w w
" U m a r - - " u m w m m m m m m P e e e e e 2 2 2 2 2 2
r - " m m r -
- o m 0 0 m w
05" t - t - q c -
- - m 0 0 0 0 0 0 w w w
m m m 0 0 0 0 0 0 w w w
w w o W W I -
3 2 2
c a m 0 r - 0 0 0 1 m m m e e 8 2 2 2
8 8
m m v 0 0 0 0 0 ( w w u
3 3 2 2 2 ,
- P I ? o o c o o c o o c S L ; N N ~
a- .u P h e, 5

n m C *-i
E Q,
C 0
>
U E m a
._ .- wl
6
.- 5
0
i3
E
L a2
g x P
0 V c)
c rr 0 L Q) P
2
x $
z .. In
a2 P -

W P ‘010 ‘or- w P w m P
“ 8 8 “ N
- 0 3 “ 2 “ “
c w O N Z” 2” N
- Y - Z 2 0- m”
W P W r. w w a w l - U w w l - VI10 vi m w 1 0 w
O - 2 2
N I?
r - 0 w m 3 ;. N
R 2”
0 m s x w”
N P z z 2- 10”
W
F N
l- m x
e a 4 $1 a d
a - e 3 f j

T - LT c
i
e r s P 0 2
z vi
0 m N
s W
i- m
2 N
vi N N
W 3
i- .s
m 0
2 -
P I D - .- L L
W vi vi
0 00 d
W m 0, -
% 2 m
3
i- 3
9 m
m 0 vi
i- W
0 N m"
g !
3 m
m vi
i- i- d
If: Q' 3 4
i- W 3
3 W
W W N
m m 2
5 n
a!
.- - E
0 N m
0 8
2 W
m m t-" If:
W W 3
W W N
iz d
It 2
m c -0
P l / i


Y .- Y
B h n
i
Q - -
Q r 4 -

L. 0
- - - _ e


" W U ' i f m - c - r - u - o c w N U
0" m 9, c
a m ' 0 m m
m W m C
0" b : c
- m o c - m m o m* m D 2 - r N P - v
m .-


m m m b r u 2 0 -

P - - m b l n m
w m w W N W zm 3
" b -" m m m e e e 2 2 2
m o o w l n w
c a m 0
P - c a m m m m e e e 2 2 2


H


- N
m W
2
$1 2
m m 3
m t-
2
m m 2

51 e m
.- P
d
e m - - - * m a

m r i b " N
o o w v m m m
- r . w m r i m m r i N
w w w " N
m a d m m m
m - r i m m w
m m m ~ m w b m b
~ m b m w r - e e e e e e m m m m m m 2 2 2 2 2 2 - N m w m w
o o m -
m c r m m m m
m - r . m v w
m b 2 m o m m w
- r i m e e e 0 - N 0 0 0 0 0 0 " N
N b t - m m m
q P

N - N “ N
M Z M
“ c e “ 0 3 m m m
- - 0 w m v , u u t i
- m u . 9223
t i l o t i “ N
u m t i “ N
w w t i w m t i m m t i
w m z N w u t i v ,
m - w c e w c e
r - m o 2325
m w r - “ 0
t i m - r - w c h P e e e e e m m c h c h a m 2 s 2 2 2 2
N ~ P N N C
m m r N N C
m r - 0 t i t i v w m r
w o 1 m m k - m m i c
w m v “ E
t i m c r 5 5 :
- ~m a : h 0 0 0
0 0 0 0 0 0 N “

- 4 ’ 9 0 9 2 2 2
? ? 9 o o v i b S
I c B
i
I
i
F B
I
: c
1 : f
I c :
-, vi Q\ - 4 6
c ? ? ? b b b
‘ “ 2 rl - 0 0 - o d w
m w w $ 6 6
‘ 9 ? c ? m w w
y o e m W
“ I ?? z z z
v i w q vi
? ? ; 3 - 0 “
2 2 : “ N
00-b
“ N w v i w
? 0 9 ? - 0 - “ N
m m - 2 2 % w D N 0 b b b
p ’ b - m m b
- ~ m 8 P Q 8 Z f i 0 0 0 “ N

t t " ! 2 2 2
'?To9 " 2 "
" ? - 2 2 2
" ' 9 1 2 2 2
P - 0 9 - i D w

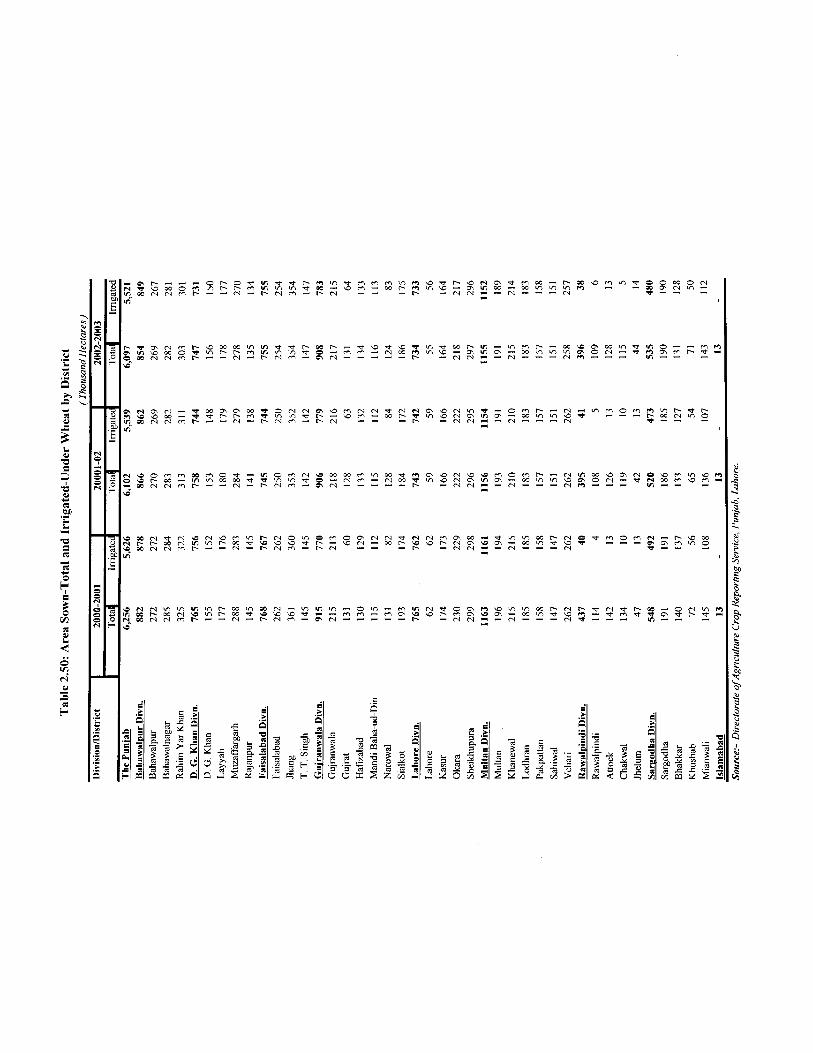
3 a ? a 1
1
a a
> >
> >
i
! ! I
! !
I


c W
L c VI
.- B h 4 B c m W L L I
U C m m
.-
- c 5 0
U .- Y
a
2 U
a


W W

m 0 0
x 0 0 N
- 0 0
0
N
7 8
0 0 s m m 2 I

c 0
U S m
.. W x
0 0 6 a m m
w - p 1 z z z
m m m - m m “ m “ N


m W ~ v i r - - f m
-" N W N
0
N r . Z Q I I ' . d N m vi N
m 09
h
t 2.
h
v 2


5 2 3 w w w
N - N 8 2 2
r - o m N N
s o 0
w o w w w r - b m -
m w r - b m w " o \ e e e 2 2 2


w z m m w e "
m w u - vi"

P a E 3 a Q)
*-i
E W E 0 E a Y v1 .- 2 i2 e u Y E a L 0 Y
Y E" LI 0 C 0
V a W
a 51 E m m a2
.- Y
E
$
: c"
.. \o
Q)
5


L 0 CI s M 3 m
31
.. 2


M 0 0 “1 64 0 :: .. n m c a h W
E
h n
i?
e” U - 3
2
0 0 0 ‘ 0 - m a . 0 t - N d
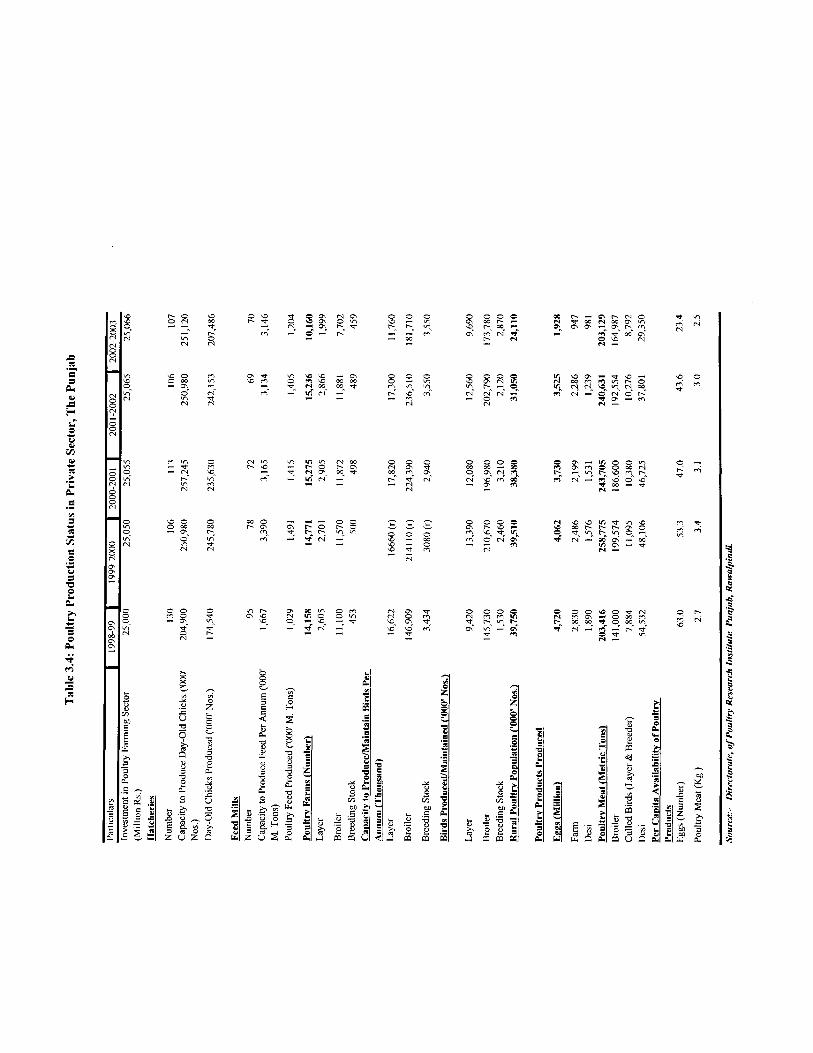

W E m W m N d 00 m -
m
0 W N N
r. W m m m m
0 0 0 m
m
m N - W W P
m W
m IT m
r. 52
m d 0' m
W
r. W m
L
e"
L
d


0 0 0 0 0 0 0 0 0 0 0 0 L " v l v l v l m v l v l v l v l v l v l v l


q 0 - w i
m m m m m m m m m m m m

x
m - b m * * w a r 4 d d m
m w m 2 ” o ‘ 8 6 ”
“ N “ m “ P I “ N
m o o m N N ~ “ N
% S T ; -“
o w 0 r i m e “ N
m l n m b b m “ N
m m r . l n l n w “ N

m" oo" m" w- w" w" oo" m" m" m" m* 00"

r- vi
N 09
0 r-
Z" C W
3
C m Q"
N
W d
N vi W
iz 3
00 N m.
d N m
m
m" N - m r-
C W
2 m m
3
0 d m vi
N % 0 0
m vi N
m m
hlz Q ) N hl
z N
m r-
r- w N
m m
m m
r- N
3
W m d d m N W C N
m vi m vi W W W m - m
Ki W N d N d N r- N W N
W r - r - r - r - " " N
r - r - r - r - r - N"" P- N r - r -
N N r- N
r- N
W
vi m e 2
m
N m e 2
vi
d m e 2
d
m m e

w m - "I- -* "* "" - - - I - m o
2 2 1 v i - 0 8 Z 2
= * I - "I- m m w
I T 2 2 v i " "
v i 0 ~ 0 ' 0 ' m "
O W " 2 0 2 0 ' 0 0
- a m o m 2 "
- 8 0
m m m w w w m 09 04 m m m
2 2 2

2. 9 Y
U E M
L m
5 0
z c 0 W 0 E m E 2 2
e L
.. W E
2 2 2 2 2 2 " 2 " 2

v i m 0 N - 0 L? L". Y m m b
w w m N "
- b e m m m

3
' 0 ' 0 0 = 2 2
w a
m w w w m m 2 2 2
m a w w a m r - r - w
w a w r - m w o 0 =
r - r - r . r . r - r - r - r - r-
r - w m 2 2 2
r - o m 2 ' 0 ' 0 - - -
m o o r - m o o " b " m
v l w w N r - m
r - r - r .
b r - 0 N O " ' O N 2 2 2
r - r - r .

8
E 3 E .s e 2
5 e 3
W w w W w w w W W w w w W
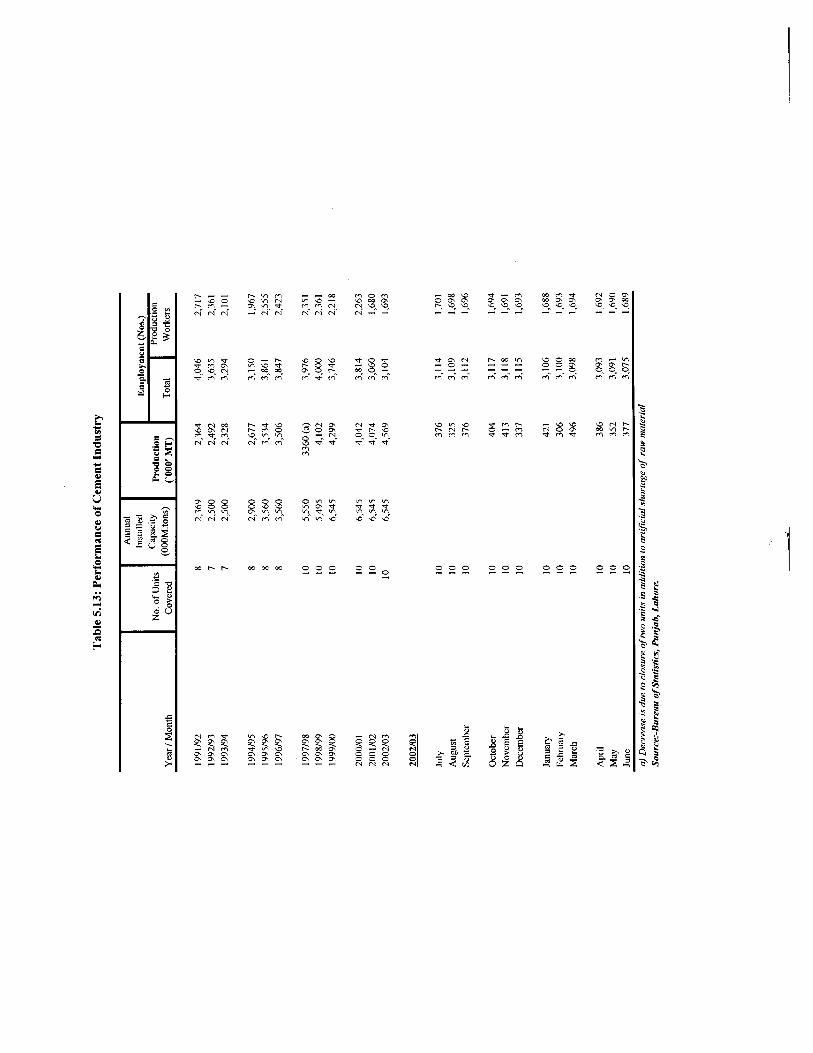
i 0
a c c i o 0 0
" N "" v? '""
c a r - r -
" * - m m a a a e e e 2 2 2
awl10 r - m r - m m m

Ir 0
L co a" f vj
m m m m m m R 3 3
0 0 0 0 0 0
0 0 0 2" 8 m m m
- m m e e e 0 - N 0 0 0 0 0 0 " N
b d d m m m 3 3 . 3 b d d m m m


w h o * * w
r - m w w w r -
m m w ' 2 2
w w w VI"
w w w 09 09 W"
m m m " N
w m o e e e 2 2 2 r - w m m m m


* - - - 0 2 0 2 0
2 2 2 - w w 0 = =
m o m O b W e e L "

m m m m m 00

c 0
.. 0 x
b - b C O N w w w
b b b
b - 0 0" w w \ o
w c a m 0 0 W W 01"
b b b b b b
m - 0 c o c a 0 0 m m m
m w m m m m m c o o o
b b b
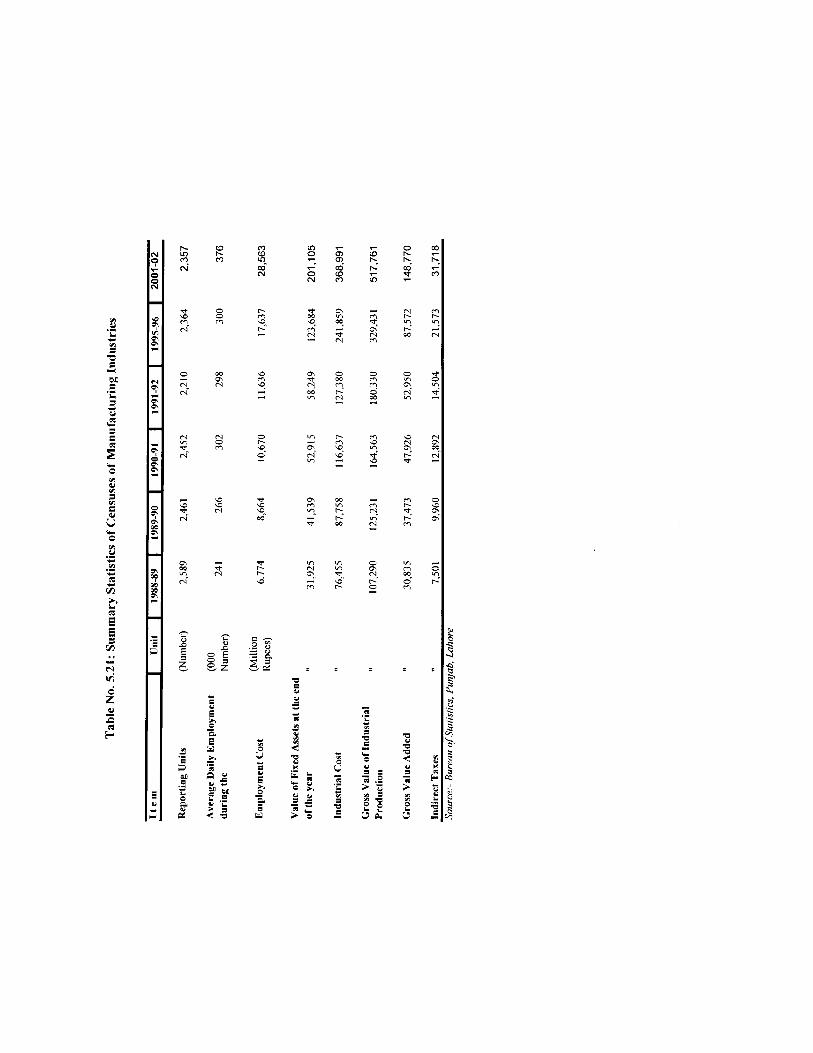
!
\
C
i I
F I ?
i
F i r
F c t F
J

010 3 2 P- N"
N N
: r r
2 a
vi
8 a ". In
2 % P W' 2
- r - e m
P - -~ m
P L 0 .- 3
P W E. P" % -
m u . m l n -" z.
m
c m
N Z" z
u . - 8 %
a ?" N W
m m r - r - - ' m - I. z P - ' - N N v i P ' w m 0 In L
e 9 I
m - W
m m m N 4:
6 P 3
6 5 P
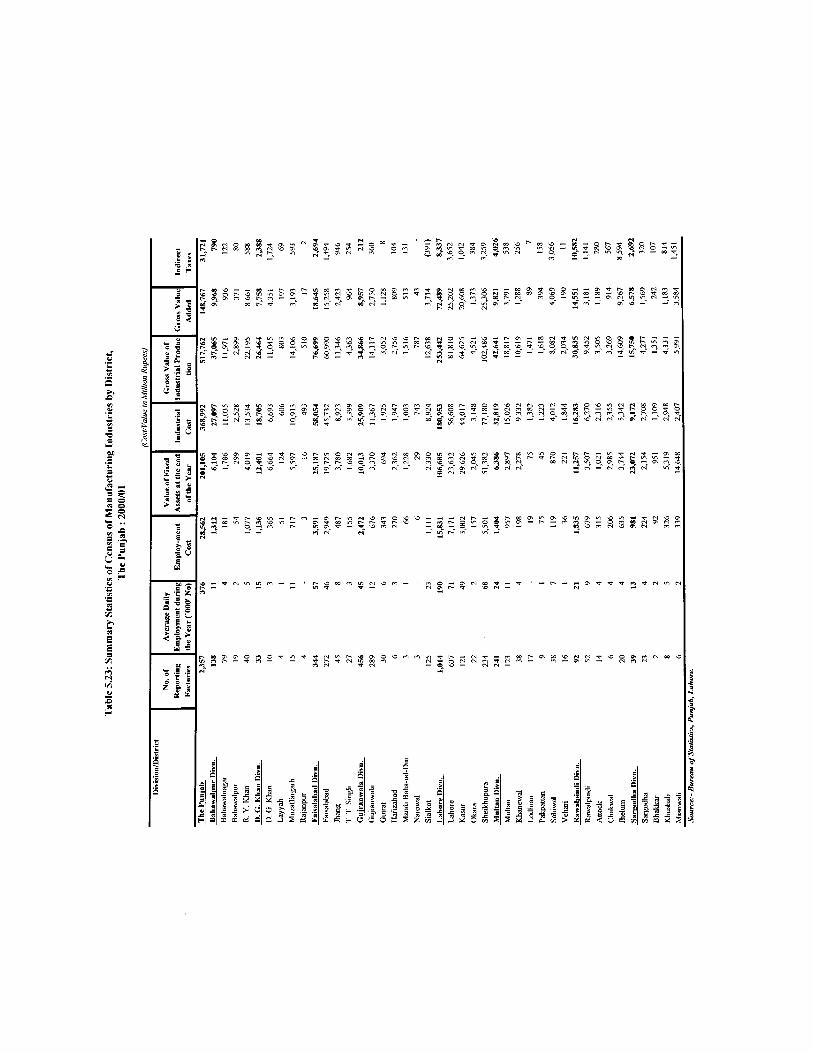
e m w - 2 " " - R
m - w v i z.
Q v i g 5" N -
I C , t
m 2
m m P
x m 2 0 1" P P " - t P N
n w Q F . V I P . * N ' o m w m Q N m m
2 B
1 3 E n 5 3
c c
anm 5 c


n
e 0 c * a -0 3
vi x 8 lL
f f i f f i m m
m W ' -
P-r - 1 N m r-
m t - m m 00 N r-
0 ' 2
o m 2 m u r-
N w m m r-
t- * w - m m ;v;zz
m o m c? N m m
c a m 0 1 b Q p ' m u m m m

I B L
w m o m P - m
o m 2 l o w x m
p

W W v, 0 P-
O vi 00
vi 0 W
m “0
d N m
m W N W

v, N
v, N
2
O N
d
I.-
m d
0 , "


G. : N
2 0' N
0' m
W
R N
m m.
a m ?
r. : m T m
N
2 m 2
x oa :: z r j
m
a '0
00
N m m
vi m '0 N
m d a
N 00
0 0 N G. m
a N m 01 -
2 i 0
r. r. 00 W s d IA 4
: s N m 0 v
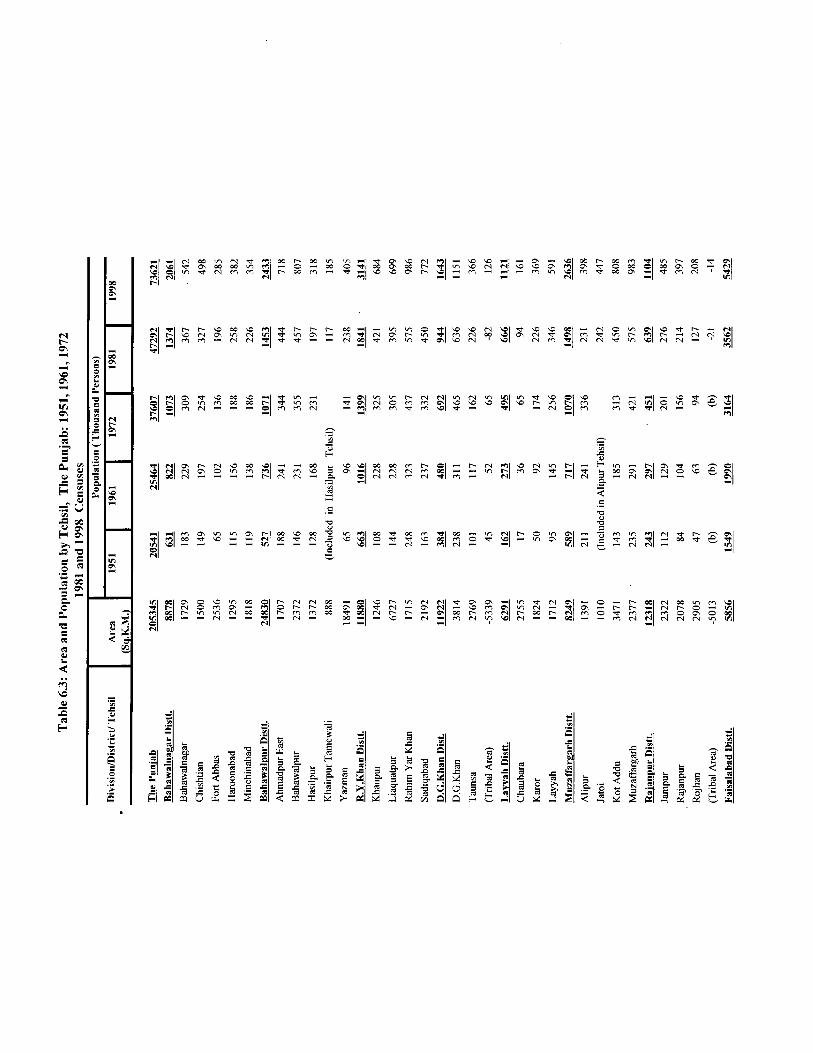
= .- E =' .- v) c
L C .-
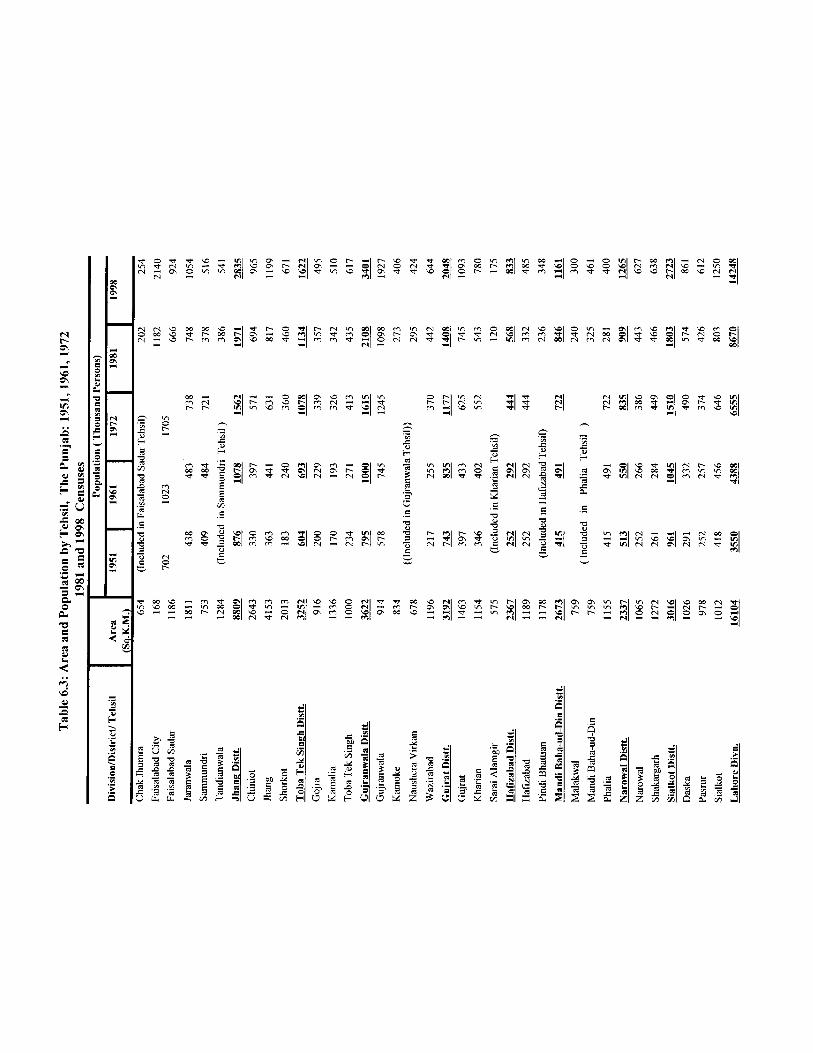
O b
N s w W b O N b b 0 - O W m u
O W P - 0 0 O w " u m w w .-
N W 2 % - m l c i
1 2 0 . "
- m m w w o b w N m I * b
b w m P I N O l n v w
h h s .- E h - .- E
m Tii 5 E z
- 0 w u m m w w b W I N N
N P I W m l n l c i m N u
m
s a
.- - m N
2 C .- C .-
3
XI r 4 0 I.
u00 w w m P - % %
P - P - w w 2 o " 0 NP-

C .- C .-
c .- B L
C .- C n .-

.. a m E -- 2
h a


3 3 i


P ' P ' 3 - N " -

.. P m C *w
a e
h P
.. 2

w w d m ~ ~ t - - m - N c N c O m 2 N Z l - J " O O m m m o m m N w m m q , d m w e - N vr m
i i N -
3 e m -
C .- a


..
c


r h U E m

O ~ N t . m m w 0 . N m ~ - O m w d d N O u m t . N ~ 0 . o z P 4 t . o m.o .m.o .m.m.0 .m P.IIc-4 P1woOc " " _ II m w m d m m N " N " - - - -
0 0 e <

a D
8 a
m m O N l n a m 3
N
o m w m a m o m 0- N N N N N N -
v, Ici N 0 m a m t- N o\ 3 w t- a t- a a
t


U
4
rr)
%9
c E
a 9 10 .-
.-


m 0 L
Y a a 8 i
d
Y = R Y .-
.. 2
m o o 0 W w W" -
OD
CI E v1
g o o 0 m - m c c o N
2 w o o 0 C
2
c o o v l 0 m 04 -
W O O N b 2 d - z o o m m - N - O C O d 2" d
M .- 5 v)

EXPLANATORY NOTES ON
MANUFACTURING INDUSTRIES SECTION
This Section includes statistics on the following topics:.
i) ii) iii) Registered Factories and their Employment by District and Industry,
iv) Industrial Credit.
Monthly Survey of Industrial Production and Employment Annual Census of Manufacturing Industries (CMI).
MONTHLY SURVEY OF INDUSTRIAL PRODUCTION AND EMPLOYMENT.
Statistical tables included in this section contain data on production and employment for the years 1991-92 to 2000-01 and monthly data for 2000-01 as well in respect of 34 items manufactured by 21 selected large scale industries in the Punjab.
This information has been collected through Bureau’s Monthly Survey o f Industrial Production and Employment which was started in October, 1971. Industry- wise proformae are used for the purpose. Data from non-responding factories i s collected by Bureau’s 0
Coverage i s complete in respect of Cotton Cloth (mill sector), Woollen and Worsted Cloth, Jute Textile, Sugar, Cigarettes, Cement, Caustic Soda, Sulphuric Acid, Fertilizers, Bicycles, Soft Drinks and Juices. Coverage for the remaining manufactured product
1 Cotton Yarn, Vegetable Ghee and Paper and Paper Board . I t excludes some units. 2 3
4
5 6 7
Woollen Yarn, Knitting Wool and Blankets: It excludes some units. Leather Tanning: Al l large Tanneries are covered. Footwear: 13 large and medium size factories including Bata, Service and Raja are being covered. Production of these factories was about 98% (of Footwear Production) of registered units of the Province. Steel Re-rolling:- According to Bureau‘s Establishment Survey o f Steel Re-rolling Industry conducted during 1975-76, about 90% of the Production i s being covered in the current survey. Diesel Engines:- 23 Factories whose production i s about 75% of the total production o f Diesel Engines are being covered. Electric Fans:- All large and medium size factories are covered. Stem for 1morovement:- To comolete coverape in resoect of Woollen Textile, Leather Tannine. Footwear, Electric Fans, Steel Re-rolline Industries Efforts are made to keep the list of factories up-to date in consultation with Central Board o f Revenue, PICIC, ADBP and Directorate of Labour Welfare, Punjab. Scope o f the Monthly Survey of Industrial Production and Employment i s being extended to some more Industries.
ANNUAL CENSUS OF MANUFCTURING INDUSTRIES (CMI)
This section contains tables on Summary Statistics (Fixed Assets, Employment, Employment Cost, Industrial Cost, Value o f Production, Gross Value Added of registered factories reporing for the annual Census o f Manufacturing Industries for the years 1988-89
Federal Bureau of Statistics:- Planning o f Census in collaboration with Provincial Bureaus o f Statistics and Directorates o f Industries. Preparation o f Questionnaire, Tabulation Plan and Editing Instructions in consultation with all concerned Federal Ministries, Provincial Departments and Preparation and Publication of CMI tables at national level. Maintenance o f an up-to-date list o f manufacturing establishments.
a) b) c) d)
e) Printing and Mailing out of Questionnaires
Directorate o f Industries and Mineral Develooment, Puniab:-
a) Notification o f the questionnaires.
b) Collection of CMI returns. c)
Bureau of Statistics, Puniab:-
a)
b) c)
Scope & Coveraee:
Preliminary editing o f CMI returns.
Statistical examination o f CMI retums
Computer processing o f CMI retums. Conducting o f Non-response Survey for estimation o f data for the establishments not reporting for the Census
All factories, carrying on manufacturing or repairing activities and registered or eligible for registration under Section 2 (J) or 5 (i) under the Factories Act 1934 (Amended in 1973), are covered under the Census. It, however, excludes Defence and other

Definitions: Important terms used in the section are defined as under:.
i) REGISTERED FACTORIES: An establishment i s said to be registered under Section 2 (J) o f Factories Act 1934, (Amended in 1973) if ten or more workers are working on any day of the preceding twelve months and in any part o f which manufacturing process i s being carried on with or
ii) GROSS VALUE OF FIXED ASSETS: It includes the gross value o f land, building, plant, machinery, transport and other fixed assets i.e. equipment, furniture etc., as at the end of the year
iii) EMPLOYMENT: It i s the total average daily employment during the year computed from the monthly employment data reported in CMI returns adjusted for contract labour
iv) EMPLOYMENT COST:
v) INDUSTRIAL COST: I t includes wages and salaries, cash and non-cash benefits and the amount paid to contract labour.
I t includes cost o f raw materials, fuel and electricity consumed and payments made to others for repair, maintenance of building and machinery and processing of establishments materials. GROSS VALUE OF INDUSTRIAL PRODUCTION: It includes value o f products and by-products, sale-proceeds from industrial waste, receipts for industrial work done and services rendered to others, sale o f electricity and value o f ' net work in process'. The value of products and by-products includes
This i s worked out by subtracting industrial cost from the gross value o f industrial production.
vi)
vii) GROSS VALUE ADDED
Limitations o f C M I The mailing list used for the census may not be up-to date.
The reported data contained reporting errors and inconsistencies, which were corrected on the basis of available supplementary information or/and past data.
Census results become available with a time-lag o f 2-3 years due to the time taken for collection, editing and tabulation processes.
Size and nature o f non-response varies from year to year. Since non-response surveys could not be conducted for all the years, the Census results were not adjusted for non-response, they may not be comparable from year to year.
The Bureau of Statistics has, during recent years, taken the following steps to improve the Census Results:- List of registered factories i s being kept up-todate.
Reported data i s subjected to manual as well as computer statistical editing, before final tabulation. Missing information estimated
The cases, where reporting errors cannot be corrected without changing the reported information significantly, managements o f the concerned units are asked to reconcile the discrepancies observed in their data. Corrections are made in the light of their
Efforts are being made to complete editing and tabulation as early as possible, after receipt of returns from Directorate of Industries and Mineral Development, Punjab.


Copyright © 2022 FDOKUMEN