Punjab & Bahawalpur State, Vol-5, Pakistan - Linguistic ...
376
M-Int-21 -00"--- CENSUS OF PAKISTAN, 1951 VOLUME 5 PUNJAB & BAHAWALPUR STATE REPORT & TABLES BY M. H. MAHMOOD Provincial Superintendent of Census Punjab Price: Rs. 8/12/-
-
Upload
khangminh22 -
Category
Documents
-
view
0 -
download
0
Transcript of Punjab & Bahawalpur State, Vol-5, Pakistan - Linguistic ...

M-Int-21 -00"---
CENSUS OF PAKISTAN, 1951
VOLUME 5
PUNJAB & BAHAWALPUR STATE
REPORT & TABLES
BY
M. H. MAHMOOD
Provincial Superintendent of Census Punjab
Price: Rs. 8/12/-

FIRST CENSUS OF PAKISTAN, 19S1-CENSUS PUBLICATIONS
Bulletins
No. I-Provisional Tables of Population.
No.2-Population according to Religion.
No.3-Urban and Rural Population and Area.
No.4-Population according to Economic Categories.
Vii/age Lists
The Village list shows the name of every Village in Pakistan in its place in the administrative organisations of Tehsils, Talukas, Halquas, Tapas, Sub-division's, Thanas etc. The names are given in English and in the appropriate vernacular script, and against each is shown the area, population as enumerated in the Census, the number of houses, and local details such as the existence of Railway Stations, Post Offices, Schools, Hospitals, etc. The Village list is issued in separate booklets for each District or group of Districts.
;_"
Census Report Printed.
'. Vol. 2-Baluchistan Report & Tables.
Vol. 3-East Bengal Report and Tables.
Vol.' 4'-'-N:-W.F.P. and Frontier Regions Report and Tables.
Vol. 5-Punjab and Bahawalpur State Report and Tables.
Vol. 6-Sind and Khairpur State Report and Tables.
Vol. 8 East Pakistan Tables of Economic Characteristics.
Census Report in course of Preparation.
Vol. I-General Report and Tables for Pakistan, showing Provincial Totals.
Vol. 7-West Pakistan Tables of Economic Characteristics,

PREFACE
This Census report for the Province of the Punjab and Bahawalpur State is one of the series of volumes in which the results of the 1951 Census of Pakistan are recorded. Underlying all the work and effort by which these figures have been produced, has been the over-whelming need for the rapid supply of information regarding the new nation. But this sense of urgency has had to contend with the great difficulty of organizing the enumeration and the subsequent abstraction of the results at a time when the administrative structure of Government was itself in the formative stages. Most strenuous efforts devoted by officers, however met the demand for data despite the slender resources, and the more essential figures were made available with remarkable speed by the issue of four Interim Bulletins. the first .')f which gave the provincial results of the Census within six weeks of the Enumeration. In addition, a District Village list has been published giving the name, population and many local details of every village.
This report now gathers together all the final details of the 1951 Census of the Provinces of Punjab and the State of Bahawalpur. It is arranged in two parts. ?art besides giving a brief description of the historical and geographical background of the Province, explains .the definitions and methods used in the collection and compilation of the Census data, provides certain comparisons with past figures, and gives some of the local details required in order to understand the differences between the figures for various parts of the Province. Part II contains the regular series of statistical tables in. which the detailed results of the Census are presented. It is strongly urged that before using or drawing conclusions from the data in Part II, the definitions and explanations in Part I should be taken into account. It is proposed to issue a further volume, which will be No."7 in the series, in which certain of the economic tables for all Provinces of West Pakistan will be presented in greater geographical and qualitative detail.
The-lack of statistical detail regarding Pakistan and especially for the newly partitioned Province of the Punjab made it imperative to adhere to the traditional Census data in February 1951 despite the undesirability of organizing such an operation without long preparation. All existing information had been rendered obsolete by the two~way flow of migration reSUlting from Partition. In addition, the tig'ures for 1941 Census naturally did not apply to the new areas in the divided distf.~~s. Moreover, they had not been tabulated in full owing to the war, and thei{ accuracy had been prejudiced by the efforts of the different communities to inflate their figures for pOlitical purposes. The figures for 1931 Census were more accurate but were badly out of date. These considerations were not only reasons
(i)

(ii) PREFACE
for a speedy Cens us but should be borne in mind when making comparisons of 1951 data with previous figures and in particular with such 1941 figures as are available. which should be used with due caution.
Nevertheless despite the hurried organisation of the enume.ation, the Provincial Superintendent of Census feels tbat the figures for the 1951 Census are reasonably accurate as regards the tobl population of the various areas, and this opinion is fortified by the fact that the preliminary House-listing enquiry conducted three or four months before the Census itself, gave figures very close indeed to tbose which were attained by the final count, In fact the enumeration itself was rather more complete, but the difference is small. Accuracy in a Census, however, is a relative matter and the same standard of accuracy cannot obviously apply to all the detailed statistics. One must allow for doubts and uncertainties in the minds of the public and this is particularly true in the case of illiterate persons in regard to age and the exact description of occupations. The sorting and tabulation work which was largely done by the traditional hand methods was most carefuliy checked, but here again the possibility of misclassification cannot be en tirely ruled out. These considerations have led to a departure from previous policy in the matter of presenting the Age data. In 1931 the age figures suffered from the usual trouble but the S-years Age-groups were adjusted arithmetically in order to smooth out the worst inequalities. In 1951 this was considered undesirable. The enumerators themselves had recorded most of the ages to the nearest 5 years, but an analysis disclosed that even then there was obvious heaping in certain groups. Had the data been presented in this report in full detail, there would have been very grave danger of figures being used hurriedly to draw conclusions of administrative importance without giving due consideration to their relative reliability. The age figures are therefore presented only in broad groups which appe;;rr to be reasonably reliable. The full tabulation in 5-year groups has been preserved and copies can be made available to students and statisticians on application to the Government of Pakistan but should only be used under expert advice and with caution,
The scope of the 1951 Census of pakistan covered more or less the same ground as previous Censuses of India except tha t the detailed analysis by Caste and Race ceased to be necessary and tribes were not recorded except in spedal areas. The enquiries regarding language, literacy, education and Economic activities were carried into greater detail. A translation of the enumerators questionnaire and instructionsheet is inserted in the back-cover of this volume together w!th a copy of the Enumeration sUp on which the answers were recorded. Some of the enquiries included in the questionnaire have proved unsuccessful and in particular the data ~~I .Unemployment and Fertility. But these innovations were worth makinr~ an:.t wilt probably result, provided the questions and procedures are re-designed in the:'iight of our present experience, in the production of more reliable data on these subjects of the next Census. In this Census no question was asked regarding. physical or mental handicaps as experience had shown the practical impossibility of supplying definitions regarding the degree of infirmity.- An enquiry into cattle resources and

PREFACE (iii)
land utilization was originally suggested for inclusion in the population Census There is a great deal to be said for collecting such information while the enumerators are recording the other data of the rural population. but in view of the short time for organization and the complex nature of such an enquiry, which would necessitate for more elaborate instruction of enumerators, nothing of this kind could be done in 1951. An enquiry into Cottage Industries was, however, included as a part of the home-listing survey. It was not completed fully everywhere but the results may be useful as for as they go.
The work of abstracting the statistical data from the millions of slips has been a tremendous undertaking which strained our resources in all directions. Traditional hand-sorting methods were largely used and the original enumeration slips were found quite suitable for this purpose. The recruitment and training of a large temporary staff of sufficient education presented considerable problems. Owing to the departure of many Hindu clerks good clerical workers were at a premium and very few persons of suitable ability were willing to take up this arduous temporary work. Standards of skill and accuracy were only achieved by patience and careful supervision. I fell the greatest credit is due to the officers and supervisors who dealt with the work of sorting, compilation and tabulation but it is of course impossible in the circumstances to claim complete accuracy. Power-Samas punched-card machinery was used for sorting the data of non-Agricultural workers and the Cottage Industry returns. This work was completely strange to all hands and it would undoubtedly have been simpler to allow hand-sorting methods to persist even in this complicated sphere. But I am sure the results would have been co"mpletely unreliable. The use of punched card machinery enabled the classifications to bi.! checked in detail and provided cwss-tabulations which would have been quite impossible by hand. This first attempt to modernize the abstraction stage of the Census is an essential innovation and should lead to far batter result in the future.
The Chapters of part I of the Report are the result of much thought and analytical work by Mr. Mahmood and his staff none of whom makes any claim to be a statistician. I have given editorial guidance but the work is mainly theirs, and is particularly valuable as an appreciation of the contents a'1d meaning of the data by men who know how the figures were obtained and can view them in the light of an intimate knowledge of the provinces. But the tables and the report will, I hope, provide a basis for much further study and research.
I take this opportunity of putting on record my favourable opInIOn of the spirit of cooperation extended to the Census work by Government officials of the Punjab and Bahawalpur State. On the whole the public themselves also displayed a helpful attitude. I imagine that a Census can never be the subject of general popular enthusiasm but the enumerators were generally given no trouble. The cooperation of the press and Radio pakistan was particularly valuable in this respect.
Nearly all the enumerators and other Census officers were Government officials to whom the Census was an extra and unpaid job in a busy life. Nevertheless

(iv) PREFACE
there was an obvious desire to obtain a complete enumeration. Great credit is due to Mr. M. H. Mahmood for his energy and organizing ability in carrying the enumeration work through satisfactorily despite the shortage of time and the disastrous floods which paralysed part of the province at a most critical period. He has been very ably helped in the abstraction and tabulation work by Sheikh Mohammad Sharif. I myself am deeply grateful for the patience and kindness which was extended to me on my many tours of instruction and inspection in the Punjab.
E. H. Slade, Fellow of the Royal Statistical Society,
Fellow of the Association of Incorporated Statisticians (London.)
Census Commissioner, Pakistan.

(v)
PART I-CONTENTS OF CHAPTERS PAGE
CHAPTER No. & TiTLE INTRODUCTION 1 I. GEOGRAPHiCAL SUMMARY ... 9
1.1 Introductory-1.2 Location & Boundaries-1.3 Area 1.4 General Description 1.5 Administrative Division-1.6 Topograpi-Jcal features 1.7 Rivers 1.8-Rainfall 1.9 Irrigation system-I.1O Cultivation-1.11 Main Crops and their yields. I.12 Minerals-l.l3 Industries-1.14 Sources of supply of electricity-I. 15 Communi· cation.
2. HISTORICAL SURVEY ... 29 2.1 Introductory-2.2 Pre·Muslim period - 2.3 Khyber Pass-2.4 Muslim Invasions 2.5 Moghals and Afghans 1526-1759-2.6 Sikh Power 1768-1849 A.D. 2.7 British Rule 1'849-1947 2.8 Conception of Pakist3n-2.9 Establishment of Pakistan 2.10 Aftermath of Partition 2.12 Effect of Partition.
3. MOVEMENT AND DISTRIBUTION OF POPULATION 37 3.1 Introductory-3.2 Section of this Chapter-3.3 Comparison with other places 3.4 Comparison with past times-3.5 Proportion of Urban and Rural Population 3.6 Accuracy of Census figures.-3.7 Variations Juring the last five decades-3.B Variations in districts over past five decades-3.9 Districts in the order of po pula· tion-3.1O District in the order of density of population .3.11 Relationship of population density to cultivable land industries & other potentialities-3,12 Religious Composition of population-3.l3 Muhajirs in districts-3.14 Selected important comparisons-3.15 Localities of specially high and specially low density-3.16 Correlation of houses and popuIation.-3.17 Types of houses.
4. URBAN AND RURAL POPULATION 52 4.1 Introductory-4.2 Classes of towns-4.3 Urbanization Trends and Tendencies-4.4 Cities and towns in the order of population 4.5 Religious Composition-4.6 Literacy and Educational levels-4.7 Individual Cities and Towns-4.8 Decaying Towns-4.9 Villages-4.10 Density of popUlation in rural areas-4.11 Agricultural Occupations-4.12 Subsidiary Occupation-Subsidiary Table No. 2 Cities and Selected Towns-Subsidiary Table No.2 Average population and Area per village in TebsiIs-Subsidiary Table No.3 Rural Density.
5. BIRTHPLACE 71 5.1 Introductory-52 Present Composition of Population-5.3 Persons born within the province-5.4 Persons born in otber provinces of Pakistan and in India-5.S Persons born abroad-5.6 Muhajirs and Repatriates-5.7 Non-Pakistanis their origin and Occupations-5.8 Main Movements of Population-Subsidiary; Table No. 1 Birthplace of Persons enumerated in all district of Punjab & Bahawalpur State--Subsidiary Table No.2 Persons born in District of enumeration and propor-tion to total population.
6. AGE, SEX AND MARITAL STATUS 78 6.1 Introductory-6.2 Accuracy of age Returns-6.3 Age Groups: Distribution of Population-6.4 Proportion of sexes comparison with other places-6.S Variations: Population and sex ratio by age groups-6.6 Proportion of children to old peopJe-6.7 Proportion of Orphans-6.8 Longevity in different area-6.9 Main cauSes of death-Marital condition by sexes in different age groups and by religion-Subs-idi· ary Table 1 General proportion of the sexes by district since 1901. Number of male per 1000 females.
7. LITERACY AND EDUCATION 88 7.1 Definitions and their interpretations-7.2 Ability to read-7.3 Ability to read the Holy Quran-7.4 Literacy Percentages comparison with past Censuses 7.5 Distribu· tlOn of Literacy: By localities by religion & by sex-7.6 Leyel of Education-7.7 Progress of Literacy-7.8 Pupils and Students.
8. LANGUAGES 99 8.1 Introductory-S.2 Classification of Languages-8.3 Mother Tongues Distribution by Districts-8.4 Proportion of Languages under·stood in each district, cities and selected towns.-8.5 Languages used as Media of fnstructions-8.6 Proportion of the population able to read the languages of local and National Press-8.7 Correlation of Languages with levels of Education.
9. ECONOMIC ACTIVITIES 105 9.1 Census Questions and their interpretation--9.2 Classitkation Code-9.3 Relationship of Occupations Economic Groups and Indu~trial Status-9.4 General distribution of Economic Grouping-9.5 Economic Divisions 9.6 Agriculture-9.7 Subsidiary Occupations of Agricultural Labour Force 9.8 Economic Activities of Landowners·-·9.9 Acreage per Agricultural Worker 9.10 Economic Condition of the Cultivating Class.-9.1l Agricultural Industries 9.12 Fishery-9.13 Forestry-9.14 Governmental Serviccs.-9. I S Production Industries-9.1 (i Occllpation-9.17 U nemployment-9 18 Cottage Industries Subsidiary Table 1 Proportion of chief Economic Divisiom Non·Agricultural Labour Force -Subsidiary Table II Workers in Important Service Occupations Subsidiary Table In Occupations.

(VI)
PART I-LIST OF STATE:MENTS
No. TITLE PAGE
I·A Annual rainfal in Punjab 16
I-B Major Canal works in Punjab & Bahawalpur State 17
I·C Cultivable & net cultivated Area Punjab & Bahawalpur State 19
I-D Area under principle Crop in Punjab ,.. 19
I-E Area under principle Crop in Bahawalpur State 21
3-A Comparison of density with the other province of Pakistan 38
3-B Comparison of density with the other countries of World 38
3-C Variation during last five decades 41
3-D Population increase since 1901 & percentage in the distnct of Punjab and in Baha-walpur State 43
3-E Rank of District in total population 44
3-F District of Punjab & BahawaJpur State in order of density 44
3-G Religious Comparison 47
3-H Proportion of Muhajirs-Punjab & Bahawalpur State 48
3-1 Comparison"of proportion of selected Tehsils 48
4-A Urban & Rural p<:rcentage of the total population 53
4-B Birthplaces of persons enumerated in district containing cities 55
4-C Charges in population of Cities and Selected Towns in 1951 Comparison with past three censuses 56
4-D Decaying Towns... 62
5-A Proportion of Immigrants & Muhajirs compared with the tOlal population
5-B Proportion of Muhajirs in selected cities and towns
6-A(l) Population by Basic Age groups Punjab & Bahawalpur State
6-A(2) Population by Broad Age groups Punjab & Bahawa1pur State
6-B Proportion of Males per 1,000 females ."
6-C Sex Ratio-Comparison with other places
6-D Variations in Age-Groups, percentages to total population
6·E
6-F
Numbers of Males per 1,000 females in the broad age groups
Proportion of children under 10
6-G Proportion of Orphans
6-H Persons per mile of total population age over 60 years
6-1 Groups of Census of death-Punjab
6-J(1) Marital Status in the Census years 1931 & 1951 (Muslims)
6-1(2) Marital Status in the Census years 1931 & 1951 (Christians!
7-A
7·B
7-e 7-D
Proportions of literate persons to total population ages 5 & over
Propotions of Jiteracy;Comparison with Past Censuses
Proportion of Literates in cities & selected towns
District in the order of Literacy
74
75
79
79
81
81
81
82
82
83
83
84
85
86
89
90
91
92

(vii)
PART I-LIST OF STATEMENTS-contd. No. TITLE PAGE.
7-E Educational of Levels 93
7-F Literacy of Muhajirs 94
7-G Comparison of Literacy with Education 96
7-H Progress in Primary Education-Punjab Literacy 96
8-A Proportion of Punjabi & Urdu languages declared as Mother Tongut', to the total population 100
8-B Languages used as medium of Instruction 101
8-C Number of Newspapers and Periodicals in the Punjab 103
8-D Grades of Education-Punjab & Bahawalpur State .. , 104
9-A Classification Code of Occupation 106
9-B Proportions of self supporting persons by Economic Division 110
9-C Proportion by Economic Divisions of self supporting Muhajirs 110
9-D Proportion of land owners tenants and landless labourers in Agricultural Labour Force 1 I 1
9-E Agricultural Labour Force Distribution of Subsidiary Occupations 112
9-F Acreage per Cultivator 113
9-G Services 116
9-H Workers in Manufacturing Industries 117
9-J Proportion of certain classes of workers Non-Agricultural Labour Force 118
9-K Workers in Cottage Industries 120

(viii)
No. TITLE
1.1 Administrative System
1.2 Rivers
1.3 Rainfal
1.4 Canals
1.5 Net Cultivated Area ...
1.6 Area under main crops
PART I -LIST OF MAPS
1.7 Location of Minerals, Industries & Hydro-Electric Installations ...
1.8 Communication
2.1 Partition of Punjab in 1947
3.2 Density ...
3.4 Proportion of Muhajirs
4.2 Proportion of Urban population
PART I-LIST OF CHARTS
No. TITLE
3.1 Decinnial Increase of Population
3.3 ReligiOUS Distribution
3.5 Housing ...
4.1 Decinnial Rise in Population in Towns
4.3 Changes in the population & Sex Ratios in Cities
6.1 Age & Sex Pyramid ...
6.2 Sex Ratios
6.3 Variations in Age Group percentages
7.1 Literacy & Education precentage & Educational Levels
7.2 Pupils & Students-Literacy
7.3 Persons Attending School or College
8.1 Ability to understand/Read Urdu and/or En~lish
PAGE
11
13
15
18
20
22
25
27
35
45
49
61
PAGE
42
47
51
54
60
80
81
82
95
97
98
130

J.
I-A.
2.
3.
4.
PART II-LIST OF TABLES
POPULATION ... ... '" ... Geographical division by districts and tehsils-States-Area in Sq. Miles-Density per sq. mile-Urban population by sex-Rural population by sex.
POPULATION OF URBAN AREAS ... Geographical division by towns and localities with urban characteristics""';Urban population in Table 1 analysed by urban areas showing for each:-Area in sq. Miles-total persons-Males-Females.
TOWNS AND CITIES Urban ·Iocalities grouped in population classes :-100,000 and .over inhabitants, 25,000 . and under 100,000, tO,OOO and under 25,000, 5,000 and under 10.000. Showing: Religious groups-Muhajirs-and Form of local Government.
VARIATION ... ... ... Geographical division by districts and State-Population 190r, 1911, 1921, 1931, 1941, 1951-Decennial changes in actual numbers and as percentages of previous census population.
AGE AND MARITAL STATUS Geographical division by districts-Broad age groups-Main religions-sexmarital status.
(ix)
PAGE.
1-1
1-8
2-1
3-1
4-1
4-A. ORPHANS 4-16
5.
6.
7.
Geographical division by districts and States-Children under 12 years whose fathers had died-main religions-Sex and Mahajirs.
BIRTHPLACE ...... Persons enumerated in each district or State. Persons born in Districts of Province of enumeration-in other provinces or states of Pakistan-In Zones elsewhere in sub-continent-in Otqer countries.
RELIGION Geographical division by districts and State: Muslims; Caste Hindus; Scheduled Castes. By-Minor reHgious groups.
MOTHER TONGUE Geographical division by districts and State-languages in main families and branches.
5-1
6-1
7-1
7-A. SPEECH ...... 7-8 Geographical division by districts and Statlls-Persons commonly speaking the nine principal languages- Percentage of population.
8. LITERACY 8-1 '. Geographical division by districts and State-Persons who c~ read-Percentagc:-Sex.
8-A. LANGUAGES OF LITERACY ... ...... 8-3 Geographical division by districts and State-Persons. able to read only, and Persons able to read and write in the nine prinCipal languages-Persons able to read Holy Quran in Arabic.
9. PUPILS AND STUDENTS ... ... '" ... ... ... 9-1 Geographical division by districts and State-Persons attending school or college bY:-·Educational age groups-Main religious groups-Percentage of total population-Sex.
9-A. YEARS OF EDUCATION 9-6 Geographical division by districts and State-Persons who have had: - Nil years of education, under 5 years, 5 to 6 years. 7 to 10 years, over 10 years-All relig-ions. Muslims, Educational Age groups-Sex.

(x)
PART II-LIST OF TABLES-(concluded) PAGE.
9-B. EDUCATIONAL LEVELS ... ..• ... ... ... 9-21 G~ographical divisi';ln by districts and ~tate -:-Literate Persons who have passed PrImary School, MIddle School, MatrIculatIon. Degree, Higher Degree-those who have no formal attainment Muslims caste Hindus, Scheduled castes and other religion-by Sex.
10. NATIONALITY ... 10-1 Non-Pakistanis by :-Countries of Nationality-Sex.
10-A. AFGHAN POWINDAHS ... 10-3 Geographical division by districts and States-Persons under 12 years-Persons 12 years and over by occupations-Sex.
11. LABOUR FORCE 11-1 Geographical division by districts, tehsils, State -Self-supporting persons : Agri-cultural labour force, Non-Agricultural Labour Force, Persons Not in Civilian Labour Force -Dependents: Under 12 years, 12 years and over-sex.
ll-A. OCCUPATION OF NON-AGRICULTURAL LABOUR FORCE 11-15 Geographical division by districts and State-Occupational Groups - Industrial Status -Age groups-Education-Sex.
11-B-1. OCCUPATIONS OF AGRICULTURAL LABOUR FORCE 11-22 Geographical division by districts and State-Cultivators-Herdsmen, etc.-Other agriculturists-Sex.
11-B-2. SUBSIDIARY OCCUPATIONS OF AGRICULTURAL LABOUR FORCE 11-25 Agriculturists with Subsidiary Occupations.
12. ECONOMIC GROUPS AND INDUSTRIAL STATUS OF NON-AGRICUL- 12-1 TURAL CIVILIAN LABOUR FORCE Geographical division by districts and State -Economic groups-Industrial Status-Sex.
13. ECONOMIC GROUPS AND OCCUPATIONS OF CIVILIAN LABOUR FORCE 13-1 Georaphical division by districts and State-Economic groups, occupations-Sex.
14. AGRICULTURAL LABOUR FORCE.. 14-1 Geographical division by districts and State- Cultivators by Land Tenure Status- Herdsmen & Dairymen, other agricultural worken- Sex.
15. LANDOWNERS 15-1 Geographical division by districts and Sta te-Persons owning land-broad categories of economic activities.
19-A. MUHAJIRS' ORIGIN 19-1 Geographical division by place of enumeration Previous residence of Muhajirs by Zones-Sex.
19-B. EDUCATIONAL LEVELS OF MUHAJIRS 19-3 Geographical division by districts and State-Literates who passed :-Primary School, Middle School, Matriculation. Degree, Higher Degree-those with no formal attainment-Sex.
19-C. MUHAJIRS IN THE LABOUR FORCE ... 19-6 Geographical division by districts, tchsils and State-Self-supporting persons : Agricultural Labours Force, Nan·Agricultural Labour Forces-Muhajirs-Not in Civilian Labour Force-Dependents; under 12 years, 12 years and over-Sex.
19-D. ECONOMIC GROUPS AND OCCUPATIONS OF MUHAJIRS 19-20 Geographical division by district§ and State-Labour Force byeconomic groups, occupations-Sex.
Supplementary tables 1 & 2--Cottage Industries S-1 to S-19

Introduction.
1. Preface.- Pakistan came into
being on the 15th August, 1947, as a
result of the partition of India. The last Census in the Indo-Pakistan Sub
continent had been taken in 1941 so the
Census taken in 1951, to which this
Report relates, is the first Census of Pakistan. At the time of the Partition, besides some territorial changes, there was mass movement of population in the area covered by this Report and hence the presentation of a comparative analYlis, wherein the chief value of census data lies, has been difficult in some cases and impossible in others. However I have attempted to make the best possible
use of the da ta collected at this Census and trust that it will be of some interest to the students of demography. Let me
disarm my critics (if any) by confessing that I do not claim to be a demographic expert or a statistician and if therefore
this Report falls short of their expectations I crave their indulgence. I have mostly confined myself to stating the facts as brought out by the data collected
at the Census and where I have hazarded an opinion it is fortified by my local
knowledge of the territory to which the Report relates. I have also done my
best to be brief (as indeed one should be in a Report of this nature) but not at the expense of clarity, I may add,
2. Contents of Report.-The first two Chapters of this Report are descriptive.
It was felt that since this was the first
Census Report after the change in the
political status of the Indo-Pakistan Subcontinent, it would be as well to give a brief geographical and historical survey of the country. Chapters 3 to 9 relate to Movement and Distribution of Popula
tion; Urban and Rural Population; Birthplace; Age, Sex and Marital Status; Literacy and Education; Languages; and
Economic Activities, in the order stated.
They are self-explanatory and call for no special comments here.
Arrangements for this Census.-The administrative arrangements for this Census are given in extenso in the Administrative Report which may be published separately. But as that Report
is meant for official use only lowe it to
the Reader to describe the arrangements briefly in order to enable him to assess the value of the data presented in Chapters
3 to 9 and the Tables published in Part II of this Report.
4. Administrative Organisation.-Census is a Central subject, that is to say,
that under the Constitution Act the taking of a census is the responsibility
o,f the Central Government. The first visible sign of this Census was the passage

2 INTRO DUCTION
of the Census Act, Act VII of 1950, by the Central Legislature. This was foJlowed by the selection of the supervisory staff required for the Central
Census Office at Karachi and for the Provincial Census Offices. I joined as tl;le Provincial Superintendent of Census punjab and, Bahawalpur State, on the 11th
May, 1950, and immediately started to organise my office. The Census Commissioner, Pakistan, assumed office in June 1950 and soon after convened a conference at Karachi which was attended by the provincial Superintendents of <:;ensus. All important matters concerning the pre-enumeration stage of this Census were settled at that conference and the Census Commissioner drew up inter alia a Census Calendar, which showed the vital dates for the completion of the various crucial stages of the preparations for enumeration. As the organisation of the Census arrangements
had made a belated start, the acceleration of some of the stages included in the Census Calendar was inevitable. After setting up my office I took up the organisation of the Census arrangements in the districts according to the decisions taken at the Conference. The district census establishment was to be under the charge of the Sub-Divisional Officers and Revenue Assistants in the Punjab
except in the Biloch Trans-Frontier Tract in the Dera Ghazi Khan District, where the Political Assistant to the Deputy Commissioner was to supervise the
arrangements. In the Bahawalpur State the Assistant Commissioners, Bahawalpur, Bhawalnagar. Rahimyarkhan and Ahmad
pur East, had to function as the District
Census Officers in thei r respective
jurisdictions. A provincial conference of the District Census Officers was convened in July 1950 at which the details of the Census Plan were explained by me. It was stressed that the programme set out in the Census Calendar ~hould be followed rigidly; all the more so because the organisation of the arrangements,
which had made a late start, brooked no. further delay.
5. Village and Town Registers CeDsus Areas and Census Officers.- The preparation of the General Village and Town Registers was started by the District Census Officers at once. These registers showed the names of villages, wards, or other well defined (and locally recognised) areas, the approximate number
of houses in each area, the number of blocks and circles proposed for each
area together with the charge in which
it could be included and the names of literate persons, who could suitably be
appointed as Enumerators and Super
visors. As in the past censuses, the
classification of ceo sus areas adopted for this Census was Block, Circle and Charge, and the officers in charge of these areas were called Enumerators, Supervisors and Charge Superintendents, respectively. The delimitation of the census areas and the appointment of the Census Officers
was then taken up by the District Census
Officers. The number of Blocks, Circles
and Charges respectively was 50,880"
7,488 and 758 in the Punjab and 3,829, 525 and 79 in the Bahawalpur State. A separate Census Officer was appointed for each of these Census areas except in

INTRODUCTION 3
sume big blocks where Assistant Enumerators were also appointed.
6. House Numbering and Listing.After the delimitation of the Census areas and the appointment of the Census officers the next important stage in the preparations for enumeration was that of house numbring and listing. Each enumerator compiled his house-li~t as he went round his block numbering the houses and other structures. The houselists showed the number of normal residents in each commensal family, the number of rooms per house and other such particulars. In order to facilitate reference t6 the Census areas a Location Code consisting of four elements was introduced. The first element was the number of the Census District which was allotted by me; the second element was the number of the Charge allocated by the District Census Officer, while the third and fourth elements, which were furnished by the Charge Superintendents, signified the Circle and Block respectively. Each enumerator had to know all four elements of his block well as these had to be indicated on each Enumeration Slip completed during the enumeration.
7; Enumeration Slip and Instruction of Enumerators.-The Census Commissioner drew up a set of questions to be asked at the time of the enumeration, called ·'the Enumeration Slip", and the explanations to those questions and the manner of recording the respondents' answers thereto, called "the Instructions for Enumerators." A facsimile of the Enumeration Slip with a copy of the
Instructions for Enumerators will be found in Appendix 'A' to this Report. In order to ensure that the enumerators filled in the enumeration slips correctly at the time of the enumeration, instructional classes were arranged in aU Census Districts in the Punjab and Bahawalpur State. Many charge Superintendents personally conducted these classes at which practical demonstrations of filling the enumeration slips were held and the enumerators encouraged to ask questions to clear the doubts in their minds. Practice enumeration slips to be used at the classes had been supplied to the Charge Superintendents. It was necessary of all enumerators to attend the instructional classes.
8. Publicity and Instruction to Public.-Tbe success of any Census without the whole-hearted cooperation of the public is inconceivable. In order to invoke the assistance of the public adequate publicity was given to this Census at all stages. The local Press and the Radio Pakistan, Lahore, willingly helped in the accomplishment of the big task of making the public census-minded. Publicity was given to the Census also by special Census Posters which indicated the importance of a Census to the State and the duties and responsibilities of the Public in connection therewith. It would be futile to claim perfection in the matter of Public cooperation with this Census; nevertheless the foregoing steps proved fairly efficacious.
9. Enumeration.-The distribution of the Enumeration Slips and Instruc-

4 INTRODUCTION
tions for Enumerators for use at the time of the enumeration was arranged by the Census Commissioner's office through the Charge Superintendents on the basis of the indents furnished by the District Census Officers. To meet the unforeseen shortages of the Enumeration Slips adequate reserves of the Enumeration Slip pads were kept with the Charge Superintendents, District Census Officers and the Provincial Superintendent of Census. The enumeration start.ed punctually on the 9th February, 1951, and continued upto the end of that month. The final check round the blocks and the enumeration of the floating population took place on the night between the 28th February and 1st March. On the whole, the enumeration proceeded satisfactorily though some difficulty was experienced in urban areas, particularly in cities and big towns.
10. Provisional Census Results.According to the instructions contained in Section 10 of the Code of Census Procedure, Part II, the District Census Officers bad to submit District Reports (called "Distreps") based on the provisional figures of the enumerated population furnish ad by the enumerators through the Charge Superintendents. The Distreps were fully received and the information contained therein was communicated to the Census Commissioner on the 14th March, 1951. The provisional figures were published on the 12th April thai year under a coordinated plan prepared by the Census Commissioner. The population of the Punjab and BahawaIpur State on the basis of the provisional
figures was 206,34 thousands as against 206,51 thousands in the final counting. The difference works out to '08 per cent which is negligible considering the speed with which the provisionnl figures were prepared.
11. Sorting.-Soon after the completion of the enumeration at the end of February, 1951, I started making arrangements for the sorting of the Census Slips. Two Hand Sorting Centres were opened for the purpose at Lahore and Rawalpindi and each District Census Officer was directed to transfer his enumeration slips to the Centre at whicn they were to be sorted. With the object of ensuring statistical uniformity of the Census results throughout pakistan, the Census Commissioner issued instructions from time to time pertaining to the Sorting operations. The work was started at both the Centres towards the end of April, 1951, and carried out in five Phases for which Sorters Tickets were specially designed by the Census Commissioner. Phase One was conducted in three parts, namely the Block Sort, the Circle Sort and the Children's Sort. The Block Sort. classified all slips by sexes and separated the Muhajir slips .. The Circle Sort ~lassified the slips by Nationality, Birthplace, Mother Tongue and Religion, making use of the model principle. The Children's Sort dealt with all the remaining characteristics of persons under 12 years of &ge. Phase Two dealt with the slips of literate persons only classifying to them according literacy and education. Phase Three classified all the slips according to occu ..

INTRODUCTION s
pations and economic status and segregated the slips of the Non-Agricultural Labour Force and Defence Services which had to be sent to the Machine Centre, Karachi Phase Four classified the slips according to age groups and further analysed them for Marital Status, .Speech and extent of Schooling and Literacy. Phase Five extracted the data cegarding Fertility, Birth and Infant Deaths from the slips of all women who had ever been married. Special care was -taken at all stages to prepare the Sorters' Tickets accurately and checks and tests were applied continuously to verify the accuracy of the band sorting operations, which were completed by the middle of December, 1951. The use of the original slips as the sorting media being modern and scientific it was possible to. produce more accurate result in a compratively lessertime. The slips of the Non-Agricul tural Labour Force and Defence Services were sorted in the Machine Sorting Centre, Karachi from where the final data was received in the third week of May, 1953.
12. Compilation and Tabulation.A compilation Section was attached to the Provincial Census Office for compilation and tabulation. The work' was generally done according to the plan prepared by the Census Commissioner as embodied in Part III of the Code of Census" Procedure and supplemented from lime to time by Census Commissioner's Circulars. At the initial stage the Com .. pilers were detailed to work in the Hand Sorting Centres in order to grasp the technicalities of hand sorting. By the J;lliddle of June 1951, when the Block Sort
was sufficiently advanced, they started checking the Circle Abstracts and Charge Summaries prepared by the Enumerators and carried out the necessary corrections. The compilation of the working sheets for the various Tables was taken up at both the Hand Sorting Centres simul~
taneously in July 1951, and Table 6-Religion was the first one to be compiled. The remaining Tables ware finalised in the Provincial Census Office and according to the programme outlined by. the Census Commissioner the whole job was finally completed by the end of June, 1953. A brief description of each Table is given in the Title Sheets published in Part II of this Report. The opportunity afforded by the Census was also availed of for compiling Village Lists· for each district of the Punjab and Bahawalpur State. These lists show the more import~ ant particulars about every village, such as, area population, number of houses and local details.
The first Census of Pakistan also saw the introduction of mechanical aids in the form of Plus Adding Machines and Calculating Machines. The former were mostly employed for checking the totals while the latter were of immem.e help in the calculation of percentages and densities. The introduction of these mechanical aids proved both useful and economical in that while ensuring accuracy it accelerated the disposal of work.
13. Commendations and AcknowJedgments.-I cannot conclude this Report without acknowledging the assistance

6 INTR(J)/JUCTION
which I received from the non-official and official sources in taking this Census. At the very outset I must thank the publie for its cooperation with the Census staff during the enumeration stage. An enumerator's job is essentially one of prying into the affairs of the persons he enumerates and, unless the latter rise above the instinctive dislike for prying by comparative strangers, no amount of care and trouble in laying out census arrangements can possibly lead to good results. I am glad to note that the public gave full support to the Ceusus staff in this respect and consequently the progress of the operations was unhampered. The press and Radio Pakistan, Lahore, made no mean contribution in educating the public about its duties and responsibilities to the Census and I take tbis opportunity to thank them for the help which they rendered me most willingly and readily. I must, also commend the untiring efforts of that vast army of honorary workers (which included Presidents and members of local bodies, businessmen, Prefessors and students of colleges, and others) who acted as Enumerators, Supervisors and Charge Superintendents. Tbey discharged their onerous. and strenuous duties unflinchingly and even if there were some instances of slipshod output of work a good standard of efficiency was generally maintained. The number of the Census field staff is mentioned in paragraph 5 supra and I leave it to the Reader to judge how costly this Census would have been had that staff, which worked for over six months upto the Gonclusion of the enumeration, been stipendiary.
Of the official agencies utilised in connection with this Census the Revenue Department, as in the past proved to be the back-bone. The net· work of Census has to spread all over the territory to be censussed and the Revenue Agency. which has its staff everywhere, provided a ready-made nucleus for the purpose. The Patwaris and Field Kanungos worked as Supervisors and Charge Superintendents, respectively, in all rural areas of the Punjab and Bahawalpur State and since many of them had previously dIS
charged the~e functions, their experience stood us in good stead. Anyone acquainted with the Revenue Administration of this country would know that the hands of the Patwaris and Field Kanungos are fully occupied and hence it is all the more creditable on their part to have shouldered these responsibili ties for which they were to receive no r~muneration. .I must therefore thank them all for their sustained efforts without which, I state unhesitatingly, we would have been nowhere. The services rendered by the Patwaris of the Irrigation Department, the school teachers of the Education Department and the clerks in the employ of Government, Railway and local bodies also 'deserve special mention.
The Census arrangents at the district level were under the charge of the District Census Officers, who performed these functions in addition to their normal administrative duties. As all these officers already had multifarious responsibilities to shoulder, this addition to their work meant a good deal of extra
labour. But by and large they steered

IN']' ROW<C'l' ION 7
~ <;~sus operations with adequate care
~4J' devotion and tbe success of this q::eBsus- to a fairly large exte>nt is due to tlaeir un tiring efforts. I am grateful to I,llL the District Census Officers in the Punjab and Bahawalpur State for their whole-hearted cooperation, which is all !:be more commendable considering that t-hey carried out the Census duties without any extra remuneration. The Deputy 4::ommissioners too proved helpful and I (hank them for their assistance.
My thanks are also due to the Mili,.. ta.ry, authorities and Executive Officers of Cantonments in tbe Punjab and Bahawalpur State under whose supervision th,e enumeration was held in Cantonment Areas. Tbeir task was quite big but it was performed in a spirit of national s~rvice.
On several occasions I had to address tbe.Heads of Departments in connection with urgent matters germane to this Census. My requests received prompt ~ttention invariably and I must record
. J1.}y. appreciation of their helpful attitude. Th.e Directors of Public Instructions, IJldustries and Public Relations, Punjab, d~serve my special thanks for their cooJ?eration and ready response.
I had to invoke the assistance of Mr. H. A. Majid, C.S.P., lately Chief Secretary to Government, Punjab, repeatedly. He was most helpful on all occa· sions and did his utmost to accommodate me. At times I had to intrude upon his valuable time to seek his advice and he willingly gave it to me. I would be
falling in my duty if I did not especially, thank him for his help and able guioance •. The Chief Secretary to the Bahawalpur State Government also deserves my, thanks for his cooperative attitude.
I cannot let the help rendered by t.ho clerical staff attached to the Provincial Census Office go unnoticed. My Head. Clerk, Chaudhri Nazir Ahmad, who remained with me from start to finish, di,s .. charged his duties diligently and effi~
cjently. During the pre-enutn.4ration stage there were a few occasions w.b.<to. due to my absence from the headquarters on tour, immediate action was requi-red to be taken on some important instructions received from the Census Commissioner .. Chaudhri Nazir Ahmad was' not found lacking in initia tive and took. the requisite action without delay. My Stenographer, Mirza Abid Ali Beg, worked industriously throughout and SO
did pir Mahboob Elahi, Accountant, and Chaudhri Manzur Ahmad, Despatchercum-Typist. Not infrequently all these officials had to work late hours and on holidays and they did so ungrudgingly" nay willingly. Several times while writing the Administrative and Statistical Reports, I have had to utilise the services of Qureshi Manzur Ahmad, the Stenographer attached to me in my capacity as the Deputy Secretary to Government, Punjab, General Administration Department. Although he had no connection whatsoever with the Provincial Census Office he worked for me willingly; with commendable speed and precision, I may add. I thank them all for their loyalty and devotion which, I must say, greatly

8 INTRODUCTION
helped me in bringing this Census to a successful conclusion. I also thank the Sorting and Compilation staff which had a tough job to handle and finished it punctually and efficiently notwithstanding their numerous working difficulties. The first Chief Compiler left us before the work ha'd started going in full swing. But I wa~ lucky in securing the services of Kazi Akhlaque Husain, an Assistant of the Punjab Civil Secretariat, for the post of the Chief Compiler and he completed the job to my entire satisfaction for which I am indeed thankful to him.
My thanks are also due to Agha Ahmad Raza Khan, P.C.S., who worked as the Deputy Provincial Superintendent of Census, Punjab and Bahawalpur State, for about two months' just before the enumeration. He inspected the field work at several places which I could not visit personally due to paucity of time.
Sheikh Muhammad Sharif, P,C.S., remained with me for more than two years; first as the Deputy Superintendent in charge of the Hand Sorting Cen tre, Lahore, from the 21st March, 1951, upto the 31st January, 1952, and then as the Deputy Superintendent of Census, Punjab and Bahawalpur State, from the 1st February, 1952, to the 30th June, 1953. His work in both these capacities has been excellent. Usually officers belong-
ing to the General Administration De partment, whose normal duties embrace diverse interesting fields, are inclined to regard Census work as dull and monotonous and they avoid it for that reason. It is indeed fortunate for me that Sheikh Muhammad Sharif did not possess that tendency and remained with me right upto the end. His valuable assistance coupled with steadiness enabled me to complete my colossal· task punctually and I offer him my warmest thanks for it. Sheikh Abdul Hamid, Superintendent, Punjab Civil Secretariat, Lahore, worked as the Deputy Superintendent in charge of the Hand Sorting Centre, Rawalpindi. On the whole his work was satisfactory.
14. CODclusioD.-I would regard this Report as incomplete if I did not pay a tribute to Colonel E. H. Slade, Census Commissioner, Pakistan. Ever since he assumed charge of his office in June 1950, Colonel Slade has been most helpful to me in every possible way and it gives me great pleasure to express my deep gratitude for his invaluable advise which he gave me readily on all occasions. Colonel Slade so endeared himself by his sympathetic and kindly treatment, his high qualities and. last but not the least, his able guidance that the chapter of my service with him will remain a pleasant memory with me for ever.

Chapter 1
Geographical Summary
1.1 Introductory.-Before the statistical data collected at the time of the first Census of Pakistan taken in February, 1951, is presented, it seems desirable to give the outlines of the physical and political geography of the territory to which this Report relates III order to enable the reader to appreciate properly the population and its trends in the Punjab (Pakistan) and Bahawalpur State. Accordingly an attempt is made in this Chapter to describe the more salient topographical features which are germane to the problem of population. For a study of the historical background of this area the reader is referred to Chapter 2 infra.
1.2 Location and Boundaries-The Punjab (Pakistan) is bounded on the north by the Himalayan Ranges; on the east by India: on the south by India and Bahawalpur State and on the west by Baluchistan (from which it is divided by the Sulaiman Range) and the North West Frontier Province. It lies between 28.25 and 34.1 N, Latitude and 69.19 and 75.56 E. Longitude. The Bahawalpur State is bounded on the north by the punjab (Pakistan); on the east and south by India and on the west by the Province of Sind. It lies between 27.42 and 30.25 N. Latitude and 69.31 and 74.1 E. Longitude.
( 9 )
1.3 Area-According to the Survey of Pakistan the Punjab (Pakistan) has an area of a bout 62,245 square miles while the Bahawalpur State covers about 17,471 sqaure miles. The population of the Punjab (Pakistan) and the Bahawalpur State is 1,88,28,015 and 18,23,125, respect .. ively, which gives a density of 302 persons per square mile for the Punjab (Pakistan) and 104 for the Bahawalpur State. The density has been calculated on the total area which includes unin. habitable sandy deserts and hilly tracts.
1.4 General Description-The punjab is predominantly an agricultural country; not less than 80 per cent of the population depends on agriculture for its livelihood. With the exception of the northern districts of Rawalpindi, CampbeUpur and Jhelum, which contain hilly tracts and ravines, the country is a land of immense fertile plains and rich valleys. The soil is a sandy loam, interspersed with patches of clay and tracts of pure sand. A great part of the soil is renewed every year by floods; and rich loams of the Himalayas are brought down to the plains by the rivers and transmitted to great distances by man-made canals. About one-third of the cultivated area depends upon natural rainfall while the rest relies

10 &EOGRAPHICAL SUMMARY
on artificial methods of irrigation, of which canal irrigation is the most extensive. There is a net work of canals drawn from the rivers by which vast arid waste lands have been turned into fertile arable regions. The canal colonies, as there regions are known, began to receive settlers after 1880. They have many flourishing market towns, the most important being Lyallpur which is now a thickly populated city.
The Bahawalpur State comprises a flat plain merging into the desert as it recedes from the rivers Like the Punjab it is mainly an agricultural country. In the riverain tract the means of irrigation consist of flood waters and ordinary wells, while a network of inundation canals exists in other parts except the desert
area. The administrative system, rivers, rainfall canals, cultivation, crops, industries and communications of the Punjab and the Bahawalpur State are depicted
by maps, which appear in the following pages.
1.5 Administrative DivisioJIS,-The Punjab is made up of three revenue Divisions each under a Commissioner who is a senior permanent civil servant. The hea<;tquarters of these Divisions are at Lahore, MuHan and Rawalpindi. The Punjab has sixteen districts in all, each under the charge of a Deputy Commissioner. For facility of administration the districts are sub-divided into smaller units
known as sub-divisions (each under an
Assistant or Extra Assistant Commissioner). tehsils (each under a Tahsildar)
and revenue circles (each under a Field
Kanungo) which are further subdivided
into smaller groups for purposes of the maintenance of revenue records and agricultural statistics (each under a Patwari or Village Registrar) The names of the districts and tehsils in each Divisions are shown below:-
District. Tahsils.
Lahore DivIsion
1. Lahore Lahore, Chunian, Kasur.
2. Sheikhupura Shcikhupura, Nankana, Shahdara.
3. Gujranwala Gujranwala, Hafizabad, Wazirabad.
4. Sialkot Sialkot. Daska, Narowal, Pasrur, Shakargarh.
Multan Divsion 5. Jhang Jhang, Chiniot, Shorkot,
6. Montgomery Montgomery, Dipalpur,
7. MuItan
Okara, Pakpattan.
Muhan, Kabirwala, Khan.wal Locihran, MaiIsi, Shujabad, Vehari.
8. Muzafi'argarh Muzaffargarh, Alipur, Kot Adu, Leiah.
9. Dera Ghazi Dera Ghazi Khan, Biloch Khan. Trans-Frontier Tract, Jampur,
Rajanpur, Sanghar. 10. Lyallpur Lyallpur, Jaranwala, Samun
dri, Toba Tek Singh. Rawalpindi Division
11. Gujrat 12. Jhelum
Gujrat, Kharian, PhaHa. Jhelum. Chakwal: Pind Dadan Khan.
13. Rawalpindi Rawalpindi, Gujar Khan, Kahuta, Murree.
14. Campbellpur Campbellpur, Pateh Jang.
15. Shahpur
16. Mianwali
Pindigheb, Talagang.
Shahpur, Bha1waJ, Khushab, Sargodba.
Mianwali, Bhakkar, Isakhel.

KEY TO DISTRICTS
PUNJAB
I Lahore
2 Shcikhupura
3 Gujranwala 4 Sialkot 5 fhang 6- Montgomery 7 Mullan
8 Muzaffargarh
9 Dera Cazi Khan
10 Lyallpur
il Gujrat 12 Jhelum
J3 Rawalpindi
14 Campbellpur
15 Shahpur 16 Mianwali
BahawalRuT State
17 Bahawalpur 18 Rahimyar Khan
GEOGRAPHICAL SUMMARY
50 MILE ~
PUNJAB
&
BAHAWALPUR STATE
ADMINISTRATIVE SYSTEM
JAMMU &-
Q
REfERENCE
. . I Provincial Boundary ~ line ~ District Boundary ,
I Line.
__ ~.J\: Tehsil Boundary
11
line .euJRAT Tehsils Name & Town

12 GEOGRAPHICAL SUMMARY
The Bahawalpur State bas a similar administrative set-up except that there are no Divisions. The names of the districts with their tehsils are:-
District. Tehsils.
17. BahawaJpur Bahawalpur, Bahawalnagar, Chishtian, Fort Abbas, MiD.
chinabad. 18. Rehimyarkhan Rahimyarkban, Abbasia,
Colony, Allahabad, Ahmad· pur East, Khanpur, Sadiq
abad.
Map 1.1 shows the location and distribution of the administrative districts of the Punjab and the Bahawalpur State.
1.6 Topographical features.-The extreme north of the Punjab is a narrow strip of country adjoining the Himalayan Range into which run some of the spurs of the Range, such as the Murree Hills, which are 7,000 feet above sea level. The districts of Campbell pur, Rawalpindi and Jhelum are included in this tract. Small streams run through the area at a high speed and irrigation by canals is not possible owing to the uneven land structive. Towards the south-west of this area is the Salt Range, which contains the salt mines of Khewra of the coal mines of pidh and Diljabba situated in the Jhelum district. The Sulaiman Range forms the southern half of the western frontier of the Punjab while the tract lying on the eastern and western sides is an alluvial plain. The Gujrat and Sialkot districts lie at the foot of hills. The districts of Lahore, Gujranwala, Sheikhupura, Montgomery, Multan, Jhang and LyaIIpur and part of Shah pur district comprise the eastern plain. The
rainfall decreases rapidly away from the hills. A network of canals-the greatest canal irrigation system in the world-has been constructed for irrigating this area. The land bounded by the jhelum and the Chenab rivers on the east and the Indus on the west, comprising the districts of Mianwali, part of Shah pur, and Muzaffargarb forms the western plains. The whole of this area is dry; rains are scanty, and until recently, cultivation was generally possible only by inundation near the beds of rivers. A major portion of this tract is known as 'ThaI' and its irrigation and colonization is well under way. The Dera Ghazi Khan district lies between the Indus and the SuI aim an Range.
The Bahawalpur State has no mountains or hills. The State can be divided lengthwise roughly into three parts. Of these the southernmost and broadest is a desert (contiguous to the great Indian Desert) consisting largely of sand dunes known as the Rohi or Cholistan. It is separated from the adjacent tract by a depression called the Hakra, which is the dry bed of some big extinct river. The central strip is chiefly a flat desert though a large portion of it has now been brought under cultivation by canal irrigation. The northern strip is a fertile narrow alluvial tract in the Su tJej valley and is generally irrigated by non-perennial canals.
1.7 Rivers.-All the great rivers of the Punjab have their sources in the eternally snow clad Himalayas and have a continued water supply all the year round. This fact bas greatly contributed to the development of the canal irrigation system found in the province. The fertile

GEOGRAPHICAL SUMMARY
PUNJAB &
BAHAWALPUR STATE
RIVERS
) AMMU &-
()
REfERENCE
13
....) Provincial Boundry Line
__) District So~~dry ...Jf Lin~ ~ Rivers

14 GEOGRAPHICAL SUMMARY
plains are all formed of the alluvial soil brought down by the rivers from the mountains. The indus is the greatest of all the Punjab rivers. After passing through the Hazara district of the North West Frontier Province it flows almost due south pass Campbellpur where it enters a deep gorge terminating at Kalabagh. Thus far it forms the western boundary; but south of Kalabagh it enters the Punjab and divides the Isakhel Tahsil from the rest of the Mianwali district. Further south again it forms the western boundary and at the extreme south it divides the Dera Ghazi Khan district from the Muzaffargarh district and theBahawalpur State. It may be mentioned that recently a great barrage, known as the "Jinnah Barrage" has been constructed on this river near Kalabagh for the' irrigation of the ThaI.
The other major rivers which travers the country from the north-east to the south-west are the Jhelum, the Chenab, the Ravi and the combined waters of the Sutlej and the Beas. The River Jhelum divides the districts of Jhelum (right bank) and Gujrat (left bank). and flowing through the Shah pur and Jhang districts, joins the River Chenab at Trimmu. After traversing the Chamba State and the Jammu Province of Kashmir the River Chenab enters the Punjab plains in the Sialkot district and parts the Sialkot and Gujranwala districts on the left bank from the Gujrat and Shahpur districts on the right. The River Ravi enters the Punjab at the border of the Sialkot . district, and passing through' ~ the 'West of the Lahore district separates it from the Montgomery. district; thence flowing through the nor-
them part of the Multan district it joins the combined waters of the Jhelum and the Chenab near the border of the Jhang district. The united streams of the three rivers are known as the Trimab. The
combined waters of thc Rivers Sutlej and Beas enter the Punjab at the border of
the Lahore district and following a
southerly course fall into the TriM2ab near Uch in the Bahawalpur State. Blow this confluence, the waters of the Jhelum, Chenab, Ravi, SutIej and Beas form the Panjnad or 'five rivers', which fall into the Indus at Mithankot.
The Bahawalpur State has no river running through its territory, but all the rivers of the Punjab from· a line on the northern and western boundaries. The Gharra, as the conflux of the Sutlej and the Beas is called in the State, runs along the northern boundary before joining the Chenab, Jhelum and Ravi at Punjnad. The Indus, with its five Punja b tributaries described above, flows along the western boundary of the State for some distance.
Map 1.2 shows the course of these rivers.
1.8 Rainfall.-The rainfall in the Punjab mainly dependS on the Monsoon currents, and normally lasts from June to September. Statement 1.A gives the figures of average rainfall, in each district for the last decade (1941-50).
The rainfall is fairly sufficient in the submontane tract of the Punjab comprising the districts of Sialkot, Rawalpindi and Jhelum which get between 26 and 34

KEY TO DISTRICTS
PUNJAB I'. Lahore 2. 'Sheikhupura 3. yujranwala It Sialkot S'. . J.hang
G Montgomery 1 Multan. g Mllzaft'argarh
9 Oera Cazi Khan
t~ Lyallpur 11 Gujrat 12 Jhelum I] Rawalpiodi 14 Campbellpl.lr 15 Shahpur 16 Mianwali
BAHAWALPU~ STATE 17 Bahawalpur 18 R~himyar Khan
.1 ..
GEOGRAPHICAL SUMMARY
PUNJAB
" BAHt\WALPUIl STATf
RAINFAJ.L
15
AVERAGE ANNUL RAINFALL
0"T05' F:::J 6"-10' ~
~11~20· [$~\~lZl"-30 ~'Wt

16 GEOGRAPHICAL SUMMARY
STATEMENT I.A.
(Reference Paragraph 1.8) Annual Average Rainfall in the Ponjab
(1941·50 decade)
District.
1. Gujranwala 2. Lahore 3. Sheikhupura 4. Sialkot 5. Dera Ghazi Khan 6. Jbang 7. LyaUpur 8. Montgomery 9. Multan
10. Muzaffargarh 1 I. Campbellpur 12. Gujrat 13. Jhelum 14. Mianwali 15. Rawalpindi 16. Sbahpur
(Inches) 23.18 18.40 15.27 31.83 5.94 9.95
12.17 9.94 6.70 6.14
23.79 26.20 26.13 t 1.94 33.89 14.69
(Inches) 23.1 16.2 16.9 32.81
4.82 9·71
12.5 10.3
5.74 5.14
23.2 25.8 30.54 10.8 34.8 14.83
Note.-1. Figures supplied by the MeterolOgica\ Department, Pakistan Government and adopt ed in the Season and Crop Reports.
jnches of rain. The district of Gujrat, Campbell pur andj Gujranwala on an average get between 23 and 25 inches rainfall, while the average of the districts of Lahore, Sheikhupura, Sargodba and Lyallpur is between 12 and 16 inches. The southern and south· western districts have scanty and often erratic rainfall which is about 10 incbes in the districts of Mianwali, Montgomery and Jhang and 5 inches in the Multan, Muzaffargarh and Dera Ghazi Khan districts. Rainfall is also scanty all over the Bahawalpur State. The eastern part is compratively better. Minchinabad, the ~ster,l) most Tahsil, gets to to 12 inches a year while the westernmost Tahsil of Sadiqabad, gets between 2.5 and 5 inches,
Map 1.3 illustrates the extent of rain
fall in the Punjab and Bahawalpur State.
1.9 Irrigation System-Due to scanty and irregular rainfall agriculture in the Punjab largely depends upon artificial methods of irrigation, According to the Season and Crop Reports, out of every 1,000 irrigated acres in the Punjab about
790 depend upon canals, 200 on wells (which number 198 thousands) and the remaining lOon other means of irrigation. Map 1.4 illustrates the network of the canal irrigation system in the Punjab and Bahawalpur State. Several projects were constructed during the last century and large areas of waste land cOlonised. The Canal Colonies are toda y the most important factor in the stability of the food economy_ The prosperity of the
Bahawalpur State like that of the punjab depends mainly on canal irrigation. Statement l.B gives an account of the major canal works in the Punjab and
Babawalpur State.
In addition, there are a series of
inundation canals taken off chiefly from the river Indus in the Dera Ghazi Khan and Muzaifargarh districts, and the river lhelum mostly in the shah pur district. These inundation canals irrigate approxi~ mateJy 11,000 acres.
1.10 CuJtivatioD.-Excluding the forests and the land not available for cultivatioo (comonly known as Ghair Mumkin), there are 29 millions acres of cultivable
land in the Punjab of which 19 millions are actually under cultivation. This means that approximately 2/3rd of the cultivable area is actually under cultivation. The cultivable area and the net cultivated ~rea

GEOGRAPHICAL SUMMARY 17
STATEMENT 1.B.
(Reference Paragraph 1.9) Major Canal Works in the Punjab and Bahawalpur State.
Canal system
1. Thai Kalabagh· Canal
2. Upper Mangla Jhelum Canal
3. Lover Rasul Jhelum Canal
4. Upper Marala Chenab Canal
5. Lower Kbanki Chenab Canal
6. Rangour Trimmu Canal
7. Haveli Canal
Trimmu
Is likely to irrigate
over 2 million acres when completed 1954
392
1,022
787
2,800
162
125
Districts Irrigated.
Mianwali Shahpur and Muzaffargarh
Gujrat, Water poured into the River Chenab a little above Khanki for feeding the Lover Chenab Canal.
Shahpur and parts of Guj· rat and Jhang (Chaj Doab).
Gujranwala and Sheikhupura. Also carries water to the Ravi River for the Lower Bari Doab Canal.
Gujranwala, Sheikhupura, Lyal1pur and Jhang.
Jhang and Muzaffargarh
Jhang (Shorkot Tahsil) and Multan district.
---------~~,=---
in the Bhawalpur State are 3.7 million and 2.8 million acres, respectively. The rest is either under forests or not availabJe for cultivation (i. e. Ohair Mumkin), Statement I.e shows the cultivable and the net cultivated area in each district in
SCYS~tnemal=11 ~-d-ir;-·~-·"'I--D-is-tr-ic-t-sIrrigated. i I OOOs acres I
-------~----
8. Upper Madhupur 650 Bari (Gurdaspur Doab district) Canal in India."
9. Lower Balloki 1,530 Bari Doab Canal
10. Sidhn8 i Sldhoai 823 Canal System
11. Suf/ej Valley Canals
(a) Dlpal- Ferozeput 550 pur Weir Canal
(b) Pakpat- Sulemanki 851 tan Canal
(c) Eastern Sulcmanki Sadiqia
(d) Fordwab Sulemanki
(e) Bahawal
(f) Qaimpur
(g) Mailsi
(h) Abbasia
(i) Panjnad
Islam Weir
Isalm Weir
Islam Weir
Panjnad Weir Panjnad Weir
783
291
462
32
413
49
918
Lahore. The source of supply being in India the supplies of water have been irregular of late. Montgomery (Ganji Bar) Multan.
Multan.
Lahore and Montgomery.
Montgomery (Pakpattan Tahsil) and
M ul tan(Mailsi Tahsil). Bahawalpur State. Bahawalpur State. Bahawalpur State. Bahawalpur State. Multan (parts of Lodhran and Mailsi Tahsill,). Ba hawal pur State. Bahawalpur State.
the Punjab and of the Bahawalpur State as a whole.
The forest in the Punjab cover a total area of about 1,721 square miles. The natural forests containing chil (Pinus

18
KEY TO DISTR(CTS
PUNJAB
Lahore 2 Shcilhllpura
Gujranwala 4 Sialkot <; lhung
6 Montgomery 7 1';1 lilt an
8 MUlaffa Igurh f) Oera Gazi Khan lO Lya!lpur
. II GUJlat 12 Jhelum
13 Rawalpindi 14 Campbeilpul 15 Shahpur 16 Mianwali
Bahawalpur Stale
17 Bahawalplll IS Rahimyar Khan
,-
GEOGRAPHICAL SUMMARY
50 t.I1llE 5 La iB<iiil
PUNJAB
&
BAHAWALPUR STATE
CANAL"
REFERENCE
Pro>lne.al BO'lndry Line
Di\lricr BOU;ldry
Kivtrs
Canal,

GEOGRAPHICAL SUMMARY 19
STATEMENT I.C.
(Reference Paragraph 1.9)
Cultivalbe and Net Cultivated Area Punjab
and Bahawalpur State
-----=------=---.~---~~----~~~ I In OOO's acres i ~
I c~iti~~l~~~ !', 8 ble area Ivated areal ~
District.
----------------~
PUNJAB 3,29,47 2,20,66 67
t. Lahore. 12,02 9,79 81 2. Sheikhupura 13,58 9,87 73 3. Gujranwala 12,74 9,91 78
4. Sialkot 11,46 10,45 91
5. Jhang 19,56 10,54 54 6. Montgamery 24,24 19,32 80 7. Multan 31,93 22,60 71 8. Muzaffargarh 29,99 8,01 24 9. Dera Ghazi Khan 24,85 10,02 40 10. Lyallpur 20,79 17,27 83 11. Gujrat 11,79 10,43 88 12. Jhelum 8.49 - 7,06 83 13. Rawalpindi 6,91 5,78 84 14. Campbell pur 13,37 11,21 84 15. Mianwali 26,71 12,72 48 16. Shahpur 23,59 17,63 75 BAHAWALPUR STATE 37,45 28,05 75
Longifolia), kail (Pinus Excelsa), kau (Olea
Cuspidata) concentrate in the Murree and Kabuta tahsiIs of the Rawalpindi district, and the Campbellpur and Jhelum districts. The cheif irrigation plantations containing shisham (Oalbergia Sissoo) mulberry (Morus Alba) and kikar (Acacia Arabica) are at Chhanga Manga, Chich a
watni, Khanewal, Dapher, Burllla, Shorkot and Wan Bhachran. Small areas for forest plan ta~ion are also reserved in
the BahawaJpur State at Bhawalnagar, Chak Katora, Ghafoor (Lal Sonhara), Shahiwala, BahawaJpur, Abbasia and Walher.
Map 1.5 illustrates the percentage of the area under cultivation in the Punjab and the Bahawalpur State. Forests have been indicated by conventional signs.
1. 11 Main Crops and their yields.Agriculture is the chief source of income of the Punjab. Wheat is the
main food. crop and covers about 39% of the total sown area. It is grown all over the Province, the principal
centres being the colony districts of Lyallpur, Shahpur. Montgomery, MuHan and Jhang and the otherwise fertile districts of Sialkot and Campbell pur.
STATEMENT 1.D.
(Reference Paragraph 1.11)
Area under principal crops i!l the Punjab with total production for year ending 30th June, 1951.
------------------~----~---------Acreage Production 1
Crop. in ooos in ooos Tons/Bales
Wheat 73,53 30,092 Tons.
Rice 8,36 4,34
Bajra 13,24 2,53 "
Gram 18,83 5,55 "
Cotton (Oesi) 1,98 74 Bales,
Cotton (American) 15,18 6,56 Bales,
Notes:-l. Based on the Season and Crops Report. 2. Due to dry weatner normal sowing and yield were
adversely affected.
The next in importance are rice. bajra (penicellaria Spicata) and gram. Rice is mostly grown in the Gujranwala, Sheikhupura, Sialkot and Montgomery dis
tricts. Bajra is chiefly sown in the

20 GEOe,RAPHICAL SUMMARY
~I - ---'-------------------------------------------------------------:M.P: I-S I,
PUNJAB .
II KEY TO DISTRICT &
PUNJAB BAHAWALI'L'R STATE II I Lahore I 2 Sheikhupura.
I ;6
3 Gujranwdla Sillikot Hang Montgomery
7 MuHan
8 M uz~lfargaTh 9 Dera G.zi Khan 10 Lyallpur 11 G ujra~ 12 lhelum 13 Rawalpindi 14 Campbe\\pur
15 Shahpur 16 Mianwalt
Bahawalpur Stale 17 Banawalpur J 8 Rahimyar Khan
50 ~11lE 5 km rl
NET CCLT!VATED i\R£A
r----T 2l% Tc 40% L--l r:.::3 41-60/~ ~7iC/_nnG/ L I 10 0 ..... (0 ~
(l r"".$tc a. 1rri9otio.
l'".iJ.ti.n

GEOGRAPHiCAL SUMMARY 21
districts of CampbeUpur, Shahpur, MuHan, Dera Ghazi Khan, Sialkot and R.awalpindi. The districts of Mianwali, Shahpur, Montgomery, Lyallpur and
Multan are the main growers of gram.
Cotton is the chief cash crop and its
production is eoncentrated in the colony
districts of Multan, Lyallpur, Mon t
gomery, Shahpur and Jhang. The other crops grown commonly are barley, jowar,
maize, pulses, oil-seeds and sugar-cane. Statement l.D gives the area and the figures of total production of the chief crops for the year ending on the 30th
June, 1951.
Map 1.6 indicates the distribution of
the main crops in the Punjab and the Bahawalpur State.
The food crops sown in the Bahawal
pur State are wheat, gram, bajra (Penicellaria Spicata) and jowar. Wheat overs about 20% of the total sown area. The main cash crops are cotton, oil
seeds and sugar-cane. The acreage under the principal crops, is given in Statement
1. E.
1.12 Minerals. - The Punjab is not rich in minerals. A brief account of the
few important minerals found in the pro
vince is herein stated.
Rock Salt.-This mineral is found in
the Salt Range. The salt bearing strata is about 600 miles in Jength while the thickness of the seam varies from 100 to 275 feet. The chief centres of excava
tion are Khewra in the Jhelum district, Warcha in the Shahpur district and Kala
bagh in the Mianwali district. The total
STATEMENT t.E.
(Reference Paragraph l.11)
Area under principal crops ill the Bahawalpur State with tot al production for
year ending 30th June, 1951.
I A "age i ~roduction Crop. I . ell; t in OOOs
I[J ODDs. Tons/Bales ~-----~-______ I-~ __ ! ___ _ Wheat 5,15 1,04 Tons.
Bajra 1,43 32 "
Toria and Sarson 4,39 97
Gram and mixed Gram ... 3,43 57
Cotton (Desi) 1,06 43 Bales.
Cotton (American) 3,47 1,52 Bales.
production of salt during the year 1949-50 in thousand tons was 130 at Khewra, 16 at Warcha and 26 at Kalabagh.
Coal.-Coal of not very superior
quality' is found in the Salt Range and
the Trans-Indus region. Its probable workable resources in thousand tons are believed to be 69,700 in the Salt Range,
6,270 in Makerwal Trans-Indus region and 12,600 in Gullakhel Trans-Indus region.
At present there are 57 collieries of which
the most important are Pidh and Diljabba in the Jhelum dishict, Katha in the Shahpur district aDd Makerwal and Gul~
lakhel in the Mianwali district. The total production of coal in the Punjab has risen from 1,35,755 tons in 1942 to
1,78,722 tons in 1949-50.
Petroleum.-Crude Oil is found in Khaur and DhulJian in the Campbellpur

22
KEY TO DISTRICTS.
. PUNJAB Total Area Sown (acres '000) I LahQr~ 871 2 Sheikhupuu 924 1 GUJran'wala 993 " Si.lko\ 1010 5 Jhang .' 100 I 6 Montgomery .. 2107
Muhar .. , 2501 MIJlalfargarh ,.. 712
9 Dcra Gaz; K ha n 693 10 lyallpur ', .. 1794
II Gujrat ... '1135
r 2 JheJum '.. 720 13 Rawalpindi '.. .588 14 Ca':'lpbt-lIpur ... JOJJ IS Shahpllr ... 1629 15 Mianwali 1049
Bahaw~l;ur Slaif
11 8ahawatpur 18 Rahimyar
Khan
GEOGRAPHICAL SUMMARY
PUNJAa
'" BAWALPUR STATE
AREA UNDER MAIN CORPS
(:earendmg lOth June 19~1)
o

GEOGRAPHICAL SUMMARY 23
district. Further sources. of supply of the oil were discovered at Joya-Mair in 1945 and Balkassar in 1948 both in the Jhelum district. The production of Crude Oil has increased from 1,17, 770barrels in 1947 to 9,47,515 barrels in 1951. The Crude Oil is taken to the re~nery at Rawalpindi from Khaur and Dhullian through a pipe-line, and from loya-Mair and Balkassar by rail.
Lime-stone & Gypsum. Vast deposits of lime-stone and gypsum are available in the Salt Range. The richest deposits of gypsum are located at Daudkhel in the Mianwali district where it is proposed to set up a Fertiliser factory. At present these minerals are chiefly used in the manufacture of Cement in the factories at Wah, district Campbellpur and Dandot, district lhelum. During 1950 the _production of limestone was 41,073 tons and gypsum 16,659 tons.
Miscellaneous Minerals.- Fire clay is excavated at Ratucha, Dandot and Lilla in the Jhelum district and Warcha in the Shahpur district. The Present production is about 6,000 tons per annum. Silica sand deposits occur in bedded form at Makcrwal and Gullakhei in the TransIndus region and Khewra in the Jhelum district The present annual production is about 3,000 tons. Building and roadmaking stone is found in the Jhelum, Shah pur and Mianwali districts.
Tbe'minerals resources of the Bahawalpur State are very meagre. GeOlogical surveys carried out by the Survey Department of the late Government of India in 1904 and 1945 revealed that the
entire area of the State lies either on alluvium or on desert sand and tha t no rock occurs except kankar and peashingle which are found in the eastern part of the State.
1.13 Indu'itries--The Punjab has made considerable advancement in the industrial field, At the time of the Partition there were 723 registered factories employing 1, 14, 021 workers. Most of these factories closed down on account of the mass movement of non-Muslim owners. Practically all abandoned factories that had not been completely da- . maged have now been rehabilitated and restored to normal working. Due to natural advantages favouring the growth of the cotton textile industry, five new textile mills have recently come into exist("nce at Lyallpur, Multan and Rawalpindi and several more are under cons
truction. Some small scale woollen mills and rayon weaving factories have also been set up. Tanning is another industry which has made headway. Ten mechanised tanneries one each at Lahore, Lyallpur, Rawalpindi and three each at Muridke {Sheikhupura district) and Multan have come into existence. The Batala Engineering Company (Pakistan) Ltd.,
have installed a big machine tool manufacturing plant at Lahore. Some other factories for the manufacture of glassware, crushed-bone, paints and varnishes sulphuric acid, hydrogenated oils and biscuits have also been started. The sports goods and surgical instrumeo ts industries of Sialkot, which had received a set back due to the Partition, are again humming with activity. The Government

24 GEOGRAPHICAL SUMMARY
Surgical and Allied Trade Development Centre at Sialkot has been expanded with a view to standardising and developing tbe metal industries there. The cutlery industry of Wazirabad and Nizamabad
il'l the Gujranwala district has also been reorganised. The refugee hand loom weavers from India have been settled in the Lyallpur, lhang and Multan districts
and arrangements have been made for finishing the cloth manufactured by them. The wheels of induqtry have also been set in motion in the Bahawalpur State. Beside'> a large number of cotton ginning and oil expelling factories, ice plants.
flour mills and founderies, the State has a modern textile mill, a hydrogenated oils plant and a soap factory and further industrial expansion is contemplated. The development of cotton and woollen
cottage industries is also progressing satisfactorily.
1.14 Sources of supply of electricity. Map 1. 7 indicates the location of miner
als, industries and hydrodectric instalia
tions in the Punjab and Bahawalpur State.
Before the Partition the Punjab (Pakistan) had two scurces of supply of electrical energy; namely. the Mandi HydroElectric Power Station at 10gindernagar
and 36 Electric Supply Undertakings of which one; viz. the Lahore Electric Supply Company, was owned by the Punjab Government. In the Partition of the Punjab the Mandi Hydro Electric Power Station fell to the share of the Punjab (India). Secondly due to the mass migration of the population, the non-Muslim
owners of many Electric Supply Undertakings abandoned their power houses. These two factors made the posilion of
the supply of electrical energy difficult in the Punjab (Pakistan) to begin with. But soon, by an agreement with the Punjab (India) Government the supply of about
10,000 K. W. from the Mandi HydroElectric Scheme was arranged. Simultaneously the rehabilitation of the abandoned electric concerns was undertaken by the Punjab (Pakistan) Public Works
Department, Electricity Branch, and as a
result, besides re-harnessing the old plants, some new diesel sets with a total capacity of 7,000 K. W. were installe t at several places. Work was also resumed with redoubled energy on tbe Rasul
Hyde} Scheme, which was designed for a
load of 22,000 K. W. This project had been started in 1945 and was progressing satisfactorily until the time of the Partition when it became completely disorga
nised owing to wide spread communal riots and the emigration of non-Muslims. The scheme has since been re-activated when it is fully in operation it will supply
electricity to 28 towns in the Gujranwala. Sheikhupura, Lyallpur, Jhang. Gujrat, lhelum and Sargodha districts. The
Punjab (Pakistan) is fortun"te in having large water-power resources estimated at one million kilowatts approximately. The ultimate objective is to harness these re
sources by the construction of large scale Hydro-Electric Schemes and to cover the whole province with a network of transmission lines so as to provide a large amonnt of electrical energy at cheap rates
not only for industrial development but
also for domestic consumption in both urban and rural areas. The supply of electrical energy in the Bahawalpur State
is not so well organised as in the PUl'ljab

',E ~ 'Te) DISTR leTS
PUNJAB
ldhor~
She l kh"pur:1 GUJranwala
4 S.alkot 5 Ihang
6 Montgomery 7 Mullan g M uza ffargarh 9 Dera Gazi Khan
10 Lyal1pur II Gujral 12 Jhelum
13 Rawalpindi \4' Campbell pur 15 Shahpur
16 Mainwali
Bahawalpur State
17 Bahawalpur
18 !{ah.myar KhOln
GEOGRAPHICAL SUAfAfARY
,~
~~"~~,~-.I t
...
HYDr.O-ELECTRIC.
EI.ECiRlC.IT.,. I-I'(ORO
"" "JHRMAl..
PUNJAB &
BAHAWALPUR STATE;
25
Local.on of Mmerals. Industries & Hydro-Electric Installations
JAMMU ~
SIGNS
(OAt..
COLLIERY C Pf'l ROLEM we'u.s 4J
,F-il. REFI"'ERY0,L;-(CW~~
KeROSEN C\'~ t/!J:
GYPSUM
CEMEl'n
INDUSTRiES
l£X1" L'G M!L1..S
MECf-lAN'ZED TANNERIE.5
MEiAL. WORKS
SPORT S GOODS
SUP.GICAL :/ \NSi~UMiN'TS O'l)
C 1.1 T LeeRY )(
-~ \\

26 GEOGRAPHICAL SUMMARY
but some of the towns in the State have been electrified. the possibility of installing a hydel plan t in one of the canals in the State is being explored.
1.15 Communications Railways. Mapl.8 illustrates the railways and roads in the Punjab and Bahawalpur State. The Western wing of Pakistan is fortunate in having inherited an extensive system of railway communications called the North Western Railway. Among other areas, this railway, which has its Headquarters Office at Lahore, serves the more important parts of the Punjab and the Bahawalpur State. It has two main lines which start at Peshawar in the North West Frontier Province and running through the Punjab, the Bahawalpur Stite and Sind terminate at Karachi. From Peshawar to Lalamusa in the Gujrat district these main lines have a common track which passes through Campbell pur. Rawalpindi and Jhelum. Bifurcation takes place at Lalamusa from where one of the lines takes a southerly course and running through Gujrat and Gujranwala reaches Lahore; thence it bears in a south·westerly direction and passing through Montgomery and Multan in the Punjab and Bahawalpur and Rahimyar Khan in the Bahawalpur State, enters the Province of Sind. The second main line runs into the Chenab Colony from Lalamusa and passing through Sargodha and Lyallpur joins tbe first line at Khanewal in the Multan district. The north-west corner of the Punjab is also connected with Karachi. by branch lines running through J{undian and Bhakkar in the Mianwali
district, Leiah and Mahmud Kot in the Muzaffargarh district; thence to Sher Shah which lies between Multan and Lodhran, on the main line. There are numerous cross branches on these three lines which together form a network of railway over the Punjab and Bahawalpur State. The only portion of the Punjabnot served by the North Western Railway is the Dera Ghazi Khan district which lies on the west of the river Indus.
Roads. There has been a notable expansion of road transport in the Punjab due largely to the extension of roads in the province. Besides the Government Transport Services run by the Punjab Transport Board in several parts of the province there are numerous privately owned transport services. 'Metalled and unmetalled roads are spread all over, even in the remotest parts of the Punjab. The chief highway is the Grand Trunk. Road which starts from Wagah in the Lahore district at the border of the Punjab (Pakistan) and the Punjab (India) and passing through Lahore, Gujranwala, Gujrat, Jhelum, Rawalpindi and Camp· belJpur enters the North West Frontier province ending at Peshawar. This highway is metalled and bridged throughout. An equally important highway runs from Lahore to Karachi through Montgomery, Multan, lhe Bahawalpur State and the Sind Province. There are also a large number of arterial roads connecting the district headquarters with important towns. The medium of road transport is utilised for both passenger and goods traffic and is particularly useful for the movement of agricultural produce to

KEY -:£0 ~ISTRICTS PUNJAB
I Lahore 2 Sheikhupura
. Gujranwala 4 Sialkol 5 Jhang 6 Montgorner Y 7 t'I,uhan 8 M u~alfargarh
9 Dera Gazl Khan 10 (..yaUpur 11 qujrat
12 Jhelum
11 Rawalpindi
14 Campbellpur
15 Shahpur 16 to1 iapwall
Baha",alpur Stale
17 Bahawalpur I~ . Rehimyar Khan
GEOGRAPHICAL SUMMARY
PUNJAB &
BAHAWALPUR STATE
COMMUNICATION
)AMM U f;:
KASHMIR
21
I Provincial Boundry ___,. Llnc
I District Boundry __" Line
-=::J'Oouble Line
_JSin~le L",e I
•. __ .,,".,' Road

2S GEOGRAPHICAL SUMMARY
market towns. The Punjab has an ambitious road extension programme which is being implemented year by year. The construction of some 400 miles of new metalled roads in the Thai has significantly contributed towards its colonisation. In 1941 the Punjab had 2,073 miles of metalled roads and 924 miles of un metalled roads. In 1951 this mileage stood at 3,346 and 1,374 giving an increase of 61% and 50% respectively. The Bahawalpur State also has been developing its roads. The total length of. public roads in the State has gone up from 1,369 miles in 1941 to 2,074 miles in 1951. The principle roads in the State are the Bahawalpur-Dera Nawab Sahib Road and the Multan-Rohri-Quetta Road.
Rivers. Due to the devdopment of rail and road traffic the rivers of the Punjab have lost much of their previous
significance as important means of communication. By and large there is little navigation now on the Rivers Ravi, Chenab and Jhelum except some ferries for crossing them. But their streams are still utilised for transporting to the plains the timber felled on the hills through which they run. In the River Indus however some trade is carried on with the neighbouring province of Sind by means of country crafts and boats though even this is on the wane.
Air. A most recent addition to the means of communication, even if still in its infancy, is civil aviation. Lahore and Rawalpindi lie on the air route from Karachi to Peshawar on which regular passenger services are run. Lahore also lies on the air route from. Karachi to Dacca in East Pakistan. Further a regular service exists between Lahore and Delhi (India).

Chapter 2
Historical
2.1 Introductory. It ic; perhaps outside the scope of this Report to give a detailed historical survey of the Punjab and Bahawalpur State. There is no dearth of treatises on that subject written by many eminent historians which leave no room for addition particularly of an amateurish one. Secondly, in the limited space that can be allotted to such a survey in a report of this nature, it would be quite impossible to cover the vast ground comprehensively. However, for the benefit of the reader who does not know the territory to which this Report relates, its historical background is outlined in this chapter very briefly.
2.2 Pre-Muslim Period. The Punjab (which means the land of the five rivers) is the country enclosed and watered by the Jhelum, Chenab, Ravi, Beas and. Sutlej rivers. It was the seat of the earliest Aryan settlemen ts in India and the Vedic civilization. Its natural advantages in soil and climate-immense fertile plains, rich valleys and abundan t water supply-lead to the belief that the territory must have been amongst the earliest settlements of man. The ruins of Harappa in the Montgomery district about 110 miles south-west of Lahore, show that it was a well arranged city with baths and granaries and that the
Survey.
people who lived in it were fairly advanced and possessed an orderly Government. From some far distant part of Asia a horde of Aryans came about 1500 B.C. and it is thought that they seized Harappa and massacred the inhabitants. Since ancient times the capital of the Punjab has been Lahore. It is situated on the left bank of the Ravi river.
2.3 Khyber Pass. The Punjab adjoins the North West Frontier Province, which is another Province of the Western wing of Pakistan. Befote the advent of navigation the Khyber Pass, which is situated in the North West Frontier Province, was the only natural gateway to India; so the Punjab was the first to be invaded by successive conquerers of the country all of whom came to India by this route. For a brief period after 500 B.C. Darius, a Persian King, founded a satrapy in the Punjab from Kalabagh in the Mianwali district to the sea. In 326 B.C. Alexander the Great of Macedonia with his Greek troops fought his way to the territory east of the Indus and there at Taxila received the surrender of the Indian King Porus, to whom he granted the country between the upper reaches of the Jhelum and Chenab. Alexander advanced as far as the Beas river; but since his soldiers were reluctant to cross that
(29 )

30 HISTORICAL SURVEY
river he returned, making Porus the Governor of all the conquered country west of the Beas. When he died in 323 B, C. the Greek rule came an end in northern
India. For the next few hundred years
the north-west corner of ancient India remained under the Buddhist rule of Asoka and his successors. Now and then fresh invaders entered the country through the Passes and there was often much confusion. By 100 B. C. the Sakas invaders from Central Asia, who adopted the Buddhism of the country, founded a kingdom in the north-west Punjab. This kingdom was overrun by the 'Kushan
tribe.
2.4 Muslim Inl'asions. The first real invasion of India by the Muslim occurred in 712 A.D. when Muhammad Bin Kasim, one of the Generals of the Khalifa.
"onquered Sind and took Multan. which then lay on the north bank of the Ravi. In 986-87 A D. the Turkish Sultan Subaktagin. with whose arrival the Islamic failh obtained its first real footing in the Indian Continent, crossed the Indus to invade the kingdom of Lahore, then ruled by the Brahman Prin~e Jaypal. They met neal;' Peshawar and Jaypal had to ransom his kingdom. Subaktagin returned in the following year to enforce the promised payment; there was again great slaughter and he took possession of till the country on his side of the Indus. His successors, Mahmud Ghazni, made a series of inroads into InQia. On gaining a victory over the Rajas of Ajmer, Kanauj, Delhi, etc., in the year 1008 he annexed the northern Punjab as part of the kingdom of Ghazni. The occupation of
Lahore was the first beginning of the future Muslim Empire of LlJia. It was
in about 1098 that Lahore became the real capital of the Ghaznavid dynasty. The second on the roll of the founders of the Muslim Empire in India was Muhammad Ghori, who ousted the decendants of Subaktagin from Lahore in ll87 and with the death of Khusru Malik, the Ghaznavid representative at Lahore,
the dynasty of Mahmud came to an end and Lahore was occupied by MuhlG1mad Ghori. In order to establish his supremacy he had to fight battles agains t the Raja of Ajmer and other Rajput chieftains. Meanwhile the Gakkhars, a tribe in the mountains of the Punjab, committed depredations on the country between the Jhelum and Chenab. They succeeded in capturing Lahore. Muhammad Ghori repelled their omlaught with the assistance of his slave general Qutab-ud-Din Aibak and recovered Lahore. In March 1205, however, he was assassinated by the .Gakkhars when he was on his way to Ghazni. On his death Qutab-ud-Din ascended the throne at Lahore and for nearly two centuries LahQre was held by the representatives of the Slave Dynasty and of the Khilji, Tughlak, Sayyad and Lo~i
Dynasties which succeeded it. In 1398 Timur invaded the Punjab in the reign of Muhammad Tughlak, plundered the country and returned to Turkistan.
2.5 Moghals and Afghans 1526·1759 A.D. In 1526 Babar, a decendant of Timur, repeated the exploits of Timur, but his ambition was for conquest and occupation and not merely for plunder. Baber defeated Ibrahim Lodi near

HISTORICAL SURVEY 31
PlfIIftt.i.t, (j~pturoo Delhi and founded tHe f6n1e' 2() years tater that the Moghal Em..:;,
~al Empire in India though it was ite was firmly established. Babar died at ~ra 1530. I;Iis son, Humayun, who succeeded bim, had to yeild to his brother Kamran
aM to confirril him as the sovereign of ibe punja-b. The temporary success of
the great Afghan General Sher Shah Sud
drove Humayun from India in 1540. Sher ~an ~etnaine'd in possession of Lahore for some years and connected Multan
and Lahore by Ii road_ It was not until 1555 that Humayun was able to return to tndia, he occupied Lahore in that year and went on to Delhi where he met his detth by an accidental fall in 1556. On
~ death of Humayun his son Akbar, ttttlti dtily about 14 years of age, was pro-
_ Cfai'lned the Emperor of India at Kalat'I''lidr in the Gurdaspur district of the Punjab, now in India. Akbar came at Ortce to Lahore and with his accession a nt!w era began. The Moghal Empire was finally and firmly established and the Punjab, after 20 years of incessant war, enjoyed comparative peace. In Akbar's reign Lahore attained its period of greatest grandeur which ended when he left the City for Delhi and the Deccan in the
42nd year of his reign, seven years before his death in 1605. Akbar was succeeded by his son Jahangir, who died at Bhimber in 1627 and was burried at Shahdara near Lahore. On the death of ]ahangir, his son Shah Jahan was proclaimed as the Emperor, at Agra early in 1628. He reigned for about 30 years
when in 1658 his son Aurangzeb engaged
with his 3 brothl:fs in a fight for succes
$i(ln to the throne, beld him as a prisoner.
He died it!. 1666. Aurangzeb, who suc
ceeded Shah Jahan, died in 1707. In the closing years of his reign signs were alrt:ady visible that the downfall of the great Moghal Empire was not far distant. The Moghal rule in the Punjab came to an end in 1759.
2.6 Sikh Power 1768-1849 A. D. The Sikhs were originally the followers of a
religious sect, founded by Baba Nanak,
who was born near Lahore in the latter half of the 15th century and died at Oeta Nanak of} the Ravi in 1538. He was succeeded by a succession of Gurus (spiritual leaders), under whom the new doctrine made steady but peaceful pro
gress. Ramdass, the fourth Guru, obtained from Akbar a gran t of land on the spot, now under the city of Amritsar the metropolis of the Sikh faith. Arjan, the fifth Guru, being involved in a quarrel with the Imperial Governor of Lahore, was imprisoned in that city. When he died his followers asserted that he had been cruelly put to death and this changed tb e in offensive and pacifist Sikhs into fanatical warriors. They became open enemies of the Muslims and their Government and committed unheard of cruelities wherever they directed their steps between Lahore and Delhi, Their activities, however, were keptunder check by the Emperor
Bahadur Shah until 1738, when after the invasion of Nadir Shah, a Turkman of humble origin, who ransacked Delhi and
weakened the power of the Moghals, the Sikhs once more gathered fresh courage to rebel. An important in cident relating to' the Sikhs took place in 1762 when
Ahmad Shah Durrani, the Afghan

32 HISTORICAL SURVEY
conqueror of the Marhattas at Panipa t in the preceding year, routed their forces completely and pursued them across the Sutlej. On his homeward march he destroyed the town of Amritsar and blew up the Sikh temple there. But as he withdrew the Sikhs rose once more and established their authority in the Punjab under Ranjit Singh, a Sikh adventurer, who had obtained a grant of Lahore from Zaman Shah, the Durrani Ruler ofKabuI. Ranjit Singh spread his power over the greater part of the Punjab. In 1809 he made a treaty with the British, by which he undertook not to encroach on the Sutlej and to preserve friendship with the British Government in return for the recognition of his sovereignty over all his conquests north of that river. This treaty, it may be mentioned. he scrupulously respected till the end of his life on the 27th June, 1839. On his death his son Kharak Singh succeeded to the throne of Lahore, but he died in November, 1840. A state of anarchy ensued, during which the Sikhs committed depredations on British territory, resulting in two Wars known as the First and 2nd Sikh Wars. The First Sikh War took place in December, 1845, When battles were fought at Mudki on the 18th
December 1845, Feroz Shah on the 21st December 1845, Aliwal on the 22nd January, 1846 and Sobraon on the 10th February, 1846. The Second Sikh War followed in 1848, when battles Were fought at Chillianwala on the I3th January, 1849 and Gujrat on the 22nd February, 1849. In all these battles the Sikhs were defeated by the British troops with heavy losses and this ended the Sikh rule in the punjab which thenceforth became a
Province of British India. The formal annexation was proclaimed at Lahore on the 29th March, 1849. Maharaja Dalip Singh was granted an annuity of £50,000/and he resigned for himself, his heir, and his successors, all right title and claim, to the sovereignty of the Punjab or to any sovereign power whatever. He r~sided
in England until his death.
2.7 British Rule 1849-1947 A.D. When in 1849 the Punjab became a pro
vince of British India, a Board of Administration was established in Lahore with powers to communicate directly with the Governor General. In February, IS53, the Board was replaced by a Chief Commissioner. Four years later there was an uprising against the British rule which was styled as the Mutiny. It was suppressed on the 14th September, 1857 with the fall of Delhi. After the Mutiny the Punjab made rapid progress in commercial and industrial wealth and security, peace and law and order were established. Railway projects and the construction of roads connecting all the big centres of population were undertaken as also grand schemes of irriga~ion, which converted thousands of acres of barren land into green smiling plains and numerous charitable institutions, schools, colleges and hospitals came into existence. The peace and prosperity that prevailed in the Punjab were reflected in the Census figures of the population which showed a steady increase. In 1858
the British Parliament, transferred the Government of India from the East India Company to the Crown. Early in the eighties the Indian National Congress was founded to plead the cause of the

,HISTORIC...fL SURVEY
, Indians in the political sphere; strange as it may seem its founder was an English-
, man named Hume_ The Muslims joined bands with the Hindus in that organisation. But by the beginning of the 20th century they had begun to realise that the Congress was not representing their iaterests prnperly and as a result the All
,'India Muslim League was formed 'in 1906. ' In 1919 the Morley-Minto Reforms gave separate electoral representation to the Muslims and armed with the power to press their claims as also with their advancement)n education. they
, were able to wield greater authority.
2.8 Conception of Pakistan. The bitterness between the two major communities, namely. Hindus and Muslims, conti'1t\ied to increase and led the Muslims to think in terms of a separate home-land for themselves within India. The first great Muslim thinker who voiced the necessity of a separate home for Muslims in India was the late Dr. Sir Mohammad Iqbal. In the annual session of the Muslim League held at Allahabad in December, 1930 a resolution detranding the creation of a Muslim India within India was passed. Qaid-i-Azam Mr. Mohammad Ali Jinnah, whO' like many Muslim leaders of India had previously been a staunch supporter of, Hindu-Muslim unity and had preached it from the Congress platform, on being convinced of the necessity of a separate home-land for Muslims gave the movement his wholehearted support. In one of his speeches
, he said, .• Many efforts have been made , since 1924- till the Round Table Confer'ence to Tsettle the Hindu-Muslim ques-
tion. AI: that time thete waS' no pnide in me and I used to beg from the Congress. I worked so incessantly to bring about a
, 'rapproachment that' a' newspaper' remarked , that 'Mr. Jinmih IS never tired of Hindu
Muslim unity'. But I received the shock of 'my life at the meetings of the Round
. Table Conference, Iii the face of danger. the Hindu sentiment, the Hitidu mInd, the Hindu attitude led me to the conclusion that there was no hope o(unitt'.
The demand kept gaifiing ground and in 1940 the All India Muslim League in its meeting held at Lahore under" the leadership of the Quid-i-Azam unanimo~sly adopt~d the historic resoh~~ on Pakistan saymg that no const_onal plan would be workable in India or acceptable to the Muslims unless it was designed on the following basic principles, namely, that geographically contiguous units should be demarcated ioto regions which should be so constituted with such territorial readjustments as may be necessary, that the areas in which the
'MusJimsare numerically in a majority, as in the North-Western .~nd Eastem Zones of India, should be grouped to constitute 'Independent States' in' which the constituent units shall be' autonomotJs and sovereign_
2.9 Establishment of Pakistan_ In the years that followed there was a sustained struggle by the Muslims all over India for the achiev~~ent' of Paki~tan. The "two-nation" theory wasso ably sponsored by the'Quad-i-Azam that eventuany. on the 3rd .June. 1947. despite the strong opposition of Hindus and Sikhs, Lord <Louis Mountbatten under instructions

HISTORICAL SURVEY
from His Majesty's Government announced the plan for the transfer of power to Indians in which the Muslim demand for Pakistan was conceded. After the agreement of the different communities of India to the plan the British Parliament passed the Indian Independence
, Act on the 18th July, 1947 which provided for the establishment in India of two Independent Dominions, namely, India and Pakistan as from the 15th August, 1947. Under the Award of the Radcliffe Boundary CoI!imission (named after its Chairman, Sir Cyril Radcliffe,) inter alia the Punjab was divided into two parts with sixteen districts in one part r nd thirteen in the other with certain territorial adjustments. The former consisting of the districts of Gujranwala, Lahore. Sheikhupura, Sia]kot, Dera jGhazi Khan, Jhang, Lyallpur. Montgomery, Multan, Muzaffargarh, Campbell pur, Gujrat, Jhelum, Mianwali. Rawa]pindi and Shahpur became a part of Pakistan and this Report deals with this part. A rough map of the Punjab showing its division in accordance with the Radcliffe Award (Map No. 2.1)
2.10 Aftermath of Partition. In the Punjab (India), soon after Pakistan came into being, there started a campaign of genocide coupled with looting against the Muslims.
This forced their oxodus en masse to . the Punjab (Pakistan), and a'l a result of its inevitable repercussions there was a similar emigration of Hindus and Sikhs from the Punjab (Pakistan). In this movement of population on both sides
over one mill]on people had to change their abode, which created problems of such complexity and magnitude as have few paralle]s in the history of the world. The Muslim refugees, commonly known as Muhajirs, arrived in Punjab (Pakistan) in a most pitiable condition and the Government of this new-born State was faced with immediate problems of feeding, housing and rehabilitation. Furthermore a void was created in the economic structure of this country. Until the Partition practically all trade, banking and industry in th~ Punjab had been in the hands of the non-Muslims. They also held a majority of the posts in the public services and their en masse emigration therefore very nearly paralysed the economic and administrative life of the Punjab (Pakistan). Almost all banks, commercial and business houses and factories cIoseddown, the channels of norma] trade dried up, there were no agencies to finance the movement of agricultural produce from the farms to the markets; the wheels of industry ceased to~re,olve and wide gaps occurred in all branches of the administrative machinery not excluding hospitals, educational institutions and canals. In these circumstances the provision of shelter and relief for tl;te refugees who were pouring in at an average rate of 50,000 per day and the restoration of the economic life and the administrative structure was all the more difficult. But, with a resolute determination to stabilise Pakistan, this colossal responsibility was shouldered earnestly by the Government and the hardships faced courageously by the people, By barnessing all possible resources at its

hISTORICAL SURVt_y
JAtMU PARTITION OF PUNJAB IN 1947 KASHMIR
....... I 'i.
.".".""'----·":1 .i . !
Omce 0(' die CensuS' Cor:nmiu;onef. Ke,achl
S. No. Punjab Dililict' S. No. Punjab DistriCts S. No. Punjab DiSlrlct~ Patistall Pakistan
I Lahore 12 Jhelum
2 Sheikhupura 13 Rawalpindi
3 Gujranwala 14 Campbcllpur 4 Si.lkot 15 Shahpur
S Jhan& 16 Mianwali
6 Montgomery Bahawalpur State 7 Multan 17 Bahawalpur II Muzaffargarh 18 Rahimyar Khan 9 Dera Gazi Khan
10 Ly.llpu r 11 vLUrat
disposal the Government was able to deal with the situation successfully and soon, among others. there started functioning in full swing, a separate Department for the rehabilitation of the refu-
India
Gurdaspur 2 Amratsar 3 Fe'roz,pur
4 JuUunder
S Hoshiar pur 6 Ludhiana 7 Ambala 8 Karnal 9 Hissar
10 Rohtak 11 Gurgaon
gees. It is gratifyi ... g to note that the ,. arrangements for the permanent resettlement of refugees are making satisfactory progress.

l1ISl'O RICAL _ SJJ RVE Y\\
2.11 Babawalpur State. The Bahawalpur State lies to the south-west of the Punjab and the north-west. of Sind and forms a connecting link between these two Provinces. The present ruling family of the State belongs to the Abbasi
clan, the descendants of the Abbaside Caliphs of Baghdad, who after the break up of the Caliphate as a result of the Mongol invasion, joined the Mamelukes in Egypt, where they enjoyed an influential position,., Between 1366-1370 ,A.D, ' Amir Sultan Ahmad 1I emigrated: to Sind and annexed a considerable area Of land. But in course of time~ the family gradually moved north-wards, losing much of the Sind territory and finally settled at Derawar in the vicinity of the present city of Bahawalpur. This area appears to have been selected owing to its more central position. The Rulers of Bahawalpur first owed allegiance to Afghanistan, but assumed independence on the fall of the Durrani Empire, which followed the expulsion of Shah Shuja from Kabul. In 1833 Bahawalpur was visited by Mr. Elphinstone. then ,on his
way to Kabul and in the same year, at the instance, of the British Governme~t, a treaty of perpetual friendship alliance and unity of interests between the East'In,dia Company and the Ruler of Bahawalpur was nogotiated. The treaty was further strengthened by a subsequent treaty in 1838. Both these treaties recognised_the Nawab and his heirs as absolute rulers of their country. The Nawab of Bahawal:' .
pur rendered assistance to the British in the Fist Afghan War and in 1847-1848 he cooperated actively with Sir Herbert Edwardes in the expedition against Multan. For these services he received the grant of the districts of Sabzalkot and Bhung, together with a life pension of . rupees one lakh per annum. The present Ruler is His Higness Lt.' General AI-Haj Sir Sadiq Muhammad Khan Bahadur Abbasi V, G.C.S.L, G.C I.E., K.C.S 1., K.C.V.O., LL.D. He was born in 1904, succeeded .to the Gaddi jn 1907'l\nd was 'investe~:l'with full ruling powers in 1924.
. '. He is Colonel-in-Chi~f of the Bahawalpur State Forces and holds the honorary rank of Lieut.-General in the Pakistan Army. He is entitled to a salute of 17 guns. The heir-apparent is Brigadier Sahibzada Muhammad Abbas Khan Abbasi.
2.12 Effect of Partition. At the time of the partition of Iadia in 1947, Bahawalpur State acceded to Pakistan. The problems which the State had to face a result of partition' were not much different from those described in paragraph 2.10 supra. There was an influx of refugees many of whom reat:hed the State territory in indigent circumstances and the State authorities did e~erything in 'their power to alleviate their suffering. The fact that the incoming refugees were over 50% more than the emigrants, manifests the magnitude of the task which confronted the authorities, but final rehabilitation of the refugees in the State is nearing completion.

Chapter 3.
Movement and Distribution of Population
STATISTICAL DATA
Table 1 Population 3 Variation 6 Religion
3.1 Introductory. This Report deals. 'lith the first Census of the Punjab and he Bahawalpur State, taken in February, .951 after the constitution of Pakistan. ~est this should convey the impression hat no Census was taken in this territory )reViously it may be stated that when 'akistan formed part of undivided India :::ens uses used to be taken periodically. rhe first census in the series was taken [} 1855 and the 9th in 1941. In order o ensure the accuracy of the 1951 Census
the. 'actual: period 'of enumeration was spread over three weeks namely from the 9th. .to th~ 28th February. 1951 and every effort was made during this period to' en~mer~ie 'the' normal residents and to secure their replies to the questionnaire included in the Enumeration Slip. The ®unting of the floating population and. the final check up took place on the nig~ of the 1st March, which was called the, '!Census Night".
3.2. Section of this Chapter. For the convenience of the reader, this Chapter is divided into 4 sections:-
(a) Total population: Decennial increase illustrated by a Chart.
(b) Distribution of population by districts: Den sity and percen tage of Muhajirs depicted by Maps: Religious distribution indicated by a Chart.
(c) Population of TehsiIs.
(d) Housing: Illustrated by .. a , Chart.
SECI'lON A-TOTAL P()PULAnoN
3.3 Comparison with other places. At the time of Census the Punjab with a total area of 62,245 square miles, had a popUlation of 1,88,28,015 (1,00,68,141 males and 87,59,814 females) which gives
(37 )

38 MOVEMENT AND DIS'rRlBUTION OF POPULAtION
a density of 302 persons per square mile. The Punjab leads all other provinces of Pakistan in area, but in population and density it is second to East Bengal, The remaining three provinces have comparatively smaller population and density. Statement 3-A gives a comparison of the area, population and density of the
Punjab with other provinces of Pakistan while Statement 3-B shows the figures in comparison to certain other countries. It will be seen that the Punjab is fairly densely populated as compared 1.0 many countries of its size.
STATEMENT 3-A.
(Reference Paragraph 3.3)
Punjab and other provinces of Pakistan
Province ~ I g.g C'. I • .;:: ~
ron ~ S =' ca:;:: I ::I 0
~~ I 2~ ",0 r:: .... oca ",::I .... 0" &
MOVEMENT AND DISTRIBUTION OF POPULATION 39
commenced in the 1921-1930 decade largely because of the extension of irrigation. with the constructicD of new canal projects and the industrial and commercial development of the province. Since then the population has made great progress due firstly to na tural increase by the excess of births over deaths and secondly to migrations into the new colonies. During the last decade there was an increase of 3,001 thousands against 2,936 thousands in the preceding decade. Although numerically the increase during the last decade was more. the percentage increase declined from 22.8 to 19.1. Since 1947 there has been an abnormal increase of population on account of the influx of some 5 million refugees from India
,against the outgoing Hindus and Sikhs who numbered about 3.8 million in the 1941 census.
The popUlation in the Bahawalpur State has risen by more than 150 per cent
, during the last 50 years and as in the case of the Punjab the rise up to the 1921 Census was slow but the growth was rapid in the ]921-1930 decade due to the
· construction of the Sutlej Valley Project which brought large areas of barren land under the plough. The increase during the last decade was 482 thousands against 356 thousands in the preceding decade. In both these decades the percen tage increase stood at about 36. After the
· partition of India in 1947 there was a mass migration of Muslims from India to
· the Bahawalpur State as well. The Mus-· Jim refugees numbered about 373 thou
sands in 1951 against 239 thousands Hindus and Sikhs enumerated in ] 941 ,
:" who migrated to India.
A fuller detail of the variations of population in the Punjab and Bahawalpur State during the last five decades with causes thereof will be found in paragraph 3.7 infra.
3.5 Proportion of Urban and Rural Population. The result of the 1951 Census reveal that in the Punjab 3.4 million persons (1.9 males and 1.5 females) reside in urb an localities, while 15.4 million ( 8,2 male sand 7.2 females) dwell in rural areas. This shows that ] 8 per~
cent of the total popuhition live in towns and cities. The corresponding figure for all Pakistan is 10 per cent. In 1931 and 1941 the urban population of the Punjab was 13 and ]5 per cent of its total popu~ lation respectively. In Bahawalpur State 195 thousand persons (1 JO males and
85 females) reside in urban areas. This
indicates that 1] per cent of the popula~ tion lives in towns and cities and the remainder in rural areas. The proportion of urban popUlation in 1931 and 1941 was 4 and 9 pe r cent, respectively. The foregoing figures indicate tha t in the Punjab and Bahawalpur State there is a mark~ ed tendency for persons to congregate in cities and towns. This tendency for urbanisation is largely the result of the growth of commerce and industry. The position will be discussed at some length in the next Chapter.
3.6 Accuracy of Census figures. It would be futile to claim that in the course of the 1951 Census no person was left out or counted more than once. Such perfec~ tion would be difficult to achieve even in
COQntries wbere the entire P9pulalioD,is

.40 MOVEMENT AND DISTRIBUTION OF POPULATION
literate and concious of its duties when a census is taken. However iospite of some inherent handicaps, which need not be dilated upon here, the Census to which this Report relates was conducted as efficiently as possible and all reasonable pr~cautions were taken to eliminate glaring inaccuracies. In rural areas the field work was-entrusted to the revenue agency which was not only ubiquitous but also had adequate personnel many of whom had already conducted a census or two and as a result the work was quite well done there. Byand large the position in urban areas was also satisfactory even
. though in some urba.n blocks particularly in the big cities the enumerators were not able to reach the standard of accuracy set by the bulk of their confrers in rural areas. Undeniably there was underenumeration in some of these blocks though not to an extent as to make the whole data unreliable. It seems worth mentioning tbat the enumeration in big cities in this country, as probably elsewhere. has always had to face similar difficulties in the past and therefore the 1951 Census was no exception. On the whole the figures collected in 1951 can be claimed to be more accurate tban those of any previous census, firstly because of the absence of communal passions which are known to have led to the inflation of figures in the past, and, secondly because of the more rational and scientific technique employed in their collection •.
3.7 Variations doring the last five decades. As a result of the partition of lnttia in 1?47 mentioned in Chapter 2 the·
Punjab which then had 29 districts was divided into two parts, namely. Punjab (Pakistan) and Punjab (India), The former to which this Report relates- contains 16 districts and the Shakargarh Tahsil previously in the Gurdaspur District and the latter has 13 districts and some-villages of the Kasur Tahsil of the Lahore Dis-
. trict. In order therefore to have a proper appreciation and comparison of the 1951 figures with those of the past censuses, adjustments have been carried out in the latter on the basis of the territorial changes. Table 3-Variations shows in the case of Punjab the figures for the five censuses taken between 1901 and 1941 adjusted on the basis of the said territorial changes and the data collected in 1951. Since in the case of the Bahawalpur State there has been no territorial change its agu·res for the past censuses have been incorporated in this table without any adjustment.
Statement 3-e shows the increase for each census period in the Punjab and Bahawalpur State from !901 onwards.
In the fir st decade of this century anepidemic of plague of great virulence with fever of specially fatal type took a heavy toll in the undivided Punjab so much so that the decade ~losed with an excess of deaths over bi rtbs. There was an appreciable decrease in the districts of Gujranwala, Sialkot and Lahore as also in the territory constituting the Punjab (lodia). The population in Montgomery, Shahpur, Lyal1pur. Jhang, Multan and some other
. districts in the Punjab (Pakistan), however' showed an excess due partly to migration to the new colonies, which had

MOVEMENT AND DISTRIBUTION OF POPULATION 41
STATEMENT 3-e (Reference Paragraph 3-7)
Total Population.
Persons Variations Census enumerated
-----~.--
year (lOOO's) Number !percent-(lOOO's) age
Punjab
1901 95,93
1911 102,10 6,17 6.4 1921 109,79 7,69 7.5 1931 128,90 19,11 17.4 1941 158,27 29,37 22.8 1951 188,28 30,01 19.1
Bahawalpur State.
1901 7,21 1911 7,80 59 8.3 1921 7,81 .1 1931 9,85 2,04 26 1941 13,41 3,56 36.2 1951 18,23 4,82 35.9
sprung up as a result of the Lower lhelum and Lower Chena b Canals and partly to better living conditions of the colonists made possible by their prosperity. Although the undivided Punjab indicated a decrease of 2.4 per cent over this decade the population of the area now forming the Punjab (Pakistan) showed an excess of 6.4 per cent.
The second decade (1911-1920) was healthy for the most part but in the year 1918 there was an influenza epidemic of a very severe type which accounted for nearly a million deaths. The popUlation that had been rising each year and was at its peak in 1917, came down violently
in 1918. The decade also saw the first World War (1914-1918), which coupled with the failure of the crops in 1915-1916. 1918·1919 and 1919-1920 upset the economic balance of the country. During 1918-1919 there was open disorder in the province which left a legacy of racial feeling and industrial unrest resulting in strikes and dislocation of industry. Nevertheless the population in the canai colonies continued to rise as compared to other parts of the province.
The next decade was on the whole a healthy one with the exception of mild epidemics of plague in 1924 and 1926; cholera in Lahore in the latter year and malaria during the autumn of the year 1929. During most of the years of this decade the birth-rate maintained a high level while the death-rate was comparatively low and this together with the opening of the Sutlej Valley Project and considerable advancement in the industrial and commercial activities led to an over-all increase of about 17 per cent in the third decade.
With the growth of political consciousness in the country the 1941 census became a burning question, especially in the cities and a~ a result Muslims and Hindus vied with each other in increasing their recorded numbers by multiple enumeration as well as by the inclusion of bogus entries. There was a certain amount of inflation on that account; hence the census taken at the end of the 1931-1940 decade has not been regarded as presenting a true picture of the population in 1941 though it must be admitted that the population did increase

42 MOVEMENT AND DISTRIBUTION OF POPULATION
during this decade due to agricultural
prosperity and industrialisation.
The results of the present census show an excess of 30 lakhs during the decade
1941-1950. Tbe excess was mainly due to tbe immigration of Muslim refugees from India, Moreover the decade remained free from any epidemic diseases and this resulted in a higher natural in
crease.
The population of the Bahawalpur State bas risen from 7 lakhs in 1901 to
18 lakhs in 1951. As Statement 3-C
will show the rates of increase were 8.3 per cent in 1911; 0.1 per cent in 1921; 26 per cent in 1931 and 36 per cent both in 1941 and 1951. On account of the absence of data it is not possible to explain the causes of these variations but it seems that the conditions prevailing in the State were not much different from those in the Punjab. The rapid growth noticeable in the 1921-1930 and 1931-1940 decades is the result of the expansion of irrigation by the Sullej Valley Project.
The increase in the 1941-1950 decade includes about 373 thousand in·coming
refugees.
Figure 3.1 illustra tes the decennial increase of population during the last
five decades.
SECTION B-DISTRffiUTION OF POPULATION BY DISTRICTS.
3· 8 Variations in districts over past five decades. Statement 3-D illustrates
the increase in total population in each district of the Punjab during the last 50
F,o: H
Decinnial Increase of Population PUNJAB & BAHAWALPUR STAT£
70S
b.?:. 2OG3?
t:::: ~
ALLREU~~
7. MUSUM
I--
'"
en .Q ;z
i<,. -< "" :;l 0 :I:
'" CHRISTIANS _....... ~ 403
55 V
V 5A J
17 .5 31·7
!OOI 1911 1921 1931 19~1 1951
CENSUS YEARS Cffke C/ Che CellSVS CcMm,u.Qrlc r KaraQlo
years. In the case of the Bahawalpur
State the figures have been shown as a whole because the collection of districtwise data for the State was undertaken
for the first time at this Census.
The increase in the four colony districts of Montgomery, Lyallpur, Multan
and Shahpur presents a remarkable contrast with the increase in the remaining districts. The reasons for this difference are not far to seek. With the ex
tensiop of canal irrisation the cultivated

MOVEMENT AND DISTRIBUTION OF POPULATION 43
STATEMENT 3-D
(Reference Paragraph 3-8)
Variations in total Population
Population-thousand. ~
Districts.
I I In- I § 1901 1951 crease i £
PUNJAB 95,93 188,28 92,35 96
Gujranwala 7,40 10,47 3,07 42
Lahore 8,90 18,95 10,05 113 Bheikhupura 5,23 9,23 4,00 76
Sialkot 11,68 14,74 3,06 26 Dera Ghazi Khan 4,96 6,31 1,35 27
Jhang 4.26 8,77 4,51 106 Lyallpur 5,86 21,53 15,67 267 Montgomery 4,30 18,16 13,86 323 Multan 7,00 21,08 14,08 201 Muzaffargarh 5,28 7.51 2,23 42 Campbellpur 4,64 7,23 2,59 56 Gujrat 7,92 11,59 3,67 46 Jhelum 5,01 6,82 1,81 36 Mianwali 3,02 5,51 2,49 82 Rawalpindi 5,59 8,76 3,17 57 Shahpur 4,88 11,63 6,75 138
BAHAWALPUR 7,21 STATE
18,23 11,02 153
area in all these districts has risen substantially, and due to the human instinct to chase food there has been a continuous flow of population there. This factor also influenced the movement of the refugees from India who migrated to these districts in a higher proportion. Next comes the Lahore district in which lies the city of Lahore, the capital of the province. Lahore is a big industrial and business centre and has been attracting a large number of people on account of the opportunities for employment in Government offices, business houses and factories. There has been an increase of
about 25 per cent in the last decade due largely to the re-settlement in Lahore
city of the refugees from Amritsar. Jullundur, Ludhiana and other urban areas in the Punjab (India). Jhang, which is also a canal irrigated tract, has been making a steady progress in every decade. Recently it has attracted a considerable number of Muhajir weavers owing to the existence of congenial conditions in Jhang-cum-Maghiana town for the manufacture of woollen materials. Gujranwala and Rawalpindi also show a rise of 15 and 12 per cent respectively in the last decade mainly in the urban population. The rise in the remaining districts has not been equally sharp and some have even recorded a fall in certain decades. For instance. the population of Gujranwala and Sialkot districts declined by 18 and 17 per cent respectively in the 1901-1910 decade while at Dera Ghazi Khan and Jhelum there was a drop of 6 and 1 per cent during the 1911-1920 decade. The Sialkot district decreased by 1 per cent again in the last decade. Bahawalpur State rose by 8 per cent in 1901-1910 decade. The increase in the next decade was nominal but thereafter it has been appreciable.
3.9 Districts in the order of Population. Statement 3-E shows the rank of each district of the Punjab and Bahawalpur State in the order of total population in 1951 and its position at 1941 Census.
The first position is now occupied by the Lyallpur district which was fourth at the last census. Multan continues to hold the second position but Lahore has

44 MO VEMENT AND DISTRIBUTION OF POPULATION
STATEMENT 3-E
(Reference Paragraph 3.9)
Rank of districts in total population
1951 1941
(1000's) (10J0's)
PUNJAB
Lyallpur 21,53 1',% Multan 21,08 2 14,84 Lahore 18,95 3 15,13 Montgomery 18,16 4 13,29 Sialkot 14,74 5 14,82 Shahpur 11,63 6 9,99 Gujrat 11,59 7 11,05 Gujranwala 10,47 8 9,12 Sheikhupura ... 9,23 9 8,53 Jhang 8,77 10 8,22 Rawalpindi ... 8,76 11 7,85 Muzaffargarh ... 7,51 12 7,13 Campbellpur 7,23 13 6,76 Jhelum 6,82 14 6,30
Dera Ghazi 6,31 15 6,22 Khan.
Mianwali 5,51 16 5,06
BAHAWALPUR STATE
4 2
5 3 7 6 g
9 10 11 12 13 14
15
16
Bahawalpur 9,70 1 Not given separa-Rahimyar 8,53 2 tely.
Khan. -,~,
been relegated to the third place. Montgomery and Shah pur have moved up one step each, while Sialkot has declined by two places. There has been no change in the order of the districts ranked No.8 and downwards.
3.10. District in tbe order of Density of population. Statement 3.F. shows the districts of the Punjab and Bahawalpur
State in the order of their density in 1951. The order of dens>ity in 1941 has also been indicated.
STATEMENT 3-F
(Reference Paragraph 3.10)
District of Punjab & BabawaJpur
State in order of Density.
1941
\
1951
--District.
O""ity. Ronk.IO""ity. Rank.
--~-----
PUNJAB Lahore 780 1 653 2 Sialkot 712 2 755 1 Lyallpur 609 3 396 4 Gujrat 513 4 488 3 Gujranwala •.• 455 5 395 5 Rawalpindi ... 433 6 388 6 Montgomery- .. 432 7 316 8
Sheikhupura ... 398 8 370 7 Multan 375 9 263 9
Jhang 258 10 241 10 Jhelum 245 11 227 11 Shahpur 243 12 209 12 Campbell pur 174 13 163 13 Muzaffargarh ..• 134 14 127 14 Mianwali 102 15 94 15
Dera Ghazi 67 18 66 16 Khan.
BAHAWAI~PUR STATE
Bahawalpur ... 126 Not given sep-arately.
Rahimyar 87 2 Khan.
The statement shows that the density
differs widely in the various districts.
The districts ranked No. 1 to 8 in the last census have changed places except
Gujranwala and Rawalpindi. There has been no change in the rank of the remain-
ing districts.

MOVEMENT AND DISTRIBUTION OF POPULATION
KEY TO DISTRICTS.
S. No. Districts
. punjab
Persons Per SQ.
Mile
I Lahore 780 2 Sheikhupura .398
Gujranwala 455 4 Sialkot 712 5 Jhang 258 6 Montgomery 432 1 Multan 375 8 Muzaffargarh.. 134
9· Dera Gazi Khan 67 10 Lyallpur' 609 II Gujlal 513 12 Jhl!\um 245 13 Rawalpindi .;. 433 14 Campbellpur 114
15 Shahpur 16 Mjanwal~
Bahawalpur Slate 17 Bahawalpur 126
18 Rahlmyar Khan
50 MlLU
~
PUNJAB &
BAHAWALPUR STATE
OEMSITY
)A.hUAU £;
KA$HMIA
REfERENCE population pei sq. mile
c=J..o To 99
100-199
200-399
400-599
45

. 46 MOVEMENT AND DISTRIBUTION OF POPULATION
3.11. Relationship of population density to cultivable land industries and other potentialities. Map 3.2. shows the relative density of each dis trict. The density is high in the eastern and central districts of the Punjab while the western part andthe Bahawalpur State are sparsely popu~ lated. Lahore, Sialkot and Lyallpur have the highest density because favourable agricultural conditions spart the districts are industrially more advanced. Gujrat, Gujranwala, Rawalpindi and Montgomery come next baving more than 3/4ths of their total area under the plough. They also contain flourishing business and industrial cities and towns wbich help to increase their density. Mianwali, Muzaffargarh and Dera Ghazi Khan are at the tail end. Their net cultivated area is less than half; the means of irrigation are poor and there is hardly any welldeveloped industry. About 1/4th of the total area of the Bahawalpur State is under cultivation and this coupled wlth the fact that the State is not industrially advanced accounts for its low density.
3 12 Religious Composition of population. Table 6-Religion, published in part II of this Report presents the 1951 population according to religions. Muslims constitute over 99 per cent of the total population in all six districts of the Rawalpindi Division, in the Dera Ghazi Khan, Jhang, Montgomery, Multan and Muzaffargarh districts of the Multan Division and in the Bahawalpur State. Lyallpur and Sheikhupura have 97 and 95 per cent Muslims, respectively while in each of the remaining three districts of Lahore, Gujranwala and Sialkot they are 94 per cent.
The number of Caste Hindus in the Punjab who are nationals of Pakistan is 1.680 and there are 1,076 in the Bahawal· pur State. The Scheduled Castes have a total population of 18,70 in the punjab and' 11,595 in the Bahawalpur State while the persons belonging to other communities number 4,00,782 and 2,074 of whom 4,00,543 and 2,074 respectively are Christians who represent about 2 per cent of the total population of the Punjab and Bahawalpur State. They were chiefly enumerated' in the districts· of Gujranwala, Lahore, Sheikhupura, Sialkot and Lyallpur.
Due to the mass migration of population at the time of the partition of India in 1947 the number of Caste Hindus and Sikhs who elected to remain in the Punjab and Bahawalpur State was infinitesimal and therefore it does not seem worthwhile to discuss the variations in their numbers in relation to the past censuses. Statement 3-G gives the religious comparison of the Muslims excluding Muhajirs and Christians for the last two censuses.
Figure 3.3 illustrates the religious distribution in the province as a whole as also in the Lahore and Sialkot districts and the cities of Lahore and Lyallpur.
3.13 Muhajirs in districts. The term 'Muhajir' was defined in the Code of Census procedur of Part II to mean a person who has moved into Pakistan as a result of partition or for fear of disturbances connected therewith. The import of this definition does not appear to have been clearly understood by some

MOVEMENT AND DISTRIBUTION OF POPULATION 47
Ftc, !-3
Religious Distribution (TOTAL POPULATION-IOO~'o)
punjab &
100 Bahawalpur SI.
~'Y-" X L:l.nore Dist Sialkot
Dis!
5 +-----u--l
~ MUSLIMS.
_ CASTE HINDUS & SCH: CASTES
c:J CHR1STIANS Office 0{ tht CerlUiS CQr.1mllS,ontl Karach'
enumerators and/or respondents and it seems that in many cases the children born in Pakistan to refugee parents have been classified as Muhajirs. The number of Muhajir children below the age of four years enumerated in 1951 is 483 thousands and since the main flow of the refugees was in 1947 and 1948 many of these children must have been born in Pakistan. Bu t due to the fact that the
refugees have kept coming in even after
STATEMENT 3-G
(Reference Paragraph 3 12)
Religious Comparison
Population (thousands)
Census Muslims I
(excluding Christians Muhajirs)
----~--__ ----____ -PUNJAB:
1941 117,74 3,88
1951 134,85 4,01
Variation 17,11 13
BAHAWALPUR STATE :
1941 10,99 3
1951 14,35 2
Variation 3,36 -1
1948 in fairlY large numbers it is not possible at this stage to give any degree of certainty the number of children who should have been classified as Muhajirs str ictly according to the definition and therefore it has been deemed advisable to present the figures as they are collected. Of the 53 lakhs (hundred thousands) Muhajirs enumerated at the time of this Census about 49 lakhs,were in the Punjab and 4 lakhs in the Bahawalpur State. In the districts of Lyallpur. Lahore, Montgomery, Sheikhupura, Multan, Gujranwala and Sialkot of the former and in the district of Bahawalpur of the latter they constitute from 25 to 46 per cent of the total population. Statement 3-H. shows the total population, the number of Muhajirs and their percentage in the
various districts of the Punjab and Baha
waJpur State.

48 MOVEMENT AND DISTRIBUTION OF POPULATION
STATEMENT 3-H. circles drawn proportionate to the
(Reference Paragraph 3.13) population of the districts.
Proportion of Muhajirs -Punjab & SECTION C-POPULATION OF
Babawalpur State TEHSILS
"'.o.,,~~ 3.14 Selected important comparisons-Population- Statement 3-I shows the name of select-thousands
Percent- ed tahsils with comparative figures of District age increase or decrease as the case may be. Total I ~uha-
JIfS
STATEMENT 3·1
PUNJAB 188,28 49,08 26 (Reference Paragraph 3.14)
Gujranwala 10,47 2,99 29 Comparison of Selected Tabsils.
Lahore 18,95 7,45 39 Population- Increase Sheikhupura 9,23 3.10 34 thousands or
Tahsils.
11931
11941
r 1951
Decrease Sialkot 14,74 3,69 25 (-) over
1941. Dera Ghazi Khan ... 6,31 36 6
Jhang 8,77 1,39 16 INCREASE.
Lyallpur 21,53 9,86 46 Lyallpur 3,34 4,06 7,02 2,96
Lahore 6,94 8,90 11,35 2,45 Montgomery 18,16 F,13 39 Toba Tek Singh ... 3,05 3,96 6,0~ 2,08
Multan 21,08 6,46 31 Montgomery 3,22 4.28 6,04 1,76 Pakpattan 2,37 3,33 4,82 1,49
Muzaffargarh 7,51 79 11 Multan 3,04 3,60 5,07 1,47
Campbellpur 7,23 38 5 Jaranwala 2,60 2,93 4,38 1,45 Khanewal 1,98 2,52 3,84 1.32
Gujrat 11,59 1,36 12 okara 2,20 2,93 4,24 1,31
Jhelum 6,82 ~52 8 Sargodba 2,26 2,78 4,05 1,27
Mianwali ! 5,51 47 9 DECREASE.
Rawalpindi 8,76 1,06 12 Sbakargarh 2.47 2,92 2,61 -31 Narowal 2,31 2,68 2,52 -16
Sbahpur 11,63 2,07 18 Minchinabad 1,10 l.30 1,19 -11
BAHAWALPUR STATE 18,23 3,73 20 Shabpur 1,56 1,84 1,75 -9 Pindigbeb 1,43 1,67 1,64 -3
Bahawalpur 9,70 2,98 31 Isakhel 69 78 76 -2
Rahimyarkban 8,53 75 9
With the exception of the Lahore
Map 3.4 on the opposite page iIlus- tahsil the increases are in the colonies trates the distributi.on of Muhajirs over and hardly need any further explanation. the Punjab and Bahawalpur State. They The excess in the case of the Lahore have been shown by black sectors in tahsil is mainly on account of the rise

MOVEMENT AND DISTRIBUTION OF POPULATION 49
M ... ' 3·4 KEY TO DlSTRICTS
PUNJAB Muhajirs' PercenJag~
PU I+! i\S
8t.
2 3
'4 S 6 1
'8 9
10 II 12 13
14 IS 16
17 IS
Lahore .• 52% Sheikhupura ••. 9% Gujranwala '. 24% Sailkot ••• 15% Jhang' •. 16% Montgomery ." 8% Ml!ltan .... 16% Muzafj'a rgarh 7% Oera Gazl Khan· 121% LyaUpur ... 13% Gujrn[ '" J)% Ihelum 12t% Rawalpindi ... 29% Ca~pbellpur 12l% Shahpur ... 18% Mianwali ... 11% Bahawalp~r State Bahaw~lpur ... 11% Rahimyar Khan 91%
,OMILII
BAHAWALPUR STATE
Proporllon of M uhajirs .
PUtlJA& l"
The squares are drawn proportion 10 the lize of the total population of Ihe' Districts: a square with a side of one· half an inch represenl~ 10 Lakhs ..

50 MOVEMENT AND DISTRIBUTION OF POPULATION
in the urban population. The decline in the cases of the Shakargarh and Narowal tahsiIs of the Sialkot district and Min
chinabad tahsil of the Bahawa}pur dist~
rict is due to their geographical situation and unfavourable physical features. The Shabpur tahsil has been declining since the transfer of the district headquarters
to Sargodha and in the case of Pindigheb
and Isakhel it appears that the Muhajirs were not attracted by these out-of-theway and dry hilly tracts in sufficient
numbers.
3.15. Localities of specially high and specially low density. There are sixteen
tahsils whose density is above 500 against the provincial density of 302. The first five are Lahore, Sialkot, LyaUpur, Daska
and Gujrat. The Biloch-Trans Frontier Tract and Raja~pur tahsil in the 'Dera Ghazi Khan district, Leiah and Kot Addu in the Muzaffargarh district and Bhakkar in the Mianwali district have the lowest densities ranging between 11
and 95. In the Bahawalpur State the highest density is 276 in the Bahawalnagar tahsils of the Bahawalpur district closely followed with 243 by the headquarters tahsil of the Rahimyarkhan district.
The density in the remaining tabsils
ranges between 29 and 174; the former being the density of the Abbasia Colony tahsil of the Rahimyarkhan district. This is a small colony which has sprung up recently. As has already been explained the highest pressure on land is in the localities which have favourable means
of cultivation and ensure good crops
. while the placeswhich are desolate and
barren tracts have the lowest density.
SECTION D-HOUSING.
3.16. Correlation of houses and population. For the purposes (If this Census the term 'household' was defined as a collection of persons living and eating in one mess with their resident dependents,
relalives, servants and lodgers, who normally reside together'. In other words the unit was the commensal, family and not the home-stead or the enclosure. In order to ensure that no place occupied, or capable of occupation by human beings was missed during
enumeration it was arrangen that
all enumerators should number the houses and prepare Household Lists for their blocks and from the data so collected Table H-Housing published as subsidiary Table I at the end of this chapter has been compiled. This Table shows separately for the rural and urban area in each district the number of households and rooms; the average number of p~rsons per households and per
room; the percentage of congested households, i.e., households baving more than 5 persons per room,
and 'pukka' houses. The number of persons per household varies from place to place though it is higher in urban than in rural areas. The a verage in citie.s and towns ranges between 4 and 6 except in Lahore, Sialkot, Multan, Sargodha, Mianwali, Mandi Bahauddin and Wazirabad where it works out to 8 or more
persons per household. Mianwali heads
the list with 14 persons per household
but the veracity of this information
seems doubtful. The towns of Dajal,
Taunsa, Keror, Pindigheb, pind Dadau

MOVEMENT AND DISTRIBUTION OF POPULATION 51
Khan and a few others have not more than 3 persons per household. Many of tbese towns have been declining in population since long. In rural areas the average number of persons per bousehold ranges from three to five except in the Montgomery district where it is seven. Both in rural and urban areas the a verage of occupants per room mostly works out from two to four except in Lyallpur rural area where it is five. The highest percentage of congested households is in certain towns in the Lyallpur, Montgomery and Multan districts. It will be noticed that all three are colony districts.
Figur(3.S illustrates the population of the Punjab and Bahawalpur State by size of dwellings,
3.17. Types of Houses. The urban localities have a large proportion of 'pukka' houses throughout the Punjab and BahawaIpnr State. In the villages 'pukka' houses are much less in number and the bulk of the rural popUlation lives in mud-houses, hut!: and ,other similar structures. The percentage of 'pukka' houses is lowest in the rural areas of the Dera Ghazi Khan, Jhang a~d ~ahawalpu.r districts.
I~·~'~'~
! Housing
I -~·;:;-I
~
I 100
"" n r: 90 .:.::
',,: .,
80 '- ') ,':
.~;
70
'" i:'
r:: .. .c: ;,t :::>
l! 'N " '" ~ .<: 0
"" .. " ~ '" ;:;
PE.RCEIliTAG OF HOUSE WOLDS -IN PUKKA BIIII.OIK'G5.
'f! " ~ ~
" n. 0; ~
'" '" ~
}~t-: ------1
;1 -.':" m
-!-j!:.<I----l':I---l? ~ ;wt------l 0 60 _, 0
} :r k·: lU
:~.:: f{t. '" ::> 50 I':.: 0 :z: "
'" ..J
: 40 I~.,: ~:; r1~
0
"' 0 < ,.. z. "' u '" w "-
f)
30 f;1
20
10
~r_------~----------~~ PERCENTAGE or HOUSEHOLDS ~ WITH OVER :I P£.RSOMS PER O.
ROOM. ~ O"keoftlte ''''fill COIJlmiIIIOnt/.I(.!'fdI"
g

Chapter 4
Urban and Rural Population
STATISTICAL DATA
Table I-Urban and Rural Population and Area.
lA-Population of Urban Areas
2-Towns and cities
3-Variations since 1901
6-Religion
8-Literacy
98 - Educational levels
ll-Labour Force
11 C -Su bsidiary Occupations of Agriculturists
14- Land Tenure Status of Agriculturists.
4.1-Introductory: This Chapter prtsents some aspects of the urban and rural population of the Punjab and Bahawalpur State manifest from the data collected at the time of the Census taken in 1951. They" lay- out of the arrangements fQr taking that Census is described in Parts I and II of the Code of Census Procedure, 1950 and need not be reproduced here in detail. Suffice to say that the whole territory to be covered by the census was divided into charges, circles and blocks; a block being the smalLest census area generally comprising a contisuous collection of not more than 150
houses in urban areas and a village in rural areas. The" term 'urban area' included the cities (places with not less than one lakh "inhabitants) towqs, all municipalities, and any other continuous collections 0(- houses inhabited' by not less than 5,000 persons and baving uman' characteristics.
4.2 Classes of towns: The urban population of the Punjab and Bahawalpur State at th~ 1951 Census was 34,04,218 and 1,94,557 respectively. Keeping in view the recommendations of the Populations Commission of the United
(52 )

URBAN AND RURAL POPULATION 53
Nations Organisations and the special conditions prevailing in Pakistan the undermentioned classification of cities and towns has been adopted for Table 2. Towns and Cities :-
Class I (cities) - 1,00,000 or over inhabitants. Class H 25,000 and under 1,00,000. Class III .. 10,000 and under 25,000. Class IV .. 5.000 and under 10,000.
It may be mentioned that the population . figures in this Table, unlike those shown in Table I-A, do not include persons claiming nationalities other than Pakistani.
Class I contains six cities, namely Lahore, Rawalpindi, Multan, Lyallpur, Sialkot and Gujranwala and their population including that of the Cantonments adjoining Lahore, Rawalpindi, Multan and Sialkot forms 51 per cent of the urban population of the Punjab. Class II includes 15 towns, of which 14 are in the Punjab and account for 18 per cent of its urban population. There are 42 and 55 towns of Classes III and IV of which 36 and 51 are in the Punjab constituting 16 and 11 per cent of the total urban population, respectively. The remaining 4 per cent of the urban population in the Punjab is made up of 21 places which were treated as urban areas at the time of the enumeration but cannot be classified as Class IV towns because the number of their inhabitants is less than 5,000. The Bahawalpur State has one Class II town which contains 21 per cent of its urban population. The number of Class III and IV towns in the State is 6 and 4, respectively, comprising 45 and 13 per cent of the urban population while the remaining 21 per cent
consists of unclassified 13 towns with less than 5,000 population.
Figure 4.1 illustrates the decennial rise in the population of towns in the Punjab and Bahawalpur State from 1901.
4.3 Urbanization Trends and Tendencies :-Statement 4-A . shows the percentages of the total population of the Punjab and Bahawalpur State cla~sed as urban and rural at the 1951 Census and in each of the five preceding censuses.
STATEMENT 4-A
(Reference Paragraph 4.3)
Total PopUlation: Urban and Rural
Percentages
Census
1951
1941
1931
1921
1911
1901
Urban I Rural
punjab \ Bahawal-I Punjab I Bahawal-pur State pur State
18
15
13
10
9
9
11
9
4
4
5
6
82
85
87
90
91
91
89
91
96
96
95
94
It will be seen that by a steady increase the urban population has doubled its proportion in the last 50 years. Starting at 9 per cent in Punjab and 6 per cent in the Bahawalpur State in 1901 it was 18 and 11 per cent, respectively, in 1951. This growth of urban population is due to the development of industry, commerce and trade in and near the towns and cities by which the rural

S4 URBAN AND lRURAL POPULATION ~----------------------~~
Decinnial Rise in Papulation in Towns
4. :5
4. 1
0:: <~ o .:J 3.1 -
%.:S
2.2
~
... ~ .. . .",.. ... __ .
CLASSN .............. .:;. ... ,.; .. ,. t::"''''':::: •••
1901
~ ~ TOTAs.-----~ V RURAL
/
/ v
I / .'
URBAY " ,,' //
. ;/ I
_~~:?- /" .I I
." ./ i ,"
" i I ,,," ! ." ,
I .I i _ .Ci.A-SS> I/
I I
I /
./", I : / " ._--
/ / / . -" i
. / _" / / /: .. ., ............... " ..
/' .>.~: ... ",- / .. ,
_ ... _,r ClJ>.'f>S 1t . ,. ,
;I , • . ;r.- .. ~ ... ~: ... :-:::.-.-s_ /
/ /'
(.: ............... ..... ./
/' CLASS 111 -'"
.'
"._ ... _,'
1~21 "lI! 1~41 \$51 CENSUS ,(E/d~S
20eSI.o
7950.0
S012.o
:S163.0
1259.0
501.2
~U6.3
I
\
(/)
a z -< ill ::> o :r I-

URBAN AND RURAL POPULATION 55
population, both well-to-do and otherwise, has been attracted by the lure of wealth to shift to urban areas. The fragmentation of agricultural holding due to the laws of inheritance has been taking place continuously since long with resultant decrease in the earning ~ower of the rural population. The force of this economic factor also has been driving vilbgers to towns. In addition there has been a regular flow of artisans moving to towns and cities in search of employment. The increased measures of security coupled with the expansion of medical, educational and transport facilities too have been responsible for this migration to urban IGCalittes. Finally the increase is due, to no small extent, to the influx of Muhajirs of whom not less than onethird Bocked into the urban areas due largely to the better opportunities for their economic rehabilita tion. The trend of urbanization on the whole is controlled by the economic forces and these cities and towns which offered better prospects have been growing faster than others. Lahore and LyaUpur are typical instances. Statement 4-B illustrates the extent of migration in the six districts of the Punjab containing the cities of Lahore, Rawalpindi. Multan, Lyallpur, ~i~~Qt and Gujranwala. The figures for the cities are shown in italics.
. . ~4 Cities and towm itt th., order of po.. pUI.non. Statement 4-C gives a .comparison Qf· the population of the silt cities and three s~l§cted tQwns of the. Punjab and Bahawalpur Stata with their figures at the past throe censuses.
STATEMENT 4. B
(Reference Paragraph 4.3)
Birthplaces of Persons enumerated in
Districts containing cities.
Districts Cities
Lahore (Lahore city)
Rawalpindi (Rawalpindi city)
Multan (Multan city) ... Lyallpur (Lyallpur city) ...
Sialkot (Sialkat City) .. Gujranwala (Gujranwala city)
18,95 8,49
8,76 2,37
21,08 1,90
21.53 1,79
14,74 1,68
10,47 1,21
I -Born outside district lor enumeration (OOO's) ~ CI)-
;S B .... 9 B t' .S·~ -58.tl -g "<::0 O_(!j~ 11 ~t ~~ ~ ----
98 14 7,69 85 13 3,87
43 24 1,15 35 16 95
85 4 6,58 12 1 93
1,03 4 9,95 14 1 1,26
33 5 3,85 14 4 56
69 2 3,02 8 62
Lahore has continued to maintairl the first pJace. Ra walpindi, which had declined by one step in 1931, regained its former position in 1941 and continues to occupy the second place. Multan has remained third except in 1931 when it had deprived Rawalpindi of the second position. Lyallpur has developed rapidly and by securing the fourth place at the 1951 Census it has moved above Sialkot and Gujranwala. Sargodha has also gone up by two steps.
Certain useful data in respect of these towns including their density is given in Subsidiary Table 1, at the end of this Ch.apter. It must bowever be mentioned that the density has been ealoulate4

56 URBAN AND RURAL POPULATION
STATEMENT 4-C
(Reference Paragraph 4.4) . Changes in Population of Cities and Selected Towns in 1951 Comparison
with past three censuses.
City or Town.
Lahore City and Cantonment
Rawalpindi City and Cantonment
Multan City and Cantonment
Lyallpur
Sialkot CIty and Cantonment
. Gujranwala
Sargodha
]hang-Maghiana
Bahawalpur Municipality and Cantonment.
I
I I
on the basis of the figures of area furnished by the local authorities, which are incorporated in Table I-A published in Part II of the Report. A scrutiny of these figures has. revealed that in many cases arable lands lying within the municipal limits have been taken into account although there is no likelihood of their being built upon for a long time to (. orne. A typical instance of this is prov ided by the Corporation of the City of Lahore, including Lahore Cantonment whose area is shown at 128 square miles. In point of fact the Lahore City including Cantonment is fairly congested but its density is:'lower_ on account of the inclu~ion in ... the _ area_figures of the land '\1nder cultivation which lies within 14e limits of the Corporation. On the other hand instances are l10t rare wh~e:
1951 1941 1931 1921
1000's I! 1000's I ~ 1000's .1 ! 1000's I ! 8,49 6,72 4,30 2,82
2,31 2 1,85 2 1,19 3 1,01 2
1,90 3 1,43 3 1,19 2 85 3
1,79 4 70 6 43 6 28 1
1,68 5 1,39 4 1,01 4 71 4
1,21 6 85 5 59 5 38 5
78 7 36 9 27 8 18 9
73 8 50 7 36 1 30 6
42 9 40 8 21 9 18 8
the ground covered by buildings only has been shown as the area, resulting in high density figures. It appears that the local authorities applied widely differing yardsticks in determining the area of the urban localities. Due to this reason it has not been deem.!d advisable to give a comparative discussion on the density of the different urban places.
4.5 Religious Composition.-After the partition of India in 1947, the composition of population by religons has undergone a complete metamorphosis in the Punjab and Bahawalpur State. With the departure of Hindus and Sikhs en bloc on the one hand. and the influx of Muslim Muhajirs on the other. the whole territory now consists of MUlJlims with ~

URBAN AND RURAL POPULATION 57
sprinkling of Chiristians and others. There are certain places in the Multan and Rawalpindi divisions where the entire population is Muslim. The Christians comprise 2.3 per cent of the total population and, as in the case of the Muslims, the rural element predominates and is 82 and 74 per cent of the total population of the Christians in the Punjab and Bahawalpur State, respectively. In the Punjab the Christians are mainly distributed over th e Gujranwala, Lahore, Sheikhupura, Sialkot, Lyal1pur, Montgomery, Multan and Rawalpindi districts while in the Bahawalpur State they are scattered all over. For the figures of the rema1DlDg religions the Reader may refer to Table 6·Religion published in Part II of this Report.
4.6 Literacy and Educational Levels.-The details of literacy and educational levels will be discussed in detail in Chapter 7 but some salient features thereof are mentioned here. The number of persons enumerated as literates in the Punjab and Bahawalpur State stands at 3,404 and 259 thousands, respectively, of whom 660 thousands reside in the six cities and two' selected towns of the Punjab and 16 thousands in Bahawalpur Municipality and Cantonment. Elsewhere too the urban population has a higher proportion of literates than the population in rural areas. Similarly the proportion of persons possessing higher educational qualifications is more in urban localities, . Of the 195 thousand literates who declared themselves to have p'ssed the Matriculation Examination, about 84 thousands i.e. 43 per cent were
residents of the six cities and three selected towns of the Punjab and Bahawalpur State. The position in respect of other higher educational levels is not different. Further details regarding these matters will be found in Table 8-Literacy and 9B-Educational Levels published in Part II of this Report.
4.7 Individual Cities and TOWDS.-At the 1941 Census there were four cities namely, Lahore, Rawalpindi, Multan and Sialkot, which had more thaD one lakh population each. They maintained their pOSition in the 1951 Census and two more cities, viz., Lyallpur and Gujranwala entered this category. The chief factors which have contributed to the growth of the papulation of these six cities will now be discussed and mention will also be made of three important towns selected for separately tabulation of data, namely, Sargodha, Ihang-Maghiana and BahawaIpur.
(a) Lahore.-The Corporation of the
City of Lahore and Lahore Cantonment
together cover an area of about 128
square miles, which has a total population
of 8,49,476 and is the largest city in the Punjab. The city has grown consistently
since 1901 and shows an increase of 319
per cent over the last 50 years. Being
the headquarters of the Provincial Go
vernment, and of the North Western Railway and its extensive Workshops,
there is a big staff of officials which forms
an important part of the population of the town. The development of commerce, trade and industry has aiSQ

58 URBAN AND RURAL POPULATION
contributed significantly to the growth of the City. Many commercial and business firms of repute have their head offices in Lahore and as a result the town is easily the most important inland commercial centre in West Pakistan. Several indusries have been established during the last fifty years mostly to meet the provincial demand. The average number of workers employed in these industries is about 31,800. Lahore is also the most important educational centre in the whole of Pakistan. Besides several Schools and Colleges teaching arts and science subjects there an~. tw 0 well equiped Medical Colleges, one Engineering College; one Law College and Technical Institutes for several trades, The Punjab University which is the oldest and biggest University in Pakistan has its headquarters at Lahore. All these institutions have helped to increase the population of Lahore. Finally tIle incoming Muhajirs who were far in excess of the outgoing Hindus and Sikhs in 1947 accounted for the marked rise over the last decade.
It will be interesting to give some information about the form of local SelfGovernment in Lahore. There is a Corporation consisting of 68 members, which look s after public health, sanitation, education, maintenance of roads and other civic matters. The es timateg income of the Corporation from rates, taxes and other sources for the year 1952-53 was Rs. 1,20,06,230 against Rs. 1,18,63,100 earmarked as expenditure on the various services. There is also an Improvement Trust which carries out such structural improvement s in the old city as become possible from time to
time and simultaneously coordinates new extension ~chemes. Recently the Trust has developed two fairly extensive areas which have been named Gulbarg Colony and Samaabad. Both of these stand out as goed examples of modern town planning. 1 he local administration in the Cantonment is under a Cantonment Board.
(b) Rawalpindi :-The City of Rawalpindi including the Cantonment has a population of 2,37,21!) against 87,68 n 1901 which gives an increase of 171 per cent during the last five decades. Rawalpindi is situated on the main line of the North Western Railway and al50 on the Grand Trunk Road running from Lahore to Peshawar. Due to the proximity of bills the climate is much more congenial than in other parts of the Punjab. Being the headquarters of the Military organization, as well as an important centre of Civil administration the, city has developed immensely in size, popUlation and commercial importance. The rise in population in the last decade is due also to a large number of Muhajirs who have settled in the town. Rawalpindi has also been developing in the field of industry. It has several industrial undertakings, the most recent important addition being a modern textile Mill. The refinery of the Attock Oil Company is situated at the outskirts of the town. The average number of workers employed in different industries is 9,400. Rawalpindi also has an adequate number of CoUeges and Schools which are all affiliated to the Punjab D,niversi ty. The local administration is in the charge of an elected municipal (,;omOlittee in the City and a partly

URBAN AND RUltAL POPULATION 59
elected and partly appointed Board in the Cantonment. The jurisdiction of these two administrative units is well defined and there is no overlap
pfug. An Improyement Trust on the
pattern Qf the one at Lahore has been
recently constituted.
(c) Multan:-The popula~ion of Mul
tan City including the Cantonment is
t90,122 and like most other towns in the Punjab it has more than doubled in the last fifty years. The influx of refugees accounts partly for the increase in the
last decade. Multan is an important rail
and road centre and is a celebrated historical town. It has ancient handloom, textile and pottery cottage industries. The mltnber of handlooms is 53,000. A
modern textile mill has been installed
recently. Other industries have also been
established and the average number of
workers employed in different factories
and mills is 6.700. Multan has advanced
in the field of education as well. It has
several Schools and Colleges, the latest
addition being the Nishter Medical College. Climatically Multan is hotter than many parts of the . province but not
unhealthy. Its average annual rainfall is
5.74 inches.
(d) Lyallpur :-Comparatively speaking Lyallpur is a new town which came into being in the beginning of this century.
It has now a population of 1,79,144. which considering that its population in
1901 was 9,]71 constitutes a remarkable
increase during the last five decades.
This city, which was meant to be a market town in the Chenab Colony, has prospered and expanded in all directions with the result that, besides being a leading market for the agricultural produce, it is in the front rank of the industrial and commercial towns. It can boast of three modern textile mills while the spinning section of one more mill has started producing yarn. Olher industries are also being established. The average number of workers employed in different factories and mills is about 8,000. Lyallpur is an important handloom centre as well with about 15,000 handloorns. The city has not lagged behind in other respects. Apart from the ordinary educational institutions the Punjab Agricultural Colleg~, which teaches agriculture on scientific lines; is located there. The city is a railway junction and is also served by good roads. As a cumulative effect of all these factors Lyallpur has been growing consistently. A very large number of Muhajirs have bcen rehabilitated in the town.
(e) Sialkot:~The population of this city including the Cantonment is 1,67,543 (The figures in Table 6 Part II are exclusive of refugee camp). The popula- . tion has increased steadily since 1901 and shows an increase of 189 per cent over the past five decades. Sialkot is world famous for its sp orts goods industry whose products are exported to many countries. The town has also a well established industry for the manufacture of surgical instruments. The Government Surgical and Allied Trade Development Centre has been expended with a view inter alia to standardising and developing this

60 URBAN AND RURAL POPULATION
industry. The average number of persons employed in different industries is 4,000. Sialkot is welt connected with other cities and markets by rail and roads and has a good climate. The local municipal committee is in charge of the sanitation and public health in the city. In the Cantonment these services are provided by the Cantonment Board.
(f) Gujranwala:- The present population of this city is 1,20,860. (The figures in Table 6. Part II are exclusive of refugee camp) which shows an increase of 314 per cent as compared to its 1901 population. Gujranwala lies on the main line to Peshawar and also On the Grant Trunk Road. It has many metal works and rice-husking mills, a sugar mill, some tanneries and other industrial con<\erns. The average number of persons employed in different industries is 2,500. The number of handlooms is also fairly large.
(g) Sargodha :-Sargodha is the headquarter:; town of the Shabpur district.
I The town has grown consistently during the last five decades and has now a population of 78,463. Like Lyallpur, Sargodha is a colony town and is well connected with other cities and markets by rail and roads. It is the chief centre of trade in the Jhelum colony. In the industrial field also Sargodha is making a steady progress.
(h) Jhang-Maghiana:-The two towns of lhang and Maghiana are adjacent to each other and form a single municipality. lhang-Maghiana ha~ a population of 73,402 which shows an increase of 201 per cent over its population in 1901.
Quite a large number of refugee weavers from India have settled in the town. The means of communication with other parts of the Punja b are satisfactory.
(i) Bahawalpur:-The popUlation of Bahawalpur including the Cantonment is 41,646 which shows an increase of 125 per cent as compared to 1901. This town is the seat of the Babawalpur State Government and occupies a prominen t position on that account. lts population bas Increased also as a result of the Sutlej Valley Project. Bahawalpur lies on the main railway line from Lahore to Karachi and is an important trade and industrial centre. Besides other educational institutions the town possesses the Sadiq Egerton College which is affiliated to the Punjab University.
(j) Map 4.2 shows the location of these Cities and Towns as also the percentage of urban population in each district of the Punjab and Bahawalpur State. Figure 4.3 illustrates the growth
P",: ... ,
CHANGES IN THE rOPUJ.AiION AND SEX RATIOS IN CITIES (BaSed on the combined Figures of the cities of
Lanore. Ly.I1pur, Multan & R~walpindiJ
400
CENSUS YEAllS

URBAN AND RURAL POPULATION 61
KEY TO DISTRICTS PUNJAB MAp. 4-l
PUNJAB Percentage of urban populatiOD &
BAHAWALPUR STATE I Lahore .', 39%. 2 Sheikhupura .. _ 34%
Gujranwala ... 29% 4 Sialkot _'. 25% 5 Jhang ... 16% 6 Montgomery ... 39% 7 Multan _ .. 31%
8 Muzaifargarh .. , II % 9 Om Gazi Khan 6% 10 LyaUpur .. ,46% II Gujrat ,;. 1-2% 12 Ihelum ... 8% 13 Rawalpindi .. , 12% 14 Campbellpur ... s% 1 S Shahpur .. , 18% 16 Mianwali .. , 9%
Bahawalpur Siatc J 7 Bahawalpur 18 Rahimyar Khan
Proportion of urban population
JAMMU ".
kAIiUna
P""JAt ...
'"The s'luares ar~ drawn proportion to the. size of the total population of Ihe Dlstncts: a squard with a size or one-half an inch represents 10 Lallha ..

62 URBAN AND RURAL POPUL1TION
in population and the change in the sex ratio of the combined population of the cities of Lahore, Lyallpur, Multan and Rawalpindi.
4.8 Decaying Towns.:-While the urban population as a whole has been jncreasing a few old towns ill the Punjab have declined in population. The decline appealS mainly to be due to the fact that after the partition the Muhajirs did not go to these towns in sufficient numbers to replace ihe departure of Hindus and Sikhs. Most of these tOwns are out of the way and held few prospects for the rehabilitation of the Mubajirs. Statt:ment 4. D shows the population of these towns at the last two censuses with the percentage of decrease.
STATEMENT 4-0
(Reference Paragraph 4.8)
Decaying Towns
-~-
Town I_~Pop u~ation_l _ _E_~reas~_ I 1951 I 1941 Num-/Percen-I ,ber tage
Karor 2,584 4,984 2,112 45
Daja! - 3,764 6,378 2,614, 41
Kat Mitha{l 3,675 :5,889 2,2"14 ' 38 , Pind iDadan Khan 7,339 i 1 ,445 4,106 36,
Hazro 7,512 11,186 3,674 3
Vehoa Town 2,827 3,781 954 25
Hasanabdal 6,349 8,089 1,740 22
Isakhel 6,366 7,931 1,565 20
Taunsa Town 7,286 8,701 1,415 16
4.9 Villages: Subsidiary Table II at the end of this Chapter gives the number of villages in each tahsil of the Punjab
and Bahawalpur State as also the average population and area per village. A village generally means any area (as distinct from a collection of habitations) for which a separate record of rights exists, or which has been separately assessed t() land revenue, or which may be specially declared to be an "estate', i, e., a village, by Government. The size of a village varies from district to district and depends upon the nature' of the soil, the means of irrigation and the climatic conditions. The average size of a village in colony dis~ tricts ranges from two to three square
. miles, The districts like Sialkot, which have extensive well irrigation, have Comparatively small villages whose average size is below one square mile. In the sandy and desolate districts of Mianwati and Muzaffargarh and the hilly tracts of Dera Ghazi Khan and Campbell pur dis~
tricts the grouping of the villages is arbitrary owing to the broken nature of the country and sandy lands. Villages Lists for each district of the Punjab and Bahawalpur State showing the name , area, popUlation number of houses and other local details have been published separately by tqe census organisation.
4.10 Density of population in rura) , , . \
. areas. The figures of rural density are given in the last column of Table I-Population and these are compared with 1941 Census in Subsidiary Table III. The rural density for the Punjab at this Census is 250 persons per square mile; Lahore Division with 429 persons is most thickly populated, Multan and Rawalpindi Divisions have a deflsity of 231 and 205, respectively. The tahsils with particularly high rural density are

URBAN AND RURAL POPULATION 63
all five tahsils of the Sialkot district; Lyallpur, Jaranwala and Sumandri tahsils of the Lyallpur district; Okara tahsil of the Montgomery district and the heddquarters tahsils of the Lahore and Gujrat districts. The sufficiency of rainfall augmented by irrigation by wells and the fertility of soil ensure good crops in the Sialkot district; hence the high density in all its five tahsils. The Lyallpur district is almost entirely a flat plain of fertile loam and the cultivated area is practically all canal irrigated. The conditions in the Okara tahsil of the Montgomery district are similar. Gujrat tahsil has heavy rainfall which helps to raise good crops. Lahore tahsil is mostly served by canals and a considerable part of it is under cultivation.
The desolate tracts comprising the three tahsils of Mianwali district, Kot Adu and Leiah tahsils of the Muzaffargarh district and Khushab tahsi~ of the Shahpur district are sparsely popu~'lted
and their density is not more than 1:;0. The low densities of Rajanpur (63), Jampur (106) and the headquarters tahsil of the Dera Ghazi Khan dirtrict (103) are due partly to the fact that the Sulaiman Range extends into this district and
partly to insufficiency of water for irrigation. Pindlgheb and Talagang tahsiIs
of the Campbellpur district have a density in the neighbourhood of 100 as the
rains there are uncertain and about 2J3rds of the total area is uncultivated, With the exception of the Rahimyar Khan and
Bahawalnagar tahsils which have favour
able means of canal irrigation, the
Bahawalpur State has a low density,
4.11. Agricultural Occopations: For the collection of data in raspect of Census Question No. 1 I the Enumerators
had to enquire the usual main occupation and subsidiary means of livelihood of
the respondents. A'tiJler of soil' was to be asked further questions regarding his
agricultural statu.;'. The results of these investigations have been compiled in
Table 14-Agricultural Labour Force and
Cultivators' Land Tenure and 11-C-Subsidiary Occupations of the Agricultural Labour Force. These tables are pub
lished in Part II of the Report. The
self-supporting Agricultural Labour
Force in the Punjab is 36,66 thousands
(35,64 tbousand males and 1,02 thousand
females) of whom 2,69 thousands reside
in urban areas mostly in the districts of
Lahore (82), Rawalpindi (40), Shahpur
(27) and Multan (21). The Bahawalpur
State bas 4,11 thousand persons of tbis
category of whom 22 thousands live in
urban areas. For further details in this
respect the Reader may refer to Table
ll-Labour Force published in Part II of
this Report. In the self-supporting Agricultural Labour Force the number of
cultivators is 34,34 thousands in the
punjab and 3,88 thousands in the
Babawalpur State while the rest are
engaged in miscellaneous occupations
connected with agriculture such as herdsmen, animal breeders, landless agricultural workers, orchard and nursery men,
malis (gardeners), dairy farmers and
poultry keepers. About 48 thousand
cultivators belong to 'Other Religions' and the rest are Muslims.

64 URBAN AND RURAL POPULATION
4.12 Subsidiary Occupations: Out of
the Agricultural Labour Force 1, 94,453
and 6,752 persons in the Punjab and BahawaJpur State, respectively, have in addi
tion to their main occupations, Don-agri
cultural subsidiary occupations, such as
weavers, spinners, blacksmiths, mechanics!
carpenters, sawyers. tailors, cooks, domestic servants etc., as detailed in Table ll-C pu blished in Part II of the Report. The number of females reporting subsidiary occupations is generally negligible. Further notes on Agricultural and Subsidiary Occupations are in Chapter 9-Economic Activities.
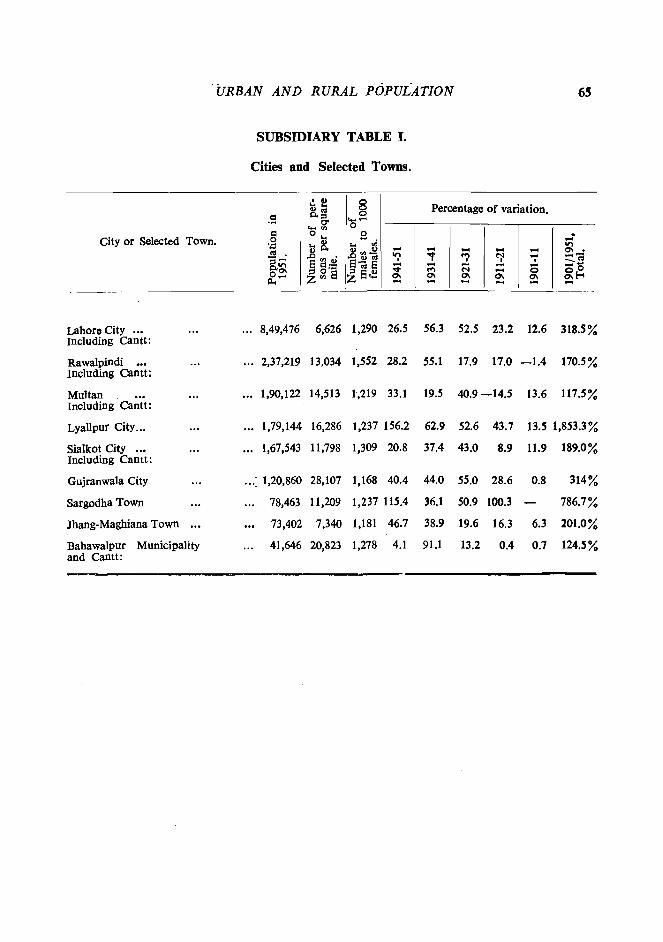
· URBAN AND RURAL POPULATION 65
SUBSIDIARY TABLE I.
Cities and Selected Towns.
~e 8 Percentage of variation. o.~ 0 .9 0- ..... -..... ., 0 c:l 0 ... 2 City or Selected Town. 0 -'';::: t8. ... .,; - 10 <II .8'S~ - - - - 0\. - . ,D., • "'/ "'f .... ~
_ ~(; ::1- 8!::~ 8ta 8 ,..!, I
0.10 - _ - 0 _ ...
00\ ::loa Z8~ -.t .... N - 0 0
jl.,- Zoo 2l 0\ 0\ 0\ 2l O\E-o - - - -Lahoro City ••• ... 8,49,476 6,626 1,290 26.5 56.3 52.5 23.2 12.6 318.5% Including Cantt:
Rawalpindi ... 2,37,219 13,034 1,552 28.2 55.1 17.9 17.0 -1.4 170.5% Including Cantt:
Multan 1,90,122 14,513 1,219 33.1 19.5 40.9-14.5 13.6 117.5% Including Cantt:
Lyallpur City .•• 1,79,144 16,286 1,237 156.2 62.9 52.6 43.7 13.5 1,853.3%
Sialkot City ... 1,67,543 11,798 1,309 20.8 37.4 43.0 8.9 11.9 189.0% Including Cantt:
Gujranwala City ... : 1,20,860 28,107 1,168 40.4 44.0 55;0 28.6 0.8 314%
Sargodha Town 78,463 11,209 1,237 115.4 36.1 50.9 100.3 786.7%
Jhang-Maghiana Town 73,402 7,340 1,181 46.7 38.9 19.6 16.3 6.3 201.0%
Bahawalpur Municipality 41,646 20,823 1,278 4.1 91.1 13.2 0.4 0.7 124.5% and Cantt:

66 URBAN AND RURAL POPULATION
SUBSIDIARY TABLE No. n. Average population and area per village in Tehsils-Census 1951.
Rural. Average.
._. ~ 0 Q)
2 0. ~ '"
District. TehsiL <Ii ~ I'i oS rn ~ 0 Q)
'" i)] <0 Ii 0- !) :::l 0 til 0.G) ';> . ~ 0. • .... .g .S ..... bO 0' 0 o~ til
<0 ~.E 0 0. Q) 0'> 0 -< Z ~ Z <
GUJRANWALA Gujranwala 549 4.23,809 920 772 I.7 Hafizabad 367 2,14,745 914 585 2.5 Wazirabad 235 1,57,421 427 670 1.8
LAHORE. Lahore 266 2,75,536 543 1,036 2.0 Chunian 442 4,78,225 1,101 1082 2.5 Kasur 159 1,60,646 639 1,010 4.0
SHElKHUPURA Sheikhupura 242 3,97,321 846 1,642 3.5 Nankana 366 2,32,023 681 634 1.9 Shahdara 413 2,11,399 745 512 1.8
SIALKOT; Sialkot 541 2,50,850 373 464 0.7 Daska 374 2,71,086 396 725 1.0 Narowal 560 2,36,434 412 422 0.7 Pasrur 538 2,34,730 377 436 0.7 Shakargarh 705 2,60,757 489 370 0.7
DERA GHAZI KHAN Dera Ghazi Khan 230 1,99,215 1,940 866. 8.4 .. . Biloch Trans 100 45,016 3,990 450 39.9
Frontier Tract Jampur 175 94,956 900 543 5.1 Rajanpur 233 1,22,616 1,943 526 8.3 Sanghar 190 93,892 590 494 3.1
JHANG Jhang 445 2,75,877 1,318 620 2.9 Chiniot 334 2,79,983 1,009 838 3.0 Shorkot 231 1,85,594 1,045 803 4.5
LYALLPUR Lyallpur 274 5,14,872 760 1,879 2.8 Jaranwala 264 4,09,919 706 1,553 2.6 Samundri 307 4,02,267 770 1,310 2.5 Toba Tek Singh 529 5,42,766 1,277 1,026 2.4
MONTGOMERY Montgomery 519 5,41,586 1,219 1,044 2.3 Dipalpur 513 2,90,271 963 566 1.9 Okara 380 3,83,616 716 1,010 1.9 Pakpattan 665 4,45,814 1,285 670 1.9
MULTAN Multan 319 3,16,693 764 993 2.4 Kabirwala 287 2,41,749 666 842 2.3 Khanewal 380 3,26,396 972 859 2.6 Lodhran 402 2,63,090 1,060 654 2.6 Mailsi 306 1,74,490 632 570 2.1 Shujabad 188 1,95,303 687 1,039 3.7 Vehari 301 2,48,575 801 826 2.7

URBAN AND RURAL POPULATION 67
SUBSIDIARY TABLE No. II.-'-contd.
Average population and area per village in Tehsils-Census 1951
, I I
Rural. Average.
; ... .S .; <l>
~ 0-<Il <l>
District. Tehsil. .; ~ - - ~
I:lO _ <l> 0 ~ bI)
d <Il • =.~. ,:g cr t~ > .2"
~ .9 til o-.~
8.~ ..... .9 ._~ ...... .g 0 ~
o • ~$ ~
0- e 0$ 0 p.. < Z <
. MllZAFFARGARH Muzaffargarh 401 2,19,177 747 547 1.9
Alipur 175 2,00,5.05 930' 1,146 5.3 KotAddu 148 1,32,502 1,502 895 rO,1 Leiah 159 1,44,705 2,407 910 15.1
CAMPBELLPUR Campellpur 190 2,00,181 651 1,054 3:4 Fatehjang 200 1,38,845 853 694 4.3 Pindigheb 142 1,54,176 1,436 1,086 10.1 Tatagang 85 1,39,847 1,192 1,645 14.0
GUJRAT Gujrat 460 3,22,668 545 701 1.2 Kharian 501 3,16,316 657 631 1.3 Phalia 433 3,88,508 1,013 897 2.3
JHELUM Jhelum 430 2,09,153 878 486 2.0 Chakwal 248 2,09,019 1,009 843 4.1 Find Dadan Khan 205 1,86,614 851 910 4.2
MIANWALI Mianwali 148 2,16,795 1,524 1,465 10.3 Bhakkar 230 2,16,498 3,140 941 13:.7 Isakhel 62 59,002 714 952 11.5
RAWALPINDI Rawaipindi 447 2,04,949 732 458 1.6 Gujar Khan 380 2,01,344 561 530 1.5 Kahuta 240 1,23,810 454 516 1.9 Murree 103 90,273 2~6 876 2.3
SHAHPUR Shahpur 258 1,46,378 570 567 2.L: Bhalwal 279 2,61,683 822 938 2.9 Khushab 190 2,22,197 2,521 1,169 1"3.3 Sargodha 293 3,19,114 823 1,089 2.8
BAHAWALPUR Bahawalpur 312 1,70,681 3,009 547 9.6 Bahawalnagar 243 1,59,755 661 657 2.7 Chishtian 415 2,46,193 1,702 593 4.1 Fort Abbas 341 1,67,546 1,623 491 4.8 Minchinabad 271 1,13,940 683 420 2.5
RAHIMYAR KHAN Rahimyar Khan 68 2,31,746 1,018 3,408 15.0 Abbasia Colony 136 7.338 257 54 1.9 Ahmadpur East 184 1,55,892 4;766 847 25.9 Allahabad 152 1,34,575 1,665 885 11.0 Khanpur 121 90,268 1,041 746 8.6 Sadiqabad 59 1,50,634 1,030 2,553 17.5

6$ URBAN AND RURAL POPULATION
District &. Tehsils.
GUJRANWALA.
Oujranwala Tebsil Hafizabad Wazirabad
LAHORE.
Lahore Chunian Kasur
" "
Tehsil
" "
SHEIKHUPURA.
Sheikhupura Tehsil Nankana Shahdara "
SIALKOT.
Sialkot Tchsil Daska " Narowal " Pasrur .. Shakargarh Tetsil
DERA GHAZI KHAN.
Dera Ghari Khan Tehsil Biloch Trans Frontier Tract Jampur Tehsil .. . Rajanpur " .. .
. SlUlghar .... .
JliANG.
Jhang Chiniot Shorkot
LYALLPUR.
Tehsil .. .. Lyallpur Tehsil Jaranwala .. Samundri " Toba Tek Singh ..
SUBSIDIARY TABLE Ill.
Rural Density.
Rural Area
(Sq: mile) (Approx)
920 914 427
543 1.101
639
846 681 745
373 396 412 377 489
1,940 3,990
900 1.943
590
1,318 1,009 1,045
760 706 770
1,277
Rural Population.
1951 I 1941
4.23,809 2,14,745 1,57,4:>.1
2,75,536 4,78.225 1,60,646
3,97,321 2,32.023 2,11.399
2,50,850 2,71,086 236,434 2,34,730 2.60,757
199,215 45,016 94,956
1,22,616 93,892
2,75,877 2,79,983 1,85,594
5,14,872 4,09,919 4,02,267 5,42,766
3,55,295 2,17,288 1,54,041
2,18.365 3,64,676 1,79,063
3,42,525 2,22,164 2,34,010
2,54,056 2,60,672 2,55,577 2,33,726 2.91,505
1,88,532 40,246 93,995
1,24.948 96,667
2.74,894 2,78.530 1,66.469
3,31,279 2,75,675 3,00,544 3,62,480
Persons per II Varia-_ sq: mile. tion
I Increase
1951 1941 d or ecrease.
461 386 235 238 369 361
75 -3
8
507 402 105 434 331 103 251 280 -29
470 405 65 341 326 15 284 314 -30
673 681 -8 685 658 27 574 620 -46 623 620 3 533 596 - 63
103 97 11 10
106 104 63 64
159 164
209 209 227 276 178 159
677 436 581 390 522 390 425 284
6 I 2
-1 -5
I 19
241 191 132 I'll
• Vehari Tebsil was carved out of the Mailsi Tehail after the 1941 Census and as such, only a consolidated figure of rural population for these two Tehsils is available in respect of 1941 Census.

URBAN AND RURAL POPULATION 69
SUBSIDIARY TABLE III.-Contd.
Rural Density.
r I Rural Population. Persons per Varia-Rural sq: mile.
Area tion District & Tehsils.
(Sq: mile)! I Increase
(APproX)i 1951 I 1941 1951 1941 or
I decrease.
MONTGOMERY.
Montgomery Tehail 1,219 5,41,586 3,81,698 444 313 13] Dipalpur 963 2,90,271 2,74,972 301 286 15 Okara 716 3,83,616 2.73,312 536 382 154 Pakpattan 1,285 4,45,814 3,08,070 347 240 107
MULTAN.
Multan Tebsil 764 3,16,693 2,16,959 415 284 131 Kabirwala .. 666 2,41,749 1,98,193 363 298 65 KhanewaI
" 972 3,26,396 2,22,326 336 229 107 Lodhran l,e60 2,63,090 2,01,326 248 190 58 Mailsi 632 1,74.490 2,67,280 276 423 • Sbujabad 687 1,95,303 1,65,684 284 241 43 Vehari 801 2,48,575 .. 310 .. "
MUZAFFARGARH.
Muzaffargarh Tehsil 747 2,19,177 2,08,709 293 279 14 Alipur 930 2,00,505 1,91,989 216 206 10 KotAddu 1,502 1,32,502 1,26,625 88 84 4 Leiah " 2,407 ],44,705 1,43,287 60 60
CAMPBELLPUR.
Campbellpur Tehsil 651 2,00181 1,87.894 307 289 18 Fatehganj 853 1,38,845 1,32,169 163 155 8 Pindigheb 1,436 1,54,176 1,48,232 107 103 4 Talagang 1,192 1,39,847 1,27,688 117 107 10
GUJRAT.
Gujrat Tehsi1 545 3,22,668 3,24,488 592 595 -3 Kharian " 657 3,16,316 3,05,234 48) 465 ]6
Phalia 1,013 3,88,508 3,78,890 384 374 10
JHELUM.
Jhelum Tehsil 878 2,09,153 1,92,050 238 219 19 Chakwal " 1,009 2,09,019 1,93,204 207 191 16 Pind Dadan Khan 851 1,86.614 1,81,325 219 213 6
MIANWALI.
Mianwali Tebsil 1,524 2,16,795 1,99,591 142 131 11 Bhakkar " 3,140 2,16,498 1,93,028 69 61 8 Isakhel " 714 59,002 61,225 83 86 -3
-"""'=~_$<-"~"""""_'"

70 URBAN AND RURAL POPULATION
SUBSIDIARY' TABLE Ill.-Concld.
Rural Density.
Rural I Rural Population.
District & Tehsils. Area 1----,----
I(Sq: mile) (APprOX) I
RAWALPINDI.
Rawalpindi Gujar Khan Kahuta Murree
SHAHPUR.
Shahpur Bhalwal Khushab Sargodha
Tehsil
..
Tehsil
"
732 563 454 236
570 822
2,521 823
1951 1941
2,04,949 2,01,344 1,23,~10
90,273
1,46,378 261,683 2,22,197 3,19,114
1,95,353 2,03,568 1,20,992
77,854
1,59,959 2,56,601 2,00,935 2,37,842
Per~ons. per I Varia_sq. mlle. I tions
I Increase
1951 1941 d or I ecrease.
280 267 13 358 362 -.-4 273 267 6 383 330 S3
257 281 -24 318 312 6
88 80 8 388 289 99

Chapter 5
Birth place
STATISTICAL DATA
Table 5-Birthplace
10-Nationality of Non-Pakistanis
lOA-Afghan Powindahs
19A-Muhajirs' Origins
5.1 Introductory: The enumerators .had been instructed to ascertain from
each respondent whether he was born in ·fhe district of enumeration, and where the reply was in the affirmative to place
a tick mark in space 3 of the Census Slip. In other eases he had to write the name of the district, if the place of birth was in Pakistan or India, and to record the name of the country only if the place of
birth was elsewhere. The Census Slip were sorted by hand and the informa~ion
so obtained has been compiled· in Table ·5-Birtbp1ace of which Section 1 gives the
statistics of birthplaces for the Punjab and Bahawafpur State as a whole and also by the administrative divisioD5 in the case of the former. Sections 2 to 5 give the same information for each district of the Punjab and BahawaJpur S tate, Section 6 furnishes the data ia respect of the sekcted cities and towns and Section 7 shows persons born in other parts of the IndoPakistan Sub-con.tinent.
(71)
5.2 Present Composition of Popula. tion: . Of the 188 lakhs 14 thousand per
sons enumerated in. the Punjab, as many as 137 lakhs 3'9 thousand· were born in the Punjab; 16 fhOlfsand in the Bahawalpur State, 81 thousand in
other provinces of Pakistan; 49 Iakhs 70 thousand in other places of the Indo
Pakistan Sub· continent and the remaining 8 thousand in other parts of the world. In the case of the Bal:\awalpur State, out of 18 lilkhs 23 thousand persons enumerated there, 12 lakhs 54
thousand were born in the State; 1 lakh
38 thousand in the Punjab; 7 thousand in other provinces of Pakistan; 4 Iakhs 23 thousands in other places of the IndoPakistan Sub-continent and one thousand . in other parts of the world.
Subsidiary Table 1 at the end of
Fhis Chapter indicates the Birthplaces of
persons enumerated in all districts of the Punjab and Bahawa1pur Stat~. The

72 BIRTH PLACE
overall position is that 69 percent of the population of the Punjab was born in the district of enumeration; 26 per cent in the Indo-Pakistan Sub-continent and 5 per cent elsewhere. In the case of the Babawalpur State the percentage of persons born in the State is also 69 per cent.
The figures for the Bahawalpur State have been published as a whole for the reason that at the time of tbe enumeration a vast majority of the enumerators and the respondents did not distinguish between the two districts of the State and as a result the birthplace of the respondents was not recorded districtwise.
.; A reference to Table 19A-Muhajirs Origin, will show that in the Punjab and Bahawalpur State the number of Muhajirs is 52 lakhs 81 thousand while the number of persons reported to have been born in other parts of the Indo-Pakistan Sub-continent is 53 lakhs 93 thousand. It seems necessary to explain the reasons for this difference of I lath 12 thousand persons. All such persons are not muhajirs as many families will have come to Paki$tan for reasons unconnected with partition and in many cases it is merely coincidental that a person was born away from the home district. Prior to the Partition there used to be frequent inter marriages between musHms residing in the Punjab (Pakistan) and Muslims in the districts now in the Punjab (India). According to a widespread custom requiring YDung wives to go to their parents' homes for their first confinement many women married in the Punjab (Pakistan) gave birth to their children in the
Punjab (India) and the childern so born though not refugees must perforce be included in the figures of the persons born outside the Punjab. Besides there are the children born to non-muhajir parents belonging to the Punjab (Pakistan) and the Bahawalpur State whilst visiting or residing in places now in India.
5.3 Persons born within the Province: Subsidiary Table I at the end of this Chapter inter alia gives the figures of persons born in the districts of enumeration and those born in other districts of the Punjab and Bahawalpur State. It will be observed that there is a marked population drift towards the colony districts, viz., Lyallpur, Montgomery, Multan, Shabpur and Sheikhupura which is due primarily to the expansion of canal irrigation. Next in importance in respect of ioter-district movement are Lohore, Gujranwala , Sialkote and Rawalpindi. The headquarters of these districts are flourishing industrial and commercial centres and there is a continuous flow of migrants from the adjoining districts. The movement of popultaion to the more backward disrticts of Muzaffargarh, Mianwali and Dera Ghazi Khan is negligible. The Bahawalpur State has been a centre of attraction during the last two decades on account of colonization as a result of the Sutlej Valley Project.
S.4 Persons born in other Provinces of Pakistan and in India. I now proceed to examine the figures of the enumerated population born in other provinces of Pakistan and in· India. The number of persons born in other provinces of Pakistan is 80,906 in the Punjab and 5,306 in

BIRTH PLACE 73
the Bahawalpur State, representing 0,4 and OJ per cent respectively, of the total population. The North-We,t Frontier Province's contribution is the largest with 68 thousand persons in the Punjab (who were mostly enumerated in the districts of Rawalpindi. Lahore. CampbelJpur, Mianwali and Sialkot) and 3 thousand in Bahawalpur State.
The number of persons born at other places in the Indo-Pakistan Sub-continent (including the Muhajirs referred to in paragraph 5.6' below) is 49 lakhs 70 thousand and 4 lakhs 24 thousand in the Punjab and Bahawalpur State, respecti.vely. Of the former 31 lakhs 38 thousand now reside in the districts of Lyallpur. Lahore. Montgomery and Multan while the rest are spread over the remaining districts of the Punjab, the smallest number being in the districts of Muzaffargarh. MianwaIi and Dera Ghazi Khan.
5.5 Pesrons born abroad: The number of Pakistanis born outside IndoPakistan Sub-continent, resident in the Punjab, is 8 thousand; 5 thousand born in Muslim countries, 2 thousands in other Asiatic countries and the remaining one thousand in Non-AsIatic countries. The Bahawalpur State has about one thousand persons of these three categories. Pakistanis born abroad are scattered all over the Punjab and Bahawalpur State and have shown no spe cial tendencies to settle in any perticular district.
5.6 Muhajirs and Repatriates: Muhajirs represent nearly one fourth of the total population of the Punjab and Saha-
walpur State. Their distribution over the variou~ districts, and certain other relevant dt!tails, are given in Statement 5.1\.
Of the total 49 lakh Muhajirs in the Punjab, 31 lakhs are spread over the districts of Lahore, Lyallpur, Montgomery and Multan. The Bahawalpur State has 3,73 thousand Muhajirs. As already mentioned the circumstances immediately foHowing the Partition of India in 1947 led to a mass movement of population. Many Muslims had to leave India at once, in many cases literally over-night. An unfortunate consequence of the confusion so caused was that a large number of women and children were abducted and forcibly detained. A special Recovery Department has been working since nearly five years which has so far -succeeded in repatriating to the Punjab (Pakistan) about 17,500 such women and children.
The eight selected cities of the Punjab have accommodated 8 lakhs and 89 thousand Muhajirs, while Bahawalpur Municipality has given refuge to 17 thousand. Statement 5.B. shows the number of the Muhajirs in each of these cities and towns together with their total population.
The vast majority of the Muhajirs now in the Punjab have migrated from the North-West zone of India. For fuller details the Reader may refer to Table 19A-Muhajirs Origin, published in Part II of this Report.
5.7 Non-Pakistanis their origin and occupations: At the time of this Census

74 BIRTH PLACE , , ~ '. ~ :.:. 1t"'
STATEMENT 5-A :; . "
(Reference Paragraph 5.6)
Proportion of Immigrants and Muhajirs compared with, the total population
I I Born in I
II' Tota! Ii IOther Dis- Indo I District/State of
Enumeration
J IEnumeration th~ Pro~ Sl!b-con-
I Population , District of I tricts of ," Pakistan I'
I I Vlllce tInent [
--------------------------------------~
Muhajirs Population.
Puniab
Gujra~wala
Lahore
Sbeikbupura
Sialkot
Dera Ghazi Khan
Jhang
Lyallpur
Moptgomery
Multan
Muzaffargarh
CaqJ.pbellp~r
Gujrat
Jhelum
Mianwali
RawalQilldi
Shahpur
Babawal~ur State
(1000's)
1,88,28
10,47
18,95
9;~3
14,74
6,31
8,77
21,53
18,16
21,08
7,51
7,23
11,59
6,82
5,SI
8,76
11,63
18,23
13,643 Afghan powindahs (8,183 males and 5,460 females) were enumerated in the Punjab and Bahawalpur State, of whom 560(525 males and 35 females) were counted in the Bahawalpur State and the rest in the Punja\> where: their main con~~ntrations were in the cliSt~icts' ,of Dera
(WOO's)
1,30,09
6,74
10,14
5,55
10,50
5,90
7,23
10,50
9,96
13,59
6,67
6,70
9,85
6,00 ,
5,08 .
6,93
8,75
12,54
(1000's)
7,46
69
98
50
33
2
20
1,03
98
85
8
10
3J
19
5
44
72
1,43
(1000's) tHIOO's) (%)
49,70 49,08 26.1
3,(]O, 2,99 28.6
7,67
3,16.
3,84
35
1,32
9,95
7,19
6,58
76
37
1,40
56
31
1,13
2,10
4,23
7,45,: 39)
3,10 33.6
3,69 25.0
36 5.7
1,39 15.8
9,86 45.8
7,13 39,3
6,46 30,6
79 10.5
38 5.3
1,36 11.7
52 7.6
47 8.5
1,06. 12.1
2,07 17.8
3,73 20.5
Ghazi Khan, Jhelum, Shah pur and Jhang. About4 thousand Powindahs were declar-' ed to be under 12 ~ears of age and of tbe remaining 10 thousands (6 thou~and males an,d",4 thp}fs:JJ1,d, fenmles).,: re.aly,,4 th.ousan~s, p1!?,St pf wqQ!U ,were .females, d\d oQPpedfy, the~r occupation" Tbr~etholJ"'-

· . _. ". -7S bIRTH PLACE
STATEMENT 5-B (Reference Paragraph 5.6,
Proportion of Mubajirs in selected cities and towns
Population OOO'S \ ~ CIS
City/Town. E
Total IMuhajirs I ~ ... - ... 0-
Lhliore 8,49 3,66 43 R'aWRIpi~di 2,37 89 37 M'iIitan 1,90 94 49 Lyiltbur 1,79 1,24 69
stalkot 1,68 54 32 Gujranwala 1,21 61 50 sIiIkodha 78 54 69 Jl!a1lg/Malihfalla 73 47 64 Bahawalp'!!r 42 17 40
s'ittds were engaged in diverse retail trades; two thousands were employed as labourers of miscellaneous categories and the rest were doing odd jobs. In additon th'e're were 795 Non-Pakistanis mainly eltgaged'in trade and commerce of whom 412 were self supporting and 323 were dependents. For further details, the Reader may refer to Tables 10 and lOA, p'tlblish'ed in Part II of the "Report.
5.8 Main Movements of Population: The movements of the urban population bave been dealt with in Chapter 4 and ~ not::be reife'atM. The rural popula. tkJn, wftteh forms 82'and 89'per cent of the total population of the Punjab and Bahawalpur State, respectively, is almost entirely
either directly or indirectly dependent on the land. A salient feature of this population as a whole has been its tendency to stay at home due largely to the self-sufficiency of the rural economy. The joint family system and early marriages have contributed to this inclination of the peasants to remain in their ancestral homes. Subsidiary Table 2 at the end of this Chapter shows the figures of the persons born in the district of enumeration as also taeir percent~ge fo the total population during
.the 1911, 1921, 1931 and 1951 C~nsuses.
This information is not available for'the 1941 Census. It will be seen tliat in 1931 the . percentage of persons born in the district of enumeration was over 80 in all districts except Sheikhupura, Sialkot, Lyallpur and Montgomery where it was 70. 73,64 and 74 respectively. The figures of the districts of Dera GhilZi Khan, Jhang, Muzaffargarh, Campbellpur, Jhelum and Mianwali shoW that the number of persons born outside these districts was 4 per cent or less. Besides the reasons already mentioned this high percentage appears also to be due to the fact that these districts contain no attractions for outsiders such as colonization of irrigated lands, The figures for the 1951 'Census sho\v a higher percen tage 'oepersons born outside the district of enumeration in all cases. The rise is largely due to the resettlement of refugees in rural areas.

76 BIRTH-PLACE
SUBSIDIARY TABLE I.
Birthplace of persons emumerated in all districts of the Punjab and Bahawalpur State.
Born in
BO I I ~o ~, I Other Part ~ I·~ .; District of Enumeration.
olE ;; ~~ g .1 Other 00;:1
. 00" di'·1"5~~:;;1 p",;,- of Indo/ p.. I .~.S! ::;-c . .glll g I Wets of ~ '-" 0 0 c: I ees of Pakistan .~ ~ g b ._. Punjab. ~ ~ II £ ~ I Pakis- Sub-Con- ::s <t! I a;:l '~(J~ I &l rIl c.!:i.~ tan. tinent. I 6 '0 ~ 8 o ...
Punjab & Bahawalpur 1,42,63,399 8,68,236 15,773 86,212 53,93,308 8,192 1,582 State.
Punjab 1,30,09,480 7,29,839 15,773 80,906 49,69,520 7,161 1,522
GUjranwala 6,74,412 68,620 557 1,400 3,00,997 843 104
Lahore 10,14,48( 97,168 559 14,658 7,66,636 1)24. 229
Sheikhupura 5,55,164 49,413 277 1,836 3,16,001 390
Sialkot 10,50,374 32,801 138 5,989 3,84,374 358 '162
Dera Ghazi Khan 5,90,482 1,588 137 710 34,610 2
]hang 7,22,812 19,197 480 736 1,31,965 318 23
LyaIJpur 10,50,061 1,01.283 1,334 4,495 9,94,635 450 143
Montgomery 9,95,676 93,737 4,130 2,863 7,18,716 748 18
Multan 13,59,160 82,762 2,399 4,758 6,57,710 404 48
Muzaffargarh 6,66,921 7,465 304 446 75,968 142 3
Campbell pur ,6,69,782 9,797 217 5,007 37,440 264 35
Gujrat 9,84,928 30,455 381 1,946 1,39,652 287 93 -
Jhelum 5,99.613 18,755 25 3,385 56,429 433 260
Mianwali 5,07,599 5,380 11 5,049 31,367 140 3
Rawalpindi 6,92,715 41,571 2,131 24,266 1,13,454 521 313
Shahpur 8,75,294 69,847 2,693 3,362 2,09,566 537 88
Bahawalpur State 12,53,919 1,38,397 5,306 4,23,788 1,031 60

BIRTH PLACE i7
SUBSIDIARY TABLE II.
Persons born in district of enumeration and proportion to total population.
Born in district of enumeration Percentage to total population. Person (OOO's).
District of --~~~---
enumeration. , 1951 1931 1921 1911 I 1951 1931 1921 1911
i ____________ ..1 ________________________ 1 ____________ • _______ ._~j ___ ~ _____ . _______
PUNJAB,
Gujranwala 674 6,46 5,43 4,60 64 88 87 76
Lahore 10,14 10,72 8,95 8,18 54 88 89 92
Sheikhupura 5,55 4,91 3,15 Not avail- 60 70 49 able.
Sialkot 10,50 9,08 8;69 9,01 ~ 71 73 79 83
Dera Ghazi Khan 5,90 5,15 4,83 5,12 93 98 97 97
Jhang 7,23 6,45 5,49 4,92 82 96 96 93
LyaUpur 10,50 7,53 5,05 2,91 49 64 52 35
Montgomery 9,96 7,49 5,58 4,77 55 74 81 99
Multan 13,59 10,23 7,88 7,29 64 88 89 91
Muzaffargarh 6,67 5,70 5,39 5,42 89 96 95 95
eampbellputr 6,70 5,64 4,95 5,00 93 96 96 96
Gujrat 9,85 8,49 7,68 7,14 85 92 93 90'
Ihelum 6,00 5,19 4,51 4,74 88 96 94 92
Mianwali 5,08 3,99 3,43 3,28 92 97 95 96
Rawalpindi 6,93 5,55 4,86 4,78 79 87 85 87 .
Shahpur 8,75 6,83 6,37 5,42 75 83 88 84
Babawalpur. State 12,54 8,41 6,97 7,07 69 85 89 90

Chapter 6
Age, Sex, and Marital Stature
STATISTICAL DATA
Table 4. Age and Marital Status.
4.-A Orphans.
6.1 Introductory: For the purposes of recording the age in reply to Census Question No.2, the Enumerators had
been instructed to use the "Month"
space on the enumeration slip for infants
under one year and "years" space for
older persons whose age had to be re
corded in complete years at last birthday.
In the case of the respondents, who did
not know their ages. the enumerators had to estimate the age in single years upto 25 and to the nearest 5 years above
that age. For the age rturns all the slips were hand sorted excepL the slips
relating to the Non-Agricultural Labour
Force and the Defence Service'l, which were sorted at the Machine Sorting Centre, Karachi. In hand-sorting the slips were first divided into broad age groups 0-11. 12-24, 25-50 and 55 and over. These were then broken down into S-years groups, the group 25-54 being sorted on a sample basis in cases where
the districts/religion batches exceeded
50,000 slips. The sixe of the sample
varied according to the Sil~ of {h~ batch
from 75 pu cent for batches under 75,000 down to 20 per cent for bat~hes over
5,00,000 but was never 100's than 50,0:>0
slips. From the data so collected and sorted Table 4 -Age and Marital Status published in Part II of this Report has been compiled.
Before proceeding further with this
Chapter I deem it advisable to mention
one important relevant factor. It is difficult if not impossible for a layman to marshall the data regarding age strictly according to the technicalities of demography. I have no pretensions of being a demographic expert and therefore
In intend presenting the figures in crude form leaving more detailed analysis to be done by the technical exports into whose hands I hope the data will come.
6.2 Accuracy of age Returns: It will be
seen from Statement 6.A-l that the distri
bution in the various age groups into

AGE. SEX AN D MARITAL STATUS 79
STATEMENT 6.-A-l
(Reference Paragraph 6. 2)
PqlWl~ti~ll.by Basic Age Groups punjab
an" BahlJwalp .... State.
Males Females ---- --'--.,-
'" ,
~ Ase groups .... '" cu ttl .... ..0'" i5 Q) '" s' ..0. ::1 8 ... EO ()
Zo .... ::18 <J)
Z , ~
0-4 14,45 13 13,47
5-0 13,28 12 11,92
10-14 19,85 18 17,91
15-19 13,31 12 12,73
20-24 8,78 8 7,61
25-29
30-:-34
35-39
40-44
45-49
50-54
55-59
60-:-69
70 & over
7,03
6,04
5,13
5,05
4,24
4,24
2,58
3,60
2.88
6
5
5
4
4
2
3
3
5,16
4,48
3,85
3,85
3,35
3,36
2,48
3,05
2,65
I
I I
OIl ttl
i5 ., () .... Q)
0..
14
12
19
13
8
5
5
4
4
4
4
2
3
3
which the slips were originally sorted is uneven_ There is a noticeable tendency
towards inflation in the age group 10-14 both in males and females. On the other hand there is a sudden decline in the age group 20-24. The heaping and shortages are due mainly to the respondents not
being sure of their ages. An overwhelmini majority of the enumerated public was illiterate and quite ignorant of their correct ages. At the same time nei
th<:r, the en\lmerllto(s had any means of
STATEMENT 6.-A-2
(Reference Paragraph 6. 3)
Population by Broad Age-groups Punjab :
and Bahawalpur State.
\~~ Age-Group \ e. ~ (Years) cu· ~ ..08 0
So 8 ::l 0 .... \ z·_ &!
All Ages 1,10,50 100
0-9 27,73 25.1
10-39 60,14 54.4
40-59 16,15 14.6
60 & over 6,48 5.9
Females.
'" "'''' cu, ..oS? Eo ::I 0 z~
95,87
25,39
51,74
13,04
5,70
100
26.5
54.0
13.6.
5.9
checking the ages stated by the resPQndents not could they assess the ages of the females and children most of whom were enumerated through the male mem
bers of their femiIies.
As a curnmulative effect of these drawbacks the age-groups in this 5 year,
presentation, must, like similar returns of previous censuses, be regarded as inaccurate. It may be mentioned that, as pointed out on page 125 of the Census
Report of 1931" unreliability in the
census age returns is not peculiar to this country. The age data has been 'carefully
examined by the statistical experts and it has been decided that only
the form broad age-groups shown in
statement 6.A-2 can be reg:Hded as sufficiently reliable to form any sure basis for drawmg conclusions. There might be a tendency were the figures to be published in the full 9atail in which they have

80 AGE, SEX AND MARITAL STATUS
been compiled, for their use to lead to wrong decisions. The pnnted tables are therefore confined to the
groups which can be regarded as reasonably reliable. The original compilations have however been preserved and copies can be made availiabJe, as application to the Government of Pakistan, for the use of Statis{icians and Students, but
they should only be used under expert guidance and with due caution.
6.3 Age Groups: Distribution of Population Statement 6.A·2 shows the distribution of the in broad age groups by sexes.
It will be seen that the children in age groups 0-9 constitute more than onc-
~ FJc;:;-l Age & Sex Pyramid
PUNJAB &. BAHAWALPUR STATE Horizontal scale Represent
percent of total population
60& OVER.
h·59
10·39
0·9
20 20 PERCENT
quaTter of the population; the next broad groups 10·39 account for more than half while the proportion of persons 60 years and over is 6 per cent. This general percentage distribution does not sh::>w any marked deviation either in the
sex-br;;:ak-down or in the district returns.
Figure 6.1 illustrates the distribution of the males and females by broad age groups for the Punjab and Bahawalpur State. This age and sex pyramid has been drawn on 10-yearsaverage age groups and it is the area of the "steps" which indicates their relative size.
6.4 Proportion of sexes Comparison with other places: The chart in Fig. 6.1 indicates that quite contrary to most Western countries, the punjab and Bahawalpur State have more males than females. The sexes of males over females at this Census was 13,06 thousands in the Punjab and 1,57 thousands in the Bahawalpur State. This higher ratio of males has been a trait of ;censuses here right from the start and must be accepted as factually correct. In spite of my best efforts it has not been possible for me to discover the reason:Jor the disparity between the two sexes and since it may 110t be quite appropriate to indulge in conjectural reasoning on the question I refrain from offering any comments. Statement 6-B gives the proportion of males per 1,000 females at the 1951Census and the past three censuses, while Statement 6.C compares our figures of sex ratio with those of other provinces of Pakistan.
Subsidiary Table I at the end of- this

AGE, SEX AND MARITAL STATUS 81
, STATEMENT 6. B
(Reference Paragraph 6. 4)
proportion of Males per 1,000 females
CENSUS YEAR Punjab,
Bahawalpur
I 1921 State 1951 1941 1931
Punjab 1,149 1,189 1,155 1,198
Bahawalpur State
1,189 1,221 1,221 1,241
chapter shows the number of males to each thousand females for each district of the Punjab and Bahawalpur State at this Census and the previous five censuses.
Figure 6.2 illustrates the sex ratio for the Punjab and Bahawalpur State.
6 5 Variations: Population and sex ratio by age groups: Statement 6-D shows the proportions of the total population
Sex Ratios PUNJAB & BAHAWALPUR STATE
GLl RELIGIOIIS~ MUSLIM' mCl4lllSTIAIiS
110
STATEMENT 6-C
(Reference Paraprapb 6. 4)
Sex Ratio-Comparison with other places.
Males per 1000
females
Punjab 1,149
Bahawalpur 1,189 State
Males per 1000
females
Pakistan Baluchistan Districts Baluchistan State Union F,ast Bengal Khairpur State North West Forntier Province Sind
1,128
1,287
1,140 I,HH 1,246
l,llS 1,219
of the Punjab and Bahawalpur State by different age groups for the 1951 Census in comparison with the three preceding censuses.
Children between 0-9 years increased steadily at the first three censuses but came down in 1951. It seems probable
STATEMENT 6-D
(Reference Paragraph 6.5)
Variations in Age-Groups. Percentages to total population.
AGE-GROUPS CENSUS
YEARS : \ \ J 60 & All Ages! 0-9 10 -39 40-59 over
1921
1931
100 29
100 30
1941 (a) 100 30
1951 100 26
49
51
51
53
15
14
14
15
7
5
5
6
NOTE (a) The figures for 1941 are on the basis of 2 % sampling sort_and tabulation.

82 AGE, SEX AND MARITAL STATUS
o
F,o: 6-3 VARIA nONS IN AGE
GROUP PERCENTAGES (Total populatiQn=100%)
&0 & OVER
40-59
10--39
0-9
if o 9
.
. . . · .
49 ~l 51
· ~3
. · . . . . . . . .
29 30 :so 26
1921 1.9JI 1941 195J CENSUS YEARS
Off,ce or It>e Census Comm'SsrMt'f, I(orach,
that there is a certain amount of heaping at age 10. As already mentioned the figures of age are full of errors, due to
innocent mis-statements and looseness of expression by the respondents on account of ignorance with the resultant upsetting of the structure of age distribution.
Statement 6-E shows the ratio of
STATEMENT 6-E
(Reference Paragraph 6.S)
Numbers of Males per 1,000 females
in the broad age groups.
PUNJAB AND BAHA W ALPUR
Age-Groups ·(years) i Religion (a) •
Census i~~-
Year I I I I 60 ___ . _I O~~~~9~ ~-~_ ~ver_
Muslims (b)
1931 1,095 1,212 1,283 1,357
1951 1,093 1,164 1,230 1,132
Christians (b)
1931 1,092 1,313 1,314 1,441
1951 1,058 1,090 1,734 1,442
(a) Figures for 1941 Census are not available .
(b) Figures for 1931 are for the undivided Punjab .
males per 1000 females in certain age groups for the Punjab and Bahawalpul' State at the 1931 and 1951 censuses. The
figures for the 1941 Census were not tabulated in this respect. It will be seen that the males in all four age groups and in both Muslim and Christian com
munities in both censuses are in excess of the females.
STATEMENT 6-F (Reference Paragraph 6.6)
Proportion of children under 10
(Persons aged 10-39 = 100 per cent.)
Punjab Bahawalpur
State
1951
47.&
44.2
1931
57.1
57.6

AGE, SEX AND MARITAL STATUS
6.6 Proportion of children to old peo
'pie: As mentioned in paragraph 6.3 ·srtpra. The children below 10 years of age .represent more than 25 per cent of the total population against the proportion of 6 per eent of the persons 60 years and 'over Statement 6. F shows that the pro
'portion of children in comparision to the
adult population aged 10·39 years. As ;far as can be Judged from the reports of tbe 1921 census, the decline at the
~ 19"51 Census seems to be in keeping with the past trend.
.. 6.7 Proportion of Orphans: The ,·!,lumber of orphans, that is, the children Q,ooer 12 years of age whose fathers were
·-dead. in the Punjab and Bahawalpur ,Slate was 2,03,568-1,06,377 males and
~97.191 females. This gives a percentage of 2,6 of the total number of children under 12 years of age enumerated at this Census. The percentage is over 3 in the case of Muhajir orphans aged from 5
. years to under 12. The details by districts are given in Census Table 4-A
Orphans. Statements 6-G shows separately for the Punjab and Bahawalpur
_ ~J'ATEMEN1! 6:G . -~ence.Far~r1.ph 6·7)
: ' .• J~ Proportion of Orphans
WJ UJ __
I Percentages to population of Number of ___ _
orphans I I' -~--000'. Children i Total Persons
--- ----,---Male Female Male Female Male Female
Punjab ... 1,02 93 2.8 2.8 1.0 1.1
Bahawalpur State 4 4 1.0 1.2 0.4 0.5
State the number of orphans and their proportions firstly to the children below 12 years and secondly to the total popu· lation.
STATEMENT 6·H
(Reference Paragraph 6.8) Persons per mille of total popUlation age
over 60 years.
District.
PUNJAB
Lahore Division Gujranwala
Lahore
Sheikhupura
Sialkot Muhan Division
Dera Ghazi Khan
Jhang
LyaJlpur
Montgomery
Multan Muzaffergarh ...
Rawalpindi Division Campbellpur Gujrat
Jhelum ]l4:ianwali
_ .1:~~ndi Bahawa]pur State
Bahawalpur Rahimyarkhan
Proportion per mille.
59 54 54 58
44 53 63 51 58
74 51 73 47
60 41 59 57
82 65
,.53. :" 51 63
It is not possible to compare this data with the past for the reason that similar information was not collected at any
previous census. 6.8 Longevity in different area: Hav
ing regard to the normal expectancy of

84 AGE, SEX AND MARITAL STATUS
life in the Punjab and Bahawalpur State a life of 60 years can be considered as long. Statement 6-H shows by districts the proportions per mille of the persons who are 60 years and over.
The proportion of persons who are
a~ove the age of 70 years is 27 per mille in the Panjab and 24 in the Bahawalpur State while there were about 6,000 centenarians. The proportion of older people is highest in the· MinawaJi distric probably· for the reason that the dry climate of this area is conductive to
. - --longevity. rhe colony districts of Lyall-pur .and MuItan have also a fairly high proportion of old people due partly to their aridity and partly to the economic prosperity of the population. The lower figure in the case of 1 he Sheikhupura
district is probably due to waterlogging which causes malaria. I have not been able to discover why the Campbellpur district should have the lowest proportion of older people.
6.9 Main causes of death: In the
Punjab the deaths are recorded by the Public Health Department according to the classification shown in Statement 6-1 which also gives the numbers of deaths and tbe death rate per mi1le for the years 1948, 1949 and 1950.
- The Statement shows "fevers" as the chief cause of death. This is actually so though not necessarily to the extent shown by the figures as not infrequently deaths resulting from other diseases are ascribed to fevers due to the ignorance
STATEMENT 6-1. (Reference Paragraph 6.9)
Groups of causes of death-Punjab
Cholera
Smallpox
Plague
Fevers
Cause of death.
Dysentery and_Diarrhoea
Injuries
Respiratory diseases
All other causeS
Figures of death (in thousands)
Years
1950 1949
2,87 2,66
4 5
3 2
27 18
48 35
1948
2
7
2,76
7
2
16
34
Deatb rate per mille.
1-1950 Years
1949 1948
().Ql 0.)2
0,002 0.01 0.38
15,48 14.60 15.51
0.23 0.28 0.38
0.15 0.13 0.14
1.42 0.98 0.89
2.63 1.93 1.89

AGE, SEX AND MARITAL STATUS 85
"fthe persons preporting them. Amongst the fevers malaria takes the biggest toll. It usually occures in an epidemic form in the months of October, November and December particularly in the waterlogged areas and the low-lying tracts affected by floods. Since the partition deaths from pulmonary tuberculosis have increased particularly amongst the refugees as a result of unfavourable economic and other conditions. The Public Health Department is taking all possible measures to control diseases. It is regretted that similar information in respect of the Bahawalpur State is not available.
6.10 Marital condition by sexes in different age groups and by religion: The Marital condition of the population, that is, the numbers of the married, never married, widowed and divorced persons in the different age groups and by main religions is given district wise in Census Table No.4. Both in the Punjab and the Bahawalpur State the number of married person is 542 per mille. The proportion of married persons is 406 per mille in the Punjab and 412 in the Bahawalpur State. In the original 5 year sorting the proportion of married males or females is nil in the age groups, 0-4 and 5-9 and insignificant in the age group 10-14, showing that many early marriages are now uncommon in the Punjab and Bahawalpur State. A study of the detailed data indica tes that generally women marry between the ages of 15 and 19 and men between 20 and 24.
Statement 6-J shows for Muslims and Christians the comparative figures of
STATKMENT 6-J (1)
(Reference Paragraph 6.10).
Marital Status in the Census years 1931 & 1951.
[Total of the Age and sex Group is~ 100 (a)J
Age Group . l Widowed I Total 'Y~ars) .MarrIedl or ! ever t ~ i Divorced IMarried
i i ! ' !
-----
MUSLIMS 1931 (b)
Males
0- 9 1.0 0.0 1.0
10-39 46.1 3,9 50.0
40-59 75.1 19.3 94,3
60 & over 56.4 39.8 96.2
Females
0- 9 3.1 0.0 3.1
10-39 68.7 4.4 73.1
40-59 61.3 37.0 98.3
60 & over 27.2 71.7 98.8
MUSLlMS-1951
Males
0- 9 0.0 0.0 0.0
10-39 43.4 1.6 45.0
40-59 83.7 ' 12.2 95.9
Never Married
' - 99.0
"'50.0
5.7
3.8
96.9
26.9
t.7
f.2
tOo.o
. -55.0
4.1
'60 & over 65.5 .. 33.1 98.1' . ·;t.2
Females
0-9 0.0 0.0 0.0 100.0
10-39 51.2 1.6 52.8 47.2
40-59 80.2 17.4 97.5 2.5
60 & over 56.4 42.5 99.0 1.0
(a) Totals may slightly vary on accont of rounding.
(b) These percentages have been caloulated from the flsures for Muslim. of the Undivided Punjab.

AGE, SEX AND MARITAL STATUS
STATEMENT 6-J. (2)
(Reference Paragraph 6.10)
Marital Status in the Census years 1931 & 1951
[Total of the Age and Sex Group is 100 (a)]
Age Group (Years)
il! Widowed Total I Married of ever I Nev,er
i Divorced Married I,Marned
G-- 9
10-39
40-59
60 & over
0-9
10-39
40-59
60 & over
0- 9
10-39
40-59
60 & over
0- 9
10-39
40-59
60 & over
I I CHRISTIANS 1931 (b)
Males
0.4 0.0 0.5
41.5 3.9 45.4
74.8 20,S 95,3
54.1 43.3 97.4
Females
1.1 0.0 1.1
63.4 3.1 66.5
65,6 31.4 97,0
28,3 69.5 97.8
CHRISTIANS 1951
Males
0.0 0,0
42.7, 1.3 440
815.2 Il2 97.4
68.0 31.8 99,8
Females
0.0 0.0
40.8 0.9 41,7
83.8 12.8 966
58.3 40.8 99.1
99.5
54.6
4.7
2,6
989
33.5
3.0
2.2
100.0
56,0
2.6
0.2
100.0
58.3
3.3
0.9
.:a) Totals may slightly vary on account of rounding,
(0) These percentages have been calculated from the figures for Christian of the Undivided Punjab,
married, never married, and widowed divorced persons in the various age groups separately for males and females
for the 1931 and 195 t Censuses.
The proportion of married persons in the age groups 10-39 is now reduced in both the Muslim and Christian communities which would seem to indicate a general raising of the age of marriage.
It is noticeable lhat child marriage has disappeared in the 0-9 age group. The proportions of widowed persons in both
sexes show a sharp decline in all the age
groups.

AGE, SEX AND MARITAL STATUS 81
SUBSIDIARY TABLE-I
General Proportion of the sexes by districts since 1901.
Number of Males per 1,000 females.
Province Census Year. State
Divisions Districts 1951 1941 1931 1921 1911 1901
pUNJAB & BAHAWALPUR STATE. 1,152 1,190 1,160 1,198 1,218 1,155
Punjab 1,149 1,189 1,155 1,19B 1.218 1,151
Lahore Division 1,177 1,237 1,266 1,271 1,290 1,178
Gujranwala 1,230 1,279 1,247 1,269 1,259 1,165 Lahore 1,213 1.329 1,360 1,331 1,355 1,233 Sheikhupura 1,152 1,188 1,230 1,272 1,284 1,255 Sialkot 1,153 1,172 1,215 1,192 1,239 1,104
Multan Division 1,151 1,190 1,208 1,197 1,220 1,181
Dera Ghazi Khan 1,185 1,224 1,220 1,221 1,203 1,197 Jhang 1,165 1,169 1,151 1,152 1,165 1,131 Lyallpur 1,131 1,168 1,212 1,257 1,310 1,360 Montgomery 1,146 1,188 1,235 1,235 1,213 1,178 Multan 1,152 1,211 1,221 1,213 1,202 1,206 Muzaifargarh 1,163 1,193 1,185 1,188 1,181 1,183
Rawalpindi Division 1,121 1,135 1,149 1,134 1,153 1,11
Compbellpur 1,091 1.117 1,109 1,072 1,109 1.092 Gujrat 1,134 1,144 1,175 1,138 1,171 1,092 Jhelum 1,058 1,063 1.094 1.025 1,106 1,019
. Mianwali 1,114 1,103 1,105 1,129 I,H4 1,096 Rawalpindi 1,153 1,181 1,175 1,209 1,179 1;159 Shahpur 1,146 1,113 1,186 1,196 1,205 1,076
. B4bawalpur State l.189 1,221 1,241 1,225 1,228 1,218
Bahawalpur 1,1741
Rahimyarkhan 1,209 ( Seperate data not available.

Chapter 7
Literacy and Education
STATISTICAL DATA
Table SA-Literacy
SA-Languages of Literacy
9-Pupils and Students
9A-Years of Education
9B-Education Levels
19B-Educational Levels of Muhajirs
7.1 Definitions and their interpretations: For the purposes of this Census the term 'Literacy' was defined to mean a person who could read clear print intelligently, and the term 'able to write' meant persons who were able to write a simple and easy letter. Persons who are able to write a language were to be presumed to be able also to read it. The Enumerators had· been instructed to explain these standards to the respondents carefully to avoid any misunderstanding.
Anyone professing to be a literate person, in reply to Census Question No.8, had to be asked further questions regarding the details of his education
and from the data so secured it has been
possible to obtain the figures of persons still receiving education; the amount of education received by each person, whether still receiving education or not; and the number of persons who have achieved certain definite standards of education. The various categories of the standards of education about which information has been obtained are (1) 'Completed Primary School' namely persons who have reached the top Primary standard; (2) 'Passed Middle School Examination' both English and Vernacular; (3) 'Matriculation' meaning the last High School examination prior to joining College or University; (4) 'University Degree meaning the first Degree such as B.A.,B. Sc., M.B.B.S.,B.E., etc; and (5) 'Higher'
( 88 )

LITERACY AND EDUCATION 89
Degree' meaning M.A.M.Sc·.,M·D., etc. It may be mentioned that there are certain examination in classical and pakistan languages known as Maulvi Fazil, Munshi FaziJ and Adib Fazil for which diplomas are awarded by the Punjab University. An eleventh-hour attempt was made to secure the data in respect of such diploma holders separately, but in the short time then left for
. the enumeration it was not possible to make the necessary arrangements for a separate record and as a result the persons possessing these diplomas are included in one or other of the foregoing categories.
7.2 Ability to Read: The number of 'persons, who declared themselves as liter'lite at the 1951 Census is 34,04,222 (20,82, ·°310 males and 13,21,912 females) in the ;'PUhja band 2,58,887. (1,49,284 males and 1;-09,603 females) in the Bahawalpur State. As a child below the age of 5 year$ normally cannot read, the children of the age group of 0-4 years have not been taken into account in wroking out the proportions of literate persons shown in Statement 7. A.
STATEMENT 7·A
(Reference Paragraph 7.2) Proportions of Literate persons to total
popUlation aged five years and above
Province and State
I
Literate per mille
Total/ Male I Female
---------------------Punjab
Babawalpur State
209 238 176
166 177 154
For fuller details the Reader may refer to Table 8-Literacy published in Part II of this Report.
7.3 Ability to read the Holy Quran: The per~ons who are able to read the Holy Quran number 21,35,694 in the Punjab and ],64,428 in the Bahawalpur State giving 134 and 106 persons per mille, respectively, of the total popUlation of Muslims aged 5 years and above . The figures for each district, city and selected town are given in Table 8ALanguages of Literacy. They show that the persons who can read the Holy Quran are evenly distributed.
7.4 Literacy Percentages Comparison with past Censuses: Statement 7.B gives for each district in the Punjab and BahawaJpur State the proportions of literates per mille at the 1921, 193 I and 1951 Censuses. The information for the 1941 Census is not available.
It will be seen that in the Punjab the proportion of literates of all religions rose from 39 per mille in 1921 to 54 per mille in 1931. The proportion of literates amongst Muslims and Christian in 1931 was 30 and 70 per mille of their population, respectively.
During the 1941 Census sorting and tabulation was done on two per cent
sampling basis according to which the proportion of Muslim and Christian literates for the undivided Punjab was 70 and 78 per mille.
In the 1951 Census the proportion of

LITERACY AND EDUCATION
STATEMENT 7-B
(Reference Paragraph 7-4)
Proportions of Literacy: Comparison with
Past Censuses
District
Punjab & Bahawalpur State
Punjab
Labore Division
Gujranwala
Lahore
Sheikhupura
Sialkote
Multan Division
Dara Ghazi Khan
Jhang
Lyallpur
Montgomery
Multan
Muzaifargarh
Rawalpindi Division
Campbellpur
Gujrat
Jhelum
Mianwali
Rawalpindi
Shahpur
Babawalpur State
Bahawalpur
Rahimyarkhan
I Number of li;;;-I per mille
1192~ 1_1931 119-;~ 37 52 178
39 54 181
46 63 240
40 54 248
67 96 248
28 39 190
34 40 257
29 44 174
33 31 120
37 46 153
32 56 194
31 40 170
38 49 186
30 31 162
42 57 131
32 39 101
35 48 111
47 63 176
28 38 97
74 96 215
35 55 95
16 22 142
Not available 177
Not available 102
literates to the total population works out to 181 for all religions in the Punjab and 183 for Muslims and 85 for other religions mostly Christians. Excluding, however, the tiguers of children under 12 years of age the proportions per mille work out to 221 for Muslims and 98 for other religions, mostly Christians.
The propottion of literacy per mille in the Bahawalpur State rose from 16 in 1921 to 22 in 1931. The proportion of Muslims was 14 only while tha~ of the Christians was negligible. In the 1951 Census the proportion of literates in the Bahawalpur State was 142 per mille for all religions and 143 for Muslims and 13 for other religions mostly Christians. Excluding the figures of children under 12 years of age the proportions per mille work out to 191 for Muslims and 9 for other religions mostly Chris
!ians.
Further details will be found in Section 2 of Table 8- Literacy published in Part II of the Report.
While the measures taken by Government to fight illiteracy account for the increase both in the absolute figures and the proportions, the higher ratio is due also to the cbange in the definition of the term 'Literacy' which for this Census meant 'a person who was able to read a clear print, as against 'a person who could both read and write' previously.
Secondly there is amongst the persons now classed as "Literate" a proportion of people whose only claim to literacy is the ability to read the Holy Quran in

LJtERACY AND EDUOATION- 91
Arabic. Since the totals of the readers of eacb language have been added separately, it is not possible to say exactly how lar] this class is. However, Table 8-A hows that the total number of persons ho claimed to be able to read the HoI Quran was about 23 lakhs while the number claiming to read Urdu (including those who can write it) is over 17 'Iakhs. It would therefore seem that tbe pllrsons who can read nothing except the Holy Quran cannot exceed 6 lakhs., This excess would include persons who can read some other language but not Urdu. These are fairly numerous aiid reduce the class of people who can read nothing but the Holy Quran.
The increase in literacy since 1931 cau be seen by a comparison of the person who can read and write Urdu, since this is now the chief language of literacy io)he Punjab. In 1931,3 lakhs and 84 thousand Muslims in the whole undivided Punjab (excluding States) could read alid write Urdu. This was 3.44 per cent 0'" the total Muslim population over 5 yC)ars of age. In 1951 when the population is 97.7 per cent Muslim, Urdu can be read and written by 15 lakhs and 14 thousand ,persons in the Punjab (pakistan). This is 9.7 per cent of the population over 5 years of age and represents an increase in full literancy of over 250 per cent in twenty years, The increase in the literacy percentage of Muslims in the Punjab from 30 per mille in 1931 to ,"" 183 per mille in 1951 would appear therefore to be due to a real advance in full (read and write) literacy accounting for about half the increase and to the change
in definition (inclusion or persons who can only read) which roughly accounts for the other half.
Statem\!nt 7-C gives the number of ' literates per mill' in the cities and selected towns of the Punjab and Bahawalpur State for the 1921, 1931 and 1951 censuses. It will be seen that the ratio of literacy in these urban areas is much higher than that of general literacy shown in Statement 7.B.
STATEMENT 7-C
(Reference Paragraph 7.4)
Proportion of Literates in cities and selected town
City or selected town.
Lahore
Sialkot
Multan
Rawalpindi
Gujranwala
Lyallpur
Jhang Maglliana ...
Sargodah
Bahawalpur
Literates per mille
1921
191
161
78
165
1931
235
119
128
231
Not available
Not available
Not' aVAilable'
Not available
Not available
1951
362
434
361
346
364
309
212
128
380
7.S Distribution of Literacy: By localities by religion & by sex. Cens u::> Table NO.8-Literacy gives, for all districts, cities and selected towns in the Punjab and Bahawalpur State, the total number of literate permos, with the figures of females in italic~, and shows the percentage of liceracy for the total population and

LITERACY AND EDUCATION
far each sex. In point of absolute figures
the Lahore district with 470 thousand literate persons ranks first but in terms of percentage it occupies the third place.
The proportion of literate persons to the total population in the Sialkot and
Gujranwala districts is 25.7 and 24.85 per cent as against 24.83 per cent in the Lahore district. Statement 7·D ranks
the various districts of the Punjab and Bahawa)pur State in the order of their
proportion of literacy and also shows the proportions of literate females.
It will be seen tbat the figures of lite
racy are highest in the districts of Sialkot, GujranwaIa, Lahore, Lyall pur, Rawalpindi, MuItan and Sheikhupura. The facilites for education as also the scope for employment of educated per
sons are admittedly better in urban than in rural areas and hence the higher percentage in the case of the first six districts which have the six cities bearing the same names. The proximity of Lahore, in the case of Sheikhupura district serves
as an incentive towards education. The districts of Shah pur, Mianwali, Cambell pur, Gujrat, Dera Ghazi Khan
in the Punjab and Rabimyarkhan in the Bahawalpur State, which do not contain any large urban areas, are backward in literacy. The overall literacy in the Rawalpindi Division is adversely affected by the conservative nature of its population particularly in regard to female education.
7.6, Level of Education: The stan
dards to which the literate persons claim to have progressed in Educational Institutions are shown in Table 8B-Educa-
STATEMENT 7-D'
(Reference Paragraph 7.5)
District in the order of Literacy
Sialkot
Gujranwala
Lahore
25.7 :178 24.5 2 167
24.8 2 260 25.4 123
24.8 3 470 23.5 3 201
Rawalpindi 21.5 4 188 6.5 13 26
LyaUpur 19.4 5 417 20.8 4 210
Sheikhupura 19.0 6 175 19.1 5 82
Multan 18.6 7 392 17.6 6 172
Bahawalpur 17.7 8 172 16.7 7 74
Jhell1m 17.6 9 119 4.9 14 16
Montgomery 17.0 10 309 16.5 8 139
Muzaffargarh 16.2 11 122 14.2 10 49
Jhang 15.3 12 134 15.3 9 62
Dera Ghazi Khan 12.0 13 75 10.0 11 31
Gujrat
Rahiroyar Khan
Cambellpur
Mianwali
Shahpur
11.1 14 128 2.7 15 14
10.2 15 87 9.1 12 35
10.1 16 73 2.0 17 7
9.7 17 53 1.8 18 5
9.S 18 110 2.7 16 15
tional Levels. Similar information in respect of Muhajirs separately is given in Table 19-B. A reference to these tables,
published in Part II of this Report, will show that the cities and selected towns have a comparatively large number of persons with high educational attainments. Statement 7 - E indicates the

LI1'ERACY ANJ) EDUCATION
STATEMENT '-E.
(Reference Paragraph 7.6.)
Educational Levels: (a) Total number of Literate Persons= 100 per cent.
I Number OOO's. Percentages. (a) 1 ________ . _____ _
/
1 Primary! Middle IIMatricu- ID I Primary II Middle IIMatricu-1 Areas
School. i School. I lation. i egree.! School. School. I lation·IDegree.
Punjab 8,77 3,97
Lahore DivisioD. 2,89 1,64
Multan Division. 3,27 1,36
R~walpindi Divi- 2,62 97 Slon.
Bahawalpur State. 59 23
number and proportions of the persons who have passed the various standards of education giving figures for the administrative divisions in the case of the Punjab, and as a whole for the Bahawal
pur State.
It will be seen that the proportion of persons who b,ave not gone above the Primary School is very high, particularly in the Rawalpindi Division. The percentage of persons whose studies finished after the Middle School examination is
also fairly high all over the Punjab and Bahawalpur State. The proportions decline still further in the higher educationallevels so much so that the percentage of literates who have obtained dagreee is only one.
Statement 7-F shows the totals of literates persons and literate Muhajirs in the Punjab and Bahawalpur State, as also the percentage of the latter to
1,52 34 26 12 4 1
74 15 23 13 6
39 9 23 9 3
39 II 39 14 6 2
7 1 23 9 3 .3
total literates and total population It. is interesting to note that in almost all cases the proportion of Ii terate Muhajrs exceeds their relative ratio in the total population.
Figure 7.1 illustrates the distribution of literacy and Levels of Education in
each district of the Punjab and Bhawal. pur State as also in the cities and selected towns based on the aggregate of their combined data. It is evident that ,the extent of literacy and standard of educational levels is much higher in these urban areas.
The persons who have received full time education number 23,97 thousands in the Punjab and 2,17 thousands in the
Bahawalpur State. Statement 7·G shows their proportion to the total literates. The difference is due to those who have acquired literacy at their homes or elsewher without any formal education.

LiTERACY AND EDUCATiON
STATEMENT 7·F.·
(Reference Paragraph 7.6.)
Literacy of Mubajirs: Comparison to total Population.
Literates in thousands Percentage of Muhajirs (0 total.
District
Total Muhajirs Literates I ~~Iation I
PUNJAB 34,04 11.04 32 26
Gujranwala 2,60 90 35 29
Lahore 4,70 1,98 42 39
Sheikhupura 1,75 71 41 34
Sialkot 3,78 83 22 25
Dera Ghazi Khan ". 75 7 9 6
Jhang 1.34 28 21 16
Lya}lpur 4,17 2,14 51 46
Montgomery 3,09 1,56 50 39
Mullan 3,92 1,35 34 31
Muzaffargarh 1,22 18 14 10
Campbellpur 73 8 11 5
Gujrat 1,28 17 13 12
lhelum 1,19 12 10 8
MianwaIi 53 7 14 8
Ra~pindi ... 1,88 40 21 l~
Shahpur 1,10 22 20 18
BAHAWALPUR STATE 2,59 72 28 20
Bahawalpur 1,72 60 35 31
Rahimyarkhan 87 12 14 9
7.7 Progress of Literacy:- During the 8.284 Primary Schools including 2,196 last decade there has been a noticeable Schools for girls with the total number of advance to fight illiteracy in the younger students on rolls at 743 thousand boys generation, and 206 thousand girls of whom 347
In 1941, the undivided Punjab and thousands were Muslim boys and 66

8 ') ~
Z o ;:; <
i ~
... 0
'" oJ ~
'"
LITERACY AND'EDUCATION 9S
lit'!racy &. Edt;<:;Hinn Percentages
'" ..: c ..
i5 ~ f IX ::> z II. ... II. 0: ::> % ..: ex ..J
_. % a: o· ..J l l!O " '> 'Z « ... !:i :::J ..: ~ :i(
~ " \:. _, .. ::Ii
z ~ ~C 'Z .~
>- ~ IX
'" 1¥5 ...
i!'! ::> ::r 0-«: « ::> "" '" N ; ~
ex ~ ~ ",lOt:: ::E ~ «
0 s: % !;;: ::> ~ ~5ff "- I,!) ::> I,!)
.. II.
~ co ~ < z .... .« a: 0. ~ ~
« 5~~ N « w IX 3 ~ i :l 0 ::>. :r :J: w i :r ...
:E '£ ..., ..., c ., V> cr '" EDUCATIONAL LEVELS- WIDTH OF COLUMNS PROPORTIONATE TO roOf' lITERAl'E5.
.. •
IX IS 11 """ I" it:
M
a
.. ;
II
U 1-1
'I f . I I I I I . J L.J
UNIVERS1TY .. 1i!IiII MIDDLE 5.:><':,0 ......... ~ PR1~.RY SClIOOL. " .. kZ2li
MPJRICULAlION. l'§3 .. 0 FORIoIAI. SlJ.IlD!.Rt>.r..:::;t

96 LITERACY AND EDUCATION
STATEMENT 7-G
(Reference Paragraph 7-6.)
Comparison of Literacy with Education
Literate Sex Persons
(1000's)
~----_--
PUNJAB
Total Persons 3404
Females 1322
BAHAWALP_UR STATE
Total Persons
Females
259
110
Persons who have been to School (1000's)
2397
818
217
80
Percent of
Literates
70
62
84
73
thousands Muslim girls. In 1945-46 the
number of Muslim boys and girls attend
ing the Primary Schools was 410 thou
sands and 77 thousands respectively,
which worked out to 52 and 33 per cent
of the total enrolments in the Boys and
Girls Primary Schools in that ·year.
Due to communal disturbances and
mass movement of population in 1947
there was a certain amount of setback
and dislocation in the years 1946· 47 and
1947-48, but as will be seen from State
ment 7-H there has been a marked
progress and improvement since.
In additional there are some boys and
girls on rolls in the Primary Sections of
the Secondary Schools. Their numbers
in 1952-53 were 2,30 thousand boys and
41 thousand girls.
The Punjab Government have em
barked upon a Five-Year Plan for the
expansion of Vernacular Education
STATEMENT 7. H. (Reference Paragraph 7.7)
Progress in Primary Education-Punjab Literacy
No. of Schools Enrolment. (000'5)
Year
Boys Girls. Boys Girls.
---."--~ ~--~-
1948·49 4,767 1,161 314 61
1949·50 4,944 1,244 353 68
1950-51 5,657 1,444 501 82
1951·52 6,101 1,612 577 92
which envisages the opening of 1,200 new
Primary Schools in the quinquennuim
1949-54. A supplementary scheme for
starting 300 Primary Schools (200 for
Boys and 100 for Girls) each year in the
rural areas bas also been sanctioned.
Primary Education has been made free
and compulsory in 36 urban and 1,740
rural areas. In non-compulsory area~
too Primary Education is free and stre
nuous efforts are being made to extend this facility even to the remotest corners
of the Punjab. Apart from the increase
in numbers an attempt has also been
made to improve the quality of Primary
Education by raising its course from four
to five years. The syllabi of schools
have been completely revised and new
text books prescribed throughout the Punjab. In order to meet the ever increasing demand of trained staff the
number of institutions turning out trained teachers has been increased. There has also been an addition of over one
hundred Secondary Schools which now

LITERACY AND EDUCATION 97
stand at 1946 for Boys and 214 for Girls. An appreciable progress has been made in tbe sphere of higher education as well. The number of Colleges, which was 18 immediately after the partition, now stands at 30. Finally through an organilled compaign for Adult Education 234 thousand adults have secured Literacy
Certificates during the last decade.
The Bahawalpur State also has been constantly trying to fight illiteracy. The number of Primary Schools in the State· has increased from 280 for boys and 2 for girls in 1941 to 519 for boys and 17 for girls. The number of students at
tendmg these schools is 35 thousands. The number of Secondary Schools too bas risen from 24 in 1941 to 134. Compulsory education has been introduced in 33 centres during the last decade. Lastly the State Government has been
devoting attention to Adult Education
as welt
7.8 Pupils and Stuilents:-TabJe- 9.Pupils and Students published in Part U of
this Report giVes by districts the number of persons \,~ho were attending schools or colleges In the PU,nJii.b and Babawal;.; pur state" at the· time. of the Census. Quite natllrally the districts of Lahore, Sialkot, LyalJpur, Multan and Rawalpindi, which contain a large number of
'. schools and Q}Ueges mostly· because of
the. cities bearingthe same, names, have , returned a higher number of students. Lahore Division leads.ill the number as well as proportion of the male. and
fe~lc ,tudent$. The proJ)ortion~ ill the Multan ; and Rawalpindi Divisions as al,o in the Bahawalpur State are small
"~: ,., PUPILS & STUDENTS-LITERACY,
1100 I 7 100
8 , I 7
.., 600
~. <II
~ 500
II IQ ~ :;, ,/ , , Z 400
1'S o z
300
200
100
ll1ERA7
,
" / ,
, " -7-~~$" S111M""
~ V
It&t tnl IU' In, CENSUS YEARS
NOlt,-(Litetacy) Data f!lr 1941 ~u'eulalcd proportionately a~ .table snow! 1/50 sample for the un. dIVIded Punjab ,_
(Pupils & Data for 1921, 1931 & 1941 ntracted Students) from the retur!!, of education deparc,
ment by culculating proportionately for the PunJab-Paktstan._
otrk~ 0( the Cen,us ,,,,,,,,,,'nlMltr. Kar~
because of the backwardness of the rural popUlation particularly in female education. Most of the rural people being poor and illiterate, are still obli vious to
the benefits of education and their outrook i~ confined almost entirely to their own surroundings and daily routine of life. But little by little through the efforts of the Education Department and otherwise, the old conservation and prejudices are dying out and it is hoped there will be a considerable improvement in the next few years. Figure 7.2 illustrates the rate of growth in education with the rise in literacy.
~. Figme 1.3 shows. the proportion of the total population of each of the main reli~ious groups which is attending the

98
20
Vl 0..
LITERACY AND EDUCATION
At11·'
Persons Attending School or College ~' PUNJAB BAHAWALPUR & SELECTED DISTRICTS
RAWA\.PtHDI OfSTRICT
g15+---------------------------------~'~----------~
o C/)
::l 9 o :::i w ~ 10+---------Z
z o i= .( ...l ;:) c..
2 5 u.. o f-< Z III U ct: IJJ 0..
UMUSLIMSl2ZaCASTEM\"'OUS~ S\4t CAS'TtS ~OTHER REUGtAHS .
/'IOTE -NO SlM1LAR DATA FOR CENSUS YEAR 193>1 AVAILABLE.
OW« 0( tltt CeinU$ CtlIflll'HIOiItt. ncr~
schools and colleges. The chart shows the overall percentages for the Punjab
and Bahawalpur State, and for comparison the figures for the districts of Lahore,
Rawalpindi and Lyallpur and the City
of Lahore have been extracted frQm th~
compilation sheets and shown seperatety. The preponderance of the Muslims in the overall percentages is due to their
overwhelming population, . which is mo're than 97 per cent in the Punjab and 'about
99 per cent in the 14abawalput State.

Chapter 8
Languages
STATISTICAL DATA
Table 7-Mother Tongues
7A-Speech
8;\-Lauguages of Ut~ra.cy
9B-Educationai Levels
8.1 Introductory.-For the purposes of this Census the word" Mother Ton
gue " was defined as the language spoken
from the cradle. In order to collect the n~essary data regarding Mother Tongues
the Census Slip was provided with sepa
rate columns for Arabic, Urdu, Bengali. English, Persian Pushto, Punjabi, Sindhi,
Baluchi and a tenth blank column in which any other language stated by the
r,espond~nt to be his mother tongue Wa~
to be recorded. According to Census Questions Nos. 6 and 7 the enumerator had to ascertain from every respondent the name of his mother tongue and tbat of eve~y other language, which he could commpnly speak and to place tick marks
in the appropriate columns on the Slip. Census Question No.8, was inserted to obt;;tin information regarding the languages w.hich a person eQuId read and write
99
or read only including the Holy Quran, The information so collected has been compiled in the first three tables mentioned above, which are published in Part II of this Report.
8.2 Clasification of Languages.-For Comparison with past statilltics, tbe various languages have been clasified in
a simple list which corresponds roughly
with the philological divisioll of Sir George Grierson's "Linguistic Survey
of India ". The main heads of classification used in Table 7 -Mother Tongue
belong to the Dravidian, Indo-Europeon
Semitic or Tibeto·Chinese Families. The classifications Jist, inter alia shows
the names and groups of tongues mentioned on the Census Slip for which the
figures had to be compiled and also
indicates how the lauguages entered in

100 LANGUAGE
the tenth column should be classified. In actual compilation the slips which showed a listed dialect were included in the main language with which the dialect is associated ; for example in the course of tabulation the figures of " Multani" dialect have been included under the
main head' Punjabi '.
8.3. Mother Tongues Distribution by Districts.-Table 7-Mother Tongues. published in Part II of this Report. gives the figures pertaining to the languages claimed as mother tongues in the punjab and Bahawalpur State and their districtwise breakdown. It will be seen that the bulk of the population. namely ],77,32,814 in the Punjab and 17.65,240 in the Bahawalpur State, has declared punjabi as the mother tongue. In other words out of every ],000 persons, 942 in the Punjab and 969 in the Bahawalpur State have Punjabi as their mother tongue. Next comes Urdu with 10,28,146 and 46.130 persons in the punjab and Bahawalpur State, i.e., 55 and 25 per mille, respectivety, These two languages taken together account for 99.7 and 99.4 per cent of the population in the punjab and Bahawalpur State.
Sections 2 to 5 of Table 7-Mother Tongues give the districtwise data of mother tongues for the Punjab and Bahawalpur State. Statement 8-A. shows the proportion of Punjabi and Urdu to
the total population in each district.
Other languages worthy of note are Pushtu and Sindhi, declared as mother tongue by 44,141 and 9,280 persons, respectively. Persons having· Pushtu as
STATEMENT 8-A
(Reference Paragraph 8-3)
Proportion of Punjabi and Urdu languages as declared as Mother Tongue to
Total Population 1951 Census.
District
Punjab
Gujranwala
Lahore
Name of per- Proportion per SODS ",hose mille or Total
Mot~er tODgu~ population IS :-
Punjabi \-U d p~b'l-d ,(OOO'S) . r u uDJa I )r u
177,33 10,28 942 55
10,22 24 976 23
17,24 1,66 910 88
Sheikhupura 9,05 17 980 18
Sialkot 14,30 31 970 28
Dera Ghazi Khan 5,92 33 943 53
Jhang 8,57 17 978 19
Lyallpur 21,10 42 980 20
Montgomery 17,71 43 975 24
Multan 17,02 4,00 808 190
Muzaffargarh 6,90 61 912 81
CampbeUpur 7,05 5 975 7
Gujrat 11,16 41 964 35
Jhelum 6,64 14 978 21
Mianwali 5,29 18 962 33
Rawalpindi
Sbahpur
Bahawalpur State
Bahawalpur
Rahimyarkhan
830 35
10,88 72
17,65 46
935 33
830 13
949 40
937 62
968 2S
964 34
974 15
their mother tongue are mainly distributed over the districts of Lahore (4,424), Sialkot (3,487), Mullan (3,952), Montgomery (2,016), Campbellpur (10,917)

LANGUA.GES 101
Mianwali (2,752) and Rawalpindi (8,991) while out of the 9,280 persons claiming
Sindhi as their mother tongue as many
as 8,660 were enumerated in the Rahimyar Khan district which adjoins the Sind Province. The proportion of the remaining languages is insignificant.
8.4 Proportion of Languages understood in each district, cities and select
ed towns. Section 1 of Table 7 A-Speech, p.ublished in Part II of this Report gives for each district, city and selected town th!' number _ of persons who commonly speak and uqderstand the nine l~nguages printed on the Census Slip while Section 2,shows the percentage of each language
to. the total population. In the Punjab
96 per cent persons speak Punjabi; 16 per cent speak Urdu and 3 per cent speak English. In the Bahawalpur State their percentages are 97,13 and 3, respectively.
The proportion of the persons who can speak the remaining languages, namely
Arabic, Baluchi, Bengali, Persian, Pushtu and Sindhi is negligible. It may be added
that the Partition of India in 1947 has not disturbed the pas t supremacy of Punjabi in the Punjab and Bahawalpur Sate for the reason that the mother tongue of a vast majority of the Mubajirs, and that of the non-Muslims. who migrated to India, was Punjabi.
Taking the districts individually. the number of Punjabi speaking persons is
STAlEMENT S-B (Reference Paragraph 8-5)
Languages used as Medium of Instmction.
s Hon over 4 years old Area -.,...---.--
Number in ~OO Ipropor~ion per Mille of popula-
____________ --'-_A_rabic !EDSliSh IperSian !urdU ~rabiC !EDSliSh I Persian !urdu
ABLE TO READ ONLY
PUnjab 60 4,56 1,10 16,21 4 28 7 99
Lahore Division 31 2,22 42 6,42 7 48 9 139
Multan Division 13 1,33 33 5,52 2 18 4 76
-R.awalpindi Division 16 1,01 35 4,27 4 23 8 96
Bahawalpur State 26 6 1,07 17 4 69
ABLE TO READ & WRITE
Punjab 18 4,08 97 14,25 1 25 6 87
Lahore Division 8 2,02 37 5,47 2 44 8 119
Multan Division 5 1,19 28 5,04 16 4 68
Rawalpindi Division 5 87 32 3,74 20 7 84
Bahawalpllr State 22 5 89 15 3 57

aboQt 97 per cent of the total population
in almost all districts of the Punjab and
Bahawalpur State except in the Multan, Mzaffargharh and Dera Ghazi Khan
districts they are 81,92 and 95 per cent
respectively. In Urdu the ditricts of Lahore (26), Multan (31), Muzaffargarh
(26) and Sialkot (19) show a higher ratio
than the Provincial percentage of 16. On the other hand the districts of Guj rat,
Campb~lIpur, Jhang, Mianwali and Ihelum show .low percentage ranging between .7 and 10. , English speaking
peoon~ .m. the.· Lahore district are 7 per
cent, that is, more than double the provincial percentage of 3 while in the districts of Mianwali and Montgomery their'number is less than one per cent. Almost all the cities have a fairly large
number of English and Urdu speaking persons, The percentage of the former in Lahore and Sialkot cities ,and Sargodha town is about 13. The percentage
of UrfIu speaking persons ranges between 32 and 43 in the cities of Lahore, Sialkot, Multan and Rawalpindi while at
Sargodha town it is as high as 64 per
cent.
8.5 Languages used as Media of Instructions. Statement 8-b shows, by ad
mfuistrative Divisions in the 'case of the
Punjab and as a whole in the case of the Babawalpur State, the number of persons who are able to read and those who are able to read and write Arabic, English, PerSIan and Urdu, the four languages
used as the medium of instruction.
It will be seen that the Lahore
Division, largely due to the Lahore City,
has more than 40 per mille of tbe total persons who are able to read and write
one or other of these four languages. The percentage is lower in the remaining
two Divsions because of the backward
districts of Dera Ghazi Khan, Muzaffar-. garh, Jhang, Mianwali and Campbellpur
which have comparatively a smaller number of person!, who know any of the four languages. Out of the two' districts of the Bahawalpur State the Rahimyar Khan district is more ba~k" ward in this respect .. The use of BaInchi, .
Bengali, Pushtu and Sindhi· -languages as· the media of instructiG!lfl in tbe "PunjaS; and Bahawalpur State is too insignificant to be discussed here. For further details the Reader may refer to Table 8A-Langu~ . ages of Literacy published in Part II of the Report.
Figure 8.1 illustrates for (1) the Pun
jab and Bahawalpur State, (2) the districts of Lahore, Multan. and Sialkot
and (3) the cities of Lahore, LyaUpur and Rawalpindi, the percentages of population in respect of those able to speak and those able to read Urdu and English.
8.6 Proportion of the populatiQll ;aWe
to read the languages of Jocal.anll Natio.Dal Press;-Slaltment 8-C shuws the number
of newspapers and periodicals published
in the Punjab at the time Of this Census and in 1931. Tne figures for the larter
have had to be given for the whole of undivided Punjab because it has not been
possible to separate them according to
the existing territories of the Punjab
(Pakistan) and the P"njab (India).

LANGUAGES ·103
FIG 8·1 I '''{''Un 10 UNDERSTAND/READ
URDV AND/OR ENGLISH I Districts Cilie~ I ...
t«f .§. 4J
.0 .... -~ c: ~
::; !I !.~~ !'! -0 C-" 'HI) 0 -" ~ OJ ?l: • . ".<: .s:: ;; .. g.~ ....
~ ~ >- .... >-I v.i t-l ~
" URDU
0
.• 0
f'"
z
L..
..
ENGLlSl-I
20 r=::J UNDERSTAND.
~READ Office of cite CetlSUJ CO'MtI.,.OtItl KO'D'"
It is apparent that Urdu has been and still is the most popular medium of circulation of news. The chief language
of the radio broadcasts from Lahore and
STATEMENT S-C
(Reference Paragraph 8.6)
Number of Newspapers and Periodicals in the Punjab
1951 332 1931 579
47 81
Urdu
285 375
Gurmukhi & Hindi & mixed languages
122
Rawalpindi is also Urdu. As will be
seen from Table 8A-Languages of
Literacy the number of persons who can
read Urdu and English is 16,21,279 and
4,56,102 giving a percentage of about
9 and 2 respectively. The number of books printed in Urdu and English during the last decade is 5,835 and
1,681.
With the rise in literacy there is a
noticeable increase in the interest in reading newspapers. There are three
news agencies functioning at Lahore,
namely, the Associated Press of Pakistan, which acts as representative for the
Reuters and the Associated Press of America; the United Press of Pakistan, which supplies the news of Pakistan; and
the Star News Agency, which collects news in Pakistan mainly for the Middle East and South Asian countries and feeds the papers in Pakistan with news from those countries.
8.7 Correlation of languages with Levels of Education:-A reference to Table
9B-Educational Levels published in Part II of this Report will show that there are
in all 36,63 thousand literates in the

104 LANGUAGES
Punjab and Bahawalpur State including 8,50 thousand children below the age of 12 years. The various standards of literacy attained by them are shown in Statement 8-0.
STATEMENT S-D (Reference Paragraph 8.7)
Grades of Education-Punjab and Babawalpur State
In thousands
Grade. r I ~~ ______ --,-T_o_ta_l.L_i _Male Female
Degree & Higber Degree 35 30 5
Matriculation 1,60 1,27 33
Middle School 4,20 3,08 1,12
Primary School 9,37 7,07 2,30
Without formal attain- 21,11 10,59 10,52 ments.
Persons without any formal educational attainment comprise; firstly the
children numbering about 5,16 thousands (4,03 thousand males and 1,13 thousand females) reading in the lower classes of the Primary Schools; secondly, (and to no less extent) thl! persons who can read the Holy Quran only; and thirdly, those persons, though cOIllparatively small in number, who have attained literacy by private study. In the second category there are a number of persons who can read the H01y Quran but do not know Urdu or any other language. This
accounts for the comparatively smaller number of persons who are shown as literates in Urdu and Punjabi in. Table
8A-Languages of Literacy. The number of persons with Middle School and higher educational attainments is 6,15 thousands as against 4,30 thousands who are able to read and write English. The latter are less because English is not .one of the subjects taught in the Vernacular Middle Schools in rural areas.

Chapter 9
Economic Activities
STATISTICAL DATA
Table I I-Labour Force. I I-A -Occupations of Non-Agricultural Labour Force. I I-B I-Occupations of Agricultural Labour Force.
r r-B 2-Subsidiary Occupations of Agricultural Labottr Force. 12-EconomicGroups and Industrial Status of Non-Agricul
tural Civilian Labour Force. 13-Economic Groups and occupations of Civilian Labour
Force. l-l-Agricultural Labour Force. l5-Landowners.
19-B-Economic Groups and Occupationsof Muhajirs.
9.1 Census Questions and their interpretation.-In the previous Censuses of the Indo-Pakistan Sub-continent the in
formation regarding Occupations used to be collected in a single conception cailed "Means of Livelihood" and tabulated under economic groups with certain
occupational sub-divisions- For the first time at this Census an attempt has been made to distinguish between "Occupation i.e., the kind of work done, and,
"Economic Group" i.e., the business, service, etc., in which that occupation is
pursued. In order to bring out this important distinction the Enumerators had been instructed to ask six question relating to the economic activities of the respondents. But before doing SO they
lOS
had to discover, by asking an eliminating
question, whether the respondents were self-supporting, which meant persons who supported themselves from their own income, salary or wages either in money
or kind, or were seeking to do so. It may be mentioned that children under
12 t~E~~:r! .. !!!1_t2.~~~~~~2 ~sl' ,g_~ .. tions. The six questions are given -below:-
Question 11 A-'What is usually your main pccupation?" The occupation for which the respondent was trained or skilled had to be described in the space provided on the Census Slip for the purpose.
Question 11 B -"Have you any SUbsidiary means of livelihood; if so, What '/" The secondary source of income, it any,

106 ECONOMIC ACTIVITIES
in the whole or part of the preceding ycar whether or not the main Occupation could be followed was to be written in reply to this question. ' A further special question "Do you receive rent in cash or kind for land you own but which is tilled by others" was to be asked and its reply recorded in Column 14 of the Census Slip.
Question 12-"What was your actual main occupation in January 19511" Where the respondent declared that he did no work at all during the month he was to be asked further questions whether he was seeking employment in that month and if so, in what occupation,
Question 13-"ln what kind of industry. business or service did you work in January 1" , The Economic GrouP. namely the actual kind of business, service. etc.. in which the respondent had worked was to be recorded in consonance witb the Standard Industrial Classification, contained in Appendix F to the Code of Census Procedure, Part II.
QuestioI;l 14-This question Was meant for recording the agricultural
status of the tillers of tbe soil. The inforrrat'on obtained by it showed whether the respondent owned all Or any of the land he tilled; whether he paid rent in cash or kind for any of the land he tilled; or ,wr.ether he worked as a labour r for another person who tilled land.
Q U'-st ion IS-This question was intended to discover the industrial status of the respondents other than the tiller of the soil.
The Enumerator's Leaflet and Part II of the Code of Census Procedure con~ tained detailed instructions regarding the import of these questions. All possible steps were taken to secure complete and accurate data on these somewhat compli~
cated questions. But it must be stated that the questions proved to be beyond the capacity of many Enumerators and illiterate respondents and hence the information derived therefrom cannot be claimed to be cent per cent reliable.
9.2 Classification Code.-After reviewing the Classification of Occupations recommended by the International Labour Office of the United Nations the Classification Code of Occupations for the Civilian Labour Force was issued by the Census Commissioner as an annexure to Part II of the Code of Census Procedure, having regard to the special needs of Pakistan. The Code was divided. into nine Main Groups which contained suitable sub-groups and a list of occupations within each Main Group. It does not seem necessary to reproduce the Code here verbatim but in order to give the Reader an idea of the classification the Main Groups together wIth their brief description are shown in Statement 9-A.
STATEMENT 9-A.
Classification Code of Occupation.
-----~ .. ~-~---Main Group
1. Professional Technical and Related workers.
Brief description Of per~uns induded.
Persons practising skilled professions or techniques usuaJly requiring specialis~ ed knowledge and train ing and after requirin

2. Managerial. Administrative, Clerical and Related workers.
3. Sales workers.
4., Farmers, Fisher~ " men, Hunters,
. Lumbermen . and' , . ~~l~ted' workers.
5. Workers in Mine and Quarry and Related Occupations.
6. Workers in operat-. jng Transport Occupations.
7. Craftsmen Production process workerS and labourers not elsewhere classified.
8. Service workers
9. occupations unidentifiable or not reported.
ECONOMIC ACTIVITIES 101
the possession of University Degrees, Diplomas or Certificates.
Persons managing or directing all or a part of busine,s, office or administrative unit persons performing clerical or office work.
Persons engaged in selling commodities, property (both movable and immovable) or financial and commelcial ancillary services not elsewhere classified.
,Pers,ons engaged in the cultivation Of land (wheother landowners or not); persons engaged jn occupations connected with forestry; persons engaged in fishing or hunting for gainful purposes; persons eng" ged in animal stock raising and the production of animal product; and persons engaged in raising insects for gainful purposes.
Persons extracting coal or other minerals, including workers emplo'ed in haulage of minerals to the surface.
Persons operating vehicles, locomotives, aircrafts or river 01 sea-going ships.
Persons exercising craf(s or engaged in semiskilled or unskilled operations in production processes.
Persons engagzd in domestic or public personal service and in the protective service excluding the Defence Forces.
Persons in occupations not elsewhere classified; persons in unidentifiable occupations and those who do not reported heir occupations.
9. 3 Relationship of Occupations Economic Groups and Industrial Status,. For the purposes of this Census the analysing of the popUlation into Economic Groups means the break up of the respondents according to the part of Pakistan's agricultural, commercial, industrial or administrative economy in which they worked, or sought work in January 1951. For instance, a clerk may be employed in a bank, a factory or Government office. In·the ·E-conQmic Grouping he would be classified .under commercial, industrial or administrative ecotiomy~ respectively.:, Ta61e1 'f2"'Ec0nomic' GroupSand Industrial s'tatus' bftlie Non-Agricultural Civilian Labour Force published in Part II of this Report gives
the break-up of the Occupations followed by the self-supporting persons in the main Economic Divisions of the Punj!lb and Bahawalpur State. A reference to this Table will show that each E~onomic
Group comprises four categ )ries of in
dustrial stalus, viz., em;Jloyer, emJlvy~e.
independent worker and unpa.id family
helper. According to the instructions contained in Part II of the Code of
Census Procedure the proprietors of businesses or institutions were' to be re
turned as employers while all persons in any kind or service had to be classed as employees. The term 'independent worker' meant a person engaged in his own business or profession but employing nO paid help. The persons included in the
last category were those who had declared themselves as partly self-supporting because of their contribution to the work of the
family farm or business; although they

10$ ECONOMIC ACTIYITEIS
received no separate salary in cash or kind.
9.4 General distribution of Economic Grol;tping. The figures given in Cens~~ Table No. 11 for the Agricultural Lllb?,!r Force represents all persons whos~ usual main occupation was culHv~ti,QP plus all other persons who in ~~nuarf 19.51 were engaged in one of the EcoJlomic groups classed as "AgricultlYpJ~~ ill the Indu~ttjal Classific!ltipn Cp,de. . 0, ~y_.:
J! pt.der f~ ~jnk the reports r~g~rdjn~ ~IfJtiv~tor,s t9 their standing as ·regards Land-tenure, their slips were classified according to their usual main occupa tion, but all the other working people were classified according to their current activity during the month of January 1951 with a view to adopting the Labour Force conception of the working population. The non-Agricultural Labour Force as listed in Table II represents lherefore all economically active persons who wtif~ engaged in January 1951 in wQrJc. oth,cr tban Agricultural activities or the Ilefence ~ervices.
The persons returning themselves as workers in the Non-Agricultural Labour Force number 19,43 thousands in the Punjab and 1,39 thousands in the Bahawalpur S~ate of whom 71 per cent in the Punjab and 65 per cent in the Babawalpur State are independent workers. The rest are largely employees who account for a percentage of 29 in the Punjab and 34 in the Bahawalpur State. The figures of Employers and Unpaid Family Helpers fC insiinificant. The distribution of all
these four categories according to the Main Economic Groups in the Punjab and Bahawalpur State as a whole and also separately for the province and BahawaJpur State is given in Table 12. This table has been repeated for each of the districts, cities and selected towns in Volume 7 of Census Report which gives the detailed tables of economic characteristics for West Pakistan. Table 12 rohows inter alia that about 19 per cent persons of the Non-Agricultural Labour Force in the Punjab and 30 per c~n~ in the Bahawalpur Slate did not' Qeclar~ th~ir ·Economic Group in idenijfi~~l~! or classifiable terms. The persons, who have been returned as belonging to the Economic Divisions of Forestry, Fishery, Mining, Electricity, Water, Gas and Post and Telecommunications are negligible. The workers in tbe Building and Construction and Transport, Shipping and Port Services also are insignificant. The remaining Economic Divisions, namely, Manufacturing, Trade & Commerce and Services have a fairly large number of workers. Subsidiary Table I at the end of this Chapter shows for each district
of the Punjab and Bahawalpur State the
proportions of the persons who are
engaged in Manufacturing, Trade and
Commerce and Governmental, Municipal, or Domestic and Personal Services.
The percentages of persons included
in the Economic Division of Manufacturing are higher in the Gujranwala, Jhang, LyaUpur, Montgomery, Gujrat and
Jhelum districts. The Muzaffargarh district appears at the tail end as about

i;CONOMIC ACTIVITIES
50 per cent of the respondents there declared unidentifiable or uncJa~sified
Occupations. In the Economic Division of Trade and Commerce the Lahore district tops the list because of the City of Lahore which is the provincial headquarter and the chief commercial centre of the Punjab. Jhang, Muzaffargarh and Campbell pur are backward in this respect. The proportion of persons returned in the Service groups is higher in the Lahore, Sialkot and Rawalpindi districts as the headquarters of Government offices and chiefs business centres and situated th.ere.
9.5 Economic Divisions. Based on the answers to the questions mentioned in paragraph 9.1 supra the total population of the Punjab and Babawalpur State has been' classed into Agricultural Civilian Labour Force, Non-Agricultural Civilian Labour Force, Not in Civilian Labour Force and Dependents. As many as 130,40 thousand persons in the Punjab and 12,59 thousand in the Bahawalpur SIa.te are dependents including the children under 12 years, which works out to 69 per cent of the total population in both cases .
. The accui~cy of the: age data- has already been ~discussed in chapter .. The inconsistencies which were found were especially serious in the ages of 10 and 11 years. It being obvious that the number. had been overstated and included persons who were in fact older. The figures for children included in tbose fo~ the dependents in Census Table
No. ] 1 can therefore be assumed to err on the high side and hence those for the Labour Force to be a little too low. The figures for the towns seem more reliable, but in the rural parts of Lahore and Multan . Divisions (inaccuracy does not appears to be so serious in Rawalpindi Division) and in Bahawalpur State, tb~ male side of the Labour Force may be taken as probably some 3 per cent larger than is shown, aod the Dependents children are probably oversta.te<.l by a
.. '$i~iJarnumber (not of course by a'sil:riUar percentage).
The entire female population in tbe Punjab and Bahawalpur State e?tcept one per cent in the former has been returned as dependents. Amongst the males the proportion of dependents is 44 per cent in the Punjab and 43 per cent in the Bahawalpur State. Statement 9-B gives the numbers and percentages of the self. supporting persons in the Punjab and Bahawalpur State according to the main classifications.
Similar information in respect of .tP~ Muhajir population is given in Statement ·9-C In their case the proportion Qf. Q~:" pendenls ~.or~s out to 66 per Cy~t.j.!l.J~ punjab and 64 per cent in the Bahawalpur State. Amongst the male~' the ratiQ of dependents is 38 per cent in the Punjab and 34 per cent in the Bahawalpur State whi Ie the female dependents are over 98 per cent in the former and cent per cent in the latter.

ilo ECONOMIC Ac'i'iV/1'IES'
STATEMENT 9-B
Proportions of self supporting persons by Economic Divisions.
Economic Division. I Number (OOO's) I Percentage to total Population t --~'----------
I All persons I Males ! Females i AJl~ersOns 1_~~e~_L~ernale~ PUNJAB
Civilian Labour Force
Agricultural 36,66 35,64 1,02 19 35
,Non-Agricultural 19,43 19,06 37 10 19
Not in Civilian Labour , 1,65 1,62 4 2 " :Force. ~ .. , .. '. -: .'.. --_ Civilian Labour Force.
BAHAWALPUR. STATE
Agricultural 4,11 4,11 '" 23 42
Non-Agricultural 1,39 1,39 '" 8 14
Not in Civilian Labour 14 14 '" Force.
'" Negligible.
STATEMENT 9-C
Proportion by Economic Divisions of self supporting Muhajirs.
Economic Division.
Civilian Lab 0 u r Force.
Agricultural
Non-Agricultural ~ .. ,
Notin C i viii a n Labour Force.
,Civilian Lab 0 u r Force.
Agricultural
Non-Agricultural
Not in C i viI ian Labour Force.
I N~mber (000'8)
!Total MUhajir.j Males. Females.
10,42
5,93
43
80
51
2
PUNJAB.
10,11
5,86
43
31
7
• BAHAWALPUR STATE.
80
51
• •
: . ,.. i~egligible.
Total I Mubajirs. Males.
21
12
21
14
38
2.2
2
39
25
• •
•
.'
Females.
1
• •
'"
'.

ECONOMIC ACTIPITIES 111
'For fuller details the Reader may
refer to Tables II-Labour Force and J9-C
Mubajirs in the Labour Force published
in Part II of this Report.
9.6. Agriculture.-Agriculture has been and is still the predominant activity
of the people of the Punjab and Bahawalpur State. Of the total population 82
per cent persons ;n the Punjab and 89 per cent in the Bahawalpur State live in rural areas and are engaged directly or indirectly in agriculture and allied pur
suits. The Agricultural Labour Force f
excluding the dependents mentioned in the preceding paragraph represents 38 per cent of the total male population in the Punjab and 42 per cent in the BahawaJpur State. A vast majority of these, namely, 34,90 thousands in the Punjab
and 3,95, thousands in the Bahawalpur
State are cultivators. Statement 9-D shows the proportion of land owners,
tenants and landless labourers in all the districts of the Punjab and Bahawalpur
State.
It will be seen that more than 90 per cent of the population included in the
Agricultural Labour Force is covered by the aforesaid three classes, the rest being
engaged in miscellaneous occupations connected with agriculture, such as herdsmen. animal breeders, orchard and
nurserymen, malis (gardeners), dairy farmers, poultry keepers, Bee keepers,
silk-worm breeders and other agricultural workers. In all there are 1,17 thousand
herdsmen and animal breeders, who are
chiefly concentrated in the districts of Lahore, Lyallpur. Montgomery, Mo!tan
STATEMENT 9-D
Proportion of land owners, tenants and landless labourers in Agricultural
Labour Force.
District.
Percentages to Agricultural Labour Force of :-
Land I owners. Tenant. Landless. labourers.
--------~----~------~------
PUNJAB
Gujranwala ...
Lahore
Sheikhupura ..•
Sialkot
61
51
61
52
64
33
39
29
41
34
1
2
Dera Ghazi Khan 57 38
Jhang
LyallpUr
M:J:1t~o;nery
Multan
Muzaffargarh
Campbellpur
Gujrat
Jhelum
Mianwali
Rawalpindi ...
Shahpur
BAHAWALPUR STATE
Bahawalpur ...
Rahimyarkhan
and Shahpur.
70
52
55
44
59
62
84
88
75
88
57
57
57
58
25
39
36
50
35
36
15
10
21
10
31
37
36
38
5 .
1
The orchard and nurserymen number about 10 thousand
of whom 6 thousand are in the LyaUpur district and the rest are scattered in small
numbers in some districts of the Punjab

t.l2 ECONOMIC ACTJ'VlTIE$
and in the Rahiinyatkhan district of the Bahawalpur State. Eighteen thousand pe~sons have been returned as Malis chiefly in the districts of Lahore, Sialkot, Lyallpur and Shahpur while 16 thousand persons a~e dairy farmers or poultry keepers residing mostly in the Sheikhupura, .Montgomery and Shah pur districts. Of the five thousand pers.)ns who are Bee keepers, 2 thousands reside in the Shahpur district, and the rest in other districts of the Punjab. The number of silkworm breeders is very small. Lastly 21 thousand persons who are spread all over the Punjab and Bahawalpur State are shown to be engaged in other agricultural pursuits. For fuller details the Reader may refer to Tables ll-B Occupations of Agricultural Labour Force-Section 1 and 14-Agricultural Labour Force and Cultivators' Land Tenure published in Part II of this Repon •.
9.7. Subsidiary Occupations of Agricultural Labour Force. According to the data collected at this Census 1-94 thousand persons in the Punjab and 7 thousand in .. the Bahawalpur State have been returned as engaged in non ·agricul·· tural subsidiary pursuits chiefly in the Manufactures and Crafts Group, which includes blacksmiths, carpenters, weavers, spinners, tailors and shoe makers. These artisans, being an essential part of the normal life in rural as well as urban areas are. evenly distributed all over the Punjab and Bahawalpur State. The other subsidiary o~cupations worth some notice are s~opkeepers, hawkers, cooks and domesti~ servants. Statement 9-E shows the ~i~trjb:~ltlon . of tbe v~rious . subsi4iary
occuptions by Main Groups. For detailed information the Reader may refer Section 2 of Table U-B Subsidiary Occu~ pations of the Agricultural Labour FC}tce published in Part II of this Report.
STATEMENT 9-E
Agricultural Labour Force Distribution
of Subsidiary OccupationS.
Occupational Group.
Total All Groups
Religious Workers
Health Workers
cierical and Office
Trade and Commerce
Primary Production
Transport
Manufacturers and Crafts.
Food Processing
General Labour Service ...
Number (ooO's.)
Punjab.
1,94
37
2.4
2
26
6
6
93
28
27
Bahawalpur State
7
3
9.8. Economic Actil'ities of Landowners. The economic activities of the persons who were returned as landowner.s is given in Table 14 A-Landowners, pub~ l1shed in Part II of this Report:· Their number is 23,23 thousands in the Punjab and 2,52 thousands in the BahawaJpur State of whom 97 pet cent in the former and 95 per cen t in the latter are engaged in agricultural activities, about one pet cent are economically inactive while the rest area absorbed in service, commeTce and indus~ry.

STATEMENT '-F
Acreage per Cultivator.
1951. 119~1.
District.
PUNJAB.
Gujranwala .... 9,9! 17,6 5.6 8.1 Lahore 9,79 2,52 3.9 7.1 Sbeikbupura 9,87 1,75 5.6 8.1 Sialkot 10,45 2,49 4.2 5.0 Dera Gbazi Kban 10,02 1,38 7.3 7.4 Jhang 10,54 1,61 6.5 9.5 Lyallpur 17,27 3,92 4.4 7.5 Montgomery 19,32 3,46 5.6 9.1 Mult,tn 22.60 3,98 5.7 10.2 Muzaffargarh 8,01 1,63 4.9 6.7 CampbeUpur 11,21 1,60 7.0 8.' Gujrat 10.43 2,19 4.8 5.5 Jhelum 7,063 1,32 5.3 6.1 Mianwali 12,72 1,2t 10.5 13.2 Rawalpindi 5;78 1,76 3.3 5.1 Shahpur 17,63 2,33 7.6 11.0 Babawalpur State 28,05 3,95 7.1 Not
avail-able.
9.9. Acreage per Agricultural Morker. the extent of the land available for cultivation in each district of the Punjab, and for the Bahawalpur State as a whole, has already been discussed in detail in paragraph 1.10 of Chapter 1 of this Report. As will be seen from the state
ment given in tha t paragraph the pro
portion of the net cultivated area to
the cultivable area varies from place to place. For the benefit of those Rea
ders who are not acquainted with the
system of lalftd administrati~n here, it may be mentioned tl1a't the term. 'cultivated area' 'means 'the -area of la'nd
sown an'd the current follows. Statement
9-F shows the average humber of acres of cultivated 'lantI ~e'r worker e~gaged i'n cultivation.
It wiH be seen that the average ~rM pei' agticu1tural worker ranges betwetfi
3.3 and to.S ll'ereS as against 5.0 and 13.2 a'Cres at 1931 Censos. The influx of tire
Mulrajirs, who have tl'JoSI'y been atlotte'd comparatively smaller holdings, is mostly reS'pbnsibte for the tall in the average acreage per agricultural workers.
9. to. tk'OitmRle Condition u£ the CUltivating Class. In arid territories like the Punjab and Baliawalpur state agriculture mainly depends 011 the availability ijf water for ittigating the crops. A "rief account of the Canal projects which have been opehd during tbe fast century to assist agt'ititilture is given in paragrapH
1.9. The cultivating class chleHy depends on these canais for irrigating their crops. In sl)me ltacH wells too ate ti~ed a~ tHe means Of irrigation. 1n cbnneetion with the canal irrigation system however it may be mentioned that due to gradual rise of the water-table some areas are
becoming waterlogged, and hence unfit for cultivation. The Irrigation Dep<1dment has been persistently fighting
agaiIist this menace.
The traditional conservatism of the farmers is more deep-rooted in the Punjab and Bahawalpur State than in many other countries with the result that old
fashioned methods of cultivation continue

114 ECONOMIC ACTIVITIES
to be in vogue. Bullocks and oxen are still used for ploughing, threshing and drawing water out of wells and mostly no manures are used except the farm yard manure. The smallness of the holdings generally also militates against the use of modern mechanical implements of agriculture though of late tractors have begun to be introduced in the bigger farms. The Department of Agriculture has been assisting the farmers by supplying seeds of improved varieties of all kinds of crops and without some success.
The Punjab and the Bahawalpur State have the privilege of possessing)ome of the finest strains of milch buffaloes and cows. The Animal Husbandry Departments have established several centres for the development and improvement of the indigenous breeds and in order to encourage the agriculturists to breed good cattle the Departments hold shows and fairs frequently at which prizes are awarded to the owners of animals possessing outstanding merit. On the whole the economic condition of the cultivating class is fairly satisfactory particularly when good prices are obtainable agricultural produce.
9.11 Agricultural Industries. Of the main crops sown in the Punjab and Bahawalpur State, wich are discussed in paragraph 1.11 cotton is by far the most important industrial crop. It is largely grown the colony districts of Multan, in Montgomery, Lyallpur. Shahpur and Jhang in the Punjab and in the canaIirrigated belt of Bahawalpur State. The improved varieties of medium and long staple cotton are in demand in the
international markets and therefore a good deal of the crop; is exported. Some quantity is also consumed •• by the local cotton spinning and weaving mills. The total yield of the improved varieties of cotton in 1951 was 6,56 thousand bales in the Punjab and 1,52 thousand bales in the Bahawalpur State. There are 128
cotton ginning and baling factories in the Punjab, rr ainly in the districts of Multan (39), Lyallpur (27), Montgomery (17) and Shah pur l14), while ,Bahawalpur State has 54 ginning factories. Raw cotton is ginned and baled for export at these factories.
The Punjab has been a centre of handlQQm industry since long. With the influx of the refugees fr om India there has been an appreciable increase in the weaving community. Small handloom factories and cottage workers are spread over almost all district s and it is estimltted that over 1,50 tb ousand handlooms are installed in the Punjab and Bahawalpur State. Their requirements of yarn are met partly by imports and partly by the local mills. The development of the cotton textile industry has also been proceeding at a qui(k pace. Since the Partition in 1947 six new cotton spinning and weaving textile mills have been set up at Lyallpur, Multan. Rawalpindi and Rahimyarkhan and some others are under con struction.
According to the information collected at th is Census the number of persons engaged in textile production was 2,10 thousands in the Punjab and 10 thousands in the Bahawalpur State, of whom 1,76 thousands in the Punjab and

ECONOMIC ACTIVITIES 115
7 thousands in the Bahawalpur State were independent" workers. The number of employees was 33 thousands in the Punjab and 3 thousands in the Bahawalpur
State. A vast majority of the persons
engaged in textile production are either illiterate or have not gone beyond the Primary Standard. The Lyallpur district leads all other districts in the number of textile workers. Next come the districts of Multan, Lahore, Sialkot and Gujrat, in the order stated. The districts of Mianwali and D~ra Ghazi Khan are at the tail end. For fuller details the Reader may refer to Table ll-A Occupations of the Non-Agricultural Labour Force published in Part II of this Report.
Sugarcane is another industrial crop grown in the Punjab and Bahawalpur State. It is mostly used for the manufacture of gur (crude sugar) which is consum
ed locally. There is a small sugar mill at
Rahwali in the Gujranwala district and
a proposal to set up a big sugar mill in the Bahawalpur State is under consideration.
9.12 Fishery. The persons engaged in fishing as an occupltion number 364 and 85 in the Punjab and Bahawalpur State, respectively, of whom 408 are independent workers and 41 employers. Lahore with 120 such persons leads all other districts while in the districts ofGujranwala and Muzaffargarh no one declared himself to be a fisherman.
9.13 Forestry. In the Punjab and Bahawalpur State 242 and 7 persons, respectively. are shown to be engaged
in forestry. Forest Officers, Guards etc.,
do not appear to have been induded in these figures. Three districts account for 302 persons - Rawalpindi 119, Lahore 45 and Sialkot 39. The number of independent workers is 165 and the remaining 84 are employees. There is very little sawing in the forests of the Punjab and practically no saw mills exist. The most important industry dep:!t1ding on timber is the Sports Goods Industry of
Sialkot, for which mulberry is supplied from the Chhanga Manga forest in the
Lahore district and other irrigated forest plantations. There is a Rosin and Turpentine Factory at lallo near Lahore which is run by Government.
9.14 Governmental Services. At the time of this C..:usus the number of workers who reported themselves as _engaged in Governmental and Municipal services, districtwise details of which are given in Table 12-Economic Groups and Industrial Status of the Non-Agricultural Labour Force, was 1,17,755 (1,17,113 males and 642 females) in the Punjab and 10,692 (10,698 males and 4 females) in the Bahawalpur State. These figures do not include persons employed in the Education, Medical, Post and Telecommu
nication Services whose details are furnished in Statement 9-G.
The large number of independent
workers under 'Education' and 'Medical Services' represents tutors and private medical practitioners. Information regarding the workers in the various important service occupations in each district of the Punjab and Bahawalpur State is given in Subsidiary Table II at
the end of this Chapter. This Table will

116 EC6JNOMIC ACTIVITIES
STATEMENT 9~G Services
.,_ "-.'_.' ' ,
Industrial States
Main Economic Division. Total
I""""".d,"'! Unpaid workers. I Employers Emlllt)yees workers Family
I Helper
-
PUNJAB
E9uCiltion 19,272 47 16,075 3,150
I\fItQjc~ Servis:es .... 1O,?47 68, 2,933 7,545 2,
PQ~~ ~Dd ~~ommuniclk t!JIJS'
2,719 ". ~75'l 27:
,QAHAWAJ'"PUR STATE
Education M79
Medical Services 429
Post apd T.~ecommu,Djca" 133 tions.
show that the number of office worker is larger than tha t of the workers in any
other service group. It may be stated
tha t not all the, persons included in the
various service groups mentioned in Statemen t 9-G and Subsidiary Table n are in Government eplployme,pt and that it has not been possible to present this
data separately for Government employees and persons engaged in private
enterprise.
9.15 P,J-oduction. Iq~us~i~i The totAl; v4l:pber of wor)<:ers, in th~ Manufac,turjpg Econon1ic Division, in tb.e Punjllb wa~, 6S.5,]59 (647,982, Illales, and 7,777
fel!lfll~s), of whom 554,48J were, ind~pe:u
dent workers; 1,420 unpllid Family Help~Js; 97s419 employ~~s, and. 2,438 emplqyen;, The, Ba{l\l.walpur, State ha~
37,33,8 w9,rker~ ill, thi:tE&9,nQqliC QivisiQq
45- 1,304 118 2,
8 159 262
133
consisting of28,291 independent workers;
195 unpaid Family Helpers; 8,620 employees and 232 employers. The main industries (other than the textile industry discussed in paragraph 9.n Supra) are
conected with metal, wood, glass and
ceramic and leather. Statement 9-H shows, the number of worke.r,s engage.d ill. the oc..c~pations connected with these industries. For fuller delails regarding their age breakdown, educational qualifications and inclustrial status the Reader lIlaY,refer to Tables II-A. Occupations of Non;
Agricultural Labour Force and 12-Economic Groups and ind!lstrial Status of Non-Agricultural Civilian Labour
Force published in Part II of this Report.
The, number, of p~rson w0rking as Directors,- Managers or Salesmen' in each of these industries cannot be indicat~'from-: the T~bles., ~paratel)'.

ECON()MJC A£1'lllITIES 1t7
STATEMENT 9-H Workers in Manufacturing Industries.
Industries (Absolute Figures)
District -g~ <U'~
~ B Leather
Ou Metal Wood
------------~--------~
PNNJAR ... 87.487 71,150 48,785 96,942
Gujranwala .. , 7,014 5,116 3,591 5,553
Lahore
Sh~ikhuPW'a.
Sialkot
'" 14,605 6,089. 2,961 7,220
3,081 3,24{i 2,118 3,913
7,709 7,901 2,439 6,186
Dera Ghazi I{han 1,006 1,403. 852 1,840
Jhang, 3,341 3,990 4,025 6,983
Lyallplll ••• 11,003. 7,969 6,051 9,427
Montgomery 9,673 6,927 5,793 7,667
Multan, 8,983 8,421 6,046 10,616
Muzaffargarb 1,387 1,818 1,298 2,601
eampbellpur 3,590 2,493 1,763 5,297
Gujftt 4,520 5,490 4,491 9,878
Jltelum 2,749 3,261 1,932 6,397
Mianwali 1,581 i,135 871 2;273
Ril~alpind\; 3,172 1,872 981 2,996
Shahpur 4,073 4,019 3,573 7,Oi5
B~flAWALPUR ST ATE 5,605 5,555' 3,915 6,858
Bahawalpur
Rahimyarkhan
3,341 3,657' 2,916 4,192
2,264 1,898 999 2,666
These industries have been organised by individual enterprise; or as joint stock companies and Cooperative Societies. The latter facilitate the procurement of raw materials by their members and help them in marketing their finished g.oods.
Most of these industries, it may be
mentioned, cater for the indigen(')Us demand and their growth has kept pace with the increase in the total popUlation.
Metal workers. The persons recorded as workers in the metal indus~ry,
comprising blacksmilhy, implement-making, cutlery and the manufacture of utenSils, number 87,487 in the Punjab and' 5,605 in the Bahawalpur State. A blacksmith is found in almost every village fur manufacturing and repairing the agricultural implements and articles of household necessity- required by the cultivating class. The chief centre for brass utensils is Gujranwala while iron and steel industry is carried on in the,
Sialkot, Gujrat and Lahore districts. The Batala Engineering Co. Ltd., has installed a big plant in Lahore for the manufacture of machine-tools. There are over a
dozen factories in Lahore and Lyallpur
engaged in the manufacture of hand and' power-driven liosiery machinery. The cutlery industry is centralised at Wazirabad and Nizamabad in the Gujranwala
dis triet. Its products are exported to many foreign countries. There are some factories in the Punjab manufacturing
electric fans while Surgical Instruments
are manufactured at Sialkot under the guidance of the Goyernment Surgical and_
Allied Trace Centre. Lastly, there are' foundries in all parts of the Punjab and Bahawalpur State to meet the local requirements.
Wood workers. Wood working is another industry which has returned a fairly large number of workers, namely, 71,150 in the Punjab and 5,555 in the Bahawalpur State. The workers are mainly~

Its ECONOMIC ACTIVITIES
carp.!nters, who work for the agriculturists in the villages or meet the demand for wood work in cities and towns. Sialkot is renowned all over the world for its Sports Goods Industry; Chiniot and Bhera are known for wood carving; and Pakpattan and Jampur for liqueur work.
Glass and Ceramic workers. The workers of this in4ustry number 48,785 in the Punjab and 3,915 in the BahawaIpur State. There is a large concentration of potters at Gujrat who produce fairly good crockery and other articles of household utility. A Pottery Demonstration Centre has been established there for the development of this industry.
Multan has also been known since long for its pottery industry. The Government Central Pottery Agency at Shahdara gives
training in pottery and also works On a commercial basis. AU big villages have Potters who make articles of daily use for the cultivating class. There are some glass factories manufacturing tumblers. bottles, chimneys, glass bangles and other simple articles.
Leather workers. The number of leather workers is 96,942 in the Punjab and 6,858 in the Bahawalpur State. They mostly manufacture shoes. There are also'some modern tanneries located in Multan, Montgomery, Lahore, Kasur, Gujranwaia, Wazirabad, Sialkot, Gujar Khan, Jhang and Lyallpur.
The number of workers in other manufacturing occupations is small and calls for no discussion.
9.16 Occupations. The more importan t service and industrial occupations
have been discussed in the foregoing paragraphs. Persons engaged in Road and Transport occupations and unskilled domestic and other service workers constitute a fairly large proportion of the
Non~Agricul[Ural Labour Force and it is therefore proposed (0 discuss them here too. Such workers have been returned from almost every district of the Punjab and Bahawalpur State as Subsidiary Table III at the end of this Chapter will show. Statement 9-J gives the number of these workers and their proportion to the Non-Agricultural Labour Force.
1.
2.
3.
4.
S.
STATEMENT 9-J
Proportion of certain classes of workers
Non Agricultural Labour Force.
Proportions Number per mille to-(OOO's) Non-Agricul
tural Labour Force.
Occupation .... .... ::I ::J ..e-o.
til 0 Punjab '" Plinjab ~- ~8 0:1'" "'IC
~ril ~Vj ~
Unskilled wor- 544 48 280 345 kers
Business Execu- 313 20 161 144 tives, sales workers & shopkeepers
Other service 146 8 75 58 workers
Domestic wor- 133 10 68 72 kers
Transport ma- 25 1 13 7 nagers aod Road vehicle
drivers

ECONOMIC ACTIVITIES 119
The number of unskilled workers was 5,44 thousands in the, Punjab and 48 thousands in the Bahawalpur State which is more than one fourth of the Non-Agri'cultural' Labour Force in each case. Next come the business executives, sales workers and shopkeepers, whose number is also fairly large. It may be mentioned that these figures do not include children
below the age of 12 years some of whom are employed as domestic servants and apprentices in business concerns. For
fuller details the Reader may refer to Tables l1-A Occupations of Non-Agricultural Labour Force, 12-Economic Groups and Industrial Status of NonAgricultural Civilian Labour Force, 13-Economic Groups and Occupations and 19-D Economic Groups and Occupations of Muhajirs, published in Part II of this
Report.
Figure 9.1 shows the changes in the strength of the different elements of the
Civilian Labour Force.
9.17. Unemployment. Question 12 on the Census Slip was designed to obtain data regarding unemployment. Persons who' had done no work through-, out January, 1951 were to be regarded as unemployed. The replies to this question were sorted for Cultivators and other
persons in the Agricultural Labour Force at tbe Hand Sorting Centres and for the Non-Agricultural Labour Force at the Machine Sorting Centre, Karachi. The number of unemployed persons was 26,663 in the Agricultural Labour Force and 809 in the Non-Agricultural Labour Force. In view of the general practice
in thi§ country th'l-t when an agricultuflll
employee looses his jOb. he is supported by his family and actually joins the work of his relatives the figure of unemployed agricultural workers appears to be reasonable. But the number of persons who reported themselves as being unemployed in the Non-Agricultural Labour Force obviously does not presen t a true picture of unemployment, The data shows, in the month in question, only 76 unemployed persons in Lahore; although enquiries made from the Manager, Regional Employment Exchange, Lahore reveal that the number of unemployed persons registered in his records for that month
was in the vicinity of 13 thousands. The patently low figures of unemployment seem attributable firstly to the
failure of the enumerators to understand the import of question 12; secondly to the inability of the respondents especially the large class of independent workers, to report on the question on account of their ignorance of their correct position; thirdly to the general reluctance on the part of respondents to confess unemployment before the Enumerators, who, where not in a position to find employmen t for them and lastly to the exclusion of the persons, who, tbough really unemployed had done some kind of work for a short period during the month in question. Tbe reported figures for industrial unemployment are so unrealistic that it is quite futile to present tbem in detail.
9.18 Cottage Industries. For tbe
purposes of the Census the term 'Cottage Industry Enterprise' meant a business establishment carried on in the home,
mainly by members of the household,

t~ ECONOMIC A.'CTWf1'IES
STATEMENT 9-K Workers in Cottage IDtlustries.
I I
I--~ Product
I Enter-prises
I
Total all Groups 44.096
Yarn & textile fabrics 40,208
Carpets, Rugs, Rope, 194 Bags etc.
Wearing Apparel and work on textile fabrics.
183
Jewellery and Ornaments 105
Glass & Cocamics 832
Fine and applied art 14
Paper and articles.
Stationery 8
Woodwork, cane and fJ79 bamboo work.
Leather processing and leather goods making.
1,267
Metal works 311
Other manufacture 109
Food, Drink and Tobacco 186 Processing.
for manufacturing goods for sale or capable of being sold, and which employed less than 20 operatives in all, or less than 10 if power driven machinery was used. The Enumerators had been directed that while preparing the household lists they should enquire whether any home manufacture was carried on by the "household and where the reply was in ,the affirmative, and not more than the aforesaid number of operatives were employed, to record in the Cottage Enquiry. Form particulars showing the
Punjab Bahawaipur State ------~--------
Enter-Workers Looms prises Workers Looms
1,45,829 65,273 2,946 7,288 1,521
1,34,297 65,199 1,451 4,453 1,521
658 74 2 3
781 5 14
197 64 102
2,626 397 842
72
39
1,845 388 '95
3,480 393 627
859 192 433
453
522 54 119
nature of work, the type of machinety, the number of workers and in the case of the textile weaving industries the material produced and the nutnber of looms. The return was a subsidiary job done atong with the house-listing which \\>as itself regarded as far more important to the success of the Census. The Cott!lge Industries Return wag made with varying degrees of thoroughness by diffcretrt enumerators and in some cases was omit .. ted altogether. There was very little opportunity fOr instructing the enumeratots

ECONOMIC ACTIVITIES 121
regarding the classification of cottage industries and it is apparent that the description of the product was often poor an~ that the definition of a Cottage Industry was not always appreciated. The return cannot therefore be regarded as complete. Nevertheless, it gives results which although inexpert and deficient, do represent a wider conspectus of Home Manufactures than bas hitherto been available. The returns submitted by the Enumerators were passed on to the Hand Sorting Centres where Coded Schedules were prepared in accordance with the instructions embodied in Part III of the Code of Census Procedure and the Coded Schedules were sorted by Machine at Dacca. The results are incorporated in Supplementary Tables No. I and No. II in Part II of this book. Briefly. the position is that the reports covered
44,096 enterprises of various kinds in the Punjab and 2,946 in the Bahawalpur State. Those using power numbered 62 in the former and 9 in the latter. Statement 9-K shows the numbers of enterprises and workers in each product group, \ together with the number of looms in the taxtile and carpet manufacturing group.
As has been mentioned the information collected through the Cottage Indus· try Enquiry is incomplete. For example the number of cottage workers in woodwork, cane work and bamboo work is 1845 and 695 in the Punjab and Bahawalpur State, respectively, but considering the number of carpenters etc., actually working in that profession in both urban and rural areas these figures are ridiculously low, and there are other equaUy obvious inaccuracies.

122 ECONOMIC ACTIVITIES
SUBSIDIARY TABLE I
Proportions of Ghief Economic Divisions; Non:-Agricultural Labour Force.
Districts
PUNJAB
Labore Division
Gujmnwala
Lah()r!.l
Sbeikhupura
Sialkot
Multan·Division
D.G. Khan
Jhang
LyaUpur
Montgomery
Multan
Muzaffargarh
Rawalpindi Division ...
CampbeUpur
Gujrllt
Jbelum
MianwaJi
Rawalpindi
Sbahpur
BAHAWALPUR STATE
Babawalpur
Rahimyar Khan
Punjab and Babawalpur State
Workers Number (000'5)
6,57
2,03
41
79
32
51
2,87
15
40
87
57
76
12
1,66
21
54
27
12
19
33
37
22
15
3,61
1,53
19
76.
23
35
1,28
7
It
44
24
36
6
79
7
21
9
7
17
17
22
11
11
1,18
42
5
24
5
8
42
4
4
14
7
10
3
34
3
6
4
3
12
6
11
8
3
1951 Census
:Percentages to total workers [in Non-Agricultural Labour
Force.
2,91 34 19 6 15
1,18 31 23 6 18
14 36 17 4 12
62 27 26 8 21
15 34 24 5 16
27 33 23 5 18
J,OI 36 16 5 13
4 34 16 9. 9 ..
11 41 II 4 11
28 39 20 6 13
29 37 15 4 19
24 35 17 5 11
5 22 II 5 9
72 33 16 7 14
9 34 11 5 15
16 40 16 4 12
8 41 14 6 12
6 29 17 7 14
14 24 21 15 18
19 28 15 5 16
22 27 16 8 16
14 24 9 15
8 32 23 6 17

PUNJAB
Gujranwala
Lahore
Sheikhupura
Sialkot
D. G. Khan
Jhang
Lyallpur
Montgomery
Multan
Muzaffargarh
Campbellpur
Gujrat
Jhelum
MiitnwaJi
Rawalpindi
Shahpur
BAHAWALPUR STATE.
Bahawalpur
Rabimyar Khan .. ,
ECONOMIC ACTIVITIES
SUBSIDIARY TABLE II.
Workers in ImpQrhmt Service Occupations,
737 1,318 1,17,080 5,591 21,436 17,271 7,364
84 30 4,286 144 1,364 1,037 358
232 620
4
25
22
23
28
13
80
6
16
15
43
77
16
17
35
40
76
53
20
29
20 46
11 12
68 167
90 37
25 99
19 82
6 17
29,215 1,235 4,874 2,857 1,429
5,110 44 994
8,215 146 1,543
3,517 2 316
3.362 36 404
14,154 242 1,926
5,975 295 1,139
10,171 150 1,691
3,004 10 387
2,529 208 1,385
4,974 1,015 1,441
760 415
1,309 515
269 106
397 543
1,690 887
1;"66 280
1,585 947
246 160
366 148
1,163 458
3,345 300 1,051 870 446
1,917 724 638 286 82
12,475 775 1,610 1,867 248
4,831 265 673 1,103 342
10,606 143 1,510 1,452 254
6,932 93 1.184 573 184
3,674 50 326 879 70
123
1,797 378
75 10
273 121
18
216
44
46
6
14
35 26
141 15
131 108
75
90
200
79
29
226
119
140
123
17
10
10
30
8
8
12
39
25
14

124
Districts.
PUNJAB
Gujranwala
Labore
Sheikhupura .. ,
Sialkot
D.G. Khan ...
Jhang
Lyallpur
Montgomery
Mu1tan
Muzaffargarh
Campbellpur
Gujrat
Jhelum
Mianwali
Rawalpindi
Shahpur
BAHAWALPUR STATE.
Bahawalpur ...
Rahimyar Khan
ECONOMIC ACTIVITIES
SUBSIDIARY TABLE III
OCCUPATIONS
Absolute Figures by Districts.
I i I Sales \
Business I Worker3 I Unskil- I Domestic Other Transport Road Managers Transport
and Exe- & I led Wor- i Wor- Service cutives. I Shop- I kers. I kers. l Workers
keepers. : !
34,348 2,80,371 5,44,306
3,029 16,579 32,395
5,606 59,722 55,424
2,371 11,037 39,431
1,078 30,626 32,013
1,238 5,453 18,340
1,327 9,189 36,152
4,613 32,684 41,131
2,953 18,991 45,9GO
6,755 26,892 65,278
778
157
305
316
• 151
1,653
700
4,989 25,066
6,343 16,998
14,871 49,541
7,694 15,872
4,587 17.788
14,593 14,519
16,12l 38,398
2,338 17,443 48,167
1,655 9,239 36,607
683 8,204 11,560
1,32,989 1,46,217
3.576 8,581
36,931 21,384
3,346 7,678
9,828 15,889
2,744 1,175
4,637 6,235
13,570 17,499
15,535 14,548
12,064 13,200
3,351
227
4,984
3,952
1,051
7,990
7,203
9,821
4,531
5,290
2,031
7,475
5,931
4,156
4,532
4,174
11,729
8,150
5,531
2,619
Pilots. operatives.
171 25,436
2
122
14
9
3
2
9
6
3
39
39
1,076
4,789
420
1,747
2,123
472
2,433
929
3,109
1,2119
609
1,739
810
451
2,470
970
507
292
215

tN.m.
y" Mths Mu jir from
2 M S W 0
e,o,n ., Educ:aUon
p M D II
Usual M.ifl Occup.tM)ft
C>A~
M •• C Hindu Sch C Budd Sub.idiary cc.wp.tion
3 4
~ Ch, Pars! Tdb Oc:cupltion _ory
6 8
.. -; <
j 1 J. ~ ~
. -6 .. l 'r J ~ c
~ :j c8 w l CD
6 z C A B
EO E
8
eire" .. 7.(

Table No.
I-A
2
3
4
<I-A
5
6
7
7-A
8
8-A
9
9-A
9-B
10
lO-A
II
II-A
II-B.I
II-B.2
12
13
14
15
19-A
19-B
19-C
19-D
PART II-LIST OF TABLES
Population
Cities of Pakistan
Towns and Cities
Variation ...
Age and Marital Status
Orphans ..
Birthplace
Religions ...
Mother Tounge
Speech
Literacy
Language of Literacy ...
Pupils and Students .,.
Years of Education
Educational Levels
Non-Pakistanis
Afghan Powindalis
Labour Force
Subject
....
Occupations Non-Agricultural Labour Force
Occupation of Agricultural Labour Force .. :
Subsidiary Occupation of Agricultural Labour Force ...
,.. ...
Economi<; Group & Industries of Non-Agricultural Civilian Labour Force ...
Economic Group and Oc..:upation of Civilian Labour Force
Agricultural Labour Force & Cultivators Land Tenure
Land Owners
Muhajir's Origin
Muhajir's Educational Levels
Muhajir's in the Labour Force
Economic Group & Occupation of Muhajirs
Supplementary Table I & 2 Cottage Industries
Page No.
1-1
1-8
2-1
3-1
4-1
4-16
5-1
6-·1
7-1
7-8
8--1
8-3
9-1
9-6
9-21
10-1
10-3
11-1
11-15
11-22
11-25
12-1
13-1
14-1
15-1
19-1
19-3
19-6
19-20
S-I to S·19

TABLE I-POPULATION
This Table shows for divisions, districts and tehsiJs, as well as for Babawalpur State likewise, the distribution of population in rural and urban areas and the persons per square mile. The population includes Non-Pakistanis also.
~. The figures for areas have been obtained from the Survey of Pakistan. They differ in some cases from pn:vious censuses due to partition of the Punjab on the Radcliffe Award.
3. Details of Partition-affected districts and adjustments of areas thereof are given below:-
Area included I Area included I ., Pre-Partition in Punjab I in Punjab I Remarks. Dlstnct Area (sq. miles) (India) (sq. ,(Pakistan) (sq ..
__ --'-_____ ~_miles.) I ._m_ile_s_.) ___ I ______ _ Labore 2,595 166
Sialkot 1.576 495
2,429
2,071
The decrease is due to exclusion of a part of Kasur Tebsil which has been included in India.
The increase is due to the inclusion of Shakargarh Tehsil from Gurdaspur district, (now in India.)
4. This Table is discussed in Chapter 3 of Part I of the Census Report.
1-1

1-2
TABLE I-POPULATION
Number of persons
Area Total Population ; personsl Districts and Tehsils sq. _____ ~ _______________ ~ ____ ' per .
I Miles Totall! Males Females ,sq. Mile. I-~---~--~-------_!_-------------·~--------~~-~-'-----~
PUNJAB & BAHA WALPUR STATE
2 PUNJAB
3
4
5 6 7
8
9 10 11
12
13 14 15
16
17 18 19 20 21
22
23
24 25 26
27
28 29 30 31
32
33 34 35 36 37 38 39
Lahore Division
Lahore
Lahore Tehsil Kasur Tehsil Chunian Tebsil
Sheikhupura
Sheikhupura Tehsil Shahdara Tehsil Nankana Tehsil
Gujranwala
Gujranwala TehsiI... Wazirabad Tehsil '" Hafizabad Tehsil '"
Sialkot
Sialkot Tehsil Narowal Tehsil Pasrur Tehsi) Daska Tehsil Shakargarh Tehsil ...
Multan Division
Jhang
Jhang Tebsil Chilliot Tehsil Shorkot Tehsil
Montgomery
Montgomery Tehsil Okara Tehsil Pakpattan Tehsil DipaJpur Tehsil
Multan
Multan Tehsil Khanewal Tehsil Kabirwala Tehsil Lodhran Tehsil Shujabad Tehsil Mailsi Tehsil Vehari Tehsil
79,716 2,06,51,140 1,10,58,610 95,92,530
62,245 1,88,28,015 1,00,68,141 87,59,874
9,119
2,429
679 644
1,106
2,318
877 751 690
2,301
930 456 915
2,071
387 416 381 398 489
31,733
3,400
1,328 1,012 1,060
4,208
1,228 722
1,293 965
5,619
777 981 672
1,064 688 633 804
53,39,873 28,86,742 24,53,131
18,95,228
11,34,900 2,44,806 5,15,522
9,23,360
4,54,283 2,20,455 2,48,622
10,47,032
5,78,223 2,17,198 2,51,611
14,74,253
4,18,393 2,51,732 2,51,991 2,91,380 2,60,757
83,35,291
8,76,761
3,49,279 3,30,094 1,97,388
18,16,120
6,03,854 4,23,941 4,81.685 3,06,640
21,07,603
5,06,815 3,84,398 2,51,234 2,89,088 2,18,392 1,84,732 2,72,944
10,38,984
6,32,218 1,31,477 2,75,289
4,94,259
2,43,297 1,18,426 1,32,536
5,63,910
3,10,329 1,16,900 1,36,681
7,89,589
2,27,431 1,34,895 1,34,325 1,55,128 1,37,810
44,58,139
4,71,779
1,87,928 1,78,376 1,05,475
9,70,093
3,22,793 2,27,366 2,56,084 1,63,850
11,28,166
2,74,117 2,04,384 1,33,463 1,54,807 1,16,963
97,911 1,46,221
8,56,244
5,02,682 1,13,329 2,40,233
4,29,101
2,10,986 1,02,029 1,16,086
4,83,122
2,67,894 1,00,298 1,14,930
6,84,664
1,90,962 1,16,837 1,17,666 1,36,252 1,22,947
38,77,152
4,04,982
1,61,351 1,51,718
91,913
8,46,027
2,81,061 1,96,575 2,25,601 1,42,790
9,79,437
2,32,398 1,80,014 1,17,771 1,34,281 1,01,429
86,821 1,26,723
Note:-1 Including persons claiming nationalities other than Pakistani.
259
302
586
780
1,671 380 466
398
518 294 360
455
622 476 275
712
1,081 605 661 732 533
263
258
261 326 186
432
492 587 373 318
375
652 392 374 272 317 292 339
2
3
4
5 6 7
8
9 10 II
12
13 14 15
16
17 18 19 20 21
22
23
24 25 26
27
28 29 30 31
32
33 34 35 36 37 38 39

1-3
TABLE l-POPULATION
Number of persons. -~~__,,_=-~ ~-=-:::
Urban Population Rural Population ----- -- --,------- ------ -- ---- --~------ --.----~--- ----~-- - - - ----__ -- -- ---_----- ------
Tolal Males Females Total Males Females , ----_---_ ----~----------- ---_---_---
1. 35,98,775 19,96,517 16,02,258 1,70,52,365 90,62,093 79,90,272 1
2 34,04,218 18,87,141 15,17,077 1,54,23,797 81,81,000 72,42,797 2
3 15,34,891 8,51,686 6,83,205 38,04,982 20,35,056 17,69,926 3
4 9,80,821 5,49,202 4,31,619 9,14,407 4,89,782 4,24,625 4
5 8,59,364 4,83,977 3,75,387 2,75,536 1,48,241 1,27,295 5 6 84,160 45,251 38,909 1,60,646 86,226 74,420 6 7 37.297 19,974 17,323 4,78,225 2,55,315 2,22,910 7
8' 82617 43,920 38,697 8,40,743 4,50,339 3,90,404 8
9 56,962 30,418 26,544 3,97,321 2,12,879 1,84,442 9 10 9,056 4,773 4,283 2,11,399 1,13,653 97,746 10 11 16,599 8,729 7,870 2,32,023 1,23,807 1,08,216 11
12 2,51,057 1,35,129 1,15,928 7,95,975 4,28,781 3,67,194 12
13 1,54,414 82,833 71,581 4,23,809 2,27,496 1,96,313 13 14 59,177 31,926 27,851 1,57,421 84,974 72,447 14 15 36,866 20,370 16,496 2,14,745 1,16,311 98,434 15
16 2,20,396 1,23,435 96,961 12,53,857 6,66,154 5,87,703 16
17 1,67,543 94,999 72,544 2,50,850 1,32,432 1,18,418 17 18 15,298 8,250 7,048 2,36,434 1,26,645 1,09,789 18 19 17,261 9,168 8,093 2,34,730 1,25,157 1,09,573 19 20 20,294 11,018 9,276 2,71,086 1,44,110 1,26,976 20 21 2,60,757 1,37,810 1,22,947 21
22 10,43,846 5,68,053 4,75,793 72,91,445 38,90,086 34,01,359 22
23 1,35,307 73,037 62,270 7,41,454 3,98,742 3,42,712 23
24 73,402 39,744 33,658 2,75,877 1,48,184 1,27,693 24 25 50,111 26,931 23,180 2,79,983 1,51,445 1,28,538 ZS 26 11,794 6,362 5,432 1,85,594 99,113 86.481 26
27 1,54,833 84,569 70,264 16,61,287 8,85,524 7,75,763 27
28 62,268 34,423 27,845 5,41,586 2,88,370 2,53,216 28 29 40,325 22,090 18,235 3,83,616 2,05,276 1,78,340 29 3() 35,871 19,384 16,487 4,45,814 2,36,700 2,09,114 30 31 16,369 8,672 7,697 2,90,271 1,55,178 1,35,093 31
32 3,41,307 1,85.774 1.55,533 17,66,296 9.42,392 8,23,904 32
33 1,90,122 1,04,478 85.644 3,16,693 1,69,939 1,46,754 33 34 58,002 31,507 26,495 3,26,396 1.72,877 1,53,519 34 35 9,485 5,164 4,321 2,41,749 1,28,299 1,13,450 35 36 25,998 13,429 12,569 2,63,090 1,41,378 1,21,712 36 37 23,089 12,138 10,951 1.95,303 1,04,825 90,478 37 38 10,242 5,490 4,752 1, 74,490 92,421 82,069 38 39 24,369 13,568 10,801 2,48,575 1,32,653 1,15,922 39

1-4
40
41 42 43 44
45
46 47 48 49 SO
51
52 53 54 55
56
57
58 59 60
61
62 63 64
65
66 67 68 69
70
71 12 13 14
75
16 77 18 19
TABLE I-POPULATION-Contd.
I Area I Total Population Districts and Tehsils Sq. I
I Miles I Total I Males I
Muzaffargarh '" ... 5,601 7,51,250 4,03,871
Muzaffargarh Tehsil ... 750 2,34,856 1,26,830 Kot Addu Tehsil ... ... 1,504 1,43,009 76,800 Alipur Tehsil " . ... 932 2,11,182 1,13,059 Leiah Tchsil '" '" 2,415 1,62,203 87,182
Dera Ghazi Khan . .. ... 9,371 6,30,694 3,41,948
Der.a Ghazi Khan Tehsil '" 1,945 2,38,147 1,28,722 Sanghar Tehsil .. , ... 592 1,04,005 55,338 Jampur Tehsil . " ... 900 1,11,955 60,745 Rajanpur Tehsil ... 1,944 1,31,571 72,317 Biloch Trans Frontier Tract ... 3,990 45,016 24,826
Lyallpur " . ... 3,534 21,52,863 11,42,282
LyaUpur Tehsil . ,. ... 771 7,02,074 3,75,292 ]aranwala Tehsil ... ... 709 4,37,987 2,32,895 Samundri Teh~il ... 771 4,08,904 2,15,956 Toba Tek Singh Tehsil ... 1,283 6,03,898 3,18,139
Rawalpindi Division .,. ... 21,393 51,52,851 27,23,260
Gujrat .. , ... 2,258 11,58,675 6,15,522
Gujrat Tehsil ... ... 565 3,96,630 2,10,160 Kharian Tehsil ," ... 664 3,46,442 1,79,706 Phalia Tehsil ... . .. 1,029 4,15,603 2,25,656
Jhelum ... .. 2,786 6,82,061 3,50,536
Jbelum Tehsil .. , ... 905 2,65,770 1,38,412 Chakwal Tehsil ... ." 1,016 2,22,338 1,12,818 Pind Dadan Khan Tehsil .. , 865 1,93,953 99,306
Rawalpindi ... ... 2,023 8,75,504 4,68,869
Rawalpindi Tehsil ... 750 4,42,168 2,50,257 Murree Tehsil '" ... 255 99,679 53,437 Gujar Khan Tehsil .. , 564 2,09,847 1,03,665 Kahuta Tehsil '" ... 454 1,23,810 61,510
Campbell pur ... ... 4,149 7,23,124 3,77,183
Campbellpur Tehsil 652 2,66,217 1,41,783 Fateh Jang Tehsil .. , 853 ,43,972 75,072 Pindlgheb Tehsil ' .. .. , 1,438 1,64,333 83,480 Talagang Tehsil '" ... 1,206 1,48,602 76,848
Shahpur ... '" '" 4,788 11,62,988 6,21,144
Shahpur Tehsil ... ... 605 1,75,397 94,074 Bhalwal Tehsil ... ... 826 3,11,432 1,67,965 Sargodha Tehsil ... ... 831 4,04,794 2,17; 45 Khushab Tehsil ... ... 2,526 2,71,365 1,41,360
Number of persons.
Persons per
Female_ Sq. Mile
3,47,379 134
1,08,026 313 66,209 95 98,123 227 75,021 67
2,88,746 67
1,09,425 122 48,667 176 51,210 124 59,254 68 20,190 11
10,10,581 609
3,26,782 910 2,05,092 618 1,92,948 530 2,85,759 471
24,29,591 241
5,43,153 513
1,86,470 702 1,66,736 522 1,89,947 404
3,31,525 245
1,27,358 294 1,09,520 219
94,647 224
4,06,635 433
1,91,911 590 46,242 391
1,06182 372 62,300 273
3,45,941 174
1,24,434 408 68,900 169 80,853 114 71,754 123
5,41,844 243
81,323 290 1,43,467 377 1,87,049 481 1,30,005 107
40
41 42 43 44
45
46 47 48 4:9 50
51
52 53 54 55
56
57
58 59 60
61
62 ro 64
6; 66 67 68 69
70
71 72 73 74
75
76 77 78 79

40
41 42 43 44
45
46 47 48 49 50
51
52 53 54 55
56
57
58 59 60
61
62 63 64
6S
66 67 68 69
70
71 72 73 74
75
76 77 78 79
Total
54,361
15,679 10,507 10,677 17,498
74,999
38,932 10,113 16,999 8,955
...
2,83,039
1,87,202 28,068 6,637
61,132
8,25,481
1.31,183
73,962 30,126 27,095
77,275
56,617 13,319 7,339
2,55,128
2,37,219 9,406 8,503
.. ,
90,075
66,036 5,127
10,157 8,755
2,13,616
29,019 49,749 85,680 49,168
-- -Urban Population
I Males
28,977
8,532 5,491 5,543 9,411
40,503
21,108 5,411 9,102 4,882
...
1,55,193
1,03,589 15,377 3,558
32,669
4,67,402
70,308
39,478 16,216 14,614
43,837
32,703 7,207 3,927
1,56,201
1,44,273 7,157 4,771
... 50,607
38,324 2,708 5,123 4,452
1,15,458
15,499 26,561 47,376 26,022
TABLE I-POPULATION-Contd.
Number of persons.
I I Rural Population !
-----
I I I Females
i Total Males Females I I
25,384 6,96,889 3,74,894 3,21,995
7,147 2,19,177 1,18,298 1,00,879 5,016 1,32,502 71,309 61,193 5,134 2,00,505 1,07,516 92,989 8,087 1,44,705 77,771 66,934
34,496 5,55,695 3,01,445 2,54,250
17,824 1,99,215 1,07,614 91,601 4,702 93,892 49,927 43,965 7,897 94,956 51,643 43,313 4,073 1,22,616 67,435 55,181
'" 45,016 24,826 20,190
1,27,846 18,69,824 9,87,089 8,82,735
83,613 5,14,872 2,71,703 2,43,169 12,691 4,09,919 2,17,518 1,92,401 3,079 4,02,267 2,12,398 1,89,869
28,463 5,42,766 2,85,470 2,57,296
,3,58,079 43,27,370 22,55,858 20,71,512
60,875 10,27,492 5,45,214 4,82,278
34,484 3,22,668 1,70,682 1,51,986 13,910 3,16,316 1,63,490 1,52,826 12,481 3,88,508 2,1l,()42 1,77,466
33,438 6,04,786 3,06,699 2,98,087
23,914 2,09,153 1,05,709 1,03,444 6,112 2,09,019 1,05,611 1,03,408 3,412 1,86,614 95,379 91,235
98,927 6,20,376 3,12,668 3,07,708
92,946 2,04,949 1,05,984 98,965 2,249 90,273 46,280 43,993 3,732 2,01,344 98,894 1,02,450
... 1,23,810 61,510 62,300
39,468 6,33,049 3,26,576 3,06,473
27,712 2,00,181 1,03,459 96,722 2.419 1,38,845 72,364 66,481 5,034 1,54,176 78,357 75,819 4,303 1,39,847 72,396 67,451
98,158 9,49,372 5,05,686 4,43,686
13,520 1,46,378 78,575 67,803 23,188 2,61,683 1,41,404 1,20,279 38,304 3,19,114 1,70.369 1,48,745 23,146 222,197 1,15,338 1,06,859
1-5
40
41 42 43 44
45
46 47 48 49 50
51
52 53 54 55
56
57
58 59 60
61
62 63 64
65
66 67 68 69
70
71 72 73 74
75
76 77 78 79

I-b
TABLE I-POPULATION-Concld.
Number of Petsons.
Area Total Population i Persons Districts and Tehsils Sq. , --- - ------ per
Miles Total Males Females Sq. Mile _---- - - ------- - -~--- --~~------~-.-------~------ --------
80 Mianwali 5,389 5,50,499 2,90,006 2,60,493 102 80
81 Mianwali Tehsil 1,528 2,43,136 1,25,880 1,14,256 157 81 82 lsakhel Tehsil ... 717 75,891 38,826 37,065 106 82 83 Bhakkar Tehsil. .. 3,144 2,34,472 1,25,300 1,09,172 75 83
84 BAHAWALPUR STATE 17,471 18,23,125 9,90,469 8,32,656 104 84
85 Bahawalpur 7,678 9,70,488 5,23,932 4,46,556 126 &5
86 Ballawalpur Tehsil 3,009 2,17,nO 1,19,767 98,153 72 86 87 Chishtian Tehsil J,70~ 2,n,953 1,46,l94 1,24,759 159 87 88 Bhawalnagar Tehsil 661 1,8Z,710 97,790 84,920 276 88 89 Minchinabad Tehsil 683 1,18,845 63,750 55,096 174 89 90 Fort Abbas Tehsil... 1,623 1,80,059 96,431 83,628 1 11 90
91 Rahimyar Khan ... 9,793 8,52,637 4,66,537 3,86,100 87 91
92 Rahimyar Khan Tehsil 1,021 2,48,381 1,35,584 1,12,797 243 92 93 Sadiqabad Tehsil 1,033 1,63,180 89,176 74,004 158 93 94 Ahmadpur East Tensil 4,772 1,87,992 1,03,566 84,426 39 94 95 Khanour Tehsil 1,044 1,08,H6 59,379 49,067 104 95 96 Allahabad Tehsil 1,666 1,37,300 74,292 63,008 82 96 97 Abbasia Colony Tehsil 257 7,338 4,540 2,798 29 97

1-7
TABLE I-POPULATION-Concld.
Number of Persons.
Urban Population Rural Population
Total Males Females Total ~------.-!--.------
Males Females I ,
~-~.~ .. -.~~-~ ._--"_._------_
80 58,204 30,991 27,213 4,92,295 2,59,015 2,33,280 80
81 23,341 12,637 10,704 2,16,795 1,13,243 1,03,552 81 82 16,889 8,747 8,142 59,002 30,079 2R,923 ~2 83 17,974 9,607 8,367 2,16,498 1,15,693 1,00,805 83
84 1,94,557 1,09,376 85,181 16,28,568 8,81,093 7,47,475 84
85 1,12,373 62,772 49,601 8,58,115 4,61,160 3,96,955 85
86 47,239 26,626 20,613 1,70,681 93,141 77,540 86 87 24,760 13,877 10,883 2,46,193 1,32,317 1,13,876 87 88 22,955 12,601 10,354 1,59,755 85,189 74,566 88 89 4,906 2,581 2,325 1,13,940 61,169 52,771 89 90 12,513 7,087 5,426 1,67,546 89,344 78,202 90
91 82,184 46,604 35,580 7,70,453 4,19,933 3,50,520 91 ,
92 16,635 9,856 6,779 2,31,746 1,25,728 1,06,018 92 93 12,546 7,174 5,372 1,50,634 82,002 68,632 93 94 32,100 17,973 14,127 1,55,892 85,593 70,299 94 95 18,178 1'0,102 8,076 90,268 49,277 40,991 95 96 2,725 1,499 1,226 1,34,575 72,793 61,782 96 97 7,338 4,540 2,798 97
.... .:~ ... ~""'-,

TABLE l·A-POPULATION OF URBAN AREAS
This Table forms an analysis of the total shown in table I for the urban portions of each district or part of a district and shows area of each urban unit in sq. miles and total population by sex. It contains a list of the names and data of all cities, municipalities and other urban areas. Cities are defined as urban areas with a popula. tion of one lakh or over and urban areas are defined as continuously built up localities consisting of 5,000 or more inhabitants and all local bodies irrespective of population. Their areas have been obtained from local authorities and are probably approximations in most cases.
2. Certain areas which were classed as urban in the previous cemus have however, ceased to be as such. They are as under:-
1. Rojhan. (District D.G. Khan)
2. Attock Fort (District Cdropbellpur)
3. Jand. (District Campbellpur)
4. Temporary Military Camps. (Campbellpur)
5. Bhaun. (District Jhelum)
6. Chaktal. Cantonment (District Rawalpindi)
7. Garhi lkhtiar Khan ... (Bahawalpur State)
8. Ghau,pur. (Bahawalpur State)
9. Janpur. (Bahawalpur State)
10. Jajja Abbasian. (Bahawalpur State)
11. Khanbela (Bahawa lpur Stat e)
12. Kot Sabzal (Bahawalpur State)
13. Maharakpur. (Bahawalpur State)
14. Tajgarh (Bahawalpur State)
IS. Tarrandah Mohammad Panah (Baha walpur State)
3. The new areas raised to the status of urbanity in this census are as folIows:-
J. Badhana (District Lahore)
2. Kot Radha Kisban N .A.C .... (District Labore)
3. Lulliani Town. (District Lahore)
4. Raiwind N.A.C. (Di.triet Lahore)
5. Raja Jang N.A.C. (District Labore)
6. Shah Kot. (District Sheikbupura)
7. Rabwah N·A.C. (District Ihan,)
8. Samundri N .A.C. (District Lyal]pur)
9. Dipalpur N.A.C. (District Montgomery)
10. Haveli. N.A.C. (District Montllomeey)
tI. Renata KhlJrd N.A.C. (District Montgomery)
12. Abdul Hakim. N.A.C, (District Mullan)
ll. DUDyapur. (District Mullan)
14. Kabirwala Town. (District Multan)
IS. Lodran N.A.C. (District Multan)
16. Vehari N.A.C. (Dutrict Multan)
17. latoi Town. (District Muzatrargarh)
18. Cement Company. Wah. ,District Campbellpur)
19. Ordinance Factoey. Wah and Mansar and Wah Refulle. Camp. (District Campbellpur)
20. Kharian Town. (District Gujral)
21. PhaIia Town. (District Gujrat)
22. Gujar Khan. (District Rawalpindi)
23. Kalra Town. (District Shahpur)
24. Sadiq Ganj. (District BahawaIpur)
25. Khanpur Railway Colony, . (District Rahimyar
Khan)
26. Sadiqabad, (District Rahimyar Khan)
4. Persons claiming nationalities other than Pakistani are included in this table.
S. This Table is discussed in Chapter 4 of Part I of the Report.

1-9
TABLE l-A-POPULATION OF URBAN AREAS
Number of persons.
Districts I Urban Area : Urban Population
Names of Urban Localities Sq. I
! Miles i Total Males j Females ~~~------ -~-.----- ~.-~
PUNJAB INCLUDING BAHAWALPUR STATE 35,98,775 19,96,517 16,02,258
PUNJAB 596 34,04,218 18,87,141 15,17,077
Lahore Division 255 15,34,891 8,51,686 6,83,205
Gujranwala 40 2,51,057 1.35,129 1,15,928
Akalgarh Town 3.7 7,413 4,012 3,491 Eminabad Municipality 1.5 9,443 4,910 4,533 Gakkhar N.A.C. 3.7 8,775 4,768 4,007 Gujranwala Municipality Including 4.3 1,20,860 65,123 55.737
Refagee Camp Hafizabad Municipality 0.7 30,082 16,552 13,530 Kamoke Municipality 1.8 15,558 8,361 7,197 Pindi Bhatian Town 0.3 6,784 3,818 2,966 Qila Didar Singh Town 2.0 8,553 4,439 4,114 Ramnagar Town 8.7 4,987 2,530 2,457 Sohdra Town 3.7 5,575 2,843 2,732 Wazirabad Municipality 9.3 33,027 17,773 15,254
Lahore 145 9,80,821 5,49,202 4,31,619
Badhana 7.5 4,524 2,473 2,051 Chunian Municipality 1.5 9,892 5,230 4,662 Kasur Municipality 3.2 63,086 34,053 29,033 Khudian Town 0.5 6,292 3,384 2,908 Kot Radha Kishan N.A.C .... 2.6 8,657 4,590 4,067 Lahore Municipality and Cantt. 128 8,49,476 4,78,581 3,70,895
Lahore Cantonment ... 13 60,076 39,779 20,297 Lulliani Town 0.5 11,177 5,975 5,202 Pattoki Municipality 12,456 6,770 5,686 Raiwind N.A.C. 0.3 5,364 2,923 2,441 Raja lang N. A. C. 1.0 9,897 5,223 4,674
Sheikhupura 46.0 82,617 43,920 38,697
Chuharkana Town 19 6,585 3,543 3,042 Nankana Municipality 9.0 16,599 8,729 7,870 Sangla Town 4.0 9,379 5,018 4,361 Shahkot Town 4.0 11,230 5,964 5,266 Sharakpur Municipality 6.0 9,056 4,773 4,283 Sheikhupura Municipality 4.0 29,768 15,893 13,875
Sialkot 24 2,20,396 1,23,435 96,961
Chawinda Town 1.5 7,858 4,181 3,677 Daska N.A.C. 1.5 15,375 8,422 6953 Narowal Municipality 3.8 15,298 8,250 7,048 Pasrur Municipaltty 2.0 9.403 4,987 4,416 Sambarial Town 0.6 4,919 2,596 2,323 Sialkot Municipality (including Refugee 14 1,67,543 94,999 72,544
Camp and Cantt.) Sialkot Cantonment 11 32,142 23,836 8,306

1·10
TABLE 1.A-POPULATION OF URBAN AREAS-Contd.
Number of persons.
-- i
Districts Urban Area I Urban Population
Names of Urban Localities Sq. I Miles Total Males Females ------~------ -_ - ------_. __ -_.- .-~---~--
MuUan Division 132 10,43,846 5,68,053 4,75,793
Dera Ghazi Khan 8 74,999 40,503 34.496
Dajal Municipality 0'2 3,764 2,030 1,734 Dera Ghazi Khan Municipality 4'0 36,239 19,678 16,561 Jampur Municipality 13,235 7,072 6.163 Kot Chhutta Town O'S 2,693 1,430 1.263 Kot Mithan Municipality 0'5 3,675 1,947 1,728 Rajanpur Municipality 0'3 5,280 2,935 2.345 Taunsa Town 1'0 7,286 3,967 3,319 Vehoa Town 1'0 2,827 1.444 1,383
Jhang 28 1,35,307 73,037 62,270
Ahmedpur Town 7'0 4,620 2,489 2,131 Chiniot Municipality 1'5 39,070 20.994 18,076 Jhang Maghiana Municipality 10 73,402 39,744 33,658 Lalian Town 0'3 8,357 4,5(l6 j,851 Rabwah N. A. C. 1'5 2,684 1,431 1,253 Sborkol Town 7'5 7,174 3,873 3,301
Lyallpur 21 2,83,039 1,55,193 1,27,846
Chak Jhumra Municipality ... 0'3 8,058 4,496 3,562 Gojra Municipality .. , 1'0 20,407 11,014 9,393 Jaranwala Municipality 2'2 17,969 9,818 8,151 Kamalia Municipality 3'5 28,636 IS,137 13,499 Lyallpur Municipality 11 1,79,144 99,093 80,051 Samundri N. A. C. 0'8 6,637 3,558 3,079 Tandlianwala Municipality •.• 1'0 10,099 5,559 4,540 Toba Tek Singh Municipality 1'5 12,089 6,518 5,571
Montgomery 24 1,54,833 84,569 70,264
Arifwala N. A. C. 1.6 11,537 6,340 5,197 Chichawatni N. A. C. 2'0 12,083 6,587 5,496 Dipalpur N. A. C. 0'5 7,889 4,117 3,172 Haveli N. A. C. 1'3 8,480 4,555 3,925 Montgomery Municipality 6'7 50,185 27,836 22,349 Okara Municipality 1'7 35,358 19,392 15,966 Pakpattan Municipality 6-0 24,326 13,036 11,290 Renalakhurd N. A. C. 4.3 4,975 2,706 2,269
MuHan ... 37 3,41,307 1,85,774 1,55,533
Abdul Hakim N_ A. C. 6'0 5,155 2,920 2,235 Burewala N. A. C. 1'7 15,383 ~,585 6,798 Dunyapur Town ... 0'2 5,786 2,933 2,853 Jalalpur Pirwala Town 1'0 8,488 4,491 3,997 Kabirwala Town 0'3 4,330 2,244 2,086 Kehror Pakka Town 15,322 7,802 7,520 Khanewal Municipality 7-7 37,915 20,786 17,129 Lodran N. A. C .... 3'2 4,890 2,694 2,196 Mailsi Town 0'9 10,242 5,490 4,752 Mian Channu Municipality 1'1 12,071 6,525 5,546 Multan Municipality and Cantt. 13 1,90,122 1,04,478 85,644
Mullan Cantonment 4'5 ]4,693 9,489 5,204 Shujabad Municipality 14,601 7,647 6,954 Tulamba Town 0-2 8,016 4,196 3,820 Vehari N. A. C .... 1'6 8,986 4,983 4,003

i-I!
TABLE loA-POPULATION OF URBAN AREAS- Contd.
Number of persons.
c~_~_~·--,-----------------------,
Districts Names of Urban Localities
Muzaffargarh .
Alipur Municipality ]atoi Town Karor Municipality Khangarh Municipality Kot Addu Town Leiah Municipality Muzafi"argarh Municipality
Rawalpindi Division
Campbellpur
Campbellpur Municipality and Cantt, Campbell pur Can tt.
Cement Company Wah Faleh Jang Town Hasanabdal Municipality Hazro Municipality Refugee camps Ordnance Factory Wah & Mansar &
Wah Pindigheb Municipality Talagang Town ...
Gujrat ...
Dinga Municipality Gujrat Municipality Jalalpur Jattan Municipality Khanan Town ... Kunjah Municipality Lalamusa Municipality Malkwal Town .. , .. Mandi Bahauddin Municipality Pbalia Town
Jhelum
Chakwal Municipality Jhelum MunicipalIty & Cantt. & Kala
Refugee Camp Jhelum Cantonmelll .,
Pind Dadan Khan Municipality
Mianwali
Bhakkar Municipality Isakhel Mumcipality Kalabagh Municipality Kallurkot Town Mianwali Municipality
Rawalpindi Oujar Khan Municipality ... Murree Municipality and Cantonment.
Murree Cantonment Rawalpindi M'pality and Cantonment.
Rawalpindi Cantonment
Urban Area I Urban Population Sqr. 1---------- --- -- ---- -Miles Total I Mal , es
14
1'5 0'5 3'0 0'5 1'5 4'5 2'0
209
17
0'6 0'5 0'2
1'6 14
43
3'0 18
1'0 1'0 1'3 3'0 5'5 7-2 3'0
49
7-3 27
11 14
11
2'0 1'0 2'0 2'0 4'0
38 0'7
19 3'3
18 14
54,361
5,933 4,744 2,584 4,408
10,507 14,914 11,271
8,25,481
90,075
17,689 7,554 1,663 5,127 6,349 7,512
32,823
10,157 8,755
1,31,183
7,570 46.986 18,154
4,598 8,822
17,958 6,106
17,175 3,814
77,275
13,319 56,617
9,208 7,339
58,204
12,397 6,366
10,523 5,577
23,341
2,55,128
8,503 9,406 5,706
2,37,219 84,149
28,977
3,058 2,485 1,604 2,312 5.491 7,807 6,220
4,67,402
50,607
11,728 5.947
943 2,708 3,497 4.032
18,124
5,123 4,452
70,308
4,119 25,309
9,571 2,409 4,598 9,688 3,416 9,251 1,947
43,837
7,207 32,703
7,679 3,927
30,991
6,694 3,227 5,520 2,913
12,637
1,56,201 4,771 7,157 4,804
1,44,273 56,843
Females - --I
25,384
2,875 2,259
980 2,096 5.016 7,107 5,051
3.58,079
39,468
5,961 1,607
720 2,419 2,852 3,480
14,699
5,034 4,303
60,875
3,451 21,677
8,583 2,189 4,224 8,270 2,690 7,924 1,867
33,438
6,112 23,914
1,529 3,412
27,213
5,703 3,139 5,003 2,664
10,704
98,927 3,732 2,249
902 92,946 27,306

1-12
TABLE l.A-POPULATiON OF URBAN AREAS-Colltd.
Number of persons.
I I
Districts Urb~~.Area 1 ___ Urban Population
Names of Urban Localities Miles I Total Males Females I
"'---~.----~-- ~-------.-------------- --- -- -----~-- --~---
Shah pur 51 2,13,616 1,15,458 98,158
Bhalwal Municipality 0'5 8,678 4,706 3,972 Bhera Municipality 1'0 16,644 8.768 7,876 Hadali Town ... 1'0 11,348 5,898 5,450 Jhawarian Town 13 6,250 3,439 2,811 Kalra Town J6 5,085 2,744 2,341 Khushab Municipality 1'0 20,476 10,845 9,631 Kot Moman Town 1'3 9,061 4,847 4,214 Miani Municipality 0'5 6,069 3,186 2,883 Mitha Tiwana Town 2'0 12,380 6,587 5,793 Nurpur Urban '" 1'0 4,964 2,692 2,272
Phullarwan Municipality 0'5 9,297 5,054 4,243 Sahiwal Municipality 1'0 8,406 4,288 4,1l8 Sargodha Municipality 7'0 78,463 43,401 35,062 Shahpur Chhauni 5'0 3,948 2,206 1,742 Shahpur City .. , 5,330 2,822 2,508 Sillanwali Municipality 0'5 7,217 3,975 3,242
BAHAWALPUR STATE 1,94,557 1,09,376 85,181
Bahawalpur 1,12,373 62,772 49,601
Bahawalnagar Municipality .. , 18,373 10,118 8,255
Bahawalpur M'pality & Cantonment 41,646 23,368 18,278 Bahawalpur Cantonment 948 845 103
Chistian Municipality 10,270 5,799 4,471 Fort Abbas Municipality 2,499 1,535 964 Haroonabad Municipality 10,014 5,552 4,462
Hasilpur Municipality 3,490 1,952 1.538 Khairpur Municipality 8,270 4,679 3,591 Khanga Sharif '"
5,593 3,258 2,335 Minchinabad Municipality.,. 4,906 2,581 2,325 Qaimpur Municipality 2,730 1,447 1,283 Sadiqganj Municipality .. , 4,582 2,483 2,099
Rahimyarkhan 15 82,184 46,604 35,580
Ahmadpur East Municipality 2'0 20,423 11,007 9,416 Ahmadpur Lamma Municipality O'S 5,044 2,757 2,287 Allahabad Municipality O'S 2,725 1,499 1,226 Chachran Sharif Municipality O'S 2,954 1,538 1,416 Dera Nawab Sahib Municipality 2'5 5,816 3,743 2,073 Goth Chani Municjpality .. , 0'5 1,689 937 752
Khanpur Municipality 2'0 13,484 7,530 5,954 Khanpur Railway Colony ... 1,740 1,034 706 Kot Samaba Town 0'5 1,716 980 736 Rahimyarkhan Municipality 2'0 14,919 8,876 6,043 Sadiqabad Municipality 1'5 5,758 3,465 2,293 SanjarpurMunicipality 0'5 1,744 952 792 Deh Sharif Municipality 1'0 4,172 2,286 1,886


2-1
TABLE 2-TOWNS AND CITIES
1. In this Table Cities and Towns are listed in order of size of population and are grouped in four classes, viz.:-
Class 1-100,000 or ove.r inhabitants.
Class II-25,OOO and under 100,000.
Class II1-10.000 and under 25,000.
Class IV-5,000 and under 10,000.
These classes correspond with the classes recommended by the Population Commission of United Nations, but differ from the classes used in previous censuses of India. In Punjab, there are six· cities in Class I. viz., Lahore, Lyallpur, Multan, Rawalpindi, Sialkot and Gujranwala.
2. For Census purposes a town is defined as an urban area consisting of a continuous collection of houses inhabited by not less than 5,000 persons.
3. The population figures of cantonments have been amalgamated in this table with those of the cities and towns adjacent to which they are situated. Separate figures for cantonments have been shown in Table I-A.
4. This Table ~xcludes persons of non-Pakistani citizenship and does not therefore agree with the numbers shown in Table I-A. This agrees. however, with Table 6.
5. Figures for Muslims shown in this Table include the !lumber of Muhajirs (refugees) which are also shown separately in the last column.
6. The source of the information regarding the form of local-self government authorized for each city and town is the appropriate department of the Province or State.
7. This Table is discussed in Chapter 4 of Part J.

2-2
TABLE 2-TOWNS AND CITIES
URBAN Areas by order of size of Population
Number of persons.
Form of I Total l I __ ~~ ~_~~~ ON_: ______ _i Town and City Local-Self fpo ulation r i I 1M uhajirs
Government p i Muslim2 I <::aste !Scheduled ~t~er I i I Hmdu I castes !RehglOns/
______________ ~ __ ~_'"__j________ I , I _
Total
Lahore (Including Cantts.)
Rawalpindi (Includ-ing Cantt:)
Multan (Including Cantt:)
LyalJpur Sialkot (Including
Cantt: & Refugee Camp)
Oujranwala (Includ-ing Refugee Camp)
Total
Sargodha Jhang Magbiana Kasur ... Montgomery Oujrat .,. Babawalpur (Includ-
ing Cantt:)
Chiniot ... Jhelum ([neluding
Cantt:) Kbanewal Ders Ghazi Kkan ... Okara ... Wazirabad Haflzabad Sheikbupura Kamalia
Total
Pakpattan Mianwali Khusbab Gojra
..
CLASS 1-1,00,000 and over
17,43,817 16,94,707 395
Corporation & Cantt: Board. ... 8,49,333 8,17,236 215
Municipal & Cantt: Board 2,36,877 2,33,842 20
Municipal & Cantt: Board ... 1,90,122 1,89,480 3
Municipal Committee 1,79,127 1,73,459 9
Municipal Committee &Cantt: Board 1,67,506 1,61,312 137
Municipal Committee 1,20,852 1,19,378 11
CLASS 11-25,000 and under 1,00,000
6,61,977 6,51,418
Municipal Committee 78,447 76,834 Municipal Committee 73,397 73,347 Municipal Committee 63,086 60,598 Municipal Committee 50,185 48,907 Municipal Committee 46,971 46,575
Municipal Committee & Cantt: Board 41,646 41,388
Municipal Committee 39,042 38,976 Municipal Committee & Cantt: Board 38,567 37,756
MunicJpal Committee 37,915 37,118 Municipal Committee 35,909 35,887 Municipal Committee 35,350 34,772 Municipal Committee 33,027 32,657 Municipal Committee 30,082 29,394 Municipli Committee 29,717 28,752 Municipal Committee 28,636 28,457
CLASS III-I0,OOO and under 25,000
Municipal Committee Municipal Committee Municipal Committee Municipal Committee
6,12,561
24,326 23,340 20,467 20,407
6,02,636
24,219 23,073 20,467 18,961
22
2
16
2
48
2,034
1,545
92
73 27
297
495
314 3
99
I 15
9
57
794
41
46,681 7,87,316
30,337 3,65,954
2,923 88,553
566 93,586 5,632 1,24,347
5,760 54,176
1,463 60,700
10,042 3,27,692
1,612 54,030 50 46,513
2,172 20,022 1,278 31,633
396 9,738
143 16,854 66 14,608
809 10,787 782 24,351 22 14,510
567 24,871 370 10,802 631 16,071 965 16,150 179 16,752
9,083 2,98,551
107 13,0291 267 4,234 I
6,686 i 1,405 13,808
I ______ ---.---~--.--~,------~------------- ,
NOTEs.-l. Excluding persons claiming Nationalities other than Pakistani. 2. Includes figures for Muhajirs wbich are also shown separately in last column.

2-3
TABLE 2-TOWNS AND CITffiS-Contd.
URBAN Areas by order of size of Population Number of Persons.
. RELIGIONS [
Town and City Form of Local Self- : Total I-~~~:--~-~~~-------~-- I Government .0POI'l,onl i I : Muh,;'"
: Muslim: C~ste (Scheduled I ~ther ! I Hmdu: caste1 Religions
: I --~--------------
______________ o_ ~_~ _________ ~~ __ ~ ___ • _____ ~ _______
CLASS I1I-(contd.)
Ahmadpur Bast Municipal Committee 20,404 20,354 50 8,145 Bhawalnagar Municipal Committee 18,373 18,172 122 79 13.187 Jalalpur Jattan Municipal Committee 18,138 17,957 181 4,964 Jaranwala Municipal Committee 17,969 17,463 506 12,312 Lalarnusa Municipal Committee 17,954 17,735 5 214 6,990
Campbellpur (Inclu- Municipal Committee ding Cantt.) & Cantt: Board 17,671 17,056 38 236 341 3,694
Mandi Bahauddin Municipal Committee 17,171 16,930 241 10,956 Bhera Municipal Committee 16,632 16,630 2 4,267 Nankana Municipal Committee 16,505 16,336 169 12,098 Kamoke Municipal Committee 15,558 15,080 478 9.716
Daska Municipal Committee 15,375 14,894 481 6,497 Burewala Notified Area Com-
mittee. 15,372 15,139 233 11,635 Kehror Pakka Municipal Committee 15,322 15,322 8,650 Narowal Municipal Committee 15,298 14,259 143 896 4,832 Rahimyarkhan Municipal Committee 14,919 14,825 94 7,212
Leiah Municipal Committee 14,913 14,913 5,989 Shujabad MuniCipal Committee 14,601 14,601 10,561 Khanpur Municipal Committee 13,457 13,382 1 40 34 6,203 ChakwaJ Municipal Committee 13,310 13,136 1 173 2,814 Jampur Municipal Committee 13,235 13,235 5,232
Pattoki Municipal Committee 12,456 1l,988 , 468 7,065 Bhakkar Municipal Committee 12,397 12,397 5,997 Mitha Tiwana None 12,380 12,380 1,915 Toba Tek Singh Municipal Committee 12,089 11,635 454 8,154 Chichawatni Municipal Committee 12,083 11,846 237 8,308
Mian Channu Municipal Committee 12,071 11,864 207 8,405 Arifwa1a Notified Area Com-
mittee. 11,537 11,324 213 8,601 Hadali None 11,348 11,348 1,342 Muzaffargarh Municipal Committee 11,27l 11,265 6 7,410 Shahkot None 11,230 10,674 555 4,081
Lulliani None 11,177 10,305 872 5,256 Kalabagh Municipal Committee 10,523 10,514 9 3,OR6 Kot Addu Municipal Committee 10,507 10,507 6,625 Chishtian Municipal Committee 10,270 10,260 10 7,734
Mailsi Municipal Committee 10,242 10,185 57 6,852 Pindighab Municipal Committee 1O~150 10,142 8 552 Tandlianwala Municipal Committee 10,09') 9,928 5 166 6,005 Haroonabad Municipal Committee 10,014 9,935 57 22 7,452
CLASS IV-S,OOO and under 10,000
Total 4,08,551 4,01,270 52 177 7,052 1,58,272
Raja Jang Notified Area Com- 9,897 9,275 622 5,339 mittee.

2-4
TABLE 2-TOWNS AND CITIES~Contd.
URBAN Areas by order of size of Population Number of persons.
Town and City Form or Local SelfGovernment
___ RELIGIONS 1
1 Total I I I I Muhajirs IPoPulation
l Muslim Caste Scheduled, O~her I
i Hmdu I caste !Rehgions, i • I .
---~.---~--' ~. ------_._-----_--'._--'-- ------
Chunian Eminabad Pasrur Murree (including
Cantt:) Sangla Phullarwan Kot Moman Town Sharakpur
Vehari
Kunjah Gokkhar
Talagang Bahaiwal
Kot Radha Kishan
Municipal Municipal Municipal Municipal & Cantt:
Municipal Municipal
None Municipal
Notified
Municipal Notified
Municipal Municipal
Notified
CLASS IV-(contd.) Committee 9,892 9,430 Committee 9,443 9,265 Committee 9,403 8,737 Committee
Board Committee Committee
Committee
Area Committee
Committee Area Com
mittee Committee Committee
Area Com-
9,398 9,379 9,297 9,061 9,022
8,986
8,822
8,775 8,755 8,674
9,398 8,567 9,272 9,061 8,709
8,986
8,749
8,241 8,750 8,605
8,307
Qila Didar Singh ... Municipal mittee
Committee Committee Committee
8,657
8,553 8,496 8,488
8,189 8,385 8,488
Gujar Khan Municipal Jalapur Pirwa}a Municipal
Haveli
Sahiwal Lalian Khairpur
ChakJhumra Tulamba Dipalpur
Chawinda
Dinga Hazro Akalgarh Pind Dadan Khan •.•
Taunsa Sillanwall Shorkot Pindi Bhatian
Samundri Chuharkana Isakhel Hasan Abdal
Khudian Jhawarin Malkwal Miani
Notified Area Com-mittee
Municipal Committee Municipal Committee Municipal Committee
Municipal Committee Town Committee
Notified Area Committee
Town Committee
Municipal Committee Municipal Committee Municipal Committee Municipal Committee
None MuniCIpal Committee
Town Committee Municipal Committee
Municipal Committee Municipal Committee Municipal Committee Municipal Committee
Town Committee None
Municipal Cnmmittee Municipal Committee
8,480 8,406 8,357 8,270
8,058 8,016
7,889 7,858
7,564 7,512 7,413 7,318
7,253 7,217 7,174 6,784
6,637 6,585 6,362 6,343
6,292 6,241 6,106 6,063
8,418 8,406 8,343 8,240
7,741 8,008
7,874 7,515
7,564 7,508 7,103 7,317
7,253 7,217 7,174 6,714
6,637 6,392 6,362 6,295
5,961 6,241 6,106 6,063
17
18
6
11
5
21
4 1
456 178 638
812 25
313
73
534
69
3jO
364 III
62
14 9
317 8
15 325
309 1
70
193
48
331
4,229 3,339 1,204
3,406 5,665 5,011 1,666 1,142
6,445
1,807
2,164 546
5,580
4,851
2,851 3,389 3,852
4,452 3,230 4,399 2,880
5-,380 5,380
3,290 2,114
2,706 834
3,096 1,384
212 5,560 3,984 1,436
4,793 4,092
33 966
3,162 788
2,640 2,191

2-5
TABLE 2-TOWN AND CITIES-Coneld.
URBAN Areas by order of size of Population Number of Persons. -
!tELl GIONS Form of Local Self Total Town and City Government Population M.ilimj ea"';""""",o,/ 0",,"'
Muhajirs
Hindu caste ReligIOnS
----~-----
Alipur ... Municipal Committee 5,933 5,933 ... ... 3,799 Dera Nawab Sahib ..• Municipal Committee 5,814 5,581 17 118 98 1.001 Duoyapur ... Town Committee 5,786 5,786 ... ... . .. 4,274 Sadiqabad ... Municipal Committee 5,739 5.695 ... 6 38 3,254 Khanga Sharif ... Municipal Committee 5,593 5,588 ... 5 '" 2 695 Kallur Kot ... Municipal Committee 5577 5,577 ... '" . .. 3,702 SoMra ... Town Committee 5,575 5,485 '" ... 90 778 Raiwind ... Notified Area Com- 5,364 4.821 '" ... 543 2,236
mittee
Shahpur City ... Town Committee 5,330 5,316 ... . .. 14 1.845 Rajanpur ... Municipal Committee 5,280 5,280 ." ... . .. 1,357 Abdul Hakim '" Notified Area Com- 5,154 5,145 ... ... 9 1,559
mittee Fateh Jang ... Municipal Committee 5,126 5,126 ... ... . .. 256 Kaira ... None 5084 5,071 ... ... 13 28 ,


3-1
TABLE 3-VARIATIONS
This table shows decennial changes in population since 1901. The population analysed in this table is the total population including persons claiming nationalities other than Pakistani. Three figures are shown under each Census data for each geographical area; two of these, one below the other, represent, first, the total population in the census year, and second, the increase or decrease in population since the previous census; the third figure at the side of the column shows this increase or decrease expressed as a percenta-ge of the population at the pervious census. Variations for the decade 1891/1901 are not shown. The figures shown for variations are preceded by a MINUS sign where the difference is a decrease; if no sign is shown the difference is an increase.
2. The figures shown in this table for the census enumeration from 1901 to 1941 are the same as those shown in the previous census reports of India, except in the cases of Lahore & Sialkot. These differences are mainly due to partition. The changes in areas are detailed in the title-sheet of Table 1. The approximate effect of these changes in the population of the districts concerned has been estimated and the figures adjusted accordingly to give the comparative population of the present areas.
3. Details are given below of the adjustments in population from 1901 to 1941 of the districts of Punjab which have either been increased or decreased as a result of the partition of the Punjab:
District
Lahore
Sialkot
1--1941 1931 1921 1911 I 1901
I -~------.~------,-------.-------------
-1,82,335 -1,65,596 -1,27,883 -1,13,133 -1,13,624
2,91,505 2,47,363 2,12,849 2,10,447 2,34,465
4. This table is discussed in Chapter 3 of the Report.

3-2 TABLE 3-VARIATION
Decennial changes in population since-1901
Number of personii.
Total populationl and Variations2 in number and percentage
District, Towns & 1901 I 1911 - _ 1921 I ---193-1 ----1941 -----195;--
Municipalities -_ ----------- - -----1"- ----- -- --------,
Per- N b Per-I N b Per- N Per-' Per-Number i Number cent um er cent
l um er cent umber cent Number cent
---.. ~-- ._" --------- --- - - - -- - ----
PUNJAB INCLU- 1,03,14,090 1,09,90580 1,17,60,170 1,38,74,837 1,71,67,768 2,06,51,140 DING BAHA- 6,76,490 7,69,590 21,14,667 32.92,931 3483,372 WALPUR STATE 6.6 7.0 18.0 23.7 20.3
PUNJAB ... 95,93,213 1,02,09,939 1,09,78,979 1,28,90,225 1,58,26,559 1,88,28,015 6,16,726 7,69040 19,11,246 29,36,334 30,01,456
6.4 7.5 17.4 22.8 19.0
Lahore Di"ision ... 33,20,753 31,14,384 33,50,523 38,72,459 47,59,784 53,39,873 -2,06,369 2,36,139 5,21,936 8,87,325 5,80,089
-6.2 7.6 15.6 22.9 12.2
Gujranwala District 7,39,546 6,05,582 6,23,581 7,36,138 9,12,234 10,47,032 -1,33,964 17,999 1,12,557 1,76,096 1,34,798
-18.1 3.0 18.1 23.9 14,8
Aka/garh Town ... (4,961) (3,943) ... (5,483) (6,546) (7,413) (-1,018) ... ... (1,063) (867)
-20.5 ... ... 19.4 13.2
Eminabad Muni- (6,494) (5,526) (5,816) (7,329) (8,679) (9,443) cipaiily (-968) (290) (1,513) (/,350) (764)
-14.9 5,2 26.0 18.4 8,8
Gakkhar N.A,C. ... ... .. . ... (6,929) (8, 775~ .. , ... .. . '" (1,846 ... ... '" ... 26.6
Gujranwaia Muni- (29,224) (29,472) (37,887) (58,716) 184,545) 0,14,201) cipalily (248) ( 8,415) (20,829) (25,829) (29,656)
0.8 28.6 55.0 44.0 35.1
Hajizabad Munl- (4,597) ... (8,854) (14,431) (17,093) (30,082) cipality ... ... (5,577) (2,662) (12,989) ... .. , 63.0 18.4 76.0
Kamoke Munici- ... ... ... . .. (11,602) (15,558) pality ... ... ... '" (3,956) ... . .. ... .., 34.1
Pindi Bhatian ... .. , ... (4.478) (5,653) (6,784) Town ... ... . .. (1,175) (J ,131) .. , .. , ... 26.2 20.0
Qila Didar Singh 2,705 ... ... .. . (6,127) (8,553) Town ... ... . .. .. . (2,426) ... ... ... ... 39.6
Ramnagar Town (7,121) (5,256) (4,632) (4.76X) (5.193) (4,987) (-1,865) (-624) (136) (425) (-206)
-26.2 -11.9 2.9 8.9 -4.0
Notes: 1, Adjusted to apply to present boundanes wherever necessary. 2. Variation~ are shown in italics. (-) minus sign denotes decrease: no sign denotes increase.

TABLE 3-VARIATION-Contd.
Decennial changes in population since-1901
Number of persons.
Total population and Variations in number and percentage ------
District, Town & 1901 1911! 1921 i 1931 ! 1941 I 1951 Municipalities ------- ---- - -! ---------I-----I~------- -1---- ---
______ ~ _______ j~~mber ____ Num~er ~:~1_~umb:__~~~ Number ~~~I ~~mber ~:~~ ~u~~e~ _~~j Gujranwala Dis··
trict-(contd).
Soltdra Town .,. (5,050)
Wazirabad Muni- (18,069) cipality
Lahore District. .. 8,90,238
Cilulliall J'\Junici- (8,959) PQ/ity
Kasur lY[lInicipa!ity (22,022)
Khudian Town (3,401 )
KOI Radha Kishan N.A. C.
Lahore Can- (16,080) ronment
Lahore City (1,86.884)
Lulliani Town
Pat/oki MlIllici-pality
Raiwind N. A. C.
Raja Jang N.A.C.
(17,146) (18,645) (-923) (1,499)
-5.1 8.7
8,86,388 10 01,956 (-3,850) (! ,15,568)
-0.4 13.0
(7,151) (7,642) (-1,8G8) (491)
-20.2 6.9
(24,783) (31,018) (2,761) (6,235)
12.5 25.2
(2,992) (-409)
12.0
(18.416) (24.486) (2,336)
14.5 (6,070)
33.0
(2,10,271) (2,57,295) (23,387) (47,024)
12.5 22.4
(20,707) (2,062)
1 [,1
12,12,974 (2,11,018)
21.1
(8,269) (627)
8.2
(46,815) (15,797)
50.9
(29,672) (5,186)
21.2
(4,00,075) (1,42,780)
55.5
(8,016)
(6,164)
(27,079) (6,372)
30.0
15,13,040 (3,00,066)
24.7
(10,093) (1,824)
22.1
(53,101) (6,286)
13.4
(4,969)
(39,523) (9,851)
(5,575) (-589)
(33,027) (5,948)
18,95,228 (3,82,188)
(9,892) (-201)
(63,086) (9,985)
(6,292) (1,323)
(8,657)
(60,076)
33.2 (20,553)
(6,32,136) (7,89,400) (2,32,061) (1,57,264)
58.0
(11,177)
(11,114) (12,456) (3,098) (1,342)
38.6
(5,364)
(9,891)
-9.6
22.0
25.3
-2.0
18.8
26.6
52.0
24.9
12.1

3-4
TABLE 3-VARIATION-Contd.
Decennial changes in population since-1901 Number of persons.
1-19o-1--T
Total population and Variations in number and percentage ---------~ ----
District 1911 1921 1931 1941 1951 Town and -_._------ ----- ----------
Municipality. ~lI~h-~-1 Num- Per Num- Per- Num- Per Num- Per- I Num- Per-ber cent. i ber cent. ber cent. ber cent. I ber cent.
---------- ---- ---_--
Sheikhupura Dis- 5,23,299 5,40,317 6,34,270 6,96,367 8,52,508 9,23 360 trict 17,018 93,953 62,097 1,56,141 70,852
3.3 17.4 9.8 22.4 8.3
Chuharkana (6,071) (6,585) Town (514)
8.5
Nankana Munici- (9,155) (12,981) (16,599) pality (3,826) (3,618)
41.8 27.9 Sangla Town (6,478) (5,721) (9,379)
(757) (3,658) 11.7 63.9
Shakot Town (11,230)
Sharakpur Muni- (4,474) (4,482) (4,127) (5,506) (6,764) (9,056) cipality (8) (-355) (929) (1,708) (2,292)
0.2 -7.9 22.5 33.8 33.9
Sheikhupura Muni- (3,487) (12,166) (22,272) (29,768) cipality (8,679) (10,106) (7,496)
248.9 83.1 33.7
Sialkot District 11,67,670 10,82,097 10,90,716 12,26,980 14,82,002 14,74,253 -85,573 8,619 1,36,264 2,55,022 -7,749
7.3 0.8 12.5 20.8 -O.~
Chawinda Town (4,695) (6,41!) (7.175) (7,858) (764) (683)
11.9 9.S
Deska N. A. C. (6,655) (6,046) (6,283) (8,636) ( 3,719) (15,375) (-609) (237) (2,353) (5,083)
58.9 (1,656)
-9,2 3.9 37.5 12.1
Narowal Muni- (4,422) (7,095) (12.021) (15,290) cipality (4,926) (3,277)
69.4 27.3
Pasrur Munici- (8,335) . (7,564) (6,909) (7,905) (10,523) (9,403) pality (-771) (-655) (996) (2,618) (-1,120)
-9.3 -8.7 14.4 33.1 -10.6 Sambarial Town (6,285) (3,324) (3,827) (4,320) (4,919)
(-2,961) (503) (493) (599) -47.1 15.1 12.9 13.9
Sia'kot Canton- (13,167) (16,274) (14,601) (15,851) (19,745) (32,142) ment .(3,107) (1,673) (1,250) (3,894) (12,397)
23.6 10.3 8.6 24.6 62.8
Sia'kot Munici- (44,789) (48,595) (56,OIS) (85,122) (1,18,963) (1,24,273) pality (3,806) (7,423) (29,104) (33.841) (5,310)
S.5 15.3 S2.0 39,8 4.~

3-5
TABLE 3~ VARIATION-Contd.
Decennial changes in population since-1901 Number of Persons.
I Total population and Variations in number and percentage 1- --------~~-~~-
District. Town & : 1901 1911 1921· 1931 1941-- 1 --1951---Municipality I_--~- ------ --- --~I-~-------~ ---~-
Multan Division
i Nom- Per- i Num- per II Num- Per /1 Num-Number I
I ber cent I ber cent ber cent ber
31,65689 37,42,503 5.76.814
18.2
41,67.746 4,25,243
11.4
51,02,917 63,65,817 9,35,171 12,62,900
22.4
Per . Numcent: ber
24.7
83,35,291 19,69,474
Per cent
30.9
Dera Ghazi Khan 4,95,873 5.28,447 4,95,810 5,20,686 6,21.596 6,30,694 District 32,574 -32,637 24,876 1.00,910 9,098
Dajal Municipality
Dera Ghazi Khan Municipality
Jampu1' Municipality
Kat Chutta Town
6.6 -6.2
(6,213) (6,893) (680)
10.9
(23,731) (18,466) (-5,265)
-22.2
(5,928) (6,517) (589)
9,9
(5,775) (-1,118)
-16.2
(20,731) (2,265)
(7,317) (800)
12.3
12,3
5.0 19.4 1.S
(6,186) (411)
7'l
(23,468) (2,737)
13.2
(9,430) (2,113)
28.9 t2,619)
(6,378) (192)
(32,139) (8,671)
(11,862) (2,432)
(3,064) (445)
3.1
36.9
25.8
17.0
(3,764) (-1,6]4)
-41'0
(36,239) (4']00)
(13,235) (J ,373)
12.8
11,6 (2,693) (-371)
-12.1
Kat Mithan Muni- (3,487) (2,589) (3,204) (615)
23.8
(2,680) (~524)
-16,4
(S ,889) (~,675) (3,209) (--2,114) cipality ( -898)
Rajanpur Municipality
Taunsa Town
Vehoa Town
Jhang District
Ahmadpur Town
Chiniot Municipality
(3,917)
4,26,225
(15,685)
-25'S
(3.704) (-213)
-5.4 (5,965)
5,24,803 98,578
23.1
(3,964) (260)
7.0 (5,103) (-862)
-14.5
5,70,559 45,756
(4,045) 8.7
(4,510) (546)
(7,506) (2,403)
(3,089)
13.8
47.1
6,64,833 94,274
16.5
(5,045) (1,000)
24.7
119.7 -37,6
(5,394) (884)
(8,701) (1,195)
(3,781) (692)
19.6
15.9
22.4 8,21,631 1,56,798
(6,248) (1,203)
23.6
23,S
(5,280) (-114)
-2.1 (7,286)
(-1,415) -16.3
(2,827) (-954)
-25.2 8,76,761
55,130 6.7
(4,620) (-1.628)
-26.1
(14,085) (n,SI3) (25,841) (34.437) (39.070) (-1,600) (3,428) (8,328) (8,596) (4,633)
-10.2 24.3 47.6 33.3 13.5
JhangjMaghiana (24,382) (25,914) (30,139) (36,035) (50,051) (73,402)
I
Municipality (1,532) (4,225) (5,896) (14,0/6) (23.351) 6.3 16.3 19.6 38.9 46.7
Lalian Town (3.216) (5,216) (8,357) (2,000) (3,141)
62.2 60,2 ----_____:

3-6
TABLE 3-vARIATION-Contd.
Decennial cbanges in population since-ll)Ol
Number of persona.
Total population and Variations in number and percentage ~---~~-----
District, TOWIl & 1901 I 1911 1921 1931 I 1941 I 1951 I Municipality -.-.-~~~
f :->-.. -~--: I Num-
-~--~
I Number Per Num- Per Num- Per: Num- Per I Num- Per I I ber cent ber cent ber cent i ber cent ber cent --~------.. --
Jbang District-(contd.)
Rabwah N.A.C. ... ... ... .. . .. . (2.684) ... ... . .. '" ... ... ... ... ...
'"
Shorkot Town ... . .. (5,317) (6,826) (5,786) (7.174) .. , ... (I ,509) -(1,040) 1,388 28.4 -15.2 24.0
Layallpur District 5,86,009 8,36,372 9,68,063 11,66,702 13,96,305 21,52,863 2.50,363 1,31,691 1,98,639 2,29,603 7,56,558
42.7 15.7 2M 19,7 54.2
Chak Jhumra '" ... ... ... (4,764) (8,058) Municipality (3,294) ... ... . .. ... 69,1
Gojra Munici- ... (5,417) (7.622) (9,779) (12,964) (20,407) palily ... (2,205) (2,157) (3,185) (7,443) ... 40.47 28.3 32.6 57.4
laranwala Muni- '" ... ... (7,320) (9,833) (17,969) cipalilY ... (2,513) (8,136)
'" ... ._ 34.3 82.7
Kamalia Munici- (6,976) (8,237) (8,916) (13,220) (14,295) t28,636) pality (1,261) (679) (4,304) (J,075) (14,341)
18.1 8.2 48.3 8.1 100.3
Layallpur Muni- (9,171) (19,578) (28,136) (42,92~ (69,930) (1,79,144) cipality (10,407) (8,558) (14,78 (27,008) (1,09,214)
113.5 43.7 52.6 62.9 156.2 Samundri N.A.C. -- ... ... .., ... (6,637)
.. . ... ... ... .. . ... Tandlianwala Mu- ... . .. ... (6,105) (7,875) (10,099)
"iclpality ... (J,770) (2,224) " ... ... 29.0 28.2
, Toba Tek Singh ... ... (5,041) (5.903) (6,666) (12,089) :
Municipality ... ... (862) (763) (5,423) ... ... 17.1 12.9 81.4
Mon~gomery Dis- (4,29,674) 4,81,965 6.85,690 9,99,772 13,29,103 18,16,120 tnet. 52,291 2,03,725 3,14,082 3,29,331 4,87,017
12.2 42.3 45.8 32.9 36.6 Arifwala N.A.C. ... '" ... ... (7,553) (11,537)
... ... ... ... (3,984) ... ... ... ... !!2.7
Chichawatni ... ... ... (4,387) (7,986) (12,083) N.A.C. '" ... '" (3,599) (4,097) ... ... . .. 82.0 ~1.3

3-7
TABLE 3-V ARIATION-Contd.
Decennial changes ia population since-1901 Number of personS.
-----~---------------------------------------------------
District, Town & Municipality
Dipalpur N.A.C.
Havell N.A.C.
Montgomery Municipality
Okaro MUlli-cipality.
Pakpattall Municipality
Renala Khurd N.A..C.
Multan District
Abdul Hakim N.A.C.
Burewa/a N.A.C.
D"nyapur Town
Jala/pur Pirwala Town
Kabirwala Town
Kehror Pakka Town
Kha1ll'!wa1 MUIlI. cipality
Lod"ra/J N.A.C .
... _,_r __ ,_ .. ______
Total population and variations in number and percentage ~- ~~~~'-~------:--~_-~--~------'l---
1901 I 1911 1921 I 1931 1941! 1951 _ -_- ----I--~---- ~-~--. -~ . i --. ------1 -~----
Numbe: _[~ll:b~_~:~~ __ ~umber ~:~~ I_Numeer ~~~; I Number ~:~~ I Number ~:~~
(7,889)
(8,480)
(6.602) (8,129) (14,601) (26.164) (38.345 ) (50,185) (1,527) (6.47}) (11.563) (12.181) (11,840)
23.1 79.6 79.2 46.6 30.9
(l0,712) (19,315) (35,358) (8,609) (16,043)
80.3 83.1
(6,192) (7,912) (7,218) (11.311) (17,852) (24.326) (1,720) (-694) (4,()93) (6,541) (6,474)
27.8 -8.8 56.7 57.8 36.3
(4,975)
7.00,227 8,01,455 8,79,146 11,59,549 14,84,333 21,07,603 1,01,228 77,691 2,80,403 3,24,784 6,23,270
14.5 9.7 31.9 28.0 42.0
(5.155)
(7,318) (15.383) (8,065)
110.2 (2,150) (5,786)
(5,149) (6,269) (8,488) (1,219)
35.4
(4,330)
(5,S52) (11,348) (15,322) 0,974)
35.0
(5,647) (11,205) (17,036) (37,915) (5,558) (5,831) (20,879)
98.4 52.0 122.6 (4,890)
>< "~.- ._....,._._ •• ...,._ ....... ,,-

Multan DlstrlctContd.
Maillsl Town
Mian Chunnu Municipality
Multan Canton- (12,767) ment
Multan Muni- (74,627) cipa/ity
Shujabad Muni- (5,880) cipality
Tu/amba Town (2,526)
Vehari N.A.C.
Muzaffargarh 5.27,681 District
Alipur Muni-cipality
(2,788)
Jatoi Town
Karor Muni- (3,243) cipality
Khangarh Mllni- (3,621) cipality
Kot Addu Town
3-8
TABLE 3-VARIATION-Contd.
Decennial changes in population slnce-1901 Number of persons.
Total population and variations in number and percentage
(6,511) (10,242) (3,731)
S7.3
(7,503) (12,071) (4,568)
60.9
(13.496) (10,536) (11,106) (9,502) (14,693) (729) (-2,960) (570) (-1,604) (5.191)
5.7 -21.9 5.4 -14.4 54.6
(85.747) (74,270) (1,08,351 ) (1,33,266) (1.75,429) (I1,120) (-11.477) (34,081) (24.915) (42,163)
14.9 -13.4 45.9 23.0 31.6
(6.334) (6.730) (6,618) (8.206) (14.601) (454) (396) (-112) U.588) (6.395)
7.7 6.3 -1.7 24.0 77.9
(5,606) (8,016) V.410)
43.0
(8,986)
5,69.461 5,68.478 5,91,375 7,12.849 7,51.250 41,780 -983 22,897 1,21.474 38,401
7.9 -0.2 4.0 20.5 ~.4
(3,312) (3.434) (3,931) (4.829) (5.933) (524) (122) (497) (898) (1,104)
18.8 3.7 14.5 22.8 22.9
(4,744)
(3.503) (3,539 ) (3,491) (4.696) (2,584) (260) (3!J) (-48) (1,205) (-2.112)
8.0 1.0 -1.4 34.5 -4S.0
(3,349) (3,184) (2,863) (4,402) (4,408) (-272) (-165) (-321) (1,539) (6)
-7.5 -4.9 -10.1 ~3.8 0.1
(4,925) (6,960) \10,507) (2,035) (3,547)
41.3 51.0

3-9
TABLE 3-VARIATION-Contd.
Decennial cbange in population sinee-1901 Number of persons.
Total populatioL and variations in number and percentage ~--.. --~-- - ----------- ----
District, Town and
1901 1911 1921 1931 1941 19S1
Muoicipality ----------- i --_--
I Number Num- Per- . Num- Per- Num- Per- Num- Per- NlIm- Per-
__ 1-ber cent. 1 ber cent. ber cent. ber cent. ber cent.
-----_ -- --_ .. --- -----~--
Muzatrargarh District-Comd.
Leiah Muni- (7,546) (8,173) (8.476) (9,578) (13,037) (14.914) cipality (627) (303) (1.102) (3.509) (1.827)
8.3 3.7 13.0 36.6 14.0
MuzaJJargarh (4.018) (4.3B7) (5.386) (6,110) (8,265) (11,271) Municipality (369) (999) (724) (Z,155) (3,006)
9.2 22.8 13.4 35.3 36.4
Rawalpindi 31,06,771 33.53.052 34.60.710 39,14,849 47,00,958 51,51,851 didsion 2.46,281 1,07,658 4,54,139 7,86,109 4,51,893
7.9 3.2 13.1 20.1 9.6
Campbellpur (4,64,430) (5.19,273) (5,12,249) (5,83,960) (6,75,875) (7,23,124)
District (54,843) (-7,024) (71,711) (91,915) (47,249) 11.8 1.4 -14.0 15.7 7.0
Cambel/pur Can- (3,036) (3,357) (6,181) (3,697) (3,494) (7,554)
tonmem (321) ( 2,824) (-2,484) (-203) (4,060) 10.6 84.1 40.2 5.5 116.2
Campbel/pur Mu- (665) (3,669) (7,997) (10,505) (10,135)
nicipillily (3,004) (4,328) (2.508) (-370) 451.7 118.0 31.4 -3.5
Faleh Jang Town (4,849) (5919 ) (5,127) (1,070) (-792)
22.1 -13.4
Hasan Abdal (5,682) (8,089) (6,349)
Municipality (2,407) (-1,740) 42.4 -21.5
Hazro Munici- (9,799) (9,950) (8,408) (9,155) (11,186) (7,512)
palily (151) ( -1,542) (747) (2,031) (-3,674) 1.5 -15.5 8.9 22.2 -32.F
Pindigheb Mu- (8,452) (9,045) (9,419) (10,506) (12,641 ) (10,157)
nicipalily (593) (374) (1,087) (2,135) (-1,484) 7.0 4.1 1l.5 20.3 -19.7·
Ttl/Olang Town (6,746) (6,438) (7,146) (8,828 ) (8,755) (-308) 708) (1,682) (-73) .
-4.6 11.0 23.5 -0.8 :
Gujrat District 7,92,159 1,97,999 8,24,046 9,2,427 11.04,952 11.58,675 ! (-4.160) (36,047) (98,381) (1,82,525) (53,723)
-0.5 4.6 11.9 19.8 4.9 i
Dlnga Munlci- (5,412) (5.351) (6.014) (7.068) (8,545) (7.570) ! p.alit)' (-61) (663) (J .054) (J .477) (--975) ~
-1.1 12.4 17.5 20.9 -11.4 i

3-10
TABLE 3-VARIATION-Conld.
Decennial change in population since-1901
Number of persons.
Total population and variations in number and percentage
District, 1901 I 1911 • 1921 1931 I 1941 1951 Town and
Municipality ---~------ ---~--- ----
Number : Num· Per- Num- Per- ; Num- Per- I Num- Per- Nurn- Per-I ber cent. ber cent. I ber cent .. ber cent ber cent.
---_
Gujrat District -Contd.
Gujral Munici- (19,410) (19,090) (21,974) (26,511 ) (30,899) (46,986) pality (-320) (2,884) (4,537) (4.388) (16,087)
-1.6 15.1 20.6 16.6 52.1
la/a/pur lattan (10,640) (11,615) (10,792) (12,507) (16.663) (18,154) Municipality (975) (-823) (1.715) (4.156) (/,491)
9.2 -7.1 15.9 33.2 8'9
Kharian Town (4,598)
Kunjah Munici- (6.431 ) (7,090) (7,240) (7,152) (8.873) (8,822) pality (659) (150) (-88) (1,721) (-51)
10.2 2.1 -1.2 24.1 -0.6
Lalamusa Muni- (12,163) ( 17,958) cipa/ity (5,795)
47.6
Malakwal (4,034) (6,445) (6,106) (2,411) (-339)
59'0 -5'9
Mandl Bahuddill (12,752) (17,175) Municipality (4,423)
34'7
Phalia TowlI (3,814)
Ihelum District 5,01,424 (5,11,575 ~ 4,77,068 5,41,076 6.29.658 6,82,061 (10,151) (-34,507) (64,008) 188,582) (52,403)
2'0 -6.7 13'4 16'4 8'3
Chakwa/ Muni- (6,520) (6,400) (7,425) (9,542) (11,835) (13,319) cipality. (-120) (1,025) (2,117) (2,293) (1,484)
-I'S 16'0 28'5 24'0 12'5
lhe/um Canfoll- (3,248) (7,380) (3,638) (6,233) (6,842) (9,208) ment, (4132) (-3,742) (2,595) (6()9) (2,366)
127'2 -50'7 71'3 9'8 34'61
Ihe/um Munici- (11,703) (12,298) (14,422) (17,266) (26,349) (29,360) pality (595) (2,124) (2,U4) (9,083) (3,011)
5'1 17'3 19'7 52'6 11'4
--~-

3-11
TABLE 3-VARlUION-Contd,
Decennial cbanges in population since-1901 Number of persons,
Total population and variations in number and percentage
District, Town & ' 1901 ! 1911 I 1921 i 1931 1941 1951 Municipality ~----~---- -_- ~-----'----~-~-
I ,
!
Per- I ,-~----
Number ' Per- I Per- Number Per' I N Per-i Number cent j Number cent cent i Number cent umber cent
Jbelum District -Contd,
Pind Dadan Khan (13,7701 (10,590) (9,919) (9,832) (11,445) (7,339) Mllnicipalit)' (-3.180) (-671) (-87) (1.613) (-4,106)
-23'1 -6'3 --0'9 16'4 -35'9
Mianwali District 3,01,910 3,41,377 3,58,205 4,11,539 5,06,321 4,50,499 39,467 16,828 53,334 94,782 44,178
31' 1 4'9 14'9 23'0 S'7
Bhakkar Munici- (5,312) (5,388) (6,198) (6,857) (9,006) (12,397) pality, (76) (805) (664) (2,]49) (3,391)
1'4 14'9 10'1 31'S 37'1
lsakhel Munici- (7,630) (6.868) (6,1 72) (7,515) (7,931) (6,366) pality, (-762) (-696) (J ,343) (416) (-1.565)
-10'0 10'1 21' 8 5'5 -19'7
Kalabagh MUllici· (5,824) (6,654) (8,455 ) (8,353) (8,714) (10,523) pality, (830) (J ,801) ( -102) (361) (l,809)
14'3 27'1 -1·2 4'3 20'S
Kallurkot Town (,tOOl) (5,517) (1,576)
39'4
Mianwali Munici· (7,064, (9,115) (15.412) (22,825) (23,341 ) pality, (2,051) (6,297) (7,413) (516)
:N'O 69'1 48'1 2'3
Rawalpindi 5,58,699 5,47,827 5,69,224 6,34,357 1,85,231 8,75,504 District -10,872 2/,397 65,133 1,50,874 90,273
1'9 3'9 11'4 23'8 11'5
Gujar Khan }.III- (8,503) nicipality.
Murree Canlon- (327) (344) (895) (450) (41C) (5,706) ment, (17) (551) (-445) (-40) (5,296)
5'2 160'2 -'49'7 S'g 1,291'7
Murree Mutlici- (l,517) (1,361) (2,397) (1,530) (2,012) (3,700) pailUy. (-156) (1.036) (-8,67) (482) (I 688)
-10'3 76'1 -36'2 31'S 83,9
Rawalpindi Can· (40,60) (39,841) (45,891) (43,517) (66,867) (84,149)
tonmenr.* (-nO) (6,050) (-2,374) (-23,350) (17,282) -1'9 -15'1 -5'2 53'7 25.8
Rawalpindi MII- (47,077) (46,642) (55,25\) (75,767) (1,18,175) (1,53,070) nicipality. (-435) (8,609) (20,516) (42,408) (34.895)
-0'9 18'S 37'1 56'0 29'5
* Including Chaklala Cantonment.

3-12
TABLE 3-VARIATION-Contd.
Decennial cbanges in population since-1901 Number of persons.
I Total population and varia lions in number and percentagc ____ _
Dis tricI, Town & 1901 I 1911 i 1921 1931 1941 1951
Municipality \ ----·-----1 ' I
N bib Per- N b Per-: N b Per- 1 N Per- : N b Per-um er i .Num er cent. urn er cent i urn er cent' umber cent I ~~e~
Shahpur District
Bhalwal Municipality.
4,88,149
Bhera Munfci- (18.6&0) pality.
Hadali Town ...
Jhawariall TowlI
Kalra Town ...
Khushab. Municipality.
Kat Moman Town
(11,403)
6,45,001 1,56,852
32'1
(15,202) (-3,478)
-18'6
(10,159) -(1,244)
-10'9
7,19,918 74,917
11'6
(4.082)
(17,027) (1,825)
(4,559)
t I0,0(}9) (-150)
12'0
-1'5
8.21.490 },01,571
(4,153) (71)
(19,741) (2,714)
(5,095) (536)
(14,194) (4,185)
Mfani MuniCIpality.
(7,220) (5,819) (5,965) (146)
(6,472) (507)
Mitha Tiwana Town.
Phullarwan Municipality.
Sahlwal Munjcipality
SargodIJa MUlliclpality
(9.163)
(-1,401) 19"4
(4,158)
(1,926)
(7,658) (6,582) (-1.505) (-1,076)
-16,4
(8.849) (17.728) (8.879)
(4,713) (555)
(2,957) (1,031)
(7,762) (1,180)
-14.1
(26,761) (9.933)
100.3
14'1
1'7
l1.g
41'8
8'5
53'5
17,9
50.9
9,98,921 1,77,431
21'6
(5,954) (1,801)
43"4
11,62,988 1,64,067
(8,678) (2,724)
16'4
45'S
(20,219) (16,644) (478) (-3,575)
2'4 -17'7
(5,203) (11 ,348) (6,145)
118'1
(6,016) (6,250) (921) (234)
18'1 3'9
(17,141, (2,947)
20'S
(7,828)
(6,713) (141)
3'7
(6,567) (1,854)
39'3
(5,030) (2,073)
(8,090) (328)
70'1
4.2
(5,085)
(20,476) (3,335)
(9,061) (1,233)
19'5
15.8
(6,069) (-644)
-9'6
(12,380) (5,813)
. 88'5
(9,297) (4,267)
(8,406) (316)
84'8
3.9
(36,420) (78.463) (9,609) (42,043)
36.1 11.N

3·13
TABLE 3-VARlA TlON-CiJ/ttd,
Decennial changes in population mce-tOOl Number of per SOil!.
Total population and variations in number and percentage -------:----~c-.~---.--~------ ---~ .-~------I
, I District, Town &
Municipality 1901 1911 [ 1921 I 1931 1941 1951
,--- ! I-~-~~) I
~ Number !Number ~:!~ I Number ~:~; I Number ~:~; i Number ~:~~ i Number ~:~i - - -- - - -- -- -- -~--- -~--~--- - -- --~ --~~---
Shabpur District-Contd.
Shahpur City (9,386) (8,739) (5,280) (5,515) (5,330) (-647) (235) (-lS5)
-6.9 4,5 -3.4 Si/Janwa/i Muni. (2,205 ) (2,583) (3,926) (7,217)
cipafity (378) (1.343) (3.291) 17.1 52.0 83.8
Babawaipur State 7.20.877 7.80,641 7,81,1")1 9.84.612 13,41,209 IS,23,US 59,764 550 2,03,421 3.56.597 4.81.916
8,3 0.1 26.0 36.2 35,9
Bahawalpur Dis. 9.70,488 trict
Bhawalnagar Muni· (6,707) (8,578) (18,337) cipality (1,871) (9,795)
27,9 114,2
Bahawalpur Can- (948) tonment
Bahawa/pur Muni· (18.546) (18,414) (18,494) (20,943) (40,015) (40,698) cipa[ity (-132) ( 80) (2,449) (19.072) (683)
-0.7 0.4 13.2 91.1 1.7
Chishtian Muni- (6,245) (10,270) cipality (4,025)
64.S
F()rt Abbas (1.167) (2,499) Municipality (1,3J2)
114.1
Haroonabad (4,888) (10.014) Municipality (5,126)
104.9
Nasi/pur Muni-cipality
(1,694) (3,490) (1,796)
106.0
Khairpur Muni· cipality
5,013 (5,964) (8,270) (2,306)
38.7
KhangCl Shari! (1,480) (5.593) (4.113)
271.9

3-14
TABLE 3 -VARIATION-Contd.
Decennial changes in population since-1901 Number of persons.
Total population and variations in number and percentage :------,---------,----------,--------:-------------------
1901 /1 1911 1921 1931 1941 1951 District, Town & Municipality -------- '-------- ------- ------
Number i Number ~:~~I Number ~:~~ Number ~~tl Number ~:~t Number ~:~t Bahawalpur Dis
trict-eontd.
Minchinabad Municipality ...
Qaimpur Municipality
Sadiq GanJ Municipality ...
Rahimyarkhan District
Ahmadpur East Municipality
Ahmadpur Lamrna Municipality
Allahabad Municipality
Chachran Sharif
Dera NawabSahib Municipality ..•
Goth Chann; Municipality
(9,928)
Khan;ur Munlci- (8,611) pal/ty
(9,472) (8,255) (-456) (-1,217)
-4.6 -12.8
(10,296) (2,041)
(9,192) (581)
(4,213) (5,231)
24.7
(-4,979) (1,018) 6.7 • -54.2 24.2
·Exc;ludin8 Railway Colony.
(3,558)
(2,342)
(12,255) (1,959)
(4,758)
(2,182)
(2,216)
(4,455)
(1,510)
(6,153) (922)
(4,906) (1,348)
(2,730) (388)
(4,582)
8,52,637
( 20,423) (8,168)
19.0
(5,044) (286)
(2,725) (543)
(2,954) (738)
(5,816) (1,361)
(1,689) (179)
37.9
16.6
66.7
6.0
24.9
33.3
30.5
11.9
(13,484·) (7,331)
17.6 119.1

3-15
TABLE 3-VARIATION-Collc!d.
Decennial cbanges in population since-1901
Number of pe~ons.
District, Town & Municipality
Total population and variations in number and percentage
1=~-_19_0l ___ - ! - ---_19_1_1-_-[-__ 19_2_1_ -I--~-!_c)3_1_-_--_-__ 19_4~1~_T~~_-1_9_5_;_·-_·_·-Number II Number cPeenrt-li Number Per-! Number Per Number Per- N mb r Per-
Rabimyarkhan Distrlct-colltd.
Kot Samaba Towli
Rahimyarkhall MUllicipality ...
Sadlqabad MUllicipality
Salljarpur MUllicipality
Uch Sharif MUllicipality .
cent' cent cent: u e cent __ ~' ________ l. ___________ . ___ _
(1,118) (l,716) (598)
S3.S
(6,239) (14,919) (8,680)
139.1
(5,758)
(1,727) (1,744) (17)
1.0
(3,11 0) (4,172) (1,062)
34.1
TABLE 4-AGE MARITAL STATUS
This Table sbows the distribution of population of each sex according to broad age-groups and marital status. It is repeated for each main religious group and for every district.
The date about age and marital status have been collected from the answers to question No.2 of the enumeration slip which provided two columns headed 'Years' and 'Months' for age and one more column with letters "M", "S", "W", and "D" for the marital status. The age of infants under one year was to be recorded in the column headed 'Months' and of all others in completed years in the column headed 'Years'. "M" was to be ringed round for 'married' "s" for 'single (never married)" "W" for 'widowed' and "D" for 'divorced'. The whole information about marital status is strictly in accordance with the replies given by the respondents to the simple question whether he/she was single, married, widowed or divorced; the information about age has been partly supplied by the respondents who know their age and has partly been recorded by the enumerators afler reminding the respondents about the dales of important events of the local events and calculating their age according to the statements made by them.
3. The age grouping shown in this table slightly differs from that shown in the past Census Tables in as much as that the number of years at the end of the each group has not been repeated at the beginning of the next group.
4. Since the Table excludes non-Pakistanis, its totals will not tally with those in Table 1.
5. Analysis has indicated that the repofting is not sufficiently accurate to justify the presentation of the data in small age-groups and the board categories shown in this table appear to be the smallest which can be regarded as reasonably reliable. The question of accuracy and the analysis of the data is discussed in Chapters 5 aod 6 0 f part I.
4-1

4-2
TABLE 4-AGE AND MARITAL STATUS
Section I-Main Religions-Punjab including Bahawalpur State
Total population according to Broad Age Groups and Marital Status.
Number of persons.
1 Population Married Age Group 1 , - ----------------1 -----~--~-.-,
(in years)
I Total I Male I -Female I Male Female
------------- ----------~-
ALL-RELIGIONS
ALL AGES 2,06,36,702 1,10,49,854 95,86,848 43,89,197 40,07,452
2 0- 9 53,12,156 27,73,113 25,39,043 589 1,048 2 3 10-39 1,1 1 ,88,083 60,13,697 51,74,386 26,10,863 26,38,470 3 4 40-59 29,18,955 16,15,039 13,03,916 13,52,052 10,46,235 4 5 60 & Over 12,17,508 6,48,005 5,69,503 4,25,693 3,21,699 5
MUSLIMS
6 ALL AGES 2,02,00,794 1,08,14,816 93,85,978 42,95,081 39,37,082 6
7 0- 9 51,95,867 27,12,994 2482,873 578 1,017 7 8 10-39 1,09,53,441 58,91,471 50,61,970 25,59,037 25,92,434 8 9 40-59 28,60,355 15,77,780 12,82,575 13,20,028 10,28,363 9
10 60 & Over 11,91,131 6,32,571 5,58,560 4,15,438 3,15,268 10
CASTE HINDUS
11 ALL AGES 2,756 1,370 1,386 504 530 11
12 0- 9 496 224 272 12 13 10-39 1,645 801 844 298 379 13 14 40-59 404 226 178 155 115 14 15 60 & Over 211 119 92 51 36 15
SCHEDULED CASTES
16 ALL AGES 30,296 16,531 13,765 5,715 4,924 16
17 0- 9 8,960 4,983 3,977 3 17 17 18 10-39 15,567 8,004 7,563 3,146 3,228 18 19 40-59 3,521 2,353 1,168 1,966 996 19 20 60 & Over 2,248 1,191 1,057 600 683 20
OTHER RELIGIONS
21 ALL AGES 4,02,856 2,17,137 1,85,719 87,897 64,916 21
22 0-- 9 1,06833 54,912 51.921 8 14 22 23 10-39 2,17,430 1,13,421 1,04,009 48,382 42,429 23 24 40-59 54,675 34,680 19,995 29,903 16,761 24 25 60 & Over 23,918 14,124 9,794 9,604 5,712 25

4-3
TABLE 4--AGE AND MARITAL STATUS
Section 1-Main Religions-Punjab including Bahawalpur State.
Total population according to Broad Age Groups and Marital Status.
Number of persons.
-- - ~f I --I
Never Married Widowed I Divorced I G j ----------------- --- 1-----· -F~~~~:-I
Age roup I I (in years) .
Male Female Male Female I Male I I _-------- ---- -------- -------_------------_-----_._ "-
ALL.-RELIGIONS
61,54,213 50,30,101 4,76,388 5,13,748 30,056 35,547 ALL AGES
2 27,72.521 25,37,983 3 11 1 0- 9 2 3 33,07,734 24,54,031 86,158 72,727 8,942 9,158 10-39 3 4 66.003 32,280 1,81,833 2,05,970 15,151 19,431 40-59 4 5 7,955 5.807 2,08,394 2,35,040 5,963 6,957 60 & Over 5
MUSLIMS
6 60,24,415 49,07,807 4,65,896 5,06,117 29,424 34,972 ALL AGES 6
7 27,12,413 24,81,844 3 11 1 0- 9 7 8 32,39,004 23,88,645 84,589 71,835 8,841 9,056 10-39 8 9 65,086 31.602 1,77,803 2,03,331 14,863 19,279 40--59 9
10 7,912 5,716 2,03,501 2,30,940 5,720 6,636 60 & Over 10
CASTE HINDUS
11 723 724 143 127 5 ALL AGES 11
12 244 272 0- 9 12 13 494 449 9 14 2 10-39 13 14 3 2 68 59 2 40-59 14 15 2 I 66 54 1 60 & Over 15
SCHEDULED CASTES
16 9,703 8,226 1,108 590 5 25 ALL AGES 16
17 4,980 3,960 0- 9 17 18 4,702 4,255 152 70 4 10 10-39 18 19 14 9 372 156 I 7 40-59 19 20 7 2 584 364 8 60 & Over 20
OTHER RELIGIONS
21 1,19,372 1,13,344 9,241 6,914 627 545 ALL AGES 21
22 54,904 51,907 0- 9 22 23 63,534 60,682 1.408 808 97 90 10-39 23 24 900 667 3,590 2,424 287 143 40-59 24 25 34 88 4.243 3,682 243 312 60 & Over 25

4-4
TABLE 4-AGE AND MARITAL STATUS-contd.
Section 2-Main ReJigions- Punjab.
Total population according to Broad Age Groups and Marital Status.
Number of persons.
Population I Married Age Group 1
I (in years) --------1
i i Total Male . Female Male Female
ALL-RELIGIONS
ALL AGES 1,88,14,2.01 1,.0.0,59.949 87,54,252 4.0,.01,196 36,44,243
2 0- 9 48,61,922 25,30,436 23,31,486 544 971 2 3 10-39 1,01 ,69 ,835 54,62,123 47,07,712 23,76,436 23,91,617 3 4 40-59 26,61,929 14,74,462 11,87,467 12,34,912 9,51,826 4 5 60 & Over 11,20,515 5,92,928 5,27,587 3,89,304 2,99,829 5
MUSLIMS
6 ALL AGES 1,83,93,.038 98,33,131 85,59,9.07 39,.09,593 35,76,.091 6
7 0- 9 47,50,137 24,72,906 22,77,231 439 955 7 8 10-39 99,42,596 53,43,926 45,98,670 23,26,163 23,47,.098 8 9 40-59 26,04,947 14,38,204 ii,66,743 12,03,610 9,34,367 9
10 60 & Over 10,95,358 5,78,095 5,17,263 3,79,281 2,93,671 10
CASTE HINDUS
11 ALL AGES 1,68.0 86.0 82.0 333 355 11
12 0- 9 277 151 126 12 13 10-39 1,047 496 551 168 232 13 14 40-59 244 143 1.01 121 94 14 15 60 & Over 112 70 42 44 29 15
SCHEDULED CASTES
16 ALL AGES 18,7.01 1.0,.04.0 8,661 3,74.0 3,136 16
17 0- 9 5,231 2,8.05 2,426 2 17 18 10--39 9,878 4,926 4,952 1,948 2,009 18 19 40-59 2,329 1,582 747 1,377 678 19 20 60 & Over 1,263 727 536 415 447 20
OTHER RELIGIONS
21 ALL AGES 4,.0.0,782 2,15,918 1,84,864 87,53.0 64,661 21
22 0- 9 1,06,277 54,574 51,703 5 14 I" 23 10-39 2.16,314 1,12,775 1,03,539 48,157 42,278 23
24 40-59 54,409 34,533 19,876 29,8.04 16,687 24
25 60 & Over 23,782 14,036 9,746 9,564 5,682 25

4-5
TABLE 4-AGE AND MARITAL STATUS-Contd.
Section 2-Main Religions-Punjab.
Total (lopulation accordillg to Broad Age Groups and Marital Status.
Number of persons.
,..._,.,-I
Never Married Widowed Divorced i
---~--
I Age Group ----.----.------------~-- ---- ---- ----------l
Male ~:~le =~~l (in years)
Male Female
ALL-RELIGIONS
55,91,635 46,06,399 4,38,139 4,69,237 28,979 34,373 ALL AGES
2 25,29,889 23,30,503 3 11 1 0- 9 2 3 29,97,669 22,41,737 97,500 65,848 8,518 8,510 10-39 3 4 56,764 28,837 1,68,052 1,87,758 14,734 19,046 40-59 4 5 7,313 5,322 1,90,584 2,15,620 5,727 6,816 60 and Over 5
MUSLIMS
6 54,66,810 44,87,830 4,28,381 4,62,176 28,347 33,810 ALL AGES 6
7 24,72,364 22,76,264 3 11 1 0- 9 7 8 29,31,328 21,78,159 78,018 64,999 8,417 8,414 10-39 8 9 55,847 28,172 1,64,301 1,85,306 14,446 18,898 40-59 9
10 7,271 5,235 1,86,059 2,11,860 5,484 6,497 60 and Over 10
CASTE HINDUS
11 478 437 49 26 2 ALL AGES 11
12 lSI 126 0- 9 12 13 322 309 6 9 10-39 13 14 3 1 19 6 40-59 14 15 2 1 24 11 60 and Over 15
SCHEDULED CASTES
16 5,720 5,330 575 179 5 16 ALL AGES 16
17 2,805 2,424 0- 9 17 18 2,894 2,904 80 3+ 4 5 10-39 18 19 14 2 190 62 I 5 4Q-59 19 20 7 305 83 6 60 and Over 20
OTHER RELIGIONS
21 1,18,627 1,12,802 9,134 6,856 627 545 ALL AGES 21
22 54,569 51,689 0- 9 22 23 63,125 60,365 1,396 806 97 90 10-39 23 24 900 662 3,542 2,384 287 143 40-59 24 25 33 86 4,196 3,666 243 312 60 and Over 25

4-6
TABLE 4-AGE AND MARITAL STATUS-Contd.
Section 3-Main Religions-Bahawalpur State.
Total population according to Broad Age Groups and Marital Status.
Number of persons.
Population Married Age Group (in years). --- ~-----~----- ---_._-
Total Male Female ~ Male Female
_ ----------- _______ ~ ____ ~ _! _______ l _____ l~ __ ALL-RELIGIONS
ALL AGES 18,22,501 9,89,905 8,32,596 3,88,001 3,63,209 1
2 0- 9 4,50,234 2,42,677 2,07,557 45 77 2 3 10-39 10,18,248 5,51,574 4,66,674 2,34,427 2,46,853 3 4 40-59 2,57,026 1,40,577 1,16,449 1,17,140 94.409 4 5 60 & Over 96,993 55,077 41,916 36,389 21,870 5
MUSLIMS
6 ALL AGES 18,07,756 9,81,685 8,26,071 3,85,488 3,60,991 6
7 0- 9 4,45,730 2,40,088 2,05,642 39 62 7 8 10-39 10,10,S45 5,47.545 4,63,300 2,32,874 2,45,336 8 9 40-59 2,55,408 1,39,576 1,15,832 1,16,418 93,996 9
10 60 & Over 95,773 54,476 41,297 36,157 21,597 10
CASTE HINDUS
11 ALL AGES 1,076 510 566 171 175 It'
12 0- 9 219 73 146 12 13 10-39 598 305 293 130 147 13 14 40-59 160 83 77 34 21 14 15 60 &. Over 99 49 50 7 7 15
SCHEDULED CASTES
16 ALL AGES 11,595 6,491 5,104 1,975 1,788 16
17 0- 9 3,729 2,178 1,551 3 15 17 18 10-39 5,689 3,078 2,611 1,198 1,119 18 19 40-59 1,192 771 421 589 318 19 20 60 & Over 985 464 521 185 ~36 20
OTHER RELIGIONS
21 ALL AGES 2,074 1,219 855 367 255 21
22 0-9 556 338 218 3 22 23 10-39 1,116 646 470 225 151 23 24 40-59 266 147 119 99 74 24 25 60 & Over 136 88 48 40 30 25

4-7
TABLE 4-AGE AND MARITAL STATUS-Contd.
Section 3-Main Religions-Bahawalpur State.
Total population according to Broad Age Groups and Marital State.
Number of persons.
Never Married (Widowed Divorced!
I ----------~I----------- ----)-----1 ~r: {':~~~
1~_M_a_Ie_--'-__ F_em~a_l_e ____ M_a_Ie_~ i Female! _ Mal: _____ Female _l ______ _
5.62,578
2 2,42,632 3 3,10,065 4 9,239 5 642
6 5,57,605
7 2,40,049 8 3,07,676 9 9,239
10 641
11
12 13 14 15
16
17 18 19 20
21
22 23 24 25
245
73 172
3,983
2,175 1,808
745
335 409 ...
4,23,702
2,07,480 1,12,294
3,443 485
4.19,977
2,05,580 2,10.486
3,430 481
287
146 140
1
2.896
1,536 1,351
7 2
542
218 317
5 2
38,249
6,658 13,781 17,810
37,515
6,571 13,502 17,442
94
3 49 42
ALL.RELIGIONS.
44,511
-. 6879
18,212 19,420
MUSLIMS
43,941
6,836 18,025 19,080
CASTE IDNDUS.
101
5 53 43
SCHEDULED CASTES
533
72 182 279
411
36 94
281
OTHER RELIGIONS
107
12 48 47
58
2 40 16
1,077
424 417 236
1,077
424 417 236
1,174
648 385 141
1,162
642 381 139
3
1 2
9
5 2 2
ALL AGES
0- 9 10-39 40-59 60 & Over
ALL AGES
0- 9 10-39 40-59 60 & Over
ALL AGES
0-9 IO 39 40 -59 60 & Over
ALL AGES
o - 9 10 -39 40-59 60 & Over
ALL AGES
0-9 10-39 40-59 60 & Over
2 3 4 5
6
7 8 9
10
11
12 13 14 15
16
17 18 19 20
21
22 23 24 25

4-8
TABLE 4-AGE AND MARITAL STATUS-Conld.
Section "-District -All-Religions.
Total population aceording to Broad Age Groups and Marital Status.
Number of persons.
Population Married Age Group ------- ~-~ ~~~.- ---~~~--~
(in years) Total Male Female Male Female
- ----~ - ~-----
LAHORE DIVISION.
Total 53,39,27] 28,86,257 24,53,014 11,63,993 9,84,500
2 0- 9 12,74,688 6,63,856 6,10,832 47 221 2 J 10-39 30,44,411 16.32,237 14.12,174- 6,97,578 6,69,240 3 4 40 -59 7,33,830 4,25,810 3,08,020 3,59,656 2,49,282 4 5 60 & Over 2,86,342 1,64,354 1,21,988 1,06,712 65,757 5
Gujranwala District.
6 Total 10,46,933 5,63,821 4,83,112 2,42,255 2,12,471 6
7 0-9 2,37,284 1,18,495 1,18,789 41 155 7 8 10-39 5,98,100 3,26,961 2,71,239 1,48,147 1,38,675 8 9 40· 59 1,54.348 86,737 67,611 73.572 58,239 9
10 60 & Over 57,101 31.628 25,473 20,495 15,402 10
Lahore District.
11 Total 18,95,061 10,38,878 8,56,18} 4,21,207 3,27,528 11
12 0-9 4,20.841 3,23440 1,97,401 12 13 10-39 11,08,559 6,02,830 5,05,729 2,58,194 2,25,510 13 14 40-59 2,55,743 1,51,382 1,04,361 1,24,206 78,458 14 15 60 & Over 1,09,918 61,226 48,692 38,807 23,560 15
Sheildmpnra District.
16 Total 9,23,081 4,94,011 4,29,070 1,87,786 1,63,781 16
17 0-9 2,55.724 1,30,978 1,24.746 6 61 17 18 10- 39 5,07,378 2,68353 2,39,525 1,10.090 1.08,964 18 19 40-59 U8,OOS 67,522 50,486 59,989 45,859 19 20 60 & Over 41,471 27,158 14,313 17,701 8,897 20
Sialkot District.
21 Total 14,74,196 7,89.547 6,84,649 3,12.745 2,80,720 21
22 0-9 3.60,839 1,90,943 1,69,896 5 22 23 10-39 8.29,774 4,34,093 3,95,681 1,81,147 1.96,091 23 24 40-59 2,05,731 1,20,169 85,562 1,01,889 66,726 24 25 60 & Over 77,852 44,342 33,510 29.709 17.898 2S
MULTAN DIVISION.
26 Total 83,29.839 44,54,552 38,75,287 17,79,789 16,75,334 26
27 0-9 21.70,052 11,25,430 10,44,622 497 750 27 28 10-39 43,94,597 23,65,606 20,28,991 10,05,879 10,74,011 28 29 40-59 12,34,841 6,80,931 558.910 5,81,649 4,60,321 29 30 60 & Over 5,25,349 2,82,585 2,42,764 1,91,764 1,40,252 30

4-9
TABLE 4-AGE AND MARITAL STATUS-Contd.
Section 4-Distrid. -All .. Rellgi&ns.
Tot •• popalatNn according to Bread Age Groups ami Marital Status.
Number of persons.
Never Married. i Widowed _ I Diyorced ------r-----I------- --- ----I -------,- ----
I I ; 1 Male j Female ! Male I Female 1 Male I Female
LAHORE DIVISION
15,84,029 13,41,563 1,31,668 1,21,401 6,567
2 6,63,806 3 9,04;511 4 13,943 5 1,769
6 2,94,891
7 1,18,451 8 1,74,190 9 ],875
10 375
11
12 13 14 15
3,61,848
2,23,440 331,453
5,930 1,023
16 2,87,255
17 1,30,972 18 1,54,871 19 1,351 20 61
21 4,4Q,G35
22 1,90,943 23 2,43,995 24 4,787 25 310
26 24,81,590
Z7 11,24,933 28 13,25,48l 29 28,252 3{) 2,924
6,10,609 7,23,526
7,017 411
1,48,103
1,18,634 1.29,435
690 44
4,71,158
1,97,401 2,71,130
2,429 198
2,54,766
1,24,685 1.29,274
784 23
3,fi6,836
1,79,889 1,83,687
3.114 146
19,82,973
10,43,862 9,20,534
15,415 3,162
3 27,207 49,820 54,638
26,212
3 4,350
11,133 lO.726
53,432
11,920 20,531 20,981
11,373
3,122 5,956 9,295
33,651
2 17,821 49,231 54,347
2,941 2,391 1,235
Gujranwala District.
21,203
2,874 8,368 9,961
463
274 157 32
L_ore District.
54,934
8.416 22,292 24,276
2,391
1,261 715 415
Sbeikbupura Districl.
10,176
1,168 3,686 5,322
Slalkot Distrfd.
35,038
2
270 226 101
3,116
7,815 5,363 1,136 J2,200 14,885 1,293 13,636 14,788 687
1,16,182
3l,777 &8,485 85,920
MULTAN DIVISION
2,05,194
9 30,223 78,673 97,289
5,991
2,469 2,545
977
5,550
1,587 2,490 1,473
635
255 314 66
2,513
673 1,182
658
347
119 157 71
2,055
540 837 678
10,786
1 4,2'23 4,501 2,061
Age Group (in years)
Tota]
0-9 10-39 40-59 60 & Over
2 3 4 5
Total 6
0-9 7 10-39 8 40-59 9 60 & Over 10
Total II
0-9 12 10-39 13 40-59 14 60 & Over 15
Tota} 16
0-9 17 10-39 18 40-59 19 60 & Over 20
Total 21
0-9 22 10-39 23 40-59 24 60 &. Over 25
Total
0-9 10-39 40-59 60& Over
26
27 28 29 30

TABLE "-AGE AND MARITAL STATUS-contd.
Section .. - Districts-All-Reliiions.
Total population according to Broad Age Groups and Marital Status.
Number of persons.
Population Married Age Group i-----------------~~W) I
______________ Total Male I __ F~:~~ ____ Male __ I_ ~_:n~le_
31 Total
32 0- 9 33 10-39 34 40-59 35 60 & Over
36 Total
37 0-9 38 10-39 39 40-59 40 60 & Over
41
~~ ! ~I I
Total
0-9 10-39 40-59 60 & Over
46 Total
47 0- 9 48 10-39 49 40---59 50 60 & Over
51 Total
52 0- 9 53 10-39 54 40-59 55 60 & Over
56
57 58 59 60
Total
0- 9 10-39 40-59 60 & Over
Dera Gbazi Kban District.
6,21,529
1,76,769 3,10,836 },07,818
32,106
3,40,069
93,862 1,68,013
60,090 18,104
Jhang District.
8,75,531
2,36,335 4,59,615 1,28,585
50,976
4,70,908
1,25,432 2,41,179
73,264 31,033
Lyallpur District.
21,52,401 11,41,938
5,74,665 10,85,808
3,31,466 1,60,462
2,93,086 5,87,ISY 1,79,221
82,472
Montgomery District.
18,15,888
3,65.603 11,25,433 2.31,809
93,043
9,69,883
1,83,118 6.08,975 1,27,015 . 50,775
Multan District.
21,07,241 11,27,883
6,05,952 10,19,356 3,28,644 1,53,289
3,16,570 5,53,786 1,79,203
78,324
Muzaffargarb District.
7,51,249
2,10,728 3,93,529 .1,11,519
35,473
4,03,871
1,13,362 2,06,494
62,138 21,877
2,87,460
82,907 1,42,823
47,728 14,002
4,04,623
1,10,903 2,18,456
55,321 19,943
10,10,463
2,81,579 4,98,M9 1,52,245 71,990
8,46,005
1,82,485 5,16,458 1,04.794 42,268
1,30,1"0
84 67,813 50,426 11,817
1,112,73"
79 1,06,521
59,457 16,677
5,01,725
261 2,84,256 1,56.242
60,966
3,51,438
73 2,07,274 1,10,364
33,727
1,22.679 31
83 32 75,045 33 39,858 34 7,693 35
1,71,760 36
109 37 1,20.672 38
43,427 39 7,552 40
4,65,287
443 2,85,122 1,27,148
52.574
41
42 43 44 45
3,54.883 46
72 47 2,52,354 48
85,285 49 17,172 50
9,79,358 4,56,056 ",14,733 51
2.89,382 4,65,570 1,49,441
74,965
3,47,378
97,366 J,87,035
49,381 13,596
2,49,852 1,54,008
52,196
1,57,696
90,163 51,152 16,381
34 52 2,43,347 53 1,23,192 44
48,160 55
1,45-992
9 97,471 4),411
7,101
56
57 58' 59 60

31
32 33 34 35
36
37 38 39 40
41
42 43 44 45
46
47 48 49 50
51
52 53 54 55
56
57 58 59 60
4-11
TABLE 4-AGE AND MARITAL STATUS-Contd.
Sectioll "-Districts-All-Religions.
Total population according to Broad Age Groups and Marital Status,
Never Married i Widowed i Divorced - - ,-- -- -------1 ------; --------------
Number of persons.
Age Group (in years)
Male i Female Male / Female Male Female __________ L ____ '--__ ---' ____________________________________ _
1,94,376
93,778 96,991 3,298
309
2.59,747
1,25.353 1,30,138
3,886 370
5,93,673
2,92,825 2,94'078
5,557 1.213
5,83,733
1,83,045 3,96,283
3,595 810
6,20,919
3,16,570 2,95,252
7.965 1,132
2,30,142
1,13,362 1,12,739
3,951 90
1,50,861
82,824 65,622
1,300 1 115
2,04,823
1,10,794 92.830
1,080 119
4,94,067
2,81,136 2,06,605
5,511 815
4,37,642
1,82,404 2,54,146
852 240
5,11,323
2,89,347 2,15,325
5,822 829
1,84,257
97,357 86,006
850 44
15,430
3,126 6,330 5,974
27,786
4.233 9,664
13,889
43,489
7,606 16,064 19,819
34,146
5,172 12,838 16,136
49,455
8,154 16,598 24,703
15,876
3,486 6,991 5,399
Dera Ghazi Khan District.
13.321
2,003 6,214 5,104
123
83 36 4
Jhang District.
27,375
4,562 10.641 12,172
641
287 257 97
Lyallpur District.
48,202
5,630 18,333 24,239
3,051
1,219 1,358
474
Montgomery District.
52,377
9 9,212
18,399 24,757
566
246 218 102
Multan District.
49,175
5,711 18,636 24,828
1,453
528 632 293
Muzaffargarh District.
. 15,744
3,105 6,450 6,189
157
106 44
7
599
153 356 90
665
392 173 100
2,907
1,292 1,253
362
1,103
746 258 99
4,127
1 1,187 1,791 1,148
1,385
453 670 262
Total 31
0- 9 32 10-39 33 40-59 34 60 & Over 35
Total 36
0- 9 37 10-39 38 40-59 39 60 & Over 40
Total 41
0- 9 42 10-39 43 40-59 44 60 & Over 45
Total 46
0- 9 47 10-39 48 40-59 49 60 & Over 50
Total 51
0- 9 52 10-39 53 40-59 54 60 & Over 55
Total 56
0- 9 57 10-39 58 40-59 59 60 & Over 60

4-12
TABLE 4-AGE AND MAIUTAL STATUS-Conld.
Section 4--Districts-Religions.
Total Population according to Broad Age Groups end Marital status.
Number of persons.
population Married Age Group --~.-- _--_-(in years)
Total Male Female Male Female
--------~.--. .~----
Rawalpindi Dhision.
61 Total 51,45,091 27,19,140 24,25.951 10,57,414 9,84,409 61
62 0- 9 14,17,182 7,41,150 6,76,032 62 63 10-39 27,30,827 14,64,280 12,66,547 6,72,979 l',48,366 63 64 40-59 6,88,258 3,67,721 3,20,537 2,93,607 2,42,223 64 65 60 & Over 3,08,824 1,45,989 1,62,835 90,828 93,820 65
CampbeUpur District.
66 Total 7,22,542 3,76,834 3,45,708 1,24,163 1,29,769 66
67 0- 9 2,09,725 1,08,214 1,01,511 67 68 10-39 4,18,406 2,25,428 1,92,978 91,922 92,431 68 69 40-59 64,550 28,488 36,062 23,031 28,031 69 70 60 & Over 29,861 14,704 15.157 9,210 9,307 70
Gujrat District.
71 Total 1l,57,742 6,14.959 5,42,783 2,82,704 2,72,739 71
72 0- 9 3,06,235 1,57,488 1,48,747 12 73 10-39 5.94,703 3,15,472 2,79,231 1,72,897 1,90,852 73 74 40-59 1,&9,240 1,09,095 80,145 85,487 52,540 74 75 60 & Over 67,564 32,904 34,660 24,320 29,347 75
Jbelum J)istrict.
76 Total 6,78,900 3,49,260 3,29,640 1,19,863 1,49,Hi3 76
77 0- 9 1,78,164 94,153 84,011 77 78 10-39 3,75,817 2,04,167 1,71.650 81,078 1,06,202 78 79 40-59 86,016 38,590 47,426 26,734 34,503 79 80 60 & Over 38,903 12,350 26,553 9,051 8,458 80
Mian-wali District.
81 Total 5,49,549 2,89,424 2,69,125 99,U76 84,541 81
82 0- 9 1,62,226 87,675 74,551 82 83 10-39 2,52,821 1,32,875 1,19,946 54,844 44,627 83 84 40-59 89,545 48.368 41.177 35,260 30,422 84 85 60 & Over 44,957 20,506 24,451 8,972 9,482 85
Rawalpindi District.
86 Total 8.74.971 4,68,565 4,06,406 1,65, 739 1,29,592 86
87 0- 9 2,38,073 1,22,515 1,15,538 87 88 10-39 4,82,824 2,62,936 2,19,888 1,01,454 77,279 88 89 40-59 97,010 53,541 43,469 44,871 34,686 89 90 60 & Over 57,064 29,573 27,491 19,414 17,627 90

4-13
TABLE 4-AGE AND MARITAL STATUS-Contd.
Section 4 - Districts-Ail-Religions.
Total Population according to Broad Age Groups and Martial Status.
Number of persons.
,
~ver ~arrie~ ____ 1 Widowed . , ____ ~~~ced Age Group
Male i Female I Male Female I M 1 Female (in Years) ____ --'! ____ -'-I ___ ~'--_____ .c._. __ a~__ .. _ .. ____ .L_._ ....... ______ ._
61 15,25,016
62 7,41,150 63 7,67,677 64 14,569 65 1,620
66
67 68 69 70
2,37,494
1,08,214 1,27.426
1,522 332
71 2,96,039
72 1,57,488 73 1,37,492 74 936 75 123
76
77 78 79 80
81
82 83 84 85
86
87 88 89 90
2,17,388
94,153 1,18,784
4,225 226
1,68,084
87,675 76,706
3,460 243
2,83,417
1,22,515 1,59,073
1,444 385
12,81,863
6,76,032 5,97677
6,405 1.749
1,95,613
1,01,511 .93,709
297 96
2,304,118
1,48,747 85,104
206 61
1,44,463
84,011 59,705
553 194
1.49,888
74,551 73,723 1,589
25
2,57.833
1,15,558 1,40,955
1,078 242
1,20,289
20,516 49,747 50,026
14,422
5,611 3,797 5,014
26,794
4,103 15,285
7,406
10,854
3,606 4,295 2,953
21,956
1.105 9,584
11,267
15,263
2,033 5,559 7,671
Rawalpindi Division.
1,41,642
17,804 59,854 63,984
16,421
3,108 9,798 3,515
Campbellpur District.
20,021
6,6i7 7,642 5,702
Gujrat District
24,491
2,281 17,136 5,074
Jeblum Distr!et,
34,615
4.836 12,025 17,754
Mianwali District.
24,249
1.363 8,483
14,403
755
469 138 148
9,422
980 7,387 1,055
1,155
699 336 120
308
220 64 24
Rawalpindi District.
15,889
1,385 7,169 7,335
4,146
376 1,667 2,103
18,037
2,700 12,055 3,282
305
161 92 52
11,435
994 10,263
178
1,399
907 345 147
1,457
233 683 541
3,092
269 536
2,287
Total 61
0- 9 72 10-39 63 40-59 64 60 & Over 65
Total 66
0- 9 67 10-39 68 40 -59 69 60 & Over 70
Total 71
0- 9 72 10 -39 73 40~59 74 60 & Over 75
Total 76
0- 9 77 10-39 78 40 -59 79 60 & Over 80
Total 81
0- 9 82 10-39 83 40-59 84 60 & Over 85
Total 86
0- 9 87 10 -39 88 40-59 89 60 & Over 90

4-14
TABLE 4:""'AGE AND MARITAL STATUS-Coli/d.
Section 4-Districts-AII-Religions.
Total population according to Broad Age Groups and Marital Status.
Number of persons.
Population Married Age Group - -_--- ------
"'--T~~ (in Years) Total Male Female Male Female
Sbabpur District.
91 Total 11,61,387 6,20,098 5,41,289 2,65,869 2,18,615 91
92 0- 9 3,22,759 1,71,105 1,51,654 92 93 10-39 6,06,256 3,23,402 2,82,854 1,70,784 1,36,975 93 94 40 -59 1,61,897 89,639 72,258 75,224 62,041 94 95 60 & Over 70,475 35,952 34,523 19,861 19,599 95
BAHAWALPUR STATE
96 Total 18,22,501 9,89,905 8,32,596 3,88,001 3,63,209 96
97 0-9 4,50,234 2,42,677 2,07,557 45 77 97 98 10-39 10,18248 5,51,574 4,66,674 2,34,427 2,46,853 98 99 40-59 2,57,026 1,40,577 1,16,449 1,17,140 94,409 99
100 60 & Over 96,993 55,077 41,916 36,389 21,870 100
8ahawalpur District.
101 Total 9,70,302 5,23,767 4,46,535 1,94,482 1,90,885 101
102 0- 9 2,01,652 1,07,827 93,825 102 103 10-39 5,90,581 3,17,212 2,73,369 1,19,030 1,29,952 103 104 40-59 1,34,096 74,753 59,343 61,160 48,377 104 105 60 & Over 43,973 23,975 19,998 14,292 12,556 105
Rahimyarkhan District.
106 Total 8,52,199 4,66,138 3,86,061 1,93,519 1,72,324 106
107 0-9 2,48,582 1,34,850 1,13,732 45 77 107 108 10-39 4,27,667 2,34,362 1,93,305 1,15,397 1,16,901 108 109 40-59 1,22,930 65.824 57,106 55,980 46,032 109 110 60 & Over 53,020 31;102 21,918 22,097 9,314 110

91
92 93 94 9S
96
97 98 99
100
101
102 103 104 105
106
107 108 109 110
TABLE 4-AGE AND MARITAL STATUS-Concld.
Section 4 -Districts-All-Religions.
Total population according to broad Age Groups and Marital Status.
Number of persons.
Never Married 1- Widowed Divorced --------_- -- -- Age Group
I Female Male i
Male I Female (in Years)
Male I I
Female I I
Shahpur District.
3.22,594 2,99,948 31,000 22,377 635 349 Total
1.71,105 1,51.654 ... 1,262
... ... 0- 9 1.48,196 1.44,481 4,058 364 136 10-39
2,982 2,682 11,227 7,399 206 136 40-59 311 1,131 15,715 13,716 65 77 60 & Over
BAHAWALPUR STATE.
5,62,578 4,23,702 38,249 44,511 1,077 1,174 Total
2,42,632 2,07,480 '" ... ... . .. 0- 9 3,10,065 2,12,2'14 6,658 6,879 424 648 10-39
9,239 3,443 13,781 18,212 417 385 40-59 642 485 17,810 19,420 236 141 60 & Over
Bahawalpur District.
3,08,587 2,35,607 20,093 19,491 605 552 Total
1,07,827 93,825 ... ... . .. ... 0- 9 1,94,500 1,39,765 3,473 3,393 209 259 10-39
5,993 1,753 7,302 8,991 298 222 40-59 267 264 9.318 7,107 98 71 60 & Over
Rahimyarkhan District.
2,53,991 1,88,095 18,156 25,020 472 622 Total
1,34,805 1,13,655 ... ... ... ... 0-9 1,15,565 72,529 3,185 3,486 215 389 10-39
3,246 1,690 6,479 9,221 119 163 40-59 375 221 8,492 12,313 138 70 60 & Over
4-15
91
92 93 94 95
96
97 98 99
100
101
102 103 104 105
106
107 108 109 110

4-16
TABLE 4-A-ORPHANS
1. This table shows the children under 12 years of age whose fathers had died before the census enumeration, The analysis is by sex and main religious groups.
2. The information regarding orphans was collected wbile recording age data in reply to census question No.2. For children reported to be under 12 years. The respondent was asked to state if the child's father was living. If the father was not living a ring was put round the age figure otherwise a tick was given. The original slips were sorted in accordance with the marks noted on them and were counted to produce the statistics shown in this table.
3. Figures shown for selected towns and cities are also included in those of the district in which the town is situated.
4. This table excludes persons claiming citizenship other than Pakistani.
5. This table is discussed in chapter 6 of the Report.

4-17
TABLE 4-A-ORPHANS
Children under 12 years of age whose father had died.
(Figures in italics show the number of Females who are included in the total above them)
Number of persons.
Total! I Muslims I ! I District & City
Tot~l __ L~Uhaji~~ I Caste IScheduled: Other
Orphans I Others Hindus I Castes I Religions
. I ----------
PUNJAB & BAHAWALPUR 2,03,568 2,00,161 55,091 1,45,070 15 393 2,999 STATE 97,191 95,461 26,165 69,296 7 194 1,529
PUNJAB 1,95,529 1,92,363 51,583 1,40,780 10 182 2,974 93,426 91,810 24,863 66,947 3 99 1.514
Lahore Division 39,338 37,117 9,662 27,455 7 158 2,056 19,706 18,574 6.018 12,556 1 86 1,045
Gujranwala ... 6.275 5,958 1,081 4,877 73 243 3,354 3,148 490 2,658 55 151
Gujranwala ... (869) (827) (474) (353) (42) (453) (426) (239) (187) (27)
Lahore 13,201 12,221 2,530 9,691 2 24 774 5,498 5,032 1,710 3,322 11 455
Lahore (8,178) (7,760) (497) (7,263) (2) (20) (396) (2,222) (1,949) (108) (1,841) (9) (264)
Sheikhupura 13,596 13,016 4,453 8,563 15 565 7,651 7,437 3,101 4,336 5 209
Sialkot 6,446 5,922 1,598 4,324 4 46 474 3,203 2,957 717 2,240 1 15 230
Sialkot (630) (498) (134) (364) (2) (130) (383) (319) (75) (244) (64)
Multan Division 72,195 71,496 32,291 39,205 7 692 31,940 31,588 14,426 17,162 4 348
Dera Ghazi Khan 3,074 3,073 759 2,314 1,508 1.508 383 1,125
Jhang 4,214 4,210 1,659 2,551 4 1,964 1,960 668 1,292 4
Jhang / Maghiana (159) (158) (66) (92) (1) (83) (82) (37) (45) (1)
Lyallpur 13,044 12,749 8,120 4,629 6 289 6,535 6,390 4,472 1,918 3 142
Lyallpur (1,328) (1,319) (1.174) (145) (9) (746) (746) (653) (93)
NOTE :-! Excluding children claiming Nationalities other than Pakistani.

4-18
TABLE 4·A-ORPHANS-Concld.
Children under 12 years of age whose father had died.
(Figures in italics show the number of Females who are included in the total above them.)
Number of penons.
I Total I Muslims I I I
District & City r Mubajirs i
Caste I Scbeduled Other
I Orphans i Hindus: Castes Religion~ Total Others I ! , I
--.---~~-
Montgomery 12.701 12,458 9.175 3.283 1 242 5.890 5,757 4,401 1.356 1 132
Multan 27,376 27.220 11.392 15.828 156 11,820 11.750 4,084 7,666 70
Mullan (632) (626) (238) (388) (6) (307) (304) (102) (202) (3)
Muzaffargarh 11 ,786 11 ,786 1,186 10,600 4,213 4,123 418 3,805
Rawalpindi Division 83,996 83,750 9,630 74,120 3 17 226 41,780 41,648 4,419 37,129 2 9 121
Campbellpur ... 11,465 11,454 483 10,971 S 3 5,339 5,337 286 5,051 1
Oujrat 17,471 17,450 2,104 15,346 2 19 7,450 7,444 944 6,500 J 5
Ihelum 10,359 10,354 770 9,584 5 6,007 6,004 356 5,648 3
Mianwali 7,176 7,173 770 6.403 3 3,355 3,354 320 3,034 1
Rawalpindi 22,323 22,211 3,057 19,154 3 7 102 12,492 12,419 1,348 nOll 2 6 65
Rawalpindi ... (4,262) (4,150) (2,543) (1,607) (3) (7) (102) (1,819) (J ,746) (1,138) (608) (2) (6) ( 65)
Shabpur 15,202 15,108 2,446 12,662 94 7,137 7,090 1,165 5,925 47
Sargodha Town (476) (442) (212) (230) (34) (162) (144) (101) (43) (18)
BAHAWALPUR STATE 8,039 7,798 3,508 4,290 5 211 25 3,765 3,651 1,302 2,349 4 95 15
Bahawalpur ... 3,455 3,391 1,191 2,200 2 44 18 1,719 1,684 600 1,084 2 23 10
Bahawalpur ... (182) (182) (70) (112) (63) (63) (29) (34)
Rahimyarkhao 4,584 4,407 2,317 2,090 3 167 7 2,046 1,967 702 1,265 2 72 5


TABLE 5.-BffiTHPLACE
This Table shows the population (excluding non-Pakistanis) analysed according to Birthplace
and place of Enumeration. The Table is divided
into 7 sections as under:-
Section 1 :-Total population of Punjab
according to place of birth.
Section 2 :-Lahore Division.
Section 3 :-Multan Division,
Section 4 :-Rawalpindi Division.
Section 5 :-Babawalpur State.
Section 6 :-Sefected Towns and Cities.
Section 7 :-Persons born in Indo-Pak sub-continent beyond the areas in
which the First Census of Pakistan was conducted.
:1. Along the stub, the names and places of birth are arranged in broad geographical divisions, within each of which the different districts, Provinces and countries arc listed in alphabetical order.
3. The data regarding birthplace were obtained in reply to Census Question No. 3 which
required a respondent to state his place of birth.
If the person was born in the district of enumeration, a tick was put in space No. 3 on the enu
meration slip; if born elseWhere in Pakistan or India, the name of the district of birth, and if
born outside India, and Pakistan, the name of the country was to be written in that space.
4. The original slips were sorted by hand in
accordance with the replies noted on them and
were counted to produce the statistics shown in this Table.
5. The various provinces and States of the sub-co:1tinent beyond the areas in wnich the First
Census of Pakistan was conducted, have been
grouped for the purposes of section 7 in "Zones" as below:-
Zones
North
East
South
West
Central
States/Provinces and Agencies
Uttar Pradesh (U.P. and States).
Assam and States, Bihar and
States, Orissa an d States, West Bengal and States and Nepal and Sikkim.
Coorg, Madras and States,
Mysore and Andeman and Nicobar Islands.
Bombay and States, Baroda
State, West Indian States and
Agencies and Portuguese India.
(This zone includes the States of Junagadh and Manavadar * )
Madhya Pradesh (C.P.), Madhya
Bharat (Central India States
and Agencies). Bhopal State
and Hyderabad State *.
North-West ... Punjab (I) and Patiala and East
Punjab States' Union, Ajmer,
Delhi and Rajputana States
and Agencies; Jammu & Kashmir State.·
Other Parts... French India, Bhutan and any
other Indian State.
• Accession disputed.
6. 'Muhajirs' are included in the figures
appearing in tbis Table, but the numbers of
'Muhajir~' emanating from each zone are also given separately in Table 19-A.
7. This Table ha;: been discussed in Chapter 5 of the Report.

5-2
TABLE 5-BIRTHPLACE
Section I-The total Population of Punjab according to place of Birth
Number of persons.
I Place of Enumeration !-----------~------------------- ~.---------- ~-----------
Place of Birth : Punjab and l . Lahore Multan ~ Bahawalpuf Punjab Division Division
~---~-------------- - --- --_ ----_----- ------ _- -.--
TOTAL, ALL PLACES 2,06,36'702 1,88,14,201 53,39,271 83,29,839
PAKISTAN 1,52,33,620 1,38,35,998 35,67,853 57,13,936
Baluchistan2 4,649 4,161 1,696 1,765 East Bengal 1,444 1,416 500 94 Karachi 2,269 2,128 1,162 347
Federal Capital Area 67.539 N.W.F.P." 70,580 19,182 8,442
Punjab2 1,51,47,408 1,37,55,092 35,43,970 56,99,928 Sind2 7,270 5,662 1,343 3,360
OTHER PARTS OF PAK! 53,93,308 49,69,520 17,68,008 26,13,604 INDIA SUB·CONTI-NENT
OTHER PARTS OF ASIA 8,192 7,161 2,915 2,064
Muslim Countries 6,339 5,351 2.176 1,851
Afghanistan 5,466 4,543 1,763 1,732 Arabia4 103 89 40 17 Indonesia' 110 109 45 15 Iran6 554 507 293 71 Iraq 60 57 13 14 Turkey 46 46 22 2
Other Countries in Asia 1,853 1,810 739 213
Burma 1,033 1,011 372 166 Ceylon 48 48 37 4 China 374 372 220 26 Tibet 21 14 10 Otters 377 365 100 17
NON·ASIATIC 1,582 1,522 495 235 COUNTRIES
Muslim Countries 24 24 19 1 Other Countries 1,558 1,498 476 234
NOTES:-IExc1udes persons claiming Nationalities other than Pakistani. 2Including States.
'Including States, AgenCies and Tribal Areas. 'Includes Saudi Arabia, Yemen, Oman, Aden and Bahrein. 'Includes Sumatra, Java, Borneo & Sarawak. 6Includes Kowait.
' Rawalpindi 'Bahawal-DivisIOn pur State
--- --- -- -----~-
51,45,091 18,22.501
45,54,209 13,97,622
700 488 822 28 619 141
39,915 3,041 45,11,194 13,92,316
959 1,608
5,87,908 4,23,788
2,182 1,031
1,324 988
1,048 923 32 14 49 1 143 47 30 3 22
858 43
473 22 7
126 2 4 7
248 12
792 60
4 788 60

5-3
TOTAL 5---BIRTHPLACE-Contd.
Section 2-The Population of Lahore Division according to place of birth.
Number of persons.
District of Enumeration
Place of Birth I I
Gujranwala I Lahore 1 Sheikhupura Sialkot I _ ._-_._-------- _______ I _
~-_--
TOTAL, ALL PLACESI 10,46,933 18,95,061 9,23,081 14,74,196
PUNJAB INCLUDING BAHA-WALPUR STATE
7,43.589 11,12,214 6,04,854 10,83,313
Lahore Division 7,17,837 10,54,118 5,89,335 10,62,600
Gujranwala 6,74,412 10,309 11,081 7,001
Lahore 5,147 10,14,487 12,355 2,531 Sheikhupura 13,391 12,956 5,55,164 2,694 SiaJkot 24,887 16,366 10,735 10,50,374
Multan Division 8,251 19,065 11,488 3,876
Dera Ghazi Khan 48 261 10 38 Jhang 1,070 672 679 112 Lyallpur 4,812 9,085 8,477 2,821 Montgomery 1,430 4,785 1,249 429 Multan ... 805 ,,953 909 4~8
Muzaffargarh 86 309 164 18
Rawalpindi Division 16,944 38,472 3,754 16,699
Campbellpur 151 1,380 134 1,207 Gujrat 11,086 11,401 1,835 6,798 Jhelum 1,156 9,617 373 3,439 Mianwali 86 2,763 266 353 Rawalpindi .::: 2,166 9,048 298 3,192 Shahpur 2,299 4,263 848 1,710
Bahawalpur State 557 559 277 138
BahawaJpur 555 559 276 138 Rahimyarkhan 2 1
BALUCHISTAN 141 723 124 708
EAST BENGAL 20 198 1 281
KARACHI 94 993 14 61
N.W.F.P. 830 12,062 1,481 4,809
SIND 315 682 216 130
OTHER PARTS OF PAK/ 3,00,997 7,66,636 3,16,001 3,84,374 INDIA SUB-CONTINENT. OTHER PARTS OF ASIA 843 1,324 390 358
Muslim Countries 733 776 389 278 Other Countries 110 548 1 80
NON-ASIATIC COUNTRIES 104 229 162
Muslim Countries 3 I 15 Other Countries 101 228 147
NOTES:_IExcluding persons claiming Nationalities other than Pakistani.

5-4
TABLE 5-BIRTHPLACE -Contd.
Section 3.-The population of Multan Division according to place of birth.
Number of persons.
District of Enumeration
Place of Birth -~~~---~~--~-------
Dera Ghazi I
, I Montgomeryl
I
Jhang I Lyallpur MuItan I Muzaffar-, Khan :
! ! garh
--~----- ---------~ --------~~ - --~-----~--------.----
TOTAL, ALL PLACES' 6,27,529 8,75,531 21,52,401 18,15,888 21,07,241 7,51,249
PUNJAB INCLUDING 5,92,207 7,42,489 11,52,678 10,93,543 14,44,321 6,74,690 BAHAWALPUR STATE
Lahore Division 261 3,367 41,433 43,081 23,578 646
Gujranwala 46 1,158 8,412 2,429 4,642 76 Lahore 93 918 7,665 25,605 9,005 259 Sheikhupura 13 362 9,362 5,598 2,847 203 Sialkot 109 929 15,994 9,449 7,084 108
MuItan Division 5,91,405 7,31,981 10,87,354 10,25,863 13,97,037 6,72,689
Dera Ghazi Khan 5,90,482 612 1,387 471 1,956 3,150 Jhang 69 7,22,812 21,338 2,305 10,612 482 Lyallpur 64 3,870 10,50,061 21,660 10,667 254
Montgomery 307 443 6,464 9,95,676 8,341 99 Multan ... 191 3,223 6,453 5,260 13,59,160 1,783 Muzaffargarh 292 1,021 1,651 491 6,301 6,66,921
Rawalpindi Division 404 6,661 22,557 20,469 21,307 1,051
Campbellpur 41 252 750 1,298 3,278 32 (J uj rat 41 1,318 7,071 5,769 4,067 119 Jhelum 100 1,108 1,863 4,152 3,342 196.
Mianwali ... 131 781 3,531 1,382 5,191 469 Rawalpindi 38 651 3,705 3,886 2,331 100 Shahpur 53 2,551 5,637 3,982 3,098 135
Bahawalpur State 137 480 1,~34 4,130 2,399 304
Bahawalpur 137 460 1,327 4,092 2,378 303 Rahimyarkhan 20 7 38 21 1
BALUCHISTAN 469 70 389 212 591 34
EAST BENGAL 19 23 5 46 1
KARACHI 7 92 49 60 133 6
N.W.F.P. 144 433 1,672 2,088 3,713 392
SIND 90 122 2,362 498 275 13
OTHER PARTS OF PAKj 34,610 1,31,965 9,94,635 7,18,716 6,57,710 75,968 INDIA SUB-CON-TINENT
OTHER PARTS OF ASIA 2 318 450 748 404 142
Muslim Countries 2 256 318 102 374 139 Other Countries 62 72 46 30 3
NON-ASIATIC COUNTRIES 23 143 18 48 3
Muslim Countries
Other Countries 22 143 18 48 3
,,-_..-~""--~
; .-Excluding persons claiming Nationalitie! other than Pakistani.

5-5
TABLE 5-BmTHPLACE-Conrd.
Section 4-The population of Rawalpindi Division according to place of brith.
Number of persons.
I District of Enumeration
Place of Birth
l~amPbellPur! Gujrat Jhelum Mianwali I Rawalpindi I Shahpur
TOTAL, ALL PLACES! ... 7,22,542 11,57,742 6,78,900 5,49,549 8,74,971 11,61,387
PUNJAB INCLUDING 6,79,796 10,15,764 6,18,393 5,12,990 7,36,417 9,47,834 BAHAWALPUR STATE
Lahore Division 1,050 11,171 2,819 906 10,138 17,649
Gujranwala 139 3,781 420 143 1,745 3,877 Lahore 246 889 634 291 2,997 1,200 Sheikhupura 41 259 11 57 371 703 Sialkot 624 6,242 1,754 415 5,025 11,869
Multan Division 316 1,691 889 1,284 2,097 17,261
Dera Ghazi Khan 1 7 40 17 14 28 Jhang 41 251 106 186 256 11,586 Lyallpur 125 872 362 241 759 3,212
Montgomery 46 261 199 70 324 439 Muhan 92 297 161 422 672 1,299 Muzaffargarh 11 3 21 348 72 647
Rawalpindi Division 6,78,213 10,02,521 6,14,660 5,10,789 7,22,051 9,10,231
Campbeilpur 6,69,782 70S 2,066 585 11.308 2,152 Gujrat 1,658 9,84,928 5,063 596 6.178 14,838 lhelum 1,945 8,135 5,99,613 523 8,457 12,Q48
Mianwali 495 1,789 461 5,07,599 1,244 3,269 Rawalpindi 3,694 1,080 5,301 639 6,92.71' 2,630 Shahpur 639 5,884 2,156 847 2,149 8,75,294
Bahawalpur State 217 381 25 11 2,131 2,693 Bahawalpur 111 343 23 3 1.411 2,670 Rahimyarkhan 106 38 2 8 720 23
BALUCHISTAN 28 162 153 28 295 34 EAST BENGAL 50 123 90 3 479 77 KARACHI 9 81 60 12 429 28 N.W.F.P. 4,834 1,454 2,855 4,912 22,760 3,100 SIND 86 126 227 94 303 123
OTHER PARTS PAK( 37,440 1,39,652 56,429 31,367 1,13454 2,09,566 INDIA SUB-CONTI-NENT
OTHER PARTS OF ASIA 264 287 433 140 521 537
Muslim Countries 124 156 86 140 304 514 Other Countries 140 131 347 217 23
NON-ASIATIC COUN-TRIES 35 93 260 3 313 88
Muslim Countries 2 2 Other Countries 35 91 260 3 311 88
I-Excluding persons claiming Nationalities other than Pakistani.

5.6
TABLE 5-BIRTHPLACE-Contd.
Section 5-The population of BahawaJpur State according to place of birth.
Place of Birth
TOTAL, ALL PLACESl
BAHAWALPUR STATE
PUNJAB
Lahore Division
Gujranwala Lahore Sheikhupura Sialkot
Multan Division
Dera Ghazi Khan Jhang Lyallpur
Montgomery Multan Muziffargarh
Rawalpindi Division
Campbellpur ... Gujrat Jhelum
MianwaJi Rawalpindi Shahpur
BALUCHISTAN EAST BENGAL KARACHI N.W.F.P SIND
OTHER PARTS OF PAK./INDIA SUB-CONTINENT OTHER PARTS OF ASIA
Muslim Countries Otber Countries ...
NON-ASIATIC COUNTRIFS
Muslim Countries Other Countries . "
I-Excluding persons claiming Nationalities other than Pakistani.
Number of persons.
District of Enumeration
Bahawalpur I Rahimyarkban ~ -----. ~ __ J _~ __
9,70,302 8,52.199
5,32,787 7,21,132
93,806 49,491
29,544 12,650
4,147 2,373 6,781 3,479 7,861 4,433
10,755 2,365
48,508 23,650
834 3,280 2,806 2,352
27,397 7,985
9,984 2,545 6,692 5,384
795 2,104
15,854 8,191
1,432 333 4,938 2,767 1,487 1,335
1,681 979 606 699
5,710 2,078
124 364 23 5 33 108
1,617 1,424 306 1,302
3,40,957 82,831 500 531
460 528 40 3
49 11
49 11

5-7
TABLE 5-BIRTHPLACE-Colltd.
Section 6-The population of Selected Cities & Towns according to place of birth.
Number of persons.
I Place of Enumeration
, Place of Birth \ Bahawai-IGUjran_1 Jhang I \---1-1 - T ----Ra~~-- . -I ~i[y wala Maghiana Laho re :Lya PUfI Multan r pindi "ISargOdha Smlkot
,--- ------ ------ --
TOTAL, ALL 41,646 1,20,852 73,397 8,49,333 1,79,127 1,90,122 2,36,877 78,447 1,67,506
I PLACES!
PUNJAB lNCLUD- 24,792 58,865 34,506 4,50,502 52,301 95,698 1,25,452 23,915 1,07,575 ING BAHA WAL-PUR STATE
Lahore Division ... 499 55,946 942 4,00,125 5,688 2,374 8,887 2,306 95,878
Gujranwala 54 51,312 497 9,312 1,182 787 1,588 424 958
Lahore 199 1,276 169 3,66,043 1,261 824 2,517 339 846 Sheikhupura 31 643 4 9,870 733 165 311 188 307 Sialkot 215 2,715 272 14,900 2,512 598 4,471 1,355 93,767
Multan Division ... 1,618 1,117 30,732 14,683 41,400 89,192 1,709 831 724
Dera Ghazi Khan 243 31 539 145 252 14 2 3 Jhang 78 66 28,711 577 1,343 693 197 333 52
Lyallpur 313 526 770 7,790 37,874 497 639 320 389
Montgomery ... 31 335 50 2,325 922 2,191 275 36 124
Muhan 875 147 510 3,540 1,169 84,361 520 132 152
Muzaffargarh ... 78 12 152 306 92 1,198 64 8 4
Rawalpindi Division 518 1,736 2,460 35,253 5,064 3,8881,13,285 20,200 10,962
Campbellpur ... 75 39 42 1,300 358 487 8,586 294 1,120 Gujrat 109 864 433 10,082 1,712 542 5,529 920 3,288 Jhelum 122 210 615 8,903 608 792 6,205 991 2,826
Mianwali 68 38 395 2,668 403 338 1.115 270 304 Rawalpindi 80 411 494 8,401 967 1,410 89,899 432 2,802
Shahpur 64 174 481 3,899 1,016 319 1,951 17,293 622
Bahawalpur State 22,157 66 372 441 149 244 1,571 578 11
Bahawalpur ... 22,038 66 372 441 149 244 1,112 569 11
Rahimyarkhan 113 459 9
BALUCHISTAN 16 28 13 624 61 95 210 14 584
EAST BENGAL ... 16 2 1 123 2 436 2 251
KARACHI. 20 17 28 916 3 69 398 1 35 N.W.F.P. 276 255 20 10,798 719 971 15,676 858 3,443
SIND. 26 61 25 644 36 66 233 18 80
OTHER PARTS ... 16,488 61,527 38,785 3,84,381 1,25,912 93,196 93,986 53,604 55,315
OF P AK(INDIA SUB-CONTINENT
OTHER PARTS ... i 86 14 1,119 77 14 348 23 128
OF ASIA Muslim Countries 6 56 11 630. 75 8 231 17 76
Other Countries 1 30 3 489 2 6 117 6 52
NON-ASIATIC ... 11 11 5 226 18 11 138 12 95
COUNTRIES Muslim Countries 1 1 2 15
Other Countries 11 10 5 225 18 11 136 12 80
"""""-----~ . .,.".,..,".>._=-=..>..-~:!.__,___~"'"'-...............
I-Excluding persons claiming Nationalities other than Pakistani.

S-8
TABLE 5-BIRTHPLACE-Concld.
Section 7-Persons Born in Indo/Pakistan slfb-continent beyond the areas in wioich the first
Census of Pakistan was conducted.
District of Enumeration Total' I North. East
India I India
Number of persons.
Zone in which born
i I Central: North West 'I' Other India i India Places
I • I
PUNJAB INCLUDING 53,93,308 1,14,416 6,477 1,511 5,711 19,924 52,44,090 1,179 BAHAWALPUR STATE
PUNJAB 49,69,520 1,09,114 6,183 1,477 4,092 18,381 48,29,094 1,179
Lahore Division
Gujranwala Lahore Sheikhupura Sialkot
Multan Division
Dera Ghazi Khan Jhang Lyallpur Montgomery Multan Muzaffargarh
Rawalpindi Division
CampbeJlpur Gujrat Jhelum Mianwali Rawalpindi Shahpur
17,68,008
3,00,997 7,66,636 3,16,001 3,84,374
26,13,604
34,610 1,31,965 9,94,635 7,18,716 6,57,710
75,968
5,87,908
37,440 1,39,652
56,429 31,367
1,13,454 2,09,566
BAHAWALPUR STATE 4,23,788
Bahawalpuf 3,40,957 Rahimyarkhan 82,831
46,307
2,652 38,628
1,346 3,681
23,157
626 2,962 6,562 3,669 8,539
799
39,650
1,437 3,682 3,184 1,947
24,007 5,393
5,302
3,995 1,307
1,768
29 1,354
240 145
2,247
4 1,154
765 255
65 4
2,168
192 129 998 126 585 138
294
16 278
855
510 260
85
98
7 6
44 29 12
524
41 176 52 13
219 23
34
5 29
1,979
34 1,910
6 '1.9
1,037
8 62
807 13
147
1,076
97 181 110 36
538 114
1,619
1,122 497
I-Excluding persons claiming Nationalities other than Pakistani.
4,642
808 3,419
123 292
3,980
133 1,677 1,040
845 262 23
9,759
695 1,805
857 505
5,527 370
1,543
1,399 144
17,12,457
2,97,474 7,20,815 3,14,026 3,80,142
25,81,959
33,839 1,26,037 9,84,395 7,13,890 6,48,668
75,130
5,34,678
34,978 1,33,663
51,228 28,740 82,541
2,03,528
4,14,996
3,34,420 80,576
1,126
.. 66
1,060
53
16
37

6-1
TABLE 6.-RELIGIONS.
This Table analyses the distribution of the population according to religions. The information in regard to religion was ob1ained in reply to Census Question No. 5 for which 8 symbols were provided on the census slip, one of which had to be ringed round by the enumerator according to the reply of the respondent. The symbols were-( 1)
Muslim, (2) Caste Hindu, (3) Scheduled Castes. (4) Buddhist, (5) Christian, (6) Parsi, (7) Tribal Religion and (8) Other Rdigion or no religion. The 8th symbol was ringed also for persons who did not report their religion. The original slips were sorted according to the marks placed round the above symbols and were counted to produce the statistics shown in this Table.
2. It will be seen that no attempt has been made to obtain data regarding sects or sub-divisions of the main religious communities or to record the separate castes of Caste Hindus and members of the Scheduled CaSles.
3. The Table has been issued in 2 sections :
Section 1 gives totals of main religious groups, and the total of smaller religious group3 for each district and municipality;
Section 2 gives the number of persons in each district in each of the smaller religious groups. The column headed "Others" includes persons who claimed to adhere to a religion not specified in the enumeration slip, or who have no religion or who refused to report their religion.
4. The population analysed in this Table excludes persons who claimed a nationality other than Pakistani.
5. This Table has been discussed in Chapter 3 of Part I of the Report.

6-2
TABLE 6.-RELIGION
Section 1 -Main Religious Groups.
Number of persons.
I I Districts & Tehsils Total : Muslim Caste I Scheduled I Others (Note I)
, Hindu i Castes
I I
PUNJAB INCLUDING BAHA WALPUR STATE
2,06,36,702 2,02,00,794 2,756 30,296 4,02,856
PUNJAB ... , .. 00' 1,88,14,201 1,83,93,038 1,680 18,701 4,00,782
LAHORE DMSION ... ... 53,39,271 50,41,735 1,519 16,983 2,79,034
Gujranwala District ... . .. 10,46,933 9,87,292 85 1,126 58,430
Gujranwala Tehsil '" 00. 5,78,179 5,33,841 84 682 43,572
Gujranwala Municipality ... 1,14,193 1,12,719 11 ... 1,463
Eminabad Municipality ... 9,443 9,265 ... ... 178
Kamoke Municipality ... 15,558 15,080 00' ... 478
Qila Didar Singh Town ... 8,553 8,189 ... ... 364
Hafizabad Tehsil ... ... 2,51,557 2,46,678 . .. 347 4,532
Hafizab(li Municipality ... 30,082 29,394 ... 57 631
Pindi Bhatian Town .. , 6,784 6,714 ... ... 70
Wazirabad Tehsil ... . .. 2,17,197 2,06,773 1 97 10,326
Wazirabad Municipality ... 33,027 32,657 ... ... 370
Akalgarh Town ... ... 7,413 7,103 ... 1 309
Gakkhar N.A.C. ... ... 8,775 8,241 ... ... 534
Ramnagar Town ... ... 4,98i 4,958 00 • ... 29
Sohdra Town ... ... 5,575 5,485 ... ... 90
Lahore District ... ... 18,95,061 17,94,331 231 2,202 98,297
Lahore Tehsil ... ... 11,34,757 10,82,417 224 1,672 50.444
Lahore City ... ... 7,89,267 7,61,302 215 1,492 26.258
Lahore Cantonment ... 60,066 55,934 ... 53 4,079
Raiwind N.A.C. ... .. , 5,364 4,821 ... . .. 543
Chunian Tebsil ... ... 5,15,507 4,85,111 5 151 30,240
Chunian Municipality ... 9,892 9,430 ... 6 456
Khudian Town ... ... 6,292 5,961 ... . .. 331
Kot Radha Kishan N.A.C. ... 8,657 8,307 ... .. . 350
Pattoki Municipality ... 12,456 11,988 ... .. . 468
NPTE:-I Excluding 14,438 persons claiming Nationalities other than Pakistani.

6-3
TABLE 6-RELIGION-Conrd.
Section I--Main Religious Groups.
Number of persons.
Caste ' I
Districts &. Tehsils. Total Muslim ~I Scheduled' Others Hindu I Castes ; i I
--~-- -----------~--- .. - --.-'----
Lahore District-(contd.)
Kasur Tehsil 2,44,797 2,26,803 2 379 17,613
Kasur Municipality 63,086 60,598 2 314 2,172
Lulliani Town 11,177 10,305 872
Raja Jang N. A. C. 9,897 9,275 622
Sheikhupura District ... 9,23,081 8,77,190 461 45,430
Sheikhupura Tehsil ... 4,54,232 4,25,105 431 28,696
Sheikhupura Municipality 29,717 28,752 965
ChuharkJlOna Town 6,585 6,392 193
Shahkot Town 11,230 10,674 1 555
Sangia Town 9,379 8,567 812
Nankana Tehsi] 2,48,528 2,42,611 7 5,910
Nankana Municipality 16,505 16,336 169
Shahdara Tehsit 2,20,321 2,09,474 23 10,821 Sharakpur Municipality 9,022 8,709 313
Sialkot District 14,74,196 13,82,922 1,203 13,194 76,877
Sialkot Tehsil 4,18,356 3,97,458 350 2,948 17,600
Sialkot Municipality 1,24,267 1,20,478 109 239 3,441
Sialkot Cantonment 31,11I 29,713 28 58 2,312
Daska Tehsil 2,91,380 2,69,578 157 138 21,507
Daska N. A. C. 15,375 14,894 481
Sambarial Town 4,919 4,493 4 422
Narowal Tebsil 2,51,732 2,28,661 211 2,605 20,255
Narowal Municipality 15,298 14,259 143 896
Pasrur Tehsil 2,51,985 2,33,255 390 6,315 12,025
Pasrur Municipality 9,403 8,737 17 11 638
Chawinda Town 7,858 7,515 18 325
Sbakargarh Tehsil 2,60,743 2,53,970 95 1,188 5,490

6-4
TABLE 6-RELIGION -Contd.
Section I-Main Religious Groups.
Number of persons.
I
District & Tehsils Total Muslim Caste : Scheduled Others Hindu Castes
~~---~------~
MULTAN DIVISION ". 83,29,839 82,22,711 47 1,181 1,05,900
Dera Ghazi Khan District 6,27,529 6,27,458 6 6S
Dera Ohazi Khan Tehsil 2,37,786 2,37,758 28
Dera Ghazi Khan Municipality 35,909 35,887 22
Kat Ghhutta Town 2,662 2,662
Biloch Trans Frontier Tract 45,016 45,016
Jampur Tehsil 1,11,955 1,11,955 ... Jampur Municipality 13,235 13,235
Daja/ Municipality 3,764 3,764
Rajanpur Tehsil 1,31,571 1,31,548 23
Rajanpur Municipality 5,280 5,280
Kat Mithan Municipality 3,675 3,675
Sanghar Tehsil 1,01,201 1,01,181 6 14
Taunsa Town 7,253 7,253
Vehoa Town 2,827 2,821 6
Jbang District 8,75,531 8,74,588 69 874
Jhang Tehsil 3,48,589 3,48,50.5 84
Jhang Maghiana Municipality 73,397 73,347 50
Chiniot Tehsil 3,29,615 3,29,520 95
Chiniot Municipality 39,042 38,976 66
Lalian Town 8,357 8,343 14
Rabwah N. A. C. ". 2,679 2,674 .5
Sborkot Tehsil 1,97,327 1,96,563 69 695
Shorkot Town 7,174 7,174
Ahmadpur Town 4,620 4,620
LyaUpur District 21,52,401 20,87,905 27 861 63,608
Lyallpur Tehsil 7,01,961 6,73,254 14 323 28,370
Lyallpur Municipality 1,79,127 1,73,459 9 27 5,632
Chak Jhumra Municipality 8,058 7,741 317

6-5
TABLE 6-RELIGION-Contd .
. Section I.-Main Religious Groups.
Number of persons.
Districts & Tebsils Total Muslim I Caste [SchedUled I Otbers
[ Hindu , Castes I
i ----~~-----------~--.------------- -- -------~------------
Lyallpur District- (contd.)
Jaranwala Tehsil 4,37,936 4,30,861 13 12 7,050
Jaranwala Municipality ... 17,969 17,463 506
Tandlianwala Municipality 10,099 9,928 5 166
Samundri Tehsil 4,08,792 3,97,586 325 10,881
Samundrl N.A.C. 6,637 6,637
Toba Tek Singh Tehsil... 6,03,712 5,86,204 201 17,307
Toba Tek Singh Municipality 12,089 11,635 454
Gojra Municipality ... 20,407 18,961 41 1,405
Kamalia Municipality 28,636 28,457 179
Montgomery District 18.15,888 17,88,930 6 84 26.868
Montgomery Tehsil 6.03,782 5,89,305 47 14,429
Montgomery Municipality 50.185 48,907 1.278
Chichawatni N.A.C. 12,083 11.846 237
Dipalpur Tehsil 3.06,608 3,06,444 164
Dipa/pur N.A.C. 7,889 7,874 15
Haveli N.A.C. -n ••• 8,480 8,418 62
Okara Tehsil... 4.23,860 4,13,821 4 31 10.004
Okara Municipality 35,350 34,772 2 9 567
Renalakhurd N.A.C . . " 4,975 4,757 2 216
Pakpattan Tehsil 4,81,638 4.79,360 6 2,271
Pakpattan Municipality 24,326 24,219 107
Arifwala N.A.C. 11,537 11,324 213
Multan District 21.07,241 20.92,624 8 143 14,466
Multan Tehsil 5,06,739 5.05,460 3 73 1,203
Mullan Municipality ... 1.75,429 1.75,335 33 61 Multan Cantonment .. , 14,693 14.145 3 40 505
Kablrwala Tehsil 2,51,133 2,50,825 308 Abdul Hakim N.A.C .... 5,154 5,145 9 Kabirwala Town 4,330 4,297 33

6-6
TABLE 6-RELIGION-Contd.
Section I.-Main Religious Groups.
Number of persons.
Districts & Tehsils Total Muslim Caste Scheduled Others Hindu Castes
Multan District-(conld.)
Khanewal Tehsil 3,84,349 3,72,875 5 51 11.418
Khanewal Municipality 37.915 37,118 15 782
Mian Channu Municipality 12.071 11,864 207
Tulamba Town 8,016 8,008 8
Lodhran Tehsil 2,89,052 2,88,939 19 94
Dunyapur Town 5,786 5,786
Kehror Pakka Town ..• 15,322 15,322
Lodhran N.A.C. 4,890 4,827 19 44
Mailsi Tehsil 1,84,708 1,84,490 218
Mailsi Town 10,242 10,185 57
Shujabad Tehsil 2,18,392 2,18,388 4
Shujabad Municipality 14,601 14,601
Jalalpur Pirwala Town 8,488 8,488
Vehari Tehsil 2,72,868 2,71,647 1,221
Burewala N.A.C. 15,371 15,139 233
Vehari N.A.C. 8,986 8,986
Muzaffargarh District 7,51,249 7,51,206 24 19
Muzaffargarh Tehsil 2,34,856 2,34,850 6
Khangarh Municipality 4,408 4,408
Muzajfargarh Municipality 11,271 11,265 6
Alipur Tehsil 2,11,182 2,11,178 4
Alipur Municipality 5,933 5,933
Jatoi Town 4,744 4,744
Kot Addu Tehsil 1,43,009 1,42,989 20
Kot Addu Town 10,507 10,507
Leiah Tehsil 1,62,202 1,62,189 13
Leiah Municipality 14,913 14,91]
Karor Municipality 2,584 2,584

6-7
TABLE 6.-RELIGION-Contd.
Section 1-Main Religious Groups.
Number of persons.
i Caste
I Districts & Tehsils Total Muslim iScheduled Others Hindu . Castes
--~--~--.-~-- -- ._. ------ -------,-- -._ ------ __ --
RAWALPINDI DIVISION 51,45,091 51,28,592 114 537 15,848
Campbellpur District 7,22,542 7,21,666 63 245 S68
Campbellpur Tehsil 2,66,096 2,65,259 42 240 555
Campbell pur Municipality ... 10,119 9,844 38 42 195
Campbell pur Cantonment 7,552 7,212 194 146
Hasan Abdal Municipality 6,343 6,295 48
Hazro Municipality 7,512 7,508 4
Fateh Jang Tehsil 1,43,791 1,43,777 13
Fateh Jang Town 5,126 5,126
Pindigheb Tehsil 1,64,073 1,64,054 8 11
Pindigheb Municipality 10,150 10,142 8
Talagang Tehsil 1,48,582 1,48,576 5
Talagang Town 8,755 8,750 5
Gujrat District 11,57,742 11,56,251 S 94 1,392
Gujrat Tehsil 3,96,502 3,95,698 73 730
Gujrat Municipality 46,971 46,575 396
Jalalpur Jattan Municipality 18,138 17,957 181
Kunjah Municipality 8,822 8,749 73
Kharian Tehsil 3,46,390 3,46,144 6 240
Dinga Municipality 7,564 7,564
Kharian Town 4,598 4,594 1 3 Lalamusa Municipality 17,954 17,735 5 214
Phalia Tehsil 4,14,850 4,14,409 4 15 422 Phalia Town 3,805 3,805 ltfalkwal Town 6,106 6,106
Mandi Bahauddin Municipality ... 17,171 16,930 241
Jhelum District 6,78,900 6,77,693 22 50 1,135
Jhelum Tehsil 2,65,766 2,64,858 29 878
Jhelum MuniCipality 29,360 29,133 227
Jheium Cantonment 9,207 8,623 1 1 582

6-8
TABLE 6.--RELIGION-Contd.
Secti()~ 1 -Main Religious Group.
Number of persons.
Districts & Tehsils Total Muslim Caste 'Scheduled Others
i Hindu Castes
--_- _----_ --------.--- --- ------
Jbelum District - (Contd.)
Chakwal Tehsil 2,22,067 2,21,842 12 213
Chakwal Municipality 13,310 13,136 1 173
Pind Dadan Khan Tehsil 1,91,067 1,90,993 9 21 44
Pind Dadan Khan Municipality ... 7,318 7,317 1
Mianwali District 5,49,549 5,48,901 648
Mianwali Tehsil 2,40,134 2,39,517 617
Mianwali Municipality 23,340 23,073 267
Bhakkar Tehsil 2,33,733 2,33,725 8
Bhakkar Municipality 12,397 12,397
Kallur Kot Town 5,577 5,577
Isakhel Tehsil 75,682 75,659 23
Isakhel Municipality 6,362 6,362
Kalabagh Municipality 10,523 10,514 9
Rawalpindi District 8,74,971 8,71,736 22 92 3,121
Rawalpindi Tehsil 4,41,726 4,38,613 20 92 3,001
Rawalpindi Municipality 1,52,893 1,51,208 13 21 1,651
Rawalpindi Cantonment 83,984 82,634 7 71 1,272
Gujar Khan Tebsil 2,09,774 2,09,662 112
Gujar Khan Municipality 8,496 8,385 111
Kahuta Tehsil 1,23,801 1,23,801
Murree Tehsil 99,670 99,660 2 8
J.lurree Municipality 3,700 3,700
Murree Cantonment 5,698 5,698
Shahpur District 11,61,387 11,52,345 2 56 8,984
Shahpur Tehsil 1,75,057 1,74,992 64
Shahiwal Municipality 8,406 8,406
Shahpur City 5,330 5,316 14
Jhawarian Town 6,241 6,241
Kalra Town 5,084 5,071 13

6-9
TABLE 6-RELIGION-Contd.
Section I-Main Religious Groups.
Districts & Tehsils
Shahpur District-(contd.)
Bahalwal Tehsil
Bahalwaf Municipality
Bhera Municipality
Kot Moman Town ...
Miani Municipality
Phullarwan M'pality
Kbushab Tehsil
Khushab Municipality
Hadali Town
Mitha Tiwana Town
Sargodha Tehsil
Sargodha Municipality
Sillanwali Municipality
BAHAWALPUR STATE
Bahawalpur District
Bahawalpur Tehsil
Bahawalpur Municipality
Bahawalpur Callfonment
Khanga Sharif
Bahawalnagar Tehsil...
Bahawalnagar Municipality
Sadiqganj Alunicipafity
Chishtian Tehsil
Chishtian Municipality
Hasi/pur Municipality
Khairpur Municipality
Qaimpur Municipality
!
Total Muslim I Caste
Number of persons.
I
.scheduled Castes Otbers
___ ~ ___ ~_~_~ __ ~~ _____ I_:indu ----
3,10,940
8,674
16,632
9,061
6,063
9,297
2,70,948
20,467
11,348
12,380
4,04,442
78,447
7,217
18,22,501
9,70,302
2,17,886
40,698
948
5,593
1,\12,6\13
18,373
4,582
2,70,854
10,270
3,490
8,270
2,730
3,10,764
8,605
16,630
9,061
6,063
9,172
2,70,108
20,467
11,348
12,380
3,96,481
76,834
7,217
18,07,756
9,67,085
2,15,952
40,440
948
5,588
1,82,428
18,172
4,556
2,70,341
10,260
3,490
8,240
2,730
2
1
1,076
93
81
16
12
37
18
11,595
1,823
1,513
99
5
152
122
16
47
21
139
69
2
25
840
7,941
1,6Z2
2,074
1,301
340
143
103
79
10
454
10
9

6-10
TABLE 6-RELIGION- Contd.
Section I-Main Religious Groups.
Number of persons.
Districts & Tehsils Total Muslim Caste Scheduled i Others Hindu I
Castes
~~---~---.-~~-"~-~~-~ ~~~ ~"--
Bahawalpur District-(contd.)
Fort Abbas Tehsil '" 1,80,033 1,79,550 79 404
Fort Abbas Municipality 2,499 2,499
Haroonabad Municipality 10,014 9,935 57 22
Mincliinabad Tehsil '" 1,18,846 1,18,814 32
Minchinabad Municipality 4,906 4,906
Rahimyarkhan District 8,52,199 8,40,671 983 9,772 773
Rahimyarkhan Tehsil 2,48,347 2,42,248 112 5,671 316
Rahimyarkhan Municipality 14,919 14,825 94
Kat Samaba Town ... 1,711 1,711
Abbasia Colony Tehsil 7,276 7,107 <} 45 115
Allahabad Tehsil 1,37,203 1,37,105 7 90
Allahabad Municipality 2,725 2,715 1 9
Ahmadpur East Tehsil 1,87,965 1,86,570 137 1,139 119
Ahmadpur East Municipality ... 20,404 20,354 50
Dera Nawab Sahib M'pality 5,814 5,581 17 118 98
Goth Ghani Municipality 1,685 1,685
Uch Sharif Municipality 4,170 4,132 22 16
Khanpur Tehsil 1,08,335 1,08,051 171 112
Khanpnr Municipality 13,457 13,382 1 40 34
Khanpur Railway Colony 1,740 1,639 25 76
Chachran Sharif Municipality ... 2,954 2,954
Sadiqabad Tehsil 1,63,073 1,59,590 717 2,656 110
Sadiqabad Municipality 5,739 5,695 6 38
Ahmadpur Lamma Municipality 4,975 4,975
Sanjarpur Municipality 1,725 1,725

6-11
TABLE 6-RELIGION-Conc/d.
Section 2-AnaJysis of Smaller Religious Groups'
Districts -------- .. _.- -- .. _.- -. _._--- ----
PUNJAB INCLUDING BAHAWALPUR STATE
PUNJAB
LAHORE DIVISION ...
Gujranwala
Lahore
Sheikhupura .. ,
Sialkot
MULTAN DIVISION
Dera Ghazi Khan
Jhang
Lyallpur
Montgomery ...
Multan
Muzaffargarh
RAWALPINDI DIVISION ...
Campbellpur ...
Gujrat
Jhelum
Mianwali
Rawalpindi
Shah pur
BAHAWALPUR .. .
Bahawalpur .. .
Rahimyarkhan
Buddhist Christian -- -- --- -- _. _- --- -- -- ---
9 4,02,617
9 4,00,543
8 2,78,816
58,419
8 98,107
45,417
76,873
1,05,883
65
874
63,608
26,864
14,453
19
1 15,844
568
1,392
1,133
648
3,119
8,984
2,074
1,301
773
Note:-1This table is an analysis of the column headed "Others", in section 1.
Number of persons.
Pani
195
195
177
173
4
17
4
13
1
Others
35
35
33
11
9
13
2
2


7-1
TABLE 7-MOTHER TONGUE
The information regarding Mother Tongue was obtained in reply to
Census Question No.6: "What is your Mother Tongue?" 'Mother Tongue' was defined as the language spoken from the craddle and Enumerators were instructed that in the case of very young children who had not learned to speak and of deaf-and-dumb persons. it should be the language spoken by their mothers. Where the mothers' language was different from the father's the Mother Tongue was taken to be the language mostly used in the home.
2. The nine main languages of Pakistan printed on the Census Slip were Arabic, Urdu, Persian, Bengali, Pashto, Punjabi, English, Sindhi and Baluchi. The Enumerator had to indicate Mother Tongue b;y ticking against one of them according to the reply. There was a tenth blank column for the purpose of recording Mother Tongues other than those printed. The original slips were sorted in accordance with the marks put on them and were counted to produce the statistics shown in this Table.
3. The list of languages has been arranged according to philological families. The Indo-European family, to which many of the languages of Pakistan belong, is sub-divided to snow separately the particular branches which contain the chief mother tongues of Pakistani citizens. Within each family or branch of the Indo-Eu, opean family the different languages are listed in alphabetical order.
4. The list of languages includes, in addition to the printed nine languages, most of the other languages which were entered iuto the 10th blank column. These languages are given separate lines in the table.
5. This table gives an analysis of the total population of the Province, excluding foreigners, and is in various sections. Selected towns and cities have been listed separately, as the distribution pattern of mother tongues in cities and larger towns often varies from that generally found in the surrounding districts.
6. The Table has been discussed in Chapter 8 of Part I of the Census Report.

7-2
TABLE 7-MOTHER TONGUES
Section 1-Divisions and State
Number of persons.
! I I Punjab l I ! I Rawalpindi! Bahawalpur Languages and Punjab Lahore Multan Bahawalpur Division Division I Division I State
State
TOTAL 2,06,36,702 1,88,14,201 53,39,271 83,29,839 51,45,091 18,22,501
Dravidian Family
South Indian Languages 90 90 15 75
Indo-European Family
Dardic Branch
Kashmiri .,. 1,441 1,441 275 57 1,109 Kohistani ... 1,019 1,019 1,019 Shina 100 100 100
European Branch
English ... 1,050 1,050 458 105 487
Indo-Aryan Branch
Bengali 2,208 2,186 364 942 880 22 Gujrati 208 208 37 63 108 Hindi 13 13 3 6 4
Punjabi 1,94,98,054 1,77,32,814 50,80,339 77,21,223 49,31,252 17,65,240 Rajasthani 942 588 257 329 2 354 Sindhi 9,280 484 54 323 107 8,796 Urdu 10,74,276 10,28,146 2,47,279 5,96,316 1,84,551 46,130
Iranian Branch
Baluchi 3,142 3,134 5 3,109 20 8 Persian ... 356 291 81 75 135 65 Pushtu 44,141 42,287 9,988 7,192 25,107 1,854
Semitic Family
Arabic 57 45 15 17 13 12
TibetooChinese Family
Burmese ... 36 [6 8 3 5 20 Other Assam-Burma
Tongues 34 34 34
Various Central Asian
Tribal Tongues of N.W. 37 37 37
Unclassified 218 218 108 64 46
Note:-1Excluding persons claiming Nationalities other than Pakistani.

TABLE 7-MOTHER TONGUES.-Contd.
Section 2-Lahore Division.
Number of persons.
DISTRICTS Lahore1 ---Languages Division
Gujranwala I I I
Lahore I Sheikhupural Sialkot
----
TOTAL ... ... .,. 53,39,271 10,46,933 18,95,061 9,23,081 14,74,196
Dravidian Family
South Indian Languages ... ... ... ... ... .. . I1Ido-European Family
Dardic Branch.
Kashmiri ... ... 275 3 271 .. . 1 Kohistani ... ... ... ... ... .. . .. . Shina ... ... ... ... ... .., ... .. . ~
European Branch
English ... . .. 458 5 113 303 37
Indo-Aryan Branch
Bengali ... ... 364 35 104 . .. 225 Gujrati ... '" 37 ... 37 .. . ... Hindi ... ... 3 3 ... ... '"
Punjabi ... ... 50,80,339 10,22,106 17,23,530 9,04,965 14,29,738 Rajasthani ... ... 257 ... 257 ... . .. Sindhi ... ... 54 8 28 12 6 Urdu ... '" 2,47,279 23,866 1,66,163 16,551 40,699
Iranian Branch I r Baluchi ... ... 5 3 1 1 . .. Persian ... ... 81 34 45 ... 2 Pushtu ... ... 9,988 828 4,424 1,249 3,487
Dometic Family
Arabic ... ... 15 11 4 . .. .. . Tibeto-Chinese Family
Burmese ... ... 8 7 .. . ... 1 Other Assam-Burman Tongues ... ... ... . .. . ..
Various Central Asian
Tribal Tongues of N.W. ... . .. ... . .. ... '"
Unclassified ... '" 108 24 84 ... '"
NOTE:-·1Exc!udlDg persons claiming Nationalities .other than Pakistani.

7-4
TABLE 7--MOTHER TONGUES.-Contd.
Seetion 3-Multan Division.
Number of persons.
I
I I DISTRICTS I
Language I Muhan' ---~---.---~--,-.-----
I ~aY~IIPUr I--~ont~l-Multan l~uza;: \ I Division DeTa \
I Ghazi I Jhang Khan, I gomery , garh.
I I ;!
-------------" ------------ -------_-
TOTAL 83,29,839 6,27,529 8,75,531 21,52,401 18,15,888 21.07,241 7,51,249
Dravidian Family
South Indian Languages 15 15
Indo-European Family
Dardic Branch
Kashmiri 57 56 Kohistani Shina
European Branch
English '" 105 4 6 8 86
Indo-Aryan Branch
Bangali 942 3 855 58 11 9 6 Gujrati 63 63 Hindi 6 6
Punjabi 77,21,223 5,91,768 8,57,043 21,09,575 17,70,553 17,02,241 6,90,043 Rajasthani 329 329 Sindhi 323 12 19 16 34 234 8 Urdu 5,96,316 32,543 17,302 42,330 43,190 4,00,018 60,933
Iranian Branch
Baluchi 3,109 2,920 3 40 135 10 Persian 75 8 21 45 1 Pushtu 7,192 283 303 394 2,016 3,952 244
Semitic Family
Arabic 17 2 10 3
Tibeto-Chinese Family
Burmese 3 3 Other Assam-Burman
Tongues,
Various Central Asian
Tribal Tongues of N.W.
Unclassified 46 4 9 3 48
NOTE.-IExcludes persons claiming Nationalities other than Pakistani.

7-5
TABLE 7-MOTHER TONGUES.-Collld.
Section 4-Rawalpindi Division.
Number of person",
I Rawal- I DISTRICTS
Languages : pindi l 1._- -~~~-~--'-
I Division Campbell-i I Mianwali I Rawal- I Shah pur Gujrat I Jhelum i i. f"ur ! , pindi
I -- '-'-~ --- I_ ___________ ~~-
Total ... 51,45,091 7,22,542 11,57,742 6,78,900 5,49,549 8,74,971 11,61,387
Dravidian Family
South Indian Lan-guages 75 7 67
Indo-European Family
Dardic Branch
Kashmiri 1,109 222 37 63 786 Kohistani 1,019 1,016 3 Shina 100 100
European Branch
English 487 25 8 27 2 388 37
JnJo-Aryan Branch
Bengali 880 34 138 8 68 630 2 Gujrati 108 II 97 Hindi 4 4
Punjabi '" 49,31,252 7,05,116 11,16,211 6,64,171 5,28,512 8,29,713 10,87,529 Rajasthani 2 2 Sindhi '" 107 9 2 9 3 81 3 Urdu ... 1,84,551 5,131 40,761 14,152 18,204 34,737 11,566
Iranian Branch
Baluchi 20 4 15 1 Persian 135 6 4 4 6 107 8 Pushtu 25,107 10,917 606 486 2,752 8,991 1,355
Semitic Family
Arabic 13 7 3
Tibero-Chinese Family
Burmese 5 2 3 Other Assam-Burman
Tongues 34 34
Various Central Asian
Tribal Tongues of N.W. 37 37
Unclassified 46 10 34
NOTE:._IExcludes persons claiming Nationalities other than Pakistani.

Languages
TABLE 7-MOTHER TONGUES-Contd.
Section 5-Bahawalpur State.
Bahawalpur f
State
7-6
Number of persons.
DISTRICTS
Bahawalpur Rahimyarkhan
Total
Dravidian Family
South Indian Lanauages
Indo·European Family
Dardic Branch
Kashmiri Kohistani Shina
Eupopean Branch
English
Indo-Aryan Branch
Bengali Gujrati Hindi
Punjabi Rajasthani Sindhi Urdu
Iranian Branch
Baluchi Persian Pushtu
Dometic Family
Arabic
Tibeto-Chinese Pami1y
Burmese ... Other Assam-Burman Tongues
Various Central Asian
Tribal Tongues of N. W.
Unclassified
18,22,501
22
17,65,240 354
8,796 46,130
8 65
1,854
12
20
NOTE.-IExciudes persons claiming Nationalities other than Pakistani.
9,70,302 8,52,199
21
9,35,385 8,29,855 354
136 8,660 33,371 12,759
I 1 35 30
1,315 539
12
20

TABLE 7-MOTHER TONGUES-CQncld.
Section 6-Selected Town and Cities.
Languages.
TOTAL! 41.646 1,20,852 73,397 8,49,333 1,79,127 1,90,122
Indo-European Family.
Dardic Branch
Kashmiri '"
European Branch
EngliSh
Indo'Aryan Branch
9 Bengali Gujrati Punjabi Sindhi Urdu
". 37,754 '" 3 '" 3,679
Iranian Branch
Baluchi Persian Pushtu
Unclassified '"
7
194
3
19
1,19,459 71,750 I
1,241 1,647
20 83
26
221
109
102 31
7,51,563 1,74,992 16 ...
93,011 4.069
1 44
4,141
88
66
56
52
1 63
1,68,602 138
.20,770
31 18
380
II
NOTE.-1Excludes persons claiming Natj~nalities other than Pakistani.
Number of persons.
2,36,877 78,447 1,67,50q l
53
266
604 I
2,01,415 42,660 43 ...
.27,395 35,573
15 53
6,925
108
7 203
3
1 t
21~ 1.45:75~
3 18,791
. ,
2,71Zi


7-8
TABLE '-A-SPEECH.
1. This table shows the number of persons who commonly speak each of the main languages of Pakistan. Nine languages were selected for the purpose of this enquiry and these were printed on the Enumeration Slip. Tick marks VI ere placed under each language by the Enumerator according to the replies he received to Census question No.7. This question followed tbe question On Mother-tongue and asked the respondent to report "Any other language you commonly speak ?".
2. Many respondents claimed to speak more than one language in addition to their Mother-tongue. Therefore no 'Total' column is provided in this table since the total number of speakers exceeds the total population, many persons appearing more than once in tbe figures.
3. The figures under each language include those who speak the language as their Mother-tongue plus those who speak it as an additional language. The standard of multi-lingualism in each language can tberefore be assessed by comparing the figures in tbis table with those in Table 7: Mother-tongues.
4. This table is in two sections: Section 1 gives the number of speakers of each language and section 2 expresses the figures as percentages of the total population. The total population figure used for this calculation excludes Non·Pakistanis but the difference which that causes in the percentages is negligible.
5. Certain minor languages or dialects, having been reported as Mother-tongues, are induded in this table under the main languages in which they were classified in Table 7.
6. For further details see the title-sheet of Table 7.

7-9
TABLE 7-A-SPEECH.
StetiQn l~NUDlberl of persons who cOlDmonly speak the nine main languages of Pakistan.
(Includes both the persons who claimed the languages as their mother tongue (See Table 7) and those who reported it as another language commonly spoken by them.)
Number of persons •.
Districts and Selected 0 :a '; .c:: c :E ::I I :a :0 0 .:!l oS oS .Q
I :::I 011 '00 :::I Cities 01 '; C 0;, .. '2 </J "0 "0 ... ... c
~ ::l ::I C .. '." , .. < ~ !Xl ~ il< il< i:ii ~ I
PUNJAB INCLUDING BAHAWALfUR
12,809 4,749 3,968 6,11,921 32,2~~729 STATE ... 1,16,181 1,97,41,743 58,781 13,272
PUNJA'B ... ... 12,738 4,719 3,902 5,60,419 1,13,474 1,79,67,151 54,190 3,515 ·29,94)52
Lahore Di'lision ... 8,184 712 1,346 2,55,647 18,257 52,24,975 14,217 1,157 :-':1'"
10,35;948 ,r',
Gujranwa!a ... 3,524 13 71 53,269 4,735 10,22,615 1,365 39 ·1,61;354 Gujranwala City •.. 539 4 29 9,098 2,974 1,19,345 686 23 2.1,,364
Lahore ... 2,346 650 440 1,23,907 5,459 18,65,482 6,450 962 4,87,909 Lahore City ... 1,361 597 265 1,03,547 2,599 8,33,670 5,590 933 2,71,702
Sheikhupura ... 630 12 9 23,903 2,377 9,05,713 1,442 49 1,08,020 Sialkot ... 1,684 37 826 54,568 5,686 14,31,165 4,960 107 2,78,665 Sialkot City ... 199 17 246 21,681 704 1,46,248 3,132 70 62,906
Multan Division ... 1,771 3,728 1,199 2,12,753 13,956 77,43,008 10,417 1,631 14,42,731
Dera Ghazi Khan ... 272 3,042 16 9,323 1,784 5,93,022 353 109 1,17,188 Jhang .•. ... 204 12 883 23,125 3,177 8,57,819 323 120 80,319
!hang Maghiana ... 2 ... 5 3,427 244 71,767 1 2 13,107 LyalJpur ... 397 112 101 74,021 2,133 21,15,152 1,109 387 2,47,482
Lyallpur City ... 48 81 17 15,998 307 1,78,892 326 56 30,457
Montgomery ... 107 131 20 8,883 1,586 17,72,932 2,778 82 1,48,150 Multan ... 146 418 161 81,336 3,544 17.10753 5,204 922 6,57,702 Multan City ... 88 120 12 15,694 1,892 1)5,363 689 297 69,411
Muzaffargarh ... 645 13 18 16,065 1,732 6,93,330 650 11 1,91,890
Rawalpindi Division 2,783 279 1,357 92,019 81,261 49,99,168 29,556 727 5,15,573
CampbeUpur .. 356 48 115 16,129 23,411 7,20,399 11,324 209 58,480 Gujrat ... ... 2e9 78 160 16,890 24,539 11,19,247 868 32 86,637 Jhelum ... 350 53 41 15,678 9,341 6,67,521 734 119 68,578 Mianwali ... 34 1 90 4,143 4,157 5,46,526 3,916 8 52,710 Rawalpindi ... 1,164 .82 835 24,632 2,666 8,44,550 11,040 214 1,36,565
Rawalpindi City ... 838 73 805 17,280 2,919 2,10,038 9,558 147 1,02,001 Sbahpur ... 670 17 116 14,547 17,147 11,00,925 1,674 145 1,12,603 Sargodha City .. , 35 11 40 9,975 7,010 68,015 1,112 32 49,877
BAHAWALPUR STATE 71 30 66 51,502 2,707 17,74,592 4,591 9,757 2,35,477
Bahawalpur ... 36 29 65 27,369 482 9,43,768 3,059 614 1,72,500 Bahawalpur City ... 13 7 27 2,982 18 38,267 204 9 8,154
Rahimyarkhan ... 35 1 1 24,133 2,225 8,30,824 1,532 9,143 62,977
NOTE:-1Excludinll persons claiming Nationalities other than Pakistani.

7,:10 " \
Sectioll"2':"-percentages.-Number1 of persons commonly speaking the nine m~ln'languages ofPakistas ~:xpr~sed a,s a percenta~e of t~e tpfal population ill ~"cll geogrllPbi.cal are~, .
Number of persons.
I :c i ;; .!: I u I
r:I :Ei Districts and :g u ., .;:1 ::I :a .e I:lIl ~ Ol ... :::
Selected Cities I
I 1: ., .S' ~ "0 "0 < d 4) r:I
I ... r:I
~ I ~ l-.j If ::I ::: ... I ~ ll.o i:il ::>
PUNJAB INCLUDING 0.06 0.02 0.02 2.97 0.56 95'66 0.28 0.06 15.65 BAHAWALPUR STATE
PUNJAB 0.07 0.03 0.02 2.98 0.60 95.50 0.2? 0.02 l5.91
Labo,", Pivisipll ... 0.15 0.01 0.03 4.79 0.34 97.86 0.27 0.02 19.40
GuJflIm\'al~ .. , 0.34 0.00 0.01 5.09 0.45 97.68 0.13 0.00 15.41
Gli.jranwala City ... 0.45 0.00 0.02 7.53 2.46 98.75 0.57 0.02 17.68
laltgre - 0.12 0.03 0.02 6.54 0.29 98.44 0.34 0.05 25.75
Lahore City ... 0.16 0.07 0.03 12.19 0.31 98.10 0.66 0.11 31.99
S~ei"buPura ... 0.07 0.00 0.00 2.59 0.26 98.12 0.16 0.01 11.70 S13ikot ... 0.11 0.00 0.06 3.70 0.39 97.08 0.34 0.01 18.90
Sialkot City ... 0.12 0.01 0.15 12.94 0.42 87.31 1.87 0.04 37.65
MuUaD, Division ... 0.02 0.04 0.01 2.55 0.17 92.96 0.13 0.02 17.32
Dera Ghazi Khan ... 0.04 0,48 0.00 1.49 0.28 94.50 0.06 0.02 18.67 Jhang ... 0.Q2 0.00 0.10 2.64 0.36 97.98 0.04 0.01 9.17
Jhang Maghiana ... 0.00 0.00 0.00 4.67 0.33 97.iB 0.00 0.00 17.86 Lyallpur ... 0.02 O.CO 0.00 3.44 0.10 98.27 0.05 0.D2 11.50
LYallpur City ... 0.03 0.05 0.00 8.93 0.17 99.87 0.18 0.03 17.00 Montgomery ... 0.01 0.01 0.00 0.49 0.09 97.63 0.15 0.00 8.16 Multan ." 0.01 0.02 0.01 3.86 0.17 81.18 0.25 0.04 31.21
Multan Cily ... O.os 0.06 0.00 8.25 1.00 92.24 0.36 0.16 36.51 Muza/fargarh ... 0.09 0.00 0.00 2.14 0.23 92.29 0.09 0.00 25.54
Rawalpindi Division 0.05 0.01 0.03 1.79 1.58 97.16 0.57 0.01 10.02
CampbeJlpur ." 0.05 0.01 0.02 2.23 3.24 99.70 1.57 0.03 8.09 Gujrat ." 0.02 0.01 0.01 1.46 2.12 96.67 0.07 0.03 7.48 Jhelum ... 0.05 0.01 0.01 2.31 1.38 98.32 0.11 0.02 10.10 Mianwali .. , 0.01 0.00 0.02 0.75 0.76 99.45 0.71 0.00 9.59 Rawalpindi ." 0.13 0.01 0.10 2.82 0.30 96.52 1 2f.i 0.02 15.61
Rawalpindi City ... 0.35 0.03 0.34 7.29 1.23 88.67 4.04 0.06 43.06
Shahpur .. , 0.06 0.00 0.01 1.25 1.48 94.79 0.14 0.01 9.70
Sargodha City ... 0.04 0.01 0.05 12.72 8.94 86.70 1.42 0.04 63.58
BAHA WALPUR STATE 0.00 0.00 0.00 2.83 0.15 97.37 0.25 0.54 lZ.92
Bahawalpur ... 0.00 0.00 0.01 2.82 0.05 97.27 0.32 0.06 17.78 Bakawa/pur City .•• 0.03 0.01 0.06 7.16 0.04 91.88 0.48 0.02 19.57
Rahimyarkban ." 0.00 0.00 0.00 2.83 0.26 97.49 0.18 1.07 7.39
Note:-1Excluding persons claiming Nationalities other than Pakistani.


8-1
TABLE 8-LITERACY
This table showl the size of the literate population (excluding persons claiming nationalities otber than Pakistani) and their percentage to the total population.
2. For census purposes; "Literacy" has been defined as the ability t" read any of the main nine languages of Pakistan, in clear print. This definition differs from that used in past censuses and care should be taken in making a comparative study,
3. The table does not give separately the number of literates between the ages of 6, which is the normal school-going age in this country and 11. An idea of literates between the ages of 6 and 11 will be given by the following tiaures obtained through the Education Department :-
NO. OF STUDENTS IN PRIMARY SCHOOLS ON THE 1ST JANUARY, 1952.
Punjab including Bahawalpur State. Punjab Bahawalpur
Boys. 3,92,658 3,70,660 21.998
Girls. 1,12,373 1.10,818 1,555
---- ---- -----Total. 5.05,031 4,81,478 23,5S3
4. The figures given for District are totals and include all towns.
State.
5. Details of the literate population by the languagos which they are able to read (or read and write) are given in Table 8-A. Levels of education attained are shown in Table 9 B. The same information separately for Mahajirs appears in Table 19-B.
6, This table is discussed in Chapter 7 of part I of the Census Report.

8-2
TABLE 8-LlTERACY
Persons who are able to read any language,
Number of persons,
'-'" 0,9 Population Literate persons' ~E
"''' District, Town & City I , ~ g.
_____ I~-_-_M~_a-Ie~~1-F-e-m-a-Ie- i --~-l--;::~e--: ~ i PUNJAB AND BAHA- 1.10,49,854 95,86,848
WALPUR STATE
PUNJAB
Lahore Division
'" 1,00,59,949
28,86,257
Gujranwala District (Gujranwala)
Lahore District (Lahore)
Sheikhupura District Sialkot District
(Sialkot)
Moltan Division
Dera Ghazi Khan District
Jhang District (Jhang Maghiana)
Lyallpur District (Lyallpur)
Montgomery District Multan DistrIct
(Multan) ". Muzaffargarh District
Rawalpindi Division
Campbellpur District Gujrat District Jheium Dislrict Mianwali District Rawalpindi District",
(Rawalpindi) Shahpur District
(Sargodha)
BAHAWALPUR STATE
Bahawalpur District (Bahawalpur)
Rahimyar Khan District
5,63,821 (65,115)
10,38,878 (4,78,499)
4,94,011 7,89,547
(94,977)
44,54,552
3,40,069
4,70,908 (39,739)
1l,41.938 (99,085) 9,69,883 11,27,883
(1,04,478) 4,03,871
27,19,140
3,76,834 6,14,959 3,49,260 2,89,424 4,68,565
(1,44,076) 6,20,098 (43,385)
9,89,905
5,23,767 (23,368) 4,66,138
87,54,252
24,53,014
4,83,112 (55,737) 8,56,183
(3,70,834) 4,29,070 6,84,649
(72.529)
38,75,287
2,87,460
4,04,623 (33,658)
10,10,463 (80,042) 8,46,005 9,79,358 (85,644) 3,47,378
24,25,951
3,45,708 5,42,783 3,29,640 2,60,125 4,06,406
,,(92,801) 5,41,289 (35,062)
8,32,596
4,46,535 (18278) 3,86,061
22,31,594 14,31,515
20,82,310 13,21,912
7,10,601 5,73,186
1,37,552 (23,040) 2,69,257
(1,76,706) 93,123
2,10,669
(45,699)
7,84,176
43,534
71,697 (7,807)
2,06,909 (30,/62) 1,69,308 2,20,038 (4],196)
72,690
5,87,533
65,918 1,13,363 1,02,989
48,403 1.61,455 (65,615)
95,405 (6,144)
1,49,284
97,253 (9,863) 52,031
1,22,566 (20,828) 2,01,209
(I,31,1I0) 81,940
1,67,471
(31,062)
6,64,607
31,446
61,945 (7,730)
2,10,365 (25,121) 1,39,419 1,72,144
(27,414) 49,288
81,119
7,061 14,654 16,269 4,797
26,456 (16,362)
14,882 (3,901)
1,09,603
74,483 (5963) 35,120
Note:-l. Excluding persons claiming Nationalities other than Pakistani.
17'8
18'1
24'0
24,8 (36'3)
24'8 (36'2)
19'0 25-7
(43'4)
17'4
12'0
15'3 (21'2)
19'4 (30'9)
17'0 18'6
(36'1) 16'2
13"1
10'1 11'1 17,6 9'7
21'5 (34"6)
9'5 (12'8)
14'2
17'7 (38'0)
10'2
2. A literate person was defined in the Census as a "Person who can read",
LIterate persons % of population
in Sex Group
Male i Female
20'7
24'6
24'4 (35'4)
25'9 (36'9)
189 26'7
(48'1)
17'6
12,8
15'2 (19'6)
18'1 (30'4)
17.5 19'5
(39.4) 18'0
21"6
17'5 18'4 29'5 16'7 34'5
(45'5) 15'4
(14'2)
15'1
18'6 (42'2)
11'2
14'9
15'1
23'4
25'4 (37"4)
23'5 (35"4)
19'1 24'5
(42'8)
17-1
10'9
15'3 (23"0)
20'8 (31.4)
16.5 17'6
(32'0) 14'2
3'5
2'0 2'7 4'9 l'8 6'5
(17'0) 2'7
(11'1)
13'2
16'7 (32'6)
9.1

8-3
TABLE 8-A-LANGUAGES OF LITERACY.
The Population analysed in this table is the total number of literate per,ons shown in table 8. In this Table these literate persons afe analysed according to their ability to read and write and to read only, each of the
nine main languages of Pakistan.
2. The number of persons able to read an d write is shown in ordinary type and immediately below is shown in italics the number able to read only.
3. In the column for Arabic is shown the number of persons who claimed ability to read in that language the Holy Quran only.
4. The nine main languages of Pakistan, shown in the heading of the table, were printed on tbe census slip. The data for this table was obtained in reply to census question No.8, which asked the respondent to state which language or languages, if any, he was able to read or write. Under the particular language 'P' was to be written for ability only to read, 'L' for read and write and 'Q' under ArE-bie for ability to read the Quranic script only,
5. Ability to read meant that a person claimed to read clear print, and ability to write meant that the person claimed to be able to write a simple letter. The original slips were sorted in accordance with the records made on them and were counted to produce the statistics shown in this table.
6. This table is discussed in Chapter 7 of the Report.

8-4
TABLE 8-A-LANGUAGES OF LITERACY
Literate Fersons able to read and write and tbose able to read only, each of the nine main Languages of Pakistan.
tNumber able to read and write is shown in ordinary type. Number able to read only in italics.)
Number of persons.
Province. States, Divisions, District & Cities
PUNJAB AND BARA- 17,810 WALPUR STATE 42,959
23,00,122*
PUNJAB PROVINCE .. , 17,512
Lahore Division
42,509 21,35.696*
7,574 23,326
7,47.636*
Gujranwala District ... 877
(Gujranwa/a)
Lahore District
(Lahore)
900 1,42.087*
(21,491*)
5,232 13,817
2,73.243 •
(4.519) (9,828)
(1.65,409* )
Sheikhupura District ... 127
Sialkot District
(Sialkot)
1,096 1,20,769*
1,338 7,513
2,11,537*
(102) (5,466)
(30.596*)
1 364 4,29,896 1.02.827 35.554 2,031 39 15,14.387 252 51,992 13,273 32,450 439 5 2.14,140
1 364 4,07,953 97,823 35,443 1.850 39 14.25,285 252 48,149 12.178 32,413 434 5 1,95.994
88 2,01,946 37.353 2.442 2'~ 9 163 20,477 4,586 14,984 199 4
29,229 7.063
(6,625)
2,220 401 744 1,286 21
(650) (221)
5,46,916 95.079
1,02.139 23,011
(17,002) (1,478)
72 163
99,554 23,448 644 59
21 9 2.33,617 4,187 1,287 8 27,996
(71) (80,408) (22.155) (482) W) (5) (1,59,624) (163) (4,093) (1,155) (52) ,2) (21,4431
16
12,493 1,474
60,670 7,753
1.782 1,324 643 3,494 50
9,903 73 3 1,912 10,145 120
(4) \16,657) (4,191) (1,437) (772)
4 44,684 8,561
1,66,476 35,511
(48,00]) (6,587\
.------------------------------------------------------.,--~----_._._---------------1. The figures marked with an asterisk show the number of persons claiming to be able to read only the Holy Quran.
2. Persons who can read and write Punjabi in Gurmukhi script.

8-5
TABLE 8·A-LANGUAGES OF LITERACY-Contd,
Literate persons able to read and write and those able to read only, each of the nine main Languages of Pakistan.
(Number able to read and write is shown in ordinary type. Number able to read only in italics.)
Number of persons.
Province, States, u " ~ .~ ..d " '.0 '..0 0; .:!3 .:;; 0 :.a :;l g oj .l:: " Divisions, Districts & '>0 "Ell '2 'Cj "" '" c ~ ... .( -;; '" <::
Cities. OJ " OJ :;l " i <:i5 :::> ~ !:xl III .... .... ....
Multan Division 4,544 1 1,18,673 28,108 15,984 98 5,03,964 8,944 16 13,905 4,895 5,681 38 48,321
10,19,085*
Dera Ghazi Khan District 2,714 4 11 11,377 189 1,470
60,694*
Jhang District 55 11,745 2,301) 1,486 52,802 82 2,052 238 413 1 3,545
84,894*
(Jhang Maghiana) ... (1,566) (1,089) (6,710)
(10,094*) (585) ~I15) (1,307)
Lyallpur Di~trict 207 1 28,544 4,882 9,252 1.41,906 1,111 4,545 832 3,5l5 10,206
3,19,436·
(Lyallpur) (4,055) (33,/00) (19) (J,466) (2111 (1,133)
(43,329*)
Montgomery District ... 880 26,249 8,S79 139 1,22,627 1,357 5,057 834 33 18,573
1,62,807*
Multsn District 1,527 42,075 9,927 5,100 1,41,481 4,452 17 1.443 2,852 1,611 37 ]0,555
2,97,16P
(MIIltan) (915) (12,123) (967) (3,326) (29,620) (15) (2) (446) (798) (24) (/,873)
(43,998*)
Muzalfargarh District 1,875 7,346 2,107 7 87 33,771 ],942 649 139 99 3,972
94,093·
Rawalpindi Division ... 5,394 1 275 87,334 32,362 17.017 1,728 30 3,74,405 10,239 73 13,737 2,697 1l,748 197 1 52,594
3,68,973*
CampbeUpur District ... 368 7,655 3,654 7 2 44,229 710 497 228 52 12,922
30,695'
Gujrat District 602 4 18,997 3,836 6 1,131 70,383 240 2,342 651 4 16 5.288
86,486*
Jhelllm District 1,364 248 9,384 3,057 6,166 91 51,862 215 1 938 309 10 69 4,386
51,901*

TABLE 8-A-LANGUAGES OF LITERACY-Concid.
Literate persons able to read and write and those able to read only, each of the nine main Languages of Pakistan.
8-6
(Number able to read and write is shown in ordinary type. Number able to read only in Italics,)
Number of persons.
Province, States, I :a i I ..0 Q :0 ~ .9 C;; Divisions, Districts & .D u
j .~ .~ I':S E ::l I ::J O/j bb <Il 'eo '"c:I
Cities .. I
t<S C;; Q ... Q 'E ... ! V Q V ::J < ~ I ~ III c.. c.. I c.. til ;:J
Rawalpindi Division ... -contd,
Mianwali District ... 429 1 3 6,087 2,164 2,056 138 2 27,452 115 ... ... 606 783 163 16 1 2,224
28,197 • . Rawalpindi District ... 1,428 . .. 20 30,439 13,219 8,439 261 27 1,18.614
7.992 ... 71 7,092 418 1l,357 96 ... 10,251 1,24,726*
(Rawalpindi) ... (I77) . .. (I8) (14,666) (5,320) (6,677) (134) (24) (47,307) (1,145) ... (71) (4,290) (1,172) (30) (147) ... (16,370)
(42,627*) ... Sbahpur District ... 1,203 ... . .. 14,772 6.432 343 105 1 61,865
967 ... ... 2,262 46.968-
308 162 . .. '" 17,523
(Sargodha) ... (1,070) ... ... (1.957) . .. ... . .. ... (6.355) (106) ... ... (55) (22) . .. .. . '" (8,314)
(5,603*)
BAHAWALPUR STATE 298 ... . .. 21,943 5.004 111 181 '" 89,102 450 ... . .. 3,843 1,095 37 5 '" 18,146
1,64,428*
Bahawalpur District ... 294 ... ... 16,627 3,104 111 .. . '" 66,285 450 ... . .. 2.632 296 27 5 '" 15,513
93,600*
(Bahawalpur City) ... (11) ... ... (2,722) (950) (47) ... . .. (7,509) (8) ... . .. (6) (2) ... (5) . .. (174)
(8,081*)
Rahlmyarkhan District 4 ... . .. 5,316 1,900 ... 181 . .. 22,817 ... ... . .. 1,211 799 10 ... . .. 2,633
70,828*


TABLE 9-PUPILS AND STUDENTS
This table shows for each district and Bahawalpur state, the number of persons by sex in two broad age-groups, who reported themselves in the census as regularly attending school or ColJege. The table is in two sections. Section 1 shows the analysis by main religious groups for the whole of Punjab and Bahawalpur the whole of Punjab and separately for Bahawalpur State. Section 2 gives the analysis for "All religions by districts.
Separate figures have been given for cities and all seiected towns, except Sargodha and are also included in the respective district figures immediately above it. The percentage which each figure in the table bears to the corresponding total population of its age, sex and religious group has been shown in italics below the respective figures.
2. Similar tables regarding school or college population were not produced in previous censuses of this sub-continent.
3. The data for the number of people still undergoing education were obtained in reply to the first Part of Census Question No. 10 which enquired whether the person was regularly attending school or college. The enumerators' leaflet explained that a person should be treated as regularly attending school or college regardless of any temporary break in attendance such as sickness or holidays.
4. Since this censl!ls information is based on verbal statements by individuals or beads of families, it is unlikely that it will agree either in general or,in particular with the official records based on registers kept by beads of schools and colleges. The number of persons attending primary schools on 1,152 according to the record of the Director of Public Instructions are :-
Punjab including
Bahawalpur State Punjab Bahawalpur.
Boys. 4,02,658 3,70,660 31,998 Girls. 1,12,373 1,10,818 1,555
---._-- ----- -----Total 5,15,031 4,81,478 33,553
Possible reasons for the difference between the total of this Census Table and the above mentioned figures are discussed in Chapter 7 of Part I of the Census Report.
9-1

9-2
TABLE 9-PUPILS AND STUDENTS
Section I-Punjab and Bahawalpur State
. Persons in each educational age-group who, according to main religious groups, at the time of Census, were or are attending Schools or Colleges.
(Figures in Italics denote percentage of the population in the age, sex & religious group.)
Number of persons.
I All Religions I
I Muslims
Age Group I
l~--~ Total ! Male Female I Total Male Female
PUNJAB INCLUDING BAHAWALPUR STATE.
1 ALL AGES 12,25,367 8,11,692 4,13,675 12,05,978 7,99,833 4,06,145 1 2 6.9 8.5 5.0 6.9 8.5 5.0 2
3 0-9 3,56,290 2,41,464 1,14.824 3,51,446 2,38,461 1,12,985 3 4 14.1 18.2 9.6 14.2 18.3 9.7 4
5 10 & Over 8,69,077 5,70,228 2,98,851 8,54,532 5,61,372 2,93,160 5 6 5.7 6.9 4.2 5.7 6.9 4.2 6
PUNJAB.
7 ALL AGES 11,23,707 7,46,858 3,76,849 11,04,429 7,35,076 3,69,353 7 8 6.9 8.5 5.0 6.9 8.6 5.0 8
9 0-9 3,39,952 2,31,332 1,08,620 3,35,1l6 2,28,335 1,06,781 9 10 14.6 18.8 9.8 14.7 18.9 9.9 10
11 10 & Over 7,83,755 5,15,526 2,68,229 7,69,313 5,06,741 2,62,572 11 12 5.6 6.8 4.2 5.6 6.9 4.2 12
BAHAWALPUR STATE.
13 ALL AGES 1,01,660 64,834 36,826 1,01,549 64,757 36,792 13 14 6.5 7.7 5.2 6.6 7.7 5.2 14
15 0-9 16,338 10,132 6,206 16,330 10,126 6,204 15 16 8.8 10.3 7.1 8.9 10.4 7.1 16
17 10 & Over 85,322 54,702 30,620 85,219 54,631 30,588 17 18 6.2 7.3 4.9 6.3 7.4 4.9 18
_"'-"~--'"
Note:-l Excluding persons claiming their nationality other than Pakistani.

9-3
TABLE 9-PUPILS AND STUDENTS-Contd.
Section-I-Punjab and Bahawalpur State.
Persons in each educational age-group who, according to main religious groups, at the time of Census, were or are attending Schools or Colleges.
(Figures in Italics denote percentage of the population in the age, sex & religious group.)
Number of persons.
Caste Hindus Scheduled Castes Other Religions
I
j Female
,
Male I Female Total I I Female-Age Group
Total I Male Total I Male
PUNJAB INCLUDING BAHAWALPUR STATE.
144 96 48 386 318 68 18,859 11,445 7,414 ALL AGES 1 2. 5.9 7.8 3.9 1.6 2.3 0.6 5.5 6.2 4.8 2
3 14 11 3 85 77 8 4,745 2,915 1,830 0-9 3 4 7.3 13.3 2.7 2.5 3.9 0.6 10.7 12.6 8.6 4
5 130 85 45 301 241 60 14,114 8,530 5,~84 10 & Over 5 6 5.8 7.4 4.0 1.4 2.1 0.6 4.8 5.3 4.2 6
PUNJAB.
7 78 55 23 367 302 65 18,833 11,425 7,408 ALL AGES 7 8 5.2 7.2 3.1 2.4 3.2 0.9 5.6 . 6.2 4.8 8
9 14 11 3 83 75 8 4,739 2,911 1,828 0-9 9 10 13.5 19.3 6.4 4.1 6.6 0.9 10.7 12.6 8.6 10
11 64 44 20 284 227 57 14,094 8,514 5,580 10 & Over 11 12 4.6 6.2 2.9 2.1 2.3 0.9 4.8 5.3 4.2 12
BAHAWALPUR STATE.
13 66 41 25 19 16 3 26 20 6 ALL AGES 13 14 7.0 8.9 5.2 0.2 0.3 0.1 1.5 1.9 0.8 14
15 2 2 6 4 2 0-9 15 16 0.1 0.2 2.5 2.9 2.0 16
17 66 41 25 17 14 3 20 16 4 10 & Over 17 18 7.7 9.4 6.0 0.2 0.3 0.1 1.3 1.8 0.6 18

9-4
TABLE 9-PUPILS AND STUDENTS-Contd.
Section 2-Districts and Selected Towns.
,Persons in each educational age-group who, at the time of Census, were or are attending Schools or Colleges.
(Figures in Italics denote percentage of the population in the age & sex group.)
Number of persons.
Total Population 0-9 Years 10 Years and over
District & State I
I i Female: i
Total Male Total Male Female I Total !
Male I Female ------"-- I
PUNJAB & ... 12,25,367 8,11,692 4,13,675 3,56,290 2,41,464 1.14,824 8,6~,077 5,70,228 2,98,851 BAHAWALPUR 6.9 8.5 5.0 14.1 18.2 9.6 5.7 6.9 4.2 STATE
PUNJAB .. 11,23,707 7,46,858 3,76,849 3,39,952 2,31,332 1,08,620 7,83,755 5,15,526 2,68,229 6.9 8.5 5.0 14.6 18.8 9.8 5.6 6.8 4.2
Lahore Division 4,13,489 2,56,284 1,57,205 1,21,072 72.209 48,863 2,92,417 1,84,075 1,08,342 9.1 10.2 7.5 22.4 24.3 20.2 7.2 B.3 5.9
Gujranwala 91,936 51,508 40,428 14,466 7,527 6,989 77,470 43,981 33,489 10.4 10.6 10.3 20.6 1B.O 24.3 9.6 9.9 9.2
(Gujranwaia ,B,285) (4,603) (3,682) (643) (353) (290) (7,642) (4,250) (3,392) City) (4.7) (3.8) (6.6) (2.2) (1.7) (3.3) (5.2) (4.2) (7.2)
Labore 1,51,974 89,603 62,371 50,602 30,002 20,600 1,01,372 59,601 41,77) 9.2 9.8 8.4 27.6 30.1 24.5 6.9 7.3 6.3
(Lahore City) (1,10,722) (56,546) (54,176) (34,248) (19,625) (14,623) (76,674) (36,921) (39,553) ~9.1) 6.7) (14.6) (14.1) (I1.8) t IB.9) (7.B) l5,4) 113.5)
Sheikhupura 59,164 43,452 15,712 18.239 12,816 5,423 40,925 30,636 10,289 7.5 10.2 4.4 15.5 20.4 9.9 6.2 B.4 3.4
Sialkot 1,10,415 71.721 38,694 37,765 21,864 15,901 72,650 49,857 22,793 8.6 10.4 6.6 22.4 23.5 21.2 6.5 8.3 4.4
(Sialkot City) (22,349) (10,623) (11,726) (3,876) (1,474) (2,402) (18,473) (9,149) (9,324) (9.3) (6.3) (16.2) (9.1) (5.2) (16.7) (9.4) (6.6) (16.0)
Multan Division 4,26,510 2,56,555 1,69,955 1,10,678 67,572 43,106 3,15,832 1,88,983 1,26,849 5.9 6.6 5.1 10.2 12.2 8.2 5.1 5.7 4.5
Dera Gazi ... 9,986 7,256 2,730 3,703 2,673 1,030 6,283 4,583 1,700 Khan 1.9 2.5 1.1 7.3 5.7 2.6 1.4 1.9 0.8
Jhang 36,057 23,958 12,099 10,439 6,963 3,476 25,618 16,995 8,623 4.7 5.8 3.0 8.4 10,4 6.1 4.0 4.9 2.9
(Jhang (4,673) ( 2,577) (2.096) (1,369) (744) (625\ (3,304) (1,833) (1,471) Maghiana) (4.4) (3.5) (6.2) (5.0) (4.2) (6.7) (4.1) (3.3) (6.0)
LyaUpur ... 92.140 48,175 43,965 23,304 13,148 10,156 68,836 35,027 33,809 4.9 4.8 5.2 7.5 8.1 6.8 4.4 4.1 4.6
(Layllpur City) (12,370) (7,422,) (4,948) (3,651) (2,024) (J ,627) (8,791) (5,398) (3,321) (4.8) (4.1) (6.2) (6.4) (5.3) (8.6) (4.3) (3.8) (5.4)
Montgomery 1,32,177 80,749 51,428 25,160 12,858 12,302 1,07,027 67,901 39,126 8.3 9.3 7.0 16.B 16.7 16.8 7.4 B.6 5.9

9-5
TABLE 9-PUPILS AND STUDENTS-Coneld.
Section 2-Districts and Selected Towns.
Persons in each educational age-group who, at the time of Census, were or are attending schools or Colleges.
(Figures in Italics denote percentage of the population in the age and sex group.)
Number of persons.
Total population 0-9 Years 10 Years and Over
District & State I Total 1,1 Male : Female ~ota~T ~ale i~e:~l~' Total _________ '' ________ '"_~ ______ ,_,, ___ _: _____ _l__ ___ ' __ '----___ _
Male Female
Multan Division --contd.
MuHan 1,18,093 69,566 6.6 7.3
48,527 32.156 5.7 10.7
20,540 11,616 85,937 49,026 36,911 14.2 7.4 5.7 6.0 5,3
(Multan City) (21,ll1l (12,454) (8,657 (6,450) (4,438) (2,012) (14,661; \8,016) (6,645) (7.7\ '6.5) (l0.]) (92) (9.4) ~8.8) (7.1) (5.6) i)0,6)
Muzaffargarh
Rawalpindi Division
Campbell pur
Gujrat
Jheium
Mianwali
Rawalpindi ..
(Rawalpindi City)
Shahpur
38,057 26,851 11,206 15,916 11,390 4,526 22,141 '15,461 5.9 7.7 3.7 14.9 20.1 8.9 4.1 5.3
2,83,708 2,34,019 49,689 1,08,202 91,551 16,651 1,75,506 1,42,468 6.4 9.9 2.4 15.2 24.3 5.0 6.4 7.2
38,265 33,904 4,361 12,672 11,479 1,193 25,593 22,425 6.2 10.0 1.5 11.9 20.8 2.3 5.0 8.3
38,627 33,107 5,520 18,976 16.760 2,216 19,651 16,347 3.8 6.2 1.2 12.2 20.8 3.0 2.3 3.6
48,641 40.527 8,114 19,622 16,473 3,149 29,019 24,054 8.1 13.2 2.8 20.3 32.1 7.0 5.8 9.4
21,077 18,597 2,480 6,734 6,125 609 14,343 12,472 4.5 7.6 1,1 8.7 14.2 1.8 3.7 6.2
94,457 74,361 20,096 30,554 24,644 5,910 63,903 49,717 12.7 18.6 5,9 30.2 45.0 11.8 10.0 14.4
(25,383) (18,535) '7.7) (7.8)
(6,848) (9,266) (6,295) '2,971) (] 6, 11 7) (,12,240) (7.4) (13,5, (J 3.2) 14.1) (6.2) (6.5)
42,641 33,523 4.2 6.2
9,118 19,644 16,070 3,574 22,997 17,453 1.9 11.5 17.4 4.5 2.7 3.9
6,680 2.7
33,038 1,9
3,168 1.3
3,304 0.8
4,965 2.0
1,871 1.0
14,186 4.9
(3,877) \ 5.4)
5,544 1.4
BAHAWALPUR 1,01,660 64,834 36,826 16,338 10,132 6,206 85,322 54,702 30,620 STATE 6.5 7.7 5.2 8.8 10.3 7.1 6.2 7.3 4.9
Bahawalpur 77,090 46,275 30,815 11,761 7,036 4,725 65,329 39,239 26,090 9.1 10.1 7.9 15.0 17.4 12.5 8.5 9.4 7.4
(Bahawalpur (,7,228) (3,572) (3,656) (1,639) (9661 (673) (5,589) (2,606) (2,983, City) (12,1) (8.6) (20.0) (12.7) (11.1) (16.0) (11.9) (7.9) p1.2)
Rahimyar Khan 24,570 18,559 3.5 4.8
6,011 4,577 1.9 4.3
3,096 1,481 19,993 5.4 2.3 3.3
15,463 4.7

9-6
TABI,E 9-A-YEARS OF EDUCATION.
This Table shows how many persons out of the whole population (excluding Non-Pakistanis) have received formal schooling and analyses them in broad age·groups according to the number of yearS spent in full time education.
2. This Table is divided into two sections as under :-
Section 1 : All Religions.
Section 2 : Muslims.
In each section the analysis is made for the Province as a whole, showing sex breakdown for each diStrict, State and Selected town and city. Separate figures given for towns are also included in those of the districts in which the town or city is situated.
3. This information for this Table was obtained from Census Question No. 10 (b) which aSlo..ed: "For how many years have you attended school or college?" The Enumeratvf was instructed that this question applied to those who had left school or college as well as to those still attending. He was also instructed that the reply should be
recorded to the nearest whole number of years. The data so recorded were sorted mostly by hand using the original enumeration slips, but the slips for certain categories of. persons were coded and sorted by punched card machines.
4. The number of children in the lowest age-group who are shown as having received full time education is smaller than the number in that age-group shown in Table 9 as currently attending school. The difference is due to children who have been at school for considerably less than one year having the answer 'Yes' recorded to Question lO-A, which asked: "Are you regularly attending school or college?" but 'None' given against Question 1 O-B in respect of the nearest whole number of years at school.
5. The number of females included in each figure is shown in italics below it.
The Table is discussed in Chapter 7 of Part I.

9-7
TABLE 9-A-YEARS OF EDUCATION-Contd.
Section I-All Religions.
Persons of each educational age group who have or are receiving full time education. (Figures in Italics show the number of Females included in the total above them.)
Number of persons.
Years in full time education Age Group Total Received!
Population Schooling Under 5 \to 6
------_._-_._-_._------ ---------._ -------
Total
0-9
10 & Over ...
Total
0-9
10 & Over ...
Total
0-9
10 & Over ...
Total
0-9
10 & Over ...
Total
0-90
10 & Over ...
Punjab including Bahawalpur State.
2,06,36,702 95,86,848
53,12,156 25,39,043
1,53,24,546 70,47,805
1,88,14,201 87,54,252
48,61,922 23,31,486
1,39,52,279 64,22,766
53,39,271 24,53,014
12,74,688 6']0,832
40,64,583 18,42,182
10,46,933 4,83,112
2,37,284 1,18,789
8,09,649 3,64,323
1,20,852 55,737
20.173 8,706
1,00,679 47,031
25,88,870 8,84,191
3,60,482 1,18,087
22,28,388 7,66,104
Punjab.
23,72,152 8,04,603
3,44,117 1,11,870
20,28,035 6,92,733
12,96,435 6,38,356 4,65,509 2,23,088
2,95,848 96,845
64.634 21,242
10,00,587 5,73,722 3,68,664 2,01,846
11,,99498 5,83,743 4,25,084 2,03,082
2,83,133 91,928
60,984 20,942
9,16,365 5,22,759 3,33,156 1,82,140
Lahore Divison.
8,85,283 3,57,922
1,23,879 50,769
7,61,404 3,07,153
4,11,909 1,77,216
1,04,166 43,030
2,19,142 92,251
19,713 7,739
3,07,743 1,99,429 1,34,186 84,512
Gujranwala District.
2,07,539 1,02,469
15,907 7,718
1,91,632 94,751
93,118 47,083
11,262 5,508
81,856 41,575
Gujranwala City.
22,371 8,855
643 290
21,728 8,565
7,676 4,073
379 195
7,297 3,878
60,528 27,866
4,645 2,210
55,883 25,656
6,090 2,514
264 95
5,816 2,419
~_~ :__Lover 10
4,75,423 1,40,506
1,78,656 55,088
4,75,423 1,78,656 1,40,506 55,088
4,27,686 1,61,225 1,26,813 49,624
4,27,686 1,61,225 1,26,813 49,624
1,89,643 64,589 64,784 23,671
1,89,643 64,784
39,817 20,(J04
39,817 20,604
6,231 1,863
6,231 1,863
64,589 23,671
14,076 6,916
14,076 6.916
2,334 405
2,384 405
NOTE :-1 Includes all persons who have attended o,r who are now attending school or College.

9-8
TABLE 9-A-YEARS OF EDUCATION-Conld.
Section 1-All Religions.
Persons of each educational age group who have or are receiving full time education. (Figures in Italics show the number of Females included in the total above them).
Number of persons.
Years in full time education Age Group Total Received
-----~---~ - ----~--- -------POPl!lation Schoohng
Under 5 5 to 6 -; to 10 Over 10 -- ---------
Lahore District.
Total 18,95,061 3,42,456 1,50,591 78,762 86,552 26,551 8,56,183 1,22,470 58,682 32,967 23,408 . 7,413
0-9 4,20,841 51,725 41.995 9,730 1,97,401 21,495 17,290 4,205
10 & Over 14,74,220 2,90,731 1,08,596 69,032 86,552 26,551 6,58,782 1,00,975 41,392 28,762 23,408 7,413
Lahore City.
Total 8,49,333 2,38,273 97,333 50,741 69,549 20,650 3,70,834 87,761 39,720 22,959 19,219 5,863
0-9 1,65,859 34,269 28,302 5,967 77,332 14,624 12,264 2,360
10 & Over 6,83,474 2,14,004 69,031 44,774 69,549 20,650 2,93,502 73,137 27,456 20,599 19,219 5,863
Sheikhupura District.
Total 9,23,081 1,40,459 68,683 34,819 24,847 12,110 4,29,070 65,107 33,468 16,066 10,732 4,841
e-9 2,55,724 18,239 16,190 2,049 1.24,746 5,423 5,048 375
10 & Over 6,67,357 1,22,220 52,493 32,770 24,847 12,110 3,04,324 59,684 28,420 15,691 10,732 4,841
Sialkot District.
Total 14,74,196 1,94,829 99,417 45,033 38,527 11,852 6,84,649 67,876 37,983 15,352 10,040 4,501
0-9 3,60,839 38,008 34,719 3,289 1,69,896 16,13 : 15,184 949
10 & Over 11,13,357 1,56,821 64,698 41,744 38,527 11,852 5,14,753 51,743 22,799 14,403 10,040 4,501
Sialkot City.
Total 1,67,506 52,274 20,622 13,112 15,120 3,420 72,529 18,828 9,311 4,706 3,605 1,206
0-9 28,330 4,092 3,808 284 14,371 2,618 2,506 112
10 & Over 1,39,176 48,182 16,814 12,828 15,120 3,420 I 58,158 16,210 6,805 4,594 3,605 1,206

9-9
TABLE 9-A-YEARS OF EDUCATION-Contd.
Section I.-All Religions
Persons of each educational age group who have or are receiving full time education.
(Figures in Italics show the number of Females included in the total above them.)
Number of persons.
Years in full time education Age Group Total Received . -.. ---.-~-~--.----
Population Schooling
I I Under 5 5 to 6 7 to 10 lOver 10
Multan Division.
Total 83,29,839 9,21,717 4,83,246 2,25,733 1,56,036 56,702 38,75,287 3,68,704 2,05,191 91,272 51,430 20,811
0-9 21,70,052 1,12,015 86,271 25,744 10,44,622 44,435 34,726 9,709
10 & Over ... 61,59,787 8,09,702 3,96,975 1,99,989 1,56,036 56,702 28,30,665 3,24,269 1,70,465 81,563 51,430 20,811
Dera Ghazi Khan District.
Total 6,27,529 20,964 10,084 5,142 4,658 1,080 2,87,460 4,431 2,416 1,242 613 160
0-9 1,76,769 3,710 2,962 748 82,907 1,034 781 253
10 & Over ... 4,50,760 17,254 7,122 4,394 4,658 1,080 2,04,553 3,397 1,635 989 613 160
Jhang District.
Total 8,75,531 73,235 34,262 22,288 13,793 2,892 4,04,623 22,164 10,510 8,395 2,670 589
0-9 2,36,335 10,439 7,414 3,025 1,10,903 3,476 2,486 990
10 & Over ... 6,39,196 62,796 26,848 19,263 13,793 2,892 2,93,720 18,688 8,024 7,405 2,670 589
Jhang Maghiana Town.
Total 73,397 10.638 4,006 3,736 2,032 864 33,658 4,149 1,582 1,955 519 93
0-9 17,910 1,369 1,214 155 9,260 625 512 113
10 & Over ... 55,487 9,269 2,792 3,581 2,032 864 24,398 3,524 1,070 1,842 519 93
Lyallpur District.
Total 21,52,401 2,09,531 98,129 50,687 44,528 16,187 10,10,463 86,752 45,198 19,944 15,387 6,223
0-9 5,74,665 23,326 16,765 6,561 2,81,579 10,176 7,504 2,672
10 & Over ... 15,77,736 1,86,205 81,364 44,126 44,528 16,187 7,28,884 76,576 37,694 17,272 15,387 6,223

9-10
TABLE 9·A-YEARS OF EDUCATION-Contd.
Section I.-All Religions.
Persons of each educational age group who have or are receiving full time education.
(Figures in Italics show the number of Females included in the total above them.)
Number of persons. ,
I I Years in full time education I Total Received Age Group
I
Population Schooling
I I I I I Under 5 5 to 6 7 to 10 Over 10
Lyallpur City.
Total .. , ... 1,79,127 32,736 10,772 8,960 10,656 2,348 80,042 11,422 4,463 3,790 2,667 502
0-9 ... ... 37,947 3,651 2,425 1,226 '" '" 18,820 1,627 1,308 319 ... ...
10 & Over ... ... 1,41,180 29,085 8,347 7,734 10,656 2,348 61,222 9,'195 3,155 3,471 2,667 502
Montgomery District.
Total ... ... 18,15,888 2,82,905 1,58,896 76,087 36,492 11,430 8,46,005 1,25,175 72,007 34,929 13,885 4,354
0-9 ... .. , 3,65,603 25,160 17,405 7,755 '" ... 1,82,485 12,303 8,505 3,798 '" ...
10 & Over ... ... 14,50,285 2,57,745 1,41,491 68,332 36,492 11,430 6,63,520 1,12,872 63,502 31,131 13,885 4,354
Multan District.
Total ... ... 21,07,241 2,73,176 1,43,776 58,450 47,405 23,545 9,79,358 1,14,030 63,566 24,083 17,259 9,122
0-9 ... ... 6.05,952 33,464 28,574 4,890 '" ... 2,89,382 12,919 11,226 1,693 ... ...
10 & Over ... . .. 15,01,289 2,39,712 1,15,202 :;3,560 47,405 23,545 6,89,976 1,01,111 52,340 22,390 17,259 9,122
Multan City.
Total ... ... 1,90,122 47,592 20.873 11,509 10,424 4,786 85,644 19,389 9,452 4,434 3,239 2,264
0-9 ... ... 47,329 6,458 5,303 1,155 ... .. . 22,853 2,015 1,772 243 '" ...
10 & Over ... .., 1,42,793 41,134 15,570 10,354 10,424 4,786 62,791 17,374 7,680 4,191 3,239 2,264
Muzaffargarh District.
Total ... ... 7,51,249 61,906 38,099 13,079 9,160 1,568 3,47,378 16,172 11,494 2,679 1,636 363
0-9 ... ... 2,10,728 15,916 13,151 2,765 ... ... 97,366 4,527 4,224 303 ... ...
10 & Over ... ." 5,40,521 45,990 24,948 10,314 9,160 1,568 2,50,012 11,645 7,270 2,376 1,636 363

TABLE 9·A-YEARS OF EDUCATION -Contd.
Section I-All Religions
Persons of each educational age group who have or are receiving full time education. (Figures in Italics sbow the number of Females included in the total above them).
9-11
Number of persons.
Years in fuU time educa.tion
Age Group Total Received Population Schooling , I lover 10 Under 5 5 to 6 7 to 10
Rawalpindi Division.
Total ... ... 51,45,091 5,65,152 3,04,343 1,38,868 82,007 39,934 24,25,951 77,957 42,677 19,559 10,579 5,142
0-9 00. ... 14,17,182 1,08,223 92,696 15,527 00' ... 6,76,032 16,666 14.172 2,494 ... ...
10 & Over ... ... 37,27,909 4,56,929 2,11,647 1,23,341 82,007 39,934 17,49,919 61,291 28,505 17,065 10,579 5,142
Campbellpur District.
Total ... ... 7,22,542 63,548 46,246 11.139 4,893 1,270 3,45,708 7,055 4,520 1,456 786 293
0-9 ... ... 2,09,725 12,675 11,924 751 ... ... 1,01,511 1,199 1,140 59 ... ...
10 & Over ... ... 5,12,817 50,873 34,322 10,388 4,893 1,270 2,44,197 5,856 3,380 1,397 786 293
Gujrat District.
Total ... . .. 11,57,742 1,10,180 70,230 25,964 10,803 3,183 5,42,783 12,531 9,270 2,160 931 170
0-9 ... ... 3,06,235 18,976 17.194 1,782 .. , ... 1,48,747 2,216 1,972 244 .. , ...
10 & Over ... ... 8,51,507 91,204 53,036 24,182 10,803 3,183 3,94,036 10,315 7,298 1.916 931 170
Jhelum District.
Total ... ... 6.78,900 79,523 42.164 23,997 11,579 1,783 3.29.640 12,757 7.266 3,907 1,446 138
0-9 ... ... 1,78,164 19,622 18,099 1,523 .., ... 84,011 3,149 2.859 290 ... . ..
10 & Over_. ... 5.00,736 59,901 24,065 22,474 11,579 1,783 2,45'629 9,608 4,407 3,617 1,446 138
Mianwali District.
Total ... ... 5.49.549 52,387 34.384 11,758 4,479 1,766 2,60,125 4,554 2,757 1,136 564 97
0-9 ... . .. 1,62,226 6,742 5,241 1,501 ... ... 74.551 614 375 239 .. , ...
10 & Over ... ... 3,87,323 45,645 29.143 10,l57 4,479 1,766 1,85,574 3,940 2.382 897 564 97

9-12
TABLE 9-A-YEARS OF EDUCATION - Contd.
Section I-All Religions
Persons of each educational age group who have or are receiving full time education. (Figures in Italics show the number of Females included in the total above them.)
Number of persons.
Years in full time education
Age Groups Total Received _- ~~---~-----
Population Schooling
I I lover 10 Under 5 5 to 6 7 to 10 - --- ---- -- -
Rawalpindi District.
Total ... ... 8,74,971 1,87,172 69,749 50,351 39,536 27,536 4,06,406 25,520 10,371 7,525 4,347 3,277
0-9 ... ... 2,38,073 30,558 23,145 7,413 . .. .. , 1,15,558 5,912 4,665 1,247 ... ...
10 & Over ... ... 6,36,898 1,56,614 46,604 42,938 39,536 27,536 2,90,848 19,608 5,706 6,278 4,347 3,277
Rawalpindi City. ,
Total ... ... 2,36,877 54,730 20,950 14,064 15,720 3,996 92,801 10,278 4,575 3,162 2,217 324
0-9 ... ... 47,671 9,266 7,374 1,892 ... ... 21,092 2,971 2,089 882
10 & Over ... 1,19,206 45,464 13,576 12,172 15,720 3,996 71,709 7,307 2,486 2,280 2,217 324
Shahpur District.
Total .. ... 11,61,387 72,342 41,570 15,659 10,717 4,396 5,41,289 15,540 8,493 3,375 2,505 1,167
0-9 '" ... 3,22,759 19,650 17,093 2,557 ... ... 1,51,654 3,576 3,161 415
10 & Over ... 8,38,628 52,692 24,477 13,102 10,717 4,396 3,89,635 11,964 5,332 2,960 2,505 1,167
Bahawalpur State.
Total ... ... 18,22,501 2,16,718 96,937 54,613 47,737 17,431 8,32,596 79,588 40,425 20,006 13,693 5,464
0-9 ... ... 4,50,234 16,365 12,715 3,650 ... ... 2,07,557 6,217 4,917 1,300
10 & Over ... 13,72,267 2,00,353 84222 50,963 47,737 17,431
t 6,25,039 73,371 35,508 18,706 13,693 5,464
Babawalpur District.
Total ... ... 9,70,302 1,55,366 73,879 38,518 31,160 11,809 4,46,535 66,065 33,752 16,274 11,468 4,571
0-9 ... ... 2,01,652 11,786 8,809 2,977 ... ... 93,825 4,736 3,649 1,087
I 10 & Over ... 7,68,650 1,43,580 65,070 35,541 31,160 11,809 3,52,710 61,329 30,103 15,187 11,468 4,571

TABLE 9-A-YEARS OF I!:DUCATION-Contd.
Section 1-All ReligIOns
Persons of each educational age group who have or are receiving fuJi time education. (Figures in Italics show the number of Females iucluded in the total above them.)
9-13
Number of persons.
Total Received Population Schooling Age Group
Under 5
Bahawalpur City.
Total 41,646 13,538 5,593 18,278 5,166 2,751
0-9 8,718 1,639 1,172 4,198 673 451
10 & Over 32,928 11,899 4.421 14,080 4,493 2,300
Rahimyar Khan District.
8,52,199 61,352 23,058 3,86,061 13,523 6,673
,Total
0-9 2,48,582 4.579 3,906 1,13,732 1,481 1.268
10 & Over 6,03,617 56.773 19,152 2,72,329 12,042 5,405
Years in full time education
5 to 6
3,187 1,332
467 222
2,720 1,110
16,095 3,722
673 213
15.422 3;509
7 to 10
3,496 783
3,496 783
lfi,577 2,225
16,577 2,225
Over 10
1,262 300
1,262 300
5,622 893
5,622 893

9-14
TABLE 9-A-YEARS OF EDUCATION-Cumd.
Section 2-Muslims
Persons of each educational age group who have or are receiving full time eJucation. (Figures in Italics show the number of Females included in the total above them.)
Number of persons.
I I Years in full time education
Total Received I Age group I Population Schooling ! I I I
Under 5 5 to 6 7 to 10 Over 10 I
_-~_-------~-_ -_--- - _-_ .-~-.-~.
Punjab including Bahawalpur State.
Total 2,02,00,794 25,54,591 12,80,76.2 6,28,218 4,69,778 1,75,833 93,85,978 8,74,015 4,60,944 2,20,437 1,38,585 54,049
0-9 51,95,867 3,55,790 2,91,923 63,867 24,82,873 1,16,510 95,460 21,050
10 & over ... 1,50,04,927 21,98,801 9,88,739 5,64,351 4,69,778 1,75,833 69,03,105 7,57,505 3,65,484 1,99,387 1,38,585 54,049
Punjab.
Total 1,83,93,038 23,38,003 11,83,869 5,73,648 4,22,072 1,58,414 85.59,907 7,94,464 4,20,534 2,00,441 1,24,902 48,587
0-9 47,50,137 3,39,433 2,79,212 60,22} 22.77,231 1,10,293 90.543 19,750
10 & Over ... 1,36,42,901 19,98,570 9,04,657 5,13,427 4,22,072 1,58,414 62,82,676 6,84,171 3,29,991 1,80,691 1,24,902 48,587
Lahore Division.
Total 50,41,735 8,65,576 4,03,037 2,13,244 1,86,700 62,595 23,15,609 3,52,792 1,74,800 91,318 63,888 22,786
0-9 11,97,201 1,20,762 1,01,465 19,297 5,73,779 49,895 42,200 7,695
10 & Over ... 38,44,534 7,44,814 3,01,572 1,93,947 1,86,700 62,595 17,41,830 3,02,897 1,32,600 83,623 63,888 22,786
Gujranwala District.
Total 9,87,292 2,02,141 92,269 58,280 38,737 12,855 4,55,428 1,00,535 46,693 27,695 20,041 6,106
0-9 2,23,842 15,750 11,065 4,685 1,11,439 7,714 5,430 2,284
10 & Over ... 7,03,450 1,86,391 81,204 53,595 38. 737 12,855 3,43,989 92,821 41,263 25,411 20,041 6,106
Gujranwala City.
Total 1,19,378 22,206 7,615 6,031 6,177 2,383 55,057 8,834 4,065 2,508 1,857 404
0-9 20,124 626 365 261 8,436 288 193 95
10 & Over ... 99,254 21,580 7,250 5,770 6,177 2,383 46.621 8,546 3,872 2,413 1,857 404

9-15
TABLE 9-A - YEARS OF EDUCATION-Contd.
Section 2-Muslims
Persons of each educational age group who have or are receiving full time education. (Figures in Italics show the number of Females included in the total above them.)
Number of persons.
Years in full time education Total Received Age Group Population Schooling
Under 5 5 to 6 7 to 10 Over 10
Lahore District.
Total 17,94,331 3,38,105 1.48,562 77,769 85,648 26,126 8.10.264 1,21,707 58,253 32,774 23,284 7,396
0-9 3,97,189 50,682 41,075 9,607 1,86,496 21,328 17,156 4,172
10 & Over ... 13,97,142 2,87,423 1,07,487 68,162 85,648 26,126 6,23,768 1,00,379 41,097 28,602 23,284 7,396
Lahore City.
Total 8.17,236 2,35,820 96,120 50,347 69,013 20,340 3,56,819 87,356 39,395 22,887 19,212 5,862
0-9 1,54,884 33,653 27,739 5,914 72,722 14,406 12,054 2,352
10 & Over ... 6,62,352 2,02,167 68,381 44,433 69,013 20,340 2,84,097 72,950 27,341 20,535 19,212 5,862
Sheikhupura District.
Total 8,77,190 1,37,390 67,098 33,785 24,426 12,081 4,07,975 64,300 33,002 15,856 10,606 4,836
0-9 2,41,557 17,839 15,850 1,989 1,18,094 5,283 4,928 355
10 & Over ... 6,35,633 1,19,551 51,248 31,796 24,426 12,081 2,89,881 59,017 28,074 15.501 10,606 4,836
Sialkot District.
Total 13,82,922 1,87,940 95,108 43,410 37,889 11,533 6,41,942 66,250 36,852 14,993 9,957 4,448
0-9 3,34,613 36,491 33,475 3,016 1,57,750 15,570 14,686 884
10 & Over ... 10,48,309 1,51,449 61.633 40,394 37,889 11,533 4,84,192 50,680 22,166 14,109 9,957 4,448
Sialkot City.
Total 1,61,312 51,299 20,029 12,908 14,962 3,400 70,280 18,591 9,107 4,673 3,605 1,206
0-9 28,254 3,688 3,428 260 14,012 2,421 2,316 105
10 & Over ... 1,33,058 47,611 16,601 12,648 14,962 3,400 56,268 16,170 6,791 4,568 3,605 1,206

9-16
TABLE 9-A-YEARS OF EDUCATION-Contd.
Section 2"':"Muslims
Persons of each educational age group who have or are receiving full time education (Figures in Italics show the number of Females included in the total above them.)
Number of persons. . --.~------
I I Years in full time education Age Group Total I Received
~.
Population I Schooling Under 5
i 5 to 6
I 7 to 10 lover
, 10 I
Multan Division.
Total 82,22,711 9,11,248 4,78,736 2,22,086 1,54,074 56,352 38,25,790 3,64,690 2,03,455 89,798 50,681 20,756
0-9 '" 21,39,797 1,10,854 85,398 25,456 '" .. , 10,29,443 43,969 34,371 9,598
]0 & Over '" 60,82,914 8,00,394 3,93,338 1,96,630 1,54,074 56,352
27,96,347 3,20,721 1,69,084 80,200 50,681 20,756
Der. Ghazi Khan District.
T~tal 6,27,458 20,938 10,063 5,139 4,656 1,080 2,87,434 4,421. 2,407 1,241 613 160
0-9 ... 1,76,747 3,699 2,951 748 ._ '" 82,899 1,028 775 253
10 & Over ... 4,50,711 17,239 7,112 4,391 4,656 1,080 2,04,535 3,393 1,632 988 613 160
Jhang District.
Total 8,74,588 73,014 34,169 22,212 13,747 2,886 4,04,207 22,010 10,447 8,342 2,637 584
0-9 ... 2,36,154 10,432 7,409 3,023 1,10,838 3,472 2,483 989
10 & Over ' .. 6,38,434 62,582 26,760 19,189 13,747 2,886 2,93,369 18,538 7,964 9,353 2,637 584
Jhang Maghiana Town.
Tj)tal 73,347 10,634 4,006 3,735 2,031 862 33,635 4,148 1,582 1,955 518 93
0-9 ... 17,903 1,369 1,214 155 ... . .. 9,246 625 512 113
10 & Over '" 55,444 9,265 2,792 3,580 2,031 862 24,389 3,523 1,070 1,842 518 93
Lyallpur District.
Total 20,87,905 2,04,347 95,906 48,843 43.563 16,035 9,80,399 84,906 44,440 19,252 15,029 6,185
0-9 '" 5,56,602 22,739 16,305 6,434 - ... 2,72,lI5 9,947 7,316 2,631
10 & Over ... 15,31,303 1,81,608 79,601 42.409 43,563 16,035 7,08,284 74,959 37,124 16,621 15,029 6,185

9-17
TABLE 9-A-YEARS OF EDUCATION-Contd.
Section 2-Muslims
Persons of each educational age group who have or are receiving full time education.
(Figures in Italics show the number of Females included in the total above them)
Number of persons.
Years in full time education
Age Group Total Received population Schooling
I I Under 5 5 to 6 7 to 10 Over 10
Lyallpur City.
Total 1,73,459 32,386 10,607 8,894 10,554 2,331 77,526 11,350 4,413 3,776 2,659 502
0-9 36,383 3,618 2,402 1,216 17,740 1,617 1,302 315
10 & Over 1,37,076 28,768 8,205 7,678 10,554 2,331 59.786 9,733 3.111 3,461 2,659 502
Montgomery District.
Total 17,88,930 2,81,153 1,58,109 75,562 36,155 11,327 8,33,799 1,24,740 71,754 34,769 13,867 4,350
0-9 3,58,827 24,967 17,337 7,630 1,79,215 12,201 8,461 3,740
10 & Over 14,30,103 2,56,186 1,40,772 67,932 36,155 11,327 6,54,584 1,12,539 63,293 31,029 13,867 4,350
Multan District.
Total 20,92,624 2,69,898 1,42,393 57,253 46,795 23,457 9,72,589 1,12,443 62,915 23,515 16,899 9,114
0-9 6,00,756 33,104 28,247 4,857 2,87,017 12,795 11,113 1,682
10 & Over 14,91,868 2,36,794 1,14,146 52,396 46,795 23,457 6,85,572 99,648 51,802 21,833 16,899 9,114
Multan City.
Total 1,89,480 47,353 20,743 11,489 10,423 4,698 85,329 19,309 9,386 4,428 3,239 2,256
0-9 47,258 6,415 5,266 1,149 22,780 1,995 1,752 243
10 & Over 1,42,222 40,938 15,477 10,340 10,423 4,698 62,549 17,314 7,634 4,185 3,239 2,256
Muzaffargarh District.
Total 7,51.206 61,898 38,096 13,077 9,158 1,567 3,47,362 16,170 11,492 2,679 1,636 363
0-9 2,10,711 15,913 13,149 2,764 97,359 4,526 4,223 303
10 & over 5,40,495 45,985 24,947 10,313 9,158 1,567 2,50,003 1l,644 7,269 2,376 1,636 363

9-18
TABLE 9-A-YEARS OF EDUCATION-Contd.
Section 2-Muslims
Persons of each educational age group who have or are receiving full time education. (Figures in Italics show the number of Females included in the total above them.)
Number of persons.
Years in full time education
Age Group Total Received 1------------------Population Schooling
5 to 6 I 7 to 10 lover 10 ' Under 5 I I
Rawalpindi Division.
Total 51,28.592 5,61,179 3,02,096 1,38,3]8 81,298 39,467 24,18,508 76,982 42,279 19,325 10,333 5,045
0-9 ]4,13,139 1,07,817 92,349 15,468 6,73,009 16,429 13,972 2,457
1{l.-9 37,15,453 4,53,362 2,09,747 1,22,850 81,298 39,467 17,44,499 60,553 28,307 16,868 /0,333 5,045
CampheJIpur District.
Total 7,21,666 63,413 46,162 11,108 4,877 1,266 3,45,331 7,017 4,495 1,449 781 292
0-9 2,09,477 12,649 11,902 747 1,01,380 1,193 1,135 58
10 & Over 5,12,189 50,764 34,260 10,361 4,877 1,266 2,43,951 5,824 3,360 1,391 781 292
Gujrat District.
Total 11,56,251 1,09,954 70,133 25,902 10,743 3,176 5,42,095 12,440 9,227 2,142 905 166
0-9 3,05.803 18,947 17,167 1,780 1,48,525 2,201 1,958 243
10 & ,Over 8,50,448 91,007 52,966 24,122 10,743 3,176 3,93,570 10,239 7,269 1,899 905 166
Jhelum District.
Total 6,77,693 79,379 42,089 23,980 11,545 1,765 3,29,123 12,715 7,250 3,901 1,436 128
0-9 1,77,916 19,607 18,084 1,523 83,893 3,144 2,854 290
10 & Oevr 4,99,777 59,772 24,005 22,457 11,545 1,765 2,45,230 9,571 7,396 3,611 1,436 128
Mianwali District.
Total . 5,48,901 51,267 33,329 11,728 4,448 1,762 2,59,856 4,501 2,733 1,121 550 97
0-9 1,62,086 6,732 5,231 1,501 74,479 606 367 239
10 & Over ... 3,86,815 44,535 28,098 10,227 4,448 1,762 1,85,377 3,895 2,366 882 550 97

TABLE 9-A-YEARS OF EDUCATION-Contd.
Section 2-Muslims
Persons of each educati6nal age group who have or are receiving full time education.
(Figures in Italics show the number of Females included in the total above them.)
9-19
Number of persons.
! I i Years in full time education
Total Received ~- ------- ----- -~-.-----
Age Group Population Schooling I I I Under 5 \
5 to 6 \
7 to 10 I
Over 10
---'--~
Rawalpindi District.
Total ... ... 8,71,736 1,85,958 69,364 50,162 39,074 27,358 4,04,952 25,103 10,242 7,426 4,198 3,237
0-9 ... ... 2,37,278 30,378 23,010 7,368 ... .. . 1,15,138 5,802 4,590 1,212
10 & Over ... ... 6,34,458 1,'5,580 46,354 42,794 39,074 27,358 2,89,814 19,301 5,652 6,214 4,198 3,237
Rawalpindi City.
Total ... 2,33,842 54,266 20,744 13,958 15,598 3,966 91,610 10,041 4,465 3,lO3 2,160 313
0-9 ... 47,649 9,091 7,244 1,847 ... . .. 20,464 2,863 2,016 847
10 & Over ... 1,86,193 45,175 13,500 12,111 15,598 3,966 71,146 7,178 2,449 2,256 2,160 313
Shahpur District. . Total ... 11,52,345 71,208 41,019 15,438 10.611 4,140
5,37,151 15,206 8,332 3,286 2,463 1,125
0-9 ... 3,20,579 19,504 16,955 2,549 ... ... 1,50,594 3,483 3,068 415
10 & Over ... 8,31,766 51,704 24,064 12,889 10,611 4,140 3,86,557 11,723 5,264 2,871 2,463 1,125
Bahawalpur State.
Total ... 18,07,756 2.16,588 96,893 54,570 47,706 17,419 8,26,071 79,551 40,410 19,996 13,683 5,462
0-9 ... 4,45,730 16,357 12,711 3,646 ... . .. 2,05,642 6,217 4,917 1,300
10 & Over ... 13,62,026 2,00,231 84,182 50,924 47,706 17,419 6,20,429 73,334 35,493 18,696 13,683 5,462
Bahawalpur District,
Total ... 9,67,085 1,55,331 73,869 38,504 31,153 11,805 4,45,126 66,057 33,745 16,274 11,467 4,571
0-9 ... 2,00,544 11,780 8,807 2,973 ... ... 93,428 4,736 3,649 1,087
to & Over ... 7,66,541 1,43,551 65,062 35,531 31,153 11,805 3,51,698 61,321 30,096 15,187 11,467 4,571

9-20
TABLE 9-A-YEARS OF EDUCATION-(concld.}
Section 2-Muslims
Persons of each educational age group who have or are receiving full time education.
(Figures in Italks show the number of Females included in the total above them).
Number of persons.
Years in full time education Total Received
"~- - _----------Age Group population Schooling
under_~ I I 5 to 6 7 to 10 Over 10
t--~- ----.------------~--"- 1 _- -"---
Bahawalpur City.
Total 41,388 13,538 5,593 3,187 3,496 1,262 18,164 5,166 2,751 1,332 783 300
0-9 8,687 1,639 1,172 467 4,197 673 451 222
10 & Over 32,701 11,899 4.421 2,720 3,496 1,262 13,967 4,493 2,300 1,110 783 300
Rahimyar Khan District.
Total 8,40,671 61,257 23,024 16,066 16,553 5,614 3,80,945 13,494 6,665 3,722 2,216 891
O~9 2,45,186 4,577 3,904 673 1,12,214 1,481 1,268 213
10 & Over 5,95,485 56,680 19,120 15,393 16,553 5,614 2,68,731 12,013 5,397 3,509 2,216 891


9-21
TABLE 9-B-EDUCATIONAL LEVFLS
This table analyses literate persons according to the educational grades claimed by them, as shown in Table 8. The population analysed in this table IS that of all literate persons excluding those who claimed nationalities other than Pakistani. The analysis is presented in 4 s~ctions as under :-
Section I-All Religions.
Section 2-Muslims.
Section 3- Caste Hindus and Scheduled Castes.
Section 4-0ther Religions.
2. In each section the analysis is made for the Province and for eac!:> district as a whole, showing separately the figures for cities and cantonments.
3. The figures shown in ordinary type are the totals of both sexes; separate figures for femaks are shown in italics below each.
4. 'MUHAJIRS' are included in the figures of tbis Table and are also shown separately in Table 19-B.
5. The information on grades of education was obtained in reply to the third part of Census Question 10, for which 5 symbols were provided on the census slip. The symbols were 'P' (those completed primary schooling). 'M' (those passed Middle Examination), 'E' (tbose passed Enterance/ Matriculation Examination), 'D' (those obtained University first degree), and 'H' \.those who obtained Higher, Post-Graduate Degree}, Whichever of these symbols was applicabk, was ringed round by the enumerator according to the respondent's reply. The original slips were sorted in accordance with the marks placed round the highest grade symbol and were counted to produce the statistics shown in this Table.
6. The total number of literate persons was derived from the replies to Question 8: "Can you read? write?" The slips of persons who claimed to be able to read (whether or not they were also able to write) were counted to obtain the literacy data. They include persons wbos~ only claim to literacy is their statement that they can read the Holy Quran in ArabIC.
7. Persons who claim to be able to r~ad but who made no claim to have passed a primary or any higher edLlcational grade, are classed as having 'no formal attainments,
8. This Table is discussed in Chapter 7 of Part I.

9·22
TABLE 9-B.-EDUCATIONAL LEVELS-Contd.
Section I-All Religions
Literate persons analysed according to the grades to which they claim to have progressed in Educational Institutions.
(Figures in Italics show the number of Females included in the totals above them.)
Number of persons.
! Without! i I i
District, State and Selected Town Total ' formal ! Primary Middle, Matri- I Degree i Higber Literates attain- ! School i School I culation I Degree
ments ! I I
PUNJAB INCLUDING 36,63,10921,11,711 9.36,646 4,19,840 1,59,792 26,553 8,567 BAHAWALPUR STATE 14,31,515 10,51,387 2,30,341 1,12,057 32,713 3,868 1,149
PUNJAB 34,04,222 19,43,534 8,77,208 3,97,260 1,52,372 25,528 8,320 13,21,912 9,67,805 2,13,259 /,05,196 30,866 3,665 1,121
Lahore Division 12,83,787 7,42,449 2,88,863 1,64,281 73,672 10,861 3,661 5,73,186 3,98,041 90,753 60,393 21,/21 2,159 719
Gujranwala 2,60,118 1,48,411 65,652 37,123 7,634 1,096 202 1,22,566 85,177 20,415 15,518 1,352 90 14
(Gujranwala) ... (43,868) (24,795) (11,547) (4,918) (2,154) (339) (115 ) (20,828) (14,693) (4,397) (1,335) (348) (46) (9)
Lahore 4,70,466 2,45,965 1,09,569 70,222 36,321 6,301 2,088 2,01,209 1,26.752 37,039 25,410 10.151 1,444 413
(Lahore) (3,07,816) (1,33,981) (80,034) (57,953) (28,266) (5,643) (1,939) (1,31,110) (65,410) (30,274) (23,936) ( 9,698) (1,392) (400)
Sheikhupura 1,75,063 1,30,830 29,735 10,565 3,296 527 110 81,940 73,499 5,591 2,080 722 38 10
Sialkot 3,78,140 2,17,243 83,907 46,371 26,421 2,937 1,261 1,67,471 1,12,613 27,708 17,385 8,896 587 282
(Sialkof) (76,761) (38,430) (19,542) (13,014) (5,094) (518) (163) (31,062) (17,6 75) (6,703) (4,967) (1,660) (48) (9)
Multan Division 14,48,783 9,38,249 3,26,568 1,35.791 39,495 6,562 2,118 6,64,607 5,32,650 88,662 35,172 7,020 881 222
Dera Ghazi Khan 74,980 55469 13,181 4,390 1,595 267 78 31,446 26,171 3,526 1,344 301 87 17
Jhang 1,33,642 73,825 40,343 14,703 3,593 817 361 61,945 48,072 10,627 2,453 723 47 23
(Jhang Maghiana) (15,537) (7 959) (4,401 ) (1,837) (1,148) (129) (63) (7,730) (5,047) (1,852) (502) (289) (24) (16)
Lyallpur 4,17,274 2,65,605 98,241 39,760 11,260 1,632 776 2,10,365 1,66,683 28,272 12,637 2,268 399 106
(Lyall pur) (55,283) (19,864) (21,109) (10,898) (2,690) (440) (282) (25,121) (12,022) (6,725) (5,414) (824) (J07) (29)
Montgomery 3,08,727 1,91,131 74,067 33,220 9,172 1,018 119 1,39,419 1,05,797 21,/56 10,157 2,204 98 7
Note: 1. Literate persons who did not claim one of the grades mentioned in this Table are classed as having no formal attainments.

9-23
TABLE 9-8 EDUCATIONAL LEVELS-Contd.
Section I-All Religions.
Literate persons analysed according to the grades to which they claim to have progressed in Educational Institution.
(Figures in Italics show the number of Females included in the table above them.)
Number of persons.
District, State and r I Without I
Primary I M'ddl i M . I I Higher Total formal 1 e atncu- . Degree
Selected Town I Literates I attain- ! School
\
~chool lation : Degree ments I I I I
Multan Division-(contd.) .,.
Muhan ... p. 3,92,182 2,62,479 78,551 36,485 11,654 2,360 653 1,72,144 1,40,776 21,781 7,882 1,428 216 61
(Multan) .,. (68,610) (41,026) (15,122) (7,608) (3,882) (755) (217) (27,414) (22,913) (3,052) (1,048) (309) (75) (17)
Muzaifargarh ... 1,21,978 89,740 22,185 7,233 2,221 468 131 49,288 45,151 3,300 699 96 34 8
Rawalpindi Division .. , 6,71,652 2,62,836 2,61,777 97,188 39,205 8,105 2,541 84,119 37,114 33,844 9,631 2,725 625 180
Campbellpur ... 72,979 26,291 33,146 9,938 3,025 438 141 7,061 3,461 2,707 708 149 28 8
Gujrat ... .., 1,28,017 50,676 51,552 17,983 6,566 950 290
14,654 6,158 6,145 1,736 548 56 11
Jhelum ... ." 1,19,258 43,845 52,813 17,003 4,859 548 190
16,269 7,466 6,895 1,548 308 46 6
Minawa1i ... ." 53,200 20,279 21,280 8,717 2,348 411 165 4,797 1,996 2,073 586 121 14 7
Rawalpindi ... .. , 1,87,911 79,003 59,605 27,238 16,493 4,289 1,283 26,456 11,279 9,660 3,746 1,277 390 104
(Rawalpindi) ... (81,977) (23,762) (25,139) (15,694) (12,926) (3,412) (1,044) (16,362) (5,706) (5,962) (3,072) (1,165) (366) (91)
Shahpur ... ... 1,10,287 42,742 43,381 16,309 5,914 1,469 472
14,882 6,754 6,364 1,307 322 91 44
(Sargodha) .. (10,045) (3,769) (2,705) (1,677) (1,292) (480) (122)
(3,901) (1,958) (1,359) (416) (136) V9) (13)
BahawaJpur State .. , 2,58,887 1,68,177 59,438 22,580 7,420 1,025 247
1,09,603 83,582 17,082 6,861 1,847 203 28
Bahawalpur ... ... 1,71,736 ]'06,913 40,769 16,957 6,121 805 171 74,483 54,419 12,721 5,641 1,506 177 19
(Bahawalpur) .. , (15,826) (8,327) (4,302) (1,987) (865) (238) (107)
(5,963) (4.100) (1,332) (429) (77) (I8) (7)
Rahimyarkhan ." 87,151 61,264 18,669 5,623 1,299 220 76
35,120 29,163 4,361 1,220 341 26 9

9-24
TABLE 9-B-EDUCATIONAL LEVELS-Contd.
Section 2-Muslims1
Literate persons analysed according to the grades to which they claim to have progressed in Educational Institutions.
(Figures in Italics show the number of Females included in the totals above them.)
Divisions. Districts and
Selected Towns.
Total Literates
Without2 I Formal 1
Attainmentsl
I
Primary i Middle School School
Matriculation
Number of persons.
I
Degree Higher I Degree
I ~--------------- -- _------- ------------- ------------ ------ _. ---------~. --
PUNJAB INCLUDING 36,27,957 20,98,387 9,24,343 4,13,992 1,57,217 25,626 8,392 BAHAWALPUR STATE 14,19,944 10.46,770 2,26,406 1,10,045 32,056 3,578 1,089
- PUNJAB
Lahore Division
GujranwaJa
(Gujranwala)
Lahore ...
(Lahore)
Sheikhupura
Sialkot
(Siatkot)
Multan Division
Dera Ghazi Khan ...
Jhang ...
(Jhang Maghina)
Lyallpur
(Lyattpur)
MODtgomery
33,69,221 19,30,322 73,10,401 9,63,236
12,60,307 5,65,455
2,57,389 1,21,742
(43,489) (20,689)
4,61,922 1,97,995
(3,01,647) (1,28,403)
1,72,120 80,947
3,68,876 1,64,771
(74,762) (30,195)
14,40,082 6,61,879
74,964 31,440
1,33,544 61,882
(15,530) (7,723)
7,32,157 3,94.606
1,47,624 84,922
(24,761) (14,684)
2,42,171 1,25,599
(1,31,328) (64,557)
1,29,646 73,087
2,12,716 1,10,998
(37,156) (17,090)
936,407 5,31-948
55,458 26,165
73,825 48,072
(7,959) (5,047)
4,13,OS3 2,65,477 2,09,056 1,66,644
(54,566) (19,864) (24,884) (12,022)
3,06,031 1,38,640
1,89,971 1,05,379
8,64,932 3,91,423 1,49,798 2,09,330 },03,189 30,210
2,81,584 88,318
64,454 20,094
(11,362) (4,329)
1,60,621 59,108
36,585 15,327
(4,812) (1,293)
71,925 20,692
7,467 1,308
(2,116) (334)
1,07,136 35,928
68,916 35,608 24,821 9,902
(78,289) (56,997) (27,688) (29,319) (23,383) (9,460)
28,748 10,023 5,264 1,867
81,246 45,097 27,032 17,093
(19,074) (12,860) (6,531) (4,889)
3,22,316 1,34,068 87,419 34,624
13,180 3,526
40,313 10,603
4,388 1,344
14,681 2,442
3,100 689
25,750 8,793
(5,016) (1,634)
38,818 6,853
1,594 301
3,572 710
24,601 3,375
10,470 2,047
1,063 79
(323) (40)
6,082 1,363
(5,474) (1,314)
500 32
2,825 573
(495) (42)
6.407 833
267 87
803 38
(4,398) (1,849)
(1,837) (1,144) (129) (502) (285) (24)
95,645 27,437
38,819 12,333
10,864 1,534 2,176 372
(20,865) (10,582) (2,577) (410) (6,651) (5,298) (793) (96)
73,129 20,936
32,781 10,039
9,034 2,183
997 96
Notes- 1 Excludes persons claiming Nationalities other than Pakistani,
8,145 1,061
3,550 684
196 12
(115) (9)
2,009 382
(1,871) (370)
1\)3 8
1,242 282
(161) ( 9)
2,066 202
77 17
350 17
(63) (16)
744 94
(268) (24)
119 7
2Literate persons who did not claim one of th-e grades mentioned in this Table are classed as having no formal attainments.

9-25
TABLE 9-B-EDUCATIONAL LEVELS-Conrd.
Section 2-Muslims
Literate.persons analysed according to the grades to which they claim to have progressed in Educational Institutions.
(Figures in Italics show the number of Females included in the totals above them.)
Number of persons.
I I Without i I I Matri-
i
DivIsions, Districts Total Primary i Middle Higher and Formal , Degree I
Selected Towns I
Literates !Attainments I School School i culation Degree
I --
Multan Division-contd.
MuHan ... 3,90,487 2,61,939 77,865 36,167 11,533 2,338 645 1,71,574 1,40,538 21,617 7,767 1,387 206 59
(Multan) ... (68,422) (40,959) (15,082) (7,548) (3,872) (747) (214) (27,308) (22,882) (3,034) (1,004) (304) (69) (15)
Muzaffargarh .. , 1.21,973 89,737 22,184 7,232 2,221 468 131 49,287 45,150 3,300 699 96 34 8
Rawalpindi Division ... 6,68,832 2,61,758 2,61,032 96,734 39,055 7,724 2,529 83,067 36,682 33,593 9,457 2,665 495 175
Campbellpur ... 72,833 26,221 33.093 9,924 3,018 437 140 7,016 3,436 2,698 702 146 27 7
Gujrat ... 1,27,840 50,600 51,506 17,952 6,542 950 290 14,585 6,129 6,129 1,724 536 56 11
Jbelum ... 1,19,071 43,806 52,749 16,978 4,825 527 186 16,213 7,449 6,880 1,540 299 40 5
Mianwali ... 53,094 20,237 21,240 8,700 2,341 411 165 4,736 1,966 2,058 576 115 14 7
Rawalpindi ... 1,86,527 78,588 59,320 26,959 16,443 3,935 1,282 25,917 11,110 9,538 3,644 1,255 267 103
(Rawalpindi) ... (80,690) (23,352) (24,873) (15,439) (12,926) (3,056) (1,044) (15,867) (5,545) (5,842) (2,981) (1,165) (243) (91)
Shahpur ... 1,09,467 42,306 43,124 16,221 5,886 1,464 466 14,600 6,592 6,290 1,271 314 91 42
(Sargodha) ... (9,821 ) (3,670) (2,636) (1,641) (1,277) (479) (1l8) (3,747) (1,880) (1,316) (391) (130) (19) (11)
Babawalpur State ... 2,58,736 1,68,065 59,411 22,569 7,419 1,025 247 1,09,543 83,534 17,076 6,856 1,846 203 28
Bahawalpur ... 1,71,699 1,06,897 40,753 16,953 6,120 805 171 74,471 54,416 12,716 5,638 1,505 177 19
(Bahawalpur) ... (15,822) (8,327) (4,299) (l,987) (864) (238) (107) (5,962) (4,100) (1,332) (429) (76) (I8) (7)
Rahimyarkhan ... 87,037 61,168 18,658 5,616 1,299 . 220 76 35,072 29,118 4,360 1,218 341 26 9

TABLE 9-B-EDUCATIONAL LEVELS-Contd.
Section 3-Caste Hindus and Scheduled Castes.
Literate Persons analysed according to the grades to which they claim to have progressed Educational Institutions.
9-26
Number of persons.
Religious Group Attainm~nts
I fu~~ i
I-~otal --!--:f Which--I- Tota -1-- of which t i Female Female.
Bahawalpur State
- -----------
CASTE HINDUSl
Total Literates
Without Formal Attainments ...
Primary School
Middle School
Matriculation
Degree
Higher Degree
SCHEDULED CASTES2
i otal Literates
Without Formal Attainments
Primary School
Middle School
Matriculation
Degree
Higher Degree
228
86
85
36
14
6
736
396
234
79
25
2
45
27
12
3
2
96
60
20
9
7
100
95
4
25
13
11
46
45
8
3
4
Notes :-1 The Largest numbers are in Sialkot District where the distribution is ;-Total Literates 111; Without Formal Attainments 58; Primary School 38 ; Middle School 11 ; and Matriculation 4.-
The largest numbers are in Sialkot District where the distribution is :-Total Literates 513 ; Without Formal Attainments 289; Primary 161; Middle 49 ; Matriculation 13 ; and Degree I,

9-27
TABLE 9-B-EDUCATIONAL LEVELS-Contd.
Section 4-0ther Religions!
Literate persons analysed according to the grades to which they claim to have progressd in Educational Instit utions.
(Figures in Italics show the number of Females included in the totals above them.)
Number of persons.
Divisious, District and
Selected Towns
PUNJAB AND BAHAWALPUR STATE
PUNJAB
Lahore Division
Gujranwala
(Gujranwala)
Lahore
(Lahore)
Sheikbupura
Sialkot
(Sialkot)
Multan Division
Vera Ghazi Khan ..•
Jhang ".
(Jhang Maghiana)
Lyallpur
(Lyallpur)
Total2 Literates
34,063 11,376
34,037 11,370
22,669 7,623
2,705 821
l375) (138)
8,401 3,190
(6,051 ) (2,683)
2.923 990
8,640 2,622
(1.933) (841)
8,605 2,708
13 6
98 63
(7) (7)
4,108 1,289
(712) (235)
! Without3 ' .
! Formal I Pnmary Attainments School
12,734 11,969 4,482 3,898
12,730 11,957 4,482 3,897
9,876 7,007 3,371 2,409
785 1,184 254 320
(33) (8)
(185) (68)
3,729 2,389 1,141 1,104
(2,609) (1.702) (841) (948)
1,182 972 410 326
4,180 2.462 1,566 659
(1,250) (449) (577) (165)
1,797 4,226 686 1.240
11 6
85 23
30 24
(3) (3)
2,574 832
(243) (73)
Middle I MatriSchool culation
5,731 1,999
5,722 1,995
3,568 1,275
532 190
(104) (42)
1,283 586
(936) (550)
539 213
1,214 286
(140) (72)
1.706 547
22 11
927 303
(314) (J 15)
2,536 648
2,535 647
1,720 421
165 44
(37) (14)
705 247
(570) (236)
196 33
654 97
(69) (21)
671 167
21 13
(4) (4)
393 92
(112) (31)
Notes:-! Excludes persons claiming Nationalities other than Pakistani. 2 Almost all are Christians.
I Higher Degree Degree
919 289
919 289
387 1I2
33 11
(16) (6)
216 81
(166) (78)
27 6
111 14
(23) (6)
154 48
14 9
97 27
(29) (11)
174 60
174 60
111 35
6 2
79 31
(68) (30)
7 2
19
(2)
51 20
11 6
32 12
(14) (5)
3 Literate persons who did not claim one of the grades mentioned in this Table arC' classed as having no formal attainments.

9-28
TABLE 9-B-EDUCATIONAL LEVELS- Concld.
Section 4-Other Religions I
Literate persons analysed according to the grades to which they claim to have progressed in Educational Institutions.
(Figures in Italics show the number of Females included in the total above them.)
Number of persons.
Divisions, D;";tricts Total Without Primary Middle Matri- Higher and Literates Formal School School culation Degree Degree Selected Towns Attainments
I ---~--- ~-~--- ----
Multan Division-contd.
Montgomery 2,688 1,160 934 437 136 21 779 418 220 118 21 2
Multan 1,694 539 686 318 121 22 8 570 238 164 115 41 10 2
(Mulfan) (188) (67) (40) (60) (10) (8) (3) (106) (31) (18) (44) (5) (6) (2)
Muzaffargarh 4 2 1 1
Rawalpindi Division 2,763 1,057 724 448 144 378 12 1,039 425 248 173 59 129 5
Campbellpur 121 61 41 12 6 1 41 23 8 6 3 1
Gujrat 172 75 46 30 21 69 29 16 12 12
]h.lum 182 38 62 25 33 20 4 55 17 15 8 8 6 I
Mianwali 106 42 40 17 7 61 30 15 10 6
Rawalpindi 1,365 405 280 276 50 353 I 531 164 120 101 22 123 1
(Rawalpindi) (1,258) (398) (257) (251) (352) (487) (8) (116) (90) (123)
Shah pur 817 436 255 88 27 S 6 282 162 74 36 8 2
Sargodha 224 99 69 36 15 4 154 78 43 25 6 2
BAHAWLPUR STATE 26 4 12 9 1 6 1 4 1
Babawalpur 15 3 8 3 1 4 1 2 1
(Bahawalpur) (2) (I) (I)
·'1 (1) (1)
Rahimyar Khan II 4 6 2 2
.. ,

10-1
TABLE IO-NATlONALITY
fhis Table gives details of 795 persons, apart from Afghan Powindahs, enumerated in Punjab, wllo reported themselves as non-Pakistanis. Details of Afghan Powindahs are disclosed in the next following table. The information tabulated herein was obtained in reply to Census Question No.4, which asked: "Are you a Pakistani? If not, what is your nationality 1" The Table gives an analysis according to nationality and by certain broad fields of activity, the data for which were obtained in answer to Census Question No. I3 which asked "In what kind of business, Industry of service did you work in January 1951 ?"
2. Persons included in this Table are excluded from all other census tables except:
Table I and I-A: Population and Areas;
Table 3: Variations in last 50 years.
3. This Table has been discussed in Chapter 5 of Part I of the Census Report.

10-2
TABLE 10-NATIONALITY
Non-Pakistanis in Punjab and Bahawalpur State.
(Figures in Italics are Female~ included in figures immediately above.)
Number of persons.
Field of Activity
ALL ACTIVITIES
Self supporting persons engaged in
Banking & Insurance
I, Nationals of I Muslim Countries
! --~---~ i s
'" 'a ~ -<
c cd ... ....
795 163 109 222 37 41
472 110 51 Jl
17 4
t .c (5
74 28
29
Trade and Commerce 18t 42 19 15
Manufacture & Utilities2
Transport & Communication
Health
Education
Religion
Government3
Other Activities
Dependents
77
45
6 4
16 7
9
4
117
323 211
21
14
5
28
53 37
12
16
58 41
13
45 28
Nationals of Non-Muslim. Countries of
Asia
.:9
" c ! ....
• ~urope America
I j I 0 ,
, .. --_------------ ---------
28 15
8
4
4
20 15
17 7
6
3
2
11 7
288 72
181 6
11
73
22
19
4 2
10 4
2
40
107 66
71 12
53
21
14
7
11
18 12
39 9
29 5
2
4
5
2 2
6 3
4
10 4
4 1
3
2
1 1
2
2
2
---------------------------------------------------------------------------------------. Notes:-(I) E1tcludes number of the Diplomatic corps accredited to Pakistan by other Govern-ments as also Afghan Powindahs who have been shown separately in Table to-B.
(2) Includes all production and maintenance industries and processes and the production and supply of water electricity gas etc.
(3) Service of the Government of Pakistan, provincial Governments, Municipalities, in activities not covered by other headings such as Transportation, education, etc.

TABLE 10-A-AFGHAN POWINDAHS
Powindahs are Afghan nationals who come over to Pakistan every year to pass their winter. This Table presents an analysis of the total population of Afghan Powindahs in Punjab by sex, age and occupations. It is in two sections:-
Section 1: It shows sex breakdown in age groups of 'under 12 years' and '12 years and over'; and
Section 2: It shows a further analysis of '12 years and over' into sex and occupations.
Figures in both the sections are shown for districts and Bahawalpur State.
2. The information tabulated herein was obtained from replies to the third and fourth parts of Census Question No.4 on Nationality, which asked: "If an Afghan are you a Powindah. 7 If so, where is your party settled this winter?" Enumerators were instructed in case a respondent did not know whether he was a Powindah or not, to treat as P<lwindah$ aU
such Afghans who had been staying temporarily in Pakistan for the preceding winter. The symbol 'PAK' was ringed on the slip in such cases, which were sorted to produce the required statistics.
3. This Table is discussed in Chapter 5 of Part I of the Census Report.

10-4
TABLE 10-A-AFGHAN POWINDAHS.
Section 1-Afghan Powindahs under 12 years, and 12 years and Over.
Number of persons.
I All-Persons Male Female
District and State I Total 12 and I Total 12 and Total 12 and 1-----c-r-u-n-de-r-;-12-Y-ea-rs! II under 12 Years Under 12 Years
r----------c_,l-___ I_Years _~:___L ___ I_Y __ e_a_rs--,-_o_v_e_r --'---__ _:__y_ea_r_s --'---_o_vc_r
PUNJAB AND BAHAWALPUR STATE
13,643 4,095 9,548 8,183 2,268 5,915 5,460 1,827 3,633
PUNJAB
Campbell pur
13,083
579
Dera Ghazi Khan... 3,165
Gujranwala
Gujrat
Jhang
Jhelum
Lahore
Layallpur
Mianwali
Montgomery
Multan
Rawalpindi
Shahpur
Sheikhupura
S;alkot
BAHAWALPUR STATE
Bahawalpur
90
903
1,197
3,120
55
438
950
178
333
381
1,597
85
12
560
148
Rahimyar Khan... 412
4,061
217
9,022
362
7,658
347
905 2,260 1,879
18
322
317
1,055
1
98
321
27
21
133
611
14
1
34
6
28
72
581
880
2,065
54
340
629
151
312
248
986
71
11
526
142
384
80
546
846
1,247
48
330
582
134
263
231
1,047
71
7
525
139
386
2,240
138
5,418 5,425
209 232
514 1,365 1,286
14
194
183
445
1
61
197
16
4
67
394
12
28
5
23
66
352
663
802
47
269
385
118
259
164
653
S9
7
497
134
363
10
357
351
1,873
7
108
368
44
70
150
550
14
5
35
9
26
1,821 3,604
79 153
391
4
128
134
610
37
124
11
17
66
217
2
1
6
1
5
895
6
229
217
1,263
7
71
244
33
53
84
333
12
4
29
8
21

10-5
TABU lO-A-AFGHAN POWINDAHS
Section 2.-A£ghan Powindabs agt!d 12 years and over, by Occupation & Sex.
( P - persons M "" Male F = Female)
Number of persons.
I
t; I.~ oj
~ i ~ d ] iO ~ Co . os!: ~
Occupation
U~ j t~ .S' ; Cl.~ 0 ----__ - __ -_._---- _. __ .:___-'-_ __:_--__:_-----
1 TOTAL 2 3
4 5 6
7 8 9
10 11 12
13 14 15
Herdsmen
Wood Cutters ...
Charcoal Burners
Agricultural Labour
P M F
P M F
P M F
P M F
P M F
9,548 5,915 3,633
117 91 26
18 17
1
7 5 2
11 10
1
362 2,260 209 1,365 153 895
2 2
29 29
7 5 2
72 581 66 352 6 229
880 2,065 54 663 802 47 217 1,263 7
13 13
54 28 26
2 2
1 2 3
4 5 6
7 8 9
10 11 12
13 14 15
16 17 18
Miscellaneous Unspecified retail Trade.
P M F
2,782 2,583
199
131 1,247 131 1,073
212 210
2
20 412 20 394
3 16 3 17
19 20 21
22 23 24
25 26 27
28 29 30
31 32 33
34 35 36
37 38 39
Mullahs
Religious Students
Physician & Harbseller
MIdwife
Drum Beater ...
Camelmen
Goldsmith
P M F
P M F
P M F
P M F
p M F
P M F
P M F
6 6
23 23
6 6
1 1
11 11
2 2
174
10 10
1 1
18
12 12
18
19 20 21
22 23 24
25 26 27
28 29 30
31 32 33
34 35 36
37 38 39

10-6
TABLE 10-A-AFGHAN POWINDAHS
Section 2-Afghan Powindahs aged 12 years and over, by Occupation & Sex.
( P = persons M = Male F = Female)
Number of persons. '
Q ~ ... Q) :; ... ::l ::l ... ~ E .: ... Co ,So
Occupation ::l 0 .: E- o 0 0
C<l Co ~ bJl g Co ..c: ~ ::::: s= E C<l ..c .,.
::::l dill
'" ~ 0 :; ~ d 'OJ .r::-~ :§ ::;,;: ::;,;:
d ..c ..c: (If dd ...l ~ 1:12 1:12 Ci:i I ~<il
1 340 629 151 312 248 986 71 11 526 P TOTAL. 1 2 269 385 118 259 164 653 59 7 497 M 2 3 71 244 33 53 84 333 12 4 29 F 3
4 11 8 P Herdsmt"n 4 5 11 8 M 5 6 F 6
7 15 P Wood Cutters. 6 8 15 M 8 9 F 9
10 P Charcoal Burners. 10 11 M 11 12 F 12
13 3 8 P Agricultural Labour. 13 14 3 7 M 14 15 1 F 15
16 33 52 26 52 12 261 7 313 P Miscellaneous Unspecified 16 17 32 48 26 52 12 261 7 313 M retail Trade. 17 18 I 4 F 18
19 5 P Mullahs. 19 20 5 M 20 21 F 21
22 P Religious Students. 22 23 M 23 24 F 24
25 6 P Physician & Harbseller. 25 26 6 M 26 27 F 27
28 P Midwife. 28 29 M 27 30 F 30
31 P Drum Beater. 31 32 M 32 33 F 33
34 1 10 P Camelmen. 34 35 1 10 M 35 36 F 36
37 2 F Goldsmith. 37 38 2 M 38 39 F 39

10-7
40 41 42
43 44 45
46 41 48
49 50 51
52 53 54
55 56 51
TABLE lO-A-AFGHAN PO~INDAHS-contd.
Section 2-Afghan Powindabs aged 12 years and over, by Occupation & Sex.
Occupation
Tailor
Masons
Domestic Service
MiscelIaneous Labour
Beggars
No Occupation .•.
P M F
p M F
p M F
14 14
129 129
P 2.323 M 2.1!\3 F 140
P M F
32 18 14
P 4,064 M 815 F 3,249
Number ofpersom:,
~ i.~ ~ i ~ ~ :8 I..c: ;
U~ II ~ ~ ,~ ~,l i i I O~ I" 0 .... I ;::; I ...J
~~--~---~------~-------~-- ._---,
24 7
17
6 6
75 65 74 59 1 6
10 10
4 4
2 600 308 2 593 262
7 46
205 882 6 367
13
13
237 1,259 69 166 6 140 27 99
136 716 227 210 1,160
40 41 42
43 44 45
46 47 48
47 49 43 50 4 51
52 53 54
4 55 1 56 3 57

10-8
TABLE 10-A-AFGHAN POWINDAHS--contd.
Section 2-Afghan Powindahs aged 12 years and over, by Occupation and Sex.
Number of persons. - !
>. oJ '-.... ~ I-; ::J
.~ 8 ::J a. t:: A i Occupation .... C<l ~ '0. '- '" C<l ;:l a:: Q ::l
i .c. '0 ~ ,.e. !l c.; 0. c:: 15 .t::. -'" -'" roO) C<l ro 0 -s a:: ro ] <;i -O~ :s :E ::E :;s ro
~ '<:Ii cO_
~ i en I
~CIl -- ----- -_-_ --- _--------- ----------------~--~-
40 1 P Tailor. 40 41 1 M 41 42 F 42
43 \ P Masons. 43 44 M 44 45 F 4S
46 10 82 2 26 P Domestic Service. 46 47 10 82 2 26 M 47 48 F 48
49 215 273 61 100 125 226 23 9 170 P Miscellaneous Labour. 49 50 212 267 61 100 122 184 23 7 167 M 50 51 3 6 3 42 2 3 F 51
52 16 1 P Beggars. 52 53 16 I M 53 54 F 54
55 87 292 49 62 99 457 14 2 42 P No Occupation. 55 56 20 58 16 9 18 168 2 16 M 56 57 67 234 33 53 81 289 12 2 26 F 57

11-1
TABLE ll-LABOUR FORCE
I. This Table classifies the total population. excluding non-Pakistanis into broad categories of
Economic Status.
2. All persons aged 12 years and over were asked "Are you usually self-supporting or partly self-supporting or seeking work?" Persons who answered "Yes" to any part of this question were then asked to state their occupation and the economic group in which they were engaged in the previous month. From their answers they have been classed as belonging to the Agricultural or non-Agricultural Labour Force, or as not being in the Civilian Labour Force. Persons who answered "No" to all three parts of the main question were classed as Dependents as were all children under 12 years of age.
3. The Agricultural Labour Force includes
all persons who reported their usual main occupation as "cultivators" or who stated that in January 1951, they were engaged or seeking work in cultivation, stock-raising, hunting and game propagation, or some other occupation
associated with the agricultural industry but not generally those engaged in forestry or fishing. It should be noted that the census definition of a 'cultivator' was a "Tiller of the soil" which term meant a person who himself works on the land or who employes others to do so under his direct personal supervision.
4. The Non-Agricultural Civilian Labour Force includes self-supporting persons who du
ring January, 1951, were engaged in Public Service (except the Armed Forces), personal service, trade commerce transportation, or any industry
other than agriculture, but including forestry and fishery. It also includes persons seeking work in any non-Agricultural occupation,
5, Persons not in the Civilian Labour Force include members of Defence Services and also the several classes of self-supporting persons who are regarded as economically inactive. The
latter consist of two main categories, first, those persons of private means who have not indicated that they follow any of the professions or occupations which would class them in the labour force This group includes retired persons and pen~ sioners, students (if they have stated that they are self-supporting or partly so) and those landownerS who have not claimed to be cultivators or to be engaged in service or industry. Secondly, the economically inactive category includes the inmates of hospitals, asylums and jails, if they have not stated an occupation which enables them to be classed .in the Labour Force. and what may be called, "Social Parasites" namely persons who have described themselves as beggars, vagrants, pr ostitutes, etc.
6. Dependents include all children under 12
years of age and all other persons who did not claim to be self-supporting, partly so or seeking work. The female element of this group therefore, contains the large number of women engaged in house-hold duties, but it does not contain those who Jescribed themselves as helpers in the trades, profession or other gainful work of the family or house-hold. Similarly, this group includes all students, old people invalids etc., living with or supported by their families or friends if such persons have not claimed to be wholly or partly supporting themselves by some definite occupation, nor to be seeking to do so.
7. It is believed that the number of Male children reported as under 12. years of age is somewhat inflated and this may have increased the figures for male dependents at the expense of the Labour Force. The data should, therefore, be used with reasonable caution. The probable effect, if expressed as a percentage of the male Labour Force is not likely to exceed 3 per cent.
8. Muhajirs are inclUded in the figures appearing in this table, but are also given separately in Table 19-C.
9. This Table has been discussed in Chapter 9 of Part 1.

11-2
TABLE ll-LABOUR FORCE
The total Population according to Economic Status1
Number of persons.
I Self-Supporting
I Civilian labour Force I Not in' District and State Total i- -l rN:~- i
Civilian Dependents labour
:Agncu tura Agricultural Force __ I _____ J ___ ~ .
ALL PERSONS.
PUN.:(AB lNCLUOlNG BAHA- 2,06,36,702 WALPUR STATE.
40,76,825 20,81,687 1,79,328 1,42,911,862
PUNJAB 1,88,14,201 36,65,610 19,42,847 1,65,449 1,30,40,295
Lallo~ division 53,39,271 9,~7,612 6,53.603 82,561 36.95,495
Gujranwala 10,46,933 1,90,049 1.14,882 20,941 7,21,061 Lahore 18,95,061 2,75,096 2.90,409 26,913 13,02,643 S!ieikhupura 9,23,081 1,86,320 95,258 2,465 6,39.038 Sialkot 14,74,196 2,56,147 1,53,054 32;242 10,32,753
M~tan division 83,29,839 16,87,829 7,88,842 43,584 58,09,584
Dera Ghazi Khan 6,27,529 1,43,192 44,299 2,121 4,37,917 Jhang 8,75,531 1,66,903 97,]]6 6,688 6,04,824 Lyallpur 21,52.401 4,16.127 2,21,804 4,524 15,09,946
Montgomery 18,15,888 3,73,161 1,56,123 11,571 12,75,033 Mullan 21,07,241 4,17,642 2,14,568 14,828 14,60,203 M uzaffargarh 7,51,249 1,70,804 54,932 3,852 5,21,661
Rawalp~ndi division 51,45,091 10.,711,169 5,00,402 39,304 35,35,216
CampbeUpur 7,22,542 1,6(,069 60,813 5,608 4,95,052 Gujrat 11,57,742 2,20,5(9 1,33,590 2,876 8,00,757 JbeJum 6,78,900 1,33,578 66,437 7,960 4,69,125
Mianwali 5,49,542 1,25,008 41,984 1,606 3,80,951 Rawalpindi 8,74.971 1,78,745 80,306 15,937 5,99,983 Shahpur 11,61.387 2,51,250 1,17,272 3,517 7,89,348
BAHA WALPUR STA TE 18,22,501 4,11,215 1,38,840 13,879 12,58,567
Bahawalpur 9,70,302 1,95,071 91,533 10,675 6,73,023 Rahimyarkhan 8,52,199 2,16,144 47,307 3,204 5,85,544
NoT£S._l Exclu~ persons who reported Nationalities other thaD p¥:i&aan.i. 'Includes Defence Services and also s.eU'-s~ (ilfiSOJIS not ~ ~tives such as
retired persons, students, institutioaa. inmates, etc,.

1[-3
2
3 4 5 6 7 8 9
10 11 12 13 14 15 16 17 18 19 20 21 22 23 24 25 26 27 28 29 30 31 32 33 34 35 36 37 38 39 40
TABLE U-LABOUR FORCE
The total Population according to Economic Status
Number of persons
I Self· supporting I
I--~- -- ----------~-----Civilian Labour Force I
District and Tebsil Total I , I Not in i Depend-
I
' I Civilian I ents Agricul. ,Non·Agri- Labour I
i tural ! cultural Force I
I: I 1----------------------- ,-=-------~----MALE
PUNJAB INCLUDING BAHA- 1,liJ,49,8S4 WALPUR STATE .. . PUNJAB ... 1,00,59.949
39,75,074
35,64,029
8,76,100 1,73,421
20,44,471 1,75,559 48,54,750
19,05,705 1,61,684 44,28,531
Lahore division Gujranwala
Gujranwala Tebsil Gujranwala Municipality Other Urban Areas'
Hafizabad Tehsil Ha/izabad Municipality Pind; Bhattian Town
Wazirabad Tehsil Wazirabad Municipality Other Urban Areas"
Lahore Lahore Tebsil Lahore City & Cantt Otfler Urban Areas'
Chunian Tehsil Other Urban Areas'
Kasur Tehsil Kasur Municipality Other Urban Areas'
Sheikhupura ... Sheikhupura Tehsil
Sheikhupura M'pality Oilier Urban Areas6
Nankana Tehsil '" Nankana M'pafity
Shahdara Tehsil '" Sharakpur Mpality
Sialkot .,. . .. Sialkol TehsiI ... Sialkot M'pality & Cantt.
Deska Tehsil ... Urban Areas 7 •••
Narowal Tehsil ... Narowal M'pality ...
Pasrur Tehsil ... Urban Areass .,.
Shakargarb Tebsil ...
28,86,257 5,63,821 3,10,289
6/,615 17,710
1,36,633 16,552 3,818
1,16,899 17.773 14",153
10,38,878 6,32,136
4,78,499 5,396
2,75,274 19,974
1,31,468 34,053 lJ ,198
4,94,011 2,43,252
15,848 14,525
1,32,447 8,640
1,18,312 4,747
7,89,547 2,27,409
89,348 1,55,128 1l,018
1,34,895 8,250
1,34,319 ' 9,168
1,37,796
96,231 5,397 2,214
45.025 869 799
32,165 3,024 2,556
2,73,734 1,23,734 69,554
554 1,08,197
4,158 41,803
3,391 3,495
1,82,881 89,625 1,207 2,858
50,126 757
43,130 467
2,46,064 52,335 6,072
49,834 1,322
44,232 907
48,203 1,594
51,460
6,48,815 1,14,216
58,989 24,879
6,999 25,107 7,579 1,137
30,120 6,530 4,070
2,89,505 2.14,382 1,87,013
2,262 43,778 6,409
31,345 15,813 2,163
94,561 45,326 7,639 4,383
25,532 3,854
23,703 1,827
1,50,533 48,534 31,217 33,607
4,618 26,764 3,635
21,365 2,748
20,263
80,998 20,865 10,123
3,915 261
9,573 117 32
1,169 360 647
26,610 24,198 17,951
61 1,611
224 801 273 174
2,456 1,367
34 855 62 43
1,027 54
31,067 21,415 13,225
1,432 31
1,212 110
3,751 320
3,257
12,80,344 2,55,319 1,44,946
27,424 8,236.
56,928 7,987 1,850
53,445 7,859 6,880
4,49,029 2,69,822 2,03,981
2,519 1,21,688
9,173 57,519 ]4,576 5,466
2,14,113 1,06,934
6,968 6,429
57.727 3,986
50,452 2,399
3,61,883 1,05,125
38,834 70,255 5,047
62,687 3,598
61,000 4,506
62,816
Notes-1lncludes Emmabad MUnicipality, Kamoke Mumcipality and Qila Didar Singh Town. 2Inciudes Akalgarh Town, Gakhar N.A.C., Ramnagar Town and Sohdra Town. sIncludes Raiwind N.A.C. and Badband. 4IncIudes Chunian Municipality, Khudian Town, Kot Radha Kisban N.A.C. and Pattoki
Municipality. 'Includes Lulliani Town and Raja Jang N.A.C. 6Includes Cbubarkana Town, Shabkot Town and Sangla Town. 'Includes Daska N.A.C. and Sambarial Town. "Includes Pasrur M'pality and <;:hawinda Town.
2
3 4 5 6 7 8 9
10 11 12 13 14 15 16 17 18 19 20 21 22 23 24 25 26 27 28 29 30 31 32 33 34 35 36 37 38 39 40

11-4
TABLE ll-LABotJR FORCE
The total population according to Economic Sta:tus
Number of persons
I Self-supporting J:r II Civilian Labour Force
Total I Not District and Tehsil
I Agricul-Civilian ts
Non-Agri- Labour I tura1 cultural Force
FEMALE 95,86,848 1,01,751 37,216 3,769 94,44,112 PUNJAB INCLUDING BAHA- 1
2 87,54,252 1,01,581 37,142 3,765 WALPUR STATE
86,11,764 PUNJAB 2
3 24,53,014 31,512 4,788 1,563 24,15.151 Lahore division 3 4 4,83,112 16,628 666 76 4,65,742 Gujranwala 4 5 2,67.890 15,709 104 75 2,52,002 Gujranwala Tehsil 5 6 52,578 20 52 52,506 Gujranwala Municipality 6 7 15,844 69 35 15,740 Other Urban Areas1 7 8 1,14,924 19 73 1,14,832 Hafizabad Teh sil 8 9 13,530 18 3 13,509 HaJizabad Municipality 9
10 2,966 2,966 Pindi Bhatian Town 10 11 1,00,298 900 489 98,908 Wazirabad Tehsil 11 12 15,254 53 19 15,182 Wazirabad Municipality 12 13 12,597 6 96 1 12,494 Other Urban Areas' 13 14 8,56,183 1,362 904 303 8,53,614 Labore i4 15 5,02,621 1,281 901 256 5,00,183 Lahore Tehsil 15 16 3,70,834 1,281 901 254 3,68,398 Lahore City & Cantt 16 17 4,492 4,492 Other Urban Areas" 17 18 2,40,233 37 3 1 2,40,192 Chunian Tehsil 18 19 17,323 1 17,322 Other Urban Areas4 19 20 1,13,329 44 46 1,13,239 Kasur Tehsil 20 21 29,033 29,033 Kasur Municipality 21 22 9,876 9 46 9,821 OtherUrban Areas5 22 23 4,29,070 3,439 697 9 4,24,925 Sbeikhupura 23 24 2,10,980 2,452 588 2,07,940 Sheikhupur:t Tehsil 24 25 13,869 7 13,862 Sheikhupura M'pality 25 26 12,669 13 2 12,654 Other Urban Areas· 26 27 1,16,081 687 1,15,394 Nankana Tehsil 27 28 7,865 7,865 Nankana M'pality 28 29 1,02,009 300 109 9 1,01,591 Shahdara Tehsil 29 30 4,275 2 52 4,221 Sharakpur M'pality 30 31 6,84,649 10,083 2,521 1.175 6,70,870 Sialkot 31 32 1.90,947 1,585 214 435 1,88,713 Sialkot TehsiJ 32 33 67,030 107 214 117 66,592 Sailkot M'pality & Cantt. 33 34 1,36,252 1,395 1 168 1,34,688 Deska Tehsil 34 35 9,276 5 9,271 Urban Areas? 35 36 1,16,837 16 98 309 1,16,414 Narowal Tehsil 36 37 7,048 45 309 6,694 Narowal M'pality 37 38 1,17,666 1,381 4 210 1,16,071 Pasrur Tehsil 38 39 8,093 7 4 3 8,079 Urban Areass 39 40 1,22,947 5,706 2,204 33 1,14,984 Shakargarh Tehsil 40
Notes-1 IncIud(!s Eminabad Municipality, Komake Municipality, and QiJa Didar Singh Town. 2 Includes Akalgarh Town, GaktJar N.A.C" Ramllagar Town and Sohdra Town. 3 Includes Raiwind N.A.C. and Badhand. • Includes Chunian Municipality, Khudian Town, Kot Radha Kishan N.A-C. and Pattoki
Municipality. 6 Includes Lulliani Town and Raja Jang N.A.C. & Includes Chuharkana Town, Shahkot Town and Sangla Town. 7 Includes Deska N.A.C. and Sambarial Town. S Includes Pasrur M'pality and Chawinda Town.

11-5
41
42
43 44 45 46 47 48 49 50 51 52
53
54 55 56 57 58 59 60
61
62 63 64 65 66 67
68 69
70 71 72 73
TABLE l1-LABOUR FORCE-can/d.
The total Population according to Economic Status
Number of persons.
----------------~~~~--------~------------~----------~ Self-S upporting
Total ! Civilian Labour Force I ,~~------~~.---~
District and Tehsil
I I ,I Agn- I Non-cultural (Agricultural i
I
Not in Uepend-Civilian I ents Labour Force
I I ----- ------~-- ------~-~~------~---
Multan division
Dera Ghazi Khan
Dera Ghazi Khan Tehsil Dera Ghazi Khan M'pality Kat Chhutta Town
Biloch Trans Frontier Tract Jampur Tehsil
Urban Areas 1
Rajanpur Tehsil Urban Areas 2
Sangar Tehsil Urban Areas 3
Jhang
Jhang Tehsil Jhallg Maghiana M'pality
Chiniot Tehsll Chiniot M'pality ... Other Urban Areas 3
Shorkot Tehsil Urban Areas Ii
LyaUpur ...
Lyall pur Tehsil Lyallplir M'pality Chak l/zumra M'pality
Jaranwala Tehsil laranwala M'pality Tandliamvala'M'palily
Samundri Tehsil Samundari N.A.C.
Toba Tek Singh Tehsil Toba Tek Singh M'pality Gajra M'pality Kamalia M'pality ...
MAL E
44,54,552 16,73,738
3,40,069
1,28,402 19,389 1,399
24,826 60,745
9,102 72,317 4,882
53,779 5,393
1,42,636
50,744 2,841
389 12,103 26,298 2,484
33,374 },164
20,117 1,047
4,70,908 1,66,456
1,87,425 39,739
1,78,045 20,974 5,932
1,05,438 6,352
11,41,938
3,75,226 99,085
4,496 2,32,847
9,818 5,559
2,15,877 3,558
3,17,988 6,518
11,014 15,137
67,328 13,784 57,995 1,287 1,133
41,133 1,922
4,14,870
1,07,046 4,153
61 94,687
517 153
83,751 218
1,29,386 1,028 1,286 3,[79
7,82,276 42,455 19,56,033 41
44,161
19,530 7,463
283 2,176 7,918 2,733 7,195 1,618 7,342 1,207
96,913
40,128 11,791 38,417 9,652 1,699
18,368 1,575
2,21,803
1,00,615 56,497
2,555 39,273 5,130 2,880
35,261 1,642
46,654 2,057 5,058 4,799
2,073
1,021 586 26
184 54 53 65 65
749 525
1,51,199 42
57,107 43 8,499 44
701 45 10,363
1
46 26,475 47 3,832 48
31,683 49 2,035 50
25,571 51 2,614 52
6,657 2,00,882 53
1,692 427
3,026 1,70 760
1,939 65
4,508
603 160 20
284 20
2,386 7
1,235 92
104 379
78,277 54 13,737 55 78,706 56 9,865 57 2,340 158
43,998 I 59 2,800 ! 60
i • I
5,00,757 ! 61 !
1,66,962 ! 62 38,275 I 63 1.660 ! 64
98,603 165 4,151 66 2,526167
94,479 68 1,691 69
1.40,713 70 3,341 ! 71 4,566 i 72 6,780 ,73
i .------------------------------~-.~--------------~ Notes;-l Includes Jampur M'pality and Dajal M'pality.
2 Includes Rajanpur M'pality and Kot Mithan M'pality. 3 Includes Taunsa Town and Vehoa Town. • Includes Lalian Town and Rabwah N.A.C. 5 Includes Shorkot Town and Ahmadpur Town,

11-6
TABLE U-LABOUR FORCE-contd.
The total Population according to Economic Status
Number of persons.
Self Supporting
Totai -~ilian Labour Force I--:ot -j-n Depend- District and Tehsil
ents :- ----- Civilian . I I Labour . Agn- Non- F
___ ~CUltlifal tgriC~I~ur~ __ 0:=-__ -----
FEMALE
41 38,75,287 14,041 6,566 1,129 38,53,551 Multan division 41
42 2,87,460 556 138 48 2,86,718 Dera Ghazi Khan 42
43 1,09,384 5 135 30 1,09,214 Dera Ghazi Khan Tehsil 43 44 16,520 16,520 Dera Ghazi Khan M'pality 44 45 1,263 1,263 Kot Chhutta Town 45 46 20,190 1 20,189 Biloch Trans Frontier Tract 46 47 51,210 377 3 50,830 Jampur Tehsil 47 48 7,897 7,897 Urban Areas 1 48 49 59,254 59,254 Rajanpur TehsiJ 49 50 4,073 4,073 Urban Areas' 50 51 47,422 173 18 47,231 Sangbar Tehsil 51 52 4,687 4,687 Urban Areas • 52
53 4,04,623 447 203 31 4,03,942 Jilang 53
54 1,61,164 5 5 1,61,154 Jhang Tehsil 54 55 33,658 5 33,653 Jhang Maghiana M'pality 55 56 1,51,570 441 198 31 1,50,900 Chiniot Tehsil 56 57 18,068 18,068 Chiniot M'pality 57 58 5,104 5,104 Other Urban Areas ' 58 59 91,889 91,888 Shorkot Tehsil 59 60 5,432 5,432 Urban Areas 0 60
61 10,10,463 1,257 1 16 10,09,189 Lyallpur 61
62 3,26,735 24 10 3,26,701 Lyallpur Tehsil 62 63 80,042 80,042 Lyallpur M'pality 63 64 3,562 3,562 Chak Jhumra M'pality 64 65 2,05,089 85 2,05,003 JaranwaJa Tehsil 65 66 8,151 8,151 Jaranwala, M'palily 66 67 4,540 4,540 Tandlianwala M'pality 67
68 1,92,915 1,92,914 Samundri Tehsil 68 69 3,079 3,079 Samundri N.A.C. 69
70 Toba Tek Singh Tehsil 70
2,85,724 l,l47 6 2,84,571 71 5,571 5,571 Toba Tek Singh M'pa[ity 71 72 9,393 9,393 Gojra M'pality 72 73 13,499 13,499 Komalia M'paJity 73
Notes:-1 Includes Jampur M'pality and Dajal M'pality. , Includes Rajanpur M'pality and Kot Mithan M'pality. 3 Includes Taunsa Town and Vehoa Town. 4 Includes Lalian Town and Rabwah N.A.C. • Includes Shorkot Town and Ahmadpur Town.

11-7
74
75 76 77 78 79 80 81 82 83 84 85
86
87 88 89 90 91 92 93 94 95 96 97 98 99
100 101 102
103
104 105 106 107 108 109 110 1Ii
TABLE ll-LABOUIl FORCE-contd.
The total Population ~ordillg to Economic StaWs.
Number of persons.
Self-supporting
District and Tehsil Total Civilian Labour Force Not in Civilian
At- I Non-Labour
eu tural . Agriculturali Force
MALE
Montgomery .. , ... 9,69,883 3,73,140 1,55,%7 11,571
Montgomery Tehsil ... 3,22,742 1,14,854 58,863 3,016 Montgomery M'pality ... 27,836 745 12,582 1,093 Chichawatni NA.C. ... f),587 217 2,893 443
DipaJpur Tehsil ." ... 1,63,798 57,480 33,224 1,209 Urban Areas' ... . .. 8,672 1,134 3,227 9
Okara Tehsil .. , ... 2,27,300 83,051 41,275 1,276 Okara M'pality ... . .. 19,384 2,328 8,754 218 Renalakhurd N.A.C. ... 2,706 258 950 124
Pakpattan Tehsil ... 2,56,043 1,17,755 22,605 6,070 Pakpattan M'pality ... 13,036 1,982 4681 227 {Ari/wala N.A.C.) ... ... 6,340 178 2,947 237
Multan ... .,. . .. 11,27,883 4,08,995 2,10,451 13,863
Multan Tehsil ,- , ... 2,74,355 70,193 79,634 9,186 Multan M'pality & Cantt. ... 1,04,478 6,304 49,445 5,404 Kabirwala Tehsil ... ... 1,33,401 53,956 18,750 852 Urban Areas' . " ... 5,163 1,182 1,529 83
Khanewal Tehsil ... 2,04,349 77,076 35,116 530 Khanewal M'pa}jty ... 20,786 2,426 8,884 70 Mian Channu M'pality ... 6,525 199 3,164 34 Tulamba Town ." ... 4,196 1,222 1,200 ...
Lodhran Tehsil ." ... 1,54,771 63,538 22,776 152 Urban Areas' ." '" 13,429 3,350 4,167 137
Mailsi Tehsil .. , ... 97,893 39,698 14,637 721 Mailsi Towil ." '" 5,490 1,579 1,121 307
Sbujabad Tehsil .. , " . 1,16,963 42,310 20,355 1,707 Urban Areas4 . " ... 12,138 732 5,604 409
Vehri Tehsil .. , ... 1,46,151 62,224 19,183 715 Urban Areas· .. , ... 13,557 2,716 5,100 131
Muzatfargarh ... . .. 4;03,871 1,67,691 52,981 3,783
Muzatfargarh Tehsil ... 1,26,830 51,758 17,061 455 Urban Areas" '.' ... 8,532 895 3,914 26
AJipur Tehsil ... . .. 1,13,059 49,734 10,473 2,145 Urban Areas' .. , ... 5,543 1,678 1,040 95
Kot Addu Tehsil .. , ... 76,800 32,363 11,111 322 Kot Addu Town ... ... 5,491 563 2,342 43
Leiah Tehsil ... ... 87,182 33,836 14,336 861 Urban Areas' ... . .. 9.411 2,216 2,122 682
Notes :_1 Includes Dipalpur N.A.C. & Havili N.A.C. 2 Includes Abdul Hakim N.A.C. & Kabirwala Town. S Includes Dunyapur Town. Kehror Pakka Town & Lodhran N.A.C. 4 Includes Shujabad M'pality & Jalalpur Pirwala Town. 5 Includes Burewala N.A.C. & Vebari N.A.C. , Includes Khangarh Municipality and Muzaffargarh Municipality. , Il'!cludes Alipu[ Municipality and Jiltoi Town. e Includes Leiall Municipality and KarQr ·M)lllicipality.
Depend-ents
I
4,29,205
1,46,001) 13,416 3,034
71,885 4,302
1,01,698 8,084 1,374
1,09,613 6,146 2,978
4,94,574
1,15,342 43,325 59,843 2,369
91,627 9,406 3,128 1,774
68,305 5,775
42,837 2,483
52,591 5,393
64,029 5,610
1,79,416
57,556 3,697
50,707 2,730
33,004 2,543
38,149 4,391
74
75 76 71 78 79 80 81 82 83 84 85
86
87 88 89 90 91 92 93 94 95 % 97 98 99
\00 101 102
103
104 105 106 107 108 109 110 III

,,7f
75
q~ 78 79 80 81 82 83 84 '85
'86 87
-88 '--S'9 90
.91 92 1)3 94 95 ,96 97 98 99
100 101 102
103
104 105 106 107 108 109 110 111
TABLE ll-LABOUR FORCE-conld.
The total Population acco~ding to Economic Status.
Number of persons.
I Self-supporting
I --
Total Civilian Labour Force Not in Depend- District and Tehsil
Civilian enls
Agri- Non- Labour I cultural Agriculturall Force I I
FEMALE
8,46,005 21 156 ... 8,45,828 Montgomery
2,81,040 1 133 ... 2,80,906 Montgomery Tehsil 22,349 ... 123 '" 22,226 Montgomery M'pality 5,496 ... ... ... 5,496 Chichawatni N.A.C.
1,42,810 ... ... ... 1,42,810 Dipalpur Tehsil 7,697 ... ... .. . 7,697 Urban Areas'
1,96,560 19 3 ... 1,96,538 Okara Tehsil 15,966 ... 3 . .. 15,963 Okara M'pality 2,269 ... ... .. . 2,269 Renalakhurd N.A.C.
2,25,595 I 20 ... 2,25,574 Pakpattan Tehsil 11,290 1 15 ... 11,274 Pakpattan M'pality
5,197 ... ... . .. 5,197 Arifwala N.A.C.
9,79,358 8,647 4,117 965 9,65,629 Multan
2,32,384 723 1,297 224 2,30,140 Multan Tehsil 85,644 216 1,038 Il5 84,275 Multan M'pality & Cantt.
1,17,732 2,250 1,288 556 1,13,638 Kabirwala Tehsil 4,321 78 ... ... 4,243 Urban Areas'
1,80,000 439 131 5 1,79,425 KhanewaJ Tehsil 17,129 63 100 ... 16,966 Khanewal M'pality 5,546 ... 19 . .. 5,527 Mian Channu M'pality 3,820 17 11 ... 3,791 Tulamba Town
1,34,281 1,344 736 ... 1,32,201 Lodhran Tehsil 12,569 3 1 ... 12,565 Urban Areas 3
86,815 542 487 172 85,614 Mailsi Tehsil .4,752 ." 8 15 4,279 Mallsi Town
1,01,429 759 ... ... 1,00;670 Shujabad Tehsil 10,951 89 10,862 Urban Areas'
1,26,717 2,590 178 8 1,23;941 Vehati Tehsil 10,801 ... 5 3 10,793 Urban Areas"
3,47,378 3,113 1,951 69 3,42,245 Muzaffargarh
1,08,026 2,099 1,141 5 1,04,781 Muzaffargarh Tehsil 7,147 34 141 ... 6,972 Urban Areas·
98,123 175 ... 5 97,943 Alipur Tehsil 5,134 ... ... ... 5,134 Urban Areas?
66,209 689 612 59 64,849 Kot Addu Tehsil 5,016 7 47 3 4,959 Kot Addu Town 75,020 150 198 '" 74,672 Leiah Tehsil 8,086 I 52 .. , 8,033 Urban Areass
--~ctes:-' Jncludes Dipalpur N.A.C. & Havel! N.A.C. 2 Includes Abdul Hakim N.A.C. & Kabirwala Town. 3 Includes Dunyapur Town, Kehror Pakka Town & Lodhran N.A.C. 4 Includes Shujabad M'paJity & Jalalpur Pirwala Town. 5 Includes Burewala N.A.C. & Vehari N.A.C. 6 Includes Khangarh Municipality & Muzaffargarh Municipality. ? Includes Alipur Municipality & Jatoi Town. S Includes Leiah Municipality llnd Karar .Moni'flP!iJity.
7.4 75
lit 78 19 80 81 82 83 84-8S
:% 87 88 89 90
'-9-1 '92 93 94 95 ~ 97
Jg }Wt 102
lO3
104 105 U)6 107 108 109 110 111

TABLE ll"-LABQUR FORCE-con/d.
The total population according to Economic
Number of persons ===-~. --~. ~~--------~---------------------,
1_____ Self-supporting
District and Tehsil Total I Civilian Labour Force I Not in
I--~~ri---I ~~~~gri-- ~~~~~~ I cultural I cultural
Dependent
112 Rawalpindi division
MALE
27,19,140 10,14,141 4,74,614 38,231 11,92,154 112
1(3
114 115
116 117 118 119 120 111 122
123
124 125 126 127 128 129 130
lli
l.tl 133 134 135 136 137
138
139 140 141 142 143 144
CampbeUpur
Campbell pur Tehsil Campbellpur l'Ju'licipalify &
Cantt. Other Urban Areas'
Fateh Jang Tehsil '" Fateh Jang Town
Pindigheb Tehsil Pindigheb Municipality
Talagang Tchsil Talagang Town
Gujrat
Gujrat Tehsil Gujrat Municipality Other Urban Areas'
Kharian Tehsil Urban Areas'
Phalia TchsiI Urban Areas'
Jbelum
Jhelurn Tehsil ]helum Municipality & CUlIIt.
Chakwal Tehsil Chakwal Afunicipality
rind Dadan Khan Teb,il Pind Dadan Khr:m Municipality
Mianwali ...
Mianwali Tehsil Mianwa!i Municipality
Bhakkar Tehsil Urban Areas"
Isakhel TehsiI Urban Areas'
3,76,834
1,41,699 n,713
11,270 74,961 2,707
83,336 5,119
76,838 4,452
6,14,959
2,10,054 25,301 14,153
1,79,677 16,210
2,25,218 14,606
3,49,260
1,38,412 24,025
1,12,681 7,203
98,167 3.917
1,54,722
53,524 812
2,189 33,530
440 32,643
792 35,025
977
2,11,616
63,867 2,183 1,502
66.120 1,548
81,629 1,316
1,20,821
46,325 1,437
45,432 1,479
29,064 282
2,89,424 1,17,230
1,25,878 12,636
1,24,835 9,607
38,711 8,744
49,202 1,876
53,927 2,621
14,101 1,401
57.210
23,429 3,363
4,923 9,864 1,020
13,680 1,794
10,237 1,176
1,25,209
46,713 10,348 6,103
29,989 6,663
48,507 7,221
62,525
22,073 7,377
17,780 2,049
n,672 1,295
40,328
18,803 4,397
15,755 2,672 5,770 3,198
5.533
4,740 4,039
160 152 23
344 39
297 53
2,838
1,413 212 52
538 92
887 58
9,707
8,704 6,320
531 122 472 76
1,123
704 16
273 63
146 100
1,59,369 113
60,006 114 3,499 115
3,998 116 31,415 117 1,224 118
36,669 119 2,494 120
31,279 121 2,246 122
2,75,296
98,071 12,558
6,496 83,030 7,907
94,195 6,011
1,56,207
61,310 8,891
48,938 3,553
45,959 2,264
1,30,743
123
124 125 126 127 128 129 130
131 132 133 134 135 136 137
138 57,169 139 6,347 140
54,880 141 4,251 142
18,694 143 4,045 144
--------~----------~----~-. -----------------------Notes.-' fl1cledes Hasan Abdal Municipality, Hazro Municipality, Cement & Ordnance Factory Wah.
2 Includes Jalalpur Jattan Municipality and Kunjah Municipality. 3 Includes Dinga Municipality, Kharian Town and LaJamusa Municipality. • Includes Phalhi Town, MaJ~klVal Town and Mandi Bahauddin Municipality. 5 Includes Bhakkar Municipality and Kallur Kot Town. • Includes Isakhel Municipality and Kalabagh Municipality.

112
113
114 US
116 iI7 118 119 120 121 1.22
123
124 125 126 127 128 129 130
131 132 133 134 135 136 137
138 139 140 141 142 143 144
Total
24,25,951
3,45,708
1,24,397 5,958
7,654 68,830 2,419
80,737 5,031
71,744 4,303
5,42,783
1,86,438 21,670 12,807
1,66,713 13,906
1,89,632 12,476
3,29,640
1,27,354 14,542
1,09,386 6,107
92,900 3,401
2,60,125
1,14,256 10,704
1,08,898 8,367
36,971 8,141
11-10
TABLE U-LABOUR FORCE-contd.
The total Population according to Economic Status
Number of persons r
Self-supporting I
Civilian Labour Force Not in Depend- District and Tehsil
Agri- I Non-Agri-cultural cultural
56,028 25,788
6,347 3,603
4,058 1,315 6 260
17 350 1,494 1,331
11 150 467 412
15 51 328 545
3 2
8,903 8,381
2,592 4,713 63 399
5 52 3,009 1,986
7 322 3,302 1,682 ... 66
)2,757 3,912
5,721 2,133 222 306
6,098 1,447 2 78
938 332 343 45
7,778 1,656
3,975 946 29 115
3,356 665 24 18
447 45 11 45
Civilian ent Labour Force
FEMALE
1,073 23,43,062
75 3,35,683
26 1,18,998 ... 5,692
... 7,287 27 65,978 ... 2,258 18 79,840 ... 4,965 4 70,867 ... 4,298
38 2,25,461
20 1,79,113 ... 21,208 ... 12,750 16 1,61,702 10 13,567 2 1,84,646 2 12,408
53 3,12,918
37 1,19,463 33 13,981 10 1,01,831
... 6,027 6 91,624
'" 3,013
483 2,50,208
131 1,09,204 4 10,556
253 1,04,624 .. , 8,325 99 36,380
... 8,085 .
Rawalpindi division.
Campbellpur.
Campbellpur Tehsil. Campbell pur Municipality &
Cantl. Other Urban Areas1•
Fateh Jang TehsiL Fa/eh Jang TOivn.
Pindigheb Tehsil. Pindigheb MUllidpality.
Talagang Tehsil. Talagang Town.
Gujrat.
Gujrat Tehsil. Gujrat Municipality. Other Urban Areas".
Kharian Tehsil. Urban Are:zs3 •
Phalia Tehsil. Urban Areas'.
Jhelum.
lhelum Teh,il. Ihelum Municipality & Cantt.
Chakwal Tehsil. Chakwal MUnicipality.
Pind Dadan Khall Tehsil. Pind Dadan Khan Municipality
Mianwali.
Mianwali Teh\il. Mianwali Municipality.
Bhakkar Tehsil. Urban Areas. 5
Isakhel Tehsil. Urban Areas ••
112
113
114 115
116 117 118 119 120 121 122
123
124 125 126 127 128 129 130
131 132 133 134 135 136 137
138 139 140 141 142 143 144
Notes.-1 Includes Hasan Abdal Municipality, Hazro Municipality, Cement & Ordnance Factory Walt.
2 Includ~s Jalalpur Jattan Municipality & Kunjah Municipality. 3 Includes Dinga Municipality, Kharian Town, Lalamusa Municipality. 4 Includes Phalia Town, Malakwal Town & Mandi Bahauddin Municipalhy. • Includes Bhakkar Municipality & Kal1ur Kot Town. e Includes Isakhel Municipality and Kalabagh M'pality.

i 1-11
TABLE tl-LABdtJR FORCE-coittd.
The total Population according to Economic Statug
Number of persons
Selr-stippbrting I
I Civilian Labour Force I District and Tehsil Total Not in
I Depend-
Civilian i ents
Agri- I Non- Labour
I cultura~ Agricultural , Force
Nt AtE
145 Rawalpindi 4,68,565 i,71,098 78,467 15,905 2,C)J,Og5 145
146 Rawalpindi Tehsil ..• 2,50,001 73,090 57,951 14,535 1,04,425 146 147 Rawalpindi M'pality & Cants ...• 1,44,076 33,645 40,686 14,108 55,637 141 148 Gujar Khan Tehsil... 1,035627 40,318 13,384 458 49,467 148 14~ Gujar Khan M'pality. 4,768 1,222 1,147 8 2,391 14~ 150 Kahuta Tehsil 61.505 28,402 3,586 247 29.278 150 151 Murree Tehsil 53,432 29,288 3,546 665 19,933 15~ 152 Muree M'pality & Cantfs: 7,153 2,846 2,421 622 1,264 152
153 Sbahpur .,. 6,20,098 2,38,654 1,10,875 3,125 2,67,444 153
154 Shahpur Tehsil 93,861 32,041 22,758 297 38,765 154 15S Urban Areas1 15,485 4,032 4,881 53 6,519 155 156 Bhalwal Tehsil 1,67,654 62,057 33,864 676 71,057 156 157 Urban Areas' 26,552 7,064 7,588 102 11,798 157 i58 Khushab Tehsil 1,41,073 60,398 20,907 795 58,973 158 159 Klrushah M'pality 10,836 1,802 3,963 42 5,029 159 160 Other Urban Areas' 15,177 6,634 1,935 116 6,492 16<1 161 Sargodha Tehsil 2,17,510 84,158 33,346 1,357 98,649 161 (62 Sargodha M'pality 43,385 4,500 12,160 252, 26,473 162 163 Sillanwali M'pality 3,975 1,060 1,366 338 1,211 163
164 BAHAWALPUR STATE 9,89,905 4,U,045 1,38,766 13,875 4,26,219 164
i6S Bahawalpur 5,23,767 1,94,901 91,459 10,671 2,26,736 i65 166
166 Bahawalpur TehsiL. 1,19,738 34,788 30,180 3,425 51,345 167 Bahawalpur M'palily & Calltts: 23,368 1,640 11,068 443 10,217 167
l~ Khanga Sharif 3,258 244 1,407 422 1,185 168 Bahawalnagar Tehsil 97,7,;7 39,912 14,055' 1,542 42,258 169
170 Bahawa{nagar M'pality 10,118 444 4,730 71 4,873 170 171 Sadiqganj M'pality 2,483 366 757 2 1,358 171 112 Chishtian Tehsil 1,46,107 56,288 22,097 3,823 63,~99 In 173 Urban Areas' 13,877 2,554 4,450 1,347 5,526 173
174 Fort Abbas Tehsil .,. 96,405 37,146 17,320 786 41,153 174 175 Urban Areas5 7,087 827 2,809 383 3,068 175 176 Minchinabad Tehsil 63,750 26,767 7,807 1,095 28,081 176 111 Minchinahad M'pality 2,581 160 1,218 29 1,174 177
Notes:-1 Includes ~ahiwal M'pality. Shahpur C!Ihauni, S!Iahpur City, Ihawarian Town & Kalra Town.
, Include. B'1alwal M'Pllity. B'1~ra M'pality, Kot M:>mlu Town, Miani M'pality & Phul-larwan M'pality.
3 Includes Urban ThaI, Nurpur Urban Area, Hadali Town and Mitha Tiwana Town. , Includes Chishtian M'pality, Hasilpur M'p:j.lity, .r<::haipur M'pality & Qaimpur M'pality. ~ Includes Fort Abbl~ M'pality anj HaroonabJi M'Pl1ity

145 ~146 147 l4B )49 ISO 15] 152
153
154 155 156 157 158 159 150 161 162 163
164
165
166 167 168 169 170 171 172 173
174 175 176 177
11·12
. Total.
4,06,406
1,91;725 92,801
1,06,147 3,728
62,296 46,238 2;245
5,41,289
81,196 13,495
1,43,286 23,175
1,19,875 ~,631
13;514 1,86,932
35,062 3,242
8,32,596
4,46,535
98.148 18,278 2,335
84,916 8,255 2,099
1,24,747 10,883
83,628 5,426
55,096 2.325
TABLE U-LABOUR FORCE-conld.
The total Population according to Economic Status
Number of persons -Self-supporting.
ClviHan Labour Force. Not in Depend- ehsil • District and T
Agri- Non~Agri-cultural. cultural.
7,647 1,839
3,817 977 2,417 733 1,184 245 ... 5 1,377 123 1,269 494
6 430
12,596 6,397
760 1,808 146 480
4,492 1,618 223 561
4,694 1,547 207 845
10 5 2,650 1,424
107 175 ... ...
170 74
170 74
17 ... ... . .. ... . .. 28 59 ... 35 ... ... 29 ... ... ... 86 9 ... ... 10 6 ... ...
Civilian ents.
Labour Force .
FEMALE
32 3,96,888
28 1,86,903 28 89,623 ... 1,04,718 ... 3,723 ... 60,796 4 44,471 4 1,805
392 5,21,904
60 78,5611 21 12,848 35 1,37,141 9 22,382
51 1,23,583 ... 8,579 ." 13,499 246 1,82,612 43 34,737 .. . 3,242
4 8,32,348
4 4,46,287
... 98,131
... 18,278 ... 2,335 ... 84,829 . .. 8,220 . .. 2,099 ... 1,24,718 . .. 10,883
... 83,533
"4 5,426 55,076 ... 2,325
. Rawalpindi.
Rawalpindi Tehsil Rawalpindi M'pa/i ty & Cantt.
Iy Gujar Khan Tehsil
Gujur Khan M'pali Kahuta Tchsil Murree Tehsil
Murree M'palily & Cantts.
Shahpur
Shah pur Tebsil Urban Areast
Bhalwai Tehsil Urban Areas &
Khushab Tehsil Khushab M'pality Other Urban Areas
Sargodha Tehsil Sargodha M'pality Sillanwali M'paUty
BAHAWALPUR STAT E
Bahawalpur
BahawaJpur Tehsil Bahawalpur M'palit y & Cantt. Khanga Sharif
Bahawalnagar Tehsil Bahawalnagar M'pa Sadiqganj M'pality
Chishtian Tehsil
lity
Urban Areas 4
Fort Abbas Tehsil Urban Areasa
Minchinabad Tehsil Minchinabad M'pali ty
Notes:- l Includes Sahiwal M'pality, Shahpur Chhauni, Shabpur City, Jhawarian Town & Kalra Town.
2 Includes Bhalwal M'pality, Bhera M'pality, Kot Moman Town, Miani M'pality & Phullarwan M'pality.
3 Includes Urban ThaI, Nurpur Urban Area, Hadali Town & Mitha Tiwana Town. 4 Includes Chishtian M'pality, Hasilpur M'paIity, Khairpur M'pality & Qaimpur M'pality. 6 Includes Port Abbas M'pality & Haroonabad M'pality.
145
146 147 148 149 150 151 152
153
154 155 156 157 158 159 160 161 162 163
164
165
166 167 168 169 170 171 172 173
174 175 176 177

1-13
\78
179 180 181 182 183 i84 185 186 187 188 139 190 191 192
I TABLE ll-LABOUR FORCE-contd.
The total Popll4lUfIIl ~r4iBg tq ~.ue Statu
Number of persons
Seli..supporting I -~ .<-
District and Te~l Total Civilian Labour For~ Not in De.Pf;nd.
Civilian ents
Agri. \ Non. LlIbour
cultural Agricultural :force
MALE
Rahimyarkban ... ... 4,66,138 2,16,144 47,307 3,204 "99,483 Rahimyarkhan Tehsil ... 1,35,558 62,119 15,296 92 S8,(l\51
Rahimyarkhan M'pality .. , 8,876 1,528 4,175 63 3;110 Kat Samaba Town ... 975 266 273 20 416
Abbasia Colony Tehsil ... 4,486 2,364 574 26 1,522 Allahabad Tehsil ... ... 74,199 33,261 5,884 528 34,526
Allahabad M'pa/ity ... 1,499 373 449 153 .524 Ahmadpur East Tehail ... 1,03,545 47,096 10,304 1,429 44,716
Ahmadpur East M'pality ... 10,994 3,520 2,825 690 3,959 Other Urban Areas' ... 6,958 1,743 2,073 695 2,447
Khanpur Tehsil ... ... 59,281 26,694 6,973 755 24,859 Chachran Sharif M'pality ... 8,550 3,229 2,209 13 3,099 Otller Urban Areas2 ... 1,538 383 462 155 538
Sadiqabad Tehsil ... ... 89,069 44,610 8,276 374 35,809 Urban Areas3 ... ... 7,067 3,528 1,364 53 2,1)2
. - . . . Notes:- 1 Includes Dera Nawab Sahib M'pallty, Goth Ghant M'pahty & Uch SharifM·-pality.
2 Includes Khanpur Municipality and Khan Railway Colony. 3 Includes Sadiqabad M'pality. Ahmadpur Lamma M'pality & Sanjarpur M'pality.
178
\79 180 181 18~ l83 184 18' 186 187 188 189 190 191 192

178
179 180 18t 182 183 184 185 186 187 188 189 19() 191 192
11-14
Total
3,86,061
1,12,789 6.043
736 2,790
63,004 1,226
84,420 9,410 4.711
49,054 6.647 1.416
74.004 5,372
TABLE ll-LABOUR FORCE-contd.
The total puptation according to EconomIc Status
Number of persons
Self-Supporting
Civilian Labour Force Not in Depend- District and Tehsil.
Agri- I Non-Agri-! cultural cultural.
... ... ... ... ... ... ... ... '" ... ... ... ... ... ... ... ... ... ... ... ... ...
Civilian ents.
Labour Force.
FEMALE
...
.. . . .. ... ... ... ... ... ...
... .. .
3,86,061
1,12,789 6,043
736 2,790
63,004 1,226
84,420 9,410 4.711
49,054 6.647 1,416
74,004 5,372
Rahimyarkhan
Rahimyarkhan Tehsil Rahimyarkhan M'pa[ity Kot Samaba Town
Abbasia Colony Tehsil Allahabad Tehsil
Allahabad M'pality Ahmadpur East Tehsil
Ahmadpur East M'palily Other Urban Areas!
Khanpur Tehsil Chachran Sharif M'pallty Other Urban Areas2
Sadiqabad Tehsil Urban Areas3
Note:- 1 Includes Dera Nawab Sahib M'pality, Goth Ghani M'pality & Uch Sharif M'pality. 2 Includes Khanpur M'pality & Khanpur Railway Colon:y. 3 Includes Sadiqabad M'pality, Ahmadpur Lamma M'pality & Sanjarpur M'pality.
178
179 180 181 182 183 184 185 186 187 188 189 190 191 192


TABLE U-A --OCCUPATION OF NON-AGRICULTURAL LABOUR FORCE.
This table shows the composition by detailed occupations and certain occupational sub-groups of the sections of the:: Civilian Labour Force classed as Non-Agricultural Labour in Table 11. 'All non-Pakistani citizens and children under 12 years of age are excluded.
2. 'Persons following each occupation are further analysed by sex. indu~trial status, age groupS and educational, levels. The age-groups chosen are related to the different phases of a persons working life.
3. The information regarding occupations- is based upon tlle replies obtained to Census Question No. 12 which asked; "what was your actual main occupation in January 1951? If you were unemployed throughout January 1951, were you seeking employment, and if so, in what occupation". The enumerator was instructed to write a brief description of H e occupation indicating what kind of worker the respondent was or what kind of work he did or sought. The respondents were instructed to distinguish dearly between the idea of occupation, which meant the kind of work done and the idea of 'Economic Group' which meant the kind of service in which the occupation is followed.
4. The descriptions so recorded were coded in accordance with the "Classification Code of occupations of the Civilian Labour Force" issued as an Annexure to Part II of the Code of Census Procedure. Slips which were endorsed as "Mazdoor (Labourer)" or "MulazimatjNaukri (Service)" were counted under 'Unskilled labourers' unless the enumeration slip contained some more information on other questions which enabled the respondent to be more accurately classified.
5. Information-regarding Industrial Status was obtained in answers to Census Question No. 14 which asked: "In your main occupation, do you employ others? Or are you an employee? Or are you an independent worker? Or an Unpaid family help?" Symbols for each of these categories were provided on the slips and the enumerators placed a ring round the appropriate symbol. The enumerators were instructed not to class a person as Employer merely by virtue of his employing domestic servants but only if he employed others in his profession or business. An independent worker was defined as a person who is his own master in his trade or business but employs no paid help". An unpaid family help was defined as it person wllo claimed to be self-supporting or partly so by virtue of assistance rendered directly in the operation of a trade or business of another member of the family, but who received no separate payment in cash or kind. Unemployed pers<Jns arc included in this table under the "Occupations" in which they were seeking work.
6. The data regarding age and Educational Statu. were obtained from replies to Census Questions Nos. 2 and 10, a description of each of which appears in the title sheets of the tables in the Age and Literacy series re~pectively .
7. For every person in the Non-Agricultural Labour Force, the Data on the enumeration slip were transferred to punched cards and sorted by machine.
8. An analysis of the information on occupation contained in this table is given in fuller details in Table E, which is separately published in the series of Census volumes of Economic Tables.
9. This Table has been discussed in Chapter 9 of the Report.
11-15

lr~r6
TABLE l1-A- OCCUPATION OF THE NON-AGRICULTURAL LABOUR FORCE
Punjab including Bahawalpur State
Self-supporting persons engaged in activities other than Cultivation and Animal Husbandry, according to their Occupation ill January 1951.
Number of persons
r-----------------~------------~~---------~.-----------------Pers~~s 1
1
__ 1--- ~_M_~a_Ie __ I_nd_u_st_n_'a_I_S, __ ta_tll_s ___ Fe_m_a_Ie ____ 1
Occupational Groups
l\ON-AGRlCULTURAL LABOUR FORCE
2 Profusional & Techo;,.1
3 Engineer •• Architects, ttc. 4 Transport Managen, Pilots etc. S Professers & Teach.,s 6 Religiolls workers 7 Pbysicians & Surgeons
8 9
10 II 12
13
14 IS 16
17
18
Nurses & other Health worken Authors, Writers. & Journalists Judges, Lawyers. etc. Chemists & metallurgists Otber ProfessioDs
Administrative
Business Executives Governmental etc, Office wo [kers
Sale. workers 8< Shopkeep ...
Forestry Workers
19 Fishermen
20 Mine 8< Quarry Workers
21 Tranlport Operatives
22 Road 23 Railway Z4 Sea & River 25 Ait
26 Manufacturing Worker. (Skilled)
27 28 29 30 31 32
33 34 35 36 37 38
Metal Workers Textile Workers Wood Workers ... Coke. Cement, Brick. & Worker. Glass & Ceramic Workers '" Chewical, Paint &. Oil Mill Workers
Leather Workers .. , ," Paper Mill Workers .. , Printing Trade Operatives .. , Building Trade Operatives Electrical Workers .. , Other Skilled production workers
19 FW~rf.*"," Tobacco proce,sing
40 Un!ki1led Labourers
41 Domestic Servant.
.2 Olber Service Workers
.f] Police, Fire" Services
"" Uncla.sified
-::;:':: ",j I-Ill! ! iii t,~ .~~~ j ~ ItJ 1= .. 2i w _ " a "C II) 0 :: 21.t: ~ g..s ~ 0
III ~ ~ ~~ ~ ~ ~ ~ ~Il<
20,81,68720.44.471 37,216 6,866 5,92,287 14,42,544 2,774 12 l4,896 22,299 9
57,484
762 210
18,723 18,471 7,618
55,596 1,388
762
333
15
iii B 66
210 17,862 861 18,H2 135
7,55l 65
1,937 517
1,127 417
7,696
1,64,471
35,368 1,417
1,27,686
1,220 439
1.125 417
7,665
1,63,952
35,32Q 1,404
1,27,219
717 78 2
'3'0
3 5
23 3
109
519 1,526
39 1,526 13
467
2,97,814
249
449
2,102
2,6,676 1,138 2,557
244 5
32,794
25,943 S,7H
973 144
447
1,897
32,788
25,943 5,729
972 1#
5,!I4,900 5,88,572
93,092 92,757 2,2.0,658 2.16,442
16,705 76,536 2,154 2,147 ~2, 700 52,206 8,727 8,638
1,03,800 377
1,605 18,356
1,988 14,738
18,779
1,02,983 371
1,605 18,269 1,988
14,624
18,015
2
205
6 66
64
i "2
6,328 1,865
335 4,216
169 7
494 89
817
87 114
764
179 773 102
36 36
658 2 3
50 6
20
27
24.677
484 207
15,206 3.092 1,338
648 158 210 181
3,153
,33,634
6,926 1,400
,25,308
41,846
83
41
1,222
14,892
8,693 5,704
352 143
30,558
263 3
2,563 15,208 6,147
569 276 892 233
4,404
28,732
26,817 4
1,911
28 t 1,179
"i "i ':;61 24 ". 28 2 .. , 39
60 ". 60
335 II
"5 476
Z 13
461
2,51,273 1,000 2 85
1 161
406
674
17,823
17,179 25
618 1
7
7 ",
88
5
708
"99 107 26
382 67 2
'2'5 43
37
"6 1,051
4
2
117
1
"j
,06,003 4,79,113 1,591 3 390 5,927
20,430 35,738 11,476
801 8,147 2,360
17,9~6 129
1,071 3,107 1,221 3,527
3,138
71,920 1,79,080
64,886 1,346
44,013 6,219
S3,9~8 246 531
15,100 761
11,063
14,828
228 851 72
'ii> 23
381
12
j'4
22
'i' zlf '" 8
61
'9' 5
7
317 3,975
161 7
436 89
756
"77 iii9 7S7
5,92,473 5,77,904 14,569
1,42,810 1,32,536 10,274
1,54,367 1,52,872 1,495
68,491 5,09,388 25 .. , 1.732 lZ,837
22,946 22',933 13
49 39 10
..' 1,32,536
491 42,772
22,938
19
1,09,570 39
18 2
'" 10,274
6 646
13
841
10
8
8
1
~QIC 1;- Persons under 12 year. of age are excluded,
1
3 4 S 6 7
8 9
10 11 12
U
14 15 16
17
18
19
20
21
22 23 24 2$
U
27 28 29 30 31 32
33 34 35 36 37 38
39
40
41
42
43
44

r
~
1 ~. 7
,~ 1 2
'~ 'U
;)
5
7
I I
t
TA&B U-A-OCCUPATION OF THE NON-AGRICULTURAL LABOUR FORCE
Punjab including Bahawalpur State
11-11
~ per!IOILI engaged in activitie9 other than Cultivation & Animal HusbandiJ. attO!'diDg to their Occupation in January 1951.
,.""."
Age Group
Male I I
1 I I I !l I
1 2: .... .... > ~ ... '" 0
I I I I I ~ ~ '" <Ill ~ '" Of)
_,IIi ~.sa,l86 2,49,666 12,08,471 2,63,036 3,093
32 81. 8,490 35,321 10,883 2
... 6 123 533 100 ... ... 1 34 167 8 ... 12 3,552 12,319 1,97'~ 1 ... 166 2,237 10,532 5,407 .., ... 237 811 4,953 1,552 ..,
... 76 211 763 170 ... 16 i4 292 57 I ... ." 132 738 255 .. , "32
IS 132 219 51 ... 341 1,184 4,805 1,304 .. ,
, 693 11,044 28,053 1,11,583 12,579 ' .. 88 1,577 6,783 21,697 5,184 ' ..
60S 1 149 1,122 132 .. , 9,466 21,121 88,764 7,263 .. ,
10,925 32,S92 37,704 1,69,350' 46,10S 50
... 19 97 115 13 ...
II 69 44 282 39 1
28 22) 271 1,134 241 ... 21 3,088 4,960 22,044 2,669 ...
'''6 2,51S 3,863 17,397 2,168 ...
481 9B 3,981 342 ... 21 85 136 583 147 ...
.. , 1 48 83 12 ... 19,749 75,260 75,348 3,33,447 74,768 348
4,666 12,3~7 12,751 52,162 10.791 26 ll,319 28,331 25,219 1,23,793 27,789 202 3,853: 10',695 9,936 42,481 9.571 7
146 398 488 796 319 , .. 2,398 5,696 6,605 29.921 7,586 47
480 1,21>9 1,282 4,168 1,419 7
5,094 12,OlS 13,391 59,362 13,121 49 27 63 54 197 36 '" 39 ISO' 454 838 124
839 2.069 2,516 10'.637 2,20'8 5 35- 212 498 1,145 98
853 1,955- 2,163 7,947 1,706 5
868 2,281 2,803 10',018 2,0'39 128
30,075 73,497 54,332 3,41,603 78,397 1,782
6,611 18,59% 17,499 76,236 13,598 686
. ,,089 18,711 16,501 91,527 20,028 96
, .. 1,914 3,559 15,788 1,672 . .. 1 4 5 24 5 ...
Female
I
I I t
~ .... .... >
'" '" 0 I
I I I
~ 0 on ~
'" '" on V)
4.923 4,374 20,203 4,623
84 476 1,052 274
.. . ... ... ...
. .. 23 255 "489 93 3 7 68 57 4 12 46 3
53 167 389 108 ... 30 41 6 ... ... 2 ...
... ... . .. 1 5 17 7
133 112 214 10
8 8 17 6 ... 3 10 ...
175 101 137 4
19~ 240 587 67
... 2 3 .. .
... ... 1 .. , 69 28 92 16
... 3 3 ...
... ... . .. . ..
... 2 3 . ..
... 1 .. , .. . ... ... .. . ... 730 986 3,496 766
39 65 172 33 389 591 2,513 521 14 15 95 38
5 99
2 94 205 49 23 14 32 13
143 156 369 100 .. , ... . " ... 8 31 '35 8 . " ... 15 15 75 4
liD 3D 438 58
2,163 1,40'4 6,8602,360
1,193 867 6,580' 948
194 221 862 122
1 3 8 1
2 2 5 1
Number of persons
Educational Lovel
Both Sexes
~ ~::::
I ~
I " .2 '5 .. '0 " _gal:
~ '0 to
~~6 ~ .. " ~ ~
15,28,009 2,81,947 1,46,964 I,Ot;870 2i,''1i1
12,956 7,558 13,491 13,758 lIonl
.,. . .. .. . 152 lil0 .., 1 4 90 151 55 742 6,389 7.254 4,289
9,721 4,723 3,314 571 148 1,078 1,160 1,816 2,344 1,220
487 475 442 438 95 29 57 189 137 lOS
... .. . 2 1,125 I 7 31 245 133
1,585 393 1,306 2,525 1,887
9,910 32,805 47,626 63,344 10,786
3,157 7,154 l1,7S~ 10,507 2,796 .. .
25,651 139 1,276
6,753 35,870 52,698 6,714
1,55,248 76,239 42,375 21,597 2,355
162 79 4 4 ... 426 19 4 . .. '"
1,802 203 '0' 7 ... 22,842 7,060 2,191 69% 3
18,696 5,480 1,499 268 '''3 3,253 1,419 655 404
863 85 25 30' 76 18
... 20' ...
4,79,665 84,919 29',599 71'1 '" 74,029 14,358 4,523 182 ...
1,64,351 39,848 16,300 159. ... 65,550 9,0'42 2,099 14 ...
1,850' 240' 57 7 ... 44,244 5,390' 3,0'28 38 .. ,
7,526 90'2 289 10' '"
94,135 8,169 1,494 2 ... 256 76 45
g~ ...
802 482 253 ... 14,406 3,114 740' ...
1,0'23 662 236 67 ... 11,493 2,636 535 74 ... 16,510 1,832 40! ~ ...
5,62,647 28,781 1,0'45 ." ." 1,26,839 15,6% 269 i2 ." 1,28,0'29 20',380 5,79'" t61 .. ,
10,94G 6,402 4,057 1,542 S
33 7 5 4 ...
2
3 4 5 6 7
8 9 to II 12
13
i4 15 16
17
IS
19
26
ii :n 11 24 2$
26
11 18 :w • 11 32
:u )of 11 M '9 38
39
40
41
42
43 44'

11-18
1
2
3 -4
6 5
7
8 9
1 0 1 1 1 2
3
14 1 5 1 6
17
18
19
20
2
22 23 24 25
1
26
27 28 29 30 31 32
33 34 35 36 37 38
39
40
41
42
43
44
TABLE U-A-QCCUPATION OF THE NON·AGRICULTURAL LABOUR FORCE
Punjab
Self-supporting persons engaged in activities other than Cultivation & Animal Husbandry. according to their Occupation in January 1951.
Persons I I I I
Occupational Groups !
, ~
\
~
I '" .!l ~ g e
c '" " e Eo< :::i p,
NON·AGRICULTURAL LABOUR 19,42,847 19,05,705 37,142 6,380 FORCE
Professional & Tedmical .. , ... 53,360 51.475 1,885 276
Engineers, Architects, etc. ... 737 737 ... 14 Transport Managers, Pilots etc. ... 171 171
860 Professors 8< Teachers .. ' ... 17,271 16,411 46 Religions Workers ... ... J7,024 16.889 135 16 Physicians & Surgeons ." ... 7,364 7,301 63 59
Nurses &; other Healtb workers ... 1,797 1,080 717 2 Autbors. Writers &; Jonrnalists ... 487 409 78 5 Iudges. Lawyers, etc. . .. ... 986 984 2 22 Cllemists 8< metallurgists ... 378 378 3 Other Professions .. , ... 7,145 7,115 30 109
Administrative '" .. , ... 1,51,428 1,50,913 515 1,504
Business Executives ... . .. 33,030 32,991 39 1,504 Governmental, etc. ... ... 1,318 1,305 13 '" Office Workers .. , ... 1,17,080 1,16,617 463 '"
Sales Workers & Sbopke.pers ... 2,80,371 2,79,234 1,137 2,383
Forestry workers .. , ... 242 237 5 ... Fisherman '" ... ... 364 362 2 ...
Mine & Quarry Workers .. , ... 2,088 1,883 205 1
Transport Operatives .. , ... 32,105 32,099 6 49
Road '" ... oO' 25,436 25,436 ... 47 Railway '" oO' , .. 5,591 5,586 5 Sea 8< River '" ... ... 935 934 1 2 Air ... '" ... .. , 143 143
'" ... Manufacturing Worker (skilled) ... 5,59.964 5,53.642 6,322 1,653
Metal workers oO' ,,, 87,487 87,152 335 150 Textile Worker$ ... ... 2,10,282 2,06,069 4,213 647 Wood Wurkers ... 71,150 70,981 169 101 Coke. Cement, Brick 8< Worker ... 2,010 2,003 7
j~ Glass 8< Cerampic Workers ... 48,785 48,294 491 Cbemical, Paint &. Oil Mill Workes 7,923 7,834 89 36
Leatber Workers , .. ... 96,942 96,125 817 611 . Paper Mill Workers ... .. , 377 377 ... 2 Printing Trade Operatives ... 1.540 1.540
81' 3
Building Trade Operatives ... 17.640 17,553 49 Electrical WOlken 1,946 1,946 6 Other Skilled producati~;; Worke~~ 13,882 13.768 1t4 13
Food, Drink & Tabaceo Processing 11,930 17,166 764 27 Workeu
Unskilled Labourers ... .. , 5,44,306 5,29,761 14,545 ... Domestic Servants ... ... 1,32,989 1,22,751 10,238 ... Olber Serrice Workers
'" .. , 1,46,217 1,44,722 1,495 487
Police, Fire, Il Services '" .. , 21,436 21,423 13 ...
Unclssaified '" ... ... 47 37 10 ...
Notel:-Persons under 12 years of age are excluded.
Number of persons
Industrial Status
Male Female .,
I .,;
I~~(> I'l :J
I
i :!~b u
" 0:1 r! ~ " '" u~" '" 0+o! U ...... ~ 0 c."," 10. 8'il .9 ir~~ go~'il -a. ~u~ a. c. e 1r:1 ed
,..c: a e ] iJ::>\I.o.o:l III .s iJ pI!.<
III III
5,"4,905 13,51,966 2,454 12 14,854 21,%67 ~
22,540 28,633 26 1 1.177 707 '"
471 252 .., .. , .. , '" '" 168 3 .. ' 761 98 . .. ,
13,867 2,498 2'4
1 '" 2,800 14,049 .. , 28 107 . ... 1,295 5,945 :2 .. , 37 26 . ...
584 494 .. , ... 335 382 '" 156 248 .. , ... 11 67 ... 184 778 .. , ... ... 2 ... 1<9 216 .. , ... 's 25 ...
2,856 4,150 .. , ... ... 1.22,l09 27,040 60 ... 471 43 ...
6,053 25,374 60 ... 2 37 '" 1,301 4 ... ... 13
'6 '" 1,14,955 1,662 .. , ... 457 '"
37,899 2.38,075 877 2 85 1,050 '"
79 158 .. , ... 1 4 ... 37 325 ... .. . ... l .. .
1,215 667 ... , .. 88 117 .., ..
14.618 17,425 7 ... S 1 .. . ..
8,563 16,819 7 ... ... .. ... 5,561 25 '" ... 5 "i '"
352 580 '" ... .. . '" 142 1 '" ... '" ... ..,
97,4024 ,53.191 1,39 63 390 5,921 .. 8
19,280 67,532 190 18 317 ", 32.900 1,71,755 767 2 231 3,972 10,026 60,782 72 .. , 8 161 ,.,"
743 1,260 iii '" S'S 7 ...
7.400 40,849 '" 433, ... 2,095 5,680 23 '" ... 89, .... 16,188 79,018 30S . .. 61 756 .~.
129 246 .. , '" '" ." ... 1,062 475 '9' 71' '" 3,017 14,475 12 1 ,'" 1,207 733 ... , .. 3,355 10,386 i4 ... 5 109' ... 2,903 14,214 22 ... 7 757, ...
61,231 4,68,505 25 .. . 1,732 12,813 . . .. 1,22,751 .. , ... .. . 10,238 .. . ~ ...
40,479 1,03,717 39 6 646 842 1 %1,423 ... '" ... 13 .. . • 1'"
19 16 2 ... .., 10 ~ ...
2
3 4 S 6 7
8 9
10 11 12
{3
14 15 16
F ~8
t9
~~
2)
2Z 23 24 ~ . 2~
2.7 28 Z9 '3<l 31 32
33 3 " 35
3 a 3li 7 8
~
4
4
4

2
3 4 5 6 7
8 9
10 11 12
13
TABLE ll-A-OCCUPATION OF THE NON-AGRICULTURAL LABOUR FORCE
Punjab
11-19
Self-Supporting persons engaged in activities other than Cultivation & Animal Husbandry, according to their Occupation in January 1951.
Number of persons ------.~~-,,~~-~-~-, --'--~---~~---------.
Age Group I Educational Level ----------------- .. --------------- -1----
Male
;!; 1
o '"
---______ 1
, ... " > o oll on
... I ~
1 N
~ 1
Female i
~ ;--' ll-~-i-i-I i ~ ,~ oll I "ii,~ .. 1 'C
Both Sexes
__ -'--_____ --_____ "l__ _________ _ N M ~ ~~o j ~
'--------
79,877 2,22,182 2,35,248 11,20,322 2,48,076 3,090 4,919 4,334 20,181 4,618 14,20,400 2,66,970 1,38,132 95,622 21,723
32
32
651
861
6 I
12 166 233
71 16
15 341
7,989
120 34
3,274 2 170
782
203 73 94
122 1,117
32,481
513 128
11,236 9,630 4,785
643 263 669 204
4,410
10,112
98 8
1,889 4,923 1,501
163 57
221 37
1,215
9,707 25,800 1,03,527 11,228
83 476 1,052 273 11,929 7,190 12,379 12,755 9,107 :2
23 255 3 7 3 12
53 167 30
5
182 110
489 68 46
389 41
2
17
93 57 2
108 6
7
213 10
55 8,770 1,030
459 29
1 1,585
1 742
4,414 1,138
442 53
7 393
8,868 30,412
4 5,628 3,133 1,748
403 185
'''28 1,250
145 90
6,796 562
2,252
408 132
2 1217
2,151
592 76
4,050 145
1,196
3 4 5 6 7
85 8 88 9
984 10 125 J1
1,766 12
43,207 58,650 10,291 13
14 88 1,426 I
8,280
6,422 20,206 4,849 117
6,262
8
174
194
8 3
99
17 10
186
6 3,157 6,756 11.239 9,202 2,676 14 1,194 15 6,421 16
15 16 5'63
17 10,239
18
19
20
21
22 23 24 25
8
28
25
6 19
30,670
19
59
222
2,090
2,429 477 83
1
137 1.050 19,241 82,271
36,184 1,57,764
96 109
37
266
4,863
3.791 890 134 48
224
1,126
21,598
17,071 3,880
565 82
44,377
13
34
241
2,623
2,145 333 133
2
26 27,640 70,521 72,010 3,12,857 70,614
27 28 29 30 31 32
33 34 35 3,6 37 38
39
4,319 10,813 3,390
139 2,213
446
4.590 27 39
817 34
813
844
11,658 27,006 9,755
386 5,213 1,196
11,102 63
146 2,004
206 1,786
2,186
12,255 24,241
9,411 469
6,236 1,209
12,700 54
446 2,422
494 2.073
2,721
48,508 1,17,459
39,602 707
27,563 3,687
55,577 197 788
10,175 1,119 7,425
9,513
10,412 26,550
8,823 302
7,069 1,296
12,156 36
121 2,135
93 1,621
1,902
50
69
348 729
26 202
"/
47 7
39 389
14 5
93 23
49 143
5 "Ii 5 'IS
128 110
240
2
28
3
2 1
586
3
4 !(711 23,656
67 1,44,049 71,922
157 77
346 14
92 16 1,789
22,367
18,332 3,179
203
6,883
5,344 1,380
3
827 29
83 76
2 122 31,966 49,326
40,935 21,148
4 4
4
89 7
2,167 685
1.493 267 631 398
rl 20 985 3,496 764 4,49,638 81,236 128,390 700
65 591
15
98 14
156
'ji
'is
30
172 33 2,511 620
95 38 2
205 48 32 13
369 100
"35 75
- ... 4
438 58
70,440 1,55,179 6,03,712
1,712 40,673 6,780
87,830 256 785
13,852 1,017
10,742
15,760
13,155 38,881
8,672 234
5,080 851
7,655 76
461 2,983
636 2,552
1,754
3,713 16,068 2,092
57 2,997
282
1.455 45
226 715 226 514
384
179 154
14 7
35 10
2
68 90 67 74
32
40 28,497 67,867 50,119 3,09,871 73,407 1,780 2,162 1,403 6,842 2,358 5,16,145 27,135 1,026
41 6,230 17,532 16,290
42
43
44
5,682 17,713
1,831
1 4
15,552
3,317
4
69,808 12,8n
86,7i1
14,710
23
19,064
1,565
5
686 1,193 831 6,580 948 1,18,299 14,466
9Ii 194
2
221
3
2
862 122 1,20,920
8 10,102
5 31
19,598
60,73
7
212 12
5,540 159
3,790 1,466
5 4
2,317 17
18
19
20
3 21
22 3 23
24 25
5
26
27 28 29 30 31 32
33 34 3S 36 37 38
39
40
41
42
43
44
-----~---------~~------

11-.t.U
TABLE ll·A-QCCUPATION OF THE NON·AGRICULTURAL LABOUR FORCE
Babawalpur State
Self -supporting persons engaged in activitres other tHan' Cultivation tbeir Occupation in January 1951.
& Animal Husbandry, according to
Number of persons
r- Persons I Industrial Status I Male Females
Occupational Groups e
•
fJ .,; S i! "" ., ., '0 ..... .. " " <= 1'0 ~ CI .,
fJ -; ~ ~ &=~ 1§E- ~ ~ !l;~ Ii l~~ 0 s .. S .9 ~Ut; ~&!1l "'S. ~ .g5~ 0 Q, ~ :§~ ... I-< ~ " s .9 ~ a e .9 ~ ~
~ ~ I ~ ~ -~--
NON-AGRICULTURAL LABOUR 1,38,840 FORCE
1,38,766 74 486 47,382 90,578 320 42 32
2 Prolessioual & Technical ... 4,124 4,121 3 57 2,137 1,915 2 2 2
3 Engineers, Architects, etc. 2S 25 13 II 3 4 Transport Managers, Pilots etc. 39 39 39
6S 4
5 Professors & Teachers 1,452 1,451 45 1,339 '2' 1 s 6 Religious workers 1,453 1,453 2 292 1,159 6 7 Physicians & Surgeons '::. 254 252 2 7 43 202 2 7
8 Nurses & other Health workers 140 140 64 75 g, g Authors, Writers & Journalists 30 30 2 28 !Y
10 Judges, Lawyers, etc. 141 141 1 26 114 HJ 11 Chemists & Metallurgis;~: 39 39 22 17 11 12 Other Professions 551 551 297 254 l1
13 Administrative ." 13,043 13,039 4 21 11,315 1,692 4 11
14 Business Excutives 2,338 2,338 22 873 1,443 14 15 Governmental, etc. 99 99 99
249 ~
16 Office Workers 10,606 10,602 4 10,353 4 16
17 Sales Workers & Shopkeepers 17,443 17,442 174 3,947 13,198 123 17
18 Forestry Worker. 7 7 4 3 18-
19 Fishermen 85 85 4 81 ~9
20 Mine & Quarry Workers ". 14 114 7 7 lG
2t 'fransport Operatives 689 689 17 274 398 ,zt
22 Road Vehicle Drivers 507 507 17 130 360 22 23 RaiJway workers 143 143 143 23 24 Sea and Rivers Craft Cr'~~s 38 38 38 24 25 Air Transport Workers ". I I l' 26 Manufacturing Workers (Skilled) 34,936 34,930 6 212 8,601 25,922 195 6 ~ 27 Metal Workers 5,605 5,605 29 1,150 4,388 38 2;l 28 Textile Workers 10,376 10,373 3 129 2,838 7,325 84 3 ~ 29 Wood Workers 5,555 5,555 I 1,450 4,104 30 Coke, Cement, Brick & Workers ::: 144 144 58 86
"3 n 31 Glass & Ceramic Workers ". 3,915 3,912 3 747 3,164 32 Chemical, Paint & oil Mill Workers 804 804 265 539
33 Leather Workers 6,858 6,858 47 1,808 4,930 73 31 34 Paper Mill Workers
"'65 '56 i~ 35 Printing Trade Operativ~ 65 "j 9
36 Building Trade Operatives 716 716 90 625 ~ 37 Electrical Workers 42 42 14 28
38 Other Skilled prodution 'Workers ::: 856 856 7 172 677 38
39 Food, Drink & Toi)baco Processing 849 849 235 614 39 Workers
40 0 Unskilled Labourers 48,16'1 48,143 24 7,260 40,883 24 41 Domestic Servants 9,821 9,785 36 9,785 36 "I 42 Other Service Workers 8,150 8,150 4 2,293 5,853 U 44 Police Fire, &c Service. 1,510 1,510 1,510 43 44 Unclassified 1 2 2 44
Note I.-Persons under 12 years ohse are excluded,

2
3 4 S 6 7
8 9
10 11 12
13
14 15 16
17
18
19
20
21 22 23 24 2S
26
27 28 29 30 31 32
33 34 35 36 37 38
39
11·21
TABLE ll·A-OCCUPATION OF THE NON.AGRICULTURAL LABOUR FORCE
Babawalpur State
Self-supporting persons engag~d in activities other tlqm Cpltivation & Animal Husbandry, according to their Occupation in January 1951.
Number of persons.
Age Group Educational Level 1----·-----------------.------- ---.-- ----- ------------------
5 • .234 16,004 14,418
42
686
2
2.109 347 506 463
7 185 34
504
22 I
40
24
9
4
1,337
lSI
d'S6
1.922
10
1
98 86 10 2
4.739 729
1.325 940
12 483 93
913
4 65 6
169
101
501
278 67 29
g 1
38 .10 67
~,2S3
361 12
1,880
1,520
7
5
97 12 23
2
3,338 496 969 525
19 369 73
691
"8 94 4
90
82
88,150 14,960
2,840
20 39
1,083 902 168
120 29 69 15
395
8,056
1,491 72
6.493
771
2
90 484
51
7
34 14 89
1,351
335 15
1,001
11,586 1,728
6
58
8
446 326
I~J " 1
20,590 3,654 6,334 2,879
89 2,358
481
3,785
"50 462 26 472
50S
5
46 23 9
14
4,154 379
1,239 748
17 517 123
965
3 73 5
85
137
3 4 40
1
2
"'1 2
22
2
2
S 1,07,609 IS,004 8,832 6,248
1,027
{is I 48
28
1,042
11,199
5
80
13
475 364 74 36 1
30,027 3,589 9.172 5,178
138 3,571
746
6,305
17 554
6 751
750
368 1,112 1,003
3'09 22
33 4
7iii 181
68
39 4
3 56
7
458 9
92
30 5
28 314
2,393 4,419 4,694
398 515
1,9iis 3,904
4,317 1,440
2
s
177 136 39
2
3,683 1,203
967 370
6 310
51
30 6
24
1,209 810 232
7
31 7
514 39
'21 'i, 131 25
26 10 84 21
78
1,305 17
3,372
449
7 1 6
17 3 5
1,147
614 2
18 3 39 4
233 5 3 6
24 7
10 8 17 9
141 10 8 11
121 12
495 13
120 14 82 IS
293 16
38 17
18
19
20
21
22 23 24 25
26 27 28 29 30 31 32
33 34 35 36 37 38
39
40 1,578 5,630
1.060 1,014
4,213
l,l09 949 142
1
31,732
6,428
4,816 1,078
4,990
701
964 107
1 18 46,502
8,540
7,109 838
2
1,646 19 40
41 42
43
44
41 381
42 407
43 83
44
36 1,224 57
782 257 329 267
2 '76

11-22
TABLE H-B-SECTION 1. OCCUPATIONS OF THE AGRICULTURAL LABOUR FORCE
1. This Table divides the Agricultural Labour Force as shown in Table 11, into cultivators, Animal Husbandmen, and other Agriculturists.
2. The data for cultivators has been further analysed by land tenure in table No, 14.
3. The number of cultivators was obtained by Census Question 11-A which asked "what is usually your main occupation (kind of work)?" If the respondent claimed to be a "Tiller of the Soil" the enumerator put a ring round the symbol printed on the slip. The total of all such slips has been included in tbe figure for Cultivators.
4. The numbers of Animal Husbandmen and other agriculturists were obtained by Census Question No. 13 which asked "In what kind of Industry, business or service did you work in January (l951)?" Enumerator were instructed to write out the respondents' answer. A summarized list of the groups into which economic activities were to be split was printed on the instruction sheet provided (in his own language) to every enumerator, The first items in this list were "AGRICULTURE split into cultivation, stock raising, Forestry, etc", The slips of persons who had not declared themselves to be "Tiller of the soil" in Question llA were placed in the Agricultural or Non-Agricultural Sections of the Labour Force according to the answers given to Question 13. Forestry and Fi<ihery were included in the Non·Agricultural industries.
5. The occupation of the persons in the Agricultural Labour Force, other than "Tillers of the soil" were elicited by Census Question No. 12 Which asked "what was your actual main occupation in January (1951),' The answers were coded in accordance with the "Classification Code of Occupations for the Civilian Labour Force" (Census 51 publication No. ll-A). Any slip coded for sub-group 4. 1 (Cultivators and Agricultural land workers) were added to the total of Cultivators given by tbe answers to Question lI-A. Slips coded in sub-group 4. 4 (Dairy Farmers and Workers in Animal Husbandry) were counted to give the total of that column in this Table. All other slips of the Agricultural Labour Force coded in Sub-group 4 are included in the headioi "Other and Unclassified".
6. Slips of Cultivators who reported in answer to Question 12 that they were unemployed throughout January 1951 account for the last column in tbis table. Very few Cultivators would have done no work at all during a period as long as a whole month, Moreover cultivators generally regard themselves as employed throughout the year, and therefore the figures are unrealistically low as a report on unemploymenl.
7. Section 2 of this Table shows the subsidiary occupations followed by some members of the Agricultural Labour Force.
8. This Table has been discussed in Chapter 9 of Part I of the Census
Report.

11-23
TABLE H-B-OCCUPATIONS OF THE AGRICULTURAL LABOUR FORCE
,Section I-Personsl engaged in Agricultllral activities according to their Main Occupations in January 1951.
(Figures in Italics show the females included in tho totals above them.)
Number of persons.
I ~
I -; ~S~ ~.;.~ Districts and States
- 01)<11
8~.,..l I
I -0 I': I I 1:::" I <liS'
I!
-oC .... ., I <II '" I ~a OZ ! I
I .~ g_g
1-------------------------------------------------------'---
PUNJAB AND HAHA- 40,76,825 38,85,464 1,16,677 WALPUR STATE 1,01,751 92,444 3,470
PUNJAB ... ~6,65,610 34,90,010 1,01,581 92,331
'Lahore Division' ... 9,07,612 8,52,366 31,512 25,140
Gujranwala 1,90,049 16,628
1,75,970 13,182
Lahore ... 2,75,096 1,362 .
2,51,203 647
Sheikhupura
.. Sialkot
Multwl Division
Dera Ghazi Khan
Jhang '"
Lyallpur
Montgomery
Multan
Muzaffargarh
Rawalpindi Division
Gujrat
1,86,320 3,439
1,74,855 2,894
.. 2,56,147 .. 2,49.338 10,083 9,017
]6,87,829 15,96,832 14,041 12,599
1,43,192 556
1,66,903 447
4,16,127 1,257
3,73,161 21
1,37,777 556
1,61,444 399
3,91,678 915
3,45,782 1
4,17,642 3,96,795 8,647 7,692
1,70,804 1,63,356 3,113 3,036
10,70,169 JO,40,812 56,028 53,992
2,20,519 2,18.503 8,903 8,897
1,04,159 3,415
28,665 1,645
5,955 101
14,687 466
5,596 525
2,427 553
6@,018 445
5,325
3,995 24
12,690 15
21,848
12,481 351
3.679 55
15;~76 1,325
1,840 6
9,537 17,688 15,725 5,064 157 611 992 79
9,218 15,938 15,475 5,064 157 611 990 79
1,954
92
1,653
209
7,094 157
22
5,635 155
417 2
1,020
170
61
5,894 5,724 526 230 432
1,180
2,340
121 10
2,253 110
5,118 174
29
502
1,648
1,424
565 174
1550
4,316 207
112
1,682 119
512 10
2,188
1,341 303
305
29
190
2
4,403 1,183 133 ...
39
579 24
1,042
1,910 10
703 77
130 22
173
485
2
523
5,348 3,355 425 79
2
Notes :_1 Excludes persons claiming nationality other than Pakistani. 2 ~e Table 11,
7 26,663 3,998
7 25,739 3,998
6 '12,477 3,465
6
1
4,865 3,226
3,666 239
3,161
785
12,581 533
210
3,434 172
1,295 8
6,076 353
1,566
681

11-24
TABLE l1~B-OCCUPATIONS OF THE AGRICULTURAL LA-BOVR,.pOR€E-Gonc1d.
'SettioD I-Persons I engaged in Agricultural activities'aeeording to tbelrtMaln'Oceapatfeas in January 1951.
(Figures in Italics show the females Included in the totals aoove tllem.)
Number of persons.
..... ~ "d' "d til>.
I II '3::1 ; ~ ;~ at;: 0 0 Cd ~ '" §'3 .. ~ . -.D til'" til
"ill .. .... c<I .... ::s ~ ,0 0
Districts and States ~..J O"'Q.l 0_ ",eo '1t,:l.;!'.! '~ .@ .e ~8 :; E'" 'Do
~Cd8 .... ., 0 0 E >._ 0 tilE 0:1<1)
'" e-", fr ~ • ,... '-.0 "0'1""1 ~ ,.c: .... ~tIl Q.l S~~ .:::: bO~ .... s:: .... 0::1 :; ';<Q U Q.l ..>01 .... , cJ'<t:..J ou <: ., OZ ~~ c:: ~ ... J.i.. :x: '" :::s Q)c<I~ ~ ::>
lhclum ... ... 1,33.578 1,31.652 1,020 ... 39 186 . .. . .. 681 12,757 12,617 123 ... '17 . ..
Mianw.a!i ... 1,2;,008 1,21,466 1,109 ... 429 1,386 618 . .. ... 7,778 7;SlI 205 .. , "J82 '"
.Rawalpindi ... 1,78,745 1,76,495 879 108 301 484 478 ... ... 7,647 7,132 }O ... 1 ... .'4
Sba~pur ... 2,51.250 2,33,079 9.516 ... 3.4lO 3.121 2.114 ... .. . 12,596 11,110 979 2fJ6 226 75
Campbell pur .. , 1,61,069 1,59,617 1.112 1 25 169 145 ... ... 6,347 6,345 2 ... ... ... ...
BAHAWALPUR STATE 4.11,215 3,95,454 12,518 319 1,750 250 '" ... 924 170 113 55 _. . ,. 2 ...
. Bahawalpur ... 1,95,071 1.84,855 8.633 ... 1.031 250 .. . ... 302 170 113 55 ... 2 ...
Rahimyar Khan . ,. 2,16,144 2.10,599 3,885 319 719 ... ... ... 622 ... ... . .. ... . .. ... I


11-25
TABLE H·B-SECTION 2-SUBSIDIARY OCCUPATIONS OF AGRICULTURAL LABOUR FORCE.
Of the 40,76,825 persons forming the Agricultural Labour Force of Punjab, 2.01,205 were recorded as following subsidiary occupations of a nonagricultural nature. This Table shows numbers engaged in .uch occupations in each district which were collected from an,werS in response to the second part of Census Question No. II, which asked:
"Have you any subsidiary means of livelihood: if so, what"?
2. This table has been discussed in ChaPter 9 of Part I of tho Census Report.

'TABLE 'tl-B-OCcuPATIONS OF THE AGRICULTURAL LABOUR FORCE
Sectitm 2-Subsidiary Occupations
11-26
Number of persons.
GROUP
i I §& I ! i Districts I :i' CLASS OF OCCUPATION I ,0 ~ I Punjab i5~~~i~niG--·--r----[-·:---'~---1
,~~! I I' uJran- I Laho ;Shelkhu-1
Sialk t'
School Teachers - &~p-ri-va-te---~-Il?_o:!_··~ ~. j _ ~.:- ~~1' -'--,- re_p._u~_a_ i ___ .. _0 I SCIENCE & ART tutors. "
Imams, Moazzins & religious 3,796 3,696 1,903 23 433 1,405 42 I workers. '
Hakims, Apothecaries, Mid- 2,591 2,448 1,158 19 869 144 126 ~ wives and other health workers.
Musioians & entertainers ... Workers in professions & Arts n.e.c.
CLERICAL Clerks and Moharrirs ... & OFFICE Peons. Dliftaries & Chowki
dars. 2.176 2,004 205
TRADE & Shop-keepers and Hawkers 27,057 26 322 8,608 COM- Trade & Commercial MERCE. workers n.e.c.
PRIMARY PRODUCTION.
TRANSPORTS.
Wood-cutters, Charcoal burners and lumbermen.
Collectors of gums, herbS & other forest products.
Fishermen Mine and quarry workers ... Primary production workers n.e.c.
Drivers of power drives vehicles.
Drivers of animals & animal drawn vehicles.
Boatmen and launchmen ... Transport workers n.e.c. '"
MANUFAC- Blacksmiths & mechanics ... TURES & Jewellers, gold & silver-CRAFTS. smiths.
Weavers and spin~rs Jute & cotton ginning wor-kers.
Textile dyers & printers Carpet & numdah makers ... Tailors & other workers on textile materials.
carpenters and sawyers Bamboo, cane & basket workers.
Pottery & Chinaware workers.
Notes.-Inclusive of female,:(1) 13 (all in Sialkot). (2) 153 (all in Lahore).
2,364
3,899
7,007
11,060 1,835
37,746
690
10,940
11,224
3,183
(3) 35 (Gujranwala 21, Sialkot 14).
1,917 100
3,817 1,128
5,941 1,489
9,898 1,472 1,798 429
36.926 4,184(1)
632 263
10,735 1,742(2)
10,935 2,249
3,070 803(3)
60
288
227
121 56
487
84
128
120
248
20
8,550
100
86
16
1,089 125
948
50
1,002
484
30
56
452
857
112
2,222
4
477
1,325
407
95
2
302
389
262 136
527
125
135
320
148

11-27
TABLE ll-B.·-OCCUPATIONS OF THE AGRICULTURAL LABOUR FORCE-Con/d.
Section 2-Subsidiary Occupations
Number of persons.
I I
GROUP CLASS OF OCCUPATION I I , I
-------
Boot & Shoe makers & lea-ther workers.
Masons, building &. cons-tnlction workers.
Manufacturing workers & craftsmen n.e.c. (Watch makers & repairers).
FOOD Grain & flour-millers, Rice PROCESS- huskers. etc. ING. Gur and sugar makers
Sweet&confectionery makers Butchers Bidi maken Food etc., processing workers
n.e.c. (skilled workers in food processing industries).
GENERAL Cooks & domestic servants LABOUR- Watermen (Bhishtis) ERS Barbers SER VICE. Wasbermen (Dhobis)
Service Workers n.e.c. (Labourers).
OTHERS & UNCLASS-IFIED.
Notes.-Inc1usive of females:(1) 51 (all in Lahore).
"0": l:i ::s ole:>.
0;
-;;~ • ...,,.Cl l:ias ci:~
18,610
824
4,910
922
22.685
8;io9 19,577
' I . : Districts
Punjab L.a~~re i ----- -, - ----
IDlVlSlon I Gujran- Sbeikhu- . I 'wala Lahore pura Slalkot I I
18,361 3,354(1) 133 448 2,610 163
817 349 88 20 180 61
4,892 2,212 37 250 1,819 106
922 187 187
22,437 7,053(2) 8 646 6,361 38
7,930 3,261(3) 178 123 2,848 112 18,955 616 614 2
(2) 1,243 (Lahore 625, Sheikbupura 591 & Sialkot 27). (3) 8 (all in Lahore).

11-28
TABLE H-B-OCCUPATIONS OF THE AGRICULTURAL LABOUR FORCE.-Conrd.
Section 2-Subsidiary Occupations.
Number of persons.
I I Districts Multan ,-----.~~--.
GROUP i I CLASS OF OCCUPATION 01,i,ion I ·0 I I I , ~ha~ ! Jhang ILyallpur g~~~~; Multan I Muzar-I faraarh
SCIENCE School Teachers & private ... ... .. . ... & ART tutors.
Imam, Moazzins & reliaiolls 600 20 50 393 workers.
Hakims, Apothecaries Mid- 571 67 64 139 wives & other, health workers.
Lawyers & legal Assistants ... ... .. . ... Musicians & entertainers ... ... ... ... ... Workers in professions & ... ... ... ... arts n.e.c.
CLERICAL Clerks & Moharrirs ... ... ... ... ... & OFFICE Peons, Duftaries & Chowki- 884 57 47 283
dars.
TRADE Shop-keepers and Hawkers 8,338 2,341 122 1,612 & COM- Trade & commercial wor- ... ... ... ... MERCE. kers n.e.c.
PRIMARY Wood-cutters, Charcoal 1,441 1,379 ... ... PRODUC- burners & lumbermen .
TION. Collectors of gums, herbs & .., ... ... ... other forest products.
Fishermen ... ... 1,893(1) 200 8 74 Mine and quarry workers ... ... . .. ... ... Primary production wor- ... ... . .. ... kers D.e.c.
rrRANS- Drivers of power driven ... ... ... ... PORT. vehicles.
Drivers of animals & animal 2,736 266 63 362 drawn vehicles.
Boatmen and launch men .. ... ... ... . .. Transport workers n.e.c. ... ... ... . .. ...
MANU- Blacksmiths and mechanics 6,108 243 350 4,131 FACTURES Jewellers, gold & silver- 661 55 53 82 & CRAFTS. smiths.
Weavers and spinners. ... 26,332(") 992 316 827 Jute and cotton ginning ... ... ... ... workers.
Textiles dyers and printers 149 ... 33 85 Carpet and numdah makers ... ... ... ... Tailors & other workers OD 6,864(3) 50 229 4,207 textile materials.
Carpenters and sawyers ... 5,591 152 251 324 Bamboo, Cane & basket ... ... ... ... workers.
Pottery and chinaware 1,019(') 150 207 ... workers.
Notes:-Inclusive offemales:-(I) 5 (all in Muzaffargarh). (2) 78 (Lyallpur 23, Multan 29 & Muzaffargarh 26) (3) 86 (Jhang 21, Lyallpur 47, Multan 13 & Muzaffargarh 5). (4) 26 (all in Muzaffargarh).
' .. ... ... 56 43 38
61 138 102
... ... .. .
... .. . .. .
... ... .. .
.. . ... ... 72 20 405
185 1,041 3,037 ... .. . '"
62 ... ...
... .., ...
58 636 917 ... .., ... ... ... .. .
... .. . ...
128 36 1,881
... .. . .. .
.. . ... 384 189 811
21 335 115
859 15,154 8,184 .. . . .. ...
31 ... ... ... .. . .. .
163 191 2,024
315 902 3,647 ... ... ... 46 . .. 616

11-29
TABLE H-B-OCCUPATIONS OF THE AGRICULTURAL LABOUR FORCE-Conld.
Section 2-Subsidiary Occupations.
Number of persons.
------------~,----------.------------.
Districts
GROUP i CLASS OF OCCUPATION! ~u!tan -~-- ~ -----------~---~---. i DIVlslOn: D.G. I Jhang I LyallPuri Mont- : Multan I Muzar-
Khan i . I gomery I fargarh ; I I
Boot & Shoe makers and 11,705 leather workers.
Masons, building & Construction workers.
Manufacturiog workers & 137 craftsmen n.e.C. (Watch makers & repairers).
I'FOOD PRO- GraiQ & flour millers, Rice CESSING. huskers, etc.
GENERAL LABOUR-
ERS SERVICE.
OTHERS & UN-CLASS
IFIED
Gur and Sugar makers Sw~et and confectionery makers.
Butchers 1,844 Bidi makers Food etc. processing workers n.e.c. (skilled workers in food processing industries ).
Cooks and Domestic ser-vants.
Watermen (Bhishtis) Barbers Wa~hermen (Dhobis) Service workers n.e.c.
(labourers)
9.893(1)
2,898(,) 616
Notes :-Inclusive of females:-
200
22
1,148
(') 294 (D.G. Khan 19, Jhang 24. Multan 251).
(2) 34 (Lyall pur 26, Multan 6 & Muzaffargarh 2).
8 1,754 61 8.466 1,216
9 124. 3
51 1.414 86 18 253
76 85 8.584
78 541 72 1.066 1,141 329. 287

11-30
TABLE H-B-OCCUPATIONS OF THE AGRICULTURAL LABOUR FORCE -Colltd.
Section 2-Subsidiary Occupations.
Number of persons.
Districts
GROUP CLASS OF OCCUPATION i
Rawal- i __ ~ __ ~ __________ _
pindi i I ---------
Division. G' Jh I ; Mian- Rawal- I Shab- I Camp-uJrat .e urn, wali pindi I pur bellpur
SCIENCE School Teachers & private & ART. tutors.
Imams, Moazzins & !,193(') religious workers.
Hakim, Apothecaries, 719 Midwives & other health workers.
Lawyers & legal Assistants. Musicians & entertainers Workers in professions and arts n.e.c.
CLER ICAL Clerks and Moharrirs & OFFICE. Peons, Duftaries
Chowkidars & 915
RADE & COMMERCE.
PRIMARY PRODUC
TION.
Shop-keepers and Hawkers 9,376(") Trade and commercial
workers n.e.c.
Wood-cutters Charcoal Burners & lumbermen.
Collectors of gums, herbs & other forest products
Fishermen. Mine and quarry workers ... Primary production workers n.e.c.
376
796
RANS- Drivers of power drives PORT. vehicles.
Drivers of animals & animal 1,716(') drawn vehicles.
Boatmen and lauDcbmen ... . Transport workers n.e.c. .. .
MANU- Blacksmiths & mechanics. 2318 FACTURES Jewellers, gold & silver- 708 & CRAFTS. smiths.
Weavers and ~pinners. 6AIO(') Jute and cotton ginning workers.
Textile dyers and printers ... 220(5) Carpet and numdah makers. Tailors & other worker~ on 2,129(6) textile materials.
Carpenters and sawyers ... 3,095(,)
256
331
455
615
13
53
83
609 193
755
21
385
557
98
26
1,052
157
47
134 7
838
292
435
50
52
2,063
455
388
72
204
3,437
16
18
654
431 148 35 17
723 2.730
85 604
395 630
245
214
106
564
95
333
145
721 72
833
179
458
817
156
24
ISO
1,645
252
235
332
275 384
531
20
305
261
-----.--~---~~--------------------------------------Notes: --Inclusive of females:(') 17 (all in Shahpur) (2) 9 (Gujrat 2 & JheJum 7) (3) 3 ~all in Campbellpur) (4) 149 (Gujrat 2, Jhelutn 5, Rawalpindi 68 & Shah pur 74) (5) J (in Campbellpur) (6) 153 (Gujrat 3, Jhelum 3, Rawalpindi 45, Shahpur 100 & Campbellpur 2). (1) 16 (Campbellpur 1 & Gujrat 15)

11-31
TABLE 11-B-OCCUPA1l0NS OF THE AGRICULTURAL LABOUR FORCE-Colltd.
Section 2-Subsidiary Occupations.
Number of persons.
, I I I I' I ! Rawal- I Districts
GROUP I CLASS OF OCCUPATION i pindi i ---.~- i ---- I '
. ! Division) Gujrat " Jbelum I Mia~- I R~wa~- ISh h I Camp-I [!.! wall I plOd! I a pur [ bell pur
-----~----~---.----~- --~------ ~----~-~ -~----.----.---~-~---
Bamboo, cane and basket workers.
Pottery and Chinaware 1,248(1) 114 72 166 646 121 workers.
Boot and shoe makers & 3,302(2) 609 220 530 964 760 leather workers.
Masons, building & construction workers.
Manufacturing workers & 331 7 75 craftsmen n.e.c. (watch makers & repairers).
FOOD PRO- Grain & flour-millers, Rice CESSING. huskers, etc.
Gur and sugar makers Sweet and confectionery makers.
Butchers. 836 18 78 28 14 188 Bidi makers. Food etc. processing 735 19 50 41 workers D.e.c. (skilled workers in food processing industries).
GENERAL Cooks and domestic serv- 5,491 (") 276 1,745 909 2,021 394 LABOUR- ants.
ERS Watermen (Bhlshties). SERVICE. Barbers.
Washermen (Dhobis) 1,771(4) 802 253 5 5 320 Service workers n.e.c. 17,723(') 2,271 2,473 21 2 12,311 (Labourers).
OTHER UN-CLASS-
IFIED.
-~."..,.".---..... -<--Notes :-Inclusive of female,:
t1) 7 (all in Shahpur). (2) 54 (Campbellpur 1, Gujrat 9, Rawalpindi 4 & Sbahpuf 40). (3) 309 (Gujrat 4, JheJum 63, Mianwali 14, Rawalpindi 51 & Shah pur 177). (4) 82 (CampbeIJpur 2, Gujrat 7, Jhelum 13 & Shahpur 50). (0) 350 (Campbellpur 19, Gujrat 32, Jhelum 50, Rawalpindi 2 & Shahpur 247).
129
219
249
510
625
146
386 645

11-32
TABLE H-B-OCCUPATIONS OF THE AGRICULTURAL LABOUR FORCE-Contd.
Section 2 -Subsidiary Occupations.
I GROUP CLASS OF OCCUPATION. ,Buhawalpur
i State
SCIENCE School Teachers & private tutors & ART Imams, Moazzins and religious workers
Hakims, Apothecaries, Midwives & other health workers.
Lawyers & legal Assistant~ Musicians & entertainers Workers in professions & arts n.e.c.
CLERICAL Clerks and Moharrirs & OFFICE Peons, Duftaries & Chowkidars
TRADE & COMMERCE
PRIMARY PRODUCTION
TRANSPORT
Shop-keepers and Hawkers Trade & commercial workers n.e.c.
Wood-cutters, charcoal burners & lumbermen Collectors of gums, Herbs & other forest products Fishermen Mine & quarry workers Primary production workers D.e.c.
Drivers of power driven vehicles Drivers of animals & animal drawn vehicles Boatmen and launchmen Transport workers n.e,c,
MANU- Blacksmiths and mechanics FAC- Jeweilers, gold and silver smiths TURES Weavers & spinners & CRAFTS Jute & cotton ginning workers ..
FOOD PROCESSING
Textile dyers and printers Carpet and numdab makers Tailors & other workers on textiie materials Carpenters and sawyers Bamboo, cane and basket workers Pottery & china ware workers .,. Boot & shoe makers & leather workers Masons, building & construction workers Manufacturing workers & craftsmen D.e,c. (watch makers & repairers).
Grain & flour-mille.rs & Rice huskers, etc. Gur and Sugar makers Sweet & confectionery makers ... Butchers Bidi makers Food etc. processing workers n.e.c.
(skilled workers in food processing industries)
Note:-Inc1usive of females all in Bahawalpur District:
(I) 5
(2) 3
100 143
172
735
447
82
1,066
1,162 37 820
58
205(1) 289
113(2) 249
7
18
Number of persons.
Districts
Bah Iwalpur I' Rahimyarkhan
-- ---._---- ---- -------_.
29 26
112
12
1,033
44 30 140
9
61 40
16 14
2
71 117
60
735
447
70
33
1,118 7
680
49
144 249
97 235
5
18

11-33
TABLE ll-B--OCCUPATIONS OF THE AGRICULTURAL LABOUR FORCE-Cone/d.
Section 2-Subsidiary Occupations.
: GROUP CLASS OF OCCUPATION iBahawalpur
! State
i ~------------- -_---- - -_- --_- - --- ---_---
GENERAL LABOURERS & SERVICE
OTHERS & UNCLASSIFIED
Cooks & domestic servants Watermen (Bhishtis) Barbers .. , Washermen (Dhobis) Service workers n.c.C. (Labourers)
Note:-1Jnclusive of 8 females all in Bahawalpur District.
179 622
Number of persons.
Districts --------1------
Bahawalpur I Rahimyar-: khan ,
8
56
240
123 622


12-1
TABLE 12-ECONOMIC GROUPS & INDUSTRIAL STATUS OF NON-AGRICULTURAL CIVILIAN LABOUR FORCE,
This table analyses the Non-Agricultural section of the Civilian Labour Porce (NALF) as shown in table 11. It gives figures by sex of the persons engaged in each Economic Division and cross-classifies them according to Industrial status. Separate figures are given for each District and for certain towns selected for special tabulation. As in the case of other Labour Force Tables, the figures exclude Non-Pakistanis and children under 12 years of age.
2. The totals in this table, including the figures for unemployed persons, agree with those shown in the analysis in table ll-A of the same population according to occupations.
3. The information regarding Economic Groups was obtained in respons, to Census Question No. 13 which asked "In what kind of Industry business or service did you work in January 1951"? The information reported was coded according to the Standard Industrial Classification Code (Pakistan) issued as Appendix' P' to the Code of Census Procedure Part II. This code had been used as a basis for instruction of enumerators who were to explain to respondents that they sh,wld report the industry, etc., in which they had been engaged at any timt: or mainly during the whole month of January 1951.
4. If a person did not work at all during that month, he was asked whether he had been seeking employment and if so, he was classed as unemployed. Persons so reporting themselves as unemployed are treated as not engaged in the work of any of the Economic Groups although they may have been seeking work in a definite occupation.
5. Data regarding Industrial Status were obtained in reply to Census qu'!stion 15 (see Title Sbeet of Table 1 I-A).
6. The data on the enumeration slips of the NALF was coded numerically and sorted by punched card machines in Karachi. This table is prepared from the records of the Machine Sorting.
7. The Census question regarding the economic group in which persons were engaged appears to have been poorly understood in many cases by respondents and also by enumerators. The classification in accordance with the official code was therefore difficult. In these circumstances, many minor inconsistencies were detected during the compilation of the table. These have been rectified as far as possible with reference to the occupa
tional typei shown in Table II-A. The resulting data cannot therefore be regarded as being accurate in detail but it is believed to give a reasonably reliable view of the over-all distribution of the Labour Force.
8. This table has been discussed in chapter 9 of part I of the report.

12-2
1'ABLI<: Ii-ECONOMIC GROllPS & INDUSTRIAL STATUS OF THE NON-AGRICULTURAL CIVILIAN LABOUR FORCE
Section I-Punjab and Babawalpur State
Self-Supporting persons aged 12 years and over according to tbe main Economic Division in which they were working and their industrial status (class of worker) in January 1951.
Figures in italics denote the number of Females included in the figures immediately above them
Number of persons.
I Industrial Status I
Main Economic Division I Tot'" Wo,km Employees I Unpaid
Employers Independent workers Family
Helpers _- ----. ---_---- ---
TOTAL ALL DIVISIONS 20,81,687 6,878 6,07,183 14,64,843 2,783 37,216 12 14,896 22,299 9
Forestry 437 182 255 5 1 4
Fishery 449 41 408 2 2
Mining & Quarrying 3,048 7 1,172 1,869 211 26 185
Manufacturing 6,93,097 2,669 1,06,039 5,82,774 ],615 7,783 3 1,349 6,423 8
Building, Construction & 37,650 135 11,745 25,759 11 Utilities 187 30 157
Trade & Commerce 3,82,763 3,542 63,430 3,14,732 1,059 1,295 8 135 1,152
Transport, Shipping & Port 48,893 84 19,795 29,007 7 Services 9 2 7
Post & Telecommunications. 2,912 2,885 27
Education 20,751 92 17,379 3,278 2 914 1 802 111
Medical Services 10,976 76 3,092 7,806 2 835 426 409
Governmental, Municipal 1,28,447 1,28,447 etc. Services 646 646
Domestic & Personal Ser- 3,12,773 197 2,09,400 1,03,140 36 vices. 12,284 10,329 1,955
Religion, Art, PUblic Infor- 22,020 23 4,410 17,576 11 mation & etc. 221 42 179
Other and Unclassified 4,17,471 53 39,166 3,78,212 40 (including unemployed) 12,824 1,108 11,715 1
Note:-1Eltcludes (a) Defence Service (b) Economically inactive persons.

, I "
i
12-3
TABLE 12-ECONOMIC GROUPS & INDUSTRIAL STATUS OF THE NON-AGRICULTURAL CIVILIAN LABOUR FORCE-(Comd.)
Section 2-Puniab
Self-supporting persons aged 12 years and over according to the main Economic Dilis;on in which they were working and their industrial status (class of worker) in January 1951.
(Figures in italics denote the number of Females included in the figures immediately above them)
Number of persons.
Industria I Status
Main Economic Division TotaJl Workers' Unpaid Emplvyers Independent
Family workers Employees I 1 Helpers
!-- ; -------_ --~- ------------------_._------_------------
I TOTAL ALL DIVISIONS 19,42,847 6,392 5,59,759 13,74,233 2,463
I 37,142 12 14,854 22,267 9
Forestry 427 177 250 5 1 4
Fishery 364 37 327 ', .. 2 2
Mining & Quarrying 2,983 7 1,144 1,832 211 26 185
Manufacturing 6,55,759 2,437 97.4l9 5,54,483 1,420 7,777 3 1.349 6,417 8
Building, Construction & 36,749 121 11,395 25,222 11 Utilities 187 30 157
Trade & Commerce 3,60,826 3,364 58,145 2,98,381 936 1,294 8 135 1,151
Transport, spipping & Port 48,056 82 19,411 28,556 7 Services 9 2 7
Post & Telecommunications 2,779 2,752 27
Education 19,272 47 16,075 3,150 913 1 802 110
- ,
Medical Services 10,547 68 2,933 7,544 2 833 424 409
Governmental, Municipal 1,17,755 1,17,755 etc. Services 642 642
pomestic & Personal Ser- 2,90,535 193 1,90,967 99,339 36 vices 12,248 10,293 1,955 ~
Religion, Art, P)lblic Infor- 20,500 20 4,123 16,346 11 mation & etc 221 42 179
Other and Unclassified 3,76,295 53 37,426 3,38,776 40 (induding unemployed) ... 12,800 1,108 11 ,691 1
~I
NOle:-1• EI'cludes (a) pefence Servi~ (b) EconolpiCi\lIy ~lllJc:tiye per~~ms.

12-4
TABLE I2-ECONOMIC GROUPS & INDUSTRIAL STATUS OF THE NON-AGRICULTURAL CIVII.IAN LABOUR FORCE
Section 3-Bahawalpur State.
Self-supporting persons aged 12 years and over according to the main Economic Division in which they were working and their industrial status (class of worker) ill January 1951.
(Figures in italics denote the number of Females included in the figures immediately above them.)
Number of persons.
~'I--'--.~-,._._-...:----"""""
Industrial Statu~
Main Economic Division I ' I To"" Wm'"" I Unpaid
______ ~_~Em~:yer~ EmpI~yeeS Independent
Workers Family Helpers
TOTAL ALL DIVISIONS 1,38,840 486 47,424 90,610 320 74 42 32
Forestry 10 5 5
Fishery 85 4 81
Mining & Quarrying 65 28 37
Manufacturing 37,338 232 8,620 28,291 195 6 6
BUilding, Construction & 901 14 350 537 Utilities.
Trade & Commerce 21,937 178 5,285 16,351 123 1 1
Transport, Shipping & Port 837 2 384 451 Services.
Post & Telecommunications 133 133
Education 1,479 45 1,304 128 2 1 1
Medical Services 429 8 159 262 2 2
Govemmental, Municipal 10,692 10,692 etc. Services. 4 4
Domestic & Personal Scr- 22.238 4 18,433 3,801 vices. 36 36
Religion, Art, Public Infor- 1,520 3 287 1,230 mat ion & etc.
Other anJ Unclassified 41,176 1,740 39.436 (including unemployed) ... 24 24
-~~-.~--
Note : __ 1. Excludes (a) Defence Service (b) Economically inactive persons.

13-1
TABLE 13.-~ECONOMIC GROUPS AND OCCUPATIONS OF CIVILIAN LABOUR FORCE.
This Table cross-classifies the persons engaged in different economic activities with the broad classification of their occupations. The population analysed is the whole of the Civilian Labour Force as shown in Table 11.
2. The classification into economic divisions is based on the Standard Industrial Classification, i.e., the classification according to the main industries and services, issued as an Appendix to the Census Code of Procedure, as already stated in the title-sheet of Table 12.
3. The occupational classification is a c implified re-arrangement of the main groups of occupational classification as shown in Table It-A. Agricultural and Fisht ry workers have b~n placed in the same column but are naturally in separate economic divisions. The group 'Administrative' has been split into two broad classes instead of three by. combining Business and Governmental Executives while showing the clerical workers separately. The skilled operatives in tbis table include 'Mine and Quarry Workers, Transport Operatives, Manufacturing Workers, and Food and Drink and Tobacco Processing Workers',
4. The sources of information for tbis table are the same as described in Table 11, I1-A and 12, so far as they concern the Industry and Occupation.
5. Females are included in each class, but are shown separately in italics immediately below each figure.
6. The Census question regarding the economic group in which persons were engaged appears to have been poorly understood in many cases by respondents and also by enumerators. The classification in accordance with the ,official code was therefore difficult. In these circumstances, many minor incon~istencies were detected during the compilation of the table. These have been rectified as far as possible with reference to the occupational types shewn in Table II-A. The' resulting data canDot therefore be regarded as being accurate in detail but it is believed to give a reasonably reliable view of the over-all distribution of the Labour Force.
7. A fuller discussion of the whole table is given in Chapter 9 of Part I of the Report.

13-2
TABLE 13 -ECONOMIC GROUPS & OCCUPATIONS OF CIVILIAN LABOUR FORCE
Section I.-Punjab and Bahawalpur State
Self-supporting persons l aged 12 years and over according to the main Economic Division and the main types of Occupation in which engaged in January 1951.
(Figures in Italics denote the number of Females included in the figures immediately above tbem.)
Number of persons.
Types of Occupations , - ---0----
I Ode;.;:·~ Main Economic! Total , _ g ~ ..
Division. ; Workers: \3 '0;} I ~: 'S~ 'a ~ f.j 8 , '§~ ~il< I :<.::1
TOTAL ALL 61,58,512 57,484 36.7B5 1,27,686 2,97,814 40,77,523 6,48,575 5,92.473 3,20.123 49 DIVISIONS. 1,38,967 1,8g8 52 467 1.138 1,01,758 7,303 14,569 11,782 10
Cultivation 38,91,513 96,399
Animal Hus- 1,32,402 bandry. 4,462
Other Agricul- 52,910 ture. 890
Forestry
Fishery
437 5
449 2
17 21
Mining and 3,048 35 38 Quarrying. 211 2
Manufacturing 6,93,097 4,163 6,010 7,783 10 24
Building, Cons- 37,650 J ,480 1,150 truction & 187 3 Utilities.
Trade & Com- 3,82,763 1,076 26,207 meree. 1,295 3 11
Transport Shipping & Port Services.
Post and Telecommunications
Education ...
Medical Services,
48,893 9
2,912
449
96
20,75\ 18,723 914 861
10,976 9,576 835 782
483 2
83
295 1
172 2
149
126
8,243 46
974
14
3,185 6
318
12,192 2,93,078 26 1,122
2,814
2,052
1,075 27
459 14
2
19
234 10
Governmental, 1,28,447 1,752 1,468 94,330 25 Municipal, etc. 646 12 12 317 Services.
38,91,513 96,399
1,32.402 4,462
52,910 890
249 5
449 2
2,058 627 150 205 4
5,70,643 90,027 10,826 6,720 877 100
20,371 11,745 1,612 102 69 13
5,459 33,245 30 97
28,747 10,328 5
477
130 7
74 3
63
156 11
150 4
11,506 6
6,070 2
41
353 7
311 20
5,733 2,632 22.507 63 '242
~--------------.------------.------------------------------Note ;-IExcludes (a) Defence Services (b) Economically inactive persons.

13-3
TABLE 13-ECONOMIC GROUPS & OCCUPATIONS OF CIVILIAN LAftOVR FORCE-contd.
Section 1.- Punjab and Babawalpur State
Self· supporting persons I age 12 years and over according to the main Economic Division and tbe main types of Occupation in wltich engaged in January 1951.
(Figures in Italics denote the number of Females included in the figures in immediately ~bove them.)
Number of persons.
M,l. E","om" I Types of occupation
.,- I
i ~'; .~.~ <Il I '- ~>. <Il <Il Total Q E~ I ., .,
""~ DiviSion Worl:.ers _0 I~ ... :3. ~ Vl .~ '" ~.- ... ~ '- :::.8tl .... .,,-
'-.~ ~ . ~ = 1- '- 0 :35 I 'S ~~ 8·~-t: ""~ B~ '" t:,.., t:~ ~ ~~ ... ..0 ... ..co ·8::2 .- u "'-'t .- U. 0
._ '- ., tl=o' ..2 "'oS >0 ..c u ... ~~~
._ 0.
;3...l ~~ ~~ ~~ D 0 ~ ! ~ ~o 0 {/l
Demestie & per- 3,12,773 171 302 1,328 46 4,741 60,650 2,45,535' sona! Services. 12,284 17 28 1,716 10,523
Religion, Art & 22,020 19.300 31 455 2 253 1,635 344 Public Informa- 221 214 4 1 2 tion, etc.
Other & Unclas- 4,17,471 646 525 3,489 891 9,889 3,81,215 20,767 49 sified (illcluding 12,824 1 16 202 11,732 863 10 Unemloycd)

13-4
lABLE 13-ECONOMIC GROUPS & OCCUPATIONS OF CIVILIAN LABOUR FORCE-Con/d.
Section 2-Punjab.
Self-supporting persons! aged 12 years and over according to the main Economic Division and the main types of Occupations in which engaged in January 1951.
(FIgures in Italics denote the number of Females included in the figures immediately above them.)
Number of persons.
Main Economic Division
Total workers
Types of occupations
t .<:i o
TOTAL ALL DIVISIONS
56,08.457 53,360 34,348 1,17,080 2,80,371 36,66,216 6,12,087 5,44,306 3,00,642 47 1,38,723 1,885 52 463 1,137 1,01,588 7,297 14,545 11,746 10
Cultivation
Animal Husbandry
Other Agricu 1-ture
Forestry
Fishery
Mining & Quarrying
Manufacturing
Building Construction & utilities.
Trade & Commerce
Transport, Shipping & Port Services
34,98,356 96,286
1,19,1'34 4.405
47,620 890
427 5
364 2
2,983 211
6.55,759 7,777
36,749 187
3,60,826 1,294
48,056 9
Post and Telc- 2,779 communications
Education ... 19,272 913
Medical Ser- 10,547 vices 833
Governmental, 1,17,755 Municipa~ 642 etc. Services
17
30 2
3,785 10
1,419 3
21
32
5,790 24
1,077
1,039 24,216 3 11
407 471
82
17,271 860
9,182 780
2
74
292 1
172 2
146
103
7,807 46
917
7
2,972 6
318
II ,994 2,75,858 26 1,121
2,734 2
1,983
1,054 27
453 14
19
231 10
1,509 1,369 84,997 25 12 12 313
34,98,351\ 96,286
1,19,634 4,405
47,620 890
242 5
364 2
2,044 205
5,36,648 6,714
19,670 102
5,004 30
28,091 5
446
129 7
49 3
5,569
627
88,821 877
11,741 69
32,136 97
10,292
63
156 11
150 4
2,632 63
1 ...
140 4
9,936 100
1,607 13
10,579 6
6,059 2
131
351 7
310 20
21,654 242
~------------------------------------------------------=~--Note:-1Excludes (a) Defence Services (b) Economically inactive persons.

13-5
TABLE 1~-ECONOMIC GROUPS & OCCUPATIONS OF CIVILIAN LABOUR FORCE-Contd,
Section 2-Punjllb
Self-supporting persons1 aged 12 years and over according to the main Economic Division and the main types of Occupation in which Engaged in January 1951.
(Figures in Italics denote tbe number of Females jnclud~d in the figures immediately above them.)
I Main Economic I
Division
I Total
workers
Domestic & 2,90,535 personal ser- 12,248 vices
Religion, Art & Public 18formation etc.
Other & Unclassified (including Unemployed)
20,500 221
3,76,295 12,800
156
17,817 214
646 1
279
31
524
1,224 17
419 4
3,249 16
Types of occupations
46
2
891
4,542 28
252 I
9,643 202
Note:-1Excludes (a) Defence Services (b) Economically inactive persons.
Number of Persons,
54,502 1,716
1,635
3,41,551 lJ,708
2,29,786 10,487
344 2
19,744 47 863 10

13-6
TABLE U-ECONOMIC GROUPS & OCCUPATIONS OF CIVlLIAN LABOUR FORCE-Coneld.
Section 3-Bahawalpur State
Self-supporting persons 1 aged lZ years and over according to the main Economic Division and the main types of Occupations in wbich engaged in January 1951.
(Figures in Italics denote the number of Females included in the figures immediately above them.)
~---.~.--------~--------------
Main Economic Division
Total workers
TOTAL ALL DIVISIONS
5,5{),055 4,124 2,437 10,606 17,443 4,11,307 244 3 -4 j 170
Cultivation 3,93,157 113
Animal 12,768 Husbandry 57
Other Agriculture 5,290
Forestry
Fishery
Mining & Quarrying
Manufacturing
Building construction & utilities.
iO
85
65
37,338 6
901
5 6
378 220
61 73
Trade & Commerce
21,937 1
37 1,991
Transport, Shipping & Port Services
Post and Telecommunications
Education
Medical Services
837 42
133 14
1,479 1,452 I 1
429 2
394 2
12
9
3
3
23
436
57
198
80
69
21
6
7
213
17,220 1
3
3,93,157 113
12,768 57
5,290
7
85
Number of persons.
36,488 4\1,167 6 24
14
33,995 6
7()1
455
656
31
25
1,206
4
1,109
19,481 2 36
10
890
5
927
11
10
2
Governmental, Municipal, etc., S~rvices
10,692 4
243 99 9,333 4
164 853 ... 1 I 1
~------------------------------------------------------------_~~I Note:-1Excludes (a) Defence Services (b) Economically inactive persons.

13·7
TABLE 13-ECONOMIC GROUPS & OCCUPATIONS OF CIVILIAN LABOUR FORCE-Colleld.
Section 3-Babawalpur State
Self-supporting personsl aged 12'years and over according to tbe main Economic Division and tbe main types of Occupations in wbich engaged in January 1951.
(Figures in Italics denote tbe number of Females included in the figures immediately above them.)
I 1
I Main Economic i
Division i
I -----.-
Domestic & per-sonal Services
Religion, Art & Public infor-mation, etc.
Other & Un-classified (in· eluding Un-employed).
Number of persons.
1
I Type of occupation I--_-~---~-.. ----.-(.~-~ --- ------- -_-_.-- - ------------------1 _'" '" 1 ._ ,_ G)-
Total I _"" 01: I' ~ ~ ~ e: » ra UJ L:! ._ ~ 0 _8..c~ rJ .~ ~ ~
workers I .~ '~ , .:; ~ ';; ~ ::;:s: ~ "0 ~ :::: ::l I c t2 .5 cd 0 u -t: .g.~ ~ u ... ,o-t 0
i .g e E ~ :..u~ ~ ~ 11 ";;: ~ 0 :::: g_ ~ .g ~CI. ~a(! ~ ... __ ~~~ ___ ~~j :;~ - -_------------ - -- ----- - - -
22,238 15 36
1,520 1,483
41,176 24
23 104
36
240
199 6,148
246 39,664 24
15,749 36
1,023 2


14-1
TABLE 14-AGRICULTURAL LABOUR FORCE AND CULllVATORS' LAND TENURE.
The Agricultural Labour Force, shown in Tabl';! 11, is further analysed in this Table by different categories of Agricutiurists and by land tenure classes of cultivators.
2. The information about the agricultural status of the cultivators was obtained in response to Question 14. The Enumerators had instructions to ask the questions and record answers of the re,pondents who had shown their occupation to be tillers, in response to Question II which dealt with the persons usual main occupation. Question 14 was ;-
"Do you own all or any of the land you till?"
"Do you pay rent in kind or cash for any of the land you till?"
"Do you work as Labourer for another person who tills land".
If 'Yes', rin g "C"
If ·Yes·. ring "A"
If 'Yes', ring "B"
3. The persons shown owing part and renting part land tilled are those who had both "C" and "B" ringed and the persons shown renting and also working for hire had both "A" and "B" ringed.
4. A 'Cultivator' (Tiller of the Soil) was defined in the Enumerators' Instructions as a person who himself works on the land or who employes others to do so under his direct-personal supervision.
5. Persons engaged in 'Forestry' and 'Fishery' arc classed in the NonAgricultural Labour Force and are s'Jown in Table~ II-A and 12.
6. This Table ex~llldes persons of a nationality other than Pakistani and also all children under 12 years of age.
7. This Table has been discussed in Chapter 9 of Part r of the Census Report.

14·2
TABLE 14-AGRICULTURAL LABOUR FORCE AND CULTIVATOR'S LAND TENURE
The Agricultural Labour Force 1 a~cording to Agriculiur<l) Slaws and Cultivators by land Tenure.
,Figures in Italics denote females included ill figures immediately above)
Number of person~.
... 'f~ Cultivators owning or Renting Land ,u
-u ! ._ ...
I E:g:;-... ::l rdu 000 ...... ------------_ .. --- - --_ -~ -~--~--- 3u~
i '" ::l 0 <..0 'Herdsmen ';.:::~ Owning to ._ ~ 0
Districts and States, Renting i:l....l , and ~vo.. o.~ ~ i Owning Part and Rentmg and also u- ; DaIrymen «~8 f-< ... o Total ' all Land' Renling all land -to -0 ... .... v~ 01)..0 working ~ ::l I
<cd tilled Part Land lilled for hire ctI~ ~~:s
....l ti]led ....l3 _0 u O~
- -----_---_.- ----~
PUNJAB AND 40,76,825 38,22,726 18,64,816 5,99,971 11,30,192 2,27,747 42,124 1.32.402 79,573 BAHAWALPVR 1,01,751 90,094 59,863 Il,078 14,23/ 4,922 2,307 4,462 4,888 STATE
PUNJAB 36.65,610 34,34,253 16,87.448 5.41.046 9,97,281 2,08,478 38,364 1.19,634 73,359 1,01,581 89,981 59,770 11,058 ]4,231 4,922 2,307 4,405 4,888
Lahore Division 9,07,612 8,40,599 3,34.131 1,89,525 2,17.168 99,775 8,852 34,389 23,772 31,512 24,880 13,652 5,605 4,181 1,442 860 2,On 3,695
Gujranwala 1,90,049 1,71,473 61,333 33,291 56.112 18,737 2,916 7,637 8,023 16,628 13,182 6,986 3,185 2,227 784 220 3,226
Lahore 2,75,096 2,46,639 1,23,230 43,950 54,202 25,257 4,255 15,199 9,003 1,362 338 331 6 1 309 476 239
Sheikhupura 1,86,320 1,73.421 75,830 21,3W 56,318 19,914 1,434 7,784 3,681 3,439 2,373 1,044 455 390 484 521 525 20
Sialkot 2.56,147 2,49.066 71,738 90,925 50,536 35,867 247 3,769 3,065 10,083 8,987 5,291 1,959 1,564 173 30 856 210
Multan Division 16,87,829 15,66,961 7,08.187 1,97,874 582,993 77,907 16,739 64,421 39,708 14,041 12,369 7.517 796 3,461 595 187 578 907
Dera Ghazi J,43,192 1,35,734 57,733 23,865 47,331 6,805 1,902 5,364 J92 Khan 556 537 536 1 19
Jhang 1,66,903 1,59,234 1,01,367 16,079 36,226 5,562 1,657 4,574 1,438 447 399 194 101 85 19 48
Lyallpur 4,16,127 3,79,292 1.77,790 39,270 1,52,815 9.417 6,052 13,732 17,051 1,257 785 774 8 3 130 15 327
Montgomery 3,73,161 3,40,017 1,49,593 56,419 1,14,071 19,934 2,587 23,758 6,799 21 1 1 10 10
Multan 4.17,642 3,91,526 1,42,529 40,108 1,89,592 J9,297 2,343 13,184 10,589 . 8,647 7,61/ 4,536 399 2,530 146 57 428 551
Muzaffargarh 1,70,804 1,61,158 79,175 22,133 42,958 16,892 2,198 3,809 3,639 3,113 3,036 1,476 287 843 430 77
Rawalpindi 10,70,169 10,26,693 6,45,130 1,53 647 1,97.120 30,796 12,773 20,824 9,879 Division 56,028 52,732 38,601 4,657 6,589 2,885 1,260 1,750 286
Gujrat 2,20,519 2,17,957 1,51,628 33,345 25,416 7,568 176 1,842 544 8,903 8,894 6,618 1,099 660 517 3 6
Notes:-1 Exclu:les persons claiming Nationalities other than Pakistani, 2 Excludes children under 12 years of age.

TABLE 14-AGRICULTURAL LABOUR FORO!; & CULTIVATOR'S LAND TENURE
The Agricultural Labour Force' according to Agricultural Status aad Cultivators by·laml Tenure.
(Figures in Italics denote femal es included in figures immediately above)
Number of persons.
I I IDistricts and Statesj
i
_ 0 1 Cultivators OwningQr Renting La'I1d . .!, ~
~ ~ ~ II , i Owning I I R' ~~ -0 ~ ::: ! Owning Pt. and Renting entmg ",,_t
f-"~2 I_T __ o_t_al __ I aU.L~nd_ Renting, aULand !~k~~~ ~.~ « J ttll~d Pt: land I tIlled I fo hire .:3'= _____ ~~I ____ , i tlUe_d_, ____ i ~r.~--_8_~ __
Jheium 1,33,578 ) ,31,570 J2,757 12,617
98,646 19,316 10,136 11,802 517 280
1,25,008 1,20,607 7,778 7,274
73,544 20,619 23,413 4,734 841 J,050
Mianwali
Rawalpindi 1,78,745 1,76,147 1,23,230 34,316 14,813 7,647 7,631 6,062 .450 453
Shahpur 2,51,250 2,21,174 1,14,506 28,986 69,097 12,596 9,971 6,112 1.051 2,031 '
Campbellpur 1,61,069 1.59,238 83,576 3,273
17,065 54,245 6,347 6,345
BAHAWALPUR 4.11215 STATE ' 170
3,88,473 1,77,368 113 93
699 2,115
58,925 1,32,911 20
3,472 12 18
3,031 580 ·6+9 117,
3,788 ,666
130 , .1
, 8,585 11 ,581
777 1.1.39
4,352 258
19,269 I •••
294
3,760 ; .,6 ~1
Bahawalpur 1,95,071 1,80,486 70,478 40,201 58,612 11,195 2,821 170 113 93 20
Rahimyarkhan 2, In, ! 44 2,07,987 1,06,890 18,724 74,299 8,074 939
1,206 J4f),
2,495 387
1,363 ~(t;
12,637 J,ZffS
1,281 2
12,768 ,'q];
790
1,326
1,105 ,. .5
5,858 .211
265
6,214
8,883 2,881 57 .. ,
3,885 3,333


TABLE IS-LANDOWNERS
1. In this table the persons over 12 years of age who reported themselves as owners of land have been classified according to broad categories of economic activities.
2. The information in this table was obtained from the following Census questions:
(a) Question 11: asked "what is usually your main occupation"? If the person was a 'tiller of the ~Oll', the enumerator put a ring round the appropriate symbol and the perSOn was asked Question 14.
(b) All persons 12 years old and over who reported that they were self-:mpporting or paItlY so were asked the Special Question: "Do you rec~ive rent in cash or kind for the: land you own but which is tilled by others"? If the answer_was 'YES', the enumerator put a ring round the appropriate symbol.
(c) Question 13: asked "In what kind of industry or service did you work in January"? The an~wers to this que,tion were used to classify landowners into Agriculturists, persons working in Non-Agricultural activities and members of the Defence services. Those who answered 'NONE' to this question, and
who had not reported in answer to Question 12 that they were seeking employment have been classified as "Economically Inactive".
(d) Question 14: asked all persons who claimed to be cultivators (see Question 11 above) whether they owned land al7d if their reply was 'YES', they have been included in the total of this table. The above questions were addressed to all persons aged 12 years and over who claimed to be fully or partly ~elf-supporting or claimed to be seeking work.
3. This table is discussed in Chapter 9 of Part I of tbe Census Report.

15-2
TABLE IS-LANDOWNERS
Economic Activities of persons owning land. Number of persons.
------------~~'~------------------Main Economic Group in which working
Districts & States
PUNJAB AND BAHAWALPUR STATE
PUNJAB
Lahore Division
Gujranwala
Lahore
Sheikhupura
Sialkot
MuHan DivIsion
Dera Ghazi Khan
Jhang
Lyallpur
Montgomery
Muhan
Muzaffargarh
Rawalpindi Division
Carnpbellpur
Gujrat
Jhelum
Mianwali
Rawalpindi
Shabpur
BAHAWALPUR STATE
Bahawalpur
Rahimyarkhan
Total Landowners
25,75,059 24,85,351 8,992 2 7
23,22,785 22,46,521 7,585 3
5,67,749 5,27,959 945
1.25,369 99.672 214
1,74,283 1,68,215 25
1,00,711 97,372 28
1,67,386 1,62,700 678
9,40,476 9,18,162 493 3
86,503 84,722 8
1,19,786 1,19,027 19
2,22,056 2,20,869 151
2,14,167 2,07,242 296
1,93,988 1,84,486 17 3
1,03,976 1,01,816 2
8,14,560 8,00,400 6,147
1,04,673 1,00,693 3,010
1,87,137 1,85,158 220
1,21,284 1,18,214 1,215
95,592 94,523 160
1,60,609 1,57,684 1,512
1,45,265 1,44128 30
2,52,274 2,38,830 1,407 2 4
1 oil
I s:; 2 ';: c) I I
I ,,- v ... 0 ~'" u , • I} tll)
a<:lil "'eo
1bl)~S:; Oc
'" 8 o..~
,,§ §:§' "'0. 't.l8 co.
1~~~1 "'a os·~
~U ... .c
t-<(/l
21.429 22,392 4,679
19,340 16,506 4,399
8,134 7,784 2,242
5,354 5,104 1,465
898 706 320
841 1,043 161
1,041 931 296
8,536 7,020 1,129
341 819 59
108 24S 201
341 368 46
2,851 1,123 215
4,415 3,679 498
480 786 110
2,670 1,702 1,028
330 193 179
647 293 127
827 475 265
230 197 281
294 311 80
342 233 96
2,089 5,886 280
1,24,899 1,12,664 1,390 2 4 1,685 5,689 '255
1,27,375 1,26,166 71 404 197 25
... c:I 0 s c . ~.~ > > 0'" Cl~
5,638
4,688
2,592
1,010
573
457
552
1,477
201
2S
87
302
387
475
619
98
85
86
47
120
183
950
812
138
-
I I, ~ ~ .
d c'" "'8 .~
Sill
"1! 0'" 0.:: ... u'" G)'-r2 c~
oS t e ~g O~p..
10,585 15,984
9,647 14,096
5,149 12,944
2.496 10,054
813 2,733
796 13
1,044 144
2,637 1,019
297 56
106 5S
114 80
1,629 509
464 39
27 280
1,861 133
IS7 13
573 34
175 27
153
598 10
205 48
938 1,888
546 1,852
392 36
,------------~-----------,---------------------------------------------.

TABLE 19·A-MUHAJIRS· ORIGIN.
ThIS Table IS similar to Table 5, Section 7, but is confined to an analysis of the population of Muhajirs only and shows from whiCh zOnts of the sub· cnntinenL outside the areas in which the First Census of Pakistan was conducted, the Mllhajirs 'Came. In comparing this Table with Table 5, it should be remembered that these zones of origin of Muhajirs frequently differ from the places of tbeir birth.
2. For Census purposes, a MUHAJIR was defined as a person who had enlered Pakistan liS a result of Partition or for fear of disturbimces connect· ed therewith, no matter from whele, when or for how l'ODS a stay.
3. tht information contained in this 'fable Was obtafne~ from the repli::s to Census Question No. 9 of the enumeration slip requiring the respondents to state whether they claimed to be MUHAJIRS and if so, to 'state the Provihce or State frem which tbey came.
4. The various Provinces and States of the sub-continent beyond the: ilreal ill which the First Census of Pakistan wits conducted have been grouped for the purposes of this Table in "Zones" as unOer :-
Zone
North
East
South
Provinces/States ani Agencies
Utter Pradesh (U. P. & Statts).
As~am &. 'States, Bihar & States, Or'risa 8. States, West Ben· ~l & Stlltes and Nepal and Sikki~,
(:oorg, MMras & Sllites, MYsore and Andeman find Nicobar
Islands-.
West Bombay & States, Baroda State, West Indian States &
Agen~'S and Portugese {~ia. (This zone includes the States of Junagadh & Manavadar*.)
Central Madhya Pradesh (C. P.), Madhya Bharat (Central India States & Agencies), Bhopal State and Hyderabad State·.
North.West Punjab (I), Padala & Ea,t Punjab States' Union, Ajmer, Delhi and Rajputana States & Agencies, Jammu & Kashmir S(ate*.
Other parts ,french Inclia, Bhutan_ and any otqer Indian Slate" •
* Accession disputed.
This Table is discussed in Chapter 5 of Part I of the Census report.

19-2
TABLE 19.A-MUHAJIRS ORIGIN
Persons enumerated in Punjab who reported themselves as Muhajil" according to their previous place of resident.
Number of persons.
I Zones of Origin2
Place of Enumeration Total 1 __________________________________ 1 --------
II' North East Soulh We,t Central Nonh Otl West ' _ lee i lndid India rfldi~_ In~~_;_ Inji~ ___ ~dia Places I
1,05,541 5,566 '" 5,41)4 11, 115 "'46"~ - - - -I PUNJAB AND BAHAWALPUR STATE
PUNJAB
Labore Division ...
Gujranwala
Lahore
Sheikhupura
Sialkot
Multan Division
Dera Ghazi Khan
Jhang
Lyallpur
Montgomery ...
Mullan
Muzaffargarh ...
Rawalpmdi Division
Campbellpur .. ,
Gujrat
Jheium
Mianwali
Rawalpindi
Shahpur
BAHAWALPUR STATE
Bahawalpur ...
Rahimyarkhan
52,81,194
49,08,328
11,23,580
2,99,145
7,45,078
3,09,890
3,69,467
25,98,385
35,740
1,38,649
9,86,236
7,13,050
6,46,151
78,559
5,86,363
38,121
1,35,676
52,376
46,672
1,06262
2,07,256
3,72866
2,98,140
74,726
1,00,724
43,998
1,789
37,547
1,768
2,894
5,238
],297
19
1,181
10
87
20,743 2,231
407 3
3.011 1,107
6,040 796
3,195 265
7,291 56
799 4
35,983 1,710
1,342 161
3,312 111
2,929 826
1,523 103
21,455 360
5,422 ]43
4,817 328
3,508
1,309
2
326
789 3,447
376 1,577
8
326 1,554
3
50 12
61 1,164
6
2 70
7 913
40 3
12 172
352 706
9 57
153 155
17 162
13 42
148 218
12 72
33 1,951
1,391
33 566
15,667 47,82,463
4,528 10,71,804
816 2,96,513
3,121 7,01,349
376 3,07,733
215 3,66,209
3,225 25,70,961
5 35,319
1,861 1,32,598
324 9,78,156
810 7,08,737
193 6,38,427
32 77,724
7,914 5,39,698
612 35,934
502 1,31,443
832 47,610
734 44,257
4,810 79,271
424 2,01,183
1,508 3,64,223
1,332 2,91,907
176 72,316
Notes.-' A Muhajir was defined ill the Census Questionnaire as '-Person who had moved into PakIstan as a result of partition or for fear of dijturl)ln~e:; cO:lOected the[~witll".
2 See Title sheet f ul' States, etc" comprising each zone.
I

IlJ-3
TABLE 19-B·-l\iUHAJIRS' EDUCATIONAL LEVELS.
This Table is a separate analysis of the literate MUHAJIRS included in Table 9-B and follows the same pattern. T1:e data for this Table also were collected in like manner.
2. A MUHAJIR was defined as a person who moved into Pakistan as a result of Partition or for fear of disturbances connected therewith, 110
matter from where, when or for how long a stay.
3. This Table is discussed in Chapter 7 of Part I of the Census Report.

19-4
TABLE 19-B.-EDUCATIONAL LEVELS OF MUHAJIRS.
Literate Muhajirs analysed accl)rding t') th~ grades to whicil th~y chim to hlVe progressed in Educational Institutions.
(Figures in Italics show the number of Females induded in the totals above them.)
Number of persons.
-----I
I Without! Divisions, Districts and Total FormJI Primlry Vliddl! Matrieu- Degree
High~r Selected Towns Literates Attain- Scho:)l School lation i Degree
ment~
I
PUNJAB AND BAHAWAL- 11,75,988 6,74,577 2,87,840 1Al,536 58.230 10,431 3,374 PUR STATE 5,1l,104 3,69,868 83,339 42,19/ 13,469 1,702 535
PUNJAB Il,04,488 6,29,685 ',70,513 1,34,745 56,073 10,148 3,324 4,81,052 3,46.408 79,001 4(},458 [ 3,051 1,6Il 523
. Lahore Division 4,41,708 2,53053 99,821 55,865 26,943 4,490 1,536 1,96,680 1,33,333 32,59.1 20,505 8,970 966 313
Glljranwala 89,964 53,826 23,018 10,115 2,704 269 32 39,779 29,063 7,127 3,109 454 24 2
Gujranwala City (22,938) (14,209) (5,397) (2,487) (727) (95) (23) (10,488) (7,492) (2, /83) (650) (I50) (ll) (2)
Lahore '" ),97,874 98,989 48,619 28,947 16,738 3,336 1,245 87,535 52,047 17,063 11,445 5,855 845 280
Lahore City & Canlt. (1,34,952) (54,987) (35,474) ( 24,526) (15,553) (3,205) (1,207) (60,736) (27,875) (14,959) (It,r)]?) (5,769) (833) (273)
Sheikhupura 70,835 50,691 12,882 5,368 , .557 290 47 33,888 29.636 2,976 1,035 227 10 4
Sialkot 83,035 49,547 15,302 11.435 5,944 595 212 35,478 22,587 5.427 4,916 2,434 87 27
Sia/kot City & Cantt. 122,132) (11,386) (3,187) (4,646) (2,601) (231) (99) (10,217) (4,619) (1,411 ) (2,854) (1,273) (21) (9)
Multan Division 5,56,607 3,38,849 1,35,847 60.738 17.146 3,152 875 2,61,928 2.04,233 37,420 16.638 3,041 458 138
Dera Ghazi Khan 7,020 1,944 2,545 1;384 866 214 67 2,799 1,041 903 506 245 87 17
Jhang 27,765 14,615 8332 3,161 1,294 260 103 13,093 9,022 2.842 819 365 29 16
Jhang Maghiana Town (6,884) (3,239) (2,019) (851) (671) (60) (44) (3,824) (2,178) (1,026) (335) (250) (20) (IS)
Lyallpur 2.14,112 1,36,609 51,682 21,082 3,958 571 210 1,09,450 89,743 12,994 6,189 414 81 29
Lyal/pur City (39,139) (13,967) (15,767) (8,001) (1,160) (/40) (104) (18,678) (9,211) (5,092) (4,146) (189) (27) (I3)
Montgomery 1,55,564 85,873 41,731 20,R04 6,255 764 137 76,002 50,567 15,857 7,699 1,692 143 44
Note: _I Literate persons who did not claim one of the grades mentioned in thIS Table are classed llS having no formal attainments.

19-5
TABLE 19·B.-EDUCATIONAL LEVELS OF MUHAJIRS.-Concld.
Literate Muhajirs analysed according to the grades to which tbey clllim to have Pl'Olre~ in E4ucational IlIstitutioDS. -,
(Figures ill Itl\lics sfll)w the Ilumber of Females in(:lilde4 in tbl! totltls alJove tbe ... )
Number of persona.
Divisions, Districts and Solected TO,V<lS
I Withoutl Ii: . I Degree Hi~ber
l)egree I l:!erate~ Allaiu- Scho ,} j School Illation i Total Fo:mal i Primary I Middle i Matricu"I
! I I I
~~.~_~~ __ ~.~ ._~ ___ ;_~~ _____ l __ m_:n_tS~ __ 1 __ ---'-1 ____ '-1 ___ '--__ -'-__ .....
Muhan
Multan Cit}' & Calltt.
Muzatfargarh
Rawalpindi Division
Campbellpur
Gujral
JheJum
Mianwali
Rawalpindi
Rawalpindi CIty & Canff. '
Shahpur
Sargodha Cify
BAHAWALPUR STATE
Bahawalpur
Bahawafpur City .. ,
Rabimyurkhan
1,34,628 54,102
(32.141) (11,067)
17,518 6,482
1,06)73 22,444
8.(186 1,687
16,9~1 2,499
12.164 2,758
7,38Z 1.648
39,563 9,166
l34,386) (8,038)
22,037 4,686
(3,287) (2,295)
71,500 30,052
59,735 24,483
(6,180) (2,176)
11,765 5,569
89,152 48,609
(17,787) (9)19)
10,656 5,251
37,783 8,842
4,080 805
6,860 911
5,048 1,317
2,506 633
10,135 2,756
(8,729) (2,247)
9,15~ 2.419
(2,080) (J,4J8)
44,892 23,460
37,611 18,996
(4,327) (1,765)
7,281 4,464
27,461 3,898
(8,345) (1244)
4,096 926
34,845 8,988
2,213 598
5,920 1,115
3,978 974
2,775 765
12.313 3,838
(10,701) (3,409)
7,586 1,698
(802) (645)
17,327 14,338
14,264 3,528
(1,413) (308)
3,063 810
12,440 1,198
(3,820) (444)
1,867 227
18.142 :(315
999 204
2,740 324
I,S90 379
1,224 195
7,869 1,782
,6,834) (1,633)
3,420 431
(215) (192)
6,791 1,733
5.723 1,516
(373) (102)
1,068 217
4,(}73 281
(1,741) (131)
700 44
11,984 1,040
614 60
1,235 137
1.030 . 76
659 48
7,120 643
(6,379) (605)
1,326 76
(78) (20)
2,157 418
1,853 355
(67) (1)
304 63
1,189 87
(348) (25)
154 31
2,506 187
123 14
142 11
157 11
159 5
1,572 113
\1,325) (111)
353 33
(60) aa)
283 91
247 80
36 11
~1J ;9 (100)
(4)
45 j
913 72
57 5
44 1
61 1
59 2
494 34
(418) (33)
198 29
(52) (10)
SO 12
31 8
13 4


TABLE 19-C-MUHAJIRS IN THE LABOUR FORCE
1. This table shows the total Muhajir population according to economic status. Muhajirs have been treated as part of the normal population and included in the figures for table 11. This is a separate table showing tbe numbers of Mubajirs in each category of table 11.
2. A Muhajir was defined for census purposts as a person who moved into Pakistan as the result of partition or fear of disturbances connected therewith. Persons, who came for tbat reason have been treated as Muhajirs no matter from where, when or for how long a stay they had come. Children born to Mubajirs families after arrival in Pakistan have generally, not been enumerated as Muhajirs.
3. Labour force, agricultural and non-agricultural, dependents and other terms have the same meaning as explained in the title-sheet of table 11, and the same method5 were used in collecting the information.

19-7
TABLE 19-C-MUHAJIRS IN THE LA80UR FORCE.
The Total Muha;ir Population according to Economic Status.
Number of persons
Self Supporting "---~------- --j
Districts Total Civil Labour Force \ Not in' Dependents
-----~"----"- , Civilian iNA' i Labour
Agricultural \ c~ftur:fl-! Force I I
ALL PERSONS
PUNJAB INCLUDING BAHAWAL- 52,81,194 11,22,782 6,43,591 45,438 34,69,383 PUR STATE
PUNJAB ... 49,08,328 10.42,301 5,92.622 43,218 32,30,187
LaJaore Division 17,23.580 3.49,480 2,25.612 20,644 11,27,844
Gujranwala 2,99,145 64,912 36,467 7,429 1,90,337
Lahore ... 7,45,078 1,38,928 1,20,584 7,628 4,77,938
Sheikhupura 3,09,890 67,580 34,621 814 2,06,875
Sialkot ••• 3,69,467 78,060 33,940 4,773 2,52,694
Multan Division :15,98,385 5,73,622 2,97,089 4,609 17,13,065
Dera Ghazi Khan 35,740 6,950 3,692 73 25,025
Jhang 1,38,649 31,122 16,167 2,066 89,294
Lyallpur 9,86,236 2,14,549 1,19,128 2,457 6,50,102
Montgomery 7,13,050 1,61,085 71,977 6,530 4,73,458
Multan 6,46,151 1,43,317 77,594 3,413 4,21,827
Muzafi'argarh 78,559 16,599 8,531 70 53,359
R~!llpindi Division 5,86,363 1,19,199 69,921 7,965 3,89,278
CampbelJpur 38,121 9,368 2,330 664 25,759
Gujrat 1,35,676 20,484 22,164 761 92,267
Jhelum 52,376 13,249 5,509 1,869 31,749
Mianwali 46,672 10,079 4,863 810 30,902
Rawalpindi 1,06,262 25,957 9,737 3,166 67,402
Shahpur 2,07,256 40,044 25,318 695 1,41,199
BAHAWALPUR STATE 3,72,866 80,481 50,969 2,220 2,39,196
Bahawalpur 2,98,140 56,832 45,626 1,713 1,93,969
- Rahimyarkhan 74,426 23,649 5,343 507 45,221
Notes-1 Includes D~f.nce Services and also self supporting persons not economically active, such as retit:~d Persons, students, institutional inmates, etc.

19-8
2 3 4 5 6 7 :~ 9
10 11 12 13
14 15 16 17 18 19
20 21 22 I
23 24 25
26
27 2~ 29 30
TABLE 19-C-MUHAJIRS IN THE LABOUR FORCE
The Total Muhajir Population according to Economic Status
Districts and Tehsils.
PUNJAB INCLllDING BAHA-WALPUR STATE. PUNJAB ... Lahore Division
Gujranwala GujranwaJa Tehsil ... Gujranwala M'pality Other Urban Areas2
Hafizabad Tehsil Ha/ziabad M'pality Pindi Bhattian Towil
Wazirabad Tehsil Wazirabad M'pality Other Urban Areas3
Lahore Lahore Tehsil
Lahore City & Cantt. Other Urban Areas'
Chunian Tehsil Other Urban Areas5
Kasur Tehsil Kasur M'pality
. Other UrbanAreas6
. Sheikhupura '-
Sheikhupura fehsil . '. Sheikhuftitra'M'pality
Other Urban Areas7
Nankana Tehsil Nankana M'pality
Total.
Self-supporting. 1------.----
1
Civilian Labour Force. i ! -- ----I .----.--I Agri- I Non-Agri- i
. cultural. I cultural.
MALE
28,44,288 10,91,496 6,36,559
26,40,730 10,11,015 5,85,590 9,33,854 3,28,350 2,23,388 1,61,366 49,213 36,434 1,12,972 35,278 20,230 29,648 2,004 13,408
8,414 972 3,886 24,498 6,458 8,860 8,818 298 4,779
820 409 232 23,896 7,477 7,344 5,946 740 3,045 3,878 717 1,109
4,09,784 1,38,925 1,20,584 2,58,535 67,922 96,986 2,05,970 43,615 27,810
2,059 343 820 1,08,224 53,571 13,459
10,368 2,719 3,391 43,025 17,432 10,139 11,115 1,234 6,191 5,658 2,132 889
1,66,236 67,580 34,621 1,11,226 46,202 20,993
8,526 362 ·4,760
7,481 875 3,532
32,713 12,542 ·7,842 6,289 635 3,052
Number of persons.
I -'1 Not inl I Depend-Civilian '\ ents. Labour Force .
I
44,999 10,71,234
42,779 10,01,346 20,474 3,61,642
7,429 68,290 6,605 50,859 3,804 10,432
126 3,430 417 8,763 16 3,725 10 169
407 8,668 7 2,154-
399 1,653 7,628 1,42,647 6,749 86,878 6,217 68,328
15 881 716 40,478 33 4,225 163 15,291 82 3,608 17 2,620
814 63;221 688 43,343
26 3,378
420 2,654
48 12,281 43 2,559
2 3 4 5 6 7 8 9
10 11 12 13 14 15 16 17
18 19
20 21 22
23 24 2S
26
27 28
Shahdara Tehsil 22,297 8,836 5,786 78 7,597 \ 29 Sharakpur M'pality 565 40 303 222 30
~-~~-~
Notes:- 1 Includes Defence Services and also self supporting persons not economically active, such as retired persons, students, institutional inmates, etc.
2 Includes Eminabad M'pality, Kamoke M'pality and Qila Didar Singh Town. 3 Includes Akillgarh Town, N.A.C., Ramnagar Town and Sohdra Town. 4 Badhana and Raiwind N.A.C. • Includes Chunian M'palily, Khudian Town, Kot
M'pality. Radha Kishan N.A.C., and Pattoki
6 Includes Lalliani Town and Raja Jang N.A.C. 7 Includes Chuharkana Town, Shahkot Town and Sangla Town.

19-9
'fABLE 19-C-MUHAJIRS IN THE LABOUR FORCE.
The Total Muhajir Popuiation according to Economic Status. l
Number of persons
~--------~------------------~~--~,--''''--------~--------~ I
I Self-supporting. I
i -------~-- ----~ -[
Total. 'i Civilian Labour Force. I N~t. ~nl i Depend- District and Tehsils. : ._. Clvll!an! ents. ! • 'I' N A' ' J abour '[ i Agn- on- gn - [- :
.. ~_. ___ J..:ltur::l_c~ltura~_L_:~:~] ______ . _____ . ____ _
2 3 4 5 6 7 8 9
10 11 12 13
14 15 16 17
18
19
20 21 22
23-24 25
26
1 27 28 I 29
1 30
24,36,906
22,67,598 7,89,726 1,37,779
97,262 24,601
7,492 20,059 7,253
616 20,458 4,856 3,395
3,35,294 2,05,058
1,59,984 1,831 93,581 8,939
36,655 8,907 4,937
1,43-,654 96,655 7,624
6,357
31,286
31,286 21,130 15,699 15,699
3 3 3
68
7,032
7,032 2,224
33 33
33
FEMALE
439 23,98,149
439 22,28.841 170 7,66,202
1,22,047 81,530 24,601 7,391
20,059 7253
616 20,458 4,856 3,395
3,35,291 2,05,055
1,59,981 1,831
93,581 8,939 36,655 8,907 4,937
1,43,654 96,655 7,624
6,357
28,267
PUNJAB INCLUDING BAHA-WALPUR STAlE
PUNJAB 2
Lahore Division 3
Gujranwala 4 Gujranwala Tehsil 5
GlIjranwala M'pa/ity 6
Other Urban Areas2 7
Hafizabad Tehsil 8 Hafizabad M'pality 9 Pindi Bhatian Town 10
Wazirabad Tehsil 11 Wazirabad M'pality 12
Other Urban Areas3 13
Lahore 14 Lahore Tehsii 15
Lahore City & Cantt. 16
Other Urban Areas4 17
Chunian Tehsil 18 Urban Areas· 19
Kasur Tehsil 20 Kaslir ,vI'pality 21 Other Urban Areas6 22
Sheikhupura 23 Sheikhupura Tehsil 24
Sheikhllpura M'pa/ify 25
Other Urban Areas7 20
Nankana Tehsil 27 28,267 5,809 5,809 Nankana M'palilY 28
18,732 577
18,732 Shahdara Tehsil 29 577 Sharakpur M'palit:__ 130
Notes :_1 Includes Defence Services and also self supporting persons not economically active, such as retired persons, students, institutional inmates, etc.
2 Includes Eminabad M'pality, Kamoke M'pality and Qila Didar Singh Town. 3 Includes Akalgarh Town, Gakkhar N.A.C., Ramnagar Town and Sohdra Town. 4 Includes Badhana and Raiwind N.A.C. 5 Includes Chunian M'pality, Khudian Town, Kot Radha Kishan N.A.C., and Pattoki
M'pality. 6 Includes Luilani Town and Raja Jang N.A.C. 7 Chuharkana Town, Shahkot Town and Sangla Town.

19-10
TABLE 19-C-MUHAJffiS IN THE LABOUR FORCE
The Total Muhajir Populatio:t according to Economic Status.
Number of persons.
Self-supporting I i I
-~-~-~-- I Civilian Labour Force I
,
Districts and Tehsils Total Not int . Depend-j --- ---I Civilian i 'n" I A' 'N i Labour
go-' 00- I For e cultural Agricultural, C
! I ----~-.-
MALE (Contd.)
31 Sialkot 1,96,468 72,632 31,749 4,603 87,484 31 32 Sialkot Tehsil 62,994 18,601 13,179 1,939 29,275 32 33 Sialkol M'pa/ily & 'Callll 23,379 1,076 9,836 1,899 10,568 33 34 Daska Tlh;il .. , 36,687 16,464 5,531 148 14,544 34 35 Urban Areas' 4,410 649 2,040 2 1,719 35 36 Narowa1 Tehsil 32,578 11,836 5,432 661 14,649 36 37 Narowal M'pality .. , 2,695 2Il 1,237 10 1,237 37 38 Pasrur Tehsil 23,677 8,353 3,262 16 12,046 38 39 Urban Areas' .. , 1,878 367 721 6 784 39 40 Shakargarh Tehsil ... 40,532 17,378 4,345 1,839 16,970 40
411 Multan Div'sion 13,89,065 5,70,007 2,95,088 4,498 5,09,472 41
42 Dera Ghazi Khan 18,701 6,950 3,692 73 7,987 42 43 Dera Ghazi Khan T~hsil 11,157 3,147 2,782 48 5,180 43 44 Vera Ghazi Khan M'pality 7,634 1,780 2,244 34 3,576 44 45 Kot Chhutta Town ... 567 291 47 229 45 46 Biloch Trans Frontier Tract 46 47 Jampur Tehsil 3,568 1,966 291 1,311 47 48 Urban Areas' 2,669 1,472 236 961 48 49 Rajanpur Tehsil 3,509 1,665 572 1,272 49 50 Urban Areas' 1,579 743 215 621 50 51 San ghar Tehsil 468 172 47 25 224 51 52 Urban Areas· 326 127 47' 15 137 52 53 Jhang 75,115 31,122 16,167 2,066 15,760 53 54 Jhang Tehsil 38,749 18,761 8,338 421 11,229 54 55 Jhang Maghiana M'pality 25,155 12,663 6,199 348 5,945 55 56 Cbiniot Tehsil 21,180 4,385 6,175 1,549 9,071 56 57 Chiniot M'pality ... 8,315 435 4,652 47 3,181 51 58 Other Urban Areas6 3,587 1,019 517 744 1,307 58 59 Shorkot Teh&il 15,186 7,976 1,654 96 5,460 S9 60 Other Urban Areas' 2,692 /,188 396 27 1.081 60 61 Lyallpur 5,27,151 2,14,549 1,19,128 2,457 1,91,017 61 62 Lyallpur Teh5i1 2,04,897 59,300 66,656 411 78,530 62 63 L}'a!1pur M'pafitl' ... 68,916 3,462 45,129 138 20,187 63 64 Chak Jhumra M'pafily 2,991 34 1,900 11 1,046 64 65 JaraOl' ala Teh,j) 1,18,865 55,777 20,012 J 17 42,959 65 66 Jaranwala .III'pality 6,739 437 3,898 10 2,394 66 67 Tandliallwala M'pality 3,268 17 1,964 1,287 67 68 Samundri Tehsil 73,769 35,928 It ,935 1,383 24,523 68 69 Samundri N.A.C . ... 2,554 173 1,326 1,055 69 70 Toba Tek Singh Tehsil 1,29,620 63,544 20,525 546 45,005 70 71 Toba Tek Singh M'pality 4,391 918 1,326 65 2,082 71 72 Gojra M'pality 7,376 772 4,152 66 2,386 72 73 Kamalia M'pality ' .. 8,801 1,644 3,034 174 3,949 73
Notes:-1 Includes Daska N.A.C. and Sambarjal Town. • Includes Pasrur M'pality and Chawinda Town. 3 Includes Jampur M'pality and Dajal M'pa)ity. • Includes Rajanpur M'pality and Kot Mithan M'pality. 5 Includes Taunsa Town and Vehea Town. 6 Includes Lalian Town and Rabwah N.A.C. 7 Includes Shorkot Towu and Ahmadpur Town.

19-11
TABLE 19-C-MUHAJIRS IN THE LABOUR FORCE
The Total Muhajic Population according to Economic Status.
Number of persons,
I ____ _self-support~ __ !
I ,
Civilian Labour Force I Not in i Total
grl- Force A . Non- I' Labour cultural Agricultural
Depend- ' ents
I : Civilian I
---~-, --------_--- ---_
31 1,72.,999 32 55,564 33 19,803 34 32,510 35 3,835 36 :.18,258 31 2,137 38 20,499 39 1,440 40 36,168 41 12,09,320 42 11,038 43 10,201 44 6,876 45 534 46 41 3.4fi8 48 2,618 49 2,977 50 1,377 51 392 52 264 53 63,534 54 33,008 55 21,358 56 17,353 57 6,293 58 3,119 S9 13,173 60 2,292 61 4,59,085 62 1,76,201 63 55,431 64 2,389 CiS 1,02,848 66 5,573 67 2,737 Cis 64,670 69 2,239 70 1,15,366 71 3,1'63 72 6,432 73 7,951
5,428
4 4
5,424 3,615
2,191
2,191 2,001
FEMALE (Colftd.)
170 1,65,210 117 55,447 117 19,686
32,510 3,835
28,258 2,137
20,495 1,436
53 28,500 Itl 12,03,593
]7,038 10,201 6,8i6
534
3,468 2,618 2,977 1,377
392 264
63,534 33,008 21,358 17,353 6,293 3,119
13,173 2,292
4,59,085 1,76,201
55,431 2,389
1,02,848 5,573 2,737
64,670 2,239
1,15,366 3,763 6,432 7,951
Districts and Tehsils
Sialkot Sialkot Tehsil
Sialkot M'pality & Cantt. Daska Tehsil
Urban Areas1
Narowal Tehsil Narowal M'pality
Pasrur Tehsil Urban Areas'
Shakargarh Tehsil Multan Division Dera Ghazi Kban Dera Ghazi Khan Tehsil
Dera Ghazi Khan M'pa/ity Kot Chhfltta Town
Biloch Trans Frontier Tract Jampur Tehsil
Urban Areas} Rajanpur Tehsil
Urban Areas' Sal' ghar Tehsil
Urban Areas' Jhang Jhang Tehsil
Jhang Maglzian(l M'palify Chiniot Tehsil
Chiniot M'palify Olher Urban Areas'
Shorkot Tehsil Other Urban Areas'
Lyallpur Lyallpur Tehsil
Lyallpur M'pality Chak Jhumra M'pality
Jaranwala Tehsil Jaranwala M'pality Tandlianwala M'pality
Samundn Tehsil Samundri N.A.C.
Toba Tek Singh Tehsil Toba Tek Singh M'pality Gojra M'pa/ify Kamalia M'palily
I ___ -----------------~~~~-;--~ Notes:-1 Includes Daska N.A.C. and Sambarial Town.
I Includes Pasrur M'pality and Chawinda Town. • Includes Jampur M'pality and Dajal M'pality. « Includes Rajanpur M'pality and Kot Mithan M'pality. 5 Includes Taunsa Town and Vehoa Town. • Includes Lalian Town and Rabwah N. A. C. 7 Includes Shorkot TowD and AIJmadpur Town,
31 32 33 34 35 36 37 38 39 40 41 42 43 44 45 46 47 48 49 50 51 52 53 54 55 56 57 58 S9 60 61 62 63 64 65 66 67 68 69 70 71 72 73

74 75 76 77 78 79 80 81 82 83 84 85
86 87 88
89 90 91 92 93 94 95 96 97 98 99
100 101 102
103 104 105 106 107 108 109 110 .111
TABLE 19-C-MUHAJIRS IN THE LABOUR FORCE.
The Total Muhajir Population according to Economic Status.
Number of persons.
I
_______ ~elf-s~port~~:_ ____ 1
Districts and Tehsils
Montgomery .. . Montgomery Tehsil .. .
Montgomery M'pality Chichawatni N.A.C.
Dipalpur Tehsil Urban Areas!
Okara Tchsil Okara M'pality ... Rena!akl!urd N.A.C.
Pakpattan Tehsil Pakpa1/an M'pality Arifwaia SA.C.
Multan Multan Tehsil ...
Multan M'palily & Cantt.
Kabirwab Tehsil Urban Areas2
Khanewal Tehsil Khenewal M'pality Mian Channu M'palily Tulamba Town ...
Lodhran Tehsil Urban Areas3
Mailsi Tehsit Mailsi Town
Shujabad Tehsil Urban Areas4
Vehari Tehsil Urban Areas'
M uzaffargarh .•• Muzaffargarh Tehsil
Urban Areas6
Alip,.r Tehsil Urban Areas7
Kot Addu Tehsil Kat Addu Town
Leiah Tehsil Urban Areas8
I
Total I Civi1i~:~our For~ j r , Agricul- I Non Agri-
____ . _____ ~~ _J~~l cwltural
MALE- (Contd.1
3,82,026 1,29,705
17,400 4,449
42,939 4,124
88,365 13,667
1,520 1,21,017
6,984 4,699
3.44,794 88,974 51,036
28,799 2,131
79,857 13,251 4,490 2,839
37,896 8,100
28,312 3,655
20,724 7,556
60,232 10,028
41,277 15,392 5,549
11,211 2,974 8,023 3,398 6,651 3,152
1,61,085 50,018
427 164
17,576 551
31,827 1,666
76 61,664 1,234
119
1,19,747 21,300 1,206
13,738 775
33,508 1,974
175 1,088 20,179 2,769 14,364 1,376 7,743
530 28,915
2,395
16,554 4,986
675 5,536
872 3,302
438 2,730 1.420
71,977 32,129 9,401 2.261 7,495 1,682
21,487 6,805
760 10,866 2.572 .1,391
75,689 32,743 28.431
3,895 587
16,816 6,164 2,425
71l 4,492 2,507 3,022
885 4,905 3,934 9,816 4.046
8,435 3,874 2,457 1,422 821
2,044 1,554 1,095
209
Not in Civilian Labour Force
6,530 1,410
375 364 395
753 155 1I7
3,972 89
228
3,302 2,617 1,917
29 11
198
27
61 59
122 3
49 44
226 39
70 30 14 12
27 27
1 1
. Depend· ents
1,42,434 74 46,148 75 7,197 76 1.660 77
17,473 78 1,891 79
34,298 80 5,041 81
567 82 44,515 S3 3,089 84 1,961 85
1,26,056 86 32,314 87 19,482 88
11,137 89 758 90
29,335 91 5.1I3 92 1,863 93 1,040 94
13,164 95 2,765 96
10,804 97 1.391 98 8,027 99 3,048 100
21,275 101 3,548 102
16,218 103 6,502 104 2,303 105 4,241 106 1,281 107 2,650 108 1,379 109 2,825 110 1,522 111
------_______________ M ______________________________ ~
Notes-1 Illcludes Dipalpur N.A.C. and Haveli N.A.C. 2 Includes Abdul Hakim N.A.C. and Kabirwala Town. 3 Includes Dunyapur Town, Kehror Pakka Town and Lodhran N.A.C. 4 Includes Shujabad M'pality and Jalalpur Pirwala Town.
S Includes Burewala N.A.C. and Vehari N.A.C. 6 Includes Khangarh M'palily and Muzaffargarh M'pality. 7 Includes Alipur M'pality and Jatoi TOWIl. S Includes leiah M'pality and Karor M'pality.

74 75 76 77 78 79 80 81 82 83 84 85
86 87 88
89 90 91 92 93 94 95 96 97 68 99
~lOO
101 102
103 104 105 106 107 108 109 110 111
19-13
TABLE 19-C-MUHAnRS IN THE LABOUR FORCE.
The Total Muhajir Population according to Economic Status.
Number of persons.
Self-supporting
!
Total ! Civilian Labour Force Not in Depend- ! Districts and Tehsils ,,-------- Civilian ents I
I Agri- I Non Agri- Labour
I cultural cultural I Force
____ -' _____ ' ____ I _____ L __
FEMALE-(contd.)
3,31,024 3,31,024 Montgomery 1,12,210 1,12,210 Montgomery Tehsil
14,233 14,233 Montgomery M'pality 3,859 3,859 Ch1chawatni lV.A.C.
37,160 37,160 Dipalpur Tehsil 3,618 3,618 Urban Areas!
75,632 75,632 Okara Tehsil 11,204 11,204 Okara M'pality 1,258 1,258 Renalakhurd N.A.C.
1,06,022 1,06,022 Pakpa(tan Tehsil 6,045 6,045 Pakpattan M'pality 3,902 3,902 Anfwala N.A.C.
3,01,357 3,570 1,905 III 2,95,771 Multan 75,157 5 444 108 74,600 Multan Tehsil 42,550 5 444 108 41,993 Multan M'pality & CanU.
25,796 1,297 1.288 23211 Kabirwala Tehsil 2.009 2.009 Urban Areas2
69924 58 113 69,753 Khanewal Tehsil 11,100 41 98 10,961 Khanewal M'pality 3,915 15 3,900 Mian Chanuu M'pality 2,541 17 2,524 Tu/amba Town
34,090 502 40 33,548 Lodhran Tehsil 7,692 7,692 Urban Areas3
25,305 303 20 24,982 Mailsi Tehsil 3,197 3,197 Mailsi Town
18,922 28 18,894 Shujabad Tehsil 6,857 6,857 Urban Areas4
52,163 1,377 3 50,783 Vehari Tehsil 8,052 8,052 Urban Areas5
37,282 45 96 37,141 Muzaffargarh 13,507 27 96 13,384 Muzafi'argarh Tchsil 4,696 96 4,600 Urban Areas~
10,383 10,383 Alipur Tehsil 2,968 2,968 Urban Areas7
7,35\ 18 7,333 Kot Addu Tehsil 3,227 3,227 Kot Addu Town 6,041 6,041 Leiah Tehsil 2,943 2,943 Urban Areas8
Notes-I Includes Dipalpur N.A.C. and Haveli N.A.C. 2 Includes Abdul Hakim N.A.C. and Kabirwala Town. 3 Includes Dunyapur Town, Kehror Pakka Town and Lodhran N.A.C. 4 Includes Shujabad M'pality and Jalalpur Pirwala Town. 6 Includes Burewala N.A.C. and Vehan N.A.C. 6 Includes Khangarh M'pality and Muzaffargarh M'pality. 7 Includes AIipur M'pality and Jatoi Town. S Includes Leiah M'pality and Karol.' M'pality,
74 7S 76 77 78 79 80 81 82 83 84 S5
86 87 88
89 90 91 92 93 94 95 96 97 98 99
100 101 102
103 104 105 106 107 108 109 110 III

19--i4
lJl 113 114 lIS
JI~
111 Ill! 119 120 121 122
123 124 125
126 127
128
129
130
I3l 132 133
134 135 136 137
138 139 140 141
142 143
144
h.BLE 1'9-t-Mtmi\liR IN tli'E LABOUR FOR'CE.
tire Total MubaJ'ir Population according 'to Economic Status.
Number of persons.
SeTr-supporting I
--------~---i I
District and Tebsils. 'Total '!Civilian ~bou~ Force I Not in ~ Depend-Civilian ents.
Agrl' - N"h A'''' I I V - gn- I Labour FOrce cultural: cultural I!
i ----- -~ -.~--------------------- -------_ --'----------~
Rawalpindi Division ... Campbellour _ CampbellpUt Tehsil.,.
Carnpbe/{pnf M'j1aiity & Cdntt.
Other Urban Are-tis l
Fateh Jang Tehsil Fatell Jang Tpwh
Pindigheb Tehsil Pindigheb M'pa/ity
Talaganj Tehsil Talaganj Town
Gujrat Gujrat Tehsil Gujrat M'pality
01her Urban Areas2
Kharian Tehsil
Urban Areas3
Phalia Tehsil
Other Urban Areas4
Jhelum Jbelum Tehsil
Jhelurn M'pality & Cantt.
Chakwal Tehsil Chakwal M'pa/ify
Pind Dadan Khan Teb§i1 Pind Dadan Khan M'pality ...
Mianwali Mianwali Tehsil
Mianwali M'palily Bhakkar Tehsil
Urban Areass Isakhel Tehsil
Urban Areas6
MAt E-(t'onrd.)
3,17,811 20,257 19,212 2,164
I,'fi]4
198 ISQ 525 JtJ7 322 281
7t542 22,631
5,250
3,545 15,820
5,583
34,091
7,9M
27,696 19.468 6,(Mj
5,380 1,495 2,848
755
24,3i2 10,618 2240 12,058
5,006 1.646
1,575
1,12,658 8,522 8,383
32
320
49 23 59 14 31 12
20,241 1i,245
551
634 3,263
393
10,733
520
9,742 7,854
368
1,277 490 611 73
9,677 4,471
260 4,844
1,971 362
345
67,114 2,301
1,860 800
676
70 60
207 122 164 162
22,063 6,993 2,474
1,576 4,320
2,745
11,350
4,462
5,176 2,401 2,290
1,897 363 878 382
4,715 1,782 979
2,413
961 520
508
7,807 664 621 484
26
6 6
32 28 5 5
755 506
53
104
74
145
49
1,859 1,593
959
132 117 134 74
683 489
6 110
63 84
84
1,3"(),131 8,770 8,318
848
592
73 '61
227 143 122 102
29,483 9,487 2,172
1,335 8,133
2,371
11,863
i,93!>
10,919 7,61() 1,462
2,074 525
1,225 226
~,247 3,876
995 4.691
2,011 680
638
112 113 iI4 lIs
It~
ll7 118
11' 120 121 122
123 124 125
126 127
128
129
13b
m 131 133
134 13; 136 131
138 13~ 140 141
142 143
144
Notes :_1 Includes Hassan Abdal M'pality. Hairo M'pality and Cement aad Ordnance Factories Wah. 2 Includes Jalalpur Jattan M'pality and Konjah M'pality. 3 Includes Dinga M'pality' Kharian Town and Lalamusa M'pality. 4 Includes Pballa Town, Malkwal To~n and M'andi Bahauddin M'pality. S Includes Bhakkar M'pality and Kallur Kot Town, b Includes Isakhel M'pality and Kalabagh M'pality.

l~~lS
TABLE 19.C-MUHA.~lRS IN THE LABOUR FOlleE
The Total Muhajir Population according to EcOlWWi.c Status
Number of persons.
Self -supporting
Total Civilian Labour Force Not in : Depend-Districts and Tehslis
----~------~~-- Civilian ents
Agri- Non-Agri- Labour
cultural cultural Force
FEMALE
112 2,63,552 6,541 2,807 158 2,59,046 Rawalpindi Division 112 113 17,864 846 29 16,989 Campbellpur 113 114 17,005 841 22 16,142 Campbell pur Tehsil 114 115 1,530 4 1,526 Campbel/pur M'pality & Cantt. 115
116 1,055 2 7 1,046 Other Urban Areas l 116
117 136 2 134 Fateh Jang TehsiJ 117 lI8 106 2 104 Fateh Jang Town 118 119 420 5 415 Pindigh,.b Tehsil 119 120 245 4 241 Pindigheb M'pality 120 121 303 3 2 298 Talagang Tehsil 121 122 265 3 2 260 To/agang Tnwn 122.
123 63,134 243 101 6 62,784 Gujrat 123 124 19,556 24 35 19,497 Gujrat Tehsil 124 125 4,488 4,488 Gujrat M'pality 125
126 3,226 3,226 Other Urban Areas2 126 127 !4,540 189 34 6 14,311 Kharian TehsiJ 127
128 4,815 4.815 Other Urban Areas3 12&
129 29,038 30 32 28,976 Phalia Tehsil 129
130 6,687 31 6,6~6 Other Urban Areas4 130
131 24,680 3,507 333 10 20,830 Jhelum 131 132 17,903 3,498 302 4 14,099 Jhelum Tehsil 132 133 4,708 18 4,690 Jhelum M'pality & Cantt. 133
134 4,625 16 4,608 Chakwal Tehsil 134 135 1,319 1,319 Chakwal M'pality 135 136 2,152 8 15 6 2,123 Pind Dadan Khan Tehsil 136 137 619 5 624 Pind Dadan Khan M'pality 137
138 22,350 420 148 127 21,655 Mianwali 138 139 9,963 399 144 127 9,293 Mianwali Tehsil 139 140 1,994 10 21 4 1,959 Mianwali M'pality 140 141 10,787 21 4 10,762 Bbakkar Tehsil I 141
14'2 4,693 21 4 4,668 Other Urban Areass 142 143 1,600 1,600 Isakhel Tehsil 143
144 1,544 1,544 . Other Urban Areas6 144
Notes:-1 Includes Hasan Abdal M'pality, Hazro M'pality and Cement and Ordnance Factories Wah, 2 Includes Jalalpur ]attan M'pality and Kunjah M,pality. 3 Includes Dinga M'pality, Kharian Town and Lalamusa M'pality. • Includes Phalla Town, Malkwal Town and Mandi Bahauddin M·pality. 5 Includes Bhakkar M'pality and Kallur Kot Town. e Includes IsakbaJ M'pality and Kalabagh Wpality.

19-16
145 146 147
148 149 150 151 152
153
154 155
156 157
158 159 160
161 162 163
164
165
166 167
168
169 170 171
172 173 174 175
TABLE 19-C-MUHAJIRS IN THE LABOUR FORCE
The Total Muhajir Population according to Economic Status
Number of persons.
Self-supporting I i _._-------------------------, -_ --
:
Districts and Tehsils. Total ! Civilian Labour Force Not in Depend-
Civilian ents
Agri- Non- Labour cultural : Agricultural Force
! --~-~------ -----_---------- - - -------------- ----- ----
MALE-(contd.)
Rawalpindi 61,964 25,331 9,199 3,159 24,275 145 Rawalpindi Tehsil 52,682 23,000 6,283 2,640 20,759 146
Rawalpindi M'pality & Cantt, 5],555 22,754 5,943 2,635 20,223 147
Gujar Khan Tehsil 4,370 1,320 893 82 2,075 148 Gujar Khan M'pality 1,917 977 34 906 149
Kahuta Tehsil 1,489 440 453 8 588 150 Murree Tehsil 3,423 571 1,570 429 853 151
Murree M'pality & Cantt. 2,392 333 1,156 423 480 152
Shahpur 1,11,030 39,145 23,(i60 687 47,538 153
Shahpur Tehsil 7,048 2,125 2,204 37 2,682 154 Urban Areas' 3,595 1,007 1,211 4 1,373 155
Bhalwal Tehsil 21,214 7,464 5,722 96 7,932 156 Urban Areas' 9,755 2,773 3,001 16 3,965 157
Khushab Tehsil 11,863 5,400 2,581 60 3,822 158 Khushab M'pality 3,601 892 1,159 12 1,538 159 Urban Areas' 2,345 1,063 441 29 812 160
Sargodha Tehsil 70,905 24,156 13,153 494 33,102 161 Sargodha M'pality 29,383 2,811 7,100 63 19,409 162 Sillanll'ali M'pality 3,031 894 1,028 284 825 163
BAHAWALPUR STATE 2,03,558 80,481 50,969 2,220 69,888 164
Bahawalpur 1,61,927 56,832 45,626 1,713 57,756 165
Bahawalpur Tehsil ... 22,263 3,524 10,224 116 8,399 166 Bahall'alpur M'pa/ity and 9,400
Cantt. 445 4.973 58 3,924 167
Khanga Sharif ... ],538 55 962 42 479 168
Bahawalnagar Tehsil 50,682 21,404 9,207 516 19,555 169 Bahawalnagr M'pality 7,217 283 3,767 46 3,121 170 Sadiqganj M'paliry 1,597 253 597 1 746 171
Chishtian Tehsil 40,185 12,787 12,668 320 14,410 172 Urban Areas' 7,868 1,475 3,803 19 2,571 173
Fort Abbas Tehsil ... 31,370 10,175 11,335 579 9281 174 Urban Areas5 5,064 474 2,286 379 1,925 175
-~ .. =~- .-------=~--Notes:-1 Includes Shahpur Chhauni, Sahiwal M'pality. Shahpur City, Jhawarian Town and Kalra
Town. • Includes Bhalwal M'pality, Bhera M'paJity, Kot Moman Town, M'iani Mpality, and
PhullalWan M'pality. 3 Includes Hadali Town and Mit'ha Tiwana Town. • Includes Chishtian M'pality, Ha5ilpur M'pality, Khairpur M'pality and Qairnpur
M'pality. • Inclujes Fort Abbas M'pality and Haroonabad M'pality.

145 146 147
148 149 150 151 152
153
154 155
156 157
158 159 160
161 162 163
164
165
166 167
168
169 170 171
172 173 174 175
19-17
TABLE 19-C-MUHAJIRS IN THE LABOUR FORCE
The Total Muhajir Population according to Economic Status.
Number of persons.
I
1 ___ S~f-SUPPor~~~ _____ I
Civilian Labour Force I Not in Depend- I Total Districts and Tehsils
I~--'----- -; Civilian ellts I I Labour , Agri- I Non- •
i cultural Agriculturali Force i I I , ' i ---- --_----~----- -- -~--- -------~
FEMALE-(contd. ) 44,298 626 538 7 43,127 Rawalpindi 145 37,836 611 90 3 37,132 Rawalpindi Tehsil 146 36,998 525 83 3 36,387 Rawalpindi M'pality & Canlt. 147
3,604 2 2 3,600 Gujar Khan Tehsil 148 1,472 1,472 Gujar Khan M'pality 149 1,240 7 3 1,230 Kahuta Tehsil 150 1,618 6 443 4 J ,165 Murree Tehsil 151 1,014 4 414 4 592 Murree M'pality & Cantt_ 152
96,226 899 1,658 8 93,661 Shahpur. 153
6,088 25 9 6.054 Shahpur Tchsil. 154 3,246 3,246 Urban Areas' 155
18,046 187 146 17,713 Bha1wal Tehsil. 156 8,960 85 74 8,801 Urban Areas' 157
9,401 288 693 5 8,415 Khushab Tehsil. 158 3,085 201 676 2,208 Khushab M'pality . 159 1,977 10 5 1,962 Urban Areas3• 160
62,691 399 810 3 61,479 Sargodha Tehsil. 161 24,647 24,647 Sargodha M'pality. 162
2,529 2.529 Sillanwali M'pality. 163
1,69,308 1,69,308 BAHAWALPUR STATE. 164
1,36,213 1.36,213 Bahawalpur. 165
17,908 17,908 Bahawalpur Tehsil. 166 7,454 7,454 Bahawa!pur M'pality and 167
Cantt. U57 1,157 Khanga Sharif. 168
43,817 43,817 Bahawalnagar Tehsil. 169 5,970 5,970 Ba/zawa/nagar M'pality. 170 1,363 [,363 Sadiqganj M·pality. 171
33,376 23,376 Chishtian Tehsil. 172 6,292 6,292 Urban Areas'. 173
26,410 26,410 Fort Abbas Tehsil. 174 4,043 4,043 Urban Areas'. 175
Notes:-' Includes Shahpur Chhauni, Sahiwal M'pality, Shahpur City, Jhawaria<l Town and Kalra Town.
• Includes Bhalwal M'pality, Bhera M'pality. Kot Moman Town, Miani M'pality and Phullarwan M'paliiy.
3 Includes Urban ThaI, Nurpur (Urban Area), Hadali Town and Mitha Tiwana Town. • Includes Chishtian M'pality, Hasilpur M'pality, Khairpur M'pality and Qaimpur
M'paJity. • Includes Fort Abbas M'pal ity and Haroonabad M·pality.

19-18 'jJ ; •
TABLE 19-C-MUHAJIRS IN THE LABOUR FORCE.
The Total Muhajir Population according to Economic Status.
Number of persons.
Self-Supporting
I
District and Tehsils. Total. Civilian Labour Force 1 Not in Civilian
I
i Labour' Agri- Non-Agri- I F cultural. cultural. I orce. ___ -'-1_ i
c-' ----------~- - ----- ----------------
MALE-(cantd.)
176 -Bahawalpur -(contd.) : Minchinabad Tehsil 17,427 8,942 2,192 182
117 Minchinapad M'po/ity 1,/90 87 637 29
178 ; Rahimyarkhan 41,631 23,649 5,343 507 179 Rahimyarkhan Tehsil 15,806 7,453 2,900 43 ISO Rahimyarkhan M'pality 4,254 778 2,144 42 181 Kat Samaba Towil ' 416 96 173 182 Abba,sia Colony Tebsi! 1,515 995 148 1113 Allaliabad Tehsil ... 2.227 1,213 333 13 1.84 Allahabad M'pality 512 344 48 11lS Ahmadpur East Tehsil 6,853 4,980 203 370 186 ' Ahmadpur East M'pality 4,285 3,228 62 363 1.87 Other Urban Areas l. 1,606 1,093 141 188 i Khanpur TehSiI ' 6,864 4,125 584 2 189 Chachran Sh(Jrif M'p(llity 193 131 17 ... 19Q Other UrbanAreas 2_ , . 3,921 2.330 349 2 191 Sadiqabad TensiI 8,366 4,883 1,175 79
IQ~ II Other Urban Areas 3 3,581 2,620 305 2
Dependents,
6,111 4,377
12,132 5,410 1,290
147 372 668 120
1,300 632 372
2,153 45
1,240 2,229
654
l'{otes.--;-I Includes Dera Nawab S~hib M'pality, Goth ~hani M'pality and Uch Sharif M'pality. 2 Includes ~hanpur M'pality and Khanpm RaIlway Colony. 3 Inclqdes Sa4iqaq~d r\'fpaIity, Ah nadpur Lamma M'pality and Sanjarpur M'pality.
176 177
17& 179
i 1'80 181,
: 182 '18l 184 ISS' 186 1&7 188 189 1'90 19f 192

176 177
178 179 180 181 182 183 184 185 186 187 188 189 190 191 192
19-19
TABLE-19-C-MUHAJIRS IN THE LABOUR FORCE.
The Total Muhajir Population according to Economic Status.
Number of persons.
I Self-supporting. I
I -"--~-
Total I Civilian Labour Force Not in Depend-I Districts and Tehsils. -~ Civilian ents. I
Agri- I Non-Agri- Labour I Force. I cultural. cultural. I
I I ------- -
FEMALE-(contd.)
14,702 ... ... '" 14,702 Minchinabad Tehsil.
1,072 ... ... --. 1,072 Minchinabad M'pality.
33,095 ... ... '" 33,095 Rahimyarkhan ... .. . 12,773 ... ... .. . 12,773 Rahimyarkhan Tehsil ... 2,958 . -. ... '" 2,958 Rahimyarkhan M'pality ...
343 ... ... '" 343 . /(o{ Sa,,!pba Tp,wfI ... 874 .... ... .. . 874 Abbasla Colony Tehsil ...
1,929 ... ... . .. 1,929 Allahabad THisil ... 461 ... ... '" 461 Allahabad M'pality ...
5,565 . " ... ... 5,565 Ahmadpur East Tehsil ... 3,860 ... ... '" 3,860 4hmadpur,E(lst M'pa!ity ...
916 ... . .. '" 916 Other Urban Areas 1 ... 5,300 ... ... '" 5,300 Khanpur Tehsil ...
145 ... ... '" 14.5 Chachran Shari/M'pality ... 3,181 ... ... -., 3,181 Other Urban Areas 2 ... 6,654 ... . .. '" 6,654 Sadiqabad Tehsi1 .. -2,829 ... ... '" 2,829 Other Urban Areas 3 ...
Notes.- I Includes Dera Nawab Sahib M'pality, Goth Ghani M'pality and Uch Sharif Municipality. 2 Includes Khanpur M'pality and Khanpur Railway Colony. 3 Includes Sadiqabad M'pality, Ahmadpur Lamma M'pality and Sanjarpur M'pality.
176 177
178 179 180 181 182 183 184 185 186 187 188 189 190 191 192

19-20
TABLE 19-D-ECONOMIC GROUPS AND OCCUPATIONS OF MUHAJIRS IN THE CIVILIAN LABOUR FORCE,
This Table is exactly the same as Table 13, but is confined to the analysis of the MUHAJlR population only.
2, For Census purposes a Muhajir was defined as a person who had entered Pakistan as a result of Partition or for fear of disturbances connected tberewith, no matter from where, when or for how long a stay,
3. This Table is discussed in Chapter 9 of the Report.

19-21
TABLE 19·D-ECONOMIC GROUPS & OCCUPATIONS OF MUHAJIRs-Contd.
Section I-Punjab and BabawaJpur
Self-supporting Muhajirs1 aged 12 years and oller according to the main Economic Dilision and the main types of Occupations in whicb engaged in January 1951.
(Figures in Italics denote the number of Females included in the figures immediately above them).
Main Economic Division
Total Workers
TOTAL ALL... 17,66,379 14,361 15,802 46,794 DIVISION 38,318 225 28
Cultivation... 10,77,242
Animal Husbandry
Other Agriculture
Forestry
Fishery
Mining & Quarrying
Manufacturing
Building Construction & utilities
30,188
37,580 1,074
6,033 24
298
1,95,628 1,270
7,486 5
7 6 27
976 2,007 2,544 I
266 460 326
N umber of persons..
Types of Occupations
1,20,537 11,22,855 1,99,467 1,56,812 89,731 20 210 31,286 1 . .011 2,320 3,238
3
574 3
9
10,77,242 30,188
37,580 1,074
6,033 24
143
1,78,551 995
5,829 5
89 23
9,196 1,800 269 2
479 117
I Trade & Commerce
1,41,593 275
181 12,228 2,274 1,19,456 207
1,698 3
4,745 63
1,011 2
... I
Transport, ... Shipping & Port Services
Post and Telecommunications
Education
Medical Services
GoveIIlmental Municipal, etc. Services
23,214 4
87 1,213 1,488
1,304 21
4,528 4,002 107 106
3,874 3,504 107 106
45,t04 26
895 1
20 1,059
70
60
307 1
143
540 36,557 25
5,832
6
17
5
Note-1 Excludes (a) Defence Sericves (b) Economically inactive persons.
9,590 4
131
5
16
1,081
2,851 2,153
52
26
54
21
112
80 ... I 1
198 5,728

TABLE 19-D-ECONOMIC GROUPS & OCCUPATIONS OF MUHAJIRS-Contd.
Section I-Punjab and Bahawalpur
Self-supporting Muhajirs1 aged 12 years and over according to the main Economic Division and the main types of Occupations in which engaged in January 1951,
(Figures in Italics denote the number of Females included in the figures immediately above them).
Main Economic Division
Domestic & Personal Services
Religion, Art & public information etc.
Other & Unclassified (including Unemployed)
i I
I Total I Workers
83,621 3,475
41
4,636 4,097 13 11
1,38,996 1,750
284
99
8
118
442
182 1
1,449 1
Number of persons.
Types of Occupations
11 899
29 1
9,121 327
257
455 1,225 1,29,733 3 1,661
73,008 3,148
62
5,612 85
20

19-23
TABLE ll)-D-ECONOMIC GROUP & OCCUPATIONS OF MUHAJIRS-CQntd.
Section 2-Punjab.
Self-supporting Mubajirsl aged 12 years and over according to the main Economic Division and the main types of Occupations in which engaged in January 1951.
{Figures In Italics denote the number or Females included in tbe figures immediately above them.)
Number of persons.
Types of Occupations J ______ ~----~--~----~~~_,------_,------_,----_,---------
M ' Be . T I' , oCl"; I' ~ -:::! %) ~ <a I I am onomle ota I - c ... w i oCl 6 I - ... » ., I 't:l t; Division I Workers I ,~,~ ,~'5 I - ~ i ~ E iil ~ I 'O'~ ~ e
I Jlllill ~~: ~ I j!~ I ~g I J~ ----------------------------
~ o
TOTAL ALL .. , 16,34,929 13,400 14,485 43,377 1,14,700 10,42,374 1,86,733 1,34,425 85,415 20 DIVISION 38,318 225 ... 28 210 31,286 1,011 2,320 3,238 , ..
Cultivation.. 9,99,234 30,188
Animal .. , Husbandry
Other Agri- ._. culture
Forestry
Fishery
Mining & ... Quarrying
37.544 10,74
5,596 24
291
Manufacturing 1,83,135 1,270
Building, .. , Construction & Utilities
7,121 5
Trade & ... 1,34,566 Commerce 275
Transport, ... Shipping & Port Services
Post & Tele-... communications
16,187 4
1,293
7
888 1
254
179
85
21
Education .. , 4,279 3,764
Medical Services
Governmental Municipal, etc. Services
107 106
3,691 3,341 107 106
41,713 26
781 I
6
1,854
421
11,197
182
20
70
60
27
2,432
302
2,226
1,440
1,048
296 1
138
457 33,571 ... 25
3
569 3
9
1,13,624 207
6
17
5
9,99,234 30,188
37,544 1,074
5,596 24
136
1.66,672 995
5,539 5
1,592 3
9,484 4
131
S
1,062
89
9,013 269
479
4,739 63
23
1,707 2
117
1,009 2
2,845 2,1.51
52 21
26
S4
112
80 1
198 5,639
~---------------------------------------------------------Note:-' Excludes (a) Defence Services (b) Economically inactive persons.

19 .. 24
TABLE 19-D-ECONOMIC GROUP & OCCUPATIONS OF MUHAJIRS-Contd.
Section l-Punjab.
Self-supp9rting Muhajirs1 aged 12 Years 811d over according to tbe main Economic Division and the main types of . OccUpations in which engaged in JanulU'Y 1951.
.
(Figures in Italics denote the number of Females inelJJed in thi figures immediately above them.)
Number of persons,
\ Types of Occupations
- .----~ .. --co<
1 '" I I I ) , ... o<!'; ]
II) II)
~» Main Economic Total '13 cIIj~ i ,l<I ~
I
I _c ~ ~~ Division WOrker~ ~.9
... ... I "'", > 'a ~ ~C3: ~ ;;~ ~ ~:g ~~ lJel .~ ., I ;,:::::s dOl ... ad os I Oil) ... .de
~~lJ ·c 8 J .~~t: ~~ ,l<I0 '~,l<I .s 00 1Il!E I
~o<!~ I Ol,D > ...
.~ Q; Cos "'0 ~~ ! ~::E Do ~ ~o ::>...:1 ~C3: 0
Domestic . " 77,194 38 93 403 II ... 883 6,032 69,734 ... & i1iitibhal 3,475 ... ". . .. ... '" 327 3,148 Services.
Religion, Art 4,271 3,758 8 156 1 ... 19 257 62 . .. & Public 13 11 ... 1 ... ". ... . .. Information etc.
Other & Un· 1,18,814 284 117 1,338 455 ... 1,199 1,10,641 4,760 20 classified 1,750 ... . .. 1 ... 3 1,661 8 ... (including Unemploy-ed) .

19-25
TABLE 19'D-ECONOMIC GROUPS & OCCUPATIONS OF MUHAJIRS-Concld.
Section 3-Bahawalpur State,
Self-supporting Muhajires1 aged 12 years and over according to the main Economic Division and the maia types of Occupations in which engaged in January 1951.
(Figlll'cfI in Italics denote the Bomber of Females included in the figures immediately above them.)
Number of persons.
Types of occupations --
~"; '" o(!"; I ' .... ._._ , ., ';;» i C _'-
~ .; .. Main Economic Total _0 ",,,, o(! , 3~~ ... e I .... 1>0 0 .~ "'f Division wOlkers ",.- -to '-u'" .~ c - ., ~ .:::..cd> as B~ I., '2 ~ I ~ 3~ B·ra~ ",oj
COl '" ... it .0'- 's:E I '~!e~ III ._I-l.. ° -'" '><.0 '> ~ u o '" ~o(!~
:;::0. "leu ~~ I~ ~~ ~o(!
"; ~o ;§...J 0° IZl CIl 1 0 .----
TOTAL ALL 1,31,450 961 1,317 3,417 5,837 89,481 12,734 22,387 4,316 DIVISION
Cultivation 78,008 18,008
Animal 2,036 2036 Husbandry
Other 437 437 Asriculture
Forestry
Fishery
Mining 7 7
Manufactur- 12,493 88 153 112 5 11,859 183 93 ing
Building & 365 12 39 24 290 Construction, Electricity, Water Gas etc.
Trade & Com- 7,027 2 1,031 48 5,832 106 6 2 merce
Transport, 369 2 4 44 296 17 6 Shipping & Port Services
Post and Teic- H 11 communications
Education 249 238 11
Medical Services 183 163 5 l~
Governmental, 3,291 114 83 2,986 19 89 Municipal, etc. Services
Note:-1 Excludes (a) Defence Services (b) Economically inactive persons.
•

19-26
TABLE 19·D-ECONOMIC GROUPS & OCCUPATIONS OF MUHAJIRS-concld.
Section 3-Bahawalpur State.
Self.supporting Muhajirs1 aged 12 years and over according to the main Economic Division and the main type of Occupations in which engaged in January 19S I.
(Figures in Italics denote tbe number of Females included in tbe figures immediately above them.)
Number of persons.
I Types of occupations
! 0-
\ I
'" I ~ta
I . ~.~ ....
I
0 -Main Economic TotaI Q ... ~ ..>: oU>' ~ '" (;.9 <'<S~ ~ ... ........ ..,~ .,
!loU ... I 0 ::I., ... . ;:: ... Division workers .2 ~
I
~ ~~ u ., ...
8~ .:J t:: - 0 ''Cli'! ;:::::3
I i <'$8">: c::~ C:: oU
. ~!S 5 ::3.-1: .~ 0
'> ~ I '" .~f1.< 0 00 ~.a ..c::o '§~ ~8 g .... .2 bGo'I$:::: c::'" 1>:::: E-<~ ~0'1$ .!!o~ oU ;;J..J U til < til !I.l
Domostic & 6,427 3 6 39 , .. ". 16 3,089 3,274 personal Services
Religion, Art 365 339 ... 26 ... ... ... .. . ... & Public Information etc,
Other & 20,182 . " I Itt ... ... 126 19,092 852. Unclassified (including Unemployed)
T. P, Kchi.-9-54-900
'" ... ~ 0
...
...
...


S-l
SUPPLEMENTARY TABLES 1 & 2-COTTAGE INDUSTRIES
Supplementary Table i-The location of cottage Industries.
SupplementarY Table 2-Number of each class of cottage industry and the uumber of workers employed therein.
An inquiry into the nature and location of generally been possible by other means. But it Cottage Industries was made while the Population is far from adequate and cannot be regarded as Census staff were surveying their Enumeration complete. After all, the Census Enumerators had Areas and preparing the Household Lists. This had very little instructions at the time of the work was spread over the period from mid- House-listing. The whole work of the Census September 1950 to mid· January 1951. The Census had to be done in a short time and this special Enumerators were at that time making a list of all enquiry could not be given the same degree of the Households in their areas and were painting priority and of check of accuracy as the main numbers on the buildings to agree with the serial work of the Census. Many of the enumerators numbers on the List. lost sight of the definition of "Home Manu
facture" and included in their returns repair shops 2. While the men were on the ground for this
purpose, they were required to ask whether any "Home Manufacture" was carried on by the house-hold. If so, particulars were to be recorded on a special form. No entry was, however, required where a business employed 20 persons or more (10 if power-driven machinery Wele used). This was intended to rule out the enterprises coming under the Factories Act.
3. The particulars recorded were: the nature of the work; whether the entel prise used powerdriven machinery, i.e., machinery driven by an engine or electricity; the number of men, women and children engaged during the working season, and for enterprise in which weaving is the main or subsidiary operation, the number of looms and the material woven.
4. The inquiry was carried out more or less satisfactorily through out most of the country and provides what is perhaps a more widespread detailed survey of Cottage Industries than has
and service enterprises such as barbers and washermen. The Cottage Industry Inquiry was not held at all in the Federal Capital Area. All that can be deduced from the tables therefore is that at the time of the investigation the enterprises shown in the tables actually existed but that many mOre would have been disclosed by a more careful and thorough enquiry.
5. The data given on the enquiry forms has . been carefully coded in accordance Wilh a list of "Products and kinds of Work" agreed with the Ministry of Industries. Irrelevant entries were eliminated and the data has been sorted and counted by punched-card machinery in the Dacca Census Machine Centre. From the M:lchine Centre's Reports, the Provincial Superintendents of Census have prepared summaries for each district on which Provincial Tabll.'s have been based.
6. These Tables has been discussed in Chapter 9 of the Report.

S-2
SUPPLEMENTARY TABLE I-COTTAGE INDUSTRIES.
PUNJAB.
I Workers I Enterprises
Product or kind of work ----r--.--I
I
I Looms.
I Total I Usmg Total Men Women Child· I power I i ren
J
TOTAL ALL GROUPS ... 44,096 62 1,45,829 82,753 43,534 19,542 65,273
O. Production of yarn & textile 40,208 27 1,34,297 73,988 41,613 18.696 65,199 fabrics.
0.1 Cotton Ginning ... ... 52 9 164 73 91 ... 5
0.2 Spinning Cotton ... ... 731 ... 1,065 47 1,013 5 20
0.3 Spinning wool .. , ... 3 ... 9 7 2 . .. 1
0.6 Weaving Cotton muslin ... 273 . .. 1,106 653 273 180 583
0.7 Weaving other cotton fabrics ... 36,001 14 1,21,335 67,320 37,503 16,512 59,473
0.8 Weaving woollen fabrics ... 34 ... 224 166 33 25 165
0.9 Weaving jute fabrics (including 23 ... 39 39 ... ... 36 sica making).
0.10 Weaving silk fabrics (including 2,961 2 to,008 Mllnga & Tassar).
5,441 2,595 1,972 4,888
0.20 Weaving of Shawls, Kantha, etc. ... ... ... ... .. . .. . .. . 0.3.0 Zari,.thread &:geta making .... 2 ... 3 3 ... .. . 1
0040 Thread ball making ... I ... 4 4 . .. .. . 12
0.60 Cloth dyeing and printing ... 126 2 339 234 103 2 15
0.90 Prodllction of textile fabrics I ... I I ... ... ... n.e.c.
1. Carpets, Rugs, Rope, Bags & 194 ... 658 440 196 22 74 Nets.
I 1.1 Woven carpets ani rug malcing 54 ...
I 177 lt4 53 10 4
j 1.2. Pile carpet and rug making· ... 9 ... 33 23 10 ... . ... 1.3 Durry making ... ... 53 .. . 189 155 30 4 64
1.5 Fiber mat making ... ... 4 ... 16 8 8 . .. ... 1.7 Rope making, other ... 66 ... 196 122 74 . .. . .. 1.8 Sack & bag making. jute fabrics ... ... ... ... .. . . .. .. . 1.10 Fishing net and trap making ... 8 ... 47 18 21 8 6
2. Wearing apparel & work on 183 1 781 605 119 57 ... textile fabrics.
2.1. Cap and kulha making . ... 34 ..... 136 136 ... ... ... 2.3 Ready made clothing ... 41 ... 85 76 8 1 -" ..

SUPPLEMENTARY TABLE I-COTTAGE INDUSTRIES
PUNJAB
I Enterprises I Workers
Product or'kind of work 1-----·------!~~-~--I Total I Using i Total Men II :=-I-~r~e·~nld-! . pow~ I
I ____ ~ ________ l____ •
2.4 Hosiery 85
I: 2.5 Zari, gota, etc., Embroidery ...
I 2.6 Knitting and needle work
!; 2.9 Work on textiles n.e.c.
Ii 3. Jewellery and Ornaments
I- 3.1 Gold and silver smithy , .. f 3.3 Buttons, seep, horn, and mother i of pearl. ! 3.8 Immitation pearl making
3.9 Mother of pearl worm
4. Giass and Ceramics ...
4.1 Crockery
4.2 Pottery un-glazed
4.3 Pottery glazed
4.6 Tiles (glazed)
4.10 Household glassware
5. Fine and applied art n.e.c.
5.1 Hand printing
5.2 Painting
6; Paper and stationery articles •
6.1 Paper making (hand)
6.8 Cardboard boxes "
17. Wood work, cane and bamboo work.
7.1 Boat Building
7.2 Tonga and Rickshaw making ...
7.3 Wood furniture
7.4 Loom making
7.5 Bobbin making
7.7 Cart wheel making ...
5
5
13
105
100
3
832
3
590
214
24
14
13
8
7
679
32
55
5
7
1
2
8
494
25
13
28
197
191
4
2,626
17
2,002
492
2
113
72
62
10
39
34
5
1,845
2
91
224
13
35
3
361
18
13
147
141
4
1,749
17
1.299
375
2
56
37
27
10
,37
34
3
1,498
2
88
193
13
16
670
84
27
25
25
514
101
55
20
20
213
22
7
49
7
2S
25
207
189
16
2
IS
15
2
2
134
3
9
)2
S-3
Looms

SUPPLEMENT ARY TABLE I-COTTAGE INDUSTRIES
PUNJAB.
I Enterprises Workers
Product or kind of work
I I Women Total Using Total Men power
I
7.8 Cane furniture and cane weav- 1 ... 1 ... 1 ing (other than matting)
7.10 Matting of split bamboo, read, murta, pati, hogla, nal, etc.
43 ... 119 77 39
7.20 Lacquer ware ... ... 1 .. . 6 6 ...
7.30 Wood carved articles '" 6 ... 48 48 ... 7.50 Agricultural implements; wood-
work and assembly 451 1 1,095 870 121
7.90 Other Wood cane and basket 76 6 208 184 22 work n.e.c.
8. Leather processing and leather 1,267 1 3,480 2,617 S82 goods making.
8.1 Curing of hides 29 ... 116 115 ... 8.2 Tanning and leather processing. 46 ... 204 194 5
8.3 Leather boots and shoes '" 1,149 1 2,986 2,140 577
8.4 Leather soled chappals and 1 ... 6 3 ... sandals
8.6 Saddlery ... ... 20 ... 65 65 .. . 8.7 Ornamental leather work ... 1 ... 3 2 ... 8.90 Leather work n.e.c. ... 21 ... 100 98 . ..
9. Metal. work ... .. . 311 13 859 714 70
9.1 Agricultural black-smithy and implement making
211 ... 498 380 64
9.2 Brass and bell metal and processing
casting 22 1 100 92 2
9.3 Guns and Rifles ... . .. 2 2 3 3 ... 9.4 Sheet steel and tin work ... 16 ... 59 55 .. . 9.6 Cutlery ... ... . .. 23 2 70 63 2
9.8 Surgical instruments ... 4 ... 6 6 ... 9.9 Enamelled wire ... ... 2 I 7 7 ...
9.20 Locks and padlocks making ... 2 ... 8 8 ... 9.30 Hardware (cooking utensils and 4 ... 25 23 2
household metal articles).
9.60 Steel Trunks, Safes & Boxes ... 3 ... 4 4 ...
8-4
Looms. Child-ren
... '"
3 ...
... .. . ... ...
104 ...
2 ...
281 ...
1 ... 5 ...
269 ... 3 ...
... .. . 1 ... 2 ...
7S ... 54 ...
6 ...
... .. . 4 ... 5 .. ,
.. . .., ... . .. . .. ... ... .. ' . .. ..,

SUPPLEMENTARY TABLE I-COTTAGE INDUSTRIES
PUNJAB
Product or kind of work
9.90 Other Metal work n.e.c.
11. Other manufacture
11.1 Brush ware
11.2 Candle making
11.3 Button making n.e.c.
11.4 Toys ...
11.6 Polishes
11.8 Soaps and cosmetics
11.9 Hair oil and perfumes
11.50 Sports goods ...
11.70 Huqa and Naicha making .. .
11.90 Other manufacture n.e .c .. ..
12 Food, Drink & Tobacoo process-ing.
12.2 Confectionery and Biscuits
12.3 Fruit preservation
12.4 Jams, pickles and Chatnies
12.5 Gur making
12.7 Vegetable oil extraction & processing.
12.8 Salt making
12.9 Other food processing
12.10 Bidi making
12.40 Other tobacco processing
12.60 Aerated water (smaller scale) ...
\ . i , Enterprises I
1- Tot:i~sing I, Total I
I ! power i
, '
22
109
8
7
3
13
15
41
16
4
186
10
2
9
86
3
65
3
5
2
6
3
3
7
3
79
453
18
19
12
16
41
55
2
161
100
29
522
29
3
7
52
160
6
232
19
11
3
Workers
Men Women
73
451
18
19
12
16
41
55
2
161
98
29
470
25
2
7
38
128
6
231
19
11
3
26
6
19
I Looms. Child- ,I
ren
6
2
2
26
4
8
13

S-6 SUPPLEMENTARY TABLE 1- COTTAGE INDUSTRIES
BAHAWALPUR STATE.
Enterprises Workers
Looms.1 Product or kind of work
I
i Total Using Total Men Women I Childern
l power
TOTAL ALL GROUPS ... 2,946 9 7,288 4,466 1,995 827 1,521
O. Production of yarn, etc. 1,451 5 4,453 2,244 1,536 673 1,521
0.1 Cotton Ginnin g 36 4 50 35 15 3
0.3 Spinning wool 2 2
0.7 W.:aving other cotton fabrics 1,299 4,101 2,013 1,419 669 1,506
0.10 Weaving silk fabrics 10 22 16 4 2 !! 0.20 Weaving of Shawls, Kantha, etc 4 4 4 3
0.30 Zari, Thread & Gota making 2 2
0.60 Cloth dyeing & Printing too 272 172 98 2
1. Carpets, Rugs, Ropes, etc 2 3 3
1.8 Sack & Bag making Jute fabrics 2 2
1.10 Fishing net & trap making
2. Wearing apparel & work on textile 5 14 12 1 1 fabrics.
2.3 Ready made clothing 3 9 8
2.4 Hosiery 2 5 4
3. Jewellery & ornaments 64 102 93 8 1
3.1 Gold & silver smithy 64 102 93 8
4. Glass & Ceramics 397 1 842 610 208 24
4.2 Pottery un-glazed 397 842 610 208 24
7. Wood work, cane &; bamboo 388 1 695 580 71 44 work.
7.5 Bobbin making 2 2
7.8 Cane furniture & cane weaving
7.50 Agricultural implements, etc 372 667 556 68 43
7.90 Other wood cane & basket 14 25 21 3 work.
8. Leatber Processing, etc 393 627 476 133 46
8.1 Curing of Hides 11 51 29 22
8.2 Tanning & leather processing 3 2 2
8.3 Leather boots & shoes 379 574 445 83 46

S-7 SUPPLEMENTARY TABLE I-COTTAGE INDUSTRIES
BAHAWALPUR STATE.
Entrprises Workers
Product or kind of work I
\ Women
I
Using I
Total power Total i Men
I 9. Metal work ... ...
9.1 Agricultural black-smithy & implement making.
9.2 Brass & bell processing.
metal casting &
9.6 Cutlery ... .. , 12. Food, Drink & Tobacco process-
ing.
12.2 Confectionery & Biscuits ... 12.7 Vegetable oil extraction and
processing.
192
187
3
2
54
3
51
... 433 362 38
... 423 352 38
... 9 9 . ..
... 1 1 ' ... 2 119 86 28
. " 12 12 ... 2 107 74 28
I Looms.
Child-
I ren
33 ... 33 ...
. .. ...
... ... 5 ...
... .. .


S-8 SUPPLEMENTARY TABLE 2.
COTTAGE INDUSTRY LOCATION TABLE.
I Number of Enterprises
I
I "dO) I I ! I I
I I \ ~E I
! I Vl I 0) ,
Product or kind of I I.
(,)
I I I .0"" c I
work ! 01::l '> 'I til >. ...... 0. i «I c
I I ...
I c_
I 0 ea El Ol e
I :l0l ...
0- .0
I ~~ ~ ~ ...
Ol .0 C 0 ~ '0 ::.:: I
:I ~ -;~
I 0-
I I Ol «I ~ 0 co d ...... ...
~ I Q ~ I o~
c .S' ~ Jl «I 0 I :I 0 >.
£-< Po. Cl ....l Vl I Vl I .<:: ....l I ~ I .... I
TOTAL ALL GROUPS 47,042 44,096 2,220 5,166 2,283 5,294 124 2,262 7,840 1,935
O. Production of yarn 41,659 40,208 2,115 4,664 2,131 4,670 114 2,199 7,611 1,852 & textile fabrics. "
0.1 Cotton ginning 88 52 ... ... ... 6 . .. 2 7 3
0.2 Spinning cotton 731 731 1 ... 2 ... ... 544 12 .. . 0.3 Spinning wool .. 4 3 ... ... ." 1 .. , ... ... .. . 0.6 Weaving, cotton,
Muslin. 273 273 48 ... 39 51 . .. 1 31 ..,
0.7 Weaving other 37,300 36,001 1,946 4,656 2,089 3,326 82 1,500 6,408 1,837 cotton fabrics.
0.8 Weaving woollen 34 34 ... 1 ... 2 12 2 2 4 fabrics.
0.9 Weaving jute fabrics (includ-
23 '23 2 ... J ... 20 . .. ... . .. ing Sica mak· ing).
0.10 Weaving silk fabrics (includ·
2,971 2,961 112 1 .. , 1,283 .. , 150 1,148 2
ing Munga and Tassar).
0.20 Weaving of 4 ... ... ." ... ... .. , ._ ... ... Shawls, t; Kantha, etc. ~
0.30 Zari, Thread and 3 2 1 ... ... '" ... .. . 1 .. . Gota making.
0.40 Thread ball mak- 1 1 .. , . " '" ... .. , . .. '" ... ing.
0.60 Cloth Dyeing and 226 126 5 6 ... 1 1 ... 2 5 printing.
0.90 Production of 1 1 ... ... ... . .. ... ... . .. 1 textile fabrics n. e. c.
1. Carpet, Rugs, Rope, 196 194 1 70 . " SO ... 1 11 ... Bags & Nets.
1.1 Woven carpets 54 54 ... ... ... 26 . .. ... ... .. . and Rug mak-ing.

S-9 SUPPLEMENTARY TABLE 2.
COTTAGE INDUSTRY LOCATION TABLE.
Number of Enterprises
I I
I I I I 2 !
I I !S ~
I Product or kind of
oS tI)
work ... ... ... .r:: 0:1 =' :a ::I ::I .:.i I:!l ..9
I
.~ I'i Q. ..9 ...
I '0 ~ ~ ~
0:1 d
I ~ 1 0:1 ;...
,D .... 8 2 ~ .S 5 0. 0:1 d ... :I <II 0:1 I '3 8 ':;' I ] 0:1
I 0:1 ..<l .r:: ~ =' <II I .~ 0:1 ,D I 0:1 0:1
I I ::a ::a u \:) I ..... ~ Vl ~ ~ ~ ----
8,707 570 728 2,766 145 911 418 2,727 2,946 2,184 762 TOTAL ALL GROUPS.
7,041 414 717 2,679 141 802 367 2,691 1,451 1,103 348 O. Production of yam & textile fabrics.
4 9 ... .. , ... ... ... 21 36 26 10 0.1 Cotton ginning.
3 ... ... .. , ... '" .. , 169 ... '" ... 0.2 Spinning cotton.
2 ... .., ... . .. ... .. , .. , 1 ... 1 0.3 Spinning wool.
102 ... .- ... .. , .., .. , 1 ... '" .. . 0.6 Weaving, cotton, Muslin.
6,576 405 700 2,679 141 801 358 2,497 1,299 979 320 0.7 Weaving other cotton fabrics.
... ... 1 ... ... ... 7 3 ... .. . .. . 0.8 Weaving woollen fabrics.
... . .. ... ... .. , ... .. . ... ... . .. .. . 0.9 Weaving jute fabrics (including Sica making).
248 ... 16 ... ... 1 ... .. . 10 . .. 10 0.10 Weaving silk fabrics (including Munga and Tassar).
... .. , ... ... ... . .. ... ... 4 ." 4 0.20 Weaving of Shawls, Kantha, etc.
... ... .. , ... ... ... .. . .. . 1 ." 1 0.30 Zari, Thread and Gota making.
... ... ... ... ... ... I ... .. . .., . .. 0.40 Thread ball male-ing.
106 ... ... ... ... ... I ." 100 98 2 0.60 Cloth Dyeing and printing.
... . .. .. , '" '" ... ... ... '" .., ... 0.90 production of textile fabrics n. e. c.
7 ... ... 7 1 35 3 8 2 1 1 1. Carpet, Rugs, Rope Bags & Nets.
.. , ... . .. 7 ... 21 ... .., ... ... .. . 1.1 Woven carpet and rug making.

5-10
SUPPLEMENTARY TABLE 2.
COTTAGE INDUSTRY LOCATION TABLE.
Number of Enterprises.
I '0<>
I I I
I r
I
I I I
Cl~ i I oj.- <> I ct or kind of til u I i I .~ I
I work .0 ...
! I ! I
I I oj=' .!!! I ~ ~ I
.,_, P. 0 I I oj i'l_ I ~~
... 0$ I I ;::l I ~ ~
I p,. I ~ P. I 1
I
I 0 '5 0$ ~
I
I ., I '0 _..e 0$
I
... ..e c:i I bI)
~ ... 0 ,.Id , 0$0$ '2 'S ..e I 'ij) ~ Cl a , o~ '" I I
,g ; 0 0 ...l ,.Q iii 0 :s ~ r-o p,. I til I
.....
Produ
1.2 Pile carpet and 9 9 rug making.
I.3 Durry making ... 53 53 24 11
1.5 Fibre mat mak- 4 4 4 ing
1.7 Rope making, 66 66 66 otber.
1.8 Sack & Bag making, Jute fabrics.
}.10 Fishing Net and 9 8 Trap making.
2. Wearing apparel & 188 183 1 11 11 100 29 work on textile fabrics.
2.1 Cap and Kulha 34 34 33 making.
2.3 Ready made 44 41 10 11 clothing.
2.4 Hosiery 87 85 7 44 24
2.5 Zari, Gota, etc., 5 5 4 Embroidery.
2.6 Knitting and 5 5 5 Needle work.
2.90 Work on textiles 13 13 12 D.e.C.
3, Jewellery Imd Or- 169 105 4 29 17 3 5 2 naments.
3.1 Gold and silver 164 100 4 26 16 3 4 2 smithy.
3.3 Buttons, seep, 3 3 3 hom & mother of pearl.
3.8 Immitation pearl making,
3.9 Mother of Pearl work.

SUPPLEMENTARY TABLE 1.
COTTAGE INDUSTRY LOCATION TABLE.
Number of Enterprises
I I I I ~ 0:1 ...
rIl ... I
] ::I ~ I .~ ..9< ,.e. '; ... <II <II
I 8 ~ i
:; ~ ~ ::I Q ..§' 0:1 .! Q <II
I 0:1
I .c:
.c: ~ ;;! .c <II <II .... rIl ~ ~
.c ... ... ::I 0:1 Co 01)
~ .... c ~ ,J::; ... !S Co 0:1
~ 8 ...
"a ::I <II ::I ~ ~ U iJ
7
7 2 7
6
1 20 1 1 2 5
20 3
7 2 2
4S 64 56
45 64 56
ill
~ .. ~ 8 :.c 0:1 ~
5
3
2
8
8
8-11
Product or kind of work
J
1.2 Pile carpet and rug making.
1.3 Durry makiI18.
1.5 Fibre mat making.
I 7 Rope milk i n 8, other.
1.8 Sack & Bag mak~ iug. Jute faMos;
1.10 Fishing Net an Trap making.
2. Wearing apparel work on textil fabric.
2.1 Cap and making.
2,3 ~eady made cloth IDg.
2.4 Hosiery.
2.5 Zari, Gaia, Em broidery.
etc.,
2.6 Knittint and need-!ewor •
2.90 Work on textiles n.e.c.
3. Jewelery and Orna-, ments.
3.1 Gold and silver smithy.
3.3 Buttons, seep, horn & mother of pea
3,8 Immitation pearl makilli·
3,9 M9ther of Pearl work.

S-12 SUPPLEMENTARY TABLE 2
COTTAGE lNDUSTRY LOCATION TABLE
--,~~",.""_=------. .<--- -.~.~ ~-
I I Number of Enterprises
I~_~_~_-------- -_ -_-_-----
I I 'dOl I ~S ! " Product or kind of
rn
I (.)
.0 .... a work t'd::l 'g cd c: »
'~o. I t'd ....
I a- .... t'd " ::l~ .... -; ::l .0 e ~ ~ 0. :i ...
Il..t'd ] .., ::l ~ .c c: " .9---; t'd <'I .... 0 00 d '2 .... 0 ~ ~ (;) c:: c; g~ '15' .c (ij E 0 ;:l j .c 0 » ~ ,... ~ (;) <f} .~ _, ....J
----------- ----~------- -- -- -~ - - - .- -_ --_---- --- -_ - __ --
4. Glass anr. Cera- 1,229 832 41 149 22 114 10 6 31 mics.
4.1 Crockery 3 3
4.2 Pottery un- 987 590 30 77 22 22 6 31 glazed.
4.3 Pottery glazed ... 214 214 9 72 70 10
4.6 Tiles (glazed) ...
4.10 Household Glass- 24 24 2 22 ware.
5. Fine and applied 14 14 1 art n. e. c.
5.1 Hand printing ... 13 13
5.2 Painting
6. Paper and sta- S 8 6 tionery articles.
6.1 Paper (hand).
making 7 7 6
6.8 Cardboard boxes
7. Wood work, cane 1,067 679 11 45 15 76 35 45 4 and bamboo work.
7.1 Boat building ...
7.2 Tonga and 32 32 30 Rickshaw mak-ing.
7.3 Wood furniture 55 55 2 31 14
7.4 Loom making ... 5 5 5
7.5 Bobbin making 8 7 4
7.7 cart wheel mak-i,ng.
7.8 cane furniture 2 and cane weav-ing (other than matting).

S--13
SUPPLEMENTARY TABLE 2
COTTAGE INDUSTRY LOCATION TABLE
Number of Enterprises I
_I --~~--_
C) I 'iii c Product or kInd of -e rn t<S work '" ... ...
~ t1l ::l ~ ::l ::l bO 0. c ~ ~ .... ~ t; .... c ~ ·-a ::l >.
.os ,D
~ I 8 ~ -;; 0. ~ ~ .§ 0:1 0. ::l C ..c:I oj
""3 N 8 .... <l oj ~ oj .c -a .d ::l t<S ·s
~ oj ..c:I oS oj
~ ~ U () ..c:I ~ Vl ~ ~ ~ ..... --------~-_ -----~.--
330 18 24 60 22 5 397 293 104 4. Glass and Cera-mics.
4.1 Crockery.
277 18 23 60 20 4 397 293 104 4.2 Pottery un-gl,a.ze
53 4.3 Pottery glazed.
4.6 Tiles (glazed).
4.10 Household Glass-ware.
12 1 5. Fine and applied art n. e. c.
12 5:1 Hand printing.
5.2 Painting.
1 6. Paper and sta-tionery articl~.
6_1 Paper making (hand).
6,8 Cardboard boxes.
413 13 3 7 6 3 3 388 274 141 7. Wood work, cane and bamboo work .
'_ 7.1 .aoat building.
7.2 Tonga and Rick-shaw making.
5 2 7.3 Wood furniture.
7.4 Loom making.
7.5 Bobbin making.
7.7 Cart wheel mak-ing.
7.8 Cane furniture and cane weav-ing (other than matting).
-

S-14
"0<> §~
ProdQct Of kind Vl ofwolik -g ..
.",,::1
~~ ~
-a~ "'«:1 gliXl
7. to Mattin~ ef aplit 43 bam&!e, read, murta, pati, bogI'a, nal etc.
1.:M'I Lacquer ware '" 1
7.30 Wood carved 6 articles.
7.S() Agricltltural im- 823 plements; woodwork & assembly.
7.fJ4} Other wood cane 90 and basket wOJ;k n. e. c.
8. Leather processing 1,660 & leather goods-making.
8.1 Curing of hides 40
S.l Taonint' and 49 l'eathet process. ing ..
8.3 Leatl~er boots 1,528 and shoes.
8.4 I&alher soled ehaPf!3~ and Sandals.
8.6 Saddlery 20
8.7 Ornamental leather work.
8.90 Leather work 21 n.e.c.
9. Metal worlo: 503
9.1 Agricultural 398 black-smithy & implement mak-ing.
SUPPLEMENTARY TABLE 2
COTTAGE INDUSTRY LOCATION TABLE
Number of Enterprises
i
I
I
<>
I u s:: .;;;: «:I .\S
,_
l ::I = '" ~ ::I
i ~ <I)
~ 0 ...
I 0 .... ~
6 ..0::: Q
"' ~ ~ ~
43 ... ... .., ...
I ... ... . .. ...
6 '" ... .., ...
451 9 39 15 ...
76 ... ... ... 15
1,267 21 136 50 103
29 I ... ... .. . 46 ... 41 ... ...
1,149 20 78 50 83
20 20
21 17
311 25 44 36 33
211 15 13 28 28
c «:I
~ d A J -_ -_ .. --'---.. . 10
. ..
. ..
... 6 2S 4
.. . 10 9
." 5 115 37
.. ,
."
... 4
14 12 1
2 7

I II
I I oS "" ::l
b'b ,.So .. ;:; I ~ t:: ..c .....
~ 0. ~ .:: ~
I N 8 'i:j' ::I ::l ~
~ ~ Cl U I
33 ... '" ...
1 ... '" ... 2 ... I 3
328 12 ... 4
40 ... 2 ...
660 121 1 5
28 ... '" ... 4 ... ... ...
626 121 ... 5
... ... ... .. ,
... ... ... .. ,
121 4 2 3
107 3
SUPPLEMENTARY TABLE 1
COTTAGE INDUSTRY LOCATION TABLE
Number of Enterprises
I
I I
I
Cl)
I ..... ~
V5
! .... .. :a ::l
I ::;
I 0. 0. .~ .& ~ I .. ~ ~ 8 B: ::l B:
I 0;
! 0.
~ s:1 ..c ~
I
~
'" ~ ..c ..c ~ '" '" '" .<: I ..c ..... i ~ ! CIl p: p:
... .. , ... ... ... .. .
.. , '" ... ... .. . .. ,
.. , ... ... ... ... ..,
... 6 I 2 372 246
... ... .. , ... 14 .. .
1 ... 5 7 393 306
... ... .. , ... II 11
... ... 1 .. . 3 3
.. , . .. 3 7 379 292
... .. , 1 . .. ... .. .
.. , . " ... ... ... '"
1 4 3 8 192 134
4 2 187 134
I I I
(
i
i
t:: ~
.<: ..:.:: ... ~
a-:E ~
~
...
...
. ..
126
14
87
.. .
.. ,
87
..,
.. .
7.1
S-15
Product or kind of work
o Matting of aplit bamboo, read, murta, pati, hogla, nal etc.
7.2 o Lacquer ware.
7.3 o Wood carved articles.
7.5 o Agricultural implements; woodwork & assembly.
7. 90 Other wood cane and basket work n. e. c.
8. Leather processing & leatber goodsmaking •
8 .1 .Curing of hides
8 .2 Tanning leather processing.
8.3 Leather boots an shoes.
8.4 Leather soled chappals and Sandals .
8 . 6 Saddlery
8.7 Ornamental leather works.
8.90 Leather work n. e. c.
58 9. Metal work
53 9.1 Agricultural blacksmithy & implement making.

8-16
SUPPLEMENTARY TABLE Z
COTTAGE INDUSTRY LOCATION TABLE.
---~""~~'·~-l-·'-~-~~~__:mb:r·' of Bnterprise's.~·~ I
Product or kind of work
j-------- --.. ---------~--·~I·--·--·---) "tj~) I c~ . ~ ... ,
tI'1 '
ro ~ ...
;:l oj c.. $ ;:l c: e ..c: ell .l<i .... 0 'OJ . ...., .t:: ;:l 01 .a 0 ....l {/l
c: ('j
..c:: ... ~
CD 0 0 .l<i c:
~ ~
c::i .<:: ..., --"-~--~- - -------~--- ---~-.-------.--------.-----.--------~-..
9.2 Brass & bell rr,etal casting & processing.
9.3 Guns and Rifles.
9.4 Sheet steel and tin work.
9.6 Cutlery
9.8 Surgical InstrumentS.
9.9 Enamelled wire.
9.20 Locks and padlocks making.
9.30 Hardware (cooking utensils & household metal articles).
9.60 Steel Trunks, Safes, and boxes.
9.90 Other met a 1 work n.e.c.
II. Other manufacture
11.1 Brush ware
11.2 Candle making.
11.3 Button making n.e.C.
11.4 Toys
11.6 Polishes
11.8 Soaps and cosmetics.
11.9 Hair oil and perfumes.
25
2
16
25
2
2
4
3
22
109
8
7
3
13
15
4
11.50 Sports goods... 41
11.70 Huqa and 16 Naicha making.
22
2
16
23
4
2
2
4
3
22
109
8
7
3
13
15
41
16
3
1
8 4
5 4
11
3
4
2
4
71
8
6
8
41
8
4
2
5
1
a _____ ,
·~,,~I I ~
3
3
-~-".~------ -------------------------,----------------

4
2
3 3
14 2 8
12
8
SUPPLEMENTARY TABLE 2
COTTAGE INDUSTRY LOCATION TABLE
Number of Enterprises
2 3
2
1 4 2
S-17
- . .._,,~~---~.~-
\
Product or kind of work
3 9.2 i
Brass & bell I metal c!lsting & processlflg.
9.3 Guns and Rifles
9.4 Sheet steel and tin work.
2 9.6 Cutlery
9.8 Surgical instruments.
9.9 Enamelled wire.
9 .20 Lock~ and padlocks making.
9.30 Hardware (cooking utensils & household metal articles).
9.60 Steel Trunks, safes, and boxes.
9.90 Other metal work n.e.c.
11. Other manufacture
11.1 Brush ware.
11.2 Candle making.
11.3 Button n.e.c.
11.4 Toys.
11.6 Polishes.
making
11.8 Soaps and cosmetics.
11.9 Hair oil and perfumes.
11.50 Sports goods.
11.70 Huqa and Naicha making.

8-18
-"'''''''''',.
I
I "00 s::-Product or kind of
I <'SE
Vl
work .0 ....
'25. I ::I';;
I
Q..~
'" 3-; ~~
11.90 Other manufac- 4 ture n.e.c.
12. Food, Drink and 240 Tobacco pro-cessing.
12.2 Confectionery 13 and Biscuits.
12.3 Fruit preserva- I tion.
12.4 Jams, Pickles 2 and Chatnies.
12.5 Gur making ." 9
12.7 Vegetable oil ex- 137 traction & pro-cessing.
12.8 Salt making ... 3
12.9 Other food pro- 65 cessing.
12.10 Bidi making ... 3
12.40 Other tobacco 5 processing . .
12.60 Aerated water 2
J (smaller scale.)
SUPPLEMENTARY TABLE 2
COTTAGE INDUSTRY LOCATION TABLE
Number of Enterprises
-~"----
! I I I I I «)
I I .13
I
,
I ... I '" 0 ~ ....
::I ....
I ~ Q.. P-
:> .0 C 0 I ..c: ... '" tIS S ..,. 0 . S' I ... I
i ~ .S' ..c:
I
'': ::I I 0
oj ..c: .e.g Q.. ....l rJ) til
4 ... 1 ... . ..
186 '" 15 il ~ ~ 71
10 '" 2 ... .. ,
I '" ... ... ...
2 ... ... ... .. ,
9 '" ... ... 6
86 '" 4 ... 16
3 '" ... ... 3
65 '" 9 ... 41
3 '" ... .. , . .. 5 '" ... . .. S
2 .. -~ .. , ... ...
I 1 I I I
I
s:: ~ <'S «)
..c: 8 .... ~ ::I ~ 0. c5 ~
..... ~ s::
0 cj ..c: $ ~ ...,
... ... . .. ...
... 4 3 8
. .. J 2 ...
. .. ... ... '"
" .. . .. ... . ..
. .. . .. ... ...
.. -. 3 1 8
. .. . .. .. , , ..
. .. ... ... ...
.. , . .. ., . . ..
... . .. ... ."
... ... '" . ..

64
5
3
51
3
13
2
11
SUPPLEMENTARY TABLE 2
COTTAGE INDUSTRY LOCATION TABLE
Number of Enterprises
S-19
Product or kind of work
______ ~~ __ ~~c_~_L__ __ ~_~ __
2
3 4 54 44
3
2 51 44
3
2
10
3
7
11.90 Other manufacture n.e.c.
12. Food. Drink and Tobacco proecssing.
12.2 Confectionery and Biscuits.
12.3 Fruit preservation.
12.4 Jams. Pickles and Chatnies.
12.5 Gur making.
12.7 Vegetable oil extraction & processing.
12.8 Salt making.
12.9 Other food proeessing.
12.10 Bidi making.
12.40 0 the r tobacco processing.
12.60 Aerated wa t e r (smaller scale).


CENSUS OF PAKISTAN 1951,
INSTRUCTIONS FOR ENUMERATORS
1. Reme~ber what you heard at the class of instruction.
2. Read the noles on the. back of this paper carefully and be read.>: to expl~m the!U to rrspondents who have any difficulty JO choostng theIr answers.
3. Fill in the Location Code at t~e foot of each slip at home before you start enumeration.
4. Do not write in the shaded ~paces on the slip: these are for use in the Census Office.
5. Write clearly in INK. Make symbols definite and firm.
QUESTIONS
PRELIMINARY
QUESTION
HOW TO WRITE ANSWERS
House Number Write in box. Have yOIl been enumerat. If not ask question 'a'.
ed already?
a. Is this your present REGULAR residence or lodging place?
b. Will )'ou be BACK in your normal residence be/ore 28 Febrllary?
If yes carry out enumeration in full. If not ask quest
ion 'b'. If no, or doubtful, carry out
enumeration.
If yes, do not make out a slip but carefully warn the person that it is hislher duty to see that a slip is made out at his/her normal residence.
1. NAME? Write it out, If a tribesman, put name of
tribe or tribal section in brackets after the name.
RELATION to Head Write under KIN 0/ Household? 1 =Head. 2=wife
SEX?
2. AGE in years?
for infants under 1 year for children under 12
years IS FATHER LiYing ?
MARRIED? SINGLE? (i. e. never
married) WIDOWED? DIVORCED?
3 -Son or Daughter 4 = Father or Mother 5 = Other relations X=No relation
In bottom corner Ring round M for Male: F for Female
Write number of years completed On 28 February 1951
Write in box, age in months. If No put Ring round age fig
ure If Yes put of after age figure. Ring round M
"
"
s W D
..... ----------------------~------3. Were YOIl BORN in ]f 'yes' put ( this DISTRICT?
If not WHERE? Other places in Pakistan or Bbarat write Dame of DISTRICT
Elsewhere write name of COUNTR Y only.
2
QUESTIONS HOW TO WRITE ANSWERS
4. Are YOIl a PAKIS- If 'yes' Ring PAK . TAN/? for Pakistanis on visits out
of 'Pakistan, write country being visited' e.g. 'IN U.K.
If not: What is yaur Write it out NATIONAUTY?
If an Afghan: Are )'011 If yes put "PA" a POWINDAH?
If so: Where is ),our Write place in respondent's party settled this win- words. ter?
5. RELIGION?
For Hindus: Are YOIl a Caste Hindu or do you belong /0 Scheduled Caste?
Ring Round the- appropriate Number. (Note that number 7 applies in Cbittagong Hill Tracks only.)
6. MOTHER TONGUE? Put ~ under language spoken from the cradle.
7. Any other language Put v under languages spoken you com m 0 n I y SPEAK?
8. Can you REA D? If 'No' put big X over all WRITE? spaces on this line.
In what languages?
Under Arabic
If 'Yes' put under language P for Reads L fOr Reads and writes
Q for Reads Holy Quran only_
9. Are )'OU a MUHAJIR? If 'No' put X
If yes: From which PRO VI NC E or STATE?
10. EDUCATION
Write it out. but if the place is seen to be the same as the person's birth place it may be indicated by putting figure 3.
(a) Are ),011 reglllarly If yes ring round S. attending School or College?
(b) For how many vears have you attended School or College?
(c) Howfar has YOllr edllcation pro-gressed?
Write figures under years. If respondent bas never attended School put X UDder Years.
Completed Primary School : Rina round P,
,. M Passed Middle Scbool Exam :
Passed Matriculation (Entrance) Exam: "
Obtained University Degree : "
Obtained Higber (Post-Graduate) Degree: ..
" E
D
" H

QUESTIONS
FOR PERSONS UNDERI2YEARS OF AGE THIS COMPLETES THE QUESTIONS
ELIMINATING QUESTION:-
Are you usually selfsupporting 0; partly self-supporting or are YOll seeking work?
IIA. What is USUALLY your main OCCUPATION (Kind of work)? (For MulJajirs: What WAS your main occupation?)
1 HO~ TO WRITE ANSWEJ
Draw big X through spa ItA to 16.
If 'No' put a big X over th whole space from llA t 15. This then comple the questions except fo
women to whom 16 applif! If 'Yes' ask all the questions.
If a 'Tiller of the Soil' Rin T. Otherwise, write it out
If DO work is (or was usually done put X.
lIB. Have you any Write it out. SUl! S IDIA R Y means of liveli· hood, if so what?
SPECIAL QUESTION:
Do you receive rent in If 'yes' Ring Z in space 14. ! cash or kind for land I you own but which is tilled by others.
12. What was your actual If same as llA put v main occupation in If not, write at out. JANUARY 1951?
I
If unemployed through· out January 1951.
A. Were you SEEKING employment ?
If 'No' put another X: t 'Yes' ask question Band
If unemployed, put X aJ ask question A.
B. In what occupation? If same as llA put ali the X otherwise write 1t out after the X I
C. How many months Put number of months a~il had you been unem- tbe above. played and seeking Example,:, 'X n, means th work at the end of person was unemploye January ? throughout January. vi
seeking work in his usual main occupation and ha~ been unemployed S:$ November 1950 i. e; for, t' 3 months ending Jauua' 31,1951: '
13. ECONOMIC GROUP
In what kind 0/ industry, Write it out. business; or service did you work in January?
14. AGRICULTURAL For persons'marked T in ques· STATUS tioli 1lA.
DQ you OWl! all or any of If. 'yes' Ring C t fie ltitrd you liII?
QUESTIONS HOW TO WRITE ANSWERS
Do you pay rent In cash If 'yes' Ring A or kind lor any of the land you till?
Do you work as a labour..." .; B er for another person who tills land?
15. IN D U S T R I A L For persons NOT marked T S TAT U S in question HA.
In your main occupation: Do you employ others? If 'yes' Ring EO
Or are you an employee?
Or are you an independ. ent worker? ,
" t,
" ,.
" B
" Or an unpaid family help ?" .. "
I
F
16. For WOMEN who are or have bee n MARRIED
a. During her Whole life: How many years has she Write under WED total num·
been married altoge· ber of years. ther?
How many children have Write under CH'RN total been born alive to her number of children. altogether?
b. During the last 12 months:-
How many children have Write under BORN. number been born alive to her? of children born during
the year ended 28 Februa· ry 1951.
Are they all living ?
What was the age in months of any of them who died?
ABSENTEES:
If 'yes' put oJ under LIVED for each Child still living.
Write under LIVED, number of months during which the child Jived.
If more than one child is given under B 0 R N, show them separately under LIVED, thus.
". ~·6 means that out of three children born in this year two are now living and one died at 6 months.
Are any persons who us· If 'yes' ask questions A and udily Ii ve in your household ABSENT?
A. Did the person leave 1 before 7 February? I
B. Wi/! the person be" If 'yes' to both question ask away until dfter 28 1 question C. February? J
C. bJ the person staying, If, 'yes' no further i action INSIDE Pakistan? needed. i
If 'No' to either A., B or C D,1ake 'out a slip for the a~seIlt person on replies Slven by a responsible member of household who should sign the slip;

EXPLANATIONS. l. PERSONS TO BE COUNTED:-
a. The Object is to include in the Census all persons who are normal residents of Pakistan, and all visitors to Pak_istan during the enumeration period. The census IS to be complete and "catch every man", but we must not count anyone more than once.
b. Therefore. visit each house at least once during the en_un;teration period, 9 to 28 February inclusive. mlssmg no place in your block. Write a slip for every person you find tbere who is 'a Normal Resident and also for Visitors, Travellers and Wanderers, in accordance with these instructions.
c. A Normal Resident is a person to whom the house is bis or ber present regular residence or lodging place. If you bave any doubt as to wbelher a person is truly a normal resident you should fill up the slip and make a note to consult the Supervisor of your Circle regarding your doubts.
d. Absent' Members of Household: The object of the prelimina!y questions is to ensure that people away from therr homes for part of the enumeration period are enumerated with the population in the localhy in which they normally reside. Persons who are away during the whole enumeration
period will be counted at tbe place in Pakistan where they have gone. But persons who are known to have gone outside Pakistan, should be enumerated as absentees at their normal place of residence. The country they are visiting should be written in sp ace 4. The Persons answering on behalf absentees should sign the slip as a guarantee of good faith. e. Visitors found in the house are dealt with in
accordance with tbe detail in the Preliminary questions. If not already enumerated they should be enumerated where they are found no matter from where they come unelss tbey will be at their normal place of residence in Pakistan at some later time during the enumeration period. If you enumerate tbem you must warn them not to allow themselves to be enumerated again under tbe penalty laid down in the Act, anti they should sign the slip.
2. NOTES ON THE QUESTIONS:-Q. 1. Name: Statistically names bave no signi
ficance and the record of them will be destroyed. The reason for the question is to assist you, the enumerator, in obtaining reliable information and in prevellting double counting. Except for visitors Women's names may be omitted if the respondent so desires. Relationship to Head ~f Houeshold is also asked
merely as a check on accuracy. Sex. Every person will be classed eitber as male
or female. Q. 2 Age: Use the" month" space only for
infants under one year. Record all older person's ages in complete years at last birthday.' For respondents wbo do not know their ale in year estimate it in single, years up to 25 and to the nearest 5 years abeve that age. Prepare for yourself a list of well-known local happenings in these periods of the past to heolp respondents fix their age group in that way. '
Marriage: '" Single" means that a person baa never been married at all. Otherwise,.a person must either still be IlllIrried (M) or the husband/wife must have'died (W), or else the marriage must have been legally dissolved (D). .
Q. 4. Nationality: Write down exactly what the respondent says. People know quite well whether they re,ard themselves as Pakistanis or not and it is their opinion that has to be recorded.
,6 ." por NOD-Paki~tanis reco~4 the name of the country.
or which they claIm to bl: CItIzens. Afghan powindalls: should be asked questions I. 2,
4 and 12 only. Try to get the name of the village in reply to the questions as t~) where the Powindahs' party is settled. If the respondent knows it, also write name of the district. If an Afghan does not know whether he is a Powindah ask him how long he is staying in Pakistan. If he is only here for the winter. treat bim as Powindah.
Q. 5. Religion. Accept responde~t's own c.lassi~cation. In caseS of doubt regardIng claSSIficatIons 2 or 3 ask the respondent to state his caste. Note his reply on the back of the slip. Give your Supervisor a list of all such cases. 'Do not argue with respondent.
Q. 6. Mother Tongue: The last column is intended for perSonS whose mother tongue is not one of those named on the slip; when that is the case write the name of the language in the blank heading.
Q. 7. Other Languages Spoken: The respond",nt should not claim to speak any language unless he can easily converse in it. If you yourself can teit him, do So. Otherwise lake his word.
Q. 8. Literacy: Ability to read means that a person can read print. Ability to write means that he can write a simple letter.
Q. 9. A Muhajir: is a person who has moved into Pakistan as the result of partition or fear of disturbances connected therewith. Persons who came for that reason are Muha)irs for census purposes no matter from where, when or for how long a stay they have come.
Q. 10 Education: A person is regarded as regularly attending School or College regardless of any temporary break in attendance such as sickness or holidays. The question on number of years dUring which a person bas attended Schoo I applies to those who have left School and College liS well as to those still attending. Write the figure in tbe nearest whole number of years. "Completed primary School" means that the
person reached the top Primary standard "Passed Middle School Examination" includes Middle English. Middle Vernacular, Junior Madrassah etc. "Matriculidion" means the last High School or Madrassah examination prior to joining College or University. "University Degree" means the first Degree such as BA., B.Sc., M.D.,B.S., B.E., etc, awarded by recognized UniverSity, the Interrpediate examination docs not count as a Degree. A "Higher (post-graduate) Degree" means M.A., M.Sc .• M.D., etc. The Eliminating Qllestion:-
Except for question 16 the rest of the questionnaire deals with economic activities. Children under 12 are not therefore asked any further questions. To all others tbe question on self-support is asked to catch all the people who support. themselves from th.eir own income, salary or wages eIther in money or IQhd, or who arc seeking to do so, There is no place to record the answer because the object of the question is merely to enable you to decide whether you should ask the remaining questions or not.
Q. llA. Usual Main Occupation: means the occupation in which a person is trained. skilled or experienced and which he regards as his permanellt meaDS of livelihood, such as:-Cultivator ("tiller of the soil"= T) HeI;dsman, F~sherman. Charcoal Burner Blacksmith, Weaver, Tailor, Carpenter' Washerman, Barber, car/Lorry Driver· Shop-keeper. \Boatman, Lascar, and $0 0.0,
Tiller of the Soil'rtleana a person who himselfw\)rks on the land Qr who employs others to do sO under his direct personal su~rvision. The word Shop-keeper will only be used for a perSon who owns and manages hb own business. Other Shop-keeping p!'rson wiII be

7 idescribed as shop-owner. shop manager, shop-salesman, !book-keeper. cashier, etc. The kind of shop should be ~t'lted thus "Cloth Shop-keeper". "Ration Shop· keeper" "Shoe Shop-manager". etc.
Q. 11.B, SlIbsidiary Occupation: means a secondary means of livelihood pursued, possibly seasonally, alternately or in addition to the usual main occu-
, pation. Special Question; There is no space on the slip for
this question but it must not be forgotton as Relit Receiving is often recorded as an occupation. The answer 'yes' to this question is recorded by ringing Z in ~pace 14 since it must be sorted and tabulated along with the other replies to Q. 14. Most rent-receivers follow some profession or business however which should be recorded as their main or subsidiary occupa,ion. If they do no work IIA and B should be marked X.
Q. 12, Occupation in January: The obj~ct of this ,question is to obtain data for a specific period of time regarding the gainfully employed population. Normally the actual main occupatiol) in January will be the same las the usual main occupation or as the subsidiary means of livelihood.
Unemployment: )f a person worked at all during January the kind of work he did will be recorded. If, however, he did 00 work at all the unemployment questions apply and are important.
Q. 13. Write the actual kind of business or service in Iwhich the person works so that he may be shown in the right one of the numerous groups into which economic activities are split. I The following are examples (but not a complete lisl):-! AGRICULTURE; split up into cultivation, Stock : raising, forestry, fisheries, etc: MINING AND QUAR'RYING; split up according to the ma~erials obtained : MANUFACTURE, split up into the various articles made BUILDING AND CONSTRUCTION, PUBLIC UTILITIES, Electricity, Water, Gas etc: COMMERCE;
i split up into wholesale trade. relai[ trade banking · and finance, insurance, etc: TRANSPORTATION AND 'STORAGE,·split up into Road, Rail, Ocean. Inland Water and Air Transport; COMMUNICATION; i.e. the
I Postal, Telegraph and Telephone Service. THE MAIN · PUBLIC SERVICES: split up into Education, Defence • Medical. Governmental. Municipal etc .• Services: THE PROFESSIONS i,e. Recreation, Religion, Arts etc:
,PERSONAL AND OTHER SERVICES; such as hotels and domestic service,
Q. 14. Agricultural Status: It is possible to have rings round two or more of these letters. For instance a man may hire out part of his owned land on rental and work the rest of it himself together with field which he rents from another landowner. Such a man would have rings round Z, C and A.
Q. 15, Industrial StalUs: Note that the whole, ! question concerns the main occupation given in Q. 12. People will not be classed as 'employers' merely by virtue of their employing domestic servants but only if they employ others in their profession or business. For example, a cook, is classed as an employee in his occupation, but if he is cooking for, let us say. a civil servant, that gentleman will be similarly classed as an employee in his occupation which is Government Service.
An independent worker is his owo master in his trade or business, but employs nO paid help.
8 An "!Inp~id fan:ily help is a member of the family
who assIst dIrectly to the trade or busmess of another member but receives no separate payment in cash or kind. Such persons wi
List of Agents in Pakistan and Abroad from whom Government of Pakistan Publications are available.
I.-INLAND
1. PROVINCiAL GOVERNMENT BOOK DEPOTS:-
East Bengal:-Deputy Controller, Stationery, Forms and Publications, Government of Pakistan Press Building, Tejgaon, Dacca.
North. West Frontier Province:-Manager, Government Printing and Stationery. N.-W. F. P., Peshawar.
punjab;--Superintendent, Government Printing Punjab. Lahort.
Sind:-Superintendent, Sind Government Book Depot and Records Office, Karachi, Sadar.
2. PRIVATE BOOK-SELLERS:-
Baluchistan:-Messrs. AJigarh Book Stall, Mission Road, Quetta.
East Bengal:-Dacca Chamber'of Commerce, 107, Kaliprashanna Ghosh St., Dacca. Messrs. Abdul Qadir and Brothers, Old Jessore Road, Khulna, E. P. Messrs. Burhani Paper Mart, 11, Bangia Bazar, Dacca, E. P. Messrs. Dacca Law Report, Manager Santi Nagar, Ramna, Dacca. Messrs. Kohinoor Library, Ander-KiIla, Chittagong. Messrs. Sikandari News Agency, Office of the Fashion House, Raja G. C. Road,
Sylhet, E. P. Messrs. The Pakistan Co-operative Book Society, Ltd., Chittagong. Messrs. The Pakistan Co-operative Book Society, Ltd., Pioneer Bank Building,
Sylhet. Messrs. The Roushan Book Stall, Thana Road, Bogra, E. P. Qazi Khurshed Mustafa, 23-Rajani Choudhary Road, Gandaria, Dacca, E. P.
Karachi:- Messrs. Aero Stores, 170, Napier Road, Karachi. Messrs. Burhani Paper Mart, Campbell Street, P. O. Box No. 26, Karachi. Messrs. Ferozsons, Bunder Road, Karachi. Messrs. Firdous Stationers, opposite New Memon Mosque, Bunder Road, 85
Liaqat Market, Karachi. Messrs'. Grenich Agencies, 510, Elphinstone Street. Karacbi.
Messrs. Kitabistan Ltd., 18, Hotel Metropole, Victoria Road, Karachi. Messrs. Pakistan Co-operative Book Society, Electric House, University Street,
Karachi. Messrs. Pakistan Law House. opposite Small Causes COUft. Wadhomal Odharam
Road, Karachi. Messrs. Pioneer Paper and Stationery House, 1. Avan Lodge, opposite Dow
Medical College, Bunder Road, Karachi. Messrs. The Bookland, Bunder Road, Karachi.
Messrs. Windsor Book Stall, Elphinstone Street, Karachi. Mr. B. A. Chishti, Stati0ners, Shop No. 40, opposite Municipal Tower, Ali Dina
Mohammad Ali Road, Karachi.
Norrh-West Frontier Prorince:-Messrs. Ferozsons, 35. The Mall, Peshawar.
Punjab:-Mallik & Sons, Commercial Bldg. Railway Road, Sialkot-City. Messrs. A. M. John & Co •• Kutchery Road, P. n. No. 297, Lahore.
[Po T. 0.]

Punjab:-contd. Mel;srs, All Pakistan Legal Decision. 35, Nabha Road. Lahore. 1I1o~U$, Danishman<1 c!t Co., Karkhana Bazar, Lyallpur. Messrs. Ferozsons, The Mall, Labore. Messrs. Hamid Noorani & Co., 59, Fleming Road, P. O. Bo)( No. 473, Lahore. Me5Srs. InternatiEmal Agency, Gujar Basti, Lyallpur. Messrs. Manloor &. Co. (Pakistan), Ltd., 6, The Mall, Lahore. Messrs. Mirza Eook Aaeocy. 20, Mayo Road, Labore. Messrs. Nawa-i-Waqt Publications, Ltd., Lahore. Messrs. Premier Book House. 4/5, Kutchery,Road, near Anarkali, Lahore. Messrs. Shah &. Sons, Book-sellers &, Publishers, Sialkot-City. ' Messrs. The London Book Co .. Rawalpindi. Messrs. The Publishers United Ltd •• 176. Anarkali. Labore. Menn. The Punjab Reli£iou1> Book Society, Anarkali. Labore. Messrs. The Editor. Punjab Marketing Weekly. Mumtaz House, Khawja Dil Mohd.
Road, Lahore. .
Mr. K. A. Baker, Prop. Baker E.lectric Press. Publishers & Law Book-sellers, Baker Lodge, SiaJkot Cantt.
Sind:-Messrs. Ameer Brothers, Hirabad. Hyderabad (Sind). Messrs. Educational Book Depot, Stationers and Book-sellers, Scbool Road
Hydtrabad, Sind. Messrs. Gul Book Depot, Neemjee Slope, Sukkuf. Messrs. The New Allies s.tores, Jail Road, Near Towel'. Hyderabad, Sind.
H.-FOREIGN
<lfl1hanisran:-Tnc Ambassador of Pakistan, Kabul clo. POllt Master, Peshawar. Australia:-The High Commissioner for Pakistan in Australia, Dalton Hou~; 11S, Pitt
Street, Sydney, Australia. Burmaft:-The Ambassador of Pakistan. Rander Houle, Phayre Street. Rangoon,
Burmah. Ccmada:-The High Commissiooer for Pakistan, 499, Wilbord Street, Ottawa, Ca~ada. Egypt :-Tile Embassy of Pakistan, Pakistan House. 11, Sharia Hodel La~n. Qarden
City. Cairo, Egypt. . ...
hallce:-The Ambassador of Pakistan, 18, Rue Lord Byron, Paris, France. lndia:-The High Commissioner for Pakistan. 8-B. Hardinge Avenue, New Oel)1i. lndonesia:-The Embassy of Pakistan, 15, Dialan Tanku Urnar, Djakarta. Iran:-The Embassy of Paki-otan, Khiaban Takhte Jamshed, Kashi, No. 276, Teh(an,
Iran. .
lraq:-The Embassy of Pakistan. Wazirya, Baghdad, Iraq. [taiY:-The Minister of Pakistan. 15, Via Guisenpe Mangili. Rom~. ital,. Netherlands:-The Embassy of Pakistan. Pliee 1813, No. ], The Hague, Netherlands. Saudi Arabia:-The Legation Qr Pakistan, Jedda, Saudi Arabia. Syria, Lebanon & Jordan:-The Minister of Pakistan, Abu Roumanch. Damascus. Tltrkey:-The Ambassador of Pakistan. 4t{Karantil Sokaka. Yanishehir, Ankara.
Turkey. . United Kingdom:--The High Commissioner for Pakis1an, 34/36, Lowndes Square,
London, S. W. 1. U.S.A.:-The Ambassador of Pakistan, 210iR Street. North-West W~lljnlt9n D. C .•
U.S.A. U.S.S.R,:-The Embassy <)fP:tkistan. 17. Sadovekudrinskava Street. Moscow, U.s.S.R.
Printed by the Manager, Times Press, Sadar, KarachL-I-55-900.