Punjab - Open Data Pakistan
279
MICS Multiple Indicator Cluster Survey Punjab Multiple Indicator Cluster Survey 2017-18 Technical Appendices (Vol - III)
-
Upload
khangminh22 -
Category
Documents
-
view
1 -
download
0
Transcript of Punjab - Open Data Pakistan

MICS Multiple IndicatorCluster Survey
Punjab
Multiple Indicator Cluster Survey
2017-18
Technical Appendices (Vol - III)
Mu
ltiple
Ind
icato
r Clu
ste
r Su
rvey 2
017-1
8 (V
ol - III)
Punjab Multiple Indicator Cluster Survey

Title page picture is taken by Mr. Muhammad Farooq with the permission from Ms. Bashiran Bibi with her 6
months daughter Amna, in her house at Tehsil Kot Radha Kishan in Kasur District, Punjab.

GENERATING EVIDENCE TO DELIVER FOR CHILDREN
Punjab Multiple Indicator Cluster Survey 2017-18
Survey Findings Report Technical Appendices (Vol-III) (Volume-I)
November, 2018
Report was endorsed by MICS Steering Committee, Punjab in November, 2018 and disseminated in March, 2019
Bureau of Statistics
Planning & Development Board
Government of the Punjab

The Multiple Indicator Cluster Survey (MICS), Punjab was carried out in 2017-18 by Bureau of Statistics,
Punjab in collaboration with United Nations Children’s Fund (UNICEF), as part of the Global MICS
Programme. Technical support was provided by the United Nations Children’s Fund (UNICEF), with
government funding and financial support of UNICEF.
The Global MICS Programme was developed by UNICEF in the 1990s as an international multi-purpose
household survey programme to support countries in collecting internationally comparable data on a
wide range of indicators on the situation of children and women. MICS surveys measure key indicators
that allow countries to generate data for use in policies, programmes, and national development
plans, and to monitor progress towards the Sustainable Development Goals (SDGs) and other
internationally agreed upon commitments. Punjab MICS, 2017-18 is the fifth MICS in Punjab since
2004. Information on the global MICS may be obtained from mics.unicef.org and information about
Bureau of Statistics, Punjab from bos.gop.pk and pndpunjab.gov.pk.
The objective of this report is to facilitate the timely dissemination and use of results from the Punjab
MICS, 2017-18. The report contains detailed information on the survey methodology, and all MICS
tables. The report is accompanied by a series of Statistical Snapshots of the main findings of the survey.
For more information on the Global MICS Programme, please go to mics.unicef.org.
Suggested citation:
Bureau of Statistics Punjab, Planning & Development Board, Government of the Punjab. 2018. Multiple Indicator Cluster Survey Punjab, 2017-18, Survey Findings Report. Lahore, Pakistan: Bureau of Statistics Punjab, Planning & Development Board, Government of the Punjab.

Page | iii
SUMMARY TABLE OF SURVEY IMPLEMENTATION AND THE SURVEY POPULATION
Survey sample and implementation
Sample frame Population Census
2017
Questionnaires Household
Women (age 15-49)
Men (age 15-49)
Children under five
Children age 5-17
Water Quality Testing
Interviewer
training
Nov-Dec 2017
Jan, 2018
Fieldwork December 03, 2017 to
March 14, 2018
Survey sample
Households
- Sampled
- Occupied
- Interviewed
- Response rate (Percent)
53,840
52,765
51,660
97.9
Children under five
- Eligible
- Mothers/caretakers interviewed
- Response rate (Percent)
42,408
39,799
93.8
Women (age 15-49)
- Eligible for interviews
- Interviewed
- Response rate (Percent)
79,510
74,010
93.1
Children age 5-17
- Eligible
- Mothers/caretakers interviewed
- Response rate (Percent)
37,052
35,482
95.8
Men (age 15-49)
- Eligible for interviews
- Interviewed
- Response rate (Percent)
39,445
27,094
68.7
Water Quality Testing
- Eligible
- Interviewed
- Response rate (Percent)
8,076
7,708
95.4
Survey population
Average household size 6.3
Percentage of population under:
- Age 5
- Age 18
12.8
42.9
Percentage of women age 15-49 years with at least one live birth in the last 2 years 21.2
Percentage of ever married women age 15-49 years with at least one live birth in
the last 2 years 31.7
Percentage of population living in
- Urban areas
- Rural areas
36.4
63.6

Page | iv
ABOUT VOLUMES
VOLUME I:
This volume contains the following contents at provincial level:
Summary Table of survey implementation and the survey population
Introduction
Survey methodology
Indicators and definitions
Sample coverage and characteristics of respondents
Survive – Child mortality
Thrive – Reproductive and maternal health
Thrive – Child health, nutrition and development
Learn – Early childhood development and education
Protected from violence and exploitation
Live in safe and clean environment
Equitable chance in life
VOLUME II:
This volume contains the following contents at division and district level:
Indicators and definitions
Sample coverage and characteristics of respondents
Survive – Child mortality
Thrive – Reproductive and maternal health
Thrive – Child health, nutrition and development
Learn – Early childhood development and education
Protected from violence and exploitation
Live in safe and clean environment
Equitable chance in life
VOLUME III:
This volume contains the following appendices related to volume I and II:
Sample Design
List of personnel involved in the survey
Estimates of sampling error
Data quality tables
Questionnaires
List of assets for wealth quintiles

Page | v
TABLE OF CONTENTS
SUMMARY TABLE OF SURVEY IMPLEMENTATION AND THE SURVEY POPULATION ................................................. III
ABOUT VOLUMES ................................................................................................................................................... IV
TABLE OF CONTENTS ............................................................................................................................................... V
LIST OF ABBREVIATIONS ....................................................................................................................................... VIII
FOREWORD ............................................................................................................................................................ XI
ACKNOWLEDGEMENT .......................................................................................................................................... XIII
APPENDIX A SAMPLE DESIGN ................................................................................................................................... 1
SAMPLE SIZE AND SAMPLE ALLOCATION ............................................................................................................... 1
SELECTION OF ENUMERATION AREAS (CLUSTERS) ................................................................................................ 3
LISTING ACTIVITIES ................................................................................................................................................. 3
SELECTION OF HOUSEHOLDS .................................................................................................................................. 3
CALCULATION OF SAMPLE WEIGHTS ...................................................................................................................... 4
APPENDIX B LIST OF PERSONNEL INVOLVED IN THE SURVEY ............................................................................... 7
APPENDIX C ESTIMATES OF SAMPLING ERROR .................................................................................................. 17
Table SE.1: Sampling errors: Total sample .................................................................................................... 19
Table SE.2: Sampling errors: Urban ................................................................................................................ 21
Table SE.3: Sampling errors: Rural .................................................................................................................. 23
Table SE.4: Sampling errors: Bahawalpur District ........................................................................................ 25
Table SE.5: Sampling errors: Bahawalnagar District ................................................................................... 27
Table SE.6: Sampling errors: RY Khan District ............................................................................................. 29
Table SE.7: Sampling errors: DG Khan District ............................................................................................. 31
Table SE.8: Sampling errors: Layyah District ................................................................................................ 33
Table SE.9: Sampling errors: Muzaffargarh District ..................................................................................... 35
Table SE.10: Sampling errors: Rajanpur District ........................................................................................... 37
Table SE.11: Sampling errors: Faisalabad District ....................................................................................... 39
Table SE.12: Sampling errors: Chiniot District............................................................................................... 41
Table SE.13: Sampling errors: Jhang District ................................................................................................ 43
Table SE.14: Sampling errors: TT Singh District ........................................................................................... 45
Table SE.15: Sampling errors: Gujranwala District ...................................................................................... 47
Table SE.16: Sampling errors: Gujrat District ................................................................................................ 49
Table SE.17: Sampling errors: Hafizabad District ......................................................................................... 51
Table SE.18: Sampling errors: Mandi Bahauddin District ........................................................................... 53
Table SE.19: Sampling errors: Narowal District ............................................................................................ 55
Table SE.20: Sampling errors: Sialkot District ............................................................................................... 57
Table SE.21: Sampling errors: Lahore District............................................................................................... 59
Table SE.22: Sampling errors: Kasur District ................................................................................................. 61
Table SE.23: Sampling errors: Nankana Sahib District ............................................................................... 63
Table SE.24: Sampling errors: Sheikhupura District .................................................................................... 65
Table SE.25: Sampling errors: Multan District ............................................................................................... 67
Table SE.26: Sampling errors: Khanewal District ......................................................................................... 69
Table SE.27: Sampling errors: Lodhran District ............................................................................................ 71
Table SE.28: Sampling errors: Vehari District ............................................................................................... 73
Table SE.29: Sampling errors: Rawalpindi District ....................................................................................... 75
Table SE.30: Sampling errors: Attock District ................................................................................................ 77
Table SE.31: Sampling errors: Chakwal District............................................................................................ 79

Page | vi
Table SE.32: Sampling errors: Jhelum District .............................................................................................. 81
Table SE.33: Sampling errors: Sahiwal District ............................................................................................. 83
Table SE.34: Sampling errors: Okara District ................................................................................................ 85
Table SE.35: Sampling errors: Pakpattan District ......................................................................................... 87
Table SE.36: Sampling errors: Sargodha District ......................................................................................... 89
Table SE.37: Sampling errors: Bhakkar District ............................................................................................ 91
Table SE.38: Sampling errors: Khushab District ........................................................................................... 93
Table SE.39: Sampling errors: Mianwali District ........................................................................................... 95
APPENDIX D DATA QUALITY .............................................................................................................................. 97
D.1 AGE DISTRIBUTION ......................................................................................................................................... 97
Table DQ.1.1: Age distribution of household population ............................................................................. 97
Table DQ.1.2W: Age distribution of eligible and interviewed women ....................................................... 98
Table DQ.1.2M: Age distribution of eligible and interviewed men ............................................................. 98
Table DQ.1.3: Age distribution of young children in households and under-5 questionnaires ........... 99
Table DQ.1.4: Age distribution of children age 3-20 in households and 5-17 questionnaires ............ 99
D.2 BIRTH DATE REPORTING ............................................................................................................................... 100
Table DQ.2.1: Birth date reporting (household population) ...................................................................... 100
Table DQ.2.2W: Birth date and age reporting (women) ............................................................................ 101
Table DQ.2.2M: Birth date and age reporting (men) .................................................................................. 102
Table DQ.2.3: Birth date reporting (live births) ............................................................................................ 103
Table DQ.2.4: Birth date and age reporting (children under age 5 years) ............................................ 104
Table DQ.2.5: Birth date reporting (children age 5-17 years) .................................................................. 105
D.3 COMPLETENESS AND MEASUREMENTS ....................................................................................................... 106
Table DQ.3.1: Completeness of salt iodisation testing .............................................................................. 106
Table DQ.3.2: Completeness and quality of information of water quality testing ................................ 107
Table DQ.3.3M: Completeness of information on dates of marriage (men) ......................................... 108
Table DQ.3.4: Completeness of information for anthropometric indicators: Underweight................. 108
Table DQ.3.5: Completeness of information for anthropometric indicators: Stunting ......................... 108
Table DQ.3.6: Completeness of information for anthropometric indicators: Wasting and overweight
................................................................................................................................................................................ 109
Table DQ.3.7: Heaping in anthropometric measurements ........................................................................ 109
Table DQ.3.8: Completeness of information for foundational learning skills indicators ..................... 110
D.4 OBSERVATIONS ............................................................................................................................................ 112
Table DQ.4.2: Observation handwashing facility ........................................................................................ 112
Table DQ.4.3: Observation of birth certificates ............................................................................................ 113
Table DQ.4.4: Observation of vaccination records ..................................................................................... 114
D.5 SCHOOL ATTENDANCE ................................................................................................................................. 115
Table DQ.5.1: School attendance by single age ......................................................................................... 115
D.6 BIRTH HISTORY ............................................................................................................................................. 116
Table DQ.6.1: Sex ratio at birth among children ever born and living .................................................... 116
Table DQ.6.2: Births by periods preceding the survey .............................................................................. 117
Table DQ.6.3: Reporting of age at death in days ........................................................................................ 118
Table DQ.6.4: Reporting of age at death in months ................................................................................... 119
D.7 SIBLINGS ....................................................................................................................................................... 120
Table DQ.7.1: Completeness of information on siblings ........................................................................... 120
Table DQ.7.2: Sibship size and sex ratio of siblings .................................................................................. 120

Page | vii
APPENDIX E QUESTIONNAIRES............................................................................................................................. 121
E.1 HOUSEHOLD QUESTIONNAIRE...................................................................................................................... 121
E.2 QUESTIONNAIRE FOR INDIVIDUAL WOMEN................................................................................................. 144
E.3 QUESTIONNAIRE FOR INDIVIDUAL MEN ....................................................................................................... 186
E.4 QUESTIONNAIRE FOR CHILDREN UNDER FIVE .............................................................................................. 207
E.5 QUESTIONNAIRE FOR CHILDREN AGE 5-17................................................................................................... 235
E.6 WATER QUALITY TESTING QUESTIONNAIRE ................................................................................................. 254
APPENDIX F LIST OF ASSETS FOR WEALTH QUINTILES .......................................................................................... 260

Page | viii
LIST OF ABBREVIATIONS
ACT Artemisinin-based Combination Therapy
AIDS Acquired Immune Deficiency Syndrome
ANC Antenatal Care
ARI Acute Respiratory Infection
ASFR Age Specific Fertility Rates
BCG Bacillus Calmette-Guérin (Tuberculosis)
BoS Bureau of Statistics
C-section Caesarean section
CAPI Computer-Assisted Personal Interviewing
CBR Crude Birth Rate
CONFEMEN Conference of the Ministers of Education of French speaking countries
CRC Convention on the Rights of the Child
CSPro Census and Survey Processing System
DTP Diphtheria, Tetanus and Pertussis
E. coli Escherichia coli
ECD Early Childhood Development
ECDI Early Child Development Index
ECE Early Childhood Education
FCT Field Check Table
g Grams
GFR General Fertility Rate
GPI Gender Parity Index
Hib Haemophilus influenzae type B
HIV Human Immunodeficiency Virus
ICLS International Conference of Labour Statisticians
ICT Information and Communication Technology
IDD Iodine Deficiency Disorders
IPT Intermittent Preventive Treatment
IPTp Intermittent Preventive Treatment for malaria in pregnancy
IPTp-SP Intermittent preventive treatment in pregnancy with Sulphadoxine-Pyrimethamine)
IPV Inactivated Polio Vaccine
IQ Intelligence quotient
IYCF Infant and Young Child Feeding
JMP WHO/UNICEF Joint Monitoring Programme for Water Supply, Sanitation and
Hygiene
LBW Low birth weight
LHW Lady Health Worker
LHV Lady Health Visitor
LPG Liquefied Petroleum Gas
MDG Millennium Development Goals
MICS Multiple Indicator Cluster Survey
MICS6 Sixth global round of Multiple Indicator Clusters Surveys programme
MMR Measles, Mumps, and Rubella
MMR Maternal Mortality Rate
MPI Multidimensional Poverty Index

Page | ix
ORS Oral Rehydration Salt Solution
OPHI Oxford Poverty & Human Development Initiative
OPV Oral Polio Vaccine
ORT Oral Rehydration Therapy
PASEC Programme for the Analysis of Education Systems
PBS Pakistan Bureau of Statistics
PNC Post-natal Care
ppm Parts Per Million
SACMEQ The Southern and Eastern Africa Consortium for Monitoring Educational Quality
SDGs Sustainable Development Goals
SP Sulphadoxine-Pyrimethamine
SPSS Statistical Package for Social Sciences
TFR Total Fertility Rate
UN United Nations
UNDP United Nations Development Programme
UNGASS United Nations General Assembly Special Session on HIV/AIDS
UNICEF United Nations Children’s Fund
WASH Water, Sanitation and Hygiene
WG Washington Group on Disability Statistics
WHO World Health Organization
WHO-MCEE WHO Maternal Child Epidemiology Estimation


Page | xi
FOREWORD
Social sector development is a priority area for the Government of Punjab. Over the
last few years, resource allocation and the development outlay of social sectors in the
province has grown manifold. The Government of Punjab has a strong commitment in
achieving the Sustainable Development Goals (SDGs) and human development is key
to the agenda. This would not only require provision of adequate resources but also a
robust system for ascertaining the area specific needs, efficient use of resources and
regular monitoring of the results and impacts.
The first district based Multiple Indicator Cluster Survey (MICS) was conducted in 2003-04. It provided
a benchmark for a number of indicators at distric t level and created a culture for using data for
planning interventions. The second and third round of MICS Punjab took place in 2007-08 and 2011.
These surveys proved to be the most imperative tools in determining government budgetary outlays,
particularly for the social sector. The data of these surveys shared with academia, local and
international research organizations and development partners has proved to be beneficial for
carrying out evidence-based research. Subsequently, the fourth round of MICS was started in 2014,
which successfully enabled the government to measure progress made on key social indicators,
providing a baseline for a number of new social indicators which were not covered in earlier rounds.
The MICS Punjab, 2017-18 is a district based survey covering over 210 indicators, and is by far the
largest on this account. The survey has been completed within the stipulated time frame and its results
will enable the government to measure progress made on key social indicators and set benchmarks
for SDG’s.
The present round of MICS, like the earlier four rounds, allows the provincial and district governments
to monitor their respective status of human and social development with precise data on variety of
key indicators. It will assist the decision-makers to move towards new avenues of human and social
development.
I am confident that this report will be a valuable source for planning efforts of Government of Punjab
and our development partners, and a reference for academia and research organizations in their
endeavors.
CHAIRMAN
Planning & Development Board, Punjab


Page | xiii
ACKNOWLEDGEMENT
The Multiple Indicator Cluster Survey (MICS) Punjab, 2017-18 is the result of dedicated efforts of different government departments and organizations consolidating the efforts towards evidence based planning and development. The survey has been completed by Government of Punjab with technical assistance from UNICEF on the design and conduct of the survey. Pakistan Bureau of Statistics has also extended its full support for the completion of this survey, through provision of sampling designs. The technical support provided by the Global MICS team and UNICEF Country Office Islamabad was instrumental to the successful completion of this complex project. I would like to extend my appreciation for the enduring efforts of Mr. Nouman Ghani, Social Policy - Planning, Monitoring and Reporting Specialist, Mr. Faateh-ud-Din Ahmad, Planning & Monitoring Officer, Social Policy, Research and Evaluation Section, UNICEF Pakistan and Mr. Muhammad Akram Rana, UNICEF MICS Consultant. I would like to thank Pakistan Bureau of Statistics for their support in terms of sample design and provision of house listing of Census 2017. Chairman, P&D Board who headed the Provincial Steering Committee and Chief Economist Punjab, P&D Board who headed the Technical Committee extended their full support throughout the process. The Director General, BOS and his team worked hard for the timely completion of the survey and their efforts are commendable. Keen interest and contribution made by members of the Steering Committee, Technical, Planning and Coordination group are also acknowledged and highly appreciated. Third party validation carried out by PERI also contributed to the completion and compilation of this report. All district governments and administrative departments deserve special thanks for their valuable support and facilitation during field work. This task could not have been accomplished without support of Local Communities, local leaders and members of the selected households who devoted their precious time to be included in the survey. They need to be applauded for their confidence in sharing personal information and enriching this survey with data that will be crucial for development planning in Punjab in the years to come.
SECRETARY
Planning & Development Board, Punjab


Appendix A Sample Design| Page 1
APPENDIX A SAMPLE DESIGN
The major features of the sample design are described in this appendix. Sample design features
include defining the sampling frame, target sample size, sample allocation, listing in sample clusters,
choice of domains, sampling stages, stratification, and the calculation of sample weights.
The primary objective of the sample design for the MICS Punjab, 2017-18 was to produce statistically
reliable estimates of most indicators, at the provincial level, for urban and rural areas, and for the 36
districts of the province. In designing the sample for the MICS Punjab, 2017-18, it was useful to review
the sample design and results of the MICS Punjab conducted in 2014, documented in the Final Report
of that survey.
A multi-stage, stratified cluster sampling approach was used for the selection of the survey sample.
The sampling frame was based on the 2017 Country Census of Population and Housing. The primary
sampling units (PSUs) selected at the first stage were the enumeration areas (EAs) defined for the
census enumeration. A listing of households conducted in each sample EA was used, and a sample of
households was selected at the second stage.
SAMPLE SIZE AND SAMPLE ALLOCATION
The overall sample size for the MICS Punjab, 2017-18 was calculated as 53,840 households. For the
calculation of the sample size, the key indicator used was the underweight prevalence among children
age 0-4 years. Since the survey results are tabulated at the district level, it was necessary to determine
the minimum sample size for each district. The following formula was used to estimate the required
sample size for this indicator:
𝑛 =𝑡2𝑟(1 − 𝑟)(𝑑𝑒𝑓𝑓)
[(𝑑𝑟)2(𝑝𝑏)(𝐻𝐻𝐴𝑣𝑒𝑆𝑖𝑧𝑒)(𝑅𝑅)]
Variable: underweight (children less than 5 years)
Prevalence rate (r) has been used from MICS Punjab 2014
Deff: the design effect for the indicator, estimated as 2 based on previous survey
t: a factor to achieve the 95 percent level of confidence; t = 1.96
Relative Margin of Error (dr): 12%
Response Rate (RR): 97%
Pb: the proportion of the total population upon which the indicator, r, is based (in this case, the proportion of children under 5 years)
HHAveSize: the average household size (mean number of persons per household); taken from Census 2017
For the calculation, r (underweight prevalence) was based on the district estimates from the MICS
Punjab, 2014. The value of deff (design effect) was taken as 2 based on the estimate from the MICS
Punjab 2014, pb (percentage of children age 0-4 years in the total population) was taken from each
district, HHAveSize (mean household size) was taken from each district, and the response rate was
assumed to be 97 percent, based on experience from the MICS Punjab 2014. 12% relative margin of
error (RME) is used (that is, a margin of error of 0.12 r). The total sample size at the provincial level
was 53,840 households.

Appendix A Sample Design| Page 2
The number of households selected per cluster for the MICS Punjab, 2017-18 was determined as 20
households, based on several considerations, including the design effect, the budget available, and
the time that would be needed per team to complete one cluster.
Sample has been allocated to the urban and rural domains within each district in proportion to the
number of households in the frame. The entire sample of households (SSUs) was drawn from 2692
Primary Sampling Units (PSUs) selected at the first sampling stage, out of which 799 were urban and
1893 were rural. Table SD.2 shows the allocation of the clusters and households to the sampling strata.
Table SD.2: Sample allocation
Allocation of sample clusters (EAs) and sample households to sampling strata, MICS Punjab, 2017-18
Sample Clusters Sample Households
Total Urban Rural Total Urban Rural
Total 2,692 799 1,893 53,840 15,980 37,860
Region
Bahawalpur 79 19 60 1,580 380 1,200
Bahawalnagar 71 13 58 1,420 260 1,160
RY Khan 89 16 73 1,780 320 1,460
DG Khan 54 8 46 1,080 160 920
Layyah 50 9 41 1,000 180 820
Muzaffargarh 79 13 66 1,580 260 1,320
Rajanpur 41 7 34 820 140 680
Faisalabad 154 70 84 3,080 1,400 1,680
Chiniot 43 11 32 860 220 640
Jhang 67 13 54 1,340 260 1,080
TT Singh 57 10 47 1,140 200 940
Gujranwala 105 54 51 2,100 1,080 1,020
Gujrat 80 19 61 1,600 380 1,220
Hafizabad 47 12 35 940 240 700
MB Din 88 16 72 1,760 320 1,440
Narowal 48 5 43 960 100 860
Sialkot 82 19 63 1,640 380 1,260
Lahore 174 174 0 3,480 3,480 0
Kasur 67 15 52 1,340 300 1,040
Nankana Sahib 48 7 41 960 140 820
Sheikhupura 76 21 55 1,520 420 1,100
Chakwal 74 11 63 1,480 220 1,260
Jhelum 55 11 44 1,100 220 880
Sahiwal 62 11 51 1,240 220 1,020
Okara 60 13 47 1,200 260 940
Pakpattan 48 7 41 960 140 820
Multan 124 51 73 2,480 1,020 1,460
Khanewal 67 13 54 1,340 260 1,080
Lodhran 48 7 41 960 140 820
Vehari 72 12 60 1,440 240 1,200
Rawalpindi 146 63 83 2,920 1,260 1,660
Attock 74 17 57 1,480 340 1,140
Sargodha 73 18 55 1,460 360 1,100
Bhakkar 66 8 58 1,320 160 1,160
Khushab 50 11 39 1,000 220 780
Mianwali 74 15 59 1,480 300 1,180

Appendix A Sample Design| Page 3
SELECTION OF ENUMERATION AREAS (CLUSTERS)
Census enumeration areas were selected from each of the sampling strata by using systematic
probability proportional to size (pps) sampling procedures, based on the number of households in
each enumeration area from the 2017 Census frame. The first stage of sampling was thus completed
by selecting the required number of sample EAs (specified in Table SD.2) from each of the 36 districts,
separately for the urban and rural strata.
LISTING ACTIVITIES
A census 2017 was completed in May, 2017. In MICS 2017-18, BoS used Census household listing
provided by Pakistan Bureau of Statistics, therefore, no fresh household listing was done separately.
SELECTION OF HOUSEHOLDS
Lists of households were prepared by the listing teams of 2017 Census in the field. The households
were then sequentially numbered from 1 to Mhi (the total number of households in each enumeration
area) at the Bureau of Statistics, Punjab, where the selection of 20 households in each enumeration
area was carried out using random systematic selection procedures. The MICS6 spreadsheet template
for systematic random selection of households was adapted for this purpose. 1
The survey also included a questionnaire for individual men that was to be administered in half of the
sample of households. The MICS household selection template includes an option to specify the
proportion of households to be selected for administering the individual questionnaire for men, and
the spreadsheet automatically selected the corresponding subsample of households. All men age 15
to 49 years in the selected households were eligible for interview.
The MICS Punjab, 2017-18 also included water quality testing for a subsample of households within
each sample cluster. A subsample of 3 of the 20 selected households was selected in each sample
cluster using random systematic sampling for conducting water quality testing, for both water in the
household and at the source. The MICS household selection template includes an option to specify
the number of households to be selected for the water quality testing, and the spreadsheet
automatically selected the corresponding subsample of households.
1 Available here: "MICS6 TOOLS." Home - UNICEF MICS. Accessed August 31, 2018.
http://mics.unicef.org/tools#survey-design.

Appendix A Sample Design| Page 4
CALCULATION OF SAMPLE WEIGHTS
Essentially, by allocating specific number of sample households to each of the districts, different sampling fractions were used in each district since the size of the districts varied. For this reason, sample weights were calculated which were used in the subsequent analysis of the survey data.
The major component of the sampling weight is the reciprocal of the sampling probabilities employed in selecting the number of sample households in that particular sampling stratum (h) and PSU (i):
hi
hif
W1
The term fhi is the sampling fraction for the i-th sample PSU in the h-th stratum, and defined as the
product of the probabilities of selection at every stage in each sampling stratum:
hihihi ppf 21
Where pshi is the probability of selection of the sampling unit at stage s for the i-th sample PSU in the
h-th sampling stratum. Based on the sample design, these probabilities were calculated as follows:
p1hi = h
hih
M
Mn
,
nh = number of sample PSUs selected in stratum h
Mhi = number of households in the frame for the i-th sample PSU in stratum h
Mh = total number of households in the frame for stratum h
p2hi = hi
hi
M
m
'
mhi= sample of twenty (20) households from each PSU
M'hi = number of households listed in the i-th sample PSU in stratum h
The number of households in each enumeration block (PSU) from the frame was used for the first
stage selection and the updated number of households in the enumeration block from the actual
household listing is generally different. Consequently, individual overall probabilities of selection for
households in each sample enumeration block (cluster) were calculated.
After the completion of fieldwork, response rates were calculated for each sampling stratum. These
were used to adjust the sample weights calculated for each cluster. Response rates in the MICS Punjab,
2017-18 are shown in Table SR.1.1 in this report.

Appendix A Sample Design| Page 5
The non-response adjustment factors for the individual women and under-5 questionnaires were
applied to the adjusted household weights. Numbers of eligible women and under-5 children were
obtained from the list of household members in the Household Questionnaire for households where
interviews were completed.
The weights for the questionnaire for individual men were calculated in a similar way. In this case the number
of eligible men in the list of household members in all the MICS sample households in the stratum was used as
the numerator of the non-response adjustment factor, while the number of completed questionnaires for men
in the stratum was obtained from the 50% subsample of households. Therefore, this adjustment factor includes
an implicit subsampling weighting factor of 2 in addition to the adjustment for the non-response to the individual
questionnaire for men.
In the case of the questionnaire for children age 5-17 years, in each sample household, one child was randomly
selected from all the children in this age group recorded in the list of household members. The household weight
for the children age 5-17 years is first adjusted based on the response rate for this questionnaire at the stratum
level. Once this adjusted household weight is normalised as described below, it is multiplied by the number of
children age 5-17 years recorded in the list of household members. Therefore, the weights for the individual
children age 5-17 years will vary by sample household. This weighting of the data for the children age 5-17 years
old is implemented in the tabulation programs for the corresponding tables.
For the water quality testing (both in household and at source) a subsample of 3 households was selected from
the 20 MICS sample households in each sample cluster. Therefore, the basic (unadjusted) household weight
would be multiplied by the inverse of this subsampling rate as follows:
𝑊𝑤𝑞ℎ𝑖 =1
𝑓ℎ𝑖
× 20
3=
20
3𝑓ℎ𝑖
where:
Wwqhi = basic weight for the subsample of households selected for the water quality testing in the
i-th sample EA in stratum h
Since the response rate may be different for the water quality testing for home consumption and at the
source, the basic weights for each were adjusted separately for non-response at the stratum level as follows:
,m
m W = W
wqh
wqh
wqhiwqhi'
'
where:
W’wqhi = adjusted weight for the subsample of households selected for the water quality testing in
the i-th sample EA in stratum h (separately for water quality testing in the household and
at the source)
mwqh = number of valid (occupied) sample households selected for water quality testing in
stratum h
m’wqh = number of sample households with completed water quality testing in stratum h
(separately for water quality testing in the household and at the source)
The MICS Punjab, 2017-18 full (raw) weights for the households were calculated by multiplying the
inverse of the probabilities of selection by the non-response adjustment factor for each stratum. These
weights were then standardised (or normalised), one purpose of which is to make the weighted sum
of the interviewed sample units equal to the total sample size at the national level. Normalisation is
achieved by dividing the full sample weights (adjusted for nonresponse) by the average of these
weights across all households at the national level. This is performed by multiplying the sample

Appendix A Sample Design| Page 6
weights by a constant factor equal to the unweighted number of households at the national level
divided by the weighted total number of households (using the full sample weights adjusted for non-
response). A similar standardisation procedure was followed in obtaining standardised weights for the
individual women, men, under-5 questionnaires and water quality testing. Adjusted (normalised)
household weights varied between 0.297817 and 3.101398 in the 2,692 sample enumeration areas
(clusters).
Sample weights were appended to all data sets and analyses were performed by weighting the data
for households, women, men, under-5s, 5-17-year olds and water quality testing with these sample
weigh

Appendix B List of Personnel Involved in the Survey | Page 7
APPENDIX B LIST OF PERSONNEL INVOLVED IN THE SURVEY
Project Director
Ch. Sajid Rasul, Director General, BoS
Deputy Project Director
Syed Waqar ul Hassan, Director, BoS
Survey Planning, Questionnaire Designing and Survey Manuals
Ch. Sajid Rasul, Director General, BoS Syed Waqar-ul-Hassan, Director, BoS Mr. Shamas Ul Huda, Deputy Director, BoS Mr. Ali Amir Raza Bukhari, Deputy Director, BoS Ms. Shaista Ashraf, Statistical Officer, BoS Mr. Muhammad Farooq, Statistical Officer, BoS Mr. Isaac Shahzad, Statistical Officer, BoS
Questionnaire Translation
Mr. Shamas Ul Huda, Deputy Director, BoS Mr. Ali Amir Raza Bhukhari, Deputy Director, BoS Mr. Shahid Saleem, Deputy Director, BoS
Ms. Shaista Ashraf, Statistical Officer, BoS
Mr. Muhammad Farooq, Statistical Officer, BoS Mr. Isaac Shahzad, Statistical Officer, BoS Mr. Abid Hussain, Stenographer, BoS
Training of Trainers (TOTs)
Ch. Sajid Rasul, Director General, BoS
Mr. Shamas Ul Huda, Deputy Director, BoS Ms. Shaista Ashraf, Statistical Officer, BoS
Trainers
Ch. Sajid Rasul, Director General, BoS
Syed Waqar-ul-Hassan, Director, BoS Mr. Shamas Ul Huda, Deputy Director, BoS Mr. Sheraz Hussain, Deputy Director, BoS Mr. Ali Amir Raza Bhukhari, Deputy Director, BoS Mr. Shahid Saleem, Deputy Director, BoS
Ms. Mehr-un-Nisa, Assistant Director, BoS
Ms. Shaista Ashraf, Statistical Officer, BoS
Mr. Muhammad Farooq, Statistical Officer, BoS Mr. Isaac Shahzad, Statistical Officer, BoS Mr. Gulzar Ahmad, Statistical Officer, BoS
Mr. Muhammad Asif Yousaf, Statistical Officer, BoS
Ms. Humera Sarwar, Statistical Officer, BoS
Ms. Sana Gul, Statistical Officer, BoS
Ms. Sana Ayub
Ms. Ayesha Cheema

Appendix B List of Personnel Involved in the Survey | Page 8
Human Resource Manager
Mr. Shahid Saleem, Deputy Director, BoS
Finance and Logistics
Mr. Akram Adeeb, Assistant Director, BoS
Mr. Razzaq Shakir, Care Taker, BoS
Mr. Bilal Javaid, Statistical Assistant, BoS
Sample Design
Ch. Sajid Rasul, Director General, BoS Mr. Shamas Ul Huda, Deputy Director, BoS Ms. Rabia Awan, Pakistan Bureau of Statistics Ms. Shaista Ashraf, Statistical Officer, BoS Mr. Isaac Shahzad, Statistical Officer, BoS
Data Processing
Mr. Muhammad Mumtaz Ahmad, Senior System Analyst
Ms. Shaista Ashraf, Statistical Officer, BoS
Mr. Muhammad Farooq, Statistical Officer, BoS
Mr. Isaac Shahzad, Statistical Officer, BoS
Mr. Rohail Amjad Mughal, System Analyst/Programmer
Mr. Muhammad Arfan , Network System Enginer
Mr. Aatif Jamil, Data Processing Assistant, BoS
Mr. Asim Shahid, Data Processing Assistant, BoS
Secondary Editing
Ms. Shaista Ashraf, Statistical Officer, BoS
Mr. Muhammad Farooq, Statistical Officer, BoS
Mr. Isaac Shahzad, Statistical Officer, BoS
Mr. Muhammad Sarfraz, Statistical Officer, BoS
Ms. Sana Gul, Statistical Officer, BoS
Ms. Sana Ayub,
Ms. Ayesha Cheema
Ms. Faiza Aslam
Ms. Laraib Allam

Appendix B List of Personnel Involved in the Survey | Page 9
Regional Supervisors
Mr. Waris Ali, Deputy Director, Bahawalpur
Mr. Shahzad Kashif Farooq, Deputy Director, DG Khan
Mr. Zahid Mahmood, Assistant Director, Faisalabad
Mr. Abdul Rehman Akhtar, Deputy Director, Gujranwala
Mr. Shakeel Ashraf, Deputy Director, Multan
Mr. Muhammad Tanvir, Deputy Director, Rawalpindi
Mr. Gulam Yasin, Assistant Director, Sahiwal
Mr. Masood Ali, Assistant Director, Sargodha
Mr. Bashir Ahmad, Deputy Director, Lahore-I
Sh. Pervaiz Iqbal, Assistant Director, Lahore-II
Editorial Board
Ch. Sajid Rasul, Director General, BoS
Mr. Shamas Ul Huda, Deputy Director, BoS Syed Wasim Abbas, Statistical Officer, BoS Ms. Shaista Ashraf, Statistical Officer, BoS
Mr. Muhammad Farooq, Statistical Officer, BoS
Mr. Isaac Shahzad, Statistical Officer, BoS
Pakistan Bureau of Statistics
Ms. Rabia Awan, Director, Sample Design Section
Mr. Muhammad Waseem, Statistical Officer, Sample Design Section
Project Consultants
Rana Muhammad Akram, Consultant on MICS, UNICEF
Mr. Sheraz Hussain, IT Consultant, UNICEF
UNICEF ROSA/HQ Office
Mr. Attila Hancioglu, Global MICS Coordinator
Mr. Turgay Unalan, Household Survey Specialist
Mr. Yadigar Coskun, Data Processing Specialist
Mr. Daniel Reijer, Statistics & Monitoring Specialist
Mr. Bo Beshanski-Pedersen, Household Survey Expert
Mr. David Megill, Sampling Expert
Mr. Eudes Hounkpodote, Data Processing Expert
UNICEF Country Office
Mr.Luis Gorjon Fernandez, Chief (PMER), UNICEF Country Office, Islamabad
Ms. Janette Shaheen Hussain, Ex-Chief (PMER), UNICEF Country Office, Islamabad
Ms. Mussarrat Youssuf, Research & Evaluation Specialist, UNICEF Country Office, Islamabad
Mr. Faateh ud Din Ahmad, PMO, Social Policy, R&E Section, UNICEF Country Office, Islamabad
UNICEF Regional Office
Mr. Abdullahi Mohammed Yussuf, Chief Field Office, UNICEF, Lahore
Mr. Douglas G.Higgins, Ex-Chief Field Office, UNICEF, Lahore
Mr. Nouman Ghani, Social Policy – Planning, Monitoring & Reporting Specialist, UNICEF Regional
Office, Lahore

Appendix B List of Personnel Involved in the Survey | Page 10
Field Formation
Bahawalpur Division Team-1 Team-2 Mr. Amir Mehmood, Team Supervisor Mr. Zaheer Ahmad, Team Supervisor Ms. Samina Waris, Female Interviewer-1 Ms. Shahana Naseem, Female Interviewer-1 Ms. Mehwish Manzoor, Female Interviewer-2 Ms. Mubshira Saleem, Female Interviewer-2 Ms. Mehwish Zia, Female Interviewer-3 Ms. Shamsa Aslam, Female Interviewer-3 Ms. Ruqia Perveen, Female Interviewer-4 Ms. Fakhra Abdul Majeed, Female Interviewer-4 Ms. Maryam Majeed, Female Interviewer-5 Ms. Fozia Riaz, Female Interviewer-5 Ms. Shumaila Jaffar, Female Interviewer-6 Ms. Rameeza Sana-Ullah, Female Interviewer-6 Mr. Muhammad Akram, Male Interviewer-1 Mr. Muhammad Farooq Akram, Male Interviewer-1 Mr. Muhammad Sami Ullah, Male Interviewer-2 Mr. Hafiz Amjad Ali, Male Interviewer-2 Ms. Nusrat Khan, Measurer-1 Ms. Shazia Parveen, Measurer-1 Ms. Tahira Zahoor, Measurer-2 Ms. Ghosia Tasleem, Measurer-2 Ms. Almas Fatima, Observer-1 Ms. Musarrat Abbas, Observer-1 Team-3 Team-4 Mr. Imran Lateef, Team Supervisor Ahmad Adeel Khan, Team Supervisor Ms. Kosar Batool, Female Interviewer-1 Ms. Shazia Mehnaz, Female Interviewer-1 Ms. Nabeela Shahzadi, Female Interviewer-2 Ms. Sidra Noreen, Female Interviewer-2 Ms. Saima Nawaz, Female Interviewer-3 Ms. Sijlata Baig, Female Interviewer-3 Ms. Mehro Nisa, Female Interviewer-4 Ms. Iqra Zafar, Female Interviewer-4 Ms. Mehwish Batool, Female Interviewer-5 Ms. Neelam Javed, Female Interviewer-5 Ms. Hafiza Khadija Younas, Female Interviewer-6 Ms. Sana Aurangzaib, Female Interviewer-6 Mr. Mazhar Hussain, Male Interviewer-1 Mr. Muhammad Tayyab, Male Interviewer-1 Mr. Muhammad Kashif Zafar, Male Interviewer-2 Mr. Muhammad Yousaf Khan, Male Interviewer-2 Ms. Najaf Bano, Measurer-1 Ms. Kousar Parveen, Measurer-1 Ms. Sadia Gillani, Measurer-2 Ms. Uzma Zafar, Measurer-2 Ms. Tabinda Nayab, Observer-1 Ms. Saba Ameen, Observer-1 DG Khan Division
Team-1 Team-2 Mr. Bilal Ahmad, Team Supervisor Mr. Umar Hayat Javed, Team Supervisor Ms. Safura Tufail, Female Interviewer-1 Ms. Farha Batool, Female Interviewer-1 Ms. Gulnaz Farooq, Female Interviewer-2 Ms. Zartasha Akhtar Jatoi, Female Interviewer-2 Ms. Shahina Bashir, Female Interviewer-3 Ms. Sara Iftikhar, Female Interviewer-3 Ms. Mahnoor Tahreem, Female Interviewer-4 Ms. Shumaila Kanwal, Female Interviewer-4 Ms. Maryam Ehsan, Female Interviewer-5 Ms. Adeela Batool, Female Interviewer-5 Ms. Lubna Kiran, Female Interviewer-6 Ms. Nasreen Akhtar, Female Interviewer-6 Mr. Hanan Akram, Male Interviewer-1 Mr. Muhammad Jahangir Zafar, Male Interviewer-1 Mr. Dilshad Hussian, Male Interviewer-2 Mr. Muhammad Asif, Male Interviewer-2 Ms. Sadaf Javaid, Measurer-1 Ms. Maria Jabeen, Measurer-1 Ms. Vajiha Iftikhar, Measurer-2 Ms. Tahira Ishaq, Measurer-2 Ms. Rubina Qadir, Observer-1 Ms. Shahana Ramzan, Observer-1 Team-3 Mr. Muhammad Hasnain Haider, Team Supervisor Ms. Asma Dilshad, Female Interviewer-1 Ms. Shagufta Naaz, Female Interviewer-2 Ms. Rashida Perveen, Female Interviewer-3 Ms. Hamaira Yasmeen, Female Interviewer-4 Ms. Bushra Hanif, Female Interviewer-5 Ms. Aaliya Arshad, Female Interviewer-6 Mr. Shakir Ali Gujjar, Male Interviewer-1 Mr. Aamir Shahzad, Male Interviewer-2 Ms. Maria Bibi, Measurer-1 Ms. Samra Akbar, Measurer-2 Ms. Habiba Shaheen, Observer-1

Appendix B List of Personnel Involved in the Survey | Page 11
Faisalabad Division
Team-1 Team-2 Mr. Muhammad Farooq, Team Supervisor Mr. Aftab Ahmad, Team Supervisor Ms. Maria Ashraf, Female Interviewer-1 Ms. Najma Latif, Female Interviewer-1 Ms. Amna Umbreen, Female Interviewer-2 Ms. Kashmala Khalid, Female Interviewer-2 Ms. Abida Hussain, Female Interviewer-3 Ms. Bushra Mehmood, Female Interviewer-3 Ms. Atkah Tanveer, Female Interviewer-4 Ms. Shazia Ilyas, Female Interviewer-4 Ms. Humaira Zulfiqar, Female Interviewer-5 Ms. Hina Abdul Latif, Female Interviewer-5 Ms. Sobia Yousaf, Female Interviewer-6 Ms. Fozia Rani, Female Interviewer-6 Mr. Allah Dittah, Male Interviewer-1 Mr. Muhammad Moazzam Irshad, Male Interviewer-1 Mr. Naseer Ahmad, Male Interviewer-2 Mr. Muhammad Arslan Chaudhary, Male Interviewer-2 Ms. Sidra Maryam, Measurer-1 Ms. Rashida Asif, Measurer-1 Ms. Mehwish Nourine, Measurer-2 Ms. Fozia Ilyas, Measurer-2 Ms. Sadaf Mubeen, Observer-1 Ms. Sadia Arshad, Observer-1 Team-3 Team-4 Mr. Abdul Hafeez, Team Supervisor Mr.Muhammad Irfan Siddique, Team Supervisor Ms. Musarat Naz, Female Interviewer-1 Ms. Sidra Habib, Female Interviewer-1 Ms. Shamsa Kanwal, Female Interviewer-2 Ms. Atiqa Wali, Female Interviewer-2 Ms. Bushra Perveen, Female Interviewer-3 Ms. Unsa Habib, Female Interviewer-3 Ms. Shumaila Yasmeen, Female Interviewer-4 Ms. Iram Naseem, Female Interviewer-4 Ms. Tasneem Arif, Female Interviewer-5 Ms. Nazia Rafique, Female Interviewer-5 Ms. Razia Sultana, Female Interviewer-6 Ms. Samina Akhtar, Female Interviewer-6 Mr. Muhammad Zia Ul Haq, Male Interviewer-1 Mr.Zafar Iqbal, Male Interviewer-1 Mr. Saif Ullah, Male Interviewer-2 Mr. Sohaib Iqbal, Male Interviewer-2 Ms. Shakila Ashiq, Measurer-1 Ms. Bushra Habib, Measurer-1 Ms. Aqsa Benish, Measurer-2 Ms. Shazia Iram, Measurer-2 Ms. Sahar Jabeen, Observer-1 Ms. Hifsa Tariq, Observer-1 Team-5 Mr. Aftab Ahmad, Team Supervisor Ms. Najma Latif, Female Interviewer-1 Ms. Kashmala Khalid, Female Interviewer-2 Ms. Bushra Mehmood, Female Interviewer-3 Ms. Shazia Ilyas, Female Interviewer-4 Ms. Hina Abdul Latif, Female Interviewer-5 Ms. Fozia Rani, Female Interviewer-6 Mr. Muhammad Moazzam Irshad, Male Interviewer-1 Mr. Muhammad Arslan Chaudhary, Male Interviewer-2 Ms. Rashida Asif, Measurer-1 Ms. Fozia Ilyas, Measurer-2 Ms. Sadia Arshad, Observer-1 Gujranwala Division Team-1 Team-2 Mr. Intizar Ahmad, Team Supervisor Mr. Abdul Basit, Team Supervisor Ms. Aamina Bibi, Female Interviewer-1 Ms. Naeema Kazmi, Female Interviewer-1 Ms. Hadia Khan, Female Interviewer-2 Ms. Shumaila Ashraf, Female Interviewer-2 Ms. Saira Mudhasar, Female Interviewer-3 Ms. Abida Saeed, Female Interviewer-3 Ms. Muqadas Zahra, Female Interviewer-4 Ms. Ume Ammara, Female Interviewer-4 Ms. Ali Arif, Female Interviewer-5 Ms. Nabila Akhtar, Female Interviewer-5 Ms. Shumaila, Female Interviewer-6 Ms. Amna Yar, Female Interviewer-6 Mr. Saif Ullah Chatha, Male Interviewer-1 Mr. Javed Iqbal Saleem, Male Interviewer-1 Mr. Kashif Abdul Munam, Male Interviewer-2 Mr. Aamir Sajjad, Male Interviewer-2 Ms. Sumaira, Measurer-1 Ms. Kiran Naz, Measurer-1 Ms.Tehmina Jamil, Measurer-2 Ms. Shazia Iqbal, Measurer-2 Ms.Iqra Kanwal, Observer-1 Ms. Saira Un Nisa, Observer-1

Appendix B List of Personnel Involved in the Survey | Page 12
Team-3 Team-4 Mr. Muhammad Arif Aziz, Team Supervisor Mr. Hafiz Ahmar Javaid, Team Supervisor Ms. Nabeela Khalid, Female Interviewer-1 Ms. Faiza Shakoor, Female Interviewer-1 Ms. Iffat Tahira, Female Interviewer-2 Ms. Ifra Arshad, Female Interviewer-2 Ms. Khadija Arooj, Female Interviewer-3 Ms. Nimra, Female Interviewer-3 Ms. Samreen Naeem, Female Interviewer-4 Ms. Kinza Shafiq Butt, Female Interviewer-4 Ms. Faiza Butt, Female Interviewer-5 Ms. Iffat Abbas, Female Interviewer-5 Ms. Rabia Kousar, Female Interviewer-6 Ms. Uzma Khan, Female Interviewer-6 Mr. Muhammad Bilal, Male Interviewer-1 Mr. Salman Raza, Male Interviewer-1 Mr. Usman Saeed, Male Interviewer-2 Mr. Khalid Bashir, Male Interviewer-2 Ms. Rehmana Sehar, Measurer-1 Ms. Saima Batool, Measurer-1 Ms. Rukhsana Kousar, Measurer-2 Ms. Sabiha, Measurer-2 Ms. Sarwat Fatima, Observer-1 Ms. Sundas Javaid, Observer-1 Team-5 Team-6 Mr. Muhammad Naeem, Mr. Gulzar Ahmad, Team Supervisor Team Supervisor Ms. Ume Farwa, Female Interviewer-1 Ms. Sanam Sadiq, Female Interviewer-1 Ms. Aqsa Ikram, Female Interviewer-2 Ms. Aneesa Rauf, Female Interviewer-2 Ms. Sumaira Fiaz,, Female Interviewer-3 Ms. Hajra Fida, Female Interviewer-3 Ms. Sara Ehsan Female Interviewer-4 Ms. Syeda Kiran Fatima, Female Interviewer-4 Ms. Rushda Asad, Female Interviewer-5 Ms. Sana Mushtaq, Female Interviewer-5 Ms. Gulnaz Shahzadi, Female Interviewer-6 Ms. Sana Javed, Female Interviewer-6 Mr. Syed Imran Hussain, Male Interviewer-1 Mr. Muhammad Haroon, Male Interviewer-1 Mr. Naveed Raza, Male Interviewer-2 Mr. Muhammad Yasir, Male Interviewer-2 Ms. Tahreem Fatima, Measurer-1 Ms. Azra Manzoor, Measurer-1 Ms. Mehak Fatima, Measurer-2 Ms. Shireen Nigar Hashmi, Measurer-2 Ms. Sadaf, Observer-1 Ms. Rubina Kusar Observer-1 Lahore-I Division
Team-1 Team-2 Mr. Muhammad Akram Team Supervisor Mr. Qaiser Iqbal Team Supervisor Ms. Sumaira Anjum Female Interviewer-1 Ms. Sadia Sharif Female Interviewer-1 Ms. Saira Ghulam Nabi Female Interviewer-2 Ms. Najma Munzoor Female Interviewer-2 Ms. Nimra Amir Female Interviewer-3 Ms. Maira Shan Female Interviewer-3 Ms. Mehwish Akram Female Interviewer-4 Ms. Madeeha Tahir Female Interviewer-4 Ms. Sidra Nazeer Female Interviewer-5 Ms. Uzma Farid Female Interviewer-5 Ms. Anam Anwar Female Interviewer-6 Ms. Rizwana Ghafoor Female Interviewer-6 Mr. Zia Ahmad Babar Male Interviewer-1 Mr. Wahaj Bin Tariq Male Interviewer-1 Mr. Nisar Malik Male Interviewer-2 Mr. Ali Raza Male Interviewer-2 Ms. Sumera Naz Measurer-1 Ms. Kehkshan Naseem Measurer-1 Ms. Farah Asif Measurer-2 Ms. Humaira Haidari Measurer-2 Ms. Dur-e-Seemi Observer-1 Neelum Khalil Observer-1 Team-3 Team-4 Mr. Junaid Talib Team Supervisor Mr. Junaid Talib Team Supervisor Ms. Benish Rashid Female Interviewer-1 Ms. Saba Naseer Female Interviewer-1 Ms. Humaira Naz Female Interviewer-2 Ms. Birrah Zia Female Interviewer-2 Ms. Nimra Shafiq Female Interviewer-3 Ms. Momina Tariq Female Interviewer-3 Ms. Sobia Hassan Female Interviewer-4 Ms. Fehmina Naz Female Interviewer-4 Ms. Ayesha Jabbar Female Interviewer-5 Ms. Tabasum Zahra Bokhari Female Interviewer-5 Ms. Bishama Samuel Female Interviewer-6 Ms. Sumyra Akram Female Interviewer-6 Mr. Liaqat Butt Male Interviewer-1 Mr. Muhammad Hanif Khan Male Interviewer-1 Mr. Abdul Waheed Male Interviewer-2 Mr. Hafiz Muhammad Mansoor Male Interviewer-2 Ms. Fahrin Aslam Measurer-1 Ms. Aneela Measurer-1 Ms. Mona Mukhtar Measurer-2 Ms. Zubaida Ali Measurer-2 Ms. Humera Qasim Observer-1 Ms. Najaf Zahra Observer-1

Appendix B List of Personnel Involved in the Survey | Page 13
Team-5 Team-6 Mr. Muhammad Asad Team Supervisor Mr. Syed Mazhar Bukhari Team Supervisor Ms. Nabila Akram Female Interviewer-1 Ms. Bibi Ruqiya Female Interviewer-1 Ms. Sana Shafiq Female Interviewer-2 Ms. Sehar Aftab Female Interviewer-2 Ms. Bushra Hassan Female Interviewer-3 Ms. Laraib Alam Female Interviewer-3 Ms. Sumbal Ijaz Female Interviewer-4 Ms. Faiza Mansoor Female Interviewer-4 Ms. Nabila Siddique Female Interviewer-5 Ms. Aqeela Parveen Female Interviewer-5 Ms. Wajiha Javed Female Interviewer-6 Ms. Kiran Shahzadi Female Interviewer-6 Mr. Yasir Nawaz Male Interviewer-1 Mr. Muhammad Qadeer Male Interviewer-1 Mr. Malik Noman Male Interviewer-2 Mr. Saif Ullah Male Interviewer-2 Ms. Sobia Mansoor Measurer-1 Ms. Ayesha Saddiqa Measurer-1 Ms. Tahrima Rafique Measurer-2 Ms. Saira Bano Measurer-2 Ms. Sadia Azad Observer-1 Ms. Khadija Ahmad Observer-1 Lahore-II Division
Team-1 Team-2 Mr. Muhamamd Shahbaz, Team Supervisor Mr. Muhammad Qamar Virk, Team Supervisor Ms. Hafia Samia Bano, Female Interviewer-1 Ms. Fatima Afeefa, Female Interviewer-1 Ms. Razia Nasrullah, Female Interviewer-2 Ms. Farzana Kousar, Female Interviewer-2 Ms. Amna Bibi, Female Interviewer-3 Ms. Abida Riaz, Female Interviewer-3 Ms. Farzana Siddique, Female Interviewer-4 Ms. Mehnaz Nazir, Female Interviewer-4 Ms. Tayyaba Baig, Female Interviewer-5 Ms. Maria Naseeb, Female Interviewer-5 Ms. Syeda Iffat Bano, Female Interviewer-6 Ms. Asma Waseem, Female Interviewer-6 Mr. Manzoor Hussain Unsar, Male Interviewer-1 Mr. Abdul Ghafoor, Male Interviewer-1 Mr. Malik Wasim Ahmad Zahid, Male Interviewer-2 Mr. Rana Naveed Anwar, Male Interviewer-2 Ms. Qurat Ul Ain Baig, Measurer-1 Ms. Faiza Tariq, Measurer-1 Ms. Rashida Asif, Measurer-2 Ms. Bushra Bashir, Measurer-2 Ms. Yasmeen Bibi, Observer-1 Ms. Jamila Rani, Observer-1 Team-3 Team-4 Mr. Muhammad Maqsood Ali, Team Supervisor Mr. Meharban Elahi, Team Supervisor Ms. Tahreem Fatima, Female Interviewer-1 Ms. Mehvish Muneer, Female Interviewer-1 Ms. Rismsha Sissel, Female Interviewer-2 Ms. Shehnaz Akhter, Female Interviewer-2 Ms. Maria Shabier, Female Interviewer-3 Ms. Sidra Riyasat, Female Interviewer-3 Ms. Fazila Talib, Female Interviewer-4 Ms. Saira Kousar, Female Interviewer-4 Ms. Asia Kousar, Female Interviewer-5 Ms. Shahzadi Amanat, Female Interviewer-5 Ms. Iqra Tariq, Female Interviewer-6 Ms. Nazia Boota, Female Interviewer-6 Mr. Muhammad Arqam Awais, Male Interviewer-1 Mr. Muhammad Shahbaz, Male Interviewer-1 Mr. Ibrar Khadam, Male Interviewer-2 Mr. Muhammad Adeel, Male Interviewer-2 Ms. Sana Shafqat, Measurer-1 Ms. Bushra Anwar, Measurer-1 Ms. Asifa Rasheed, Measurer-2 Ms. Mahwash Hina, Measurer-2 Ms. Julia Shafqat, Observer-1 Ms. Farzana Shahid, Observer-1 Multan Division
Team-1 Team-2 Mr. Ashraf Ali, Team Supervisor Mr. Rizwan Bashir, Team Supervisor Ms. Arfa Yousaf, Female Interviewer-1 Ms. Rashida Nazar, Female Interviewer-1 Ms. Aroosa Kiran, Female Interviewer-2 Ms. Kousar Parveen, Female Interviewer-2 Ms. Khansa Naeem, Female Interviewer-3 Ms. Samia Naz, Female Interviewer-3 Ms. Bushra Fareed, Female Interviewer-4 Ms. Sofia Siddique, Female Interviewer-4 Ms. Aliya Sarwar, Female Interviewer-5 Ms. Taskeen Fatima, Female Interviewer-5 Ms. Sabahat Maqbool, Female Interviewer-6 Ms. Khalida Parveen, Female Interviewer-6 Mr. Muhammad Saqlain, Male Interviewer-1 Mr. Muhammad Nouman Shabbir, Male Interviewer-1 Mr. Muhammad Nabeel Ahsraf, Male Interviewer-2 Mr. Muhammad Rashid, Male Interviewer-2 Ms. Raheela Shoukat, Measurer-1 Ms. Sadia Shereen, Measurer-1 Ms. Naheed Nawaz, Measurer-2 Ms. Anam Shoukat, Measurer-2 Ms. Rabia Nisar, Observer-1 Ms. Aisha Kiran, Observer-1

Appendix B List of Personnel Involved in the Survey | Page 14
Team-3 Team-4 Mr. Mudassir Jamil, Team Supervisor Mr. Nazar Muhammad Nasir, Team Supervisor Ms. Ishrat Jamil, Female Interviewer-1 Ms. Ruqia Habib, Female Interviewer-1 Ms. Zahra Batool, Female Interviewer-2 Ms. Parsa, Female Interviewer-2 Ms. Romana Munir, Female Interviewer-3 Ms. Farzana Mukhtar, Female Interviewer-3 Ms. Sumaira Saeed, Female Interviewer-4 Ms. Ayesha Khaleeq, Female Interviewer-4 Ms. Pakeeza Kiran, Female Interviewer-5 Ms. Umay Kalsoom, Female Interviewer-5 Ms. Sonia Sarwar, Female Interviewer-6 Ms. Beenish Zulfiqar, Female Interviewer-6 Mr. Muhammad Akram, Male Interviewer-1 Mr. Muhamamd Amjad Jamil, Male Interviewer-1 Mr. Shahbaz Nawaz, Male Interviewer-2 Mr. Ijaz Khan, Male Interviewer-2 Ms. Zaibunisa, Measurer-1 Ms. Sobia Mushtaq, Measurer-1 Ms. Saher Zafar, Measurer-2 Ms. Parveen Akhtar, Measurer-2 Ms. Rafia Rehman, Observer-1 Ms. Syeda Fouzia Bukhari, Observer-1 Rawalpindi Division
Team-1 Team-2 Mr. Liaqat Ali, Team Supervisor Mr. Muhammad Irfan, Team Supervisor Ms. Samina Bibi, Female Interviewer-1 Ms. Nimra Sharmih, Female Interviewer-1 Ms. Iqra Bibi, Female Interviewer-2 Ms. Manahil Khan, Female Interviewer-2 Ms. Ismat Jehan, Female Interviewer-3 Ms. Anees Zahra, Female Interviewer-3 Ms. Sadaf Mehmood, Female Interviewer-4 Ms. Sana Shoukat, Female Interviewer-4 Ms. Saba Riaz, Female Interviewer-5 Ms. Adeeba Batool, Female Interviewer-5 Ms. Madeeha Rahman, Female Interviewer-6 Ms. Ayesha Bibi, Female Interviewer-6 Mr. Basit Mehmood, Male Interviewer-1 Mr. Malik Zabair, Male Interviewer-1 Mr. Syed Safdar Ali Shah, Male Interviewer-2 Mr. Bilal Ahmad, Male Interviewer-2 Ms. Fouzia Qammar, Measurer-1 Ms. Samreen Khalid, Measurer-1 Ms. Warda Naheed, Measurer-2 Ms. Attiya Naseer, Measurer-2 Ms. Kehkshan Gull, Observer-1 Ms. Asia Sehar, Observer-1 Team-3 Team-4 Mr. Noman Zahoor, Team Supervisor Mr. Muhammad Saeed Shakir, Team Supervisor Ms. Shahida Sikandar, Female Interviewer-1 Ms. Farhat Naheed, Female Interviewer-1 Ms. Rizwana Zamurd, Female Interviewer-2 Ms. Madeeha Manzoor, Female Interviewer-2 Ms. Salma Bibi, Female Interviewer-3 Ms. Sarwat Shaheen, Female Interviewer-3 Ms. Tayyeba Zanib, Female Interviewer-4 Ms. Tahira Yasmin, Female Interviewer-4 Ms. Sadia Batool, Female Interviewer-5 Ms. Aamna Bibi, Female Interviewer-5 Ms. Hajra Zahida, Female Interviewer-6 Ms. Riaz Fatima, Female Interviewer-6 Mr. Muhammad Hussain, Male Interviewer-1 Mr. Muhammad Faizan, Male Interviewer-1 Mr. Hamad Ahmad Khan, Male Interviewer-2 Mr. Muhammad Waqas, Male Interviewer-2 Ms. Tahmeena Hassan, Measurer-1 Ms. Rabia Javed, Measurer-1 Ms. Azeema Akhtar, Measurer-2 Ms. Hina Firdous, Measurer-2 Ms. Tehmina Afzal, Observer-1 Ms. Asma Rubab, Observer-1 Team-5 Team-6 Mr. Ghulam Sarwar, Team Supervisor Ms. Aneela Abraiz, Team Supervisor Ms. Hajra Hussain, Female Interviewer-1 Ms. Saba Gul, Female Interviewer-1 Ms. Fatima Sakhi, Female Interviewer-2 Ms. Hira Saeed Amir, Female Interviewer-2 Ms. Asia Batool, Female Interviewer-3 Ms. Afifa Batool, Female Interviewer-3 Ms. Memona Manzoor, Female Interviewer-4 Ms. Saiqa Mubeen, Female Interviewer-4 Ms. Misbah Naseem, Female Interviewer-5 Ms. Maria Batool, Female Interviewer-5 Ms. Farkhanda Manzor, Female Interviewer-6 Ms. Tehmina Zia, Female Interviewer-6 Mr. Aamir Sohal, Male Interviewer-1 Mr. Abid Hussain, Male Interviewer-1 Mr. Muhammad Saleem, Male Interviewer-2 Mr. Malik Hashim, Male Interviewer-2 Ms. Asma Ramzan, Measurer-1 Ms. Razia Parveen, Measurer-1 Ms. Saba Nabi, Measurer-2 Ms. Shanza Afroz, Measurer-2 Ms. Tanzilla Butt, Observer-1 Ms. Asma Rubab Observer-1

Appendix B List of Personnel Involved in the Survey | Page 15
Team-7
Mr. Muhammad Shahbaz, Team Supervisor Ms. Farzana Shaheen, Female Interviewer-1 Ms. Noshaba Naved, Female Interviewer-2 Ms. Misheal Rizwan, Female Interviewer-3 Ms. Noreen Bibi, Female Interviewer-4 Ms. Bushra Tasneem, Female Interviewer-5 Ms. Shahzia Rehman, Female Interviewer-6 Mr. Zahoor Abbas, Male Interviewer-1 Mr. Saeed Akhtar, Male Interviewer-2 Ms. Sajida Malik, Measurer-1 Ms. Sidra Khalid, Measurer-2 Ms. Naheed Akhtar, Observer-1 Sahiwal Division
Team-1 Team-2 Team-1 Team-2 Mr. Manzoor Hussain, Team Supervisor Mr. Manzoor Hussain, Team Supervisor Ms. Mahvish Rehan, Female Interviewer-1 Ms. Mahvish Rehan, Female Interviewer-1 Ms. Rehana Kousar, Female Interviewer-2 Ms. Rehana Kousar, Female Interviewer-2 Ms. Shumaila Yaseen, Female Interviewer-3 Ms. Shumaila Yaseen, Female Interviewer-3 Ms. Irshad, Female Interviewer-4 Ms. Irshad, Female Interviewer-4 Ms. Maria Allah Ditta, Female Interviewer-5 Ms. Maria Allah Ditta, Female Interviewer-5 Ms. Samreen Nazir, Female Interviewer-6 Ms. Samreen Nazir, Female Interviewer-6 Mr. Zeeshan Sharif, Male Interviewer-1 Mr. Zeeshan Sharif, Male Interviewer-1 Mr. Muhammad Niaz, Male Interviewer-2 Mr. Muhammad Niaz, Male Interviewer-2 Ms. Ismat Tahira, Measurer-1 Ms. Ismat Tahira, Measurer-1 Ms. Saleha Aslam, Measurer-2 Ms. Saleha Aslam, Measurer-2 Ms. Arshia Muneer, Observer-1 Ms. Arshia Muneer, Observer-1 Sargodha Division
Team-1 Team-2 Mr. Muhammad Azhar Saleem, Team Supervisor Mr. Shahid Jamil, Team Supervisor Ms. Asma Attique, Female Interviewer-1 Ms. Samina Nazish, Female Interviewer-1 Ms. Hira Fardous, Female Interviewer-2 Ms. Tahira Naaz, Female Interviewer-2 Ms. Shumaila Ambreen, Female Interviewer-3 Ms. Rukhsana Perveen, Female Interviewer-3 Ms. Rukhsana Kanwal, Female Interviewer-4 Ms. Shahrish Jabeen, Female Interviewer-4 Ms. Ruqia Anwar, Female Interviewer-5 Ms. Hafsa Zahoor, Female Interviewer-5 Ms. Faira Yasmeen, Female Interviewer-6 Ms. Sumaira Sher, Female Interviewer-6 Mr. Rehmatullah, Male Interviewer-1 Mr. Aurangzaib, Male Interviewer-1 Mr. Muhammad Hanif, Male Interviewer-2 Mr. Abdul Wahab Ali, Male Interviewer-2 Ms. Robina Kousar, Measurer-1 Ms. Kalsoom Bivi, Measurer-1 Ms. Sonia Bashir, Measurer-2 Ms. Rukhsana Riaz, Measurer-2 Ms. Tehmeena Riaz, Observer-1 Ms. Gulshan Saeed, Observer-1 Team-3 Team-4 Mr. Rizwan Farooq, Team Supervisor Mr. Ahmad Nawaz, Team Supervisor Ms. Kishwar Sajjad, Female Interviewer-1 Ms. Sumaiya Naveed, Female Interviewer-1 Ms. Salma Sajjad, Female Interviewer-2 Ms. Palwasha Shireen, Female Interviewer-2 Ms. Asia Mushtaq, Female Interviewer-3 Ms. Salma Parveen, Female Interviewer-3 Ms. Saira Bibi, Female Interviewer-4 Ms. Farzana Iqbal, Female Interviewer-4 Ms. Shazia Bibi, Female Interviewer-5 Ms. Abida Iqbal, Female Interviewer-5 Ms. Muqaddas Tahira, Female Interviewer-6 Ms. Saba Saeed, Female Interviewer-6 Mr. Ghulam Ghaus, Male Interviewer-1 Mr. Sami Ullah, Male Interviewer-1 Mr. Muhammad Irfan Hussain, Male Interviewer-2 Mr. Usman Ghani, Male Interviewer-2 Ms. Imtiaz Bibi, Measurer-1 Ms. Kaubab Rubab, Measurer-1 Ms. Mehwish Shahzadi, Measurer-2 Ms. Shamsa Ahmad Measurer-2 Ms. Zubaria Mukhtar, Observer-1 Ms. Rehana Kousar, Observer-1

Appendix C Estimates of Sampling Error | Page 17
APPENDIX C ESTIMATES OF SAMPLING ERROR
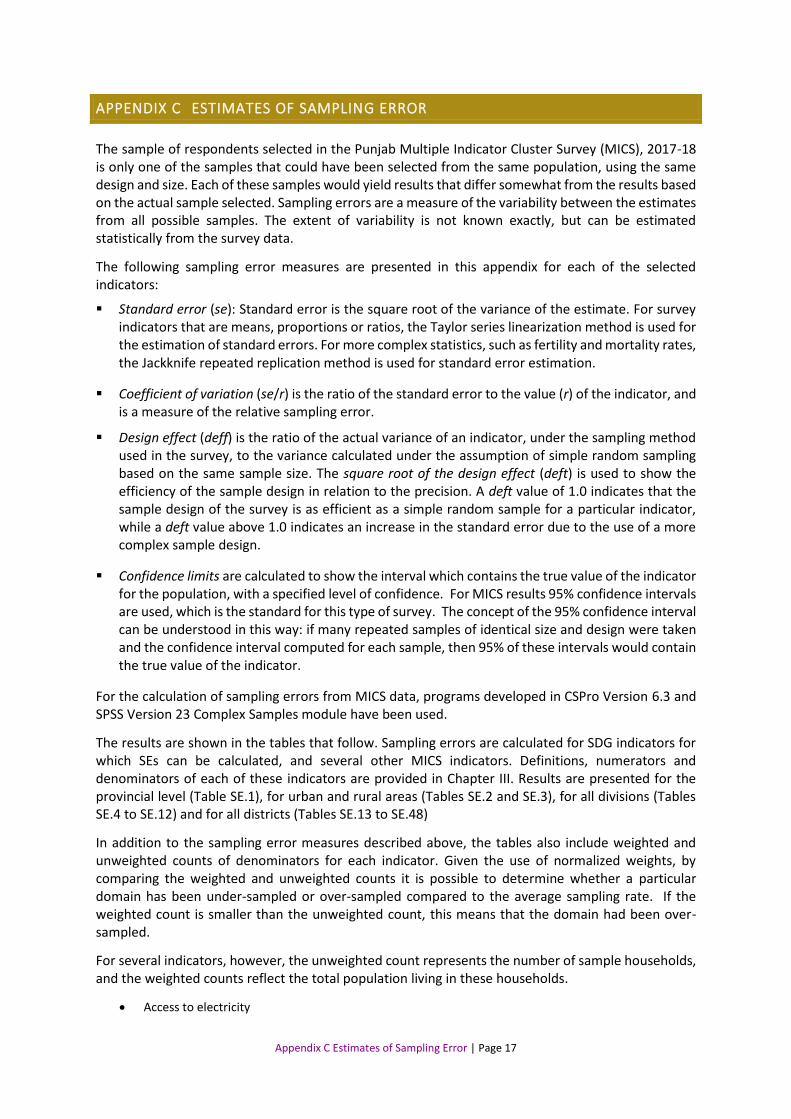
The sample of respondents selected in the Punjab Multiple Indicator Cluster Survey (MICS), 2017-18 is only one of the samples that could have been selected from the same population, using the same design and size. Each of these samples would yield results that differ somewhat from the results based on the actual sample selected. Sampling errors are a measure of the variability between the estimates from all possible samples. The extent of variability is not known exactly, but can be estimated statistically from the survey data.
The following sampling error measures are presented in this appendix for each of the selected indicators:
Standard error (se): Standard error is the square root of the variance of the estimate. For survey indicators that are means, proportions or ratios, the Taylor series linearization method is used for the estimation of standard errors. For more complex statistics, such as fertility and mortality rates, the Jackknife repeated replication method is used for standard error estimation.
Coefficient of variation (se/r) is the ratio of the standard error to the value (r) of the indicator, and is a measure of the relative sampling error.
Design effect (deff) is the ratio of the actual variance of an indicator, under the sampling method used in the survey, to the variance calculated under the assumption of simple random sampling based on the same sample size. The square root of the design effect (deft) is used to show the efficiency of the sample design in relation to the precision. A deft value of 1.0 indicates that the sample design of the survey is as efficient as a simple random sample for a particular indicator, while a deft value above 1.0 indicates an increase in the standard error due to the use of a more complex sample design.
Confidence limits are calculated to show the interval which contains the true value of the indicator for the population, with a specified level of confidence. For MICS results 95% confidence intervals are used, which is the standard for this type of survey. The concept of the 95% confidence interval can be understood in this way: if many repeated samples of identical size and design were taken and the confidence interval computed for each sample, then 95% of these intervals would contain the true value of the indicator.
For the calculation of sampling errors from MICS data, programs developed in CSPro Version 6.3 and SPSS Version 23 Complex Samples module have been used.
The results are shown in the tables that follow. Sampling errors are calculated for SDG indicators for which SEs can be calculated, and several other MICS indicators. Definitions, numerators and denominators of each of these indicators are provided in Chapter III. Results are presented for the provincial level (Table SE.1), for urban and rural areas (Tables SE.2 and SE.3), for all divisions (Tables SE.4 to SE.12) and for all districts (Tables SE.13 to SE.48)
In addition to the sampling error measures described above, the tables also include weighted and unweighted counts of denominators for each indicator. Given the use of normalized weights, by comparing the weighted and unweighted counts it is possible to determine whether a particular domain has been under-sampled or over-sampled compared to the average sampling rate. If the weighted count is smaller than the unweighted count, this means that the domain had been over-sampled.
For several indicators, however, the unweighted count represents the number of sample households, and the weighted counts reflect the total population living in these households.
Access to electricity

Appendix C Estimates of Sampling Error | Page 18
Primary reliance on clean fuels and technologies for cooking, space heating and lighting
Use of basic drinking water services
Use of safely managed drinking water services
Handwashing facility with water and soap
Use of basic sanitation services
Population covered by social transfers

Appendix C Estimates of Sampling Error | Page 19
Table SE.1: Sampling errors: Total sample
Standard errors, coefficients of variation, design effects (deff), square root of design effects (deft), and confidence intervals for selected SDG and other indicators, Punjab, 2017-18
Coefficient of
variation (se/r)
Square root of design
effect (deft)
Confidence limits
MICS Indicator
Value (r)
Standard error (se)
Design effect (deff)
Weighted count
Unweighted count
Lower bound r - 2se
Upper bound r + 2se
Sample coverage and characteristics of respondents
Access to electricity SR.1 0.9658 0.0014 0.001 3.176 1.782 327,980 51,660 0.963 0.969
Ownership of mobile phone (women) SR.10 0.3912 0.0028 0.007 2.467 1.571 74,010 74,010 0.386 0.397
Ownership of mobile phone (men) SR.10 0.8665 0.0025 0.003 1.430 1.196 27,094 27,094 0.862 0.871
Use of internet during last 3 months(women) SR.12a 0.1218 0.0024 0.020 4.147 2.036 74,010 74,010 0.117 0.127
Use of internet during last 3 months(men) SR.12a 0.3020 0.0041 0.014 2.189 1.480 27,094 27,094 0.294 0.310
ICT skills (women) SR.13 0.0514 0.0015 0.029 3.452 1.858 74,010 74,010 0.048 0.054
ICT skills (men) SR.13 0.1445 0.0032 0.022 2.195 1.482 27,094 27,094 0.138 0.151
Tobacco use (women) SR.14 0.0328 0.0008 0.025 1.630 1.277 74,010 74,010 0.031 0.035
Tobacco use (men) SR.14 0.2397 0.0031 0.013 1.439 1.200 27,094 27,094 0.234 0.246
Survive
Neonatal mortality rate CS.1 41 1.1 0.03 na na na na 39 43
Infant mortality rate CS.3 60 1.3 0.02 na na na na 58 63
Under-five mortality rate CS.5 69 1.4 0.02 na na na na 66 72
Thrive - Reproductive and maternal health
Total fertility rate - 3.7105 0.0294 0.008 na na na na 3.652 3.769
Adolescent birth rate TM.1 39.664 1.1947 0.030 na na na na 37.27 42.05
Contraceptive prevalence rate TM.3 0.3435 0.0026 0.008 1.435 1.198 47,030 47,087 0.338 0.349
Need for family planning satisfied with modern contraception TM.4 0.5722 0.0038 0.007 1.437 1.199 24,548 24,284 0.565 0.580
Antenatal care coverage (at least four times by any provider) TM.5b 0.5292 0.0047 0.009 1.377 1.173 15,656 15,731 0.520 0.539
Skilled attendant at delivery TM.9 0.7641 0.0042 0.006 1.546 1.243 15,656 15,731 0.756 0.773
Thrive - Child health, nutrition and development
Diphtheria, tetanus and pertussis (DTP) immunization coverage
TC.3 0.8729 0.0044 0.005 1.362 1.167 7,867 7,842 0.864 0.882
Pneumococcal (Conjugate) immunization coverage TC.6 0.8625 0.0046 0.005 1.378 1.174 7,867 7,842 0.853 0.872
Measles immunization coverage TC.10 0.8274 0.0050 0.006 1.345 1.160 7,867 7,842 0.817 0.837
Primary reliance on clean fuels and technologies for cooking, space heating and lighting
TC.18 0.4490 0.0046 0.010 4.372 2.091 327,980 51,660 0.440 0.458
Care-seeking for children with acute respiratory infection (ARI) symptoms
TC.19 0.7474 0.0074 0.010 0.957 0.978 3,331 3,305 0.733 0.762
Exclusive breastfeeding under 6 months TC.32 0.4206 0.0070 0.017 0.932 0.965 4,570 4,588 0.407 0.435
Stunting prevalence (moderate and severe) TC.45a 0.3149 0.0031 0.010 1.717 1.310 38,016 38,047 0.309 0.321
Wasting prevalence (moderate and severe) TC.46a 0.0745 0.0015 0.020 1.258 1.121 37,744 37,779 0.071 0.078
Overweight prevalence (moderate and severe) TC.47a 0.0199 0.0008 0.040 1.225 1.107 37,744 37,779 0.018 0.021
Early child development index TC.53 0.5942 0.0043 0.007 1.222 1.105 15,931 15,973 0.586 0.603

Appendix C Estimates of Sampling Error | Page 20
Table SE.1: Sampling errors: Total sample
Standard errors, coefficients of variation, design effects (deff), square root of design effects (deft), and confidence intervals for selected SDG and other indicators, Punjab, 2017-18
Coefficient of
variation (se/r)
Square root of design
effect (deft)
Confidence limits
MICS Indicator
Value (r)
Standard error (se)
Design effect (deff)
Weighted count
Unweighted count
Lower bound r - 2se
Upper bound r + 2se
Learn
Participation rate in organised learning (adjusted) LN.2 0.7355 0.0053 0.007 1.261 1.123 8,716 8,733 0.725 0.746
Children with foundational reading and number skills (reading)
LN.22a 0.3276 0.0042 0.013 1.417 1.190 17,471 17,558 0.319 0.336
Children with foundational reading and number skills (numeracy)
LN.22d 0.0451 0.0018 0.039 1.284 1.133 17,471 17,558 0.042 0.049
Protected from violence and exploitation
Birth registration PR.1 0.7534 0.0034 0.005 2.504 1.582 39,799 39,799 0.747 0.760
Violent discipline PR.2 0.7891 0.0021 0.003 1.640 1.281 59,559 59,550 0.785 0.793
Child labour PR.3 0.1345 0.0021 0.015 1.294 1.138 35,482 35,482 0.130 0.139
Child marriage (before age 15) (women) PR.4a 0.0334 0.0016 0.048 1.061 1.030 13,633 13,568 0.030 0.037
Child marriage (before age 18) (women) PR.4b 0.1463 0.0034 0.023 1.239 1.113 13,633 13,568 0.140 0.153
Crime reporting (women) PR.13 0.1212 0.0088 0.072 0.680 0.825 961 943 0.104 0.139
Crime reporting (men) PR.13 0.2260 0.0101 0.044 0.233 0.482 409 404 0.206 0.246
Safety (women) PR.14 0.5587 0.0025 0.005 1.911 1.382 74,010 74,010 0.554 0.564
Safety (men) PR.14 0.9374 0.0020 0.002 1.835 1.355 27,094 27,094 0.933 0.941
Live in a safe and clean environment
Use of basic drinking water service WS.2 0.9593 0.0015 0.002 2.846 1.687 327,980 51,660 0.956 0.962
Use of safely managed drinking water WS.6 0.4369 0.0069 0.016 1.587 1.260 44,286 6,850 0.423 0.451
Handwashing facility with water and soap WS.7 0.9206 0.0016 0.002 1.878 1.371 326,805 51,455 0.917 0.924
Use of improved sanitation WS.8 0.8008 0.0032 0.004 3.218 1.794 327,980 51,660 0.794 0.807
Use of basic sanitation service WS.9 0.7042 0.0033 0.005 2.664 1.632 327,980 51,660 0.698 0.711
Equitable chance in life
Children with functional dificulty EQ.1 0.1328 0.0015 0.012 1.214 1.102 59,282 59,290 0.130 0.136
Population covered by social transfers EQ.3 0.4280 0.0030 0.007 1.861 1.364 327,980 51,660 0.422 0.434
Discrimination (women) EQ.7 0.0966 0.0014 0.014 1.624 1.274 74,010 74,010 0.094 0.099
Discrimination (men) EQ.7 0.0852 0.0021 0.024 1.496 1.223 27,094 27,094 0.081 0.089
Overall life satisfaction index (women age 15-24) EQ.9a 7.2563 0.0174 0.002 1.695 1.302 28,103 28,001 7.221 7.291
Overall life satisfaction index (men age 15-24) EQ.9a 6.7688 0.0265 0.004 1.515 1.231 10,976 11,000 6.716 6.822
na: not applicable
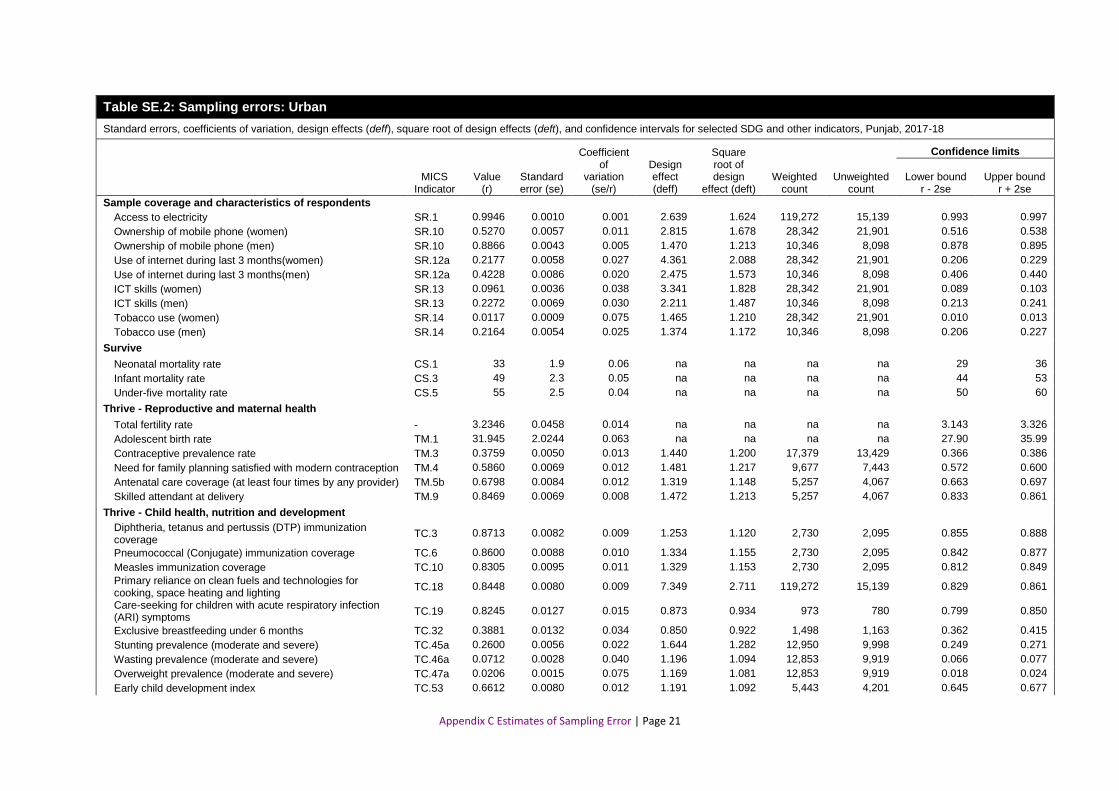
Appendix C Estimates of Sampling Error | Page 21
Table SE.2: Sampling errors: Urban
Standard errors, coefficients of variation, design effects (deff), square root of design effects (deft), and confidence intervals for selected SDG and other indicators, Punjab, 2017-18
Coefficient of
variation (se/r)
Square root of design
effect (deft)
Confidence limits
MICS Indicator
Value (r)
Standard error (se)
Design effect (deff)
Weighted count
Unweighted count
Lower bound r - 2se
Upper bound r + 2se
Sample coverage and characteristics of respondents
Access to electricity SR.1 0.9946 0.0010 0.001 2.639 1.624 119,272 15,139 0.993 0.997
Ownership of mobile phone (women) SR.10 0.5270 0.0057 0.011 2.815 1.678 28,342 21,901 0.516 0.538
Ownership of mobile phone (men) SR.10 0.8866 0.0043 0.005 1.470 1.213 10,346 8,098 0.878 0.895
Use of internet during last 3 months(women) SR.12a 0.2177 0.0058 0.027 4.361 2.088 28,342 21,901 0.206 0.229
Use of internet during last 3 months(men) SR.12a 0.4228 0.0086 0.020 2.475 1.573 10,346 8,098 0.406 0.440
ICT skills (women) SR.13 0.0961 0.0036 0.038 3.341 1.828 28,342 21,901 0.089 0.103
ICT skills (men) SR.13 0.2272 0.0069 0.030 2.211 1.487 10,346 8,098 0.213 0.241
Tobacco use (women) SR.14 0.0117 0.0009 0.075 1.465 1.210 28,342 21,901 0.010 0.013
Tobacco use (men) SR.14 0.2164 0.0054 0.025 1.374 1.172 10,346 8,098 0.206 0.227
Survive
Neonatal mortality rate CS.1 33 1.9 0.06 na na na na 29 36
Infant mortality rate CS.3 49 2.3 0.05 na na na na 44 53
Under-five mortality rate CS.5 55 2.5 0.04 na na na na 50 60
Thrive - Reproductive and maternal health
Total fertility rate - 3.2346 0.0458 0.014 na na na na 3.143 3.326
Adolescent birth rate TM.1 31.945 2.0244 0.063 na na na na 27.90 35.99
Contraceptive prevalence rate TM.3 0.3759 0.0050 0.013 1.440 1.200 17,379 13,429 0.366 0.386
Need for family planning satisfied with modern contraception TM.4 0.5860 0.0069 0.012 1.481 1.217 9,677 7,443 0.572 0.600
Antenatal care coverage (at least four times by any provider) TM.5b 0.6798 0.0084 0.012 1.319 1.148 5,257 4,067 0.663 0.697
Skilled attendant at delivery TM.9 0.8469 0.0069 0.008 1.472 1.213 5,257 4,067 0.833 0.861
Thrive - Child health, nutrition and development
Diphtheria, tetanus and pertussis (DTP) immunization coverage
TC.3 0.8713 0.0082 0.009 1.253 1.120 2,730 2,095 0.855 0.888
Pneumococcal (Conjugate) immunization coverage TC.6 0.8600 0.0088 0.010 1.334 1.155 2,730 2,095 0.842 0.877
Measles immunization coverage TC.10 0.8305 0.0095 0.011 1.329 1.153 2,730 2,095 0.812 0.849
Primary reliance on clean fuels and technologies for cooking, space heating and lighting
TC.18 0.8448 0.0080 0.009 7.349 2.711 119,272 15,139 0.829 0.861
Care-seeking for children with acute respiratory infection (ARI) symptoms
TC.19 0.8245 0.0127 0.015 0.873 0.934 973 780 0.799 0.850
Exclusive breastfeeding under 6 months TC.32 0.3881 0.0132 0.034 0.850 0.922 1,498 1,163 0.362 0.415
Stunting prevalence (moderate and severe) TC.45a 0.2600 0.0056 0.022 1.644 1.282 12,950 9,998 0.249 0.271
Wasting prevalence (moderate and severe) TC.46a 0.0712 0.0028 0.040 1.196 1.094 12,853 9,919 0.066 0.077
Overweight prevalence (moderate and severe) TC.47a 0.0206 0.0015 0.075 1.169 1.081 12,853 9,919 0.018 0.024
Early child development index TC.53 0.6612 0.0080 0.012 1.191 1.092 5,443 4,201 0.645 0.677

Appendix C Estimates of Sampling Error | Page 22
Table SE.2: Sampling errors: Urban
Standard errors, coefficients of variation, design effects (deff), square root of design effects (deft), and confidence intervals for selected SDG and other indicators, Punjab, 2017-18
Coefficient of
variation (se/r)
Square root of design
effect (deft)
Confidence limits
MICS Indicator
Value (r)
Standard error (se)
Design effect (deff)
Weighted count
Unweighted count
Lower bound r - 2se
Upper bound r + 2se
Learn
Participation rate in organised learning (adjusted) LN.2 0.8006 0.0089 0.011 1.158 1.076 2,978 2,337 0.783 0.818
Children with foundational reading and number skills (reading)
LN.22a 0.4182 0.0078 0.019 1.188 1.090 6,123 4,813 0.403 0.434
Children with foundational reading and number skills (numeracy)
LN.22d 0.0595 0.0040 0.067 1.371 1.171 6,123 4,813 0.051 0.067
Protected from violence and exploitation
Birth registration PR.1 0.8416 0.0056 0.007 2.428 1.558 13,609 10,476 0.830 0.853
Violent discipline PR.2 0.7633 0.0042 0.005 1.562 1.250 20,936 16,165 0.755 0.772
Child labour PR.3 0.0645 0.0026 0.041 1.148 1.072 13,040 10,096 0.059 0.070
Child marriage (before age 15) (women) PR.4a 0.0218 0.0024 0.109 1.071 1.035 5,285 4,078 0.017 0.026
Child marriage (before age 18) (women) PR.4b 0.1111 0.0056 0.051 1.302 1.141 5,285 4,078 0.100 0.122
Crime reporting (women) PR.13 0.1318 0.0186 0.141 0.939 0.969 397 310 0.095 0.169
Crime reporting (men) PR.13 0.2610 0.0187 0.072 0.241 0.491 173 134 0.224 0.298
Safety (women) PR.14 0.5539 0.0045 0.008 1.826 1.351 28,342 21,901 0.545 0.563
Safety (men) PR.14 0.9441 0.0035 0.004 1.853 1.361 10,346 8,098 0.937 0.951
Live in a safe and clean environment
Use of basic drinking water service WS.2 0.9641 0.0021 0.002 1.880 1.371 119,272 15,139 0.960 0.968
Use of safely managed drinking water WS.6 0.3603 0.0120 0.033 1.370 1.171 16,227 1,942 0.336 0.384
Handwashing facility with water and soap WS.7 0.9667 0.0021 0.002 1.985 1.409 118,663 15,049 0.963 0.971
Use of improved sanitation WS.8 0.9277 0.0042 0.005 4.059 2.015 119,272 15,139 0.919 0.936
Use of basic sanitation service WS.9 0.8543 0.0049 0.006 2.961 1.721 119,272 15,139 0.844 0.864
Equitable chance in life
Children with functional dificulty EQ.1 0.1310 0.0028 0.021 1.123 1.060 21,247 16,424 0.125 0.137
Population covered by social transfers EQ.3 0.3197 0.0051 0.016 1.809 1.345 119,272 15,139 0.309 0.330
Discrimination (women) EQ.7 0.0954 0.0025 0.026 1.548 1.244 28,342 21,901 0.090 0.100
Discrimination (men) EQ.7 0.0795 0.0035 0.045 1.390 1.179 10,346 8,098 0.072 0.087
Overall life satisfaction index (women age 15-24) EQ.9a 7.4173 0.0311 0.004 1.683 1.297 10,807 8,347 7.355 7.479
Overall life satisfaction index (men age 15-24) EQ.9a 7.0604 0.0464 0.007 1.468 1.212 4,180 3,278 6.968 7.153
na: not applicable

Appendix C Estimates of Sampling Error | Page 23
Table SE.3: Sampling errors: Rural
Standard errors, coefficients of variation, design effects (deff), square root of design effects (deft), and confidence intervals for selected SDG and other indicators, Punjab, 2017-18
Coefficient of
variation (se/r)
Square root of design
effect (deft)
Confidence limits
MICS Indicator
Value (r)
Standard error (se)
Design effect (deff)
Weighted count
Unweighted count
Lower bound r - 2se
Upper bound r + 2se
Sample coverage and characteristics of respondents
Access to electricity SR.1 0.9493 0.0022 0.002 3.589 1.894 208,708 36,521 0.945 0.954
Ownership of mobile phone (women) SR.10 0.3070 0.0029 0.010 2.131 1.460 45,668 52,109 0.301 0.313
Ownership of mobile phone (men) SR.10 0.8540 0.0030 0.004 1.378 1.174 16,748 18,996 0.848 0.860
Use of internet during last 3 months(women) SR.12a 0.0623 0.0017 0.027 2.503 1.582 45,668 52,109 0.059 0.066
Use of internet during last 3 months(men) SR.12a 0.2274 0.0039 0.017 1.668 1.291 16,748 18,996 0.220 0.235
ICT skills (women) SR.13 0.0237 0.0009 0.039 1.949 1.396 45,668 52,109 0.022 0.026
ICT skills (men) SR.13 0.0934 0.0027 0.029 1.621 1.273 16,748 18,996 0.088 0.099
Tobacco use (women) SR.14 0.0460 0.0012 0.027 1.828 1.352 45,668 52,109 0.043 0.048
Tobacco use (men) SR.14 0.2541 0.0038 0.015 1.436 1.198 16,748 18,996 0.247 0.262
Survive
Neonatal mortality rate CS.1 45 1.3 0.03 na na na na 43 48
Infant mortality rate CS.3 66 1.6 0.02 na na na na 63 69
Under-five mortality rate CS.5 76 1.7 0.02 na na na na 73 79
Thrive - Reproductive and maternal health
Total fertility rate - 4.0068 0.0356 0.009 na na na na 3.936 4.078
Adolescent birth rate TM.1 44.360 1.4600 0.033 na na na na 41.44 47.28
Contraceptive prevalence rate TM.3 0.3245 0.0030 0.009 1.340 1.157 29,651 33,658 0.319 0.330
Need for family planning satisfied with modern contraception TM.4 0.5632 0.0044 0.008 1.302 1.141 14,872 16,841 0.555 0.572
Antenatal care coverage (at least four times by any provider) TM.5b 0.4531 0.0054 0.012 1.389 1.178 10,399 11,664 0.442 0.464
Skilled attendant at delivery TM.9 0.7223 0.0053 0.007 1.632 1.278 10,399 11,664 0.712 0.733
Thrive - Child health, nutrition and development
Diphtheria, tetanus and pertussis (DTP) immunization coverage
TC.3 0.8737 0.0051 0.006 1.367 1.169 5,138 5,747 0.863 0.884
Pneumococcal (Conjugate) immunization coverage TC.6 0.8638 0.0052 0.006 1.330 1.153 5,138 5,747 0.853 0.874
Measles immunization coverage TC.10 0.8257 0.0057 0.007 1.287 1.135 5,138 5,747 0.814 0.837
Primary reliance on clean fuels and technologies for cooking, space heating and lighting
TC.18 0.2229 0.0054 0.024 6.185 2.487 208,708 36,521 0.212 0.234
Care-seeking for children with acute respiratory infection (ARI) symptoms
TC.19 0.7157 0.0089 0.013 0.993 0.997 2,358 2,525 0.698 0.734
Exclusive breastfeeding under 6 months TC.32 0.4364 0.0082 0.019 0.944 0.971 3,072 3,425 0.420 0.453
Stunting prevalence (moderate and severe) TC.45a 0.3433 0.0037 0.011 1.745 1.321 25,065 28,049 0.336 0.351
Wasting prevalence (moderate and severe) TC.46a 0.0762 0.0018 0.023 1.247 1.117 24,891 27,860 0.073 0.080
Overweight prevalence (moderate and severe) TC.47a 0.0195 0.0009 0.046 1.192 1.092 24,891 27,860 0.018 0.021
Early child development index TC.53 0.5594 0.0050 0.009 1.214 1.102 10,487 11,772 0.549 0.570

Appendix C Estimates of Sampling Error | Page 24
Table SE.3: Sampling errors: Rural
Standard errors, coefficients of variation, design effects (deff), square root of design effects (deft), and confidence intervals for selected SDG and other indicators, Punjab, 2017-18
Coefficient of
variation (se/r)
Square root of design
effect (deft)
Confidence limits
MICS Indicator
Value (r)
Standard error (se)
Design effect (deff)
Weighted count
Unweighted count
Lower bound r - 2se
Upper bound r + 2se
Learn
Participation rate in organised learning (adjusted) LN.2 0.7016 0.0065 0.009 1.310 1.144 5,738 6,396 0.689 0.715
Children with foundational reading and number skills (reading)
LN.22a 0.2787 0.0048 0.017 1.484 1.218 11,348 12,745 0.269 0.288
Children with foundational reading and number skills (numeracy)
LN.22d 0.0374 0.0017 0.045 0.997 0.999 11,348 12,745 0.034 0.041
Protected from violence and exploitation
Birth registration PR.1 0.7076 0.0043 0.006 2.642 1.625 26,190 29,323 0.699 0.716
Violent discipline PR.2 0.8031 0.0024 0.003 1.594 1.262 38,622 43,385 0.798 0.808
Child labour PR.3 0.1751 0.0029 0.016 1.441 1.200 22,442 25,386 0.169 0.181
Child marriage (before age 15) (women) PR.4a 0.0408 0.0021 0.052 1.085 1.042 8,348 9,490 0.037 0.045
Child marriage (before age 18) (women) PR.4b 0.1686 0.0042 0.025 1.200 1.096 8,348 9,490 0.160 0.177
Crime reporting (women) PR.13 0.1137 0.0071 0.062 0.314 0.560 563 633 0.100 0.128
Crime reporting (men) PR.13 0.2004 0.0108 0.054 0.194 0.440 236 270 0.179 0.222
Safety (women) PR.14 0.5616 0.0030 0.005 1.860 1.364 45,668 52,109 0.556 0.568
Safety (men) PR.14 0.9333 0.0024 0.003 1.763 1.328 16,748 18,996 0.929 0.938
Live in a safe and clean environment
Use of basic drinking water service WS.2 0.9565 0.0020 0.002 3.434 1.853 208,708 36,521 0.953 0.960
Use of safely managed drinking water WS.6 0.4813 0.0084 0.017 1.686 1.298 28,059 4,908 0.464 0.498
Handwashing facility with water and soap WS.7 0.8943 0.0023 0.003 2.010 1.418 208,142 36,406 0.890 0.899
Use of improved sanitation WS.8 0.7283 0.0043 0.006 3.444 1.856 208,708 36,521 0.720 0.737
Use of basic sanitation service WS.9 0.6184 0.0043 0.007 2.872 1.695 208,708 36,521 0.610 0.627
Equitable chance in life
Children with functional dificulty EQ.1 0.1337 0.0018 0.014 1.220 1.104 38,036 42,866 0.130 0.137
Population covered by social transfers EQ.3 0.4899 0.0036 0.007 1.919 1.385 208,708 36,521 0.483 0.497
Discrimination (women) EQ.7 0.0973 0.0016 0.017 1.590 1.261 45,668 52,109 0.094 0.101
Discrimination (men) EQ.7 0.0888 0.0025 0.029 1.524 1.234 16,748 18,996 0.084 0.094
Overall life satisfaction index (women age 15-24) EQ.9a 7.1558 0.0205 0.003 1.615 1.271 17,297 19,654 7.115 7.197
Overall life satisfaction index (men age 15-24) EQ.9a 6.5894 0.0315 0.005 1.473 1.214 6,796 7,722 6.526 6.652
na: not applicable

Appendix C Estimates of Sampling Error | Page 25
Table SE.4: Sampling errors: Bahawalpur District
Standard errors, coefficients of variation, design effects (deff), square root of design effects (deft), and confidence intervals for selected SDG and other indicators, Punjab, 2017-18
Coefficient of
variation (se/r)
Square root of design
effect (deft)
Confidence limits
MICS Indicator
Value (r)
Standard error (se)
Design effect (deff)
Weighted count
Unweighted count
Lower bound r - 2se
Upper bound r + 2se
Sample coverage and characteristics of respondents
Access to electricity SR.1 0.9242 0.0128 0.014 3.431 1.852 10,271 1,466 0.899 0.950
Ownership of mobile phone (women) SR.10 0.2907 0.0241 0.083 5.095 2.257 2,229 1,804 0.242 0.339
Ownership of mobile phone (men) SR.10 0.8636 0.0187 0.022 1.807 1.344 822 608 0.826 0.901
Use of internet during last 3 months(women) SR.12a 0.0452 0.0109 0.242 4.996 2.235 2,229 1,804 0.023 0.067
Use of internet during last 3 months(men) SR.12a 0.2170 0.0283 0.130 2.856 1.690 822 608 0.160 0.274
ICT skills (women) SR.13 0.0272 0.0080 0.295 4.381 2.093 2,229 1,804 0.011 0.043
ICT skills (men) SR.13 0.1490 0.0239 0.161 2.745 1.657 822 608 0.101 0.197
Tobacco use (women) SR.14 0.0237 0.0036 0.154 1.034 1.017 2,229 1,804 0.016 0.031
Tobacco use (men) SR.14 0.2384 0.0223 0.094 1.668 1.292 822 608 0.194 0.283
Survive
Neonatal mortality rate CS.1 40 6.8 0.17 na na na na 26 53
Infant mortality rate CS.3 61 8.6 0.14 na na na na 44 78
Under-five mortality rate CS.5 72 9.9 0.14 na na na na 52 91
Thrive - Reproductive and maternal health
Total fertility rate - 3.9253 0.1878 0.048 na na na na 3.550 4.301
Adolescent birth rate TM.1 50.366 7.6535 0.152 na na na na 35.06 65.67
Contraceptive prevalence rate TM.3 0.3777 0.0159 0.042 1.288 1.135 1,467 1,206 0.346 0.409
Need for family planning satisfied with modern contraception TM.4 0.6840 0.0253 0.037 1.707 1.307 716 579 0.633 0.735
Antenatal care coverage (at least four times by any provider) TM.5b 0.3550 0.0265 0.075 1.257 1.121 485 411 0.302 0.408
Skilled attendant at delivery TM.9 0.6056 0.0236 0.039 0.956 0.978 485 411 0.558 0.653
Thrive - Child health, nutrition and development
Diphtheria, tetanus and pertussis (DTP) immunization coverage
TC.3 0.8552 0.0290 0.034 1.394 1.181 245 207 0.797 0.913
Pneumococcal (Conjugate) immunization coverage TC.6 0.8464 0.0298 0.035 1.408 1.187 245 207 0.787 0.906
Measles immunization coverage TC.10 0.7626 0.0385 0.050 1.688 1.299 245 207 0.686 0.840
Primary reliance on clean fuels and technologies for cooking, space heating and lighting
TC.18 0.2530 0.0378 0.149 11.054 3.325 10,271 1,466 0.178 0.329
Care-seeking for children with acute respiratory infection (ARI) symptoms
TC.19 0.6958 0.0638 0.092 0.981 0.990 62 52 0.568 0.823
Exclusive breastfeeding under 6 months TC.32 0.4379 0.0469 0.107 1.137 1.066 153 128 0.344 0.532
Stunting prevalence (moderate and severe) TC.45a 0.3682 0.0183 0.050 1.443 1.201 1,210 1,007 0.332 0.405
Wasting prevalence (moderate and severe) TC.46a 0.0865 0.0093 0.107 1.099 1.048 1,210 1,008 0.068 0.105
Overweight prevalence (moderate and severe) TC.47a 0.0224 0.0051 0.229 1.215 1.102 1,210 1,008 0.012 0.033
Early child development index TC.53 0.6315 0.0268 0.042 1.271 1.127 499 412 0.578 0.685

Appendix C Estimates of Sampling Error | Page 26
Table SE.4: Sampling errors: Bahawalpur District
Standard errors, coefficients of variation, design effects (deff), square root of design effects (deft), and confidence intervals for selected SDG and other indicators, Punjab, 2017-18
Coefficient of
variation (se/r)
Square root of design
effect (deft)
Confidence limits
MICS Indicator
Value (r)
Standard error (se)
Design effect (deff)
Weighted count
Unweighted count
Lower bound r - 2se
Upper bound r + 2se
Learn
Participation rate in organised learning (adjusted) LN.2 0.5905 0.0349 0.059 1.139 1.067 265 227 0.521 0.660
Children with foundational reading and number skills (reading)
LN.22a 0.1938 0.0291 0.150 2.503 1.582 557 464 0.136 0.252
Children with foundational reading and number skills (numeracy)
LN.22d 0.0059 0.0042 0.714 1.401 1.184 557 464 0.000 0.014
Protected from violence and exploitation
Birth registration PR.1 0.4959 0.0244 0.049 2.501 1.582 1,257 1,049 0.447 0.545
Violent discipline PR.2 0.7988 0.0131 0.016 1.723 1.313 1,957 1,622 0.773 0.825
Child labour PR.3 0.1333 0.0112 0.084 1.057 1.028 1,185 969 0.111 0.156
Child marriage (before age 15) (women) PR.4a 0.0353 0.0106 0.300 1.102 1.050 431 336 0.014 0.056
Child marriage (before age 18) (women) PR.4b 0.1934 0.0250 0.129 1.341 1.158 431 336 0.143 0.243
Crime reporting (women) PR.13 0.0479 0.0478 1.000 0.804 0.896 21 17 0.000 0.144
Crime reporting (men) PR.13 0.0854 0.0000 0.000 0.000 0.000 13 10 0.085 0.085
Safety (women) PR.14 0.6041 0.0175 0.029 2.312 1.521 2,229 1,804 0.569 0.639
Safety (men) PR.14 0.9538 0.0128 0.013 2.265 1.505 822 608 0.928 0.979
Live in a safe and clean environment
Use of basic drinking water service WS.2 0.9528 0.0132 0.014 5.678 2.383 10,271 1,466 0.926 0.979
Use of safely managed drinking water WS.6 0.4431 0.0465 0.105 1.917 1.385 1,410 190 0.350 0.536
Handwashing facility with water and soap WS.7 0.8008 0.0182 0.023 3.015 1.736 10,238 1,461 0.764 0.837
Use of improved sanitation WS.8 0.6960 0.0249 0.036 4.291 2.072 10,271 1,466 0.646 0.746
Use of basic sanitation service WS.9 0.5766 0.0253 0.044 3.836 1.959 10,271 1,466 0.526 0.627
Equitable chance in life
Children with functional dificulty EQ.1 0.1368 0.0081 0.059 0.877 0.937 1,933 1,590 0.121 0.153
Population covered by social transfers EQ.3 0.3531 0.0201 0.057 2.603 1.613 10,271 1,466 0.313 0.393
Discrimination (women) EQ.7 0.0810 0.0081 0.100 1.588 1.260 2,229 1,804 0.065 0.097
Discrimination (men) EQ.7 0.1165 0.0129 0.110 0.975 0.987 822 608 0.091 0.142
Overall life satisfaction index (women age 15-24) EQ.9a 7.0547 0.1290 0.018 1.895 1.377 847 673 6.797 7.313
Overall life satisfaction index (men age 15-24) EQ.9a 6.7895 0.1613 0.024 1.323 1.150 306 216 6.467 7.112
na: not applicable

Appendix C Estimates of Sampling Error | Page 27
Table SE.5: Sampling errors: Bahawalnagar District
Standard errors, coefficients of variation, design effects (deff), square root of design effects (deft), and confidence intervals for selected SDG and other indicators, Punjab, 2017-18
Coefficient of
variation (se/r)
Square root of design
effect (deft)
Confidence limits
MICS Indicator
Value (r)
Standard error (se)
Design effect (deff)
Weighted count
Unweighted count
Lower bound r - 2se
Upper bound r + 2se
Sample coverage and characteristics of respondents
Access to electricity SR.1 0.9505 0.0080 0.008 1.872 1.368 9,005 1,370 0.934 0.967
Ownership of mobile phone (women) SR.10 0.2536 0.0149 0.059 2.138 1.462 1,966 1,829 0.224 0.283
Ownership of mobile phone (men) SR.10 0.8216 0.0134 0.016 0.824 0.908 738 670 0.795 0.848
Use of internet during last 3 months(women) SR.12a 0.0173 0.0034 0.194 1.214 1.102 1,966 1,829 0.011 0.024
Use of internet during last 3 months(men) SR.12a 0.0818 0.0115 0.141 1.180 1.086 738 670 0.059 0.105
ICT skills (women) SR.13 0.0140 0.0033 0.240 1.490 1.221 1,966 1,829 0.007 0.021
ICT skills (men) SR.13 0.0695 0.0091 0.130 0.848 0.921 738 670 0.051 0.088
Tobacco use (women) SR.14 0.0258 0.0042 0.162 1.266 1.125 1,966 1,829 0.017 0.034
Tobacco use (men) SR.14 0.3015 0.0194 0.064 1.192 1.092 738 670 0.263 0.340
Survive
Neonatal mortality rate CS.1 43 6.3 0.15 na na na na 30 56
Infant mortality rate CS.3 62 8.3 0.13 na na na na 45 78
Under-five mortality rate CS.5 71 8.2 0.12 na na na na 54 87
Thrive - Reproductive and maternal health
Total fertility rate - 3.7244 0.1560 0.042 na na na na 3.412 4.036
Adolescent birth rate TM.1 34.371 6.3392 0.184 na na na na 21.69 47.05
Contraceptive prevalence rate TM.3 0.4384 0.0147 0.033 0.956 0.978 1,177 1,096 0.409 0.468
Need for family planning satisfied with modern contraception TM.4 0.6667 0.0165 0.025 0.752 0.867 665 615 0.634 0.700
Antenatal care coverage (at least four times by any provider) TM.5b 0.4028 0.0307 0.076 1.454 1.206 401 373 0.341 0.464
Skilled attendant at delivery TM.9 0.6610 0.0256 0.039 1.086 1.042 401 373 0.610 0.712
Thrive - Child health, nutrition and development
Diphtheria, tetanus and pertussis (DTP) immunization coverage
TC.3 0.8080 0.0317 0.039 1.316 1.147 222 204 0.745 0.871
Pneumococcal (Conjugate) immunization coverage TC.6 0.8084 0.0324 0.040 1.373 1.172 222 204 0.744 0.873
Measles immunization coverage TC.10 0.7344 0.0314 0.043 1.029 1.014 222 204 0.672 0.797
Primary reliance on clean fuels and technologies for cooking, space heating and lighting
TC.18 0.1343 0.0250 0.186 7.353 2.712 9,005 1,370 0.084 0.184
Care-seeking for children with acute respiratory infection (ARI) symptoms
TC.19 0.6943 0.0388 0.056 0.927 0.963 144 132 0.617 0.772
Exclusive breastfeeding under 6 months TC.32 0.3072 0.0477 0.155 1.035 1.017 108 98 0.212 0.403
Stunting prevalence (moderate and severe) TC.45a 0.3940 0.0242 0.061 2.316 1.522 1,034 948 0.346 0.442
Wasting prevalence (moderate and severe) TC.46a 0.0735 0.0083 0.112 0.935 0.967 1,021 936 0.057 0.090
Overweight prevalence (moderate and severe) TC.47a 0.0170 0.0046 0.269 1.166 1.080 1,021 936 0.008 0.026
Early child development index TC.53 0.6395 0.0264 0.041 1.258 1.121 453 417 0.587 0.692

Appendix C Estimates of Sampling Error | Page 28
Table SE.5: Sampling errors: Bahawalnagar District
Standard errors, coefficients of variation, design effects (deff), square root of design effects (deft), and confidence intervals for selected SDG and other indicators, Punjab, 2017-18
Coefficient of
variation (se/r)
Square root of design
effect (deft)
Confidence limits
MICS Indicator
Value (r)
Standard error (se)
Design effect (deff)
Weighted count
Unweighted count
Lower bound r - 2se
Upper bound r + 2se
Learn
Participation rate in organised learning (adjusted) LN.2 0.6848 0.0376 0.055 1.295 1.138 210 199 0.610 0.760
Children with foundational reading and number skills (reading)
LN.22a 0.2656 0.0329 0.124 2.323 1.524 436 419 0.200 0.331
Children with foundational reading and number skills (numeracy)
LN.22d 0.0068 0.0050 0.732 1.526 1.235 436 419 0.000 0.017
Protected from violence and exploitation
Birth registration PR.1 0.6259 0.0234 0.037 2.281 1.510 1,062 974 0.579 0.673
Violent discipline PR.2 0.8201 0.0116 0.014 1.397 1.182 1,628 1,526 0.797 0.843
Child labour PR.3 0.1689 0.0146 0.087 1.450 1.204 999 953 0.140 0.198
Child marriage (before age 15) (women) PR.4a 0.0338 0.0097 0.287 1.029 1.014 387 359 0.014 0.053
Child marriage (before age 18) (women) PR.4b 0.1312 0.0224 0.171 1.573 1.254 387 359 0.086 0.176
Crime reporting (women) PR.13 0.2023 0.0005 0.002 0.000 0.006 27 25 0.201 0.203
Crime reporting (men) PR.13 0.2115 0.0000 0.000 0.000 0.000 10 9 0.212 0.212
Safety (women) PR.14 0.4393 0.0156 0.036 1.816 1.348 1,966 1,829 0.408 0.471
Safety (men) PR.14 0.9885 0.0028 0.003 0.470 0.686 738 670 0.983 0.994
Live in a safe and clean environment
Use of basic drinking water service WS.2 0.9186 0.0151 0.016 4.167 2.041 9,005 1,370 0.888 0.949
Use of safely managed drinking water WS.6 0.2089 0.0417 0.200 0.997 0.998 1,278 89 0.125 0.292
Handwashing facility with water and soap WS.7 0.8531 0.0127 0.015 1.771 1.331 8,992 1,367 0.828 0.879
Use of improved sanitation WS.8 0.6951 0.0245 0.035 3.887 1.971 9,005 1,370 0.646 0.744
Use of basic sanitation service WS.9 0.6074 0.0259 0.043 3.843 1.960 9,005 1,370 0.556 0.659
Equitable chance in life
Children with functional dificulty EQ.1 0.1763 0.0129 0.073 1.779 1.334 1,642 1,544 0.150 0.202
Population covered by social transfers EQ.3 0.5494 0.0169 0.031 1.578 1.256 9,005 1,370 0.516 0.583
Discrimination (women) EQ.7 0.1232 0.0082 0.067 1.146 1.070 1,966 1,829 0.107 0.140
Discrimination (men) EQ.7 0.0351 0.0110 0.314 2.400 1.549 738 670 0.013 0.057
Overall life satisfaction index (women age 15-24) EQ.9a 6.6818 0.1066 0.016 1.631 1.277 787 733 6.469 6.895
Overall life satisfaction index (men age 15-24) EQ.9a 6.8834 0.1802 0.026 1.731 1.316 296 268 6.523 7.244
na: not applicable
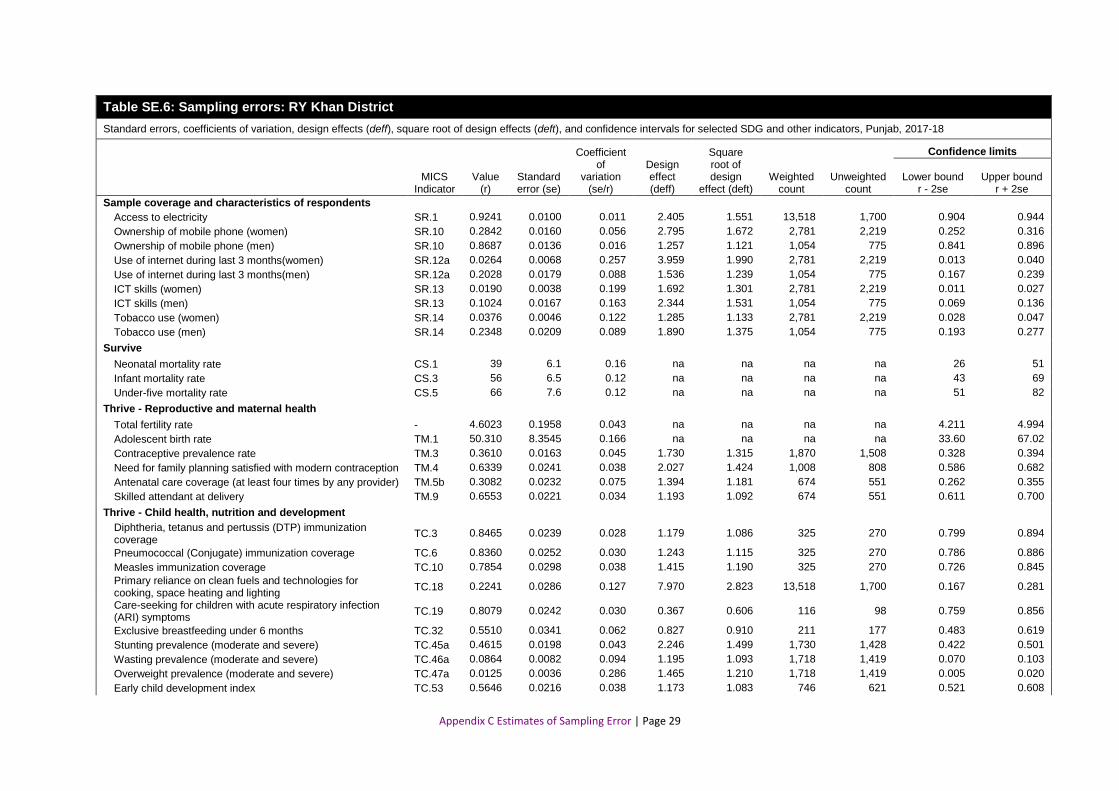
Appendix C Estimates of Sampling Error | Page 29
Table SE.6: Sampling errors: RY Khan District
Standard errors, coefficients of variation, design effects (deff), square root of design effects (deft), and confidence intervals for selected SDG and other indicators, Punjab, 2017-18
Coefficient of
variation (se/r)
Square root of design
effect (deft)
Confidence limits
MICS Indicator
Value (r)
Standard error (se)
Design effect (deff)
Weighted count
Unweighted count
Lower bound r - 2se
Upper bound r + 2se
Sample coverage and characteristics of respondents
Access to electricity SR.1 0.9241 0.0100 0.011 2.405 1.551 13,518 1,700 0.904 0.944
Ownership of mobile phone (women) SR.10 0.2842 0.0160 0.056 2.795 1.672 2,781 2,219 0.252 0.316
Ownership of mobile phone (men) SR.10 0.8687 0.0136 0.016 1.257 1.121 1,054 775 0.841 0.896
Use of internet during last 3 months(women) SR.12a 0.0264 0.0068 0.257 3.959 1.990 2,781 2,219 0.013 0.040
Use of internet during last 3 months(men) SR.12a 0.2028 0.0179 0.088 1.536 1.239 1,054 775 0.167 0.239
ICT skills (women) SR.13 0.0190 0.0038 0.199 1.692 1.301 2,781 2,219 0.011 0.027
ICT skills (men) SR.13 0.1024 0.0167 0.163 2.344 1.531 1,054 775 0.069 0.136
Tobacco use (women) SR.14 0.0376 0.0046 0.122 1.285 1.133 2,781 2,219 0.028 0.047
Tobacco use (men) SR.14 0.2348 0.0209 0.089 1.890 1.375 1,054 775 0.193 0.277
Survive
Neonatal mortality rate CS.1 39 6.1 0.16 na na na na 26 51
Infant mortality rate CS.3 56 6.5 0.12 na na na na 43 69
Under-five mortality rate CS.5 66 7.6 0.12 na na na na 51 82
Thrive - Reproductive and maternal health
Total fertility rate - 4.6023 0.1958 0.043 na na na na 4.211 4.994
Adolescent birth rate TM.1 50.310 8.3545 0.166 na na na na 33.60 67.02
Contraceptive prevalence rate TM.3 0.3610 0.0163 0.045 1.730 1.315 1,870 1,508 0.328 0.394
Need for family planning satisfied with modern contraception TM.4 0.6339 0.0241 0.038 2.027 1.424 1,008 808 0.586 0.682
Antenatal care coverage (at least four times by any provider) TM.5b 0.3082 0.0232 0.075 1.394 1.181 674 551 0.262 0.355
Skilled attendant at delivery TM.9 0.6553 0.0221 0.034 1.193 1.092 674 551 0.611 0.700
Thrive - Child health, nutrition and development
Diphtheria, tetanus and pertussis (DTP) immunization coverage
TC.3 0.8465 0.0239 0.028 1.179 1.086 325 270 0.799 0.894
Pneumococcal (Conjugate) immunization coverage TC.6 0.8360 0.0252 0.030 1.243 1.115 325 270 0.786 0.886
Measles immunization coverage TC.10 0.7854 0.0298 0.038 1.415 1.190 325 270 0.726 0.845
Primary reliance on clean fuels and technologies for cooking, space heating and lighting
TC.18 0.2241 0.0286 0.127 7.970 2.823 13,518 1,700 0.167 0.281
Care-seeking for children with acute respiratory infection (ARI) symptoms
TC.19 0.8079 0.0242 0.030 0.367 0.606 116 98 0.759 0.856
Exclusive breastfeeding under 6 months TC.32 0.5510 0.0341 0.062 0.827 0.910 211 177 0.483 0.619
Stunting prevalence (moderate and severe) TC.45a 0.4615 0.0198 0.043 2.246 1.499 1,730 1,428 0.422 0.501
Wasting prevalence (moderate and severe) TC.46a 0.0864 0.0082 0.094 1.195 1.093 1,718 1,419 0.070 0.103
Overweight prevalence (moderate and severe) TC.47a 0.0125 0.0036 0.286 1.465 1.210 1,718 1,419 0.005 0.020
Early child development index TC.53 0.5646 0.0216 0.038 1.173 1.083 746 621 0.521 0.608

Appendix C Estimates of Sampling Error | Page 30
Table SE.6: Sampling errors: RY Khan District
Standard errors, coefficients of variation, design effects (deff), square root of design effects (deft), and confidence intervals for selected SDG and other indicators, Punjab, 2017-18
Coefficient of
variation (se/r)
Square root of design
effect (deft)
Confidence limits
MICS Indicator
Value (r)
Standard error (se)
Design effect (deff)
Weighted count
Unweighted count
Lower bound r - 2se
Upper bound r + 2se
Learn
Participation rate in organised learning (adjusted) LN.2 0.5499 0.0279 0.051 1.063 1.031 415 340 0.494 0.606
Children with foundational reading and number skills (reading)
LN.22a 0.2668 0.0239 0.089 1.763 1.328 735 607 0.219 0.315
Children with foundational reading and number skills (numeracy)
LN.22d 0.0398 0.0078 0.196 0.963 0.981 735 607 0.024 0.055
Protected from violence and exploitation
Birth registration PR.1 0.3795 0.0218 0.057 3.042 1.744 1,821 1,508 0.336 0.423
Violent discipline PR.2 0.7530 0.0131 0.017 2.017 1.420 2,648 2,184 0.727 0.779
Child labour PR.3 0.1668 0.0144 0.086 1.774 1.332 1,460 1,188 0.138 0.196
Child marriage (before age 15) (women) PR.4a 0.0501 0.0111 0.221 0.922 0.960 454 359 0.028 0.072
Child marriage (before age 18) (women) PR.4b 0.1883 0.0189 0.100 0.835 0.914 454 359 0.151 0.226
Crime reporting (women) PR.13 0.2158 0.0383 0.177 0.337 0.581 49 40 0.139 0.292
Crime reporting (men) PR.13 0.0000 0.0000 20 14 0.000 0.000
Safety (women) PR.14 0.6629 0.0141 0.021 1.961 1.400 2,781 2,219 0.635 0.691
Safety (men) PR.14 0.9424 0.0088 0.009 1.105 1.051 1,054 775 0.925 0.960
Live in a safe and clean environment
Use of basic drinking water service WS.2 0.9625 0.0071 0.007 2.377 1.542 13,518 1,700 0.948 0.977
Use of safely managed drinking water WS.6 0.5553 0.0394 0.071 1.498 1.224 1,849 212 0.476 0.634
Handwashing facility with water and soap WS.7 0.8787 0.0115 0.013 2.090 1.446 13,514 1,699 0.856 0.902
Use of improved sanitation WS.8 0.7563 0.0188 0.025 3.256 1.805 13,518 1,700 0.719 0.794
Use of basic sanitation service WS.9 0.6550 0.0191 0.029 2.736 1.654 13,518 1,700 0.617 0.693
Equitable chance in life
Children with functional dificulty EQ.1 0.1775 0.0083 0.047 1.002 1.001 2,591 2,123 0.161 0.194
Population covered by social transfers EQ.3 0.4263 0.0147 0.034 1.501 1.225 13,518 1,700 0.397 0.456
Discrimination (women) EQ.7 0.0715 0.0059 0.083 1.174 1.083 2,781 2,219 0.060 0.083
Discrimination (men) EQ.7 0.1219 0.0140 0.115 1.424 1.193 1,054 775 0.094 0.150
Overall life satisfaction index (women age 15-24) EQ.9a 7.8084 0.1067 0.014 1.733 1.316 998 788 7.595 8.022
Overall life satisfaction index (men age 15-24) EQ.9a 7.2434 0.1493 0.021 1.331 1.154 391 279 6.945 7.542
na: not applicable

Appendix C Estimates of Sampling Error | Page 31
Table SE.7: Sampling errors: DG Khan District
Standard errors, coefficients of variation, design effects (deff), square root of design effects (deft), and confidence intervals for selected SDG and other indicators, Punjab, 2017-18
Coefficient of
variation (se/r)
Square root of design
effect (deft)
Confidence limits
MICS Indicator
Value (r)
Standard error (se)
Design effect (deff)
Weighted count
Unweighted count
Lower bound r - 2se
Upper bound r + 2se
Sample coverage and characteristics of respondents
Access to electricity SR.1 0.8311 0.0227 0.027 3.818 1.954 7,552 1,043 0.786 0.876
Ownership of mobile phone (women) SR.10 0.2221 0.0175 0.079 2.644 1.626 1,457 1,487 0.187 0.257
Ownership of mobile phone (men) SR.10 0.8305 0.0190 0.023 1.149 1.072 540 450 0.792 0.868
Use of internet during last 3 months(women) SR.12a 0.0359 0.0107 0.299 4.935 2.221 1,457 1,487 0.014 0.057
Use of internet during last 3 months(men) SR.12a 0.3091 0.0309 0.100 2.011 1.418 540 450 0.247 0.371
ICT skills (women) SR.13 0.0177 0.0055 0.313 2.616 1.617 1,457 1,487 0.007 0.029
ICT skills (men) SR.13 0.1015 0.0199 0.196 1.956 1.399 540 450 0.062 0.141
Tobacco use (women) SR.14 0.1083 0.0121 0.112 2.269 1.506 1,457 1,487 0.084 0.133
Tobacco use (men) SR.14 0.2772 0.0292 0.105 1.908 1.381 540 450 0.219 0.336
Survive
Neonatal mortality rate CS.1 30 5.4 0.18 na na na na 19 41
Infant mortality rate CS.3 53 5.7 0.11 na na na na 42 65
Under-five mortality rate CS.5 63 6.1 0.10 na na na na 51 75
Thrive - Reproductive and maternal health
Total fertility rate - 5.4048 0.2429 0.045 na na na na 4.919 5.891
Adolescent birth rate TM.1 86.591 12.2375 0.141 na na na na 62.12 111.07
Contraceptive prevalence rate TM.3 0.2056 0.0130 0.063 1.128 1.062 1,066 1,094 0.180 0.232
Need for family planning satisfied with modern contraception TM.4 0.4640 0.0334 0.072 2.040 1.428 445 457 0.397 0.531
Antenatal care coverage (at least four times by any provider) TM.5b 0.3616 0.0246 0.068 1.299 1.140 481 495 0.312 0.411
Skilled attendant at delivery TM.9 0.4376 0.0289 0.066 1.680 1.296 481 495 0.380 0.495
Thrive - Child health, nutrition and development
Diphtheria, tetanus and pertussis (DTP) immunization coverage
TC.3 0.6314 0.0374 0.059 1.432 1.196 232 239 0.557 0.706
Pneumococcal (Conjugate) immunization coverage TC.6 0.6275 0.0355 0.057 1.282 1.132 232 239 0.556 0.698
Measles immunization coverage TC.10 0.5945 0.0440 0.074 1.912 1.383 232 239 0.506 0.682
Primary reliance on clean fuels and technologies for cooking, space heating and lighting
TC.18 0.1475 0.0227 0.154 4.259 2.064 7,552 1,043 0.102 0.193
Care-seeking for children with acute respiratory infection (ARI) symptoms
TC.19 0.7740 0.0373 0.048 1.439 1.200 181 182 0.699 0.849
Exclusive breastfeeding under 6 months TC.32 0.5748 0.0482 0.084 1.615 1.271 166 171 0.478 0.671
Stunting prevalence (moderate and severe) TC.45a 0.4643 0.0229 0.049 2.272 1.507 1,041 1,083 0.419 0.510
Wasting prevalence (moderate and severe) TC.46a 0.0894 0.0103 0.116 1.415 1.190 1,035 1,079 0.069 0.110
Overweight prevalence (moderate and severe) TC.47a 0.0125 0.0044 0.351 1.677 1.295 1,035 1,079 0.004 0.021
Early child development index TC.53 0.3700 0.0249 0.067 1.290 1.136 467 486 0.320 0.420

Appendix C Estimates of Sampling Error | Page 32
Table SE.7: Sampling errors: DG Khan District
Standard errors, coefficients of variation, design effects (deff), square root of design effects (deft), and confidence intervals for selected SDG and other indicators, Punjab, 2017-18
Coefficient of
variation (se/r)
Square root of design
effect (deft)
Confidence limits
MICS Indicator
Value (r)
Standard error (se)
Design effect (deff)
Weighted count
Unweighted count
Lower bound r - 2se
Upper bound r + 2se
Learn
Participation rate in organised learning (adjusted) LN.2 0.5285 0.0318 0.060 1.047 1.023 250 259 0.465 0.592
Children with foundational reading and number skills (reading)
LN.22a 0.1667 0.0305 0.183 2.542 1.594 372 381 0.106 0.228
Children with foundational reading and number skills (numeracy)
LN.22d 0.0454 0.0132 0.290 1.521 1.233 372 381 0.019 0.072
Protected from violence and exploitation
Birth registration PR.1 0.3033 0.0217 0.071 2.656 1.630 1,153 1,196 0.260 0.347
Violent discipline PR.2 0.7567 0.0133 0.018 1.525 1.235 1,536 1,589 0.730 0.783
Child labour PR.3 0.2004 0.0147 0.073 1.094 1.046 789 815 0.171 0.230
Child marriage (before age 15) (women) PR.4a 0.0732 0.0186 0.253 1.339 1.157 259 265 0.036 0.110
Child marriage (before age 18) (women) PR.4b 0.3034 0.0328 0.108 1.340 1.158 259 265 0.238 0.369
Crime reporting (women) PR.13 0.4790 0.0000 0.000 0.000 0.000 6 5 0.479 0.479
Crime reporting (men) PR.13 0.3278 0.1418 0.432 0.821 0.906 14 10 0.044 0.611
Safety (women) PR.14 0.4388 0.0156 0.036 1.475 1.215 1,457 1,487 0.408 0.470
Safety (men) PR.14 0.8772 0.0132 0.015 0.721 0.849 540 450 0.851 0.903
Live in a safe and clean environment
Use of basic drinking water service WS.2 0.9085 0.0145 0.016 2.641 1.625 7,552 1,043 0.879 0.938
Use of safely managed drinking water WS.6 0.5679 0.0645 0.114 2.364 1.537 986 123 0.439 0.697
Handwashing facility with water and soap WS.7 0.8285 0.0143 0.017 1.497 1.223 7,542 1,041 0.800 0.857
Use of improved sanitation WS.8 0.6143 0.0283 0.046 3.530 1.879 7,552 1,043 0.558 0.671
Use of basic sanitation service WS.9 0.5001 0.0291 0.058 3.523 1.877 7,552 1,043 0.442 0.558
Equitable chance in life
Children with functional dificulty EQ.1 0.0618 0.0058 0.094 0.866 0.931 1,442 1,494 0.050 0.073
Population covered by social transfers EQ.3 0.5143 0.0284 0.055 3.368 1.835 7,552 1,043 0.457 0.571
Discrimination (women) EQ.7 0.1193 0.0146 0.122 3.006 1.734 1,457 1,487 0.090 0.148
Discrimination (men) EQ.7 0.1190 0.0190 0.160 1.544 1.243 540 450 0.081 0.157
Overall life satisfaction index (women age 15-24) EQ.9a 6.1862 0.2194 0.035 4.009 2.002 548 558 5.747 6.625
Overall life satisfaction index (men age 15-24) EQ.9a 5.4579 0.1676 0.031 0.964 0.982 251 209 5.123 5.793
na: not applicable

Appendix C Estimates of Sampling Error | Page 33
Table SE.8: Sampling errors: Layyah District
Standard errors, coefficients of variation, design effects (deff), square root of design effects (deft), and confidence intervals for selected SDG and other indicators, Punjab, 2017-18
Coefficient of
variation (se/r)
Square root of design
effect (deft)
Confidence limits
MICS Indicator
Value (r)
Standard error (se)
Design effect (deff)
Weighted count
Unweighted count
Lower bound r - 2se
Upper bound r + 2se
Sample coverage and characteristics of respondents
Access to electricity SR.1 0.9171 0.0170 0.019 3.722 1.929 5,534 978 0.883 0.951
Ownership of mobile phone (women) SR.10 0.3302 0.0214 0.065 2.916 1.708 1,186 1,415 0.287 0.373
Ownership of mobile phone (men) SR.10 0.8730 0.0166 0.019 1.355 1.164 442 549 0.840 0.906
Use of internet during last 3 months(women) SR.12a 0.0344 0.0076 0.220 2.430 1.559 1,186 1,415 0.019 0.049
Use of internet during last 3 months(men) SR.12a 0.1966 0.0179 0.091 1.106 1.052 442 549 0.161 0.232
ICT skills (women) SR.13 0.0252 0.0052 0.208 1.576 1.255 1,186 1,415 0.015 0.036
ICT skills (men) SR.13 0.0819 0.0128 0.157 1.200 1.095 442 549 0.056 0.108
Tobacco use (women) SR.14 0.1213 0.0155 0.127 3.171 1.781 1,186 1,415 0.090 0.152
Tobacco use (men) SR.14 0.1914 0.0199 0.104 1.402 1.184 442 549 0.152 0.231
Survive
Neonatal mortality rate CS.1 37 6.8 0.18 na na na na 23 50
Infant mortality rate CS.3 54 7.3 0.14 na na na na 39 68
Under-five mortality rate CS.5 61 7.9 0.13 na na na na 45 76
Thrive - Reproductive and maternal health
Total fertility rate - 4.0251 0.1975 0.049 na na na na 3.630 4.420
Adolescent birth rate TM.1 50.213 9.4220 0.188 na na na na 31.37 69.06
Contraceptive prevalence rate TM.3 0.4000 0.0170 0.042 1.128 1.062 787 938 0.366 0.434
Need for family planning satisfied with modern contraception TM.4 0.6584 0.0225 0.034 1.178 1.085 441 525 0.613 0.703
Antenatal care coverage (at least four times by any provider) TM.5b 0.4446 0.0303 0.068 1.221 1.105 275 329 0.384 0.505
Skilled attendant at delivery TM.9 0.6811 0.0274 0.040 1.135 1.065 275 329 0.626 0.736
Thrive - Child health, nutrition and development
Diphtheria, tetanus and pertussis (DTP) immunization coverage
TC.3 0.8636 0.0293 0.034 1.169 1.081 136 162 0.805 0.922
Pneumococcal (Conjugate) immunization coverage TC.6 0.8636 0.0293 0.034 1.169 1.081 136 162 0.805 0.922
Measles immunization coverage TC.10 0.7942 0.0322 0.041 1.019 1.009 136 162 0.730 0.859
Primary reliance on clean fuels and technologies for cooking, space heating and lighting
TC.18 0.0951 0.0135 0.142 2.071 1.439 5,534 978 0.068 0.122
Care-seeking for children with acute respiratory infection (ARI) symptoms
TC.19 0.7816 0.0348 0.045 0.839 0.916 100 119 0.712 0.851
Exclusive breastfeeding under 6 months TC.32 0.3206 0.0493 0.154 0.962 0.981 73 87 0.222 0.419
Stunting prevalence (moderate and severe) TC.45a 0.2957 0.0204 0.069 1.673 1.294 704 836 0.255 0.337
Wasting prevalence (moderate and severe) TC.46a 0.0699 0.0097 0.139 1.199 1.095 700 831 0.051 0.089
Overweight prevalence (moderate and severe) TC.47a 0.0166 0.0029 0.173 0.420 0.648 700 831 0.011 0.022
Early child development index TC.53 0.5244 0.0301 0.057 1.230 1.109 286 339 0.464 0.585

Appendix C Estimates of Sampling Error | Page 34
Table SE.8: Sampling errors: Layyah District
Standard errors, coefficients of variation, design effects (deff), square root of design effects (deft), and confidence intervals for selected SDG and other indicators, Punjab, 2017-18
Coefficient of
variation (se/r)
Square root of design
effect (deft)
Confidence limits
MICS Indicator
Value (r)
Standard error (se)
Design effect (deff)
Weighted count
Unweighted count
Lower bound r - 2se
Upper bound r + 2se
Learn
Participation rate in organised learning (adjusted) LN.2 0.7699 0.0302 0.039 0.940 0.969 157 183 0.709 0.830
Children with foundational reading and number skills (reading)
LN.22a 0.4105 0.0308 0.075 1.617 1.272 347 413 0.349 0.472
Children with foundational reading and number skills (numeracy)
LN.22d 0.0707 0.0110 0.156 0.761 0.872 347 413 0.049 0.093
Protected from violence and exploitation
Birth registration PR.1 0.7220 0.0265 0.037 2.999 1.732 723 859 0.669 0.775
Violent discipline PR.2 0.8667 0.0146 0.017 2.307 1.519 1,049 1,247 0.837 0.896
Child labour PR.3 0.2317 0.0225 0.097 2.012 1.418 596 709 0.187 0.277
Child marriage (before age 15) (women) PR.4a 0.0079 0.0056 0.705 1.034 1.017 219 262 0.000 0.019
Child marriage (before age 18) (women) PR.4b 0.1802 0.0311 0.172 1.706 1.306 219 262 0.118 0.242
Crime reporting (women) PR.13 0.0615 0.0036 0.059 0.003 0.058 13 16 0.054 0.069
Crime reporting (men) PR.13 0.3955 0.0000 0.000 0.000 0.000 4 5 0.396 0.396
Safety (women) PR.14 0.4954 0.0129 0.026 0.936 0.968 1,186 1,415 0.470 0.521
Safety (men) PR.14 0.9402 0.0131 0.014 1.667 1.291 442 549 0.914 0.966
Live in a safe and clean environment
Use of basic drinking water service WS.2 0.9942 0.0036 0.004 2.181 1.477 5,534 978 0.987 1.000
Use of safely managed drinking water WS.6 0.6382 0.0517 0.081 2.030 1.425 680 140 0.535 0.742
Handwashing facility with water and soap WS.7 0.9443 0.0107 0.011 2.111 1.453 5,534 978 0.923 0.966
Use of improved sanitation WS.8 0.8154 0.0263 0.032 4.489 2.119 5,534 978 0.763 0.868
Use of basic sanitation service WS.9 0.6467 0.0319 0.049 4.360 2.088 5,534 978 0.583 0.711
Equitable chance in life
Children with functional dificulty EQ.1 0.1465 0.0149 0.102 2.190 1.480 1,033 1,227 0.117 0.176
Population covered by social transfers EQ.3 0.5973 0.0203 0.034 1.666 1.291 5,534 978 0.557 0.638
Discrimination (women) EQ.7 0.1226 0.0134 0.109 2.353 1.534 1,186 1,415 0.096 0.149
Discrimination (men) EQ.7 0.0698 0.0137 0.197 1.591 1.261 442 549 0.042 0.097
Overall life satisfaction index (women age 15-24) EQ.9a 7.3080 0.0986 0.013 1.323 1.150 444 530 7.111 7.505
Overall life satisfaction index (men age 15-24) EQ.9a 6.1859 0.1865 0.030 1.665 1.290 188 233 5.813 6.559
na: not applicable

Appendix C Estimates of Sampling Error | Page 35
Table SE.9: Sampling errors: Muzaffargarh District
Standard errors, coefficients of variation, design effects (deff), square root of design effects (deft), and confidence intervals for selected SDG and other indicators, Punjab, 2017-18
Coefficient of
variation (se/r)
Square root of design
effect (deft)
Confidence limits
MICS Indicator
Value (r)
Standard error (se)
Design effect (deff)
Weighted count
Unweighted count
Lower bound r - 2se
Upper bound r + 2se
Sample coverage and characteristics of respondents
Access to electricity SR.1 0.9061 0.0159 0.017 4.624 2.150 12,258 1,567 0.874 0.938
Ownership of mobile phone (women) SR.10 0.2259 0.0164 0.072 3.136 1.771 2,489 2,050 0.193 0.259
Ownership of mobile phone (men) SR.10 0.8553 0.0137 0.016 1.300 1.140 932 854 0.828 0.883
Use of internet during last 3 months(women) SR.12a 0.0312 0.0070 0.225 3.351 1.831 2,489 2,050 0.017 0.045
Use of internet during last 3 months(men) SR.12a 0.2364 0.0185 0.078 1.612 1.270 932 854 0.199 0.273
ICT skills (women) SR.13 0.0128 0.0034 0.265 1.867 1.366 2,489 2,050 0.006 0.020
ICT skills (men) SR.13 0.0548 0.0087 0.158 1.233 1.110 932 854 0.038 0.072
Tobacco use (women) SR.14 0.0746 0.0092 0.124 2.536 1.593 2,489 2,050 0.056 0.093
Tobacco use (men) SR.14 0.2774 0.0179 0.064 1.358 1.166 932 854 0.242 0.313
Survive
Neonatal mortality rate CS.1 49 7.1 0.14 na na na na 35 63
Infant mortality rate CS.3 77 8.5 0.11 na na na na 60 94
Under-five mortality rate CS.5 86 8.8 0.10 na na na na 68 103
Thrive - Reproductive and maternal health
Total fertility rate - 4.6893 0.1701 0.036 na na na na 4.349 5.030
Adolescent birth rate TM.1 68.763 7.4916 0.109 na na na na 53.78 83.75
Contraceptive prevalence rate TM.3 0.2471 0.0143 0.058 1.616 1.271 1,799 1,480 0.219 0.276
Need for family planning satisfied with modern contraception TM.4 0.4807 0.0192 0.040 1.050 1.025 866 714 0.442 0.519
Antenatal care coverage (at least four times by any provider) TM.5b 0.3748 0.0235 0.063 1.265 1.125 652 537 0.328 0.422
Skilled attendant at delivery TM.9 0.5277 0.0296 0.056 1.889 1.374 652 537 0.468 0.587
Thrive - Child health, nutrition and development
Diphtheria, tetanus and pertussis (DTP) immunization coverage
TC.3 0.9463 0.0195 0.021 1.951 1.397 315 262 0.907 0.985
Pneumococcal (Conjugate) immunization coverage TC.6 0.9272 0.0212 0.023 1.739 1.319 315 262 0.885 0.970
Measles immunization coverage TC.10 0.8838 0.0233 0.026 1.385 1.177 315 262 0.837 0.931
Primary reliance on clean fuels and technologies for cooking, space heating and lighting
TC.18 0.1307 0.0222 0.170 6.790 2.606 12,258 1,567 0.086 0.175
Care-seeking for children with acute respiratory infection (ARI) symptoms
TC.19 0.6528 0.0244 0.037 0.870 0.933 398 331 0.604 0.702
Exclusive breastfeeding under 6 months TC.32 0.3195 0.0266 0.083 0.565 0.752 211 175 0.266 0.373
Stunting prevalence (moderate and severe) TC.45a 0.3917 0.0153 0.039 1.351 1.163 1,649 1,368 0.361 0.422
Wasting prevalence (moderate and severe) TC.46a 0.0611 0.0072 0.118 1.216 1.103 1,626 1,349 0.047 0.075
Overweight prevalence (moderate and severe) TC.47a 0.0216 0.0040 0.187 1.043 1.022 1,626 1,349 0.013 0.030
Early child development index TC.53 0.4260 0.0216 0.051 1.098 1.048 695 577 0.383 0.469

Appendix C Estimates of Sampling Error | Page 36
Table SE.9: Sampling errors: Muzaffargarh District
Standard errors, coefficients of variation, design effects (deff), square root of design effects (deft), and confidence intervals for selected SDG and other indicators, Punjab, 2017-18
Coefficient of
variation (se/r)
Square root of design
effect (deft)
Confidence limits
MICS Indicator
Value (r)
Standard error (se)
Design effect (deff)
Weighted count
Unweighted count
Lower bound r - 2se
Upper bound r + 2se
Learn
Participation rate in organised learning (adjusted) LN.2 0.5857 0.0262 0.045 0.895 0.946 399 317 0.533 0.638
Children with foundational reading and number skills (reading)
LN.22a 0.2572 0.0174 0.067 1.066 1.032 830 677 0.222 0.292
Children with foundational reading and number skills (numeracy)
LN.22d 0.0646 0.0069 0.107 0.535 0.731 830 677 0.051 0.078
Protected from violence and exploitation
Birth registration PR.1 0.4192 0.0240 0.057 3.323 1.823 1,694 1,405 0.371 0.467
Violent discipline PR.2 0.8015 0.0105 0.013 1.446 1.203 2,512 2,068 0.780 0.823
Child labour PR.3 0.2386 0.0123 0.052 0.957 0.978 1,411 1,152 0.214 0.263
Child marriage (before age 15) (women) PR.4a 0.0785 0.0119 0.152 0.745 0.863 465 382 0.055 0.102
Child marriage (before age 18) (women) PR.4b 0.3220 0.0242 0.075 1.020 1.010 465 382 0.274 0.370
Crime reporting (women) PR.13 0.0687 0.0344 0.501 0.519 0.720 35 29 0.000 0.138
Crime reporting (men) PR.13 0.5632 0.0000 0.000 0.000 0.000 10 9 0.563 0.563
Safety (women) PR.14 0.5723 0.0144 0.025 1.724 1.313 2,489 2,050 0.544 0.601
Safety (men) PR.14 0.9211 0.0114 0.012 1.517 1.232 932 854 0.898 0.944
Live in a safe and clean environment
Use of basic drinking water service WS.2 0.9896 0.0050 0.005 3.817 1.954 12,258 1,567 0.980 1.000
Use of safely managed drinking water WS.6 0.6294 0.0334 0.053 1.298 1.139 1,590 233 0.563 0.696
Handwashing facility with water and soap WS.7 0.9230 0.0070 0.008 1.068 1.033 12,223 1,563 0.909 0.937
Use of improved sanitation WS.8 0.6586 0.0205 0.031 2.938 1.714 12,258 1,567 0.618 0.700
Use of basic sanitation service WS.9 0.4749 0.0183 0.038 2.098 1.448 12,258 1,567 0.438 0.511
Equitable chance in life
Children with functional dificulty EQ.1 0.0735 0.0053 0.072 0.816 0.903 2,431 1,998 0.063 0.084
Population covered by social transfers EQ.3 0.6021 0.0146 0.024 1.392 1.180 12,258 1,567 0.573 0.631
Discrimination (women) EQ.7 0.1373 0.0092 0.067 1.464 1.210 2,489 2,050 0.119 0.156
Discrimination (men) EQ.7 0.1711 0.0137 0.080 1.128 1.062 932 854 0.144 0.198
Overall life satisfaction index (women age 15-24) EQ.9a 7.5061 0.0805 0.011 1.349 1.162 984 811 7.345 7.667
Overall life satisfaction index (men age 15-24) EQ.9a 5.4312 0.1469 0.027 0.933 0.966 380 346 5.137 5.725
na: not applicable

Appendix C Estimates of Sampling Error | Page 37
Table SE.10: Sampling errors: Rajanpur District
Standard errors, coefficients of variation, design effects (deff), square root of design effects (deft), and confidence intervals for selected SDG and other indicators, Punjab, 2017-18
Coefficient of
variation (se/r)
Square root of design
effect (deft)
Confidence limits
MICS Indicator
Value (r)
Standard error (se)
Design effect (deff)
Weighted count
Unweighted count
Lower bound r - 2se
Upper bound r + 2se
Sample coverage and characteristics of respondents
Access to electricity SR.1 0.7649 0.0334 0.044 4.976 2.231 5,439 805 0.698 0.832
Ownership of mobile phone (women) SR.10 0.1467 0.0151 0.103 1.980 1.407 1,035 1,092 0.117 0.177
Ownership of mobile phone (men) SR.10 0.8229 0.0212 0.026 0.992 0.996 393 322 0.780 0.865
Use of internet during last 3 months(women) SR.12a 0.0212 0.0035 0.166 0.650 0.806 1,035 1,092 0.014 0.028
Use of internet during last 3 months(men) SR.12a 0.2282 0.0297 0.130 1.603 1.266 393 322 0.169 0.288
ICT skills (women) SR.13 0.0103 0.0024 0.230 0.599 0.774 1,035 1,092 0.006 0.015
ICT skills (men) SR.13 0.0925 0.0172 0.187 1.138 1.067 393 322 0.058 0.127
Tobacco use (women) SR.14 0.2295 0.0184 0.080 2.082 1.443 1,035 1,092 0.193 0.266
Tobacco use (men) SR.14 0.3450 0.0311 0.090 1.376 1.173 393 322 0.283 0.407
Survive
Neonatal mortality rate CS.1 33 6.8 0.20 na na na na 20 47
Infant mortality rate CS.3 54 8.8 0.16 na na na na 37 72
Under-five mortality rate CS.5 62 8.5 0.14 na na na na 45 79
Thrive - Reproductive and maternal health
Total fertility rate - 5.9208 0.3340 0.056 na na na na 5.253 6.589
Adolescent birth rate TM.1 80.356 11.8141 0.147 na na na na 56.73 103.98
Contraceptive prevalence rate TM.3 0.2030 0.0165 0.081 1.336 1.156 759 800 0.170 0.236
Need for family planning satisfied with modern contraception TM.4 0.4597 0.0335 0.073 1.439 1.200 302 319 0.393 0.527
Antenatal care coverage (at least four times by any provider) TM.5b 0.2721 0.0244 0.090 1.069 1.034 337 356 0.223 0.321
Skilled attendant at delivery TM.9 0.4032 0.0304 0.076 1.368 1.169 337 356 0.342 0.464
Thrive - Child health, nutrition and development
Diphtheria, tetanus and pertussis (DTP) immunization coverage
TC.3 0.7182 0.0517 0.072 2.229 1.493 159 170 0.615 0.822
Pneumococcal (Conjugate) immunization coverage TC.6 0.7004 0.0443 0.063 1.581 1.257 159 170 0.612 0.789
Measles immunization coverage TC.10 0.6593 0.0400 0.061 1.204 1.097 159 170 0.579 0.739
Primary reliance on clean fuels and technologies for cooking, space heating and lighting
TC.18 0.0648 0.0195 0.302 5.068 2.251 5,439 805 0.026 0.104
Care-seeking for children with acute respiratory infection (ARI) symptoms
TC.19 0.6628 0.0389 0.059 1.601 1.265 220 237 0.585 0.741
Exclusive breastfeeding under 6 months TC.32 0.3169 0.0397 0.125 0.853 0.924 110 118 0.237 0.396
Stunting prevalence (moderate and severe) TC.45a 0.4738 0.0191 0.040 1.312 1.146 835 896 0.436 0.512
Wasting prevalence (moderate and severe) TC.46a 0.0869 0.0133 0.153 1.996 1.413 836 897 0.060 0.114
Overweight prevalence (moderate and severe) TC.47a 0.0146 0.0049 0.333 1.477 1.215 836 897 0.005 0.024
Early child development index TC.53 0.3951 0.0266 0.067 1.161 1.077 365 392 0.342 0.448

Appendix C Estimates of Sampling Error | Page 38
Table SE.10: Sampling errors: Rajanpur District
Standard errors, coefficients of variation, design effects (deff), square root of design effects (deft), and confidence intervals for selected SDG and other indicators, Punjab, 2017-18
Coefficient of
variation (se/r)
Square root of design
effect (deft)
Confidence limits
MICS Indicator
Value (r)
Standard error (se)
Design effect (deff)
Weighted count
Unweighted count
Lower bound r - 2se
Upper bound r + 2se
Learn
Participation rate in organised learning (adjusted) LN.2 0.5299 0.0609 0.115 2.563 1.601 169 173 0.408 0.652
Children with foundational reading and number skills (reading)
LN.22a 0.1172 0.0263 0.225 2.169 1.473 307 325 0.065 0.170
Children with foundational reading and number skills (numeracy)
LN.22d 0.0307 0.0081 0.264 0.715 0.845 307 325 0.014 0.047
Protected from violence and exploitation
Birth registration PR.1 0.1343 0.0207 0.154 3.444 1.856 875 939 0.093 0.176
Violent discipline PR.2 0.7934 0.0116 0.015 1.031 1.016 1,178 1,254 0.770 0.817
Child labour PR.3 0.2859 0.0194 0.068 1.123 1.060 578 609 0.247 0.325
Child marriage (before age 15) (women) PR.4a 0.0860 0.0238 0.277 1.241 1.114 164 173 0.038 0.134
Child marriage (before age 18) (women) PR.4b 0.3068 0.0481 0.157 1.868 1.367 164 173 0.211 0.403
Crime reporting (women) PR.13 0.0746 0.0003 0.004 0.000 0.004 12 13 0.074 0.075
Crime reporting (men) PR.13 0.2187 0.0000 0.000 0.000 0.000 10 8 0.219 0.219
Safety (women) PR.14 0.6042 0.0158 0.026 1.144 1.070 1,035 1,092 0.573 0.636
Safety (men) PR.14 0.8839 0.0219 0.025 1.506 1.227 393 322 0.840 0.928
Live in a safe and clean environment
Use of basic drinking water service WS.2 0.9372 0.0240 0.026 7.838 2.800 5,439 805 0.889 0.985
Use of safely managed drinking water WS.6 0.4882 0.0588 0.120 1.675 1.294 652 103 0.371 0.606
Handwashing facility with water and soap WS.7 0.8409 0.0272 0.032 4.454 2.111 5,439 805 0.786 0.895
Use of improved sanitation WS.8 0.5224 0.0295 0.057 2.811 1.676 5,439 805 0.463 0.581
Use of basic sanitation service WS.9 0.3951 0.0261 0.066 2.288 1.513 5,439 805 0.343 0.447
Equitable chance in life
Children with functional dificulty EQ.1 0.0683 0.0080 0.117 1.197 1.094 1,117 1,188 0.052 0.084
Population covered by social transfers EQ.3 0.5533 0.0324 0.059 3.416 1.848 5,439 805 0.489 0.618
Discrimination (women) EQ.7 0.1097 0.0168 0.154 3.166 1.779 1,035 1,092 0.076 0.143
Discrimination (men) EQ.7 0.0799 0.0121 0.152 0.640 0.800 393 322 0.056 0.104
Overall life satisfaction index (women age 15-24) EQ.9a 7.7852 0.1392 0.018 1.902 1.379 388 411 7.507 8.064
Overall life satisfaction index (men age 15-24) EQ.9a 6.3977 0.2301 0.036 1.079 1.039 161 133 5.937 6.858
na: not applicable

Appendix C Estimates of Sampling Error | Page 39
Table SE.11: Sampling errors: Faisalabad District
Standard errors, coefficients of variation, design effects (deff), square root of design effects (deft), and confidence intervals for selected SDG and other indicators, Punjab, 2017-18
Coefficient of
variation (se/r)
Square root of design
effect (deft)
Confidence limits
MICS Indicator
Value (r)
Standard error (se)
Design effect (deff)
Weighted count
Unweighted count
Lower bound r - 2se
Upper bound r + 2se
Sample coverage and characteristics of respondents
Access to electricity SR.1 0.9868 0.0031 0.003 2.208 1.486 22,091 3,013 0.981 0.993
Ownership of mobile phone (women) SR.10 0.4510 0.0124 0.027 2.692 1.641 5,108 4,341 0.426 0.476
Ownership of mobile phone (men) SR.10 0.8496 0.0105 0.012 1.696 1.302 1,924 1,982 0.829 0.870
Use of internet during last 3 months(women) SR.12a 0.1793 0.0135 0.075 5.379 2.319 5,108 4,341 0.152 0.206
Use of internet during last 3 months(men) SR.12a 0.3729 0.0182 0.049 2.795 1.672 1,924 1,982 0.337 0.409
ICT skills (women) SR.13 0.0757 0.0064 0.085 2.566 1.602 5,108 4,341 0.063 0.089
ICT skills (men) SR.13 0.1535 0.0117 0.076 2.071 1.439 1,924 1,982 0.130 0.177
Tobacco use (women) SR.14 0.0196 0.0029 0.146 1.859 1.363 5,108 4,341 0.014 0.025
Tobacco use (men) SR.14 0.2725 0.0123 0.045 1.502 1.225 1,924 1,982 0.248 0.297
Survive
Neonatal mortality rate CS.1 46 4.3 0.09 na na na na 37 54
Infant mortality rate CS.3 63 5.2 0.08 na na na na 53 74
Under-five mortality rate CS.5 72 5.7 0.08 na na na na 61 83
Thrive - Reproductive and maternal health
Total fertility rate - 3.2506 0.1026 0.032 na na na na 3.045 3.456
Adolescent birth rate TM.1 18.693 2.9442 0.158 na na na na 12.80 24.58
Contraceptive prevalence rate TM.3 0.4580 0.0112 0.024 1.319 1.148 3,089 2,628 0.436 0.480
Need for family planning satisfied with modern contraception TM.4 0.6353 0.0138 0.022 1.234 1.111 1,776 1,505 0.608 0.663
Antenatal care coverage (at least four times by any provider) TM.5b 0.6466 0.0176 0.027 1.130 1.063 974 832 0.611 0.682
Skilled attendant at delivery TM.9 0.8249 0.0190 0.023 2.073 1.440 974 832 0.787 0.863
Thrive - Child health, nutrition and development
Diphtheria, tetanus and pertussis (DTP) immunization coverage
TC.3 0.8944 0.0157 0.018 1.103 1.050 509 426 0.863 0.926
Pneumococcal (Conjugate) immunization coverage TC.6 0.8920 0.0165 0.019 1.206 1.098 509 426 0.859 0.925
Measles immunization coverage TC.10 0.8329 0.0186 0.022 1.055 1.027 509 426 0.796 0.870
Primary reliance on clean fuels and technologies for cooking, space heating and lighting
TC.18 0.6424 0.0183 0.028 4.394 2.096 22,091 3,013 0.606 0.679
Care-seeking for children with acute respiratory infection (ARI) symptoms
TC.19 0.8274 0.0256 0.031 0.664 0.815 173 146 0.776 0.879
Exclusive breastfeeding under 6 months TC.32 0.3743 0.0261 0.070 0.672 0.820 278 233 0.322 0.426
Stunting prevalence (moderate and severe) TC.45a 0.2884 0.0126 0.044 1.612 1.270 2,483 2,079 0.263 0.314
Wasting prevalence (moderate and severe) TC.46a 0.0581 0.0055 0.094 1.132 1.064 2,475 2,073 0.047 0.069
Overweight prevalence (moderate and severe) TC.47a 0.0208 0.0035 0.170 1.268 1.126 2,475 2,073 0.014 0.028
Early child development index TC.53 0.6777 0.0177 0.026 1.234 1.111 1,025 860 0.642 0.713

Appendix C Estimates of Sampling Error | Page 40
Table SE.11: Sampling errors: Faisalabad District
Standard errors, coefficients of variation, design effects (deff), square root of design effects (deft), and confidence intervals for selected SDG and other indicators, Punjab, 2017-18
Coefficient of
variation (se/r)
Square root of design
effect (deft)
Confidence limits
MICS Indicator
Value (r)
Standard error (se)
Design effect (deff)
Weighted count
Unweighted count
Lower bound r - 2se
Upper bound r + 2se
Learn
Participation rate in organised learning (adjusted) LN.2 0.7676 0.0205 0.027 1.093 1.045 563 464 0.727 0.809
Children with foundational reading and number skills (reading)
LN.22a 0.3407 0.0174 0.051 1.468 1.212 1,296 1,094 0.306 0.375
Children with foundational reading and number skills (numeracy)
LN.22d 0.0401 0.0062 0.154 1.077 1.038 1,296 1,094 0.028 0.052
Protected from violence and exploitation
Birth registration PR.1 0.9086 0.0093 0.010 2.192 1.481 2,530 2,118 0.890 0.927
Violent discipline PR.2 0.7899 0.0104 0.013 2.157 1.469 3,911 3,286 0.769 0.811
Child labour PR.3 0.1125 0.0076 0.067 1.177 1.085 2,435 2,051 0.097 0.128
Child marriage (before age 15) (women) PR.4a 0.0184 0.0055 0.298 1.343 1.159 949 808 0.007 0.029
Child marriage (before age 18) (women) PR.4b 0.0958 0.0120 0.125 1.341 1.158 949 808 0.072 0.120
Crime reporting (women) PR.13 0.1267 0.0487 0.384 1.691 1.300 96 80 0.029 0.224
Crime reporting (men) PR.13 0.1288 0.0004 0.003 0.000 0.006 24 24 0.128 0.130
Safety (women) PR.14 0.5064 0.0119 0.024 2.459 1.568 5,108 4,341 0.483 0.530
Safety (men) PR.14 0.9476 0.0076 0.008 2.284 1.511 1,924 1,982 0.932 0.963
Live in a safe and clean environment
Use of basic drinking water service WS.2 0.9269 0.0075 0.008 2.482 1.575 22,091 3,013 0.912 0.942
Use of safely managed drinking water WS.6 0.2036 0.0204 0.100 1.071 1.035 3,104 369 0.163 0.244
Handwashing facility with water and soap WS.7 0.9637 0.0041 0.004 1.422 1.193 22,051 3,007 0.956 0.972
Use of improved sanitation WS.8 0.8524 0.0128 0.015 3.950 1.987 22,091 3,013 0.827 0.878
Use of basic sanitation service WS.9 0.7374 0.0142 0.019 3.128 1.769 22,091 3,013 0.709 0.766
Equitable chance in life
Children with functional dificulty EQ.1 0.1557 0.0073 0.047 1.336 1.156 3,945 3,315 0.141 0.170
Population covered by social transfers EQ.3 0.4090 0.0138 0.034 2.375 1.541 22,091 3,013 0.381 0.437
Discrimination (women) EQ.7 0.1305 0.0085 0.065 2.783 1.668 5,108 4,341 0.113 0.148
Discrimination (men) EQ.7 0.0976 0.0088 0.090 1.750 1.323 1,924 1,982 0.080 0.115
Overall life satisfaction index (women age 15-24) EQ.9a 7.6767 0.0608 0.008 1.385 1.177 1,901 1,618 7.555 7.798
Overall life satisfaction index (men age 15-24) EQ.9a 7.4548 0.0998 0.013 2.020 1.421 771 791 7.255 7.654
na: not applicable

Appendix C Estimates of Sampling Error | Page 41
Table SE.12: Sampling errors: Chiniot District
Standard errors, coefficients of variation, design effects (deff), square root of design effects (deft), and confidence intervals for selected SDG and other indicators, Punjab, 2017-18
Coefficient of
variation (se/r)
Square root of design
effect (deft)
Confidence limits
MICS Indicator
Value (r)
Standard error (se)
Design effect (deff)
Weighted count
Unweighted count
Lower bound r - 2se
Upper bound r + 2se
Sample coverage and characteristics of respondents
Access to electricity SR.1 0.9447 0.0119 0.013 2.310 1.520 4,027 852 0.921 0.969
Ownership of mobile phone (women) SR.10 0.2781 0.0191 0.069 2.089 1.445 857 1,150 0.240 0.316
Ownership of mobile phone (men) SR.10 0.8249 0.0232 0.028 2.141 1.463 334 574 0.778 0.871
Use of internet during last 3 months(women) SR.12a 0.0475 0.0111 0.234 3.140 1.772 857 1,150 0.025 0.070
Use of internet during last 3 months(men) SR.12a 0.1535 0.0267 0.174 3.145 1.773 334 574 0.100 0.207
ICT skills (women) SR.13 0.0222 0.0039 0.177 0.820 0.906 857 1,150 0.014 0.030
ICT skills (men) SR.13 0.0965 0.0145 0.150 1.379 1.174 334 574 0.068 0.125
Tobacco use (women) SR.14 0.0562 0.0080 0.141 1.369 1.170 857 1,150 0.040 0.072
Tobacco use (men) SR.14 0.3594 0.0289 0.080 2.079 1.442 334 574 0.302 0.417
Survive
Neonatal mortality rate CS.1 65 8.9 0.14 na na na na 47 83
Infant mortality rate CS.3 85 9.9 0.12 na na na na 65 104
Under-five mortality rate CS.5 94 9.9 0.10 na na na na 74 114
Thrive - Reproductive and maternal health
Total fertility rate - 3.8387 0.2131 0.056 na na na na 3.412 4.265
Adolescent birth rate TM.1 47.355 10.3741 0.219 na na na na 26.61 68.10
Contraceptive prevalence rate TM.3 0.2579 0.0251 0.098 2.540 1.594 572 770 0.208 0.308
Need for family planning satisfied with modern contraception TM.4 0.5272 0.0425 0.081 2.430 1.559 253 337 0.442 0.612
Antenatal care coverage (at least four times by any provider) TM.5b 0.4875 0.0413 0.085 1.778 1.334 190 262 0.405 0.570
Skilled attendant at delivery TM.9 0.8010 0.0242 0.030 0.963 0.981 190 262 0.752 0.849
Thrive - Child health, nutrition and development
Diphtheria, tetanus and pertussis (DTP) immunization coverage
TC.3 0.8956 0.0230 0.026 0.686 0.828 90 122 0.850 0.942
Pneumococcal (Conjugate) immunization coverage TC.6 0.8956 0.0230 0.026 0.686 0.828 90 122 0.850 0.942
Measles immunization coverage TC.10 0.8316 0.0329 0.040 0.934 0.967 90 122 0.766 0.897
Primary reliance on clean fuels and technologies for cooking, space heating and lighting
TC.18 0.3204 0.0277 0.087 3.003 1.733 4,027 852 0.265 0.376
Care-seeking for children with acute respiratory infection (ARI) symptoms
TC.19 0.5811 0.0614 0.106 0.526 0.725 25 35 0.458 0.704
Exclusive breastfeeding under 6 months TC.32 0.4496 0.0396 0.088 0.596 0.772 70 95 0.370 0.529
Stunting prevalence (moderate and severe) TC.45a 0.3600 0.0158 0.044 0.703 0.838 486 650 0.328 0.392
Wasting prevalence (moderate and severe) TC.46a 0.0745 0.0089 0.120 0.747 0.864 486 650 0.057 0.092
Overweight prevalence (moderate and severe) TC.47a 0.0226 0.0078 0.345 1.783 1.335 486 650 0.007 0.038
Early child development index TC.53 0.6686 0.0320 0.048 1.237 1.112 203 269 0.605 0.733

Appendix C Estimates of Sampling Error | Page 42
Table SE.12: Sampling errors: Chiniot District
Standard errors, coefficients of variation, design effects (deff), square root of design effects (deft), and confidence intervals for selected SDG and other indicators, Punjab, 2017-18
Coefficient of
variation (se/r)
Square root of design
effect (deft)
Confidence limits
MICS Indicator
Value (r)
Standard error (se)
Design effect (deff)
Weighted count
Unweighted count
Lower bound r - 2se
Upper bound r + 2se
Learn
Participation rate in organised learning (adjusted) LN.2 0.7382 0.0435 0.059 1.539 1.240 119 158 0.651 0.825
Children with foundational reading and number skills (reading)
LN.22a 0.2064 0.0372 0.180 2.785 1.669 246 331 0.132 0.281
Children with foundational reading and number skills (numeracy)
LN.22d 0.0212 0.0098 0.463 1.536 1.239 246 331 0.002 0.041
Protected from violence and exploitation
Birth registration PR.1 0.7718 0.0252 0.033 2.409 1.552 498 667 0.721 0.822
Violent discipline PR.2 0.7570 0.0168 0.022 1.574 1.254 761 1,024 0.723 0.791
Child labour PR.3 0.1868 0.0229 0.123 2.078 1.442 445 602 0.141 0.233
Child marriage (before age 15) (women) PR.4a 0.0814 0.0207 0.254 1.108 1.052 146 195 0.040 0.123
Child marriage (before age 18) (women) PR.4b 0.2517 0.0322 0.128 1.066 1.032 146 195 0.187 0.316
Crime reporting (women) PR.13 0.0000 0.0000 11 13 0.000 0.000
Crime reporting (men) PR.13 0.2425 0.0146 0.060 0.017 0.132 8 16 0.213 0.272
Safety (women) PR.14 0.5154 0.0196 0.038 1.762 1.327 857 1,150 0.476 0.555
Safety (men) PR.14 0.7095 0.0246 0.035 1.684 1.298 334 574 0.660 0.759
Live in a safe and clean environment
Use of basic drinking water service WS.2 0.9915 0.0035 0.004 1.252 1.119 4,027 852 0.985 0.999
Use of safely managed drinking water WS.6 0.6804 0.0486 0.071 1.729 1.315 545 124 0.583 0.778
Handwashing facility with water and soap WS.7 0.9322 0.0130 0.014 2.258 1.503 4,025 850 0.906 0.958
Use of improved sanitation WS.8 0.5926 0.0388 0.065 5.304 2.303 4,027 852 0.515 0.670
Use of basic sanitation service WS.9 0.4977 0.0352 0.071 4.218 2.054 4,027 852 0.427 0.568
Equitable chance in life
Children with functional dificulty EQ.1 0.1226 0.0123 0.100 1.414 1.189 749 1,005 0.098 0.147
Population covered by social transfers EQ.3 0.5330 0.0207 0.039 1.462 1.209 4,027 852 0.492 0.574
Discrimination (women) EQ.7 0.0734 0.0094 0.128 1.492 1.222 857 1,150 0.055 0.092
Discrimination (men) EQ.7 0.1655 0.0209 0.126 1.806 1.344 334 574 0.124 0.207
Overall life satisfaction index (women age 15-24) EQ.9a 7.6612 0.0989 0.013 0.990 0.995 302 402 7.463 7.859
Overall life satisfaction index (men age 15-24) EQ.9a 6.7622 0.2099 0.031 2.021 1.422 123 214 6.342 7.182
na: not applicable

Appendix C Estimates of Sampling Error | Page 43
Table SE.13: Sampling errors: Jhang District
Standard errors, coefficients of variation, design effects (deff), square root of design effects (deft), and confidence intervals for selected SDG and other indicators, Punjab, 2017-18
Coefficient of
variation (se/r)
Square root of design
effect (deft)
Confidence limits
MICS Indicator
Value (r)
Standard error (se)
Design effect (deff)
Weighted count
Unweighted count
Lower bound r - 2se
Upper bound r + 2se
Sample coverage and characteristics of respondents
Access to electricity SR.1 0.9156 0.0145 0.016 3.529 1.878 8,455 1,294 0.887 0.945
Ownership of mobile phone (women) SR.10 0.2447 0.0113 0.046 1.278 1.130 1,832 1,852 0.222 0.267
Ownership of mobile phone (men) SR.10 0.8330 0.0191 0.023 1.713 1.309 674 651 0.795 0.871
Use of internet during last 3 months(women) SR.12a 0.0484 0.0074 0.152 2.183 1.477 1,832 1,852 0.034 0.063
Use of internet during last 3 months(men) SR.12a 0.2097 0.0266 0.127 2.785 1.669 674 651 0.156 0.263
ICT skills (women) SR.13 0.0318 0.0058 0.183 2.033 1.426 1,832 1,852 0.020 0.043
ICT skills (men) SR.13 0.1202 0.0209 0.174 2.681 1.637 674 651 0.078 0.162
Tobacco use (women) SR.14 0.0552 0.0058 0.105 1.203 1.097 1,832 1,852 0.044 0.067
Tobacco use (men) SR.14 0.2988 0.0178 0.060 0.987 0.994 674 651 0.263 0.334
Survive
Neonatal mortality rate CS.1 52 5.7 0.11 na na na na 40 63
Infant mortality rate CS.3 81 6.2 0.08 na na na na 69 94
Under-five mortality rate CS.5 90 6.3 0.07 na na na na 77 102
Thrive - Reproductive and maternal health
Total fertility rate - 4.2804 0.1821 0.043 na na na na 3.916 4.645
Adolescent birth rate TM.1 63.999 7.7686 0.121 na na na na 48.46 79.54
Contraceptive prevalence rate TM.3 0.2514 0.0155 0.061 1.590 1.261 1,240 1,254 0.220 0.282
Need for family planning satisfied with modern contraception TM.4 0.4647 0.0209 0.045 1.027 1.014 581 587 0.423 0.506
Antenatal care coverage (at least four times by any provider) TM.5b 0.4283 0.0275 0.064 1.365 1.168 438 444 0.373 0.483
Skilled attendant at delivery TM.9 0.7320 0.0240 0.033 1.299 1.140 438 444 0.684 0.780
Thrive - Child health, nutrition and development
Diphtheria, tetanus and pertussis (DTP) immunization coverage
TC.3 0.8514 0.0284 0.033 1.316 1.147 202 208 0.795 0.908
Pneumococcal (Conjugate) immunization coverage TC.6 0.8467 0.0285 0.034 1.296 1.138 202 208 0.790 0.904
Measles immunization coverage TC.10 0.8021 0.0366 0.046 1.746 1.321 202 208 0.729 0.875
Primary reliance on clean fuels and technologies for cooking, space heating and lighting
TC.18 0.2113 0.0141 0.067 1.547 1.244 8,455 1,294 0.183 0.240
Care-seeking for children with acute respiratory infection (ARI) symptoms
TC.19 0.6212 0.0366 0.059 0.936 0.967 162 165 0.548 0.694
Exclusive breastfeeding under 6 months TC.32 0.4160 0.0402 0.097 0.952 0.976 142 144 0.336 0.496
Stunting prevalence (moderate and severe) TC.45a 0.3514 0.0193 0.055 1.822 1.350 1,086 1,113 0.313 0.390
Wasting prevalence (moderate and severe) TC.46a 0.0886 0.0097 0.110 1.284 1.133 1,075 1,101 0.069 0.108
Overweight prevalence (moderate and severe) TC.47a 0.0151 0.0041 0.271 1.243 1.115 1,075 1,101 0.007 0.023
Early child development index TC.53 0.5324 0.0251 0.047 1.165 1.080 450 461 0.482 0.583

Appendix C Estimates of Sampling Error | Page 44
Table SE.13: Sampling errors: Jhang District
Standard errors, coefficients of variation, design effects (deff), square root of design effects (deft), and confidence intervals for selected SDG and other indicators, Punjab, 2017-18
Coefficient of
variation (se/r)
Square root of design
effect (deft)
Confidence limits
MICS Indicator
Value (r)
Standard error (se)
Design effect (deff)
Weighted count
Unweighted count
Lower bound r - 2se
Upper bound r + 2se
Learn
Participation rate in organised learning (adjusted) LN.2 0.7697 0.0248 0.032 0.900 0.949 256 260 0.720 0.819
Children with foundational reading and number skills (reading)
LN.22a 0.2640 0.0225 0.085 1.212 1.101 451 467 0.219 0.309
Children with foundational reading and number skills (numeracy)
LN.22d 0.0256 0.0082 0.322 1.267 1.126 451 467 0.009 0.042
Protected from violence and exploitation
Birth registration PR.1 0.7830 0.0152 0.019 1.562 1.250 1,122 1,148 0.753 0.813
Violent discipline PR.2 0.8251 0.0108 0.013 1.327 1.152 1,599 1,644 0.804 0.847
Child labour PR.3 0.1849 0.0182 0.099 2.048 1.431 901 929 0.148 0.221
Child marriage (before age 15) (women) PR.4a 0.0752 0.0143 0.191 0.997 0.998 333 338 0.047 0.104
Child marriage (before age 18) (women) PR.4b 0.2373 0.0220 0.093 0.901 0.949 333 338 0.193 0.281
Crime reporting (women) PR.13 0.0356 0.0015 0.041 0.002 0.043 30 31 0.033 0.039
Crime reporting (men) PR.13 0.3598 0.0000 0.000 0.000 0.000 8 8 0.360 0.360
Safety (women) PR.14 0.5066 0.0171 0.034 2.170 1.473 1,832 1,852 0.472 0.541
Safety (men) PR.14 0.8751 0.0190 0.022 2.140 1.463 674 651 0.837 0.913
Live in a safe and clean environment
Use of basic drinking water service WS.2 0.9936 0.0025 0.002 1.235 1.111 8,455 1,294 0.989 0.999
Use of safely managed drinking water WS.6 0.5996 0.0434 0.072 1.721 1.312 1,121 184 0.513 0.686
Handwashing facility with water and soap WS.7 0.9252 0.0080 0.009 1.188 1.090 8,424 1,290 0.909 0.941
Use of improved sanitation WS.8 0.6712 0.0229 0.034 3.071 1.753 8,455 1,294 0.625 0.717
Use of basic sanitation service WS.9 0.5808 0.0235 0.040 2.928 1.711 8,455 1,294 0.534 0.628
Equitable chance in life
Children with functional dificulty EQ.1 0.1888 0.0094 0.050 0.941 0.970 1,577 1,620 0.170 0.208
Population covered by social transfers EQ.3 0.5756 0.0154 0.027 1.254 1.120 8,455 1,294 0.545 0.606
Discrimination (women) EQ.7 0.0594 0.0059 0.100 1.165 1.079 1,832 1,852 0.048 0.071
Discrimination (men) EQ.7 0.0589 0.0111 0.189 1.455 1.206 674 651 0.037 0.081
Overall life satisfaction index (women age 15-24) EQ.9a 6.2456 0.1030 0.016 1.352 1.163 669 677 6.040 6.452
Overall life satisfaction index (men age 15-24) EQ.9a 7.3436 0.1812 0.025 1.440 1.200 244 230 6.981 7.706
na: not applicable

Appendix C Estimates of Sampling Error | Page 45
Table SE.14: Sampling errors: TT Singh District
Standard errors, coefficients of variation, design effects (deff), square root of design effects (deft), and confidence intervals for selected SDG and other indicators, Punjab, 2017-18
Coefficient of
variation (se/r)
Square root of design
effect (deft)
Confidence limits
MICS Indicator
Value (r)
Standard error (se)
Design effect (deff)
Weighted count
Unweighted count
Lower bound r - 2se
Upper bound r + 2se
Sample coverage and characteristics of respondents
Access to electricity SR.1 0.9866 0.0034 0.003 0.959 0.979 6,630 1,115 0.980 0.993
Ownership of mobile phone (women) SR.10 0.4255 0.0173 0.041 2.148 1.466 1,601 1,762 0.391 0.460
Ownership of mobile phone (men) SR.10 0.8816 0.0124 0.014 1.076 1.037 552 730 0.857 0.906
Use of internet during last 3 months(women) SR.12a 0.1614 0.0138 0.085 2.466 1.570 1,601 1,762 0.134 0.189
Use of internet during last 3 months(men) SR.12a 0.3252 0.0280 0.086 2.597 1.612 552 730 0.269 0.381
ICT skills (women) SR.13 0.0583 0.0066 0.114 1.419 1.191 1,601 1,762 0.045 0.072
ICT skills (men) SR.13 0.1358 0.0170 0.125 1.787 1.337 552 730 0.102 0.170
Tobacco use (women) SR.14 0.0274 0.0047 0.172 1.471 1.213 1,601 1,762 0.018 0.037
Tobacco use (men) SR.14 0.1972 0.0158 0.080 1.143 1.069 552 730 0.166 0.229
Survive
Neonatal mortality rate CS.1 43 8.2 0.19 na na na na 27 60
Infant mortality rate CS.3 61 9.4 0.15 na na na na 42 80
Under-five mortality rate CS.5 74 9.6 0.13 na na na na 54 93
Thrive - Reproductive and maternal health
Total fertility rate - 3.5061 0.1725 0.049 na na na na 3.161 3.851
Adolescent birth rate TM.1 25.577 4.7106 0.184 na na na na 16.16 35.00
Contraceptive prevalence rate TM.3 0.4336 0.0163 0.038 1.171 1.082 978 1,077 0.401 0.466
Need for family planning satisfied with modern contraception TM.4 0.5860 0.0214 0.036 1.100 1.049 529 586 0.543 0.629
Antenatal care coverage (at least four times by any provider) TM.5b 0.5147 0.0443 0.086 2.594 1.611 301 331 0.426 0.603
Skilled attendant at delivery TM.9 0.8009 0.0312 0.039 2.012 1.418 301 331 0.739 0.863
Thrive - Child health, nutrition and development
Diphtheria, tetanus and pertussis (DTP) immunization coverage
TC.3 0.9123 0.0284 0.031 1.667 1.291 153 166 0.855 0.969
Pneumococcal (Conjugate) immunization coverage TC.6 0.8984 0.0292 0.033 1.542 1.242 153 166 0.840 0.957
Measles immunization coverage TC.10 0.8639 0.0316 0.037 1.399 1.183 153 166 0.801 0.927
Primary reliance on clean fuels and technologies for cooking, space heating and lighting
TC.18 0.4376 0.0400 0.091 7.234 2.690 6,630 1,115 0.358 0.518
Care-seeking for children with acute respiratory infection (ARI) symptoms
TC.19 0.8304 0.0340 0.041 0.615 0.784 71 76 0.762 0.898
Exclusive breastfeeding under 6 months TC.32 0.2810 0.0511 0.182 1.255 1.120 88 98 0.179 0.383
Stunting prevalence (moderate and severe) TC.45a 0.2978 0.0218 0.073 1.878 1.370 750 825 0.254 0.341
Wasting prevalence (moderate and severe) TC.46a 0.0791 0.0106 0.134 1.261 1.123 744 819 0.058 0.100
Overweight prevalence (moderate and severe) TC.47a 0.0264 0.0060 0.225 1.127 1.061 744 819 0.015 0.038
Early child development index TC.53 0.5061 0.0249 0.049 0.882 0.939 326 358 0.456 0.556
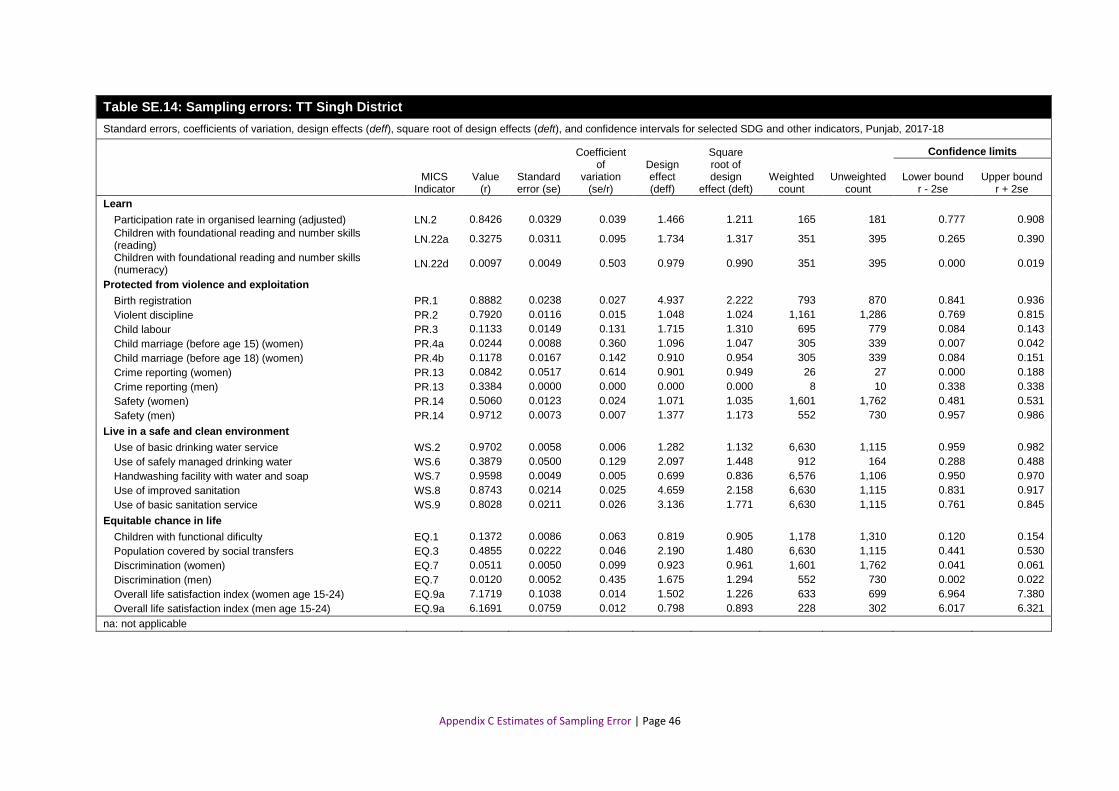
Appendix C Estimates of Sampling Error | Page 46
Table SE.14: Sampling errors: TT Singh District
Standard errors, coefficients of variation, design effects (deff), square root of design effects (deft), and confidence intervals for selected SDG and other indicators, Punjab, 2017-18
Coefficient of
variation (se/r)
Square root of design
effect (deft)
Confidence limits
MICS Indicator
Value (r)
Standard error (se)
Design effect (deff)
Weighted count
Unweighted count
Lower bound r - 2se
Upper bound r + 2se
Learn
Participation rate in organised learning (adjusted) LN.2 0.8426 0.0329 0.039 1.466 1.211 165 181 0.777 0.908
Children with foundational reading and number skills (reading)
LN.22a 0.3275 0.0311 0.095 1.734 1.317 351 395 0.265 0.390
Children with foundational reading and number skills (numeracy)
LN.22d 0.0097 0.0049 0.503 0.979 0.990 351 395 0.000 0.019
Protected from violence and exploitation
Birth registration PR.1 0.8882 0.0238 0.027 4.937 2.222 793 870 0.841 0.936
Violent discipline PR.2 0.7920 0.0116 0.015 1.048 1.024 1,161 1,286 0.769 0.815
Child labour PR.3 0.1133 0.0149 0.131 1.715 1.310 695 779 0.084 0.143
Child marriage (before age 15) (women) PR.4a 0.0244 0.0088 0.360 1.096 1.047 305 339 0.007 0.042
Child marriage (before age 18) (women) PR.4b 0.1178 0.0167 0.142 0.910 0.954 305 339 0.084 0.151
Crime reporting (women) PR.13 0.0842 0.0517 0.614 0.901 0.949 26 27 0.000 0.188
Crime reporting (men) PR.13 0.3384 0.0000 0.000 0.000 0.000 8 10 0.338 0.338
Safety (women) PR.14 0.5060 0.0123 0.024 1.071 1.035 1,601 1,762 0.481 0.531
Safety (men) PR.14 0.9712 0.0073 0.007 1.377 1.173 552 730 0.957 0.986
Live in a safe and clean environment
Use of basic drinking water service WS.2 0.9702 0.0058 0.006 1.282 1.132 6,630 1,115 0.959 0.982
Use of safely managed drinking water WS.6 0.3879 0.0500 0.129 2.097 1.448 912 164 0.288 0.488
Handwashing facility with water and soap WS.7 0.9598 0.0049 0.005 0.699 0.836 6,576 1,106 0.950 0.970
Use of improved sanitation WS.8 0.8743 0.0214 0.025 4.659 2.158 6,630 1,115 0.831 0.917
Use of basic sanitation service WS.9 0.8028 0.0211 0.026 3.136 1.771 6,630 1,115 0.761 0.845
Equitable chance in life
Children with functional dificulty EQ.1 0.1372 0.0086 0.063 0.819 0.905 1,178 1,310 0.120 0.154
Population covered by social transfers EQ.3 0.4855 0.0222 0.046 2.190 1.480 6,630 1,115 0.441 0.530
Discrimination (women) EQ.7 0.0511 0.0050 0.099 0.923 0.961 1,601 1,762 0.041 0.061
Discrimination (men) EQ.7 0.0120 0.0052 0.435 1.675 1.294 552 730 0.002 0.022
Overall life satisfaction index (women age 15-24) EQ.9a 7.1719 0.1038 0.014 1.502 1.226 633 699 6.964 7.380
Overall life satisfaction index (men age 15-24) EQ.9a 6.1691 0.0759 0.012 0.798 0.893 228 302 6.017 6.321
na: not applicable

Appendix C Estimates of Sampling Error | Page 47
Table SE.15: Sampling errors: Gujranwala District
Standard errors, coefficients of variation, design effects (deff), square root of design effects (deft), and confidence intervals for selected SDG and other indicators, Punjab, 2017-18
Coefficient of
variation (se/r)
Square root of design
effect (deft)
Confidence limits
MICS Indicator
Value (r)
Standard error (se)
Design effect (deff)
Weighted count
Unweighted count
Lower bound r - 2se
Upper bound r + 2se
Sample coverage and characteristics of respondents
Access to electricity SR.1 0.9997 0.0003 0.000 0.695 0.834 15,368 2,010 0.999 1.000
Ownership of mobile phone (women) SR.10 0.4448 0.0125 0.028 2.063 1.436 3,649 3,284 0.420 0.470
Ownership of mobile phone (men) SR.10 0.8502 0.0119 0.014 1.346 1.160 1,293 1,220 0.826 0.874
Use of internet during last 3 months(women) SR.12a 0.1060 0.0103 0.098 3.700 1.924 3,649 3,284 0.085 0.127
Use of internet during last 3 months(men) SR.12a 0.2500 0.0172 0.069 1.918 1.385 1,293 1,220 0.216 0.284
ICT skills (women) SR.13 0.0431 0.0050 0.117 2.021 1.422 3,649 3,284 0.033 0.053
ICT skills (men) SR.13 0.1047 0.0118 0.112 1.803 1.343 1,293 1,220 0.081 0.128
Tobacco use (women) SR.14 0.0039 0.0011 0.289 1.070 1.035 3,649 3,284 0.002 0.006
Tobacco use (men) SR.14 0.2117 0.0133 0.063 1.302 1.141 1,293 1,220 0.185 0.238
Survive
Neonatal mortality rate CS.1 28 3.8 0.14 na na na na 20 35
Infant mortality rate CS.3 41 5.1 0.13 na na na na 31 51
Under-five mortality rate CS.5 52 5.8 0.11 na na na na 41 64
Thrive - Reproductive and maternal health
Total fertility rate - 3.4073 0.1136 0.033 na na na na 3.180 3.634
Adolescent birth rate TM.1 27.191 3.7519 0.138 na na na na 19.69 34.70
Contraceptive prevalence rate TM.3 0.1674 0.0091 0.054 1.164 1.079 2,195 1,976 0.149 0.186
Need for family planning satisfied with modern contraception TM.4 0.3482 0.0186 0.053 1.323 1.150 958 869 0.311 0.385
Antenatal care coverage (at least four times by any provider) TM.5b 0.5872 0.0206 0.035 1.130 1.063 712 644 0.546 0.629
Skilled attendant at delivery TM.9 0.8520 0.0160 0.019 1.301 1.140 712 644 0.820 0.884
Thrive - Child health, nutrition and development
Diphtheria, tetanus and pertussis (DTP) immunization coverage
TC.3 0.8426 0.0253 0.030 1.558 1.248 360 325 0.792 0.893
Pneumococcal (Conjugate) immunization coverage TC.6 0.8291 0.0284 0.034 1.846 1.359 360 325 0.772 0.886
Measles immunization coverage TC.10 0.7882 0.0278 0.035 1.495 1.223 360 325 0.733 0.844
Primary reliance on clean fuels and technologies for cooking, space heating and lighting
TC.18 0.8546 0.0161 0.019 4.210 2.052 15,368 2,010 0.822 0.887
Care-seeking for children with acute respiratory infection (ARI) symptoms
TC.19 0.7962 0.0359 0.045 0.413 0.642 59 53 0.724 0.868
Exclusive breastfeeding under 6 months TC.32 0.3596 0.0321 0.089 0.841 0.917 215 189 0.295 0.424
Stunting prevalence (moderate and severe) TC.45a 0.2467 0.0139 0.057 1.700 1.304 1,813 1,626 0.219 0.275
Wasting prevalence (moderate and severe) TC.46a 0.0683 0.0077 0.113 1.517 1.232 1,809 1,624 0.053 0.084
Overweight prevalence (moderate and severe) TC.47a 0.0264 0.0043 0.161 1.140 1.068 1,809 1,624 0.018 0.035
Early child development index TC.53 0.5333 0.0169 0.032 0.770 0.877 752 670 0.499 0.567

Appendix C Estimates of Sampling Error | Page 48
Table SE.15: Sampling errors: Gujranwala District
Standard errors, coefficients of variation, design effects (deff), square root of design effects (deft), and confidence intervals for selected SDG and other indicators, Punjab, 2017-18
Coefficient of
variation (se/r)
Square root of design
effect (deft)
Confidence limits
MICS Indicator
Value (r)
Standard error (se)
Design effect (deff)
Weighted count
Unweighted count
Lower bound r - 2se
Upper bound r + 2se
Learn
Participation rate in organised learning (adjusted) LN.2 0.8262 0.0199 0.024 0.951 0.975 388 345 0.786 0.866
Children with foundational reading and number skills (reading)
LN.22a 0.3724 0.0214 0.058 1.102 1.050 632 562 0.330 0.415
Children with foundational reading and number skills (numeracy)
LN.22d 0.0000 0.0000 632 562 0.000 0.000
Protected from violence and exploitation
Birth registration PR.1 0.9285 0.0088 0.010 1.939 1.393 1,844 1,655 0.911 0.946
Violent discipline PR.2 0.7117 0.0106 0.015 1.339 1.157 2,729 2,450 0.691 0.733
Child labour PR.3 0.0602 0.0059 0.099 0.928 0.964 1,658 1,489 0.048 0.072
Child marriage (before age 15) (women) PR.4a 0.0163 0.0050 0.305 0.996 0.998 710 644 0.006 0.026
Child marriage (before age 18) (women) PR.4b 0.0703 0.0106 0.151 1.115 1.056 710 644 0.049 0.092
Crime reporting (women) PR.13 0.1122 0.0000 0.000 0.000 0.000 19 18 0.112 0.112
Crime reporting (men) PR.13 0.3193 0.0000 0.000 0.000 0.000 6 6 0.319 0.319
Safety (women) PR.14 0.6317 0.0090 0.014 1.132 1.064 3,649 3,284 0.614 0.650
Safety (men) PR.14 0.9925 0.0030 0.003 1.525 1.235 1,293 1,220 0.986 0.999
Live in a safe and clean environment
Use of basic drinking water service WS.2 0.9865 0.0030 0.003 1.361 1.167 15,368 2,010 0.980 0.993
Use of safely managed drinking water WS.6 0.4826 0.0411 0.085 2.180 1.477 2,110 280 0.400 0.565
Handwashing facility with water and soap WS.7 0.9438 0.0062 0.007 1.473 1.213 15,360 2,008 0.931 0.956
Use of improved sanitation WS.8 0.9791 0.0050 0.005 2.411 1.553 15,368 2,010 0.969 0.989
Use of basic sanitation service WS.9 0.9360 0.0068 0.007 1.541 1.241 15,368 2,010 0.922 0.950
Equitable chance in life
Children with functional dificulty EQ.1 0.1419 0.0077 0.054 1.195 1.093 2,766 2,482 0.127 0.157
Population covered by social transfers EQ.3 0.1234 0.0103 0.083 1.963 1.401 15,368 2,010 0.103 0.144
Discrimination (women) EQ.7 0.0477 0.0033 0.070 0.810 0.900 3,649 3,284 0.041 0.054
Discrimination (men) EQ.7 0.0731 0.0089 0.121 1.412 1.188 1,293 1,220 0.055 0.091
Overall life satisfaction index (women age 15-24) EQ.9a 8.0774 0.0655 0.008 1.266 1.125 1,459 1,315 7.946 8.208
Overall life satisfaction index (men age 15-24) EQ.9a 7.5361 0.1046 0.014 1.460 1.208 549 517 7.327 7.745
na: not applicable

Appendix C Estimates of Sampling Error | Page 49
Table SE.16: Sampling errors: Gujrat District
Standard errors, coefficients of variation, design effects (deff), square root of design effects (deft), and confidence intervals for selected SDG and other indicators, Punjab, 2017-18
Coefficient of
variation (se/r)
Square root of design
effect (deft)
Confidence limits
MICS Indicator
Value (r)
Standard error (se)
Design effect (deff)
Weighted count
Unweighted count
Lower bound r - 2se
Upper bound r + 2se
Sample coverage and characteristics of respondents
Access to electricity SR.1 0.9988 0.0012 0.001 1.931 1.390 8,599 1,554 0.996 1.000
Ownership of mobile phone (women) SR.10 0.4929 0.0158 0.032 2.401 1.550 2,134 2,418 0.461 0.524
Ownership of mobile phone (men) SR.10 0.8802 0.0134 0.015 1.169 1.081 646 684 0.853 0.907
Use of internet during last 3 months(women) SR.12a 0.2545 0.0171 0.067 3.739 1.934 2,134 2,418 0.220 0.289
Use of internet during last 3 months(men) SR.12a 0.5489 0.0233 0.042 1.495 1.223 646 684 0.502 0.595
ICT skills (women) SR.13 0.0482 0.0073 0.151 2.802 1.674 2,134 2,418 0.034 0.063
ICT skills (men) SR.13 0.1756 0.0223 0.127 2.336 1.528 646 684 0.131 0.220
Tobacco use (women) SR.14 0.0115 0.0019 0.166 0.775 0.880 2,134 2,418 0.008 0.015
Tobacco use (men) SR.14 0.2432 0.0180 0.074 1.203 1.097 646 684 0.207 0.279
Survive
Neonatal mortality rate CS.1 37 5.6 0.15 na na na na 26 49
Infant mortality rate CS.3 52 6.3 0.12 na na na na 40 65
Under-five mortality rate CS.5 58 6.4 0.11 na na na na 45 71
Thrive - Reproductive and maternal health
Total fertility rate - 3.1073 0.1013 0.033 na na na na 2.905 3.310
Adolescent birth rate TM.1 17.449 3.7501 0.215 na na na na 9.95 24.95
Contraceptive prevalence rate TM.3 0.3103 0.0120 0.039 0.995 0.997 1,303 1,478 0.286 0.334
Need for family planning satisfied with modern contraception TM.4 0.5318 0.0182 0.034 0.943 0.971 636 710 0.495 0.568
Antenatal care coverage (at least four times by any provider) TM.5b 0.6998 0.0211 0.030 0.923 0.961 385 438 0.658 0.742
Skilled attendant at delivery TM.9 0.9298 0.0158 0.017 1.682 1.297 385 438 0.898 0.962
Thrive - Child health, nutrition and development
Diphtheria, tetanus and pertussis (DTP) immunization coverage
TC.3 0.9366 0.0170 0.018 1.039 1.019 189 214 0.903 0.971
Pneumococcal (Conjugate) immunization coverage TC.6 0.9384 0.0165 0.018 1.001 1.000 189 214 0.905 0.971
Measles immunization coverage TC.10 0.9579 0.0159 0.017 1.335 1.155 189 214 0.926 0.990
Primary reliance on clean fuels and technologies for cooking, space heating and lighting
TC.18 0.5983 0.0227 0.038 3.331 1.825 8,599 1,554 0.553 0.644
Care-seeking for children with acute respiratory infection (ARI) symptoms
TC.19 0.8677 0.0206 0.024 0.252 0.502 59 69 0.826 0.909
Exclusive breastfeeding under 6 months TC.32 0.3565 0.0335 0.094 0.621 0.788 113 128 0.290 0.424
Stunting prevalence (moderate and severe) TC.45a 0.1997 0.0179 0.090 2.132 1.460 934 1,059 0.164 0.236
Wasting prevalence (moderate and severe) TC.46a 0.0473 0.0074 0.157 1.282 1.132 926 1,049 0.032 0.062
Overweight prevalence (moderate and severe) TC.47a 0.0184 0.0035 0.190 0.709 0.842 926 1,049 0.011 0.025
Early child development index TC.53 0.6919 0.0300 0.043 1.853 1.361 391 440 0.632 0.752

Appendix C Estimates of Sampling Error | Page 50
Table SE.16: Sampling errors: Gujrat District
Standard errors, coefficients of variation, design effects (deff), square root of design effects (deft), and confidence intervals for selected SDG and other indicators, Punjab, 2017-18
Coefficient of
variation (se/r)
Square root of design
effect (deft)
Confidence limits
MICS Indicator
Value (r)
Standard error (se)
Design effect (deff)
Weighted count
Unweighted count
Lower bound r - 2se
Upper bound r + 2se
Learn
Participation rate in organised learning (adjusted) LN.2 0.8941 0.0206 0.023 1.140 1.068 228 256 0.853 0.935
Children with foundational reading and number skills (reading)
LN.22a 0.4503 0.0137 0.031 0.394 0.627 460 517 0.423 0.478
Children with foundational reading and number skills (numeracy)
LN.22d 0.0341 0.0107 0.314 1.799 1.341 460 517 0.013 0.056
Protected from violence and exploitation
Birth registration PR.1 0.9657 0.0058 0.006 1.091 1.045 960 1,088 0.954 0.977
Violent discipline PR.2 0.7604 0.0115 0.015 1.226 1.107 1,486 1,677 0.737 0.783
Child labour PR.3 0.1197 0.0085 0.071 0.739 0.860 948 1,068 0.103 0.137
Child marriage (before age 15) (women) PR.4a 0.0061 0.0036 0.589 0.915 0.957 383 432 0.000 0.013
Child marriage (before age 18) (women) PR.4b 0.0564 0.0134 0.238 1.456 1.207 383 432 0.030 0.083
Crime reporting (women) PR.13 0.0460 0.0013 0.028 0.001 0.027 17 20 0.043 0.049
Crime reporting (men) PR.13 0.1248 0.0043 0.034 0.003 0.055 18 19 0.116 0.133
Safety (women) PR.14 0.5168 0.0141 0.027 1.938 1.392 2,134 2,418 0.489 0.545
Safety (men) PR.14 0.9344 0.0134 0.014 2.004 1.416 646 684 0.908 0.961
Live in a safe and clean environment
Use of basic drinking water service WS.2 0.9776 0.0049 0.005 1.694 1.301 8,599 1,554 0.968 0.987
Use of safely managed drinking water WS.6 0.4921 0.0339 0.069 1.153 1.074 1,146 207 0.424 0.560
Handwashing facility with water and soap WS.7 0.9566 0.0073 0.008 1.981 1.407 8,539 1,544 0.942 0.971
Use of improved sanitation WS.8 0.9400 0.0090 0.010 2.213 1.488 8,599 1,554 0.922 0.958
Use of basic sanitation service WS.9 0.8600 0.0106 0.012 1.457 1.207 8,599 1,554 0.839 0.881
Equitable chance in life
Children with functional dificulty EQ.1 0.0922 0.0081 0.087 1.334 1.155 1,523 1,718 0.076 0.108
Population covered by social transfers EQ.3 0.4893 0.0195 0.040 2.361 1.537 8,599 1,554 0.450 0.528
Discrimination (women) EQ.7 0.0529 0.0037 0.069 0.646 0.804 2,134 2,418 0.046 0.060
Discrimination (men) EQ.7 0.0781 0.0098 0.126 0.912 0.955 646 684 0.058 0.098
Overall life satisfaction index (women age 15-24) EQ.9a 8.4368 0.0851 0.010 1.437 1.199 774 876 8.267 8.607
Overall life satisfaction index (men age 15-24) EQ.9a 7.3832 0.1096 0.015 0.780 0.883 304 322 7.164 7.602
na: not applicable
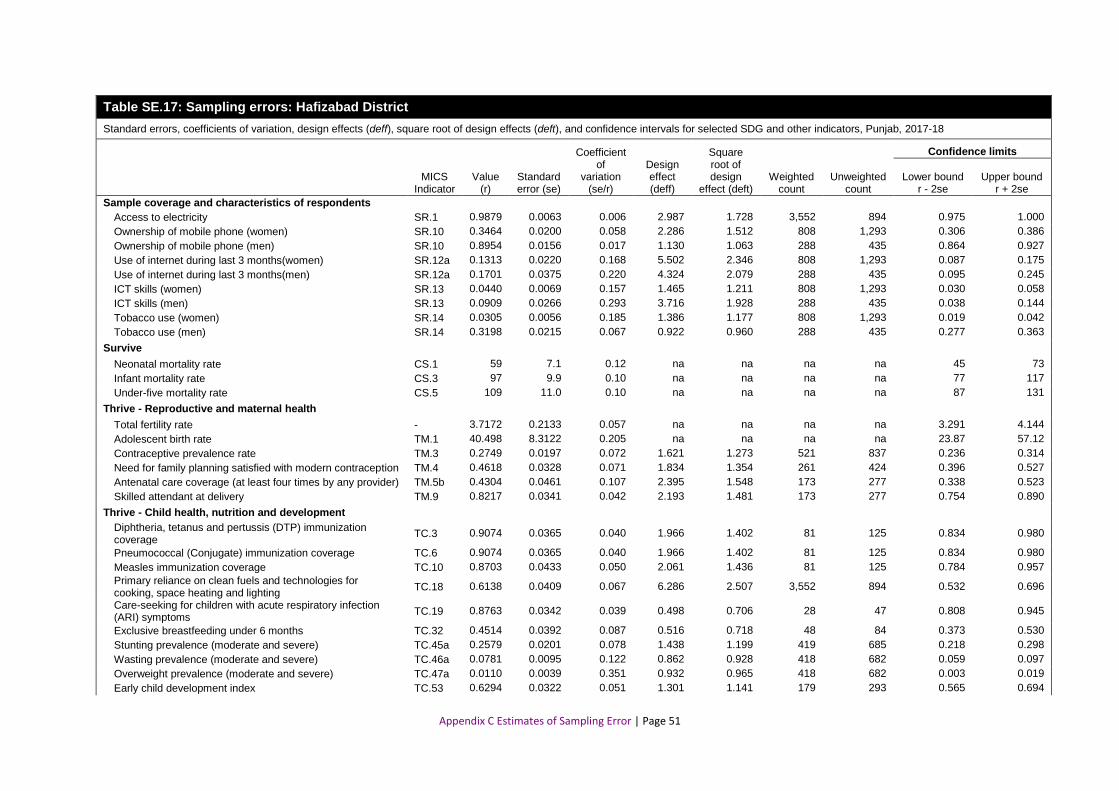
Appendix C Estimates of Sampling Error | Page 51
Table SE.17: Sampling errors: Hafizabad District
Standard errors, coefficients of variation, design effects (deff), square root of design effects (deft), and confidence intervals for selected SDG and other indicators, Punjab, 2017-18
Coefficient of
variation (se/r)
Square root of design
effect (deft)
Confidence limits
MICS Indicator
Value (r)
Standard error (se)
Design effect (deff)
Weighted count
Unweighted count
Lower bound r - 2se
Upper bound r + 2se
Sample coverage and characteristics of respondents
Access to electricity SR.1 0.9879 0.0063 0.006 2.987 1.728 3,552 894 0.975 1.000
Ownership of mobile phone (women) SR.10 0.3464 0.0200 0.058 2.286 1.512 808 1,293 0.306 0.386
Ownership of mobile phone (men) SR.10 0.8954 0.0156 0.017 1.130 1.063 288 435 0.864 0.927
Use of internet during last 3 months(women) SR.12a 0.1313 0.0220 0.168 5.502 2.346 808 1,293 0.087 0.175
Use of internet during last 3 months(men) SR.12a 0.1701 0.0375 0.220 4.324 2.079 288 435 0.095 0.245
ICT skills (women) SR.13 0.0440 0.0069 0.157 1.465 1.211 808 1,293 0.030 0.058
ICT skills (men) SR.13 0.0909 0.0266 0.293 3.716 1.928 288 435 0.038 0.144
Tobacco use (women) SR.14 0.0305 0.0056 0.185 1.386 1.177 808 1,293 0.019 0.042
Tobacco use (men) SR.14 0.3198 0.0215 0.067 0.922 0.960 288 435 0.277 0.363
Survive
Neonatal mortality rate CS.1 59 7.1 0.12 na na na na 45 73
Infant mortality rate CS.3 97 9.9 0.10 na na na na 77 117
Under-five mortality rate CS.5 109 11.0 0.10 na na na na 87 131
Thrive - Reproductive and maternal health
Total fertility rate - 3.7172 0.2133 0.057 na na na na 3.291 4.144
Adolescent birth rate TM.1 40.498 8.3122 0.205 na na na na 23.87 57.12
Contraceptive prevalence rate TM.3 0.2749 0.0197 0.072 1.621 1.273 521 837 0.236 0.314
Need for family planning satisfied with modern contraception TM.4 0.4618 0.0328 0.071 1.834 1.354 261 424 0.396 0.527
Antenatal care coverage (at least four times by any provider) TM.5b 0.4304 0.0461 0.107 2.395 1.548 173 277 0.338 0.523
Skilled attendant at delivery TM.9 0.8217 0.0341 0.042 2.193 1.481 173 277 0.754 0.890
Thrive - Child health, nutrition and development
Diphtheria, tetanus and pertussis (DTP) immunization coverage
TC.3 0.9074 0.0365 0.040 1.966 1.402 81 125 0.834 0.980
Pneumococcal (Conjugate) immunization coverage TC.6 0.9074 0.0365 0.040 1.966 1.402 81 125 0.834 0.980
Measles immunization coverage TC.10 0.8703 0.0433 0.050 2.061 1.436 81 125 0.784 0.957
Primary reliance on clean fuels and technologies for cooking, space heating and lighting
TC.18 0.6138 0.0409 0.067 6.286 2.507 3,552 894 0.532 0.696
Care-seeking for children with acute respiratory infection (ARI) symptoms
TC.19 0.8763 0.0342 0.039 0.498 0.706 28 47 0.808 0.945
Exclusive breastfeeding under 6 months TC.32 0.4514 0.0392 0.087 0.516 0.718 48 84 0.373 0.530
Stunting prevalence (moderate and severe) TC.45a 0.2579 0.0201 0.078 1.438 1.199 419 685 0.218 0.298
Wasting prevalence (moderate and severe) TC.46a 0.0781 0.0095 0.122 0.862 0.928 418 682 0.059 0.097
Overweight prevalence (moderate and severe) TC.47a 0.0110 0.0039 0.351 0.932 0.965 418 682 0.003 0.019
Early child development index TC.53 0.6294 0.0322 0.051 1.301 1.141 179 293 0.565 0.694

Appendix C Estimates of Sampling Error | Page 52
Table SE.17: Sampling errors: Hafizabad District
Standard errors, coefficients of variation, design effects (deff), square root of design effects (deft), and confidence intervals for selected SDG and other indicators, Punjab, 2017-18
Coefficient of
variation (se/r)
Square root of design
effect (deft)
Confidence limits
MICS Indicator
Value (r)
Standard error (se)
Design effect (deff)
Weighted count
Unweighted count
Lower bound r - 2se
Upper bound r + 2se
Learn
Participation rate in organised learning (adjusted) LN.2 0.7239 0.0406 0.056 1.203 1.097 87 147 0.643 0.805
Children with foundational reading and number skills (reading)
LN.22a 0.3203 0.0295 0.092 1.080 1.039 167 271 0.261 0.379
Children with foundational reading and number skills (numeracy)
LN.22d 0.0000 0.0000 167 271 0.000 0.000
Protected from violence and exploitation
Birth registration PR.1 0.8772 0.0186 0.021 2.220 1.490 425 694 0.840 0.914
Violent discipline PR.2 0.8438 0.0126 0.015 1.248 1.117 642 1,045 0.819 0.869
Child labour PR.3 0.1252 0.0166 0.133 1.577 1.256 386 628 0.092 0.158
Child marriage (before age 15) (women) PR.4a 0.0246 0.0106 0.431 1.084 1.041 145 233 0.003 0.046
Child marriage (before age 18) (women) PR.4b 0.1448 0.0277 0.191 1.439 1.200 145 233 0.089 0.200
Crime reporting (women) PR.13 0.0635 0.0013 0.020 0.001 0.026 16 26 0.061 0.066
Crime reporting (men) PR.13 0.0000 0.0000 5 9 0.000 0.000
Safety (women) PR.14 0.6362 0.0167 0.026 1.549 1.244 808 1,293 0.603 0.669
Safety (men) PR.14 0.9513 0.0153 0.016 2.190 1.480 288 435 0.921 0.982
Live in a safe and clean environment
Use of basic drinking water service WS.2 0.9390 0.0123 0.013 2.342 1.530 3,552 894 0.915 0.964
Use of safely managed drinking water WS.6 0.5264 0.0553 0.105 1.876 1.369 451 115 0.416 0.637
Handwashing facility with water and soap WS.7 0.9326 0.0065 0.007 0.597 0.773 3,545 892 0.920 0.946
Use of improved sanitation WS.8 0.8508 0.0240 0.028 4.037 2.009 3,552 894 0.803 0.899
Use of basic sanitation service WS.9 0.7792 0.0253 0.032 3.321 1.822 3,552 894 0.729 0.830
Equitable chance in life
Children with functional dificulty EQ.1 0.0753 0.0084 0.111 1.063 1.031 644 1,052 0.058 0.092
Population covered by social transfers EQ.3 0.4658 0.0235 0.050 1.985 1.409 3,552 894 0.419 0.513
Discrimination (women) EQ.7 0.0554 0.0061 0.110 0.922 0.960 808 1,293 0.043 0.068
Discrimination (men) EQ.7 0.0626 0.0143 0.229 1.519 1.232 288 435 0.034 0.091
Overall life satisfaction index (women age 15-24) EQ.9a 7.8962 0.0809 0.010 1.065 1.032 293 473 7.735 8.058
Overall life satisfaction index (men age 15-24) EQ.9a 8.0715 0.1864 0.023 1.910 1.382 100 157 7.699 8.444
na: not applicable

Appendix C Estimates of Sampling Error | Page 53
Table SE.18: Sampling errors: Mandi Bahauddin District
Standard errors, coefficients of variation, design effects (deff), square root of design effects (deft), and confidence intervals for selected SDG and other indicators, Punjab, 2017-18
Coefficient of
variation (se/r)
Square root of design
effect (deft)
Confidence limits
MICS Indicator
Value (r)
Standard error (se)
Design effect (deff)
Weighted count
Unweighted count
Lower bound r - 2se
Upper bound r + 2se
Sample coverage and characteristics of respondents
Access to electricity SR.1 0.9909 0.0024 0.002 1.076 1.037 4,764 1,690 0.986 0.996
Ownership of mobile phone (women) SR.10 0.4171 0.0123 0.030 1.552 1.246 1,139 2,492 0.393 0.442
Ownership of mobile phone (men) SR.10 0.8830 0.0122 0.014 1.140 1.068 375 791 0.859 0.907
Use of internet during last 3 months(women) SR.12a 0.1347 0.0110 0.082 2.610 1.615 1,139 2,492 0.113 0.157
Use of internet during last 3 months(men) SR.12a 0.2507 0.0177 0.071 1.321 1.149 375 791 0.215 0.286
ICT skills (women) SR.13 0.0367 0.0039 0.107 1.089 1.043 1,139 2,492 0.029 0.045
ICT skills (men) SR.13 0.1131 0.0127 0.112 1.267 1.125 375 791 0.088 0.138
Tobacco use (women) SR.14 0.0291 0.0040 0.136 1.379 1.174 1,139 2,492 0.021 0.037
Tobacco use (men) SR.14 0.3095 0.0173 0.056 1.101 1.049 375 791 0.275 0.344
Survive
Neonatal mortality rate CS.1 42 6.0 0.14 na na na na 30 54
Infant mortality rate CS.3 62 7.9 0.13 na na na na 46 78
Under-five mortality rate CS.5 66 8.1 0.12 na na na na 50 82
Thrive - Reproductive and maternal health
Total fertility rate - 3.4132 0.1354 0.040 na na na na 3.142 3.684
Adolescent birth rate TM.1 27.379 5.3937 0.197 na na na na 16.59 38.17
Contraceptive prevalence rate TM.3 0.1986 0.0101 0.051 0.998 0.999 706 1,548 0.178 0.219
Need for family planning satisfied with modern contraception TM.4 0.3989 0.0195 0.049 1.168 1.081 337 741 0.360 0.438
Antenatal care coverage (at least four times by any provider) TM.5b 0.5862 0.0217 0.037 0.927 0.963 217 478 0.543 0.630
Skilled attendant at delivery TM.9 0.7872 0.0182 0.023 0.947 0.973 217 478 0.751 0.824
Thrive - Child health, nutrition and development
Diphtheria, tetanus and pertussis (DTP) immunization coverage
TC.3 0.9041 0.0223 0.025 1.449 1.204 117 254 0.860 0.949
Pneumococcal (Conjugate) immunization coverage TC.6 0.8968 0.0222 0.025 1.343 1.159 117 254 0.853 0.941
Measles immunization coverage TC.10 0.8414 0.0285 0.034 1.542 1.242 117 254 0.784 0.898
Primary reliance on clean fuels and technologies for cooking, space heating and lighting
TC.18 0.4177 0.0238 0.057 3.945 1.986 4,764 1,690 0.370 0.465
Care-seeking for children with acute respiratory infection (ARI) symptoms
TC.19 0.8820 0.0323 0.037 0.340 0.583 16 35 0.817 0.947
Exclusive breastfeeding under 6 months TC.32 0.4165 0.0367 0.088 0.758 0.870 64 138 0.343 0.490
Stunting prevalence (moderate and severe) TC.45a 0.2425 0.0126 0.052 1.027 1.013 544 1,183 0.217 0.268
Wasting prevalence (moderate and severe) TC.46a 0.0926 0.0083 0.090 0.962 0.981 541 1,175 0.076 0.109
Overweight prevalence (moderate and severe) TC.47a 0.0256 0.0039 0.153 0.726 0.852 541 1,175 0.018 0.033
Early child development index TC.53 0.6874 0.0191 0.028 0.903 0.950 245 532 0.649 0.726

Appendix C Estimates of Sampling Error | Page 54
Table SE.18: Sampling errors: Mandi Bahauddin District
Standard errors, coefficients of variation, design effects (deff), square root of design effects (deft), and confidence intervals for selected SDG and other indicators, Punjab, 2017-18
Coefficient of
variation (se/r)
Square root of design
effect (deft)
Confidence limits
MICS Indicator
Value (r)
Standard error (se)
Design effect (deff)
Weighted count
Unweighted count
Lower bound r - 2se
Upper bound r + 2se
Learn
Participation rate in organised learning (adjusted) LN.2 0.7069 0.0313 0.044 1.157 1.076 110 246 0.644 0.769
Children with foundational reading and number skills (reading)
LN.22a 0.3785 0.0208 0.055 0.916 0.957 226 500 0.337 0.420
Children with foundational reading and number skills (numeracy)
LN.22d 0.0591 0.0126 0.214 1.433 1.197 226 500 0.034 0.084
Protected from violence and exploitation
Birth registration PR.1 0.9028 0.0123 0.014 2.165 1.472 583 1,267 0.878 0.927
Violent discipline PR.2 0.7338 0.0115 0.016 1.289 1.135 868 1,906 0.711 0.757
Child labour PR.3 0.1092 0.0105 0.096 1.322 1.150 525 1,165 0.088 0.130
Child marriage (before age 15) (women) PR.4a 0.0291 0.0084 0.288 1.146 1.071 211 462 0.012 0.046
Child marriage (before age 18) (women) PR.4b 0.1363 0.0152 0.112 0.907 0.953 211 462 0.106 0.167
Crime reporting (women) PR.13 0.0883 0.0417 0.472 0.474 0.689 11 23 0.005 0.172
Crime reporting (men) PR.13 0.3852 0.0000 0.000 0.000 0.000 4 8 0.385 0.385
Safety (women) PR.14 0.5717 0.0123 0.022 1.546 1.243 1,139 2,492 0.547 0.596
Safety (men) PR.14 0.9541 0.0077 0.008 1.084 1.041 375 791 0.939 0.970
Live in a safe and clean environment
Use of basic drinking water service WS.2 0.9504 0.0064 0.007 1.449 1.204 4,764 1,690 0.938 0.963
Use of safely managed drinking water WS.6 0.3754 0.0297 0.079 1.538 1.240 613 246 0.316 0.435
Handwashing facility with water and soap WS.7 0.9235 0.0067 0.007 1.069 1.034 4,757 1,687 0.910 0.937
Use of improved sanitation WS.8 0.7921 0.0169 0.021 2.916 1.708 4,764 1,690 0.758 0.826
Use of basic sanitation service WS.9 0.7320 0.0159 0.022 2.172 1.474 4,764 1,690 0.700 0.764
Equitable chance in life
Children with functional dificulty EQ.1 0.1102 0.0086 0.078 1.448 1.203 880 1,935 0.093 0.127
Population covered by social transfers EQ.3 0.4217 0.0125 0.030 1.086 1.042 4,764 1,690 0.397 0.447
Discrimination (women) EQ.7 0.0543 0.0049 0.090 1.162 1.078 1,139 2,492 0.044 0.064
Discrimination (men) EQ.7 0.0676 0.0105 0.156 1.386 1.177 375 791 0.047 0.089
Overall life satisfaction index (women age 15-24) EQ.9a 7.6551 0.0743 0.010 1.386 1.177 439 958 7.507 7.804
Overall life satisfaction index (men age 15-24) EQ.9a 7.1430 0.1474 0.021 1.554 1.247 152 320 6.848 7.438
na: not applicable

Appendix C Estimates of Sampling Error | Page 55
Table SE.19: Sampling errors: Narowal District
Standard errors, coefficients of variation, design effects (deff), square root of design effects (deft), and confidence intervals for selected SDG and other indicators, Punjab, 2017-18
Coefficient of
variation (se/r)
Square root of design
effect (deft)
Confidence limits
MICS Indicator
Value (r)
Standard error (se)
Design effect (deff)
Weighted count
Unweighted count
Lower bound r - 2se
Upper bound r + 2se
Sample coverage and characteristics of respondents
Access to electricity SR.1 0.9971 0.0020 0.002 1.222 1.106 5,271 909 0.993 1.000
Ownership of mobile phone (women) SR.10 0.4981 0.0161 0.032 1.467 1.211 1,179 1,412 0.466 0.530
Ownership of mobile phone (men) SR.10 0.8442 0.0201 0.024 1.339 1.157 414 439 0.804 0.884
Use of internet during last 3 months(women) SR.12a 0.0756 0.0134 0.178 3.637 1.907 1,179 1,412 0.049 0.102
Use of internet during last 3 months(men) SR.12a 0.4165 0.0268 0.064 1.295 1.138 414 439 0.363 0.470
ICT skills (women) SR.13 0.0316 0.0053 0.168 1.305 1.143 1,179 1,412 0.021 0.042
ICT skills (men) SR.13 0.1770 0.0185 0.105 1.032 1.016 414 439 0.140 0.214
Tobacco use (women) SR.14 0.0130 0.0055 0.421 3.302 1.817 1,179 1,412 0.002 0.024
Tobacco use (men) SR.14 0.2655 0.0228 0.086 1.168 1.081 414 439 0.220 0.311
Survive
Neonatal mortality rate CS.1 34 7.8 0.23 na na na na 18 49
Infant mortality rate CS.3 50 9.3 0.19 na na na na 31 68
Under-five mortality rate CS.5 53 9.4 0.18 na na na na 34 72
Thrive - Reproductive and maternal health
Total fertility rate - 3.9896 0.2314 0.058 na na na na 3.527 4.452
Adolescent birth rate TM.1 20.555 4.8317 0.235 na na na na 10.89 30.22
Contraceptive prevalence rate TM.3 0.3280 0.0215 0.066 1.806 1.344 716 862 0.285 0.371
Need for family planning satisfied with modern contraception TM.4 0.4763 0.0259 0.054 1.218 1.104 377 454 0.425 0.528
Antenatal care coverage (at least four times by any provider) TM.5b 0.6058 0.0313 0.052 1.227 1.108 246 300 0.543 0.668
Skilled attendant at delivery TM.9 0.8997 0.0256 0.028 2.167 1.472 246 300 0.849 0.951
Thrive - Child health, nutrition and development
Diphtheria, tetanus and pertussis (DTP) immunization coverage
TC.3 0.9627 0.0126 0.013 0.637 0.798 119 145 0.937 0.988
Pneumococcal (Conjugate) immunization coverage TC.6 0.9388 0.0167 0.018 0.703 0.838 119 145 0.905 0.972
Measles immunization coverage TC.10 0.9311 0.0204 0.022 0.931 0.965 119 145 0.890 0.972
Primary reliance on clean fuels and technologies for cooking, space heating and lighting
TC.18 0.2507 0.0225 0.090 2.437 1.561 5,271 909 0.206 0.296
Care-seeking for children with acute respiratory infection (ARI) symptoms
TC.19 0.7189 0.0000 0.000 0.000 0.000 8 11 0.719 0.719
Exclusive breastfeeding under 6 months TC.32 0.3834 0.0513 0.134 1.068 1.034 78 97 0.281 0.486
Stunting prevalence (moderate and severe) TC.45a 0.2352 0.0215 0.091 1.923 1.387 622 752 0.192 0.278
Wasting prevalence (moderate and severe) TC.46a 0.0708 0.0079 0.112 0.716 0.846 621 753 0.055 0.087
Overweight prevalence (moderate and severe) TC.47a 0.0144 0.0061 0.423 1.965 1.402 621 753 0.002 0.027
Early child development index TC.53 0.6112 0.0393 0.064 2.057 1.434 266 318 0.533 0.690

Appendix C Estimates of Sampling Error | Page 56
Table SE.19: Sampling errors: Narowal District
Standard errors, coefficients of variation, design effects (deff), square root of design effects (deft), and confidence intervals for selected SDG and other indicators, Punjab, 2017-18
Coefficient of
variation (se/r)
Square root of design
effect (deft)
Confidence limits
MICS Indicator
Value (r)
Standard error (se)
Design effect (deff)
Weighted count
Unweighted count
Lower bound r - 2se
Upper bound r + 2se
Learn
Participation rate in organised learning (adjusted) LN.2 0.9085 0.0182 0.020 0.654 0.809 133 165 0.872 0.945
Children with foundational reading and number skills (reading)
LN.22a 0.4820 0.0292 0.061 1.087 1.043 262 320 0.424 0.540
Children with foundational reading and number skills (numeracy)
LN.22d 0.0772 0.0134 0.173 0.801 0.895 262 320 0.050 0.104
Protected from violence and exploitation
Birth registration PR.1 0.9534 0.0078 0.008 1.069 1.034 650 781 0.938 0.969
Violent discipline PR.2 0.8438 0.0152 0.018 2.020 1.421 941 1,146 0.813 0.874
Child labour PR.3 0.1094 0.0102 0.093 0.730 0.854 551 681 0.089 0.130
Child marriage (before age 15) (women) PR.4a 0.0119 0.0059 0.493 0.866 0.931 249 297 0.000 0.024
Child marriage (before age 18) (women) PR.4b 0.0611 0.0149 0.244 1.144 1.070 249 297 0.031 0.091
Crime reporting (women) PR.13 0.5005 0.0000 0.000 0.000 0.000 6 8 0.501 0.501
Crime reporting (men) PR.13 0.2326 0.0124 0.053 0.016 0.127 18 20 0.208 0.257
Safety (women) PR.14 0.7577 0.0122 0.016 1.153 1.074 1,179 1,412 0.733 0.782
Safety (men) PR.14 0.9522 0.0156 0.016 2.332 1.527 414 439 0.921 0.983
Live in a safe and clean environment
Use of basic drinking water service WS.2 0.9927 0.0039 0.004 1.935 1.391 5,271 909 0.985 1.000
Use of safely managed drinking water WS.6 0.7188 0.0413 0.058 1.372 1.171 742 134 0.636 0.801
Handwashing facility with water and soap WS.7 0.9339 0.0111 0.012 1.821 1.350 5,266 906 0.912 0.956
Use of improved sanitation WS.8 0.8961 0.0161 0.018 2.520 1.587 5,271 909 0.864 0.928
Use of basic sanitation service WS.9 0.8078 0.0211 0.026 2.616 1.617 5,271 909 0.766 0.850
Equitable chance in life
Children with functional dificulty EQ.1 0.0528 0.0099 0.188 2.275 1.508 945 1,153 0.033 0.073
Population covered by social transfers EQ.3 0.3518 0.0203 0.058 1.640 1.281 5,271 909 0.311 0.392
Discrimination (women) EQ.7 0.0727 0.0082 0.113 1.422 1.193 1,179 1,412 0.056 0.089
Discrimination (men) EQ.7 0.0505 0.0113 0.224 1.167 1.080 414 439 0.028 0.073
Overall life satisfaction index (women age 15-24) EQ.9a 8.0439 0.1249 0.016 2.097 1.448 498 605 7.794 8.294
Overall life satisfaction index (men age 15-24) EQ.9a 6.9222 0.1825 0.026 1.376 1.173 194 209 6.557 7.287
na: not applicable

Appendix C Estimates of Sampling Error | Page 57
Table SE.20: Sampling errors: Sialkot District
Standard errors, coefficients of variation, design effects (deff), square root of design effects (deft), and confidence intervals for selected SDG and other indicators, Punjab, 2017-18
Coefficient of
variation (se/r)
Square root of design
effect (deft)
Confidence limits
MICS Indicator
Value (r)
Standard error (se)
Design effect (deff)
Weighted count
Unweighted count
Lower bound r - 2se
Upper bound r + 2se
Sample coverage and characteristics of respondents
Access to electricity SR.1 0.9971 0.0011 0.001 0.649 0.806 11,090 1,587 0.995 0.999
Ownership of mobile phone (women) SR.10 0.5243 0.0107 0.020 1.171 1.082 2,687 2,540 0.503 0.546
Ownership of mobile phone (men) SR.10 0.8619 0.0137 0.016 1.655 1.287 883 1,054 0.835 0.889
Use of internet during last 3 months(women) SR.12a 0.2163 0.0118 0.054 2.069 1.438 2,687 2,540 0.193 0.240
Use of internet during last 3 months(men) SR.12a 0.3914 0.0207 0.053 1.889 1.374 883 1,054 0.350 0.433
ICT skills (women) SR.13 0.0497 0.0064 0.129 2.220 1.490 2,687 2,540 0.037 0.063
ICT skills (men) SR.13 0.1172 0.0141 0.120 2.026 1.423 883 1,054 0.089 0.145
Tobacco use (women) SR.14 0.0101 0.0021 0.210 1.146 1.071 2,687 2,540 0.006 0.014
Tobacco use (men) SR.14 0.1533 0.0122 0.080 1.214 1.102 883 1,054 0.129 0.178
Survive
Neonatal mortality rate CS.1 36 5.7 0.16 na na na na 24 47
Infant mortality rate CS.3 55 6.8 0.12 na na na na 41 68
Under-five mortality rate CS.5 60 6.8 0.11 na na na na 47 74
Thrive - Reproductive and maternal health
Total fertility rate - 3.4547 0.1386 0.040 na na na na 3.177 3.732
Adolescent birth rate TM.1 21.706 4.3105 0.199 na na na na 13.08 30.33
Contraceptive prevalence rate TM.3 0.3630 0.0132 0.036 1.129 1.062 1,590 1,503 0.337 0.389
Need for family planning satisfied with modern contraception TM.4 0.4959 0.0202 0.041 1.388 1.178 918 854 0.456 0.536
Antenatal care coverage (at least four times by any provider) TM.5b 0.6336 0.0246 0.039 1.254 1.120 502 483 0.584 0.683
Skilled attendant at delivery TM.9 0.8891 0.0189 0.021 1.742 1.320 502 483 0.851 0.927
Thrive - Child health, nutrition and development
Diphtheria, tetanus and pertussis (DTP) immunization coverage
TC.3 0.9338 0.0156 0.017 0.970 0.985 260 248 0.903 0.965
Pneumococcal (Conjugate) immunization coverage TC.6 0.9355 0.0163 0.017 1.092 1.045 260 248 0.903 0.968
Measles immunization coverage TC.10 0.9081 0.0198 0.022 1.161 1.078 260 248 0.869 0.948
Primary reliance on clean fuels and technologies for cooking, space heating and lighting
TC.18 0.6808 0.0274 0.040 5.470 2.339 11,090 1,587 0.626 0.736
Care-seeking for children with acute respiratory infection (ARI) symptoms
TC.19 0.8365 0.0333 0.040 0.438 0.661 56 55 0.770 0.903
Exclusive breastfeeding under 6 months TC.32 0.5498 0.0430 0.078 0.905 0.951 133 122 0.464 0.636
Stunting prevalence (moderate and severe) TC.45a 0.2480 0.0148 0.060 1.381 1.175 1,250 1,179 0.218 0.278
Wasting prevalence (moderate and severe) TC.46a 0.0762 0.0084 0.110 1.163 1.078 1,231 1,162 0.059 0.093
Overweight prevalence (moderate and severe) TC.47a 0.0304 0.0047 0.156 0.889 0.943 1,231 1,162 0.021 0.040
Early child development index TC.53 0.6232 0.0195 0.031 0.765 0.875 506 473 0.584 0.662

Appendix C Estimates of Sampling Error | Page 58
Table SE.20: Sampling errors: Sialkot District
Standard errors, coefficients of variation, design effects (deff), square root of design effects (deft), and confidence intervals for selected SDG and other indicators, Punjab, 2017-18
Coefficient of
variation (se/r)
Square root of design
effect (deft)
Confidence limits
MICS Indicator
Value (r)
Standard error (se)
Design effect (deff)
Weighted count
Unweighted count
Lower bound r - 2se
Upper bound r + 2se
Learn
Participation rate in organised learning (adjusted) LN.2 0.8644 0.0204 0.024 0.884 0.940 269 249 0.824 0.905
Children with foundational reading and number skills (reading)
LN.22a 0.4322 0.0172 0.040 0.670 0.818 593 557 0.398 0.467
Children with foundational reading and number skills (numeracy)
LN.22d 0.0609 0.0146 0.240 2.081 1.443 593 557 0.032 0.090
Protected from violence and exploitation
Birth registration PR.1 0.9565 0.0072 0.008 1.498 1.224 1,281 1,206 0.942 0.971
Violent discipline PR.2 0.7978 0.0126 0.016 1.798 1.341 1,948 1,826 0.773 0.823
Child labour PR.3 0.0629 0.0080 0.128 1.243 1.115 1,219 1,140 0.047 0.079
Child marriage (before age 15) (women) PR.4a 0.0169 0.0059 0.351 1.039 1.019 509 492 0.005 0.029
Child marriage (before age 18) (women) PR.4b 0.0903 0.0127 0.141 0.967 0.983 509 492 0.065 0.116
Crime reporting (women) PR.13 0.1604 0.0927 0.578 1.533 1.238 23 25 0.000 0.346
Crime reporting (men) PR.13 0.3954 0.0664 0.168 0.240 0.490 11 14 0.262 0.528
Safety (women) PR.14 0.6088 0.0106 0.017 1.197 1.094 2,687 2,540 0.588 0.630
Safety (men) PR.14 0.9594 0.0103 0.011 2.840 1.685 883 1,054 0.939 0.980
Live in a safe and clean environment
Use of basic drinking water service WS.2 0.9731 0.0041 0.004 1.035 1.017 11,090 1,587 0.965 0.981
Use of safely managed drinking water WS.6 0.2805 0.0305 0.109 1.284 1.133 1,510 236 0.220 0.342
Handwashing facility with water and soap WS.7 0.9796 0.0035 0.004 0.984 0.992 11,030 1,580 0.973 0.987
Use of improved sanitation WS.8 0.8224 0.0249 0.030 6.722 2.593 11,090 1,587 0.773 0.872
Use of basic sanitation service WS.9 0.7366 0.0233 0.032 4.419 2.102 11,090 1,587 0.690 0.783
Equitable chance in life
Children with functional dificulty EQ.1 0.1124 0.0071 0.063 0.932 0.965 1,987 1,861 0.098 0.127
Population covered by social transfers EQ.3 0.3348 0.0121 0.036 1.044 1.022 11,090 1,587 0.311 0.359
Discrimination (women) EQ.7 0.0823 0.0070 0.085 1.629 1.276 2,687 2,540 0.068 0.096
Discrimination (men) EQ.7 0.0388 0.0063 0.163 1.125 1.060 883 1,054 0.026 0.051
Overall life satisfaction index (women age 15-24) EQ.9a 7.6864 0.0852 0.011 1.604 1.266 1,068 1,020 7.516 7.857
Overall life satisfaction index (men age 15-24) EQ.9a 7.3974 0.1023 0.014 1.283 1.133 385 465 7.193 7.602
na: not applicable

Appendix C Estimates of Sampling Error | Page 59
Table SE.21: Sampling errors: Lahore District
Standard errors, coefficients of variation, design effects (deff), square root of design effects (deft), and confidence intervals for selected SDG and other indicators, Punjab, 2017-18
Coefficient of
variation (se/r)
Square root of design
effect (deft)
Confidence limits
MICS Indicator
Value (r)
Standard error (se)
Design effect (deff)
Weighted count
Unweighted count
Lower bound r - 2se
Upper bound r + 2se
Sample coverage and characteristics of respondents
Access to electricity SR.1 0.9965 0.0011 0.001 1.162 1.078 31,662 3,271 0.994 0.999
Ownership of mobile phone (women) SR.10 0.5865 0.0135 0.023 3.402 1.844 7,599 4,543 0.560 0.613
Ownership of mobile phone (men) SR.10 0.9073 0.0079 0.009 1.212 1.101 2,835 1,620 0.891 0.923
Use of internet during last 3 months(women) SR.12a 0.2912 0.0155 0.053 5.313 2.305 7,599 4,543 0.260 0.322
Use of internet during last 3 months(men) SR.12a 0.4808 0.0186 0.039 2.234 1.495 2,835 1,620 0.444 0.518
ICT skills (women) SR.13 0.1466 0.0106 0.072 4.098 2.024 7,599 4,543 0.125 0.168
ICT skills (men) SR.13 0.2961 0.0170 0.057 2.240 1.497 2,835 1,620 0.262 0.330
Tobacco use (women) SR.14 0.0049 0.0011 0.227 1.153 1.074 7,599 4,543 0.003 0.007
Tobacco use (men) SR.14 0.2145 0.0111 0.052 1.190 1.091 2,835 1,620 0.192 0.237
Survive
Neonatal mortality rate CS.1 24 3.9 0.16 na na na na 16 32
Infant mortality rate CS.3 38 4.7 0.12 na na na na 29 48
Under-five mortality rate CS.5 44 4.9 0.11 na na na na 34 53
Thrive - Reproductive and maternal health
Total fertility rate - 3.1097 0.0924 0.030 na na na na 2.925 3.294
Adolescent birth rate TM.1 29.507 4.1810 0.142 na na na na 21.14 37.87
Contraceptive prevalence rate TM.3 0.4003 0.0113 0.028 1.489 1.220 4,703 2,820 0.378 0.423
Need for family planning satisfied with modern contraception TM.4 0.6053 0.0144 0.024 1.431 1.196 2,758 1,652 0.577 0.634
Antenatal care coverage (at least four times by any provider) TM.5b 0.7539 0.0163 0.022 1.176 1.084 1,371 823 0.721 0.787
Skilled attendant at delivery TM.9 0.8684 0.0139 0.016 1.397 1.182 1,371 823 0.841 0.896
Thrive - Child health, nutrition and development
Diphtheria, tetanus and pertussis (DTP) immunization coverage
TC.3 0.7702 0.0202 0.026 1.005 1.003 731 437 0.730 0.811
Pneumococcal (Conjugate) immunization coverage TC.6 0.7440 0.0213 0.029 1.034 1.017 731 437 0.702 0.787
Measles immunization coverage TC.10 0.7564 0.0191 0.025 0.866 0.931 731 437 0.718 0.795
Primary reliance on clean fuels and technologies for cooking, space heating and lighting
TC.18 0.9155 0.0129 0.014 7.010 2.648 31,662 3,271 0.890 0.941
Care-seeking for children with acute respiratory infection (ARI) symptoms
TC.19 0.9033 0.0303 0.034 1.040 1.020 170 100 0.843 0.964
Exclusive breastfeeding under 6 months TC.32 0.4265 0.0288 0.067 0.733 0.856 367 218 0.369 0.484
Stunting prevalence (moderate and severe) TC.45a 0.2405 0.0109 0.045 1.248 1.117 3,203 1,907 0.219 0.262
Wasting prevalence (moderate and severe) TC.46a 0.0733 0.0069 0.094 1.325 1.151 3,201 1,906 0.060 0.087
Overweight prevalence (moderate and severe) TC.47a 0.0186 0.0033 0.179 1.154 1.074 3,201 1,906 0.012 0.025
Early child development index TC.53 0.7193 0.0167 0.023 1.104 1.051 1,342 800 0.686 0.753

Appendix C Estimates of Sampling Error | Page 60
Table SE.21: Sampling errors: Lahore District
Standard errors, coefficients of variation, design effects (deff), square root of design effects (deft), and confidence intervals for selected SDG and other indicators, Punjab, 2017-18
Coefficient of
variation (se/r)
Square root of design
effect (deft)
Confidence limits
MICS Indicator
Value (r)
Standard error (se)
Design effect (deff)
Weighted count
Unweighted count
Lower bound r - 2se
Upper bound r + 2se
Learn
Participation rate in organised learning (adjusted) LN.2 0.7851 0.0187 0.024 0.935 0.967 738 452 0.748 0.822
Children with foundational reading and number skills (reading)
LN.22a 0.4569 0.0153 0.034 0.846 0.920 1,499 893 0.426 0.488
Children with foundational reading and number skills (numeracy)
LN.22d 0.0909 0.0115 0.126 1.424 1.193 1,499 893 0.068 0.114
Protected from violence and exploitation
Birth registration PR.1 0.8422 0.0111 0.013 1.902 1.379 3,477 2,072 0.820 0.864
Violent discipline PR.2 0.6983 0.0093 0.013 1.317 1.147 5,434 3,242 0.680 0.717
Child labour PR.3 0.0506 0.0049 0.097 1.023 1.012 3,452 2,055 0.041 0.060
Child marriage (before age 15) (women) PR.4a 0.0259 0.0052 0.199 0.900 0.949 1,419 853 0.016 0.036
Child marriage (before age 18) (women) PR.4b 0.1098 0.0109 0.099 1.038 1.019 1,419 853 0.088 0.132
Crime reporting (women) PR.13 0.1889 0.0434 0.229 0.785 0.886 111 65 0.102 0.276
Crime reporting (men) PR.13 0.1974 0.0000 0.000 0.000 0.000 37 21 0.197 0.197
Safety (women) PR.14 0.6932 0.0096 0.014 1.974 1.405 7,599 4,543 0.674 0.712
Safety (men) PR.14 0.9443 0.0086 0.009 2.277 1.509 2,835 1,620 0.927 0.962
Live in a safe and clean environment
Use of basic drinking water service WS.2 0.9595 0.0048 0.005 1.957 1.399 31,662 3,271 0.950 0.969
Use of safely managed drinking water WS.6 0.2765 0.0211 0.076 0.899 0.948 4,417 371 0.234 0.319
Handwashing facility with water and soap WS.7 0.9658 0.0041 0.004 1.622 1.274 31,298 3,219 0.958 0.974
Use of improved sanitation WS.8 0.9642 0.0064 0.007 3.835 1.958 31,662 3,271 0.952 0.977
Use of basic sanitation service WS.9 0.9121 0.0077 0.008 2.394 1.547 31,662 3,271 0.897 0.927
Equitable chance in life
Children with functional dificulty EQ.1 0.0850 0.0050 0.059 1.060 1.029 5,513 3,285 0.075 0.095
Population covered by social transfers EQ.3 0.1571 0.0086 0.055 1.832 1.354 31,662 3,271 0.140 0.174
Discrimination (women) EQ.7 0.0737 0.0042 0.057 1.186 1.089 7,599 4,543 0.065 0.082
Discrimination (men) EQ.7 0.0430 0.0046 0.107 0.839 0.916 2,835 1,620 0.034 0.052
Overall life satisfaction index (women age 15-24) EQ.9a 7.3013 0.0599 0.008 1.319 1.148 2,884 1,729 7.181 7.421
Overall life satisfaction index (men age 15-24) EQ.9a 7.2290 0.0948 0.013 1.241 1.114 1,078 618 7.039 7.419
na: not applicable

Appendix C Estimates of Sampling Error | Page 61
Table SE.22: Sampling errors: Kasur District
Standard errors, coefficients of variation, design effects (deff), square root of design effects (deft), and confidence intervals for selected SDG and other indicators, Punjab, 2017-18
Coefficient of
variation (se/r)
Square root of design
effect (deft)
Confidence limits
MICS Indicator
Value (r)
Standard error (se)
Design effect (deff)
Weighted count
Unweighted count
Lower bound r - 2se
Upper bound r + 2se
Sample coverage and characteristics of respondents
Access to electricity SR.1 0.9864 0.0036 0.004 1.220 1.105 10,478 1,281 0.979 0.994
Ownership of mobile phone (women) SR.10 0.3028 0.0129 0.043 1.379 1.174 2,312 1,757 0.277 0.329
Ownership of mobile phone (men) SR.10 0.8434 0.0181 0.022 1.710 1.308 868 688 0.807 0.880
Use of internet during last 3 months(women) SR.12a 0.0397 0.0061 0.153 1.694 1.302 2,312 1,757 0.028 0.052
Use of internet during last 3 months(men) SR.12a 0.2410 0.0250 0.104 2.343 1.531 868 688 0.191 0.291
ICT skills (women) SR.13 0.0142 0.0038 0.266 1.788 1.337 2,312 1,757 0.007 0.022
ICT skills (men) SR.13 0.1221 0.0139 0.114 1.243 1.115 868 688 0.094 0.150
Tobacco use (women) SR.14 0.0088 0.0025 0.282 1.232 1.110 2,312 1,757 0.004 0.014
Tobacco use (men) SR.14 0.2576 0.0161 0.062 0.926 0.962 868 688 0.225 0.290
Survive
Neonatal mortality rate CS.1 51 7.2 0.14 na na na na 37 65
Infant mortality rate CS.3 73 7.9 0.11 na na na na 57 89
Under-five mortality rate CS.5 80 8.4 0.11 na na na na 63 97
Thrive - Reproductive and maternal health
Total fertility rate - 4.3262 0.1634 0.038 na na na na 3.999 4.653
Adolescent birth rate TM.1 42.110 6.8994 0.164 na na na na 28.31 55.91
Contraceptive prevalence rate TM.3 0.4132 0.0139 0.034 0.876 0.936 1,444 1,098 0.385 0.441
Need for family planning satisfied with modern contraception TM.4 0.6224 0.0195 0.031 1.041 1.020 842 641 0.583 0.662
Antenatal care coverage (at least four times by any provider) TM.5b 0.4227 0.0254 0.060 1.114 1.055 551 423 0.372 0.474
Skilled attendant at delivery TM.9 0.6795 0.0285 0.042 1.569 1.253 551 423 0.623 0.736
Thrive - Child health, nutrition and development
Diphtheria, tetanus and pertussis (DTP) immunization coverage
TC.3 0.7514 0.0342 0.046 1.261 1.123 261 202 0.683 0.820
Pneumococcal (Conjugate) immunization coverage TC.6 0.7275 0.0340 0.047 1.174 1.084 261 202 0.659 0.796
Measles immunization coverage TC.10 0.6424 0.0310 0.048 0.842 0.917 261 202 0.580 0.704
Primary reliance on clean fuels and technologies for cooking, space heating and lighting
TC.18 0.2904 0.0278 0.096 4.792 2.189 10,478 1,281 0.235 0.346
Care-seeking for children with acute respiratory infection (ARI) symptoms
TC.19 0.6264 0.0482 0.077 0.605 0.778 80 62 0.530 0.723
Exclusive breastfeeding under 6 months TC.32 0.4651 0.0407 0.087 0.798 0.893 157 121 0.384 0.546
Stunting prevalence (moderate and severe) TC.45a 0.3274 0.0216 0.066 2.050 1.432 1,266 972 0.284 0.371
Wasting prevalence (moderate and severe) TC.46a 0.0896 0.0092 0.102 0.986 0.993 1,251 959 0.071 0.108
Overweight prevalence (moderate and severe) TC.47a 0.0154 0.0051 0.332 1.649 1.284 1,251 959 0.005 0.026
Early child development index TC.53 0.5058 0.0282 0.056 1.188 1.090 489 375 0.449 0.562

Appendix C Estimates of Sampling Error | Page 62
Table SE.22: Sampling errors: Kasur District
Standard errors, coefficients of variation, design effects (deff), square root of design effects (deft), and confidence intervals for selected SDG and other indicators, Punjab, 2017-18
Coefficient of
variation (se/r)
Square root of design
effect (deft)
Confidence limits
MICS Indicator
Value (r)
Standard error (se)
Design effect (deff)
Weighted count
Unweighted count
Lower bound r - 2se
Upper bound r + 2se
Learn
Participation rate in organised learning (adjusted) LN.2 0.7744 0.0303 0.039 1.228 1.108 302 235 0.714 0.835
Children with foundational reading and number skills (reading)
LN.22a 0.3480 0.0277 0.080 1.431 1.196 562 424 0.293 0.403
Children with foundational reading and number skills (numeracy)
LN.22d 0.0233 0.0091 0.391 1.540 1.241 562 424 0.005 0.041
Protected from violence and exploitation
Birth registration PR.1 0.8264 0.0198 0.024 2.783 1.668 1,333 1,022 0.787 0.866
Violent discipline PR.2 0.7244 0.0152 0.021 1.722 1.312 1,944 1,480 0.694 0.755
Child labour PR.3 0.1067 0.0107 0.100 1.026 1.013 1,134 855 0.085 0.128
Child marriage (before age 15) (women) PR.4a 0.0220 0.0076 0.346 0.912 0.955 449 339 0.007 0.037
Child marriage (before age 18) (women) PR.4b 0.1187 0.0199 0.168 1.281 1.132 449 339 0.079 0.159
Crime reporting (women) PR.13 0.0462 0.0001 0.002 0.000 0.002 32 25 0.046 0.046
Crime reporting (men) PR.13 0.2660 0.1349 0.507 0.559 0.748 8 7 0.000 0.536
Safety (women) PR.14 0.6438 0.0131 0.020 1.306 1.143 2,312 1,757 0.618 0.670
Safety (men) PR.14 0.9306 0.0109 0.012 1.259 1.122 868 688 0.909 0.952
Live in a safe and clean environment
Use of basic drinking water service WS.2 0.9613 0.0093 0.010 2.964 1.722 10,478 1,281 0.943 0.980
Use of safely managed drinking water WS.6 0.4836 0.0429 0.089 1.507 1.227 1,439 180 0.398 0.569
Handwashing facility with water and soap WS.7 0.9417 0.0098 0.010 2.239 1.496 10,467 1,279 0.922 0.961
Use of improved sanitation WS.8 0.7622 0.0197 0.026 2.747 1.657 10,478 1,281 0.723 0.802
Use of basic sanitation service WS.9 0.6138 0.0185 0.030 1.842 1.357 10,478 1,281 0.577 0.651
Equitable chance in life
Children with functional dificulty EQ.1 0.0789 0.0054 0.068 0.569 0.754 1,905 1,445 0.068 0.090
Population covered by social transfers EQ.3 0.4477 0.0197 0.044 2.018 1.421 10,478 1,281 0.408 0.487
Discrimination (women) EQ.7 0.0813 0.0064 0.079 0.966 0.983 2,312 1,757 0.068 0.094
Discrimination (men) EQ.7 0.0352 0.0085 0.242 1.461 1.209 868 688 0.018 0.052
Overall life satisfaction index (women age 15-24) EQ.9a 7.6786 0.1106 0.014 2.303 1.518 938 716 7.457 7.900
Overall life satisfaction index (men age 15-24) EQ.9a 6.4585 0.1563 0.024 1.734 1.317 347 278 6.146 6.771
na: not applicable

Appendix C Estimates of Sampling Error | Page 63
Table SE.23: Sampling errors: Nankana Sahib District
Standard errors, coefficients of variation, design effects (deff), square root of design effects (deft), and confidence intervals for selected SDG and other indicators, Punjab, 2017-18
Coefficient of
variation (se/r)
Square root of design
effect (deft)
Confidence limits
MICS Indicator
Value (r)
Standard error (se)
Design effect (deff)
Weighted count
Unweighted count
Lower bound r - 2se
Upper bound r + 2se
Sample coverage and characteristics of respondents
Access to electricity SR.1 0.9943 0.0029 0.003 1.446 1.202 4,087 946 0.988 1.000
Ownership of mobile phone (women) SR.10 0.4024 0.0214 0.053 2.655 1.629 907 1,390 0.360 0.445
Ownership of mobile phone (men) SR.10 0.8763 0.0126 0.014 1.017 1.008 349 690 0.851 0.902
Use of internet during last 3 months(women) SR.12a 0.0701 0.0129 0.184 3.556 1.886 907 1,390 0.044 0.096
Use of internet during last 3 months(men) SR.12a 0.3502 0.0272 0.078 2.243 1.498 349 690 0.296 0.405
ICT skills (women) SR.13 0.0378 0.0063 0.166 1.511 1.229 907 1,390 0.025 0.050
ICT skills (men) SR.13 0.1129 0.0195 0.173 2.615 1.617 349 690 0.074 0.152
Tobacco use (women) SR.14 0.0320 0.0052 0.164 1.234 1.111 907 1,390 0.022 0.043
Tobacco use (men) SR.14 0.2994 0.0259 0.087 2.207 1.486 349 690 0.248 0.351
Survive
Neonatal mortality rate CS.1 52 9.2 0.18 na na na na 34 70
Infant mortality rate CS.3 76 11.0 0.15 na na na na 54 98
Under-five mortality rate CS.5 86 11.7 0.14 na na na na 63 110
Thrive - Reproductive and maternal health
Total fertility rate - 3.7005 0.1841 0.050 na na na na 3.332 4.069
Adolescent birth rate TM.1 39.600 7.7384 0.195 na na na na 24.12 55.08
Contraceptive prevalence rate TM.3 0.3923 0.0191 0.049 1.289 1.136 553 845 0.354 0.430
Need for family planning satisfied with modern contraception TM.4 0.5361 0.0248 0.046 1.112 1.054 296 451 0.486 0.586
Antenatal care coverage (at least four times by any provider) TM.5b 0.6311 0.0257 0.041 0.876 0.936 202 309 0.580 0.683
Skilled attendant at delivery TM.9 0.8752 0.0224 0.026 1.413 1.189 202 309 0.830 0.920
Thrive - Child health, nutrition and development
Diphtheria, tetanus and pertussis (DTP) immunization coverage
TC.3 0.9480 0.0267 0.028 2.263 1.504 104 158 0.895 1.000
Pneumococcal (Conjugate) immunization coverage TC.6 0.9545 0.0213 0.022 1.647 1.283 104 158 0.912 0.997
Measles immunization coverage TC.10 0.9626 0.0165 0.017 1.186 1.089 104 158 0.930 0.996
Primary reliance on clean fuels and technologies for cooking, space heating and lighting
TC.18 0.4752 0.0525 0.111 10.450 3.233 4,087 946 0.370 0.580
Care-seeking for children with acute respiratory infection (ARI) symptoms
TC.19 0.6983 0.0282 0.040 0.129 0.359 23 35 0.642 0.755
Exclusive breastfeeding under 6 months TC.32 0.4230 0.0630 0.149 1.300 1.140 53 81 0.297 0.549
Stunting prevalence (moderate and severe) TC.45a 0.2898 0.0193 0.066 1.342 1.158 491 746 0.251 0.328
Wasting prevalence (moderate and severe) TC.46a 0.0552 0.0081 0.147 0.953 0.976 494 751 0.039 0.072
Overweight prevalence (moderate and severe) TC.47a 0.0202 0.0062 0.307 1.459 1.208 494 751 0.008 0.033
Early child development index TC.53 0.6808 0.0288 0.042 1.206 1.098 208 316 0.623 0.739

Appendix C Estimates of Sampling Error | Page 64
Table SE.23: Sampling errors: Nankana Sahib District
Standard errors, coefficients of variation, design effects (deff), square root of design effects (deft), and confidence intervals for selected SDG and other indicators, Punjab, 2017-18
Coefficient of
variation (se/r)
Square root of design
effect (deft)
Confidence limits
MICS Indicator
Value (r)
Standard error (se)
Design effect (deff)
Weighted count
Unweighted count
Lower bound r - 2se
Upper bound r + 2se
Learn
Participation rate in organised learning (adjusted) LN.2 0.8137 0.0336 0.041 1.240 1.114 113 167 0.746 0.881
Children with foundational reading and number skills (reading)
LN.22a 0.2931 0.0332 0.113 1.998 1.413 251 377 0.227 0.359
Children with foundational reading and number skills (numeracy)
LN.22d 0.0294 0.0097 0.329 1.230 1.109 251 377 0.010 0.049
Protected from violence and exploitation
Birth registration PR.1 0.8110 0.0254 0.031 3.217 1.794 502 764 0.760 0.862
Violent discipline PR.2 0.7916 0.0137 0.017 1.301 1.141 753 1,137 0.764 0.819
Child labour PR.3 0.1625 0.0170 0.105 1.378 1.174 434 651 0.129 0.196
Child marriage (before age 15) (women) PR.4a 0.0116 0.0087 0.747 1.590 1.261 158 243 0.000 0.029
Child marriage (before age 18) (women) PR.4b 0.0866 0.0171 0.197 0.890 0.943 158 243 0.052 0.121
Crime reporting (women) PR.13 0.0817 0.0371 0.454 0.919 0.958 35 51 0.007 0.156
Crime reporting (men) PR.13 0.1142 0.0675 0.591 0.857 0.926 10 20 0.000 0.249
Safety (women) PR.14 0.5103 0.0157 0.031 1.374 1.172 907 1,390 0.479 0.542
Safety (men) PR.14 0.8412 0.0170 0.020 1.499 1.224 349 690 0.807 0.875
Live in a safe and clean environment
Use of basic drinking water service WS.2 0.9006 0.0131 0.015 1.820 1.349 4,087 946 0.874 0.927
Use of safely managed drinking water WS.6 0.2392 0.0440 0.184 2.031 1.425 531 141 0.151 0.327
Handwashing facility with water and soap WS.7 0.9427 0.0106 0.011 1.984 1.409 4,087 946 0.921 0.964
Use of improved sanitation WS.8 0.8324 0.0205 0.025 2.847 1.687 4,087 946 0.791 0.873
Use of basic sanitation service WS.9 0.6901 0.0231 0.033 2.356 1.535 4,087 946 0.644 0.736
Equitable chance in life
Children with functional dificulty EQ.1 0.0954 0.0074 0.077 0.702 0.838 736 1,110 0.081 0.110
Population covered by social transfers EQ.3 0.4872 0.0268 0.055 2.719 1.649 4,087 946 0.434 0.541
Discrimination (women) EQ.7 0.0877 0.0100 0.114 1.748 1.322 907 1,390 0.068 0.108
Discrimination (men) EQ.7 0.0684 0.0121 0.177 1.579 1.256 349 690 0.044 0.093
Overall life satisfaction index (women age 15-24) EQ.9a 7.8295 0.0934 0.012 1.171 1.082 328 504 7.643 8.016
Overall life satisfaction index (men age 15-24) EQ.9a 7.1155 0.1128 0.016 1.126 1.061 126 248 6.890 7.341
na: not applicable

Appendix C Estimates of Sampling Error | Page 65
Table SE.24: Sampling errors: Sheikhupura District
Standard errors, coefficients of variation, design effects (deff), square root of design effects (deft), and confidence intervals for selected SDG and other indicators, Punjab, 2017-18
Coefficient of
variation (se/r)
Square root of design
effect (deft)
Confidence limits
MICS Indicator
Value (r)
Standard error (se)
Design effect (deff)
Weighted count
Unweighted count
Lower bound r - 2se
Upper bound r + 2se
Sample coverage and characteristics of respondents
Access to electricity SR.1 0.9925 0.0023 0.002 1.046 1.023 10,076 1,456 0.988 0.997
Ownership of mobile phone (women) SR.10 0.4212 0.0132 0.031 1.524 1.235 2,281 2,146 0.395 0.448
Ownership of mobile phone (men) SR.10 0.8623 0.0105 0.012 1.036 1.018 895 1,117 0.841 0.883
Use of internet during last 3 months(women) SR.12a 0.1378 0.0149 0.108 3.995 1.999 2,281 2,146 0.108 0.168
Use of internet during last 3 months(men) SR.12a 0.3441 0.0253 0.074 3.164 1.779 895 1,117 0.293 0.395
ICT skills (women) SR.13 0.0501 0.0109 0.218 5.398 2.323 2,281 2,146 0.028 0.072
ICT skills (men) SR.13 0.1557 0.0142 0.091 1.719 1.311 895 1,117 0.127 0.184
Tobacco use (women) SR.14 0.0106 0.0020 0.190 0.830 0.911 2,281 2,146 0.007 0.015
Tobacco use (men) SR.14 0.2282 0.0138 0.060 1.203 1.097 895 1,117 0.201 0.256
Survive
Neonatal mortality rate CS.1 40 6.7 0.17 na na na na 26 53
Infant mortality rate CS.3 56 9.2 0.16 na na na na 38 75
Under-five mortality rate CS.5 64 10.3 0.16 na na na na 44 85
Thrive - Reproductive and maternal health
Total fertility rate - 3.7163 0.1490 0.040 na na na na 3.418 4.014
Adolescent birth rate TM.1 46.103 7.5033 0.163 na na na na 31.10 61.11
Contraceptive prevalence rate TM.3 0.2770 0.0142 0.051 1.401 1.184 1,472 1,384 0.248 0.305
Need for family planning satisfied with modern contraception TM.4 0.5201 0.0209 0.040 1.239 1.113 743 710 0.478 0.562
Antenatal care coverage (at least four times by any provider) TM.5b 0.6201 0.0245 0.040 1.199 1.095 499 470 0.571 0.669
Skilled attendant at delivery TM.9 0.8569 0.0198 0.023 1.495 1.223 499 470 0.817 0.896
Thrive - Child health, nutrition and development
Diphtheria, tetanus and pertussis (DTP) immunization coverage
TC.3 0.8900 0.0244 0.027 1.349 1.161 232 222 0.841 0.939
Pneumococcal (Conjugate) immunization coverage TC.6 0.8583 0.0259 0.030 1.220 1.105 232 222 0.806 0.910
Measles immunization coverage TC.10 0.8319 0.0253 0.030 1.009 1.004 232 222 0.781 0.882
Primary reliance on clean fuels and technologies for cooking, space heating and lighting
TC.18 0.6443 0.0331 0.051 6.962 2.639 10,076 1,456 0.578 0.711
Care-seeking for children with acute respiratory infection (ARI) symptoms
TC.19 0.8711 0.0264 0.030 0.380 0.616 66 62 0.818 0.924
Exclusive breastfeeding under 6 months TC.32 0.4707 0.0410 0.087 1.044 1.022 159 156 0.389 0.553
Stunting prevalence (moderate and severe) TC.45a 0.2790 0.0191 0.068 1.956 1.399 1,155 1,084 0.241 0.317
Wasting prevalence (moderate and severe) TC.46a 0.0804 0.0099 0.123 1.409 1.187 1,142 1,070 0.061 0.100
Overweight prevalence (moderate and severe) TC.47a 0.0402 0.0061 0.152 1.038 1.019 1,142 1,070 0.028 0.052
Early child development index TC.53 0.6938 0.0219 0.032 0.998 0.999 466 442 0.650 0.738

Appendix C Estimates of Sampling Error | Page 66
Table SE.24: Sampling errors: Sheikhupura District
Standard errors, coefficients of variation, design effects (deff), square root of design effects (deft), and confidence intervals for selected SDG and other indicators, Punjab, 2017-18
Coefficient of
variation (se/r)
Square root of design
effect (deft)
Confidence limits
MICS Indicator
Value (r)
Standard error (se)
Design effect (deff)
Weighted count
Unweighted count
Lower bound r - 2se
Upper bound r + 2se
Learn
Participation rate in organised learning (adjusted) LN.2 0.7462 0.0215 0.029 0.613 0.783 271 252 0.703 0.789
Children with foundational reading and number skills (reading)
LN.22a 0.3419 0.0222 0.065 0.973 0.987 460 446 0.298 0.386
Children with foundational reading and number skills (numeracy)
LN.22d 0.0336 0.0073 0.216 0.722 0.850 460 446 0.019 0.048
Protected from violence and exploitation
Birth registration PR.1 0.8259 0.0143 0.017 1.624 1.274 1,221 1,149 0.797 0.854
Violent discipline PR.2 0.7783 0.0102 0.013 1.018 1.009 1,780 1,676 0.758 0.799
Child labour PR.3 0.1226 0.0111 0.091 1.177 1.085 1,083 1,021 0.100 0.145
Child marriage (before age 15) (women) PR.4a 0.0307 0.0075 0.246 0.808 0.899 456 424 0.016 0.046
Child marriage (before age 18) (women) PR.4b 0.1471 0.0182 0.123 1.113 1.055 456 424 0.111 0.183
Crime reporting (women) PR.13 0.0554 0.0590 1.065 1.661 1.289 37 26 0.000 0.173
Crime reporting (men) PR.13 0.0000 0.0000 20 24 0.000 0.000
Safety (women) PR.14 0.6829 0.0135 0.020 1.797 1.341 2,281 2,146 0.656 0.710
Safety (men) PR.14 0.9467 0.0097 0.010 2.063 1.436 895 1,117 0.927 0.966
Live in a safe and clean environment
Use of basic drinking water service WS.2 0.9325 0.0087 0.009 1.760 1.327 10,076 1,456 0.915 0.950
Use of safely managed drinking water WS.6 0.4929 0.0396 0.080 1.419 1.191 1,343 194 0.414 0.572
Handwashing facility with water and soap WS.7 0.9186 0.0107 0.012 2.218 1.489 10,047 1,452 0.897 0.940
Use of improved sanitation WS.8 0.9577 0.0045 0.005 0.728 0.853 10,076 1,456 0.949 0.967
Use of basic sanitation service WS.9 0.8717 0.0106 0.012 1.457 1.207 10,076 1,456 0.850 0.893
Equitable chance in life
Children with functional dificulty EQ.1 0.1784 0.0105 0.059 1.286 1.134 1,807 1,696 0.157 0.199
Population covered by social transfers EQ.3 0.1771 0.0111 0.063 1.239 1.113 10,076 1,456 0.155 0.199
Discrimination (women) EQ.7 0.0748 0.0076 0.102 1.789 1.337 2,281 2,146 0.060 0.090
Discrimination (men) EQ.7 0.0814 0.0095 0.117 1.351 1.162 895 1,117 0.062 0.100
Overall life satisfaction index (women age 15-24) EQ.9a 7.6947 0.0953 0.012 2.121 1.456 929 874 7.504 7.885
Overall life satisfaction index (men age 15-24) EQ.9a 6.9743 0.0960 0.014 0.929 0.964 334 429 6.782 7.166
na: not applicable

Appendix C Estimates of Sampling Error | Page 67
Table SE.25: Sampling errors: Multan District
Standard errors, coefficients of variation, design effects (deff), square root of design effects (deft), and confidence intervals for selected SDG and other indicators, Punjab, 2017-18
Coefficient of
variation (se/r)
Square root of design
effect (deft)
Confidence limits
MICS Indicator
Value (r)
Standard error (se)
Design effect (deff)
Weighted count
Unweighted count
Lower bound r - 2se
Upper bound r + 2se
Sample coverage and characteristics of respondents
Access to electricity SR.1 0.9774 0.0047 0.005 2.408 1.552 14,504 2,413 0.968 0.987
Ownership of mobile phone (women) SR.10 0.3762 0.0133 0.035 2.578 1.606 3,173 3,422 0.350 0.403
Ownership of mobile phone (men) SR.10 0.8706 0.0091 0.010 1.086 1.042 1,217 1,489 0.852 0.889
Use of internet during last 3 months(women) SR.12a 0.1307 0.0103 0.079 3.183 1.784 3,173 3,422 0.110 0.151
Use of internet during last 3 months(men) SR.12a 0.2875 0.0154 0.054 1.733 1.316 1,217 1,489 0.257 0.318
ICT skills (women) SR.13 0.0518 0.0065 0.125 2.914 1.707 3,173 3,422 0.039 0.065
ICT skills (men) SR.13 0.1627 0.0120 0.074 1.578 1.256 1,217 1,489 0.139 0.187
Tobacco use (women) SR.14 0.0204 0.0028 0.135 1.299 1.140 3,173 3,422 0.015 0.026
Tobacco use (men) SR.14 0.1788 0.0114 0.064 1.321 1.149 1,217 1,489 0.156 0.202
Survive
Neonatal mortality rate CS.1 42 5.4 0.13 na na na na 31 53
Infant mortality rate CS.3 59 6.4 0.11 na na na na 46 71
Under-five mortality rate CS.5 70 6.7 0.10 na na na na 56 83
Thrive - Reproductive and maternal health
Total fertility rate - 3.6229 0.1258 0.035 na na na na 3.371 3.874
Adolescent birth rate TM.1 55.256 5.7487 0.104 na na na na 43.76 66.75
Contraceptive prevalence rate TM.3 0.4958 0.0121 0.024 1.348 1.161 2,113 2,290 0.472 0.520
Need for family planning satisfied with modern contraception TM.4 0.7105 0.0144 0.020 1.381 1.175 1,269 1,371 0.682 0.739
Antenatal care coverage (at least four times by any provider) TM.5b 0.5682 0.0205 0.036 1.252 1.119 673 734 0.527 0.609
Skilled attendant at delivery TM.9 0.8009 0.0175 0.022 1.414 1.189 673 734 0.766 0.836
Thrive - Child health, nutrition and development
Diphtheria, tetanus and pertussis (DTP) immunization coverage
TC.3 0.9747 0.0077 0.008 0.938 0.969 369 395 0.959 0.990
Pneumococcal (Conjugate) immunization coverage TC.6 0.9798 0.0073 0.007 1.057 1.028 369 395 0.965 0.994
Measles immunization coverage TC.10 0.9228 0.0132 0.014 0.958 0.979 369 395 0.896 0.949
Primary reliance on clean fuels and technologies for cooking, space heating and lighting
TC.18 0.5102 0.0213 0.042 4.379 2.093 14,504 2,413 0.468 0.553
Care-seeking for children with acute respiratory infection (ARI) symptoms
TC.19 0.7778 0.0369 0.047 1.295 1.138 154 165 0.704 0.852
Exclusive breastfeeding under 6 months TC.32 0.3475 0.0371 0.107 1.211 1.100 187 201 0.273 0.422
Stunting prevalence (moderate and severe) TC.45a 0.3557 0.0138 0.039 1.528 1.236 1,720 1,843 0.328 0.383
Wasting prevalence (moderate and severe) TC.46a 0.0737 0.0065 0.089 1.155 1.074 1,718 1,841 0.061 0.087
Overweight prevalence (moderate and severe) TC.47a 0.0152 0.0030 0.199 1.127 1.061 1,718 1,841 0.009 0.021
Early child development index TC.53 0.7015 0.0210 0.030 1.463 1.210 714 699 0.660 0.743

Appendix C Estimates of Sampling Error | Page 68
Table SE.25: Sampling errors: Multan District
Standard errors, coefficients of variation, design effects (deff), square root of design effects (deft), and confidence intervals for selected SDG and other indicators, Punjab, 2017-18
Coefficient of
variation (se/r)
Square root of design
effect (deft)
Confidence limits
MICS Indicator
Value (r)
Standard error (se)
Design effect (deff)
Weighted count
Unweighted count
Lower bound r - 2se
Upper bound r + 2se
Learn
Participation rate in organised learning (adjusted) LN.2 0.7092 0.0257 0.036 1.362 1.167 400 426 0.658 0.761
Children with foundational reading and number skills (reading)
LN.22a 0.2982 0.0176 0.059 1.443 1.201 897 974 0.263 0.333
Children with foundational reading and number skills (numeracy)
LN.22d 0.0338 0.0059 0.174 1.031 1.015 897 974 0.022 0.046
Protected from violence and exploitation
Birth registration PR.1 0.6740 0.0165 0.025 2.328 1.526 1,752 1,877 0.641 0.707
Violent discipline PR.2 0.8837 0.0068 0.008 1.319 1.148 2,688 2,897 0.870 0.897
Child labour PR.3 0.1336 0.0105 0.078 1.627 1.275 1,587 1,719 0.113 0.155
Child marriage (before age 15) (women) PR.4a 0.0452 0.0089 0.196 1.141 1.068 584 628 0.028 0.063
Child marriage (before age 18) (women) PR.4b 0.1794 0.0161 0.090 1.102 1.050 584 628 0.147 0.212
Crime reporting (women) PR.13 0.0976 0.0471 0.482 0.805 0.897 31 33 0.003 0.192
Crime reporting (men) PR.13 0.3205 0.0000 0.000 0.000 0.000 18 22 0.321 0.321
Safety (women) PR.14 0.4422 0.0109 0.025 1.642 1.281 3,173 3,422 0.420 0.464
Safety (men) PR.14 0.9389 0.0087 0.009 1.966 1.402 1,217 1,489 0.922 0.956
Live in a safe and clean environment
Use of basic drinking water service WS.2 0.9747 0.0053 0.005 2.714 1.647 14,504 2,413 0.964 0.985
Use of safely managed drinking water WS.6 0.4652 0.0354 0.076 2.085 1.444 1,995 343 0.394 0.536
Handwashing facility with water and soap WS.7 0.9250 0.0065 0.007 1.449 1.204 14,501 2,411 0.912 0.938
Use of improved sanitation WS.8 0.6325 0.0191 0.030 3.776 1.943 14,504 2,413 0.594 0.671
Use of basic sanitation service WS.9 0.5314 0.0195 0.037 3.688 1.920 14,504 2,413 0.492 0.570
Equitable chance in life
Children with functional dificulty EQ.1 0.1920 0.0075 0.039 1.034 1.017 2,625 2,831 0.177 0.207
Population covered by social transfers EQ.3 0.4700 0.0146 0.031 2.078 1.442 14,504 2,413 0.441 0.499
Discrimination (women) EQ.7 0.1433 0.0070 0.049 1.384 1.176 3,173 3,422 0.129 0.157
Discrimination (men) EQ.7 0.1386 0.0153 0.110 2.919 1.708 1,217 1,489 0.108 0.169
Overall life satisfaction index (women age 15-24) EQ.9a 6.8945 0.0743 0.011 1.845 1.358 1,220 1,311 6.746 7.043
Overall life satisfaction index (men age 15-24) EQ.9a 7.2249 0.1015 0.014 1.388 1.178 522 634 7.022 7.428
na: not applicable

Appendix C Estimates of Sampling Error | Page 69
Table SE.26: Sampling errors: Khanewal District
Standard errors, coefficients of variation, design effects (deff), square root of design effects (deft), and confidence intervals for selected SDG and other indicators, Punjab, 2017-18
Coefficient of
variation (se/r)
Square root of design
effect (deft)
Confidence limits
MICS Indicator
Value (r)
Standard error (se)
Design effect (deff)
Weighted count
Unweighted count
Lower bound r - 2se
Upper bound r + 2se
Sample coverage and characteristics of respondents
Access to electricity SR.1 0.9588 0.0081 0.008 2.121 1.456 9,459 1,278 0.943 0.975
Ownership of mobile phone (women) SR.10 0.3137 0.0138 0.044 1.628 1.276 2,141 1,846 0.286 0.341
Ownership of mobile phone (men) SR.10 0.8346 0.0141 0.017 0.931 0.965 818 652 0.806 0.863
Use of internet during last 3 months(women) SR.12a 0.0749 0.0089 0.119 2.105 1.451 2,141 1,846 0.057 0.093
Use of internet during last 3 months(men) SR.12a 0.1476 0.0177 0.120 1.620 1.273 818 652 0.112 0.183
ICT skills (women) SR.13 0.0179 0.0038 0.211 1.502 1.226 2,141 1,846 0.010 0.025
ICT skills (men) SR.13 0.1174 0.0158 0.134 1.565 1.251 818 652 0.086 0.149
Tobacco use (women) SR.14 0.0287 0.0037 0.130 0.922 0.960 2,141 1,846 0.021 0.036
Tobacco use (men) SR.14 0.2283 0.0208 0.091 1.601 1.265 818 652 0.187 0.270
Survive
Neonatal mortality rate CS.1 50 7.7 0.15 na na na na 34 65
Infant mortality rate CS.3 81 9.0 0.11 na na na na 63 99
Under-five mortality rate CS.5 93 9.9 0.11 na na na na 74 113
Thrive - Reproductive and maternal health
Total fertility rate - 3.9922 0.1851 0.046 na na na na 3.622 4.362
Adolescent birth rate TM.1 55.528 8.6721 0.156 na na na na 38.18 72.87
Contraceptive prevalence rate TM.3 0.3984 0.0175 0.044 1.518 1.232 1,374 1,186 0.363 0.433
Need for family planning satisfied with modern contraception TM.4 0.6333 0.0254 0.040 1.757 1.325 733 633 0.582 0.684
Antenatal care coverage (at least four times by any provider) TM.5b 0.4532 0.0247 0.054 1.045 1.022 493 427 0.404 0.502
Skilled attendant at delivery TM.9 0.7230 0.0294 0.041 1.841 1.357 493 427 0.664 0.782
Thrive - Child health, nutrition and development
Diphtheria, tetanus and pertussis (DTP) immunization coverage
TC.3 0.8764 0.0257 0.029 1.263 1.124 234 208 0.825 0.928
Pneumococcal (Conjugate) immunization coverage TC.6 0.8670 0.0256 0.030 1.178 1.086 234 208 0.816 0.918
Measles immunization coverage TC.10 0.7945 0.0333 0.042 1.410 1.187 234 208 0.728 0.861
Primary reliance on clean fuels and technologies for cooking, space heating and lighting
TC.18 0.2942 0.0245 0.083 3.687 1.920 9,459 1,278 0.245 0.343
Care-seeking for children with acute respiratory infection (ARI) symptoms
TC.19 0.8039 0.0403 0.050 0.886 0.941 98 87 0.723 0.885
Exclusive breastfeeding under 6 months TC.32 0.3640 0.0428 0.118 0.966 0.983 139 123 0.278 0.450
Stunting prevalence (moderate and severe) TC.45a 0.3634 0.0203 0.056 1.725 1.314 1,094 970 0.323 0.404
Wasting prevalence (moderate and severe) TC.46a 0.0971 0.0081 0.084 0.720 0.849 1,081 959 0.081 0.113
Overweight prevalence (moderate and severe) TC.47a 0.0125 0.0040 0.318 1.230 1.109 1,081 959 0.005 0.020
Early child development index TC.53 0.6461 0.0322 0.050 1.865 1.365 285 411 0.582 0.711

Appendix C Estimates of Sampling Error | Page 70
Table SE.26: Sampling errors: Khanewal District
Standard errors, coefficients of variation, design effects (deff), square root of design effects (deft), and confidence intervals for selected SDG and other indicators, Punjab, 2017-18
Coefficient of
variation (se/r)
Square root of design
effect (deft)
Confidence limits
MICS Indicator
Value (r)
Standard error (se)
Design effect (deff)
Weighted count
Unweighted count
Lower bound r - 2se
Upper bound r + 2se
Learn
Participation rate in organised learning (adjusted) LN.2 0.7300 0.0333 0.046 1.349 1.161 266 240 0.663 0.797
Children with foundational reading and number skills (reading)
LN.22a 0.2208 0.0275 0.124 1.924 1.387 504 440 0.166 0.276
Children with foundational reading and number skills (numeracy)
LN.22d 0.0878 0.0114 0.130 0.718 0.847 504 440 0.065 0.111
Protected from violence and exploitation
Birth registration PR.1 0.6975 0.0251 0.036 2.993 1.730 1,134 1,006 0.647 0.748
Violent discipline PR.2 0.7326 0.0121 0.017 1.103 1.050 1,675 1,474 0.708 0.757
Child labour PR.3 0.2042 0.0148 0.073 1.184 1.088 1,005 878 0.175 0.234
Child marriage (before age 15) (women) PR.4a 0.0486 0.0122 0.251 1.124 1.060 405 350 0.024 0.073
Child marriage (before age 18) (women) PR.4b 0.1697 0.0190 0.112 0.895 0.946 405 350 0.132 0.208
Crime reporting (women) PR.13 0.1037 0.0006 0.006 0.000 0.008 22 19 0.103 0.105
Crime reporting (men) PR.13 0.4319 0.1141 0.264 0.850 0.922 24 17 0.204 0.660
Safety (women) PR.14 0.3294 0.0180 0.055 2.703 1.644 2,141 1,846 0.293 0.365
Safety (men) PR.14 0.8742 0.0174 0.020 1.793 1.339 818 652 0.839 0.909
Live in a safe and clean environment
Use of basic drinking water service WS.2 0.9899 0.0033 0.003 1.389 1.179 9,459 1,278 0.983 0.996
Use of safely managed drinking water WS.6 0.6942 0.0355 0.051 1.263 1.124 1,267 183 0.623 0.765
Handwashing facility with water and soap WS.7 0.9282 0.0073 0.008 1.027 1.013 9,419 1,269 0.914 0.943
Use of improved sanitation WS.8 0.7102 0.0192 0.027 2.297 1.515 9,459 1,278 0.672 0.749
Use of basic sanitation service WS.9 0.6109 0.0220 0.036 2.601 1.613 9,459 1,278 0.567 0.655
Equitable chance in life
Children with functional dificulty EQ.1 0.1679 0.0091 0.054 0.864 0.930 1,666 1,463 0.150 0.186
Population covered by social transfers EQ.3 0.5313 0.0200 0.038 2.045 1.430 9,459 1,278 0.491 0.571
Discrimination (women) EQ.7 0.0554 0.0059 0.107 1.229 1.109 2,141 1,846 0.044 0.067
Discrimination (men) EQ.7 0.0644 0.0124 0.192 1.659 1.288 818 652 0.040 0.089
Overall life satisfaction index (women age 15-24) EQ.9a 6.7769 0.1050 0.015 1.758 1.326 829 715 6.567 6.987
Overall life satisfaction index (men age 15-24) EQ.9a 6.3265 0.1823 0.029 1.393 1.180 342 270 5.962 6.691
na: not applicable

Appendix C Estimates of Sampling Error | Page 71
Table SE.27: Sampling errors: Lodhran District
Standard errors, coefficients of variation, design effects (deff), square root of design effects (deft), and confidence intervals for selected SDG and other indicators, Punjab, 2017-18
Coefficient of
variation (se/r)
Square root of design
effect (deft)
Confidence limits
MICS Indicator
Value (r)
Standard error (se)
Design effect (deff)
Weighted count
Unweighted count
Lower bound r - 2se
Upper bound r + 2se
Sample coverage and characteristics of respondents
Access to electricity SR.1 0.9561 0.0098 0.010 2.141 1.463 4,937 944 0.937 0.976
Ownership of mobile phone (women) SR.10 0.2353 0.0127 0.054 1.111 1.054 1,003 1,246 0.210 0.261
Ownership of mobile phone (men) SR.10 0.8590 0.0162 0.019 1.004 1.002 397 464 0.827 0.891
Use of internet during last 3 months(women) SR.12a 0.0440 0.0094 0.214 2.615 1.617 1,003 1,246 0.025 0.063
Use of internet during last 3 months(men) SR.12a 0.1806 0.0167 0.092 0.872 0.934 397 464 0.147 0.214
ICT skills (women) SR.13 0.0204 0.0041 0.200 1.043 1.021 1,003 1,246 0.012 0.029
ICT skills (men) SR.13 0.1031 0.0142 0.138 1.014 1.007 397 464 0.075 0.132
Tobacco use (women) SR.14 0.0316 0.0064 0.202 1.666 1.291 1,003 1,246 0.019 0.044
Tobacco use (men) SR.14 0.2087 0.0244 0.117 1.664 1.290 397 464 0.160 0.257
Survive
Neonatal mortality rate CS.1 63 8.7 0.14 na na na na 45 80
Infant mortality rate CS.3 88 9.6 0.11 na na na na 68 107
Under-five mortality rate CS.5 105 11.0 0.10 na na na na 83 127
Thrive - Reproductive and maternal health
Total fertility rate - 3.8432 0.1784 0.046 na na na na 3.486 4.200
Adolescent birth rate TM.1 66.023 10.7219 0.162 na na na na 44.58 87.47
Contraceptive prevalence rate TM.3 0.3096 0.0177 0.057 1.245 1.116 683 849 0.274 0.345
Need for family planning satisfied with modern contraception TM.4 0.6325 0.0296 0.047 1.347 1.160 289 358 0.573 0.692
Antenatal care coverage (at least four times by any provider) TM.5b 0.3655 0.0357 0.098 1.641 1.281 241 299 0.294 0.437
Skilled attendant at delivery TM.9 0.7268 0.0379 0.052 2.150 1.466 241 299 0.651 0.802
Thrive - Child health, nutrition and development
Diphtheria, tetanus and pertussis (DTP) immunization coverage
TC.3 0.9357 0.0170 0.018 0.664 0.815 113 139 0.902 0.970
Pneumococcal (Conjugate) immunization coverage TC.6 0.9217 0.0220 0.024 0.922 0.960 113 139 0.878 0.966
Measles immunization coverage TC.10 0.8946 0.0230 0.026 0.775 0.880 113 139 0.849 0.941
Primary reliance on clean fuels and technologies for cooking, space heating and lighting
TC.18 0.1057 0.0182 0.172 3.313 1.820 4,937 944 0.069 0.142
Care-seeking for children with acute respiratory infection (ARI) symptoms
TC.19 0.7617 0.0363 0.048 0.384 0.620 44 54 0.689 0.834
Exclusive breastfeeding under 6 months TC.32 0.4802 0.0388 0.081 0.644 0.803 88 108 0.403 0.558
Stunting prevalence (moderate and severe) TC.45a 0.4395 0.0183 0.042 0.921 0.959 550 675 0.403 0.476
Wasting prevalence (moderate and severe) TC.46a 0.0932 0.0141 0.151 1.586 1.259 552 678 0.065 0.121
Overweight prevalence (moderate and severe) TC.47a 0.0451 0.0077 0.170 0.925 0.962 552 678 0.030 0.060
Early child development index TC.53 0.7017 0.0319 0.045 1.696 1.302 199 350 0.638 0.765

Appendix C Estimates of Sampling Error | Page 72
Table SE.27: Sampling errors: Lodhran District
Standard errors, coefficients of variation, design effects (deff), square root of design effects (deft), and confidence intervals for selected SDG and other indicators, Punjab, 2017-18
Coefficient of
variation (se/r)
Square root of design
effect (deft)
Confidence limits
MICS Indicator
Value (r)
Standard error (se)
Design effect (deff)
Weighted count
Unweighted count
Lower bound r - 2se
Upper bound r + 2se
Learn
Participation rate in organised learning (adjusted) LN.2 0.5639 0.0448 0.080 1.553 1.246 158 191 0.474 0.654
Children with foundational reading and number skills (reading)
LN.22a 0.2250 0.0302 0.134 1.911 1.382 307 367 0.165 0.285
Children with foundational reading and number skills (numeracy)
LN.22d 0.0082 0.0048 0.585 1.032 1.016 307 367 0.000 0.018
Protected from violence and exploitation
Birth registration PR.1 0.5048 0.0304 0.060 2.643 1.626 581 714 0.444 0.566
Violent discipline PR.2 0.8068 0.0143 0.018 1.446 1.202 917 1,109 0.778 0.835
Child labour PR.3 0.1925 0.0198 0.103 1.670 1.292 556 662 0.153 0.232
Child marriage (before age 15) (women) PR.4a 0.0651 0.0150 0.230 0.843 0.918 185 229 0.035 0.095
Child marriage (before age 18) (women) PR.4b 0.2747 0.0346 0.126 1.371 1.171 185 229 0.205 0.344
Crime reporting (women) PR.13 0.1038 0.0000 0.000 0.000 0.000 15 19 0.104 0.104
Crime reporting (men) PR.13 0.2910 0.0000 0.000 0.000 0.000 6 7 0.291 0.291
Safety (women) PR.14 0.4309 0.0165 0.038 1.390 1.179 1,003 1,246 0.398 0.464
Safety (men) PR.14 0.9393 0.0127 0.013 1.301 1.141 397 464 0.914 0.965
Live in a safe and clean environment
Use of basic drinking water service WS.2 0.9415 0.0138 0.015 3.267 1.807 4,937 944 0.914 0.969
Use of safely managed drinking water WS.6 0.2391 0.0498 0.208 2.173 1.474 678 130 0.140 0.339
Handwashing facility with water and soap WS.7 0.8392 0.0148 0.018 1.533 1.238 4,930 942 0.810 0.869
Use of improved sanitation WS.8 0.6272 0.0209 0.033 1.757 1.325 4,937 944 0.586 0.669
Use of basic sanitation service WS.9 0.4672 0.0213 0.046 1.722 1.312 4,937 944 0.425 0.510
Equitable chance in life
Children with functional dificulty EQ.1 0.1684 0.0125 0.074 1.197 1.094 889 1,072 0.143 0.193
Population covered by social transfers EQ.3 0.5655 0.0180 0.032 1.237 1.112 4,937 944 0.530 0.601
Discrimination (women) EQ.7 0.1684 0.0098 0.058 0.859 0.927 1,003 1,246 0.149 0.188
Discrimination (men) EQ.7 0.2820 0.0267 0.095 1.632 1.277 397 464 0.229 0.335
Overall life satisfaction index (women age 15-24) EQ.9a 6.8983 0.1235 0.018 1.537 1.240 384 477 6.651 7.145
Overall life satisfaction index (men age 15-24) EQ.9a 5.7049 0.1338 0.023 1.049 1.024 148 173 5.437 5.973
na: not applicable

Appendix C Estimates of Sampling Error | Page 73
Table SE.28: Sampling errors: Vehari District
Standard errors, coefficients of variation, design effects (deff), square root of design effects (deft), and confidence intervals for selected SDG and other indicators, Punjab, 2017-18
Coefficient of
variation (se/r)
Square root of design
effect (deft)
Confidence limits
MICS Indicator
Value (r)
Standard error (se)
Design effect (deff)
Weighted count
Unweighted count
Lower bound r - 2se
Upper bound r + 2se
Sample coverage and characteristics of respondents
Access to electricity SR.1 0.9532 0.0105 0.011 3.277 1.810 8,965 1,325 0.932 0.974
Ownership of mobile phone (women) SR.10 0.3062 0.0182 0.060 2.940 1.715 2,007 1,881 0.270 0.343
Ownership of mobile phone (men) SR.10 0.8558 0.0155 0.018 1.090 1.044 715 560 0.825 0.887
Use of internet during last 3 months(women) SR.12a 0.0323 0.0063 0.196 2.419 1.555 2,007 1,881 0.020 0.045
Use of internet during last 3 months(men) SR.12a 0.2111 0.0262 0.124 2.306 1.519 715 560 0.159 0.263
ICT skills (women) SR.13 0.0150 0.0034 0.223 1.429 1.195 2,007 1,881 0.008 0.022
ICT skills (men) SR.13 0.0907 0.0150 0.165 1.526 1.236 715 560 0.061 0.121
Tobacco use (women) SR.14 0.0307 0.0051 0.167 1.669 1.292 2,007 1,881 0.020 0.041
Tobacco use (men) SR.14 0.2119 0.0208 0.098 1.448 1.204 715 560 0.170 0.254
Survive
Neonatal mortality rate CS.1 54 6.4 0.12 na na na na 41 67
Infant mortality rate CS.3 75 7.3 0.10 na na na na 60 89
Under-five mortality rate CS.5 84 7.3 0.09 na na na na 70 99
Thrive - Reproductive and maternal health
Total fertility rate - 3.7580 0.1412 0.038 na na na na 3.476 4.040
Adolescent birth rate TM.1 44.228 6.8438 0.155 na na na na 30.54 57.92
Contraceptive prevalence rate TM.3 0.3700 0.0145 0.039 1.091 1.044 1,291 1,212 0.341 0.399
Need for family planning satisfied with modern contraception TM.4 0.6776 0.0230 0.034 1.457 1.207 642 603 0.632 0.724
Antenatal care coverage (at least four times by any provider) TM.5b 0.4480 0.0318 0.071 1.702 1.305 445 416 0.384 0.512
Skilled attendant at delivery TM.9 0.7695 0.0223 0.029 1.159 1.077 445 416 0.725 0.814
Thrive - Child health, nutrition and development
Diphtheria, tetanus and pertussis (DTP) immunization coverage
TC.3 0.9121 0.0165 0.018 0.672 0.820 216 199 0.879 0.945
Pneumococcal (Conjugate) immunization coverage TC.6 0.8918 0.0215 0.024 0.951 0.975 216 199 0.849 0.935
Measles immunization coverage TC.10 0.8511 0.0273 0.032 1.167 1.080 216 199 0.796 0.906
Primary reliance on clean fuels and technologies for cooking, space heating and lighting
TC.18 0.2311 0.0240 0.104 4.284 2.070 8,965 1,325 0.183 0.279
Care-seeking for children with acute respiratory infection (ARI) symptoms
TC.19 0.9219 0.0287 0.031 0.710 0.842 66 63 0.864 0.979
Exclusive breastfeeding under 6 months TC.32 0.5400 0.0514 0.095 1.342 1.159 136 127 0.437 0.643
Stunting prevalence (moderate and severe) TC.45a 0.3305 0.0207 0.062 1.889 1.374 1,051 981 0.289 0.372
Wasting prevalence (moderate and severe) TC.46a 0.0790 0.0082 0.103 0.876 0.936 1,026 959 0.063 0.095
Overweight prevalence (moderate and severe) TC.47a 0.0184 0.0049 0.268 1.292 1.137 1,026 959 0.009 0.028
Early child development index TC.53 0.6883 0.0340 0.049 1.259 1.122 145 234 0.620 0.756

Appendix C Estimates of Sampling Error | Page 74
Table SE.28: Sampling errors: Vehari District
Standard errors, coefficients of variation, design effects (deff), square root of design effects (deft), and confidence intervals for selected SDG and other indicators, Punjab, 2017-18
Coefficient of
variation (se/r)
Square root of design
effect (deft)
Confidence limits
MICS Indicator
Value (r)
Standard error (se)
Design effect (deff)
Weighted count
Unweighted count
Lower bound r - 2se
Upper bound r + 2se
Learn
Participation rate in organised learning (adjusted) LN.2 0.7229 0.0370 0.051 1.583 1.258 246 232 0.649 0.797
Children with foundational reading and number skills (reading)
LN.22a 0.2336 0.0182 0.078 0.930 0.964 526 501 0.197 0.270
Children with foundational reading and number skills (numeracy)
LN.22d 0.0243 0.0075 0.307 1.173 1.083 526 501 0.009 0.039
Protected from violence and exploitation
Birth registration PR.1 0.8082 0.0188 0.023 2.371 1.540 1,118 1,042 0.771 0.846
Violent discipline PR.2 0.8465 0.0122 0.014 1.801 1.342 1,685 1,579 0.822 0.871
Child labour PR.3 0.1892 0.0121 0.064 0.897 0.947 992 935 0.165 0.213
Child marriage (before age 15) (women) PR.4a 0.0431 0.0106 0.245 0.853 0.924 336 316 0.022 0.064
Child marriage (before age 18) (women) PR.4b 0.1560 0.0214 0.137 1.097 1.047 336 316 0.113 0.199
Crime reporting (women) PR.13 0.2407 0.0558 0.232 0.324 0.569 22 20 0.129 0.352
Crime reporting (men) PR.13 0.5242 0.0000 0.000 0.000 0.000 10 7 0.524 0.524
Safety (women) PR.14 0.5066 0.0159 0.031 1.890 1.375 2,007 1,881 0.475 0.538
Safety (men) PR.14 0.9016 0.0148 0.016 1.390 1.179 715 560 0.872 0.931
Live in a safe and clean environment
Use of basic drinking water service WS.2 0.9780 0.0046 0.005 1.292 1.137 8,965 1,325 0.969 0.987
Use of safely managed drinking water WS.6 0.6016 0.0387 0.064 1.409 1.187 1,265 192 0.524 0.679
Handwashing facility with water and soap WS.7 0.9130 0.0114 0.012 2.145 1.465 8,957 1,323 0.890 0.936
Use of improved sanitation WS.8 0.7026 0.0205 0.029 2.657 1.630 8,965 1,325 0.662 0.744
Use of basic sanitation service WS.9 0.6268 0.0210 0.033 2.488 1.577 8,965 1,325 0.585 0.669
Equitable chance in life
Children with functional dificulty EQ.1 0.1301 0.0091 0.070 1.130 1.063 1,661 1,559 0.112 0.148
Population covered by social transfers EQ.3 0.5389 0.0192 0.036 1.967 1.403 8,965 1,325 0.500 0.577
Discrimination (women) EQ.7 0.0821 0.0071 0.086 1.254 1.120 2,007 1,881 0.068 0.096
Discrimination (men) EQ.7 0.1085 0.0171 0.158 1.695 1.302 715 560 0.074 0.143
Overall life satisfaction index (women age 15-24) EQ.9a 6.5578 0.0766 0.012 1.196 1.093 717 673 6.405 6.711
Overall life satisfaction index (men age 15-24) EQ.9a 5.9957 0.0877 0.015 0.972 0.986 257 204 5.820 6.171
na: not applicable

Appendix C Estimates of Sampling Error | Page 75
Table SE.29: Sampling errors: Rawalpindi District
Standard errors, coefficients of variation, design effects (deff), square root of design effects (deft), and confidence intervals for selected SDG and other indicators, Punjab, 2017-18
Coefficient of
variation (se/r)
Square root of design
effect (deft)
Confidence limits
MICS Indicator
Value (r)
Standard error (se)
Design effect (deff)
Weighted count
Unweighted count
Lower bound r - 2se
Upper bound r + 2se
Sample coverage and characteristics of respondents
Access to electricity SR.1 0.9991 0.0005 0.001 0.859 0.927 16,169 2,687 0.998 1.000
Ownership of mobile phone (women) SR.10 0.5998 0.0111 0.019 1.913 1.383 3,803 3,697 0.577 0.622
Ownership of mobile phone (men) SR.10 0.9072 0.0077 0.009 0.817 0.904 1,377 1,155 0.892 0.923
Use of internet during last 3 months(women) SR.12a 0.2634 0.0128 0.049 3.112 1.764 3,803 3,697 0.238 0.289
Use of internet during last 3 months(men) SR.12a 0.5594 0.0192 0.034 1.734 1.317 1,377 1,155 0.521 0.598
ICT skills (women) SR.13 0.1183 0.0081 0.068 2.309 1.520 3,803 3,697 0.102 0.134
ICT skills (men) SR.13 0.2480 0.0181 0.073 2.017 1.420 1,377 1,155 0.212 0.284
Tobacco use (women) SR.14 0.0306 0.0035 0.115 1.545 1.243 3,803 3,697 0.024 0.038
Tobacco use (men) SR.14 0.2469 0.0129 0.052 1.028 1.014 1,377 1,155 0.221 0.273
Survive
Neonatal mortality rate CS.1 21 3.7 0.17 na na na na 14 29
Infant mortality rate CS.3 35 4.9 0.14 na na na na 25 44
Under-five mortality rate CS.5 41 5.7 0.14 na na na na 30 53
Thrive - Reproductive and maternal health
Total fertility rate - 3.1613 0.1214 0.038 na na na na 2.918 3.404
Adolescent birth rate TM.1 29.665 5.0363 0.170 na na na na 19.59 39.74
Contraceptive prevalence rate TM.3 0.3390 0.0110 0.032 1.249 1.118 2,385 2,318 0.317 0.361
Need for family planning satisfied with modern contraception TM.4 0.5575 0.0156 0.028 1.263 1.124 1,320 1,289 0.526 0.589
Antenatal care coverage (at least four times by any provider) TM.5b 0.7525 0.0215 0.029 1.649 1.284 689 668 0.710 0.795
Skilled attendant at delivery TM.9 0.8805 0.0179 0.020 2.033 1.426 689 668 0.845 0.916
Thrive - Child health, nutrition and development
Diphtheria, tetanus and pertussis (DTP) immunization coverage
TC.3 0.8468 0.0203 0.024 1.133 1.065 363 358 0.806 0.887
Pneumococcal (Conjugate) immunization coverage TC.6 0.8364 0.0228 0.027 1.361 1.167 363 358 0.791 0.882
Measles immunization coverage TC.10 0.8490 0.0204 0.024 1.153 1.074 363 358 0.808 0.890
Primary reliance on clean fuels and technologies for cooking, space heating and lighting
TC.18 0.7438 0.0176 0.024 4.343 2.084 16,169 2,687 0.709 0.779
Care-seeking for children with acute respiratory infection (ARI) symptoms
TC.19 0.8273 0.0273 0.033 0.920 0.959 185 177 0.773 0.882
Exclusive breastfeeding under 6 months TC.32 0.3764 0.0383 0.102 1.083 1.041 182 174 0.300 0.453
Stunting prevalence (moderate and severe) TC.45a 0.2217 0.0147 0.066 1.997 1.413 1,634 1,605 0.192 0.251
Wasting prevalence (moderate and severe) TC.46a 0.0735 0.0066 0.090 1.009 1.005 1,606 1,578 0.060 0.087
Overweight prevalence (moderate and severe) TC.47a 0.0331 0.0046 0.140 1.061 1.030 1,606 1,578 0.024 0.042
Early child development index TC.53 0.5494 0.0168 0.031 0.844 0.918 691 740 0.516 0.583

Appendix C Estimates of Sampling Error | Page 76
Table SE.29: Sampling errors: Rawalpindi District
Standard errors, coefficients of variation, design effects (deff), square root of design effects (deft), and confidence intervals for selected SDG and other indicators, Punjab, 2017-18
Coefficient of
variation (se/r)
Square root of design
effect (deft)
Confidence limits
MICS Indicator
Value (r)
Standard error (se)
Design effect (deff)
Weighted count
Unweighted count
Lower bound r - 2se
Upper bound r + 2se
Learn
Participation rate in organised learning (adjusted) LN.2 0.8057 0.0240 0.030 1.190 1.091 341 325 0.758 0.854
Children with foundational reading and number skills (reading)
LN.22a 0.4723 0.0193 0.041 1.264 1.124 875 847 0.434 0.511
Children with foundational reading and number skills (numeracy)
LN.22d 0.0066 0.0031 0.465 1.225 1.107 875 847 0.000 0.013
Protected from violence and exploitation
Birth registration PR.1 0.8986 0.0162 0.018 5.021 2.241 1,774 1,737 0.866 0.931
Violent discipline PR.2 0.8172 0.0093 0.011 1.570 1.253 2,782 2,709 0.799 0.836
Child labour PR.3 0.0778 0.0071 0.092 1.204 1.097 1,752 1,693 0.064 0.092
Child marriage (before age 15) (women) PR.4a 0.0229 0.0062 0.269 1.099 1.048 673 648 0.011 0.035
Child marriage (before age 18) (women) PR.4b 0.1150 0.0143 0.124 1.302 1.141 673 648 0.086 0.144
Crime reporting (women) PR.13 0.1179 0.0110 0.093 0.100 0.317 86 87 0.096 0.140
Crime reporting (men) PR.13 0.1408 0.0316 0.224 0.379 0.616 53 47 0.078 0.204
Safety (women) PR.14 0.5500 0.0130 0.024 2.527 1.590 3,803 3,697 0.524 0.576
Safety (men) PR.14 0.9396 0.0075 0.008 1.132 1.064 1,377 1,155 0.925 0.955
Live in a safe and clean environment
Use of basic drinking water service WS.2 0.9181 0.0080 0.009 2.268 1.506 16,169 2,687 0.902 0.934
Use of safely managed drinking water WS.6 0.2102 0.0301 0.143 2.257 1.502 2,145 348 0.150 0.270
Handwashing facility with water and soap WS.7 0.9190 0.0068 0.007 1.680 1.296 16,100 2,674 0.905 0.933
Use of improved sanitation WS.8 0.9302 0.0080 0.009 2.651 1.628 16,169 2,687 0.914 0.946
Use of basic sanitation service WS.9 0.9023 0.0079 0.009 1.898 1.378 16,169 2,687 0.887 0.918
Equitable chance in life
Children with functional dificulty EQ.1 0.2019 0.0090 0.045 1.391 1.179 2,826 2,746 0.184 0.220
Population covered by social transfers EQ.3 0.4211 0.0133 0.032 1.945 1.395 16,169 2,687 0.395 0.448
Discrimination (women) EQ.7 0.2273 0.0087 0.038 1.599 1.264 3,803 3,697 0.210 0.245
Discrimination (men) EQ.7 0.1907 0.0112 0.059 0.943 0.971 1,377 1,155 0.168 0.213
Overall life satisfaction index (women age 15-24) EQ.9a 7.4012 0.0688 0.009 1.429 1.195 1,376 1,338 7.264 7.539
Overall life satisfaction index (men age 15-24) EQ.9a 6.7724 0.1467 0.022 1.747 1.322 551 458 6.479 7.066
na: not applicable

Appendix C Estimates of Sampling Error | Page 77
Table SE.30: Sampling errors: Attock District
Standard errors, coefficients of variation, design effects (deff), square root of design effects (deft), and confidence intervals for selected SDG and other indicators, Punjab, 2017-18
Coefficient of
variation (se/r)
Square root of design
effect (deft)
Confidence limits
MICS Indicator
Value (r)
Standard error (se)
Design effect (deff)
Weighted count
Unweighted count
Lower bound r - 2se
Upper bound r + 2se
Sample coverage and characteristics of respondents
Access to electricity SR.1 0.9930 0.0025 0.003 1.299 1.140 5,987 1,401 0.988 0.998
Ownership of mobile phone (women) SR.10 0.3984 0.0161 0.040 2.231 1.494 1,407 2,056 0.366 0.431
Ownership of mobile phone (men) SR.10 0.8941 0.0103 0.012 0.788 0.888 479 704 0.874 0.915
Use of internet during last 3 months(women) SR.12a 0.0740 0.0085 0.114 2.148 1.466 1,407 2,056 0.057 0.091
Use of internet during last 3 months(men) SR.12a 0.3042 0.0206 0.068 1.416 1.190 479 704 0.263 0.345
ICT skills (women) SR.13 0.0330 0.0059 0.177 2.209 1.486 1,407 2,056 0.021 0.045
ICT skills (men) SR.13 0.1055 0.0132 0.125 1.293 1.137 479 704 0.079 0.132
Tobacco use (women) SR.14 0.0173 0.0027 0.153 0.852 0.923 1,407 2,056 0.012 0.023
Tobacco use (men) SR.14 0.2113 0.0215 0.102 1.942 1.394 479 704 0.168 0.254
Survive
Neonatal mortality rate CS.1 29 5.8 0.20 na na na na 18 41
Infant mortality rate CS.3 40 6.3 0.16 na na na na 27 52
Under-five mortality rate CS.5 48 7.9 0.16 na na na na 33 64
Thrive - Reproductive and maternal health
Total fertility rate - 3.3892 0.1321 0.039 na na na na 3.125 3.653
Adolescent birth rate TM.1 39.284 6.3530 0.162 na na na na 26.58 51.99
Contraceptive prevalence rate TM.3 0.2592 0.0139 0.054 1.335 1.155 913 1,328 0.231 0.287
Need for family planning satisfied with modern contraception TM.4 0.4638 0.0216 0.047 1.258 1.122 460 671 0.421 0.507
Antenatal care coverage (at least four times by any provider) TM.5b 0.6034 0.0293 0.049 1.501 1.225 288 419 0.545 0.662
Skilled attendant at delivery TM.9 0.7745 0.0272 0.035 1.775 1.332 288 419 0.720 0.829
Thrive - Child health, nutrition and development
Diphtheria, tetanus and pertussis (DTP) immunization coverage
TC.3 0.8535 0.0260 0.030 1.007 1.003 130 187 0.802 0.906
Pneumococcal (Conjugate) immunization coverage TC.6 0.8316 0.0264 0.032 0.929 0.964 130 187 0.779 0.884
Measles immunization coverage TC.10 0.8178 0.0283 0.035 1.001 1.000 130 187 0.761 0.874
Primary reliance on clean fuels and technologies for cooking, space heating and lighting
TC.18 0.5123 0.0360 0.070 7.263 2.695 5,987 1,401 0.440 0.584
Care-seeking for children with acute respiratory infection (ARI) symptoms
TC.19 0.7828 0.0360 0.046 0.692 0.832 65 92 0.711 0.855
Exclusive breastfeeding under 6 months TC.32 0.5262 0.0423 0.080 0.941 0.970 91 132 0.442 0.611
Stunting prevalence (moderate and severe) TC.45a 0.2263 0.0167 0.074 1.448 1.203 630 914 0.193 0.260
Wasting prevalence (moderate and severe) TC.46a 0.0561 0.0080 0.143 1.093 1.046 617 897 0.040 0.072
Overweight prevalence (moderate and severe) TC.47a 0.0227 0.0048 0.210 0.924 0.961 617 897 0.013 0.032
Early child development index TC.53 0.5639 0.0251 0.045 0.971 0.985 430 380 0.514 0.614

Appendix C Estimates of Sampling Error | Page 78
Table SE.30: Sampling errors: Attock District
Standard errors, coefficients of variation, design effects (deff), square root of design effects (deft), and confidence intervals for selected SDG and other indicators, Punjab, 2017-18
Coefficient of
variation (se/r)
Square root of design
effect (deft)
Confidence limits
MICS Indicator
Value (r)
Standard error (se)
Design effect (deff)
Weighted count
Unweighted count
Lower bound r - 2se
Upper bound r + 2se
Learn
Participation rate in organised learning (adjusted) LN.2 0.7716 0.0323 0.042 1.292 1.137 146 219 0.707 0.836
Children with foundational reading and number skills (reading)
LN.22a 0.2638 0.0241 0.091 1.206 1.098 272 405 0.216 0.312
Children with foundational reading and number skills (numeracy)
LN.22d 0.0027 0.0027 0.997 1.085 1.042 272 405 0.000 0.008
Protected from violence and exploitation
Birth registration PR.1 0.8659 0.0225 0.026 4.498 2.121 714 1,035 0.821 0.911
Violent discipline PR.2 0.8284 0.0108 0.013 1.251 1.118 1,049 1,530 0.807 0.850
Child labour PR.3 0.0581 0.0102 0.175 1.734 1.317 620 917 0.038 0.078
Child marriage (before age 15) (women) PR.4a 0.0285 0.0084 0.296 0.935 0.967 250 365 0.012 0.045
Child marriage (before age 18) (women) PR.4b 0.1412 0.0204 0.145 1.252 1.119 250 365 0.100 0.182
Crime reporting (women) PR.13 0.0573 0.0006 0.011 0.000 0.014 21 29 0.056 0.059
Crime reporting (men) PR.13 0.0000 0.0000 3 4 0.000 0.000
Safety (women) PR.14 0.5086 0.0118 0.023 1.146 1.071 1,407 2,056 0.485 0.532
Safety (men) PR.14 0.9762 0.0069 0.007 1.452 1.205 479 704 0.962 0.990
Live in a safe and clean environment
Use of basic drinking water service WS.2 0.9086 0.0168 0.018 4.739 2.177 5,987 1,401 0.875 0.942
Use of safely managed drinking water WS.6 0.5045 0.0448 0.089 1.922 1.386 795 185 0.415 0.594
Handwashing facility with water and soap WS.7 0.8785 0.0138 0.016 2.467 1.571 5,936 1,393 0.851 0.906
Use of improved sanitation WS.8 0.8666 0.0179 0.021 3.900 1.975 5,987 1,401 0.831 0.902
Use of basic sanitation service WS.9 0.8421 0.0180 0.021 3.413 1.848 5,987 1,401 0.806 0.878
Equitable chance in life
Children with functional dificulty EQ.1 0.1302 0.0086 0.066 1.004 1.002 1,048 1,535 0.113 0.147
Population covered by social transfers EQ.3 0.5219 0.0169 0.032 1.602 1.266 5,987 1,401 0.488 0.556
Discrimination (women) EQ.7 0.0829 0.0075 0.090 1.504 1.226 1,407 2,056 0.068 0.098
Discrimination (men) EQ.7 0.0905 0.0140 0.155 1.680 1.296 479 704 0.062 0.119
Overall life satisfaction index (women age 15-24) EQ.9a 7.6299 0.0852 0.011 1.479 1.216 501 735 7.459 7.800
Overall life satisfaction index (men age 15-24) EQ.9a 7.7253 0.1383 0.018 1.260 1.123 187 273 7.449 8.002
na: not applicable

Appendix C Estimates of Sampling Error | Page 79
Table SE.31: Sampling errors: Chakwal District
Standard errors, coefficients of variation, design effects (deff), square root of design effects (deft), and confidence intervals for selected SDG and other indicators, Punjab, 2017-18
Coefficient of
variation (se/r)
Square root of design
effect (deft)
Confidence limits
MICS Indicator
Value (r)
Standard error (se)
Design effect (deff)
Weighted count
Unweighted count
Lower bound r - 2se
Upper bound r + 2se
Sample coverage and characteristics of respondents
Access to electricity SR.1 0.9852 0.0054 0.006 2.868 1.694 4,645 1,410 0.974 0.996
Ownership of mobile phone (women) SR.10 0.4949 0.0164 0.033 2.032 1.426 1,092 1,897 0.462 0.528
Ownership of mobile phone (men) SR.10 0.8689 0.0218 0.025 2.381 1.543 390 571 0.825 0.913
Use of internet during last 3 months(women) SR.12a 0.0887 0.0095 0.107 2.116 1.455 1,092 1,897 0.070 0.108
Use of internet during last 3 months(men) SR.12a 0.3739 0.0237 0.064 1.373 1.172 390 571 0.326 0.421
ICT skills (women) SR.13 0.0406 0.0061 0.150 1.795 1.340 1,092 1,897 0.028 0.053
ICT skills (men) SR.13 0.1084 0.0194 0.179 2.221 1.490 390 571 0.070 0.147
Tobacco use (women) SR.14 0.0331 0.0045 0.135 1.182 1.087 1,092 1,897 0.024 0.042
Tobacco use (men) SR.14 0.2065 0.0205 0.099 1.460 1.208 390 571 0.166 0.247
Survive
Neonatal mortality rate CS.1 23 5.3 0.23 na na na na 12 33
Infant mortality rate CS.3 38 7.4 0.20 na na na na 23 53
Under-five mortality rate CS.5 43 7.8 0.18 na na na na 27 58
Thrive - Reproductive and maternal health
Total fertility rate - 2.9568 0.1376 0.047 na na na na 2.682 3.232
Adolescent birth rate TM.1 22.358 5.8357 0.261 na na na na 10.69 34.03
Contraceptive prevalence rate TM.3 0.3112 0.0137 0.044 1.022 1.011 677 1,170 0.284 0.339
Need for family planning satisfied with modern contraception TM.4 0.5409 0.0202 0.037 0.969 0.984 342 590 0.500 0.581
Antenatal care coverage (at least four times by any provider) TM.5b 0.7225 0.0288 0.040 1.335 1.155 185 323 0.665 0.780
Skilled attendant at delivery TM.9 0.8686 0.0150 0.017 0.639 0.799 185 323 0.838 0.899
Thrive - Child health, nutrition and development
Diphtheria, tetanus and pertussis (DTP) immunization coverage
TC.3 0.9036 0.0218 0.024 0.828 0.910 87 153 0.860 0.947
Pneumococcal (Conjugate) immunization coverage TC.6 0.9036 0.0218 0.024 0.828 0.910 87 153 0.860 0.947
Measles immunization coverage TC.10 0.8713 0.0292 0.034 1.155 1.075 87 153 0.813 0.930
Primary reliance on clean fuels and technologies for cooking, space heating and lighting
TC.18 0.4228 0.0319 0.075 5.879 2.425 4,645 1,410 0.359 0.487
Care-seeking for children with acute respiratory infection (ARI) symptoms
TC.19 0.7839 0.0372 0.047 0.286 0.534 21 36 0.710 0.858
Exclusive breastfeeding under 6 months TC.32 0.3960 0.0372 0.094 0.474 0.689 48 83 0.322 0.470
Stunting prevalence (moderate and severe) TC.45a 0.2371 0.0189 0.080 1.618 1.272 464 816 0.199 0.275
Wasting prevalence (moderate and severe) TC.46a 0.0805 0.0141 0.176 2.178 1.476 459 806 0.052 0.109
Overweight prevalence (moderate and severe) TC.47a 0.0334 0.0073 0.219 1.334 1.155 459 806 0.019 0.048
Early child development index TC.53 0.5625 0.0309 0.055 1.105 1.051 232 286 0.501 0.624

Appendix C Estimates of Sampling Error | Page 80
Table SE.31: Sampling errors: Chakwal District
Standard errors, coefficients of variation, design effects (deff), square root of design effects (deft), and confidence intervals for selected SDG and other indicators, Punjab, 2017-18
Coefficient of
variation (se/r)
Square root of design
effect (deft)
Confidence limits
MICS Indicator
Value (r)
Standard error (se)
Design effect (deff)
Weighted count
Unweighted count
Lower bound r - 2se
Upper bound r + 2se
Learn
Participation rate in organised learning (adjusted) LN.2 0.8751 0.0264 0.030 1.182 1.087 106 186 0.822 0.928
Children with foundational reading and number skills (reading)
LN.22a 0.5170 0.0247 0.048 1.077 1.038 248 440 0.467 0.566
Children with foundational reading and number skills (numeracy)
LN.22d 0.0559 0.0106 0.190 0.940 0.969 248 440 0.035 0.077
Protected from violence and exploitation
Birth registration PR.1 0.9412 0.0114 0.012 2.030 1.425 489 860 0.918 0.964
Violent discipline PR.2 0.8311 0.0100 0.012 0.953 0.976 763 1,344 0.811 0.851
Child labour PR.3 0.0840 0.0101 0.121 1.151 1.073 485 861 0.064 0.104
Child marriage (before age 15) (women) PR.4a 0.0200 0.0081 0.405 1.092 1.045 188 328 0.004 0.036
Child marriage (before age 18) (women) PR.4b 0.0895 0.0209 0.234 1.759 1.326 188 328 0.048 0.131
Crime reporting (women) PR.13 0.1681 0.0000 0.000 0.000 0.000 10 18 0.168 0.168
Crime reporting (men) PR.13 0.0000 0.0000 2 3 0.000 0.000
Safety (women) PR.14 0.5473 0.0151 0.028 1.742 1.320 1,092 1,897 0.517 0.578
Safety (men) PR.14 0.9790 0.0071 0.007 1.414 1.189 390 571 0.965 0.993
Live in a safe and clean environment
Use of basic drinking water service WS.2 0.9568 0.0130 0.014 5.757 2.399 4,645 1,410 0.931 0.983
Use of safely managed drinking water WS.6 0.4497 0.0411 0.091 1.749 1.323 622 182 0.367 0.532
Handwashing facility with water and soap WS.7 0.9067 0.0087 0.010 1.261 1.123 4,641 1,409 0.889 0.924
Use of improved sanitation WS.8 0.8566 0.0124 0.014 1.769 1.330 4,645 1,410 0.832 0.881
Use of basic sanitation service WS.9 0.7857 0.0149 0.019 1.847 1.359 4,645 1,410 0.756 0.815
Equitable chance in life
Children with functional dificulty EQ.1 0.1548 0.0102 0.066 1.112 1.055 791 1,398 0.134 0.175
Population covered by social transfers EQ.3 0.6151 0.0188 0.031 2.111 1.453 4,645 1,410 0.577 0.653
Discrimination (women) EQ.7 0.2014 0.0128 0.064 1.939 1.393 1,092 1,897 0.176 0.227
Discrimination (men) EQ.7 0.0830 0.0135 0.163 1.368 1.170 390 571 0.056 0.110
Overall life satisfaction index (women age 15-24) EQ.9a 7.0847 0.0687 0.010 0.771 0.878 365 636 6.947 7.222
Overall life satisfaction index (men age 15-24) EQ.9a 7.0819 0.1226 0.017 1.339 1.157 179 267 6.837 7.327
na: not applicable

Appendix C Estimates of Sampling Error | Page 81
Table SE.32: Sampling errors: Jhelum District
Standard errors, coefficients of variation, design effects (deff), square root of design effects (deft), and confidence intervals for selected SDG and other indicators, Punjab, 2017-18
Coefficient of
variation (se/r)
Square root of design
effect (deft)
Confidence limits
MICS Indicator
Value (r)
Standard error (se)
Design effect (deff)
Weighted count
Unweighted count
Lower bound r - 2se
Upper bound r + 2se
Sample coverage and characteristics of respondents
Access to electricity SR.1 0.9946 0.0024 0.002 1.078 1.038 3,824 1,031 0.990 0.999
Ownership of mobile phone (women) SR.10 0.5133 0.0155 0.030 1.493 1.222 984 1,562 0.482 0.544
Ownership of mobile phone (men) SR.10 0.8697 0.0202 0.023 1.237 1.112 312 344 0.829 0.910
Use of internet during last 3 months(women) SR.12a 0.1669 0.0163 0.097 2.966 1.722 984 1,562 0.134 0.199
Use of internet during last 3 months(men) SR.12a 0.4275 0.0239 0.056 0.802 0.895 312 344 0.380 0.475
ICT skills (women) SR.13 0.0771 0.0084 0.109 1.542 1.242 984 1,562 0.060 0.094
ICT skills (men) SR.13 0.1286 0.0215 0.167 1.417 1.190 312 344 0.086 0.172
Tobacco use (women) SR.14 0.0237 0.0046 0.192 1.399 1.183 984 1,562 0.015 0.033
Tobacco use (men) SR.14 0.2316 0.0273 0.118 1.439 1.200 312 344 0.177 0.286
Survive
Neonatal mortality rate CS.1 46 9.2 0.20 na na na na 28 65
Infant mortality rate CS.3 56 9.2 0.16 na na na na 38 74
Under-five mortality rate CS.5 61 9.6 0.16 na na na na 41 80
Thrive - Reproductive and maternal health
Total fertility rate - 3.1130 0.1662 0.053 na na na na 2.781 3.445
Adolescent birth rate TM.1 17.830 4.5022 0.253 na na na na 8.83 26.83
Contraceptive prevalence rate TM.3 0.3016 0.0165 0.055 1.192 1.092 579 924 0.269 0.335
Need for family planning satisfied with modern contraception TM.4 0.5576 0.0275 0.049 1.419 1.191 292 464 0.503 0.613
Antenatal care coverage (at least four times by any provider) TM.5b 0.8127 0.0284 0.035 1.483 1.218 178 280 0.756 0.870
Skilled attendant at delivery TM.9 0.9392 0.0114 0.012 0.637 0.798 178 280 0.916 0.962
Thrive - Child health, nutrition and development
Diphtheria, tetanus and pertussis (DTP) immunization coverage
TC.3 0.9831 0.0129 0.013 1.324 1.150 85 132 0.957 1.000
Pneumococcal (Conjugate) immunization coverage TC.6 0.9711 0.0159 0.016 1.182 1.087 85 132 0.939 1.000
Measles immunization coverage TC.10 0.9562 0.0204 0.021 1.306 1.143 85 132 0.915 0.997
Primary reliance on clean fuels and technologies for cooking, space heating and lighting
TC.18 0.5174 0.0273 0.053 3.081 1.755 3,824 1,031 0.463 0.572
Care-seeking for children with acute respiratory infection (ARI) symptoms
TC.19 0.8376 0.0655 0.078 0.695 0.833 15 23 0.707 0.969
Exclusive breastfeeding under 6 months TC.32 0.5369 0.0441 0.082 0.588 0.767 48 76 0.449 0.625
Stunting prevalence (moderate and severe) TC.45a 0.2113 0.0215 0.102 1.682 1.297 378 605 0.168 0.254
Wasting prevalence (moderate and severe) TC.46a 0.0512 0.0089 0.174 0.982 0.991 378 604 0.033 0.069
Overweight prevalence (moderate and severe) TC.47a 0.0254 0.0048 0.191 0.572 0.756 378 604 0.016 0.035
Early child development index TC.53 0.4950 0.0227 0.046 0.863 0.929 449 418 0.449 0.540

Appendix C Estimates of Sampling Error | Page 82
Table SE.32: Sampling errors: Jhelum District
Standard errors, coefficients of variation, design effects (deff), square root of design effects (deft), and confidence intervals for selected SDG and other indicators, Punjab, 2017-18
Coefficient of
variation (se/r)
Square root of design
effect (deft)
Confidence limits
MICS Indicator
Value (r)
Standard error (se)
Design effect (deff)
Weighted count
Unweighted count
Lower bound r - 2se
Upper bound r + 2se
Learn
Participation rate in organised learning (adjusted) LN.2 0.8281 0.0358 0.043 1.061 1.030 71 119 0.757 0.900
Children with foundational reading and number skills (reading)
LN.22a 0.4193 0.0220 0.053 0.656 0.810 204 330 0.375 0.463
Children with foundational reading and number skills (numeracy)
LN.22d 0.0333 0.0113 0.340 1.312 1.146 204 330 0.011 0.056
Protected from violence and exploitation
Birth registration PR.1 0.9686 0.0083 0.009 1.437 1.199 394 632 0.952 0.985
Violent discipline PR.2 0.7440 0.0117 0.016 0.690 0.831 602 968 0.721 0.767
Child labour PR.3 0.0542 0.0092 0.170 1.077 1.038 402 650 0.036 0.073
Child marriage (before age 15) (women) PR.4a 0.0000 0.0000 175 272 0.000 0.000
Child marriage (before age 18) (women) PR.4b 0.0540 0.0128 0.236 0.864 0.930 175 272 0.029 0.080
Crime reporting (women) PR.13 0.2079 0.0548 0.264 0.547 0.740 18 31 0.098 0.318
Crime reporting (men) PR.13 0.0000 0.0000 1 1 0.000 0.000
Safety (women) PR.14 0.5718 0.0216 0.038 2.986 1.728 984 1,562 0.528 0.615
Safety (men) PR.14 0.9201 0.0188 0.020 1.645 1.283 312 344 0.883 0.958
Live in a safe and clean environment
Use of basic drinking water service WS.2 0.9355 0.0119 0.013 2.405 1.551 3,824 1,031 0.912 0.959
Use of safely managed drinking water WS.6 0.5735 0.0343 0.060 0.830 0.911 530 131 0.505 0.642
Handwashing facility with water and soap WS.7 0.9409 0.0099 0.011 1.794 1.339 3,757 1,011 0.921 0.961
Use of improved sanitation WS.8 0.9163 0.0100 0.011 1.332 1.154 3,824 1,031 0.896 0.936
Use of basic sanitation service WS.9 0.8464 0.0146 0.017 1.685 1.298 3,824 1,031 0.817 0.876
Equitable chance in life
Children with functional dificulty EQ.1 0.2365 0.0133 0.056 0.975 0.988 619 1,003 0.210 0.263
Population covered by social transfers EQ.3 0.5301 0.0179 0.034 1.327 1.152 3,824 1,031 0.494 0.566
Discrimination (women) EQ.7 0.1591 0.0112 0.070 1.462 1.209 984 1,562 0.137 0.181
Discrimination (men) EQ.7 0.0946 0.0133 0.141 0.709 0.842 312 344 0.068 0.121
Overall life satisfaction index (women age 15-24) EQ.9a 6.9109 0.0980 0.014 1.534 1.238 364 568 6.715 7.107
Overall life satisfaction index (men age 15-24) EQ.9a 5.2220 0.2645 0.051 1.192 1.092 133 148 4.693 5.751
na: not applicable

Appendix C Estimates of Sampling Error | Page 83
Table SE.33: Sampling errors: Sahiwal District
Standard errors, coefficients of variation, design effects (deff), square root of design effects (deft), and confidence intervals for selected SDG and other indicators, Punjab, 2017-18
Coefficient of
variation (se/r)
Square root of design
effect (deft)
Confidence limits
MICS Indicator
Value (r)
Standard error (se)
Design effect (deff)
Weighted count
Unweighted count
Lower bound r - 2se
Upper bound r + 2se
Sample coverage and characteristics of respondents
Access to electricity SR.1 0.9718 0.0064 0.007 1.824 1.350 7,382 1,219 0.959 0.985
Ownership of mobile phone (women) SR.10 0.3439 0.0167 0.048 2.133 1.460 1,660 1,732 0.311 0.377
Ownership of mobile phone (men) SR.10 0.8682 0.0167 0.019 1.538 1.240 621 634 0.835 0.902
Use of internet during last 3 months(women) SR.12a 0.0797 0.0082 0.103 1.603 1.266 1,660 1,732 0.063 0.096
Use of internet during last 3 months(men) SR.12a 0.2453 0.0263 0.107 2.361 1.537 621 634 0.193 0.298
ICT skills (women) SR.13 0.0414 0.0048 0.117 1.024 1.012 1,660 1,732 0.032 0.051
ICT skills (men) SR.13 0.1652 0.0227 0.138 2.373 1.540 621 634 0.120 0.211
Tobacco use (women) SR.14 0.0208 0.0030 0.142 0.745 0.863 1,660 1,732 0.015 0.027
Tobacco use (men) SR.14 0.2277 0.0187 0.082 1.260 1.123 621 634 0.190 0.265
Survive
Neonatal mortality rate CS.1 47 7.4 0.16 na na na na 32 62
Infant mortality rate CS.3 66 9.7 0.15 na na na na 47 85
Under-five mortality rate CS.5 76 9.6 0.13 na na na na 57 95
Thrive - Reproductive and maternal health
Total fertility rate - 3.6499 0.1771 0.049 na na na na 3.296 4.004
Adolescent birth rate TM.1 28.211 5.7272 0.203 na na na na 16.76 39.67
Contraceptive prevalence rate TM.3 0.3989 0.0168 0.042 1.240 1.114 1,005 1,052 0.365 0.433
Need for family planning satisfied with modern contraception TM.4 0.6889 0.0207 0.030 1.088 1.043 524 545 0.647 0.730
Antenatal care coverage (at least four times by any provider) TM.5b 0.5929 0.0337 0.057 1.670 1.292 339 355 0.525 0.660
Skilled attendant at delivery TM.9 0.8439 0.0206 0.024 1.137 1.066 339 355 0.803 0.885
Thrive - Child health, nutrition and development
Diphtheria, tetanus and pertussis (DTP) immunization coverage
TC.3 0.9638 0.0112 0.012 0.689 0.830 188 194 0.941 0.986
Pneumococcal (Conjugate) immunization coverage TC.6 0.9569 0.0149 0.016 1.042 1.021 188 194 0.927 0.987
Measles immunization coverage TC.10 0.9394 0.0172 0.018 0.997 0.999 188 194 0.905 0.974
Primary reliance on clean fuels and technologies for cooking, space heating and lighting
TC.18 0.2795 0.0302 0.108 5.522 2.350 7,382 1,219 0.219 0.340
Care-seeking for children with acute respiratory infection (ARI) symptoms
TC.19 0.6302 0.0414 0.066 0.742 0.862 100 102 0.547 0.713
Exclusive breastfeeding under 6 months TC.32 0.3965 0.0438 0.111 0.802 0.896 98 101 0.309 0.484
Stunting prevalence (moderate and severe) TC.45a 0.3044 0.0201 0.066 1.695 1.302 854 887 0.264 0.345
Wasting prevalence (moderate and severe) TC.46a 0.0480 0.0066 0.138 0.847 0.920 853 885 0.035 0.061
Overweight prevalence (moderate and severe) TC.47a 0.0147 0.0045 0.305 1.227 1.108 853 885 0.006 0.024
Early child development index TC.53 0.5935 0.0319 0.054 1.491 1.221 340 354 0.530 0.657

Appendix C Estimates of Sampling Error | Page 84
Table SE.33: Sampling errors: Sahiwal District
Standard errors, coefficients of variation, design effects (deff), square root of design effects (deft), and confidence intervals for selected SDG and other indicators, Punjab, 2017-18
Coefficient of
variation (se/r)
Square root of design
effect (deft)
Confidence limits
MICS Indicator
Value (r)
Standard error (se)
Design effect (deff)
Weighted count
Unweighted count
Lower bound r - 2se
Upper bound r + 2se
Learn
Participation rate in organised learning (adjusted) LN.2 0.7194 0.0326 0.045 1.102 1.050 200 210 0.654 0.785
Children with foundational reading and number skills (reading)
LN.22a 0.2411 0.0287 0.119 2.016 1.420 427 450 0.184 0.298
Children with foundational reading and number skills (numeracy)
LN.22d 0.0950 0.0167 0.176 1.459 1.208 427 450 0.062 0.128
Protected from violence and exploitation
Birth registration PR.1 0.8868 0.0133 0.015 1.581 1.258 864 897 0.860 0.913
Violent discipline PR.2 0.8870 0.0090 0.010 1.118 1.057 1,322 1,382 0.869 0.905
Child labour PR.3 0.2037 0.0171 0.084 1.495 1.223 791 832 0.170 0.238
Child marriage (before age 15) (women) PR.4a 0.0143 0.0070 0.487 0.953 0.976 267 278 0.000 0.028
Child marriage (before age 18) (women) PR.4b 0.0892 0.0168 0.188 0.958 0.979 267 278 0.056 0.123
Crime reporting (women) PR.13 0.2018 0.0000 0.000 0.000 0.000 10 10 0.202 0.202
Crime reporting (men) PR.13 0.6122 0.0044 0.007 0.000 0.018 5 5 0.603 0.621
Safety (women) PR.14 0.7052 0.0095 0.013 0.746 0.864 1,660 1,732 0.686 0.724
Safety (men) PR.14 0.8454 0.0155 0.018 1.160 1.077 621 634 0.814 0.876
Live in a safe and clean environment
Use of basic drinking water service WS.2 0.9689 0.0122 0.013 6.004 2.450 7,382 1,219 0.945 0.993
Use of safely managed drinking water WS.6 0.5285 0.0464 0.088 1.724 1.313 960 166 0.436 0.621
Handwashing facility with water and soap WS.7 0.9291 0.0093 0.010 1.593 1.262 7,371 1,217 0.910 0.948
Use of improved sanitation WS.8 0.7846 0.0235 0.030 3.974 1.993 7,382 1,219 0.738 0.832
Use of basic sanitation service WS.9 0.6888 0.0235 0.034 3.145 1.774 7,382 1,219 0.642 0.736
Equitable chance in life
Children with functional dificulty EQ.1 0.0782 0.0089 0.114 1.508 1.228 1,303 1,364 0.060 0.096
Population covered by social transfers EQ.3 0.4704 0.0183 0.039 1.640 1.280 7,382 1,219 0.434 0.507
Discrimination (women) EQ.7 0.0348 0.0050 0.143 1.271 1.127 1,660 1,732 0.025 0.045
Discrimination (men) EQ.7 0.0653 0.0112 0.172 1.302 1.141 621 634 0.043 0.088
Overall life satisfaction index (women age 15-24) EQ.9a 4.3328 0.1293 0.030 1.885 1.373 592 617 4.074 4.591
Overall life satisfaction index (men age 15-24) EQ.9a 7.0364 0.1782 0.025 1.893 1.376 241 245 6.680 7.393
na: not applicable

Appendix C Estimates of Sampling Error | Page 85
Table SE.34: Sampling errors: Okara District
Standard errors, coefficients of variation, design effects (deff), square root of design effects (deft), and confidence intervals for selected SDG and other indicators, Punjab, 2017-18
Coefficient of
variation (se/r)
Square root of design
effect (deft)
Confidence limits
MICS Indicator
Value (r)
Standard error (se)
Design effect (deff)
Weighted count
Unweighted count
Lower bound r - 2se
Upper bound r + 2se
Sample coverage and characteristics of respondents
Access to electricity SR.1 0.9834 0.0043 0.004 1.297 1.139 9,795 1,170 0.975 0.992
Ownership of mobile phone (women) SR.10 0.3109 0.0153 0.049 1.789 1.337 2,113 1,643 0.280 0.341
Ownership of mobile phone (men) SR.10 0.8260 0.0180 0.022 1.569 1.252 804 700 0.790 0.862
Use of internet during last 3 months(women) SR.12a 0.0626 0.0101 0.162 2.879 1.697 2,113 1,643 0.042 0.083
Use of internet during last 3 months(men) SR.12a 0.1786 0.0185 0.104 1.633 1.278 804 700 0.142 0.216
ICT skills (women) SR.13 0.0275 0.0063 0.228 2.410 1.552 2,113 1,643 0.015 0.040
ICT skills (men) SR.13 0.1106 0.0135 0.122 1.286 1.134 804 700 0.084 0.137
Tobacco use (women) SR.14 0.0249 0.0047 0.190 1.513 1.230 2,113 1,643 0.015 0.034
Tobacco use (men) SR.14 0.2501 0.0139 0.056 0.720 0.849 804 700 0.222 0.278
Survive
Neonatal mortality rate CS.1 49 6.8 0.14 na na na na 36 63
Infant mortality rate CS.3 72 7.9 0.11 na na na na 56 88
Under-five mortality rate CS.5 83 8.2 0.10 na na na na 67 100
Thrive - Reproductive and maternal health
Total fertility rate - 4.2751 0.2169 0.051 na na na na 3.841 4.709
Adolescent birth rate TM.1 59.596 8.8556 0.149 na na na na 41.88 77.31
Contraceptive prevalence rate TM.3 0.2839 0.0181 0.064 1.729 1.315 1,375 1,072 0.248 0.320
Need for family planning satisfied with modern contraception TM.4 0.5655 0.0323 0.057 2.084 1.444 630 493 0.501 0.630
Antenatal care coverage (at least four times by any provider) TM.5b 0.4670 0.0280 0.060 1.270 1.127 513 405 0.411 0.523
Skilled attendant at delivery TM.9 0.7462 0.0285 0.038 1.734 1.317 513 405 0.689 0.803
Thrive - Child health, nutrition and development
Diphtheria, tetanus and pertussis (DTP) immunization coverage
TC.3 0.9461 0.0167 0.018 1.132 1.064 266 209 0.913 0.979
Pneumococcal (Conjugate) immunization coverage TC.6 0.9418 0.0172 0.018 1.119 1.058 266 209 0.907 0.976
Measles immunization coverage TC.10 0.9090 0.0304 0.033 2.323 1.524 266 209 0.848 0.970
Primary reliance on clean fuels and technologies for cooking, space heating and lighting
TC.18 0.3335 0.0370 0.111 7.190 2.681 9,795 1,170 0.260 0.407
Care-seeking for children with acute respiratory infection (ARI) symptoms
TC.19 0.6360 0.0756 0.119 1.779 1.334 95 73 0.485 0.787
Exclusive breastfeeding under 6 months TC.32 0.5588 0.0524 0.094 1.248 1.117 145 113 0.454 0.664
Stunting prevalence (moderate and severe) TC.45a 0.3123 0.0187 0.060 1.566 1.251 1,237 960 0.275 0.350
Wasting prevalence (moderate and severe) TC.46a 0.0513 0.0064 0.125 0.807 0.898 1,230 955 0.038 0.064
Overweight prevalence (moderate and severe) TC.47a 0.0134 0.0038 0.282 1.027 1.014 1,230 955 0.006 0.021
Early child development index TC.53 0.6243 0.0265 0.043 1.190 1.091 517 397 0.571 0.677

Appendix C Estimates of Sampling Error | Page 86
Table SE.34: Sampling errors: Okara District
Standard errors, coefficients of variation, design effects (deff), square root of design effects (deft), and confidence intervals for selected SDG and other indicators, Punjab, 2017-18
Coefficient of
variation (se/r)
Square root of design
effect (deft)
Confidence limits
MICS Indicator
Value (r)
Standard error (se)
Design effect (deff)
Weighted count
Unweighted count
Lower bound r - 2se
Upper bound r + 2se
Learn
Participation rate in organised learning (adjusted) LN.2 0.7516 0.0327 0.043 1.270 1.127 280 223 0.686 0.817
Children with foundational reading and number skills (reading)
LN.22a 0.2899 0.0284 0.098 1.706 1.306 549 437 0.233 0.347
Children with foundational reading and number skills (numeracy)
LN.22d 0.0230 0.0072 0.313 1.005 1.002 549 437 0.009 0.037
Protected from violence and exploitation
Birth registration PR.1 0.7965 0.0189 0.024 2.226 1.492 1,299 1,008 0.759 0.834
Violent discipline PR.2 0.8519 0.0121 0.014 1.709 1.307 1,879 1,473 0.828 0.876
Child labour PR.3 0.1783 0.0132 0.074 0.967 0.984 1,028 819 0.152 0.205
Child marriage (before age 15) (women) PR.4a 0.0534 0.0130 0.243 1.105 1.051 429 333 0.027 0.079
Child marriage (before age 18) (women) PR.4b 0.2083 0.0263 0.126 1.390 1.179 429 333 0.156 0.261
Crime reporting (women) PR.13 0.0000 0.0000 23 19 0.000 0.000
Crime reporting (men) PR.13 0.6412 0.0115 0.018 0.002 0.041 6 4 0.618 0.664
Safety (women) PR.14 0.4315 0.0117 0.027 0.917 0.958 2,113 1,643 0.408 0.455
Safety (men) PR.14 0.9847 0.0045 0.005 0.944 0.972 804 700 0.976 0.994
Live in a safe and clean environment
Use of basic drinking water service WS.2 0.9787 0.0061 0.006 2.125 1.458 9,795 1,170 0.966 0.991
Use of safely managed drinking water WS.6 0.4975 0.0440 0.089 1.514 1.230 1,328 171 0.409 0.586
Handwashing facility with water and soap WS.7 0.9219 0.0103 0.011 1.725 1.313 9,723 1,161 0.901 0.943
Use of improved sanitation WS.8 0.7294 0.0224 0.031 2.973 1.724 9,795 1,170 0.685 0.774
Use of basic sanitation service WS.9 0.6276 0.0229 0.037 2.628 1.621 9,795 1,170 0.582 0.673
Equitable chance in life
Children with functional dificulty EQ.1 0.1742 0.0102 0.059 1.032 1.016 1,813 1,424 0.154 0.195
Population covered by social transfers EQ.3 0.3411 0.0210 0.062 2.302 1.517 9,795 1,170 0.299 0.383
Discrimination (women) EQ.7 0.0406 0.0039 0.097 0.654 0.809 2,113 1,643 0.033 0.048
Discrimination (men) EQ.7 0.0291 0.0080 0.275 1.586 1.259 804 700 0.013 0.045
Overall life satisfaction index (women age 15-24) EQ.9a 7.0132 0.0733 0.010 0.843 0.918 831 648 6.867 7.160
Overall life satisfaction index (men age 15-24) EQ.9a 6.3783 0.1139 0.018 1.359 1.166 348 301 6.151 6.606
na: not applicable

Appendix C Estimates of Sampling Error | Page 87
Table SE.35: Sampling errors: Pakpattan District
Standard errors, coefficients of variation, design effects (deff), square root of design effects (deft), and confidence intervals for selected SDG and other indicators, Punjab, 2017-18
Coefficient of
variation (se/r)
Square root of design
effect (deft)
Confidence limits
MICS Indicator
Value (r)
Standard error (se)
Design effect (deff)
Weighted count
Unweighted count
Lower bound r - 2se
Upper bound r + 2se
Sample coverage and characteristics of respondents
Access to electricity SR.1 0.9464 0.0163 0.017 4.898 2.213 5,510 932 0.914 0.979
Ownership of mobile phone (women) SR.10 0.2488 0.0163 0.065 1.757 1.325 1,229 1,243 0.216 0.281
Ownership of mobile phone (men) SR.10 0.8741 0.0151 0.017 1.092 1.045 454 528 0.844 0.904
Use of internet during last 3 months(women) SR.12a 0.0401 0.0069 0.172 1.531 1.237 1,229 1,243 0.026 0.054
Use of internet during last 3 months(men) SR.12a 0.1475 0.0197 0.133 1.623 1.274 454 528 0.108 0.187
ICT skills (women) SR.13 0.0172 0.0028 0.160 0.559 0.748 1,229 1,243 0.012 0.023
ICT skills (men) SR.13 0.0843 0.0168 0.199 1.924 1.387 454 528 0.051 0.118
Tobacco use (women) SR.14 0.0338 0.0057 0.168 1.223 1.106 1,229 1,243 0.022 0.045
Tobacco use (men) SR.14 0.2173 0.0218 0.100 1.466 1.211 454 528 0.174 0.261
Survive
Neonatal mortality rate CS.1 34 7.7 0.22 na na na na 19 50
Infant mortality rate CS.3 61 8.5 0.14 na na na na 44 78
Under-five mortality rate CS.5 72 9.6 0.13 na na na na 53 91
Thrive - Reproductive and maternal health
Total fertility rate - 3.6039 0.1776 0.049 na na na na 3.249 3.959
Adolescent birth rate TM.1 36.921 9.3137 0.252 na na na na 18.29 55.55
Contraceptive prevalence rate TM.3 0.3749 0.0222 0.059 1.622 1.274 765 771 0.330 0.419
Need for family planning satisfied with modern contraception TM.4 0.6021 0.0260 0.043 1.162 1.078 408 412 0.550 0.654
Antenatal care coverage (at least four times by any provider) TM.5b 0.3828 0.0402 0.105 1.706 1.306 248 250 0.302 0.463
Skilled attendant at delivery TM.9 0.7180 0.0285 0.040 1.001 1.000 248 250 0.661 0.775
Thrive - Child health, nutrition and development
Diphtheria, tetanus and pertussis (DTP) immunization coverage
TC.3 0.9163 0.0213 0.023 0.700 0.837 119 119 0.874 0.959
Pneumococcal (Conjugate) immunization coverage TC.6 0.9081 0.0222 0.024 0.698 0.835 119 119 0.864 0.953
Measles immunization coverage TC.10 0.8586 0.0341 0.040 1.132 1.064 119 119 0.790 0.927
Primary reliance on clean fuels and technologies for cooking, space heating and lighting
TC.18 0.1310 0.0302 0.231 7.472 2.734 5,510 932 0.071 0.191
Care-seeking for children with acute respiratory infection (ARI) symptoms
TC.19 0.6450 0.0659 0.102 0.986 0.993 53 53 0.513 0.777
Exclusive breastfeeding under 6 months TC.32 0.4816 0.0569 0.118 0.856 0.925 67 67 0.368 0.595
Stunting prevalence (moderate and severe) TC.45a 0.3628 0.0204 0.056 1.150 1.073 640 638 0.322 0.404
Wasting prevalence (moderate and severe) TC.46a 0.0676 0.0113 0.167 1.285 1.133 636 634 0.045 0.090
Overweight prevalence (moderate and severe) TC.47a 0.0156 0.0058 0.371 1.385 1.177 636 634 0.004 0.027
Early child development index TC.53 0.6307 0.0266 0.042 0.839 0.916 278 278 0.578 0.684

Appendix C Estimates of Sampling Error | Page 88
Table SE.35: Sampling errors: Pakpattan District
Standard errors, coefficients of variation, design effects (deff), square root of design effects (deft), and confidence intervals for selected SDG and other indicators, Punjab, 2017-18
Coefficient of
variation (se/r)
Square root of design
effect (deft)
Confidence limits
MICS Indicator
Value (r)
Standard error (se)
Design effect (deff)
Weighted count
Unweighted count
Lower bound r - 2se
Upper bound r + 2se
Learn
Participation rate in organised learning (adjusted) LN.2 0.7451 0.0323 0.043 0.851 0.923 152 156 0.681 0.810
Children with foundational reading and number skills (reading)
LN.22a 0.3780 0.0295 0.078 1.218 1.104 323 330 0.319 0.437
Children with foundational reading and number skills (numeracy)
LN.22d 0.0479 0.0112 0.233 0.900 0.949 323 330 0.026 0.070
Protected from violence and exploitation
Birth registration PR.1 0.8295 0.0201 0.024 1.842 1.357 647 645 0.789 0.870
Violent discipline PR.2 0.8202 0.0169 0.021 1.972 1.404 1,005 1,015 0.786 0.854
Child labour PR.3 0.1848 0.0137 0.074 0.766 0.875 608 620 0.157 0.212
Child marriage (before age 15) (women) PR.4a 0.0364 0.0071 0.196 0.324 0.569 222 224 0.022 0.051
Child marriage (before age 18) (women) PR.4b 0.1637 0.0248 0.152 1.005 1.002 222 224 0.114 0.213
Crime reporting (women) PR.13 0.0983 0.0129 0.131 0.019 0.137 11 11 0.072 0.124
Crime reporting (men) PR.13 0.0000 0.0000 4 5 0.000 0.000
Safety (women) PR.14 0.5530 0.0177 0.032 1.574 1.255 1,229 1,243 0.518 0.588
Safety (men) PR.14 0.9603 0.0092 0.010 1.180 1.086 454 528 0.942 0.979
Live in a safe and clean environment
Use of basic drinking water service WS.2 0.9797 0.0061 0.006 1.744 1.321 5,510 932 0.968 0.992
Use of safely managed drinking water WS.6 0.4288 0.0570 0.133 1.823 1.350 713 116 0.315 0.543
Handwashing facility with water and soap WS.7 0.9187 0.0127 0.014 2.023 1.422 5,502 931 0.893 0.944
Use of improved sanitation WS.8 0.6941 0.0238 0.034 2.475 1.573 5,510 932 0.647 0.742
Use of basic sanitation service WS.9 0.5827 0.0245 0.042 2.307 1.519 5,510 932 0.534 0.632
Equitable chance in life
Children with functional dificulty EQ.1 0.1115 0.0095 0.086 0.932 0.966 1,005 1,016 0.092 0.131
Population covered by social transfers EQ.3 0.4841 0.0228 0.047 1.941 1.393 5,510 932 0.438 0.530
Discrimination (women) EQ.7 0.0582 0.0065 0.111 0.945 0.972 1,229 1,243 0.045 0.071
Discrimination (men) EQ.7 0.0471 0.0116 0.247 1.591 1.262 454 528 0.024 0.070
Overall life satisfaction index (women age 15-24) EQ.9a 6.1788 0.1495 0.024 1.436 1.198 465 470 5.880 6.478
Overall life satisfaction index (men age 15-24) EQ.9a 6.7541 0.1610 0.024 1.087 1.043 177 205 6.432 7.076
na: not applicable

Appendix C Estimates of Sampling Error | Page 89
Table SE.36: Sampling errors: Sargodha District
Standard errors, coefficients of variation, design effects (deff), square root of design effects (deft), and confidence intervals for selected SDG and other indicators, Punjab, 2017-18
Coefficient of
variation (se/r)
Square root of design
effect (deft)
Confidence limits
MICS Indicator
Value (r)
Standard error (se)
Design effect (deff)
Weighted count
Unweighted count
Lower bound r - 2se
Upper bound r + 2se
Sample coverage and characteristics of respondents
Access to electricity SR.1 0.9815 0.0044 0.005 1.528 1.236 12,037 1,406 0.973 0.990
Ownership of mobile phone (women) SR.10 0.3489 0.0137 0.039 1.689 1.300 2,763 2,038 0.321 0.376
Ownership of mobile phone (men) SR.10 0.8782 0.0149 0.017 1.518 1.232 1,022 731 0.848 0.908
Use of internet during last 3 months(women) SR.12a 0.0817 0.0107 0.131 3.096 1.760 2,763 2,038 0.060 0.103
Use of internet during last 3 months(men) SR.12a 0.1972 0.0192 0.097 1.704 1.305 1,022 731 0.159 0.236
ICT skills (women) SR.13 0.0386 0.0071 0.183 2.732 1.653 2,763 2,038 0.024 0.053
ICT skills (men) SR.13 0.1190 0.0134 0.112 1.248 1.117 1,022 731 0.092 0.146
Tobacco use (women) SR.14 0.0418 0.0052 0.124 1.358 1.165 2,763 2,038 0.032 0.052
Tobacco use (men) SR.14 0.2832 0.0183 0.065 1.209 1.100 1,022 731 0.247 0.320
Survive
Neonatal mortality rate CS.1 53 6.6 0.12 na na na na 40 66
Infant mortality rate CS.3 72 7.7 0.11 na na na na 56 87
Under-five mortality rate CS.5 78 8.1 0.10 na na na na 62 94
Thrive - Reproductive and maternal health
Total fertility rate - 3.6305 0.1307 0.036 na na na na 3.369 3.892
Adolescent birth rate TM.1 37.405 5.9857 0.160 na na na na 25.43 49.38
Contraceptive prevalence rate TM.3 0.3434 0.0139 0.041 1.096 1.047 1,733 1,276 0.316 0.371
Need for family planning satisfied with modern contraception TM.4 0.5477 0.0184 0.034 0.902 0.950 898 662 0.511 0.584
Antenatal care coverage (at least four times by any provider) TM.5b 0.4932 0.0271 0.055 1.256 1.121 580 429 0.439 0.547
Skilled attendant at delivery TM.9 0.8330 0.0193 0.023 1.151 1.073 580 429 0.794 0.872
Thrive - Child health, nutrition and development
Diphtheria, tetanus and pertussis (DTP) immunization coverage
TC.3 0.9652 0.0105 0.011 0.715 0.846 306 220 0.944 0.986
Pneumococcal (Conjugate) immunization coverage TC.6 0.9508 0.0133 0.014 0.823 0.907 306 220 0.924 0.977
Measles immunization coverage TC.10 0.9207 0.0178 0.019 0.953 0.976 306 220 0.885 0.956
Primary reliance on clean fuels and technologies for cooking, space heating and lighting
TC.18 0.4233 0.0364 0.086 7.628 2.762 12,037 1,406 0.350 0.496
Care-seeking for children with acute respiratory infection (ARI) symptoms
TC.19 0.8192 0.0338 0.041 0.439 0.662 77 58 0.752 0.887
Exclusive breastfeeding under 6 months TC.32 0.3805 0.0311 0.082 0.440 0.663 144 108 0.318 0.443
Stunting prevalence (moderate and severe) TC.45a 0.2828 0.0145 0.051 1.009 1.004 1,338 976 0.254 0.312
Wasting prevalence (moderate and severe) TC.46a 0.0779 0.0082 0.105 0.903 0.950 1,327 968 0.062 0.094
Overweight prevalence (moderate and severe) TC.47a 0.0124 0.0033 0.264 0.841 0.917 1,327 968 0.006 0.019
Early child development index TC.53 0.5587 0.0268 0.048 1.201 1.096 565 412 0.505 0.612

Appendix C Estimates of Sampling Error | Page 90
Table SE.36: Sampling errors: Sargodha District
Standard errors, coefficients of variation, design effects (deff), square root of design effects (deft), and confidence intervals for selected SDG and other indicators, Punjab, 2017-18
Coefficient of
variation (se/r)
Square root of design
effect (deft)
Confidence limits
MICS Indicator
Value (r)
Standard error (se)
Design effect (deff)
Weighted count
Unweighted count
Lower bound r - 2se
Upper bound r + 2se
Learn
Participation rate in organised learning (adjusted) LN.2 0.8147 0.0296 0.036 1.534 1.238 340 265 0.755 0.874
Children with foundational reading and number skills (reading)
LN.22a 0.2930 0.0227 0.077 1.047 1.023 567 423 0.248 0.338
Children with foundational reading and number skills (numeracy)
LN.22d 0.0511 0.0115 0.226 1.158 1.076 567 423 0.028 0.074
Protected from violence and exploitation
Birth registration PR.1 0.8758 0.0109 0.012 1.127 1.062 1,422 1,038 0.854 0.898
Violent discipline PR.2 0.7679 0.0129 0.017 1.442 1.201 2,102 1,550 0.742 0.794
Child labour PR.3 0.0989 0.0122 0.123 1.564 1.251 1,256 939 0.074 0.123
Child marriage (before age 15) (women) PR.4a 0.0292 0.0068 0.232 0.601 0.775 501 372 0.016 0.043
Child marriage (before age 18) (women) PR.4b 0.1565 0.0196 0.125 1.081 1.040 501 372 0.117 0.196
Crime reporting (women) PR.13 0.0924 0.0041 0.044 0.004 0.063 28 21 0.084 0.101
Crime reporting (men) PR.13 0.0000 0.0000 1 1 0.000 0.000
Safety (women) PR.14 0.5454 0.0138 0.025 1.564 1.251 2,763 2,038 0.518 0.573
Safety (men) PR.14 0.9604 0.0096 0.010 1.781 1.334 1,022 731 0.941 0.980
Live in a safe and clean environment
Use of basic drinking water service WS.2 0.9894 0.0022 0.002 0.642 0.801 12,037 1,406 0.985 0.994
Use of safely managed drinking water WS.6 0.4388 0.0379 0.086 1.240 1.113 1,565 188 0.363 0.515
Handwashing facility with water and soap WS.7 0.9681 0.0056 0.006 1.449 1.204 12,029 1,405 0.957 0.979
Use of improved sanitation WS.8 0.8117 0.0178 0.022 2.908 1.705 12,037 1,406 0.776 0.847
Use of basic sanitation service WS.9 0.6540 0.0196 0.030 2.388 1.545 12,037 1,406 0.615 0.693
Equitable chance in life
Children with functional dificulty EQ.1 0.1093 0.0104 0.095 1.715 1.310 2,092 1,550 0.089 0.130
Population covered by social transfers EQ.3 0.6040 0.0137 0.023 1.108 1.053 12,037 1,406 0.577 0.631
Discrimination (women) EQ.7 0.1048 0.0084 0.080 1.534 1.239 2,763 2,038 0.088 0.122
Discrimination (men) EQ.7 0.0768 0.0103 0.135 1.100 1.049 1,022 731 0.056 0.098
Overall life satisfaction index (women age 15-24) EQ.9a 7.1316 0.1091 0.015 1.487 1.219 1,070 792 6.913 7.350
Overall life satisfaction index (men age 15-24) EQ.9a 4.8482 0.1387 0.029 1.349 1.161 461 331 4.571 5.126
na: not applicable

Appendix C Estimates of Sampling Error | Page 91
Table SE.37: Sampling errors: Bhakkar District
Standard errors, coefficients of variation, design effects (deff), square root of design effects (deft), and confidence intervals for selected SDG and other indicators, Punjab, 2017-18
Coefficient of
variation (se/r)
Square root of design
effect (deft)
Confidence limits
MICS Indicator
Value (r)
Standard error (se)
Design effect (deff)
Weighted count
Unweighted count
Lower bound r - 2se
Upper bound r + 2se
Sample coverage and characteristics of respondents
Access to electricity SR.1 0.9653 0.0074 0.008 2.086 1.444 5,789 1,271 0.950 0.980
Ownership of mobile phone (women) SR.10 0.2258 0.0113 0.050 1.432 1.197 1,284 1,960 0.203 0.248
Ownership of mobile phone (men) SR.10 0.8834 0.0165 0.019 1.493 1.222 473 566 0.850 0.916
Use of internet during last 3 months(women) SR.12a 0.0463 0.0116 0.250 5.948 2.439 1,284 1,960 0.023 0.069
Use of internet during last 3 months(men) SR.12a 0.2462 0.0250 0.101 1.900 1.378 473 566 0.196 0.296
ICT skills (women) SR.13 0.0178 0.0057 0.320 3.620 1.903 1,284 1,960 0.006 0.029
ICT skills (men) SR.13 0.1120 0.0155 0.139 1.371 1.171 473 566 0.081 0.143
Tobacco use (women) SR.14 0.1287 0.0124 0.096 2.683 1.638 1,284 1,960 0.104 0.153
Tobacco use (men) SR.14 0.1891 0.0229 0.121 1.937 1.392 473 566 0.143 0.235
Survive
Neonatal mortality rate CS.1 56 9.3 0.17 na na na na 37 74
Infant mortality rate CS.3 74 10.1 0.14 na na na na 54 94
Under-five mortality rate CS.5 78 10.2 0.13 na na na na 58 99
Thrive - Reproductive and maternal health
Total fertility rate - 4.1530 0.1858 0.045 na na na na 3.781 4.525
Adolescent birth rate TM.1 45.605 7.1496 0.157 na na na na 31.31 59.90
Contraceptive prevalence rate TM.3 0.3348 0.0127 0.038 0.892 0.945 805 1,229 0.309 0.360
Need for family planning satisfied with modern contraception TM.4 0.5793 0.0232 0.040 1.313 1.146 390 594 0.533 0.626
Antenatal care coverage (at least four times by any provider) TM.5b 0.3429 0.0187 0.055 0.666 0.816 284 430 0.305 0.380
Skilled attendant at delivery TM.9 0.7263 0.0208 0.029 0.932 0.965 284 430 0.685 0.768
Thrive - Child health, nutrition and development
Diphtheria, tetanus and pertussis (DTP) immunization coverage
TC.3 0.8479 0.0306 0.036 1.505 1.227 138 208 0.787 0.909
Pneumococcal (Conjugate) immunization coverage TC.6 0.8479 0.0306 0.036 1.505 1.227 138 208 0.787 0.909
Measles immunization coverage TC.10 0.8093 0.0336 0.042 1.517 1.232 138 208 0.742 0.877
Primary reliance on clean fuels and technologies for cooking, space heating and lighting
TC.18 0.0716 0.0152 0.212 4.413 2.101 5,789 1,271 0.041 0.102
Care-seeking for children with acute respiratory infection (ARI) symptoms
TC.19 0.6784 0.0417 0.061 0.653 0.808 54 83 0.595 0.762
Exclusive breastfeeding under 6 months TC.32 0.3004 0.0340 0.113 0.638 0.798 78 117 0.232 0.368
Stunting prevalence (moderate and severe) TC.45a 0.3684 0.0180 0.049 1.476 1.215 703 1,059 0.332 0.404
Wasting prevalence (moderate and severe) TC.46a 0.0832 0.0109 0.130 1.620 1.273 697 1,051 0.062 0.105
Overweight prevalence (moderate and severe) TC.47a 0.0090 0.0029 0.320 0.975 0.987 697 1,051 0.003 0.015
Early child development index TC.53 0.6157 0.0215 0.035 0.876 0.936 296 450 0.573 0.659

Appendix C Estimates of Sampling Error | Page 92
Table SE.37: Sampling errors: Bhakkar District
Standard errors, coefficients of variation, design effects (deff), square root of design effects (deft), and confidence intervals for selected SDG and other indicators, Punjab, 2017-18
Coefficient of
variation (se/r)
Square root of design
effect (deft)
Confidence limits
MICS Indicator
Value (r)
Standard error (se)
Design effect (deff)
Weighted count
Unweighted count
Lower bound r - 2se
Upper bound r + 2se
Learn
Participation rate in organised learning (adjusted) LN.2 0.7239 0.0425 0.059 2.560 1.600 181 284 0.639 0.809
Children with foundational reading and number skills (reading)
LN.22a 0.2671 0.0221 0.083 1.012 1.006 265 407 0.223 0.311
Children with foundational reading and number skills (numeracy)
LN.22d 0.1707 0.0197 0.115 1.113 1.055 265 407 0.131 0.210
Protected from violence and exploitation
Birth registration PR.1 0.6831 0.0215 0.032 2.339 1.529 725 1,094 0.640 0.726
Violent discipline PR.2 0.8813 0.0086 0.010 1.117 1.057 1,039 1,581 0.864 0.899
Child labour PR.3 0.2871 0.0167 0.058 1.252 1.119 595 915 0.254 0.321
Child marriage (before age 15) (women) PR.4a 0.0492 0.0109 0.222 0.851 0.922 221 335 0.027 0.071
Child marriage (before age 18) (women) PR.4b 0.1934 0.0257 0.133 1.409 1.187 221 335 0.142 0.245
Crime reporting (women) PR.13 0.1419 0.0260 0.183 0.106 0.325 13 20 0.090 0.194
Crime reporting (men) PR.13 0.3266 0.0000 0.000 0.000 0.000 2 3 0.327 0.327
Safety (women) PR.14 0.4326 0.0155 0.036 1.922 1.387 1,284 1,960 0.402 0.464
Safety (men) PR.14 0.9716 0.0088 0.009 1.602 1.266 473 566 0.954 0.989
Live in a safe and clean environment
Use of basic drinking water service WS.2 0.9992 0.0008 0.001 1.039 1.019 5,789 1,271 0.998 1.000
Use of safely managed drinking water WS.6 0.7013 0.0386 0.055 1.763 1.328 752 187 0.624 0.779
Handwashing facility with water and soap WS.7 0.9012 0.0118 0.013 1.991 1.411 5,789 1,271 0.878 0.925
Use of improved sanitation WS.8 0.7574 0.0262 0.035 4.732 2.175 5,789 1,271 0.705 0.810
Use of basic sanitation service WS.9 0.5921 0.0260 0.044 3.560 1.887 5,789 1,271 0.540 0.644
Equitable chance in life
Children with functional dificulty EQ.1 0.1705 0.0096 0.056 1.031 1.015 1,032 1,576 0.151 0.190
Population covered by social transfers EQ.3 0.6425 0.0202 0.031 2.249 1.500 5,789 1,271 0.602 0.683
Discrimination (women) EQ.7 0.1276 0.0080 0.062 1.118 1.058 1,284 1,960 0.112 0.144
Discrimination (men) EQ.7 0.0294 0.0072 0.244 1.014 1.007 473 566 0.015 0.044
Overall life satisfaction index (women age 15-24) EQ.9a 7.0786 0.1033 0.015 2.023 1.422 497 759 6.872 7.285
Overall life satisfaction index (men age 15-24) EQ.9a 8.2634 0.1051 0.013 1.085 1.042 206 246 8.053 8.474
na: not applicable

Appendix C Estimates of Sampling Error | Page 93
Table SE.38: Sampling errors: Khushab District
Standard errors, coefficients of variation, design effects (deff), square root of design effects (deft), and confidence intervals for selected SDG and other indicators, Punjab, 2017-18
Coefficient of
variation (se/r)
Square root of design
effect (deft)
Confidence limits
MICS Indicator
Value (r)
Standard error (se)
Design effect (deff)
Weighted count
Unweighted count
Lower bound r - 2se
Upper bound r + 2se
Sample coverage and characteristics of respondents
Access to electricity SR.1 0.9296 0.0142 0.015 2.848 1.687 4,294 929 0.901 0.958
Ownership of mobile phone (women) SR.10 0.2994 0.0184 0.061 2.158 1.469 988 1,342 0.263 0.336
Ownership of mobile phone (men) SR.10 0.9024 0.0143 0.016 1.029 1.014 353 441 0.874 0.931
Use of internet during last 3 months(women) SR.12a 0.0666 0.0085 0.128 1.569 1.253 988 1,342 0.050 0.084
Use of internet during last 3 months(men) SR.12a 0.1569 0.0207 0.132 1.426 1.194 353 441 0.115 0.198
ICT skills (women) SR.13 0.0420 0.0060 0.143 1.206 1.098 988 1,342 0.030 0.054
ICT skills (men) SR.13 0.0857 0.0136 0.159 1.043 1.021 353 441 0.058 0.113
Tobacco use (women) SR.14 0.0601 0.0080 0.133 1.525 1.235 988 1,342 0.044 0.076
Tobacco use (men) SR.14 0.1903 0.0243 0.128 1.688 1.299 353 441 0.142 0.239
Survive
Neonatal mortality rate CS.1 53 9.3 0.17 na na na na 35 72
Infant mortality rate CS.3 72 11.2 0.16 na na na na 50 94
Under-five mortality rate CS.5 86 12.2 0.14 na na na na 61 110
Thrive - Reproductive and maternal health
Total fertility rate - 3.2670 0.1922 0.059 na na na na 2.882 3.651
Adolescent birth rate TM.1 30.533 7.2988 0.239 na na na na 15.94 45.13
Contraceptive prevalence rate TM.3 0.2854 0.0145 0.051 0.852 0.923 606 825 0.256 0.314
Need for family planning satisfied with modern contraception TM.4 0.5074 0.0293 0.058 1.476 1.215 316 430 0.449 0.566
Antenatal care coverage (at least four times by any provider) TM.5b 0.3873 0.0363 0.094 1.492 1.221 194 269 0.315 0.460
Skilled attendant at delivery TM.9 0.7626 0.0325 0.043 1.564 1.251 194 269 0.698 0.828
Thrive - Child health, nutrition and development
Diphtheria, tetanus and pertussis (DTP) immunization coverage
TC.3 0.9172 0.0212 0.023 0.719 0.848 91 123 0.875 0.960
Pneumococcal (Conjugate) immunization coverage TC.6 0.9071 0.0233 0.026 0.783 0.885 91 123 0.861 0.954
Measles immunization coverage TC.10 0.8667 0.0294 0.034 0.915 0.957 91 123 0.808 0.926
Primary reliance on clean fuels and technologies for cooking, space heating and lighting
TC.18 0.2103 0.0325 0.155 5.911 2.431 4,294 929 0.145 0.275
Care-seeking for children with acute respiratory infection (ARI) symptoms
TC.19 0.7069 0.0402 0.057 0.484 0.695 48 63 0.627 0.787
Exclusive breastfeeding under 6 months TC.32 0.4344 0.0453 0.104 0.651 0.807 59 79 0.344 0.525
Stunting prevalence (moderate and severe) TC.45a 0.3333 0.0249 0.075 1.695 1.302 455 609 0.284 0.383
Wasting prevalence (moderate and severe) TC.46a 0.1243 0.0135 0.109 1.012 1.006 451 605 0.097 0.151
Overweight prevalence (moderate and severe) TC.47a 0.0109 0.0047 0.433 1.241 1.114 451 605 0.001 0.020
Early child development index TC.53 0.5473 0.0249 0.045 0.682 0.826 206 274 0.498 0.597

Appendix C Estimates of Sampling Error | Page 94
Table SE.38: Sampling errors: Khushab District
Standard errors, coefficients of variation, design effects (deff), square root of design effects (deft), and confidence intervals for selected SDG and other indicators, Punjab, 2017-18
Coefficient of
variation (se/r)
Square root of design
effect (deft)
Confidence limits
MICS Indicator
Value (r)
Standard error (se)
Design effect (deff)
Weighted count
Unweighted count
Lower bound r - 2se
Upper bound r + 2se
Learn
Participation rate in organised learning (adjusted) LN.2 0.7026 0.0388 0.055 1.044 1.022 102 146 0.625 0.780
Children with foundational reading and number skills (reading)
LN.22a 0.2886 0.0251 0.087 1.000 1.000 235 328 0.239 0.339
Children with foundational reading and number skills (numeracy)
LN.22d 0.0372 0.0091 0.246 0.763 0.873 235 328 0.019 0.056
Protected from violence and exploitation
Birth registration PR.1 0.8647 0.0188 0.022 1.989 1.410 493 659 0.827 0.902
Violent discipline PR.2 0.7416 0.0174 0.023 1.574 1.255 734 998 0.707 0.776
Child labour PR.3 0.1567 0.0145 0.092 0.949 0.974 429 598 0.128 0.186
Child marriage (before age 15) (women) PR.4a 0.0427 0.0125 0.292 0.937 0.968 184 247 0.018 0.068
Child marriage (before age 18) (women) PR.4b 0.1547 0.0268 0.173 1.352 1.163 184 247 0.101 0.208
Crime reporting (women) PR.13 0.0631 0.0033 0.052 0.003 0.054 12 17 0.056 0.070
Crime reporting (men) PR.13 0.3755 0.0000 0.000 0.000 0.000 2 2 0.376 0.376
Safety (women) PR.14 0.4828 0.0189 0.039 1.924 1.387 988 1,342 0.445 0.521
Safety (men) PR.14 0.9805 0.0079 0.008 1.433 1.197 353 441 0.965 0.996
Live in a safe and clean environment
Use of basic drinking water service WS.2 0.8992 0.0195 0.022 3.879 1.969 4,294 929 0.860 0.938
Use of safely managed drinking water WS.6 0.2596 0.0457 0.176 1.408 1.187 589 107 0.168 0.351
Handwashing facility with water and soap WS.7 0.7106 0.0196 0.028 1.716 1.310 4,254 920 0.671 0.750
Use of improved sanitation WS.8 0.6773 0.0239 0.035 2.429 1.558 4,294 929 0.629 0.725
Use of basic sanitation service WS.9 0.5859 0.0266 0.045 2.701 1.643 4,294 929 0.533 0.639
Equitable chance in life
Children with functional dificulty EQ.1 0.1330 0.0086 0.065 0.638 0.799 724 989 0.116 0.150
Population covered by social transfers EQ.3 0.5632 0.0152 0.027 0.870 0.933 4,294 929 0.533 0.594
Discrimination (women) EQ.7 0.1580 0.0107 0.068 1.164 1.079 988 1,342 0.136 0.179
Discrimination (men) EQ.7 0.0487 0.0127 0.260 1.530 1.237 353 441 0.023 0.074
Overall life satisfaction index (women age 15-24) EQ.9a 6.3675 0.1213 0.019 1.449 1.204 359 487 6.125 6.610
Overall life satisfaction index (men age 15-24) EQ.9a 4.3382 0.1312 0.030 0.990 0.995 144 181 4.076 4.601
na: not applicable

Appendix C Estimates of Sampling Error | Page 95
Table SE.39: Sampling errors: Mianwali District
Standard errors, coefficients of variation, design effects (deff), square root of design effects (deft), and confidence intervals for selected SDG and other indicators, Punjab, 2017-18
Coefficient of
variation (se/r)
Square root of design
effect (deft)
Confidence limits
MICS Indicator
Value (r)
Standard error (se)
Design effect (deff)
Weighted count
Unweighted count
Lower bound r - 2se
Upper bound r + 2se
Sample coverage and characteristics of respondents
Access to electricity SR.1 0.9802 0.0038 0.004 1.095 1.046 4,959 1,443 0.973 0.988
Ownership of mobile phone (women) SR.10 0.2851 0.0200 0.070 4.244 2.060 1,128 2,169 0.245 0.325
Ownership of mobile phone (men) SR.10 0.8887 0.0126 0.014 1.051 1.025 408 652 0.863 0.914
Use of internet during last 3 months(women) SR.12a 0.0488 0.0076 0.157 2.731 1.652 1,128 2,169 0.034 0.064
Use of internet during last 3 months(men) SR.12a 0.2714 0.0262 0.097 2.268 1.506 408 652 0.219 0.324
ICT skills (women) SR.13 0.0168 0.0032 0.192 1.360 1.166 1,128 2,169 0.010 0.023
ICT skills (men) SR.13 0.1048 0.0158 0.151 1.735 1.317 408 652 0.073 0.136
Tobacco use (women) SR.14 0.0581 0.0064 0.111 1.634 1.278 1,128 2,169 0.045 0.071
Tobacco use (men) SR.14 0.2477 0.0174 0.070 1.063 1.031 408 652 0.213 0.283
Survive
Neonatal mortality rate CS.1 49 7.0 0.14 na na na na 35 63
Infant mortality rate CS.3 66 7.6 0.12 na na na na 51 81
Under-five mortality rate CS.5 79 9.0 0.11 na na na na 61 97
Thrive - Reproductive and maternal health
Total fertility rate - 3.7061 0.1681 0.045 na na na na 3.370 4.042
Adolescent birth rate TM.1 30.841 5.4696 0.177 na na na na 19.90 41.78
Contraceptive prevalence rate TM.3 0.2476 0.0171 0.069 2.169 1.473 718 1,383 0.213 0.282
Need for family planning satisfied with modern contraception TM.4 0.4876 0.0236 0.048 1.405 1.185 329 631 0.440 0.535
Antenatal care coverage (at least four times by any provider) TM.5b 0.5356 0.0355 0.066 2.335 1.528 239 461 0.465 0.607
Skilled attendant at delivery TM.9 0.8263 0.0236 0.029 1.784 1.336 239 461 0.779 0.873
Thrive - Child health, nutrition and development
Diphtheria, tetanus and pertussis (DTP) immunization coverage
TC.3 0.9357 0.0224 0.024 1.921 1.386 120 232 0.891 0.980
Pneumococcal (Conjugate) immunization coverage TC.6 0.9357 0.0224 0.024 1.921 1.386 120 232 0.891 0.980
Measles immunization coverage TC.10 0.9267 0.0266 0.029 2.401 1.549 120 232 0.874 0.980
Primary reliance on clean fuels and technologies for cooking, space heating and lighting
TC.18 0.1224 0.0196 0.160 5.152 2.270 4,959 1,443 0.083 0.162
Care-seeking for children with acute respiratory infection (ARI) symptoms
TC.19 0.7158 0.0488 0.068 0.855 0.925 39 74 0.618 0.813
Exclusive breastfeeding under 6 months TC.32 0.3376 0.0253 0.075 0.344 0.587 63 121 0.287 0.388
Stunting prevalence (moderate and severe) TC.45a 0.2687 0.0168 0.063 1.557 1.248 563 1,083 0.235 0.302
Wasting prevalence (moderate and severe) TC.46a 0.0817 0.0081 0.099 0.930 0.964 554 1,066 0.065 0.098
Overweight prevalence (moderate and severe) TC.47a 0.0131 0.0039 0.298 1.255 1.120 554 1,066 0.005 0.021
Early child development index TC.53 0.5530 0.0275 0.050 1.344 1.159 228 439 0.498 0.608

Appendix C Estimates of Sampling Error | Page 96
Table SE.39: Sampling errors: Mianwali District
Standard errors, coefficients of variation, design effects (deff), square root of design effects (deft), and confidence intervals for selected SDG and other indicators, Punjab, 2017-18
Coefficient of
variation (se/r)
Square root of design
effect (deft)
Confidence limits
MICS Indicator
Value (r)
Standard error (se)
Design effect (deff)
Weighted count
Unweighted count
Lower bound r - 2se
Upper bound r + 2se
Learn
Participation rate in organised learning (adjusted) LN.2 0.7701 0.0360 0.047 1.720 1.312 117 236 0.698 0.842
Children with foundational reading and number skills (reading)
LN.22a 0.3899 0.0300 0.077 1.654 1.286 231 439 0.330 0.450
Children with foundational reading and number skills (numeracy)
LN.22d 0.2163 0.0164 0.076 0.696 0.834 231 439 0.183 0.249
Protected from violence and exploitation
Birth registration PR.1 0.8234 0.0173 0.021 2.315 1.522 584 1,124 0.789 0.858
Violent discipline PR.2 0.8607 0.0087 0.010 1.031 1.015 850 1,626 0.843 0.878
Child labour PR.3 0.1625 0.0166 0.102 1.896 1.377 493 935 0.129 0.196
Child marriage (before age 15) (women) PR.4a 0.0318 0.0088 0.278 1.033 1.016 213 408 0.014 0.049
Child marriage (before age 18) (women) PR.4b 0.1292 0.0187 0.145 1.266 1.125 213 408 0.092 0.167
Crime reporting (women) PR.13 0.1886 0.0000 0.000 0.000 0.000 3 6 0.189 0.189
Crime reporting (men) PR.13 0.1918 0.0000 0.000 0.000 0.000 3 5 0.192 0.192
Safety (women) PR.14 0.4835 0.0164 0.034 2.325 1.525 1,128 2,169 0.451 0.516
Safety (men) PR.14 0.9228 0.0160 0.017 2.349 1.533 408 652 0.891 0.955
Live in a safe and clean environment
Use of basic drinking water service WS.2 0.9613 0.0114 0.012 5.071 2.252 4,959 1,443 0.938 0.984
Use of safely managed drinking water WS.6 0.5672 0.0414 0.073 1.810 1.345 651 186 0.484 0.650
Handwashing facility with water and soap WS.7 0.8986 0.0128 0.014 2.572 1.604 4,941 1,438 0.873 0.924
Use of improved sanitation WS.8 0.8273 0.0168 0.020 2.837 1.684 4,959 1,443 0.794 0.861
Use of basic sanitation service WS.9 0.6645 0.0191 0.029 2.365 1.538 4,959 1,443 0.626 0.703
Equitable chance in life
Children with functional dificulty EQ.1 0.0909 0.0076 0.084 1.135 1.065 846 1,613 0.076 0.106
Population covered by social transfers EQ.3 0.6538 0.0174 0.027 1.930 1.389 4,959 1,443 0.619 0.689
Discrimination (women) EQ.7 0.0402 0.0058 0.145 1.903 1.379 1,128 2,169 0.029 0.052
Discrimination (men) EQ.7 0.0427 0.0085 0.198 1.143 1.069 408 652 0.026 0.060
Overall life satisfaction index (women age 15-24) EQ.9a 6.7787 0.0929 0.014 1.578 1.256 419 805 6.593 6.964
Overall life satisfaction index (men age 15-24) EQ.9a 6.3090 0.1564 0.025 1.997 1.413 175 280 5.996 6.622
na: not applicable

Appendix D Data Quality| Page 97
APPENDIX D DATA QUALITY
D.1 AGE DISTRIBUTION
Table DQ.1.1: Age distribution of household population
Single-year age distribution of household population, by sex, Punjab, 2017-18
Males Females Transgender
Males Females Transgender
Num
be
r
Pe
rce
nt
Num
be
r
Pe
rce
nt
Num
ber
Pe
rce
nt
Num
be
r
Pe
rce
nt
Num
be
r
Pe
rce
nt
Num
be
r
Pe
rce
nt
Age Age
0 4,463 2.7 4,235 2.6 - - 45 1,701 1.0 1,493 0.9 - -
1 4,302 2.6 4,040 2.5 - - 46 1,228 0.7 1,148 0.7 - -
2 4,302 2.6 4,007 2.5 - - 47 1,252 0.8 1,297 0.8 - -
3 4,415 2.7 4,275 2.6 - - 48 1,469 0.9 1,429 0.9 - -
4 4,138 2.5 3,913 2.4 - - 49 1,141 0.7 766 0.5 - -
5 4,540 2.7 4,319 2.7 - - 50 1,645 1.0 2,211 1.4 2 5.3
6 4,240 2.6 4,039 2.5 1 2.1 51 1,273 0.8 1,272 0.8 1 3.2
7 4,521 2.7 4,478 2.8 1 2.6 52 1,427 0.9 1,635 1.0 3 6.9
8 4,237 2.6 4,226 2.6 - - 53 1,422 0.9 1,594 1.0 - -
9 4,017 2.4 3,799 2.3 - - 54 1,143 0.7 903 0.6 - -
10 4,222 2.5 3,797 2.3 1 1.9 55 1,466 0.9 1,384 0.9 2 4.6
11 3,603 2.2 3,398 2.1 - - 56 934 0.6 766 0.5 - -
12 4,077 2.5 3,857 2.4 1 2.9 57 923 0.6 754 0.5 - -
13 3,498 2.1 3,387 2.1 - - 58 928 0.6 1,081 0.7 1 3.7
14 3,630 2.2 3,641 2.2 - - 59 712 0.4 588 0.4 1 1.3
15 3,282 2.0 3,086 1.9 2 4.3 60 1,472 0.9 1,454 0.9 3 7.0
16 3,356 2.0 3,025 1.9 - - 61 746 0.4 617 0.4 1 2.0
17 3,394 2.0 2,950 1.8 - - 62 902 0.5 806 0.5 - -
18 3,698 2.2 3,593 2.2 1 1.3 63 794 0.5 721 0.4 - -
19 3,140 1.9 2,992 1.8 1 2.1 64 591 0.4 466 0.3 2 3.9
20 3,317 2.0 3,391 2.1 5 12.9 65 982 0.6 865 0.5 1 1.8
21 2,768 1.7 2,727 1.7 1 1.3 66 524 0.3 471 0.3 - -
22 3,173 1.9 3,225 2.0 1 1.9 67 482 0.3 476 0.3 - -
23 2,680 1.6 2,834 1.8 - - 68 642 0.4 589 0.4 - -
24 2,564 1.5 2,611 1.6 - - 69 400 0.2 343 0.2 - -
25 3,093 1.9 3,509 2.2 2 3.9 70 876 0.5 880 0.5 1 2.3
26 2,425 1.5 2,555 1.6 1 1.8 71 449 0.3 353 0.2 - -
27 2,450 1.5 2,658 1.6 1 1.3 72 414 0.2 343 0.2 - -
28 2,605 1.6 2,776 1.7 - - 73 366 0.2 338 0.2 - -
29 2,299 1.4 2,224 1.4 - - 74 257 0.2 201 0.1 1 3.4
30 2,910 1.8 3,150 1.9 - - 75 403 0.2 347 0.2 - -
31 2,031 1.2 1,960 1.2 1 2.0 76 221 0.1 149 0.1 - -
32 2,207 1.3 2,332 1.4 - - 77 229 0.1 145 0.1 - -
33 1,859 1.1 2,013 1.2 - - 78 262 0.2 231 0.1 - -
34 1,802 1.1 1,690 1.0 - - 79 174 0.1 134 0.1 - -
35 2,517 1.5 2,725 1.7 - - 80 357 0.2 362 0.2 1 3.2
36 2,013 1.2 1,892 1.2 - - 81 129 0.1 79 0.0 - -
37 1,975 1.2 1,880 1.2 3 6.2 82 122 0.1 98 0.1 - -
38 2,000 1.2 2,211 1.4 - - 83 103 0.1 78 0.0 - -
39 1,541 0.9 1,508 0.9 - - 84 66 0.0 47 0.0 - -
40 2,110 1.3 2,129 1.3 1 1.8 85+ 532 0.3 512 0.3 1 1.3
41 1,338 0.8 1,231 0.8 - - - -
42 1,493 0.9 1,528 0.9 - - DK/
Missing 38 (0.0) 51 0.0 - -
43 1,428 0.9 1,613 1.0 - -
44 1,184 0.7 978 0.6 - - Total 166,054 100 161,886 100.0 40 100.0
( ) Figures that are based on 25-49 unweighted cases
‘ - ‘ denotes 0 unweighted case in that cell or in the denominator

Appendix D Data Quality| Page 98
Table DQ.1.2W: Age distribution of eligible and interviewed women
Household population of women age 10-54 years, interviewed women age 15-49 years, and percentage of eligible women who were interviewed, by five-year age groups, Punjab, 2017-18
Household population of women age 10-54 years
Interviewed women age 15-49 years
Percentage of eligible women
interviewed (Completion rate) Number Number Percent
Age
10-14 18,080 na na na
15-19 15,647 14,447 19.6 92.3
20-24 14,789 13,561 18.4 91.7
25-29 13,722 12,573 17.1 91.6
30-34 11,144 10,477 14.2 94.0
35-39 10,216 9,667 13.1 94.6
40-44 7,480 7,087 9.6 94.7
45-49 6,133 5,773 7.8 94.1
50-54 7,614 na na na
Punjab (15-49) 79,130 73,586 100.0 93.0
Ratios
10-14 to 15-19 1.16 na na na
50-54 to 45-49 1.24 na na na
na: not applicable
Table DQ.1.2M: Age distribution of eligible and interviewed men
Household population of men age 10-54 years, in all households and in households selected for men's interviews, interviewed men age 15-49 years, and percentage of eligible men who were interviewed, by five-year age groups, Punjab, 2017-18
Household population of men age 10-54 years
Interviewed men age 15-49 years
Percentage of eligible men interviewed
(Completion rate)
In all households
In selected households
Number Number Number Percent
Age
10-14 19,030 9,596 na na na
15-19 16,870 8,305 6,132 22.5 73.8
20-24 14,502 7,244 4,887 17.9 67.5
25-29 12,872 6,403 4,348 16.0 67.9
30-34 10,810 5,352 3,591 13.2 67.1
35-39 10,046 5,126 3,500 12.8 68.3
40-44 7,553 3,747 2,497 9.2 66.7
45-49 6,791 3,316 2,284 8.4 68.9
50-54 6,911 3,451 na na na
Punjab (15-49) 79,443 39,494 27,238 100.0 69.0
Ratios
10-14 to 15-19 1.13 1.16 na na na
50-54 to 45-49 1.02 1.04 na na na
na: not applicable

Appendix D Data Quality| Page 99
Table DQ.1.3: Age distribution of young children in households and under-5 questionnaires
Household population of children age 0-7 years, children age 0-4 years whose mothers/caretakers were interviewed, and percentage of under-5 children whose mothers/caretakers were interviewed, by single years of age, Punjab, 2017-18
Household population of children 0-7 years
Under-5s with completed interviews
Percentage of eligible under-5s with completed
interviews (Completion rate) Number Number Percent
Age
0 8,698 7,985 20.2 91.8 1 8,342 7,821 19.8 93.8 2 8,309 7,808 19.8 94.0 3 8,690 8,194 20.8 94.3 4 8,051 7,646 19.4 95.0 5 8,859 na na na 6 8,280 na na na 7 9,000 na na na
Punjab (0-4) 42,090 39,454 100.0 93.7 Ratios
Ratio of 2 to 1 1.00 na na na Ratio of 5 to 4 1.10 na na na
na: not applicable
Table DQ.1.4: Age distribution of children age 3-20 in households and 5-17 questionnaires
Number of households with at least one member age 3-20 years, percent distribution of children selected for interview and number and percent of children age 5-17 years whose mothers/caretakers were interviewed, by single years of age, Punjab, 2017-18
Number of households with at
least one household
member age 3-20 years
Percent distribution of children selected for
interviewA
5-17s with completed interviews
Percentage of eligible 5-17s with completed
interviews (Completion rate) Number Percent
Age
3 8,422 na na na na 4 7,773 na na na na 5 8,591 10.7 3,800 10.7 95.8 6 8,050 9.6 3,417 9.7 95.8 7 8,844 9.3 3,304 9.3 95.6 8 8,323 8.0 2,822 8.0 95.8 9 7,663 7.0 2,497 7.1 96.7 10 7,873 7.0 2,484 7.0 96.0 11 6,927 6.0 2,138 6.0 96.0 12 7,803 7.2 2,556 7.2 95.7 13 6,821 6.4 2,251 6.4 95.6 14 7,188 7.1 2,507 7.1 95.2 15 6,304 6.7 2,367 6.7 95.3 16 6,311 7.3 2,561 7.2 95.5 17 6,261 7.6 2,661 7.5 94.5 18 7,023 na na na na 19 5,933 na na na na 20 6,390 na na na na
Punjab (5-17) 96,959 na na na na
Ratios
Ratio of 4 to 5 0.9 na na na na Ratio of 6 to 7 0.91 1.03 na na na Ratio of 15 to14 0.88 0.35 na na na Ratio of 18 to 17 1.12 na na na na
A Number of cases are used to calculate the ‘Ratio of 6 to 7’ and ‘Ratio of 15 to14 na: not applicable

Appendix D Data Quality| Page 100
D.2 BIRTH DATE REPORTING
Table DQ.2.1: Birth date reporting (household population)
Percent distribution of household population by completeness of date of birth information, Punjab, 2017-18
Completeness of reporting of date of birth and age
Total
Number of household members
Year and month of
birth
Year of birth and
age Year of
birth only Age only Missing/ DK/Other
Punjab 85.4 11.3 0.0 3.1 0.2 100.0 327,980
Area of Residence
Rural 83.6 12.3 0.0 3.8 0.2 100.0 208,708 All Urban 88.4 9.5 0.0 1.9 0.2 100.0 119,272
Major Cities 91.1 7.5 0.0 1.3 0.1 100.0 64,987 Other Urban 85.3 11.9 0.0 2.6 0.3 100.0 54,285
Age
0-4 98.7 0.7 0.0 0.5 0.1 100.0 42,090 5-14 95.9 2.7 0.0 1.2 0.2 100.0 79,530 15-24 90.4 6.0 0.0 3.3 0.3 100.0 61,817 25-49 81.4 14.4 0.0 4.0 0.2 100.0 96,772 50-64 61.4 32.9 0.0 5.6 0.1 100.0 32,647 65-84 51.1 40.9 0.0 7.9 0.2 100.0 13,991 85+ 40.7 43.3 0.0 15.7 0.3 100.0 1,044 DK/Missing 0.0 0.0 15.5 0.0 84.5 100.0 89
Division
Bahawalpur 79.9 15.3 0.0 4.3 0.5 100.0 32,793 D.G.Khan 80.1 15.9 0.0 3.9 0.2 100.0 30,783 Faisalabad 93.6 4.8 0.0 1.5 0.1 100.0 41,202 Gujranwala 88.8 8.4 0.0 2.5 0.3 100.0 48,643 Lahore 89.1 9.3 0.0 1.5 0.1 100.0 56,304 Multan 83.2 13.6 0.0 3.0 0.1 100.0 37,864 Rawalpindi 82.1 13.0 0.0 4.6 0.2 100.0 30,625 Sahiwal 82.6 14.8 0.0 2.4 0.2 100.0 22,687 Sargodha 80.8 12.0 0.0 6.7 0.5 100.0 27,079
District
Bahawalpur 80.4 15.3 0.0 4.2 0.1 100.0 10,271 Bahawalnagar 80.6 14.0 0.0 5.1 0.3 100.0 9,005 RY Khan 79.1 16.1 0.0 4.0 0.8 100.0 13,518 DG Khan 78.4 14.1 0.0 7.2 0.2 100.0 7,552 Layyah 89.6 8.8 0.0 1.6 0.0 100.0 5,534 Muzaffargarh 79.7 16.9 0.0 3.3 0.1 100.0 12,258 Rajanpur 73.5 23.4 0.0 2.8 0.3 100.0 5,439 Faisalabad 95.1 3.7 0.0 1.3 0.0 100.0 22,091 Chiniot 97.0 2.7 0.0 0.3 0.0 100.0 4,027 Jhang 90.3 7.1 0.0 2.3 0.3 100.0 8,455 TT Singh 91.0 6.9 0.0 2.0 0.1 100.0 6,630 Gujranwala 89.2 9.4 0.0 1.3 0.1 100.0 15,368 Gujrat 88.6 7.5 0.0 3.2 0.7 100.0 8,599 Hafizabad 87.8 8.8 0.0 3.2 0.2 100.0 3,552 Mandi Bahauddin 89.6 7.7 0.0 2.3 0.4 100.0 4,764 Narowal 87.4 9.9 0.0 2.7 0.0 100.0 5,271 Sialkot 89.2 7.2 0.0 3.4 0.2 100.0 11,090 Lahore 92.2 7.5 0.0 0.3 0.0 100.0 31,662 Kasur 86.5 11.5 0.0 1.9 0.1 100.0 10,478 Nankana Sahib 97.3 1.7 0.0 0.8 0.1 100.0 4,087 Sheikhupura 78.6 16.0 0.0 5.2 0.3 100.0 10,076 Multan 84.7 13.0 0.0 2.1 0.2 100.0 14,504 Khanewal 77.5 14.6 0.0 7.7 0.2 100.0 9,459 Lodhran 89.9 9.0 0.0 1.0 0.1 100.0 4,937 Vehari 83.1 16.1 0.0 0.7 0.0 100.0 8,965 Rawalpindi 82.8 10.7 0.0 6.2 0.3 100.0 16,169 Attock 77.2 17.7 0.0 4.9 0.2 100.0 5,987 Chakwal 83.3 14.6 0.0 2.0 0.1 100.0 4,645 Jhelum 85.3 13.6 0.0 1.0 0.1 100.0 3,824 Sahiwal 89.8 9.2 0.0 1.0 0.0 100.0 7,382 Okara 77.5 19.4 0.0 3.1 0.0 100.0 9,795 Pakpattan 82.1 14.0 0.0 3.4 0.5 100.0 5,510 Sargodha 81.5 8.3 0.0 9.5 0.7 100.0 12,037 Bhakkar 78.9 18.4 0.0 2.6 0.1 100.0 5,789 Khushab 72.4 16.6 0.0 10.3 0.7 100.0 4,294 Mianwali 88.8 9.5 0.0 1.5 0.2 100.0 4,959

Appendix D Data Quality| Page 101
Table DQ.2.2W: Birth date and age reporting (women)
Percent distribution of women age 15-49 years by completeness of date of birth/age information, Punjab, 2017-18
Completeness of reporting of date of birth and age
Total Number of
women
Year and month of
birth Year of birth
and age Year of
birth only Age only Missing/ DK/Other
Punjab 84.4 11.5 0.0 4.0 0.2 100.0 74,010
Area of Residence
Rural 81.4 13.1 0.0 5.3 0.2 100.0 45,668 All Urban 89.3 8.8 0.0 1.8 0.1 100.0 28,342
Major Cities 92.3 6.5 0.0 1.2 0.1 100.0 15,563 Other Urban 85.6 11.6 0.0 2.6 0.2 100.0 12,778
Age
15-19 92.3 4.9 0.0 2.5 0.2 100.0 14,541 20-24 85.9 9.2 0.0 4.8 0.2 100.0 13,633 25-29 84.6 10.2 0.0 5.0 0.2 100.0 12,625 30-34 85.5 9.9 0.0 4.5 0.1 100.0 10,544 35-39 80.6 15.2 0.0 4.1 0.1 100.0 9,726 40-44 77.7 18.9 0.0 3.2 0.2 100.0 7,125 45-49 73.3 23.3 0.0 3.3 0.1 100.0 5,815
Division
Bahawalpur 78.8 15.3 0.0 5.6 0.3 100.0 6,976 D.G.Khan 72.3 21.9 0.0 5.8 0.1 100.0 6,167 Faisalabad 93.3 4.9 0.0 1.8 0.0 100.0 9,398 Gujranwala 89.3 7.8 0.0 2.7 0.3 100.0 11,596 Lahore 87.8 10.0 0.0 2.0 0.1 100.0 13,099 Multan 81.5 13.6 0.0 4.8 0.1 100.0 8,324 Rawalpindi 87.0 9.4 0.0 3.5 0.1 100.0 7,285 Sahiwal 79.2 17.3 0.0 3.3 0.2 100.0 5,003 Sargodha 78.1 11.3 0.0 10.1 0.5 100.0 6,163
District
Bahawalpur 80.9 14.5 0.0 4.5 0.1 100.0 2,229 Bahawalnagar 77.5 14.8 0.0 7.2 0.5 100.0 1,966 RY Khan 77.9 16.4 0.0 5.4 0.2 100.0 2,781 DG Khan 68.3 21.2 0.0 10.3 0.2 100.0 1,457 Layyah 86.6 10.5 0.0 2.9 0.0 100.0 1,186 Muzaffargarh 70.7 23.6 0.0 5.6 0.0 100.0 2,489 Rajanpur 65.1 31.6 0.0 3.3 0.0 100.0 1,035 Faisalabad 95.3 3.3 0.0 1.4 0.0 100.0 5,108 Chiniot 97.5 1.9 0.0 0.5 0.0 100.0 857 Jhang 88.4 8.6 0.0 2.9 0.1 100.0 1,832 TT Singh 90.4 7.3 0.0 2.3 0.0 100.0 1,601 Gujranwala 87.5 10.8 0.0 1.6 0.1 100.0 3,649 Gujrat 91.2 5.6 0.0 2.5 0.7 100.0 2,134 Hafizabad 88.7 9.1 0.0 2.3 0.0 100.0 808 Mandi Bahauddin 89.4 7.0 0.0 3.1 0.5 100.0 1,139 Narowal 89.4 7.6 0.0 2.9 0.0 100.0 1,179 Sialkot 90.1 5.4 0.0 4.3 0.2 100.0 2,687 Lahore 92.2 7.6 0.0 0.2 0.0 100.0 7,599 Kasur 84.0 13.2 0.0 2.6 0.2 100.0 2,312 Nankana Sahib 97.9 1.3 0.0 0.8 0.0 100.0 907 Sheikhupura 73.1 18.4 0.0 8.1 0.3 100.0 2,281 Multan 85.4 11.9 0.0 2.5 0.1 100.0 3,173 Khanewal 71.6 15.0 0.0 13.4 0.1 100.0 2,141 Lodhran 90.0 8.7 0.0 1.2 0.2 100.0 1,003 Vehari 81.6 17.2 0.0 1.2 0.0 100.0 2,007 Rawalpindi 87.4 7.9 0.0 4.6 0.1 100.0 3,803 Attock 82.0 13.9 0.0 3.9 0.2 100.0 1,407 Chakwal 88.9 10.0 0.0 1.1 0.0 100.0 1,092 Jhelum 90.5 8.4 0.0 1.0 0.1 100.0 984 Sahiwal 91.6 6.9 0.0 1.5 0.0 100.0 1,660 Okara 69.2 27.2 0.0 3.6 0.0 100.0 2,113 Pakpattan 79.7 14.3 0.0 5.1 0.8 100.0 1,229 Sargodha 78.4 5.9 0.0 14.8 0.9 100.0 2,763 Bhakkar 72.0 20.8 0.0 7.1 0.1 100.0 1,284 Khushab 73.9 15.5 0.0 10.3 0.3 100.0 988 Mianwali 88.1 10.1 0.0 1.8 0.0 100.0 1,128

Appendix D Data Quality| Page 102
Table DQ.2.2M: Birth date and age reporting (men)
Percent distribution of men age 15-49 years by completeness of date of birth/age information, Punjab, 2017-18
Completeness of reporting of date of birth and age
Total Number of
men
Year and month of
birth
Year of birth and
age Year of
birth only Age only Missing/ DK/Other
Punjab 89.7 9.0 0.0 1.2 0.1 100.0 27,094
Area of Residence
Rural 87.5 10.9 0.0 1.6 0.1 100.0 16,748 All Urban 93.2 6.1 0.0 0.6 0.1 100.0 10,346
Major Cities 95.7 3.6 0.0 0.5 0.1 100.0 5,779 Other Urban 90.0 9.3 0.0 0.8 0.0 100.0 4,567
Age
15-19 94.7 3.7 0.0 1.6 0.1 100.0 6,146 20-24 94.6 4.0 0.0 1.4 0.1 100.0 4,841 25-29 94.1 4.9 0.0 0.9 0.1 100.0 4,300 30-34 92.4 6.5 0.0 1.0 0.1 100.0 3,581 35-39 82.7 16.3 0.0 1.0 0.0 100.0 3,478 40-44 79.4 19.3 0.0 1.3 0.1 100.0 2,479 45-49 74.8 24.0 0.0 1.2 0.0 100.0 2,269
Division
Bahawalpur 82.8 14.7 0.0 2.5 0.0 100.0 2,614 D.G.Khan 79.2 19.1 0.0 1.7 0.1 100.0 2,306 Faisalabad 95.9 3.5 0.0 0.6 0.0 100.0 3,485 Gujranwala 93.5 5.5 0.0 0.9 0.1 100.0 3,900 Lahore 92.6 6.6 0.0 0.8 0.1 100.0 4,948 Multan 85.6 12.8 0.0 1.5 0.1 100.0 3,147 Rawalpindi 93.3 5.5 0.0 1.2 0.1 100.0 2,558 Sahiwal 88.4 10.7 0.0 0.8 0.2 100.0 1,880 Sargodha 88.3 9.7 0.0 1.9 0.1 100.0 2,256
District
Bahawalpur 81.9 16.8 0.0 1.3 0.0 100.0 822 Bahawalnagar 84.2 13.5 0.0 2.3 0.0 100.0 738 RY Khan 82.5 14.0 0.0 3.5 0.0 100.0 1,054 DG Khan 83.2 12.9 0.0 3.6 0.2 100.0 540 Layyah 88.5 10.0 0.0 1.4 0.0 100.0 442 Muzaffargarh 76.5 22.3 0.0 1.2 0.0 100.0 932 Rajanpur 69.4 30.3 0.0 0.3 0.0 100.0 393 Faisalabad 96.5 2.9 0.0 0.6 0.0 100.0 1,924 Chiniot 97.3 2.4 0.0 0.3 0.0 100.0 334 Jhang 95.1 4.6 0.0 0.3 0.0 100.0 674 TT Singh 93.5 5.2 0.0 1.3 0.0 100.0 552 Gujranwala 92.8 6.4 0.0 0.8 0.0 100.0 1,293 Gujrat 96.8 2.6 0.0 0.6 0.0 100.0 646 Hafizabad 92.1 6.5 0.0 1.3 0.0 100.0 288 Mandi Bahauddin 93.1 6.0 0.0 0.6 0.2 100.0 375 Narowal 93.5 6.3 0.0 0.2 0.0 100.0 414 Sialkot 92.8 5.3 0.0 1.7 0.2 100.0 883 Lahore 96.8 2.8 0.0 0.3 0.1 100.0 2,835 Kasur 90.7 9.3 0.0 0.0 0.0 100.0 868 Nankana Sahib 97.7 1.9 0.0 0.4 0.0 100.0 349 Sheikhupura 78.9 17.7 0.0 3.3 0.1 100.0 895 Multan 89.5 9.7 0.0 0.6 0.1 100.0 1,217 Khanewal 81.2 14.6 0.0 4.3 0.0 100.0 818 Lodhran 87.9 11.6 0.0 0.4 0.0 100.0 397 Vehari 82.7 16.8 0.0 0.5 0.0 100.0 715 Rawalpindi 94.2 4.4 0.0 1.3 0.1 100.0 1,377 Attock 87.8 10.5 0.0 1.5 0.2 100.0 479 Chakwal 94.2 5.0 0.0 0.8 0.0 100.0 390 Jhelum 96.3 2.8 0.0 0.7 0.2 100.0 312 Sahiwal 92.8 6.7 0.0 0.5 0.0 100.0 621 Okara 86.5 13.4 0.0 0.1 0.0 100.0 804 Pakpattan 85.9 11.2 0.0 2.3 0.6 100.0 454 Sargodha 90.0 7.2 0.0 2.8 0.0 100.0 1,022 Bhakkar 81.9 17.6 0.0 0.5 0.0 100.0 473 Khushab 84.1 12.5 0.0 2.9 0.5 100.0 353 Mianwali 95.2 4.5 0.0 0.3 0.0 100.0 408

Appendix D Data Quality| Page 103
Table DQ.2.3: Birth date reporting (live births)
Percent distribution of first and most recent live births to women age 15-49 years by completeness of date of birth (unimputed), Punjab, 2017-18
Completeness of reporting of date of birth
Date of first live birth
Total
Number of first
live births
Date of last birth
Total
Number of most recent
live births
Year
and m
onth
of
birth
Year
of birth
only
Com
ple
ted y
ears
sin
ce f
irst birth
only
Mis
sin
g/ D
K/O
ther
Year
and m
onth
of
birth
Year
of birth
only
Mis
sin
g/D
K/O
ther
Punjab 96.1 3.4 0.1 0.5 100.0 43,285 97.6 2.3 0.1 100.0 36,614
Area of Residence
Rural 95.5 3.9 0.1 0.5 100.0 27,102 97.3 2.6 0.1 100.0 23,009
All Urban 97.0 2.5 0.0 0.5 100.0 16,183 98.0 1.9 0.1 100.0 13,606
Major Cities 97.6 2.0 0.0 0.3 100.0 8,853 98.4 1.6 0.0 100.0 7,436
Other Urban 96.3 3.1 0.0 0.6 100.0 7,330 97.6 2.3 0.1 100.0 6,169
Division
Bahawalpur 91.8 7.7 0.2 0.4 100.0 4,202 94.8 4.9 0.3 100.0 3,610
D.G.Khan 93.2 6.3 0.1 0.4 100.0 3,992 97.2 2.8 0.1 100.0 3,418
Faisalabad 97.8 1.7 0.1 0.5 100.0 5,424 98.2 1.8 0.1 100.0 4,548
Gujranwala 95.5 3.7 0.2 0.7 100.0 6,449 97.3 2.5 0.1 100.0 5,450
Lahore 96.8 2.7 0.1 0.4 100.0 7,606 97.5 2.4 0.1 100.0 6,494
Multan 98.0 1.9 0.0 0.1 100.0 5,027 98.5 1.5 0.0 100.0 4,281
Rawalpindi 95.6 3.8 0.0 0.7 100.0 4,147 97.3 2.6 0.1 100.0 3,405
Sahiwal 98.5 1.1 0.0 0.4 100.0 2,885 98.7 1.3 0.0 100.0 2,435
Sargodha 97.5 2.0 0.0 0.6 100.0 3,553 99.0 1.0 0.0 100.0 2,974
District
Bahawalpur 93.1 6.3 0.1 0.5 100.0 1,363 95.0 5.0 0.0 100.0 1,160
Bahawalnagar 96.2 3.6 0.0 0.3 100.0 1,119 98.5 1.4 0.1 100.0 952
RY Khan 87.9 11.4 0.4 0.3 100.0 1,720 92.3 7.1 0.6 100.0 1,499
DG Khan 92.6 7.0 0.1 0.3 100.0 984 95.9 4.0 0.1 100.0 817
Layyah 99.1 0.5 0.0 0.5 100.0 718 99.6 0.4 0.0 100.0 614
Muzaffargarh 94.8 4.5 0.1 0.6 100.0 1,601 98.4 1.6 0.0 100.0 1,398
Rajanpur 84.1 15.5 0.1 0.3 100.0 688 93.6 6.3 0.2 100.0 589
Faisalabad 98.3 1.0 0.0 0.7 100.0 2,865 98.6 1.4 0.0 100.0 2,381
Chiniot 98.9 0.8 0.0 0.3 100.0 535 99.0 1.0 0.0 100.0 449
Jhang 96.6 3.3 0.0 0.2 100.0 1,149 97.2 2.7 0.1 100.0 965
TT Singh 96.9 2.6 0.4 0.1 100.0 875 97.7 2.0 0.3 100.0 754
Gujranwala 94.7 4.9 0.0 0.5 100.0 2,025 96.3 3.7 0.0 100.0 1,709
Gujrat 95.3 3.5 0.0 1.2 100.0 1,179 97.5 2.5 0.0 100.0 969
Hafizabad 94.0 5.6 0.0 0.5 100.0 485 96.1 3.7 0.1 100.0 421
Mandi Bahauddin 96.7 2.7 0.0 0.7 100.0 641 97.3 2.6 0.1 100.0 542
Narowal 92.9 6.2 0.0 0.9 100.0 655 97.9 2.1 0.0 100.0 559
Sialkot 97.8 0.9 0.8 0.4 100.0 1,464 98.8 0.7 0.5 100.0 1,250
Lahore 97.8 2.0 0.0 0.2 100.0 4,384 98.1 1.8 0.0 100.0 3,760
Kasur 96.5 3.2 0.1 0.2 100.0 1,338 97.3 2.7 0.0 100.0 1,140
Nankana Sahib 98.9 0.4 0.1 0.6 100.0 524 99.6 0.4 0.0 100.0 451
Sheikhupura 93.1 5.3 0.1 1.4 100.0 1,361 94.9 5.0 0.2 100.0 1,143
Multan 98.7 1.2 0.1 0.1 100.0 1,932 99.5 0.5 0.0 100.0 1,630
Khanewal 96.7 3.2 0.0 0.2 100.0 1,279 96.8 3.2 0.0 100.0 1,086
Lodhran 99.2 0.8 0.0 0.0 100.0 633 99.8 0.2 0.0 100.0 540
Vehari 97.7 2.1 0.0 0.2 100.0 1,183 98.1 1.9 0.0 100.0 1,025
Rawalpindi 95.9 3.6 0.0 0.5 100.0 2,161 97.5 2.5 0.1 100.0 1,778
Attock 92.1 7.2 0.0 0.7 100.0 837 95.9 4.1 0.0 100.0 699
Chakwal 97.9 1.7 0.0 0.4 100.0 619 98.5 1.4 0.1 100.0 504
Jhelum 96.8 1.6 0.0 1.6 100.0 530 97.7 2.3 0.0 100.0 424
Sahiwal 99.4 0.4 0.0 0.2 100.0 922 99.5 0.5 0.0 100.0 788
Okara 97.8 1.6 0.0 0.5 100.0 1,273 98.1 1.9 0.0 100.0 1,066
Pakpattan 98.6 1.1 0.0 0.3 100.0 690 99.0 1.0 0.0 100.0 581
Sargodha 98.6 1.1 0.0 0.3 100.0 1,625 99.4 0.6 0.0 100.0 1,371
Bhakkar 97.1 1.5 0.0 1.4 100.0 747 99.7 0.3 0.0 100.0 626
Khushab 94.3 5.3 0.0 0.4 100.0 550 96.6 3.4 0.0 100.0 450
Mianwali 97.7 1.9 0.0 0.4 100.0 631 99.3 0.7 0.0 100.0 527

Appendix D Data Quality| Page 104
Table DQ.2.4: Birth date and age reporting (children under age 5 years)
Percent distribution children under 5 by completeness of date of birth/age information, Punjab, 2017-18
Completeness of reporting of date of birth and age
Total Number of
children under 5 Year and
month of birth Year of birth
and age Year of birth
only Age only
Punjab 100.0 0.0 0.0 0.0 100.0 39,799
Area of Residence
Rural 100.0 0.0 0.0 0.0 100.0 26,190 All Urban 100.0 0.0 0.0 0.0 100.0 13,609
Major Cities 100.0 0.0 0.0 0.0 100.0 7,118 Other Urban 99.9 0.1 0.0 0.0 100.0 6,491
Age
0 100.0 0.0 0.0 0.0 100.0 8,104 1 100.0 0.0 0.0 0.0 100.0 7,894 2 100.0 0.0 0.0 0.0 100.0 7,870 3 100.0 0.0 0.0 0.0 100.0 8,247 4 99.9 0.1 0.0 0.0 100.0 7,683
Division
Bahawalpur 99.9 0.1 0.0 0.0 100.0 4,141 D.G.Khan 99.9 0.1 0.0 0.0 100.0 4,445 Faisalabad 100.0 0.0 0.0 0.0 100.0 4,943 Gujranwala 100.0 0.0 0.0 0.0 100.0 5,744 Lahore 100.0 0.0 0.0 0.0 100.0 6,534 Multan 100.0 0.0 0.0 0.0 100.0 4,586 Rawalpindi 100.0 0.0 0.0 0.0 100.0 3,372 Sahiwal 99.9 0.1 0.0 0.0 100.0 2,810 Sargodha 100.0 0.0 0.0 0.0 100.0 3,225
District
Bahawalpur 100.0 0.0 0.0 0.0 100.0 1,257 Bahawalnagar 99.9 0.1 0.0 0.0 100.0 1,062 RY Khan 99.8 0.2 0.0 0.0 100.0 1,821 DG Khan 99.8 0.2 0.0 0.0 100.0 1,153 Layyah 100.0 0.0 0.0 0.0 100.0 723 Muzaffargarh 100.0 0.0 0.0 0.0 100.0 1,694 Rajanpur 100.0 0.0 0.0 0.0 100.0 875 Faisalabad 100.0 0.0 0.0 0.0 100.0 2,530 Chiniot 100.0 0.0 0.0 0.0 100.0 498 Jhang 100.0 0.0 0.0 0.0 100.0 1,122 TT Singh 100.0 0.0 0.0 0.0 100.0 793 Gujranwala 100.0 0.0 0.0 0.0 100.0 1,844 Gujrat 100.0 0.0 0.0 0.0 100.0 960 Hafizabad 100.0 0.0 0.0 0.0 100.0 425 Mandi Bahauddin 100.0 0.0 0.0 0.0 100.0 583 Narowal 100.0 0.0 0.0 0.0 100.0 650 Sialkot 99.9 0.1 0.0 0.0 100.0 1,281 Lahore 100.0 0.0 0.0 0.0 100.0 3,477 Kasur 100.0 0.0 0.0 0.0 100.0 1,333 Nankana Sahib 100.0 0.0 0.0 0.0 100.0 502 Sheikhupura 100.0 0.0 0.0 0.0 100.0 1,221 Multan 100.0 0.0 0.0 0.0 100.0 1,752 Khanewal 100.0 0.0 0.0 0.0 100.0 1,134 Lodhran 100.0 0.0 0.0 0.0 100.0 581 Vehari 100.0 0.0 0.0 0.0 100.0 1,118 Rawalpindi 100.0 0.0 0.0 0.0 100.0 1,774 Attock 99.9 0.1 0.0 0.0 100.0 714 Chakwal 100.0 0.0 0.0 0.0 100.0 489 Jhelum 100.0 0.0 0.0 0.0 100.0 394 Sahiwal 99.9 0.1 0.0 0.0 100.0 864 Okara 99.9 0.1 0.0 0.0 100.0 1,299 Pakpattan 100.0 0.0 0.0 0.0 100.0 647 Sargodha 100.0 0.0 0.0 0.0 100.0 1,422 Bhakkar 100.0 0.0 0.0 0.0 100.0 725 Khushab 99.9 0.1 0.0 0.0 100.0 493 Mianwali 100.0 0.0 0.0 0.0 100.0 584

Appendix D Data Quality| Page 105
Table DQ.2.5: Birth date reporting (children age 5-17 years)
Percent distribution of selected children age 5-17 years by completeness of date of birth information, Punjab, 2017-18
Completeness of reporting of date of birth and age
Total
Number of selected children age 5-17 years
Year and month of
birth
Year of birth and
age Year of
birth only Age only
Missing/ DK/Other
Punjab 96.1 0.3 2.2 0.2 1.3 100.0 35,482
Area of Residence
Rural 95.3 0.3 2.6 0.2 1.6 100.0 22,442 All Urban 97.5 0.2 1.5 0.1 0.7 100.0 13,040
Major Cities 98.2 0.1 1.2 0.1 0.4 100.0 7,104 Other Urban 96.7 0.4 1.9 0.2 1.0 100.0 5,936
Age
5-9 97.0 0.6 1.3 0.4 0.7 100.0 15,884 10-14 95.8 0.0 2.8 0.0 1.5 100.0 11,980 15-17 94.7 0.0 3.2 0.0 2.1 100.0 7,618
Division
Bahawalpur 90.9 1.2 4.9 0.5 2.6 100.0 3,643 D.G.Khan 93.5 0.3 4.9 0.1 1.1 100.0 3,374 Faisalabad 97.8 0.0 1.2 0.1 0.8 100.0 4,476 Gujranwala 97.0 0.3 1.7 0.1 0.9 100.0 5,288 Lahore 97.4 0.1 2.0 0.0 0.4 100.0 6,103 Multan 97.2 0.1 1.2 0.1 1.4 100.0 4,139 Rawalpindi 95.9 0.3 1.5 0.3 2.0 100.0 3,258 Sahiwal 97.0 0.1 1.9 0.2 0.8 100.0 2,427 Sargodha 96.8 0.1 0.8 0.2 2.1 100.0 2,773
District
Bahawalpur 93.7 0.5 3.4 0.3 2.1 100.0 1,185 Bahawalnagar 95.9 0.5 2.2 0.1 1.3 100.0 999 RY Khan 85.2 2.1 8.1 0.9 3.8 100.0 1,460 DG Khan 92.9 0.5 4.1 0.3 2.2 100.0 789 Layyah 99.9 0.0 0.1 0.0 0.0 100.0 596 Muzaffargarh 95.3 0.2 3.2 0.1 1.2 100.0 1,411 Rajanpur 83.1 0.7 15.2 0.2 0.8 100.0 578 Faisalabad 98.6 0.0 0.7 0.0 0.5 100.0 2,435 Chiniot 100.0 0.0 0.0 0.0 0.0 100.0 445 Jhang 95.2 0.0 2.3 0.4 2.1 100.0 901 TT Singh 96.9 0.1 2.1 0.0 0.9 100.0 695 Gujranwala 96.0 0.3 3.0 0.1 0.6 100.0 1,658 Gujrat 96.2 0.2 1.5 0.2 1.7 100.0 948 Hafizabad 95.8 0.4 2.1 0.3 1.5 100.0 386 Mandi Bahauddin 97.2 0.3 1.2 0.3 1.1 100.0 525 Narowal 96.9 0.4 1.8 0.0 0.9 100.0 551 Sialkot 99.2 0.1 0.2 0.0 0.5 100.0 1,219 Lahore 98.4 0.1 1.5 0.0 0.0 100.0 3,452 Kasur 97.4 0.4 1.6 0.0 0.6 100.0 1,134 Nankana Sahib 99.4 0.0 0.3 0.0 0.3 100.0 434 Sheikhupura 93.3 0.1 4.7 0.2 1.7 100.0 1,083 Multan 97.9 0.0 0.5 0.0 1.6 100.0 1,587 Khanewal 94.2 0.5 2.2 0.2 2.9 100.0 1,005 Lodhran 99.1 0.0 0.3 0.0 0.6 100.0 556 Vehari 97.8 0.1 2.0 0.0 0.1 100.0 992 Rawalpindi 95.7 0.3 1.1 0.5 2.4 100.0 1,752 Attock 93.1 0.5 3.9 0.1 2.4 100.0 620 Chakwal 98.6 0.0 0.6 0.1 0.7 100.0 485 Jhelum 97.6 0.4 0.9 0.3 0.8 100.0 402 Sahiwal 99.6 0.0 0.4 0.0 0.0 100.0 791 Okara 95.3 0.1 2.9 0.5 1.2 100.0 1,028 Pakpattan 96.4 0.2 2.3 0.0 1.2 100.0 608 Sargodha 96.8 0.0 0.5 0.3 2.4 100.0 1,256 Bhakkar 98.8 0.0 0.5 0.0 0.7 100.0 595 Khushab 91.9 0.3 2.1 0.7 5.0 100.0 429 Mianwali 98.6 0.1 0.7 0.0 0.5 100.0 493

Appendix D Data Quality| Page 106
D.3 COMPLETENESS AND MEASUREMENTS
Table DQ.3.1: Completeness of salt iodisation testing
Percent distribution of households by completion of test for salt iodisation, Punjab, 2017-18
Salt was tested Salt was not tested, by reason
Total Number of households 1st test >0 ppm 2nd test >0 ppm 2nd test 0 ppm
No salt in household OtherA
Punjab 92.1 0.8 5.3
1.1 0.5 100.0 51,660
Area of Residence
Rural 92.1 0.8 5.1
1.1 0.7 100.0 32,234 All Urban 92.2 0.7 5.6
1.1 0.3 100.0 19,426
Major Cities 91.5 0.7 6.1
1.2 0.3 100.0 10,807 Other Urban 93.0 0.7 5.0
1.0 0.3 100.0 8,619
Wealth index quintile
Poorest 91.1 0.9 5.7
1.9 0.4 100.0 10,860 Second 91.5 0.9 5.5
1.2 0.6 100.0 10,226
Middle 91.8 0.9 5.3
1.0 0.7 100.0 9,913 Fourth 91.9 0.6 6.0
0.9 0.5 100.0 10,154
Richest 94.3 0.6 4.0
0.5 0.4 100.0 10,507 Division
Bahawalpur 94.3 0.9 4.0
0.8 0.0 100.0 5,311 D.G.Khan 93.9 0.3 4.8
0.9 0.1 100.0 4,616
Faisalabad 89.4 0.9 6.9
1.0 1.8 100.0 6,591 Gujranwala 95.5 0.3 2.8
1.0 0.1 100.0 7,415
Lahore 88.4 1.0 7.4
1.5 1.3 100.0 9,185 Multan 93.1 1.0 4.5
1.3 0.1 100.0 5,894
Rawalpindi 95.8 0.6 2.7
0.5 0.3 100.0 5,109 Sahiwal 90.7 1.0 6.8
1.5 0.0 100.0 3,558
Sargodha 89.1 1.1 8.0
1.4 0.2 100.0 3,981 District
Bahawalpur 93.2 1.2 4.5
1.0 0.0 100.0 1,757 Bahawalnagar 93.0 1.1 5.2
0.6 0.1 100.0 1,450
RY Khan 96.1 0.4 2.7
0.8 0.0 100.0 2,103 DG Khan 93.5 0.5 5.0
0.9 0.2 100.0 1,027
Layyah 95.8 0.5 2.9
0.7 0.1 100.0 838 Muzaffargarh 94.0 0.2 4.7
1.1 0.0 100.0 1,970
Rajanpur 91.9 0.4 6.9
0.9 0.0 100.0 782 Faisalabad 87.0 0.7 8.3
0.8 3.2 100.0 3,650
Chiniot 91.1 0.3 6.1
2.5 0.0 100.0 649 Jhang 94.7 0.3 3.9
1.0 0.1 100.0 1,280
TT Singh 90.3 2.6 6.2
0.9 0.0 100.0 1,012 Gujranwala 96.7 0.4 1.8
0.8 0.1 100.0 2,273
Gujrat 94.7 0.6 2.9
1.2 0.1 100.0 1,356 Hafizabad 93.3 0.3 4.1
2.1 0.0 100.0 540
Mandi Bahauddin 96.1 0.2 2.1
1.0 0.6 100.0 766 Narowal 90.2 0.4 8.5
0.9 0.1 100.0 747
Sialkot 97.4 0.1 1.5
0.7 0.0 100.0 1,733 Lahore 88.8 0.7 8.4
1.8 0.2 100.0 5,348
Kasur 89.3 2.2 7.1
1.3 0.2 100.0 1,621 Nankana Sahib 93.4 1.7 3.3
1.7 0.0 100.0 641
Sheikhupura 84.1 0.6 6.3
0.8 6.5 100.0 1,575 Multan 93.1 1.0 4.4
1.3 0.1 100.0 2,282
Khanewal 90.6 1.6 5.8
1.9 0.1 100.0 1,423 Lodhran 94.5 1.1 3.1
1.1 0.0 100.0 781
Vehari 94.6 0.2 4.3
0.8 0.1 100.0 1,408 Rawalpindi 97.0 0.5 1.5
0.5 0.3 100.0 2,745
Attock 97.2 0.6 1.6
0.3 0.2 100.0 929 Chakwal 93.7 0.8 5.0
0.6 0.0 100.0 802
Jhelum 90.9 1.1 6.9
0.6 0.5 100.0 633 Sahiwal 94.3 0.5 4.6
0.7 0.0 100.0 1,167
Okara 85.7 1.6 10.4
2.1 0.1 100.0 1,482 Pakpattan 94.4 0.5 3.7
1.3 0.0 100.0 909
Sargodha 88.6 1.0 8.5
1.8 0.0 100.0 1,808 Bhakkar 92.8 1.8 4.0
1.2 0.1 100.0 810
Khushab 83.6 0.2 13.9
0.8 1.3 100.0 646 Mianwali 91.4 1.2 6.1
1.2 0.0 100.0 717
A Includes those tests indicating 0 ppm in first test where a second test was not performed

Appendix D Data Quality| Page 107
Table DQ.3.2: Completeness and quality of information of water quality testing
Percentage of households selected and completed household and source water quality testing and percentage of positive blank tests by area, Punjab, 2017-18
Percentage of households:
Tota
l n
um
be
r o
f h
ou
se
ho
lds
in s
am
ple
Percentage of households selected
for water quality testing with
completed results for:
Tota
l n
um
be
r o
f h
ou
se
ho
lds
se
lecte
d fo
r w
ate
r q
ua
lity
testin
g
Pe
rce
nta
ge o
f p
ositiv
e b
lank
tests
Num
be
r o
f b
lan
k tests
com
ple
ted
Num
be
r o
f h
ou
se
ho
lds
se
lecte
d fo
r b
lank te
stA
Selected for Water Quality
Testing questionnaire
With completed
Water Quality Testing
questionnaire Household Source
Punjab 15.1 14.9 51,660 98.6 86.8 7,811 2.1 2,527 2,601
Area of Residence
Rural 15.1 14.9 32,234 98.6 89.0 4,855 2.0 1,570 1,612 All Urban 15.2 15.0 19,426 98.7 83.4 2,957 2.2 958 989
Major Cities 15.1 14.9 10,807 98.5 81.6 1,635 2.8 523 541 Other Urban 15.3 15.2 8,619 99.0 85.6 1,321 1.5 434 448
Wealth index quintile
Poorest 14.5 14.3 10,860 97.9 89.9 1,574 1.6 457 477 Second 15.0 14.9 10,226 98.7 88.9 1,537 2.1 538 547 Middle 15.5 15.4 9,913 98.8 88.7 1,540 1.7 499 517 Fourth 14.8 14.6 10,154 99.0 86.8 1,501 3.0 492 504 Richest 15.8 15.6 10,507 98.8 80.5 1,659 2.1 541 556
Division
Bahawalpur 15.2 15.0 5,311 99.1 71.1 806 2.9 260 271 D.G.Khan 15.0 14.7 4,616 96.8 92.1 691 1.7 226 232 Faisalabad 15.0 14.7 6,591 98.3 88.5 989 0.7 315 329 Gujranwala 15.1 15.0 7,415 99.5 92.7 1,121 3.1 368 375 Lahore 15.3 15.0 9,185 98.6 81.6 1,401 1.9 454 468 Multan 15.1 14.9 5,894 98.8 94.3 890 1.8 291 296 Rawalpindi 15.3 15.2 5,109 99.3 84.9 781 3.5 248 252 Sahiwal 15.1 14.8 3,558 98.5 91.3 536 1.4 170 179 Sargodha 15.0 14.9 3,981 98.5 88.0 597 1.5 195 199
District
Bahawalpur 15.0 14.6 1,757 97.2 84.0 264 6.5 83 90 Bahawalnagar 15.2 15.2 1,450 100.0 43.0 220 3.0 73 73 RY Khan 15.3 15.3 2,103 100.0 79.8 322 0.0 103 108 DG Khan 15.2 14.7 1,027 94.1 79.6 156 0.0 50 51 Layyah 14.7 14.7 838 100.0 97.2 123 (0.0) 42 43 Muzaffargarh 15.0 15.0 1,970 100.0 99.1 295 0.0 98 98 Rajanpur 14.9 13.8 782 89.1 85.7 117 (10.0) 37 40 Faisalabad 15.0 14.9 3,650 99.0 82.2 548 0.7 175 182 Chiniot 15.0 14.5 649 96.7 96.7 98 (0.0) 32 33 Jhang 14.8 14.2 1,280 95.7 95.7 189 0.0 58 63 TT Singh 15.2 15.2 1,012 100.0 96.7 154 2.1 49 51 Gujranwala 15.1 15.1 2,273 100.0 92.3 342 6.6 114 115 Gujrat 15.0 14.8 1,356 98.1 88.6 204 1.1 67 69 Hafizabad 15.0 14.9 540 99.3 83.1 81 (0.0) 27 28 Mandi Bahauddin 15.1 15.1 766 100.0 96.6 116 2.5 38 40 Narowal 15.3 15.3 747 100.0 93.8 114 (5.8) 37 37 Sialkot 15.2 15.1 1,733 99.4 97.3 264 0.0 85 87 Lahore 15.2 14.9 5,348 97.7 74.6 813 2.4 263 271 Kasur 15.3 15.3 1,621 100.0 91.7 248 0.0 82 82 Nankana Sahib 15.0 14.9 641 99.3 99.3 96 (0.0) 32 32 Sheikhupura 15.4 15.4 1,575 99.6 87.8 243 3.0 77 82 Multan 15.0 15.0 2,282 100.0 94.4 342 2.5 110 112 Khanewal 14.8 14.8 1,423 99.5 96.4 211 0.0 71 71 Lodhran 15.0 14.6 781 97.2 91.6 118 (0.0) 37 39 Vehari 15.5 15.1 1,408 97.1 93.6 218 3.4 72 73 Rawalpindi 15.5 15.3 2,745 98.8 83.9 425 4.3 134 135 Attock 15.2 15.1 929 99.5 86.4 141 1.2 43 46 Chakwal 14.9 14.9 802 100.0 87.4 120 4.0 38 39 Jhelum 15.1 15.1 633 100.0 84.2 96 3.0 32 32 Sahiwal 15.0 14.3 1,167 95.3 90.5 175 1.7 53 59 Okara 15.2 15.2 1,482 100.0 96.7 225 2.1 73 75 Pakpattan 14.9 14.9 909 100.0 83.2 136 (0.0) 45 46 Sargodha 15.0 14.8 1,808 98.9 88.7 270 0.0 90 90 Bhakkar 14.9 14.9 810 100.0 98.9 121 6.3 40 40 Khushab 15.3 15.0 646 93.9 75.2 99 (0.0) 31 33 Mianwali 15.0 15.0 717 100.0 85.9 107 1.4 35 36
A One blank test (a test of uncontaminated water) was designed to be performed in each cluster. For practical reasons, the blank test was assigned to one of the households selected for water quality testing. ( ) Figures that are based on 25-49 unweighted cases

Appendix D Data Quality| Page 108
Table DQ.3.3M: Completeness of information on dates of marriage (men)
Percentage of men age 15-49 years with missing or incomplete information on date of and age at first marriage, Punjab, 2017-18
Percent with missing/ incomplete
informationA Number of men
Ever married (age 15-49 years)
Date of first marriage missing 11.6 14,410
Only month missing 8.0 14,410
Both month and year missing 3.5 14,410
Age at first marriage missing 0.0 14,410 A Includes "Don't know" responses
Table DQ.3.4: Completeness of information for anthropometric indicators: Underweight
Percent distribution of children under 5 by completeness of information on date of birth and weight, Punjab, 2017-18
Valid weight
and date of birth
Reason for exclusion from analysis
Total
Percent of children excluded
from analysis
Number of children under
5
Weight not
measured
Incomplete date of
birth
Weight not measured
and incomplete date of birth
Flagged cases
(outliers)
Punjab 96.2 3.1 0.0 0.0 0.6 100.0 3.8 39,799
Age (in months)A
<6 95.8 2.8 0.0 0.0 1.4 100.0 4.2 4,570
6-11 97.5 1.7 0.0 0.0 0.8 100.0 2.5 3,523
12-23 97.3 2.3 0.0 0.0 0.3 100.0 2.7 7,867
24-35 96.6 3.1 0.0 0.0 0.4 100.0 3.4 7,862
36-47 95.7 3.8 0.0 0.0 0.5 100.0 4.3 8,277
48-59 95.2 4.3 0.1 0.0 0.5 100.0 4.8 7,676 A The category of “No information” in the background characteristic of “Age” has been suppressed from the table due to small number of unweighted cases
Table DQ.3.5: Completeness of information for anthropometric indicators: Stunting
Percent distribution of children under 5 by completeness of information on date of birth and length or height, Punjab, 2017-18
Valid length/height and date
of birth
Reason for exclusion from analysis
Total
Percent of
children excluded
from analysis
Number of children under 5
Length/Height not
measured
Incomplete date of birth
Length/Height not measured,
incomplete date of birth
Flagged cases
(outliers)
Punjab 95.5 1.2 0.0 0.0 3.2 100.0 4.5 39,799
Age (in months)A
<6 93.3 1.8 0.0 0.0 4.9 100.0 6.7 4,570
6-11 95.5 0.9 0.0 0.0 3.6 100.0 4.5 3,523
12-23 96.2 1.2 0.0 0.0 2.6 100.0 3.8 7,867
24-35 96.2 1.4 0.0 0.0 2.4 100.0 3.8 7,862
36-47 95.8 1.3 0.0 0.0 2.9 100.0 4.2 8,277
48-59 95.3 0.9 0.1 0.0 3.7 100.0 4.7 7,676 A The category of “No information” in the background characteristic of “Age” has been suppressed from the table due to small number of unweighted cases

Appendix D Data Quality| Page 109
Table DQ.3.6: Completeness of information for anthropometric indicators: Wasting and overweight Percent distribution of children under 5 by completeness of information on weight and length or height, Punjab, 2017-18
Valid weight
and length/hei
ght
Reason for exclusion from analysis
Total
Percent of children excluded
from analysis
Number of children under 5
Weight not
measured
Length/Height not
measured
Weight and length/height not measured
Flagged cases
(outliers)
Punjab 94.8 0.4 0.2 1.0 3.5 100.0 5.2 39,799
Age (in months)A
<6 91.9 0.3 0.4 1.4 6.0 100.0 8.1 4,570
6-11 96.6 0.2 0.1 0.8 2.3 100.0 3.4 3,523
12-23 96.1 0.3 0.3 0.9 2.4 100.0 3.9 7,867
24-35 95.2 0.5 0.3 1.0 2.9 100.0 4.8 7,862
36-47 94.9 0.4 0.2 1.0 3.4 100.0 5.1 8,277
48-59 94.1 0.5 0.1 0.8 4.5 100.0 5.9 7,676 A The category of “No information” in the background characteristic of “Age” has been suppressed from the table due to small number of unweighted cases
Table DQ.3.7: Heaping in anthropometric measurements
Distribution of weight and height/length measurements by decimal digit recorded, Punjab, 2017-18
Weight Height or length
Number Percent Number Percent
Punjab 38,546 100.0 38,700 100.0
Digit
0 3,442 8.9 3,429 8.9
1 3,966 10.3 3,816 9.9
2 4,177 10.8 4,708 12.2
3 3,852 10.0 4,355 11.3
4 4,017 10.4 4,361 11.3
5 3,771 9.8 3,963 10.2
6 3,872 10.0 4,208 10.9
7 3,676 9.5 3,710 9.6
8 3,874 10.0 3,085 8.0
9 3,900 10.1 3,065 7.9
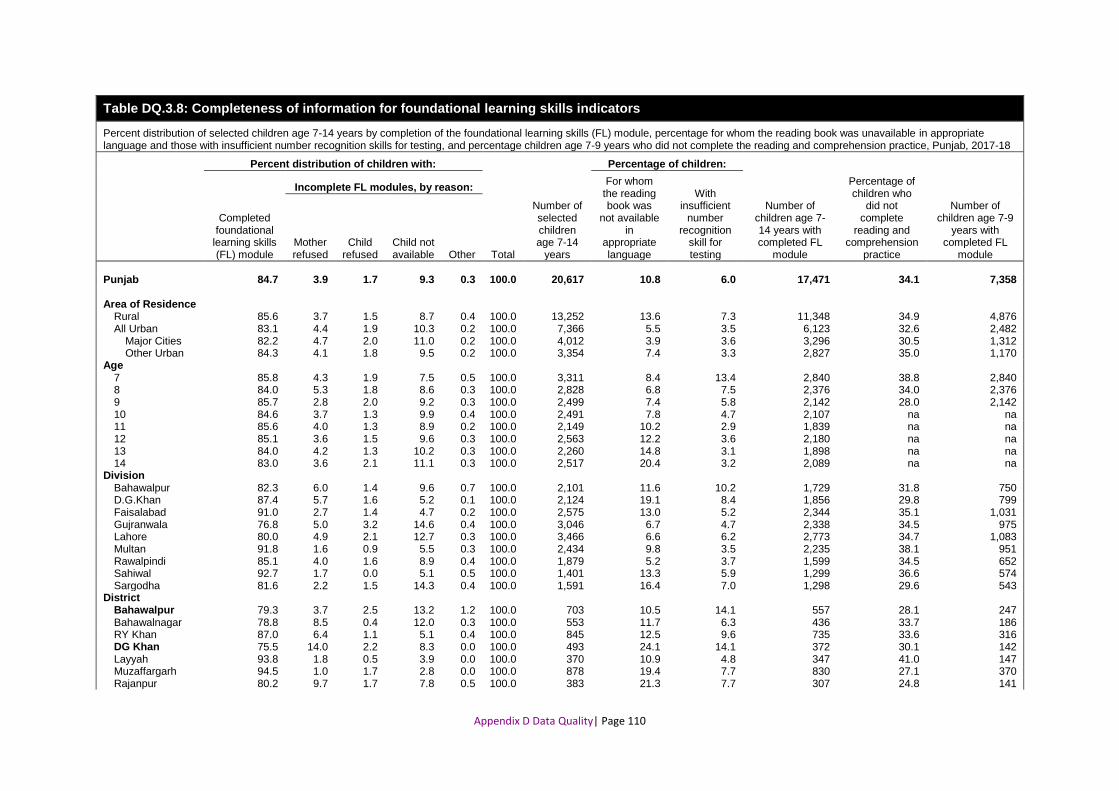
Appendix D Data Quality| Page 110
Table DQ.3.8: Completeness of information for foundational learning skills indicators
Percent distribution of selected children age 7-14 years by completion of the foundational learning skills (FL) module, percentage for whom the reading book was unavailable in appropriate language and those with insufficient number recognition skills for testing, and percentage children age 7-9 years who did not complete the reading and comprehension practice, Punjab, 2017-18
Percent distribution of children with:
Total
Number of selected children age 7-14
years
Percentage of children:
Number of children age 7-14 years with completed FL
module
Percentage of children who
did not complete
reading and comprehension
practice
Number of children age 7-9
years with completed FL
module
Completed foundational
learning skills (FL) module
Incomplete FL modules, by reason: For whom
the reading book was
not available in
appropriate language
With insufficient
number recognition
skill for testing
Mother refused
Child refused
Child not available Other
Punjab 84.7 3.9 1.7 9.3 0.3 100.0 20,617 10.8 6.0 17,471 34.1 7,358
Area of Residence
Rural 85.6 3.7 1.5 8.7 0.4 100.0 13,252 13.6 7.3 11,348 34.9 4,876 All Urban 83.1 4.4 1.9 10.3 0.2 100.0 7,366 5.5 3.5 6,123 32.6 2,482
Major Cities 82.2 4.7 2.0 11.0 0.2 100.0 4,012 3.9 3.6 3,296 30.5 1,312 Other Urban 84.3 4.1 1.8 9.5 0.2 100.0 3,354 7.4 3.3 2,827 35.0 1,170
Age
7 85.8 4.3 1.9 7.5 0.5 100.0 3,311 8.4 13.4 2,840 38.8 2,840 8 84.0 5.3 1.8 8.6 0.3 100.0 2,828 6.8 7.5 2,376 34.0 2,376 9 85.7 2.8 2.0 9.2 0.3 100.0 2,499 7.4 5.8 2,142 28.0 2,142 10 84.6 3.7 1.3 9.9 0.4 100.0 2,491 7.8 4.7 2,107 na na 11 85.6 4.0 1.3 8.9 0.2 100.0 2,149 10.2 2.9 1,839 na na 12 85.1 3.6 1.5 9.6 0.3 100.0 2,563 12.2 3.6 2,180 na na 13 84.0 4.2 1.3 10.2 0.3 100.0 2,260 14.8 3.1 1,898 na na 14 83.0 3.6 2.1 11.1 0.3 100.0 2,517 20.4 3.2 2,089 na na
Division
Bahawalpur 82.3 6.0 1.4 9.6 0.7 100.0 2,101 11.6 10.2 1,729 31.8 750 D.G.Khan 87.4 5.7 1.6 5.2 0.1 100.0 2,124 19.1 8.4 1,856 29.8 799 Faisalabad 91.0 2.7 1.4 4.7 0.2 100.0 2,575 13.0 5.2 2,344 35.1 1,031 Gujranwala 76.8 5.0 3.2 14.6 0.4 100.0 3,046 6.7 4.7 2,338 34.5 975 Lahore 80.0 4.9 2.1 12.7 0.3 100.0 3,466 6.6 6.2 2,773 34.7 1,083 Multan 91.8 1.6 0.9 5.5 0.3 100.0 2,434 9.8 3.5 2,235 38.1 951 Rawalpindi 85.1 4.0 1.6 8.9 0.4 100.0 1,879 5.2 3.7 1,599 34.5 652 Sahiwal 92.7 1.7 0.0 5.1 0.5 100.0 1,401 13.3 5.9 1,299 36.6 574 Sargodha 81.6 2.2 1.5 14.3 0.4 100.0 1,591 16.4 7.0 1,298 29.6 543
District
Bahawalpur 79.3 3.7 2.5 13.2 1.2 100.0 703 10.5 14.1 557 28.1 247 Bahawalnagar 78.8 8.5 0.4 12.0 0.3 100.0 553 11.7 6.3 436 33.7 186 RY Khan 87.0 6.4 1.1 5.1 0.4 100.0 845 12.5 9.6 735 33.6 316 DG Khan 75.5 14.0 2.2 8.3 0.0 100.0 493 24.1 14.1 372 30.1 142 Layyah 93.8 1.8 0.5 3.9 0.0 100.0 370 10.9 4.8 347 41.0 147 Muzaffargarh 94.5 1.0 1.7 2.8 0.0 100.0 878 19.4 7.7 830 27.1 370 Rajanpur 80.2 9.7 1.7 7.8 0.5 100.0 383 21.3 7.7 307 24.8 141

Appendix D Data Quality| Page 111
Table DQ.3.8: Completeness of information for foundational learning skills indicators
Percent distribution of selected children age 7-14 years by completion of the foundational learning skills (FL) module, percentage for whom the reading book was unavailable in appropriate language and those with insufficient number recognition skills for testing, and percentage children age 7-9 years who did not complete the reading and comprehension practice, Punjab, 2017-18
Percent distribution of children with:
Total
Number of selected children age 7-14
years
Percentage of children:
Number of children age 7-14 years with completed FL
module
Percentage of children who
did not complete
reading and comprehension
practice
Number of children age 7-9
years with completed FL
module
Completed foundational
learning skills (FL) module
Incomplete FL modules, by reason: For whom
the reading book was
not available in
appropriate language
With insufficient
number recognition
skill for testing
Mother refused
Child refused
Child not available Other
Punjab 84.7 3.9 1.7 9.3 0.3 100.0 20,617 10.8 6.0 17,471 34.1 7,358
Faisalabad 92.5 1.3 1.1 5.0 0.2 100.0 1,400 10.2 5.1 1,296 38.3 544 Chiniot 90.5 6.6 1.8 0.8 0.3 100.0 272 29.6 6.4 246 24.8 117 Jhang 86.5 4.7 2.2 6.5 0.2 100.0 521 17.3 4.9 451 31.6 215 TT Singh 92.1 2.7 1.0 4.2 0.0 100.0 381 6.3 5.1 351 36.7 154 Gujranwala 67.2 5.8 3.8 22.5 0.7 100.0 940 5.8 6.3 632 30.7 263 Gujrat 83.0 1.7 0.8 14.4 0.1 100.0 554 7.3 4.1 460 38.1 200 Hafizabad 75.3 5.7 6.0 12.2 0.7 100.0 222 12.7 4.7 167 40.8 75 Mandi Bahauddin 74.7 5.4 1.4 18.2 0.4 100.0 302 9.0 4.0 226 30.4 92 Narowal 79.1 1.3 4.8 14.6 0.2 100.0 330 5.8 4.2 262 41.8 100 Sialkot 84.9 7.9 3.6 3.4 0.1 100.0 698 4.9 3.9 593 32.3 245 Lahore 77.0 7.2 2.5 13.1 0.2 100.0 1,945 2.8 4.2 1,499 26.2 581 Kasur 85.4 2.8 2.3 8.8 0.6 100.0 658 9.9 9.7 562 52.4 223 Nankana Sahib 98.4 0.5 0.0 1.1 0.0 100.0 256 17.3 10.4 251 43.3 109 Sheikhupura 75.8 1.6 1.4 20.4 0.7 100.0 607 9.3 6.3 460 35.0 170 Multan 94.5 1.3 0.6 3.5 0.1 100.0 950 9.2 2.5 897 38.5 374 Khanewal 91.7 1.9 1.0 5.3 0.0 100.0 549 7.9 2.5 504 46.8 239 Lodhran 89.2 3.9 1.7 3.9 1.2 100.0 345 10.3 6.8 307 27.5 122 Vehari 89.1 0.3 0.9 9.5 0.2 100.0 591 12.5 4.1 526 33.9 215 Rawalpindi 86.2 4.7 0.7 8.0 0.4 100.0 1,016 4.0 2.4 875 36.0 364 Attock 74.2 3.2 4.9 17.1 0.6 100.0 367 8.2 7.7 272 29.1 106 Chakwal 89.6 2.7 0.5 6.7 0.4 100.0 276 5.0 2.6 248 31.9 103 Jhelum 92.6 4.1 1.1 1.7 0.5 100.0 220 6.3 5.0 204 38.2 79 Sahiwal 94.1 4.1 0.0 1.8 0.0 100.0 454 9.0 8.5 427 43.1 190 Okara 92.6 0.7 0.0 6.0 0.8 100.0 593 16.5 3.9 549 32.7 243 Pakpattan 91.3 0.3 0.0 7.9 0.5 100.0 354 13.4 5.9 323 34.4 141 Sargodha 81.6 1.2 0.4 16.5 0.4 100.0 696 12.0 5.3 567 39.6 238 Bhakkar 79.1 5.0 2.1 13.7 0.2 100.0 335 23.0 9.3 265 24.6 116 Khushab 86.5 3.2 1.5 8.2 0.6 100.0 272 19.8 8.7 235 22.7 88 Mianwali 80.1 0.4 3.4 15.4 0.7 100.0 289 15.8 7.0 231 17.4 100
na: not applicable

Appendix D Data Quality| Page 112
D.4 OBSERVATIONS
Table DQ.4.2: Observation handwashing facility
Percent distribution of handwashing facility observed by the interviewers in all interviewed households, Punjab, 2017-18
Handwashing facility
Total Number of households
Observed Not observed
Fixed facility
Mobile object
Not in the dwelling, plot
or yard
No permission
to see Other
reason
Punjab 87.5 10.5 1.6 0.3 0.1 100.0 51,660
Area of Residence
Rural 83.8 13.7 2.3 0.1 0.2 100.0 32,234 All Urban 93.6 5.3 0.4 0.6 0.1 100.0 19,426
Major Cities 94.2 4.5 0.4 0.9 0.0 100.0 10,807 Other Urban 92.9 6.2 0.5 0.3 0.1 100.0 8,619
Wealth index quintile
Poorest 72.7 21.1 5.7 0.2 0.3 100.0 10,860 Second 83.4 15.2 1.1 0.1 0.1 100.0 10,226 Middle 89.9 9.4 0.5 0.1 0.1 100.0 9,913 Fourth 94.3 5.1 0.2 0.4 0.1 100.0 10,154 Richest 97.9 1.3 0.0 0.7 0.0 100.0 10,507
Division Bahawalpur 81.5 16.0 2.3 0.1 0.1 100.0 5,311 D.G.Khan 92.6 5.5 1.8 0.1 0.1 100.0 4,616 Faisalabad 91.8 6.3 1.5 0.1 0.2 100.0 6,591 Gujranwala 95.6 3.0 1.0 0.2 0.1 100.0 7,415 Lahore 91.0 7.0 0.9 1.0 0.0 100.0 9,185 Multan 84.6 13.7 1.5 0.2 0.1 100.0 5,894 Rawalpindi 68.9 29.2 1.3 0.5 0.1 100.0 5,109 Sahiwal 82.8 13.1 3.7 0.1 0.3 100.0 3,558 Sargodha 91.5 6.8 1.4 0.2 0.1 100.0 3,981
District Bahawalpur 78.0 17.3 4.4 0.1 0.2 100.0 1,757 Bahawalnagar 78.0 20.4 1.4 0.1 0.1 100.0 1,450 RY Khan 86.7 11.9 1.3 0.0 0.1 100.0 2,103 DG Khan 82.5 14.6 2.7 0.1 0.1 100.0 1,027 Layyah 97.4 1.5 1.0 0.0 0.0 100.0 838 Muzaffargarh 97.5 1.4 0.8 0.1 0.1 100.0 1,970 Rajanpur 88.6 7.8 3.6 0.0 0.0 100.0 782 Faisalabad 94.0 4.9 0.9 0.1 0.1 100.0 3,650 Chiniot 87.9 7.8 4.0 0.1 0.1 100.0 649 Jhang 89.3 7.9 2.6 0.1 0.2 100.0 1,280 TT Singh 89.8 8.5 0.9 0.0 0.8 100.0 1,012 Gujranwala 98.7 0.8 0.3 0.1 0.1 100.0 2,273 Gujrat 94.0 4.3 0.9 0.5 0.2 100.0 1,356 Hafizabad 99.4 0.2 0.1 0.0 0.3 100.0 540 Mandi Bahauddin 87.9 6.9 4.9 0.1 0.1 100.0 766 Narowal 89.1 9.1 1.5 0.0 0.3 100.0 747 Sialkot 97.8 1.3 0.4 0.4 0.1 100.0 1,733 Lahore 92.5 5.2 0.6 1.6 0.0 100.0 5,348 Kasur 84.0 13.9 1.9 0.2 0.0 100.0 1,621 Nankana Sahib 91.4 7.1 1.5 0.0 0.0 100.0 641 Sheikhupura 92.9 6.1 0.8 0.0 0.2 100.0 1,575 Multan 85.5 13.6 0.8 0.0 0.0 100.0 2,282 Khanewal 93.3 4.4 1.5 0.6 0.2 100.0 1,423 Lodhran 70.4 27.5 1.9 0.0 0.2 100.0 781 Vehari 82.0 15.5 2.3 0.0 0.1 100.0 1,408 Rawalpindi 75.5 23.3 0.8 0.3 0.2 100.0 2,745 Attock 59.5 36.7 3.1 0.5 0.2 100.0 929 Chakwal 53.6 44.5 1.8 0.1 0.0 100.0 802 Jhelum 73.3 24.1 0.6 1.6 0.3 100.0 633 Sahiwal 81.0 15.0 3.8 0.0 0.2 100.0 1,167 Okara 88.6 6.9 3.7 0.3 0.5 100.0 1,482 Pakpattan 75.4 21.0 3.6 0.0 0.1 100.0 909 Sargodha 98.8 0.6 0.5 0.0 0.1 100.0 1,808 Bhakkar 97.6 1.7 0.7 0.0 0.0 100.0 810 Khushab 71.5 23.4 4.0 0.8 0.2 100.0 646 Mianwali 84.5 13.3 1.9 0.3 0.1 100.0 717

Appendix D Data Quality| Page 113
Table DQ.4.3: Observation of birth certificates
Percent distribution of children under 5 by presence of birth certificates and percentage of birth certificates seen, Punjab, 2017-18
Child has birth certificate
Child does not have
birth certificate
DK/ Missing Total
Percentage of birth
certificates seen by the interviewer
(1)/(1+2)*100 Number of
children under 5
Seen by the interviewer
(1)
Not seen by the
interviewer (2)
Punjab 35.6 13.6 50.4 0.3 100.0 72.3 39,799
Area of Residence
Rural 29.2 11.4 59.1 0.4 100.0 72.0 26,190 All Urban 48.1 18.0 33.7 0.2 100.0 72.7 13,609
Major Cities 52.7 20.2 26.9 0.1 100.0 72.3 7,118 Other Urban 43.0 15.6 41.2 0.2 100.0 73.4 6,491
Age (in months)A
0-5 25.3 10.6 63.8 0.3 100.0 70.4 4,570 6-11 32.3 12.7 54.7 0.3 100.0 71.8 3,523 12-23 34.2 13.7 51.8 0.3 100.0 71.5 7,867 24-35 37.0 14.3 48.3 0.4 100.0 72.1 7,862 36-47 39.2 13.9 46.6 0.3 100.0 73.7 8,277 48-59 39.5 14.8 45.4 0.3 100.0 72.8 7,676
Division
Bahawalpur 13.8 4.6 81.5 0.2 100.0 75.2 4,141 D.G.Khan 9.8 6.6 82.8 0.8 100.0 59.8 4,445 Faisalabad 48.3 11.3 40.1 0.3 100.0 81.0 4,943 Gujranwala 51.2 21.5 27.0 0.3 100.0 70.4 5,744 Lahore 50.5 18.2 31.2 0.1 100.0 73.5 6,534 Multan 20.0 14.8 65.1 0.1 100.0 57.5 4,586 Rawalpindi 56.0 20.7 23.0 0.3 100.0 73.0 3,372 Sahiwal 35.0 10.9 54.0 0.1 100.0 76.2 2,810 Sargodha 23.7 8.8 67.1 0.4 100.0 72.8 3,225
District
Bahawalpur 16.6 6.9 75.9 0.6 100.0 70.7 1,257 Bahawalnagar 10.9 3.7 85.4 0.1 100.0 74.9 1,062 RY Khan 13.5 3.4 83.0 0.0 100.0 79.7 1,821 DG Khan 3.4 3.5 92.3 0.8 100.0 49.3 1,153 Layyah 29.3 4.2 66.2 0.3 100.0 87.4 723 Muzaffargarh 9.3 11.0 78.7 0.9 100.0 45.9 1,694 Rajanpur 3.2 4.1 91.7 1.0 100.0 43.8 875 Faisalabad 56.8 13.4 29.5 0.2 100.0 80.8 2,530 Chiniot 27.8 4.1 67.8 0.3 100.0 87.0 498 Jhang 38.2 8.5 53.2 0.1 100.0 81.9 1,122 TT Singh 48.5 13.0 37.6 0.9 100.0 78.9 793 Gujranwala 57.4 18.4 24.2 0.0 100.0 75.7 1,844 Gujrat 43.6 24.1 32.2 0.1 100.0 64.4 960 Hafizabad 25.1 37.2 37.2 0.5 100.0 40.3 425 Mandi Bahauddin 42.2 27.8 28.2 1.8 100.0 60.2 583 Narowal 58.5 16.4 24.9 0.2 100.0 78.1 650 Sialkot 57.0 18.4 24.4 0.3 100.0 75.6 1,281 Lahore 52.7 20.6 26.7 0.1 100.0 71.9 3,477 Kasur 46.8 16.0 37.1 0.1 100.0 74.5 1,333 Nankana Sahib 48.4 5.8 45.7 0.1 100.0 89.3 502 Sheikhupura 49.1 18.8 32.0 0.1 100.0 72.4 1,221 Multan 20.9 19.2 59.7 0.2 100.0 52.1 1,752 Khanewal 12.9 12.7 74.3 0.1 100.0 50.3 1,134 Lodhran 9.3 10.4 80.1 0.3 100.0 47.3 581 Vehari 31.2 12.2 56.6 0.0 100.0 71.9 1,118 Rawalpindi 52.8 22.0 25.0 0.2 100.0 70.5 1,774 Attock 51.2 27.2 21.0 0.6 100.0 65.3 714 Chakwal 65.9 14.1 19.8 0.2 100.0 82.4 489 Jhelum 67.2 10.9 21.8 0.0 100.0 86.0 394 Sahiwal 23.8 3.8 72.4 0.0 100.0 86.2 864 Okara 46.7 15.1 38.0 0.2 100.0 75.6 1,299 Pakpattan 26.3 12.0 61.6 0.2 100.0 68.8 647 Sargodha 25.3 8.4 65.8 0.4 100.0 75.0 1,422 Bhakkar 17.3 5.5 77.0 0.1 100.0 75.7 725 Khushab 25.7 17.9 55.3 1.2 100.0 58.9 493 Mianwali 25.7 6.2 67.9 0.2 100.0 80.5 584
A The category of “No information” in the background characteristic of “Age” has been suppressed from the table due to small number of unweighted cases

Appendix D Data Quality| Page 114
Table DQ.4.4: Observation of vaccination records
Percent distribution of children age 0-35 months by presence of vaccination records, and the percentage of vaccination records seen by the interviewers, Punjab, 2017-18
Child does not have vaccination records
Child has vaccination records
DK/ Missing Total
Percentage of
vaccination records seen
by the interviewer
(1)/(1+2)*100
Number of children age 0-35 months
Had vaccination records previously
Never had vaccination
records
Seen by the
interviewer (1)
Not seen by the
interviewer (2)
Punjab 14.1 8.8 73.8 2.8 0.4 100.0 96.3 23,825
Area of Residence
Rural 13.2 9.0 75.1 2.3 0.4 100.0 97.1 15,682 All Urban 15.9 8.4 71.5 3.9 0.3 100.0 94.9 8,144
Major Cities 18.1 10.1 66.8 4.6 0.4 100.0 93.5 4,267 Other Urban 13.5 6.5 76.7 3.0 0.2 100.0 96.2 3,876
Age (in months)A
0-5 5.4 16.2 76.8 1.6 0.1 100.0 97.9 4,570 6-11 7.6 6.6 83.8 2.0 0.1 100.0 97.7 3,523 12-23 13.5 6.7 77.5 2.2 0.1 100.0 97.3 7,867 24-35 22.7 7.6 64.1 4.5 0.9 100.0 93.4 7,862
Division
Bahawalpur 14.4 11.6 72.0 1.5 0.3 100.0 97.9 2,440 D.G.Khan 16.1 15.6 66.1 1.7 0.3 100.0 97.5 2,630 Faisalabad 14.5 8.0 75.0 2.1 0.4 100.0 97.3 2,937 Gujranwala 12.2 6.4 77.5 3.6 0.3 100.0 95.6 3,398 Lahore 16.6 11.4 66.7 4.9 0.4 100.0 93.1 4,015 Multan 14.4 7.2 75.5 2.7 0.3 100.0 96.6 2,781 Rawalpindi 15.8 5.6 74.5 3.6 0.4 100.0 95.4 2,025 Sahiwal 12.1 3.9 82.3 1.3 0.3 100.0 98.5 1,675 Sargodha 8.4 6.0 82.8 2.1 0.7 100.0 97.5 1,926
District
Bahawalpur 16.1 11.9 70.4 1.2 0.4 100.0 98.3 754 Bahawalnagar 12.0 10.0 76.7 1.1 0.3 100.0 98.6 609 RY Khan 14.6 12.3 70.4 2.0 0.2 100.0 97.3 1,077 DG Khan 13.3 29.3 55.1 1.7 0.6 100.0 97.0 685 Layyah 10.4 7.3 80.7 1.3 0.2 100.0 98.4 437 Muzaffargarh 18.7 5.7 73.4 1.9 0.2 100.0 97.4 997 Rajanpur 19.7 23.4 54.2 1.7 0.4 100.0 97.0 510 Faisalabad 16.2 8.0 73.6 1.9 0.3 100.0 97.5 1,506 Chiniot 13.6 7.6 77.2 0.9 0.7 100.0 98.9 296 Jhang 12.0 11.1 75.0 1.6 0.3 100.0 98.0 669 TT Singh 13.1 3.6 78.4 4.3 0.4 100.0 94.8 467 Gujranwala 13.7 11.2 71.8 2.7 0.6 100.0 96.3 1,090 Gujrat 11.3 2.0 83.4 3.3 0.0 100.0 96.1 565 Hafizabad 8.6 6.1 80.6 4.5 0.0 100.0 94.7 248 Mandi Bahauddin 12.3 8.5 73.8 5.1 0.4 100.0 93.5 337 Narowal 15.2 5.1 73.6 6.1 0.0 100.0 92.3 384 Sialkot 10.5 2.7 83.7 2.6 0.5 100.0 97.0 775 Lahore 19.0 13.4 61.1 6.0 0.4 100.0 91.0 2,128 Kasur 16.5 13.6 66.7 3.0 0.0 100.0 95.6 839 Nankana Sahib 8.3 3.3 86.8 1.2 0.2 100.0 98.7 295 Sheikhupura 12.8 6.2 74.8 5.4 0.8 100.0 93.2 753 Multan 15.8 4.7 77.6 1.6 0.2 100.0 98.0 1,059 Khanewal 13.4 11.0 70.5 4.6 0.5 100.0 93.8 703 Lodhran 15.5 7.4 72.6 4.3 0.2 100.0 94.5 349 Vehari 12.4 7.0 78.9 1.5 0.2 100.0 98.2 669 Rawalpindi 18.3 5.9 70.9 4.4 0.4 100.0 94.2 1,060 Attock 10.4 7.3 78.9 2.9 0.5 100.0 96.5 426 Chakwal 20.6 6.3 68.9 3.3 0.9 100.0 95.4 289 Jhelum 8.4 0.9 88.8 1.8 0.0 100.0 98.0 250 Sahiwal 12.5 4.1 81.7 1.7 0.0 100.0 98.0 524 Okara 12.6 3.1 82.6 0.9 0.7 100.0 98.9 782 Pakpattan 10.6 5.4 82.6 1.4 0.0 100.0 98.3 369 Sargodha 6.9 3.3 85.3 3.4 1.2 100.0 96.2 856 Bhakkar 11.2 10.4 77.2 0.9 0.3 100.0 98.9 426 Khushab 10.0 8.4 79.7 1.6 0.2 100.0 98.0 287 Mianwali 7.4 5.1 86.2 1.0 0.3 100.0 98.8 356
A The category of “No information” in the background characteristic of “Age” has been suppressed from the table due to small number of unweighted cases"

Appendix D Data Quality| Page 115
D.5 SCHOOL ATTENDANCE
Table DQ.5.1: School attendance by single age
Distribution of household population age 3-24 years by educational level and grade attended in the current (or most recent) school year, Punjab, 2017-18
Not attending
school
Currently attending
DK
/Mis
sin
g
Total
Number of household
members age 3-24 years
Pre-school/ Kachi/ECE
Primary school
DK
/Mis
sin
g
Lower secondary
school
DK
/Mis
sin
g
Upper secondary
school
DK
/Mis
sin
g
Higher than secondary
Grade Grade Grade
1 2 3 4 5
1 2 3
1 2
Age at beginning of school year
3 53.8 44.1 1.9 0.1 0.0 0.1 0.0 0.0 0.0 0.0 0.0 0.0 0.0 0.0 0.0 0.0 0.0 100.0 8,175
4 26.4 63.0 8.9 1.4 0.1 0.1 0.1 0.0 0.0 0.0 0.0 0.0 0.0 0.0 0.0 0.0 0.0 100.0 8,716
5 16.3 51.7 23.5 6.8 1.3 0.2 0.0 0.0 0.0 0.0 0.0 0.0 0.0 0.0 0.0 0.0 0.0 100.0 8,317
6 12.6 29.5 29.9 20.5 5.7 1.3 0.2 0.1 0.1 0.1 0.0 0.0 0.0 0.0 0.0 0.0 0.0 100.0 8,813
7 11.4 14.2 20.3 28.3 18.2 5.6 1.4 0.1 0.2 0.1 0.0 0.0 0.0 0.0 0.0 0.0 0.0 100.0 8,640
8 11.7 7.0 10.1 20.5 26.5 16.7 5.9 0.2 0.9 0.2 0.1 0.0 0.1 0.0 0.0 0.0 0.0 100.0 7,870
9 13.2 3.8 5.8 11.9 18.8 22.6 17.9 0.1 4.3 1.2 0.2 0.0 0.1 0.0 0.0 0.0 0.0 100.0 8,013
10 15.1 1.7 2.6 6.3 11.5 17.9 24.9 0.1 13.1 4.8 1.5 0.0 0.3 0.0 0.0 0.0 0.0 100.0 7,137
11 20.8 1.1 1.3 3.7 6.5 10.4 18.4 0.0 17.7 12.7 5.8 0.0 1.5 0.1 0.0 0.0 0.0 100.0 7,762
12 24.9 0.5 0.7 1.7 3.1 6.2 10.5 0.0 13.0 17.4 14.2 0.0 7.0 0.6 0.0 0.1 0.0 100.0 7,012
13 32.1 0.2 0.4 0.7 1.4 2.8 5.3 0.0 6.9 11.1 18.1 0.0 16.8 3.6 0.0 0.5 0.0 100.0 7,269
14 36.6 0.1 0.2 0.3 0.5 1.4 2.4 0.0 3.2 6.0 12.2 0.0 21.2 12.2 0.1 3.5 0.0 100.0 6,532
15 43.9 0.1 0.1 0.2 0.2 0.4 0.9 0.0 1.3 2.8 6.0 0.0 15.4 16.9 0.1 11.7 0.0 100.0 6,453
16 50.8 0.1 0.0 0.1 0.1 0.2 0.4 0.0 0.4 1.4 2.5 0.0 8.6 12.6 0.0 22.8 0.0 100.0 6,314
17 64.1 0.1 0.0 0.0 0.0 0.0 0.1 0.0 0.2 0.5 1.3 0.0 3.9 6.2 0.0 23.3 0.0 100.0 7,201
18 69.6 0.0 0.0 0.0 0.0 0.0 0.1 0.0 0.1 0.2 0.6 0.0 1.3 3.7 0.0 24.2 0.0 100.0 6,223
19 78.0 0.0 0.0 0.0 0.0 0.0 0.0 0.0 0.0 0.1 0.2 0.0 0.8 1.7 0.0 18.9 0.0 100.0 6,730
20 81.1 0.0 0.0 0.0 0.0 0.0 0.0 0.0 0.0 0.0 0.1 0.0 0.4 1.0 0.0 17.3 0.0 100.0 5,622
21 85.3 0.0 0.0 0.0 0.0 0.0 0.0 0.0 0.0 0.0 0.1 0.0 0.2 0.6 0.0 13.7 0.0 100.0 6,287
22 88.7 0.1 0.0 0.0 0.0 0.0 0.0 0.0 0.0 0.0 0.1 0.0 0.3 0.4 0.0 10.4 0.0 100.0 5,534
23 92.1 0.0 0.0 0.0 0.0 0.0 0.1 0.0 0.0 0.0 0.1 0.0 0.1 0.3 0.0 7.3 0.0 100.0 5,319
24 92.0 0.1 0.0 0.0 0.0 0.0 0.3 0.0 0.0 0.0 0.0 0.0 0.0 0.4 0.0 7.1 0.0 100.0 1,161 A Those age 25 at the time of interview who were age 24 at beginning of school year are excluded as current attendance was only collected for those age 5-24 at the time of interview

Appendix D Data Quality| Page 116
D.6 BIRTH HISTORY
Table DQ.6.1: Sex ratio at birth among children ever born and living
Sex ratio (number of males per 100 females) among children ever born (at birth), children living, and deceased children born to women age 15-49 years, by age of women, Punjab, 2017-18
Children Ever Born Children Living Children Deceased
Number of
women Sons Daughters
Sex ratio at
birth Sons Daughters Sex ratio Sons Daughters
Sex ratio
Punjab 81,159 76,666 1.06 74,281 70,675 1.05 6,878 5,991 1.15 74,010
Age
15-19 419 389 1.08 377 372 1.01 43 18 2.42 14,541
20-24 4,001 3,661 1.09 3,703 3,402 1.09 298 258 1.15 13,633
25-29 10,989 10,315 1.07 10,149 9,634 1.05 840 680 1.23 12,625
30-34 15,803 14,996 1.05 14,583 13,906 1.05 1,220 1,090 1.12 10,544
35-39 19,291 18,334 1.05 17,736 16,990 1.04 1,556 1,344 1.16 9,726
40-44 16,140 15,215 1.06 14,639 13,967 1.05 1,501 1,248 1.20 7,125
45-49 14,515 13,756 1.06 13,094 12,403 1.06 1,421 1,353 1.05 5,815

Appendix D Data Quality| Page 117
Table DQ.6.2: Births by periods preceding the survey
Number of births, sex ratio at birth, and period ratio by periods preceding the survey, according to living, deceased, and total children (imputed), as reported in the birth histories of women age 15-49 years, Punjab, 2017-18
Number of births Percent with complete birth dateA Sex ratio at birthB Period ratioC
Living Deceased Total Living Deceased Total Living Deceased Total Living Deceased Total
Total 144,956 12,869 157,825 96.8 82.2 95.6 105.1 114.8 105.9 na na na
Years preceding survey 0 7,849 392 8,241 99.3 94.8 99.1 104.9 122.9 105.7 na na na
1 7,842 443 8,285 99.3 90.0 98.8 107.6 101.4 107.3 100.3 93.0 99.9
2 7,783 561 8,344 98.9 86.4 98.0 107.4 125.3 108.5 97.9 107.6 98.5
3 8,062 599 8,662 98.2 90.2 97.7 104.1 118.7 105.1 104.4 102.1 104.2
4 7,661 613 8,274 98.0 83.6 96.9 104.4 93.9 103.6 94.3 98.9 94.7
5 8,182 640 8,822 97.8 86.1 96.9 106.7 101.4 106.3 106.8 105.2 106.7
6 7,654 604 8,258 97.3 87.5 96.6 105.2 117.9 106.1 92.9 96.4 93.1
7 8,304 613 8,917 96.6 85.2 95.8 101.8 109.8 102.3 108.6 102.9 108.2
8 7,641 587 8,228 96.8 81.5 95.7 99.0 119.8 100.4 100.3 96.1 100.0
9 6,928 609 7,537 97.3 85.8 96.4 105.5 102.1 105.2 18.6 15.6 18.3
10+ 67,047 7,209 74,256 95.5 78.6 93.9 105.6 118.4 106.8 na na na
Five-year periods preceding survey 0-4 39,198 2,608 41,806 98.7 88.5 98.1 105.7 111.2 106.0 na na na
5-9 38,710 3,052 41,762 97.2 85.3 96.3 103.6 109.7 104.0 na na na
10-14 30,113 2,652 32,765 97.0 80.6 95.7 104.8 123.0 106.1 na na na
15-19 20,505 2,123 22,628 95.8 77.8 94.2 105.7 124.7 107.3 na na na
20+ 16,430 2,434 18,864 92.5 77.2 90.6 107.3 108.6 107.4 na na na A Both month and year of birth given. The inverse of the percent reported is the percent with incomplete and therefore imputed date of birth
B (Bm/Bf) x 100, where Bm and Bf are the numbers of male and female births, respectively
C (2 x Bt/(Bt-1 + Bt+1)) x 100, where Bt is the number of births in year t preceding the survey
na: not applicable

Appendix D Data Quality| Page 118
Table DQ.6.3: Reporting of age at death in days
Distribution of reported deaths under one month of age by age at death in days and the percentage of neonatal deaths reported to occur at ages 0–6 days, among live-born children to women age 15-49 years, by 5-year periods preceding the survey (imputed), Punjab, 2017-18
Number of years preceding the survey
Total for the 20 years preceding the survey 0–4 5–9 10–14 15–19
Age at death (in days)
0 447 472 396 299 1,614
1 400 438 360 257 1,456
2 129 144 109 64 445
3 183 165 145 112 605
4 73 65 49 46 233
5 78 75 62 44 259
6 45 53 45 30 172
7 47 45 37 34 163
8 38 58 31 29 155
9 14 11 10 9 44
10 33 28 39 29 129
11 28 30 20 14 91
12 26 17 19 12 75
13 11 13 12 11 47
14 15 6 11 9 41
15 24 29 32 30 115
16 6 11 7 11 34
17 7 12 3 4 25
18 14 17 15 9 55
19 - 4 5 1 11
20 30 10 16 8 64
21 11 8 8 14 40
22 15 22 13 10 61
23 2 5 2 2 12
24 6 3 4 1 14
25 5 17 9 5 35
26 1 3 1 1 5
27 3 6 2 - 10
28 2 7 5 1 14
29 0 - 1 3 4
30 5 2 2 2 12
Total 0–30 days 1,700 1,774 1,468 1,099 6,041
Percent early neonatalA 79.7 79.5 79.5 77.5 79.2
A Deaths during the first 7 days (0-6), divided by deaths during the first month (0-30 days)

Appendix D Data Quality| Page 119
Table DQ.6.4: Reporting of age at death in months
Distribution of reported deaths under two years of age by age at death in months and the percentage of infant deaths reported to occur at age under one month among live-born children to women age 15-49 years, for the 5-year periods of birth preceding the survey (imputed), Punjab, 2017-18
Number of years preceding the survey
Total for the 20 years preceding the survey 0–4 5–9 10–14 15–19
Age at death (in months)
0A 1,700 1,774 1,468 1,099 6,041
1 153 177 153 121 605
2 117 111 94 79 401
3 96 110 84 62 352
4 64 61 58 33 215
5 49 53 41 20 163
6 69 83 75 66 293
7 43 47 24 42 156
8 36 56 42 29 163
9 45 73 42 27 186
10 14 17 18 17 65
11 42 47 40 27 157
12 3 10 8 6 27
13 23 15 21 12 71
14 9 7 2 8 26
15 9 16 14 11 50
16 5 7 2 4 18
17 1 1 1 3 7
18 18 32 17 9 75
19 1 1 1 - 2
20 1 1 1 1 4
22 - 3 1 - 4
Reported as 1 year 2 3 1 1 7
Total 0–11 months 2,428 2,609 2,137 1,622 8,796
Percent neonatalB 70.0 68.0 68.7 67.7 68.7
A Includes deaths under one month reported in days
B Deaths under one month, divided by deaths under one year

Appendix D Data Quality| Page 120
D.7 SIBLINGS
Table DQ.7.1: Completeness of information on siblings
Completeness of information on the survival status of (all) siblings and age of living siblings reported by interviewed women age 15-49 years, and age at death and years since death of siblings who have died, Punjab, 2017-18
Sisters Brothers All siblings
Number Percent Number Percent Number Percent
Survival status of siblings
Living 174,382 90.5 186,894 89.8 361,276 90.1
Dead 18,341 9.5 21,207 10.2 39,548 9.9
DK/Missing 34 (0.0) 58 0.0 92 0.0
Total 192,757 100.0 208,159 100.0 400,916 100.0
Age of living siblings
Reported 174,079 99.8 186,557 99.8 360,636 99.8
DK/Missing 303 0.2 337 0.2 640 0.2
Total 174,382 100.0 186,894 100.0 361,276 100.0
Age at death and years since death for siblings who have diedA
Both reported 18,251 99.5 21,103 99.5 39,354 99.5
Only years since death reported - - - - - -
Only age at death reported 90 0.5 104 0.5 194 0.5
Total 18,341 100.0 21,207 100.0 39,548 100.0
( ) Figures that are based on 25-49 unweighted cases
“–” denotes 0 unweighted case in that cell or in the denominator
Table DQ.7.2: Sibship size and sex ratio of siblings
Mean sibship size and sex ratio of siblings at birth to women age 15-49 years, Punjab, 2017-18
Mean sibship sizeA
Sex ratio of siblings at birthB Number of women
Total 5.6 1.08 71,581
Age
15-19 5.0 1.05 14,184
20-24 5.3 1.06 13,332
25-29 5.6 1.07 12,207
30-34 5.8 1.07 10,133
35-39 6.0 1.09 9,317
40-44 6.0 1.14 6,852
45-49 5.9 1.14 5,556
A Includes the respondent
B Excludes the respondent

Appendix E Questionnaires| Page 121
APPENDIX E QUESTIONNAIRES
E.1 Household questionnaire

Appendix E Questionnaires| Page 122

Appendix E Questionnaires| Page 123

Appendix E Questionnaires| Page 124
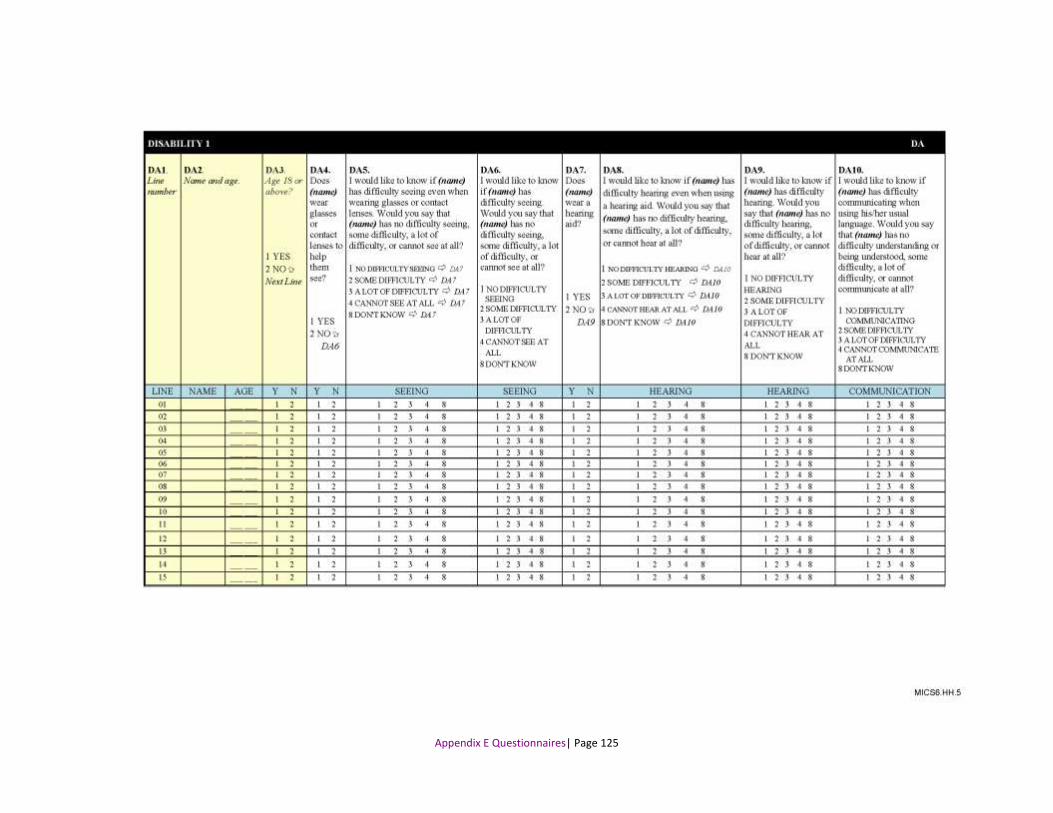
Appendix E Questionnaires| Page 125

Appendix E Questionnaires| Page 126
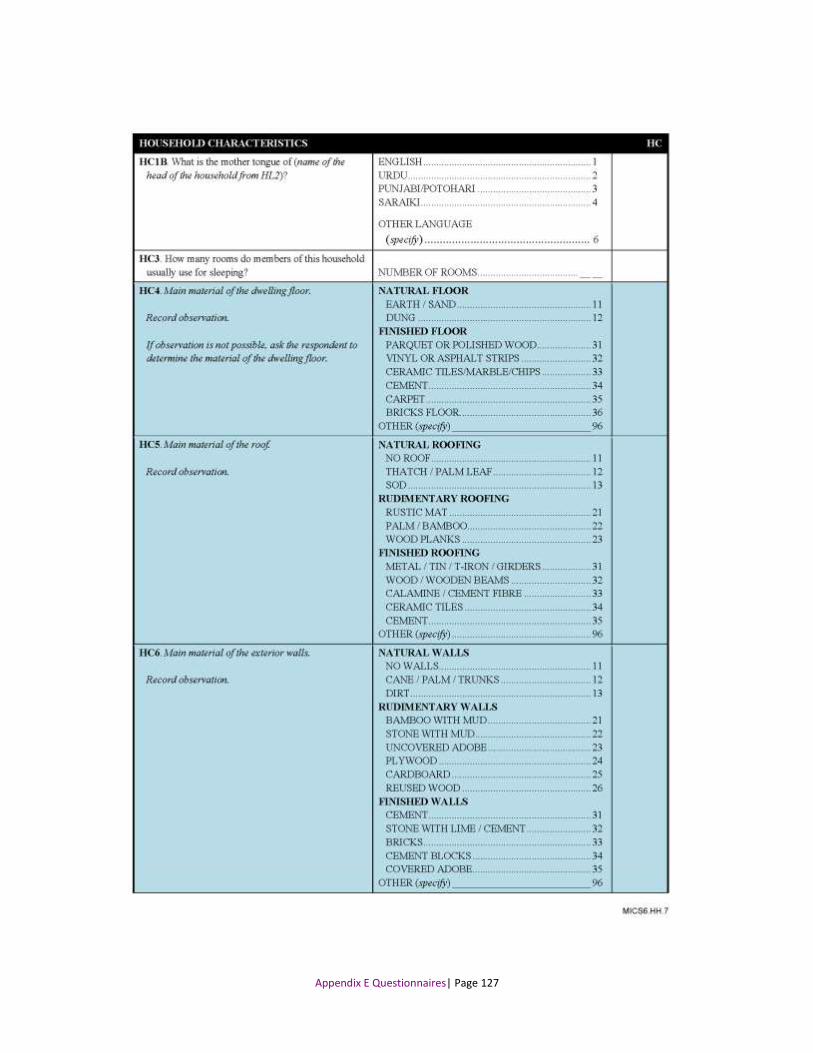
Appendix E Questionnaires| Page 127

Appendix E Questionnaires| Page 128

Appendix E Questionnaires| Page 129

Appendix E Questionnaires| Page 130

Appendix E Questionnaires| Page 131

Appendix E Questionnaires| Page 132

Appendix E Questionnaires| Page 133

Appendix E Questionnaires| Page 134

Appendix E Questionnaires| Page 135
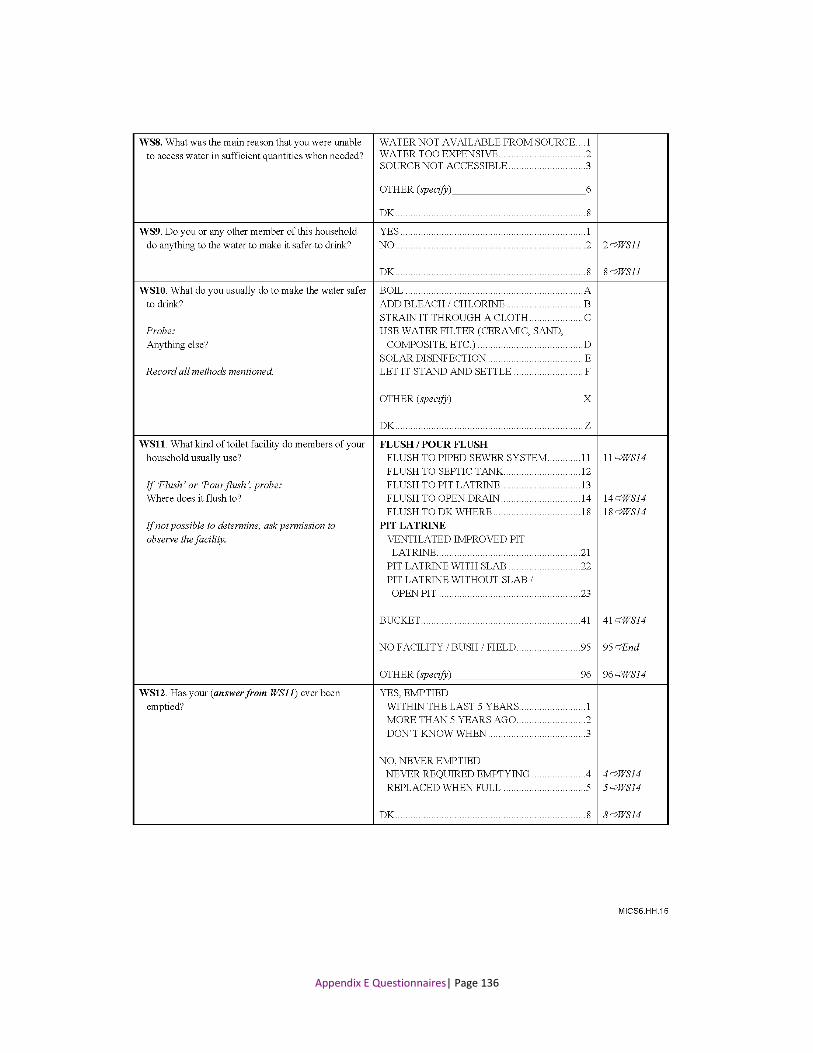
Appendix E Questionnaires| Page 136
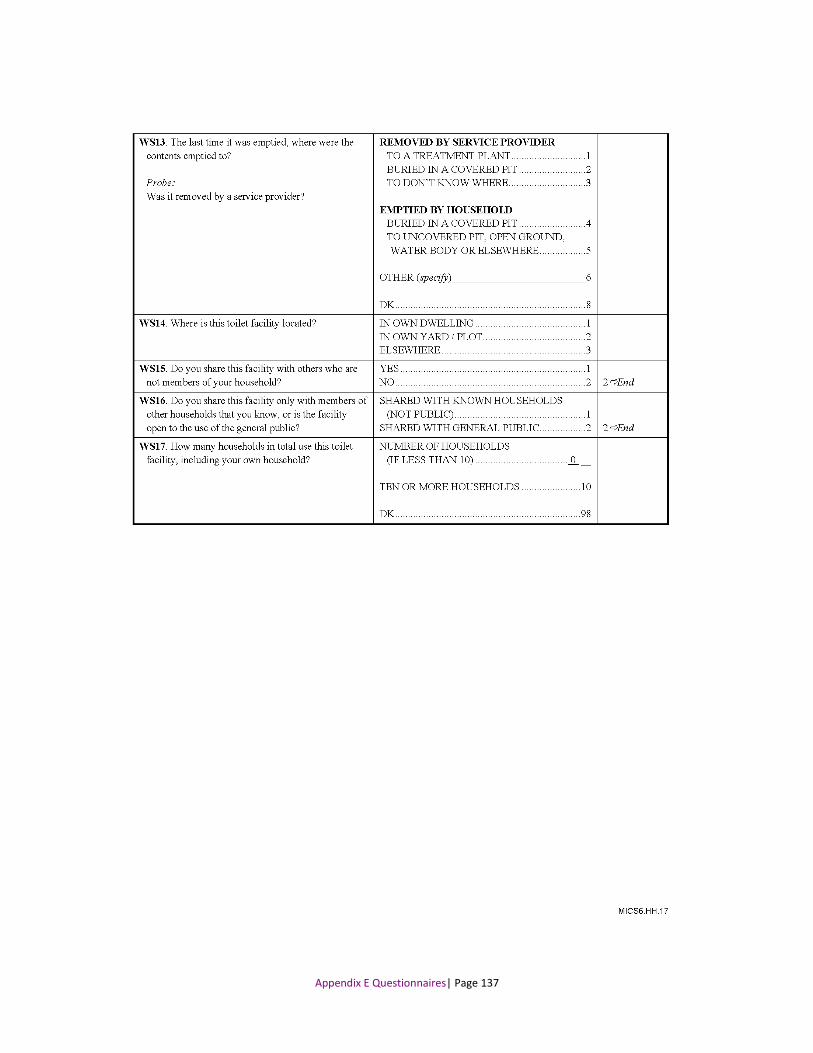
Appendix E Questionnaires| Page 137

Appendix E Questionnaires| Page 138

Appendix E Questionnaires| Page 139

Appendix E Questionnaires| Page 140

Appendix E Questionnaires| Page 141

Appendix E Questionnaires| Page 142

Appendix E Questionnaires| Page 143

Appendix E Questionnaires| Page 144
E.2 QUESTIONNAIRE FOR INDIVIDUAL WOMEN

Appendix E Questionnaires| Page 145

Appendix E Questionnaires| Page 146

Appendix E Questionnaires| Page 147

Appendix E Questionnaires| Page 148

Appendix E Questionnaires| Page 149

Appendix E Questionnaires| Page 150

Appendix E Questionnaires| Page 151

Appendix E Questionnaires| Page 152
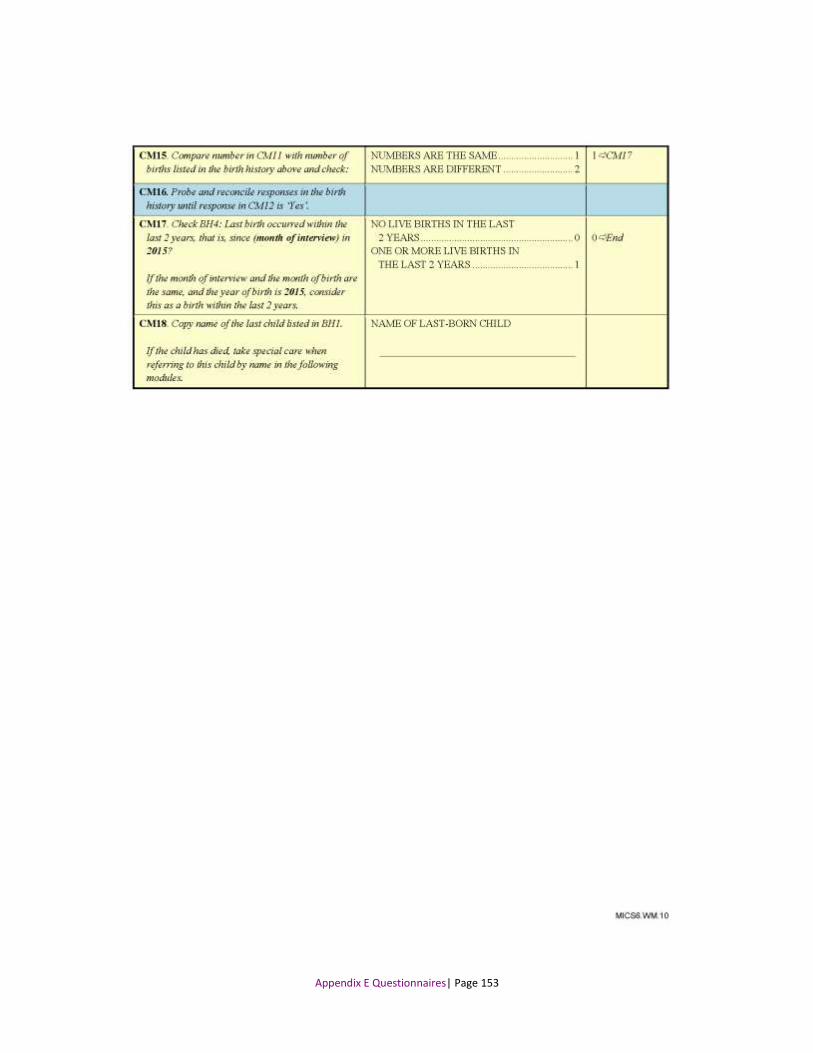
Appendix E Questionnaires| Page 153

Appendix E Questionnaires| Page 154

Appendix E Questionnaires| Page 155

Appendix E Questionnaires| Page 156

Appendix E Questionnaires| Page 157

Appendix E Questionnaires| Page 158

Appendix E Questionnaires| Page 159

Appendix E Questionnaires| Page 160

Appendix E Questionnaires| Page 161

Appendix E Questionnaires| Page 162

Appendix E Questionnaires| Page 163

Appendix E Questionnaires| Page 164

Appendix E Questionnaires| Page 165

Appendix E Questionnaires| Page 166

Appendix E Questionnaires| Page 167

Appendix E Questionnaires| Page 168

Appendix E Questionnaires| Page 169

Appendix E Questionnaires| Page 170

Appendix E Questionnaires| Page 171

Appendix E Questionnaires| Page 172

Appendix E Questionnaires| Page 173

Appendix E Questionnaires| Page 174

Appendix E Questionnaires| Page 175

Appendix E Questionnaires| Page 176
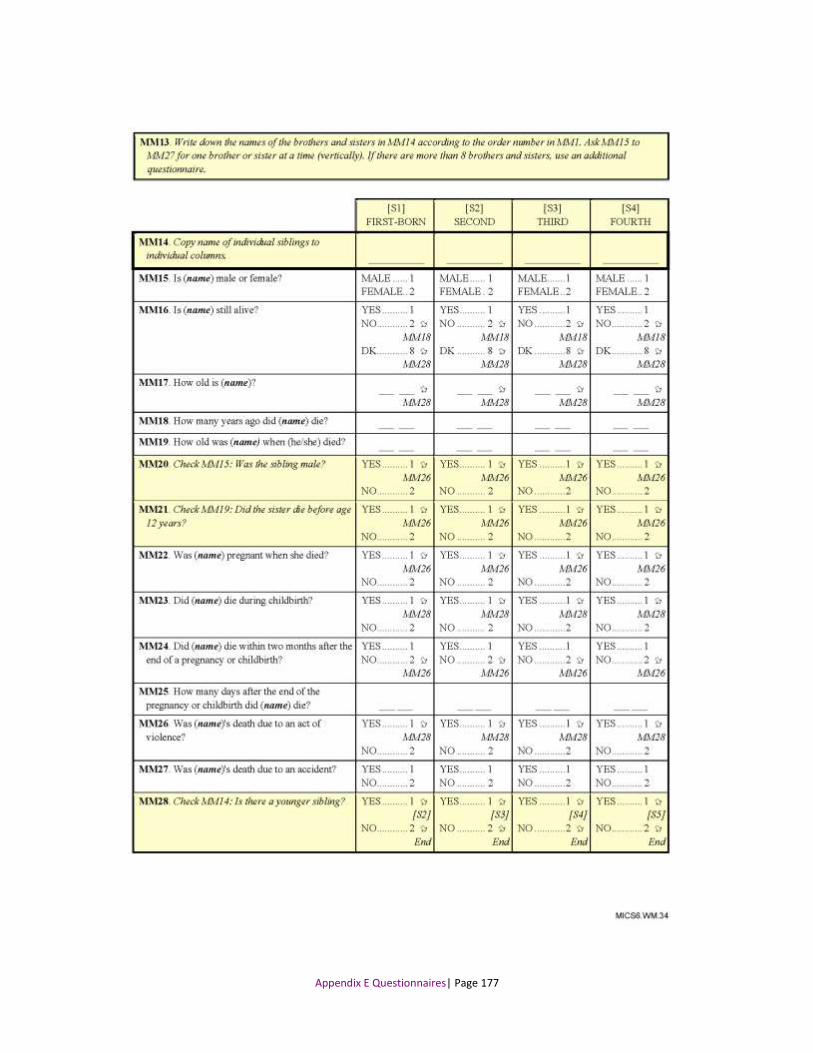
Appendix E Questionnaires| Page 177

Appendix E Questionnaires| Page 178

Appendix E Questionnaires| Page 179

Appendix E Questionnaires| Page 180

Appendix E Questionnaires| Page 181

Appendix E Questionnaires| Page 182

Appendix E Questionnaires| Page 183

Appendix E Questionnaires| Page 184
Appendix E Questionnaires| Page 185

Appendix E Questionnaires| Page 186
E.3 QUESTIONNAIRE FOR INDIVIDUAL MEN

Appendix E Questionnaires| Page 187

Appendix E Questionnaires| Page 188

Appendix E Questionnaires| Page 189

Appendix E Questionnaires| Page 190

Appendix E Questionnaires| Page 191

Appendix E Questionnaires| Page 192

Appendix E Questionnaires| Page 193

Appendix E Questionnaires| Page 194

Appendix E Questionnaires| Page 195

Appendix E Questionnaires| Page 196

Appendix E Questionnaires| Page 197

Appendix E Questionnaires| Page 198

Appendix E Questionnaires| Page 199

Appendix E Questionnaires| Page 200

Appendix E Questionnaires| Page 201

Appendix E Questionnaires| Page 202

Appendix E Questionnaires| Page 203

Appendix E Questionnaires| Page 204

Appendix E Questionnaires| Page 205

Appendix E Questionnaires| Page 206

Appendix E Questionnaires| Page 207
E.4 QUESTIONNAIRE FOR CHILDREN UNDER FIVE

Appendix E Questionnaires| Page 208

Appendix E Questionnaires| Page 209

Appendix E Questionnaires| Page 210

Appendix E Questionnaires| Page 211

Appendix E Questionnaires| Page 212

Appendix E Questionnaires| Page 213

Appendix E Questionnaires| Page 214

Appendix E Questionnaires| Page 215

Appendix E Questionnaires| Page 216

Appendix E Questionnaires| Page 217

Appendix E Questionnaires| Page 218

Appendix E Questionnaires| Page 219

Appendix E Questionnaires| Page 220

Appendix E Questionnaires| Page 221

Appendix E Questionnaires| Page 222

Appendix E Questionnaires| Page 223

Appendix E Questionnaires| Page 224

Appendix E Questionnaires| Page 225

Appendix E Questionnaires| Page 226

Appendix E Questionnaires| Page 227

Appendix E Questionnaires| Page 228

Appendix E Questionnaires| Page 229

Appendix E Questionnaires| Page 230

Appendix E Questionnaires| Page 231

Appendix E Questionnaires| Page 232

Appendix E Questionnaires| Page 233

Appendix E Questionnaires| Page 234

Appendix E Questionnaires| Page 235
E.5 QUESTIONNAIRE FOR CHILDREN AGE 5-17

Appendix E Questionnaires| Page 236

Appendix E Questionnaires| Page 237

Appendix E Questionnaires| Page 238

Appendix E Questionnaires| Page 239

Appendix E Questionnaires| Page 240

Appendix E Questionnaires| Page 241

Appendix E Questionnaires| Page 242

Appendix E Questionnaires| Page 243

Appendix E Questionnaires| Page 244

Appendix E Questionnaires| Page 245

Appendix E Questionnaires| Page 246

Appendix E Questionnaires| Page 247

Appendix E Questionnaires| Page 248

Appendix E Questionnaires| Page 249

Appendix E Questionnaires| Page 250

Appendix E Questionnaires| Page 251

Appendix E Questionnaires| Page 252

Appendix E Questionnaires| Page 253

Appendix E Questionnaires| Page 254
E.6 WATER QUALITY TESTING QUESTIONNAIRE

Appendix E Questionnaires| Page 255

Appendix E Questionnaires| Page 256

Appendix E Questionnaires| Page 257

Appendix E Questionnaires| Page 258

Appendix E Questionnaires| Page 259

Appendix F List of Assets for Wealth Quintiles| Page 260
APPENDIX F LIST OF ASSETS FOR WEALTH QUINTILES
Household Characteristics Gas heater
Persons per sleeping room Cooking range
Type of floor Sewing machine
Earth/sand floor Iron (Gas/Coal)
Dung floor Bed
Parquet/polished wood floor Sofa
Vinyl/asphalt strip floor Cupboard
Ceramic tiles floor Wall clock
Cement floor Electricity
Carpet floor Yes, interconnected grid
Bricks floor Yes, off-grid (generator/isolated system)
Type of roof No
No roof Household assets - 2
Thatch/palm leaf roof Television
Sod roof Refrigetaror
Rustic mat roof Washing machine/Dryer
Palm/bamboo roof Air cooler/fan
Wood planks roof Microwave oven
Metal/tin roof Iron
Wood roof Water filter
Calamine/cement fibre roof Dunky pump/turbine
Ceramic tiles roof Air conditioner
Cement roof Sewing/knitting machine
Type of wall Household members assets
No walls Watch
Cane/palm/trunks walls Bicycle
Dirt walls Motorcycle/scooter
Bamboo with mud wall Animal drawn cart
Stone with mud walls Car/van/bus/truck
Uncovered adobe walls Boat with motor
Plywood walls Tractor/trolley
Cardboard walls Auto rickshaw/Chingchi
Reused wood walls Computer / Mobile / Internet
Cement walls Computer
Stone with lime/cement walls Mobile telephone
Brick walls Internet at home
Cement blocks walls Land ownership
Covered adobe walls Land area
Household assets - 1 Bank account
Fixed telephone line Household owns bank account
Radio

Appendix F List of Assets for Wealth Quintiles| Page 261
Type of cookstove Alcohol/ethanol
Electric stove Gasoline / diesel
Solar cooker Kerosene / paraffin
Liquefied petroleum gas (lpg)/ cooking gas stove Coal / lignite
Piped natural gas stove Charcoal
Biogas stove Wood
Liquid fuel stove Crop residue / grass /straw / shrubs
Three stone stove / open fire Animal dung / waste
No food cooked Processed biomass (pellets) or woodchips
Manufactured solid fuel stove Garbage / plastic
Traditional solid fuel stove Sawdust
Type of energy used at cookstove Source of light
Alcohol/ethanol Electricity
Gasoline/diesel Solar lantern
Kerosene/paraffin Rechargeable flashlight, torch or lantern
Coal/lignite Battery powered flashlight, torch or lantern
Charcoal Biogas lamp
Wood Gasoline lamp
Crop residue/grass/straw/shrubs Kerosene or paraffin lamp
Animal dung/waste Charcoal
Processed biomass (pellets) or woodchips Wood
Garbage/plastic Crop residue/grass/straw/shrubs
Sawdust Animal dung/waste
Type of household fuel Oil lamp
In main house - no separate room Candle
In main house - in a separate room No lighting
In a separate building Source of drinking water
Outdoors - open air Water piped into dwelling
Outdoors - on veranda or covered porch Water piped into yard/plot
Type of space heating Water piped to neighbor
Central heating Public tap/standpipe for water
Three stone stove / open fire Tubewell/borehole for water
No space heating in the household Motorized pump
Manufactured space heater Hand pump
Traditional space heater Protected well for water
Manufactured cookstove Unprotected well for water
Traditional cookstove Protected spring for water
Type of household fuel Unprotected spring for water
Solar air heater Rainwater for water
Electricity Tanker truck for water
Piped natural gas Cart with small tank for water
Liquefied petroleum gas (lpg)/cooking gas Water kiosk
Biogas Surface water

Appendix F List of Assets for Wealth Quintiles| Page 262
Type of cookstove Alcohol/ethanol
Electric stove Gasoline / diesel
Solar cooker Kerosene / paraffin
Liquefied petroleum gas (LPG)/ cooking gas stove Coal / lignite
Piped natural gas stove Charcoal
Biogas stove Wood
Bottled water Pit latrine without slab/open pit toilet
Location of water source Bucket toilet
Water in own dwelling No facility/bush/field
Water in own yard or plot Location of sanitation facility
Water less than 30 minutes away Water piped into dwelling
Water more than 30 minutes away Water piped into yard/plot
Water not collected by household member Water piped to neighbor
Sufficient water Sharing sanitation facilities
Water was not sufficient last month - At least once Shares toilet with other households or uses public
toilets
Water was not sufficient last month - Always sufficient Shares toilet with less than 10 households
Shares toilet with 10+ households or uses public
Type of sanitation facility toilets
Flush to piped sewer system toilet Availability of water at place for handwashing
Flush to septic system toilet Water present at handwashing place in the
Flush to pit latrine toilet dwelling
Flush to open drain toilet Availability of soap
Flush to unknown place toilet Has soap in household
Ventilated improved pit latrine toilet Servant variables
Pit latrine with slab toilet One or more live-in servants
Flush to pit latrine toilet

MICS Multiple IndicatorCluster Survey
Punjab
Multiple Indicator Cluster Survey
2017-18
Provincial Report (Vol - I)
Mu
ltiple
Ind
icato
r Clu
ste
r Su
rvey 2
017-1
8 (V
ol - I)
Punjab Multiple Indicator Cluster Survey