Sustaining crop water productivity in rice-wheat systems of South Asia: A case study from the...
47
WORKING PAPER 115 International Water Management Institute Waqar Ahmed Jehangir, Ilyas Masih, Shehzad Ahmed, Mustaq Ahmad Gill, Maqsood Ahmad, Riaz Ahmad Mann, Muhammad Rafiq Chaudhary, Asad Sarwar Qureshi and Hugh Turral Sustaining Crop Water Productivity in Rice-Wheat Systems of South Asia: A Case Study from the Punjab, Pakistan
-
Upload
independent -
Category
Documents
-
view
0 -
download
0
Transcript of Sustaining crop water productivity in rice-wheat systems of South Asia: A case study from the...

WORKING PAPER 115
I n t e r n a t i o n a lWater ManagementI n s t i t u t e
Waqar Ahmed Jehangir, Ilyas Masih, Shehzad Ahmed,Mustaq Ahmad Gill, Maqsood Ahmad, Riaz Ahmad Mann,Muhammad Rafiq Chaudhary, Asad Sarwar Qureshi andHugh Turral
Sustaining Crop WaterProductivity in Rice-WheatSystems of South Asia:A Case Study from thePunjab, Pakistan

i
Working Paper 115
Sustaining Crop Water Productivity in Rice-WheatSystems of South Asia: A Case Study from the
Punjab, Pakistan
Waqar Ahmed Jehangir, Ilyas Masih, Shehzad Ahmed,Mustaq Ahmad Gill, Maqsood Ahmad, Riaz Ahmad Mann,
Muhammad Rafiq Chaudhary, Asad Sarwar Qureshiand Hugh Turral
International Water Management Institute

ii
The authors: Waqar Ahmad Jehangir is Senior Agricultural Economist, IWMI-Pakistan; Ilyas Masihis Hydrologist, IWMI-Pakistan; Shehzad Ahmed is Research Officer, IWMI-Pakistan; MustaqAhmad Gill is Director General, OFWM, Punjab; Maqsood Ahmad is Assistant Director Technical,OFWM, Punjab; Riaz Ahmad Mann is Coordinator, Rice-Wheat Program, PARC; Muhammad RafiqChaudhary is Professor, Dept. of Irrigation and Drainage, UAF; Asad Sarwar Qureshi is Head,IWMI-Iran; and Hugh Turral is Principal Researcher/Theme Leader, IWMI-Sri Lanka.
Acknowledgements: The Rice-Wheat Consortium of the Indo-Gangetic Plains initiated thisdevelopment and collaborative research project. The main source of funding was the AsianDevelopment Bank.
The authors thank farmers (Syed Ijlal Haider Zaidi, Malik Sajjad Solomon, Sardar Zahoor andAhmed Dogar) for providing their land for the field trials and for their good cooperation duringdata collection activities. They especially appreciate the hard work of Mr. Anwar Iqbal, SeniorField Assistant, IWMI and field team (Mr. Ummer bin Abdul Aziz, Mr. Arif Ali, Mr. Ehsan Elahiand Mr. Muhammad Ashraf) for collecting field data. Also, they thank research staff of IWMI,namely Messrs. Asghar Hussain, Khalid Mehmood Sidique, Zubair Tahir and Mrs. MehmoodaTabassum for their valuable contributions in data analysis.
The authors also wish to thank Dr. Muhammad Aslam, former IWMI researcher, for his goodplanning during early stages of this work. Finally, the authors extend their thanks to Dr. ZongpingZhu, Director, IWMI-Pakistan, for his constructive ideas on water balance analysis and hissuggestions to improve conclusions and the future directions for sustainable productivity of rice-wheat systems.
Jehangir, W. A.; Masih, I.; Ahmed, S.; Gill, M. A.; Ahmad, M.; Mann, R. A.; Chaudhary, M. R.;Qureshi, A. S.; Turral, H. 2007. Sustaining crop water productivity in rice-wheat systems ofSouth Asia: A case study from the Punjab, Pakistan. Colombo, Sri Lanka: International WaterManagement Institute. 45p. (IWMI Working Paper 115)
wheat / rice / water balance / productivity / water use / water requirements / waterconservation / water table / groundwater / water quality / economic aspects / Pakistan
ISBN 978-92-9090-653-7
Copyright © 2007, by IWMI. All rights reserved.
Please direct inquiries and comments to: [email protected]
IWMI receives its principal funding from 58 governments, private foundations and internationaland regional organizations known as the Consultative Group on International AgriculturalResearch (CGIAR). Support is also given by the Governments of Ghana, Pakistan, SouthAfrica, Sri Lanka and Thailand.

iii
Contents
List of Tables .............................................................................................................................. iv
List of Figures .............................................................................................................................. iv
List of Annexures ............................................................................................................................ v
List of Acronyms ............................................................................................................................vi
Summary ............................................................................................................................. vii
1 INTRODUCTION ................................................................................................................... 1
1.1 Background ...................................................................................................................... 11.2 Project Goal and Purpose ................................................................................................ 2
2 RESEARCH METHODOLOGY ............................................................................................ 2
2.1 Research Locale .............................................................................................................. 22.1.1 Research Sites and Experimental Set Up ........................................................... 2
2.2 Data Collection and Analysis for Water Balance and Water Productivity .................... 52.2.1 Field Level Analysis ............................................................................................. 52.2.2 Farm Level Analysis ............................................................................................ 62.2.3 Watercourse Level Analysis ................................................................................ 7
2.3 Framework for the Promotion of Resource Conservation Technologies ....................... 72.4 Socioeconomic Aspects of RCT Adoption ...................................................................... 7
3 RESULTS AND DISCUSSION .............................................................................................. 8
3.1 Water Balance and Water Productivity at Various Scales ............................................. 83.1.1 Field Level Evaluation of Conventional Rice-Wheat Rotation ........................... 83.1.2 Farm Level Water Balance and Water Productivity .......................................... 93.1.3 Watercourse Level Water Balance and Water Productivity ............................ 103.1.4 Change in Source Groundwater Table Depth ................................................... 133.1.5 Change in Groundwater Quality ........................................................................ 14
3.2 Field Level Testing and Development of Rice-Wheat Crop Establishment Methods . 163.2.1 Agronomic Evaluation of Rice-Wheat Crop Establishment Methods .............. 163.2.2 Water Balances of Rice-Wheat Treatments ..................................................... 193.2.3 Comparing Water Productivity of Rice Treatments ......................................... 203.2.4 Comparing Water Productivity of Wheat Treatments ...................................... 21
3.3 Promotion of Resource Conservation Technologies ..................................................... 223.3.1 Adoption of Resource Conservation Technologies ........................................... 223.3.2 Farmers’ Views About Resource Conservation Technologies ......................... 243.3.3 Constraints and Opportunities in Adoption of Resource Conservation
Technologies ....................................................................................................... 24
4 CONCLUSIONS AND RECOMMENDATIONS ............................................................... 26
5 FUTURE DIRECTION AND THE WAY FORWARD ...................................................... 27
6 LITERATURE CITED ........................................................................................................... 29
ANNEXURES ............................................................................................................................ 31

iv
List of Tables
Table 1. Salient features of the sample watercourses 4Table 2. Performance indicators for water productivity analysis 6Table 3. Water balance and water productivity analysis for conventional
rice-wheat rotation at farmer’s field, watercourse 32326/L,Ghour Dour Distributary, Punjab, Pakistan 8
Table 4. Farm-wise variation in water balance and water productivityof rice and wheat 11
Table 5. Gross value of production per unit of water at the watercourse level 13Table 6. Tubewell water quality in the study area 15Table 7. Adoption of resource conservation technologies in the project areas 23Table 8. Farmers’ views about the advantages and constraints regarding
resource conservation technologies 25
List of Figures
Figure 1. Rice-wheat cropping zones in Pakistan 3Figure 2. Schematic layout of the sample watercourses and farms 4Figure 3a. Comparison of water balance components (Kharif 2001) 12Figure 3b. Comparison of water balance components (Rabi 2001-2002) 12Figure 4. Seasonal groundwater table depth in the sample watercourses
(Kharif 2001-2003) 14Figure 5. Variation in groundwater quality measured from piezometers during
2001-2003 15Figure 6. Incidence of weeds in various rice establishment methods 17Figure 7. Rice yield under various establishment methods at sample farms 18Figure 8. Wheat yield under various establishment methods at the sample sites 19Figure 9. Comparison of water balance components for rice-wheat treatments 20Figure 10. Water productivity (WP_
GI) of rice establishment methods 21
Figure 11. Average water productivity (WP_GI
) of wheat establishment methods 22Figure 12. Comparison of zero tillage and conventional wheat production costs
and income (Rabi 2002-2003) 26

v
List of Annexures
Annex 1. Data collection and analysis at field, farm and watercourse levels 31Annex 2. Seasonal water balance and water productivity analysis for
conventional rice-wheat cultivation at farmer’s fields, watercourse32326/L, Ghour Dour Distributary, Punjab, Pakistan 33
Annex 3A. Gross value of production per unit of water at the watercourse level 34Annex 3B. Crop-wise value of production at the watercourse scale during Kharif 2001 35Annex 3C. Crop-wise value of production at the watercourse scale during Rabi 2001 36Annex 4. Socioeconomic characteristics of sample farmers 37

vi
List of Acronyms
ACIAR Australian Centre for International Agricultural Research
ADB Asian Development Bank
BW2R Bed Planted Wheat with 2 rows
BW3R Bed Planted Wheat with 3 rows
CIMMYT International Maize and Wheat Improvement Center
CIP International Potato Center
CW Conventional Wheat
DSRB Direct Seeded Rice on Beds
DSRF Direct Seeded Rice on Flat
ICRISAT International Crops Research Institute for the Semi-Arid Tropics
IGP Indo-Gangetic Plains
IRRI International Rice Research Institute
IWASRI International Waterlogging and Salinity Research Institute
IWMI International Water Management Institute
OFWM On-Farm Water Management
PARC Pakistan Agricultural Research Council
RCT Resource Conservation Technologies
RWC Rice-Wheat Consortium
TPRB Transplanted Rice on Beds
TPRF Transplanted Rice on Flat
UAF University of Agriculture, Faisalabad
WAPDA Water and Power Development Authority
WP Water Productivity
ZTW Zero Tillage Wheat
vii
Summary
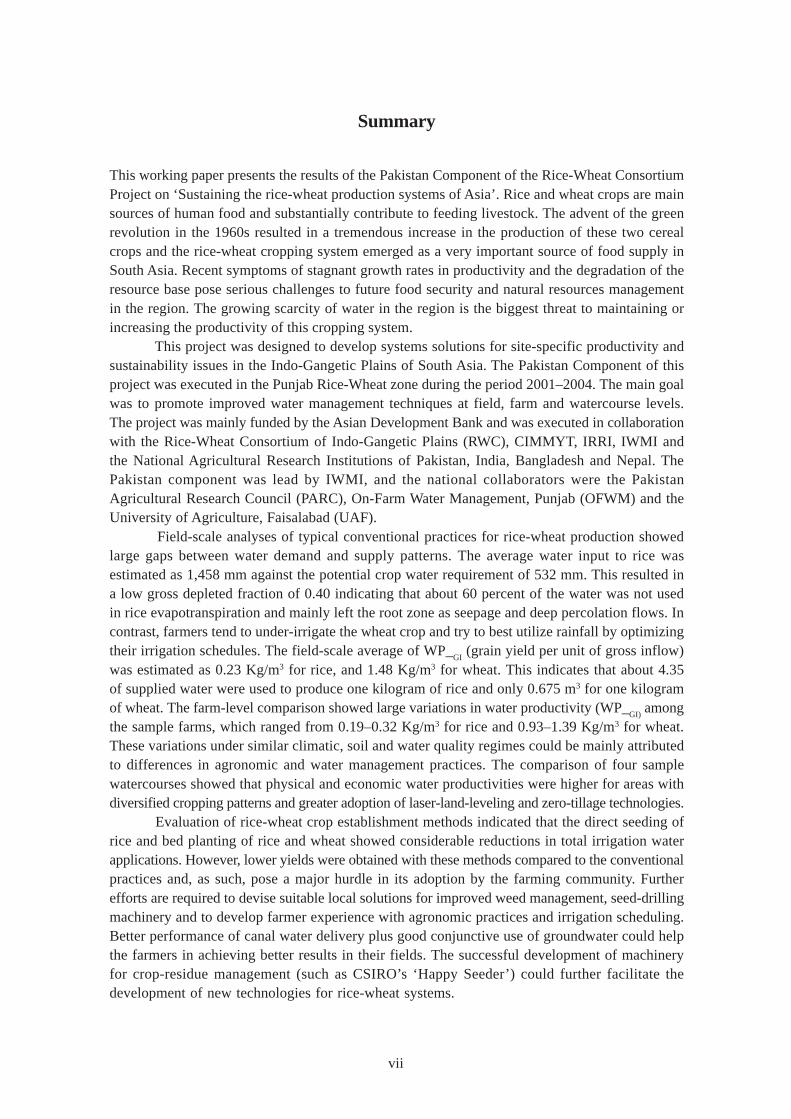
This working paper presents the results of the Pakistan Component of the Rice-Wheat ConsortiumProject on ‘Sustaining the rice-wheat production systems of Asia’. Rice and wheat crops are mainsources of human food and substantially contribute to feeding livestock. The advent of the greenrevolution in the 1960s resulted in a tremendous increase in the production of these two cerealcrops and the rice-wheat cropping system emerged as a very important source of food supply inSouth Asia. Recent symptoms of stagnant growth rates in productivity and the degradation of theresource base pose serious challenges to future food security and natural resources managementin the region. The growing scarcity of water in the region is the biggest threat to maintaining orincreasing the productivity of this cropping system.
This project was designed to develop systems solutions for site-specific productivity andsustainability issues in the Indo-Gangetic Plains of South Asia. The Pakistan Component of thisproject was executed in the Punjab Rice-Wheat zone during the period 2001–2004. The main goalwas to promote improved water management techniques at field, farm and watercourse levels.The project was mainly funded by the Asian Development Bank and was executed in collaborationwith the Rice-Wheat Consortium of Indo-Gangetic Plains (RWC), CIMMYT, IRRI, IWMI andthe National Agricultural Research Institutions of Pakistan, India, Bangladesh and Nepal. ThePakistan component was lead by IWMI, and the national collaborators were the PakistanAgricultural Research Council (PARC), On-Farm Water Management, Punjab (OFWM) and theUniversity of Agriculture, Faisalabad (UAF).
Field-scale analyses of typical conventional practices for rice-wheat production showedlarge gaps between water demand and supply patterns. The average water input to rice wasestimated as 1,458 mm against the potential crop water requirement of 532 mm. This resulted ina low gross depleted fraction of 0.40 indicating that about 60 percent of the water was not usedin rice evapotranspiration and mainly left the root zone as seepage and deep percolation flows. Incontrast, farmers tend to under-irrigate the wheat crop and try to best utilize rainfall by optimizingtheir irrigation schedules. The field-scale average of WP_
GI (grain yield per unit of gross inflow)
was estimated as 0.23 Kg/m3 for rice, and 1.48 Kg/m3 for wheat. This indicates that about 4.35of supplied water were used to produce one kilogram of rice and only 0.675 m3 for one kilogramof wheat. The farm-level comparison showed large variations in water productivity (WP_
GI) among
the sample farms, which ranged from 0.19–0.32 Kg/m3 for rice and 0.93–1.39 Kg/m3 for wheat.These variations under similar climatic, soil and water quality regimes could be mainly attributedto differences in agronomic and water management practices. The comparison of four samplewatercourses showed that physical and economic water productivities were higher for areas withdiversified cropping patterns and greater adoption of laser-land-leveling and zero-tillage technologies.
Evaluation of rice-wheat crop establishment methods indicated that the direct seeding ofrice and bed planting of rice and wheat showed considerable reductions in total irrigation waterapplications. However, lower yields were obtained with these methods compared to the conventionalpractices and, as such, pose a major hurdle in its adoption by the farming community. Furtherefforts are required to devise suitable local solutions for improved weed management, seed-drillingmachinery and to develop farmer experience with agronomic practices and irrigation scheduling.Better performance of canal water delivery plus good conjunctive use of groundwater could helpthe farmers in achieving better results in their fields. The successful development of machineryfor crop-residue management (such as CSIRO’s ‘Happy Seeder’) could further facilitate thedevelopment of new technologies for rice-wheat systems.

viii
Higher land and water productivity together with increased net income has attracted farmersto adopt the zero-tillage technology. However, financial problems, lack of machinery, lack offamiliarity are major constraints to accelerating the adoption of new technologies among the small-scale farmers. Formulation of a suitable policy framework and actions for the promotion of promising‘Resource Conservation Technologies’ is an essential requirement.
Farmers in Pakistan’s Punjab and many parts of South Asia have opted to increaseeconomic returns from rice production by diverting large amounts of fresh water. They are moreconcerned to increase land productivity to ensure enhanced farm incomes and food security ascompared to focusing on efforts for improved water productivity. Therefore more research anddevelopment efforts are needed to realize the dual goals of increased water and land productivityusing innovative water management techniques for rice-wheat systems. The study shows that theresource conservation technologies result in water savings at the field level, but whether thesecan be translated into real water savings at the system scale is not yet well understood. The up-scaled adoption of resource conservation technologies is likely to result in complex interactionsamong various water balance components. Therefore, the impact of these technologies on realwater savings and water productivity needs to be further evaluated at various scales of an irrigationsystem/river basin.

1
1 INTRODUCTION
1.1 Background
Rice and wheat are of central importance in meeting food needs of the growing population in theworld. These two cereal crops provide 45 percent of the digestible energy and 30 percent of thetotal protein in the human diet, as well as substantially contributing to livestock feed (Evans 1993).Rice and wheat crops are grown sequentially on about 13.5 Mha in the Indo-Gangetic Plains (IGP),including the Indus (areas in Pakistan, and parts of Punjab and Haryana India) and the GangeticPlains extending over Uttar Pradesh, Bihar and West Bengal in India, Nepal and Bangladesh,respectively (Timsina and Connor 2001). Rice-wheat is a major cropping system for sustainingfood security in the region, and millions of farmers and agricultural workers depend on this systemfor employment and livelihoods.
The advent of the green revolution in the early 1960s dramatically increased the area andproductivity of rice-wheat systems in the IGP. The main contributory factors were the introductionof improved varieties, increased use of fertilizers and other chemicals, and the expansion of irrigation.However, more recently yields have stagnated or even declined, and there remain large gaps betweenpotential, experimental and farmers’ yields (Ladha et al. 2003). Therefore, the sustainability of rice-wheat systems of the IGP and their ability to enhance productivity to keep pace with populationgrowth are major concerns. Symptoms of degradation of the resource base include: a) decliningsoil organic matter content and nutrient availability; b) increasing soil salinization and weed; andc) pathogen and pest populations (Pingali and Shah 1999; Timsina and Connor 2001).
The biggest threat to sustaining or increasing the productivity of rice-wheat systems of SouthAsia is water shortage. Supply of fresh water to the agriculture sector will be reduced in the futuredue to the increasing demand and competition from environmental, industrial and domestic sectors.The major challenge for the agriculture sector during the twenty-first century is to produce morefood with less water. Water savings from rice-based cropping systems will be of significantimportance, as nearly 50 percent of the freshwater used in Asian agriculture is utilized for riceproduction (Gleick 1993). To meet the increasing demand for food, and cope with an increasingscarcity of water, more rice needs to be produced using less water (Guerra et al. 1998).
The Rice-Wheat Consortium (RWC) of Indo-Gangetic Plains initiated a project called‘Sustaining the rice-wheat production systems of Asia’, with the main objective of developing systemsthat would provide solutions to site-specific productivity and sustainability problems of intensive rice-wheat cropping systems in the Indo-Gangetic Plains. The project was funded by Asian DevelopmentBank, National Agricultural Research Systems of the participating countries, International AgriculturalResearch Centers (CIMMYT; IRRI; IWMI; ICRISAT; and CIP) and other sources (Governments ofthe United Kingdom and the Netherlands). This project was proposed to help the farmers in the rice-wheat zones of the four consortium countries, Bangladesh, Nepal, India and Pakistan, to: 1) improvefood production at least cost; 2) sustain the production capacity of the resource base; and 3) diversifythe rice-wheat cropping system to obtain alternative sources of income.
The study was mainly focused on intensively cultivated and irrigated rice-wheat croppingsystems of the Indo-Gangetic Plains, which occupy large areas in these four countries. New technologiesthat address issues of crop productivity and natural resource conservation along with packages ofagronomic and crop management practices (called resource conserving technologies (RCT) have beendeveloped with extensive farmer participation. These technologies include: a) zero-tillage; b) bed-planting; and c) surface-seeding and direct-seeded rice on a raised bed-planting system.

2
1.2 Project Goal and Purpose
The Pakistan component of the overall project on ‘Sustaining the rice-wheat production systems ofAsia’ was called ‘Sustaining crop and water productivity in the irrigated rice-wheat cropping systemsof the Pakistan’s Punjab’. The 3-year project started in April 2001 and was completed successfullyin 2004. The International Water Management Institute (IWMI) led the Pakistan component andthe other collaborators were: Pakistan Agricultural Research Council (PARC); On-Farm WaterManagement (OFWM), Punjab; and the University of Agriculture Faisalabad (UAF). The mainobjective of this component of the project was the promotion of water management techniques toachieve a sustainable productivity increase in rice-wheat system at the field, farm and watercoursecommand levels. The main purpose was the assessment of the water saving potential at the field,farm and watercourse levels through the establishment of alternative wheat and rice crop managementpractices and their effects on the groundwater table and quality.
2 RESEARCH METHODOLOGY
2.1 Research Locale
The rice-wheat production system of Pakistan occupies about 2.2 Mha of the total farmland of thecountry (21 Mha), and is distributed into four rice-wheat growing zones categorized on the basisof climate, land and water use as shown in figure 1 (Aslam et al. 2002). This study was conductedin the Punjab rice-wheat agro-ecological region (zone 2) located in the Northern Irrigated Plain ofthe Punjab Province of Pakistan. The climate is sub-tropical continental, characterized as semi-arid with large seasonal fluctuations in temperature and rainfall. Summers are long and hot, lastingfrom April through September with maximum daytime temperature varying between 27°C and 43°C,while in winter it varies between 4°C and 24°C. The average annual rainfall in the area is about550 mm, while the average annual evaporation is around 1,400 mm. About 80 percent of the totalrainfall is received during the monsoon period (July to November), which coincides with ricecultivation.
The soils in the Indus River System are predominantly alluvial, mostly brown to grayishbrown, calcareous and weakly structured. The soil texture ranges from coarse to fine with about85 percent in the moderately coarse to moderately fine categories, mostly suitable for irrigatedagriculture. The rice-wheat sequence is practiced on different kinds of soil textures such as loam,silt loam, silty clay loam and sandy loam. The rice-wheat zone of the Punjab is served by anintensively developed canal irrigation system, providing water on a perennial and non-perennial basis.Groundwater provides the major share of total water supply at the farm gate. Groundwater hasbeen extensively developed over the past 50 years by public sector (during initial phase of the greenrevolution, in 1960s) and by the private sector after the 1980s. Cropping intensities are more than150 percent and are high compared to other cropping systems of the Punjab Province. The maincrops are rice and wheat along with fodder, orchards, vegetables and sugarcane.
2.1.1 Research Sites and Experimental Set Up
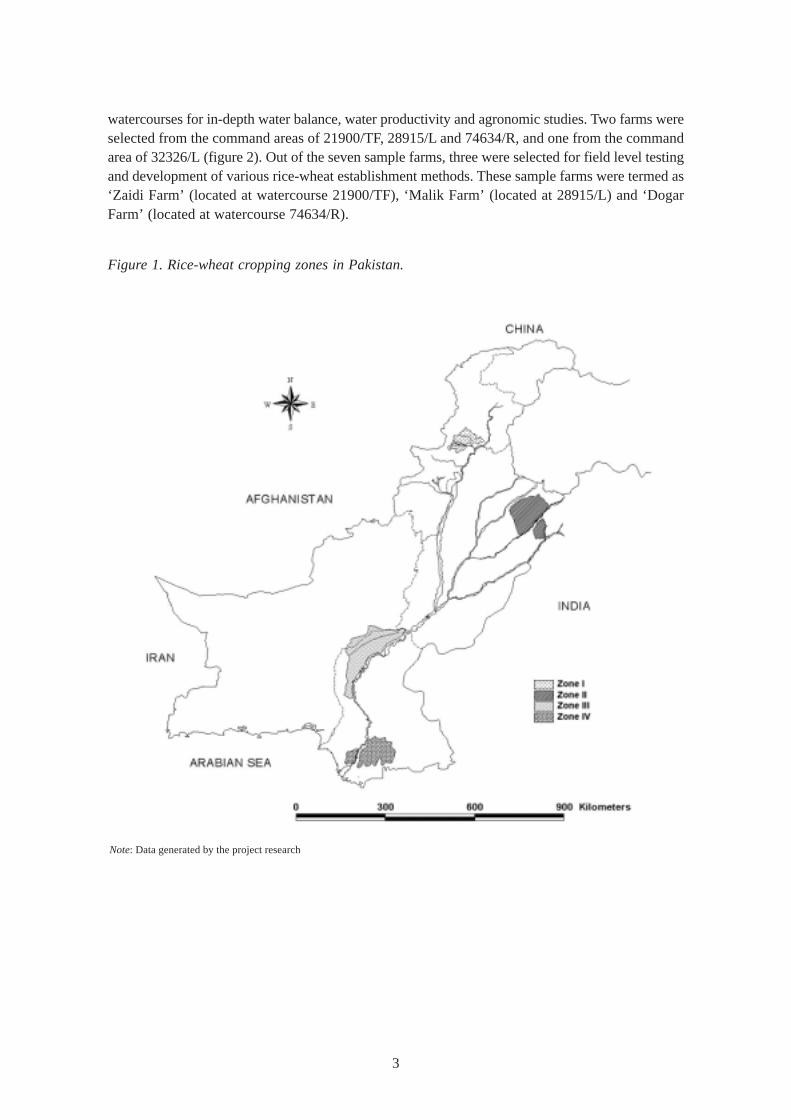
Four watercourses were selected from the Sheikhupura District (figure 1). The salient features ofthese watercourses are given in table1. Water balance and water productivity analyses were doneat the field, farm and watercourse levels. Seven sample farms were selected from the sample
3
watercourses for in-depth water balance, water productivity and agronomic studies. Two farms wereselected from the command areas of 21900/TF, 28915/L and 74634/R, and one from the commandarea of 32326/L (figure 2). Out of the seven sample farms, three were selected for field level testingand development of various rice-wheat establishment methods. These sample farms were termed as‘Zaidi Farm’ (located at watercourse 21900/TF), ‘Malik Farm’ (located at 28915/L) and ‘DogarFarm’ (located at watercourse 74634/R).
Figure 1. Rice-wheat cropping zones in Pakistan.
Note: Data generated by the project research

4
Table 1. Salient features of the sample watercourses.
Salient features Sample watercourses
21900/TF 28915/L 32326/L 74634/R
Canal commandMain Canal Upper Chenab Upper Gugera Upper Gugera Upper Gugera
Canal (UCC) branch canal branch canal branch canal
Distributary/minor Kakar Gill Ghour Dour Ghour Dour GajjianaSub-minor Distributary Distributary Distributary
District Sheikhupura Sheikhupura Sheikhupura Sheikhupura
GCA (ha) 232 72 110 268
CCA (ha) 199 72 108 267
Design canal discharge (m3/s) 0.068 0.007 0.016 0.040
Number of tubewells (averagedischarge capacity 0.028 m3/s) 25 2 17 38
Average Tubewell water electricalconductivity (dS/m) 0.8 1.1 1.2 0.8
Area under rice-wheat (%)
Rice 2001 88 42 65 60
Wheat 2001-2 78 45 81 72
Note: Data generated by the project research
Figure 2. Schematic layout of the sample watercourses and farms.
Note: Data generated by the project research

5
2.2 Data Collection and Analysis for Water Balance and Water Productivity
The data collected for the water balance and water productivity analyses at the field, farm andwatercourse scales are presented in annex 1. The water balance analysis was carried out using theprinciple of mass balance (inflow – outflow = change in storage) that involves the monitoring ofall inflow and outflow components (Perry 1996; Kijne 1996). The main inflow components for thestudy area are irrigation from the canal and tubewell sources, rainfall, surface and subsurface inflows.Outflow components are evapotranspiration, seepage, deep percolation, surface and subsurfaceoutflows. Water productivity was estimated on the basis of the yield and monetary value per unitof the gross inflow and irrigation inflow.
2.2.1 Field Level Analysis
At one site (watercourse 32326/L), only conventional practices were monitored and at the otherthree sites, the four rice-wheat treatments were:
1. T1: Direct seeding of rice on flat fields (DSRF) and wheat with the zero-tillage method(ZTW)
2. T2: Direct seeding of rice on beds (DSRB) and wheat on beds with two rows (BW2R)
3. T3: Transplanting of rice on beds (TPRB) and wheat on beds with three rows (BW3R)
4. T4: Transplanting of rice by conventional method (TPRF) and conventional wheat (CW)
These trials were established at Zaidi, Malik and Dogar farms located in the watercoursecommand areas of 21900/TF, 28915/L and 74634/R, respectively. A randomized complete blockdesign was used with three replicates at each site. Cut throat flumes were used to measure theirrigation inflow to the sample fields. The duration and source of irrigation were also recorded foreach irrigation interval. The amount of irrigation water was calculated by integrating dischargerate over the time of irrigation. Rainfall was measured by rain gauges installed in each selectedwatercourse command area, and crop evapotranspiration was calculated by using Hargreave’sequation and suitable crop coefficients for the study area (Allen et al.1998; Ullah et al. 2001). Theclimatic data from a nearby station belonging to WAPDA (Water and Power Development Authority)were used to calculate the daily reference evapotranspiration (ET
0). The potential crop water
requirements were used in the water balance and water productivity analyses, as the requiredequipment to estimate actual evapotranspiration was not available. For a more robust water balanceanalysis, the actual evapotranspiration can be estimated using simulation models and remote sensingtechniques (Sarwar and Bastiaanssen 2001; Ahmad et al. 2002; Bastiaanssen et al. 2002). Landand water productivity of the rice-wheat establishment methods were estimated using the indicatorsgiven in table 2 (Molden 1997; Molden and Sakthivadivel 1999).

6
Table 2. Performance indicators for water productivity analysis.
Performance indicators Unit Estimation method
Gross depleted fraction (-) Evapotranspiration/Gross inflow
Land productivity Kg/ha Crop yield per unit area
Water Productivity Kg/m3 and Crop yield per unit of water (Kg/m3) andRs/m3 gross value of crop yield per unit of water (Rs/m3)
WP_Gross inflow
= WP_
GICrop yield/Gross inflow
WP_Irrigation inflow
= WP_
ICrop yield/Irrigation inflow
Note: Data generated by the project research
2.2.1.1 Data collection and analysis for agronomic evaluation of rice-wheat establishmentmethods: During the Kharif season, rice was established using direct seeding (T1 and T2) andtransplanting methods (T3 and T4). Then during Rabi season, wheat was established throughzero tillage (T1), bed planting (T2 and T3) and the conventional method (T4). The direct seedingof rice on a flat field and on beds was performed in June and transplanting of 25–30 days oldseedlings occurred about one month later in July. Rice was direct seeded into a finely preparedseedbed using a direct drill at 30 cm row-to-row distance. Beds were formed using a shaper andset at 76 cm between rows i.e., top width for bed and furrow were 42 cm and 34 cm,respectively. The rice crop was harvested during the month of November and then the wheatcrop was sown by way of zero-tillage, bed-planting and the conventional methods during themonth of November. Wheat was harvested in April. The plot area was 0.2 ha for all the fourtreatments. The fertilizer use and plant protection measures were standardized and uniform. Theseed rate for direct- seeded rice was 50 Kg/ha and 75-85 kg/ha for wheat with zero-tillage andbeds, while 135 kg/ha for conventional sowing. The crop varieties for rice and wheat were‘Super Basmati and Inqlab 91’, respectively. The following data were recorded:
• Yield and yield components
• Incidence of insect pests
• Population of bio-control agents
• Incidence of diseases
• Population of weeds
• Plant population of rice and wheat
2.2.2 Farm Level Analysis
The agronomic and irrigation details of the experiments were collected at each sample farm, andthey included: tillage practice; sowing and harvesting dates; fertilizer use; weedicide/pesticide use;and yield and market value. The number, duration and source of irrigations were recorded for eachfield in the command of the sample farm. Farm-level crop-productivity was estimated in terms ofgross value of production per unit of land (Rs/ha) and water (Rs/m3).
7
2.2.3. Watercourse Level Analysis
At the watercourse level, the gross inflow was estimated by recording canal inflow, rainfall andtotal groundwater pumped from tubewells. Discharges were recorded daily at the inlet to sampledistributaries/minors. The total groundwater pumped in a sample watercourse command wasestimated by recording the daily operational hours of every tubewell in a watercourse command,and periodically measuring their flow rates. Daily rainfall was measured through the rain gaugesinstalled at each of the sample watercourse commands. The crop-water demand for each watercoursecommand was estimated by taking the average sowing and harvesting dates of every crop grown ineach watercourse command. Then based on the area of each crop, the weighted average crop waterrequirement was estimated for each watercourse command.
To keep the analysis simple, the water balance of the root zone domain and study of groundwaterbehavior were kept separate. The comparison of the gross water inflow and crop-water requirementprovided a good overview of the water demand and supply pattern in the study area. The impacton the groundwater table and groundwater quality was evaluated through the analysis of the dataon groundwater table depth and groundwater quality. For this data set, piezometers were installedat various locations of each sample watercourse (figure 2). The land productivity (yield per unit ofland, Kg/ha) and farm market value were estimated for every crop through seasonal and annualsurveys. The economic productivity of land (Rs/ha) and water (Rs/m3) were estimated on both aseasonal and annual basis for the four sample watercourses.
2.3 Framework for the Promotion of Resource Conservation Technologies
A framework was developed to promote resource conservation technologies in the sample areas.The promotion of RCT was carried out through:
• Provision of information through farmers’ meetings, farmers’ field days and fielddemonstrations
• Facilitation of LASER leveling services, establishment of rental services of RCT equipmentand technical assistance in RCT adoption
• Enhancing interaction among farmers through cross-farm visits, arranging field days togather various stakeholders i.e., farmers, researchers, government officials and manufacturers
• Providing feedback to government and private machinery manufactures for improving thequality of RCT equipment
2.4 SocioeconomicAspects of RCT Adoption
Socioeconomic surveys were conducted on a seasonal and annual basis to study the socioeconomicaspects of the RCT adoption in the study area. The questionnaires were prepared to study farmers’

8
socioeconomic characteristics in detail, as well as water use patterns and agronomic practices. Surveydata was also collected to compare RCT with the traditional methods, understand farmers’ viewsabout the advantages and pitfalls of RCTs and, identify technical, socioeconomic and policy issuesconstraining the adoption of RCT in the rice-wheat zone of Pakistan’s Punjab.
3 RESULTS AND DISCUSSION
3.1 Water Balance and Water Productivity at Various Scales
3.1.1 Field Level Evaluation of Conventional Rice-Wheat Rotation
The water balance and water productivity analyses of conventional rice-wheat cultivation practicesfor one sample location are presented in table 3. The gross inflow (sum of canal water irrigation,groundwater irrigation and rainfall) to rice cultivation was 1,458 mm. The crop evapotranspirationwas estimated as 532 mm, which when compared to gross inflow indicated a large excess in thewater supply. This was due to the large volume of deep percolation during ‘puddling’ and then in‘ponded’ water conditions usually associated with conventional rice cultivation. The gross depletedfraction was estimated as 0.40, which indicates that 60 percent of gross inflow was not beneficiallyused as crop evapotranspiration. Wheat had a higher water use efficiency than rice, as farmersrestricted the total water supply.
Table 3. Water balance and water productivity analysis for conventional rice-wheat rotation atfarmer’s field, watercourse 32326/L, Ghour Dour Distributary, Punjab, Pakistan.
Performance indicators Rice Wheat
Field area, (m2) 4,160 4,049
Inflow components, (mm)
Irrigation 1,244 253
Rainfall 214 103
Gross inflow 1,458 357
Outflow components, (mm)
Evapotranspiration 532 396
Seepage and percolation 1,202 -40
Performance
Gross depleted fraction, (-) 0.39 1.12
Grain yield , (Kg/ha) 3,243 5,245
Water productivity, (Kg/m3)
WP_GI
0.23 1.48
WP_I
0.29 2.15
Notes: Data generated by the project researchThe values represent averages of three fields extensively monitored during 2001-2003. The results for rice are the average ofthree seasons (Kharif 2001; Kharif 2002; Kharif 2003), whereas the wheat results represent a two season average (Rabi 2001/2002; Rabi 2002/2003). For seasonal detail, see annex 2.
The average grain yields for rice (paddy) and wheat were 3.3 t/ha and 5.3 t/ha, respectively.At this location, the average yield of rice was comparable to that of neighboring farmers. However,

9
the wheat yield was above average, which was only 3.5 t/ha on local farmers’ fields. The WP_GI
(grain yield per unit of gross inflow) was estimated as 0.23 Kg/m3 for rice and 1.48 Kg/m3 forwheat. The irrigation water productivity was estimated as 0.29 Kg/m3 and 2.15 Kg/m3 for rice andwheat, respectively. However, the meaning of this is not clear, given that more than 30 percent ofcrop water demand is sourced from rainfall in the case of wheat cultivation. The lower waterproductivity of rice indicates potential scope for enhancement through focusing on targeting yieldincreases and water conservation strategies. However, the water productivity per unit ofevapotranspiration (Et) for rice is similar to that for wheat, and in fresh groundwater areas, therecharge by deep percolation will be re-pumped for irrigation elsewhere.
3.1.2 Farm Level Water Balance and Water Productivity
The results of farm level analysis of water balance, land and water productivity are presented intable 4. The results represent farm level average values for rice and wheat for the study period(three seasons for rice and two seasons for wheat). The results show that the potential crop-waterdemand for rice varied from 537 mm to 627 mm, with average value of 573 mm. Rice wastransplanted during the months of June and July, and in some cases delayed until August, resultingin lower crop water requirement, but at the cost of yield losses. Farmers transplanting in the laterhalf of June used more water compared to those who transplanted later. The study indicates thatthe most of the rice was transplanted during first–fourth week of July. The farm-level averageirrigation supply, rainfall and gross inflow were 1,224 mm, 192 mm and 1,417 mm, respectively.The sample farm F1-21TF had better water management with the lowest amount of gross inflow(1,209 mm) compared to other sample farms. Laser land leveling was one of the main factors inreducing the total irrigation input at F1-21TF, F1-28L and F1-74R. These sample farms alsoproduced good rice harvests of 3.8 t/ha for F1-21TF and 3.2 t/ha for F1-28L and F1-74R. Theaverage gross value of production for rice was 38, 910 Rs/ha with highest value of 48, 328 Rs/hafor F1-21TF and lowest value of 33,148 Rs/ha for F2-21TF.
The farm-level average water productivities of rice in terms of WP_GI
and WP_I were 0.25
Kg/m3 and 0.29 Kg/m3, respectively. The farm-level variations in WP_I ranged from 0.19-0.32 Kg/
m3. The economic water productivity of rice was 2.93 Rs/m3 and 3.50 Rs/m3 per unit of irrigationand gross inflow, respectively. Higher physical and economic water productivity was observed forF1-21TF, F1-28L and F1-74R, which could be attributed to better water management practicesand the adoption of laser land leveling in these farms.
Water application on wheat was considerably lower than that of rice. The average grossinflow varied from 251 mm to 368 mm across the sample farms, whereas potential crop waterrequirement ranged from 392 mm to 459 mm. The results show that irrigation input and gross inflowwere lower than the potential crop-water requirement at all the sample farms. This shortfall was122 mm (gross inflow: 299 mm and crop-water requirement: 411 mm) for F1-21TF and 66 mmfor F1-32L (gross inflow: 333 mm and crop-water requirement: 399 mm). The results indicatedthat wheat was under-irrigated and may have faced a bit of water stress, though the deficit couldbe partially met from the moisture left in the root zone after the rice harvest. The farm-wise analysisshows better performance of residual moisture utilization where zero tillage was adopted (F1-21TF,F1-28L, F1-74 R) compared to farms under conventional practices (F1-32L, F2-74R, F2-21TF).
The physical water productivity measured in terms of yield per unit of gross inflow (WP_GI
)of wheat ranged from 0.93 Kg/m3 to 1.39 Kg/m3 across the sample farms, with a farm-level averageof 1.15 Kg/m3. The irrigation water productivity was higher than that of gross inflow and, wasmainly influenced by the proportion of rainfall in gross inflow. The economic water productivity of

10
wheat, WP_GI
and WP_I was 8.42 Rs/m3 and 13.57 Rs/m3, respectively. The results indicate that
economic productivity of water is higher for wheat compared to rice, but the opposite is true interms of land productivity. Rice, being a cash crop, produces more farm revenue (Rice GVP/ha:38,910 Rs/ha) than wheat (Wheat GVP/ha: 25,246 Rs/ha). The farmers are more concerned inmaximizing the yields from their land resources than water productivity increases, as they couldpump good-quality groundwater. However, increasing pumping costs and declining groundwatertables call for improved water management practices in rice cultivation.
3.1.3 Watercourse Level Water Balance and Water Productivity
Estimation of water productivity becomes complex when moving from micro level to system level,which involves various crops and multiple uses of water. Within a watercourse command area inaddition to crop cultivation, water is used for multiple purposes such as livestock, poultry, fishery,trees, drinking and other domestic uses. All these uses have social and economic value, and it becomesextremely intricate to study the overall productivity of water for larger irrigated domains. Theanalysis is further constrained by accurate measurement of water used for all these purposes andestimating the value of production per unit of water (Renwick 2001; Meinzen-Dick and van derHoek 2001). To keep the analysis simple, the focus was on the gross inflow available at thewatercourse command level and the gross value of production obtained by the crop sector. Thewater availability from canals, groundwater and rainfall was estimated and compared with the crop-water requirement for all the crops grown in the sample watercourse commands. The economicwater productivity was estimated, in order to provide good indicator for comparison across therange crops grown in an irrigation system, that have differing yield ceilings, components and values.
3.1.3.1 Comparing Water Availability and Crop Water Requirement: The cropping patternindicates that farmers are intensively growing high-water-loving cash crops. The seasonal crop-water requirement and the availability of water at the watercourse level are shown in figures 3aand 3b. The canal water supply was much less than the crop-water requirement in the studyarea. Quantitatively, it could not meet more than 35 percent and 25 percent of the crop demandin Kharif and Rabi seasons, respectively. The variation in daily discharge data shows thatreliability was also low due to variations in actual flows, occasional breeching and canal clo-sures. Rainfall events were sporadic and mostly concentrated over the Kharif season (July toAugust). This scenario led the farmers to pump more groundwater in order to sustain theircrops. Groundwater has acquired a central role as it supplies about three-fourths of the grossinflow. However, seasonal groundwater withdrawals were higher than the crop water demand.The groundwater reservoir was subjected to immense ‘pumpage’. Almost every farmer of thesample watercourses owned a tubewell. The average density of tubewells was one tubewell per13 ha of cultivable land.
The average balance between gross inflow and crop-water demand was estimated to be 893 ±304 mm and 176 ± 78 mm during Kharif and Rabi seasons, respectively. This balance amount isdivided into evaporation, conveyance losses from main and branch watercourses, evapotranspirationfrom banks of watercourses and fields (grasses and trees), irrigation application losses due to seepageand percolation and nonagricultural uses. The disparity between water availability and demand wasquite significant during the Kharif season compared to the Rabi season. On an average, gross inflowwas 60 ± 9 percent and 31 ±9 percent higher than the crop demand during Kharif and Rabi seasons,respectively. This was due to the fact that besides conveyance and other inefficiencies, a large amountof water was needed to offset the seepage and percolation losses to maintain continuous flooding

11
Tabl
e 4.
Far
m-w
ise
vari
atio
n in
wat
er b
alan
ce a
nd w
ater
pro
duct
ivit
y of
ric
e an
d w
heat
.
Indi
cato
rsS
ampl
e Fa
rms
F1-
21T
FF
2-21
TF
F1-
28L
F2-
28L
F1-
74R
F2-
74R
F1-
32L
Farm
ave
rage
Farm
are
a (m
2 )13
3,84
410
1,22
383
,991
96,1
6111
1,78
210
2,23
376
,929
100,
880
Res
ults
for
Ric
e cr
op
Ric
e ar
ea (
m2 )
94,7
0199
,199
72,5
2074
,567
51,7
1266
,478
58,0
3073
,887
Irri
gati
on (
mm
)1,
042
1,25
91,
095
1,51
11,
109
1,37
41,
181
1,22
4
Rai
nfal
l (m
m)
167
163
214
210
187
189
217
192
Gro
ss in
flow
(m
m)
1,20
91,
422
1,30
91,
720
1,29
61,
563
1,39
81,
417
Cro
p w
ater
req
uire
men
t (E
Tc)
(m
m)
627
55
3
608
573
56
3
549
53
7
573
Ric
e yi
eld
(Kg/
ha)
3,78
82,
997
3,26
03,
260
3,22
73,
326
3,03
03,
270
Gro
ss v
alue
of
prod
ucti
on (
Rs/
ha)
48,3
28
33,1
48
39,0
46
39
,046
39
,766
38
,263
34
,778
38
,910
Phy
sica
l Wat
er p
rodu
ctiv
ity
(Kg/
m3 )
WP
_ GI
0.32
0.2
40.
250.
190.
250.
230.
23 0
.25
WP
_ I
0.38
0.30
0.30
0
.22
0
.29
0
.28
0.29
0.29
Eco
nom
ic W
ater
pro
duct
ivit
y (R
s/m
3 )
WP
_ GI
4.05
2.63
2.98
2.34
3.09
2.79
2.59
2.93
WP
_ I
4.78
3.
27
3.
57
2.
69
3.62
3.35
3.26
3.50
Res
ults
for
Whe
at c
rop
Whe
at a
rea
(m2 )
74,9
5510
1,19
884
,035
76,9
0855
,537
69,5
2166
,792
75,5
64
Irri
gati
on (
mm
)19
520
917
725
715
321
722
920
5
Rai
nfal
l (m
m)
104
104
111
111
9897
104
104
Gro
ss in
flow
(m
m)
299
313
288
368
251
314
333
309
Cro
p w
ater
req
uire
men
t (E
Tc)
(m
m)
4
11
4
14
392
403
459
4
50
3
99
4
18
Whe
at y
ield
(K
g/ha
)4,
150
3,26
03,
359
3,35
93,
112
3,40
93,
508
3,45
1
Gro
ss v
alue
of
prod
ucti
on (
Rs/
ha)
31
,902
23
,320
24
,206
24
,206
23
,340
24
,776
24
,972
25
,246
Phy
sica
l Wat
er p
rodu
ctiv
ity
(Kg/
m3 )
WP
_ GI
1.39
1.07
1.17
0.93
1.35
1.08
51.
061.
15
WP
_ I
2.
60
1.56
2.
07
1.
30
2.
04
1.
699
1
.58
1.84
Eco
nom
ic W
ater
pro
duct
ivit
y (K
g/m
3 )
WP
_ GI
10.6
97.
558.
446.
7110
.10
7.87
8.41
8.42
WP
_ I
20.1
9
11
.14
15
.12
9.4
515
.27
12
.45
3.
57
13.5
7
Not
e: D
ata
gene
rate
d by
the
proj
ect r
esea
rch

12
Figure 3a. Comparison of water balance components (Kharif 2001).
Note: Data generated by the project research
Figure 3b. Comparison of water balance components (Rabi 2001-2002).
-1,500
-1,000
-500
0
500
1,000
1,500
2,000
21900-TF 28915-L 74634-R 32326-L Average
Wat
er Q
uan
tity
(mm
)
Rainfall Canal supply Groundwater pumpage Gross inflow Crop water requirement Balance
-700
-450
-200
50
300
550
800
21900-TF 28915-L 74634-R 32326-L Average
Wat
er Q
uan
tity
(mm
)
Rainfall Canal supply Groundwater pumpage Gross inflow Crop water requirement Balance
conditions for traditional rice cultivation. The availability of a high volume of water compared tothe crop-water requirement at the watercourse level during the Rabi season appears to becontradictory to the opposite situation at field and farm levels described earlier. This spatialdifference could be mainly attributed to the seepage and percolation from the watercourses beforereaching the field. Various studies reported a conveyance loss of 25–50 percent from the watercourses(Corey and Clyma 1974; IWASRI 1988; WAPDA 1996).
Note: Data generated by the project research

13
3.1.3.2 Crop Water Productivity at the Watercourse Level: The seasonal and annual gross valueof production for sample watercourse is summarized in table 5. The watercourse-wise details ofgross value of production, inflow values and water productivity are given in annex 3A. Theaverage water productivity at the watercourse level during the Kharif season was estimated as1.75 Rs/m3 and 2.11 Rs/m3 on the basis of gross and irrigation inflow, respectively. The corre-sponding values of WP_
GI and WP_
Irrigation for the Rabi season were estimated as 4.43 Rs/m3 and
4.70 Rs/m3. The annual GVP was skewed towards the Kharif value and estimated as 2.50 Rs/m3
and 2.91 Rs/m3 for gross and irrigation inflows, respectively.The variations among watercourses show that 21-TF had the highest crop-water productivity
followed by 28-L, 32-L and 74-R. It was observed that the areas, where farmers had diversifiedthe cropping pattern by introducing orchards, sugarcane and Rabi vegetables obtained higher grossincome per unit of land and a higher level of crop-water productivity. As shown in annexes 3B and3C, the crop-wise analysis of land and water productivity indicates that:
• Rice gave the maximum gross income per unit of land using maximum water (maximumland return outweighs the water productivity concern from a farmer’s perspective)
• Orchards gave high gross income per unit of land using less water (optimal land returnwith a higher level water productivity)
• Sugarcane gave a high gross income per unit of land, using a large volume of water (optimalland return with a higher level of water productivity)
• Sorghum (Kharif fodder) and oil seeds gave the least gross income per ha using the leastamount of water.
Also, the watercourses with higher levels of adoption of laser–land-leveling and zero tillagetechnologies (21-TF and 28-L) had higher land and water productivity compared to the controlwatercourse (32-L) with no adoption and 74-R with a comparatively low level of RCT adoption.
Table 5. Gross value of production per unit of water at the watercourse level.
Watercourse Crop Water Kharif 2001 Rabi AnnualProductivity (Rs/m3) 2001/2002 2001/2002
21900/TF WP_GI
2.56 5.52 3.28WP_
I3.17 5.91 3.91
28915/L WP_GI
1.93 4.07 2.66WP_
I2.64 4.34 3.32
74634/R WP_GI
1.35 3.96 2.08WP_
I1.57 4.17 2.35
32326/L WP_GI
1.28 4.40 2.25WP_
I1.57 4.66 2.63
Overall average WP_GI
1.75 4.43 2.50WP_
I2.11 4.70 2.91
Note: Data generated by the project research
3.1.4 Change in Source Groundwater Table Depth
Figure 4 shows the seasonal groundwater table depth measured with reference to natural soil surface.In 2001, the groundwater depth at different sample watercourses during the Kharif cropping seasonvaried between 4.38 m and 5.66 m. The seasonal observations show a declining trend at three

14
watercourses (74634-R, 28915-L and 32326-L), whereas the water table was almost stable at 21900-TF. The groundwater observations show that during Kharif 2003 the groundwater table depth variedfrom 4.35 m to 6.63 m in the study area. The watercourse-wise analyses over the study periodshow a decline of 0.97 m in the groundwater table’s depth at the watercourse command of 74634-R (Kharif 2001: 5.66 m vs. Kharif 2003: 6.63 m). The other two watercourses showed a similartrend with 0.52 m and 0.62 m decline in the groundwater table’s depth at watercourse commandsof 28915-L and 32326-L, respectively, for the period Kharif 2001 to Kharif 2003. However, a slightrise of 0.03 m in the groundwater table was observed for the command area of 21900-TF (Kharif2001: 4.35 m vs. Kharif 2003: 4.38 m). It could be attributed to the location of the watercourse(near the bank of two main canals i.e., Qadar Abad Baloki [Q.B.] the location of this Link canaland Upper Gugera Branch canal), also because the groundwater table was mainly influenced bythe seepage from the aforesaid two canals.
Groundwater withdrawals from the aquifer were greater than the recharge rate during the threeKharif seasons and the Rabi 2001-2002 cropping season. However, in all the watercourse commands,a rise in the groundwater table was observed for Rabi 2002-2003 cropping season, indicating a netrecharge to the aquifer. This is attributed to the intense rainfall during this season, which contributedto higher recharge and lower abstractions from tubewells.
Figure 4. Seasonal groundwater table depth in the sample watercourses (Kharif 2001-2003).
Note: Data generated by the project research
3.1.5 Change in Groundwater Quality
Groundwater quality of tubewells was measured by using an electrical conductivity meter (EC meter),and the results are summarized in table 6. The groundwater quality at 21900-TF varied from 0.580to 1.20 dS/m, with an average of 0.843 dS/m. Two tubewells supplied groundwater to the commandof 28915-L, with an average quality of 1.045 dS/m. At watercourse 32326-L, 17 tubewells weremonitored and they showed large variations in pumped groundwater quality ranging from 0.890 to1.690 dS/m. There were two tubewells in this watercourse command area having groundwater quality
4.377
5.659
4.348
5.192
6.627
5.104
4.6754.489
0.00
1.00
2.00
3.00
4.00
5.00
6.00
7.00
21900-TF 28915-L 74634-R 32326-L
Gro
undw
ater
tab
le d
epth
bel
ow N
SL (m
eter
s)
Kharif -01
Rabi 01-02
Kharif -02
Rabi 02-03
Kharif -03

15
poorer than 1.5 dS/m, and they were categorized as pumping marginal∗ quality groundwater. At74634/R, 38 tubewells had water quality in the range of 0.610 to 1.140 dS/m and an average valueof 0.829 dS/m. The overall groundwater quality was acceptable for irrigation (i.e., < 1.5 dS/m).
Figure 5 indicates the temporal variation in groundwater quality measured at piezometers withinthe watercourses, which shows similar trends in the four watercourses with lower values for 21900-TF and 74634-R compared to 28915-L and 32326-L. The average groundwater quality ranged from0.64 dS/m to 0.94 dS/m during the year 2001-2003. A slight variation of 2-13 percent was observedover the study period.
Table 6. Tubewell water quality in the study area.
Watercourse Tubewells monitored (#) Groundwater quality (EC, dS/m)
Range Average
21900-TF 23 0.580 to 1.20 0.843
28915-L 2 1.010 to 1.080 1.045
74634-R 38 0.610 to 1.140 0.829
32326-L 17 0.890 to 1.690 1.244
Note: Data generated by the project research
Figure 5. Variation in groundwater quality measured at piezometers during 2001-2003.
Note: Data generated by the project research
∗Following criteria of Water and Power Development Authority for the study area, groundwater of EC < 1.5 dS/m was considered asfresh, 1.5 to 2.7 dS/m as marginal and > 2.7 dS/m as saline (Beg and Lone 1992).
0.64
0.85
0.92
0.62
0.82 0.830.87
0.94
0.00
0.10
0.20
0.30
0.40
0.50
0.60
0.70
0.80
0.90
1.00
21900-TF 28915-L 74634-R 32326-L
Gro
un
dw
ate
r Q
ual
ity
(EC
, dS/
m)
2001-2002
2002-2003

16
3.2 Field Level Testing and Development of Rice-Wheat Crop Establishment Methods
3.2.1 Agronomic Evaluation of Rice-Wheat Crop Establishment Methods
Direct seeded rice was established about one month earlier than the transplanted rice. During thefirst year, both direct seeding and transplanting were done in July, but the direct seeded crop wassown only one week earlier than transplanted rice. In the following two seasons, the crop was directseeded in mid-June and transplanted in July. In some fields at F1-74R (Dogar Farm), ricetransplanting was delayed up to the first week of August. The harvesting of rice was done at thesame time for all the treatments during November. The wheat sowing was completed within 1–2weeks after the rice harvest, and it was harvested during April and May.
3.2.1.1 Agronomic Performance of Rice: The plant height for four rice treatments ranged from93 cm to 116 cm, with a lower height attained by the direct seeded rice when compared to thatof the transplanted rice. The panicle length for DSRF and DSRB was 25.32 cm and 24.08 cm,whereas the corresponding values for TPRB and TPRF were 27.57 cm and 28.31 cm, respec-tively. Rice may be attacked by 70 species of insect pests in Pakistan, which can cause 25–30percent yield losses annually. Of these, stem borers, leaf folder, white backed plant hopper andgrasshoppers are the chief destroyers. However, in our experimental plots the population of theseinsects was too small to damage the crop and the successful pesticide applications too contrib-uted in checking this pest menace.
Weed type and the degree of infestation in rice fields are often determined by the type of riceculture (irrigated, rain-fed lowland, deepwater or tidal wetlands); stand establishment method(transplanted, direct seeded); moisture regime (irrigated, rain-fed) land preparation and culturalpractices (De Datta 1981; Baltazar and De Datta 1992). Out of the more than 1,000 weed speciesreported to grow in rice fields, the grass family Poaceae is the most common, followed by Cyperaceae(sedge) family. Other important weed families are: Alismataceae, Asteraceae, Fabaceae, Lythraceaeand Scrophulariaceae (Smith 1983). The number of weed species that make up the major portionof weed flora in any rice field is usually less than ten; in most cases only three or four species areimportant (Ahmed and Moody 1982; Kim and Moody 1980). Similar findings were observed inour sample sites. Higher weed infestations were observed in direct seeded rice (DSRF: 47 weeds/m2; DSRB: 26 weeds/m2) when compared with transplanted rice (TPRB: 14 weeds/m2; TPRF: 9weeds/m2) (figure 6). The main weeds were Cyprus rotundus, Echinochloa crassgali and Cyprusiria. Due to high weed infestation in direct seeded rice, more weed control measures were taken interms of manual weeding and herbicide application compared to those in transplanted rice. Betterweed control was achieved at F1-21TF (Zaidi Farm) compared to the other two farms, with leastsuccess at F1-74R (Dogar Farm). The interaction between water, tillage and weeds is complex anddifficult to manage on farm, where effective herbicides are not available and water reliability is aconstraint. Bhagat et al. (1996), after comprehensive study of such interactions, suggested furtherresearch was still required.
Figure 7 summarizes the rice yields obtained in the field trials. The yield of all treatments wasbetter at F1-21TF (Zaidi Farm) compared to F1-28L (Malik Farm) and F1-74R (Dogar Farm).The 3-year average paddy yield for DSRF ranged from 1,391 Kg/ha, at F1-74R (Dogar Farm), to4,185 Kg/ha, at F1-21TF (Zaidi Farm). The corresponding values for TPRB and TPRF were inthe range of 1,868 Kg/ha to 3,762 Kg/ha, and 2,809 Kg/ha to 4,551 Kg/ha, respectively. Theperformance of all treatments at 21-TF (Zaidi Farm) was better than the other six sample farms.The paddy yield under DSRF, DSRB and TPRB was around 4 t/ha at F1-21TF (Zaidi Farm), which

17
was higher than the paddy rice yield obtained by conventional methods at other sample farms (3 t/ha) (see table 4). Overall, DSRF (2,878 Kg/ha) and DSRB (2,850 Kg/ha) produced 26 percentand 27 percent, lower yields when compared to TPRF (3,910 Kg/ha). Whereas, TPRB (3,124 Kg/ha) yielded 20 percent lower as compared to TPRF. The following major yield-reducing factorswere identified:
• With DSRF, DSRB and TPRB, weeds are the major constraint and severely affected yieldat F1-74R and F1-28L.
• The poor seed germination resulted in poor stand uniformity and density. Better depthprecision is required from direct seeders, which now place the seed deep for successfulgermination.
• Lack of experience in agronomy and irrigation management with the alternative technologiesin farm settings, particularly in relation to managing water supplies.
• Poor canal water availability particularly affected the direct seeded rice on beds and on theflat. The lack of water control resulted in poor weed management under direct seeded andbed planted rice, which contributed to high yield loss at F1-74R (Dogar Farm).
There could be many other reasons for lower yields under alternately wet and dry ricecultivation (DSRF, DSRB and TPRB), which have not been monitored during this study. Forinstance, Sharma et al. (2002) and Singh et al. (2002) reported lower rice yields under aerobicconditions, which have often occurred in these trials without being an explicit treatment. The majoryield reducing factors were reported to be iron and zinc deficiency, higher nematode populationscausing root galling, excessive infestation of weeds and lack of availability of suitable rice cultivars.
Figure 6. Incidence of weeds in various rice establishment methods.
Note: Data generated by the project research
47
26
14
9
0
10
20
30
40
50
60
DSRF DSRB TPRB TPRF
Rice establishment method
Wee
d d
ensi
ty (N
o/m
2 )
F1-21TF (Zaidi Farm)F1-28L (Malik Farm)
F1-74R (Dogar Farm)Overall average

18
Figure 7. Rice yield under various establishment methods at sample farms.
Note: Data generated by the project research
3.2.1.2 Agronomic Performance of Wheat: The plant height for four wheat treatments rangedfrom 93-95 cm, at F1-21TF (Zaidi Farm), 91-95 cm at F1-28L (Malik Farm) and 97-100 cm atF1-74R (Dogar Farm). The spike length also showed minor variations across the sample farmsand ranged from 10-12 cm. The incidence of insects and weeds remained normal in all thestudied methods and suitable agronomic and chemical control measures were used as and whenrequired. Compared to rice, lower spatial variations were observed among the sample sites(figure 8). The wheat yield under zero tillage was higher than the other three methods at all threesites. The wheat yield for zero tillage ranged from 3.8 t/ha, at F1-28L (Malik Farm), to 4.9 t/haat 21-TF (Zaidi Farm), whereas, the corresponding values under conventional tillage rangedfrom 3.7 t/ha at F1-28L (Malik Farm) to 4.6 t/ha at F1-21TF (Zaidi Farm). Bed planted wheathad lower yield than zero tillage and conventional ploughing, averaging 3.3 t/ha (WB2R andWB3R) and 4.1 t/ha (conventional). The wheat yield on beds was significantly lower (2.6 t/ha)during the first year of experiment.
The rice crop residue obstructed the smooth sowing and germination of wheat seed. Basedon this experience, during the second year beds were re-constructed after the harvesting of ricecrop. Wheat seed was sown on these new beds, which resulted in better crop germination. Therefore,during the second year wheat yields increased to 3.9 t/ha, although it was still slightly lower thanthe wheat yield obtained under conventional (4.1 t/ha) and zero tillage method (4.3 t/ha). The resultsindicate that the introduction of suitable machinery for proper management of crop residuemanagement could help in improving wheat yields under zero tillage and beds planting methods.
0
500
1,000
1,500
2,000
2,500
3,000
3,500
4,000
4,500
5,000
F1-21TF (Zaidi Farm) F1-28L (Malik Farm) F1-74R (Dogar Farm) Overall average
Sample Farms
Pad
dy
rice
yie
ld (K
g/h
a)
DSRF DSRB
TPRB TPRF

19
Figure 8. Wheat yield under various establishment methods at the sample sites.
Note: Data generated by the project research
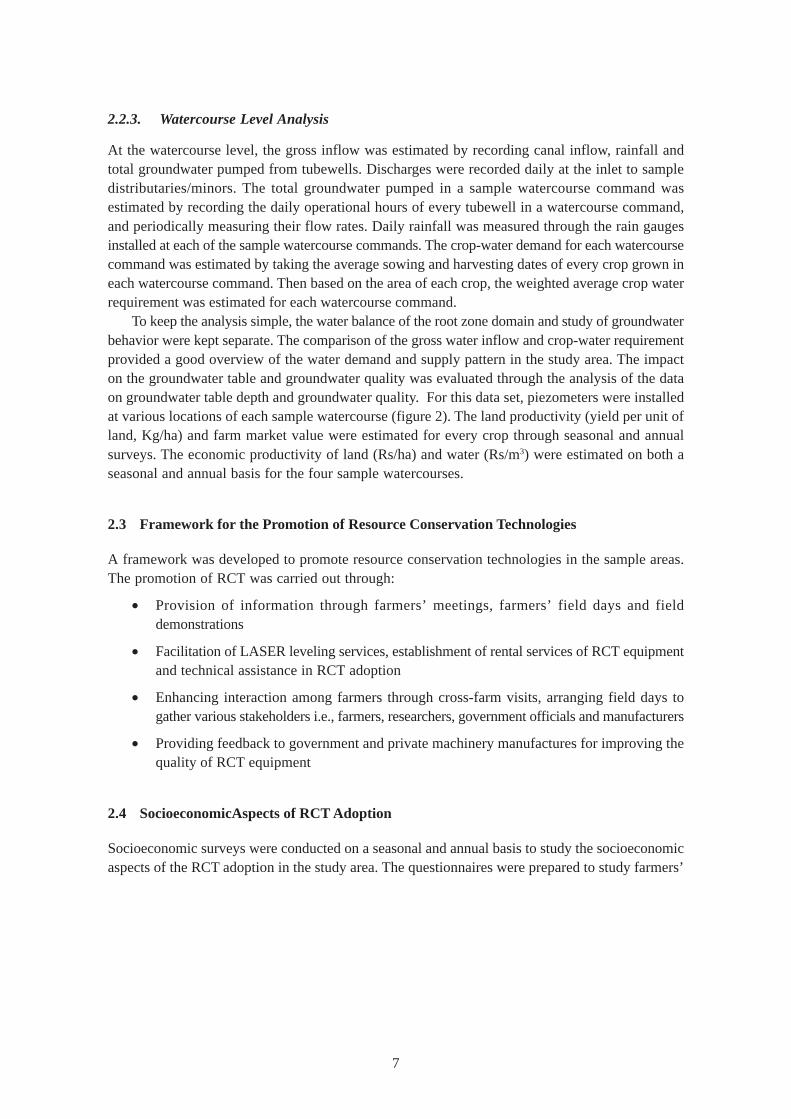
3.2.2 Water Balances of Rice-Wheat Treatments
Figure 9 shows the water balance components for rice-wheat establishment methods. Crop waterdemand and water supply were higher in rice than in wheat, indicating higher dependence of riceon irrigation compared to wheat. Irrigation for direct seeded rice was lower than in the conventionaltransplanting methods. The irrigation depths on DSRB and DSRF were 920 mm and 966 mm,respectively, some 34 percent and 30 percent lower than the 1,384 mm applied with conventionaltransplanting. The transplanting rice on beds (TPRB) also used 13 percent less water thantransplanting on the flat. The rainfall share in gross inflow for rice was less than 25 percent ofsupply at 198 mm for direct seeded and 183 mm for transplanted rice, making for a slightly higherrainfall contribution to the earlier planted direct seeded rice. The comparison of total water input(gross inflow) and crop-water requirements show a greater excess with conventional practices (1,567mm supplied for Et
p = 544 mm). Hence, about 65 percent of the water supplied to conventionally
transplanted rice leaves the field as seepage and percolation, and in turn recharging the groundwateraquifer. This water is recycled through groundwater pumping in the same/adjoining areas ordownstream of the study areas. The gross inflow to DSRF and DSRB was 1,164 mm, and 1,118mm, against the potential crop-water requirement of 695 mm: direct seeded rice used about 60 percentof gross inflow beneficially as evapotranspiration and 40 percent water goes to seepage andpercolation. More efficient water management occurred at F1-21TF (Zaidi Farm) compared to othertwo sample farmers’ farms.
0
1,000
2,000
3,000
4,000
5,000
6,000
F1-21TF (Zaidi Farm) F1-28L (Malik Farm) F1-74R (Dogar Farm) Overall average
Sample Farms
Wh
eat
yiel
d (K
g/h
a)
ZTW BW2R
BW3R CW
20
Figure 9. Comparison of water balance components for rice-wheat treatments.
Note: Data generated by the project research
Irrigation applications on wheat ranged from 148 mm to 185 mm, and the corresponding grossinflow from 254 mm to 291 mm against the potential crop-water requirement of 415 mm. Alltreatments received less potential crop-water requirement. This potential water stress was mitigatedby the water stored in the root zone after the rice harvest, although it was not measured in thisstudy. The practice of under-irrigating wheat was observed throughout the study area, as farmerstend to maximize the benefit of rainwater. Bed-planted wheat received 17 percent less irrigationthan the conventional treatment. In the case of on Zero-tilled wheat, 176 mm were applied, whichis, only 5 percent lower than what is used in conventional wheat (185 mm). Normally greater watersavings are attributed to zero tillage as more root zone moisture is available than after conventionalploughing. The fact that the sowing dates for ZT and conventional treatments were the same hasprobably contributed to masking this commonly observed difference. The reduction in water neededfor bed planting is due to more rapid watering, and more limited ‘ponding’.
3.2.3 Comparing Water Productivity of Rice Treatments
Water productivity of rice establishment methods showed large variations with respect to site. Thewater productivity of the four establishment methods was higher at F1-21TF (Zaidi Farm) comparedto F1-28L (Malik Farm) and F1-74R (Dogar Farm), as shown by figure 10. The average WP_
GI
ranged for 0.31 Kg/m3 to 0.38 Kg/m3 for the four rice treatments at F1-21TF, indicating about 23percent higher WP_
G1 for direct seeded rice (DSRF and DSRB) over transplanted rice (TPRB and
TPRF). At this farm, irrigation water productivity of direct seeded rice was about 33 percent higher(DSRF: 0.47 Kg/m3 and DSRB: 0.48 Kg/m3) compared to transplanted rice on beds (TPRB: 0.36Kg/m3) and flat ‘puddled’ fields (TPRF: 0.35 Kg/m3).
966920
1,200
1,384
176148 160 185
1,1641,118
1,383
1,567
416 415 415 416
291265254281
544539
695695
0
200
400
600
800
1,000
1,200
1,400
1,600
1,800
DSRF DSRB TPRB TPRF ZTW BW2R BW3R CW
Rice-wheat establishment methods
Wat
er b
alan
ce c
om
po
nen
ts (m
m)
Irrigation
Rainfall
Gross inflow
Evapotranspiration

21
Figure 10. Water productivity (WP_GI
) of rice establishment methods.
Note: Data generated by the project research
At F1-28L (Malik Farm), WP_GI
was 0.26 Kg/m3 and 0.21 Kg/m3 for transplanted rice on flatand beds, respectively. The corresponding values for direct seeded rice on flat and beds were 0.21Kg/m3 and 0.23 Kg/m3, respectively. The lowest water productivity for all four rice establishmentmethods was observed at F1-74R ranging from 0.07 Kg/m3 for DSRB and 0.16 Kg/m3 for TPRF.Consistent with F1-21TF, WP_
I was higher than WP_
GI and was in the range 0.25-0.30 Kg/m3 and
0.08-0.19 Kg/m3 at F1-28L and F1-74 R respectively. The results show that, despite of lower waterinput to direct seeded rice and bed planting rice, the water productivity remained lower than forthe conventional method at these two sites. The gains in water productivity were restricted due tothe fact that water savings were outweighed by reduced yields for direct seeded and bed plantedrice compared to the conventional method at F1-28L (Malik Farm) and F1-74R (Dogar Farm).
Combining the results of the entire three-sample sites, WP_GI
of direct seeded rice on flat andconventional transplanted methods was similar (0.25 Kg/m3). The DSRB and TPRB were also notmarkedly different with overall average of 0.26 Kg/m3 and 0.23 Kg/m3, respectively. Researchconducted in the Burdekin River Irrigation Area in Queensland, Australia, also showed similarevidence (Borrell et al. 1997; Thompson 2002). The 4-year comparison showed 10 percent watersavings under bed planted rice over the traditional flat planting method. A similar reduction in grainyield (11.6 t/ha for flat sowing and 10.2 t/ha for bed sowing) resulted in no net improvement inwater productivity. This study shows that to obtain a sustainable increase in the water productivityof rice (through direct seeded and bed planting methods) requires reliable mechanisms to cope withthe yield-reducing factors.
3.2.4 Comparing Water Productivity of Wheat Treatments
Figure 11 shows the average water productivity of wheat establishment methods at the three samplefarms. Compared to rice, wheat did not show a markedly different behavior across the sites. TheWP_
GI of conventional wheat ranged from 1.39-1.81 Kg/m3, with an average of 1.53 Kg/m3. The
average WP_GI
for zero tillage was 1.62 Kg/m3, ranging from 1.33-1.95 Kg/m3. ZT wheat had an
0.00
0.05
0.10
0.15
0.20
0.25
0.30
0.35
0.40
0.45
F1-21TF (Zaidi Farm) F1-28L (Malik Farm) F1-74R (Dogar Farm) Overall average
Sample Farm
Wat
er p
rod
uct
ivit
y (K
g/m
3 )
DSRF DSRB
TPRB TPRF

22
8 percent and an 11 percent higher WP_GI
compared to those of the conventional methods i.e., atF1-74R and F1-21TF. However, at F1-28L, WP_
GI was 4 percent less than the conventional method.
The irrigation water productivity of zero tillage wheat was 11–25 percent higher than with theconventional establishment at the three sample farms.
Figure 11. Average water productivity (WP_GI
) of wheat establishment methods.
Note: Data generated by the project research
Overall, WP_I for zero tillage wheat was 3.00 Kg/m3 and was higher than that for conventional
(WC: 2.51 Kg/m3) and bed planted wheat (BW2R: 2.98 Kg/m3 and BW3R: 2.57 Kg/m3). Theaverage water productivity of bed planted wheat was consistently lower than conventional and zerotillage methods. This was due to the considerably lower yields, which is attributed to the difficultyin sowing through rice residue on permanent beds resulting in poor seed germination. During Rabi2001-2002 WP_
GI was 1.2 Kg/m3 and 1.12 Kg/m3 for BW2R and BW3R, compared to 1.78 Kg/
m3 for conventional wheat and 1.70 Kg/m3 for zero tillage wheat. However, during Rabi 2002-2003 new beds were formed and WP_
GI was higher (BW2R: 1.45 Kg/m3 and BW3R: 1.36 Kg/m3)
than for conventional (CW: 1.28 Kg/m3) but lower than that for zero tillage wheat (1.54 Kg/m3).
3.3 Promotion of Resource Conservation Technologies
3.3.1 Adoption of Resource Conservation Technologies
The promotion of RCTs for wheat generated a more encouraging response than the adoption ofother new methods for rice cultivation. Rice growers benefited by the laser leveling of their undulatingfields, but farmers were well aware of the poor performance of direct seeding and bed planting ofrice. Table 7 summarizes the adoption of the various resource conservation technologies in the projectarea over the span of the project.
0.00
0.50
1.00
1.50
2.00
2.50
F1-21TF (Zaidi Farm) F1-28L (Malik Farm) F1-74R (Dogar Farm) Overall average
Sample Farm
Wat
er p
rod
uct
ivit
y (K
g/m
3 )
ZTW BW2R
BW3R CW

23
Table 7. Adoption of resource conservation technologies in the project areas.
RCTs adopted Sample watercourses Total
21900-TF 28915-L 74634-R
Laser land leveling (ha)Baseline 2001-2002 57 6 4 68Project end 2003-2004 115 42 50 208Zero tillage drills (#)Baseline 2001-2002 4 1 1 6Project end 2003-2004 10 2 7 19Wheat area under zero tillage (ha)Baseline 2001-2002 39 24 40 104Project end 2003-2004 158 29 125 312Wheat residue management (ha)Baseline 2001-2002 2 0 0 2Project end 2002-2003 51 6 2 59Rice residue management (ha)Baseline 2001-2002 0 0 0 0Project end 2003-2004 17 4 2 23
Note: Data generated by the project research
The area under laser leveling for the three sample villages increased from 68 ha during 2000-2001 to 208 ha during 2003-2004. The area laser leveled in sample villages increased from 57 to115 ha, 6 to 42 ha, and 4 to 50 ha, during 2001-2004, at 21900-TF, 28915-L and 74634-R,respectively. Although the window available to complete ‘Laser Land Leveling’ is limited due tothe importance of timely wheat planting following rice, many farmers still made a big effort tolevel their fields.
The number of zero tillage drills in the project area increased from 7 units to 19 units frombaseline year 2000-2001 to 2003-2004. Owners provided a rental service of ZT drills, which wasa major factor in technology transfer to small farmers. The promotion of zero tillage technology toadjacent areas resulted in an increase zero tillage drills from 2 to 33 units over the same period oftime. Consequently, the area under zero tillage wheat in sample villages was increased from 104ha (32% of area) during 2000-2001 to 312 ha (90% of area) during 2003-2004. The bed plantingof rice-wheat received little attention from farmers. The farmers experimented with 16 ha of wheaton beds in 2002-2003 but they were not impressed. A lack of bed planting equipment and difficultyin crop residue management may have contributed to negate any farmer enthusiasm. However,key factor restricting adoption was attributed to yield impacts.
The management of crop residue was identified as the key issue in improving the adoption ofRCTs in rice-wheat system. Innovative techniques for residue incorporation and management weredemonstrated in each crop season and appropriate machinery was made available by OFWM. Similardemonstrations were made at Farmers’ Days. The area under wheat residue management increasedfrom 2 to 59 ha during the project period. A few farmers also started incorporating rice residueinto their soils increasing area under rice residue management from 0 to 23 ha. Farmers normallyburn rice-wheat residues left after a combine harvesting. Efforts were made to link localmanufacturers and the Farm Machinery Institute (FMI) of PARC to rectify technical problems andmodify the existing equipment available for residue management. These modifications will lead todevelopment of a new machine capable of performing both operations in one and at the same time.

24
3.3.2 Farmers’ Views About Resource Conservation Technologies
The farmers’ views about the advantages and problems of laser land leveling, zero tillage and bedplanting are summarized in table 8. The socioeconomic profile of the sample farmers is given inannex 4. The survey results showed that 57 to 100 percent of the sample farmers in the fourwatercourses were aware of laser leveling. With respect to zero tillage technology, 71 percent ofrespondents at 74634/R, 100 percent at 28915/L and 21900/TF and 75 percent at 32326/L wereaware of this technology. Furrow-bed technology was known to 40 to 60 percent of the respondentsat different watercourse commands. The majority of farmers received information about thesetechnologies from fellow farmers who had adopted these technologies and from the ‘On Farm WaterManagement Department’.
The majority of the farmers indicated that these technologies are useful in water savingand enhancing crop yields. They identified several benefits and constraints of laser leveling, zerotillage and bed planting as enlisted in table 8. The results indicated that farmers are more convincedabout the advantages of these technologies. Though they were not able to quantify these benefits,they still considered laser leveling, zero tillage and bed planting as means of saving water, increasingyield, reducing cost and increasing farm incomes. More efforts are needed to devise suitable policiesto provide greater number of this equipment, and demonstrating how to use them in farmers’ fieldswith a view to enhance their adoption prospects. Farmer’s opinions about the effectiveness of bedplanting are not consistent with the results obtained in field trials, where performance (of bedplanting) was considerably poorer than in conventional methods. Since adoption rates thus far arealso low, this is hard to explain, but farmers are anecdotally aware of the success of this methodwith crops such as maize grown beds in Punjab and North West Frontier Province NWFP, inassociation with ACIAR sponsored research.
3.3.3 Constraints and Opportunities in Adoption of Resource Conservation Technologies
The socioeconomic and adoption survey was conducted in the four sample watercourses, for which41 respondent farmers from where the adoption of Resource Conservation Technologies had beenpromoted (i.e., 21900/TF, 28915/L and 74634/R), and 16 farmers from the control watercourse32326/L, where no intervention was carried out were selected. The rapid adoption of the zero tillagetechnology was observed among the sample farmers, while other technologies failed to make muchof an impression. This was because they were not either readily accessible to farmers (e.g., laserland leveling, residue chopper and bed planter) or they required further improvement to generateacceptable crop yields (e.g., direct seeding and bed planting of rice). Therefore, the discussion ofsurvey results regarding the adoption of Resource Conservation Technologies will, hereafter, referto zero tillage only. Laser leveling has not been widely adopted in the rice-wheat area where thisresearch was conducted. However, it is being more extensively used in the sugarcane-wheat zone,where groundwater salinity is higher and canal water supplies are erratic.

25
Table 8. Farmers’ views about the advantages and constraints regarding resource conservationtechnologies.
Laser leveling Zero tillage Bed planting
Advantages
• Water saving • Cheaper source of water saving • Efficient irrigation• Bigger plot sizing making • Saves time and energy requiring less amount of
cultivation and harvesting easier • Increases yield water and saves time• Smooth fields and uniform • No waste of fertilizer • Better crop stand
water distribution and seed • Good technology for• Better crop stand and yield • Covers more area per unit poor/saline soils• Reduced field dikes/bunds of time • Saving of puddling cost in• Earlier field preparation • Better seed germination rice production
• Reduce land preparation • Fertilizer savingcost
Disadvantages
• Shortage of laser equipments • Lack of zero tillage machines • Unavailability of bed planteranecdotally • Continuous use may cause • Difficulty in harvesting
• Difficult access particularly for soil compaction and reduce operationsmall farmers yields • More weed management and
• More farm management efforts labor requirementsabout weed control
Note: Data generated by the project research
The main reasons for not adopting these technologies were financial, unavailability ofRCT machinery, small landholdings and preference for traditional practices. The four farmers whoadopted the zero tillage and later abandoned the practice reported unavailability of zero tillage drillon time, lack of financial resources and adequate advice and difficulty in weed control as the majorreasons for doing so. However, 95 percent of the adopters intended to continue using zero tillagetechnology for wheat cultivation.
Figure 12 indicates the relative costs of production against income from zero tillage andconventional wheat in the study area. Zero tillage reduces costs for tillage and irrigation practices.Zero tillage adopters use more fertilizer, resulting in higher costs compared to the conventionalmethod. The survey responses indicate lower labor requirements for zero tillage, but these have notbeen estimated here. Adopters of zero tillage obtained higher gross margins by 2,327 Rs/ha (grossmargins: 13,022 Rs/ha) than those using conventional practices (gross margin: 10,695 Rs/ha). Thehigher economic returns from adopting zero tillage technology were attributed to lower cost ofproduction (Zero tillage: 10,154 Rs/ha vs. Conventional: 11,235 Rs/ha) and a slightly higher yield(Zero tillage: 3,143 Kg/ha vs. Conventional: 2,965 Kg/ha), which is reflected as higher GVP inFigure 12.

26
Figure 12. Comparison of zero tillage and conventional wheat production costs and income (Rabi2002-2003).
Note: Data generated by the project research
4 CONCLUSIONS AND RECOMMENDATIONS
• There is a considerable over-supply of irrigation water to rice cultivated through conventionalpractices at field, farm and watercourse levels. While much of it is lost as percolation togroundwater, which can be recycled where water quality is good. Higher irrigation efficiencywill contribute to reduce pumping costs, help diminish un-productive evaporation andminimize long-term mixing of saline and freshwater aquifers. In scaling from field and farmto watercourse levels, crop-water productivity shows a large spatial and temporal variation.The adoption of two resource conservation technologies (laser land leveling and zero tillage)contributes to higher land and water productivity at field and farm scale, for wheat only.None of the technologies promoted for rice cultivation are yet to show profitability on thefarm and, thereby creating a need to further develop these technologies. It is not possibleto assess the impact of water savings at the system scale with the available data, and inaddition to that there are methodological difficulties concerning measurement. These canbe addressed by a carefully targeted and quantified survey of adopters’ assessments of watersavings and what they do with that water.
• Direct seeded rice lowered total water input by 30 percent, whereas conventional transplantedrice on beds had a 15 percent reduction in the total water input. The average waterproductivity of rice ranged from 0.29 to 0.32 Kg/m3 among the treatments, with directseeding giving higher water productivity than conventional transplanting. However, riceyields were considerably lower under direct seeding, mainly due to :a) poor seed germinationand crop establishment; b) causing high weed infestation; and, c) machinery problems and
765 978 813
4,560
2,471
23,176
13,022
2,329
515
11,235
567
10,15410,695
9601,127
2,471
3,833
21,930
0
5,000
10,000
15,000
20,000
25,000
Tilla
geSe
ed
Irrig
atio
n cost
Ferti
lizer
cost
Wee
dicide
Harve
stin
g/thre
shin
g
Tota
l cost
Gross
val
ue of p
roduct
ion
Gross
mar
gin
Rs/h
a
Zero tillage wheat
Conventional wheat

27
lack of on-farm experience regarding water management and agronomic practices for newrice establishment methods.
• Zero tillaged wheat provided better land and water productivity compared to conventionalploughing and seeding. And in the case of bed planted wheat, further refinement in plantingmachinery is needed to achieve uniform germination and in the improvement of land andwater productivities.
• Farmers are convinced of the benefits of laser leveling and zero tillage, but adoption isconstrained, particularly for small farmers by access, cost and time availability. Farmerswould benefit from further training on the selection and use of resource conservationtechnologies.
• Further research and development is needed to secure acceptable yields of rice under directseeding and bed planting, before educating the farmers on the advantages of adopting thesetechnologies. Further work needs to be done to understand the extent of real water savingsat the system level, which might justify further development and promotion of water savingtechnologies for rice in Pakistan’s Punjab.
5 FUTURE DIRECTION AND THE WAY FORWARD
The socioeconomic conditions of farmers in the Rice-Wheat Zone of Pakistan’s Punjab and mostparts of South Asia compel them to concentrate more on increasing the economic returns from riceproduction by diverting large amounts of fresh water. They are more keen on increasing landproductivity in order to improve their incomes and food security than improving water use efficiency.Adoption of resource conserving technologies, particularly ones that save water, depend primarilyon their economic attractiveness to farmers (if they save production costs and increase profitability,then there is little standing in the way of adoption in the long run). If significant costs are imposed,but the benefits are still greater, the element of risk will play a major role in determining the degreeof attractiveness to different farmers.
Policies that encourage the adoption of resource conserving technologies to save water need toensure that the expected real water savings will accrue. The policymakers should have a clearunderstanding of the types of incentives required to put the policy into practice, ranging from enablinglocal market activity to outright subsidy. Although at the field scale, these technologies look promisingwater saving options, whether they really save water at irrigation system/river basin level is notyet known and requires further study. The application of an integrated modeling approach at field,irrigation system and basin levels can provide answers under scenarios of accelerated adoption ofresource conservation.
The long-term impact of these new crop establishment methods on soil-health and productivityneeds to be explored, particularly in areas where excessive irrigation plays a significant role inleaching salts below the root zone.
Further promotion of the resource conservation technologies in Pakistan’s rice-wheat systemrequires a multi-dimensional and integrated effort. Three simultaneous activities are implied below:
1. A suitable policy framework and action program to promote well-developed waterconservation technologies. At present, laser leveling and zero tillage methods receive moreattention from farmers. Improving farmers’ access to these technologies may be the firststep in improving land and water productivity at the system level. Encouraging rental markets

28
and provision of lower cost machinery appropriate for small farms would address theseissues. The history of machinery pools and state provided equipment is not encouragingand more self-sustaining solutions are needed.
2. Further research is needed to perfect technologies that minimize yield penalties comparedto conventional practice: these should allow better seeding depth control and cropestablishment through crop residues for rice, both on the flat and on beds; and for wheaton beds. Further work is required to optimize the sizing and irrigation management ofpermanent beds, and an economic analysis of the cost benefit of laser leveling and temporaryand permanent bed cultivation. The reductions in yield compared to conventional methodsof rice cultivation on beds in Australia are marginal compared to those experienced inPunjab, although they probably have a significant effect on gross margin, since most ofthe profit generated is derived from the final ton or so of production (i.e. the fifth ton ofproduction in a 5t/ha crop).
3. Further research is needed to justify the economic and regional case that water savingsgenerated by RCT adoption justify policy and technological development. This meansassessing and modeling adoption rates, impacts and understanding what farmers do with‘saved’ water. Where do real savings accrue and to whom? Long-term justification forminimizing groundwater use relates to the likelihood and risk of the mixing between salineand fresh groundwater through continuous pumping and recycling, especially in riceproducing areas. This can also be modeled in order to develop better long term strategiesfor conjunctive use that minimize water quality degradation of the aquifer.

29
LITERATURE CITED
Ahmad, M.D.; Bastiaanssen, W.G.M.; Feddes, R.A. 2002. Sustainable use of groundwater for irrigation: A numericalanalysis of the subsoil water fluxes. Irrigation and Drainage 51 (3): 227-241.
Ahmed, N.U.; Moody K. 1982. Weeds in rain-fed rice cropping systems as affected landscape position. In Plant Protectionin Tropics. Proceedings of the International Conference on Plant Protection in Tropics, Kuala Lumpur. pp 1-7.
Allen, R. G.; Pereira, L. S.; Raes, D.; Smith M. 1998. Guidelines for computing crop water requirements. Food andAgriculture Organization of the United Nations (FAO). Irrigation and Drainage Paper 56. Rome, Itlay: FAO.
Aslam, M.; Qureshi, A. S.; Hornikova, V. M. 2002. Water saving strategies for irrigated rice. Pakistan Council of Researchin Water Resources. Drainage and Water Management 6 (1)
Baltazar, A.M.; De Datta, S.K. 1992. Weed management in rice, Weed Abstract 41: 495-508.
Bastiaanssen, W. G. M.; M. D. Ahmad and Chemin Y. 2002. Satellite surveillance of evaporative depletion across theIndus Basin. American Geophysical Union. Water Resources Research, 38 (12) 1273.
Beg, A. and M.I. Lone. 1992. Trends of changes in groundwater quality of SCARP-1. In: Proceedings of 5th InternationalDrainage Workshop, Lahore, Pakistan. ICID-IWASRI, 1992, Vol. II, 3.73-3.85.
Bhagat, R. M.; Bhuiyan, S.I.; Moody, K. 1996. Water, tillage and weed interactions in lowland tropical rice: A review.Agricultural Water Management 31: 165-184.
Borrell, A.; Graside, A.; Fukai, S. 1997. Improving efficiency of water use for irrigated rice in a semi-arid tropicalenvironment. Field Crop Research 52: 231-248.
Corey, G. L.; and Clyma, W. 1974. The importance of farm water management in Pakistan. CSU, USA.
De Datta, S.K. 1981. Weeds and weed control in rice. In: Principles and Practices of Rice Production. John Wiley, NY,pp. 460-512.
Evans, L. T. 1993. Crop Evolution, adaptation and yield. Cambridge university press, Cambridge.
Gleick, P. H. (ed.). 1993. Water crisis: A guide to the world’s fresh water resources. Pacific Institute of Studies inDevelopment, Environment and Security. Stockhlom Environment Institute. Oxford University Press. New York.
Guerra, L. C.; Bhuiyan, S. I.; Tuong, T. P.; Barker R. 1998. Producing more rice with less water from irrigated systems.SWIM Paper 5. Colombo, Sri Lanka: International Water Management Institute (IWMI).
IWASRI (International Waterlogging and Salinity Research Institute). 1988. Abstract of WAPDA research studies onwaterlogging and salinity and water management. Lahore, Pakistan: International Waterlogging and SalinityResearch Institute (IWASRI).
Kijne, J.W. 1996. Water and Salinity Balances for Irrigated Agriculture in Pakistan. Research Report 6. Colombo, SriLanka: International Irrigation Management Institute (IIMI).
Kim, S.C.; Moody, K. 1980. Effect of plant spacing in the competitive ability of rice growing in associated with variousweed communities at different nitrogen levels. Korean Society of Crop Sciences 25: 17-27.
Ladha, J. K.; Pathak, H.; Tirol-Padre, A.; Dawe, D.; Gupta, R. K. 2003. Productivity trends in intensive rice-wheat croppingsystems in Asia. In: Improving the Productivity and Sustainability of Rice-Wheat Systems: Issues and Impacts. J.K.,Ladha; J. E. Hill; J. M. Duxbury; R. K. Gupta; R. J. Buresh (eds). ASA Special Publication 65, ASAInc, CSSAInc,SSSAInc, Madison, USA. pp. 45-76.
Meinzen-Dick, R. S.; van der Hoek, W. 2001. Multiple Uses of Water in Irrigated Areas. Irrigation and Drainage Systems15: 93-98.
Molden, D. 1997. Accounting for water use and productivity. SWIM Paper 1. Colombo, Sri Lanka: International WaterManagement Institute (IWMI).
Molden, D.; Sakthivadivel, R. 1999. Water accounting to assess use and productivity of water. Water ResourcesDevelopment 15: 55-71.
Perry, C. J. 1996. The IIMI Water Balance Framework: A Model for Project Level Analysis. Research Report 5. Colombo,Sri Lanka: International Irrigation Management Institute (IIMI).
Pingali, P. L.; Shah, M. 1999. Rice-wheat cropping systems in the Indo-Gangetic plains: Policy re-directions forsustainable resource use. In: Sustaining rice-wheat production systems: socioeconomic and policy issues. Rice-WheatConsortium Paper Series 5, Rice-Wheat Consortium, Delhi, India.
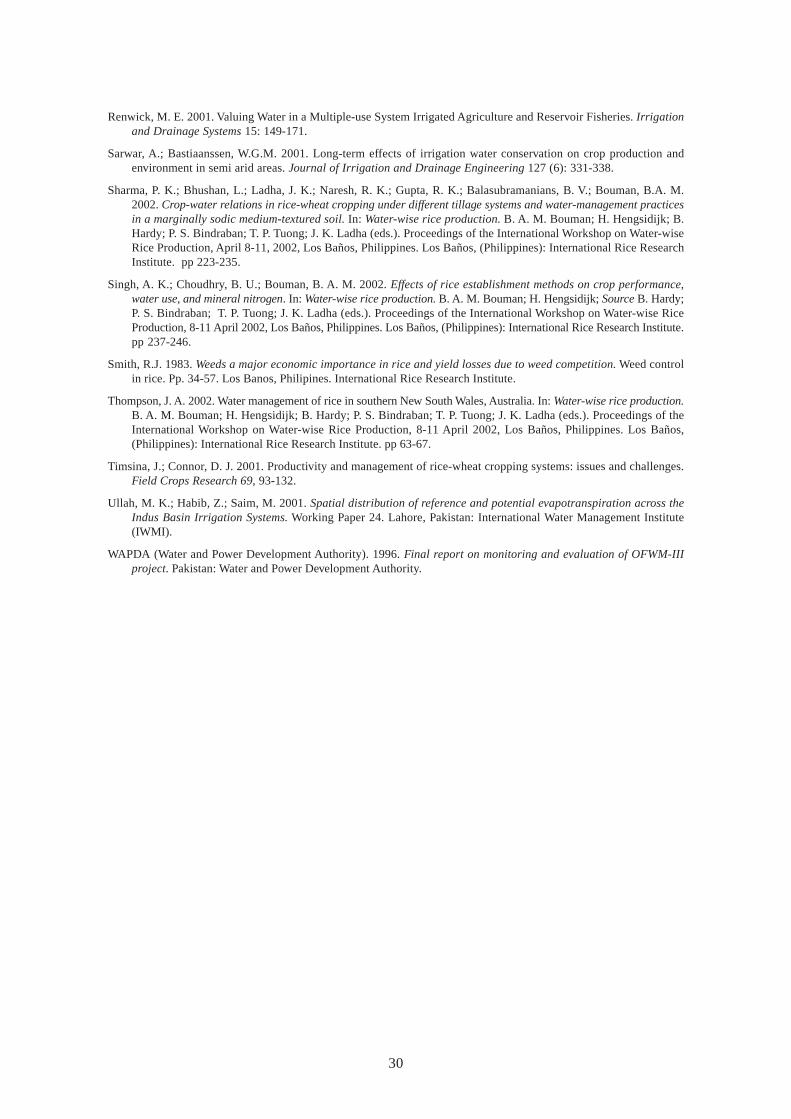
30
Renwick, M. E. 2001. Valuing Water in a Multiple-use System Irrigated Agriculture and Reservoir Fisheries. Irrigationand Drainage Systems 15: 149-171.
Sarwar, A.; Bastiaanssen, W.G.M. 2001. Long-term effects of irrigation water conservation on crop production andenvironment in semi arid areas. Journal of Irrigation and Drainage Engineering 127 (6): 331-338.
Sharma, P. K.; Bhushan, L.; Ladha, J. K.; Naresh, R. K.; Gupta, R. K.; Balasubramanians, B. V.; Bouman, B.A. M.2002. Crop-water relations in rice-wheat cropping under different tillage systems and water-management practicesin a marginally sodic medium-textured soil. In: Water-wise rice production. B. A. M. Bouman; H. Hengsidijk; B.Hardy; P. S. Bindraban; T. P. Tuong; J. K. Ladha (eds.). Proceedings of the International Workshop on Water-wiseRice Production, April 8-11, 2002, Los Baños, Philippines. Los Baños, (Philippines): International Rice ResearchInstitute. pp 223-235.
Singh, A. K.; Choudhry, B. U.; Bouman, B. A. M. 2002. Effects of rice establishment methods on crop performance,water use, and mineral nitrogen. In: Water-wise rice production. B. A. M. Bouman; H. Hengsidijk; Source B. Hardy;P. S. Bindraban; T. P. Tuong; J. K. Ladha (eds.). Proceedings of the International Workshop on Water-wise RiceProduction, 8-11 April 2002, Los Baños, Philippines. Los Baños, (Philippines): International Rice Research Institute.pp 237-246.
Smith, R.J. 1983. Weeds a major economic importance in rice and yield losses due to weed competition. Weed controlin rice. Pp. 34-57. Los Banos, Philipines. International Rice Research Institute.
Thompson, J. A. 2002. Water management of rice in southern New South Wales, Australia. In: Water-wise rice production.B. A. M. Bouman; H. Hengsidijk; B. Hardy; P. S. Bindraban; T. P. Tuong; J. K. Ladha (eds.). Proceedings of theInternational Workshop on Water-wise Rice Production, 8-11 April 2002, Los Baños, Philippines. Los Baños,(Philippines): International Rice Research Institute. pp 63-67.
Timsina, J.; Connor, D. J. 2001. Productivity and management of rice-wheat cropping systems: issues and challenges.Field Crops Research 69, 93-132.
Ullah, M. K.; Habib, Z.; Saim, M. 2001. Spatial distribution of reference and potential evapotranspiration across theIndus Basin Irrigation Systems. Working Paper 24. Lahore, Pakistan: International Water Management Institute(IWMI).
WAPDA (Water and Power Development Authority). 1996. Final report on monitoring and evaluation of OFWM-IIIproject. Pakistan: Water and Power Development Authority.

31
AN
NE
X 1
Dat
a C
olle
ctio
n an
d A
naly
sis
at F
ield
, Far
m a
nd W
ater
cour
se L
evel
s
Sr.
#L
evel
Com
pone
ntS
ub-c
ompo
nent
Uni
tF
requ
ency
Met
hod
1F
ield
Infl
owC
anal
wat
ercm
Whe
neve
r ir
riga
ted
mea
sure
d by
cut
thro
at f
lum
e
Tub
ewel
l wat
ercm
Whe
neve
r ir
riga
ted
reco
rded
dis
char
ge r
ate
and
oper
atio
n ho
urs
R
ainf
all
mm
Dai
lym
easu
red
by r
ain
gaug
e ne
ar th
e fi
eld
Im
port
ed w
ater
cmW
hene
ver
impo
rted
mea
sure
d by
cut
thro
at f
lum
e
from
oth
er f
ield
Sto
rage
cha
nge
m
mE
ach
crop
sea
son
infl
ow m
inus
out
flow
Out
flow
Eva
potr
ansp
irat
ion
mm
/dD
aily
Har
grea
ves
met
hod
D
eep
perc
olat
ion
mm
/dO
nce
for
rice
esti
mat
ed u
sing
bas
ic in
filt
rati
on r
ate
E
T +
DP
mm
/dD
aily
mea
sure
d by
dai
ly d
eple
tion
dat
a us
ing
scal
es
Exp
orte
d w
ater
toot
her
fiel
dscm
per
even
tm
easu
red
by c
utth
roat
flu
me
2Fa
rmIn
flow
Can
al w
ater
cmD
aily
mea
sure
d by
cur
rent
met
er/c
utth
roat
flu
me
T
ubew
ell w
ater
cmD
aily
tube
wel
l ope
rati
ng h
ours
reco
rded
dis
char
ge r
ate
and
oper
atio
n ho
urs
for
all t
ubew
ells
R
ainf
all
mm
Dai
lym
easu
red
by r
ain
gaug
e
Sto
rage
cha
nge
m
mE
ach
crop
sea
son
infl
ow m
inus
out
flow
Out
flow
Eva
potr
ansp
irat
ion
mm
/dD
aily
tota
l E
T b
y m
ulti
plyi
ng
ET
of
each
cro
p by
resp
ectiv
e ar
ea
Dee
p pe
rcol
atio
nm
m/d
Onc
e fo
r ri
cees
tim
ated
usi
ng s
tead
y st
ate
infi
ltra
tion
rat
e
Sur
face
dra
inag
ecm
per
even
tm
easu
red
by c
utth
roat
flu
me
(con
tinue
d)

32
3W
ater
cour
seIn
flow
Can
al w
ater
cmD
aily
mea
sure
d by
hea
d af
ter
cali
brat
ion
of th
e ou
tlet
and
cutt
hroa
t flu
me
Tub
ewel
l wat
ercm
Dai
ly tu
bew
ell o
pera
ting
hou
rsre
cord
ed d
isch
arge
rat
e an
d op
erat
ion
hour
s fo
ral
l tub
ewel
ls
R
ainf
all
mm
Dai
lym
easu
red
by r
ain
gaug
e
S
ubsu
rfac
e in
flow
cmfr
om m
easu
red
wat
er ta
ble
grad
ient
sby
mon
itor
ing
grou
ndw
ater
flu
ctua
tion
thro
ugh
piez
omet
ers
Sto
rage
cha
nge
cm
Eac
h cr
op s
easo
nIn
flow
min
us o
utfl
ow
Out
flow
Eva
potr
ansp
irat
ion
mm
/dD
aily
Tota
l E
T b
y m
ulti
plyi
ng
ET
of
each
cro
p by
resp
ectiv
e ar
ea
D
eep
perc
olat
ion
mm
/dO
nce
for
rice
esti
mat
ed u
sing
bas
ic in
filt
rati
on r
ate
Sur
face
dra
inag
ecm
per
even
tby
mea
suri
ng f
low
thro
ugh
surf
ace
drai
ns
Sub
surf
ace
outf
low
cmO
n m
onth
ly/s
easo
nal b
asis
by m
onit
orin
g gr
ound
wat
er f
luct
uati
on b
ypi
ezom
eter
s
4O
ther
Dat
a
Wat
er ta
ble
dept
hm
On
wee
kly
basi
spi
ezom
eter
mon
itor
ing
on w
eekl
y ba
sis
E
lect
rica
l con
duct
ivity
ds/m
On
mon
thly
bas
isel
ectr
ical
con
duct
ivit
y th
roug
h E
C m
eter
D
istr
ibut
ary
disc
harg
ecu
mec
sD
aily
mea
sure
d di
scha
rge
at h
ead
of th
e di
stri
buta
ry
Cro
p da
ta
For
who
le c
ropp
ing
seas
onre
cord
ed ty
pe o
f th
e cr
op a
nd a
crea
ge s
own
A
gric
ultu
ral p
ract
ices
Fo
r w
hole
cro
ppin
g se
ason
reco
rded
agr
onom
ic p
ract
ices
O
ther
rel
ated
dat
a
fr
om p
rim
ary
and
seco
ndar
y so
urce
s
Not
e: D
ata
gene
rate
d by
the
proj
ect r
esea
rch
AN
NE
X 1
(C
onti
nued
)
Dat
a C
olle
ctio
n an
d A
naly
sis
at F
ield
, Far
m a
nd W
ater
cour
se L
evel
s
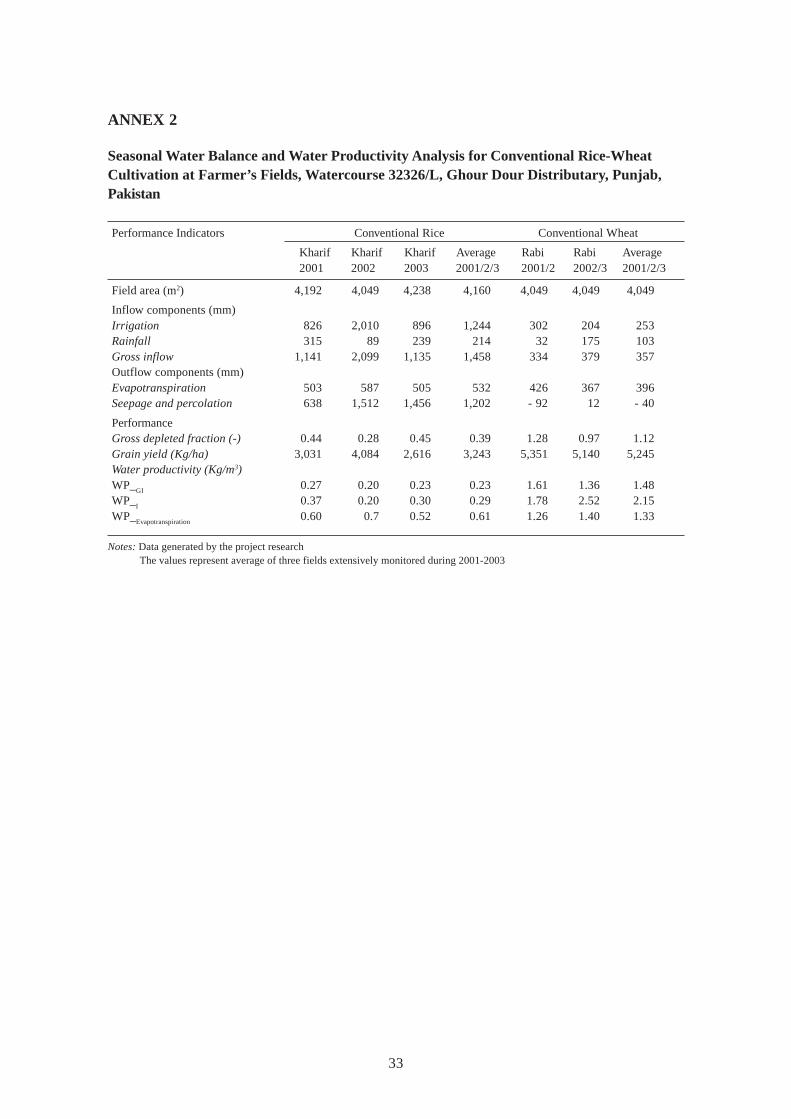
33
ANNEX 2
Seasonal Water Balance and Water Productivity Analysis for Conventional Rice-WheatCultivation at Farmer’s Fields, Watercourse 32326/L, Ghour Dour Distributary, Punjab,Pakistan
Performance Indicators Conventional Rice Conventional Wheat
Kharif Kharif Kharif Average Rabi Rabi Average2001 2002 2003 2001/2/3 2001/2 2002/3 2001/2/3
Field area (m2) 4,192 4,049 4,238 4,160 4,049 4,049 4,049
Inflow components (mm)Irrigation 826 2,010 896 1,244 302 204 253Rainfall 315 89 239 214 32 175 103Gross inflow 1,141 2,099 1,135 1,458 334 379 357Outflow components (mm)Evapotranspiration 503 587 505 532 426 367 396Seepage and percolation 638 1,512 1,456 1,202 - 92 12 - 40
PerformanceGross depleted fraction (-) 0.44 0.28 0.45 0.39 1.28 0.97 1.12Grain yield (Kg/ha) 3,031 4,084 2,616 3,243 5,351 5,140 5,245Water productivity (Kg/m3)WP_
GI0.27 0.20 0.23 0.23 1.61 1.36 1.48
WP_I
0.37 0.20 0.30 0.29 1.78 2.52 2.15WP_
Evapotranspiration0.60 0.7 0.52 0.61 1.26 1.40 1.33
Notes: Data generated by the project researchThe values represent average of three fields extensively monitored during 2001-2003

34
AN
NE
X 3
A
Gro
ss V
alue
of
Pro
duct
ion
Per
Uni
t of
Wat
er a
t th
e W
ater
cour
se L
evel
Wat
erco
urse
Seas
onA
rea
Gro
ss I
ncom
eIr
riga
tion
Inf
low
Gro
ss I
nflo
wG
VP
_IG
VP
_GI
(ha)
(Mil
lion
Rs)
(Mil
lion
m3 )
(Mil
lion
m3 )
(Rs/
m3 )
(Rs/
m3 )
21-T
FK
hari
f 20
0119
76.
412.
022.
503.
172.
56
Rab
i 20
01/2
002
188
4.41
0.75
0.80
5.91
5.52
Ann
ual
385
10.8
12.
773.
303.
913.
28
28-L
Kha
rif
2001
63
1.45
0.55
0.75
2.64
1.93
Rab
i 20
01/2
002
68
1.59
0.37
0.39
4.34
4.07
Ann
ual
132
3.04
0.92
1.14
3.32
2.66
74-R
Kha
rif
2001
222
5.24
3.34
3.88
1.57
1.35
Rab
i 20
01/2
002
253
5.99
1.44
1.51
4.17
3.96
Ann
ual
475
11.2
34.
775.
392.
352.
08
32-L
Kha
rif
2001
80
1.74
1.11
1.36
1.57
1.28
Rab
i 20
01/2
002
106
2.70
0.58
0.61
4.66
4.40
Ann
ual
185
4.45
1.69
1.98
2.63
2.25
Ove
rall
Wat
erco
urse
Kha
rif
2001
140
3.71
1.75
2.12
2.11
1.75
Rab
i 20
01/2
002
154
3.67
0.78
0.83
4.70
4.43
Ann
ual
294
7.38
2.54
2.95
2.91
2.50
Not
es:
Dat
a ge
nera
ted
by th
e pr
ojec
t res
earc
hS
ugar
cane
and
orc
hard
s ar
e th
e an
nual
cro
ps a
nd th
eir
gros
s va
lue
of p
rodu
ctio
n w
as e
qual
ly d
ivid
ed in
to K
hari
f an
d R
abi s
easo
ns

35
ANNEX 3B
Crop-wise Value of Production at the Watercourse Scale During Kharif 2001
Area Yield/ha GVP
Watercourse Crop ha percent of CA Kg/ha Rs/ha Total Rs
21900-TF Rice 172.66 87.86 3,385 33,444 5,774,450
Sugarcane 12.15 6.18 59,280 29,640 360,138
Orchards 9.81 4.99 na 24,700 242,312
Fodder 1.49 0.76 na 9,880 14,703
Vegetable 0.41 0.21 na 33,345 13,631
Total 196.52 100.00 6,405,234
28915/L Rice 26.56 41.89 3,352 29,162 774,658
Orchards 31.29 49.33 na 18,525 579,581
Vegetables 1.21 1.91 na 22,230 26,967
Fodder 2.93 4.62 na 9,880 28,931
Sugarcane 0.82 1.29 69,160 34,580 28,241
Oil Seed 0.61 0.96 593 13,634 8,339
Total 63.42 100.00 1,446,717
74634/R Rice 135.17 60.86 3,069 288,486 3,899,364
Fodder 36.38 16.38 na 9,880 359,432
Oil Seed 37.13 16.72 593 13,634 506,260
Sugarcane 12.61 5.68 74,100 37,050 467,071
Orchards 0.81 0.36 na 14,820 11,995
Total 222.10 100.00 5,244,122
32326/L Rice 52.16 65.48 2,848 26,031 1,357,729
Fodder 15.35 19.28 na 9,880 151,699
Sugarcane 2.98 3.74 69,160 34,580 103,080
Oil Seed 8.35 10.48 593 13,634 113,872
Vegetable 0.81 1.02 na 22,230 18,002
Total 79.65 100.00 1,744,382
Notes: Data generated by the project researchna = not available

36
ANNEX 3C
Crop-wise Value of Production at the Watercourse Scale During Rabi 2001
Area Yield/ha GVP
Watercourse Crop ha percent of CA Kg/ha Rs/ha Total Rs
21900/TF Wheat 147 77.91 3,395 23,290 3,415,509
Orchard 18 9.34 na 24,700 242,312
Sugarcane 12 6.24 59,280 29,640 360,138
Fodder 5 2.61 na 34,580 169,618
Vegetable 7 3.91 na 29,640 218,094
Total 189 100.00 4,405,671
28915/L Wheat 31 45.01 3,855 26,831 826,544
Orchard 31 45.71 na 18,525 579,581
Vegetable 4 5.36 na 24,700 90,612
Fodder 2 2.91 na 34,580 68,876
Sugarcane 1 1.01 69,160 34,580 28,241
Total 69 100.00 1,593,854
74634/R Wheat 184 72.91 3,157 216,57.02 3,994,546
Orchard 1 0.32 na 14,820 11,995
Vegetable 21 8.39 na 24,700 524,050
Fodder 29 11.34 na 34,580 991,976
Sugarcane 18 7.05 74,100 37,050 467,071
Total 253 100.00 5,989,638
32326/L Wheat 86 81.14 3,321 23,812 2,039,542
Fodder 12 11.58 na 34,580 422,862
Sugarcane 2 2.06 69,160 34,580 103,080
Vegetable 6 5.22 na 24,700 136,102
Total 106 100.00 2,701,586
Notes: Data generated by the project researchna = not available

37
ANNEX 4
Socioeconomic Characteristics of Sample Farmers
Description Sample Watercourses Overall
21900/TF 28915/L 74634/R 32326/L Mean
Family size (#)Family members 12 7 11 10 10Male 7 3 6 6 6Female 5 4 5 4 4Working at the farm 3 2 3 2 2Profession (%)Agriculturist 89 80 93 100 93Agri + Industrial 11 -- 7 -- 5Agri + Employee -- 20 -- -- 3Farming experience(Years) 17 32 25 27 23Farm size (ha) 8.93 71.00 8.31 5.01 8.66Tenancy status (%)Owner 63 100 50 75 61Owner-cum-tenant 25 -- 21 6 18Tenant 13 -- 29 19 21Soil typeLoam 71 -- 33 31 43Clay loam 18 100 21 31 25Sandy loam 6 -- 29 31 22Other 6 -- 17 7 12Soil salinity problem (%) 59 — 38 44 45Education (%)Illiterate 11 -- 50 50 35Read and write only 11 -- 7 -- 5Primary 33 20 14 8 17Middle 22 80 7 25 25High school 22 -- 7 8 10Intermediate -- -- 7 8 5Graduate -- -- 7 -- 3
Household assetsTelevision 65 100 42 50 50Radio/tape recorder 53 100 42 44 45Bicycle 82 100 79 44 71Motorbike 24 100 17 13 19Sewing machine 77 100 83 63 74Brick house 77 100 50 56 60
Farm assetsTractor (%) 59 100 50 25 47Trolley (%) 47 100 7 6 29Seed drill (%) 35 100 3 100 19Thresher (%) 41 100 5 -- 22Cows (#/farm) 1 5 3 3 3Buffalos (#/farm) 4 -- 6 7 5Goats/sheep (#/farm) 1 -- 2 2 2
Notes: Data generated by the project researchThe results are based on 58 respondent farmers distributed to four watercourse; 21900TF (17), 28915/L (1), 74634/R (24) and32326/L (16)

ISBN: 978-92-9090-653-7
SM
IWMI is a Future Harvest Centersupported by the CGIAR
Postal Address:P O Box 2075ColomboSri Lanka
Location:127, Sunil MawathaPelawattaBattaramullaSri Lanka
Tel:+94-11 2787404
Fax:+94-11 2786854
E-mail:[email protected]
Website:http://www.iwmi.org
I n t e r n a t i o n a lWater ManagementI n s t i t u t e