Punjab - UNICEF
317
MICS Multiple Indicator Cluster Survey Punjab Multiple Indicator Cluster Survey 2017-18 Provincial Report (Vol - I)
-
Upload
khangminh22 -
Category
Documents
-
view
1 -
download
0
Transcript of Punjab - UNICEF
MICS Multiple IndicatorCluster Survey
Punjab
Multiple Indicator Cluster Survey
2017-18
Provincial Report (Vol - I)
Mu
ltiple
Ind
icato
r Clu
ste
r Su
rvey 2
017-1
8 (V
ol - I)
Punjab Multiple Indicator Cluster Survey

Title page picture is taken by Mr. Muhammad Farooq with the permission from Ms. Bashiran Bibi with her 6
months daughter amna, in her house at Tehsil Kot Radha Kishan in Kasur District, Punjab.
GENERATING EVIDENCE TO DELIVER FOR CHILDREN
Punjab Multiple Indicator Cluster Survey 2017-18
Survey Findings Report
Provincial Report (Vol-I) (Volume-I) November, 2018
Report was endorsed by MICS Steering Committee, Punjab in November, 2018 and disseminated in March, 2019
Bureau of Statistics
Planning & Development Board
Government of the Punjab
The Multiple Indicator Cluster Survey (MICS), Punjab was carried out in 2017-18 by Bureau of Statistics,
Punjab in collaboration with United Nations Children’s Fund (UNICEF), as part of the Global MICS
Programme. Technical support was provided by the United Nations Children’s Fund (UNICEF), with
government funding and financial support of UNICEF.
The Global MICS Programme was developed by UNICEF in the 1990s as an international multi-purpose
household survey programme to support countries in collecting internationally comparable data on a
wide range of indicators on the situation of children and women. MICS surveys measure key indicators
that allow countries to generate data for use in policies, programmes, and national development
plans, and to monitor progress towards the Sustainable Development Goals (SDGs) and other
internationally agreed upon commitments. Punjab MICS, 2017-18 is the fifth MICS in Punjab since
2004. Information on the global MICS may be obtained from mics.unicef.org and information about
Bureau of Statistics, Punjab from bos.gop.pk and pndpunjab.gov.pk.
The objective of this report is to facilitate the timely dissemination and use of results from the Punjab
MICS, 2017-18. The report contains detailed information on the survey methodology, and all MICS
tables. The report is accompanied by a series of Statistical Snapshots of the main findings of the survey.
For more information on the Global MICS Programme, please go to mics.unicef.org.
Suggested citation:
Bureau of Statistics Punjab, Planning & Development Board, Government of the Punjab. 2018. Multiple Indicator Cluster Survey Punjab, 2017-18, Survey Findings Report. Lahore, Pakistan: Bureau of Statistics Punjab, Planning & Development Board, Government of the Punjab.
Page | iii
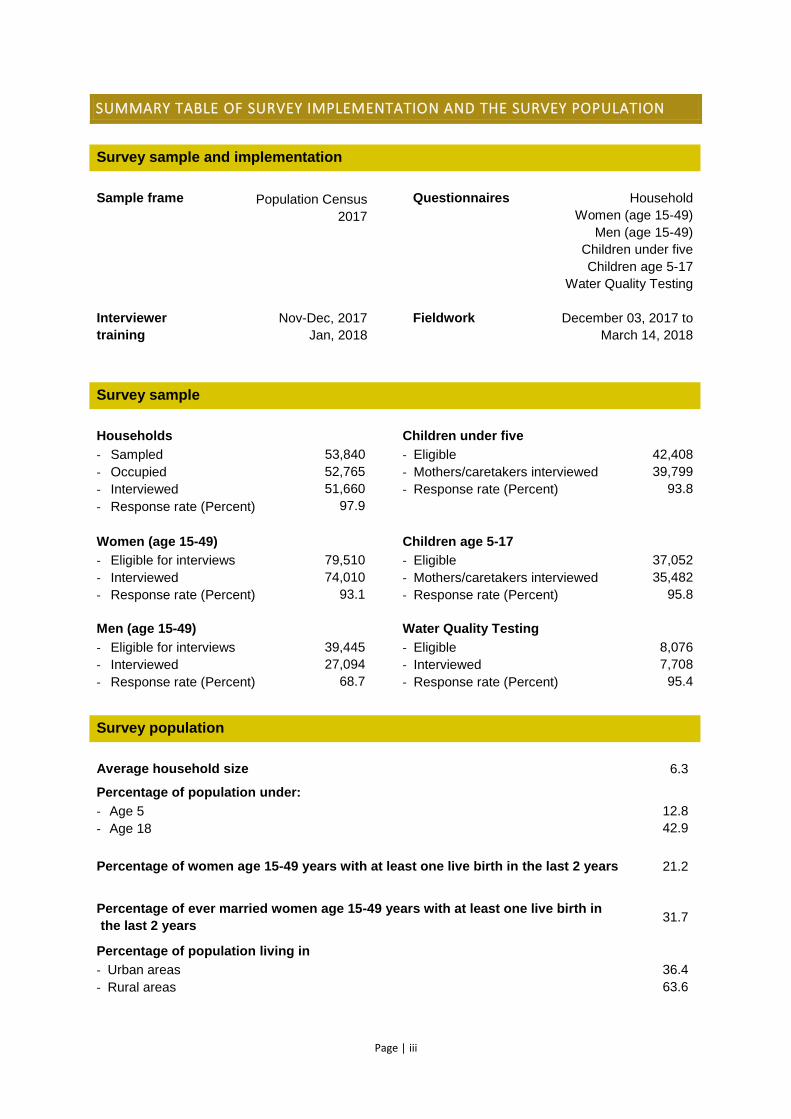
SUMMARY TABLE OF SURVEY IMPLEMENTATION AND THE SURVEY POPULATION
Survey sample and implementation
Sample frame
Population Census
2017
Questionnaires Household
Women (age 15-49)
Men (age 15-49)
Children under five
Children age 5-17
Water Quality Testing
Interviewer
training
Nov-Dec, 2017
Jan, 2018
Fieldwork
December 03, 2017 to
March 14, 2018
Survey sample
Households
- Sampled
- Occupied
- Interviewed
- Response rate (Percent)
53,840
52,765
51,660
97.9
Children under five
- Eligible
- Mothers/caretakers interviewed
- Response rate (Percent)
42,408
39,799
93.8
Women (age 15-49)
- Eligible for interviews
- Interviewed
- Response rate (Percent)
79,510
74,010
93.1
Children age 5-17
- Eligible
- Mothers/caretakers interviewed
- Response rate (Percent)
37,052
35,482
95.8
Men (age 15-49)
- Eligible for interviews
- Interviewed
- Response rate (Percent)
39,445
27,094
68.7
Water Quality Testing
- Eligible
- Interviewed
- Response rate (Percent)
8,076
7,708
95.4
Survey population
Average household size 6.3
Percentage of population under:
- Age 5
- Age 18
12.8
42.9
Percentage of women age 15-49 years with at least one live birth in the last 2 years 21.2
Percentage of ever married women age 15-49 years with at least one live birth in
the last 2 years 31.7
Percentage of population living in
- Urban areas
- Rural areas
36.4
63.6
Page | iv
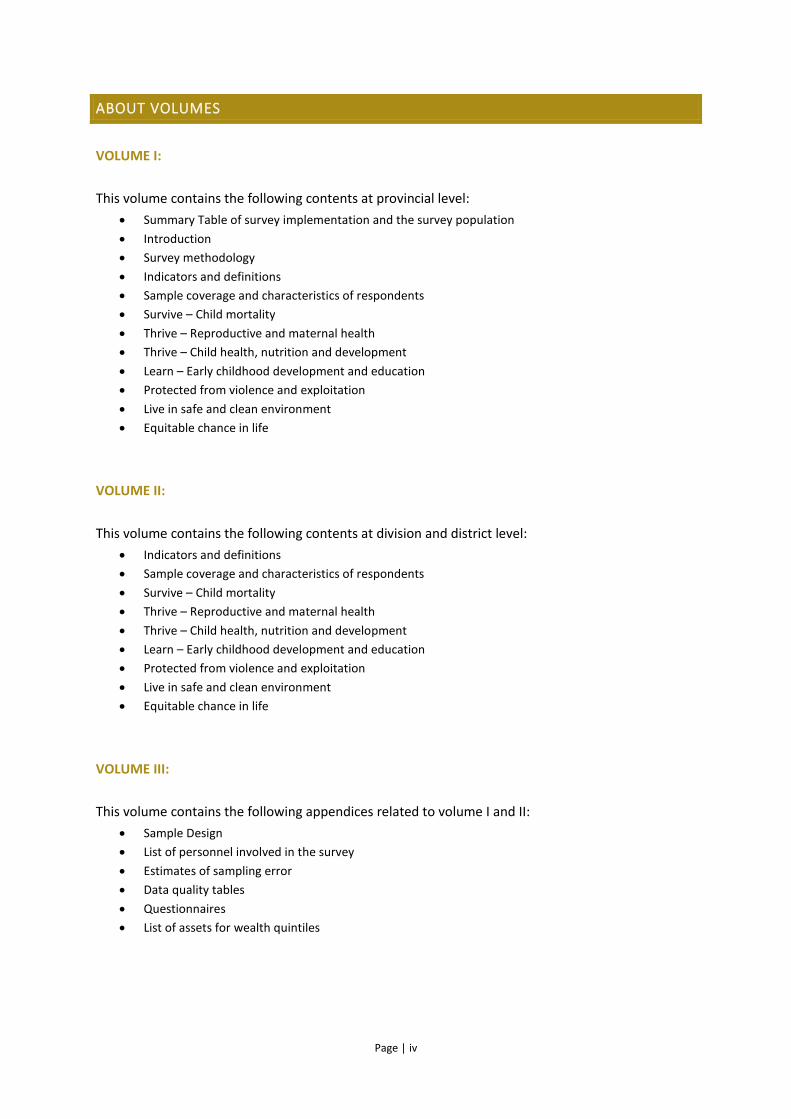
ABOUT VOLUMES
VOLUME I:
This volume contains the following contents at provincial level:
Summary Table of survey implementation and the survey population
Introduction
Survey methodology
Indicators and definitions
Sample coverage and characteristics of respondents
Survive – Child mortality
Thrive – Reproductive and maternal health
Thrive – Child health, nutrition and development
Learn – Early childhood development and education
Protected from violence and exploitation
Live in safe and clean environment
Equitable chance in life
VOLUME II:
This volume contains the following contents at division and district level:
Indicators and definitions
Sample coverage and characteristics of respondents
Survive – Child mortality
Thrive – Reproductive and maternal health
Thrive – Child health, nutrition and development
Learn – Early childhood development and education
Protected from violence and exploitation
Live in safe and clean environment
Equitable chance in life
VOLUME III:
This volume contains the following appendices related to volume I and II:
Sample Design
List of personnel involved in the survey
Estimates of sampling error
Data quality tables
Questionnaires
List of assets for wealth quintiles
Page | v
TABLE OF CONTENTS
SUMMARY TABLE OF SURVEY IMPLEMENTATION AND THE SURVEY POPULATION ................................................. III
ABOUT VOLUMES ................................................................................................................................................... IV
TABLE OF CONTENTS ............................................................................................................................................... V
LIST OF ABBREVIATIONS ......................................................................................................................................... XI
FOREWORD .......................................................................................................................................................... XIV
ACKNOWLEDGEMENT .......................................................................................................................................... XVI
1. INTRODUCTION ............................................................................................................................................... 1
2. SURVEY METHODOLOGY.................................................................................................................................. 3
SAMPLE DESIGN ...................................................................................................................................................... 3
QUESTIONNAIRES ................................................................................................................................................... 3
ETHICAL PROTOCOL ................................................................................................................................................ 4
DATA COLLECTION METHOD .................................................................................................................................. 5
TRAINING ................................................................................................................................................................ 5
FIELDWORK ............................................................................................................................................................. 5
FIELDWORK QUALITY CONTROL MEASURES .......................................................................................................... 5
DATA MANAGEMENT, EDITING AND ANALYSIS...................................................................................................... 6
DATA SHARING ....................................................................................................................................................... 6
3. INDICATORS AND DEFINITIONS ........................................................................................................................ 7
4. SAMPLE COVERAGE AND CHARACTERISTICS OF RESPONDENTS ..................................................................... 31
SR.1 RESULTS OF INTERVIEWS .............................................................................................................................. 31
Table SR.1.1: Results of household, women's, men's, under-5's and children age 5-17's interviews
.................................................................................................................................................................................. 32
SR.2 HOUSING AND HOUSEHOLD CHARACTERISTICS ........................................................................................... 33
Table SR.2.1: Housing characteristics ............................................................................................................. 34
Table SR.2.2: Household and personal assets ............................................................................................. 35
Table SR.2.3: Wealth quintiles .......................................................................................................................... 36
Table SR.2.4: House, agricultural land, and livestock ownership ............................................................. 36
Table SR.2.5: Household size and mean household size........................................................................... 37
Table SR.2.6a: Main material of household flooring..................................................................................... 38
Table SR.2.6b: Main material of household roofing ..................................................................................... 39
Table SR.2.6c: Main material of household walls ......................................................................................... 40
Table SR.2.7: Working outside Pakistan ......................................................................................................... 41
SR.3 HOUSEHOLD COMPOSITION ......................................................................................................................... 42
Table SR.3.1: Household composition ............................................................................................................ 43
SR.4 AGE STRUCTURE OF HOUSEHOLD POPULATION .......................................................................................... 44
Table SR.4.1: Age distribution of household population by sex ................................................................ 44
SR.5 RESPONDENTS’ BACKGROUND CHARACTERISTICS ....................................................................................... 45
Table SR.5.1W: Women's background characteristics ................................................................................ 46
Table SR.5.1M: Men's background characteristics....................................................................................... 47
Table SR.5.2: Children under 5's background characteristics ................................................................... 48
Table SR.5.3: Children age 5-17's background characteristics ................................................................. 49
SR.6 LITERACY ....................................................................................................................................................... 50
Table SR.6.1W: Literacy (women) .................................................................................................................... 51
Table SR.6.1M: Literacy (men) .......................................................................................................................... 52
Page | vi
SR.7 MIGRATORY STATUS ..................................................................................................................................... 53
Table SR.7.1W: Migratory status of women ................................................................................................... 54
Table SR.7.1M: Migratory status of men ......................................................................................................... 55
SR.8 ADULT FUNCTIONING AND DISABILITY ......................................................................................................... 56
Table SR.8.2: Adult functioning (household members age 18 years and above) ................................. 57
Table SR.8.3: Disability (household members age 18 years and above) ............................................... 58
Table SR.8.4: Social protection/transfers for disabled persons ................................................................. 59
SR.9 MASS MEDIA AND ICT ................................................................................................................................... 60
Table SR.9.1W: Exposure to mass media (women)..................................................................................... 61
Table SR.9.1M: Exposure to mass media (men) .......................................................................................... 62
Table SR.9.2: Household ownership of ICT equipment and access to internet ..................................... 63
Table SR.9.3W: Use of ICT (women) .............................................................................................................. 64
Table SR.9.3M: Use of ICT (men) .................................................................................................................... 65
Table SR.9.4W: ICT skills (women).................................................................................................................. 66
Table SR.9.4M: ICT skills (men) ....................................................................................................................... 67
SR.10 TOBACCO USE ............................................................................................................................................. 68
Table SR.10.1W: Current and ever use of tobacco (women)..................................................................... 69
Table SR.10.1M: Current and ever use of tobacco (men) .......................................................................... 70
Table SR.10.2W: Age at first use of cigarettes and frequency of use (women) .................................... 71
Table SR.10.2M: Age at first use of cigarettes and frequency of use (men) .......................................... 72
SR.11 CHILDREN'S LIVING ARRANGEMENTS ......................................................................................................... 73
Table SR.11.1: Children's living arrangements and orphanhood .............................................................. 74
Table SR.11.2: Children's living arrangements and co-residence with parents ..................................... 75
Table SR.11.3: Children not in parental care ................................................................................................. 76
5. SURVIVE......................................................................................................................................................... 77
Table CS.1: Early childhood mortality rates ................................................................................................... 78
Table CS.2: Early childhood mortality rates by socioeconomic characteristics ..................................... 78
Table CS.3: Early childhood mortality rates by demographic characteristics ......................................... 79
Table CS.4: Pre-mature births ........................................................................................................................... 80
6. THRIVE – REPRODUCTIVE AND MATERNAL HEALTH ....................................................................................... 81
TM.1 FERTILITY ..................................................................................................................................................... 81
Table TM.1.1: Fertility rates ................................................................................................................................ 82
TM.2 EARLY CHILDBEARING.................................................................................................................................. 83
Table TM.2.1: Adolescent birth rate and total fertility rate ........................................................................... 84
Table TM.2.2W: Early childbearing (young women)..................................................................................... 85
Table TM.2.2M: Early fatherhood (young men) ............................................................................................. 86
Table TM.2.3W: Trends in early childbearing (women) ............................................................................... 87
Table TM.2.3M: Trends in early fatherhood (men) ....................................................................................... 88
TM.3 FAMILY PLANNING ...................................................................................................................................... 89
Table TM.3.1: Use of contraception (currently married) .............................................................................. 91
Table TM.3.3: Need for contraception (currently married) .......................................................................... 92
TM.4 ANTENATAL CARE ........................................................................................................................................ 93
Table TM.4.1: Antenatal care coverage .......................................................................................................... 94
Table TM.4.2: Number of antenatal care visits and timing of first visit ..................................................... 95
Table TM.4.3: Content of antenatal care ......................................................................................................... 96
TM.5 NEONATAL TETANUS ................................................................................................................................... 97
Table TM.5.1: Neonatal tetanus protection .................................................................................................... 98
TM.6 DELIVERY CARE ............................................................................................................................................ 99
Page | vii
Table TM.6.1: Place of delivery ....................................................................................................................... 100
Table TM.6.2: Assistance during delivery and caesarian section ........................................................... 101
Table TM.6.3: Family Planning Counselling ................................................................................................. 102
TM.7 BIRTHWEIGHT ............................................................................................................................................ 103
Table TM.7.1: Infants weighed at birth .......................................................................................................... 105
TM.8 POST-NATAL CARE ..................................................................................................................................... 106
Table TM.8.1: Post-partum stay in health facility ........................................................................................ 108
Table TM.8.2: Post-natal health checks for newborns ............................................................................... 109
Table TM.8.3: Post-natal care visits for newborns within one week of birth ......................................... 109
Table TM.8.4: Thermal care for newborns .................................................................................................... 111
Table TM.8.5: Cord cutting and care .............................................................................................................. 112
Table TM.8.6: Content of postnatal care for newborns .............................................................................. 113
Table TM.8.7: Post-natal health checks for mothers .................................................................................. 114
Table TM.8.8: Post-natal care visits for mothers within one week of birth ............................................ 115
Table TM.8.9: Post-natal health checks for mothers and newborns....................................................... 116
Table TM.8.10: Care provided by Lady health worker (LHW) .................................................................. 117
TM.9 ADULT AND MATERNAL MORTALITY ......................................................................................................... 118
Table TM.9.1: Adult mortality rates ................................................................................................................. 119
Table TM.9.2: Adult mortality probabilities .................................................................................................... 120
Table TM.9.3: Maternal mortality .................................................................................................................... 120
TM.11 HIV/AIDS .................................................................................................................................................. 121
Table TM.11.1W: Knowledge about HIV transmission, misconceptions about HIV, and
comprehensive knowledge about HIV transmission (women) ................................................................. 123
Table TM.11.1M: Knowledge about HIV transmission, misconceptions about HIV, and
comprehensive knowledge about HIV transmission (men) ....................................................................... 124
Table TM.11.2W: Knowledge of mother-to-child HIV transmission (women) ....................................... 125
Table TM.11.2M: Knowledge of mother-to-child HIV transmission (men) ............................................. 126
Table TM.11.3W: Attitudes towards people living with HIV (women) ..................................................... 127
Table TM.11.3M: Attitudes towards people living with HIV (men) ........................................................... 128
Table TM.11.4W: Knowledge of a place for HIV testing (women) .......................................................... 129
Table TM.11.4M: Knowledge of a place for HIV testing (men) ................................................................ 130
Table TM.11.5: HIV counselling and testing during antenatal care ........................................................ 131
Table TM.11.6W: Key HIV and AIDS indicators (young women) ............................................................ 132
Table TM.11.6M: Key HIV and AIDS indicators (young men) .................................................................. 133
7. THRIVE – CHILD HEALTH, NUTRITION AND DEVELOPMENT .......................................................................... 135
TC.1 IMMUNISATION .......................................................................................................................................... 135
Table TC.1.1: Vaccinations in the first years of life ..................................................................................... 137
Table TC.1.2: Vaccinations by background characteristics ...................................................................... 138
TC.2 DISEASE EPISODES ...................................................................................................................................... 139
Table TC.2.1: Reported disease episodes ................................................................................................... 140
TC.3 DIARRHOEA ................................................................................................................................................. 141
Table TC.3.1: Care-seeking during diarrhoea .............................................................................................. 142
Table TC.3.2: Feeding practices during diarrhoea ...................................................................................... 143
Table TC.3.3: Oral rehydration solutions, government-recommended homemade fluid and zinc ... 144
Table TC.3.4: Oral rehydration therapy with continued feeding and other treatments ....................... 145
Table TC.3.5: Source of ORS and zinc ......................................................................................................... 146
TC.4 HOUSEHOLD ENERGY USE .......................................................................................................................... 147
Table TC.4.1: Primary reliance on clean fuels and technologies for cooking ....................................... 148
Table TC.4.2: Primary reliance on solid fuels for cooking ......................................................................... 149

Page | viii
Table TC.4.3: Polluting fuels and technologies for cooking by type and characteristics of cookstove
and place of cooking .......................................................................................................................................... 150
Table TC.4.4: Primary reliance on clean fuels and technologies for space heating ........................... 151
Table TC.4.5: Type of space heater mainly used and presence of chimney ........................................ 152
Table TC.4.6: Primary reliance on clean fuels and technologies for lighting ........................................ 153
Table TC.4.7: Primary reliance on clean fuels and technologies for cooking, space heating, and
lighting ................................................................................................................................................................... 154
TC.5 SYMPTOMS OF ACUTE RESPIRATORY INFECTION....................................................................................... 155
Table TC.5.1: Care-seeking for and antibiotic treatment of symptoms of acute respiratory infection
(ARI) ....................................................................................................................................................................... 156
TC.6 MALARIA ..................................................................................................................................................... 157
Table TC.6.9: Use of Intermittent Preventive Treatment for malaria (IPTp) by women during
pregnancy ............................................................................................................................................................. 158
Table TC.6.10: Care-seeking during fever .................................................................................................... 159
Table TC.6.11: Treatment of children with fever ......................................................................................... 160
Table TC.6.12: Diagnostics and anti-malarial treatment of children ....................................................... 161
Table TC.6.13: Source of anti-malarial .......................................................................................................... 162
TC.7 INFANT AND YOUNG CHILD FEEDING ......................................................................................................... 163
Table TC.7.1: Initial breastfeeding .................................................................................................................. 167
Table TC.7.2: Newborn feeding ...................................................................................................................... 168
Table TC.7.3: Breastfeeding status ................................................................................................................ 169
Table TC.7.4: Duration of breastfeeding ....................................................................................................... 170
Table TC.7.5: Age-appropriate breastfeeding .............................................................................................. 171
Table TC.7.6: Introduction of solid, semi-solid, or soft foods ................................................................... 172
Table TC.7.7: Infant and young child feeding (IYCF) practices ............................................................... 173
Table TC.7.8: Bottle feeding ............................................................................................................................ 174
TC.8 MALNUTRITION .......................................................................................................................................... 175
Table TC.8.1: Nutritional status of children................................................................................................... 177
Table TC.8.2: Children's vitamin A supplementation.................................................................................. 178
TC.9 SALT IODISATION ........................................................................................................................................ 179
Table TC.9.1: Iodized salt consumption ........................................................................................................ 180
TC.10 EARLY CHILDHOOD DEVELOPMENT .......................................................................................................... 181
Table TC.10.1: Support for learning ............................................................................................................... 182
Table TC.10.2: Learning materials ................................................................................................................. 183
Table TC.10.3: Inadequate supervision ........................................................................................................ 184
TC.11 EARLY CHILD DEVELOPMENT INDEX ......................................................................................................... 185
Table TC.11.1: Early child development index ............................................................................................ 186
8. LEARN .......................................................................................................................................................... 187
LN.1 EARLY CHILDHOOD EDUCATION ................................................................................................................. 187
Table LN.1.1: Early childhood education ...................................................................................................... 188
Table LN.1.2: Participation rate in organised learning ............................................................................... 189
LN.2 ATTENDANCE .............................................................................................................................................. 190
Table LN.2.1: School readiness ...................................................................................................................... 192
Table LN.2.2: Primary school entry ................................................................................................................ 193
Table LN.2.3: Primary school attendance and out of school children .................................................... 194
Table LN.2.4: Lower secondary school attendance and out of school adolescents ........................... 195
Table LN.2.5: Age for grade ............................................................................................................................. 196
Table LN.2.6: Upper secondary school attendance and out of school youth ....................................... 197
Table LN.2.7: Gross intake, completion and effective transition rates ................................................... 198
Page | ix
Table LN.2.8: Parity indices ............................................................................................................................. 199
Table LN.2.9: Participation rate ....................................................................................................................... 200
Table LN.2.10: School attendance of orphans and non-orphans ............................................................ 201
LN.3 PARENTAL INVOLVEMENT .......................................................................................................................... 202
Table LN.3.1: Support for child learning at school ...................................................................................... 203
Table LN.3.2: School-related reasons for inability to attend class .......................................................... 205
Table LN.3.3: Learning environment at home .............................................................................................. 207
LN.4 FOUNDATIONAL LEARNING SKILLS ............................................................................................................. 209
Table LN.4.1: Reading skills ............................................................................................................................ 211
Table LN.4.2: Numeracy skills ......................................................................................................................... 213
9. PROTECTED FROM VIOLENCE AND EXPLOITATION....................................................................................... 215
PR.1 BIRTH REGISTRATION ................................................................................................................................. 215
Table PR.1.1: Birth registration ....................................................................................................................... 216
PR.2 CHILD DISCIPLINE ........................................................................................................................................ 217
Table PR.2.1: Child discipline .......................................................................................................................... 218
Table PR.2.2: Attitudes toward physical punishment ................................................................................. 219
PR.3 CHILD LABOUR ............................................................................................................................................ 220
Table PR.3.1: Children's involvement in economic activities ................................................................... 222
Table PR.3.2: Children's involvement in household chores ..................................................................... 223
Table PR.3.3: Child labour ............................................................................................................................... 224
PR.4 CHILD MARRIAGE........................................................................................................................................ 225
Table PR.4.1W: Early marriage and polygyny (women) ............................................................................ 226
Table PR.4.1M: Early marriage and polygyny (men) ................................................................................. 227
Table PR.4.2W: Trends in early marriage (women) ................................................................................... 228
Table PR.4.2M: Trends in early marriage (men) ......................................................................................... 229
Table PR.4.3: Spousal age difference ........................................................................................................... 230
PR.6 VICTIMISATION ........................................................................................................................................... 231
Table PR.6.1W: Victims of robbery and assault (women) ......................................................................... 232
Table PR.6.1M: Victims of robbery and assault (men) .............................................................................. 233
Table PR.6.2W: Circumstances of latest incident of robbery (women) .................................................. 234
Table PR.6.2M: Circumstances of latest incident of robbery (men) ....................................................... 235
Table PR.6.3W: Location and circumstances of latest incident of assault (women) .......................... 236
Table PR.6.3M: Location and circumstances of latest incident of assault (men) ................................ 237
Table PR.6.4W: Reporting of robbery and assault in the last one year (women) ................................ 238
Table PR.6.4M: Reporting of robbery and assault in the last one year (men) ..................................... 239
PR.7 FEELINGS OF SAFETY ................................................................................................................................... 240
Table PR.7.1W: Feelings of safety (women) ................................................................................................ 241
Table PR.7.1M: Feelings of safety (men)...................................................................................................... 242
PR.8 ATTITUDES TOWARDS DOMESTIC VIOLENCE ............................................................................................. 243
Table PR.8.1W: Attitudes toward domestic violence (women) ................................................................ 243
Table PR.8.1M: Attitudes toward domestic violence (men) ...................................................................... 244
10. LIVE IN A SAFE AND CLEAN ENVIRONMENT ............................................................................................. 245
WS.1 DRINKING WATER ...................................................................................................................................... 245
Table WS.1.1: Use of improved and unimproved water sources ............................................................ 247
Table WS.1.2: Use of basic and limited drinking water services ............................................................. 248
Table WS.1.3: Person collecting water .......................................................................................................... 249
Table WS.1.4: Time spent collecting water .................................................................................................. 250
Table WS.1.5: Availability of sufficient drinking water when needed ...................................................... 251
Page | x
Table WS.1.6: Quality of source drinking water .......................................................................................... 252
Table WS.1.7: Quality of household drinking water .................................................................................... 253
Table WS.1.8: Safely managed drinking water services ........................................................................... 254
Table WS.1.9: Household water treatment ................................................................................................... 255
WS.2 HANDWASHING ......................................................................................................................................... 256
Table WS.2.1: Handwashing facility with soap and water on premises ................................................. 257
WS.3 SANITATION ............................................................................................................................................... 258
Table WS.3.1: Use of improved and unimproved sanitation facilities .................................................... 259
Table WS.3.2: Use of basic and limited sanitation services ..................................................................... 260
Table WS.3.3: Emptying and removal of excreta from on-site sanitation facilities .............................. 261
Table WS.3.4: Management of excreta from household sanitation facilities ........................................ 262
Table WS.3.5: Disposal of child's faeces ...................................................................................................... 263
Table WS.3.6: Drinking water, sanitation and handwashing ladders ..................................................... 264
WS.4 MENSTRUAL HYGIENE ............................................................................................................................... 265
Table WS.4.1: Menstrual hygiene management ......................................................................................... 266
Table WS.4.2: Exclusion from activities during menstruation .................................................................. 267
11. EQUITABLE CHANCE IN LIFE ..................................................................................................................... 269
EQ.1 CHILD FUNCTIONING .................................................................................................................................. 269
Table EQ.1.2: Child functioning (children age 5-17 years) ....................................................................... 271
Table EQ.1.3: Use of assistive devices (children age 2-17 years) .......................................................... 272
EQ.2 SOCIAL TRANSFERS .................................................................................................................................... 274
Table EQ.2.1W: Health insurance coverage (women) ............................................................................... 275
Table EQ.2.1M: Health insurance coverage (men) .................................................................................... 276
Table EQ.2.2: Health insurance coverage (children age 5-17 years) .................................................... 277
Table EQ.2.5: Coverage of social transfers and benefits: All household members ............................ 280
Table EQ.2.6: Coverage of social transfers and benefits: Households in the lowest two wealth
quintiles ................................................................................................................................................................. 281
Table EQ.2.7: Coverage of social transfers and benefits: Children in all households ........................ 282
Table EQ.2.8: Coverage of school support programmes: Members age 5-24 in all households .... 283
Table EQ.2.9: Received cash donations ....................................................................................................... 284
EQ.3 DISCRIMINATION AND HARASSMENT ........................................................................................................ 285
Table EQ.3.1W: Discrimination and harassment (women) ....................................................................... 286
Table EQ.3.1M: Discrimination and harassment (men) ............................................................................. 287
EQ.4 SUBJECTIVE WELL-BEING ........................................................................................................................... 288
Table EQ.4.1W: Overall life satisfaction and happiness (women) .......................................................... 289
Table EQ.4.1M: Overall life satisfaction and happiness (men) ................................................................ 290
Table EQ.4.2W: Perception of a better life (women) .................................................................................. 291
Table EQ.4.2M: Perception of a better life (men) ........................................................................................ 292
EQ.5 MULTIDIMENSIONAL POVERTY INDEX (MPI) ............................................................................................. 293
EQ.6 DIMENSIONS, INDICATORS, CUT-OFFS AND WEIGHTS OF MPI .................................................................. 294
Table EQ.5.1: The Multidimensional Poverty Index (MPI) ........................................................................ 296
Table EQ.5.2: The MPI Poor ............................................................................................................................ 297
Page | xi
LIST OF ABBREVIATIONS
ACT Artemisinin-based Combination Therapy
AIDS Acquired Immune Deficiency Syndrome
ANC Antenatal Care
ARI Acute Respiratory Infection
ASFR Age Specific Fertility Rates
BCG Bacillus Calmette-Guérin (Tuberculosis)
BoS Bureau of Statistics
C-section Caesarean section
CAPI Computer-Assisted Personal Interviewing
CBR Crude Birth Rate
CONFEMEN Conference of the Ministers of Education of French speaking countries
CRC Convention on the Rights of the Child
CSPro Census and Survey Processing System
DTP Diphtheria, Tetanus and Pertussis
E. coli Escherichia coli
ECD Early Childhood Development
ECDI Early Child Development Index
ECE Early Childhood Education
FCT Field Check Table
g Grams
GFR General Fertility Rate
GPI Gender Parity Index
Hib Haemophilus influenzae type B
HIV Human Immunodeficiency Virus
ICLS International Conference of Labour Statisticians
ICT Information and Communication Technology
IDD Iodine Deficiency Disorders
IPT Intermittent Preventive Treatment
IPTp Intermittent Preventive Treatment for malaria in pregnancy
IPTp-SP Intermittent preventive treatment in pregnancy with Sulphadoxine-Pyrimethamine)
IPV Inactivated Polio Vaccine
IQ Intelligence quotient
IYCF Infant and Young Child Feeding
JMP WHO/UNICEF Joint Monitoring Programme for Water Supply, Sanitation and
Hygiene
LBW Low birth weight
LHW Lady Health Worker
LHV Lady Health Visitor
LPG Liquefied Petroleum Gas
MDG Millennium Development Goals
MICS Multiple Indicator Cluster Survey
MICS6 Sixth global round of Multiple Indicator Clusters Surveys programme
MMR Measles, Mumps, and Rubella
MMR Maternal Mortality Rate
MPI Multidimensional Poverty Index
Page | xii
ORS Oral Rehydration Salt Solution
OPHI Oxford Poverty & Human Development Initiative
OPV Oral Polio Vaccine
ORT Oral Rehydration Therapy
PASEC Programme for the Analysis of Education Systems
PBS Pakistan Bureau of Statistics
PNC Post-natal Care
ppm Parts Per Million
SACMEQ The Southern and Eastern Africa Consortium for Monitoring Educational Quality
SDGs Sustainable Development Goals
SP Sulphadoxine-Pyrimethamine
SPSS Statistical Package for Social Sciences
TFR Total Fertility Rate
UN United Nations
UNDP United Nations Development Programme
UNGASS United Nations General Assembly Special Session on HIV/AIDS
UNICEF United Nations Children’s Fund
WASH Water, Sanitation and Hygiene
WG Washington Group on Disability Statistics
WHO World Health Organization
WHO-MCEE WHO Maternal Child Epidemiology Estimation

Page | xiv
FOREWORD
Social sector development is a priority area for the Government of Punjab. Over the
last few years, resource allocation and the development outlay of social sectors in the
province has grown manifold. The Government of Punjab has a strong commitment in
achieving the Sustainable Development Goals (SDGs) and human development is key
to the agenda. This would not only require provision of adequate resources but also a
robust system for ascertaining the area specific needs, efficient use of resources and
regular monitoring of the results and impacts.
The first district based Multiple Indicator Cluster Survey (MICS) was conducted in 2003-04. It provided
a benchmark for a number of indicators at distric t level and created a culture for using data for
planning interventions. The second and third round of MICS Punjab took place in 2007-08 and 2011.
These surveys proved to be the most imperative tools in determining government budgetary outlays,
particularly for the social sector. The data of these surveys shared with academia, local and
international research organizations and development partners has proved to be beneficial for
carrying out evidence-based research. Subsequently, the fourth round of MICS was started in 2014,
which successfully enabled the government to measure progress made on key social indicators,
providing a baseline for a number of new social indicators which were not covered in earlier rounds.
The MICS Punjab, 2017-18 is a district based survey covering over 210 indicators, and is by far the
largest on this account. The survey has been completed within the stipulated time frame and its results
will enable the government to measure progress made on key social indicators and set benchmarks
for SDG’s.
The present round of MICS, like the earlier four rounds, allows the provincial and district governments
to monitor their respective status of human and social development with precise data on variety of
key indicators. It will assist the decision-makers to move towards new avenues of human and social
development.
I am confident that this report will be a valuable source for planning efforts of Government of Punjab
and our development partners, and a reference for academia and research organizations in their
endeavors.
CHAIRMAN
Planning & Development Board, Punjab

Page | xvi
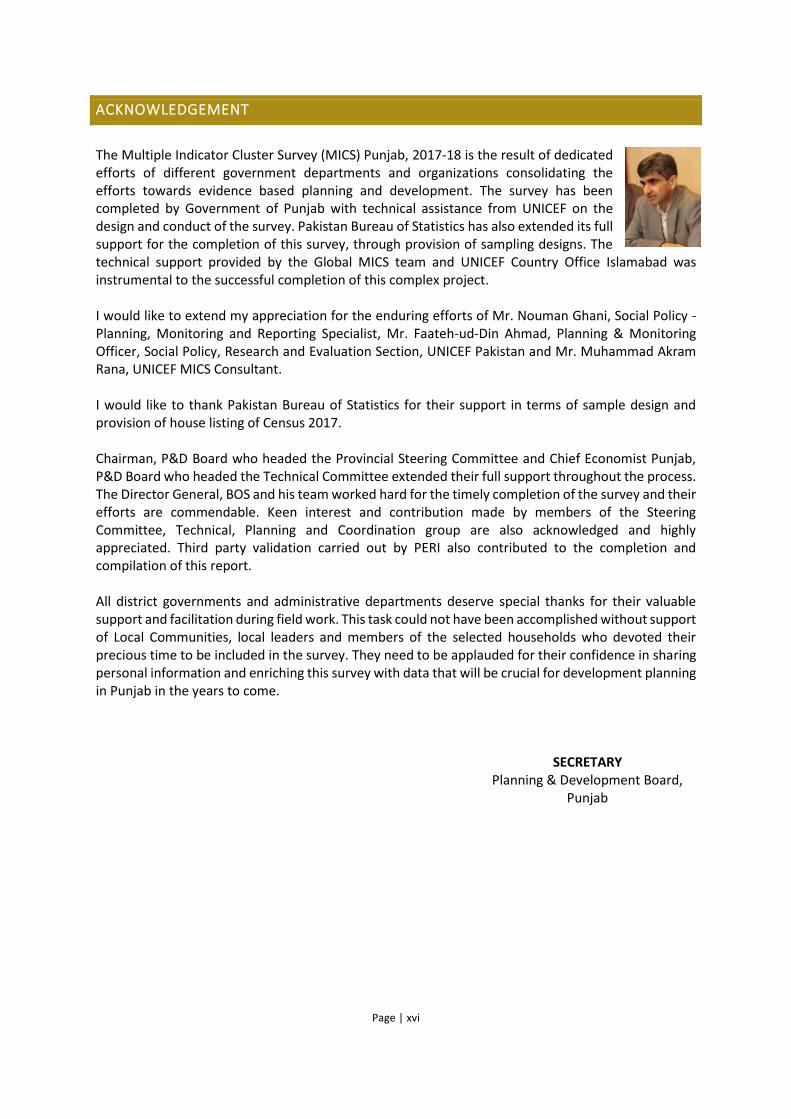
ACKNOWLEDGEMENT
The Multiple Indicator Cluster Survey (MICS) Punjab, 2017-18 is the result of dedicated efforts of different government departments and organizations consolidating the efforts towards evidence based planning and development. The survey has been completed by Government of Punjab with technical assistance from UNICEF on the design and conduct of the survey. Pakistan Bureau of Statistics has also extended its full support for the completion of this survey, through provision of sampling designs. The technical support provided by the Global MICS team and UNICEF Country Office Islamabad was instrumental to the successful completion of this complex project. I would like to extend my appreciation for the enduring efforts of Mr. Nouman Ghani, Social Policy - Planning, Monitoring and Reporting Specialist, Mr. Faateh-ud-Din Ahmad, Planning & Monitoring Officer, Social Policy, Research and Evaluation Section, UNICEF Pakistan and Mr. Muhammad Akram Rana, UNICEF MICS Consultant. I would like to thank Pakistan Bureau of Statistics for their support in terms of sample design and provision of house listing of Census 2017. Chairman, P&D Board who headed the Provincial Steering Committee and Chief Economist Punjab, P&D Board who headed the Technical Committee extended their full support throughout the process. The Director General, BOS and his team worked hard for the timely completion of the survey and their efforts are commendable. Keen interest and contribution made by members of the Steering Committee, Technical, Planning and Coordination group are also acknowledged and highly appreciated. Third party validation carried out by PERI also contributed to the completion and compilation of this report. All district governments and administrative departments deserve special thanks for their valuable support and facilitation during field work. This task could not have been accomplished without support of Local Communities, local leaders and members of the selected households who devoted their precious time to be included in the survey. They need to be applauded for their confidence in sharing personal information and enriching this survey with data that will be crucial for development planning in Punjab in the years to come.
SECRETARY
Planning & Development Board, Punjab

Introduction | Page 1
1. INTRODUCTION
This report is based on the Multiple Indicator Cluster Survey (MICS), Punjab conducted in 2017-18 by Bureau of
Statistics, Planning and Development Board, Government of the Punjab. The survey provides statistically sound
and internationally comparable data essential for developing evidence-based policies and programmes, and for
monitoring progress toward national goals and global commitments.
A Commitment to Action: National and International Reporting Responsibilities
More than two decades ago, the Plan of Action for Implementing the World Declaration on the Survival,
Protection and Development of Children in the 1990s called for:
“Each country should establish appropriate mechanisms for the regular and timely
collection, analysis and publication of data required to monitor relevant social indicators
relating to the well-being of children …. Indicators of human development should be
periodically reviewed by national leaders and decision makers, as is currently done with
indicators of economic development…”
The Multiple Indicator Cluster Surveys programme was developed soon after, in the mid-1990s, to support
countries in this endeavour.
Governments that signed the World Fit for Children Declaration and Plan of Action also committed
themselves to monitoring progress towards the goals and objectives:
“We will monitor regularly at the national level and, where appropriate, at the regional level
and assess progress towards the goals and targets of the present Plan of Action at the
national, regional and global levels. Accordingly, we will strengthen our national statistical
capacity to collect, analyse and disaggregate data, including by sex, age and other relevant
factors that may lead to disparities, and support a wide range of child-focused research” (A
World Fit for Children, paragraph 60)
Similarly, the Millennium Declaration (paragraph 31) called for periodic reporting on progress:
“…We request the General Assembly to review on a regular basis the progress made in
implementing the provisions of this Declaration, and ask the Secretary-General to issue
periodic reports for consideration by the General Assembly and as a basis for further
action.”
The General Assembly Resolution, adopted on 25 September 2015, “Transforming Our World: the
2030 Agenda for Sustainable Development” stipulates that for the success of the universal
Sustainable Development Goals (SDGs) agenda,
“quality, accessible, timely and reliable disaggregated data will be needed to help with the
measurement of progress and to ensure that no one is left behind” (paragraph 48);
recognizes that “…baseline data for several of the targets remains unavailable...” and calls
for “…strengthening data collection and capacity building in Member States...”
MICS Punjab, 2017-18 is expected to contribute to the evidence base of several other important
initiatives, including Committing to Child Survival: A Promise Renewed, a global movement to end
child deaths from preventable causes, and the accountability framework proposed by the Commission
on Information and Accountability for the Global Strategy for Women's and Children's Health.
MICS Punjab, 2017-18 results are critically important for the purposes of SDG monitoring, as the
survey produces information on 32 global SDG indicators.
Introduction | Page 2
The MICS Punjab, 2017-18 has as its primary objectives:
To provide high quality data for assessing the situation of children, adolescents, women and
households in Punjab;
To furnish data needed for monitoring progress toward national goals, as a basis for future action;
To collect disaggregated data for the identification of disparities, to inform policies aimed at social
inclusion of the most vulnerable;
To validate data from other sources and the results of focused interventions;
To generate data on national and global SDG indicators;
To generate internationally comparable data for the assessment of the progress made in various
areas, and to put additional efforts in those areas that require more attention;
To generate behavioural and attitudinal data not available in other data sources.
This report presents the results of the MICS Punjab, 2017-18. Following Chapter 2 on survey
methodology, including sample design and implementation, all indicators covered by the survey, with
their definitions, are presented in “Indicators and definitions”. Prior to presenting the survey results,
organized into thematic chapters, the coverage of the sample and the main characteristics of
respondents is covered in Chapter 4, “Sample coverage and characteristics of respondents”. From
Chapter 5, all survey results are presented in seven thematic chapters. In each chapter, a brief
introduction of the topic and the description of all tables, are followed by the tabulations.
Chapter 5, “Survive”, includes findings on under-5 mortality.
This is followed by Chapter 6, “Thrive – Reproductive and maternal health”, which presents findings
on fertility, early childbearing, contraception, unmet need, antenatal care, neonatal tetanus, delivery
care, birthweight, and post-natal care, adult and maternal mortality, and Human Immunodeficiency
Virus (HIV), and ends with male circumcision.
The following chapter, “Thrive – Child health, nutrition and development” presents findings on
immunisation, disease episodes, diarrhoea, household energy use, symptoms of acute respiratory
infection, malaria, infant and young child feeding, malnutrition, salt iodisation, and early childhood
development.
Learning is the topic of the next chapter, where survey findings on early childhood education,
educational attendance, paternal involvement in children’s education, and foundational learning skills
are covered.
The next chapter, “Protected from violence and exploitation”, includes survey results on birth
registration, child discipline, child labour, child marriage, victimisation, feelings of safety, and attitudes
toward domestic violence.
Chapter 10, “Live in a safe and clean environment”, covers the topics of drinking water, handwashing,
sanitation, and menstrual hygiene.
The final thematic chapter is on equity – titled “Equitable chance in life”, the chapter presents findings
on a range of equity related topics, including child functioning, social transfers, discrimination and
harassment, and subjective well-being.
The report ends with appendices, with detailed information on sample design, personnel involved in
the survey, estimates of sampling errors, data quality, and the questionnaires used.
Survey Methodology | Page 3
2. SURVEY METHODOLOGY
SAMPLE DESIGN
The sample for the MICS Punjab, 2017-18 was designed to provide estimates for a large number of
indicators on the situation of children and women at the Punjab level, for urban and rural areas, and
for all 36 districts of Punjab. The urban and rural areas within each district were identified as the main
sampling strata, and the sample of households was selected in two stages. Within each stratum, a
specified number of census enumeration areas were selected systematically with probability
proportional to size. Using the listing of households from the Census 2017 for each sample
enumeration area, provided by Pakistan Bureau of Statistics, a systematic sample of 20 households
was drawn in each sample enumeration area1. The total sample size was 53,840 households in 2,692
sample clusters. All the selected enumeration areas were visited during the fieldwork period. As the
sample is not self-weighting, sample weights are used for reporting survey results. A more detailed
description of the sample design can be found in Appendix A: Sample Design.
QUESTIONNAIRES
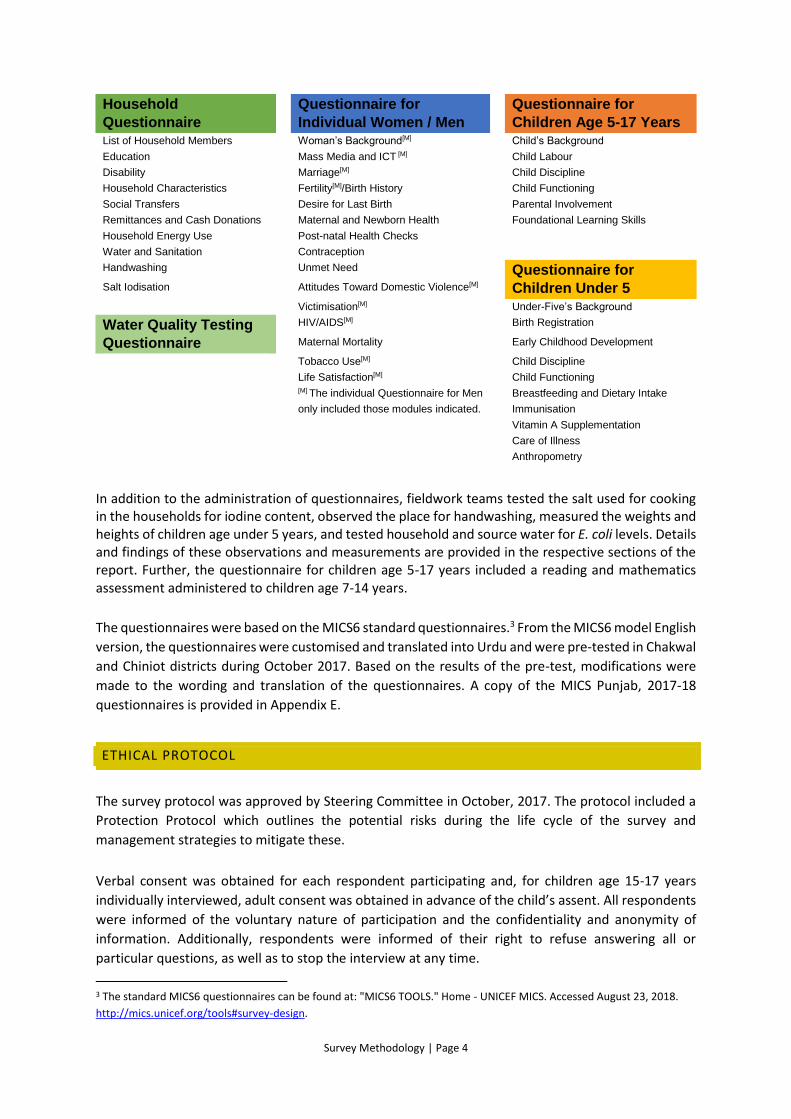
Six questionnaires were used in the survey: 1) a household questionnaire to collect basic demographic
information on all de jure household members (usual residents), the household, and the dwelling; 2)
a water quality testing questionnaire administered in three households in each cluster of the sample;
3) a questionnaire for individual women administered in each household to all women age 15-49
years; 4) a questionnaire for individual men administered in every second household to all men age
15-49 years; 5) an under-5 questionnaire, administered to mothers (or caretakers) of all children under
5 living in the household; and 6) a questionnaire for children age 5-17 years, administered to the
mother (or caretaker) of one randomly selected child age 5-17 years living in the household.2 The
questionnaires included the following modules:
1 In the initial phase of the fieldwork, the selection of 20 households from each cluster was done with a slight bias due to
rounding of the sampling interval. This may have increased the chance of non-sampling of the last 1-2 households in the
cluster household listing. The resulting bias is miniscule, especially when compared to the potential sources of non-
sampling errors which were minimized through quality control procedures during the field work. Once detected, very early
on in the fieldwork, the household selection procedure was adjusted to include the “decimal part” of the sampling interval
in the selection of further households. 2 Children age 15-17 years living without their mother and with no identified caretaker in the household were considered
emancipated and the questionnaire for children age 5-17 years was administered directly to them. This slightly reworded
questionnaire that only includes the Child’s Background, Child Labour and Child Functioning modules is not reproduced in
Appendix E.
Survey Methodology | Page 4
Household
Questionnaire
Questionnaire for
Individual Women / Men
Questionnaire for
Children Age 5-17 Years List of Household Members Woman’s Background[M] Child’s Background
Education Mass Media and ICT [M] Child Labour
Disability Marriage[M] Child Discipline
Household Characteristics Fertility[M]/Birth History Child Functioning
Social Transfers Desire for Last Birth Parental Involvement
Remittances and Cash Donations Maternal and Newborn Health Foundational Learning Skills
Household Energy Use Post-natal Health Checks
Water and Sanitation Contraception
Handwashing Unmet Need Questionnaire for
Children Under 5 Salt Iodisation Attitudes Toward Domestic Violence[M]
Victimisation[M] Under-Five’s Background
Water Quality Testing
Questionnaire
HIV/AIDS[M] Birth Registration
Maternal Mortality Early Childhood Development
Tobacco Use[M] Child Discipline
Life Satisfaction[M] Child Functioning
[M] The individual Questionnaire for Men Breastfeeding and Dietary Intake
only included those modules indicated. Immunisation
Vitamin A Supplementation
Care of Illness
Anthropometry
In addition to the administration of questionnaires, fieldwork teams tested the salt used for cooking in the households for iodine content, observed the place for handwashing, measured the weights and heights of children age under 5 years, and tested household and source water for E. coli levels. Details and findings of these observations and measurements are provided in the respective sections of the report. Further, the questionnaire for children age 5-17 years included a reading and mathematics assessment administered to children age 7-14 years.
The questionnaires were based on the MICS6 standard questionnaires.3 From the MICS6 model English
version, the questionnaires were customised and translated into Urdu and were pre-tested in Chakwal
and Chiniot districts during October 2017. Based on the results of the pre-test, modifications were
made to the wording and translation of the questionnaires. A copy of the MICS Punjab, 2017-18
questionnaires is provided in Appendix E.
ETHICAL PROTOCOL
The survey protocol was approved by Steering Committee in October, 2017. The protocol included a
Protection Protocol which outlines the potential risks during the life cycle of the survey and
management strategies to mitigate these.
Verbal consent was obtained for each respondent participating and, for children age 15-17 years
individually interviewed, adult consent was obtained in advance of the child’s assent. All respondents
were informed of the voluntary nature of participation and the confidentiality and anonymity of
information. Additionally, respondents were informed of their right to refuse answering all or
particular questions, as well as to stop the interview at any time.
3 The standard MICS6 questionnaires can be found at: "MICS6 TOOLS." Home - UNICEF MICS. Accessed August 23, 2018.
http://mics.unicef.org/tools#survey-design.
Survey Methodology | Page 5
DATA COLLECTION METHOD
MICS surveys utilise Computer-Assisted Personal Interviewing (CAPI). The data collection application
was based on the CSPro (Census and Survey Processing System) software, Version 6.3, including a
MICS dedicated data management platform. Procedures and standard programs4 developed under
the global MICS programme were adapted to the MICS Punjab, 2017-18 final questionnaires and used
throughout. The CAPI application was tested in Lahore district during December 2017. Based on the
results of the CAPI-test, modifications were made to the questionnaires and application.
TRAINING
Training for the fieldwork was conducted for 22 days in November-December, 2017 and for 15 days
in January 2018. Training included lectures on interviewing techniques and the contents of the
questionnaires, and mock interviews between trainees to gain practice in asking questions.
Participants first completed full training on paper questionnaires, followed by training on the CAPI
application. The trainings were conducted in two phases. The trainees spent two days in field practice
and one day on a full pilot survey in Multan & Faisalabad in first phase and Lahore & Rawalpindi in
second phase. The training agenda was based on the template MICS6 training agenda.5
Measurers received dedicated training on anthropometric measurements and water quality testing
for a total of 12 days, including two days in field practice and pilot survey.
Field Supervisors attended additional training on the duties of team supervision and responsibilities.
FIELDWORK
The data were collected by 45 teams; each was comprised of eight interviewers, one driver, two
measurers, an observer and a supervisor. Fieldwork began in December 2017 and concluded in March
2018.
Data was collected using tablet computers running the Windows 10 operating system, utilising a
Bluetooth application for field operations, enabling transfer of assignments and completed
questionnaires between supervisor and interviewer tablets.
FIELDWORK QUALITY CONTROL MEASURES
Team supervisors were responsible for the daily monitoring of fieldwork. Mandatory re-interviewing
was implemented on three households per cluster. Daily observations of interviewer skills and
performance was conducted.
4 The standard MICS6 data collection application can be found at: "MICS6 TOOLS." Home - UNICEF MICS. Accessed August
23, 2018. http://mics.unicef.org/tools#data-processing. 5 The template training agenda can be found at: "MICS6 TOOLS." Home - UNICEF MICS. Accessed August 23, 2018.
http://mics.unicef.org/tools#survey-design.
Survey Methodology | Page 6
During the fieldwork period, each team was visited multiple times by survey management team
members and field visits were arranged for UNICEF MICS Team members.
Throughout the fieldwork, field check tables (FCTs) were produced weekly for analysis and action with
field teams. The FCTs were customised versions of the standard tables produced by the MICS
Programme.6
DATA MANAGEMENT, EDITING AND ANALYSIS
Data were received at the Bureau of Statistics, Punjab via Internet File Streaming System (IFSS)
integrated into the management application on the supervisors’ tablets. Whenever logistically
possible, synchronisation was daily. The central office communicated application updates to field
teams through this system.
During data collection and following the completion of fieldwork, data were edited according to
editing process described in detail in the Guidelines for Secondary Editing, a customised version of the
standard MICS6 documentation.7
Data were analysed using the Statistical Package for Social Sciences (SPSS) software, Version 24 Model
syntax and tabulation plan developed by UNICEF were customised and used for this purpose.8
DATA SHARING
Unique identifiers such as location and names collected during interviews were removed from
datasets to ensure privacy. These anonymised data files are made available on www.bos.gop.pk and
on the MICS website9 and can be freely downloaded for legitimate research purposes. Users are
required to submit final research to entities listed in the included readme file, strictly for information
purposes.
6 The standard field check tables can be found at: "MICS6 TOOLS." Home - UNICEF MICS. Accessed August 23, 2018.
http://mics.unicef.org/tools#data-collection. 7 The standard guidelines can be found at: "MICS6 TOOLS." Home - UNICEF MICS. Accessed August 23, 2018.
http://mics.unicef.org/tools#data-processing. 8 The standard tabulation plan and syntax files can be found at: "MICS6 TOOLS." Home - UNICEF MICS. Accessed August 23,
2018. http://mics.unicef.org/tools#analysis 9 The survey datasets can be found at: "Surveys." Home - UNICEF MICS. Accessed August 24, 2018.
http://mics.unicef.org/surveys.
Indicators and Definition | Page 7
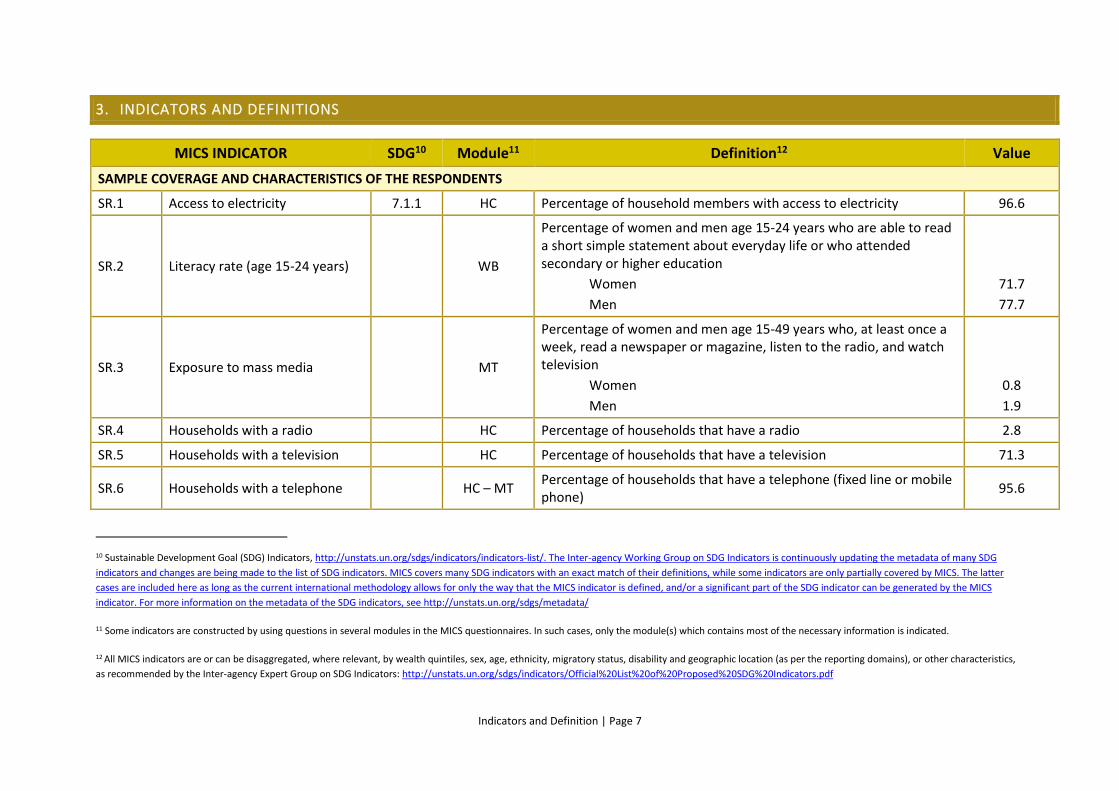
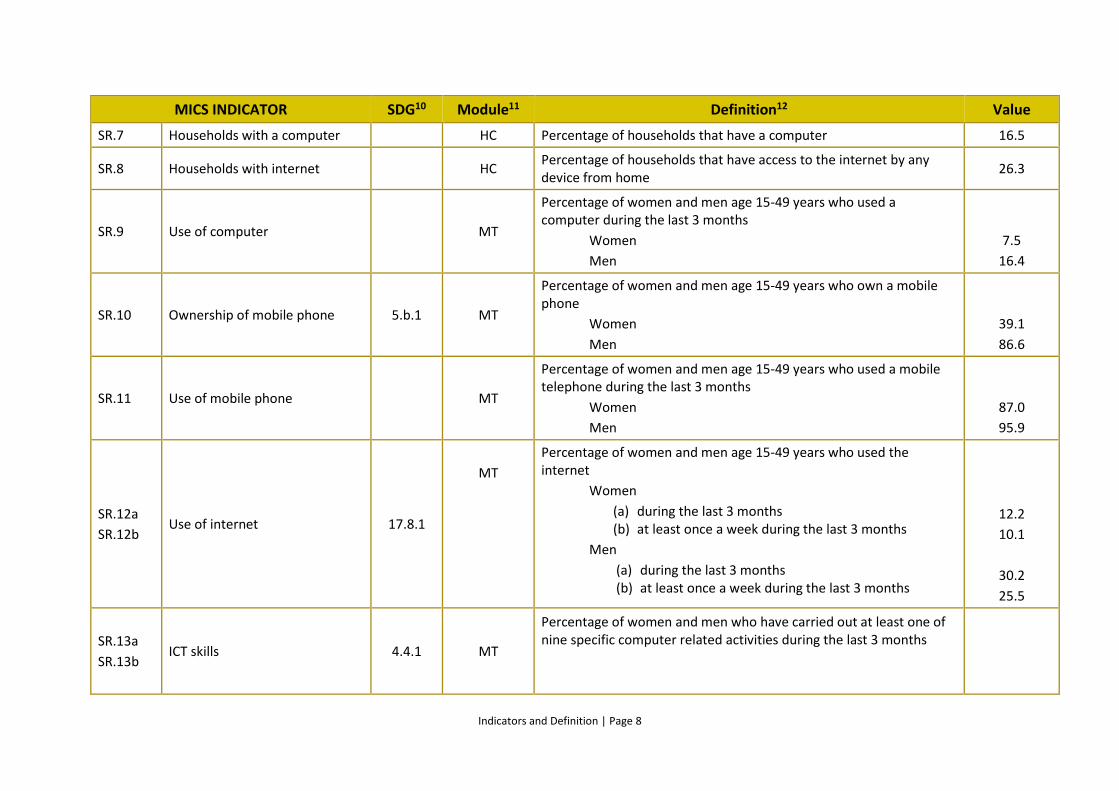
3. INDICATORS AND DEFINITIONS
MICS INDICATOR SDG10 Module11 Definition12 Value
SAMPLE COVERAGE AND CHARACTERISTICS OF THE RESPONDENTS
SR.1 Access to electricity 7.1.1 HC Percentage of household members with access to electricity 96.6
SR.2 Literacy rate (age 15-24 years) WB
Percentage of women and men age 15-24 years who are able to read a short simple statement about everyday life or who attended secondary or higher education
Women
Men
71.7
77.7
SR.3 Exposure to mass media MT
Percentage of women and men age 15-49 years who, at least once a week, read a newspaper or magazine, listen to the radio, and watch television
Women
Men
0.8
1.9
SR.4 Households with a radio HC Percentage of households that have a radio 2.8
SR.5 Households with a television HC Percentage of households that have a television 71.3
SR.6 Households with a telephone HC – MT Percentage of households that have a telephone (fixed line or mobile phone)
95.6
10 Sustainable Development Goal (SDG) Indicators, http://unstats.un.org/sdgs/indicators/indicators-list/. The Inter-agency Working Group on SDG Indicators is continuously updating the metadata of many SDG
indicators and changes are being made to the list of SDG indicators. MICS covers many SDG indicators with an exact match of their definitions, while some indicators are only partially covered by MICS. The latter
cases are included here as long as the current international methodology allows for only the way that the MICS indicator is defined, and/or a significant part of the SDG indicator can be generated by the MICS
indicator. For more information on the metadata of the SDG indicators, see http://unstats.un.org/sdgs/metadata/
11 Some indicators are constructed by using questions in several modules in the MICS questionnaires. In such cases, only the module(s) which contains most of the necessary information is indicated.
12 All MICS indicators are or can be disaggregated, where relevant, by wealth quintiles, sex, age, ethnicity, migratory status, disability and geographic location (as per the reporting domains), or other characteristics,
as recommended by the Inter-agency Expert Group on SDG Indicators: http://unstats.un.org/sdgs/indicators/Official%20List%20of%20Proposed%20SDG%20Indicators.pdf
Indicators and Definition | Page 8
MICS INDICATOR SDG10 Module11 Definition12 Value
SR.7 Households with a computer HC Percentage of households that have a computer 16.5
SR.8 Households with internet HC Percentage of households that have access to the internet by any device from home
26.3
SR.9 Use of computer MT
Percentage of women and men age 15-49 years who used a computer during the last 3 months
Women
Men
7.5
16.4
SR.10 Ownership of mobile phone 5.b.1 MT
Percentage of women and men age 15-49 years who own a mobile phone
Women
Men
39.1
86.6
SR.11 Use of mobile phone MT
Percentage of women and men age 15-49 years who used a mobile telephone during the last 3 months
Women
Men
87.0
95.9
SR.12a
SR.12b Use of internet 17.8.1
MT
Percentage of women and men age 15-49 years who used the internet
Women
(a) during the last 3 months (b) at least once a week during the last 3 months
Men
(a) during the last 3 months (b) at least once a week during the last 3 months
12.2
10.1
30.2
25.5
SR.13a
SR.13b ICT skills 4.4.1 MT
Percentage of women and men who have carried out at least one of nine specific computer related activities during the last 3 months
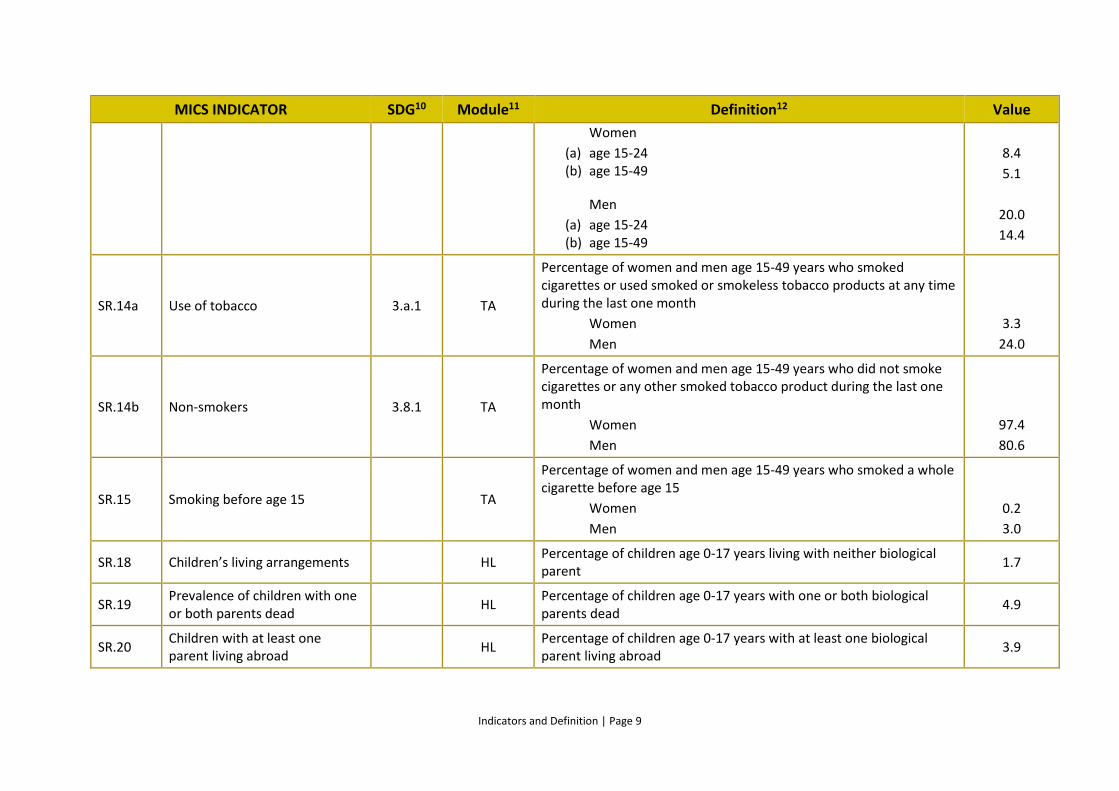
Indicators and Definition | Page 9
MICS INDICATOR SDG10 Module11 Definition12 Value
Women
(a) age 15-24 (b) age 15-49
Men
(a) age 15-24 (b) age 15-49
8.4
5.1
20.0
14.4
SR.14a Use of tobacco 3.a.1 TA
Percentage of women and men age 15-49 years who smoked cigarettes or used smoked or smokeless tobacco products at any time during the last one month
Women
Men
3.3
24.0
SR.14b Non-smokers 3.8.1 TA
Percentage of women and men age 15-49 years who did not smoke cigarettes or any other smoked tobacco product during the last one month
Women
Men
97.4
80.6
SR.15 Smoking before age 15 TA
Percentage of women and men age 15-49 years who smoked a whole cigarette before age 15
Women
Men
0.2
3.0
SR.18 Children’s living arrangements HL Percentage of children age 0-17 years living with neither biological parent
1.7
SR.19 Prevalence of children with one or both parents dead
HL Percentage of children age 0-17 years with one or both biological parents dead
4.9
SR.20 Children with at least one parent living abroad
HL Percentage of children age 0-17 years with at least one biological parent living abroad
3.9
Indicators and Definition | Page 10
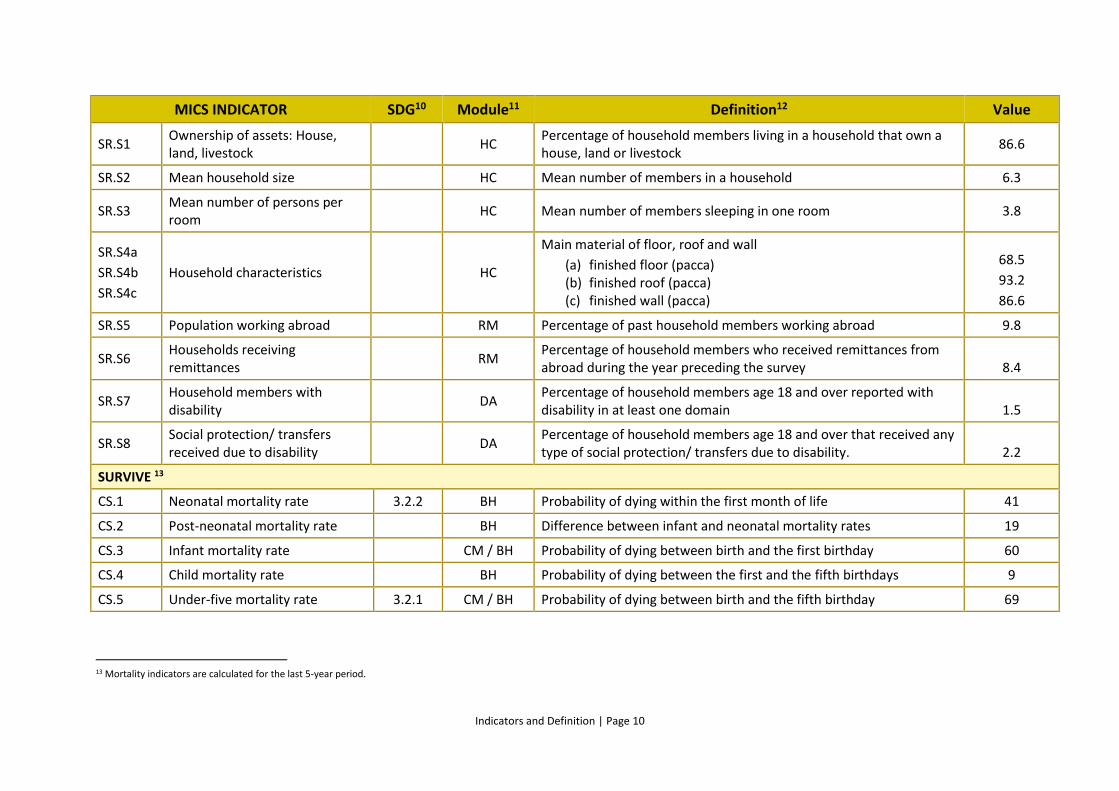
MICS INDICATOR SDG10 Module11 Definition12 Value
SR.S1 Ownership of assets: House, land, livestock
HC Percentage of household members living in a household that own a house, land or livestock
86.6
SR.S2 Mean household size HC Mean number of members in a household 6.3
SR.S3 Mean number of persons per room
HC Mean number of members sleeping in one room 3.8
SR.S4a
SR.S4b
SR.S4c
Household characteristics HC
Main material of floor, roof and wall
(a) finished floor (pacca) (b) finished roof (pacca) (c) finished wall (pacca)
68.5
93.2
86.6
SR.S5 Population working abroad RM Percentage of past household members working abroad 9.8
SR.S6 Households receiving remittances
RM Percentage of household members who received remittances from abroad during the year preceding the survey 8.4
SR.S7 Household members with disability
DA Percentage of household members age 18 and over reported with disability in at least one domain 1.5
SR.S8 Social protection/ transfers received due to disability
DA Percentage of household members age 18 and over that received any type of social protection/ transfers due to disability. 2.2
SURVIVE 13
CS.1 Neonatal mortality rate 3.2.2 BH Probability of dying within the first month of life 41
CS.2 Post-neonatal mortality rate BH Difference between infant and neonatal mortality rates 19
CS.3 Infant mortality rate CM / BH Probability of dying between birth and the first birthday 60
CS.4 Child mortality rate BH Probability of dying between the first and the fifth birthdays 9
CS.5 Under-five mortality rate 3.2.1 CM / BH Probability of dying between birth and the fifth birthday 69
13 Mortality indicators are calculated for the last 5-year period.
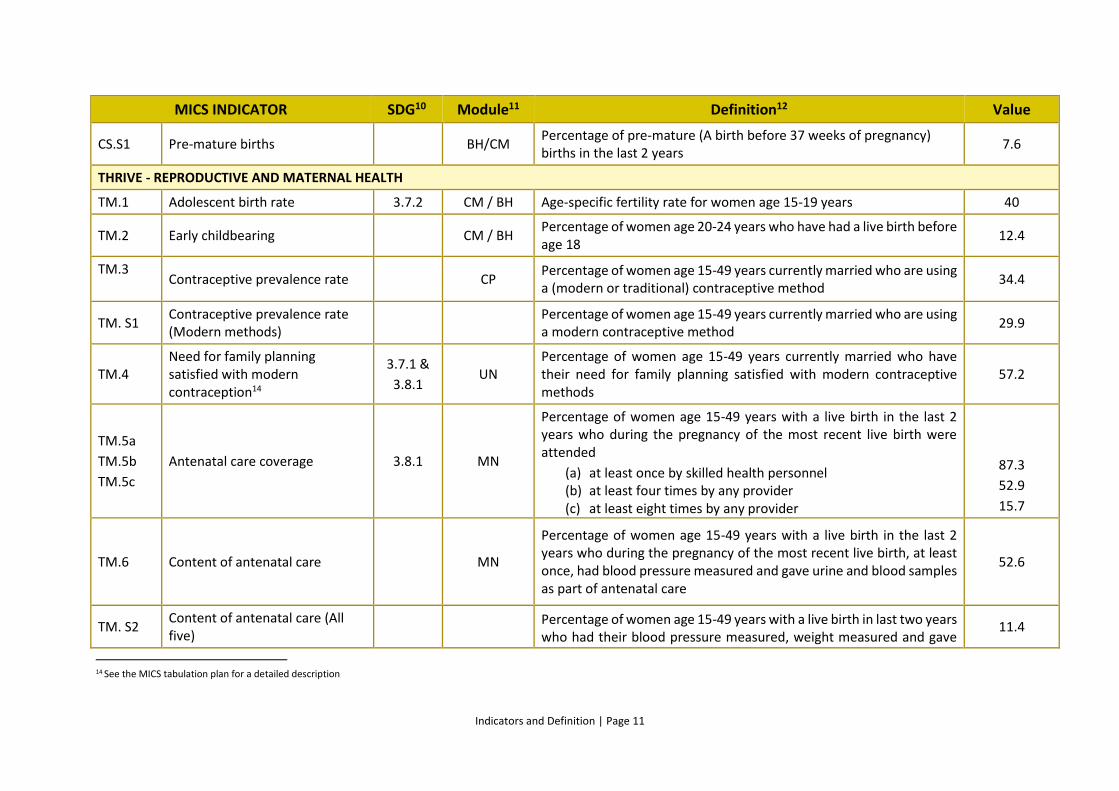
Indicators and Definition | Page 11
MICS INDICATOR SDG10 Module11 Definition12 Value
CS.S1 Pre-mature births BH/CM Percentage of pre-mature (A birth before 37 weeks of pregnancy) births in the last 2 years
7.6
THRIVE - REPRODUCTIVE AND MATERNAL HEALTH
TM.1 Adolescent birth rate 3.7.2 CM / BH Age-specific fertility rate for women age 15-19 years 40
TM.2 Early childbearing CM / BH Percentage of women age 20-24 years who have had a live birth before age 18
12.4
TM.3
Contraceptive prevalence rate CP
Percentage of women age 15-49 years currently married who are using a (modern or traditional) contraceptive method
34.4
TM. S1 Contraceptive prevalence rate (Modern methods)
Percentage of women age 15-49 years currently married who are using a modern contraceptive method
29.9
TM.4 Need for family planning satisfied with modern contraception14
3.7.1 &
3.8.1 UN
Percentage of women age 15-49 years currently married who have their need for family planning satisfied with modern contraceptive methods
57.2
TM.5a
TM.5b
TM.5c
Antenatal care coverage 3.8.1 MN
Percentage of women age 15-49 years with a live birth in the last 2 years who during the pregnancy of the most recent live birth were attended
(a) at least once by skilled health personnel (b) at least four times by any provider (c) at least eight times by any provider
87.3
52.9
15.7
TM.6 Content of antenatal care MN
Percentage of women age 15-49 years with a live birth in the last 2 years who during the pregnancy of the most recent live birth, at least once, had blood pressure measured and gave urine and blood samples as part of antenatal care
52.6
TM. S2 Content of antenatal care (All five)
Percentage of women age 15-49 years with a live birth in last two years who had their blood pressure measured, weight measured and gave
11.4
14 See the MICS tabulation plan for a detailed description
Indicators and Definition | Page 12
MICS INDICATOR SDG10 Module11 Definition12 Value
urine, blood samples and counselling on family planning methods & its importance during the last pregnancy that led to a live birth.
TM.7 Neonatal tetanus protection MN
Percentage of women age 15-49 years with a live birth in the last 2 years who during the pregnancy of the most recent live birth were given at least two doses of tetanus toxoid containing vaccine or had received the appropriate number of doses with appropriate interval15
prior to the most recent birth
75.9
TM.8 Institutional deliveries MN Percentage of women age 15-49 years with a live birth in the last 2 years whose most recent live birth was delivered in a health facility
73.3
TM.9 Skilled attendant at delivery 3.1.2 MN Percentage of women age 15-49 years with a live birth in the last 2 years whose most recent live birth was attended by skilled health personnel
76.4
TM.10 Caesarean section MN Percentage of women age 15-49 years with a live birth in the last 2 years whose most recent live birth was delivered by caesarean section
28.9
TM.11 Children weighed at birth MN Percentage of women age 15-49 years with a live birth in the last 2 years whose most recent live-born child was weighed at birth
18.6
TM.12 Post-partum stay in health facility
PN Percentage of women age 15-49 years with a live birth in the last 2 years and delivered the most recent live birth in a health facility who stayed in the health facility for 12 hours or more after the delivery
52.5
TM.13 Post-natal health check for the newborn
PN
Percentage of women age 15-49 years with a live birth in the last 2 years whose most recent live-born child received a health check while in facility or at home following delivery, or a post-natal care visit within 2 days after delivery
69.6
TM.14 Newborns dried MN Percentage of women age 15-49 years with a live birth in the last 2 years whose most recent live-born child was dried after birth
92.7
15 See Table TM.5.1 for a detailed description
Indicators and Definition | Page 13
MICS INDICATOR SDG10 Module11 Definition12 Value
TM.15 Skin-to-skin care MN Percentage of women age 15-49 years with a live birth in the last 2 years whose most recent live-born child was placed on the mother’s bare chest after birth
1.9
TM.16 Delayed bathing MN Percentage of women age 15-49 years with a live birth in the last 2 years whose most recent live-born child was first bathed more than 24 hours after birth
59.7
TM.17 Cord cut with clean instrument MN Percentage of women age 15-49 years with a live birth in the last 2 years and delivered the most recent live-born child outside a facility whose umbilical cord was cut with a new blade or boiled instrument
64.7
TM.18 Nothing harmful applied to cord MN Percentage of women age 15-49 years with a live birth in the last 2 years and delivered the most recent live-born child outside a facility who had nothing harmful applied to the cord
34.5
TM.19 Post-natal signal care functions16 PN Percentage of women age 15-49 years with a live birth in the last 2 years for whom the most recent live-born child received a least 2 post-natal signal care functions within 2 days of birth
43.8
TM.20 Post-natal health check for the mother
PN
Percentage of women age 15-49 years with a live birth in the last 2 years who received a health check while in facility or at home following delivery, or a post-natal care visit within 2 days after delivery of their most recent live birth
70.7
TM.21 Maternal mortality ratio 3.1.1 MM Deaths during pregnancy, childbirth, or within 42 days of termination excluding accidents and acts of violence, per 100,000 live births
180
TM.S3 Care provided by Lady Health Worker (LHW)
MN Percentage of ever married women aged 15–49 years who have given birth in the previous 2 years and were visited by a Lady Health Worker (LHW) in the last month
54.5
16 Signal functions are 1) Checking the cord, 2) Counseling on danger signs, 3) Assessing temperature,4) Observing/counseling on breastfeeding, and 5) Weighing the baby (where applicable).
Indicators and Definition | Page 14
MICS INDICATOR SDG10 Module11 Definition12 Value
TM.S4 Counselling on family planning methods
PN Percentage of ever-married women age 15-49 years with a live birth in the last 2 years who had counselled, told and guided for family planning methods before leaving health facility.
16.0
TM.S5 Knowledge about HIV prevention among young people
HA
Percentage of ever-married women and men age 15-24 years who correctly identify ways of preventing the sexual transmission of HIV17, and who reject major misconceptions about HIV transmission
Women
Men
2.4
5.3
TM.S6 Knowledge of mother-to-child transmission of HIV
HA
Percentage of ever-married women and men age 15-49 years who correctly identify all three means18 of mother-to-child transmission of HIV
Women
Men
15.2
23.5
TM.S7 Discriminatory attitudes towards people living with HIV
HA
Percentage of ever-married women and men age 15-49 who have heard of HIV reporting discriminatory attitudes19 toward people living with HIV
Women
Men
59.7
63.3
TM.S8 People who know where to be tested for HIV
HA
Percentage of ever-married women and men age 15-49 years who state knowledge of a place to be tested for HIV
Women
Men
6.2
17.4
17 Using condoms and limiting sex to one faithful, uninfected partner
18 Transmission during pregnancy, during delivery, and by breastfeeding
19 Women who answered no to either of the following two questions: 1) Would you buy fresh vegetables from a shopkeeper or vendor if you knew that this person had HIV? 2) Do you think children living with HIV
should be able to attend school with children who are HIV negative?
Indicators and Definition | Page 15
MICS INDICATOR SDG10 Module11 Definition12 Value
TM.S9 People who have been tested for HIV and know the results
HA
Percentage of ever-married women and men age 15-49 years who have been tested for HIV in the last 12 months and who know their results
Women
Men
0.8
1.8
TM.S10a
TM.S10b
HIV counselling during antenatal care
HA
Percentage of ever-married women age 15-49 years with a live birth in the last 2 years who received antenatal care at least once by skilled health personnel during the pregnancy of the most recent live birth and during an ANC visit received
(a) counselling on HIV (b) information or counselling on HIV after receiving the HIV test
results
1.8
1.1
TM.S11 HIV testing during antenatal care HA
Percentage of ever-married women age 15-49 years with a live birth in the last 2 years who received antenatal care at least once by skilled health personnel during the pregnancy of the most recent live birth and during an ANC visit were offered and accepted an HIV test and received test results 1.8
THRIVE - CHILD HEALTH, NUTRITION AND DEVELOPMENT
TC.1 Tuberculosis immunization coverage
IM Percentage of children age 12-23 months who received BCG containing vaccine at any time before the survey
94.8
TC.2 Polio immunization coverage IM
Percentage of children age 12-23 months who received at least one dose of Inactivated Polio Vaccine (IPV) and the third/fourth dose of either IPV or Oral Polio Vaccine (OPV) vaccines at any time before the survey
85.7
TC.3
TC.4
TC.5
Diphtheria, tetanus and pertussis (DTP), Hepatitis B and Haemophilus influenzae type B (Hib) (PENTA) immunization coverage
3.b.1 &
3.8.1 IM
Percentage of children age 12-23 months who received the third dose of PENTA vaccine (diphtheria, pertussis, tetanus, hepatitis B and haemophilus influenza B) at any time before the survey
87.3
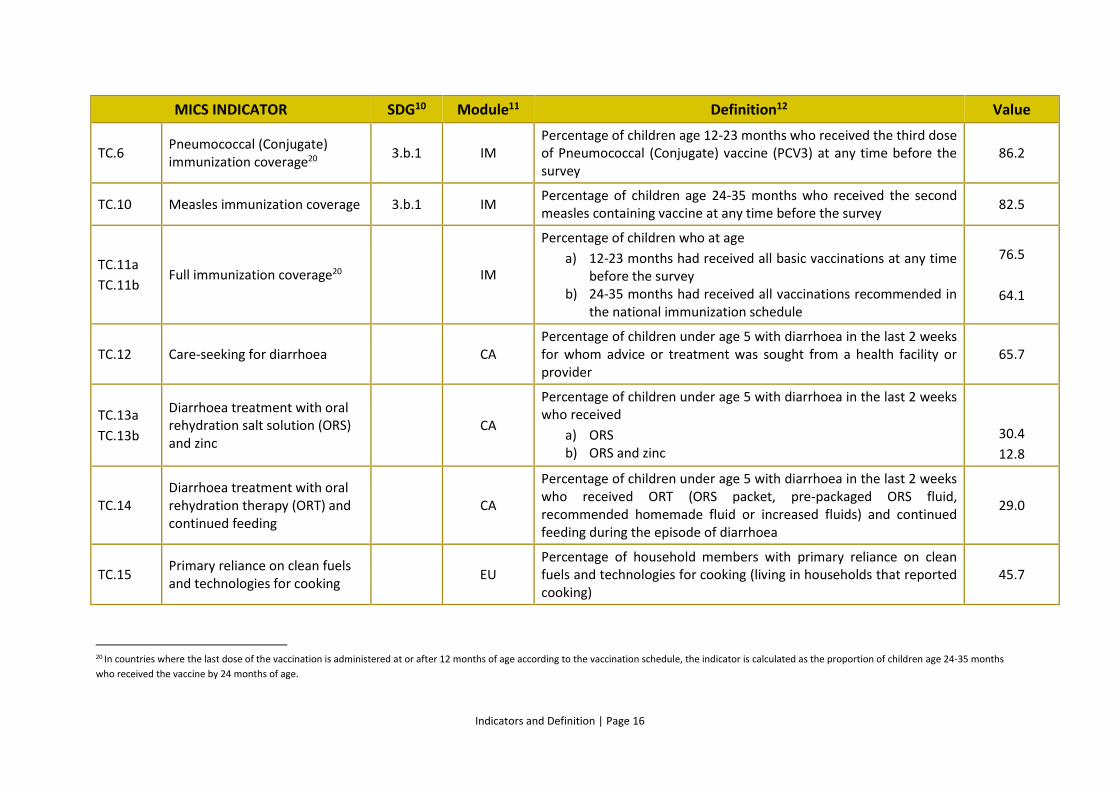
Indicators and Definition | Page 16
MICS INDICATOR SDG10 Module11 Definition12 Value
TC.6 Pneumococcal (Conjugate) immunization coverage20
3.b.1 IM Percentage of children age 12-23 months who received the third dose of Pneumococcal (Conjugate) vaccine (PCV3) at any time before the survey
86.2
TC.10 Measles immunization coverage 3.b.1 IM Percentage of children age 24-35 months who received the second measles containing vaccine at any time before the survey
82.5
TC.11a
TC.11b Full immunization coverage20 IM
Percentage of children who at age
a) 12-23 months had received all basic vaccinations at any time before the survey
b) 24-35 months had received all vaccinations recommended in the national immunization schedule
76.5
64.1
TC.12 Care-seeking for diarrhoea CA Percentage of children under age 5 with diarrhoea in the last 2 weeks for whom advice or treatment was sought from a health facility or provider
65.7
TC.13a
TC.13b
Diarrhoea treatment with oral rehydration salt solution (ORS) and zinc
CA
Percentage of children under age 5 with diarrhoea in the last 2 weeks who received
a) ORS b) ORS and zinc
30.4
12.8
TC.14 Diarrhoea treatment with oral rehydration therapy (ORT) and continued feeding
CA
Percentage of children under age 5 with diarrhoea in the last 2 weeks who received ORT (ORS packet, pre-packaged ORS fluid, recommended homemade fluid or increased fluids) and continued feeding during the episode of diarrhoea
29.0
TC.15 Primary reliance on clean fuels and technologies for cooking
EU Percentage of household members with primary reliance on clean fuels and technologies for cooking (living in households that reported cooking)
45.7
20 In countries where the last dose of the vaccination is administered at or after 12 months of age according to the vaccination schedule, the indicator is calculated as the proportion of children age 24-35 months
who received the vaccine by 24 months of age.
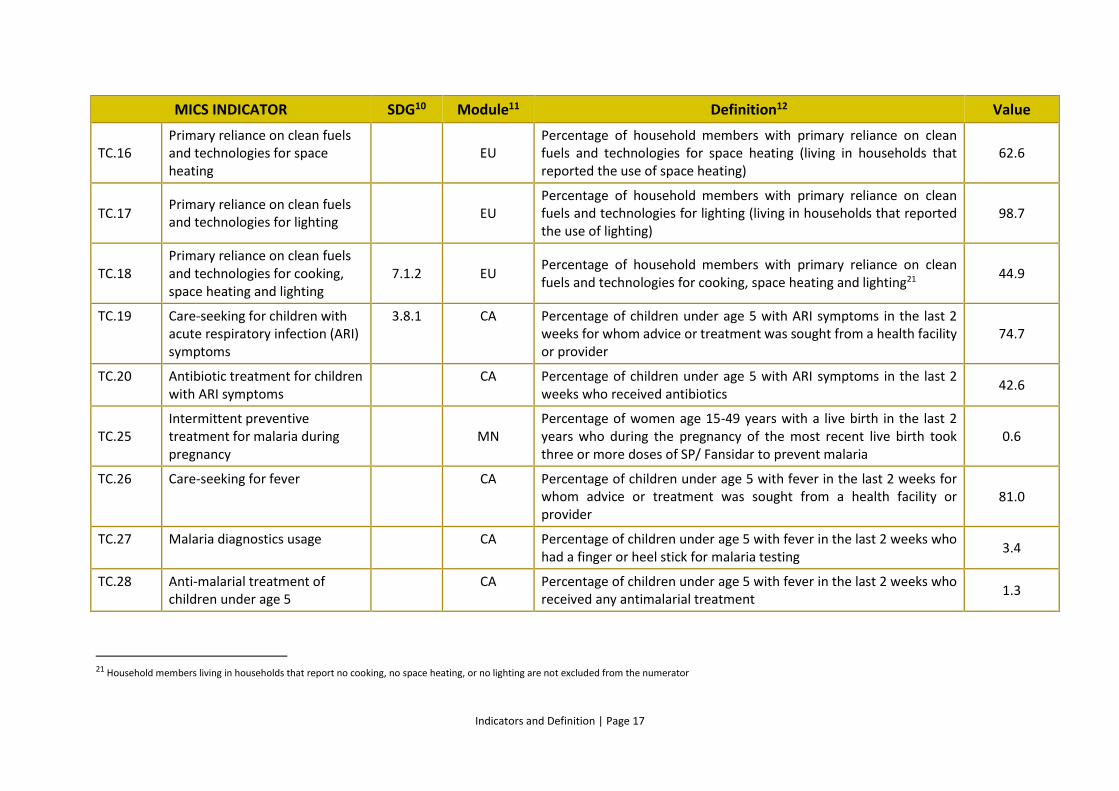
Indicators and Definition | Page 17
MICS INDICATOR SDG10 Module11 Definition12 Value
TC.16 Primary reliance on clean fuels and technologies for space heating
EU Percentage of household members with primary reliance on clean fuels and technologies for space heating (living in households that reported the use of space heating)
62.6
TC.17 Primary reliance on clean fuels and technologies for lighting
EU Percentage of household members with primary reliance on clean fuels and technologies for lighting (living in households that reported the use of lighting)
98.7
TC.18 Primary reliance on clean fuels and technologies for cooking, space heating and lighting
7.1.2 EU Percentage of household members with primary reliance on clean fuels and technologies for cooking, space heating and lighting21
44.9
TC.19 Care-seeking for children with acute respiratory infection (ARI) symptoms
3.8.1 CA Percentage of children under age 5 with ARI symptoms in the last 2 weeks for whom advice or treatment was sought from a health facility or provider
74.7
TC.20 Antibiotic treatment for children with ARI symptoms
CA Percentage of children under age 5 with ARI symptoms in the last 2 weeks who received antibiotics
42.6
TC.25 Intermittent preventive treatment for malaria during pregnancy
MN Percentage of women age 15-49 years with a live birth in the last 2 years who during the pregnancy of the most recent live birth took three or more doses of SP/ Fansidar to prevent malaria
0.6
TC.26 Care-seeking for fever CA Percentage of children under age 5 with fever in the last 2 weeks for whom advice or treatment was sought from a health facility or provider
81.0
TC.27 Malaria diagnostics usage CA Percentage of children under age 5 with fever in the last 2 weeks who had a finger or heel stick for malaria testing
3.4
TC.28 Anti-malarial treatment of children under age 5
CA Percentage of children under age 5 with fever in the last 2 weeks who received any antimalarial treatment
1.3
21 Household members living in households that report no cooking, no space heating, or no lighting are not excluded from the numerator
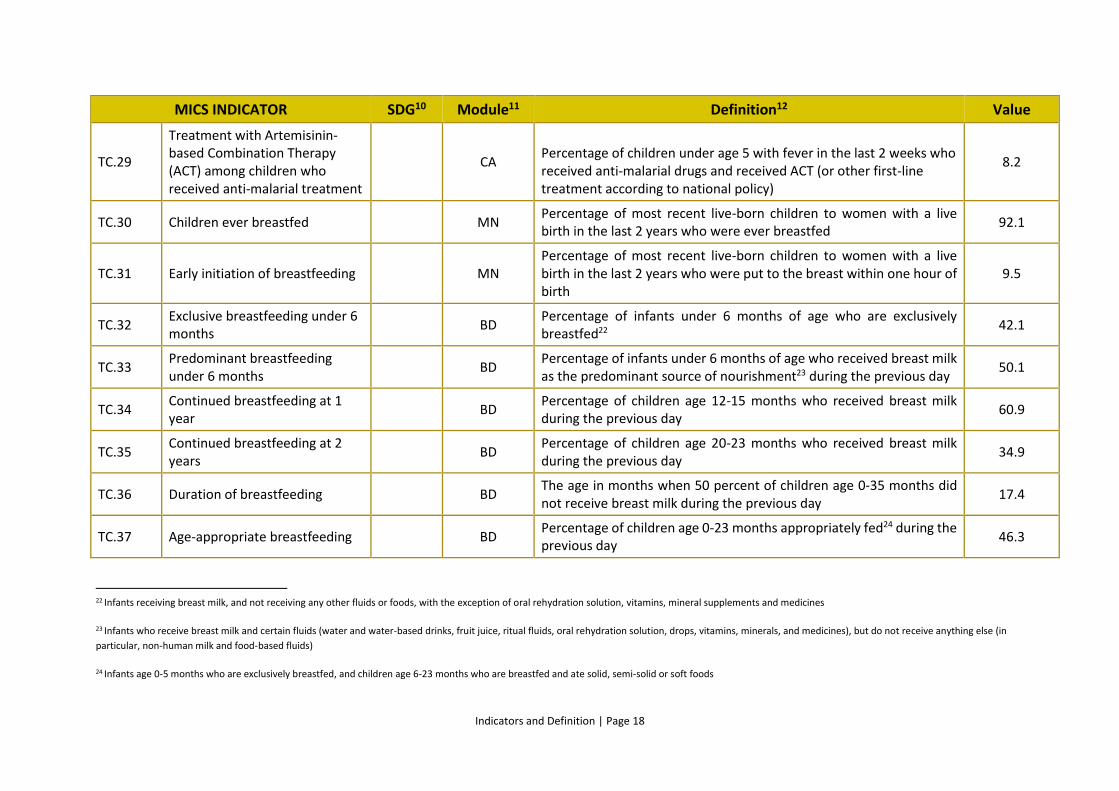
Indicators and Definition | Page 18
MICS INDICATOR SDG10 Module11 Definition12 Value
TC.29
Treatment with Artemisinin-based Combination Therapy (ACT) among children who received anti-malarial treatment
CA Percentage of children under age 5 with fever in the last 2 weeks who received anti-malarial drugs and received ACT (or other first-line treatment according to national policy)
8.2
TC.30 Children ever breastfed MN Percentage of most recent live-born children to women with a live birth in the last 2 years who were ever breastfed
92.1
TC.31 Early initiation of breastfeeding MN Percentage of most recent live-born children to women with a live birth in the last 2 years who were put to the breast within one hour of birth
9.5
TC.32 Exclusive breastfeeding under 6 months
BD Percentage of infants under 6 months of age who are exclusively breastfed22
42.1
TC.33 Predominant breastfeeding under 6 months
BD Percentage of infants under 6 months of age who received breast milk as the predominant source of nourishment23 during the previous day
50.1
TC.34 Continued breastfeeding at 1 year
BD Percentage of children age 12-15 months who received breast milk during the previous day
60.9
TC.35 Continued breastfeeding at 2 years
BD Percentage of children age 20-23 months who received breast milk during the previous day
34.9
TC.36 Duration of breastfeeding BD The age in months when 50 percent of children age 0-35 months did not receive breast milk during the previous day
17.4
TC.37 Age-appropriate breastfeeding BD Percentage of children age 0-23 months appropriately fed24 during the previous day
46.3
22 Infants receiving breast milk, and not receiving any other fluids or foods, with the exception of oral rehydration solution, vitamins, mineral supplements and medicines
23 Infants who receive breast milk and certain fluids (water and water-based drinks, fruit juice, ritual fluids, oral rehydration solution, drops, vitamins, minerals, and medicines), but do not receive anything else (in
particular, non-human milk and food-based fluids)
24 Infants age 0-5 months who are exclusively breastfed, and children age 6-23 months who are breastfed and ate solid, semi-solid or soft foods
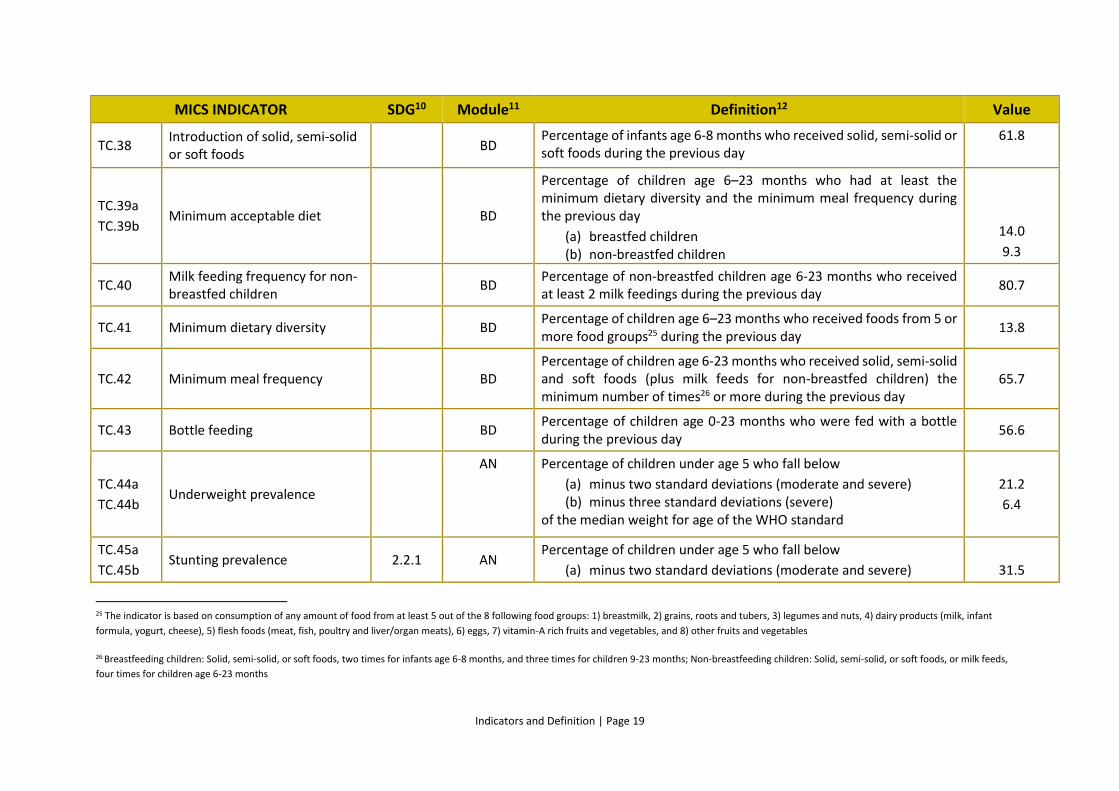
Indicators and Definition | Page 19
MICS INDICATOR SDG10 Module11 Definition12 Value
TC.38 Introduction of solid, semi-solid or soft foods
BD Percentage of infants age 6-8 months who received solid, semi-solid or soft foods during the previous day
61.8
TC.39a
TC.39b Minimum acceptable diet BD
Percentage of children age 6–23 months who had at least the minimum dietary diversity and the minimum meal frequency during the previous day
(a) breastfed children (b) non-breastfed children
14.0
9.3
TC.40 Milk feeding frequency for non-breastfed children
BD Percentage of non-breastfed children age 6-23 months who received at least 2 milk feedings during the previous day
80.7
TC.41 Minimum dietary diversity BD Percentage of children age 6–23 months who received foods from 5 or more food groups25 during the previous day
13.8
TC.42 Minimum meal frequency BD Percentage of children age 6-23 months who received solid, semi-solid and soft foods (plus milk feeds for non-breastfed children) the minimum number of times26 or more during the previous day
65.7
TC.43 Bottle feeding BD Percentage of children age 0-23 months who were fed with a bottle during the previous day
56.6
TC.44a
TC.44b Underweight prevalence
AN
Percentage of children under age 5 who fall below
(a) minus two standard deviations (moderate and severe) (b) minus three standard deviations (severe)
of the median weight for age of the WHO standard
21.2
6.4
TC.45a
TC.45b Stunting prevalence 2.2.1 AN
Percentage of children under age 5 who fall below
(a) minus two standard deviations (moderate and severe)
31.5
25 The indicator is based on consumption of any amount of food from at least 5 out of the 8 following food groups: 1) breastmilk, 2) grains, roots and tubers, 3) legumes and nuts, 4) dairy products (milk, infant
formula, yogurt, cheese), 5) flesh foods (meat, fish, poultry and liver/organ meats), 6) eggs, 7) vitamin-A rich fruits and vegetables, and 8) other fruits and vegetables
26 Breastfeeding children: Solid, semi-solid, or soft foods, two times for infants age 6-8 months, and three times for children 9-23 months; Non-breastfeeding children: Solid, semi-solid, or soft foods, or milk feeds,
four times for children age 6-23 months
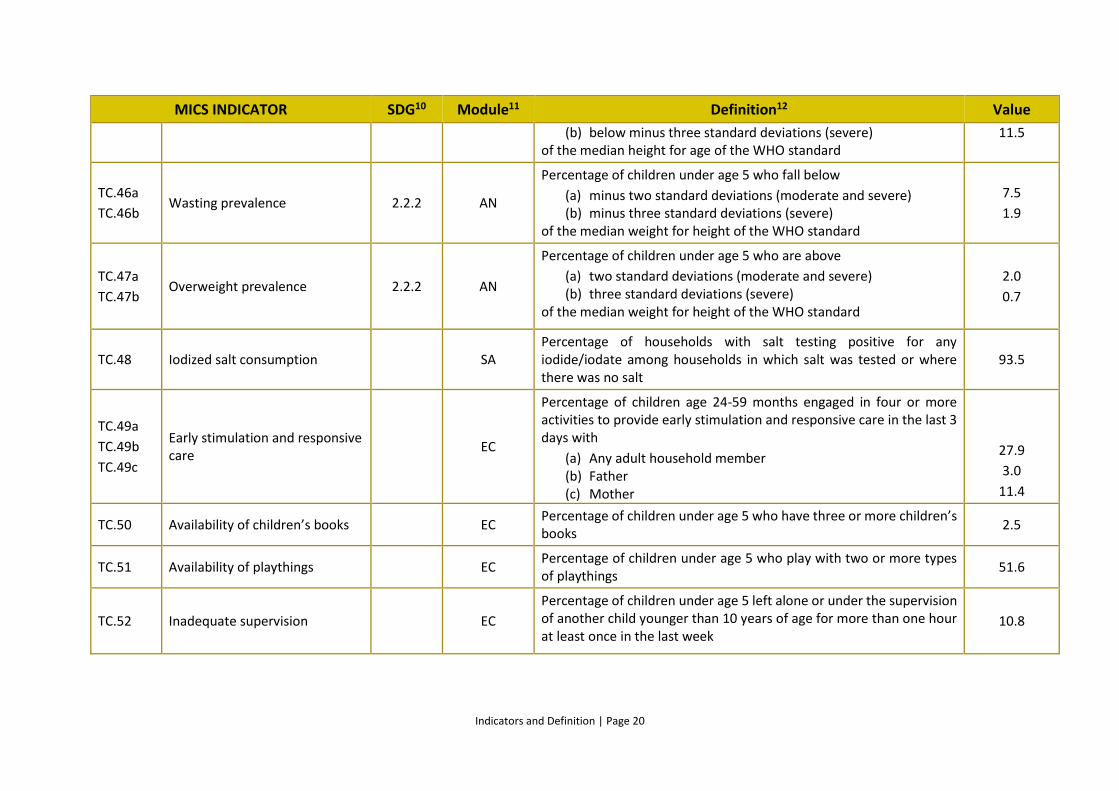
Indicators and Definition | Page 20
MICS INDICATOR SDG10 Module11 Definition12 Value
(b) below minus three standard deviations (severe) of the median height for age of the WHO standard
11.5
TC.46a
TC.46b Wasting prevalence 2.2.2 AN
Percentage of children under age 5 who fall below
(a) minus two standard deviations (moderate and severe) (b) minus three standard deviations (severe)
of the median weight for height of the WHO standard
7.5
1.9
TC.47a
TC.47b Overweight prevalence 2.2.2 AN
Percentage of children under age 5 who are above
(a) two standard deviations (moderate and severe) (b) three standard deviations (severe)
of the median weight for height of the WHO standard
2.0
0.7
TC.48 Iodized salt consumption SA Percentage of households with salt testing positive for any iodide/iodate among households in which salt was tested or where there was no salt
93.5
TC.49a
TC.49b
TC.49c
Early stimulation and responsive care
EC
Percentage of children age 24-59 months engaged in four or more activities to provide early stimulation and responsive care in the last 3 days with
(a) Any adult household member (b) Father (c) Mother
27.9
3.0
11.4
TC.50 Availability of children’s books EC Percentage of children under age 5 who have three or more children’s books
2.5
TC.51 Availability of playthings EC Percentage of children under age 5 who play with two or more types of playthings
51.6
TC.52 Inadequate supervision
EC
Percentage of children under age 5 left alone or under the supervision of another child younger than 10 years of age for more than one hour at least once in the last week
10.8
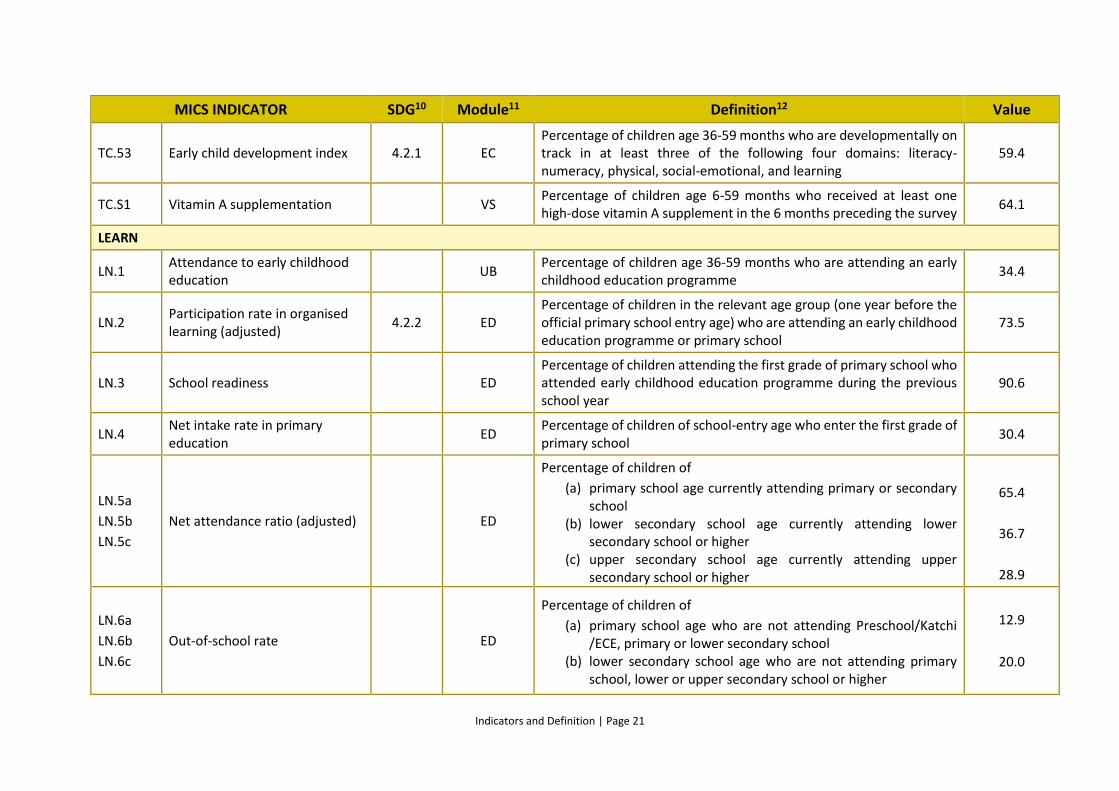
Indicators and Definition | Page 21
MICS INDICATOR SDG10 Module11 Definition12 Value
TC.53 Early child development index 4.2.1 EC Percentage of children age 36-59 months who are developmentally on track in at least three of the following four domains: literacy-numeracy, physical, social-emotional, and learning
59.4
TC.S1 Vitamin A supplementation VS Percentage of children age 6-59 months who received at least one high-dose vitamin A supplement in the 6 months preceding the survey
64.1
LEARN
LN.1 Attendance to early childhood education
UB Percentage of children age 36-59 months who are attending an early childhood education programme
34.4
LN.2 Participation rate in organised learning (adjusted)
4.2.2 ED Percentage of children in the relevant age group (one year before the official primary school entry age) who are attending an early childhood education programme or primary school
73.5
LN.3 School readiness ED Percentage of children attending the first grade of primary school who attended early childhood education programme during the previous school year
90.6
LN.4 Net intake rate in primary education
ED Percentage of children of school-entry age who enter the first grade of primary school
30.4
LN.5a
LN.5b
LN.5c
Net attendance ratio (adjusted) ED
Percentage of children of
(a) primary school age currently attending primary or secondary school
(b) lower secondary school age currently attending lower secondary school or higher
(c) upper secondary school age currently attending upper secondary school or higher
65.4
36.7
28.9
LN.6a
LN.6b
LN.6c
Out-of-school rate ED
Percentage of children of
(a) primary school age who are not attending Preschool/Katchi /ECE, primary or lower secondary school
(b) lower secondary school age who are not attending primary school, lower or upper secondary school or higher
12.9
20.0
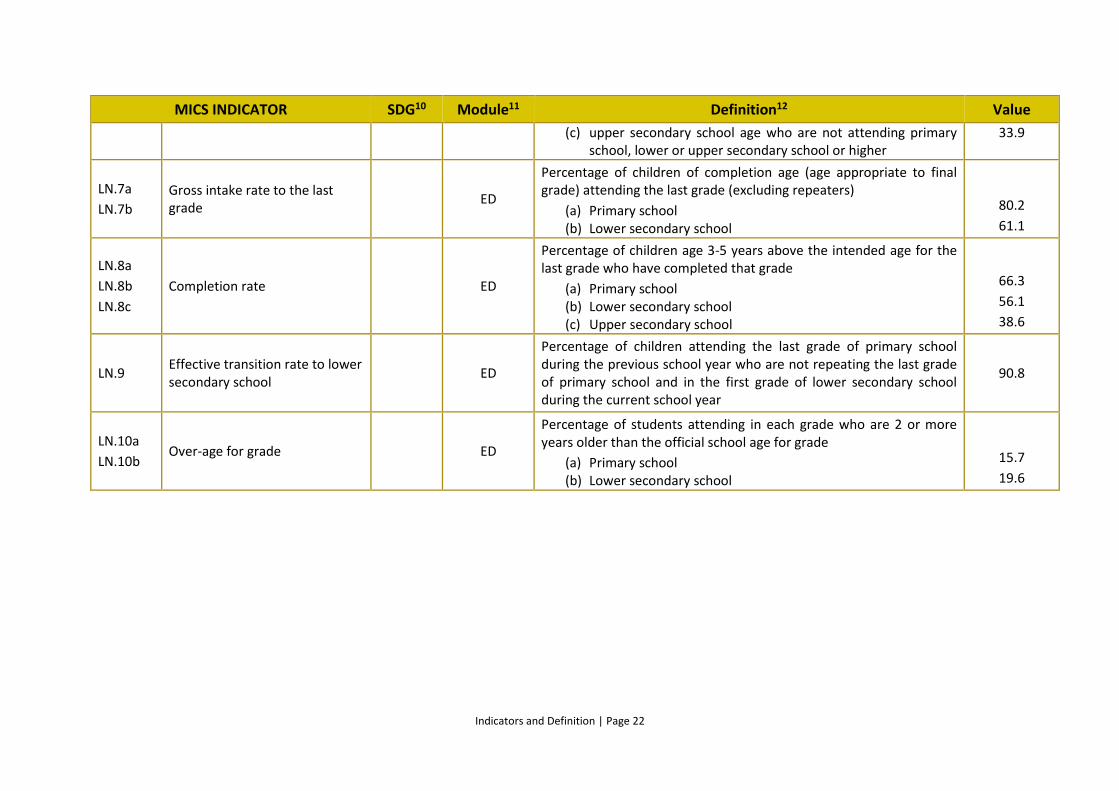
Indicators and Definition | Page 22
MICS INDICATOR SDG10 Module11 Definition12 Value
(c) upper secondary school age who are not attending primary school, lower or upper secondary school or higher
33.9
LN.7a
LN.7b
Gross intake rate to the last grade
ED
Percentage of children of completion age (age appropriate to final grade) attending the last grade (excluding repeaters)
(a) Primary school (b) Lower secondary school
80.2
61.1
LN.8a
LN.8b
LN.8c
Completion rate ED
Percentage of children age 3-5 years above the intended age for the last grade who have completed that grade
(a) Primary school (b) Lower secondary school (c) Upper secondary school
66.3
56.1
38.6
LN.9 Effective transition rate to lower secondary school
ED
Percentage of children attending the last grade of primary school during the previous school year who are not repeating the last grade of primary school and in the first grade of lower secondary school during the current school year
90.8
LN.10a
LN.10b Over-age for grade ED
Percentage of students attending in each grade who are 2 or more years older than the official school age for grade
(a) Primary school (b) Lower secondary school
15.7
19.6
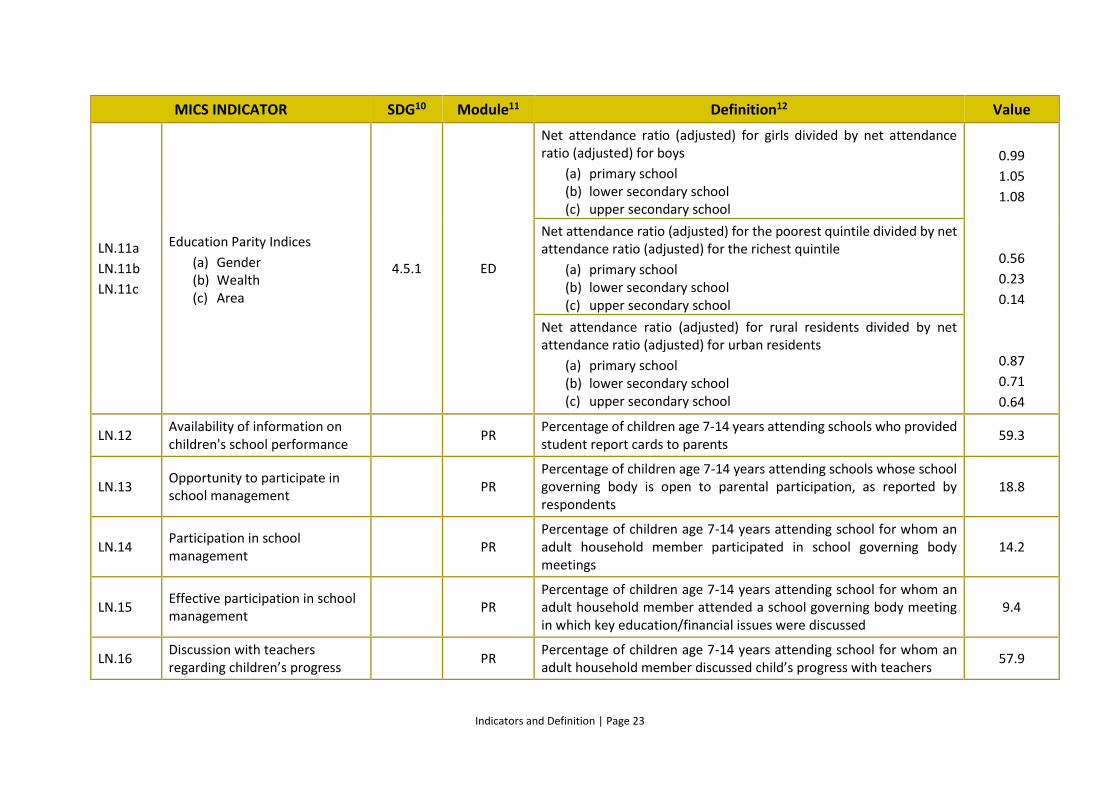
Indicators and Definition | Page 23
MICS INDICATOR SDG10 Module11 Definition12 Value
LN.11a
LN.11b
LN.11c
Education Parity Indices
(a) Gender (b) Wealth (c) Area
4.5.1 ED
Net attendance ratio (adjusted) for girls divided by net attendance ratio (adjusted) for boys
(a) primary school (b) lower secondary school (c) upper secondary school
0.99
1.05
1.08
0.56
0.23
0.14
0.87
0.71
0.64
Net attendance ratio (adjusted) for the poorest quintile divided by net attendance ratio (adjusted) for the richest quintile
(a) primary school (b) lower secondary school (c) upper secondary school
Net attendance ratio (adjusted) for rural residents divided by net attendance ratio (adjusted) for urban residents
(a) primary school (b) lower secondary school (c) upper secondary school
LN.12 Availability of information on children's school performance
PR Percentage of children age 7-14 years attending schools who provided student report cards to parents
59.3
LN.13 Opportunity to participate in school management
PR Percentage of children age 7-14 years attending schools whose school governing body is open to parental participation, as reported by respondents
18.8
LN.14 Participation in school management
PR Percentage of children age 7-14 years attending school for whom an adult household member participated in school governing body meetings
14.2
LN.15 Effective participation in school management
PR Percentage of children age 7-14 years attending school for whom an adult household member attended a school governing body meeting in which key education/financial issues were discussed
9.4
LN.16 Discussion with teachers regarding children’s progress
PR Percentage of children age 7-14 years attending school for whom an adult household member discussed child’s progress with teachers
57.9
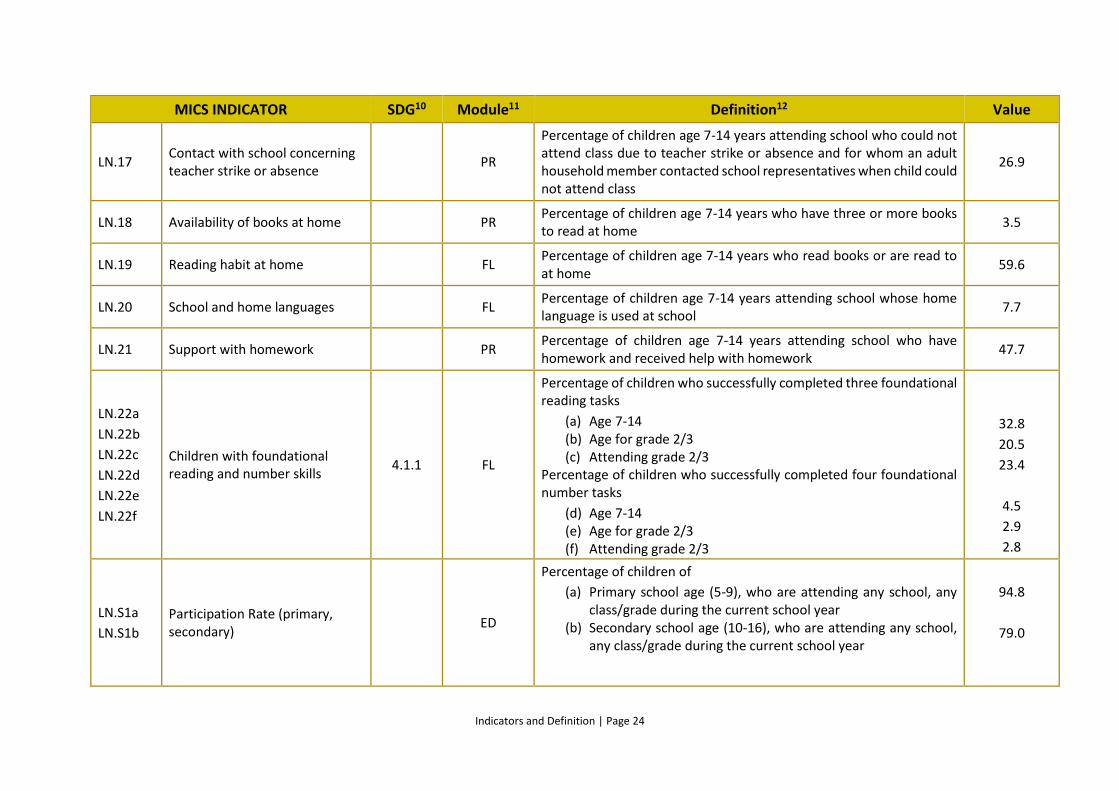
Indicators and Definition | Page 24
MICS INDICATOR SDG10 Module11 Definition12 Value
LN.17 Contact with school concerning teacher strike or absence
PR
Percentage of children age 7-14 years attending school who could not attend class due to teacher strike or absence and for whom an adult household member contacted school representatives when child could not attend class
26.9
LN.18 Availability of books at home PR Percentage of children age 7-14 years who have three or more books to read at home
3.5
LN.19 Reading habit at home FL Percentage of children age 7-14 years who read books or are read to at home
59.6
LN.20 School and home languages FL Percentage of children age 7-14 years attending school whose home language is used at school
7.7
LN.21 Support with homework PR Percentage of children age 7-14 years attending school who have homework and received help with homework
47.7
LN.22a
LN.22b
LN.22c
LN.22d
LN.22e
LN.22f
Children with foundational reading and number skills
4.1.1 FL
Percentage of children who successfully completed three foundational reading tasks
(a) Age 7-14 (b) Age for grade 2/3 (c) Attending grade 2/3
Percentage of children who successfully completed four foundational number tasks
(d) Age 7-14 (e) Age for grade 2/3 (f) Attending grade 2/3
32.8
20.5
23.4
4.5
2.9
2.8
LN.S1a
LN.S1b
Participation Rate (primary, secondary)
ED
Percentage of children of
(a) Primary school age (5-9), who are attending any school, any class/grade during the current school year
(b) Secondary school age (10-16), who are attending any school, any class/grade during the current school year
94.8
79.0
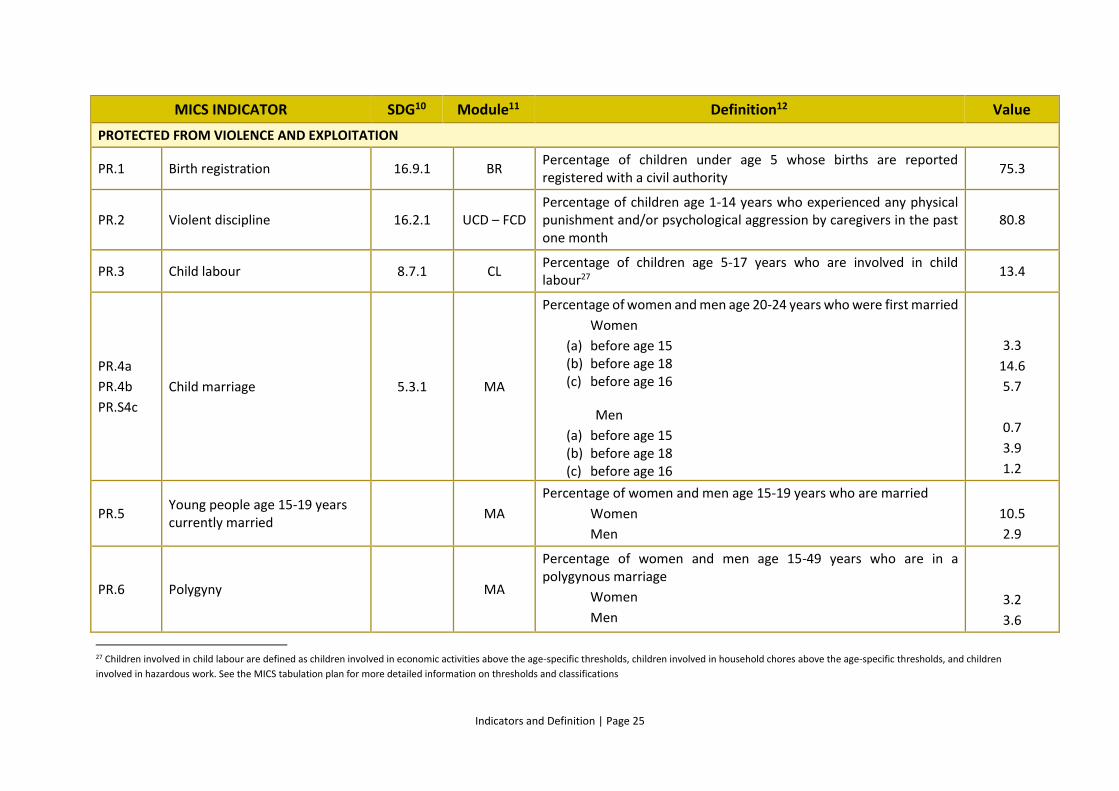
Indicators and Definition | Page 25
MICS INDICATOR SDG10 Module11 Definition12 Value
PROTECTED FROM VIOLENCE AND EXPLOITATION
PR.1 Birth registration 16.9.1 BR Percentage of children under age 5 whose births are reported registered with a civil authority
75.3
PR.2 Violent discipline 16.2.1 UCD – FCD Percentage of children age 1-14 years who experienced any physical punishment and/or psychological aggression by caregivers in the past one month
80.8
PR.3 Child labour 8.7.1 CL Percentage of children age 5-17 years who are involved in child labour27
13.4
PR.4a
PR.4b
PR.S4c
Child marriage 5.3.1 MA
Percentage of women and men age 20-24 years who were first married
Women
(a) before age 15 (b) before age 18 (c) before age 16
Men
(a) before age 15 (b) before age 18 (c) before age 16
3.3
14.6
5.7
0.7
3.9
1.2
PR.5 Young people age 15-19 years currently married
MA
Percentage of women and men age 15-19 years who are married
Women
Men
10.5
2.9
PR.6 Polygyny MA
Percentage of women and men age 15-49 years who are in a polygynous marriage
Women
Men
3.2
3.6
27 Children involved in child labour are defined as children involved in economic activities above the age-specific thresholds, children involved in household chores above the age-specific thresholds, and children
involved in hazardous work. See the MICS tabulation plan for more detailed information on thresholds and classifications
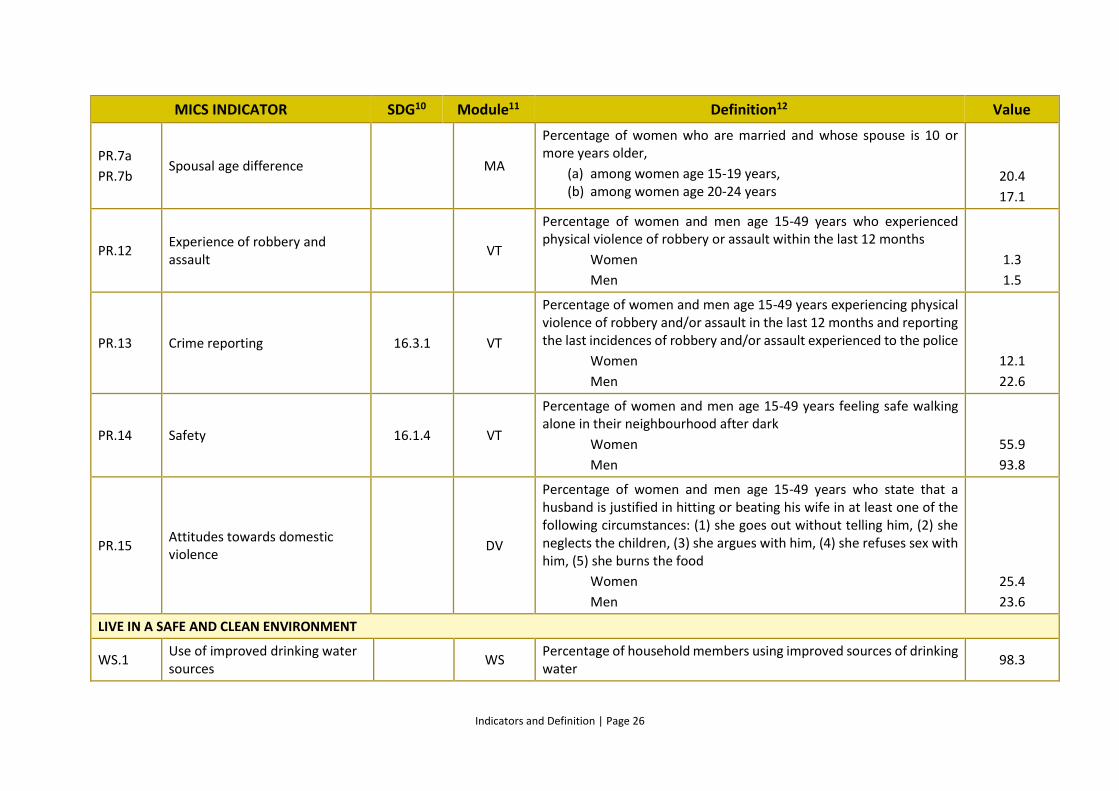
Indicators and Definition | Page 26
MICS INDICATOR SDG10 Module11 Definition12 Value
PR.7a
PR.7b Spousal age difference MA
Percentage of women who are married and whose spouse is 10 or more years older,
(a) among women age 15-19 years, (b) among women age 20-24 years
20.4
17.1
PR.12 Experience of robbery and assault
VT
Percentage of women and men age 15-49 years who experienced physical violence of robbery or assault within the last 12 months
Women
Men
1.3
1.5
PR.13 Crime reporting 16.3.1 VT
Percentage of women and men age 15-49 years experiencing physical violence of robbery and/or assault in the last 12 months and reporting the last incidences of robbery and/or assault experienced to the police
Women
Men
12.1
22.6
PR.14 Safety 16.1.4 VT
Percentage of women and men age 15-49 years feeling safe walking alone in their neighbourhood after dark
Women
Men
55.9
93.8
PR.15 Attitudes towards domestic violence
DV
Percentage of women and men age 15-49 years who state that a husband is justified in hitting or beating his wife in at least one of the following circumstances: (1) she goes out without telling him, (2) she neglects the children, (3) she argues with him, (4) she refuses sex with him, (5) she burns the food
Women
Men
25.4
23.6
LIVE IN A SAFE AND CLEAN ENVIRONMENT
WS.1 Use of improved drinking water sources
WS Percentage of household members using improved sources of drinking water
98.3
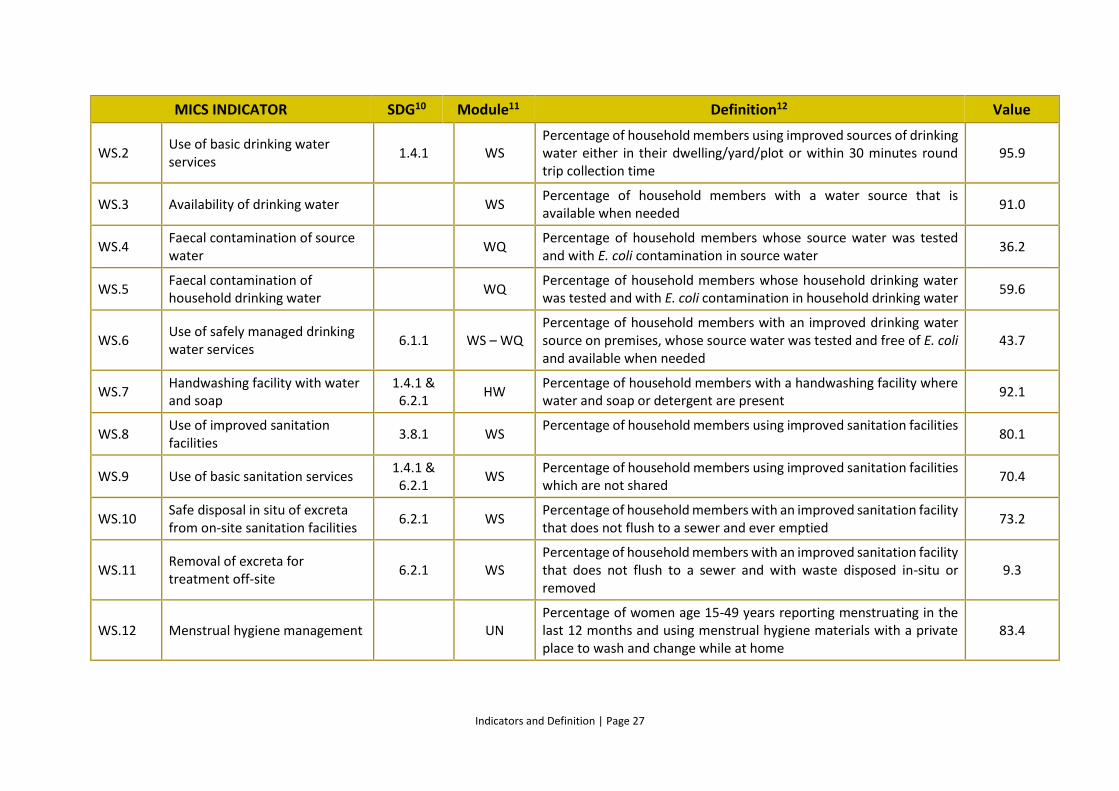
Indicators and Definition | Page 27
MICS INDICATOR SDG10 Module11 Definition12 Value
WS.2 Use of basic drinking water services
1.4.1 WS Percentage of household members using improved sources of drinking water either in their dwelling/yard/plot or within 30 minutes round trip collection time
95.9
WS.3 Availability of drinking water WS Percentage of household members with a water source that is available when needed
91.0
WS.4 Faecal contamination of source water
WQ Percentage of household members whose source water was tested and with E. coli contamination in source water
36.2
WS.5 Faecal contamination of household drinking water
WQ Percentage of household members whose household drinking water was tested and with E. coli contamination in household drinking water
59.6
WS.6 Use of safely managed drinking water services
6.1.1 WS – WQ Percentage of household members with an improved drinking water source on premises, whose source water was tested and free of E. coli and available when needed
43.7
WS.7 Handwashing facility with water and soap
1.4.1 & 6.2.1
HW Percentage of household members with a handwashing facility where water and soap or detergent are present
92.1
WS.8 Use of improved sanitation facilities
3.8.1 WS Percentage of household members using improved sanitation facilities
80.1
WS.9 Use of basic sanitation services 1.4.1 &
6.2.1 WS
Percentage of household members using improved sanitation facilities which are not shared
70.4
WS.10 Safe disposal in situ of excreta from on-site sanitation facilities
6.2.1 WS Percentage of household members with an improved sanitation facility that does not flush to a sewer and ever emptied
73.2
WS.11 Removal of excreta for treatment off-site
6.2.1 WS Percentage of household members with an improved sanitation facility that does not flush to a sewer and with waste disposed in-situ or removed
9.3
WS.12 Menstrual hygiene management
UN Percentage of women age 15-49 years reporting menstruating in the last 12 months and using menstrual hygiene materials with a private place to wash and change while at home
83.4
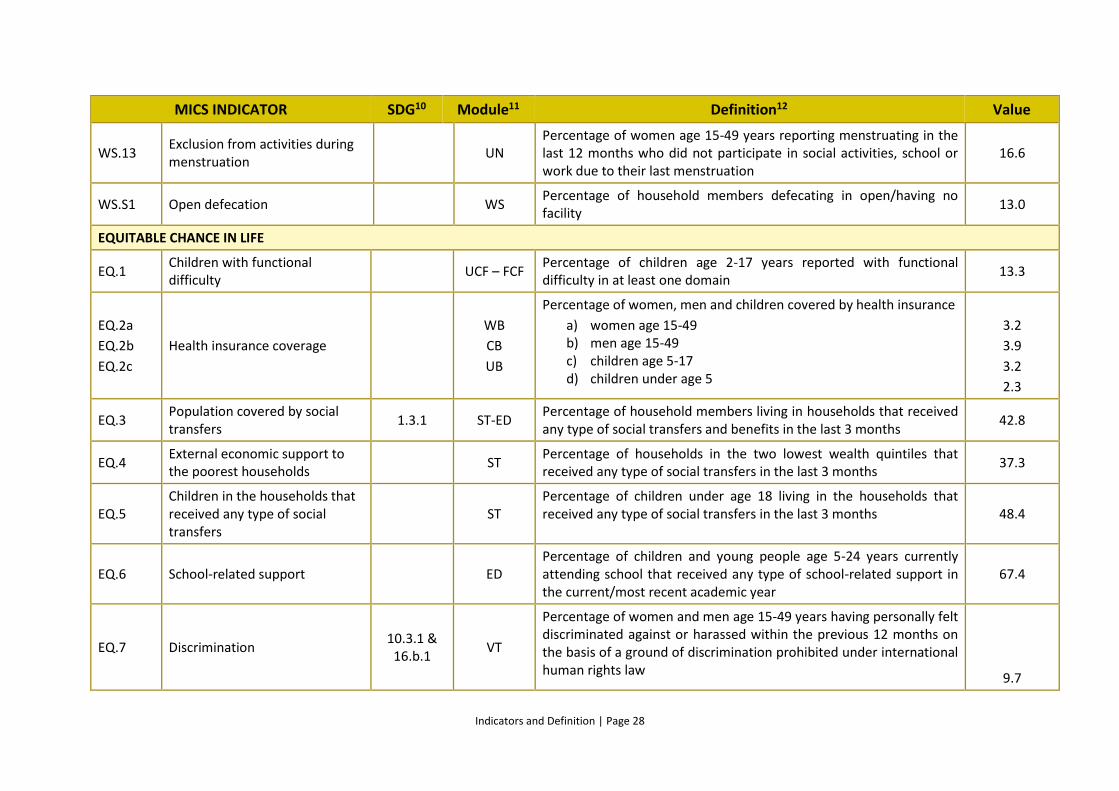
Indicators and Definition | Page 28
MICS INDICATOR SDG10 Module11 Definition12 Value
WS.13 Exclusion from activities during menstruation
UN
Percentage of women age 15-49 years reporting menstruating in the last 12 months who did not participate in social activities, school or work due to their last menstruation
16.6
WS.S1 Open defecation
WS Percentage of household members defecating in open/having no facility
13.0
EQUITABLE CHANCE IN LIFE
EQ.1 Children with functional difficulty
UCF – FCF Percentage of children age 2-17 years reported with functional difficulty in at least one domain
13.3
EQ.2a
EQ.2b
EQ.2c
Health insurance coverage
WB
CB
UB
Percentage of women, men and children covered by health insurance
a) women age 15-49 b) men age 15-49 c) children age 5-17 d) children under age 5
3.2
3.9
3.2
2.3
EQ.3 Population covered by social transfers
1.3.1 ST-ED Percentage of household members living in households that received any type of social transfers and benefits in the last 3 months
42.8
EQ.4 External economic support to the poorest households
ST Percentage of households in the two lowest wealth quintiles that received any type of social transfers in the last 3 months
37.3
EQ.5 Children in the households that received any type of social transfers
ST Percentage of children under age 18 living in the households that received any type of social transfers in the last 3 months 48.4
EQ.6 School-related support ED Percentage of children and young people age 5-24 years currently attending school that received any type of school-related support in the current/most recent academic year
67.4
EQ.7 Discrimination 10.3.1 & 16.b.1
VT
Percentage of women and men age 15-49 years having personally felt discriminated against or harassed within the previous 12 months on the basis of a ground of discrimination prohibited under international human rights law
9.7
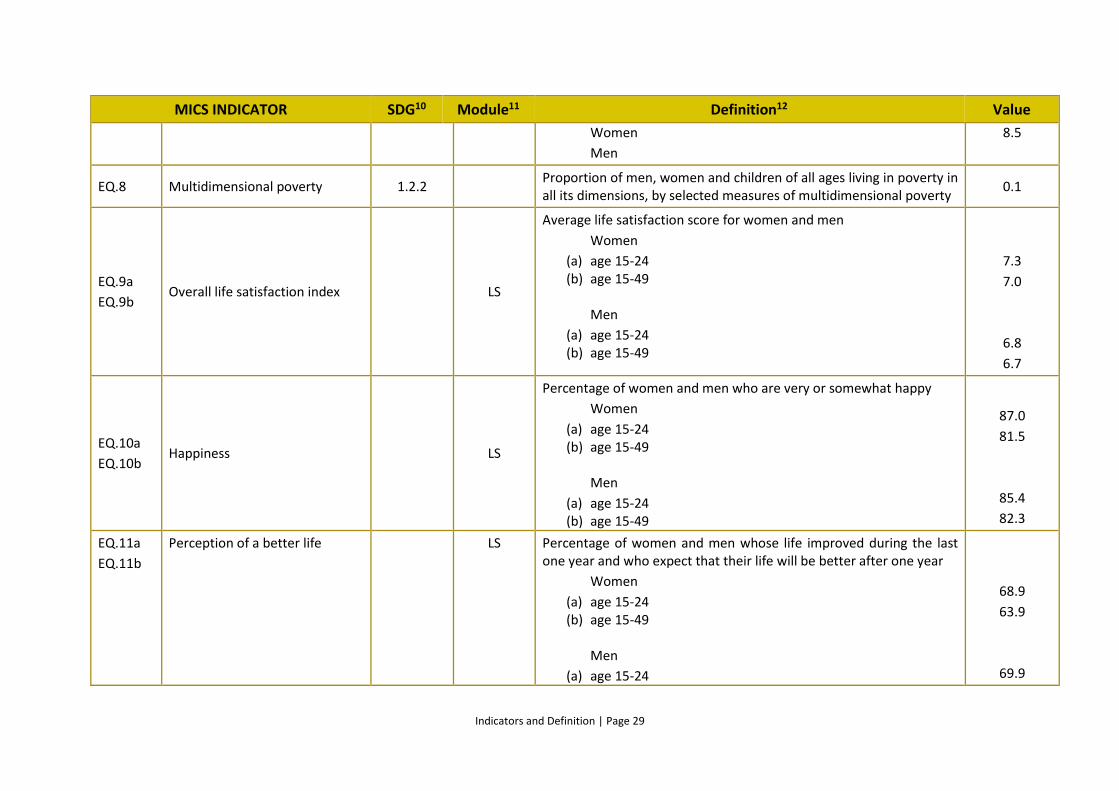
Indicators and Definition | Page 29
MICS INDICATOR SDG10 Module11 Definition12 Value
Women
Men
8.5
EQ.8 Multidimensional poverty 1.2.2 Proportion of men, women and children of all ages living in poverty in all its dimensions, by selected measures of multidimensional poverty
0.1
EQ.9a
EQ.9b Overall life satisfaction index LS
Average life satisfaction score for women and men
Women
(a) age 15-24 (b) age 15-49
Men
(a) age 15-24 (b) age 15-49
7.3
7.0
6.8
6.7
EQ.10a
EQ.10b Happiness LS
Percentage of women and men who are very or somewhat happy
Women
(a) age 15-24 (b) age 15-49
Men
(a) age 15-24 (b) age 15-49
87.0
81.5
85.4
82.3
EQ.11a
EQ.11b
Perception of a better life LS Percentage of women and men whose life improved during the last one year and who expect that their life will be better after one year
Women
(a) age 15-24 (b) age 15-49
Men
(a) age 15-24
68.9
63.9
69.9

Indicators and Definition | Page 30
MICS INDICATOR SDG10 Module11 Definition12 Value
(b) age 15-49 65.5
EQ.S1 Receiving pensions ST Percentage of household who received pension during the year preceding the survey 6.6
EQ.S2 Receiving cash donation RM Percentage of household members living in a household that received cash donation such as zakat or other means during the year preceding the survey 3.1
Sample Coverage and Characteristics of Respondents | Page 31
4. SAMPLE COVERAGE AND CHARACTERISTICS OF RESPONDENTS
SR.1 RESULTS OF INTERVIEWS
Table SR.1.1 presents results of the sample implementation, including response rates. Of the 53,840
households selected for the sample, 52,765 were found occupied. Of these, 51,660 were successfully
interviewed for a household response rate of 97.9 percent.
The Water Quality Testing Questionnaire was administered to 3 randomly selected households in each
cluster. Of these, 7,708 were successfully tested for household drinking water yielding a response rate
of 95.4 percent. Also, 6,860 were successfully tested for source drinking water quality yielding a
response rate of 84.9 percent.
In the interviewed households, 79,510 women (age 15-49 years) were identified. Of these, 74,010
were successfully interviewed, yielding a response rate of 93.1 percent within the interviewed
households.
The survey also sampled men (age 15-49), but required only a subsample. All men (age 15-49) were
identified by random start with first two households and use equal walk method for the remaining.
39,445 men (age 15-49 years) were listed in the household questionnaires. Questionnaires were
completed for 27,094 eligible men, which corresponds to a response rate of 68.7 percent within
eligible interviewed households.
There were 42,408 children under age five listed in the household questionnaires. Questionnaires
were completed for 39,799 of these children, which corresponds to a response rate of 93.8 percent
within interviewed households.
A sub-sample of children age 5-17 years was used to administer the questionnaire for children age 5-
17. Only one child has been selected randomly in each household interviewed, and there were 99,151
children age 5-17 years listed in the household questionnaires. Of these, 37,052 children were
selected, and questionnaires were completed for 35,482 which correspond to a response rate of 95.8
percent within the interviewed households.
Overall response rates of 91.1, 67.2, 91.9, and 93.8 are calculated for the individual interviews of
women, men, under-5s, and children age 5-17 years, respectively.
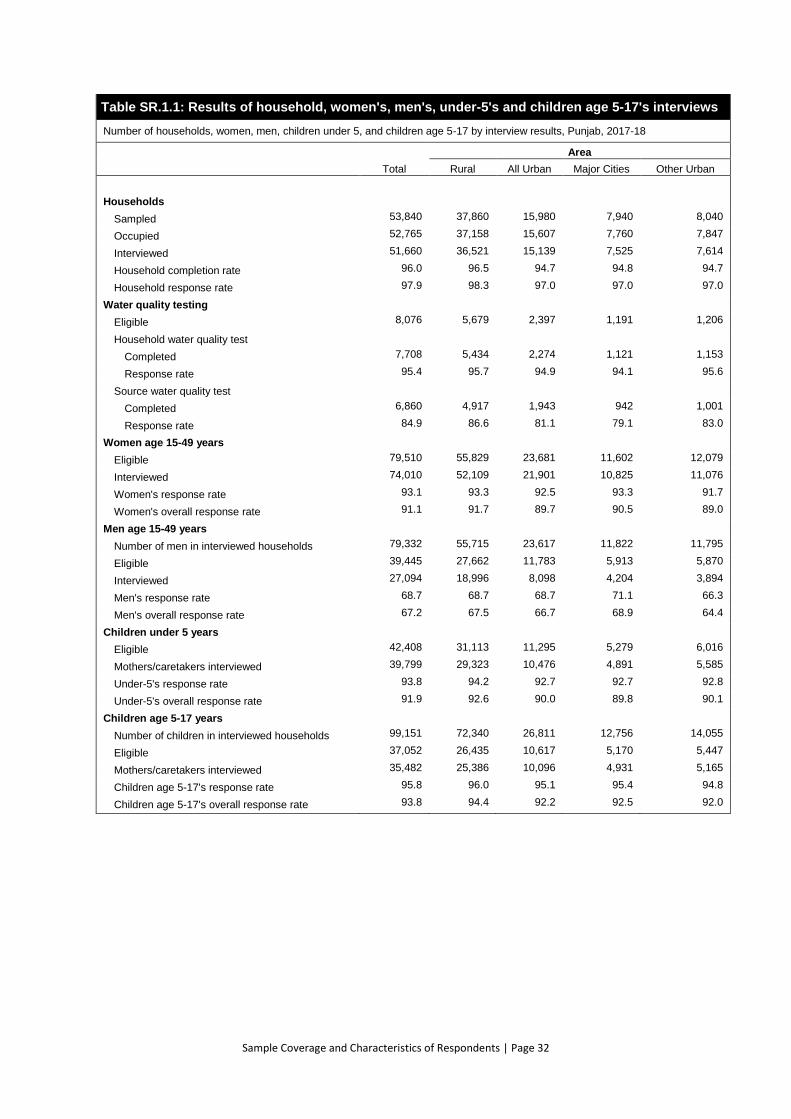
Sample Coverage and Characteristics of Respondents | Page 32
Table SR.1.1: Results of household, women's, men's, under-5's and children age 5-17's interviews
Number of households, women, men, children under 5, and children age 5-17 by interview results, Punjab, 2017-18
Total
Area
Rural All Urban Major Cities Other Urban
Households
Sampled 53,840 37,860 15,980 7,940 8,040
Occupied 52,765 37,158 15,607 7,760 7,847
Interviewed 51,660 36,521 15,139 7,525 7,614
Household completion rate 96.0 96.5 94.7 94.8 94.7
Household response rate 97.9 98.3 97.0 97.0 97.0
Water quality testing
Eligible 8,076 5,679 2,397 1,191 1,206
Household water quality test
Completed 7,708 5,434 2,274 1,121 1,153
Response rate 95.4 95.7 94.9 94.1 95.6
Source water quality test
Completed 6,860 4,917 1,943 942 1,001
Response rate 84.9 86.6 81.1 79.1 83.0
Women age 15-49 years
Eligible 79,510 55,829 23,681 11,602 12,079
Interviewed 74,010 52,109 21,901 10,825 11,076
Women's response rate 93.1 93.3 92.5 93.3 91.7
Women's overall response rate 91.1 91.7 89.7 90.5 89.0
Men age 15-49 years
Number of men in interviewed households 79,332 55,715 23,617 11,822 11,795
Eligible 39,445 27,662 11,783 5,913 5,870
Interviewed 27,094 18,996 8,098 4,204 3,894
Men's response rate 68.7 68.7 68.7 71.1 66.3
Men's overall response rate 67.2 67.5 66.7 68.9 64.4
Children under 5 years
Eligible 42,408 31,113 11,295 5,279 6,016
Mothers/caretakers interviewed 39,799 29,323 10,476 4,891 5,585
Under-5's response rate 93.8 94.2 92.7 92.7 92.8
Under-5's overall response rate 91.9 92.6 90.0 89.8 90.1
Children age 5-17 years
Number of children in interviewed households 99,151 72,340 26,811 12,756 14,055
Eligible 37,052 26,435 10,617 5,170 5,447
Mothers/caretakers interviewed 35,482 25,386 10,096 4,931 5,165
Children age 5-17's response rate 95.8 96.0 95.1 95.4 94.8
Children age 5-17's overall response rate 93.8 94.4 92.2 92.5 92.0
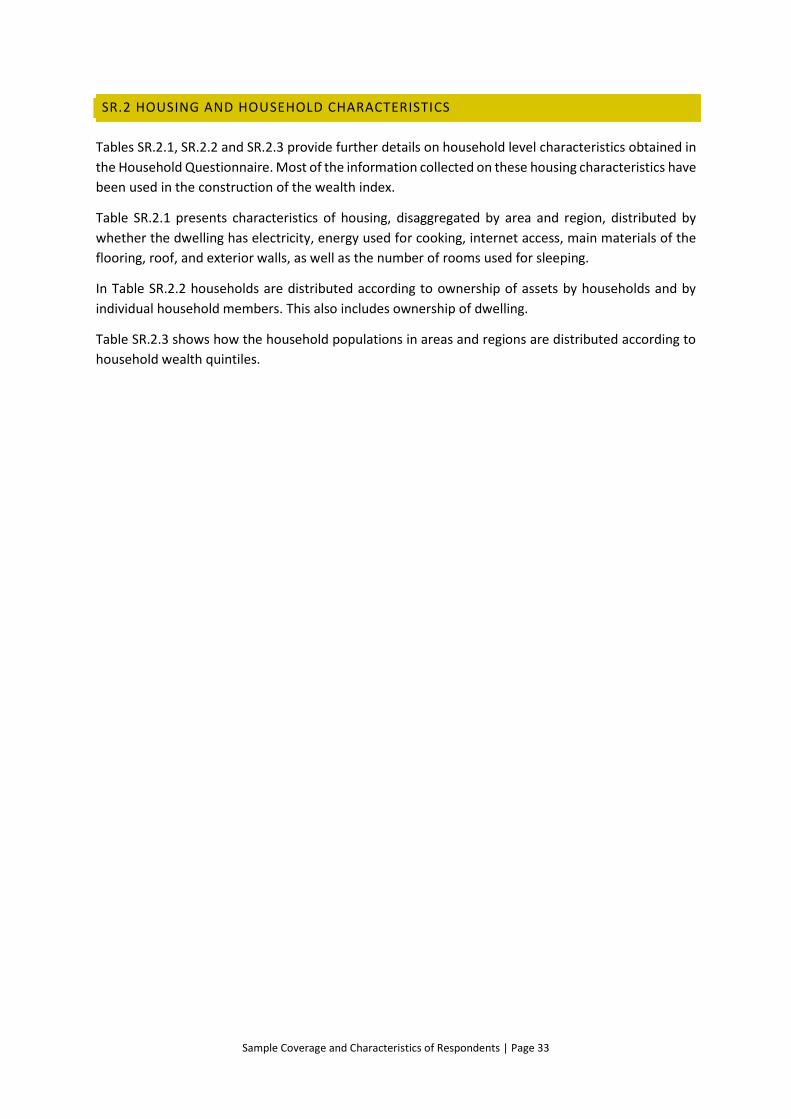
Sample Coverage and Characteristics of Respondents | Page 33
SR.2 HOUSING AND HOUSEHOLD CHARACTERISTICS
Tables SR.2.1, SR.2.2 and SR.2.3 provide further details on household level characteristics obtained in
the Household Questionnaire. Most of the information collected on these housing characteristics have
been used in the construction of the wealth index.
Table SR.2.1 presents characteristics of housing, disaggregated by area and region, distributed by
whether the dwelling has electricity, energy used for cooking, internet access, main materials of the
flooring, roof, and exterior walls, as well as the number of rooms used for sleeping.
In Table SR.2.2 households are distributed according to ownership of assets by households and by
individual household members. This also includes ownership of dwelling.
Table SR.2.3 shows how the household populations in areas and regions are distributed according to
household wealth quintiles.
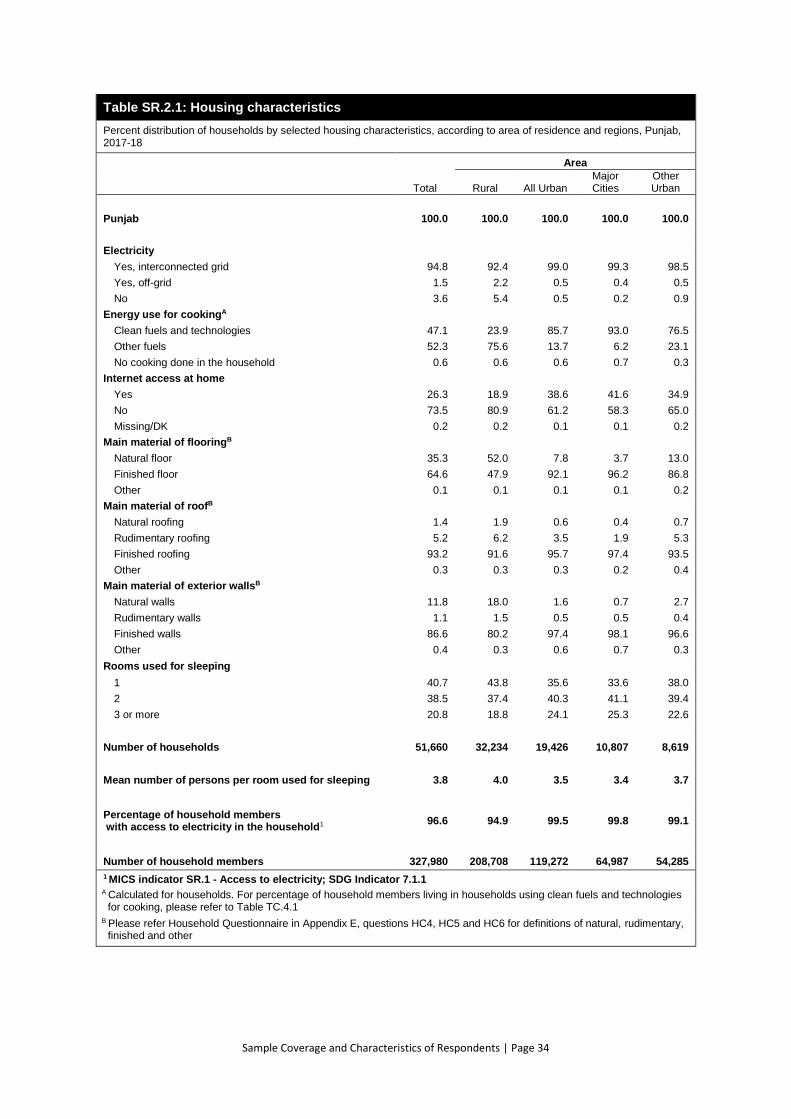
Sample Coverage and Characteristics of Respondents | Page 34
Table SR.2.1: Housing characteristics
Percent distribution of households by selected housing characteristics, according to area of residence and regions, Punjab, 2017-18
Total
Area
Rural All Urban Major Cities
Other Urban
Punjab 100.0 100.0 100.0 100.0 100.0
Electricity
Yes, interconnected grid 94.8 92.4 99.0 99.3 98.5
Yes, off-grid 1.5 2.2 0.5 0.4 0.5
No 3.6 5.4 0.5 0.2 0.9
Energy use for cookingA
Clean fuels and technologies 47.1 23.9 85.7 93.0 76.5
Other fuels 52.3 75.6 13.7 6.2 23.1
No cooking done in the household 0.6 0.6 0.6 0.7 0.3
Internet access at home
Yes 26.3 18.9 38.6 41.6 34.9
No 73.5 80.9 61.2 58.3 65.0
Missing/DK 0.2 0.2 0.1 0.1 0.2
Main material of flooringB
Natural floor 35.3 52.0 7.8 3.7 13.0
Finished floor 64.6 47.9 92.1 96.2 86.8
Other 0.1 0.1 0.1 0.1 0.2
Main material of roofB
Natural roofing 1.4 1.9 0.6 0.4 0.7
Rudimentary roofing 5.2 6.2 3.5 1.9 5.3
Finished roofing 93.2 91.6 95.7 97.4 93.5
Other 0.3 0.3 0.3 0.2 0.4
Main material of exterior wallsB
Natural walls 11.8 18.0 1.6 0.7 2.7
Rudimentary walls 1.1 1.5 0.5 0.5 0.4
Finished walls 86.6 80.2 97.4 98.1 96.6
Other 0.4 0.3 0.6 0.7 0.3
Rooms used for sleeping
1 40.7 43.8 35.6 33.6 38.0
2 38.5 37.4 40.3 41.1 39.4
3 or more 20.8 18.8 24.1 25.3 22.6
Number of households 51,660 32,234 19,426 10,807 8,619
Mean number of persons per room used for sleeping 3.8 4.0 3.5 3.4 3.7
Percentage of household members with access to electricity in the household1
96.6 94.9 99.5 99.8 99.1
Number of household members 327,980 208,708 119,272 64,987 54,285
1 MICS indicator SR.1 - Access to electricity; SDG Indicator 7.1.1 A Calculated for households. For percentage of household members living in households using clean fuels and technologies
for cooking, please refer to Table TC.4.1 B Please refer Household Questionnaire in Appendix E, questions HC4, HC5 and HC6 for definitions of natural, rudimentary,
finished and other
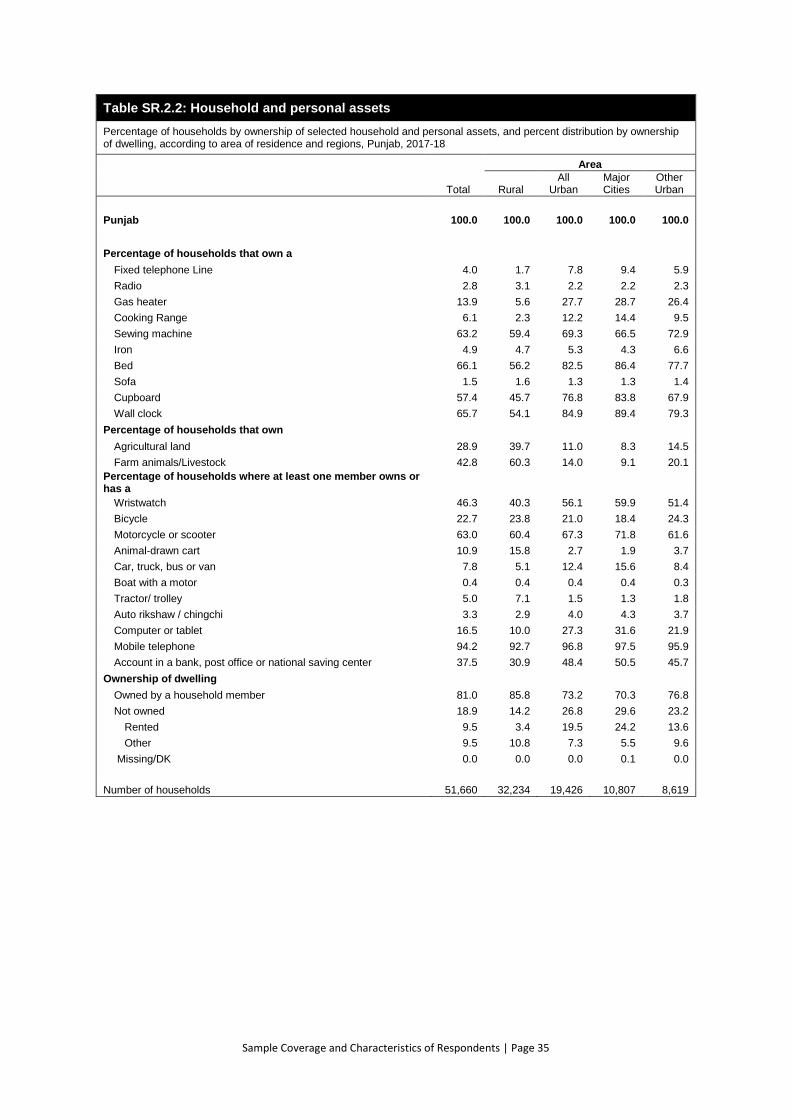
Sample Coverage and Characteristics of Respondents | Page 35
Table SR.2.2: Household and personal assets
Percentage of households by ownership of selected household and personal assets, and percent distribution by ownership of dwelling, according to area of residence and regions, Punjab, 2017-18
Total
Area
Rural All
Urban Major Cities
Other Urban
Punjab 100.0 100.0 100.0 100.0 100.0
Percentage of households that own a
Fixed telephone Line 4.0 1.7 7.8 9.4 5.9
Radio 2.8 3.1 2.2 2.2 2.3
Gas heater 13.9 5.6 27.7 28.7 26.4
Cooking Range 6.1 2.3 12.2 14.4 9.5
Sewing machine 63.2 59.4 69.3 66.5 72.9
Iron 4.9 4.7 5.3 4.3 6.6
Bed 66.1 56.2 82.5 86.4 77.7
Sofa 1.5 1.6 1.3 1.3 1.4
Cupboard 57.4 45.7 76.8 83.8 67.9
Wall clock 65.7 54.1 84.9 89.4 79.3
Percentage of households that own
Agricultural land 28.9 39.7 11.0 8.3 14.5
Farm animals/Livestock 42.8 60.3 14.0 9.1 20.1
Percentage of households where at least one member owns or has a
Wristwatch 46.3 40.3 56.1 59.9 51.4
Bicycle 22.7 23.8 21.0 18.4 24.3
Motorcycle or scooter 63.0 60.4 67.3 71.8 61.6
Animal-drawn cart 10.9 15.8 2.7 1.9 3.7
Car, truck, bus or van 7.8 5.1 12.4 15.6 8.4
Boat with a motor 0.4 0.4 0.4 0.4 0.3
Tractor/ trolley 5.0 7.1 1.5 1.3 1.8
Auto rikshaw / chingchi 3.3 2.9 4.0 4.3 3.7
Computer or tablet 16.5 10.0 27.3 31.6 21.9
Mobile telephone 94.2 92.7 96.8 97.5 95.9
Account in a bank, post office or national saving center 37.5 30.9 48.4 50.5 45.7
Ownership of dwelling
Owned by a household member 81.0 85.8 73.2 70.3 76.8
Not owned 18.9 14.2 26.8 29.6 23.2
Rented 9.5 3.4 19.5 24.2 13.6
Other 9.5 10.8 7.3 5.5 9.6
Missing/DK 0.0 0.0 0.0 0.1 0.0
Number of households 51,660 32,234 19,426 10,807 8,619
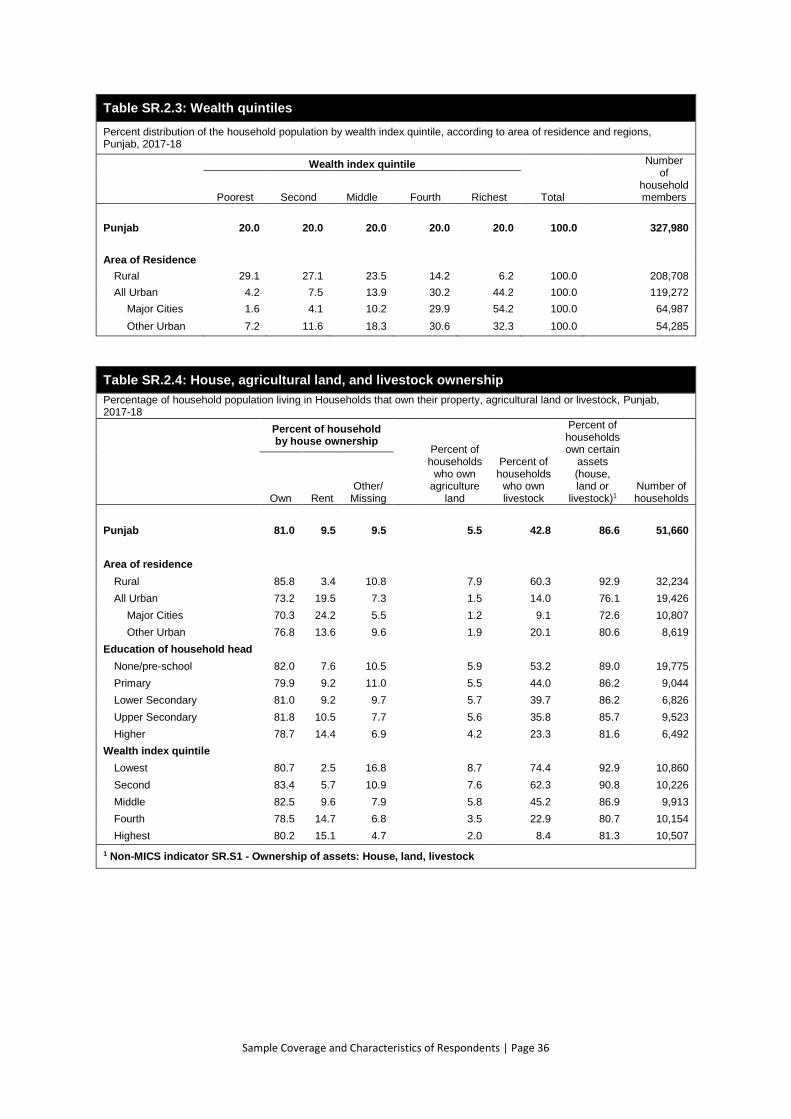
Sample Coverage and Characteristics of Respondents | Page 36
Table SR.2.3: Wealth quintiles
Percent distribution of the household population by wealth index quintile, according to area of residence and regions, Punjab, 2017-18
Wealth index quintile
Total
Number of
household members Poorest Second Middle Fourth Richest
Punjab 20.0 20.0 20.0 20.0 20.0 100.0 327,980
Area of Residence
Rural 29.1 27.1 23.5 14.2 6.2 100.0 208,708
All Urban 4.2 7.5 13.9 30.2 44.2 100.0 119,272
Major Cities 1.6 4.1 10.2 29.9 54.2 100.0 64,987
Other Urban 7.2 11.6 18.3 30.6 32.3 100.0 54,285
Table SR.2.4: House, agricultural land, and livestock ownership
Percentage of household population living in Households that own their property, agricultural land or livestock, Punjab, 2017-18
Percent of household by house ownership
Percent of households
who own agriculture
land
Percent of households
who own livestock
Percent of households own certain
assets (house, land or
livestock)1 Number of households Own Rent
Other/ Missing
Punjab 81.0 9.5 9.5 5.5 42.8 86.6 51,660
Area of residence
Rural 85.8 3.4 10.8 7.9 60.3 92.9 32,234
All Urban 73.2 19.5 7.3 1.5 14.0 76.1 19,426
Major Cities 70.3 24.2 5.5 1.2 9.1 72.6 10,807
Other Urban 76.8 13.6 9.6 1.9 20.1 80.6 8,619
Education of household head
None/pre-school 82.0 7.6 10.5 5.9 53.2 89.0 19,775
Primary 79.9 9.2 11.0 5.5 44.0 86.2 9,044
Lower Secondary 81.0 9.2 9.7 5.7 39.7 86.2 6,826
Upper Secondary 81.8 10.5 7.7 5.6 35.8 85.7 9,523
Higher 78.7 14.4 6.9 4.2 23.3 81.6 6,492
Wealth index quintile
Lowest 80.7 2.5 16.8 8.7 74.4 92.9 10,860
Second 83.4 5.7 10.9 7.6 62.3 90.8 10,226
Middle 82.5 9.6 7.9 5.8 45.2 86.9 9,913
Fourth 78.5 14.7 6.8 3.5 22.9 80.7 10,154
Highest 80.2 15.1 4.7 2.0 8.4 81.3 10,507
1 Non-MICS indicator SR.S1 - Ownership of assets: House, land, livestock
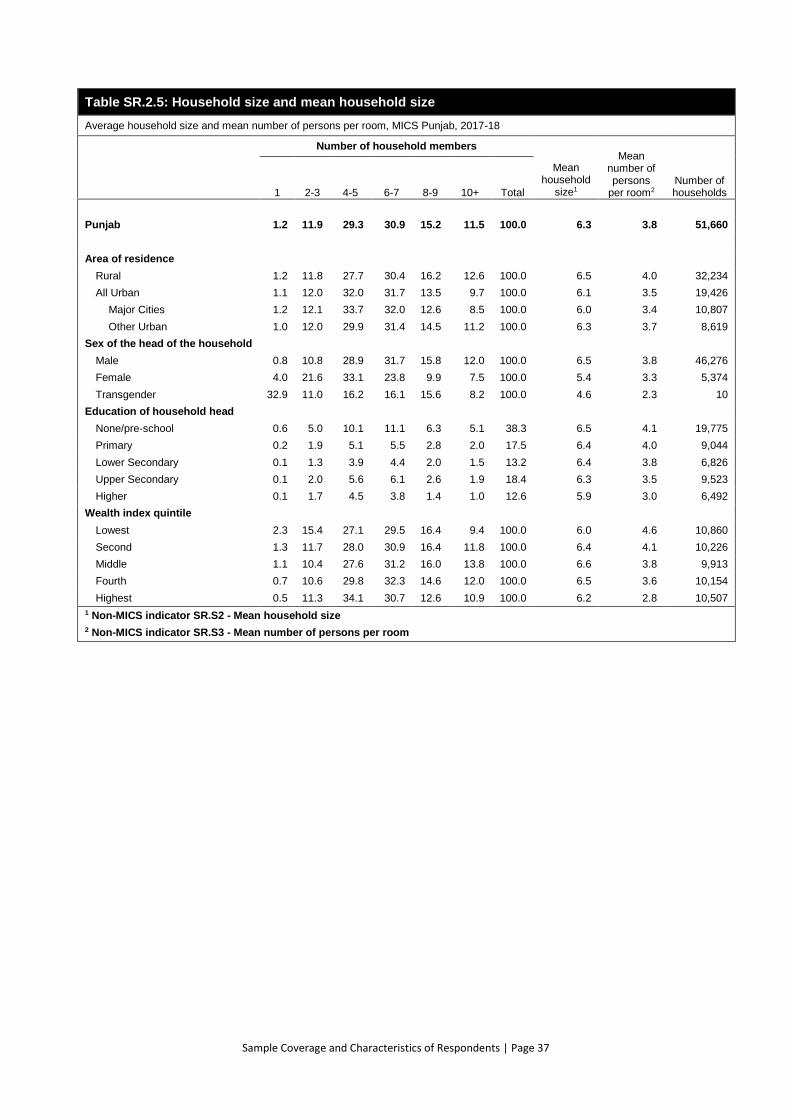
Sample Coverage and Characteristics of Respondents | Page 37
Table SR.2.5: Household size and mean household size
Average household size and mean number of persons per room, MICS Punjab, 2017-18
Number of household members
Mean household
size1
Mean number of persons
per room2 Number of households 1 2-3 4-5 6-7 8-9 10+ Total
Punjab 1.2 11.9 29.3 30.9 15.2 11.5 100.0 6.3 3.8 51,660
Area of residence
Rural 1.2 11.8 27.7 30.4 16.2 12.6 100.0 6.5 4.0 32,234
All Urban 1.1 12.0 32.0 31.7 13.5 9.7 100.0 6.1 3.5 19,426
Major Cities 1.2 12.1 33.7 32.0 12.6 8.5 100.0 6.0 3.4 10,807
Other Urban 1.0 12.0 29.9 31.4 14.5 11.2 100.0 6.3 3.7 8,619
Sex of the head of the household
Male 0.8 10.8 28.9 31.7 15.8 12.0 100.0 6.5 3.8 46,276
Female 4.0 21.6 33.1 23.8 9.9 7.5 100.0 5.4 3.3 5,374
Transgender 32.9 11.0 16.2 16.1 15.6 8.2 100.0 4.6 2.3 10
Education of household head
None/pre-school 0.6 5.0 10.1 11.1 6.3 5.1 38.3 6.5 4.1 19,775
Primary 0.2 1.9 5.1 5.5 2.8 2.0 17.5 6.4 4.0 9,044
Lower Secondary 0.1 1.3 3.9 4.4 2.0 1.5 13.2 6.4 3.8 6,826
Upper Secondary 0.1 2.0 5.6 6.1 2.6 1.9 18.4 6.3 3.5 9,523
Higher 0.1 1.7 4.5 3.8 1.4 1.0 12.6 5.9 3.0 6,492
Wealth index quintile
Lowest 2.3 15.4 27.1 29.5 16.4 9.4 100.0 6.0 4.6 10,860
Second 1.3 11.7 28.0 30.9 16.4 11.8 100.0 6.4 4.1 10,226
Middle 1.1 10.4 27.6 31.2 16.0 13.8 100.0 6.6 3.8 9,913
Fourth 0.7 10.6 29.8 32.3 14.6 12.0 100.0 6.5 3.6 10,154
Highest 0.5 11.3 34.1 30.7 12.6 10.9 100.0 6.2 2.8 10,507
1 Non-MICS indicator SR.S2 - Mean household size
2 Non-MICS indicator SR.S3 - Mean number of persons per room
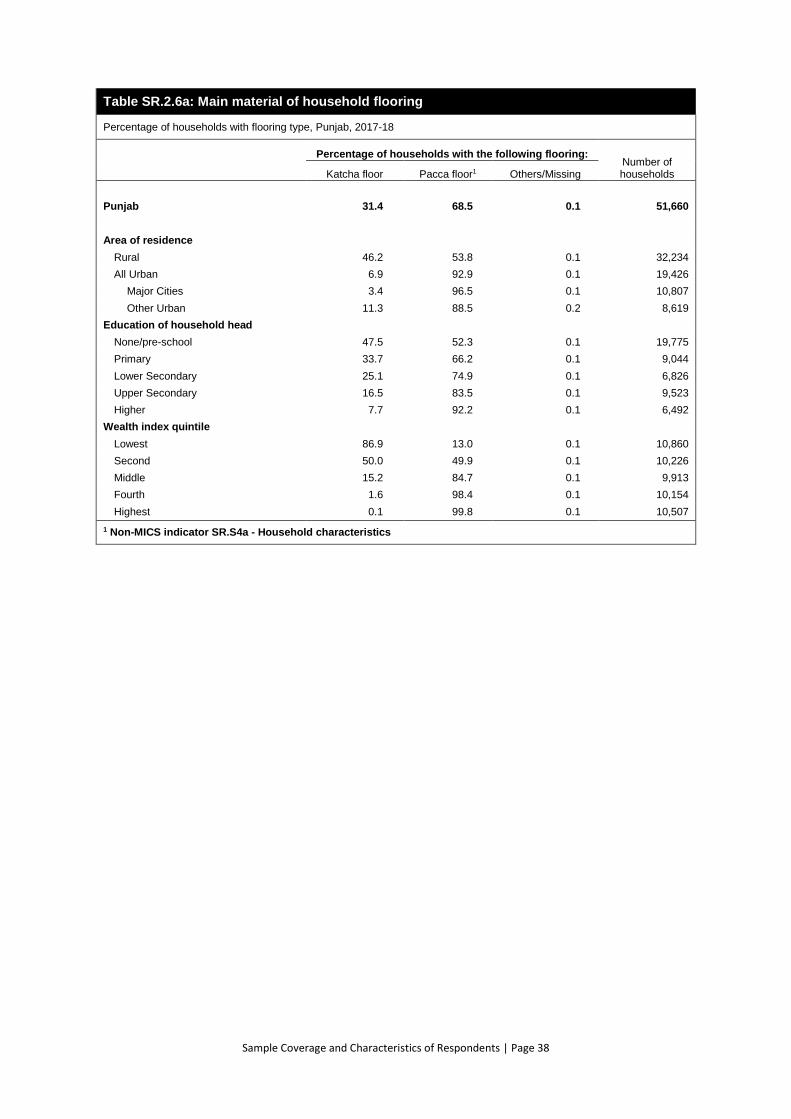
Sample Coverage and Characteristics of Respondents | Page 38
Table SR.2.6a: Main material of household flooring
Percentage of households with flooring type, Punjab, 2017-18
Percentage of households with the following flooring:
Number of households Katcha floor Pacca floor1 Others/Missing
Punjab 31.4 68.5 0.1 51,660
Area of residence
Rural 46.2 53.8 0.1 32,234
All Urban 6.9 92.9 0.1 19,426
Major Cities 3.4 96.5 0.1 10,807
Other Urban 11.3 88.5 0.2 8,619
Education of household head
None/pre-school 47.5 52.3 0.1 19,775
Primary 33.7 66.2 0.1 9,044
Lower Secondary 25.1 74.9 0.1 6,826
Upper Secondary 16.5 83.5 0.1 9,523
Higher 7.7 92.2 0.1 6,492
Wealth index quintile
Lowest 86.9 13.0 0.1 10,860
Second 50.0 49.9 0.1 10,226
Middle 15.2 84.7 0.1 9,913
Fourth 1.6 98.4 0.1 10,154
Highest 0.1 99.8 0.1 10,507
1 Non-MICS indicator SR.S4a - Household characteristics
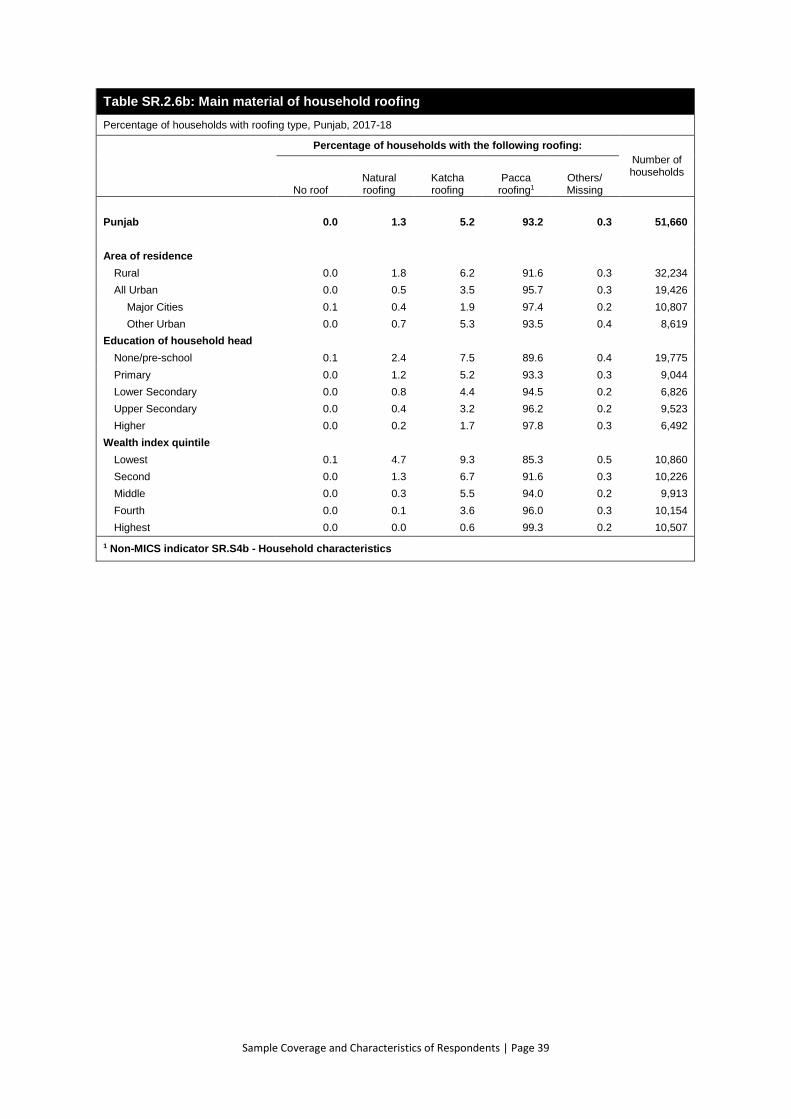
Sample Coverage and Characteristics of Respondents | Page 39
Table SR.2.6b: Main material of household roofing
Percentage of households with roofing type, Punjab, 2017-18
Percentage of households with the following roofing:
Number of households
No roof Natural roofing
Katcha roofing
Pacca roofing1
Others/ Missing
Punjab 0.0 1.3 5.2 93.2 0.3 51,660
Area of residence
Rural 0.0 1.8 6.2 91.6 0.3 32,234
All Urban 0.0 0.5 3.5 95.7 0.3 19,426
Major Cities 0.1 0.4 1.9 97.4 0.2 10,807
Other Urban 0.0 0.7 5.3 93.5 0.4 8,619
Education of household head
None/pre-school 0.1 2.4 7.5 89.6 0.4 19,775
Primary 0.0 1.2 5.2 93.3 0.3 9,044
Lower Secondary 0.0 0.8 4.4 94.5 0.2 6,826
Upper Secondary 0.0 0.4 3.2 96.2 0.2 9,523
Higher 0.0 0.2 1.7 97.8 0.3 6,492
Wealth index quintile
Lowest 0.1 4.7 9.3 85.3 0.5 10,860
Second 0.0 1.3 6.7 91.6 0.3 10,226
Middle 0.0 0.3 5.5 94.0 0.2 9,913
Fourth 0.0 0.1 3.6 96.0 0.3 10,154
Highest 0.0 0.0 0.6 99.3 0.2 10,507
1 Non-MICS indicator SR.S4b - Household characteristics

Sample Coverage and Characteristics of Respondents | Page 40
Table SR.2.6c: Main material of household walls
Percentage of households with walls type, Punjab, 2017-18
Percentage of household with the following wall materials:
No walls Natural walls
Katcha walls
Pacca walls1
Others/ Missing
Number of households
Punjab 4.7 7.1 1.1 86.6 0.4 51,660
Area of residence
Rural 7.0 11.0 1.5 80.2 0.3 32,234
All Urban 0.9 0.7 0.5 97.4 0.6 19,426
Major Cities 0.5 0.2 0.5 98.1 0.7 10,807
Other Urban 1.4 1.3 0.4 96.6 0.4 8,619
Education of household head
None/pre-school 7.6 11.7 1.6 78.7 0.4 19,775
Primary 4.1 7.8 1.2 86.5 0.3 9,044
Lower Secondary 3.4 4.4 1.0 90.8 0.4 6,826
Upper Secondary 2.4 2.9 0.7 93.6 0.3 9,523
Higher 1.1 1.4 0.3 96.4 0.8 6,492
Wealth index quintile
Lowest 17.7 26.7 2.6 52.5 0.5 10,860
Second 3.4 6.9 1.8 87.6 0.2 10,226
Middle 0.9 0.8 0.7 97.5 0.1 9,913
Fourth 0.4 0.1 0.3 99.0 0.2 10,154
Highest 0.1 0.0 0.1 98.9 0.9 10,507
1 Non-MICS indicator SR.S4c - Household characteristics
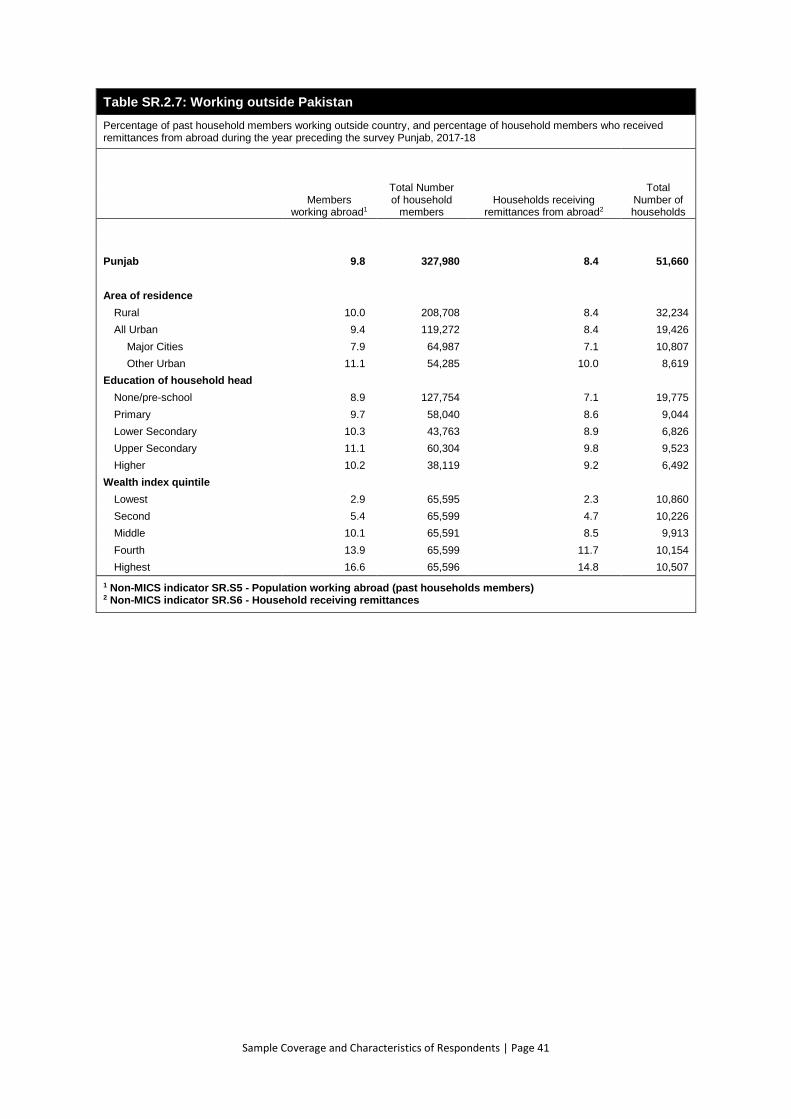
Sample Coverage and Characteristics of Respondents | Page 41
Table SR.2.7: Working outside Pakistan
Percentage of past household members working outside country, and percentage of household members who received remittances from abroad during the year preceding the survey Punjab, 2017-18
Members working abroad1
Total Number of household
members Households receiving
remittances from abroad2
Total Number of households
Punjab 9.8 327,980 8.4 51,660
Area of residence
Rural 10.0 208,708 8.4 32,234
All Urban 9.4 119,272 8.4 19,426
Major Cities 7.9 64,987 7.1 10,807
Other Urban 11.1 54,285 10.0 8,619
Education of household head
None/pre-school 8.9 127,754 7.1 19,775
Primary 9.7 58,040 8.6 9,044
Lower Secondary 10.3 43,763 8.9 6,826
Upper Secondary 11.1 60,304 9.8 9,523
Higher 10.2 38,119 9.2 6,492
Wealth index quintile
Lowest 2.9 65,595 2.3 10,860
Second 5.4 65,599 4.7 10,226
Middle 10.1 65,591 8.5 9,913
Fourth 13.9 65,599 11.7 10,154
Highest 16.6 65,596 14.8 10,507
1 Non-MICS indicator SR.S5 - Population working abroad (past households members) 2 Non-MICS indicator SR.S6 - Household receiving remittances
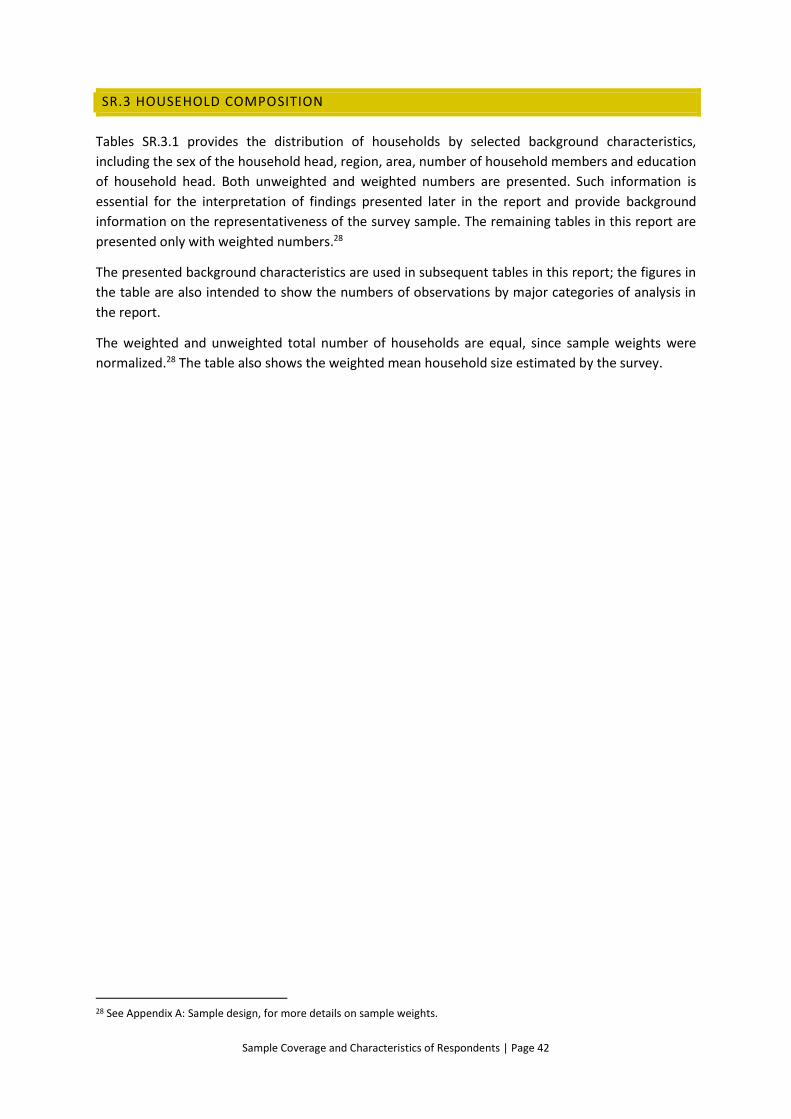
Sample Coverage and Characteristics of Respondents | Page 42
SR.3 HOUSEHOLD COMPOSITION
Tables SR.3.1 provides the distribution of households by selected background characteristics,
including the sex of the household head, region, area, number of household members and education
of household head. Both unweighted and weighted numbers are presented. Such information is
essential for the interpretation of findings presented later in the report and provide background
information on the representativeness of the survey sample. The remaining tables in this report are
presented only with weighted numbers.28
The presented background characteristics are used in subsequent tables in this report; the figures in
the table are also intended to show the numbers of observations by major categories of analysis in
the report.
The weighted and unweighted total number of households are equal, since sample weights were
normalized.28 The table also shows the weighted mean household size estimated by the survey.
28 See Appendix A: Sample design, for more details on sample weights.
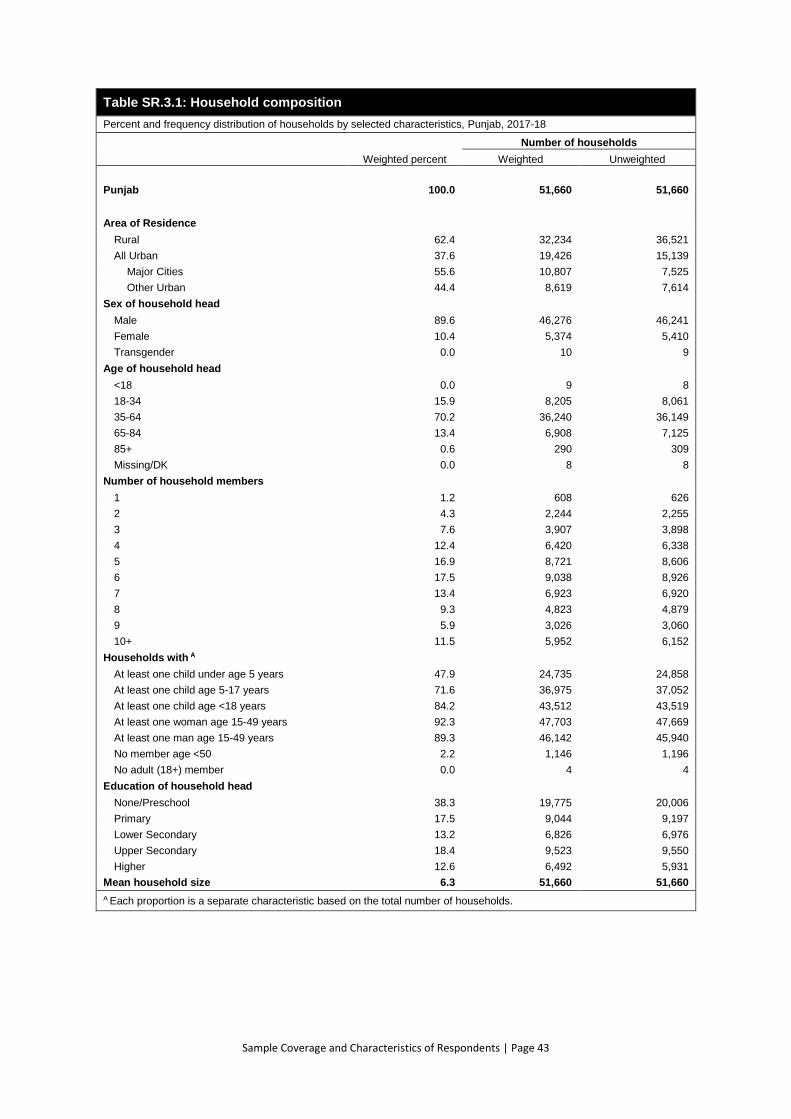
Sample Coverage and Characteristics of Respondents | Page 43
Table SR.3.1: Household composition
Percent and frequency distribution of households by selected characteristics, Punjab, 2017-18
Weighted percent
Number of households
Weighted Unweighted
Punjab 100.0 51,660 51,660
Area of Residence
Rural 62.4 32,234 36,521
All Urban 37.6 19,426 15,139
Major Cities 55.6 10,807 7,525
Other Urban 44.4 8,619 7,614
Sex of household head
Male 89.6 46,276 46,241
Female 10.4 5,374 5,410
Transgender 0.0 10 9
Age of household head
<18 0.0 9 8
18-34 15.9 8,205 8,061
35-64 70.2 36,240 36,149
65-84 13.4 6,908 7,125
85+ 0.6 290 309
Missing/DK 0.0 8 8
Number of household members
1 1.2 608 626
2 4.3 2,244 2,255
3 7.6 3,907 3,898
4 12.4 6,420 6,338
5 16.9 8,721 8,606
6 17.5 9,038 8,926
7 13.4 6,923 6,920
8 9.3 4,823 4,879
9 5.9 3,026 3,060
10+ 11.5 5,952 6,152
Households with A
At least one child under age 5 years 47.9 24,735 24,858
At least one child age 5-17 years 71.6 36,975 37,052
At least one child age <18 years 84.2 43,512 43,519
At least one woman age 15-49 years 92.3 47,703 47,669
At least one man age 15-49 years 89.3 46,142 45,940
No member age <50 2.2 1,146 1,196
No adult (18+) member 0.0 4 4
Education of household head
None/Preschool 38.3 19,775 20,006
Primary 17.5 9,044 9,197
Lower Secondary 13.2 6,826 6,976
Upper Secondary 18.4 9,523 9,550
Higher 12.6 6,492 5,931
Mean household size 6.3 51,660 51,660
A Each proportion is a separate characteristic based on the total number of households.
Sample Coverage and Characteristics of Respondents | Page 44
SR.4 AGE STRUCTURE OF HOUSEHOLD POPULATION
The weighted age and sex distribution of the survey population is provided in Table SR.4.1. In the
households successfully interviewed in the survey, a weighted total of 327,980 household members
were listed. Of these, 166,054 were males, and 161,886 were females.29
Table SR.4.1: Age distribution of household population by sex
Percent and frequency distribution of the household population by five-year age groups, dependency age groups, and by child (age 0-17 years) and adult populations (age 18 or more), by sex, Punjab, 2017-18
Males Females Transgender Total
Number Percent Number Percent Number Percent Number Percent
Punjab 166,054 100.0 161,886 100.0 40 100.0 327,980 100.0
Age
0-4 21,620 13.0 20,470 12.6 - - 42,090 12.8
5-9 21,555 13.0 20,861 12.9 2 4.6 42,418 12.9
10-14 19,030 11.5 18,080 11.2 2 4.8 37,112 11.3
15-19 16,870 10.2 15,647 9.7 3 7.7 32,520 9.9
15-17 10,032 6.0 9,062 5.6 2 4.3 19,096 5.8
18-19 6,838 4.1 6,585 4.1 1 3.3 13,425 4.1
20-24 14,502 8.7 14,789 9.1 6 16.1 29,297 8.9
25-29 12,872 7.8 13,722 8.5 3 7.0 26,596 8.1
30-34 10,810 6.5 11,144 6.9 1 2.0 21,955 6.7
35-39 10,046 6.0 10,216 6.3 3 6.2 20,264 6.2
40-44 7,553 4.5 7,480 4.6 1 1.8 15,033 4.6
45-49 6,791 4.1 6,133 3.8 - - 12,923 3.9
50-54 6,911 4.2 7,614 4.7 6 15.3 14,532 4.4
55-59 4,963 3.0 4,574 2.8 4 9.7 9,541 2.9
60-64 4,505 2.7 4,064 2.5 5 12.9 8,575 2.6
65-69 3,030 1.8 2,744 1.7 1 1.8 5,775 1.8
70-74 2,363 1.4 2,114 1.3 2 5.7 4,479 1.4
75-79 1,289 0.8 1,006 0.6 - - 2,295 0.7
80-84 776 0.5 665 0.4 1 3.2 1,442 0.4
85+ 532 0.3 512 0.3 1 1.3 1,044 0.3
Missing/DK 38 0.0 51 0.0 - - 89 0.0
0-14 62,204 37.5 59,411 36.7 4 9.4 121,619 37.1
15-64 95,822 57.7 95,383 58.9 31 78.5 191,236 58.3
65+ 7,990 4.8 7,041 4.3 5 12.1 15,035 4.6
Missing/DK 38 0.0 51 0.0 - - 89 0.0
Children age 0-17 years 72,236 43.5 68,473 42.3 6 13.8 140,715 42.9
Adults age 18+ years 93,780 56.5 93,362 57.7 35 86.2 187,176 57.1
Missing/DK 38 0.0 51 0.0 - - 89 0.0
' - ' denotes 0 unweighted cases in that cell
2The single year age distribution is provided in Table DQ.1.1 in Appendix D: Data quality
Sample Coverage and Characteristics of Respondents | Page 45
SR.5 RESPONDENTS’ BACKGROUND CHARACTERISTICS
Tables SR.5.1W, SR.5.1M, SR.5.2, and SR.5.3 provide information on the background characteristics of
female and male respondents 15-49 years of age, children under age 5 and children age 5-17 years. In
all these tables, the total numbers of weighted and unweighted observations are equal, since sample
weights have been normalized (standardized).1 In addition to providing useful information on the
background characteristics of women, men, children age 5-17, and children under age five, the tables
are also intended to show the numbers of observations in each background category. These categories
are used in the subsequent tabulations of this report.
Tables SR.5.1W and SR.5.1M provide background characteristics of female and male respondents, age
15-49 years. The tables include information on the distribution of women and men according to area,
region, age, education30, marital status, motherhood/fatherhood status, health insurance, functional
difficulties (for age 18-49), and wealth index quintiles.31, 32 The functional difficulties (age 18-49 years)
has been calculated from Punjab –specific “Disability” Module in the household questionnaire which
is used widely as a background characteristic in many tables of the report.
Background characteristics of children age 5-17 and under 5 are presented in Tables SR.5.2 and SR.5.3.
These include the distribution of children by several attributes: sex, area, region, age in months,
mother’s (or caretaker’s) education, respondent type, health insurance, functional difficulties (for
children under age 5 only for age 2-4 years) and wealth index quintiles.
30 Throughout this report when used as a background variable, unless otherwise stated, “education” refers to highest
educational level ever attended by the respondent. 31 The wealth index is a composite indicator of wealth. To construct the wealth index, principal components analysis is
performed by using information on the ownership of consumer goods, dwelling characteristics, water and sanitation, and
other characteristics that are related to the household’s wealth, to generate weights (factor scores) for each of the items
used. First, initial factor scores are calculated for the total sample. Then, separate factor scores are calculated for households
in urban and rural areas. Finally, the urban and rural factor scores are regressed on the initial factor scores to obtain the
combined, final factor scores for the total sample. This is carried out to minimize the urban bias in the wealth index values.
Each household in the total sample is then assigned a wealth score based on the assets owned by that household and on the
final factor scores obtained as described above. The survey household population is then ranked according to the wealth
score of the household they are living in, and is finally divided into 5 equal parts (quintiles) from lowest (poorest) to highest
(richest). In MICS Punjab, 2017-18 the following assets were used in these calculations: List assets used in calculations
(Annex-I). The wealth index is assumed to capture the underlying long-term wealth through information on the household
assets, and is intended to produce a ranking of households by wealth, from poorest to richest. The wealth index does not
provide information on absolute poverty, current income or expenditure levels. The wealth scores calculated are applicable
for only the particular data set they are based on. Further information on the construction of the wealth index can be found
in:
Filmer, D., and L. Pritchett. "Estimating Wealth Effects without Expenditure Data — or Tears: An Application to Educational
Enrollments in States of India*." Demography 38, no. 1 (2001): 115-32. doi:10.1353/dem.2001.0003.;
Rutstein, S., and K. Johnson. The DHS Wealth Index. DHS Comparative Reports No. 6. Calverton: ORC Macro, 2004.
https://dhsprogram.com/pubs/pdf/CR6/CR6.pdf.;
Rutstein, S. The DHS Wealth Index: Approaches for Rural and Urban Areas. Calverton: Macro International, 2008.
https://dhsprogram.com/pubs/pdf/WP60/WP60.pdf. 32 When describing survey results by wealth quintiles, appropriate terminology is used when referring to individual household
members, such as for instance “women in the richest population quintile”, which is used interchangeably with “women in
the wealthiest survey population”, “women living in households in the richest population wealth quintile”, and similar.
Sample Coverage and Characteristics of Respondents | Page 46
Table SR.5.1W: Women's background characteristics
Percent and frequency distribution of women age 15-49 years by selected background characteristics, Punjab, 2017-18
Weighted percent
Number of women
Weighted Unweighted
Punjab 100.0 74,010 74,010
Area of Residence
Rural 61.7 45,668 52,109
All Urban 38.3 28,342 21,901
Major Cities 54.9 15,563 10,825
Other Urban 45.1 12,778 11,076
Functional difficulties (age 18-49 years)A
Has functional difficulty 3.5 2,270 2,254
Has no functional difficulty 96.5 63,366 63,370
Age
15-19 19.6 14,541 14,504
15-17 11.3 8,380 8,393
18-19 8.3 6,161 6,111
20-24 18.4 13,633 13,568
25-29 17.1 12,625 12,642
30-34 14.2 10,544 10,588
35-39 13.1 9,726 9,737
40-44 9.6 7,125 7,153
45-49 7.9 5,815 5,818
Marital status
Currently married 63.5 47,030 47,087
Widowed 1.6 1,158 1,147
Divorced 1.0 727 747
Separated 0.6 473 485
Never married 33.3 24,621 24,543
Missing 0.0 1 1
Motherhood and recent births
Never gave birth 41.5 30,725 30,785
Ever gave birth 58.5 43,285 43,225
Gave birth in last two years 21.2 15,656 15,731
No birth in last two years 37.1 27,447 27,301
Health insurance
With insurance 3.2 2,348 2,447
Without insurance 96.7 71,564 71,466
Missing 0.1 98 97
Women’s education
None/Preschool 33.9 25,122 26,054
Primary 18.4 13,584 14,154
Lower Secondary 10.9 8,086 8,044
Upper Secondary 16.9 12,510 12,177
Higher 19.9 14,705 13,579
Missing/DK 0.0 3 2
Wealth index quintile
Poorest 17.1 12,641 13,532
Second 19.4 14,335 15,474
Middle 20.4 15,105 16,267
Fourth 21.3 15,739 15,269
Richest 21.9 16,191 13,468 A The background characteristic ‘Functional difficulties (age 18-49 years)’ has been calculated from Disability Module in the
household questionnaire
Sample Coverage and Characteristics of Respondents | Page 47
Table SR.5.1M: Men's background characteristics
Percent and frequency distribution of men age 15-49 years by selected background characteristics, Punjab, 2017-18
Weighted percent
Number of men
Weighted Unweighted
Punjab 100.0 27,094 27,094
Area of Residence
Rural 61.8 16,748 18,996
All Urban 38.2 10,346 8,098
Major Cities 55.9 5,779 4,204
Other Urban 44.1 4,567 3,894
Functional difficulties (age 18-49 years)
Has functional difficulty 2.3 538 554
Has no functional difficulty 97.7 22,774 22,742
Age
15-19 22.7 6,146 6,156
15-17 13.8 3,733 3,750
18-19 8.9 2,413 2,406
20-24 17.9 4,841 4,855
25-29 15.9 4,300 4,269
30-34 13.2 3,581 3,573
35-39 12.8 3,478 3,485
40-44 9.1 2,479 2,470
45-49 8.4 2,269 2,286
Marital status
Currently married 52.1 14,111 14,131
Widowed 0.4 96 102
Divorced 0.5 127 132
Separated 0.2 64 63
Never married 46.8 12,684 12,656
Missing 0.0 12 10
Fatherhood status
Has at least one living child 45.2 12,249 12,244
Has no living children 54.8 14,838 14,843
Missing/DK 0.0 7 7
Health insurance
With insurance 3.9 1,066 1,024
Without insurance 95.9 25,983 26,028
Missing 0.2 46 42
Men’s education
None/Preschool 17.2 4,665 4,681
Primary 18.2 4,923 4,985
Lower Secondary 17.7 4,803 4,926
Upper Secondary 25.8 7,000 7,089
Higher 21.0 5,701 5,412
Missing/DK 0.0 2 1
Wealth index quintile
Poorest 17.8 4,827 5,053
Second 19.9 5,398 5,848
Middle 20.1 5,447 5,923
Fourth 20.5 5,561 5,389
Richest 21.6 5,861 4,881 A The background characteristic ‘Functional difficulties (age 18-49 years)’ has been calculated from Disability Module in the
household questionnaire
Sample Coverage and Characteristics of Respondents | Page 48
Table SR.5.2: Children under 5's background characteristics
Percent and frequency distribution of children under five years of age by selected characteristics, Punjab, 2017-18
Weighted percent
Number of under-5 children
Weighted Unweighted
Punjab 100.0 39,799 39,799
Area of Residence
Rural 65.8 26,190 29,323
All Urban 34.2 13,609 10,476
Major Cities 52.3 7,118 4,891
Other Urban 47.7 6,491 5,585
Sex
Male 51.4 20,468 20,523
Female 48.6 19,331 19,276
Child's functional difficulties (age 2-4 years)B,C
Has functional difficulty 6.4 1,525 1,530
Has no functional difficulty 93.6 22,276 22,278
Mother's functional difficultiesD
Has functional difficulty 2.2 856 841
Has no functional difficulty 96.6 38,464 38,473
No information 1.2 479 485
Age in months
0-5 11.5 4,570 4,588
6-11 8.9 3,523 3,522
12-23 19.8 7,867 7,842
24-35 19.8 7,862 7,827
36-47 20.8 8,277 8,322
48-59 19.3 7,676 7,674
No information 0.1 24 24
Respondent to the under-5 questionnaire
Mother 98.7 39,289 39,279
Other primary caretaker 1.3 510 520
Health insurance
With insurance 2.3 908 952
Without insurance 97.6 38,854 38,812
Missing 0.1 37 35
Mother’s educationA
None/Preschool 42.5 16,922 17,402
Primary 19.6 7,797 8,039
Lower Secondary 10.4 4,141 4,089
Upper Secondary 13.8 5,488 5,269
Higher 13.7 5,451 5,000
Wealth index quintile
Poorest 22.6 9,001 9,483
Second 19.9 7,935 8,474
Middle 19.7 7,853 8,310
Fourth 19.6 7,814 7,499
Richest 18.1 7,195 6,033 A In this table and throughout the report, mother's education refers to educational attainment of mothers as well as
caretakers of children under 5, who are the respondents to the under-5 questionnaire if the mother is deceased or is living elsewhere.
B The results of the Child Functioning module are presented in Chapter 11.1. c Children age 0-1 years are excluded, as the child functioning is only collected for age 2-4 years. D In this table and throughout the report, mother's functional difficulties refers to functional difficulty of mothers as well as
caretakers of children under 5 as mentioned in note A. The category of "No information" applies to mothers or caretakers to whom the Disability module was not administered, e.g. the mother is below age 18.
Sample Coverage and Characteristics of Respondents | Page 49
Table SR.5.3: Children age 5-17's background characteristics
Percent and frequency distribution of children age 5-17 by selected characteristics, Punjab, 2017-18
Weighted percent
Number of children age 5-17
Weighted Unweighted
Punjab 100.0 35,482 35,482
Area of Residence
Rural 63.2 22,442 25,386
All Urban 36.8 13,040 10,096
Major Cities 54.5 7,104 4,931
Other Urban 45.5 5,936 5,165
Sex
Male 51.8 18,376 18,397
Female 48.2 17,106 17,085
Child's functional difficultiesC
Has functional difficulty 17.9 6,346 6,411
Has no functional difficulty 82.1 29,136 29,071
Mother's functional difficultiesD
Has functional difficulty 4.3 1,510 1,479
Has no functional difficulty 77.8 27,622 27,544
No information 17.9 6,349 6,459
Age
5-9 44.8 15,884 15,865
10-14 33.8 11,980 12,005
15-17 21.5 7,618 7,612
Respondent to the children age 5-17 questionnaire
Mother 93.8 33,288 33,248
Other primary caretaker 6.2 2,191 2,232
EmancipatedB 0.0 2 2
Health insurance
With insurance 3.2 1,140 1,163
Without insurance 96.7 34,316 34,293
Missing 0.1 25 26
Mother’s educationA
None/Preschool 53.2 18,868 19,488
Primary 18.1 6,408 6,582
Lower Secondary 8.5 3,031 2,912
Upper Secondary 10.9 3,874 3,612
Higher 9.3 3,300 2,886
No information 0.0 2 2
Wealth index quintile
Poorest 21.7 7,697 8,192
Second 20.5 7,278 7,835
Middle 19.4 6,883 7,317
Fourth 19.7 7,005 6,678
Richest 18.7 6,619 5,460
A In this table and throughout the report where applicable, mother's education refers to educational attainment of mothers as well as caretakers of children age 5-17, who are the respondents to the children age 5-17 questionnaire if the mother is deceased or is living elsewhere. For emancipated children this is the education status of the selected child.
B Children age 15-17 years were considered emancipated and individually interviewed if not living with his/her mother and the respondent to the Household Questionnaire indicated that the child does not have a primary caretaker.
C The results of the Child Functioning module is presented in Chapter 11.1. D In this table and throughout the report, mother's functional difficulties refers to functional difficulty of mothers as well as
caretakers of children age 5-17 as mentioned in note A. The category of "No information" applies to mothers or caretakers to whom the Adult Functioning module was not administered, e.g. the mother is below age 18 or above age 49. Emancipated children are also included here.
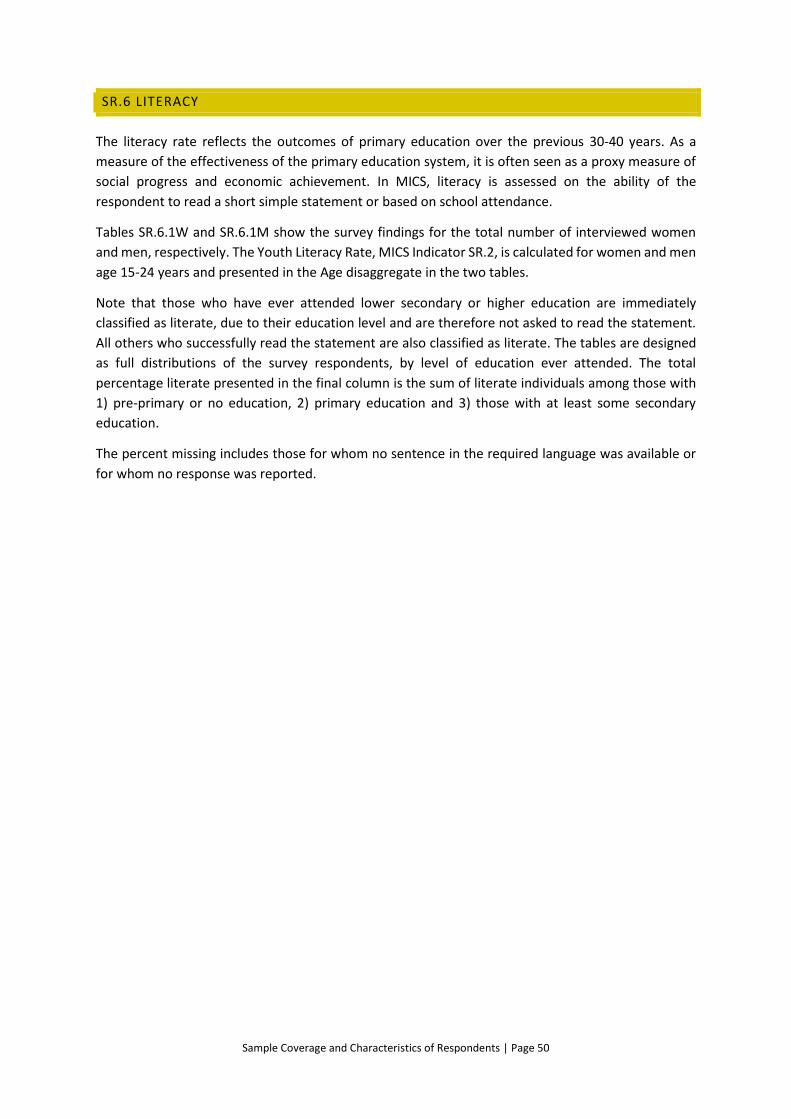
Sample Coverage and Characteristics of Respondents | Page 50
SR.6 LITERACY
The literacy rate reflects the outcomes of primary education over the previous 30-40 years. As a
measure of the effectiveness of the primary education system, it is often seen as a proxy measure of
social progress and economic achievement. In MICS, literacy is assessed on the ability of the
respondent to read a short simple statement or based on school attendance.
Tables SR.6.1W and SR.6.1M show the survey findings for the total number of interviewed women
and men, respectively. The Youth Literacy Rate, MICS Indicator SR.2, is calculated for women and men
age 15-24 years and presented in the Age disaggregate in the two tables.
Note that those who have ever attended lower secondary or higher education are immediately
classified as literate, due to their education level and are therefore not asked to read the statement.
All others who successfully read the statement are also classified as literate. The tables are designed
as full distributions of the survey respondents, by level of education ever attended. The total
percentage literate presented in the final column is the sum of literate individuals among those with
1) pre-primary or no education, 2) primary education and 3) those with at least some secondary
education.
The percent missing includes those for whom no sentence in the required language was available or
for whom no response was reported.
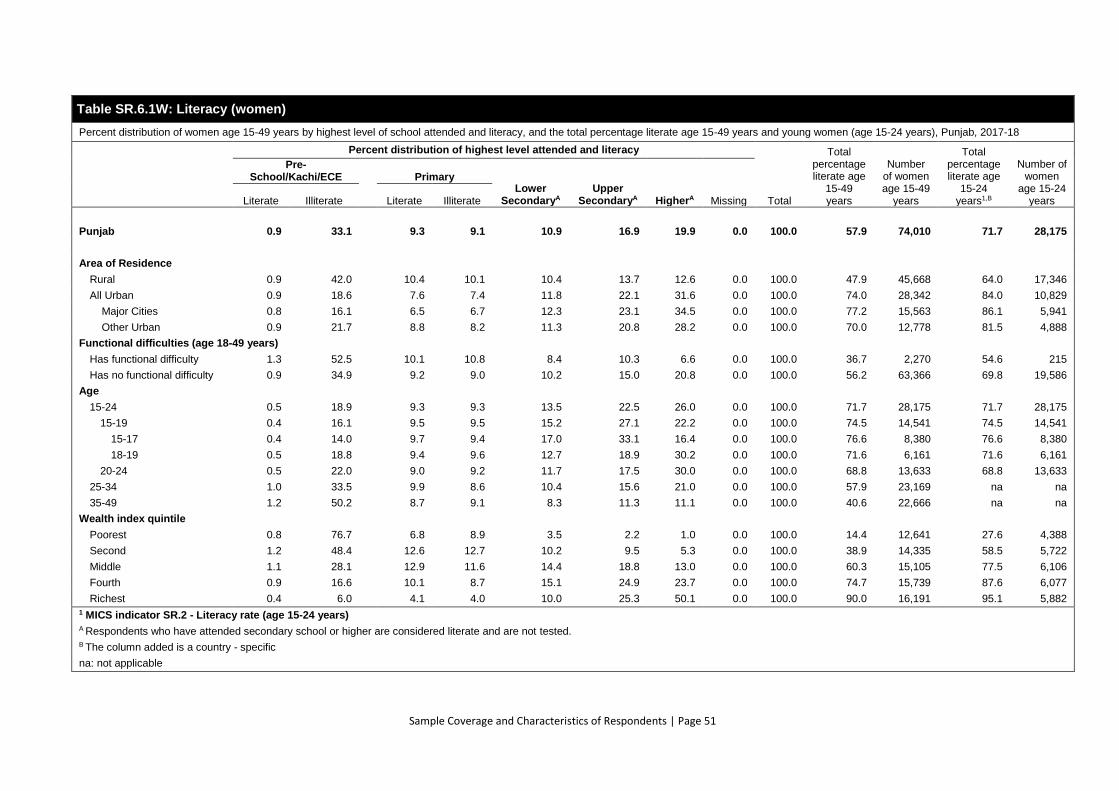
Sample Coverage and Characteristics of Respondents | Page 51
Table SR.6.1W: Literacy (women)
Percent distribution of women age 15-49 years by highest level of school attended and literacy, and the total percentage literate age 15-49 years and young women (age 15-24 years), Punjab, 2017-18
Percent distribution of highest level attended and literacy
Total
Total percentage literate age
15-49 years
Number of women age 15-49
years
Total percentage literate age
15-24 years1,B
Number of women
age 15-24 years
Pre-School/Kachi/ECE Primary
Lower SecondaryA
Upper SecondaryA HigherA Missing Literate Illiterate Literate Illiterate
Punjab 0.9 33.1 9.3 9.1 10.9 16.9 19.9 0.0 100.0 57.9 74,010 71.7 28,175
Area of Residence
Rural 0.9 42.0 10.4 10.1 10.4 13.7 12.6 0.0 100.0 47.9 45,668 64.0 17,346
All Urban 0.9 18.6 7.6 7.4 11.8 22.1 31.6 0.0 100.0 74.0 28,342 84.0 10,829
Major Cities 0.8 16.1 6.5 6.7 12.3 23.1 34.5 0.0 100.0 77.2 15,563 86.1 5,941
Other Urban 0.9 21.7 8.8 8.2 11.3 20.8 28.2 0.0 100.0 70.0 12,778 81.5 4,888
Functional difficulties (age 18-49 years)
Has functional difficulty 1.3 52.5 10.1 10.8 8.4 10.3 6.6 0.0 100.0 36.7 2,270 54.6 215
Has no functional difficulty 0.9 34.9 9.2 9.0 10.2 15.0 20.8 0.0 100.0 56.2 63,366 69.8 19,586
Age
15-24 0.5 18.9 9.3 9.3 13.5 22.5 26.0 0.0 100.0 71.7 28,175 71.7 28,175
15-19 0.4 16.1 9.5 9.5 15.2 27.1 22.2 0.0 100.0 74.5 14,541 74.5 14,541
15-17 0.4 14.0 9.7 9.4 17.0 33.1 16.4 0.0 100.0 76.6 8,380 76.6 8,380
18-19 0.5 18.8 9.4 9.6 12.7 18.9 30.2 0.0 100.0 71.6 6,161 71.6 6,161
20-24 0.5 22.0 9.0 9.2 11.7 17.5 30.0 0.0 100.0 68.8 13,633 68.8 13,633
25-34 1.0 33.5 9.9 8.6 10.4 15.6 21.0 0.0 100.0 57.9 23,169 na na
35-49 1.2 50.2 8.7 9.1 8.3 11.3 11.1 0.0 100.0 40.6 22,666 na na
Wealth index quintile
Poorest 0.8 76.7 6.8 8.9 3.5 2.2 1.0 0.0 100.0 14.4 12,641 27.6 4,388
Second 1.2 48.4 12.6 12.7 10.2 9.5 5.3 0.0 100.0 38.9 14,335 58.5 5,722
Middle 1.1 28.1 12.9 11.6 14.4 18.8 13.0 0.0 100.0 60.3 15,105 77.5 6,106
Fourth 0.9 16.6 10.1 8.7 15.1 24.9 23.7 0.0 100.0 74.7 15,739 87.6 6,077
Richest 0.4 6.0 4.1 4.0 10.0 25.3 50.1 0.0 100.0 90.0 16,191 95.1 5,882 1 MICS indicator SR.2 - Literacy rate (age 15-24 years) A Respondents who have attended secondary school or higher are considered literate and are not tested. B The column added is a country - specific
na: not applicable
Sample Coverage and Characteristics of Respondents | Page 52
Table SR.6.1M: Literacy (men)
Percent distribution of men age 15-49 years by highest level of school attended and literacy, and the total percentage literate age 15-49 years and young men (age 15-24 years), Punjab, 2017-18
Percent distribution of highest level attended and literacy
Total
Total percentage literate age 15-49 years
Number of men age
15-49 years
Total percentage literate
age 15-24 years1
Number of men age
15-24 years
Pre-School/Kachi/ECE Primary
Lower SecondaryA
Upper SecondaryA HigherA Missing Literate Illiterate Literate Illiterate
Punjab 0.3 16.9 6.0 12.2 17.7 25.8 21.0 0.0 100.0 70.9 27,094 77.7 10,987
Area of Residence
Rural 0.3 20.0 6.4 13.5 18.5 25.1 16.2 0.0 100.0 66.5 16,748 74.4 6,805
All Urban 0.4 11.8 5.3 10.1 16.5 27.0 28.8 0.0 100.0 78.1 10,346 83.2 4,182
Major Cities 0.6 12.1 4.6 9.0 16.3 27.7 29.7 0.0 100.0 78.8 5,779 83.7 2,331
Other Urban 0.2 11.4 6.3 11.5 16.7 26.1 27.8 0.0 100.0 77.1 4,567 82.5 1,851
Functional difficulties (age 18-49 years)
Has functional difficulty 1.1 32.0 8.2 15.1 15.0 19.8 8.7 0.0 100.0 52.9 538 56.2 79
Has no functional difficulty 0.4 17.9 6.0 12.3 17.0 24.1 22.4 0.0 100.0 69.9 22,774 76.9 7,127
Age
15-24 0.2 10.6 5.1 11.7 18.8 29.1 24.5 0.0 100.0 77.7 10,987 77.7 10,987
15-19 0.1 9.4 5.2 11.8 19.9 33.7 20.0 0.0 100.0 78.8 6,146 78.8 6,146
15-17 0.1 8.7 5.3 11.2 22.8 37.6 14.3 0.0 100.0 80.1 3,733 80.1 3,733
18-19 0.2 10.4 5.0 12.7 15.3 27.5 28.8 0.0 100.0 76.8 2,413 76.8 2,413
20-24 0.2 12.1 5.0 11.5 17.6 23.3 30.2 0.0 100.0 76.4 4,841 76.4 4,841
25-34 0.4 17.1 6.5 12.8 17.8 23.6 21.7 0.0 100.0 70.1 7,881 na na
35-49 0.5 25.0 6.6 12.4 16.2 23.6 15.8 0.0 100.0 62.6 8,226 na na
Wealth index quintile
Poorest 0.5 42.1 8.4 18.8 14.3 11.1 4.8 0.0 100.0 39.2 4,827 49.6 1,866
Second 0.3 21.1 8.1 15.7 21.0 23.3 10.6 0.0 100.0 63.2 5,398 73.1 2,350
Middle 0.3 12.2 6.3 13.0 21.4 29.4 17.3 0.0 100.0 74.7 5,447 80.6 2,296
Fourth 0.3 9.2 5.0 10.3 19.4 32.2 23.4 0.0 100.0 80.5 5,561 85.8 2,221
Richest 0.3 3.9 2.6 4.6 12.5 30.9 45.3 0.0 100.0 91.6 5,861 95.0 2,255 1 MICS indicator SR.2 - Literacy rate (age 15-24 years) A Respondents who have attended secondary school or higher are considered literate and are not tested.
Sample Coverage and Characteristics of Respondents | Page 53
SR.7 MIGRATORY STATUS
The Background module of the MICS Punjab, 2017-18 asked respondents to the Individual
Questionnaire for Women and Men how long they have been continuously living in the current
residence and, if they were not living there since birth, whether they lived in a city, town or rural area
and the name of the region they lived in before moving to their current place of residence. Tables
SR.7.1W and 7.1.M present the percentage of women and men who have changed residence
according to the time since last move and also compares the place of residence of each individual at
the time of the survey with that of the last place of residence and the type of residence.
Sample Coverage and Characteristics of Respondents | Page 54
Table SR.7.1W: Migratory status of women
Percent distribution of women age 15-49 years by migratory status and years since last move, and percent distribution of women who migrated, by type and place of last residence, Punjab, 2017-18
Contin
uously
liv
ing in
the s
am
e r
esid
ence
Percentage of women, by time of last move
To
tal
Num
ber
of
wom
en Percentage of women whose last migration was from:
To
tal
Number of women
who changed residence L
ess t
han o
ne
year
1-4
years
5-9
years
10 y
ears
or
mo
re
City
To
wn
Rura
l are
a
Mis
sin
g
To
tal
Punja
b
Sin
dh
Balu
chis
tan
GB
/AJK
KP
K/F
AT
A
ICT
Outs
ide c
ountr
y
Mis
sin
g
Punjab 57.3 2.7 9.8 9.8 20.3 100.0 74,010 36.4 8.0 55.4 0.1 100.0 94.3 2.4 0.2 0.7 1.8 0.3 0.3 0.0 100.0 31,639
Area of Residence
Rural 59.6 2.5 8.7 9.3 19.8 100.0 45,668 21.4 8.6 69.8 0.1 100.0 95.5 2.2 0.2 0.6 1.2 0.2 0.1 0.0 100.0 18,433
All Urban 53.4 3.2 11.6 10.6 21.2 100.0 28,342 57.3 7.2 35.3 0.1 100.0 92.6 2.7 0.3 0.8 2.7 0.3 0.5 0.0 100.0 13,206
Major Cities 53.0 3.4 12.3 10.5 20.9 100.0 15,563 63.8 5.9 30.3 0.1 100.0 92.8 2.2 0.2 1.0 2.7 0.4 0.7 0.0 100.0 7,318
Other Urban 53.9 2.9 10.8 10.7 21.7 100.0 12,778 49.3 8.9 41.6 0.2 100.0 92.4 3.4 0.5 0.6 2.8 0.2 0.2 0.0 100.0 5,888
Functional difficulties (age 18-49 years)
Has functional difficulty 45.8 1.3 7.4 8.4 37.1 100.0 2,270 32.0 9.1 58.7 0.2 100.0 92.4 2.4 0.3 1.3 3.2 0.2 0.2 0.0 100.0 1,229
Has no functional difficulty 54.3 2.9 10.6 10.6 21.6 100.0 63,366 36.4 8.0 55.5 0.1 100.0 94.5 2.4 0.2 0.6 1.8 0.3 0.3 0.0 100.0 28,940
Age
15-19 80.1 3.2 6.5 3.8 6.3 100.0 14,541 39.5 8.9 51.2 0.5 100.0 92.2 2.9 0.3 0.7 2.6 0.4 0.8 0.1 100.0 2,887
15-17 82.5 2.2 4.8 3.9 6.6 100.0 8,380 40.4 8.2 50.9 0.5 100.0 92.3 2.5 0.2 0.8 2.6 0.6 0.9 0.2 100.0 1,469
18-19 77.0 4.7 8.8 3.7 5.9 100.0 6,161 38.5 9.6 51.5 0.5 100.0 92.1 3.4 0.3 0.6 2.7 0.2 0.7 0.0 100.0 1,418
20-24 66.4 4.6 15.8 7.6 5.6 100.0 13,633 38.2 7.7 53.9 0.2 100.0 94.1 2.4 0.2 0.7 2.1 0.2 0.2 0.1 100.0 4,585
25-29 52.9 3.4 15.5 18.7 9.5 100.0 12,625 36.8 8.4 54.7 0.2 100.0 94.0 2.5 0.3 0.6 1.9 0.2 0.4 0.0 100.0 5,944
30-34 45.9 1.9 9.7 17.1 25.3 100.0 10,544 37.2 8.0 54.8 0.0 100.0 94.5 2.3 0.3 0.7 1.7 0.4 0.1 0.0 100.0 5,700
35-39 45.6 1.5 6.0 9.0 37.8 100.0 9,726 36.3 8.2 55.5 0.1 100.0 94.6 2.4 0.1 0.8 1.6 0.3 0.2 0.0 100.0 5,295
40-44 43.7 1.5 5.0 5.3 44.4 100.0 7,125 33.4 7.4 59.1 0.1 100.0 94.8 2.4 0.1 0.7 1.5 0.3 0.3 0.0 100.0 4,010
45-49 44.7 0.9 4.3 4.3 45.9 100.0 5,815 33.0 7.7 59.3 0.0 100.0 95.2 2.1 0.1 0.5 1.7 0.1 0.2 0.1 100.0 3,218
Marital status
Ever married 43.6 3.6 13.0 13.0 26.8 100.0 49,389 35.1 8.0 56.8 0.1 100.0 94.6 2.3 0.2 0.7 1.8 0.3 0.2 0.0 100.0 27,840
Never married 84.6 1.1 3.6 3.4 7.4 100.0 24,621 46.0 8.1 45.4 0.6 100.0 92.0 3.3 0.3 0.7 2.3 0.4 1.0 0.1 100.0 3,799
EducationA 0.0 0.0
None/Preschool 54.5 2.1 8.3 9.2 25.9 100.0 25,122 20.3 7.7 71.9 0.1 100.0 94.2 2.2 0.3 0.5 2.6 0.1 0.1 0.0 100.0 11,437
Primary 54.5 2.7 10.2 10.3 22.2 100.0 13,584 29.2 8.4 62.4 0.1 100.0 95.3 2.1 0.1 0.6 1.6 0.2 0.0 0.0 100.0 6,181
Lower Secondary 56.4 3.1 10.5 11.2 18.7 100.0 8,086 40.6 9.0 50.3 0.1 100.0 95.3 2.1 0.2 0.7 1.3 0.2 0.2 0.0 100.0 3,524
Upper Secondary 60.1 3.3 10.3 10.0 16.3 100.0 12,510 51.1 8.2 40.5 0.2 100.0 93.8 3.0 0.3 1.0 1.2 0.3 0.3 0.1 100.0 4,994
Higher 62.6 3.2 11.3 9.6 13.4 100.0 14,705 62.0 7.5 30.3 0.2 100.0 93.1 2.9 0.2 0.8 1.5 0.7 0.9 0.0 100.0 5,502
Wealth index quintile
Poorest 67.0 1.7 6.5 7.6 17.2 100.0 12,641 10.9 7.0 82.0 0.1 100.0 96.1 2.3 0.2 0.2 1.1 0.0 0.1 0.0 100.0 4,173
Second 60.6 2.1 8.1 8.8 20.4 100.0 14,335 19.4 8.3 72.3 0.1 100.0 95.3 2.3 0.4 0.4 1.2 0.2 0.1 0.0 100.0 5,645
Middle 56.0 3.0 9.9 9.9 21.2 100.0 15,105 27.5 8.7 63.7 0.1 100.0 94.9 2.5 0.2 0.5 1.7 0.1 0.1 0.1 100.0 6,650
Fourth 51.5 3.6 11.7 11.2 22.0 100.0 15,739 42.6 9.4 47.8 0.2 100.0 93.6 2.3 0.1 0.8 2.5 0.3 0.3 0.0 100.0 7,636
Richest 53.5 3.1 12.0 11.1 20.4 100.0 16,191 64.8 6.4 28.6 0.2 100.0 92.7 2.6 0.2 1.1 2.2 0.6 0.8 0.0 100.0 7,535 A The category of “Don’t know/Missing” in the background characteristic of “Education” has been suppressed from the table due to small number of unweighted cases.
Sample Coverage and Characteristics of Respondents | Page 55
Table SR.7.1M: Migratory status of men
Percent distribution of men age 15-49 years by migratory status and years since last move, and percent distribution of men who migrated, by type and place of last residence, Punjab, 2017-18
Contin
uously
livin
g in
the s
am
e
resid
ence
Percentage of men, by time of last move
To
tal
Num
ber
of m
en Percentage of men whose last migration was from:
To
tal
Number of men who changed residence L
ess t
han
one y
ear
1-4
years
5-9
years
10 y
ears
or
mo
re
City
To
wn
Rura
l are
a
Mis
sin
g
To
tal
Punja
b
Sin
dh
Balu
chis
tan
GB
/AJK
KP
K/F
AT
A
ICT
Outs
ide
countr
y
Mis
sin
g
Punjab 84.7 1.2 3.2 3.2 7.7 100.0 27,094 40.6 9.1 50.1 0.2 100.0 92.1 2.7 0.3 0.9 3.0 0.3 0.6 0.1 100.0 4,140 Area of Residence
Rural 88.8 0.7 2.0 2.3 6.3 100.0 16,748 19.7 10.9 69.0 0.4 100.0 91.5 3.5 0.1 1.2 2.8 0.3 0.4 0.2 100.0 1,884 All Urban 78.2 2.1 5.0 4.7 10.0 100.0 10,346 58.0 7.5 34.3 0.1 100.0 92.6 2.1 0.4 0.6 3.2 0.2 0.8 0.0 100.0 2,256 Major Cities 76.7 2.7 5.4 5.0 10.2 100.0 5,779 64.5 6.5 28.8 0.1 100.0 92.8 1.5 0.3 0.9 3.0 0.4 1.0 0.1 100.0 1,348 Other Urban 80.1 1.5 4.4 4.3 9.7 100.0 4,567 48.3 9.1 42.5 0.1 100.0 92.3 3.1 0.7 0.1 3.5 0.0 0.4 0.0 100.0 908
Functional difficulties (age 18-49 years) Has functional difficulty 79.7 0.3 2.7 4.3 13.0 100.0 538 32.9 10.5 56.6 0.0 100.0 94.0 3.7 0.0 0.0 2.3 0.0 0.0 0.0 100.0 109 Has no functional difficulty 84.4 1.2 3.2 3.1 8.1 100.0 22,774 41.0 9.4 49.4 0.3 100.0 91.9 2.8 0.2 0.9 3.2 0.3 0.6 0.1 100.0 3,557
Age 15-19 87.2 1.4 3.4 3.3 4.7 100.0 6,146 42.1 7.1 50.5 0.3 100.0 92.9 1.9 0.8 0.9 2.7 0.1 0.7 0.0 100.0 784
15-17 87.6 1.4 3.3 3.2 4.5 100.0 3,733 40.3 6.9 52.9 0.0 100.0 93.1 2.1 0.9 1.1 2.2 0.0 0.6 0.0 100.0 463 18-19 86.7 1.5 3.4 3.4 5.0 100.0 2,413 44.7 7.5 47.0 0.8 100.0 92.6 1.7 0.6 0.6 3.5 0.3 0.8 0.0 100.0 321
20-24 86.6 1.1 3.0 3.0 6.2 100.0 4,841 46.0 6.8 46.8 0.4 100.0 91.8 2.4 0.0 0.8 3.3 0.7 0.7 0.3 100.0 647 25-29 86.6 1.2 2.9 3.0 6.4 100.0 4,300 40.3 11.8 47.9 0.0 100.0 92.1 3.1 0.0 1.1 3.2 0.2 0.1 0.2 100.0 578 30-34 84.5 1.7 3.3 3.1 7.4 100.0 3,581 45.7 6.0 47.8 0.5 100.0 89.9 5.1 0.3 0.6 3.1 0.2 0.7 0.2 100.0 555 35-39 81.8 0.9 3.8 3.7 9.8 100.0 3,478 37.5 9.9 52.5 0.2 100.0 91.1 2.5 0.4 0.3 4.6 0.3 0.6 0.0 100.0 631 40-44 80.4 1.0 3.2 3.2 12.3 100.0 2,479 35.7 10.7 53.7 0.0 100.0 92.6 3.1 0.0 1.4 1.8 0.2 0.8 0.0 100.0 487 45-49 79.8 1.2 2.3 3.1 13.6 100.0 2,269 33.8 13.3 52.7 0.2 100.0 94.7 1.2 0.4 1.3 1.8 0.0 0.6 0.0 100.0 459
Marital statusA Ever married 82.6 1.1 3.5 3.4 9.5 100.0 14,398 35.9 10.6 53.2 0.2 100.0 92.3 2.6 0.2 0.9 3.0 0.3 0.6 0.1 100.0 2,509 Never married 87.2 1.4 2.8 3.0 5.6 100.0 12,684 47.7 6.7 45.3 0.3 100.0 91.8 3.0 0.4 0.9 3.1 0.3 0.5 0.1 100.0 1,629
EducationB None/Preschool 81.0 1.5 3.5 4.0 10.1 100.0 4,665 24.8 11.5 63.5 0.2 100.0 93.6 1.8 0.1 0.9 2.7 0.4 0.5 0.0 100.0 886 Primary 84.1 1.1 3.2 3.2 8.3 100.0 4,923 32.3 9.5 58.0 0.2 100.0 91.1 4.0 0.5 0.1 3.3 0.5 0.4 0.0 100.0 781 Lower Secondary 86.9 1.0 2.7 2.4 7.0 100.0 4,803 40.1 10.8 48.9 0.2 100.0 91.8 3.7 0.3 0.6 3.0 0.0 0.5 0.2 100.0 628 Upper Secondary 86.8 1.3 2.7 2.6 6.6 100.0 7,000 44.0 9.4 46.5 0.1 100.0 90.7 2.7 0.6 1.1 4.3 0.2 0.3 0.1 100.0 922 Higher 83.8 1.3 3.8 3.9 7.1 100.0 5,701 59.5 5.0 35.0 0.5 100.0 93.1 2.0 0.0 1.5 1.8 0.2 1.2 0.2 100.0 924
Wealth index quintile Poorest 86.6 0.8 2.6 2.5 7.4 100.0 4,827 10.9 9.3 79.6 0.2 100.0 93.9 3.0 0.0 0.1 2.3 0.3 0.5 0.0 100.0 645 Second 87.8 1.0 2.6 3.0 5.6 100.0 5,398 19.8 11.6 68.3 0.3 100.0 92.4 3.4 0.9 0.7 2.2 0.2 0.2 0.0 100.0 659 Middle 87.4 0.8 2.2 2.8 6.8 100.0 5,447 36.6 9.4 54.0 0.0 100.0 91.7 2.7 0.0 0.7 4.1 0.2 0.6 0.0 100.0 686 Fourth 82.2 1.5 3.8 3.0 9.5 100.0 5,561 46.9 8.5 44.3 0.3 100.0 91.1 2.7 0.6 1.5 3.2 0.4 0.2 0.2 100.0 989 Richest 80.2 2.1 4.4 4.5 8.8 100.0 5,861 65.7 7.9 26.0 0.4 100.0 92.0 2.3 0.0 1.0 3.1 0.2 1.2 0.2 100.0 1,161
A The category of “Missing” in the background characteristic of “Marital status” has been suppressed from the table due to small number of unweighted cases. B The category of “Don’t know/Missing” in the background characteristic of “Education” has been suppressed from the table due to small number of unweighted cases.
Sample Coverage and Characteristics of Respondents | Page 56
SR.8 ADULT FUNCTIONING AND DISABILITY
The Adult Functioning is calculated from Punjab survey specific “Disability” module included in the
household questionnaire which is based on the “short set” of questions developed by the Washington
Group on Disability Statistics (WG) – a UN City Group established under the United Nations Statistical
Commission. These questions reflect six domains for measuring disability: seeing, hearing, walking,
self-care, communication and cognition.
Even though the Adult Functioning modules are part of Individual questionnaires in the Standard
MICS, in Punjab MICS we obtained information using a “roster” approach of recommended short-set
of questions in the household questionnaire. A single proxy respondent answered this module (and
rest of the household questionnaire) on behalf of all adult household members age 18 years and
above.
Tables SR.8.2 presents the percentage of household members age 18 years and above who have
functional difficulties, by domain (Seeing, hearing, walking, self-care, communication, and
remembering).
Table SR.8.3 presents the percentage of household members age 18 years and above who have
disability (cannot do at all) by domain (Seeing, hearing, walking, self-care, communication, and
remembering).
Table SR.8.4 presents the percentage of disabled household members age 18 and above who received
any type of social protection/transfers due to disability in any domain with social protection.

Sample Coverage and Characteristics of Respondents | Page 57
Table SR.8.2: Adult functioning (household members age 18 years and above)
Percentage of household members age 18 years and above who have functional difficulty, by domain, Punjab, 2017-18
Percentage of household members age 18 years and above with functional difficultyA in the domain of:
Percentage of household members
age 18 years and above with functional
difficulty in at least one domainA
Number of household members age 18
years and above Seeing Hearing
Walking/ Climbing
Self-care Communication Memory
Punjab 2.5 1.1 4.7 1.1 0.7 1.3 7.7 187,265
Area of Residence
Rural 3.0 1.3 5.0 1.2 0.7 1.5 8.4 116,643
All Urban 1.9 0.8 4.2 1.0 0.6 1.1 6.5 70,621
Major Cities 1.5 0.6 3.7 0.9 0.6 0.9 5.6 39,208
Other Urban 2.3 1.0 4.9 1.1 0.7 1.3 7.7 31,413
Sex
Male 2.1 1.1 3.9 1.0 0.7 1.1 6.6 93,817
Female 3.0 1.1 5.5 1.2 0.7 1.6 8.7 93,413
Transgender (3.7) (0.0) (8.3) (0.0) (0.0) (1.5) (12.0) 35
Wealth index quintile
Poorest 4.0 1.8 5.6 1.5 0.9 1.8 10.0 32,628
Second 3.2 1.3 5.5 1.2 0.8 1.6 9.0 36,161
Middle 2.7 1.2 4.7 1.1 0.8 1.4 7.9 38,168
Fourth 2.1 0.8 4.4 1.1 0.6 1.2 6.9 38,689
Richest 1.2 0.6 3.6 0.8 0.5 0.8 5.3 41,618
A Functional difficulty for household members age 18 years and above are defined as having responded "A lot of difficulty" or "Cannot at all" to questions within all listed domains
( ) Figures that are based on 25-49 unweighted cases

Sample Coverage and Characteristics of Respondents | Page 58
Table SR.8.3: Disability (household members age 18 years and above)
Percentage of household members age 18 years and above who have disability, by domain, Punjab, 2017-18
Percentage of household members age 18 years and above with disabilityA in the domain of:
Percentage of household
members age 18 years and above
with disability in at least one domain1
Number of household members age 18
years and above Seeing Hearing
Walking/ Climbing
Self-care Communication Memory
Punjab 0.1 0.2 1.0 0.5 0.3 0.3 1.5 187,265
Area of Residence
Rural 0.2 0.2 1.1 0.6 0.3 0.3 1.7 116,643
All Urban 0.1 0.1 0.9 0.4 0.2 0.2 1.3 70,621
Major Cities 0.1 0.1 0.7 0.4 0.2 0.2 1.1 39,208
Other Urban 0.1 0.1 1.0 0.5 0.2 0.2 1.5 31,413
Sex
Male 0.1 0.2 0.9 0.5 0.3 0.2 1.4 93,817
Female 0.2 0.2 1.1 0.6 0.3 0.3 1.7 93,413
Transgender (0.0) (0.0) (4.5) (0.0) (0.0) (0.0) (4.5) 35
Wealth index quintile
Poorest 0.2 0.3 1.3 0.7 0.4 0.3 2.1 32,628
Second 0.2 0.2 1.3 0.5 0.3 0.3 1.9 36,161
Middle 0.1 0.2 1.0 0.6 0.3 0.3 1.6 38,168
Fourth 0.1 0.1 0.9 0.5 0.2 0.2 1.3 38,689
Richest 0.1 0.1 0.6 0.4 0.2 0.2 1.0 41,618 1 Non-MICS indicator SR.S7 - Household members with disability A Disability for household members age 18 years and above are defined as having responded "Cannot at all" to questions within all listed domains.
( ) Figures that are based on 25-49 unweighted cases
Sample Coverage and Characteristics of Respondents | Page 59
Table SR.8.4: Social protection/transfers for disabled persons
Percentage of disabled household members age 18 and above who received any type of social protection/transfers due to disability, Punjab, 2017-18
Percentage of household members age 18 years and above with disability in any domain with social protection:
Number of household members
age 18 and above with disability
Za
kat and
Bait u
l m
aal
BIS
P
Khid
ma
t C
ard
Pensio
n/
Retire
me
nt
Wata
n/
Health C
ard
Oth
er
No b
enefits
DK
/Mis
sin
g
Any
Pro
tectio
n1
Punjab 0.3 0.6 0.3 0.7 0.2 0.2 97.3 0.5 2.2 2,889
Area of Residence
Rural 0.4 0.8 0.5 0.6 0.1 0.1 97.2 0.4 2.4 1,990
All Urban 0.0 0.3 0.0 0.8 0.2 0.4 97.6 0.6 1.8 900
Major Cities 0.0 0.0 0.0 0.4 0.4 0.0 98.8 0.5 0.7 436
Other Urban 0.0 0.6 0.0 1.3 0.0 0.9 96.6 0.6 2.8 463
SexA
Male 0.5 0.3 0.4 0.8 0.2 0.2 97.0 0.6 2.4 1,342
Female 0.1 0.9 0.3 0.5 0.1 0.2 97.7 0.3 2.0 1,546
Wealth index quintile
Poorest 0.7 0.9 0.8 0.3 0.1 0.0 96.8 0.4 2.8 692
Second 0.4 0.8 0.4 0.6 0.0 0.4 97.1 0.5 2.4 672
Middle 0.1 0.7 0.3 0.7 0.2 0.3 97.7 0.3 2.1 603
Fourth 0.0 0.4 0.1 1.0 0.1 0.0 97.6 0.8 1.6 519
Richest 0.1 0.2 0.0 0.8 0.4 0.1 98.0 0.4 1.7 402
1 Non-MICS indicator SR.S8 - Social Protection/ Transfers due to disability A The category of “Transgender” in the background characteristic of “Sex” has been suppressed from the table due to small number of unweighted cases.
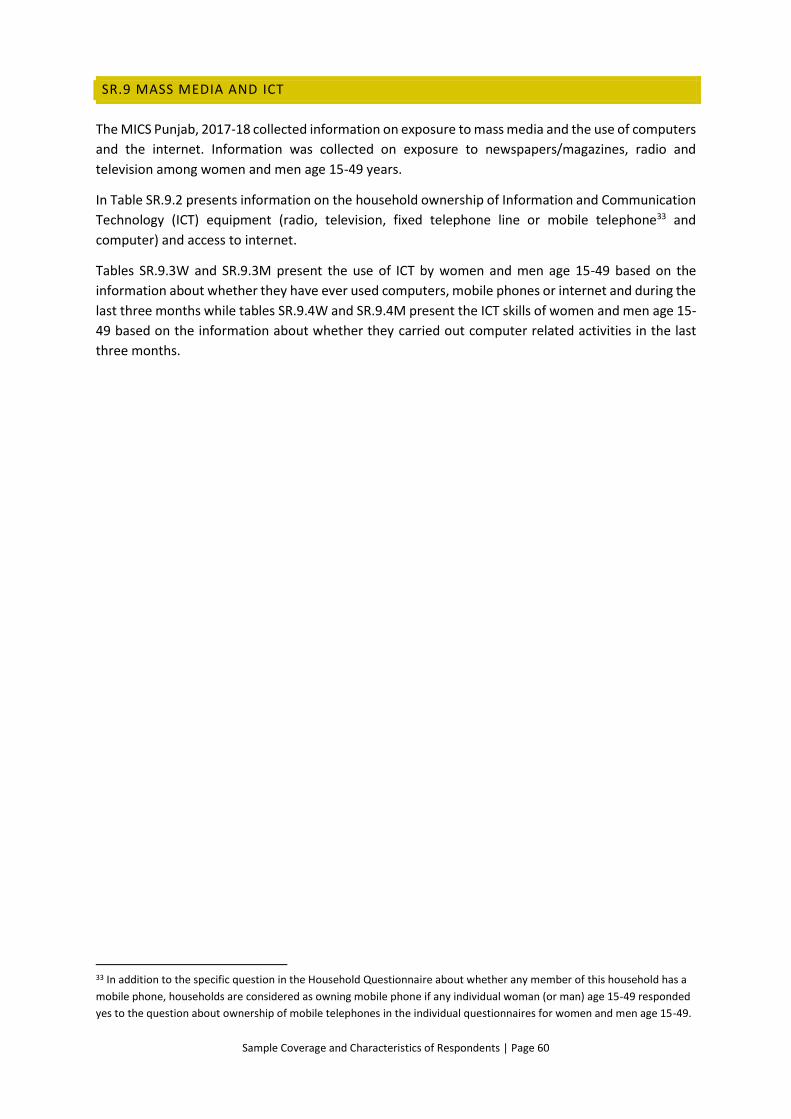
Sample Coverage and Characteristics of Respondents | Page 60
SR.9 MASS MEDIA AND ICT
The MICS Punjab, 2017-18 collected information on exposure to mass media and the use of computers
and the internet. Information was collected on exposure to newspapers/magazines, radio and
television among women and men age 15-49 years.
In Table SR.9.2 presents information on the household ownership of Information and Communication
Technology (ICT) equipment (radio, television, fixed telephone line or mobile telephone33 and
computer) and access to internet.
Tables SR.9.3W and SR.9.3M present the use of ICT by women and men age 15-49 based on the
information about whether they have ever used computers, mobile phones or internet and during the
last three months while tables SR.9.4W and SR.9.4M present the ICT skills of women and men age 15-
49 based on the information about whether they carried out computer related activities in the last
three months.
33 In addition to the specific question in the Household Questionnaire about whether any member of this household has a
mobile phone, households are considered as owning mobile phone if any individual woman (or man) age 15-49 responded
yes to the question about ownership of mobile telephones in the individual questionnaires for women and men age 15-49.
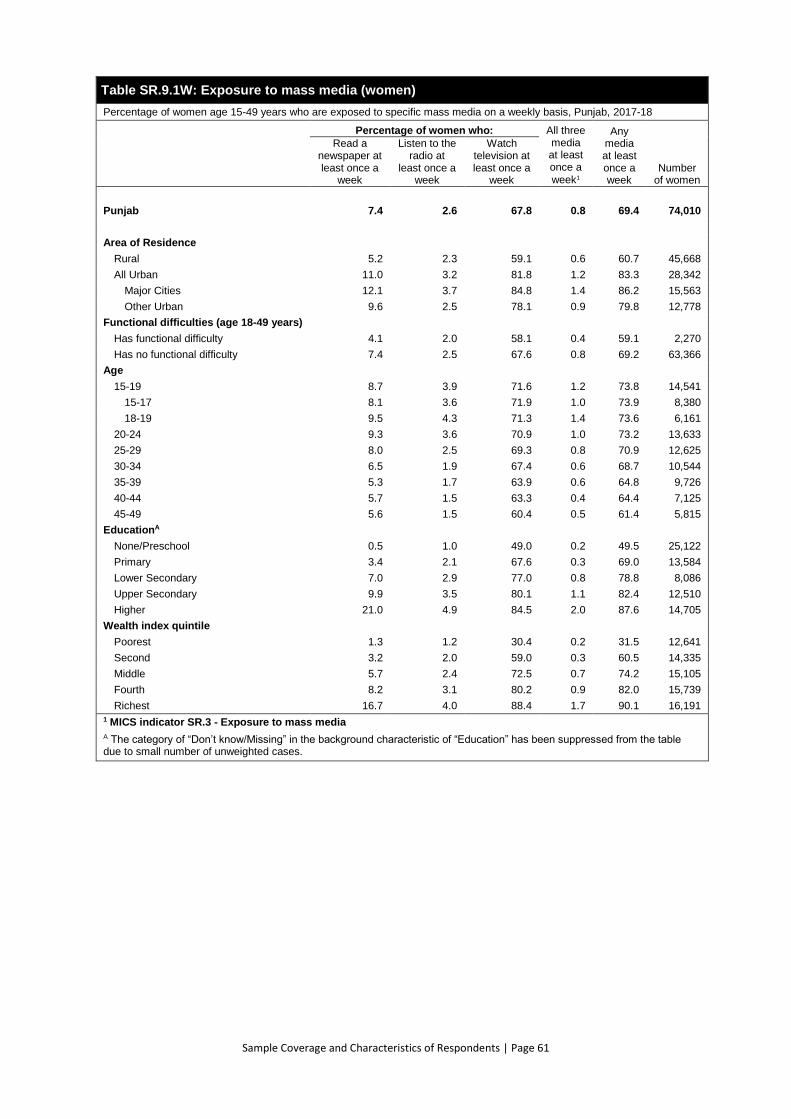
Sample Coverage and Characteristics of Respondents | Page 61
Table SR.9.1W: Exposure to mass media (women)
Percentage of women age 15-49 years who are exposed to specific mass media on a weekly basis, Punjab, 2017-18
Percentage of women who: All three media at least once a
week1
Any media at least once a week
Number of women
Read a newspaper at least once a
week
Listen to the radio at
least once a week
Watch television at least once a
week
Punjab 7.4 2.6 67.8 0.8 69.4 74,010
Area of Residence
Rural 5.2 2.3 59.1 0.6 60.7 45,668
All Urban 11.0 3.2 81.8 1.2 83.3 28,342
Major Cities 12.1 3.7 84.8 1.4 86.2 15,563
Other Urban 9.6 2.5 78.1 0.9 79.8 12,778
Functional difficulties (age 18-49 years)
Has functional difficulty 4.1 2.0 58.1 0.4 59.1 2,270
Has no functional difficulty 7.4 2.5 67.6 0.8 69.2 63,366
Age
15-19 8.7 3.9 71.6 1.2 73.8 14,541
15-17 8.1 3.6 71.9 1.0 73.9 8,380
18-19 9.5 4.3 71.3 1.4 73.6 6,161
20-24 9.3 3.6 70.9 1.0 73.2 13,633
25-29 8.0 2.5 69.3 0.8 70.9 12,625
30-34 6.5 1.9 67.4 0.6 68.7 10,544
35-39 5.3 1.7 63.9 0.6 64.8 9,726
40-44 5.7 1.5 63.3 0.4 64.4 7,125
45-49 5.6 1.5 60.4 0.5 61.4 5,815
EducationA
None/Preschool 0.5 1.0 49.0 0.2 49.5 25,122
Primary 3.4 2.1 67.6 0.3 69.0 13,584
Lower Secondary 7.0 2.9 77.0 0.8 78.8 8,086
Upper Secondary 9.9 3.5 80.1 1.1 82.4 12,510
Higher 21.0 4.9 84.5 2.0 87.6 14,705
Wealth index quintile
Poorest 1.3 1.2 30.4 0.2 31.5 12,641
Second 3.2 2.0 59.0 0.3 60.5 14,335
Middle 5.7 2.4 72.5 0.7 74.2 15,105
Fourth 8.2 3.1 80.2 0.9 82.0 15,739
Richest 16.7 4.0 88.4 1.7 90.1 16,191 1 MICS indicator SR.3 - Exposure to mass media
A The category of “Don’t know/Missing” in the background characteristic of “Education” has been suppressed from the table due to small number of unweighted cases.
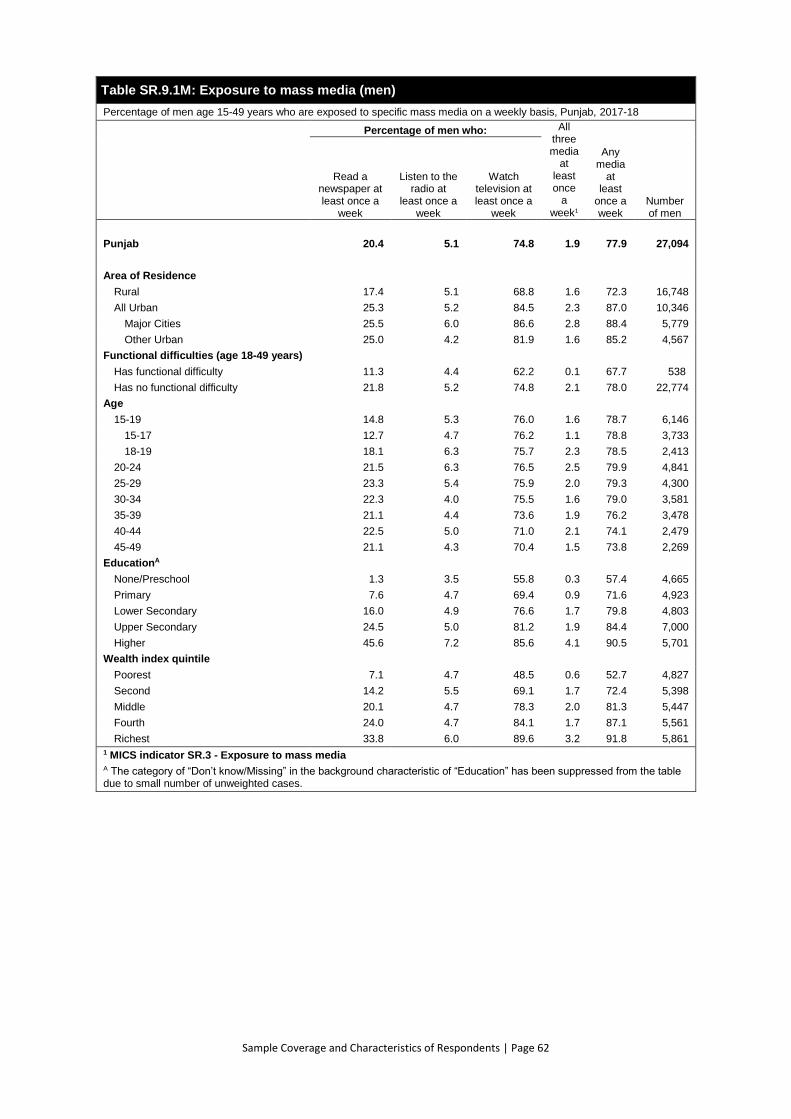
Sample Coverage and Characteristics of Respondents | Page 62
Table SR.9.1M: Exposure to mass media (men)
Percentage of men age 15-49 years who are exposed to specific mass media on a weekly basis, Punjab, 2017-18
Percentage of men who: All three media
at least once
a
week1
Any media
at least
once a week
Number of men
Read a newspaper at least once a
week
Listen to the radio at
least once a week
Watch television at least once a
week
Punjab 20.4 5.1 74.8 1.9 77.9 27,094
Area of Residence
Rural 17.4 5.1 68.8 1.6 72.3 16,748
All Urban 25.3 5.2 84.5 2.3 87.0 10,346
Major Cities 25.5 6.0 86.6 2.8 88.4 5,779
Other Urban 25.0 4.2 81.9 1.6 85.2 4,567
Functional difficulties (age 18-49 years)
Has functional difficulty 11.3 4.4 62.2 0.1 67.7 538
Has no functional difficulty 21.8 5.2 74.8 2.1 78.0 22,774
Age
15-19 14.8 5.3 76.0 1.6 78.7 6,146
15-17 12.7 4.7 76.2 1.1 78.8 3,733
18-19 18.1 6.3 75.7 2.3 78.5 2,413
20-24 21.5 6.3 76.5 2.5 79.9 4,841
25-29 23.3 5.4 75.9 2.0 79.3 4,300
30-34 22.3 4.0 75.5 1.6 79.0 3,581
35-39 21.1 4.4 73.6 1.9 76.2 3,478
40-44 22.5 5.0 71.0 2.1 74.1 2,479
45-49 21.1 4.3 70.4 1.5 73.8 2,269
EducationA
None/Preschool 1.3 3.5 55.8 0.3 57.4 4,665
Primary 7.6 4.7 69.4 0.9 71.6 4,923
Lower Secondary 16.0 4.9 76.6 1.7 79.8 4,803
Upper Secondary 24.5 5.0 81.2 1.9 84.4 7,000
Higher 45.6 7.2 85.6 4.1 90.5 5,701
Wealth index quintile
Poorest 7.1 4.7 48.5 0.6 52.7 4,827
Second 14.2 5.5 69.1 1.7 72.4 5,398
Middle 20.1 4.7 78.3 2.0 81.3 5,447
Fourth 24.0 4.7 84.1 1.7 87.1 5,561
Richest 33.8 6.0 89.6 3.2 91.8 5,861 1 MICS indicator SR.3 - Exposure to mass media A The category of “Don’t know/Missing” in the background characteristic of “Education” has been suppressed from the table due to small number of unweighted cases.
Sample Coverage and Characteristics of Respondents | Page 63
Table SR.9.2: Household ownership of ICT equipment and access to internet
Percentage of households with a radio, a television, a telephone and a computer, and have access to the internet at home, Punjab, 2017-18
Percentage of households with a: Percentage of
household that have access to
the internet at home5
Number of households Radio1 Television2
Telephone
Computer4 Fixed line
Mobile phone Any3
Punjab 2.8 71.3 4.0 95.6 95.6 16.5 26.3 51,660
Area of Residence
Rural 3.1 61.6 1.7 94.2 94.3 10.0 18.9 32,234
All Urban 2.2 87.4 7.8 97.9 97.9 27.3 38.6 19,426
Major Cities 2.2 90.5 9.4 98.5 98.5 31.6 41.6 10,807
Other Urban 2.3 83.5 5.9 97.2 97.3 21.9 34.9 8,619
Head of Household's education
None/Preschool 2.4 59.4 1.0 91.5 91.5 6.2 14.1 19,775
Primary 2.7 69.8 1.9 96.8 96.8 10.8 21.7 9,044
Lower Secondary 2.8 76.4 2.7 98.0 98.0 15.5 27.0 6,826
Upper Secondary 2.8 81.9 5.1 98.8 98.8 23.3 34.9 9,523
Higher 3.9 88.8 15.7 99.4 99.4 47.4 56.8 6,492
Wealth index quintile
Poorest 2.8 27.7 0.2 86.2 86.2 0.8 3.6 10,860
Second 2.4 63.4 0.4 95.6 95.6 3.8 10.7 10,226
Middle 2.7 80.4 0.7 98.0 98.0 9.3 20.5 9,913
Fourth 2.3 90.2 2.0 99.1 99.1 18.1 33.2 10,154
Richest 3.5 97.3 16.4 99.9 99.9 50.5 63.8 10,507 1 MICS indicator SR.4 - Households with a radio 2 MICS indicator SR.5 - Households with a television 3 MICS indicator SR.6 - Households with a telephone 4 MICS indicator SR.7 - Households with a computer 5 MICS indicator SR.8 - Households with internet
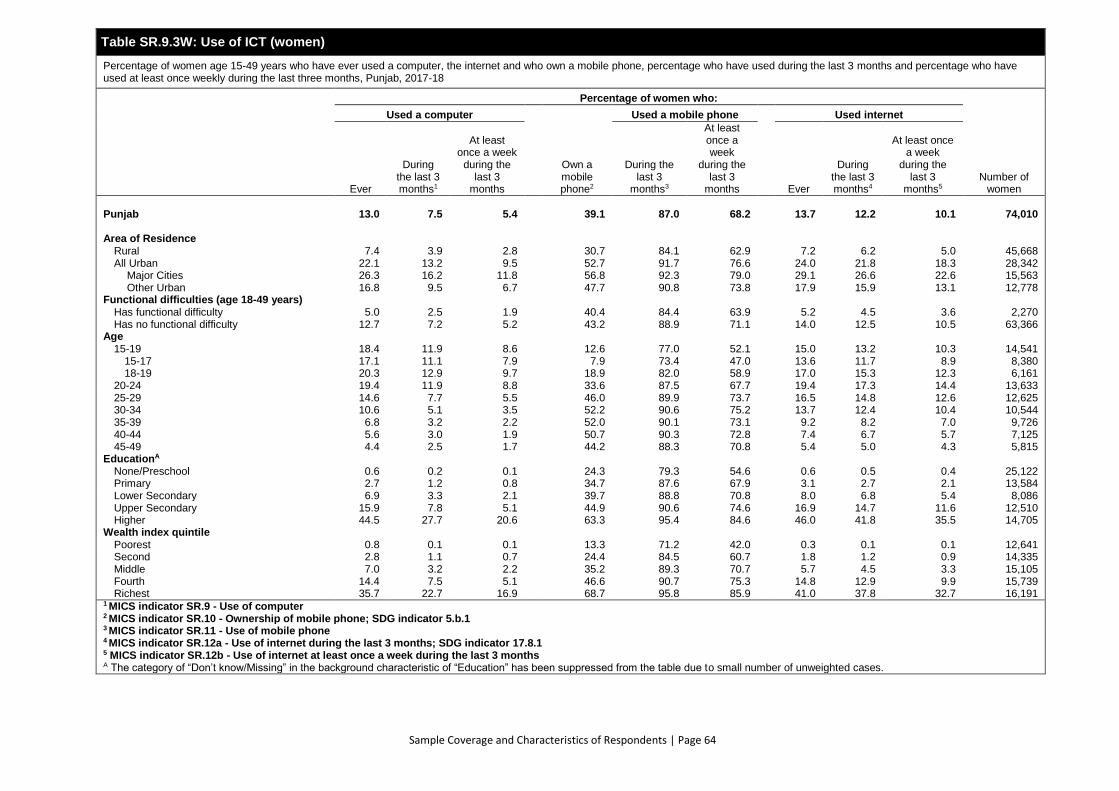
Sample Coverage and Characteristics of Respondents | Page 64
Table SR.9.3W: Use of ICT (women)
Percentage of women age 15-49 years who have ever used a computer, the internet and who own a mobile phone, percentage who have used during the last 3 months and percentage who have used at least once weekly during the last three months, Punjab, 2017-18
Percentage of women who:
Number of women
Used a computer
Own a mobile phone2
Used a mobile phone Used internet
Ever
During the last 3 months1
At least once a week
during the last 3
months
During the last 3
months3
At least once a week
during the last 3
months Ever
During the last 3 months4
At least once a week
during the last 3
months5
Punjab 13.0 7.5 5.4 39.1 87.0 68.2 13.7 12.2 10.1 74,010
Area of Residence
Rural 7.4 3.9 2.8 30.7 84.1 62.9 7.2 6.2 5.0 45,668 All Urban 22.1 13.2 9.5 52.7 91.7 76.6 24.0 21.8 18.3 28,342 Major Cities 26.3 16.2 11.8 56.8 92.3 79.0 29.1 26.6 22.6 15,563 Other Urban 16.8 9.5 6.7 47.7 90.8 73.8 17.9 15.9 13.1 12,778
Functional difficulties (age 18-49 years)
Has functional difficulty 5.0 2.5 1.9 40.4 84.4 63.9 5.2 4.5 3.6 2,270 Has no functional difficulty 12.7 7.2 5.2 43.2 88.9 71.1 14.0 12.5 10.5 63,366
Age
15-19 18.4 11.9 8.6 12.6 77.0 52.1 15.0 13.2 10.3 14,541 15-17 17.1 11.1 7.9 7.9 73.4 47.0 13.6 11.7 8.9 8,380 18-19 20.3 12.9 9.7 18.9 82.0 58.9 17.0 15.3 12.3 6,161
20-24 19.4 11.9 8.8 33.6 87.5 67.7 19.4 17.3 14.4 13,633 25-29 14.6 7.7 5.5 46.0 89.9 73.7 16.5 14.8 12.6 12,625 30-34 10.6 5.1 3.5 52.2 90.6 75.2 13.7 12.4 10.4 10,544 35-39 6.8 3.2 2.2 52.0 90.1 73.1 9.2 8.2 7.0 9,726 40-44 5.6 3.0 1.9 50.7 90.3 72.8 7.4 6.7 5.7 7,125 45-49 4.4 2.5 1.7 44.2 88.3 70.8 5.4 5.0 4.3 5,815
EducationA
None/Preschool 0.6 0.2 0.1 24.3 79.3 54.6 0.6 0.5 0.4 25,122 Primary 2.7 1.2 0.8 34.7 87.6 67.9 3.1 2.7 2.1 13,584 Lower Secondary 6.9 3.3 2.1 39.7 88.8 70.8 8.0 6.8 5.4 8,086 Upper Secondary 15.9 7.8 5.1 44.9 90.6 74.6 16.9 14.7 11.6 12,510 Higher 44.5 27.7 20.6 63.3 95.4 84.6 46.0 41.8 35.5 14,705
Wealth index quintile
Poorest 0.8 0.1 0.1 13.3 71.2 42.0 0.3 0.1 0.1 12,641 Second 2.8 1.1 0.7 24.4 84.5 60.7 1.8 1.2 0.9 14,335 Middle 7.0 3.2 2.2 35.2 89.3 70.7 5.7 4.5 3.3 15,105 Fourth 14.4 7.5 5.1 46.6 90.7 75.3 14.8 12.9 9.9 15,739 Richest 35.7 22.7 16.9 68.7 95.8 85.9 41.0 37.8 32.7 16,191
1 MICS indicator SR.9 - Use of computer 2 MICS indicator SR.10 - Ownership of mobile phone; SDG indicator 5.b.1 3 MICS indicator SR.11 - Use of mobile phone 4 MICS indicator SR.12a - Use of internet during the last 3 months; SDG indicator 17.8.1 5 MICS indicator SR.12b - Use of internet at least once a week during the last 3 months A The category of “Don’t know/Missing” in the background characteristic of “Education” has been suppressed from the table due to small number of unweighted cases.
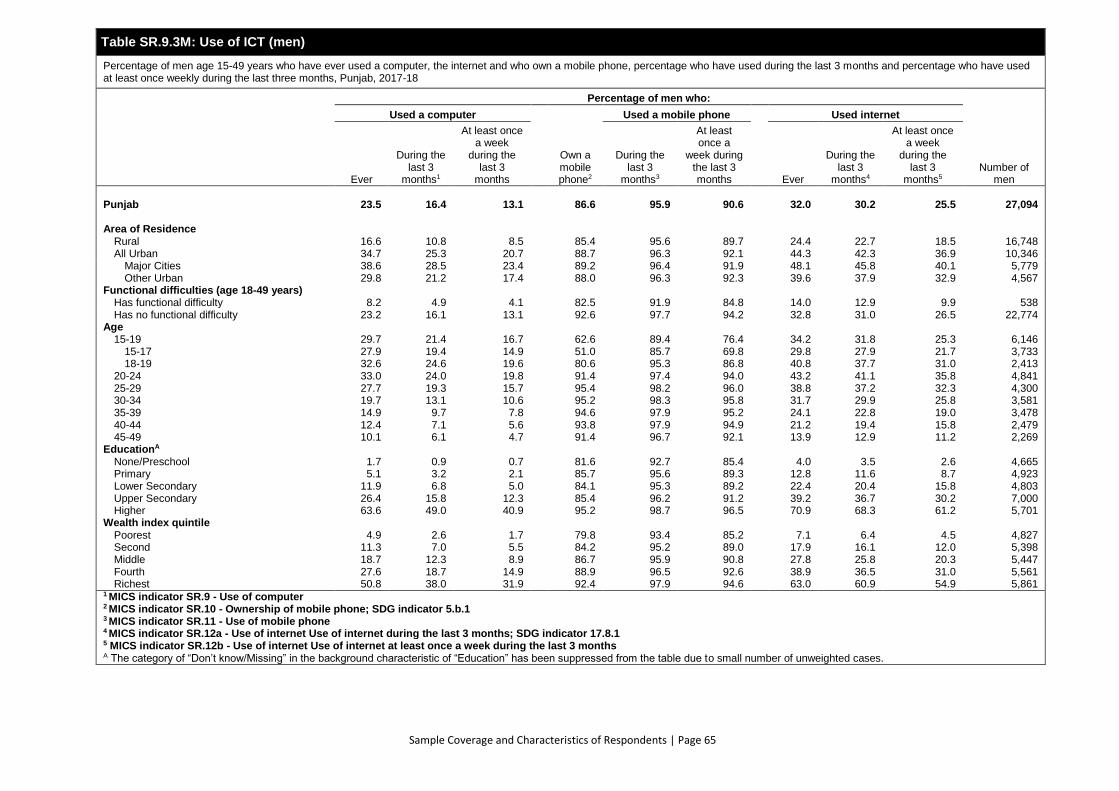
Sample Coverage and Characteristics of Respondents | Page 65
Table SR.9.3M: Use of ICT (men)
Percentage of men age 15-49 years who have ever used a computer, the internet and who own a mobile phone, percentage who have used during the last 3 months and percentage who have used at least once weekly during the last three months, Punjab, 2017-18
Percentage of men who:
Number of men
Used a computer
Own a mobile phone2
Used a mobile phone Used internet
Ever
During the last 3
months1
At least once a week
during the last 3
months
During the last 3
months3
At least once a
week during the last 3 months Ever
During the last 3
months4
At least once a week
during the last 3
months5
Punjab 23.5 16.4 13.1 86.6 95.9 90.6 32.0 30.2 25.5 27,094
Area of Residence
Rural 16.6 10.8 8.5 85.4 95.6 89.7 24.4 22.7 18.5 16,748 All Urban 34.7 25.3 20.7 88.7 96.3 92.1 44.3 42.3 36.9 10,346
Major Cities 38.6 28.5 23.4 89.2 96.4 91.9 48.1 45.8 40.1 5,779 Other Urban 29.8 21.2 17.4 88.0 96.3 92.3 39.6 37.9 32.9 4,567
Functional difficulties (age 18-49 years)
Has functional difficulty 8.2 4.9 4.1 82.5 91.9 84.8 14.0 12.9 9.9 538 Has no functional difficulty 23.2 16.1 13.1 92.6 97.7 94.2 32.8 31.0 26.5 22,774
Age
15-19 29.7 21.4 16.7 62.6 89.4 76.4 34.2 31.8 25.3 6,146 15-17 27.9 19.4 14.9 51.0 85.7 69.8 29.8 27.9 21.7 3,733 18-19 32.6 24.6 19.6 80.6 95.3 86.8 40.8 37.7 31.0 2,413
20-24 33.0 24.0 19.8 91.4 97.4 94.0 43.2 41.1 35.8 4,841 25-29 27.7 19.3 15.7 95.4 98.2 96.0 38.8 37.2 32.3 4,300 30-34 19.7 13.1 10.6 95.2 98.3 95.8 31.7 29.9 25.8 3,581 35-39 14.9 9.7 7.8 94.6 97.9 95.2 24.1 22.8 19.0 3,478 40-44 12.4 7.1 5.6 93.8 97.9 94.9 21.2 19.4 15.8 2,479 45-49 10.1 6.1 4.7 91.4 96.7 92.1 13.9 12.9 11.2 2,269
EducationA
None/Preschool 1.7 0.9 0.7 81.6 92.7 85.4 4.0 3.5 2.6 4,665 Primary 5.1 3.2 2.1 85.7 95.6 89.3 12.8 11.6 8.7 4,923 Lower Secondary 11.9 6.8 5.0 84.1 95.3 89.2 22.4 20.4 15.8 4,803 Upper Secondary 26.4 15.8 12.3 85.4 96.2 91.2 39.2 36.7 30.2 7,000 Higher 63.6 49.0 40.9 95.2 98.7 96.5 70.9 68.3 61.2 5,701
Wealth index quintile
Poorest 4.9 2.6 1.7 79.8 93.4 85.2 7.1 6.4 4.5 4,827 Second 11.3 7.0 5.5 84.2 95.2 89.0 17.9 16.1 12.0 5,398 Middle 18.7 12.3 8.9 86.7 95.9 90.8 27.8 25.8 20.3 5,447 Fourth 27.6 18.7 14.9 88.9 96.5 92.6 38.9 36.5 31.0 5,561 Richest 50.8 38.0 31.9 92.4 97.9 94.6 63.0 60.9 54.9 5,861
1 MICS indicator SR.9 - Use of computer 2 MICS indicator SR.10 - Ownership of mobile phone; SDG indicator 5.b.1 3 MICS indicator SR.11 - Use of mobile phone 4 MICS indicator SR.12a - Use of internet Use of internet during the last 3 months; SDG indicator 17.8.1 5 MICS indicator SR.12b - Use of internet Use of internet at least once a week during the last 3 months A The category of “Don’t know/Missing” in the background characteristic of “Education” has been suppressed from the table due to small number of unweighted cases.
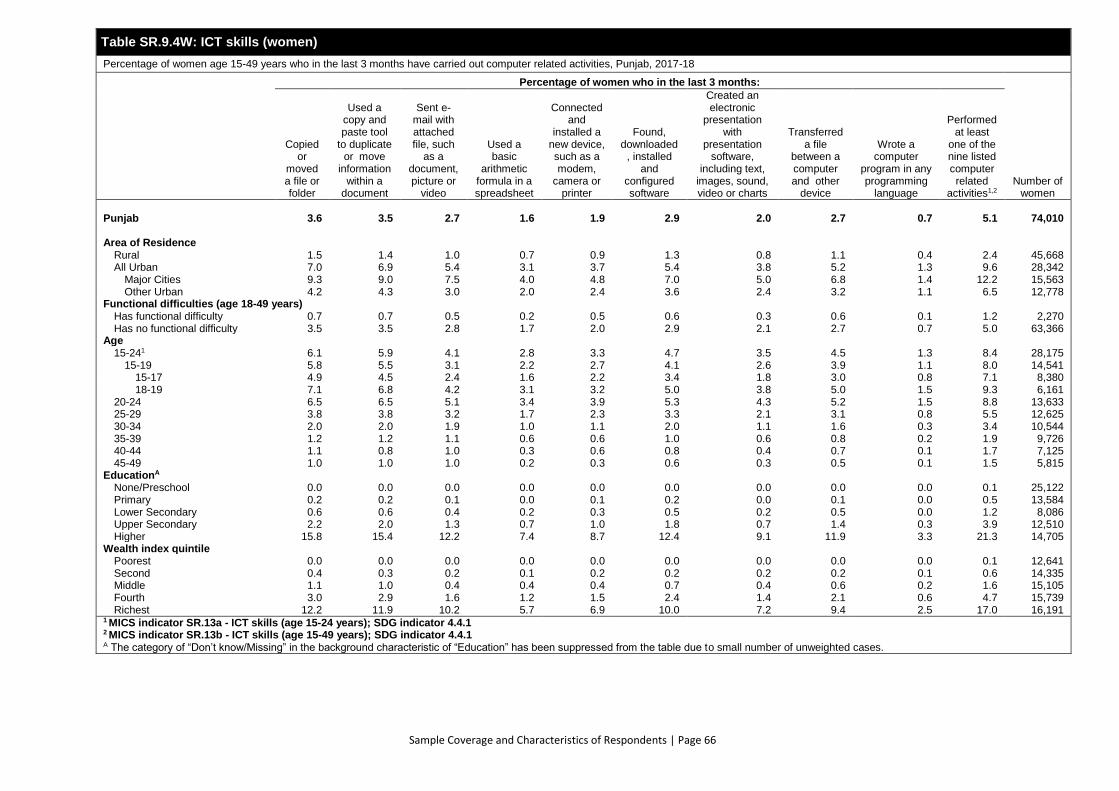
Sample Coverage and Characteristics of Respondents | Page 66
Table SR.9.4W: ICT skills (women)
Percentage of women age 15-49 years who in the last 3 months have carried out computer related activities, Punjab, 2017-18
Percentage of women who in the last 3 months:
Number of women
Copied or
moved a file or folder
Used a copy and paste tool
to duplicate or move
information within a
document
Sent e-mail with attached file, such
as a document, picture or
video
Used a basic
arithmetic formula in a spreadsheet
Connected and
installed a new device, such as a modem,
camera or printer
Found, downloaded
, installed and
configured software
Created an electronic
presentation with
presentation software,
including text, images, sound, video or charts
Transferred a file
between a computer and other
device
Wrote a computer
program in any programming
language
Performed at least
one of the nine listed computer related
activities1,2
Punjab 3.6 3.5 2.7 1.6 1.9 2.9 2.0 2.7 0.7 5.1 74,010
Area of Residence
Rural 1.5 1.4 1.0 0.7 0.9 1.3 0.8 1.1 0.4 2.4 45,668 All Urban 7.0 6.9 5.4 3.1 3.7 5.4 3.8 5.2 1.3 9.6 28,342
Major Cities 9.3 9.0 7.5 4.0 4.8 7.0 5.0 6.8 1.4 12.2 15,563 Other Urban 4.2 4.3 3.0 2.0 2.4 3.6 2.4 3.2 1.1 6.5 12,778
Functional difficulties (age 18-49 years)
Has functional difficulty 0.7 0.7 0.5 0.2 0.5 0.6 0.3 0.6 0.1 1.2 2,270 Has no functional difficulty 3.5 3.5 2.8 1.7 2.0 2.9 2.1 2.7 0.7 5.0 63,366
Age
15-241 6.1 5.9 4.1 2.8 3.3 4.7 3.5 4.5 1.3 8.4 28,175 15-19 5.8 5.5 3.1 2.2 2.7 4.1 2.6 3.9 1.1 8.0 14,541
15-17 4.9 4.5 2.4 1.6 2.2 3.4 1.8 3.0 0.8 7.1 8,380 18-19 7.1 6.8 4.2 3.1 3.2 5.0 3.8 5.0 1.5 9.3 6,161
20-24 6.5 6.5 5.1 3.4 3.9 5.3 4.3 5.2 1.5 8.8 13,633 25-29 3.8 3.8 3.2 1.7 2.3 3.3 2.1 3.1 0.8 5.5 12,625 30-34 2.0 2.0 1.9 1.0 1.1 2.0 1.1 1.6 0.3 3.4 10,544 35-39 1.2 1.2 1.1 0.6 0.6 1.0 0.6 0.8 0.2 1.9 9,726 40-44 1.1 0.8 1.0 0.3 0.6 0.8 0.4 0.7 0.1 1.7 7,125 45-49 1.0 1.0 1.0 0.2 0.3 0.6 0.3 0.5 0.1 1.5 5,815
EducationA
None/Preschool 0.0 0.0 0.0 0.0 0.0 0.0 0.0 0.0 0.0 0.1 25,122 Primary 0.2 0.2 0.1 0.0 0.1 0.2 0.0 0.1 0.0 0.5 13,584 Lower Secondary 0.6 0.6 0.4 0.2 0.3 0.5 0.2 0.5 0.0 1.2 8,086 Upper Secondary 2.2 2.0 1.3 0.7 1.0 1.8 0.7 1.4 0.3 3.9 12,510 Higher 15.8 15.4 12.2 7.4 8.7 12.4 9.1 11.9 3.3 21.3 14,705
Wealth index quintile
Poorest 0.0 0.0 0.0 0.0 0.0 0.0 0.0 0.0 0.0 0.1 12,641 Second 0.4 0.3 0.2 0.1 0.2 0.2 0.2 0.2 0.1 0.6 14,335 Middle 1.1 1.0 0.4 0.4 0.4 0.7 0.4 0.6 0.2 1.6 15,105 Fourth 3.0 2.9 1.6 1.2 1.5 2.4 1.4 2.1 0.6 4.7 15,739 Richest 12.2 11.9 10.2 5.7 6.9 10.0 7.2 9.4 2.5 17.0 16,191
1 MICS indicator SR.13a - ICT skills (age 15-24 years); SDG indicator 4.4.1 2 MICS indicator SR.13b - ICT skills (age 15-49 years); SDG indicator 4.4.1 A The category of “Don’t know/Missing” in the background characteristic of “Education” has been suppressed from the table due to small number of unweighted cases.
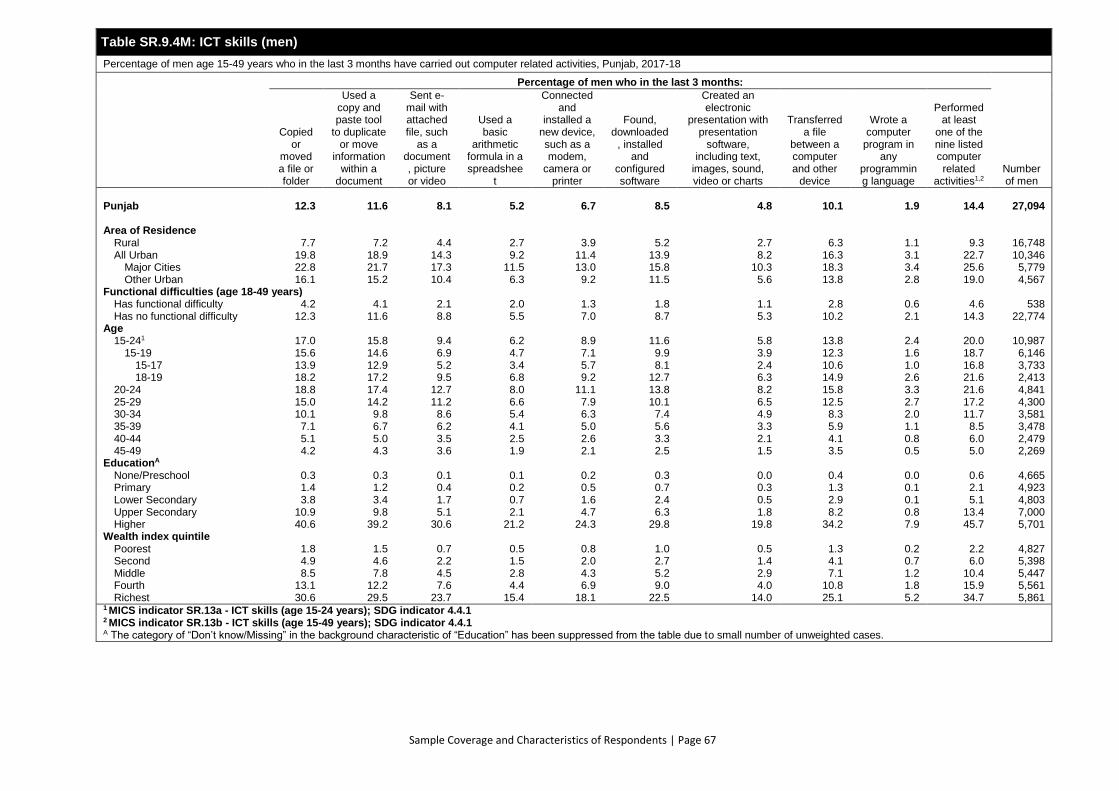
Sample Coverage and Characteristics of Respondents | Page 67
Table SR.9.4M: ICT skills (men)
Percentage of men age 15-49 years who in the last 3 months have carried out computer related activities, Punjab, 2017-18
Percentage of men who in the last 3 months:
Number of men
Copied or
moved a file or folder
Used a copy and paste tool
to duplicate or move
information within a
document
Sent e-mail with attached file, such
as a document, picture or video
Used a basic
arithmetic formula in a spreadshee
t
Connected and
installed a new device, such as a modem,
camera or printer
Found, downloaded
, installed and
configured software
Created an electronic
presentation with presentation
software, including text,
images, sound, video or charts
Transferred a file
between a computer and other
device
Wrote a computer
program in any
programming language
Performed at least
one of the nine listed computer related
activities1,2
Punjab 12.3 11.6 8.1 5.2 6.7 8.5 4.8 10.1 1.9 14.4 27,094
Area of Residence
Rural 7.7 7.2 4.4 2.7 3.9 5.2 2.7 6.3 1.1 9.3 16,748 All Urban 19.8 18.9 14.3 9.2 11.4 13.9 8.2 16.3 3.1 22.7 10,346
Major Cities 22.8 21.7 17.3 11.5 13.0 15.8 10.3 18.3 3.4 25.6 5,779 Other Urban 16.1 15.2 10.4 6.3 9.2 11.5 5.6 13.8 2.8 19.0 4,567
Functional difficulties (age 18-49 years)
Has functional difficulty 4.2 4.1 2.1 2.0 1.3 1.8 1.1 2.8 0.6 4.6 538 Has no functional difficulty 12.3 11.6 8.8 5.5 7.0 8.7 5.3 10.2 2.1 14.3 22,774
Age
15-241 17.0 15.8 9.4 6.2 8.9 11.6 5.8 13.8 2.4 20.0 10,987 15-19 15.6 14.6 6.9 4.7 7.1 9.9 3.9 12.3 1.6 18.7 6,146
15-17 13.9 12.9 5.2 3.4 5.7 8.1 2.4 10.6 1.0 16.8 3,733 18-19 18.2 17.2 9.5 6.8 9.2 12.7 6.3 14.9 2.6 21.6 2,413
20-24 18.8 17.4 12.7 8.0 11.1 13.8 8.2 15.8 3.3 21.6 4,841 25-29 15.0 14.2 11.2 6.6 7.9 10.1 6.5 12.5 2.7 17.2 4,300 30-34 10.1 9.8 8.6 5.4 6.3 7.4 4.9 8.3 2.0 11.7 3,581 35-39 7.1 6.7 6.2 4.1 5.0 5.6 3.3 5.9 1.1 8.5 3,478 40-44 5.1 5.0 3.5 2.5 2.6 3.3 2.1 4.1 0.8 6.0 2,479 45-49 4.2 4.3 3.6 1.9 2.1 2.5 1.5 3.5 0.5 5.0 2,269
EducationA
None/Preschool 0.3 0.3 0.1 0.1 0.2 0.3 0.0 0.4 0.0 0.6 4,665 Primary 1.4 1.2 0.4 0.2 0.5 0.7 0.3 1.3 0.1 2.1 4,923 Lower Secondary 3.8 3.4 1.7 0.7 1.6 2.4 0.5 2.9 0.1 5.1 4,803 Upper Secondary 10.9 9.8 5.1 2.1 4.7 6.3 1.8 8.2 0.8 13.4 7,000 Higher 40.6 39.2 30.6 21.2 24.3 29.8 19.8 34.2 7.9 45.7 5,701
Wealth index quintile
Poorest 1.8 1.5 0.7 0.5 0.8 1.0 0.5 1.3 0.2 2.2 4,827 Second 4.9 4.6 2.2 1.5 2.0 2.7 1.4 4.1 0.7 6.0 5,398 Middle 8.5 7.8 4.5 2.8 4.3 5.2 2.9 7.1 1.2 10.4 5,447 Fourth 13.1 12.2 7.6 4.4 6.9 9.0 4.0 10.8 1.8 15.9 5,561 Richest 30.6 29.5 23.7 15.4 18.1 22.5 14.0 25.1 5.2 34.7 5,861
1 MICS indicator SR.13a - ICT skills (age 15-24 years); SDG indicator 4.4.1 2 MICS indicator SR.13b - ICT skills (age 15-49 years); SDG indicator 4.4.1 A The category of “Don’t know/Missing” in the background characteristic of “Education” has been suppressed from the table due to small number of unweighted cases.
Sample Coverage and Characteristics of Respondents | Page 68
SR.10 TOBACCO USE
Tobacco products are products made entirely or partly of leaf tobacco as raw material, which are
intended to be smoked, sucked, chewed, or snuffed. All contain the highly addictive psychoactive
ingredient, nicotine. Tobacco use is one of the main risk factors for a number of chronic diseases,
including cancer, lung diseases, and cardiovascular diseases.34 If mentioned, e-cigarettes are included
in the other response category of smokeless tobacco product use.
The MICS Punjab, 2017-18 collected information on ever and current use of tobacco among women
and men age 15-49 years. This section presents the main results.
Table SR.10.1W presents the current and ever use of tobacco products by women age 15-49 years,
and Table SR.10.1M presents the corresponding information for men of the same age group.
Tables SR.10.2W and SR.10.2M present results on age at first use of cigarettes, as well as frequency
of use, for women and men respectively.
34 "Tobacco Key Facts." World Health Organization. March 9, 2018. Accessed August 24, 2018.
http://www.who.int/en/news-room/fact-sheets/detail/tobacco.
Sample Coverage and Characteristics of Respondents | Page 69
Table SR.10.1W: Current and ever use of tobacco (women)
Percentage of women age 15-49 years by pattern of use of tobacco, Punjab, 2017-18
Never smoked
cigarettes or used other
tobacco products
Ever users
Users of tobacco products at any time during the last one month
Percentage of women who did not use any smoked
tobacco product in the last month2
Number of women
Only cigarettes
Cigarettes and other tobacco products
Only other
tobacco products
Any tobacco product
Only cigarettes
Cigarettes and other tobacco products
Only other
tobacco products
Any tobacco product1
Punjab 94.6 1.0 0.5 3.6 5.1 0.5 0.3 2.5 3.3 97.4 74,010 Area of Residence
Rural 93.4 1.1 0.7 4.5 6.3 0.6 0.4 3.6 4.6 96.5 45,668 All Urban 96.6 0.8 0.3 2.0 3.0 0.3 0.1 0.8 1.2 99.0 28,342
Major Cities 97.3 0.8 0.2 1.5 2.5 0.3 0.0 0.4 0.7 99.4 15,563 Other Urban 95.7 0.8 0.3 2.6 3.7 0.3 0.1 1.3 1.7 98.5 12,778
Functional difficulties (age 18-49 years) Has functional difficulty 88.2 2.8 1.8 6.7 11.3 1.8 0.8 5.6 8.2 93.2 2,270 Has no functional difficulty 94.3 1.0 0.6 3.8 5.3 0.5 0.3 2.7 3.5 97.3 63,366
Age 15-19 98.1 0.3 0.1 1.2 1.6 0.0 0.0 0.5 0.5 99.5 14,541
15-17 98.3 0.2 0.1 1.0 1.4 0.0 0.0 0.3 0.4 99.5 8,380 18-19 97.8 0.4 0.1 1.3 1.9 0.1 0.0 0.6 0.7 99.4 6,161
20-24 97.5 0.5 0.2 1.6 2.2 0.1 0.0 0.8 0.9 99.2 13,633 25-29 95.9 0.8 0.2 2.8 3.8 0.3 0.1 1.7 2.0 98.3 12,625 30-34 94.2 1.1 0.5 4.0 5.5 0.5 0.2 3.0 3.7 97.1 10,544 35-39 92.0 1.5 1.0 5.1 7.7 1.0 0.5 4.0 5.5 95.7 9,726 40-44 90.2 1.7 1.2 6.6 9.4 1.0 0.6 5.2 6.8 95.0 7,125 45-49 86.8 2.3 1.8 8.8 12.9 1.7 0.9 7.1 9.7 92.8 5,815
Under-5s in the same household At least one 94.5 1.0 0.5 3.7 5.2 0.5 0.2 2.7 3.4 97.3 37,511 None 94.7 1.0 0.6 3.4 5.0 0.6 0.3 2.3 3.2 97.6 36,499
EducationA None/Preschool 89.7 1.7 1.2 7.0 9.9 1.2 0.7 5.9 7.9 94.1 25,122 Primary 95.5 0.9 0.4 2.9 4.2 0.3 0.1 1.9 2.3 98.2 13,584 Lower Secondary 97.2 0.6 0.2 1.7 2.4 0.1 0.0 0.7 0.8 99.2 8,086 Upper Secondary 97.7 0.3 0.2 1.4 1.9 0.1 0.0 0.4 0.4 99.4 12,510 Higher 98.0 0.5 0.1 1.1 1.7 0.0 0.0 0.2 0.2 99.7 14,705
Wealth index quintile Poorest 87.5 1.9 1.5 8.9 12.2 1.4 0.8 8.1 10.4 92.4 12,641 Second 94.1 1.0 0.6 3.9 5.6 0.7 0.4 3.1 4.1 96.8 14,335 Middle 95.9 0.8 0.3 2.7 3.8 0.3 0.1 1.5 2.0 98.4 15,105 Fourth 96.9 0.7 0.3 1.8 2.8 0.2 0.1 0.7 1.0 99.1 15,739 Richest 97.2 0.6 0.2 1.6 2.4 0.1 0.0 0.4 0.5 99.4 16,191
1 MICS indicator SR.14a - Tobacco use; SDG indicator 3.a.1 2 MICS indicator SR.14b - Non-smokers; SDG indicator 3.8.1 A The category of “Don’t know/Missing” in the background characteristic of “Education” has been suppressed from the table due to small number of unweighted cases.

Sample Coverage and Characteristics of Respondents | Page 70
Table SR.10.1M: Current and ever use of tobacco (men)
Percentage of men age 15-49 years by pattern of use of tobacco, Punjab, 2017-18
Never smoked
cigarettes or used other
tobacco products
Ever users
Users of tobacco products at any time during the last one month
Percentage of men who did not use any smoked
tobacco product in the last month2 Number of men
Only cigarettes
Cigarettes and other tobacco products
Only other
tobacco products
Any tobacco product
Only cigarettes
Cigarettes and other tobacco products
Only other
tobacco products
Any tobacco product1
Punjab 69.8 17.6 5.9 6.3 29.9 13.9 3.7 6.4 24.0 80.6 27,094
Area of Residence Rural 69.0 17.5 6.9 6.2 30.7 14.2 4.4 6.8 25.4 79.1 16,748 All Urban 71.1 17.8 4.3 6.5 28.6 13.4 2.4 5.8 21.6 83.1 10,346
Major Cities 70.8 18.5 4.2 6.3 28.9 13.9 2.4 5.3 21.6 82.8 5,779 Other Urban 71.5 17.0 4.5 6.7 28.2 12.9 2.4 6.4 21.7 83.6 4,567
Functional difficulties (age 18-49 years) Has functional difficulty 51.3 24.3 13.9 9.9 48.1 20.4 9.0 11.7 41.1 67.2 538 Has no functional difficulty 66.3 20.0 6.6 6.8 33.4 15.8 4.1 7.0 26.9 78.1 22,774
Age 15-19 91.0 3.7 1.1 4.0 8.7 1.8 0.5 2.9 5.2 96.6 6,146
15-17 93.6 2.2 0.8 3.1 6.1 1.2 0.3 2.2 3.7 97.6 3,733 18-19 86.9 5.9 1.6 5.3 12.8 2.8 0.9 4.0 7.7 95.1 2,413
20-24 80.9 10.1 2.8 5.7 18.7 6.6 1.6 5.2 13.3 90.6 4,841 25-29 70.7 17.6 4.7 6.7 29.0 13.1 2.9 6.3 22.3 82.7 4,300 30-34 60.8 23.9 7.6 7.4 38.9 19.7 4.5 8.4 32.5 74.3 3,581 35-39 53.5 27.1 11.2 8.0 46.2 22.6 7.1 8.8 38.5 67.7 3,478 40-44 51.8 30.8 9.6 7.4 47.8 26.2 6.2 8.8 41.2 64.5 2,479 45-49 45.8 32.9 13.1 7.9 53.9 28.0 8.8 9.3 46.1 59.3 2,269
Under-5s in the same household At least one 66.0 19.7 7.0 7.0 33.7 15.7 4.3 7.6 27.6 78.1 13,273 None 73.5 15.6 4.9 5.6 26.2 12.2 3.1 5.3 20.5 83.1 13,821
EducationA None/Preschool 53.1 25.9 10.9 9.7 46.5 23.0 7.7 10.7 41.4 65.9 4,665 Primary 63.4 20.4 8.2 7.9 36.4 16.6 4.8 8.8 30.3 76.7 4,923 Lower Secondary 69.5 18.2 5.6 6.5 30.4 14.3 3.2 6.8 24.3 81.0 4,803 Upper Secondary 76.1 14.2 4.1 5.3 23.6 10.8 2.4 4.9 18.1 85.3 7,000 Higher 81.6 12.3 2.4 3.3 18.0 7.6 1.3 2.3 11.2 90.0 5,701
Wealth index quintile Poorest 61.2 19.8 10.2 8.5 38.5 17.6 7.3 9.7 34.6 71.9 4,827 Second 68.6 17.5 6.8 6.7 31.1 14.6 4.3 7.3 26.3 79.0 5,398 Middle 71.0 17.2 5.7 5.8 28.7 13.2 3.3 6.4 22.9 81.7 5,447 Fourth 72.0 17.3 4.3 6.2 27.7 13.2 2.3 5.5 21.0 83.4 5,561 Richest 74.8 16.7 3.4 4.8 24.9 11.5 1.7 3.7 16.9 85.7 5,861
1 MICS indicator SR.14a - Tobacco use; SDG indicator 3.a.1 2 MICS indicator SR.14b - Non-smokers; SDG indicator 3.8.1 A The category of “Don’t know/Missing” in the background characteristic of “Education” has been suppressed from the table due to small number of unweighted cases.
Sample Coverage and Characteristics of Respondents | Page 71
Table SR.10.2W: Age at first use of cigarettes and frequency of use (women)
Percentage of women age 15-49 years who smoked a whole cigarette before age 15, and percent distribution of current smokers by the number of cigarettes smoked in the last 24 hours, Punjab, 2017-18
Percentage of women who smoked a whole
cigarette before age 151 Number of
women
Number of cigarettes in the last 24 hours
Total
Number of women who are current
cigarette smokers Less than 5 5-9 10-19 20+
Punjab 0.2 74,010 63.0 14.4 10.1 12.5 100.0 561 Area of Residence
Rural 0.3 45,668 64.4 14.6 9.4 11.6 100.0 465 All Urban 0.2 28,342 56.3 13.4 13.7 16.6 100.0 96
Major Cities 0.2 15,563 (59.2) (14.1) (15.5) (11.2) 100.0 43 Other Urban 0.2 12,778 (53.9) (12.8) (12.3) (21.0) 100.0 53
Functional difficulties (age 18-49 years) Has functional difficulty 0.6 2,270 65.9 19.5 5.6 8.9 100.0 59 Has no functional difficulty 0.2 63,366 62.6 13.7 10.7 13.0 100.0 498
Age 15-19 0.2 14,541 (*) (*) (*) (*) 100.0 8
15-17 0.2 8,380 (*) (*) (*) (*) 100.0 4 18-19 0.3 6,161 (*) (*) (*) (*) 100.0 4
20-24 0.2 13,633 (*) (*) (*) (*) 100.0 15 25-29 0.2 12,625 (56.2) (13.5) (16.8) (13.5) 100.0 43 30-34 0.2 10,544 67.7 15.8 4.5 12.0 100.0 80 35-39 0.4 9,726 63.6 14.2 7.5 14.7 100.0 150 40-44 0.3 7,125 69.5 10.7 12.8 7.0 100.0 114 45-49 0.4 5,815 55.8 15.9 12.0 16.3 100.0 151
Under-5s in the same household At least one 0.2 37,511 63.3 14.4 9.9 12.5 100.0 250 None 0.3 36,499 62.8 14.4 10.3 12.5 100.0 312
EducationA None/Preschool 0.4 25,122 61.2 14.8 10.7 13.3 100.0 480 Primary 0.2 13,584 69.1 15.4 8.3 7.3 100.0 55 Lower Secondary 0.1 8,086 (*) (*) (*) (*) 100.0 12 Upper Secondary 0.1 12,510 (*) (*) (*) (*) 100.0 10 Higher 0.2 14,705 (*) (*) (*) (*) 100.0 4
Wealth index quintile Poorest 0.5 12,641 61.5 13.3 10.2 15.0 100.0 285 Second 0.2 14,335 65.5 15.9 9.8 8.8 100.0 154 Middle 0.2 15,105 64.5 14.7 11.3 9.5 100.0 67 Fourth 0.2 15,739 (59.9) (16.1) (9.5) (14.5) 100.0 42 Richest 0.2 16,191 (*) (*) (*) (*) 100.0 15
1 MICS indicator SR.15 - Smoking before age 15 A The category of “Don’t know/Missing” in the background characteristic of “Education” has been suppressed from the table due to small number of unweighted cases. ( ) Figures that are based on 25-49 unweighted cases (*) Figures that are based on fewer than 25 unweighted cases

Sample Coverage and Characteristics of Respondents | Page 72
Table SR.10.2M: Age at first use of cigarettes and frequency of use (men)
Percentage of men age 15-49 years who smoked a whole cigarette before age 15, and percent distribution of current smokers by the number of cigarettes smoked in the last 24 hours, Punjab, 2017-18
Percentage of men who
smoked a whole cigarette before age 151
Number of men
Number of cigarettes in the last 24 hours
Total
Number of men who are current cigarette
smokers Less than 5 5-9 10-19 20+
Punjab 3.0 27,094 22.4 18.6 27.7 31.3 100.0 4,760 Area of Residence
Rural 3.5 16,748 20.5 17.9 28.2 33.4 100.0 3,119 All Urban 2.2 10,346 26.0 20.0 26.7 27.2 100.0 1,641
Major Cities 1.7 5,779 23.4 19.9 26.9 29.8 100.0 943 Other Urban 2.7 4,567 29.6 20.3 26.4 23.8 100.0 698
Functional difficulties (age 18-49 years) Has functional difficulty 6.1 538 24.5 15.8 31.4 28.2 100.0 158 Has no functional difficulty 3.2 22,774 22.0 18.8 27.5 31.7 100.0 4,544
Age 15-19 1.6 6,146 37.9 21.5 25.2 15.4 100.0 143
15-17 1.5 3,733 45.3 16.2 27.2 11.4 100.0 55 18-19 1.7 2,413 33.4 24.8 23.9 17.9 100.0 89
20-24 2.0 4,841 36.1 22.4 25.0 16.5 100.0 394 25-29 2.7 4,300 27.7 19.8 28.3 24.2 100.0 687 30-34 3.4 3,581 21.6 19.1 29.1 30.3 100.0 865 35-39 4.2 3,478 20.0 17.4 27.9 34.7 100.0 1,032 40-44 4.1 2,479 18.8 18.1 28.5 34.7 100.0 803 45-49 6.0 2,269 16.3 17.0 26.3 40.5 100.0 835
Under-5s in the same household At least one 3.3 13,273 22.9 18.5 28.7 30.0 100.0 2,654 None 2.8 13,821 21.8 18.8 26.4 32.9 100.0 2,106
EducationA None/Preschool 6.1 4,665 16.4 17.2 30.4 36.0 100.0 1,433 Primary 4.4 4,923 20.1 18.1 26.2 35.6 100.0 1,057 Lower Secondary 2.7 4,803 24.0 18.4 28.4 29.2 100.0 841 Upper Secondary 1.7 7,000 25.7 20.4 27.3 26.6 100.0 922 Higher 1.1 5,701 35.5 20.9 22.7 21.0 100.0 507
Wealth index quintile Poorest 5.7 4,827 14.6 16.6 30.5 38.3 100.0 1,201 Second 3.2 5,398 21.0 17.9 29.0 32.1 100.0 1,024 Middle 2.6 5,447 22.5 20.5 27.5 29.5 100.0 899 Fourth 2.7 5,561 26.8 20.8 24.0 28.4 100.0 863 Richest 1.2 5,861 31.4 18.2 25.8 24.6 100.0 773
1 MICS indicator SR.15 - Smoking before age 15 A The category of “Don’t know/Missing” in the background characteristic of “Education” has been suppressed from the table due to small number of unweighted cases.
Sample Coverage and Characteristics of Respondents | Page 73
SR.11 CHILDREN'S LIVING ARRANGEMENTS
The Convention on the Rights of the Child (CRC) recognizes that “the child, for the full and harmonious
development of his or her personality, should grow up in a family environment, in an atmosphere of
happiness, love and understanding”. Millions of children around the world grow up without the care
of their parents for several reasons, including due to the premature death of the parents or their
migration for work. In most cases, these children are cared for by members of their extended families,
while in others, children may be living in households other than their own, as live-in domestic workers
for instance. Understanding the children’s living arrangements, including the composition of the
households in which they live and the relationships with their primary caregivers, is key to design
targeted interventions aimed at promoting child’s care and wellbeing.
Table SR.11.1 presents information on the living arrangements and orphanhood status of children
under age 18.
The MICS Punjab, 2017-18 included a simple measure of one particular aspect of migration related to
what is termed “children left behind”, i.e. for whom one or both parents have moved abroad. While
the amount of literature is growing, the long-term effects of the benefits of remittances versus the
potential adverse psycho-social effects are not yet conclusive, as there is somewhat conflicting
evidence available as to the effects on children. Table SR.11.2 presents information on the living
arrangements and co-residence with parents of children under age 18.
Table SR.11.3 presents information on children under age 18 years not living with a biological parent
according to relationship to the head of household and those living in households headed by a family
member.

Sample Coverage and Characteristics of Respondents | Page 74
Table SR.11.1: Children's living arrangements and orphanhood
Percent distribution of children age 0-17 years according to living arrangements, percentage of children age 0-17 years not living with a biological parent and percentage of children who have one or both parents dead, Punjab, 2017-18
Living with both
parents
Living with neither biological parent
Living with mother only
Living with father only
Missing information on father/ mother Total
Not living with
biological mother
Living with
neither biological parent1
One or both
parents dead2
Number of
children age 0-17
years
Only father alive
Only mother alive
Both alive
Both dead
Father alive
Father dead
Mother alive
Mother dead
Punjab 87.5 0.2 0.2 1.1 0.2 6.0 2.9 0.4 1.3 0.1 100.0 3.6 1.7 4.9 140,715
Area of Residence
Rural 87.1 0.2 0.2 1.2 0.2 6.2 3.0 0.4 1.5 0.1 100.0 3.7 1.8 5.0 92,064
All Urban 88.2 0.2 0.1 1.1 0.2 5.6 2.9 0.4 1.1 0.1 100.0 3.2 1.6 4.5 48,651
Major Cities 89.8 0.2 0.1 0.9 0.2 4.3 2.7 0.4 1.0 0.1 100.0 3.0 1.5 4.3 25,779
Other Urban 86.4 0.3 0.1 1.2 0.2 7.0 3.0 0.4 1.2 0.1 100.0 3.5 1.8 4.8 22,872
SexA
Male 87.7 0.2 0.2 0.9 0.2 5.9 3.0 0.5 1.4 0.1 100.0 3.3 1.4 4.9 72,236
Female 87.2 0.3 0.2 1.4 0.2 6.1 2.8 0.4 1.3 0.1 100.0 3.8 2.0 4.8 68,473
Age
0-4 91.3 0.1 0.0 0.5 0.0 6.7 0.7 0.2 0.3 0.1 100.0 1.3 0.7 1.2 42,090
5-9 88.3 0.3 0.1 1.0 0.1 6.2 2.3 0.5 1.1 0.1 100.0 3.1 1.5 3.9 42,418
10-14 85.5 0.3 0.3 1.2 0.2 5.4 4.3 0.6 2.1 0.1 100.0 4.7 2.0 7.2 37,112
15-17 81.2 0.3 0.4 2.6 0.5 5.0 6.6 0.5 2.8 0.2 100.0 7.2 3.8 10.6 19,096
Wealth index quintile
Poorest 89.2 0.2 0.2 1.1 0.2 3.5 3.3 0.5 1.6 0.1 100.0 3.9 1.7 5.6 32,966
Second 88.2 0.3 0.2 1.2 0.1 4.7 3.2 0.5 1.5 0.1 100.0 3.9 1.8 5.3 29,438
Middle 87.1 0.3 0.2 1.2 0.2 6.0 3.0 0.4 1.4 0.2 100.0 3.8 1.9 5.1 27,423
Fourth 85.8 0.3 0.1 1.0 0.2 8.0 2.8 0.3 1.3 0.1 100.0 3.4 1.7 4.8 26,910
Richest 86.5 0.2 0.1 1.0 0.1 8.7 2.1 0.3 0.8 0.1 100.0 2.7 1.5 3.3 23,978 1 MICS indicator SR.18 - Children’s living arrangements 2 MICS indicator SR.19 - Prevalence of children with one or both parents dead A The category of “Transgender” in the background characteristic of “Sex” has been suppressed from the table due to small number of unweighted cases.
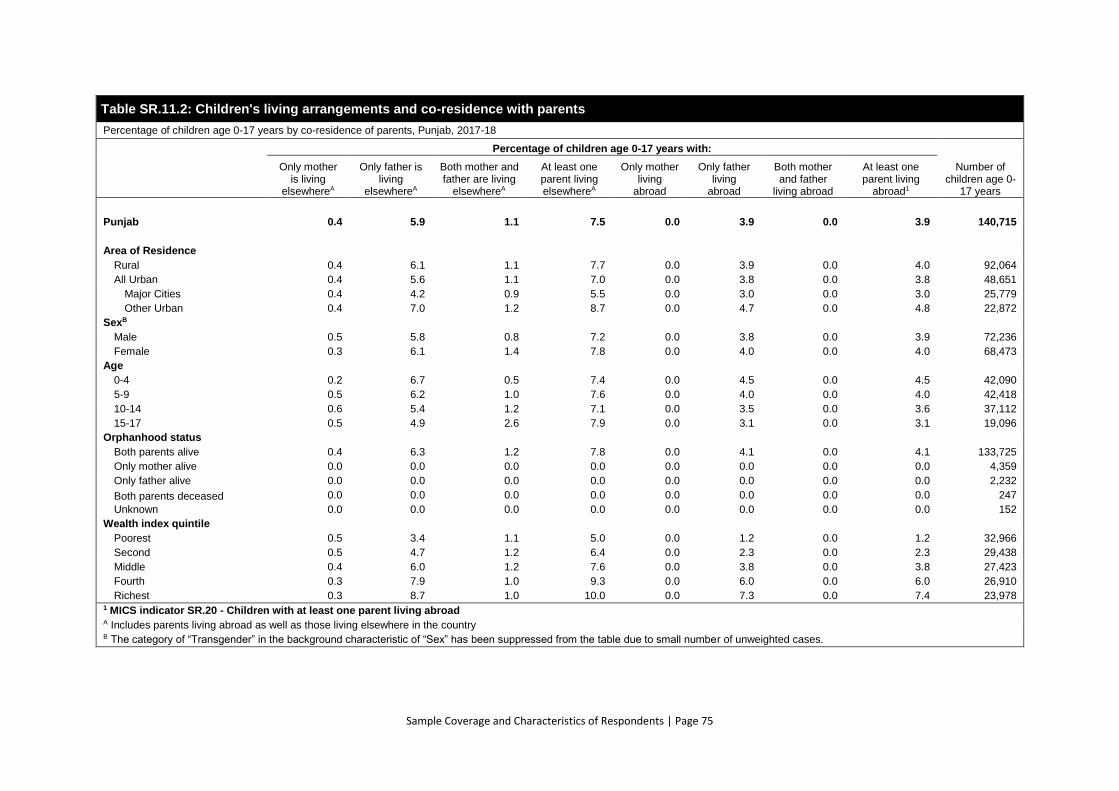
Sample Coverage and Characteristics of Respondents | Page 75
Table SR.11.2: Children's living arrangements and co-residence with parents
Percentage of children age 0-17 years by co-residence of parents, Punjab, 2017-18
Percentage of children age 0-17 years with:
Number of children age 0-
17 years
Only mother is living
elsewhereA
Only father is living
elsewhereA
Both mother and father are living
elsewhereA
At least one parent living elsewhereA
Only mother living
abroad
Only father living
abroad
Both mother and father
living abroad
At least one parent living
abroad1
Punjab 0.4 5.9 1.1 7.5 0.0 3.9 0.0 3.9 140,715
Area of Residence
Rural 0.4 6.1 1.1 7.7 0.0 3.9 0.0 4.0 92,064
All Urban 0.4 5.6 1.1 7.0 0.0 3.8 0.0 3.8 48,651
Major Cities 0.4 4.2 0.9 5.5 0.0 3.0 0.0 3.0 25,779
Other Urban 0.4 7.0 1.2 8.7 0.0 4.7 0.0 4.8 22,872
SexB
Male 0.5 5.8 0.8 7.2 0.0 3.8 0.0 3.9 72,236
Female 0.3 6.1 1.4 7.8 0.0 4.0 0.0 4.0 68,473
Age
0-4 0.2 6.7 0.5 7.4 0.0 4.5 0.0 4.5 42,090
5-9 0.5 6.2 1.0 7.6 0.0 4.0 0.0 4.0 42,418
10-14 0.6 5.4 1.2 7.1 0.0 3.5 0.0 3.6 37,112
15-17 0.5 4.9 2.6 7.9 0.0 3.1 0.0 3.1 19,096
Orphanhood status
Both parents alive 0.4 6.3 1.2 7.8 0.0 4.1 0.0 4.1 133,725
Only mother alive 0.0 0.0 0.0 0.0 0.0 0.0 0.0 0.0 4,359
Only father alive 0.0 0.0 0.0 0.0 0.0 0.0 0.0 0.0 2,232
Both parents deceased 0.0 0.0 0.0 0.0 0.0 0.0 0.0 0.0 247
Unknown 0.0 0.0 0.0 0.0 0.0 0.0 0.0 0.0 152
Wealth index quintile
Poorest 0.5 3.4 1.1 5.0 0.0 1.2 0.0 1.2 32,966
Second 0.5 4.7 1.2 6.4 0.0 2.3 0.0 2.3 29,438
Middle 0.4 6.0 1.2 7.6 0.0 3.8 0.0 3.8 27,423
Fourth 0.3 7.9 1.0 9.3 0.0 6.0 0.0 6.0 26,910
Richest 0.3 8.7 1.0 10.0 0.0 7.3 0.0 7.4 23,978 1 MICS indicator SR.20 - Children with at least one parent living abroad A Includes parents living abroad as well as those living elsewhere in the country B The category of “Transgender” in the background characteristic of “Sex” has been suppressed from the table due to small number of unweighted cases.
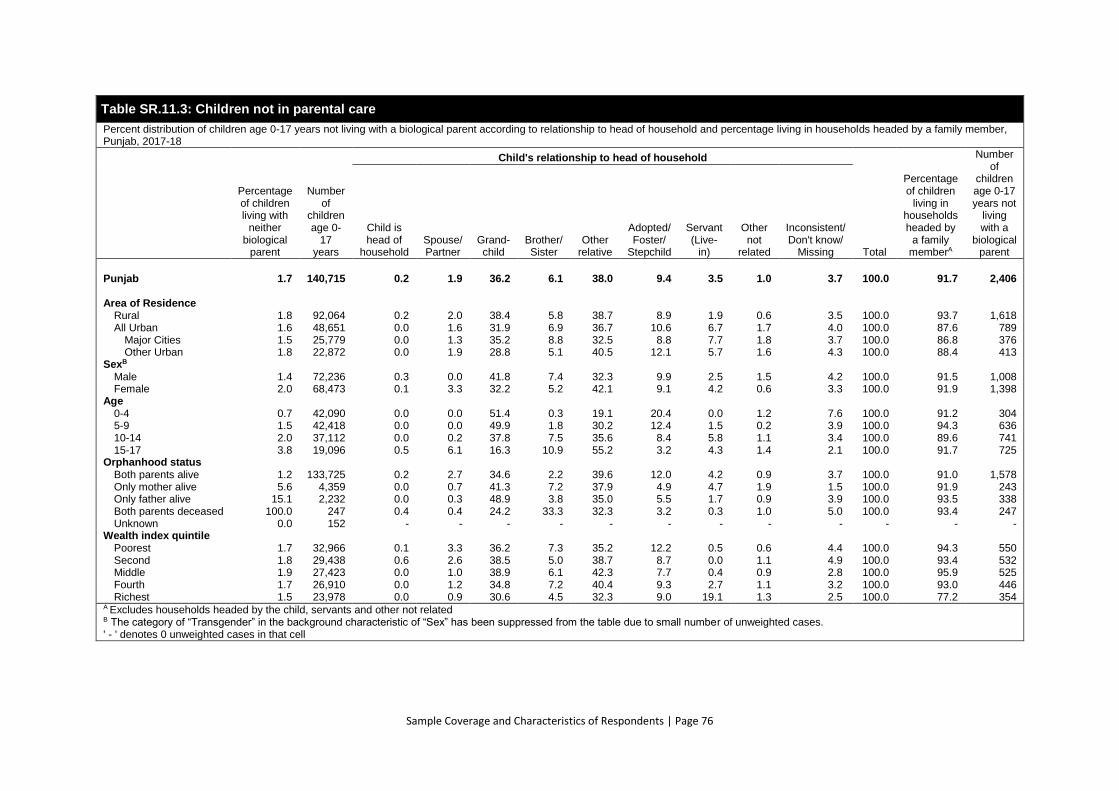
Sample Coverage and Characteristics of Respondents | Page 76
Table SR.11.3: Children not in parental care
Percent distribution of children age 0-17 years not living with a biological parent according to relationship to head of household and percentage living in households headed by a family member, Punjab, 2017-18
Percentage of children living with
neither biological
parent
Number of
children age 0-
17 years
Child's relationship to head of household
Total
Percentage of children
living in households headed by
a family memberA
Number of
children age 0-17 years not
living with a
biological parent
Child is head of
household Spouse/ Partner
Grand-child
Brother/ Sister
Other relative
Adopted/ Foster/
Stepchild
Servant (Live-
in)
Other not
related
Inconsistent/ Don't know/
Missing
Punjab 1.7 140,715 0.2 1.9 36.2 6.1 38.0 9.4 3.5 1.0 3.7 100.0 91.7 2,406
Area of Residence
Rural 1.8 92,064 0.2 2.0 38.4 5.8 38.7 8.9 1.9 0.6 3.5 100.0 93.7 1,618 All Urban 1.6 48,651 0.0 1.6 31.9 6.9 36.7 10.6 6.7 1.7 4.0 100.0 87.6 789
Major Cities 1.5 25,779 0.0 1.3 35.2 8.8 32.5 8.8 7.7 1.8 3.7 100.0 86.8 376 Other Urban 1.8 22,872 0.0 1.9 28.8 5.1 40.5 12.1 5.7 1.6 4.3 100.0 88.4 413
SexB
Male 1.4 72,236 0.3 0.0 41.8 7.4 32.3 9.9 2.5 1.5 4.2 100.0 91.5 1,008 Female 2.0 68,473 0.1 3.3 32.2 5.2 42.1 9.1 4.2 0.6 3.3 100.0 91.9 1,398
Age
0-4 0.7 42,090 0.0 0.0 51.4 0.3 19.1 20.4 0.0 1.2 7.6 100.0 91.2 304 5-9 1.5 42,418 0.0 0.0 49.9 1.8 30.2 12.4 1.5 0.2 3.9 100.0 94.3 636 10-14 2.0 37,112 0.0 0.2 37.8 7.5 35.6 8.4 5.8 1.1 3.4 100.0 89.6 741 15-17 3.8 19,096 0.5 6.1 16.3 10.9 55.2 3.2 4.3 1.4 2.1 100.0 91.7 725
Orphanhood status
Both parents alive 1.2 133,725 0.2 2.7 34.6 2.2 39.6 12.0 4.2 0.9 3.7 100.0 91.0 1,578 Only mother alive 5.6 4,359 0.0 0.7 41.3 7.2 37.9 4.9 4.7 1.9 1.5 100.0 91.9 243 Only father alive 15.1 2,232 0.0 0.3 48.9 3.8 35.0 5.5 1.7 0.9 3.9 100.0 93.5 338 Both parents deceased 100.0 247 0.4 0.4 24.2 33.3 32.3 3.2 0.3 1.0 5.0 100.0 93.4 247 Unknown 0.0 152 - - - - - - - - - - - -
Wealth index quintile
Poorest 1.7 32,966 0.1 3.3 36.2 7.3 35.2 12.2 0.5 0.6 4.4 100.0 94.3 550 Second 1.8 29,438 0.6 2.6 38.5 5.0 38.7 8.7 0.0 1.1 4.9 100.0 93.4 532 Middle 1.9 27,423 0.0 1.0 38.9 6.1 42.3 7.7 0.4 0.9 2.8 100.0 95.9 525 Fourth 1.7 26,910 0.0 1.2 34.8 7.2 40.4 9.3 2.7 1.1 3.2 100.0 93.0 446 Richest 1.5 23,978 0.0 0.9 30.6 4.5 32.3 9.0 19.1 1.3 2.5 100.0 77.2 354
A Excludes households headed by the child, servants and other not related B The category of “Transgender” in the background characteristic of “Sex” has been suppressed from the table due to small number of unweighted cases. ' - ' denotes 0 unweighted cases in that cell
Survive | Page 77
5. SURVIVE
With the SDG target (3.2) for child mortality, on ending preventable deaths of newborns and children
under 5 years of age, the international community has retained the overarching goal of reducing child
mortality. While the global target calls for reducing neonatal mortality to at least as low as 12 deaths per
1,000 live births and under-five mortality to at least as low as 25 deaths per 1,000 live births, reduction of
child mortality continues to be one of the most important objectives in national plans and programmes in
each and every country.
Mortality rates presented in this chapter are calculated from information collected in the birth histories
of the Women’s Questionnaires. All interviewed women were asked whether they had ever given birth,
and those who had were asked to report the number of sons and daughters who live with them, the
number who live elsewhere, and the number who have died. In addition, women were asked to provide
detailed information on their live births, starting with the firstborn, in chronological order. This
information included whether births were single or multiple, and for each live birth, sex, date of birth
(month and year), and survival status. Further, for children alive at the time of survey, women were asked
the current age of the child; for deceased children, the age at death was obtained. Childhood mortality
rates are expressed by conventional age categories and are defined as follows:
• Neonatal mortality (NN): probability of dying within the first month of life
• Post-neonatal mortality (PNN): difference between infant and neonatal mortality rates
• Infant mortality (1q0): probability of dying between birth and the first birthday
• Child mortality (4q1): probability of dying between the first and the fifth birthdays
• Under-five mortality (5q0): the probability of dying between birth and the fifth birthday
Neonatal, infant and under-five mortality rates are expressed as deaths per 1,000 live births. Child
mortality is expressed as deaths per 1,000 children surviving to age one. Post-neonatal mortality is
calculated as the difference between infant and neonatal mortality rates.
Table CS.1 presents neonatal, post-neonatal, infant, child, and under-five mortality rates for the three
most recent five-year periods before the survey. For each mortality rate in the table, it is possible to assess
changes over time, during the last 15 years preceding the survey.
Tables CS.2 and CS.3 provide estimates of child mortality by socioeconomic and demographic
characteristics. Using the rates calculated for the 5-year period immediately preceding the survey,
differentials in mortality rates by socioeconomic characteristics, such as region, mother’s education and
wealth, and by demographic characteristics such as sex and mother’s age at birth are presented.
Table CS.4 presents the percent distribution of pre-mature births (a birth before 37 weeks of pregnancy)
in last 2 years preceding the survey.

Survive | Page 78
Table CS.1: Early childhood mortality rates
Neonatal, post-neonatal, infant, child and under-five mortality rates for five year periods preceding the survey, Punjab, 2017-18
Neonatal
mortality rate1 Post-neonatal mortality rate2,A
Infant mortality rate3
Child mortality rate4
Under-five mortality rate5
Years preceding the survey
0-4 41 19 60 9 69
5-9 43 21 63 8 71
10-14 45 20 65 9 74
1 MICS indicator CS.1 - Neonatal mortality rate; SDG indicator 3.2.2 2 MICS indicator CS.2 - Post-neonatal mortality rate 3 MICS indicator CS.3 - Infant mortality rate 4 MICS indicator CS.4 - Child mortality rate 5 MICS indicator CS.5 - Under-five mortality rate; SDG indicator 3.2.1 A Post-neonatal mortality rates are computed as the difference between the infant and neonatal mortality rates
Table CS.2: Early childhood mortality rates by socioeconomic characteristics
Neonatal, post-neonatal, infant, child and under-five mortality rates for the five-year period preceding the survey, by socioeconomic characteristics, Punjab, 2017-18
Neonatal
mortality rate1 Post-neonatal mortality rate2,A
Infant mortality rate3
Child mortality rate4
Under-five mortality rate5
Punjab 41 19 60 9 69
Area of Residence
Rural 45 21 66 11 76
All Urban 33 16 49 6 55
Major Cities 28 14 42 6 48
Other Urban 37 18 56 7 62
Mother's functional difficulties
Has functional difficulty 49 22 71 15 85
Has no functional difficulty 41 19 60 9 68
Mother’s education
None/Preschool 49 26 75 12 87
Primary 47 19 65 7 72
Middle 35 15 50 8 58
Secondary 32 13 45 7 52
Higher 20 6 26 3 30
DK/Missing 24 8 32 0 32
Wealth index quintile
Poorest 53 30 83 14 95
Second 50 24 74 11 84
Middle 43 17 60 9 68
Fourth 35 14 49 7 55
Richest 19 8 27 3 30 1 MICS indicator CS.1 - Neonatal mortality rate; SDG indicator 3.2.2 2 MICS indicator CS.2 - Post-neonatal mortality rate 3 MICS indicator CS.3 - Infant mortality rate 4 MICS indicator CS.4 - Child mortality rate 5 MICS indicator CS.5 - Under-five mortality rate; SDG indicator 3.2.1 A Post-neonatal mortality rates are computed as the difference between the infant and neonatal mortality rates
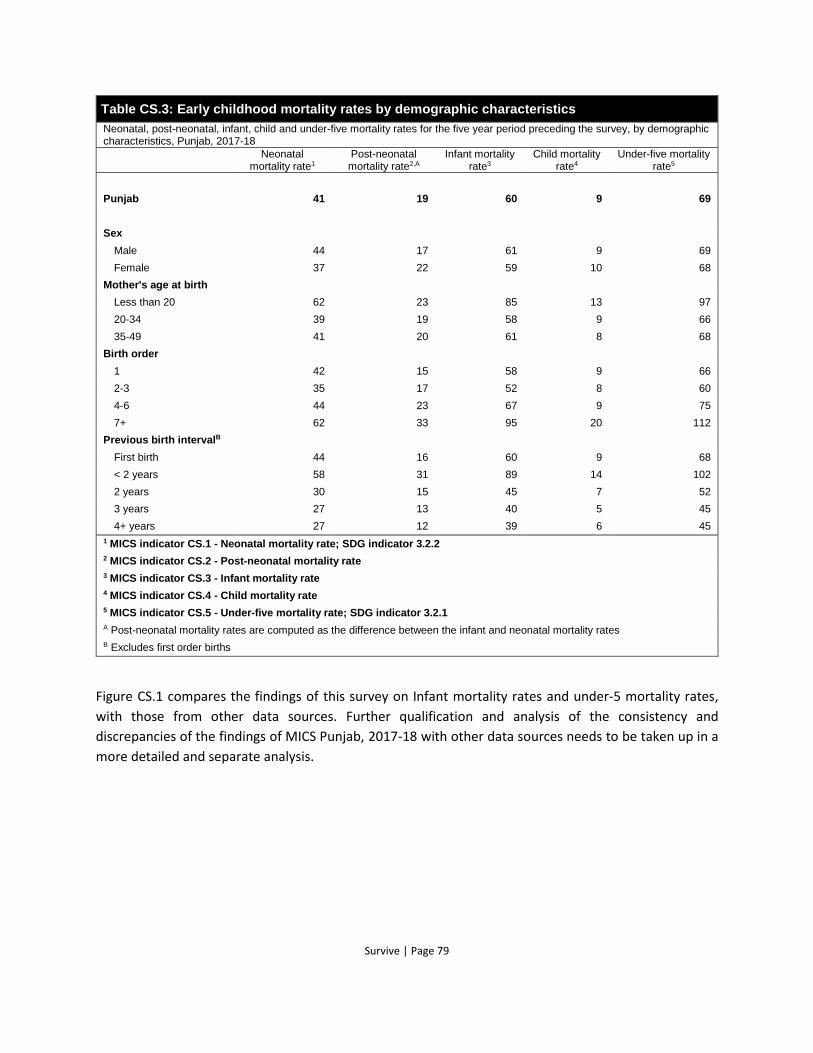
Survive | Page 79
Table CS.3: Early childhood mortality rates by demographic characteristics
Neonatal, post-neonatal, infant, child and under-five mortality rates for the five year period preceding the survey, by demographic characteristics, Punjab, 2017-18
Neonatal mortality rate1
Post-neonatal mortality rate2,A
Infant mortality rate3
Child mortality rate4
Under-five mortality rate5
Punjab 41 19 60 9 69
Sex
Male 44 17 61 9 69
Female 37 22 59 10 68
Mother's age at birth
Less than 20 62 23 85 13 97
20-34 39 19 58 9 66
35-49 41 20 61 8 68
Birth order
1 42 15 58 9 66
2-3 35 17 52 8 60
4-6 44 23 67 9 75
7+ 62 33 95 20 112
Previous birth intervalB
First birth 44 16 60 9 68
< 2 years 58 31 89 14 102
2 years 30 15 45 7 52
3 years 27 13 40 5 45
4+ years 27 12 39 6 45
1 MICS indicator CS.1 - Neonatal mortality rate; SDG indicator 3.2.2
2 MICS indicator CS.2 - Post-neonatal mortality rate
3 MICS indicator CS.3 - Infant mortality rate
4 MICS indicator CS.4 - Child mortality rate
5 MICS indicator CS.5 - Under-five mortality rate; SDG indicator 3.2.1
A Post-neonatal mortality rates are computed as the difference between the infant and neonatal mortality rates
B Excludes first order births
Figure CS.1 compares the findings of this survey on Infant mortality rates and under-5 mortality rates,
with those from other data sources. Further qualification and analysis of the consistency and
discrepancies of the findings of MICS Punjab, 2017-18 with other data sources needs to be taken up in a
more detailed and separate analysis.
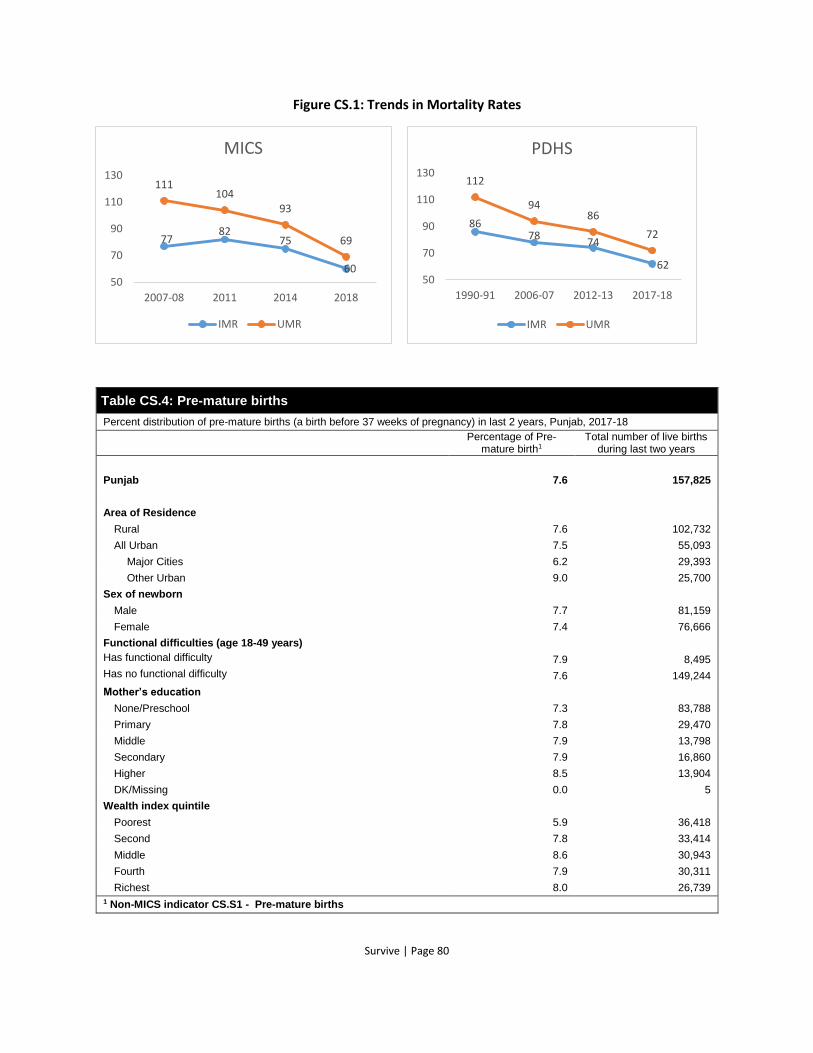
Survive | Page 80
Figure CS.1: Trends in Mortality Rates
Table CS.4: Pre-mature births
Percent distribution of pre-mature births (a birth before 37 weeks of pregnancy) in last 2 years, Punjab, 2017-18
Percentage of Pre-
mature birth1 Total number of live births
during last two years
Punjab 7.6 157,825
Area of Residence
Rural 7.6 102,732
All Urban 7.5 55,093
Major Cities 6.2 29,393
Other Urban 9.0 25,700
Sex of newborn
Male 7.7 81,159
Female 7.4 76,666
Functional difficulties (age 18-49 years)
Has functional difficulty 7.9 8,495
Has no functional difficulty 7.6 149,244
Mother’s education
None/Preschool 7.3 83,788
Primary 7.8 29,470
Middle 7.9 13,798
Secondary 7.9 16,860
Higher 8.5 13,904
DK/Missing 0.0 5
Wealth index quintile
Poorest 5.9 36,418
Second 7.8 33,414
Middle 8.6 30,943
Fourth 7.9 30,311
Richest 8.0 26,739
1 Non-MICS indicator CS.S1 - Pre-mature births
7782
75
60
111104
93
69
50
70
90
110
130
2007-08 2011 2014 2018
MICS
IMR UMR
8678
74
62
112
9486
72
50
70
90
110
130
1990-91 2006-07 2012-13 2017-18
PDHS
IMR UMR
Thrive – Reproductive & Maternal Health| Page 81
6. THRIVE – REPRODUCTIVE AND MATERNAL HEALTH
TM.1 FERTILITY
Measures of current fertility are presented in Table TM.1.1 for the three-year period preceding the survey.
A three-year period was chosen for calculating these rates to provide the most current information, while
also allowing the rates to be calculated for a sufficient number of cases so as not to compromise the
statistical precision of the estimates. The current fertility measures, presented in the table by urban and
rural residence, are as follows:
Age-specific fertility rates (ASFRs), expressed as the number of births per 1,000 women in a specified age
group, show the age pattern of fertility. Numerators for ASFRs are calculated by identifying live births that
occurred in the three-year period preceding the survey, classified according to the age of the mother (in
five-year age groups) at the time of the child’s birth. Denominators of the rates represent the number of
woman-years lived by all interviewed women (or in simplified terms, the average number of women) in
each of the five-year age groups during the specified period.
The total fertility rate (TFR) is a synthetic measure that denotes the number of live births a woman would
have if she were subject to the current age-specific fertility rates throughout her reproductive years (15-49
years).
The general fertility rate (GFR) is the number of live births occurring during the specified period per 1,000
women age 15-49.
The crude birth rate (CBR) is the number of live births per 1,000 household population during the specified
period.
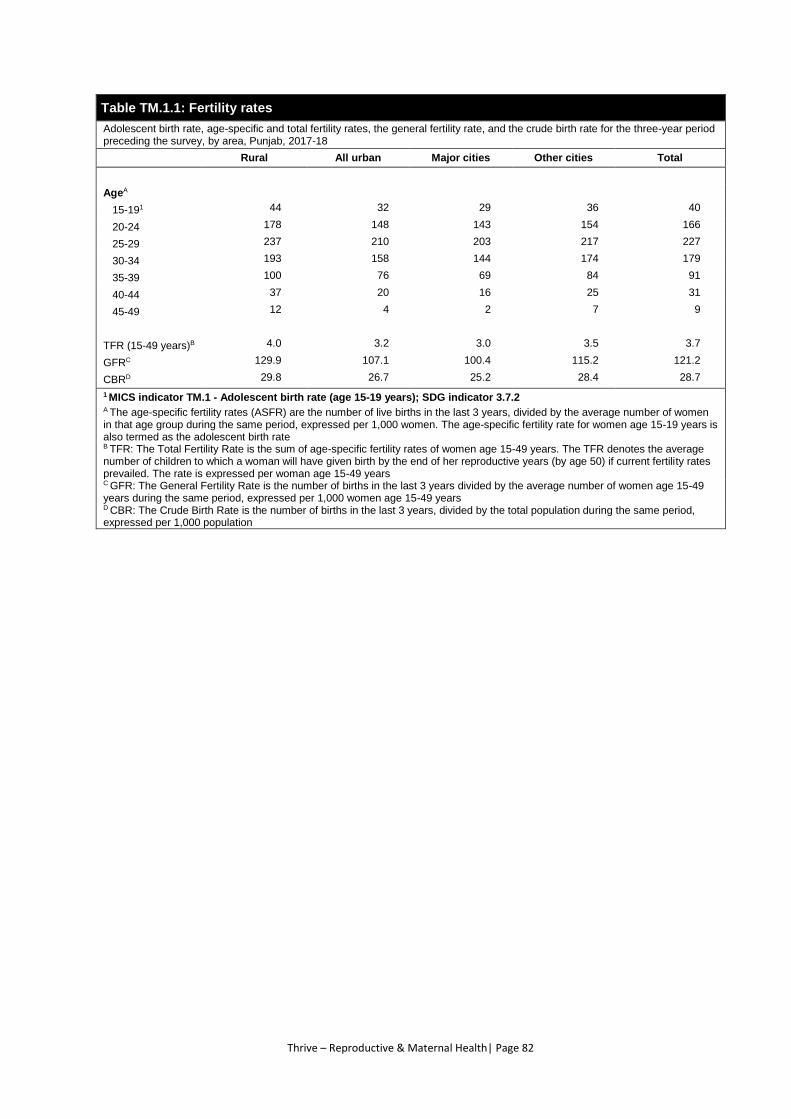
Thrive – Reproductive & Maternal Health| Page 82
Table TM.1.1: Fertility rates
Adolescent birth rate, age-specific and total fertility rates, the general fertility rate, and the crude birth rate for the three-year period preceding the survey, by area, Punjab, 2017-18
Rural All urban Major cities Other cities Total
AgeA
15-191 44 32 29 36 40
20-24 178 148 143 154 166
25-29 237 210 203 217 227
30-34 193 158 144 174 179
35-39 100 76 69 84 91
40-44 37 20 16 25 31
45-49 12 4 2 7 9
TFR (15-49 years)B 4.0 3.2 3.0 3.5 3.7
GFRC 129.9 107.1 100.4 115.2 121.2
CBRD 29.8 26.7 25.2 28.4 28.7
1 MICS indicator TM.1 - Adolescent birth rate (age 15-19 years); SDG indicator 3.7.2 A The age-specific fertility rates (ASFR) are the number of live births in the last 3 years, divided by the average number of women in that age group during the same period, expressed per 1,000 women. The age-specific fertility rate for women age 15-19 years is also termed as the adolescent birth rate B TFR: The Total Fertility Rate is the sum of age-specific fertility rates of women age 15-49 years. The TFR denotes the average number of children to which a woman will have given birth by the end of her reproductive years (by age 50) if current fertility rates prevailed. The rate is expressed per woman age 15-49 years C GFR: The General Fertility Rate is the number of births in the last 3 years divided by the average number of women age 15-49 years during the same period, expressed per 1,000 women age 15-49 years D CBR: The Crude Birth Rate is the number of births in the last 3 years, divided by the total population during the same period, expressed per 1,000 population
Thrive – Reproductive & Maternal Health| Page 83
TM.2 EARLY CHILDBEARING
Table TM.2.1 presents the survey findings on adolescent birth rates and further disaggregates of the total
fertility rate.
The adolescent birth rate (age-specific fertility rate for women age 15-19) is defined as the number of births
to women age 15-19 years during the three-year period preceding the survey, divided by the average
number of women age 15-19 (number of women-years lived between ages 15 through 19, inclusive) during
the same period, expressed per 1,000 women.
The adolescent birth rate is a Global SDG indicator (3.7.2) for ensuring universal access to sexual and
reproductive health-care services (Target 3.7).
Tables TM.2.2W and TM.2.2M present a selection of early childbearing and fatherhood indicators for young
women and men age 15-19 and 20-24 years. In Table TM.2.2W, percentages among women age 15-19 who
have had a live birth and those who are pregnant with their first child are presented. For the same age
group, the table also presents the percentage of women who have had a live birth before age 15. These
estimates are all derived from the detailed birth histories of women.
To estimate the proportion of women who have had a live birth before age 18 – when they were still
children themselves – data based on women age 20-24 years at the time of survey are used to avoid
truncation.35
Table TM.2.2M presents findings on early fatherhood. Percentages among men age 15-19 and age 20-24
years who became fathers before ages 15 and 18, respectively, show the extent to which men are becoming
fathers when they are still children.
Tables TM.2.3W and TM.2.3M are designed to look at trends in early childbearing for women and early
fatherhood for men, by presenting percentages of women and men who became mother and fathers
before ages 15 and 18, for successive age cohorts. The table is designed to capture trends in urban and
rural areas separately.
35 Using women age 15-19 to estimate the percentage who had given birth before age 18 would introduce truncation to the
estimates, since the majority of women in this age group will not have completed age 18, and therefore will not have completed
exposure to childbearing before age 18. The age group 20-24 is used to estimate the percentage of women giving birth before
age 18, since all women in this age group have completed exposure to childbearing at very early ages.
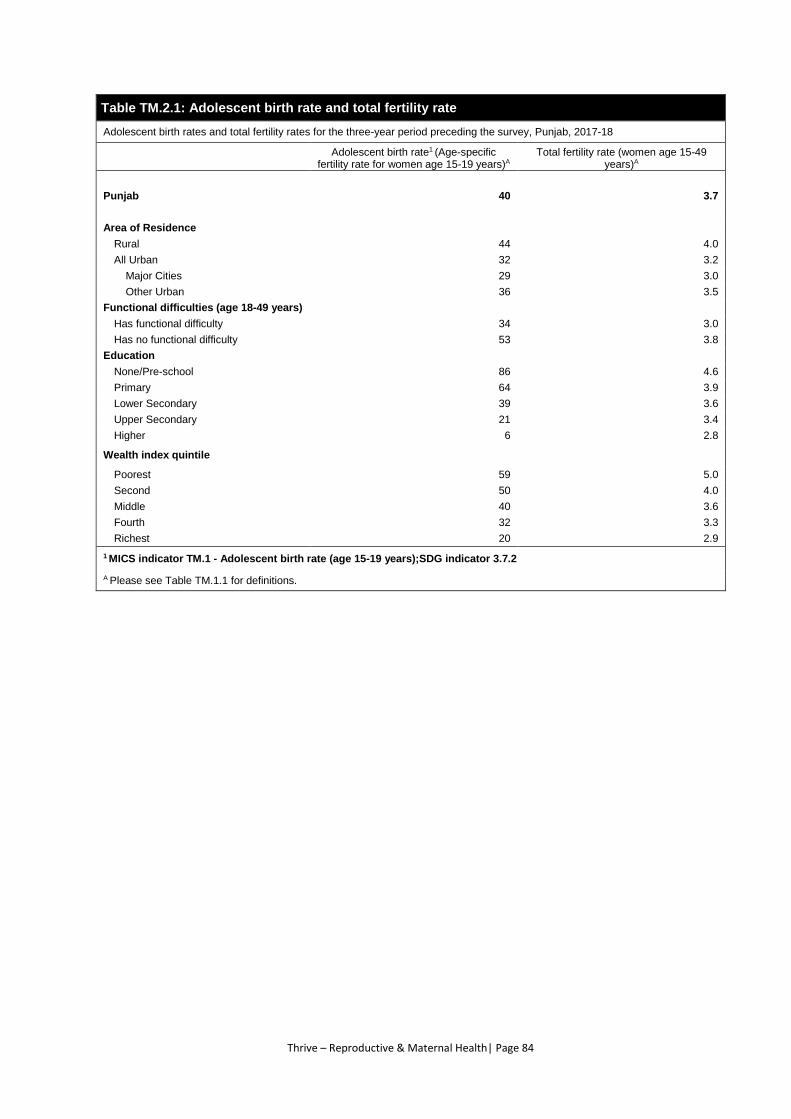
Thrive – Reproductive & Maternal Health| Page 84
Table TM.2.1: Adolescent birth rate and total fertility rate
Adolescent birth rates and total fertility rates for the three-year period preceding the survey, Punjab, 2017-18
Adolescent birth rate1 (Age-specific fertility rate for women age 15-19 years)A
Total fertility rate (women age 15-49 years)A
Punjab 40 3.7
Area of Residence
Rural 44 4.0
All Urban 32 3.2
Major Cities 29 3.0
Other Urban 36 3.5
Functional difficulties (age 18-49 years)
Has functional difficulty 34 3.0
Has no functional difficulty 53 3.8
Education
None/Pre-school 86 4.6
Primary 64 3.9
Lower Secondary 39 3.6
Upper Secondary 21 3.4
Higher 6 2.8
Wealth index quintile
Poorest 59 5.0
Second 50 4.0
Middle 40 3.6
Fourth 32 3.3
Richest 20 2.9
1 MICS indicator TM.1 - Adolescent birth rate (age 15-19 years);SDG indicator 3.7.2
A Please see Table TM.1.1 for definitions.
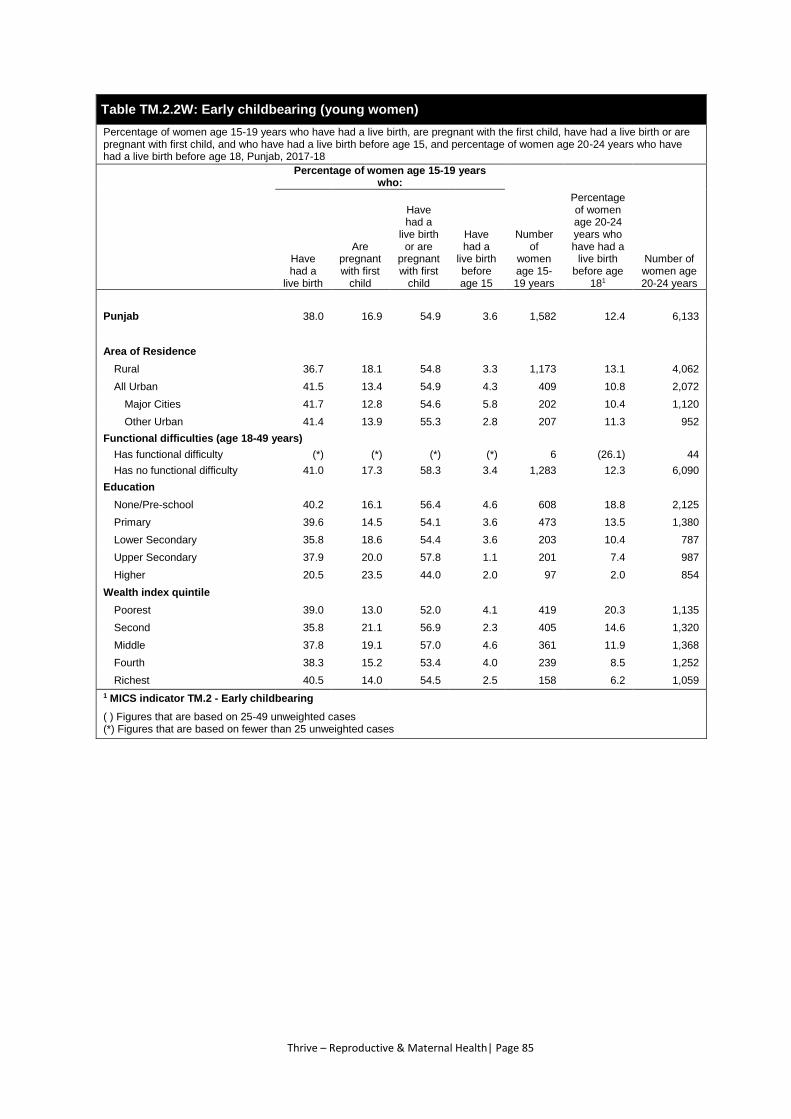
Thrive – Reproductive & Maternal Health| Page 85
Table TM.2.2W: Early childbearing (young women)
Percentage of women age 15-19 years who have had a live birth, are pregnant with the first child, have had a live birth or are pregnant with first child, and who have had a live birth before age 15, and percentage of women age 20-24 years who have had a live birth before age 18, Punjab, 2017-18
Percentage of women age 15-19 years
who:
Number of
women age 15-19 years
Percentage of women age 20-24 years who have had a
live birth before age
181
Number of women age 20-24 years
Have had a
live birth
Are pregnant with first
child
Have had a
live birth or are
pregnant with first
child
Have had a
live birth before age 15
Punjab 38.0 16.9 54.9 3.6 1,582 12.4 6,133
Area of Residence
Rural 36.7 18.1 54.8 3.3 1,173 13.1 4,062
All Urban 41.5 13.4 54.9 4.3 409 10.8 2,072
Major Cities 41.7 12.8 54.6 5.8 202 10.4 1,120
Other Urban 41.4 13.9 55.3 2.8 207 11.3 952
Functional difficulties (age 18-49 years)
Has functional difficulty (*) (*) (*) (*) 6 (26.1) 44
Has no functional difficulty 41.0 17.3 58.3 3.4 1,283 12.3 6,090
Education
None/Pre-school 40.2 16.1 56.4 4.6 608 18.8 2,125
Primary 39.6 14.5 54.1 3.6 473 13.5 1,380
Lower Secondary 35.8 18.6 54.4 3.6 203 10.4 787
Upper Secondary 37.9 20.0 57.8 1.1 201 7.4 987
Higher 20.5 23.5 44.0 2.0 97 2.0 854
Wealth index quintile
Poorest 39.0 13.0 52.0 4.1 419 20.3 1,135
Second 35.8 21.1 56.9 2.3 405 14.6 1,320
Middle 37.8 19.1 57.0 4.6 361 11.9 1,368
Fourth 38.3 15.2 53.4 4.0 239 8.5 1,252
Richest 40.5 14.0 54.5 2.5 158 6.2 1,059
1 MICS indicator TM.2 - Early childbearing
( ) Figures that are based on 25-49 unweighted cases (*) Figures that are based on fewer than 25 unweighted cases
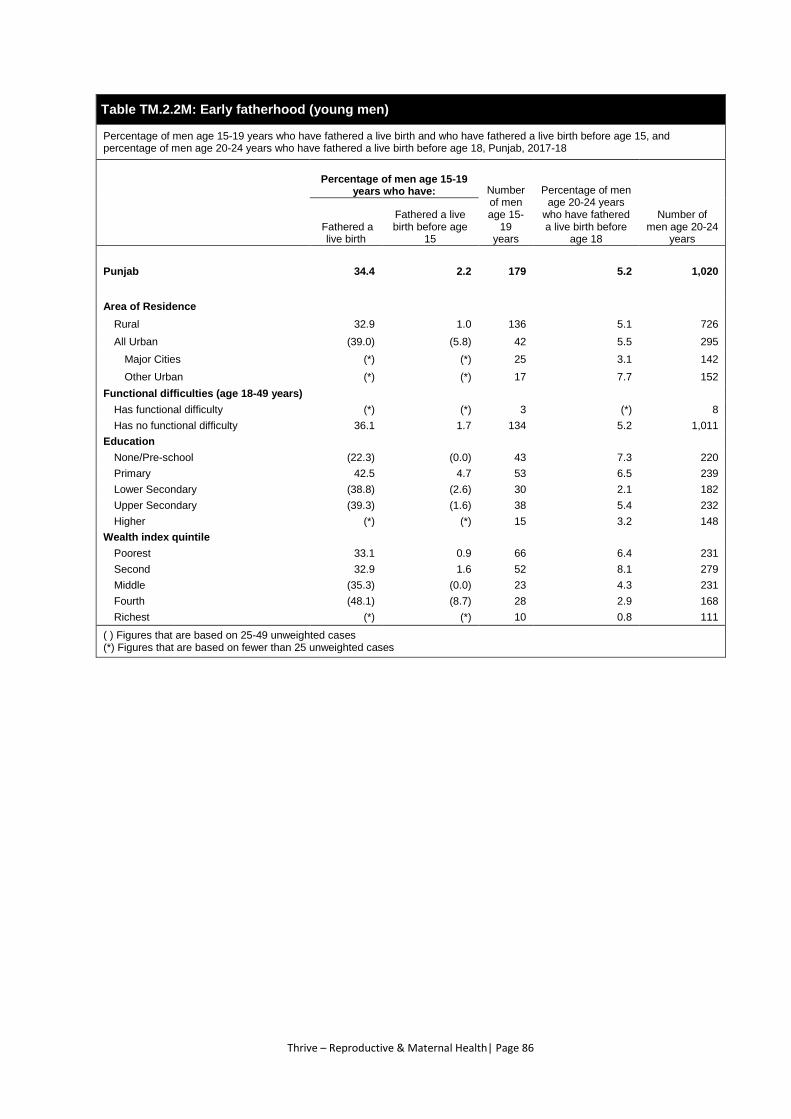
Thrive – Reproductive & Maternal Health| Page 86
Table TM.2.2M: Early fatherhood (young men)
Percentage of men age 15-19 years who have fathered a live birth and who have fathered a live birth before age 15, and percentage of men age 20-24 years who have fathered a live birth before age 18, Punjab, 2017-18
Percentage of men age 15-19
years who have: Number of men age 15-
19 years
Percentage of men age 20-24 years
who have fathered a live birth before
age 18
Number of men age 20-24
years
Fathered a live birth
Fathered a live birth before age
15
Punjab 34.4 2.2 179 5.2 1,020
Area of Residence
Rural 32.9 1.0 136 5.1 726
All Urban (39.0) (5.8) 42 5.5 295
Major Cities (*) (*) 25 3.1 142
Other Urban (*) (*) 17 7.7 152
Functional difficulties (age 18-49 years)
Has functional difficulty (*) (*) 3 (*) 8
Has no functional difficulty 36.1 1.7 134 5.2 1,011
Education
None/Pre-school (22.3) (0.0) 43 7.3 220
Primary 42.5 4.7 53 6.5 239
Lower Secondary (38.8) (2.6) 30 2.1 182
Upper Secondary (39.3) (1.6) 38 5.4 232
Higher (*) (*) 15 3.2 148
Wealth index quintile
Poorest 33.1 0.9 66 6.4 231
Second 32.9 1.6 52 8.1 279
Middle (35.3) (0.0) 23 4.3 231
Fourth (48.1) (8.7) 28 2.9 168
Richest (*) (*) 10 0.8 111
( ) Figures that are based on 25-49 unweighted cases (*) Figures that are based on fewer than 25 unweighted cases
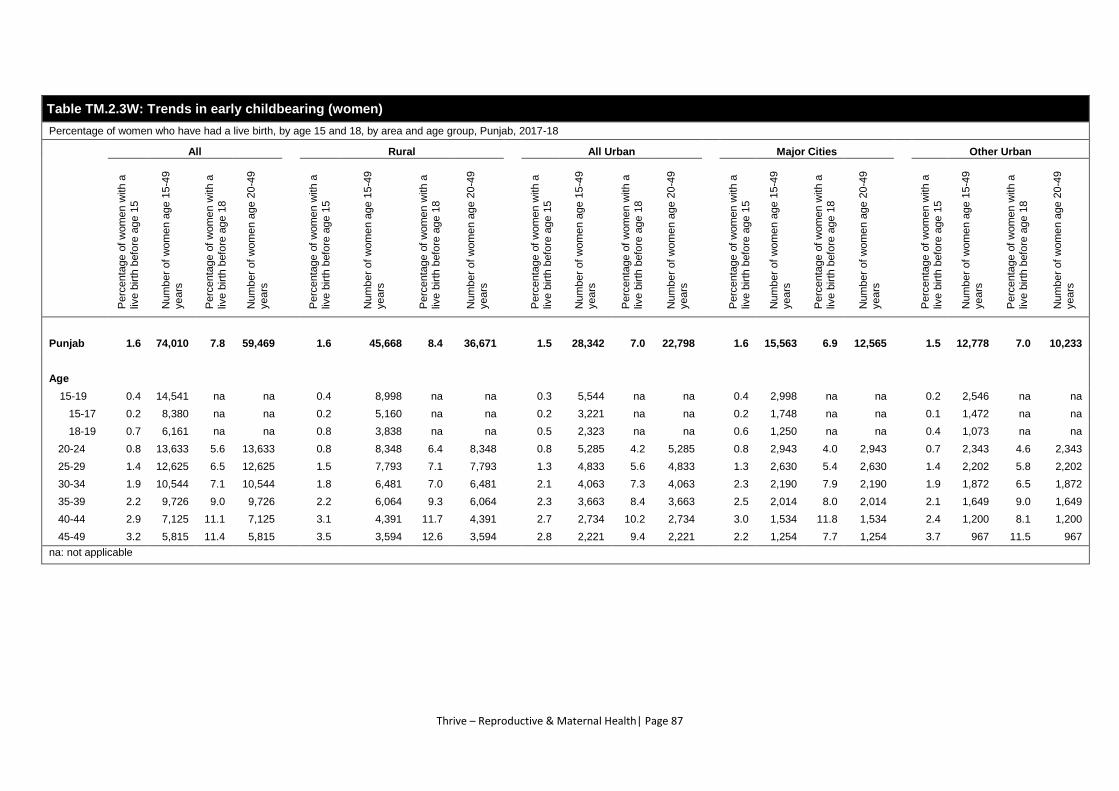
Thrive – Reproductive & Maternal Health| Page 87
Table TM.2.3W: Trends in early childbearing (women)
Percentage of women who have had a live birth, by age 15 and 18, by area and age group, Punjab, 2017-18
All Rural All Urban Major Cities Other Urban
Perc
enta
ge o
f w
om
en w
ith a
live b
irth
befo
re a
ge 1
5
Num
ber
of
wom
en a
ge 1
5-4
9
years
Perc
enta
ge o
f w
om
en w
ith a
live b
irth
befo
re a
ge 1
8
Num
ber
of
wom
en a
ge 2
0-4
9
years
P
erc
enta
ge o
f w
om
en w
ith a
live b
irth
befo
re a
ge 1
5
Num
ber
of
wom
en a
ge 1
5-4
9
years
Perc
enta
ge o
f w
om
en w
ith a
liv
e b
irth
befo
re a
ge 1
8
Num
ber
of
wom
en a
ge 2
0-4
9
years
Perc
enta
ge o
f w
om
en w
ith a
liv
e b
irth
befo
re a
ge 1
5
Num
ber
of
wom
en a
ge 1
5-4
9
years
Perc
enta
ge o
f w
om
en w
ith a
live b
irth
befo
re a
ge 1
8
Num
ber
of
wom
en a
ge 2
0-4
9
years
Perc
enta
ge o
f w
om
en w
ith a
live b
irth
befo
re a
ge 1
5
Num
ber
of
wom
en a
ge 1
5-4
9
years
Perc
enta
ge o
f w
om
en w
ith a
liv
e b
irth
befo
re a
ge 1
8
Num
ber
of
wom
en a
ge 2
0-4
9
years
Perc
enta
ge o
f w
om
en w
ith a
live b
irth
befo
re a
ge 1
5
Num
ber
of
wom
en a
ge 1
5-4
9
years
Perc
enta
ge o
f w
om
en w
ith a
live b
irth
befo
re a
ge 1
8
Num
ber
of
wom
en a
ge 2
0-4
9
years
Punjab 1.6 74,010 7.8 59,469 1.6 45,668 8.4 36,671 1.5 28,342 7.0 22,798 1.6 15,563 6.9 12,565 1.5 12,778 7.0 10,233
Age
15-19 0.4 14,541 na na 0.4 8,998 na na 0.3 5,544 na na 0.4 2,998 na na 0.2 2,546 na na
15-17 0.2 8,380 na na 0.2 5,160 na na 0.2 3,221 na na 0.2 1,748 na na 0.1 1,472 na na
18-19 0.7 6,161 na na 0.8 3,838 na na 0.5 2,323 na na 0.6 1,250 na na 0.4 1,073 na na
20-24 0.8 13,633 5.6 13,633 0.8 8,348 6.4 8,348 0.8 5,285 4.2 5,285 0.8 2,943 4.0 2,943 0.7 2,343 4.6 2,343
25-29 1.4 12,625 6.5 12,625 1.5 7,793 7.1 7,793 1.3 4,833 5.6 4,833 1.3 2,630 5.4 2,630 1.4 2,202 5.8 2,202
30-34 1.9 10,544 7.1 10,544 1.8 6,481 7.0 6,481 2.1 4,063 7.3 4,063 2.3 2,190 7.9 2,190 1.9 1,872 6.5 1,872
35-39 2.2 9,726 9.0 9,726 2.2 6,064 9.3 6,064 2.3 3,663 8.4 3,663 2.5 2,014 8.0 2,014 2.1 1,649 9.0 1,649
40-44 2.9 7,125 11.1 7,125 3.1 4,391 11.7 4,391 2.7 2,734 10.2 2,734 3.0 1,534 11.8 1,534 2.4 1,200 8.1 1,200
45-49 3.2 5,815 11.4 5,815 3.5 3,594 12.6 3,594 2.8 2,221 9.4 2,221 2.2 1,254 7.7 1,254 3.7 967 11.5 967
na: not applicable
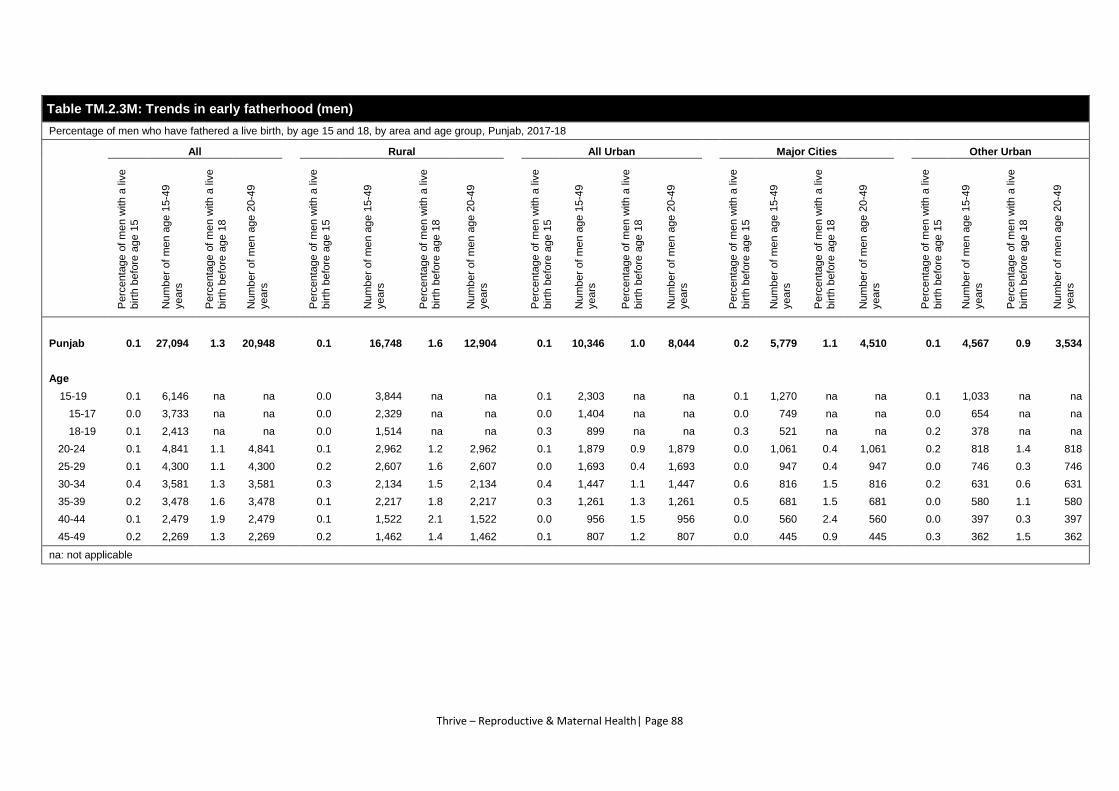
Thrive – Reproductive & Maternal Health| Page 88
Table TM.2.3M: Trends in early fatherhood (men)
Percentage of men who have fathered a live birth, by age 15 and 18, by area and age group, Punjab, 2017-18
All Rural All Urban Major Cities Other Urban
Perc
enta
ge o
f m
en w
ith a
liv
e
birth
befo
re a
ge 1
5
Num
ber
of
me
n a
ge 1
5-4
9
years
Perc
enta
ge o
f m
en w
ith a
liv
e
birth
befo
re a
ge 1
8
Num
ber
of
me
n a
ge 2
0-4
9
years
P
erc
enta
ge o
f m
en w
ith a
liv
e
birth
befo
re a
ge 1
5
Num
ber
of
me
n a
ge 1
5-4
9
years
Perc
enta
ge o
f m
en w
ith a
liv
e
birth
befo
re a
ge 1
8
Num
ber
of
me
n a
ge 2
0-4
9
years
Perc
enta
ge o
f m
en w
ith a
liv
e
birth
befo
re a
ge 1
5
Num
ber
of
me
n a
ge 1
5-4
9
years
Perc
enta
ge o
f m
en w
ith a
liv
e
birth
befo
re a
ge 1
8
Num
ber
of
me
n a
ge 2
0-4
9
years
Perc
enta
ge o
f m
en w
ith a
liv
e
birth
befo
re a
ge 1
5
Num
ber
of
me
n a
ge 1
5-4
9
years
Perc
enta
ge o
f m
en w
ith a
liv
e
birth
befo
re a
ge 1
8
Num
ber
of
me
n a
ge 2
0-4
9
years
Perc
enta
ge o
f m
en w
ith a
liv
e
birth
befo
re a
ge 1
5
Num
ber
of
me
n a
ge 1
5-4
9
years
Perc
enta
ge o
f m
en w
ith a
liv
e
birth
befo
re a
ge 1
8
Num
ber
of
me
n a
ge 2
0-4
9
years
Punjab 0.1 27,094 1.3 20,948 0.1 16,748 1.6 12,904 0.1 10,346 1.0 8,044 0.2 5,779 1.1 4,510 0.1 4,567 0.9 3,534
Age
15-19 0.1 6,146 na na 0.0 3,844 na na 0.1 2,303 na na 0.1 1,270 na na 0.1 1,033 na na
15-17 0.0 3,733 na na 0.0 2,329 na na 0.0 1,404 na na 0.0 749 na na 0.0 654 na na
18-19 0.1 2,413 na na 0.0 1,514 na na 0.3 899 na na 0.3 521 na na 0.2 378 na na
20-24 0.1 4,841 1.1 4,841 0.1 2,962 1.2 2,962 0.1 1,879 0.9 1,879 0.0 1,061 0.4 1,061 0.2 818 1.4 818
25-29 0.1 4,300 1.1 4,300 0.2 2,607 1.6 2,607 0.0 1,693 0.4 1,693 0.0 947 0.4 947 0.0 746 0.3 746
30-34 0.4 3,581 1.3 3,581 0.3 2,134 1.5 2,134 0.4 1,447 1.1 1,447 0.6 816 1.5 816 0.2 631 0.6 631
35-39 0.2 3,478 1.6 3,478 0.1 2,217 1.8 2,217 0.3 1,261 1.3 1,261 0.5 681 1.5 681 0.0 580 1.1 580
40-44 0.1 2,479 1.9 2,479 0.1 1,522 2.1 1,522 0.0 956 1.5 956 0.0 560 2.4 560 0.0 397 0.3 397
45-49 0.2 2,269 1.3 2,269 0.2 1,462 1.4 1,462 0.1 807 1.2 807 0.0 445 0.9 445 0.3 362 1.5 362
na: not applicable
Thrive – Reproductive & Maternal Health| Page 89
TM.3 FAMILY PLANNING
Appropriate contraceptive use is important to the health of women and children by: 1) preventing
pregnancies that are too early or too late; 2) extending the period between births; and 3) limiting the total
number of children.36
Table TM.3.1 presents the current use of contraception for women who are currently married while Table
TM.3.2 presents the same information for women who are not currently married. In Table TM.3.1, use of
specific methods of contraception are first presented; specific methods are then grouped into modern and
traditional methods and presented as such. For women who are not currently married.
Unmet need for contraception refers to fecund women who are not using any method of contraception,
but who wish to postpone the next birth (spacing) or who wish to stop childbearing altogether (limiting).
Unmet need is identified in MICS by using a set of questions eliciting current behaviours and preferences
pertaining to contraceptive use, fecundity, and fertility preferences.
Table TM.3.3 shows the levels of unmet need and met need for contraception, and the demand for
contraception satisfied for women who are currently married.
Unmet need for spacing is defined as the percentage of women who are not using a method of
contraception AND
are i) not pregnant, ii) not post-partum amenorrheic37 and iii) fecund38 and say they want to wait
two or more years for their next birth OR
are i) not pregnant, ii) not post-partum amenorrheic, and iii) fecund and unsure whether they want
another child OR
are pregnant, and say that pregnancy was mistimed (would have wanted to wait) OR
are post-partum amenorrheic and say that the birth was mistimed (would have wanted to wait).
Unmet need for limiting is defined as percentage of women who are married and are not using a method
of contraception AND
are i) not pregnant, ii) not post-partum amenorrheic, and iii) fecund and say they do not want any
more children OR
are pregnant and say they did not want to have a child OR
are post-partum amenorrheic and say that they did not want the birth.
Total unmet need for contraception is the sum of unmet need for spacing and unmet need for limiting.
36 PATH, and United Nations Population Fund. Meeting the Need: Strengthening Family Planning Programs. Seattle:
PATH/UNFPA, 2006. https://www.unfpa.org/sites/default/files/resource-pdf/family_planning06.pdf. 37 A woman is post-partum amenorrheic if she had a live birth in last two years and is not currently pregnant, and her menstrual
period has not returned since the birth of the last child. 38 A woman is considered infecund if she is neither pregnant nor post-partum amenorrheic, and
(1a) has not had menstruation for at least six months, or (1b) has never menstruated, or (1c) had last menstruation occurring
before her last birth, or (1d) is in menopause/has had hysterectomy OR
(2) she declares that she i) has had hysterectomy, ii) has never menstruated, iii) is menopausal or iv) has been trying to get
pregnant for at least 2 years without result in response to questions on why she thinks she is not physically able to get
pregnant at the time of survey OR
(3) she declares she cannot get pregnant when asked about desire for future birth OR
(4) she has not had a birth in the preceding 5 years, is currently not using contraception and is currently married and was
continuously married during the last 5 years preceding the survey.
Thrive – Reproductive & Maternal Health| Page 90
Met need for limiting includes women who are using (or whose partner is using) a contraceptive method39
and who want no more children, are using male or female sterilisation or declare themselves as infecund.
Met need for spacing includes women who are using (or whose partner is using) a contraceptive method
and who want to have another child or are undecided whether to have another child. Summing the met
need for spacing and limiting results in the total met need for contraception.
Using information on contraception and unmet need, the percentage of demand for contraception satisfied
is also estimated from the MICS data. The percentage of demand satisfied is defined as the proportion of
women who are currently using contraception over the total demand for contraception. The total demand
for contraception includes women who currently have an unmet need (for spacing or limiting) plus those
who are currently using contraception.
Percentage of demand for family planning satisfied with modern methods is one of the indicators used to
track progress toward the Sustainable Development Goal (SDG), Target 3.7, on ensuring universal access
to reproductive health-care services, including for family planning, information and education and the
integration of reproductive health into national strategies and programmes. While SDG indicator 3.7.1
relates to all women age 15-49 years, it is only reported for women currently married and, therefore,
located in Table TM.3.3 alone.
39 In this chapter, whenever reference is made to the use of a contraceptive by a woman, this includes her partner using a
contraceptive method (such as male condom).
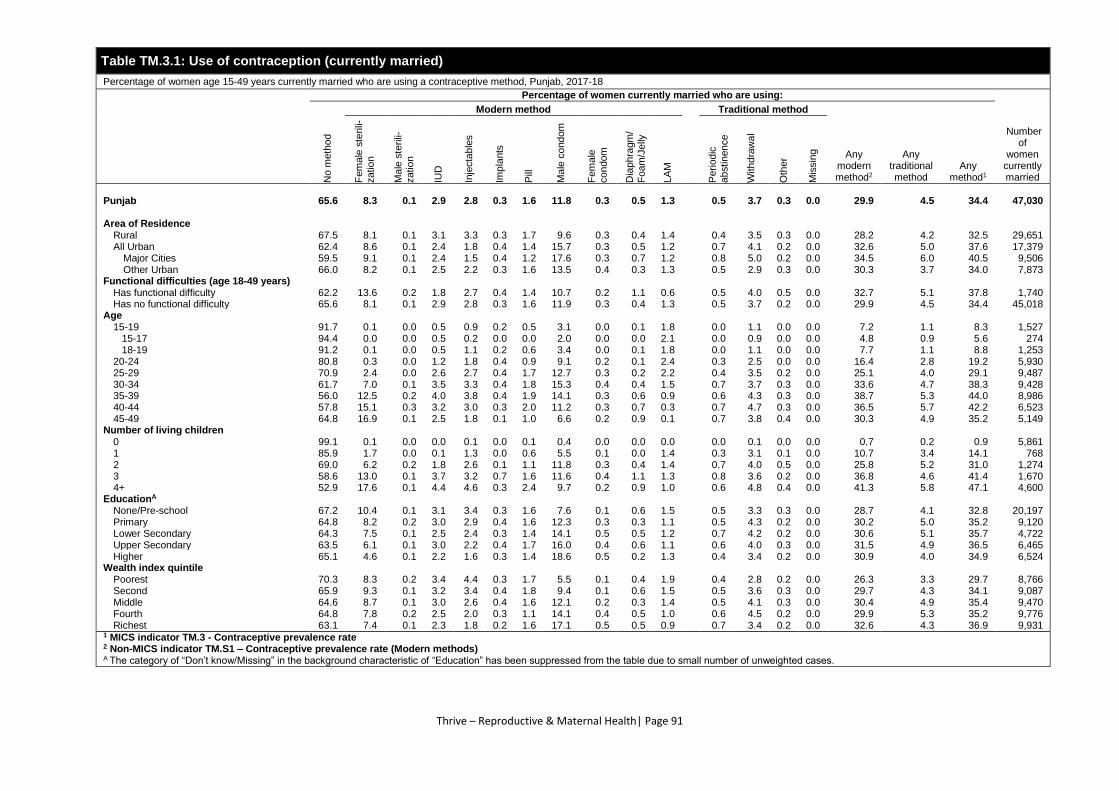
Thrive – Reproductive & Maternal Health| Page 91
Table TM.3.1: Use of contraception (currently married)
Percentage of women age 15-49 years currently married who are using a contraceptive method, Punjab, 2017-18
Percentage of women currently married who are using:
Number of
women currently married N
o m
eth
od
Modern method Traditional method
Any modern method2
Any traditional method
Any method1 F
em
ale
ste
rili-
zatio
n
Ma
le s
terili-
zatio
n
IUD
Inje
cta
ble
s
Imp
lants
Pill
Ma
le c
ond
om
Fem
ale
co
ndom
Dia
ph
ragm
/
Fo
am
/Je
lly
LA
M
Pe
rio
dic
ab
stin
en
ce
With
dra
wa
l
Oth
er
Mis
sin
g
Punjab 65.6 8.3 0.1 2.9 2.8 0.3 1.6 11.8 0.3 0.5 1.3 0.5 3.7 0.3 0.0 29.9 4.5 34.4 47,030 Area of Residence
Rural 67.5 8.1 0.1 3.1 3.3 0.3 1.7 9.6 0.3 0.4 1.4 0.4 3.5 0.3 0.0 28.2 4.2 32.5 29,651 All Urban 62.4 8.6 0.1 2.4 1.8 0.4 1.4 15.7 0.3 0.5 1.2 0.7 4.1 0.2 0.0 32.6 5.0 37.6 17,379
Major Cities 59.5 9.1 0.1 2.4 1.5 0.4 1.2 17.6 0.3 0.7 1.2 0.8 5.0 0.2 0.0 34.5 6.0 40.5 9,506 Other Urban 66.0 8.2 0.1 2.5 2.2 0.3 1.6 13.5 0.4 0.3 1.3 0.5 2.9 0.3 0.0 30.3 3.7 34.0 7,873
Functional difficulties (age 18-49 years) Has functional difficulty 62.2 13.6 0.2 1.8 2.7 0.4 1.4 10.7 0.2 1.1 0.6 0.5 4.0 0.5 0.0 32.7 5.1 37.8 1,740 Has no functional difficulty 65.6 8.1 0.1 2.9 2.8 0.3 1.6 11.9 0.3 0.4 1.3 0.5 3.7 0.2 0.0 29.9 4.5 34.4 45,018
Age 15-19 91.7 0.1 0.0 0.5 0.9 0.2 0.5 3.1 0.0 0.1 1.8 0.0 1.1 0.0 0.0 7.2 1.1 8.3 1,527 15-17 94.4 0.0 0.0 0.5 0.2 0.0 0.0 2.0 0.0 0.0 2.1 0.0 0.9 0.0 0.0 4.8 0.9 5.6 274 18-19 91.2 0.1 0.0 0.5 1.1 0.2 0.6 3.4 0.0 0.1 1.8 0.0 1.1 0.0 0.0 7.7 1.1 8.8 1,253 20-24 80.8 0.3 0.0 1.2 1.8 0.4 0.9 9.1 0.2 0.1 2.4 0.3 2.5 0.0 0.0 16.4 2.8 19.2 5,930 25-29 70.9 2.4 0.0 2.6 2.7 0.4 1.7 12.7 0.3 0.2 2.2 0.4 3.5 0.2 0.0 25.1 4.0 29.1 9,487 30-34 61.7 7.0 0.1 3.5 3.3 0.4 1.8 15.3 0.4 0.4 1.5 0.7 3.7 0.3 0.0 33.6 4.7 38.3 9,428 35-39 56.0 12.5 0.2 4.0 3.8 0.4 1.9 14.1 0.3 0.6 0.9 0.6 4.3 0.3 0.0 38.7 5.3 44.0 8,986 40-44 57.8 15.1 0.3 3.2 3.0 0.3 2.0 11.2 0.3 0.7 0.3 0.7 4.7 0.3 0.0 36.5 5.7 42.2 6,523 45-49 64.8 16.9 0.1 2.5 1.8 0.1 1.0 6.6 0.2 0.9 0.1 0.7 3.8 0.4 0.0 30.3 4.9 35.2 5,149
Number of living children 0 99.1 0.1 0.0 0.0 0.1 0.0 0.1 0.4 0.0 0.0 0.0 0.0 0.1 0.0 0.0 0.7 0.2 0.9 5,861 1 85.9 1.7 0.0 0.1 1.3 0.0 0.6 5.5 0.1 0.0 1.4 0.3 3.1 0.1 0.0 10.7 3.4 14.1 768 2 69.0 6.2 0.2 1.8 2.6 0.1 1.1 11.8 0.3 0.4 1.4 0.7 4.0 0.5 0.0 25.8 5.2 31.0 1,274 3 58.6 13.0 0.1 3.7 3.2 0.7 1.6 11.6 0.4 1.1 1.3 0.8 3.6 0.2 0.0 36.8 4.6 41.4 1,670 4+ 52.9 17.6 0.1 4.4 4.6 0.3 2.4 9.7 0.2 0.9 1.0 0.6 4.8 0.4 0.0 41.3 5.8 47.1 4,600
EducationA None/Pre-school 67.2 10.4 0.1 3.1 3.4 0.3 1.6 7.6 0.1 0.6 1.5 0.5 3.3 0.3 0.0 28.7 4.1 32.8 20,197 Primary 64.8 8.2 0.2 3.0 2.9 0.4 1.6 12.3 0.3 0.3 1.1 0.5 4.3 0.2 0.0 30.2 5.0 35.2 9,120 Lower Secondary 64.3 7.5 0.1 2.5 2.4 0.3 1.4 14.1 0.5 0.5 1.2 0.7 4.2 0.2 0.0 30.6 5.1 35.7 4,722 Upper Secondary 63.5 6.1 0.1 3.0 2.2 0.4 1.7 16.0 0.4 0.6 1.1 0.6 4.0 0.3 0.0 31.5 4.9 36.5 6,465 Higher 65.1 4.6 0.1 2.2 1.6 0.3 1.4 18.6 0.5 0.2 1.3 0.4 3.4 0.2 0.0 30.9 4.0 34.9 6,524
Wealth index quintile Poorest 70.3 8.3 0.2 3.4 4.4 0.3 1.7 5.5 0.1 0.4 1.9 0.4 2.8 0.2 0.0 26.3 3.3 29.7 8,766 Second 65.9 9.3 0.1 3.2 3.4 0.4 1.8 9.4 0.1 0.6 1.5 0.5 3.6 0.3 0.0 29.7 4.3 34.1 9,087 Middle 64.6 8.7 0.1 3.0 2.6 0.4 1.6 12.1 0.2 0.3 1.4 0.5 4.1 0.3 0.0 30.4 4.9 35.4 9,470 Fourth 64.8 7.8 0.2 2.5 2.0 0.3 1.1 14.1 0.4 0.5 1.0 0.6 4.5 0.2 0.0 29.9 5.3 35.2 9,776 Richest 63.1 7.4 0.1 2.3 1.8 0.2 1.6 17.1 0.5 0.5 0.9 0.7 3.4 0.2 0.0 32.6 4.3 36.9 9,931
1 MICS indicator TM.3 - Contraceptive prevalence rate 2 Non-MICS indicator TM.S1 – Contraceptive prevalence rate (Modern methods) A The category of “Don’t know/Missing” in the background characteristic of “Education” has been suppressed from the table due to small number of unweighted cases.
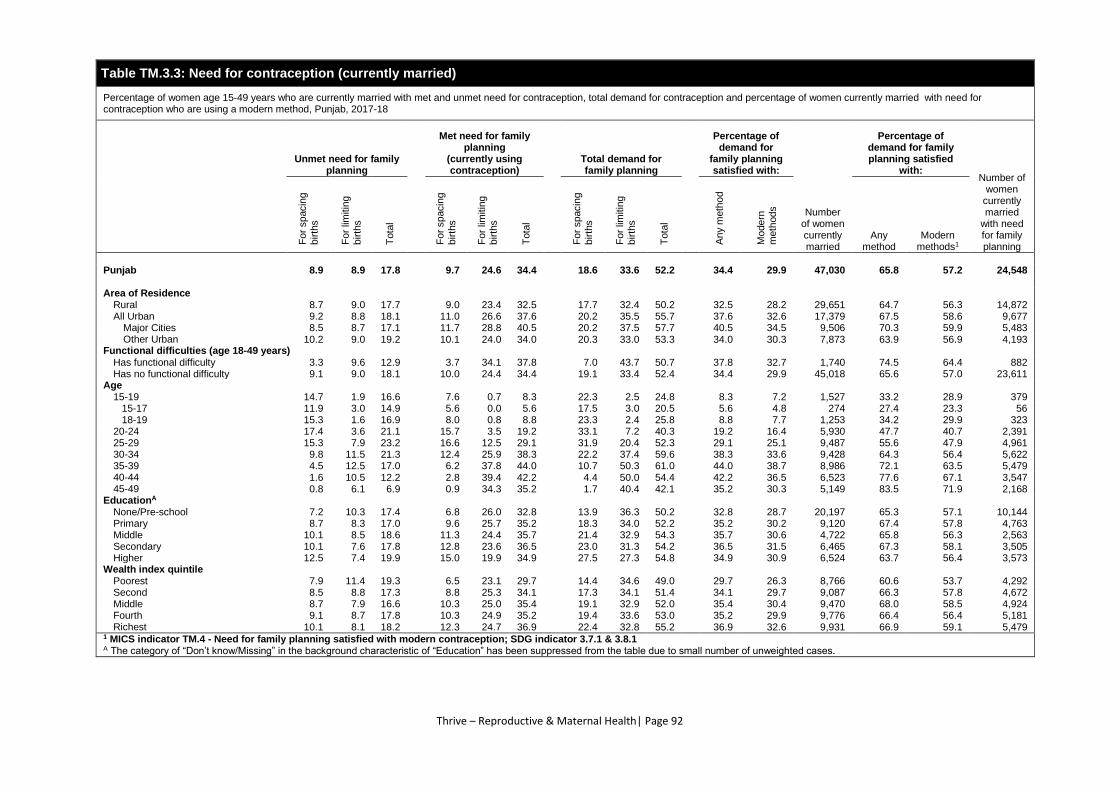
Thrive – Reproductive & Maternal Health| Page 92
Table TM.3.3: Need for contraception (currently married)
Percentage of women age 15-49 years who are currently married with met and unmet need for contraception, total demand for contraception and percentage of women currently married with need for contraception who are using a modern method, Punjab, 2017-18
Unmet need for family planning
Met need for family planning
(currently using contraception)
Total demand for family planning
Percentage of demand for
family planning satisfied with:
Number of women currently married
Percentage of demand for family planning satisfied
with: Number of
women currently married
with need for family planning
Fo
r sp
acin
g
birth
s
Fo
r lim
itin
g
birth
s
Tota
l
Fo
r sp
acin
g
birth
s
Fo
r lim
itin
g
birth
s
Tota
l
Fo
r sp
acin
g
birth
s
Fo
r lim
itin
g
birth
s
Tota
l
An
y m
eth
od
Mo
de
rn
meth
od
s
Any method
Modern methods1
Punjab 8.9 8.9 17.8 9.7 24.6 34.4 18.6 33.6 52.2 34.4 29.9 47,030 65.8 57.2 24,548 Area of Residence
Rural 8.7 9.0 17.7 9.0 23.4 32.5 17.7 32.4 50.2 32.5 28.2 29,651 64.7 56.3 14,872 All Urban 9.2 8.8 18.1 11.0 26.6 37.6 20.2 35.5 55.7 37.6 32.6 17,379 67.5 58.6 9,677
Major Cities 8.5 8.7 17.1 11.7 28.8 40.5 20.2 37.5 57.7 40.5 34.5 9,506 70.3 59.9 5,483 Other Urban 10.2 9.0 19.2 10.1 24.0 34.0 20.3 33.0 53.3 34.0 30.3 7,873 63.9 56.9 4,193
Functional difficulties (age 18-49 years) Has functional difficulty 3.3 9.6 12.9 3.7 34.1 37.8 7.0 43.7 50.7 37.8 32.7 1,740 74.5 64.4 882 Has no functional difficulty 9.1 9.0 18.1 10.0 24.4 34.4 19.1 33.4 52.4 34.4 29.9 45,018 65.6 57.0 23,611
Age 15-19 14.7 1.9 16.6 7.6 0.7 8.3 22.3 2.5 24.8 8.3 7.2 1,527 33.2 28.9 379 15-17 11.9 3.0 14.9 5.6 0.0 5.6 17.5 3.0 20.5 5.6 4.8 274 27.4 23.3 56 18-19 15.3 1.6 16.9 8.0 0.8 8.8 23.3 2.4 25.8 8.8 7.7 1,253 34.2 29.9 323 20-24 17.4 3.6 21.1 15.7 3.5 19.2 33.1 7.2 40.3 19.2 16.4 5,930 47.7 40.7 2,391 25-29 15.3 7.9 23.2 16.6 12.5 29.1 31.9 20.4 52.3 29.1 25.1 9,487 55.6 47.9 4,961 30-34 9.8 11.5 21.3 12.4 25.9 38.3 22.2 37.4 59.6 38.3 33.6 9,428 64.3 56.4 5,622 35-39 4.5 12.5 17.0 6.2 37.8 44.0 10.7 50.3 61.0 44.0 38.7 8,986 72.1 63.5 5,479 40-44 1.6 10.5 12.2 2.8 39.4 42.2 4.4 50.0 54.4 42.2 36.5 6,523 77.6 67.1 3,547 45-49 0.8 6.1 6.9 0.9 34.3 35.2 1.7 40.4 42.1 35.2 30.3 5,149 83.5 71.9 2,168
EducationA None/Pre-school 7.2 10.3 17.4 6.8 26.0 32.8 13.9 36.3 50.2 32.8 28.7 20,197 65.3 57.1 10,144 Primary 8.7 8.3 17.0 9.6 25.7 35.2 18.3 34.0 52.2 35.2 30.2 9,120 67.4 57.8 4,763 Middle 10.1 8.5 18.6 11.3 24.4 35.7 21.4 32.9 54.3 35.7 30.6 4,722 65.8 56.3 2,563 Secondary 10.1 7.6 17.8 12.8 23.6 36.5 23.0 31.3 54.2 36.5 31.5 6,465 67.3 58.1 3,505 Higher 12.5 7.4 19.9 15.0 19.9 34.9 27.5 27.3 54.8 34.9 30.9 6,524 63.7 56.4 3,573
Wealth index quintile Poorest 7.9 11.4 19.3 6.5 23.1 29.7 14.4 34.6 49.0 29.7 26.3 8,766 60.6 53.7 4,292 Second 8.5 8.8 17.3 8.8 25.3 34.1 17.3 34.1 51.4 34.1 29.7 9,087 66.3 57.8 4,672 Middle 8.7 7.9 16.6 10.3 25.0 35.4 19.1 32.9 52.0 35.4 30.4 9,470 68.0 58.5 4,924 Fourth 9.1 8.7 17.8 10.3 24.9 35.2 19.4 33.6 53.0 35.2 29.9 9,776 66.4 56.4 5,181 Richest 10.1 8.1 18.2 12.3 24.7 36.9 22.4 32.8 55.2 36.9 32.6 9,931 66.9 59.1 5,479
1 MICS indicator TM.4 - Need for family planning satisfied with modern contraception; SDG indicator 3.7.1 & 3.8.1 A The category of “Don’t know/Missing” in the background characteristic of “Education” has been suppressed from the table due to small number of unweighted cases.
Thrive – Reproductive & Maternal Health| Page 93
TM.4 ANTENATAL CARE
The antenatal period presents important opportunities for reaching pregnant women with a number of
interventions that may be vital to their health and well-being and that of their infants. For example,
antenatal care can be used to inform women and families about risks and symptoms in pregnancy and
about the risks of labour and delivery, and therefore it may provide the route for ensuring that pregnant
women do, in practice, deliver with the assistance of a skilled health care provider. Antenatal visits also
provide an opportunity to supply information on birth spacing, which is recognised as an important factor
in improving infant survival.
WHO recommends a minimum of eight antenatal visits based on a review of the effectiveness of different
models of antenatal care.40 WHO guidelines are specific on the content on antenatal care visits, which
include:
Blood pressure measurement
Urine testing for bacteriuria and proteinuria
Blood testing to detect syphilis and severe anaemia
Weight/height measurement (optional).
It is of crucial importance for pregnant women to start attending antenatal care visits as early in pregnancy
as possible and ideally have the first visit during the first trimester to prevent and detect pregnancy
conditions that could affect both the woman and her baby. Antenatal care should continue throughout the
entire pregnancy.40
Antenatal care is a tracer indicator of the Reproductive and Maternal Health Dimension of SDG 3.8
Universal Health Coverage. The type of personnel providing antenatal care to women age 15-49 years who
gave birth in the two years preceding is presented in Table TM.4.1.
Table TM.4.2 shows the number of antenatal care visits during the pregnancy of their most recent birth
within the two years preceding the survey, regardless of provider, by selected characteristics. Table TM.4.2
also provides information about the timing of the first antenatal care visit.
The coverage of key services that pregnant women are expected to receive during antenatal care are shown
in Table TM.4.3.
40 WHO. WHO recommendations on antenatal care for a positive pregnancy experience. Geneva: WHO Press, 2016.
http://apps.who.int/iris/bitstream/handle/10665/250796/9789241549912-eng.pdf?sequence=1.
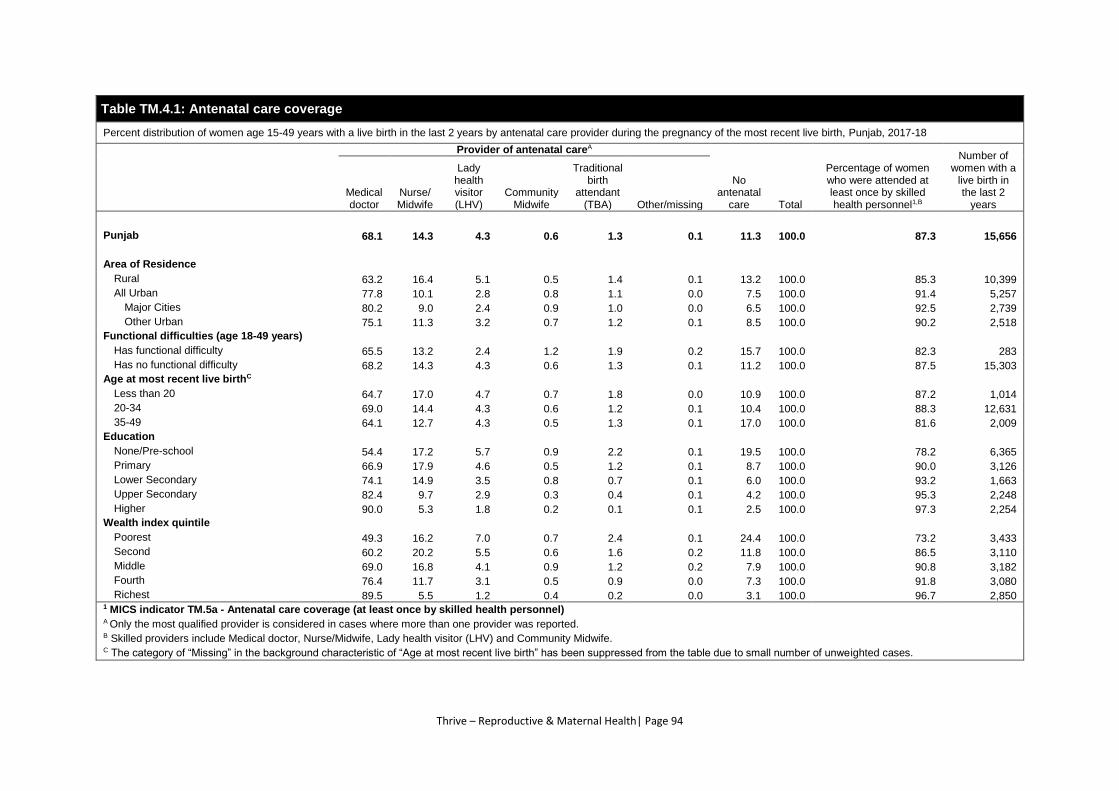
Thrive – Reproductive & Maternal Health| Page 94
Table TM.4.1: Antenatal care coverage
Percent distribution of women age 15-49 years with a live birth in the last 2 years by antenatal care provider during the pregnancy of the most recent live birth, Punjab, 2017-18
Provider of antenatal careA
No antenatal
care Total
Percentage of women who were attended at least once by skilled health personnel1,B
Number of women with a
live birth in the last 2
years Medical doctor
Nurse/ Midwife
Lady health visitor (LHV)
Community Midwife
Traditional birth
attendant (TBA) Other/missing
Punjab 68.1 14.3 4.3 0.6 1.3 0.1 11.3 100.0 87.3 15,656
Area of Residence
Rural 63.2 16.4 5.1 0.5 1.4 0.1 13.2 100.0 85.3 10,399
All Urban 77.8 10.1 2.8 0.8 1.1 0.0 7.5 100.0 91.4 5,257
Major Cities 80.2 9.0 2.4 0.9 1.0 0.0 6.5 100.0 92.5 2,739
Other Urban 75.1 11.3 3.2 0.7 1.2 0.1 8.5 100.0 90.2 2,518
Functional difficulties (age 18-49 years) Has functional difficulty 65.5 13.2 2.4 1.2 1.9 0.2 15.7 100.0 82.3 283
Has no functional difficulty 68.2 14.3 4.3 0.6 1.3 0.1 11.2 100.0 87.5 15,303
Age at most recent live birthC Less than 20 64.7 17.0 4.7 0.7 1.8 0.0 10.9 100.0 87.2 1,014
20-34 69.0 14.4 4.3 0.6 1.2 0.1 10.4 100.0 88.3 12,631
35-49 64.1 12.7 4.3 0.5 1.3 0.1 17.0 100.0 81.6 2,009
Education None/Pre-school 54.4 17.2 5.7 0.9 2.2 0.1 19.5 100.0 78.2 6,365
Primary 66.9 17.9 4.6 0.5 1.2 0.1 8.7 100.0 90.0 3,126
Lower Secondary 74.1 14.9 3.5 0.8 0.7 0.1 6.0 100.0 93.2 1,663
Upper Secondary 82.4 9.7 2.9 0.3 0.4 0.1 4.2 100.0 95.3 2,248
Higher 90.0 5.3 1.8 0.2 0.1 0.1 2.5 100.0 97.3 2,254
Wealth index quintile Poorest 49.3 16.2 7.0 0.7 2.4 0.1 24.4 100.0 73.2 3,433
Second 60.2 20.2 5.5 0.6 1.6 0.2 11.8 100.0 86.5 3,110
Middle 69.0 16.8 4.1 0.9 1.2 0.2 7.9 100.0 90.8 3,182
Fourth 76.4 11.7 3.1 0.5 0.9 0.0 7.3 100.0 91.8 3,080
Richest 89.5 5.5 1.2 0.4 0.2 0.0 3.1 100.0 96.7 2,850 1 MICS indicator TM.5a - Antenatal care coverage (at least once by skilled health personnel) A Only the most qualified provider is considered in cases where more than one provider was reported. B Skilled providers include Medical doctor, Nurse/Midwife, Lady health visitor (LHV) and Community Midwife. C The category of “Missing” in the background characteristic of “Age at most recent live birth” has been suppressed from the table due to small number of unweighted cases.
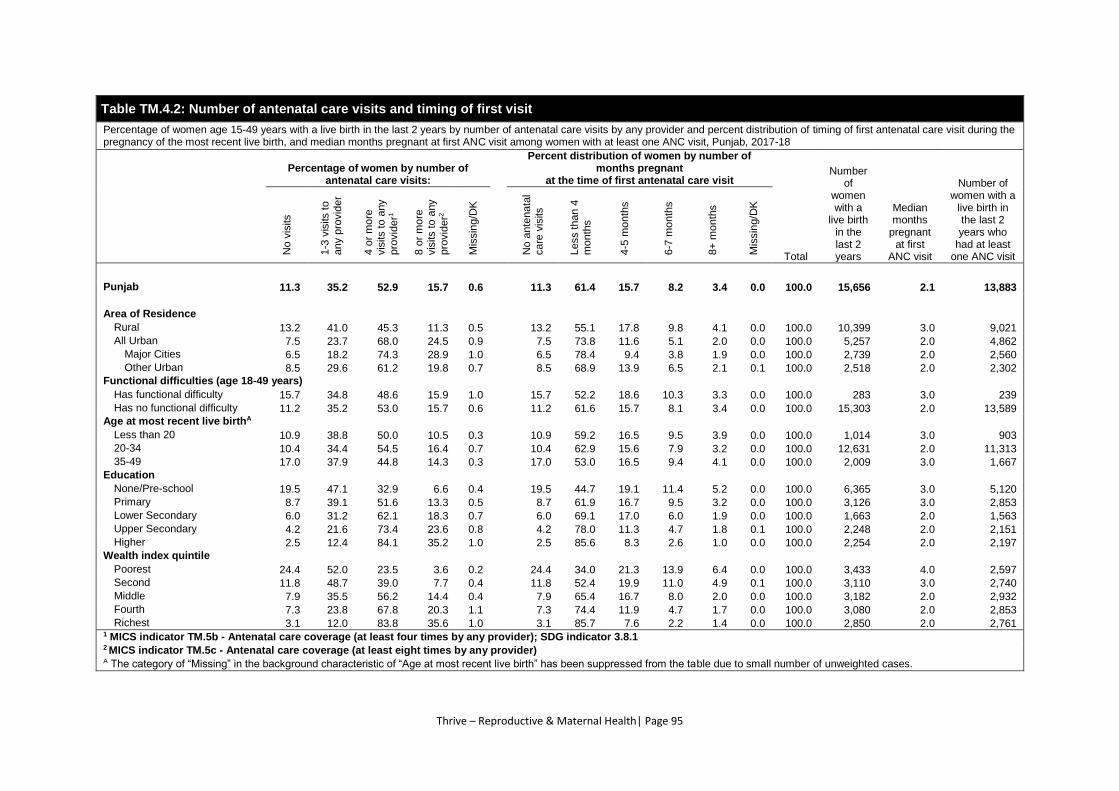
Thrive – Reproductive & Maternal Health| Page 95
Table TM.4.2: Number of antenatal care visits and timing of first visit
Percentage of women age 15-49 years with a live birth in the last 2 years by number of antenatal care visits by any provider and percent distribution of timing of first antenatal care visit during the pregnancy of the most recent live birth, and median months pregnant at first ANC visit among women with at least one ANC visit, Punjab, 2017-18
Percentage of women by number of antenatal care visits:
Percent distribution of women by number of months pregnant
at the time of first antenatal care visit
Total
Number of
women with a
live birth in the last 2 years
Median months
pregnant at first
ANC visit
Number of women with a
live birth in the last 2 years who
had at least one ANC visit N
o v
isits
1-3
vis
its to
any p
rovid
er
4 o
r m
ore
vis
its to a
ny
pro
vid
er1
8 o
r m
ore
vis
its to a
ny
pro
vid
er2
Mis
sin
g/D
K
No a
nte
nata
l care
vis
its
Less t
han 4
m
onth
s
4-5
mo
nth
s
6-7
mo
nth
s
8+
mo
nth
s
Mis
sin
g/D
K
Punjab 11.3 35.2 52.9 15.7 0.6 11.3 61.4 15.7 8.2 3.4 0.0 100.0 15,656 2.1 13,883
Area of Residence
Rural 13.2 41.0 45.3 11.3 0.5 13.2 55.1 17.8 9.8 4.1 0.0 100.0 10,399 3.0 9,021
All Urban 7.5 23.7 68.0 24.5 0.9 7.5 73.8 11.6 5.1 2.0 0.0 100.0 5,257 2.0 4,862
Major Cities 6.5 18.2 74.3 28.9 1.0 6.5 78.4 9.4 3.8 1.9 0.0 100.0 2,739 2.0 2,560
Other Urban 8.5 29.6 61.2 19.8 0.7 8.5 68.9 13.9 6.5 2.1 0.1 100.0 2,518 2.0 2,302
Functional difficulties (age 18-49 years) Has functional difficulty 15.7 34.8 48.6 15.9 1.0 15.7 52.2 18.6 10.3 3.3 0.0 100.0 283 3.0 239
Has no functional difficulty 11.2 35.2 53.0 15.7 0.6 11.2 61.6 15.7 8.1 3.4 0.0 100.0 15,303 2.0 13,589
Age at most recent live birthA Less than 20 10.9 38.8 50.0 10.5 0.3 10.9 59.2 16.5 9.5 3.9 0.0 100.0 1,014 3.0 903
20-34 10.4 34.4 54.5 16.4 0.7 10.4 62.9 15.6 7.9 3.2 0.0 100.0 12,631 2.0 11,313
35-49 17.0 37.9 44.8 14.3 0.3 17.0 53.0 16.5 9.4 4.1 0.0 100.0 2,009 3.0 1,667
Education None/Pre-school 19.5 47.1 32.9 6.6 0.4 19.5 44.7 19.1 11.4 5.2 0.0 100.0 6,365 3.0 5,120
Primary 8.7 39.1 51.6 13.3 0.5 8.7 61.9 16.7 9.5 3.2 0.0 100.0 3,126 3.0 2,853
Lower Secondary 6.0 31.2 62.1 18.3 0.7 6.0 69.1 17.0 6.0 1.9 0.0 100.0 1,663 2.0 1,563
Upper Secondary 4.2 21.6 73.4 23.6 0.8 4.2 78.0 11.3 4.7 1.8 0.1 100.0 2,248 2.0 2,151
Higher 2.5 12.4 84.1 35.2 1.0 2.5 85.6 8.3 2.6 1.0 0.0 100.0 2,254 2.0 2,197
Wealth index quintile Poorest 24.4 52.0 23.5 3.6 0.2 24.4 34.0 21.3 13.9 6.4 0.0 100.0 3,433 4.0 2,597
Second 11.8 48.7 39.0 7.7 0.4 11.8 52.4 19.9 11.0 4.9 0.1 100.0 3,110 3.0 2,740
Middle 7.9 35.5 56.2 14.4 0.4 7.9 65.4 16.7 8.0 2.0 0.0 100.0 3,182 2.0 2,932
Fourth 7.3 23.8 67.8 20.3 1.1 7.3 74.4 11.9 4.7 1.7 0.0 100.0 3,080 2.0 2,853
Richest 3.1 12.0 83.8 35.6 1.0 3.1 85.7 7.6 2.2 1.4 0.0 100.0 2,850 2.0 2,761 1 MICS indicator TM.5b - Antenatal care coverage (at least four times by any provider); SDG indicator 3.8.1 2 MICS indicator TM.5c - Antenatal care coverage (at least eight times by any provider) A The category of “Missing” in the background characteristic of “Age at most recent live birth” has been suppressed from the table due to small number of unweighted cases.
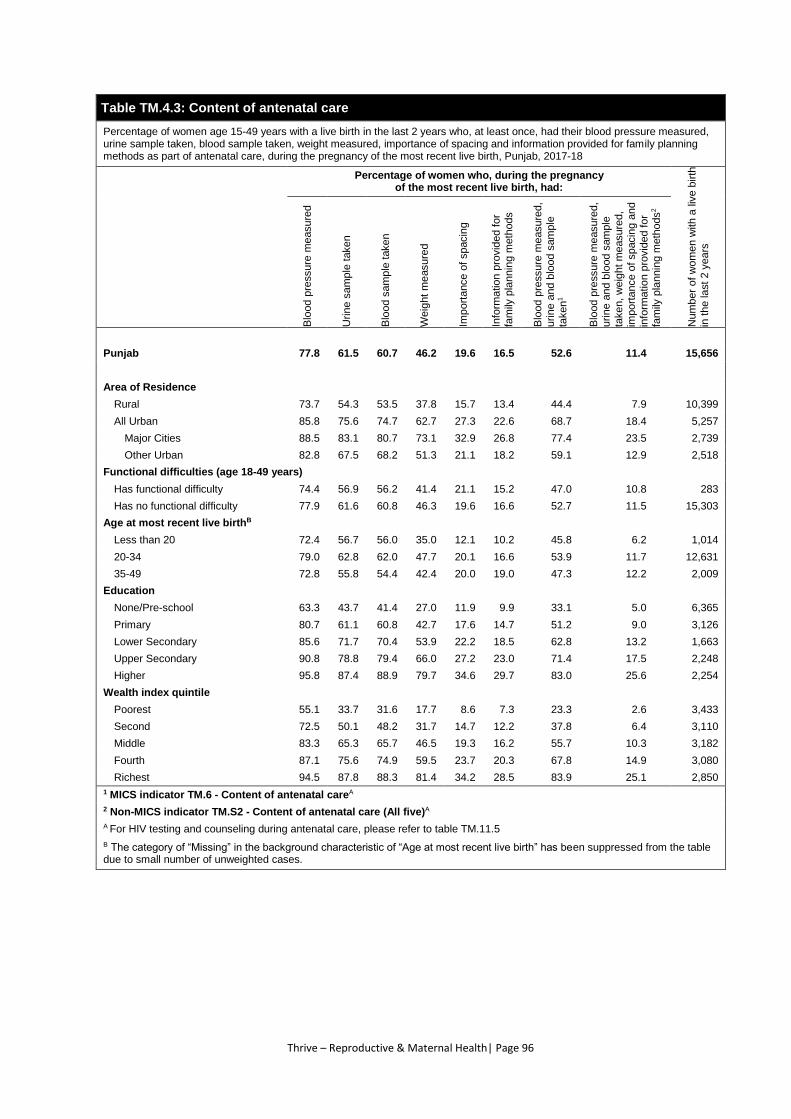
Thrive – Reproductive & Maternal Health| Page 96
Table TM.4.3: Content of antenatal care
Percentage of women age 15-49 years with a live birth in the last 2 years who, at least once, had their blood pressure measured, urine sample taken, blood sample taken, weight measured, importance of spacing and information provided for family planning methods as part of antenatal care, during the pregnancy of the most recent live birth, Punjab, 2017-18
Percentage of women who, during the pregnancy of the most recent live birth, had:
Num
ber
of
wom
en w
ith a
liv
e b
irth
in t
he la
st
2 y
ears
Blo
od p
ressure
me
asure
d
Urin
e s
am
ple
taken
Blo
od s
am
ple
taken
Weig
ht
me
asure
d
Imp
ort
ance o
f spacin
g
Info
rma
tio
n p
rovid
ed f
or
fam
ily p
lannin
g m
eth
ods
Blo
od p
ressure
me
asure
d,
urin
e a
nd b
lood s
am
ple
ta
ken
1
Blo
od p
ressure
me
asure
d,
urin
e a
nd b
lood s
am
ple
taken, w
eig
ht m
easure
d,
import
ance o
f spacin
g a
nd
info
rma
tio
n p
rovid
ed for
fam
ily p
lannin
g m
eth
ods
2
Punjab 77.8 61.5 60.7 46.2 19.6 16.5 52.6 11.4 15,656
Area of Residence
Rural 73.7 54.3 53.5 37.8 15.7 13.4 44.4 7.9 10,399
All Urban 85.8 75.6 74.7 62.7 27.3 22.6 68.7 18.4 5,257
Major Cities 88.5 83.1 80.7 73.1 32.9 26.8 77.4 23.5 2,739
Other Urban 82.8 67.5 68.2 51.3 21.1 18.2 59.1 12.9 2,518
Functional difficulties (age 18-49 years)
Has functional difficulty 74.4 56.9 56.2 41.4 21.1 15.2 47.0 10.8 283
Has no functional difficulty 77.9 61.6 60.8 46.3 19.6 16.6 52.7 11.5 15,303
Age at most recent live birthB
Less than 20 72.4 56.7 56.0 35.0 12.1 10.2 45.8 6.2 1,014
20-34 79.0 62.8 62.0 47.7 20.1 16.6 53.9 11.7 12,631
35-49 72.8 55.8 54.4 42.4 20.0 19.0 47.3 12.2 2,009
Education
None/Pre-school 63.3 43.7 41.4 27.0 11.9 9.9 33.1 5.0 6,365
Primary 80.7 61.1 60.8 42.7 17.6 14.7 51.2 9.0 3,126
Lower Secondary 85.6 71.7 70.4 53.9 22.2 18.5 62.8 13.2 1,663
Upper Secondary 90.8 78.8 79.4 66.0 27.2 23.0 71.4 17.5 2,248
Higher 95.8 87.4 88.9 79.7 34.6 29.7 83.0 25.6 2,254
Wealth index quintile
Poorest 55.1 33.7 31.6 17.7 8.6 7.3 23.3 2.6 3,433
Second 72.5 50.1 48.2 31.7 14.7 12.2 37.8 6.4 3,110
Middle 83.3 65.3 65.7 46.5 19.3 16.2 55.7 10.3 3,182
Fourth 87.1 75.6 74.9 59.5 23.7 20.3 67.8 14.9 3,080
Richest 94.5 87.8 88.3 81.4 34.2 28.5 83.9 25.1 2,850
1 MICS indicator TM.6 - Content of antenatal careA
2 Non-MICS indicator TM.S2 - Content of antenatal care (All five)A
A For HIV testing and counseling during antenatal care, please refer to table TM.11.5
B The category of “Missing” in the background characteristic of “Age at most recent live birth” has been suppressed from the table due to small number of unweighted cases.
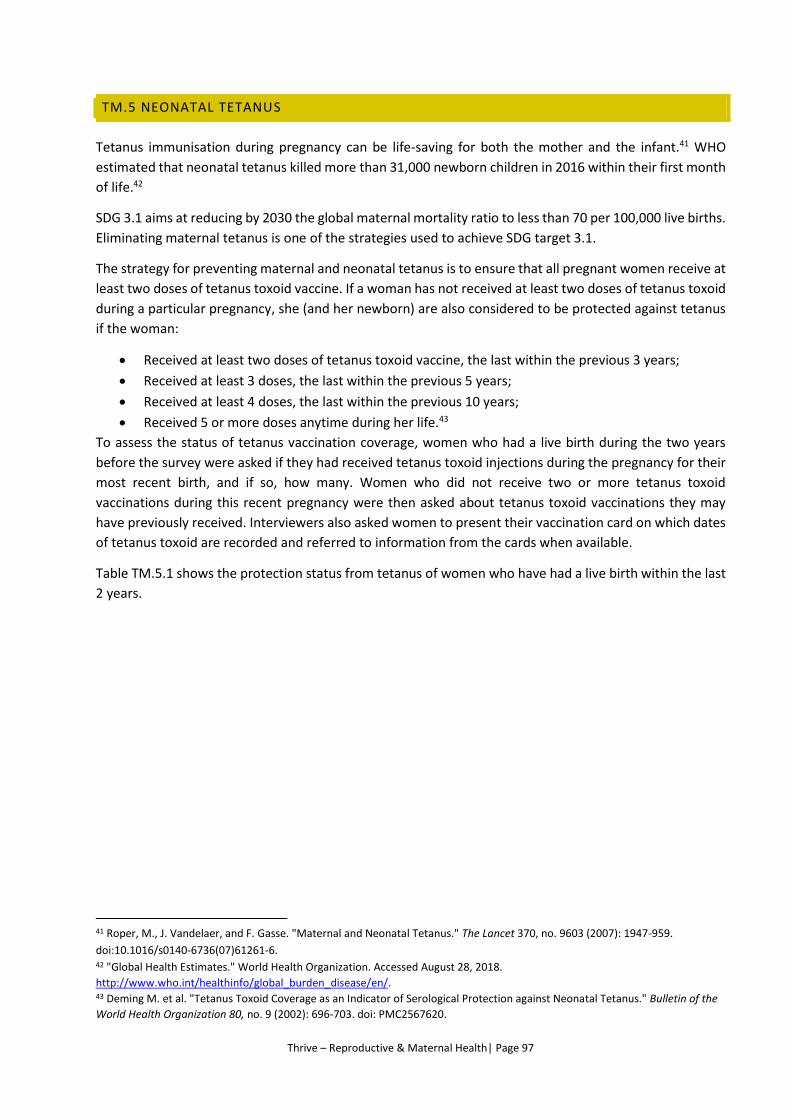
Thrive – Reproductive & Maternal Health| Page 97
TM.5 NEONATAL TETANUS
Tetanus immunisation during pregnancy can be life-saving for both the mother and the infant.41 WHO
estimated that neonatal tetanus killed more than 31,000 newborn children in 2016 within their first month
of life.42
SDG 3.1 aims at reducing by 2030 the global maternal mortality ratio to less than 70 per 100,000 live births.
Eliminating maternal tetanus is one of the strategies used to achieve SDG target 3.1.
The strategy for preventing maternal and neonatal tetanus is to ensure that all pregnant women receive at
least two doses of tetanus toxoid vaccine. If a woman has not received at least two doses of tetanus toxoid
during a particular pregnancy, she (and her newborn) are also considered to be protected against tetanus
if the woman:
Received at least two doses of tetanus toxoid vaccine, the last within the previous 3 years;
Received at least 3 doses, the last within the previous 5 years;
Received at least 4 doses, the last within the previous 10 years;
Received 5 or more doses anytime during her life.43
To assess the status of tetanus vaccination coverage, women who had a live birth during the two years
before the survey were asked if they had received tetanus toxoid injections during the pregnancy for their
most recent birth, and if so, how many. Women who did not receive two or more tetanus toxoid
vaccinations during this recent pregnancy were then asked about tetanus toxoid vaccinations they may
have previously received. Interviewers also asked women to present their vaccination card on which dates
of tetanus toxoid are recorded and referred to information from the cards when available.
Table TM.5.1 shows the protection status from tetanus of women who have had a live birth within the last
2 years.
41 Roper, M., J. Vandelaer, and F. Gasse. "Maternal and Neonatal Tetanus." The Lancet 370, no. 9603 (2007): 1947-959.
doi:10.1016/s0140-6736(07)61261-6. 42 "Global Health Estimates." World Health Organization. Accessed August 28, 2018.
http://www.who.int/healthinfo/global_burden_disease/en/. 43 Deming M. et al. "Tetanus Toxoid Coverage as an Indicator of Serological Protection against Neonatal Tetanus." Bulletin of the
World Health Organization 80, no. 9 (2002): 696-703. doi: PMC2567620.
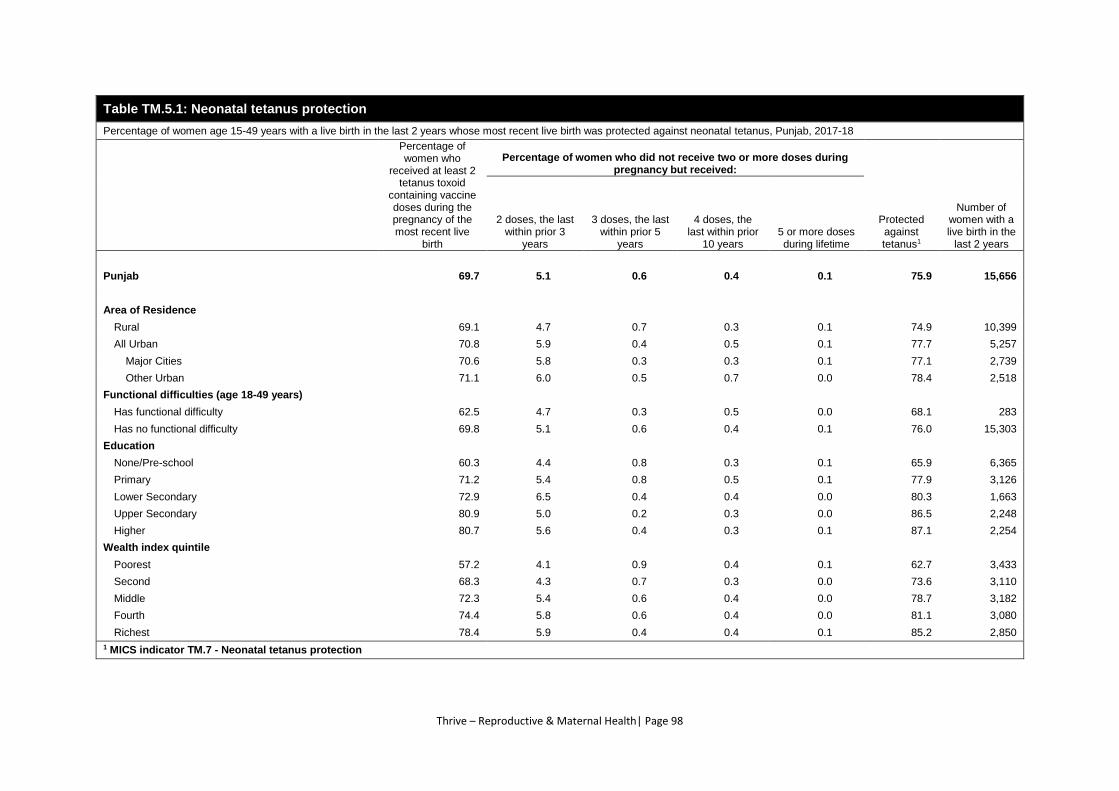
Thrive – Reproductive & Maternal Health| Page 98
Table TM.5.1: Neonatal tetanus protection
Percentage of women age 15-49 years with a live birth in the last 2 years whose most recent live birth was protected against neonatal tetanus, Punjab, 2017-18
Percentage of women who
received at least 2 tetanus toxoid
containing vaccine doses during the pregnancy of the most recent live
birth
Percentage of women who did not receive two or more doses during pregnancy but received:
Protected against tetanus1
Number of women with a live birth in the
last 2 years
2 doses, the last within prior 3
years
3 doses, the last within prior 5
years
4 doses, the last within prior
10 years 5 or more doses during lifetime
Punjab 69.7 5.1 0.6 0.4 0.1 75.9 15,656
Area of Residence
Rural 69.1 4.7 0.7 0.3 0.1 74.9 10,399
All Urban 70.8 5.9 0.4 0.5 0.1 77.7 5,257
Major Cities 70.6 5.8 0.3 0.3 0.1 77.1 2,739
Other Urban 71.1 6.0 0.5 0.7 0.0 78.4 2,518
Functional difficulties (age 18-49 years)
Has functional difficulty 62.5 4.7 0.3 0.5 0.0 68.1 283
Has no functional difficulty 69.8 5.1 0.6 0.4 0.1 76.0 15,303
Education
None/Pre-school 60.3 4.4 0.8 0.3 0.1 65.9 6,365
Primary 71.2 5.4 0.8 0.5 0.1 77.9 3,126
Lower Secondary 72.9 6.5 0.4 0.4 0.0 80.3 1,663
Upper Secondary 80.9 5.0 0.2 0.3 0.0 86.5 2,248
Higher 80.7 5.6 0.4 0.3 0.1 87.1 2,254
Wealth index quintile
Poorest 57.2 4.1 0.9 0.4 0.1 62.7 3,433
Second 68.3 4.3 0.7 0.3 0.0 73.6 3,110
Middle 72.3 5.4 0.6 0.4 0.0 78.7 3,182
Fourth 74.4 5.8 0.6 0.4 0.0 81.1 3,080
Richest 78.4 5.9 0.4 0.4 0.1 85.2 2,850
1 MICS indicator TM.7 - Neonatal tetanus protection
Thrive – Reproductive & Maternal Health| Page 99
TM.6 DELIVERY CARE
Increasing the proportion of births that are delivered in health facilities is an important factor in reducing
the health risks to both the mother and the baby. Proper medical attention and hygienic conditions during
delivery can reduce the risks of complications and infection that can cause morbidity and mortality to either
the mother or the baby.44
Table TM.6.1 presents the percent distribution of women age 15-49 who had a live birth in the two years
preceding the survey by place of delivery of the most recent birth, and the percentage of their most recent
births delivered in a health facility, according to background characteristics.
About three quarters of all maternal deaths occur due to direct obstetric causes.45 The single most critical
intervention for safe motherhood is to ensure that a competent health worker with midwifery skills is
present at every birth, and, in case of emergency, that there is a referral system in place to provide obstetric
care in the right level of facility.44 The skilled attendant at delivery indicator is used to track progress toward
the Sustainable Development Goal 3.1 of reducing maternal mortality and it is SDG indicator 3.1.2.
The MICS included questions to assess the proportion of births attended by a skilled attendant. According
to the revised definition44, skilled health personnel, as referenced by SDG indicator 3.1.2, are competent
maternal and newborn health professionals educated, trained and regulated to national and international
standards. They are competent to: facilitate physiological processes during labour to ensure clean and safe
birth; and identify and manage or refer women and/or newborns with complications. The skilled attendants
are doctor, nurse/midwife, lady health visitor (LHV) and community midwife.
Table TM.6.2 presents information on assistance during delivery of the most recent birth in the two years
preceding the survey. Table TM.6.2 also shows information on women who delivered by caesarean section
(C-section) and provides additional information on the timing of the decision to conduct a C-section (before
labour pains began or after) to better assess if such decisions are mostly driven by medical or non–medical
reasons.
Table TM.6.3 presents the percentage of ever married women age 15-49 years with a live birth in the last
two years who were counselled, told and guided for family planning methods before leaving health facility
during the last pregnancy that led to a live birth.
44 WHO. Defining competent maternal and newborn health professionals: background document to the 2018 joint statement by
WHO, UNFPA, UNICEF, ICM, ICN, FIGO and IPA: definition of skilled health personnel providing care during childbirth. Geneva:
WHO Press, 2018. http://apps.who.int/iris/bitstream/handle/10665/272817/9789241514200-eng.pdf?sequence=1&isAllowed=y. 45 Say, L. et al. "Global Causes of Maternal Death: A WHO Systematic Analysis." The Lancet Global Health 2, no. 6 (2014): 323-33.
doi:10.1016/s2214-109x(14)70227-x.
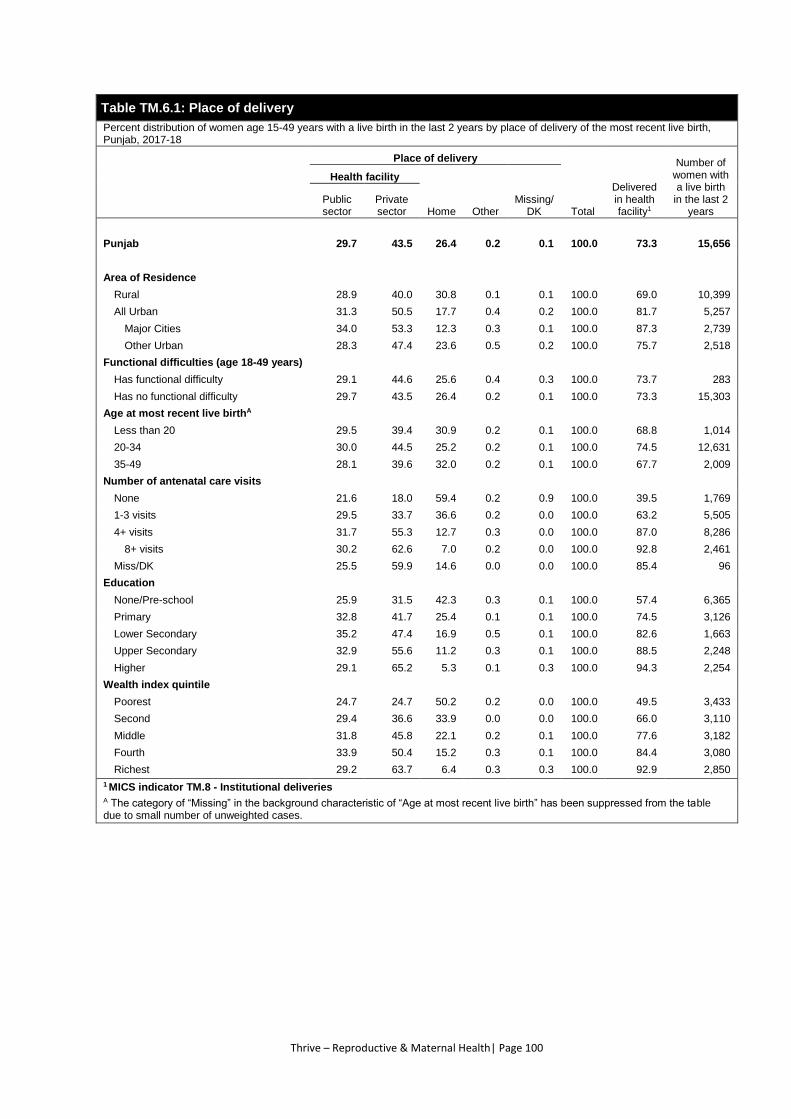
Thrive – Reproductive & Maternal Health| Page 100
Table TM.6.1: Place of delivery
Percent distribution of women age 15-49 years with a live birth in the last 2 years by place of delivery of the most recent live birth, Punjab, 2017-18
Place of delivery
Total
Delivered in health facility1
Number of women with a live birth
in the last 2 years
Health facility
Home Other Missing/
DK Public sector
Private sector
Punjab 29.7 43.5 26.4 0.2 0.1 100.0 73.3 15,656
Area of Residence
Rural 28.9 40.0 30.8 0.1 0.1 100.0 69.0 10,399
All Urban 31.3 50.5 17.7 0.4 0.2 100.0 81.7 5,257
Major Cities 34.0 53.3 12.3 0.3 0.1 100.0 87.3 2,739
Other Urban 28.3 47.4 23.6 0.5 0.2 100.0 75.7 2,518
Functional difficulties (age 18-49 years)
Has functional difficulty 29.1 44.6 25.6 0.4 0.3 100.0 73.7 283
Has no functional difficulty 29.7 43.5 26.4 0.2 0.1 100.0 73.3 15,303
Age at most recent live birthA
Less than 20 29.5 39.4 30.9 0.2 0.1 100.0 68.8 1,014
20-34 30.0 44.5 25.2 0.2 0.1 100.0 74.5 12,631
35-49 28.1 39.6 32.0 0.2 0.1 100.0 67.7 2,009
Number of antenatal care visits
None 21.6 18.0 59.4 0.2 0.9 100.0 39.5 1,769
1-3 visits 29.5 33.7 36.6 0.2 0.0 100.0 63.2 5,505
4+ visits 31.7 55.3 12.7 0.3 0.0 100.0 87.0 8,286
8+ visits 30.2 62.6 7.0 0.2 0.0 100.0 92.8 2,461
Miss/DK 25.5 59.9 14.6 0.0 0.0 100.0 85.4 96
Education
None/Pre-school 25.9 31.5 42.3 0.3 0.1 100.0 57.4 6,365
Primary 32.8 41.7 25.4 0.1 0.1 100.0 74.5 3,126
Lower Secondary 35.2 47.4 16.9 0.5 0.1 100.0 82.6 1,663
Upper Secondary 32.9 55.6 11.2 0.3 0.1 100.0 88.5 2,248
Higher 29.1 65.2 5.3 0.1 0.3 100.0 94.3 2,254
Wealth index quintile
Poorest 24.7 24.7 50.2 0.2 0.0 100.0 49.5 3,433
Second 29.4 36.6 33.9 0.0 0.0 100.0 66.0 3,110
Middle 31.8 45.8 22.1 0.2 0.1 100.0 77.6 3,182
Fourth 33.9 50.4 15.2 0.3 0.1 100.0 84.4 3,080
Richest 29.2 63.7 6.4 0.3 0.3 100.0 92.9 2,850
1 MICS indicator TM.8 - Institutional deliveries A The category of “Missing” in the background characteristic of “Age at most recent live birth” has been suppressed from the table due to small number of unweighted cases.

Thrive – Reproductive & Maternal Health| Page 101
Table TM.6.2: Assistance during delivery and caesarian section
Percent distribution of women age 15-49 years with a live birth in the last 2 years by person providing assistance at delivery of the most recent live birth, and percentage of most recent live births delivered by C-section, Punjab, 2017-18
Person assisting at delivery
No a
tten
da
nt
Tota
l
De
live
ry a
ssis
ted
by a
ny s
kill
ed
atte
nd
an
t1
Percent delivered by C-section
Number of women with a live birth in
the last 2 years
Skilled attendant Other
Decid
ed
be
fore
on
set of
lab
ou
r
pa
ins
Decid
ed
afte
r o
nset of
lab
ou
r
pa
ins
Tota
l2
Me
dic
al
do
cto
r
Nu
rse/
Mid
wife
La
dy h
ea
lth
vis
ito
r (L
HV
)
Com
mu
nity
Mid
wife
Tra
ditio
na
l b
irth
atte
nd
an
t
(TB
A)
Re
lative/
Frien
d
Oth
er/
mis
sin
g
Punjab 56.8 14.2 4.2 1.3 21.7 1.4 0.2 0.3 100.0 76.4 20.0 9.0 28.9 15,656
Area of Residence
Rural 50.4 15.8 4.8 1.2 25.5 1.7 0.2 0.3 100.0 72.2 17.5 8.3 25.8 10,399 All Urban 69.4 10.9 3.0 1.4 14.1 0.7 0.3 0.2 100.0 84.7 24.8 10.3 35.1 5,257 Major Cities 76.2 8.9 2.4 1.5 10.2 0.4 0.1 0.2 100.0 89.1 26.5 11.7 38.3 2,739 Other Urban 61.9 13.1 3.6 1.3 18.4 1.0 0.4 0.3 100.0 79.9 22.9 8.7 31.6 2,518
Functional difficulties (age 18-49 years)
Has functional difficulty 56.8 13.0 4.3 1.0 22.0 2.1 0.3 0.6 100.0 75.0 22.9 5.7 28.6 283 Has no functional difficulty 56.8 14.2 4.2 1.3 21.7 1.4 0.2 0.3 100.0 76.5 19.9 9.1 29.0 15,303
Age at most recent live birthA
Less than 20 51.6 15.4 4.0 0.9 25.6 2.1 0.2 0.2 100.0 72.0 13.4 10.7 24.1 1,014 20-34 58.0 14.2 4.1 1.3 20.6 1.2 0.2 0.3 100.0 77.7 20.7 9.1 29.9 12,631 35-49 51.5 13.6 4.6 1.2 26.3 2.0 0.2 0.5 100.0 70.9 18.3 7.3 25.6 2,009
Number of antenatal care visits
None 23.6 13.7 3.6 1.5 51.0 4.3 1.1 1.2 100.0 42.4 5.8 2.9 8.7 1,769 1-3 visits 42.1 17.7 5.8 1.7 30.3 1.9 0.2 0.4 100.0 67.2 12.6 5.7 18.2 5,505 4+ visits 73.4 12.0 3.3 1.0 9.8 0.4 0.0 0.1 100.0 89.7 27.8 12.5 40.3 8,286
8+ visits 81.9 9.2 3.1 0.9 4.8 0.2 0.0 0.0 100.0 95.0 33.7 14.2 47.9 2,461 Missing/DK 75.6 9.3 3.0 0.0 9.7 2.4 0.0 0.0 100.0 87.9 27.6 9.4 37.0 96
Place of delivery
Home 2.1 6.7 2.6 2.1 80.2 5.1 0.2 1.0 100.0 13.6 0.0 0.0 0.0 4,134 Health facility 76.6 16.9 4.8 1.0 0.6 0.1 0.1 0.1 100.0 99.3 27.2 12.3 39.5 11,469
Public 69.4 22.8 6.3 1.1 0.4 0.0 0.0 0.1 100.0 99.5 16.1 7.4 23.5 4,653 Private 81.5 12.9 3.8 0.9 0.7 0.1 0.1 0.0 100.0 99.1 34.8 15.6 50.4 6,816
Other/DK/Missing (28.9) (4.9) (0.0) (2.0) (21.5) (2.7) (36.1) (3.9) 100.0 (35.8) (0.0) (0.0) (0.0) 53 Education
None/Pre-school 37.9 15.8 5.3 1.8 35.6 2.7 0.3 0.5 100.0 60.9 11.1 5.8 17.0 6,365 Primary 55.7 17.0 4.4 1.1 20.4 0.9 0.1 0.3 100.0 78.2 19.2 7.9 27.2 3,126 Lower Secondary 66.6 15.2 3.4 0.8 13.0 0.6 0.1 0.1 100.0 86.1 22.1 10.3 32.4 1,663 Upper Secondary 76.2 11.4 3.1 0.7 8.1 0.3 0.1 0.1 100.0 91.4 28.5 12.3 40.8 2,248 Higher 84.9 7.6 2.3 0.7 3.9 0.0 0.3 0.1 100.0 95.6 35.7 15.1 50.8 2,254
Wealth index quintile
Poorest 30.2 14.8 6.0 1.6 42.7 3.7 0.3 0.8 100.0 52.6 8.2 4.0 12.2 3,433 Second 45.4 18.0 4.9 1.1 28.7 1.5 0.1 0.2 100.0 69.4 14.5 7.4 21.9 3,110 Middle 58.3 17.6 4.0 1.5 17.7 0.4 0.2 0.2 100.0 81.5 20.9 9.7 30.6 3,182 Fourth 70.5 12.4 3.8 1.3 11.1 0.5 0.2 0.2 100.0 88.0 23.9 10.8 34.6 3,080 Richest 84.9 7.3 1.7 0.8 4.5 0.4 0.4 0.1 100.0 94.6 34.8 14.0 48.8 2,850
1 MICS indicator TM.9 - Skilled attendant at delivery; SDG indicator 3.1.2 2 MICS indicator TM.10 - Caesarean section A The category of “Missing” in the background characteristic of “Age at most recent live birth” has been suppressed from the table due to small number of unweighted cases. ( ) Figures that are based on 25-49 unweighted cases
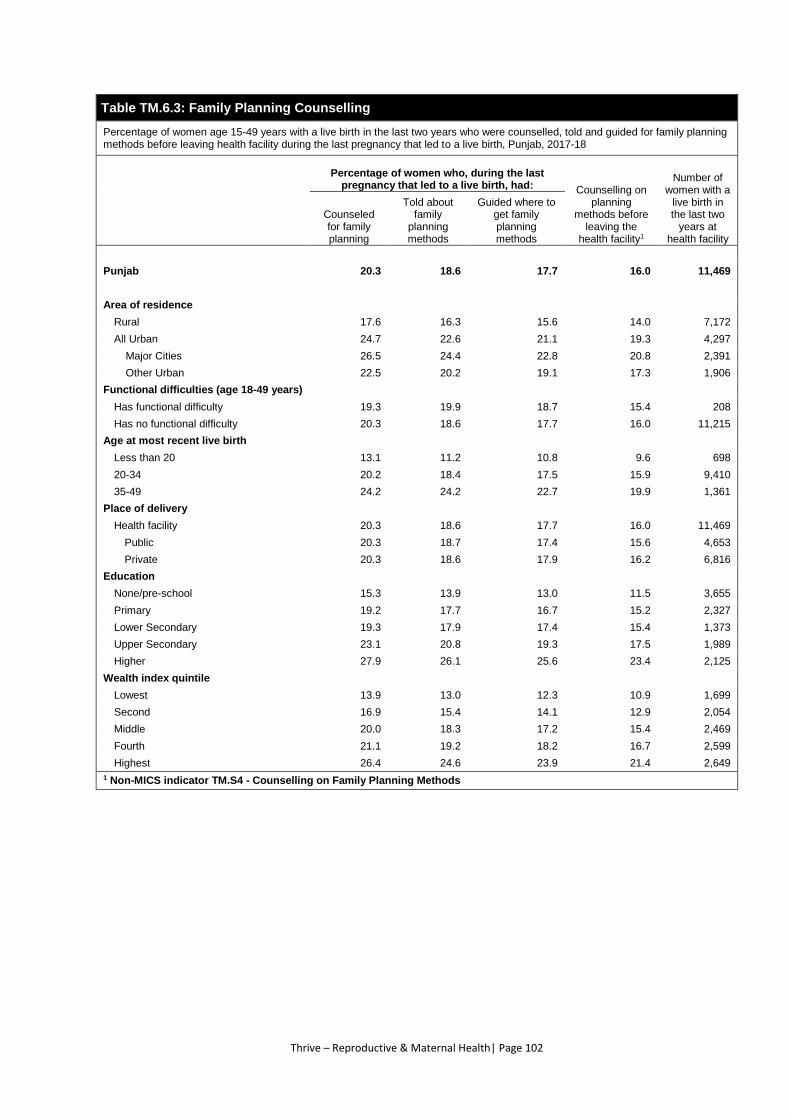
Thrive – Reproductive & Maternal Health| Page 102
Table TM.6.3: Family Planning Counselling
Percentage of women age 15-49 years with a live birth in the last two years who were counselled, told and guided for family planning methods before leaving health facility during the last pregnancy that led to a live birth, Punjab, 2017-18
Percentage of women who, during the last pregnancy that led to a live birth, had: Counselling on
planning methods before
leaving the health facility1
Number of women with a
live birth in the last two
years at health facility
Counseled for family planning
Told about family
planning methods
Guided where to get family planning methods
Punjab 20.3 18.6 17.7 16.0 11,469
Area of residence
Rural 17.6 16.3 15.6 14.0 7,172
All Urban 24.7 22.6 21.1 19.3 4,297
Major Cities 26.5 24.4 22.8 20.8 2,391
Other Urban 22.5 20.2 19.1 17.3 1,906
Functional difficulties (age 18-49 years)
Has functional difficulty 19.3 19.9 18.7 15.4 208
Has no functional difficulty 20.3 18.6 17.7 16.0 11,215
Age at most recent live birth
Less than 20 13.1 11.2 10.8 9.6 698
20-34 20.2 18.4 17.5 15.9 9,410
35-49 24.2 24.2 22.7 19.9 1,361
Place of delivery
Health facility 20.3 18.6 17.7 16.0 11,469
Public 20.3 18.7 17.4 15.6 4,653
Private 20.3 18.6 17.9 16.2 6,816
Education
None/pre-school 15.3 13.9 13.0 11.5 3,655
Primary 19.2 17.7 16.7 15.2 2,327
Lower Secondary 19.3 17.9 17.4 15.4 1,373
Upper Secondary 23.1 20.8 19.3 17.5 1,989
Higher 27.9 26.1 25.6 23.4 2,125
Wealth index quintile
Lowest 13.9 13.0 12.3 10.9 1,699
Second 16.9 15.4 14.1 12.9 2,054
Middle 20.0 18.3 17.2 15.4 2,469
Fourth 21.1 19.2 18.2 16.7 2,599
Highest 26.4 24.6 23.9 21.4 2,649
1 Non-MICS indicator TM.S4 - Counselling on Family Planning Methods
Thrive – Reproductive & Maternal Health| Page 103
TM.7 BIRTHWEIGHT
Weight at birth is a good indicator not only of a mother's health and nutritional status but also the newborn's chances
for survival, growth, long-term health and psychosocial development. Low birth weight (LBW), defined as a
birthweight less than 2,500 grams (g) regardless of gestational age, carries a range of grave health and developmental
risks for children. LBW babies face a greatly increased risk of dying during their early days with more than 80% of
neonatal deaths occurring in LBW newborns; recent evidence also links increased mortality risk through adolescence
to LBW. For those who do survive, LBW contributes to a wide range of poor health outcomes including higher risk of
stunted linear growth in childhood, and long-term effects into adulthood such as lower IQ and an increased risk of
chronic conditions including obesity, diabetes and cardiovascular problems.46,47
Premature birth, being born before 37 weeks gestation, is the primary cause of LBW given that a baby born early has
less time to grow and gain weight in utero, especially as much of the foetal weight is gained during the latter part of
pregnancy. The other cause of LBW is intrauterine growth restriction, which occurs when the foetus does not grow
well because of problems with the mother's health and/or nutrition, placental problems, or birth defects. While poor
dietary intake and disease during pregnancy can affect birthweight outcome, an intergenerational effect has also been
noted with mothers who were themselves LBW having an increased risk of having an LBW offspring.48,49,50 Short
maternal stature and maternal thinness before pregnancy can increase risk of having an LBW child which can be offset
by dietary interventions including micronutrient supplementation.51,52 Other factors such as cigarette smoking during
pregnancy can increase the risk of LBW, especially among certain age groups.53,54
A major limitation of monitoring LBW globally is the lack of birthweight data for many children, especially in some
countries. There is a notable bias among the unweighted, with those born to poorer, less educated, rural mothers
being less likely to have a birthweight when compared to their richer, urban counterparts with more highly educated
mothers. As the characteristics of the unweighted are related to being LBW, LBW estimates that do not represent
these children may be lower than the true value. Furthermore, poor quality of available data with regard to excessive
heaping on multiples of 500 g or 100 g exists in the majority of available data from low and middle-income countries
and can further bias LBW estimates.55 To help overcome some of these limitations, a method was developed to adjust
LBW estimates for missing birth weights and heaping on 2,500 g.56 This method comprises a single imputation allowing
46 Katz, J. et al. "Mortality Risk in Preterm and Small-for-gestational-age Infants in Low-income and Middle-income Countries: A
Pooled Country Analysis." The Lancet 382, no. 9890 (2013): 417-25. doi:10.1016/s0140-6736(13)60993-9. 47 Watkins, J., S. Kotecha, and S. Kotecha. "Correction: All-Cause Mortality of Low Birthweight Infants in Infancy, Childhood, and
Adolescence: Population Study of England and Wales." PLOS Medicine 13, no. 5 (2016). doi:10.1371/journal.pmed.1002069. 48Abu-Saad, K., and D. Fraser. "Maternal Nutrition and Birth Outcomes." Epidemiologic Reviews 32, no. 1 (2010): 5-25.
doi:10.1093/epirev/mxq001. 49 Qian, M. et al. "The Intergenerational Transmission of Low Birth Weight and Intrauterine Growth Restriction: A Large Cross-
generational Cohort Study in Taiwan." Maternal and Child Health Journal 21, no. 7 (2017): 1512-521. doi:10.1007/s10995-017-
2276-1. 50Drake, A., and B. Walker. "The Intergenerational Effects of Fetal Programming: Non-genomic Mechanisms for the Inheritance of
Low Birth Weight and Cardiovascular Risk." Journal of Endocrinology 180, no. 1 (2004): 1-16. doi:10.1677/joe.0.1800001. 51 Han, Z. et al. 2012. "Maternal Height and the Risk of Preterm Birth and Low Birth Weight: A Systematic Review and Meta-
Analyses." Journal of Obstetrics and Gynaecology Canada 34, no. 8 (2012): 721-46. doi:10.1016/s1701-2163(16)35337-3. 52 Han, Z. et al. "Maternal Underweight and the Risk of Preterm Birth and Low Birth Weight: A Systematic Review and Meta-
analyses." International Journal of Epidemiology 40, no. 1 (2011): 65-101. doi:10.1093/ije/dyq195. 53 Periera, P. et al. 2017. "Maternal Active Smoking During Pregnancy and Low Birth Weight in the Americas: A Systematic Review
and Meta-analysis." Nicotine & Tobacco Research 19, no. 5 (2017): 497-505. doi:10.1093/ntr/ntw228. 54 Zheng, W. et al. "Association between Maternal Smoking during Pregnancy and Low Birthweight: Effects by Maternal Age." Plos
One 11, no. 1 (2016). doi:10.1371/journal.pone.0146241. 55 Blanc, A., and T. Wardlaw. "Monitoring Low Birth Weight: An Evaluation of International Estimates and an Updated Estimation
Procedure." Bulletin of the World Health Organization83, no. 3 (2005): 178-85. doi:PMC2624216. 56 UNICEF, and WHO. Low Birthweight: Country, regional and global estimates. New York: UNICEF, 2004.
Thrive – Reproductive & Maternal Health| Page 104
births with missing birthweights to be included in the LBW estimate using data on maternal perception of size at birth,
and also moved 25 per cent of data heaped on 2500 g to the LBW category. This was applied to available household
survey data and the results were reflected in the UNICEF global LBW database between 2004 and 2017. This
computation has been used in earlier rounds of MICS reports.
However, the method of estimating LBW has now been replaced with superior modelling. Currently, this new method
is not ready for inclusion in the standard tabulations of MICS. Table TM.7.1 therefore only present the crude
percentage, which is known to not be representative for the birthweight of all children. It does however present the
percentage of LBW among children weighed at birth as reported on available cards or from mother’s recall.
https://www.unicef.org/publications/files/low_birthweight_from_EY.pdf.

Thrive – Reproductive & Maternal Health| Page 105
Table TM.7.1: Infants weighed at birth
Percentage of women age 15-49 years with a live birth in the last 2 years whose most recent live-born child was weighed at birth, by source of information, and percentage of those with a recorded or recalled birthweight estimated to have weighed below 2,500 grams at birth, by source of information, Punjab, 2017-18
Percentage of live births weighed at birth:
Number of women with a live birth in the last 2
years
Percentage of weighed live births recorded below 2,500 grams (crude low birth-weight)B:
Number of women with a live birth in the last 2 years
whose most recent live-born child have a recorded or
recalled birthweight From card From recall Total1,A From card From recall Total
Punjab 1.9 14.9 18.6 15,656 3.6 28.7 32.2 2,630
Area of Residence
Rural 0.9 11.4 13.9 10,399 2.4 32.7 35.1 1,286 All Urban 3.7 21.8 27.7 5,257 4.6 24.8 29.5 1,344
Major Cities 5.0 26.4 33.8 2,739 4.5 24.2 28.6 859 Other Urban 2.4 16.8 21.2 2,518 4.9 26.0 30.9 485
Functional difficulties (age 18-49 years)
Has functional difficulty 2.0 10.7 14.4 283 (2.9) (39.6) (42.5) 36 Has no functional difficulty 1.9 15.0 18.6 15,303 3.6 28.5 32.1 2,585
Age at most recent live birthC
Less than 20 years 1.2 10.0 12.8 1,014 5.2 35.6 40.8 114 20-34 years 1.9 15.5 19.1 12,631 3.6 29.1 32.7 2,198 35-49 years 1.9 14.0 18.2 2,009 2.9 23.2 26.1 318
Place of delivery
Home 0.1 1.4 1.6 4,134 1.8 47.0 48.9 63 Health facility 2.5 19.8 24.7 11,469 3.6 28.3 31.9 2,562
Public 2.6 19.3 24.5 4,653 3.4 27.9 31.2 1,020 Private 2.4 20.2 24.9 6,816 3.8 28.5 32.3 1,541
Other/DK/Missing (2.7) (6.8) (9.6) 53 (*) (*) (*) 5 Birth order of most recent live birth
1 2.6 19.7 24.3 3,585 4.6 27.2 31.9 798 2-3 2.2 16.1 20.1 6,660 3.4 27.1 30.5 1,218 4-5 1.2 12.3 15.1 3,621 2.7 34.6 37.3 490 6+ 0.6 6.3 8.6 1,790 1.9 30.0 31.9 124
Education
None/Pre-school 0.6 6.2 7.7 6,365 3.9 35.6 39.5 431 Primary 1.2 10.8 13.9 3,126 1.6 30.4 32.0 375 Lower Secondary 1.9 16.6 20.8 1,663 4.9 34.7 39.6 308 Upper Secondary 2.8 22.2 28.0 2,248 3.2 26.7 30.0 563 Higher 5.6 36.7 44.6 2,254 3.9 24.0 28.0 953
Wealth index quintile
Poorest 0.2 3.9 5.0 3,433 2.1 44.9 47.0 139 Second 0.6 7.7 9.7 3,110 1.6 39.0 40.6 258 Middle 1.3 12.4 15.5 3,182 2.8 34.0 36.8 437 Fourth 2.2 18.7 23.5 3,080 2.4 28.5 31.0 646 Richest 5.6 34.8 42.8 2,850 5.1 22.4 27.5 1,151
1 MICS indicator TM.11 - Children weighed at birth A The indicator includes children that were reported weighed at birth, but with no actual birthweight recorded or recalled B The values here are as recorded on card or as reported by respondent. The Total crude low birth-weight typically requires adjustment for heaping, particularly at exactly 2,500 gram. The results presented here cannot be considered to represent the precise rate of low birth-weight (very likely an underestimate) and therefore not reported as a MICS indicator. C The category of “Missing” in the background characteristic of “Age at most recent live birth” has been suppressed from the table due to small number of unweighted cases. ( ) Figures that are based on 25-49 unweighted cases (*) Figures that are based on fewer than 25 unweighted cases
Thrive – Reproductive & Maternal Health| Page 106
TM.8 POST-NATAL CARE
The time of birth and immediately after is a critical window of opportunity to deliver lifesaving interventions for both
the mother and newborn. Across the world, approximately 2.6 million newborns annually die in the first month of
life57 and the majority of these deaths occur within a day or two of birth58, which is also the time when the majority
of maternal deaths occur59.
The Post-natal Health Checks module includes information on newborns’ and mothers’ contact with a provider, and
specific questions on content of care. Measuring contact alone is important as Post-natal care (PNC) programmes
scale up, it is vital to measure the coverage of that scale up and ensure that the platform for providing essential
services is in place.
Table TM.8.1 presents the percent distribution of women age 15-49 who gave birth in a health facility in
the two years preceding the survey by duration of stay in the facility following the delivery, according to
background characteristics.
Safe motherhood programmes recommend that all women and newborns receive a health check within
two days of delivery.60 To assess the extent of post-natal care utilisation, women were asked whether they
and their newborn received a health check after the delivery, the timing of the first check, and the type of
health provider for the woman’s most recent birth in the two years preceding the survey.
Table TM.8.2 shows the percentage of newborns born in the last two years who received health checks and
post-natal care visits from any health provider after birth. Please note that health checks following birth
while in facility or at home refer to checks provided by any health provider regardless of timing (column 1),
whereas post-natal care visits refer to a separate visit to check on the health of the newborn and provide
preventive care services and therefore do not include health checks following birth while in facility or at
home. The indicator Post-natal health checks includes any health check after birth received while in the
health facility and at home (column 1), regardless of timing, as well as PNC visits within two days of delivery
(columns 2, 3, and 4).
In Table TM.8.3, newborns who received the first PNC visit within one week of birth are distributed by
location and type of provider of service. As defined above, a visit does not include a check in the facility or
at home following birth.
Essential components of the content of post-natal care include, but are not limited to, thermal and cord
care, breastfeeding counselling, assessing the baby’s temperature, weighing the baby and counselling the
mother on danger signs for newborns. Thermal care and cord care are essential elements of newborn care
which contributes to keeping the baby stable and preventing hypothermia. Appropriate cord care is
important for preventing life-threatening infections for both mother and baby.61 Table TM.8.4 presents the
57 UNICEF, et al. Levels and Trends in Child Mortality Report 2017. New York: UNICEF, 2017.
https://www.unicef.org/publications/files/Child_Mortality_Report_2017.pdf. 58 Lawn, J. et al. "Every Newborn: Progress, Priorities, and Potential beyond Survival." The Lancet 384, no. 9938 (2014): 189-205.
doi:10.1016/s0140-6736(14)60496-7. 59 WHO et al. Trends in Maternal Mortality: 1990-2015. Geneva: WHO Press, 2015.
http://apps.who.int/iris/bitstream/handle/10665/194254/9789241565141_eng.pdf?sequence=1. 60 PNC visits, for mothers and for babies, within two days of delivery, is a WHO recommendation that has been identified as a
priority indicator for the Global Strategy for Women’s, Children’s and Adolescents’ Health (2016-2030) and other related global
monitoring frameworks like Every Newborn Action Plan and Ending Preventable Maternal Mortality. 61 WHO. WHO recommendations on Postnatal care of the mother and newborn. Geneva: WHO Press, 2013.
http://apps.who.int/iris/bitstream/handle/10665/97603/9789241506649_eng.pdf?sequence=1.
Thrive – Reproductive & Maternal Health| Page 107
percentage of last-born children in the last 2 years who were dried after birth, percentage who were given
skin to skin contact and percent distribution of timing of first bath. Table TM.8.5 shows the percent
distribution of most recent live births in the last 2 years delivered outside a facility by the type of instrument
used to cut the umbilical cord and the substance applied to the cord.
Table TM.8.6 presents indicators related to the content of PNC visits, specifically the percent of most recent
live births in the last two years for which, within 2 days after birth, i) the umbilical cord was examined, ii)
the temperature of the newborn was assessed, iii) breastfeeding counselling was done or breastfeeding
observed, iv) the newborn was weighed and v) counselling on danger signs for newborns was done.
Tables TM.8.7 and TM.8.8 present information collected on post-natal health checks and visits of the mother and are
identical to Tables TM.8.2 and TM.8.3 that presented the data collected for newborns.
Table TM.8.8 matches Table TM.8.3, but now deals with PNC visits for mothers by location and type of provider. As
defined above, a visit does not include a check in the facility or at home following birth.
Table TM.8.9 presents the distribution of women with a live birth in the two years preceding the survey by receipt of
health checks or PNC visits within 2 days of birth for the mother and the newborn, thus combining the indicators
presented in Tables TM.8.2 and TM.8.7.
Table TM.8.10 presents the percentage of ever married women with a live birth in the last 2 years who
reported that a LHW visited the house during the past month preceding the survey.
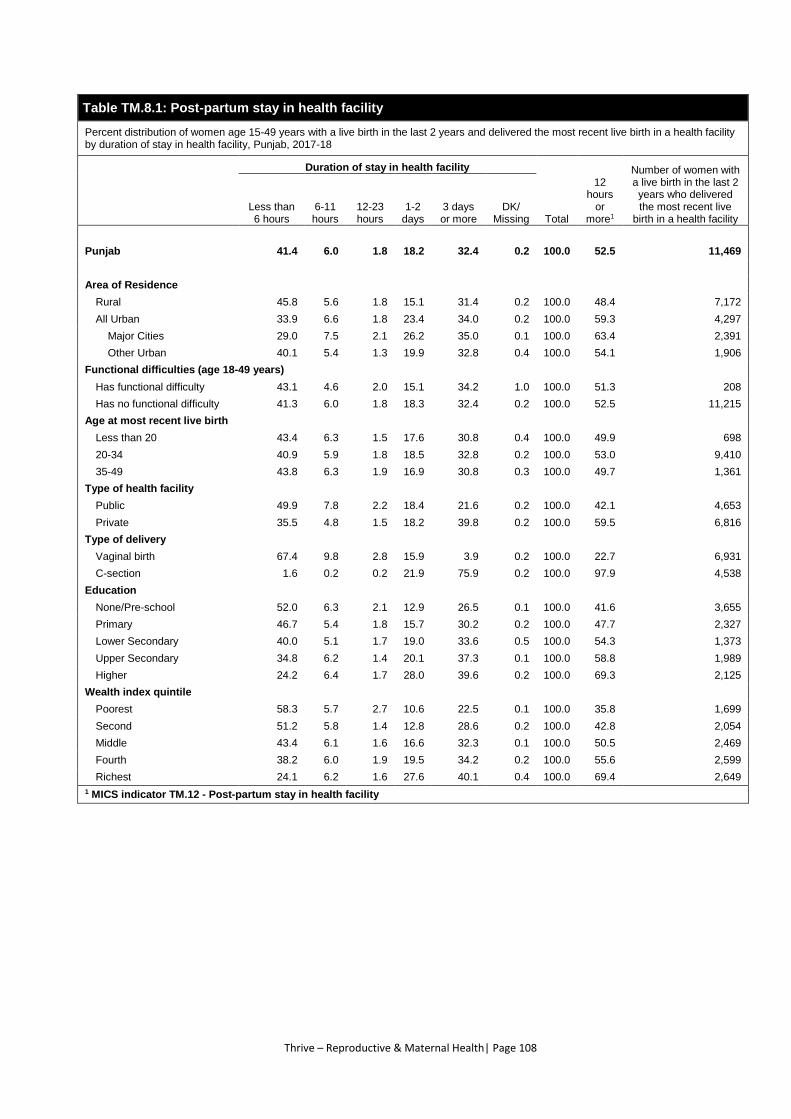
Thrive – Reproductive & Maternal Health| Page 108
Table TM.8.1: Post-partum stay in health facility
Percent distribution of women age 15-49 years with a live birth in the last 2 years and delivered the most recent live birth in a health facility by duration of stay in health facility, Punjab, 2017-18
Duration of stay in health facility
Total
12 hours
or more1
Number of women with a live birth in the last 2 years who delivered the most recent live
birth in a health facility Less than 6 hours
6-11 hours
12-23 hours
1-2 days
3 days or more
DK/ Missing
Punjab 41.4 6.0 1.8 18.2 32.4 0.2 100.0 52.5 11,469
Area of Residence
Rural 45.8 5.6 1.8 15.1 31.4 0.2 100.0 48.4 7,172
All Urban 33.9 6.6 1.8 23.4 34.0 0.2 100.0 59.3 4,297
Major Cities 29.0 7.5 2.1 26.2 35.0 0.1 100.0 63.4 2,391
Other Urban 40.1 5.4 1.3 19.9 32.8 0.4 100.0 54.1 1,906
Functional difficulties (age 18-49 years)
Has functional difficulty 43.1 4.6 2.0 15.1 34.2 1.0 100.0 51.3 208
Has no functional difficulty 41.3 6.0 1.8 18.3 32.4 0.2 100.0 52.5 11,215
Age at most recent live birth
Less than 20 43.4 6.3 1.5 17.6 30.8 0.4 100.0 49.9 698
20-34 40.9 5.9 1.8 18.5 32.8 0.2 100.0 53.0 9,410
35-49 43.8 6.3 1.9 16.9 30.8 0.3 100.0 49.7 1,361
Type of health facility
Public 49.9 7.8 2.2 18.4 21.6 0.2 100.0 42.1 4,653
Private 35.5 4.8 1.5 18.2 39.8 0.2 100.0 59.5 6,816
Type of delivery
Vaginal birth 67.4 9.8 2.8 15.9 3.9 0.2 100.0 22.7 6,931
C-section 1.6 0.2 0.2 21.9 75.9 0.2 100.0 97.9 4,538
Education
None/Pre-school 52.0 6.3 2.1 12.9 26.5 0.1 100.0 41.6 3,655
Primary 46.7 5.4 1.8 15.7 30.2 0.2 100.0 47.7 2,327
Lower Secondary 40.0 5.1 1.7 19.0 33.6 0.5 100.0 54.3 1,373
Upper Secondary 34.8 6.2 1.4 20.1 37.3 0.1 100.0 58.8 1,989
Higher 24.2 6.4 1.7 28.0 39.6 0.2 100.0 69.3 2,125
Wealth index quintile
Poorest 58.3 5.7 2.7 10.6 22.5 0.1 100.0 35.8 1,699
Second 51.2 5.8 1.4 12.8 28.6 0.2 100.0 42.8 2,054
Middle 43.4 6.1 1.6 16.6 32.3 0.1 100.0 50.5 2,469
Fourth 38.2 6.0 1.9 19.5 34.2 0.2 100.0 55.6 2,599
Richest 24.1 6.2 1.6 27.6 40.1 0.4 100.0 69.4 2,649
1 MICS indicator TM.12 - Post-partum stay in health facility
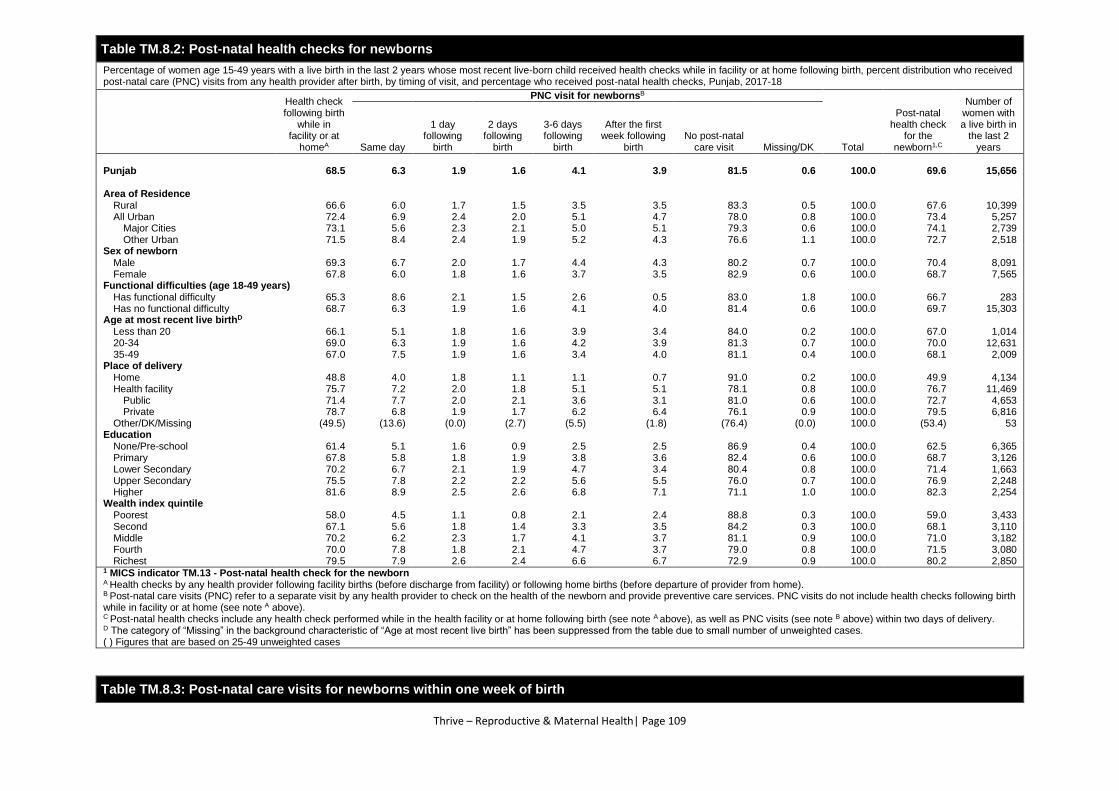
Thrive – Reproductive & Maternal Health| Page 109
Table TM.8.2: Post-natal health checks for newborns
Percentage of women age 15-49 years with a live birth in the last 2 years whose most recent live-born child received health checks while in facility or at home following birth, percent distribution who received post-natal care (PNC) visits from any health provider after birth, by timing of visit, and percentage who received post-natal health checks, Punjab, 2017-18
Health check following birth
while in facility or at
homeA
PNC visit for newbornsB
Total
Post-natal health check
for the newborn1,C
Number of women with a live birth in
the last 2 years Same day
1 day following
birth
2 days following
birth
3-6 days following
birth
After the first week following
birth No post-natal
care visit Missing/DK
Punjab 68.5 6.3 1.9 1.6 4.1 3.9 81.5 0.6 100.0 69.6 15,656
Area of Residence
Rural 66.6 6.0 1.7 1.5 3.5 3.5 83.3 0.5 100.0 67.6 10,399 All Urban 72.4 6.9 2.4 2.0 5.1 4.7 78.0 0.8 100.0 73.4 5,257
Major Cities 73.1 5.6 2.3 2.1 5.0 5.1 79.3 0.6 100.0 74.1 2,739 Other Urban 71.5 8.4 2.4 1.9 5.2 4.3 76.6 1.1 100.0 72.7 2,518
Sex of newborn
Male 69.3 6.7 2.0 1.7 4.4 4.3 80.2 0.7 100.0 70.4 8,091 Female 67.8 6.0 1.8 1.6 3.7 3.5 82.9 0.6 100.0 68.7 7,565
Functional difficulties (age 18-49 years)
Has functional difficulty 65.3 8.6 2.1 1.5 2.6 0.5 83.0 1.8 100.0 66.7 283 Has no functional difficulty 68.7 6.3 1.9 1.6 4.1 4.0 81.4 0.6 100.0 69.7 15,303
Age at most recent live birthD
Less than 20 66.1 5.1 1.8 1.6 3.9 3.4 84.0 0.2 100.0 67.0 1,014 20-34 69.0 6.3 1.9 1.6 4.2 3.9 81.3 0.7 100.0 70.0 12,631 35-49 67.0 7.5 1.9 1.6 3.4 4.0 81.1 0.4 100.0 68.1 2,009
Place of delivery
Home 48.8 4.0 1.8 1.1 1.1 0.7 91.0 0.2 100.0 49.9 4,134 Health facility 75.7 7.2 2.0 1.8 5.1 5.1 78.1 0.8 100.0 76.7 11,469
Public 71.4 7.7 2.0 2.1 3.6 3.1 81.0 0.6 100.0 72.7 4,653 Private 78.7 6.8 1.9 1.7 6.2 6.4 76.1 0.9 100.0 79.5 6,816
Other/DK/Missing (49.5) (13.6) (0.0) (2.7) (5.5) (1.8) (76.4) (0.0) 100.0 (53.4) 53 Education
None/Pre-school 61.4 5.1 1.6 0.9 2.5 2.5 86.9 0.4 100.0 62.5 6,365 Primary 67.8 5.8 1.8 1.9 3.8 3.6 82.4 0.6 100.0 68.7 3,126 Lower Secondary 70.2 6.7 2.1 1.9 4.7 3.4 80.4 0.8 100.0 71.4 1,663 Upper Secondary 75.5 7.8 2.2 2.2 5.6 5.5 76.0 0.7 100.0 76.9 2,248 Higher 81.6 8.9 2.5 2.6 6.8 7.1 71.1 1.0 100.0 82.3 2,254
Wealth index quintile
Poorest 58.0 4.5 1.1 0.8 2.1 2.4 88.8 0.3 100.0 59.0 3,433 Second 67.1 5.6 1.8 1.4 3.3 3.5 84.2 0.3 100.0 68.1 3,110 Middle 70.2 6.2 2.3 1.7 4.1 3.7 81.1 0.9 100.0 71.0 3,182 Fourth 70.0 7.8 1.8 2.1 4.7 3.7 79.0 0.8 100.0 71.5 3,080 Richest 79.5 7.9 2.6 2.4 6.6 6.7 72.9 0.9 100.0 80.2 2,850
1 MICS indicator TM.13 - Post-natal health check for the newborn A Health checks by any health provider following facility births (before discharge from facility) or following home births (before departure of provider from home). B Post-natal care visits (PNC) refer to a separate visit by any health provider to check on the health of the newborn and provide preventive care services. PNC visits do not include health checks following birth while in facility or at home (see note A above). C Post-natal health checks include any health check performed while in the health facility or at home following birth (see note A above), as well as PNC visits (see note B above) within two days of delivery. D The category of “Missing” in the background characteristic of “Age at most recent live birth” has been suppressed from the table due to small number of unweighted cases. ( ) Figures that are based on 25-49 unweighted cases
Table TM.8.3: Post-natal care visits for newborns within one week of birth
Thrive – Reproductive & Maternal Health| Page 110
Percent distribution of women age 15-49 years with a live birth in the last 2 years whose most recent live-born child received a post-natal care (PNC) visit within one week of birth, by location and provider of the first PNC visit, Punjab, 2017-18
Location of first PNC visit for newborns
Total
Provider of first PNC visit for newborns
Total
Number of women with a live birth in the last 2 years
whose most recent live-born child had a PNC visit within
one week of birth Home Public Sector
Private sector
Other location
Medical doctor
Nurse/ Midwife
Lady health visitor (LHV)
Community Midwife
Traditional birth
attendant
Punjab 18.2 29.2 52.2 0.4 100.0 71.1 12.4 6.2 1.1 9.2 100.0 2,187
Area of Residence
Rural 21.5 27.6 50.7 0.2 100.0 66.1 13.7 7.6 1.5 11.1 100.0 1,323 All Urban 13.2 31.6 54.4 0.7 100.0 78.9 10.3 3.9 0.5 6.4 100.0 864
Major Cities 11.2 35.5 52.6 0.6 100.0 82.1 7.7 4.7 0.0 5.5 100.0 412 Other Urban 15.0 28.0 56.1 0.8 100.0 75.9 12.7 3.2 1.0 7.2 100.0 453
Sex of newborn
Male 16.7 27.9 55.3 0.1 100.0 73.7 11.9 5.6 0.8 8.1 100.0 1,197 Female 20.0 30.7 48.5 0.8 100.0 68.0 12.9 6.9 1.6 10.5 100.0 991
Functional difficulties (age 18-49 years)
Has functional difficulty (14.9) (31.5) (53.6) (0.0) 100.0 (59.4) (19.5) (6.2) (0.0) (14.9) 100.0 42 Has no functional difficulty 18.3 29.2 52.1 0.4 100.0 71.4 12.2 6.2 1.2 9.1 100.0 2,137
Age at most recent live birth
Less than 20 19.2 31.7 48.5 0.6 100.0 71.1 8.6 3.4 0.8 16.1 100.0 125 20-34 18.2 29.1 52.3 0.4 100.0 71.5 12.5 6.1 1.2 8.7 100.0 1,772 35-49 17.8 28.7 53.0 0.5 100.0 69.0 13.2 7.5 0.7 9.6 100.0 290
Place of deliveryA
Home 73.1 8.3 18.7 0.0 100.0 31.7 9.3 6.4 2.5 50.2 100.0 333 Health facility 8.4 33.1 58.5 0.0 100.0 78.1 12.9 6.2 0.9 1.8 100.0 1,843
Public 11.3 79.1 9.6 0.0 100.0 70.0 16.6 10.8 1.3 1.3 100.0 713 Private 6.6 4.1 89.3 0.0 100.0 83.3 10.6 3.3 0.6 2.2 100.0 1,130
Education
None/Pre-school 24.7 29.0 45.6 0.7 100.0 59.3 16.3 6.7 1.5 16.1 100.0 644 Primary 21.1 29.4 49.5 0.0 100.0 68.3 11.9 8.3 1.3 10.2 100.0 419 Lower Secondary 18.4 32.2 49.0 0.5 100.0 68.4 15.7 6.9 1.8 7.2 100.0 256 Upper Secondary 15.8 30.1 53.6 0.5 100.0 76.9 10.9 4.9 0.7 6.6 100.0 399 Higher 8.8 26.7 64.2 0.3 100.0 86.4 6.7 4.1 0.6 2.2 100.0 470
Wealth index quintile
Poorest 25.5 27.2 47.3 0.0 100.0 59.7 14.2 7.3 1.4 17.5 100.0 294 Second 25.2 29.3 45.3 0.2 100.0 59.5 16.1 8.8 1.4 14.2 100.0 375 Middle 23.3 30.0 46.0 0.7 100.0 64.9 13.6 8.6 2.4 10.5 100.0 456 Fourth 15.4 31.0 52.8 0.8 100.0 74.7 12.8 5.6 0.4 6.5 100.0 507 Richest 8.0 27.8 64.0 0.3 100.0 86.8 7.5 2.3 0.5 2.9 100.0 556
A The category of “Other/Don’t know/Missing” in the background characteristic of “Place of delivery” has been suppressed from the table due to small number of unweighted cases. ( ) Figures that are based on 25-49 unweighted cases

Thrive – Reproductive & Maternal Health| Page 111
Table TM.8.4: Thermal care for newborns
Percentage of women age 15-49 years with a live birth in the last 2 years whose most recent live-born child was dried after birth and percentage given skin to skin contact and percent distribution of timing of first bath of child, Punjab, 2017-18
Percentage of children who were: Timing of first bath of child
Total
Number of
women with a live
birth in the last 2 years
Dried (wiped) after birth1
Given skin-to-skin contact with
mother2
Less than
6 hours after birth
6-23 hours after birth
More than 24
hours after birth3
DK/Don't remember
Punjab 92.7 1.9 30.7 8.8 59.7 0.9 100.0 15,656
Area of Residence
Rural 93.1 2.1 31.7 10.1 57.3 0.9 100.0 10,399
All Urban 92.1 1.6 28.5 6.3 64.3 0.8 100.0 5,257
Major Cities 91.7 1.8 29.1 4.3 65.5 1.1 100.0 2,739
Other Urban 92.5 1.4 27.9 8.5 63.1 0.5 100.0 2,518
Sex of newborn
Male 92.9 2.1 30.0 7.9 61.1 1.0 100.0 8,091
Female 92.6 1.7 31.3 9.8 58.2 0.7 100.0 7,565
Functional difficulties (age 18-49 years)
Has functional difficulty 84.8 2.1 28.8 6.2 62.9 2.1 100.0 283
Has no functional difficulty 92.9 1.9 30.7 8.9 59.6 0.8 100.0 15,303
Age at most recent live birthA
Less than 20 92.9 2.1 32.2 9.8 56.4 1.6 100.0 1,014
20-34 92.9 1.9 30.1 8.7 60.4 0.8 100.0 12,631
35-49 91.7 2.0 33.2 9.3 56.8 0.7 100.0 2,009
Place of delivery
Home 95.1 1.3 52.7 12.3 34.5 0.5 100.0 4,134
Health facility 92.0 2.1 22.7 7.6 68.8 0.9 100.0 11,469
Public 92.5 2.8 26.0 9.1 64.1 0.8 100.0 4,653
Private 91.7 1.7 20.4 6.6 72.1 1.0 100.0 6,816
Other/DK/Missing (63.1) (1.4) (37.9) (3.4) (34.1) (24.6) 100.0 53
Education
None/Pre-school 93.1 1.8 37.7 11.0 50.4 0.9 100.0 6,365
Primary 93.1 1.8 30.9 9.2 59.1 0.8 100.0 3,126
Lower Secondary 92.9 2.0 24.8 8.1 66.1 1.0 100.0 1,663
Upper Secondary 91.5 2.3 24.6 5.6 69.1 0.7 100.0 2,248
Higher 92.1 2.2 20.8 5.9 72.5 0.9 100.0 2,254
Wealth index quintile
Poorest 94.2 1.8 38.7 14.7 45.8 0.9 100.0 3,433
Second 94.1 1.7 35.8 10.2 53.1 0.9 100.0 3,110
Middle 91.7 2.1 28.9 7.9 62.4 0.8 100.0 3,182
Fourth 91.1 1.8 25.9 5.9 67.5 0.7 100.0 3,080
Richest 92.5 2.3 22.6 4.4 71.9 1.1 100.0 2,850
1 MICS indicator TM.14 - Newborns dried
2 MICS indicator TM.15 - Skin-to-skin care
3 MICS indicator TM.16 - Delayed bathing
A The category of “Missing” in the background characteristic of “Age at most recent live birth” has been suppressed from the table due to small number of unweighted cases.
( ) Figures that are based on 25-49 unweighted cases
Thrive – Reproductive & Maternal Health| Page 112
Table TM.8.5: Cord cutting and care
Percent distribution of women age 15-49 years with a live birth in the last 2 years who delivered the most recent live birth outside a facility by what instrument was used to cut the umbilical cord and percentage of cords cut with clean instruments and what substance was applied to the cord, Punjab, 2017-18
Instrument used to cut the cord
Total
Percentage of children whose cord was cut with:
SubstancesB applied to the cord
Percentage with nothing
harmful applied to the cord2
Number of women with a live birth in the last 2 years
who delivered the most recent live birth outside a
facility
New
bla
de
Use
d b
lad
e
Scis
so
rs
Oth
er
DK
No r
esp
on
se
Noth
ing
Ch
lorh
exid
ine
or
oth
er
an
tise
ptic
Ha
rmfu
l
su
bsta
nce
Bo
iled o
r
ste
riliz
ed
instr
um
en
ts
A c
lean
instr
um
en
t1,A
Punjab 56.4 0.5 28.0 1.7 13.0 0.3 100.0 23.0 64.7 15.4 19.1 63.3 34.5 4,186
Area of Residence
Rural 60.6 0.5 25.4 2.1 11.2 0.2 100.0 22.1 67.7 15.7 17.3 65.7 33.1 3,227 All Urban 42.4 0.5 36.8 0.4 19.2 0.7 100.0 26.3 54.7 14.4 24.9 55.2 39.4 960
Major Cities 34.0 0.5 46.8 0.8 17.5 0.5 100.0 27.1 50.2 14.8 24.7 59.0 39.5 348 Other Urban 47.2 0.5 31.1 0.2 20.2 0.8 100.0 25.8 57.2 14.2 25.1 53.0 39.3 612
Sex of newborn
Male 56.7 0.4 28.7 1.4 12.5 0.4 100.0 23.3 65.4 16.1 19.7 61.4 35.8 2,029 Female 56.2 0.6 27.4 2.0 13.6 0.3 100.0 22.8 64.1 14.8 18.5 65.1 33.3 2,157
Functional difficulties (age 18-49 years)
Has functional difficulty 51.5 0.9 30.6 2.5 13.3 1.1 100.0 27.8 61.2 14.5 19.4 65.9 33.8 75 Has no functional difficulty 56.4 0.5 28.1 1.7 13.1 0.3 100.0 23.0 64.6 15.4 19.1 63.3 34.5 4,088
Age at most recent live birthC
Less than 20 59.1 0.4 23.7 1.9 14.6 0.4 100.0 21.2 66.0 17.3 20.3 58.7 37.6 316 20-34 55.9 0.5 28.7 1.6 13.0 0.3 100.0 23.4 64.2 15.1 19.2 63.6 34.2 3,221 35-49 57.7 0.7 26.9 1.9 12.5 0.3 100.0 22.3 66.5 16.3 18.1 64.0 34.4 648
Place of delivery
Home 56.8 0.5 28.2 1.7 12.8 0.0 100.0 23.1 65.1 15.6 18.9 63.8 34.5 4,134 Other/DK/Missing (29.9) (0.0) (15.0) (0.0) (29.9) (25.2) 100.0 (17.2) (35.1) (5.3) (31.5) (25.9) (36.8) 53
Assistance at delivery
Skilled attendant 55.7 0.5 28.8 1.6 13.4 0.0 100.0 23.4 64.1 15.4 19.4 63.2 34.8 3,907 Traditional birth Attendant 66.2 0.0 18.0 2.7 7.6 5.6 100.0 17.4 72.5 15.3 13.4 65.4 28.8 238 Other/No attendant (72.8) (0.0) (12.4) (7.8) (6.9) (0.0) 100.0 (23.3) (79.6) (15.0) (24.1) (59.7) (39.1) 42
Education
None/Pre-school 62.8 0.6 23.5 1.8 11.2 0.2 100.0 21.1 69.0 16.5 14.9 67.2 31.5 2,711 Primary 48.9 0.5 34.7 1.8 13.9 0.2 100.0 22.5 59.1 15.2 20.1 60.7 35.3 798 Lower Secondary 43.9 0.0 37.0 1.4 17.4 0.3 100.0 31.9 59.0 14.0 32.0 51.8 46.0 290 Upper Secondary 38.6 0.2 38.7 0.9 20.8 0.8 100.0 32.9 53.9 6.8 37.8 52.2 44.6 259 Higher 32.7 0.0 40.9 1.7 20.8 3.9 100.0 27.8 44.7 14.6 33.2 44.8 47.7 129
Wealth index quintile
Poorest 71.1 0.4 20.0 1.8 6.6 0.1 100.0 19.1 75.9 16.4 13.1 70.0 29.5 1,735 Second 55.2 0.8 27.8 2.3 13.9 0.0 100.0 22.0 62.3 15.5 17.6 64.6 33.1 1,056 Middle 42.3 0.2 36.7 1.6 18.7 0.5 100.0 27.3 55.0 16.9 24.5 56.3 41.4 713 Fourth 36.8 0.6 40.9 0.5 21.0 0.2 100.0 31.1 51.5 13.6 27.4 53.1 41.0 481 Richest 33.3 0.0 37.2 0.9 24.7 3.8 100.0 27.5 47.0 5.7 39.4 48.1 45.2 201
1 MICS indicator TM.17 - Cord cut with clean instrument 2 MICS indicator TM.18 - Nothing harmful applied to cord A Clean instruments are all new blades and boiled or sterilized used blades or scissors B Substances include: Chlorhexidine, other antiseptic (such as alcohol, spirit, gentian violet), mustard oil, ash, animal dung and others. Mustard oil, ash and animal dung are considered harmful C The category of “Missing” in the background characteristic of “Age at most recent live birth” has been suppressed from the table due to small number of unweighted cases. ( ) Figures that are based on 25-49 unweighted cases
Thrive – Reproductive & Maternal Health| Page 113
Table TM.8.6: Content of postnatal care for newborns
Percentage of women age 15-49 years with a live birth in the last 2 years for whom, within 2 days of the most recent live birth, the umbilical cord was examined, the temperature of the newborn was assessed, breastfeeding counseling was done or breastfeeding observed, the newborn was weighed and counseling on danger signs for newborns was done, Punjab, 2017-18
Percentage of newborns receiving post-natal signal care function of: Percentage of newborns who
received at least 2 of the preceding post-natal signal
care functions within 2 days of birth1
Number of women with a live birth in
the last 2 years
Cord examination
Temperature assessment
Breastfeeding
Weight assessment
Receiving information on the
symptoms requiring care-seeking Counseling Observation
Counseling or
observation
Punjab 23.4 16.6 24.5 33.4 41.0 8.2 13.6 43.8 15,656
Area of Residence
Rural 21.8 15.4 22.7 32.1 39.5 7.1 12.4 41.9 10,399 All Urban 26.5 18.9 28.0 35.9 44.2 10.4 15.9 47.4 5,257
Major Cities 26.8 19.6 29.0 37.0 46.0 11.0 16.3 48.5 2,739 Other Urban 26.1 18.2 27.0 34.7 42.1 9.8 15.5 46.3 2,518
Sex of newborn
Male 24.7 17.7 25.5 34.2 42.6 8.6 13.8 45.6 8,091 Female 22.0 15.3 23.4 32.5 39.3 7.8 13.3 41.8 7,565
Functional difficulties (age 18-49 years)
Has functional difficulty 19.3 16.1 18.5 32.1 41.1 7.0 11.6 43.6 283 Has no functional difficulty 23.4 16.6 24.6 33.4 41.0 8.3 13.6 43.7 15,303
Age at most recent live birthA
Less than 20 23.2 14.8 23.8 30.2 37.8 6.0 13.9 40.9 1,014 20-34 23.5 16.7 24.9 33.4 41.2 8.4 13.7 44.0 12,631 35-49 22.8 16.4 22.4 34.7 41.6 8.6 12.6 43.9 2,009
Place of delivery
Home 13.3 5.5 14.8 27.2 30.0 3.6 7.0 32.2 4,134 Health facility 27.0 20.6 28.0 35.7 45.1 9.9 15.9 48.0 11,469
Public 23.2 17.2 26.0 36.2 43.6 9.3 14.8 46.5 4,653 Private 29.6 22.9 29.4 35.3 46.0 10.3 16.6 49.0 6,816
Other/DK/Missing (23.1) (11.9) (25.9) (25.9) (27.6) (11.8) (12.0) (32.8) 53 Education
None/Pre-school 17.7 11.1 17.2 29.5 35.0 4.5 9.8 36.9 6,365 Primary 22.1 15.2 24.3 32.8 39.9 7.5 12.8 42.9 3,126 Lower Secondary 26.5 17.9 26.4 34.4 43.4 9.2 15.2 46.5 1,663 Upper Secondary 27.6 21.0 31.2 37.6 46.8 11.0 15.1 50.2 2,248 Higher 34.6 28.3 37.3 40.1 52.3 16.3 22.2 55.8 2,254
Wealth index quintile
Poorest 15.6 10.2 14.4 24.8 30.4 3.7 9.3 31.9 3,433 Second 19.9 13.2 20.0 31.9 38.1 5.7 10.9 40.3 3,110 Middle 24.1 16.0 25.1 34.7 42.2 7.7 13.8 45.4 3,182 Fourth 26.1 19.1 30.0 36.8 45.0 9.7 14.8 48.2 3,080 Richest 32.7 25.7 35.1 40.2 51.5 15.4 19.9 55.2 2,850
1 MICS indicator TM.19 - Post-natal signal care functions A The category of “Missing” in the background characteristic of “Age at most recent live birth” has been suppressed from the table due to small number of unweighted cases. ( ) Figures that are based on 25-49 unweighted cases
Thrive – Reproductive & Maternal Health| Page 114
Table TM.8.7: Post-natal health checks for mothers
Percentage of women age 15-49 years with a live birth in the last 2 years who for the most recent live birth received health checks while in facility or at home following birth, percent distribution who received post-natal care (PNC) visits from any health provider after birth at the time of last birth, by timing of visit, and percentage who received post-natal health checks, Punjab, 2017-18
Health check following birth while in facility or
at homeA
PNC visit for mothersB
Total
Post-natal health check
for the mother1,C
Number of women with a live birth in the last 2
years Same day
1 day following
birth
2 days following
birth
3-6 days following
birth
After the first week following
birth No post-natal
care visit Missing/DK
Punjab 70.1 3.5 1.2 1.1 3.1 8.2 82.6 0.3 100.0 70.7 15,656
Area of Residence
Rural 68.2 3.3 1.2 1.0 2.9 7.2 84.2 0.2 100.0 68.8 10,399 All Urban 73.8 3.9 1.3 1.2 3.6 10.0 79.4 0.5 100.0 74.5 5,257
Major Cities 74.9 3.8 1.6 1.0 3.6 11.8 77.9 0.4 100.0 75.5 2,739 Other Urban 72.6 4.1 1.0 1.5 3.7 8.1 81.0 0.6 100.0 73.3 2,518
Sex of newborn
Male 70.7 3.5 1.3 1.1 3.2 8.4 82.1 0.3 100.0 71.4 8,091 Female 69.4 3.5 1.2 1.0 3.1 7.9 83.0 0.3 100.0 70.0 7,565
Functional difficulties (age 18-49 years)
Has functional difficulty 67.6 2.5 0.6 1.6 2.6 5.5 86.2 0.9 100.0 68.4 283 Has no functional difficulty 70.2 3.5 1.3 1.1 3.2 8.2 82.5 0.3 100.0 70.8 15,303
Age at most recent live birthD
Less than 20 67.2 3.6 0.9 0.5 2.7 6.8 85.2 0.2 100.0 67.7 1,014 20-34 70.6 3.3 1.2 1.1 3.2 8.5 82.4 0.3 100.0 71.2 12,631 35-49 68.1 4.3 1.5 1.3 3.0 7.0 82.5 0.2 100.0 69.4 2,009
Place of delivery
Home 48.0 2.4 1.5 0.7 0.6 0.5 94.2 0.1 100.0 49.1 4,134 Health facility 78.1 3.9 1.2 1.2 4.1 11.0 78.3 0.4 100.0 78.6 11,469
Public 73.1 4.3 1.4 1.5 2.6 5.5 84.4 0.3 100.0 73.8 4,653 Private 81.6 3.6 1.0 1.0 5.1 14.7 74.2 0.5 100.0 81.9 6,816
Other/DK/Missing (47.9) (5.3) (0.0) (2.7) (0.0) (2.7) (89.2) (0.0) 100.0 (50.1) 53 Type of delivery
Vaginal birth 62.2 3.7 1.3 0.9 1.4 1.5 91.0 0.2 100.0 63.1 11,117 C-section 89.4 2.9 1.0 1.4 7.5 24.6 61.9 0.7 100.0 89.5 4,538
Education
None/Pre-school 62.4 2.6 1.1 0.8 1.9 4.8 88.7 0.2 100.0 63.1 6,365 Primary 69.3 3.3 1.1 0.8 3.0 7.3 84.2 0.3 100.0 69.9 3,126 Lower Secondary 71.9 4.3 1.6 1.1 4.0 8.7 80.1 0.2 100.0 72.6 1,663 Upper Secondary 78.1 3.7 1.0 1.4 4.0 11.8 77.6 0.4 100.0 78.7 2,248 Higher 83.4 5.3 2.0 1.8 5.5 14.9 69.9 0.7 100.0 84.0 2,254
Wealth index quintile
Poorest 58.4 2.1 1.2 0.7 1.6 3.4 91.0 0.2 100.0 59.2 3,433 Second 68.1 3.0 0.9 0.6 2.2 6.6 86.6 0.1 100.0 68.8 3,110 Middle 72.6 3.7 1.2 1.3 3.6 8.4 81.3 0.5 100.0 73.3 3,182 Fourth 72.8 4.4 1.3 1.4 3.9 9.1 79.7 0.3 100.0 73.5 3,080 Richest 80.5 4.5 1.7 1.4 4.8 14.5 72.7 0.5 100.0 81.0 2,850
1 MICS indicator TM.20 - Post-natal health check for the mother A Health checks by any health provider following facility births (before discharge from facility) or following home births (before departure of provider from home). B Post-natal care visits (PNC) refer to a separate visit by any health provider to check on the health of the mother and provide preventive care services. PNC visits do not include health checks following birth while in facility or at home (see note A above). C Post-natal health checks include any health check performed while in the health facility or at home following birth (see note A above), as well as PNC visits (see note B above) within two days of delivery. D The category of “Missing” in the background characteristic of “Age at most recent live birth” has been suppressed from the table due to small number of unweighted cases. ( ) Figures that are based on 25-49 unweighted cases
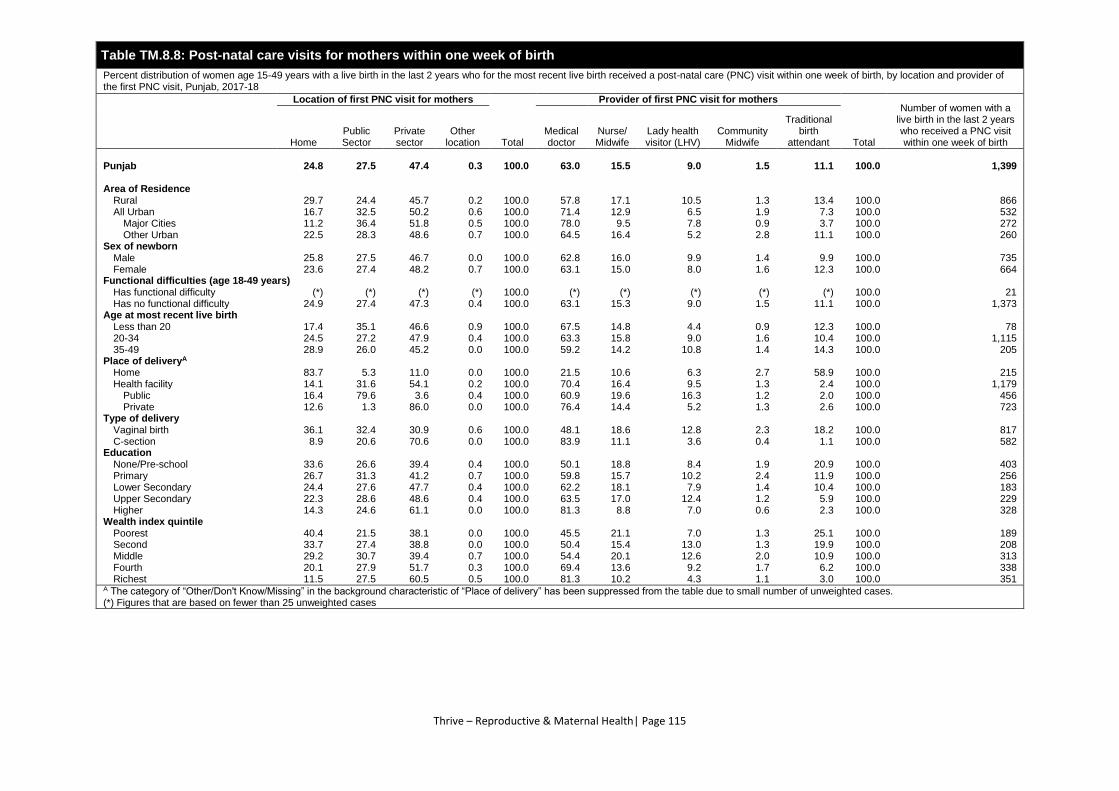
Thrive – Reproductive & Maternal Health| Page 115
Table TM.8.8: Post-natal care visits for mothers within one week of birth
Percent distribution of women age 15-49 years with a live birth in the last 2 years who for the most recent live birth received a post-natal care (PNC) visit within one week of birth, by location and provider of the first PNC visit, Punjab, 2017-18
Location of first PNC visit for mothers
Total
Provider of first PNC visit for mothers
Total
Number of women with a live birth in the last 2 years who received a PNC visit within one week of birth Home
Public Sector
Private sector
Other location
Medical doctor
Nurse/ Midwife
Lady health visitor (LHV)
Community Midwife
Traditional birth
attendant
Punjab 24.8 27.5 47.4 0.3 100.0 63.0 15.5 9.0 1.5 11.1 100.0 1,399
Area of Residence
Rural 29.7 24.4 45.7 0.2 100.0 57.8 17.1 10.5 1.3 13.4 100.0 866 All Urban 16.7 32.5 50.2 0.6 100.0 71.4 12.9 6.5 1.9 7.3 100.0 532
Major Cities 11.2 36.4 51.8 0.5 100.0 78.0 9.5 7.8 0.9 3.7 100.0 272 Other Urban 22.5 28.3 48.6 0.7 100.0 64.5 16.4 5.2 2.8 11.1 100.0 260
Sex of newborn
Male 25.8 27.5 46.7 0.0 100.0 62.8 16.0 9.9 1.4 9.9 100.0 735 Female 23.6 27.4 48.2 0.7 100.0 63.1 15.0 8.0 1.6 12.3 100.0 664
Functional difficulties (age 18-49 years)
Has functional difficulty (*) (*) (*) (*) 100.0 (*) (*) (*) (*) (*) 100.0 21 Has no functional difficulty 24.9 27.4 47.3 0.4 100.0 63.1 15.3 9.0 1.5 11.1 100.0 1,373
Age at most recent live birth
Less than 20 17.4 35.1 46.6 0.9 100.0 67.5 14.8 4.4 0.9 12.3 100.0 78 20-34 24.5 27.2 47.9 0.4 100.0 63.3 15.8 9.0 1.6 10.4 100.0 1,115 35-49 28.9 26.0 45.2 0.0 100.0 59.2 14.2 10.8 1.4 14.3 100.0 205
Place of deliveryA
Home 83.7 5.3 11.0 0.0 100.0 21.5 10.6 6.3 2.7 58.9 100.0 215 Health facility 14.1 31.6 54.1 0.2 100.0 70.4 16.4 9.5 1.3 2.4 100.0 1,179
Public 16.4 79.6 3.6 0.4 100.0 60.9 19.6 16.3 1.2 2.0 100.0 456 Private 12.6 1.3 86.0 0.0 100.0 76.4 14.4 5.2 1.3 2.6 100.0 723
Type of delivery
Vaginal birth 36.1 32.4 30.9 0.6 100.0 48.1 18.6 12.8 2.3 18.2 100.0 817 C-section 8.9 20.6 70.6 0.0 100.0 83.9 11.1 3.6 0.4 1.1 100.0 582
Education
None/Pre-school 33.6 26.6 39.4 0.4 100.0 50.1 18.8 8.4 1.9 20.9 100.0 403 Primary 26.7 31.3 41.2 0.7 100.0 59.8 15.7 10.2 2.4 11.9 100.0 256 Lower Secondary 24.4 27.6 47.7 0.4 100.0 62.2 18.1 7.9 1.4 10.4 100.0 183 Upper Secondary 22.3 28.6 48.6 0.4 100.0 63.5 17.0 12.4 1.2 5.9 100.0 229 Higher 14.3 24.6 61.1 0.0 100.0 81.3 8.8 7.0 0.6 2.3 100.0 328
Wealth index quintile
Poorest 40.4 21.5 38.1 0.0 100.0 45.5 21.1 7.0 1.3 25.1 100.0 189 Second 33.7 27.4 38.8 0.0 100.0 50.4 15.4 13.0 1.3 19.9 100.0 208 Middle 29.2 30.7 39.4 0.7 100.0 54.4 20.1 12.6 2.0 10.9 100.0 313 Fourth 20.1 27.9 51.7 0.3 100.0 69.4 13.6 9.2 1.7 6.2 100.0 338 Richest 11.5 27.5 60.5 0.5 100.0 81.3 10.2 4.3 1.1 3.0 100.0 351
A The category of “Other/Don't Know/Missing” in the background characteristic of “Place of delivery” has been suppressed from the table due to small number of unweighted cases. (*) Figures that are based on fewer than 25 unweighted cases
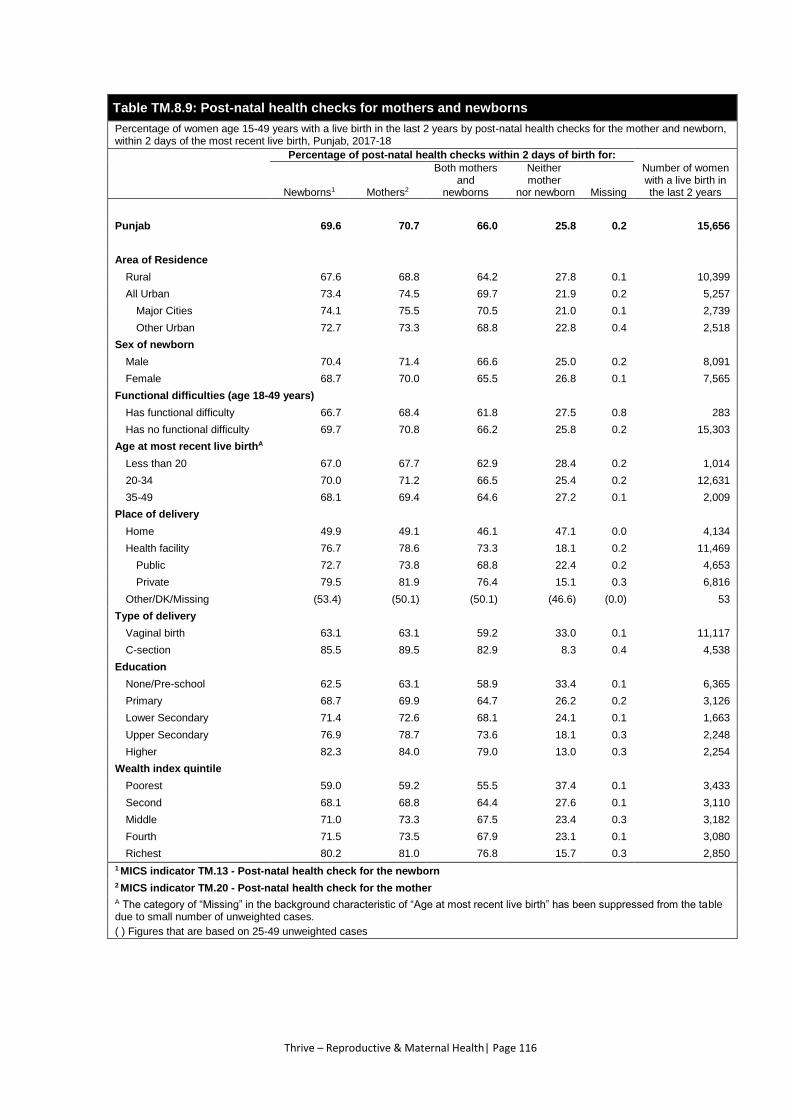
Thrive – Reproductive & Maternal Health| Page 116
Table TM.8.9: Post-natal health checks for mothers and newborns
Percentage of women age 15-49 years with a live birth in the last 2 years by post-natal health checks for the mother and newborn, within 2 days of the most recent live birth, Punjab, 2017-18
Percentage of post-natal health checks within 2 days of birth for:
Number of women with a live birth in the last 2 years Newborns1 Mothers2
Both mothers and
newborns
Neither mother
nor newborn Missing
Punjab 69.6 70.7 66.0 25.8 0.2 15,656
Area of Residence
Rural 67.6 68.8 64.2 27.8 0.1 10,399
All Urban 73.4 74.5 69.7 21.9 0.2 5,257
Major Cities 74.1 75.5 70.5 21.0 0.1 2,739
Other Urban 72.7 73.3 68.8 22.8 0.4 2,518
Sex of newborn
Male 70.4 71.4 66.6 25.0 0.2 8,091
Female 68.7 70.0 65.5 26.8 0.1 7,565
Functional difficulties (age 18-49 years)
Has functional difficulty 66.7 68.4 61.8 27.5 0.8 283
Has no functional difficulty 69.7 70.8 66.2 25.8 0.2 15,303
Age at most recent live birthA
Less than 20 67.0 67.7 62.9 28.4 0.2 1,014
20-34 70.0 71.2 66.5 25.4 0.2 12,631
35-49 68.1 69.4 64.6 27.2 0.1 2,009
Place of delivery
Home 49.9 49.1 46.1 47.1 0.0 4,134
Health facility 76.7 78.6 73.3 18.1 0.2 11,469
Public 72.7 73.8 68.8 22.4 0.2 4,653
Private 79.5 81.9 76.4 15.1 0.3 6,816
Other/DK/Missing (53.4) (50.1) (50.1) (46.6) (0.0) 53
Type of delivery
Vaginal birth 63.1 63.1 59.2 33.0 0.1 11,117
C-section 85.5 89.5 82.9 8.3 0.4 4,538
Education
None/Pre-school 62.5 63.1 58.9 33.4 0.1 6,365
Primary 68.7 69.9 64.7 26.2 0.2 3,126
Lower Secondary 71.4 72.6 68.1 24.1 0.1 1,663
Upper Secondary 76.9 78.7 73.6 18.1 0.3 2,248
Higher 82.3 84.0 79.0 13.0 0.3 2,254
Wealth index quintile
Poorest 59.0 59.2 55.5 37.4 0.1 3,433
Second 68.1 68.8 64.4 27.6 0.1 3,110
Middle 71.0 73.3 67.5 23.4 0.3 3,182
Fourth 71.5 73.5 67.9 23.1 0.1 3,080
Richest 80.2 81.0 76.8 15.7 0.3 2,850
1 MICS indicator TM.13 - Post-natal health check for the newborn
2 MICS indicator TM.20 - Post-natal health check for the mother A The category of “Missing” in the background characteristic of “Age at most recent live birth” has been suppressed from the table due to small number of unweighted cases.
( ) Figures that are based on 25-49 unweighted cases

Thrive – Reproductive & Maternal Health| Page 117
Table TM.8.10: Care provided by Lady health worker (LHW)
Percentage of ever married women with a live birth in the last 2 years who reported that a LHW visited the house during the past month, Punjab, 2017-18
HH visited by lady health worker (LHW): Number of ever married women with a live birth in the last
2 years Yes1 No DK No response
Punjab 54.5 44.9 0.5 0.1 15,656
Area of residence
Rural 58.8 40.6 0.5 0.1 10,399
All Urban 46.0 53.4 0.4 0.2 5,257
Major Cities 38.1 61.4 0.3 0.1 2,739
Other Urban 54.5 44.7 0.5 0.2 2,518
Education
None/pre-school 52.2 47.3 0.5 0.1 6,365
Primary 56.1 43.3 0.5 0.1 3,126
Lower Secondary 58.2 41.3 0.4 0.1 1,663
Upper Secondary 56.0 43.4 0.5 0.1 2,248
Higher 54.6 44.5 0.6 0.3 2,254
Wealth index quintile
Lowest 49.8 49.9 0.3 0.0 3,433
Second 59.9 39.5 0.6 0.0 3,110
Middle 62.6 36.7 0.6 0.1 3,182
Fourth 53.4 46.1 0.4 0.0 3,080
Highest 46.3 52.7 0.6 0.4 2,850
1 Non-MICS indicator TM.S3 - Care provided by Lady Health Worker (LHW)
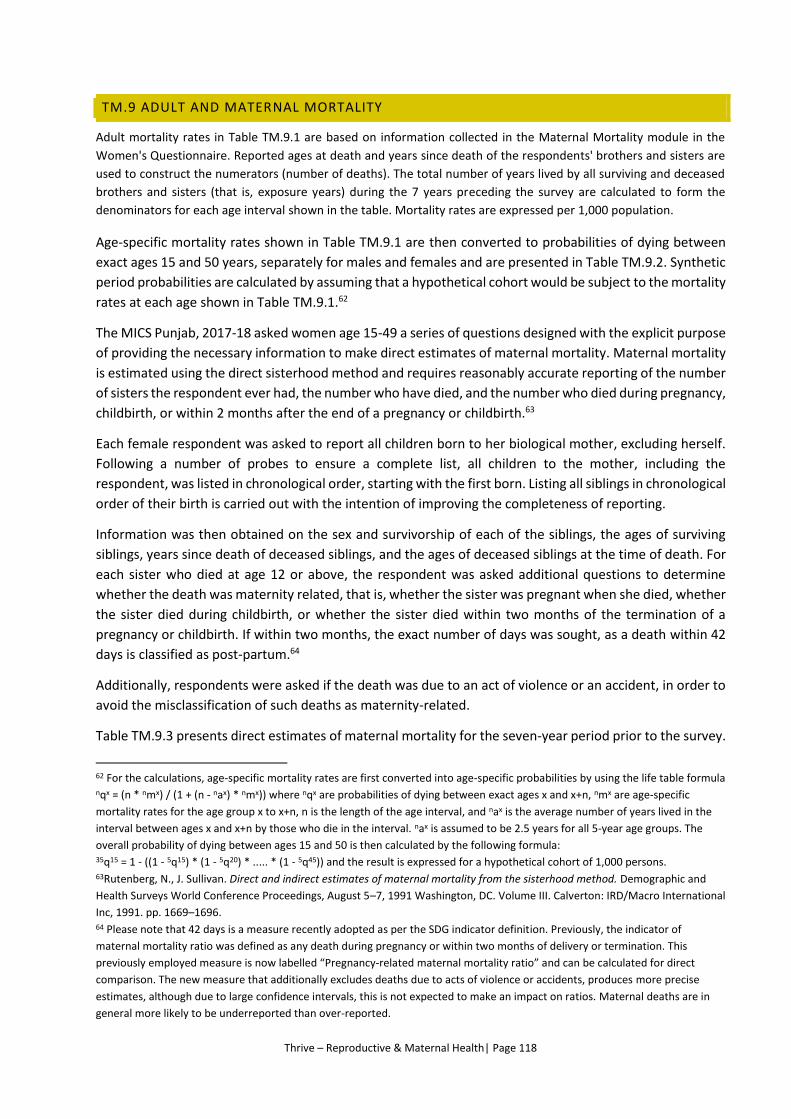
Thrive – Reproductive & Maternal Health| Page 118
TM.9 ADULT AND MATERNAL MORTALITY
Adult mortality rates in Table TM.9.1 are based on information collected in the Maternal Mortality module in the
Women's Questionnaire. Reported ages at death and years since death of the respondents' brothers and sisters are
used to construct the numerators (number of deaths). The total number of years lived by all surviving and deceased
brothers and sisters (that is, exposure years) during the 7 years preceding the survey are calculated to form the
denominators for each age interval shown in the table. Mortality rates are expressed per 1,000 population.
Age-specific mortality rates shown in Table TM.9.1 are then converted to probabilities of dying between
exact ages 15 and 50 years, separately for males and females and are presented in Table TM.9.2. Synthetic
period probabilities are calculated by assuming that a hypothetical cohort would be subject to the mortality
rates at each age shown in Table TM.9.1.62
The MICS Punjab, 2017-18 asked women age 15-49 a series of questions designed with the explicit purpose
of providing the necessary information to make direct estimates of maternal mortality. Maternal mortality
is estimated using the direct sisterhood method and requires reasonably accurate reporting of the number
of sisters the respondent ever had, the number who have died, and the number who died during pregnancy,
childbirth, or within 2 months after the end of a pregnancy or childbirth.63
Each female respondent was asked to report all children born to her biological mother, excluding herself.
Following a number of probes to ensure a complete list, all children to the mother, including the
respondent, was listed in chronological order, starting with the first born. Listing all siblings in chronological
order of their birth is carried out with the intention of improving the completeness of reporting.
Information was then obtained on the sex and survivorship of each of the siblings, the ages of surviving
siblings, years since death of deceased siblings, and the ages of deceased siblings at the time of death. For
each sister who died at age 12 or above, the respondent was asked additional questions to determine
whether the death was maternity related, that is, whether the sister was pregnant when she died, whether
the sister died during childbirth, or whether the sister died within two months of the termination of a
pregnancy or childbirth. If within two months, the exact number of days was sought, as a death within 42
days is classified as post-partum.64
Additionally, respondents were asked if the death was due to an act of violence or an accident, in order to
avoid the misclassification of such deaths as maternity-related.
Table TM.9.3 presents direct estimates of maternal mortality for the seven-year period prior to the survey.
62 For the calculations, age-specific mortality rates are first converted into age-specific probabilities by using the life table formula nqx = (n * nmx) / (1 + (n - nax) * nmx)) where nqx are probabilities of dying between exact ages x and x+n, nmx are age-specific
mortality rates for the age group x to x+n, n is the length of the age interval, and nax is the average number of years lived in the
interval between ages x and x+n by those who die in the interval. nax is assumed to be 2.5 years for all 5-year age groups. The
overall probability of dying between ages 15 and 50 is then calculated by the following formula: 35q15 = 1 - ((1 - 5q15) * (1 - 5q20) * ..... * (1 - 5q45)) and the result is expressed for a hypothetical cohort of 1,000 persons. 63Rutenberg, N., J. Sullivan. Direct and indirect estimates of maternal mortality from the sisterhood method. Demographic and
Health Surveys World Conference Proceedings, August 5–7, 1991 Washington, DC. Volume III. Calverton: IRD/Macro International
Inc, 1991. pp. 1669–1696. 64 Please note that 42 days is a measure recently adopted as per the SDG indicator definition. Previously, the indicator of
maternal mortality ratio was defined as any death during pregnancy or within two months of delivery or termination. This
previously employed measure is now labelled “Pregnancy-related maternal mortality ratio” and can be calculated for direct
comparison. The new measure that additionally excludes deaths due to acts of violence or accidents, produces more precise
estimates, although due to large confidence intervals, this is not expected to make an impact on ratios. Maternal deaths are in
general more likely to be underreported than over-reported.
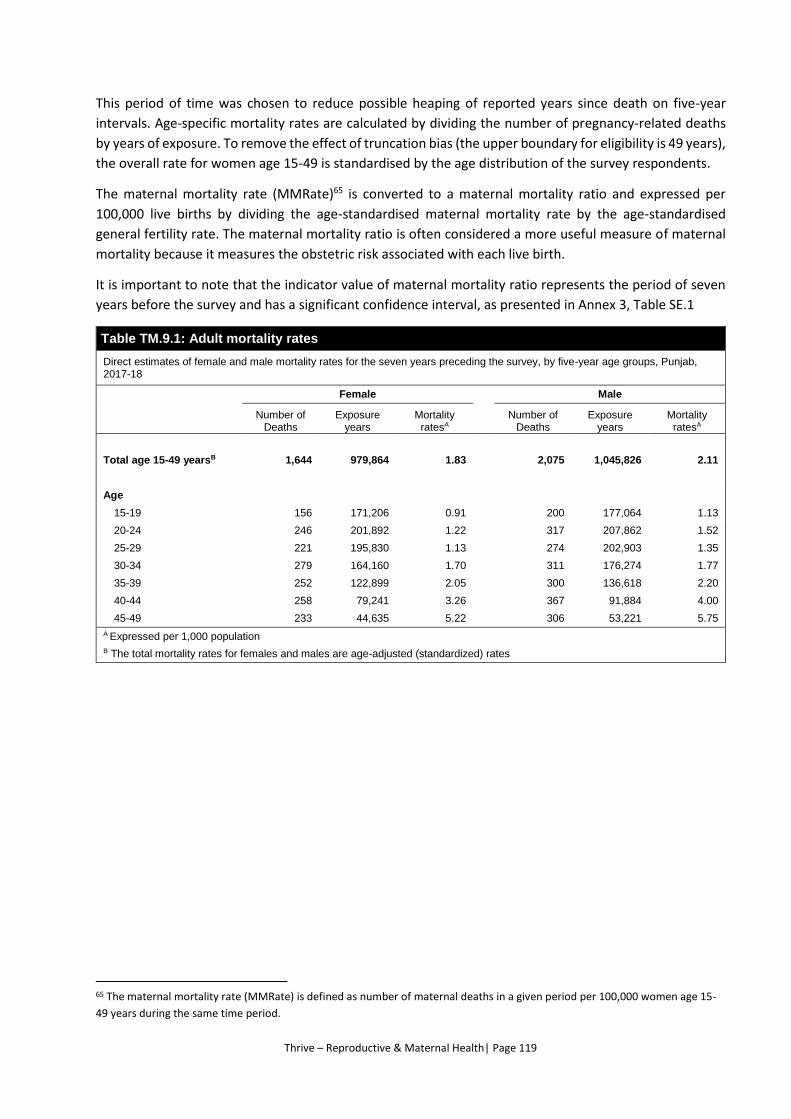
Thrive – Reproductive & Maternal Health| Page 119
This period of time was chosen to reduce possible heaping of reported years since death on five-year
intervals. Age-specific mortality rates are calculated by dividing the number of pregnancy-related deaths
by years of exposure. To remove the effect of truncation bias (the upper boundary for eligibility is 49 years),
the overall rate for women age 15-49 is standardised by the age distribution of the survey respondents.
The maternal mortality rate (MMRate)65 is converted to a maternal mortality ratio and expressed per
100,000 live births by dividing the age-standardised maternal mortality rate by the age-standardised
general fertility rate. The maternal mortality ratio is often considered a more useful measure of maternal
mortality because it measures the obstetric risk associated with each live birth.
It is important to note that the indicator value of maternal mortality ratio represents the period of seven
years before the survey and has a significant confidence interval, as presented in Annex 3, Table SE.1
Table TM.9.1: Adult mortality rates
Direct estimates of female and male mortality rates for the seven years preceding the survey, by five-year age groups, Punjab, 2017-18
Female Male
Number of Deaths
Exposure years
Mortality ratesA
Number of Deaths
Exposure years
Mortality ratesA
Total age 15-49 yearsB 1,644 979,864 1.83 2,075 1,045,826 2.11
Age
15-19 156 171,206 0.91 200 177,064 1.13
20-24 246 201,892 1.22 317 207,862 1.52
25-29 221 195,830 1.13 274 202,903 1.35
30-34 279 164,160 1.70 311 176,274 1.77
35-39 252 122,899 2.05 300 136,618 2.20
40-44 258 79,241 3.26 367 91,884 4.00
45-49 233 44,635 5.22 306 53,221 5.75
A Expressed per 1,000 population
B The total mortality rates for females and males are age-adjusted (standardized) rates
65 The maternal mortality rate (MMRate) is defined as number of maternal deaths in a given period per 100,000 women age 15-
49 years during the same time period.
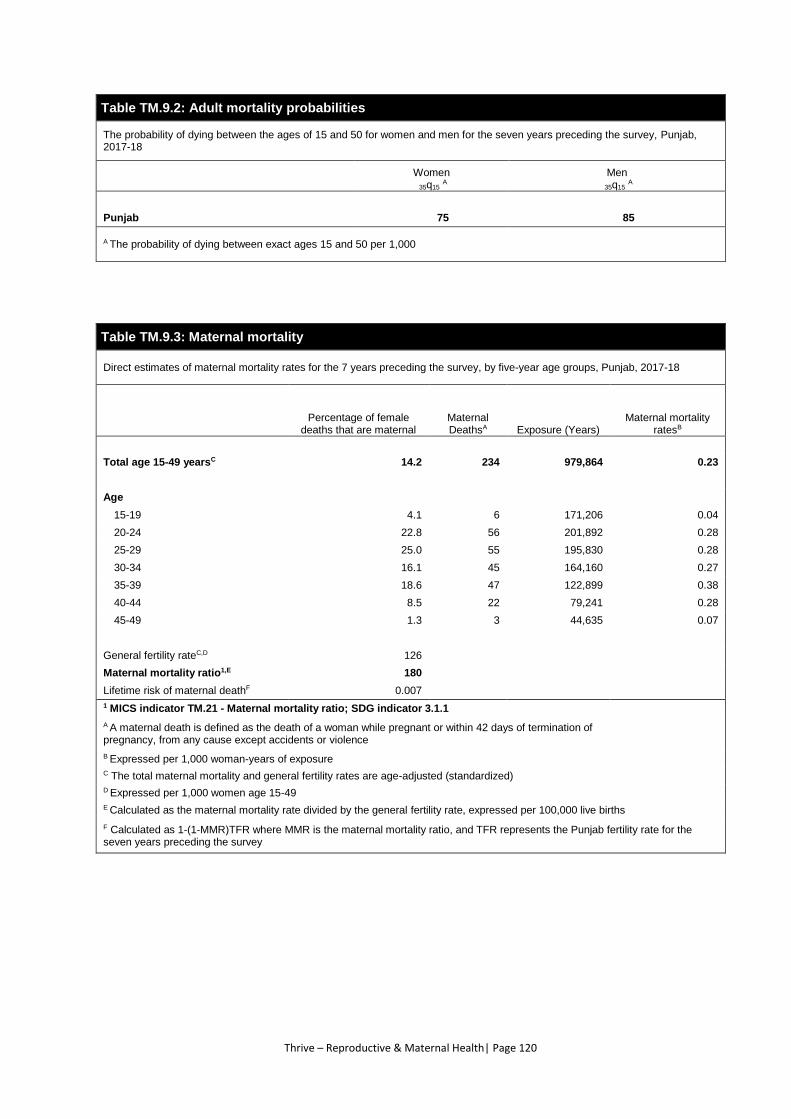
Thrive – Reproductive & Maternal Health| Page 120
Table TM.9.2: Adult mortality probabilities
The probability of dying between the ages of 15 and 50 for women and men for the seven years preceding the survey, Punjab, 2017-18
Women 35q15
A Men
35q15 A
Punjab 75 85
A The probability of dying between exact ages 15 and 50 per 1,000
Table TM.9.3: Maternal mortality
Direct estimates of maternal mortality rates for the 7 years preceding the survey, by five-year age groups, Punjab, 2017-18
Percentage of female
deaths that are maternal Maternal DeathsA Exposure (Years)
Maternal mortality ratesB
Total age 15-49 yearsC 14.2 234 979,864 0.23
Age
15-19 4.1 6 171,206 0.04
20-24 22.8 56 201,892 0.28
25-29 25.0 55 195,830 0.28
30-34 16.1 45 164,160 0.27
35-39 18.6 47 122,899 0.38
40-44 8.5 22 79,241 0.28
45-49 1.3 3 44,635 0.07
General fertility rateC,D 126
Maternal mortality ratio1,E 180
Lifetime risk of maternal deathF 0.007
1 MICS indicator TM.21 - Maternal mortality ratio; SDG indicator 3.1.1
A A maternal death is defined as the death of a woman while pregnant or within 42 days of termination of pregnancy, from any cause except accidents or violence
B Expressed per 1,000 woman-years of exposure
C The total maternal mortality and general fertility rates are age-adjusted (standardized)
D Expressed per 1,000 women age 15-49
E Calculated as the maternal mortality rate divided by the general fertility rate, expressed per 100,000 live births
F Calculated as 1-(1-MMR)TFR where MMR is the maternal mortality ratio, and TFR represents the Punjab fertility rate for the seven years preceding the survey
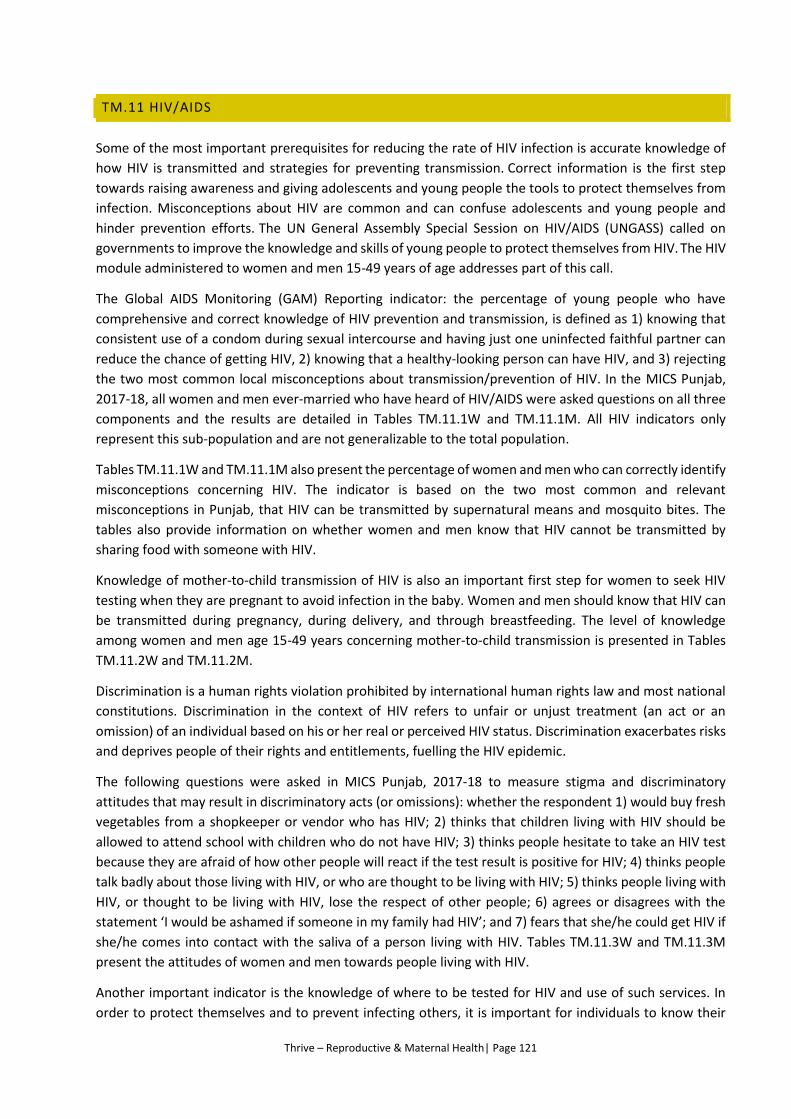
Thrive – Reproductive & Maternal Health| Page 121
TM.11 HIV/AIDS
Some of the most important prerequisites for reducing the rate of HIV infection is accurate knowledge of
how HIV is transmitted and strategies for preventing transmission. Correct information is the first step
towards raising awareness and giving adolescents and young people the tools to protect themselves from
infection. Misconceptions about HIV are common and can confuse adolescents and young people and
hinder prevention efforts. The UN General Assembly Special Session on HIV/AIDS (UNGASS) called on
governments to improve the knowledge and skills of young people to protect themselves from HIV. The HIV
module administered to women and men 15-49 years of age addresses part of this call.
The Global AIDS Monitoring (GAM) Reporting indicator: the percentage of young people who have
comprehensive and correct knowledge of HIV prevention and transmission, is defined as 1) knowing that
consistent use of a condom during sexual intercourse and having just one uninfected faithful partner can
reduce the chance of getting HIV, 2) knowing that a healthy-looking person can have HIV, and 3) rejecting
the two most common local misconceptions about transmission/prevention of HIV. In the MICS Punjab,
2017-18, all women and men ever-married who have heard of HIV/AIDS were asked questions on all three
components and the results are detailed in Tables TM.11.1W and TM.11.1M. All HIV indicators only
represent this sub-population and are not generalizable to the total population.
Tables TM.11.1W and TM.11.1M also present the percentage of women and men who can correctly identify
misconceptions concerning HIV. The indicator is based on the two most common and relevant
misconceptions in Punjab, that HIV can be transmitted by supernatural means and mosquito bites. The
tables also provide information on whether women and men know that HIV cannot be transmitted by
sharing food with someone with HIV.
Knowledge of mother-to-child transmission of HIV is also an important first step for women to seek HIV
testing when they are pregnant to avoid infection in the baby. Women and men should know that HIV can
be transmitted during pregnancy, during delivery, and through breastfeeding. The level of knowledge
among women and men age 15-49 years concerning mother-to-child transmission is presented in Tables
TM.11.2W and TM.11.2M.
Discrimination is a human rights violation prohibited by international human rights law and most national
constitutions. Discrimination in the context of HIV refers to unfair or unjust treatment (an act or an
omission) of an individual based on his or her real or perceived HIV status. Discrimination exacerbates risks
and deprives people of their rights and entitlements, fuelling the HIV epidemic.
The following questions were asked in MICS Punjab, 2017-18 to measure stigma and discriminatory
attitudes that may result in discriminatory acts (or omissions): whether the respondent 1) would buy fresh
vegetables from a shopkeeper or vendor who has HIV; 2) thinks that children living with HIV should be
allowed to attend school with children who do not have HIV; 3) thinks people hesitate to take an HIV test
because they are afraid of how other people will react if the test result is positive for HIV; 4) thinks people
talk badly about those living with HIV, or who are thought to be living with HIV; 5) thinks people living with
HIV, or thought to be living with HIV, lose the respect of other people; 6) agrees or disagrees with the
statement ‘I would be ashamed if someone in my family had HIV’; and 7) fears that she/he could get HIV if
she/he comes into contact with the saliva of a person living with HIV. Tables TM.11.3W and TM.11.3M
present the attitudes of women and men towards people living with HIV.
Another important indicator is the knowledge of where to be tested for HIV and use of such services. In
order to protect themselves and to prevent infecting others, it is important for individuals to know their
Thrive – Reproductive & Maternal Health| Page 122
HIV status. Knowledge of own status is also a critical factor in the decision to seek treatment. Questions
related to knowledge of a facility for HIV testing and whether a person has ever been tested are presented
in Tables TM.11.4W and TM.11.4M.
Among women who had given birth within the two years preceding the survey, the percentage who
received counselling and HIV testing during antenatal care is presented in Table TM.11.5. This indicator is
used to track progress towards global and national goals to eliminate mother-to-child transmission of HIV.
High coverage enables early initiation of care and treatment for HIV positive mothers required to live
healthy and productive lives
In many countries, over half of new adult HIV infections are among young people age 15-24 years thus a
change in behaviour among members of this age group is especially important to reduce new infections.
The next tables present specific information on this age group. Tables TM.11.6W and TM.11.6M summarise
information on key HIV indicators for young women and young men.
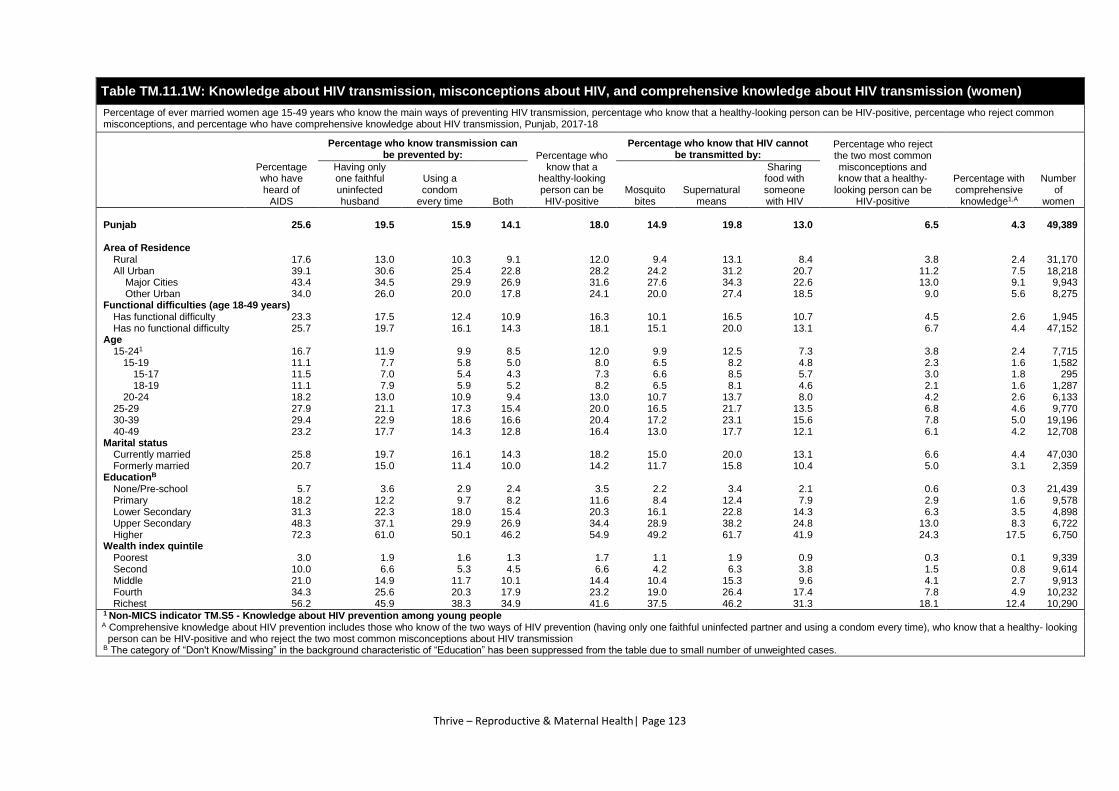
Thrive – Reproductive & Maternal Health| Page 123
Table TM.11.1W: Knowledge about HIV transmission, misconceptions about HIV, and comprehensive knowledge about HIV transmission (women)
Percentage of ever married women age 15-49 years who know the main ways of preventing HIV transmission, percentage who know that a healthy-looking person can be HIV-positive, percentage who reject common misconceptions, and percentage who have comprehensive knowledge about HIV transmission, Punjab, 2017-18
Percentage who have heard of
AIDS
Percentage who know transmission can be prevented by: Percentage who
know that a healthy-looking person can be HIV-positive
Percentage who know that HIV cannot be transmitted by:
Percentage who reject the two most common misconceptions and know that a healthy-
looking person can be HIV-positive
Percentage with comprehensive knowledge1,A
Number of
women
Having only one faithful uninfected husband
Using a condom
every time Both Mosquito
bites Supernatural
means
Sharing food with someone with HIV
Punjab 25.6 19.5 15.9 14.1 18.0 14.9 19.8 13.0 6.5 4.3 49,389
Area of Residence
Rural 17.6 13.0 10.3 9.1 12.0 9.4 13.1 8.4 3.8 2.4 31,170 All Urban 39.1 30.6 25.4 22.8 28.2 24.2 31.2 20.7 11.2 7.5 18,218 Major Cities 43.4 34.5 29.9 26.9 31.6 27.6 34.3 22.6 13.0 9.1 9,943 Other Urban 34.0 26.0 20.0 17.8 24.1 20.0 27.4 18.5 9.0 5.6 8,275
Functional difficulties (age 18-49 years)
Has functional difficulty 23.3 17.5 12.4 10.9 16.3 10.1 16.5 10.7 4.5 2.6 1,945 Has no functional difficulty 25.7 19.7 16.1 14.3 18.1 15.1 20.0 13.1 6.7 4.4 47,152
Age
15-241 16.7 11.9 9.9 8.5 12.0 9.9 12.5 7.3 3.8 2.4 7,715 15-19 11.1 7.7 5.8 5.0 8.0 6.5 8.2 4.8 2.3 1.6 1,582
15-17 11.5 7.0 5.4 4.3 7.3 6.6 8.5 5.7 3.0 1.8 295 18-19 11.1 7.9 5.9 5.2 8.2 6.5 8.1 4.6 2.1 1.6 1,287
20-24 18.2 13.0 10.9 9.4 13.0 10.7 13.7 8.0 4.2 2.6 6,133 25-29 27.9 21.1 17.3 15.4 20.0 16.5 21.7 13.5 6.8 4.6 9,770 30-39 29.4 22.9 18.6 16.6 20.4 17.2 23.1 15.6 7.8 5.0 19,196 40-49 23.2 17.7 14.3 12.8 16.4 13.0 17.7 12.1 6.1 4.2 12,708
Marital status
Currently married 25.8 19.7 16.1 14.3 18.2 15.0 20.0 13.1 6.6 4.4 47,030 Formerly married 20.7 15.0 11.4 10.0 14.2 11.7 15.8 10.4 5.0 3.1 2,359
EducationB
None/Pre-school 5.7 3.6 2.9 2.4 3.5 2.2 3.4 2.1 0.6 0.3 21,439 Primary 18.2 12.2 9.7 8.2 11.6 8.4 12.4 7.9 2.9 1.6 9,578 Lower Secondary 31.3 22.3 18.0 15.4 20.3 16.1 22.8 14.3 6.3 3.5 4,898 Upper Secondary 48.3 37.1 29.9 26.9 34.4 28.9 38.2 24.8 13.0 8.3 6,722 Higher 72.3 61.0 50.1 46.2 54.9 49.2 61.7 41.9 24.3 17.5 6,750
Wealth index quintile
Poorest 3.0 1.9 1.6 1.3 1.7 1.1 1.9 0.9 0.3 0.1 9,339 Second 10.0 6.6 5.3 4.5 6.6 4.2 6.3 3.8 1.5 0.8 9,614 Middle 21.0 14.9 11.7 10.1 14.4 10.4 15.3 9.6 4.1 2.7 9,913 Fourth 34.3 25.6 20.3 17.9 23.2 19.0 26.4 17.4 7.8 4.9 10,232 Richest 56.2 45.9 38.3 34.9 41.6 37.5 46.2 31.3 18.1 12.4 10,290
1 Non-MICS indicator TM.S5 - Knowledge about HIV prevention among young people A Comprehensive knowledge about HIV prevention includes those who know of the two ways of HIV prevention (having only one faithful uninfected partner and using a condom every time), who know that a healthy- looking
person can be HIV-positive and who reject the two most common misconceptions about HIV transmission B The category of “Don't Know/Missing” in the background characteristic of “Education” has been suppressed from the table due to small number of unweighted cases.
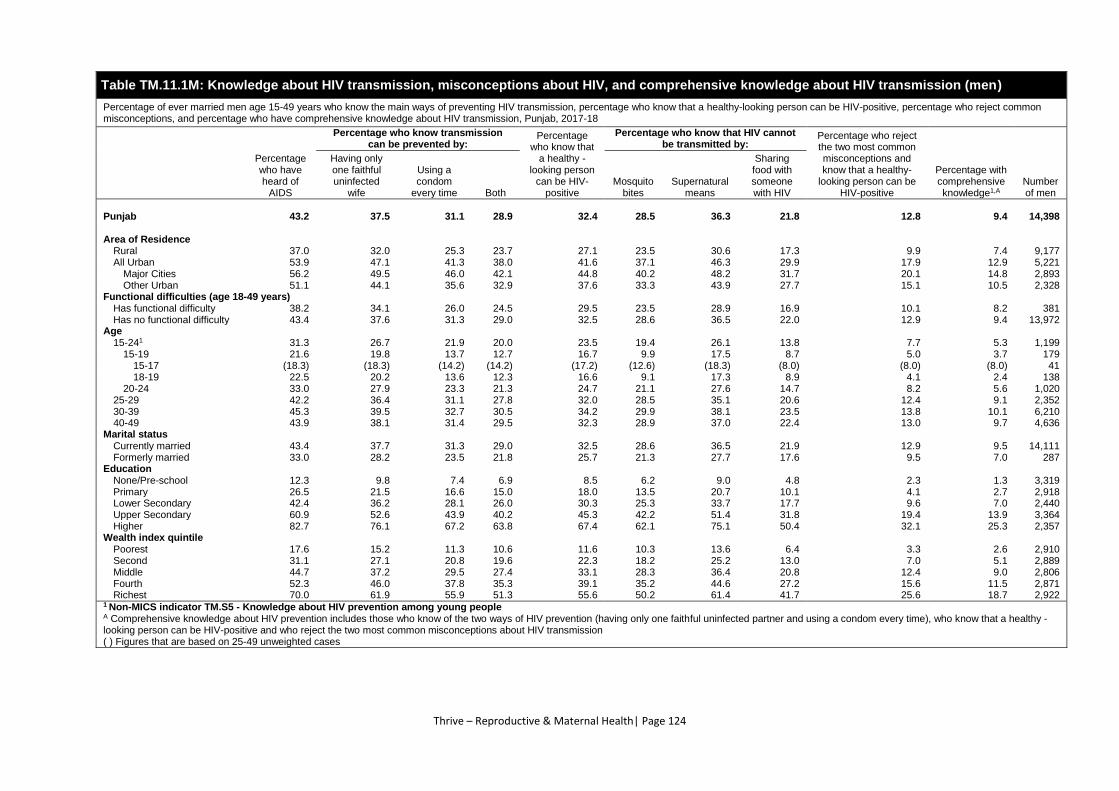
Thrive – Reproductive & Maternal Health| Page 124
Table TM.11.1M: Knowledge about HIV transmission, misconceptions about HIV, and comprehensive knowledge about HIV transmission (men)
Percentage of ever married men age 15-49 years who know the main ways of preventing HIV transmission, percentage who know that a healthy-looking person can be HIV-positive, percentage who reject common misconceptions, and percentage who have comprehensive knowledge about HIV transmission, Punjab, 2017-18
Percentage who have heard of
AIDS
Percentage who know transmission can be prevented by:
Percentage who know that
a healthy -looking person
can be HIV-positive
Percentage who know that HIV cannot be transmitted by:
Percentage who reject the two most common misconceptions and know that a healthy-
looking person can be HIV-positive
Percentage with comprehensive knowledge1,A
Number of men
Having only one faithful uninfected
wife
Using a condom
every time Both Mosquito
bites Supernatural
means
Sharing food with someone with HIV
Punjab 43.2 37.5 31.1 28.9 32.4 28.5 36.3 21.8 12.8 9.4 14,398
Area of Residence
Rural 37.0 32.0 25.3 23.7 27.1 23.5 30.6 17.3 9.9 7.4 9,177 All Urban 53.9 47.1 41.3 38.0 41.6 37.1 46.3 29.9 17.9 12.9 5,221
Major Cities 56.2 49.5 46.0 42.1 44.8 40.2 48.2 31.7 20.1 14.8 2,893 Other Urban 51.1 44.1 35.6 32.9 37.6 33.3 43.9 27.7 15.1 10.5 2,328
Functional difficulties (age 18-49 years)
Has functional difficulty 38.2 34.1 26.0 24.5 29.5 23.5 28.9 16.9 10.1 8.2 381 Has no functional difficulty 43.4 37.6 31.3 29.0 32.5 28.6 36.5 22.0 12.9 9.4 13,972
Age
15-241 31.3 26.7 21.9 20.0 23.5 19.4 26.1 13.8 7.7 5.3 1,199 15-19 21.6 19.8 13.7 12.7 16.7 9.9 17.5 8.7 5.0 3.7 179
15-17 (18.3) (18.3) (14.2) (14.2) (17.2) (12.6) (18.3) (8.0) (8.0) (8.0) 41 18-19 22.5 20.2 13.6 12.3 16.6 9.1 17.3 8.9 4.1 2.4 138
20-24 33.0 27.9 23.3 21.3 24.7 21.1 27.6 14.7 8.2 5.6 1,020 25-29 42.2 36.4 31.1 27.8 32.0 28.5 35.1 20.6 12.4 9.1 2,352 30-39 45.3 39.5 32.7 30.5 34.2 29.9 38.1 23.5 13.8 10.1 6,210 40-49 43.9 38.1 31.4 29.5 32.3 28.9 37.0 22.4 13.0 9.7 4,636
Marital status
Currently married 43.4 37.7 31.3 29.0 32.5 28.6 36.5 21.9 12.9 9.5 14,111 Formerly married 33.0 28.2 23.5 21.8 25.7 21.3 27.7 17.6 9.5 7.0 287
Education
None/Pre-school 12.3 9.8 7.4 6.9 8.5 6.2 9.0 4.8 2.3 1.3 3,319 Primary 26.5 21.5 16.6 15.0 18.0 13.5 20.7 10.1 4.1 2.7 2,918 Lower Secondary 42.4 36.2 28.1 26.0 30.3 25.3 33.7 17.7 9.6 7.0 2,440 Upper Secondary 60.9 52.6 43.9 40.2 45.3 42.2 51.4 31.8 19.4 13.9 3,364 Higher 82.7 76.1 67.2 63.8 67.4 62.1 75.1 50.4 32.1 25.3 2,357
Wealth index quintile
Poorest 17.6 15.2 11.3 10.6 11.6 10.3 13.6 6.4 3.3 2.6 2,910 Second 31.1 27.1 20.8 19.6 22.3 18.2 25.2 13.0 7.0 5.1 2,889 Middle 44.7 37.2 29.5 27.4 33.1 28.3 36.4 20.8 12.4 9.0 2,806 Fourth 52.3 46.0 37.8 35.3 39.1 35.2 44.6 27.2 15.6 11.5 2,871 Richest 70.0 61.9 55.9 51.3 55.6 50.2 61.4 41.7 25.6 18.7 2,922
1 Non-MICS indicator TM.S5 - Knowledge about HIV prevention among young people A Comprehensive knowledge about HIV prevention includes those who know of the two ways of HIV prevention (having only one faithful uninfected partner and using a condom every time), who know that a healthy -looking person can be HIV-positive and who reject the two most common misconceptions about HIV transmission ( ) Figures that are based on 25-49 unweighted cases
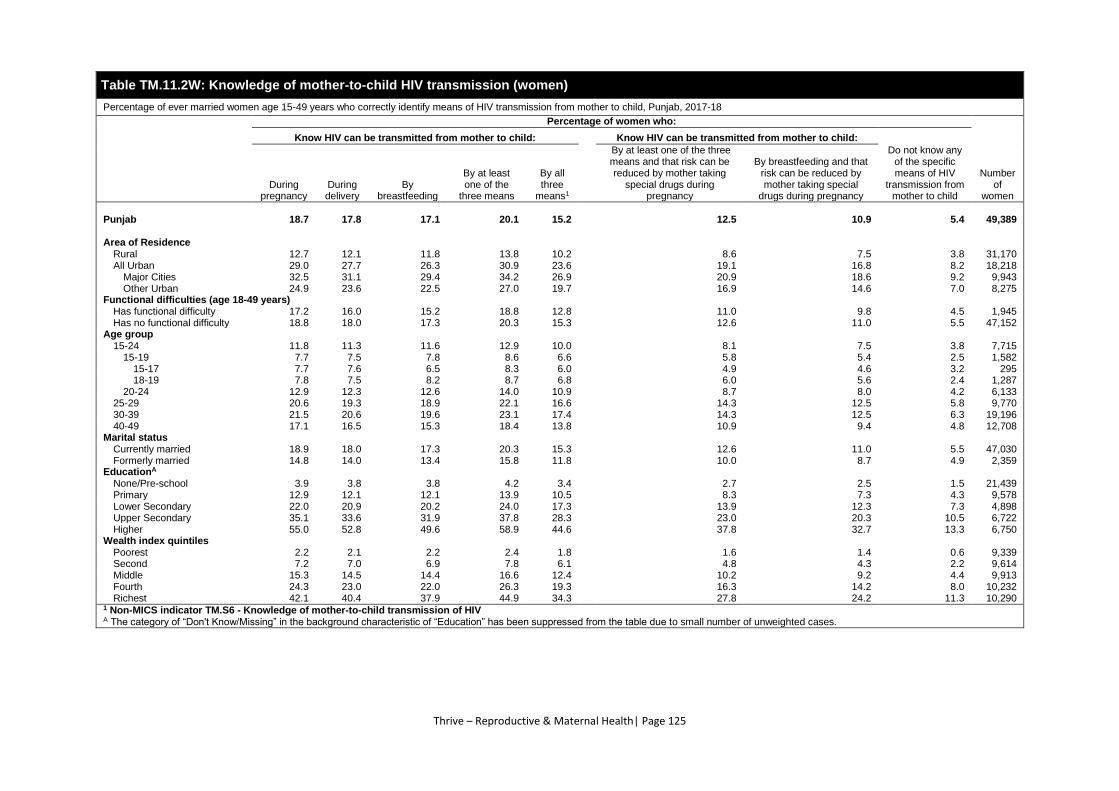
Thrive – Reproductive & Maternal Health| Page 125
Table TM.11.2W: Knowledge of mother-to-child HIV transmission (women)
Percentage of ever married women age 15-49 years who correctly identify means of HIV transmission from mother to child, Punjab, 2017-18
Percentage of women who:
Number of
women
Know HIV can be transmitted from mother to child: Know HIV can be transmitted from mother to child:
Do not know any of the specific means of HIV
transmission from mother to child
During pregnancy
During delivery
By breastfeeding
By at least one of the
three means
By all three
means1
By at least one of the three means and that risk can be reduced by mother taking
special drugs during pregnancy
By breastfeeding and that risk can be reduced by mother taking special
drugs during pregnancy
Punjab 18.7 17.8 17.1 20.1 15.2 12.5 10.9 5.4 49,389
Area of Residence
Rural 12.7 12.1 11.8 13.8 10.2 8.6 7.5 3.8 31,170 All Urban 29.0 27.7 26.3 30.9 23.6 19.1 16.8 8.2 18,218
Major Cities 32.5 31.1 29.4 34.2 26.9 20.9 18.6 9.2 9,943 Other Urban 24.9 23.6 22.5 27.0 19.7 16.9 14.6 7.0 8,275
Functional difficulties (age 18-49 years)
Has functional difficulty 17.2 16.0 15.2 18.8 12.8 11.0 9.8 4.5 1,945 Has no functional difficulty 18.8 18.0 17.3 20.3 15.3 12.6 11.0 5.5 47,152
Age group
15-24 11.8 11.3 11.6 12.9 10.0 8.1 7.5 3.8 7,715 15-19 7.7 7.5 7.8 8.6 6.6 5.8 5.4 2.5 1,582
15-17 7.7 7.6 6.5 8.3 6.0 4.9 4.6 3.2 295 18-19 7.8 7.5 8.2 8.7 6.8 6.0 5.6 2.4 1,287
20-24 12.9 12.3 12.6 14.0 10.9 8.7 8.0 4.2 6,133 25-29 20.6 19.3 18.9 22.1 16.6 14.3 12.5 5.8 9,770 30-39 21.5 20.6 19.6 23.1 17.4 14.3 12.5 6.3 19,196 40-49 17.1 16.5 15.3 18.4 13.8 10.9 9.4 4.8 12,708
Marital status
Currently married 18.9 18.0 17.3 20.3 15.3 12.6 11.0 5.5 47,030 Formerly married 14.8 14.0 13.4 15.8 11.8 10.0 8.7 4.9 2,359
EducationA
None/Pre-school 3.9 3.8 3.8 4.2 3.4 2.7 2.5 1.5 21,439 Primary 12.9 12.1 12.1 13.9 10.5 8.3 7.3 4.3 9,578 Lower Secondary 22.0 20.9 20.2 24.0 17.3 13.9 12.3 7.3 4,898 Upper Secondary 35.1 33.6 31.9 37.8 28.3 23.0 20.3 10.5 6,722 Higher 55.0 52.8 49.6 58.9 44.6 37.8 32.7 13.3 6,750
Wealth index quintiles
Poorest 2.2 2.1 2.2 2.4 1.8 1.6 1.4 0.6 9,339 Second 7.2 7.0 6.9 7.8 6.1 4.8 4.3 2.2 9,614 Middle 15.3 14.5 14.4 16.6 12.4 10.2 9.2 4.4 9,913 Fourth 24.3 23.0 22.0 26.3 19.3 16.3 14.2 8.0 10,232 Richest 42.1 40.4 37.9 44.9 34.3 27.8 24.2 11.3 10,290
1 Non-MICS indicator TM.S6 - Knowledge of mother-to-child transmission of HIV A The category of “Don't Know/Missing” in the background characteristic of “Education” has been suppressed from the table due to small number of unweighted cases.
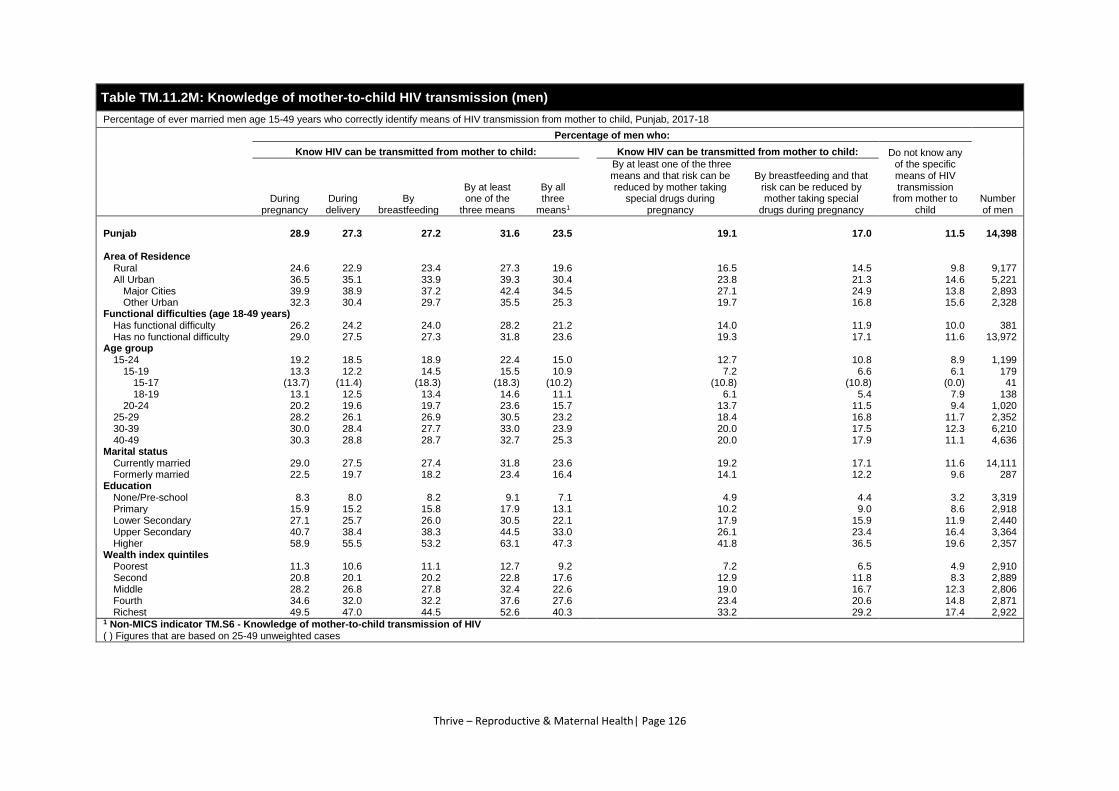
Thrive – Reproductive & Maternal Health| Page 126
Table TM.11.2M: Knowledge of mother-to-child HIV transmission (men)
Percentage of ever married men age 15-49 years who correctly identify means of HIV transmission from mother to child, Punjab, 2017-18
Percentage of men who:
Number of men
Know HIV can be transmitted from mother to child: Know HIV can be transmitted from mother to child: Do not know any of the specific means of HIV transmission
from mother to child
During pregnancy
During delivery
By breastfeeding
By at least one of the
three means
By all three
means1
By at least one of the three means and that risk can be reduced by mother taking
special drugs during pregnancy
By breastfeeding and that risk can be reduced by mother taking special
drugs during pregnancy
Punjab 28.9 27.3 27.2 31.6 23.5 19.1 17.0 11.5 14,398
Area of Residence
Rural 24.6 22.9 23.4 27.3 19.6 16.5 14.5 9.8 9,177 All Urban 36.5 35.1 33.9 39.3 30.4 23.8 21.3 14.6 5,221
Major Cities 39.9 38.9 37.2 42.4 34.5 27.1 24.9 13.8 2,893 Other Urban 32.3 30.4 29.7 35.5 25.3 19.7 16.8 15.6 2,328
Functional difficulties (age 18-49 years)
Has functional difficulty 26.2 24.2 24.0 28.2 21.2 14.0 11.9 10.0 381 Has no functional difficulty 29.0 27.5 27.3 31.8 23.6 19.3 17.1 11.6 13,972
Age group
15-24 19.2 18.5 18.9 22.4 15.0 12.7 10.8 8.9 1,199 15-19 13.3 12.2 14.5 15.5 10.9 7.2 6.6 6.1 179
15-17 (13.7) (11.4) (18.3) (18.3) (10.2) (10.8) (10.8) (0.0) 41 18-19 13.1 12.5 13.4 14.6 11.1 6.1 5.4 7.9 138
20-24 20.2 19.6 19.7 23.6 15.7 13.7 11.5 9.4 1,020 25-29 28.2 26.1 26.9 30.5 23.2 18.4 16.8 11.7 2,352 30-39 30.0 28.4 27.7 33.0 23.9 20.0 17.5 12.3 6,210 40-49 30.3 28.8 28.7 32.7 25.3 20.0 17.9 11.1 4,636
Marital status
Currently married 29.0 27.5 27.4 31.8 23.6 19.2 17.1 11.6 14,111 Formerly married 22.5 19.7 18.2 23.4 16.4 14.1 12.2 9.6 287
Education
None/Pre-school 8.3 8.0 8.2 9.1 7.1 4.9 4.4 3.2 3,319 Primary 15.9 15.2 15.8 17.9 13.1 10.2 9.0 8.6 2,918 Lower Secondary 27.1 25.7 26.0 30.5 22.1 17.9 15.9 11.9 2,440 Upper Secondary 40.7 38.4 38.3 44.5 33.0 26.1 23.4 16.4 3,364 Higher 58.9 55.5 53.2 63.1 47.3 41.8 36.5 19.6 2,357
Wealth index quintiles
Poorest 11.3 10.6 11.1 12.7 9.2 7.2 6.5 4.9 2,910 Second 20.8 20.1 20.2 22.8 17.6 12.9 11.8 8.3 2,889 Middle 28.2 26.8 27.8 32.4 22.6 19.0 16.7 12.3 2,806 Fourth 34.6 32.0 32.2 37.6 27.6 23.4 20.6 14.8 2,871 Richest 49.5 47.0 44.5 52.6 40.3 33.2 29.2 17.4 2,922
1 Non-MICS indicator TM.S6 - Knowledge of mother-to-child transmission of HIV ( ) Figures that are based on 25-49 unweighted cases
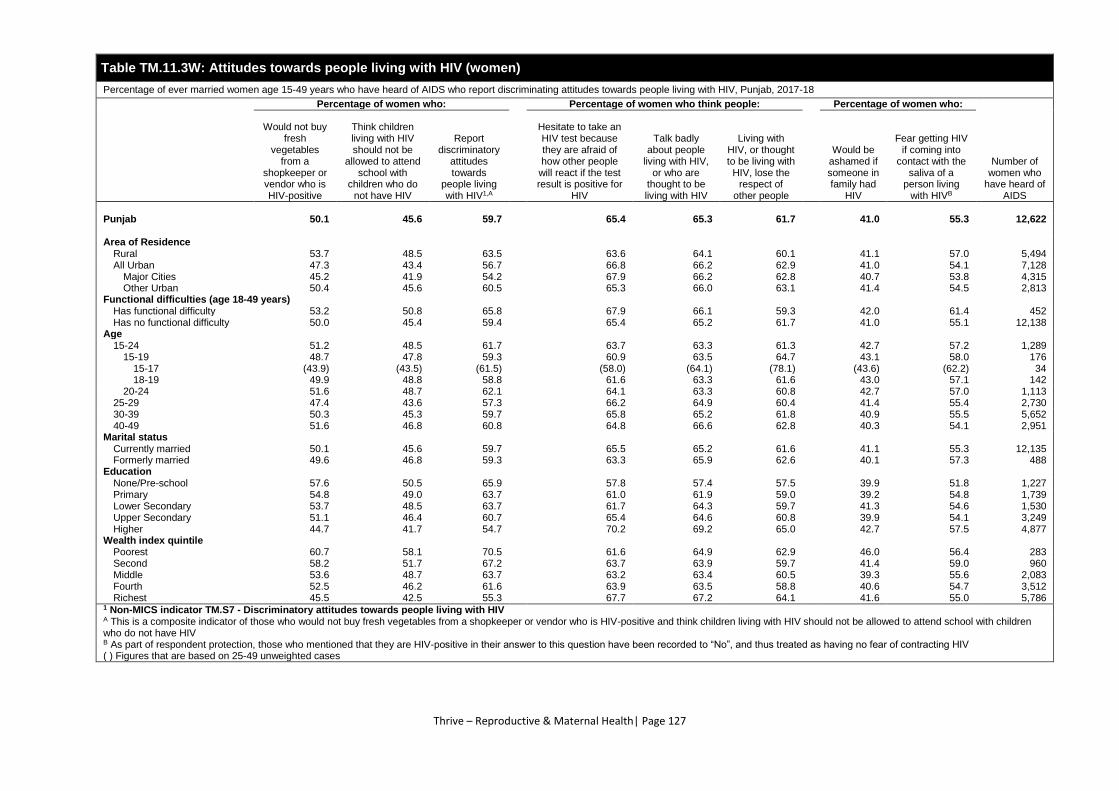
Thrive – Reproductive & Maternal Health| Page 127
Table TM.11.3W: Attitudes towards people living with HIV (women)
Percentage of ever married women age 15-49 years who have heard of AIDS who report discriminating attitudes towards people living with HIV, Punjab, 2017-18
Percentage of women who: Percentage of women who think people: Percentage of women who:
Number of women who
have heard of AIDS
Would not buy fresh
vegetables from a
shopkeeper or vendor who is HIV-positive
Think children living with HIV should not be
allowed to attend school with
children who do not have HIV
Report discriminatory
attitudes towards
people living with HIV1,A
Hesitate to take an HIV test because they are afraid of how other people will react if the test result is positive for
HIV
Talk badly about people
living with HIV, or who are
thought to be living with HIV
Living with HIV, or thought to be living with HIV, lose the
respect of other people
Would be ashamed if someone in family had
HIV
Fear getting HIV if coming into
contact with the saliva of a
person living with HIVB
Punjab 50.1 45.6 59.7 65.4 65.3 61.7 41.0 55.3 12,622
Area of Residence
Rural 53.7 48.5 63.5 63.6 64.1 60.1 41.1 57.0 5,494 All Urban 47.3 43.4 56.7 66.8 66.2 62.9 41.0 54.1 7,128
Major Cities 45.2 41.9 54.2 67.9 66.2 62.8 40.7 53.8 4,315 Other Urban 50.4 45.6 60.5 65.3 66.0 63.1 41.4 54.5 2,813
Functional difficulties (age 18-49 years)
Has functional difficulty 53.2 50.8 65.8 67.9 66.1 59.3 42.0 61.4 452 Has no functional difficulty 50.0 45.4 59.4 65.4 65.2 61.7 41.0 55.1 12,138
Age
15-24 51.2 48.5 61.7 63.7 63.3 61.3 42.7 57.2 1,289 15-19 48.7 47.8 59.3 60.9 63.5 64.7 43.1 58.0 176
15-17 (43.9) (43.5) (61.5) (58.0) (64.1) (78.1) (43.6) (62.2) 34 18-19 49.9 48.8 58.8 61.6 63.3 61.6 43.0 57.1 142
20-24 51.6 48.7 62.1 64.1 63.3 60.8 42.7 57.0 1,113 25-29 47.4 43.6 57.3 66.2 64.9 60.4 41.4 55.4 2,730 30-39 50.3 45.3 59.7 65.8 65.2 61.8 40.9 55.5 5,652 40-49 51.6 46.8 60.8 64.8 66.6 62.8 40.3 54.1 2,951
Marital status
Currently married 50.1 45.6 59.7 65.5 65.2 61.6 41.1 55.3 12,135 Formerly married 49.6 46.8 59.3 63.3 65.9 62.6 40.1 57.3 488
Education
None/Pre-school 57.6 50.5 65.9 57.8 57.4 57.5 39.9 51.8 1,227 Primary 54.8 49.0 63.7 61.0 61.9 59.0 39.2 54.8 1,739 Lower Secondary 53.7 48.5 63.7 61.7 64.3 59.7 41.3 54.6 1,530 Upper Secondary 51.1 46.4 60.7 65.4 64.6 60.8 39.9 54.1 3,249 Higher 44.7 41.7 54.7 70.2 69.2 65.0 42.7 57.5 4,877
Wealth index quintile
Poorest 60.7 58.1 70.5 61.6 64.9 62.9 46.0 56.4 283 Second 58.2 51.7 67.2 63.7 63.9 59.7 41.4 59.0 960 Middle 53.6 48.7 63.7 63.2 63.4 60.5 39.3 55.6 2,083 Fourth 52.5 46.2 61.6 63.9 63.5 58.8 40.6 54.7 3,512 Richest 45.5 42.5 55.3 67.7 67.2 64.1 41.6 55.0 5,786
1 Non-MICS indicator TM.S7 - Discriminatory attitudes towards people living with HIV A This is a composite indicator of those who would not buy fresh vegetables from a shopkeeper or vendor who is HIV-positive and think children living with HIV should not be allowed to attend school with children who do not have HIV B As part of respondent protection, those who mentioned that they are HIV-positive in their answer to this question have been recorded to “No”, and thus treated as having no fear of contracting HIV ( ) Figures that are based on 25-49 unweighted cases
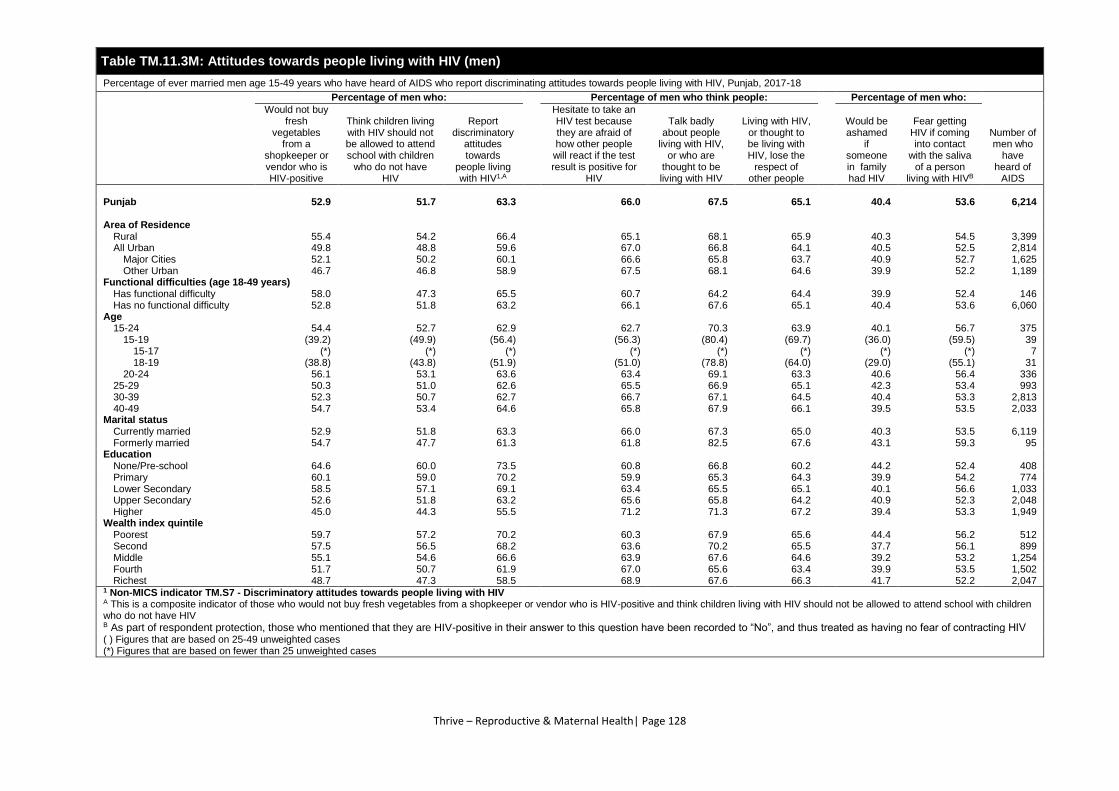
Thrive – Reproductive & Maternal Health| Page 128
Table TM.11.3M: Attitudes towards people living with HIV (men)
Percentage of ever married men age 15-49 years who have heard of AIDS who report discriminating attitudes towards people living with HIV, Punjab, 2017-18
Percentage of men who: Percentage of men who think people: Percentage of men who:
Number of men who
have heard of
AIDS
Would not buy fresh
vegetables from a
shopkeeper or vendor who is HIV-positive
Think children living with HIV should not be allowed to attend school with children
who do not have HIV
Report discriminatory
attitudes towards
people living with HIV1,A
Hesitate to take an HIV test because they are afraid of how other people will react if the test result is positive for
HIV
Talk badly about people
living with HIV, or who are
thought to be living with HIV
Living with HIV, or thought to be living with HIV, lose the
respect of other people
Would be ashamed
if someone in family had HIV
Fear getting HIV if coming into contact
with the saliva of a person
living with HIVB
Punjab 52.9 51.7 63.3 66.0 67.5 65.1 40.4 53.6 6,214
Area of Residence
Rural 55.4 54.2 66.4 65.1 68.1 65.9 40.3 54.5 3,399 All Urban 49.8 48.8 59.6 67.0 66.8 64.1 40.5 52.5 2,814
Major Cities 52.1 50.2 60.1 66.6 65.8 63.7 40.9 52.7 1,625 Other Urban 46.7 46.8 58.9 67.5 68.1 64.6 39.9 52.2 1,189
Functional difficulties (age 18-49 years)
Has functional difficulty 58.0 47.3 65.5 60.7 64.2 64.4 39.9 52.4 146 Has no functional difficulty 52.8 51.8 63.2 66.1 67.6 65.1 40.4 53.6 6,060
Age
15-24 54.4 52.7 62.9 62.7 70.3 63.9 40.1 56.7 375 15-19 (39.2) (49.9) (56.4) (56.3) (80.4) (69.7) (36.0) (59.5) 39
15-17 (*) (*) (*) (*) (*) (*) (*) (*) 7 18-19 (38.8) (43.8) (51.9) (51.0) (78.8) (64.0) (29.0) (55.1) 31
20-24 56.1 53.1 63.6 63.4 69.1 63.3 40.6 56.4 336 25-29 50.3 51.0 62.6 65.5 66.9 65.1 42.3 53.4 993 30-39 52.3 50.7 62.7 66.7 67.1 64.5 40.4 53.3 2,813 40-49 54.7 53.4 64.6 65.8 67.9 66.1 39.5 53.5 2,033
Marital status
Currently married 52.9 51.8 63.3 66.0 67.3 65.0 40.3 53.5 6,119 Formerly married 54.7 47.7 61.3 61.8 82.5 67.6 43.1 59.3 95
Education
None/Pre-school 64.6 60.0 73.5 60.8 66.8 60.2 44.2 52.4 408 Primary 60.1 59.0 70.2 59.9 65.3 64.3 39.9 54.2 774 Lower Secondary 58.5 57.1 69.1 63.4 65.5 65.1 40.1 56.6 1,033 Upper Secondary 52.6 51.8 63.2 65.6 65.8 64.2 40.9 52.3 2,048 Higher 45.0 44.3 55.5 71.2 71.3 67.2 39.4 53.3 1,949
Wealth index quintile
Poorest 59.7 57.2 70.2 60.3 67.9 65.6 44.4 56.2 512 Second 57.5 56.5 68.2 63.6 70.2 65.5 37.7 56.1 899 Middle 55.1 54.6 66.6 63.9 67.6 64.6 39.2 53.2 1,254 Fourth 51.7 50.7 61.9 67.0 65.6 63.4 39.9 53.5 1,502 Richest 48.7 47.3 58.5 68.9 67.6 66.3 41.7 52.2 2,047
1 Non-MICS indicator TM.S7 - Discriminatory attitudes towards people living with HIV A This is a composite indicator of those who would not buy fresh vegetables from a shopkeeper or vendor who is HIV-positive and think children living with HIV should not be allowed to attend school with children who do not have HIV B As part of respondent protection, those who mentioned that they are HIV-positive in their answer to this question have been recorded to “No”, and thus treated as having no fear of contracting HIV
( ) Figures that are based on 25-49 unweighted cases (*) Figures that are based on fewer than 25 unweighted cases
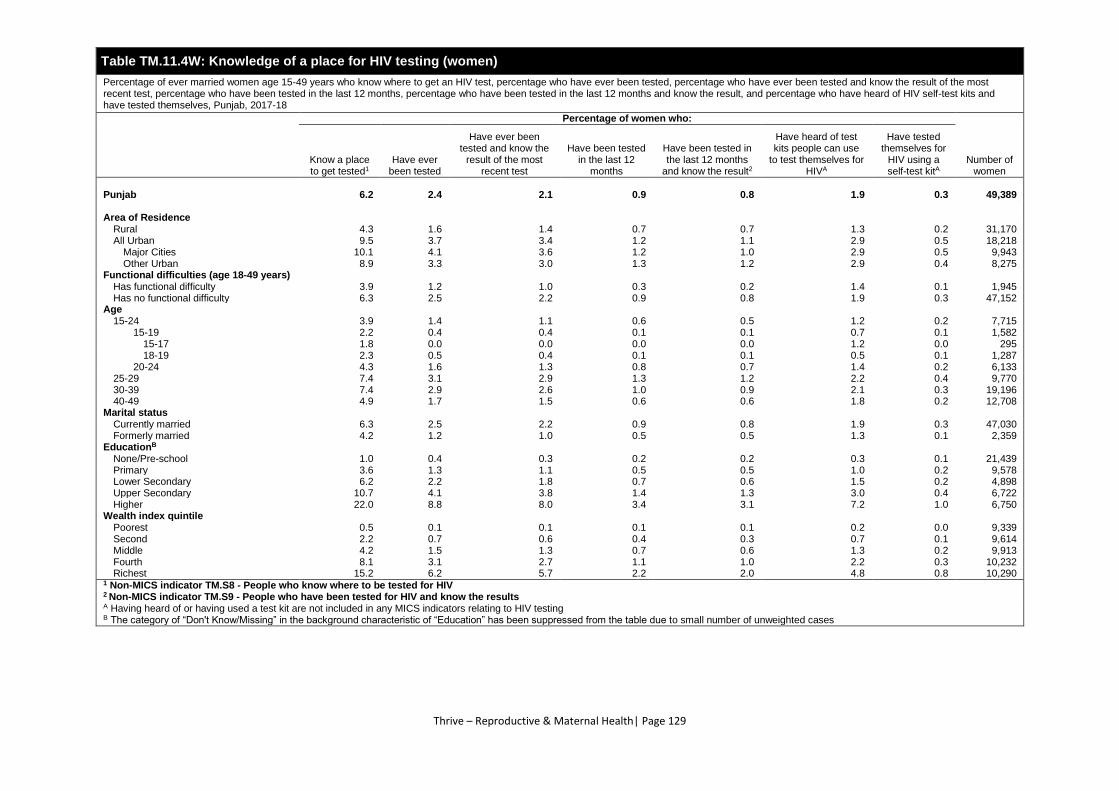
Thrive – Reproductive & Maternal Health| Page 129
Table TM.11.4W: Knowledge of a place for HIV testing (women)
Percentage of ever married women age 15-49 years who know where to get an HIV test, percentage who have ever been tested, percentage who have ever been tested and know the result of the most recent test, percentage who have been tested in the last 12 months, percentage who have been tested in the last 12 months and know the result, and percentage who have heard of HIV self-test kits and have tested themselves, Punjab, 2017-18
Percentage of women who:
Number of women
Know a place to get tested1
Have ever been tested
Have ever been tested and know the
result of the most recent test
Have been tested in the last 12
months
Have been tested in the last 12 months
and know the result2
Have heard of test kits people can use
to test themselves for HIVA
Have tested themselves for
HIV using a self-test kitA
Punjab 6.2 2.4 2.1 0.9 0.8 1.9 0.3 49,389
Area of Residence
Rural 4.3 1.6 1.4 0.7 0.7 1.3 0.2 31,170 All Urban 9.5 3.7 3.4 1.2 1.1 2.9 0.5 18,218
Major Cities 10.1 4.1 3.6 1.2 1.0 2.9 0.5 9,943 Other Urban 8.9 3.3 3.0 1.3 1.2 2.9 0.4 8,275
Functional difficulties (age 18-49 years)
Has functional difficulty 3.9 1.2 1.0 0.3 0.2 1.4 0.1 1,945 Has no functional difficulty 6.3 2.5 2.2 0.9 0.8 1.9 0.3 47,152
Age
15-24 3.9 1.4 1.1 0.6 0.5 1.2 0.2 7,715 15-19 2.2 0.4 0.4 0.1 0.1 0.7 0.1 1,582
15-17 1.8 0.0 0.0 0.0 0.0 1.2 0.0 295 18-19 2.3 0.5 0.4 0.1 0.1 0.5 0.1 1,287
20-24 4.3 1.6 1.3 0.8 0.7 1.4 0.2 6,133 25-29 7.4 3.1 2.9 1.3 1.2 2.2 0.4 9,770 30-39 7.4 2.9 2.6 1.0 0.9 2.1 0.3 19,196 40-49 4.9 1.7 1.5 0.6 0.6 1.8 0.2 12,708
Marital status
Currently married 6.3 2.5 2.2 0.9 0.8 1.9 0.3 47,030 Formerly married 4.2 1.2 1.0 0.5 0.5 1.3 0.1 2,359
EducationB
None/Pre-school 1.0 0.4 0.3 0.2 0.2 0.3 0.1 21,439 Primary 3.6 1.3 1.1 0.5 0.5 1.0 0.2 9,578 Lower Secondary 6.2 2.2 1.8 0.7 0.6 1.5 0.2 4,898 Upper Secondary 10.7 4.1 3.8 1.4 1.3 3.0 0.4 6,722 Higher 22.0 8.8 8.0 3.4 3.1 7.2 1.0 6,750
Wealth index quintile
Poorest 0.5 0.1 0.1 0.1 0.1 0.2 0.0 9,339 Second 2.2 0.7 0.6 0.4 0.3 0.7 0.1 9,614 Middle 4.2 1.5 1.3 0.7 0.6 1.3 0.2 9,913 Fourth 8.1 3.1 2.7 1.1 1.0 2.2 0.3 10,232 Richest 15.2 6.2 5.7 2.2 2.0 4.8 0.8 10,290
1 Non-MICS indicator TM.S8 - People who know where to be tested for HIV 2 Non-MICS indicator TM.S9 - People who have been tested for HIV and know the results A Having heard of or having used a test kit are not included in any MICS indicators relating to HIV testing B The category of “Don't Know/Missing” in the background characteristic of “Education” has been suppressed from the table due to small number of unweighted cases
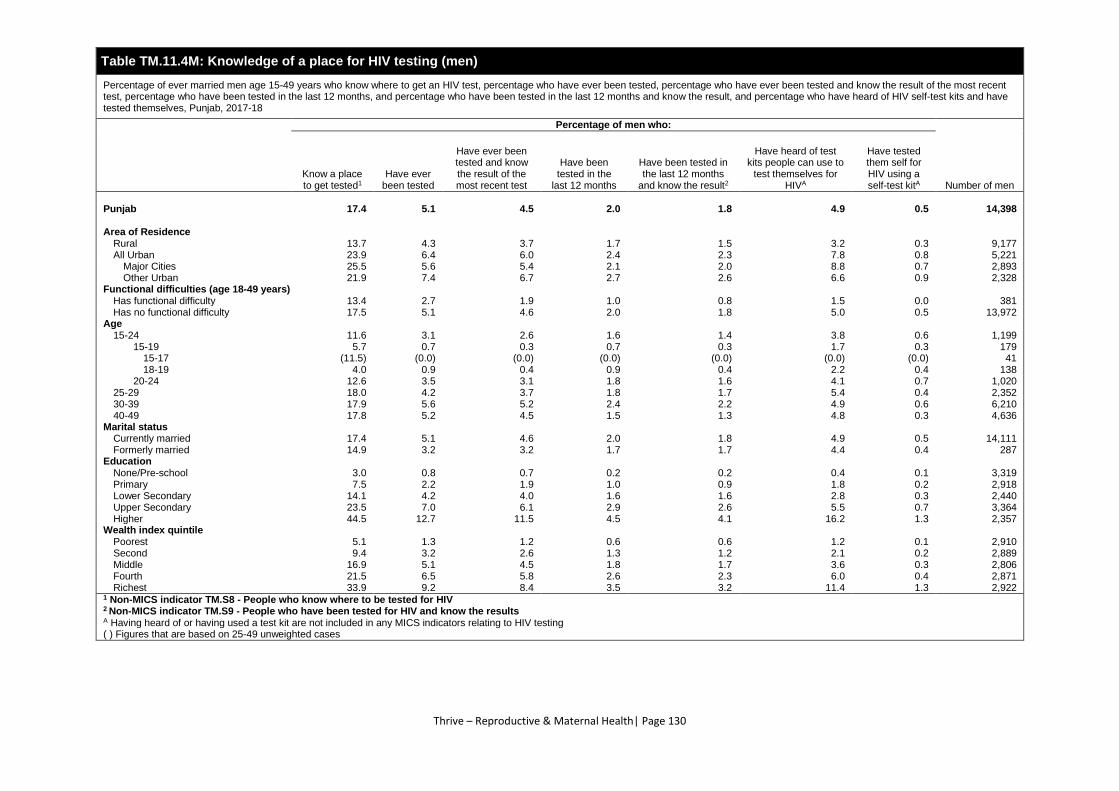
Thrive – Reproductive & Maternal Health| Page 130
Table TM.11.4M: Knowledge of a place for HIV testing (men)
Percentage of ever married men age 15-49 years who know where to get an HIV test, percentage who have ever been tested, percentage who have ever been tested and know the result of the most recent test, percentage who have been tested in the last 12 months, and percentage who have been tested in the last 12 months and know the result, and percentage who have heard of HIV self-test kits and have tested themselves, Punjab, 2017-18
Percentage of men who:
Number of men Know a place to get tested1
Have ever been tested
Have ever been tested and know the result of the most recent test
Have been tested in the
last 12 months
Have been tested in the last 12 months
and know the result2
Have heard of test kits people can use to
test themselves for HIVA
Have tested them self for HIV using a self-test kitA
Punjab 17.4 5.1 4.5 2.0 1.8 4.9 0.5 14,398
Area of Residence
Rural 13.7 4.3 3.7 1.7 1.5 3.2 0.3 9,177 All Urban 23.9 6.4 6.0 2.4 2.3 7.8 0.8 5,221
Major Cities 25.5 5.6 5.4 2.1 2.0 8.8 0.7 2,893 Other Urban 21.9 7.4 6.7 2.7 2.6 6.6 0.9 2,328
Functional difficulties (age 18-49 years)
Has functional difficulty 13.4 2.7 1.9 1.0 0.8 1.5 0.0 381 Has no functional difficulty 17.5 5.1 4.6 2.0 1.8 5.0 0.5 13,972
Age
15-24 11.6 3.1 2.6 1.6 1.4 3.8 0.6 1,199 15-19 5.7 0.7 0.3 0.7 0.3 1.7 0.3 179
15-17 (11.5) (0.0) (0.0) (0.0) (0.0) (0.0) (0.0) 41 18-19 4.0 0.9 0.4 0.9 0.4 2.2 0.4 138
20-24 12.6 3.5 3.1 1.8 1.6 4.1 0.7 1,020 25-29 18.0 4.2 3.7 1.8 1.7 5.4 0.4 2,352 30-39 17.9 5.6 5.2 2.4 2.2 4.9 0.6 6,210 40-49 17.8 5.2 4.5 1.5 1.3 4.8 0.3 4,636
Marital status
Currently married 17.4 5.1 4.6 2.0 1.8 4.9 0.5 14,111 Formerly married 14.9 3.2 3.2 1.7 1.7 4.4 0.4 287
Education
None/Pre-school 3.0 0.8 0.7 0.2 0.2 0.4 0.1 3,319 Primary 7.5 2.2 1.9 1.0 0.9 1.8 0.2 2,918 Lower Secondary 14.1 4.2 4.0 1.6 1.6 2.8 0.3 2,440 Upper Secondary 23.5 7.0 6.1 2.9 2.6 5.5 0.7 3,364 Higher 44.5 12.7 11.5 4.5 4.1 16.2 1.3 2,357
Wealth index quintile
Poorest 5.1 1.3 1.2 0.6 0.6 1.2 0.1 2,910 Second 9.4 3.2 2.6 1.3 1.2 2.1 0.2 2,889 Middle 16.9 5.1 4.5 1.8 1.7 3.6 0.3 2,806 Fourth 21.5 6.5 5.8 2.6 2.3 6.0 0.4 2,871 Richest 33.9 9.2 8.4 3.5 3.2 11.4 1.3 2,922
1 Non-MICS indicator TM.S8 - People who know where to be tested for HIV 2 Non-MICS indicator TM.S9 - People who have been tested for HIV and know the results A Having heard of or having used a test kit are not included in any MICS indicators relating to HIV testing ( ) Figures that are based on 25-49 unweighted cases

Thrive – Reproductive & Maternal Health| Page 131
Table TM.11.5: HIV counselling and testing during antenatal care
Percentage of ever married women age 15-49 years with a live birth in the last 2 years who received antenatal care from a health professional during the pregnancy of the most recent birth, percentage who received HIV counselling, percentage who were offered and tested for HIV, percentage who were offered, tested and received the results of the HIV test, percentage who received counselling and were offered, accepted and received the results of the HIV test, and percentage who were offered, accepted and received the results of the HIV test and received post-test health information or counselling, Punjab, 2017-18
Percentage of women who:
Number of women with a live birth in the last 2 years
Received antenatal care from a health care
professional for the pregnancy of the most
recent live birth
Received HIV counselling
during antenatal care1,A
Were offered an HIV test and were
tested for HIV during antenatal
care
Were offered an HIV test and were tested for HIV during antenatal care,
and received the results2
Received HIV counselling, were
offered an HIV test, accepted and
received the results
Were offered an HIV test, accepted and received the results,
and received post-test health information or counselling related
to HIV3
Punjab 87.3 1.8 1.9 1.8 1.0 1.1 15,656
Area of Residence
Rural 85.3 1.2 1.3 1.2 0.6 0.8 10,399 All Urban 91.4 3.1 3.1 3.1 1.6 1.7 5,257 Major Cities 92.5 3.7 3.7 3.7 2.1 2.1 2,739 Other Urban 90.2 2.5 2.5 2.4 1.2 1.4 2,518
Functional difficulties (age 18-49 years)
Has functional difficulty 82.3 1.0 1.1 1.1 0.2 0.9 283 Has no functional difficulty 87.5 1.9 1.9 1.8 1.0 1.1 15,303
Age
15-24 89.2 1.2 1.2 1.2 0.5 0.7 3,908 15-19 86.3 1.2 0.5 0.5 0.5 0.5 546
15-17 77.6 0.0 0.0 0.0 0.0 0.0 71 18-19 87.6 1.3 0.5 0.5 0.5 0.5 474
20-24 89.7 1.2 1.3 1.3 0.5 0.7 3,362 25-29 89.0 1.9 2.3 2.2 1.0 1.2 5,172 30-39 85.7 2.2 2.0 2.0 1.3 1.3 5,920 40-49 77.5 2.0 1.3 1.3 0.8 1.1 656
Marital status
Currently married 87.4 1.9 1.9 1.8 1.0 1.1 15,498 Formerly married 79.3 0.4 0.4 0.4 0.4 0.4 158
Education
None/Pre-school 78.2 0.2 0.2 0.2 0.1 0.1 6,365 Primary 90.0 0.9 0.8 0.7 0.4 0.5 3,126 Lower Secondary 93.2 1.5 0.8 0.8 0.4 0.5 1,663 Upper Secondary 95.3 3.3 3.5 3.4 1.6 2.0 2,248 Higher 97.3 6.7 7.4 7.1 3.8 4.1 2,254
Wealth index quintile
Poorest 73.2 0.1 0.1 0.1 0.1 0.1 3,433 Second 86.5 0.6 0.5 0.5 0.3 0.4 3,110 Middle 90.8 1.2 1.1 1.1 0.6 0.8 3,182 Fourth 91.8 2.6 2.5 2.3 1.0 1.2 3,080 Richest 96.7 5.2 5.8 5.6 3.0 3.3 2,850
1 Non-MICS indicator TM.S10a - HIV counselling during antenatal care (counselling on HIV) 2 Non-MICS indicator TM.S11 - HIV testing during antenatal care 3 Non-MICS indicator TM.S10b - HIV counselling during antenatal care (information or counselling on HIV after receiving the HIV test results) A In this context, counseling means that someone talked with the respondent about all three of the following topics: 1) babies getting the HIV from their mother, 2) preventing HIV, and 3) getting tested for HIV.
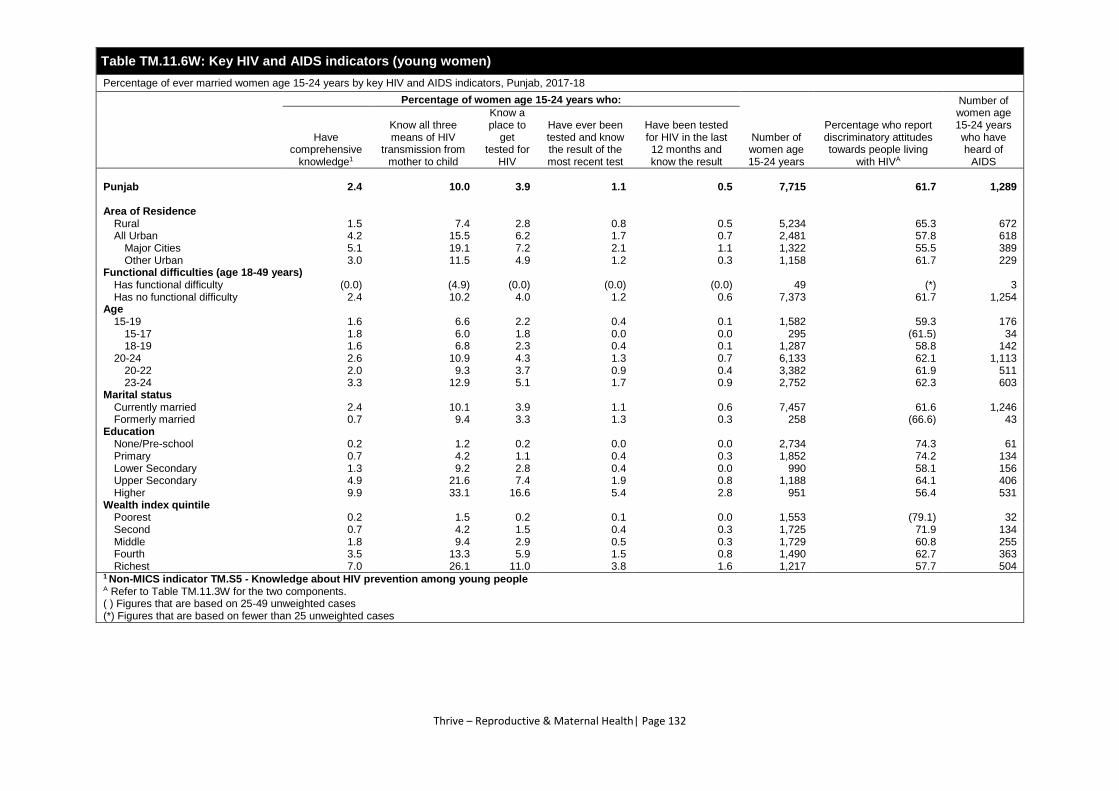
Thrive – Reproductive & Maternal Health| Page 132
Table TM.11.6W: Key HIV and AIDS indicators (young women)
Percentage of ever married women age 15-24 years by key HIV and AIDS indicators, Punjab, 2017-18
Percentage of women age 15-24 years who:
Number of women age 15-24 years
Percentage who report discriminatory attitudes towards people living
with HIVA
Number of women age 15-24 years who have heard of
AIDS
Have comprehensive
knowledge1
Know all three means of HIV
transmission from mother to child
Know a place to
get tested for
HIV
Have ever been tested and know the result of the most recent test
Have been tested for HIV in the last 12 months and know the result
Punjab 2.4 10.0 3.9 1.1 0.5 7,715 61.7 1,289
Area of Residence
Rural 1.5 7.4 2.8 0.8 0.5 5,234 65.3 672 All Urban 4.2 15.5 6.2 1.7 0.7 2,481 57.8 618
Major Cities 5.1 19.1 7.2 2.1 1.1 1,322 55.5 389 Other Urban 3.0 11.5 4.9 1.2 0.3 1,158 61.7 229
Functional difficulties (age 18-49 years)
Has functional difficulty (0.0) (4.9) (0.0) (0.0) (0.0) 49 (*) 3 Has no functional difficulty 2.4 10.2 4.0 1.2 0.6 7,373 61.7 1,254
Age
15-19 1.6 6.6 2.2 0.4 0.1 1,582 59.3 176 15-17 1.8 6.0 1.8 0.0 0.0 295 (61.5) 34 18-19 1.6 6.8 2.3 0.4 0.1 1,287 58.8 142
20-24 2.6 10.9 4.3 1.3 0.7 6,133 62.1 1,113 20-22 2.0 9.3 3.7 0.9 0.4 3,382 61.9 511 23-24 3.3 12.9 5.1 1.7 0.9 2,752 62.3 603
Marital status
Currently married 2.4 10.1 3.9 1.1 0.6 7,457 61.6 1,246 Formerly married 0.7 9.4 3.3 1.3 0.3 258 (66.6) 43
Education
None/Pre-school 0.2 1.2 0.2 0.0 0.0 2,734 74.3 61 Primary 0.7 4.2 1.1 0.4 0.3 1,852 74.2 134 Lower Secondary 1.3 9.2 2.8 0.4 0.0 990 58.1 156 Upper Secondary 4.9 21.6 7.4 1.9 0.8 1,188 64.1 406 Higher 9.9 33.1 16.6 5.4 2.8 951 56.4 531
Wealth index quintile
Poorest 0.2 1.5 0.2 0.1 0.0 1,553 (79.1) 32 Second 0.7 4.2 1.5 0.4 0.3 1,725 71.9 134 Middle 1.8 9.4 2.9 0.5 0.3 1,729 60.8 255 Fourth 3.5 13.3 5.9 1.5 0.8 1,490 62.7 363 Richest 7.0 26.1 11.0 3.8 1.6 1,217 57.7 504
1 Non-MICS indicator TM.S5 - Knowledge about HIV prevention among young people A Refer to Table TM.11.3W for the two components. ( ) Figures that are based on 25-49 unweighted cases (*) Figures that are based on fewer than 25 unweighted cases
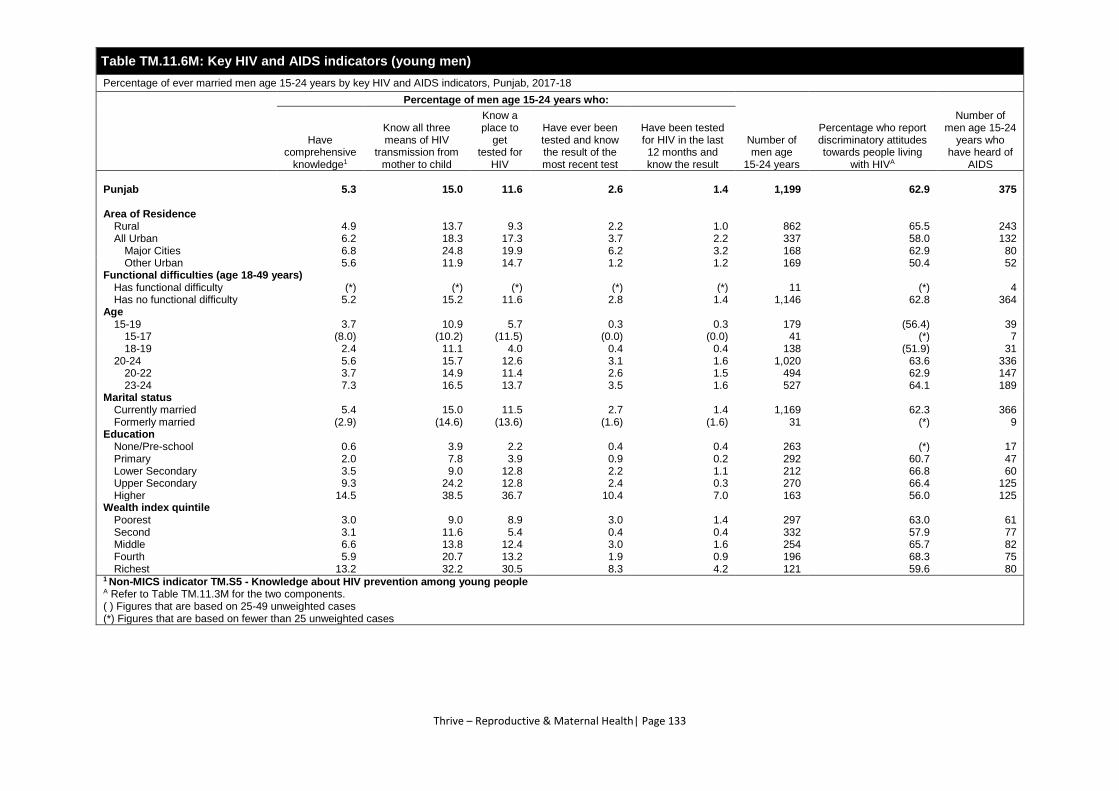
Thrive – Reproductive & Maternal Health| Page 133
Table TM.11.6M: Key HIV and AIDS indicators (young men)
Percentage of ever married men age 15-24 years by key HIV and AIDS indicators, Punjab, 2017-18
Percentage of men age 15-24 years who:
Number of men age
15-24 years
Percentage who report discriminatory attitudes towards people living
with HIVA
Number of men age 15-24
years who have heard of
AIDS
Have comprehensive
knowledge1
Know all three means of HIV
transmission from mother to child
Know a place to
get tested for
HIV
Have ever been tested and know the result of the most recent test
Have been tested for HIV in the last 12 months and know the result
Punjab 5.3 15.0 11.6 2.6 1.4 1,199 62.9 375
Area of Residence
Rural 4.9 13.7 9.3 2.2 1.0 862 65.5 243 All Urban 6.2 18.3 17.3 3.7 2.2 337 58.0 132
Major Cities 6.8 24.8 19.9 6.2 3.2 168 62.9 80 Other Urban 5.6 11.9 14.7 1.2 1.2 169 50.4 52
Functional difficulties (age 18-49 years)
Has functional difficulty (*) (*) (*) (*) (*) 11 (*) 4 Has no functional difficulty 5.2 15.2 11.6 2.8 1.4 1,146 62.8 364
Age
15-19 3.7 10.9 5.7 0.3 0.3 179 (56.4) 39 15-17 (8.0) (10.2) (11.5) (0.0) (0.0) 41 (*) 7 18-19 2.4 11.1 4.0 0.4 0.4 138 (51.9) 31
20-24 5.6 15.7 12.6 3.1 1.6 1,020 63.6 336 20-22 3.7 14.9 11.4 2.6 1.5 494 62.9 147 23-24 7.3 16.5 13.7 3.5 1.6 527 64.1 189
Marital status
Currently married 5.4 15.0 11.5 2.7 1.4 1,169 62.3 366 Formerly married (2.9) (14.6) (13.6) (1.6) (1.6) 31 (*) 9
Education
None/Pre-school 0.6 3.9 2.2 0.4 0.4 263 (*) 17 Primary 2.0 7.8 3.9 0.9 0.2 292 60.7 47 Lower Secondary 3.5 9.0 12.8 2.2 1.1 212 66.8 60 Upper Secondary 9.3 24.2 12.8 2.4 0.3 270 66.4 125 Higher 14.5 38.5 36.7 10.4 7.0 163 56.0 125
Wealth index quintile
Poorest 3.0 9.0 8.9 3.0 1.4 297 63.0 61 Second 3.1 11.6 5.4 0.4 0.4 332 57.9 77 Middle 6.6 13.8 12.4 3.0 1.6 254 65.7 82 Fourth 5.9 20.7 13.2 1.9 0.9 196 68.3 75 Richest 13.2 32.2 30.5 8.3 4.2 121 59.6 80
1 Non-MICS indicator TM.S5 - Knowledge about HIV prevention among young people A Refer to Table TM.11.3M for the two components. ( ) Figures that are based on 25-49 unweighted cases (*) Figures that are based on fewer than 25 unweighted cases

Thrive – Child Health, Nutrition & Development| Page 135
7. THRIVE – CHILD HEALTH, NUTRITION AND DEVELOPMENT
TC.1 IMMUNISATION
Immunisation is a proven tool for controlling and eliminating life-threatening infectious diseases and
is estimated to avert between 2 and 3 million deaths each year.66 It is one of the most cost-effective
health investments, with proven strategies that make it accessible to even the most hard-to-reach and
vulnerable populations.
The WHO Recommended Routine Immunisations for Children67 recommends all children to be
vaccinated against tuberculosis, diphtheria, tetanus, pertussis, polio, measles, hepatitis B,
haemophilus influenza type b, pneumococcal bacteria/disease, rotavirus, and rubella.68
At the global level, SDG indicator 3.b.1 is used to monitor the progress of the vaccination of children
at the national level. The proportions of the target population covered by DTP, pneumococcal
(conjugate) and measles are presented in Table TC.1.1.
All doses in the primary series are recommended to be completed before the child’s first birthday,
although depending on the epidemiology of disease in a country, the first doses of measles and rubella
containing vaccines may be recommended at 12 months or later. The recommended number and
timing of most other doses also vary slightly with local epidemiology and may include booster doses
later in childhood.
The vaccination schedule followed by the Punjab, Pakistan National Immunisation Programme
provides all the above-mentioned vaccinations with birth doses of BCG, Polio, and Hepatitis B vaccines
(within 24 hours of birth), three doses of the Pentavalent vaccine containing DTP, Hepatitis B, and
Haemophilus influenza type b (Hib) antigens, three doses of Polio vaccine, three doses of
Pneumococcal (conjugate) vaccine: 6 wks, 10 wks and two doses of the MMR vaccine containing
measles. All vaccinations should be received during the first year of life except the doses of MMR at
12 and 18 months. Taking into consideration this vaccination schedule, the estimates for full
immunisation coverage from the MICS Punjab, 2017-18 are based on children age 12-23/24-35
months.
Information on vaccination coverage was collected for all children under three years of age. All
mothers or caretakers were asked to provide vaccination cards. If the vaccination card for a child was
available, interviewers copied vaccination information from the cards onto the MICS questionnaire. If
no vaccination card was available for the child, the interviewer proceeded to ask the mother to recall
whether the child had received each of the vaccinations, and, for applicable antigens, how many doses
were received. The final vaccination coverage estimates are based on information obtained from the
vaccination card and the mother’s report of vaccinations received by the child.
66 "Immunization Highlights 2015." World Health Organization. June 27, 2016. Accessed August 23, 2018.
http://www.who.int/immunization/highlights/2015/en/. 67 "WHO Recommendations for Routine Immunization - Summary Tables." World Health Organization. August 22, 2018.
Accessed August 23, 2018. http://www.who.int/immunization/policy/immunization_tables/en/. 68 Additionally, vaccination against the human papillomavirus (HPV) is recommended for girls from 9 to 14 years of age67,
but coverage of this vaccine is not yet included in MICS, as methodology is under development.
Thrive – Child Health, Nutrition & Development| Page 136
Table TC.1.2 presents vaccination coverage estimates among children age 12-23 and 24-35 months by
background characteristics. The figures indicate children receiving the vaccinations at any time up to
the date of the survey, and are based on information from both the vaccination cards and
mothers’/caretakers’ reports.
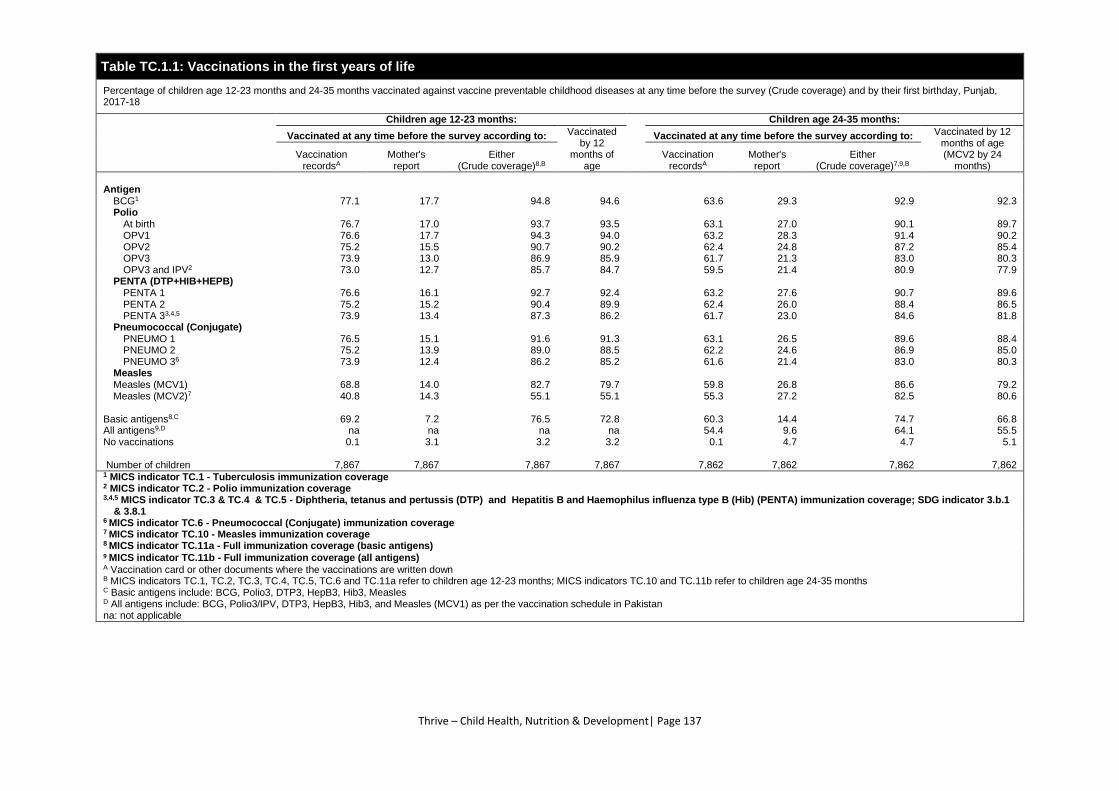
Thrive – Child Health, Nutrition & Development| Page 137
Table TC.1.1: Vaccinations in the first years of life
Percentage of children age 12-23 months and 24-35 months vaccinated against vaccine preventable childhood diseases at any time before the survey (Crude coverage) and by their first birthday, Punjab, 2017-18
Children age 12-23 months: Children age 24-35 months:
Vaccinated at any time before the survey according to: Vaccinated by 12
months of age
Vaccinated at any time before the survey according to: Vaccinated by 12 months of age (MCV2 by 24
months) Vaccination
recordsA Mother's
report Either
(Crude coverage)8,B Vaccination
recordsA Mother's
report Either
(Crude coverage)7,9,B
Antigen
BCG1 77.1 17.7 94.8 94.6 63.6 29.3 92.9 92.3 Polio
At birth 76.7 17.0 93.7 93.5 63.1 27.0 90.1 89.7 OPV1 76.6 17.7 94.3 94.0 63.2 28.3 91.4 90.2 OPV2 75.2 15.5 90.7 90.2 62.4 24.8 87.2 85.4 OPV3 73.9 13.0 86.9 85.9 61.7 21.3 83.0 80.3 OPV3 and IPV2 73.0 12.7 85.7 84.7 59.5 21.4 80.9 77.9
PENTA (DTP+HIB+HEPB) PENTA 1 76.6 16.1 92.7 92.4 63.2 27.6 90.7 89.6 PENTA 2 75.2 15.2 90.4 89.9 62.4 26.0 88.4 86.5 PENTA 33,4,5 73.9 13.4 87.3 86.2 61.7 23.0 84.6 81.8
Pneumococcal (Conjugate) PNEUMO 1 76.5 15.1 91.6 91.3 63.1 26.5 89.6 88.4 PNEUMO 2 75.2 13.9 89.0 88.5 62.2 24.6 86.9 85.0 PNEUMO 36 73.9 12.4 86.2 85.2 61.6 21.4 83.0 80.3
Measles Measles (MCV1) 68.8 14.0 82.7 79.7 59.8 26.8 86.6 79.2 Measles (MCV2)7 40.8 14.3 55.1 55.1 55.3 27.2 82.5 80.6
Basic antigens8,C 69.2 7.2 76.5 72.8 60.3 14.4 74.7 66.8 All antigens9,D na na na na 54.4 9.6 64.1 55.5 No vaccinations 0.1 3.1 3.2 3.2 0.1 4.7 4.7 5.1 Number of children 7,867 7,867 7,867 7,867 7,862 7,862 7,862 7,862 1 MICS indicator TC.1 - Tuberculosis immunization coverage 2 MICS indicator TC.2 - Polio immunization coverage 3,4,5 MICS indicator TC.3 & TC.4 & TC.5 - Diphtheria, tetanus and pertussis (DTP) and Hepatitis B and Haemophilus influenza type B (Hib) (PENTA) immunization coverage; SDG indicator 3.b.1
& 3.8.1 6 MICS indicator TC.6 - Pneumococcal (Conjugate) immunization coverage 7 MICS indicator TC.10 - Measles immunization coverage 8 MICS indicator TC.11a - Full immunization coverage (basic antigens) 9 MICS indicator TC.11b - Full immunization coverage (all antigens) A Vaccination card or other documents where the vaccinations are written down B MICS indicators TC.1, TC.2, TC.3, TC.4, TC.5, TC.6 and TC.11a refer to children age 12-23 months; MICS indicators TC.10 and TC.11b refer to children age 24-35 months C Basic antigens include: BCG, Polio3, DTP3, HepB3, Hib3, Measles D All antigens include: BCG, Polio3/IPV, DTP3, HepB3, Hib3, and Measles (MCV1) as per the vaccination schedule in Pakistan na: not applicable
Thrive – Child Health, Nutrition & Development| Page 138
Table TC.1.2: Vaccinations by background characteristics
Percentage of children age 12-23 months and 24-35 months currently vaccinated against vaccine preventable childhood diseases (Crude coverage), Punjab, 2017-18
Percentage of children age 12-23 months who received:
Percentage with:
Num
be
r o
f child
ren a
ge
12-2
3 m
onth
s
Percentage of children age 24-35
months who received:
Percentage with:
Number of
children age 24-
35 months BCG1
Polio
PENTA PCV
Mea
sle
s 1
(MC
V1)
Basic
Basic
antigen
sA
,B
Vaccin
atio
n
card
sB
Vaccin
atio
n
card
s s
een
C
Mea
sle
s 2
(MC
V2)7
Full vaccination
Vaccin
atio
n
card
sB
Vaccin
atio
n
card
s s
een
C
At birth
OPV 1
OPV 2
OPV 3
OPV 3 & IPV2 1 2 33,4,5 1 2 3 6
Basic
antigen
sA
All
antigen
s9,D
Punjab 94.8 93.7 94.3 90.7 86.9 85.7 92.7 90.4 87.3 91.6 89.0 86.2 82.7 76.5 79.6 77.5 7,867 82.5 74.7 64.1 68.5 64.1 7,862
Area of Residence
Rural 94.9 93.6 94.7 91.5 88.1 85.6 92.5 90.4 87.4 91.4 89.1 86.4 82.6 77.3 80.3 78.5 5,138 82.5 76.7 65.7 70.1 66.9 5,105
All Urban 94.5 93.8 93.4 89.1 84.6 86.1 93.0 90.4 87.1 91.9 89.0 86.0 83.1 74.9 78.3 75.6 2,730 82.5 71.0 61.1 65.7 58.9 2,756
Major Cities 93.0 92.5 92.3 87.1 80.8 83.9 91.1 87.7 83.4 90.0 86.3 82.2 80.2 69.4 74.9 71.8 1,483 81.5 65.6 55.2 59.6 50.8 1,423
Other Urban 96.3 95.3 94.7 91.6 89.2 88.7 95.3 93.7 91.5 94.1 92.2 90.5 86.4 81.5 82.3 80.2 1,247 83.6 76.8 67.3 72.3 67.4 1,334
Sex
Male 95.0 94.3 94.6 91.1 87.7 86.9 93.1 91.2 88.3 92.0 89.8 87.1 84.4 78.1 80.5 78.4 4,065 82.7 74.4 63.8 68.5 64.3 4,062
Female 94.6 93.0 94.0 90.3 86.1 84.5 92.3 89.6 86.2 91.2 88.2 85.3 81.0 74.7 78.6 76.5 3,802 82.2 75.0 64.4 68.5 63.8 3,800
Mother's education
None/Preschool 92.0 91.1 92.3 88.5 84.4 80.6 88.9 85.8 82.3 87.7 84.1 81.1 75.5 70.3 76.2 75.0 3,177 76.4 71.2 59.6 65.7 62.2 3,258
Primary 96.2 94.6 95.8 92.4 88.9 87.8 93.8 91.6 88.8 92.5 90.6 88.0 84.2 78.6 81.4 80.0 1,562 84.1 78.1 67.4 71.9 68.2 1,505
Middle 96.7 95.1 96.3 93.1 89.8 90.2 95.9 94.6 92.5 94.8 93.5 91.2 89.2 82.5 83.0 80.4 842 85.3 74.6 64.8 69.2 64.4 814
Secondary 96.9 96.6 95.3 92.6 89.4 90.3 95.9 94.7 91.2 95.0 93.7 90.9 89.2 82.6 83.2 80.3 1,135 88.5 78.1 68.7 72.4 67.3 1,164
Higher 97.1 95.7 95.1 90.8 86.5 89.5 96.1 94.2 91.3 95.2 92.7 89.8 89.6 79.9 80.6 76.1 1,152 89.8 76.9 67.1 68.0 60.3 1,121
Wealth index quintile
Poorest 90.2 89.4 91.0 86.9 83.1 77.8 86.3 82.9 79.1 84.8 81.0 77.8 71.7 66.5 72.9 71.8 1,694 73.0 68.3 56.9 62.5 59.6 1,666
Second 95.6 93.9 95.1 91.6 88.5 86.5 93.4 91.2 88.5 92.4 90.1 87.7 83.3 77.7 81.0 79.8 1,541 82.7 78.7 66.1 72.9 70.3 1,569
Middle 96.6 95.6 95.6 92.4 89.1 87.5 94.8 92.9 89.6 94.0 92.1 89.1 86.3 81.6 83.2 81.5 1,585 85.4 78.1 67.8 71.0 67.3 1,583
Fourth 95.6 94.6 95.2 92.5 88.0 88.6 93.9 92.3 89.4 92.5 90.2 88.0 86.6 80.1 81.0 78.8 1,564 85.6 77.2 67.7 70.9 65.4 1,571
Richest 96.3 95.3 94.7 90.2 86.3 89.1 95.7 93.7 90.6 94.9 92.7 89.4 86.9 77.2 80.5 76.0 1,484 86.6 71.5 62.0 65.6 57.5 1,473
1 MICS indicator TC.1 - Tuberculosis immunization coverage 2 MICS indicator TC.2 - Polio immunization coverage 3,4,5 MICS indicator TC.3 & TC.4 & TC.5 - Diphtheria, pertussis tetanus (DTP) and Hepatitis B and Haemophilus influenzae type B (Hib) (PENTA) immunization coverage; SDG indicator 3.b.1 & 3.8.1 6 MICS indicator TC.6 - Pneumococcal (Conjugate) immunization coverage 7 MICS indicator TC.10 - Measles immunization coverage 8 MICS indicator TC.11a - Full immunization coverage (basic antigens) 9 MICS indicator TC.11b - Full immunization coverage (all antigens) A Vaccination card or other documents where the vaccinations are written down B MICS indicators TC.1, TC.2, TC.3, TC.4, TC.5, TC.6 and TC.11a refer to children age 12-23 months; MICS indicators TC.10 and TC.11b refer to children age 24-35 months C Basic antigens include: BCG, Polio3, DTP3, HepB3, Hib3, Measles D All antigens include: BCG, Polio3/IPV, DTP3, HepB3, Hib3, and Measles (MCV1) as per the vaccination schedule in Pakistan
Thrive – Child Health, Nutrition & Development| Page 139
TC.2 DISEASE EPISODES
A key strategy for achieving progress toward SDG 3.2: By 2030, end preventable deaths of newborns
and children under 5 years of age, with all countries aiming to reduce neonatal mortality to at least as
low as 12 per 1,000 live births and under-5 mortality to at least as low as 25 per 1,000 live births, is to
tackle the diseases such as diarrhoea, pneumonia and malaria which are still among the leading killers
of children under 5.69 Target 3.3 of the SDGs on ending the epidemics on malaria by 2030 along with
other diseases is interpreted as the attainment of the Global Technical Strategy for malaria 2016–2030
and the Roll Back Malaria advocacy plan, Action and Investment to defeat Malaria 2016–2030 targets
which aim at reducing malaria mortality rates globally by 90 percent compared with 2015.
Table TC.2.1 presents the percentage of children under 5 years of age who were reported to have had
an episode of diarrhoea, symptoms of acute respiratory infection (ARI) or fever during the 2 weeks
preceding the survey. These results are not measuring of true prevalence, and should not be used as
such, but rather the period-prevalence of those illnesses over a two-week time window.
The definition of a case of diarrhoea or fever, in this survey, was the mother’s (or caretaker’s) report
that the child had such symptoms over the specified period; no other evidence was sought beside the
opinion of the mother. A child was considered to have had symptoms of ARI if the mother or caretaker
reported that the child had, over the specified period, an illness with a cough with rapid or difficult
breathing, and whose symptoms were perceived to be due to a problem in the chest or both a problem
in the chest and a blocked or runny nose. While this approach is reasonable in the context of a multi-
topic household survey, these basically simple case definitions must be kept in mind when interpreting
the results, as well as the potential for reporting and recall biases. Further, diarrhoea, fever and ARI
are not only seasonal but are also characterized by the often-rapid spread of localized outbreaks from
one area to another at different points in time. The timing of the survey and the location of the teams
might thus considerably affect the results, which must consequently be interpreted with caution. For
these reasons, although the period-prevalence over a two-week time window is reported, these data
should not be used to assess the epidemiological characteristics of these diseases but rather to obtain
denominators for the indicators related to use of health services and treatment.
69 The main killers of children under age 5 in 2016 included preterm birth complications (18 per cent), pneumonia (16 per
cent), intrapartum related events (12 per cent), diarrhoea (8 per cent), neonatal sepsis (7 per cent) and malaria (5 per
cent). UNICEF et al. Levels and Trends in Child Mortality Report 2017. New York: UNICEF, 2017.
https://www.unicef.org/publications/index_101071.html.
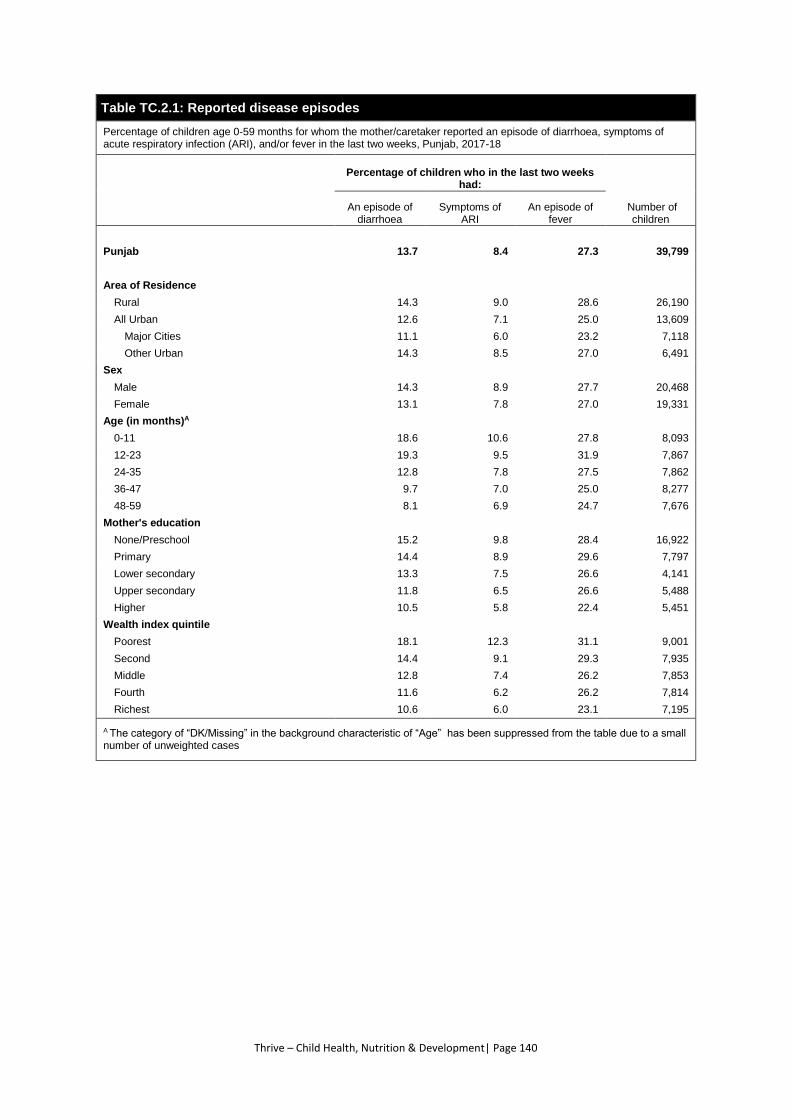
Thrive – Child Health, Nutrition & Development| Page 140
Table TC.2.1: Reported disease episodes
Percentage of children age 0-59 months for whom the mother/caretaker reported an episode of diarrhoea, symptoms of acute respiratory infection (ARI), and/or fever in the last two weeks, Punjab, 2017-18
Percentage of children who in the last two weeks had:
Number of children
An episode of diarrhoea
Symptoms of ARI
An episode of fever
Punjab 13.7 8.4 27.3 39,799
Area of Residence
Rural 14.3 9.0 28.6 26,190
All Urban 12.6 7.1 25.0 13,609
Major Cities 11.1 6.0 23.2 7,118
Other Urban 14.3 8.5 27.0 6,491
Sex
Male 14.3 8.9 27.7 20,468
Female 13.1 7.8 27.0 19,331
Age (in months)A
0-11 18.6 10.6 27.8 8,093
12-23 19.3 9.5 31.9 7,867
24-35 12.8 7.8 27.5 7,862
36-47 9.7 7.0 25.0 8,277
48-59 8.1 6.9 24.7 7,676
Mother's education
None/Preschool 15.2 9.8 28.4 16,922
Primary 14.4 8.9 29.6 7,797
Lower secondary 13.3 7.5 26.6 4,141
Upper secondary 11.8 6.5 26.6 5,488
Higher 10.5 5.8 22.4 5,451
Wealth index quintile
Poorest 18.1 12.3 31.1 9,001
Second 14.4 9.1 29.3 7,935
Middle 12.8 7.4 26.2 7,853
Fourth 11.6 6.2 26.2 7,814
Richest 10.6 6.0 23.1 7,195
A The category of “DK/Missing” in the background characteristic of “Age” has been suppressed from the table due to a small number of unweighted cases
Thrive – Child Health, Nutrition & Development| Page 141
TC.3 DIARRHOEA
Diarrhoea is one of the leading causes of death among children under five worldwide.70 Most
diarrhoea-related deaths in children are due to dehydration from loss of large quantities of water and
electrolytes from the body in liquid stools. Management of diarrhoea – either through oral rehydration
salt solution (ORS) or a recommended homemade fluid (RHF) – can prevent many of these deaths.71
In addition, provision of zinc supplements has been shown to reduce the duration and severity of the
illness as well as the risk of future episodes within the next two or three months.
Almost 60 per cent of deaths due to diarrhoea worldwide are attributable to unsafe drinking water
and poor hygiene and sanitation. Hand washing with soap alone can cut the risk of diarrhoea by at
least 40 per cent and significantly lower the risk of respiratory infections. Clean home environments
and good hygiene are important for preventing the spread of both pneumonia and diarrhoea, and safe
drinking water and proper disposal of human waste, including child faeces, are vital to stopping the
spread of diarrhoeal disease among children and adults.5
In the MICS, mothers or caretakers were asked whether their child under age five years had an episode
of diarrhoea in the two weeks prior to the survey. In cases where mothers reported that the child had
diarrhoea, a series of questions were asked about the treatment of the illness, including what the child
had been given to drink and eat during the episode and whether this was more or less than what was
usually given to the child.
Table TC.3.1 shows the percentage of children age 0-59 months with diarrhoea in the two weeks preceding the
survey for whom advice or treatment was sought and where.
Table TC.3.2 shows patterns on drinking and feeding practices during diarrhoea among children age
0-59 months.
Table TC.3.3 shows the percentage of children age 0-59 months receiving ORS, various types of
recommended homemade fluids and zinc during the episode of diarrhoea. Since children may have
been given more than one type of liquid, the percentages do not necessarily add to 100.
Table TC3.4 provides the proportion of children age 0-59 months with diarrhoea in the last two weeks
who received oral rehydration therapy with continued feeding, and the percentage of children with
diarrhoea who received other treatments.
Table TC.3.5 provides information on the source of ORS and zinc for children age 0-59 months who
received these treatments.
70 UNICEF. One is Too Many: Ending Child Deaths from Pneumonia and Diarrhoea. New York: UNICEF, 2016.
https://data.unicef.org/wp-content/uploads/2016/11/UNICEF-Pneumonia-Diarrhoea-report2016-web-version.pdf. 71 In 2004, UNICEF and WHO published a joint statement with diarrhoea treatment recommendations for low-income
countries, which promotes low-osmolarity rehydration salts (ORS) and zinc, in addition to continued feeding: WHO, and
UNICEF. Clinical Management of Acute Diarrhoea. Joint Statement, New York: UNICEF, 2004.
https://www.unicef.org/publications/files/ENAcute_Diarrhoea_reprint.pdf.
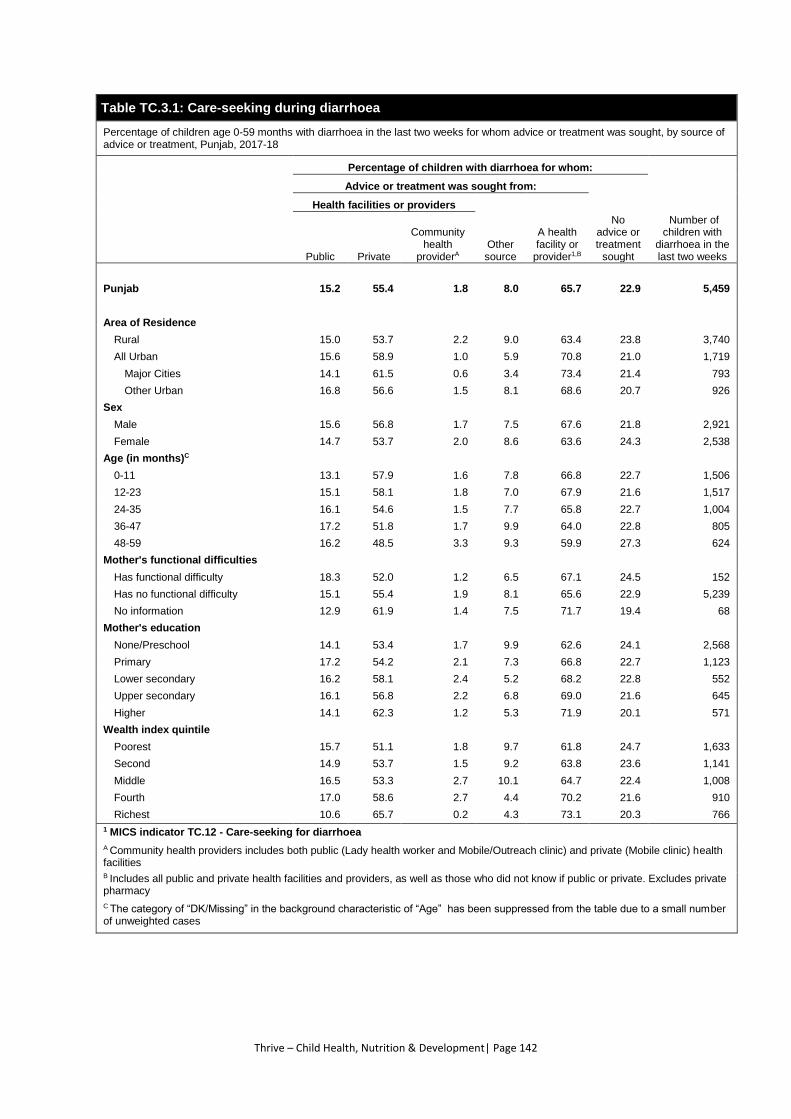
Thrive – Child Health, Nutrition & Development| Page 142
Table TC.3.1: Care-seeking during diarrhoea
Percentage of children age 0-59 months with diarrhoea in the last two weeks for whom advice or treatment was sought, by source of advice or treatment, Punjab, 2017-18
Percentage of children with diarrhoea for whom:
Number of children with
diarrhoea in the last two weeks
Advice or treatment was sought from:
No advice or treatment
sought
Health facilities or providers
Other source
A health facility or
provider1,B Public Private
Community health
providerA
Punjab 15.2 55.4 1.8 8.0 65.7 22.9 5,459
Area of Residence
Rural 15.0 53.7 2.2 9.0 63.4 23.8 3,740
All Urban 15.6 58.9 1.0 5.9 70.8 21.0 1,719
Major Cities 14.1 61.5 0.6 3.4 73.4 21.4 793
Other Urban 16.8 56.6 1.5 8.1 68.6 20.7 926
Sex
Male 15.6 56.8 1.7 7.5 67.6 21.8 2,921
Female 14.7 53.7 2.0 8.6 63.6 24.3 2,538
Age (in months)C
0-11 13.1 57.9 1.6 7.8 66.8 22.7 1,506
12-23 15.1 58.1 1.8 7.0 67.9 21.6 1,517
24-35 16.1 54.6 1.5 7.7 65.8 22.7 1,004
36-47 17.2 51.8 1.7 9.9 64.0 22.8 805
48-59 16.2 48.5 3.3 9.3 59.9 27.3 624
Mother's functional difficulties
Has functional difficulty 18.3 52.0 1.2 6.5 67.1 24.5 152
Has no functional difficulty 15.1 55.4 1.9 8.1 65.6 22.9 5,239
No information 12.9 61.9 1.4 7.5 71.7 19.4 68
Mother's education
None/Preschool 14.1 53.4 1.7 9.9 62.6 24.1 2,568
Primary 17.2 54.2 2.1 7.3 66.8 22.7 1,123
Lower secondary 16.2 58.1 2.4 5.2 68.2 22.8 552
Upper secondary 16.1 56.8 2.2 6.8 69.0 21.6 645
Higher 14.1 62.3 1.2 5.3 71.9 20.1 571
Wealth index quintile
Poorest 15.7 51.1 1.8 9.7 61.8 24.7 1,633
Second 14.9 53.7 1.5 9.2 63.8 23.6 1,141
Middle 16.5 53.3 2.7 10.1 64.7 22.4 1,008
Fourth 17.0 58.6 2.7 4.4 70.2 21.6 910
Richest 10.6 65.7 0.2 4.3 73.1 20.3 766
1 MICS indicator TC.12 - Care-seeking for diarrhoea
A Community health providers includes both public (Lady health worker and Mobile/Outreach clinic) and private (Mobile clinic) health facilities B Includes all public and private health facilities and providers, as well as those who did not know if public or private. Excludes private pharmacy
C The category of “DK/Missing” in the background characteristic of “Age” has been suppressed from the table due to a small number of unweighted cases
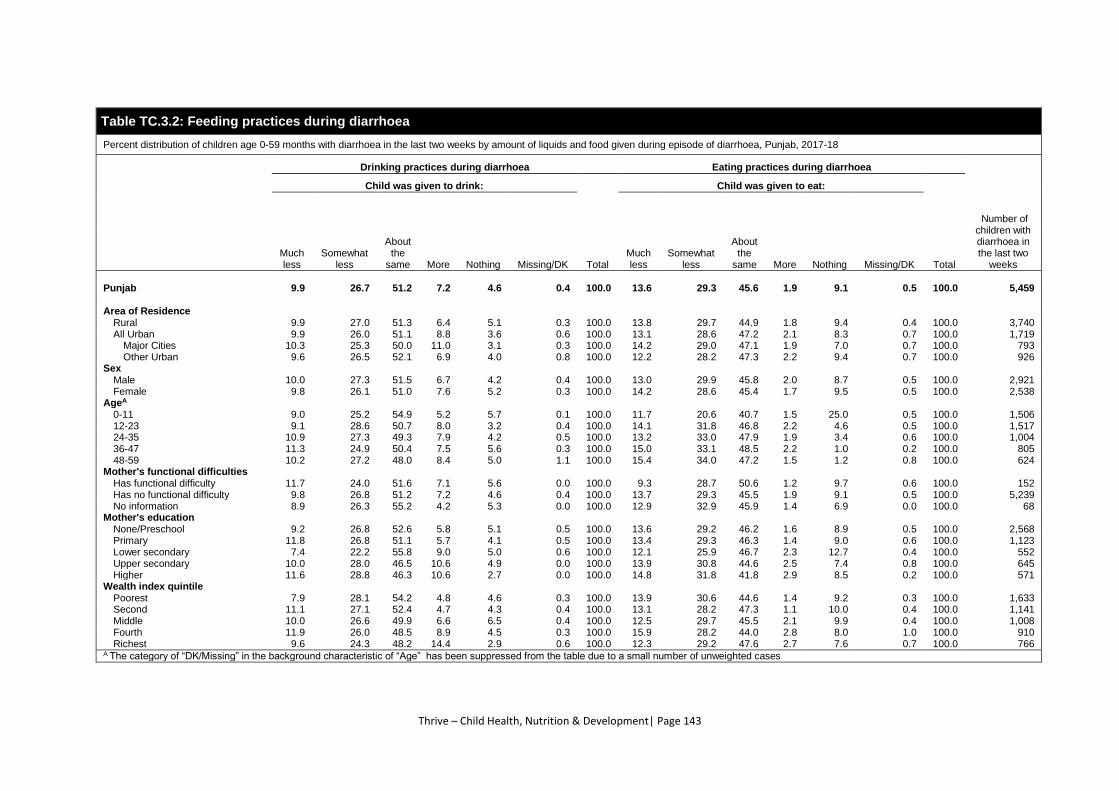
Thrive – Child Health, Nutrition & Development| Page 143
Table TC.3.2: Feeding practices during diarrhoea
Percent distribution of children age 0-59 months with diarrhoea in the last two weeks by amount of liquids and food given during episode of diarrhoea, Punjab, 2017-18
Drinking practices during diarrhoea Eating practices during diarrhoea
Number of children with diarrhoea in the last two
weeks
Child was given to drink:
Total
Child was given to eat:
Total Much less
Somewhat less
About the
same More Nothing Missing/DK Much less
Somewhat less
About the
same More Nothing Missing/DK
Punjab 9.9 26.7 51.2 7.2 4.6 0.4 100.0 13.6 29.3 45.6 1.9 9.1 0.5 100.0 5,459
Area of Residence
Rural 9.9 27.0 51.3 6.4 5.1 0.3 100.0 13.8 29.7 44.9 1.8 9.4 0.4 100.0 3,740 All Urban 9.9 26.0 51.1 8.8 3.6 0.6 100.0 13.1 28.6 47.2 2.1 8.3 0.7 100.0 1,719
Major Cities 10.3 25.3 50.0 11.0 3.1 0.3 100.0 14.2 29.0 47.1 1.9 7.0 0.7 100.0 793 Other Urban 9.6 26.5 52.1 6.9 4.0 0.8 100.0 12.2 28.2 47.3 2.2 9.4 0.7 100.0 926
Sex
Male 10.0 27.3 51.5 6.7 4.2 0.4 100.0 13.0 29.9 45.8 2.0 8.7 0.5 100.0 2,921 Female 9.8 26.1 51.0 7.6 5.2 0.3 100.0 14.2 28.6 45.4 1.7 9.5 0.5 100.0 2,538
AgeA 0-11 9.0 25.2 54.9 5.2 5.7 0.1 100.0 11.7 20.6 40.7 1.5 25.0 0.5 100.0 1,506 12-23 9.1 28.6 50.7 8.0 3.2 0.4 100.0 14.1 31.8 46.8 2.2 4.6 0.5 100.0 1,517 24-35 10.9 27.3 49.3 7.9 4.2 0.5 100.0 13.2 33.0 47.9 1.9 3.4 0.6 100.0 1,004 36-47 11.3 24.9 50.4 7.5 5.6 0.3 100.0 15.0 33.1 48.5 2.2 1.0 0.2 100.0 805 48-59 10.2 27.2 48.0 8.4 5.0 1.1 100.0 15.4 34.0 47.2 1.5 1.2 0.8 100.0 624
Mother's functional difficulties
Has functional difficulty 11.7 24.0 51.6 7.1 5.6 0.0 100.0 9.3 28.7 50.6 1.2 9.7 0.6 100.0 152 Has no functional difficulty 9.8 26.8 51.2 7.2 4.6 0.4 100.0 13.7 29.3 45.5 1.9 9.1 0.5 100.0 5,239 No information 8.9 26.3 55.2 4.2 5.3 0.0 100.0 12.9 32.9 45.9 1.4 6.9 0.0 100.0 68
Mother's education
None/Preschool 9.2 26.8 52.6 5.8 5.1 0.5 100.0 13.6 29.2 46.2 1.6 8.9 0.5 100.0 2,568 Primary 11.8 26.8 51.1 5.7 4.1 0.5 100.0 13.4 29.3 46.3 1.4 9.0 0.6 100.0 1,123 Lower secondary 7.4 22.2 55.8 9.0 5.0 0.6 100.0 12.1 25.9 46.7 2.3 12.7 0.4 100.0 552 Upper secondary 10.0 28.0 46.5 10.6 4.9 0.0 100.0 13.9 30.8 44.6 2.5 7.4 0.8 100.0 645 Higher 11.6 28.8 46.3 10.6 2.7 0.0 100.0 14.8 31.8 41.8 2.9 8.5 0.2 100.0 571
Wealth index quintile
Poorest 7.9 28.1 54.2 4.8 4.6 0.3 100.0 13.9 30.6 44.6 1.4 9.2 0.3 100.0 1,633 Second 11.1 27.1 52.4 4.7 4.3 0.4 100.0 13.1 28.2 47.3 1.1 10.0 0.4 100.0 1,141 Middle 10.0 26.6 49.9 6.6 6.5 0.4 100.0 12.5 29.7 45.5 2.1 9.9 0.4 100.0 1,008 Fourth 11.9 26.0 48.5 8.9 4.5 0.3 100.0 15.9 28.2 44.0 2.8 8.0 1.0 100.0 910 Richest 9.6 24.3 48.2 14.4 2.9 0.6 100.0 12.3 29.2 47.6 2.7 7.6 0.7 100.0 766
A The category of “DK/Missing” in the background characteristic of “Age” has been suppressed from the table due to a small number of unweighted cases
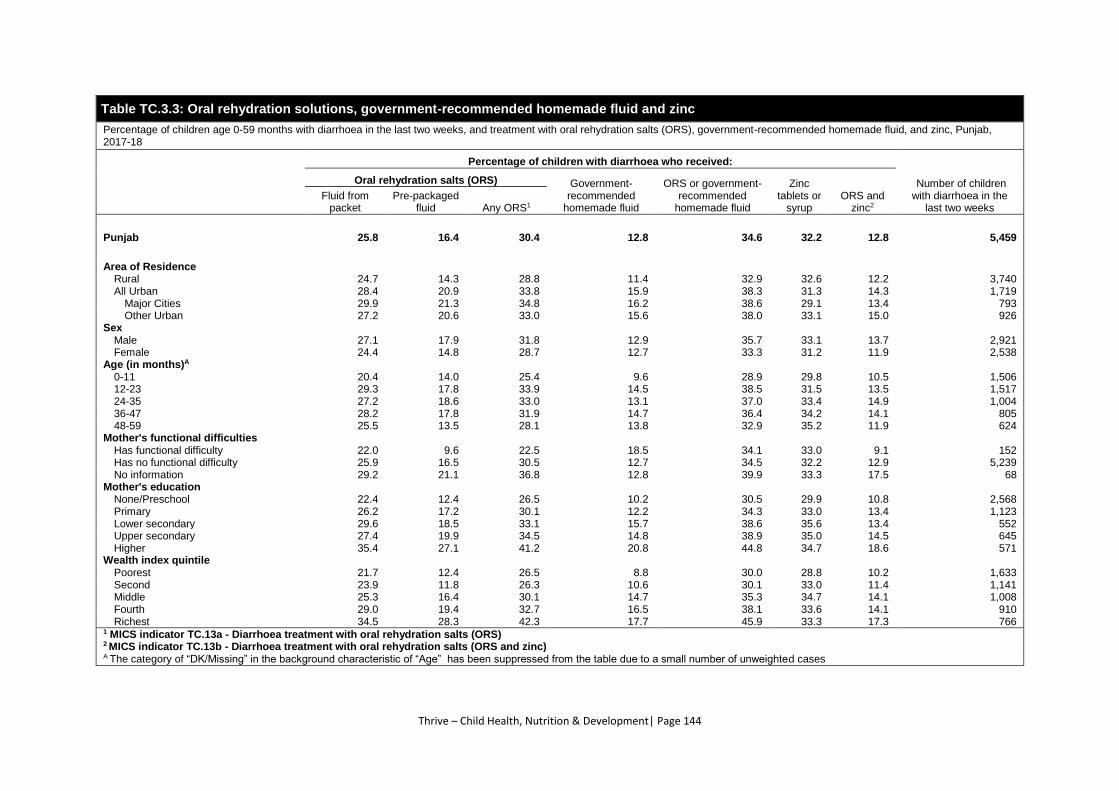
Thrive – Child Health, Nutrition & Development| Page 144
Table TC.3.3: Oral rehydration solutions, government-recommended homemade fluid and zinc
Percentage of children age 0-59 months with diarrhoea in the last two weeks, and treatment with oral rehydration salts (ORS), government-recommended homemade fluid, and zinc, Punjab, 2017-18
Percentage of children with diarrhoea who received:
Number of children with diarrhoea in the
last two weeks
Oral rehydration salts (ORS) Government-recommended
homemade fluid
ORS or government-recommended
homemade fluid
Zinc tablets or
syrup ORS and
zinc2 Fluid from
packet Pre-packaged
fluid Any ORS1
Punjab 25.8 16.4 30.4 12.8 34.6 32.2 12.8 5,459
Area of Residence Rural 24.7 14.3 28.8 11.4 32.9 32.6 12.2 3,740 All Urban 28.4 20.9 33.8 15.9 38.3 31.3 14.3 1,719
Major Cities 29.9 21.3 34.8 16.2 38.6 29.1 13.4 793 Other Urban 27.2 20.6 33.0 15.6 38.0 33.1 15.0 926
Sex Male 27.1 17.9 31.8 12.9 35.7 33.1 13.7 2,921 Female 24.4 14.8 28.7 12.7 33.3 31.2 11.9 2,538
Age (in months)A 0-11 20.4 14.0 25.4 9.6 28.9 29.8 10.5 1,506 12-23 29.3 17.8 33.9 14.5 38.5 31.5 13.5 1,517 24-35 27.2 18.6 33.0 13.1 37.0 33.4 14.9 1,004 36-47 28.2 17.8 31.9 14.7 36.4 34.2 14.1 805 48-59 25.5 13.5 28.1 13.8 32.9 35.2 11.9 624
Mother's functional difficulties Has functional difficulty 22.0 9.6 22.5 18.5 34.1 33.0 9.1 152 Has no functional difficulty 25.9 16.5 30.5 12.7 34.5 32.2 12.9 5,239 No information 29.2 21.1 36.8 12.8 39.9 33.3 17.5 68
Mother's education None/Preschool 22.4 12.4 26.5 10.2 30.5 29.9 10.8 2,568 Primary 26.2 17.2 30.1 12.2 34.3 33.0 13.4 1,123 Lower secondary 29.6 18.5 33.1 15.7 38.6 35.6 13.4 552 Upper secondary 27.4 19.9 34.5 14.8 38.9 35.0 14.5 645 Higher 35.4 27.1 41.2 20.8 44.8 34.7 18.6 571
Wealth index quintile Poorest 21.7 12.4 26.5 8.8 30.0 28.8 10.2 1,633 Second 23.9 11.8 26.3 10.6 30.1 33.0 11.4 1,141 Middle 25.3 16.4 30.1 14.7 35.3 34.7 14.1 1,008 Fourth 29.0 19.4 32.7 16.5 38.1 33.6 14.1 910 Richest 34.5 28.3 42.3 17.7 45.9 33.3 17.3 766
1 MICS indicator TC.13a - Diarrhoea treatment with oral rehydration salts (ORS) 2 MICS indicator TC.13b - Diarrhoea treatment with oral rehydration salts (ORS and zinc) A The category of “DK/Missing” in the background characteristic of “Age” has been suppressed from the table due to a small number of unweighted cases
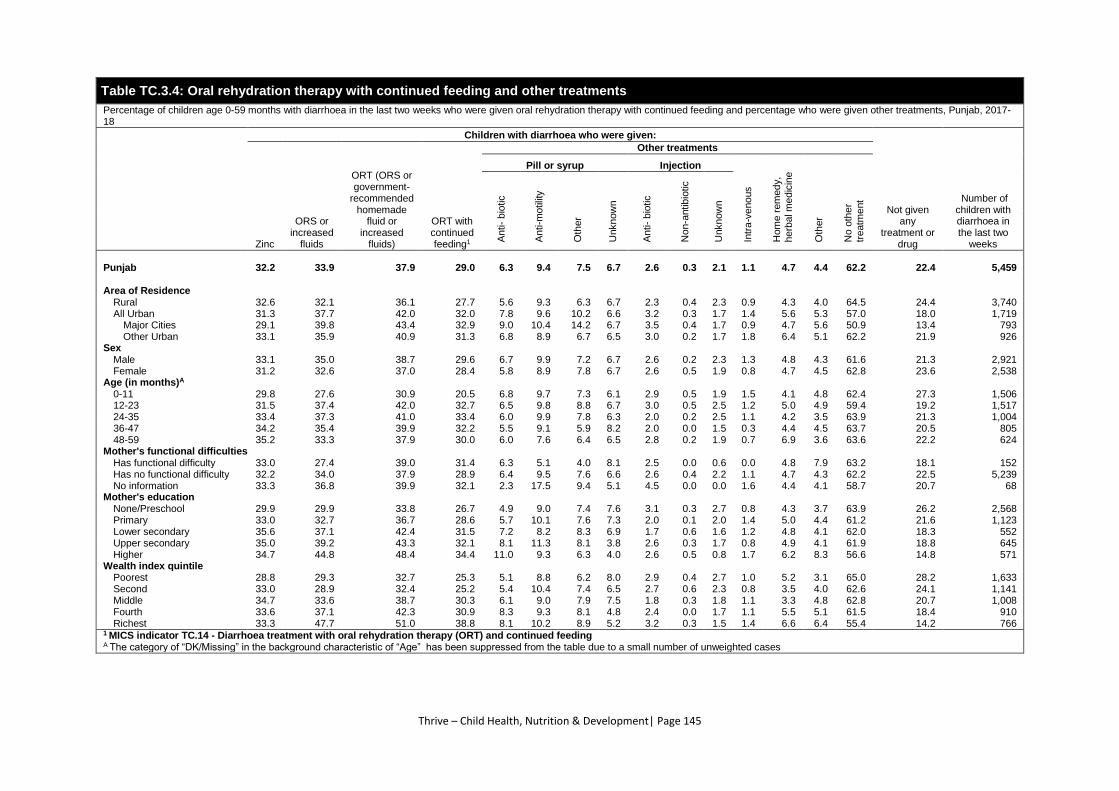
Thrive – Child Health, Nutrition & Development| Page 145
Table TC.3.4: Oral rehydration therapy with continued feeding and other treatments
Percentage of children age 0-59 months with diarrhoea in the last two weeks who were given oral rehydration therapy with continued feeding and percentage who were given other treatments, Punjab, 2017-18
Children with diarrhoea who were given:
Not given any
treatment or drug
Number of children with diarrhoea in the last two
weeks Zinc
ORS or increased
fluids
ORT (ORS or government-
recommended homemade
fluid or increased
fluids)
ORT with continued feeding1
Other treatments
Pill or syrup Injection
Intr
a-v
eno
us
Hom
e r
em
ed
y,
he
rba
l m
ed
icin
e
Oth
er
No o
the
r
tre
atm
ent
An
ti-
bio
tic
An
ti-m
otilit
y
Oth
er
Unkn
ow
n
An
ti-
bio
tic
No
n-a
ntib
iotic
Unkn
ow
n
Punjab 32.2 33.9 37.9 29.0 6.3 9.4 7.5 6.7 2.6 0.3 2.1 1.1 4.7 4.4 62.2 22.4 5,459
Area of Residence
Rural 32.6 32.1 36.1 27.7 5.6 9.3 6.3 6.7 2.3 0.4 2.3 0.9 4.3 4.0 64.5 24.4 3,740 All Urban 31.3 37.7 42.0 32.0 7.8 9.6 10.2 6.6 3.2 0.3 1.7 1.4 5.6 5.3 57.0 18.0 1,719
Major Cities 29.1 39.8 43.4 32.9 9.0 10.4 14.2 6.7 3.5 0.4 1.7 0.9 4.7 5.6 50.9 13.4 793 Other Urban 33.1 35.9 40.9 31.3 6.8 8.9 6.7 6.5 3.0 0.2 1.7 1.8 6.4 5.1 62.2 21.9 926
Sex
Male 33.1 35.0 38.7 29.6 6.7 9.9 7.2 6.7 2.6 0.2 2.3 1.3 4.8 4.3 61.6 21.3 2,921 Female 31.2 32.6 37.0 28.4 5.8 8.9 7.8 6.7 2.6 0.5 1.9 0.8 4.7 4.5 62.8 23.6 2,538
Age (in months)A
0-11 29.8 27.6 30.9 20.5 6.8 9.7 7.3 6.1 2.9 0.5 1.9 1.5 4.1 4.8 62.4 27.3 1,506 12-23 31.5 37.4 42.0 32.7 6.5 9.8 8.8 6.7 3.0 0.5 2.5 1.2 5.0 4.9 59.4 19.2 1,517 24-35 33.4 37.3 41.0 33.4 6.0 9.9 7.8 6.3 2.0 0.2 2.5 1.1 4.2 3.5 63.9 21.3 1,004 36-47 34.2 35.4 39.9 32.2 5.5 9.1 5.9 8.2 2.0 0.0 1.5 0.3 4.4 4.5 63.7 20.5 805 48-59 35.2 33.3 37.9 30.0 6.0 7.6 6.4 6.5 2.8 0.2 1.9 0.7 6.9 3.6 63.6 22.2 624
Mother's functional difficulties
Has functional difficulty 33.0 27.4 39.0 31.4 6.3 5.1 4.0 8.1 2.5 0.0 0.6 0.0 4.8 7.9 63.2 18.1 152 Has no functional difficulty 32.2 34.0 37.9 28.9 6.4 9.5 7.6 6.6 2.6 0.4 2.2 1.1 4.7 4.3 62.2 22.5 5,239 No information 33.3 36.8 39.9 32.1 2.3 17.5 9.4 5.1 4.5 0.0 0.0 1.6 4.4 4.1 58.7 20.7 68
Mother's education
None/Preschool 29.9 29.9 33.8 26.7 4.9 9.0 7.4 7.6 3.1 0.3 2.7 0.8 4.3 3.7 63.9 26.2 2,568 Primary 33.0 32.7 36.7 28.6 5.7 10.1 7.6 7.3 2.0 0.1 2.0 1.4 5.0 4.4 61.2 21.6 1,123 Lower secondary 35.6 37.1 42.4 31.5 7.2 8.2 8.3 6.9 1.7 0.6 1.6 1.2 4.8 4.1 62.0 18.3 552 Upper secondary 35.0 39.2 43.3 32.1 8.1 11.3 8.1 3.8 2.6 0.3 1.7 0.8 4.9 4.1 61.9 18.8 645 Higher 34.7 44.8 48.4 34.4 11.0 9.3 6.3 4.0 2.6 0.5 0.8 1.7 6.2 8.3 56.6 14.8 571
Wealth index quintile
Poorest 28.8 29.3 32.7 25.3 5.1 8.8 6.2 8.0 2.9 0.4 2.7 1.0 5.2 3.1 65.0 28.2 1,633 Second 33.0 28.9 32.4 25.2 5.4 10.4 7.4 6.5 2.7 0.6 2.3 0.8 3.5 4.0 62.6 24.1 1,141 Middle 34.7 33.6 38.7 30.3 6.1 9.0 7.9 7.5 1.8 0.3 1.8 1.1 3.3 4.8 62.8 20.7 1,008 Fourth 33.6 37.1 42.3 30.9 8.3 9.3 8.1 4.8 2.4 0.0 1.7 1.1 5.5 5.1 61.5 18.4 910 Richest 33.3 47.7 51.0 38.8 8.1 10.2 8.9 5.2 3.2 0.3 1.5 1.4 6.6 6.4 55.4 14.2 766
1 MICS indicator TC.14 - Diarrhoea treatment with oral rehydration therapy (ORT) and continued feeding A The category of “DK/Missing” in the background characteristic of “Age” has been suppressed from the table due to a small number of unweighted cases
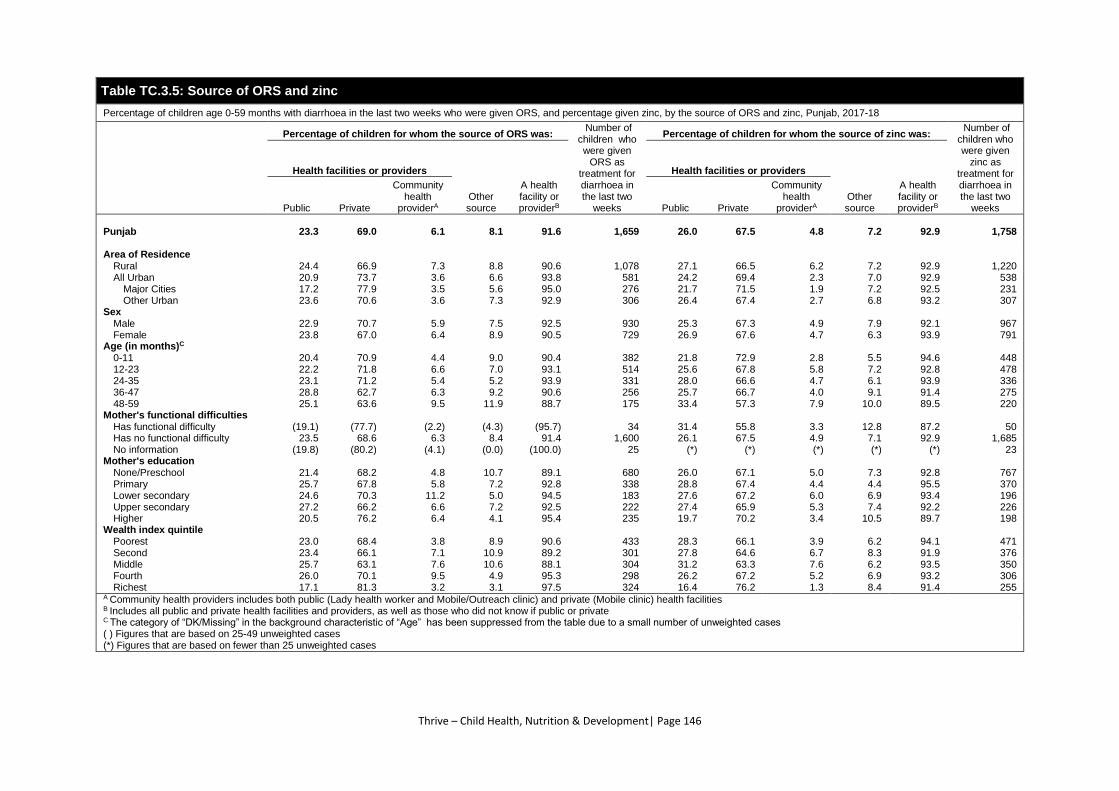
Thrive – Child Health, Nutrition & Development| Page 146
Table TC.3.5: Source of ORS and zinc
Percentage of children age 0-59 months with diarrhoea in the last two weeks who were given ORS, and percentage given zinc, by the source of ORS and zinc, Punjab, 2017-18
Percentage of children for whom the source of ORS was:
Number of children who were given
ORS as treatment for diarrhoea in the last two
weeks
Percentage of children for whom the source of zinc was: Number of
children who were given
zinc as treatment for diarrhoea in the last two
weeks
Health facilities or providers
Other source
A health facility or providerB
Health facilities or providers
Other source
A health facility or providerB Public Private
Community health
providerA Public Private
Community health
providerA
Punjab 23.3 69.0 6.1 8.1 91.6 1,659 26.0 67.5 4.8 7.2 92.9 1,758
Area of Residence
Rural 24.4 66.9 7.3 8.8 90.6 1,078 27.1 66.5 6.2 7.2 92.9 1,220 All Urban 20.9 73.7 3.6 6.6 93.8 581 24.2 69.4 2.3 7.0 92.9 538
Major Cities 17.2 77.9 3.5 5.6 95.0 276 21.7 71.5 1.9 7.2 92.5 231 Other Urban 23.6 70.6 3.6 7.3 92.9 306 26.4 67.4 2.7 6.8 93.2 307
Sex
Male 22.9 70.7 5.9 7.5 92.5 930 25.3 67.3 4.9 7.9 92.1 967 Female 23.8 67.0 6.4 8.9 90.5 729 26.9 67.6 4.7 6.3 93.9 791
Age (in months)C
0-11 20.4 70.9 4.4 9.0 90.4 382 21.8 72.9 2.8 5.5 94.6 448 12-23 22.2 71.8 6.6 7.0 93.1 514 25.6 67.8 5.8 7.2 92.8 478 24-35 23.1 71.2 5.4 5.2 93.9 331 28.0 66.6 4.7 6.1 93.9 336 36-47 28.8 62.7 6.3 9.2 90.6 256 25.7 66.7 4.0 9.1 91.4 275 48-59 25.1 63.6 9.5 11.9 88.7 175 33.4 57.3 7.9 10.0 89.5 220
Mother's functional difficulties
Has functional difficulty (19.1) (77.7) (2.2) (4.3) (95.7) 34 31.4 55.8 3.3 12.8 87.2 50 Has no functional difficulty 23.5 68.6 6.3 8.4 91.4 1,600 26.1 67.5 4.9 7.1 92.9 1,685 No information (19.8) (80.2) (4.1) (0.0) (100.0) 25 (*) (*) (*) (*) (*) 23
Mother's education
None/Preschool 21.4 68.2 4.8 10.7 89.1 680 26.0 67.1 5.0 7.3 92.8 767 Primary 25.7 67.8 5.8 7.2 92.8 338 28.8 67.4 4.4 4.4 95.5 370 Lower secondary 24.6 70.3 11.2 5.0 94.5 183 27.6 67.2 6.0 6.9 93.4 196 Upper secondary 27.2 66.2 6.6 7.2 92.5 222 27.4 65.9 5.3 7.4 92.2 226 Higher 20.5 76.2 6.4 4.1 95.4 235 19.7 70.2 3.4 10.5 89.7 198
Wealth index quintile
Poorest 23.0 68.4 3.8 8.9 90.6 433 28.3 66.1 3.9 6.2 94.1 471 Second 23.4 66.1 7.1 10.9 89.2 301 27.8 64.6 6.7 8.3 91.9 376 Middle 25.7 63.1 7.6 10.6 88.1 304 31.2 63.3 7.6 6.2 93.5 350 Fourth 26.0 70.1 9.5 4.9 95.3 298 26.2 67.2 5.2 6.9 93.2 306 Richest 17.1 81.3 3.2 3.1 97.5 324 16.4 76.2 1.3 8.4 91.4 255
A Community health providers includes both public (Lady health worker and Mobile/Outreach clinic) and private (Mobile clinic) health facilities B Includes all public and private health facilities and providers, as well as those who did not know if public or private C The category of “DK/Missing” in the background characteristic of “Age” has been suppressed from the table due to a small number of unweighted cases ( ) Figures that are based on 25-49 unweighted cases (*) Figures that are based on fewer than 25 unweighted cases
Thrive – Child Health, Nutrition & Development| Page 147
TC.4 HOUSEHOLD ENERGY USE
There is a global consensus and an ever-growing body of evidence that expanding access to clean
household energy for cooking, heating, and lighting is key to achieving a range of global priorities such
as improving health, gender equality, equitable economic development and environmental
protection. Goal 7 of the Sustainable Development Goals seeks to ensure access to affordable, reliable
sustainable and modern energy for all by 2030 and would be measured as the percentage of the
population relying on clean fuels and technology. 72
The MICS Punjab, 2017-18 included a module with questions to assess the main technologies and fuels
used for cooking, heating, and lighting. Information was also collected about the use of technologies
with chimneys or other venting mechanisms which can improve indoor air quality through moving a
fraction of the pollutants outdoors.
Households that use clean fuels and technologies for cooking are those mainly using electric stove,
solar cooker, LPG (Liquefied Petroleum Gas)/cooking gas stove, biogas stove, or a liquid fuel stove
burning ethanol/alcohol only. Table TC.4.1 presents the percent distribution of household members
according to type of cookstove mainly used by the household and percentage of household members
living in households using clean fuels and technologies for cooking.
Table TC.4.2 further presents the percent distribution of household members using polluting fuels and
technologies for cooking according to type of cooking fuel mainly used by the household, and
percentage of household members living in households using polluting fuels and technologies for
cooking while Table TC.4.3 presents the percent distribution of household members in households
using polluted fuels for cooking by type and characteristics of cookstove and by place of cooking.
Households that use clean fuels and technologies for space heating are those mainly relying on central
heating or using solar air heater, electricity, piped natural gas, LPG/cooking gas, biogas, or
alcohol/ethanol. Table TC.4.4 presents the percent distribution of household members according to
type of fuel mainly used for space heating by the household, and percentage of household members
living in households using clean fuels and technologies for space heating. Table TC.4.5 presents the
percent distribution of household members by the type of space heating mainly used in the household
and presence of chimney.
Households that use clean fuels and technologies for lighting are those mainly using electricity, solar
lantern, rechargeable or battery powered flashlight, torch or lantern, or biogas lamp. Table TC.4.6
presents the percent distribution of household members according to type of lighting fuel mainly used
for lighting by the household, and percentage of household members living in households using clean
fuels and technologies for lighting.
The questions asked about cooking, space heating and lighting help to monitor SDG indicator 7.1.2,
“Proportion of population with primary reliance on clean fuels and technology” for cooking, space
heating and lighting. Table TC.4.7 presents the percentage of household members living in households
using clean fuels and technologies for cooking, space heating, and lighting.
72 WHO. Burning Opportunity: Clean Household Energy for Health, Sustainable Development, and Wellbeing of Women and
Children. Geneva: WHO Press, 2016.
http://apps.who.int/iris/bitstream/handle/10665/204717/9789241565233_eng.pdf;jsessionid=63CEC48ED96098D4256007
A76FEB8907?sequence=1.
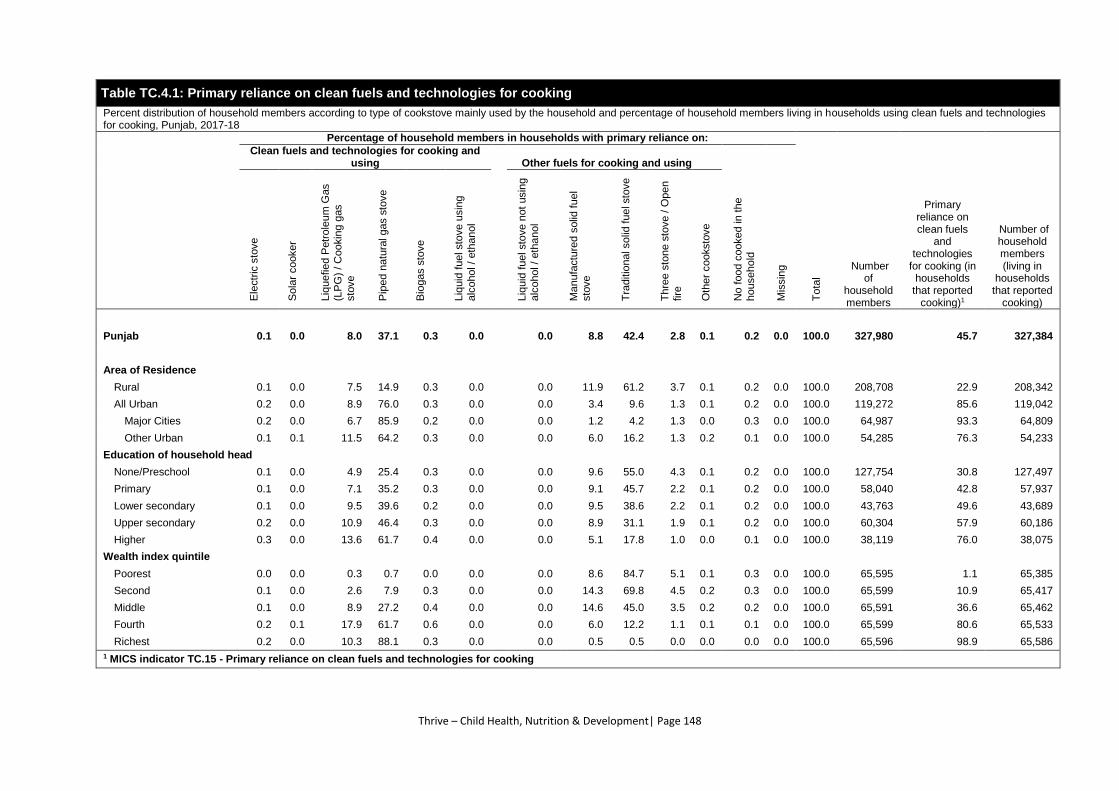
Thrive – Child Health, Nutrition & Development| Page 148
Table TC.4.1: Primary reliance on clean fuels and technologies for cooking
Percent distribution of household members according to type of cookstove mainly used by the household and percentage of household members living in households using clean fuels and technologies for cooking, Punjab, 2017-18
Percentage of household members in households with primary reliance on:
To
tal
Number of
household members
Primary reliance on clean fuels
and technologies
for cooking (in households
that reported cooking)1
Number of household members (living in
households that reported
cooking)
Clean fuels and technologies for cooking and using Other fuels for cooking and using
No f
ood c
ooked in
the
household
Mis
sin
g
Ele
ctr
ic s
tove
Sola
r cooker
Liq
uefie
d P
etr
ole
um
Gas
(LP
G)
/ C
ookin
g g
as
sto
ve
Pip
ed n
atu
ral gas s
tove
Bio
gas s
tove
Liq
uid
fuel sto
ve u
sin
g
alc
ohol /
eth
anol
Liq
uid
fuel sto
ve n
ot
usin
g
alc
ohol /
eth
anol
Ma
nufa
ctu
red s
olid
fuel
sto
ve
Tra
ditio
nal solid
fuel sto
ve
Th
ree s
tone s
tove / O
pen
fire
Oth
er
cooksto
ve
Punjab 0.1 0.0 8.0 37.1 0.3 0.0 0.0 8.8 42.4 2.8 0.1 0.2 0.0 100.0 327,980 45.7 327,384
Area of Residence
Rural 0.1 0.0 7.5 14.9 0.3 0.0 0.0 11.9 61.2 3.7 0.1 0.2 0.0 100.0 208,708 22.9 208,342
All Urban 0.2 0.0 8.9 76.0 0.3 0.0 0.0 3.4 9.6 1.3 0.1 0.2 0.0 100.0 119,272 85.6 119,042
Major Cities 0.2 0.0 6.7 85.9 0.2 0.0 0.0 1.2 4.2 1.3 0.0 0.3 0.0 100.0 64,987 93.3 64,809
Other Urban 0.1 0.1 11.5 64.2 0.3 0.0 0.0 6.0 16.2 1.3 0.2 0.1 0.0 100.0 54,285 76.3 54,233
Education of household head
None/Preschool 0.1 0.0 4.9 25.4 0.3 0.0 0.0 9.6 55.0 4.3 0.1 0.2 0.0 100.0 127,754 30.8 127,497
Primary 0.1 0.0 7.1 35.2 0.3 0.0 0.0 9.1 45.7 2.2 0.1 0.2 0.0 100.0 58,040 42.8 57,937
Lower secondary 0.1 0.0 9.5 39.6 0.2 0.0 0.0 9.5 38.6 2.2 0.1 0.2 0.0 100.0 43,763 49.6 43,689
Upper secondary 0.2 0.0 10.9 46.4 0.3 0.0 0.0 8.9 31.1 1.9 0.1 0.2 0.0 100.0 60,304 57.9 60,186
Higher 0.3 0.0 13.6 61.7 0.4 0.0 0.0 5.1 17.8 1.0 0.0 0.1 0.0 100.0 38,119 76.0 38,075
Wealth index quintile
Poorest 0.0 0.0 0.3 0.7 0.0 0.0 0.0 8.6 84.7 5.1 0.1 0.3 0.0 100.0 65,595 1.1 65,385
Second 0.1 0.0 2.6 7.9 0.3 0.0 0.0 14.3 69.8 4.5 0.2 0.3 0.0 100.0 65,599 10.9 65,417
Middle 0.1 0.0 8.9 27.2 0.4 0.0 0.0 14.6 45.0 3.5 0.2 0.2 0.0 100.0 65,591 36.6 65,462
Fourth 0.2 0.1 17.9 61.7 0.6 0.0 0.0 6.0 12.2 1.1 0.1 0.1 0.0 100.0 65,599 80.6 65,533
Richest 0.2 0.0 10.3 88.1 0.3 0.0 0.0 0.5 0.5 0.0 0.0 0.0 0.0 100.0 65,596 98.9 65,586
1 MICS indicator TC.15 - Primary reliance on clean fuels and technologies for cooking
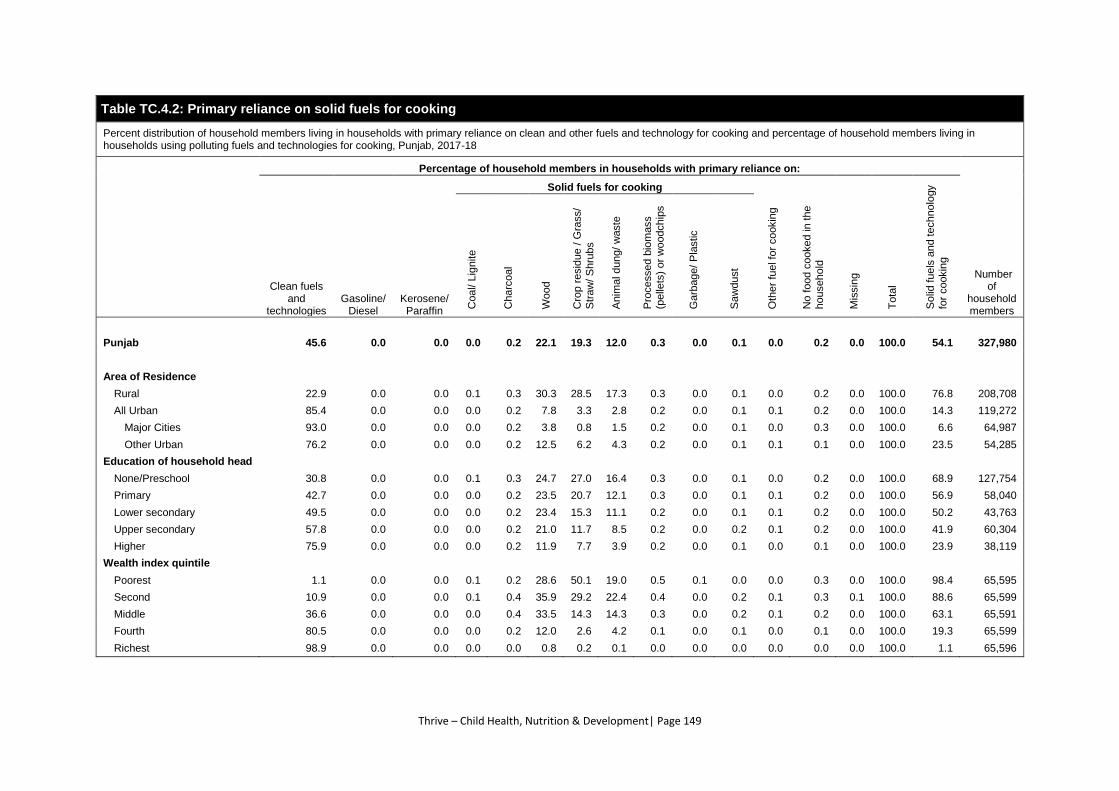
Thrive – Child Health, Nutrition & Development| Page 149
Table TC.4.2: Primary reliance on solid fuels for cooking
Percent distribution of household members living in households with primary reliance on clean and other fuels and technology for cooking and percentage of household members living in households using polluting fuels and technologies for cooking, Punjab, 2017-18
Percentage of household members in households with primary reliance on:
Number of
household members
Clean fuels and
technologies Gasoline/
Diesel Kerosene/ Paraffin
Solid fuels for cooking
Oth
er
fuel fo
r cookin
g
No f
ood c
ooked in
the
household
Mis
sin
g
To
tal
Solid
fuels
and technolo
gy
for
cookin
g
Coal/ L
ignite
Charc
oal
Wood
Cro
p r
esid
ue / G
rass/
Str
aw
/ S
hru
bs
Anim
al dung/
waste
Pro
cessed b
iom
ass
(pelle
ts)
or
woodchip
s
Garb
age/
Pla
stic
Saw
dust
Punjab 45.6 0.0 0.0 0.0 0.2 22.1 19.3 12.0 0.3 0.0 0.1 0.0 0.2 0.0 100.0 54.1 327,980
Area of Residence
Rural 22.9 0.0 0.0 0.1 0.3 30.3 28.5 17.3 0.3 0.0 0.1 0.0 0.2 0.0 100.0 76.8 208,708
All Urban 85.4 0.0 0.0 0.0 0.2 7.8 3.3 2.8 0.2 0.0 0.1 0.1 0.2 0.0 100.0 14.3 119,272
Major Cities 93.0 0.0 0.0 0.0 0.2 3.8 0.8 1.5 0.2 0.0 0.1 0.0 0.3 0.0 100.0 6.6 64,987
Other Urban 76.2 0.0 0.0 0.0 0.2 12.5 6.2 4.3 0.2 0.0 0.1 0.1 0.1 0.0 100.0 23.5 54,285
Education of household head
None/Preschool 30.8 0.0 0.0 0.1 0.3 24.7 27.0 16.4 0.3 0.0 0.1 0.0 0.2 0.0 100.0 68.9 127,754
Primary 42.7 0.0 0.0 0.0 0.2 23.5 20.7 12.1 0.3 0.0 0.1 0.1 0.2 0.0 100.0 56.9 58,040
Lower secondary 49.5 0.0 0.0 0.0 0.2 23.4 15.3 11.1 0.2 0.0 0.1 0.1 0.2 0.0 100.0 50.2 43,763
Upper secondary 57.8 0.0 0.0 0.0 0.2 21.0 11.7 8.5 0.2 0.0 0.2 0.1 0.2 0.0 100.0 41.9 60,304
Higher 75.9 0.0 0.0 0.0 0.2 11.9 7.7 3.9 0.2 0.0 0.1 0.0 0.1 0.0 100.0 23.9 38,119
Wealth index quintile
Poorest 1.1 0.0 0.0 0.1 0.2 28.6 50.1 19.0 0.5 0.1 0.0 0.0 0.3 0.0 100.0 98.4 65,595
Second 10.9 0.0 0.0 0.1 0.4 35.9 29.2 22.4 0.4 0.0 0.2 0.1 0.3 0.1 100.0 88.6 65,599
Middle 36.6 0.0 0.0 0.0 0.4 33.5 14.3 14.3 0.3 0.0 0.2 0.1 0.2 0.0 100.0 63.1 65,591
Fourth 80.5 0.0 0.0 0.0 0.2 12.0 2.6 4.2 0.1 0.0 0.1 0.0 0.1 0.0 100.0 19.3 65,599
Richest 98.9 0.0 0.0 0.0 0.0 0.8 0.2 0.1 0.0 0.0 0.0 0.0 0.0 0.0 100.0 1.1 65,596
Thrive – Child Health, Nutrition & Development| Page 150
Table TC.4.3: Polluting fuels and technologies for cooking by type and characteristics of cookstove and place of cooking
Percentage of household members living in households with primary reliance on polluting fuels and technology for cooking and percent distribution of household members living in households using polluted fuels for cooking by type and characteristics of cookstove and by place of cooking, Punjab, 2017-18
Percentage of
household members living in
households with
primary reliance on
polluting fuels and
technology for cooking
Number of
household members
Percentage of household members living in households cooking with polluting fuels and
Mis
sin
g
To
tal
Percentage of household members living in
households cooking with
polluting fuels and
technology in poorly
ventilated locations
Number of household members living in
households using
polluting fuels and
technology for cooking
Cookstove has Place of cooking is:
Chim
ney
Fa
n
In main house
In a
separa
te b
uild
ing
Outdoors
Oth
er
pla
ce
No s
epara
te r
oom
In a
separa
te
room
Open a
ir
On v
era
nda o
r
covere
d p
orc
h
Punjab 54.2 327,980 4.0 0.5 16.7 20.1 1.9 43.9 17.0 0.3 0.0 100.0 29.0 327,980
Area of Residence
Rural 76.9 208,708 6.0 0.7 16.1 20.5 2.0 43.9 17.2 0.2 0.0 100.0 28.8 208,708
All Urban 14.4 119,272 0.6 0.1 22.6 16.3 1.3 44.2 15.0 0.5 0.0 100.0 31.1 119,272
Major Cities 6.7 64,987 0.1 0.0 29.0 10.5 1.7 47.3 10.8 0.7 0.0 100.0 29.9 64,987
Other Urban 23.7 54,285 1.2 0.2 20.4 18.2 1.1 43.2 16.5 0.5 0.1 100.0 31.4 54,285
Education of household head
None/Preschool 69.0 127,754 3.3 0.4 18.4 16.4 1.7 46.6 16.7 0.2 0.0 100.0 28.7 127,754
Primary 57.1 58,040 4.0 0.3 16.8 20.2 1.8 43.9 17.0 0.2 0.1 100.0 30.2 58,040
Lower secondary 50.3 43,763 5.3 0.6 14.9 23.9 2.5 41.5 16.8 0.3 0.0 100.0 28.8 43,763
Upper secondary 42.0 60,304 5.4 0.7 13.8 26.8 2.2 39.3 17.6 0.2 0.0 100.0 28.1 60,304
Higher 23.9 38,119 2.8 0.3 12.9 28.4 2.9 36.5 18.9 0.5 0.0 100.0 31.0 38,119
Wealth index quintile
Poorest 98.5 65,595 2.1 0.3 19.3 10.8 1.2 52.3 16.1 0.2 0.0 100.0 26.6 65,595
Second 88.8 65,599 4.7 0.6 16.9 17.4 1.8 45.3 18.4 0.2 0.0 100.0 28.4 65,599
Middle 63.2 65,591 8.5 0.7 13.8 29.7 2.6 35.9 17.6 0.3 0.0 100.0 31.1 65,591
Fourth 19.4 65,599 4.5 0.7 13.4 45.8 3.9 22.7 13.5 0.6 0.0 100.0 36.4 65,599
Richest 1.1 65,596 0.4 0.1 4.3 69.4 2.4 10.9 13.0 0.0 0.0 100.0 43.4 65,596
Thrive – Child Health, Nutrition & Development| Page 151
Table TC.4.4: Primary reliance on clean fuels and technologies for space heating
Percent distribution of household members according to type of fuel mainly used for space heating by the household, and percentage of household members living in households using clean fuels and technologies for space heating, Punjab, 2017-18
Percentage of household members in households with primary reliance on
To
tal
Number of
household members
Primary reliance on clean fuels
and technologies
for space heating (in households
that reported the
use of space
heating)1
Number of household members (living in
households that
reported the use of
space heating)
Centr
al heatin
g
Clean fuels for space heatingA: Polluting fuels for space heatingA:
No s
pace h
eatin
g in
the
household
Sola
r air h
eate
r
Ele
ctr
icity
Pip
ed n
atu
ral gas
Liq
uefie
d P
etr
ole
um
Gas (
LP
G)
/ C
ookin
g
gas
Bio
gas
Gasolin
e/ D
iesel
Kero
sene/ P
ara
ffin
Coal/ L
ignite
Charc
oal
Wood
Cro
p r
esid
ue / G
rass/
Str
aw
/ S
hru
bs
Anim
al dung/
waste
Pro
cessed b
iom
ass
(pelle
ts)
or
woodchip
s
Saw
dust
Oth
er
No r
esponse
Punjab 0.0 0.0 1.0 10.5 0.7 0.1 0.0 0.0 0.6 1.7 2.0 2.2 0.7 0.0 0.0 0.0 0.0 80.4 100.0 327,980 62.6 64,315
Area of Residence
Rural 0.0 0.0 0.9 3.9 0.7 0.1 0.0 0.0 0.6 2.2 2.7 3.3 1.0 0.1 0.0 0.0 0.0 84.4 100.0 208,708 35.6 32,530
All Urban 0.1 0.0 1.2 22.0 0.6 0.0 0.0 0.0 0.4 0.7 0.8 0.4 0.2 0.0 0.0 0.0 0.1 73.4 100.0 119,272 90.2 31,784
Major Cities 0.2 0.0 1.2 23.0 0.4 0.0 0.0 0.0 0.2 0.2 0.5 0.1 0.1 0.0 0.0 0.0 0.0 74.0 100.0 64,987 95.3 16,874
Other Urban 0.0 0.0 1.3 20.9 0.9 0.1 0.0 0.0 0.7 1.3 1.1 0.7 0.3 0.0 0.0 0.0 0.1 72.5 100.0 54,285 84.5 14,910
Education of household head
None/Preschool 0.0 0.0 0.5 5.1 0.5 0.0 0.0 0.0 0.4 1.7 2.1 3.3 1.0 0.0 0.0 0.0 0.0 85.3 100.0 127,754 41.4 18,739
Primary 0.1 0.0 0.6 7.8 0.5 0.0 0.0 0.0 0.7 1.6 2.1 2.4 0.8 0.1 0.0 0.0 0.0 83.3 100.0 58,040 54.1 9,681
Lower secondary 0.0 0.0 0.8 10.2 0.6 0.1 0.0 0.0 0.7 2.1 2.3 1.6 0.5 0.1 0.0 0.0 0.0 81.1 100.0 43,763 61.6 8,268
Upper secondary 0.1 0.0 1.6 14.6 0.7 0.1 0.0 0.0 0.7 1.6 2.1 1.3 0.4 0.0 0.0 0.0 0.1 76.7 100.0 60,304 73.1 14,065
Higher 0.1 0.0 3.1 26.5 1.4 0.1 0.0 0.0 0.6 1.3 1.2 0.8 0.3 0.0 0.0 0.0 0.1 64.4 100.0 38,119 87.8 13,562
Wealth index quintile
Poorest 0.0 0.0 0.0 0.0 0.1 0.0 0.0 0.0 0.2 1.6 2.8 7.1 1.4 0.1 0.0 0.0 0.0 86.6 100.0 65,595 1.3 8,794
Second 0.0 0.0 0.2 0.8 0.2 0.0 0.0 0.0 0.4 2.1 2.8 2.8 1.2 0.0 0.0 0.0 0.0 89.3 100.0 65,599 11.5 6,987
Middle 0.0 0.0 0.4 2.7 0.7 0.0 0.0 0.0 0.9 2.6 2.9 1.0 0.6 0.1 0.0 0.0 0.0 88.1 100.0 65,591 32.2 7,833
Fourth 0.0 0.0 1.0 9.3 0.9 0.1 0.0 0.0 0.9 1.8 1.5 0.2 0.3 0.0 0.0 0.0 0.1 83.7 100.0 65,599 69.9 10,697
Richest 0.2 0.0 3.5 39.4 1.3 0.2 0.0 0.0 0.5 0.3 0.1 0.0 0.0 0.0 0.0 0.0 0.1 54.3 100.0 65,596 97.8 30,004
1 MICS indicator TC.16 - Primary reliance on clean fuels and technologies for space heating
A For those living in households that are not using central heating
Thrive – Child Health, Nutrition & Development| Page 152
Table TC.4.5: Type of space heater mainly used and presence of chimney
Percent distribution of household members by the type of space heating mainly used in the household and presence of chimney, Punjab, 2017-18
Percentage of household members mainly using:
No space heating in
the household
DK/ Missing Total
Number of household members
Central heating
Space heater
Cookstove for space heating Three stone stove / Open fire for space
heating Other
Manufactured Traditional
Manufactured Traditional
With chimney
Without chimney
With chimney
Without chimney
With chimney
Without chimney
With chimney
Without chimney
Punjab 0.0 1.1 9.1 0.3 5.0 0.1 1.6 0.1 1.4 0.3 0.4 80.4 0.1 100.0 327,980
Area of Residence
Rural 0.0 0.5 4.1 0.4 6.5 0.2 1.0 0.2 1.9 0.4 0.4 84.4 0.1 100.0 208,708
All Urban 0.1 2.3 18.0 0.1 2.3 0.1 2.7 0.0 0.5 0.2 0.3 73.4 0.1 100.0 119,272
Major Cities 0.2 2.6 18.4 0.1 1.0 0.1 2.8 0.0 0.4 0.2 0.2 74.0 0.0 100.0 64,987
Other Urban 0.0 1.9 17.6 0.1 3.9 0.1 2.5 0.0 0.7 0.2 0.3 72.5 0.2 100.0 54,285
Education of household head
None/Preschool 0.0 0.4 4.0 0.1 5.5 0.1 1.7 0.1 1.9 0.5 0.4 85.3 0.1 100.0 127,754
Primary 0.1 0.8 6.1 0.3 5.0 0.1 2.0 0.1 1.4 0.3 0.5 83.3 0.1 100.0 58,040
Lower secondary 0.0 0.7 8.9 0.3 5.2 0.2 1.4 0.2 1.4 0.2 0.4 81.1 0.0 100.0 43,763
Upper secondary 0.1 1.7 13.3 0.4 4.7 0.2 1.5 0.1 0.8 0.2 0.3 76.7 0.1 100.0 60,304
Higher 0.1 3.9 24.9 0.3 3.5 0.1 1.4 0.1 0.7 0.2 0.2 64.4 0.1 100.0 38,119
Wealth index quintile
Poorest 0.0 0.0 0.1 0.1 7.1 0.3 0.5 0.2 3.7 0.9 0.5 86.6 0.0 100.0 65,595
Second 0.0 0.0 0.6 0.3 6.4 0.1 0.9 0.1 1.4 0.4 0.4 89.3 0.0 100.0 65,599
Middle 0.0 0.1 1.7 0.4 6.0 0.1 1.8 0.1 0.9 0.4 0.4 88.1 0.1 100.0 65,591
Fourth 0.0 0.5 7.4 0.3 3.9 0.1 2.8 0.0 0.7 0.1 0.3 83.7 0.1 100.0 65,599
Richest 0.2 5.2 35.9 0.1 1.6 0.2 2.0 0.0 0.2 0.0 0.2 54.3 0.1 100.0 65,596
Thrive – Child Health, Nutrition & Development| Page 153
Table TC.4.6: Primary reliance on clean fuels and technologies for lighting
Percent distribution of household members according to type of lighting fuel mainly used for lighting by the household, and percentage of household members living in households using clean fuels and technologies for lighting, Punjab, 2017-18
Percentage of household members in households with primary reliance on
Number of household members
(in households
that reported
the use of lighting)
Clean fuels for lighting: Polluting fuels for lighting:
Oth
er
fuel fo
r lig
htin
g
No lig
htin
g in
the h
ousehold
Mis
sin
g
To
tal
Number of
household members
Primary reliance on
clean fuels and technologies for lighting in households
that reported the use of lighting1
Ele
ctr
icity
Sola
r la
nte
rn
Recharg
eable
fla
shlig
ht,
torc
h o
r la
nte
rn
Batt
ery
pow
ere
d
fla
shlig
ht, t
orc
h o
r la
nte
rn
Bio
gas la
mp
Gasolin
e la
mp
Kero
sene o
r para
ffin
lam
p
Charc
oal
Wood
Cro
p r
esid
ue/
Gra
ss/
Str
aw
/ S
hru
bs
Anim
al dung/
waste
Oil
lam
p
Candle
Punjab 94.7 1.4 1.7 0.8 0.0 0.0 0.3 0.0 0.0 0.1 0.1 0.5 0.2 0.1 0.2 0.0 100.0 327,980 98.7 327,388
Area of Residence
Rural 92.6 2.0 2.2 1.2 0.0 0.0 0.4 0.0 0.1 0.1 0.1 0.8 0.2 0.1 0.2 0.0 100.0 208,708 98.2 208,247
All Urban 98.5 0.2 0.7 0.1 0.0 0.0 0.0 0.0 0.0 0.0 0.1 0.1 0.1 0.0 0.1 0.0 100.0 119,272 99.6 119,142
Major Cities 98.4 0.1 0.9 0.1 0.0 0.0 0.0 0.0 0.0 0.0 0.1 0.1 0.1 0.0 0.2 0.0 100.0 64,987 99.7 64,871
Other Urban 98.5 0.4 0.5 0.1 0.0 0.0 0.1 0.0 0.0 0.0 0.0 0.1 0.1 0.0 0.0 0.0 100.0 54,285 99.5 54,270
Education of household head
None/Preschool 91.0 2.1 2.8 1.5 0.0 0.0 0.6 0.0 0.1 0.1 0.1 1.0 0.4 0.1 0.3 0.0 100.0 127,754 97.7 127,368
Primary 95.4 1.2 1.5 0.6 0.0 0.0 0.3 0.0 0.0 0.0 0.1 0.5 0.1 0.0 0.1 0.0 100.0 58,040 98.9 57,972
Lower secondary 96.9 1.1 0.8 0.3 0.0 0.0 0.0 0.0 0.0 0.1 0.1 0.3 0.1 0.0 0.1 0.0 100.0 43,763 99.3 43,701
Upper secondary 97.9 0.7 0.8 0.2 0.0 0.0 0.0 0.0 0.0 0.1 0.1 0.1 0.0 0.1 0.1 0.0 100.0 60,304 99.6 60,258
Higher 98.5 0.5 0.6 0.1 0.0 0.0 0.0 0.0 0.0 0.1 0.1 0.0 0.0 0.0 0.1 0.0 100.0 38,119 99.7 38,088
Wealth index quintile
Poorest 76.5 6.4 7.2 3.8 0.0 0.0 1.4 0.1 0.1 0.2 0.1 2.6 0.8 0.3 0.6 0.0 100.0 65,595 94.4 65,213
Second 99.1 0.2 0.2 0.1 0.0 0.0 0.0 0.0 0.0 0.1 0.1 0.0 0.1 0.0 0.1 0.0 100.0 65,599 99.7 65,520
Middle 99.4 0.1 0.1 0.0 0.0 0.0 0.0 0.0 0.1 0.0 0.1 0.0 0.0 0.0 0.1 0.0 100.0 65,591 99.8 65,533
Fourth 99.3 0.1 0.4 0.0 0.0 0.0 0.0 0.0 0.0 0.0 0.0 0.0 0.0 0.0 0.1 0.0 100.0 65,599 99.8 65,535
Richest 99.3 0.1 0.4 0.1 0.0 0.0 0.0 0.0 0.0 0.0 0.1 0.0 0.0 0.0 0.0 0.0 100.0 65,596 99.8 65,587
1 MICS indicator TC.17 - Primary reliance on clean fuels and technologies for lighting
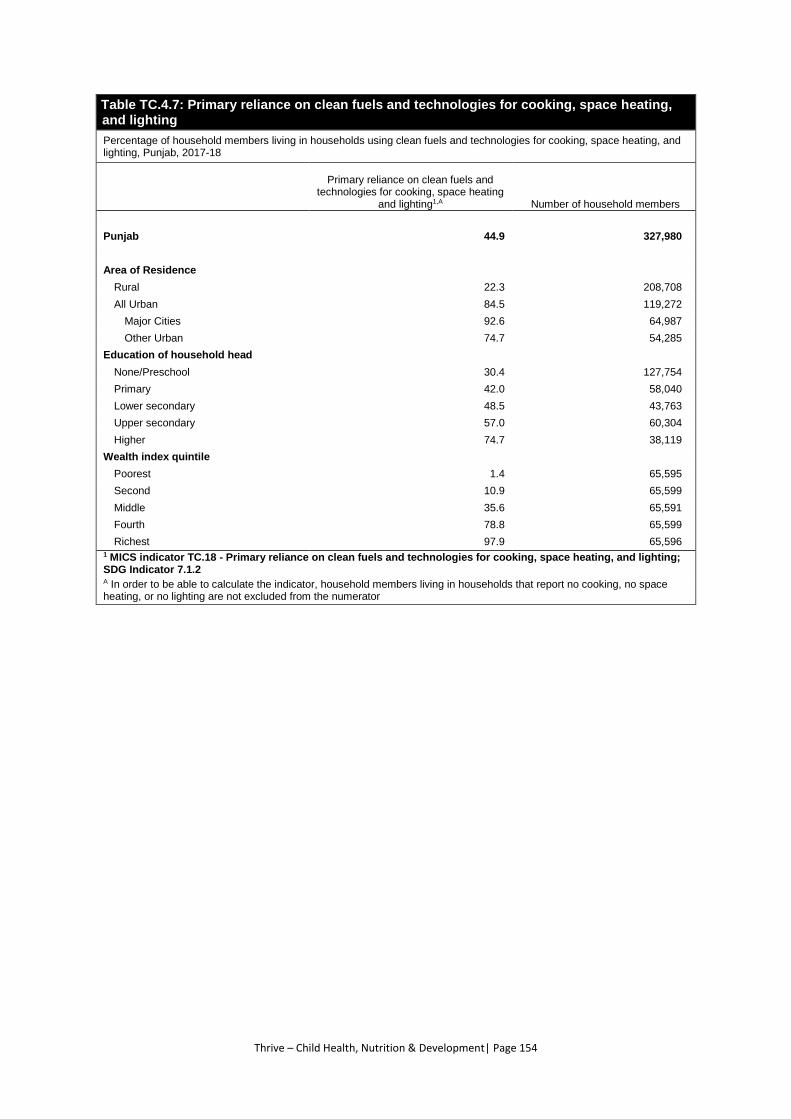
Thrive – Child Health, Nutrition & Development| Page 154
Table TC.4.7: Primary reliance on clean fuels and technologies for cooking, space heating, and lighting
Percentage of household members living in households using clean fuels and technologies for cooking, space heating, and lighting, Punjab, 2017-18
Primary reliance on clean fuels and
technologies for cooking, space heating and lighting1,A Number of household members
Punjab 44.9 327,980
Area of Residence
Rural 22.3 208,708
All Urban 84.5 119,272
Major Cities 92.6 64,987
Other Urban 74.7 54,285
Education of household head
None/Preschool 30.4 127,754
Primary 42.0 58,040
Lower secondary 48.5 43,763
Upper secondary 57.0 60,304
Higher 74.7 38,119
Wealth index quintile
Poorest 1.4 65,595
Second 10.9 65,599
Middle 35.6 65,591
Fourth 78.8 65,599
Richest 97.9 65,596 1 MICS indicator TC.18 - Primary reliance on clean fuels and technologies for cooking, space heating, and lighting; SDG Indicator 7.1.2 A In order to be able to calculate the indicator, household members living in households that report no cooking, no space heating, or no lighting are not excluded from the numerator
Thrive – Child Health, Nutrition & Development| Page 155
TC.5 SYMPTOMS OF ACUTE RESPIRATORY INFECTION
Symptoms of ARI are collected during the MICS Punjab, 2017-18 to capture symptoms related to
pneumonia, a leading cause of death in children under five.69 Once diagnosed, pneumonia is treated
effectively with antibiotics. Studies have shown a limitation in the survey approach of measuring
pneumonia because many of the cases reported in surveys by the mothers or caretakers with
symptoms of pneumonia are in fact, not true pneumonia.73 While this limitation does not affect the
level and patterns of care-seeking for symptoms of ARI, it limits the validity of the level of treatment
of ARI with antibiotics, as reported through household surveys. The treatment indicator described in
this report must therefore be taken with caution.
Table TC.5.1 presents the percentage of children with symptoms of ARI, which is also generally
referred to as symptoms of pneumonia, in the two weeks preceding the survey for whom care was
sought, by source of care and the percentage who received antibiotics. Information is also presented
by sex, age, region, area, age, and socioeconomic factors and the point of treatment among children
with symptoms of ARI who were treated with antibiotics.
73 Campbell, H. et al. “Measuring Coverage in MNCH: Challenges in Monitoring the Proportion of Young Children with
Pneumonia Who Receive Antibiotic Treatment.” PLoS Med 10, no.5 (2013). doi:10.1371/journal.pmed.1001421
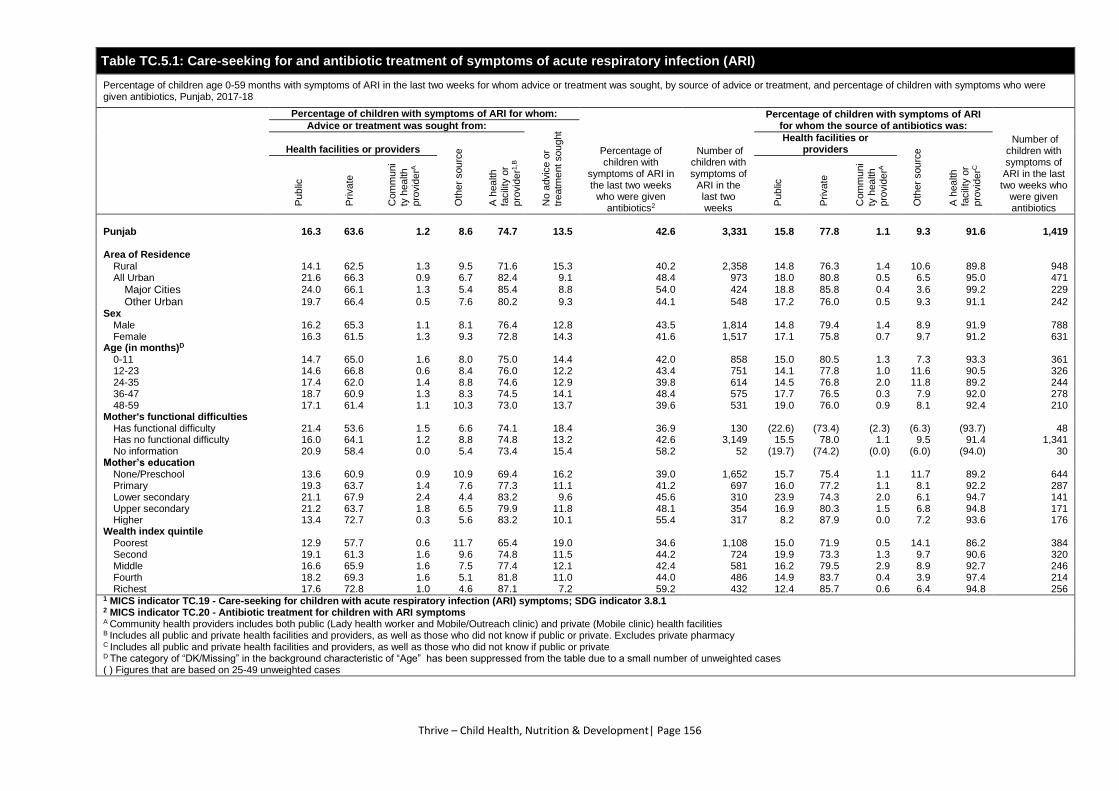
Thrive – Child Health, Nutrition & Development| Page 156
Table TC.5.1: Care-seeking for and antibiotic treatment of symptoms of acute respiratory infection (ARI)
Percentage of children age 0-59 months with symptoms of ARI in the last two weeks for whom advice or treatment was sought, by source of advice or treatment, and percentage of children with symptoms who were given antibiotics, Punjab, 2017-18
Percentage of children with symptoms of ARI for whom:
Percentage of children with
symptoms of ARI in the last two weeks
who were given antibiotics2
Number of children with symptoms of
ARI in the last two weeks
Percentage of children with symptoms of ARI for whom the source of antibiotics was:
Number of children with symptoms of ARI in the last two weeks who
were given antibiotics
Advice or treatment was sought from:
No a
dvic
e o
r
tre
atm
ent so
ug
ht
Health facilities or providers
Oth
er
sou
rce
A h
ea
lth
facili
ty o
r
pro
vid
er1
,B
Health facilities or providers
Oth
er
sou
rce
A h
ea
lth
facili
ty o
r
pro
vid
erC
Pu
blic
Priva
te
Com
mu
ni
ty h
ea
lth
pro
vid
erA
Pu
blic
Priva
te
Com
mu
ni
ty h
ea
lth
p
rovid
erA
Punjab 16.3 63.6 1.2 8.6 74.7 13.5 42.6 3,331 15.8 77.8 1.1 9.3 91.6 1,419
Area of Residence
Rural 14.1 62.5 1.3 9.5 71.6 15.3 40.2 2,358 14.8 76.3 1.4 10.6 89.8 948 All Urban 21.6 66.3 0.9 6.7 82.4 9.1 48.4 973 18.0 80.8 0.5 6.5 95.0 471
Major Cities 24.0 66.1 1.3 5.4 85.4 8.8 54.0 424 18.8 85.8 0.4 3.6 99.2 229
Other Urban 19.7 66.4 0.5 7.6 80.2 9.3 44.1 548 17.2 76.0 0.5 9.3 91.1 242 Sex
Male 16.2 65.3 1.1 8.1 76.4 12.8 43.5 1,814 14.8 79.4 1.4 8.9 91.9 788 Female 16.3 61.5 1.3 9.3 72.8 14.3 41.6 1,517 17.1 75.8 0.7 9.7 91.2 631
Age (in months)D
0-11 14.7 65.0 1.6 8.0 75.0 14.4 42.0 858 15.0 80.5 1.3 7.3 93.3 361 12-23 14.6 66.8 0.6 8.4 76.0 12.2 43.4 751 14.1 77.8 1.0 11.6 90.5 326 24-35 17.4 62.0 1.4 8.8 74.6 12.9 39.8 614 14.5 76.8 2.0 11.8 89.2 244 36-47 18.7 60.9 1.3 8.3 74.5 14.1 48.4 575 17.7 76.5 0.3 7.9 92.0 278 48-59 17.1 61.4 1.1 10.3 73.0 13.7 39.6 531 19.0 76.0 0.9 8.1 92.4 210
Mother's functional difficulties
Has functional difficulty 21.4 53.6 1.5 6.6 74.1 18.4 36.9 130 (22.6) (73.4) (2.3) (6.3) (93.7) 48 Has no functional difficulty 16.0 64.1 1.2 8.8 74.8 13.2 42.6 3,149 15.5 78.0 1.1 9.5 91.4 1,341 No information 20.9 58.4 0.0 5.4 73.4 15.4 58.2 52 (19.7) (74.2) (0.0) (6.0) (94.0) 30
Mother’s education
None/Preschool 13.6 60.9 0.9 10.9 69.4 16.2 39.0 1,652 15.7 75.4 1.1 11.7 89.2 644 Primary 19.3 63.7 1.4 7.6 77.3 11.1 41.2 697 16.0 77.2 1.1 8.1 92.2 287 Lower secondary 21.1 67.9 2.4 4.4 83.2 9.6 45.6 310 23.9 74.3 2.0 6.1 94.7 141 Upper secondary 21.2 63.7 1.8 6.5 79.9 11.8 48.1 354 16.9 80.3 1.5 6.8 94.8 171 Higher 13.4 72.7 0.3 5.6 83.2 10.1 55.4 317 8.2 87.9 0.0 7.2 93.6 176
Wealth index quintile
Poorest 12.9 57.7 0.6 11.7 65.4 19.0 34.6 1,108 15.0 71.9 0.5 14.1 86.2 384 Second 19.1 61.3 1.6 9.6 74.8 11.5 44.2 724 19.9 73.3 1.3 9.7 90.6 320 Middle 16.6 65.9 1.6 7.5 77.4 12.1 42.4 581 16.2 79.5 2.9 8.9 92.7 246 Fourth 18.2 69.3 1.6 5.1 81.8 11.0 44.0 486 14.9 83.7 0.4 3.9 97.4 214 Richest 17.6 72.8 1.0 4.6 87.1 7.2 59.2 432 12.4 85.7 0.6 6.4 94.8 256
1 MICS indicator TC.19 - Care-seeking for children with acute respiratory infection (ARI) symptoms; SDG indicator 3.8.1 2 MICS indicator TC.20 - Antibiotic treatment for children with ARI symptoms A Community health providers includes both public (Lady health worker and Mobile/Outreach clinic) and private (Mobile clinic) health facilities B Includes all public and private health facilities and providers, as well as those who did not know if public or private. Excludes private pharmacy C Includes all public and private health facilities and providers, as well as those who did not know if public or private D The category of “DK/Missing” in the background characteristic of “Age” has been suppressed from the table due to a small number of unweighted cases
( ) Figures that are based on 25-49 unweighted cases
Thrive – Child Health, Nutrition & Development| Page 157
TC.6 MALARIA
Malaria is a major cause of death of children under age five worldwide.69 Preventive measures and
treatment with an effective antimalarial can dramatically reduce malaria mortality rates among
children.74
In 2010 the World Health Organization issued a recommendation for universal use of diagnostic
testing to confirm malaria infection and apply appropriate treatment based on the results. According
to the guidelines, treatment solely on the basis of clinical suspicion should only be considered when a
parasitological diagnosis is not accessible. This recommendation was based on studies that showed
substantial reduction in the proportion of fever that are associated with malaria to a low level.75 This
recommendation implies that the indicator on proportion of children with fever that received
antimalarial treatment is no longer an acceptable indicator of the level of treatment of malaria in the
population of children under age five. However, for purposes of comparisons, as well assessment of
patterns across socio-demographic characteristics, the indicator remains a standard MICS indicator.
Pregnant women living in places where malaria is highly prevalent are highly vulnerable to malaria. Once
infected, pregnant women risk anemia, premature delivery and stillbirth. Their babies are increased risk of low
birth weight, which carries an increased risk to die in infancy.76 For this reason, steps are taken to protect
pregnant women by distributing insecticide-treated mosquito nets and treatment during antenatal check-ups
with drugs that prevent malaria infection (Intermittent preventive treatment or IPT). WHO recommends a
schedule of at least four antenatal care visits during pregnancy? Starting as early as possible in the second
trimester, IPTp-SP (Intermittent preventive treatment in pregnancy with Sulphadoxine-Pyrimethamine) is
recommended for all pregnant women at each scheduled antenatal care visit until the time of delivery, provided
that the doses are given at least one month apart. SP should not be given during the first trimester of pregnancy;
however, the last dose of IPTp-SP can be administered up to the time of delivery without safety concerns.74
In the MICS Punjab, 2017-18 women age 15-49 years were asked of the medicines they had received to prevent
malaria in their last pregnancy during the 2 years preceding the survey. Women are considered to have received
intermittent preventive therapy if they have received at least 3 doses of SP/Fansidar during the pregnancy, at
least one of which was taken during antenatal care. Intermittent preventive treatment for malaria in pregnant
women who gave birth in the two years preceding the survey is presented in Table TC.6.9.
Table TC.6.10 presents the percentage of children under age five with fever in the last two weeks for
whom advice or treatment was sought by source of advice or treatment. Table TC.6.11 provide further
insight on treatment of children with fever.
Mothers were also asked to report all of the medicines given to a child to treat the fever, including
both medicines given at home and medicines given or prescribed at a health facility. Artemisinin-based
Combination therapy (ACT) is the recommended first line antimalarial recommended by the World
Health Organization and use in Pakistan. In addition, Table TC. 6.12 presents the percentage of
children age 0-59 months who had a fever in the last two weeks who had a finger or heel stick for
74 WHO. Guidelines for the treatment of malaria. Third Edition. Geneva: WHO Press, 2015.
http://apps.who.int/iris/bitstream/handle/10665/162441/9789241549127_eng.pdf?sequence=1. 75 D'Acremont, V. et al. "Reduction in the proportion of fevers associated with Plasmodium falciparum parasitaemia in
Africa: a systematic review.” Malaria Journal 9, no. 240 (2010). doi:10.1186/1475-2875-9-240. 76 Shulman, C. and K. Dorman. “Importance and prevention of malaria in pregnancy.” Trans R Soc Trop Med Hyg 97, no.1
(2003): 30–55. doi:10.1016/s0035-9203(03)90012-5.
Thrive – Child Health, Nutrition & Development| Page 158
malaria testing, who were given Artemisinin-based Combination Therapy (ACT) and any anti-malarial
drugs, and percentage who were given ACT among those who were given anti-malarial drugs. Where
Table TC.6.13 shows the percentage of children age 0-59 months with fever in the last two weeks who
were given anti-malarial by the source of anti-malarial.
Table TC.6.9: Use of Intermittent Preventive Treatment for malaria (IPTp) by women during pregnancy
Percentage of women age 15-49 years with a live birth in the last 2 years who took intermittent preventive treatment (IPTp) for malaria during the pregnancy of the most recent live birth, Punjab, 2017-18
Percentage of pregnant women:
Number of women with a live birth in the
last 2 years
Who took any medicine to
prevent malaria
who took SP/Fansidar:
At least once
Two or more times
Three or more times1
Four or more times
Punjab 2.8 2.8 1.4 0.6 0.4 15,656
Area of Residence
Rural 2.5 2.5 1.5 0.6 0.3 10,399
All Urban 3.4 3.4 1.2 0.7 0.5 5,257
Major Cities 3.9 3.9 1.3 0.9 0.6 2,739
Other Urban 2.8 2.8 1.2 0.5 0.3 2,518
Women's Education
None/Preschool 2.0 2.0 1.2 0.6 0.4 6,365
Primary 2.6 2.6 1.4 0.7 0.2 3,126
Lower secondary 2.3 2.3 0.8 0.2 0.1 1,663
Upper secondary 3.7 3.7 1.8 0.7 0.4 2,248
Higher 4.8 4.8 2.3 1.1 0.7 2,254
Wealth index quintile
Poorest 2.2 2.2 1.3 0.6 0.3 3,433
Second 2.0 2.0 1.3 0.6 0.4 3,110
Middle 2.2 2.2 1.5 0.4 0.2 3,182
Fourth 3.2 3.2 1.2 0.4 0.2 3,080
Richest 4.8 4.8 2.1 1.1 0.8 2,850
1 MICS indicator TC.25 - Intermittent preventive treatment for malaria during pregnancy
Thrive – Child Health, Nutrition & Development| Page 159
Table TC.6.10: Care-seeking during fever
Percentage of children age 0-59 months with fever in the last two weeks for whom advice or treatment was sought, by source of advice or treatment, Punjab, 2017-18
Percentage of children with fewer for whom:
Number of children with fever in last two weeks
Advice or treatment was sought from:
No advice or treatment
sought
Health facilities or providers
Other source
A health facility or
provider1,B Public Private
Community health
providerA
Punjab 14.7 62.3 1.0 8.6 81.0 16.1 10,885
Area of Residence
Rural 13.7 61.1 1.2 9.6 80.1 17.0 7,481
All Urban 16.8 64.9 0.6 6.5 83.0 14.1 3,404
Major Cities 16.8 67.4 0.5 5.5 84.3 12.6 1,654
Other Urban 16.8 62.6 0.7 7.4 81.7 15.6 1,750
Sex
Male 14.5 64.4 1.1 8.4 82.5 14.6 5,660
Female 14.9 60.0 1.0 8.9 79.3 17.7 5,225
Age (in months)C
0-11 12.5 63.5 1.2 7.6 79.4 17.8 2,249
12-23 13.6 63.1 0.7 9.2 81.2 15.9 2,511
24-35 15.9 62.5 1.1 8.0 82.9 14.9 2,158
36-47 16.0 60.2 1.2 8.4 79.6 17.3 2,071
48-59 15.8 61.9 1.1 10.1 81.9 14.3 1,892
Mother's functional difficulties
Has functional difficulty 16.7 58.3 0.6 6.2 78.1 19.7 329
Has no functional difficulty 14.6 62.4 1.1 8.7 81.1 16.0 10,414
No information 14.2 61.4 0.0 11.0 80.3 14.8 142
Mother’s education
None/Preschool 13.6 58.7 0.9 10.9 78.6 18.2 4,799
Primary 16.2 62.5 1.1 8.5 83.1 14.4 2,305
Lower secondary 16.1 64.6 1.1 5.9 82.0 15.0 1,100
Upper secondary 16.4 64.8 1.3 6.4 82.3 14.4 1,458
Higher 12.7 70.8 0.9 4.8 83.9 13.7 1,223
Wealth index quintile
Poorest 14.4 55.4 1.1 11.8 76.8 19.9 2,801
Second 15.5 59.6 1.1 10.0 80.8 16.4 2,322
Middle 15.2 63.0 0.9 8.7 82.5 14.9 2,056
Fourth 15.3 67.2 1.2 5.5 82.9 14.0 2,045
Richest 12.6 70.9 0.8 5.0 84.0 13.4 1,661
1 MICS indicator TC.26 - Care-seeking for fever
A Community health providers includes both public (Lady health worker and Mobile/Outreach clinic) and private (Mobile clinic) health facilities
B Includes all public and private health facilities and providers, as well as those who did not know if public or private. Also includes shops C The category of “DK/Missing” in the background characteristic of “Age” has been suppressed from the table due to a small number of unweighted cases
Thrive – Child Health, Nutrition & Development| Page 160
Table TC.6.11: Treatment of children with fever
Percentage of children age 0-59 months who had a fever in the last two weeks, by type of medicine given for the illness, Punjab, 2017-18
Children with a fever in the last two weeks who were given:
Number of children with fever in last two weeks
Anti-malarials Other medications
Oth
er
DK
/ M
issin
g
SP
/ F
ansid
ar
Ch
loro
qu
ine
Am
od
ia-q
uin
e
Qu
inin
e p
ills
Qu
inin
e in
jectio
n/I
V
Art
esun
ate
recta
l
Art
esun
ate
in
jection
/IV
Art
em
isin
in-b
ase
d
Com
bin
atio
n
Th
era
py (
AC
T)
Oth
er
an
ti-m
ala
ria
l
Am
oxic
illin
Cotr
imoxazo
le
Oth
er
an
tib
iotic p
ill o
r
syru
p
Oth
er
an
tib
iotic
inje
ction
Pa
raceta
mo
l/
Pa
na
dol/
Aceta
min
op
hen
Asp
irin
Ibu
pro
fen
Punjab 0.3 0.1 0.1 0.1 0.2 0.1 0.3 0.1 0.2 7.5 0.9 28.2 5.6 42.0 2.1 25.7 12.2 6.2 10,885
Area of Residence
Rural 0.2 0.1 0.1 0.1 0.2 0.1 0.3 0.1 0.2 7.4 1.1 26.0 5.3 41.2 1.8 26.4 12.4 6.6 7,481 All Urban 0.4 0.2 0.1 0.2 0.2 0.0 0.3 0.1 0.2 7.7 0.4 33.0 6.1 43.7 2.7 24.1 11.6 5.2 3,404
Major Cities 0.8 0.3 0.1 0.1 0.0 0.0 0.2 0.0 0.3 7.8 0.3 41.0 6.9 46.6 3.6 22.2 8.1 3.4 1,654 Other Urban 0.0 0.0 0.0 0.3 0.4 0.0 0.3 0.1 0.1 7.6 0.6 25.5 5.3 40.9 1.9 26.0 14.9 7.0 1,750
Sex
Male 0.3 0.0 0.1 0.1 0.2 0.0 0.3 0.1 0.2 8.0 0.9 29.3 5.6 41.8 2.2 25.4 12.6 6.2 5,660 Female 0.2 0.1 0.0 0.2 0.2 0.1 0.2 0.1 0.2 7.0 0.9 27.0 5.5 42.1 2.0 25.9 11.7 6.1 5,225
Age (in months)A
0-11 0.1 0.0 0.2 0.0 0.1 0.0 0.3 0.1 0.2 6.1 0.7 26.6 5.8 47.2 2.0 19.5 13.7 5.0 2,249 12-23 0.3 0.0 0.0 0.2 0.1 0.1 0.4 0.2 0.3 7.6 1.0 27.9 6.3 41.6 2.0 25.2 12.6 5.6 2,511 24-35 0.2 0.1 0.0 0.2 0.3 0.1 0.1 0.2 0.2 8.1 0.9 28.8 5.3 41.2 2.4 27.1 12.0 7.0 2,158 36-47 0.3 0.1 0.1 0.2 0.1 0.0 0.3 0.0 0.1 7.8 1.0 29.0 5.5 39.7 1.6 28.5 10.9 7.0 2,071 48-59 0.3 0.3 0.1 0.2 0.3 0.1 0.2 0.1 0.2 8.1 0.9 28.9 4.9 39.6 2.4 28.9 11.2 6.6 1,892
Mother's functional difficulties
Has functional difficulty 0.0 0.0 0.0 0.3 0.0 0.0 0.7 0.7 0.3 6.3 0.8 19.6 5.2 37.7 3.2 29.3 21.0 5.4 329 Has no functional difficulty 0.3 0.1 0.1 0.1 0.2 0.1 0.2 0.1 0.2 7.5 0.9 28.4 5.6 42.2 2.1 25.7 11.9 6.1 10,414 No information 0.0 0.0 0.0 0.0 0.0 0.0 0.0 0.0 0.0 8.9 1.4 33.2 4.0 35.7 1.9 17.3 8.2 12.2 142
Mother’s education
None/Preschool 0.1 0.0 0.1 0.2 0.2 0.0 0.3 0.1 0.2 7.1 1.3 25.1 5.5 37.4 1.4 25.1 11.6 8.2 4,799 Primary 0.3 0.0 0.0 0.0 0.0 0.0 0.1 0.0 0.2 7.4 0.8 27.3 5.0 42.7 2.1 26.3 12.6 5.5 2,305 Lower secondary 0.4 0.2 0.0 0.3 0.1 0.0 0.2 0.1 0.1 7.1 0.3 31.6 6.2 44.0 3.6 27.1 13.7 5.0 1,100 Upper secondary 0.4 0.2 0.2 0.1 0.2 0.1 0.4 0.3 0.2 8.5 0.6 30.0 5.4 48.4 2.9 25.7 11.8 4.5 1,458 Higher 0.4 0.2 0.1 0.0 0.1 0.2 0.3 0.2 0.4 8.6 0.4 36.9 6.5 48.7 2.6 25.6 12.4 2.3 1,223
Wealth index quintile
Poorest 0.2 0.1 0.1 0.1 0.3 0.0 0.4 0.1 0.1 6.6 1.4 21.3 5.4 33.2 1.0 26.2 12.0 9.4 2,801 Second 0.2 0.0 0.1 0.2 0.0 0.0 0.3 0.0 0.3 9.1 1.1 25.7 5.7 41.3 1.5 26.9 12.5 5.3 2,322 Middle 0.0 0.1 0.0 0.0 0.1 0.0 0.2 0.1 0.1 6.5 0.8 28.6 5.0 45.2 2.5 24.6 12.8 6.3 2,056 Fourth 0.5 0.2 0.1 0.1 0.2 0.1 0.2 0.1 0.4 7.8 0.5 31.3 5.1 47.3 2.8 24.2 13.4 4.8 2,045 Richest 0.4 0.2 0.0 0.2 0.1 0.1 0.2 0.1 0.1 7.8 0.2 39.1 7.0 47.2 3.4 26.2 9.6 3.4 1,661
A The category of “DK/Missing” in the background characteristic of “Age” has been suppressed from the table due to a small number of unweighted cases
Thrive – Child Health, Nutrition & Development| Page 161
Table TC.6.12: Diagnostics and anti-malarial treatment of children
Percentage of children age 0-59 months who had a fever in the last two weeks who had a finger or heel stick for malaria testing, who were given Artemisinin-based Combination Therapy (ACT) and any anti-malarial drugs, and percentage who were given ACT among those who were given anti-malarial drugs, Punjab, 2017-18
Percentage of children with fever who:
Number of children with
fever in the last two weeks
Treatment with ACT among children with fever who received anti-malarial
treatment3
Number of children with fever in the last two
weeks who were given any antimalarial drugs
Had blood taken from a finger or
heel for testing1
Were given:
Artemisinin-based Combination
Therapy (ACT)
ACT the same or next day
Any antimalarial
drugs2
Any antimalarial drugs same or
next day
Punjab 3.4 0.1 0.1 1.3 1.0 10,885 8.2 138 Area of Residence
Rural 3.3 0.1 0.1 1.1 0.9 7,481 10.6 85 All Urban 3.6 0.1 0.0 1.6 1.4 3,404 (4.3) 53
Major Cities 3.2 0.0 0.0 1.9 1.7 1,654 (*) 31 Other Urban 4.0 0.1 0.1 1.3 1.1 1,750 (*) 22
Sex Male 3.8 0.1 0.1 1.3 1.1 5,660 9.2 76 Female 3.0 0.1 0.1 1.2 0.9 5,225 6.9 62
Age (in months)A 0-11 3.2 0.1 0.0 0.9 0.6 2,249 (*) 21 12-23 3.6 0.2 0.1 1.5 1.3 2,511 (12.7) 37 24-35 3.6 0.2 0.2 1.2 0.9 2,158 (13.2) 26 36-47 3.0 0.0 0.0 1.0 1.0 2,071 (*) 21 48-59 3.6 0.1 0.1 1.7 1.3 1,892 (5.0) 33
Mother's functional difficulties Has functional difficulty 1.9 0.7 0.7 2.0 1.6 329 (*) 6 Has no functional difficulty 3.5 0.1 0.1 1.3 1.0 10,414 6.9 131 No information 2.5 0.0 0.0 0.0 0.0 142 - -
Mother’s education None/Preschool 2.9 0.1 0.1 1.2 0.9 4,799 7.3 56 Primary 2.8 0.0 0.0 0.7 0.6 2,305 (*) 15 Lower secondary 3.7 0.1 0.0 1.4 1.2 1,100 (*) 15 Upper secondary 4.9 0.3 0.3 1.9 1.6 1,458 (13.4) 28 Higher 4.7 0.2 0.2 1.9 1.5 1,223 (*) 24
Wealth index quintile Poorest 2.9 0.1 0.1 1.2 0.9 2,801 (11.0) 33 Second 2.8 0.0 0.0 1.2 1.0 2,322 (2.3) 28 Middle 3.3 0.1 0.1 0.7 0.6 2,056 (*) 15 Fourth 3.3 0.1 0.1 1.9 1.4 2,045 (5.5) 39 Richest 5.2 0.1 0.1 1.4 1.3 1,661 (*) 23
1 MICS indicator TC.27 - Malaria diagnostics usage 2 MICS indicator TC.28 - Anti-malarial treatment of children under age 5 3 MICS indicator TC.29 - Treatment with Artemisinin Combination Therapy (ACT) among children who received anti-malarial treatment A The category of “DK/Missing” in the background characteristic of “Age” has been suppressed from the table due to a small number of unweighted cases ( ) Figures that are based on 25-49 unweighted cases (*) Figures that are based on fewer than 25 unweighted cases "-" denotes 0 unweighted cases in that cell
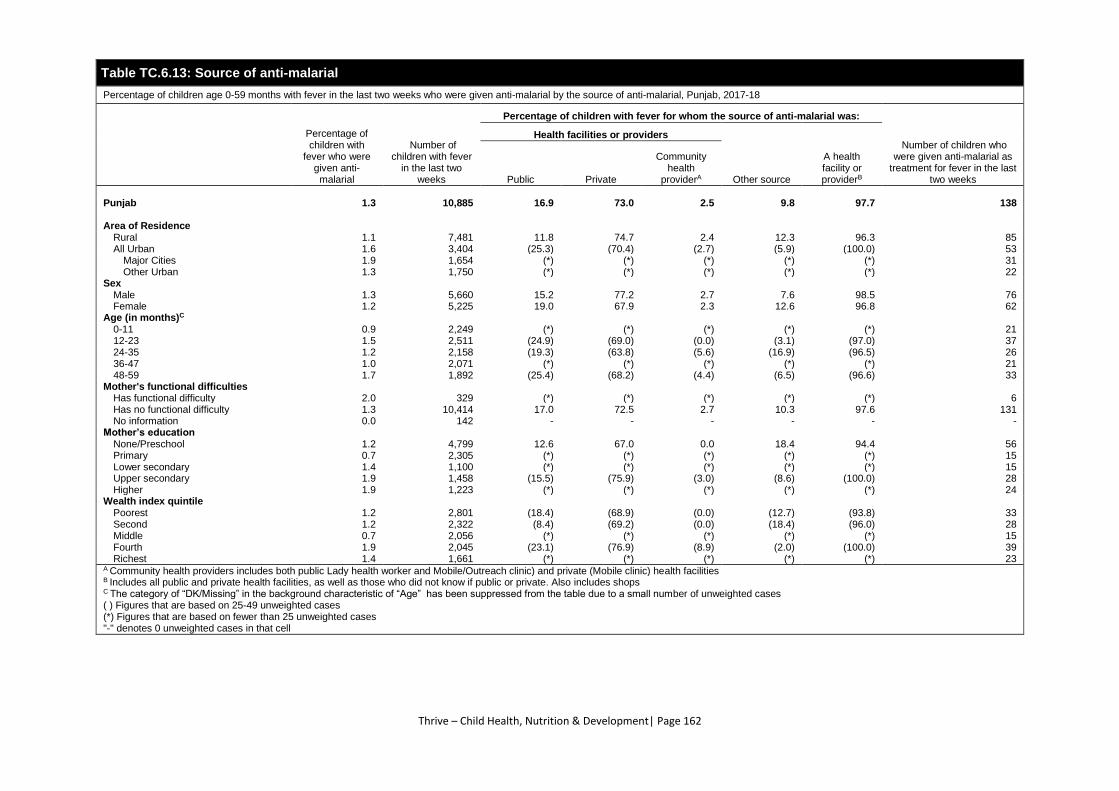
Thrive – Child Health, Nutrition & Development| Page 162
Table TC.6.13: Source of anti-malarial
Percentage of children age 0-59 months with fever in the last two weeks who were given anti-malarial by the source of anti-malarial, Punjab, 2017-18
Percentage of children with
fever who were given anti-malarial
Number of children with fever
in the last two weeks
Percentage of children with fever for whom the source of anti-malarial was:
Number of children who were given anti-malarial as
treatment for fever in the last two weeks
Health facilities or providers
Other source
A health facility or providerB Public Private
Community health
providerA
Punjab 1.3 10,885 16.9 73.0 2.5 9.8 97.7 138
Area of Residence
Rural 1.1 7,481 11.8 74.7 2.4 12.3 96.3 85 All Urban 1.6 3,404 (25.3) (70.4) (2.7) (5.9) (100.0) 53
Major Cities 1.9 1,654 (*) (*) (*) (*) (*) 31 Other Urban 1.3 1,750 (*) (*) (*) (*) (*) 22
Sex
Male 1.3 5,660 15.2 77.2 2.7 7.6 98.5 76 Female 1.2 5,225 19.0 67.9 2.3 12.6 96.8 62
Age (in months)C
0-11 0.9 2,249 (*) (*) (*) (*) (*) 21 12-23 1.5 2,511 (24.9) (69.0) (0.0) (3.1) (97.0) 37 24-35 1.2 2,158 (19.3) (63.8) (5.6) (16.9) (96.5) 26 36-47 1.0 2,071 (*) (*) (*) (*) (*) 21 48-59 1.7 1,892 (25.4) (68.2) (4.4) (6.5) (96.6) 33
Mother's functional difficulties
Has functional difficulty 2.0 329 (*) (*) (*) (*) (*) 6 Has no functional difficulty 1.3 10,414 17.0 72.5 2.7 10.3 97.6 131 No information 0.0 142 - - - - - -
Mother’s education
None/Preschool 1.2 4,799 12.6 67.0 0.0 18.4 94.4 56 Primary 0.7 2,305 (*) (*) (*) (*) (*) 15 Lower secondary 1.4 1,100 (*) (*) (*) (*) (*) 15 Upper secondary 1.9 1,458 (15.5) (75.9) (3.0) (8.6) (100.0) 28 Higher 1.9 1,223 (*) (*) (*) (*) (*) 24
Wealth index quintile
Poorest 1.2 2,801 (18.4) (68.9) (0.0) (12.7) (93.8) 33 Second 1.2 2,322 (8.4) (69.2) (0.0) (18.4) (96.0) 28 Middle 0.7 2,056 (*) (*) (*) (*) (*) 15 Fourth 1.9 2,045 (23.1) (76.9) (8.9) (2.0) (100.0) 39 Richest 1.4 1,661 (*) (*) (*) (*) (*) 23
A Community health providers includes both public Lady health worker and Mobile/Outreach clinic) and private (Mobile clinic) health facilities B Includes all public and private health facilities, as well as those who did not know if public or private. Also includes shops C The category of “DK/Missing” in the background characteristic of “Age” has been suppressed from the table due to a small number of unweighted cases ( ) Figures that are based on 25-49 unweighted cases (*) Figures that are based on fewer than 25 unweighted cases "-" denotes 0 unweighted cases in that cell
Thrive – Child Health, Nutrition & Development| Page 163
TC.7 INFANT AND YOUNG CHILD FEEDING
Optimal infant and young child feeding practices can increase survival and promote healthy growth
and development, particularly during the critical window from birth to 2 years of age.
Breastfeeding in the first few years of life protects children from infection, provides an ideal source of
nutrients and is economical and safe.77 Despite these critical benefits, breastfeeding practices are
suboptimal in many parts of the world. Many children do not start breastfeeding early enough, do not
breastfeed exclusively for the recommended six months or stop breastfeeding too soon.78 Mothers
often face pressures to switch to infant formula, which can contribute to growth faltering and
micronutrient malnutrition. Infant formula and other breastmilk substitutes can also be life-
threatening in settings where hygienic conditions and safe drinking water are not readily available. In
some cases, it can be unsafe even with proper and hygienic preparation in the home due to food
adulteration or other contamination that can affect unaware consumers.79 As children reach the age
of 6 months, their consumption of appropriate, adequate and safe complementary foods and
continued breastfeeding leads to better health and growth outcomes, with the potential to reduce
stunting during the first two years of life.80
UNICEF and WHO recommend that infants be: (i) breastfed within one hour of birth; (ii) breastfed
exclusively for the first six months of life; and (iii) breastfed for up to 2 years of age and beyond.81
Starting at 6 months, breastfeeding should be combined with safe, age-appropriate feeding of solid,
semi-solid and soft foods with specific guiding principles available about how the feeding should be
done with topics ranging from food consistency to responsive feeding.82,83 The breastfeeding
recommendations and guiding principles for complementary feeding for which standard indicators84,85
have been developed, and which are collected in this survey, are listed in the table below.
77 Victora, C. et al. “Breastfeeding in the 21st century: epidemiology, mechanisms, and lifelong effect.” The Lancet 387, (2016): 475–90. doi: https://doi.org/10.1016/S0140-6736(15)01024-7 78 UNICEF. From the first hour of life. Making the case for improved infant and young child feeding everywhere. New York: UNICEF, 2016. https://data.unicef.org/wp-content/uploads/2016/10/From-the-first-hour-of-life.pdf 79 Gossner, C. et al. “The Melamine incident: Implications for international food and feed safety.” Environ Health Perspective 117, no. 12 (2009): 1803–1808. doi: 10.1289/ehp.0900949 80 Bhuta, Z. et al. “Evidence-based interventions for improvement of maternal and child nutrition: what can be done and at what cost?” The Lancet 382, no. 9890 (2013):452-477. doi: 10.1016/S0140-6736(13)60996-4 81 WHO. Implementing the Global Strategy for Infant and Young Child Feeding. Meeting Report, Geneva: WHO Press, 2003. http://apps.who.int/iris/bitstream/handle/10665/42590/9241562218.pdf?sequence=1 82 PAHO. Guiding principles for complementary feeding of the breastfed child. 2003. 83 WHO. Guiding principles for feeding non-breastfed children 6-24 months of age. Geneva: WHO Press, 2005. http://apps.who.int/iris/bitstream/handle/10665/43281/9241593431.pdf?sequence=1 84 WHO, UNICEF, USAID, AED, UCDAVIS, IFPRI. Indicators for assessing infant and young child feeding practices, Part I
definitions. 2008. 85 UNICEF, FANTA, USAID, WHO. Reconsidering, refining and extending the WHO IYCF Indicators. Meeting Report, New York, 2017. https://data.unicef.org/resources/meeting-report-infant-young-child-feeding-indicators/
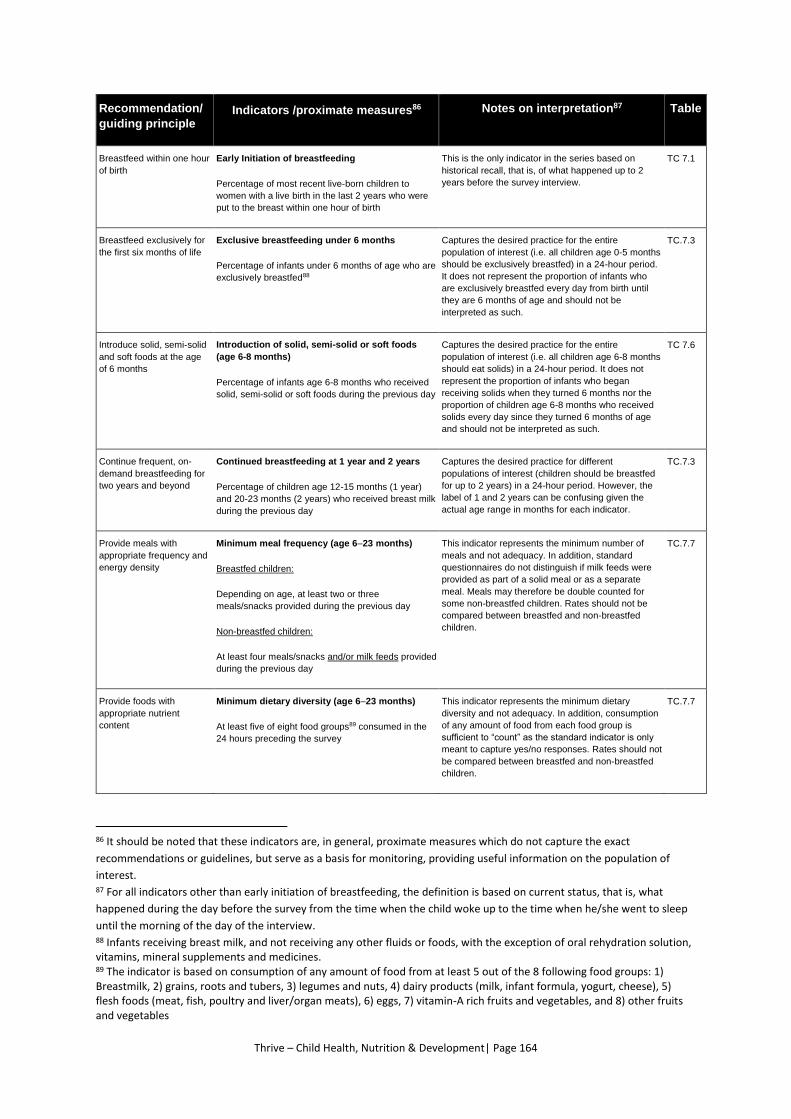
Thrive – Child Health, Nutrition & Development| Page 164
Recommendation/
guiding principle Indicators /proximate measures86 Notes on interpretation87 Table
Breastfeed within one hour
of birth
Early Initiation of breastfeeding
Percentage of most recent live-born children to
women with a live birth in the last 2 years who were
put to the breast within one hour of birth
This is the only indicator in the series based on
historical recall, that is, of what happened up to 2
years before the survey interview.
TC 7.1
Breastfeed exclusively for
the first six months of life
Exclusive breastfeeding under 6 months
Percentage of infants under 6 months of age who are
exclusively breastfed88
Captures the desired practice for the entire
population of interest (i.e. all children age 0-5 months
should be exclusively breastfed) in a 24-hour period.
It does not represent the proportion of infants who
are exclusively breastfed every day from birth until
they are 6 months of age and should not be
interpreted as such.
TC.7.3
Introduce solid, semi-solid
and soft foods at the age
of 6 months
Introduction of solid, semi-solid or soft foods
(age 6-8 months)
Percentage of infants age 6-8 months who received
solid, semi-solid or soft foods during the previous day
Captures the desired practice for the entire
population of interest (i.e. all children age 6-8 months
should eat solids) in a 24-hour period. It does not
represent the proportion of infants who began
receiving solids when they turned 6 months nor the
proportion of children age 6-8 months who received
solids every day since they turned 6 months of age
and should not be interpreted as such.
TC 7.6
Continue frequent, on-
demand breastfeeding for
two years and beyond
Continued breastfeeding at 1 year and 2 years
Percentage of children age 12-15 months (1 year)
and 20-23 months (2 years) who received breast milk
during the previous day
Captures the desired practice for different
populations of interest (children should be breastfed
for up to 2 years) in a 24-hour period. However, the
label of 1 and 2 years can be confusing given the
actual age range in months for each indicator.
TC.7.3
Provide meals with
appropriate frequency and
energy density
Minimum meal frequency (age 6–23 months)
Breastfed children:
Depending on age, at least two or three
meals/snacks provided during the previous day
Non-breastfed children:
At least four meals/snacks and/or milk feeds provided
during the previous day
This indicator represents the minimum number of
meals and not adequacy. In addition, standard
questionnaires do not distinguish if milk feeds were
provided as part of a solid meal or as a separate
meal. Meals may therefore be double counted for
some non-breastfed children. Rates should not be
compared between breastfed and non-breastfed
children.
TC.7.7
Provide foods with
appropriate nutrient
content
Minimum dietary diversity (age 6–23 months)
At least five of eight food groups89 consumed in the
24 hours preceding the survey
This indicator represents the minimum dietary
diversity and not adequacy. In addition, consumption
of any amount of food from each food group is
sufficient to “count” as the standard indicator is only
meant to capture yes/no responses. Rates should not
be compared between breastfed and non-breastfed
children.
TC.7.7
86 It should be noted that these indicators are, in general, proximate measures which do not capture the exact
recommendations or guidelines, but serve as a basis for monitoring, providing useful information on the population of
interest. 87 For all indicators other than early initiation of breastfeeding, the definition is based on current status, that is, what
happened during the day before the survey from the time when the child woke up to the time when he/she went to sleep
until the morning of the day of the interview. 88 Infants receiving breast milk, and not receiving any other fluids or foods, with the exception of oral rehydration solution, vitamins, mineral supplements and medicines. 89 The indicator is based on consumption of any amount of food from at least 5 out of the 8 following food groups: 1) Breastmilk, 2) grains, roots and tubers, 3) legumes and nuts, 4) dairy products (milk, infant formula, yogurt, cheese), 5) flesh foods (meat, fish, poultry and liver/organ meats), 6) eggs, 7) vitamin-A rich fruits and vegetables, and 8) other fruits and vegetables

Thrive – Child Health, Nutrition & Development| Page 165
Recommendation/
guiding principle Indicators /proximate measures86 Notes on interpretation87 Table
Provide an appropriate
amount of food
No standard indicator exists na
Provide food with
appropriate consistency
No standard indicator exists na
Use of vitamin-mineral
supplements or fortified
products
No standard indicator exists na
Safe preparation and
storage of foods
While it was not possible to develop indicators to fully
capture guidance, one indicator does cover part of
the principle: Not feeding with a bottle with a nipple
TC.7.8
Responsive feeding No standard indicator exists na
na: not applicable
In addition to the indicators in the table above, three dimensions of complementary feeding are
combined to form a composite indicator of “minimum acceptable diet”. This indicator assesses energy
needs and nutrient adequacy (apart from iron). To have a minimum acceptable diet, a child must have
received in the previous day:
(i) The appropriate number of meals/snacks/milk feeds;
(ii) Food items from at least 5 out of 8 food groups for breastfed children; and 4 out of 790 food groups
for non-breastfed children; and
(iii) At least two milk feeds for non-breastfed children.
Table TC.7.1 is based on mothers’ reports of when their last-born child, born in the last two years, was
first put to the breast. It indicates the proportion who were ever breastfed, as well as those who were
first breastfed within one hour and one day of birth.
Table TC.7.2 presents information about liquids or other items newborns were given in the first 3 days
of life, apart from breastmilk. The data are disaggregated by various background characteristics,
including whether the child was ever breastfed or not.
The set of infant and young child feeding indicators reported in tables TC.7.3 through TC.7.6 are based
on the mother’s report of consumption of food and liquids during the day or night prior to being
interviewed. Data are subject to a number of limitations, some related to the respondent’s ability to
provide a full report on the child’s liquid and food intake due to recall errors, as well as lack of
knowledge in cases where the child was fed by other individuals.
In Table TC.7.3, breastfeeding status is presented for exclusively breastfed infants age 0–5 months (i.e.
those who receive only breastmilk) and predominantly breastfed infants age 0–5 months (i.e. those
who receive breastmilk in addition to plain water and/or non-milk liquids). The table also shows
continued breastfeeding of children age 12–15 months and age 20–23 months.
90 Note that the denominator becomes 7 food groups for non-breastfed children in the composite indicator as the milk products group is removed from diet diversity, as this is assessed separately.
Thrive – Child Health, Nutrition & Development| Page 166
Table TC.7.4 shows the median duration of any breastfeeding among children age 0–35 months and
the median duration of exclusive breastfeeding and predominant breastfeeding among children age
0–23 months.
The age-appropriateness of breastfeeding practices for children under the age of 24 months is
provided in Table TC.7.5. Different feeding criteria are used depending on the age of the child. For
infants age 0–5 months, exclusive breastfeeding is considered age-appropriate feeding, while children
age 6–23 months are considered appropriately fed if they are receiving breastmilk and solid, semi-
solid or soft foods.
Table TC.7.6 further looks into the introduction of solid, semi-solid, or soft foods for infants age 6–8
months, while Table TC.7.7 presents the percentage of children age 6–23 months who received the
minimum number and diversity of meals/snacks during the previous day (referring to solid, semi-solid,
or soft food, but also milk feeds for non-breastfed children), by breastfeeding status.
The continued practice of bottle-feeding is a concern because of the potential for contamination if the
bottle and/or nipple are not properly cleaned or sterilized. Bottle-feeding can also hinder
breastfeeding due to nipple confusion, especially at the youngest ages.91 Table TC.7.8 presents the
percentage of children aged 0–23 months who were bottle-fed with a nipple during the previous day.
91 Zimmerman, E. and K. Thopmson. “Clarifying Nipple confusion.” J Perinatol 35, no.11 (2015):895-9. doi:
10.1038/jp.2015.83.

Thrive – Child Health, Nutrition & Development| Page 167
Table TC.7.1: Initial breastfeeding
Percentage of most recent live-born children to women age 15-49 years with a live birth in the last two years who were ever breastfed, breastfed within one hour of birth and within one day of birth, Punjab, 2017-18
Percentage who were ever
breastfed1
Percentage of children who were first breastfed:
Number of most recent live-born children to
women with a live birth in the last 2 years
Within one hour of birth2
Within one day of birth
Punjab 92.1 9.5 39.4 15,656
Area of Residence
Rural 92.0 8.6 38.2 10,399
All Urban 92.1 11.4 41.9 5,257
Major Cities 91.9 13.4 44.1 2,739
Other Urban 92.2 9.1 39.5 2,518
Months since last birth
0-11 months 92.2 9.6 38.1 8,121
12-23 months 91.9 9.5 40.8 7,535
Assistance at delivery
Skilled attendant 92.2 9.4 39.3 15,356
Traditional birth attendant 86.3 15.2 49.0 252
Other/No attendant 90.2 15.2 46.6 48
Place of delivery
Home 93.3 11.4 46.4 4,134
Health facility 91.7 8.9 36.9 11,469
Public 92.3 11.8 46.2 4,653
Private 91.3 6.9 30.6 6,816
Other/DK/Missing (65.7) (11.8) (37.4) 53
Type of delivery
Vaginal birth 92.8 11.8 47.8 11,117
C-Section 90.2 4.1 18.8 4,538
Mother's functional difficulties
Has functional difficulty 85.8 10.5 38.3 283
Has no functional difficulty 92.2 9.5 39.4 15,303
Mother’s education
None/Preschool 92.0 9.7 40.1 6,365
Primary 92.7 8.3 39.1 3,126
Lower secondary 91.0 9.4 38.3 1,663
Upper secondary 91.1 10.1 38.3 2,248
Higher 92.9 10.2 39.9 2,254
Wealth index quintile
Poorest 93.4 8.8 40.5 3,433
Second 92.0 7.7 37.7 3,110
Middle 91.6 9.1 37.6 3,182
Fourth 91.1 10.9 41.0 3,080
Richest 92.1 11.5 40.3 2,850
1 MICS indicator TC.30 - Children ever breastfed
2 MICS indicator TC.31 - Early initiation of breastfeeding
( ) Figures that are based on 25-49 unweighted cases
Thrive – Child Health, Nutrition & Development| Page 168
Table TC.7.2: Newborn feeding
Percentage of most recent live-born children to women age 15-49 years with a live birth in the last 2 years by type of liquids or items (not considering breastmilk) consumed in the first 3 days of life, Punjab, 2017-18
Percentage of children who consumed: TypeA of liquids or items (not considering breastmilk) consumed in
the first 3 days of life
Number of most recent
live-born children to
women with a live birth in
the last 2 years
Milk
(oth
er
tha
n
bre
astm
ilk)
Pla
in w
ate
r
Su
ga
r o
r g
lucose
wate
r
Grip
e w
ate
r
Fru
it ju
ice
Infa
nt fo
rmula
Te
a/In
fusio
ns/
Tra
ditio
na
l h
erb
al
pre
pa
ratio
ns
Ho
ne
y
Pre
scrib
ed
me
dic
ine
/
OR
S/S
ug
ar-
sa
lt
so
lution
s
Oth
er
Milk
-ba
se
d
liqu
ids o
nly
No
n-m
ilk-
ba
sed
liqu
ids/
item
s o
nly
Bo
th
Any
Punjab 34.5 1.4 1.0 1.8 0.1 19.6 4.1 37.3 1.7 1.6
21.1 31.5 21.6 74.2 15,656
Area of Residence
Rural 38.7 1.3 1.1 1.6 0.1 17.5 4.2 37.4 1.7 1.7
20.6 33.1 22.1 75.8 10,399 All Urban 26.2 1.7 0.9 2.4 0.1 23.7 4.0 37.2 1.5 1.5
22.0 28.3 20.7 71.0 5,257
Major Cities 20.2 2.3 0.8 2.7 0.0 28.0 3.2 34.9 1.4 1.8
20.1 26.9 20.5 67.4 2,739
Other Urban 32.7 1.0 1.0 2.1 0.3 19.1 4.8 39.8 1.7 1.2
24.0 29.9 20.9 74.8 2,518
Months since last birth
0-11 months 34.3 1.3 1.0 1.7 0.1 19.7 4.0 36.7 1.6 1.8
20.6 31.5 21.6 73.7 8,121 12-23 months 34.6 1.6 1.0 2.0 0.1 19.5 4.2 38.0 1.8 1.5
21.5 31.5 21.7 74.7 7,535
Breastfeeding statusB
Ever breastfed 34.5 1.4 1.0 1.9 0.1 18.8 4.2 38.0 1.6 1.6
21.7 30.9 21.6 74.1 14,412 Never breastfed 34.9 2.2 1.3 1.3 0.1 29.3 2.7 30.0 2.1 2.6
14.1 39.1 22.8 76.1 1,222
Assistance at delivery
Skilled attendant 34.4 1.4 1.0 1.9 0.1 19.9 3.9 37.5 1.7 1.7
21.0 31.5 21.9 74.4 15,356 Traditional birth attendant 38.7 0.6 0.6 0.5 0.0 2.0 13.6 28.1 1.0 1.1
25.9 30.6 9.8 66.3 252
Other/No attendant 39.6 2.3 0.0 0.0 0.0 0.0 4.3 19.2 0.0 0.0
19.3 33.0 6.5 58.8 48 Place of delivery
Home 45.2 1.3 0.7 1.5 0.1 3.6 5.3 36.9 1.4 1.9
24.6 30.1 18.3 73.0 4,134 Health facility 30.7 1.5 1.1 2.0 0.1 25.4 3.7 37.6 1.8 1.5
19.8 32.0 22.9 74.8 11,469
Public 29.7 1.6 1.1 1.8 0.1 17.5 4.2 36.0 1.8 1.6
22.4 27.5 19.0 68.9 4,653 Private 31.3 1.4 1.1 2.2 0.1 30.8 3.3 38.6 1.8 1.5
18.1 35.0 25.6 78.7 6,816
Other/DK/Missing (25.4) (0.0) (0.0) (0.0) (0.0) (6.0) (4.3) (15.4) (2.2) (1.2) (9.4) (23.9) (7.5) (40.9) 53 Mother's functional difficulties
Has functional difficulty 30.1 1.3 0.3 1.2 0.0 19.0 5.1 34.3 1.7 2.8
20.8 29.0 19.8 69.6 283 Has no functional difficulty 34.5 1.4 1.0 1.9 0.1 19.6 4.1 37.4 1.7 1.6
21.1 31.5 21.7 74.3 15,303
Mother’s education
None/Preschool 42.2 1.3 0.9 1.5 0.0 12.4 4.8 34.0 1.5 1.7
20.2 34.2 19.6 74.0 6,365 Primary 35.8 1.1 0.9 2.1 0.2 18.0 4.0 40.4 1.9 1.6
22.8 29.9 22.9 75.6 3,126
Lower secondary 28.9 2.0 1.3 2.4 0.1 23.1 3.8 39.8 2.2 1.5
22.8 28.5 22.7 74.0 1,663 Upper secondary 26.1 1.7 1.0 1.6 0.1 28.1 3.6 38.9 1.2 1.7
20.6 29.6 23.5 73.8 2,248
Higher 23.4 1.5 1.3 2.2 0.0 30.9 2.9 39.0 1.9 1.4
20.2 30.0 23.2 73.4 2,254 Wealth index quintile
Poorest 51.0 1.2 0.8 1.5 0.1 8.4 4.4 32.6 1.4 2.2
18.2 38.4 20.4 76.9 3,433 Second 42.1 1.3 1.1 1.5 0.0 14.9 4.2 37.3 1.5 1.3
20.5 34.0 22.0 76.5 3,110
Middle 31.7 1.0 0.9 1.7 0.1 21.5 4.2 39.7 2.4 1.3
21.8 29.4 22.7 74.0 3,182 Fourth 23.8 2.0 1.1 2.2 0.0 24.3 3.8 39.2 1.6 1.6
23.7 26.5 21.0 71.2 3,080
Richest 20.8 1.8 1.1 2.5 0.2 31.1 3.8 38.3 1.4 1.7
21.4 28.1 22.4 71.9 2,850 A Milk-based liquids include milk (other than breastmilk) and infant formula. Non-milk-based include plain water, sugar or glucose water, gripe water, fruit juice, tea/infusions/traditional herbal preparations, honey and "other". Note that prescribed medicine/ORS/sugar-salt solutions are not included in any category. B The category of “Missing” in the background characteristic of “Breastfeeding status” has been suppressed from the table due to a small number of unweighted cases ( ) Figures that are based on 25-49 unweighted cases
Thrive – Child Health, Nutrition & Development| Page 169
Table TC.7.3: Breastfeeding status
Percentage of living children according to breastfeeding status at selected age groups, Punjab, 2017-18
Children age 0-3 months
Children age 0-5 months Children age 12-15
months Children age 20-23
months
Percent exclusively breastfed
Percent predominantly
breastfed
Number of
children
Percent exclusively breastfed1
Percent predominantly
breastfed2
Number of
children
Percent breastfed
(Continued breastfeeding
at 1 year)3
Number of
children
Percent breastfed
(Continued breastfeeding at 2 years)4
Number
of children
Punjab 49.2 56.4 2,948 42.1 50.1 4,570 60.9 2,862 34.9 2,179
Area of Residence
Rural 50.9 59.5 2,012 43.6 53.0 3,072 63.3 1,823 36.3 1,471 All Urban 45.5 49.8 936 38.8 44.1 1,498 56.7 1,039 32.0 707
Major Cities 38.7 43.4 487 36.0 41.0 753 55.1 561 33.6 413 Other Urban 52.8 56.7 449 41.7 47.1 745 58.6 478 29.6 294
Sex
Male 50.2 57.7 1,517 42.7 50.7 2,366 61.3 1,457 36.1 1,154 Female 48.1 55.2 1,431 41.4 49.4 2,203 60.5 1,405 33.6 1,025
Mother's functional difficulties
Has functional difficulty (52.1) (63.0) 35 40.7 49.1 65 60.5 58 (36.2) 40 Has no functional difficulty 49.4 56.5 2,880 42.3 50.2 4,456 61.0 2,776 35.0 2,121 No information (26.6) (46.9) 32 24.8 43.5 49 (51.2) 28 (*) 18
Mother’s education
None/Preschool 53.0 62.3 1,243 45.8 56.5 1,897 67.2 1,118 39.6 915 Primary 48.7 55.5 600 41.4 48.8 936 58.4 568 35.9 425 Lower secondary 46.6 51.7 315 39.4 45.9 503 61.7 282 24.8 230 Upper secondary 48.3 52.4 397 41.4 45.7 613 56.3 427 33.7 295 Higher 41.3 47.2 392 34.6 39.9 621 52.7 467 28.6 313
Wealth index quintile
Poorest 51.7 63.1 682 45.0 57.9 1,031 69.7 596 42.6 506 Second 48.9 57.6 577 41.5 51.3 917 64.5 535 31.6 437 Middle 52.5 58.8 619 45.9 52.8 935 56.4 582 33.3 442 Fourth 51.1 55.3 547 42.8 47.5 872 59.7 580 33.8 388 Richest 40.5 45.0 522 33.7 38.5 815 54.2 570 31.7 405
1 MICS indicator TC.32 - Exclusive breastfeeding under 6 months 2 MICS indicator TC.33 - Predominant breastfeeding under 6 months 3 MICS indicator TC.34 - Continued breastfeeding at 1 year 4 MICS indicator TC.35 - Continued breastfeeding at 2 years ( ) Figures that are based on 25-49 unweighted cases (*) Figures that are based on fewer than 25 unweighted cases
Thrive – Child Health, Nutrition & Development| Page 170
Table TC.7.4: Duration of breastfeeding
Median duration of any breastfeeding among children age 0-35 months and median duration of exclusive breastfeeding and predominant breastfeeding among children age 0-23 months, Punjab, 2017-18
Median duration (in
months) of any breastfeeding1
Number of children age 0-35 months
Median duration (in months) of: Number
of children age 0-23 months
Exclusive breastfeeding
Predominant breastfeeding
Punjab 17.4 23,822 1.5 2.5 15,960
Area of Residence
Rural 17.6 15,678 1.7 3.0 10,573
All Urban 17.1 8,144 0.7 1.1 5,387
Major Cities 16.2 4,267 0.6 0.7 2,845
Other Urban 17.6 3,876 1.6 2.1 2,542
Sex
Male 17.8 12,292 1.5 2.6 8,230
Female 17.1 11,530 1.5 2.4 7,730
Mother's functional difficulties
Has functional difficulty 16.9 441 1.3 2.4 266
Has no functional difficulty 17.5 23,160 1.5 2.5 15,543
Mother’s education
None/Preschool 18.9 9,726 1.9 3.7 6,469
Primary 17.6 4,678 1.5 2.3 3,172
Lower secondary 16.6 2,520 0.7 1.0 1,706
Upper secondary 15.5 3,445 1.4 1.8 2,281
Higher 14.9 3,454 0.9 1.2 2,332
Wealth index quintile
Poorest 19.1 5,157 1.9 3.8 3,491
Second 17.9 4,727 1.4 2.8 3,158
Middle 16.9 4,829 1.9 2.9 3,246
Fourth 16.6 4,702 1.7 2.1 3,131
Richest 15.5 4,407 0.7 0.7 2,934
1 MICS indicator TC.36 - Duration of breastfeeding
Thrive – Child Health, Nutrition & Development| Page 171
Table TC.7.5: Age-appropriate breastfeeding
Percentage of children age 0-23 months who were appropriately breastfed during the previous day, Punjab, 2017-18
Children age 0-5 months
Children age 6-23 months
Children age 0-23 months
Percent exclusively breastfed1
Number
of children
Percent currently
breastfeeding and receiving solid, semi-solid or soft
foods
Number
of children
Percent appropriately
breastfed2
Number of
children
Punjab 42.1 4,570
48.0 11,390
46.3 15,960
Area of Residence
Rural 43.6 3,072
48.6 7,501
47.2 10,573
All Urban 38.8 1,498
46.8 3,889
44.6 5,387
Major Cities 36.0 753
46.0 2,092
43.4 2,845
Other Urban 41.7 745
47.7 1,797
45.9 2,542
Sex
Male 42.7 2,366
48.3 5,864
46.7 8,230
Female 41.4 2,203
47.7 5,527
45.9 7,730
Mother's functional difficulties
Has functional difficulty 40.7 65
47.7 201
46.0 266
Has no functional difficulty 42.3 4,456
48.1 11,087
46.4 15,543
No information (24.8) 49
35.8 102
32.3 151
Mother’s education
None/Preschool 45.8 1,897
49.4 4,572
48.3 6,469
Primary 41.4 936
47.1 2,236
45.4 3,172
Lower secondary 39.4 503
44.4 1,203
42.9 1,706
Upper secondary 41.4 613
48.9 1,668
46.9 2,281
Higher 34.6 621
47.0 1,712
43.7 2,332
Wealth index quintile
Poorest 45.0 1,031
51.0 2,460
49.2 3,491
Second 41.5 917
48.6 2,241
46.6 3,158
Middle 45.9 935
45.0 2,311
45.3 3,246
Fourth 42.8 872
47.9 2,259
46.5 3,131
Richest 33.7 815
47.2 2,119
43.5 2,934
1 MICS indicator TC.32 - Exclusive breastfeeding under 6 months
2 MICS indicator TC.37 - Age-appropriate breastfeeding
( ) Figures that are based on 25-49 unweighted cases
Thrive – Child Health, Nutrition & Development| Page 172
Table TC.7.6: Introduction of solid, semi-solid, or soft foods
Percentage of infants age 6-8 months who received solid, semi-solid, or soft foods during the previous day, Punjab, 2017-18
Currently breastfeeding
Currently not breastfeeding All
Percent receiving
solid, semi-solid or soft
foods
Number of
children age 6-8 months
Percent receiving
solid, semi-solid or soft
foods
Number of
children age 6-8 months
Percent receiving
solid, semi-solid or soft
foods1
Number
of children age 6-8 months
Punjab 62.3 1,574 59.6 356 61.8 1,930
Area of Residence
Rural 60.3 1,082 55.2 224 59.4 1,305
All Urban 66.8 492 67.1 133 66.9 625
Major Cities 67.9 234 73.5 81 69.3 315
Other Urban 65.9 258 (57.2) 52 64.5 310
Sex
Male 61.3 803 60.1 182 61.1 984
Female 63.4 771 59.2 175 62.6 946
Mother's functional difficultiesA
Has functional difficulty (*) 17 (*) 5 (*) 22
Has no functional difficulty 62.1 1,545 59.8 345 61.7 1,889
Mother’s education
None/Preschool 50.8 644 45.8 132 49.9 777
Primary 62.3 301 57.0 71 61.3 372
Lower secondary 63.2 156 (76.3) 33 65.5 190
Upper secondary 81.0 231 71.6 59 79.1 290
Higher 74.8 241 72.2 60 74.2 302
Wealth index quintile
Poorest 52.4 363 43.7 60 51.2 423
Second 58.0 316 54.7 69 57.5 385
Middle 61.7 334 55.5 84 60.4 417
Fourth 68.6 311 74.0 68 69.5 379
Richest 75.3 250 68.3 76 73.7 326
1 MICS indicator TC.38 - Introduction of solid, semi-solid or soft foods A The category of “No information” in the background characteristic of “Mother's functional difficulties” has been suppressed from the table due to a small number of unweighted cases ( ) Figures that are based on 25-49 unweighted cases (*) Figures that are based on fewer than 25 unweighted cases
Thrive – Child Health, Nutrition & Development| Page 173
Table TC.7.7: Infant and young child feeding (IYCF) practices
Percentage of children age 6-23 months who received appropriate liquids and solid, semi-solid, or soft foods the minimum number of times or more during the previous day, by breastfeeding status, Punjab, 2017-18
Currently breastfeeding Currently not breastfeeding All
Percent of children who received: Number of
children age 6-
23 months
Percent of children who received: Number of
children age 6-
23 months
Percent of children who received: Number of
children age 6-
23 months
Minimum dietary
diversityA
Minimum meal
frequencyB
Minimum acceptable
diet1,C
Minimum dietary
diversityA
Minimum meal
frequencyB
Minimum acceptable
diet2,C
At least 2
milk feeds3
Minimum dietary
diversity4,A
Minimum meal
frequency5,B
Minimum acceptable
dietC
Punjab 16.1 52.0 14.0 6,660 10.6 84.9 9.3 80.7 4,730 13.8 65.7 12.1 11,390
Area of Residence
Rural 14.6 51.1 12.9 4,497 9.6 84.2 8.6 80.3 3,004 12.6 64.4 11.2 7,501 All Urban 19.0 53.8 16.3 2,163 12.4 86.2 10.6 81.4 1,726 16.1 68.2 13.8 3,889
Major Cities 21.2 55.5 17.9 1,134 12.0 85.8 10.7 82.1 958 17.0 69.3 14.6 2,092 Other Urban 16.6 51.9 14.6 1,029 12.8 86.7 10.5 80.6 768 15.0 66.8 12.9 1,797
Sex
Male 15.7 52.4 13.6 3,448 10.0 85.2 8.9 80.4 2,416 13.4 65.9 11.7 5,864 Female 16.4 51.5 14.4 3,213 11.3 84.6 9.7 81.0 2,314 14.3 65.4 12.5 5,527
Age (in months)
6-8 5.2 47.8 4.8 1,574 1.2 83.1 1.0 82.0 356 4.5 54.3 4.1 1,930 9-11 10.7 42.0 9.2 1,177 8.4 84.4 7.2 87.6 416 10.1 53.1 8.7 1,593 12-17 19.5 54.4 16.7 2,530 9.8 87.0 8.7 82.7 1,817 15.5 68.1 13.4 4,347 18-23 26.7 60.7 23.5 1,379 13.3 83.6 11.6 77.5 2,141 18.6 74.6 16.3 3,520
Mother's functional difficulties
Has functional difficulty 21.0 50.0 18.0 113 12.3 87.1 11.2 83.9 88 17.1 66.3 15.0 201 Has no functional difficulty 16.0 52.1 14.0 6,502 10.7 85.0 9.4 80.8 4,585 13.8 65.7 12.1 11,087 No information (10.8) (44.1) (8.0) 45 2.5 78.4 2.5 72.8 57 6.2 63.1 4.9 102
Mother’s education
None/Preschool 11.0 49.3 9.7 2,874 5.2 81.3 4.4 75.3 1,697 8.8 61.2 7.8 4,572 Primary 15.8 51.0 14.3 1,298 8.8 84.8 6.9 81.3 938 12.9 65.2 11.2 2,236 Lower secondary 16.3 48.3 14.4 654 14.6 90.3 13.5 86.9 549 15.5 67.4 14.0 1,203 Upper secondary 21.2 56.3 18.3 921 15.1 87.7 13.6 84.3 747 18.5 70.4 16.2 1,668 Higher 27.0 60.1 22.3 914 17.6 86.5 15.8 84.1 798 22.6 72.4 19.3 1,712
Wealth index quintile
Poorest 8.7 49.6 7.9 1,587 4.3 80.2 3.4 74.2 873 7.2 60.4 6.3 2,460 Second 13.4 49.8 12.3 1,347 6.1 85.1 5.4 80.7 894 10.5 63.8 9.5 2,241 Middle 15.6 50.4 14.0 1,299 12.3 85.8 10.9 82.4 1,012 14.1 65.9 12.6 2,311 Fourth 19.2 53.1 16.2 1,290 13.3 86.8 11.3 81.4 970 16.7 67.6 14.1 2,259 Richest 26.4 58.4 22.0 1,138 16.1 86.2 14.6 84.2 981 21.6 71.3 18.6 2,119
1 MICS indicator TC.39a - Minimum acceptable diet (breastfed children) 2 MICS indicator TC.39b - Minimum acceptable diet (non-breastfed children) 3 MICS indicator TC.40 - Milk feeding frequency for non-breastfed children 4 MICS indicator TC.41 - Minimum dietary diversity 5 MICS indicator TC.42 - Minimum meal frequency A Minimum dietary diversity is defined as receiving foods from at least 5 of 8 food groups: 1) breastmilk, 2) grains, roots and tubers, 3) legumes and nuts, 4) dairy products (milk, infant formula, yogurt, cheese), 5) flesh foods (meat, fish, poultry and liver/organ meats), 6) eggs, 7) vitamin-A rich fruits and vegetables, and 8) other fruits and vegetables. B Minimum meal frequency among currently breastfeeding children is defined as children who also received solid, semi-solid, or soft foods 2 times or more daily for children age 6-8 months and 3 times or more daily for children age 9-23 months. For non-breastfeeding children age 6-23 months it is defined as receiving solid, semi-solid or soft foods, or milk feeds, at least 4 times. C The minimum acceptable diet for breastfed children age 6-23 months is defined as receiving the minimum dietary diversity and the minimum meal frequency, while it for non-breastfed children further requires at least 2 milk feedings and that the minimum dietary diversity is achieved without counting milk feeds. ( ) Figures that are based on 25-49 unweighted cases
Thrive – Child Health, Nutrition & Development| Page 174
Table TC.7.8: Bottle feeding
Percentage of children age 0-23 months who were fed with a bottle with a nipple during the previous day, Punjab, 2017-18
Percentage of children age 0-23 months fed with a bottle with a
nipple1 Number of children
age 0-23 months
Punjab 56.6 15,963
Area of Residence
Rural 54.4 10,576
All Urban 61.1 5,387
Major Cities 64.3 2,845
Other Urban 57.4 2,542
Sex
Male 57.3 8,231
Female 56.0 7,732
Age (in months)
0-5 44.1 4,573
6-11 57.3 3,523
12-23 63.7 7,867
Mother's functional difficulties
Has functional difficulty 55.3 266
Has no functional difficulty 56.7 15,546
No information 58.2 151
Mother's education
None/Preschool 49.1 6,471
Primary 58.3 3,172
Lower secondary 59.6 1,707
Upper secondary 63.0 2,281
Higher 66.9 2,332
Wealth index quintile
Poorest 45.7 3,493
Second 54.1 3,158
Middle 58.2 3,247
Fourth 60.8 3,131
Richest 66.2 2,934
1 MICS indicator TC.43 - Bottle feeding
Thrive – Child Health, Nutrition & Development| Page 175
TC.8 MALNUTRITION
Children’s nutritional status reflects their overall health. When children have access to an adequate
food supply, are not exposed to repeated illness, and are well cared for, they reach their growth
potential and are considered well-nourished.
Undernutrition is associated with nearly half of all child deaths worldwide.92 Children suffering from
undernutrition are more likely to die from common childhood ailments, and those who survive often
suffer recurring sicknesses and faltering growth. Three-quarters of children who die from causes
related to undernutrition only had mild or moderate forms of undernutrition, meaning they showed
little outward sign of their vulnerability.93 The Sustainable Development Goal target 2.2 is to reduce
the prevalence of stunting among children under five by 40 per cent between 2012 and 2025 as well
as to reduce wasting to <5 per cent and have no increase in overweight over the same period. A
reduction in the prevalence of malnutrition will also contribute to the achievement of several other
global goals, including the goal to end preventable newborn and child deaths.
In a well-nourished population, there is a reference distribution of height and weight for how children
under 5 should grow. The reference population used in this report is based on the WHO growth
standards.94 Undernutrition in a population can be gauged by comparing children to this reference
population. Each of the three nutritional status indicators – weight-for-age, height-for-age, and
weight-for-height – can be expressed in standard deviation units (z-scores) from the median of the
reference population.
Weight-for-age is a measure of both acute and chronic malnutrition. Children whose weight-for-age
is more than two standard deviations below the median of the reference population are considered
moderately or severely underweight, while those whose weight-for-age is more than three standard
deviations below the median are classified as severely underweight.
Height-for-age is a measure of linear growth. Children whose height-for-age is more than two
standard deviations below the median of the reference population are considered short for their age
and are classified as moderately or severely stunted. Those whose height-for-age is more than three
standard deviations below the median are classified as severely stunted. Stunting, or chronic
malnutrition, is the result of failure to receive adequate nutrition in early life over an extended period
and/or recurrent or chronic illness.
Weight-for-height can be used to assess wasting and overweight status. Children whose weight-for-
height is more than two standard deviations below the median of the reference population are
classified as moderately or severely wasted, while those who fall more than three standard deviations
below the median are classified as severely wasted. Wasting is usually the result of poor nutrient
intake or disease. The prevalence of wasting may shift seasonally in response to changes in the
availability of food and/or disease prevalence.
92 Black, R. et al. “Maternal and Child Undernutrition and Overweight in Low-income and Middle-income Countries.” The
Lancet 382, no. 9890 (2013): 427–451. doi:10.1016/s0140-6736(13)60937-x 93 Black, R., et al. “Maternal and Child Undernutrition: global and regional exposures and health consequences.” The Lancet
371, no. 9608 (2008): 243–60. doi: 10.1016/S0140-6736(07)61690-0 94 WHO. Child Growth Standards. Technical Report, Geneva: WHO Press, 2006.
http://www.who.int/childgrowth/standards/Technical_report.pdf?ua=1
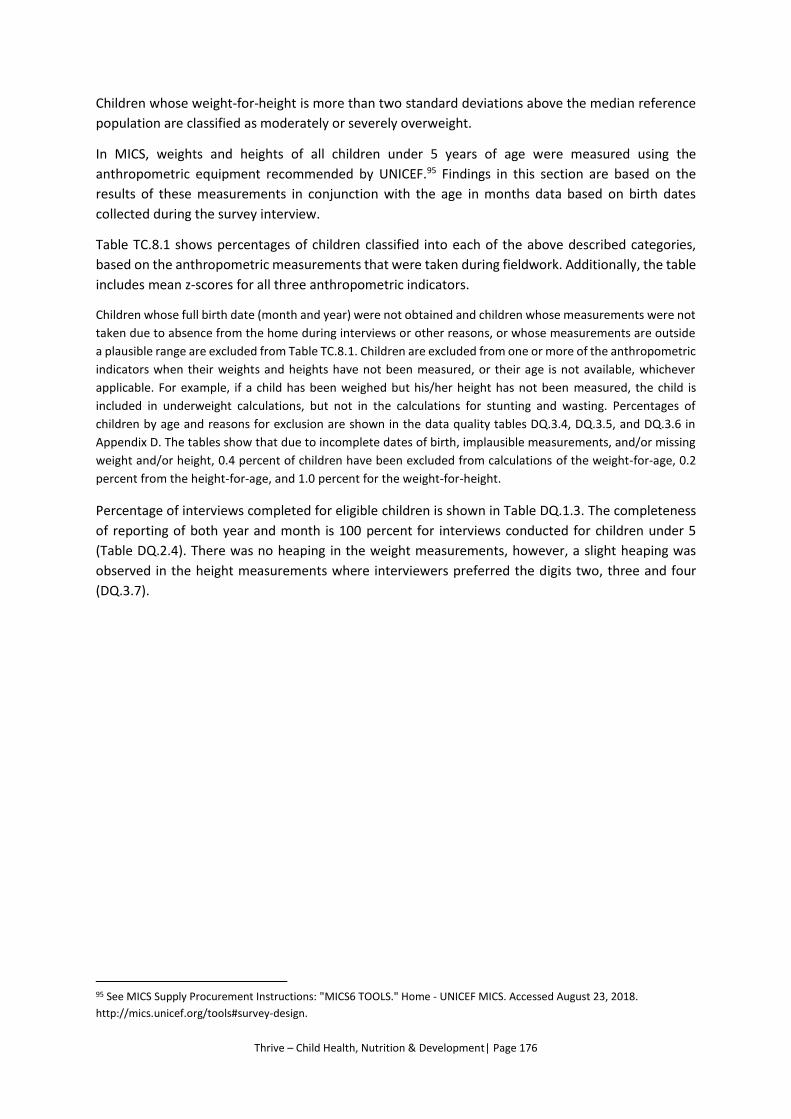
Thrive – Child Health, Nutrition & Development| Page 176
Children whose weight-for-height is more than two standard deviations above the median reference
population are classified as moderately or severely overweight.
In MICS, weights and heights of all children under 5 years of age were measured using the
anthropometric equipment recommended by UNICEF.95 Findings in this section are based on the
results of these measurements in conjunction with the age in months data based on birth dates
collected during the survey interview.
Table TC.8.1 shows percentages of children classified into each of the above described categories,
based on the anthropometric measurements that were taken during fieldwork. Additionally, the table
includes mean z-scores for all three anthropometric indicators.
Children whose full birth date (month and year) were not obtained and children whose measurements were not
taken due to absence from the home during interviews or other reasons, or whose measurements are outside
a plausible range are excluded from Table TC.8.1. Children are excluded from one or more of the anthropometric
indicators when their weights and heights have not been measured, or their age is not available, whichever
applicable. For example, if a child has been weighed but his/her height has not been measured, the child is
included in underweight calculations, but not in the calculations for stunting and wasting. Percentages of
children by age and reasons for exclusion are shown in the data quality tables DQ.3.4, DQ.3.5, and DQ.3.6 in
Appendix D. The tables show that due to incomplete dates of birth, implausible measurements, and/or missing
weight and/or height, 0.4 percent of children have been excluded from calculations of the weight-for-age, 0.2
percent from the height-for-age, and 1.0 percent for the weight-for-height.
Percentage of interviews completed for eligible children is shown in Table DQ.1.3. The completeness
of reporting of both year and month is 100 percent for interviews conducted for children under 5
(Table DQ.2.4). There was no heaping in the weight measurements, however, a slight heaping was
observed in the height measurements where interviewers preferred the digits two, three and four
(DQ.3.7).
95 See MICS Supply Procurement Instructions: "MICS6 TOOLS." Home - UNICEF MICS. Accessed August 23, 2018.
http://mics.unicef.org/tools#survey-design.
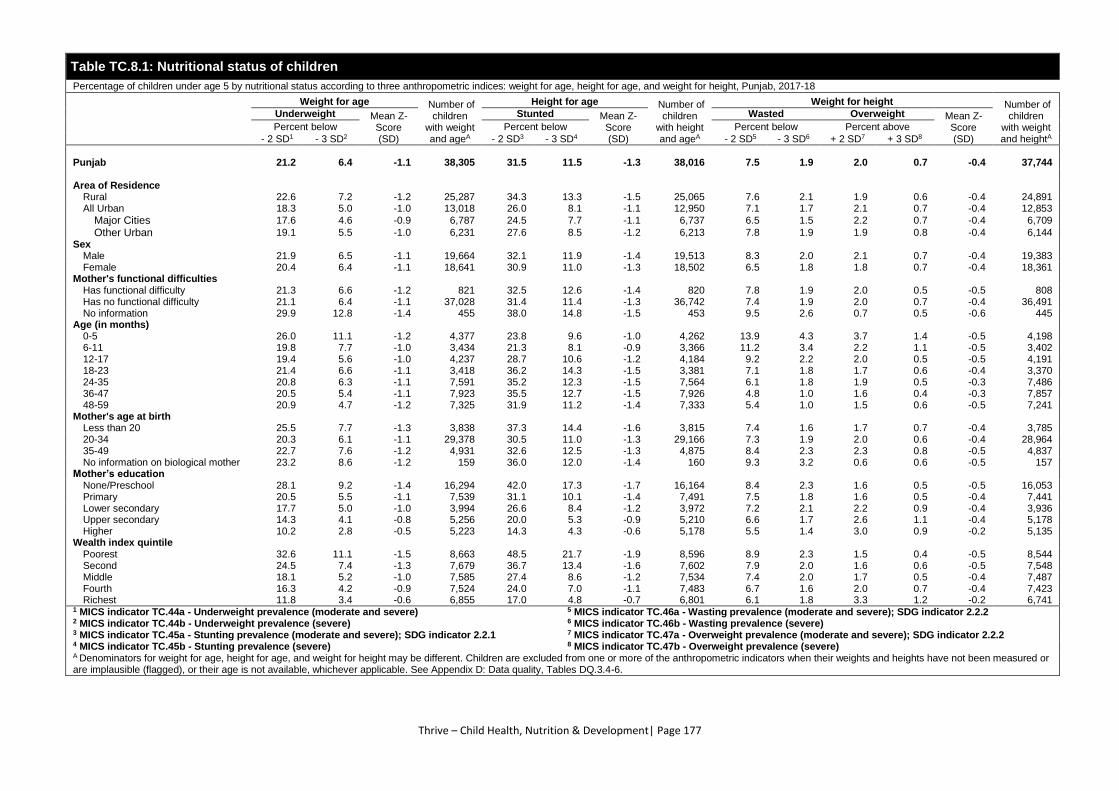
Thrive – Child Health, Nutrition & Development| Page 177
Table TC.8.1: Nutritional status of children
Percentage of children under age 5 by nutritional status according to three anthropometric indices: weight for age, height for age, and weight for height, Punjab, 2017-18
Weight for age Number of children
with weight and ageA
Height for age Number of children
with height and ageA
Weight for height Number of children
with weight and heightA
Underweight Mean Z-Score (SD)
Stunted Mean Z-Score (SD)
Wasted Overweight Mean Z-Score (SD)
Percent below Percent below Percent below Percent above
- 2 SD1 - 3 SD2 - 2 SD3 - 3 SD4 - 2 SD5 - 3 SD6 + 2 SD7 + 3 SD8
Punjab 21.2 6.4 -1.1 38,305 31.5 11.5 -1.3 38,016 7.5 1.9 2.0 0.7 -0.4 37,744
Area of Residence
Rural 22.6 7.2 -1.2 25,287 34.3 13.3 -1.5 25,065 7.6 2.1 1.9 0.6 -0.4 24,891 All Urban 18.3 5.0 -1.0 13,018 26.0 8.1 -1.1 12,950 7.1 1.7 2.1 0.7 -0.4 12,853
Major Cities 17.6 4.6 -0.9 6,787 24.5 7.7 -1.1 6,737 6.5 1.5 2.2 0.7 -0.4 6,709
Other Urban 19.1 5.5 -1.0 6,231 27.6 8.5 -1.2 6,213 7.8 1.9 1.9 0.8 -0.4 6,144
Sex
Male 21.9 6.5 -1.1 19,664 32.1 11.9 -1.4 19,513 8.3 2.0 2.1 0.7 -0.4 19,383 Female 20.4 6.4 -1.1 18,641 30.9 11.0 -1.3 18,502 6.5 1.8 1.8 0.7 -0.4 18,361
Mother's functional difficulties
Has functional difficulty 21.3 6.6 -1.2 821 32.5 12.6 -1.4 820 7.8 1.9 2.0 0.5 -0.5 808 Has no functional difficulty 21.1 6.4 -1.1 37,028 31.4 11.4 -1.3 36,742 7.4 1.9 2.0 0.7 -0.4 36,491 No information 29.9 12.8 -1.4 455 38.0 14.8 -1.5 453 9.5 2.6 0.7 0.5 -0.6 445
Age (in months)
0-5 26.0 11.1 -1.2 4,377 23.8 9.6 -1.0 4,262 13.9 4.3 3.7 1.4 -0.5 4,198 6-11 19.8 7.7 -1.0 3,434 21.3 8.1 -0.9 3,366 11.2 3.4 2.2 1.1 -0.5 3,402 12-17 19.4 5.6 -1.0 4,237 28.7 10.6 -1.2 4,184 9.2 2.2 2.0 0.5 -0.5 4,191 18-23 21.4 6.6 -1.1 3,418 36.2 14.3 -1.5 3,381 7.1 1.8 1.7 0.6 -0.4 3,370 24-35 20.8 6.3 -1.1 7,591 35.2 12.3 -1.5 7,564 6.1 1.8 1.9 0.5 -0.3 7,486 36-47 20.5 5.4 -1.1 7,923 35.5 12.7 -1.5 7,926 4.8 1.0 1.6 0.4 -0.3 7,857 48-59 20.9 4.7 -1.2 7,325 31.9 11.2 -1.4 7,333 5.4 1.0 1.5 0.6 -0.5 7,241
Mother's age at birth
Less than 20 25.5 7.7 -1.3 3,838 37.3 14.4 -1.6 3,815 7.4 1.6 1.7 0.7 -0.4 3,785 20-34 20.3 6.1 -1.1 29,378 30.5 11.0 -1.3 29,166 7.3 1.9 2.0 0.6 -0.4 28,964 35-49 22.7 7.6 -1.2 4,931 32.6 12.5 -1.3 4,875 8.4 2.3 2.3 0.8 -0.5 4,837 No information on biological mother 23.2 8.6 -1.2 159 36.0 12.0 -1.4 160 9.3 3.2 0.6 0.6 -0.5 157
Mother’s education
None/Preschool 28.1 9.2 -1.4 16,294 42.0 17.3 -1.7 16,164 8.4 2.3 1.6 0.5 -0.5 16,053 Primary 20.5 5.5 -1.1 7,539 31.1 10.1 -1.4 7,491 7.5 1.8 1.6 0.5 -0.4 7,441 Lower secondary 17.7 5.0 -1.0 3,994 26.6 8.4 -1.2 3,972 7.2 2.1 2.2 0.9 -0.4 3,936 Upper secondary 14.3 4.1 -0.8 5,256 20.0 5.3 -0.9 5,210 6.6 1.7 2.6 1.1 -0.4 5,178 Higher 10.2 2.8 -0.5 5,223 14.3 4.3 -0.6 5,178 5.5 1.4 3.0 0.9 -0.2 5,135
Wealth index quintile
Poorest 32.6 11.1 -1.5 8,663 48.5 21.7 -1.9 8,596 8.9 2.3 1.5 0.4 -0.5 8,544 Second 24.5 7.4 -1.3 7,679 36.7 13.4 -1.6 7,602 7.9 2.0 1.6 0.6 -0.5 7,548 Middle 18.1 5.2 -1.0 7,585 27.4 8.6 -1.2 7,534 7.4 2.0 1.7 0.5 -0.4 7,487 Fourth 16.3 4.2 -0.9 7,524 24.0 7.0 -1.1 7,483 6.7 1.6 2.0 0.7 -0.4 7,423 Richest 11.8 3.4 -0.6 6,855 17.0 4.8 -0.7 6,801 6.1 1.8 3.3 1.2 -0.2 6,741
1 MICS indicator TC.44a - Underweight prevalence (moderate and severe) 5 MICS indicator TC.46a - Wasting prevalence (moderate and severe); SDG indicator 2.2.2 2 MICS indicator TC.44b - Underweight prevalence (severe) 6 MICS indicator TC.46b - Wasting prevalence (severe) 3 MICS indicator TC.45a - Stunting prevalence (moderate and severe); SDG indicator 2.2.1 7 MICS indicator TC.47a - Overweight prevalence (moderate and severe); SDG indicator 2.2.2 4 MICS indicator TC.45b - Stunting prevalence (severe) 8 MICS indicator TC.47b - Overweight prevalence (severe) A Denominators for weight for age, height for age, and weight for height may be different. Children are excluded from one or more of the anthropometric indicators when their weights and heights have not been measured or are implausible (flagged), or their age is not available, whichever applicable. See Appendix D: Data quality, Tables DQ.3.4-6.
Thrive – Child Health, Nutrition & Development| Page 178
Table TC.8.2: Children's vitamin A supplementation
Percent distribution of children age 6-59 months by receipt of a high dose vitamin A supplement in the last 6 months, Punjab, 2017-18
Percentage of children who received Vitamin A during the last 6 months1
Number of children age 6-59 months
Punjab 64.1 33,078
Area of residence
Rural 68.0 21,746
All Urban 56.6 11,332
Major Cities 52.4 5,935
Other Urban 61.3 5,397
Sex
Male 64.3 16,967
Female 63.9 16,111
Age
6-11 months 56.7 3,327
12-23 months 64.6 7,520
24-35 months 67.6 7,481
36-47 months 64.6 7,898
48-59 months 62.7 6,853
Mother’s education
None/pre-school 65.0 14,105
Primary 65.5 6,461
Lower secondary 62.2 3,398
Upper secondary 61.9 4,610
Higher 63.1 4,503
Wealth index quintile
Lowest 67.1 7,511
Second 69.5 6,592
Middle 66.9 6,507
Fourth 58.5 6,513
Highest 57.5 5,956
1 Non-MICS indicator TC.S1 - Vitamin A supplementation
Thrive – Child Health, Nutrition & Development| Page 179
TC.9 SALT IODISATION
Iodine Deficiency Disorders (IDD) are the world’s leading cause of preventable brain damage and impaired
psychomotor development in young children.96 In its most extreme form, iodine deficiency causes cretinism. It
also increases the risks of stillbirth and miscarriage in pregnant women. Iodine deficiency is most commonly and
visibly associated with goitre. IDD takes its greatest toll in impaired mental growth and development,
contributing to poor learning outcomes, reduced intellectual ability, and impaired work performance.97 The
indicator reported in MICS is the percentage of households consuming iodized salt as assessed using rapid test
kits.
In MICS Punjab, 2017-18 salt used for cooking in the household was tested for presence of iodine using
rapid test kits for potassium iodide or potassium iodate or both. Table TC.9.1 presents the percent
distribution of households by consumption of iodized salt.
96 ICCIDD, UNICEF, WHO. Assessment of iodine deficiency disorders and monitoring their elimination: a guide for
programme managers. Geneva: WHO Press (2007).
http://apps.who.int/iris/bitstream/handle/10665/43781/9789241595827_eng.pdf?sequence=1 97 Zimmermann M.B. “The role of iodine in human growth and development.” Seminars in Cell & Developmental Biology 22,
(2011): 645-652. doi: 10.1016/j.semcdb.2011.07.009
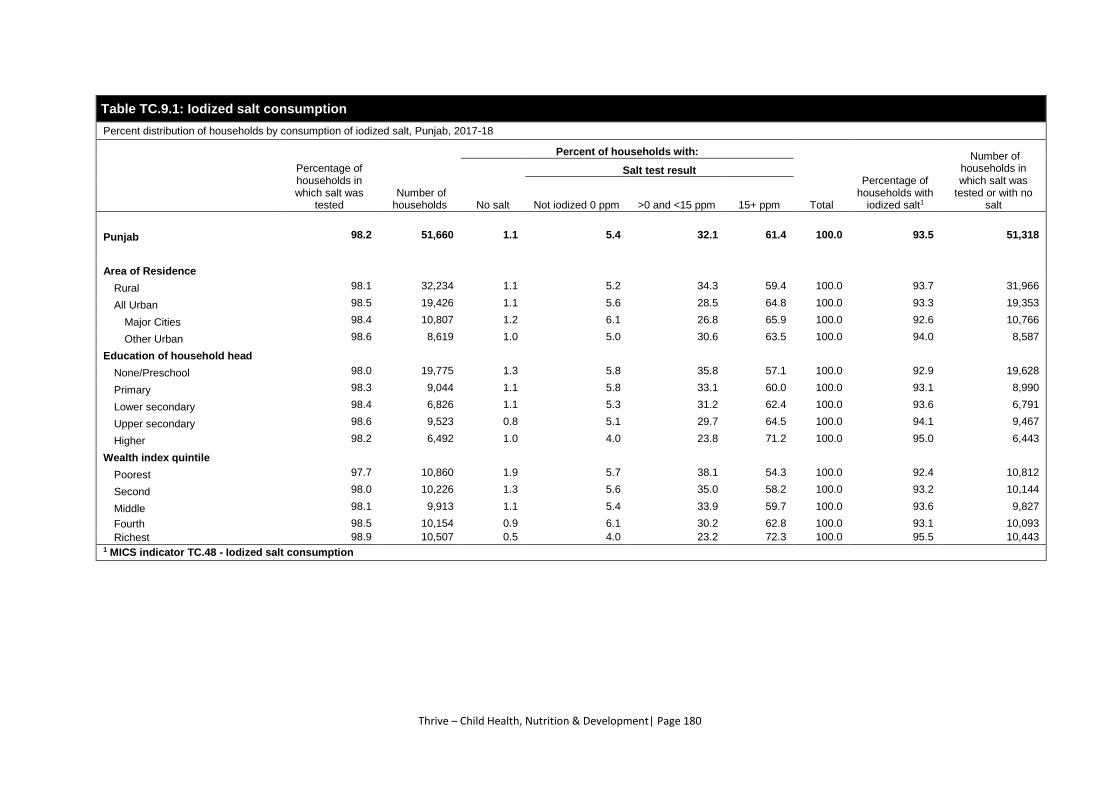
Thrive – Child Health, Nutrition & Development| Page 180
Table TC.9.1: Iodized salt consumption
Percent distribution of households by consumption of iodized salt, Punjab, 2017-18
Percentage of households in which salt was
tested Number of households
Percent of households with:
Total
Percentage of households with
iodized salt1
Number of households in which salt was
tested or with no salt No salt
Salt test result
Not iodized 0 ppm >0 and <15 ppm 15+ ppm
Punjab 98.2 51,660 1.1 5.4 32.1 61.4 100.0 93.5 51,318
Area of Residence
Rural 98.1 32,234 1.1 5.2 34.3 59.4 100.0 93.7 31,966
All Urban 98.5 19,426 1.1 5.6 28.5 64.8 100.0 93.3 19,353
Major Cities 98.4 10,807 1.2 6.1 26.8 65.9 100.0 92.6 10,766
Other Urban 98.6 8,619 1.0 5.0 30.6 63.5 100.0 94.0 8,587
Education of household head
None/Preschool 98.0 19,775 1.3 5.8 35.8 57.1 100.0 92.9 19,628
Primary 98.3 9,044 1.1 5.8 33.1 60.0 100.0 93.1 8,990
Lower secondary 98.4 6,826 1.1 5.3 31.2 62.4 100.0 93.6 6,791
Upper secondary 98.6 9,523 0.8 5.1 29.7 64.5 100.0 94.1 9,467
Higher 98.2 6,492 1.0 4.0 23.8 71.2 100.0 95.0 6,443
Wealth index quintile
Poorest 97.7 10,860 1.9 5.7 38.1 54.3 100.0 92.4 10,812
Second 98.0 10,226 1.3 5.6 35.0 58.2 100.0 93.2 10,144
Middle 98.1 9,913 1.1 5.4 33.9 59.7 100.0 93.6 9,827
Fourth 98.5 10,154 0.9 6.1 30.2 62.8 100.0 93.1 10,093
Richest 98.9 10,507 0.5 4.0 23.2 72.3 100.0 95.5 10,443 1 MICS indicator TC.48 - Iodized salt consumption
Thrive – Child Health, Nutrition & Development| Page 181
TC.10 EARLY CHILDHOOD DEVELOPMENT
It is well recognized that a period of rapid brain development occurs in the first years of life, and the
quality of children’s home environment and their interactions with caregivers is a major determinant
of their development during this period. 98 Children’s early experiences with responsive caregiving
serves an important neurological function and these interactions can boost cognitive, physical, social
and emotional development.99 In this context, engagement of adults in activities with children,
presence of books and playthings in the home for the child, and the conditions of care are important
indicators.
Information on a number of activities that provide children with early stimulation and responsive care
was collected in the survey. These included the involvement of adults in the household with children
in the following activities: reading books or looking at picture books, telling stories, singing songs,
taking children outside the home, compound or yard, playing with children, and spending time with
children naming, counting, or drawing things.
Exposure to books in early years not only provides children with greater understanding of the nature
of print, but may also give them opportunities to see others reading, such as older siblings doing school
work. Presence of books is important for later school performance. The mothers/caretakers of all
children under 5 were asked about the number of children’s books or picture books they have for the
child, and the types of playthings that are available at home.
Some research has found that leaving children without adequate supervision is a risk factor for
unintentional injuries.100 In MICS, two questions were asked to find out whether children age 0-59
months were left alone during the week preceding the interview, and whether children were left in
the care of other children under 10 years of age.
98 Black, M. et al. "Early Childhood Development Coming of Age: Science through the Life Course." The Lancet 389, no.
10064 (2016): 77-90. doi:10.1016/s0140-6736(16)31389-7; Shonkoff J. et al. "The Lifelong Effects of Early Childhood
Adversity and Toxic Stress." Pediatrics 129, no. 1 (2011): 232-46. doi:10.1542/peds.2011-2663. 99 Britto, P. et al. “Nurturing Care: Promoting early childhood development.” The Lancet 389, no. 10064 (2017): 91–102.
doi: 10.1016/S0140-6736(16)31390-3; Milteer R. et al. “The Importance of Play in Promoting Healthy Child Development
and Maintaining Strong Parent-Child Bond: Focus on children in poverty” American Academy of Pediatrics 1129, no. 1
(2012): 183–191. doi: 10.1542/peds.2011-2953. 100 Howe, L., S. Huttly and T. Abramsky. “Risk Factors for Injuries in Young Children in Four Developing Countries: The Young
Lives Study.” Tropical Medicine and International Health 11, no. 10 (2006): 1557-1566. doi: 10.1111/j.1365-
3156.2006.01708.x.; Morrongiello, B. et al. “Understanding Unintentional Injury Risk in Young Children II. The Contribution
of Caregiver Supervision, Child Attributes, and Parent Attributes.” Journal of Pediatric Psychology 31, no. 6 (2006): 540-551.
doi: 10.1093/jpepsy/jsj073.
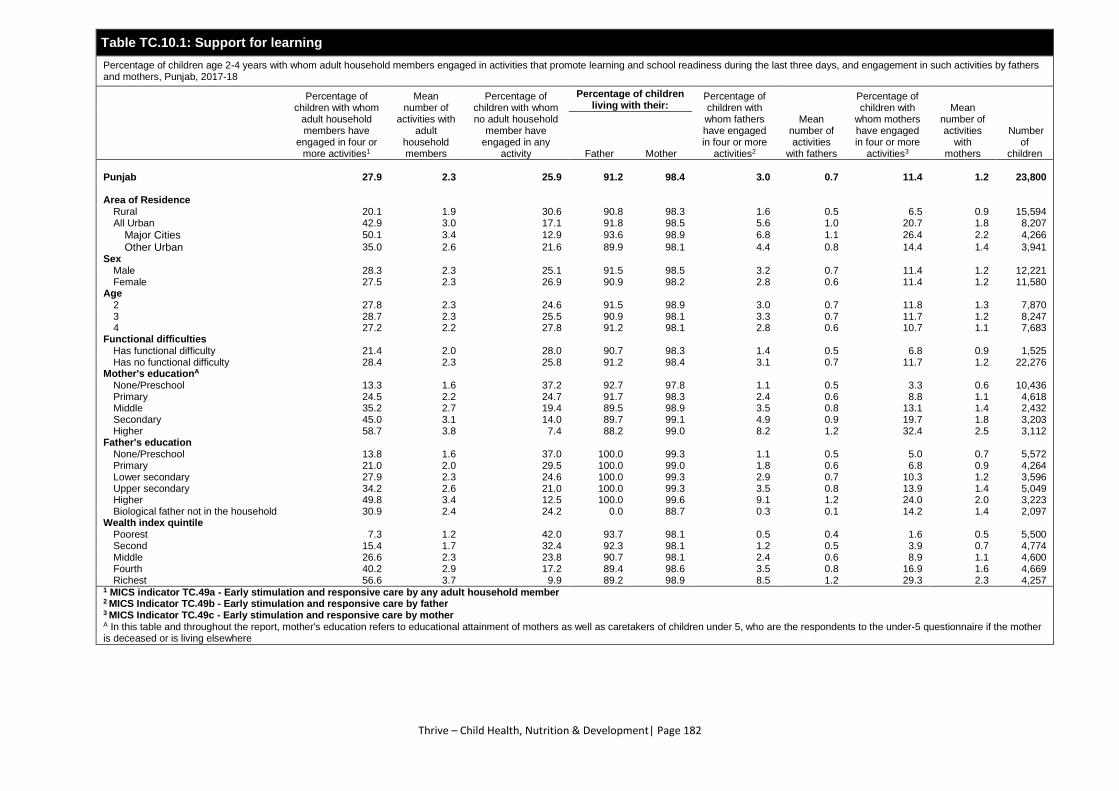
Thrive – Child Health, Nutrition & Development| Page 182
Table TC.10.1: Support for learning
Percentage of children age 2-4 years with whom adult household members engaged in activities that promote learning and school readiness during the last three days, and engagement in such activities by fathers and mothers, Punjab, 2017-18
Percentage of children with whom
adult household members have
engaged in four or more activities1
Mean number of
activities with adult
household members
Percentage of children with whom no adult household
member have engaged in any
activity
Percentage of children living with their:
Percentage of children with whom fathers have engaged in four or more
activities2
Mean number of activities
with fathers
Percentage of children with
whom mothers have engaged in four or more
activities3
Mean number of activities
with mothers
Number of
children Father Mother
Punjab 27.9 2.3 25.9 91.2 98.4 3.0 0.7 11.4 1.2 23,800
Area of Residence
Rural 20.1 1.9 30.6 90.8 98.3 1.6 0.5 6.5 0.9 15,594 All Urban 42.9 3.0 17.1 91.8 98.5 5.6 1.0 20.7 1.8 8,207
Major Cities 50.1 3.4 12.9 93.6 98.9 6.8 1.1 26.4 2.2 4,266
Other Urban 35.0 2.6 21.6 89.9 98.1 4.4 0.8 14.4 1.4 3,941 Sex
Male 28.3 2.3 25.1 91.5 98.5 3.2 0.7 11.4 1.2 12,221 Female 27.5 2.3 26.9 90.9 98.2 2.8 0.6 11.4 1.2 11,580
Age
2 27.8 2.3 24.6 91.5 98.9 3.0 0.7 11.8 1.3 7,870 3 28.7 2.3 25.5 90.9 98.1 3.3 0.7 11.7 1.2 8,247 4 27.2 2.2 27.8 91.2 98.1 2.8 0.6 10.7 1.1 7,683
Functional difficulties
Has functional difficulty 21.4 2.0 28.0 90.7 98.3 1.4 0.5 6.8 0.9 1,525 Has no functional difficulty 28.4 2.3 25.8 91.2 98.4 3.1 0.7 11.7 1.2 22,276
Mother's educationA
None/Preschool 13.3 1.6 37.2 92.7 97.8 1.1 0.5 3.3 0.6 10,436 Primary 24.5 2.2 24.7 91.7 98.3 2.4 0.6 8.8 1.1 4,618 Middle 35.2 2.7 19.4 89.5 98.9 3.5 0.8 13.1 1.4 2,432 Secondary 45.0 3.1 14.0 89.7 99.1 4.9 0.9 19.7 1.8 3,203 Higher 58.7 3.8 7.4 88.2 99.0 8.2 1.2 32.4 2.5 3,112
Father's education
None/Preschool 13.8 1.6 37.0 100.0 99.3 1.1 0.5 5.0 0.7 5,572 Primary 21.0 2.0 29.5 100.0 99.0 1.8 0.6 6.8 0.9 4,264 Lower secondary 27.9 2.3 24.6 100.0 99.3 2.9 0.7 10.3 1.2 3,596 Upper secondary 34.2 2.6 21.0 100.0 99.3 3.5 0.8 13.9 1.4 5,049 Higher 49.8 3.4 12.5 100.0 99.6 9.1 1.2 24.0 2.0 3,223 Biological father not in the household 30.9 2.4 24.2 0.0 88.7 0.3 0.1 14.2 1.4 2,097
Wealth index quintile
Poorest 7.3 1.2 42.0 93.7 98.1 0.5 0.4 1.6 0.5 5,500 Second 15.4 1.7 32.4 92.3 98.1 1.2 0.5 3.9 0.7 4,774 Middle 26.6 2.3 23.8 90.7 98.1 2.4 0.6 8.9 1.1 4,600 Fourth 40.2 2.9 17.2 89.4 98.6 3.5 0.8 16.9 1.6 4,669 Richest 56.6 3.7 9.9 89.2 98.9 8.5 1.2 29.3 2.3 4,257
1 MICS indicator TC.49a - Early stimulation and responsive care by any adult household member 2 MICS Indicator TC.49b - Early stimulation and responsive care by father 3 MICS Indicator TC.49c - Early stimulation and responsive care by mother A In this table and throughout the report, mother's education refers to educational attainment of mothers as well as caretakers of children under 5, who are the respondents to the under-5 questionnaire if the mother is deceased or is living elsewhere
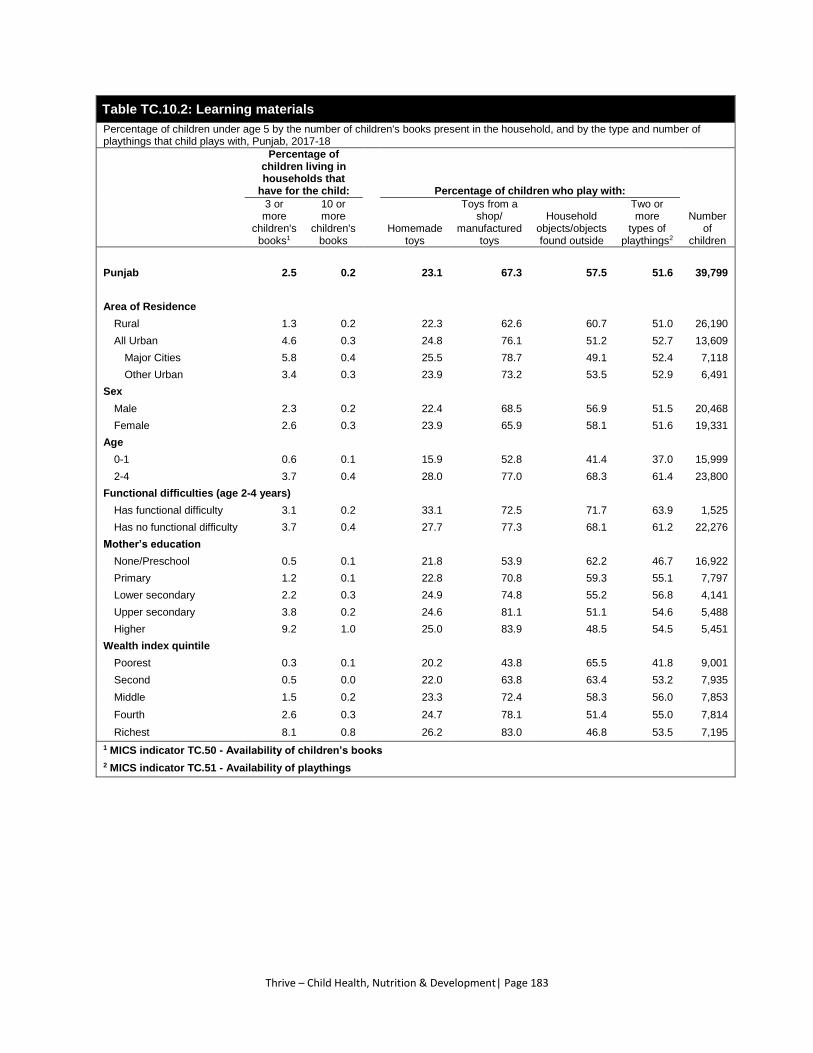
Thrive – Child Health, Nutrition & Development| Page 183
Table TC.10.2: Learning materials
Percentage of children under age 5 by the number of children's books present in the household, and by the type and number of playthings that child plays with, Punjab, 2017-18
Percentage of children living in households that
have for the child: Percentage of children who play with:
Number
of children
3 or more
children's books1
10 or more
children's books
Homemade toys
Toys from a shop/
manufactured toys
Household objects/objects found outside
Two or more
types of playthings2
Punjab 2.5 0.2 23.1 67.3 57.5 51.6 39,799
Area of Residence
Rural 1.3 0.2 22.3 62.6 60.7 51.0 26,190
All Urban 4.6 0.3 24.8 76.1 51.2 52.7 13,609
Major Cities 5.8 0.4 25.5 78.7 49.1 52.4 7,118
Other Urban 3.4 0.3 23.9 73.2 53.5 52.9 6,491
Sex
Male 2.3 0.2 22.4 68.5 56.9 51.5 20,468
Female 2.6 0.3 23.9 65.9 58.1 51.6 19,331
Age
0-1 0.6 0.1 15.9 52.8 41.4 37.0 15,999
2-4 3.7 0.4 28.0 77.0 68.3 61.4 23,800
Functional difficulties (age 2-4 years)
Has functional difficulty 3.1 0.2 33.1 72.5 71.7 63.9 1,525
Has no functional difficulty 3.7 0.4 27.7 77.3 68.1 61.2 22,276
Mother’s education
None/Preschool 0.5 0.1 21.8 53.9 62.2 46.7 16,922
Primary 1.2 0.1 22.8 70.8 59.3 55.1 7,797
Lower secondary 2.2 0.3 24.9 74.8 55.2 56.8 4,141
Upper secondary 3.8 0.2 24.6 81.1 51.1 54.6 5,488
Higher 9.2 1.0 25.0 83.9 48.5 54.5 5,451
Wealth index quintile
Poorest 0.3 0.1 20.2 43.8 65.5 41.8 9,001
Second 0.5 0.0 22.0 63.8 63.4 53.2 7,935
Middle 1.5 0.2 23.3 72.4 58.3 56.0 7,853
Fourth 2.6 0.3 24.7 78.1 51.4 55.0 7,814
Richest 8.1 0.8 26.2 83.0 46.8 53.5 7,195
1 MICS indicator TC.50 - Availability of children’s books
2 MICS indicator TC.51 - Availability of playthings
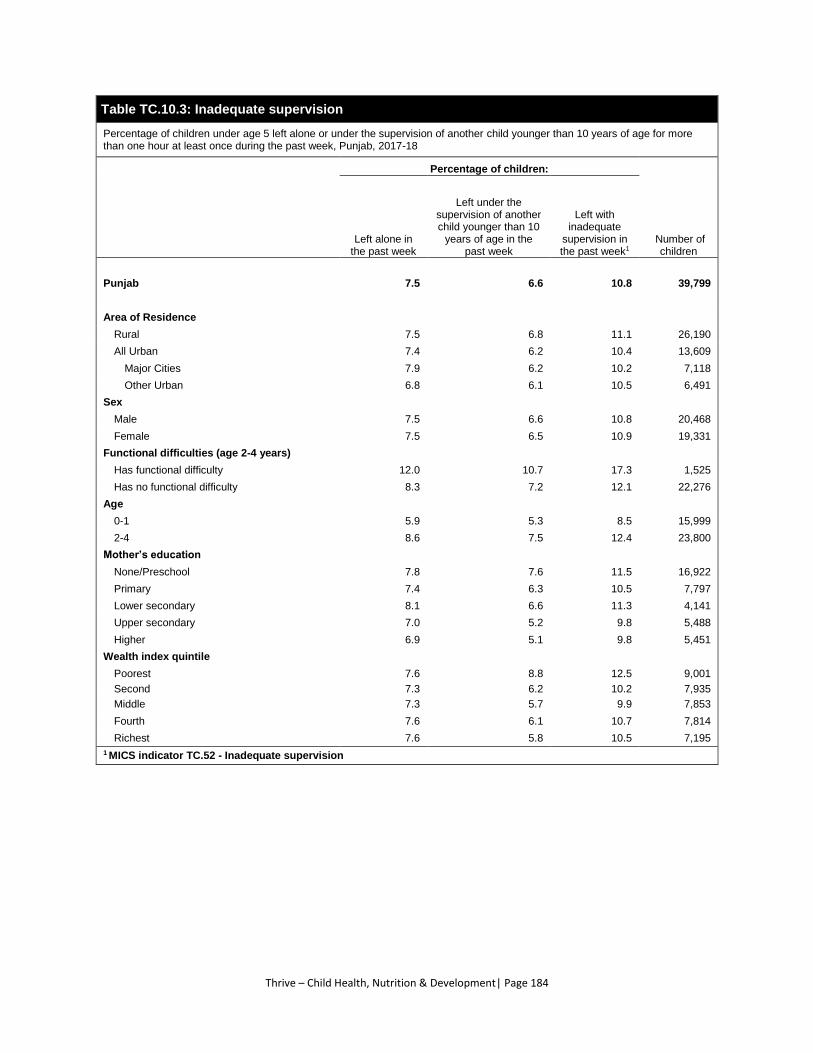
Thrive – Child Health, Nutrition & Development| Page 184
Table TC.10.3: Inadequate supervision
Percentage of children under age 5 left alone or under the supervision of another child younger than 10 years of age for more than one hour at least once during the past week, Punjab, 2017-18
Percentage of children:
Number of children
Left alone in the past week
Left under the supervision of another child younger than 10
years of age in the past week
Left with inadequate
supervision in the past week1
Punjab 7.5 6.6 10.8 39,799
Area of Residence
Rural 7.5 6.8 11.1 26,190
All Urban 7.4 6.2 10.4 13,609
Major Cities 7.9 6.2 10.2 7,118
Other Urban 6.8 6.1 10.5 6,491
Sex
Male 7.5 6.6 10.8 20,468
Female 7.5 6.5 10.9 19,331
Functional difficulties (age 2-4 years)
Has functional difficulty 12.0 10.7 17.3 1,525
Has no functional difficulty 8.3 7.2 12.1 22,276
Age
0-1 5.9 5.3 8.5 15,999
2-4 8.6 7.5 12.4 23,800
Mother’s education
None/Preschool 7.8 7.6 11.5 16,922
Primary 7.4 6.3 10.5 7,797
Lower secondary 8.1 6.6 11.3 4,141
Upper secondary 7.0 5.2 9.8 5,488
Higher 6.9 5.1 9.8 5,451
Wealth index quintile
Poorest 7.6 8.8 12.5 9,001
Second 7.3 6.2 10.2 7,935
Middle 7.3 5.7 9.9 7,853
Fourth 7.6 6.1 10.7 7,814
Richest 7.6 5.8 10.5 7,195
1 MICS indicator TC.52 - Inadequate supervision
Thrive – Child Health, Nutrition & Development| Page 185
TC.11 EARLY CHILD DEVELOPMENT INDEX
Early childhood development is multidimensional and involves an ordered progression of motor,
cognitive, language, socio-emotional and regulatory skills and capacities across the first few years of
life.101. Physical growth, literacy and numeracy skills, socio-emotional development and readiness to learn
are vital domains of a child’s overall development, which build the foundation for later life and set the
trajectory for health, learning and well-being. 102
A 10-item module was used to calculate the Early Child Development Index (ECDI). The primary purpose
of the ECDI is to inform public policy regarding the developmental status of children in Pakistan. The index
is based on selected milestones that children are expected to achieve by ages 3 and 4. The 10 items are
used to determine if children are developmentally on track in four domains:
Literacy-numeracy: Children are identified as being developmentally on track based on whether
they can identify/name at least ten letters of the alphabet, whether they can read at least four
simple, popular words, and whether they know the name and recognize the symbols of all
numbers from 1 to 10. If at least two of these are true, then the child is considered
developmentally on track.
Physical: If the child can pick up a small object with two fingers, like a stick or a rock from the
ground and/or the mother/caretaker does not indicate that the child is sometimes too sick to
play, then the child is regarded as being developmentally on track in the physical domain.
Social-emotional: Children are considered to be developmentally on track if two of the following
are true: If the child gets along well with other children, if the child does not kick, bite, or hit other
children and if the child does not get distracted easily.
Learning: If the child follows simple directions on how to do something correctly and/or when
given something to do, is able to do it independently, then the child is considered to be
developmentally on track in this domain.
ECDI is then calculated as the percentage of children who are developmentally on track in at least three
of these four domains.
101 UNICEF et al. Advancing Early Childhood Development: From Science to Scale. Executive Summary, The Lancet, 2016.
https://www.thelancet.com/pb-assets/Lancet/stories/series/ecd/Lancet_ECD_Executive_Summary.pdf. 102Shonkoff, J. and D. Phillips. From Neurons to Neighborhoods: The Science of Early Childhood Development. Washington, D.C.:
National Academy Press, 2000.; United Nations Children’s Fund, Early Moments Matter, New York: UNICEF, 2017.
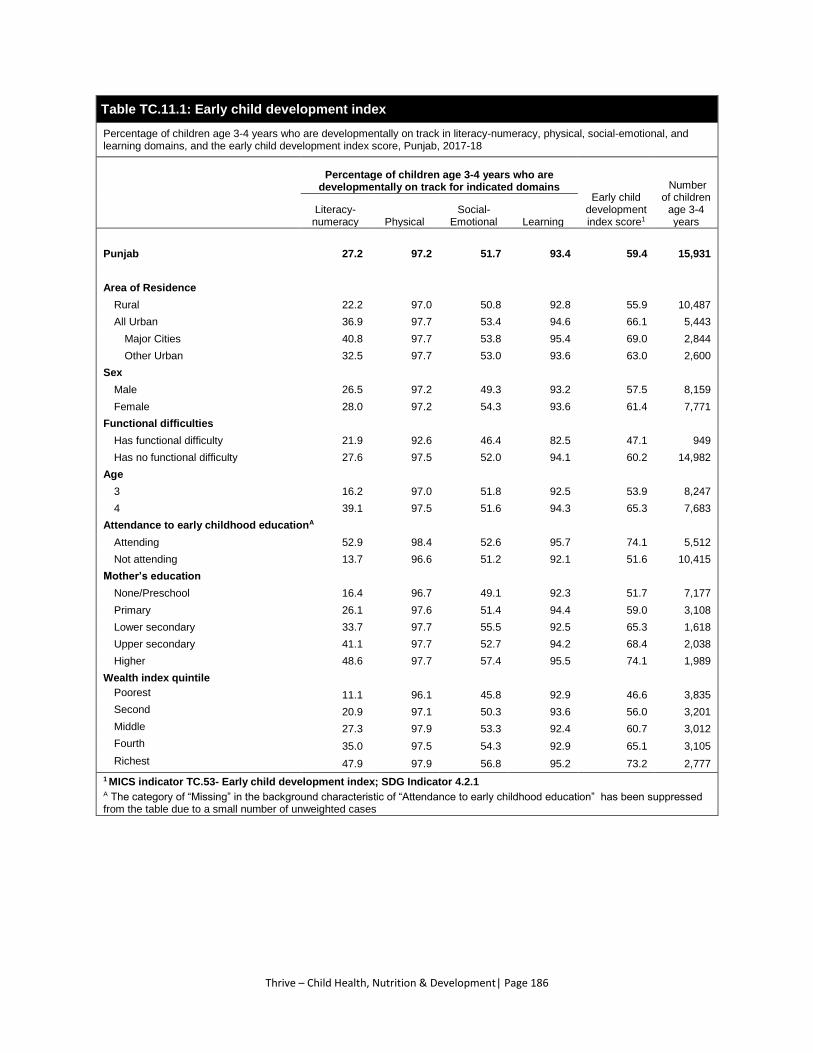
Thrive – Child Health, Nutrition & Development| Page 186
Table TC.11.1: Early child development index
Percentage of children age 3-4 years who are developmentally on track in literacy-numeracy, physical, social-emotional, and learning domains, and the early child development index score, Punjab, 2017-18
Percentage of children age 3-4 years who are developmentally on track for indicated domains
Early child development index score1
Number of children
age 3-4 years
Literacy-numeracy Physical
Social-Emotional Learning
Punjab 27.2 97.2 51.7 93.4 59.4 15,931
Area of Residence
Rural 22.2 97.0 50.8 92.8 55.9 10,487
All Urban 36.9 97.7 53.4 94.6 66.1 5,443
Major Cities 40.8 97.7 53.8 95.4 69.0 2,844
Other Urban 32.5 97.7 53.0 93.6 63.0 2,600
Sex
Male 26.5 97.2 49.3 93.2 57.5 8,159
Female 28.0 97.2 54.3 93.6 61.4 7,771
Functional difficulties
Has functional difficulty 21.9 92.6 46.4 82.5 47.1 949
Has no functional difficulty 27.6 97.5 52.0 94.1 60.2 14,982
Age
3 16.2 97.0 51.8 92.5 53.9 8,247
4 39.1 97.5 51.6 94.3 65.3 7,683
Attendance to early childhood educationA
Attending 52.9 98.4 52.6 95.7 74.1 5,512
Not attending 13.7 96.6 51.2 92.1 51.6 10,415
Mother’s education
None/Preschool 16.4 96.7 49.1 92.3 51.7 7,177
Primary 26.1 97.6 51.4 94.4 59.0 3,108
Lower secondary 33.7 97.7 55.5 92.5 65.3 1,618
Upper secondary 41.1 97.7 52.7 94.2 68.4 2,038
Higher 48.6 97.7 57.4 95.5 74.1 1,989
Wealth index quintile
Poorest 11.1 96.1 45.8 92.9 46.6 3,835
Second 20.9 97.1 50.3 93.6 56.0 3,201
Middle 27.3 97.9 53.3 92.4 60.7 3,012
Fourth 35.0 97.5 54.3 92.9 65.1 3,105
Richest 47.9 97.9 56.8 95.2 73.2 2,777
1 MICS indicator TC.53- Early child development index; SDG Indicator 4.2.1 A The category of “Missing” in the background characteristic of “Attendance to early childhood education” has been suppressed from the table due to a small number of unweighted cases
Learn| Page 187
8. LEARN
LN.1 EARLY CHILDHOOD EDUCATION
Readiness of children for primary school can be improved through attendance to early childhood
education programmes or through preschool. Early childhood education programmes include
programmes for children that have organised learning components as opposed to baby-sitting and day-
care, which do not typically have organised education and learning.
It is widely acknowledged that the effects of what happens during the pre-natal period & during the
earliest months and years of a child’s life can last a lifetime. This is because the kind of early care a child
receives from parents, pre-school teachers and caregivers determines how a child learns and relates to
school and life in general. It is during early care that a child develops all the key elements of emotional
intelligence, confidence, curiosity, purposefulness, self-control, connectedness, the capacity to
communicate and co-cooperativeness103.
Any preschool/ Katchi / Early Childhood Education is listed for children who do not attend the first grade
of primary school, but do attend some form of organized learning or early childhood education
programme, whereas this programme is considered as part of the school system. The definition of
organized early learning programme does not refer to programmes offering only babysitting or child
minding.
Schools that carry out non-standard curriculum (non-formal education) are not part of school system here.
A non-standard curriculum includes religious schools, such as Quranic schools, that do not teach a full,
standard school curriculum. If a school teaches religious courses but also includes the standard curriculum
– such as many Registered Madrassa, Missionary schools it would be considered as a standard (formal)
school.
Table LN.1.1 shows the percent of children age 3 and 4 years currently attending early childhood
education: MICS indicator LN.1. This is based on question UB8 in the Questionnaire for Children under 5.
If the child was currently on a school break, but regularly attends, the interviewer is asked to record this
as currently attending.
Table LN.1.2 is similar to Table LN.1.1, but looks only at children who were 5 years old at the beginning of
the school year. In Punjab, the school year begins in April.
Specifically, the table presents the percent distribution of children age one year younger than the official
primary school entry age at the beginning of the school year, by attendance to education. This table
utilises question UB7 for attendance. The indicator captured is the adjusted net attendance ratio, which
corresponds to SDG indicator 4.2.2: Participation rate in organised learning (adjusted104). The official
primary school entry age in Punjab is age 5 - years.
103 National Curriculum for Early Childhood Education 2007. 104 The ratio is termed "adjusted" since it also includes children attending primary education. All children age one year before
official primary school entry age (at the beginning of the school year) are included in the denominator.

Learn| Page 188
Table LN.1.1: Early childhood education
Percentage of children age 36-59 months who are attending early childhood education, Punjab, 2017-18
Percentage of children age 36-59 months attending early childhood education1
Number of children age 36-59 months
Punjab 34.4 15,953
Area of Residence
Rural 32.5 10,497
All Urban 38.2 5,456
Major Cities 38.8 2,846
Other Urban 37.4 2,611
Sex
Male 34.6 8,167
Female 34.3 7,786
Child's functional difficulties
Has functional difficulty 25.8 949
Has no functional difficulty 35.0 15,004
Age (in months)
36-47 17.9 8,277
48-59 52.3 7,676
Mother's education
None/Preschool 25.4 7,183
Primary 36.1 3,118
Lower Secondary 42.0 1,617
Upper Secondary 44.0 2,040
Higher 48.3 1,995
Wealth index quintile
Poorest 20.9 3,837
Second 32.2 3,204
Middle 37.5 3,020
Fourth 40.7 3,106
Richest 45.4 2,786 1 MICS indicator LN.1 - Attendance to early childhood education
Learn| Page 189
Table LN.1.2: Participation rate in organised learning
Percent distribution of children age one year younger than the official primary school entry age at the beginning of the school year, by attendance to education, and attendance to an early childhood education programme or primary education (adjusted net attendance ratio), Punjab, 2017-18
Percent of children:
Total
Net attendance
ratio1
Number of children age 5 years at the beginning of the
school year
Attending an early
childhood education
programme
Attending primary
education
Not attending an early
childhood education
programme or primary
education
Punjab 63.0 10.6 26.5 100.0 73.5 8,716
Area of Residence Rural 58.9 11.3 29.8 100.0 70.2 5,738
All Urban 71.0 9.1 19.9 100.0 80.1 2,978
Major Cities 72.1 7.9 20.0 100.0 80.0 1,551
Other Urban 69.7 10.4 19.9 100.0 80.1 1,427
Sex
Male 64.2 10.3 25.5 100.0 74.5 4,450
Female 61.7 10.8 27.5 100.0 72.5 4,266
Mother's functional difficulties
Has functional difficulty 60.8 10.4 28.8 100.0 71.2 252
Has no functional difficulty 63.7 10.2 26.1 100.0 73.9 7,933
No information 53.4 15.8 30.8 100.0 69.2 531
Mother's education
None/Preschool 51.5 8.5 40.0 100.0 60.0 4,133
Primary 67.4 13.3 19.3 100.0 80.7 1,678
Lower Secondary 74.2 11.7 14.1 100.0 85.9 835
Upper Secondary 74.1 13.6 12.3 100.0 87.7 1,077
Higher 81.9 10.2 7.9 100.0 92.1 994
Wealth index quintile
Poorest 44.5 6.0 49.5 100.0 50.5 2,102
Second 60.3 12.0 27.7 100.0 72.3 1,780
Middle 65.6 13.9 20.5 100.0 79.5 1,748
Fourth 72.0 12.1 15.9 100.0 84.1 1,641
Richest 79.8 9.7 10.5 100.0 89.5 1,445 1 MICS indicator LN.2- Participation rate in organised learning (adjusted); SDG indicator 4.2.2
Learn| Page 190
LN.2 ATTENDANCE
Attendance to pre-primary education is important for the readiness of children to school. Table LN.2.1
shows the proportion of children in the first grade of primary school (regardless of age) who attended any
early childhood education the previous year105.
Ensuring that all girls and boys complete primary and secondary education is a target of the 2030 Agenda
for Sustainable Development. Education is a vital prerequisite for combating poverty, empowering
women, economic growth, protecting children from hazardous and exploitative labour and sexual
exploitation, promoting human rights and democracy, protecting the environment, and influencing
population growth.
In Punjab, children enter primary school at age 5, lower secondary at age 10 and upper secondary school
at age 13. There are 5 grades in primary school and 3 + 2 grades in secondary school. In primary school,
grades are referred to as year 1 to year 5. For lower secondary school, grades are referred to as year 1 to
year 3 and in upper secondary to year 1 to year 2. The school year typically runs from April of one year to
March of the following year.
Table LN.2.2 presents the percentage of children of primary school entry age entering year 1.
Table LN.2.3 provides the percentage of children of primary school age 6 to 11 years who are attending
primary or secondary school106, and those who are out of school. Similarly, the lower secondary school
adjusted net attendance ratio is presented in Table LN.2.4107 for children age 12 to 14 years.
In Table LN.2.5, children are distributed according to their age against current grade of attendance (age-
for-grade). For example, a 7-year-old child (at the beginning of the school year) is expected to be in year
3, as per the official age-for-grade. If this child is currently in year 1, he/she will be classified over-age by
2 years. The table includes both primary and lower secondary levels.
The upper secondary school adjusted net attendance ratio, and out of school children ratio are presented
in Table LN.2.6108.
The gross intake rate to the last grade of primary school, primary school completion rate and transition
rate to secondary education are presented in Table LN.2.7. The gross intake rate is the ratio of the total
number of students, regardless of age, entering the last grade of primary school for the first time, to the
105 The computation of the indicator does not exclude repeaters, and therefore is inclusive of both children who are attending
primary school for the first time, as well as those who were in the first grade of primary school the previous school year and are
repeating. Children repeating may have attended pre-primary education prior to the school year during which they attended
the first grade of primary school for the first time; these children are not captured in the numerator of the indicator. 106 Ratios presented in this table are "adjusted" since they include not only primary school attendance, but also secondary
school attendance in the numerator. 107 Ratios presented in this table are "adjusted" since they include not only lower secondary school attendance, but also
attendance to higher levels in the numerator. 108 Ratios presented in this table are "adjusted" since they include not only upper secondary school attendance, but also
attendance to higher levels in the numerator.
Learn| Page 191
number of children of the primary graduation age at the beginning of the current (or most recent) school
year.
Completion rate of primary education represents the percentage of a cohort of children aged 3 to 5 years
above the official age of the last grade of primary education, that is, the percentage of children who are
14 to 16 years old, who completed primary education in Punjab.
The table also provides the “effective” transition rate, which takes account of the presence of repeaters
in the final grade of primary school. This indicator reflects situations in which pupils repeat the last grade
of primary education but eventually make the transition to the secondary level.109
Table LN.2.8 focusses on the ratio of girls to boys attending primary and secondary education. These ratios
are better known as the Gender Parity Index (GPI). Note that the ratios included here are obtained from
adjusted net attendance ratios rather than gross attendance ratios. The latter provide an erroneous
description of the GPI mainly because, in most cases, the majority of over-age children attending primary
education tend to be boys.
Table LN.2.10 presents the school attendance of children age 10-14 years by orphan hood.
109 The simple transition rate, which is no longer calculated in MICS, tends to underestimate pupils’ progression to secondary
school as it assumes that the repeaters never reach secondary school.
Learn| Page 192
Table LN.2.1: School readiness
Percentage of children attending first grade of primary school who attended pre-school the previous year, Punjab, 2017-18
Percentage of children attending first grade who attended preschool in previous year1
Number of children attending first grade of
primary school
Punjab 90.6 8,953
Area of Residence Rural 91.3 5,958
All Urban 89.3 2,995
Major Cities 88.7 1,580
Other Urban 90.0 1,415
Sex
Male 90.6 4,641
Female 90.7 4,312
Mother's functional difficulties
Has functional difficulty 88.3 569
Has no functional difficulty 90.5 2,905
No information 90.9 5,480
Mother's education
None/Preschool 89.6 4,439
Primary 91.1 1,844
Lower Secondary 89.5 823
Upper Secondary 93.0 1,007
Higher 93.2 836
Wealth index quintile
Poorest 89.9 1,949
Second 91.0 2,069
Middle 91.1 1,810
Fourth 90.7 1,730
Richest 90.5 1,395 1 MICS indicator LN.3 - School readiness
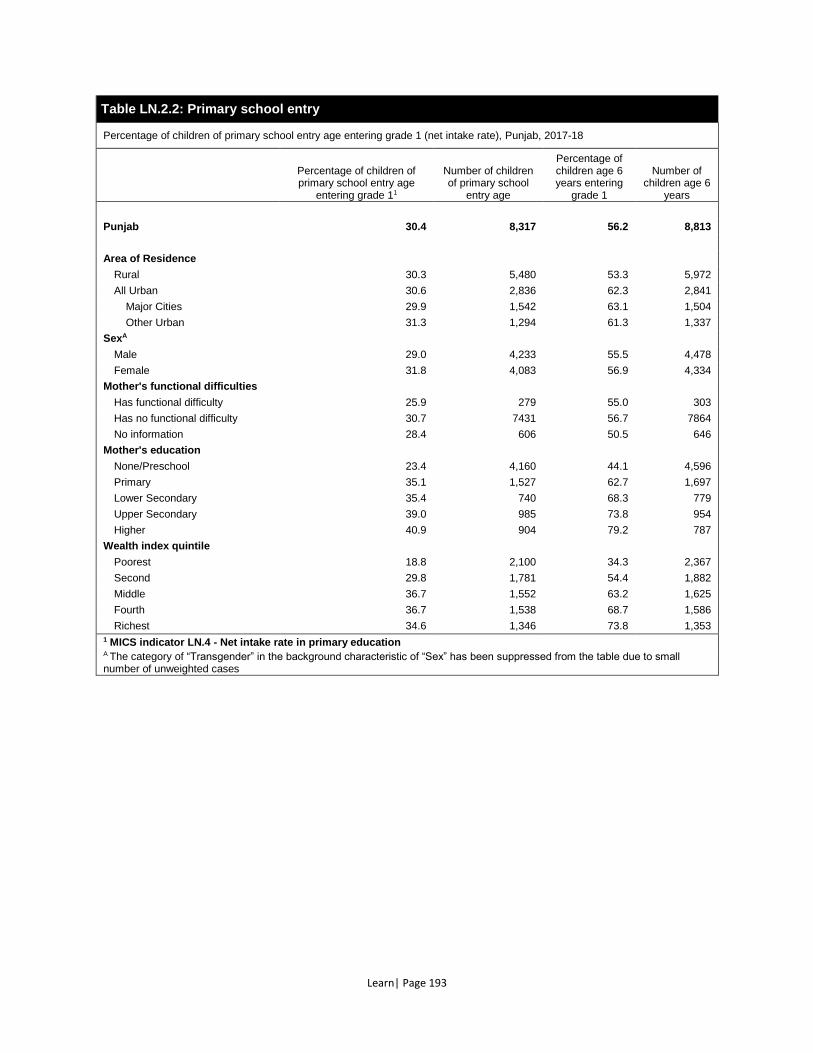
Learn| Page 193
Table LN.2.2: Primary school entry
Percentage of children of primary school entry age entering grade 1 (net intake rate), Punjab, 2017-18
Percentage of children of primary school entry age
entering grade 11
Number of children of primary school
entry age
Percentage of children age 6 years entering
grade 1
Number of children age 6
years
Punjab 30.4 8,317 56.2 8,813
Area of Residence Rural 30.3 5,480 53.3 5,972
All Urban 30.6 2,836 62.3 2,841
Major Cities 29.9 1,542 63.1 1,504
Other Urban 31.3 1,294 61.3 1,337
SexA Male 29.0 4,233 55.5 4,478
Female 31.8 4,083 56.9 4,334
Mother's functional difficulties
Has functional difficulty 25.9 279 55.0 303
Has no functional difficulty 30.7 7431 56.7 7864
No information 28.4 606 50.5 646
Mother's education
None/Preschool 23.4 4,160 44.1 4,596
Primary 35.1 1,527 62.7 1,697
Lower Secondary 35.4 740 68.3 779
Upper Secondary 39.0 985 73.8 954
Higher 40.9 904 79.2 787
Wealth index quintile
Poorest 18.8 2,100 34.3 2,367
Second 29.8 1,781 54.4 1,882
Middle 36.7 1,552 63.2 1,625
Fourth 36.7 1,538 68.7 1,586
Richest 34.6 1,346 73.8 1,353 1 MICS indicator LN.4 - Net intake rate in primary education A The category of “Transgender” in the background characteristic of “Sex” has been suppressed from the table due to small number of unweighted cases
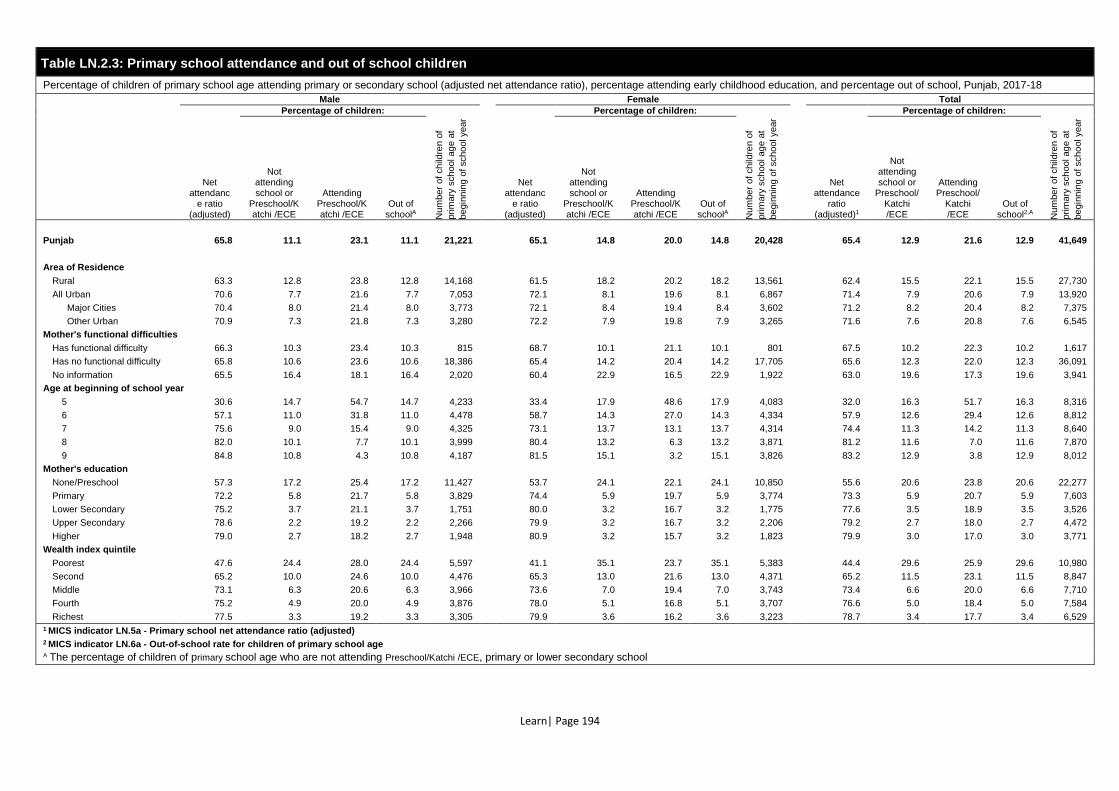
Learn| Page 194
Table LN.2.3: Primary school attendance and out of school children
Percentage of children of primary school age attending primary or secondary school (adjusted net attendance ratio), percentage attending early childhood education, and percentage out of school, Punjab, 2017-18
Male Female Total
Net attendanc
e ratio (adjusted)
Percentage of children:
Num
ber
of
child
ren o
f
prim
ary
sch
ool ag
e a
t
begin
nin
g o
f scho
ol year
year
Net attendanc
e ratio (adjusted)
Percentage of children:
Num
ber
of
child
ren o
f
prim
ary
sch
ool ag
e a
t
begin
nin
g o
f scho
ol year
year
Net attendance
ratio (adjusted)1
Percentage of children:
Num
ber
of
child
ren o
f
prim
ary
sch
ool ag
e a
t
begin
nin
g o
f scho
ol year
Not attending school or
Preschool/Katchi /ECE
Attending Preschool/Katchi /ECE
Out of schoolA
Not attending school or
Preschool/Katchi /ECE
Attending Preschool/Katchi /ECE
Out of schoolA
Not attending school or
Preschool/Katchi /ECE
Attending Preschool/
Katchi /ECE
Out of school2,A
Punjab 65.8 11.1 23.1 11.1 21,221 65.1 14.8 20.0 14.8 20,428 65.4 12.9 21.6 12.9 41,649
Area of Residence
Rural 63.3 12.8 23.8 12.8 14,168 61.5 18.2 20.2 18.2 13,561 62.4 15.5 22.1 15.5 27,730
All Urban 70.6 7.7 21.6 7.7 7,053 72.1 8.1 19.6 8.1 6,867 71.4 7.9 20.6 7.9 13,920
Major Cities 70.4 8.0 21.4 8.0 3,773 72.1 8.4 19.4 8.4 3,602 71.2 8.2 20.4 8.2 7,375
Other Urban 70.9 7.3 21.8 7.3 3,280 72.2 7.9 19.8 7.9 3,265 71.6 7.6 20.8 7.6 6,545
Mother's functional difficulties
Has functional difficulty 66.3 10.3 23.4 10.3 815 68.7 10.1 21.1 10.1 801 67.5 10.2 22.3 10.2 1,617
Has no functional difficulty 65.8 10.6 23.6 10.6 18,386 65.4 14.2 20.4 14.2 17,705 65.6 12.3 22.0 12.3 36,091
No information 65.5 16.4 18.1 16.4 2,020 60.4 22.9 16.5 22.9 1,922 63.0 19.6 17.3 19.6 3,941
Age at beginning of school year
5 30.6 14.7 54.7 14.7 4,233 33.4 17.9 48.6 17.9 4,083 32.0 16.3 51.7 16.3 8,316
6 57.1 11.0 31.8 11.0 4,478 58.7 14.3 27.0 14.3 4,334 57.9 12.6 29.4 12.6 8,812
7 75.6 9.0 15.4 9.0 4,325 73.1 13.7 13.1 13.7 4,314 74.4 11.3 14.2 11.3 8,640
8 82.0 10.1 7.7 10.1 3,999 80.4 13.2 6.3 13.2 3,871 81.2 11.6 7.0 11.6 7,870
9 84.8 10.8 4.3 10.8 4,187 81.5 15.1 3.2 15.1 3,826 83.2 12.9 3.8 12.9 8,012
Mother's education
None/Preschool 57.3 17.2 25.4 17.2 11,427 53.7 24.1 22.1 24.1 10,850 55.6 20.6 23.8 20.6 22,277
Primary 72.2 5.8 21.7 5.8 3,829 74.4 5.9 19.7 5.9 3,774 73.3 5.9 20.7 5.9 7,603
Lower Secondary 75.2 3.7 21.1 3.7 1,751 80.0 3.2 16.7 3.2 1,775 77.6 3.5 18.9 3.5 3,526
Upper Secondary 78.6 2.2 19.2 2.2 2,266 79.9 3.2 16.7 3.2 2,206 79.2 2.7 18.0 2.7 4,472
Higher 79.0 2.7 18.2 2.7 1,948 80.9 3.2 15.7 3.2 1,823 79.9 3.0 17.0 3.0 3,771
Wealth index quintile
Poorest 47.6 24.4 28.0 24.4 5,597 41.1 35.1 23.7 35.1 5,383 44.4 29.6 25.9 29.6 10,980
Second 65.2 10.0 24.6 10.0 4,476 65.3 13.0 21.6 13.0 4,371 65.2 11.5 23.1 11.5 8,847
Middle 73.1 6.3 20.6 6.3 3,966 73.6 7.0 19.4 7.0 3,743 73.4 6.6 20.0 6.6 7,710
Fourth 75.2 4.9 20.0 4.9 3,876 78.0 5.1 16.8 5.1 3,707 76.6 5.0 18.4 5.0 7,584
Richest 77.5 3.3 19.2 3.3 3,305 79.9 3.6 16.2 3.6 3,223 78.7 3.4 17.7 3.4 6,529
1 MICS indicator LN.5a - Primary school net attendance ratio (adjusted) 2 MICS indicator LN.6a - Out-of-school rate for children of primary school age A The percentage of children of primary school age who are not attending Preschool/Katchi /ECE, primary or lower secondary school
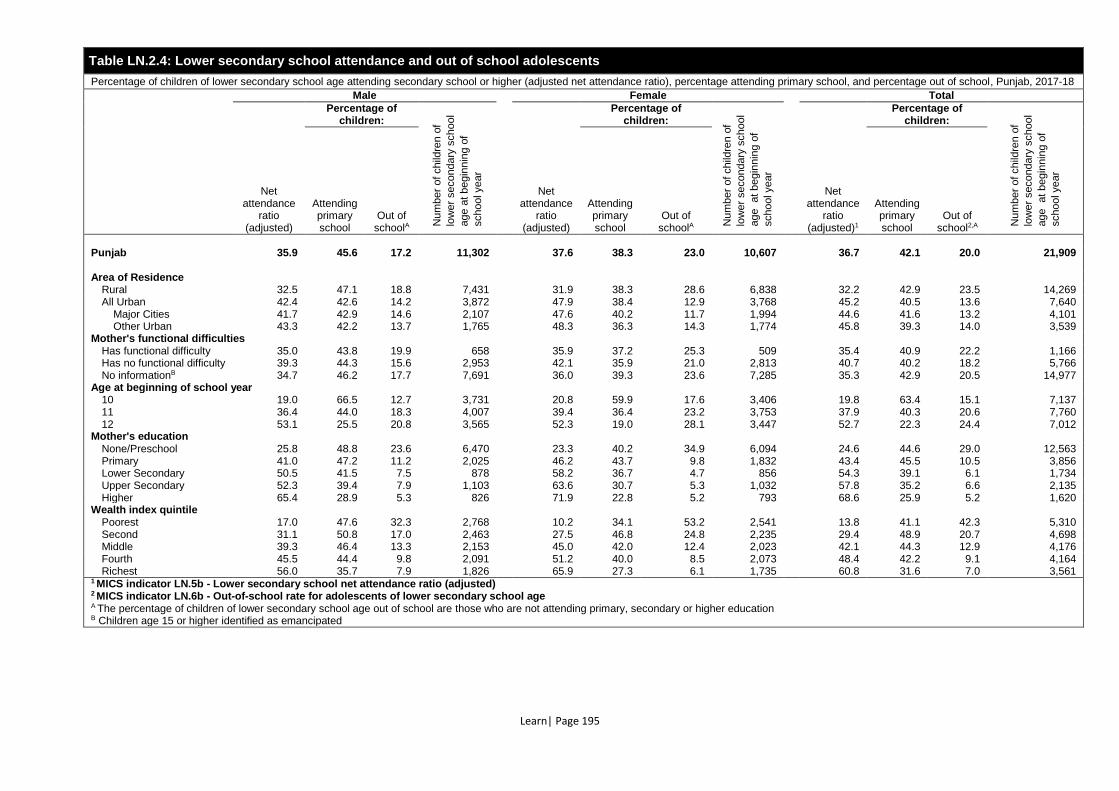
Learn| Page 195
Table LN.2.4: Lower secondary school attendance and out of school adolescents
Percentage of children of lower secondary school age attending secondary school or higher (adjusted net attendance ratio), percentage attending primary school, and percentage out of school, Punjab, 2017-18
Male Female Total
Net attendance
ratio (adjusted)
Percentage of children:
Num
ber
of child
ren o
f
low
er
secondary
school
age a
t begin
nin
g o
f
school year
Net attendance
ratio (adjusted)
Percentage of children:
Num
ber
of child
ren o
f
low
er
secondary
school
age
at begin
nin
g o
f
school year
Net attendance
ratio (adjusted)1
Percentage of children:
Num
ber
of child
ren o
f
low
er
secondary
school
age
at begin
nin
g o
f
school year
Attending primary school
Out of schoolA
Attending primary school
Out of schoolA
Attending primary school
Out of school2,A
Punjab 35.9 45.6 17.2 11,302 37.6 38.3 23.0 10,607 36.7 42.1 20.0 21,909
Area of Residence
Rural 32.5 47.1 18.8 7,431 31.9 38.3 28.6 6,838 32.2 42.9 23.5 14,269 All Urban 42.4 42.6 14.2 3,872 47.9 38.4 12.9 3,768 45.2 40.5 13.6 7,640
Major Cities 41.7 42.9 14.6 2,107 47.6 40.2 11.7 1,994 44.6 41.6 13.2 4,101 Other Urban 43.3 42.2 13.7 1,765 48.3 36.3 14.3 1,774 45.8 39.3 14.0 3,539
Mother's functional difficulties Has functional difficulty 35.0 43.8 19.9 658 35.9 37.2 25.3 509 35.4 40.9 22.2 1,166 Has no functional difficulty 39.3 44.3 15.6 2,953 42.1 35.9 21.0 2,813 40.7 40.2 18.2 5,766 No informationB 34.7 46.2 17.7 7,691 36.0 39.3 23.6 7,285 35.3 42.9 20.5 14,977
Age at beginning of school year 10 19.0 66.5 12.7 3,731 20.8 59.9 17.6 3,406 19.8 63.4 15.1 7,137 11 36.4 44.0 18.3 4,007 39.4 36.4 23.2 3,753 37.9 40.3 20.6 7,760 12 53.1 25.5 20.8 3,565 52.3 19.0 28.1 3,447 52.7 22.3 24.4 7,012
Mother's education
None/Preschool 25.8 48.8 23.6 6,470 23.3 40.2 34.9 6,094 24.6 44.6 29.0 12,563 Primary 41.0 47.2 11.2 2,025 46.2 43.7 9.8 1,832 43.4 45.5 10.5 3,856 Lower Secondary 50.5 41.5 7.5 878 58.2 36.7 4.7 856 54.3 39.1 6.1 1,734 Upper Secondary 52.3 39.4 7.9 1,103 63.6 30.7 5.3 1,032 57.8 35.2 6.6 2,135 Higher 65.4 28.9 5.3 826 71.9 22.8 5.2 793 68.6 25.9 5.2 1,620
Wealth index quintile Poorest 17.0 47.6 32.3 2,768 10.2 34.1 53.2 2,541 13.8 41.1 42.3 5,310 Second 31.1 50.8 17.0 2,463 27.5 46.8 24.8 2,235 29.4 48.9 20.7 4,698 Middle 39.3 46.4 13.3 2,153 45.0 42.0 12.4 2,023 42.1 44.3 12.9 4,176 Fourth 45.5 44.4 9.8 2,091 51.2 40.0 8.5 2,073 48.4 42.2 9.1 4,164 Richest 56.0 35.7 7.9 1,826 65.9 27.3 6.1 1,735 60.8 31.6 7.0 3,561
1 MICS indicator LN.5b - Lower secondary school net attendance ratio (adjusted) 2 MICS indicator LN.6b - Out-of-school rate for adolescents of lower secondary school age A The percentage of children of lower secondary school age out of school are those who are not attending primary, secondary or higher education B Children age 15 or higher identified as emancipated
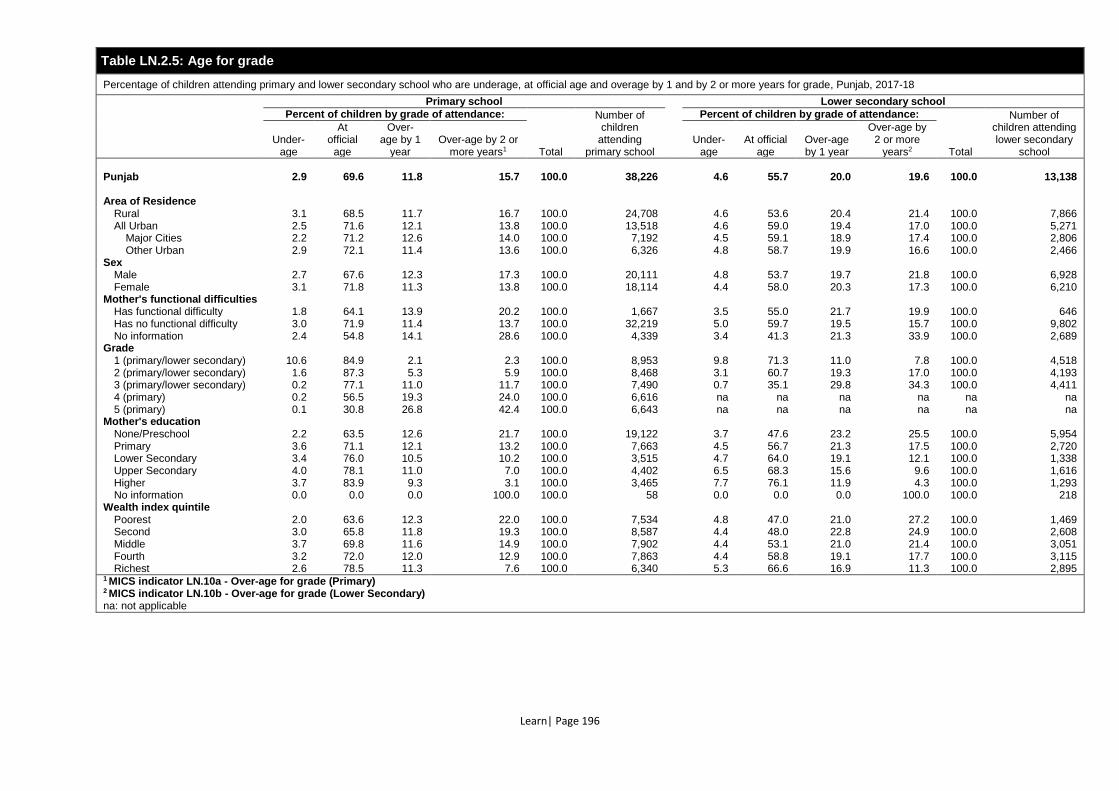
Learn| Page 196
Table LN.2.5: Age for grade
Percentage of children attending primary and lower secondary school who are underage, at official age and overage by 1 and by 2 or more years for grade, Punjab, 2017-18
Primary school
Lower secondary school
Percent of children by grade of attendance:
Total
Number of children
attending primary school
Percent of children by grade of attendance:
Total
Number of children attending lower secondary
school Under-
age
At official
age
Over-age by 1
year Over-age by 2 or
more years1 Under-
age At official
age Over-age by 1 year
Over-age by 2 or more
years2
Punjab 2.9 69.6 11.8 15.7 100.0 38,226 4.6 55.7 20.0 19.6 100.0 13,138
Area of Residence
Rural 3.1 68.5 11.7 16.7 100.0 24,708 4.6 53.6 20.4 21.4 100.0 7,866 All Urban 2.5 71.6 12.1 13.8 100.0 13,518 4.6 59.0 19.4 17.0 100.0 5,271
Major Cities 2.2 71.2 12.6 14.0 100.0 7,192 4.5 59.1 18.9 17.4 100.0 2,806 Other Urban 2.9 72.1 11.4 13.6 100.0 6,326 4.8 58.7 19.9 16.6 100.0 2,466
Sex
Male 2.7 67.6 12.3 17.3 100.0 20,111 4.8 53.7 19.7 21.8 100.0 6,928 Female 3.1 71.8 11.3 13.8 100.0 18,114 4.4 58.0 20.3 17.3 100.0 6,210
Mother's functional difficulties
Has functional difficulty 1.8 64.1 13.9 20.2 100.0 1,667 3.5 55.0 21.7 19.9 100.0 646 Has no functional difficulty 3.0 71.9 11.4 13.7 100.0 32,219 5.0 59.7 19.5 15.7 100.0 9,802 No information 2.4 54.8 14.1 28.6 100.0 4,339 3.4 41.3 21.3 33.9 100.0 2,689
Grade
1 (primary/lower secondary) 10.6 84.9 2.1 2.3 100.0 8,953 9.8 71.3 11.0 7.8 100.0 4,518 2 (primary/lower secondary) 1.6 87.3 5.3 5.9 100.0 8,468 3.1 60.7 19.3 17.0 100.0 4,193 3 (primary/lower secondary) 0.2 77.1 11.0 11.7 100.0 7,490 0.7 35.1 29.8 34.3 100.0 4,411 4 (primary) 0.2 56.5 19.3 24.0 100.0 6,616 na na na na na na 5 (primary) 0.1 30.8 26.8 42.4 100.0 6,643 na na na na na na
Mother's education
None/Preschool 2.2 63.5 12.6 21.7 100.0 19,122 3.7 47.6 23.2 25.5 100.0 5,954 Primary 3.6 71.1 12.1 13.2 100.0 7,663 4.5 56.7 21.3 17.5 100.0 2,720 Lower Secondary 3.4 76.0 10.5 10.2 100.0 3,515 4.7 64.0 19.1 12.1 100.0 1,338 Upper Secondary 4.0 78.1 11.0 7.0 100.0 4,402 6.5 68.3 15.6 9.6 100.0 1,616 Higher 3.7 83.9 9.3 3.1 100.0 3,465 7.7 76.1 11.9 4.3 100.0 1,293 No information 0.0 0.0 0.0 100.0 100.0 58 0.0 0.0 0.0 100.0 100.0 218
Wealth index quintile
Poorest 2.0 63.6 12.3 22.0 100.0 7,534 4.8 47.0 21.0 27.2 100.0 1,469 Second 3.0 65.8 11.8 19.3 100.0 8,587 4.4 48.0 22.8 24.9 100.0 2,608 Middle 3.7 69.8 11.6 14.9 100.0 7,902 4.4 53.1 21.0 21.4 100.0 3,051 Fourth 3.2 72.0 12.0 12.9 100.0 7,863 4.4 58.8 19.1 17.7 100.0 3,115 Richest 2.6 78.5 11.3 7.6 100.0 6,340 5.3 66.6 16.9 11.3 100.0 2,895
1 MICS indicator LN.10a - Over-age for grade (Primary) 2 MICS indicator LN.10b - Over-age for grade (Lower Secondary) na: not applicable
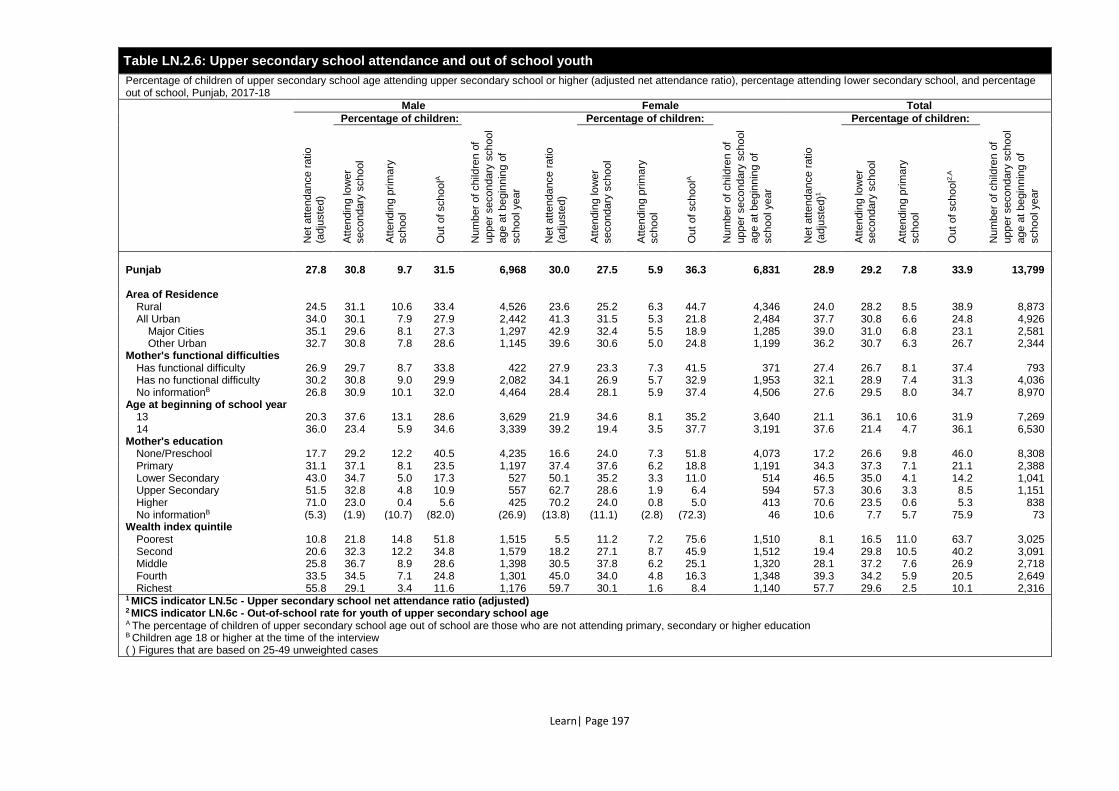
Learn| Page 197
Table LN.2.6: Upper secondary school attendance and out of school youth
Percentage of children of upper secondary school age attending upper secondary school or higher (adjusted net attendance ratio), percentage attending lower secondary school, and percentage out of school, Punjab, 2017-18
Male Female Total
Net
attendance r
atio
(adju
ste
d)
Percentage of children:
Num
ber
of child
ren o
f
upper
secondary
school
age a
t begin
nin
g o
f
school year
Net
attendance r
atio
(a
dju
ste
d)
Percentage of children:
Num
ber
of child
ren o
f
upper
secondary
school
age a
t begin
nin
g o
f
school year
Net
attendance r
atio
(adju
ste
d)1
Percentage of children:
Num
ber
of child
ren o
f
upper
secondary
school
age a
t begin
nin
g o
f
school year
Att
endin
g lo
wer
secondary
school
Att
endin
g p
rim
ary
school
Out
of schoolA
Att
endin
g lo
wer
secondary
school
Att
endin
g p
rim
ary
school
Out
of schoolA
Att
endin
g lo
wer
secondary
school
Att
endin
g p
rim
ary
school
Out
of school2
,A
Punjab 27.8 30.8 9.7 31.5 6,968 30.0 27.5 5.9 36.3 6,831 28.9 29.2 7.8 33.9 13,799
Area of Residence
Rural 24.5 31.1 10.6 33.4 4,526 23.6 25.2 6.3 44.7 4,346 24.0 28.2 8.5 38.9 8,873 All Urban 34.0 30.1 7.9 27.9 2,442 41.3 31.5 5.3 21.8 2,484 37.7 30.8 6.6 24.8 4,926
Major Cities 35.1 29.6 8.1 27.3 1,297 42.9 32.4 5.5 18.9 1,285 39.0 31.0 6.8 23.1 2,581 Other Urban 32.7 30.8 7.8 28.6 1,145 39.6 30.6 5.0 24.8 1,199 36.2 30.7 6.3 26.7 2,344
Mother's functional difficulties Has functional difficulty 26.9 29.7 8.7 33.8 422 27.9 23.3 7.3 41.5 371 27.4 26.7 8.1 37.4 793 Has no functional difficulty 30.2 30.8 9.0 29.9 2,082 34.1 26.9 5.7 32.9 1,953 32.1 28.9 7.4 31.3 4,036 No informationB 26.8 30.9 10.1 32.0 4,464 28.4 28.1 5.9 37.4 4,506 27.6 29.5 8.0 34.7 8,970
Age at beginning of school year 13 20.3 37.6 13.1 28.6 3,629 21.9 34.6 8.1 35.2 3,640 21.1 36.1 10.6 31.9 7,269 14 36.0 23.4 5.9 34.6 3,339 39.2 19.4 3.5 37.7 3,191 37.6 21.4 4.7 36.1 6,530
Mother's education
None/Preschool 17.7 29.2 12.2 40.5 4,235 16.6 24.0 7.3 51.8 4,073 17.2 26.6 9.8 46.0 8,308 Primary 31.1 37.1 8.1 23.5 1,197 37.4 37.6 6.2 18.8 1,191 34.3 37.3 7.1 21.1 2,388 Lower Secondary 43.0 34.7 5.0 17.3 527 50.1 35.2 3.3 11.0 514 46.5 35.0 4.1 14.2 1,041 Upper Secondary 51.5 32.8 4.8 10.9 557 62.7 28.6 1.9 6.4 594 57.3 30.6 3.3 8.5 1,151 Higher 71.0 23.0 0.4 5.6 425 70.2 24.0 0.8 5.0 413 70.6 23.5 0.6 5.3 838 No informationB (5.3) (1.9) (10.7) (82.0) (26.9) (13.8) (11.1) (2.8) (72.3) 46 10.6 7.7 5.7 75.9 73
Wealth index quintile
Poorest 10.8 21.8 14.8 51.8 1,515 5.5 11.2 7.2 75.6 1,510 8.1 16.5 11.0 63.7 3,025 Second 20.6 32.3 12.2 34.8 1,579 18.2 27.1 8.7 45.9 1,512 19.4 29.8 10.5 40.2 3,091 Middle 25.8 36.7 8.9 28.6 1,398 30.5 37.8 6.2 25.1 1,320 28.1 37.2 7.6 26.9 2,718 Fourth 33.5 34.5 7.1 24.8 1,301 45.0 34.0 4.8 16.3 1,348 39.3 34.2 5.9 20.5 2,649 Richest 55.8 29.1 3.4 11.6 1,176 59.7 30.1 1.6 8.4 1,140 57.7 29.6 2.5 10.1 2,316
1 MICS indicator LN.5c - Upper secondary school net attendance ratio (adjusted) 2 MICS indicator LN.6c - Out-of-school rate for youth of upper secondary school age A The percentage of children of upper secondary school age out of school are those who are not attending primary, secondary or higher education B Children age 18 or higher at the time of the interview ( ) Figures that are based on 25-49 unweighted cases
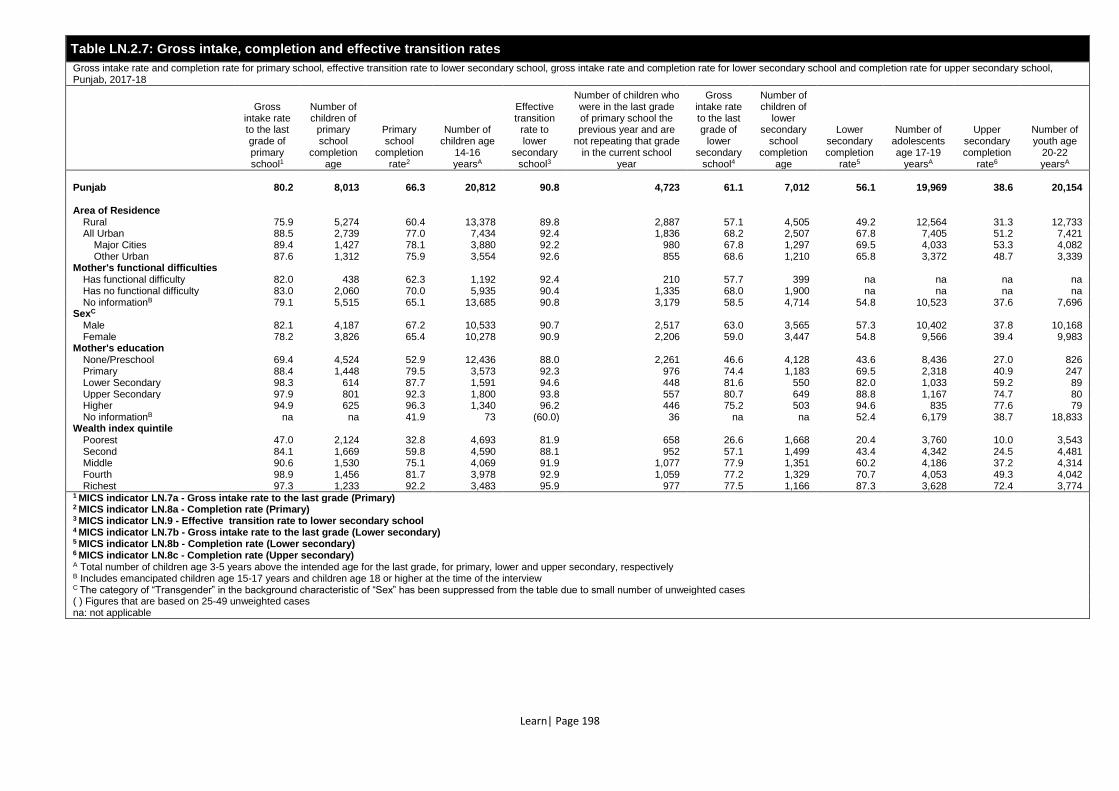
Learn| Page 198
Table LN.2.7: Gross intake, completion and effective transition rates
Gross intake rate and completion rate for primary school, effective transition rate to lower secondary school, gross intake rate and completion rate for lower secondary school and completion rate for upper secondary school, Punjab, 2017-18
Gross intake rate to the last grade of primary school1
Number of children of
primary school
completion age
Primary school
completion rate2
Number of children age
14-16 yearsA
Effective transition
rate to lower
secondary school3
Number of children who were in the last grade of primary school the previous year and are
not repeating that grade in the current school
year
Gross intake rate to the last grade of
lower secondary
school4
Number of children of
lower secondary
school completion
age
Lower secondary completion
rate5
Number of adolescents age 17-19
yearsA
Upper secondary completion
rate6
Number of youth age
20-22 yearsA
Punjab 80.2 8,013 66.3 20,812 90.8 4,723 61.1 7,012 56.1 19,969 38.6 20,154
Area of Residence
Rural 75.9 5,274 60.4 13,378 89.8 2,887 57.1 4,505 49.2 12,564 31.3 12,733 All Urban 88.5 2,739 77.0 7,434 92.4 1,836 68.2 2,507 67.8 7,405 51.2 7,421
Major Cities 89.4 1,427 78.1 3,880 92.2 980 67.8 1,297 69.5 4,033 53.3 4,082 Other Urban 87.6 1,312 75.9 3,554 92.6 855 68.6 1,210 65.8 3,372 48.7 3,339
Mother's functional difficulties
Has functional difficulty 82.0 438 62.3 1,192 92.4 210 57.7 399 na na na na Has no functional difficulty 83.0 2,060 70.0 5,935 90.4 1,335 68.0 1,900 na na na na No informationB 79.1 5,515 65.1 13,685 90.8 3,179 58.5 4,714 54.8 10,523 37.6 7,696
SexC
Male 82.1 4,187 67.2 10,533 90.7 2,517 63.0 3,565 57.3 10,402 37.8 10,168 Female 78.2 3,826 65.4 10,278 90.9 2,206 59.0 3,447 54.8 9,566 39.4 9,983
Mother's education
None/Preschool 69.4 4,524 52.9 12,436 88.0 2,261 46.6 4,128 43.6 8,436 27.0 826 Primary 88.4 1,448 79.5 3,573 92.3 976 74.4 1,183 69.5 2,318 40.9 247 Lower Secondary 98.3 614 87.7 1,591 94.6 448 81.6 550 82.0 1,033 59.2 89 Upper Secondary 97.9 801 92.3 1,800 93.8 557 80.7 649 88.8 1,167 74.7 80 Higher 94.9 625 96.3 1,340 96.2 446 75.2 503 94.6 835 77.6 79 No informationB na na 41.9 73 (60.0) 36 na na 52.4 6,179 38.7 18,833
Wealth index quintile
Poorest 47.0 2,124 32.8 4,693 81.9 658 26.6 1,668 20.4 3,760 10.0 3,543 Second 84.1 1,669 59.8 4,590 88.1 952 57.1 1,499 43.4 4,342 24.5 4,481 Middle 90.6 1,530 75.1 4,069 91.9 1,077 77.9 1,351 60.2 4,186 37.2 4,314 Fourth 98.9 1,456 81.7 3,978 92.9 1,059 77.2 1,329 70.7 4,053 49.3 4,042 Richest 97.3 1,233 92.2 3,483 95.9 977 77.5 1,166 87.3 3,628 72.4 3,774
1 MICS indicator LN.7a - Gross intake rate to the last grade (Primary) 2 MICS indicator LN.8a - Completion rate (Primary) 3 MICS indicator LN.9 - Effective transition rate to lower secondary school 4 MICS indicator LN.7b - Gross intake rate to the last grade (Lower secondary) 5 MICS indicator LN.8b - Completion rate (Lower secondary) 6 MICS indicator LN.8c - Completion rate (Upper secondary) A Total number of children age 3-5 years above the intended age for the last grade, for primary, lower and upper secondary, respectively B Includes emancipated children age 15-17 years and children age 18 or higher at the time of the interview C The category of “Transgender” in the background characteristic of “Sex” has been suppressed from the table due to small number of unweighted cases ( ) Figures that are based on 25-49 unweighted cases na: not applicable
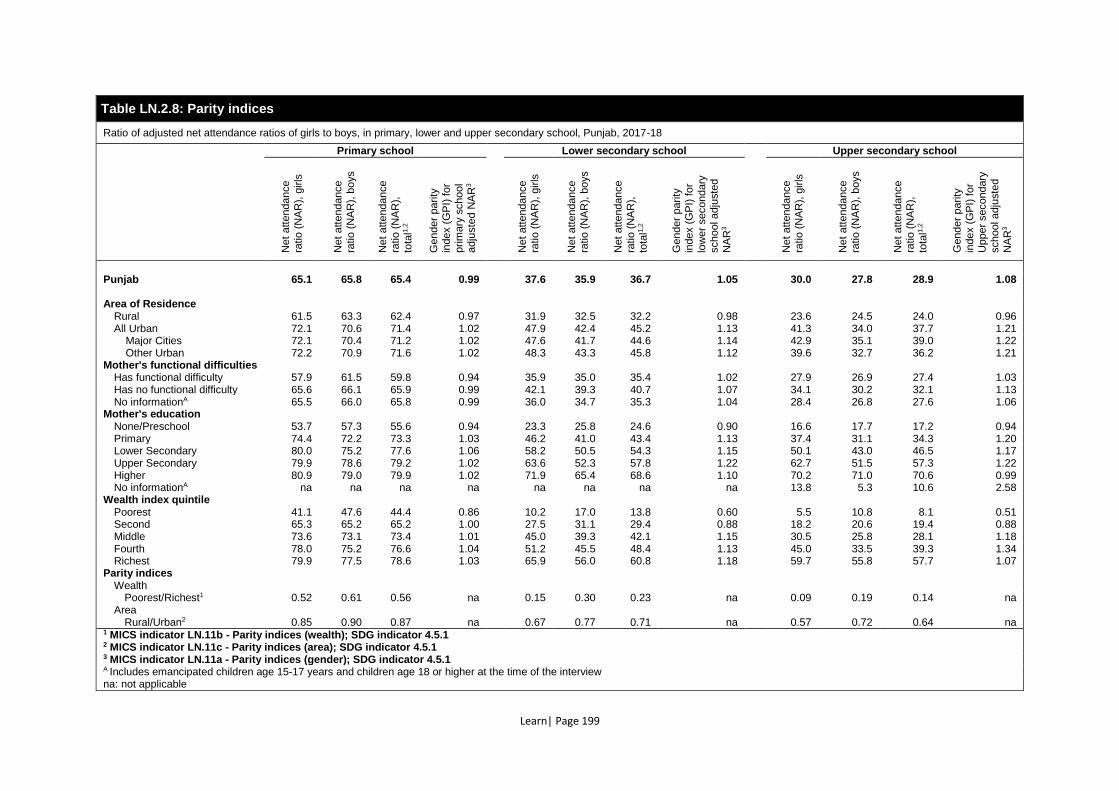
Learn| Page 199
Table LN.2.8: Parity indices
Ratio of adjusted net attendance ratios of girls to boys, in primary, lower and upper secondary school, Punjab, 2017-18
Primary school Lower secondary school Upper secondary school
Net
attendance
ratio
(N
AR
), g
irls
Net
attendance
ratio
(N
AR
), b
oys
Net
attendance
ratio
(N
AR
),
tota
l1,2
Gender
parity
index (
GP
I) for
prim
ary
school
adju
ste
d N
AR
3
Net
attendance
ratio
(N
AR
), g
irls
Net
attendance
ratio
(N
AR
), b
oys
Net
attendance
ratio
(N
AR
),
tota
l1,2
Gender
parity
index (
GP
I) for
low
er
secondary
school adju
ste
d
NA
R3
Net
attendance
ratio
(N
AR
), g
irls
Net
attendance
ratio
(N
AR
), b
oys
Net
attendance
ratio
(N
AR
),
tota
l1,2
Gender
parity
index (
GP
I) for
U
pper
secondary
school adju
ste
d
NA
R3
Punjab 65.1 65.8 65.4 0.99 37.6 35.9 36.7 1.05 30.0 27.8 28.9 1.08
Area of Residence
Rural 61.5 63.3 62.4 0.97 31.9 32.5 32.2 0.98 23.6 24.5 24.0 0.96 All Urban 72.1 70.6 71.4 1.02 47.9 42.4 45.2 1.13 41.3 34.0 37.7 1.21
Major Cities 72.1 70.4 71.2 1.02 47.6 41.7 44.6 1.14 42.9 35.1 39.0 1.22 Other Urban 72.2 70.9 71.6 1.02 48.3 43.3 45.8 1.12 39.6 32.7 36.2 1.21
Mother's functional difficulties
Has functional difficulty 57.9 61.5 59.8 0.94 35.9 35.0 35.4 1.02 27.9 26.9 27.4 1.03 Has no functional difficulty 65.6 66.1 65.9 0.99 42.1 39.3 40.7 1.07 34.1 30.2 32.1 1.13 No informationA 65.5 66.0 65.8 0.99 36.0 34.7 35.3 1.04 28.4 26.8 27.6 1.06
Mother's education
None/Preschool 53.7 57.3 55.6 0.94 23.3 25.8 24.6 0.90 16.6 17.7 17.2 0.94 Primary 74.4 72.2 73.3 1.03 46.2 41.0 43.4 1.13 37.4 31.1 34.3 1.20 Lower Secondary 80.0 75.2 77.6 1.06 58.2 50.5 54.3 1.15 50.1 43.0 46.5 1.17 Upper Secondary 79.9 78.6 79.2 1.02 63.6 52.3 57.8 1.22 62.7 51.5 57.3 1.22 Higher 80.9 79.0 79.9 1.02 71.9 65.4 68.6 1.10 70.2 71.0 70.6 0.99 No informationA na na na na na na na na 13.8 5.3 10.6 2.58
Wealth index quintile
Poorest 41.1 47.6 44.4 0.86 10.2 17.0 13.8 0.60 5.5 10.8 8.1 0.51 Second 65.3 65.2 65.2 1.00 27.5 31.1 29.4 0.88 18.2 20.6 19.4 0.88 Middle 73.6 73.1 73.4 1.01 45.0 39.3 42.1 1.15 30.5 25.8 28.1 1.18 Fourth 78.0 75.2 76.6 1.04 51.2 45.5 48.4 1.13 45.0 33.5 39.3 1.34 Richest 79.9 77.5 78.6 1.03 65.9 56.0 60.8 1.18 59.7 55.8 57.7 1.07
Parity indices
Wealth
Poorest/Richest1 0.52 0.61 0.56 na 0.15 0.30 0.23 na 0.09 0.19 0.14 na Area
Rural/Urban2 0.85 0.90 0.87 na 0.67 0.77 0.71 na 0.57 0.72 0.64 na 1 MICS indicator LN.11b - Parity indices (wealth); SDG indicator 4.5.1 2 MICS indicator LN.11c - Parity indices (area); SDG indicator 4.5.1 3 MICS indicator LN.11a - Parity indices (gender); SDG indicator 4.5.1 A Includes emancipated children age 15-17 years and children age 18 or higher at the time of the interview na: not applicable
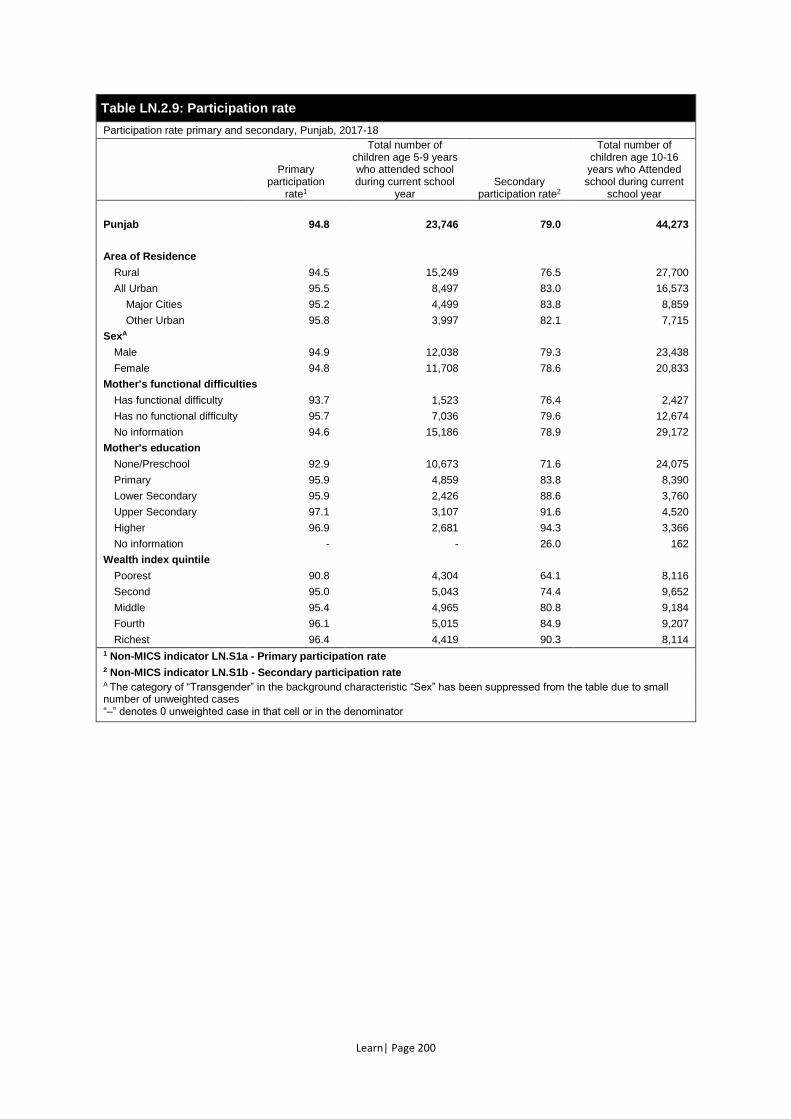
Learn| Page 200
Table LN.2.9: Participation rate
Participation rate primary and secondary, Punjab, 2017-18
Primary participation
rate1
Total number of children age 5-9 years who attended school during current school
year Secondary
participation rate2
Total number of children age 10-16 years who Attended school during current
school year
Punjab 94.8 23,746 79.0 44,273
Area of Residence
Rural 94.5 15,249 76.5 27,700
All Urban 95.5 8,497 83.0 16,573
Major Cities 95.2 4,499 83.8 8,859
Other Urban 95.8 3,997 82.1 7,715
SexA
Male 94.9 12,038 79.3 23,438
Female 94.8 11,708 78.6 20,833
Mother's functional difficulties
Has functional difficulty 93.7 1,523 76.4 2,427
Has no functional difficulty 95.7 7,036 79.6 12,674
No information 94.6 15,186 78.9 29,172
Mother's education
None/Preschool 92.9 10,673 71.6 24,075
Primary 95.9 4,859 83.8 8,390
Lower Secondary 95.9 2,426 88.6 3,760
Upper Secondary 97.1 3,107 91.6 4,520
Higher 96.9 2,681 94.3 3,366
No information - - 26.0 162
Wealth index quintile
Poorest 90.8 4,304 64.1 8,116
Second 95.0 5,043 74.4 9,652
Middle 95.4 4,965 80.8 9,184
Fourth 96.1 5,015 84.9 9,207
Richest 96.4 4,419 90.3 8,114
1 Non-MICS indicator LN.S1a - Primary participation rate 2 Non-MICS indicator LN.S1b - Secondary participation rate A The category of “Transgender” in the background characteristic “Sex” has been suppressed from the table due to small number of unweighted cases “–” denotes 0 unweighted case in that cell or in the denominator
Learn| Page 201
Table LN.2.10: School attendance of orphans and non-orphans
School attendance of children age 10-14 years by orphan hood, Punjab, 2017-18
Percentage of children
whose mother and father have
died (orphans)
Percentage of children whose parents are still alive and who are living with at least one parent (non-
orphans)
Percentage of
children whose mother
or father has died
Number of children
age 10-14 years
Percentage of children whose
mother and father have
died (orphans) and are
attending school
Total number of
orphan children
age 10-14 years
Percentage of children whose parents are still alive, who are living with at
least one parent (non-orphans), and who are
attending school
Total number of
non-orphan children
age 10-14 years
Punjab 0.2 91.5 7.2 37,112 0.2 91.6 71.9 37,020
Area of residence
Rural 0.3 91.3 7.4 24,238 0.1 61.0 68.2 24,177
All Urban 0.2 92.0 6.8 12,874 0.2 30.6 79.0 12,843
Major Cities 0.3 92.4 6.5 6,838 0.2 18.9 80.0 6,819
Other Urban 0.2 91.4 7.1 6,036 0.2 11.7 77.8 6,025
SexA
Male 0.2 91.6 7.3 19,030 0.2 43.2 74.6 18,986
Female 0.3 91.5 7.1 18,080 0.2 48.4 69.2 18,032 A The category of “Transgender” in the background characteristic of “Sex” has been suppressed from the table due to small number of unweighted cases

Learn| Page 202
LN.3 PARENTAL INVOLVEMENT
Parental involvement in their children’s education is widely accepted to have a positive effect on their
child’s learning performance. For instance, reading activities at home have significant positive
influences on reading achievement, language comprehension and expressive language skills.110
Research also shows that parental involvement in their child’s literacy practices is a positive long-term
predictor of later educational attainment.111
Beyond learning activities at home, parental involvement that occurs in school (like participating in
school meetings, talking with teachers, attending school meetings and volunteering in schools) can
also benefit a student’s performance.112 Research studies have shown that, in the primary school age
range, the impact of parental involvement in school activities can even be much bigger than
differences associated with variations in the quality of schools, regardless of social class and ethnic
group.113
The PR module included in the Questionnaire for children age 5-17 years was developed and tested
for inclusion in MICS6. The work is described in detail in MICS Methodological Papers (Paper No. 5).114
Table LN.3.1 presents percentages of children age 7-14 years for whom an adult household member
received a report card and was involved in school management and school activities in the last year,
including discussion with teachers on children’s progress.
In Table LN.3.2, reasons for children unable to attend class due to school-related reasons are
presented. Reasons include natural and man-made disaster, teacher strike and teacher absenteeism.
Lastly, Table LN.3.3 shows learning environment at home, i.e., percentage of children with 3 or more
books to read, percentage of children who have homework, percentage whose teachers use the
language also spoken at home, and percentage of children who receive help with homework.
110 Gest, D. et al. "Shared Book Reading and Children’s Language Comprehension Skills: The Moderating Role of Parental
Discipline Practices." Early Childhood Research Quarterly19, no. 2 (2004): 319-36. doi:10.1016/j.ecresq.2004.04.007. 111 Fluori, E. and A. Buchanan. "Early Father's and Mother's Involvement and Child's Later Educational
Outcomes." Educational Psychology74, no. 2 (2004): 141-53. doi:10.1348/000709904773839806. 112 Pomerantz, M., E. Moorman and S. Litwack. "The How, Whom, and Why of Parents’ Involvement in Children’s Academic
Lives: More Is Not Always Better." Review of Educational Research77, no. 3 (2007): 373-410.
doi:10.3102/003465430305567. 113 Desforges, C. and A, Abouchaar. The Impact of Parental Involvement, Parental Support and Family Education on Pupil
Achievements and Adjustment: A Literature Review. Research report. Nottingham: Queen’s Printer, 2003.
https://www.nationalnumeracy.org.uk/sites/default/files/the_impact_of_parental_involvement.pdf. 114 Hattori, H., M. Cardoso and B. Ledoux. Collecting data on foundational learning skills and parental involvement in
education. MICS Methodological Papers. New York: UNICEF, 2017.
http://mics.unicef.org/files?job=W1siZiIsIjIwMTcvMDYvMTUvMTYvMjcvMDAvNzMxL01JQ1NfTWV0aG9kb2xvZ2ljYWxfUGF
wZXJfNS5wZGYiXV0&sha=39f5c31dbb91df26.
Learn| Page 203
Table LN.3.1: Support for child learning at school
Percentage of children attending school and, among those, percentage of children for whom an adult member of the household received a report card for the child, and involvement of adults in school management and school activities in the last year, Punjab, 2017-18
Percentage of children attending schoolA
Number of children age 7-
14
Percentage of children for
whom an adult household
member in the last year
received a report card for
the child1
Involvement by adult in school management in last year
Involvement by adult in school activities in last year
Number of children age 7-14 years attending
school
School has a
governing body
open to parents2
Attended meeting called by governing
body3
A meeting discussed
key education/ financial issues4
Attended school
celebration or a sport event
Met with teachers to
discuss child's
progress5
Punjab 83.5 20,617 59.3 18.8 14.2 9.4 27.8 57.9 17,211
Area of Residence
Rural 80.0 13,252 50.2 13.7 9.4 5.7 21.4 51.7 10,604
All Urban 89.7 7,366 73.9 26.9 22.0 15.2 38.0 67.7 6,607
Major Cities 90.3 4,012 79.1 30.5 25.4 18.1 40.2 71.0 3,621
Other Urban 89.0 3,354 67.6 22.6 17.9 11.7 35.4 63.8 2,986
Sex
Male 85.5 10,587 58.8 18.6 14.2 9.2 27.1 57.7 9,053
Female 81.3 10,031 59.9 18.9 14.3 9.5 28.5 58.0 8,158
Child's functional difficulties
Has functional difficulty 80.4 3,602 58.2 17.8 13.1 8.6 26.2 59.0 2,898
Has no functional difficulty 84.1 17,016 59.5 19.0 14.5 9.5 28.1 57.6 14,313
Mother's functional difficulties
Has functional difficulty 86.2 942 51.8 20.3 15.3 9.3 26.5 56.4 812
Has no functional difficulty 85.4 16,646 60.7 19.1 14.8 9.9 28.7 59.3 14,222
No information 71.8 3,029 52.9 15.9 10.1 6.0 22.3 49.3 2,176
Age at beginning of school year
6 88.3 2,644 59.5 18.1 13.7 8.9 28.0 59.4 2,335
7 89.9 2,953 59.0 18.6 14.1 9.6 27.8 57.8 2,654
8 90.2 2,541 59.8 17.9 14.1 9.0 28.9 59.6 2,292
9 88.4 2,499 60.3 17.6 13.8 9.0 27.6 57.9 2,209
10 86.2 2,164 61.5 20.2 15.2 9.6 29.4 59.6 1,865
11 79.8 2,482 58.2 18.6 13.9 9.1 27.3 57.3 1,981
12 76.9 2,316 59.9 20.2 15.2 10.2 27.2 56.4 1,780
13 69.6 2,503 56.6 19.8 14.0 9.5 26.5 54.2 1,743
14 68.1 516 56.3 19.0 15.0 11.0 24.1 55.7 352
School attendanceA
Early childhood education 100.0 1,449 38.4 13.1 9.4 6.9 16.3 42.7 1,449
Primary 100.0 11,046 60.0 18.1 13.8 8.8 28.1 58.6 11,046
Lower secondary 100.0 3,731 63.2 21.0 15.9 10.8 29.7 60.1 3,731
Upper secondary 100.0 984 67.9 26.0 19.3 13.5 34.1 63.2 984
Learn| Page 204
Table LN.3.1: Support for child learning at school
Percentage of children attending school and, among those, percentage of children for whom an adult member of the household received a report card for the child, and involvement of adults in school management and school activities in the last year, Punjab, 2017-18
Percentage of children attending schoolA
Number of children age 7-
14
Percentage of children for
whom an adult household
member in the last year
received a report card for
the child1
Involvement by adult in school management in last year
Involvement by adult in school activities in last year
Number of children age 7-14 years attending
school
School has a
governing body
open to parents2
Attended meeting called by governing
body3
A meeting discussed
key education/ financial issues4
Attended school
celebration or a sport event
Met with teachers to
discuss child's
progress5
Punjab 83.5 20,617 59.3 18.8 14.2 9.4 27.8 57.9 17,211
Out-of-school 0.0 3,407 na na na na na na na
School ManagementB
Public 99.9 8,915 48.8 12.8 8.3 5.2 17.7 49.9 8,906
Non-public 99.9 6,584 78.7 28.1 23.3 15.6 44.4 72.6 6,577
Mother's education
None/Preschool 74.4 11,171 43.8 11.4 7.4 4.6 15.9 45.2 8,312
Primary 91.9 3,668 61.8 17.2 13.0 8.3 26.4 60.3 3,370
Lower Secondary 95.0 1,711 71.8 24.6 18.4 12.1 36.3 66.9 1,626
Upper Secondary 95.0 2,216 81.5 28.6 22.5 14.9 44.4 75.3 2,104
Higher 97.1 1,852 89.2 39.0 34.5 24.4 58.0 83.2 1,799
Wealth index quintile
Poorest 62.8 4,900 25.9 5.0 2.5 1.4 7.1 34.1 3,077
Second 83.4 4,249 46.0 9.4 5.5 2.9 16.6 49.1 3,544
Middle 89.4 3,850 59.7 16.0 10.9 6.9 24.7 57.2 3,443
Fourth 92.5 3,904 73.5 23.6 18.1 11.9 34.9 67.1 3,613
Richest 95.1 3,715 86.8 37.9 32.5 22.7 52.7 78.6 3,533 1 MICS indicator LN.12 - Availability of information on children's school performance 2 MICS indicator LN.13 - Opportunity to participate in School Management 3 MICS indicator LN.14: Participation in school management 4 MICS indicator LN.15 - Effective participation in school management 5 MICS indicator LN.16 - Discussion with teachers regarding children’s progress A Attendance to school here is not directly comparable to net attendance ratios reported in preceding tables, which utilise information on all children in the sample. This and subsequent tables present results of the Parental Participation and Foundational Learning Skills modules administered to mothers of a randomly selected subsample of children age 7-14 years. B School management sector was collected for children attending primary education or higher. Children out of school or attending ECE are not shown
na: not applicable
Learn| Page 205
Table LN.3.2: School-related reasons for inability to attend class
Percentage of children not able to attend class due to absence of teacher or school closure, by reason for inability, and percentage of adult household members contacting school officials or governing body representatives on instances of teacher strike or absence, Punjab, 2017-18
Percentage of children who
in the last year could not attend class
due to absence of teacher or
school closure
Number of
children age 7-14
years attending
school
Percentage of children unable to attend class in the last year due to a school-related reason: Number of children
age 7-14 who could not attend class in the last year due to a school-related
reason
Percentage of adult household members
contacting school officials or governing body representatives
on instances of teacher strike or
absence1
Number of children age 7-14 years who
could not attend class in the last
year due to teacher strike or
absence Natu
ral
dis
aste
rs
Ma
n-m
ade
dis
aste
rs
Te
acher
str
ike
Oth
er
Te
acher
absence
Te
acher
str
ike o
r absence
Punjab 32.5 17,211 11.6 74.7 8.3 10.0 20.0 25.4 5,587 26.9 1,419
Area of Residence
Rural 31.2 10,604 9.1 73.9 7.8 9.2 22.2 27.6 3,308 23.4 914
All Urban 34.5 6,607 15.2 75.7 9.0 11.1 16.7 22.2 2,278 33.4 506
Major Cities 38.8 3,621 16.6 78.7 9.2 12.3 15.0 20.1 1,404 33.5 283
Other Urban 29.3 2,986 13.0 70.9 8.6 9.3 19.4 25.5 874 33.2 223
Sex Male 32.5 9,053 11.5 74.5 8.6 9.3 21.1 26.5 2,946 27.8 780
Female 32.4 8,158 11.8 74.8 8.0 10.9 18.8 24.2 2,640 25.9 640
Child's functional difficulties Has functional difficulty 41.0 2,898 10.5 73.4 8.8 10.5 25.3 31.0 1,189 30.6 368
Has no functional difficulty 30.7 14,313 11.9 75.0 8.2 9.9 18.6 23.9 4,397 25.7 1,051
Mother's functional difficulties Has functional difficulty 37.1 812 10.9 69.6 8.6 11.0 24.2 29.6 301 29.1 89
Has no functional difficulty 32.4 14,222 11.8 74.8 8.4 10.0 19.3 24.8 4,614 28.3 1,142
No information 30.9 2,176 10.6 75.7 7.8 9.4 23.0 28.0 671 18.0 188
Age at beginning of school year 6 30.7 2,335 9.4 73.3 8.0 11.3 19.7 26.2 717 26.6 188
7 30.8 2,654 9.0 76.3 6.9 10.3 18.4 23.2 818 21.2 190
8 33.6 2,292 12.2 75.5 9.1 8.5 18.6 24.9 769 30.7 191
9 33.7 2,209 12.1 76.0 6.6 8.5 20.8 24.5 745 29.7 182
10 33.5 1,865 11.8 74.6 9.3 9.7 19.0 25.0 624 26.4 156
11 34.1 1,981 11.8 75.5 8.8 10.7 21.0 25.7 676 34.0 174
12 32.9 1,780 14.0 74.5 9.1 12.2 20.1 26.2 585 25.8 153
13 30.8 1,743 13.9 69.8 10.4 9.6 23.8 30.4 537 21.7 163
14 32.7 352 11.7 75.3 4.1 8.8 18.1 18.9 115 (*) 22
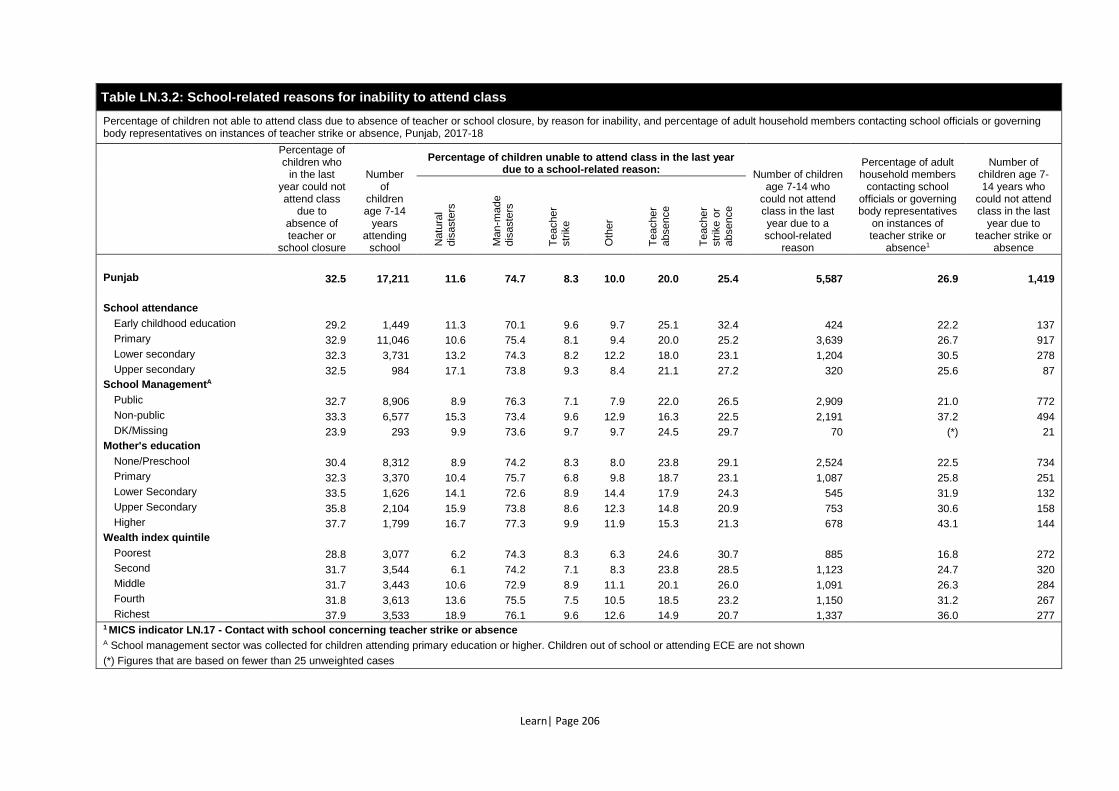
Learn| Page 206
Table LN.3.2: School-related reasons for inability to attend class
Percentage of children not able to attend class due to absence of teacher or school closure, by reason for inability, and percentage of adult household members contacting school officials or governing body representatives on instances of teacher strike or absence, Punjab, 2017-18
Percentage of children who
in the last year could not attend class
due to absence of teacher or
school closure
Number of
children age 7-14
years attending
school
Percentage of children unable to attend class in the last year due to a school-related reason: Number of children
age 7-14 who could not attend class in the last year due to a school-related
reason
Percentage of adult household members
contacting school officials or governing body representatives
on instances of teacher strike or
absence1
Number of children age 7-14 years who
could not attend class in the last
year due to teacher strike or
absence Natu
ral
dis
aste
rs
Ma
n-m
ade
dis
aste
rs
Te
acher
str
ike
Oth
er
Te
acher
absence
Te
acher
str
ike o
r absence
Punjab 32.5 17,211 11.6 74.7 8.3 10.0 20.0 25.4 5,587 26.9 1,419
School attendance
Early childhood education 29.2 1,449 11.3 70.1 9.6 9.7 25.1 32.4 424 22.2 137
Primary 32.9 11,046 10.6 75.4 8.1 9.4 20.0 25.2 3,639 26.7 917
Lower secondary 32.3 3,731 13.2 74.3 8.2 12.2 18.0 23.1 1,204 30.5 278
Upper secondary 32.5 984 17.1 73.8 9.3 8.4 21.1 27.2 320 25.6 87
School ManagementA Public 32.7 8,906 8.9 76.3 7.1 7.9 22.0 26.5 2,909 21.0 772
Non-public 33.3 6,577 15.3 73.4 9.6 12.9 16.3 22.5 2,191 37.2 494
DK/Missing 23.9 293 9.9 73.6 9.7 9.7 24.5 29.7 70 (*) 21
Mother's education
None/Preschool 30.4 8,312 8.9 74.2 8.3 8.0 23.8 29.1 2,524 22.5 734
Primary 32.3 3,370 10.4 75.7 6.8 9.8 18.7 23.1 1,087 25.8 251
Lower Secondary 33.5 1,626 14.1 72.6 8.9 14.4 17.9 24.3 545 31.9 132
Upper Secondary 35.8 2,104 15.9 73.8 8.6 12.3 14.8 20.9 753 30.6 158
Higher 37.7 1,799 16.7 77.3 9.9 11.9 15.3 21.3 678 43.1 144
Wealth index quintile Poorest 28.8 3,077 6.2 74.3 8.3 6.3 24.6 30.7 885 16.8 272
Second 31.7 3,544 6.1 74.2 7.1 8.3 23.8 28.5 1,123 24.7 320
Middle 31.7 3,443 10.6 72.9 8.9 11.1 20.1 26.0 1,091 26.3 284
Fourth 31.8 3,613 13.6 75.5 7.5 10.5 18.5 23.2 1,150 31.2 267
Richest 37.9 3,533 18.9 76.1 9.6 12.6 14.9 20.7 1,337 36.0 277 1 MICS indicator LN.17 - Contact with school concerning teacher strike or absence A School management sector was collected for children attending primary education or higher. Children out of school or attending ECE are not shown
(*) Figures that are based on fewer than 25 unweighted cases
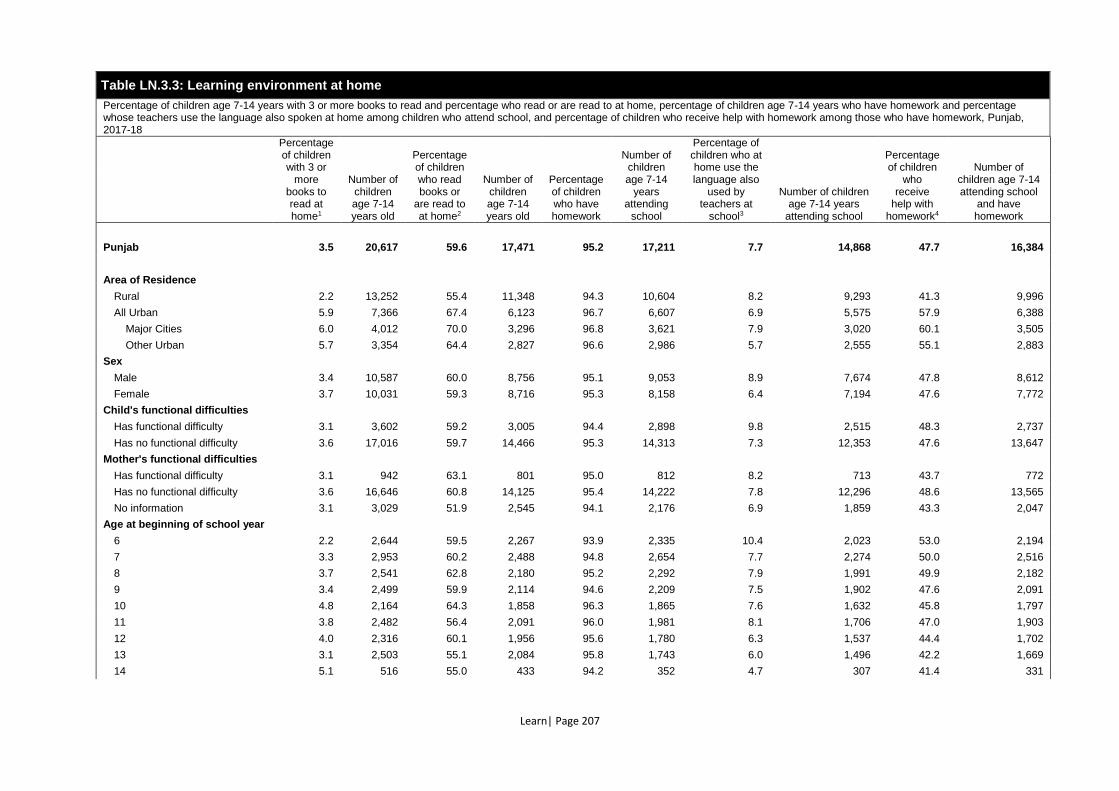
Learn| Page 207
Table LN.3.3: Learning environment at home
Percentage of children age 7-14 years with 3 or more books to read and percentage who read or are read to at home, percentage of children age 7-14 years who have homework and percentage whose teachers use the language also spoken at home among children who attend school, and percentage of children who receive help with homework among those who have homework, Punjab, 2017-18
Percentage of children with 3 or
more books to read at home1
Number of children age 7-14 years old
Percentage of children who read books or
are read to at home2
Number of children age 7-14 years old
Percentage of children who have homework
Number of children age 7-14
years attending
school
Percentage of children who at home use the language also
used by teachers at
school3
Number of children age 7-14 years
attending school
Percentage of children
who receive
help with homework4
Number of children age 7-14 attending school
and have homework
Punjab 3.5 20,617 59.6 17,471 95.2 17,211 7.7 14,868 47.7 16,384
Area of Residence
Rural 2.2 13,252 55.4 11,348 94.3 10,604 8.2 9,293 41.3 9,996
All Urban 5.9 7,366 67.4 6,123 96.7 6,607 6.9 5,575 57.9 6,388
Major Cities 6.0 4,012 70.0 3,296 96.8 3,621 7.9 3,020 60.1 3,505
Other Urban 5.7 3,354 64.4 2,827 96.6 2,986 5.7 2,555 55.1 2,883
Sex
Male 3.4 10,587 60.0 8,756 95.1 9,053 8.9 7,674 47.8 8,612
Female 3.7 10,031 59.3 8,716 95.3 8,158 6.4 7,194 47.6 7,772
Child's functional difficulties
Has functional difficulty 3.1 3,602 59.2 3,005 94.4 2,898 9.8 2,515 48.3 2,737
Has no functional difficulty 3.6 17,016 59.7 14,466 95.3 14,313 7.3 12,353 47.6 13,647
Mother's functional difficulties
Has functional difficulty 3.1 942 63.1 801 95.0 812 8.2 713 43.7 772
Has no functional difficulty 3.6 16,646 60.8 14,125 95.4 14,222 7.8 12,296 48.6 13,565
No information 3.1 3,029 51.9 2,545 94.1 2,176 6.9 1,859 43.3 2,047
Age at beginning of school year
6 2.2 2,644 59.5 2,267 93.9 2,335 10.4 2,023 53.0 2,194
7 3.3 2,953 60.2 2,488 94.8 2,654 7.7 2,274 50.0 2,516
8 3.7 2,541 62.8 2,180 95.2 2,292 7.9 1,991 49.9 2,182
9 3.4 2,499 59.9 2,114 94.6 2,209 7.5 1,902 47.6 2,091
10 4.8 2,164 64.3 1,858 96.3 1,865 7.6 1,632 45.8 1,797
11 3.8 2,482 56.4 2,091 96.0 1,981 8.1 1,706 47.0 1,903
12 4.0 2,316 60.1 1,956 95.6 1,780 6.3 1,537 44.4 1,702
13 3.1 2,503 55.1 2,084 95.8 1,743 6.0 1,496 42.2 1,669
14 5.1 516 55.0 433 94.2 352 4.7 307 41.4 331
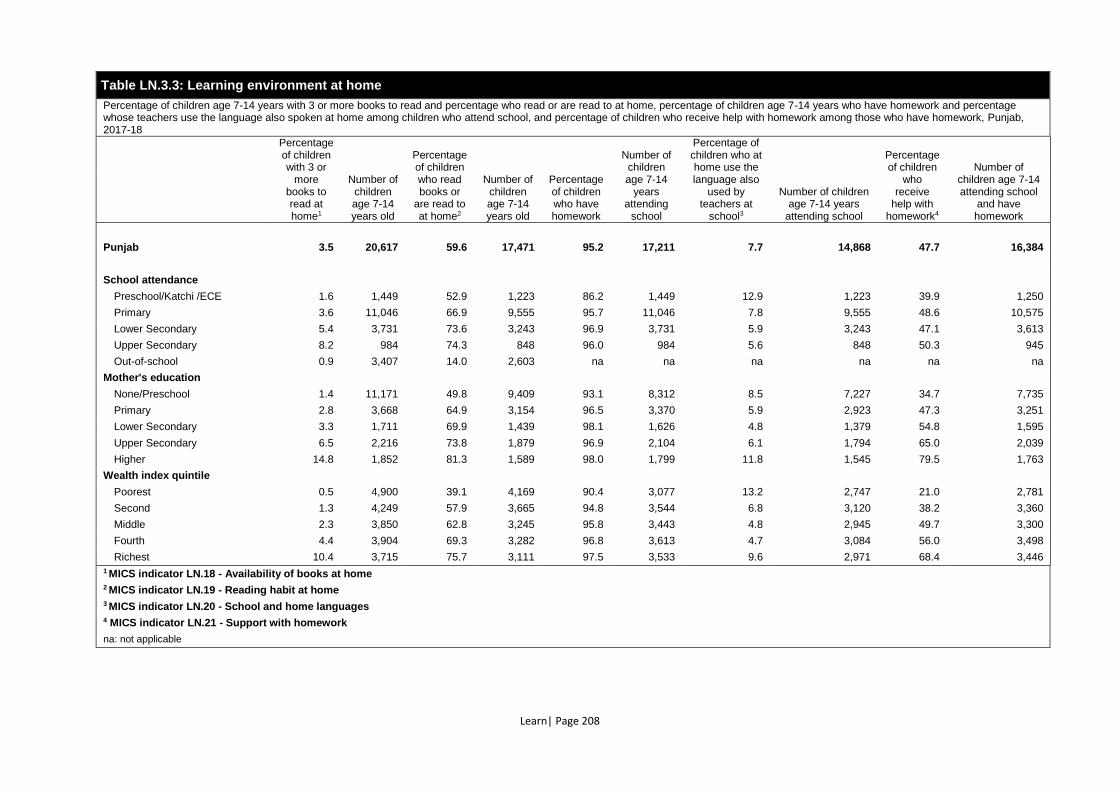
Learn| Page 208
Table LN.3.3: Learning environment at home
Percentage of children age 7-14 years with 3 or more books to read and percentage who read or are read to at home, percentage of children age 7-14 years who have homework and percentage whose teachers use the language also spoken at home among children who attend school, and percentage of children who receive help with homework among those who have homework, Punjab, 2017-18
Percentage of children with 3 or
more books to read at home1
Number of children age 7-14 years old
Percentage of children who read books or
are read to at home2
Number of children age 7-14 years old
Percentage of children who have homework
Number of children age 7-14
years attending
school
Percentage of children who at home use the language also
used by teachers at
school3
Number of children age 7-14 years
attending school
Percentage of children
who receive
help with homework4
Number of children age 7-14 attending school
and have homework
Punjab 3.5 20,617 59.6 17,471 95.2 17,211 7.7 14,868 47.7 16,384
School attendance
Preschool/Katchi /ECE 1.6 1,449 52.9 1,223 86.2 1,449 12.9 1,223 39.9 1,250
Primary 3.6 11,046 66.9 9,555 95.7 11,046 7.8 9,555 48.6 10,575
Lower Secondary 5.4 3,731 73.6 3,243 96.9 3,731 5.9 3,243 47.1 3,613
Upper Secondary 8.2 984 74.3 848 96.0 984 5.6 848 50.3 945
Out-of-school 0.9 3,407 14.0 2,603 na na na na na na
Mother's education
None/Preschool 1.4 11,171 49.8 9,409 93.1 8,312 8.5 7,227 34.7 7,735
Primary 2.8 3,668 64.9 3,154 96.5 3,370 5.9 2,923 47.3 3,251
Lower Secondary 3.3 1,711 69.9 1,439 98.1 1,626 4.8 1,379 54.8 1,595
Upper Secondary 6.5 2,216 73.8 1,879 96.9 2,104 6.1 1,794 65.0 2,039
Higher 14.8 1,852 81.3 1,589 98.0 1,799 11.8 1,545 79.5 1,763
Wealth index quintile
Poorest 0.5 4,900 39.1 4,169 90.4 3,077 13.2 2,747 21.0 2,781
Second 1.3 4,249 57.9 3,665 94.8 3,544 6.8 3,120 38.2 3,360
Middle 2.3 3,850 62.8 3,245 95.8 3,443 4.8 2,945 49.7 3,300
Fourth 4.4 3,904 69.3 3,282 96.8 3,613 4.7 3,084 56.0 3,498
Richest 10.4 3,715 75.7 3,111 97.5 3,533 9.6 2,971 68.4 3,446
1 MICS indicator LN.18 - Availability of books at home 2 MICS indicator LN.19 - Reading habit at home 3 MICS indicator LN.20 - School and home languages 4 MICS indicator LN.21 - Support with homework
na: not applicable
Learn| Page 209
LN.4 FOUNDATIONAL LEARNING SKILLS
The ability to read and understand a simple text is one of the most fundamental skills a child can learn.
Yet in many countries, students enrolled in school for as many as 6 years are unable to read and
understand simple texts, as shown for instance by regional assessments such as the Latin American
Laboratory for Assessment of the Quality of Education (LLECE), the Programme for the Analysis of
Education Systems (PASEC) and the Southern and Eastern Africa Consortium for Monitoring
Educational Quality (SACMEQ).115 Acquiring literacy in the early grades of primary is crucial because
doing so becomes more difficult in later grades, for those who are lagging behind.116
A strong foundation in basic numeracy skills during the early grades is crucial for success in
mathematics in the later years. Mathematics is a skill very much in demand and most competitive jobs
require some level of skill in mathematics. Early mathematical knowledge is a primary predictor of
later academic achievement and future success in mathematics is related to an early and strong
conceptual foundation.117
There are a number of existing tools for measuring learning outcomes118 with each approach having
their own strengths and limitations as well as varying levels of applicability to household surveys such
as MICS. For some international assessments, it may just be too late: “Even though international
testing programs like PISA and TIMSS are steadily increasing their coverage to also cover developing
countries, (…) much of the divergence in test scores happens before the points in the educational
trajectories of children where they are tested by international assessments”, according to longitudinal
surveys like the Young Lives Study.119 National assessments such as the Early Grade Reading
Assessment, which happens earlier and is more context specific, will however be less appropriate for
cross-country analysis; although it may be possible to compare children who do not complete an
exercise, (zero scores) set at a level which reflects each national target for children by a certain age or
grade. Additionally, it is recognized that some assessments only capture children in school. However,
115 CONFEMEN. PASEC 2014 Education system performance in Francophone sub-Saharan Africa. Competencies and learning
factors in primary education. Dakar: CONFEMEN, 2015. http://www.pasec.confemen.org/wp-
content/uploads/2015/12/Rapport_Pasec2014_GB_webv2.pdf.;
Makuwa, D. and J. Maarse. "The Impact of Large-Scale International Assessments: A Case Study of How the Ministry of
Education in Namibia Used SACMEQ Assessments to Improve Learning Outcomes." Research in Comparative and
International Education 8, no. 3 (2013): 349-58. doi:10.2304/rcie.2013.8.3.349.;
Spaull, N. "Poverty & Privilege: Primary School Inequality in South Africa." International Journal of Educational
Development 33, no. 5 (2013): 436-47. doi:10.1016/j.ijedudev.2012.09.009. 116 Stanovich, K. "Matthew Effects in Reading: Some Consequences of Individual Differences in the Acquisition of
Literacy." Reading Research Quarterly 21, no. 4 (1986): 360-407. doi:10.1598/rrq.21.4.1. 117 Duncan, G. "School Readiness and Later Achievement." Developmental Psychology 43, no. 6 (2007): 1428-446.
doi:10.1037/0012-1649.43.6.1428. 118 LMTF. Toward Universal Learning. A Global Framework for Measuring Learning. Report No. 2 of the Learning Metrics
Task Force. Montreal and Washington: UNESCO Institute for Statistics and Center for Universal Education at the Brookings
Institution. https://www.brookings.edu/wp-content/uploads/2016/06/LMTFReport2ES_final.pdf.;
Buckner, E. and R. Hatch. Literacy Data: More, but not always better. Washington: Education Policy and Data Center, 2014.
https://www.epdc.org/epdc-data-points/literacy-data-more-not-always-better-part-1-2.;
Wagner, D. Smaller, Quicker Cheaper – Improving Leaning Assessments for Developing Countries. Paris: International
Institute for Educational Planning, 2011. http://unesdoc.unesco.org/images/0021/002136/213663e.pdf. 119 Singh, A. Emergence and evolution of learning gaps across countries: Linked panel evidence from Ethiopia, India, Peru
and Vietnam. Oxford: Young Lives, 2014. http://www.younglives.org.uk/files/YL-WP124_Singh_learning%20gaps.pdf.
Learn| Page 210
given that, many children do not attend school, further data on these out-of-school children is needed
and these can be adequately captured in household surveys.
Tables LN.4.1 and LN.4.2 present percentages of children age 7-14 years who correctly answered
foundational reading tasks and numeracy skills, respectively, by age, sex, location, region, wealth
index quintile and other disaggregation. These MICS indicators are designed and developed for both
national policy development and SDG reporting for SDG4.1.1 (a): Proportion of children in grade 2/3
achieving a minimum proficiency in (i) reading and (ii) mathematics by sex.
The assessment score of reading tasks is further disaggregated by results of the literal questions and
inferential questions. The disaggregation of numeracy skills such as number reading, number
discrimination, addition and pattern recognitions are also available.
Learn| Page 211
Table LN.4.1: Reading skills
Percentage of children aged 7-14 who demonstrate foundational reading skills by successfully completing three foundational reading tasks, by sex, Punjab, 2017-18
Male Female Total
Perc
enta
ge w
ho c
orr
ectly
read 9
0%
of w
ord
s in
a s
tory
Percentage who correctly
answered comprehension
questions
Perc
enta
ge w
ho
dem
onstr
ate
d f
oundatio
nal
readin
g s
kill
s
Num
ber
of child
ren a
ge 7
-14
years
Perc
enta
ge w
ho c
orr
ectly
read 9
0%
of w
ord
s in
a s
tory
Percentage who correctly
answered comprehension
questions
Perc
enta
ge w
ho
dem
onstr
ate
d f
oundatio
nal
readin
g s
kill
s
Num
ber
of child
ren a
ge 7
-14
years
Perc
enta
ge w
ho c
orr
ectly
read 9
0%
of w
ord
s in
a s
tory
Percentage who correctly answered
comprehension questions
Perc
enta
ge o
f child
ren w
ho
dem
onstr
ate
foundatio
nal
readin
g s
kill
s1,2
,3
Perc
enta
ge o
f child
ren for
whom
the r
eadin
g b
ook w
as
not
availa
ble
in a
ppro
pria
te
language
Num
ber
of child
ren a
ge 7
-14
years
Th
ree litera
l
Tw
o in
fere
ntia
l
Th
ree litera
l
Tw
o in
fere
ntia
l
Th
ree litera
l
Tw
o in
fere
ntia
l
Punjab 68.4 41.4 40.3 31.9 8,756 67.0 42.4 42.2 33.7 8,716 67.7 41.9 41.2 32.8 13.8 17,471
Area of Residence
Rural 64.5 36.2 34.7 27.8 5,737 60.8 35.8 35.3 28.0 5,611 62.7 36.0 35.0 27.9 16.0 11,348 All Urban 75.7 51.2 51.0 39.7 3,019 78.1 54.4 54.5 43.9 3,105 76.9 52.8 52.8 41.8 9.7 6,123
Major Cities 75.2 52.7 53.1 40.1 1,658 77.7 57.5 57.8 45.9 1,638 76.5 55.1 55.4 43.0 10.5 3,296 Other Urban 76.3 49.3 48.5 39.1 1,361 78.6 50.9 50.8 41.7 1,466 77.5 50.1 49.7 40.5 8.7 2,827
Child's functional difficulties
Has functional difficulty 64.7 36.3 35.1 27.8 1,610 64.4 36.5 36.1 27.8 1,396 64.5 36.4 35.6 27.8 15.5 3,005 Has no functional difficulty 69.2 42.5 41.5 32.8 7,146 67.5 43.6 43.3 34.8 7,320 68.3 43.0 42.4 33.8 13.4 14,466
Mother's functional difficulties
Has functional difficulty 65.3 43.3 43.4 32.0 418 66.9 40.7 39.6 31.9 382 66.1 42.1 41.6 32.0 18.4 801 Has no functional difficulty 69.5 40.4 39.5 31.1 7,048 69.2 42.5 42.3 33.7 7,077 69.4 41.4 40.9 32.4 14.0 14,125 No information 63.3 45.9 43.8 35.9 1,289 54.3 42.8 42.3 33.7 1,256 58.9 44.4 43.1 34.8 11.3 2,545
Age at beginning of school year
6 70.3 12.6 11.9 10.1 1,104 70.3 13.6 12.3 9.5 1,163 70.3 13.1 12.1 9.8 16.0 2,267 7-82 72.8 24.9 23.1 18.4 2,319 71.6 28.1 27.3 22.5 2,349 72.2 26.5 25.2 20.5 15.3 4,668
7 73.7 21.3 19.5 15.7 1,241 72.7 23.8 22.6 18.7 1,247 73.2 22.6 21.0 17.2 14.8 2,488 8 71.8 29.1 27.3 21.6 1,078 70.3 33.0 32.5 26.7 1,102 71.1 31.1 30.0 24.2 15.8 2,180
9 69.9 43.8 42.9 34.9 1,091 69.1 47.5 49.1 37.3 1,023 69.5 45.6 45.9 36.1 15.0 2,114 10 67.2 52.9 52.7 39.2 970 67.6 59.0 58.2 45.8 889 67.4 55.8 55.3 42.3 14.6 1,858 11 66.8 56.9 55.6 43.3 1,060 63.9 54.2 54.0 42.9 1,031 65.4 55.5 54.8 43.1 12.9 2,091 12 66.1 59.8 58.7 45.6 967 63.7 60.5 59.9 48.7 989 64.9 60.2 59.3 47.2 11.2 1,956 13 61.7 59.0 58.2 48.3 1,037 58.5 55.7 56.7 46.1 1,047 60.1 57.3 57.5 47.2 10.0 2,084 14 58.2 57.9 57.8 43.9 209 57.8 58.2 57.1 44.3 224 58.0 58.1 57.5 44.1 11.5 433
School attendanceA
Early childhood education 74.1 5.0 4.8 4.3 656 74.6 3.7 3.3 2.2 567 74.3 4.4 4.1 3.3 24.2 1,223 Primary 76.2 37.7 36.1 28.5 4,970 79.7 42.2 41.3 32.6 4,585 77.9 39.9 38.6 30.5 16.5 9,555
Grade 1 78.5 10.9 9.6 7.2 882 80.3 10.5 9.9 7.5 779 79.4 10.7 9.7 7.3 17.1 1,660 Grade 2-33 74.8 29.5 27.7 21.4 2,204 77.4 34.6 33.1 25.6 2,144 76.1 32.0 30.4 23.4 17.3 4,348
Grade 2 74.2 22.1 19.5 15.4 1,107 75.3 25.0 23.3 17.9 1,082 74.7 23.5 21.4 16.6 19.0 2,189 Grade 3 75.3 37.0 35.9 27.4 1,097 79.5 44.3 43.1 33.4 1,063 77.4 40.6 39.5 30.3 15.6 2,160
Grade 4 75.3 51.5 50.3 40.1 931 80.2 61.3 58.7 47.4 820 77.6 56.1 54.2 43.5 15.7 1,751 Grade 5 78.6 67.9 66.3 53.5 951 84.6 72.2 74.0 59.2 842 81.4 69.9 69.9 56.2 14.5 1,793
Learn| Page 212
Table LN.4.1: Reading skills
Percentage of children aged 7-14 who demonstrate foundational reading skills by successfully completing three foundational reading tasks, by sex, Punjab, 2017-18
Male Female Total
Perc
enta
ge w
ho c
orr
ectly
read 9
0%
of w
ord
s in
a s
tory
Percentage who correctly
answered comprehension
questions
Perc
enta
ge w
ho
dem
onstr
ate
d f
oundatio
nal
readin
g s
kill
s
Num
ber
of child
ren a
ge 7
-14
years
Perc
enta
ge w
ho c
orr
ectly
read 9
0%
of w
ord
s in
a s
tory
Percentage who correctly
answered comprehension
questions
Perc
enta
ge w
ho
dem
onstr
ate
d f
oundatio
nal
readin
g s
kill
s
Num
ber
of child
ren a
ge 7
-14
years
Perc
enta
ge w
ho c
orr
ectly
read 9
0%
of w
ord
s in
a s
tory
Percentage who correctly answered
comprehension questions
Perc
enta
ge o
f child
ren w
ho
dem
onstr
ate
foundatio
nal
readin
g s
kill
s1,2
,3
Perc
enta
ge o
f child
ren for
whom
the r
eadin
g b
ook w
as
not
availa
ble
in a
ppro
pria
te
language
Num
ber
of child
ren a
ge 7
-14
years
Th
ree litera
l
Tw
o in
fere
ntia
l
Th
ree litera
l
Tw
o in
fere
ntia
l
Th
ree litera
l
Tw
o in
fere
ntia
l
Punjab 68.4 41.4 40.3 31.9 8,756 67.0 42.4 42.2 33.7 8,716 67.7 41.9 41.2 32.8 13.8 17,471
Lower Secondary 83.2 78.8 78.0 63.5 1,654 85.7 82.8 83.6 68.6 1,589 84.5 80.8 80.7 66.0 13.6 3,243
Grade 1 80.2 74.1 72.2 56.4 603 84.7 79.4 81.5 65.3 601 82.4 76.8 76.8 60.8 14.9 1,204 Grade 2 84.1 78.6 78.8 64.6 566 86.3 82.9 83.3 69.3 551 85.2 80.7 81.0 66.9 12.7 1,118 Grade 3 86.1 84.8 84.3 71.0 485 86.4 87.4 87.0 72.1 435 86.2 86.0 85.6 71.5 13.0 920
Upper Secondary 85.4 88.6 88.4 75.2 381 87.8 85.6 87.2 73.9 442 86.7 87.0 87.7 74.5 12.1 822 Grade 1 84.0 89.7 90.1 74.7 306 87.4 85.5 87.1 73.8 366 85.9 87.4 88.4 74.2 12.8 671 Grade 2 91.0 84.2 81.4 77.0 75 89.6 86.4 87.6 74.3 76 90.3 85.3 84.5 75.6 9.4 151
Higher (*) (*) (*) (*) 14 (*) (*) (*) (*) 12 (*) (*) (*) (*) (*) 25 Out-of-school 0.0 5.9 5.9 0.0 1,081 0.0 2.5 2.5 0.0 1,522 0.0 3.9 3.9 0.0 0.0 2,603
Mother's education None/Preschool 60.3 32.7 31.0 24.5 4,693 56.1 30.4 29.8 23.4 4,716 58.2 31.5 30.4 24.0 15.1 9,409 Primary 74.2 42.7 41.6 33.1 1,614 77.6 49.2 49.3 39.3 1,541 75.9 45.9 45.3 36.1 13.0 3,154 Lower Secondary 83.0 50.9 49.6 41.8 715 80.2 55.7 53.4 43.4 724 81.6 53.3 51.5 42.6 10.4 1,439 Upper Secondary 79.2 54.5 54.6 43.5 933 82.3 59.4 60.9 49.3 947 80.8 56.9 57.8 46.4 10.9 1,879 Higher 78.0 65.7 67.0 50.4 801 80.6 68.9 69.5 55.9 788 79.3 67.3 68.2 53.1 14.4 1,589
Wealth index quintile
Poorest 50.4 21.5 19.6 15.2 2,091 41.5 16.6 16.4 12.7 2,077 46.0 19.1 18.0 14.0 17.3 4,169 Second 66.7 36.0 35.5 27.9 1,843 64.9 36.2 35.1 27.7 1,822 65.8 36.1 35.3 27.8 16.2 3,665 Middle 73.1 45.2 43.3 35.2 1,661 73.3 47.0 46.4 36.2 1,584 73.2 46.1 44.9 35.7 13.5 3,245 Fourth 78.3 48.6 47.4 38.5 1,586 81.4 55.6 55.6 45.4 1,696 79.9 52.2 51.7 42.1 9.3 3,282 Richest 79.3 62.8 63.1 48.5 1,574 81.5 65.4 66.1 53.4 1,536 80.4 64.1 64.6 50.9 11.5 3,111
1 MICS indicator LN.22a - Foundational reading and number skills (reading, age 7-14) 2 MICS indicator LN.22b - Foundational reading and number skills (reading, age for grade 2/3) 3 MICS indicator LN.22c - Foundational reading and number skills (reading, attending grade 2/3); SDG indicator 4.1.1 A The category of “Don’t know/Missing” in the background characteristic of “School attendance” has been suppressed from the table due to small number of unweighted cases
(*) Figures that are based on fewer than 25 unweighted cases
Learn| Page 213
Table LN.4.2: Numeracy skills
Percentage of children aged 7-14 who demonstrate foundational numeracy skills by successfully completing three foundational numeracy tasks, by sex, Punjab, 2017-18
Male
Female
Total
Percentage of children who successfully completed tasks
of:
Pe
rce
nta
ge o
f child
ren
wh
o d
em
onstr
ate
fou
nd
atio
na
l nu
me
racy
skill
s
Num
be
r o
f ch
ildre
n a
ge
7-1
4 y
ea
rs
Percentage of children who successfully completed tasks
of:
Pe
rce
nta
ge o
f child
ren
wh
o d
em
onstr
ate
fou
nd
atio
na
l nu
me
racy
skill
s
Num
be
r o
f ch
ildre
n a
ge
7-1
4 y
ea
rs
Percentage of children who successfully completed tasks
of:
Pe
rce
nta
ge o
f child
ren
wh
o d
em
onstr
ate
fou
nd
atio
na
l nu
me
racy
skill
s1,2
,3
Num
be
r o
f ch
ildre
n a
ge
7-1
4 y
ea
rs
Num
be
r re
ad
ing
Num
be
r
dis
crim
ina
tio
n
Ad
ditio
n
Pa
tte
rn
recog
nitio
n a
nd
com
ple
tion
Num
be
r re
ad
ing
Num
be
r d
iscrim
ina
tio
n
Ad
ditio
n
Pa
tte
rn
recog
nitio
n a
nd
com
ple
tion
Num
be
r re
ad
ing
Num
be
r
dis
crim
ina
tio
n
Ad
ditio
n
Pa
tte
rn
recog
nitio
n a
nd
com
ple
tion
Punjab 60.2 57.5 13.0 7.2 4.8 8,756 55.8 52.5 11.5 6.5 4.2 8,716 58.0 55.0 12.2 6.8 4.5 17,471
Area of Residence
Rural 55.6 53.2 11.2 6.2 4.1 5,737 48.2 46.6 9.7 5.2 3.4 5,611 52.0 50.0 10.5 5.7 3.7 11,348 All Urban 69.0 65.6 16.2 9.1 6.2 3,019 69.4 63.2 14.9 8.8 5.7 3,105 69.2 64.4 15.5 9.0 5.9 6,123
Major Cities 68.9 63.7 16.4 9.1 5.9 1,658 71.8 62.4 14.9 9.5 5.6 1,638 70.4 63.1 15.6 9.3 5.8 3,296 Other Urban 69.1 67.9 16.0 9.0 6.6 1,361 66.7 64.1 14.9 8.0 5.8 1,466 67.9 65.9 15.4 8.5 6.2 2,827
Child's functional difficulties
Has functional difficulty 54.8 53.6 10.4 5.7 3.7 1,610 49.5 48.0 9.8 5.0 3.4 1,396 52.3 51.0 10.1 5.4 3.5 3,005 Has no functional difficulty 61.4 58.4 13.5 7.5 5.1 7,146 57.0 53.4 11.8 6.7 4.3 7,320 59.2 55.9 12.7 7.1 4.7 14,466
Mother's functional difficulties
Has functional difficulty 62.1 64.0 12.5 5.1 4.2 418 56.4 50.2 8.3 4.0 1.1 382 59.4 57.4 10.5 4.5 2.7 801 Has no functional difficulty 59.1 56.2 12.8 7.0 4.7 7,048 55.3 52.4 11.5 6.4 4.2 7,077 57.2 54.3 12.1 6.7 4.5 14,125 No information 65.9 62.4 14.1 8.7 6.0 1,289 58.0 54.1 12.8 7.4 4.8 1,256 62.0 58.3 13.5 8.1 5.4 2,545
Age at beginning of school year
6 28.4 30.3 4.1 2.6 1.1 1,104 25.6 26.6 4.1 2.6 1.3 1,163 26.9 28.4 4.1 2.6 1.2 2,267 7-82 46.0 47.0 9.0 4.8 2.6 2,319 43.8 44.9 8.8 4.8 3.2 2,349 44.9 46.0 8.9 4.8 2.9 4,668
7 40.6 42.3 7.3 3.7 1.8 1,241 38.8 39.8 7.7 4.6 3.3 1,247 39.7 41.1 7.5 4.2 2.5 2,488 8 52.3 52.4 10.9 6.0 3.6 1,078 49.4 50.7 10.1 5.0 3.0 1,102 50.8 51.6 10.5 5.5 3.3 2,180
9 61.9 58.4 14.2 8.8 5.9 1,091 57.2 53.9 11.5 5.9 3.2 1,023 59.6 56.2 12.9 7.4 4.6 2,114 10 70.2 68.2 17.1 8.9 6.1 970 66.9 61.2 12.1 6.6 4.5 889 68.6 64.8 14.7 7.8 5.3 1,858 11 75.0 70.3 16.7 9.5 7.2 1,060 67.6 62.0 14.0 8.3 5.7 1,031 71.3 66.2 15.4 8.9 6.4 2,091 12 77.4 70.8 17.4 8.6 6.5 967 73.1 66.4 16.5 9.4 6.0 989 75.2 68.6 17.0 9.0 6.2 1,956 13 79.9 71.1 17.4 9.6 6.7 1,037 73.2 63.9 16.4 8.6 5.7 1,047 76.6 67.4 16.9 9.1 6.2 2,084 14 79.3 68.6 16.6 10.7 8.8 209 75.3 68.1 20.4 14.8 11.2 224 77.2 68.3 18.5 12.8 10.0 433
School attendanceA
Early childhood education 12.9 15.4 0.9 0.7 0.2 656 10.4 11.1 1.7 1.4 0.5 567 11.7 13.4 1.3 1.0 0.3 1,223 Primary 58.8 58.7 12.4 6.6 4.0 4,970 56.3 55.4 11.0 5.9 3.6 4,585 57.6 57.1 11.7 6.2 3.8 9,555
Grade 1 27.8 31.0 5.5 2.4 0.6 882 24.8 26.1 4.0 2.7 1.1 779 26.4 28.7 4.8 2.5 0.8 1,660 Grade 2-33 54.1 56.2 9.8 5.6 2.7 2,204 50.7 53.0 9.6 4.8 3.0 2,144 52.4 54.6 9.7 5.2 2.8 4,348
Grade 2 44.8 50.0 7.2 4.5 1.7 1,107 40.2 45.1 6.8 4.0 2.3 1,082 42.5 47.5 7.0 4.3 2.0 2,189 Grade 3 63.5 62.4 12.4 6.8 3.7 1,097 61.4 61.0 12.5 5.7 3.7 1,063 62.5 61.7 12.4 6.2 3.7 2,160
Grade 4 75.6 70.7 18.3 9.5 6.6 931 72.0 68.2 15.7 7.8 5.4 820 73.9 69.5 17.1 8.7 6.0 1,751 Grade 5 81.6 78.7 19.1 10.0 7.6 951 84.3 76.1 16.7 9.4 5.9 842 82.9 77.5 17.9 9.7 6.8 1,793
Lower Secondary 91.1 80.7 20.2 11.5 9.0 1,654 90.9 79.6 20.2 11.8 8.0 1,589 91.0 80.2 20.2 11.7 8.5 3,243 Grade 1 88.9 80.8 17.3 11.4 8.8 603 87.3 80.1 18.7 9.2 6.3 601 88.1 80.4 18.0 10.3 7.5 1,204 Grade 2 90.3 79.2 22.0 11.4 9.0 566 91.2 78.2 19.0 12.9 8.6 551 90.7 78.7 20.5 12.1 8.8 1,118
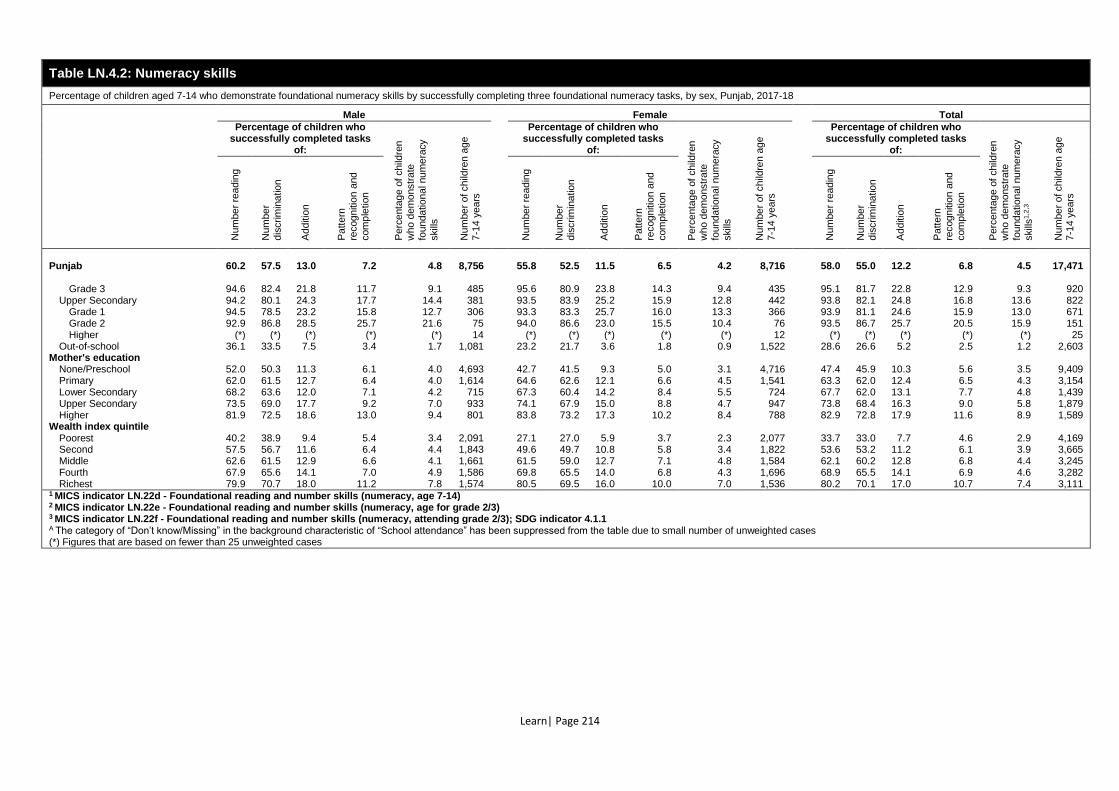
Learn| Page 214
Table LN.4.2: Numeracy skills
Percentage of children aged 7-14 who demonstrate foundational numeracy skills by successfully completing three foundational numeracy tasks, by sex, Punjab, 2017-18
Male
Female
Total
Percentage of children who successfully completed tasks
of:
Pe
rce
nta
ge o
f child
ren
wh
o d
em
onstr
ate
fou
nd
atio
na
l nu
me
racy
skill
s
Num
be
r o
f ch
ildre
n a
ge
7-1
4 y
ea
rs
Percentage of children who successfully completed tasks
of:
Pe
rce
nta
ge o
f child
ren
wh
o d
em
onstr
ate
fou
nd
atio
na
l nu
me
racy
skill
s
Num
be
r o
f ch
ildre
n a
ge
7-1
4 y
ea
rs
Percentage of children who successfully completed tasks
of:
Pe
rce
nta
ge o
f child
ren
wh
o d
em
onstr
ate
fou
nd
atio
na
l nu
me
racy
skill
s1,2
,3
Num
be
r o
f ch
ildre
n a
ge
7-1
4 y
ea
rs
Num
be
r re
ad
ing
Num
be
r
dis
crim
ina
tio
n
Ad
ditio
n
Pa
tte
rn
recog
nitio
n a
nd
com
ple
tion
Num
be
r re
ad
ing
Num
be
r d
iscrim
ina
tio
n
Ad
ditio
n
Pa
tte
rn
recog
nitio
n a
nd
com
ple
tion
Num
be
r re
ad
ing
Num
be
r
dis
crim
ina
tio
n
Ad
ditio
n
Pa
tte
rn
recog
nitio
n a
nd
com
ple
tion
Punjab 60.2 57.5 13.0 7.2 4.8 8,756 55.8 52.5 11.5 6.5 4.2 8,716 58.0 55.0 12.2 6.8 4.5 17,471
Grade 3 94.6 82.4 21.8 11.7 9.1 485 95.6 80.9 23.8 14.3 9.4 435 95.1 81.7 22.8 12.9 9.3 920 Upper Secondary 94.2 80.1 24.3 17.7 14.4 381 93.5 83.9 25.2 15.9 12.8 442 93.8 82.1 24.8 16.8 13.6 822
Grade 1 94.5 78.5 23.2 15.8 12.7 306 93.3 83.3 25.7 16.0 13.3 366 93.9 81.1 24.6 15.9 13.0 671 Grade 2 92.9 86.8 28.5 25.7 21.6 75 94.0 86.6 23.0 15.5 10.4 76 93.5 86.7 25.7 20.5 15.9 151 Higher (*) (*) (*) (*) (*) 14 (*) (*) (*) (*) (*) 12 (*) (*) (*) (*) (*) 25
Out-of-school 36.1 33.5 7.5 3.4 1.7 1,081 23.2 21.7 3.6 1.8 0.9 1,522 28.6 26.6 5.2 2.5 1.2 2,603 Mother's education
None/Preschool 52.0 50.3 11.3 6.1 4.0 4,693 42.7 41.5 9.3 5.0 3.1 4,716 47.4 45.9 10.3 5.6 3.5 9,409 Primary 62.0 61.5 12.7 6.4 4.0 1,614 64.6 62.6 12.1 6.6 4.5 1,541 63.3 62.0 12.4 6.5 4.3 3,154 Lower Secondary 68.2 63.6 12.0 7.1 4.2 715 67.3 60.4 14.2 8.4 5.5 724 67.7 62.0 13.1 7.7 4.8 1,439 Upper Secondary 73.5 69.0 17.7 9.2 7.0 933 74.1 67.9 15.0 8.8 4.7 947 73.8 68.4 16.3 9.0 5.8 1,879 Higher 81.9 72.5 18.6 13.0 9.4 801 83.8 73.2 17.3 10.2 8.4 788 82.9 72.8 17.9 11.6 8.9 1,589
Wealth index quintile
Poorest 40.2 38.9 9.4 5.4 3.4 2,091 27.1 27.0 5.9 3.7 2.3 2,077 33.7 33.0 7.7 4.6 2.9 4,169 Second 57.5 56.7 11.6 6.4 4.4 1,843 49.6 49.7 10.8 5.8 3.4 1,822 53.6 53.2 11.2 6.1 3.9 3,665 Middle 62.6 61.5 12.9 6.6 4.1 1,661 61.5 59.0 12.7 7.1 4.8 1,584 62.1 60.2 12.8 6.8 4.4 3,245 Fourth 67.9 65.6 14.1 7.0 4.9 1,586 69.8 65.5 14.0 6.8 4.3 1,696 68.9 65.5 14.1 6.9 4.6 3,282 Richest 79.9 70.7 18.0 11.2 7.8 1,574 80.5 69.5 16.0 10.0 7.0 1,536 80.2 70.1 17.0 10.7 7.4 3,111
1 MICS indicator LN.22d - Foundational reading and number skills (numeracy, age 7-14) 2 MICS indicator LN.22e - Foundational reading and number skills (numeracy, age for grade 2/3) 3 MICS indicator LN.22f - Foundational reading and number skills (numeracy, attending grade 2/3); SDG indicator 4.1.1 A The category of “Don’t know/Missing” in the background characteristic of “School attendance” has been suppressed from the table due to small number of unweighted cases (*) Figures that are based on fewer than 25 unweighted cases
Protected from violence and exploitation | Page 215
9. PROTECTED FROM VIOLENCE AND EXPLOITATION
PR.1 BIRTH REGISTRATION
A name and nationality is every child’s right, enshrined in the Convention on the Rights of the Child (CRC)
and other international treaties. Registering children at birth is the first step in securing their recognition
before the law, safeguarding their rights, and ensuring that any violation of these rights does not go
unnoticed. 120 Birth certificates are proof of registration and the first form of legal identity and are often
required to access health care or education. Having legal identification can also be one form of protection
from entering into marriage or the labour market, or being conscripted into the armed forces, before the
legal age. Birth registration and certification is also legal proof of one’s place of birth and family ties and thus
necessary to obtain a passport. In adulthood, birth certificates may be required to obtain social assistance
or a job in the formal sector, to buy or inherit property and to vote.
The manual birth registration in Pakistan takes place at Union Council level. Registration of birth in the Union
Council’s handwritten register is free of charge. Birth registration does not happen automatically when a
child is born but it is done through representatives from NADRA, and the representative of Union Council.
The parents, or a close relative, register the birth at the local Union Council by completing a form known as
a form A. The required documentation is a hospital or midwife note and in case the child is not born in a
hospital or without the presence of a midwife, a vaccination card is used as documentation. The Union
Council Chairman signs the form A, but in the case, the Chairman is absent, the vice Chairman is authorized
to sign the document on his behalf. The original form A is kept by the parents, while a copy hereof is kept at
the Union Council along with the required breeder documents, e.g. hospital note, and a copy of the parents’
Computerized National Identity Cards (CNIC). The Union Council then registers the birth in their manual
register. Examples of the form A from the different Union Councils handed out during the delegation’s visit
to Pakistan showed that the layout can have local variations but that it contains information about the child’s
name, date of birth and the parents’ names and CNIC numbers. According to the National Database and
Registration Authority Ordinance 2000, a child has to be registered within a month after delivery. The
delegation’s visits to Pakistan in March 2017-18, however, showed that there exist different local practices
for when a registration is regarded as normal entry or late entry.
The requirements for late entry vary depending on how late the child is registered. In the timespan between
61 days up until seven years after birth, the chairman has to attest the document. If registration is done later
than seven years after birth the parents have to get an affidavit from court and the district commissioner
has to approve the registration. Furthermore, the parents need to submit a medical attest which evaluates
the age of the child and a school attest when completing the form A, and the parents need to publish a note
in a local newspaper stating that they intend to register the child.121
120 UNICEF. Every Child’s Birth Right: Inequities and trends in birth registration. New York: UNICEF, 2013.
https://www.unicef.org/publications/files/Birth_Registration_11_Dec_13.pdf.
121 Pakistan: Birth registration and related civil status documents. Danish National ID Centre
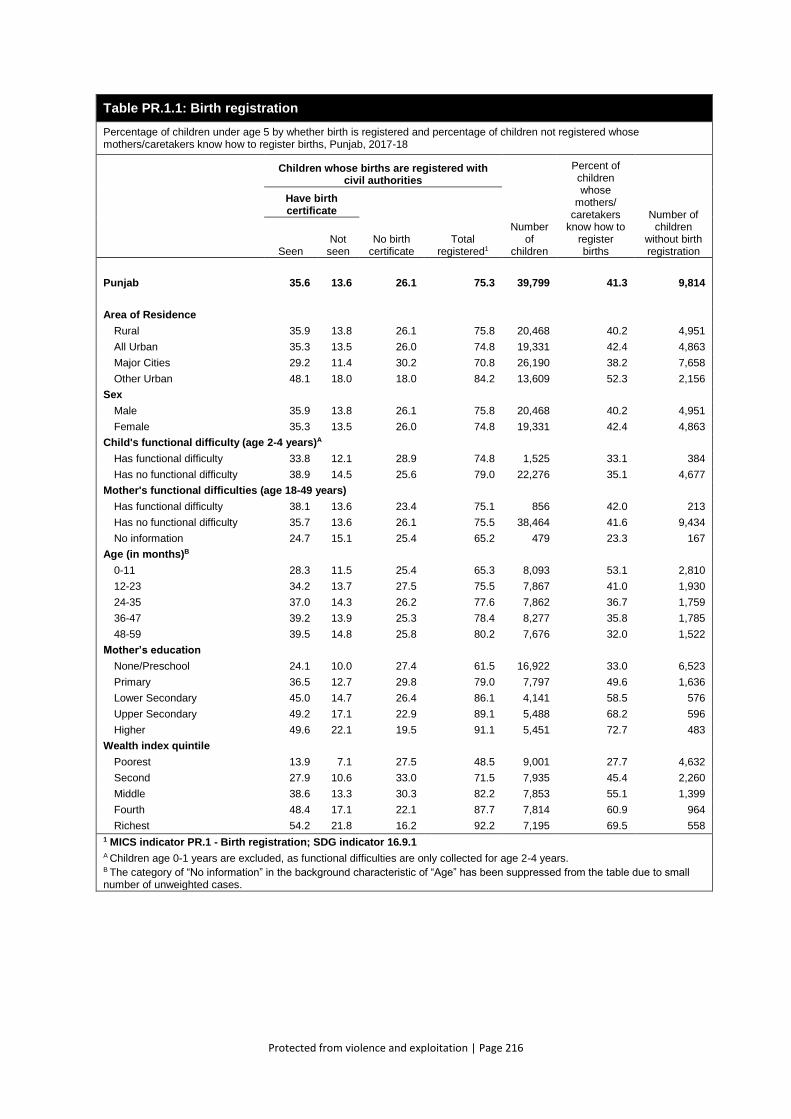
Protected from violence and exploitation | Page 216
Table PR.1.1: Birth registration
Percentage of children under age 5 by whether birth is registered and percentage of children not registered whose mothers/caretakers know how to register births, Punjab, 2017-18
Children whose births are registered with civil authorities
Number of
children
Percent of children whose
mothers/ caretakers
know how to register births
Number of children
without birth registration
Have birth certificate
No birth certificate
Total registered1 Seen
Not seen
Punjab 35.6 13.6 26.1 75.3 39,799 41.3 9,814
Area of Residence
Rural 35.9 13.8 26.1 75.8 20,468 40.2 4,951
All Urban 35.3 13.5 26.0 74.8 19,331 42.4 4,863
Major Cities 29.2 11.4 30.2 70.8 26,190 38.2 7,658
Other Urban 48.1 18.0 18.0 84.2 13,609 52.3 2,156
Sex
Male 35.9 13.8 26.1 75.8 20,468 40.2 4,951
Female 35.3 13.5 26.0 74.8 19,331 42.4 4,863
Child's functional difficulty (age 2-4 years)A
Has functional difficulty 33.8 12.1 28.9 74.8 1,525 33.1 384
Has no functional difficulty 38.9 14.5 25.6 79.0 22,276 35.1 4,677
Mother's functional difficulties (age 18-49 years)
Has functional difficulty 38.1 13.6 23.4 75.1 856 42.0 213
Has no functional difficulty 35.7 13.6 26.1 75.5 38,464 41.6 9,434
No information 24.7 15.1 25.4 65.2 479 23.3 167
Age (in months)B
0-11 28.3 11.5 25.4 65.3 8,093 53.1 2,810
12-23 34.2 13.7 27.5 75.5 7,867 41.0 1,930
24-35 37.0 14.3 26.2 77.6 7,862 36.7 1,759
36-47 39.2 13.9 25.3 78.4 8,277 35.8 1,785
48-59 39.5 14.8 25.8 80.2 7,676 32.0 1,522
Mother’s education
None/Preschool 24.1 10.0 27.4 61.5 16,922 33.0 6,523
Primary 36.5 12.7 29.8 79.0 7,797 49.6 1,636
Lower Secondary 45.0 14.7 26.4 86.1 4,141 58.5 576
Upper Secondary 49.2 17.1 22.9 89.1 5,488 68.2 596
Higher 49.6 22.1 19.5 91.1 5,451 72.7 483
Wealth index quintile
Poorest 13.9 7.1 27.5 48.5 9,001 27.7 4,632
Second 27.9 10.6 33.0 71.5 7,935 45.4 2,260
Middle 38.6 13.3 30.3 82.2 7,853 55.1 1,399
Fourth 48.4 17.1 22.1 87.7 7,814 60.9 964
Richest 54.2 21.8 16.2 92.2 7,195 69.5 558 1 MICS indicator PR.1 - Birth registration; SDG indicator 16.9.1 A Children age 0-1 years are excluded, as functional difficulties are only collected for age 2-4 years. B The category of “No information” in the background characteristic of “Age” has been suppressed from the table due to small number of unweighted cases.
Protected from violence and exploitation | Page 217
PR.2 CHILD DISCIPLINE
Teaching children self-control and acceptable behaviour is an integral part of child discipline in all
cultures. Positive parenting practices involve providing guidance on how to handle emotions or
conflicts in manners that encourage judgment and responsibility and preserve children's self-esteem,
physical and psychological integrity and dignity. Too often however, children are raised using punitive
methods that rely on the use of physical force or verbal intimidation to obtain desired behaviours.
Studies122 have found that exposing children to violent discipline has harmful consequences, which
range from immediate impacts to long-term harm that children carry forward into adult life. Violence
hampers children’s development, learning abilities and school performance; it inhibits positive
relationships, provokes low self-esteem, emotional distress and depression; and, at times, it leads to
risk taking and self-harm.
In the MICS Punjab, 2017-18 mothers or caretakers of children under age five and of one randomly
selected child aged 5-17 were asked a series of questions on the methods adults in the household
used to discipline the child during the past month and if the respondent believes that physical
punishment is a necessary part of child-rearing. Tables PR.2.1 and PR.2.2 present the results.
122 Straus, M. and M. Paschall. "Corporal Punishment by Mothers and Development of Children’s Cognitive Ability: A
Longitudinal Study of Two Nationally Representative Age Cohorts." Journal of Aggression, Maltreatment & Trauma 18, no.
5 (2009): 459-83. doi:10.1080/10926770903035168.; Erickson, M. and B. Egeland. "A Developmental View of the
Psychological Consequences of Maltreatment." School Psychology Review 16, no. 2 (1987): 156-68.
http://psycnet.apa.org/record/1987-29817-001.; Schneider, M. et al. "Do Allegations of Emotional Maltreatment Predict
Developmental Outcomes beyond That of Other Forms of Maltreatment?" Child Abuse & Neglect 29, no. 5 (2005): 513-32.
doi:10.1016/j.chiabu.2004.08.010.
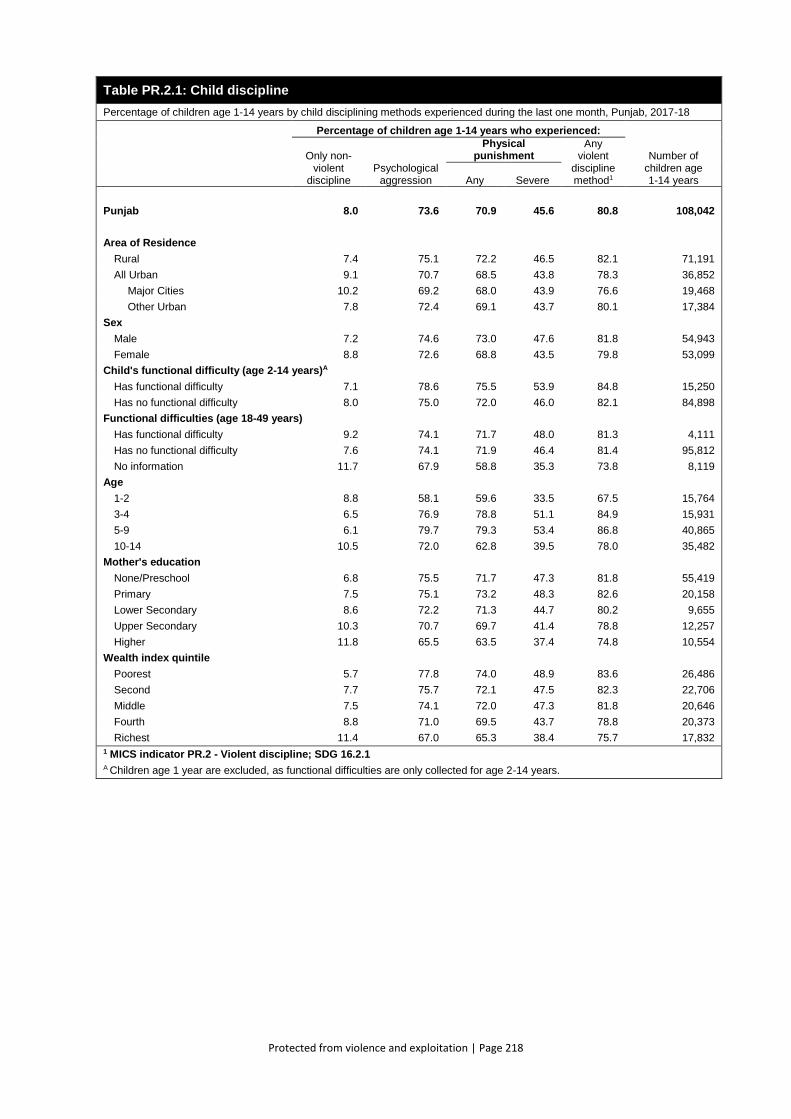
Protected from violence and exploitation | Page 218
Table PR.2.1: Child discipline
Percentage of children age 1-14 years by child disciplining methods experienced during the last one month, Punjab, 2017-18
Percentage of children age 1-14 years who experienced:
Number of children age 1-14 years
Only non-violent
discipline Psychological
aggression
Physical punishment
Any violent
discipline method1 Any Severe
Punjab 8.0 73.6 70.9 45.6 80.8 108,042
Area of Residence
Rural 7.4 75.1 72.2 46.5 82.1 71,191
All Urban 9.1 70.7 68.5 43.8 78.3 36,852
Major Cities 10.2 69.2 68.0 43.9 76.6 19,468
Other Urban 7.8 72.4 69.1 43.7 80.1 17,384
Sex
Male 7.2 74.6 73.0 47.6 81.8 54,943
Female 8.8 72.6 68.8 43.5 79.8 53,099
Child's functional difficulty (age 2-14 years)A
Has functional difficulty 7.1 78.6 75.5 53.9 84.8 15,250
Has no functional difficulty 8.0 75.0 72.0 46.0 82.1 84,898
Functional difficulties (age 18-49 years)
Has functional difficulty 9.2 74.1 71.7 48.0 81.3 4,111
Has no functional difficulty 7.6 74.1 71.9 46.4 81.4 95,812
No information 11.7 67.9 58.8 35.3 73.8 8,119
Age
1-2 8.8 58.1 59.6 33.5 67.5 15,764
3-4 6.5 76.9 78.8 51.1 84.9 15,931
5-9 6.1 79.7 79.3 53.4 86.8 40,865
10-14 10.5 72.0 62.8 39.5 78.0 35,482
Mother's education
None/Preschool 6.8 75.5 71.7 47.3 81.8 55,419
Primary 7.5 75.1 73.2 48.3 82.6 20,158
Lower Secondary 8.6 72.2 71.3 44.7 80.2 9,655
Upper Secondary 10.3 70.7 69.7 41.4 78.8 12,257
Higher 11.8 65.5 63.5 37.4 74.8 10,554
Wealth index quintile
Poorest 5.7 77.8 74.0 48.9 83.6 26,486
Second 7.7 75.7 72.1 47.5 82.3 22,706
Middle 7.5 74.1 72.0 47.3 81.8 20,646
Fourth 8.8 71.0 69.5 43.7 78.8 20,373
Richest 11.4 67.0 65.3 38.4 75.7 17,832 1 MICS indicator PR.2 - Violent discipline; SDG 16.2.1 A Children age 1 year are excluded, as functional difficulties are only collected for age 2-14 years.
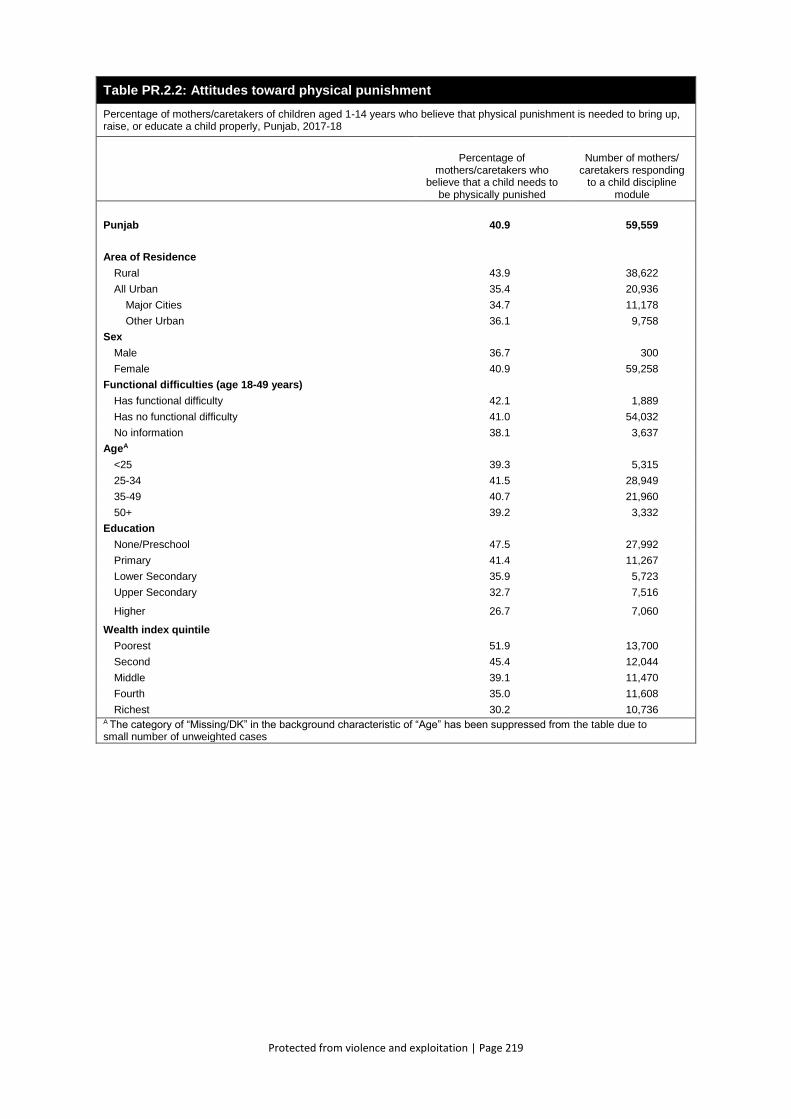
Protected from violence and exploitation | Page 219
Table PR.2.2: Attitudes toward physical punishment
Percentage of mothers/caretakers of children aged 1-14 years who believe that physical punishment is needed to bring up, raise, or educate a child properly, Punjab, 2017-18
Percentage of mothers/caretakers who
believe that a child needs to be physically punished
Number of mothers/ caretakers responding
to a child discipline module
Punjab 40.9 59,559
Area of Residence
Rural 43.9 38,622
All Urban 35.4 20,936
Major Cities 34.7 11,178
Other Urban 36.1 9,758
Sex
Male 36.7 300
Female 40.9 59,258
Functional difficulties (age 18-49 years)
Has functional difficulty 42.1 1,889
Has no functional difficulty 41.0 54,032
No information 38.1 3,637
AgeA
<25 39.3 5,315
25-34 41.5 28,949
35-49 40.7 21,960
50+ 39.2 3,332
Education
None/Preschool 47.5 27,992
Primary 41.4 11,267
Lower Secondary 35.9 5,723
Upper Secondary 32.7 7,516
Higher 26.7 7,060
Wealth index quintile
Poorest 51.9 13,700
Second 45.4 12,044
Middle 39.1 11,470
Fourth 35.0 11,608
Richest 30.2 10,736 A The category of “Missing/DK” in the background characteristic of “Age” has been suppressed from the table due to small number of unweighted cases
Protected from violence and exploitation | Page 220
PR.3 CHILD LABOUR
Children around the world are routinely engaged in paid and unpaid forms of work that are not
harmful to them. However, they are classified as child labourers when they are either too young to
work or are involved in hazardous activities that may compromise their physical, mental, social or
educational development. Article 32 (1) of the CRC states: "States Parties recognize the right of the
child to be protected from economic exploitation and from performing any work that is likely to be
hazardous or to interfere with the child's education, or to be harmful to the child's health or physical,
mental, spiritual, moral or social development".
THE PUNJAB RESTRICTION ON EMPLOYMENT OF CHILDREN ACT 2016 is to prohibit the employment
of children and to restrict the employment of adolescents in certain occupations and processes. It is
necessary to prohibit the employment of children and to restrict the employment of adolescents in
certain occupations; and, to deal with ancillary matters.
The child labour module was administered for one randomly selected child age 5-17 years in each
household and includes questions on the type of work a child does and the number of hours he or she
is engaged in it. Data are collected on both economic activities (paid or unpaid work for someone who
is not a member of the household, work for a family farm or business) and domestic work (household
chores such as cooking, cleaning or caring for children, as well as collecting firewood or fetching
water).123 The module also collects information on hazardous working conditions.124,125
Table PR.3.1 presents children’s involvement in economic activities. The methodology of the MICS
Indicator on Child Labour uses three age-specific thresholds for the number of hours children can
perform economic activity without being classified as child labourers. A child that performed economic
activities during the last week for more than the age-specific number of hours is classified as in child
labour:
i. age 5-11: 1 hour or more
ii. age 12-14: 14 hours or more
iii. age 15-17: 43 hours or more
Table PR.3.2 presents children’s involvement in household chores. As for economic activity above, the
methodology also uses age-specific thresholds for the number of hours children can perform
household chores without being classified as child labourers. A child that performed household chores
during the last week for more than the age-specific number of hours is classified as in child labour:
i. age 5-11 and age 12-14: 28 hours or more
ii. age 15-17: 43 hours or more
123 Please note that activities of collecting firewood and fetching water per Resolution I, Section 22(b), of the 19th
International Conference of Labour Statisticians (ICLS) is to be classified as own-use production work, i.e. an economic
activity. Because the 20th ICLS is expected to discuss this classification and this classification has enormous impact on child
labour prevalence in large parts of the world, these activities remain classified as household chores in MICS, pending
outcome of the ICLS. 124 UNICEF. How Sensitive Are Estimates of Child Labour to Definitions? MICS Methodological Paper No. 1. New York:
UNICEF, 2012. https://data.unicef.org/wp-content/uploads/2015/12/Child_Labour_Paper_No.1_FINAL_162.pdf. 125 The Child Labour module was administered in the Questionnaire for Children Age 5-17 (See Appendix E:
Questionnaires). In households with at least one child age 5-17, one child was randomly selected. To account for the
random selection, the household sample weight is multiplied by the total number of children age 5-17 in each household;
this weight is used when producing the relevant tables.
Protected from violence and exploitation | Page 221
SDG Target 8.7 aims to “take immediate and effective measures to eradicate forced labour, end
modern slavery and human trafficking and secure the prohibition and elimination of the worst forms
of child labour, including recruitment and use of child soldiers, and by 2025 end child labour in all its
forms.” The SDG indicator 8.7.1 provides the proportion of children aged 5-17 years who are engaged
in child labour. Table PR.3.3 combines the children working and performing economic activities and
household chores at or above and below the age-specific thresholds as detailed in the previous tables,
as well as those children reported working under hazardous conditions, into the total child labour
indicator.126
126 Note that the definition of child labour, hence the MICS indicator PR.3 presented in this report, also includes working in
activities that are hazardous in nature. However, to ensure comparability of estimates, it has been decided by UNICEF and
ILO to exclude engagement in hazardous occupations or under hazardous working conditions from the estimates of child
labour for the purpose of reporting on SDG 8.7.1 in 2018. Another reason for exclusion of hazardous conditions in the
reporting is the further methodological work needed to validate questions aimed at identifying children engaged in
hazardous activities.
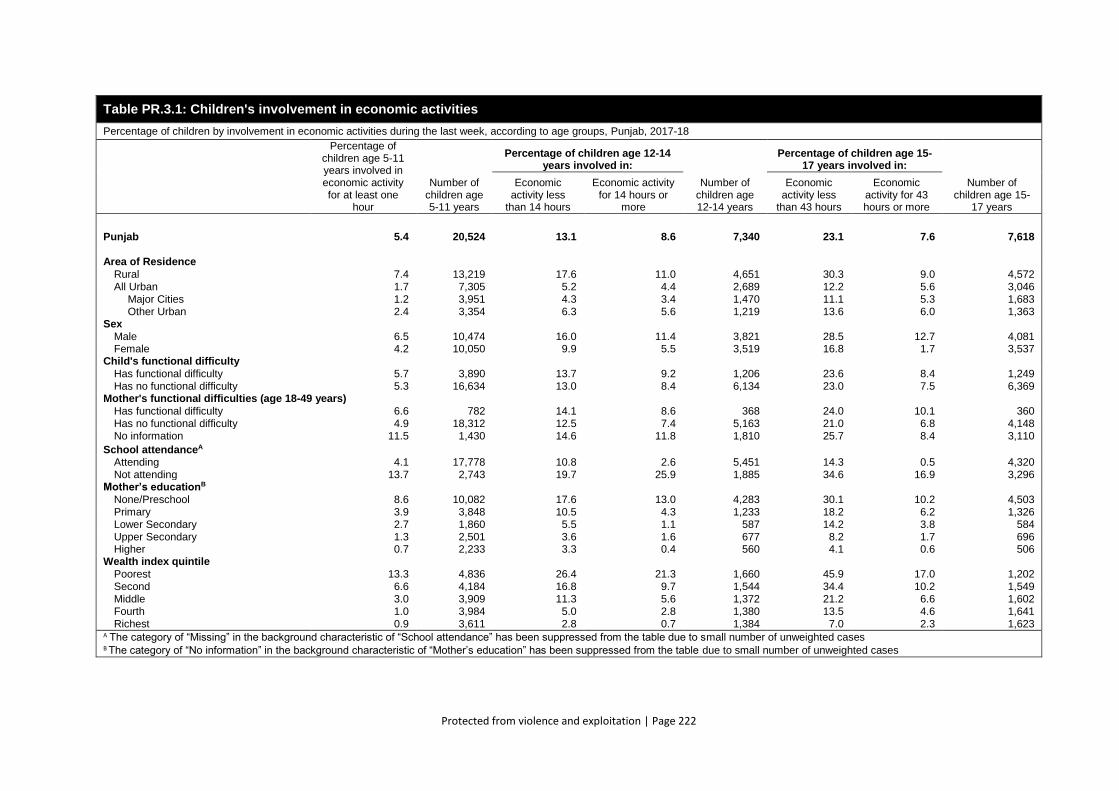
Protected from violence and exploitation | Page 222
Table PR.3.1: Children's involvement in economic activities
Percentage of children by involvement in economic activities during the last week, according to age groups, Punjab, 2017-18
Percentage of children age 5-11 years involved in economic activity for at least one
hour
Number of children age 5-11 years
Percentage of children age 12-14 years involved in:
Number of children age 12-14 years
Percentage of children age 15-17 years involved in:
Number of children age 15-
17 years
Economic activity less
than 14 hours
Economic activity for 14 hours or
more
Economic activity less
than 43 hours
Economic activity for 43 hours or more
Punjab 5.4 20,524 13.1 8.6 7,340 23.1 7.6 7,618
Area of Residence
Rural 7.4 13,219 17.6 11.0 4,651 30.3 9.0 4,572 All Urban 1.7 7,305 5.2 4.4 2,689 12.2 5.6 3,046 Major Cities 1.2 3,951 4.3 3.4 1,470 11.1 5.3 1,683 Other Urban 2.4 3,354 6.3 5.6 1,219 13.6 6.0 1,363
Sex
Male 6.5 10,474 16.0 11.4 3,821 28.5 12.7 4,081 Female 4.2 10,050 9.9 5.5 3,519 16.8 1.7 3,537
Child's functional difficulty
Has functional difficulty 5.7 3,890 13.7 9.2 1,206 23.6 8.4 1,249 Has no functional difficulty 5.3 16,634 13.0 8.4 6,134 23.0 7.5 6,369
Mother's functional difficulties (age 18-49 years)
Has functional difficulty 6.6 782 14.1 8.6 368 24.0 10.1 360 Has no functional difficulty 4.9 18,312 12.5 7.4 5,163 21.0 6.8 4,148 No information 11.5 1,430 14.6 11.8 1,810 25.7 8.4 3,110
School attendanceA
Attending 4.1 17,778 10.8 2.6 5,451 14.3 0.5 4,320 Not attending 13.7 2,743 19.7 25.9 1,885 34.6 16.9 3,296
Mother’s educationB
None/Preschool 8.6 10,082 17.6 13.0 4,283 30.1 10.2 4,503 Primary 3.9 3,848 10.5 4.3 1,233 18.2 6.2 1,326 Lower Secondary 2.7 1,860 5.5 1.1 587 14.2 3.8 584 Upper Secondary 1.3 2,501 3.6 1.6 677 8.2 1.7 696 Higher 0.7 2,233 3.3 0.4 560 4.1 0.6 506
Wealth index quintile
Poorest 13.3 4,836 26.4 21.3 1,660 45.9 17.0 1,202 Second 6.6 4,184 16.8 9.7 1,544 34.4 10.2 1,549 Middle 3.0 3,909 11.3 5.6 1,372 21.2 6.6 1,602 Fourth 1.0 3,984 5.0 2.8 1,380 13.5 4.6 1,641 Richest 0.9 3,611 2.8 0.7 1,384 7.0 2.3 1,623
A The category of “Missing” in the background characteristic of “School attendance” has been suppressed from the table due to small number of unweighted cases B The category of “No information” in the background characteristic of “Mother’s education” has been suppressed from the table due to small number of unweighted cases
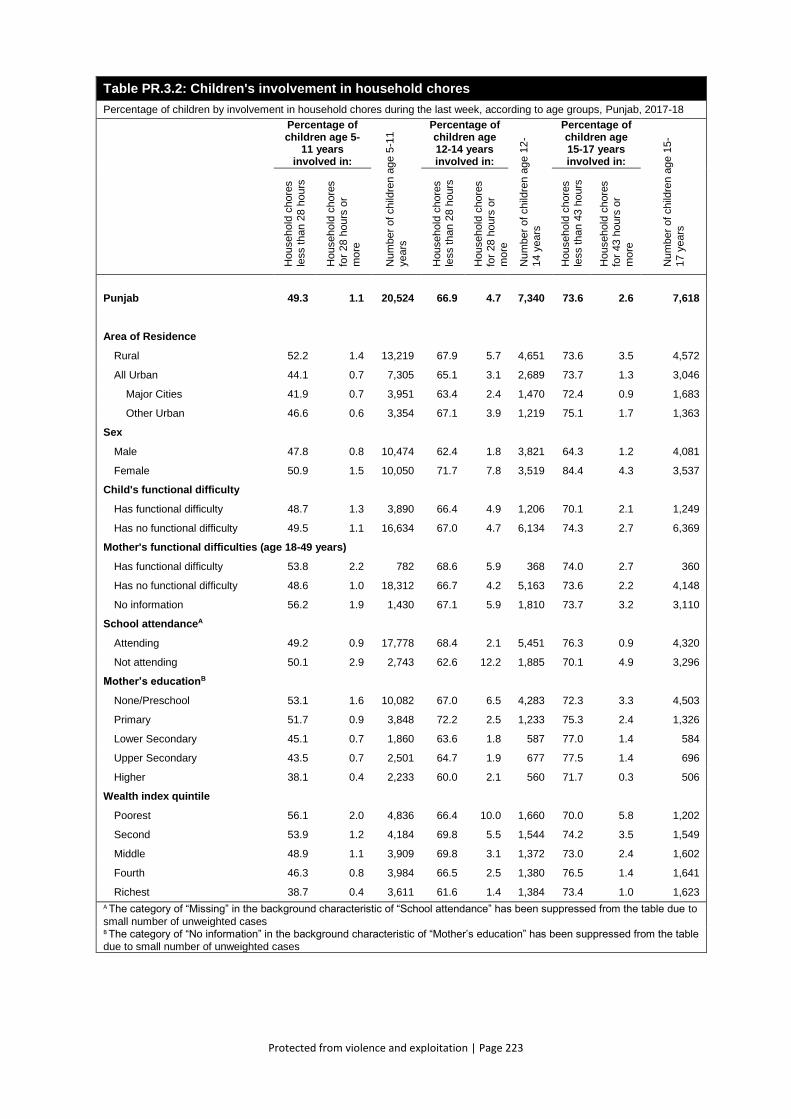
Protected from violence and exploitation | Page 223
Table PR.3.2: Children's involvement in household chores
Percentage of children by involvement in household chores during the last week, according to age groups, Punjab, 2017-18
Percentage of children age 5-
11 years involved in:
Num
ber
of child
ren a
ge 5
-11
years
Percentage of children age 12-14 years involved in:
Num
ber
of child
ren a
ge 1
2-
14 y
ears
Percentage of children age 15-17 years involved in:
Num
ber
of child
ren a
ge 1
5-
17 y
ears
Household
chore
s
less t
han 2
8 h
ours
Household
chore
s
for
28 h
ours
or
mo
re
Household
chore
s
less t
han 2
8 h
ours
Household
chore
s
for
28 h
ours
or
mo
re
Household
chore
s
less t
han 4
3 h
ours
Household
chore
s
for
43 h
ours
or
mo
re
Punjab 49.3 1.1 20,524 66.9 4.7 7,340 73.6 2.6 7,618
Area of Residence
Rural 52.2 1.4 13,219 67.9 5.7 4,651 73.6 3.5 4,572
All Urban 44.1 0.7 7,305 65.1 3.1 2,689 73.7 1.3 3,046
Major Cities 41.9 0.7 3,951 63.4 2.4 1,470 72.4 0.9 1,683
Other Urban 46.6 0.6 3,354 67.1 3.9 1,219 75.1 1.7 1,363
Sex
Male 47.8 0.8 10,474 62.4 1.8 3,821 64.3 1.2 4,081
Female 50.9 1.5 10,050 71.7 7.8 3,519 84.4 4.3 3,537
Child's functional difficulty
Has functional difficulty 48.7 1.3 3,890 66.4 4.9 1,206 70.1 2.1 1,249
Has no functional difficulty 49.5 1.1 16,634 67.0 4.7 6,134 74.3 2.7 6,369
Mother's functional difficulties (age 18-49 years)
Has functional difficulty 53.8 2.2 782 68.6 5.9 368 74.0 2.7 360
Has no functional difficulty 48.6 1.0 18,312 66.7 4.2 5,163 73.6 2.2 4,148
No information 56.2 1.9 1,430 67.1 5.9 1,810 73.7 3.2 3,110
School attendanceA
Attending 49.2 0.9 17,778 68.4 2.1 5,451 76.3 0.9 4,320
Not attending 50.1 2.9 2,743 62.6 12.2 1,885 70.1 4.9 3,296
Mother’s educationB
None/Preschool 53.1 1.6 10,082 67.0 6.5 4,283 72.3 3.3 4,503
Primary 51.7 0.9 3,848 72.2 2.5 1,233 75.3 2.4 1,326
Lower Secondary 45.1 0.7 1,860 63.6 1.8 587 77.0 1.4 584
Upper Secondary 43.5 0.7 2,501 64.7 1.9 677 77.5 1.4 696
Higher 38.1 0.4 2,233 60.0 2.1 560 71.7 0.3 506
Wealth index quintile
Poorest 56.1 2.0 4,836 66.4 10.0 1,660 70.0 5.8 1,202
Second 53.9 1.2 4,184 69.8 5.5 1,544 74.2 3.5 1,549
Middle 48.9 1.1 3,909 69.8 3.1 1,372 73.0 2.4 1,602
Fourth 46.3 0.8 3,984 66.5 2.5 1,380 76.5 1.4 1,641
Richest 38.7 0.4 3,611 61.6 1.4 1,384 73.4 1.0 1,623
A The category of “Missing” in the background characteristic of “School attendance” has been suppressed from the table due to
small number of unweighted cases B The category of “No information” in the background characteristic of “Mother’s education” has been suppressed from the table
due to small number of unweighted cases
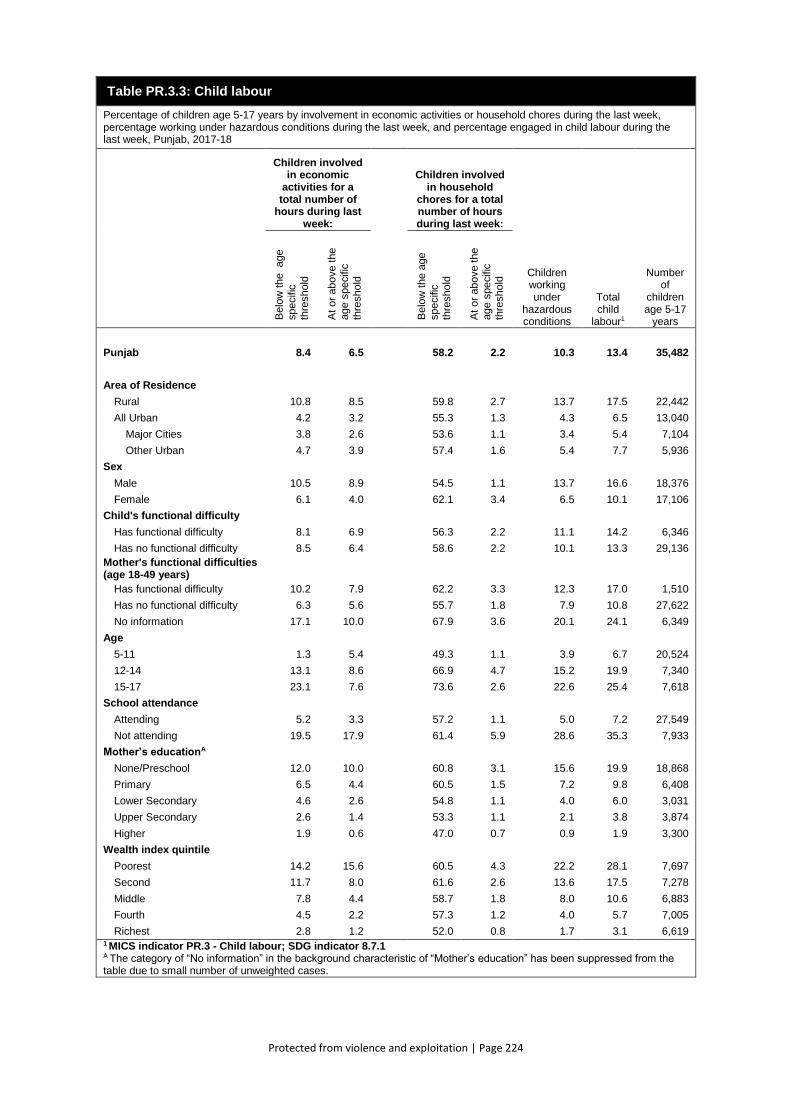
Protected from violence and exploitation | Page 224
Table PR.3.3: Child labour
Percentage of children age 5-17 years by involvement in economic activities or household chores during the last week, percentage working under hazardous conditions during the last week, and percentage engaged in child labour during the last week, Punjab, 2017-18
Children involved in economic
activities for a total number of
hours during last week:
Children involved in household
chores for a total number of hours during last week:
Children working under
hazardous conditions
Total child
labour1
Number of
children age 5-17
years Belo
w t
he
age
specific
thre
shold
At
or
above the
age s
pecific
thre
shold
Belo
w t
he a
ge
specific
th
reshold
At
or
above the
age s
pecific
th
reshold
Punjab 8.4 6.5 58.2 2.2 10.3 13.4 35,482
Area of Residence
Rural 10.8 8.5 59.8 2.7 13.7 17.5 22,442
All Urban 4.2 3.2 55.3 1.3 4.3 6.5 13,040
Major Cities 3.8 2.6 53.6 1.1 3.4 5.4 7,104
Other Urban 4.7 3.9 57.4 1.6 5.4 7.7 5,936
Sex
Male 10.5 8.9 54.5 1.1 13.7 16.6 18,376
Female 6.1 4.0 62.1 3.4 6.5 10.1 17,106
Child's functional difficulty
Has functional difficulty 8.1 6.9 56.3 2.2 11.1 14.2 6,346
Has no functional difficulty 8.5 6.4 58.6 2.2 10.1 13.3 29,136
Mother's functional difficulties (age 18-49 years)
Has functional difficulty 10.2 7.9 62.2 3.3 12.3 17.0 1,510
Has no functional difficulty 6.3 5.6 55.7 1.8 7.9 10.8 27,622
No information 17.1 10.0 67.9 3.6 20.1 24.1 6,349
Age
5-11 1.3 5.4 49.3 1.1 3.9 6.7 20,524
12-14 13.1 8.6 66.9 4.7 15.2 19.9 7,340
15-17 23.1 7.6 73.6 2.6 22.6 25.4 7,618
School attendance
Attending 5.2 3.3 57.2 1.1 5.0 7.2 27,549
Not attending 19.5 17.9 61.4 5.9 28.6 35.3 7,933
Mother’s educationA
None/Preschool 12.0 10.0 60.8 3.1 15.6 19.9 18,868
Primary 6.5 4.4 60.5 1.5 7.2 9.8 6,408
Lower Secondary 4.6 2.6 54.8 1.1 4.0 6.0 3,031
Upper Secondary 2.6 1.4 53.3 1.1 2.1 3.8 3,874
Higher 1.9 0.6 47.0 0.7 0.9 1.9 3,300
Wealth index quintile
Poorest 14.2 15.6 60.5 4.3 22.2 28.1 7,697
Second 11.7 8.0 61.6 2.6 13.6 17.5 7,278
Middle 7.8 4.4 58.7 1.8 8.0 10.6 6,883
Fourth 4.5 2.2 57.3 1.2 4.0 5.7 7,005
Richest 2.8 1.2 52.0 0.8 1.7 3.1 6,619 1 MICS indicator PR.3 - Child labour; SDG indicator 8.7.1 A The category of “No information” in the background characteristic of “Mother’s education” has been suppressed from the table due to small number of unweighted cases.
Protected from violence and exploitation | Page 225
PR.4 CHILD MARRIAGE
Marriage127 before the age of 18 is violation of human rights, yet remains a reality for many children. The right
to 'free and full' consent to a marriage is recognized in the Universal Declaration of Human Rights - with the
recognition that consent cannot be 'free and full' when one of the parties involved is not sufficiently mature to
make an informed decision about a life partner. In the Sustainable Development Goals, child marriage has been
identified as a harmful practice, which the world should aim to eliminate by 2030.
Child marriage is more common among girls than boys, but does occur around the world among children of both
sexes. The impacts specific to boys married in childhood are not yet well understood, but marriage does place
boys in an adult role accompanied by responsibilities for which they may not be prepared.
In many parts of the world parents encourage the marriage of their daughters while they are still children in
hopes that the marriage will benefit them both financially and socially, while also relieving financial burdens on
the family. In actual fact, child marriage compromises the development of girls and often results in early
pregnancy and social isolation, with little education and poor vocational training reinforcing the gendered nature
of poverty.128
Closely related to the issue of child marriage is the age at which sexual activity – and for females, childbearing –
may begin. Women who were married before the age of 18 tend to have more children than those who marry
later in life and are less likely to receive maternal health care services.129,130 In addition, pregnancy related
deaths are known to be a leading cause of mortality for both married and unmarried girls between the ages of
15 and 19.
Tables PR.4.1W and PR.4.1M present the percentage of women and men married before ages 15 and
18 years, the percentage of adolescent girls aged 15-19 who are currently married, and the percentage
of women in a polygynous union.
Tables PR.4.2W and PR.4.2M present, respectively, the proportion of women and men who were first
married or entered into a marital union before age 15 and 18 by area and age groups. Examining the
percentages married before ages 15 and 18 across different age groups allow for trends to be observed
in child marriage over time.
Another component is the spousal age difference with the indicator being the percentage of
married/in union women 10 or more years younger than their current spouse. Table PR.4.3 presents
the results of the age difference between women and their husband or partner.
127 All references to marriage in this chapter include cohabiting unions as well. 128 Bajracharya, A. and N. Amin, S. Poverty, marriage timing, and transitions to adulthood in Nepal: A longitudinal analysis
using the Nepal living standards survey. Poverty, Gender, and Youth Working Paper No. 19. New York: Population Council,
2010. http://www.popcouncil.org/uploads/pdfs/wp/pgy/019.pdf.;
Godha, D. et al. 2011. The influence of child marriage on fertility, fertility-control, and maternal health care utilization.
MEASURE/Evaluation PRH Project Working paper 11-124. 129 Godha D., D. Hotchkiss and A. Gage. "Association Between Child Marriage and Reproductive Health Outcomes and
Service Utilization: A Multi-Country Study from South Asia." Journal of Adolescent Health 52, no. 5 (2013): 552-58.
doi:10.1016/j.jadohealth.2013.01.021. 130 Nour, N. "Health Consequences of Child Marriage in Africa." Emerging Infectious Diseases 12, no. 11 (2006): 1644-649.
doi:10.3201/eid1211.060510.
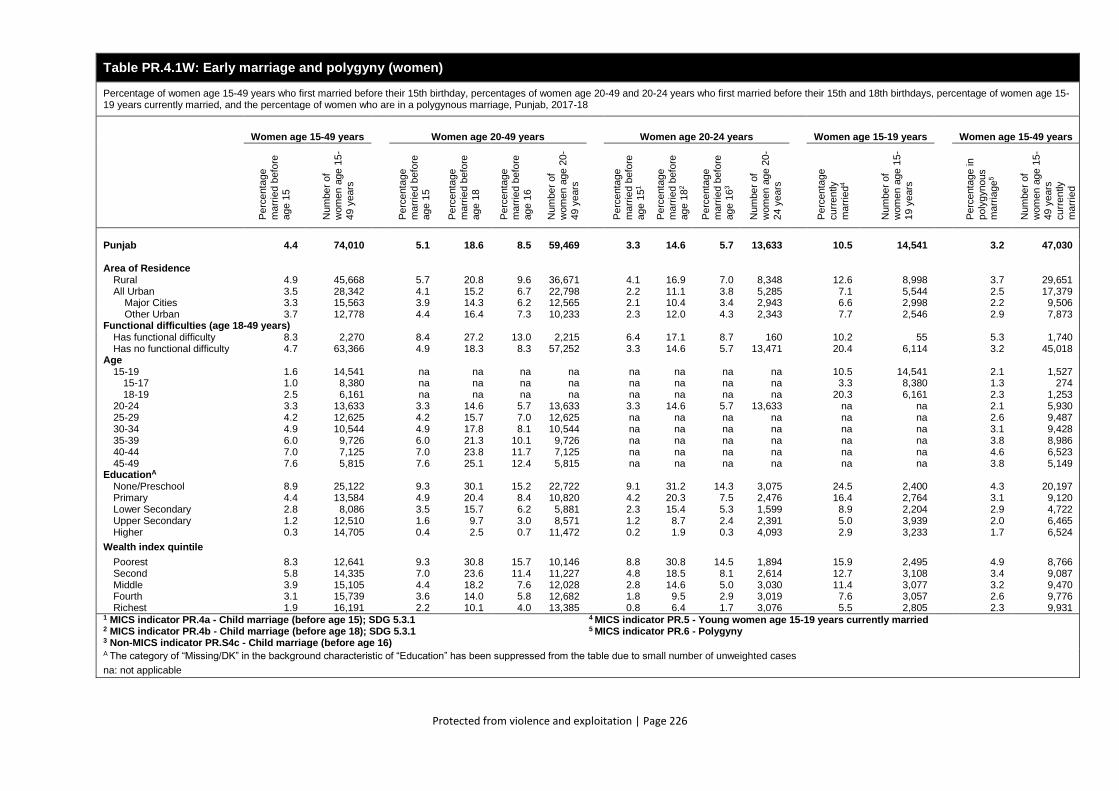
Protected from violence and exploitation | Page 226
Table PR.4.1W: Early marriage and polygyny (women)
Percentage of women age 15-49 years who first married before their 15th birthday, percentages of women age 20-49 and 20-24 years who first married before their 15th and 18th birthdays, percentage of women age 15-19 years currently married, and the percentage of women who are in a polygynous marriage, Punjab, 2017-18
Women age 15-49 years Women age 20-49 years
Women age 20-24 years
Women age 15-19 years Women age 15-49 years
Pe
rce
nta
ge
ma
rrie
d b
efo
re
ag
e 1
5
Num
be
r o
f w
om
en
ag
e 1
5-
49
ye
ars
Pe
rce
nta
ge
ma
rrie
d b
efo
re
ag
e 1
5
Pe
rce
nta
ge
ma
rrie
d b
efo
re
ag
e 1
8
Pe
rce
nta
ge
ma
rrie
d b
efo
re
age 1
6
Num
be
r o
f w
om
en
ag
e 2
0-
49
ye
ars
Pe
rce
nta
ge
ma
rrie
d b
efo
re
ag
e 1
51
Pe
rce
nta
ge
ma
rrie
d b
efo
re
ag
e 1
82
Pe
rce
nta
ge
ma
rrie
d b
efo
re
ag
e 1
63
Num
be
r o
f
wom
en
ag
e 2
0-
24
ye
ars
Pe
rce
nta
ge
cu
rre
ntly
ma
rrie
d4
Num
be
r o
f w
om
en
ag
e 1
5-
19
ye
ars
Pe
rce
nta
ge in
poly
gyn
ous
ma
rria
ge
5
Num
be
r o
f
wom
en
ag
e 1
5-
49
ye
ars
cu
rre
ntly
ma
rrie
d
Punjab 4.4 74,010 5.1 18.6 8.5 59,469 3.3 14.6 5.7 13,633 10.5 14,541 3.2 47,030
Area of Residence
Rural 4.9 45,668 5.7 20.8 9.6 36,671 4.1 16.9 7.0 8,348 12.6 8,998 3.7 29,651 All Urban 3.5 28,342 4.1 15.2 6.7 22,798 2.2 11.1 3.8 5,285 7.1 5,544 2.5 17,379
Major Cities 3.3 15,563 3.9 14.3 6.2 12,565 2.1 10.4 3.4 2,943 6.6 2,998 2.2 9,506 Other Urban 3.7 12,778 4.4 16.4 7.3 10,233 2.3 12.0 4.3 2,343 7.7 2,546 2.9 7,873
Functional difficulties (age 18-49 years) Has functional difficulty 8.3 2,270 8.4 27.2 13.0 2,215 6.4 17.1 8.7 160 10.2 55 5.3 1,740 Has no functional difficulty 4.7 63,366 4.9 18.3 8.3 57,252 3.3 14.6 5.7 13,471 20.4 6,114 3.2 45,018
Age
15-19 1.6 14,541 na na na na na na na na 10.5 14,541 2.1 1,527 15-17 1.0 8,380 na na na na na na na na 3.3 8,380 1.3 274 18-19 2.5 6,161 na na na na na na na na 20.3 6,161 2.3 1,253
20-24 3.3 13,633 3.3 14.6 5.7 13,633 3.3 14.6 5.7 13,633 na na 2.1 5,930 25-29 4.2 12,625 4.2 15.7 7.0 12,625 na na na na na na 2.6 9,487 30-34 4.9 10,544 4.9 17.8 8.1 10,544 na na na na na na 3.1 9,428 35-39 6.0 9,726 6.0 21.3 10.1 9,726 na na na na na na 3.8 8,986 40-44 7.0 7,125 7.0 23.8 11.7 7,125 na na na na na na 4.6 6,523 45-49 7.6 5,815 7.6 25.1 12.4 5,815 na na na na na na 3.8 5,149
EducationA
None/Preschool 8.9 25,122 9.3 30.1 15.2 22,722 9.1 31.2 14.3 3,075 24.5 2,400 4.3 20,197 Primary 4.4 13,584 4.9 20.4 8.4 10,820 4.2 20.3 7.5 2,476 16.4 2,764 3.1 9,120 Lower Secondary 2.8 8,086 3.5 15.7 6.2 5,881 2.3 15.4 5.3 1,599 8.9 2,204 2.9 4,722 Upper Secondary 1.2 12,510 1.6 9.7 3.0 8,571 1.2 8.7 2.4 2,391 5.0 3,939 2.0 6,465 Higher 0.3 14,705 0.4 2.5 0.7 11,472 0.2 1.9 0.3 4,093 2.9 3,233 1.7 6,524
Wealth index quintile
Poorest 8.3 12,641 9.3 30.8 15.7 10,146 8.8 30.8 14.5 1,894 15.9 2,495 4.9 8,766 Second 5.8 14,335 7.0 23.6 11.4 11,227 4.8 18.5 8.1 2,614 12.7 3,108 3.4 9,087 Middle 3.9 15,105 4.4 18.2 7.6 12,028 2.8 14.6 5.0 3,030 11.4 3,077 3.2 9,470 Fourth 3.1 15,739 3.6 14.0 5.8 12,682 1.8 9.5 2.9 3,019 7.6 3,057 2.6 9,776 Richest 1.9 16,191 2.2 10.1 4.0 13,385 0.8 6.4 1.7 3,076 5.5 2,805 2.3 9,931
1 MICS indicator PR.4a - Child marriage (before age 15); SDG 5.3.1 2 MICS indicator PR.4b - Child marriage (before age 18); SDG 5.3.1 3 Non-MICS indicator PR.S4c - Child marriage (before age 16)
4 MICS indicator PR.5 - Young women age 15-19 years currently married 5 MICS indicator PR.6 - Polygyny
A The category of “Missing/DK” in the background characteristic of “Education” has been suppressed from the table due to small number of unweighted cases
na: not applicable
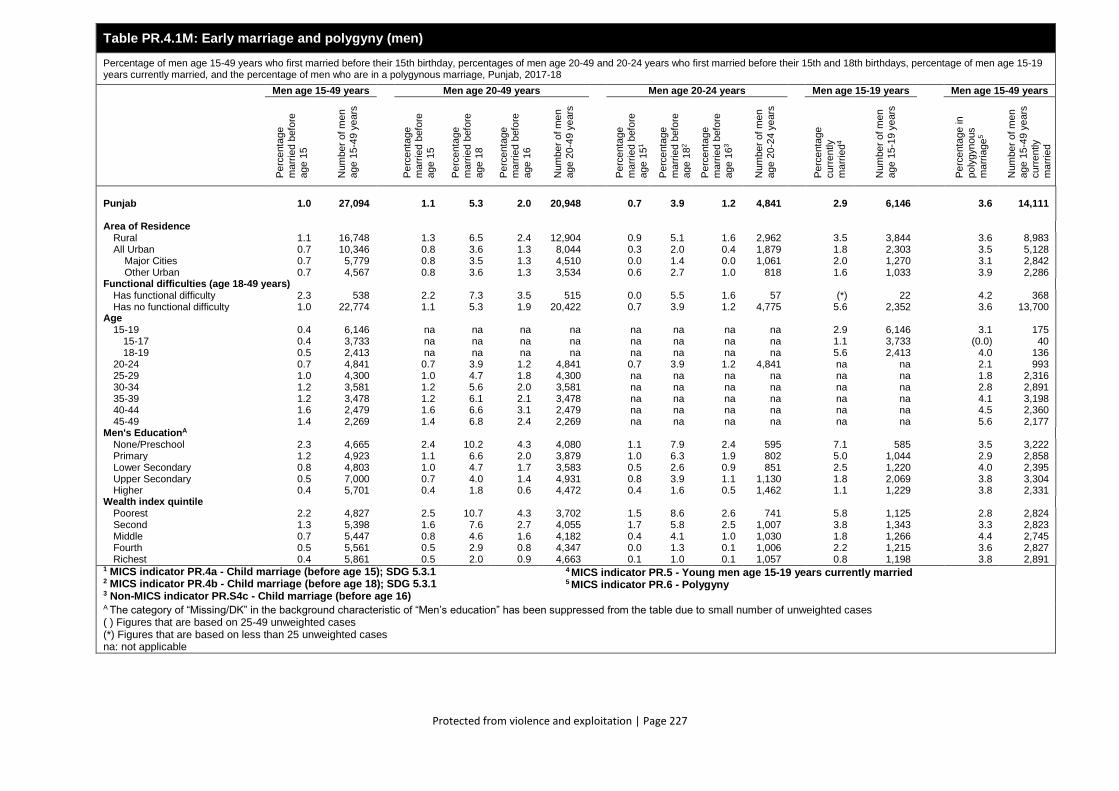
Protected from violence and exploitation | Page 227
Table PR.4.1M: Early marriage and polygyny (men)
Percentage of men age 15-49 years who first married before their 15th birthday, percentages of men age 20-49 and 20-24 years who first married before their 15th and 18th birthdays, percentage of men age 15-19 years currently married, and the percentage of men who are in a polygynous marriage, Punjab, 2017-18
Men age 15-49 years Men age 20-49 years Men age 20-24 years Men age 15-19 years Men age 15-49 years
Pe
rce
nta
ge
ma
rrie
d b
efo
re
ag
e 1
5
Num
be
r o
f m
en
ag
e 1
5-4
9 y
ears
Pe
rce
nta
ge
ma
rrie
d b
efo
re
ag
e 1
5
Pe
rce
nta
ge
ma
rrie
d b
efo
re
ag
e 1
8
Pe
rce
nta
ge
ma
rrie
d b
efo
re
ag
e 1
6
Num
be
r o
f m
en
ag
e 2
0-4
9 y
ears
Pe
rce
nta
ge
ma
rrie
d b
efo
re
ag
e 1
51
Pe
rce
nta
ge
ma
rrie
d b
efo
re
ag
e 1
82
Pe
rce
nta
ge
ma
rrie
d b
efo
re
ag
e 1
63
Num
be
r o
f m
en
ag
e 2
0-2
4 y
ears
Pe
rce
nta
ge
cu
rre
ntly
ma
rrie
d4
Num
be
r o
f m
en
ag
e 1
5-1
9 y
ears
Perc
enta
ge in
po
lyg
yn
ous
ma
rria
ge
5
Num
be
r o
f m
en
ag
e 1
5-4
9 y
ears
cu
rre
ntly
ma
rrie
d
Punjab 1.0 27,094 1.1 5.3 2.0 20,948 0.7 3.9 1.2 4,841 2.9 6,146 3.6 14,111
Area of Residence Rural 1.1 16,748 1.3 6.5 2.4 12,904 0.9 5.1 1.6 2,962 3.5 3,844 3.6 8,983 All Urban 0.7 10,346 0.8 3.6 1.3 8,044 0.3 2.0 0.4 1,879 1.8 2,303 3.5 5,128
Major Cities 0.7 5,779 0.8 3.5 1.3 4,510 0.0 1.4 0.0 1,061 2.0 1,270 3.1 2,842 Other Urban 0.7 4,567 0.8 3.6 1.3 3,534 0.6 2.7 1.0 818 1.6 1,033 3.9 2,286
Functional difficulties (age 18-49 years) Has functional difficulty 2.3 538 2.2 7.3 3.5 515 0.0 5.5 1.6 57 (*) 22 4.2 368 Has no functional difficulty 1.0 22,774 1.1 5.3 1.9 20,422 0.7 3.9 1.2 4,775 5.6 2,352 3.6 13,700
Age
15-19 0.4 6,146 na na na na na na na na 2.9 6,146 3.1 175 15-17 0.4 3,733 na na na na na na na na 1.1 3,733 (0.0) 40 18-19 0.5 2,413 na na na na na na na na 5.6 2,413 4.0 136
20-24 0.7 4,841 0.7 3.9 1.2 4,841 0.7 3.9 1.2 4,841 na na 2.1 993 25-29 1.0 4,300 1.0 4.7 1.8 4,300 na na na na na na 1.8 2,316 30-34 1.2 3,581 1.2 5.6 2.0 3,581 na na na na na na 2.8 2,891 35-39 1.2 3,478 1.2 6.1 2.1 3,478 na na na na na na 4.1 3,198 40-44 1.6 2,479 1.6 6.6 3.1 2,479 na na na na na na 4.5 2,360 45-49 1.4 2,269 1.4 6.8 2.4 2,269 na na na na na na 5.6 2,177
Men's EducationA None/Preschool 2.3 4,665 2.4 10.2 4.3 4,080 1.1 7.9 2.4 595 7.1 585 3.5 3,222 Primary 1.2 4,923 1.1 6.6 2.0 3,879 1.0 6.3 1.9 802 5.0 1,044 2.9 2,858 Lower Secondary 0.8 4,803 1.0 4.7 1.7 3,583 0.5 2.6 0.9 851 2.5 1,220 4.0 2,395 Upper Secondary 0.5 7,000 0.7 4.0 1.4 4,931 0.8 3.9 1.1 1,130 1.8 2,069 3.8 3,304 Higher 0.4 5,701 0.4 1.8 0.6 4,472 0.4 1.6 0.5 1,462 1.1 1,229 3.8 2,331
Wealth index quintile Poorest 2.2 4,827 2.5 10.7 4.3 3,702 1.5 8.6 2.6 741 5.8 1,125 2.8 2,824 Second 1.3 5,398 1.6 7.6 2.7 4,055 1.7 5.8 2.5 1,007 3.8 1,343 3.3 2,823 Middle 0.7 5,447 0.8 4.6 1.6 4,182 0.4 4.1 1.0 1,030 1.8 1,266 4.4 2,745 Fourth 0.5 5,561 0.5 2.9 0.8 4,347 0.0 1.3 0.1 1,006 2.2 1,215 3.6 2,827 Richest 0.4 5,861 0.5 2.0 0.9 4,663 0.1 1.0 0.1 1,057 0.8 1,198 3.8 2,891
1 MICS indicator PR.4a - Child marriage (before age 15); SDG 5.3.1 2 MICS indicator PR.4b - Child marriage (before age 18); SDG 5.3.1 3 Non-MICS indicator PR.S4c - Child marriage (before age 16)
4 MICS indicator PR.5 - Young men age 15-19 years currently married 5 MICS indicator PR.6 - Polygyny
A The category of “Missing/DK” in the background characteristic of “Men’s education” has been suppressed from the table due to small number of unweighted cases ( ) Figures that are based on 25-49 unweighted cases (*) Figures that are based on less than 25 unweighted cases na: not applicable
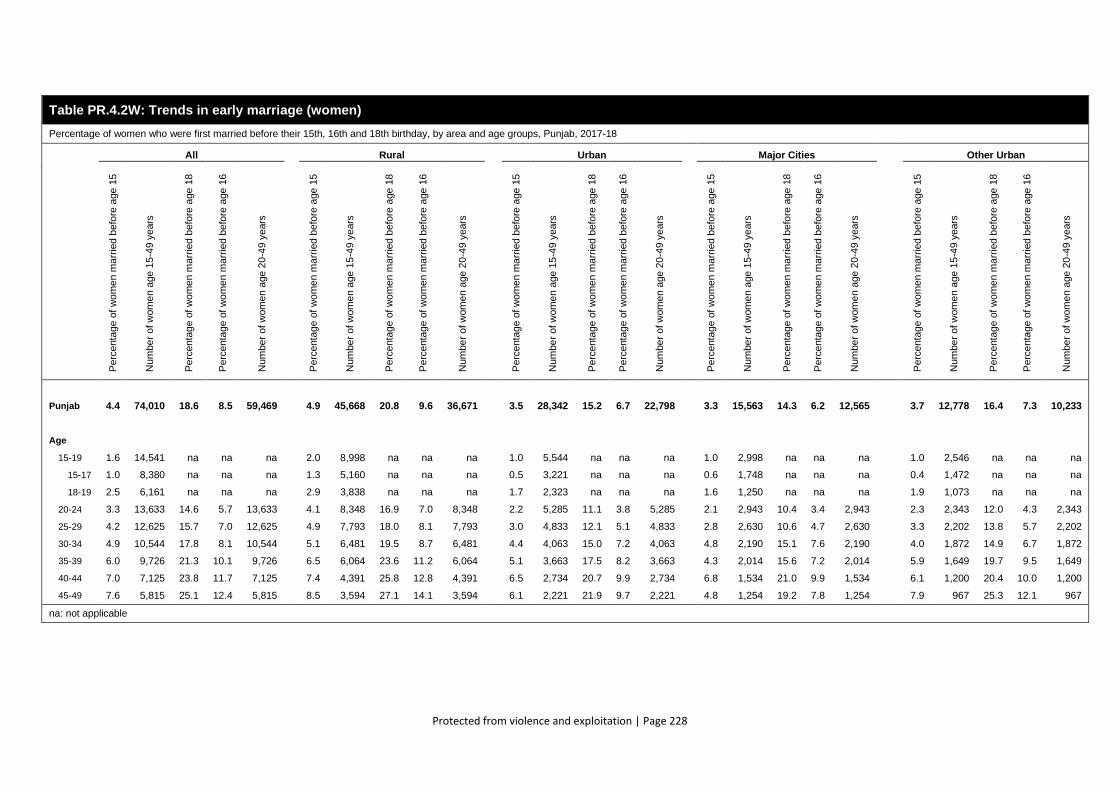
Protected from violence and exploitation | Page 228
Table PR.4.2W: Trends in early marriage (women)
Percentage of women who were first married before their 15th, 16th and 18th birthday, by area and age groups, Punjab, 2017-18
All Rural Urban Major Cities Other Urban
Pe
rce
nta
ge o
f w
om
en m
arr
ied
be
fore
age
15
Num
be
r o
f w
om
en a
ge
15
-49 y
ears
Pe
rce
nta
ge o
f w
om
en m
arr
ied
be
fore
age
18
Pe
rce
nta
ge o
f w
om
en m
arr
ied
be
fore
age
16
Num
be
r o
f w
om
en a
ge
20
-49 y
ears
Pe
rce
nta
ge o
f w
om
en m
arr
ied
be
fore
age
15
Num
be
r o
f w
om
en a
ge
15
-49 y
ears
Pe
rce
nta
ge o
f w
om
en m
arr
ied
be
fore
age
18
Pe
rce
nta
ge o
f w
om
en m
arr
ied
be
fore
age
16
Num
be
r o
f w
om
en a
ge
20
-49 y
ears
Pe
rce
nta
ge o
f w
om
en m
arr
ied
be
fore
age
15
Num
be
r o
f w
om
en a
ge
15
-49 y
ears
Pe
rce
nta
ge o
f w
om
en m
arr
ied
be
fore
age
18
Pe
rce
nta
ge o
f w
om
en m
arr
ied
be
fore
age
16
Num
be
r o
f w
om
en a
ge
20
-49 y
ears
Pe
rce
nta
ge o
f w
om
en m
arr
ied
be
fore
age
15
Num
be
r o
f w
om
en a
ge
15
-49 y
ears
Pe
rce
nta
ge o
f w
om
en m
arr
ied
be
fore
age
18
Pe
rce
nta
ge o
f w
om
en m
arr
ied
be
fore
age
16
Num
be
r o
f w
om
en a
ge
20
-49 y
ears
Pe
rce
nta
ge o
f w
om
en m
arr
ied
be
fore
age
15
Num
be
r o
f w
om
en a
ge
15
-49 y
ears
Pe
rce
nta
ge o
f w
om
en m
arr
ied
be
fore
age
18
Pe
rce
nta
ge o
f w
om
en m
arr
ied
be
fore
age
16
Num
be
r o
f w
om
en a
ge
20
-49 y
ears
Punjab 4.4 74,010 18.6 8.5 59,469 4.9 45,668 20.8 9.6 36,671 3.5 28,342 15.2 6.7 22,798 3.3 15,563 14.3 6.2 12,565 3.7 12,778 16.4 7.3 10,233
Age
15-19 1.6 14,541 na na na 2.0 8,998 na na na 1.0 5,544 na na na 1.0 2,998 na na na 1.0 2,546 na na na
15-17 1.0 8,380 na na na 1.3 5,160 na na na 0.5 3,221 na na na 0.6 1,748 na na na 0.4 1,472 na na na
18-19 2.5 6,161 na na na 2.9 3,838 na na na 1.7 2,323 na na na 1.6 1,250 na na na 1.9 1,073 na na na
20-24 3.3 13,633 14.6 5.7 13,633 4.1 8,348 16.9 7.0 8,348 2.2 5,285 11.1 3.8 5,285 2.1 2,943 10.4 3.4 2,943 2.3 2,343 12.0 4.3 2,343
25-29 4.2 12,625 15.7 7.0 12,625 4.9 7,793 18.0 8.1 7,793 3.0 4,833 12.1 5.1 4,833 2.8 2,630 10.6 4.7 2,630 3.3 2,202 13.8 5.7 2,202
30-34 4.9 10,544 17.8 8.1 10,544 5.1 6,481 19.5 8.7 6,481 4.4 4,063 15.0 7.2 4,063 4.8 2,190 15.1 7.6 2,190 4.0 1,872 14.9 6.7 1,872
35-39 6.0 9,726 21.3 10.1 9,726 6.5 6,064 23.6 11.2 6,064 5.1 3,663 17.5 8.2 3,663 4.3 2,014 15.6 7.2 2,014 5.9 1,649 19.7 9.5 1,649
40-44 7.0 7,125 23.8 11.7 7,125 7.4 4,391 25.8 12.8 4,391 6.5 2,734 20.7 9.9 2,734 6.8 1,534 21.0 9.9 1,534 6.1 1,200 20.4 10.0 1,200
45-49 7.6 5,815 25.1 12.4 5,815 8.5 3,594 27.1 14.1 3,594 6.1 2,221 21.9 9.7 2,221 4.8 1,254 19.2 7.8 1,254 7.9 967 25.3 12.1 967
na: not applicable
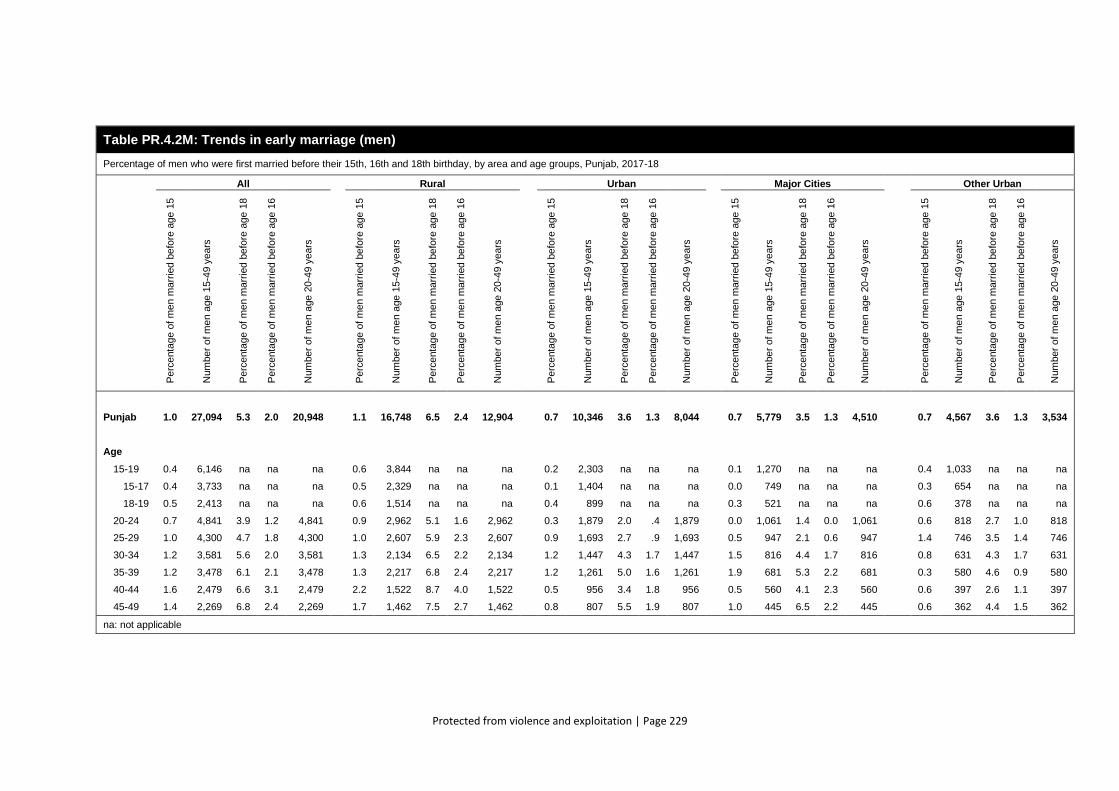
Protected from violence and exploitation | Page 229
Table PR.4.2M: Trends in early marriage (men)
Percentage of men who were first married before their 15th, 16th and 18th birthday, by area and age groups, Punjab, 2017-18
All Rural Urban Major Cities Other Urban
Pe
rce
nta
ge o
f m
en
ma
rrie
d b
efo
re a
ge
15
Num
be
r o
f m
en a
ge
15
-49 y
ea
rs
Pe
rce
nta
ge o
f m
en
ma
rrie
d b
efo
re a
ge
18
Pe
rce
nta
ge o
f m
en
ma
rrie
d b
efo
re a
ge
16
Num
be
r o
f m
en a
ge
20-4
9 y
ea
rs
Pe
rce
nta
ge o
f m
en
ma
rrie
d b
efo
re a
ge
15
Num
be
r o
f m
en a
ge
15
-49 y
ea
rs
Pe
rce
nta
ge o
f m
en
ma
rrie
d b
efo
re a
ge
18
Pe
rce
nta
ge o
f m
en
ma
rrie
d b
efo
re a
ge
16
Num
be
r o
f m
en a
ge
20
-49 y
ea
rs
Pe
rce
nta
ge o
f m
en
ma
rrie
d b
efo
re a
ge
15
Num
be
r o
f m
en a
ge
15
-49 y
ea
rs
Pe
rce
nta
ge o
f m
en
ma
rrie
d b
efo
re a
ge
18
Pe
rce
nta
ge o
f m
en
ma
rrie
d b
efo
re a
ge
16
Num
be
r o
f m
en a
ge
20
-49 y
ea
rs
Pe
rce
nta
ge o
f m
en
ma
rrie
d b
efo
re a
ge
15
Num
be
r o
f m
en a
ge
15
-49 y
ea
rs
Pe
rce
nta
ge o
f m
en
ma
rrie
d b
efo
re a
ge
18
Pe
rce
nta
ge o
f m
en
ma
rrie
d b
efo
re a
ge
16
Num
be
r o
f m
en a
ge
20
-49 y
ea
rs
Pe
rce
nta
ge o
f m
en
ma
rrie
d b
efo
re a
ge
15
Num
be
r o
f m
en a
ge
15
-49 y
ea
rs
Pe
rce
nta
ge o
f m
en
ma
rrie
d b
efo
re a
ge
18
Pe
rce
nta
ge o
f m
en
ma
rrie
d b
efo
re a
ge
16
Num
be
r o
f m
en a
ge
20
-49 y
ea
rs
Punjab 1.0 27,094 5.3 2.0 20,948 1.1 16,748 6.5 2.4 12,904 0.7 10,346 3.6 1.3 8,044 0.7 5,779 3.5 1.3 4,510 0.7 4,567 3.6 1.3 3,534
Age
15-19 0.4 6,146 na na na 0.6 3,844 na na na 0.2 2,303 na na na 0.1 1,270 na na na 0.4 1,033 na na na
15-17 0.4 3,733 na na na 0.5 2,329 na na na 0.1 1,404 na na na 0.0 749 na na na 0.3 654 na na na
18-19 0.5 2,413 na na na 0.6 1,514 na na na 0.4 899 na na na 0.3 521 na na na 0.6 378 na na na
20-24 0.7 4,841 3.9 1.2 4,841 0.9 2,962 5.1 1.6 2,962 0.3 1,879 2.0 .4 1,879 0.0 1,061 1.4 0.0 1,061 0.6 818 2.7 1.0 818
25-29 1.0 4,300 4.7 1.8 4,300 1.0 2,607 5.9 2.3 2,607 0.9 1,693 2.7 .9 1,693 0.5 947 2.1 0.6 947 1.4 746 3.5 1.4 746
30-34 1.2 3,581 5.6 2.0 3,581 1.3 2,134 6.5 2.2 2,134 1.2 1,447 4.3 1.7 1,447 1.5 816 4.4 1.7 816 0.8 631 4.3 1.7 631
35-39 1.2 3,478 6.1 2.1 3,478 1.3 2,217 6.8 2.4 2,217 1.2 1,261 5.0 1.6 1,261 1.9 681 5.3 2.2 681 0.3 580 4.6 0.9 580
40-44 1.6 2,479 6.6 3.1 2,479 2.2 1,522 8.7 4.0 1,522 0.5 956 3.4 1.8 956 0.5 560 4.1 2.3 560 0.6 397 2.6 1.1 397
45-49 1.4 2,269 6.8 2.4 2,269 1.7 1,462 7.5 2.7 1,462 0.8 807 5.5 1.9 807 1.0 445 6.5 2.2 445 0.6 362 4.4 1.5 362
na: not applicable
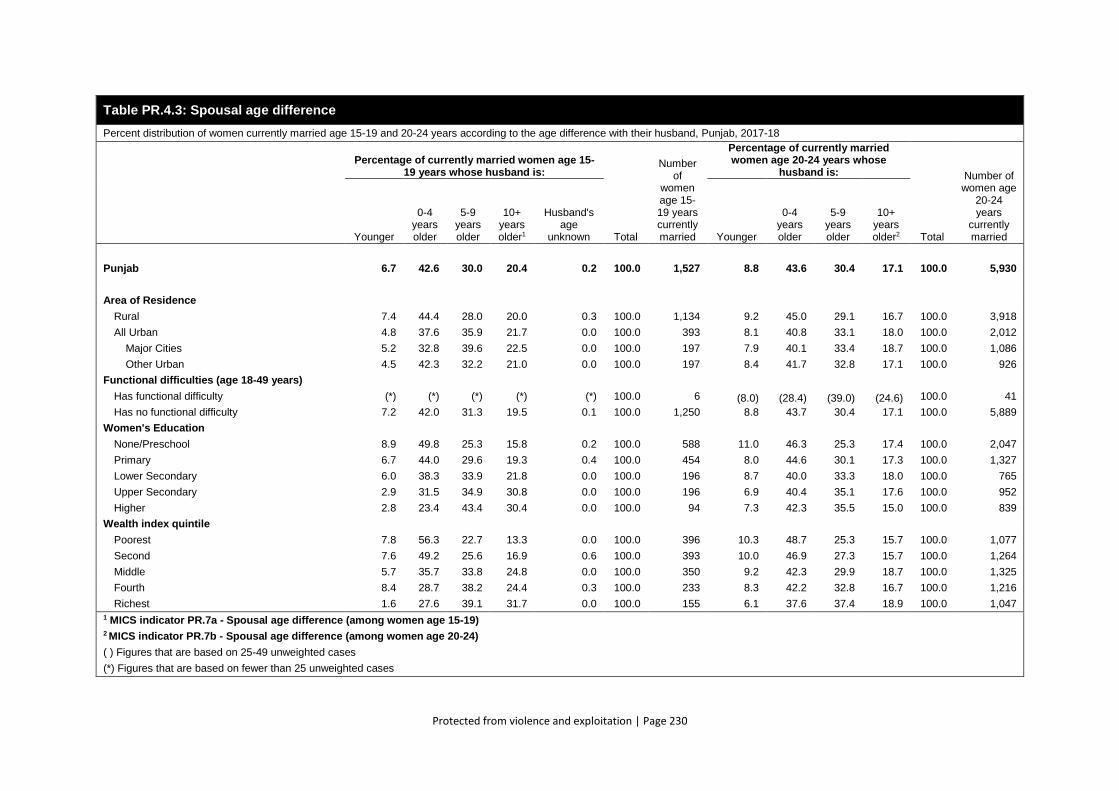
Protected from violence and exploitation | Page 230
Table PR.4.3: Spousal age difference
Percent distribution of women currently married age 15-19 and 20-24 years according to the age difference with their husband, Punjab, 2017-18
Percentage of currently married women age 15-19 years whose husband is:
Total
Number of
women age 15-19 years currently married
Percentage of currently married women age 20-24 years whose
husband is:
Total
Number of women age
20-24 years
currently married Younger
0-4 years older
5-9 years older
10+ years older1
Husband's age
unknown Younger
0-4 years older
5-9 years older
10+ years older2
Punjab 6.7 42.6 30.0 20.4 0.2 100.0 1,527 8.8 43.6 30.4 17.1 100.0 5,930
Area of Residence
Rural 7.4 44.4 28.0 20.0 0.3 100.0 1,134 9.2 45.0 29.1 16.7 100.0 3,918
All Urban 4.8 37.6 35.9 21.7 0.0 100.0 393 8.1 40.8 33.1 18.0 100.0 2,012
Major Cities 5.2 32.8 39.6 22.5 0.0 100.0 197 7.9 40.1 33.4 18.7 100.0 1,086
Other Urban 4.5 42.3 32.2 21.0 0.0 100.0 197 8.4 41.7 32.8 17.1 100.0 926
Functional difficulties (age 18-49 years)
Has functional difficulty (*) (*) (*) (*) (*) 100.0 6 (8.0) (28.4) (39.0) (24.6) 100.0 41
Has no functional difficulty 7.2 42.0 31.3 19.5 0.1 100.0 1,250 8.8 43.7 30.4 17.1 100.0 5,889
Women's Education
None/Preschool 8.9 49.8 25.3 15.8 0.2 100.0 588 11.0 46.3 25.3 17.4 100.0 2,047
Primary 6.7 44.0 29.6 19.3 0.4 100.0 454 8.0 44.6 30.1 17.3 100.0 1,327
Lower Secondary 6.0 38.3 33.9 21.8 0.0 100.0 196 8.7 40.0 33.3 18.0 100.0 765
Upper Secondary 2.9 31.5 34.9 30.8 0.0 100.0 196 6.9 40.4 35.1 17.6 100.0 952
Higher 2.8 23.4 43.4 30.4 0.0 100.0 94 7.3 42.3 35.5 15.0 100.0 839
Wealth index quintile
Poorest 7.8 56.3 22.7 13.3 0.0 100.0 396 10.3 48.7 25.3 15.7 100.0 1,077
Second 7.6 49.2 25.6 16.9 0.6 100.0 393 10.0 46.9 27.3 15.7 100.0 1,264
Middle 5.7 35.7 33.8 24.8 0.0 100.0 350 9.2 42.3 29.9 18.7 100.0 1,325
Fourth 8.4 28.7 38.2 24.4 0.3 100.0 233 8.3 42.2 32.8 16.7 100.0 1,216
Richest 1.6 27.6 39.1 31.7 0.0 100.0 155 6.1 37.6 37.4 18.9 100.0 1,047 1 MICS indicator PR.7a - Spousal age difference (among women age 15-19) 2 MICS indicator PR.7b - Spousal age difference (among women age 20-24)
( ) Figures that are based on 25-49 unweighted cases (*) Figures that are based on fewer than 25 unweighted cases
Protected from violence and exploitation | Page 231
PR.6 VICTIMISATION
Crime can have a large impact the lives of victims and the wider community in which they live. Those
who are victims of crimes can suffer physically and psychologically and experience loss of assets and
income. Crime can also carry significant economic costs to the community through the provision of
preventative measures as well as corrective services131.
Tables PR.6.1W and PR.6.1M present the percentage of women and men who were victims of robbery
or assault in the last 3 and 1 year prior to the survey, by various background characteristics. Tables
PR.6.2W and PR.6.2M show if weapons (namely, knife, gun or other weapons) were used during the
last robbery. Tables PR.6.3W and PR.6.3M expand on the circumstances of the latest assault, indicating
where it took place and type of weapon used. Finally, Tables PR.6.4W and PR.6.4M indicate if the last
robbery or assault experienced by women and men was reported to the police.
131 United Nations Office on Drugs and Crime, and United Nations Economic Commission for Europe. Manual on
Victimization Surveys. Geneva: UN. https://www.unodc.org/documents/data-and-analysis/Crime-
statistics/Manual_on_Victimization_surveys_2009_web.pdf.
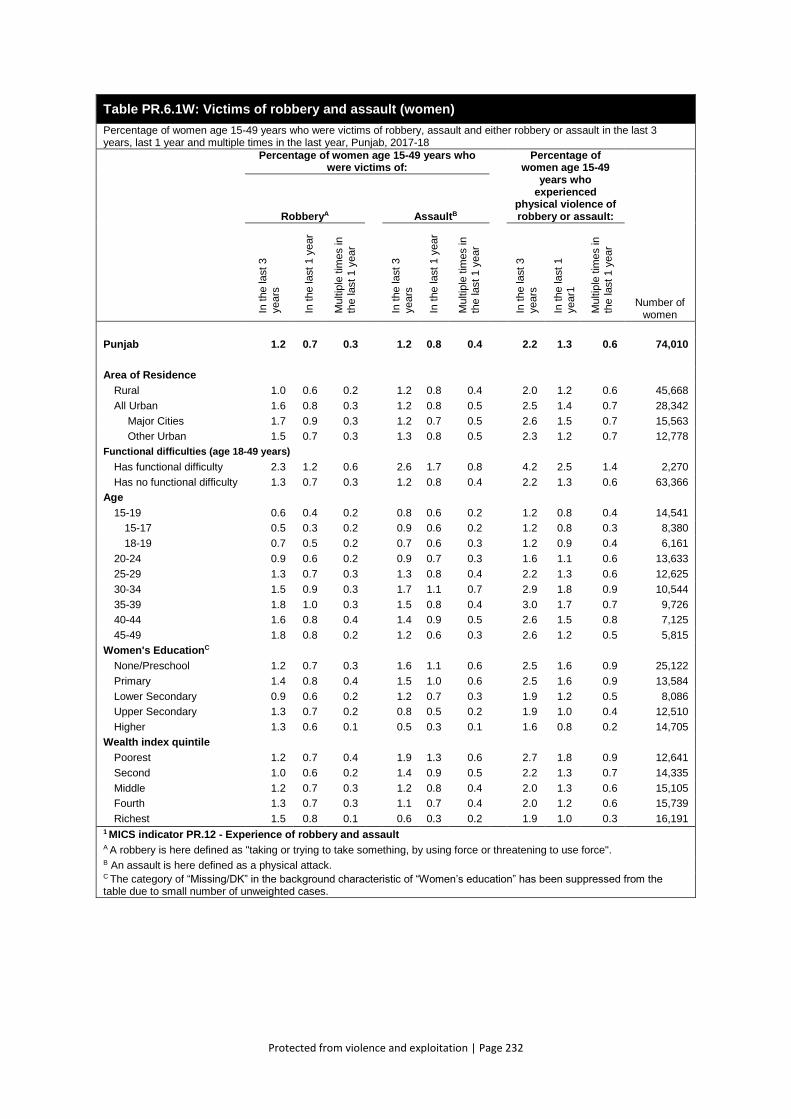
Protected from violence and exploitation | Page 232
Table PR.6.1W: Victims of robbery and assault (women)
Percentage of women age 15-49 years who were victims of robbery, assault and either robbery or assault in the last 3 years, last 1 year and multiple times in the last year, Punjab, 2017-18
Percentage of women age 15-49 years who were victims of:
Percentage of women age 15-49
years who experienced
physical violence of robbery or assault:
Number of women
RobberyA AssaultB
In t
he la
st
3
years
In t
he la
st
1 y
ear
Mu
ltip
le t
ime
s in
the last 1 y
ear
In t
he la
st
3
years
In t
he la
st
1 y
ear
Mu
ltip
le t
ime
s in
the last 1 y
ear
In t
he la
st
3
years
In t
he la
st
1
year1
Mu
ltip
le t
ime
s in
the last 1 y
ear
Punjab 1.2 0.7 0.3 1.2 0.8 0.4 2.2 1.3 0.6 74,010
Area of Residence
Rural 1.0 0.6 0.2 1.2 0.8 0.4 2.0 1.2 0.6 45,668
All Urban 1.6 0.8 0.3 1.2 0.8 0.5 2.5 1.4 0.7 28,342
Major Cities 1.7 0.9 0.3 1.2 0.7 0.5 2.6 1.5 0.7 15,563
Other Urban 1.5 0.7 0.3 1.3 0.8 0.5 2.3 1.2 0.7 12,778
Functional difficulties (age 18-49 years)
Has functional difficulty 2.3 1.2 0.6 2.6 1.7 0.8 4.2 2.5 1.4 2,270
Has no functional difficulty 1.3 0.7 0.3 1.2 0.8 0.4 2.2 1.3 0.6 63,366
Age
15-19 0.6 0.4 0.2 0.8 0.6 0.2 1.2 0.8 0.4 14,541
15-17 0.5 0.3 0.2 0.9 0.6 0.2 1.2 0.8 0.3 8,380
18-19 0.7 0.5 0.2 0.7 0.6 0.3 1.2 0.9 0.4 6,161
20-24 0.9 0.6 0.2 0.9 0.7 0.3 1.6 1.1 0.6 13,633
25-29 1.3 0.7 0.3 1.3 0.8 0.4 2.2 1.3 0.6 12,625
30-34 1.5 0.9 0.3 1.7 1.1 0.7 2.9 1.8 0.9 10,544
35-39 1.8 1.0 0.3 1.5 0.8 0.4 3.0 1.7 0.7 9,726
40-44 1.6 0.8 0.4 1.4 0.9 0.5 2.6 1.5 0.8 7,125
45-49 1.8 0.8 0.2 1.2 0.6 0.3 2.6 1.2 0.5 5,815
Women's EducationC
None/Preschool 1.2 0.7 0.3 1.6 1.1 0.6 2.5 1.6 0.9 25,122
Primary 1.4 0.8 0.4 1.5 1.0 0.6 2.5 1.6 0.9 13,584
Lower Secondary 0.9 0.6 0.2 1.2 0.7 0.3 1.9 1.2 0.5 8,086
Upper Secondary 1.3 0.7 0.2 0.8 0.5 0.2 1.9 1.0 0.4 12,510
Higher 1.3 0.6 0.1 0.5 0.3 0.1 1.6 0.8 0.2 14,705
Wealth index quintile
Poorest 1.2 0.7 0.4 1.9 1.3 0.6 2.7 1.8 0.9 12,641
Second 1.0 0.6 0.2 1.4 0.9 0.5 2.2 1.3 0.7 14,335
Middle 1.2 0.7 0.3 1.2 0.8 0.4 2.0 1.3 0.6 15,105
Fourth 1.3 0.7 0.3 1.1 0.7 0.4 2.0 1.2 0.6 15,739
Richest 1.5 0.8 0.1 0.6 0.3 0.2 1.9 1.0 0.3 16,191
1 MICS indicator PR.12 - Experience of robbery and assault A A robbery is here defined as "taking or trying to take something, by using force or threatening to use force". B An assault is here defined as a physical attack. C The category of “Missing/DK” in the background characteristic of “Women’s education” has been suppressed from the table due to small number of unweighted cases.
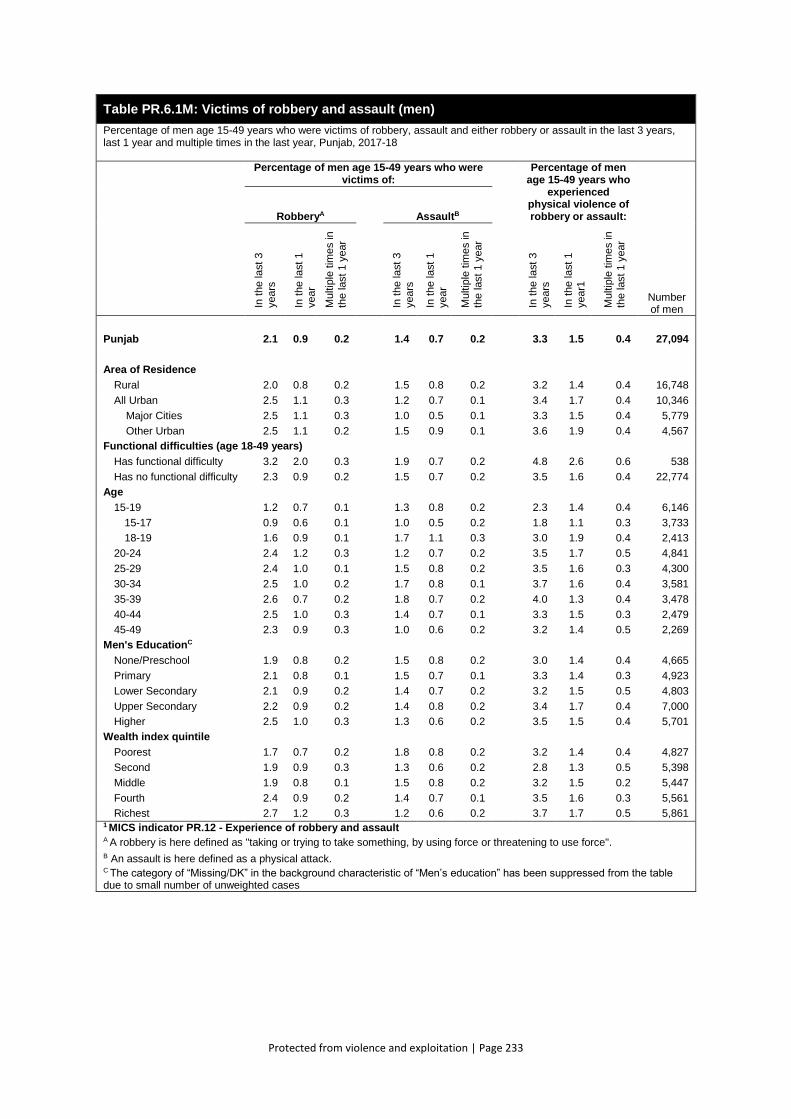
Protected from violence and exploitation | Page 233
Table PR.6.1M: Victims of robbery and assault (men)
Percentage of men age 15-49 years who were victims of robbery, assault and either robbery or assault in the last 3 years, last 1 year and multiple times in the last year, Punjab, 2017-18
Percentage of men age 15-49 years who were victims of:
Percentage of men age 15-49 years who
experienced physical violence of robbery or assault:
Number of men
RobberyA AssaultB
In t
he la
st
3
years
In t
he la
st
1
year
Mu
ltip
le t
ime
s in
the last 1 y
ear
In t
he la
st
3
years
In t
he la
st
1
year
Mu
ltip
le t
ime
s in
the last 1 y
ear
In t
he la
st
3
years
In t
he la
st
1
year1
Mu
ltip
le t
ime
s in
the last 1 y
ear
Punjab 2.1 0.9 0.2 1.4 0.7 0.2 3.3 1.5 0.4 27,094
Area of Residence
Rural 2.0 0.8 0.2 1.5 0.8 0.2 3.2 1.4 0.4 16,748
All Urban 2.5 1.1 0.3 1.2 0.7 0.1 3.4 1.7 0.4 10,346
Major Cities 2.5 1.1 0.3 1.0 0.5 0.1 3.3 1.5 0.4 5,779
Other Urban 2.5 1.1 0.2 1.5 0.9 0.1 3.6 1.9 0.4 4,567
Functional difficulties (age 18-49 years)
Has functional difficulty 3.2 2.0 0.3 1.9 0.7 0.2 4.8 2.6 0.6 538
Has no functional difficulty 2.3 0.9 0.2 1.5 0.7 0.2 3.5 1.6 0.4 22,774
Age
15-19 1.2 0.7 0.1 1.3 0.8 0.2 2.3 1.4 0.4 6,146
15-17 0.9 0.6 0.1 1.0 0.5 0.2 1.8 1.1 0.3 3,733
18-19 1.6 0.9 0.1 1.7 1.1 0.3 3.0 1.9 0.4 2,413
20-24 2.4 1.2 0.3 1.2 0.7 0.2 3.5 1.7 0.5 4,841
25-29 2.4 1.0 0.1 1.5 0.8 0.2 3.5 1.6 0.3 4,300
30-34 2.5 1.0 0.2 1.7 0.8 0.1 3.7 1.6 0.4 3,581
35-39 2.6 0.7 0.2 1.8 0.7 0.2 4.0 1.3 0.4 3,478
40-44 2.5 1.0 0.3 1.4 0.7 0.1 3.3 1.5 0.3 2,479
45-49 2.3 0.9 0.3 1.0 0.6 0.2 3.2 1.4 0.5 2,269
Men's EducationC
None/Preschool 1.9 0.8 0.2 1.5 0.8 0.2 3.0 1.4 0.4 4,665
Primary 2.1 0.8 0.1 1.5 0.7 0.1 3.3 1.4 0.3 4,923
Lower Secondary 2.1 0.9 0.2 1.4 0.7 0.2 3.2 1.5 0.5 4,803
Upper Secondary 2.2 0.9 0.2 1.4 0.8 0.2 3.4 1.7 0.4 7,000
Higher 2.5 1.0 0.3 1.3 0.6 0.2 3.5 1.5 0.4 5,701
Wealth index quintile
Poorest 1.7 0.7 0.2 1.8 0.8 0.2 3.2 1.4 0.4 4,827
Second 1.9 0.9 0.3 1.3 0.6 0.2 2.8 1.3 0.5 5,398
Middle 1.9 0.8 0.1 1.5 0.8 0.2 3.2 1.5 0.2 5,447
Fourth 2.4 0.9 0.2 1.4 0.7 0.1 3.5 1.6 0.3 5,561
Richest 2.7 1.2 0.3 1.2 0.6 0.2 3.7 1.7 0.5 5,861 1 MICS indicator PR.12 - Experience of robbery and assault A A robbery is here defined as "taking or trying to take something, by using force or threatening to use force". B An assault is here defined as a physical attack. C The category of “Missing/DK” in the background characteristic of “Men’s education” has been suppressed from the table due to small number of unweighted cases
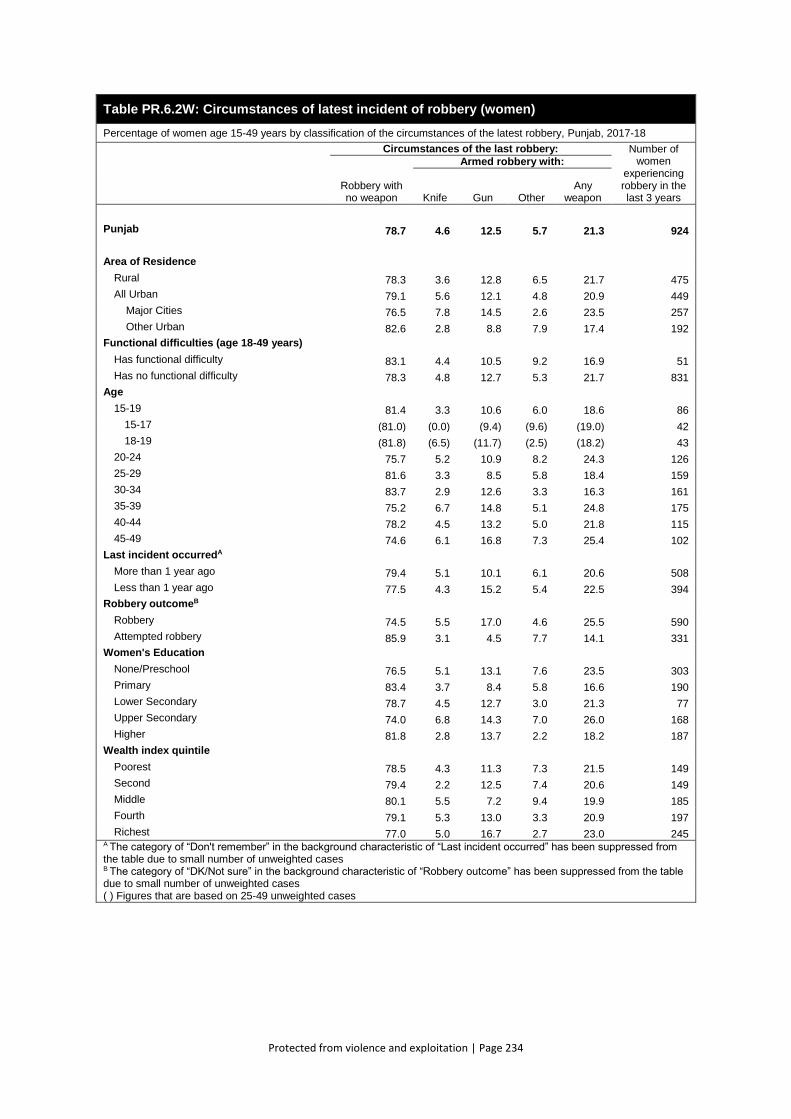
Protected from violence and exploitation | Page 234
Table PR.6.2W: Circumstances of latest incident of robbery (women)
Percentage of women age 15-49 years by classification of the circumstances of the latest robbery, Punjab, 2017-18
Circumstances of the last robbery: Number of women
experiencing robbery in the last 3 years
Robbery with no weapon
Armed robbery with:
Knife Gun Other Any
weapon
Punjab 78.7 4.6 12.5 5.7 21.3 924
Area of Residence
Rural 78.3 3.6 12.8 6.5 21.7 475
All Urban 79.1 5.6 12.1 4.8 20.9 449
Major Cities 76.5 7.8 14.5 2.6 23.5 257
Other Urban 82.6 2.8 8.8 7.9 17.4 192
Functional difficulties (age 18-49 years) Has functional difficulty 83.1 4.4 10.5 9.2 16.9 51
Has no functional difficulty 78.3 4.8 12.7 5.3 21.7 831
Age 15-19 81.4 3.3 10.6 6.0 18.6 86
15-17 (81.0) (0.0) (9.4) (9.6) (19.0) 42
18-19 (81.8) (6.5) (11.7) (2.5) (18.2) 43
20-24 75.7 5.2 10.9 8.2 24.3 126
25-29 81.6 3.3 8.5 5.8 18.4 159
30-34 83.7 2.9 12.6 3.3 16.3 161
35-39 75.2 6.7 14.8 5.1 24.8 175
40-44 78.2 4.5 13.2 5.0 21.8 115
45-49 74.6 6.1 16.8 7.3 25.4 102
Last incident occurredA More than 1 year ago 79.4 5.1 10.1 6.1 20.6 508
Less than 1 year ago 77.5 4.3 15.2 5.4 22.5 394
Robbery outcomeB Robbery 74.5 5.5 17.0 4.6 25.5 590
Attempted robbery 85.9 3.1 4.5 7.7 14.1 331
Women's Education None/Preschool 76.5 5.1 13.1 7.6 23.5 303
Primary 83.4 3.7 8.4 5.8 16.6 190
Lower Secondary 78.7 4.5 12.7 3.0 21.3 77
Upper Secondary 74.0 6.8 14.3 7.0 26.0 168
Higher 81.8 2.8 13.7 2.2 18.2 187
Wealth index quintile Poorest 78.5 4.3 11.3 7.3 21.5 149
Second 79.4 2.2 12.5 7.4 20.6 149
Middle 80.1 5.5 7.2 9.4 19.9 185
Fourth 79.1 5.3 13.0 3.3 20.9 197
Richest 77.0 5.0 16.7 2.7 23.0 245 A The category of “Don't remember” in the background characteristic of “Last incident occurred” has been suppressed from the table due to small number of unweighted cases B The category of “DK/Not sure” in the background characteristic of “Robbery outcome” has been suppressed from the table due to small number of unweighted cases ( ) Figures that are based on 25-49 unweighted cases
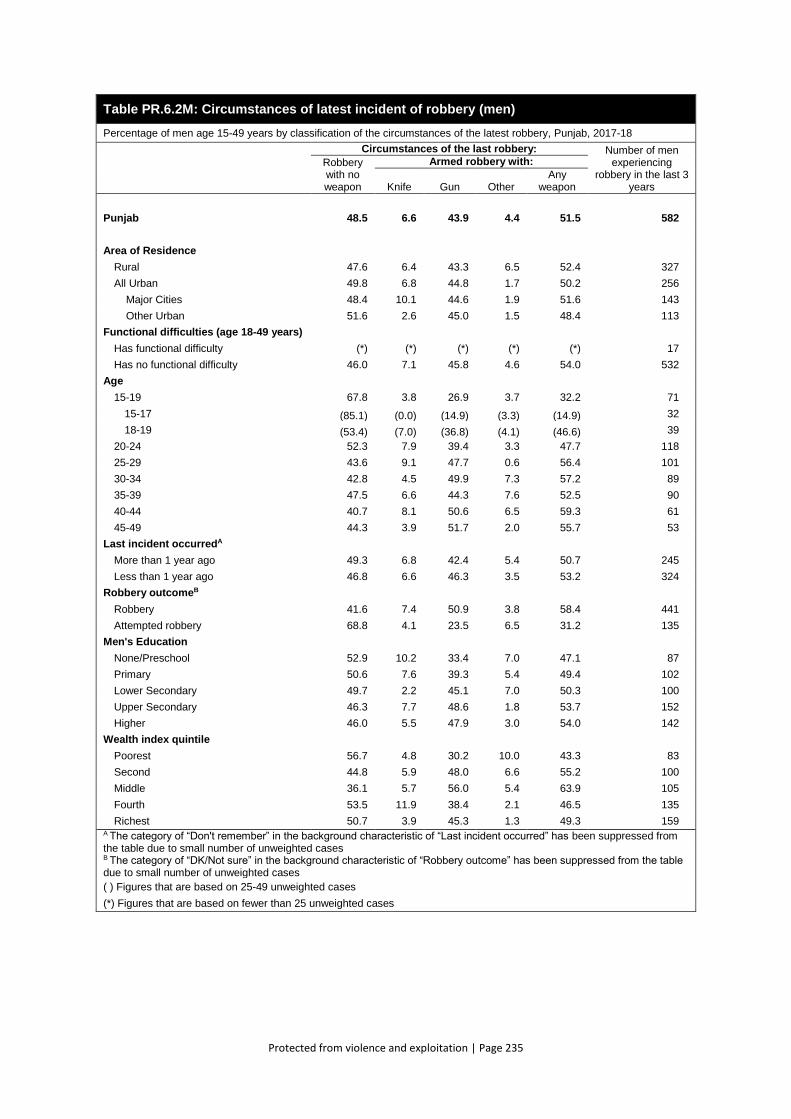
Protected from violence and exploitation | Page 235
Table PR.6.2M: Circumstances of latest incident of robbery (men)
Percentage of men age 15-49 years by classification of the circumstances of the latest robbery, Punjab, 2017-18
Circumstances of the last robbery: Number of men experiencing
robbery in the last 3 years
Robbery with no weapon
Armed robbery with:
Knife Gun Other Any
weapon
Punjab 48.5 6.6 43.9 4.4 51.5 582
Area of Residence
Rural 47.6 6.4 43.3 6.5 52.4 327
All Urban 49.8 6.8 44.8 1.7 50.2 256
Major Cities 48.4 10.1 44.6 1.9 51.6 143
Other Urban 51.6 2.6 45.0 1.5 48.4 113
Functional difficulties (age 18-49 years)
Has functional difficulty (*) (*) (*) (*) (*) 17
Has no functional difficulty 46.0 7.1 45.8 4.6 54.0 532
Age
15-19 67.8 3.8 26.9 3.7 32.2 71
15-17 (85.1) (0.0) (14.9) (3.3) (14.9) 32
18-19 (53.4) (7.0) (36.8) (4.1) (46.6) 39
20-24 52.3 7.9 39.4 3.3 47.7 118
25-29 43.6 9.1 47.7 0.6 56.4 101
30-34 42.8 4.5 49.9 7.3 57.2 89
35-39 47.5 6.6 44.3 7.6 52.5 90
40-44 40.7 8.1 50.6 6.5 59.3 61
45-49 44.3 3.9 51.7 2.0 55.7 53
Last incident occurredA
More than 1 year ago 49.3 6.8 42.4 5.4 50.7 245
Less than 1 year ago 46.8 6.6 46.3 3.5 53.2 324
Robbery outcomeB
Robbery 41.6 7.4 50.9 3.8 58.4 441
Attempted robbery 68.8 4.1 23.5 6.5 31.2 135
Men's Education
None/Preschool 52.9 10.2 33.4 7.0 47.1 87
Primary 50.6 7.6 39.3 5.4 49.4 102
Lower Secondary 49.7 2.2 45.1 7.0 50.3 100
Upper Secondary 46.3 7.7 48.6 1.8 53.7 152
Higher 46.0 5.5 47.9 3.0 54.0 142
Wealth index quintile
Poorest 56.7 4.8 30.2 10.0 43.3 83
Second 44.8 5.9 48.0 6.6 55.2 100
Middle 36.1 5.7 56.0 5.4 63.9 105
Fourth 53.5 11.9 38.4 2.1 46.5 135
Richest 50.7 3.9 45.3 1.3 49.3 159 A The category of “Don't remember” in the background characteristic of “Last incident occurred” has been suppressed from the table due to small number of unweighted cases B The category of “DK/Not sure” in the background characteristic of “Robbery outcome” has been suppressed from the table due to small number of unweighted cases
( ) Figures that are based on 25-49 unweighted cases
(*) Figures that are based on fewer than 25 unweighted cases
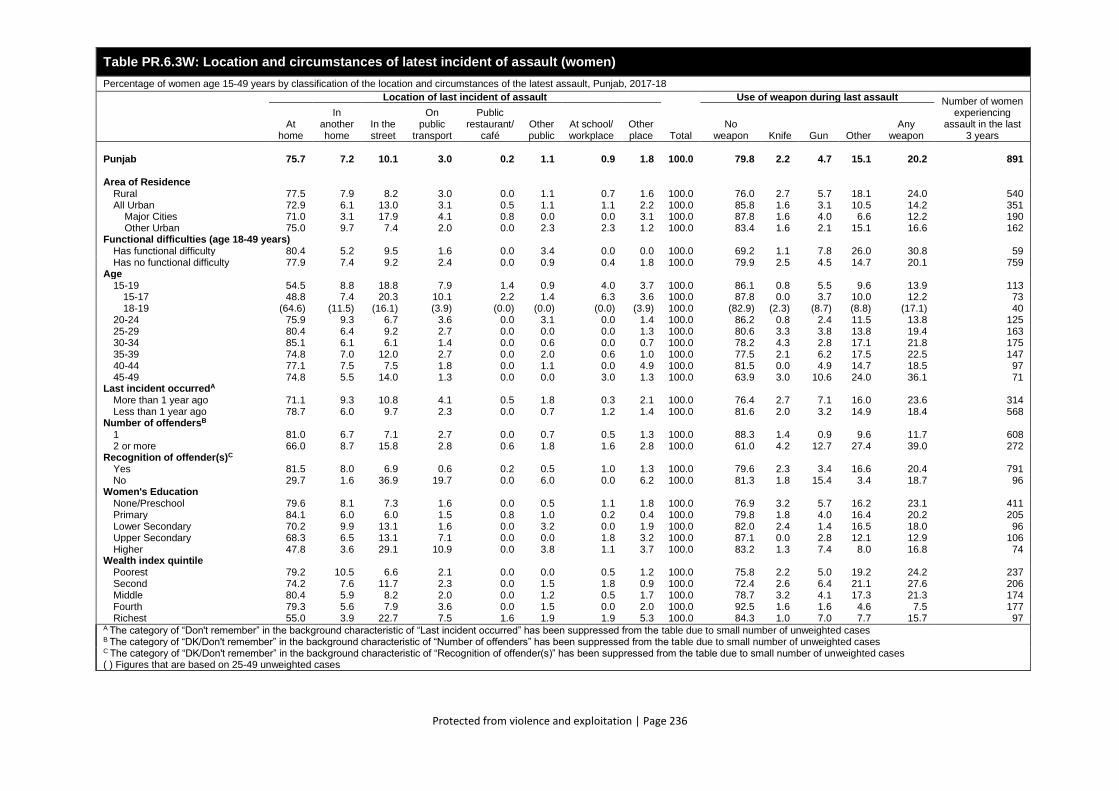
Protected from violence and exploitation | Page 236
Table PR.6.3W: Location and circumstances of latest incident of assault (women)
Percentage of women age 15-49 years by classification of the location and circumstances of the latest assault, Punjab, 2017-18
Location of last incident of assault
Total
Use of weapon during last assault Number of women experiencing
assault in the last 3 years
At home
In another home
In the street
On public
transport
Public restaurant/
café Other public
At school/ workplace
Other place
No weapon Knife Gun Other
Any weapon
Punjab 75.7 7.2 10.1 3.0 0.2 1.1 0.9 1.8 100.0 79.8 2.2 4.7 15.1 20.2 891
Area of Residence
Rural 77.5 7.9 8.2 3.0 0.0 1.1 0.7 1.6 100.0 76.0 2.7 5.7 18.1 24.0 540 All Urban 72.9 6.1 13.0 3.1 0.5 1.1 1.1 2.2 100.0 85.8 1.6 3.1 10.5 14.2 351
Major Cities 71.0 3.1 17.9 4.1 0.8 0.0 0.0 3.1 100.0 87.8 1.6 4.0 6.6 12.2 190 Other Urban 75.0 9.7 7.4 2.0 0.0 2.3 2.3 1.2 100.0 83.4 1.6 2.1 15.1 16.6 162
Functional difficulties (age 18-49 years)
Has functional difficulty 80.4 5.2 9.5 1.6 0.0 3.4 0.0 0.0 100.0 69.2 1.1 7.8 26.0 30.8 59 Has no functional difficulty 77.9 7.4 9.2 2.4 0.0 0.9 0.4 1.8 100.0 79.9 2.5 4.5 14.7 20.1 759
Age
15-19 54.5 8.8 18.8 7.9 1.4 0.9 4.0 3.7 100.0 86.1 0.8 5.5 9.6 13.9 113 15-17 48.8 7.4 20.3 10.1 2.2 1.4 6.3 3.6 100.0 87.8 0.0 3.7 10.0 12.2 73 18-19 (64.6) (11.5) (16.1) (3.9) (0.0) (0.0) (0.0) (3.9) 100.0 (82.9) (2.3) (8.7) (8.8) (17.1) 40
20-24 75.9 9.3 6.7 3.6 0.0 3.1 0.0 1.4 100.0 86.2 0.8 2.4 11.5 13.8 125 25-29 80.4 6.4 9.2 2.7 0.0 0.0 0.0 1.3 100.0 80.6 3.3 3.8 13.8 19.4 163 30-34 85.1 6.1 6.1 1.4 0.0 0.6 0.0 0.7 100.0 78.2 4.3 2.8 17.1 21.8 175 35-39 74.8 7.0 12.0 2.7 0.0 2.0 0.6 1.0 100.0 77.5 2.1 6.2 17.5 22.5 147 40-44 77.1 7.5 7.5 1.8 0.0 1.1 0.0 4.9 100.0 81.5 0.0 4.9 14.7 18.5 97 45-49 74.8 5.5 14.0 1.3 0.0 0.0 3.0 1.3 100.0 63.9 3.0 10.6 24.0 36.1 71
Last incident occurredA
More than 1 year ago 71.1 9.3 10.8 4.1 0.5 1.8 0.3 2.1 100.0 76.4 2.7 7.1 16.0 23.6 314 Less than 1 year ago 78.7 6.0 9.7 2.3 0.0 0.7 1.2 1.4 100.0 81.6 2.0 3.2 14.9 18.4 568
Number of offendersB
1 81.0 6.7 7.1 2.7 0.0 0.7 0.5 1.3 100.0 88.3 1.4 0.9 9.6 11.7 608 2 or more 66.0 8.7 15.8 2.8 0.6 1.8 1.6 2.8 100.0 61.0 4.2 12.7 27.4 39.0 272
Recognition of offender(s)C
Yes 81.5 8.0 6.9 0.6 0.2 0.5 1.0 1.3 100.0 79.6 2.3 3.4 16.6 20.4 791 No 29.7 1.6 36.9 19.7 0.0 6.0 0.0 6.2 100.0 81.3 1.8 15.4 3.4 18.7 96
Women's Education
None/Preschool 79.6 8.1 7.3 1.6 0.0 0.5 1.1 1.8 100.0 76.9 3.2 5.7 16.2 23.1 411 Primary 84.1 6.0 6.0 1.5 0.8 1.0 0.2 0.4 100.0 79.8 1.8 4.0 16.4 20.2 205 Lower Secondary 70.2 9.9 13.1 1.6 0.0 3.2 0.0 1.9 100.0 82.0 2.4 1.4 16.5 18.0 96 Upper Secondary 68.3 6.5 13.1 7.1 0.0 0.0 1.8 3.2 100.0 87.1 0.0 2.8 12.1 12.9 106 Higher 47.8 3.6 29.1 10.9 0.0 3.8 1.1 3.7 100.0 83.2 1.3 7.4 8.0 16.8 74
Wealth index quintile
Poorest 79.2 10.5 6.6 2.1 0.0 0.0 0.5 1.2 100.0 75.8 2.2 5.0 19.2 24.2 237 Second 74.2 7.6 11.7 2.3 0.0 1.5 1.8 0.9 100.0 72.4 2.6 6.4 21.1 27.6 206 Middle 80.4 5.9 8.2 2.0 0.0 1.2 0.5 1.7 100.0 78.7 3.2 4.1 17.3 21.3 174 Fourth 79.3 5.6 7.9 3.6 0.0 1.5 0.0 2.0 100.0 92.5 1.6 1.6 4.6 7.5 177 Richest 55.0 3.9 22.7 7.5 1.6 1.9 1.9 5.3 100.0 84.3 1.0 7.0 7.7 15.7 97
A The category of “Don't remember” in the background characteristic of “Last incident occurred” has been suppressed from the table due to small number of unweighted cases B The category of “DK/Don't remember” in the background characteristic of “Number of offenders” has been suppressed from the table due to small number of unweighted cases C The category of “DK/Don't remember” in the background characteristic of “Recognition of offender(s)” has been suppressed from the table due to small number of unweighted cases ( ) Figures that are based on 25-49 unweighted cases
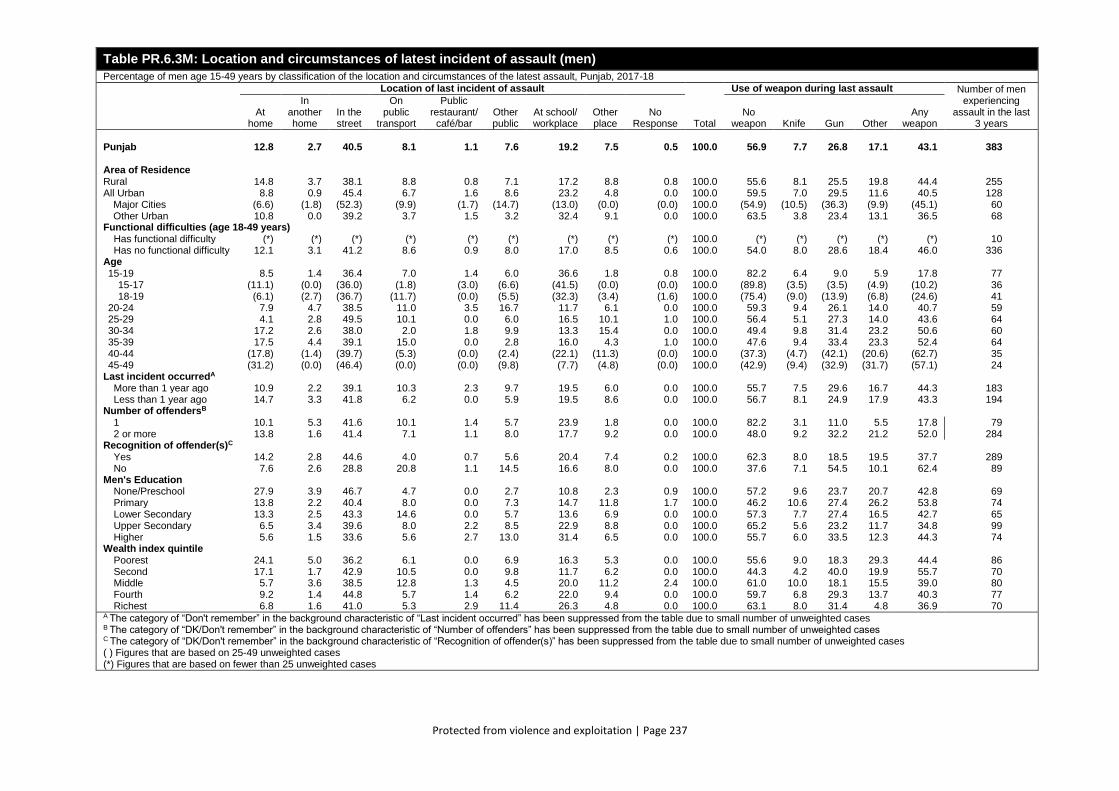
Protected from violence and exploitation | Page 237
Table PR.6.3M: Location and circumstances of latest incident of assault (men)
Percentage of men age 15-49 years by classification of the location and circumstances of the latest assault, Punjab, 2017-18
Location of last incident of assault
Total
Use of weapon during last assault Number of men experiencing
assault in the last 3 years
At home
In another home
In the street
On public
transport
Public restaurant/
café/bar Other public
At school/ workplace
Other place
No Response
No weapon Knife Gun Other
Any weapon
Punjab 12.8 2.7 40.5 8.1 1.1 7.6 19.2 7.5 0.5 100.0 56.9 7.7 26.8 17.1 43.1 383
Area of Residence
Rural 14.8 3.7 38.1 8.8 0.8 7.1 17.2 8.8 0.8 100.0 55.6 8.1 25.5 19.8 44.4 255 All Urban 8.8 0.9 45.4 6.7 1.6 8.6 23.2 4.8 0.0 100.0 59.5 7.0 29.5 11.6 40.5 128
Major Cities (6.6) (1.8) (52.3) (9.9) (1.7) (14.7) (13.0) (0.0) (0.0) 100.0 (54.9) (10.5) (36.3) (9.9) (45.1) 60 Other Urban 10.8 0.0 39.2 3.7 1.5 3.2 32.4 9.1 0.0 100.0 63.5 3.8 23.4 13.1 36.5 68
Functional difficulties (age 18-49 years)
Has functional difficulty (*) (*) (*) (*) (*) (*) (*) (*) (*) 100.0 (*) (*) (*) (*) (*) 10 Has no functional difficulty 12.1 3.1 41.2 8.6 0.9 8.0 17.0 8.5 0.6 100.0 54.0 8.0 28.6 18.4 46.0 336
Age
15-19 8.5 1.4 36.4 7.0 1.4 6.0 36.6 1.8 0.8 100.0 82.2 6.4 9.0 5.9 17.8 77 15-17 (11.1) (0.0) (36.0) (1.8) (3.0) (6.6) (41.5) (0.0) (0.0) 100.0 (89.8) (3.5) (3.5) (4.9) (10.2) 36 18-19 (6.1) (2.7) (36.7) (11.7) (0.0) (5.5) (32.3) (3.4) (1.6) 100.0 (75.4) (9.0) (13.9) (6.8) (24.6) 41
20-24 7.9 4.7 38.5 11.0 3.5 16.7 11.7 6.1 0.0 100.0 59.3 9.4 26.1 14.0 40.7 59 25-29 4.1 2.8 49.5 10.1 0.0 6.0 16.5 10.1 1.0 100.0 56.4 5.1 27.3 14.0 43.6 64 30-34 17.2 2.6 38.0 2.0 1.8 9.9 13.3 15.4 0.0 100.0 49.4 9.8 31.4 23.2 50.6 60 35-39 17.5 4.4 39.1 15.0 0.0 2.8 16.0 4.3 1.0 100.0 47.6 9.4 33.4 23.3 52.4 64 40-44 (17.8) (1.4) (39.7) (5.3) (0.0) (2.4) (22.1) (11.3) (0.0) 100.0 (37.3) (4.7) (42.1) (20.6) (62.7) 35 45-49 (31.2) (0.0) (46.4) (0.0) (0.0) (9.8) (7.7) (4.8) (0.0) 100.0 (42.9) (9.4) (32.9) (31.7) (57.1) 24
Last incident occurredA
More than 1 year ago 10.9 2.2 39.1 10.3 2.3 9.7 19.5 6.0 0.0 100.0 55.7 7.5 29.6 16.7 44.3 183 Less than 1 year ago 14.7 3.3 41.8 6.2 0.0 5.9 19.5 8.6 0.0 100.0 56.7 8.1 24.9 17.9 43.3 194
Number of offendersB
1 10.1 5.3 41.6 10.1 1.4 5.7 23.9 1.8 0.0 100.0 82.2 3.1 11.0 5.5 17.8 79 2 or more 13.8 1.6 41.4 7.1 1.1 8.0 17.7 9.2 0.0 100.0 48.0 9.2 32.2 21.2 52.0 284
Recognition of offender(s)C
Yes 14.2 2.8 44.6 4.0 0.7 5.6 20.4 7.4 0.2 100.0 62.3 8.0 18.5 19.5 37.7 289 No 7.6 2.6 28.8 20.8 1.1 14.5 16.6 8.0 0.0 100.0 37.6 7.1 54.5 10.1 62.4 89
Men's Education
None/Preschool 27.9 3.9 46.7 4.7 0.0 2.7 10.8 2.3 0.9 100.0 57.2 9.6 23.7 20.7 42.8 69 Primary 13.8 2.2 40.4 8.0 0.0 7.3 14.7 11.8 1.7 100.0 46.2 10.6 27.4 26.2 53.8 74 Lower Secondary 13.3 2.5 43.3 14.6 0.0 5.7 13.6 6.9 0.0 100.0 57.3 7.7 27.4 16.5 42.7 65 Upper Secondary 6.5 3.4 39.6 8.0 2.2 8.5 22.9 8.8 0.0 100.0 65.2 5.6 23.2 11.7 34.8 99 Higher 5.6 1.5 33.6 5.6 2.7 13.0 31.4 6.5 0.0 100.0 55.7 6.0 33.5 12.3 44.3 74
Wealth index quintile
Poorest 24.1 5.0 36.2 6.1 0.0 6.9 16.3 5.3 0.0 100.0 55.6 9.0 18.3 29.3 44.4 86 Second 17.1 1.7 42.9 10.5 0.0 9.8 11.7 6.2 0.0 100.0 44.3 4.2 40.0 19.9 55.7 70 Middle 5.7 3.6 38.5 12.8 1.3 4.5 20.0 11.2 2.4 100.0 61.0 10.0 18.1 15.5 39.0 80 Fourth 9.2 1.4 44.8 5.7 1.4 6.2 22.0 9.4 0.0 100.0 59.7 6.8 29.3 13.7 40.3 77 Richest 6.8 1.6 41.0 5.3 2.9 11.4 26.3 4.8 0.0 100.0 63.1 8.0 31.4 4.8 36.9 70
A The category of “Don't remember” in the background characteristic of “Last incident occurred” has been suppressed from the table due to small number of unweighted cases B The category of “DK/Don't remember” in the background characteristic of “Number of offenders” has been suppressed from the table due to small number of unweighted cases C The category of “DK/Don't remember” in the background characteristic of “Recognition of offender(s)” has been suppressed from the table due to small number of unweighted cases ( ) Figures that are based on 25-49 unweighted cases (*) Figures that are based on fewer than 25 unweighted cases

Protected from violence and exploitation | Page 238
Table PR.6.4W: Reporting of robbery and assault in the last one year (women)
Percentage of women age 15-49 years who experienced robbery in the last year, by type of last robbery, percentage who experienced assault in the last 1 year, by type of last assault, and percentage whose last experience of either robbery or assault was reported to the police, Punjab, 2017-18
Percentage of women for whom last incident of robbery was reported to
the police Number of women
experiencing robbery in
the last year
Percentage of women for whom last incident of assault was
reported to the police Number of women
experiencing assault in the
last year
Percentage of women for whom the last
incident of physical violence of robbery and/or assault in the
last year was reported to the police1,A
Number of women experiencing
physical violence of robbery or assault in
the last year Robbery with no weapon
Robbery with any weapon
Any robbery
Assault with no weapon
Assault with any weapon
Any assault
Punjab 13.7 8.3 22.0 508 7.2 6.1 13.3 568 12.1 961
Area of Residence
Rural 13.9 8.6 22.5 271 6.3 7.8 14.2 352 11.4 563 All Urban 13.5 7.9 21.4 237 8.7 3.3 12.0 216 13.2 397
Major Cities 13.0 10.6 23.7 141 6.3 2.3 8.6 116 14.8 238 Other Urban 14.1 3.9 18.0 96 11.5 4.4 15.9 100 10.8 160
Women's functional difficulties (age 18-49 years)
Has functional difficulty (8.8) (3.5) (12.3) (27.4) (10.6) (8.1) (18.7) 38 7.8 57 Has no functional difficulty 13.9 8.8 22.6 454 6.8 6.6 13.3 481 12.7 839
Age
15-19 16.9 6.1 23.0 56 7.9 4.8 12.7 83 10.6 120 15-17 (15.6) (4.7) (20.3) (26.6) (9.3) (0.0) (9.3) 49 8.3 65 18-19 (18.0) (7.4) (25.4) (29.2) (5.9) (11.6) (17.5) 34 13.4 56
20-24 12.1 9.1 21.2 76 7.5 5.2 12.7 94 11.2 145 25-29 14.2 10.8 25.1 85 7.6 4.8 12.4 98 13.2 160 30-34 10.5 6.5 17.0 93 4.0 5.8 9.9 112 8.8 189 35-39 15.9 9.3 25.1 96 7.1 6.0 13.0 78 15.2 164 40-44 10.5 6.8 17.4 56 11.2 5.3 16.5 66 11.6 110 45-49 (17.2) (8.2) (25.5) 46 (7.2) (17.3) (24.5) 37 16.3 71
Party reporting crime
Self 60.4 37.8 98.2 67 61.4 38.6 100.0 49 68.7 100 Other (62.7) (37.3) (100.0) (46.9) (38.3) (54.8) (93.1) 30 71.9 65
Women's Education
None/Preschool 11.8 7.9 19.8 183 5.1 8.0 13.1 265 9.6 400 Primary 10.6 6.6 17.2 103 11.3 6.3 17.6 141 8.3 213 Lower Secondary 18.2 11.0 29.2 45 7.2 1.3 8.5 59 13.7 96 Upper Secondary 14.3 8.6 22.9 84 8.8 3.9 12.7 65 15.6 129 Higher 18.0 9.3 27.3 92 (4.7) (3.3) (8.0) 38 21.8 123
Wealth index quintile
Poorest 14.0 10.3 24.3 88 6.8 8.3 15.1 163 10.0 226 Second 13.1 4.3 17.4 85 3.7 10.0 13.8 124 8.5 187 Middle 12.3 6.0 18.3 105 7.8 5.8 13.6 113 10.0 193 Fourth 14.2 10.4 24.6 107 11.4 0.0 11.4 114 14.6 192 Richest 14.5 9.8 24.3 122 (6.6) (4.0) (10.6) 53 18.7 163
1 MICS indicator PR.13 - Crime reporting; SDG indicator 16.3.1 A This indicator is constructed using both last incidences of robbery and assault, as respondents may have experienced 1) no incident, 2) one last incident of either robbery or assault or 3) both robbery and assault. ( ) Figures that are based on 25-49 unweighted cases
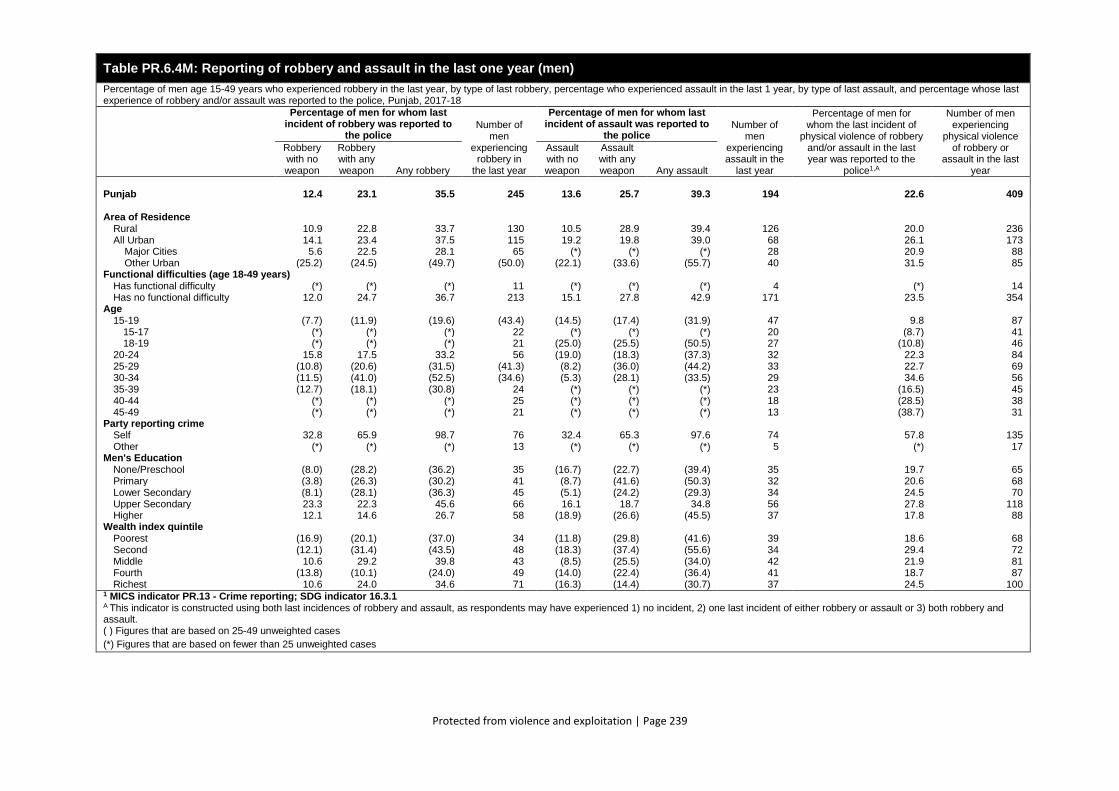
Protected from violence and exploitation | Page 239
Table PR.6.4M: Reporting of robbery and assault in the last one year (men)
Percentage of men age 15-49 years who experienced robbery in the last year, by type of last robbery, percentage who experienced assault in the last 1 year, by type of last assault, and percentage whose last experience of robbery and/or assault was reported to the police, Punjab, 2017-18
Percentage of men for whom last incident of robbery was reported to
the police Number of
men experiencing
robbery in the last year
Percentage of men for whom last incident of assault was reported to
the police Number of
men experiencing assault in the
last year
Percentage of men for whom the last incident of
physical violence of robbery and/or assault in the last year was reported to the
police1,A
Number of men experiencing
physical violence of robbery or
assault in the last year
Robbery with no weapon
Robbery with any weapon Any robbery
Assault with no weapon
Assault with any weapon Any assault
Punjab 12.4 23.1 35.5 245 13.6 25.7 39.3 194 22.6 409
Area of Residence
Rural 10.9 22.8 33.7 130 10.5 28.9 39.4 126 20.0 236 All Urban 14.1 23.4 37.5 115 19.2 19.8 39.0 68 26.1 173
Major Cities 5.6 22.5 28.1 65 (*) (*) (*) 28 20.9 88 Other Urban (25.2) (24.5) (49.7) (50.0) (22.1) (33.6) (55.7) 40 31.5 85
Functional difficulties (age 18-49 years)
Has functional difficulty (*) (*) (*) 11 (*) (*) (*) 4 (*) 14 Has no functional difficulty 12.0 24.7 36.7 213 15.1 27.8 42.9 171 23.5 354
Age
15-19 (7.7) (11.9) (19.6) (43.4) (14.5) (17.4) (31.9) 47 9.8 87 15-17 (*) (*) (*) 22 (*) (*) (*) 20 (8.7) 41 18-19 (*) (*) (*) 21 (25.0) (25.5) (50.5) 27 (10.8) 46
20-24 15.8 17.5 33.2 56 (19.0) (18.3) (37.3) 32 22.3 84 25-29 (10.8) (20.6) (31.5) (41.3) (8.2) (36.0) (44.2) 33 22.7 69 30-34 (11.5) (41.0) (52.5) (34.6) (5.3) (28.1) (33.5) 29 34.6 56 35-39 (12.7) (18.1) (30.8) 24 (*) (*) (*) 23 (16.5) 45 40-44 (*) (*) (*) 25 (*) (*) (*) 18 (28.5) 38 45-49 (*) (*) (*) 21 (*) (*) (*) 13 (38.7) 31
Party reporting crime
Self 32.8 65.9 98.7 76 32.4 65.3 97.6 74 57.8 135 Other (*) (*) (*) 13 (*) (*) (*) 5 (*) 17
Men's Education
None/Preschool (8.0) (28.2) (36.2) 35 (16.7) (22.7) (39.4) 35 19.7 65 Primary (3.8) (26.3) (30.2) 41 (8.7) (41.6) (50.3) 32 20.6 68 Lower Secondary (8.1) (28.1) (36.3) 45 (5.1) (24.2) (29.3) 34 24.5 70 Upper Secondary 23.3 22.3 45.6 66 16.1 18.7 34.8 56 27.8 118 Higher 12.1 14.6 26.7 58 (18.9) (26.6) (45.5) 37 17.8 88
Wealth index quintile
Poorest (16.9) (20.1) (37.0) 34 (11.8) (29.8) (41.6) 39 18.6 68 Second (12.1) (31.4) (43.5) 48 (18.3) (37.4) (55.6) 34 29.4 72 Middle 10.6 29.2 39.8 43 (8.5) (25.5) (34.0) 42 21.9 81 Fourth (13.8) (10.1) (24.0) 49 (14.0) (22.4) (36.4) 41 18.7 87 Richest 10.6 24.0 34.6 71 (16.3) (14.4) (30.7) 37 24.5 100
1 MICS indicator PR.13 - Crime reporting; SDG indicator 16.3.1 A This indicator is constructed using both last incidences of robbery and assault, as respondents may have experienced 1) no incident, 2) one last incident of either robbery or assault or 3) both robbery and assault. ( ) Figures that are based on 25-49 unweighted cases
(*) Figures that are based on fewer than 25 unweighted cases
Protected from violence and exploitation | Page 240
PR.7 FEELINGS OF SAFETY
Questions about fear, such as feelings of safety and perceptions of crime as a problem, indicate
respondents’ level of perceived safety in everyday life. This is important as such; perceptions limit
people’s freedom of movement and influence how they manage threats to their safety 131
Tables PR.7.1W and PR.7.1M present data for women and men on their feelings of safety for walking
alone in their neighbourhood after dark and for being at home alone after dark
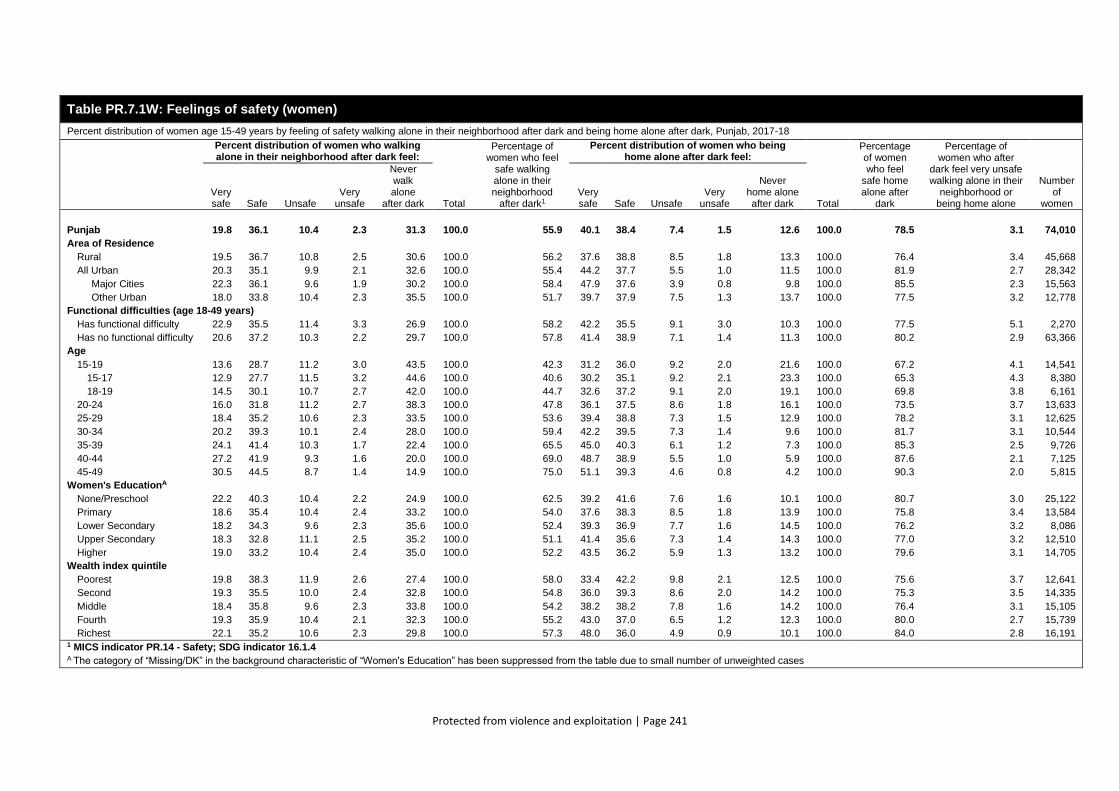
Protected from violence and exploitation | Page 241
Table PR.7.1W: Feelings of safety (women)
Percent distribution of women age 15-49 years by feeling of safety walking alone in their neighborhood after dark and being home alone after dark, Punjab, 2017-18
Percent distribution of women who walking alone in their neighborhood after dark feel:
Total
Percentage of women who feel
safe walking alone in their neighborhood
after dark1
Percent distribution of women who being home alone after dark feel:
Total
Percentage of women who feel
safe home alone after
dark
Percentage of women who after
dark feel very unsafe walking alone in their
neighborhood or being home alone
Number of
women Very safe Safe Unsafe
Very unsafe
Never walk alone
after dark Very safe Safe Unsafe
Very unsafe
Never home alone after dark
Punjab 19.8 36.1 10.4 2.3 31.3 100.0 55.9 40.1 38.4 7.4 1.5 12.6 100.0 78.5 3.1 74,010
Area of Residence
Rural 19.5 36.7 10.8 2.5 30.6 100.0 56.2 37.6 38.8 8.5 1.8 13.3 100.0 76.4 3.4 45,668
All Urban 20.3 35.1 9.9 2.1 32.6 100.0 55.4 44.2 37.7 5.5 1.0 11.5 100.0 81.9 2.7 28,342
Major Cities 22.3 36.1 9.6 1.9 30.2 100.0 58.4 47.9 37.6 3.9 0.8 9.8 100.0 85.5 2.3 15,563
Other Urban 18.0 33.8 10.4 2.3 35.5 100.0 51.7 39.7 37.9 7.5 1.3 13.7 100.0 77.5 3.2 12,778
Functional difficulties (age 18-49 years)
Has functional difficulty 22.9 35.5 11.4 3.3 26.9 100.0 58.2 42.2 35.5 9.1 3.0 10.3 100.0 77.5 5.1 2,270
Has no functional difficulty 20.6 37.2 10.3 2.2 29.7 100.0 57.8 41.4 38.9 7.1 1.4 11.3 100.0 80.2 2.9 63,366
Age
15-19 13.6 28.7 11.2 3.0 43.5 100.0 42.3 31.2 36.0 9.2 2.0 21.6 100.0 67.2 4.1 14,541
15-17 12.9 27.7 11.5 3.2 44.6 100.0 40.6 30.2 35.1 9.2 2.1 23.3 100.0 65.3 4.3 8,380
18-19 14.5 30.1 10.7 2.7 42.0 100.0 44.7 32.6 37.2 9.1 2.0 19.1 100.0 69.8 3.8 6,161
20-24 16.0 31.8 11.2 2.7 38.3 100.0 47.8 36.1 37.5 8.6 1.8 16.1 100.0 73.5 3.7 13,633
25-29 18.4 35.2 10.6 2.3 33.5 100.0 53.6 39.4 38.8 7.3 1.5 12.9 100.0 78.2 3.1 12,625
30-34 20.2 39.3 10.1 2.4 28.0 100.0 59.4 42.2 39.5 7.3 1.4 9.6 100.0 81.7 3.1 10,544
35-39 24.1 41.4 10.3 1.7 22.4 100.0 65.5 45.0 40.3 6.1 1.2 7.3 100.0 85.3 2.5 9,726
40-44 27.2 41.9 9.3 1.6 20.0 100.0 69.0 48.7 38.9 5.5 1.0 5.9 100.0 87.6 2.1 7,125
45-49 30.5 44.5 8.7 1.4 14.9 100.0 75.0 51.1 39.3 4.6 0.8 4.2 100.0 90.3 2.0 5,815
Women's EducationA
None/Preschool 22.2 40.3 10.4 2.2 24.9 100.0 62.5 39.2 41.6 7.6 1.6 10.1 100.0 80.7 3.0 25,122
Primary 18.6 35.4 10.4 2.4 33.2 100.0 54.0 37.6 38.3 8.5 1.8 13.9 100.0 75.8 3.4 13,584
Lower Secondary 18.2 34.3 9.6 2.3 35.6 100.0 52.4 39.3 36.9 7.7 1.6 14.5 100.0 76.2 3.2 8,086
Upper Secondary 18.3 32.8 11.1 2.5 35.2 100.0 51.1 41.4 35.6 7.3 1.4 14.3 100.0 77.0 3.2 12,510
Higher 19.0 33.2 10.4 2.4 35.0 100.0 52.2 43.5 36.2 5.9 1.3 13.2 100.0 79.6 3.1 14,705
Wealth index quintile
Poorest 19.8 38.3 11.9 2.6 27.4 100.0 58.0 33.4 42.2 9.8 2.1 12.5 100.0 75.6 3.7 12,641
Second 19.3 35.5 10.0 2.4 32.8 100.0 54.8 36.0 39.3 8.6 2.0 14.2 100.0 75.3 3.5 14,335
Middle 18.4 35.8 9.6 2.3 33.8 100.0 54.2 38.2 38.2 7.8 1.6 14.2 100.0 76.4 3.1 15,105
Fourth 19.3 35.9 10.4 2.1 32.3 100.0 55.2 43.0 37.0 6.5 1.2 12.3 100.0 80.0 2.7 15,739
Richest 22.1 35.2 10.6 2.3 29.8 100.0 57.3 48.0 36.0 4.9 0.9 10.1 100.0 84.0 2.8 16,191 1 MICS indicator PR.14 - Safety; SDG indicator 16.1.4 A The category of “Missing/DK” in the background characteristic of “Women's Education” has been suppressed from the table due to small number of unweighted cases
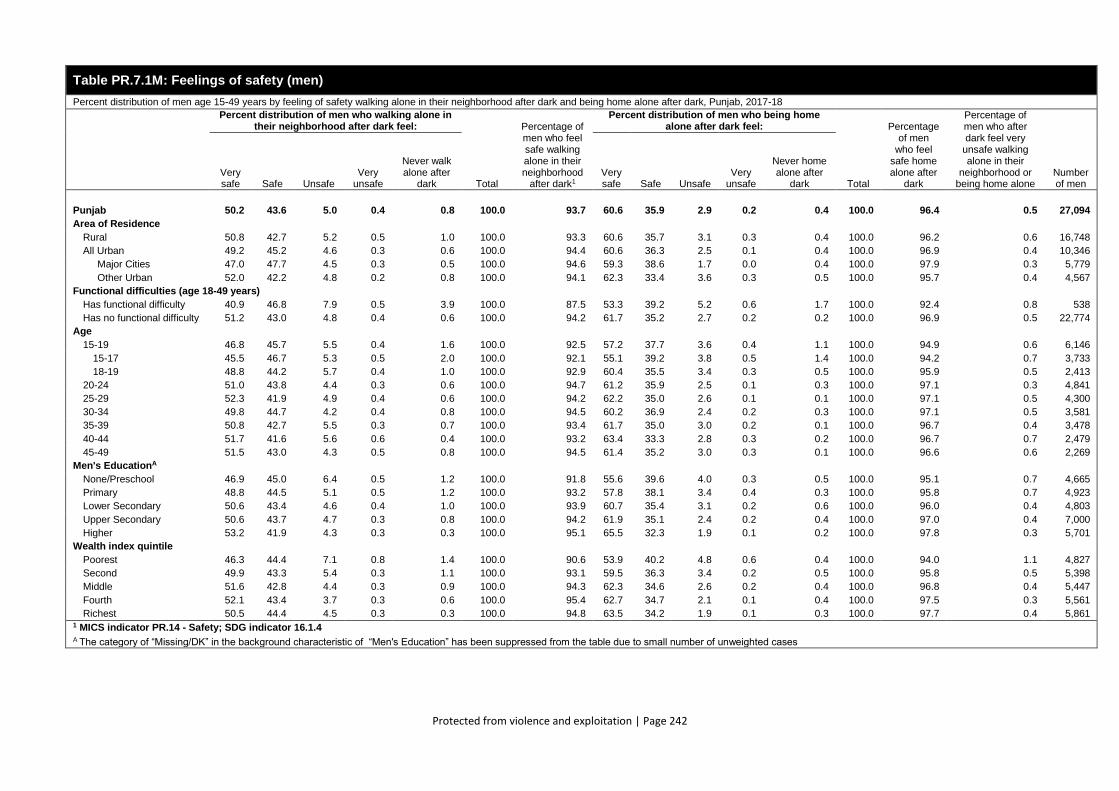
Protected from violence and exploitation | Page 242
Table PR.7.1M: Feelings of safety (men)
Percent distribution of men age 15-49 years by feeling of safety walking alone in their neighborhood after dark and being home alone after dark, Punjab, 2017-18
Percent distribution of men who walking alone in their neighborhood after dark feel:
Total
Percentage of men who feel safe walking alone in their neighborhood
after dark1
Percent distribution of men who being home alone after dark feel:
Total
Percentage of men
who feel safe home alone after
dark
Percentage of men who after dark feel very
unsafe walking alone in their
neighborhood or being home alone
Number of men
Very safe Safe Unsafe
Very unsafe
Never walk alone after
dark Very safe Safe Unsafe
Very unsafe
Never home alone after
dark
Punjab 50.2 43.6 5.0 0.4 0.8 100.0 93.7 60.6 35.9 2.9 0.2 0.4 100.0 96.4 0.5 27,094
Area of Residence
Rural 50.8 42.7 5.2 0.5 1.0 100.0 93.3 60.6 35.7 3.1 0.3 0.4 100.0 96.2 0.6 16,748
All Urban 49.2 45.2 4.6 0.3 0.6 100.0 94.4 60.6 36.3 2.5 0.1 0.4 100.0 96.9 0.4 10,346
Major Cities 47.0 47.7 4.5 0.3 0.5 100.0 94.6 59.3 38.6 1.7 0.0 0.4 100.0 97.9 0.3 5,779
Other Urban 52.0 42.2 4.8 0.2 0.8 100.0 94.1 62.3 33.4 3.6 0.3 0.5 100.0 95.7 0.4 4,567
Functional difficulties (age 18-49 years)
Has functional difficulty 40.9 46.8 7.9 0.5 3.9 100.0 87.5 53.3 39.2 5.2 0.6 1.7 100.0 92.4 0.8 538
Has no functional difficulty 51.2 43.0 4.8 0.4 0.6 100.0 94.2 61.7 35.2 2.7 0.2 0.2 100.0 96.9 0.5 22,774
Age
15-19 46.8 45.7 5.5 0.4 1.6 100.0 92.5 57.2 37.7 3.6 0.4 1.1 100.0 94.9 0.6 6,146
15-17 45.5 46.7 5.3 0.5 2.0 100.0 92.1 55.1 39.2 3.8 0.5 1.4 100.0 94.2 0.7 3,733
18-19 48.8 44.2 5.7 0.4 1.0 100.0 92.9 60.4 35.5 3.4 0.3 0.5 100.0 95.9 0.5 2,413
20-24 51.0 43.8 4.4 0.3 0.6 100.0 94.7 61.2 35.9 2.5 0.1 0.3 100.0 97.1 0.3 4,841
25-29 52.3 41.9 4.9 0.4 0.6 100.0 94.2 62.2 35.0 2.6 0.1 0.1 100.0 97.1 0.5 4,300
30-34 49.8 44.7 4.2 0.4 0.8 100.0 94.5 60.2 36.9 2.4 0.2 0.3 100.0 97.1 0.5 3,581
35-39 50.8 42.7 5.5 0.3 0.7 100.0 93.4 61.7 35.0 3.0 0.2 0.1 100.0 96.7 0.4 3,478
40-44 51.7 41.6 5.6 0.6 0.4 100.0 93.2 63.4 33.3 2.8 0.3 0.2 100.0 96.7 0.7 2,479
45-49 51.5 43.0 4.3 0.5 0.8 100.0 94.5 61.4 35.2 3.0 0.3 0.1 100.0 96.6 0.6 2,269
Men's EducationA
None/Preschool 46.9 45.0 6.4 0.5 1.2 100.0 91.8 55.6 39.6 4.0 0.3 0.5 100.0 95.1 0.7 4,665
Primary 48.8 44.5 5.1 0.5 1.2 100.0 93.2 57.8 38.1 3.4 0.4 0.3 100.0 95.8 0.7 4,923
Lower Secondary 50.6 43.4 4.6 0.4 1.0 100.0 93.9 60.7 35.4 3.1 0.2 0.6 100.0 96.0 0.4 4,803
Upper Secondary 50.6 43.7 4.7 0.3 0.8 100.0 94.2 61.9 35.1 2.4 0.2 0.4 100.0 97.0 0.4 7,000
Higher 53.2 41.9 4.3 0.3 0.3 100.0 95.1 65.5 32.3 1.9 0.1 0.2 100.0 97.8 0.3 5,701
Wealth index quintile
Poorest 46.3 44.4 7.1 0.8 1.4 100.0 90.6 53.9 40.2 4.8 0.6 0.4 100.0 94.0 1.1 4,827
Second 49.9 43.3 5.4 0.3 1.1 100.0 93.1 59.5 36.3 3.4 0.2 0.5 100.0 95.8 0.5 5,398
Middle 51.6 42.8 4.4 0.3 0.9 100.0 94.3 62.3 34.6 2.6 0.2 0.4 100.0 96.8 0.4 5,447
Fourth 52.1 43.4 3.7 0.3 0.6 100.0 95.4 62.7 34.7 2.1 0.1 0.4 100.0 97.5 0.3 5,561
Richest 50.5 44.4 4.5 0.3 0.3 100.0 94.8 63.5 34.2 1.9 0.1 0.3 100.0 97.7 0.4 5,861 1 MICS indicator PR.14 - Safety; SDG indicator 16.1.4 A The category of “Missing/DK” in the background characteristic of “Men's Education” has been suppressed from the table due to small number of unweighted cases
Protected from violence and exploitation | Page 243
PR.8 ATTITUDES TOWARDS DOMESTIC VIOLENCE
MICS Punjab, 2017-18 assessed the attitudes of women and men age 15-49 years towards wife beating
by asking the respondents whether they think that husbands are justified to hit or beat their wives in
a variety of situations. The purpose of these questions is to capture the social justification of violence
(in contexts where women have a lower status in society) as a disciplinary action when a woman does
not comply with certain expected gender roles. The responses to these questions can be found in
Table PR.8.1W for women and in Table PR.8.1M for men.
Table PR.8.1W: Attitudes toward domestic violence (women)
Percentage of women age 15-49 years who believe a husband is justified in beating his wife in various circumstances, Punjab, 2017-18
Percentage of women who believe a husband is justified in beating his wife:
Number of
women
If she goes out without
telling him
If she neglects
the children
If she argues
with him
If she refuses sex with
him
If she burns
the food
For any of these
five reasons1
Punjab 16.3 18.0 19.2 15.2 12.3 25.4 74,010
Area of Residence
Rural 20.8 22.8 24.4 19.4 16.4 31.6 45,668 All Urban 9.2 10.2 10.7 8.4 5.9 15.3 28,342
Major Cities 7.0 7.6 8.2 6.4 3.8 12.1 15,563 Other Urban 12.0 13.3 13.9 10.8 8.4 19.3 12,778
Functional difficulties (age 18-49 years) Has functional difficulty 22.2 23.7 25.1 20.7 16.0 33.8 2,270 Has no functional difficulty 16.9 18.6 19.8 16.0 12.8 26.1 63,366
Age
15-19 11.7 13.1 14.1 8.6 9.0 19.2 14,541 15-17 10.6 12.0 12.7 7.3 7.9 17.6 8,380 18-19 13.1 14.6 16.0 10.4 10.5 21.4 6,161
20-24 14.1 15.6 16.5 11.9 10.6 22.5 13,633 25-29 16.0 18.0 18.8 15.5 12.1 25.4 12,625 30-34 18.1 19.9 21.0 17.8 13.6 27.7 10,544 35-39 20.1 21.7 23.3 19.9 15.0 30.0 9,726 40-44 20.2 21.7 23.5 19.9 15.0 29.9 7,125 45-49 19.6 21.6 23.3 20.0 15.0 29.6 5,815
Marital status
Currently married 19.0 20.9 22.3 18.9 14.4 29.0 47,030 Formerly married 20.6 21.4 23.1 20.8 15.4 30.4 2,359 Never married 10.8 12.1 12.7 7.4 8.1 18.0 24,621
Women's EducationA
None/Preschool 25.8 28.3 30.3 25.6 21.3 37.0 25,122 Primary 19.5 21.4 22.6 17.5 14.6 30.1 13,584 Lower Secondary 12.3 13.9 15.1 10.5 8.3 21.2 8,086 Upper Secondary 9.4 10.2 10.8 7.5 5.5 16.5 12,510 Higher 5.4 6.2 6.4 4.3 3.0 10.8 14,705
Wealth index quintile
Poorest 29.4 32.5 34.5 29.2 25.3 41.5 12,641 Second 23.0 25.6 27.0 21.6 18.3 34.4 14,335 Middle 16.2 17.7 19.1 14.4 11.7 26.0 15,105 Fourth 11.0 11.6 12.7 9.4 6.6 18.5 15,739 Richest 5.6 6.4 6.6 4.9 3.2 10.8 16,191
1 MICS indicator PR.15 - Attitudes towards domestic violence A The category of “Missing/DK” in the background characteristic of “Women's Education” has been suppressed from the table due to small number of unweighted cases
Protected from violence and exploitation | Page 244
Table PR.8.1M: Attitudes toward domestic violence (men)
Percentage of men age 15-49 years who believe a husband is justified in beating his wife in various circumstances, Punjab, 2017-18
Percentage of men who believe a husband is justified in beating his wife:
Number of men
If she goes out without telling him
If she neglects the
children
If she argues
with him
If she refuses
sex with him
If she burns the
food
For any of these
five reasons1
Punjab 14.7 15.2 16.6 10.6 7.5 23.6 27,094
Area of Residence
Rural 17.8 18.1 19.8 13.0 9.2 27.7 16,748
All Urban 9.6 10.3 11.3 6.7 4.6 17.0 10,346
Major Cities 9.0 9.9 10.3 6.4 4.4 15.0 5,779
Other Urban 10.5 10.9 12.6 7.0 4.8 19.5 4,567
Functional difficulties (age 18-49 years)
Has functional difficulty 17.4 18.0 18.6 12.7 10.2 27.6 538
Has no functional difficulty 15.3 15.7 17.1 11.2 7.6 24.3 22,774
Age
15-19 11.4 12.2 13.7 7.3 6.2 19.5 6,146
15-17 11.0 11.7 13.1 6.7 6.0 18.7 3,733
18-19 12.0 13.0 14.6 8.2 6.4 20.7 2,413
20-24 13.8 14.7 16.0 10.5 7.0 22.9 4,841
25-29 15.2 15.0 16.8 11.2 7.8 24.3 4,300
30-34 15.8 15.9 17.8 11.1 8.3 25.3 3,581
35-39 17.3 17.4 18.3 13.1 8.2 26.4 3,478
40-44 16.9 17.4 17.5 12.3 7.6 25.7 2,479
45-49 16.8 17.5 19.3 11.9 8.8 25.8 2,269
Marital statusA
Currently married 16.9 17.1 18.3 12.3 8.3 26.2 14,111
Formerly married 28.0 26.3 29.3 21.4 13.8 37.5 287
Never married 12.0 12.8 14.3 8.5 6.4 20.5 12,684
Men's EducationB
None/Preschool 24.8 25.6 26.7 19.8 14.2 35.2 4,665
Primary 18.4 18.8 20.5 13.0 9.7 28.6 4,923
Lower Secondary 14.9 15.4 17.2 10.1 7.3 24.1 4,803
Upper Secondary 11.4 11.6 13.4 8.1 5.5 20.2 7,000
Higher 7.2 7.7 8.3 4.5 2.4 13.6 5,701
Wealth index quintile
Poorest 25.9 25.8 27.8 19.8 14.3 37.5 4,827
Second 18.3 18.6 19.8 12.7 9.8 27.7 5,398
Middle 14.5 14.5 16.4 9.9 7.0 23.9 5,447
Fourth 10.0 11.0 11.8 7.0 4.3 17.9 5,561
Richest 6.9 7.9 9.0 5.0 3.2 13.6 5,861 1 MICS indicator PR.15 - Attitudes towards domestic violence A The category of “Missing” in the background characteristic of “Marital status” has been suppressed from the table due to small number of unweighted cases
B The category of “Missing/DK” in the background characteristic of “Men's Education” has been suppressed from the table due to small number of unweighted cases
Live in Safe and Clean Environment | Page 245
10. LIVE IN A SAFE AND CLEAN ENVIRONMENT
WS.1 DRINKING WATER
Access to safe drinking water, sanitation and hygiene (WASH) is essential for good health, welfare and
productivity and is widely recognised as a human right132. Inadequate WASH is primarily responsible
for the transmission of diseases such as cholera, diarrhoea, dysentery, hepatitis A, typhoid and polio.
Diarrhoeal diseases exacerbate malnutrition and remain a leading global cause of child deaths.
Drinking water may be contaminated with human or animal faeces containing pathogens, or with
chemical and physical contaminants with harmful effects on child health and development. While
improving water quality is critical to prevent disease, improving the accessibility and availability of
drinking water is equally important, particularly for women and girls who usually bear the primary
responsibility for carrying water, often for long distances.133
The SDG targets relating to drinking water are much more ambitious than the MDGs and variously aim
to achieve universal access to basic services (SDG 1.4) and universal access to safely managed services
(SDG 6.1). For more information on global targets and indicators please visit the website of the
WHO/UNICEF Joint Monitoring Programme for Water Supply, Sanitation and Hygiene.134
The distribution of the population by main source of drinking water is shown in Table WS.1.1. The
population using improved sources of drinking water are those using any of the following types of
supply: piped water (into dwelling, compound, yard or plot, to neighbour, public tap/standpipe), tube
well/borehole, protected dug well, protected spring, rainwater collection, and packaged or delivered
water135.
Table WS 1.2 shows the amount of time taken per round trip to collect water for users of improved
and unimproved sources. Household members using improved water sources located on premises or
requiring up to and including 30 minutes per trip for water collection meet the SDG criteria for a ‘basic’
drinking water service.
Table WS.1.3 presents the sex and age of the household member usually responsible for water
collection among household members without water sources on premises. Table WS 1.4 shows the
average time spent each day by the household member mainly responsible for collecting drinking
water.
Table WS.1.5 shows the proportion of household members with sufficient water available when
needed from their main source of drinking water and the main reasons household members are
unable to access water in sufficient quantities when needed.
Table WS.1.6 presents the proportion of household members with an indicator of faecal
contamination detected in their drinking water source. The risk of faecal contamination is shown
132 The human rights to water and sanitation were explicitly recognised by the UN General Assembly and Human Rights
Council in 2010 and in 2015. 133 WHO, and UNICEF. Safely Managed Drinking Water: thematic report on drinking water. Geneva: WHO Press, 2017.
https://data.unicef.org/wp-content/uploads/2017/03/safely-managed-drinking-water-JMP-2017-1.pdf. 134 "Home." JMP. Accessed September 06, 2018. https://washdata.org/. 135 Packaged water (bottled water and sachet water) and delivered water (tanker truck and cart with small drum/tank) are
treated as improved based in new SDG definition.
Live in Safe and Clean Environment | Page 246
based on the number of Escherichia coli (E. coli) bacteria detected, ranging from low (<1 E. coli per
100 mL), to moderate (1-10 E. coli per 100 mL), high (11-100 E. coli per 100 mL) and very high risk
(>100 E. coli per 100 mL). Table WS.1.7 shows the proportion of household members with E. coli
detected in their household drinking water. Contamination may occur between the source and the
household during transport, handling and storage.
Table WS.1.8 shows the proportion of household population with improved and unimproved drinking
water sources located on premises, available when needed, and free from contamination. Households
with improved sources accessible on premises, with sufficient quantities of water available when
needed, and free from contamination meet the SDG criteria for ‘safely managed’ drinking water
services.
Table WS.1.9 presents the main methods by which households report treating water in order to make
it safer to drink. Boiling water, adding bleach or chlorine, using a water filter and using solar
disinfection are considered appropriate methods of water.
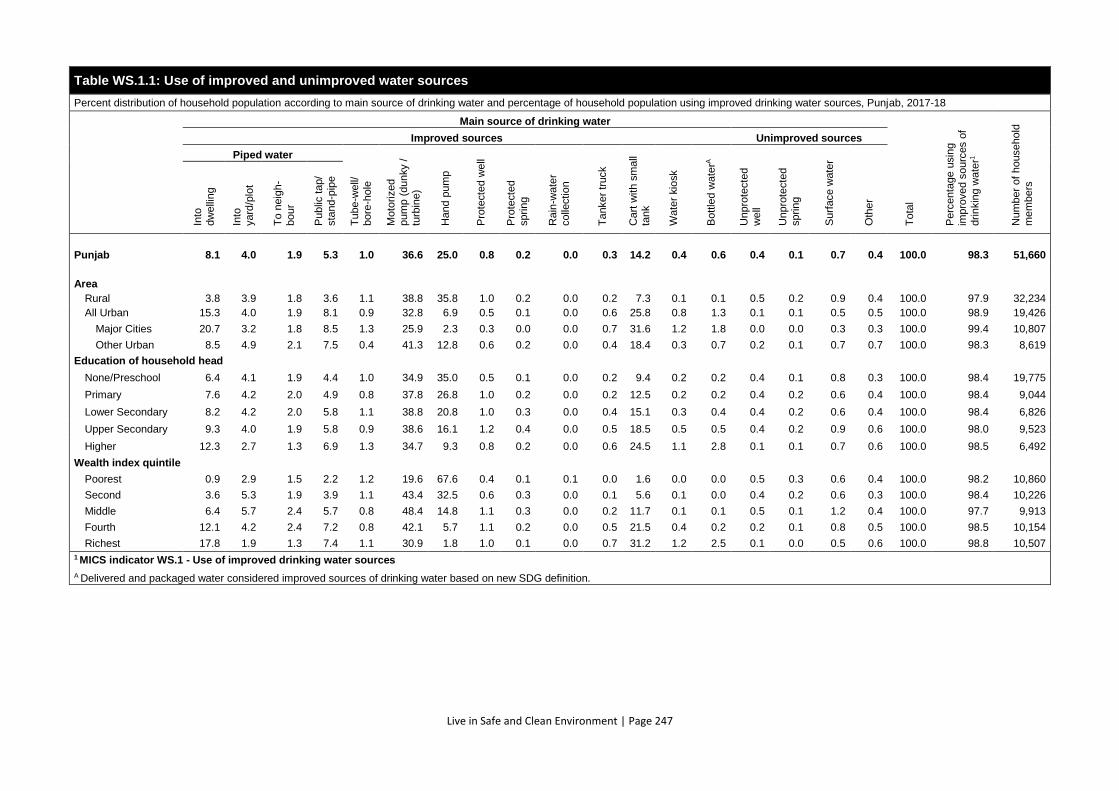
Live in Safe and Clean Environment | Page 247
Table WS.1.1: Use of improved and unimproved water sources
Percent distribution of household population according to main source of drinking water and percentage of household population using improved drinking water sources, Punjab, 2017-18
Main source of drinking water
To
tal
Perc
enta
ge u
sin
g
impro
ved s
ourc
es o
f
drin
kin
g w
ate
r1
Num
ber
of
household
me
mb
ers
Improved sources Unimproved sources
Piped water
Tu
be-w
ell/
bore
-hole
Mo
torized
pum
p (
dunky /
turb
ine)
Hand p
um
p
Pro
tecte
d w
ell
Pro
tecte
d
sprin
g
Rain
-wate
r
colle
ctio
n
Ta
nker
truck
Cart
with s
ma
ll ta
nk
Wate
r kio
sk
Bottle
d w
ate
rA
Unpro
tecte
d
well
Unpro
tecte
d
sprin
g
Surf
ace w
ate
r
Oth
er
Into
dw
elli
ng
Into
yard
/plo
t
To
neig
h-
bour
Public
tap/
sta
nd-p
ipe
Punjab 8.1 4.0 1.9 5.3 1.0 36.6 25.0 0.8 0.2 0.0 0.3 14.2 0.4 0.6 0.4 0.1 0.7 0.4 100.0 98.3 51,660
Area
Rural 3.8 3.9 1.8 3.6 1.1 38.8 35.8 1.0 0.2 0.0 0.2 7.3 0.1 0.1 0.5 0.2 0.9 0.4 100.0 97.9 32,234
All Urban 15.3 4.0 1.9 8.1 0.9 32.8 6.9 0.5 0.1 0.0 0.6 25.8 0.8 1.3 0.1 0.1 0.5 0.5 100.0 98.9 19,426
Major Cities 20.7 3.2 1.8 8.5 1.3 25.9 2.3 0.3 0.0 0.0 0.7 31.6 1.2 1.8 0.0 0.0 0.3 0.3 100.0 99.4 10,807
Other Urban 8.5 4.9 2.1 7.5 0.4 41.3 12.8 0.6 0.2 0.0 0.4 18.4 0.3 0.7 0.2 0.1 0.7 0.7 100.0 98.3 8,619
Education of household head
None/Preschool 6.4 4.1 1.9 4.4 1.0 34.9 35.0 0.5 0.1 0.0 0.2 9.4 0.2 0.2 0.4 0.1 0.8 0.3 100.0 98.4 19,775
Primary 7.6 4.2 2.0 4.9 0.8 37.8 26.8 1.0 0.2 0.0 0.2 12.5 0.2 0.2 0.4 0.2 0.6 0.4 100.0 98.4 9,044
Lower Secondary 8.2 4.2 2.0 5.8 1.1 38.8 20.8 1.0 0.3 0.0 0.4 15.1 0.3 0.4 0.4 0.2 0.6 0.4 100.0 98.4 6,826
Upper Secondary 9.3 4.0 1.9 5.8 0.9 38.6 16.1 1.2 0.4 0.0 0.5 18.5 0.5 0.5 0.4 0.2 0.9 0.6 100.0 98.0 9,523
Higher 12.3 2.7 1.3 6.9 1.3 34.7 9.3 0.8 0.2 0.0 0.6 24.5 1.1 2.8 0.1 0.1 0.7 0.6 100.0 98.5 6,492
Wealth index quintile
Poorest 0.9 2.9 1.5 2.2 1.2 19.6 67.6 0.4 0.1 0.1 0.0 1.6 0.0 0.0 0.5 0.3 0.6 0.4 100.0 98.2 10,860
Second 3.6 5.3 1.9 3.9 1.1 43.4 32.5 0.6 0.3 0.0 0.1 5.6 0.1 0.0 0.4 0.2 0.6 0.3 100.0 98.4 10,226
Middle 6.4 5.7 2.4 5.7 0.8 48.4 14.8 1.1 0.3 0.0 0.2 11.7 0.1 0.1 0.5 0.1 1.2 0.4 100.0 97.7 9,913
Fourth 12.1 4.2 2.4 7.2 0.8 42.1 5.7 1.1 0.2 0.0 0.5 21.5 0.4 0.2 0.2 0.1 0.8 0.5 100.0 98.5 10,154
Richest 17.8 1.9 1.3 7.4 1.1 30.9 1.8 1.0 0.1 0.0 0.7 31.2 1.2 2.5 0.1 0.0 0.5 0.6 100.0 98.8 10,507
1 MICS indicator WS.1 - Use of improved drinking water sources
A Delivered and packaged water considered improved sources of drinking water based on new SDG definition.
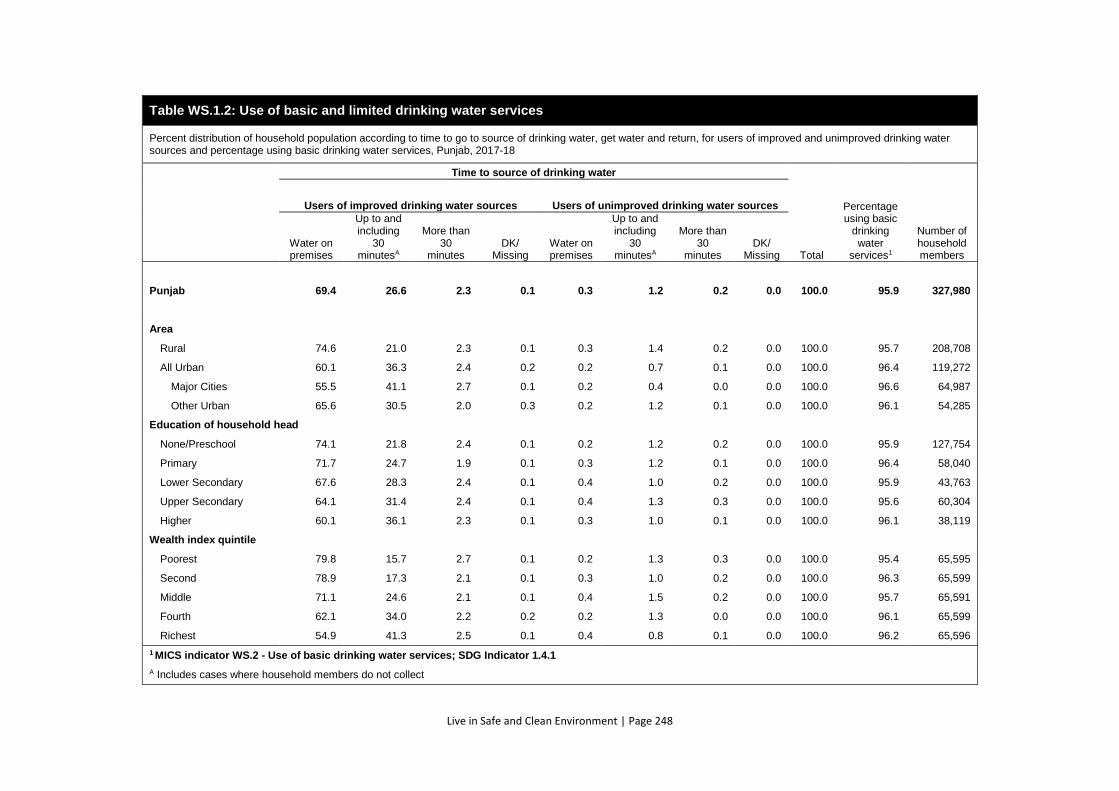
Live in Safe and Clean Environment | Page 248
Table WS.1.2: Use of basic and limited drinking water services
Percent distribution of household population according to time to go to source of drinking water, get water and return, for users of improved and unimproved drinking water sources and percentage using basic drinking water services, Punjab, 2017-18
Time to source of drinking water
Total
Percentage using basic
drinking water
services1
Number of household members
Users of improved drinking water sources Users of unimproved drinking water sources
Water on premises
Up to and including
30 minutesA
More than 30
minutes DK/
Missing Water on premises
Up to and including
30 minutesA
More than 30
minutes DK/
Missing
Punjab 69.4 26.6 2.3 0.1 0.3 1.2 0.2 0.0 100.0 95.9 327,980
Area
Rural 74.6 21.0 2.3 0.1 0.3 1.4 0.2 0.0 100.0 95.7 208,708
All Urban 60.1 36.3 2.4 0.2 0.2 0.7 0.1 0.0 100.0 96.4 119,272
Major Cities 55.5 41.1 2.7 0.1 0.2 0.4 0.0 0.0 100.0 96.6 64,987
Other Urban 65.6 30.5 2.0 0.3 0.2 1.2 0.1 0.0 100.0 96.1 54,285
Education of household head
None/Preschool 74.1 21.8 2.4 0.1 0.2 1.2 0.2 0.0 100.0 95.9 127,754
Primary 71.7 24.7 1.9 0.1 0.3 1.2 0.1 0.0 100.0 96.4 58,040
Lower Secondary 67.6 28.3 2.4 0.1 0.4 1.0 0.2 0.0 100.0 95.9 43,763
Upper Secondary 64.1 31.4 2.4 0.1 0.4 1.3 0.3 0.0 100.0 95.6 60,304
Higher 60.1 36.1 2.3 0.1 0.3 1.0 0.1 0.0 100.0 96.1 38,119
Wealth index quintile
Poorest 79.8 15.7 2.7 0.1 0.2 1.3 0.3 0.0 100.0 95.4 65,595
Second 78.9 17.3 2.1 0.1 0.3 1.0 0.2 0.0 100.0 96.3 65,599
Middle 71.1 24.6 2.1 0.1 0.4 1.5 0.2 0.0 100.0 95.7 65,591
Fourth 62.1 34.0 2.2 0.2 0.2 1.3 0.0 0.0 100.0 96.1 65,599
Richest 54.9 41.3 2.5 0.1 0.4 0.8 0.1 0.0 100.0 96.2 65,596
1 MICS indicator WS.2 - Use of basic drinking water services; SDG Indicator 1.4.1
A Includes cases where household members do not collect
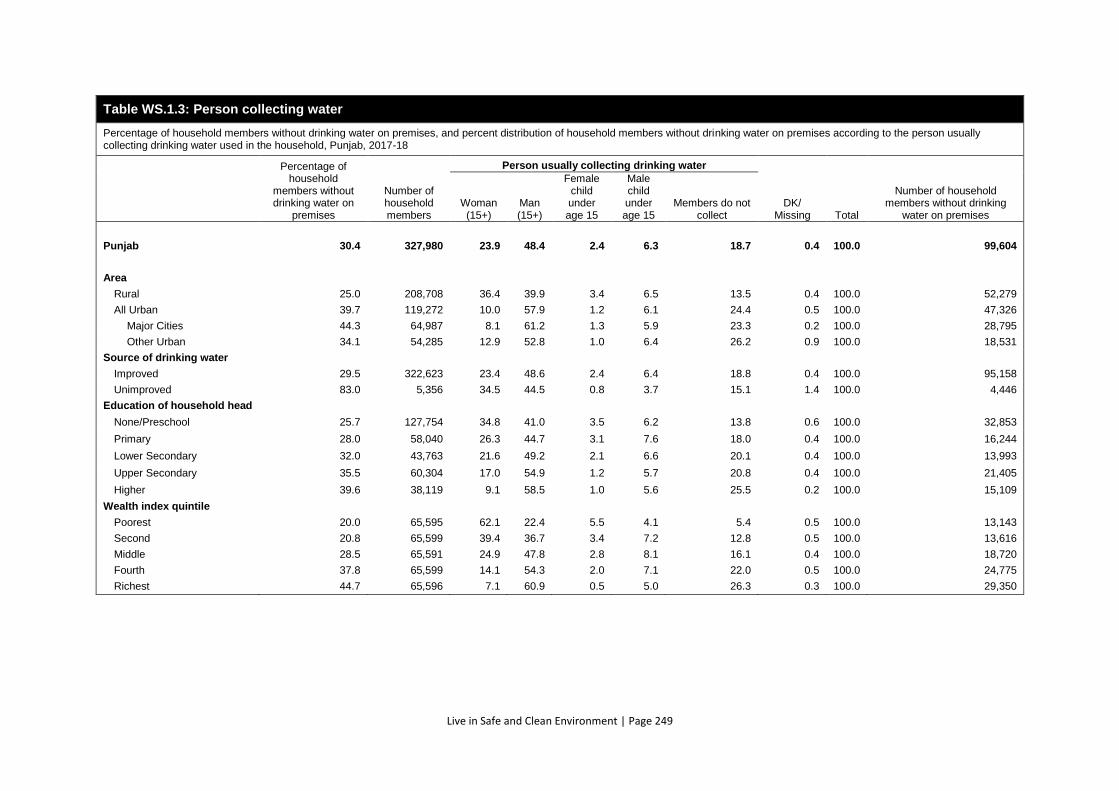
Live in Safe and Clean Environment | Page 249
Table WS.1.3: Person collecting water
Percentage of household members without drinking water on premises, and percent distribution of household members without drinking water on premises according to the person usually collecting drinking water used in the household, Punjab, 2017-18
Percentage of household
members without drinking water on
premises
Number of household members
Person usually collecting drinking water
DK/ Missing Total
Number of household members without drinking
water on premises Woman (15+)
Man (15+)
Female child under age 15
Male child under age 15
Members do not
collect
Punjab 30.4 327,980 23.9 48.4 2.4 6.3 18.7 0.4 100.0 99,604
Area
Rural 25.0 208,708 36.4 39.9 3.4 6.5 13.5 0.4 100.0 52,279
All Urban 39.7 119,272 10.0 57.9 1.2 6.1 24.4 0.5 100.0 47,326
Major Cities 44.3 64,987 8.1 61.2 1.3 5.9 23.3 0.2 100.0 28,795
Other Urban 34.1 54,285 12.9 52.8 1.0 6.4 26.2 0.9 100.0 18,531
Source of drinking water
Improved 29.5 322,623 23.4 48.6 2.4 6.4 18.8 0.4 100.0 95,158
Unimproved 83.0 5,356 34.5 44.5 0.8 3.7 15.1 1.4 100.0 4,446
Education of household head
None/Preschool 25.7 127,754 34.8 41.0 3.5 6.2 13.8 0.6 100.0 32,853
Primary 28.0 58,040 26.3 44.7 3.1 7.6 18.0 0.4 100.0 16,244
Lower Secondary 32.0 43,763 21.6 49.2 2.1 6.6 20.1 0.4 100.0 13,993
Upper Secondary 35.5 60,304 17.0 54.9 1.2 5.7 20.8 0.4 100.0 21,405
Higher 39.6 38,119 9.1 58.5 1.0 5.6 25.5 0.2 100.0 15,109
Wealth index quintile
Poorest 20.0 65,595 62.1 22.4 5.5 4.1 5.4 0.5 100.0 13,143
Second 20.8 65,599 39.4 36.7 3.4 7.2 12.8 0.5 100.0 13,616
Middle 28.5 65,591 24.9 47.8 2.8 8.1 16.1 0.4 100.0 18,720
Fourth 37.8 65,599 14.1 54.3 2.0 7.1 22.0 0.5 100.0 24,775
Richest 44.7 65,596 7.1 60.9 0.5 5.0 26.3 0.3 100.0 29,350
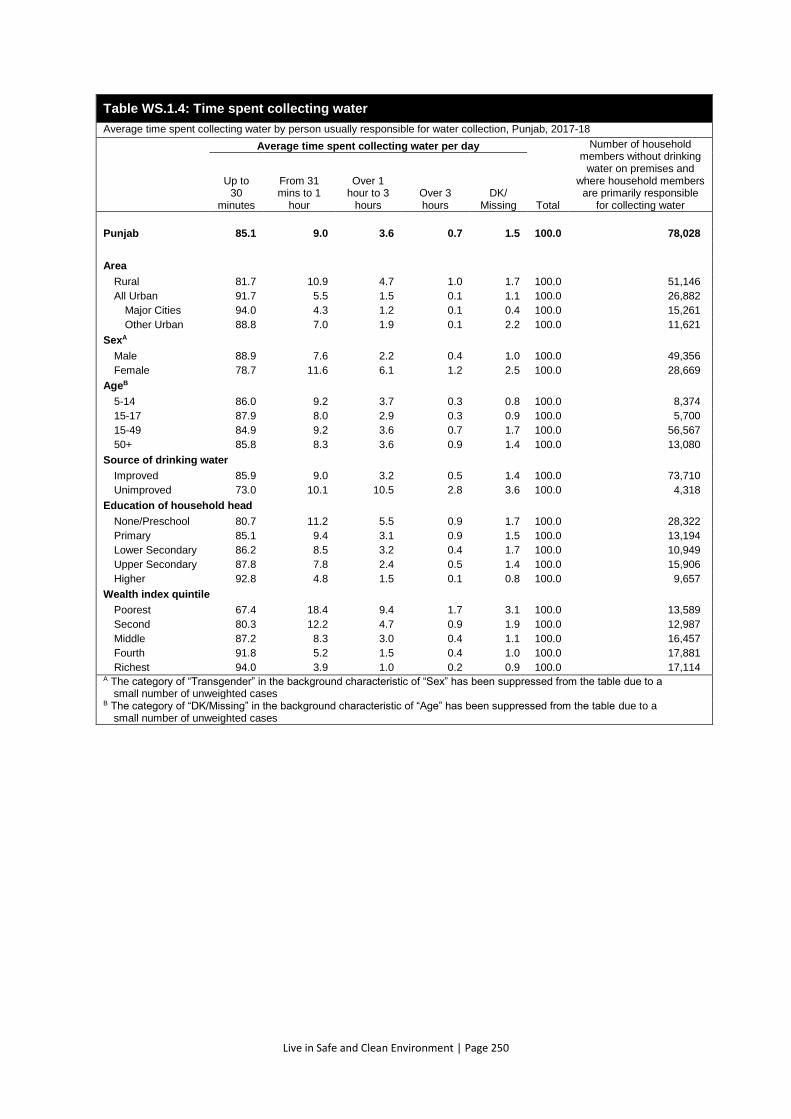
Live in Safe and Clean Environment | Page 250
Table WS.1.4: Time spent collecting water
Average time spent collecting water by person usually responsible for water collection, Punjab, 2017-18
Average time spent collecting water per day
Total
Number of household members without drinking
water on premises and where household members
are primarily responsible for collecting water
Up to 30
minutes
From 31 mins to 1
hour
Over 1 hour to 3
hours Over 3 hours
DK/ Missing
Punjab 85.1 9.0 3.6 0.7 1.5 100.0 78,028
Area
Rural 81.7 10.9 4.7 1.0 1.7 100.0 51,146
All Urban 91.7 5.5 1.5 0.1 1.1 100.0 26,882
Major Cities 94.0 4.3 1.2 0.1 0.4 100.0 15,261
Other Urban 88.8 7.0 1.9 0.1 2.2 100.0 11,621
SexA
Male 88.9 7.6 2.2 0.4 1.0 100.0 49,356
Female 78.7 11.6 6.1 1.2 2.5 100.0 28,669
AgeB
5-14 86.0 9.2 3.7 0.3 0.8 100.0 8,374
15-17 87.9 8.0 2.9 0.3 0.9 100.0 5,700
15-49 84.9 9.2 3.6 0.7 1.7 100.0 56,567
50+ 85.8 8.3 3.6 0.9 1.4 100.0 13,080
Source of drinking water
Improved 85.9 9.0 3.2 0.5 1.4 100.0 73,710
Unimproved 73.0 10.1 10.5 2.8 3.6 100.0 4,318
Education of household head
None/Preschool 80.7 11.2 5.5 0.9 1.7 100.0 28,322
Primary 85.1 9.4 3.1 0.9 1.5 100.0 13,194
Lower Secondary 86.2 8.5 3.2 0.4 1.7 100.0 10,949
Upper Secondary 87.8 7.8 2.4 0.5 1.4 100.0 15,906
Higher 92.8 4.8 1.5 0.1 0.8 100.0 9,657
Wealth index quintile
Poorest 67.4 18.4 9.4 1.7 3.1 100.0 13,589
Second 80.3 12.2 4.7 0.9 1.9 100.0 12,987
Middle 87.2 8.3 3.0 0.4 1.1 100.0 16,457
Fourth 91.8 5.2 1.5 0.4 1.0 100.0 17,881
Richest 94.0 3.9 1.0 0.2 0.9 100.0 17,114 A The category of “Transgender” in the background characteristic of “Sex” has been suppressed from the table due to a
small number of unweighted cases B The category of “DK/Missing” in the background characteristic of “Age” has been suppressed from the table due to a
small number of unweighted cases
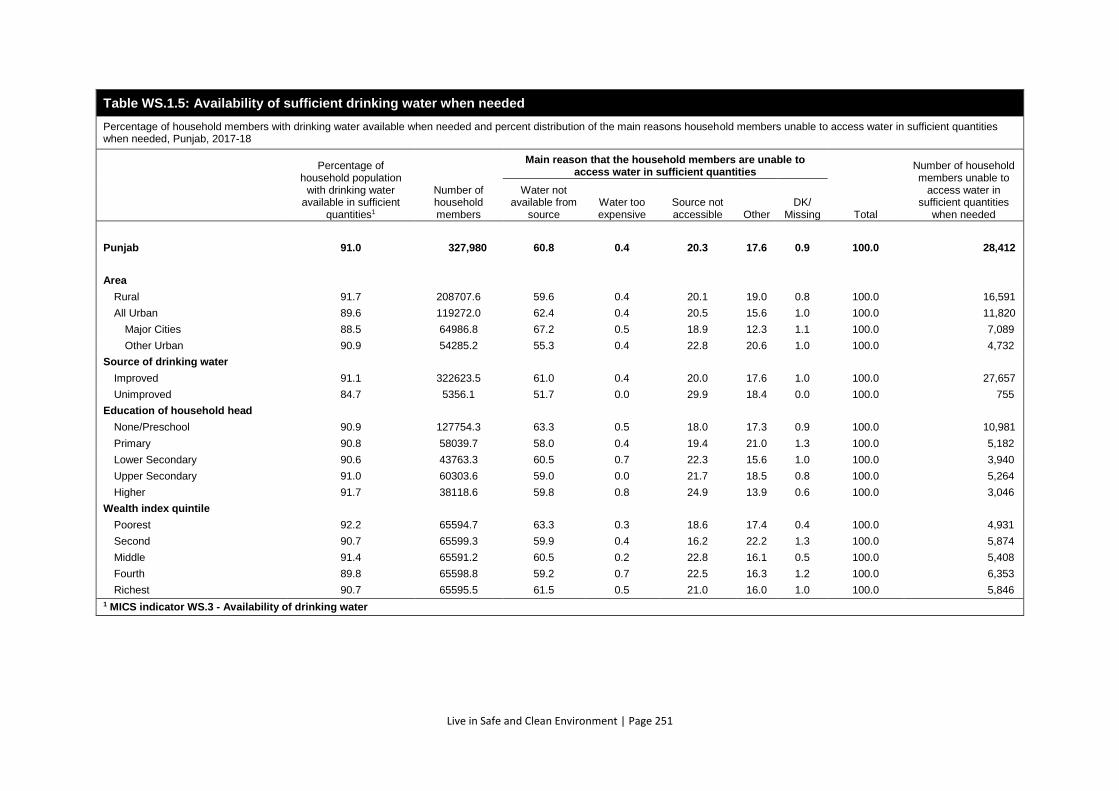
Live in Safe and Clean Environment | Page 251
Table WS.1.5: Availability of sufficient drinking water when needed
Percentage of household members with drinking water available when needed and percent distribution of the main reasons household members unable to access water in sufficient quantities when needed, Punjab, 2017-18
Percentage of household population
with drinking water available in sufficient
quantities1
Number of household members
Main reason that the household members are unable to access water in sufficient quantities
Total
Number of household members unable to
access water in sufficient quantities
when needed
Water not available from
source Water too expensive
Source not accessible Other
DK/ Missing
Punjab 91.0 327,980 60.8 0.4 20.3 17.6 0.9 100.0 28,412
Area
Rural 91.7 208707.6 59.6 0.4 20.1 19.0 0.8 100.0 16,591
All Urban 89.6 119272.0 62.4 0.4 20.5 15.6 1.0 100.0 11,820
Major Cities 88.5 64986.8 67.2 0.5 18.9 12.3 1.1 100.0 7,089
Other Urban 90.9 54285.2 55.3 0.4 22.8 20.6 1.0 100.0 4,732
Source of drinking water
Improved 91.1 322623.5 61.0 0.4 20.0 17.6 1.0 100.0 27,657
Unimproved 84.7 5356.1 51.7 0.0 29.9 18.4 0.0 100.0 755
Education of household head
None/Preschool 90.9 127754.3 63.3 0.5 18.0 17.3 0.9 100.0 10,981
Primary 90.8 58039.7 58.0 0.4 19.4 21.0 1.3 100.0 5,182
Lower Secondary 90.6 43763.3 60.5 0.7 22.3 15.6 1.0 100.0 3,940
Upper Secondary 91.0 60303.6 59.0 0.0 21.7 18.5 0.8 100.0 5,264
Higher 91.7 38118.6 59.8 0.8 24.9 13.9 0.6 100.0 3,046
Wealth index quintile
Poorest 92.2 65594.7 63.3 0.3 18.6 17.4 0.4 100.0 4,931
Second 90.7 65599.3 59.9 0.4 16.2 22.2 1.3 100.0 5,874
Middle 91.4 65591.2 60.5 0.2 22.8 16.1 0.5 100.0 5,408
Fourth 89.8 65598.8 59.2 0.7 22.5 16.3 1.2 100.0 6,353
Richest 90.7 65595.5 61.5 0.5 21.0 16.0 1.0 100.0 5,846
1 MICS indicator WS.3 - Availability of drinking water
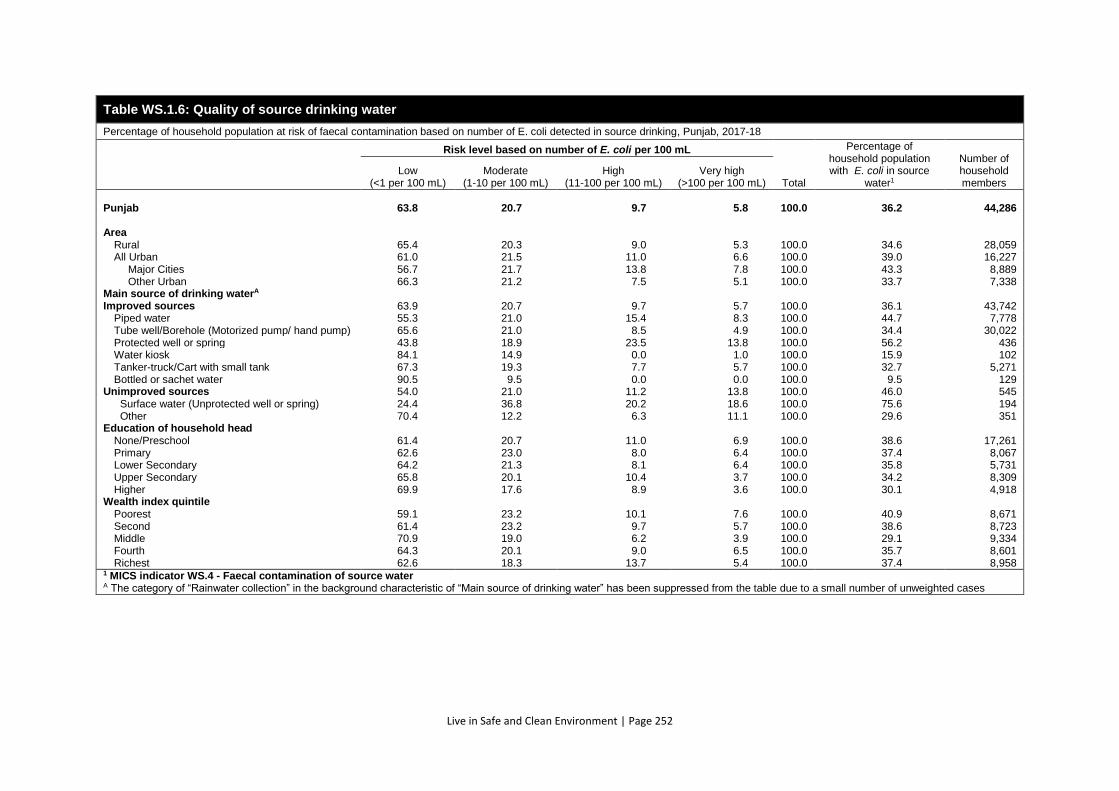
Live in Safe and Clean Environment | Page 252
Table WS.1.6: Quality of source drinking water
Percentage of household population at risk of faecal contamination based on number of E. coli detected in source drinking, Punjab, 2017-18
Risk level based on number of E. coli per 100 mL
Total
Percentage of household population with E. coli in source
water1
Number of household members
Low (<1 per 100 mL)
Moderate (1-10 per 100 mL)
High (11-100 per 100 mL)
Very high (>100 per 100 mL)
Punjab 63.8 20.7 9.7 5.8 100.0 36.2 44,286
Area
Rural 65.4 20.3 9.0 5.3 100.0 34.6 28,059 All Urban 61.0 21.5 11.0 6.6 100.0 39.0 16,227 Major Cities 56.7 21.7 13.8 7.8 100.0 43.3 8,889 Other Urban 66.3 21.2 7.5 5.1 100.0 33.7 7,338
Main source of drinking waterA
Improved sources 63.9 20.7 9.7 5.7 100.0 36.1 43,742 Piped water 55.3 21.0 15.4 8.3 100.0 44.7 7,778 Tube well/Borehole (Motorized pump/ hand pump) 65.6 21.0 8.5 4.9 100.0 34.4 30,022 Protected well or spring 43.8 18.9 23.5 13.8 100.0 56.2 436 Water kiosk 84.1 14.9 0.0 1.0 100.0 15.9 102 Tanker-truck/Cart with small tank 67.3 19.3 7.7 5.7 100.0 32.7 5,271 Bottled or sachet water 90.5 9.5 0.0 0.0 100.0 9.5 129
Unimproved sources 54.0 21.0 11.2 13.8 100.0 46.0 545 Surface water (Unprotected well or spring) 24.4 36.8 20.2 18.6 100.0 75.6 194 Other 70.4 12.2 6.3 11.1 100.0 29.6 351
Education of household head
None/Preschool 61.4 20.7 11.0 6.9 100.0 38.6 17,261 Primary 62.6 23.0 8.0 6.4 100.0 37.4 8,067 Lower Secondary 64.2 21.3 8.1 6.4 100.0 35.8 5,731 Upper Secondary 65.8 20.1 10.4 3.7 100.0 34.2 8,309 Higher 69.9 17.6 8.9 3.6 100.0 30.1 4,918
Wealth index quintile
Poorest 59.1 23.2 10.1 7.6 100.0 40.9 8,671 Second 61.4 23.2 9.7 5.7 100.0 38.6 8,723 Middle 70.9 19.0 6.2 3.9 100.0 29.1 9,334 Fourth 64.3 20.1 9.0 6.5 100.0 35.7 8,601 Richest 62.6 18.3 13.7 5.4 100.0 37.4 8,958
1 MICS indicator WS.4 - Faecal contamination of source water A The category of “Rainwater collection” in the background characteristic of “Main source of drinking water” has been suppressed from the table due to a small number of unweighted cases
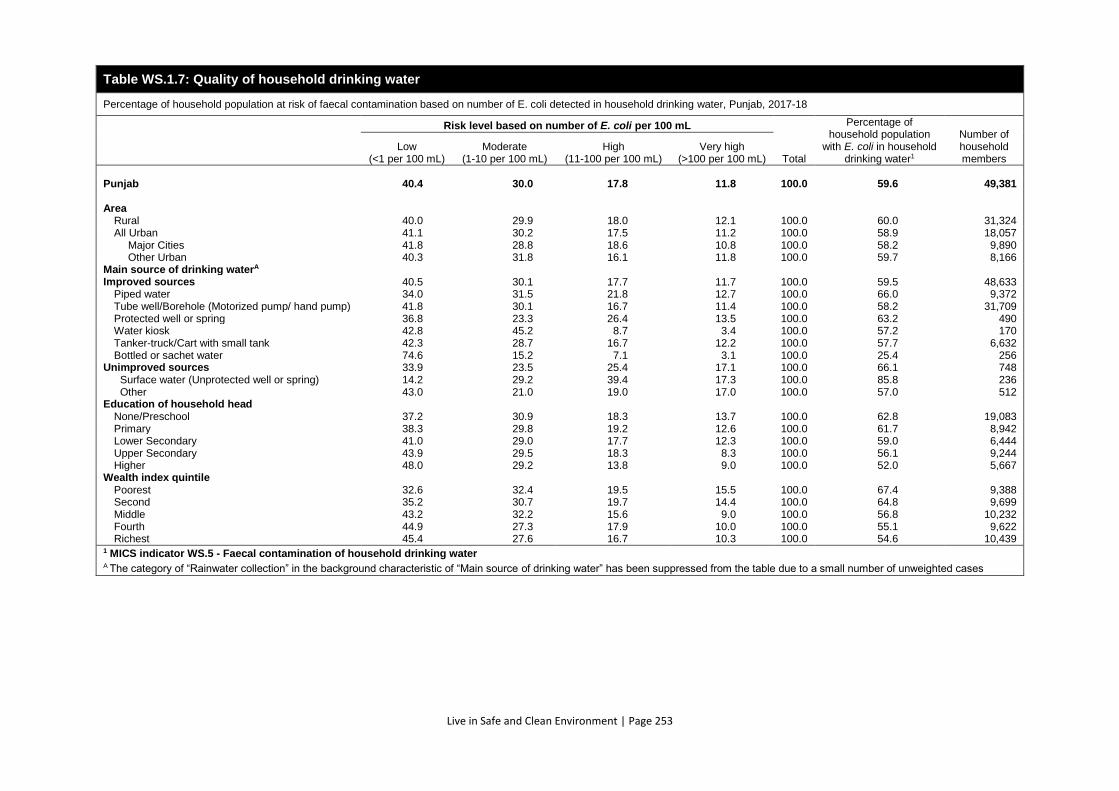
Live in Safe and Clean Environment | Page 253
Table WS.1.7: Quality of household drinking water
Percentage of household population at risk of faecal contamination based on number of E. coli detected in household drinking water, Punjab, 2017-18
Risk level based on number of E. coli per 100 mL
Total
Percentage of household population
with E. coli in household drinking water1
Number of household members
Low (<1 per 100 mL)
Moderate (1-10 per 100 mL)
High (11-100 per 100 mL)
Very high (>100 per 100 mL)
Punjab 40.4 30.0 17.8 11.8 100.0 59.6 49,381 Area
Rural 40.0 29.9 18.0 12.1 100.0 60.0 31,324 All Urban 41.1 30.2 17.5 11.2 100.0 58.9 18,057 Major Cities 41.8 28.8 18.6 10.8 100.0 58.2 9,890 Other Urban 40.3 31.8 16.1 11.8 100.0 59.7 8,166
Main source of drinking waterA Improved sources 40.5 30.1 17.7 11.7 100.0 59.5 48,633
Piped water 34.0 31.5 21.8 12.7 100.0 66.0 9,372 Tube well/Borehole (Motorized pump/ hand pump) 41.8 30.1 16.7 11.4 100.0 58.2 31,709 Protected well or spring 36.8 23.3 26.4 13.5 100.0 63.2 490 Water kiosk 42.8 45.2 8.7 3.4 100.0 57.2 170 Tanker-truck/Cart with small tank 42.3 28.7 16.7 12.2 100.0 57.7 6,632 Bottled or sachet water 74.6 15.2 7.1 3.1 100.0 25.4 256
Unimproved sources 33.9 23.5 25.4 17.1 100.0 66.1 748 Surface water (Unprotected well or spring) 14.2 29.2 39.4 17.3 100.0 85.8 236 Other 43.0 21.0 19.0 17.0 100.0 57.0 512
Education of household head None/Preschool 37.2 30.9 18.3 13.7 100.0 62.8 19,083 Primary 38.3 29.8 19.2 12.6 100.0 61.7 8,942 Lower Secondary 41.0 29.0 17.7 12.3 100.0 59.0 6,444 Upper Secondary 43.9 29.5 18.3 8.3 100.0 56.1 9,244 Higher 48.0 29.2 13.8 9.0 100.0 52.0 5,667
Wealth index quintile Poorest 32.6 32.4 19.5 15.5 100.0 67.4 9,388 Second 35.2 30.7 19.7 14.4 100.0 64.8 9,699 Middle 43.2 32.2 15.6 9.0 100.0 56.8 10,232 Fourth 44.9 27.3 17.9 10.0 100.0 55.1 9,622 Richest 45.4 27.6 16.7 10.3 100.0 54.6 10,439
1 MICS indicator WS.5 - Faecal contamination of household drinking water A The category of “Rainwater collection” in the background characteristic of “Main source of drinking water” has been suppressed from the table due to a small number of unweighted cases
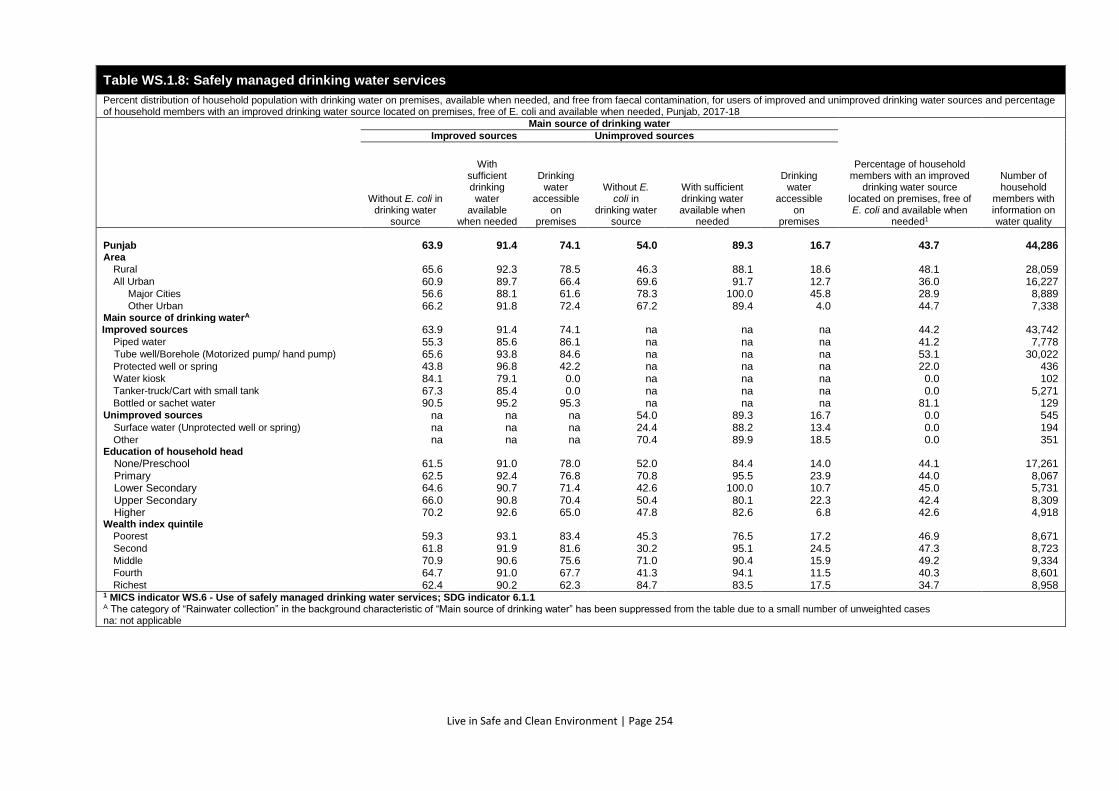
Live in Safe and Clean Environment | Page 254
Table WS.1.8: Safely managed drinking water services
Percent distribution of household population with drinking water on premises, available when needed, and free from faecal contamination, for users of improved and unimproved drinking water sources and percentage of household members with an improved drinking water source located on premises, free of E. coli and available when needed, Punjab, 2017-18
Main source of drinking water
Percentage of household members with an improved
drinking water source located on premises, free of E. coli and available when
needed1
Number of household
members with information on water quality
Improved sources Unimproved sources
Without E. coli in drinking water
source
With sufficient drinking water
available when needed
Drinking water
accessible on
premises
Without E. coli in
drinking water source
With sufficient drinking water available when
needed
Drinking water
accessible on
premises
Punjab 63.9 91.4 74.1 54.0 89.3 16.7 43.7 44,286 Area
Rural 65.6 92.3 78.5 46.3 88.1 18.6 48.1 28,059
All Urban 60.9 89.7 66.4 69.6 91.7 12.7 36.0 16,227
Major Cities 56.6 88.1 61.6 78.3 100.0 45.8 28.9 8,889
Other Urban 66.2 91.8 72.4 67.2 89.4 4.0 44.7 7,338 Main source of drinking waterA
Improved sources 63.9 91.4 74.1 na na na 44.2 43,742
Piped water 55.3 85.6 86.1 na na na 41.2 7,778
Tube well/Borehole (Motorized pump/ hand pump) 65.6 93.8 84.6 na na na 53.1 30,022
Protected well or spring 43.8 96.8 42.2 na na na 22.0 436
Water kiosk 84.1 79.1 0.0 na na na 0.0 102
Tanker-truck/Cart with small tank 67.3 85.4 0.0 na na na 0.0 5,271
Bottled or sachet water 90.5 95.2 95.3 na na na 81.1 129
Unimproved sources na na na 54.0 89.3 16.7 0.0 545
Surface water (Unprotected well or spring) na na na 24.4 88.2 13.4 0.0 194
Other na na na 70.4 89.9 18.5 0.0 351 Education of household head
None/Preschool 61.5 91.0 78.0 52.0 84.4 14.0 44.1 17,261
Primary 62.5 92.4 76.8 70.8 95.5 23.9 44.0 8,067
Lower Secondary 64.6 90.7 71.4 42.6 100.0 10.7 45.0 5,731
Upper Secondary 66.0 90.8 70.4 50.4 80.1 22.3 42.4 8,309
Higher 70.2 92.6 65.0 47.8 82.6 6.8 42.6 4,918 Wealth index quintile
Poorest 59.3 93.1 83.4 45.3 76.5 17.2 46.9 8,671
Second 61.8 91.9 81.6 30.2 95.1 24.5 47.3 8,723
Middle 70.9 90.6 75.6 71.0 90.4 15.9 49.2 9,334
Fourth 64.7 91.0 67.7 41.3 94.1 11.5 40.3 8,601
Richest 62.4 90.2 62.3 84.7 83.5 17.5 34.7 8,958 1 MICS indicator WS.6 - Use of safely managed drinking water services; SDG indicator 6.1.1 A The category of “Rainwater collection” in the background characteristic of “Main source of drinking water” has been suppressed from the table due to a small number of unweighted cases na: not applicable
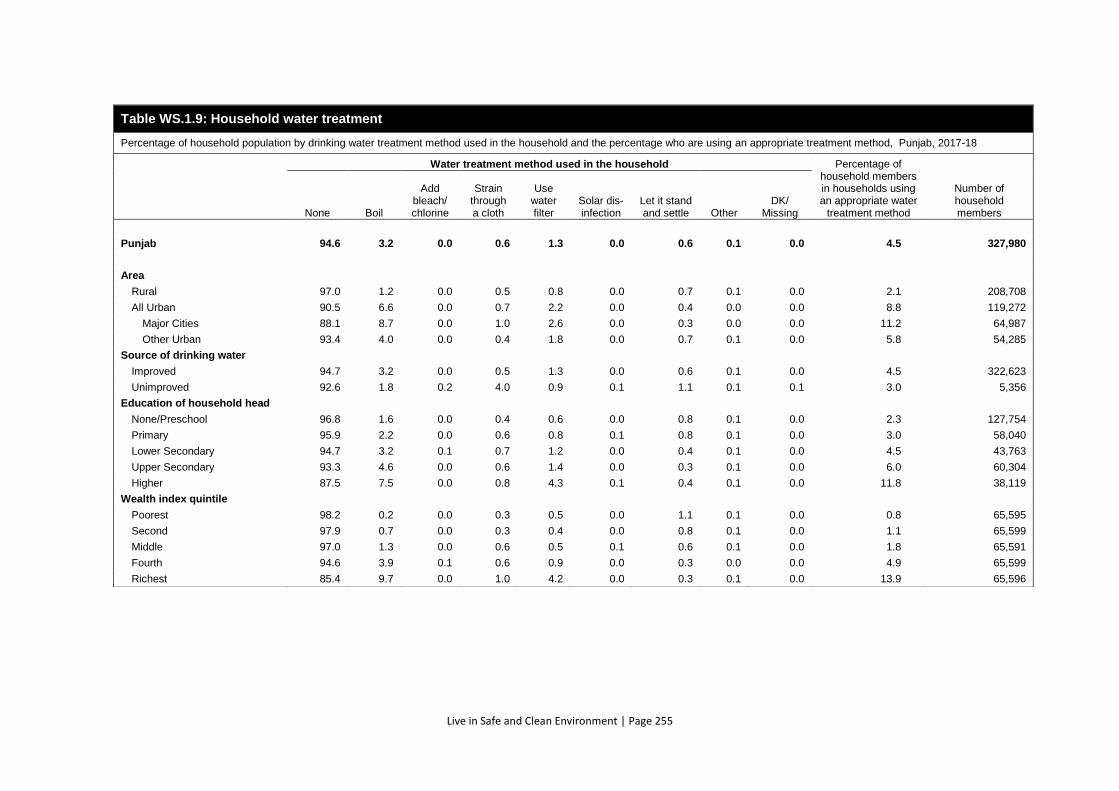
Live in Safe and Clean Environment | Page 255
Table WS.1.9: Household water treatment
Percentage of household population by drinking water treatment method used in the household and the percentage who are using an appropriate treatment method, Punjab, 2017-18
Water treatment method used in the household Percentage of household members in households using an appropriate water
treatment method
Number of household members None Boil
Add bleach/ chlorine
Strain through a cloth
Use water filter
Solar dis-infection
Let it stand and settle Other
DK/ Missing
Punjab 94.6 3.2 0.0 0.6 1.3 0.0 0.6 0.1 0.0 4.5 327,980
Area
Rural 97.0 1.2 0.0 0.5 0.8 0.0 0.7 0.1 0.0 2.1 208,708
All Urban 90.5 6.6 0.0 0.7 2.2 0.0 0.4 0.0 0.0 8.8 119,272
Major Cities 88.1 8.7 0.0 1.0 2.6 0.0 0.3 0.0 0.0 11.2 64,987
Other Urban 93.4 4.0 0.0 0.4 1.8 0.0 0.7 0.1 0.0 5.8 54,285
Source of drinking water
Improved 94.7 3.2 0.0 0.5 1.3 0.0 0.6 0.1 0.0 4.5 322,623
Unimproved 92.6 1.8 0.2 4.0 0.9 0.1 1.1 0.1 0.1 3.0 5,356
Education of household head
None/Preschool 96.8 1.6 0.0 0.4 0.6 0.0 0.8 0.1 0.0 2.3 127,754
Primary 95.9 2.2 0.0 0.6 0.8 0.1 0.8 0.1 0.0 3.0 58,040
Lower Secondary 94.7 3.2 0.1 0.7 1.2 0.0 0.4 0.1 0.0 4.5 43,763
Upper Secondary 93.3 4.6 0.0 0.6 1.4 0.0 0.3 0.1 0.0 6.0 60,304
Higher 87.5 7.5 0.0 0.8 4.3 0.1 0.4 0.1 0.0 11.8 38,119
Wealth index quintile
Poorest 98.2 0.2 0.0 0.3 0.5 0.0 1.1 0.1 0.0 0.8 65,595
Second 97.9 0.7 0.0 0.3 0.4 0.0 0.8 0.1 0.0 1.1 65,599
Middle 97.0 1.3 0.0 0.6 0.5 0.1 0.6 0.1 0.0 1.8 65,591
Fourth 94.6 3.9 0.1 0.6 0.9 0.0 0.3 0.0 0.0 4.9 65,599
Richest 85.4 9.7 0.0 1.0 4.2 0.0 0.3 0.1 0.0 13.9 65,596
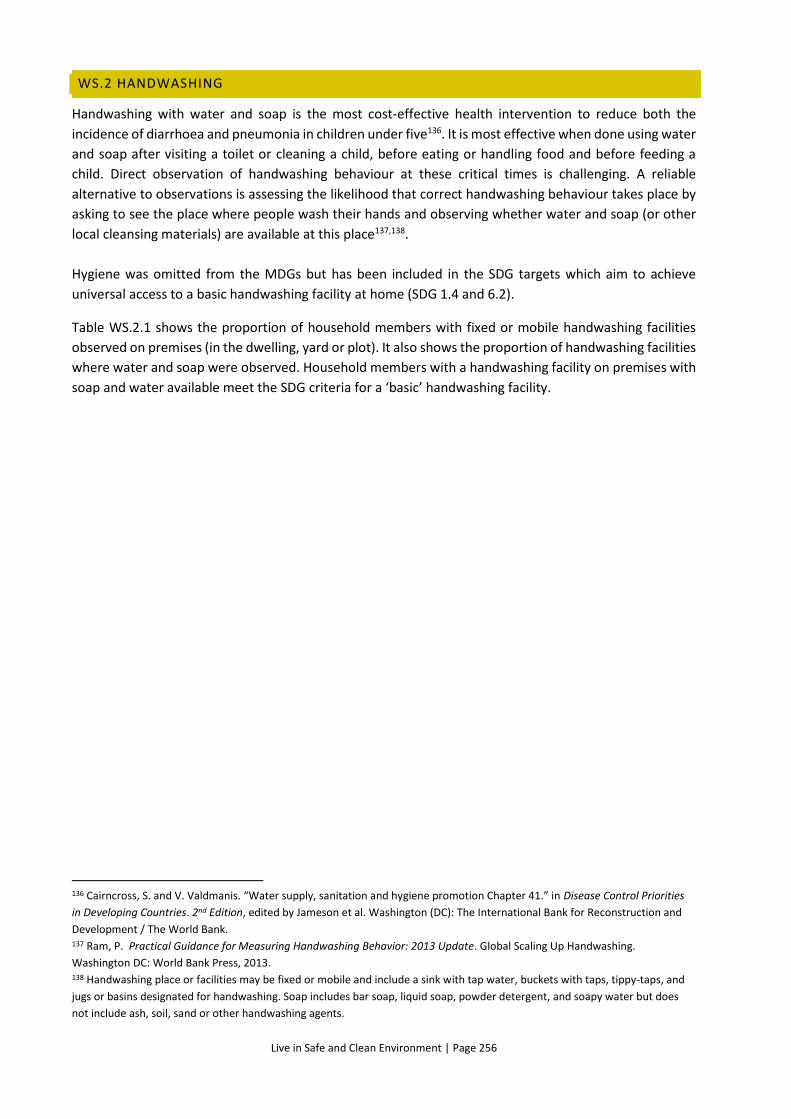
Live in Safe and Clean Environment | Page 256
WS.2 HANDWASHING
Handwashing with water and soap is the most cost-effective health intervention to reduce both the
incidence of diarrhoea and pneumonia in children under five136. It is most effective when done using water
and soap after visiting a toilet or cleaning a child, before eating or handling food and before feeding a
child. Direct observation of handwashing behaviour at these critical times is challenging. A reliable
alternative to observations is assessing the likelihood that correct handwashing behaviour takes place by
asking to see the place where people wash their hands and observing whether water and soap (or other
local cleansing materials) are available at this place137,138.
Hygiene was omitted from the MDGs but has been included in the SDG targets which aim to achieve
universal access to a basic handwashing facility at home (SDG 1.4 and 6.2).
Table WS.2.1 shows the proportion of household members with fixed or mobile handwashing facilities
observed on premises (in the dwelling, yard or plot). It also shows the proportion of handwashing facilities
where water and soap were observed. Household members with a handwashing facility on premises with
soap and water available meet the SDG criteria for a ‘basic’ handwashing facility.
136 Cairncross, S. and V. Valdmanis. “Water supply, sanitation and hygiene promotion Chapter 41.” in Disease Control Priorities
in Developing Countries. 2nd Edition, edited by Jameson et al. Washington (DC): The International Bank for Reconstruction and
Development / The World Bank. 137 Ram, P. Practical Guidance for Measuring Handwashing Behavior: 2013 Update. Global Scaling Up Handwashing.
Washington DC: World Bank Press, 2013. 138 Handwashing place or facilities may be fixed or mobile and include a sink with tap water, buckets with taps, tippy-taps, and
jugs or basins designated for handwashing. Soap includes bar soap, liquid soap, powder detergent, and soapy water but does
not include ash, soil, sand or other handwashing agents.
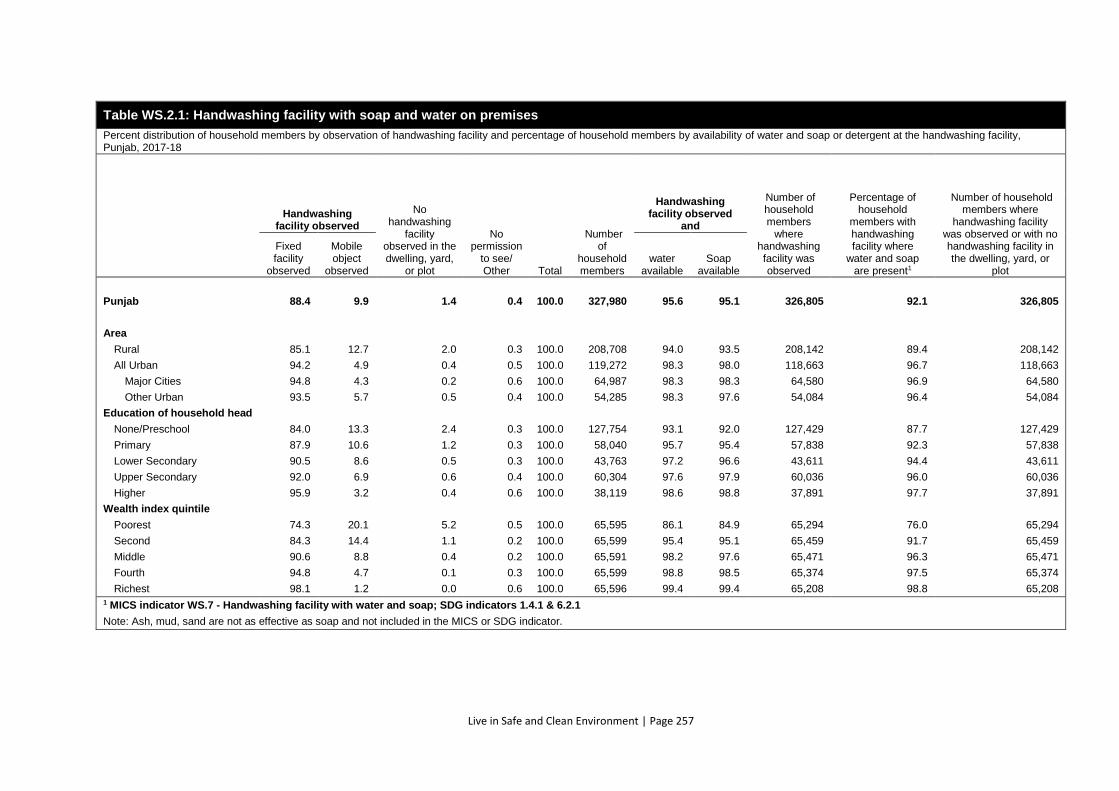
Live in Safe and Clean Environment | Page 257
Table WS.2.1: Handwashing facility with soap and water on premises
Percent distribution of household members by observation of handwashing facility and percentage of household members by availability of water and soap or detergent at the handwashing facility, Punjab, 2017-18
Handwashing facility observed
No handwashing
facility observed in the dwelling, yard,
or plot
No permission
to see/ Other Total
Number of
household members
Handwashing facility observed
and
Number of household members
where handwashing facility was observed
Percentage of household
members with handwashing facility where
water and soap are present1
Number of household members where
handwashing facility was observed or with no handwashing facility in the dwelling, yard, or
plot
Fixed facility
observed
Mobile object
observed water
available Soap
available
Punjab 88.4 9.9 1.4 0.4 100.0 327,980 95.6 95.1 326,805 92.1 326,805
Area
Rural 85.1 12.7 2.0 0.3 100.0 208,708 94.0 93.5 208,142 89.4 208,142
All Urban 94.2 4.9 0.4 0.5 100.0 119,272 98.3 98.0 118,663 96.7 118,663
Major Cities 94.8 4.3 0.2 0.6 100.0 64,987 98.3 98.3 64,580 96.9 64,580
Other Urban 93.5 5.7 0.5 0.4 100.0 54,285 98.3 97.6 54,084 96.4 54,084
Education of household head
None/Preschool 84.0 13.3 2.4 0.3 100.0 127,754 93.1 92.0 127,429 87.7 127,429
Primary 87.9 10.6 1.2 0.3 100.0 58,040 95.7 95.4 57,838 92.3 57,838
Lower Secondary 90.5 8.6 0.5 0.3 100.0 43,763 97.2 96.6 43,611 94.4 43,611
Upper Secondary 92.0 6.9 0.6 0.4 100.0 60,304 97.6 97.9 60,036 96.0 60,036
Higher 95.9 3.2 0.4 0.6 100.0 38,119 98.6 98.8 37,891 97.7 37,891
Wealth index quintile
Poorest 74.3 20.1 5.2 0.5 100.0 65,595 86.1 84.9 65,294 76.0 65,294
Second 84.3 14.4 1.1 0.2 100.0 65,599 95.4 95.1 65,459 91.7 65,459
Middle 90.6 8.8 0.4 0.2 100.0 65,591 98.2 97.6 65,471 96.3 65,471
Fourth 94.8 4.7 0.1 0.3 100.0 65,599 98.8 98.5 65,374 97.5 65,374
Richest 98.1 1.2 0.0 0.6 100.0 65,596 99.4 99.4 65,208 98.8 65,208 1 MICS indicator WS.7 - Handwashing facility with water and soap; SDG indicators 1.4.1 & 6.2.1
Note: Ash, mud, sand are not as effective as soap and not included in the MICS or SDG indicator.
Live in Safe and Clean Environment | Page 258
WS.3 SANITATION
Unsafe management of human excreta and poor personal hygiene are closely associated with diarrhoea as well as parasitic infections, such as soil transmitted helminths (worms). Improved sanitation and hygiene can reduce diarrhoeal disease by more than a third139, and can substantially reduce the health impact of soil-transmitted helminth infection and a range of other neglected tropical diseases which affect over 1 billion people worldwide140. The SDG targets relating to sanitation are much more ambitious than the MDGs and variously aim to achieve universal access to basic services (SDG 1.4) and universal access to safely managed services (SDG 6.2). An improved sanitation facility is defined as one that hygienically separates human excreta from human contact. Improved sanitation facilities include flush or pour flush to piped sewer systems, septic tanks or pit latrines, ventilated improved pit latrines and pit latrines with slabs. Table WS.3.1 shows the population using improved and unimproved sanitation facilities. It also shows the proportion who dispose of faeces in fields, forests, bushes, open water bodies of water, beaches or other open spaces, or with solid waste, a practice known as ‘open defecation’. Table WS. 3.2 presents the distribution of household population using improved and unimproved sanitation facilities which are private, shared with other households or public facilities. Those using shared or public improved sanitation facilities are classed as having a ‘limited’ service for the purpose of SDG monitoring. Households using improved sanitation facilities that are not shared with other households meet the SDG criteria for a ‘basic’ sanitation service, and may be considered ‘safely managed’ depending on how excreta are managed. Table WS.3.3 shows the methods used for emptying and removal of excreta from improved pit latrines and septic tanks. Excreta from improved pit latrines and septic tanks that is never emptied (or don’t know if ever emptied) or is emptied and buried in a covered pit is classed as ‘safely disposed in situ’ and meets the SDG criteria for a ‘safely managed’ sanitation service. Excreta from improved pit latrines and septic tanks that is removed by a service provider to treatment may also be safely managed, depending on the type of treatment received. Other methods of emptying and removal are not considered ‘safely managed’. Table WS.3.4 summarises the main ways in which excreta is managed from households with improved on-site sanitation systems (improved pit latrines and septic tanks) and compares these with the proportion with sewer connections, unimproved sanitation or practicing open defecation. Table WS.3.5 shows the main methods used for disposal of child faeces among households with children aged 0-2 years. Appropriate methods for disposing of the stool include the child using a toilet or latrine and putting or rinsing the stool into a toilet or latrine. Putting disposable diapers with solid waste, a very common practice throughout the world, is only considered an appropriate means of disposal if there is also a system in place for hygienic collection and disposal of the solid waste itself. This classification is currently under review. The JMP has produced regular estimates of national, regional and global progress on drinking water, sanitation and hygiene (WASH) since 1990. The JMP service ‘ladders’ enable benchmarking and comparison of progress across countries at different stages of development. As of 2015, updated water and sanitation ladders have been introduced which build on established indicators and establish new rungs with additional criteria relating to service levels. A third ladder has also been introduced for handwashing hygiene141. Table WS.3.6 summarises the percentages of household population meeting the SDG criteria for ‘basic’ drinking water, sanitation and handwashing services.
139 Cairncross, S. et al. "Water, Sanitation and Hygiene for the Prevention of Diarrhoea." International Journal of
Epidemiology39, no. Suppl1 (2010): 193-205. doi:10.1093/ije/dyq035. 140 WHO. Water, sanitation and hygiene for accelerating and sustaining progress on Neglected Tropical Diseases. A Global
Strategy 2015-2020. Geneva: WHO Press, 2015.
http://apps.who.int/iris/bitstream/handle/10665/182735/WHO_FWC_WSH_15.12_eng.pdf;jsessionid=7F7C38216E04E69E7908
AB6E8B63318F?sequence=1. 141 WHO, UNICEF and JMP. Progress on Drinking Water, Sanitation and Hygiene. Geneva: WHO Press, 2017.
Live in Safe and Clean Environment | Page 259
Table WS.3.1: Use of improved and unimproved sanitation facilities
Percent distribution of household population according to type of sanitation facility used by the household, Punjab, 2017-18
Type of sanitation facility used by household
DK/ Missing
Open defecation (no facility,
bush, field)2 Total
Percentage using
improved sanitation1
Number of
household members
Improved sanitation facility Unimproved sanitation facility
Flush/Pour flush to:
Ventilated improved pit latrine
Pit latrine with slab
Pit latrine without slab/
open pit Bucket Open drain Other
Piped sewer system
Septic tank
Pit latrine
DK where
Punjab 23.8 43.5 10.8 0.7 0.7 0.5 0.2 0.0 6.2 0.4 0.0 13.0 100.0 80.1 327,980
Area
Rural 4.9 50.0 15.4 0.7 1.0 0.7 0.3 0.0 6.6 0.5 0.0 19.7 100.0 72.8 208,708
All Urban 56.9 32.0 2.8 0.6 0.2 0.2 0.0 0.0 5.5 0.3 0.0 1.4 100.0 92.8 119,272
Major Cities 76.0 18.9 0.9 0.2 0.1 0.1 0.0 0.0 3.3 0.1 0.0 0.5 100.0 96.1 64,987
Other Urban 34.0 47.8 5.1 1.1 0.4 0.3 0.1 0.1 8.1 0.5 0.1 2.4 100.0 88.8 54,285
Location of sanitation facility
In dwelling 38.3 48.0 7.4 0.7 0.6 0.4 0.1 0.0 4.3 0.2 0.0 0.0 100.0 95.4 145,245
In plot/yard 16.4 52.3 17.7 0.9 1.0 0.8 0.4 0.1 10.1 0.3 0.0 0.0 100.0 89.1 136,523
Elsewhere 6.1 39.2 20.9 2.1 0.7 0.2 0.9 0.3 8.5 20.9 0.0 0.0 100.0 69.3 3,498
No Facility/Bush/Field 0.0 0.0 0.0 0.0 0.0 0.0 0.0 0.0 0.0 0.0 0.0 100.0 100.0 0.0 42,643
No response 0.0 29.6 0.0 0.0 0.0 0.0 0.0 0.0 0.0 24.0 46.4 0.0 100.0 29.6 71
Education of household head
None/Preschool
Primary 16.1 39.3 12.2 0.8 0.7 0.7 0.4 0.1 7.2 0.5 0.0 22.1 100.0 69.7 127,754
Lower Secondary 20.9 44.2 12.0 0.8 0.8 0.7 0.1 0.0 7.0 0.6 0.0 12.8 100.0 79.4 58,040
Upper Secondary 24.7 48.2 10.6 0.6 0.9 0.4 0.2 0.0 6.1 0.5 0.0 7.8 100.0 85.3 43,763
Higher 28.4 50.5 9.7 0.6 0.6 0.3 0.1 0.0 4.7 0.3 0.0 4.7 100.0 90.1 60,304
Wealth index quintile 46.0 40.0 6.4 0.6 0.5 0.3 0.1 0.0 4.1 0.1 0.1 1.8 100.0 93.8 38,119
Poorest
Second 1.0 18.1 16.4 0.5 0.9 0.8 0.8 0.1 6.1 0.9 0.0 54.4 100.0 37.7 65,595
Middle 6.2 49.9 20.4 1.0 1.4 0.9 0.3 0.0 9.8 0.6 0.0 9.4 100.0 79.8 65,599
Fourth 14.2 62.8 11.9 0.7 0.9 0.6 0.0 0.1 7.5 0.2 0.0 1.1 100.0 91.1 65,591
Richest 35.8 52.7 4.2 0.9 0.3 0.2 0.0 0.0 5.5 0.2 0.1 0.1 100.0 94.1 65,599
1 MICS indicator WS.8 - Use of improved sanitation facilities; SDG indicator 3.8.1 2 Non-MICS indicator WS.S1 - Open defecation
Live in Safe and Clean Environment | Page 260
Table WS.3.2: Use of basic and limited sanitation services
Percent distribution of household population by use of private and public sanitation facilities and use of shared facilities, by users of improved and unimproved sanitation facilities, Punjab, 2017-18
Users of improved sanitation facilities Users of unimproved sanitation facilities
Open defecation (no facility, bush, field) Total
Number of household members
Not shared1
Shared by
Public facility
DK/ missing
Not shared
Shared by
Public facility
DK/ missing
5 households
or less
More than 5
households
5 households
or less
More than 5
households
Punjab 70.4 9.0 0.4 0.2 0.0 5.6 1.3 0.1 0.0 0.0 13.0 100.0 327,980
Area
Rural 61.8 10.3 0.4 0.2 0.0 5.8 1.6 0.1 0.0 0.0 19.7 100.0 208,708
All Urban 85.4 6.8 0.4 0.2 0.0 5.1 0.7 0.1 0.0 0.0 1.4 100.0 119,272
Major Cities 89.5 5.9 0.3 0.3 0.0 3.0 0.5 0.0 0.0 0.0 0.5 100.0 64,987
Other Urban 80.5 7.7 0.4 0.1 0.0 7.7 1.0 0.1 0.0 0.0 2.4 100.0 54,285
Location of sanitation facility
In dwelling 89.3 5.6 0.3 0.2 0.0 4.2 0.4 0.0 0.0 0.0 na 100.0 145,245
In plot/yard 73.6 14.7 0.6 0.2 0.0 8.7 2.1 0.1 0.0 0.0 na 100.0 136,523
Elsewhere 23.5 38.7 3.9 3.2 0.0 8.1 20.2 1.1 1.0 0.3 na 100.0 3,498
No facility/Bush/Field na na na na na na na na na na 100.0 100.0 42,643
No response 29.6 0.0 0.0 0.0 0.0 70.4 0.0 0.0 0.0 0.0 0.0 100.0 71
Education of household head
None/Preschool 59.6 9.4 0.5 0.2 0.0 6.5 1.5 0.1 0.0 0.0 22.1 100.0 127,754
Primary 67.7 11.0 0.5 0.3 0.0 5.8 1.8 0.1 0.0 0.0 12.8 100.0 58,040
Lower Secondary 75.2 9.5 0.4 0.2 0.0 5.5 1.2 0.1 0.0 0.0 7.8 100.0 43,763
Upper Secondary 81.2 8.4 0.3 0.1 0.0 4.3 0.8 0.0 0.0 0.0 4.7 100.0 60,304
Higher 88.2 5.2 0.2 0.1 0.0 4.0 0.4 0.0 0.0 0.0 1.8 100.0 38,119
Wealth index quintile
Poorest 25.6 11.3 0.5 0.2 0.0 5.2 2.5 0.1 0.0 0.0 54.4 100.0 65,595
Second 63.9 15.0 0.7 0.2 0.0 8.3 2.3 0.1 0.0 0.0 9.4 100.0 65,599
Middle 79.8 10.6 0.4 0.3 0.0 6.8 1.0 0.0 0.0 0.0 1.1 100.0 65,591
Fourth 87.1 6.5 0.4 0.1 0.0 5.3 0.5 0.0 0.0 0.0 0.1 100.0 65,599
Richest 95.7 1.8 0.1 0.1 0.0 2.2 0.0 0.0 0.0 0.0 0.0 100.0 65,596 1 MICS indicator WS.9 - Use of basic sanitation services; SDG indicators 1.4.1 & 6.2.1
na: not applicable

Live in Safe and Clean Environment | Page 261
Table WS.3.3: Emptying and removal of excreta from on-site sanitation facilities
Percent distribution of household members in households with septic tanks and improved latrines by method of emptying and removal, Punjab, 2017-18
Emptying and disposal of wastes from septic tanks Emptying and disposal of wastes from other improved on-site
sanitation facilities
Tota
l
Sa
fe d
ispo
sa
l in
situ o
f excre
ta
from
on
-site s
an
ita
tio
n fa
cili
tie
s1
Unsafe
dis
posa
l of e
xcre
ta fro
m
on
-site s
an
itatio
n facili
ties
Rem
ova
l of e
xcre
ta fo
r tr
eatm
ent
from
on
-site s
an
ita
tio
n fa
cili
tie
s
Num
be
r o
f h
ou
se
ho
ld m
em
be
rs
in h
ou
se
ho
lds w
ith
im
pro
ve
d o
n-
site
san
ita
tio
n facili
ties
Rem
ove
d b
y a
se
rvic
e
pro
vid
er
to tre
atm
en
t
Rem
ove
d b
y a
se
rvic
e
pro
vid
er
to D
K
Bu
rie
d in a
cove
red p
it
To u
ncove
red
pit, o
pen
gro
un
d, w
ate
r b
ody o
r e
lsew
he
re
Oth
er
Do
n't
kn
ow
whe
re w
aste
s
we
re take
n
Neve
r em
ptied
Re
pla
ce
d w
he
n fu
ll
DK
if
ever
em
ptie
d
Rem
ove
d b
y a
se
rvic
e
pro
vid
er
to tre
atm
en
t
Rem
ove
d b
y a
se
rvic
e
pro
vid
er
to D
K
Bu
rie
d in a
cove
red p
it
To u
ncove
red
pit, o
pen
gro
un
d, w
ate
r b
ody o
r e
lsew
he
re
Oth
er
Do
n't
kn
ow
whe
re w
aste
s
we
re take
n
Neve
r em
ptied
Re
pla
ce
d w
he
n fu
ll
DK
if
ever
em
ptie
d
Punjab 2.1 11.3 3.5 5.4 0.2 1.9 2.5 48.3 3.1 0.3 1.1 0.8 0.9 0.1 0.2 0.9 17.2 0.3 100.0 73.2 6.6 16.8 182,166
Area
Rural 1.4 9.8 3.0 5.5 0.3 1.5 2.5 48.5 2.0 0.3 1.3 0.9 1.0 0.1 0.2 1.0 20.6 0.3 100.0 75.3 6.8 14.4 140,144
All Urban 4.2 16.4 4.9 5.0 0.2 3.0 2.5 47.7 7.1 0.2 0.8 0.2 0.6 0.1 0.1 0.5 6.0 0.5 100.0 66.3 5.9 24.8 42,022
Major Cities 6.8 19.2 5.4 4.7 0.2 3.9 1.8 41.7 11.2 0.1 0.6 0.2 0.3 0.0 0.1 0.4 2.8 0.5 100.0 61.9 5.3 30.6 12,917
Other Urban 3.1 15.2 4.6 5.2 0.2 2.7 2.8 50.3 5.2 0.2 0.8 0.2 0.7 0.1 0.2 0.6 7.3 0.6 100.0 68.3 6.2 22.2 29,105
Type of sanitation facility
Flush to septic tank 2.7 14.5 4.4 6.9 0.3 2.4 3.1 61.7 4.0 na na na na na na na 0.0 na 100.0 70.2 7.2 19.5 142,608
Latrines and other improved na na na na na na na 0.0 na 1.2 5.3 3.5 4.2 0.3 0.7 4.1 79.1 1.6 100.0 84.2 4.5 7.2 39,559
Flush to septic tank na na na na na na na 61.7 na 0.0 0.0 0.0 0.0 0.0 0.0 0.0 0.0 0.0 100.0 70.2 7.2 19.5 142,608
Flush to pit latrine na na na na na na na 0.0 na 1.1 5.5 3.3 4.3 0.3 0.7 4.0 79.1 1.5 100.0 83.9 4.7 7.4 35,543
Ventilated improved Pit latrine na na na na na na na 0.0 na 1.0 4.2 4.7 2.8 0.4 0.8 4.3 80.6 1.1 100.0 86.4 3.2 6.1 2,303
Pit latrine with slab na na na na na na na 0.0 na 1.7 2.6 4.8 3.0 0.0 0.6 5.4 77.3 4.6 100.0 86.8 3.0 4.9 1,713
Education of household head
None/Preschool 1.8 9.4 2.6 5.4 0.3 2.0 2.5 46.6 3.6 0.2 1.2 0.6 1.1 0.1 0.2 1.0 20.8 0.5 100.0 74.7 7.0 14.8 67,587
Primary 2.0 11.1 3.7 5.1 0.2 1.7 2.3 47.8 2.7 0.1 1.2 0.9 1.0 0.1 0.1 1.2 18.5 0.4 100.0 74.0 6.3 16.2 33,472
Lower Secondary 1.9 11.8 3.5 5.4 0.2 1.8 2.4 50.7 2.6 0.2 1.1 0.8 0.6 0.1 0.1 0.9 15.6 0.3 100.0 73.5 6.2 17.0 26,259
Upper Secondary 2.6 12.7 4.0 5.8 0.3 1.7 2.3 50.6 2.6 0.3 0.9 0.8 0.8 0.1 0.2 0.5 13.6 0.2 100.0 71.8 6.9 18.5 36,861
Higher 2.5 15.3 5.0 4.9 0.1 2.0 2.9 48.0 4.0 0.6 1.4 0.7 0.6 0.1 0.2 0.6 10.9 0.2 100.0 68.8 5.7 22.0 17,988
Wealth index quintile
Poorest 0.1 4.6 1.4 3.9 0.3 0.4 1.9 36.5 1.0 0.3 1.7 1.2 1.7 0.0 0.3 2.3 41.6 0.9 100.0 82.7 5.9 7.3 23,769
Second 0.9 7.3 3.0 5.8 0.2 1.2 1.9 46.4 2.0 0.2 1.4 1.2 1.4 0.2 0.2 1.2 25.2 0.4 100.0 78.2 7.6 11.1 47,625
Middle 1.5 11.1 3.8 6.3 0.3 1.9 2.7 51.8 3.0 0.3 1.2 0.7 0.8 0.1 0.2 0.6 13.5 0.2 100.0 73.0 7.5 16.2 49,919
Fourth 3.7 15.6 4.0 5.6 0.3 3.0 2.8 51.9 4.9 0.2 0.7 0.4 0.4 0.0 0.1 0.4 5.6 0.3 100.0 67.1 6.3 23.3 37,661
Richest 5.1 20.1 4.8 3.6 0.1 2.8 3.2 51.1 4.9 0.3 0.7 0.1 0.2 0.0 0.0 0.2 2.5 0.1 100.0 63.6 4.0 29.1 23,193 1 MICS indicator WS.10 - Safe disposal in situ of excreta from on-site sanitation facilities; SDG indicators 6.2.1
na: not applicable
Live in Safe and Clean Environment | Page 262
Table WS.3.4: Management of excreta from household sanitation facilities
Percent distribution of household population by management of excreta from household sanitation facilities, Punjab, 2017-18
Using improved on-site sanitation systems (including shared)
Connected to sewer
Using unimproved sanitation facilities
Practicing open
defecation Missing Total
Number of household members
Safe disposal in situ of excreta from on-site sanitation facilities
Unsafe disposal of excreta from on-site sanitation facilities
Removal of excreta for treatment from on-site
sanitation facilities1
Punjab 40.7 3.7 9.3 24.5 6.9 13.0 0.0 100.0 327,980
Area
Rural 50.5 4.6 9.7 5.7 7.5 19.7 0.0 100.0 208,708
All Urban 23.4 2.1 8.7 57.5 5.8 1.4 0.0 100.0 119,272
Major Cities 12.3 1.0 6.1 76.2 3.4 0.5 0.0 100.0 64,987
Other Urban 36.6 3.3 11.9 35.2 8.8 2.4 0.1 100.0 54,285
Education of household head
None/Preschool 39.5 3.7 7.8 16.8 8.1 22.1 0.0 100.0 127,754
Primary 42.7 3.7 9.3 21.7 7.7 12.8 0.0 100.0 58,040
Lower Secondary 44.1 3.7 10.2 25.3 6.8 7.8 0.0 100.0 43,763
Upper Secondary 43.9 4.2 11.3 29.0 5.1 4.7 0.0 100.0 60,304
Higher 32.5 2.7 10.4 46.6 4.3 1.8 0.1 100.0 38,119
Wealth index quintile
Poorest 30.0 2.1 2.6 1.4 7.9 54.4 0.0 100.0 65,595
Second 56.8 5.5 8.1 7.2 10.7 9.4 0.0 100.0 65,599
Middle 55.6 5.7 12.3 15.0 7.8 1.1 0.0 100.0 65,591
Fourth 38.5 3.6 13.4 36.7 5.7 0.1 0.1 100.0 65,599
Richest 22.5 1.4 10.3 62.4 2.3 0.0 0.0 100.0 65,596
1 MICS indicator WS.11 - Removal of excreta for treatment off-site; SDG indicator 6.2.1
Live in Safe and Clean Environment | Page 263
Table WS.3.5: Disposal of child's faeces
Percent distribution of children age 0-2 years according to place of disposal of child's faeces, and the percentage of children age 0-2 years whose stools were disposed of safely the last time the child passed stools, Punjab, 2017-18
Place of disposal of child's faeces
Total
Percentage of children whose last
stools were disposed of safelyA
Number of children age 0-2 years
Child used toilet/latrine
Put/rinsed into toilet or
latrine
Put/rinsed into drain or
ditch
Thrown into
garbage Buried
Left in the
open Other DK/missing
Punjab 10.5 47.2 7.5 29.4 0.5 4.2 0.2 0.4 100.0 57.7 23,868
Area
Rural 8.6 47.1 8.4 28.4 0.7 6.1 0.3 0.4 100.0 55.7 15,703
All Urban 14.3 47.2 5.8 31.4 0.2 0.7 0.1 0.3 100.0 61.6 8,165
Major Cities 16.2 42.5 4.5 36.2 0.1 0.2 0.0 0.3 100.0 58.6 4,274
Other Urban 12.3 52.5 7.3 26.0 0.2 1.3 0.2 0.3 100.0 64.8 3,891
Type of sanitation facility
Improved 12.4 51.8 6.5 27.1 0.2 1.4 0.1 0.4 100.0 64.2 18,771
Unimproved 7.8 60.9 6.9 22.0 0.1 2.1 0.0 0.1 100.0 68.8 1,688
Open defecation (No Facility/Bush/Field) 1.8 14.6 13.0 45.8 2.4 20.9 1.1 0.4 100.0 16.5 3,409
Mother’s educationB
None/Preschool 8.1 42.9 9.1 29.7 0.9 8.5 0.4 0.4 100.0 51.0 9,745
Primary 10.2 53.6 7.6 24.6 0.5 3.1 0.1 0.3 100.0 63.8 4,689
Lower Secondary 12.4 52.1 6.8 27.2 0.2 0.7 0.1 0.6 100.0 64.5 2,523
Upper Secondary 13.8 49.1 5.0 30.9 0.2 0.5 0.1 0.4 100.0 62.9 3,450
Higher 13.3 44.9 5.8 35.4 0.1 0.2 0.1 0.3 100.0 58.1 3,462
Wealth index quintile
Poorest 3.8 29.4 11.5 37.5 1.7 15.2 0.6 0.3 100.0 33.3 5,166
Second 7.9 57.4 8.4 21.6 0.4 3.6 0.2 0.5 100.0 65.3 4,734
Middle 12.3 58.8 6.4 20.6 0.3 1.0 0.1 0.4 100.0 71.2 4,841
Fourth 14.9 50.7 6.0 27.9 0.1 0.1 0.1 0.3 100.0 65.5 4,709
Richest 14.7 40.3 4.7 39.7 0.1 0.1 0.0 0.4 100.0 55.1 4,418 A In many countries’ disposal of children's faeces with solid waste is a common. The risks will vary between and within countries depending on whether solid waste is regularly collected and well
managed. For the purposes of international comparability solid waste is not considered safely disposed.
B The category of “DK/Missing” in the background characteristic of “Mother's education” has been suppressed from the table due to a small number of unweighted cases
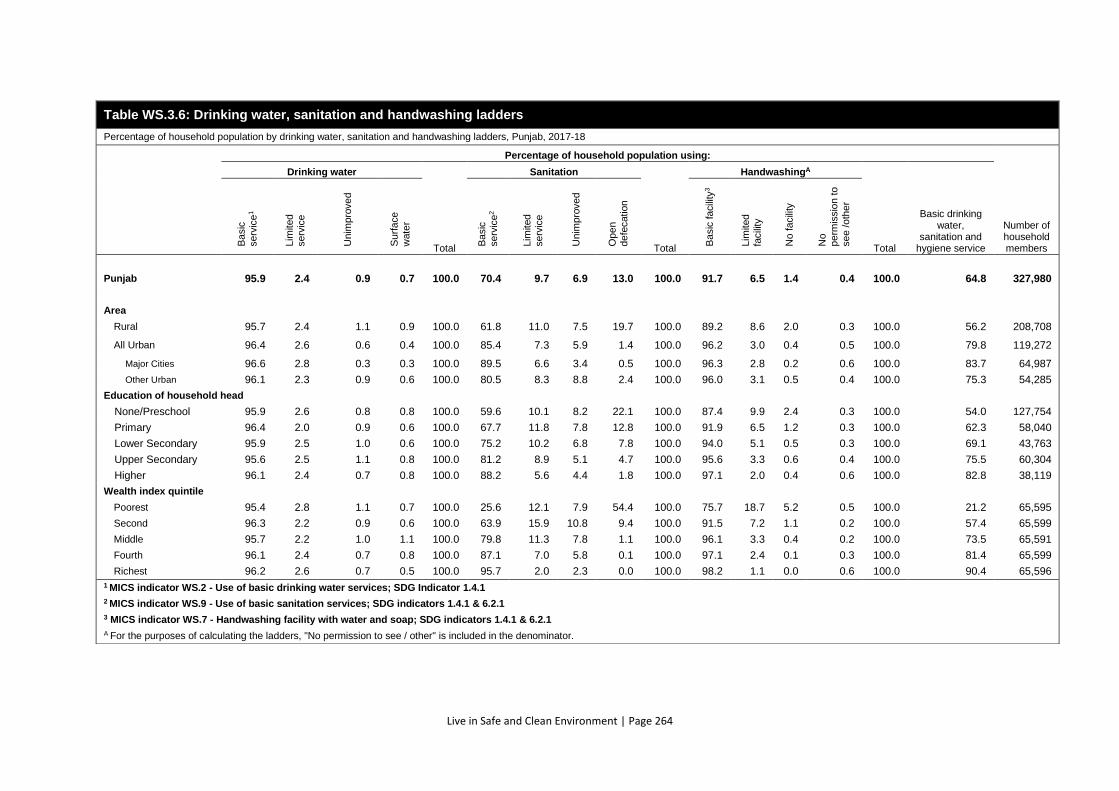
Live in Safe and Clean Environment | Page 264
Table WS.3.6: Drinking water, sanitation and handwashing ladders
Percentage of household population by drinking water, sanitation and handwashing ladders, Punjab, 2017-18
Percentage of household population using:
Number of household members
Drinking water
Total
Sanitation
Total
HandwashingA
Total
Basic drinking water,
sanitation and hygiene service
Ba
sic
se
rvic
e1
Lim
ited
se
rvic
e
Un
impro
ve
d
Su
rfa
ce
wate
r
Ba
sic
se
rvic
e2
Lim
ited
se
rvic
e
Un
impro
ve
d
Op
en
de
fecation
Ba
sic
fa
cili
ty3
Lim
ited
facili
ty
No fa
cili
ty
No
pe
rmis
sio
n to
se
e /o
the
r
Punjab 95.9 2.4 0.9 0.7 100.0 70.4 9.7 6.9 13.0 100.0 91.7 6.5 1.4 0.4 100.0 64.8 327,980
Area
Rural 95.7 2.4 1.1 0.9 100.0 61.8 11.0 7.5 19.7 100.0 89.2 8.6 2.0 0.3 100.0 56.2 208,708
All Urban 96.4 2.6 0.6 0.4 100.0 85.4 7.3 5.9 1.4 100.0 96.2 3.0 0.4 0.5 100.0 79.8 119,272
Major Cities 96.6 2.8 0.3 0.3 100.0 89.5 6.6 3.4 0.5 100.0 96.3 2.8 0.2 0.6 100.0 83.7 64,987
Other Urban 96.1 2.3 0.9 0.6 100.0 80.5 8.3 8.8 2.4 100.0 96.0 3.1 0.5 0.4 100.0 75.3 54,285
Education of household head
None/Preschool 95.9 2.6 0.8 0.8 100.0 59.6 10.1 8.2 22.1 100.0 87.4 9.9 2.4 0.3 100.0 54.0 127,754
Primary 96.4 2.0 0.9 0.6 100.0 67.7 11.8 7.8 12.8 100.0 91.9 6.5 1.2 0.3 100.0 62.3 58,040
Lower Secondary 95.9 2.5 1.0 0.6 100.0 75.2 10.2 6.8 7.8 100.0 94.0 5.1 0.5 0.3 100.0 69.1 43,763
Upper Secondary 95.6 2.5 1.1 0.8 100.0 81.2 8.9 5.1 4.7 100.0 95.6 3.3 0.6 0.4 100.0 75.5 60,304
Higher 96.1 2.4 0.7 0.8 100.0 88.2 5.6 4.4 1.8 100.0 97.1 2.0 0.4 0.6 100.0 82.8 38,119
Wealth index quintile
Poorest 95.4 2.8 1.1 0.7 100.0 25.6 12.1 7.9 54.4 100.0 75.7 18.7 5.2 0.5 100.0 21.2 65,595
Second 96.3 2.2 0.9 0.6 100.0 63.9 15.9 10.8 9.4 100.0 91.5 7.2 1.1 0.2 100.0 57.4 65,599
Middle 95.7 2.2 1.0 1.1 100.0 79.8 11.3 7.8 1.1 100.0 96.1 3.3 0.4 0.2 100.0 73.5 65,591
Fourth 96.1 2.4 0.7 0.8 100.0 87.1 7.0 5.8 0.1 100.0 97.1 2.4 0.1 0.3 100.0 81.4 65,599
Richest 96.2 2.6 0.7 0.5 100.0 95.7 2.0 2.3 0.0 100.0 98.2 1.1 0.0 0.6 100.0 90.4 65,596
1 MICS indicator WS.2 - Use of basic drinking water services; SDG Indicator 1.4.1
2 MICS indicator WS.9 - Use of basic sanitation services; SDG indicators 1.4.1 & 6.2.1
3 MICS indicator WS.7 - Handwashing facility with water and soap; SDG indicators 1.4.1 & 6.2.1
A For the purposes of calculating the ladders, "No permission to see / other" is included in the denominator.
Live in Safe and Clean Environment | Page 265
WS.4 MENSTRUAL HYGIENE
The ability of women and adolescent girls to safely manage their monthly menstrual cycle in privacy and with
dignity is fundamental to their health, psychosocial well-being and mobility. Women and girls who lack access
to adequate menstrual hygiene management facilities and supplies experience stigma and social exclusion
while also forgoing important educational, social and economic opportunities.142
Table WS.4.1 shows the percentage of women and girls aged 15-49 who menstruated in the last 12
months reporting having a private place to wash and change while at home. It also presents whether
they used appropriate materials including reusable and non-reusable materials during last
menstruation. Table WS.4.2 shows the percentage of women who reported not being able to
participate in social activities, school or work during their last menstruation.
142 Sommer, M., C. Sutherland and V. Chandra-Mouli. "Putting Menarche and Girls into the Global Population Health
Agenda." Reproductive Health 12, no. 1 (2015). doi:10.1186/s12978-015-0009-8.
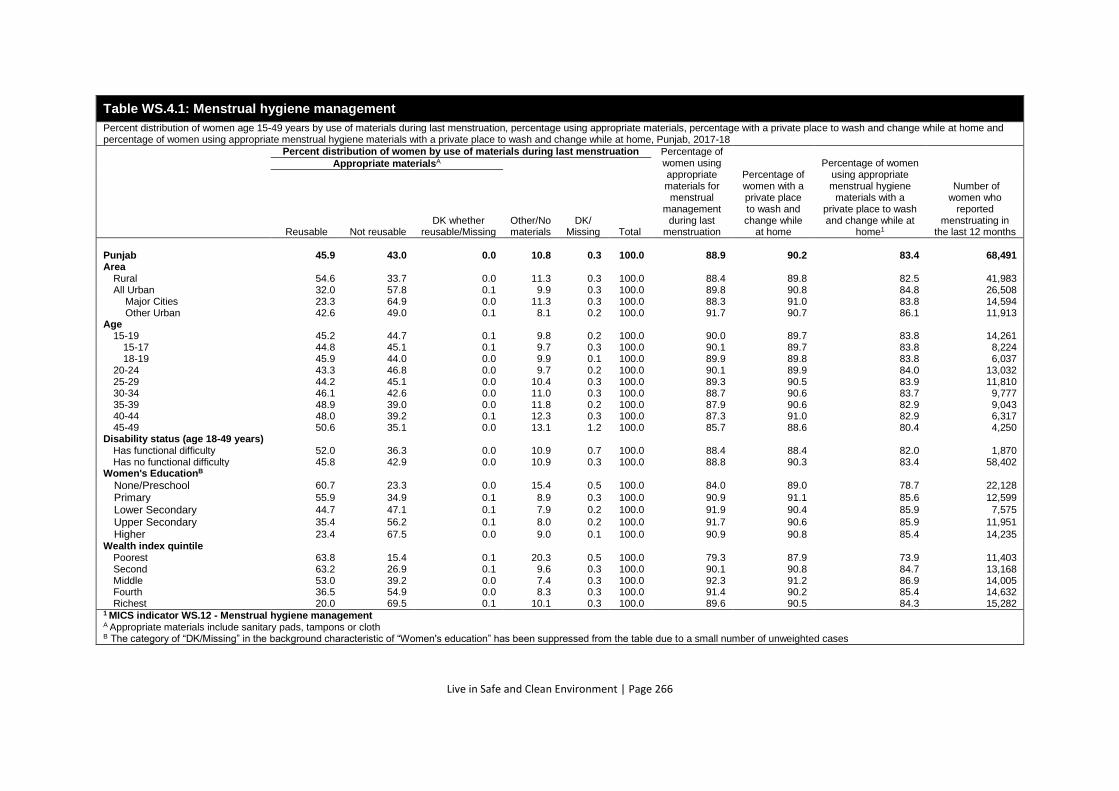
Live in Safe and Clean Environment | Page 266
Table WS.4.1: Menstrual hygiene management
Percent distribution of women age 15-49 years by use of materials during last menstruation, percentage using appropriate materials, percentage with a private place to wash and change while at home and percentage of women using appropriate menstrual hygiene materials with a private place to wash and change while at home, Punjab, 2017-18
Percent distribution of women by use of materials during last menstruation Percentage of women using appropriate materials for menstrual
management during last
menstruation
Percentage of women with a private place to wash and change while
at home
Percentage of women using appropriate menstrual hygiene
materials with a private place to wash and change while at
home1
Number of women who
reported menstruating in
the last 12 months
Appropriate materialsA
Other/No materials
DK/ Missing Total Reusable Not reusable
DK whether reusable/Missing
Punjab 45.9 43.0 0.0 10.8 0.3 100.0 88.9 90.2 83.4 68,491 Area
Rural 54.6 33.7 0.0 11.3 0.3 100.0 88.4 89.8 82.5 41,983 All Urban 32.0 57.8 0.1 9.9 0.3 100.0 89.8 90.8 84.8 26,508 Major Cities 23.3 64.9 0.0 11.3 0.3 100.0 88.3 91.0 83.8 14,594 Other Urban 42.6 49.0 0.1 8.1 0.2 100.0 91.7 90.7 86.1 11,913
Age 15-19 45.2 44.7 0.1 9.8 0.2 100.0 90.0 89.7 83.8 14,261
15-17 44.8 45.1 0.1 9.7 0.3 100.0 90.1 89.7 83.8 8,224 18-19 45.9 44.0 0.0 9.9 0.1 100.0 89.9 89.8 83.8 6,037
20-24 43.3 46.8 0.0 9.7 0.2 100.0 90.1 89.9 84.0 13,032 25-29 44.2 45.1 0.0 10.4 0.3 100.0 89.3 90.5 83.9 11,810 30-34 46.1 42.6 0.0 11.0 0.3 100.0 88.7 90.6 83.7 9,777 35-39 48.9 39.0 0.0 11.8 0.2 100.0 87.9 90.6 82.9 9,043 40-44 48.0 39.2 0.1 12.3 0.3 100.0 87.3 91.0 82.9 6,317 45-49 50.6 35.1 0.0 13.1 1.2 100.0 85.7 88.6 80.4 4,250
Disability status (age 18-49 years) Has functional difficulty 52.0 36.3 0.0 10.9 0.7 100.0 88.4 88.4 82.0 1,870 Has no functional difficulty 45.8 42.9 0.0 10.9 0.3 100.0 88.8 90.3 83.4 58,402
Women's EducationB
None/Preschool 60.7 23.3 0.0 15.4 0.5 100.0 84.0 89.0 78.7 22,128
Primary 55.9 34.9 0.1 8.9 0.3 100.0 90.9 91.1 85.6 12,599
Lower Secondary 44.7 47.1 0.1 7.9 0.2 100.0 91.9 90.4 85.9 7,575
Upper Secondary 35.4 56.2 0.1 8.0 0.2 100.0 91.7 90.6 85.9 11,951
Higher 23.4 67.5 0.0 9.0 0.1 100.0 90.9 90.8 85.4 14,235 Wealth index quintile
Poorest 63.8 15.4 0.1 20.3 0.5 100.0 79.3 87.9 73.9 11,403 Second 63.2 26.9 0.1 9.6 0.3 100.0 90.1 90.8 84.7 13,168 Middle 53.0 39.2 0.0 7.4 0.3 100.0 92.3 91.2 86.9 14,005 Fourth 36.5 54.9 0.0 8.3 0.3 100.0 91.4 90.2 85.4 14,632 Richest 20.0 69.5 0.1 10.1 0.3 100.0 89.6 90.5 84.3 15,282
1 MICS indicator WS.12 - Menstrual hygiene management A Appropriate materials include sanitary pads, tampons or cloth B The category of “DK/Missing” in the background characteristic of “Women's education” has been suppressed from the table due to a small number of unweighted cases

Live in Safe and Clean Environment | Page 267
Table WS.4.2: Exclusion from activities during menstruation
Percentage of women age 15-49 years who did not participate in social activities, school, or work due to their last menstruation in the last 12 months, Punjab, 2017-18
Percentage of women who did not participate in social activities,
school or work due to their last menstruation in the last 12
months1
Number of women who reported menstruating in
the last 12 months
Punjab 16.6 68,491
Area
Rural 16.2 41,983
All Urban 17.3 26,508
Major Cities 16.1 14,594
Other Urban 18.7 11,913
Age
15-19 18.8 14,261
20-24 17.3 13,032
25-29 15.6 11,810
30-39 15.9 18,820
40-49 15.4 10,567
Disability status (age 18-49 years)
Has functional difficulty 19.7 1,870
Has no functional difficulty 16.1 58,402
Women's EducationA
None/Preschool 14.8 22,128
Primary 15.8 12,599
Lower Secondary 18.4 7,575
Upper Secondary 18.2 11,951
Higher 17.9 14,235
Wealth index quintile 0.0
Poorest 14.1 11,403
Second 15.3 13,168
Middle 17.4 14,005
Fourth 18.2 14,632
Richest 17.5 15,282
1 MICS indicator WS.13 - Exclusion from activities during menstruation
A The category of “DK/Missing” in the background characteristic of “Women's education” has been suppressed from the table due to a small number of unweighted cases

Equitable Chance in Life| Page 269
11. EQUITABLE CHANCE IN LIFE
EQ.1 CHILD FUNCTIONING
The Convention on the Rights of Persons with Disabilities143 outlines States Parties’ obligations to
ensure the full realization of rights for children with disabilities on an equal basis with other children.
The presence of functional difficulties of mother may place children at risk of experiencing limited
participation in an unaccommodating environment, and limit the fulfilment of their rights.
MICS Punjab, 2017-18 included child functioning modules intended to provide an estimate of the
number/proportion of children with functional difficulties as reported by their mothers or primary
caregivers. The module included in the Questionnaire for Children Under Five that covered children
between 2 and 4 years of age while a similar module was also included in the Questionnaire for
Children Age 5-17.
Functional domains covered in Questionnaire for Children Under Five are as follows: Seeing, hearing,
walking, fine motor, communication, learning, playing, and controlling behaviour while functional
domains covered in Questionnaire for Children Age 5-17 are as follows: Seeing, hearing, walking, self-
care, communication, learning, remembering, concentrating, accepting change, controlling behaviour,
making friends, anxiety, and depression.
Tables EQ.1.1 presents the percentage of children by sex, area of residence, age group, early childhood
education attendance, mother’s education, Mother's functional difficulties, wealth index quintile with
functional difficulty by domain.
Table EQ.1.2 presents the percentage of children by sex, area of residence, age group, school
attendance, mother’s education, Mother's functional difficulties (age 18-49 years), wealth index
quintile with functional difficulty by domain.
Table EQ.1.3 presents the percentage of children by sex, area of residence, age group, early childhood
education attendance, mother’s education, Mother's functional difficulties (age 18-49 years), wealth
index quintile who use assistive devices and still have difficulty within the relevant functional domains.
Table EQ.1.4 is a summary table presenting the percentage of children by age group with functional
difficulty. All these tables by district and division can be find in annex.
143 "Convention on the Rights of Persons with Disabilities." United Nations. Accessed August 31, 2018.
https://www.un.org/development/desa/disabilities/convention-on-the-rights-of-persons-with-disabilities/convention-on-
the-rights-of-persons-with-disabilities-2.html.
Equitable Chance in Life| Page 270
Table EQ.1.1: Child functioning (children age 2-4 years)
Percentage of children age 2-4 years who have functional difficulty, by domain, Punjab, 2017-18
Percentage of children aged 2-4 years with functional difficultyA in the domain of: Percentage of children age 2-4 years with
functional difficulty in at least one domain
Number of children age
2-4 years Seeing Hearing Walking Fine
motor Communication Learning Playing Controlling behavior
Punjab 0.4 0.3 0.8 0.4 1.6 1.2 0.6 3.6 6.4 23,800 Area of Residence
Rural 0.5 0.3 0.9 0.4 1.8 1.4 0.8 3.7 6.9 15,594 All Urban 0.3 0.3 0.6 0.4 1.3 0.9 0.4 3.4 5.4 8,207 Major Cities 0.1 0.4 0.5 0.2 0.9 0.6 0.2 3.4 4.7 4,266 Other Urban 0.4 0.3 0.8 0.5 1.8 1.3 0.7 3.3 6.2 3,941
Sex 0.0 0.0 0.0 0.0 0.0 0.0 0.0 0.0 0.0 - Male 0.5 0.3 0.8 0.4 1.8 1.3 0.6 4.0 6.9 12,221 Female 0.4 0.3 0.8 0.4 1.5 1.2 0.7 3.2 5.8 11,580
Mother's functional difficulties (age 18-49 years) Has functional difficulty 0.3 0.3 1.8 0.6 3.3 2.3 0.9 5.1 9.9 586 Has no functional difficulty 0.4 0.3 0.8 0.4 1.6 1.2 0.6 3.6 6.3 22,888 No information 1.1 0.7 0.7 0.4 2.2 1.5 0.4 3.5 7.4 327
Age 2 0.5 0.3 1.1 0.5 2.6 1.6 0.8 3.4 7.3 7,870 3 0.4 0.3 0.8 0.4 1.3 1.1 0.6 3.7 6.2 8,247 4 0.4 0.4 0.5 0.2 1.0 0.9 0.5 3.7 5.7 7,683
Early childhood education attendanceB,C Attending 0.2 0.1 0.1 0.0 0.3 0.5 0.1 3.5 4.5 5,512 Not attending 0.5 0.5 0.9 0.5 1.6 1.3 0.8 3.8 6.7 10,415
Mother’s education None/Preschool 0.4 0.4 1.1 0.5 2.0 1.6 0.8 3.8 7.3 10,436 Primary 0.6 0.2 0.7 0.3 1.4 1.1 0.6 3.3 6.2 4,618 Lower Secondary 0.3 0.4 0.6 0.4 1.4 1.1 0.7 3.8 5.9 2,432 Upper Secondary 0.4 0.4 0.7 0.3 1.4 1.0 0.5 3.3 5.4 3,203 Higher 0.2 0.3 0.4 0.3 1.1 0.5 0.3 3.4 5.0 3,112
Wealth index quintile Poorest 0.5 0.4 1.1 0.4 2.1 1.7 0.8 3.9 7.6 5,500 Second 0.6 0.4 1.1 0.7 1.9 1.6 0.9 3.7 7.3 4,774 Middle 0.5 0.2 0.6 0.3 1.6 1.2 0.6 3.5 6.2 4,600 Fourth 0.3 0.2 0.6 0.4 1.3 0.9 0.5 3.5 5.6 4,669 Richest 0.2 0.4 0.5 0.2 1.1 0.6 0.4 3.4 5.0 4,257
A Functional difficulty for children age 2-4 years are defined as having responded "A lot of difficulty" or "Cannot at all" to questions within all listed domains, except the last domain of controlling behavior, for which the response category "A lot more" is considered a functional difficulty
B Children age 2 are excluded, as early childhood education attendance is only collected for age 3-4 years C The category of “Don’t know/Missing” in the background characteristic of “Early childhood education attendance” has been suppressed from the table due to a small number of unweighted cases
Equitable Chance in Life| Page 271
Table EQ.1.2: Child functioning (children age 5-17 years)
Percentage of children age 5-17 years who have functional difficulty, by domain, Punjab, 2017-18
Percentage of children aged 5-17 years with functional difficultyA in the domain of: Percentage of children age 5-17
years with functional difficulty in at least
one domain
Number of
children age 5-
17 years Seeing Hearing Walking Self-care
Communication Learning
Remembering
Concentrating
Accepting change
Controlling behaviour
Making friends Anxiety
Depression
Punjab 0.3 0.4 3.0 1.0 1.0 1.2 1.2 1.0 4.1 9.1 1.8 3.7 2.7 17.9 35,482
Area of Residence
Rural 0.3 0.4 2.8 1.0 1.1 1.2 1.4 1.1 4.2 9.2 1.8 3.6 2.7 17.9 22,442
All Urban 0.3 0.3 3.4 0.9 0.8 1.0 1.0 0.9 3.9 8.8 1.6 3.8 2.7 17.9 13,040
Major Cities 0.3 0.3 2.9 0.7 0.7 0.8 0.8 0.7 3.6 8.4 1.4 3.6 2.7 16.4 7,104
Other Urban 0.4 0.3 3.9 1.0 1.0 1.3 1.2 1.1 4.2 9.3 1.9 4.1 2.6 19.7 5,936
Sex
Male 0.4 0.4 2.9 1.0 1.1 1.2 1.2 1.1 4.6 10.5 1.6 3.6 2.7 18.8 18,376
Female 0.3 0.3 3.2 0.9 0.9 1.1 1.2 0.9 3.6 7.5 1.9 3.8 2.8 16.9 17,106 Mother's functional difficulties (age 18-49 years)
Has functional difficulty 0.7 0.6 5.6 1.3 1.3 2.2 2.4 1.6 6.6 16.1 3.0 7.2 5.4 29.9 1,510
Has no functional difficulty 0.3 0.4 3.2 1.0 1.0 1.1 1.2 1.0 4.1 8.8 1.6 3.4 2.4 17.5 27,622
No information 0.4 0.3 1.8 0.6 0.8 1.0 1.0 0.8 3.5 8.4 2.1 4.1 3.3 16.6 6,349 Age
5-9 0.3 0.4 4.2 1.4 1.3 1.3 1.5 1.2 4.8 9.3 1.6 3.5 2.4 19.5 15,884
10-14 0.4 0.4 2.3 0.7 0.8 1.1 1.1 0.9 3.7 8.9 1.7 3.6 2.7 16.6 11,980
15-17 0.3 0.3 1.6 0.5 0.7 0.9 0.9 0.8 3.4 8.7 2.1 4.3 3.4 16.4 7,618 School attendanceB
Attending 0.2 0.2 2.6 0.5 0.4 0.6 0.7 0.5 3.7 8.7 1.0 3.3 2.4 17.1 27,549
Not attending 0.8 1.0 4.5 2.5 2.9 3.2 3.1 2.8 5.5 10.1 4.3 4.9 3.9 20.8 7,925 Mother's educationC
None/Preschool 0.4 0.5 2.8 1.0 1.1 1.3 1.3 1.1 3.8 9.1 1.9 3.6 2.8 17.8 18,868
Primary 0.3 0.2 3.4 1.0 1.0 1.3 1.6 1.1 4.9 10.0 1.5 3.6 2.5 19.2 6,408
Lower Secondary 0.3 0.4 3.2 1.2 1.0 1.4 1.2 1.1 4.3 9.1 1.5 4.6 3.2 18.7 3,031
Upper Secondary 0.3 0.4 3.4 1.0 0.8 0.8 0.9 1.0 4.2 8.8 1.7 3.7 2.7 17.6 3,874
Higher 0.1 0.2 2.6 0.6 0.5 0.5 0.4 0.5 3.6 7.0 1.4 3.2 2.4 15.5 3,300 Wealth index quintile
Poorest 0.3 0.4 2.9 1.0 1.2 1.5 1.5 1.2 3.9 9.0 2.2 3.3 2.8 17.7 7,697
Second 0.4 0.5 3.0 0.8 1.1 1.2 1.5 1.1 4.0 9.4 1.7 3.4 2.5 18.0 7,278
Middle 0.3 0.4 3.1 1.1 1.2 1.3 1.2 1.0 4.6 9.6 1.7 3.7 2.6 18.3 6,883
Fourth 0.3 0.3 3.5 1.2 0.9 1.1 1.1 1.1 4.1 9.4 1.8 4.1 2.9 18.6 7,005
Richest 0.3 0.2 2.6 0.7 0.5 0.7 0.7 0.7 3.8 7.9 1.4 4.0 2.8 16.8 6,619 A Functional difficulty for children age 5-17 years are defined as having responded "A lot of difficulty" or "Cannot at all" to questions within all listed domains, except the last domains of anxiety and depression, for
which the response category "Daily" is considered a functional difficulty B The category of “Missing” in the background characteristic of “School attendance” has been suppressed from the table due to a small number of unweighted cases C The category of “Don’t know/Missing” in the background characteristic of “Mother education attendance” has been suppressed from the table due to a small number of unweighted cases
Equitable Chance in Life| Page 272
Table EQ.1.3: Use of assistive devices (children age 2-17 years)
Percentage of children age 2-17 years who use assistive devices and have functional difficulty within domain of assistive devices, Punjab, 2017-18
Percentage of children age 2-17 years who: Number
of children age 2-17
years
Percentage of children with
difficulties seeing when
wearing glasses
Number of children age 2-17
years who wear
glasses
Percentage of children with
difficulties hearing when using hearing
aid
Number of children age 2-17
years who use hearing
aid
Percentage of children with
difficulties walking when using
equipment or receiving assistance
Number of children age 2-17 years
who use equipment or receive
assistance for walking
Wear glasses
Use hearing
aid
Use equipment or receive
assistance for walking
Punjab 2.3 0.6 1.3 59,282 1.7 1,387 5.5 327 21.1 800 Area of Residence
Rural 1.6 0.5 1.3 38,036 2.1 593 5.8 182 22.4 508 All Urban 3.7 0.7 1.4 21,247 1.4 794 5.1 145 18.7 292 Major Cities 0.8 0.4 1.4 4,266 (0.0) 36 (*) 19 (10.1) 60 Other Urban 0.9 0.9 1.9 3,941 (7.3) 34 (1.5) 36 16.4 76
Sex
Male 2.8 0.6 1.2 18,376 2.3 523 6.7 111 26.1 227 Female 4.2 0.5 1.2 17,106 1.2 712 5.8 87 28.3 198
Mother's functional difficulties (age 18-49 years) Has functional difficulty 3.5 0.9 2.0 2,096 0.0 73 (*) 18 (28.9) 42 Has no functional difficulty 2.1 0.5 1.3 50,510 1.9 1,047 5.3 266 20.9 682 No information 4.0 0.6 1.1 6,676 1.5 268 (9.1) 42 17.9 76
Age
2-4 0.6 0.5 1.6 23,800 2.0 152 4.3 128 14.2 375 5-9 1.4 0.5 1.1 15,884 2.3 215 9.9 85 29.9 180 10-14 4.0 0.6 1.3 11,980 1.4 475 4.5 69 23.8 158 15-17 7.2 0.6 1.1 7,618 1.6 545 (2.2) 45 27.3 86
Mother's educationA
None/Preschool 1.5 0.5 1.3 29,304 1.6 446 3.5 157 26.0 377 Primary 2.4 0.4 1.5 11,026 2.3 264 4.2 49 16.4 165 Lower Secondary 3.0 0.6 1.4 5,462 2.4 164 (2.7) 31 24.5 77 Upper Secondary 3.5 0.6 1.4 7,077 1.9 249 (13.2) 42 18.5 99 Higher 4.1 0.7 1.3 6,412 0.7 264 (8.6) 48 7.5 81
Wealth index quintile
Poorest 0.8 0.4 1.2 13,197 3.2 104 1.8 55 26.2 164 Second 1.3 0.5 1.3 12,052 5.3 158 7.1 58 21.8 160 Middle 2.1 0.5 1.3 11,483 0.9 239 3.6 62 18.7 149 Fourth 2.8 0.6 1.4 11,675 1.5 330 9.7 73 22.0 165 Richest 5.1 0.7 1.5 10,876 0.9 556 4.6 79 16.3 161
A The category of “Missing” In the background characteristic of “Mother’s education” has been suppressed from the table due to a small number of unweighted cases. ( ) Figures that are based on 25-49 unweighted cases (*) Figures that are based on fewer than 25 unweighted cases
Equitable Chance in Life| Page 273
Table EQ.1.4: Child functioning (children age 2-17 years)
Percentage of children age 2-4, 5-17 and 2-17 years with functional difficulty, Punjab, 2017-18
Percentage of children
age 2-4 years with functional
difficulty in at least one domain
Number of children age
2-4 years
Percentage of children age 5-17 years with functional
difficulty in at least one domain
Number of children age 5-17 years
Percentage of children age 2-17 years
with functional
difficulty in at least one domain1
Number of
children age 2-17
years
Punjab 6.4 23,800 17.9 35,482 13.3 59,282
Area of Residence
Rural 6.9 15,594 17.9 22,442 13.4 38,036
All Urban 5.4 8,207 17.9 13,040 13.1 21,247
Major Cities 4.7 4,266 16.4 7,104 12.0 11,370
Other Urban 6.2 3,941 19.7 5,936 14.3 9,876
Sex
Male 6.9 12,221 18.8 18,376 14.0 30,596
Female 5.8 11,580 16.9 17,106 12.5 28,686
Mother's functional difficulties (age 18-49 years)
Has functional difficulty 9.9 586 29.9 1,510 24.3 2,096
Has no functional difficulty 6.3 22,888 17.5 27,622 12.4 50,510
No information 7.4 327 16.6 6,349 16.1 6,676
Mother's educationA
None/Preschool 7.3 10,436 17.8 18,868 14.1 29,304
Primary 6.2 4,618 19.2 6,408 13.8 11,026
Lower Secondary 5.9 2,432 18.7 3,031 13.0 5,462
Upper Secondary 5.4 3,203 17.6 3,874 12.1 7,077
Higher 5.0 3,112 15.5 3,300 10.4 6,412
Wealth index quintile
Poorest 7.6 5,500 17.7 7,697 13.5 13,197
Second 7.3 4,774 18.0 7,278 13.7 12,052
Middle 6.2 4,600 18.3 6,883 13.5 11,483
Fourth 5.6 4,669 18.6 7,005 13.4 11,675
Richest 5.0 4,257 16.8 6,619 12.2 10,876
1 MICS indicator EQ.1 - Children with functional difficulty A The category of “Missing” in the background characteristic of “Mother’s education” has been suppressed from the table due to a small number of unweighted cases
Equitable Chance in Life| Page 274
EQ.2 SOCIAL TRANSFERS
Social protection is the set of public and private policies and programmes aimed at preventing,
reducing and eliminating economic and social vulnerabilities to poverty and deprivation. Increasing
volatility at the macro and household level, the persistence of inequalities and exclusion, threats
posed to sustainable development by climate change and changing population trends have
heightened the relevance and political momentum for social protection globally.144
Social transfers or external economic support can be defined as ‘free economic help’ and includes
various social protection schemes – examples in Pakistan include Zakat, Bait ul Maal, Khidmat Card,
BISP, Retirement pension, Watan Card or Sehat Card, any other external assistance program, or School
tuition or school related other support, excluding transfers or assistance from family members,
relatives or neighbours.
Health insurance is one protection scheme and tables EQ.2.1W and EQ.2.1M present the percentage
of women and men age 15-49 years who have a health insurance and among those with an insurance,
the percentage insured by type of insurance. Tables EQ.2.2 and EQ.2.3 further elaborates the
existence of health insurance for children under age five and 5-17 separately.
Table EQ.2.4 presents the percentage of households who are aware and have received external
economic support, as reported by the respondent to the Household Questionnaire. The percentage of
household members living in households that received social transfers or benefits in the last 3 months
is further shown in Table EQ.2.5, by type of transfers and benefits. The benefits also include school
tuition or school related other support available for any household member age 5-24. SDG indicator
1.3.1, the proportion of population covered by social protection floors/systems is presented in this
table.
It is well known that social and economic shocks affect the health conditions of individuals and
undermine household resilience. These shocks affect the capacity of families to care for their children
and place barriers to services that stand in the way of achieving goals and progress for children. In
particular poor households are vulnerable to the impacts of these shocks through the increased
burden of health costs; the illness and death of household members, leading to labour constraints in
the household and the further impoverishment of children who have lost one or both parents, or their
primary caregiver; and other vulnerable children, cause them to drop out of school and engage in
harmful child labour and other risky behaviours. As an attempt to measure coverage of social
protection programmes, a global indicator, ‘Proportion of the poorest households that received
external economic support in the past three months’, was proposed to measure the extent to which
economic support is reaching households severely affected by various shocks.145 Table EQ.2.6 presents
the percentage of households in the lowest two quintiles that received social transfers or benefits in
the last 3 months, by type of transfers or benefits.
144 UNICEF. Collecting Data to Measure Social Protection Programme Coverage: Pilot-Testing the Social Protection Module
in Viet Nam. A methodological report. New York: UNICEF, 2016.
http://mics.unicef.org/files?job=W1siZiIsIjIwMTgvMDcvMTkvMjAvMzcvMzAvNzQ0L1ZpZXRuYW1fUmVwb3J0X1BpbG90X1
Rlc3RpbmdfU1BfTW9kdWxlX0RlY2VtYmVyXzIwMTZfRklOQUwuUERGIl1d&sha=3df47c3a17992c8f 145 UNAIDS, UNICEF, and WHO. Joint United Nations Programme on HIV/AIDS, Global AIDS Response Progress Reporting
2014: Construction of core indicators for monitoring the 2011 United Nations Political Declaration on HIV and AIDS. Geneva:
UNAIDS/WHO Press, 2014. http://www.unaids.org/sites/default/files/media_asset/GARPR_2014_guidelines_en_0.pdf.
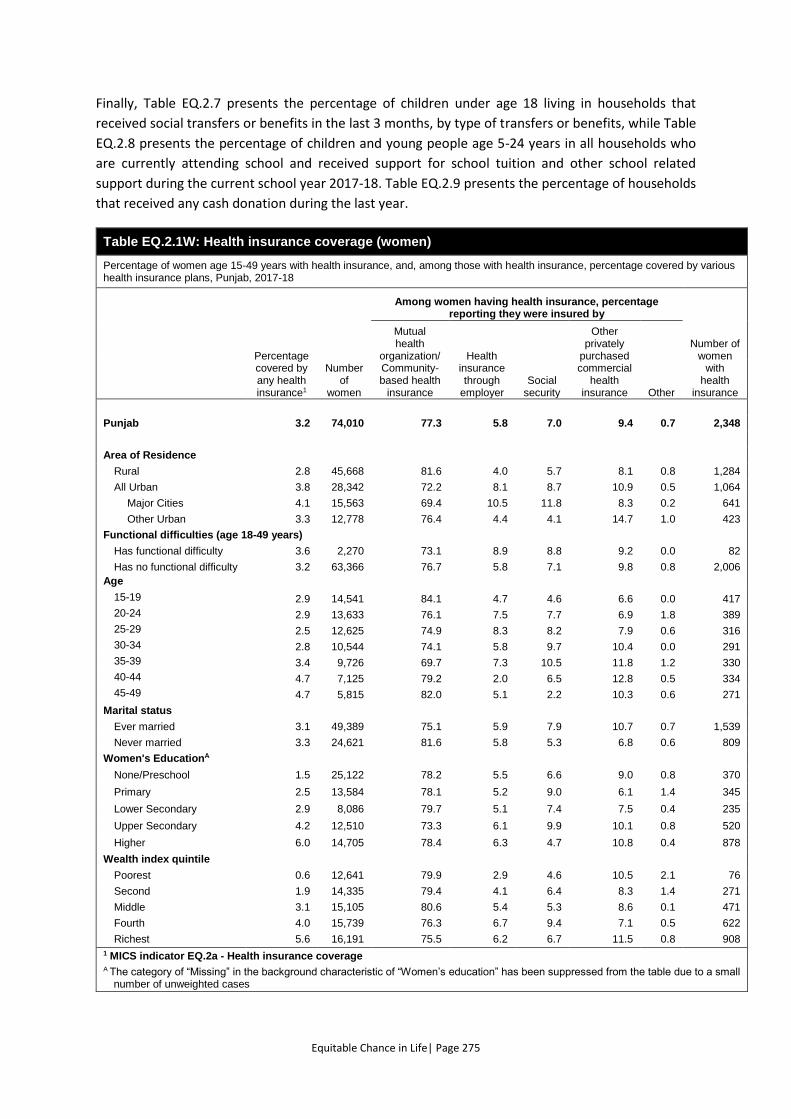
Equitable Chance in Life| Page 275
Finally, Table EQ.2.7 presents the percentage of children under age 18 living in households that
received social transfers or benefits in the last 3 months, by type of transfers or benefits, while Table
EQ.2.8 presents the percentage of children and young people age 5-24 years in all households who
are currently attending school and received support for school tuition and other school related
support during the current school year 2017-18. Table EQ.2.9 presents the percentage of households
that received any cash donation during the last year.
Table EQ.2.1W: Health insurance coverage (women)
Percentage of women age 15-49 years with health insurance, and, among those with health insurance, percentage covered by various health insurance plans, Punjab, 2017-18
Percentage covered by any health insurance1
Number of
women
Among women having health insurance, percentage reporting they were insured by
Number of women
with health
insurance
Mutual health
organization/ Community-based health
insurance
Health insurance through
employer Social
security
Other privately
purchased commercial
health insurance Other
Punjab 3.2 74,010 77.3 5.8 7.0 9.4 0.7 2,348
Area of Residence
Rural 2.8 45,668 81.6 4.0 5.7 8.1 0.8 1,284
All Urban 3.8 28,342 72.2 8.1 8.7 10.9 0.5 1,064
Major Cities 4.1 15,563 69.4 10.5 11.8 8.3 0.2 641
Other Urban 3.3 12,778 76.4 4.4 4.1 14.7 1.0 423
Functional difficulties (age 18-49 years)
Has functional difficulty 3.6 2,270 73.1 8.9 8.8 9.2 0.0 82
Has no functional difficulty 3.2 63,366 76.7 5.8 7.1 9.8 0.8 2,006
Age
15-19 2.9 14,541 84.1 4.7 4.6 6.6 0.0 417
20-24 2.9 13,633 76.1 7.5 7.7 6.9 1.8 389
25-29 2.5 12,625 74.9 8.3 8.2 7.9 0.6 316
30-34 2.8 10,544 74.1 5.8 9.7 10.4 0.0 291
35-39 3.4 9,726 69.7 7.3 10.5 11.8 1.2 330
40-44 4.7 7,125 79.2 2.0 6.5 12.8 0.5 334
45-49 4.7 5,815 82.0 5.1 2.2 10.3 0.6 271
Marital status
Ever married 3.1 49,389 75.1 5.9 7.9 10.7 0.7 1,539
Never married 3.3 24,621 81.6 5.8 5.3 6.8 0.6 809
Women's EducationA
None/Preschool 1.5 25,122 78.2 5.5 6.6 9.0 0.8 370
Primary 2.5 13,584 78.1 5.2 9.0 6.1 1.4 345
Lower Secondary 2.9 8,086 79.7 5.1 7.4 7.5 0.4 235
Upper Secondary 4.2 12,510 73.3 6.1 9.9 10.1 0.8 520
Higher 6.0 14,705 78.4 6.3 4.7 10.8 0.4 878
Wealth index quintile
Poorest 0.6 12,641 79.9 2.9 4.6 10.5 2.1 76
Second 1.9 14,335 79.4 4.1 6.4 8.3 1.4 271
Middle 3.1 15,105 80.6 5.4 5.3 8.6 0.1 471
Fourth 4.0 15,739 76.3 6.7 9.4 7.1 0.5 622
Richest 5.6 16,191 75.5 6.2 6.7 11.5 0.8 908
1 MICS indicator EQ.2a - Health insurance coverage A The category of “Missing” in the background characteristic of “Women’s education” has been suppressed from the table due to a small
number of unweighted cases
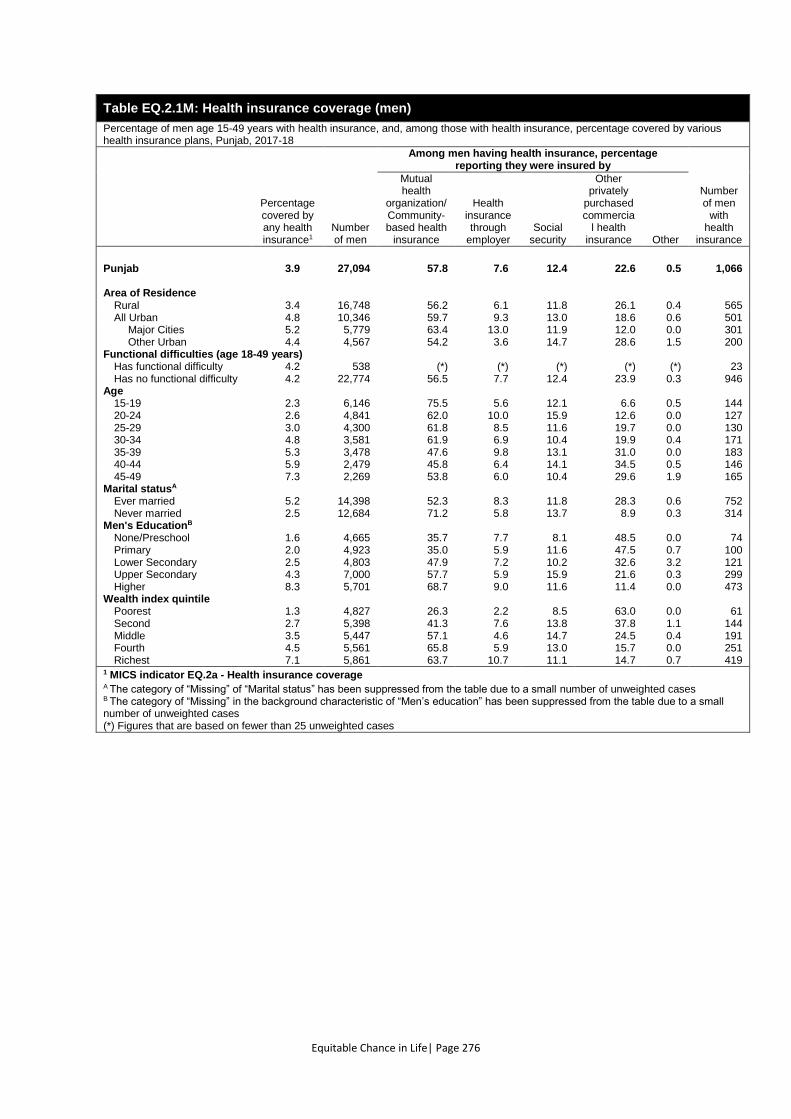
Equitable Chance in Life| Page 276
Table EQ.2.1M: Health insurance coverage (men)
Percentage of men age 15-49 years with health insurance, and, among those with health insurance, percentage covered by various health insurance plans, Punjab, 2017-18
Percentage covered by any health insurance1
Number of men
Among men having health insurance, percentage reporting they were insured by
Number of men
with health
insurance
Mutual health
organization/ Community-based health
insurance
Health insurance through
employer Social
security
Other privately
purchased commercia
l health insurance Other
Punjab 3.9 27,094 57.8 7.6 12.4 22.6 0.5 1,066 Area of Residence
Rural 3.4 16,748 56.2 6.1 11.8 26.1 0.4 565 All Urban 4.8 10,346 59.7 9.3 13.0 18.6 0.6 501 Major Cities 5.2 5,779 63.4 13.0 11.9 12.0 0.0 301 Other Urban 4.4 4,567 54.2 3.6 14.7 28.6 1.5 200
Functional difficulties (age 18-49 years) Has functional difficulty 4.2 538 (*) (*) (*) (*) (*) 23 Has no functional difficulty 4.2 22,774 56.5 7.7 12.4 23.9 0.3 946
Age 15-19 2.3 6,146 75.5 5.6 12.1 6.6 0.5 144 20-24 2.6 4,841 62.0 10.0 15.9 12.6 0.0 127 25-29 3.0 4,300 61.8 8.5 11.6 19.7 0.0 130 30-34 4.8 3,581 61.9 6.9 10.4 19.9 0.4 171 35-39 5.3 3,478 47.6 9.8 13.1 31.0 0.0 183 40-44 5.9 2,479 45.8 6.4 14.1 34.5 0.5 146 45-49 7.3 2,269 53.8 6.0 10.4 29.6 1.9 165
Marital statusA Ever married 5.2 14,398 52.3 8.3 11.8 28.3 0.6 752 Never married 2.5 12,684 71.2 5.8 13.7 8.9 0.3 314
Men's EducationB None/Preschool 1.6 4,665 35.7 7.7 8.1 48.5 0.0 74 Primary 2.0 4,923 35.0 5.9 11.6 47.5 0.7 100 Lower Secondary 2.5 4,803 47.9 7.2 10.2 32.6 3.2 121 Upper Secondary 4.3 7,000 57.7 5.9 15.9 21.6 0.3 299 Higher 8.3 5,701 68.7 9.0 11.6 11.4 0.0 473
Wealth index quintile Poorest 1.3 4,827 26.3 2.2 8.5 63.0 0.0 61 Second 2.7 5,398 41.3 7.6 13.8 37.8 1.1 144 Middle 3.5 5,447 57.1 4.6 14.7 24.5 0.4 191 Fourth 4.5 5,561 65.8 5.9 13.0 15.7 0.0 251 Richest 7.1 5,861 63.7 10.7 11.1 14.7 0.7 419
1 MICS indicator EQ.2a - Health insurance coverage A The category of “Missing” of “Marital status” has been suppressed from the table due to a small number of unweighted cases B The category of “Missing” in the background characteristic of “Men’s education” has been suppressed from the table due to a small number of unweighted cases (*) Figures that are based on fewer than 25 unweighted cases
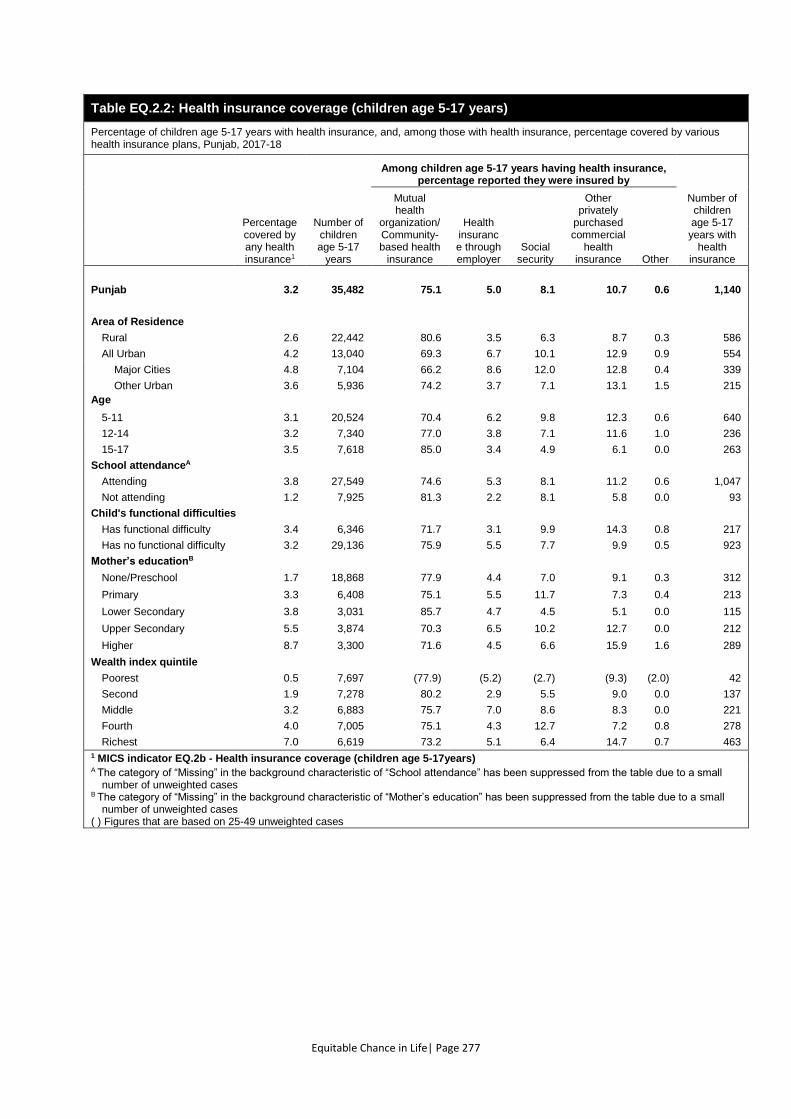
Equitable Chance in Life| Page 277
Table EQ.2.2: Health insurance coverage (children age 5-17 years)
Percentage of children age 5-17 years with health insurance, and, among those with health insurance, percentage covered by various health insurance plans, Punjab, 2017-18
Percentage covered by any health insurance1
Number of children age 5-17
years
Among children age 5-17 years having health insurance, percentage reported they were insured by
Number of children age 5-17 years with
health insurance
Mutual health
organization/ Community-based health
insurance
Health insurance through employer
Social security
Other privately
purchased commercial
health insurance Other
Punjab 3.2 35,482 75.1 5.0 8.1 10.7 0.6 1,140
Area of Residence
Rural 2.6 22,442 80.6 3.5 6.3 8.7 0.3 586
All Urban 4.2 13,040 69.3 6.7 10.1 12.9 0.9 554
Major Cities 4.8 7,104 66.2 8.6 12.0 12.8 0.4 339
Other Urban 3.6 5,936 74.2 3.7 7.1 13.1 1.5 215
Age
5-11 3.1 20,524 70.4 6.2 9.8 12.3 0.6 640
12-14 3.2 7,340 77.0 3.8 7.1 11.6 1.0 236
15-17 3.5 7,618 85.0 3.4 4.9 6.1 0.0 263
School attendanceA
Attending 3.8 27,549 74.6 5.3 8.1 11.2 0.6 1,047
Not attending 1.2 7,925 81.3 2.2 8.1 5.8 0.0 93
Child's functional difficulties
Has functional difficulty 3.4 6,346 71.7 3.1 9.9 14.3 0.8 217
Has no functional difficulty 3.2 29,136 75.9 5.5 7.7 9.9 0.5 923
Mother’s educationB
None/Preschool 1.7 18,868 77.9 4.4 7.0 9.1 0.3 312
Primary 3.3 6,408 75.1 5.5 11.7 7.3 0.4 213
Lower Secondary 3.8 3,031 85.7 4.7 4.5 5.1 0.0 115
Upper Secondary 5.5 3,874 70.3 6.5 10.2 12.7 0.0 212
Higher 8.7 3,300 71.6 4.5 6.6 15.9 1.6 289
Wealth index quintile
Poorest 0.5 7,697 (77.9) (5.2) (2.7) (9.3) (2.0) 42
Second 1.9 7,278 80.2 2.9 5.5 9.0 0.0 137
Middle 3.2 6,883 75.7 7.0 8.6 8.3 0.0 221
Fourth 4.0 7,005 75.1 4.3 12.7 7.2 0.8 278
Richest 7.0 6,619 73.2 5.1 6.4 14.7 0.7 463 1 MICS indicator EQ.2b - Health insurance coverage (children age 5-17years) A The category of “Missing” in the background characteristic of “School attendance” has been suppressed from the table due to a small
number of unweighted cases B The category of “Missing” in the background characteristic of “Mother’s education” has been suppressed from the table due to a small
number of unweighted cases ( ) Figures that are based on 25-49 unweighted cases
Equitable Chance in Life| Page 278
Table EQ.2.3: Health insurance coverage (children under age 5)
Percentage of children under age 5 with health insurance, and, among those with health insurance, percentage covered by various health insurance plans, Punjab, 2017-18
Percentage covered by any health insurance1
Number
of children under age 5
Among children under age 5 having health insurance, percentage reported they were insured by
Number of children under age
5 with health
insurance
Mutual health
organization/ Community-based health
insurance
Health insurance through
employer Social
security
Other privately
purchased commercial
health insurance Other
Punjab 2.3 39,799 70.6 6.6 12.5 8.7 0.4 908
Area of Residence
Rural 1.9 26,190 80.2 4.3 7.7 6.8 0.0 493
All Urban 3.1 13,609 59.3 9.3 18.1 10.9 0.9 415
Major Cities 3.6 7,118 58.8 10.9 20.3 9.3 0.7 259
Other Urban 2.4 6,491 60.0 6.7 14.6 13.7 1.1 156
Child's functional difficulties (age 2-4 years)A
Has functional difficulty 2.3 1,525 (83.6) (7.7) (0.0) (8.7) (0.0) 35
Has no functional difficulty 2.4 22,276 68.9 7.1 13.1 10.1 0.3 528
AgeB
0-11 months 2.0 8,093 72.6 6.5 10.6 6.7 1.1 165
12-23 months 2.3 7,867 71.3 5.1 14.9 6.4 0.0 180
24-35 months 2.3 7,862 69.3 9.2 9.7 11.8 0.0 182
36-47 months 2.4 8,277 67.7 3.5 16.8 11.4 0.0 199
48-59 months 2.4 7,676 72.7 8.9 10.0 6.6 1.0 182
Mother’s education
None/Preschool 0.9 16,922 73.4 7.0 7.1 10.4 0.0 145
Primary 1.7 7,797 74.1 4.8 16.8 2.7 0.0 136
Lower Secondary 2.8 4,141 74.2 9.5 12.7 3.6 0.0 117
Upper Secondary 3.7 5,488 62.9 5.3 16.6 13.1 0.0 201
Higher 5.7 5,451 71.5 6.9 10.4 9.5 1.1 309
Wealth index quintile
Poorest 0.3 9,001 (92.0) (4.6) (0.0) (3.4) (0.0) 23
Second 1.3 7,935 74.3 9.8 6.0 6.1 0.0 106
Middle 2.6 7,853 78.1 1.3 12.5 7.7 0.0 203
Fourth 3.2 7,814 67.1 4.4 20.2 6.6 0.0 249
Richest 4.5 7,195 66.0 10.7 9.6 12.1 1.1 327 1 MICS indicator EQ.2c - Health insurance coverage (children under age 5) A Children age 0-1 years are excluded, as the child functioning is only collected for age 2-4 years. B The category of “Missing” in the background characteristic of “Age” has been suppressed from the table due to a small number of unweighted cases. ( ) Figures that are based on 25-49 unweighted cases
Equitable Chance in Life| Page 279
Table EQ.2.4: Awareness and ever use of external economic support
Percentage of households who are aware and have received external economic support, Punjab, 2017-18
Percentage of households who are aware of economic
assistance programme
Percentage of households who are aware and have ever received assistance
Number of households
Punjab 88.1 18.4 51,660
Area of Residence
Rural 88.5 21.3 32,234
All Urban 87.4 13.7 19,426
Major Cities 86.4 10.1 10,807
Other Urban 88.7 18.1 8,619
SexA
Male 88.1 18.2 46,276
Female 87.6 20.6 5,374
Age of household head
15-19 91.3 21.9 79
20-24 86.5 10.5 874
25-49 87.6 14.7 26,690
50+ 88.7 22.9 24,016
Household with orphans
With at least one orphan 87.8 23.0 3,303
With no orphans 88.1 18.1 48,357
Wealth index quintiles
Poorest 89.2 25.2 10,860
Second 88.4 21.7 10,226
Middle 86.5 18.2 9,913
Fourth 84.9 14.3 10,154
Richest 91.1 12.5 10,507
A The category of “Transgender” in the background characteristic of “Sex” has been suppressed from the table due to a small number of unweighted cases
Equitable Chance in Life| Page 280
Table EQ.2.5: Coverage of social transfers and benefits: All household members
Percentage of household members living in households that received social transfers or benefits in the last 3 months, by type of transfers and benefits, Punjab, 2017-18
Percentage of household members living in households receiving specific types of support in the last 3 months:
Any social transfers or
benefits1
No social transfers
or benefits
Number of household members
Zakat, Bait ul Maal BISP
Khidmat Card
Any retirement pension2
Watan Card or Sehat Card
Any other external
assistance program
School tuition or school related other
support for any household member
age 5-24 years
Punjab 0.1 7.9 1.0 6.6 0.2 0.1 34.6 42.8 57.2 327,980
Area of Residence
Rural 0.1 10.2 1.2 6.5 0.2 0.1 40.4 49.0 51.0 208,708
All Urban 0.0 3.9 0.8 6.9 0.2 0.1 24.5 32.0 68.0 119,272
Major Cities 0.0 1.9 0.1 6.2 0.2 0.1 17.2 23.8 76.2 64,987
Other Urban 0.0 6.3 1.6 7.7 0.2 0.1 33.1 41.8 58.2 54,285
Sex
Male 0.1 8.0 1.1 6.5 0.2 0.1 35.1 43.2 56.8 298,991
Female 0.2 7.0 0.6 8.5 0.2 0.1 28.9 38.7 61.3 28,944
Transgender (0.0) (0.0) (0.0) (21.3) (0.0) (0.0) (27.1) (48.3) (51.7) 44
Education household head
None/Preschool 0.1 12.0 1.0 2.9 0.3 0.1 34.6 42.7 57.3 127,754
Primary 0.1 9.8 1.2 4.8 0.2 0.1 40.0 46.9 53.1 58,040
Lower Secondary 0.0 5.6 1.3 7.0 0.2 0.1 38.8 45.1 54.9 43,763
Upper Secondary 0.0 3.4 1.1 12.3 0.2 0.1 34.1 43.6 56.4 60,304
Higher 0.0 1.2 0.8 12.9 0.1 0.1 22.2 33.2 66.8 38,119
Wealth quintile
Poorest 0.0 18.1 1.2 1.2 0.3 0.1 42.5 51.4 48.6 65,595
Second 0.1 12.2 1.5 4.3 0.3 0.1 45.9 53.5 46.5 65,599
Middle 0.1 6.5 1.5 8.2 0.3 0.1 40.2 48.0 52.0 65,591
Fourth 0.0 2.6 0.8 8.7 0.3 0.1 29.5 37.1 62.9 65,599
Richest 0.0 0.3 0.2 10.8 0.1 0.1 14.9 24.2 75.8 65,596 1 MICS indicator EQ.3 - Population covered by social transfers; SDG indicator 1.3.1 2 Non-MICS indicator EQ.S1 - Receiving Pensions
( ) Figures that are based on 25-49 unweighted cases
Equitable Chance in Life| Page 281
Table EQ.2.6: Coverage of social transfers and benefits: Households in the lowest two wealth quintiles
Percentage of households in the lowest two wealth quintiles that received social transfers or benefits in the last 3 months, by type of transfers or benefits, Punjab, 2017-18
Percentage of households receiving specific types of support in the last 3 months: Any
social transfers
or benefits1
No social transfers
or benefits
Number of households in the two
lowest wealth
quintiles
Zakat, Bait ul Maal BISP
Khidmat Card
Any retirement pension
Watan Card or Sehat
Card
Any other external
assistance program
School tuition or school related other support for any household member
age 5-24 years
Punjab 0.1 6.5 0.9 6.3 0.2 0.1 29.3 37.3 62.7 51,660
Area of Residence
Rural 0.1 8.6 1.0 6.2 0.2 0.1 34.4 42.8 57.2 32,234 All Urban 0.1 3.1 0.6 6.5 0.2 0.1 21.0 28.1 71.9 19,426 Major Cities 0.0 1.5 0.0 5.9 0.2 0.1 14.8 21.1 78.9 10,807 Other Urban 0.1 5.0 1.4 7.3 0.1 0.1 28.7 36.9 63.1 8,619
SexA
Male 0.1 6.6 0.9 6.1 0.2 0.1 30.0 37.7 62.3 46,276 Female 0.3 5.9 0.5 8.0 0.3 0.1 24.0 33.7 66.3 5,374
Age of household head
15-19 1.1 7.8 0.0 1.4 0.0 0.0 21.7 29.8 70.2 79 20-24 0.0 4.3 0.5 2.7 0.0 0.2 11.9 17.5 82.5 874 25-29 0.1 3.3 0.1 2.4 0.1 0.1 12.0 16.5 83.5 2,705 30-34 0.0 3.5 0.4 2.0 0.2 0.0 23.1 26.7 73.3 4,555 35-39 0.1 6.1 0.8 2.1 0.2 0.1 34.7 38.8 61.2 6,659 40-44 0.1 7.6 1.4 2.6 0.1 0.1 40.3 44.7 55.3 6,373 45-49 0.1 9.2 1.6 4.7 0.2 0.1 41.8 48.1 51.9 6,398 50-59 0.1 8.2 1.0 7.7 0.2 0.1 30.3 39.7 60.3 12,195 60-69 0.1 5.5 0.4 13.3 0.2 0.1 19.6 34.0 66.0 7,677 70+ 0.1 4.4 0.4 12.9 0.3 0.1 22.0 35.5 64.5 4,144
Education of household head
None/Preschool 0.1 10.3 0.8 2.7 0.2 0.1 29.1 36.8 63.2 19,775 Primary 0.1 8.1 0.9 4.6 0.2 0.1 34.4 41.2 58.8 9,044 Lower Secondary 0.0 4.4 1.1 6.7 0.2 0.0 33.4 39.7 60.3 6,826 Upper Secondary 0.0 2.8 0.9 11.4 0.1 0.1 29.4 38.7 61.3 9,523 Higher 0.0 0.8 0.6 12.1 0.1 0.1 18.4 29.0 71.0 6,492
Wealth quintile
Poorest 0.1 14.8 1.0 1.2 0.3 0.1 35.2 43.4 56.6 10,860 Second 0.1 10.1 1.2 4.3 0.2 0.1 39.3 46.5 53.5 10,226 Middle 0.1 5.1 1.3 7.8 0.2 0.1 34.8 42.3 57.7 9,913 Fourth 0.1 2.1 0.7 8.3 0.2 0.1 25.2 32.7 67.3 10,154 Richest 0.0 0.3 0.2 10.4 0.0 0.1 12.4 21.8 78.2 10,507
1 MICS indicator EQ.4 - External economic support to the poorest households A The category of “Transgender” in the background characteristic of “Sex” has been suppressed from the table due to a small number of unweighted cases
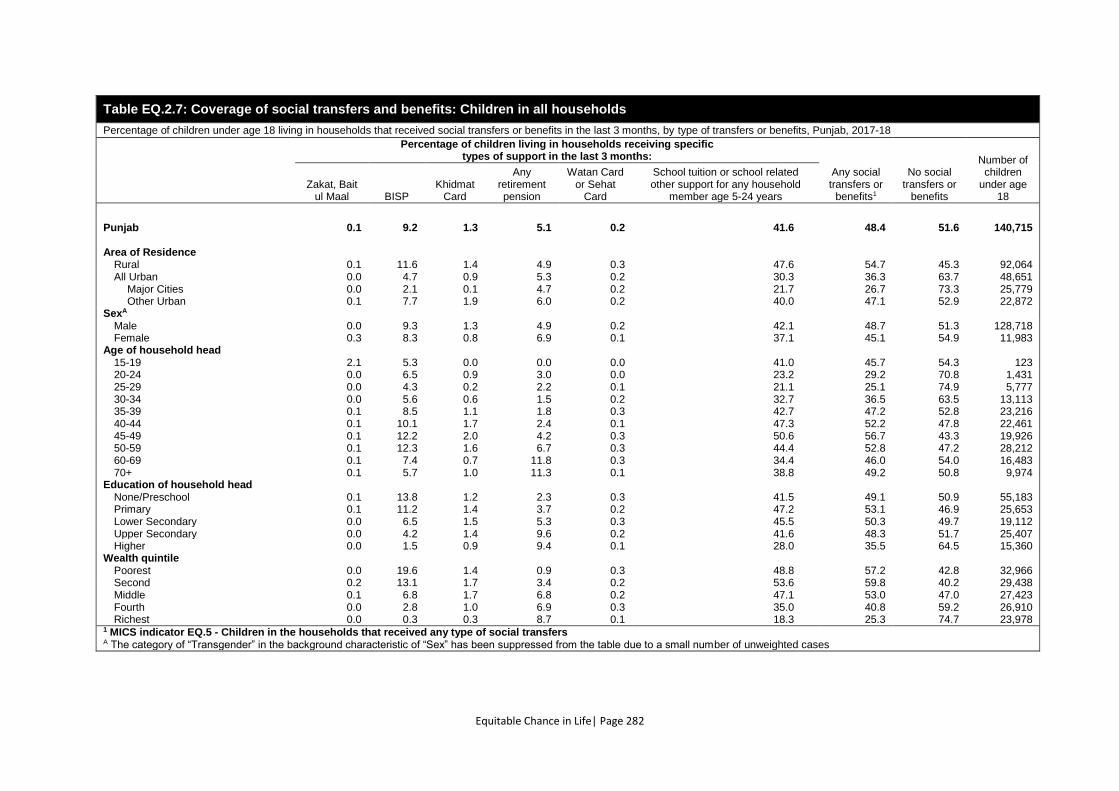
Equitable Chance in Life| Page 282
Table EQ.2.7: Coverage of social transfers and benefits: Children in all households
Percentage of children under age 18 living in households that received social transfers or benefits in the last 3 months, by type of transfers or benefits, Punjab, 2017-18
Percentage of children living in households receiving specific types of support in the last 3 months:
Any social transfers or
benefits1
No social transfers or
benefits
Number of children
under age 18
Zakat, Bait ul Maal BISP
Khidmat Card
Any retirement pension
Watan Card or Sehat
Card
School tuition or school related other support for any household
member age 5-24 years
Punjab 0.1 9.2 1.3 5.1 0.2 41.6 48.4 51.6 140,715
Area of Residence
Rural 0.1 11.6 1.4 4.9 0.3 47.6 54.7 45.3 92,064 All Urban 0.0 4.7 0.9 5.3 0.2 30.3 36.3 63.7 48,651 Major Cities 0.0 2.1 0.1 4.7 0.2 21.7 26.7 73.3 25,779 Other Urban 0.1 7.7 1.9 6.0 0.2 40.0 47.1 52.9 22,872
SexA Male 0.0 9.3 1.3 4.9 0.2 42.1 48.7 51.3 128,718 Female 0.3 8.3 0.8 6.9 0.1 37.1 45.1 54.9 11,983
Age of household head 15-19 2.1 5.3 0.0 0.0 0.0 41.0 45.7 54.3 123 20-24 0.0 6.5 0.9 3.0 0.0 23.2 29.2 70.8 1,431 25-29 0.0 4.3 0.2 2.2 0.1 21.1 25.1 74.9 5,777 30-34 0.0 5.6 0.6 1.5 0.2 32.7 36.5 63.5 13,113 35-39 0.1 8.5 1.1 1.8 0.3 42.7 47.2 52.8 23,216 40-44 0.1 10.1 1.7 2.4 0.1 47.3 52.2 47.8 22,461 45-49 0.1 12.2 2.0 4.2 0.3 50.6 56.7 43.3 19,926 50-59 0.1 12.3 1.6 6.7 0.3 44.4 52.8 47.2 28,212 60-69 0.1 7.4 0.7 11.8 0.3 34.4 46.0 54.0 16,483 70+ 0.1 5.7 1.0 11.3 0.1 38.8 49.2 50.8 9,974
Education of household head None/Preschool 0.1 13.8 1.2 2.3 0.3 41.5 49.1 50.9 55,183 Primary 0.1 11.2 1.4 3.7 0.2 47.2 53.1 46.9 25,653 Lower Secondary 0.0 6.5 1.5 5.3 0.3 45.5 50.3 49.7 19,112 Upper Secondary 0.0 4.2 1.4 9.6 0.2 41.6 48.3 51.7 25,407 Higher 0.0 1.5 0.9 9.4 0.1 28.0 35.5 64.5 15,360
Wealth quintile Poorest 0.0 19.6 1.4 0.9 0.3 48.8 57.2 42.8 32,966 Second 0.2 13.1 1.7 3.4 0.2 53.6 59.8 40.2 29,438 Middle 0.1 6.8 1.7 6.8 0.2 47.1 53.0 47.0 27,423 Fourth 0.0 2.8 1.0 6.9 0.3 35.0 40.8 59.2 26,910 Richest 0.0 0.3 0.3 8.7 0.1 18.3 25.3 74.7 23,978
1 MICS indicator EQ.5 - Children in the households that received any type of social transfers A The category of “Transgender” in the background characteristic of “Sex” has been suppressed from the table due to a small number of unweighted cases
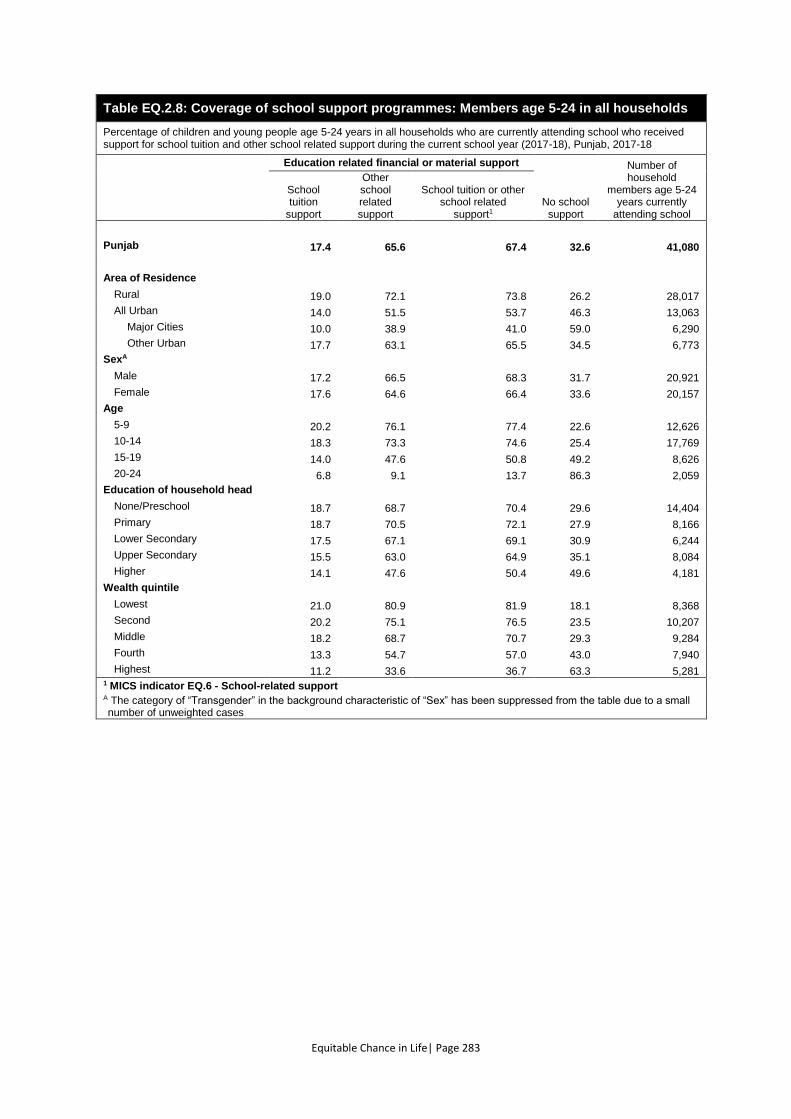
Equitable Chance in Life| Page 283
Table EQ.2.8: Coverage of school support programmes: Members age 5-24 in all households
Percentage of children and young people age 5-24 years in all households who are currently attending school who received support for school tuition and other school related support during the current school year (2017-18), Punjab, 2017-18
Education related financial or material support
No school support
Number of household
members age 5-24 years currently
attending school
School tuition
support
Other school related support
School tuition or other school related
support1
Punjab 17.4 65.6 67.4 32.6 41,080
Area of Residence
Rural 19.0 72.1 73.8 26.2 28,017
All Urban 14.0 51.5 53.7 46.3 13,063
Major Cities 10.0 38.9 41.0 59.0 6,290
Other Urban 17.7 63.1 65.5 34.5 6,773
SexA Male 17.2 66.5 68.3 31.7 20,921
Female 17.6 64.6 66.4 33.6 20,157
Age 5-9 20.2 76.1 77.4 22.6 12,626
10-14 18.3 73.3 74.6 25.4 17,769
15-19 14.0 47.6 50.8 49.2 8,626
20-24 6.8 9.1 13.7 86.3 2,059
Education of household head None/Preschool 18.7 68.7 70.4 29.6 14,404
Primary 18.7 70.5 72.1 27.9 8,166
Lower Secondary 17.5 67.1 69.1 30.9 6,244
Upper Secondary 15.5 63.0 64.9 35.1 8,084
Higher 14.1 47.6 50.4 49.6 4,181
Wealth quintile Lowest 21.0 80.9 81.9 18.1 8,368
Second 20.2 75.1 76.5 23.5 10,207
Middle 18.2 68.7 70.7 29.3 9,284
Fourth 13.3 54.7 57.0 43.0 7,940
Highest 11.2 33.6 36.7 63.3 5,281 1 MICS indicator EQ.6 - School-related support A The category of “Transgender” in the background characteristic of “Sex” has been suppressed from the table due to a small number of unweighted cases
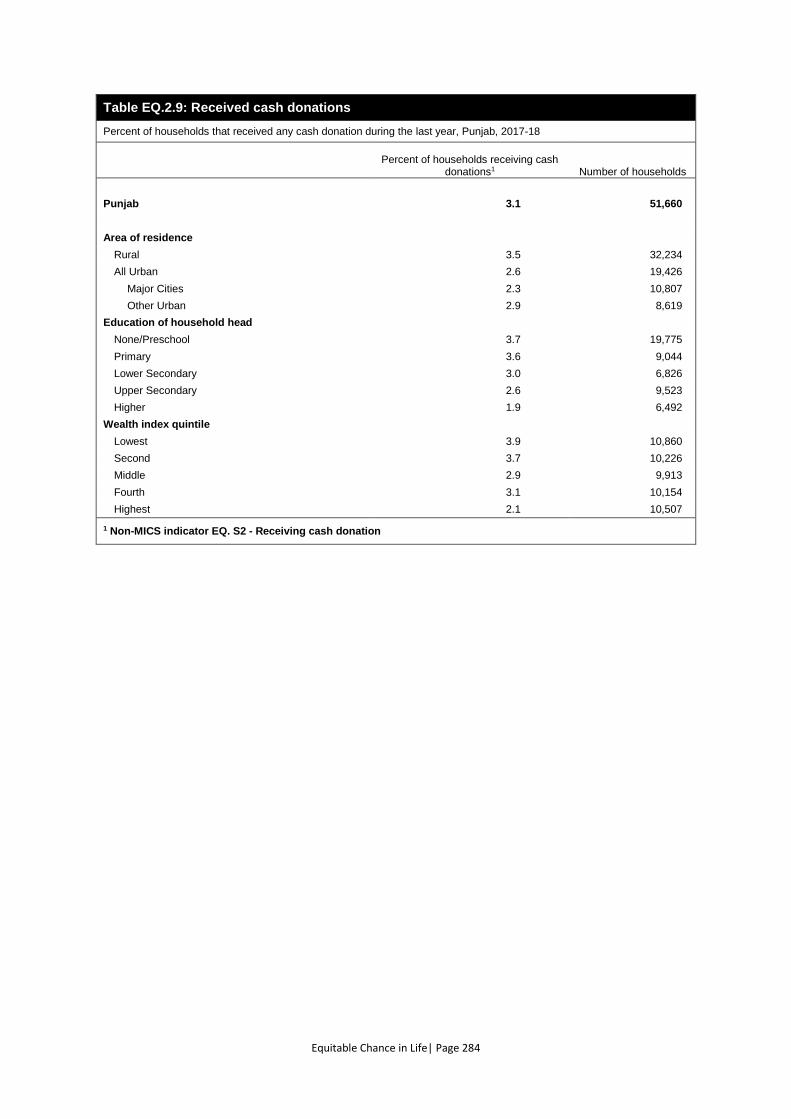
Equitable Chance in Life| Page 284
Table EQ.2.9: Received cash donations
Percent of households that received any cash donation during the last year, Punjab, 2017-18
Percent of households receiving cash donations1 Number of households
Punjab 3.1 51,660
Area of residence
Rural 3.5 32,234
All Urban 2.6 19,426
Major Cities 2.3 10,807
Other Urban 2.9 8,619
Education of household head
None/Preschool 3.7 19,775
Primary 3.6 9,044
Lower Secondary 3.0 6,826
Upper Secondary 2.6 9,523
Higher 1.9 6,492
Wealth index quintile
Lowest 3.9 10,860
Second 3.7 10,226
Middle 2.9 9,913
Fourth 3.1 10,154
Highest 2.1 10,507
1 Non-MICS indicator EQ. S2 - Receiving cash donation
Equitable Chance in Life| Page 285
EQ.3 DISCRIMINATION AND HARASSMENT
Discrimination can impede individuals from accessing opportunities and services in a fair and equal
manner. These questions are designed to measure the experiences of discrimination and harassment
of respondents in the 12 months before the survey. The questions include specific grounds of
discrimination and harassment which can increase the respondents’ recall of events.
Tables EQ.3.1W and EQ.3.1M show the percentage of women and men (age 15-49) who felt
discriminated against or harassed based on a number of grounds.
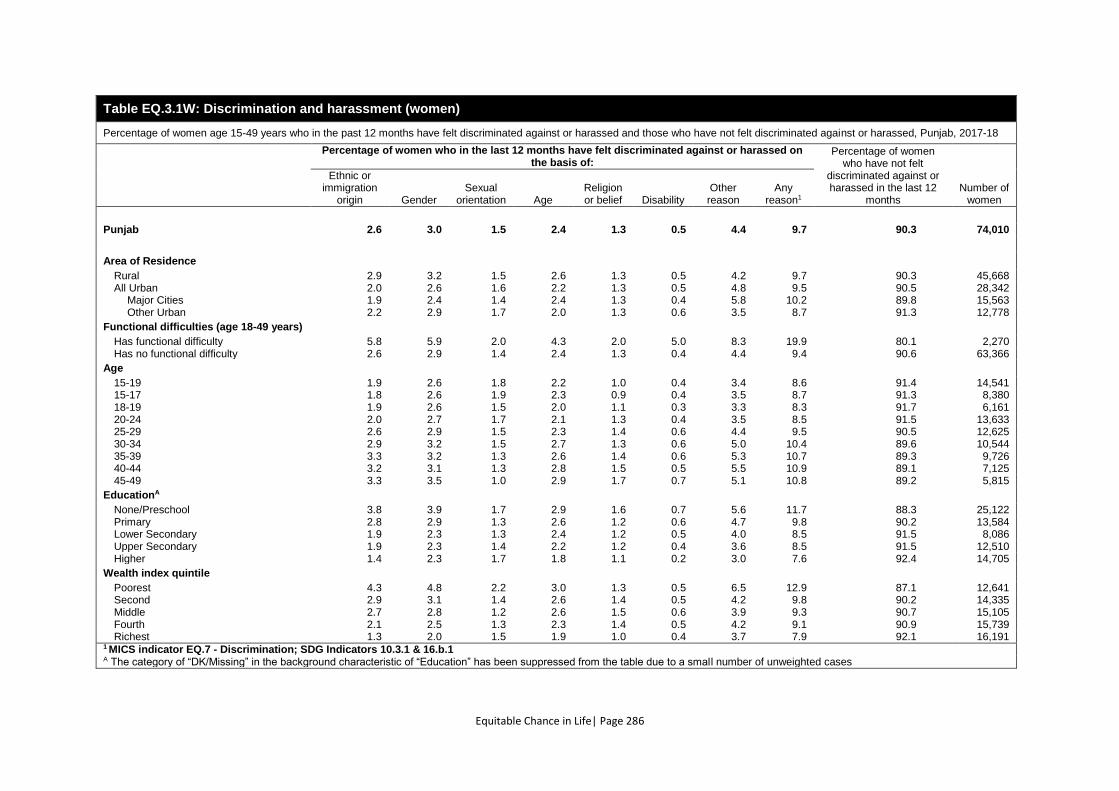
Equitable Chance in Life| Page 286
Table EQ.3.1W: Discrimination and harassment (women)
Percentage of women age 15-49 years who in the past 12 months have felt discriminated against or harassed and those who have not felt discriminated against or harassed, Punjab, 2017-18
Percentage of women who in the last 12 months have felt discriminated against or harassed on the basis of:
Percentage of women who have not felt
discriminated against or harassed in the last 12
months Number of
women
Ethnic or immigration
origin Gender Sexual
orientation Age Religion or belief Disability
Other reason
Any reason1
Punjab 2.6 3.0 1.5 2.4 1.3 0.5 4.4 9.7 90.3 74,010
Area of Residence
Rural 2.9 3.2 1.5 2.6 1.3 0.5 4.2 9.7 90.3 45,668 All Urban 2.0 2.6 1.6 2.2 1.3 0.5 4.8 9.5 90.5 28,342 Major Cities 1.9 2.4 1.4 2.4 1.3 0.4 5.8 10.2 89.8 15,563 Other Urban 2.2 2.9 1.7 2.0 1.3 0.6 3.5 8.7 91.3 12,778
Functional difficulties (age 18-49 years)
Has functional difficulty 5.8 5.9 2.0 4.3 2.0 5.0 8.3 19.9 80.1 2,270 Has no functional difficulty 2.6 2.9 1.4 2.4 1.3 0.4 4.4 9.4 90.6 63,366
Age
15-19 1.9 2.6 1.8 2.2 1.0 0.4 3.4 8.6 91.4 14,541 15-17 1.8 2.6 1.9 2.3 0.9 0.4 3.5 8.7 91.3 8,380 18-19 1.9 2.6 1.5 2.0 1.1 0.3 3.3 8.3 91.7 6,161 20-24 2.0 2.7 1.7 2.1 1.3 0.4 3.5 8.5 91.5 13,633 25-29 2.6 2.9 1.5 2.3 1.4 0.6 4.4 9.5 90.5 12,625 30-34 2.9 3.2 1.5 2.7 1.3 0.6 5.0 10.4 89.6 10,544 35-39 3.3 3.2 1.3 2.6 1.4 0.6 5.3 10.7 89.3 9,726 40-44 3.2 3.1 1.3 2.8 1.5 0.5 5.5 10.9 89.1 7,125 45-49 3.3 3.5 1.0 2.9 1.7 0.7 5.1 10.8 89.2 5,815
EducationA
None/Preschool 3.8 3.9 1.7 2.9 1.6 0.7 5.6 11.7 88.3 25,122 Primary 2.8 2.9 1.3 2.6 1.2 0.6 4.7 9.8 90.2 13,584 Lower Secondary 1.9 2.3 1.3 2.4 1.2 0.5 4.0 8.5 91.5 8,086 Upper Secondary 1.9 2.3 1.4 2.2 1.2 0.4 3.6 8.5 91.5 12,510 Higher 1.4 2.3 1.7 1.8 1.1 0.2 3.0 7.6 92.4 14,705
Wealth index quintile
Poorest 4.3 4.8 2.2 3.0 1.3 0.5 6.5 12.9 87.1 12,641 Second 2.9 3.1 1.4 2.6 1.4 0.5 4.2 9.8 90.2 14,335 Middle 2.7 2.8 1.2 2.6 1.5 0.6 3.9 9.3 90.7 15,105 Fourth 2.1 2.5 1.3 2.3 1.4 0.5 4.2 9.1 90.9 15,739 Richest 1.3 2.0 1.5 1.9 1.0 0.4 3.7 7.9 92.1 16,191
1 MICS indicator EQ.7 - Discrimination; SDG Indicators 10.3.1 & 16.b.1 A The category of “DK/Missing” in the background characteristic of “Education” has been suppressed from the table due to a small number of unweighted cases

Equitable Chance in Life| Page 287
Table EQ.3.1M: Discrimination and harassment (men)
Percentage of men age 15-49 years who in the past 12 months have felt discriminated against or harassed and those who have not felt discriminated against or harassed, Punjab, 2017-18
Percentage of men who in the last 12 months have felt discriminated against or harassed on the basis of: Percentage of men who
have not felt discriminated against or harassed in the
last 12 months Number of
men
Ethnic or immigration
origin Gender Sexual
orientation Age Religion or belief Disability
Other reason
Any reason1
Punjab 3.0 1.4 0.7 2.2 2.2 0.6 2.7 8.5 91.5 27,094
Area of Residence
Rural 3.5 1.4 0.8 2.2 2.3 0.6 2.3 8.9 91.1 16,748 All Urban 2.1 1.4 0.6 2.2 2.2 0.6 3.2 8.0 92.0 10,346 Major Cities 1.7 1.5 0.4 2.3 2.1 0.6 3.8 8.2 91.8 5,779 Other Urban 2.5 1.2 0.8 2.1 2.2 0.6 2.3 7.6 92.4 4,567
Functional difficulties (age 18-49 years)
Has functional difficulty 3.7 1.4 0.0 2.0 2.3 9.0 3.7 15.5 84.5 538 Has no functional difficulty 3.0 1.4 0.7 2.1 2.2 0.4 2.7 8.4 91.6 22,774
Age
15-19 2.6 1.5 0.8 3.3 2.3 0.4 2.3 8.6 91.4 6,146 15-17 2.5 1.4 1.1 3.3 2.2 0.5 2.0 8.2 91.8 3,733 18-19 2.7 1.5 0.4 3.2 2.6 0.4 2.8 9.1 90.9 2,413 20-24 2.8 1.3 0.7 2.2 2.4 0.7 2.2 8.2 91.8 4,841 25-29 2.7 1.5 0.8 1.8 1.9 0.6 3.2 8.3 91.7 4,300 30-34 3.1 1.4 0.8 2.1 2.1 0.5 2.6 8.2 91.8 3,581 35-39 3.2 1.5 0.6 2.0 2.3 0.7 2.6 8.5 91.5 3,478 40-44 3.5 1.0 0.5 1.4 2.1 0.7 2.3 8.4 91.6 2,479 45-49 3.7 1.0 0.9 1.8 2.5 0.9 3.8 10.2 89.8 2,269
Men's EducationA
None/Preschool 5.4 1.4 0.9 2.7 2.9 1.1 3.4 11.8 88.2 4,665 Primary 3.0 1.1 0.7 2.2 2.1 0.8 2.8 8.6 91.4 4,923 Lower Secondary 2.6 1.1 0.6 2.0 2.3 0.4 2.3 7.3 92.7 4,803 Upper Secondary 2.3 1.4 0.6 2.3 2.0 0.4 2.6 7.8 92.2 7,000 Higher 2.0 1.9 0.9 2.0 2.0 0.4 2.3 7.7 92.3 5,701
Wealth index quintile Poorest 5.7 1.8 1.1 2.6 2.8 1.0 3.1 11.2 88.8 4,827 Second 3.2 1.2 0.6 2.8 2.5 0.7 2.5 9.0 91.0 5,398 Middle 2.6 1.1 0.7 2.1 2.0 0.6 2.8 8.2 91.8 5,447 Fourth 1.8 1.1 0.5 1.6 2.1 0.6 2.1 6.9 93.1 5,561 Richest 1.8 1.6 0.8 2.1 1.9 0.4 2.8 7.7 92.3 5,861
1 MICS indicator EQ.7 - Discrimination; SDG Indicators 10.3.1 & 16.b.1 A The category of “DK/Missing” in the background characteristic of “Men's Education” has been suppressed from the table due to a small number of unweighted cases

Equitable Chance in Life| Page 288
EQ.4 SUBJECTIVE WELL-BEING
Subjective perceptions of individuals of their incomes, health, living environments and the like, play a
significant role in their lives and can impact their perception of well-being, irrespective of objective
conditions such as actual income and physical health status146.
MICS Punjab, 2017-18 included a question about happiness and the respondents’ overall satisfaction with
life. To assist respondents in answering the question on happiness, they were shown a card with smiling
faces (and not so smiling faces) that corresponded to the response categories (see the Questionnaires in
Appendix E) ‘very happy’, ‘somewhat happy ‘, ‘neither happy nor unhappy’, ‘somewhat unhappy’ and ‘very
unhappy’. They were then shown a pictorial of a ladder with steps numbered from 0 at the bottom to 10 at
the top and asked to indicate at which step of the ladder they feel they are standing at the time of the survey
to indicate their level of life satisfaction. Tables EQ.4.1W and EQ.4.1M present the percentage of women
age 15-49 years, and age 15-24 years separately, who are very or somewhat satisfied with their life overall,
ladder step reported and the average life satisfaction score.
In addition to the questions on life satisfaction and happiness, respondents were also asked two simple
questions on whether they think their life improved during the last one year, and whether they think their
life will be better in one year’s time. Such information may contribute to the understanding of desperation
that may exist among young people, as well as hopelessness and hopes for the future. Specific combinations
of the perceptions during the last one year and expectations for the next one year may be valuable
information to understand the general sense of well-being among young people. In Tables EQ.4.2W and
EQ.4.2M, women’s and men’s perceptions of a better life are shown.
146 OECD. OECD Guidelines on Measuring Subjective Well-being. Paris: OECD Publishing, 2013. https://read.oecd-
ilibrary.org/economics/oecd-guidelines-on-measuring-subjective-well-being_9789264191655-en#page1
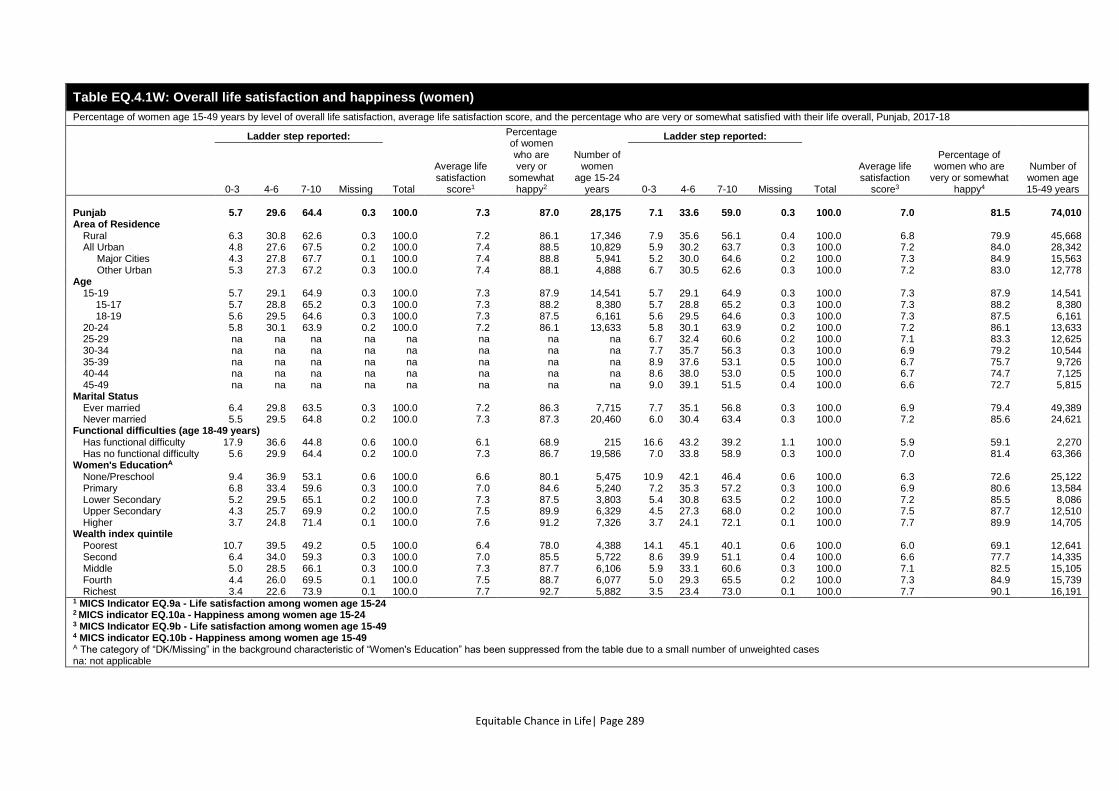
Equitable Chance in Life| Page 289
Table EQ.4.1W: Overall life satisfaction and happiness (women)
Percentage of women age 15-49 years by level of overall life satisfaction, average life satisfaction score, and the percentage who are very or somewhat satisfied with their life overall, Punjab, 2017-18
Ladder step reported:
Total
Average life satisfaction
score1
Percentage of women who are very or
somewhat happy2
Number of women
age 15-24 years
Ladder step reported:
Total
Average life satisfaction
score3
Percentage of women who are
very or somewhat happy4
Number of women age 15-49 years 0-3 4-6 7-10 Missing 0-3 4-6 7-10 Missing
Punjab 5.7 29.6 64.4 0.3 100.0 7.3 87.0 28,175 7.1 33.6 59.0 0.3 100.0 7.0 81.5 74,010 Area of Residence
Rural 6.3 30.8 62.6 0.3 100.0 7.2 86.1 17,346 7.9 35.6 56.1 0.4 100.0 6.8 79.9 45,668 All Urban 4.8 27.6 67.5 0.2 100.0 7.4 88.5 10,829 5.9 30.2 63.7 0.3 100.0 7.2 84.0 28,342 Major Cities 4.3 27.8 67.7 0.1 100.0 7.4 88.8 5,941 5.2 30.0 64.6 0.2 100.0 7.3 84.9 15,563 Other Urban 5.3 27.3 67.2 0.3 100.0 7.4 88.1 4,888 6.7 30.5 62.6 0.3 100.0 7.2 83.0 12,778
Age
15-19 5.7 29.1 64.9 0.3 100.0 7.3 87.9 14,541 5.7 29.1 64.9 0.3 100.0 7.3 87.9 14,541 15-17 5.7 28.8 65.2 0.3 100.0 7.3 88.2 8,380 5.7 28.8 65.2 0.3 100.0 7.3 88.2 8,380 18-19 5.6 29.5 64.6 0.3 100.0 7.3 87.5 6,161 5.6 29.5 64.6 0.3 100.0 7.3 87.5 6,161 20-24 5.8 30.1 63.9 0.2 100.0 7.2 86.1 13,633 5.8 30.1 63.9 0.2 100.0 7.2 86.1 13,633 25-29 na na na na na na na na 6.7 32.4 60.6 0.2 100.0 7.1 83.3 12,625 30-34 na na na na na na na na 7.7 35.7 56.3 0.3 100.0 6.9 79.2 10,544 35-39 na na na na na na na na 8.9 37.6 53.1 0.5 100.0 6.7 75.7 9,726 40-44 na na na na na na na na 8.6 38.0 53.0 0.5 100.0 6.7 74.7 7,125 45-49 na na na na na na na na 9.0 39.1 51.5 0.4 100.0 6.6 72.7 5,815
Marital Status
Ever married 6.4 29.8 63.5 0.3 100.0 7.2 86.3 7,715 7.7 35.1 56.8 0.3 100.0 6.9 79.4 49,389 Never married 5.5 29.5 64.8 0.2 100.0 7.3 87.3 20,460 6.0 30.4 63.4 0.3 100.0 7.2 85.6 24,621
Functional difficulties (age 18-49 years)
Has functional difficulty 17.9 36.6 44.8 0.6 100.0 6.1 68.9 215 16.6 43.2 39.2 1.1 100.0 5.9 59.1 2,270 Has no functional difficulty 5.6 29.9 64.4 0.2 100.0 7.3 86.7 19,586 7.0 33.8 58.9 0.3 100.0 7.0 81.4 63,366
Women's EducationA
None/Preschool 9.4 36.9 53.1 0.6 100.0 6.6 80.1 5,475 10.9 42.1 46.4 0.6 100.0 6.3 72.6 25,122 Primary 6.8 33.4 59.6 0.3 100.0 7.0 84.6 5,240 7.2 35.3 57.2 0.3 100.0 6.9 80.6 13,584 Lower Secondary 5.2 29.5 65.1 0.2 100.0 7.3 87.5 3,803 5.4 30.8 63.5 0.2 100.0 7.2 85.5 8,086 Upper Secondary 4.3 25.7 69.9 0.2 100.0 7.5 89.9 6,329 4.5 27.3 68.0 0.2 100.0 7.5 87.7 12,510 Higher 3.7 24.8 71.4 0.1 100.0 7.6 91.2 7,326 3.7 24.1 72.1 0.1 100.0 7.7 89.9 14,705
Wealth index quintile
Poorest 10.7 39.5 49.2 0.5 100.0 6.4 78.0 4,388 14.1 45.1 40.1 0.6 100.0 6.0 69.1 12,641 Second 6.4 34.0 59.3 0.3 100.0 7.0 85.5 5,722 8.6 39.9 51.1 0.4 100.0 6.6 77.7 14,335 Middle 5.0 28.5 66.1 0.3 100.0 7.3 87.7 6,106 5.9 33.1 60.6 0.3 100.0 7.1 82.5 15,105 Fourth 4.4 26.0 69.5 0.1 100.0 7.5 88.7 6,077 5.0 29.3 65.5 0.2 100.0 7.3 84.9 15,739 Richest 3.4 22.6 73.9 0.1 100.0 7.7 92.7 5,882 3.5 23.4 73.0 0.1 100.0 7.7 90.1 16,191
1 MICS Indicator EQ.9a - Life satisfaction among women age 15-24 2 MICS indicator EQ.10a - Happiness among women age 15-24 3 MICS Indicator EQ.9b - Life satisfaction among women age 15-49 4 MICS indicator EQ.10b - Happiness among women age 15-49 A The category of “DK/Missing” in the background characteristic of “Women's Education” has been suppressed from the table due to a small number of unweighted cases na: not applicable
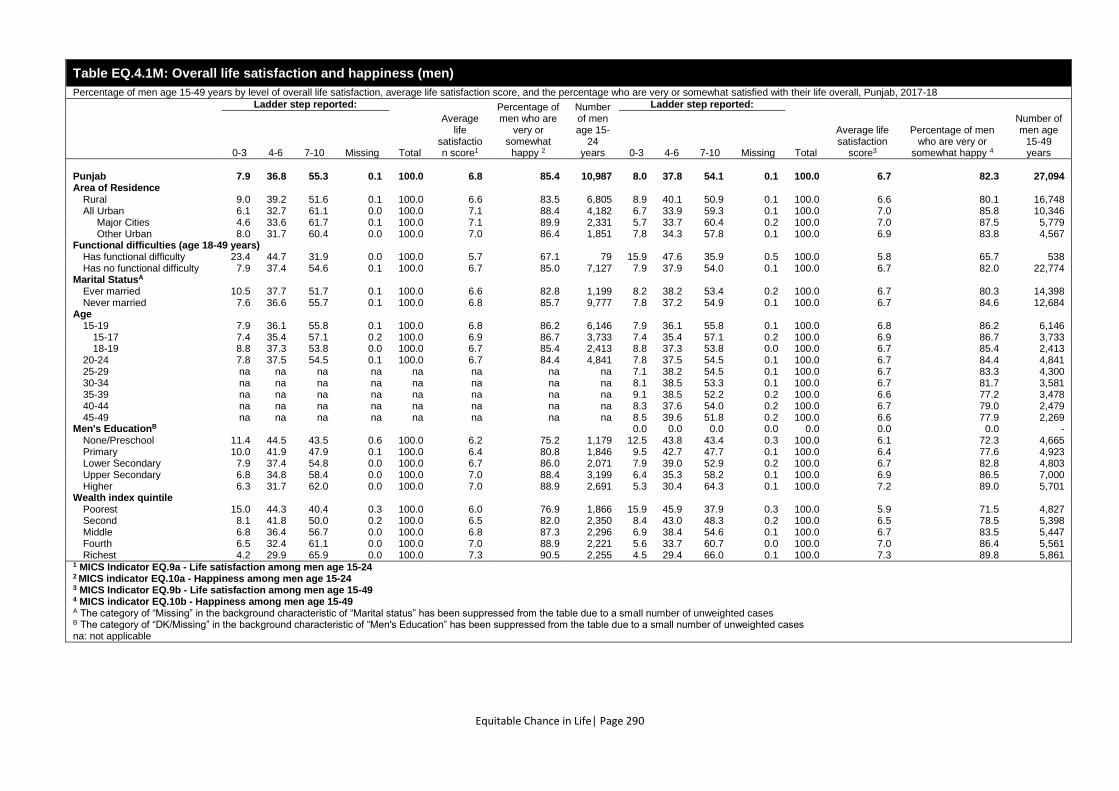
Equitable Chance in Life| Page 290
Table EQ.4.1M: Overall life satisfaction and happiness (men)
Percentage of men age 15-49 years by level of overall life satisfaction, average life satisfaction score, and the percentage who are very or somewhat satisfied with their life overall, Punjab, 2017-18
Ladder step reported:
Total
Average life
satisfaction score1
Percentage of men who are
very or somewhat
happy 2
Number of men age 15-
24 years
Ladder step reported:
Total
Average life satisfaction
score3
Percentage of men who are very or
somewhat happy 4
Number of men age
15-49 years 0-3 4-6 7-10 Missing 0-3 4-6 7-10 Missing
Punjab 7.9 36.8 55.3 0.1 100.0 6.8 85.4 10,987 8.0 37.8 54.1 0.1 100.0 6.7 82.3 27,094 Area of Residence
Rural 9.0 39.2 51.6 0.1 100.0 6.6 83.5 6,805 8.9 40.1 50.9 0.1 100.0 6.6 80.1 16,748 All Urban 6.1 32.7 61.1 0.0 100.0 7.1 88.4 4,182 6.7 33.9 59.3 0.1 100.0 7.0 85.8 10,346 Major Cities 4.6 33.6 61.7 0.1 100.0 7.1 89.9 2,331 5.7 33.7 60.4 0.2 100.0 7.0 87.5 5,779 Other Urban 8.0 31.7 60.4 0.0 100.0 7.0 86.4 1,851 7.8 34.3 57.8 0.1 100.0 6.9 83.8 4,567
Functional difficulties (age 18-49 years)
Has functional difficulty 23.4 44.7 31.9 0.0 100.0 5.7 67.1 79 15.9 47.6 35.9 0.5 100.0 5.8 65.7 538 Has no functional difficulty 7.9 37.4 54.6 0.1 100.0 6.7 85.0 7,127 7.9 37.9 54.0 0.1 100.0 6.7 82.0 22,774
Marital StatusA
Ever married 10.5 37.7 51.7 0.1 100.0 6.6 82.8 1,199 8.2 38.2 53.4 0.2 100.0 6.7 80.3 14,398 Never married 7.6 36.6 55.7 0.1 100.0 6.8 85.7 9,777 7.8 37.2 54.9 0.1 100.0 6.7 84.6 12,684
Age
15-19 7.9 36.1 55.8 0.1 100.0 6.8 86.2 6,146 7.9 36.1 55.8 0.1 100.0 6.8 86.2 6,146 15-17 7.4 35.4 57.1 0.2 100.0 6.9 86.7 3,733 7.4 35.4 57.1 0.2 100.0 6.9 86.7 3,733 18-19 8.8 37.3 53.8 0.0 100.0 6.7 85.4 2,413 8.8 37.3 53.8 0.0 100.0 6.7 85.4 2,413
20-24 7.8 37.5 54.5 0.1 100.0 6.7 84.4 4,841 7.8 37.5 54.5 0.1 100.0 6.7 84.4 4,841 25-29 na na na na na na na na 7.1 38.2 54.5 0.1 100.0 6.7 83.3 4,300 30-34 na na na na na na na na 8.1 38.5 53.3 0.1 100.0 6.7 81.7 3,581 35-39 na na na na na na na na 9.1 38.5 52.2 0.2 100.0 6.6 77.2 3,478 40-44 na na na na na na na na 8.3 37.6 54.0 0.2 100.0 6.7 79.0 2,479 45-49 na na na na na na na na 8.5 39.6 51.8 0.2 100.0 6.6 77.9 2,269
Men's EducationB 0.0 0.0 0.0 0.0 0.0 0.0 0.0 - None/Preschool 11.4 44.5 43.5 0.6 100.0 6.2 75.2 1,179 12.5 43.8 43.4 0.3 100.0 6.1 72.3 4,665 Primary 10.0 41.9 47.9 0.1 100.0 6.4 80.8 1,846 9.5 42.7 47.7 0.1 100.0 6.4 77.6 4,923 Lower Secondary 7.9 37.4 54.8 0.0 100.0 6.7 86.0 2,071 7.9 39.0 52.9 0.2 100.0 6.7 82.8 4,803 Upper Secondary 6.8 34.8 58.4 0.0 100.0 7.0 88.4 3,199 6.4 35.3 58.2 0.1 100.0 6.9 86.5 7,000 Higher 6.3 31.7 62.0 0.0 100.0 7.0 88.9 2,691 5.3 30.4 64.3 0.1 100.0 7.2 89.0 5,701
Wealth index quintile
Poorest 15.0 44.3 40.4 0.3 100.0 6.0 76.9 1,866 15.9 45.9 37.9 0.3 100.0 5.9 71.5 4,827 Second 8.1 41.8 50.0 0.2 100.0 6.5 82.0 2,350 8.4 43.0 48.3 0.2 100.0 6.5 78.5 5,398 Middle 6.8 36.4 56.7 0.0 100.0 6.8 87.3 2,296 6.9 38.4 54.6 0.1 100.0 6.7 83.5 5,447 Fourth 6.5 32.4 61.1 0.0 100.0 7.0 88.9 2,221 5.6 33.7 60.7 0.0 100.0 7.0 86.4 5,561 Richest 4.2 29.9 65.9 0.0 100.0 7.3 90.5 2,255 4.5 29.4 66.0 0.1 100.0 7.3 89.8 5,861
1 MICS Indicator EQ.9a - Life satisfaction among men age 15-24 2 MICS indicator EQ.10a - Happiness among men age 15-24 3 MICS Indicator EQ.9b - Life satisfaction among men age 15-49 4 MICS indicator EQ.10b - Happiness among men age 15-49 A The category of “Missing” in the background characteristic of “Marital status” has been suppressed from the table due to a small number of unweighted cases B The category of “DK/Missing” in the background characteristic of “Men's Education” has been suppressed from the table due to a small number of unweighted cases na: not applicable
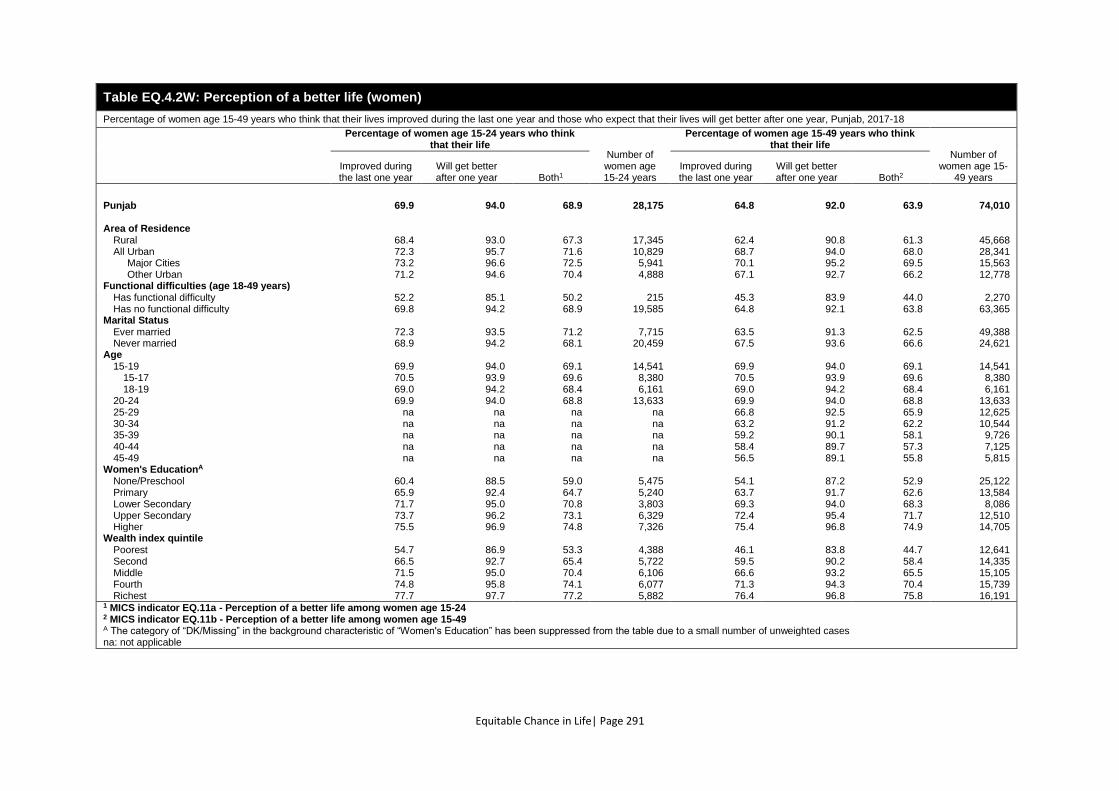
Equitable Chance in Life| Page 291
Table EQ.4.2W: Perception of a better life (women)
Percentage of women age 15-49 years who think that their lives improved during the last one year and those who expect that their lives will get better after one year, Punjab, 2017-18
Percentage of women age 15-24 years who think that their life
Number of women age 15-24 years
Percentage of women age 15-49 years who think that their life
Number of women age 15-
49 years Improved during the last one year
Will get better after one year Both1
Improved during the last one year
Will get better after one year Both2
Punjab 69.9 94.0 68.9 28,175 64.8 92.0 63.9 74,010
Area of Residence
Rural 68.4 93.0 67.3 17,345 62.4 90.8 61.3 45,668 All Urban 72.3 95.7 71.6 10,829 68.7 94.0 68.0 28,341 Major Cities 73.2 96.6 72.5 5,941 70.1 95.2 69.5 15,563 Other Urban 71.2 94.6 70.4 4,888 67.1 92.7 66.2 12,778
Functional difficulties (age 18-49 years) Has functional difficulty 52.2 85.1 50.2 215 45.3 83.9 44.0 2,270 Has no functional difficulty 69.8 94.2 68.9 19,585 64.8 92.1 63.8 63,365
Marital Status Ever married 72.3 93.5 71.2 7,715 63.5 91.3 62.5 49,388 Never married 68.9 94.2 68.1 20,459 67.5 93.6 66.6 24,621
Age 15-19 69.9 94.0 69.1 14,541 69.9 94.0 69.1 14,541
15-17 70.5 93.9 69.6 8,380 70.5 93.9 69.6 8,380 18-19 69.0 94.2 68.4 6,161 69.0 94.2 68.4 6,161
20-24 69.9 94.0 68.8 13,633 69.9 94.0 68.8 13,633 25-29 na na na na 66.8 92.5 65.9 12,625 30-34 na na na na 63.2 91.2 62.2 10,544 35-39 na na na na 59.2 90.1 58.1 9,726 40-44 na na na na 58.4 89.7 57.3 7,125 45-49 na na na na 56.5 89.1 55.8 5,815
Women's EducationA None/Preschool 60.4 88.5 59.0 5,475 54.1 87.2 52.9 25,122 Primary 65.9 92.4 64.7 5,240 63.7 91.7 62.6 13,584 Lower Secondary 71.7 95.0 70.8 3,803 69.3 94.0 68.3 8,086 Upper Secondary 73.7 96.2 73.1 6,329 72.4 95.4 71.7 12,510 Higher 75.5 96.9 74.8 7,326 75.4 96.8 74.9 14,705
Wealth index quintile Poorest 54.7 86.9 53.3 4,388 46.1 83.8 44.7 12,641 Second 66.5 92.7 65.4 5,722 59.5 90.2 58.4 14,335 Middle 71.5 95.0 70.4 6,106 66.6 93.2 65.5 15,105 Fourth 74.8 95.8 74.1 6,077 71.3 94.3 70.4 15,739 Richest 77.7 97.7 77.2 5,882 76.4 96.8 75.8 16,191
1 MICS indicator EQ.11a - Perception of a better life among women age 15-24 2 MICS indicator EQ.11b - Perception of a better life among women age 15-49 A The category of “DK/Missing” in the background characteristic of “Women's Education” has been suppressed from the table due to a small number of unweighted cases na: not applicable
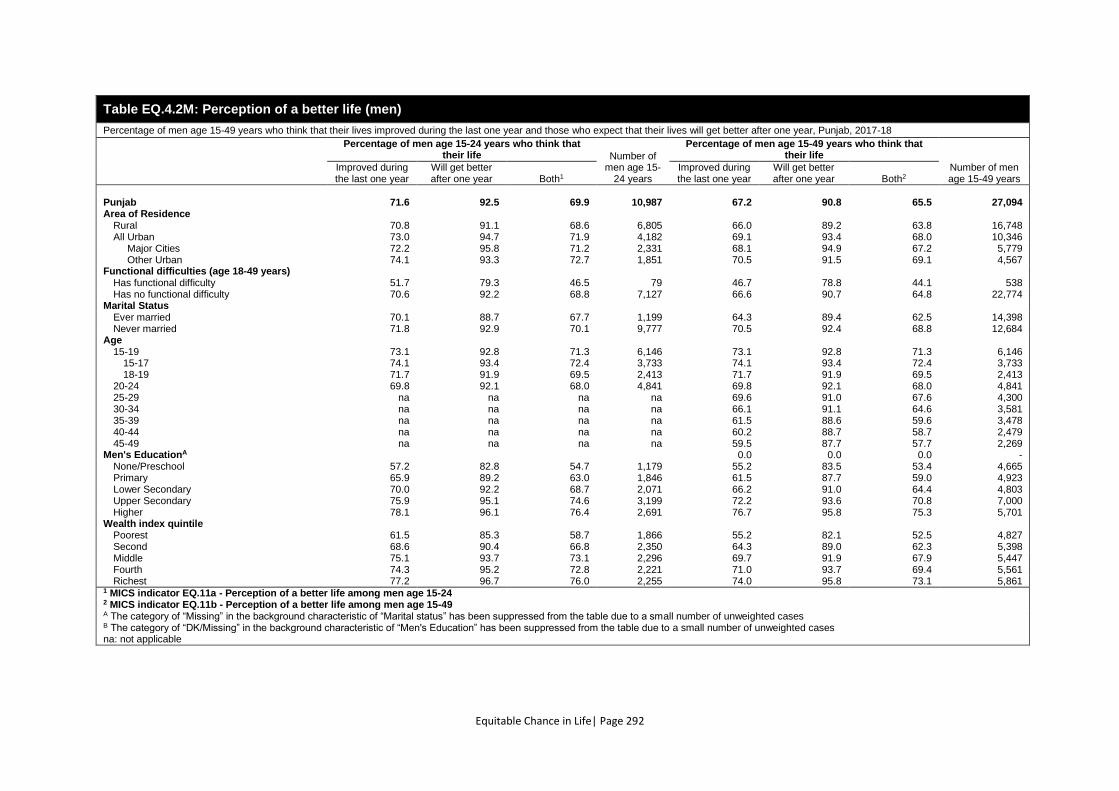
Equitable Chance in Life| Page 292
Table EQ.4.2M: Perception of a better life (men)
Percentage of men age 15-49 years who think that their lives improved during the last one year and those who expect that their lives will get better after one year, Punjab, 2017-18
Percentage of men age 15-24 years who think that their life Number of
men age 15-24 years
Percentage of men age 15-49 years who think that their life
Number of men age 15-49 years
Improved during the last one year
Will get better after one year Both1
Improved during the last one year
Will get better after one year Both2
Punjab 71.6 92.5 69.9 10,987 67.2 90.8 65.5 27,094 Area of Residence
Rural 70.8 91.1 68.6 6,805 66.0 89.2 63.8 16,748 All Urban 73.0 94.7 71.9 4,182 69.1 93.4 68.0 10,346 Major Cities 72.2 95.8 71.2 2,331 68.1 94.9 67.2 5,779 Other Urban 74.1 93.3 72.7 1,851 70.5 91.5 69.1 4,567
Functional difficulties (age 18-49 years)
Has functional difficulty 51.7 79.3 46.5 79 46.7 78.8 44.1 538 Has no functional difficulty 70.6 92.2 68.8 7,127 66.6 90.7 64.8 22,774
Marital Status
Ever married 70.1 88.7 67.7 1,199 64.3 89.4 62.5 14,398 Never married 71.8 92.9 70.1 9,777 70.5 92.4 68.8 12,684
Age
15-19 73.1 92.8 71.3 6,146 73.1 92.8 71.3 6,146 15-17 74.1 93.4 72.4 3,733 74.1 93.4 72.4 3,733 18-19 71.7 91.9 69.5 2,413 71.7 91.9 69.5 2,413
20-24 69.8 92.1 68.0 4,841 69.8 92.1 68.0 4,841 25-29 na na na na 69.6 91.0 67.6 4,300 30-34 na na na na 66.1 91.1 64.6 3,581 35-39 na na na na 61.5 88.6 59.6 3,478 40-44 na na na na 60.2 88.7 58.7 2,479 45-49 na na na na 59.5 87.7 57.7 2,269
Men's EducationA 0.0 0.0 0.0 - None/Preschool 57.2 82.8 54.7 1,179 55.2 83.5 53.4 4,665 Primary 65.9 89.2 63.0 1,846 61.5 87.7 59.0 4,923 Lower Secondary 70.0 92.2 68.7 2,071 66.2 91.0 64.4 4,803 Upper Secondary 75.9 95.1 74.6 3,199 72.2 93.6 70.8 7,000 Higher 78.1 96.1 76.4 2,691 76.7 95.8 75.3 5,701
Wealth index quintile
Poorest 61.5 85.3 58.7 1,866 55.2 82.1 52.5 4,827 Second 68.6 90.4 66.8 2,350 64.3 89.0 62.3 5,398 Middle 75.1 93.7 73.1 2,296 69.7 91.9 67.9 5,447 Fourth 74.3 95.2 72.8 2,221 71.0 93.7 69.4 5,561 Richest 77.2 96.7 76.0 2,255 74.0 95.8 73.1 5,861
1 MICS indicator EQ.11a - Perception of a better life among men age 15-24 2 MICS indicator EQ.11b - Perception of a better life among men age 15-49 A The category of “Missing” in the background characteristic of “Marital status” has been suppressed from the table due to a small number of unweighted cases B The category of “DK/Missing” in the background characteristic of “Men's Education” has been suppressed from the table due to a small number of unweighted cases na: not applicable
Equitable Chance in Life| Page 293
EQ.5 MULTIDIMENSIONAL POVERTY INDEX (MPI)
Poverty is a complex and multidimensional phenomenon. There are various facets of deprivation that can
affect well-being, such as the inability to attain a good education, a lack of access to healthcare facilities,
poor housing and an unsafe environment in which to live. Although an income-based measure continues
to be among the most widely used measures of poverty, a unidimensional measure based on income alone
is insufficient to reflect the true extent and depth of poverty.
The Multidimensional Poverty Index (MPI)147, developed by Oxford Poverty & Human Development
Initiative (OPHI) and the Human Development Report Office of the United Nations Development
Programme (UNDP) is one of several relatively new measures to compute multidimensional poverty. The
MPI complements household-level consumption-based poverty measures by reflecting deprivations in
other dimensions such as education, health and standard of living.
The MPI provides disaggregated statistics on the main contributors to household level multidimensional
poverty; education, health and standard of living. Thus, the MPI provides strong evidence for policy
makers, with which to identify the root causes of poverty and deprivation. The biggest utility of having
multidimensional poverty is its disaggregation according to different vulnerabilities and geographies thus
enabling policy makers to develop context specific development plans.
The MPI captures the severe deprivations suffered in the household with respect to education, health and
standard of living. MPI is the product of two components:
Incidence of poverty (H): the percentage of people who are identified as multi-dimensionally poor, or the
poverty headcount, because they live in households identified as multidimensionally poor.
Intensity of poverty (A): the average percentage of dimensions in which poor people are deprived. In
simple terms it means how intense, how bad the multidimensional poverty is, on average, for those who
are poor.
147 The website of OPHI provides an extensive description of the methodology and computations, and additionally provides
Country Briefings, presenting results for around 100 countries: http://www.ophi.org.uk/multidimensional-poverty-index/
The latest Country Briefing for Pakistan (based on the 2012/13 DHS) is available here:
https://ophi.org.uk/wp-content/uploads/CB_PAK-2.pdf
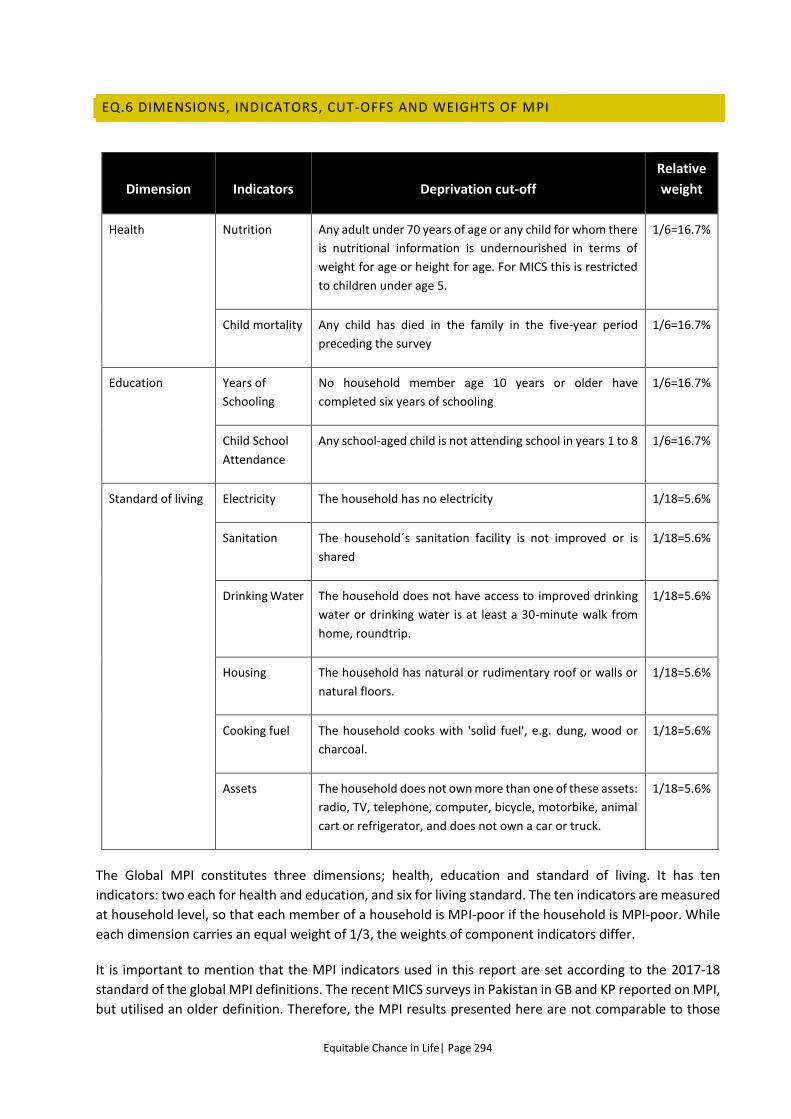
Equitable Chance in Life| Page 294
EQ.6 DIMENSIONS, INDICATORS, CUT-OFFS AND WEIGHTS OF MPI
Dimension Indicators Deprivation cut-off
Relative
weight
Health Nutrition Any adult under 70 years of age or any child for whom there
is nutritional information is undernourished in terms of
weight for age or height for age. For MICS this is restricted
to children under age 5.
1/6=16.7%
Child mortality Any child has died in the family in the five-year period
preceding the survey
1/6=16.7%
Education Years of
Schooling
No household member age 10 years or older have
completed six years of schooling
1/6=16.7%
Child School
Attendance
Any school-aged child is not attending school in years 1 to 8 1/6=16.7%
Standard of living Electricity The household has no electricity 1/18=5.6%
Sanitation The household´s sanitation facility is not improved or is
shared
1/18=5.6%
Drinking Water The household does not have access to improved drinking
water or drinking water is at least a 30-minute walk from
home, roundtrip.
1/18=5.6%
Housing The household has natural or rudimentary roof or walls or
natural floors.
1/18=5.6%
Cooking fuel The household cooks with 'solid fuel', e.g. dung, wood or
charcoal.
1/18=5.6%
Assets The household does not own more than one of these assets:
radio, TV, telephone, computer, bicycle, motorbike, animal
cart or refrigerator, and does not own a car or truck.
1/18=5.6%
The Global MPI constitutes three dimensions; health, education and standard of living. It has ten
indicators: two each for health and education, and six for living standard. The ten indicators are measured
at household level, so that each member of a household is MPI-poor if the household is MPI-poor. While
each dimension carries an equal weight of 1/3, the weights of component indicators differ.
It is important to mention that the MPI indicators used in this report are set according to the 2017-18
standard of the global MPI definitions. The recent MICS surveys in Pakistan in GB and KP reported on MPI,
but utilised an older definition. Therefore, the MPI results presented here are not comparable to those
Equitable Chance in Life| Page 295
presented for GB in KP. Indicators of nutrition, years of schooling, housing and assets have changed to an
increased probability of deprivation and only the indicator of child mortality has a reduced probability.
This makes increases in incidence and intensity very likely between the two methods.
Table EQ.5.1 shows that the headcount ratio (H) of multidimensional poverty (the percentage of poor
people, based on their belonging to households identified as multidimensionally poor) in Punjab is 26.1
percent (using the same indicators and thresholds as in the global MPI). The average intensity of
deprivation among the poor people (A), which reflects the share of deprivations each poor person
experiences on average (see Table EQ.5.2), is 46.9 percent. Since the MPI is the product of H and A, it
yields a value of 0.123. This means that multi-dimensionally poor people in Punjab experience 12.3 percent
of the total deprivations that would be experienced if all people were deprived in all indicators.
As expected, estimates for H that in Punjab are considerably higher among households who are in the
lowest asset-based wealth quintile and where head of households has no education in contrast to richest
households and head of households having higher level of education (poorest-69.9 percent vs richest-4.8
percent; no education-42.9 percent vs higher level of education 4.2 percent respectively).
The proportion of people identified as multi-dimensionally poor (the headcount, H) in urban areas is
considerably lower than in rural areas – 12.3 percent and 33.9 percent, respectively.
Table EQ.5.2 is calculated on a denominator of only MPI-poor household members. Each indicator column
now presents the percentage of poor people facing deprivation in each of these. These are also referred
to as censored headcount ratios. The general method of interpreting results is similar to that of Table
EQ.5.1, but allows for comparison to Table EQ.5.1 in the sense that there are less clear patterns between
the less educated and higher educated, the wealthier and the less wealthy on some indicators.
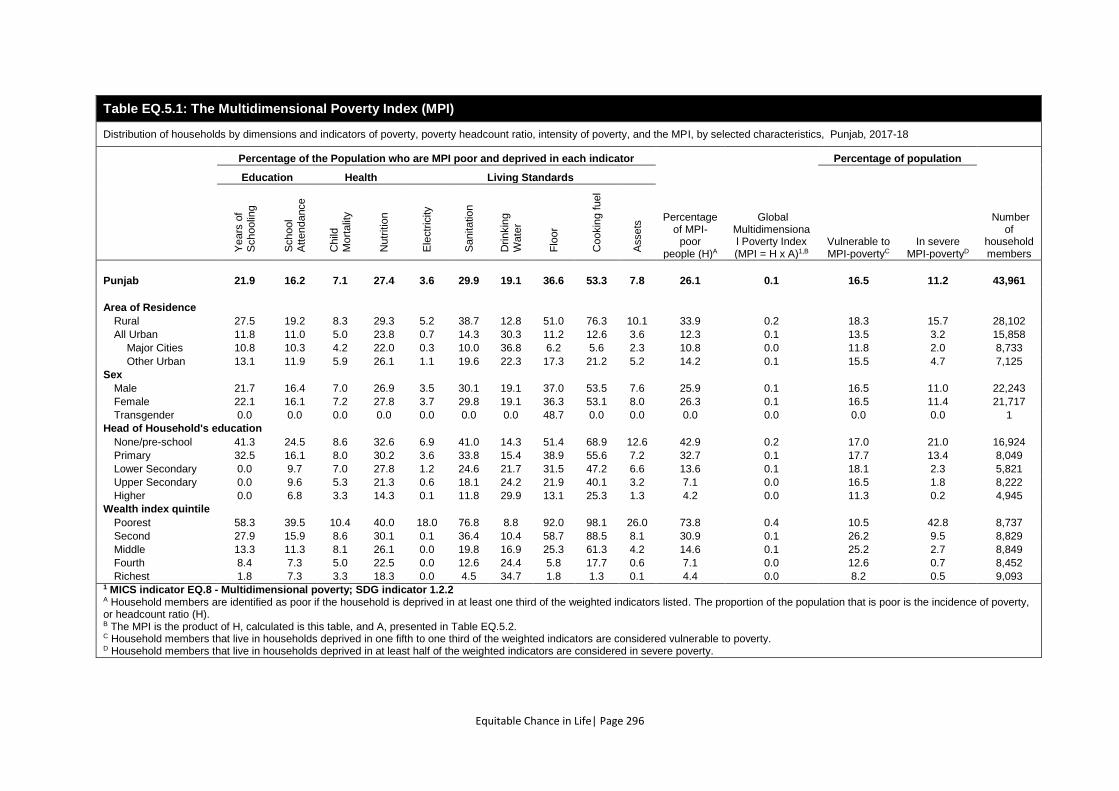
Equitable Chance in Life| Page 296
Table EQ.5.1: The Multidimensional Poverty Index (MPI)
Distribution of households by dimensions and indicators of poverty, poverty headcount ratio, intensity of poverty, and the MPI, by selected characteristics, Punjab, 2017-18
Percentage of the Population who are MPI poor and deprived in each indicator
Percentage of MPI-
poor people (H)A
Global Multidimensional Poverty Index (MPI = H x A)1,B
Percentage of population
Number of
household members
Education Health Living Standards
Vulnerable to MPI-povertyC
In severe MPI-povertyD
Years
of
Schoolin
g
School
Att
endance
Child
Mo
rtalit
y
Nutr
itio
n
Ele
ctr
icity
Sanitatio
n
Drin
kin
g
Wate
r
Flo
or
Cookin
g f
uel
Assets
Punjab 21.9 16.2 7.1 27.4 3.6 29.9 19.1 36.6 53.3 7.8 26.1 0.1 16.5 11.2 43,961
Area of Residence
Rural 27.5 19.2 8.3 29.3 5.2 38.7 12.8 51.0 76.3 10.1 33.9 0.2 18.3 15.7 28,102
All Urban 11.8 11.0 5.0 23.8 0.7 14.3 30.3 11.2 12.6 3.6 12.3 0.1 13.5 3.2 15,858
Major Cities 10.8 10.3 4.2 22.0 0.3 10.0 36.8 6.2 5.6 2.3 10.8 0.0 11.8 2.0 8,733
Other Urban 13.1 11.9 5.9 26.1 1.1 19.6 22.3 17.3 21.2 5.2 14.2 0.1 15.5 4.7 7,125
Sex
Male 21.7 16.4 7.0 26.9 3.5 30.1 19.1 37.0 53.5 7.6 25.9 0.1 16.5 11.0 22,243
Female 22.1 16.1 7.2 27.8 3.7 29.8 19.1 36.3 53.1 8.0 26.3 0.1 16.5 11.4 21,717
Transgender 0.0 0.0 0.0 0.0 0.0 0.0 0.0 48.7 0.0 0.0 0.0 0.0 0.0 0.0 1
Head of Household's education
None/pre-school 41.3 24.5 8.6 32.6 6.9 41.0 14.3 51.4 68.9 12.6 42.9 0.2 17.0 21.0 16,924
Primary 32.5 16.1 8.0 30.2 3.6 33.8 15.4 38.9 55.6 7.2 32.7 0.1 17.7 13.4 8,049
Lower Secondary 0.0 9.7 7.0 27.8 1.2 24.6 21.7 31.5 47.2 6.6 13.6 0.1 18.1 2.3 5,821
Upper Secondary 0.0 9.6 5.3 21.3 0.6 18.1 24.2 21.9 40.1 3.2 7.1 0.0 16.5 1.8 8,222
Higher 0.0 6.8 3.3 14.3 0.1 11.8 29.9 13.1 25.3 1.3 4.2 0.0 11.3 0.2 4,945
Wealth index quintile
Poorest 58.3 39.5 10.4 40.0 18.0 76.8 8.8 92.0 98.1 26.0 73.8 0.4 10.5 42.8 8,737
Second 27.9 15.9 8.6 30.1 0.1 36.4 10.4 58.7 88.5 8.1 30.9 0.1 26.2 9.5 8,829
Middle 13.3 11.3 8.1 26.1 0.0 19.8 16.9 25.3 61.3 4.2 14.6 0.1 25.2 2.7 8,849
Fourth 8.4 7.3 5.0 22.5 0.0 12.6 24.4 5.8 17.7 0.6 7.1 0.0 12.6 0.7 8,452
Richest 1.8 7.3 3.3 18.3 0.0 4.5 34.7 1.8 1.3 0.1 4.4 0.0 8.2 0.5 9,093 1 MICS indicator EQ.8 - Multidimensional poverty; SDG indicator 1.2.2 A Household members are identified as poor if the household is deprived in at least one third of the weighted indicators listed. The proportion of the population that is poor is the incidence of poverty, or headcount ratio (H). B The MPI is the product of H, calculated is this table, and A, presented in Table EQ.5.2. C Household members that live in households deprived in one fifth to one third of the weighted indicators are considered vulnerable to poverty. D Household members that live in households deprived in at least half of the weighted indicators are considered in severe poverty.
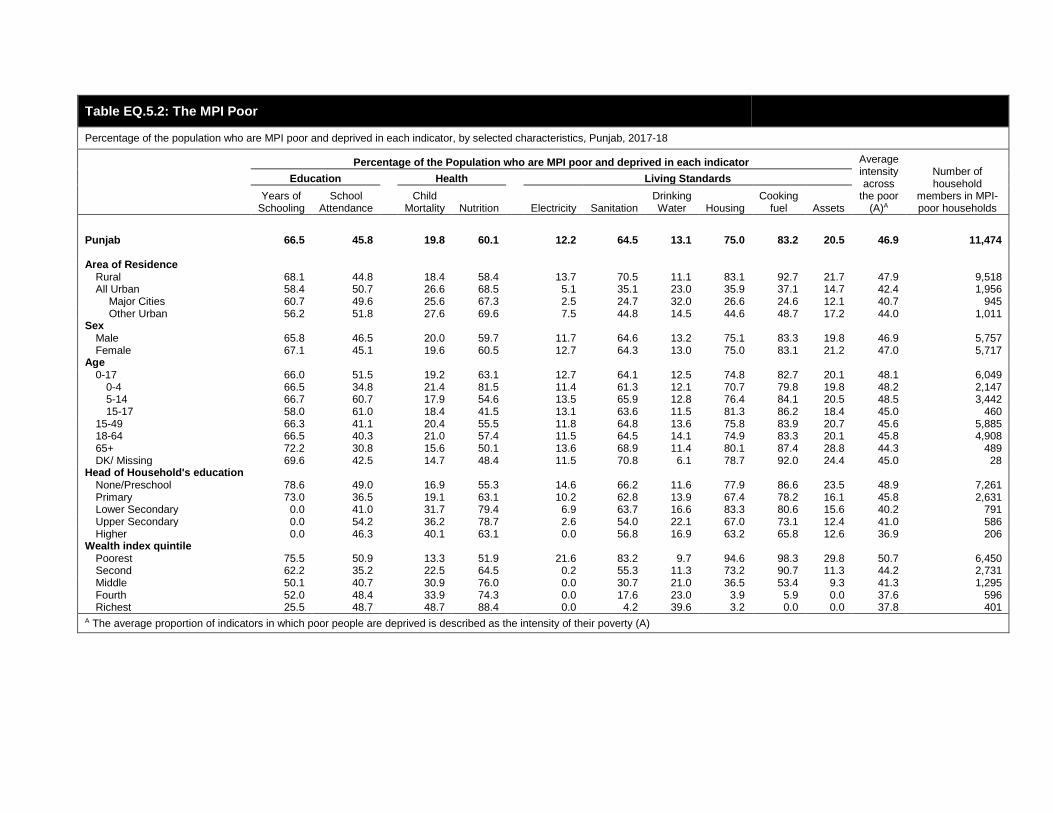
Table EQ.5.2: The MPI Poor
Percentage of the population who are MPI poor and deprived in each indicator, by selected characteristics, Punjab, 2017-18
Percentage of the Population who are MPI poor and deprived in each indicator Average intensity across
the poor (A)A
Number of household
members in MPI-poor households
Education Health Living Standards
Years of Schooling
School Attendance
Child Mortality Nutrition Electricity Sanitation
Drinking Water Housing
Cooking fuel Assets
Punjab 66.5 45.8 19.8 60.1 12.2 64.5 13.1 75.0 83.2 20.5 46.9 11,474
Area of Residence
Rural 68.1 44.8 18.4 58.4 13.7 70.5 11.1 83.1 92.7 21.7 47.9 9,518 All Urban 58.4 50.7 26.6 68.5 5.1 35.1 23.0 35.9 37.1 14.7 42.4 1,956 Major Cities 60.7 49.6 25.6 67.3 2.5 24.7 32.0 26.6 24.6 12.1 40.7 945 Other Urban 56.2 51.8 27.6 69.6 7.5 44.8 14.5 44.6 48.7 17.2 44.0 1,011
Sex Male 65.8 46.5 20.0 59.7 11.7 64.6 13.2 75.1 83.3 19.8 46.9 5,757 Female 67.1 45.1 19.6 60.5 12.7 64.3 13.0 75.0 83.1 21.2 47.0 5,717
Age 0-17 66.0 51.5 19.2 63.1 12.7 64.1 12.5 74.8 82.7 20.1 48.1 6,049
0-4 66.5 34.8 21.4 81.5 11.4 61.3 12.1 70.7 79.8 19.8 48.2 2,147 5-14 66.7 60.7 17.9 54.6 13.5 65.9 12.8 76.4 84.1 20.5 48.5 3,442 15-17 58.0 61.0 18.4 41.5 13.1 63.6 11.5 81.3 86.2 18.4 45.0 460
15-49 66.3 41.1 20.4 55.5 11.8 64.8 13.6 75.8 83.9 20.7 45.6 5,885 18-64 66.5 40.3 21.0 57.4 11.5 64.5 14.1 74.9 83.3 20.1 45.8 4,908 65+ 72.2 30.8 15.6 50.1 13.6 68.9 11.4 80.1 87.4 28.8 44.3 489 DK/ Missing 69.6 42.5 14.7 48.4 11.5 70.8 6.1 78.7 92.0 24.4 45.0 28
Head of Household's education None/Preschool 78.6 49.0 16.9 55.3 14.6 66.2 11.6 77.9 86.6 23.5 48.9 7,261 Primary 73.0 36.5 19.1 63.1 10.2 62.8 13.9 67.4 78.2 16.1 45.8 2,631 Lower Secondary 0.0 41.0 31.7 79.4 6.9 63.7 16.6 83.3 80.6 15.6 40.2 791 Upper Secondary 0.0 54.2 36.2 78.7 2.6 54.0 22.1 67.0 73.1 12.4 41.0 586 Higher 0.0 46.3 40.1 63.1 0.0 56.8 16.9 63.2 65.8 12.6 36.9 206
Wealth index quintile Poorest 75.5 50.9 13.3 51.9 21.6 83.2 9.7 94.6 98.3 29.8 50.7 6,450 Second 62.2 35.2 22.5 64.5 0.2 55.3 11.3 73.2 90.7 11.3 44.2 2,731 Middle 50.1 40.7 30.9 76.0 0.0 30.7 21.0 36.5 53.4 9.3 41.3 1,295 Fourth 52.0 48.4 33.9 74.3 0.0 17.6 23.0 3.9 5.9 0.0 37.6 596 Richest 25.5 48.7 48.7 88.4 0.0 4.2 39.6 3.2 0.0 0.0 37.8 401
A The average proportion of indicators in which poor people are deprived is described as the intensity of their poverty (A)