National Micronutrient Survey - UNICEF
182
National Micronutrient Survey 2011-12 Institute of Public Health Nutrition Directorate General of Health Services Ministry of Health and Family Welfare Government of the People's Republic of Bangladesh
-
Upload
khangminh22 -
Category
Documents
-
view
1 -
download
0
Transcript of National Micronutrient Survey - UNICEF

National MicronutrientSurvey2011-12
Institute of Public Health NutritionDirectorate General of Health ServicesMinistry of Health and Family Welfare
Government of the People's Republic of Bangladesh

b National Micronutrient Survey 2011-12

National MicronutrientSurvey2011-12
Institute of Public Health NutritionDirectorate General of Health ServicesMinistry of Health and Family Welfare
Government of the People’s Republic of Bangladesh

ii National Micronutrient Survey 2011-12
National Micronutrient Survey 2011-12
Date of Publication: June 2014Published byInstitute of Public Heath Nutrition (IPHN)Mohakhali, DhakaBangladesh
This report summarizes the findings of the National Micronutrient Survey 2011-12 conducted under the authority of the Institute of Public Health Nutrition (IPHN) of the Directorate General of Health Services, Ministry of Health and Family Welfare, and carried out by icddr,b and Mitra and Associates of Dhaka. Financial and technical assistance was provided by United Nation Children’s Fund (UNICEF) and Global Alliance for Improved Nutrition (GAIN) for the survey. This publication is permitted for use by all programmers, researchers, government, non-government, national and international institutes/organizations. However, reprints or reproductions of portions or the entirety of this document are encouraged, provided due acknowledgement is given to the publisher and the publication.
Additional information about the National Micronutrient Survey 2011-12 may be obtained from:
Centre for Nutrition and Food Security, icddr,b UNICEF, Bangladesh68, Shaheed Tajuddin Ahmed Sharani BSL Office ComplexMohakhali, Dhaka, Bangladesh 1 Minto Road, Dhaka, BangladeshTelephone: 880-2-9882252 Telephone: 880-2-8852266Fax: 880-2-861-3362 Fax: 880-2-9335641
Photo Credit : UNICEF and icddr,b
Design and Layout: Dhrupadi
Edited by:Barbara Hall, Consultant, UNICEFIreen Akhter Chowdhury, UNICEFAhmed Shafiqur Rahman, icddr,b
Suggested Citation:National Micronutrient Survey 2011-12, Final Report. Dhaka, Bangladesh: Institute of Public Health Nutrition, United Nation Children’s Fund (UNICEF), icddr,b and Global Allaince for Improved Nutrition (GAIN)

iiiNational Micronutrient Survey 2011-12
I am privileged to write the foreword for the first ever National Micronutrient Survey in Bangladesh. Prior to 2011, micronutrient specific area based data showed that micronutrient deficiencies were common in Bangladesh, but representative national data were not available for some of the important essential micronutrients. Therefore, a National Micronutrient Survey was undertaken to generate data for evidence based advocacy, planning and programming for micronutrient deficiency control interventions and to assess the impact of ongoing micronutrient interventions.
This report presents the findings of the National Micronutrient Survey undertaken in 2011. The report provides valuable information which will inform policy and programming in the short, medium and longer term future for the benefit of the people of Bangladesh.
With our support, I expect that the Institute of Public Health Nutrition will use the survey data to develop a National Micronutrient Deficiency Control Strategy to address micronutrient deficiencies in Bangladesh. We hope that the multi-sectoral approach to addressing micronutrient deficiencies will deliver effective and efficient policies and programmes to ensure a significantly better nutrition situation in Bangladesh.
Joy Bangla, Joy BangabandhuLong Live Bangladesh
(Mohammed Nasim)MinisterMinistry of Health and Family WelfareGovernment of the People’s Republic of Bangladesh
FOREWORD

iv National Micronutrient Survey 2011-12
MESSAGE
Although Bangladesh has made good progress in improving the nutrition situation over the last two decades, micronutrient malnutrition still poses a significant public health problem. Along with efforts in a number of other sectors, the Ministry of Health and Family Welfare is implementing number of national and sub-national level interventions to combat micronutrient deficiencies among the population particularly. The Ministry of Health and Family Welfare strives to ensure its strategies and programmes are informed by evidence and driven by strong data.
Therefore the National Micronutrient Survey has been undertaken at a time when the Government of Bangladesh has increased its commitment to nutrition, thereby allowing strategies, programmes and interventions to be reviewed and updated.
We appreciate the continued focus and commitment demonstrated by the Institute of Public Health Nutrition for the initiative taken to conduct this comprehensive National Micronutrient Survey. The survey report provides current deficiency status of all important micronutrients, which are essential for the growth and development of the children. I trust the findings of the survey will now guide us to formulate effective strategies to prevent and control these deficiencies.
Joy Bangla, Joy BangabandhuLong Live Bangladesh
(Zahid Maleque) State MinisterMinistry of Health and Family WelfareGovernment of the People’s Republic of Bangladesh

vNational Micronutrient Survey 2011-12
MESSAGE
he National Micronutrient Survey 2011-12 is a nationally representative survey designed to provide information on all essential micronutrient deficiencies, understand knowledge and practices related to iodine deficiency disorders, vitamin A and iron-rich food consumption, as well as consumption and purchasing patterns of edible oil and salt in the population of Bangladesh.
The survey presents a valuable opportunity for a thorough review of the country situation in relation to Micronutrient Deficiencies which are of public health importance and current interventions to prevent and control.
Further detailed analysis and interpretation of results of National Micronutrient Survey data presents an interesting challenge for academics, researchers, program personnel and experts from different cross-cutting programmes to provide more in-depth knowledge for future direction and effective implementation of national micronutrient interventions.
We recognise that a strong micronutrient deficiency control programme is multi-sectoral in nature and are committed to working in collaboration with other sectors to ensure success.
(M.M. Neazuddin) Secretary Ministry of Health & Family WelfareGovernment of the People’s Republic of Bangladesh

vi National Micronutrient Survey 2011-12
It is my pleasure to note that the first ever comprehensive National Micronutrient Survey in Bangladesh had been conducted revealing update situation of the country. It was a long time need for the situation analysis and strategy formulation. The previous experience of discrete initiatives are over and an effective and efficient method of conducting comprehensive survey have been explored. The most important opportunity is that based on the survey findings a national strategy to be formulated to address the micronutrient deficiency situation of the country.
Bangladesh possesses a huge burden of deficiencies of a range of micronutrients including iron and folic acid, vitamin A, iodine, zinc, calcium, B12 etc. However, the real parameters were unknown. It’s good to observe that programming across Ministries including Health and Family Welfare, Industries, Agriculture etc. are contributing towards controlling micronutrient deficiency related problems. Directorate General of Health Services through its relevant Operational Plans has been contributing significantly to the fight against the menace of hidden hunger.
I congratulate the Institute of Public Health Nutrition (IPHN) to take the lead of conducting the survey, the technical committee for its guidance and at the same time UNICEF, GAIN and icddr,b for their roles of support and technical assistance.
Let we dream for a country free from preventable menace of micronutrient deficiencies.
(Professor Dr. Deen Mohd. Noorul Huq)Director General of Health ServicesMinistry of Health and Family WelfareGovernment of the People’s Republic of Bangladesh
MESSAGE

viiNational Micronutrient Survey 2011-12
Bangladesh has been acclaimed globally for its remarkable success in health and population control achievements, however with a low pace in terms of nutrition. Micronutrient malnutrition still poses a significant public health problem in Bangladesh. One feature regarding the micronutrient deficiencies was dearth of recent data, as a result designing pragmatic programming. The National Micronutrient Survey was a time befitting undertaking at a time when the Government intends to strengthen its nutrition programming through updated strategies.
I appreciate the Institute of Public Health Nutrition and its collaborating organizations and agencies for their initiative to conduct this comprehensive National Micronutrient Survey. I notice with encouragement the possibility of formulating a national strategy on micronutrient deficiency based on the up to date data generated through the survey.
Bangladesh already possess a multi-sector programming targeted towards control of micronutrient deficiencies. Directorate General of Family Planning through its relevant Operational Plans has been putting efforts to that end.
I believe the days are not too far when we can effectively control the outcomes of essential micronutrients deficiencies.
(Md. Nur Hossain Talukder)Director General of Family PlanningMinistry of Health and Family WelfareGovernment of the People’s Republic of Bangladesh
MESSAGE

viii National Micronutrient Survey 2011-12
ACKNOWLEDGEMENTThe Ministry of Health and Family Welfare, along with other key Ministries, supports a number of micronutrient deficiency control programmes which include supplementation specific target groups with iron and folic acid, vitamin A and zinc. At the same time Ministry of Health and Family Welfare is providing technical support to Ministry of Industries to implement food fortification programmes to reduce iodine and vitamin A deficiency in the population in Bangladesh. Ministries in the food sector actively promote cultivation and consumption of micronutrient rich foods.
Recognising the need to review progress and ensure strategies are based on current data and evidence, the Institute of Public Health Nutrition (IPHN) in collaboration with UNICEF, GAIN and icddr,b conducted the National Micronutrient Survey 2011-12. For the first time, this survey collected biological samples for all essential micronutrients and provided current updates on vitamin A, iron, iodine, vitamin D, calcium, folate, B12 and anaemia.
I express my sincere thanks and gratitude to the Technical Committee Members for their valuable guidance and inputs and their continuous monitoring of the quality of survey methods and analysis throughout the entire process.
I would like to thank UNICEF and GAIN for financial, technical and logistic support in conducting the survey. UNICEF also provided additional support for editing of the report and publication.
I would like to acknowledge the valuable role of all the field team members (technicians, interviewers, supervisors in the field), investigators, laboratory and statistical analysis team members, and administration staff related with the survey for their valuable contributions.
Finally, I would like to thank the local administrators, Chairmen of Upazila Parishad, Health and Family Planning Managers and above all the respondents in the survey areas whose active co-operation and enthusiastic participation made this huge exercise possible.
(Dr. Md. Shah Nawaz)Director, Institute of Public Health Nutrition& Line Director National Nutrition ServicesDirectorate General of Health ServicesMinistry of Health and Family WelfareGovernment of the People’s Republic of Bangladesh

ixNational Micronutrient Survey 2011-12
Table of ContentsList of Tables xv
Acronyms and Abbreviations xx
Summary of Findings 1
1. Introduction 4
1.1 Objectives 5
2. Methodology 6
2.1 Survey Population 6
2.1.1 Inclusion Criteria for the Household 6
2.1.2 Inclusion Criteria for the Individual 6
2.2 Sample Size Determination 7
2.3 Sampling Design 8
2.3.1 First Stage Sampling 8
2.3.2 Second Stage Sampling 8
2.3.3 Third Stage Sampling 9
2.4 Sub-Sampling for Biological Samples (in 20 households) 10
2.5 Retailer Salt Sampling 11
2.6 Household Salt Samples 11
2.7 Sample Weight 11
2.7.1 Estimate of Sample Weight 11
2.8 Questionnaire and Data Collection 12
2.8.1 Questionnaires 12
2.9 Field Operational Guidelines 13
2.9.1 Standard Operating Procedure 13
2.9.2 Survey Monitoring Tools 13
2.10 Survey Training, Planning and Organization 13
2.10.1 Training and Field work 13
2.10.2 Daily Plan for the Data Collection Teams 14
2.11 Socio-economic Status Indicators 14
2.12 Household Food Insecurity 14
2.13 Estimate of Children’s Ages 15
2.14 Child Anthropometry 15
2.15 Food Consumption Data 15
2.16 Household Monthly Expenses 15

x National Micronutrient Survey 2011-12
2.17 Adjusting Ferritin, Retinol and Zinc for Infection 15
2.18 Biological Sample Collection, Preparation, Transport and Storage 16
2.18.1 Blood Sample Collection and Processing 16
2.18.2 Collection of Urine Samples 16
2.18.3 Collection of Salt Samples 16
2.19 Data Processing and Analysis 17
2.20 Quality Control 17
2.20.1 Quality Control of the Laboratory Analysis 17
2.20.1.1 External Quality Control (EQC) 17
2.20.1.2 Internal Quality Control 18
2.21 Project Management Structure 20
2.22 Ethical Approval 20
3. Results 21
3.1. Household Characteristics 21
3.1.1 Household Construction Materials 22
3.1.2 Number of Rooms 23
3.1.3 Land Ownership 24
3.1.4 Toilets Facilities for the Households 24
3.1.5 Cooking Fuel Used in the Households 25
3.1.6 Household Monthly Expenses 26
3.1.7 Household Food Insecurity 26
3.2 Morbidity: Preschool Children 27
3.2.1 Morbidity by Cluster 27
3.2.2 Morbidity by Socio-economic Status 27
3.3 Morbidity: School-age Children 28
3.4 Prevalence of Vitamin A Deficiency 28
3.4.1 Degrees of Vitamin A Deficiency 29
3.4.2 Vitamin A Supplementation in Preschool Children 30
3.5 Vitamin A Consumption from Food 31
3.5.1 Vitamin A Consumption in Preschool Children by Cluster 31
3.5.2 Vitamin A Consumption in Preschool Children according to the Asset Index 31
3.5.3 Vitamin A Consumption in the Preschool Children by Household Food
Insecurity Status 31
3.5.4 Vitamin A Consumption in School-age Children by Cluster 32
3.5.5 Vitamin A Consumption in School-age Children by SES 32

xiNational Micronutrient Survey 2011-12
3.5.6 Vitamin A Consumption in School-age Children by Household Food
Insecurity Status 32
3.5.7 Vitamin A Consumption in NPNL Women by Cluster 33
3.5.8 Vitamin A Consumption in NPNL Women by Socio-economic Status 33
3.5.9 Vitamin A Consumption among NPNL Women by Household Food Insecurity 33
3.5.10 Vitamin A Consumption Compared to the Recommended Daily Allowance (RDA) 34
3.6 Knowledge about Vitamin A-related Issues 34
3.6.1 Knowledge about Vitamin A-rich Food Sources 34
3.6.2 Knowledge of Health Benefits of Eating Vitamin A-rich Foods 35
3.7. Per Capita Oil Consumption 36
3.7.1 Daily per Capita Oil Consumption 36
3.7.2 Type of Cooking Oil used in Households 36
3.7.3 Monthly Spending on Cooking Oil 37
3.8 Anemia and Iron Status 37
3.8.1 Status of Hemoglobin 37
3.8.1.1 Status of Haemoglobin Concentration by Cluster 37
3.8.1.2 Status of Hemoglobin Concentration by Socio-economic Status 38
3.8.1.3 Hemoglobin Concentration by Household Food Insecurity Status 38
3.8.2 Prevalence of Iron Deficiency and Anemia 38
3.8.2.1 Anemia and Iron Status in Preschool Children and NPNL Women 39
3.8.2.2 Anemia and Iron Status in School-age Children 39
3.9 Consumption of Iron from Food 40
3.9.1 Consumption of Iron from Food by Cluster 40
3.9.2 Consumption of Iron from Food by Socio-economic Status 41
3.9.3 Consumption of Daily Iron from Food by Household Food Insecurity 42
3.9.4 Consumption of Iron from Food compared to the Recommended Daily
Allowance 43
3.10. Knowledge about Iron-rich Food 44
3.11 Zinc Nutrition 45
3.11.1 Prevalence of Zinc Deficiency 45
3.11.2 Mean Serum Zinc 46
3.12 Consumption of zinc From Food 46
3.12.1 Consumption of Zinc from Food 48
3.12.2 Categories of the Phytate-zinc Molar Ratio 49
3.12.3 Mean Phytate-zinc Molar Ratio 49

xii National Micronutrient Survey 2011-12
3.13 Prevalence of Folate and Vitamin B12 Deficiency 50
3.13.1 Folate Status in NPNL Women 50
3.13.2 Consumption of Folate from Food 50
3.13.3 Vitamin B12 Status in NPNL Women 51
3.13.4 Consumption of Vitamin B12 from Food: NPNL Women 51
3.14 Salt Iodization 52
3.14.1 Consumption of Iodized Salt 52
3.14.2 Reason for not Consuming Salt Packets 53
3.15 Iodine Nutrition 53
3.15.1 Prevalence of Iodine Deficiency in School-age Children 54
3.15.2 Prevalence of Iodine Deficiency in NPNL Women 55
3.16 Iodine Status in Retailers’ Salt 56
3.16.1 Iodine Content in Retailers’ Salt 56
3.16.2 Relationship of the Respondent to the Owner of the Retail Shops 57
3.16.3 Education of Retail Shopkeepers 57
3.17 Purchase, Sale and Storage of Salt 58
3.17.1 Purchase and Sale of Salt, by Type (Retailers) 58
3.17.2 Source of Salt Packet Purchases (Retailers) 58
3.17.3 Storage of Open Salt by the Retailers’ Shopkeepers 59
3.17.4 Practice of Retailers Packaging their Open Salt 59
3.18 Retailers’ Knowledge about Iodized Salt 60
3.18.1 Retailers’ Knowledge about Iodized Salt - Source of Information 60
3.18.2 Retailers’ Knowledge about Iodized Salt-Type of Salt and Iodine Content 61
3.18.3 Retailers’ Knowledge about Benefits of Iodized Salt 61
3.18.4 Retailer’s Knowledge about Testing of Salt for Iodine 62
3.18.5 Retail Shopkeeper’s Knowledge about the Salt Law 63
3.18.6 Retailers’ Knowledge on Reading the Results of Testing Salt for Iodine 64
3.18.7 Retailer’s Practice Regarding Testing Salt for Iodine 64
3.18.7.1 Iodine Level in Household Salt and Iodine Status in NPNL Women 65
3.18.7.2 Relationship Between Iodine Levels in Household Salt and Iodine Status of .School-age Children 65
3.18.8 Source of Household Respondents’ Knowledge about Iodized Salt and .about Which Type of Salt Contains Iodine 65
3.18.9 Household Respondents' Knowledge of the Benefits of Iodized Salt 67
3.18.10 Household Respondents’ Knowledge on Testing Salt for Iodine 67
3.18.11 Household Practice of Including Salt in Livestock Feed 69

xiiiNational Micronutrient Survey 2011-12
3.18.12 Source of Salt Purchase in Households 69
3.18.13 Household Practice of using Salt 69
3.19 Anthropometry 70
3.19.1 Stunting in Preschool Children 70
3.19.2 Underweight in Preschool Children 70
3.19.3 Wasting in Preschool Children 71
3.19.4 Height-for-age z-score in Preschool Children 71
3.19.5 Weight-for-age z-score in Preschool Children 72
3.19.6 Weight-for-height z-score in Preschool Children 72
4. Discussion 73
4.1 Anemia 73
4.1.1 Assessment Methods 73
4.2 Iron Deficiency 73
4.3 Vitamin A 78
4.4 Zinc 79
4.5 Iodine 79
4.6 Folate 81
4.7 Nutritional Status in Preschool Children 81
4.8 State of Nutrition in the Slum Cluster 82
5. Salient Findings 83
5.1 Vitamin A 83
5.2 Anemia and Iron 83
5.3 Zinc 83
5.4 Iodine 83
5.5 Folate and B12 84
6. Additional Vitamin D Analyses and Calcium Assessment 85
6.1. Vitamin D Status 87
6.1.1 Mean Vitamin D Concentration 87
6.1.2 Prevalence of Vitamin D Deficiency 88
6.1.3 Mean Intake of Food from Animal Sources among Groups by Vitamin D Status 90
6.2. Calcium Status 91
6.2.1 Mean Calcium Concentration 91
6.2.2 Prevalence of Calcium Deficiency 92
6.3 Key Findings 94

xiv National Micronutrient Survey 2011-12
Reference 95
7. Annex 99
Annex 7. 1 Biochemical Assessment 99
7.1.1 Determination of Serum Retinol 99
7.1.2 Anemia (hemoglobin) 99
7.1.3 Ferritin (iron deficiency), and C-reactive protein (CRP), Alpha-1-Acid Glycoprotein (AGP) (inflammatory markers) 100
7.1.4 Zinc 100
7.1.5 Folate 100
7.1.6 Vitamin B12 101
7.1.7 Urinary Iodine 101
7.1.8 Estimation of Iodine Content in Salt 101
Annex 7.2 Sample Size 102
Annex 7.3 Standard Errors for Selected Estimates Calculated from the Data Analysis 105
Annex 7.4 Elevated Inflammatory Biomarkers 107
Annex 7.5 Household Food Insecurity Questions 108
Annex 7.6 List of Primary Sampling Units (PSU) for the National Micronutrient Survey 109
Annex 7.7 Questionnaires 114
Annex 7.7.1 Household Questionnaire 114
Annex 7.7.2 Questionnaire: Preschool Children (6-59 months) 125
Annex 7.7.3 School-aged Children’s Form 132
Annex 7.7.4 NPNL Women Form 134
Annex 7.7.5 Retailer’s Questionnaire 138
Annex 7.8 Biological Sample Collection Forms 142
Annex 7.8.1 Blood Sample Collection Form 142
Annex 7.8.2 Household Salt Sample Collection Form 143
Annex 7.8.3 Retailer’s Salt Sample Collection Form 144
Annex 7.8.4 Urine Sample Collection Form 145
Annex 7.9 Cluster Monitoring Form 146
Annex 7.10 Bi-weekly Monitoring Report Form 148
Annex 7.11 The Individuals engaged in the National Micronutrient Survey 2011-12 149
7.11.1 The Survey Administrators 149
7.11.2 The Technical Committee for the National Micronutrient Survey 150
7.11.3 Monitoring and Supervision Teams 151
7.11.4 Staff Members from Mitra and Associates 151

xvNational Micronutrient Survey 2011-12
List of TablesTable A: Prevalence of Micronutrient and Nutritional Status by Cluster 3
Table 1: Parameters for Analysis 6
Table 2: Adjusted Sample Size for Laboratory Parameters 8
Table 3: Cluster Sample Requirement 10
Table 4: Parameters by Population Groups 16
Table 5: Performance of the Internal Quality Control for Laboratory Analysis 19
Table 6: Household Characteristics 21
Table 7: Household Construction Material 23
Table 8: Number of Rooms 24
Table 9: Land Ownership 24
Table 10: Toilet Facilities for the Households 25
Table 11: Cooking Fuel Used in the Households 25
Table 12: Household Monthly Expenses 26
Table 13: Household Food Insecurity 26
Table 14: Morbidity in Preschool Children by Cluster 27
Table 15: Morbidity in Preschool Children by Socio-economic Status 28
Table 16: Morbidity by Cluster 28
Table 17: Prevalence of Vitamin A Deficiency 29
Table 18: Degrees of Vitamin A Deficiency 29
Table 19: Vitamin A Supplementation in Preschool Children 30
Table 20: Vitamin A Consumption in Preschool Children by Cluster 31
Table 21: Vitamin A Consumption in Preschool Children according to the Asset Index 31
Table 22: Vitamin A Consumption in Preschool Children by Household Food Insecurity Status 32
Table 23: Vitamin A Consumption in School-age Children by Cluster 32
Table 24: Vitamin A Consumption in School-age Children according to the Asset Index 32
Table 25: Vitamin A Consumption in School-age Children by Household Food Insecurity Status 33
Table 26: Vitamin A Consumption in NPNL Women by Cluster 33
Table 27: Vitamin A Consumption in NPNL Women according to the Asset Index 33
Table 28: Vitamin A Consumption in NPNL Women by Household Food Insecurity Status 34
Table 29: Consumption of Vitamin A Compared to the Recommended Daily Allowance 34
Table 30: Knowledge on Vitamin A-rich Food Sources 34
Table 31: Knowledge on Health Benefits of Eating Vitamin A-rich Foods 35
Table 32: Per Capita Oil Consumption 36
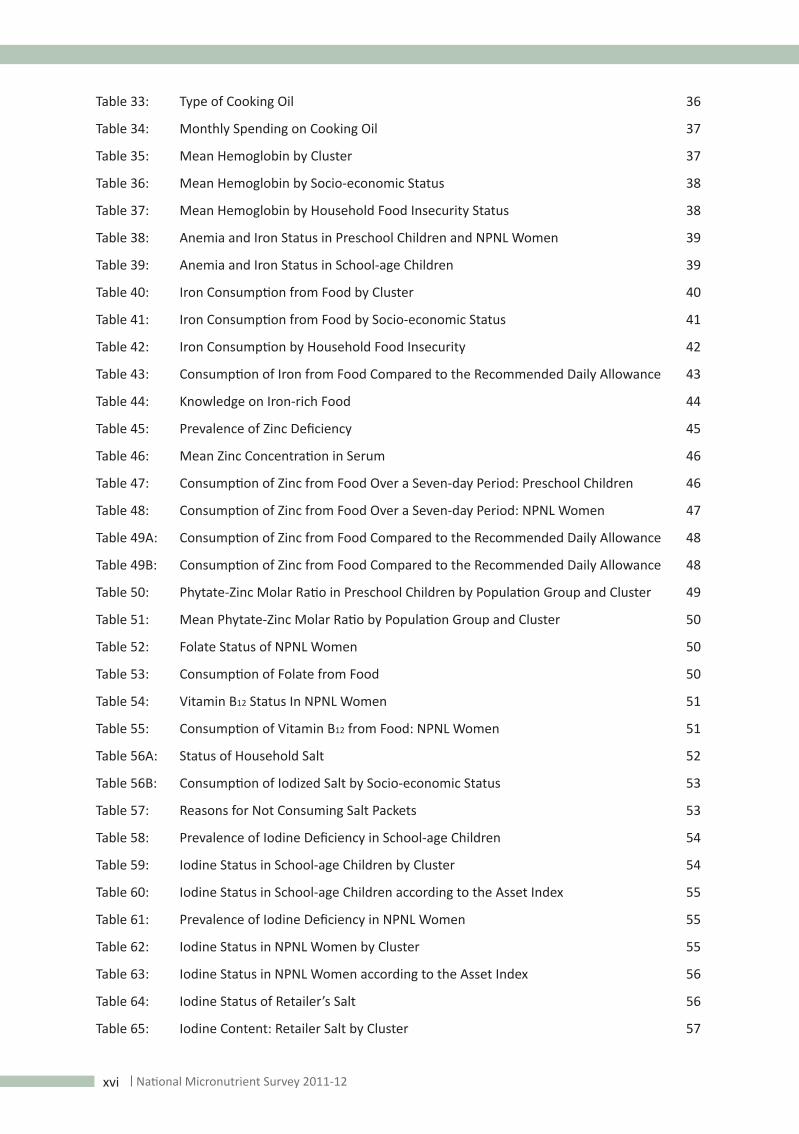
xvi National Micronutrient Survey 2011-12
Table 33: Type of Cooking Oil 36
Table 34: Monthly Spending on Cooking Oil 37
Table 35: Mean Hemoglobin by Cluster 37
Table 36: Mean Hemoglobin by Socio-economic Status 38
Table 37: Mean Hemoglobin by Household Food Insecurity Status 38
Table 38: Anemia and Iron Status in Preschool Children and NPNL Women 39
Table 39: Anemia and Iron Status in School-age Children 39
Table 40: Iron Consumption from Food by Cluster 40
Table 41: Iron Consumption from Food by Socio-economic Status 41
Table 42: Iron Consumption by Household Food Insecurity 42
Table 43: Consumption of Iron from Food Compared to the Recommended Daily Allowance 43
Table 44: Knowledge on Iron-rich Food 44
Table 45: Prevalence of Zinc Deficiency 45
Table 46: Mean Zinc Concentration in Serum 46
Table 47: Consumption of Zinc from Food Over a Seven-day Period: Preschool Children 46
Table 48: Consumption of Zinc from Food Over a Seven-day Period: NPNL Women 47
Table 49A: Consumption of Zinc from Food Compared to the Recommended Daily Allowance 48
Table 49B: Consumption of Zinc from Food Compared to the Recommended Daily Allowance 48
Table 50: Phytate-Zinc Molar Ratio in Preschool Children by Population Group and Cluster 49
Table 51: Mean Phytate-Zinc Molar Ratio by Population Group and Cluster 50
Table 52: Folate Status of NPNL Women 50
Table 53: Consumption of Folate from Food 50
Table 54: Vitamin B12 Status In NPNL Women 51
Table 55: Consumption of Vitamin B12 from Food: NPNL Women 51
Table 56A: Status of Household Salt 52
Table 56B: Consumption of Iodized Salt by Socio-economic Status 53
Table 57: Reasons for Not Consuming Salt Packets 53
Table 58: Prevalence of Iodine Deficiency in School-age Children 54
Table 59: Iodine Status in School-age Children by Cluster 54
Table 60: Iodine Status in School-age Children according to the Asset Index 55
Table 61: Prevalence of Iodine Deficiency in NPNL Women 55
Table 62: Iodine Status in NPNL Women by Cluster 55
Table 63: Iodine Status in NPNL Women according to the Asset Index 56
Table 64: Iodine Status of Retailer’s Salt 56
Table 65: Iodine Content: Retailer Salt by Cluster 57

xviiNational Micronutrient Survey 2011-12
Table 66: Relationship of Respondent to Owner of the Retail Shops 57
Table 67: Education of Retail Shopkeepers 58
Table 68: Purchase and Sale of Crude and Open Salt (Retailers) 58
Table 69: Purchase and Sale of Salt Packets (Retailers) 59
Table 70: Storage of Open Salt (Retailers) 59
Table 71: Retailers' Practices of Packaging and Storing Open Salt (Retailers) 60
Table 72: Knowledge about Iodized Salt and its Source (Retailers) 60
Table 73: Knowledge about Iodized Salt (Retailers) 61
Table 74: Knowledge of the Benefits of Iodized Salt (Retailers) 62
Table 75: Testing of Salt for Iodine (Retailers) 62
Table 76: Knowledge about the Salt Law (Retailers) 64
Table 77: Retailer’s Knowledge about the Results of Testing Salt for Iodine 64
Table 78: Retailer’s Practice regarding Testing the Salt for Iodine 64
Table 79: Iodine level in Household Salt and Iodine Status in NPNL Women 65
Table 80: Relationship between Iodine Levels in Household Salt and Iodine Status of School-age Children 65
Table 81: Source of Household Respondents’ Knowledge about Iodized salt and about Which Type of Salt Contains Iodine 65
Table 82: Household Respondents’ Knowledge of the Benefits of Iodized Salt 67
Table 83: Household Respondents’ Knowledge on Testing of Salt for Iodine 68
Table 84: Household Practice of Including Salt in Livestock Feed 69
Table 85: Source of Salt Purchase 69
Table 86: Household Practice of Using Salt 69
Table 87: Prevalence of Stunting in Preschool Children 70
Table 88: Prevalence of Underweight in Preschool Children 71
Table 89: Prevalence of Wasting in Preschool Children 71
Table 90: Height-for-Age z-Score in Preschool Children 72
Table 91: Weight-for-Age z-score in Preschool Children 72
Table 92: Weight-for-Height z-score in Preschool Children 72
Table 93: Comparison of Mean Ferritin by Groundwater Iron Status 74
Table 94: Serum Ferritin in NPNL Women and Related Variables 74
Table 95: Determinants of Serum Ferritin in NPNL women 75
Table 96: Iron Consumption Compared to Iron RDI 76
Table 97: Coverage of Multiple Micronutrients Powder in Under-Two Children in Bangladesh 77
Table 98: Percentage of use of “Open” Salt by Socio-economic Status and Household Food 81 Security Status

xviii National Micronutrient Survey 2011-12
Table 99: Prevalence of Micronutrient Defficiency and Nutrition Status by Cluster 82
Table 1A: Mean Serum Vitamin D Concentration among Population Groups and by Cluster (nmol/L) 87
Table 2A: Mean Serum Vitamin D Concentration Disaggregated by Socio-economic Status 87
Table 3A: Mean Serum Vitamin D Concentration Disaggregated by Household Food Security Status 88
Table 4A: Mean Serum Citamin D Concentration and Prevalence of Vitamin D Deficiency in School-age Children, Disaggregated by Gender 88
Table 5A: Prevalence of Vitamin D Deficiency (Serum Vitamin D Level <50.0 nmol/L) in Population Groups and by Cluster 88
Table 6A: Prevalence of Vitamin D Deficiency (Serum Vitamin D Level <25.0 nmol/L) in Population Groups and by Cluster 89
Table 7A: Prevalence of Vitamin D Deficiency (Serum Vitamin D Level <50.0 nmol/L) Disaggregated by Socio-economic Status 89
Table 8A: Prevalence of Vitamin D Deficiency (Serum Vitamin D Level <25.0 nmol/L) Disaggregated by Socio-economic Status 89
Table 9A: Prevalence of Vitamin D Deficiency (Serum Vitamin D Level <50.0 nmol/L) Disaggregated by Household Food Security Status 90
Table 10A Prevalence of Vitamin D Deficiency (Serum Vitamin D Level <25.0 nmol/L) Disaggregated by Household Food Security Status 90
Table 11A: Seven-day Mean Intake of Foods from All Animal Sources by Vitamin D Deficiency Status among the Groups 90
Table 12A: Seven-day Mean Intake of Meat, Poultry and Fish according to Vitamin D Deficiency Status in the Population Groups 91
Table 13A: Mean Serum Calcium Concentration in Population Groups and by Cluster 91
Table 14A: Mean Serum Calcium Concentration Disaggregated by Socio-economic Status) 91
Table 15A: Mean Serum Calcium Concentration Disaggregated by Household Food Security Status 92
Table 16A: Prevalence of Calcium Deficiency by Population Groups and Cluster 92
Table 17A: Prevalence of Calcium Deficiency Disaggregated by Socio-economic Status 93
Table 18A: Prevalence of Calcium Deficiency Disaggregated by Household Food Security Status 93
Table 100: Cut-off Values for Anemia according to WHO Recommendations 99
Table 101: Definition of Iodization of Salt And Adequacy of Iodization 102
Table 102: Hypothetical Sample Size Calculated to Detect Desired Changes in the Prevalence of Vitamin A Deficiency 102
Table 103: Actual Sample Size Used for the Survey to Detect Changes in the Prevalence of Vitamin A Deficiency 102
Table 104: Hypothetical Sample Size for Other Indicators (Anemia, Iron, Folate and Vitamin B12 Deficiencies) 103
Table 105: Actual Sample Size for Other Indicators (Anemia, Iron, Folate and Vitamin B12 Deficiencies) 103

xixNational Micronutrient Survey 2011-12
Table 106: Actual Sample Size for the Prevalence of Zinc Deficiency 104
Table 107: Actual Sample Size Required for Assessing Iodine Deficiency and Coverage of USI 104
Table 108: Standard Errors for Selected Estimates 105
Table 109: Elevated Inflammatory Biomarkers 107
Table 110: Primary Sampling Units for the Survey 109
Table 111: Blood Sample Collection Form 142
Table 112: Household Salt Sample Collection Form 143
Table 113: Retailer’s Salt Sample Collection Form 144
Table 114: Urine Sample Collection Form 145
Table 115: Cluster Monitoring Form 146
Table 116: Bi-weekly Monitoring Report Form 148
List of FiguresFigure 1: Selected 150 Primary Sampling Units 9
Figure 2: Project Management Structure 20
Figure 3: Drinking of Tube-Well Water (groundwater) vs. the Prevalence of Iron 77 Deficiency in Preschool Children
Figure 4: Trend of Iodine Status in School-age Children 81
Figure 5: Trend of Iodine Status in NPNL Women 81

xx National Micronutrient Survey 2011-12
Acronyms and abbreviationsAGP Alpha acetylated glycoprotein
BBS Bangladesh Bureau of Statistics
BDHS Bangladesh Demographic and Health Survey
BDT Bangladesh Taka
CI Confidence interval
CDC Center for Disease Control and Prevention (USA)
CRP C-reactive protein
CUS Center for Urban Studies
CV Co-efficient of variation
EPI Expanded Programme on Immunization
ERC Ethical Review Committee
EQUIP Ensuring the Quality of Iodine Procedures
FFQ Food Frequency Questionnaire
FANTA Food and Nutrition Technical Assistance
GOB Government of Bangladesh
G Gram
GDP Gross domestic product
HKI Hellen Keller International
HH Household
icddr,b International Centre for Diarrheal Diseases Research, Bangladesh
ID Iron deficiency
IDA Iron deficiency anemia
IDD Iodine deficiency disorders
IOM Institute of Medicine
IPHN Institute of Public Health Nutrition
IRB Institutional Review Board
IVACG International Vitamin A Consultative Group
IZINCG International Zinc Nutrition Consultative Group
LPG Liquid petroleum gas
KAP Knowledge Attitude and Practice
MDG Millennium Development Goals
MICS Multiple Indicator Cluster Sampling
MMQAP Micronutrients Measurement Quality Assurance Program
Mmol/l Micromole per litre

xxiNational Micronutrient Survey 2011-12
MUAC Mid-upper arm circumference
NGO Non-government organization
NIST National Institute of Standards and Technology
Ng/ml Nanogram per millilitre
Nmol/l Nano mole per litre
NPNL Non-pregnant non-lactating
PCA Principal Component Analysis
Pg/ml Pico gram per millilitre
PHM Photometeric hemoglobinometer
PPM Parts per million
PSU Primary Sampling Unit
QC Quality control
RDA Recommended Daily Allowance
RE Retinol equivalents
RRC Research Review Committee
SES Socio-economic status
SOP Standard Operating Procedure
THFPO Thana Health and Family Planning Officer
UIC Urinary Iodine Concentration
UNICEF United Nation’s Children’s Fund
USI Universal Salt Iodization
VITAL EQA Vitamin A Laboratory – External Quality Assurance
WHO World Health Organization

xxii National Micronutrient Survey 2011-12

1National Micronutrient Survey 2011-12
Summary of Findings
Household assets: Nationally, 68.7% of households had electricity, 41.6% owned televisions and 12.0% owned refrigerators. A high percentage of households owned mobile phones.
Household food insecurity: Over half of the households (52%) were “food-secure”; 53.5% of the households in the urban clusters and 36.3% of households in the slum clusters were “food-secure”; 12.3% of households were severely “food-insecure”.
Household monthly spending: The average monthly expenditure was BDT 8,944.00. It was slightly higher in the urban (BDT11,006.00) than in the rural (BDT 8,393.00) area. Households with “food-secure” had significantly higher spending power than the households which were “severely food-insecure” (BDT 10,357.00 against BDT 6,505.00).
Consumption of oil: The national estimate of per capita daily consumption of oil was 24.4 grams broken as follows: 29.7 g, 25.9 g, and 22.9 g, respectively, in the urban, slum and rural areas. In food-secure households, consumption was 27.8 g compared to 16.4 g in the “severely food-insecure” households.
Type of cooking oil used in households: In all households, consumption was: soybean oil, 89.5%; mustard oil, 17.2%; and “brand” oil in 25.7%. In the rural, urban and slum clusters, 22.8%, 38.6% and 12.7%, respectively, used “brand” oil. However, the vast majority of the households at the national level consumed “open” oil (73.2%).1
Sub-clinical vitamin A deficiency status: The prevalence of sub-clinical vitamin A deficiency, as measured by serum retinol level (serum retinol< 0.7 mmol/l), was 20.5% among preschool children (aged 6-59 months); the prevalence was significantly higher in the slum clusters, at 38.1%. The prevalence was 20.9% and 5.4%, respectively, among school-age children and non-pregnant, non-lactating (NPNL) women. Prevalence in school-age children in the slums was 27.1%.
Vitamin A supplementation in preschool children: The national estimate of the coverage was 77%. It was 77.9%, 73.1% and 72.4%, respectively, in the rural, urban and the slum clusters. According to the Asset Index, the coverage was 76.4% in the “poorest” section and 87.5% in the “richest” section of population.
Anemia: The prevalence of anemia in the preschool children was 33.1%. It was 36.6% and 22.8% respectively in the rural and the urban clusters. The prevalence appeared to be lower than the earlier nationally representative estimates of the country (47.0%, NSP 2001); however, this may be accountable to the difference in the assessment methods. Venous hemoCue was used in the National Micronutrients Survey. The prevalence of anemia in school-age children was 19.1% and 17.1%, in 6-11 year-olds and 12-14 year-olds, respectively. The prevalence of anemia in NPNL women was 26.0% against 33.0% in the earlier, nationally representative survey (NSP 2001).
Iron deficiency: Iron deficiency was measured by estimating serum ferritin level. In the National Micronutrients Survey, for the first time, nationally representative data on serum ferritin were available. The ferritin value in serum was adjusted for presence of infection by addressing the elevated values of CRP (>10 mg/l) and AGP (>1 gm/l), the biomarkers for infection. The national prevalence of iron deficiency, as measured by low ferritin (preschool children<12 ng/ml; school-age children and NPNL women<15 ng/ml) was 10.7% in preschool children and 7.1%. in NPNL women; and 3.9% and 9.5% in school children aged 6-11 year and 12-14, respectively. The prevalence of iron deficiency in the Bangladesh population was substantially lower than the widely held assumption. The amount of consumption of iron from food is below the daily recommended requirement (RDA) in all the population groups studied. The total consumption of iron from food was 41-82% of the recommended daily requirement across age and gender of the studied population groups. The mean ferritin level in the blood in the studied population
1“Branded” refers to selling in bottle, packet, tin with labelling, certification logo and company name/logo. “Open” oil refers to bulk oil sold in a drum.

2 National Micronutrient Survey 2011-12
groups were significantly higher (p<0.001) in the areas where groundwater iron concentration was higher than in the areas where groundwater iron was lower. In spite of lower consumption of iron from food, iron deficiency in the population was lower than expected and was presumably linked with high level of iron in the groundwater, which is the largest source for drinking water in the Bangladesh population (80.0%).
Zinc status: For the first time in Bangladesh, the National Micronutrients Survey 2011-12 provided nationally representative data on zinc status in selected populations. The national prevalence of zinc deficiency was 44.6% in preschool children; 51.7% in the slums and 29.5% in the urban cluster. The national prevalence of zinc deficiency in NPNL women was 57.3%; 66.4% in the slums, 57.5% in the rural and 54.5% in the urban cluster.
The consumption of zinc was well below the RDA in NPNL women: 54.7% in the urban cluster and 47.0% in the slum cluster. Out of total consumption, most of the zinc is derived from plants, which is poorly bio-available.
Vitamin B12and folate status: Vitamin B12 and folate status were estimated in NPNL women. This was the first time that a National Micronutrients Survey had provided nationally representative data on these deficiencies. The national prevalence of folate deficiency was 9.1%. The prevalence of vitamin B12 deficiency (frank deficiency and marginal deficiency) was 23.0% at the national level.
Status of iodine and salt iodization: The prevalence of iodine deficiency was 40.0%, as measured by the percentage of school children whose mean urinary iodine concentration (UIC) was below the cut-off mark of 100 µg/l. This showed a rising trend from 33.8% in the 2004/5 data. In NPNL women, the prevalence of iodine deficiency was 42.1%, which has also shown a rising trend from earlier data, at 38.0%. However, according to median UIC, which was above the cut-off mark for defining deficiency (100 µg/l), the trend in iodine deficiency prevalence was on the rise although the country as a whole, based on the total population, was iodine-sufficient. The median urinary iodine concentration in school-age children and NPNL women was 145.7 µg/l and 122.6 µg/l, respectively. According to the Asset Index, the bottom two quintiles, the “poorest” and “poorer” NPNL women, had a median urinary iodine concentration below 100 µg/l, indicating that these women were iodine-deficient.
Around 80% of households used iodized salt (iodine level >5 ppm), while 57.6% of households used adequately iodized salt (iodine level >15 ppm). In the rural areas, use of adequately iodized salt was just 51.8%. The national use rate of “brand” salt was 75.8%; however, a substantial percentage (29.2%) of the households in the rural areas still used “open” salt. The consumption of “open” salt was 37.0% and 17.0% in the “poorest” and the “richest” households, respectively. The percentage of use of retailer salt samples with adequately iodized salt (>20 ppm) was 66.4%.
Nutritional status of preschool children: The prevalence of stunting (height-for-age z-score <-2) in preschool children (6-59 months) was 32.1%: it was higher in the slums (51.1%) than in the urban (31.3%) and rural areas (31.4%). The prevalence of underweight (weight-for-age z-score<-2) at the national level was 30.0%. It was more prevalent in the slum cluster (47.4%) than in the other two clusters – 29.6% in the rural cluster and 28.1% in the urban cluster. The prevalence of wasting (weight-for-height z- score<-2) was 19.3%, with proportionately more children in the slums (20.3%) and rural clusters (21.1%) than in the urban cluster (12.9%).
Micronutrients consumption from food: Although the consumption level of animal source foods has been increasing in the country (Household Income & Expenditure Survey of Bangladesh, 2010), the data of the National Micronutrients Survey suggests that the population of Bangladesh is still well below the Recommended Daily Allowance (RDA) of food intake for the key micronutrients. The median daily consumption of vitamin A, as expressed by RE, was 270.0, 318.0, and 372.0 REs in preschool children, school-age children and NPNL women, respectively, which were below the RDA amount for the respective age and population groups. Daily median consumption of iron from food was 4.17, 5.21 and 6.64 mg in preschool children, school-age children and the NPNL women, respectively, which were lower than the RDAs for the age and population. The consumption of iron from animal sources, i.e. the

3National Micronutrient Survey 2011-12
form of dietary iron that is readily absorbed in the body, was a low share of the total iron consumption. The percentage of animal source iron of the total iron consumption was 23.0%, 24.0% and 18.0%, in school children, preschool children and NPNL women, respectively. With regard to consumption of zinc from food, the median daily consumption was 3.20 mg and 2.67 mg in the urban and slum clusters, respectively, compared to the RDA of 3-5 mg for zinc in preschool children.
Micronutirients and nutritional status among the slum population: The National Micronutrients Survey recorded for the first time micronutrients status among the slums population, addressing a long-felt need for data on key micronutrients. The findings were remarkable, because populations in the slum cluster suffer from key micronutrients deficiencies, and the undernutrition status was higher than in urban and rural areas, yet the SES indicators were not below those in the rural cluster (Table A).
Table A. Prevalence of Micronutrient and Nutritional Status by Cluster
Rural (%) Urban (%) Slum (%)Subclinical vitamin A deficiencyPreschool Children 19.4 21.2 38.1School-age children 20.2 22.1 27.1NPNL women 5.4 4.9 6.9Zinc deficiencyPreschool children 48.6 29.5 51.7NPNL women 57.5 54.5 66.4Nutritional status of preschool childrenStunting 31.4 31.3 51.1Wasting 21.1 12.9 20.3Underweight 29.6 28.1 47.4

4 National Micronutrient Survey 2011-12
1. Introduction
Bangladesh has been making impressive progress in reducing undernutrition and is one of the countries that is on course to likely meet the Millennium Development Goal (MDG) 1 on nutrition. However, the prevalence of micronutrient deficiency persists at a high level. It was estimated that micronutrient deficiency accounted for the loss of $7.9 billion losses in national gross domestic product (GDP). The major micronutrient deficiency affecting the population of Bangladesh concern vitamin A, iron and anemia, zinc and iodine. According to the most recent nationally representative survey, the prevalence of sub-clinical vitamin A deficiency, as measured by low serum retinol level (<0.7 mmol/l) in the pre-school children (6-59 months), was 22.0% (IPHN/HKI 1997-98). In a more recent study conducted in the areas where home gardening was practised, it was reported that around one-fifth (19.6%) of the young children had a serum retinol level of <0.7 µmol/l (Faruque et al., 2006). The vitamin A capsule distribution programme for preschool children (aged 2-<5 years) has successfully contributed to decreasing the magnitude of the problem over the past decade, especially in reducing the prevalence of night blindness. However, there are pockets of areas where there might be severe vitamin A deficiency. Post-partum vitamin A supplementation coverage was only 17.0% (BDHS 2007). To increase the coverage of vitamin A interventions, the Government of Bangladesh, under the auspices of the Ministry of Industry, has initiated the National Oil Fortification Programme. The Programme fortifies locally processed cooking oil (soybean, palm oil) with vitamin A. The current National Micronutrients Survey includes the baseline assessment of the current subclinical vitamin A status. The impact of the Oil Fortification Programme can be assessed based on this survey.
Anemia is probably the biggest public health problem of the country, affecting around half of preschool children (BBS/UNICEF. Anaemia Prevalence Survey 2003). Prevalence among under-two children is pervasive: over 60% suffer from anemia (Nutrition Surveillance Project 2001). The most recent nationally representative anemia survey was conducted approximately one decade ago, and it is unanimously recommended by the policy actors of the country for conducting a national survey on anemia and iron deficiency. Until now in Bangladesh, there have been no nationwide data on iron deficiency assessed using serum ferritin or other specific indicators of iron such as sTfR. There are only sporadic small-scale studies using such iron indicators. Therefore, this survey was an attempt to obtain a nationally representative data on iron deficiency for the first time in the country.
Although iodine deficiency disorders (IDD) have been successfully controlled for over a decade, this problem is still a fundamental health public health issue. The prevalence of IDD, as indicated by UIC below a defined cut-off mark (100 µg /l), was 33% in school-age children and 38 percent in NPNL women. The national IDD control programme is mandated to monitor the situation over time; the most recent Iodine Deficiency Disorders and Universal Salt Iodization (IDD/USI) survey was conducted in 2004. Hence, this survey provides the opportunity for informing the updated status of iodine nutrition and of iodine in salt.
Zinc is essential for normal growth and immune function. In children living in countries with an elevated risk of zinc deficiency, zinc supplementation enhances growth, decreases morbidity from diarrhea and pneumonia, and decreases mortality. Zinc is available in animal source foods, meat, fish and eggs, etc. However, the diet of Bangladesh lacks the optimal amount of animal source food and is predominantly staple-based, which is a poor source of zinc. An estimated 50 percent of the population is at risk of inadequate zinc intake based on national food supply data. A recent study conducted in two of the subdistricts in Bangladesh, which examined the efficacy of bio-fortified rice, showed a prevalence of inadequate serum zinc in under-five children and women is 22% and 73%, respectively (Arsenault, 2010). However, since nationally representative data on zinc deficiency were unavailable, the present survey provided, for the first time, nationally representative data on zinc nutrition in the selected population groups. The survey also provided nationwide data on folate and vitamin B12 deficiencies in NPNL women.
A conglomerate of multiple micronutrients for the survey was efficient in terms of resources. Perhaps more importantly, there was an essential public nutrition response to inform policy makers on the

5National Micronutrient Survey 2011-12
nation-wide population status of key micronutrients such as iron, zinc, folate, vitamin B12, which was previously unknown, and on the updated status of other key micronutrients such as vitamin A, iodine. Ongoing monitoring of the key micronutrients is required for the population’s improved nutrition.
1.1 Objectives
To estimate the status of key micronutrients (vitamin A, iron, iodine) for the selected population groups, i.e. preschool children (6–59 months), school-age children (6–14 years) and NPNL women of reproductive age (15–49 years) for rural, urban and slum cluster in order to:
a) estimate the current prevalence of sub-clinical vitamin A deficiency in preschool children, school-age children, and NPNL women as the baseline for the Government’s National Oil Fortification Programme as measured using serum retinol concentrations;
b) assess the current status of iodine deficiency disorder (IDD) among school-aged children and NPNL as measured by UIC;
c) estimate the current prevalence of anemia in the preschool children (6-59 months), school-aged children and NPNL as measured by hemoglobin;
d) estimate current prevalence of iron deficiency in the preschool children (6-59 months), school-aged children and NPNL as measured by ferritin (and CRP and AGP for adjusting for infection);
e) estimate current prevalence of zinc deficiency in the preschool children (6-59 months), and NPNL as measured by serum zinc;
f) assess the share of households using adequately iodized salt by analysing salt samples collected from households;
g) obtain information on the awareness of the survey populations on IDD, vitamin A and iron-rich food consumption, oil consumption and purchasing patterns of the survey population;
h) assess the percentage of households using oil that will be fortified by inquiring about the use of refined oil and collecting the brand names, where possible;
i) compare progress in coverage of adequately iodized salt and the iodine status with the previous findings in the National Iodine Deficiency Disorders and Universal Salt Iodization (IDD/USI) survey;
j) assess prevalence of folate and vitamin B12 deficiency in NPNL.
6 National Micronutrient Survey 2011-12
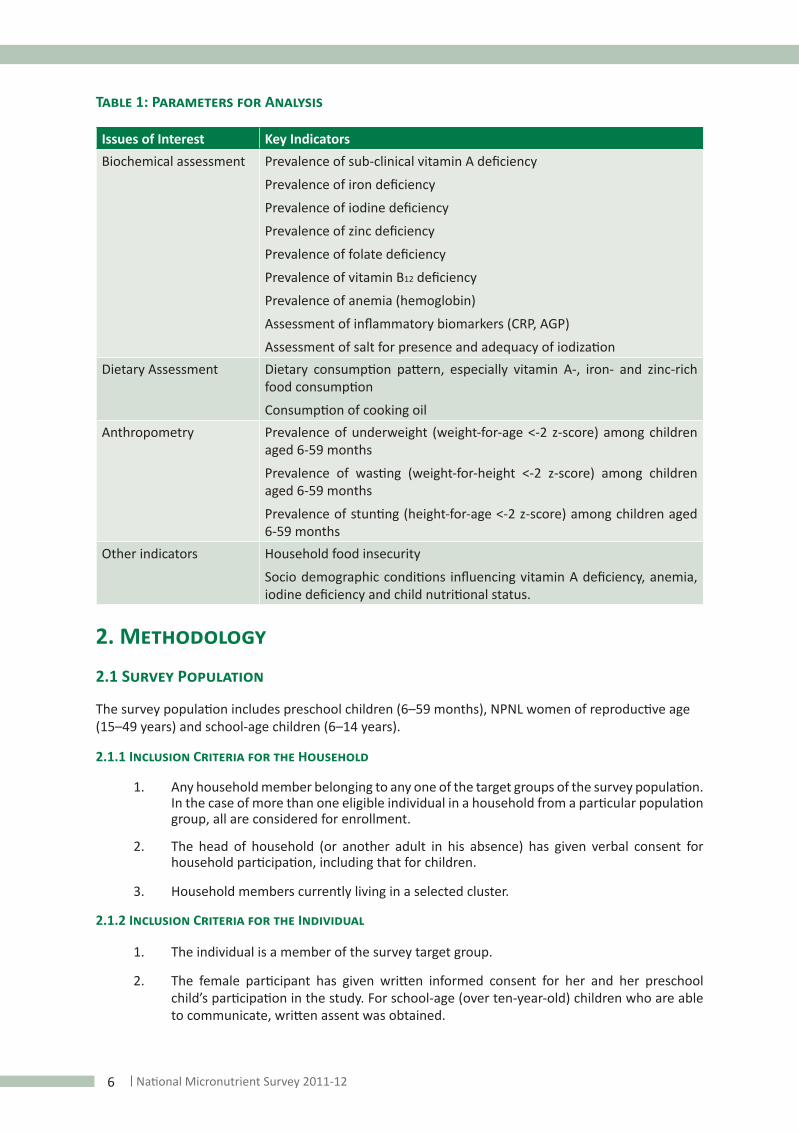
Table 1: Parameters for Analysis
Issues of Interest Key IndicatorsBiochemical assessment Prevalence of sub-clinical vitamin A deficiency
Prevalence of iron deficiency
Prevalence of iodine deficiency
Prevalence of zinc deficiency
Prevalence of folate deficiency
Prevalence of vitamin B12 deficiency
Prevalence of anemia (hemoglobin)
Assessment of inflammatory biomarkers (CRP, AGP)
Assessment of salt for presence and adequacy of iodizationDietary Assessment Dietary consumption pattern, especially vitamin A-, iron- and zinc-rich
food consumption
Consumption of cooking oilAnthropometry Prevalence of underweight (weight-for-age <-2 z-score) among children
aged 6-59 months
Prevalence of wasting (weight-for-height <-2 z-score) among children aged 6-59 months
Prevalence of stunting (height-for-age <-2 z-score) among children aged 6-59 months
Other indicators Household food insecurity
Socio demographic conditions influencing vitamin A deficiency, anemia, iodine deficiency and child nutritional status.
2. Methodology
2.1 Survey Population
The survey population includes preschool children (6–59 months), NPNL women of reproductive age (15–49 years) and school-age children (6–14 years).
2.1.1 Inclusion Criteria for the Household
1. Any household member belonging to any one of the target groups of the survey population. In the case of more than one eligible individual in a household from a particular population group, all are considered for enrollment.
2. The head of household (or another adult in his absence) has given verbal consent for household participation, including that for children.
3. Household members currently living in a selected cluster.
2.1.2 Inclusion Criteria for the Individual
1. The individual is a member of the survey target group.
2. The female participant has given written informed consent for her and her preschool child’s participation in the study. For school-age (over ten-year-old) children who are able to communicate, written assent was obtained.

7National Micronutrient Survey 2011-12
2.2 Sample Size Determination
Sample size was calculated in two different ways depending on the indicators. For the assessment of serum retinol, the sample size for each target group was calculated to detect with statistical significance a minimum assumed decline in the prevalence of low serum retinol between the two surveys, as shown in Table 102 (Annex 7.2). The following formula was used to calculate the sample size.
x design effect x factor to adjust non-response rate
Where n= required sample size for each survey, expressed as number of units of analysis,
P1 = Proportion in the pre-intervention (or the baseline) survey,
P2 = Proportion in post-intervention survey,
(P2 - P1) = Expected difference between the baseline and follow-up surveys,
P = (P1 + P2) /2 and Q = (1 - P),
Zα = 1.96 at α = 0.05 and Z1-β = (-0.842) for power of the test set at 0.80,
and the design effect = 2 and factor to adjust non-response rate of 20%
The sample size thus calculated could detect the statistical significance for the stated change between the baseline and end-line retinol status in each of the cluster separately. However, this would require visiting more than 13,000 households, thus making it unfeasible to carry out the survey due to constraint of logistics, resources and time. Hence, only 3,000 households were considered for the survey, which would be sufficient to detect the stated change in low retinol prevalence between the baseline and end line in all the three clusters together, and would be logistically feasible to carry out. Table 103 (Annex 7.2), which shows actual p values obtained for each target group for differences in the prevalence of vitamin A between the baseline and follow-up surveys, includes 3,000 households in the sample for each survey.
In order to estimate the prevalence of anemia, iron deficiency, iodine deficiency, zinc deficiency, folate deficiency and vitamin B12 deficiency, the minimum sample size was calculated in order to obtain a specified precision, i.e., a confidence interval of a specified width around a single point estimate in the survey for each target group and outcome. The required precision depended on the target group and outcome, as shown in Table 104, (Annex 7.2). The formula used for these calculations is:
x design effect
P = the current prevalence, Zα = 1.96 at α=0.05, d = the half confidence interval and the design effect = 2
Table 105, 107 (Annex 2) shows the actual confidence intervals obtained for each target group, for anemia, iron deficiency, folate, vitamin B12, urinary iodine and iodine concentration in salt at households and retailers, given that 3,000 households were included in the sample. Based on the feasible sample size calculated in Tables 103, 105, 106 and 107 (Annex 7.2), Table 2 gives the adjusted (i.e. to the whole numbers for field work) and the definitive sample size for each of the parameters in the different population groups.

8 National Micronutrient Survey 2011-12
Table 2: Adjusted Sample Size for Laboratory Parameters
Parameter Population Actual sample (3 clusters)
Adjusted to whole numbers for field work
S. RetinolPreschool children 1176 1200NPNL women 954 1050School-age children 1455 1500
Total 3750
Hemoglobin Preschool children 588 600NPNL women 954 1050School-age children 1455 1500
Total 3150
S. FerritinPreschool children 588 600NPNL women 954 1050School-age children 1455 1500
Total 3150
S. ZincPreschool children 969 1050NPNL women 1514 1500
Total 2550S. Folate NPNL women 954 1050B12 NPNL women 954 1050
Urinary iodineNPNL women 1401 1500School-age children 1320 1350
Total 2850Salt for iodide (Household)-“adequacy of iodized” salt* 1800Retailer’s salt- “sale of iodized salt”** 1650
*The sample size also covered the sample for “Purchase of iodized salt”.
**The sample size also covered the sample for “Adequacy of iodization in salt”.
2.3 Sampling Design
The outcomes were estimated for three clusters (rural, urban and slum. The list of the 15,000 primary sampling units (PSUs) selected for the Bangladesh Multiple Indicator Cluster Survey (MICS 2009) was used as the sampling frame to select the required number of PSUs per cluster for this survey. Sampling was carried out in three stages.
2.3.1 First Stage Sampling: In the first stage, the PSUs were selected by systematic random sampling with equal probability in each cluster. Equal probability of selection was used to preserve equal selection probability for every household in the cluster because the 15,000 PSUs used in the MICS 2009 survey had already been selected by population share to size (PPS). In this way, a total of 150 PSUs were selected, 50 in each clusters.
2.3.2 Second Stage Sampling: In the second stage, the selected PSUs (enumeration area) were subdivided into segments. The size of each segment was as close to 50 households as possible. The field supervisor on arrival in the sampled PSU asked the local people around its size, boundary. He requested a local inhabitant to help and accompany him on a walk through the mouza. On the walk, the number of baris (holdings) and the number of households in each bari were counted. In this way,

9National Micronutrient Survey 2011-12
the number of holdings containing 50-55 households was identified by drawing a ‘segment’ on a piece of a paper. This was continued until a second segment (containing the holdings’ housing next 50-55 households) was drawn on the paper. When the process was completed for that PSU, one ‘segment’ having approximately 50 households was chosen at random.
2.3.3 Third Stage Sampling: In the third stage, a list was drawn of the households and their respective eligible study participants in the selected 50-household segment. From this list, 20 households were selected using simple random sampling by random numbers. The computer-generated random numbers (for selecting 20 households from the list of the 50) were produced beforehand. Five sets of random numbers generated were handed over to the field teams. The field teams used all those different sets by turn. These 20 households were the definitive list for data and biological sample collection.
Figure 1 shows the distribution of the sample PSUs in the divisions and districts.
Figure 1: Selected 150 Primary Sampling Units

10 National Micronutrient Survey 2011-12
2.4 Sub-Sampling for Biological Samples (in 20 households)
Since the sample sizes calculated for laboratory testing in different target groups are different, households differed as regards to which target group members were recruited.
Table 3 shows the required number of study participants by each cluster for the collection of the biological samples for different parameters.
Table 3: Cluster Sample Requirements Per Parameter
Parameters Population group No. required per cluster (20 households)
Serum RetinolPreschool children (6-59 months) 8NPNL women 7School-age children 10
HemoglobinPreschool children (6-59 months) 4NPNL women 7School-age children 10
Serum FerritinPreschool children (6-59 months) 4NPNL women 7School-age children 10
Serum ZincPreschool children (6-59 months) 7NPNL women 10
Serum Folate NPNL women 7Serum Vitamin B12 NPNL women 7
Urinary IodineNPNL women 10School-age children 9
From these 20 households, a maximum of eight samples from retinol in the preschool children and ten samples for retinol from school-age children were required. Also, ten urine (UIC) samples from NPNL women were required. At first, every odd-numbered household in the list was approached until the target for each of the parameters in each of the population groups was achieved (i.e. Households 1, 3, 5….11, 13…19, in the 20-household form). In the case of a shortfall in the number of samples of a particular population group, the even-numbered households were approached in order to obtain the required number of samples (i.e. Households 2, 4, 6, 8….12, 14….20, in the 20-household form). In the case of more than one participant of a population group residing in a household, all were considered for data and biological sample collection.
Four preschool children from the eight selected for retinol were picked randomly for hemoglobin, ferritin, CRP and AGP. Four random computer-generated numbers were provided by the field teams. The field data collectors selected the four participants according to the given random numbers for estimating hemoglobin, ferritin, CRP and AGP. From the eight pre-school-age children selected for retinol, one was randomly excluded, and the seven remaining were considered for assessing zinc.
All ten school-age children selected for retinol were considered for hemoglobin, ferritin, CRP and AGP. One of the children was randomly excluded and the remaining nine were considered for collecting urine sample.
Seven of the ten NPNL women selected for urinary iodine were randomly selected by the field staff for hemoglobin, ferritin, CRP, AGP, folate and B12. Three random computer-generated numbers were

11National Micronutrient Survey 2011-12
provided to the field team. They selected the three participants according to the given random numbers and excluded them from estimating for hemoglobin, ferritin, CRP, AGP, folate and B12. All ten women selected for urinary iodine were considered for serum zinc assessment.
2.5 Retailer Salt Sampling
The salt retailers were selected by asking the respondents in the households in each cluster where they usually buy their salt. This questioning continued until six different retailers were identified. A survey team member then visited these six retailers to interview them and to collect two salt specimens at each shop. The first specimen was brand name salt (‘brand salt’). The second specimen was from an open salt container (‘bulk salt’). If there was no ‘open’ salt in the shop, a second brand specimen was collected.
2.6 Household Salt Samples
Twelve salt samples from the 20 selected households were collected. The household salt samples were collected from the households where at least one NPNL woman or school-age child, or both, resided and were selected for urinary iodine/data collection. One salt sample per household was taken.
2.7 Sample Weight
Sample fractions (or selection probabilities) were different for different domains because population size of the clusters and enumeration area varied widely. Sample weights Wh = 1/Ph where Ph equals the overall selection probability in the hth cluster were used in the analysis of the survey data. The programme used for data analysis of the National Micronutrients Survey (STATA 10.0) calculated the estimates as the total weighted number of units of analysis included in the analyses being the same as the unadjusted total.
2.7.1 Estimate of Sample Weight
The National Micronutrient Survey (NMS) 2011-12 randomly sampled 50 PSUs from each of the three clusters:
• Rural + other urban clusters (“rural”)
• Municipalities (including cities) without slums (“urban”)
• Slums in Dhaka, Chittagong, Rajshahi and Khulna (“slum”).
Data from the Population Census 2001 of the Bangladesh Bureau of Statistics (BBS) and the Slum Census 2005 of the Centre of Urban Studies (CUS) were used to estimate populations in each domain in 2011. The 2001 census data were disaggregated for rural, urban and slum clusters, and used to project the size of the rural and urban populations for 2001-2050. CUS provided estimates of the populations in non-slum and slum in six cities (Chittagong, Dhaka, Khulna, Rajshahi, Sylhet and Barisal) in 2005.
Data from these two sources were used to estimate the size of the populations in each cluster in 2011 under the assumptions that: (i) the inter-census growth rates of the rural and urban populations during 2001-2011 were similar to the growth rates during 1991-2001; and (ii) the percentage of the slum and non-slum population in 2011 was the same as in 2005.
In 2011, estimates of the populations in the three clusters – rural, and other urban clusters (rural), municipalities and urban slums – were 122.6 million, 23.3 million and 5.5 million, respectively. Despite the large difference in size, 50 PSUs were selected from each cluster, which resulted in differential selection probabilities and representations across the clusters. Sample weights are applied to the households in each cluster to compensate for the differential representations and to derive weighted

12 National Micronutrient Survey 2011-12
estimates combining the estimates of the three clusters. The sampled households are weighted by the inverse of the differential probabilities at household, cluster and cluster levels. The procedure used for calculating the selection probability (SP) is given below.
No.of households interviewed in a segment 1 segment per PSU)SP = × 50 householdsinasegment No.of segments in a PSU
50 PSUs in a stratum × No. of PSUs in a stratum
200 households per PSU × Estimated number of households in a stratum
1The sample weight is the inverse of SP Weight = SP
2.8 Questionnaire and Data Collection
2.8.1 Questionnaires
The National Micronutrient Survey used five types of questionnaires: (i) the Household Questionnaire; (ii) the Preschool Children’s Questionnaire; (iii) the School-age Children’s Questionnaire; (iv) the NPNL Women’s Questionnaire; and (v) the Retailer Questionnaire. The contents of the questionnaires were finalized upon consultation with the Technical Committee, formed for the survey. Field testing of the questionnaires was conducted, and necessary modification was made. The Institutional Review Board (IRB) of icddr,b approved all the tools, including the research and ethical protocols. The questionnaires were developed in English and then translated and printed in Bangla.
The Household Questionnaire was used to list all the members and visitors in the selected households. Information was collected on the dwelling unit, such as the source of water, type of toilet facilities, materials used to construct the floor and walls, and ownership of various consumer goods. It covered knowledge on the source and health benefits of consumption of vitamin A- and iron-rich food, iodized salt and its benefits and household practice with the use of iodized salt. It was also used to keep record of the collected salt samples from the household.
The NPNL Women’s Questionnaire was used to collect information from NPNL women of reproductive age. Women were asked questions on the following topics:
Background (e.g. age, education, occupation)
Reproductive history
Food consumption
Record of biological parameters collected, e.g. retinol, hemoglobin, ferritin, CRP, AGP, folate, B12, zinc and urinary iodine.
The School-age Children’s Questionnaire was used to collect information from children aged 6-14 years. The children were asked questions on the following topics:
Background (e.g. age, education, occupation of household head),

13National Micronutrient Survey 2011-12
Morbidity history
Record of biological parameters collected, e.g. retinol, hemoglobin, ferritin, CRP, AGP and urinary iodine.
The Preschool Children’s Questionnaire was used to collect information from children aged 6-59 months old. The primary caregiver was asked questions on the following topics:
Background (age of the child, vitamin A supplementation, mother’s education)
Food consumption
Morbidity history (fever, respiratory infection, diarrhea, malaria, etc.)
The Retailer’s Questionnaire was used to collect information from the retailer on the following topics:
type of salt sold, knowledge related with iodized salt and salt iodization, laws on salt iodization
knowledge on fortification of oil with vitamin A, type of oil sold, etc.
2.9 Field Operational Guidelines
2.9.1 Standard Operating Procedure
A Standard Operating Procedure (SOP) was developed prior to the start of the survey. It developed through pre-testing and includes guidance on asking survey questions, sampling techniques, anthropometry measurements, and biological sample collection and management.
2.9.2 Survey Monitoring Tools
A survey monitoring tool was prepared to monitor the performance of the interviewers and enumerators and laboratory technicians in the field. The tools objectively assessed various field performances in light of the SOP and quantitatively evaluated the cluster performance. A bi-weekly monitoring reporting form was developed to capture average performance of several clusters, measured in quantitative assessments. These tools were helpful to inform the field team on their strength and weaknesses, and thereby improve the performance subsequently.
2.10 Survey Training, Planning and Organization
2.10.1 Training and Field Work
The training was organized in two stages. In the first stage (5-8 September 2011) held at icddr,b, a cadre of master trainers from Mitra and Associates (data collection agency) and monitoring officers from icddr,b were given theoretical and practical orientation on different aspects of the survey (e.g. on-field cluster identification, study participant selection, study parameter selection, interviewing, anthropometry, management of biological samples such as blood collection, serum separation, aliquot preparation, labelling, maintenance of cold chain). Specialist trainers from icddr,b convened the sessions. It was followed by the second stage, held on 18-30 September 2011, in which the field staff were given the necessary orientation, supervised by icddr,b representatives, Mitra trainers from the first stage and the core trainers of the Mitra. In the process, a total of 87 field data collectors, laboratory technicians and data management assistants were trained for the survey.
Nine field teams from Mitra and Associates, each consisting of five individuals, were engaged in data collection. Each team consisted of one supervisor, two interviewers, one quality control officer and one laboratory technician. The interviewers conducted the interviews. The laboratory technician was responsible for the management of biological samples collection, serum separation, aliquot preparation, labelling, and dispatching to the laboratory. The team supervisor was responsible for the coordination of the activities, logistics management, contacting the local authorities and rapport-building with the

14 National Micronutrient Survey 2011-12
community. The quality control officer was responsible for spot checking of the filled-in questionnaires, observation of interviews, and feedback on the activities. icddr,b hired six field-based monitoring officers, who worked very closely with the Mitra teams to supervise the work. Field supervisors from the Institute of Public Health Nutrition (IPHN) visited the fields to monitor the activities.
2.10.2 Daily Plan for the Data Collection Teams
Day 1: Upon arrival in a selected mouza, the survey field team visited the sub-district health and family planning officers (Thana Health and Family Planning Officers, or THFPOs),Thana Nirbahi Officer (sub-district administrative officer),ward commissioner and local law enforcement agencies to brief them on the survey and to garner support for assistance to facilitate the survey. The teams then segmented the mouza and randomly selected a 50-household segment. They listed the 50 households of the selected segment, randomly selected the required number of study participants, and organized the blood sampling at a local health centre, NGO offices, and the primary schools or the residences provided by the local people.
Day 2-3: The teams collected data on socio-demography, food consumption, morbidity, knowledge and practice-related to the issues on vitamin A, iodine and iron, conducted anthropometry measurements and collected the biological samples (blood, urine) and salt samples from the selected respondents and households/retail shops in the PSU.
Day 4: The teams completed the unfinished work and proceeded to the next PSU according to the travel plan.
The survey started on 4 October 2011 and was conducted in two phases. In the first phase, data were collected from 72 clusters in the divisions of Rajshahi, Khulna, and part of Dhaka. The work of the first phase was continued until 3 November 2011. The second phase followed the Eid holidays (Eid-ul-azha) commencing on 14 November to complete the remaining 78 clusters in the division of Sylhet, Barishal, Chittagong, Dhaka and part of Rajshahi. The field work was completed on 20 December 2011.
2.11 Socio-economic Status Indicators
Information on ethnicity, religion, level of education of household head, occupation of household head, number of family members, home ownership, number of rooms, household construction materials, toilet facilities, sources of drinking water, household assets, land ownership and household’s monthly expenditure were collected as key indicators of SES.
An asset index was used as a measure of socio-economic status (SES), which was created by using information on household assets. The variables included were land (homestead, land under cultivation), construction materials of the walls, roofs and floors of homes, ownership of household assets (electricity, radio, television, mobile phone, land line, chairs, watches, tables, cupboards, rickshaws, vans, animal-drawn carts, refrigerators, motor boats) and type of toilet facility. The categories for construction materials of the roof and walls were taken into consideration – tin, brick-cement (pacca) and other materials, as well those of the floor – brick-cement (pacca), mud and other materials. For household assets, each item was categorized as ‘‘owned’’ or ‘‘not owned’’ by the household. A principal component analysis (PCA) was used to create the Asset Index. A weight was attached to each item from the first principal component. The households were classified into SES quintiles based on the Asset Index: quintile 1 (poorest), 2 (lower-middle/poorer), 3 (middle), 4 (upper-middle/richer) and 5 (richest).
2.12 Household Food Insecurity
The questionnaire consisted of nine occurrence questions that represent a generally increasing level of severity of food insecurity (access), and nine “frequency-of-occurrence” questions asked as a follow-up to each occurrence question to determine how often the condition occurred. Some of the nine occurrence questions concern respondents’ perceptions of food vulnerability or stress and the respondents’ behavioural responses to insecurity. The questions address the situation of all household

15National Micronutrient Survey 2011-12
members and do not distinguish adults from children or adolescents. All of the occurrence questions ask whether the respondent or other household members felt a certain way or performed a particular behaviour over the previous four weeks. The generic occurrence questions are grouped into three domains: (i) anxiety and uncertainty over the household food supply; (ii) insufficient food quality; and (iii) insufficient food intake and its physical consequences. The questions are provided in Annex 7.5.
2.13 Estimate of Children’s Ages
The children’s ages were estimated using immunization cards and birth registration certificates. In the absence of the immunization card/birth registration certificates, age was verified by well-tested questions, e.g. historical events, natural disasters, religious festivals, etc. The Bengali calendar was used as required.
2.14 Child Anthropometry
The children’s weight was taken using an electronic scale (Tanita Inc., Japan) with 100-gram precision. Calibration of the weighing scales was checked before the start of every day, using the same known weights (5-kg standard weight). Length/height was measured on a locally constructed standardized wooden length/height board. Mid-upper arm circumference (MUAC) of preschool children was measured to the nearest 1 mm using colour-coded MUAC tape.
2.15 Food Consumption Data
To assess food consumption, a seven-day semi-quantitative Food Frequency Questionnaire (FFQ) was used taking into consideration commonly consumed foods, with special attention to vitamin A-, iron- and zinc-rich foods. Food photographs indicating the serving and amount (grams) were used to assess the quantity of consumption. Raw food weight was calculated by using appropriate conversion factors (Ali SKM, 1991). Nutrient values (protein, carbohydrate, lipid, vitamin A, iron, zinc, folate, B12, phytate, energy) were calculated per 100 gram of raw food consumed using the most updated Food Composition Table on Bangladesh Food (Islam, 2010).
2.16 Household Monthly Expenses
The data on household monthly expenses were derived from collective expenses incurred on various items, e.g. food, housing, utilities, transportation, education, recreation, treatment, etc. For example, for the household’s approximate monthly food requirements such as rice, oil, salt, sugar, fish and meat, the amount and unit cost for each was collected, and costs were calculated.
2.17 Adjusting Ferritin, Retinol and Zinc for Infection
Ferritin, retinol and zinc were analysed keeping in mind the indicators of infection (CRP, AGP). Adjustment for elevated CRP (>10.0 mg/l) and AGP (>1.0 g/l) was made through a mathematical correction, a procedure increasingly used at present and published in renowned journals (Thurnham, 2010; Engle-Stone, 2011). With regard to the procedure, respondents were divided into four groups – the “incubation” (CRP >10 mg/l and AGP<1 g/l), “early convalescence” (CRP>10 mg/l & AGP>1 g/l), “late convalescence” (CRP<10 mg/l and AGP>1 g/l, and the “healthy/reference” (CRP<10 mg/l & AGP<1 g/l) group. Geometric mean of serum ferritin was calculated for each of these groups. Typically, ferritin value was skewed at the population level; therefore, ferritin value was log-transformed and then back-transformed to obtain the geometric means for each of the groups. The correction factor for ferritin was calculated as the ratio of geometric means of the “healthy/reference” group to that of the infection groups (incubation, early convalescence, late convalescence). Ferritin values in the infection groups were adjusted by multiplication by the group-specific correction factors. For example, the correction factors to adjust ferritin in the preschool children data were 0.79, 0.37, and 0.72, in the “incubation”, “early convalescence” and “late convalescence” groups, respectively. By the same technique, the correction factor for retinol and zinc were calculated and used to adjust the retinol and zinc level in serum.

16 National Micronutrient Survey 2011-12
2.18 Biological Sample Collection, Preparation, Transport and Storage
2.18.1 Blood Sample Collection and Processing
Blood samples were collected in a nearby health facility, e.g. a sub-district health complex, a Union subcentre, a primary school, the Expanded Programme on Immunization (EPI) clinic, an NGO clinic, an NGO office, or a residence provide by local people, etc. The selected respondents were given a token indicating their name and identification, and were requested to come to the temporary blood collection unit.
In order to obtain 1200 µl serum, at least 3.5 ml of venous blood was collected in a Venoject tube. After collection, the blood tube was placed in a cool box and allowed to clot. At the end of each day, the whole blood was centrifuged, and the serum was aliqoted into at least four cryovials by pipetting using a disposable pipette. One aliquot of approximately 250 µl was used for the analysis of retinol; one aliquot of 450 µl for ferritin, CRP and AGP; one for zinc and for specimens from the NPNL women; and a third aliquot of 450 µl for the analysis of folate and vitamin B12. A sample ID tag was applied on each of the cryovials. The serum was stored in a freezer (-20ºC or colder) as soon as possible. Alternatively, the serum was kept in a cool box and put into a freezer (-20ºC or colder) within 3-4 hours. Aliquoted samples of the same cluster were kept in cryo-boxes and labelled with the cluster-s name on the box. In this way, the laboratory could easily identify which particular clusters were to be tested in a batch, thus minimizing the possibilities of increasing freeze/thaw cycles. A sample record and handover form was filled indicating the name of the participants, ID number, sample ID number, and type of analysis to be carried out. The samples were carried to the nutritional biochemistry laboratory in Dhaka in dry ice. Samples were received at the laboratory, stored in a -70 ⁰C freezer and analysed to estimate the blood parameters.
2.18.2 Collection of Urine Samples
The children and women selected for urine sample collection were provided with disposable plastic cups. The samples were transferred to wide-mouthed, screw-capped plastic bottles that were previously washed with de-ionized water and dried. All the samples from one cluster were packed in one carton, transported to the nutritional biochemistry laboratory in icddr,b and stored in a freezer at -20⁰ C, where the analysis was carried out.
2.18.3 Collection of Salt Samples
Salt samples were collected from salt retailer shops and households. Households selected for salt collection were asked to provide a sample of salt used for cooking. Salt samples were collected from the retailers (sold in sealed/labelled/polyethylene packets). Open salt (not sold in sealed labelled polyethylene packets) was also collected. All salt samples were transferred to air-tight containers and stored at room temperature in the nutritional biochemistry laboratory of icddr,b prior to analysis.
Table 4 provides an overview of the indicators that were assessed for each of the population groups.
Table 4: Parameters by Population Group
Indicator Preschool Children
School -age Children
NPNL Women Retailers Household
Serum Retinol √ √ √Serum Markers of Inflammation
√ √ √
Hemoglobin √ √ √Serum Ferritin √ √ √Serum Zinc √ √

17National Micronutrient Survey 2011-12
Urinary Iodine √ √Serum Folate √Serum B12 √Salt Iodine √ √Height √Weight √
2.19 Data Processing and Analysis
Questionnaires for the National Micronutrients Survey were periodically returned to Dhaka for data processing at Mitra and Associates. Data processing consisted of office editing, coding of open-ended questions, data entry, and editing of inconsistencies found by the computer programs. The data were processed by two data entry operators and one data entry supervisor. Data processing was carried out using CSPro, a joint software product of the U.S. Census Bureau, Macro International and Serpro S.A.
Data analysis was performed using the statistical software STATA 10.0 SE (Statacorp, College station, Texas) and SPSS 11.5. Proportions were calculated with a 95% confidence interval. Estimates were weighted to represent the population level and means were calculated with a 95% confidence interval.
2.20 Quality Control
The quality control of the survey data was ensured by training and refresher training of the field staff, and extensive monitoring and supervision of the field activities. icddr,b led the training and refresher training by guiding Mitra and Associates field staff on the questionnaire administration, interviewing techniques, biological sample collection and processing, and anthropometry. A three-pronged monitoring and supervision was conducted. First, six full-time monitoring officers from icddr,b were deployed to observe the interviews, the collection of samples and anthropometry, and then conducted repeat interviews and on-the-spot checks of the data forms. They provided necessary guidance and supportive supervision to the field teams. In another level, investigators of the study from icddr,b and UNICEF provided frequent visits to the field to oversee the activities. At a different level, an independent monitoring team from the Institute of Public Health Nutrition (IPHN) regularly visited the field sites. The quality of the biological sample analysis was confirmed by satisfactory performance in the external quality assurance programmes of the Center for Disease Control and Prevention (CDC), United States of America.
As far as general consistency in data is concerned, the Cronbach’s alpha was ~80.0% (reference limit: 70.0–90.0%), which indicates a high correlation among the related variables (e.g. socio-economic and micronutrients status variables) in the data. This statistical assessment confirmed the quality of data collection.
2.20.1 Quality Control of the Laboratory Analysis
2.20.1.1 External Quality Control (EQC)
For external quality control, the Nutritional Biochemistry Laboratory of icddr,b participated in the Micronutrients Measurement Quality Assurance Program (MMQAP) for retinol. This programme is organized by National Institute of Standards and Technology (NIST). The Laboratory had also participated in The Vitamin A Laboratory – External Quality Assurance (VITAL-EQA) program for Retinol, Ferritin, CRP, Folate and Vitamin B12, which is organized by the Global Micronutrient Laboratory at the CDC. The Vitamin A Laboratory-External Quality Assurance program (VITAL-EQA) is a standardization programme designed to support laboratories accurately assessing serum nutrition markers. The performance of each laboratory is shared.

18 National Micronutrient Survey 2011-12
The Laboratory participated in the Ensuring the Quality of Iodine Procedures (EQUIP) programme for urinary iodine (UI) analysis, which is provided by CDC. Three times a year, CDC sends participating laboratories three to five urine samples that have been spiked with iodine (in a range of 10 to 300 μg/L) for UI analysis. At the end of each year, laboratories receive a certificate with tabulated scores for that year.
2.20.1.2 Internal Quality Control
For internal quality control (IQC), the Nutritional Biochemistry Laboratory of icddr,b used the following IQC materials:
1. PreciControl Anemia 1, 2 and 3 (Roche Diagnostics GmbH, D-68298 Mannheim, Germany) for ferritin, folate and vitamin B12.
2. Precinorm Protein and Precipath Protein (Roche Diagnostics GmbH, D-68298 Mannheim, Germany) for CRP and AGP.
3. Bi-level serum toxicology control (UTAK Laboratories Inc. 25020 Avenue Tibbitts Valencia, CA 91355) for zinc.
4. Pooled serum whose values were assigned in the Nutritional Biochemistry Laboratory against standard reference material (SRM) for retinol and zinc. The pooled serum was stored in a freezer and analysed with every batch of samples. The pooled serum was analysed with standard reference material (fat-soluble vitamins, carotenoids and cholesterol in human serum, 968c; National Institute of Standards and Technology, Gaithersburg, MD, USA) in ten replicates within the same day. The mean (X), standard deviation (SD) and 95% confidence interval of this pooled serum were calculated.
The stated assayed control material values corresponding to the methodology and instrumentation employed by the manufacturer were used as the target values. These QC materials were used together with study samples to monitor systemic and random errors. After a significant number of control determinations was completed, the SD and the coefficient variation were calculated.
For retinol measurement, internal standards were added to the sample at the beginning of the extraction procedure to compensate for losses of retinol at each step of the sample preparation. It was also used as a control. If the extraction of the internal standard was below 84%, the analysis was repeated.
Urinary Iodine
For the internal verification, the analysis was carried out on the remaining EQUIP reference sample, which has a certified concentration value for iodine, in triplicate in each micro-plate run. The coefficients of variation for the intra-assays and the inter-assays were calculated for each EQUIP reference material. For recovery, an equal volume of standard and sample were mixed, and then run as a sample. The recovery of urinary iodine was 92-108%.
The results of the QC analyses carried out together with the analysis of the monitoring samples are shown in Table 5. In general, the QC results were in good agreement with the reference values, and it can be assumed that the systemic errors of the monitoring data do not exceed the limit of assigned values.

19National Micronutrient Survey 2011-12
Table 5: Performance of the Internal Quality Control for Laboratory Analysis
Name of quality control standard Name of parameter Assigned value CV %
Precicontrol anemia Lot 163921
Ferritin (21.6-33.2) ng/ml 4.2(285-437) ng/ml 3.9(605-927) ng/ml 3.7
Folate (2.57-6.77) ng/ml 8.6(6.71-10.3) ng/ml 5.8(12.1-17.5) ng/ml 5.6
Vitamin B12 (173-321) pg/ml 4.6(426-612) pg/ml 4.6
(952-1288) pg/ml 3.5Precinorm protein, Lot 161643-02 CRP (7.83-11.73) mg/l 8.6Precipath protein, Lot 157580-02 (37.9-57.1) mg/l 3.9Precinorm protein, Lot 161643-02 AGP (58.4-95.6) mg/dl 5.5Precipath protein, Lot 157580-02 (100-166) mg/dl 5.2Pool serum Retinol 52.9-58.0 µg /dl 1.5Pool serum Zinc (0.73-0.96) mg/l 4.5QC-normal (0.51-0.85) mg/l 4.1QC-high (2.0-3.0)mg/l 4UI 100604 Urinary Iodine (414-560.1) µg/l 6.7UI 100609 (48.3-80.5) µg/l 10.4UI 100629 (109.6-164.4) µg/l 8.3UI 100601 (76.7-127.9) µg/l 7.5

20 National Micronutrient Survey 2011-12
2.21 Project Management Structure
A National Technical Committee consisting of experts in the field and spearheaded by the Institute of Public Health Nutrition (IPHN) was formed. The members of the Committee hailed from the academia, research organizations, the Ministry of Industry and related government organizations, programme managers from government sectors and NGOs, and representatives from the development partners. The Technical Committee reviewed the survey protocol and provided guidance in different stages of the survey, e.g. technical protocol, field data collection, report preparation, communication and national dissemination. The Committee convened meetings at different stages of the project. There were independent monitoring teams from icddr,b, UNICEF and the Institute of Public Health Nutrition (IPHN) for monitoring the field activities. Six field-based staff members of icddr,b were in charge to oversee the full-time supervision and monitoring of the field activities. They prepared the biweekly monitoring reports on the field performance, which were collated and summarized in icddrb, and shared with the Technical Committee to monitor progress.
Figure 2: Project Management Structure
icddr,b
2.22 Ethical Approval
Ethical approval for this study was obtained from the Institutional Review Board (IRB) of icddr,b. Board-s Research Review Committee (RRC) provided approval on the technical aspects of the protocol. Then, the Ethical Review Committee (ERC) granted its approval by considering ethical obligation that the study had to follow. The participants and/or the guardian of the participants in the study provided the written informed consent.

21National Micronutrient Survey 2011-12
3. Results3.1. Household Characteristics
Bangalees constituted the overwhelming share of the ethnic group (98.1%). With regard to religion, 89.0% of the households practised Islam. The percentage was slightly higher in the slum and rural clusters than in the urban cluster. In regard to the education of the household head, one in four had no formal education. This is in agreement with the BDHS 2011, which reports that 26% and 28% of men and women respectively did not have formal education. This percentage was higher in the slums (35.6%). The national estimate of the household heads having completed secondary education was 16.4%, which was consistent with the findings of BDHS 2011, which reported 18% and 12% of men and women had secondary or higher education, respectively. Proportionately more household heads from the urban clusters attained secondary or higher education (urban, 29.7%; rural, 13.1%).
Table 6: Household Characteristics
Rural Urban Slum National
% 95% CI % 95% CI % 95% CI % 95% CI
Ethnic group (n=661) (n=693) (n=649) (n=2003)
Bangalee 97.7 95.1-100 99.6 98.9-100 98.9 96.7-100 98.1 96.2-100
Chakma 0.53 0.0-1.5 0.02 0.0-0.08 0.41 0.0-1.1
Marma 0.96 0.0-2.8 0.34 0.0-1.0 0.80 0.0-2.2
Garo 1.1 0.0-3.2 0.04 0.0-0.12
Sautaal 0.26 0.0-0.8 0.19 0.0-0.59
Other 0.47 0.0-1.3 0.36 0.0-1.0
Religion (n=661) (n=693) (n=649) (n=2 003)
Islam 90.6 83.4-97.7 86.2 77.5-94.9 95.6 92.2-98.9 89.9 84.2-95.5
Hinduism 7.4 0.9-13.1 13.0 4.3-21.7 3.3 0.6-5.9 8.4 3.1-13.6
Buddism 1.5 0.0-3.8 0.4 0.0-1.0 1.2 0.0-2.9
Christianity 0.4 0.0-1.3 0.3 0.0-0.9 1.0 0.0-3.2 0.44 0.0-1.1
Others
Education (n=659) (n=692) (n=645) (n=1 996)
No education 27.4 22.8-31.9 20.5 15.3-25.6 35.6 28.1-43.2 26.3 22.7-29.8
Primary incomplete 26.7 21.7-31.7 18.3 13.2-23.4 25.8 20.5-31.1 25.0 21.1-28.9
Primary complete 14.4 11.2-17.5 9.3 6.2-12.4 11.4 8.1-14.6 13.2 10.7-15.8
Secondary incomplete 18.2 15.1-21.4 22.0 16.9-27.1 17.5 11.9-23.0 19.0 16.4-21.5
Secondary complete and higher 13.1 9.5-16.6 29.7 22.1-37.3 9.6 6.4-12.7 16.4 12.9-19.8
Assets (n=661) (n=693) (n=649) (n=2 003)
Electricity 63.4 50.6-76.1 83.3 74.3-92.3 95.3 92.2-98.5 68.7 59.4-78.0
Radio 8.5 4.8-12.2 11.1 1.3-20.9 4.0 2.2-5.8 8.9 5.4-12.3
Television 35.2 27.1-43.3 62.2 51.6-72.8 58.2 52.0-64.3 41.6 35.1-48.2
Mobile phone 76.0 70.7-81.3 87.0 81.6-92.3 77.9 72.9-82.9 78.4 74.2-82.4
Land line 1.3 0.0-2.8 1.8 0.8-2.9 0.33 0.0-0.77 1.4 0.0-2.5
Refrigerator 7.6 4.0-11.2 28.9 18.1-39.7 8.7 5.4-12.0 12.0 7.9-16.2
Almirah 45.8 34.7-57.0 55.9 49.3-62.4 41.3 32.7-49.8 47.7 39.5-56.0

22 National Micronutrient Survey 2011-12
Asset Index
Poorest 30.3 14.6 15.4
Second 25.1 15.9 19.2
Middle 23.9 15.2 21.2
Fourth 13.0 20.5 26.6
Richest 7.7 33.9 17.7
In regard to the ownership of assets, over the recent years, there has been a considerable increase in mobile phones, televisions and refrigerators. In 2012, ownership of mobile phones was 78.4% at the national level, a phenomenal increase from the BDHS 2007 estimate (35.0%). Around 42.0% of the population owned a television at the national level, which increased from BDHS 2007 estimate (32.9%). There has been an upward trend in ownership of refrigerators, from 8.0% in 2007 (BDHS 2007) to 12.0%. Nearly seven out of ten households had electricity, an increase from the BDHS 2007 estimate (48.9%). According to the Wealth Index, more of the “richest” households were located in the urban cluster than in the rural or slum cluster (urban, 34%; slums, 17.7%; rural, 7.7%).
3.1.1 Household Construction Materials
Table 7 shows the materials used in home construction. At the national level, 74% of households had floors of earth/sand; 84.6% in rural areas, 41.7% in the urban cluster and 32.2% in the slums. Cement was the second most popular material (22.2%), more commonly used in the urban (56.5%) than in the rural cluster (10.9%).
In regard to household roofs, tin was most common material: 89% had tin roofs nationally, and over 80.0% in all the clusters; followed by cement, at 5.8% of households; and 15.4% in the urban, 3.2% rural and 5.0% in the slum cluster.
In regard to external walls of the households, tin was the most commonly used material (45%); urban cluster (29.3%), rural (49.3%) and slums (46.6%). Cement was another important material for external walls in 15.6% of the households; 38% in the urban cluster, which was significantly higher than in the rural cluster, at 9.3% and 19.3% in slums. In nearly one-fifth (18%) of the households, bamboo with mud was used to construct the external walls.
Note : Estimates weighted to represent at the population level

23National Micronutrient Survey 2011-12
Table 7: Household Construction Material
Construction material characteristics
Rural (n=661) Urban (n=693) Slum (n=649) National (n=2003)
% 95% CI % 95% CI % 95% CI % 95% CI
Flooring material
Earth/sand 84.6 77.5-91.7 41.7 29.5-54.0 32.2 23.3-41.1 73.8 67.2-80.3
Wood/planks 0.6 -0.3-1.4 1.3 -0.6-3.1 3.5 0.1-6.9 0.8 0.0-1.6
Palm/bamboo 0.5 -0.3-1.3 0.0 0.0-0.1 3.6 0.1-7.1 0.4 -0.2-1.0
Wood 3.1 -2.8-9.0 0.1 -0.1-0.3 0.2 -0.1-0.5 2.5 -1.9-6.9
Ceramic tiles/mosaic 0.0 0.0 0.2 0.0-0.4 59.6 51.4-67.8 0.0 0.0-0.1
Cement 10.9 5.7-16.2 56.5 45.0-68.0 0.1 -0.1-0.2 22.2 17.0-27.4
Carpet 0.0 0.0 0.0 0.0 0.0 0.0 0.0 0.0-0.0
Other 0.2 -0.1-0.5 0.1 -0.1-0.4 0.8 -0.4-2.0 0.2 0.0-0.5
Main roof
No roof 1.0 -0.5-2.4 0.3 -0.2-0.7 0.0 0.0 0.8 -0.3-1.9
Thatch/palm leaf 3.9 1.1-6.7 0.6 -0.4-1.6 0.8 0.1-1.5 3.1 1.0-5.2
Bamboo 0.5 -0.1-1.2 0.3 -0.1-0.7 0.5 -0.0-1.0 0.5 0.0-1.0
Tin 90.8 85.9-95.6 81.3 75.0-87.5 90.2 85.2-95.2 88.8 85.0-92.6
Wood 0.1 -0.1-0.4 0.3 -0.0-0.7 1.0 -0.4-2.5 0.2 0.0-0.4
Ceramic tiles 0.0 -0.0-0.1 1.7 -0.0-4.9 0.0 0.0 0.4 -0.3-1.0
Cement 3.2 0.8-5.7 15.4 10.1-20.8 5.0 1.5-8.6 5.8 3.5-8.1
Other 0.4 -0.1-0.8 0.2 -0.3-0.7 2.5 -0.7-5.6 0.4 0.1-0.8
External wall
No wall 0.0 0.0 0.1 -0.1-0.4 0.0 0.0 0.0 0.0-0.1
Cane/palm/trunks 1.8 0.2-3.4 0.3 -0.2-0.7 0.5 0.0-1.1 1.4 0.3-2.6
Bamboo with mud 19.9 7.4-32.5 12.2 3.1-21.3 11.1 3.9-18.4 18.0 8.3-27.6
Stone with mud 0.1 -0.1-0.2 0.1 -0.1-0.4 0.1 0.0-0.2
Tin 49.3 32.5-66.2 29.3 19.0-39.7 46.6 33.2-60.0 45.1 32.4-57.8
Cement 9.3 2.8-15.8 37.9 25.0-50.7 19.3 11.0-27.7 15.6 10.0-21.1
Stone with lime/cement 0.3 -0.1-0.6 1.0 0.1-1.8 0.6 -0.3-1.6 0.4 0.1-0.8
Bricks 5.9 2.2-9.5 12.7 7.8-17.6 13.2 7.3-19.1 7.5 4.5-10.6
Wood planks/shingles 2.1 -0.5-4.7 2.1 -0.1-4.2 1.3 0.0-2.6 2.1 0.1-4.1
Other 11.3 3.9-18.7 4.4 1.4-7.4 7.2 2.2-12.3 9.8 4.3-15.2
3.1.2 Number of Rooms
Table 8 shows the number of rooms. At the national level, 40.6% of the households had one room. Most of the slum households (77.7%) used one room for living. More than one third of the households in the rural (36%) and urban (34.6%) clusters had two rooms for living; however in the slums only 17.3% of the households had two rooms. At the national level, 17.6% of households had three rooms; 19.1%, 14.9% and 2.6%, respectively, in the rural, urban and slums area. Less than 2% of households at the national level had five rooms.

24 National Micronutrient Survey 2011-12
Table 8: Number Of rooms
Number of rooms Rural (n=661) Urban (n=693) Slum (n=649) National (n=2003)
% 95% CI % 95% CI % 95% CI % 95% CI
1 38.1 30.1-46.0 42.8 35.8-49.8 77.7 70.6-84.7 40.6 34.3-46.9
2 36.0 31.3-40.7 34.6 27.8-41.4 17.3 11.6-23.0 35.0 31.3-38.7
3 19.1 10.2-27.9 14.9 9.7-20.2 2.6 0.8-4.4 17.6 10.8-24.4
4 4.7 1.8-7.5 4.9 2.3-7.6 1.8 0.4-3.1 4.6 2.4-6.8
5 1.5 0.2-2.8 2.0 0.2-3.8 0.6 -0.2-1.3 1.6 0.6-2.6
3.1.3 Land Ownership
Table 9: Land Ownership
Land ownershipRural (n=661) Urban (n=693) Slum (n=649) National (n=2 003)
% 95% CI % 95% CI % 95% CI % 95% CI
Homestead ownership 93.2 89.8-96.5 78.5 71.4-85.6 33.6 25.6-41.5 87.8 84.4-91.2
Homestead ownership in elsewhere 4.9 -1.0-10.8 32.6 15.3-49.9 30.9 20.9-40.8 20.5 13.3-27.7
Any land other than homestead land 45.0 38.7-51.4 24.1 18.1-30.1 15.9 9.8-22.0 39.6 34.5-44.7
Table 9 presents the profile of land ownership: 87.8% of households owned a homestead. The percentage was higher in rural (93.2%) and urban clusters (78.5%) than in the slums (33.6%). One in five households owned a homestead in other places; the percentage was greater in urban (32.6 %) and slums (30.9%) cluster than in the rural cluster, where just under 5% of households had owned homestead in other places. Four in ten households (39.6%) owned land other than homestead land; the percentage was higher in the rural cluster (45%) than in the urban (24%) or slum cluster (15.9%).
3.1.4 Toilets Facilities for the Households
Table 10 shows toilet usage in Bangladesh. Most households in Bangladesh used pit latrines. Nationally, 47.6% used pit latrines with slabs; 44.2%, 60.2% and 47.2% in the rural, urban and slum cluster, respectively. One in five households (21.7%) used pit latrines without slabs, i.e. an ”open pit”, which was slightly higher in the rural (24.5%) than in the urban (14.3%) and slum clusters (7.9%). In the rural, urban and slums clusters, the usage of toilets that flushed to a piped sewer system was 7.9%, 11.8% and 17.6%, respectively. Just 6.6% of the households had toilets that flushed into septic tanks. A very small percentage of households used bucket toilets (1.2%) and hanging toilets (1.6%). At the national level, 4.1% of the households did not have toilet facilities or used open-air toilets in the bush and fields, etc.; the percentage was concentrated mainly in the rural cluster (5.4%).

25National Micronutrient Survey 2011-12
Table 10: Toilet Facilities
Toilet facilitiesRural (n=661) Urban (n=693) Slum (n=649) National (n=2003)% 95% CI % 95% CI % 95% CI % 95% CI
Flush to piped sewer sys-tem 7.9 2.2-13.7 11.8 4.9-18.6 17.6 8.1-27.1 9.1 4.6-13.6
Flush to septic tank 6.5 2.9-10.1 7.0 1.5-12.5 5.9 2.3-9.5 6.6 3.7-9.5Flush to pit latrine 6.5 1.1-11.8 4.3 1.5-7.1 3.8 1.1-6.4 5.9 1.9-9.9Flush to somewhere else 1.4 -0.6-3.4 0.4 -0.1-0.8 4.3 0.0-8.6 1.3 -0.2-2.8Pit latrine with slab 44.2 32.7-55.7 60.2 49.9-70.5 47.2 35.8-58.6 47.6 38.5-56.7Pit latrine without slab/open pit 24.5 15.6-33.3 14.3 7.8-20.8 7.9 4.2-11.6 21.7 14.8-28.6
Bucket toilet 1.4 0.3-2.5 0.8 -0.1-1.7 - - 1.2 0.4-2.1Hanging toilet 1.8 0.6-3.1 0.8 -0.1-1.7 0.9 -0.3-2.2 1.6 0.7-2.5No facility/bush/field 5.4 2.0-8.9 0.2 -0.1-0.5 - - 4.1 1.6-6.7Others 0.2 0.0-0.4 0.3 -0.2-0.8 12.4 -0.2-24.9 0.7 0.1-1.3
3.1.5 Cooking Fuel Used in the Households
Table 11 shows cooking fuel used in the households. Wood was the most commonly used cooking fuel in 56.7% of households; 59.8%, 45.8% and 54.5%, in the rural, urban and slum clusters, respectively. Straw/shrubs/grass was the next most common cooking fuel (22.8%), used in 28.4%, 6.5% and 1.9% of the rural, urban and slum clusters, respectively. At the national level, 8.7% of households used natural gas; 33.5% and 34.8% of households in the urban and slum cluster, respectively, and in the rural cluster, there was a very negligible use (0.5%). The other sources of cooking fuel were agricultural crops (6.8%), animal dung (2.2%), coal (0.8%), LPG (0.8%), electric heaters (0.4%) and biogas (0.1%).
Table 11: Cooking Fuel Used in the Households
Cooking fuelRural (n=661) Urban (n=693) Slum (n=649) National (n=2 003)% 95% CI % 95% CI % 95% CI % 95% CI
Electricity 0.0 0.0 1.7 -0.6-4.1 2.2 -1.1-5.6 0.4 -0.1-0.9LPG 0.0 0.0 3.5 0.5-6.4 1.0 0.2-1.8 0.8 0.1-1.4Natural gas 0.5 -0.4-1.4 33.5 -0.6-4.1 34.8 20.1-49.4 8.7 3.4-13.8Biogas 0.0 0.0 0.3 0.5-6.4 1.0 -0.2-49.4 0.1 0.0-0.2Kerosene 0.0 0.0 0.0 0.0 0.8 -0.2-1.7 0.0 0.0-0.1Coal 0.9 -0.4-2.3 0.5 -0.2-1.4 0.0 0.0 0.8 -0.2-1.8Wood 59.8 47.6-72.0 45.8 32.2-59.4 54.5 41.0-67.9 56.7 47.1-66.4Straw/shrubs/grass 28.4 16.4-40.3 6.5 -0.0-12.9 1.9 0.3-3.6 22.8 13.5-32.2Agricultural crop 7.5 3.0-11.9 5.6 1.1-10.2 0.5 -0.0-1.1 6.8 3.4-10.2Animal dung 2.4 0.7-4.2 1.6 0.0-3.1 0.5 -0.0-1.3 2.2 0.9-3.5Other 0.5 -0.2-1.2 1.1 -0.1-2.3 2.8 0.1-5.5 0.7 0.1-1.3

26 National Micronutrient Survey 2011-12
3.1.6 Household Monthly Expenses
Table 12 shows household monthly expenses. The national average of household expenditure was BDT 8,944.00; BDT 8,393.00, BDT 11,006.00 and BDT 8,779.00 in the rural, urban and slums, respectively. According to household food insecurity status, the household’s spending power decreased as households had increasing food insecurity. Household’s average monthly expenditure was BDT 10,357.00 in the food-secure households; BDT 8,206.00, BDT 7,324.00, and BDT 6505.00 in cases of mild, moderate and severe household food insecurity, respectively.
Table 12: Household Monthly Expenses
n Mean (BDT) 95% CIClustersNational 1931 8 944.00 8 212.00-9 674.00Rural 638 8 393.00 7 664.00-9 121.00
Urban 669 11 006.00 8 956.00-13 055.00
Slums 624 8 779.00 8 109.00-9 449.00According to household food insecurity
Food-secure 888 10 357.00 9 266.00-1 1447.00
Mildly insecure 298 8 206.00 7 304.00-9 109.00Moderately insecure 487 7 324.00 6 711.00-7 937.00Severely insecure 258 6 505.00 5 513.00-7 496.00
3.1.7 Household Food Insecurity
Table 13 shows household food insecurity by cluster: 52% of households at the national level were food-secure. The share of food-secure households was lower in the slums (36.3%) than in rural (52.4%) and urban (53.5%) clusters. Just over 12% of households experienced severe food insecurity at the national level as well as in the rural and urban clusters. This percentage was slightly higher in the slum cluster (17.2%).
Table 13: Household Food Insecurity
Clusters Percentage (%) 95% CINationalFood-secure 52.0 45.5-58.4Mildly insecure 14.1 10.8-17.4Moderately insecure 21.6 16.1-27.0Severely insecure 12.3 8.2-16.3RuralFood-secure 52.4 44.0-60.3Mildly insecure 14.0 9.8-18.2Moderately insecure 21.6 14.5-28.6Severely insecure 12.0 6.8-17.1
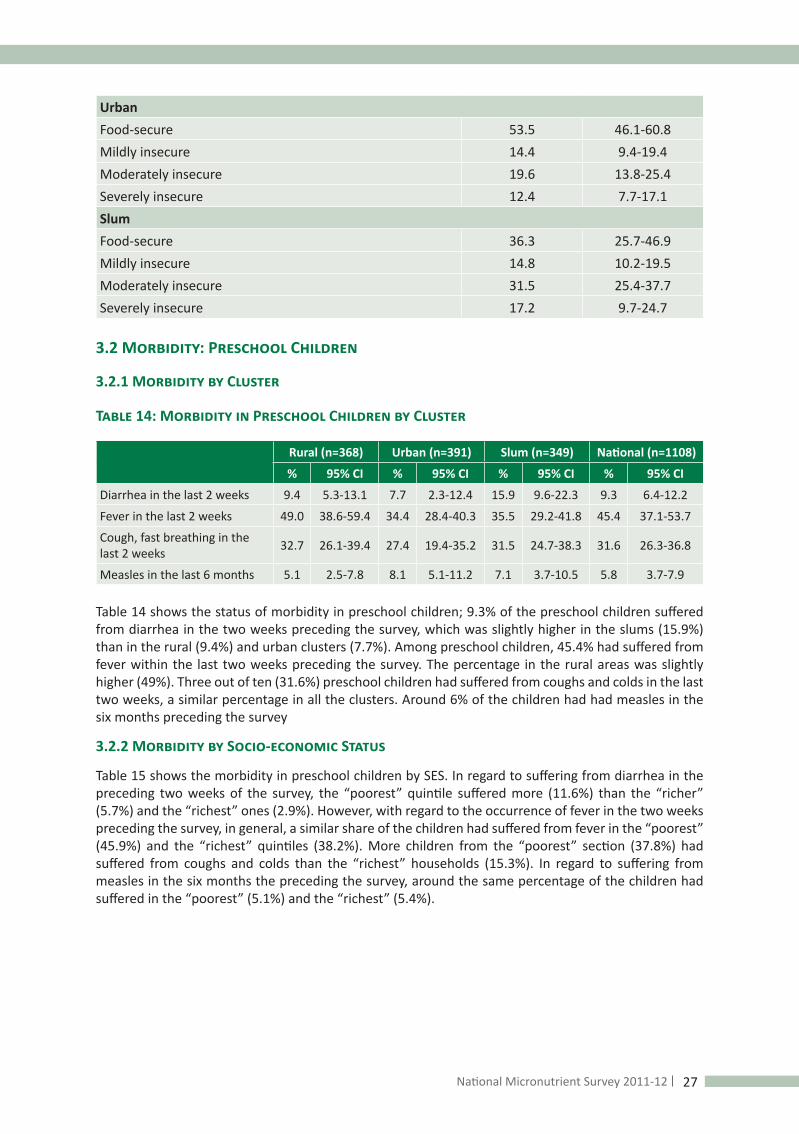
27National Micronutrient Survey 2011-12
UrbanFood-secure 53.5 46.1-60.8Mildly insecure 14.4 9.4-19.4Moderately insecure 19.6 13.8-25.4Severely insecure 12.4 7.7-17.1SlumFood-secure 36.3 25.7-46.9Mildly insecure 14.8 10.2-19.5Moderately insecure 31.5 25.4-37.7Severely insecure 17.2 9.7-24.7
3.2 Morbidity: Preschool Children
3.2.1 Morbidity by Cluster
Table 14: Morbidity in Preschool Children by Cluster
Rural (n=368) Urban (n=391) Slum (n=349) National (n=1108)
% 95% CI % 95% CI % 95% CI % 95% CI
Diarrhea in the last 2 weeks 9.4 5.3-13.1 7.7 2.3-12.4 15.9 9.6-22.3 9.3 6.4-12.2
Fever in the last 2 weeks 49.0 38.6-59.4 34.4 28.4-40.3 35.5 29.2-41.8 45.4 37.1-53.7
Cough, fast breathing in the last 2 weeks 32.7 26.1-39.4 27.4 19.4-35.2 31.5 24.7-38.3 31.6 26.3-36.8
Measles in the last 6 months 5.1 2.5-7.8 8.1 5.1-11.2 7.1 3.7-10.5 5.8 3.7-7.9
Table 14 shows the status of morbidity in preschool children; 9.3% of the preschool children suffered from diarrhea in the two weeks preceding the survey, which was slightly higher in the slums (15.9%) than in the rural (9.4%) and urban clusters (7.7%). Among preschool children, 45.4% had suffered from fever within the last two weeks preceding the survey. The percentage in the rural areas was slightly higher (49%). Three out of ten (31.6%) preschool children had suffered from coughs and colds in the last two weeks, a similar percentage in all the clusters. Around 6% of the children had had measles in the six months preceding the survey
3.2.2 Morbidity by Socio-economic Status
Table 15 shows the morbidity in preschool children by SES. In regard to suffering from diarrhea in the preceding two weeks of the survey, the “poorest” quintile suffered more (11.6%) than the “richer” (5.7%) and the “richest” ones (2.9%). However, with regard to the occurrence of fever in the two weeks preceding the survey, in general, a similar share of the children had suffered from fever in the “poorest” (45.9%) and the “richest” quintiles (38.2%). More children from the “poorest” section (37.8%) had suffered from coughs and colds than the “richest” households (15.3%). In regard to suffering from measles in the six months the preceding the survey, around the same percentage of the children had suffered in the “poorest” (5.1%) and the “richest” (5.4%).

28 National Micronutrient Survey 2011-12
Table 15: Morbidity in Preschool Children by Socio-economic Status
Poorest (n=221) Poorer (n=221) Middle (n=224) Richer (n=221) Richest (n=221)% 95% CI % 95% CI % 95% CI % 95% CI % 95% CI
Diarrhea in the last 2 weeks 11.6 6.7-16.4 11.9 5.4-18.5 11.7 1.7-21.6 5.7 2.2-9.2 2.9 -0.9-6.8
Fever in the last 2 weeks 45.9 33.5-58.4 40.8 26.4-55.2 59.9 44.0-75.9 44.3 27.6-
61.1 38.2 20.1-56.3
Cough and cold 37.8 25.4-50.1 35.1 21.9-48.2 38.6 22.8-54.5 26.4 17.2-35.4 15.3 8.1-22.5
Measles (6 months preceding the survey)
5.1 1.7-8.4 8.8 2.8-14.8 1.6 0.4-2.9 6.9 1.7-12.1 5.4 -0.4-11.4
3.3 Morbidity: School-age Children
Table 16: Morbidity by Cluster
Rural (n=475) Urban (n=484) Slums (n=468) National (n=1 427)
% 95% CI % 95% CI % 95% CI % 95% CIDiarrhea in the last 2 weeks preceding the survey 4.6 0.9-8.4 4.9 1.7-8.2 3.2 1.3-5.2 4.6 1.8-7.5
Fever in the last 2 weeks preceding the survey 19.5 13.3-25.7 19.6 12.4-26.8 16.1 11.9-20.1 19.4 14.6-24.2
Measles in the last 6 months preceding the survey 1.0 0.06-2.0 1.7 -0.07-4.1 0.3 -0.008-
0.6 1.1 0.2-2.2
Table 16 shows pattern of morbidity in school-age children. The prevalence of diarrhea in the last two weeks was similar across the clusters – 4.6%, 4.9% and 3.2% in the rural, urban and slum clusters, respectively. Around one in five children (19.4%) had suffered from fever within two weeks of the survey, a similar percentage in all the clusters. Just over 1% of the children had suffered from measles within the preceding six months.
3.4 Prevalence of Vitamin A Deficiency
Table 17 shows the prevalence of subclinical vitamin A deficiency. The national prevalence of sub-clinical vitamin A deficiency in preschool children, as measured by estimating the prevalence of low serum retinol (serum retinol <0.7mmol/l), was 20.5%. The prevalence in children in the slum cluster was 38.1%. The national prevalence in school-age children was 20.9%. A higher percentage of school-age children in the slums was vitamin A deficient (27.1%).
The prevalence subclinical vitamin A deficiency in NPNL women was 5.4%, with a higher percentage in the slums (6.9%).

29National Micronutrient Survey 2011-12
table 17: Prevalence of Vitamin a Deficiency
n Vitamin A deficiency1,2,6
(%) 95% CI
Preschool children3
National 873 20.5 15.9-25.0Rural 306 19.4 13.6-25.2Urban 305 21.2 15.5-26.8Slums 262 38.1 28.4-47.7School-age children4
National 1 267 20.9 17.4-24.4Rural 432 20.2 16.3-24.1Urban 431 22.1 12.8-31.5Slums 404 27.1 21.5-32.7NPNL women5
National 918 5.4 2.8-8.1Rural 328 5.4 2.1-8.7Urban 304 4.9 1.7-8.2Slums 286 6.9 2.9-10.8
1Retinol deficiency is defined as serum retinol level of <0.7mmol/l (WHO/IVACG).2Adjusted for elevated CRP (>10mg/l) or elevated AGP (>1 g/l) by mathematical correction (Thurnham et al., 2010; Engle-Stone et al., 2011).3Aged 6-59 months.4Aged 6-14 years.5Aged 15-49 years.6Estimates weighted to represent the population level.
3.4.1 Degrees of Vitamin A Deficiency
Table 18 shows degrees of subclinical vitamin A deficiency in preschool and school-age children, and the NPNL women. At the national level, over half of preschool (56.3%) and school-age children (53.3%) had a mild degree of vitamin A deficiency, while mild deficiency affects over one-third (34.3%) of NPNL women. Although the prevalence of severe degree of the deficiency was low in all the population groups studied (less than 1.0% in most of the clusters), it was slightly higher in preschool children (2.4%) and school-age children (2.2%) in the slums. The normal status of serum retinol in the preschool children was 21.7%, 30.4% and 8.5% in the rural, urban and slum cluster.
Table 18: Degrees of Vitamin A Deficiency
Preschool children School-age children NPNL women% 95% CI % 95% CI % 95% CI
National (n=873) (n=1 267) (n=933)Normal status1 23.1 16.3-29.9 25.5 20.8-30.2 60.3 54.8-65.8Mild deficiency2 56.3 47.6-65.1 53.5 48.8-58.2 34.3 39.0-39.7Moderate deficiency3 20.0 15.5-24.5 19.8 16.7-22.9 5.1 2.6-7.7Severe deficiency4 0.5 0.08-0.8 1.1 0.0009-2.1 0.1 -0.04-0.3Rural (n=306) (n=432) (n=331)Normal status1 21.7 13.8-29.6 25.9 19.7-32.1 59.6 52.8-66.3Mild deficiency2 58.7 47.8-69.7 53.8 47.8-59.9 35.1 28.3-41.7Moderate deficiency3 19.1 13.2-24.8 19.4 15.8-23.0 5.3 2.0-8.6Severe deficiency4 0.4 0.0-0.8 0.8 -0.3-1.9 0.06 -0.06-0.2

30 National Micronutrient Survey 2011-12
Urban (n=305) (n=431) (n=312)Normal status1 30.4 16.1-44.7 25.8 19.5-32.1 63.7 54.1-73.3Mild deficiency2 48.4 35.9-60.8 52.0 45.9-58.1 31.6 22.9-40.2Moderate deficiency3 20.9 15.3-26.5 20.4 12.8-28.1 4.3 1.2-7.4Severe deficiency4 0.2 0.0-0.7 1.7 -1.0-4.5 0.4 -0.4-1.1Slum (n=262) (n=404) (n=290)Normal status1 8.5 4.7-12.3 17.0 12.6-21.4 58.7 50.8-66.6Mild deficiency2 53.4 45.2-61.5 55.8 50.1-61.5 34.5 27.1-41.7Moderate deficiency3 35.6 26.5-44.7 24.9 19.4-30.5 6.6 2.7-10.4Severe deficiency4 2.4 0.2-4.6 2.2 0.01-4.4 0.2 -0.2-0.7
1Normal status: S. retinol>-1.05 µmol/l.2Mild deficiency: S. retinol >=0.7-<1.05 µmol/l. 3Moderate deficiency: S. retinol>=0.35-<0.7 µmol/l.4Severe deficiency: S. retinol<0.35 µmol/l.
3.4.2 Vitamin A Supplementation in Preschool Children
Table 19 shows the coverage of vitamin A supplementation in preschool children. At the national level, 77.0% of the children received vitamin A supplementation before the six months of the survey date: 77.9%, 73.1% and 72.4% in the rural, urban and the slum clusters, respectively. According to the Asset Index, the coverage was higher in the “richest” (87.5%) than the “poorest” (76.4%) quintile.
Table 19: Vitamin A Supplementation in Preschool Children
Clusters n % 95% CINational<=6m1 932 77.0 69.4-84.26-12m2 16.5 10.3-22.8>12m3 6.6 2.7-10.4Rural<=6m 319 77.9 68.4-87.46-12m 15.6 7.4-23.8>12m 6.4 1.5-11.4Urban<=6m 320 73.1 66.1-80.26-12m 19.6 13.6-25.6>12m 7.2 2.7-11.6Slum<=6m 293 72.4 63.1-81.76-12m 21.3 13.3-29.7>12m 6.2 1.9-10.5Asset indexPoorest<=6m 175 76.4 62.3-90.46-12m 17.1 4.7-29.1>12m 6.4 1.3-11.4Poorer<=6m 190 69.6 58.0-81.26-12m 19.6 8.8-30.5>12m 10.6 2.1-19.2

31National Micronutrient Survey 2011-12
Middle<=6m 200 80.0 67.4-92.86-12m 12.3 0.9-23.8>12m 7.6 0.3-14.8Richer<=6m 176 74.5 61.6-87.56-12m 22.9 9.8-36.0>12m 2.5 -0.3-5.3Richest<=6m 191 87.5 81.8-93.16-12m 9.5 4.9-14.2>12m 2.9 0.4-5.5
1<=6m: Supplemented within 6 months; 26-12m: Supplemented within 6-12 months; 3>12m: Supplemented earlier than last 12 months preceding the survey.
3.5 Vitamin A Consumption from Food
3.5.1 Vitamin A Consumption in Preschool Children by Cluster
Table 20 shows the daily vitamin A consumption in preschool children. The median intake was 270.4 RE. The median daily consumption of animal-source vitamin A was 52.6 RE. The medians for the rural, urban and slums clusters were 52.4 RE, 61.1 RE and 40.2 RE, respectively. The median intake of plant-source vitamin A was 186.3 RE, 105.3 RE and 111.8 RE in the rural, urban and slums clusters, respectively.
Table 20: Vitamin A Consumption in Preschool Children by Cluster
National (n=845) Rural (n=284) Urban (n=296) Slum (n=265)Median (Retinol Equivalents)
Total vitamin A 270.4 291.5 230.3 209.1Animal-source vitamin A 52.6 52.4 61.1 40.2Plant-source vitamin A 162.8 186.3 105.3 111.8
3.5.2 Vitamin A Consumption in Preschool Children according to the Asset Index
Table 21 shows vitamin A consumption in preschool children by SES. The animal-source vitamin A consumption increased from the “poorest” (median, 11.8 RE) to the “richest” (median, 99.9 RE) quintiles. The plant-source vitamin A consumption was similar over the two extremes of the SES (94.8 RE in the “poorest” and 96.1 RE in the “richest” quintiles).
Table 21: Vitamin A Consumption in Preschool Children according to the Asset Index
Poorest Poorer Middle Richer RichestMedian (Retinol Equivalents)
Total vitamin A 115.8 314.4 367.3 576.4 230.6Vitamin A from animal sources 11.8 39.0 76.8 90.0 99.9Vitamin A from plant sources 94.8 207.6 286.2 196.9 96.1
3.5.3 Vitamin A Consumption in the Preschool Children by Household Food Insecurity Status
Table 22 shows vitamin A consumption in preschool children by household food insecurity status. Consumption decreased as households had an increasing level of food insecurity, especially with regard to total vitamin A consumption and vitamin A consumption from animal sources.
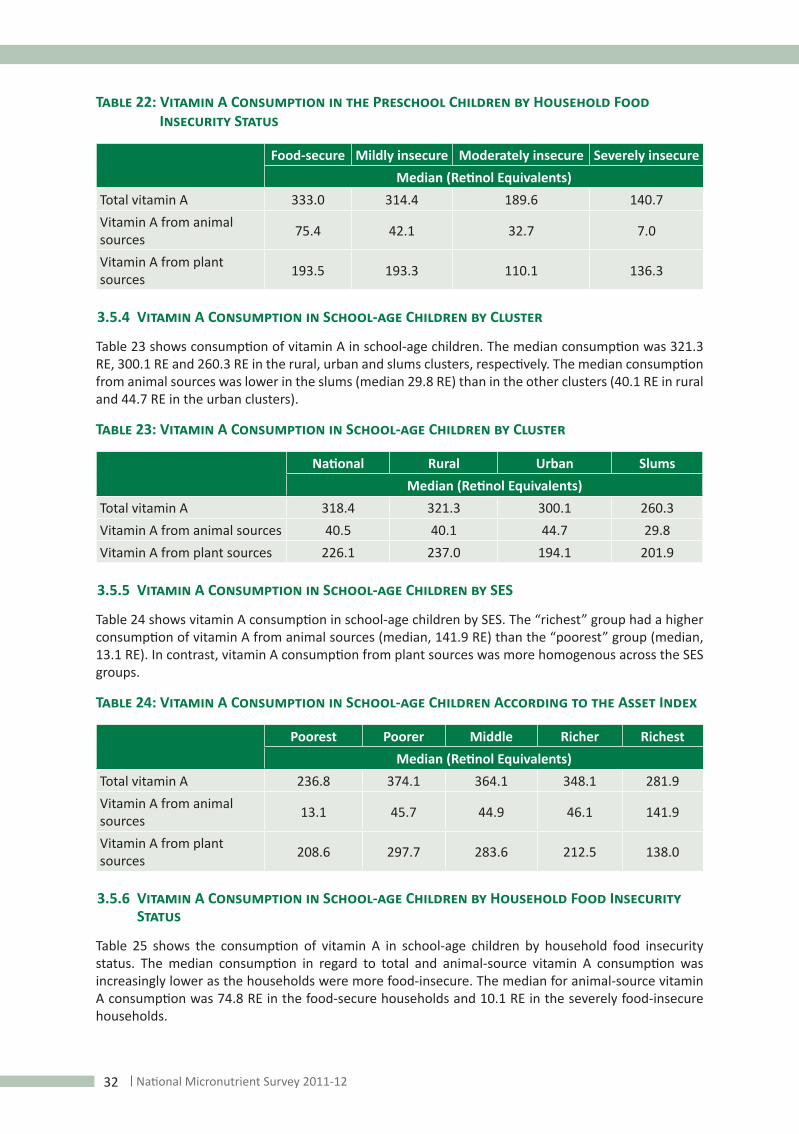
32 National Micronutrient Survey 2011-12
Table 22: Vitamin A Consumption in the Preschool Children by Household Food Insecurity Status
Food-secure Mildly insecure Moderately insecure Severely insecureMedian (Retinol Equivalents)
Total vitamin A 333.0 314.4 189.6 140.7Vitamin A from animal sources 75.4 42.1 32.7 7.0
Vitamin A from plant sources 193.5 193.3 110.1 136.3
3.5.4 Vitamin A Consumption in School-age Children by Cluster
Table 23 shows consumption of vitamin A in school-age children. The median consumption was 321.3 RE, 300.1 RE and 260.3 RE in the rural, urban and slums clusters, respectively. The median consumption from animal sources was lower in the slums (median 29.8 RE) than in the other clusters (40.1 RE in rural and 44.7 RE in the urban clusters).
Table 23: Vitamin A Consumption in School-age Children by Cluster
National Rural Urban SlumsMedian (Retinol Equivalents)
Total vitamin A 318.4 321.3 300.1 260.3Vitamin A from animal sources 40.5 40.1 44.7 29.8Vitamin A from plant sources 226.1 237.0 194.1 201.9
3.5.5 Vitamin A Consumption in School-age Children by SES
Table 24 shows vitamin A consumption in school-age children by SES. The “richest” group had a higher consumption of vitamin A from animal sources (median, 141.9 RE) than the “poorest” group (median, 13.1 RE). In contrast, vitamin A consumption from plant sources was more homogenous across the SES groups.
Table 24: Vitamin A Consumption in School-age Children According to the Asset Index
Poorest Poorer Middle Richer RichestMedian (Retinol Equivalents)
Total vitamin A 236.8 374.1 364.1 348.1 281.9Vitamin A from animal sources 13.1 45.7 44.9 46.1 141.9
Vitamin A from plant sources 208.6 297.7 283.6 212.5 138.0
3.5.6 Vitamin A Consumption in School-age Children by Household Food Insecurity Status
Table 25 shows the consumption of vitamin A in school-age children by household food insecurity status. The median consumption in regard to total and animal-source vitamin A consumption was increasingly lower as the households were more food-insecure. The median for animal-source vitamin A consumption was 74.8 RE in the food-secure households and 10.1 RE in the severely food-insecure households.

33National Micronutrient Survey 2011-12
Table 25: Vitamin A Consumption in School-age Children by Household Food Insecurity Status
Food-secure Mildly insecure Moderately insecure Severely
insecureMedian (Retinol Equivalents)
Total vitamin A 374.1 368.7 265.5 194.2Vitamin A from animal sources 74.8 40.1 24.8 10.1
Vitamin A from plant sources 275.5 286.6 201.3 190.5
3.5.7 Vitamin A Consumption in NPNL Women by Cluster
Table 26 shows consumption of vitamin A in NPNL women by cluster. The median consumption of animal-source vitamin A was 28.9 RE, 40.2 RE and 30.3 RE in the rural, urban and slum clusters, respectively.
Table 26: Vitamin A Consumption in NPNL Women by Cluster
National Rural Urban SlumMedian (Retinol Equivalents)
Total vitamin A 372.1 315.9 467.2 412.5Vitamin A from animal sources 31.8 28.9 40.2 30.3Vitamin A from plant sources 285.8 258.7 392.3 373.2
3.5.8 Vitamin A Consumption in NPNL Women by Socio-economic status
Table 27 shows vitamin A consumption in NPNL women by SES. The median consumption increased as the SES increased. The median for total consumption was 245.9 RE and 485.3 RE in the “poorest” and the “richest” quintiles, respectively. The median consumption of animal-source vitamin A was 13.1 RE and 90.4 RE, respectively, in the “poorest” and the “richest” groups.
Table 27: Vitamin a Consumption in npnl Women according to the Asset Index
Poorest Poorer Middle Richer RichestMedian (Retinol Equivalents)
Total vitamin A 245.9 317.6 418.7 389.2 485.3Vitamin A from animal sources 13.1 23.5 45.1 40.9 90.4Vitamin A from plant sources 218.9 283.7 383.4 370.9 383.1
3.5.9 Vitamin A Consumption among NPNL Women by Household Food Insecurity
Table 28 shows vitamin A consumption in NPNL women by household food insecurity status. The total consumption and consumption from animal sources were lower as household food insecurity increased. The median for animal source consumption was 46.2 RE and 11.3 RE in the “food-secured” and “severely food-insecure” households, respectively. However, consumption from plant sources was generally homogenous across the food security status.

34 National Micronutrient Survey 2011-12
Table 28: Vitamin A Consumption in the NPNL Women by Household Food Insecurity Status
Food-secure Mildly insecure Moderately insecure
Severely insecure
Median (Retinol Equivalents)Total vitamin A 385.6 306.8 299.5 272.0Vitamin A from animal sources 46.2 31.1 22.5 11.3Vitamin A from plant sources 305.5 260.2 234.6 241.1
3.5.10 Vitamin A Consumption Compared to the Recommended Daily Allowance (RDA)
Table 29 shows consumption of total vitamin A (RE) from food compared to the Recommended Daily Allowance (RDA). Median consumption was below the RDA in all the population groups studied.
Table 29: Consumption of Vitamin A Compared to the Recommended Daily Allowance (RDA)
National consumption (RE) (Median) RDA1
Preschool children2 270 300-400School-age children3 318 400-600NPNL women4 372 700
1Institute of Medicine (IOM).2Age 1-3 years: 300 RE; age 4-5 years: 400 RE. 3Age 6-8 years: 400 RE; age 9-13 years: 600 RE.4Age 15-49 years (NPNL): 700 RE.
3.6 Knowledge about Vitamin A-related Issues
3.6.1 Knowledge about Vitamin A-rich Food Sources
Table 30: Knowledge about Vitamin A-rich Food Sources
Rural Urban Slum National% 95% CI % 95% CI % 95% CI % 95% CI
Do you know about vitamin A-rich foods? (n=661) (n=693) (n=649) (n=2003)
Yes 74.4 70.8-78.0 71.9 65.2-78.5 71.3 63.0-79.5 73.7 70.7-76.7No 25.6 22.0-29.2 28.1 21.5-34.8 28.7 20.5-37.0 26.3 23.3-29.3Green leafy vegetables (n=485) (n=492) (n=477) (n=1454)
Mentioned 95.9 96.0 98.4 96.0Didn’t mention 4.1 4.0 1.6 4.0Yellow/orange vegetables and fruits (n=485) (n=492) (n=477) (n=1454)
Mentioned 35.9 27.2-44.6 49.2 43.6-54.7 39.5 32.5-46.4 38.7 31.9-45.5Didn’t mention 64.1 55.4-72.8 50.8 45.3-56.4 60.5 53.6-67.5 61.3 54.5-68.1Small fish (n=485) (n=492) (n=477) (n=1454)Mentioned 45.1 34.1-56.1 48.1 38.7-57.6 37.8 31.0-44.7 45.4 37.0-53.8Didn’t mention 54.9 43.9-65.9 51.9 42.4-61.3 62.2 55.3-69.0 54.6 46.2-63.0

35National Micronutrient Survey 2011-12
Liver (n=485) (n=492) (n=477) (n=1454)Mentioned 4.0 1.9-6.0 4.2 1.8-6.6 1.8 -0.1-3.7 3.9 2.3-5.6Didn’t mention 96.0 94.0-98.1 95.8 93.4-98.2 98.2 96.3-100.1 96.1 94.4-97.7
Table 30 shows the knowledge of respondents on the issues relating to vitamin A. At the national level, 73.7% stated that they knew which foods were rich in vitamin A. The percentages were similar in all the clusters. Over 95% of the respondents mentioned that green leafy vegetables were a rich source of vitamin A, and the response rate was even across the clusters. Moreover, 49.2% of the urban respondents mentioned that yellow and orange vegetables and fruits were rich sources of vitamin A; the percentage was slighter lower in the rural cluster (35.9%); 48.1% of respondents from the urban cluster and 37.8% from slums mentioned that small fish species was a rich source of vitamin A; 3.9% of the respondents mentioned that liver was a good source of vitamin A.
3.6.2 Knowledge of Health Benefits of Eating Vitamin A-rich Foods
Table 31: Knowledge of Health Benefits of Eating Vitamin A-rich Foods
Rural Urban Slum National
% 95% CI % 95% CI % 95% CI % 95% CI
Knowledge on benefits of eating vitamin A-rich foods? (n=661) (n=693) (n=649) (n=2003)
Yes 68.0 62.9-73.1 76.1 67.3-85.0 70.1 62.7-77.5 69.7 65.3-74.2
No 32.0 26.9-37.1 23.9 15.0-32.7 29.9 22.5-37.3 30.3 25.8-34.7
Good for the eyesight (n=459) (n=503) (n=469) (n= 1431)
Mentioned 55.2 45.5-65.0 60.1 50.3-69.8 51.7 44.0-59.4 56.2 48.9-63.5
Didn’t mention 44.8 35.0-54.5 39.9 30.2-49.7 48.3 40.6-56.0 43.8 36.5-51.1
Healthy (n=459) (n=503) (n=469) (n= 1431)
Mentioned 84.0 79.2-88.7 77.8 70.6-84.9 77.5 71.8-83.2 82.3 78.5-86.2
Didn’t mention 16.0 11.3-20.8 22.2 15.1-29.4 22.5 16.8-28.2 17.7 13.8-21.5
Good for the skin (n=459) (n=503) (n=469) (n= 1431)
Mentioned 3.7 1.3-6.0 9.5 4.7-14.3 4.3 2.0-6.5 5.0 3.0-7.0
Didn’t mention 96.3 94.0-98.7 90.5 85.7-95.3 95.7 93.5-98.0 95.0 93.0-97.0
Prevent night blindness (n=459) (n=503) (n=469) (n= 1431)
Mentioned 17.0 12.3-21.7 28.1 23.033.2 14.4 10.1-18.6 19.4 15.6-23.2
Didn’t mention 83.0 78.3-87.7 71.9 66.8-77.0 85.6 81.4-89.9 80.6 76.8-84.4
Others (n=459) (n=503) (n=469) (n= 1431)
Mentioned 0.2 -0.1-0.4 5.2 1.1-9.2 0.9 -0.1-1.9 1.3 0.2-2.4
Didn’t mention 99.8 99.6-100.1 94.8 90.8-98.9 99.1 98.1-100.1 98.7 97.6-99.8
Around 70% of respondents mentioned that they knew the benefits of eating vitamin A-rich food (Table 31), which was generally consistent in all the clusters. Over 50% of the respondents mentioned that eating vitamin A-rich foods was good for the eyesight. Over 80% of the respondents mentioned that eating vitamin A-rich food was good for the health. In the urban cluster, 28.1% mentioned that eating vitamin A-rich food prevented night blindness, compared to 17% and 14.4% in the rural area and slums, respectively. It was mentioned by 9.5% of the respondents in the urban cluster that Vitamin A was good for the skin compared to 4% in the rural and slum clusters.

36 National Micronutrient Survey 2011-12
3.7. Per Capita Oil Consumption
3.7.1 Daily per Capita oil Consumption
Table 32: Per Capita Oil Consumption
n Mean (gm) 95% CIClusterNational 2 000 24.4 22.1-26.7Rural 659 22.9 20.0-25.8Urban 692 29.7 25.8-33.7Slum 649 25.9 24.1-27.6By household food insecurity status2
Food-secure 918 27.8 23.9-31.8Mildly insecure 305 24.7 19.5-29.8Moderately insecure 509 20.5 17.8-23.1Severely insecure 268 16.4 14.5-18.4
1Estimates were weighted to represent the population level.2Coates et al., 2007.
Table 32 show per capita daily consumption of oil: 24.4 g at the national level; and 22.9 g, 29.7 g and 25.9 g in the rural, urban and slums clusters, respectively. Per capita daily oil consumption decreased as households became more food-insecure, 27.8 g in “food-secure” households against 16.4 g in “severely food-insecure” households.
3.7.2 Type of Cooking oil Used in Households
Table 33: Type of Cooking Oil
Rural (n=661) Urban (n=693) Slum (n=649) National (n=2 003)% 95% CI % 95% CI % 95% CI % 95% CI
Soybean 87.6 81.6-93.5 95.9 92.9-98.9 94.1 88.0-100.1 89.5 85.2-93.9Mustard 20.7 11.7-29.7 6.3 2.2-10.5 7.4 0.7-14.0 17.2 10.2-24.3Supper/palm 0.1 -0.1-0.3 1.9 -0.3-4.1 0.1 -0.1-0.3 0.5 0.0-0.9Coconut 0.0 0.0 0.1 -0.1-0.2 0.0 0.0 0.0 0.0Others 0.2 -0.1-0.6 0.0 0.0 0.0 0.0 0.2 -0.1-0.5
Brand oil 22.8 17.0-28.6 38.6 32.0-45.1 12.7 7.9-17.6 25.7 20.8-30.5Open oil 76.1 70.2-82.0 60.1 53.6-66.7 86.2 81.0-91.3 73.2 68.3-78.1Both 0.5 0.0-1.0 1.1 -0.3-2.5 1.1 -0.3-2.4 0.6 0.1-1.1Others 0.6 0.1-1.2 0.2 -0.1-0.5 0.0 0.0 0.5 0.1-0.9
Table 33 shows the use of cooking oil in the households. Soybean was used in 89.5% of the households: 87.6%, 95.9% and 94.1% in rural, urban and slum households, respectively. In around one in five households (17.2%), mustard oil was used for cooking, which was higher in the rural (20.7%) than in the urban (6.3%) and slum clusters (7.4%). The consumption of palm oil and coconut oil was negligible.
One in four households (25.7%) used “brand” oil for cooking; the rate of usage was 38.6%, 22.8% and 12.7% in the urban, rural and slum clusters, respectively. The rate of usage of “open” oil was 73.2%

37National Micronutrient Survey 2011-12
at the national level; 86.2% in the slums, followed by 76.1% in the rural cluster and 60% in the urban cluster. A negligible percentage of households used both types of cooking oil.
3.7.3 monthly Spending on Cooking Oil
Table 34: Monthly Spending on Cooking Oil
n Mean (BDT) 95% CIClustersNational 2 003 380.00 347.40-412.60Rural 661 356.80 319.60-394.10Urban 693 463.50 399.10-527.10Slum 649 388.30 361.20-415.40By household food insecurity statusFood-secure 919 436.60 385.60-487.60Mildly insecure 305 358.50 322.40-394.70Moderately insecure 510 324.00 273.60-374.30Severely insecure 269 263.40 225.50-301.40
Table 34 shows spending on cooking oil in the households. The national average monthly spending on cooking oil was BDT 380.00 (US$ 4.6), which was lower in the rural cluster (BDT 356.8) and the slum cluster (BDT 388.3) than in the urban cluster, at BDT 463.50. In food-secure households, the monthly spending on cooking oil was BDT 436.60 compared to BDT 263.40 in severely food-insecure households.
3.8 Anemia and Iron Status
3.8.1 Status of Hemoglobin
3.8.1.1 Status of Haemoglobin Concentration by Cluster
Table 35 shows the mean hemoglobin concentration in blood. The means for preschool children were 11.4, 11.7 and 11.4 gm/dl in the rural, urban and slum clusters, respectively; for NPNL women, 12.4, 12.6 and 12.6 gm/dl in the rural, urban and slum clusters, respectively; and for school-age children, 12.3, 12.5 and 12.4 gm/dl, respectively.
Table 35: Mean Hemoglobin by Cluster
National Rural Urban Slum
Mean(g/dl) 95% CI Mean
(g/dl) 95% CI Mean (g/dl) 95% CI Mean
(g/dl) 95% CI
(n= 607) (n=207) (n=220) (n=180)Preschool children 11.5 11.3-11.7 11.4 11.2-11.7 11.7 11.4-12.1 11.4 11.3-11.6
(n=1031) (n=362) (n=351) (n=318)NPNL women 12.4 12.3-12.6 12.4 12.2-12.6 12.6 12.3-12.8 12.6 12.4-12.8
(n=1320) (n=441) (n=452) (n=427)School-age children 12.3 12.2-12.5 12.3 12.1-12.5 12.5 12.4-12.7 12.4 12.2-12.5

38 National Micronutrient Survey 2011-12
3.8.1.2 Status of Hemoglobin Concentration by Socio-economic Status
Table 36 shows the mean estimates of hemoglobin in the studied population groups by SES. In the preschool children, the means were 11.2 g/dl and 11.7 g/dl in the “poorest” and the “richest” quintiles, respectively; in school-age children, 12.3 and 12.5 g/dl in the “poorest” and the “richest” quintiles, respectively; and in NPNL women, a similar trend was observed, 12.4 g/dl and 12.8 g/dl in the “poorest” and the “richest” quintiles, respectively.
Table 36: Mean Hemoglobin by Socio-economic Status
Poorest Poorer Middle Richer Richest
Mean (g/dl) 95% CI Mean
(g/dl) 95% CI Mean (g/dl)% 95% CI Mean
(g/dl) 95% CI Mean (g/dl) 95% CI
(n=114) (n=128) (n=118) (n=116) (n=131)Pre-school children
11.2 10.9-11.5 11.5 11.2-11.8 11.7 10.9-12.4 11.4 11.2-11.5 11.7 11.2-12.3
NPNL women
12.4 12.1-12.7 12.5 12.3-12.8 12.3 12.1-12.5 12.4 12.1-12.7 12.8 12.6-13.1
(n=256) (n=262) (n=268) (n=269) (n=265)School-age children 12.3 11.9-12.6 12.3 12.1-12.5 12.3 12.2-
12.5 12.4 12.1-12.7 12.5 12.2-12.8
3.8.1.3 Hemoglobin Concentration by Household Food Insecurity Status
Table 37 shows the mean hemoglobin level according to household food insecurity status. The mean level of hemoglobin in blood (g/dl) was similar in all the studied population groups.
Table 37: Mean Hemoglobin by Household Food Insecurity Status
Food-secure Mildly insecure Moderately insecure Severely insecure
Mean (g/dl) 95% CI Mean
(g/dl) 95% CI Mean (g/dl) 95% CI Mean
(g/dl) 95% CI
(n=272) (n=94) (n=153) (n=88)
Preschool children 11.6 11.3-11.9 11.3 10.8-11.8 11.3 11.-11.5 11.6 11.3-12.0
(n=490) (n=138) (n=272) (n=131)
NPNL women 12.5 12.3-12.7 12.3 11.8-12.7 12.4 12.1-12.6 12.7 12.4-13.0
(n=559) (n=204) (n=361) (n=196)
School-age children 12.4 12.2-12.6 12.4 12.0-12.7 12.3 12.1-12.5 12.4 12.1-12.6
3.8.2 Prevalence of Iron Deficiency and AnemiaThe national prevalence of anemia was 33.1% in preschool children (Table 38). The prevalence in rural, urban and slum clusters was 37%, 23% and 22%, respectively. The national prevalence of anemia was 26% in NPNL women; it was high in the rural cluster 27.4%.

39National Micronutrient Survey 2011-12
3.8.2.1 Anemia and Iron Status in Preschool Children and NPNL Women
Table 38: Anemia And Iron Status in Preschool Children And NPNL Women
Preschool children5 NPNL women6
n % 95% CI n % 95% CIAnemia1,7
National 607 33.1 25.7-40.4 1 031 26.0 20.2-31.6Rural 207 36.6 27.5-45.6 362 27.4 20.3-34.6Urban 220 22.8 12.9-32.8 351 21.4 13.7-29.1Slum 180 22.0 14.1-29.9 318 20.1 12.9-27.3Iron deficiency2,3,7
National 468 10.7 5.8-15.6 882 7.1 4.2-9.9Rural 155 9.4 3.2-15.7 314 6.7 3.1-10.2Urban 164 12.3 4.3-20.2 298 8.7 4.1-13.3Slum 149 27.2 19.5-34.9 270 7.4 3.8-11.1Iron Deficiency Anemia4,7
National 449 7.2 2.4-11.9 868 4.8 2.1-7.8Rural 149 6.1 -0.02-12.1 312 5.0 1.6-8.4Urban 158 10.1 2.2-18.0 294 4.1 1.4-6.7Slum 142 13.9 5.5-22.2 262 4.1 1.3-6.8
1Anemia is defined as hemoglobin level <12.0gm/dl in NPNL women and <11.0gm/dl in preschool children.2Iron deficiency is defined as serum ferritin level <15.0ng/ml in NPNL women and <12.0ng/ml in preschool children (WHO, 2001), 3Adjusted for elevated CRP (>10.0 mg/l) or elevated AGP (>1.0 g/l) by mathematical correction (Thurnham et al. 2010; Engle-Stone et al. 2011).4Iron deficiency anemia is defined as hemoglobin<12.0 g/dl plus ferritin level<15.0 ng/ml in NPNL women and hemoglobin<11.0 g/dl plus ferritin level<12.0 ng/ml in preschool children.5Age 6-59 months.6Age 15-49 years. 7Estimates weighted to represent the population level.
3.8.2.2 Anemia and Iron Status in School-age Children
Table 39: Anemia And Iron Status in School-age Children5
6-11 y 12-14 yn % 95% CI n % 95% CI
Anemia1
National 995 19.1 13.1-25.1 326 17.1 7.4-26.6Rural 340 21.7 13.7-29.5 102 18.1 5.4-30.7Urban 342 11.8 8.3-15.2 110 13.2 2.3-24.1Slum 313 13.2 7.0-19.4 114 18.1 10.6-25.6Iron deficiency2,3
National 960 3.9 1.7-6.1 319 9.5 -0.6-19.7Rural 331 4.1 1.1-6.9 98 10.0 -0.4-23.8Urban 329 3.6 1.2-5.9 112 8.1 2.1-14.2Slum 300 3.4 1.2-5.5 109 8.3 1.8-14.8Iron deficiency anemia4,3

40 National Micronutrient Survey 2011-12
National 944 1.3 0.2-2.4 312 1.8 -0.2-3.9Rural 324 1.1 -0.3-2.5 97 1.8 -0.8-4.6Urban 325 2.1 1.1-4.0 108 1.7 -0.6-4.1Slum 295 1.3 -0.1-2.7 107 1.8 -0.3-3.9
1 Anemia is defined as hemoglobin level <11.5 gm/dl in children 6-11 years old and <12.0 gm/dl in children 12-14 years.2Iron deficiency is defined as serum ferritin level<15.0 ng/ml (WHO 2001). 3 Adjusted for elevated CRP (>10.0 mg/l) or elevated AGP (>1.0 g/l) by mathematical correction (Thurnham et al., 2010; Engle-Stone et al., 2011)4Iron deficiency anemia is defined as hemoglobin<11.5 g/dl plus ferritin level<15.0 ng/ml in children 6-11 years and hemoglobin<12.0 g/dl plus ferritin level<15.0 ng/ml in children 12-14 years. 5Estimates weighted to represent the population level.
Tables 38 and 39 show the iron status in the population. The national prevalence of iron deficiency (ID), i.e. low ferritin, in preschool children was 10.7%. The deficiency was higher in the slums than in the rural or urban clusters (slums, 27.2%, rural cluster, 9.4%, urban cluster, 12.3%). In NPNL women, the national prevalence was 7.1%; 8.7% and 6.7% in the urban and rural clusters, respectively. In school-age children, the national prevalence was around 3.9% in children 6-11 years old and 9.5% in children 12-14 years old (Table 39).
The national prevalence of iron deficiency anemia (IDA) was 7.2%and 4.8% respectively in the preschool children, and the NPNL women (Table 38). For school-age children, the prevalence was 1.3% and 1.8% for children 6-11 years old and 12-14 years old, respectively (Table 39).
3.9 Consumption of Iron from Food
3.9.1 Consumption of Iron from Food by Cluster
Table 40 shows the daily consumption of iron from food in the studied population groups. In preschool children, the average daily consumption of total iron was 4.61 mg, 4.65 mg and 4.10 mg in the rural, urban and the slum clusters, respectively. The consumption of animal source (heme iron) was 0.94 mg, 1.12 mg and 0.96 mg in the rural, urban and the slums clusters, respectively. In school-age children, mean consumption in the rural, urban and slums clusters was 5.95 mg, 6.8 mg and 6.15 mg, respectively. The consumption of animal source heme iron was 1.14 mg, 1.28 mg, and 1.09 mg in the rural, urban and slums clusters, respectively. In NPNL women, the mean consumption in the rural, urban and slums clusters was 7.18 mg, 8.24 mg and 7.83 mg, respectively. Consumption of animal source iron was 1.16 mg, 1.18 mg and 1.09 mg in the rural, urban and slum clusters, respectively.
Table 40: Iron Consumption from Food by Cluster
National (n=845) Rural (n=284) Urban (n=296) Slum (n=265)mg/day
Preschool childrenDaily total ironMean 4.59 4.61 4.65 4.10Median 4.17 4.19 3.81 3.69Daily iron from animal sourcesMean 0.98 0.94 1.12 0.96Median 0.74 0.71 0.79 0.72Daily iron from non-animal sourcesMean 3.61 3.66 3.52 3.13Median 3.06 3.12 2.77 2.84

41National Micronutrient Survey 2011-12
School-age childrenDaily total iron Mean 6.13 5.95 6.8 6.15Median 5.21 5.17 5.49 5.19Daily iron from animal sources Mean 1.16 1.14 1.28 1.09Median 0.90 0.94 0.88 0.70Daily iron from non-animal sources Mean 4.96 4.81 5.52 5.05Median 4.14 4.10 4.24 4.36NPNL womenDaily total iron Mean 7.42 7.18 8.24 7.83Median 6.64 6.42 7.27 6.68Daily iron from animal sources Mean 1.16 1.16 1.18 1.09Median 0.99 0.99 1.03 0.87Daily iron from non-animal sources Mean 6.25 6.01 7.06 6.74Median 5.48 5.34 6.13 5.74
3.9.2 Consumption of Iron from Food by Socio-economic Status
Table 41 shows the consumption of iron from food by SES. Consumption tends to increase as the SES improves. In preschool children, the mean consumption of total iron was 3.89 mg in the “poorest” and 4.72 mg in the “richest” quintile. Consumption of animal-source iron was m 0.54 mg in the “poorest” quintile, which increased gradually as the SES increased; it was 1.48 mg in the “richest” quintile of the population. In NPNL women, the mean consumption of total iron was 6.67 mg in the “poorest”, against 8.85 mg in the “richest” quintile. The iron consumption from animal-source food was 0.82 mg in the “poorest” and 1.88 mg in the “richest” quintile. In regard to school-age children, the daily consumption of total iron was 5.79 mg in the “poorest” and 6.89 mg in the “richest” group. Consumption of animal-source iron, it was 0.69 mg and 1.88 mg, respectively.
Table 41: Iron Consumption from Food by Socio-economic Status
Poorest Poorer Middle Richer Richest
mg/day
Preschool children
Daily total iron
Mean 3.89 4.40 5.03 5.44 4.72
Median 3.09 4.19 5.24 5.54 4.55
Daily iron from animal-sources
Mean 0.54 0.77 0.97 1.53 1.48
Median 0.32 0.65 1.01 1.44 1.40
Daily iron from non-animal sources
Mean 3.34 3.62 4.05 3.91 3.23
Median 2.69 3.06 4.06 3.20 2.82

42 National Micronutrient Survey 2011-12
School-age children
Daily total iron
Mean 5.79 5.93 6.13 6.24 6.89
Median 4.50 5.51 5.17 5.48 6.04
Daily iron from animal sources
Mean 0.69 1.05 1.15 1.43 1.88
Median 0.52 0.95 1.05 0.99 1.81
Daily iron from non-animal sources
Mean 5.10 4.87 4.98 4.81 5.01
Median 3.85 4.44 4.08 4.41 4.09
NPNL women
Daily total iron
Mean 6.67 6.99 7.78 7.48 8.85
Median 6.12 6.27 7.04 6.83 7.97
Daily iron from animal sources
Mean 0.82 0.98 1.24 1.25 1.88
Median 0.55 0.81 1.0 1.06 1.58
Daily iron from non-animal-sources
Mean 5.84 6.0 6.53 6.22 6.97
Median 5.01 5.40 6.11 5.33 6.28
3.9.3 Consumption of Daily Iron from Food by Household Food Insecurity
Table 42 shows iron consumption according to household food insecurity status. In preschool children, mean consumption of total iron was 4.97 mg in the food-secure households, compared to 3.59 mg in the severely food-insecure households. Mean consumption of animal source iron (heme iron) was 1.23 mg and 0.43 mg in food-secure and severely food-insecure households, respectively. For school-age children, the mean consumption of total iron in the food-secure households was 6.69 mg, compared to 5.44 mg in severely food-insecure households. Consumption of animal source iron was 1.6 mg in the food-secure households and just 0.61 mg in the severely food-insecure households. NPNL women from food-secure households consumed on average 7.85 mg of total iron, while those from severely food-insecure households consumed 6.89 mg every day. The consumption of animal source heme iron was 1.44 mg in food-secure households and 0.66 mg in food-insecure households. However, consumption of non-animal source iron was generally consistent, irrespective of household food insecurity status: 6.41 mg and 6.23 mg in the food-secure and severely food-insecure households, respectively.
Table 42: Iron Consumption by Household Food Insecurity
Food-secure Mildly insecure Moderately insecure Severely insecuremg/day
Preschool childrenDaily total iron Mean 4.97 3.97 4.63 3.59Median 4.55 3.89 4.19 2.81Daily iron from animal sources Mean 1.23 0.81 0.77 0.43Median 1.20 0.61 0.59 0.32

43National Micronutrient Survey 2011-12
Daily iron from plant sources Mean 3.73 3.15 3.86 3.16Median 3.32 2.84 3.11 2.41School-age childrenDaily total iron Mean 6.69 5.29 6.0 5.44Median 5.96 4.44 5.33 4.19Daily iron from animal sources Mean 1.6 0.94 0.84 0.61Median 1.33 0.73 0.58 0.46Daily iron from plant sources Mean 5.08 4.35 5.17 4.82Median 4.41 3.74 4.44 3.72NPNL womenDaily total iron Mean 7.85 7.14 6.84 6.89Median 7.24 6.07 6.23 6.05Daily iron from animal sources Mean 1.44 1.10 0.84 0.66Median 1.23 1.09 0.68 0.50Daily iron from plant sources Mean 6.41 6.04 6.0 6.23Median 5.74 4.79 5.25 5.31
3.9.4 Consumption of Iron from Food Compared to the Recommended Daily Allowance
Table 43 shows the daily consumption of iron from food and how it compares with the RDA. The median consumption of iron was below the RDAs in all the population groups studied.
Table 43: Consumption of Iron from Food Compared to the Recommended Daily Allowance
Daily total iron consumption, median (mg) RDA1
Preschool children 4.17 7-102
School-age children 5.21 8-103
NPNL women 6.64 15-184
1Institute of Medicine (IOM).2 Age 1-3 year: 7mg; age 4-5: 10 mg. 3Age 6-8 years: 10 mg; age 9-13: 8 mg.4Age 15-18 year: 15 mg; Age 19-49: 18 mg.

44 National Micronutrient Survey 2011-12
3.10. Knowledge about Iron-rich Food
Table 44: Knowledge about Iron-Rich Food
Rural Urban Slum National% 95% CI % 95% CI % 95% CI % 95% CI
Do you have knowledge about food containing iron? (n=661) (n=693) (n=649) (n=2003)
Yes 30.1 24.9-35.2 48.6 38.7-58.5 35.0 27.9-42.1 34.1 29.3-38.8No 69.9 64.8-75.1 51.4 41.5-61.5 65.0 57.9-72.1 65.9 61.2-70.7Do you know that fish is an iron-rich food (n=213) (n=298) (n=245) (n=756)
Yes 53.8 39.9-67.8 60.7 51.9-69.4 56.2 45.4-67.0 55.9 46.6-65.3No 46.2 32.2-60.1 39.3 30.6-48.1 43.8 33.0-54.6 44.1 34.7-53.4Meat (n=213) (n=298) (n=245) (n=756)Mentioned 32.2 21.9-42.6 47.5 38.5-56.5 32.1 21.5-42.7 36.7 29.2-44.2Didn’t mention 67.8 57.4-78.1 52.5 43.5-61.5 67.9 57.3-78.5 63.3 55.8-70.8Eggs (n=213) (n=298) (n=245) (n=756)Mentioned 38.9 26.7-51.1 39.6 30.8-48.5 28.8 17.7-39.8 38.7 30.3-47.1Didn’t mention 61.1 48.9-73.3 60.4 51.5-69.2 71.2 60.2-82.3 61.3 52.9-69.7Milk (n=213) (n=298) (n=245) (n=756)Mentioned 28.2 17.2-39.3 28.7 19.7-37.6 19.8 10.6-29.0 28.0 20.3-35.7Didn’t mention 71.8 60.7-82.8 71.3 62.4-80.3 80.2 71.0-89.4 72.0 64.3-79.7Mentioned other iron-rich foodsYes 2.0 0.1-3.9 3.4 -0.3-7.0 3.2 0.6-5.7 2.4 0.8-4.1No 98.0 96.1-99.9 96.6 93.0-100.3 96.8 94.3-99.4 97.6 95.9-99.2Do you know about the benefits of eating iron-rich food
(n=238) (n=297) (n=263) (n=798)
Yes 34.2 26.7-41.6 47.6 37.5-57.7 41.5 34.3-48.6 37.2 31.1-43.4No 65.8 58.4-73.3 52.4 42.3-62.5 58.5 51.4-65.7 62.8 56.6-68.9Provides energy (n=238) (n=297) (n=263) (n=798)Yes 56.9 49.5-64.4 53.9 47.5-60.4 57.3 45.2-69.5 56.2 50.7-61.6No 43.1 35.6-50.5 46.1 39.6-52.5 42.7 30.5-54.8 43.8 38.4-49.3Provides iron (n=238) (n=297) (n=263) (n=798)Mentioned 14.6 5.3-23.8 9.6 4.1-15.2 8.1 4.0-12.3 13.0 6.3-19.7Didn’t mention 85.4 76.2-94.7 90.4 84.8-95.9 91.9 87.7-96.0 87.0 80.3-93.7Iron-rich food is healthy (n=238) (n=297) (n=263) (n=798)Mentioned 77.4 68.2-86.7 76.4 69.3-83.4 65.5 54.6-76.3 76.6 70.0-83.2Didn’t mention 22.6 13.3-31.8 23.6 16.6-30.7 34.5 23.7-45.4 23.4 16.8-30.0Others (n=238) (n=297) (n=263) (n=798)Mentioned 2.6 0.1-5.2 1.2 -0.1-2.4 4.2 1.2-7.1 2.3 0.5-4.1Didn’t mention 97.4 94.8-99.9 98.8 97.6-100.1 95.8 92.9-98.8 97.7 95.9-99.5
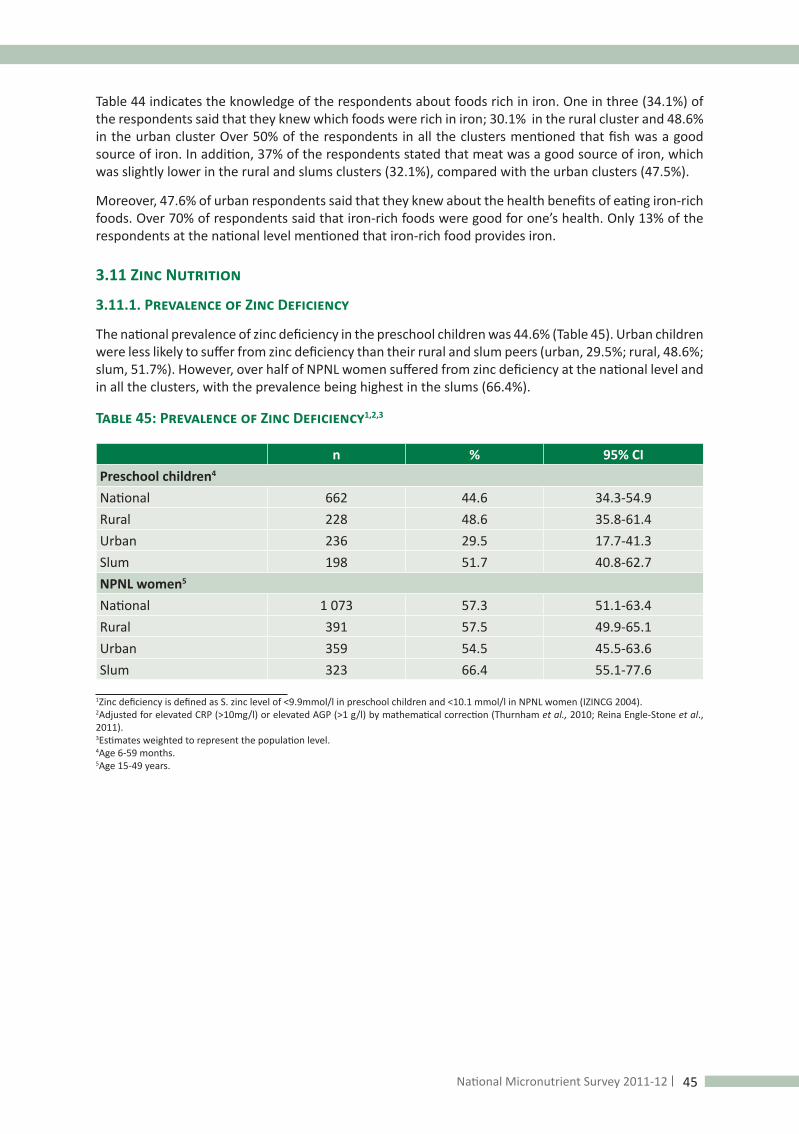
45National Micronutrient Survey 2011-12
Table 44 indicates the knowledge of the respondents about foods rich in iron. One in three (34.1%) of the respondents said that they knew which foods were rich in iron; 30.1% in the rural cluster and 48.6% in the urban cluster Over 50% of the respondents in all the clusters mentioned that fish was a good source of iron. In addition, 37% of the respondents stated that meat was a good source of iron, which was slightly lower in the rural and slums clusters (32.1%), compared with the urban clusters (47.5%).
Moreover, 47.6% of urban respondents said that they knew about the health benefits of eating iron-rich foods. Over 70% of respondents said that iron-rich foods were good for one’s health. Only 13% of the respondents at the national level mentioned that iron-rich food provides iron.
3.11 Zinc Nutrition
3.11.1. Prevalence of Zinc Deficiency
The national prevalence of zinc deficiency in the preschool children was 44.6% (Table 45). Urban children were less likely to suffer from zinc deficiency than their rural and slum peers (urban, 29.5%; rural, 48.6%; slum, 51.7%). However, over half of NPNL women suffered from zinc deficiency at the national level and in all the clusters, with the prevalence being highest in the slums (66.4%).
Table 45: Prevalence of Zinc Deficiency1,2,3
n % 95% CIPreschool children4
National 662 44.6 34.3-54.9Rural 228 48.6 35.8-61.4Urban 236 29.5 17.7-41.3Slum 198 51.7 40.8-62.7NPNL women5
National 1 073 57.3 51.1-63.4Rural 391 57.5 49.9-65.1Urban 359 54.5 45.5-63.6Slum 323 66.4 55.1-77.6
1Zinc deficiency is defined as S. zinc level of <9.9mmol/l in preschool children and <10.1 mmol/l in NPNL women (IZINCG 2004). 2Adjusted for elevated CRP (>10mg/l) or elevated AGP (>1 g/l) by mathematical correction (Thurnham et al., 2010; Reina Engle-Stone et al., 2011).3Estimates weighted to represent the population level.4Age 6-59 months.5Age 15-49 years.

46 National Micronutrient Survey 2011-12
3.11.2 Mean Serum Zinc
Table 46: Mean Zinc Concentration in Serum1,2
Preschool children3 NPNL women4
Mean (mmol/l) 95% CI Mean (mmol/l) 95% CINational 10.25 9.9-10.6 10.04 9.81-10.27Rural 10.04 9.63-10.46 10.06 9.77-10.34Urban 11.02 10.37-11.67 10.05 9.73-10.37Slum 9.89 9.56-10.23 9.67 9.29-10.05
1 Adjusted for elevated CRP (>10mg/l) or elevated AGP (>1 g/l) by mathematical correction (Thurnham et al., 2010; Engle-Stone et al., 2011). 2Estimates weighted to represent the population level.3Age 6-59 month.4Age 15-49 years.
Table 46 shows mean zinc level in serum. The national average levels were 10.25 mmol/l and 10.04 mmol/l in the preschool children and NPNL women, respectively. The mean serum zinc was higher in the urban cluster than in the slums in both the population groups studied.
3.12 Consumption of Zinc from Food
Table 47 shows consumption of zinc from food in preschool children over a seven-day period. The mean animal source zinc consumption in the rural, urban and slums was 8.1 mg, 9.4 mg, and 7.5 mg, respectively. Total zinc consumption decreased as households became gradually more food-insecure. The same trend was observed in regard to consumption of animal source zinc, with a consumption of 10.2 mg and 3.6 mg in the food-secure and severely food-insecure households, respectively.
Table 47: Consumption of Zinc from Food over a Seven-day Period: Preschool Children
Clusters n mean (mg) 95% CITotal zinc consumptionNational 845 22.3 19.8-24.8Rural 284 22.4 19.1-25.7Urban 296 22.7 19.7-25.6Slum 265 18.7 16.5-20.8Zinc consumption from animal sources National 845 8.3 7.2-9.5Rural 284 8.1 6.6-9.6Urban 296 9.4 7.9-10.8Slum 265 7.5 6.1-8.8Zinc consumption from non-animal sources National 845 13.9 12.2-15.7Rural 284 14.3 12.1-16.5Urban 296 13.3 11.4-15.1Slum 265 11.2 9.8-12.5By household food insecurity statusTotal zinc consumption

47National Micronutrient Survey 2011-12
Food-secure 382 25.4 22.4-28.3Mildly insecure 125 20.6 16.8-24.3Moderately insecure 210 20.4 13.8-27.1Severely insecure 128 13.7 10.2-17.2Zinc consumption from animal sources Food-secure 382 10.2 9.0-11.4Mildly insecure 125 7.8 5.4-10.3Moderately insecure 210 6.6 4.3-8.9Severely insecure 128 3.6 2.7-4.5Zinc consumption from non-animal sources Food-secure 382 15.2 12.9-17.4Mildly insecure 125 12.7 9.3-16.0Moderately insecure 210 13.8 9.3-18.3Severely insecure 128 10.1 7.2-13.1
Table 48 shows the consumption of zinc by NPNL women over a seven-day period. Consumption of total zinc was 29 mg, 32.3 mg and 28.4 mg, in the rural, urban and slum clusters, respectively; zinc consumption from animal sources was 8.9 mg, 9.4 mg and 8.1 mg, respectively. In regard to household food insecurity, consumption of total zinc gradually decreased as households became increasingly food-insecure. The similar observation was noted for the consumption of zinc from animal sources.
Table 48: Consumption of Zinc from Food over a Seven-day Period: NPNL Women
Clusters n mean (mg) 95% CITotal consumption of zincNational 1412 29.6 27.0-32.3Rural 486 29.0 25.4-32.6Urban 482 32.3 29.8-34.8Slum 444 28.4 25.6-31.3Zinc consumption from animal sources National 1412 9.1 7.8-10.2Rural 486 8.9 7.3-10.6Urban 482 9.4 8.4-10.5Slum 444 8.1 6.6-9.1Zinc consumption from non-animal sources National 1412 20.6 18.8-22.4Rural 486 20.0 17.6-22.4Urban 482 22.9 21.0-24.7Slum 444 20.3 18.2-22.3By household food insecurity statusTotal consumption of zinc Food-secure 674 33.3 30.6-35.9Mildly insecure 193 28.5 18.7-38.2Moderately insecure 365 25.8 22.7-28.9Severely insecure 180 22.5 18.8-26.2

48 National Micronutrient Survey 2011-12
Zinc consumption from animal sources Food-secure 674 11.3 9.7-12.8Mildly insecure 193 8.3 6.3-10.3Moderately insecure 365 6.4 5.2-7.6Severely insecure 180 5.1 3.3-6.9Zinc consumption from non-animal sources Food-secure 674 22.1 20.2-23.1Mildly insecure 193 20.1 12.1-28.2Moderately insecure 365 19.4 16.8-21.9
3.12.1 Consumption of Zinc from Food Compared to the Recommended Daily Allowance
Table 49A shows the daily consumption of zinc from food and how this compares with the RDA. In general, preschool children (6-59 month) are slightly below the RDA of consumption for zinc. The status of consumption in NPNL women was even worse. In general, for NPNL women in the urban cluster, the median consumption was half the RDA, and in the slums, just one-third of the RDA.
Table 49A: Consumption of Zinc from Food Compared to the Recommended Daily Allowance
Daily total consumption of zinc from food (mg); median RDA1
Preschool children Rural 3.20
3-52Urban 3.23Slum 2.67NPNL womenRural 3.93
8-93Urban 4.47Slum 3.61
1Institute of Medicine (IOM).2Age 1-3 years: 3 mg; age 4-5 years: 5 mg.3Age 15-18 years: 9 mg; age 19+: 8 mg.
Table 49b: Consumption of Zinc from Food Compared to the Recommended Daily Allowance
RDA for zinc for NPNL
women (mg)Clusters
Total daily mean intake from animal
source (mg)
Total daily mean intake (mg) % of RDA
Prevalence of zinc deficiency
(%)
9.01
National 1.92 4.87 54.1 57.3Rural 2.02 4.88 54.2 57.5Urban 1.67 4.93 54.7 54.5Slum 1.33 4.23 47.0 66.4
1Institute of Medicine.

49National Micronutrient Survey 2011-12
Table 49B shows the average daily zinc consumption from food by NPNL women, 4.88 mg, 4.93 mg and 4.23 mg in the rural, urban and slum clusters, respectively, which corresponds to 54.2% and 54.7.0% and 47.0% of the RDA, respectively.
3.12.2 Categories of the Phytate-zinc Molar Ratio
Table 50 shows the molar ratio of phytate to zinc in the food of the studied population groups. Phytate present in the food is an inhibitor of zinc absorption. The phytate to zinc molar ratio, which is an indicator of relative proportion of phytate to zinc in the food, is an indicator of zinc absorption. The higher the ratio, the greater the amount of phytate in relation to zinc and the less the zinc absorption. The International Zinc Nutrition Consultative Group (IZING) devised three categories of phytate-zinc molar ratios to account for dietary quality facilitating zinc absorption. Table 50 shows that, in general, Bangladeshi food for preschool children falls in the moderate category (phytate to zinc molar ratio of 5:15), at around two-thirds. The diet of urban children was more conducive to zinc absorption (phytate to zinc molar ratio of <5); 26.3% of urban children were classified within this category, compared to children in the rural and slum clusters, at 23.6% and 17.2%, respectively. The ratio in the diet of one-fourth of school-age children in the slums was >15.0, indicating a high content of phytate. The diet of one-third of NPNL women in the slums had a ratio >15.0. This could be linked to a very high rate of zinc deficiency in the slums populations.
Table 50: Phytate-zinc Molar Ratio in Preschool Children by Population Group and Cluster
Phytate-zinc molar ratio1
Preschool children <5.0 5.0-15.0 >15.0% 95% CI % 95% CI % 95% CI
National 23.9 17.8-30.1 63.1 57.9-68.1 13.0 7.7-18.2Rural 23.6 15.7-31.5 62.1 55.3-68.9 14.1 7.1-21.2Urban 26.3 18.4-34.2 64.9 59.3-70.6 8.6 3.6-13.7Slum 17.2 8.6-25.7 69.6 58.2-81.1 13.1 4.3-21.8School-age childrenNational 14.1 7.2-21.0 65.3 59.2-71.4 20.5 13.5-27.5Rural 15.8 6.8-24.8 62.9 55.1-70.6 21.2 12.1-30.4Urban 10.1 4.8-15.5 72.7 64.2-81.2 17.1 8.4-25.6Slum 2.4 0.8-4.1 73.2 66.1-80.3 24.2 16.9-31.6NPNL womenNational 7.5 3.2-11.9 65.1 57.5-72.6 27.3 18.6-35.9Rural 8.9 3.3-14.6 62.4 52.3-72.5 28.5 17.1-40.0Urban 3.2 0.9-5.6 75.2 69.6-80.9 21.4 15.1-27.8Slum 2.1 0.4-3.7 64.1 57.6-70.6 33.7 27.2-40.2
1 World Health Organization
3.12.3 Mean Phytate-zinc Molar Ratio
Table 51 shows the mean phytate-zinc molar ratio in the foods consumed by the studied populations. The ratio in the preschool children was 9.0. In the rural, urban and slums clusters, the ratio was 9.13, 8.42, and 9.77, respectively. In NPNL women, the ratio was 12.0 at the national level; 12.0, 11.67 and 13.45 in the rural, urban and slum clusters, respectively. In school-age children, the ratio at the national level was 10.67; 10.6, 10.6 and 12.5 in the rural, urban and slums, respectively.

50 National Micronutrient Survey 2011-12
Table 51: Mean Phytate-zinc Molar Ratio by Population Group and Cluster
n mean 95% CIPreschool children
National 843 9.01 8.02-10.0
Rural 284 9.13 7.82-10.44
Urban 296 8.42 7.42-9.42
Slum 263 9.77 8.78-10.75
NPNL women
National 1412 12.0 10.6-13.5
Rural 486 12.0 10.2-13.7
Urban 482 11.67 10.6-12.7
Slum 444 13.45 12.7-14.1
School-age children
National 1428 10.67 9.3-12.0
Rural 476 10.60 8.8-12.4
Urban 484 10.60 8.95-12.2
Slum 468 12.50 11.5-13.4
3.13 Prevalence of Folate and Vitamin B12 Deficiency
The prevalence of folate deficiency was 9.1% at the national level (Table 52); 8.6% and 11.4% in the rural and urban clusters, respectively.
3.13.1 Folate Status in NPNL WomenTable 52: Folate Status of NPNL Women
Prevalence of folate deficiency1,2 n % 95% CINational 849 9.1 5.3-12.9Rural 294 8.6 3.6-13.5Urban 288 11.4 6.6-16.3Slum 267 7.9 3.3-12.4
1S. Folate level <6.8 nmol/l (Lindstorm et al., 2011)2Estimates weighted to represent the population level.
3.13.2 Consumption of Folate from FoodTable 53 shows folate consumption from food over a seven-day period. As households became increasingly more food-insecure, the contribution of animal source folate decreased.
Table 53: Consumption of Folate from Food
Household food insecurity
Folate from plant sources over a 7-day period (µg)
Folate from animal sources over a 7-day period (µg)
Food-secure 1 057.5 109.3Mildly insecure 946.9 90.5Moderately insecure 935.5 62.6Severely insecure 1 153.1 39.6

51National Micronutrient Survey 2011-12
3.13.3 Vitamin B12 Status in NPNL Women
Table 54: Vitamin B12 Status in NPNL Women
Prevalence4 of Vitamin B12 Deficiency n % 95% CI
National
Deficiency1
872
6.1 2.1-10.1
Marginal deficiency2 15.9 12.0-19.9
Normal status3 77.9 70.8-85.0
Rural
Deficiency1
303
5.7 0.5-11.0
Marginal deficiency2 15.8 10.8-20.8
Normal status3 78.4 69.3-87.6
Urban
Deficiency1
295
7.5 3.0-11.9
Marginal deficiency2 16.0 10.3-21.7
Normal status3 76.5 67.6-85.3
Slum
Deficiency1
274
6.5 1.9-11.0
Marginal deficiency2 18.1 11.5-24.6
Normal status3 75.5 67.4-83.5
1Serum B12 level <200 pg/ml.2Serum B12 level 200.0-300.0 pg/ml.3Serum B12 level >300.0 pg/ml.4Estimates weighted to represent the population level.
At the national level, 22% of NPNL women (Table 54) suffered from vitamin B12 deficiency. The percentage was similar in all the clusters, albeit slightly higher in the slums, at around 25%.
3.13.4 Consumption of Vitamin B12 from Food: NPNL Women
Table 55 shows the daily consumption of B12 from food. The mean consumption was 1.98 mg, 2.43 mg and 2.10 mg in the rural, urban and slum clusters, respectively. The consumption followed a decreasing trend as the households become increasingly more food-insecure. The mean consumption was 2.58 mg in the food-secure households and 1.07 mg in the severely food-insecure households.
Table 55: Consumption of Vitamin B12 from Food
n Mean (mg) 95% CI
Clusters
National 1412 2.07 1.76-2.39
Rural 486 1.98 1.59-2.37
Urban 482 2.43 1.79-3.06
Slum 444 2.10 1.6-2.6
By household food insecurity status
Food-secure 674 2.58 2.11-3.06
Mildly insecure 193 1.69 1.12-2.27
Moderately insecure 365 1.69 1.30-2.08
Severely insecure 180 1.07 0.83-1.30

52 National Micronutrient Survey 2011-12
3.14 Salt Iodization
3.14.1 Consumption of Iodized Salt
Table 56A shows the profile of salt consumed at the household level. The national estimate of usage of iodized salt (≥5 ppm) at the household level was 80.3%. The percentages were 76.7%, 91.7% and 91.1% in the rural, urban and the slum clusters, respectively. At the national level, 57.6% of the households used adequately iodized salt (≥15 ppm). Three out of four households in the urban cluster and slums used adequately iodized salt, while the percentage was just over 50% in the rural cluster.
Table 56A: Status Of Household Salt1
n % 95% CIPresence of iodine(≥5 ppm)National 1692 80.3 75.1-85.5Rural 564 76.7 69.8-83.5Urban 574 91.7 88.1-95.4Slum 554 91.1 84.6-97.5Presence of adequate iodine (≥15 ppm)National 1692 57.6 50.4-64.8Rural 564 51.8 42.8-60.9Urban 574 75.4 68.0-82.9Slum 554 76.9 64.7-89.0Brand salt2
National 1709 75.8 66.1-85.5Rural 566 70.8 58.1-83.4Urban 576 92.3 87.8-96.6Slum 567 88.2 79.5-96.9Open salt3
National 1709 24.2 24.4-33.8Rural 566 29.2 16.5-41.9Urban 576 7.7 3.3-12.1Slum 567 11.8 3.0-20.5
1Estimates weighted to represent the population level. 2Sold in sealed plastic packets, e.g. 0.5 kg to1kg packets.3Kept in bulk containers and sold in small amounts, e.g. in a few hundred grams wrapped in paper.
The estimate of household consumption of “brand” salt was 75.8% at the national level. More urban households consume “brand” salt than rural ones (92.3% against 70.8%). The percentage of “open” salt consumption in the households was 24.2% at the national level. More rural households consumed “open” salt than urban ones (29.2% against 7.7%).

53National Micronutrient Survey 2011-12
Table 56B: Consumption of Iodized Salt by Socio-economic Status
Consumption of iodized salt1 Consumption of adequately iodized salt2
n % 95% CI n % 95% CIAccording to the Asset IndexPoorest 347 73.1 60.0-86.3 Poorest 347 51.9 40.2-63.6Poorer 327 82.1 73.2-90.1 Poorer 327 56.3 46.6-66.0Middle 342 80.4 72.2-88.5 Middle 342 57.8 48.8-66.8Richer 337 88.2 82.0-94.4 Richer 337 64.8 51.8-77.9Richest 338 86.0 78.4-93.4 Richest 338 65.1 51.8-78.1By household food insecurity statusFood-secure 777 84.2 77.6-90.7 Food-secure 777 63.3 55.0-71.6Mildly insecure 260 86.2 77.4-94.9 Mildly insecure 260 54.9 37.3-72.6Moderately insecure 432 75.0 67.2-82.8 Moderately insecure 432 51.4 42.0-60.8
Severely insecure 223 66.9 55.7-78.1 Severely insecure 223 48.9 37.1-60.7 1Salt iodization level >=5 ppm. 2Salt iodization level>=15 ppm.
Table 56B shows the use of iodized salt across different SES at a national level. The consumption rate of iodized salt increases as the SES rises. A similar trend was observed in regard to usage of adequately iodized salt. The usage of both iodized and adequately salt decreased as households became increasingly more food-insecure.
3.14.2 Reasons for not Consuming Salt Packets
Table 57: Reasons for not Consuming Salt Packets
If not consuming salt packets, why? n % 95% CIDo not like the taste
362
14.9 4.8-24.9Too expensive 83.9 77.3-90.5Not available 18.7 3.1-34.3Do not believe it is iodized 11.5 2.0-21.8Cannot buy it in a small amount 23.9 16.8-30.9Do not know 0.5 -0.4-1.4Others 2.3 0.03-4.7
The most common reason for not taking salt packets was that it was “too expensive”, as mentioned by 83.9% of the household respondents. Another important reason was that one “cannot buy it in a small amount”, which was mentioned by approximately one-fourth of household respondents (23.9%). Among other notable reasons were “not available” (18.7%)”, “do not like the taste” (14.9%) and “do not believe it is iodized” (11.5%)(Table 57).
3.15 Iodine Nutrition
Iodine status can be reported as a mean and/or median UIC (µg/l) (Andersson et al., 2012). Prevalence of inadequate iodine intake or iodine deficiency is reported as percentage of the population with a mean UIC <100 µg/l. Historically, in Bangladesh and in other countries, iodine nutrition is reported in
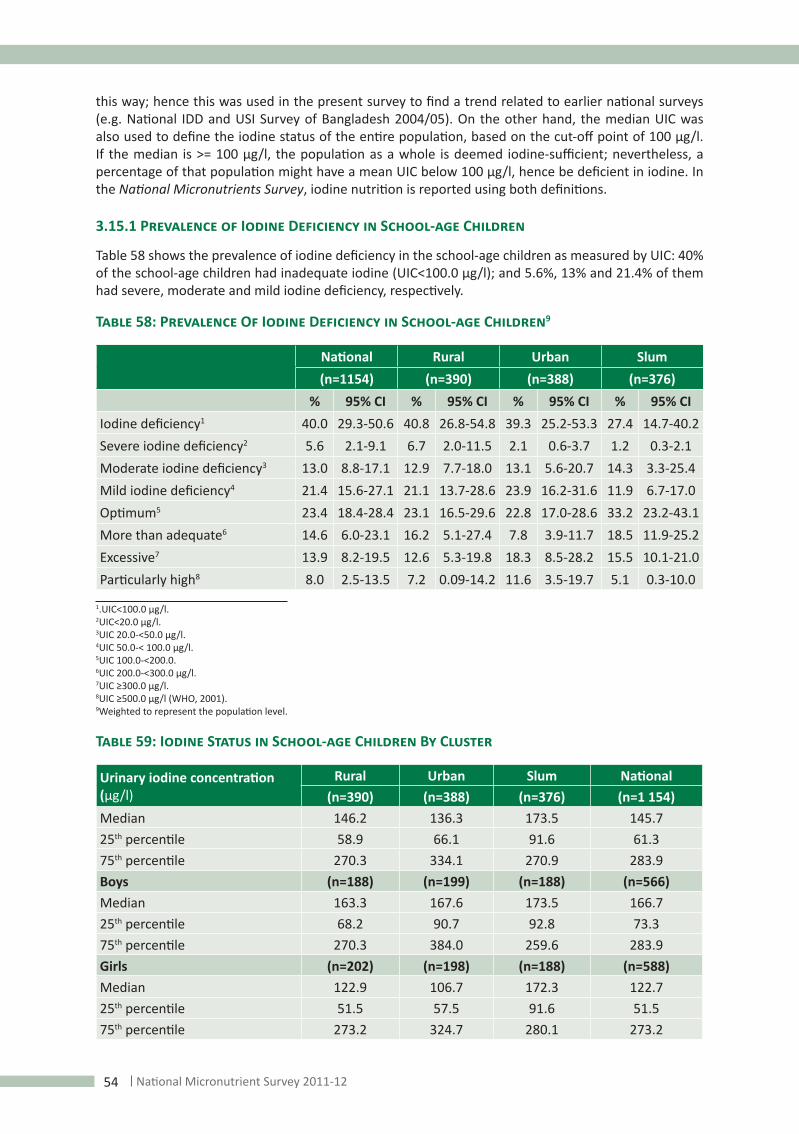
54 National Micronutrient Survey 2011-12
this way; hence this was used in the present survey to find a trend related to earlier national surveys (e.g. National IDD and USI Survey of Bangladesh 2004/05). On the other hand, the median UIC was also used to define the iodine status of the entire population, based on the cut-off point of 100 µg/l. If the median is >= 100 µg/l, the population as a whole is deemed iodine-sufficient; nevertheless, a percentage of that population might have a mean UIC below 100 µg/l, hence be deficient in iodine. In the National Micronutrients Survey, iodine nutrition is reported using both definitions.
3.15.1 Prevalence of Iodine Deficiency in School-age Children
Table 58 shows the prevalence of iodine deficiency in the school-age children as measured by UIC: 40% of the school-age children had inadequate iodine (UIC<100.0 µg/l); and 5.6%, 13% and 21.4% of them had severe, moderate and mild iodine deficiency, respectively.
Table 58: Prevalence Of Iodine Deficiency in School-age Children9
National Rural Urban Slum(n=1154) (n=390) (n=388) (n=376)
% 95% CI % 95% CI % 95% CI % 95% CIIodine deficiency1 40.0 29.3-50.6 40.8 26.8-54.8 39.3 25.2-53.3 27.4 14.7-40.2Severe iodine deficiency2 5.6 2.1-9.1 6.7 2.0-11.5 2.1 0.6-3.7 1.2 0.3-2.1Moderate iodine deficiency3 13.0 8.8-17.1 12.9 7.7-18.0 13.1 5.6-20.7 14.3 3.3-25.4Mild iodine deficiency4 21.4 15.6-27.1 21.1 13.7-28.6 23.9 16.2-31.6 11.9 6.7-17.0Optimum5 23.4 18.4-28.4 23.1 16.5-29.6 22.8 17.0-28.6 33.2 23.2-43.1More than adequate6 14.6 6.0-23.1 16.2 5.1-27.4 7.8 3.9-11.7 18.5 11.9-25.2Excessive7 13.9 8.2-19.5 12.6 5.3-19.8 18.3 8.5-28.2 15.5 10.1-21.0Particularly high8 8.0 2.5-13.5 7.2 0.09-14.2 11.6 3.5-19.7 5.1 0.3-10.0
1.UIC<100.0 µg/l.2UIC<20.0 µg/l.3UIC 20.0-<50.0 µg/l. 4UIC 50.0-< 100.0 µg/l.5UIC 100.0-<200.0.6UIC 200.0-<300.0 µg/l.7UIC ≥300.0 µg/l.8UIC ≥500.0 µg/l (WHO, 2001).9Weighted to represent the population level.
Table 59: Iodine Status in School-age Children By Cluster
Urinary iodine concentration (μg/l)
Rural Urban Slum National(n=390) (n=388) (n=376) (n=1 154)
Median 146.2 136.3 173.5 145.725th percentile 58.9 66.1 91.6 61.375th percentile 270.3 334.1 270.9 283.9Boys (n=188) (n=199) (n=188) (n=566)Median 163.3 167.6 173.5 166.725th percentile 68.2 90.7 92.8 73.375th percentile 270.3 384.0 259.6 283.9Girls (n=202) (n=198) (n=188) (n=588)Median 122.9 106.7 172.3 122.725th percentile 51.5 57.5 91.6 51.575th percentile 273.2 324.7 280.1 273.2

55National Micronutrient Survey 2011-12
Table 60: Iodine Status in School-age Children according to the Asset Index
Urinary iodine concentration(μg/l)Poorest Poorer Middle Richer Richest(n=234) (n=232) (n=226) (n=227) (n=235)
Median 93.6 146.8 147.4 152.5 151.325th percentile 44.2 54.6 66.4 59.5 127.175th percentile 204.1 285.2 287.8 299.9 312.9
Table 59 shows that the median UIC in school-age children was 145.7 µg/l at the national level. The estimate was above 100.0 µg/l in all the clusters – rural, urban and slums. The median UIC was higher than 100.0 µg/l in boys and girls. It was 93.3 µg/l in the “poorest “quintile of the population (Table 60).
3.15.2 Prevalence of Iodine Deficiency in NPNL Women
Table 61 shows iodine status in NPNL women. The national prevalence of iodine deficiency (UIC<100.0 µg/l) was 42%. The prevalence of severe and moderate iodine deficiencies was 7.1% and 17.5%, respectively. The prevalence of optimum iodine level was 24.9%.
Table 61: Prevalence of Iodine Deficiency in NPNL Women9
National Rural Urban Slum(n=1273) (n=452) (n=433) (n=388)
% 95% CI % 95% CI % 95% CI % 95% CIIodine deficiency1 42.1 31.7-52.5 44.7 31.3-58.1 33.3 19.3-47.2 33.5 23.5-43.4Severe iodine deficiency2 7.1 3.7-10.5 8.3 3.8-12.8 3.3 1.0-5.6 1.6 0.08-3.2Moderate iodine deficiency3 17.5 12.1-22.9 19.0 12.0-26.1 12.4 5.4-19.4 12.2 5.7-18.6Mild iodine deficiency4 17.4 12.4-22.1 17.3 11.4-23.3 17.5 10.4-24.6 19.6 14.2-24.9Optimum5 24.9 18.9-30.8 24.3 16.7-31.8 27.1 19.3-34.8 26.2 18.8-33.5More than adequate6 11.9 8.9-14.9 11.3 7.3-15.1), 13.5 9.6-17.5 17.5 12.2-22.5Excessive7 11.6 6.5-16.7 9.7 3.9-15.4 19.0 5.3-32.7 13.6 9.2-18.1Particularly high8 9.3 3.9-14.7 9.9 2.9-16.9 7.0 3.5-10.5 9.1 2.4-15.7
1UIC< 100.0 µg/l. 2UIC< 20.0 µg/l.3UIC 20.0-<50.0 µg/l. 4UIC 50.0-<100.0 µg/l. 5UIC 100.0-<200.0.6UIC 200.0-<300.0 µg/l.7UIC ≥300.0 µg/l.8UIC ≥500.0 µg/l (WHO 2001).9Weighted to represent the population level.
Table 62: Iodine Status in NPNL Women by Cluster
Urinary iodine concentration(μg/l)Rural Urban Slum National
(n=452) (n=433) (n=388) (n=1 276)Median 112.8 151.1 154.9 122.625th percentile 41.6 76.9 75.1 50.475th percentile 225.1 306.6 280.5 257.7Iodine deficiency (%) 44.7 33.2 33.4 42.1

56 National Micronutrient Survey 2011-12
Table 63: Iodine Status in NPNL Women according to the Asset Index
Urinary iodine concentration(μg/l)
Poorest (n=262)
Poorer(n=259)
Middle(n=254)
Richer (n=248)
Richest(n=253)
Median 99.3 92.7 145.1 137.8 201.025th percentile 33.1 39.7 68.3 57.2 100.175th percentile 197.7 250.5 383.8 211.7 354.6
Table 62 shows that the median UIC in NPNL women was 122.6 µg/l at the national level. The estimate was above 100.0 µg/l across all the clusters – rural, urban and slums. The median UICs were below 100.0 µg/l in the “poorest” and “poorer” quintiles of the population (Table 63).
3.16 Iodine Status in Retailers’ Salt
3.16.1 Iodine Content in Retailers’ Salt
Table 64 shows the status of iodine in retailer’s salt: 91.9% of the samples had iodine levels ≥5 ppm. The percentage was lower in the rural than in the urban cluster (85% against 96%).
The percentage of retailer salt samples with adequately iodized salt (≥ 20 ppm)2 was 66.4%. Fewer shops in the rural cluster than in the urban cluster sold adequately iodized salt (57.3% against 68.5%).
Table 64: Iodine Status of Retailer’s Salt1
n % 95% CIPresence of iodine (≥ 5 ppm)National 1 566 91.9 90.5-93.2Rural 514 85.0 81.9-88.1Urban 544 94.8 93.0-96.7Slum 508 95.6 93.8-97.6Presence of adequate iodine (≥ 20 ppm)2
National 1 566 66.4 64.1-68.7Rural 514 57.3 53.1-61.6Urban 544 68.5 64.6-72.5Slum 508 73.2 69.3-77.1
1Based on samples collected from the retailer shops.2National IDD/USI Survey, Bangladesh, 2004-05.
With regard to iodine content of retailer salt, 8.1% of the salt samples contained negligible iodine (<5 ppm)(Table 65). In addition, 33.5% of retailer salt samples had inadequately iodized salt (< 20 ppm). There were very few salt samples (~0.0%) with excess iodine (>100 ppm).

57National Micronutrient Survey 2011-12
Table 65: Iodine Content: Retailer Salt By Cluster1
National Rural Urban Slum(n=1566) (n=514) (n=544) (n=508)
ppm2 % 95% CI % 95% CI % 95% CI % 95% CINil 8.1 6.7-9.4 14.9 11.8-18.1 5.1 3.2-7.0 4.3 2.5-6.15.0-<20.0 25.4 23.3-27.6 27.6 23.7-31.5 26.2 22.5-29.9 22.4 18.8-26.120-<40.0 42.9 40.4-45.3 35.7 31.6-39.9 42.4 38.3-46.6 50.6 46.2-54.940.0-<60.0 20.8 18.8-22.8 18.4 15.1-21.8 22.4 18.9-25.9 21.4 17.8-25.160.0-<80.0 2.1 0.9-3.3 2.1 0.88-3.3 2.7 1.3-4.1 1.1 0.23-2.180.0-<100.0 0.44 0.11-0.77 0.97 0.12-1.8 0.36 -0.14-0.87 0.0 0.0100.0-<200.0 0.19 -0.002-0.4 0.0 0.0 0.55 -0.7-1.1 0.0 0.0200.0-<300.0 0.0 0.0 0.0 0.0 0.0 0.0 0.0 0.0>300.0 0.0 0.0 0.0 0.0 0.0 0.0 0.0 0.0
1Iodine level, based on collected samples from retailer shops.2Parts per million.
3.16.2 Relationship of the Respondent to the Owner of the Retail Shops
Table 66: Relationship of the Respondent to Owner of the Retail Shops
Combined Rural Urban Slum (n=1 567) (n=515) (n=544) (n=508)
% % % %None (Owner) 89.9 94.8 92.5 82.1Employee 4.7 2.1 5.3 6.5Brother-in-law 0.1 0.4Nephew 1.0 0.8 0.4 2.0Sister 0.1 0.4Wife 1.8 1.2 1.1 3.1Daughter 0.4 0.4 0.4 0.4Brother 2.0 - 0.4 5.9
Table 66 shows the relationship of the respondent with the owner of the retail shop. In most of the cases, the respondent was the owner of the shop (89.9%). In around 5% of the cases, the respondents were employees of the shop owner. This percentage was slightly higher in the urban (5.3%) and slum clusters (6.5%) than in the rural cluster (2.1%). Family members constituted a minor percentage of the respondents.
3.16.3 Education of Retail Shopkeepers
Table 67 shows the education level of the respondents. Around one in ten of the respondents (9.1%) did not have any form of institutional education. Around one in four of the respondents (24.6%) had completed secondary or higher education in all the clusters.

58 National Micronutrient Survey 2011-12
Table 67: Education of Retail shopkeepers
Combined Rural Urban Slum(n=1567) (n=515) (n=544) (n=508)
% 95% CI % 95% CI % 95% CI % 95% CINo education 9.1 7.7-10.5 8.1 5.7-10.5 9.3 6.9-11.8 9.8 7.2-12.4Primary incomplete 17.6 15.7-19.5 16.3 13.1-19.5 15.2 12.2-18.2 21.4 17.8-25.0Primary complete 19.5 17.5-21.5 18.8 15.4-22.2 22.2 18.7-25.7 17.3 14.0-20.6Secondary incomplete 29.2 26.9-31.4 33.6 29.5-37.6 29.2 25.3-33.1 24.6 20.8-28.3Secondary complete and higher 24.6 22.4-26.7 23.1 19.4-26.7 23.9 20.3-27.4 26.8 22.9-30.6
3.17 Purchase, Sale and Storage of Salt
3.17.1 purchase and Sale of Salt, by Type (Retailers)
Table 68 shows the purchase and sale of crude and open salts by retail shopkeepers. Nearly one in five respondents (18.3%) stated that they sold open salt. The percentage was higher in the rural cluster (38.3%) than in the urban (14.3%) and slum clusters (2.3%). Just 1.0% of the respondents stated that they sold crude salt. In regard to the source where open salt is bought, two-thirds of respondents (66.9%) stated that they bought it from wholesalers, while one fourth (27.1%) bought it from markets.
Table 68: Purchase and Sale of Crude and Open Salt (Retailers)
Combined Rural Urban Slum% 95% CI % 95% CI % 95% CI % 95% CI
(n=1567) (n=515) (n=544) (n=508)Selling of crude salt 1.0 0.5-1.4 2.1 0.9-3.3 0.4 0.0-0.8 0.4 0.0-0.9Selling of open salt 18.3 16.4-20.2 38.3 34.0-42.4 14.3 11.4-17.3 2.3 1.0-3.6Buying crude salt from? (n=15) (n=11) (n=2) (n=2)Wholesaler 20.0 0.0-42.9 9.1 0.0-29.9 100 - - -Market 53.3 24.7-81.9 72.7 41.3-
100.0 - - - -
Other 26.7 1.3-52.0 18.2 -8.0-45.0 - - 100 -Whom do you buy open salt from? (n=287) (n=197) (n=78) (n=12)
Factory 0.7 0.0-1.6 2.6 0.0-6.1Retailer 1.4 0.03-2.7 2.0 0.04-4.0Wholesaler 66.9 61.4-72.3 66.0 59.3-72.6 74.3 64.4-84.2 33.3 2.0-64.6Market 27.1 22.0-32.3 29.4 23.0-35.8 20.5 11.3-29.6 33.3 2.0-64.6Other 3.8 1.6-6.1 2.5 0.3-4.7 2.6 0.0-6.1 33.3 2.0-64.6
3.17.2 Source of Salt Packet Purchases (Retailers)
Table 69 shows the purchase and sale of salt packets by retailers. Almost all the respondents (99.2%) said that they sold salt packets. In regard to where the salt packets was bought, 67.6% stated that they had bought salt packets from the wholesalers, while one in five (21%) of the retail shopkeepers bought it from the market.

59National Micronutrient Survey 2011-12
Table 69: Purchase and Sale of Salt Packets (Retailers)
Combined Rural Urban Slum% 95% CI % 95% CI % 95% CI % 95% CI
(n=1 567) (n=515) (n=544) (n=508)Selling salt packets 99.2 98.8-99.6 98.3 97.1-99.3 99.4 98.8-100 100 -If so, where do you purchase salt packets? (n=1555) (n=506) (n=541) (n=508)
Factory 2.2 1.4-2.9 1.4 0.4-2.4 1.3 0.3-2.2 3.9 2.2-5.6Retailer 1.5 0.9-2.1 1.7 0.6-2.9 1.8 0.7-2.9 1.0 0.1-1.8Wholesaler 67.6 65.2-69.9 69.0 64.9-73.0 70.1 66.1-73.9 63.5 59.3-67.7Market 22.6 20.5-24.7 24.9 21.1-28.6 22.4 18.8-25.8 20.6 17.1-24.2Other 6.0 4.8-7.2 3.0 1.5-4.4 4.4 2.7-6.1 10.8 8.1-13.5
3.17.3 Storage of Open Salt by the Retailers’ Shopkeepers
Table 70 shows how open salt is stored by retailers: 90% of the respondents stated that they sealed the salt from large sacks in small packets. Nearly half of all respondents (45.9%) stated that they stored the open salt in a ventilated place; this percentage was lower in the urban cluster (30.7%); 42% stated that they stored the open salt in a cool, dry, and dark place; and 7.3% stored the open salt in open sunlight.
Table 70: Storage of Open Salt (Retailers)
Combined Rural Urban Slum% 95% CI % 95% CI % 95% CI % 95% CI
(n=287) (n=197) (n=78) (n=12)Sealed the salt from large sacks in small packets 90.6 87.2-94.0 93.4 89.9-96.9 94.8 89.8-99.8 16.7 0.0-41.4
Mode of storing open salt (n=285) (n=195) (n=78) (n=12)Open sunlight 7.3 4.3-10.4 8.2 4.3-12.1 5.1 0.1-10.1 8.3 0.0-26.6Damp place 1.4 0.03-2.7 - - 5.1 0.1-10.1 - -Ventilated place 45.9 40.1-51.7 52.3 45.2-59.3 30.7 20.2-41.2 41.6 8.9-74.3Cool, dry, dark place 42.4 36.6-48.2 38.4 31.5-45.3 53.8 42.5-65.1 33.3 20.5-64.6Other 2.8 0.9-4.7 1.0 0.0-2.4 5.1 0.1-10.1 16.7 0.0-41.3
3.17.4 Practice of Retailers Packaging their Open Salt
Table 71 shows the practice of retailers packaging their open salt: less than 1% of the respondents reported that they packaged salt in small packets of 0.5 kg to 1 kg for sale; 71.4% folded the opening of the 0.5 kg to 1 kg packets and 57.1% sealed the 0.5 kg to1 kg packets. Moreover, 42.9% stored the 0.5 to 1 kg packets in cool, dry and dark places, while 28.6% of them stored them in ventilated places.

60 National Micronutrient Survey 2011-12
Table 71: Retailers’ Practices of Packaging and Storing Open Salt
Combined Rural Urban Slum% 95% CI % 95% CI % 95% CI % 95% CI
(n=1 555) (n=506) (n=541) (n=508)Packaging salt in small packets of 0.5 kg to 1 kg packets and selling them?
0.9 0.4-1.3 1.6 0.5-2.6 0.4 0.0-0.9 0.8 0.01-1.5
(n=14) (n=8) (n=2) (n=4)Opening of the 0.5 kg to 1 kg packets kept folded 71.4 44.3-98.4 100.0 - 100.0 - 50.0 -
Seal the small packets made from 0.5 kg to 1kg packets 57.1 27.4-86.1 100.0 - 100.0 - 100.0 -
Mode of storing the 0.5 kg to 1kg packets used to make small packets
(n=14) (n=8) (n=2) (n=4)
Ventilated places 28.6 1.5-55.6 25.0 0.0-63.7 - - 50.0 -Cool, dry, dark places 42.9 13.2-72.5 75.0 36.2-100.0 - -Other 28.6 1.5-55.6 - - 100.0 - 50.0 -
3.18 Retailers’ Knowledge about Iodized Salt
3.18.1 Retailers’ Knowledge about Iodized Salt – Source of Information
Table 72 shows the knowledge of retailers with regard to iodized salt. Among the respondents, 81.1% had heard about iodized salt. With regard to the source of knowledge, four of the five respondents (79.4%) had heard about it on television; 70.7%, 81.7% and 85.6% in the rural, urban and slum clusters, respectively. One in four of the respondents (26.3%) heard about it on the radio. About one in five of the respondents (18.6%) knew about it from newspapers, 14.7% in the rural and 21.1% in the urban clusters. One in five of the respondents (21.3%) heard about it from health care workers; a higher percentage in the urban cluster (25.3%) than in the slums (16.1%). A considerable percentage (31.1%) of the respondents knew about iodized salt from friends and relatives; the percentage was higher in the rural (38.6%) than in the urban cluster (26.9%). Interestingly, only 9% of the respondents knew about it from the label of the packet. Other very minor sources of information were seminars, the Internet, NGOs and government officials, etc.
Table 72: Knowledge about Iodized Salt and its Source (Retailers)
Combined Rural Urban Slums% 95% CI % 95% CI % 95% CI % 95% CI
(n=1 567) (n=515) (n=544) (n=508)Heard about iodized salt 81.1 79.2-83.1 80.4 76.9-83.8 83.5 80.3-86.5 79.5 76.0-83.1
Where did you learn about iodized salt? (n=1 272) (n=414) (n=454) (n=404)
Television 79.4 77.1-81.6 70.7 66.3-75.1 81.7 78.1-85.2 85.6 82.2-89.1Radio 26.3 23.9-28.7 23.7 19.5-27.7 30.4 26.1-34.6 24.5 20.3-28.5Newspaper 18.6 16.5-20.7 14.7 11.3-18.1 21.1 17.3-24.9 19.8 15.9-23.7Poster/leaflet 8.6 7.1-10.2 5.3 3.1-7.4 6.4 4.1-8.6 14.6 11.1-18.1

61National Micronutrient Survey 2011-12
Health care worker 21.3 19.1-23.5 22.0 17.9-25.9 25.3 21.3-29.3 16.1 12.5-19.6Friend/relative 31.1 28.5-33.5 38.6 33.9-43.3 26.9 22.7-30.9 27.9 23.5-32.3School child 8.4 6.8-9.9 7.5 4.9-10.0 7.9 5.4-10.4 9.9 6.9-12.8School teacher 7.5 6.1-9.0 10.1 7.2-13.1 5.7 3.5-7.8 6.9 4.4-9.4From label of packets 9.0 11.5 6.8 8.9Other1 1.7 2.2 1.8 1.0
1 Seminar, Internet, retailer, NGO, government official.
3.18.2 Retailers’ Knowledge about Iodized Salt-type of Salt and Iodine Content
Table 73 shows the knowledge of retailers about salt iodization. Less than 1% of the respondents stated that crude salt contained iodine. Around 16% did not know if crude salt contained iodine. Among the respondents, 3% stated that open salt contained iodine. Over one half of the respondents (52.9%) stated that all salt packets contained iodine, while another 43.7% stated that some of the salt packets contained iodine.
Table 73: Knowledge about Iodized Salt (Retailers)
Combined Rural Urban Slum% 95% CI % 95% CI % 95% CI % 95% CI
Does crude salt contain iodine? (n=1272) (n=414) (n=454) (n=404)
Yes, all 0.9 0.4-1.4 1.0 0.02-1.9 1.3 0.3-2.3 0.5 0.0-1.1Yes, some 2.8 1.9-3.7 3.4 1.6-5.1 2.6 1.1-4.1 2.4 0.9-3.9No 80.4 78.2-82.6 79.2 75.3-83.1 78.6 74.8-82.4 83.6 80.0-87.2Do not know 15.8 13.8-17.8 16.4 12.8-20.0 17.4 13.9-20.9 13.4 10.0-16.7Does open salt contain iodine? (n=1272) (n=414) (n=454) (n=404)
Yes, all 2.9 2.0-3.8 3.6 1.8-5.4 3.9 2.1-5.7 1.0 0.02-1.9Yes, some 8.6 7.1-10.2 9.1 6.3-11.9 10.6 7.7-13.4 5.9 3.6-8.2No 75.8 73.5-78.2 71.7 67.4-76.1 74.2 70.2-78.2 81.9 78.1-85.7Do not know 12.6 10.7-14.4 15.4 11.9-18.9 11.2 8.3-14.1 11.1 8.1-14.2Do packet salts contain iodine? (n=1272) (n=414) (n=454) (n=404)
Yes, all 52.9 50.1-55.6 50.2 45.4-55.1 61.9 57.4-66.3 45.5 40.6-50.4Yes, some 43.7 40.9-46.4 45.9 41.1-50.7 36.3 31.9-40.7 49.8 44.8-54.6No 1.5 0.9-2.2 3.1 1.4-4.8 - - 1.7 0.4-3.0Do not know 1.8 1.0-2.5 0.7 0.0-1.5 1.7 0.5-2.9 2.9 1.3-4.6
3.18.3 Retailers’ Knowledge about Benefits of Iodized Salt
Table 74 shows the retail shopkeepers’ knowledge of the benefits of iodized salt. Seven of the ten respondents (71.3%) stated that they knew the benefits of iodized salt. Among them, 72.3% reported that iodized salt “prevented goiter”. Around one quarter of them (27.2%) knew that the iodized salt “prevented cretinism”. Approximately one in five respondents stated that iodized salt “promoted mental development/intelligence” (21.1%) and “promoted growth” (20.1%). Less than 10% of the respondents stated that iodized salt “prevented abortion and stillbirth”. Nearly 70% of the respondents stated that iodized salt was “healthy”.

62 National Micronutrient Survey 2011-12
Table 74: Knowledge of the Benefits of Iodized Salt (Retailers)
Combined Rural Urban Slum% 95% CI % 95% CI % 95% CI % 95% CI
(n=1 272) (n=414) (n=454) (n=404)Knowledge of the benefits of iodized salt? 71.3 68.8-73.7 72.0 67.6-76.3 70.9 66.7-75.1 71.0 66.6-75.4
(n=907) (n=298) (n=322) (n=287)Prevents goiter 72.3 69.4-75.2 64.8 59.3-70.2 75.8 71.1-80.4 76.3 71.3-81.2Prevents cretinism 27.2 24.3-30.1 20.5 15.9-25.0 29.8 24.7-34.8 31.4 25.9-36.8Promotes mental development/intelligence 21.1 18.4-23.7 20.5 15.9-25.1 18.3 14.1-22.5 24.7 19.7-29.7
Promote growth 20.1 17.4-22.6 16.1 11.9-20.3 24.5 19.8-29.2 19.2 14.6-23.7Prevents abortion and stillbirth 9.0 7.2-10.9 8.4 5.2-11.5 9.0 5.9-12.1 9.8 6.3-13.2
Healthy 68.8 65.7-71.8 71.1 65.9-76.3 67.4 62.2-72.5 67.9 62.5-73.3Others 5.3 3.8-6.7 5.4 2.8-7.9 3.7 1.6-5.8 7.0 4.0-9.9
3.18.4 Retailer’s Knowledge about Testing of Salt for Iodine
Table 75 shows the knowledge of the respondents on the testing of salt for iodine and their practice of testing the salt. Around one-third of the respondents (31.5%) stated that they knew how to test salt for iodine; the percentage is similar across all the clusters. Over 80% of the respondents stated that the “home-made” technique was the method for testing salt for iodine, while just over 10% mentioned the “test kit” method for testing the salt. Knowledge about the “test kit” method was less common among the slums respondents (4.1%) than among the urban respondents (17.1%). In regard to testing the salt that they sell, one half of the respondents (51.1%) used the home-made or test kit methods; the percentage was higher in the urban (60.5%) than in the slum cluster (45.5%). Of those who tested the salt that they sold for iodine, 87% used the home-made method. Among those who mentioned that they knew how to test salt for iodine, 81.8% knew that “salt” was an ingredient to test the salt for iodine. About 90% of them correctly stated that a “pinch” of salt was required. Around 16.7% of the respondents stated that they knew that “cooked rice” was an ingredient to test salt for iodine. Among them, over 80% correctly said that a “small amount” of cooked rice was required. Over 85.0% of the respondents stated that they knew that “lemon juice” was an ingredient to test salt for iodine. Among them, 95% correctly said that a “few drops” of lemon juice were required.
Table 75: Testing of Salt for Iodine (Retailers)
Combined Rural Urban Slum% 95% CI % 95% CI % 95% CI % 95% CI
(n=1272) (n=414) (n=454) (n=404)Knowledge about testing salt for iodine 31.5 28.9-34.1 30.9 26.4-35.3 33.5 29.1-37.8 30.0 25.4-34.4
How do you test salt for iodine? (n=401) (n=128) (n=152) (n=121)
Test kit 11.7 8.5-14.8 12.5 6.7-18.3 17.1 11.1-23.1 4.1 0.5-7.7Home-made 83.5 79.9-87.1 82.0 75.2-88.7 79.6 73.1-86.1 90.1 84.7-95.4Both 4.7 2.6-6.8 5.5 1.5-9.4 3.3 0.4-6.1 5.8 1.5-10.0

63National Micronutrient Survey 2011-12
Testing salt for iodine using either method 51.1 46.2-56.0 45.3 36.5-54.1 60.5 52.6-68.3 45.5 36.4-54.4
How do you test your salt for iodine? (n=205) (n=58) (n=92) (n=55)
Test kit 13.7 8.9-18.4 15.5 5.9-25.1 20.7 12.2-29.1 0.0 -Home-made 86.3 81.6-91.1 84.5 74.8-94.1 79.3 70.9-87.7 100. -
(n=401) (n=128) (n=152) (n=121)Knowledge of which ingredients are required for testing salt for iodine
81.8 78.0-85.5 79.7 72.6-86.7 83.6 77.5-89.5 81.8 74.8-88.7
How much salt should be used for testing? (n=326) (n=102) (n=127) (n=97)
A pinch 88.0 84.4-91.5 90.2 84.3-96.1 86.6 80.6-92.6 87.6 80.9-94.2A level teaspoon 9.5 6.3-12.7 7.8 2.5-13.1 8.7 3.7-13.6 12.4 5.7-19.0Other amounts 0.6 -0.2-1.4 2.0 -0.7-4.6 0.0 - 0.0 -Do not know 1.8 0.3-3.3 0.0 - 4.7 1.0-8.4 0.0 -
(n=401) (n=128) (n=152) (n=121)Knowledge of which ingredients are required for testing salt for iodine (cooked rice)?
16.7 13.1-20.3 18.8 11.9-25.6 19.7 13.3-26.1 10.7 5.1-16.3
How much cooked rice should be used for testing? (n=59) (n=21) (n=28) (n=10)
A small amount 81.4 71.1-91.5 66.7 44.6-88.6 85.7 71.9-99.5 100. -5 grains 18.6 8.4-28.8 33.3 11.3-55.3 14.3 0.5-28.1 0.0 -
(n=401) (n=128) (n=152) (n=121)Knowledge of which ingredients are used for test salt for iodine (lemon juice)?
87.3 84.0-90.5 85.2 78.9-91.3 86.2 80.6-91.7 90.9 85.7-96.1
How much lemon juice should be used for testing? (n=342) (n=107) (n=127) (n=108)
A few drops 95.3 93.1-97.5 94.4 89.9-98.8 93.7 89.4-97.9 98.1 95.5-100.Other amounts 2.6 0.9-4.3 4.7 0.6-8.7 3.1 0.07-6.2 0.0 -Do not know 2.0 0.5-3.5 0.9 -0.9-2.7 3.1 0.07-6.2 1.9 -0.7-4.4
3.18.5 Retail Shopkeeper’s Knowledge about the Salt Law
Table 76 indicates the knowledge of the retail shopkeepers concerning the salt law. One fourth of the respondents (27.5%) stated that they knew about the salt law. The percentage was higher in the urban (32.0%) and rural (29.5%) clusters than in the slums (20.9%). With regard to punitive measures in case of violation of the law, one in five of the respondents (20.4%) stated that they “[did] not know” about any punitive measure in place; this percentage was higher in the slums (30.2%) and urban clusters (23.1%) than in the rural (10.5%) area.

64 National Micronutrient Survey 2011-12
Table 76: Knowledge about the Salt Law (retailers)
Combined Rural Urban Slum% 95% CI % 95% CI % 95% CI % 95% CI
n=1567) (n=515) (n=544) (n=508)Do you know that there is a salt law? 27.5 25.3-29.7 29.5 25.6-33.4 31.8 27.9-35.7 20.9 17.3-24.4
Is there any punishment for violating the salt law? (n=431) (n=152) (n=173) (n=106)
Yes 71.2 66.9-75.5 83.6 77.6-89.5 68.8 61.8-75.7 57.5 48.0-67.1No 8.4 5.7-10.9 5.9 2.1-9.7 8.1 4.0-12.1 12.3 5.9-18.6Do not know 20.4 16.6-24.2 10.5 5.6-15.4 23.1 16.8-29.4 30.2 21.3-39.1If so, what is the punishment? (n=307) (n=127) (n=119) (n=61)Imprisonment 9.4 6.1-12.7 4.7 1.0-8.4 9.2 3.9-14.5 19.7 9.4-29.9Fine 34.5 29.2-39.8 37.0 28.5-45.5 27.7 19.5-35.8 42.6 29.8-55.3Both 56.0 50.4-61.6 58.3 49.6-66.9 63.0 54.2-71.8 37.7 25.1-50.2
3.18.6 Retailers’ Knowledge on Reading the Results of Testing Salt for Iodine
Table 77 shows the retail shopkeeper’s knowledge on the results of testing salt for iodine. More than 86% of the respondents correctly mentioned that the colour of salt turns violet/bluish if it contains iodine.
Table 77: Retailer’s Knowledge about the Results of Testing Salt for Iodine
Combined Rural Urban Slums% 95% CI % 95% CI % 95% CI % 95% CI
What colour does the salt turn if it contains iodine? (n=401) (n=128) (n=152) (n=121)
White 4.7 2.6-6.8 2.3 -0.3-5.0 7.9 3.5-12.2 3.3 0.07-6.5Violet/bluish 86.8 83.4-90.1 89.8 84.5-95.1 83.5 77.6-89.5 87.6 81.6-93.5Other 3.2 1.5-4.9 4.7 1.0-8.3 2.6 0.06-5.2 2.5 -0.3-5.2Do not know 5.2 3.1-7.4 3.1 0.07-6.1 5.9 2.1-9.7 6.6 2.1-11.8
3.18.7 Retailer’s Practice Regarding Testing Salt for Iodine
Table 78 shows the retail shopkeeper’s practice in regard to testing salt for iodine. Every four of the ten respondents stated that they never carried out testing, with a majority of the respondents (59%) reporting that they “sometimes” tested the salt for iodine.
Table 78: Retailers’ Practice Regarding Testing Salt for Iodine
Combined Rural Urban Slum% 95% CI % 95% CI % 95% CI % 95% CI
How often do you test the salt that you sell for iodine?
(n=401) (n=128) (n=152) (n=121)
Never 40.6 35.8-45.4 41.4 32.7-50.0 36.8 29.1-44.5 44.6 35.6-53.6Sometimes 58.8 54.0-63.7 57.0 48.3-65.7 63.1 55.4-70.9 55.3 46.4-64.3Always 0.5 -0.2-1.2 1.5 -0.6-3.7 - - - -

65National Micronutrient Survey 2011-12
3.18.7.1 Iodine Level in Household Salt and Iodine Status in NPNL Women
Table 79: Iodine Level in Household Salt and Iodine Status in NPNL Women
Iodine level in household salt (ppm) Median urinary iodine (µg/l) in NPNL women<15.0 69.7
15.0-29.0 130.8>=30.0 175.2
Table 79 shows the relationship between iodine levels in household salt and corresponding iodine status in NPNL women. In Bangladesh, iodine adequacy of household salt is defined by the presence of iodine in salt at concentration>15 ppm. The table shows that at an inadequate iodine concentration in salt (<15 ppm), NPNL women were iodine deficient (median UICs below 100 µg/l, the cut-off defining iodine deficiency). However, with adequate iodine in the household salt (>15 ppm), the iodine status was sufficient.
3.18.7.2 Relationship Between Iodine Levels in Household Salt and Iodine Status of School-age Children
Table 80: Relationship Between Iodine Levels in Household Salt and Iodine Status of School-age Children
Salt iodization level of household salt (ppm) Median urinary iodine (µg/l) in school-age children<15.0 91.5
15.0-29.0 157.6>=30.0 187.9
Table 80 shows the relationship between iodine levels in household salt and iodine status in school-age children. In Bangladesh, iodine adequacy of household salt is defined by the presence of iodine in salt at a concentration >15 ppm. The table shows that at an inadequate iodine concentration in the salt (<15 ppm), the children were iodine deficient (median UICs below 100 µg/l, the cut-off defining iodine deficiency); however, with adequate iodine in the household salt (>15 ppm), the iodine status was sufficient.
3.18.8 Source of Household Respondents’ Knowledge about Iodized Salt and about Which Type of Salt Contains Iodine
Table 81: Source of Household Respondents’ Knowledge about Iodized Salt and about Which Type of Salt Contains Iodine
Rural Urban Slum National% 95% CI % 95% CI % 95% CI % 95% CI
Knowledge about iodized salt (n=661) (n=693) (n=649) (n=2003)
68.8 60.9-76.8 78.7 72.7-84.8 77.3 70.3-84.3 71.2 65.2-77.2Source of knowledge about iodine
(n=443) (n=536) (n=473) (n=1452)
TV 62.4 56.1-68.7 84.2 77.6-90.7 81.0 74.8-87.1 68.1 63.5-72.8Radio 15.5 8.8-22.2 12.8 6.7-18.9 3.3 1.5-5.2 14.4 9.4-19.3

66 National Micronutrient Survey 2011-12
Newspaper 4.2 0.0-8.3 9.4 4.9-14.0 1.4 0.4-2.5 5.3 2.1-8.4Poster/leaflet 4.0 0.5-7.5 5.5 2.3-8.6 0.3 -0.1-0.7 4.2 1.5-6.8Health care worker 24.8 17.5-32.1 21.9 15.2-28.5 23.7 17.6-29.8 24.1 18.6-29.6Friend/relative 28.7 18.5-39.0 22.9 14.8-30.9 22.0 14.8-29.2 27.1 19.6-34.7School child 4.9 1.7-8.1 3.7 1.5-5.9 2.1 0.6-3.7 4.5 2.2-6.9Teacher 7.8 3.5-12.0 11.3 6.7-15.8 5.9 2.7-9.1 8.5 5.2-11.8Others 0.1 -0.1-0.3 0.3 -0.1-0.7 0.7 0.0-1.4 0.2 0.0-0.3Knowledge about crude salt containing iodine
(n=443) (n=536) (n=473) (n=1 452)
Yes 1.4 -0.2-3.0 1.2 0.2-2.2 0.4 -0.1-0.9 1.3 0.1-2.5Yes, some 2.3 0.6-4.0 2.1 0.6-3.5 1.3 0.0-2.6 2.2 1.0-3.5No 75.8 69.7-81.9 85.5 78.6-92.4 75.7 64.3-87.0 78.0 73.1-82.9Don’t know 20.5 13.5-27.5 11.2 5.1-17.4 22.6 11.1-34.1 18.5 13.1-23.9Knowledge about open salt containing iodine
(n=443) (n=536) (n=473) (n=1 452)
Yes 4.1 1.8-6.4 2.8 1.0-4.6 6.6 2.4-10.8 3.9 2.2-5.6Yes, some 8.7 3.3-14.2 4.5 1.7-7.3 6.0 2.3-9.7 7.7 3.6-11.7No 73.5 65.6-81.4 85.7 78.8-92.5 75.4 69.8-80.9 76.3 70.0-82.7Don’t know 13.7 8.8-18.5 7.1 2.6-11.5 12.1 7.5-16.6 12.1 8.4-15.8Knowledge about salt packets containing iodine
(n=443) (n=536) (n=473) (n=1 452)
Yes 75.6 63.6-87.5 75.6 69.1-82.0 79.7 73.1-86.3 75.7 67.0-84.5Yes, some 18.9 8.0-29.7 20.9 13.7-28.1 14.7 8.8-20.6 19.2 11.2-27.1No 3.1 0.8-5.3 1.2 0.2-2.3 1.8 -0.2-3.9 2.6 0.9-4.3Don’t know 2.5 0.6-4.3 2.3 0.7-4.0 3.8 1.2-6.4 2.5 1.1-3.9
Table 81 shows that, at the national level, the respondents of 68% of the households knew about iodized salt from television; 62.4%, 84.2% and 81% in the rural, urban and slums clusters, respectively. Radio was a source of knowledge on iodized salt in 14.4% of households; 15.5%, 12.8% and 3.3% in the rural, urban and slums, respectively. The other two major sources were health care workers and friends, from whom one in four of the respondents obtained information; the percentages were generally consistent in all the clusters. Around three of the four respondents stated that salt packets contained iodine. Around 4% of the respondents mentioned that open salt contained iodine. Only 1.3% of the respondents reported that crude salt contained iodine.

67National Micronutrient Survey 2011-12
3.18.9 Household Respondents ‘Knowledge of the Benefits of Iodized Salt
Table 82: Household Respondents Knowledge of the Benefits of Iodized Salt
Rural Urban Slum National% 95% CI % 95% CI % 95% CI % 95% CI
Knowledge on the benefits of iodized salt63.8 56.7-70.8 78.0 68.8-87.2 58.6 48.9-68.3 66.8 60.9-72.7
Benefits of iodized salt?(n=443) (n=536) (n=473) (n=1452)
Prevents goiter 78.1 68.2-87.9 80.9 72.9-88.8 74.0 62.6-85.3 78.7 71.7-85.7Prevents cretinism 22.4 14.5-30.3 21.1 12.7-29.5 14.8 9.4-20.1 21.8 15.9-27.6Promotes mental development/intelligence 6.1 2.2-10.1 5.8 3.5-8.1 7.0 2.5-11.6 6.1 3.3-8.9Promotes normal growth 12.9 7.3-18.5 9.2 6.1-12.2 6.2 2.1-10.3 11.6 7.6-15.7Prevents abortion and still-births 0.5 -0.2-1.2 3.5 0.2-6.9 0.6 -0.6-1.9 1.3 0.3-2.4Healthy 67.3 53.1-81.4 61.6 51.5-71.7 51.3 39.3-63.4 65.1 55.0-75.3Tests iodine? (n=443) (n=536) (n=473) (n=1452)
12.7 7.0-18.4 21.8 8.9-34.6 9.4 5.8-12.9 14.6 9.4-19.8
At the national level, around 67% of the respondents said that they knew the benefits of consuming iodized salt; 78% in the urban and 58.6% in the slum cluster (Table 82). Over 74% of the respondents in all clusters mentioned that iodized salt prevented goiter. One in five respondents mentioned that iodized salt prevented cretinism; 21.1% in the urban and 14.8% in the slums cluster; only 1.3% of the respondents knew that iodized salt prevented abortion and stillbirths.
3.18.10 Household Respondents’ Knowledge on Testing Salt for Iodine
Table 83 shows the household respondent’s knowledge of testing salt for iodine: 14.0% of the respondents said that they tested salt for iodine, 22% in the urban and 12% in the rural cluster. Among those who tested iodine in salt, the majority (82.7%) used the home-made method.
One in five of the respondents correctly stated that the testing of salt for iodine required salt and lemon juice, 30% of respondents in the urban cluster, 19.4% in the rural cluster, and 22.9% in the slum cluster; however, only 7.0% of the respondents correctly stated that cooked rice was required in testing salt for iodine.
Eighty percent of the respondents correctly stated that a pinch of salt was required to test the salt, which was slightly higher in the rural and urban (80%) than in the slum cluster (69.7%). Just over a quarter of the respondents correctly stated that “5 grains” of rice were required for the testing. Over 90% of the respondents stated that a “few drops” of lemon juice were required.

68 National Micronutrient Survey 2011-12
Table 83: Household Respondents’ Knowledge on Testing of Salt for Iodine
Rural Urban Slum NationalDo you test for iodine? (n=443) (n=536) (n=473) (n=1452)
% 95% CI % 95% CI % 95% CI % 95% CI12.2 7.0-18.4 21.8 8.9-34.6 9.4 5.8-12.9 14.6 9.4-19.8n=54 n=82 n=48 n=184
Test kit 20.9 1.2-40.6 10.1 -3.1-23.4 10.1 -6.6-26.8 17.0 3.5-30.4Home-made method 78.6 58.8-98.4 89.9 76.6-103.1 89.9 73.2-106.6 82.7 69.2-96.2Both 0.5 -0.6-1.5 -0.3-0.9Knowledge on ingredients to test iodine – salt (n=443) (n=536) (n=472) (n=1451)
Mentioned 19.1 13.3-24.9 31.2 19.6-42.8 20.3 11.6-28.9 21.9 16.7-27.1Didn’t mention 80.9 75.1-86.7 68.8 57.2-80.4 79.7 71.1-88.4 78.1 72.9-83.3Knowledge about cooked rice as ingredient to test iodine
(n=443) (n=536) (n=472) (n=1451)
Mentioned 5.2 3.0-7.5 12.5 4.9-20.1 5.8 1.7-10.0 6.9 4.3-9.5Didn’t mention 94.8 92.5-97.0 87.5 79.9-95.1 94.2 90.0-98.3 93.1 90.5-95.7Knowledge about lemon juice as ingredient to test iodine
(n=443) (n=536) (n=472) (n=1451)
Mentioned 19.4 13.7-25.1 30.8 19.2-42.3 22.9 14.3-31.6 22.1 17.0-27.3Didn’t mention 80.6 74.9-86.3 69.2 57.7-80.8 77.1 68.4-85.7 77.9 72.7-83.0Amount of salt? (n=101) (n=144) (n=98) (n=343)A pinch 80.6 69.7-91.5 81.3 64.6-98.0 69.7 52.9-86.4 80.4 71.7-89.1A level teaspoon 12.9 5.6-20.3 9.3 2.1-16.6 17.2 5.8-28.6 11.9 6.7-17.1Do not know 6.4 -2.2-15.0 9.4 -5.5-24.4 13.1 -1.1-27.3 7.6 0.5-14.9Amount of rice? (n=22) (n=32) (n=26) (n=80)Small amount 1.7 -2.2-5.6 0.7 -1.1-2.4 19.5 -12.6-51.6 2.5 -0.8-5.85 grains 32.4 -0.6-65.3 16.4 -7.3-40.1 20.9 -8.8-50.6 26.9 6.1-47.7Others 0.0 0.0 7.5 -9.3-24.3 0.6 -0.9-2.1 2.3 -2.3-6.8Do not know 66.0 32.4-99.6 75.4 36.7-114.2 59.0 21.1-96.8 68.4 45.1-91.6Knowledge about lemon juice as ingredient to test iodine
(n=103) (n=146) (n=108) (n=357)
A few drops 94.2 86.0-102.4 90.8 75.9-105.6 86.7 74.5-98.9 92.7 85.8-99.7Other amounts 0.2 -0.2-0.7 0.0 0.0 1.1 -1.0-3.1 0.2 -0.1-0.5Do not know 5.6 -2.6-13.8 9.2 -5.6-24.1 12.3 -0.1-24.6 7.1 0.1-14.0What colour does salt change to when tested for iodine?
(n=443) (n=536) (n=472) (n=1451)
White 29.6 17.3-41.9 35.2 23.8-46.5 25.9 17.5-34.3 30.7 21.5-39.9Violet/bluish 0.3 -0.2-0.7 2.1 0.3-3.8 0.7 -0.1-1.4 0.7 0.2-1.2Other 1.3 -0.2-2.9 2.1 -1.1-5.3 2.1 0.3-3.8 1.5 0.2-2.8Don’t know 68.9 56.9-80.8 60.7 50.5-70.9 71.4 62.7-80.0 67.1 58.2-76.0

69National Micronutrient Survey 2011-12
3.18.11 Household Practice of Including Salt in Livestock Feed
Table 84 shows the household practice of including salt in livestock feed. At the national level, 46.0% of the respondents included salt; among whom, 26.0% used iodized salt.
Table 84: Household Practice of Including Salt in Livestock Feed
Rural Urban Slum National% 95% CI % 95% CI % 95% CI % 95% CI
including salt in livestock feed (n=485) (n=266) (n=80) (n=831)
46.9 39.7-54.1 42.9 30.0-55.8 14.5 0.8-28.1 46.2 39.9-52.6Type of salt (n=251) (n=118) (n=15) (n=384)Iodized 26.9 17.3-36.6 23.4 8.9-37.8 48.7 22.3-75.2 26.6 18.0-35.3Not iodized 45.8 35.0-56.6 55.3 38.5-72.0 10.9 -3.4-25.2 46.6 37.0-56.3Do not know 27.3 17.3-37.3 21.4 7.0-35.7 40.3 14.0-66.7 26.7 17.8-35.7
3.18.12 Source of Salt Purchase in Households
Table 85: Source of Salt Purchase
National Rural Urban Slum% 95% CI % 95% CI % 95% CI % 95% CI
Open salt (n=366) (n=201) (n=74) (n=91)City shop 3.2 0.7-5.8 1.2 -0.7-3.2 26.4 7.6-45.3 24.6 3.9-45.2Village/local shop/haat1 93.6 89.3-97.8 96.4 92.9-99.9 64.2 45.2-83.1 54.4 34.4-74.4Others 3.0 0.3-5.5 2.1 -0.4-4.7 9.3 -0.2-18.8 20.9 7.4-34.4Salt packets (n=1628) (n=464) (n=614) (n=553)City shop 25.4 17.2-33.6 12.6 3.2-21.9 54.9 38.6-71.1 61.3 46.5-76.1Village/local shop/haat 73.9 65.6-82.1 86.9 77.6-96.2 43.9 27.9-59.8 38.1 23.3-52.8Others 0.6 -0.01-1.3 0.5 -0.5-1.4 1.1 -0.2-2.5 0.5 -0.07-1.0Crude salt2 - - - - - - - -
1. haat is a common market place2. Data on crude salt is not given because the number of observations is too small for meaningful statistical inference.
With regard to the sources of open salt purchases, the “village/local shop” was the most common source: 96.0%, 64.0% and 54.0 % in the rural, urban and slum clusters, respectively. Packet salt was mostly purchased from city shops in the urban (55.0%) and slum clusters (61.0%), but was commonly purchased from village shop/local shops in the rural cluster (86.0%).
3.18.13 Household Practice of Using Salt
Table 86: Household Practice of Using Salt
National (n=2003) Rural (n=661) Urban (n=691) Slum (n=649)% 95% CI % 95% CI % 95% CI % 95% CI
Salt storageClosed packet/container 97.3 95.9-98.7 97.4 95.6-99.2 97.1 95.2-98.9 98.5 97.3-99.7
Open packet/container 2.4 1.1-3.8 2.4 0.7-4.1 2.6 0.8-4.4 1.5 0.3-2.6Both 0.1 -0.02-0.3 0.1 -0.06-0.3 0.2 -0.2-0.6 - -Timing for adding salt

70 National Micronutrient Survey 2011-12
During cooking 98.5 97.6-99.5 98.6 97.3-99.8 98.6 97.7-99.6 97.6 95.5-99.6After cooking 0.4 -0.009-0.9 0.4 -0.2-1.0 0.5 -0.1-1.1 0.6 -0.3-1.3Both 0.97 0.35-1.6 1.0 0.2-1.8 0.8 0.03-1.5 1.8 -0.1-3.8Salt is added to meals at the time of eatingAlways 60.7 52.2-69.1 60.4 49.3-71.5 62.4 54.7-70.0 56.7 48.7-64.8Sometimes 19.9 12.4-27.3 20.4 10.5-30.3 17.3 12.3-22.2 22.3 16.1-28.5Never 19.4 15.6-23.1 19.1 14.3-23.8 20.3 14.2-26.3 20.9 13.4-28.3
Table 86 shows that, at the national level, salt was stored in closed packets/containers in 97.0% of the households. The percentages were similar in all the clusters. In 98.5% of households, salt was added to food at the time of eating. The percentage was similar in all the clusters. In 60.0% of the households, salt was “always” taken on plate: 60.4%, 62.4% and 56.7% in the rural, urban and slum clusters, respectively. Moreover, 19.4% of the household respondents never added salt to dishes, and the percentages were similar in all the clusters.
3.19 Anthropometry
3.19.1 Stunting in Preschool Children
Table 87 shows the prevalence of stunting (height-for-age z score<2z) in preschool children. The national estimate was 32.1%. The prevalence in the slums (51.1%) was higher than in the rural (31.4%) and urban (31.3%) clusters. According to the Asset Index, the higher SES tended to have a lower prevalence of stunting. Stunting was observed in 44.3% and 20.6% of the “poorest” and the “richest” quintiles, respectively. The prevalence of stunting was 49.1% in the severe food-insecure households, compared to 28.1% in food-secure households.
Table 87: Prevalence of Stunting in Preschool Children
n % 95% CIClustersNational 1016 32.1 26.2-38.0Rural 344 31.4 23.7-39.1Urban 361 31.3 24.7-37.9Slums 311 51.1 44.9-57.2According to the Asset IndexPoorest 198 44.3 32.9-55.7Poorer 205 36.5 24.6-48.3Middle 205 24.1 13.1-35.1Richer 202 28.9 17.1-40.7Richest 206 20.6 9.5-31.7By household food insecurity statusFood-secure 461 28.1 17.8-38.3Mildly insecure 145 39.8 22.9-56.7Moderately insecure 255 29.4 16.7-42.1Severely insecure 155 49.1 37.5-60.7
3.19.2 Underweight in Preschool Children
Table 88 shows the prevalence of underweight (weight-for-age z score<-2z) in preschool children. The prevalence at the national level was 30%, which was higher in the slums (47.4%) than in the rural cluster (29.6%). The prevalence was 36.9% in the “poorest” and 17.8% in the “richest” quintiles.

71National Micronutrient Survey 2011-12
Table 88: Prevalence of Underweight in Preschool Children
n % 95% CIClustersNational 1033 30.0 24.7-35.3Rural 352 29.6 22.8-36.5Urban 364 28.1 21.0-35.1Slums 317 47.4 39.3-55.5According to the Asset Index Poorest 205 36.9 28.0-45.7Poorer 209 36.5 25.8-47.1Middle 209 27.8 17.6-37.9Richer 203 24.3 12.9-35.8Richest 207 17.8 9.8-25.8By household food insecurity statusFood-secure 466 24.2 15.7-32.8Mildly insecure 150 41.3 21.5-61.1Moderately insecure 258 30.0 17.8-42.3Severely insecure 159 45.3 35.1-55.6
3.19.3 Wasting in Preschool Children
Table 89 shows the prevalence of wasting (weight-for-height z score<-2z) in preschool children. The national prevalence of wasting was 19.3%. The prevalence was slightly lower in the urban (12.9%) than in the rural (21.1%) and slum clusters (20.3%). The prevalence was generally consistent in all SES groups. In regard to the household food insecurity status, the prevalence of wasting was 19.6% and 25.2% in the food-secure and mildly food-insecure households, respectively.
Table 89: Prevalence of Wasting in Preschool Children
n % 95% CIClustersNational 997 19.3 14.4-24.2Rural 336 21.1 14.8-27.3Urban 355 12.9 7.6-18.2Slum 306 20.3 13.0-27.6According to the Asset IndexPoorest 195 16.3 8.6-23.9Poorer 201 20.6 13.4-27.9Middle 201 24.3 2.9-45.7Richer 197 19.0 7.6-30.4Richest 203 16.1 8.1-24.1By household food insecurity status Food-secure 455 19.6 14.7-24.5Mildly insecure 140 25.2 5.4-44.9Moderately insecure 249 14.9 6.9-22.8Severely insecure 153 19.7 10.7-28.7
3.19.4 Height-for-age z-score in Preschool Children
Table 90 shows the mean z-score for height-for-age in preschool children. The children in the slums had lower scores (-1.97) than their rural (-1.29) and urban (-1.30) peers. In general, the z-score for height-for-age increased as the children belonged to an increasingly higher SES.

72 National Micronutrient Survey 2011-12
Table 90: Height-for-age z-score in Preschool Children
n Mean 95% CIClustersNational 1017 -1.32 -1.51-(-1.13)Rural 344 -1.29 -1.54-(-1.04)Urban 361 -1.30 -1.57-(-1.04)Slum 312 -1.97 -2.19-(-1.75)According to the Asset IndexPoorest 199 -1.66 -1.99-(-1.33)Poorer 205 -1.52 -1.87-(-1.17)Middle 205 -1.20 -1.55-(-0.85)Richer 202 -0.86 -1.56-(-0.17)Richest 206 -1.10 -1.44-(-0.77)
3.19.5 Weight-for-age Z-score in Preschool Children
Table 91 shows the weight-for-age z-scores in the preschool children; the z-score in the slum cluster (-1.85) was lower than in the urban (-1.19) and rural (-1.48) clusters.
Table 91: Weight-for-age z-score in Preschool Children
n Mean 95% CIClustersNational 1033 -1.43 -1.57-(-1.29)Rural 352 -1.48 -1.65-(-1.31)Urban 364 -1.19 -1.39-(-0.98)Slum 317 -1.85 -2.03-(-1.67)According to Asset IndexPoorest 205 -1.67 -1.91-(-1.42)Poorer 209 -1.56 -1.83-(-1.28)Middle 209 -1.57 -1.76-(-1.38)Richer 203 -1.10 -1.44-(-0.75)Richest 207 -1.08 -1.36-(-0.80)
3.19.6 Weight-for-height z-score in Preschool Children
Table 92 shows the weight-for-height z- score in preschool children; the score was higher among children in the urban cluster (-0.61) than their peers in the slum (-0.94) and rural (-0.95) clusters. The z-score increased as the children’s SES increased.
Table 92: Weight-for-height z-score in Preschool Children
n Mean 95% CIClustersNational 997 -0.88 -1.08-(-0.67)Rural 336 -0.95 -1.20-(-0.70)Urban 355 -0.61 -0.84-(-0.37)Slums 306 -0.94 -1.12-(-0.77)According to the Asset indexPoorest 195 -0.86 -1.20-(-0.51)Poorer 201 -0.99 -1.21-(-0.77)Middle 201 -0.99 -1.57-(-0.41)Richer 197 -0.77 -1.29-(-0.24)Richest 203 -0.70 -1.07-(-0.33)

73National Micronutrient Survey 2011-12
4. Discussion4.1 Anemia
The survey revealed a prevalence of anemia in preschool children at the national level of 33.0%. The prevalence of anemia in the preschool children (under-five) was 47.0%, based on the national survey data in rural areas conducted in 2001 (Nutrition Surveillance Project, HKI, 2001). The prevalence of anemia in six-month-old infants was 44.0% according to a study in a rural site in Bangladesh (Eneroth et al., 2010). A nationally representative survey estimated the anemia prevalence in children under two-years of age as 49.0% (Harun-or-Rashid et al., 2009).
The prevalence of anemia in NPNL women was 26% in the National Micronutrient Survey. According to the Nutrition Surveillance Project, HKI, 2001, the prevalence in NPNL of reproductive age (15-49 years) was 33.2%. The Anemia Prevalence Survey of Urban Bangladesh, a nationally representative survey, estimated the prevalence among NPNL women as 32.9% in 2001-03.
The prevalence of anemia was 19.1% and 17.1% in children aged 6-11 years and 12-14 years, respectively. The nationally representative data for children aged 13-14 years revealed a prevalence of 24.6% in the urban cluster in 2001-03 (Anemia Prevalence Survey of Urban Bangladesh and Rural Chittagong Hill Tracts 2003).
4.1.1 Assessment Methods
The lower prevalence of anemia found in this survey than in earlier estimates might be the following: The National Micronutrient Survey used venous blood samples with hemocue, whereas commonly, capillary blood is used with hemocue to assess anemia in Bangladesh and other regions for public health studies. Published literature reported wide variations in the measure of hemoglobin with the Photometric Hemoglobinometer (PHM) method, i.e. hemocue with capillary blood. The reliability of the hemocue with capillary blood method is low; it varies widely from site to site (between samples taken at the same time from two different parts of the body) and over time (samples taken from the same site of the body of the same individual at a few days’ interval). This unreliability may lead to misclassification of anemia status in individuals and biases in anemia prevalence estimates (Morris et al., 1999). The other studies also reported wide variability in hemoglobin measurement with the capillary hemocue (Xiaoyan, 2009; Rippmann, 1997; Chen et al., 1992). The present survey reports a 40% prevalence of anemia in children aged 6-23 months at the national level; 56.3% in the “poorest” quintile and 45% in the slum cluster. Very few population-based studies have been conducted in Bangladesh that employed the similar method (venous hemocue) or the venous cyanomethemoglobin method, the gold standard. A very recent study using the venous cyanomethemoglobin method, conducted by icddr,b (personal communication, manuscript under preparation), among the poor rural community, estimated the prevalence of anemia in children under two at 55%. Another ongoing icddr,b study conducted in a slum in Dhaka and employing the venous hemocue method reported a 48.3% prevalence of anemia in children aged seven months (personal communication). Therefore, when compared with a similar method or the gold standard method after adjusting for age group and SES, the estimates of the present survey were consistent.
4.2 Iron Deficiency
The prevalence of iron deficiency (low serum ferritin) in Bangladesh is much lower than what is assumed: 10.7% in preschool children and 7.1% in NPNL women. It should be noted that, for the very first time in Bangladesh, a nationwide estimate of ferritin was obtained in the National Micronutrient Survey. There were only some smaller-scale studies reporting the estimates of iron deficiency. In a 2007 study in a rural sub-district among married, nulliparous women, 11.0% were iron deficient (Khambalia et al., 2009). In another study in a rural sub-district, the prevalence was 8.0% among pregnant women (Lindstrom et al., 2010). One recent study reported the prevalence of iron deficiency in nulliparous women in a northern district in Bangladesh at 0.0% (Merrill et al., 2011). In that study, daily iron intake from water [42 mg (18,71)] was positively correlated with plasma ferritin (r = 0.36) and total body iron

74 National Micronutrient Survey 2011-12
(r = 0.35). It also revealed a strong, positive, dose-response association between natural iron content in groundwater, intake of iron from such sources, and iron status of women. They study linked the findings with very high iron in groundwater consumed through drinking water. The study further pointed out that the groundwater iron and therefore the status of iron deficiency in population may not be the unique to that particular district. A British geological survey on the mineral content in groundwater across Bangladesh showed that iron concentration is high in most parts of the groundwater (Kinniburgh et al., 2001). According to this report, the range of groundwater iron in Bangladesh is <0.004 mg/l to 61.0 mg/l, and the medians are 1.4 mg/l and 0.2 mg/l in shallow and deep groundwater, respectively. This survey and other reports have shown that the aquifer environment is reducing (Merrill et al., 2010; Roberts et al., 2007), indicating that dissolved iron is predominantly ferrous (Fe2+), a form that is readily absorbed through the intestine (Hallberg, 1991). This is supported by an experimental study, which showed natural water with electrolytically reduced iron (ferrous) is readily absorbed (Halksworth et al., 2003).
The authors referred to the British Geological Survey report and accordingly identified the areas with an arbitrarily termed “high” level of groundwater iron (areas with groundwater iron concentration >=2.8 mg/l), and the areas with a “low” level of groundwater iron (areas with groundwater iron concentration <2.8 mg/l). The mean serum ferritin in the data were compared between these two categories of areas (Table 93).
Table 93: Comparison of Mean Ferritin by Groundwater Iron Status
Ferritin(ng/ml)1 (geometric mean)
Preschool children NPNL women School-age children
Areas with groundwater iron concentration: ‘high” (>=2.8 mg/l) 38.9 P=0.0002 67.9 P=0.0001 57.1 P=0.0001
Areas with groundwater iron concentration: ‘low” (<2.8mg/l) 23.1 44.7 42.1
1Ferritin is adjusted for infection.
The mean ferritin level in serum was statistically significantly higher in all the studied population groups in the areas with “high” groundwater iron, as discussed in the following descriptive and multivariate analyses.
Table 94: Serum Ferritin in NPNL Women and Related Variables
Serum ferritin (ng/ml) (geometric mean)
Household monthly expense (BDT)
(geometric mean)
7-day iron consumption from food (mg)
Household food insecurity (FANTA HFIAP* tools) Food-secure 45.1 9 509.00 55.0 Mildly insecure 55.7 7 631.00 50.0 Moderately insecure 61.5 7 186.00 47.9 Severely insecure 52.4 6 634.00 48.2Asset Index Richest 49.4 15 017.00 62.0 Richer 49.9 10 117.00 52.3 Middle 41.6 8 910.00 54.5

75National Micronutrient Survey 2011-12
Poorer 56.8 7 435.00 49.0 Poorest 54.6 5 558.00 46.7Groundwater iron (GWI) GWI>=2.8 mg/l 67.9 7 707.00 49.8 GWI<2.8 mg/l 44.7 8 604.00 54.8
*Coates et al., 2007
Table 94 shows that “food-insecure” households had lower household spending power (ranging from BDT 7,631 in “mild food-insecure” to BDT 6,634 in the “severe food-insecure”) than the “food-secure” households (BDT 9,509.0). Seven-day iron consumption from food was lower in the “food-insecure” households (48.0-50.0 mg) than in “food-secure” households, where consumption was 55.0 mg. According to the Wealth Index, households of the upper quintiles had gradually increasing spending power. Consumption of iron from food over a seven-day period was similar, with a gradually higher consumption from the bottom to the top quintiles.
However, defying the trend, the serum level of ferritin was lower in the “food-secure” households (45.1 ng/ml) than the households with different degrees of food insecurity (52.0-61.0 ng/ml), which was substantiated by observing the Wealth Index. The mean serum ferritin was 49.0 ng/ml in the top two quintiles, compared to around 55.0 ng/ml in the bottom two quintiles. This unusual occurrence could possibly be explained by the groundwater iron. In the areas with “high” (>=2.8 mg/l) groundwater iron, NPNL women had a higher level of serum ferritin (67.9 ng/ml) than the areas with “low” (<2.8 mg/l) groundwater iron, where mean serum ferritin was 44.7 ng/ml. This was despite the fact that area with “high” groundwater iron had significantly lower household’s spending power (BDT 7 707 against 8 604) and consumption of iron was less (49.8 mg against 54.8 mg) as well than the area with “low” groundwater iron. Therefore, serum ferritin in NPNL women did not depend on higher SES or higher level iron consumption from food. However, groundwater iron exerted a positive influence on serum ferritin.
Table 95: Determinants of Serum Ferritin in NPNL Women
Variables Coefficient T P Standardized effect size (Beta)
Household monthly expenses -0.000014 -2.26 0.02 -0.12Iron consumption from food over a 7-day period 0.0006 0.47 0.63 0.02
Mother’s institutional education (Ref: No education) 0.011 0.15 0.88 0.0068
Retinol status (s.retinol) 0.18 2.08 0.038 0.09Para (parity) -0.009 -0.56 0.57 -0.024Area of residence (Ref: rural)Urban -0.002 -0.03 0.97 -0.001Slums -0.02 -0.13 0.89 -0.006Asset Index (Ref: poorest)Poorer 0.21 2.42 0.016 0.13Middle 0.07 0.69 0.48 0.04Richer 0.178 1.34 0.18 0.079Richest 0.458 2.62 0.009 0.19

76 National Micronutrient Survey 2011-12
Zinc status (s. zinc) 0.013 0.72 0.46 0.034Groundwater iron (Ref: GWI<2.8 mg/l)GWI>=2.8 mg/l 0.46 4.32 0.000 0.22HH food insecurity (Ref: food-secure)Mildly insecure 0.07 0.69 0.48 0.03Moderately insecure 0.22 2.67 0.008 0.13Severely insecure 0.17 1.7 0.09 0.08Serum B12 0.12 1.97 0.05 0.09Serum folate 0.23 3.08 0.002 0.13Owns a refrigerator 0.32 2.37 0.018 0.14
To determine the association with serum ferritin (dependent variable) in NPNL women, related independent variables were entered into the multivariate regression analysis (Table 95). Monthly household expenses were negatively associated with serum ferritin (p=0.02). This indicates that the women of poor households have higher levels of ferritin, which is also evident from the descriptive statistics (see Table 94). The is further substantiated by the observation that moderately food-insecure households are associated with higher levels of serum ferritin in NPNL women than in food-secure households (p=0.008). Households with NPNL women in the rural cluster have the lowest household monthly expenses – BDT 7,707.00 (rural), BDT 8,350.00 (slums), and BDT 10,721.00 (urban). However, usage of tube-wells as a source of drinking water (tube-well water is exclusively groundwater, rich in absorbable iron) is greater in the rural (~80%) than in the urban (62%) or slum cluster (30%). This possibly explains the reason for the negative correlation between household spending power and ferritin status in NPNL women.
Among the nutrients, serum retinol and folate were positively associated with serum ferritin in NPNL women.
The environmental factor-the groundwater iron was in highly significant positive association with serum ferritin. The areas with “high” groundwater iron (>=2.8 mg/l) were associated with higher serum level of ferritin in NPNL women than the areas with “low” levels of groundwater iron (<2.8 mg/l)(p<0.001). From the standardized effect size (Beta), groundwater iron had the highest absolute effect size (0.22) among the independent variables.
The similar effect of groundwater iron on iron status was noted in preschool and school-age children by the descriptive and multivariate regression analysis.
The authors explored the effect of food consumption on iron status. Table 96 shows consumption of iron from food in different age groups and genders from the National Micronutrient Survey data and the RDA for iron.
Table 96: Iron Consumption Compared to Iron RDI
RDA1 (mg) Daily iron consumption (mg)
Daily consumption of iron from animal sources (mg)
Aged 2-3 years 7.0 4.76 0.98Aged 4-5 years 10.0 4.77 0.98Boys 9-14 years 8.0 6.60 1.20Girls 9-14 years 8.0 5.90 0.97Women 15-50 years 18.0 7.40 1.12
1Institute of Medicine (IOM).

77National Micronutrient Survey 2011-12
Although consumption of animal source food, e.g. meat, fish and eggs, has increased in Bangladesh (HIES, 2010), consumption of iron from food is still well below the RDA. Table 96 shows the daily consumption of iron and food from animal source, as estimated in the National Micronutrient Survey. The estimates reveal that daily consumption was below the RDA in each of the age groups and genders. Iron consumption from animal sources, which is rich in heme iron, constitutes a small percentage of the total iron. The findings suggest that iron consumption through food is unlikely to make a positive impact on ferritin status, which is in line with the findings of other contemporary studies in the country (Merrill et al., 2011). The findings are also consistent with those of the multivariate regression analyses presented in this report, which did not show any impact of iron consumption from food on serum level of ferritin (Table 95).
There was a question in the National Micronutrient Survey on sources of drinking water. Figure 3 illustrates how the drinking of tube-well water (groundwater) affected the iron status in preschool children.
Figure 3: Drinking of Tube-well Water (Groundwater) vs. the Prevalence of Iron Deficiency in Preschool Children
Tubwell waterdrinking (%)
ID (Prev. of lowferrtin, %)
Rural Urban Slums
0
10
20
30
40
50
60
70
80
9078
27.2
12.39.4
67
31
The more tube-well water (groundwater) consumed, the lower the prevalence of iron deficiency (Figure 3). The same trend was observed in NPNL women and school-age children.
The widespread presence of high groundwater iron may contribute to high ferritin status among populations in Bangladesh, irrespective of SES, location of residence or status of food consumption. In the absence of adequate iron from food, food fortification programmes and with a very limited coverage (1%) of multiple micronutrient powder (MNP) supplementation in young children found in this survey. (Table 97), high groundwater iron might have an association with low prevalence of iron deficiency in Bangladesh population, which was observed in the National Micronutrient Survey.
Table 97: Coverage of Multiple Micronutrient Powder (MNP) in Under-two Children in Bangladesh
Clusters n % 95% CINational 247 1.3 -0.3-2.9Rural 78 0.7 -0.8-2.3Urban 89 3.3 -1.5-8.1Slum 80 0.0 -
78 National Micronutrient Survey 2011-12
To define target population, evidence-based research suggests that groundwater can offer a cheap, sustainable source of bioavailable iron commonly not taken into account in traditional dietary assessments or intervention planning phases (Merrill, 2012).
The resultant modest prevalence of iron deficiency supports the finding of anemia in this study. Iron deficiency is widely considered the major cause of anemia. However, it can be observed from the data of the National Micronutrient Survey that iron deficiency (prevalence of low ferritin) was not a widespread problem in Bangladesh. Consequently, the role played by iron deficiency in causing anemia was less than assumed, resulting in a relatively low prevalence of anemia, as observed in this survey.
4.3 Vitamin A
The prevalence of vitamin A deficiency was 20.5%, 20.9% and 5.4% in preschool children, school-age children and NPNL women, respectively. The status of vitamin A nutrition in general remained similar to the most recent nationally representative survey (Helen Keller International. 1999). The IPHN/HKI survey reported the estimates as 21.7%, 19.6% and 5.0% in the above population groups, respectively. In another study in a rural community, the prevalence in six-month-old infants was 19.0% (Eneroth et al., 2010). The current estimates have indicated persistent vitamin A deficiency of a public health significance in preschool and school-age children. The problem was pervasive in the slum cluster, where prevalence was 38% and 27% in the preschool and school-age children, respectively.
The national prevalence of subclinical vitamin A deficiency remained at the same level in all the population groups studied, e.g. preschool children, school-age children and NPNL women, as in the earlier nationally representative survey conducted in 1997 (Helen Keller International. 1999). One of the reasons for this may be the intake of vitamin A from the diet. According to data of the National Micronutrient Survey, the median daily consumption of vitamin A in preschool children was 270 REs, compared to the RDA of 300-400 REs. In school-age children, it was 318 REs compared to the RDA of 400-600 REs. In NPNL women, it was 372 REs against the the RDA of 700 RE. Therefore, in all the population groups studied, consumption did not meet the requirements. Again, the Bangladesh diet is dominated by the vitamin A from plant sources (carotenoids). The data revealed that the share of vitamin A from plant sources (carotenoids) to total vitamin A consumption is 77%, 71% and 60% in NPNL women, school-age children and preschool children, respectively. Vitamin A from plant sources is a less bio-available form of vitamin A. Although in this report, the chosen conversion factor for beta carotene to retinol was 12:1 (Institute of Medicine, 2002), increasingly more literature reports that bio-conversion for beta carotene to retinol in the body is even weaker; some literature suggest a conversion factor of 29: 1 for beta-carotene to retinol (Hickenbottom, 2002; Tang et al., 2002; Solomons, 1999; Brubacher et al., 1985). A recent study states that a higher level of consumption of provitamin A (carotenoids), which is the typical case scenario in Bangladesh, is related to inefficient bio-conversion to retinol in the body (Novotny et al., 2010). This may explain the stagnation and persistent higher prevalence of sub-clinical vitamin A deficiency, measured by serum level of retinol in the Bangladesh population.
The data of the National Micronutrient Survey show that the slum cluster have a consistently higher level of retinol deficiency than the other two clusters, notably in comparison to the urban cluster. This trend was consistent in all the studied population groups. One possible reason may be dietary intake. In preschool children, the daily median consumption of vitamin A was 209 REs in the slums, against 291 RE and 231 REs of the rural and urban clusters, respectively. The median consumption of vitamin A from animal sources providing more biologically available retinols was 40.2 REs in the slums, compared to 52.4 RE and 61.1 REs of the rural and urban clusters, respectively. School-age children from the slums had a median daily consumption of 260.3 REs, compared to 321.3 and 300.1 REs in the rural and urban clusters, respectively. The daily median consumption of animal-source vitamin A was 29.8 REs in the slums, against 40.1 and 44.7 REs in the rural and urban clusters. Hence, children in the slum cluster may have a lower consumption of total and animal-source vitamin A from food than their peers from the rural and urban clusters. This could be linked with a higher prevalence of subclinical vitamin A deficiency in preschool and school-age children of the slums.

79National Micronutrient Survey 2011-12
The national coverage of vitamin A supplementation is 77%; it is higher than 72% in all clusters, yet differences do exist in coverage across SES. For example, the coverage was 76.0% in the “poorest” quintile compared to around 87.0% in the “richest” quintile. Therefore, there is room to improve coverage, e.g. at the bottom quintile of the population according to the Wealth Index.
The Bangladesh Demographic and Health Survey (BDHS) 2007 reported the coverage of vitamin A supplementation as 84%. However, in the BDHS 2011, there was only a 60% coverage of vitamin A supplementation because they missed the deadline of the national immunization days by six-month prior to the survey (BDHS 2011), thus considerably failed to be taken into consideration in the estimate. In the National Micronutrient Survey, the coverage was 77%. This can be explained by the fact that the latest national immunization day prior to the present survey was held on 29 May 2011. The survey started on 4 October 2011 and continued until 20 December 2011. Therefore, the last three weeks of the survey were outside the six-month margin from the last immunization day (29 May 2011), thus, although there were less coverage data missing coverage in this survey than in the BDHS 2011, a small amount of additional coverage estimate was not taken into consideration. Therefore, in general, the coverage of vitamin A supplementation in preschool children remained similar to the BDHS 2007 estimate. Nevertheless, there is need to further increase coverage.
Since the estimates of prevalence of subclinical vitamin A deficiency in general remains the same over the last 15 years, and there are still pocket of areas or underprivileged groups where coverage of supplementation of vitamin A was slightly lower than the rest of the population, the findings of the National Micronutrient Survey is a perfect setter to initiate the wide-scale cooking oil vitamin A fortification programme in the country.
4.4 Zinc
National prevalence of zinc deficiency was 44.0% in preschool children and 57.0% in NPNL women. In a study in Bangladesh, the prevalence of zinc deficiency was reported to be 49.7% in children aged 3-7 years (Kongsbak et al., 2006). Another study in a rural community reported the CRP adjusted prevalence of zinc deficiency in infant as 56.0% (Eneroth et al., 2010). A study in a rural sub-district reported zinc deficiency at 49.0-66.0% in pregnant women (Lindstrom et al., 2011). Therefore, in general, the findings for zinc were comparable with other studies.
The relatively high burden of zinc deficiency among the Bangladesh population was likely attributed to dietary intake, which shows that consumption was well below the RDA amount. For the preschool children, the median daily consumption of zinc was 2.67 mg in the slums and 3.23 mg in the urban cluster, against the daily requirement of 3-5 mg (RDA). In NPNL women, consumption was much lower: 4.47 mg in the urban cluster, 3.61 mg in the slum cluster and 3.93 mg in the rural cluster compared to the RDA of 8-9 mg, indicating that NPNL women consumed just 33-50% of the RDA for zinc.
In addition to this issue of low dietary intake, the content of phytate in the food, an inhibitor of zinc absorption, is high in the Bangladesh diet. The phytate-zinc molar ratio is an indicator of relative abundance of phytate to zinc in the food. The higher the ratio, the lower the absorption of zinc. The diet of 26.3% of urban preschool children had a phytate-zinc molar ratio <5 (a ratio favourable for zinc absorption), compared to just 17.2% in the diet of children in the slums, possibly explaining the higher prevalence of zinc deficiency in the children in the slums than their urban peers. The diet of one-third of NPNL women had a very high phytate-zinc molar ratio (>15), indicating a high inhibition of zinc absorption from the diet.
Therefore, compounded with low intake from diet, the issue of phytate in food possibly explains for very high prevalence of zinc deficiency in NPNL women as well as in preschool children in Bangladesh.
4.5 Iodine
The national estimate of usage of iodized salt (≥5 ppm) at the household level was 80.3%, which was generally similar to the estimate in the preceding National IDD/USI Survey 2004-5 (81.4%). The usage of

80 National Micronutrient Survey 2011-12
iodized salt was lower in the rural households than in the urban or slum clusters (rural, 76.7%; urban, 91.7%, slums, 91.1%). At the national level, 57.6% of the households used adequately iodized salt (≥15 ppm), which was a slight improvement from the 2004-5 estimate (51.2%). However, the difference between the two estimates was not statistically significant. Three out of four households in the urban and slum clusters used adequately iodized salt, while the percentage was just over 50.0% in the rural area.
The estimate of household consumption of “brand” salt was 75.8% at the national level, which was generally consistent to the 2004-5 estimates (71.4%). Proportionately more urban households consumed “brand” salt than in rural households (92% against 71%). The percentage of “open” salt consumption in the households was 24.2% at the national level, which showed a declining trend from the 2004-5 estimates (30.1%). More rural households consumed “open” salt than in the urban cluster (29.2% against 7.7%).
With regard to iodine content of retailer salt, 8.1% of the samples had negligible iodine (<5.0 ppm) (Table 65). This estimate was an improvement over the earlier survey (10%, 2004-5). The percentage of retailer salt sample with adequately iodized salt (>=20 ppm) was 66.4%, which improved from 2004-5 estimate (53%). Almost no shops (~0%) had samples with excess iodine (>100 ppm). This percentage was ~2.0% in 2004-5.
According to this survey, although sales adequately iodized salt improved at the retailer level, at the household level, consumption of adequately iodized salt was generally the same as in the previous survey.
With regard to iodine deficiency, at the population level, the survey revealed that the Bangladeshi population was iodine sufficient. This was indicated by the median UICs, which was estimated above the 100.0 µg/l (the cut-off <100 µg/l defines iodine deficiency at the population level) in all the clusters as well as the combined national estimates, in school-age children and NPNL women. However, when observing the trend of iodine deficiency in school-age children from 1999 to 2012, it is on a declining trend, from 42.5% (1999) to 33.8% in 2004-05, followed by an upward trend to 40.0% in 2012 (Figure 4). An inverse trend in median UIC with the prevalence of iodine deficiency was also observed during this period (1999-2012). The median UIC was 125 µg/l in 1999, increased to 162.5 µg/l in 2004/05 and dropped again to 145.0 µg/l in 2012. Similar trends were observed with regard to iodine deficiency and median UIC in NPNL women (Figure 4).
The survey reported on the practice of adding salt to dishes, which was highly prevalent (~99.0%), and showed a rising trend from the 2004/5 data, at 95.0%. This indicates a loss of iodine from salt while cooking could be substantial. Adding salt to dishes causes a substantial loss of iodine through vaporization, which could be as high as 25.0% of the total iodine. This may be one of the factors underlying the falling concentration of iodine in urine of the studied population groups. Educating mothers to cover cooking pots during cooking or to add salt when the food is almost ready may help reduce this loss.
Another issue was use of “open” salt, especially in the rural clusters, where 30% of the households used it. When asked why the respondents did not use “packet” salt, the overwhelming majority (84%) responded that the “packet” salt was “too expensive” (Table 57). About one fourth of them responded that the “packet” salt was not available in “small amounts”. According to the Trading Corporation of Bangladesh (The Financial Express, 19 June 2012), the price of packet salt increased by 66% in 2012 over a one-year period while a survey carried out by the Bangladesh Small and Cottage Industries Corporation (BSCIC), the price of salt increased by 43.75% in 2012 over a one-year period (The Financial Express, 11 September 2012). The recent rising trend of price over the last 1-2 years may have influenced the respondents in using the “open” salt, as supported by the data in Table 98. The use of “open” salt seemed higher in the “poorest” and “severely food-insecure” households. Iodized salt (>5 ppm) and adequately iodized salt (>15 ppm) was used less as the households SES decreased and status of household food security decreased (Table 56b).

81National Micronutrient Survey 2011-12
Table 98: Use of “Open” Salt by Socio-economic Status and Household Food Security Status
Use of “open” salt (%)“Poorest” households 37.1“Richest” households 17.6“Severely food-insecure” households 31.2“Food-secure” households 26.7
In support of the above observations, according to the Wealth Index, the bottom two quintiles of NPNL women and the bottom quintile of school-age children, who are socio-economically underprivileged, were iodine deficient (Tables 60 and 63).
Figure 4: Trend of Iodine Status in School-age Children
Figure 5: Trend of Iodine Status in NPNL Women
4.6 Folate
With regard to folate deficiency, the national prevalence among NPNL women was 9.1%. In Bangladesh, 18.0% of rural pregnant women were reported to be folate deficient according to a study conducted in 2002 (Lindstorm et al., 2010). Another Bangladesh study conducted in 2007 reported folate deficiency of 13.3 % in married, non-pregnant women (Khambalia et al., 2009). Therefore, the findings are consistent with those of other studies.
4.7 Nutritional Status in Preschool ChildrenPrevalence of stunting, underweight and wasting was 32.1%, 30% and 19%, respectively. According to the BDHS 2011, the respective estimates are 41%, 36% and 16%. The difference in the estimates,
1999
median urinary iodine in schoolchildren (µg/l)
20122004/5
median urinary iodine (µg/l)
0
50
100
150
200
125.8
162.5145.7
1999
% of iodine deficiency in schoolchildren
20122004/5
% of iodine deficiency
0
20
10
30
40
5042.5
33.840
1999
median urinary iodine inNPNL (µg/l)
20122004/5
median urinary iodine in NPNL (µg/l)
0
50
100
150
111.5
139.9122.6
1999
% of iodine deficiency in NPNL
20122004/5
% of iodine deficiency in NPNL
34
38
36
40
44
42
46
4845.6
38.6
42.1

82 National Micronutrient Survey 2011-12
especially in the stunting and underweight may have been due to the fact that the sample size in the National Micronutrient Survey was estimated by taking into consideration micronutrient deficiencies. The given sample size was less than optimal to assess the nutritional status of preschool children.
4.8 State of Nutrition in the Slum Cluster
Together with industrialization, e.g. the ready-made garments industry and rapid urbanization, the informal service sector has been growing exponentially over the last decade. This calls for inevitable expansion of slums population, especially in the metropolitan cities of the country. According to the Slum Census 2005 of CUS, the projected current slum population is 5.5 million. Too many people live in congested small places, devoid of adequate utilities and services. The National Micronutrient Survey 2011-12 is probably the first analysis of the nutrition situation at a comprehensive scale in the ever-growing slum population of the country. The household’s average monthly spending in the slums was higher than in the rural households (BDT 8,944.00 against BDT 8,393.00, 6.5% higher); however, the slums population had a higher burden of malnutrition, as highlighted in Table 99.
Table 99: Prevalence of Micronutient Deficency and Nutrition Status by Cluster
Rural % Urban % Slum %Subclinical vitamin A deficiencyPreschool children 19.4 21.2 38.1School-age children 20.2 22.1 27.1NPNL women 5.4 4.9 6.9Zinc deficiencyPreschool children 48.6 29.5 51.7NPNL women 57.5 54.5 66.4Nutritional status of preschool childrenStunting 31.4 31 51Wasting 21.1 12 20Underweight 29.6 28.1 47.4
Table 99 shows that the prevalence of subclinical vitamin A deficiency and zinc deficiency was proportionately higher in the slums than in urban and rural clusters. Vitamin A supplementation coverage in preschool children was 72% in the slums, 73% in the urban cluster and 78% in the rural cluster (Table 19). However, dietary consumption of vitamin A was lower in the slums. According to data shown elsewhere in this report, the daily median consumption of total vitamin A and vitamin A from animal sources was lower in the slums than in the other two clusters in all the studied populations. The same observation holds true with regard to the consumption of zinc from food – the seven-day consumption of total and zinc from animal sources was lower in the slums among preschool children and NPNL women (Tables 47 and 48).
Therefore, the greater burden of malnutrition in the slums could be attributed to the fact that most of the slum dwellers have to pay for rent, which constitutes a significant portion of their spending. Their peers from the rural cluster mostly own their homesteads (homestead ownership: rural, 93%; urban, 78% and slums, 33%) and do not need to pay for houses. A further stress factor for slum dwellers is the fact that they live in expensive metropolitan cities (Dhaka, Khulna, Chiitagong, Rajshahi), where the cost of living is higher than in the rural areas. Compounded with this, slum households may experience more food insecurity. Just 36% of the households in the slums were “food-secure” against 53% in the urban and 52% in the rural clusters. Seventeen percent of households were “severely food-insecure” in the slums, against 12% in the rural and urban clusters (Table 13). Therefore, in spite of having slightly higher spending power than the rural households, the actual financial power is limited in the slum dwellers, resulting in lower levels of micronutrients and a low nutritional status in the slums population.

83National Micronutrient Survey 2011-12
5. Salient Findings
5.1 Vitamin A
The subclinical deficiency of vitamin A, as measured by low serum retinol (<0.7 mmol/l) was 20.5%, 20.9% and 5.4% in preschool children, school-age children and NPNL women respectively. The prevalence was higher among children in the slums: 38.1% in preschool children and 27.1% in school-age children. Vitamin A consumption from food was below the RDA in all the population groups surveyed. Most of the vitamin A (60-77%), across the population groups studied came from the plant sources (beta-carotene), which is poorly bio-available in the body. Higher bio-available vitamin A from animal sources (retinol) constitutes only a meagre percentage of total consumption. Coverage of vitamin A supplementation in preschool children was 77%: 87% and 76% among the “richest” and “poorest” quintile.
5.2 Anemia and Iron
The prevalence of anemia in preschool children was 33.0%. The prevalence in school-age children was 19.1% and 17.1% in 6-11 and 12-14 year-old children, respectively, and 26% in NPNL women. The prevalence of iron deficiency measured by low ferritin (<12 ng/ml in preschool children; <15 ng/ml in school-age children and the NPNL women) in serum was lower than the widely held assumption. It was 10.7% in preschool children; 7.1 % in NPNL women; 3.9% in school-age children 6-11 years; and 9.5% in children 12-14 years.
The amount of consumption of iron from food is below the RDA in all the population groups studied. The total consumption of iron from food was 41-82% of the RDA across age and sex of the studied population groups. The amount of consumption of heme iron from animal sources, which has higher bio-availability, was a meagre 6-15% of the RDA. Due to a lower consumption of iron from food and the lack of a general food fortification programme, which includes iron, iron deficiency in the population was much lower than expected. It was presumably linked with a high level of iron in the drinking water (groundwater).
5.3 Zinc
The prevalence of zinc deficiency was very high, at 44% in preschool children and 57% in NPNL women. The deficiency was higher in the slums – 52% in preschool children and 66% in NPNL women. The amount of consumption of zinc was well below the RDA. In NPNL women, total consumption was 54.7% of the RDA in the urban cluster and 47% in the slums. Most of the total consumption of zinc comes from plant sources, which is poorly bio-available. Phytate, an inhibitor of zinc absorption in the body that comes from food from plant sources, was high in the foods consumed by Bangladesh population, contributing to a high zinc deficiency.
5.4 Iodine
At the household level, usage of iodized salt (iodine level >5 ppm) was 80.3%; the use of adequately iodized salt (iodine level >15 ppm) was 57.6%. The estimate of household consumption of “brand” salt was 75.8% at the national level. Around 30.0% of the rural households consumed “open” salt; the consumption of “open” salt was 37.0% and 17.0% in the “poorest” and the “richest” households, respectively. The percentage of retailer salt samples with adequately iodized salt (> 20 ppm) was 66.4%. In school-age children, 40.0% had iodine deficiency (UIC below 100.0 µg/l), indicating inadequate iodine in the body. Among NPNL women, 42.1% had iodine deficiency. However, the median of the UIC was 145.7 µg/l and 122.6 µg/l in school-age children and NPNL women, respectively, indicating that, in the population as a whole, iodine nutrition was sufficient. Nevertheless, the poorest quintiles of NPNL women and school-age children were iodine deficient.
84 National Micronutrient Survey 2011-12
The trend of iodine deficiency is rising; 33.8% (2004/05) against 40.0% in school-age children, and 38.6% (2004/05) against 42.1% in NPNL women. The poorest quintiles of the populations were iodine deficient.
5.5 Folate and B12
In NPNL women, the prevalence of folate deficiency was 9.1% and the prevalence of B12 deficiency (frank deficiency and marginal deficiency) was 23.0%.

85National Micronutrient Survey 2011-12
6. Additional Vitamin D Analyses and Calcium Assessment
Introduction: Vitamin D is well known for its crucial role in mineral metabolism and bone growth. It is also essential for the maintenance of calcium homeostasis and bone mineralization. Extreme deficiency of vitamin D in adults causes osteomalacia (Chapuy et al., 1992). Vitamin D deficiency causes growth retardation and rickets in children (Holick and Chen, 2008) and osteopenia, osteoporosis and bone fracture in adults (Lanham-New, 2008). It is postulated that a combination of vitamin D insufficiency and low dietary intake of calcium causes rickets in young children (Pettifor, 2004). Vitamin D deficiency in pregnant women has shown to have adverse effects on foetal growth, bone ossification, tooth enamel formation, and neonatal calcium homeostasis (Specker, 1994). Vitamin D deficiency is very likely to occur due to its increasing demand during rapid growth in foetal life, infancy, early childhood and puberty, pregnancy, lactation period and in the geriatric phase (Alfaham et al., 1995).
Rationale: Vitamin D deficiency was reported in varying degrees in tropical and subtropical countries among children and women (Atiq et al., 1998). National prevalence of rickets in Bangladesh among children aged 1-15 was 1% (National Rickets Survey, Bangladesh 2008), with a reported higher prevalence among children aged 1-5 years. However, the consumption of fish, fish products, meat, liver, milk and fortified foods, which are major sources of vitamin D is insufficient in Bangladesh, with no availability of food fortified with vitamin D. Therefore, nutritional vitamin D intake from food is considered low. An inadequate dietary calcium intake mainly based on cereal sources was observed among NPNL women in Bangladesh (Islam et al., 2002). The cereal-based diet is known to have high content of phytate that inhibits calcium absorption, which may have an negative effect on vitamin D status and bone metabolism (Clements et al., 1987). Traditional avoidance of sun exposure due to wearing veils (purdah) in Muslim women or lack of direct exposure to sunshine among Bangladeshi women may attribute to vitamin D deficiency in NPNL women. The study of M.Z. Islam (Islam et al., 2002) suggests that vitamin D deficiency and borderline low vitamin D status are common in Bangladeshi women. However, national estimates of vitamin D and calcium status among different population groups – e.g. preschool children, school-age children and NPNL women – were unavailable until now. Upon recommendation from the National Technical Committee for the National Micronutrient Survey 2011-12, vitamin D and calcium serum concentration in pre-school children, school-age children and NPNL women were analysed from the remaining samples used for other micronutrients analyses of the National Micronutrients Survey.
Objective: To estimate vitamin D and calcium status in three selected population groups, i.e. pre-school-age children, 6-59 months of age (preschool children), school-age children, 6-14 years of age and NPNL women, 15-49 years of age. Specifically the objectives were to:
a) estimate the current prevalence of vitamin D deficiency among preschool children, school-aged children and NPNL women;
b) Assess the current status of calcium deficiency among preschool children, school-aged children and NPNL women.
Sample size: A convenience sample size based on availability of serum samples used for other micronutrients for the National Micronutrients Survey 2011-12 was considered for vitamin D and calcium estimation for each of the three population groups i.e. preschool children, school-aged children and NPNL women. A total of 1,649 serum samples was available for analysis of vitamin D and calcium in the 3 target groups (461 samples for preschool children; 557 samples for school-aged children; and 631 samples for NPNL women). An a posteriori precision analysis revealed that with a sample size of 461 in preschool children and a prevalence of vitamin D deficiency of 7.5%, based on serum vitamin D level <25.0 nmol/L (Table 6), the precision of the estimate was 6.5%. On the other hand, the precision was 15.4% when prevalence of vitamin D deficiency was estimated at 39.6%, based on serum vitamin D level <50.0 nmol/L (Table 5) in preschool children. Similarly, the precision was 4.2% and 10.5% in school-aged children and 9.4% and 12% in NPNL women, respectively.

86 National Micronutrient Survey 2011-12
Since calcium is closely linked with vitamin D metabolism and both the nutrients are linked with causation of nutritional rickets/osteomalacia and osteoporosis, serum concentration of calcium and vitamin D were measured on the serum samples.
Laboratory analyses of vitamin D and calcium: All the serum samples were analysed for vitamin D and calcium at the Nutritional Biochemistry Laboratory of icddr,b.
Vitamin D
Serum vitamin D3 was estimated by electrochemiluminiscence immunoassay (ECLIA) on automated Roche immunoassay analyzers, Cobas e601using Vitamin D3 (25-OH) Kit (Cat. no. 03314847190, Roche Diagnostics GmbH, Sandhofer Strasse 116, D-68305 Mannheim, Germany). This assay uses a polyclonal antibody directed against 25-OH vitamin D3. It is a competitive assay that has been standardized against LC-MSMS. Results were determined via a calibration curve, which was generated by vitamin D3 (25-OH) CalSet (Cat. no. 03314855190, Roche Diagnostics).
For internal quality control, commercial quality control material (Elecsys PreciControl Varia, Cat No. 05618860 from Roche Diagnostics) was used. The co-efficient of variation (CV) was 4.9% and 2.7% for control 1 and control 2, respectively.
To assess comparative performances, the Nutritional Biochemistry Laboratory of icddr,b participates in the vitamin D External Quality Assessment Scheme (DEQAS) organized by Imperial College Healthcare NHS Trust, Charing Cross Hospital, London, UK.
Calcium
Calcium was measured by Colorimetric assay (Gindler EM et al., 1972) with an endpoint determination and sample blank using a calcium kit (Cat. No. 11489216 216, Roche Diagnostics GmbH, Sandhofer Strasse 116, D-68305 Mannheim, Germany) on an automated clinical chemistry analyzers (Hitachi 902, Roche Diagnostics Mannheim, Germany). Calcium in the sample forms a violet complex with o-cresolphthalein complexone in an alkaline medium. The colour intensity of the purple complex formed is directly proportional to the calcium concentration and is measured photometrically.
For internal quality control, commercial quality control materials, Precinorm U, Cat. No. 10171743 and Precipath U Cat. No. 10171778 (Roche Diagnostics) was used. The co-efficient of variation (CV) was 2.0% and 2.1% for Precinorm U and Precipath U, respectively.
Data processing and analysis: Data for vitamin D and calcium were entered in the main database of the National Micronutrient Survey 2011-12 by data entry operators. Data were checked for errors or inconsistency by the investigators before any analysis was performed. Data analyses were performed using the statistical software-Stata 12.0 SE (Statacorp, College station, Texas). The NMS survey database with variables used to assess SES (quintiles), household food security status (four categories) and dietary intake (amount) were used for all analyses disaggregated by these variables. Means and percentages were estimated with a 95% confidence interval (95% CI). All estimates were cluster-adjusted and weighted to represent the results at the population level.
Definition for vitamin D and calcium deficiency: Due to lack of global consensus on the cut-off values for serum vitamin D concentration to classify vitamin D status, analyses were based on two different cut-off values for serum vitamin D levels reflecting vitamin D deficiency for all three groups. The cut-off values used to define vitamin D deficiency were serum vitamin D level <50.0 nmol/L suggested by Institute of Medicine (Ross AC et al. 2011) and serum vitamin D level <25.0 nmol/L used by other surveys, e.g. UK National Diet and Nutrition Surveys (Gregory et al,. 2000; Henderson et al., 2002) and studies conducted in Bangladesh (Combs et al., 2008; Islam et al., 2002).
Calcium deficiency was defined as total serum calcium level <8.8 mg/dL in preschool children and school-aged children and <8.4 mg/dL in NPNL women (Nelson Textbook of Pediatrics, 18th Edition, 2008).

87National Micronutrient Survey 2011-12
Results:6.1. Vitamin D Status
6.1.1. Mean Vitamin D Concentration
Table 1 shows the mean serum vitamin D concentration in preschool children, school-aged children and NPNL women; the national means were 56.3, 50.7 and 41.8 nmol/L, respectively. The mean vitamin D concentration was lower among preschool children, school-aged children and NPNL women living in the slum cluster than in the rural and urban clusters; however, the differences among the clusters were not statistically significant.
Table 1A: Mean Serum Vitamin D Concentration among Population Groups and by Cluster
National Rural Urban SlumMean 95% CI Mean 95% CI Mean 95% CI Mean 95% CI
(n=461) (n=141) (n=127) (n=193)Preschool children 56.3 50.6, 62.1 56.5 49.1, 63.9 56.2 47.5, 64.9 54.6 48.8, 60.4
(n=557) (n=147) (n=158) (n=252)school-aged children 50.7 46.8, 54.6 51.3 46.3, 56.3 50.3 41.2, 59.4 44.9 39.2, 50.7
(n=631) (n=185) (n=176) (n=270)NPNL 41.8 37.5, 46.2 43.1 37.4, 48.7 38.2 31.5, 45.0 34.2 30.0, 38.4
Tables 2 and 3 show the mean vitamin D concentrations in three population groups disaggregated by household SES and food security status. Although not statistically significant, the mean serum vitamin D concentration was lower in preschool children and higher in school-aged children and NPNL women belonging to the poorest households than in the better-off households. There was no significant difference in the mean vitamin D concentration among households with different food security status in any of the population groups measured (Table 3).
Table 2A: Mean Serum Vitamin D Concentration Disaggregated by Socio-economic Status
Poorest Poorer Middle Richer RichestMean
(nmol/L) 95% CI Mean (nmol/L) 95% CI Mean
(nmol/L) 95% CI Mean (nmol/L) 95% CI Mean
(nmol/L) 95% CI
(n=104) (n=91) (n=96) (n=99) (n=71)Preschool children 52.1 36.8,
67.4 57.4 49.5, 65.4 60.2 52.0,
68.4 55.8 48.3, 63.3 57.5 50.5,
64.5(n=93) (n=106) (n=114) (n=132) (n=112)
School-aged children 56.7 48.8,
64.6 53.2 47.6, 58.8 49.9 40.1,
59.6 45.3 40.5, 50.2 45.1 38.9,
51.2(n=112) (n=106) (n=145) (n=142) (n=126)
NPNL women 47.9 35.6,
60.1 43.3 40.2, 46.4 41.6 34.0,
49.2 39.2 33.5, 45.0 34.3 26.4,
42.1

88 National Micronutrient Survey 2011-12
Table 3A: Mean Serum Vitamin D Concentration Disaggregated by Household Food Security Status
Food-secure Mildly insecure Moderately insecure Severely insecureMean
(nmol/L) 95% CI Mean (nmol/L) 95% CI Mean
(nmol/L) 95% CI Mean (nmol/L) 95% CI
(n=189) (n=76) (n=122) (n=74)Preschool children 56.3 52.1,
60.5 53.3 42.2, 64.3 61.9 51.9, 71.9 47.9 33.9, 61.9
(n=237) (n=113) (n=138) (n=69)School-aged children 49.1 43.5,
54.7 50.8 41.5, 60.2 51.9 47.9, 55.8 57.6 48.0, 67.2
(n=318) (n=96) (n=143) (n=74)
NPNL women 40.4 36.8, 44.0 40.2 36.2, 44.2 45.9 38.2, 53.5 45.8 21.9, 69.7
Among school-aged children, the mean serum vitamin D concentration was higher in boys (54.2 nmol/L, 95% CI 49, 59.5) than in girls (47.2 nmol/L, 95% CI 41.9, 52.5), although the difference between them was not statistically significant (p>0.05). Similarly, prevalence of vitamin D deficiency was lower in boys than in girls (Table 4).
Table 4A: Mean Serum Vitamin D Concentration and Prevalence of Vitamin D Deficiency in School-age Children, Disaggregated by Gender
Gender
National
Serum vitamin D concentration, nmol/L
Low serum vitamin D level [<50.0 nmol/L (Ref. IOM)]
Low serum vitamin D level [<25.0 nmol/L (Ref. Gregory J et.al., 2000)]
Mean 95% CI % 95% CI % 95% CI
Male (n=281) 54.2 49, 59.5 39.3 35.0, 56.1 5.0 0, 11.6
Female (n=276) 47.2 41.9, 52.5 51.6 36.0, 67.2 7.9 1.8, 14.1
6.1.2. Prevalence of Vitamin D Deficiency
As shown in Table 5, the national prevalence of vitamin D deficiency in preschool children, school-aged children and NPNL women was 39.6%, 45.5% and 71.5%, respectively, according to serum vitamin D level cut-off <50.0 nmol/L, compared to 7.5%, 6.5% and 21%, respectively, when the cut-off of <25.0 nmol/L was used (Table 6). The prevalence of vitamin D deficiency was lower in the rural cluster among all three population groups than in the urban and slum clusters, but the differences were not statistically significant.
Table 5A: Prevalence of Vitamin D Deficiency (Serum Vitamin D Level <50.0 nmol/L) in Population Groups and by Cluster
National Rural Urban Slum
% 95% CI % 95% CI % 95% CI % 95% CI
(n=461) (n=141) (n=127) (n=193)
Preschool children 39.6 24.2, 55.1 38.0 18.0, 57.9 44.6 30.3, 58.9 47.9 34.9, 61.0
(n=252) (n=147) (n=158) (n=252)
School-aged children 45.5 35.0, 56.1 41.2 27.4, 55.0 54.2 36.1, 72.2 66.5 53.7, 79.3
(n=631) (n=185) (n=176) (n=270)
NPNL women 71.5 59.5, 83.5 70.6 54.8, 86.4 72.4 62.0, 82.7 83.1 75.0, 91.2
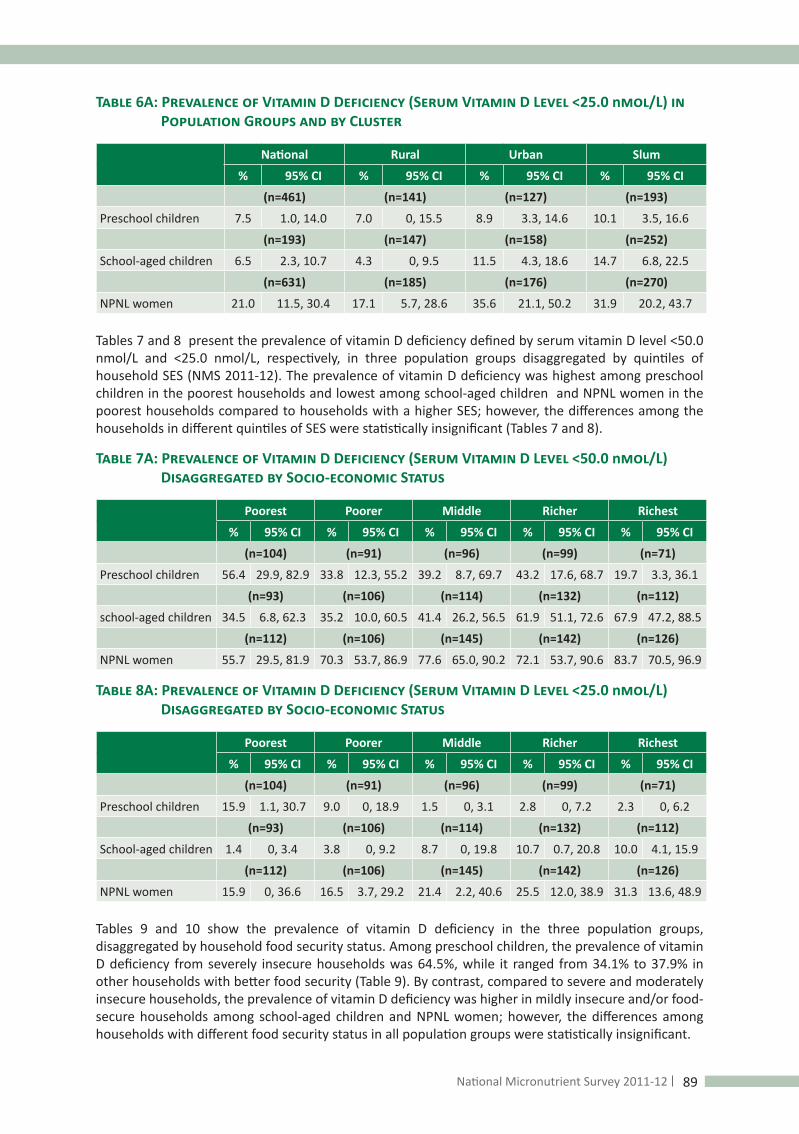
89National Micronutrient Survey 2011-12
Table 6A: Prevalence of Vitamin D Deficiency (Serum Vitamin D Level <25.0 nmol/L) in Population Groups and by Cluster
National Rural Urban Slum
% 95% CI % 95% CI % 95% CI % 95% CI
(n=461) (n=141) (n=127) (n=193)
Preschool children 7.5 1.0, 14.0 7.0 0, 15.5 8.9 3.3, 14.6 10.1 3.5, 16.6
(n=193) (n=147) (n=158) (n=252)
School-aged children 6.5 2.3, 10.7 4.3 0, 9.5 11.5 4.3, 18.6 14.7 6.8, 22.5
(n=631) (n=185) (n=176) (n=270)
NPNL women 21.0 11.5, 30.4 17.1 5.7, 28.6 35.6 21.1, 50.2 31.9 20.2, 43.7
Tables 7 and 8 present the prevalence of vitamin D deficiency defined by serum vitamin D level <50.0 nmol/L and <25.0 nmol/L, respectively, in three population groups disaggregated by quintiles of household SES (NMS 2011-12). The prevalence of vitamin D deficiency was highest among preschool children in the poorest households and lowest among school-aged children and NPNL women in the poorest households compared to households with a higher SES; however, the differences among the households in different quintiles of SES were statistically insignificant (Tables 7 and 8).
Table 7A: Prevalence of Vitamin D Deficiency (Serum Vitamin D Level <50.0 nmol/L) Disaggregated by Socio-economic Status
Poorest Poorer Middle Richer Richest
% 95% CI % 95% CI % 95% CI % 95% CI % 95% CI
(n=104) (n=91) (n=96) (n=99) (n=71)
Preschool children 56.4 29.9, 82.9 33.8 12.3, 55.2 39.2 8.7, 69.7 43.2 17.6, 68.7 19.7 3.3, 36.1
(n=93) (n=106) (n=114) (n=132) (n=112)
school-aged children 34.5 6.8, 62.3 35.2 10.0, 60.5 41.4 26.2, 56.5 61.9 51.1, 72.6 67.9 47.2, 88.5
(n=112) (n=106) (n=145) (n=142) (n=126)
NPNL women 55.7 29.5, 81.9 70.3 53.7, 86.9 77.6 65.0, 90.2 72.1 53.7, 90.6 83.7 70.5, 96.9
Table 8A: Prevalence of Vitamin D Deficiency (Serum Vitamin D Level <25.0 nmol/L) Disaggregated by Socio-economic Status
Poorest Poorer Middle Richer Richest
% 95% CI % 95% CI % 95% CI % 95% CI % 95% CI
(n=104) (n=91) (n=96) (n=99) (n=71)
Preschool children 15.9 1.1, 30.7 9.0 0, 18.9 1.5 0, 3.1 2.8 0, 7.2 2.3 0, 6.2
(n=93) (n=106) (n=114) (n=132) (n=112)
School-aged children 1.4 0, 3.4 3.8 0, 9.2 8.7 0, 19.8 10.7 0.7, 20.8 10.0 4.1, 15.9
(n=112) (n=106) (n=145) (n=142) (n=126)
NPNL women 15.9 0, 36.6 16.5 3.7, 29.2 21.4 2.2, 40.6 25.5 12.0, 38.9 31.3 13.6, 48.9
Tables 9 and 10 show the prevalence of vitamin D deficiency in the three population groups, disaggregated by household food security status. Among preschool children, the prevalence of vitamin D deficiency from severely insecure households was 64.5%, while it ranged from 34.1% to 37.9% in other households with better food security (Table 9). By contrast, compared to severe and moderately insecure households, the prevalence of vitamin D deficiency was higher in mildly insecure and/or food-secure households among school-aged children and NPNL women; however, the differences among households with different food security status in all population groups were statistically insignificant.

90 National Micronutrient Survey 2011-12
Table 9A: Prevalence of Vitamin D Deficiency (Serum Vitamin D Level <50.0 nmol/L) Disaggregated by Household Food Security Status
Food-secure Mildly insecure Moderately insecure Severely insecure% 95% CI % 95% CI % 95% CI % 95% CI
(n=189) (n=76) (n=122) (n=74)Preschool children 37.9 24.4, 51.3 34.7 7.1, 62.3 34.1 8.6, 59.5 64.5 39.4, 89.5
(n=237) (n=113) (n=138) (n=69)school-aged children 50.2 29.3, 71.1 46.5 25.1, 67.9 40.0 25.0, 54.9 31.8 11.7, 51.9
(n=318) (n=96) (n=143) (n=74)NPNL 75.5 63.8, 87.2 76.8 59.5, 94.1 56.8 30.4, 83.2 65.7 31.6, 99.7
Table 10A: Prevalence of Vitamin D Deficiency (Serum Vitamin D Level <25.0 nmol/L) Disaggregated by Household Food Security Status
Food-secure Mildly insecure Moderately insecure Severely insecure% 95% CI % 95% CI % 95% CI % 95% CI
(n=189) (n=76) (n=122) (n=74)Preschool children 2.2 0, 4.7 16.3 0, 42.2 10.0 0, 22.9 18.6 4.9, 32.3
(n=237) (n=113) (n=138) (n=69)school-aged children 9.5 1.5, 17.5 5.5 0, 12.5 2.3 0, 5.1 6.2 0, 15.5
(n=318) (n=96) (n=143) (n=74)NPNL 21.8 12.6, 30.9 14.1 1.8, 26.5 16.0 0, 35.2 32.5 0, 69.7
6.1.3. Mean Intake of Food from Animal Sources among Groups by Vitamin D Status
Tables 11 and 12 present seven-day mean intake of food from all animal sources and from meat/poultry/fish intake, respectively, broken down by vitamin D deficiency status in the population groups. The amount of animal source food or meat/poultry/fish intake was higher in subjects with serum vitamin D level ≥50.0 nmol/L or ≥25.0 nmol/L than in subjects with lower levels, among preschool children and school-aged children; however, the differences were not statistically significant except among school-aged children when mean intake of animal source food intake was significantly higher in children with vitamin D level ≥25.0 nmol/L compared to vitamin D level <25.0 nmol/L (1,097 g, 95% CI 853, 1,340 against 653 g, 95% CI 472, 834). This trend was less observed in NPNL women, whose amount of food intake from animal sources was lower with vitamin D level ≥50.0 nmol/L than vitamin D level <50.0 nmol/L. However, the differences in intake from animal sources or meat/poultry/fish between groups among NPNL women were not statistically significant.
Table 11A: Seven-Day Mean Intake of Foods from All Animal Sources by Vitamin D Deficiency Status among the Groups
Animal sources food intake (g)Vit. D deficiency (serum vit. D <50.0 nmol/L) Vit. D deficiency (serum vit. D <25.0 nmol/L)
Yes No Yes No,Mean (95% CI) Mean (95% CI) Mean (95% CI) Mean (95% CI)
(n=200 ) (n=261 ) (n=37 ) (n=424)Preschool children 618 (308, 928) 811 (583, 1038) 356 (36, 675) 765 (513, 1016)
(n=303) (n=254) (n=58) (n=499)School-aged children 842 (702, 983) 1257 (855, 1659) 653 (472, 834) 1097 (853, 1340)*
(n=462) (n=169) (n=155) (n=476)NPNL women 1013 (700, 1327) 881 (734, 1029) 908 (445, 1371) 994 (786, 1203)
* The difference between the groups is statistically significant at p <0.05.

91National Micronutrient Survey 2011-12
Table 12A: Seven-Day Mean Intake of Meat, Poultry and Fish according To Vitamin D Deficiency Status in the Population Groups
Meat/poultry/fish intake (g)Vit. D deficiency (serum vit. D <50.0 nmol/L) Vit. D deficiency (serum vit. D <25.0 nmol/L)
Yes No Yes No Mean (95% CI) Mean (95% CI) Mean (95% CI) Mean (95% CI)
(n=200 ) (n=261) (n=37) (n=424)Preschool children 340 (217, 464) 396 (313, 479) 220 (125, 317) 386 (305, 468)
(n=303) (n=254) (n=58) (n=499)School-aged children 577 (495, 658) 683 (486, 880) 446 (339, 554) 648 (520, 775)
(n=462 ) (n=169) (n=155) (n=476)NPNL women 693 (464, 923) 691 (575, 807) 567 (416, 719) 726 (546, 906)
6.2. Calcium Status
6.2.1. Mean Calcium Concentration
Tables 13, 14 and 15 present the national mean serum calcium concentration further disaggregated by different the clusters, SES and household food security status, respectively, among the preschool children, school-aged children and NPNL women. No significant difference in the mean calcium concentration was found in the rural, urban and slum clusters, in the different quintiles of SES, or in households with different food security status in the three population groups.
Table 13A: Mean Serum Calcium Concentration in Population Groups and by Cluster
National Rural Urban SlumMean
(mg/dL) 95% CI Mean (mg/dL) 95% CI Mean
(mg/dL) 95% CI Mean (mg/dL) 95% CI
(n=461) (n=141) (n=127) (n=193)Preschool children 9.1 8.8, 9.5 9.1 8.6, 9.5 9.3 9.1, 9.6 9.5 9.1, 9.8
(n=557) (n=147) (n=158) (n=252)School-aged children 9.3 9.1, 9.5 9.3 9.1, 9.6 9.4 9.1, 9.6 9.1 8.8, 9.5
(n=631) (n=185) (n=176) (n=270)NPNL women 8.9 8.4, 9.3 8.9 8.3, 9.5 8.8 8.4, 9.2 8.7 8.5, 8.9
Table 14A: Mean Serum Calcium Concentration Disaggregated by Socio-economic Status)
Poorest Poorer Middle Richer RichestMean
(mg/dL) 95% CI Mean (mg/dL) 95% CI Mean
(mg/dL) 95% CI Mean (mg/dL) 95% CI Mean
(mg/dL) 95% CI
(n=104) (n=91) (n=96) (n=99) (n=71)Preschool children 9.2 9.0, 9.3 9.0 8.6, 9.3 9.1 8.2, 10.0 9.5 9.2, 9.7 9.0 8.3, 9.7
(n=93) (n=106) (n=114) (n=132) (n=112)School-aged children 9.5 9.1, 9.9 9.3 9.1, 9.5 9.2 8.9, 9.5 9.2 9.1, 9.4 9.3 8.9, 9.7
(n=74) (n=106) (n=145) (n=142) (n=126)NPNL women 8.9 8.7, 9.2 8.8 8.2, 9.4 8.8 8.0, 9.6 9.0 8.4, 9.6 8.7 8.3, 9.2

92 National Micronutrient Survey 2011-12
Table 15A: Mean Serum Calcium Concentration Disaggregated by Household Food Security Status
Population groupsFood-secure Mildly insecure Moderately insecure Severely insecure
Mean (mg/dL) 95% CI Mean
(mg/dL) 95% CI Mean (mg/dL) 95% CI Mean
(mg/dL) 95% CI
(n=189) (n=76) (n=122) (n=74)
Preschool children 8.9 8.4, 9.5 9.3 9.1, 9.6 9.5 9.2, 9.7 9.1 8.9, 9.4
(n=237) (n=113) (n=138) (n=69)
School-aged children 9.2 9.1, 9.4 9.3 9.0, 9.5 9.5 9.2, 9.8 9.3 9.0, 9.6
(n=318) (n=96) (n=143) (n=74)
NPNL women 8.8 8.2, 9.4 8.8 8.4, 9.3 9.2 8.8, 9.5 8.8 8.5, 9.2
6.2.2. Prevalence of Calcium Deficiency
The national prevalence of calcium deficiency among preschool children, school-aged children and NPNL women was 24.4%, 17.6% and 26.3%, respectively (Table 16). The prevalence of calcium deficiency in preschool children was higher in the rural cluster than the urban and slum clusters and the prevalence was higher in the slums among school-aged children. However, the differences among clusters were not statistically significant. In NPNL women, the prevalence calcium deficiency was similar across the clusters.
Table 16A: Prevalence of Calcium Deficiency by Population Groups and Cluster *
National Rural Urban Slum
% 95% CI % 95% CI % 95% CI % 95% CI
(n=461) (n=141) (n=127) (n=193)
Preschool children 24.4 9.7, 39.1 26.8 7.7, 45.9 15.9 7.3, 24.5 16.4 5.1, 27.7
(n=557) (n=147) (n=158) (n=252)
School-aged children 17.6 10.7, 24.5 15.5 6.7, 24.4 21.5 10.1, 33.0 28.0 15.2, 40.8
(n=631) (n=185) (n=176) (n=270)
NPNL women 26.3 6.8, 45.8 26.5 1.0, 52.0 25.2 9.1, 41.3 26.2 15.1, 37.3
*Note: Calcium deficiency was defined as serum calcium level <8.8 mg/dL for preschool and school-age children, and <8.4 mg/dL for NPNL women.
Tables 17 and 18 present the prevalence of calcium deficiency disaggregated by SES and household food security status, in the three population groups. The prevalence of calcium deficiency was lowest in preschool children and NPNL women from the poorest households and highest among NPNL women from the richest households (Table 17). As shown in Table 18, the prevalence of calcium deficiency from food-secure households among preschool children, school-aged children and NPNL women was 34.2%, 21.6% and 29.8%, respectively, which was higher than the prevalence of calcium deficiency in mildly, moderately or severely food-insecure households (Table 18). However, differences in the prevalence of calcium deficiency in households with different SES or food security status were not statistically significant in any of the population groups.

93National Micronutrient Survey 2011-12
Table 17A: Prevalence of Calcium Deficiency Disaggregated by Socio-economic Status*
Poorest Poorer Middle Richer Richest
% 95% CI % 95% CI % 95% CI % 95% CI % 95% CI
(n=104) (n=91) (n=96) (n=99) (n=71)
Preschool children 12.1 2.2, 21.9 36.4 11.1, 61.6 25.0 0, 54.6 13.3 2.0, 24.7 32.7 0, 65.3
(n=93) (n=106) (n=114) (n=132) (n=112)
School-aged children 14.0 1.8, 26.1 10.1 1.4, 18.7 21.2 0, 41.9 25.2 14.7, 35.6 21.4 5.7, 37.1
(n=112) (n=106) (n=145) (n=142) (n=126)
NPNL women 14.9 2.9, 26.9 31.4 0, 66.4 23.4 6.0, 40.8 21.9 7.7, 36.0 38.7 0, 78.9
*Note: Calcium deficiency was defined as serum calcium level <8.8 mg/dL for preschool and school-age children, and <8.4 mg/dL for NPNL women.
Table 18A: Prevalence of Calcium Deficiency Disaggregated by Household Food Security Status*
Food-secure Mildly insecure Moderately insecure Severely insecure
% 95% CI % 95% CI % 95% CI % 95% CI
(n=189) (n=76) (n=122) (n=74)
Preschool children 34.2 9.4, 59.1 15.4 3.6, 27.3 10.0 1.4, 18.1 17.4 4.4, 30.4
(n=237) (n=113) (n=138) (n=69)
School-aged children 21.6 10.6, 32.7 14.7 0, 29.0 13.3 0, 30.7 14.0 0, 27.2
(n=318) (n=96) (n=143) (n=74)
NPNL women 29.8 6.1, 53.6 29.6 0, 61.0 14.1 0, 27.8 20.8 13.7, 27.9
*Note: Calcium deficiency was defined as serum calcium level <8.8 mg/dL for preschool and school-age children and <8.4 mg/dL for NPNL women.

94 National Micronutrient Survey 2011-12
6.3 Key Findings
Prevalence of vitamin D deficiency
• At the national level, the prevalence of vitamin D deficiency (based on serum vitamin D level <50.0 nmol/L) in pre-school-age children (preschool children) was 39.6%, without a significant variation among rural, urban and slum clusters.
• In preschool children, no significant variation in the prevalence of vitamin D deficiency was observed among different quintiles of SES.
• In preschool children, no significant variation in the prevalence of vitamin D deficiency was observed among households with different food security status.
• At the national level, the prevalence of vitamin D deficiency (based on serum vit. D level <50.0 nmol/L) among school-age children was 45.5%, without any significant variation among the rural, urban and slum clusters.
• In school-aged children, no significant variation was observed in the prevalence of vitamin D deficiency among different quintiles of SES.
• No significant variation in the prevalence of vitamin D deficiency was observed among households with different food security status in school-aged children.
• In NPNL women, the prevalence of vitamin D deficiency (based on serum vit. D level <50.0 nmol/L) was 71.5% at the national level, without any significant variation among rural, urban and slum clusters.
• In the NPNL women, no significant variation was observed in the prevalence of vitamin D deficiency among different quintiles of SES.
• No significant variation in the prevalence of vitamin D deficiency was observed among households with different food security status in NPNL women.
Prevalence of calcium deficiency
• At the national level, the prevalence of calcium deficiency among pre-school-age children was 24.4%, without any significant variation among rural, urban and slum clusters.
• No significant variation was observed in the prevalence of calcium deficiency in the different SES quintiles or in households with different food security status in the preschool children.
• At the national level, the prevalence of calcium deficiency among school-age children was 17.6%, without any significant variation among the rural, urban and slum clusters.
• No significant variation was observed in the prevalence of calcium deficiency among different SES quintiles or among households with different food security status in school-aged children.
• At the national level, in NPNL women, the prevalence of calcium deficiency was 26.3%, without any significant variation among the rural, urban and slum clusters.
• No significant variation was observed in the prevalence of calcium deficiency in different quintiles of SES or among households with different food security status in NPNL women.

95National Micronutrient Survey 2011-12
ReferencesAlfaham M, Woodhead S, Pask G, Davies D. Vitamin D deficiency: a concern in pregnant Asian women. Br J Nutr. 1995; 73: 881–887.
Ali SMK, Pramanik MMA. Conversion factors and Dietary Calculations. Dhaka, Bangladesh: Institute of Nutrition and Food Science, University of Dhaka, 1991
Andersson M, Karunbunathan V, Zimmermann V. Global iodine status in 2011 and the trends over the past decade. J. Nutr. 2012; 142: 744–750.
Arsenault JE. The current high prevalence of dietary zinc inadequacy among children and women in rural Bangladesh could be substantially ameliorated by zinc biofortification of rice. J. Nutr. 2010; 140: 1683–1690.
Atiq M, Suria A, Nizami SQ, Ahmed I. Vitamin D status of breastfed Pakistani infants. Acta Paediatr. 1998 (7); 87: 737-740.
Bangladesh Bureau of Statistics and UNICEF. Anemia prevalence survey of urban Bangladesh and rural Chittagong Hill tracts. Bangladesh; 2003.
Bangladesh Bureau of Statistics. Bangladesh Household Income and Expenditure Survey; 2010.
Brubacher GB and Weiser H. The vitamin A activity of beta-carotene. International Journal of Vitamin and Nutrition Research. 1985; 55(1):5-15.
Chapuy MC, Arlot ME, Duboeuf F, Brun J, Crouzet B, Arnaud S . Vitamin D3 and calcium to prevent hip fractures in elderly women. New Engl J Med. 1992; 327: 1637 – 1642.
Chen PP, Short TG, Leung DH, Oh TE. A clinical evaluation of the hemocuehemoglobinometer using capillary, venous andarterial samples. Anaesth Intensive Care. 1992; 20:497-500.
Clements MR, Johnson L, Fraser DR. A new mechanism for induced vitamin D deficiency in calcium deprivation. Nature. 1987; 325: 62 – 65.
Coates J, Swindale A, Bilinsky P. Household Food Insecurity Access Scale (HFIAS) for Measurement of Food Access: Indicator Guide. version 3: FANTA; 2007.
Combs GF Jr, Hassan N, Dellagana N, Staab D, Fischer P, Hunt C,Watts J. Apparent efficacy of food-based calcium supplementation in preventing rickets in Bangladesh. Biol Trace Elem Res. 2008; 121:193–204.
Dietary Reference Intakes for Vitamin A, Vitamin K, Arsenic, Boron, Chromium, Copper, Iodine, Iron, Manganese, Molybdenum, Nickel, Silicon, Vanadium, and Zinc. Institute of Medicine. National Academy Press, Washington, D.C.: IOM; 2002.
Driskell WJ, Neese JW, Bryant CC, Bashor MM. Measearment of vitamin A and vitamin E in human serum by high-performance liquid chromography. J Chromatogr 1982 Sep 10; 231 (2):439-44.
Eneroth H, El Arefeen S, AkePersson L, Lonnerdal B, Hossain B, Stephensen C Maternal multiple micronutrient supplementation has limited impact on micronutrient status of Bangladeshi infants compared with standard iron and folic acid supplementation. J. Nutr. 2010; 140: 618–624.
Engle-Stone R, Haskell MJ, Ndjebayi AO, Nankap M, Erhardt JG, Gimou M-M. Plasma retinol-binding protein predicts plasma retinol concentration in both infected and uninfected Cameroonian women and children. J. Nutr. doi: 10.3945/jn.111.145805.
Faruque AS, Khan AI, Malek MA, Huq S, Wahed MA, Salam MA, Fuchs GJ, Khaled MA. Childhood anemia and vitamin a deficiency in rural Bangladesh. Southeast Asian J Trop Med Public Health 2006 Jul; 37(4):771-7.

96 National Micronutrient Survey 2011-12
Gindler EM, King JD. Rapid colorimetric determination of calcium in biologic fluids with methylthymol blue. Am J Clin Pathol. 1972; 58:376-382.
Government of Bangladesh. Population census – 2001, National series Vol. 1, Analytical report 2007. Bangladesh Bureau of Statistics, Planning Division, Ministry of Planning,
Gregory J, Lowe S, Bates CJ, Prentice A, Jackson LV, Smithers G. National Diet and Nutrition Survey of People Aged 4–18 Years. vol. 1. Report of the Diet and Nutrition Survey. London: The Stationery Office; 2000.
Halksworth G, Moseley L, Carter K, Worwood M. Iron absorption from Spatone (a natural mineral water) for prevention of iron deficiencyin pregnancy. Clin Lab Haematol. 2003; 25:227–31.
Hallberg L. Bioavailability of dietary iron in man. Annu Rev Nutr. 1991; 1:123–47.
Harun-or-Rashid, UH, Khatun F, Yoshida Y, Morita S, Chowdhury N, Sakamoto J. Iron and iodine deficiencies among under two children, adolescent girls, and pregnant women of Bangladesh: Association with common diseases. Nagoya J. Med. Sci. 2009; 71: 39 - 49.
Helen Keller International and Institute of Public Health Nutrion. Vitamin A Status throughout the Life Cycle in Rural Bangladesh; National Vitamin A Survey 1997-98; Helen Keller International, 1999.
Henderson L, Gregory J, Swan G. National diet and nutrition survey: adults aged 19–64 years. vol. 1: types and quantities of foods consumed. London: The Stationery Office; 2002.
Hickenbottom SJ. Dual isotope test for assessing beta-carotene cleavage to vitamin A in humans. European Journal of Nutrition. 2002 Aug; 41(4):141-147.
Holick MF, Chen TC. Vitamin D deficiency: a worldwide problem with health consequences. Am J Clin Nutr. 2008; 87(suppl): 1080S– 6S.
International Zinc Nutrition Consultative Group Technical Document #1; Food and Nutrition Bulletin. 2004; 25(suppl 2).
Islam MZ, lamberg-Allardt C, Karkkainen M, Outila T, Salamatullah Q, Shamim AA. Vitamin D deficiency: a concern in premenopausal Bangladeshi women of two socio-economic groups in rural and urban region. Eur J Clin Nutr. 2002 Jan; 56(1):51-6.
Islam N, Mahbub A, Nazem NI, Angeles G, Lance P. Slum of Urban Bangladesh: Mapping and Census, 2005. Centre for Urban Studies, MEASURE Evaluation, NIPORT; May 2006.
Islam SN. A Food composition database for Bangladesh with special reference to selected ethnic foods. National Food Policy Capacity Strengthening Programme, USAID; November 2010.
Khambalia, A,, O’Connor, D, Zlotkin S. Periconceptional iron and folate status is inadequate among married, nulliparous women in rural Bangladesh. J. Nutr. 2009; 139: 1–6.
Kinniburgh DG, Smedley PL. Arsenic contamination of groundwater in Bangladesh. 1st vol. Summary. British Geologic Survey Report WC/00/19. British Geologic Survey. Keyworth (UK): 2001.
Kongsbak K, Wahed MA, Friis H, Thilsted SH. Acute phase protein levels, T. trichiura, and maternal education are predictors of serum zinc in a cross-sectional study in Bangladeshi children. J Nutr. 2006 Aug; 136(8):2262-8.
Lanham-New SA. Importance of calcium, vitamin D and vitamin K for osteoporosis prevention and treatment. Proceedings of the Nutrition Society 2008; 67:163–176.
Lindstrom E, El Arefeen S, Raqib R, Lonnerdal B, Hossain B, Ekstrom EC, Acta Obstetricia et Gynecologica Scandinavica. 2011; 90: 47–56.

97National Micronutrient Survey 2011-12
Looker AC, Dallman PR, Carroll MD, Gunter EW, Jhonson CI. Prevalence of iron deficiency in the United States. JAMA 1997 Mar 26; 277 (12):973-6.
Merrill RD, Labrique AB, Shamim AA, Schulze KJ, Christian PK, West KP Jr. Elevated and variable groundwater iron in rural northwestern Bangladesh. J Water Health. 2010; 8:818–25.
Merrill RD, Shamim, Hasmot Ali H, NusratJahan, Labrique AB, Schultz K, et al. Iron Status of Women is Associated with the Iron Concentration of Potable Groundwater in Rural Bangladesh. J Nutr. 2011.
Merrill R. Iron in Groundwater: A source for anemia prevention. Vitamin and Trace Elements. 2012;1:3.
Mitra and Associate and Macro International. Bangladesh demographic and health survey. National Institute of Population Research and Training (NIPORT); 2007.
Mitra and Associate and Macro International. Bangladesh demographic and health survey.. National Institute of Population Research and Training (NIPORT);2011
Morris SS, Ruel MT, Cohen RJ, Dewey KG, de la Brière B, Hassan MN. Precision, accuracy, and reliability of hemoglobin assessment with use of capillary blood. Am J ClinNutr.1999; 69:1243–8.
National Rickets Survey, Bangladesh 2008. Health and Science Bulletin 2009; vol. 7 (1) icddr,b.
National Survey on Iodine Deficiency Disorder and Universal Salt Iiodization in Bangladesh 2004-5.
Nelson Textbook of Pediatrics. 18th Edition. 2008.
Novotny JA, Harrison DJ, Pawlosky R, Flanagan VP, Harrison EH, Kurilich AC. b-Carotene Conversion to Vitamin A Decreases as the dietary dose increases in humans. J Nutr 2010; 140(5): 915–918.
Nutritional Surveilance Project (NSP) 2001, HKI/IPHN.
Patro BK, Saboth P, Zodpey S, Shukla A, Karmarkar MG, Pandav CS. Tracking progress toward elimination of iodine deficiency disorders in jaarkhand, India. Ind J Comm Med 2008; 33(3):182-85.
Pettifor JM. Nutritional rickets: deficiency of vitamin D, calcium, or both? Am J Clin Nutr. 2004; 80(suppl):1725S–9S.
Ranganathan S. Karmarkar MG. Estimation of iodine in salt fortified with iodine & iron. Indian J Med Res. 2006 Apr; 123(4):531-40.
Roberts LC, Hug SJ, Dittmar J, Voegelin A, Saha GC, Ali MA. Spatial distribution and temporal variability of arsenic in irrigated rice fields in Bangladesh. 1. Irrigation water. Environ Sci Technol. 2007; 41:5960–6.
Ross AC, Taylor CL, Yaktine AL, Del Valle HB, Editors. Committee to Review Dietary Reference Intakes for Vitamin D and Calcium; Chapter 5. Dietary reference intakes for adequacy: Calcium and Vitamin D. Institute of Medicine, National Academy of Sciences (USA); 2011.
Solomons NW. Plant sources of provitamin A and human nutriture: How much is still too little? Nutrition Reviews 1999 Nov; 57(11):350-361.
Specker BL. Do North American women need supplemental vitamin D during pregnancy or lactation? Am J Clin Nutr. 1994; 59: S484 – S491.
Tang G, Qin J, Dolnikowski GG, Russell RM. Vitamin A equivalence of beta-carotene in a woman as determined by a stable isotope reference method. European Journal of Nutrition. 2002 Feb; 39(1):7-11.
Thurnham DI, McCabe LD, Haldar S, Wieringa FT, Northrop-Clewes CA, McCabe GP. Adjusting plasma ferritin concentrations to remove the effects of subclinical inflammation in the assessment of iron deficiency: a meta-analysis. Am J Clin Nutr. 2010; 92:546–55.

98 National Micronutrient Survey 2011-12
World Health Organization. Department of Nutrition for Health and Development. Assessment of iodine deficiency disorders and monitoring their elimination: A guide for programme managers. WHO Geneva, Switzerland; 2001.
World Health Organization. Iron deficiency anemia, Assessment, Prevention, and Control: A guide for programme managers; 2001 WHO/NHD/01.3.
Xiaoyan Z, Hong Y, Yuan X, Shaonong D, Bianba Z, Duolao W. Evaluation of a portable haemoglobin photometer in pregnant women in a high altitude area: a pilot study. BMC Public Health. 2009; 9:228.
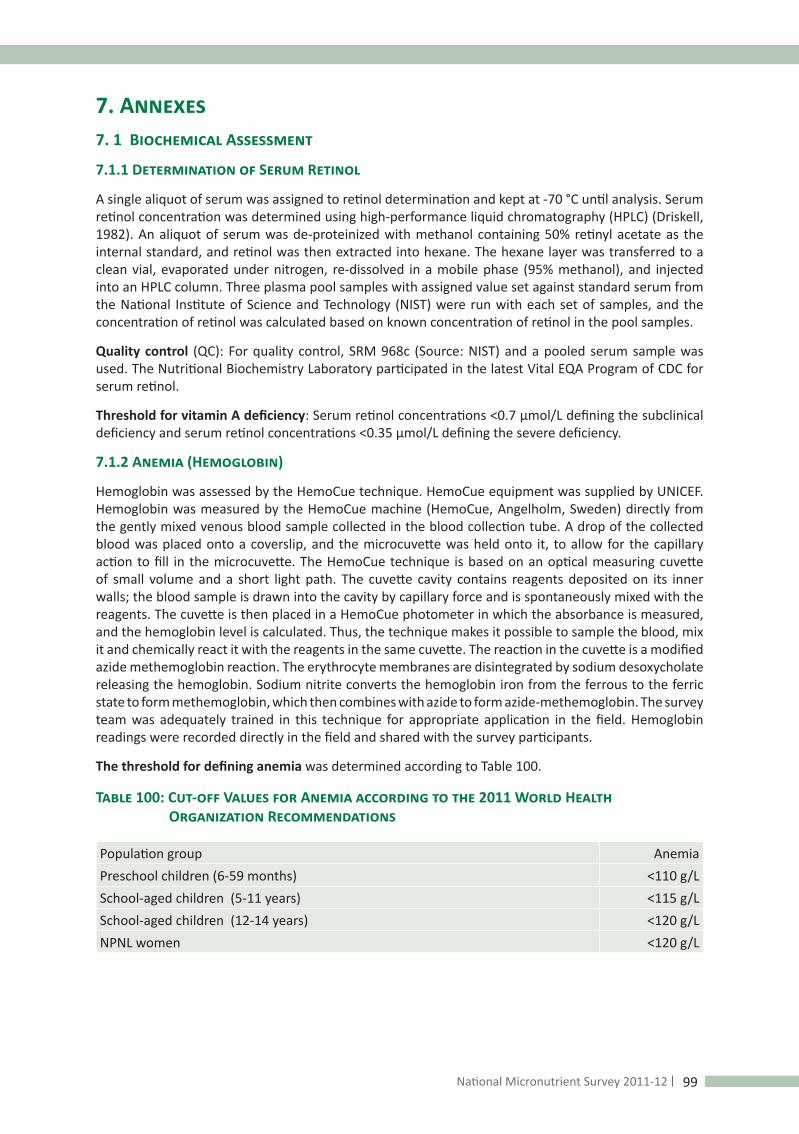
99National Micronutrient Survey 2011-12
7. Annexes7. 1 Biochemical Assessment
7.1.1 Determination of Serum Retinol
A single aliquot of serum was assigned to retinol determination and kept at -70 °C until analysis. Serum retinol concentration was determined using high-performance liquid chromatography (HPLC) (Driskell, 1982). An aliquot of serum was de-proteinized with methanol containing 50% retinyl acetate as the internal standard, and retinol was then extracted into hexane. The hexane layer was transferred to a clean vial, evaporated under nitrogen, re-dissolved in a mobile phase (95% methanol), and injected into an HPLC column. Three plasma pool samples with assigned value set against standard serum from the National Institute of Science and Technology (NIST) were run with each set of samples, and the concentration of retinol was calculated based on known concentration of retinol in the pool samples.
Quality control (QC): For quality control, SRM 968c (Source: NIST) and a pooled serum sample was used. The Nutritional Biochemistry Laboratory participated in the latest Vital EQA Program of CDC for serum retinol.
Threshold for vitamin A deficiency: Serum retinol concentrations <0.7 µmol/L defining the subclinical deficiency and serum retinol concentrations <0.35 µmol/L defining the severe deficiency.
7.1.2 Anemia (Hemoglobin)
Hemoglobin was assessed by the HemoCue technique. HemoCue equipment was supplied by UNICEF. Hemoglobin was measured by the HemoCue machine (HemoCue, Angelholm, Sweden) directly from the gently mixed venous blood sample collected in the blood collection tube. A drop of the collected blood was placed onto a coverslip, and the microcuvette was held onto it, to allow for the capillary action to fill in the microcuvette. The HemoCue technique is based on an optical measuring cuvette of small volume and a short light path. The cuvette cavity contains reagents deposited on its inner walls; the blood sample is drawn into the cavity by capillary force and is spontaneously mixed with the reagents. The cuvette is then placed in a HemoCue photometer in which the absorbance is measured, and the hemoglobin level is calculated. Thus, the technique makes it possible to sample the blood, mix it and chemically react it with the reagents in the same cuvette. The reaction in the cuvette is a modified azide methemoglobin reaction. The erythrocyte membranes are disintegrated by sodium desoxycholate releasing the hemoglobin. Sodium nitrite converts the hemoglobin iron from the ferrous to the ferric state to form methemoglobin, which then combines with azide to form azide-methemoglobin. The survey team was adequately trained in this technique for appropriate application in the field. Hemoglobin readings were recorded directly in the field and shared with the survey participants.
The threshold for defining anemia was determined according to Table 100.
Table 100: Cut-off Values for Anemia according to the 2011 World Health Organization Recommendations
Population group AnemiaPreschool children (6-59 months) <110 g/LSchool-aged children (5-11 years) <115 g/LSchool-aged children (12-14 years) <120 g/LNPNL women <120 g/L

100 National Micronutrient Survey 2011-12
7.1.3 Ferritin (iron deficiency), and C-reactive protein (CRP), Alpha-1-Acid Glycoprotein (AGP) (inflammatory markers)
Serum ferritin was determined by electrochemiluminescence immunoassay (ECLIA) using automated immune chemistry analyzer cobas e601. It had been standardized against the Elecsys Ferritin assay. The Elecsys Ferritin assay had been standardized against the Enzymun-Test Ferritin method. This in turn had been standardized against the 1st International Standard (IS), National Institute for Biological Standards and Control (NIBSC) “Reagent for Ferritin (human liver)” 80/602. CRP and AGP in human serum was determined immunoturbidometrically on Roche-automated clinical chemistry, analyzer Hitachi 902 (Boehringer Mannheim, Germany). Human CRP agglutinates with latex particles coated with monoclonal anti-CRP antibodies. The precipitate is determined turbidmetrically at 570 nm. Anti-AGP antibodies react with AGP in the sample to form an antigen-antibody complex. Following agglutination, the precipitate was measured turbidimetrically. AGP concentration is proportional to the amount of turbidity formed. For quality control, commercially available QC materials were used (Precinorm Protein and Precipath Protein) from Roche Diagnostics.
Quality Control: For quality control, Precinorm Protein and Precipath Protein were used (Source: Roche Diagnostics GmbH D-68298 Mannheim, Germany). The Nutritional Biochemistry laboratory participated in the Vital EQA program of the U.S. Center for Disease Control and Prevention (CDC) for serum ferritin and CRP. Mean and SD were measured by analysing each QC material in ten replicates within same day and established a quality control chart by using mean±2SD. When the results of QC material during regular analysis fell outside ±2SD, corrective measures were taken.
Thresholds for iron deficiency: Iron deficiency was defined as a ferritin level of <12 ng/ml in children under 5 and <15 ng/ml in older children and adults (WHO 2001). Biochemical evidence of inflammation was defined as a CRP level of >10 mg/L and/or AGP >1 g/L (Looker, 1997).
7.1.4 Zinc
Principle: Serum zinc was estimated by atomic absorption spectrophotometry (AAS). Atomic absorption is a physical process involving the absorption of light by the free atoms at a wavelength specific to that element. Flame Atomic Absorption Spectrophotometry (Shimadzu-7000) was used.
Sample preparation: Samples were diluted with deionized water without deproteinization or adding any other reagents.
Precautions: Haemolyzed serum samples or any blood cells present in the serum was avoided.
Quality control: Bi-level serum trace element control was provided from the UTAK Laboratories Inc. USA. Normal and high was used as a check for both accuracy and precision. Pooled serum was also used in every day as internal quality control. One or more working standard solutions were run at intervals to check drifting. Duplication assays were also carried out to watch for precision.
7.1.5 Folate
The serum sample was analysed for folate using an electrochemiluminescence immunoassay (Roche kit). The analyzer was Cobas 6000. The serum was incubated with the folate pre.treatment reagents to release bound folate from endogenous folate binding proteins. Then, the pre-treated sample was incubated with the ruthenium labelled folate binding protein and a folate complex was formed, the amount of which was dependent upon the analyte concentration in the sample. Next, streptavidin-coated microparticles and folate labelled with biotin were added, and the unbound sites of the ruthenium-labelled folate-binding protein was occupied, with formation of a ruthenium-labelled folate-binding protein-folate biotin complex. The entire complex was bound to the solid phase via interaction of biotin and streptavidin. The reaction mixture was then aspirated into the measuring cell where the microparticles were magnetically captured onto the surface of the electrode. Unbound substances were washed away and application of a voltage to the electrode induced chemiluminescent emission, which was measured by a photomultiplier. Results were determined via a calibration curve.

101National Micronutrient Survey 2011-12
Quality control: A pooled serum sample was used which was prepared in the nutritional biochemistry lab. Elecsys PreciControl anemia 1, 2 and 3 (Roche Diagnostics). Mean and SD were established by analysing each QC material in ten replicates within the same day and a quality control chart was established by using mean ± 2SD (Roche kits). The Nutritional Biochemistry laboratory participated in the Vital EQA Program of the CDC for serum folate.
Threshold for folate deficiency: <6.8 nmol/l (Lindstorm et al., 2011).
7.1.6 Vitamin B12
The serum sample was analysed for vitamin B12 using the Electrochemiluminescence immunoassay method (Roche kit). The analyzer was Cobas 6000. Serum was incubated with vitamin B12 pre-treatment reagent to release bound vitamin B12. By incubating the pre-treated sample with the ruthenium labelled intrinsic factor, a vitamin B12-binding protein complex was formed, the amount of which was dependent upon the analyte concentration in the sample. After addition of streptavidin-coated microparticles and vitamin B12 labelled with biotin, the still-vacant sites of the ruthenium labelled intrinsic factor became occupied, with formation of a ruthenium labelled intrinsic factor-vitamin B12 biotin complex. The entire complex became bound to the solid phase via interaction of biotin and streptavidin. The reaction mixture was aspirated into the measuring cell where the microparticles were magnetically captured onto the surface of the electrode. Unbound substances were then removed with ProCell. Application of a voltage to the electrode then induced a chemiluminescent emission, which was measured by a photomultiplier. Results were determined via a calibration curve which was instrument-specifically generated by 2-point calibration, and a master curve provided via the reagent barcode.
Quality control: Elecsys PreciControl anemia 1, 2 and 3 were used for QC. Additionally, pooled serum samples were used as internal quality control. The Nutritional Biochemistry laboratory participated in the CDC’s Vital EQA Program for serum vitamin B12.
Threshold for vitamin B12 deficiency: <200 pmol/l (Lindstorm et al., 2011)
7.1.7 rinary Iodine
3-5 ml urine was collected and stored at -20 ˚C. The samples were transported to the nutritional biochemistry lab at icddr,b. Urinary iodine was measured by microplate method based on the Sandell–Kolthoff reaction. Urine was digested in a microplate at 110°C for 60 minutes using a specially designed sealing cassette to prevent loss of vapour and cross-contamination among wells. After the digestion, mixture was transferred to a transparent microplate and the Sandell–Kolthoff reaction was performed at 25 °C for 15 minutes; urinary iodine was measured by a microplate reader at 405 nm.
Quality control: The Nutritional Biochemistry Laboratory participated in Ensuring the Quality of Iodine Procedures (EQUIP), a standardization programme that addresses laboratory quality-assurance issues related to testing for iodine deficiency.
Threshold for iodine deficiency: Deficiency of a population will be defined as a median urinary iodine excretion level of < 100 µgram/L.
7.1.8 Estimation of Iodine Content in Salt
The iodine content in iodated salt was estimated by titrimetric procedure known as iodometric titration (Ranganathan, 2006). In this reaction, free iodine reacts with sodium thio-sulphate solution to give a light yellow colour complex. This colour complex combines with soluble chemical starch, which indicates the presence of sodium iodide.

102 National Micronutrient Survey 2011-12
Table 101: Definition of Iodization of Salt and Adequacy of Iodization
Type of salt Iodized salt (ppm) Adequately iodized salt (ppm)Household ≥5* ≥15Retailer ≥5 ≥20*Presence of iodine at < 5 ppm in salt (Patro, 2008)
Annex 7.2: Sample size
Table 102: Hypothetical Sample Size Calculated to Detect Desired Changes in the Prevalence of Vitamin A*
Target group Indicator Survey
1 (%)Survey 2 (%)
Minimum number of individuals in 1 cluster
Minimum number of individuals
in all clusters
% of target popul-ation
Households in 1 cluster
House-holds in 3 clusters
Preschool children
Low serum retinol 25 20 2155 6465 10.5 4409 13227
NPNL women
Low serum retinol 5 2 1158 3474 25.8 965 2895
School-age children
Low serum retinol 25 20 2155 6465 26 1781 5343
*Notes: Sample size adjusting for the wesign effect of 2.0 and household response of 95%.
Table 103: Actual Sample Size Used for the Survey to Detect Changes in the Prevalence of Vitamin A Deficiency*
Number of individuals with complete data P value
Target group Indicator
% households target group
recruited
1 cluster All clusters 1 cluster All clusters
Preschool children Low serum retinol 100% 392 1 176 0.236 0.040
NPNL women Low serum retinol 33% 318 954 0.146 0.012
School-age children Low serum retinol 50% 485 1 455 0.187 0.022
*Notes: Number of households that were visited was limited to 3,000 or less; actual p values obtained for each target group for difference in the prevalence of vitamin A deficiency between the baseline and follow-up surveys.
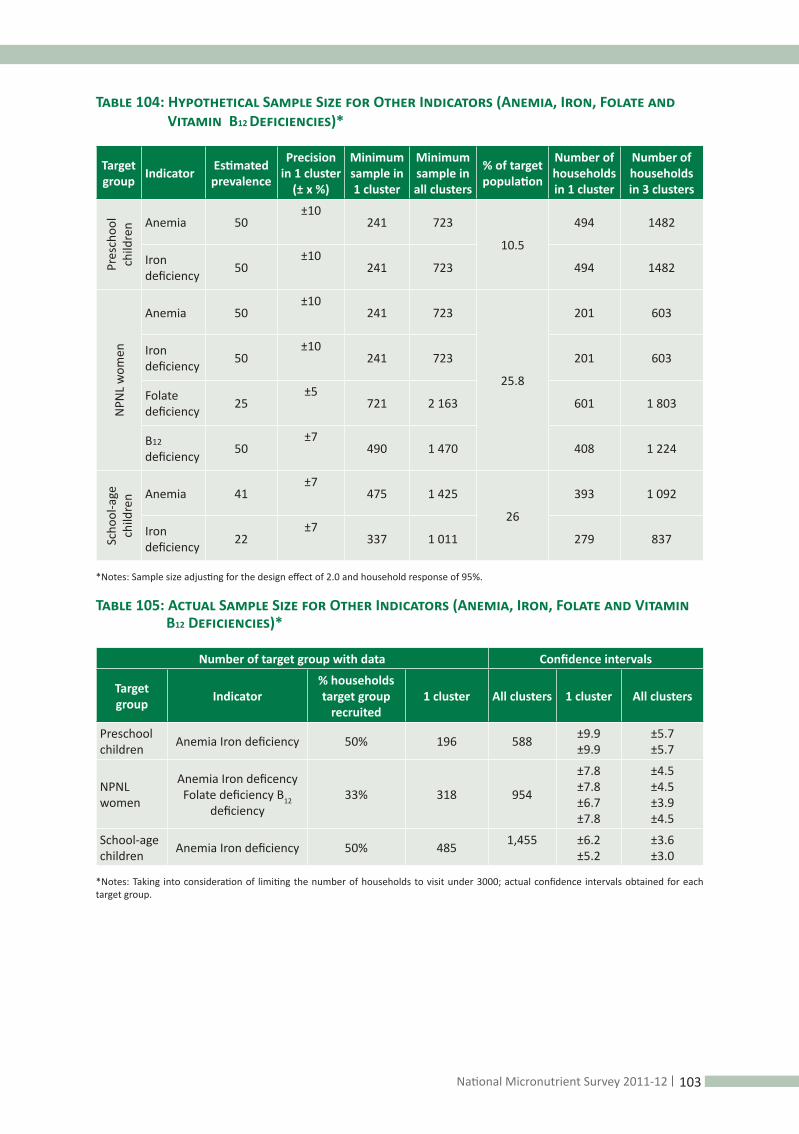
103National Micronutrient Survey 2011-12
Table 104: Hypothetical Sample Size for Other Indicators (Anemia, Iron, Folate and Vitamin B12 Deficiencies)*
Target group Indicator Estimated
prevalence
Precision in 1 cluster
(± x %)
Minimum sample in 1 cluster
Minimum sample in all clusters
% of target population
Number of households in 1 cluster
Number of households in 3 clusters
Pres
choo
l ch
ildre
n Anemia 50±10
241 723
10.5
494 1482
Iron deficiency 50
±10241 723 494 1482
NPN
L w
omen
Anemia 50±10
241 723
25.8
201 603
Iron deficiency 50
±10241 723 201 603
Folate deficiency 25
±5721 2 163 601 1 803
B12 deficiency 50
±7490 1 470 408 1 224
Scho
ol-a
ge
child
ren Anemia 41
±7475 1 425
26
393 1 092
Iron deficiency 22
±7337 1 011 279 837
*Notes: Sample size adjusting for the design effect of 2.0 and household response of 95%.
Table 105: Actual Sample Size for Other Indicators (Anemia, Iron, Folate and Vitamin B12 Deficiencies)*
Number of target group with data Confidence intervals
Target group Indicator
% households target group
recruited1 cluster All clusters 1 cluster All clusters
Preschool children Anemia Iron deficiency 50% 196 588 ±9.9
±9.9±5.7±5.7
NPNL women
Anemia Iron deficency Folate deficiency B12
deficiency33% 318 954
±7.8±7.8±6.7±7.8
±4.5±4.5±3.9±4.5
School-age children Anemia Iron deficiency 50% 485 1,455 ±6.2
±5.2±3.6±3.0
*Notes: Taking into consideration of limiting the number of households to visit under 3000; actual confidence intervals obtained for each target group.

104 National Micronutrient Survey 2011-12
Table 106: Actual Sample Size for the Prevalence of Zinc Deficiency*
Population P z d PQZ^2 Design effect
Adjustment for non-response
Population %
N=1 clusters
N=3 clusters
Adjusted sample in 3 clusters
Preschool children 0.22 1.96 0.07 0.659 2 1.2 0.10 323 969 1 050
NPNL women 0.73 1.96 0.06 0.757 2 1.2 0.25 505 1514 1 500
Total 2 550
*Notes: Sample size adjusted for a design effect of 2 and individual non-response of 20%; taking into consideration of limiting the number of households to visit under 3000.
Table 107: Actual Sample Size Required for Assessing Iodine Deficiency and Coverage of USI*
Target group Indicator Estimated prevalence
Precision in 1 cluster
(± x%)
Minimum sample in 1
cluster
Minimum sample in all clusters
% of target population
No. of households in 1 clusters
No. of households in 3 clusters
NPNL women UIE<100 39 ±7 467 1,401 25.8 389 1,167
School-aged children
UIE<100 34 ±7 440 1,320 26 364 1,092
Household KAP on iodine “good health”
29.3 ±6 NA NA NA 466 1,398
KAP on iodine “prevents goiter”
24.6 ±6 NA NA NA 417 1,251
Purchase of iodized salt
69 ±6 NA NA NA 481 1,443
Adequacy of iodization in salt (≥15 ppm)
51 ±6 NA NA NA 562 1,686
Retailer(assume 95% response)
KAP on iodine (“good health”)
38.8 ±8 301 903 NA NA NA
KAP on iodine (“prevents goiter”)
38.5 ±8 300 900 NA NA NA
Sale of iodized salt 41 ±6 544 1,632 NA NA NA
Adequacy of iodization in salt (≥20 ppm)
53.3 ±10 202 606 NA NA NA
*Notes: Sample size adjusted for a design effect of 2, household response rate of 95% and individual response of 80%; taking into consideration of limiting the number of households to visit under 3000.

105National Micronutrient Survey 2011-12
Annex 7.3 Standard Errors for Selected Variables Calculated from the Data Analysis
Table 108: Standard Errors for Selected Estimates
Estimate Value Standard error (SE)Number of household membersNational Mean 4.67 0.07Rural Mean 4.70 0.08Urban Mean 4.58 0.11Slum Mean 4.47 0.10ReligionIslam Percentage 0.89 0.028Hinduism Percentage 0.08 0.026Buddhism Percentage 0.004 0.003Christianity Percentage 0.012 0.008Ethnic groupBangalee Percentage 0.98 0.009Chakma Percentage 0.004 0.003Marma Percentage 0.007 0.007Garo Percentage 0.0004 0.0004Saotal Percentage 0.002 0.002Other Percentage 0.003 0.003Has electricity Percentage 0.687 0.046Owns a mobile phone Percentage 0.783 0.02Monthly household expenses (taka)National Mean 8943 369Rural Mean 8392 362Urban Mean 11005 1019Slum Mean 8778 333Per capita oil consumption per day (gm) Mean 24.4 1.16Prevalence of anemia in preschool childrenNational Percentage 0.33 0.03Rural Percentage 0.37 0.04Urban Percentage 0.23 0.049Slum Percentage 0.22 0.039Prevalence of iron deficiency in preschool childrenNational Percentage 0.107 0.024Rural Percentage 0.094 0.031Urban Percentage 0.123 0.039Slum Percentage 0.272 0.038Prevalence of vitamin A deficiency in preschool childrenNational Percentage 0.204 0.022Rural Percentage 0.194 0.029Urban Percentage 0.212 0.028Slum Percentage 0.38 0.047

106 National Micronutrient Survey 2011-12
Prevalence of zinc deficiency in preschool childrenNational Percentage 0.446 0.052Rural Percentage 0.486 0.063Urban Percentage 0.295 0.058Slum Percentage 0.517 0.054Prevalence of anemia in NPNL womenNational Percentage 0.26 0.028Rural Percentage 0.27 0.034Urban Percentage 0.21 0.038Slum Percentage 0.20 0.035Prevalence of iron deficiency in NPNL womenNational Percentage 0.071 0.014Rural Percentage 0.066 0.017Urban Percentage 0.087 0.023Slum Percentage 0.074 0.018Prevalence of zinc deficiency in NPNL womenNational Percentage 0.572 0.031Rural Percentage 0.575 0.037Urban Percentage 0.545 0.044Slum Percentage 0.664 0.055Prevalence of vitamin A deficiency in NPNL womenNational Percentage 0.054 0.013Rural Percentage 0.054 0.016Urban Percentage 0.049 0.016Slum Percentage 0.068 0.019Iodine Deficiency In NPNL WomenNational Percentage 0.421 0.052Rural Percentage 0.447 0.066Urban Percentage 0.332 0.069Slum Percentage 0.334 0.049

107National Micronutrient Survey 2011-12
Annex 7.4. Elevated Inflammatory Biomarkers
Table 109: Elevated Inflammatory Biomarkers
Elevated CRP (>10 mg/l) Elevated AGP (>1 g/l)n % 95% CI n % 95% CI
Preschool childrenNational 471 4.6 1.8-7.5 National 473 28.5 22.6-34.5Rural 157 3.6 0.4-6.7 Rural 158 28.2 20.5-35.9Urban 165 7.8 1.0-14.7 Urban 165 27.8 21.5-34.2Slum 149 8.8 1.7-16.0 Slum 150 37.7 25.5-49.9NPNL womenNational 896 1.9 0.7-3.2 National 896 12.8 9.0-16.6Rural 317 1.0 -0.2-2.1 Rural 318 11.5 6.5-16.5Urban 300 5.8 1.4-10.2 Urban 299 17.8 12.5-23.1Slum 279 2.9 0.6-5.2 Slum 279 13.7 8.2-19.1School-age childrenNational 1 277 2.2 0.7-3.7 National 1 277 15.3 12.1-18.5Rural 432 1.9 0.02-3.9 Rural 432 14.6 11.0-18.3Urban 439 3.3 0.6-6.0 Urban 439 18.0 9.8-26.2Slum 406 1.3 -0.2-2.9 Slum 406 14.1 8.1-19.9

108 National Micronutrient Survey 2011-12
Annex 7.5 Household Food Insecurity Questions
The generic occurrence questions, grouped by domain, are:
1) Anxiety and uncertainty about household food supply:
♦ Did you worry that your household would not have enough food?
2) Insufficient quality (includes variety and preferences of the type of food):
♦ Were you or any household member not able to eat the kinds of foods you preferred due to a lack of resources?
♦ Did you or any household member have to eat a limited variety of foods due to a lack of resources?
♦ Did you or any household member have to eat some foods that you really did not want to eat due to a lack of resources to obtain other types of food?
3) Insufficient food intake and its physical consequences:
♦ Did you or any household member have to eat a smaller meal than you felt you needed because there was not enough food?
♦ Did you or any household member have to eat fewer meals in a day because there was not enough food?
♦ Was there ever no food to eat of any kind in your household because of a lack of resources to get food?
♦ Did you or any household member go to sleep at night hungry because there was not enough food?
♦ Did you or any household member go a whole day and night without eating anything because there was not enough food?(Coates et al., 2007)

109National Micronutrient Survey 2011-12
Annex 7.6: List of Primary Sampling Units (PSU) for the National Micronutrient Survey 2011-12
Table 110: Primary Sampling Units (PSUs) for the Survey
Cluster# District Upazilla Union/ward Mauza Area Mauza name
1 280 Barisal Gaurnadi Ward 08 352 2 Diasur
2 405 Barisal Mhendiganj Ward 06 563 2 Kharki
3 712 Jhalokati Jhalokati Sadar Ward 05 659 2 Mudi Patty
4 1 019 Patuakhali Patuakhali Sadar Ward 07 510 2 Power House
5 1 300 Bandarban Bandarban Sadar Ward 06 496 2 Keochin Para
6 1 711 Chandpur Chandpur Sadar Ward 01 426 2 Puran Bazar Uttar
7 2 018 Chittagong Bakalia Ward 35 (Part) 295 3 Chaktai
8 2 169 Chittagong Kotwali Ward 21 396 3 Jamal Khan
9 2 424 Comilla Barura Ward 04 516 2 Kamedda
10 2 913 Cox’s Bazar Cox’s Bazar Sadar Ward 09 381 2 Ghonar Para (Part)
11 3 324 Khagrachhari Khagrachhari Sadar Ward 05 395 2 Govt. High School Area
12 3 631 Lakshmipur Ramganj Ward 07 926 2 Sreepur
13 4 198 Rangamati Rangamati Sadar Ward 02 884 2 Reserve Bazar (Par
14 4 297 Dhaka Dhanmondi Ward 48 (Part) 820 3 Tinmazar (Jhigatala)
15 4 370 Dhaka Khilkhet Dhaka C.C./Ward 17 (Part) 513 3 Khilkhet Kha Para
16 4 443 Dhaka Motijheel Ward 34 192 3 Dakshin Shahjahanpur
17 4 542 Dhaka Shyampur Shyampur 912 2 Shyampur
18 4 693 Faridpur Faridpur Sadar Ward 08 725 2 Uttar Alipur
19 5 000 Gopalganj Gopalganj Sadar Ward 07 640 2 Pacshim Tegharia
20 5 333 Jamalpur Sarishabari Ward 06 549 2 Katiar Bari
21 5 770 Madaripur Madaripur Sadar Ward 03 673 2 Mahisher Char(Part)
22 6 129 Munshiganj Munshiganj Sadar Ward 02 300 2 Gopalnagar
23 6 462 Mymensingh Mymensingh Sadar Ward 16 450 2 Ganginapar (Part)
24 6 821 Narsingdi Narsingdi Sadar Ward 01 088 2 Bhelanagar
25 7 180 Netrakona Netrokona Sadar Ward 07 533 2 Mukter Para
26 7 461 Shariatpur Naria Ward 05 160 2 Bitik Kuri
27 7 690 Sherpur Sreebardi Ward 04 927 2 Uttar Sreebardi
28 8 205 Bagerhat Mongla Ward 02 862 2 Selabunia
29 8 460 Jessore Abhaynagar Ward 02 718 2 Paschim Noapara
30 8 793 Jhenaidah Kotchandpur Ward 02 468 2 Kazi Para
31 9 022 Khulna Khalishpur Ward 14 043 3 Bara Boyra (Part 1-3)
32 9 095 Khulna Paikgachha Ward 08 107 2 Batikhali (Part)

110 National Micronutrient Survey 2011-12
Cluster# District Upazilla Union/ward Mauza Area Mauza name
33 9 376 Kushtia Mirpur Ward 09 576 2 Khandakbaria
34 9 605 Meherpur Meherpur Sadar Ward 04 527 2 Kased Para
35 9 808 Satkhira Kalaroa Ward 04 280 2 Jikra Uttar
36 10 115 Bogra Kahaloo Ward 01 479 2 Sarai
37 10 708 Gaibandha Gaibandha Sadar Ward 05 675 2 Madha Gobindapur
38 10 963 Joypurhat Kalai Ward 09 588 2 Kalai Talukder Para
39 11 400 Lalmonirhat Lalmonirhat Sadar Ward 06 175 2 Baniar Dighi
40 11 681 Naogaon Patnitala Ward 07 458 2 North Harirampur
41 12 066 Chapai Nababgan
Chapai Nababganj Sad Ward 06 937 2 Sankarbati
42 12 347 Pabna Bera Ward 03 620 2 Moytar Baidya
43 12 680 Panchagarh Panchagarh Sadar Ward 04 660 2 Jalashi Colony
44 12 857 Rajshahi Durgapur Ward 06 096 2 Baharampur
45 13 112 Rangpur Kaunia Ward 01 360 2 Jumma Para
46 13 471 Sirajganj Sirajganj Sadar Ward 06 814 2 Nutan Bhangabari
47 13 804 Habiganj Chunarughat Ward 08 079 2 Azimabad
48 14 085 Maulvibazar Maulvibazar Sadar Ward 08 875 2 Sabujbagh T&T Colony
49 14 652 Sylhet Golapganj Ward 04 915 2 Nij Sarashwati
50 14 803 Sylhet Sylhet Sadar Ward 21 800 3 Shaplabagh
51 97 Barguna Barguna Sadar Naltona 394 1 Gazi Mamud
52 422 Barisal Mhendiganj Char Ekkaria 978 1 Uttar Dadpur
53 725 Jhalokati Jhalokati Sadar Binoykati 382 1 Garanga
54 1 003 Patuakhali Mirzaganj Majidbari 687 1 Mazidbaria
55 1 319 Bandarban Bandarban Sadar Kuhalong 559 1 Kuhalang
56 1 602 Brahmanbaria Kasba Badair 066 1 Badair
57 1 881 Chandpur Matlab Dakshin Uttar Upadi 731 1 Naogaon
58 2 221 Chittagong Mirsharai Ichhakhali 660 1 Paschim Ichhakhali
59 2 500 Comilla Burichang Sholanal 111 1 Berajal Kadamtali
60 2 776 Comilla Meghna Gobindapur 164 1 Buriar Char
61 3 057 Cox’s Bazar Teknaf Baharchhara 746 1 Shilkhali
62 3 350 Khagrachhari Khagrachhari Sadar Khagrachhari 459 1 Gamaridhala
63 3 641 Lakshmipur Ramganj Chandipur 192 1 Chandipur
64 3 921 Noakhali Subarnachar Purba Char Bata 393 1 Hajipur
65 4 183 Rangamati Rajasthali Ghila Chhari Unio 795 1 Kukya Chhari

111National Micronutrient Survey 2011-12
Cluster# District Upazilla Union/ward Mauza Area Mauza name
66 4 657 Faridpur Char Bhadrasan Char Harirampur 212 1 Char Harirampur
67 4 954 Gazipur Kapasia Singasree 898 1 Singasree
68 5 256 Jamalpur Jamalpur Sadar Meshta 156 1 Bir Fular Para
69 5 535 Kishoregonj Katiadi Achmita 041 1 Astagharia
70 5 822 Madaripur Rajoir Kadambari 267 1 Gazaria
71 6 107 Munshiganj Lohajang Gaodia 719 1 Pakhidia
72 6 395 Mymensingh Gauripur Sahanati 432 1 Jogir Danguri
73 6 674 Narayanganj Bandar Kalagachhia 379 1 Gokul Gobindabari
74 6 977 Netrakona Barhatta Asma 476 1 Hariatala
75 7 257 Rajbari Baliakandi Jangal 894 1 Sasapur
76 7 567 Sherpur Jhenaigati Hatibandha 703 1 Laykhan
77 7 854 Tangail Ghatail Sandhanpur 341 1 Gauri Jainabari
78 8 138 Bagerhat Fakirhat Mulghar 282 1 Faltita Baniakhali
79 8 437 Chuadanga Jiban Nagar Banka 071 1 Banka
80 8 720 Jhenaidah Harinakunda Raghunathpur 478 1 Kalaparia
81 9 071 Khulna Koyra Bagali 422 1 Ghugrakati
82 9 377 Kushtia Mirpur Ambaria 024 1 Ambaria Mirzapur
83 9 705 Narail Lohagara Lohagara 210 1 Char Baghjuri
84 10 013 Bogra Bogra Sadar Gokul 416 1 Gokul
85 10 276 Bogra Shibganj Saidpur 430 1 Gopiballabh
86 10 542 Dinajpur Kaharole Rasulpur 019 1 Baharpur
87 10 831 Gaibandha Shaghata Bonar Para 119 1 Bati
88 11 117 Kurigram Chilmari Raniganj 994 1 Uttar Uari
89 11 417 Lalmonirhat Lalmonirhat Sadar Harati 962 1 Taluk Harati
90 11 707 Naogaon Patnitala Shihara 020 1 Asanta
91 11 987 Chapai Nababgan Bholahat Gohalbari 420 1 Gohalbari
92 12 297 Nilphamari Saidpur Bothlagari 211 1 Bothlagari (Part)
93 12 577 Pabna Sujanagar Satbaria 537 1 Kandarpapur
94 12 899 Rajshahi Godagari Gogram 082 1 Baghdhara
95 13 217 Rangpur Pirgachha Annadanagar 040 1 Annadanagar
96 13 494 Sirajganj Sirajganj Sadar Ratankandi 377 1 Ekdala
97 13 782 Habiganj Baniachong Baraiuri 110 1 Bara Ujirpur
98 14 073 Maulvibazar Kulaura Sharifpur 212 1 Daudpur (Sonapur) Part
99 14 358 Sunamganj Jagannathpur Mirpur 675 1 Nabinagar

112 National Micronutrient Survey 2011-12
Cluster# District Upazilla Union/ward Mauza Area Mauza name
100 14 626 Sylhet Fenchuganj Fenchuganj 331 1 Gayasi
101 14 868 Chittagong Baezid Bostami WARD 02 346 4 Kulgaon
102 14 870 Chittagong Bakolia Ward 17 721 4 Paschim Bakalia (Part 1)
103 14 871 Chittagong Bakolia Ward 18 111 4 Purba Bakalia(Part 2)
104 14 875 Chittagong Chandgaon Ward 06 721 4 Paschim Bakalia (Part)
105 14 880 Chittagong Doubul Moring Ward 29 479 4 Paschim Madrbari (Part)
106 14 881 Chittagong Halishahar Ward 24 640 4 Pangi Para
107 14 884 Chittagong Kotowali Ward 21 396 4 Jamal Khan
108 14 885 Chittagong Kotowali Ward 31 80 4 AL- Karan
109 14 886 Chittagong Kotowali Ward 34 895 4 Patharghata
110 14 891 Chittagong Kulshi Ward 14 810 4 Shah Garib Ullah
111 14 894 Chittagong Kulshi Ward 14 700 4 Railway Colony (Tiger Pass)
112 14 896 Chittagong Pahartoli Ward 11 236 4 Dakshin Kattali Part
113 14 897 Chittagong Pahartoli Ward 12 735 4 Sarai Para
114 14 898 Chittagong Panchlaisn Ward 03 999 4 Shohid Nagar
115 14 900 Chittagong Panchlaisn Ward 07 822 4 Paschim Shola Shahar (Part 2
116 14 911 Dhaka Newmarket Ward 52 370 4 Nilkhet Babupura
117 14 912 Dhaka Gulshan Ward 18 500 4 Kalachandpur (Madhya)
118 14 918 Dhaka Hajaribag Ward 58 574 4 Hazaribag Road, Nabipur Basti
119 14 919 Dhaka Kufrul Ward 04 145 4 Purba Baishtek
120 14 921 Dhaka Kufrul Ward 15 78 4 Bashan Tek 1 no. Basti
121 14 924 Dhaka Kufrul Ward 16 630 4 Paschim Kafrul, Nahar Bakery Basti
122 14 925 Dhaka Khilgaon Ward 22 257 4 257 Purba Rampura
123 14 928 Dhaka Khilgaon Ward 26 500 4 500 Meradia (Part 1)
124 14 929 Dhaka Khilgaon Ward 26 501 4 501 Meradia (Part 2)
125 14 936 Dhaka Mirpur Ward 10 225 4 Darussalam Society Basti
126 14 939 Dhaka Muhammadpur Ward 43 515 4 Baitul Aman Housing
127 14 941 Dhaka Muhammadpur Ward 46 500 4 Paschim Katashur Bottala Basti
128 14 942 Dhaka Muhammadpur Ward 47 208 4 Paschim Jafrabad Vandarir Basti

113National Micronutrient Survey 2011-12
Cluster# District Upazilla Union/ward Mauza Area Mauza name
129 14 943 Dhaka Matijhil Ward 31 226 4 Gopibag
130 14 946 Dhaka Pallabi Ward 02 148 4 Begun Tila Basti
131 14 947 Dhaka Pallabi Ward 03 410 4Mirpur, Section-11, Block-C, Paris Road Basti
132 14 949 Dhaka Pallabi Ward 05 570 4Mirpur, Section-11, Block-A, Bihari Camp Basti
133 14 950 Dhaka Pallabi Ward 06 212 4 Doari Para
134 14 954 Dhaka Shampur Ward 83 187 4 D.I.T Area, Gandaria Rail Line Basti
135 14 956 Dhaka Shampur Ward 87 654 4 Uttar Mirhazirbagh, Khetpar Basti
136 14 958 Dhaka Shampur Ward 90 705 4 Tula Bagicha
137 14 963 Dhaka Tejgaon Ward 38 960 4Uttar Paschim Nakhalpara, Kebla bari Basti
138 14 964 Dhaka Tejgaon Ward 38 177 4Purba Nakhal Para, Rashid Chairman Basti
139 14 969 Khulna Khalishpur Ward 07 995 4 Crisent Bazar
140 14 971 Khulna Khalishpur Ward 08 605 4 People Jute Mill Area
141 14 973 Khulna Khalishpur Ward 14 138 4 Goalkhali Bastuhara Colony
142 14 975 Khulna Khalishpur Ward 16 114 4 Dakshin Boyra Junction
143 14 978 Khulna Khulna Sadar Ward 22 628 4 Natun Bazar
144 14 980 Khulna Khulna Sadar Ward 24 669 4 Roy Para
145 14 983 Khulna Khulna Sadar Ward 31 430 4 Laban Chora (Madinabad)
146 14 985 Khulna Sona Danga Ward 17 713 4 Sonadanga Purba
147 14 991 Rajshahi Boalia Ward 25 919 4 Shekher Char
148 14 993 Rajshahi Boalia Ward 28 252 4 Jamalpur
149 14 997 Rajshahi Raj Para Ward 02 721 4 Harogram Ranidighi
150 14 998 Rajshahi Raj Para Ward 04 431 4 Keshabpur

114 National Micronutrient Survey 2011-12
Annex 7.7 Questionnaires
Annex 7.7.1 Household Questionnaire
Household # (50-household listing): Household # (Sl. 20-household list):
Household Identification
Cluster:1=Rural; 2=Cities+Municipalities; 3= Urban (Slum)
Division: 1=Dhaka, 2=Chittagong, 3= Rajshahi, 4=Khulna5=Sylhet, 6=Barishal
Division: District:
Upazilla/municipality ___________________________Union: Ward: (............)
Mauza _______________________________________Cluster No:
Household Identification:
Name of the household head _____________________ Date of data collection:DD/MM/YY / /
Household landline /cell phone no.:
Name of the Interviewer_________________________ Signature: ______________________________
Name of the Supervisor _________________________ Signature: ______________________________
Name of the Quality Control Officer ________________ Signature: ______________________________
Written informed consent: 1=Yes, 2=No
Result Code: Completed=1 Incomplete=2
Reason for which the data collection was not completed .........................................................................................................................................................................................................................................................................
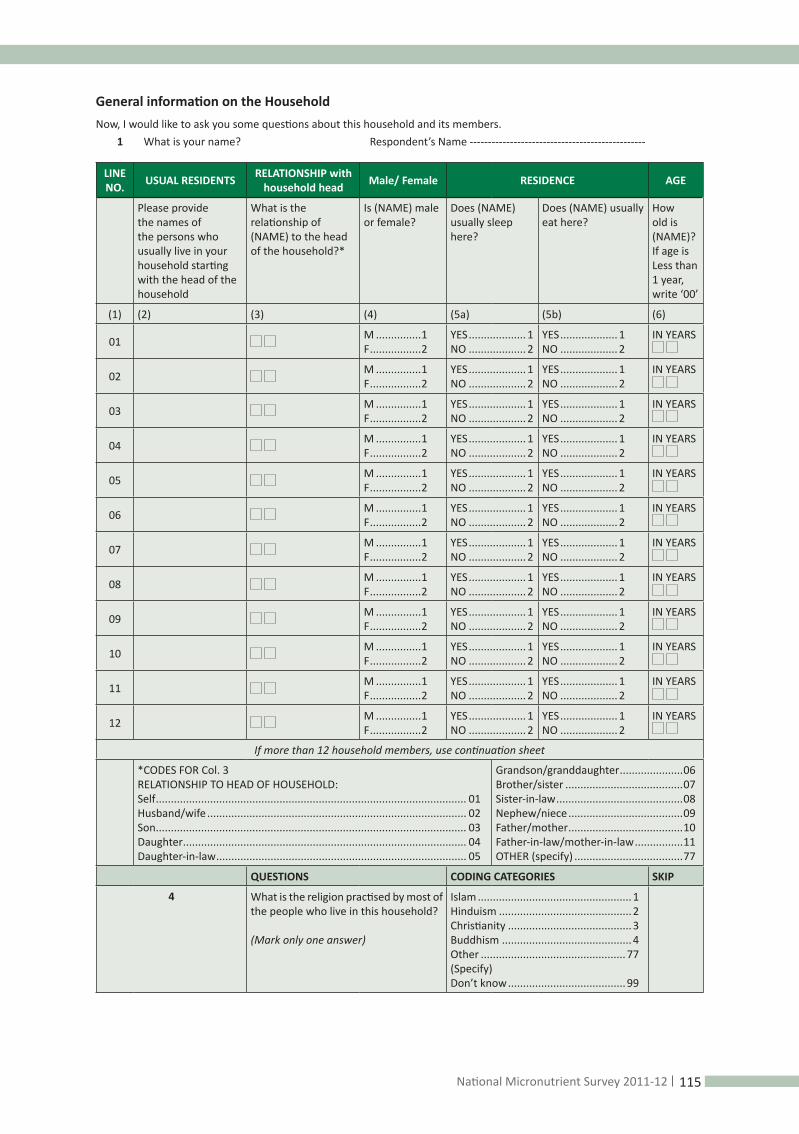
115National Micronutrient Survey 2011-12
General information on the Household Now, I would like to ask you some questions about this household and its members. 1 What is your name? Respondent’s Name ------------------------------------------------
LINENO. USUAL RESIDENTS RELATIONSHIP with
household head Male/ Female RESIDENCE AGE
Please provide the names of the persons who usually live in your household starting with the head of the household
What is the relationship of (NAME) to the head of the household?*
Is (NAME) male or female?
Does (NAME) usually sleep here?
Does (NAME) usually eat here?
How old is (NAME)?If age is Less than 1 year, write ‘00’
(1) (2) (3) (4) (5a) (5b) (6)
01 M ...............1F .................2
YES ................... 1NO ................... 2
YES ................... 1NO ................... 2
IN YEARS
02 M ...............1F .................2
YES ................... 1NO ................... 2
YES ................... 1NO ................... 2
IN YEARS
03 M ...............1F .................2
YES ................... 1NO ................... 2
YES ................... 1NO ................... 2
IN YEARS
04 M ...............1F .................2
YES ................... 1NO ................... 2
YES ................... 1NO ................... 2
IN YEARS
05 M ...............1F .................2
YES ................... 1NO ................... 2
YES ................... 1NO ................... 2
IN YEARS
06 M ...............1F .................2
YES ................... 1NO ................... 2
YES ................... 1NO ................... 2
IN YEARS
07 M ...............1F .................2
YES ................... 1NO ................... 2
YES ................... 1NO ................... 2
IN YEARS
08 M ...............1F .................2
YES ................... 1NO ................... 2
YES ................... 1NO ................... 2
IN YEARS
09 M ...............1F .................2
YES ................... 1NO ................... 2
YES ................... 1NO ................... 2
IN YEARS
10 M ...............1F .................2
YES ................... 1NO ................... 2
YES ................... 1NO ................... 2
IN YEARS
11 M ...............1F .................2
YES ................... 1NO ................... 2
YES ................... 1NO ................... 2
IN YEARS
12 M ...............1F .................2
YES ................... 1NO ................... 2
YES ................... 1NO ................... 2
IN YEARS
If more than 12 household members, use continuation sheet
*CODES FOR Col. 3RELATIONSHIP TO HEAD OF HOUSEHOLD:Self ....................................................................................................... 01Husband/wife ...................................................................................... 02Son ....................................................................................................... 03Daughter .............................................................................................. 04Daughter-in-law ................................................................................... 05
Grandson/granddaughter .....................06Brother/sister .......................................07Sister-in-law ..........................................08Nephew/niece ......................................09Father/mother ......................................10Father-in-law/mother-in-law ................11OTHER (specify) ....................................77
QUESTIONS CODING CATEGORIES SKIP
4 What is the religion practised by most of the people who live in this household?
(Mark only one answer)
Islam ................................................... 1Hinduism ............................................ 2Christianity .........................................3Buddhism ........................................... 4Other ................................................ 77(Specify)Don’t know .......................................99

116 National Micronutrient Survey 2011-12
LINENO. USUAL RESIDENTS RELATIONSHIP with
household head Male/ Female RESIDENCE AGE
5 What ethnic group do you belong to?
Bangali ................................................ 1 Chakma. ............................................. 2Marma ................................................ 3Garo .................................................... 4Saotal .................................................. 5Other ................................................ 77(Specify)
6 What is the main occupation of the head of the household?
Professional/technical ......................01Small business ..................................02Large business .................................03Factory worker..................................04Service ..............................................05Skilled labour/service .......................06Unskilled labour ...............................07Farmer/agricultural worker ............. 08Poultry/cattle raising ...................... .09Home manufacturing .......................10Domestic help ...................................11Housewife .........................................12Other ................................................ 77(Specify)
7 What is the level of formal education of the (Household Head)?
No education ......................................1Primary incomplete ............................2Primary complete ...............................3Secondary incomplete ........................4Secondary complete or higher ...........5Don’t know .......................................99
8 What is the main source of drinking water for members of your household?
Piped into dwelling ...........................01Piped to yard/plot ............................02Public tap ..........................................03Tube-well ..........................................04Protected well ..................................05Unprotected well ..............................06Unprotected spring well ...................07Protected spring well ........................08Rainwater .........................................09Tanker truck ......................................10Surface water (river/dam/lake/pond/ stream/canal/irrigation channel)......11Other ............................................... 77(Specify)
9 Do you do anything to the water to make it safer to drink?
Yes ...................................................... 1No ....................................................... 2Don’t know .........................................9
|→11|
10 What do you usually do to make water safer to drink?
Boil ..................................................... 1Add bleach/chlorine/purifying tablet .2Strain through a cloth .........................3Use water filter (ceramic/sand/composite) .......................................... 4Let it sand and settle ..........................5Do nothing ..........................................6Other ................................................ 77 (Specify)

117National Micronutrient Survey 2011-12
QUESTIONS CODING CATEGORIES SKIP11 What kind of toilet facilities do members of your
household usually use?
(See for yourself)
Flushed to piped sewer system ...........................01Flush to septic tank..............................................02 Flush to pit latrine ...............................................03Flush to somewhere else .....................................04Pit latrine with slab ..............................................05Pit latrine without slab/open pit .........................06 Bucket toilet ........................................................07Hanging toilet ......................................................08No facility/bush/field...........................................09Others ..................................................................77(Specify)
12 Does your household or anyone of your household have:a. Electricity? Yes .........................................................................1
No ..........................................................................2b. A radio? Yes .........................................................................1
No ..........................................................................2c. A television? Yes .........................................................................1
No ..........................................................................2d. A mobile phone? Yes .........................................................................1
No ..........................................................................2e. A land line? Yes .........................................................................1
No ..........................................................................2f. A refrigerator? Yes .........................................................................1
No ..........................................................................2g. An almirah/wardrobe? Yes .........................................................................1
No ..........................................................................2h. Tables? Yes .........................................................................1
No ..........................................................................2i. Chairs? Yes .........................................................................1
No ..........................................................................2j. A watch? Yes .........................................................................1
No ..........................................................................2k. A bicycle? Yes .........................................................................1
No ..........................................................................2l. A motorcycle/scooter/tempo? Yes .........................................................................1
No ..........................................................................2m. An animal-drawn cart? Yes .........................................................................1
No ..........................................................................2n. A car or truck? Yes .........................................................................1
No ..........................................................................2o. A boat? Yes .........................................................................1
No ..........................................................................2p. A rickshaw/van? Yes .........................................................................1
No ..........................................................................213 What type of fuel does your household usually use for
cooking?Electricity .............................................................01LPG .....................................................................02Natural gas ..........................................................03Biogas ..................................................................04Kerosene ..............................................................05Coal......................................................................06 Wood ...................................................................07Straw/shrubs/grass ..............................................08Agricultural crop ..................................................09Animal dung ........................................................10Other ...................................................................77(Specify)

118 National Micronutrient Survey 2011-12
QUESTIONS CODING CATEGORIES SKIP14 What is the main material of the floor?
(See for yourself) Natural floorEarth/sand ...........................................................01Rudimentary floorWood/planks .......................................................02Palm/bamboo ......................................................03Finished floor (parquet or polished)Wood ..................................................................04Ceramic tiles/mosaic ...........................................05Cement ...............................................................06Carpet ..................................................................07Other ...................................................................77(Specify)
15 What is the main material of the roof? (See for yourself)
Natural roofingNo roof ...............................................................01Thatch/palm leaf .................................................02Rudimentary roofingBamboo ...............................................................03Wood planks ........................................................04Cardboard ............................................................05Finished roofingTin ........................................................................06Wood ...................................................................07Ceramic tiles ........................................................08Cement ................................................................09Other ...................................................................77(Specify)
16 What is the main material of the external wall?(See for yourself)
Natural wallsNo walls ...............................................................01Cane/palm/trunks ...............................................02Rudimentary wallsBamboo with mud ...............................................03Stone with mud ...................................................04Plywood ...............................................................05Cardboard ............................................................06Finished wallsTin ........................................................................07Cement ................................................................08Stone with lime/cement ......................................09Bricks ...................................................................10Wood planks/shingles .........................................11Other ...................................................................77(Specify)
17 How many rooms in the household are used for sleeping?
Number of bedrooms ....................................
18 Does the household own any homestead? Yes .........................................................................1No ..........................................................................2 →19
18A Does the household own a homestead elsewhere? Yes .........................................................................1No ..........................................................................2
19 Does the household own any land other than homestead land (cultivable/fallen land)?
Yes .........................................................................1No ..........................................................................2 →21
20 How much land does the household own other than the homestead land (cultivable/fallen)?
Acres: ............................................................. Decimals: .......................................................
21 Do you know the monthly expenditure of your family? Yes .........................................................................1No/don’t know ......................................................2 →22
21A What is the approximate monthly expenditure of your family (approximate collective expenditure of all the family members)?
Taka ............................................

119National Micronutrient Survey 2011-12
QUESTIONS CODING CATEGORIES SKIP22 What type of cooking oil do you use in your household?
(Multiple answers possible)
Soybean ...............................................................01Mustard ...............................................................02Supper/palm ........................................................03 Coconut ...............................................................04Others ..................................................................77(Specify)
22A What kinds of cooking oil does your household buy? “Brand” oil ..........................................................01Open oil ..............................................................02Both .....................................................................03Others .................................................................77 (Specify)
→23
→23
22B (If you are using “brand” oil),what is the name of the “brand” oil you buy/use?
Brand name___________________________________________________________
22C Was the brand consumed by the household “fortified with vitamin A”?(Please check the oil container in the household for labelling, or check in shops whether the “brand” was fortified)
Yes .........................................................................1No ..........................................................................2
23 How often do you buy cooking oil in a month? Number of times ........................................... 23A How much cooking oil do you buy at a time? Liters ........................................................................23B How much does your household spend on cooking oil
in a month?Taka ......................................................
24 Do you know which foods are rich in vitamin A? Yes .........................................................................1No ..........................................................................2 →24b
24A Please state the name of the foods that are rich in vitamin A? a. Green leafy vegetables Mentioned .............................................................1
Did not mention ....................................................2b. Yellow/orange vegetables and fruits Mentioned .............................................................1
Did not mention ....................................................2c. Small fish species Mentioned .............................................................1
Did not mention ....................................................2d. Liver Mentioned .............................................................1
Did not mention ....................................................2e. Others (specify) ____________________________________________________________________________
Mentioned .............................................................1Did not mention ....................................................2
24B Do you know what the benefits are of eating foods rich in vitamin A, e.g. green leafy vegetables, yellow/orange vegetables and fruits and small fish species?
Yes .........................................................................1No ..........................................................................2 →25
24C If so, what are they? (Do not prompt)a. Good for the eye sight Mentioned .............................................................1
Did not mention ....................................................2b. Healthy Mentioned .............................................................1
Did not mention ....................................................2c. Good for the skin Mentioned .............................................................1
Did not mention ....................................................2e. Prevents night blindness Mentioned .............................................................1
Did not mention ....................................................2f. Other (specify) ____________________________________________________________________________
Mentioned .............................................................1Did not mention ....................................................2
25 Do you know which foods are rich in iron? Yes .........................................................................1No ..........................................................................2 →25b
25C Please list the name of the foods that are rich in iron (Do not prompt)a. Fish Mentioned .............................................................1
Did not mention ....................................................2b. Meat Mentioned .............................................................1
Did not mention ....................................................2
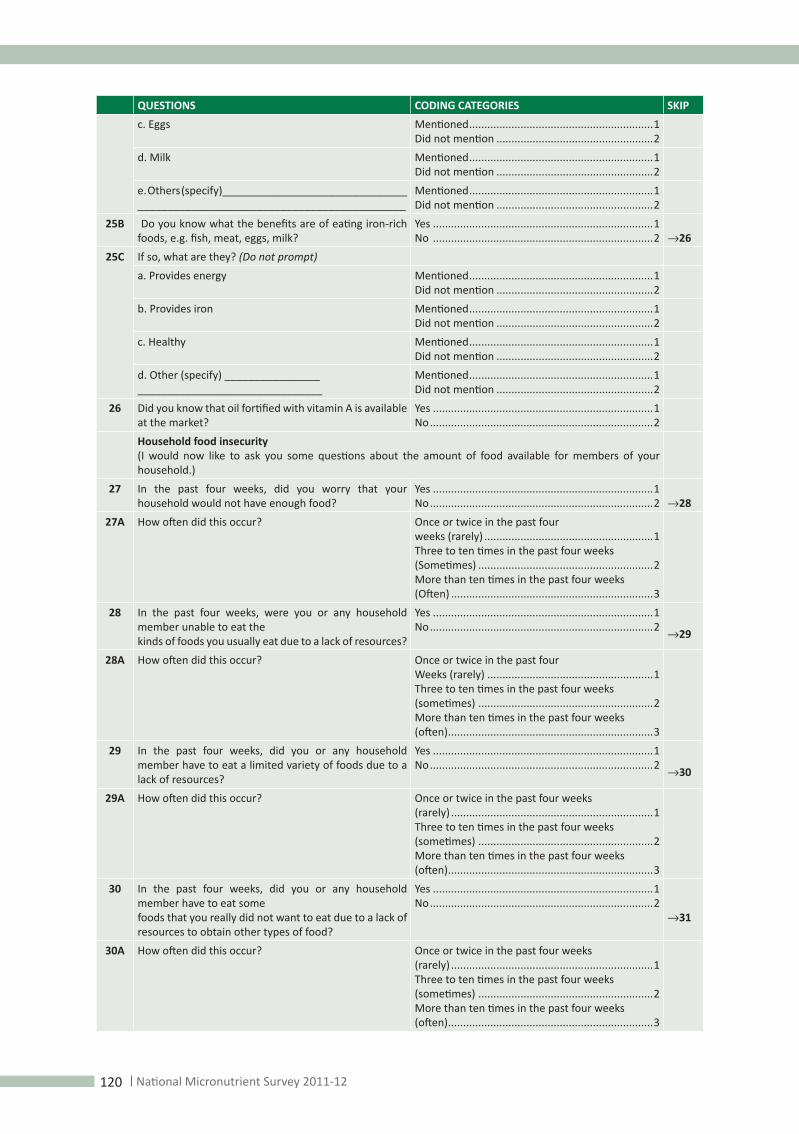
120 National Micronutrient Survey 2011-12
QUESTIONS CODING CATEGORIES SKIPc. Eggs Mentioned .............................................................1
Did not mention ....................................................2d. Milk Mentioned .............................................................1
Did not mention ....................................................2e. Others (specify)____________________________________________________________________________
Mentioned .............................................................1Did not mention ....................................................2
25B Do you know what the benefits are of eating iron-rich foods, e.g. fish, meat, eggs, milk?
Yes .........................................................................1No .........................................................................2 →26
25C If so, what are they? (Do not prompt)a. Provides energy Mentioned .............................................................1
Did not mention ....................................................2b. Provides iron Mentioned .............................................................1
Did not mention ....................................................2c. Healthy Mentioned .............................................................1
Did not mention ....................................................2d. Other (specify) _______________________________________________
Mentioned .............................................................1Did not mention ....................................................2
26 Did you know that oil fortified with vitamin A is available at the market?
Yes .........................................................................1No ..........................................................................2
Household food insecurity (I would now like to ask you some questions about the amount of food available for members of your household.)
27 In the past four weeks, did you worry that your household would not have enough food?
Yes .........................................................................1No ..........................................................................2 →28
27A How often did this occur? Once or twice in the past fourweeks (rarely) ........................................................1Three to ten times in the past four weeks (Sometimes) ..........................................................2More than ten times in the past four weeks (Often) ...................................................................3
28 In the past four weeks, were you or any household member unable to eat thekinds of foods you usually eat due to a lack of resources?
Yes .........................................................................1No ..........................................................................2 →29
28A How often did this occur? Once or twice in the past fourWeeks (rarely) .......................................................1Three to ten times in the past four weeks (sometimes) ..........................................................2More than ten times in the past four weeks (often) ....................................................................3
29 In the past four weeks, did you or any household member have to eat a limited variety of foods due to a lack of resources?
Yes .........................................................................1No ..........................................................................2 →30
29A How often did this occur? Once or twice in the past four weeks (rarely) ...................................................................1Three to ten times in the past four weeks (sometimes) ..........................................................2More than ten times in the past four weeks (often) ....................................................................3
30 In the past four weeks, did you or any household member have to eat somefoods that you really did not want to eat due to a lack of resources to obtain other types of food?
Yes .........................................................................1No ..........................................................................2
→31
30A How often did this occur? Once or twice in the past four weeks (rarely) ...................................................................1Three to ten times in the past four weeks (sometimes) ..........................................................2 More than ten times in the past four weeks (often) ....................................................................3

121National Micronutrient Survey 2011-12
QUESTIONS CODING CATEGORIES SKIP31 In the past four weeks, did you or any household
member have to eat a smaller quantity of food at a meal than you felt you needed because there was not enough food?
Yes .........................................................................1No ..........................................................................2
→32
31A How often did this occur? Once or twice in the past four weeks (rarely) ...................................................................1Three to ten times in the past four weeks (sometimes) ..........................................................2More than ten times in the past four weeks (often) ...................................................................3
32 In the past four weeks, did you or any other household member have to eat fewer meals in a day because there was not enough food?
Yes .........................................................................1No ..........................................................................2 →33
32A How often did this occur? Once or twice in the past four weeks (rarely) ...................................................................1Three to ten times in the past four weeks (sometimes) ..........................................................2More than ten times in the past four weeks (often) ...................................................................3
33 In the past four weeks, was there ever no food to eat of any kind in your household due to a lack of resources?
Yes .........................................................................1No ..........................................................................2 →34
33A How often did this occur? Once or twice in the past four weeks (rarely) ...................................................................1Three to ten times in the past four weeks (sometimes) ..........................................................2More than ten times in the past four weeks (often) ...................................................................3
34 In the past four weeks, did you or any household member go to sleep atnight hungry because there was not enough food?
Yes .........................................................................1No ..........................................................................2 →35
34A 35a. How often did this occur? Once or twice in the past four weeks (rarely) ...................................................................1Three to ten times in the past four weeks (Sometimes) ..........................................................2More than ten times in the past four weeks (Often) ..................................................................3
35 In the past four weeks, did you or any household member go a whole dayand night without eating anything because there was not enough food?
Yes .........................................................................1No ..........................................................................2 →36
35A How often did this occur?Once or twice in the past four weeks (rarely) ...................................................................1Three to ten times in the past four weeks (Sometimes) ..........................................................2More than ten times in the past four weeks (Often) ..................................................................3
Universal Salt Iodization(Now I would like to ask you some questions about the salt used in this household and about salt in general)
36 Does your household usually use any of these types of salt?(Read types and record yes or no for each type.)1. Crude salt? Yes .........................................................................1
No ..........................................................................22. Open? Yes .........................................................................1
No ..........................................................................23. Packet? Yes .........................................................................1
No ..........................................................................2 →38
37 If you do not consume salt packets at home, why not? (Please read each question and indicate yes or no)

122 National Micronutrient Survey 2011-12
QUESTIONS CODING CATEGORIES SKIP1.Don’t like the taste Yes .........................................................................1
No ..........................................................................22. Too expensive Yes .........................................................................1
No ..........................................................................23. Not available Yes .........................................................................1
No ..........................................................................24. Don’t believe it is iodized Yes .........................................................................1
No ..........................................................................25. Can’t buy in small amounts Yes .........................................................................1
No ..........................................................................26. Don’t know ______________ Yes .........................................................................1
No ..........................................................................27. Other (specify) ______________ Yes .........................................................................1
No ..........................................................................2Interviewers: In Q.36 if the respondent mentions crude salt, then ask Q.38.1; if open salt, then ask Q.38.2, and packet, then ask Q.38.3.
38 Where do you usually buy/obtain each of the following types of salt?[Please ask each type and indicate code for source]?1. Crude salt? City shop ................................................................1
Village/ local shop/haa ..........................................2Others .................................................................77 (Specify)N/A ......................................................................88
2. Open salt? City shop ................................................................1Village/ local shop/haat ........................................2Others .................................................................77 (Specify)N/A ......................................................................88
3. Salt packets? City shop ................................................................1Village/ local shop/haat ........................................2Others .................................................................77 (Specify)N/A ......................................................................88
39 How do you store salt in your house? Closed packet or container ....................................1Open packet or container (bamboo shell, pumpkin shell, earthen pot, etc.) .........................................2Both .......................................................................3
40 While cooking, when do you usually add salt? During cooking ......................................................1After cooking ........................................................2Both .......................................................................3
41 Do you add salt with meals? Always ...................................................................1Sometimes .............................................................2No (Never) .............................................................3
42 Have you heard about iodized salt? Yes .........................................................................1No ..........................................................................2 →51
43 How do you know about iodized salt? (Do not prompt)TV Mentioned .................…………….…………………………..1
Did not mention ....................................................2Radio Mentioned ................…………….…………………………...1
Did not mention ....................................................2Newspaper Poster/Leaflet Mentioned ................…………….…………………………...1
Did not mention ....................................................2Health care worker Mentioned ................…………….…………………………...1
Did not mention ....................................................2Friend/relative Mentioned .................…………….…………………………..1
Did not mention ....................................................2

123National Micronutrient Survey 2011-12
QUESTIONS CODING CATEGORIES SKIPSchool child Mentioned .................…………….…………………………..1
Did not mention ....................................................2Teacher/school Mentioned .................…………….…………………………..1
Did not mention ....................................................2Other _________________________________(Specify)
Mentioned .................…………….…………………………..1Did not mention ....................................................2
44Does crude salt contain iodine?
Yes .........................................................................1Yes, some ...............................................................2No ..........................................................................3Don’t know ............................................................9
45Does open salt contain iodine?
Yes .........................................................................1Yes, some ...............................................................2No ..........................................................................3Don’t know ............................................................9
46Does salt packets contain iodine?
Yes .........................................................................1Yes, some ...............................................................2No ..........................................................................3Don’t know ............................................................9
47 Do you know benefits of iodized salt? Yes .........................................................................1No ..........................................................................2 →49
48 If so, what are the benefits?(Do not prompt)a. Prevents goiter Mentioned .................…………….…………………………..1
Did not mention ....................................................2b. Prevents cretinism Mentioned .................…………….…………………………..1
Did not mention ....................................................2c. Promotes mental development/intelligence Mentioned .................…………….…………………………..1
Did not mention ....................................................2d. Promotes normal growth Mentioned .................…………….…………………………..1
Did not mention ....................................................2e. Prevents abortion and stillbirths Mentioned .................…………….…………………………..1
Did not mention ....................................................2f. Healthy Mentioned .................…………….…………………………..1
Did not mention ....................................................2g. Other _______________________________(Specify)
Mentioned .................…………….…………………………..1Did not mention ....................................................2
49 Do you test your salt for iodine using testing kit or home-made method?
Yes .........................................................................1No ..........................................................................2 →No
49A Which method do you use to test salt for iodine? Test kit ...................................................................1Home-made method .............................................2Both .......................................................................3
50 Do you know the ingredients to test salt for iodine? (Do not prompt)1. Salt? Mentioned .............................................................1
Did not mention ....................................................2
2. Cooked rice? Mentioned .................…………….…………………………..1Did not mention ....................................................2
3. Lemon juice? Mentioned .................................................... ………1Did not mention ....................................................2
Interviewers: In Q.50 if the respondent mentions salt, then ask Q.50a; if cooked rice, then ask Q.50b, and if lemon juice, then askQ.50c.
50A How much salt?(Do not prompt)
A pinch...................................................................1A level teaspoon ....................................................2Other amount ......................................................77(Specify)Don’t know ..........................................................99N/A ......................................................................88
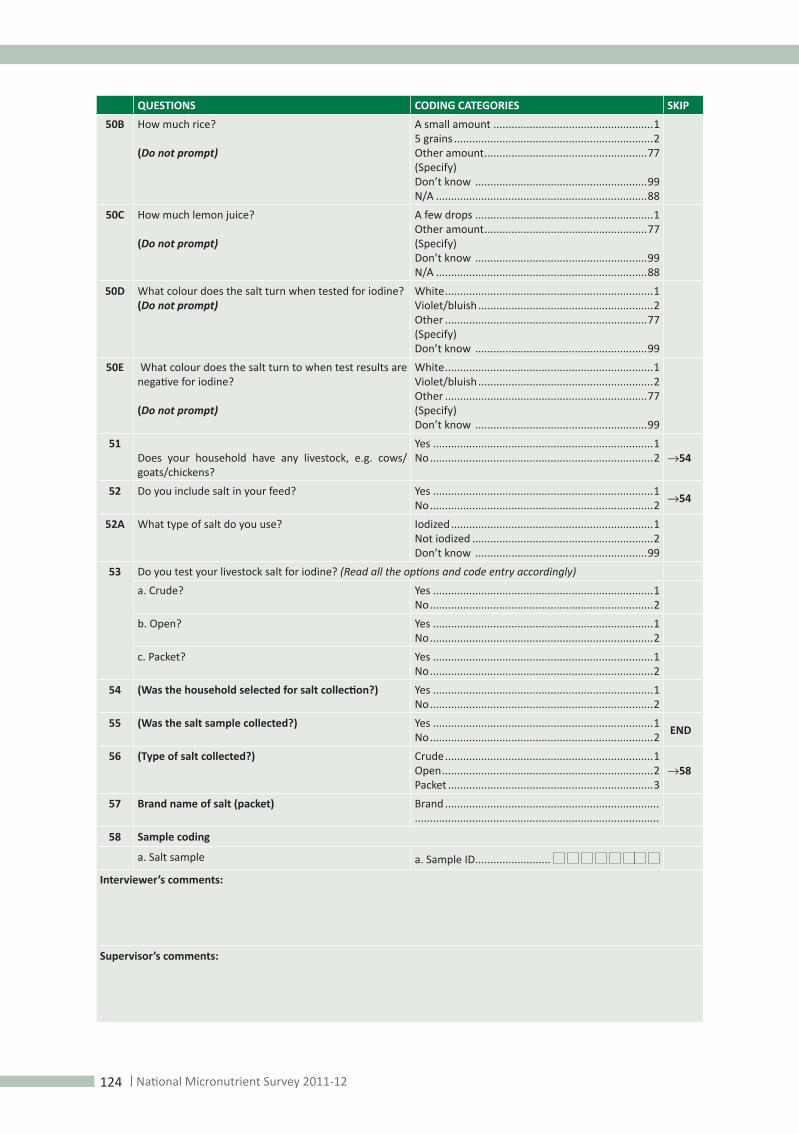
124 National Micronutrient Survey 2011-12
QUESTIONS CODING CATEGORIES SKIP50B How much rice?
(Do not prompt)
A small amount .....................................................15 grains ..................................................................2Other amount ......................................................77(Specify)Don’t know .........................................................99N/A ......................................................................88
50C How much lemon juice?
(Do not prompt)
A few drops ...........................................................1Other amount ......................................................77(Specify)Don’t know .........................................................99N/A ......................................................................88
50D What colour does the salt turn when tested for iodine?(Do not prompt)
White .....................................................................1Violet/bluish ..........................................................2Other ...................................................................77(Specify)Don’t know .........................................................99
50E What colour does the salt turn to when test results are negative for iodine?
(Do not prompt)
White .....................................................................1Violet/bluish ..........................................................2Other ...................................................................77(Specify)Don’t know .........................................................99
51Does your household have any livestock, e.g. cows/goats/chickens?
Yes .........................................................................1No ..........................................................................2 →54
52 Do you include salt in your feed? Yes .........................................................................1No ..........................................................................2 →54
52A What type of salt do you use? Iodized ...................................................................1Not iodized ............................................................2Don’t know .........................................................99
53 Do you test your livestock salt for iodine? (Read all the options and code entry accordingly)a. Crude? Yes .........................................................................1
No ..........................................................................2b. Open? Yes .........................................................................1
No ..........................................................................2c. Packet? Yes .........................................................................1
No ..........................................................................254 (Was the household selected for salt collection?) Yes .........................................................................1
No ..........................................................................255 (Was the salt sample collected?) Yes .........................................................................1
No ..........................................................................2 END
56 (Type of salt collected?) Crude .....................................................................1Open ......................................................................2Packet ....................................................................3
→58
57 Brand name of salt (packet) Brand ........................................................................................................................................................
58 Sample coding
a. Salt sample a. Sample ID .........................
Interviewer’s comments:
Supervisor’s comments:

125National Micronutrient Survey 2011-12
Annex 7.7.2: Questionnaire: Preschool Children (6-59 months)
Instructions, Starte with the youngest children. In case of more than one mother with children in the household, ask about each under-5 child. Use a separate form for each child.
Household # (50-HH listing): Household# (Sl. In 20-HH list):
Household Identification
Cluster:1=Rural; 2=Cities+Municipalities; 3= Urban (Slum).
Division: 1=Dhaka, 2=Chittagong, 3= Rajshahi, 4=Khulna5=Sylhet, 6=Barishal
Division:
District:
Upazilla/Municipality ______________________________________ Union: Ward:
(..................)
Mauza __________________________________________________ Cluster No:
Household identification
Name of the household head ________________________________ Date: DD/MM/YY / /
Household landline/cell phone no.:
Name of the Interviewer____________________________________ Signature:
Name of the Supervisor ____________________________________ Signature:
Name of the Quality Control Officer ___________________________ Signature:
Written informed consent: 1=Yes, 2=No
Result Code:
Completed=1
Incomplete=2
Reason for which the data collection were not completed................................................................................................
...........................................................................................................................................................................
Sl. No. of Children: Sl. No. of Mother/Primary Guardian:

126 National Micronutrient Survey 2011-12
General Information about the Child1. What is the name of the child? Name of the child
1a. Child ID (P/Clusters/Division/Cluster/HH no/Sl. No. of the child)
2. What is your name? (mother/primary guardian) Name
2a. What is your level of education? No education .............................................................. .1Primary incomplete .................................................... .2Primary complete ....................................................... .3 Secondary incomplete ................................................ .4Secondary complete or above .................................... .5
2b. What is the date of birth of the child? / / (DD/MM/YY)
3. What is the age of the child (completed months)? ………………………………………..Months
4. What is the sex of the child? Male 1Female 2
Child Morbidity (Children aged 6-59 months Preschool children)Sl.
No. QUESTION CODING CATEGORIES SKIP
5. Did the child (Name) have diarrhoea in the last 2 weeks?(diarrhoea: 3 or more watery or loose/liquid stools in last 24 hrs)
Yes ...............................................................................1No ................................................................................2Don’t know ................................................................99
5a. In case of diarrhoea in the last 2 weeks, what treatment did (child’s name) receive?
ORS ............................................................................ .1ORS and zinc .............................................................. .2Did not receive treatment ......................................... .3Other treatment (specify ........................................... .4
6. “Has (Name) been ill with a fever at any time in the past 2 weeks?”
Yes ............................................................................. .1No .............................................................................. .2Don’t know .............................................................. .99
7. In the past two weeks, has (Name) had an illness accompanied by a cough, and fast breathing or difficulty in breathing?
Yes ............................................................................. .1No .............................................................................. .2Don’t know .............................................................. .99
8. Was the fast breathing or difficulty in breathing due to a problem in the chest or to a blocked or runny nose?
Yes ............................................................................. .1No .............................................................................. .2Don’t know .............................................................. .99
9. Did (Name) have measles in the last 6 months? Yes ............................................................................. .1No .............................................................................. .2Don’t know .............................................................. .99
10. Does (Name) have a Expanded Programme on Immunization (EPI) card?
Yes ............................................................................. .1No .............................................................................. .2Don’t know .............................................................. .99
→11
10a. Interviewer: If response is YES in Question no. 10, ask the respondent to show the card.
11. Did the child (Name) at any time receive (…..)?
11a. Immunization from measles? Yes .............................................................................. 1No ............................................................................... 2Don’t know ............................................................... 99
11b. Vitamin A supplementation?(Show the sample)
Ye ................................................................................ 1No .............................................................................. .2Don’t know ............................................................... 99
→ 11d
11c. When did the child (Name) receive the last dose of vitamin A?
Month………..……….………….Year………….……….………….Don’t know ............................................................... 99
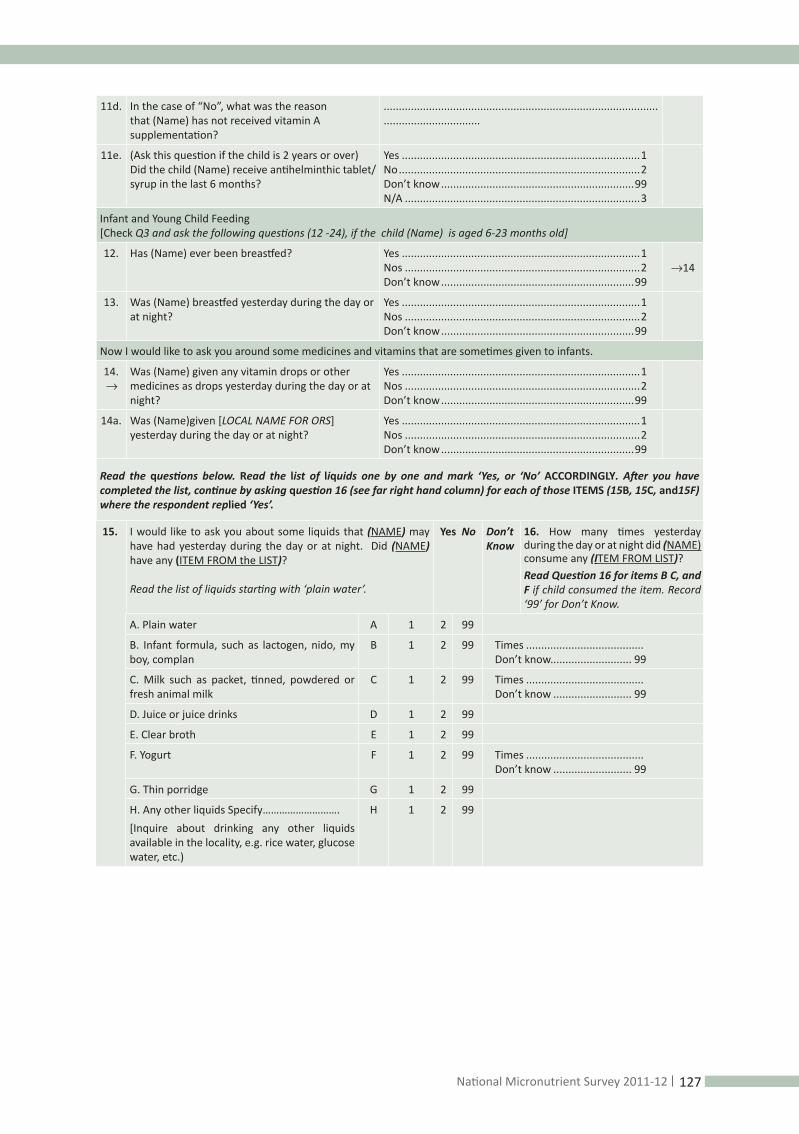
127National Micronutrient Survey 2011-12
11d. In the case of “No”, what was the reason that (Name) has not received vitamin A supplementation?
...........................................................................................
................................
11e. (Ask this question if the child is 2 years or over)Did the child (Name) receive antihelminthic tablet/syrup in the last 6 months?
Yes ...............................................................................1No ................................................................................2Don’t know ................................................................99N/A ..............................................................................3
Infant and Young Child Feeding [Check Q3 and ask the following questions (12 -24), if the child (Name) is aged 6-23 months old]
12. Has (Name) ever been breastfed? Yes ...............................................................................1Nos ..............................................................................2Don’t know ................................................................99
→14
13. Was (Name) breastfed yesterday during the day or at night?
Yes ...............................................................................1Nos ..............................................................................2Don’t know ................................................................99
Now I would like to ask you around some medicines and vitamins that are sometimes given to infants.
14. →
Was (Name) given any vitamin drops or other medicines as drops yesterday during the day or at night?
Yes ...............................................................................1Nos ..............................................................................2Don’t know ................................................................99
14a. Was (Name)given [LOCAL NAME FOR ORS] yesterday during the day or at night?
Yes ...............................................................................1Nos ..............................................................................2Don’t know ................................................................99
Read the questions below. Read the list of liquids one by one and mark ‘Yes, or ‘No’ ACCORDINGLY. After you have completed the list, continue by asking question 16 (see far right hand column) for each of those ITEMS (15B, 15C, and15F) where the respondent replied ‘Yes’.
15. I would like to ask you about some liquids that (NAME) may have had yesterday during the day or at night. Did (NAME) have any (ITEM FROM the LIST)?
Read the list of liquids starting with ‘plain water’.
Yes No Don’t Know
16. How many times yesterday during the day or at night did (NAME) consume any (ITEM FROM LIST)? Read Question 16 for items B C, and F if child consumed the item. Record ‘99’ for Don’t Know.
A. Plain water A 1 2 99
B. Infant formula, such as lactogen, nido, my boy, complan
B 1 2 99 Times ....................................... Don’t know........................... 99
C. Milk such as packet, tinned, powdered or fresh animal milk
C 1 2 99 Times ....................................... Don’t know .......................... 99
D. Juice or juice drinks D 1 2 99
E. Clear broth E 1 2 99
F. Yogurt F 1 2 99 Times ....................................... Don’t know .......................... 99
G. Thin porridge G 1 2 99
H. Any other liquids Specify……………………….[Inquire about drinking any other liquids available in the locality, e.g. rice water, glucose water, etc.)
H 1 2 99

128 National Micronutrient Survey 2011-12
16. Please describe everything that (NAME) ate yesterday during the day or night, whether at home or outside the home. a) Think about when (NAME) first woke up yesterday. Did (NAME) eat anything at that time? If so, please tell me everything that (NAME) ate. Probe: Did he or she eat anything else? Until respondent says nothing else. If not, continue to Question b). b) What did (NAME) do after that? Did (NAME) eat anything at that time? If so, tell me everything (NAME) ate at that time. Probe: Anything else? Until respondent says nothing more. Repeat question b) above until respondent says the child went to sleep until the next day. If respondent mentions mixed dishes such as PORRIDGE, sauce or stew, probe: c) What ingredients were in that (MIXED DISH)? Probe: Anything else? Until respondent says nothing more. As the respondent recalls foods, underline the corresponding food and circle ‘1’ in the column next to the food group. If the food is not listed in any of the food groups below, write the food in the box labelled ‘other foods’. If foods are used in small amounts for seasoning or as a condiment, include them under the condiments food group. Once the respondent finishes recalling foods eaten, read each food group where ‘1’ was not circled, ask the following question and circle ‘1’ if the respondent says yes, ‘2’ if no, and ‘8’ if don’t know: Yesterday during the day or night, did (NAME) drink/eat any (FOOD GROUP ITEMS)?
A. Rice, bread, rice pudding, semolina, or other foods made from grains
Yes ....................1No .....................2Don’t know .....99
Put in the box the maximum number of times any item of the group was eaten
B. Pumpkin, carrots, squash, or sweet potatoes that are yellow or orange inside
Yes ....................1No .....................2Don’t know .....99
Put in the box the maximum number of times any item of the group was eaten
C. White potatoes, white yams, manioc, cassava, or any other foods made from roots
Yes ....................1No .....................2Don’t know .....99
Put in the box the maximum number of times any item of the group was eaten
D. Any dark green leafy vegetables, e.g. pui shak, kolmishak, mula shak, kochu shak, data shak, palong shak, paat shak, shorisha shak, etc.
Yes ....................1No .....................2Don’t know .....99
Put in the box the maximum number of times any item of the group was eaten
E. Ripe mangoes, ripe papayas, or inquire about other locally available vitamin A rich fruits, e.g. jack fruit)
Yes ....................1No .....................2Don’t know .....99
Put in the box the maximum number of times any item of the group was eaten
F. Any other fruits or vegetables Yes ....................1No .....................2Don’t know .....99
Put in the box the maximum number of times any item of the group was eaten
G. Liver, kidney, heart, or other offal Yes ....................1No .....................2Don’t know .....99
Enter the maximum number of times that any item of the group was eaten
H. Any meat, such as beef, pork, lamb, goat, chicken, or duck
Yes ....................1No .....................2Don’t know .....99
Put in the box the maximum number of times any item of the group was eaten
I. Eggs Yes ....................1No .....................2Don’t know .....99
Put in the box the maximum number of times the item of the group was eaten
J. Fresh or dried fish, shellfish, or seafood Yes ....................1No .....................2Don’t know .....99
Put in the box the maximum number of times any item of the group was eaten
K. Any foods made from beans, peas, lentils, nuts
Yes ....................1No .....................2Don’t know .....99
Put in the box the maximum number of times any item of the group was eaten
L. Seeds Yes ....................1No .....................2Don’t know .....99
Put in the box the maximum number of times any item of the group was eaten
M. Cheese, yogurt, or other milk products
Yes ....................1No .....................2Don’t know .....99
Put in the box the maximum number of times any item of the group was eaten

129National Micronutrient Survey 2011-12
N. Any oil, fats, or butter, or foods made with any of these
Yes ....................1No .....................2Don’t know .....99
Put in the box the maximum number of times any item of the group was eaten
O. Any sugary foods such as chocolates, sweets, candies, pastries, cakes, or biscuits
Yes ....................1No .....................2Don’t know .....99
Put in the box the maximum number of times any item of the group was eaten
P. Condiments such as chilies, spices, herbs, or fish powder
Yes ....................1No .....................2Don’t know .....99
Put in the box the maximum number of times any item of the group was eaten
Q. Foods made with red palm oil Yes ....................1No .....................2Don’t know .....99
Put in the box the maximum number of times any item of the group was eaten
R. Other foodsSpecify………………………
Yes ....................1No .....................2Don’t know .....99
Put in the box the maximum number of times any item of the group was eaten
17. Did (NAME) eat any solid, semi-solid, or soft foods yesterday during the day or at night? IF‘YES’ probe: What kind of solid, semi-solid, or soft foods did (NAME) eat?
Yes .................................................................. 1No ................................................................... 2Don’t know .................................................. 99
Q20
Interviewer’s Note: If the response is YES in the Q. 18, return to Q. 17 and observe the record for verification. Then continue with Q. 19
Yes .................................................................. 1No ................................................................... 2Don’t know .................................................. 99
18. How many times did (NAME) eat solid, semi-solid, or soft foods other than liquids yesterday during the day or at night?
Number of times ..............................................
Don’t know .................................................. 99
19. Did (NAME) drink anything from a bottle with a nipple yesterday during the day or night?
Yes .................................................................. 1No ................................................................... 2Don’t know .................................................. 99
Now I would like to ask you about some particular foods (NAME) may eat. I am interested in knowing if your child has eaten this particular food even if it was combined with other foods.
20. Yesterday, during the day or night, did (Name) consume any [ ] (Inquire about iron-fortified solid, semi-solid or soft foods specifically for infants and young children locally available)
Yes .................................................................. 1No ................................................................... 2Don’t know .................................................. 99
21. Yesterday, during the day or night, did (Name) consume any food to which you added Monimixor or something similar?
Yes .................................................................. 1No ................................................................... 2Don’t know .................................................. 99
22 Yesterday, during the day or night, did (Name) consume any Plumpy’Nuts? (Ask to show common sample of plumpy’ nut, if it is available)
Yes .................................................................. 1No ................................................................... 2Don’t know .................................................. 99
23 Yesterday, during the day or night, did (Name) consume any [iron-fortified infant/toddler formulas available in the local setting]? [Inquire if there are any locally available)iron- fortified infant formulas, e.g. ‘Nido’, ‘Mother’s smile’, ‘Bio-milk’, ‘Lactogen’, etc.
Yes .................................................................. 1No ................................................................... 2Don’t know .................................................. 99

130 National Micronutrient Survey 2011-12
Food consumption data Interviewer: Check Q3 and ask Q 25 if the child is 24-59 months old?
Now I would like to ask you some questions around the food eaten by your child (24-59 months old). I know this is sometimes hard to remember, but please provide the best answer you can.
24. During the past 7 days, on how many days did your child (Name) eat the following foods?
Foods Serving size
# of days in last 7 days
# of servings in last 7 days
gm/ml
1. Rice? 1 cup
Breads
2.Chapatti? 2 pieces
3.Bread? 2 slices
4.Parata? 1 piece
Fish
5. Small fish species(with bones)? 60 gram
6. Big fish species (boneless)? 30 gram
7. Egg? One
8. Dal? ½ cup
Green Leafy Vegetables (Shak)
9. Pui shak? ½ cup
10. Palong shak? ½ cup
11.Lal shak ½ cup
12. Kalmi shak ½ cup
13.Paat shak? ½ cup
14.Kochu shak? ½ cup
15.Shorisha shak? ½ cup
16.Moola shak? ½ cup
17.Others (specify........) ½ cup
Yellow/orange vegetables/fruit
18.Carrots ½ cup
Record the amount......................................................................
19.Ripe mango ½ cup
Record the amount......................................................................
20.Sweet Pumpkin ½ cup
Record the amount......................................................................
.21.Ripe jackfruit ½ cup
Record the amount......................................................................
22.Ripe papaya ½ cup
Record the amount......................................................................
23.Tomato ½ cup
Record the amount......................................................................
24.Sweet potato ½ cup
Record the amount......................................................................
25.Orange ½ cup
Record the amount......................................................................
26.Watermelon ½ cup

131National Micronutrient Survey 2011-12
Record the amount......................................................................
27.Banana ½ cup
Record the amount ......................................................................
28.Others(Specify.........)
Meats
29.Chicken 60 gram
30.Beef 60 gram
31.Mutton 60 gram
32.Liver 60 gram
Milk and milk products
33.Milk 1 cup
34.Yogurt ½ cup
35.Cheese Measure of a thumb
36.Sugar, honey, molasses 1 tbsf
37. Beans, nuts ½ cup
25. Hand washing practice
Activities Do you wash your hands ……..?Yes=1No= 2
How do you wash your hands …….?Soap and water=01, Ash and water=02,=Mud and water=03, only water=04, Others=77,NA=8,
25a. Before cooking? If Others (77), specify)………………………..
25b. Before feeding the child? If Others (77), specify)………………………..
25c. Before taking food? If Others (77), specify)………………………..
25d. After cleaning baby’s bottom? If Others (77), specify)………………………..
25e. After defecation? If Others (77), specify)………………………..
26. Biological sample (Give tick mark in the middle and right columns against each of the parameters)
Name Stipulated for collection Actual collection
S. Retinol
Sample ID
Hemoglobin
Sample ID
Hemoglobin%: .
S. Ferritin
Sample ID
S. Zinc
Sample ID

132 National Micronutrient Survey 2011-12
Annex 7.7.3: School-aged Children’s Form
(This form is for school-aged children, aged 6-14 years, who will provide the biological samples. Use separate form for each of the children) Household # (50-HH listing): Household# (Sl. In 20-HH list):
Household IdentificationCluster:1=Rural; 2=Cities+Municipalities; 3= Urban (Slums).
Division: 1=Dhaka, 2=Chittagong, 3= Rajshahi, 4=Khulna5=Sylhet, 6=Barishal
Division: District:
Upazilla/municipality Union: Ward: (............)
Mauza Cluster No:
Household identification
Name of the household head Date: DD/MM/YY / /
Household landline/Cell Phone No.:
Name of the Interviewer Signature:
Name of the Supervisor Signature:
Name of the Quality control Officer Signature:
Written informed consent: 1=Yes, 2=No
Result Code: Completed=1 Incomplete=2
Reason for which the data collection was not completed:.......................................................................................................................................................................................................................................................................
Identification of the Child:1. Sl. No of the child: Sl. No .......................................................
2. ID: (P/Clusters/Division/Cluster/HH no/Sl. No. of the child)
3. What is the name of the child? Name .......................................................
4. What is (Name)’s age (Complete Years)? Years .................................................................
5. What is (Name)’s Sex? Male ............................................................... 1Female ............................................................ 2
Child Morbidity (School-age children)Q.
No. QUESTION CODING CATEGORIES SKIP
6. Did (Name) have diarrhoea in last 2 weeks?(diarrhoea: 3 or more watery or loose/liquid stool in last 24 hrs)
Yes .................................................................. 1No ................................................................... 2Dont know ................................................... .99
7. Did (Name) have diarhoea with blood in the last 2 weeks?
Yes .................................................................. 1No ................................................................... 2Dont know ................................................... .99
8. Has (Name) been ill with a fever at any time in the last 2 weeks?
Yes .................................................................. 1No ................................................................... 2Dont know ................................................... .99
9. Did (Name) have malaria in the last 3 months? Yes .................................................................. 1No ................................................................... 2Dont know ................................................... .99

133National Micronutrient Survey 2011-12
Food consumption data Now I would like to ask you some questions around the food eaten by you/your child. I know this is sometimes hard to remember, but please give me the best answer you can.
10. During the past 7 days, on how many days did you/ your child (Name) eat the following foods?
Foods Serving size
# of days in last 7 days
# of servings in last 7 days gm/ml
1. Rice? 1 cup
Breads
2.Chapatti? 2 pieces
3.Bread? 2 slices
4.Parata? 1 piece
Fish
5. Small fish species (with bones)? 60 gram
6. Big fish species (boneless)? 30 gram
7. Egg? One
8. Dal? ½ cup
Green Leafy Vegetables (Shak)
9. Pui shak? ½ cup
10. Palong shak? ½ cup
11.Lal skak ½ cup
12. Kalmi shak ½ cup
13.Paat shak? ½ cup
14.Kochu shak? ½ cup
15.Shorisha shak? ½ cup
16.Moola shak? ½ cup
17.Others (specify........) ½ cup
Yellow/orange vegetables/fruit
18.Carrots ½ cup
Record the amount......................................................................
19.Ripe mango ½ cup
Record the amount......................................................................
20.Sweet Pumpkin ½ cup
Record the amount......................................................................
21.Ripe jackfruit ½ cup
Record the amount......................................................................
22.Ripe papaya ½ cup
Record the amount......................................................................
23.Tomato ½ cup
Record the amount......................................................................
24.Sweet potato ½ cup
Record the amount......................................................................
25.Orange ½ cup
Record the amount......................................................................

134 National Micronutrient Survey 2011-12
26.Watermelon ½ cup
Record the amount......................................................................
27.Banana ½ cup
Record the amount ......................................................................
28.Others (Specify.........)
Meats
29.Chicken 60 gram
30.Beef 60 gram
31.Mutton 60 gram
32.Liver 60 gram
Milk and milk products
33.Milk 1 cup
34.Yogurt ½ cup
35.Cheese Measure of a thumb
36.Sugar, honey, molasses 1 tbsf
37. Beans, nuts ½ cup
11. Biological Sample (Give tick mark in the middle and right columns against each of the parameters)
Name Stipulated for collection Actual collection
S. Retinol
Sample ID
HemoglobinSample ID
Hemoglobin %: .
S. FerritinSample ID
Urinary Iodine
Sample ID
Annex 7.7.4: NPNL Women Form
(This form is for the non-pregnant, non-lactating (NPNL) women, who will provide the biological samples. Use separate form for each of the women) Household # (50-HH listing): Household# (Sl. In 20-HH list):
Household Identification
Cluster:1=Rural; 2=Cities+Municipalities; 3= Urban (Slums).
Division: 1=Dhaka, 2=Chittagong, 3= Rajshahi, 4=Khulna5=Sylhet, 6=Barishal
Division: District:
Upazilla/Municipality Union: Ward: (............)
Mauza Cluster No:
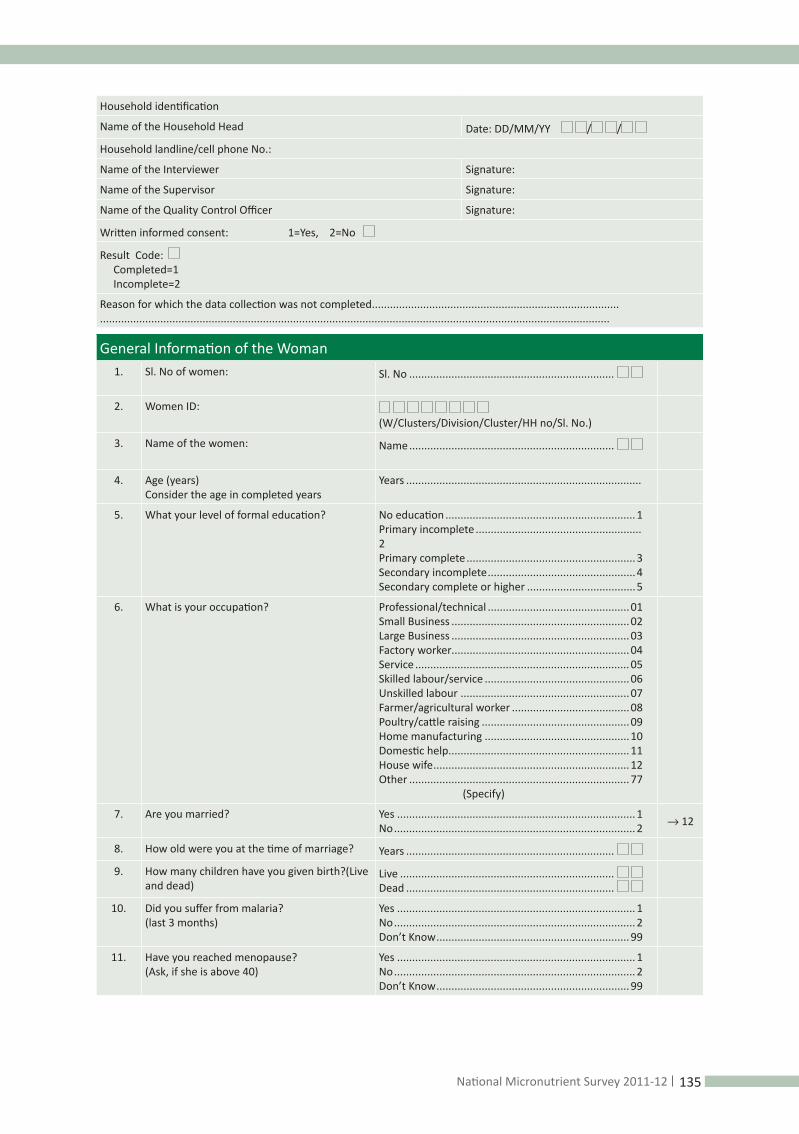
135National Micronutrient Survey 2011-12
Household identification
Name of the Household Head Date: DD/MM/YY / /
Household landline/cell phone No.:
Name of the Interviewer Signature:
Name of the Supervisor Signature:
Name of the Quality Control Officer Signature:
Written informed consent: 1=Yes, 2=No
Result Code: Completed=1 Incomplete=2
Reason for which the data collection was not completed...........................................................................................................................................................................................................................................................
General Information of the Woman1. Sl. No of women: Sl. No ....................................................................
2. Women ID: (W/Clusters/Division/Cluster/HH no/Sl. No.)
3. Name of the women: Name ....................................................................
4. Age (years) Consider the age in completed years
Years ..............................................................................
5. What your level of formal education? No education ...............................................................1Primary incomplete ....................................................... 2Primary complete ........................................................3 Secondary incomplete .................................................4Secondary complete or higher ....................................5
6. What is your occupation? Professional/technical ...............................................01Small Business ...........................................................02Large Business ...........................................................03 Factory worker...........................................................04Service .......................................................................05 Skilled labour/service ................................................06Unskilled labour ........................................................07Farmer/agricultural worker .......................................08 Poultry/cattle raising .................................................09Home manufacturing ................................................10Domestic help ............................................................11House wife .................................................................12Other .........................................................................77 (Specify)
7. Are you married? Yes ............................................................................... 1No ................................................................................ 2 → 12
8. How old were you at the time of marriage? Years .....................................................................
9. How many children have you given birth?(Live and dead)
Live ....................................................................... Dead .....................................................................
10. Did you suffer from malaria?(last 3 months)
Yes ............................................................................... 1No ................................................................................ 2Don’t Know ................................................................99
11. Have you reached menopause? (Ask, if she is above 40)
Yes ............................................................................... 1No ................................................................................ 2Don’t Know ................................................................99
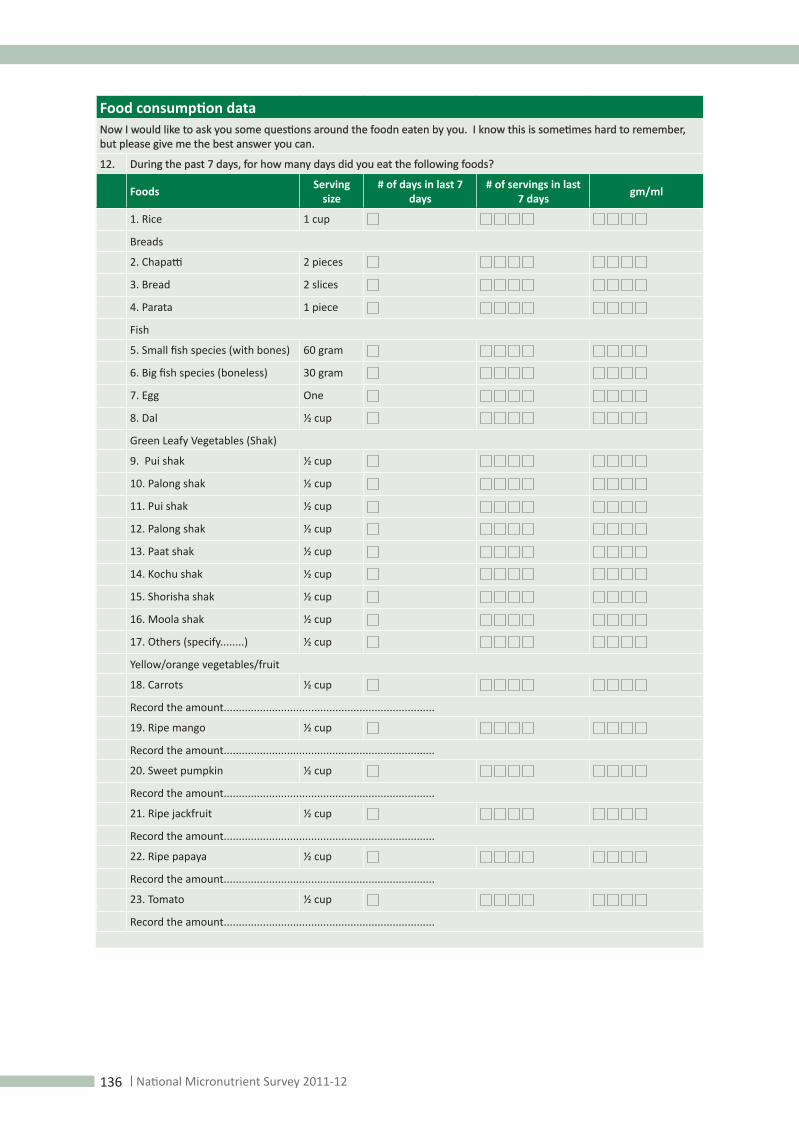
136 National Micronutrient Survey 2011-12
Food consumption data Now I would like to ask you some questions around the foodn eaten by you. I know this is sometimes hard to remember, but please give me the best answer you can.
12. During the past 7 days, for how many days did you eat the following foods?
Foods Serving size
# of days in last 7 days
# of servings in last 7 days gm/ml
1. Rice 1 cup
Breads
2. Chapatti 2 pieces
3. Bread 2 slices
4. Parata 1 piece
Fish
5. Small fish species (with bones) 60 gram
6. Big fish species (boneless) 30 gram
7. Egg One
8. Dal ½ cup
Green Leafy Vegetables (Shak)
9. Pui shak ½ cup
10. Palong shak ½ cup
11. Pui shak ½ cup
12. Palong shak ½ cup
13. Paat shak ½ cup
14. Kochu shak ½ cup
15. Shorisha shak ½ cup
16. Moola shak ½ cup
17. Others (specify........) ½ cup
Yellow/orange vegetables/fruit
18. Carrots ½ cup
Record the amount......................................................................
19. Ripe mango ½ cup
Record the amount......................................................................
20. Sweet pumpkin ½ cup
Record the amount......................................................................
21. Ripe jackfruit ½ cup
Record the amount......................................................................
22. Ripe papaya ½ cup
Record the amount......................................................................
23. Tomato ½ cup
Record the amount......................................................................

137National Micronutrient Survey 2011-12
24. Sweet potato ½ cup
Record the amount......................................................................
25.Orange ½ cup
Record the amount......................................................................
26.Watermelon ½ cup
Record the amount......................................................................
27. Banana ½ cup
Record the amount ......................................................................
28.Others(Specify.........)
Meats
29.Chicken 60 gram
30.Beef 60 gram
31.Mutton 60 gram
32.Liver 60 gram
Milk and milk products
33. Milk 1 cup
34. Yogurt ½ cup
35. Cheese Measure of a thumb
36. Sugar, honey, molasses 1 tbsf
37. Beans, nuts ½ cup
Now I would like to collect 3-5 ml of your blood sample to assess level of vitamin A, A/ Hemoglobin/ Iron /Zinc/Folate and B12 in your body. I would like to request that you provide 30 ml of your urine sample for assessing level of iodine in your body.
13 Biological Sample (Tick offthe middle and right columns against each of the parameters)Name Stipulated for collection Actual collection
S. Retinol
Sample ID
Hemoglobin
Sample ID
Hemoglobin %: .
S. Ferritin
Sample ID
S. Zinc
Sample ID
Urinary Iodine
Sample ID
S. Folate/B12
Sample ID

138 National Micronutrient Survey 2011-12
Annex 7.7.5: Retailer’s Questionnaire
(This form will be used to collect information from retail shopkeepers.Use one form for each of the shop)
Section A: Retailer identification
Cluster:1=Rural; 2=Cities+Municipalities; 3= Urban (Slums).
Division: 1=Dhaka, 2=Chittagong, 3= Rajshahi, 4=Khulna5=Sylhet, 6=Barishal
Division: District:
Upazilla/Municipality Union: Ward: (............)
Mauza Cluster No:
Name of shop: Shop number:
Name of shop owner: Date: DD/MM/YY
Landline/cell phone no. of the shop:
Name of the interviewer: Signature:
Name of the Supervisor Signature:
Name of the Quality control Officer Signature:
Written informed consent: 1=Yes, 2=No
Result Code: Completed=1 Incomplete=2
Reason, the data collection was not completed..........................................................................................................................................................................................................................................................................
Section B: Data collection from retail shopkeeper
Q. No. QUESTION CODING CATEGORIES SKIP
1. What is the relationship of respondent to the owner of the retail shop?
None (Owner) ..............................................................1Employee .....................................................................2Others ........................................................................77
2. What is your Name? Name .............................................................................
3. What is your level of education? No education ...............................................................1Primary incomplete .....................................................2Primary complete ........................................................3 Secondary incomplete .................................................4 Secondary complete and higher ..................................5
4. Do you sell crude salt? Yes ............................................................................... 1No ................................................................................ 2 → Q6
5. Where do you usually buy crude salt from? Factory ......................................................................... 1Retailer ........................................................................ 2Wholesaler ..................................................................3Market ......................................................................... 4Crude salt producer .....................................................5Other .........................................................................77
(Specify)
6. Do you sell open salt? Yes ............................................................................... 1No ................................................................................ 2 → Q10
7. Where do you usually buy open salt from? Factory ......................................................................... 1Retailer ........................................................................ 2Wholesaler ..................................................................3Market ......................................................................... 4Other .........................................................................77
(Specify)
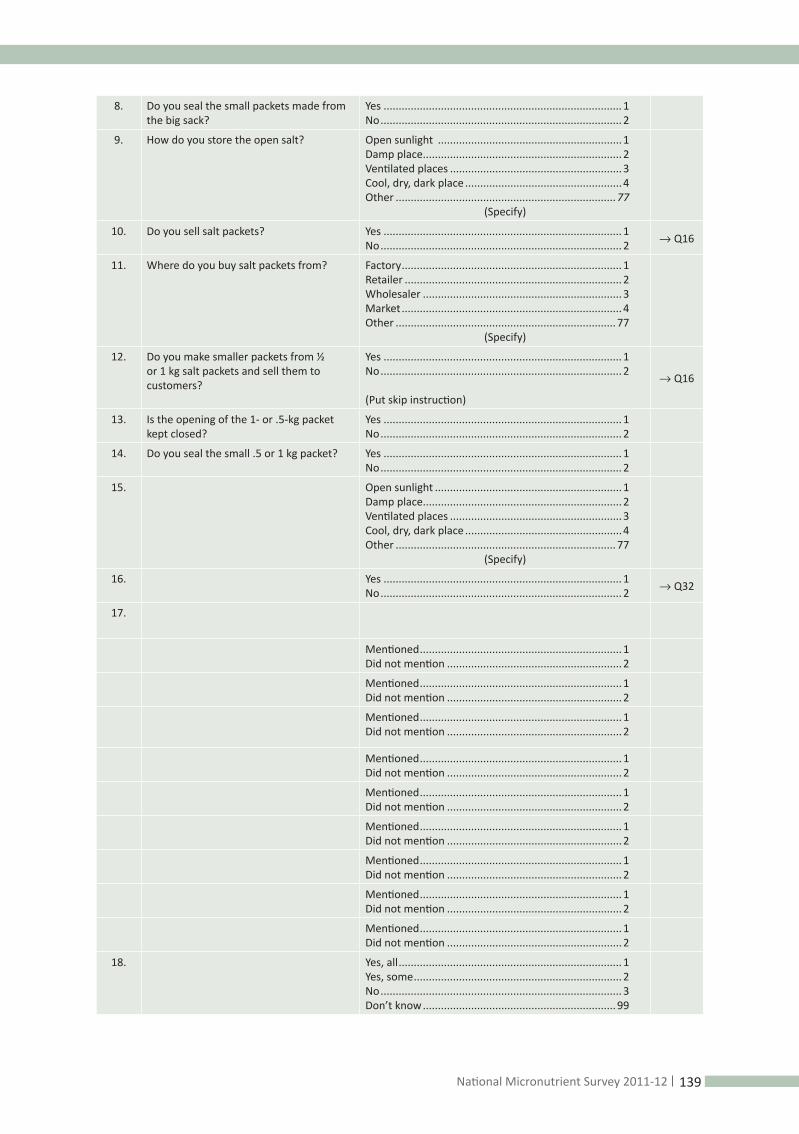
139National Micronutrient Survey 2011-12
8. Do you seal the small packets made from the big sack?
Yes ............................................................................... 1No ................................................................................ 2
9. How do you store the open salt? Open sunlight .............................................................1Damp place..................................................................2Ventilated places .........................................................3 Cool, dry, dark place ....................................................4Other .........................................................................77
(Specify)
10. Do you sell salt packets? Yes ............................................................................... 1No ................................................................................ 2 → Q16
11. Where do you buy salt packets from? Factory ......................................................................... 1Retailer ........................................................................ 2Wholesaler ..................................................................3Market ......................................................................... 4Other .........................................................................77
(Specify)
12. Do you make smaller packets from ½ or 1 kg salt packets and sell them to customers?
Yes ............................................................................... 1No ................................................................................ 2
(Put skip instruction)
→ Q16
13. Is the opening of the 1- or .5-kg packet kept closed?
Yes ............................................................................... 1No ................................................................................ 2
14. Do you seal the small .5 or 1 kg packet? Yes ............................................................................... 1No ................................................................................ 2
15. Open sunlight ..............................................................1Damp place..................................................................2Ventilated places .........................................................3 Cool, dry, dark place ....................................................4Other .........................................................................77
(Specify)
16. Yes ............................................................................... 1No ................................................................................ 2 → Q32
17.
Mentioned ...................................................................1Did not mention ..........................................................2
Mentioned ...................................................................1Did not mention ..........................................................2
Mentioned ...................................................................1Did not mention ..........................................................2
Mentioned ...................................................................1Did not mention ..........................................................2
Mentioned ...................................................................1Did not mention ..........................................................2
Mentioned ...................................................................1Did not mention ..........................................................2
Mentioned ...................................................................1Did not mention ..........................................................2
Mentioned ...................................................................1Did not mention ..........................................................2
Mentioned ...................................................................1Did not mention ..........................................................2
18. Yes, all .......................................................................... 1Yes, some ..................................................................... 2No ................................................................................ 3Don’t know ................................................................99

140 National Micronutrient Survey 2011-12
19. Yes, all .......................................................................... 1Yes, some ..................................................................... 2No ................................................................................ 3Don’t know ................................................................99
20. Yes, all .......................................................................... 1Yes, some ..................................................................... 2No ................................................................................ 3Don’t know ................................................................99
21. Yes ............................................................................... 1No ................................................................................ 2 → Q23
Q. No. QUESTION CODING CATEGORIES SKIP
22. Please state the benefits? (Do not prompt)
a. Prevents goiter Mentioned ...................................................................1Did not mention ..........................................................2
b. Prevents cretinism Mentioned ...................................................................1Did not mention ..........................................................2
c. Promotes mental development/intelli-gence
Mentioned ...................................................................1Did not mention ..........................................................2
d. Promotes normal growth Mentioned ...................................................................1Did not mention ..........................................................2
e. Prevents abortion and stillbirths Mentioned ...................................................................1Did not mention ..........................................................2
f. Healthy Mentioned ...................................................................1Did not mention ..........................................................2
g. Other (Specify ………) Mentioned ...................................................................1Did not mention ..........................................................2
23. Do you know how to test salt for iodine? Know ............................................................................ 1Don’t Know ..................................................................2 → Q32
23a. Please explain how to test salt for iodine, Test kit ......................................................................... 1Home-made.................................................................2Both ............................................................................. 3
24. Do you test your salt for iodine using test-ing kit or home-made method?
Yes ............................................................................... 1 No ................................................................................ 3 → Q25
24a. How do you test your salt for iodine? Test kit ......................................................................... 1Home-made.................................................................2Both ............................................................................. 3
25. Do you know the ingredients to test salt for iodine?(Do not prompt)
1. Salt? Mentioned ...................................................................1Did not mention ..........................................................2
2. Cooked rice? Mentioned ...................................................................1Did not mention ...............................…………………………2
3. Lemon juice? Mentioned ...................................................................1Did not mention ..........................................................2
Interviewers: In Q.25 if the respondent mentions salt then ask Q.26, if cooked rice, then ask Q.27 and if lemon juice, then ask Q.28.
26. How much salt? (Do not prompt) A pinch ........................................................................ 1A level teaspoon ..........................................................2Other ........................................................................... 3
(Specify)Don’t know ................................................................99N/A .............................................................................. 4
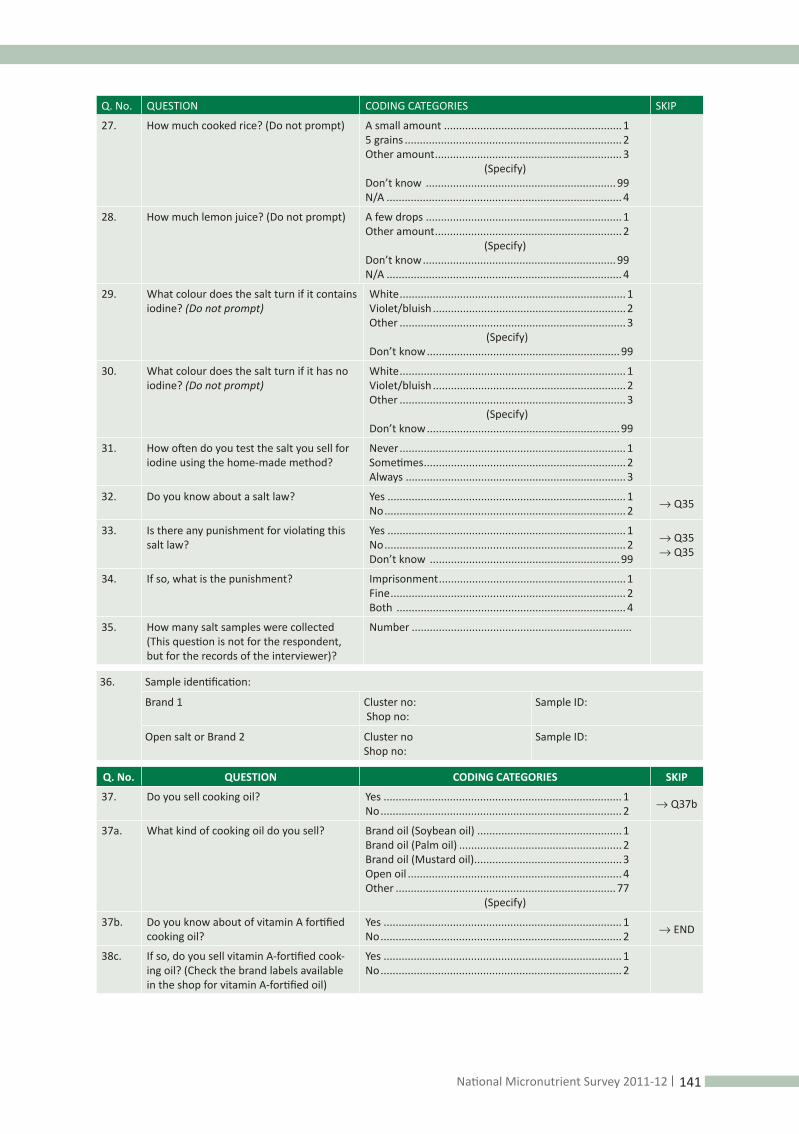
141National Micronutrient Survey 2011-12
Q. No. QUESTION CODING CATEGORIES SKIP
27. How much cooked rice? (Do not prompt) A small amount ...........................................................15 grains ........................................................................ 2Other amount ..............................................................3
(Specify)Don’t know ...............................................................99N/A .............................................................................. 4
28. How much lemon juice? (Do not prompt) A few drops .................................................................1Other amount ..............................................................2
(Specify)Don’t know ................................................................99N/A .............................................................................. 4
29. What colour does the salt turn if it contains iodine? (Do not prompt)
White ........................................................................... 1Violet/bluish ................................................................2Other ........................................................................... 3
(Specify)Don’t know ................................................................99
30. What colour does the salt turn if it has no iodine? (Do not prompt)
White ........................................................................... 1Violet/bluish ................................................................2Other ........................................................................... 3
(Specify)Don’t know ................................................................99
31. How often do you test the salt you sell for iodine using the home-made method?
Never ........................................................................... 1Sometimes ...................................................................2Always ......................................................................... 3
32. Do you know about a salt law? Yes ............................................................................... 1No ................................................................................ 2 → Q35
33. Is there any punishment for violating this salt law?
Yes ............................................................................... 1No ................................................................................ 2Don’t know ...............................................................99
→ Q35→ Q35
34. If so, what is the punishment? Imprisonment ..............................................................1Fine .............................................................................. 2Both ............................................................................ 4
35. How many salt samples were collected (This question is not for the respondent, but for the records of the interviewer)?
Number .........................................................................
36. Sample identification:
Brand 1 Cluster no: Shop no:
Sample ID:
Open salt or Brand 2 Cluster no Shop no:
Sample ID:
Q. No. QUESTION CODING CATEGORIES SKIP
37. Do you sell cooking oil? Yes ............................................................................... 1No ................................................................................ 2 → Q37b
37a. What kind of cooking oil do you sell? Brand oil (Soybean oil) ................................................1Brand oil (Palm oil) ......................................................2Brand oil (Mustard oil) .................................................3Open oil ....................................................................... 4Other .........................................................................77
(Specify)
37b. Do you know about of vitamin A fortified cooking oil?
Yes ............................................................................... 1No ................................................................................ 2 → END
38c. If so, do you sell vitamin A-fortified cook-ing oil? (Check the brand labels available in the shop for vitamin A-fortified oil)
Yes ............................................................................... 1No ................................................................................ 2

142 National Micronutrient Survey 2011-12
Annex 7.8: Biological Sample Collection Forms
Annex 7.8.1: Blood Sample Collection Form
Table 111: Blood Sample Collection Form
TYPE OF AREA: CLUSTER NO.: DIVISION: DISTRICT:
50 HH No
20 HH No
Participants’ Name P S W
Lab. ID (For laboratory use
only)
Participant ID Sample ID Remarks
R F B Z
TOTAL Collected by: Collection date: Time:
Assisted by: Carried by:Date:
Received by:Date: Time:

143National Micronutrient Survey 2011-12
Annex 7.8.2: Household Salt Sample Collection Form
Table 112: Household Salt Sample Collection Form
TEAM: TYPE OF AREA: CLUSTER NO.: DIVISION: DISTRICT:
50-HH no. 20-HH no.Name of the Household
Head
Lab. ID(For laboratory
use only)Sample ID Remarks
Collected by: Collection date: Time:
Assisted by: Carried by:
Date:
Received by:Date: Time:

144 National Micronutrient Survey 2011-12
Annex 7.8.3: Retailer’s Salt Sample Collection Form
Table 113: Retailer’s Salt Sample Collection Form
TEAM: TYPE OF AREA: CLUSTER NO.: DIVISION: DISTRICT:
Shop no. Name of Shop Name of Shop Owner
Lab. ID (For laboratory use
only)Sample ID Remarks
Total Retailer’s salt sample
Collected by: Collection date: Time:
Assisted by: Carried by:
Date:
Received by:
Date: Time:
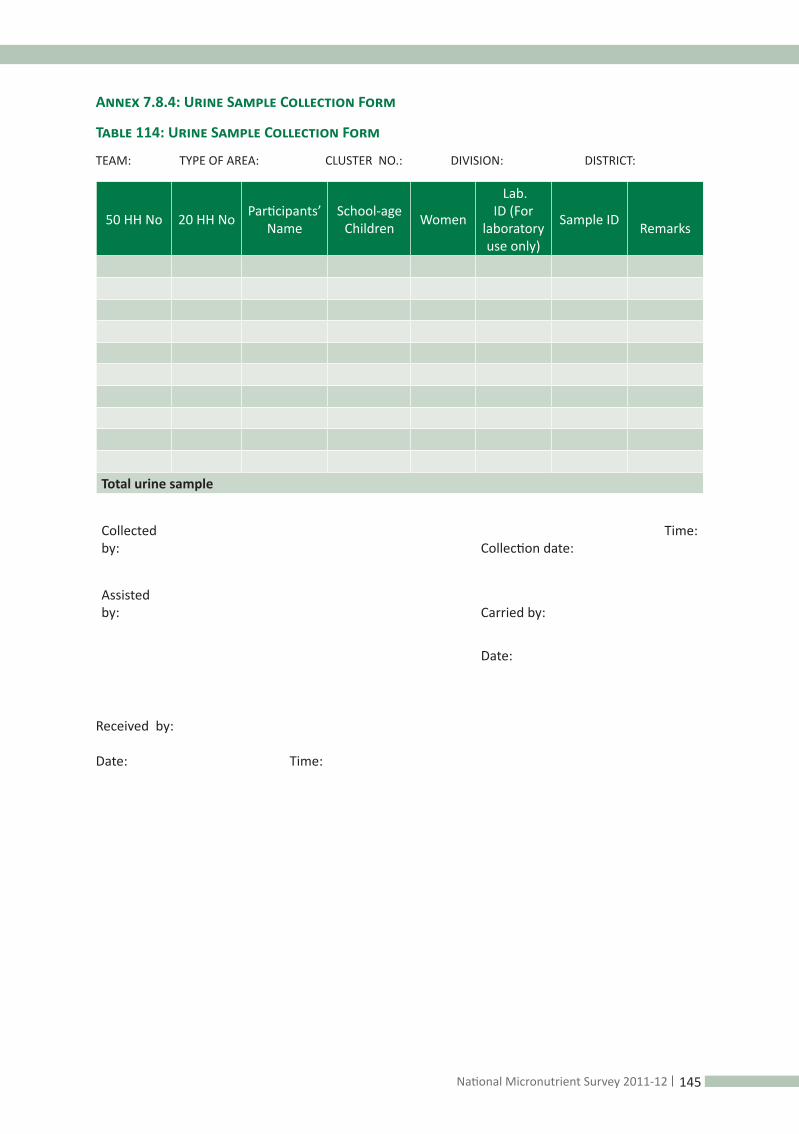
145National Micronutrient Survey 2011-12
Annex 7.8.4: Urine Sample Collection Form
Table 114: Urine Sample Collection Form
TEAM: TYPE OF AREA: CLUSTER NO.: DIVISION: DISTRICT:
50 HH No 20 HH No Participants’ Name
School-age Children Women
Lab. ID (For
laboratory use only)
Sample ID Remarks
Total urine sample
Collected by: Collection date:
Time:
Assisted by: Carried by:
Date:
Received by:
Date: Time:

146 National Micronutrient Survey 2011-12
Annex:7.9 Cluster Monitoring Form
Table 115: Cluster Monitoring Form
Cluster: Rural/urban/slum (Tick off as appropriate)
Cluster#.................................... Date……....... to ……………
Division................................... District……............... Sub-district……............... Union………….............Ward Mauza………............. Mauza no………..........
Question Response (Tick as appropriate)
1Was the sampling of the households carried out appropriately?
Well Fair Unsatisfactory
2Was the sampling of the biological specimen carried out appropriately?
Well FairUnsatisfactory
3 Was the introduction, consent taking conducted appropriately?
Well Fair Unsatisfactory
4Was the patient properly explained to about the procedure before drawing blood?
Well Fair Unsatisfactory
5 Was aseptic precaution taken? WellFair Unsatisfactory
6 Was the blood collection carried out appropriately? Well Fair Unsatisfactory
7Was the serum separation (centrifuge) conducted appropriately?
Well Fair Unsatisfactory
8 Was the aliquot preparation conducted appropriately
Well FairUnsatisfactory
9Was labelling done appropriately, including checking the sample ID in the forms?
Well Fair Unsatisfactory
10
Was the cold chain appropriately maintained at every stage from blood collection to sending back to the laboratory?
Well Fair Unsatisfactory
11Were the used syringes, microcuvettes, cotton, etc. disposed appropriately?
Well Fair Unsatisfactory
12Was the weight of the young children measured appropriately?
Well Fair Unsatisfactory

147National Micronutrient Survey 2011-12
13Was the length/height of the young children measured appropriately?
Well Fair Unsatisfactory
14Was the mid-upper arm circumference (MUAC) of the young children measured appropriately?
Well Fair Unsatisfactory
15Were the questions on young child feeding asked appropriately?
Well Fair Unsatisfactory
16Were the questions on food consumption asked appropriately?
WellFair Unsatisfactory
17Were the questions on household food insecurity asked appropriately?
Well Fair Unsatisfactory
18Was the question on household monthly expenses asked appropriately?
Well Fair Unsatisfactory
19 Was the coding done appropriately?WellFair Unsatisfactory
20 Did you conduct repeat interviews2 in the cluster? Yes No
21 If so, what is degree of agreement between the repeat interview2 and the regular interview?
Well Fair Unsatisfactory
“Appropriately” means as per the training and/or operational guidelines.2Do not ask the questions on infant feeding and food consumption questions in the repeat interviews. Try to administer the repeat interview after 24 hours and no later than 48 hours.Score: The following score is accounted for the responses: Well=2, Fair=1, Unsatisfactory=0Score obtained: Possible score: Result (%):[Share the results and discuss with the field team in a supportive, supervisory manner]
Name, Signature of the Officer: Date:
Signature of the Supervisor/Principal Investigator: Date:

148 National Micronutrient Survey 2011-12
Annex:7.10 Bi-weekly Monitoring Report Form
Table 116: Bi-weekly Monitoring Report Form
Period covering: From……..............................…. to …......................……… Date: Name of the Officer:
Division: Districts: Sub-district/sub-districts:Questions Results
1 How many clusters did you visit over the fortnight? Rural……….............…(no.)Cluster Nos.....................Urban……..…….......…(no.)Cluster Nos..………............Slum.………..…...….....(no.)Cluster Nos...…………........Total…………..........….(no.)
2 How many repeat interviews did you conduct over the fortnight?3 How many field interviews did you observe over the fortnight?4 How many field interviews did you observe conducted satisfactorily1
over the fortnight?5 What was the percentage of the number of the field interviews you
observed conducted satisfactorily1 over the fortnight?Q5 (%) =Q4/ Q3 × 100
6 How many episodes of length/height taking of young children did you observe over the fortnight?
7 How many episodes of length/height taking of young children did you observe conducted correctly2 over the fortnight?
8 What was the percentage of the number of episodes of length/height taking of young children you observed conducted correctly2 over the fortnight?Q8 (%) =Q7/Q6×100
9 How many participants did you observe, with whom biological samples (blood, urine) were managed 3over the fortnight?
10 How many participants did you observe, with whom biological samples (blood, urine) were correctly2 managed3 over the fortnight?
11 What was the percentage of participants you observed, with whom biological samples (blood, urine) were correctly2 managed3 over the fortnight:Q11(%) = Q10/ Q9 × 100
12 How many feedback episodes did you take with the field data teams over the fortnight, in the cases of any inconsistencies observed?
13 What was the average score (%) of the cluster performance over the fortnight?
14 General comments:
15 Specific comments:

149National Micronutrient Survey 2011-12
1 “Satisfactorily”: When the following questions, e.g. food consumption questions, household food insecurity questions, household monthly expense questions along with appropriate administration of other questions are satisfactorily administered, the interview will be termed “satisfactorily” conducted.2“Correctly :As per training and operational guidelines3“Manage”: Blood collection, serum separation (ultra centrifuze), aliquot preparation, labeling, and maintenance of cold chain.
Signature of the officer: Date
Signature of the supervisor/PI: Date:
Annex 7.11 The Individuals Engaged in the National Micronutrient Survey 2011-12
7.11.1 The Survey Administrators:
Institute of Public Health Nutrition (IPHN)Dr. Mohammad Hedayetul Islam, Director, Institute of Public Health Nutrition and Line Director of the National Nutrition Services, Co-Principal Investigator
Centre for Nutrition and Food Security, icddr,b Dr. Sabuktgain Rahman, Principal Investigator/Survey DirectorDr.Tahmeed Ahmed, Co-Principal InvestigatorDr. Ahmed Shafiqur Rahman, Co-investigatorDr. A.M. Shamsir Ahmed, Co-investigatorDr. Nurul Alam, Co-investigator/statistician/demographer
UNICEF, BangladeshDr. Ireen Akter Chowdhury, Co-investigatorMs. Lilian Selenje, Co-investigatorDr. Indrani Chakma, Co-investigator

150 National Micronutrient Survey 2011-12
7.11.2 The Technical Committee for the National Micronutrient Survey 2011-12
Institute of Public Health Nutrition (IPHN)Dr. Mohammad Hedayetul Islam, Director, Institute of Public Health Nutrition and Line Director of the National Nutrition Services, ChairmanDr. SM Mustafizur Rahman, Program Manager, NNSDr. Ashraf Hossain Sarkar, Deputy Director and Program Manager, NNSDr. Taherul Islam Khan, Program Manager, NNS
Institute of Epidemiology, Disease Control and Research (IEDCR)Dr. M. Mushtuq Hussain, Principal Scientific Officer
Ministry of IndustriesKhandakar Nuruzzaman, Joint Chief and Project Director, Fortification of Edible oil in Bangladesh ProjectAbu Taher Khan, Director (Technology), BSCIC and Project Director, CIDD project, Bangladesh Small and Cottage Industries Corporation (BSCIC)Mumtahenah Siddique, Assistant Director (Programme), Fortification of Edible Oil in Bangladesh-Project
Dhaka Medical College and HospitalDr. Mainuddin Ahmed, Associate Professor of Pediatrics
Shaheed Ziaur Rahman Medical CollegeDr. Ferdousi Begum, Associate Professor, Obstetrics and Gynaecology
Bangladesh Council of Scientific and Industrial Research Ms. Krishna Chowdhury, PSO & Section Chief, Oilseed and Lipid Technology Section, IFST
University of DhakaDr. Md. Nazrul Islam Khan, Professor, Institute of Nutrition and Food ScienceDr. Sheikh Nazrul Islam, Professor, Institute of Nutrition and Food Science
Centre for Nutrition and Food Security, icddr,b Dr. Tahmeed Ahmed, Senior Scientist and Director, Centre for Nutrition and Food Security Dr. Ahmed Shafiqur Rahman, Associate Scientist, Centre for Nutrition and Food Security Professor Dr. Md. Sohrab Ali, Member, Board of Trustees (BOT)Dr. Sabuktagin Rahman, Assistant Scientist, Centre for Nutrition and Food Security
UNICEF, BangladeshNoreen Prendiville, Chief Nutrition SectionDr. Md. Mohsin Ali, Nutrition SpecialistDr. Ireen Akhter Chowdhury, Nutrition Specialist
Micronutrient InitiativesDr. Zeba Mahmud, Country Director

151National Micronutrient Survey 2011-12
7.11.3 Monitoring and Supervision Teams
Centre for Nutrition and Food Security, icddr,b Morad Hossain, Field Reseach OfficerAkul Chandra Halder, Field Reseach OfficerKamruzzaman, Field Reseach OfficerMostofa Mohsin, Field Reseach OfficerKhairul Islam Akanda, Field Reseach OfficerKazi Alom, Field Reseach OfficerDr. Sabuktagin Rahman, Assistant Scientist & Principal Investigator, National Micronutrients SurveyDr. Tahmeed Ahmed; Director, CNFS, icddr,b
UNICEF, BangladeshDr. Ireen Akhter Chowdhury, Nutrition SpecialistDr. Mohsin Ali, Nutrition Specialist
Institute of Public Health Nutrition (IPHN)A.K.M. Abdur Rob Khan; Field visitorMd. Shafiqul Islam; Home visitorMd. Sarwar Alam; Home visitorMd. Jafrul Islam; Field assistantMd. Abdus Salam; Home visitor
7.11.4. Staff Members from Mitra and Associates
S N Mitra Executive DirectorSiddique Mazumder Director, TrainingFuad Pasha Director, AdministrationJahangir Hossain Sharif Assistant DirectorSittul Muna Senior Research OfficerSayed Abdullah Al Ahsan Senior Research OfficerMominul Haque Quality. Control OfficerBodruddoza H. TechnicianBidyut Barai H. TechnicianMitu Ballabhnth InterviewerNurun Nahar InterviewerShamim Sardar Quality Control OfficerFaruk Hossain Quality Control OfficerShahidur Rahman(Sohel) Quality Control OfficerNazmul Islam Quality Control OfficerIsrat Jahan (Anth) Quality Control OfficerMitu Ballabhnth (Anth) Quality Control OfficerAbdul Halim Khaddam SupervisorSoheb Hossen SupervisorAbdul Ahad SupervisorBiplab Kumar Roy SupervisorAminul Islam (Khulna) Supervisor

152 National Micronutrient Survey 2011-12
Tajul Islam SupervisorMeherul Islam SupervisorAbedul Haque SupervisorAmirul Islam Kabil SupervisorShahidal Islam Supervisor
Rayhanul Islam H. TechnicianJugal Majumder H. TechnicianZeaur Rahman H. TechnicianTauhid Hossain H. TechnicianAnwara Begum Soma H. TechnicianKamrul Islam H. TechnicianBodruddoza H. TechnicianYounus Ali H. TechnicianMominul Islam H. TechnicianAyesha Khatun H. TechnicianBidyt Barai H. TechnicianThamina Akther H. Technician
Aminul Islam (Patua) AttendanceHassan Selim AttendanceArifuzzman AttendanceAnishur Rahman OfficeDebashis Bachar OfficeEakub Ali Khan OfficeJahirul Islam OfficeMominuzzaman OfficeZahidul Islam Office
Anjuman Ara Begam (Anth-2) InterviewerAshma Hossain InterviewerAsma Akhter (Anth) InterviewerBulbuli Begum InterviewerFarzana Jakaria OfficeFerdausi Akhter InterviewerJahidha Khatun (Anth) InterviewerLipi Begum InterviewerLovely Rani Das InterviewerMazeda Khatun OfficeMonira Pathan Lutfa OfficeMousumi Akter (Lasmin)(Anth) InterviewerNasrin Akter (Anth) Interviewer

153National Micronutrient Survey 2011-12
Nur Banu (Anth-3) InterviewerNurun Nahar OfficeParul Begum InterviewerRina Aktar (Anth) InterviewerRinky Khanam InterviewerRipa Begum InterviewerSahrima Khan (Anth-3) InterviewerSalma Akther (Anth) InterviewerSamsun Nahar InterviewerSheuli Rani (Anth-2) InterviewerSuborna Parvin (Anth-3) InterviewerSuma Akhter InterviewerSumina Liva (Sumi) InterviewerTaslima Akhter Lipi InterviewerZohura Khatun (Anth-2) Interviewer
Shishir Paul Data Processor Jharna Datta Data Enty and Edit Jayead Data Enty and Edit Rokshana Data Enty and Edit Sharif Hossain Talukdar Data Enty and Edit Arefin Hossain Data Enty and Edit Pronob Das Data Enty and Edit Ripon Barman Data Enty and Edit Amran Hossain Data Enty and Edit Songta Modok Data Enty and Edit

154 National Micronutrient Survey 2011-12

155National Micronutrient Survey 2011-12

156 National Micronutrient Survey 2011-12

157National Micronutrient Survey 2011-12

158 National Micronutrient Survey 2011-12
Supported by: