ADVANCE COPY - UNICEF
176
Using data to shed light on the well-being of children with disabilities Seen, Counted, Included ADVANCE COPY
-
Upload
khangminh22 -
Category
Documents
-
view
2 -
download
0
Transcript of ADVANCE COPY - UNICEF

Using data to shed lighton the well-being of
children with disabilities
Seen,Counted, Included
ADVANCE COPY
© United Nations Children’s Fund (UNICEF), Division of Data, Analytics, Planning and Monitoring, November 2021
Permission is required to reproduce any part of this publication. Permission will be freely granted to educational or non-profit organizations.
To request permission or for any other information on this publication, please contact:
UNICEF Data and Analytics Section Division of Data, Analytics, Planning and Monitoring 3 United Nations Plaza, New York, NY 10017, USA Telephone: +1 212 326 7000 Email: [email protected]
All reasonable precautions have been taken by UNICEF to verify the information contained in this publication. For any data updates subsequent to release, please visit <data.unicef.org>.
Suggested citation: United Nations Children’s Fund, Seen, Counted, Included: Using data to shed light on the well-being of children with disabilities, UNICEF, New York, 2021.
Photography credits: Cover: © Elwa Design Studio; © Eric Krull on Unsplash; Adobe Stock: © ProstoSvet, © isavira, © bigjom, © ronstik, © Noey smiley, © Anneke, © Adam Ján Figel, © Jarretera, © Irina Vorontsova, © chitlada, © arinahabich, © Gudellaphoto, © converse677, © charles taylor, © klavdiyav, © igishevamaria, © mariesacha, © Alrandir, © Дарья Колпакова, © vejaa,© Tierney, © Moon Safari, © kzdanowska, © New Africa, © _nastassia; Page 2: © Elwa Design Studio; © Alis Photo, © kzdanowska; Page 3:© Elwa Design Studio, © Arcansél, © converse677; Back cover: © Elwa Design Studio
Acknowledgements The preparation of this publication was led by Claudia Cappa and Filipa de Castro (Data and Analytics Section, UNICEF Headquarters), with inputs from Claire Thomson (independent consultant). Munkhbadar Jugder (Data and Analytics Section, UNICEF Headquarters) and Celia Hubert (independent consultant) contributed to data processing, with guidance from Ivana Bjelic and Yadigar Coskun (Data and Analytics Section, UNICEF Headquarters). Tonatiuh Barrientos, Ariela Braverman and Martin Romero (independent consultants) supported the estimation work. Isabel Jijon (independent consultant) was involved in fact-checking. The report was edited by Lois Jensen, copyedited by Tina Johnson and designed by Elwa Design Studio (independent consultants).
Valuable feedback and comments were provided by Bisi Agberemi, Diogo Amaro, Elena Atanassova, Rosangela Berman-Bieler, Liliana Carvajal, Alexandre Cote, Enrique Delamonica, Erinna Dia, Mamadou S. Diallo, Ayca Donmez, Alberto Vasquez Encalada, Solrun Engilbertsdottir, Chika Hayashi, Afrooz Kaviani Johnson, Margaret Kelly, Julia Krasevec, Aniruddha
Kulkarni, Asma Maladwala, Bhaskar Mishra, Sakshi Mishra, Suguru Mizunoya, Natalia Mufel, Ana Nieto, Lauren Pandolfelli, Nicole Petrowski, Chemba Raghavan, Vijaya Ratnam Raman, Jennifer Requejo, Lucy Marie Richardson, Tom Slaymaker, Wongani Grace Taulo, Megan T. Tucker and Ann Willhoite. Gratitude also goes to the many colleagues who shared relevant material and lent their support to the preparation and launch of the report, in particular Kokou Sefako Amelewonou, Aurelia Ardito, Yumi Bae, Cynthia Brizuela, Anna Burlyaeva, Talei Cama, Jose Sierra Castillo, Issa Davies, Deepak Kumar Dey, Boris Diechtiareff, Derya Dostlar, Italo Dutra, Ana Carolina Fonseca, Maud Droogleever Fortuyn, Fazlul Haque, Tess Ingram, Benjamin Johnson, Kristel Juriloo, James Kaphuka, Farhod Khamidov, Marth Kibur, Shenrui Li, Siraj Mahmudlu, Kanchan Dyuti Maiti, Yetnebersh Nigussie Molla, Lucy Evelyn Vieira Silva Monteiro, Sarah Musau, Bo Pederson, Meri Poghosyan, Eva Quintana, Luigi Peter Ragno, Lieve Sabbe, Nora Shabani, Nafisa Binte Shafique, Manar Soliman, Mary Thomas, Turgay Unalan, Jayachandran Vasudevan, Vincenzo Vinci, Hrayr Wannis and Fang Yan.
Technical advice and inputs were generously provided by Lucian Agafitei (Eurostat); Anjlee Agarwal (National Centre for Accessible Environments, India); Purnendu Kishore Banerjee (National Informatics Centre, India); Tonatiuh Barrientos (National Institute of Public Health, Mexico); Ariela Braverman (Drexel University); Clodoaldo Alberto Castiano (Mozambican Association of People with Disabilities, Mozambique); Mulugeta Bayisa Chala (Institute of Health Policy, Management and Evaluation, Ethiopia); Gráinne Collins (Department of Children, Equality, Disability, Integration and Youth, Ireland); Elena de Palma (Italian National Statistics Office, Italy); Clare Farrell (Department of Children, Equality, Disability, Integration and Youth, Ireland); Monika Foldvari (Hungarian Central Statistical Office, Hungary); Lidia Gargulio (Italian National Statistics Office, Italy); Maíra Bonna Lenzi (Brazilian Institute of Geography and Statistics, Brazil); Mitch Loeb (Washington Group on Disability Statistics); Jennifer Madans (Washington Group on Disability Statistics); Rafael Meza (University of Michigan, USA); Daniel Mont (Center for Inclusive Policy, USA); Heiko Pfaff (Germany Federal Statistics Office, Germany); Gillian Roche (Central Statistics Office, Ireland); Martin Romero (National Institute of Public Health, Mexico); Somaya El-Saadani (Cairo University, Egypt); Brisa Sánchez (Drexel University, USA); Feng Shanwei (China Disabled Persons Federation, China); Alessandro Solipaca (Italian National Statistics Office, Italy); Mikael Tefera (Ethiopia Central Statistics Agency, Ethiopia); Nicola Tickner (Department of Children, Equality, Disability, Integration and Youth, Ireland); Işıl Tunacan (Turkish Statistical Institute, Turkey); Heidi Ullmann (National Center for Health Statistics, USA, and Washington Group on Disability Statistics); Julie D. Weeks (National Center for Health Statistics, USA, and Washington Group on Disability Statistics); Yasemin Yazicioğlu (Turkish Statistical Institute, Turkey) and Fatma El-Zanaty (Cairo University, Egypt).
This report was made possible through core funding to UNICEF and a generous grant from the Department of Foreign Affairs and Trade of the Government of Australia.
Using data to shed lighton the well-being of
children with disabilities
Seen,Counted, Included
This version of the report has not been fully edited and has not been made fully accessible for readers with disabilities.
A fully edited and accessible version of the report will be available after 15 November 2021.
© UNICEF/UN040426/Preechapanich
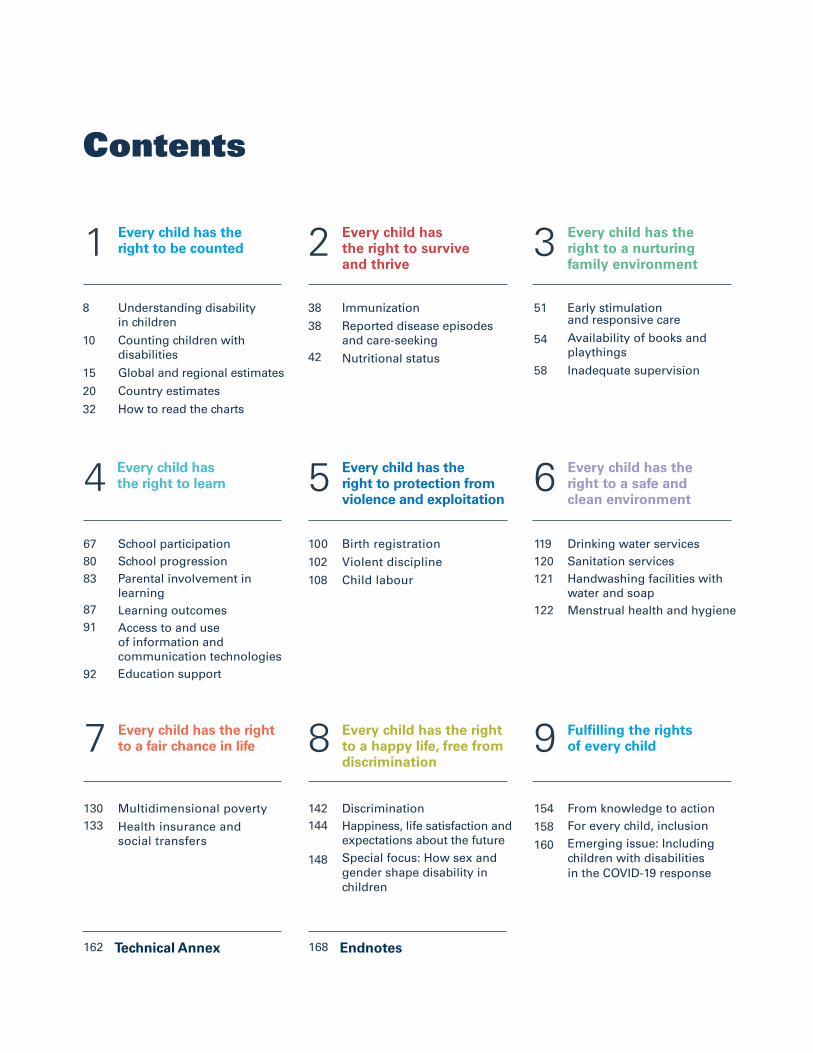
Contents
Every child has the right to survive and thrive
Every child has the right to a nurturing family environment
Every child has the right to be counted
Early stimulation and responsive care
Availability of books and playthings
Inadequate supervision
2 3
Every child has the right to protection from violence and exploitation
Every child has the right to a safe and clean environment
Every child has the right to learn
School participationSchool progressionParental involvement in learningLearning outcomesAccess to and use of information and communication technologiesEducation support
Birth registration
Violent discipline
Child labour
Drinking water servicesSanitation servicesHandwashing facilities with water and soapMenstrual health and hygiene
Every child has the right to a happy life, free from discrimination
Fulfilling the rights of every child
Every child has the right to a fair chance in life
Multidimensional poverty
Health insurance and social transfers
Discrimination Happiness, life satisfaction and expectations about the futureSpecial focus: How sex and gender shape disability in children
From knowledge to actionFor every child, inclusionEmerging issue: Including children with disabilities in the COVID-19 response
Understanding disability in children
Counting children with disabilities
Global and regional estimates
Country estimates
How to read the charts
8
10
15
20
32
Immunization
Reported disease episodes and care-seeking
Nutritional status
38
38
42
5 6678083
8791
92
100
102
108
119120121
122
8 9
130133
154
158
160
142144
148
51
54
58
1
Technical Annex 162
4
7
Endnotes 168
6 Seen, Counted, Included: Using data to shed light on the well-being of children with disabilities
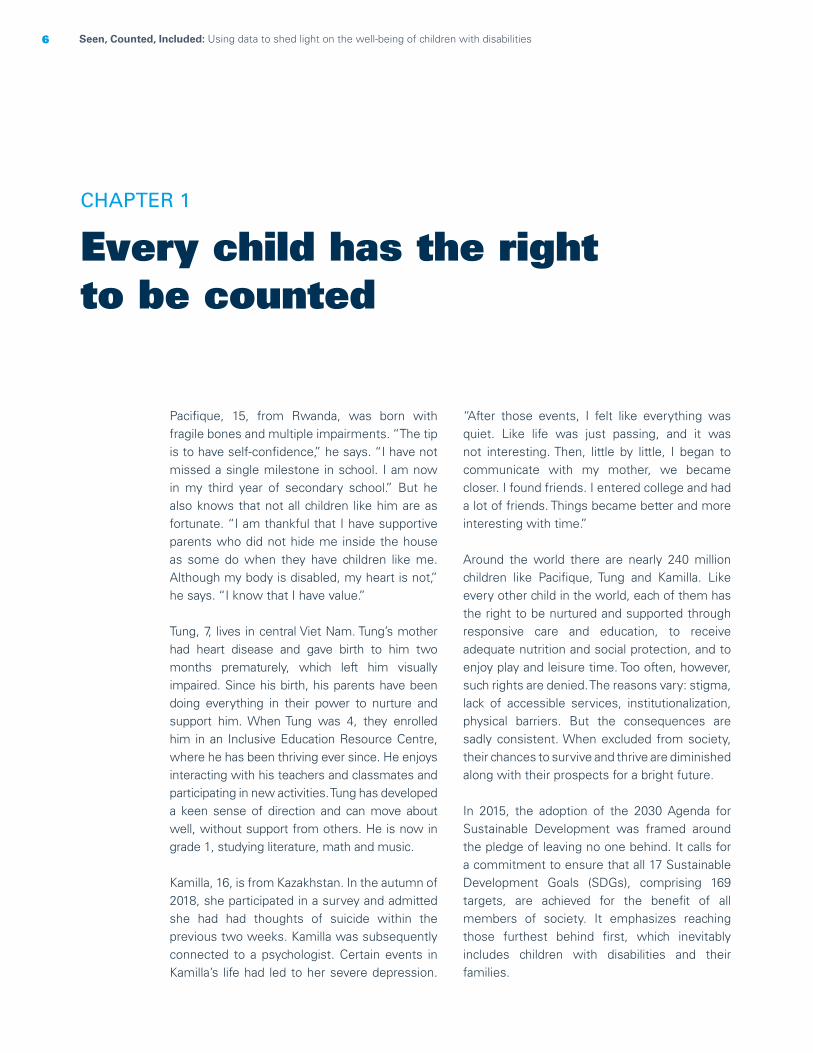
Every child has the right to be counted
Pacifique, 15, from Rwanda, was born with fragile bones and multiple impairments. “The tip is to have self-confidence,” he says. “I have not missed a single milestone in school. I am now in my third year of secondary school.” But he also knows that not all children like him are as fortunate. “I am thankful that I have supportive parents who did not hide me inside the house as some do when they have children like me. Although my body is disabled, my heart is not,” he says. “I know that I have value.”
Tung, 7, lives in central Viet Nam. Tung’s mother had heart disease and gave birth to him two months prematurely, which left him visually impaired. Since his birth, his parents have been doing everything in their power to nurture and support him. When Tung was 4, they enrolled him in an Inclusive Education Resource Centre, where he has been thriving ever since. He enjoys interacting with his teachers and classmates and participating in new activities. Tung has developed a keen sense of direction and can move about well, without support from others. He is now in grade 1, studying literature, math and music.
Kamilla, 16, is from Kazakhstan. In the autumn of 2018, she participated in a survey and admitted she had had thoughts of suicide within the previous two weeks. Kamilla was subsequently connected to a psychologist. Certain events in Kamilla’s life had led to her severe depression.
“After those events, I felt like everything was quiet. Like life was just passing, and it was not interesting. Then, little by little, I began to communicate with my mother, we became closer. I found friends. I entered college and had a lot of friends. Things became better and more interesting with time.”
Around the world there are nearly 240 million children like Pacifique, Tung and Kamilla. Like every other child in the world, each of them has the right to be nurtured and supported through responsive care and education, to receive adequate nutrition and social protection, and to enjoy play and leisure time. Too often, however, such rights are denied. The reasons vary: stigma, lack of accessible services, institutionalization, physical barriers. But the consequences are sadly consistent. When excluded from society, their chances to survive and thrive are diminished along with their prospects for a bright future.
In 2015, the adoption of the 2030 Agenda for Sustainable Development was framed around the pledge of leaving no one behind. It calls for a commitment to ensure that all 17 Sustainable Development Goals (SDGs), comprising 169 targets, are achieved for the benefit of all members of society. It emphasizes reaching those furthest behind first, which inevitably includes children with disabilities and their families.
CHAPTER 1

7CHAPTER 1 Every child has the right to be counted 7CHAPTER 1 Every child has the right to be counted
© UNICEF/UN0425663/Sokol
8 Seen, Counted, Included: Using data to shed light on the well-being of children with disabilities
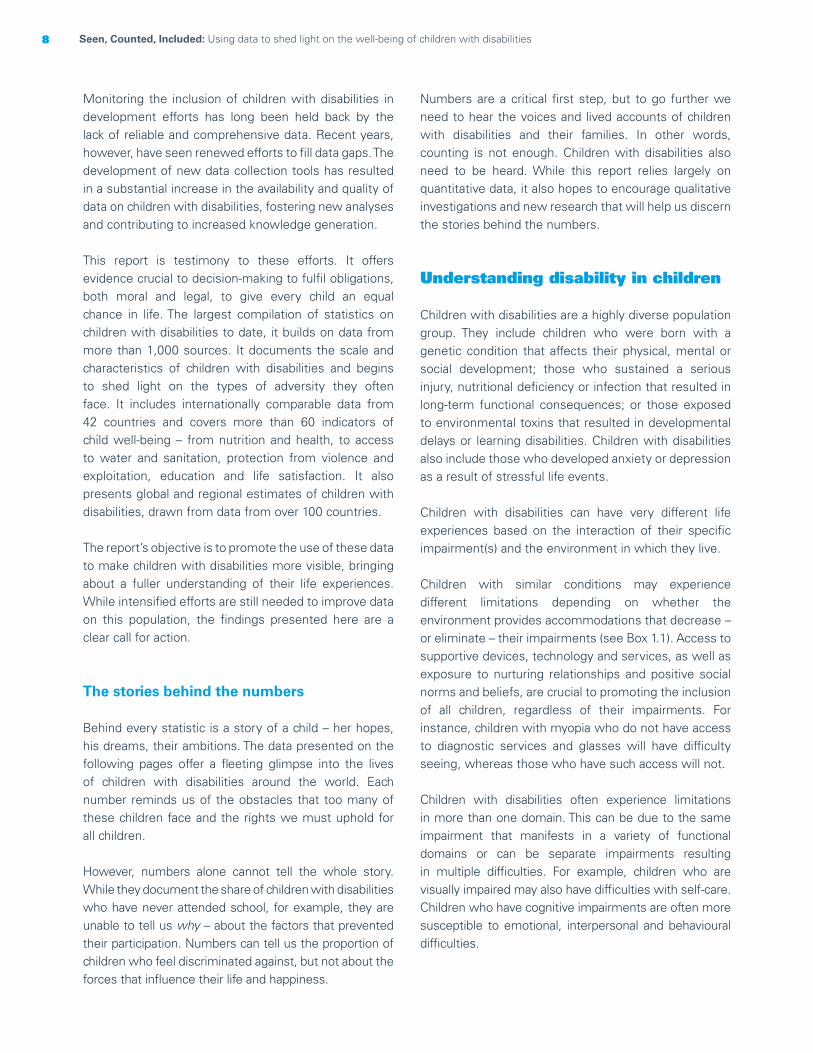
Monitoring the inclusion of children with disabilities in development efforts has long been held back by the lack of reliable and comprehensive data. Recent years, however, have seen renewed efforts to fill data gaps. The development of new data collection tools has resulted in a substantial increase in the availability and quality of data on children with disabilities, fostering new analyses and contributing to increased knowledge generation.
This report is testimony to these efforts. It offers evidence crucial to decision-making to fulfil obligations, both moral and legal, to give every child an equal chance in life. The largest compilation of statistics on children with disabilities to date, it builds on data from more than 1,000 sources. It documents the scale and characteristics of children with disabilities and begins to shed light on the types of adversity they often face. It includes internationally comparable data from 42 countries and covers more than 60 indicators of child well-being – from nutrition and health, to access to water and sanitation, protection from violence and exploitation, education and life satisfaction. It also presents global and regional estimates of children with disabilities, drawn from data from over 100 countries.
The report’s objective is to promote the use of these data to make children with disabilities more visible, bringing about a fuller understanding of their life experiences. While intensified efforts are still needed to improve data on this population, the findings presented here are a clear call for action.
The stories behind the numbers
Behind every statistic is a story of a child – her hopes, his dreams, their ambitions. The data presented on the following pages offer a fleeting glimpse into the lives of children with disabilities around the world. Each number reminds us of the obstacles that too many of these children face and the rights we must uphold for all children.
However, numbers alone cannot tell the whole story. While they document the share of children with disabilities who have never attended school, for example, they are unable to tell us why – about the factors that prevented their participation. Numbers can tell us the proportion of children who feel discriminated against, but not about the forces that influence their life and happiness.
Numbers are a critical first step, but to go further we need to hear the voices and lived accounts of children with disabilities and their families. In other words, counting is not enough. Children with disabilities also need to be heard. While this report relies largely on quantitative data, it also hopes to encourage qualitative investigations and new research that will help us discern the stories behind the numbers.
Understanding disability in children
Children with disabilities are a highly diverse population group. They include children who were born with a genetic condition that affects their physical, mental or social development; those who sustained a serious injury, nutritional deficiency or infection that resulted in long-term functional consequences; or those exposed to environmental toxins that resulted in developmental delays or learning disabilities. Children with disabilities also include those who developed anxiety or depression as a result of stressful life events.
Children with disabilities can have very different life experiences based on the interaction of their specific impairment(s) and the environment in which they live.
Children with similar conditions may experience different limitations depending on whether the environment provides accommodations that decrease – or eliminate – their impairments (see Box 1.1). Access to supportive devices, technology and services, as well as exposure to nurturing relationships and positive social norms and beliefs, are crucial to promoting the inclusion of all children, regardless of their impairments. For instance, children with myopia who do not have access to diagnostic services and glasses will have difficulty seeing, whereas those who have such access will not.
Children with disabilities often experience limitations in more than one domain. This can be due to the same impairment that manifests in a variety of functional domains or can be separate impairments resulting in multiple difficulties. For example, children who are visually impaired may also have difficulties with self-care. Children who have cognitive impairments are often more susceptible to emotional, interpersonal and behavioural difficulties.
9CHAPTER 1 Every child has the right to be counted
BOX 1.1 Defining disability
Disability is a complex and evolving concept, involving aspects of body function and structure (impairments), capacity (measured by the ability to carry out basic activities without the benefit of assistance in any form) and performance (measured by the individual’s ability to carry out these same basic activities using available assistive technologies and assistance). As stated in the Convention on the Rights of Persons with Disabilities, disability stems from the interaction between certain conditions or impairments and an unaccommodating environment that hinders an individual’s full and effective participation in society on an equal basis with others.
The framework of the International Classification of Functioning, Disability and Health (ICF) relies on a three-level model to describe the concept of disability. According to the ICF, disability can occur as:
• An impairment in body function or structure (for example, a cataract or opacity of the natural lens of
the eye, which prevents the passage of rays of light and impairs or destroys sight)
• A limitation in activity (for example, low vision or inability to see, read or engage in other activities)
• A restriction in participation (for example, exclusion from school or participation in other social, recreational or other events or roles).
The ICF framework defines disability within a biopsychosocial model, integrating both factors pertaining to the individual and his or her environment in defining disability. In contrast, the medical model defines disability as a problem resulting from a medical condition. Awareness of the important role of the social context in defining disability led to the development of the social model of disability, which defines disability not merely as a medical condition or diagnosis but rather as a failure of the policy, cultural and physical environments to accommodate differences in function.
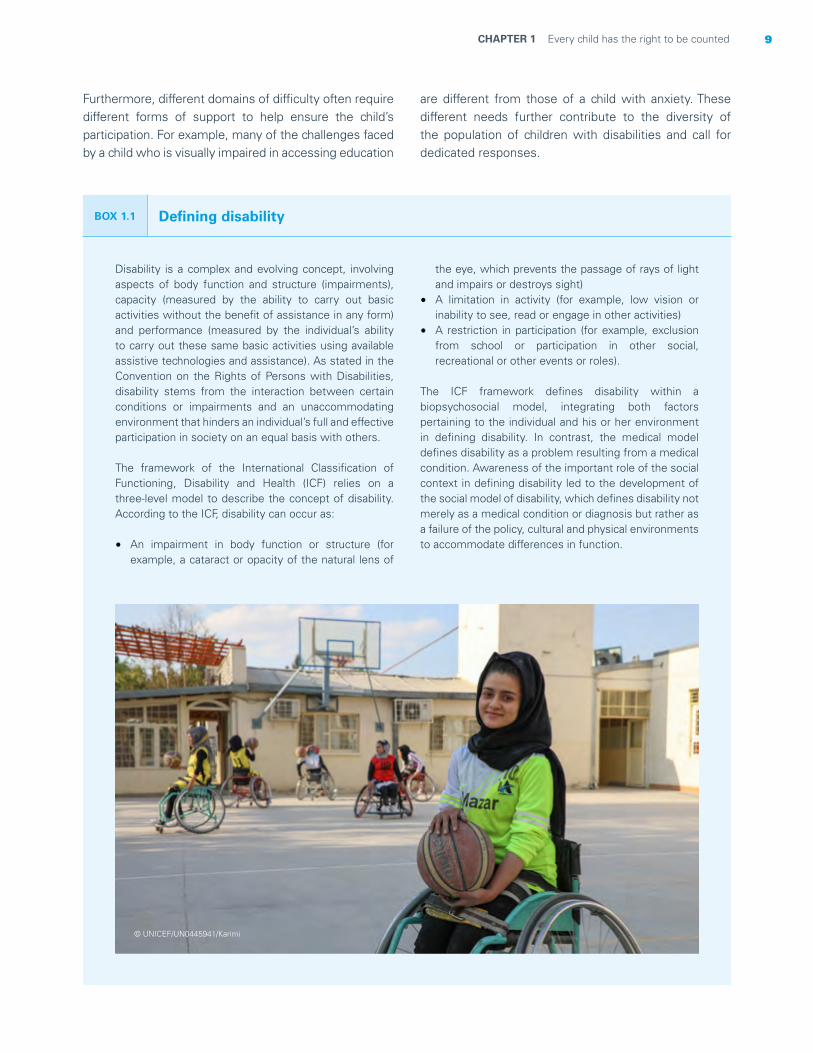
Furthermore, different domains of difficulty often require different forms of support to help ensure the child’s participation. For example, many of the challenges faced by a child who is visually impaired in accessing education
are different from those of a child with anxiety. These different needs further contribute to the diversity of the population of children with disabilities and call for dedicated responses.
© UNICEF/UN0445941/Karimi
10 Seen, Counted, Included: Using data to shed light on the well-being of children with disabilities
Counting children with disabilities
The availability of data on children with disabilities has been a longstanding challenge due to limitations related to the use of narrow definitions and the lack of a standardized data collection methodology.
While most countries have produced estimates of the number of persons with disabilities, the use of different measurement tools limits the validity and comparability of the data. The definition of disability that is used in any given data collection instrument determines who is identified as having a disability and included in the appraisal of evidence. Different conceptualizations and differences in operationalizing the concept of disability will directly impact the quality and utility of the gathered data. Historically, measures of disability have focused on domains related to physical and sensory functioning, while other domains, notably those related to psychosocial functioning, were largely overlooked. Language that was stigmatizing or judgemental was also commonly found in some of the questionnaires used to determine disability status.
An additional limitation to the production of high-quality data on children with disabilities relates to the protocols used to collect them. Non-inclusive data collection methods and analyses can lead to the generation of inaccurate, incomplete, irrelevant or misleading evidence (see Box 1.2). The absence of inclusiveness may result in severe underestimations and misidentification of
persons with disabilities, aggravating exclusion and preventing the implementation of efforts where they are most needed.
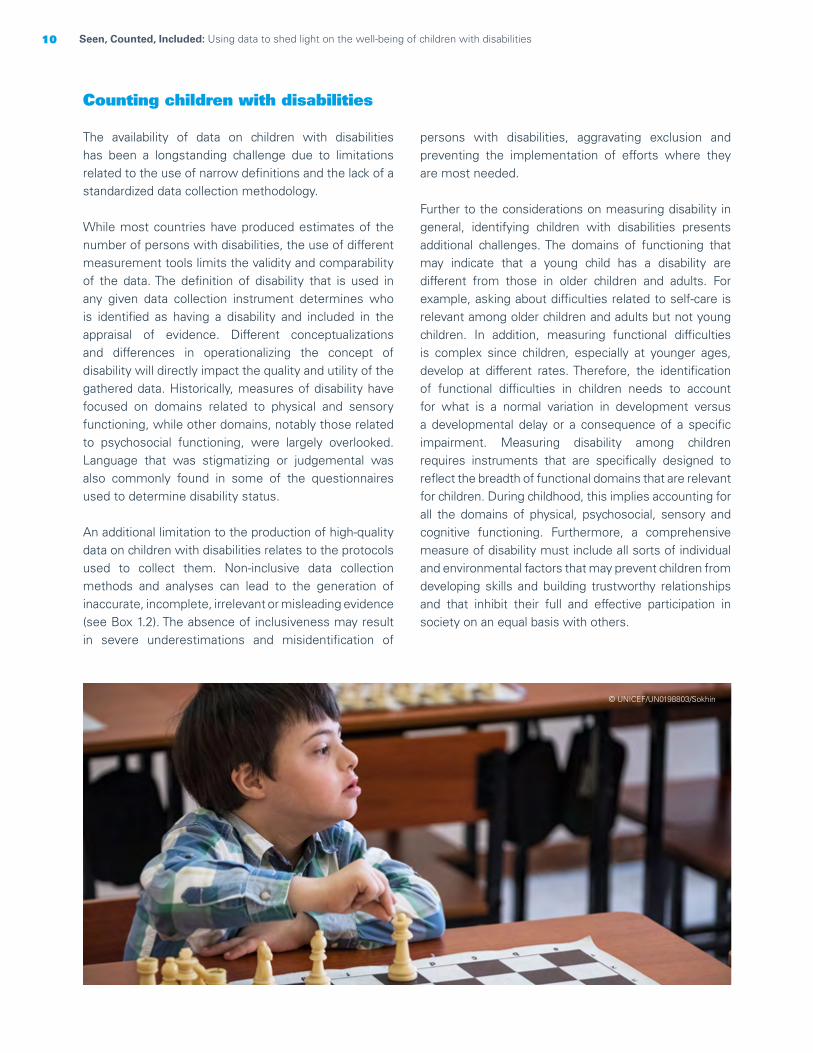
Further to the considerations on measuring disability in general, identifying children with disabilities presents additional challenges. The domains of functioning that may indicate that a young child has a disability are different from those in older children and adults. For example, asking about difficulties related to self-care is relevant among older children and adults but not young children. In addition, measuring functional difficulties is complex since children, especially at younger ages, develop at different rates. Therefore, the identification of functional difficulties in children needs to account for what is a normal variation in development versus a developmental delay or a consequence of a specific impairment. Measuring disability among children requires instruments that are specifically designed to reflect the breadth of functional domains that are relevant for children. During childhood, this implies accounting for all the domains of physical, psychosocial, sensory and cognitive functioning. Furthermore, a comprehensive measure of disability must include all sorts of individual and environmental factors that may prevent children from developing skills and building trustworthy relationships and that inhibit their full and effective participation in society on an equal basis with others.
© UNICEF/UN0198803/Sokhin
11CHAPTER 1 Every child has the right to be counted
BOX 1.2 Generating inclusive data
Inclusive data are key to eliminating discrimination on the basis of disability and accelerating global efforts towards inclusive programming.
Inclusivity needs to be considered at all stages of the data generation process – from the design of studies for the generation of country-level statistics to the methodological approaches used in the production of global estimates. This involves using data collection instruments and protocols that allow for the disaggregation of key indicators according to disability status and developing and implementing accommodation strategies to ensure that persons with
disabilities can participate in surveys, censuses and programme evaluation data collection. The production of inclusive data also demands the involvement of persons with disabilities in all data collection processes and outcomes. This will help ensure that their experiences and needs are adequately reflected in the evidence being generated.
For guidance on how to ensure inclusivity in data collection, see: United Nations Children’s Fund, ‘Producing Disability-Inclusive Data: Why it matters and what it takes’, UNICEF, New York, 2020.
United Nations Children’s Fund, ‘Producing Disability-Inclusive Data: Why it matters and what it takes’, UNICEF, New York, 2020.
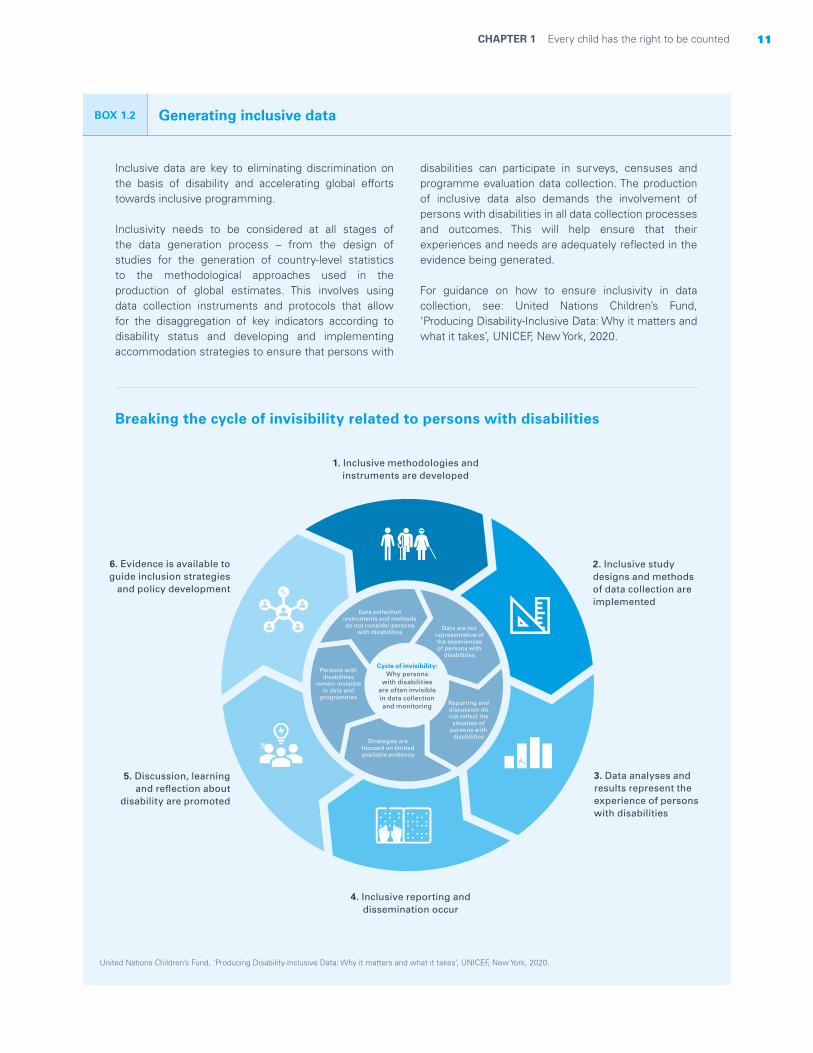
Breaking the cycle of invisibility related to persons with disabilities
Data collection instruments and methods do not consider persons
with disabilities Data are not
representative of the experiences of persons with
disabilities
Reporting and discussion do not reflect the
situation of persons with disabilities
Strategies are focused on limited available evidence
Persons with disabilities
remain invisible in data and
programmes
4. Inclusive reporting and dissemination occur
3. Data analyses and results represent the experience of persons with disabilities
5. Discussion, learning and reflection about
disability are promoted
2. Inclusive study designs and methods of data collection are implemented
6. Evidence is available to guide inclusion strategies
and policy development
1. Inclusive methodologies and instruments are developed
Cycle of invisibility: Why persons
with disabilities are often invisible in data collection and monitoring

12 Seen, Counted, Included: Using data to shed light on the well-being of children with disabilities
To address the paucity of data on the situation of children with disabilities globally, UNICEF and the Washington Group on Disability Statistics developed the Child Functioning Module for use in censuses and surveys. The module is intended to provide a population-level estimate of the number and proportion of children with functional difficulties.
The module covers children and adolescents between 2 and 17 years of age and assesses difficulties in various domains of functioning.1 It conforms to the biopsychosocial model of disability, focusing on the presence and extent of functional difficulties rather than on body structure or conditions (that is, the causes of those difficulties). For example, a mobility limitation can be the result of cerebral palsy, loss of limbs, paralysis, muscular dystrophy or spinal cord injuries. Behavioural issues may result from autism, attention deficit hyperactivity disorder or a mental health condition. Basing disability statistics on questions that ask about diagnosable conditions is problematic. Many caregivers may not know their children’s diagnosis, particularly if this involves mental and psychosocial conditions; and knowledge about diagnoses is often correlated with education, socioeconomic status and access to health services, all of which may bias collected data. Questions that focus on basic actions such as those in the Child Functioning Module serve as a better basis for identifying disability. For the purposes of social participation and equalizing opportunities, functional status – and how that impacts someone’s life – is of greater interest than the cause (medical or otherwise). Children with the same conditions or impairments may have very different degrees of difficulties. For example, a child with cerebral palsy might have a slight speech impairment but can easily be understood while another child with the same condition might not be able to speak at all, making communication challenging. Some of these difficulties are traditionally seen as a ‘disability’ while others are not.
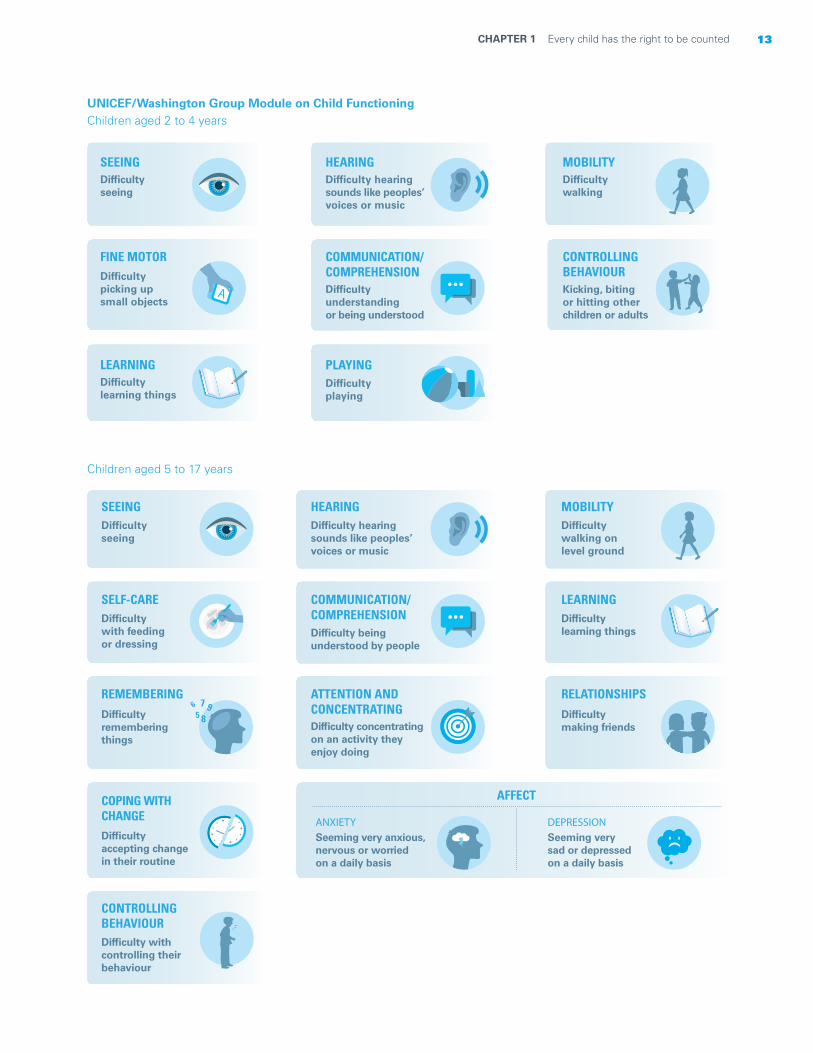
The Child Functioning Module is comprised of two questionnaires, one with 16 questions for children aged 2 to 4 years and another with 24 questions for children aged 5 to 17 years. The questions are to be administered to the mother or primary caregiver of the child in question. They are designed to identify difficulties according to a range of severity in a number of domains. To better reflect the degree of functional difficulty, each area is assessed against a rating scale.
In addition to collecting data on domains related to physical, sensory and cognitive functioning, the Child Functioning Module includes questions on difficulties in psychosocial functioning during childhood. These questions identify children having difficulties expressing and managing emotions, accepting changes, controlling behaviour and making friends. While all children may sometimes manifest worry, sadness or anxiety, these emotions may be significant and frequent enough to place certain children at higher risk of dropping out of school, withdrawing from family or community life or harming themselves. As with other questions in the module, questions in the psychosocial domains are intended to collect information about difficulties across a spectrum of severity. This allows for the identification of children at risk of experiencing significant disruptions to their well-being and development due to such difficulties. For example, the question on difficulties in coping with change is not intended to identify children who may be stubborn at times or show resistance to some routine changes. Rather, it is intended to identify those who have major issues transitioning from one activity to another on a consistent basis and have difficulty with disruptions to their routine, including children who are on the autism spectrum – a group of conditions often characterized by the need for routines and rituals. These children can struggle with unexpected changes, causing upset and disruption to varying degrees, especially during periods of transition common to adolescents, such as changing schools, moving and taking on more mature roles as they age.2
A new way to measure disability in children
13CHAPTER 1 Every child has the right to be counted
UNICEF/Washington Group Module on Child Functioning
Children aged 5 to 17 years
COMMUNICATION/COMPREHENSIONDifficulty understanding or being understood
CONTROLLINGBEHAVIOURKicking, biting or hitting other children or adults
LEARNINGDifficulty learning things
MOBILITYDifficultywalking
HEARINGDifficulty hearingsounds like peoples’voices or music
SEEINGDifficulty seeing
FINE MOTORDifficulty picking up small objects
PLAYINGDifficultyplaying
Children aged 2 to 4 years
COPING WITH CHANGEDifficulty accepting change in their routine
CONTROLLINGBEHAVIOURDifficulty with controlling their behaviour
REMEMBERING
Difficulty remembering things
SEEINGDifficulty seeing
SELF-CAREDifficulty with feedingor dressing
COMMUNICATION/COMPREHENSIONDifficulty beingunderstood by people
ATTENTION ANDCONCENTRATINGDifficulty concentratingon an activity they enjoy doing
HEARINGDifficulty hearingsounds like peoples’voices or music
ANXIETY
AFFECT
Seeming very anxious,nervous or worried on a daily basis
DEPRESSIONSeeming very sad or depressed on a daily basis
LEARNINGDifficulty learning things
RELATIONSHIPS
Difficulty making friends
MOBILITYDifficulty walking on level ground
A
14 Seen, Counted, Included: Using data to shed light on the well-being of children with disabilities
Psychosocial functioning is also fundamental in facilitating positive engagement between a child and his or her environment and establishing positive relationships. For example, psychosocial difficulties can have repercussions in many areas; children who have such difficulties may face significant barriers in accessing education and other services without support and to build and maintain social interactions.
The Child Functioning Module was developed in consultation with organizations of persons with disabilities, among other stakeholder groups.3 These organizations were instrumental in the design of the module, including through their engagement during its validation in the field.4 The module underwent extensive review by other experts and was tested in several countries to determine the quality of questions being
asked and how well they are understood by people in diverse cultures.5
In March 2017, a joint statement issued by multiple UN agencies and Member States, organizations of persons with disabilities and other stakeholders recommended the module as the appropriate tool for SDG data disaggregation for children.6 The development of the Child Functioning Module and its roll-out as part of the Multiple Indicator Cluster Survey (MICS) (see Box 1.3) has led to the release, for the first time, of cross-nationally comparable data on children with disabilities. In addition, many countries have also included the module as part of their nationally representative surveys. Estimates from around 50 countries have been released as of November 2021, and data from 20 more surveys are expected to become available over the next couple of years.
BOX 1.3 Collecting data on children with disabilities through Multiple Indicator Cluster Surveys
The Multiple Indicator Cluster Survey (MICS) is an international household survey programme designed to assist countries in collecting and analysing data on the situation of women and children. Since its inception in the mid-1990s, the MICS has enabled nearly 120 countries to collect nationally representative and internationally comparable data on more than 100 key indicators in areas such as nutrition, child health, mortality, education, water and sanitation, child protection, and HIV and AIDS. To date, six rounds of the MICS have been completed and a seventh round is currently under way.
The MICS tools, including core questionnaires and modules on specific topics, are developed by UNICEF in consultation with relevant experts from various UN organizations and interagency monitoring groups. The surveys are designed by country teams and implemented by local agencies, typically national statistical offices. The core questionnaires are a household questionnaire, a questionnaire for individual girls and women between the ages of 15 and 49, a questionnaire for individual boys and men aged 15 years and older, a questionnaire on children under age 5 (administered to mothers or primary caregivers), and a questionnaire on children aged 5 to 17 years (also administered to mothers or primary caregivers). The questionnaires are all modular in nature and can be adapted or customized to the needs of the country. In countries as diverse as Argentina, Bangladesh,
Côte d’Ivoire, Fiji, Qatar, Thailand and Turkmenistan, trained fieldwork teams conduct interviews with household members on a variety of topics – focusing mainly on those issues that directly affect the lives of children and women. The MICS is an integral part of the policies and plans of many governments around the world and a major data source for more than 30 SDG indicators.
Starting in 2016, the Child Functioning Module and the Washington Group Short Set on Functioning (WG-SS)7 became part of the MICS and are used to collect data on children aged 2 to 17 and on adult women and men aged 18 and older, respectively. With the inclusion of these two tools, the MICS programme has become the largest source of internationally comparable data on children and adults with disabilities. The recent release of standardized and comparable data from more than 40 MICS represents an unprecedented opportunity to address the evidence gap on persons with disabilities. Furthermore, when analysed in conjunction with other MICS indicators, the data can be used to document the inequities experienced by children with functional difficulties aged 2 to 17 years at the global level for monitoring several SDG indicators and other key indicators across the main sectoral areas and relevant cross-cutting themes.

15CHAPTER 1 Every child has the right to be counted
Estimation challenges
Despite the recent increase in standardized data on children with disabilities, the availability of comparable data is still highly uneven within and across countries. Past estimates aimed at quantifying the number of children with disabilities have been largely based on data sources that rely on very different definitions and methods. Moreover, they have mostly been based on medical concepts of disability, which emphasize clinical conditions, sequelae and the presence of specific impairments. Typically, shortcomings in terms of data quality, comparability and coverage are addressed by adjusting and harmonizing data through different modelling techniques, with various limitations.8
In the context of disability measurement, such shortcomings have serious implications when attempting to produce global and regional estimates of the number of children with disabilities. While data adjustments and modelling are central to overcoming harmonization issues, they cannot address fundamental conceptual differences in what is being measured. Harmonizing data based on medically informed measurements into an estimate that more accurately reflects the breadth and severity of functional difficulties is a complex task. Data sources based on a medical definition of disability emphasize a subpopulation with more severe conditions and impairments in ‘visible’ domains of functioning. As a result, they under-identify children who may have less severe difficulties, or difficulties in domains that tend to be left out of measurement tools.
BOX 1.4 Previous efforts to estimate the number of children with disabilities
Until this report, no estimation of the global number of children with disabilities has been made that takes into account a full range of functional difficulties along with behavioural and mental health issues.
The only estimate available for many years indicated that 10 per cent of the world’s population had some form of disability.9 In 2011, this was updated to 15 per cent, and an estimate was produced on the number of children aged 14 or younger with a moderate or severe disability: 93 million children, or 5 per cent of children in that age group.10 Such global estimates are affected by well-known limitations surrounding disability measurement.
The concept of disability described in the World Health Organization’s (WHO’s) Global Burden of Disease 2004 (upon which WHO’s 2011 estimate for children is based) refers to the perceived short- or long-term loss of health associated with a condition and is not aligned with the ICF definition of disability. This metric of disability has been criticized for its lack of consideration of core participatory and rights-based principles and for being
discriminatory on the value of persons with disabilities.11
A critical limitation to this approach is that the weights attributed to each impairment do not account for the differential impact that an impairment may have on various individuals as a result of environmental
conditions.12 Moreover, the weights used by the Global Burden of Disease do not vary across geographic regions, disregarding the multiple contextual factors that can worsen functionality in persons with the same impairments.13
The use of medical concepts of disability also has implications for the quality of data. Reporting of these impairments usually depends on parents’ awareness of symptoms and a pre-existing diagnosis. Therefore under-identification remains a problem since diagnosis depends on the availability of health-care facilities where children can be screened.
More recent estimates have introduced improvements, such as increasing the internal consistency of different sources of data by using a metanalytic approach and
adjusting estimates for comorbidity.14 That said, these
latest estimates are still largely focused on the burden of different impairments and medical conditions, rather than on the functional difficulties or restrictions to participation experienced by children with disabilities.
Global and regional estimates

16 Seen, Counted, Included: Using data to shed light on the well-being of children with disabilities
Methodology
The technical work behind this report aimed to produce an estimate of the number of children with disabilities aligned with the Convention on the Rights of Persons with Disabilities and a biopsychosocial concept of disability. The regional and global estimates presented here rely mainly on information about functional difficulties or limitations among children gathered through sources with some degree of international comparability. These include MICS, Demographic and Health Surveys (DHS), the European Health Interview Survey (EHIS) and the European Survey on Income and Living Conditions (EU-SILC). While most of the data sources included in the estimates refer to data collected from 2017 onwards, the data points used for some countries are not the most recent ones, but those most aligned with the notion of disability underlying the global estimate. Detailed technical information on the estimation work and the data sources is provided in the technical annex at the end of this report.
How data were selected
UNICEF maintains a global database of disability data sources from 195 countries. The database includes more than 1,000 data points together with information on methodological aspects that can impact the number of children who are identified as having a disability. The selection of data sources involved an extensive process of data compilation and consultations with country-level experts to overcome limitations on data availability and comparability, and to ensure their views were reflected in
the data selection, harmonization and estimation process. After screening the disability global database, sources of data collected prior to 2005, as well as those not derived from censuses or household surveys, were excluded. Information selected for inclusion focused on identifying data aligned as closely as possible with the concept of disability described earlier. This meant selecting sources of data gathered through measurement tools that collect information on functional difficulties, rather than specific impairments or health conditions. Another selection criterion was the use of a rating scale to capture the severity of functional difficulties, rather than the use of ‘yes’ or ‘no’ questions.
On the basis of these considerations, and in consultation with experts, 104 data sources were selected (see Table 1.1). Collectively, these data sources represent 84 per cent of the world’s population of children and at least 50 per cent of the population of children within each region.
Technical consultations
Heterogeneity across data sources is a common concern when generating global estimates. While this can be dealt with using a strictly statistical approach, incorporating country-level expertise into the data selection and harmonization process was considered important.
The estimation work was part of an iterative process that included three technical consultations with experts in the field of data on children with disabilities. They included professionals from national statistical offices, organizations of persons with disabilities and academia.
Number of countries and areas
Number of countries and areas with available data that
meet the inclusion criteria
Percentage of the child population covered
by the available data
East Asia and the Pacific 33 16 80
Eastern and Southern Africa 25 13 74
Europe and Central Asia 55 31 59
Latin America and the Caribbean 37 14 74
Middle East and North Africa 19 10 73
North America 2 2 100
South Asia 8 6 97
West and Central Africa 24 12 74
World 203 104 84
TABLE 1.1. Data coverage
17CHAPTER 1 Every child has the right to be counted
Following a standard protocol, the consultation sought to obtain their views on the prevalence of children with functional difficulties in their countries. The initial part of the consultation was dedicated to building a common understanding of disability aligned with the ICF and the Convention on the Rights of Persons with Disabilities. This was followed by in-depth discussion of the available country-level information, and the results of the data harmonization analyses and estimation work. For each consultation, UNICEF shared details on the process and methodology used for estimations as well as on the selected data sources for each region and country. Experts’ inputs in relation to the data harmonization approach were incorporated and reflected in the regional and global estimates.
Data harmonization and final estimates
Instruments that collect data based on a restricted number of functional domains tend to underestimate the percentage of children with disabilities in a given population. Results from several countries that have measured disability among children aged 5 to 17 years
using both the Child Functioning Module (involving 13 domains) and the Washington Group Short Set on Functioning (six domains) show that the number of children identified as having functional difficulties by the Short Set is substantively lower than that identified by the Child Functioning Module. This finding was considered in the final harmonization process. Data sources based on the Short Set were adjusted to approximate the expected prevalence that would have been obtained by the Child Functioning Module, accounting for a country’s under-five mortality rate.
Despite screening, selecting and harmonizing data points prior to the estimation process, the resulting data still contained significant variability across countries and regions. For this reason, the estimation process was largely based on meta-analyses of proportions that were considered suitable to account for the variability of the data. The final estimates that follow should be regarded as the best possible on the basis of available data and should be seen as indicating orders of magnitude rather than precise figures (see technical annex for additional details).
BOX 1.5 Working together towards more robust and inclusive estimates
Global and regional estimates of the number of children with disabilities remain highly complex and will continue to depend on the availability of adequate and comparable population-level data. Committed efforts and stronger investment are required to nurture the principle of disability-inclusion at all stages of the data collection and statistics production cycle. The objective of making all children with disabilities visible in official statistics and in global estimates can only be achieved by promoting good-quality country data. This will require building capacities across the board to bring countries to a common standard of disability statistics. The reliance on sophisticated statistical approaches to overcome the shortage of data and mitigate its flaws and uncertainties will not be sufficient to make this objective a reality. Rather, countries need support to strengthen their capacities to collect, analyse and use disability data through effective technical support and the engagement – and empowerment – of stakeholders,
including persons with disabilities. Special consideration should be given to strengthening the availability and quality of data for the youngest children, particularly those under age 2, for which population-level data remain scarce.
Finally, while mainstream surveys and censuses provide representative estimates of children living in households, these sources do not consider children in residential care or children who do not live in a household. While these children usually represent a small proportion of the child population, their under-identification could be significant in countries with high levels of institutionalization among children with disabilities and those with large ‘floating’ populations, such as those experiencing armed conflict or forced displacement. More comprehensive global estimates will need to include such children as well.
18 Seen, Counted, Included: Using data to shed light on the well-being of children with disabilities
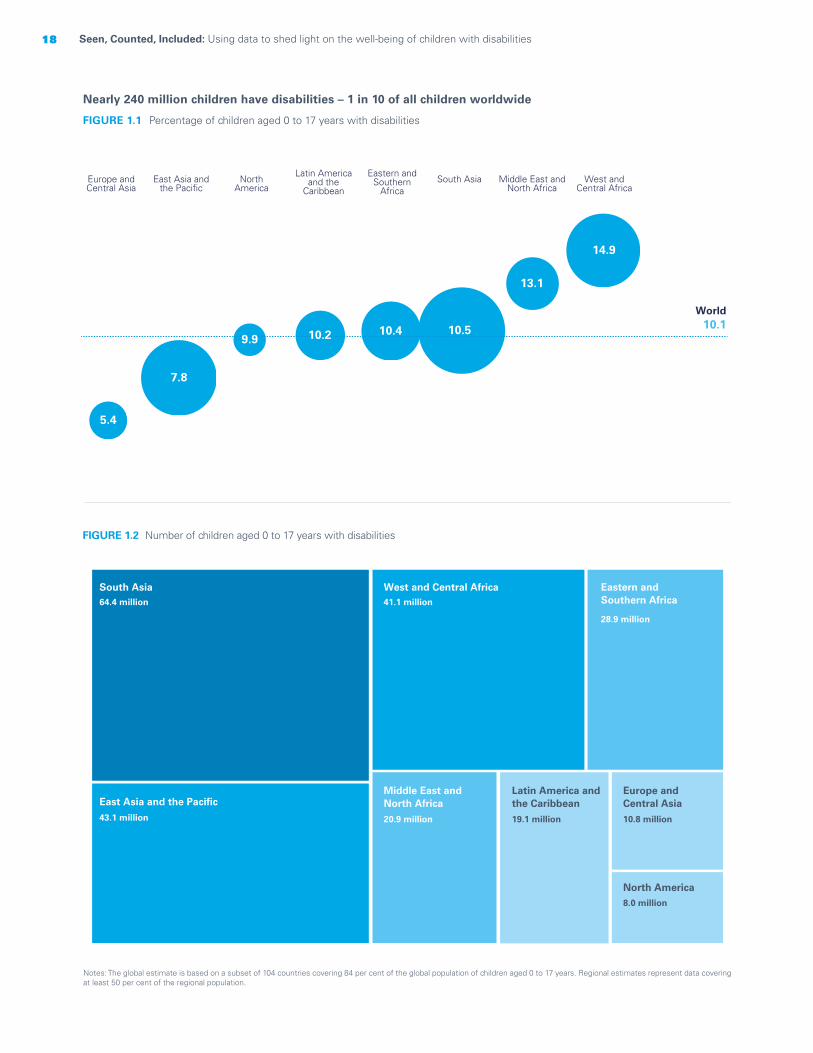
FIGURE 1.1 Percentage of children aged 0 to 17 years with disabilities
FIGURE 1.2 Number of children aged 0 to 17 years with disabilities
Nearly 240 million children have disabilities – 1 in 10 of all children worldwide
Notes: The global estimate is based on a subset of 104 countries covering 84 per cent of the global population of children aged 0 to 17 years. Regional estimates represent data covering at least 50 per cent of the regional population.
West and Central Africa
Middle East and North Africa
South Asia Eastern and
Southern Africa
Latin America and the
Caribbean North
America East Asia and
the Pacific Europe and Central Asia
5.4
7.8
10.4 10.5
13.1
14.9
World10.1
9.9 10.2
South Asia64.4 million
43.1 million
41.1 million
20.9 million 19.1 million 10.8 million
8.0 million
28.9 million
East Asia and the Pacific
West and Central Africa
Latin America andthe Caribbean
Eastern andSouthern Africa
Middle East andNorth Africa
Europe andCentral Asia
North America

19CHAPTER 1 Every child has the right to be counted
© UNICEF/UN040642/Miljanic
20 Seen, Counted, Included: Using data to shed light on the well-being of children with disabilities
Country estimates
Indicators used in this section
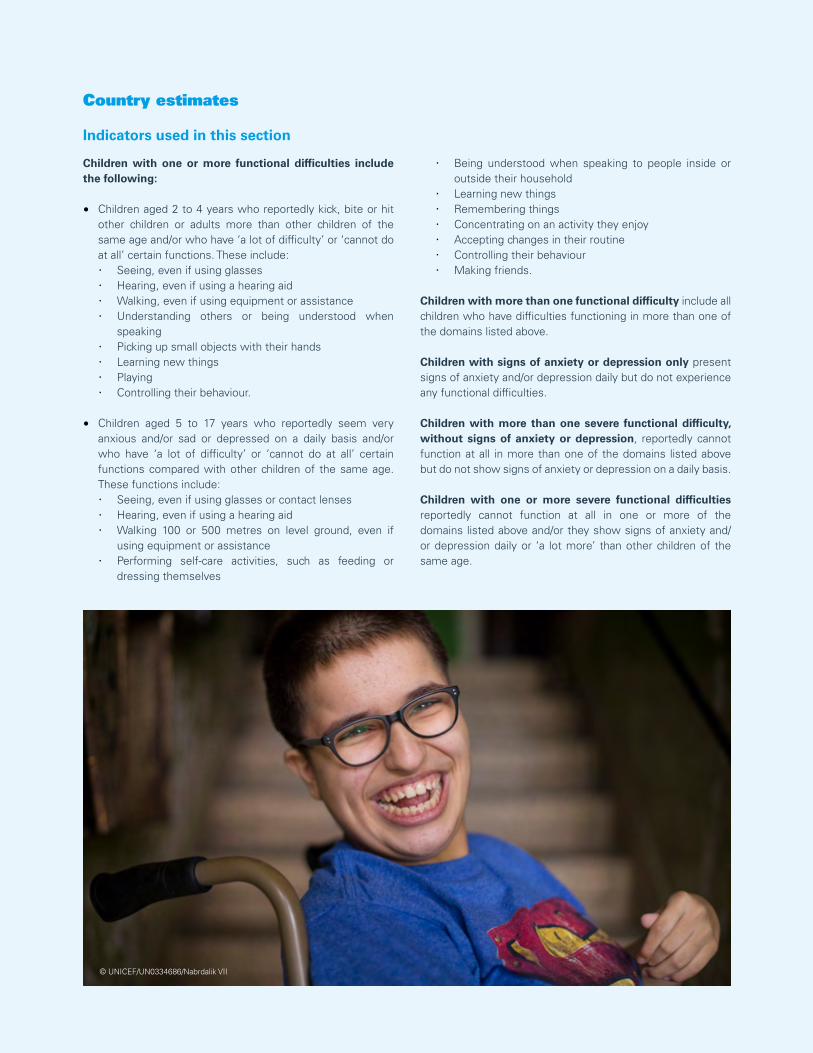
Children with one or more functional difficulties include the following:
• Children aged 2 to 4 years who reportedly kick, bite or hit other children or adults more than other children of the same age and/or who have ‘a lot of difficulty’ or ‘cannot do at all’ certain functions. These include: · Seeing, even if using glasses · Hearing, even if using a hearing aid · Walking, even if using equipment or assistance · Understanding others or being understood when
speaking · Picking up small objects with their hands · Learning new things · Playing · Controlling their behaviour.
• Children aged 5 to 17 years who reportedly seem very anxious and/or sad or depressed on a daily basis and/or who have ‘a lot of difficulty’ or ‘cannot do at all’ certain functions compared with other children of the same age. These functions include: · Seeing, even if using glasses or contact lenses · Hearing, even if using a hearing aid · Walking 100 or 500 metres on level ground, even if
using equipment or assistance · Performing self-care activities, such as feeding or
dressing themselves
· Being understood when speaking to people inside or outside their household
· Learning new things · Remembering things · Concentrating on an activity they enjoy · Accepting changes in their routine · Controlling their behaviour · Making friends.
Children with more than one functional difficulty include all children who have difficulties functioning in more than one of the domains listed above.
Children with signs of anxiety or depression only present signs of anxiety and/or depression daily but do not experience any functional difficulties.
Children with more than one severe functional difficulty, without signs of anxiety or depression, reportedly cannot function at all in more than one of the domains listed above but do not show signs of anxiety or depression on a daily basis.
Children with one or more severe functional difficulties reportedly cannot function at all in one or more of the domains listed above and/or they show signs of anxiety and/or depression daily or ‘a lot more’ than other children of the same age.
© UNICEF/UN0334686/Nabrdalik VII
21CHAPTER 1 Every child has the right to be counted
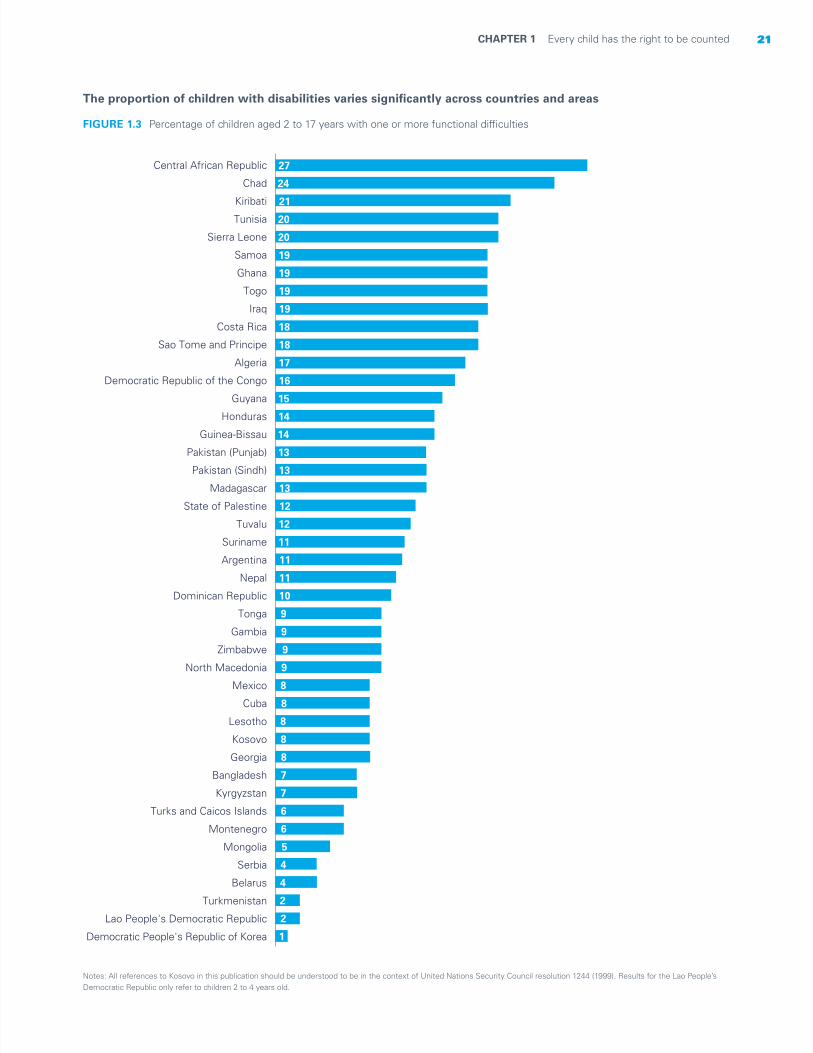
The proportion of children with disabilities varies significantly across countries and areas
FIGURE 1.3 Percentage of children aged 2 to 17 years with one or more functional difficulties
Notes: All references to Kosovo in this publication should be understood to be in the context of United Nations Security Council resolution 1244 (1999). Results for the Lao People’s Democratic Republic only refer to children 2 to 4 years old.
Central African Republic
Chad
Kiribati
Tunisia
Sierra Leone
Samoa
Ghana
Togo
Iraq
Costa Rica
Sao Tome and Principe
Algeria
Democratic Republic of the Congo
Guyana
Honduras
Guinea-Bissau
Pakistan (Punjab)
Pakistan (Sindh)
Madagascar
State of Palestine
Tuvalu
Suriname
Argentina
Nepal
Dominican Republic
Tonga
Gambia
Zimbabwe
North Macedonia
Mexico
Cuba
Lesotho
Kosovo
Georgia
Bangladesh
Kyrgyzstan
Turks and Caicos Islands
Montenegro
Mongolia
Serbia
Belarus
Turkmenistan
Lao People's Democratic Republic
Democratic People's Republic of Korea
27
24
21
20
20
19
19
19
19
18
18
17
16
15
14
14
13
13
13
12
12
11
11
11
10
9
9
9
9
8
8
8
8
8
7
7
6
6
5
4
4
2
2
1
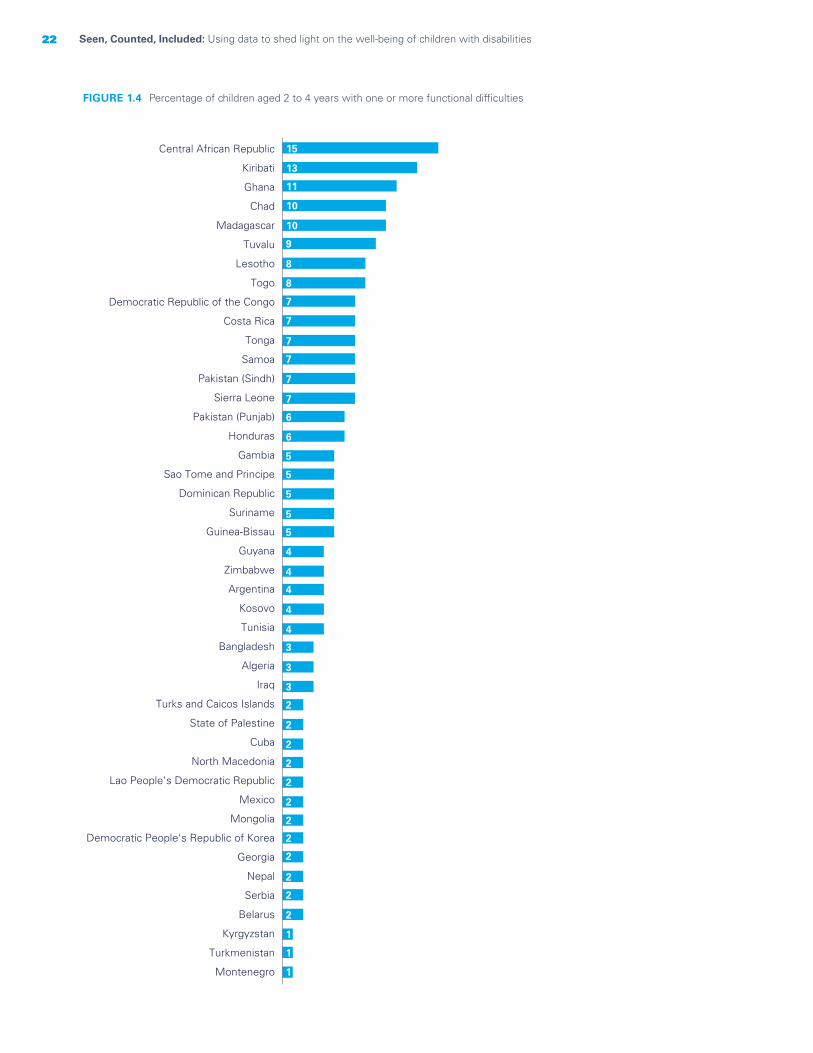
22 Seen, Counted, Included: Using data to shed light on the well-being of children with disabilities
FIGURE 1.4 Percentage of children aged 2 to 4 years with one or more functional difficulties
Central African Republic
Kiribati
Ghana
Chad
Madagascar
Tuvalu
Lesotho
Togo
Democratic Republic of the Congo
Costa Rica
Tonga
Samoa
Pakistan (Sindh)
Sierra Leone
Pakistan (Punjab)
Honduras
Gambia
Sao Tome and Principe
Dominican Republic
Suriname
Guinea-Bissau
Guyana
Zimbabwe
Argentina
Kosovo
Tunisia
Bangladesh
Algeria
Iraq
Turks and Caicos Islands
State of Palestine
Cuba
North Macedonia
Lao People's Democratic Republic
Mexico
Mongolia
Democratic People's Republic of Korea
Georgia
Nepal
Serbia
Belarus
Kyrgyzstan
Turkmenistan
Montenegro
15
13
11
10
10
9
8
8
7
7
7
7
7
7
6
6
5
5
5
5
5
4
4
4
4
4
3
3
3
2
2
2
2
2
2
2
2
2
2
2
2
1
1
1

23CHAPTER 1 Every child has the right to be counted
FIGURE 1.5 Percentage of children aged 5 to 17 years with one or more functional difficulties
Central African Republic
Chad
Tunisia
Sierra Leone
Samoa
Kiribati
Iraq
Togo
Costa Rica
Ghana
Algeria
Sao Tome and Principe
Democratic Republic of the Congo
Pakistan (Punjab)
Guyana
Guinea-Bissau
Honduras
Pakistan (Sindh)
State of Palestine
Madagascar
Argentina
Suriname
Nepal
Tuvalu
Cuba
Dominican Republic
Mexico
North Macedonia
Zimbabwe
Gambia
Tonga
Georgia
Kyrgyzstan
Kosovo
Bangladesh
Lesotho
Montenegro
Turks and Caicos Islands
Mongolia
Serbia
Belarus
Turkmenistan
Democratic People's Republic of Korea
31
29
24
23
23
23
22
21
21
21
21
20
20
18
18
16
16
15
15
14
14
14
13
13
12
11
11
11
10
10
10
10
9
9
8
8
8
7
6
5
5
3
1
24 Seen, Counted, Included: Using data to shed light on the well-being of children with disabilities
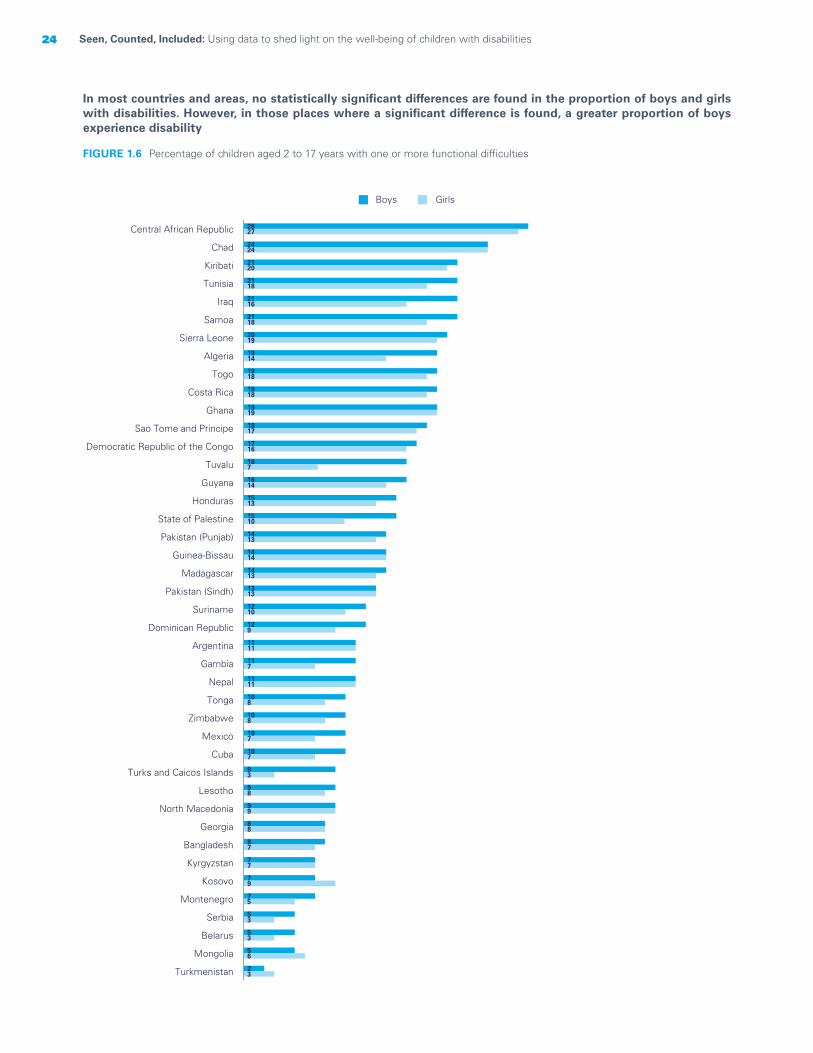
In most countries and areas, no statistically significant differences are found in the proportion of boys and girls with disabilities. However, in those places where a significant difference is found, a greater proportion of boys experience disability
FIGURE 1.6 Percentage of children aged 2 to 17 years with one or more functional difficulties
Boys Girls
28
24
21
21
21
21
20
19
19
19
19
18
17
16
16
15
15
14
14
14
13
12
12
11
11
11
10
10
10
10
9
9
9
8
8
7
7
7
5
5
5
2
27
24
20
18
16
18
19
14
18
18
19
17
16
7
14
13
10
13
14
13
13
10
9
11
7
11
8
8
7
7
3
8
9
8
7
7
9
5
3
3
6
3
Central African Republic
Chad
Kiribati
Tunisia
Iraq
Samoa
Sierra Leone
Algeria
Togo
Costa Rica
Ghana
Sao Tome and Principe
Democratic Republic of the Congo
Tuvalu
Guyana
Honduras
State of Palestine
Pakistan (Punjab)
Guinea-Bissau
Madagascar
Pakistan (Sindh)
Suriname
Dominican Republic
Argentina
Gambia
Nepal
Tonga
Zimbabwe
Mexico
Cuba
Turks and Caicos Islands
Lesotho
North Macedonia
Georgia
Bangladesh
Kyrgyzstan
Kosovo
Montenegro
Serbia
Belarus
Mongolia
Turkmenistan
25CHAPTER 1 Every child has the right to be counted
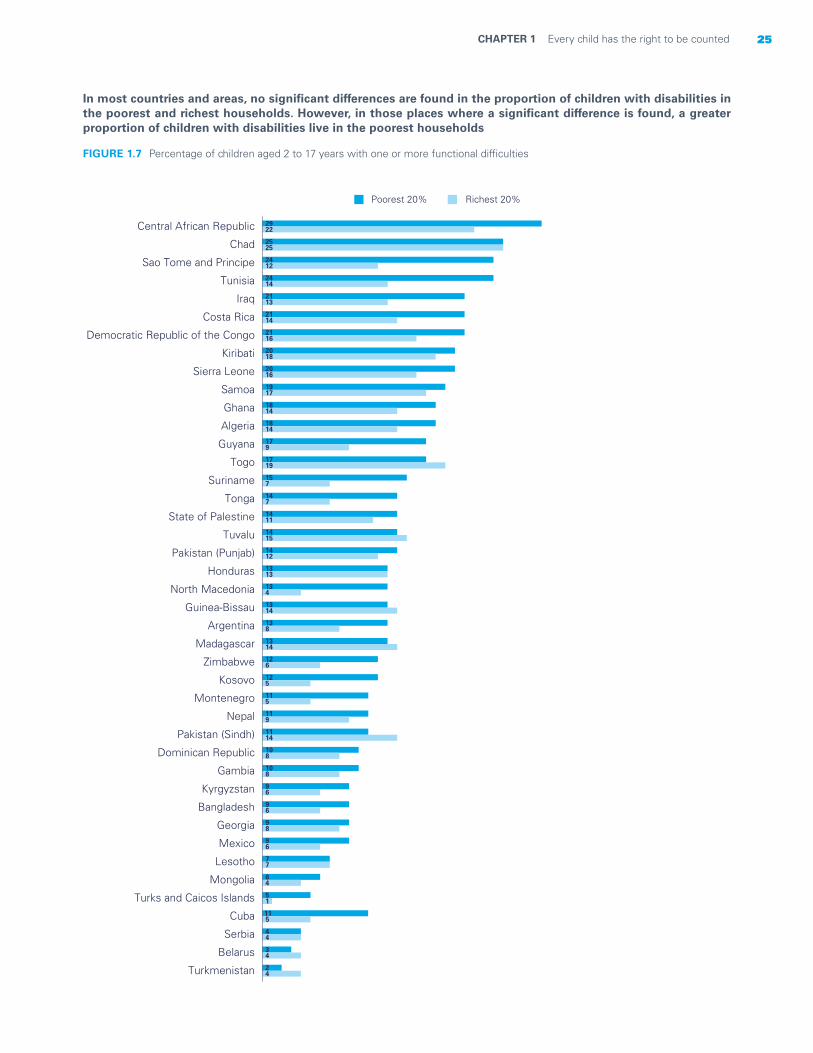
In most countries and areas, no significant differences are found in the proportion of children with disabilities in the poorest and richest households. However, in those places where a significant difference is found, a greater proportion of children with disabilities live in the poorest households
FIGURE 1.7 Percentage of children aged 2 to 17 years with one or more functional difficulties
Poorest 20% Richest 20%
29
25
24
24
21
21
21
20
20
19
18
18
17
17
15
14
14
14
14
13
13
13
13
13
12
12
11
11
11
10
10
9
9
9
9
7
6
5
11
4
3
2
22
25
12
14
13
14
16
18
16
17
14
14
9
19
7
7
11
15
12
13
4
14
8
14
6
5
5
9
14
8
8
6
6
8
6
7
4
1
5
4
4
4
Central African Republic
Chad
Sao Tome and Principe
Tunisia
Iraq
Costa Rica
Democratic Republic of the Congo
Kiribati
Sierra Leone
Samoa
Ghana
Algeria
Guyana
Togo
Suriname
Tonga
State of Palestine
Tuvalu
Pakistan (Punjab)
Honduras
North Macedonia
Guinea-Bissau
Argentina
Madagascar
Zimbabwe
Kosovo
Montenegro
Nepal
Pakistan (Sindh)
Dominican Republic
Gambia
Kyrgyzstan
Bangladesh
Georgia
Mexico
Lesotho
Mongolia
Turks and Caicos Islands
Cuba
Serbia
Belarus
Turkmenistan

26 Seen, Counted, Included: Using data to shed light on the well-being of children with disabilities
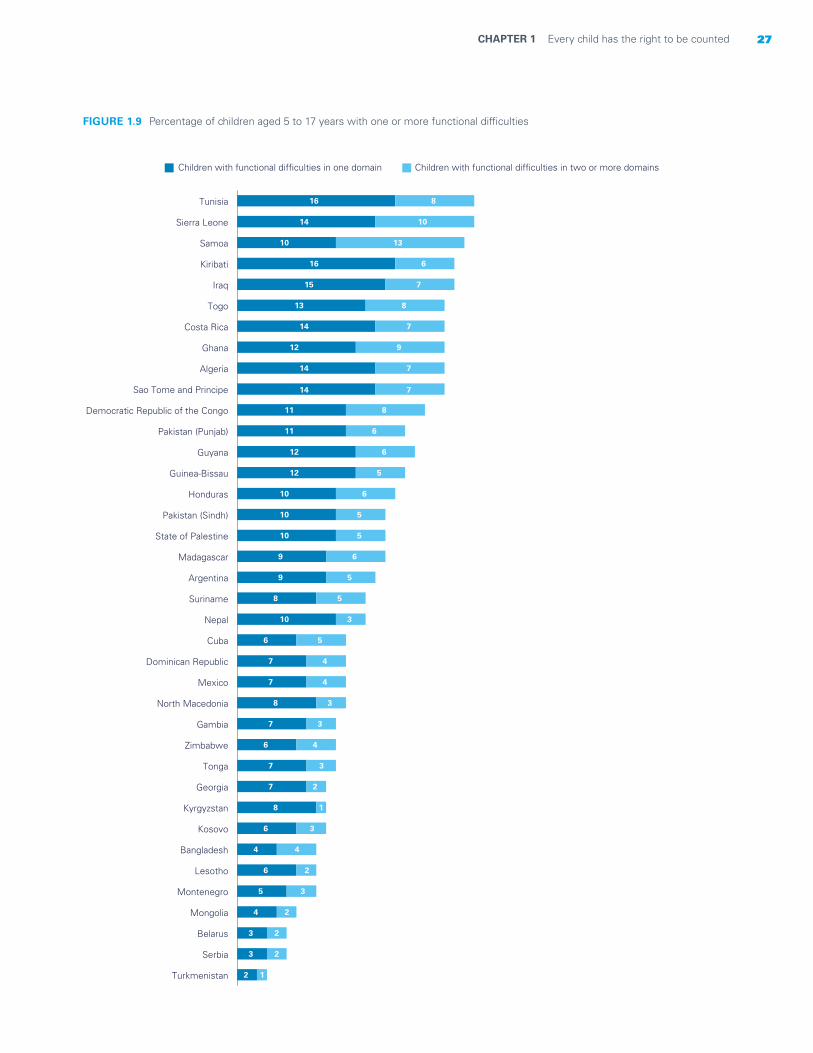
Most children with disabilities have functional difficulties in only one domain
FIGURE 1.8 Percentage of children aged 2 to 4 years with one or more functional difficulties
1
1
1
1
1
1
1
2
2
2
1
1
2
2
2
2
3
3
3
3
4
4
4
4
5
5
5
5
6
6
7
7
7
7
7
9
11
11
0,2
0,4
0,4
0,4
1
1
1
0,4
1
0,3
1
1
1
1
1
1
1
1
1
1
0,1
1
1
1
1
1
2
1
1
1
1
1
1
3
3
1
1
4
Montenegro
Turkmenistan
Kyrgyzstan
Serbia
Belarus
Nepal
Georgia
Lao People's Democratic Republic
Mongolia
Mexico
North Macedonia
Cuba
State of Palestine
Iraq
Algeria
Bangladesh
Kosovo
Tunisia
Zimbabwe
Guyana
Guinea-Bissau
Suriname
Dominican Republic
Sao Tome and Principe
Gambia
Pakistan (Punjab)
Sierra Leone
Pakistan (Sindh)
Tonga
Democratic Republic of the Congo
Costa Rica
Togo
Lesotho
Madagascar
Chad
Ghana
Kiribati
Central African Republic
Children with functional difficulties in one domain Children with functional difficulties in two or more domains
27CHAPTER 1 Every child has the right to be counted
FIGURE 1.9 Percentage of children aged 5 to 17 years with one or more functional difficulties
2
3
3
4
5
6
4
6
8
7
7
6
7
8
7
7
6
10
8
9
9
10
10
10
12
12
11
11
14
14
12
14
13
15
16
10
14
16
1
2
2
2
3
2
4
3
1
2
3
4
3
3
4
4
5
3
5
5
6
5
5
6
5
6
6
8
7
7
9
7
8
7
6
13
10
8
Turkmenistan
Serbia
Belarus
Mongolia
Montenegro
Lesotho
Bangladesh
Kosovo
Kyrgyzstan
Georgia
Tonga
Zimbabwe
Gambia
North Macedonia
Mexico
Dominican Republic
Cuba
Nepal
Suriname
Argentina
Madagascar
State of Palestine
Pakistan (Sindh)
Honduras
Guinea-Bissau
Guyana
Pakistan (Punjab)
Democratic Republic of the Congo
Sao Tome and Principe
Algeria
Ghana
Costa Rica
Togo
Iraq
Kiribati
Samoa
Sierra Leone
Tunisia
Children with functional difficulties in one domain Children with functional difficulties in two or more domains
28 Seen, Counted, Included: Using data to shed light on the well-being of children with disabilities
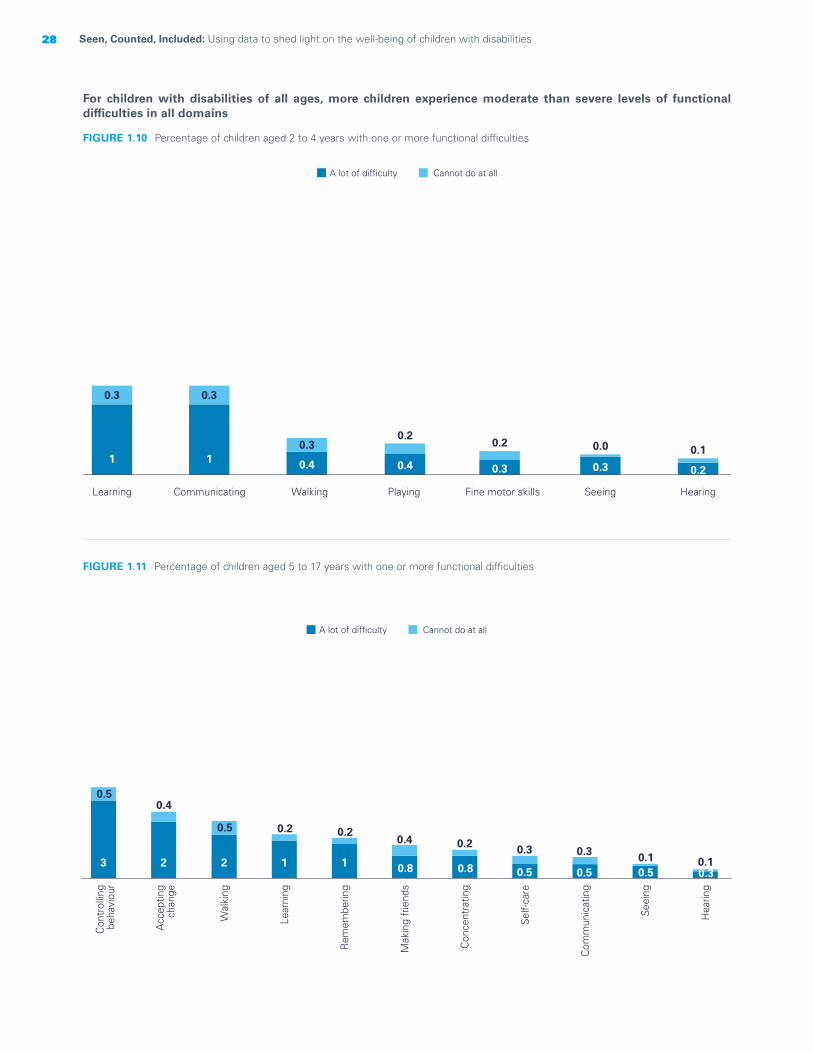
For children with disabilities of all ages, more children experience moderate than severe levels of functional difficulties in all domains
FIGURE 1.10 Percentage of children aged 2 to 4 years with one or more functional difficulties
FIGURE 1.11 Percentage of children aged 5 to 17 years with one or more functional difficulties
0.2
0.1
Hearing
0.3
0.0
Seeing
0.3
0.2
Fine motor skills
0.4
0.2
Playing
0.4
0.3
WalkingCommunicating
1
0.3
1
0.3
Learning
A lot of difficulty Cannot do at all
0.30.1
Hea
ring
0.50.1
Seei
ng
0.5
0.3
Com
mun
icat
ing
0.5
0.3
Self-
care
0.8
0.2
Con
cent
ratin
g
0.8
0.4
Mak
ing
frie
nds
1
0.2
Rem
embe
ring
1
0.2
Lear
ning
2
0.5
Wal
king
2
0.4
Acc
eptin
gch
ange
3
0.5
Con
trol
ling
beha
viou
r
A lot of difficulty Cannot do at all
29CHAPTER 1 Every child has the right to be counted
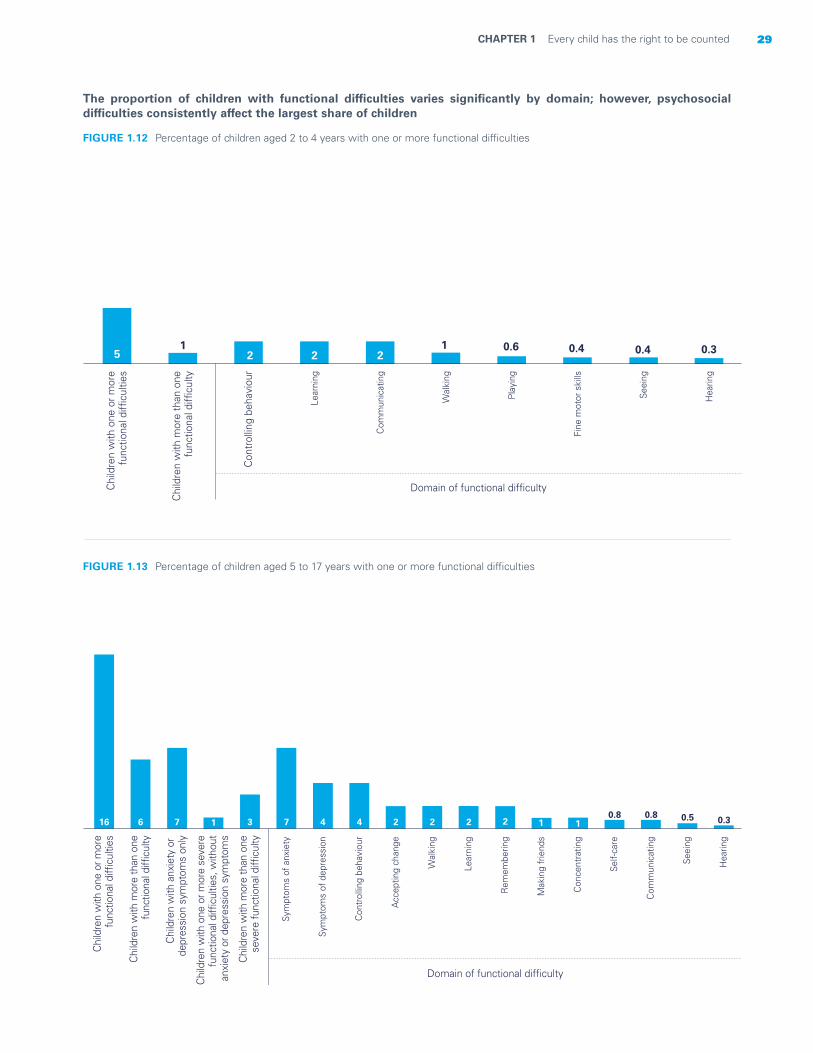
The proportion of children with functional difficulties varies significantly by domain; however, psychosocial difficulties consistently affect the largest share of children
FIGURE 1.12 Percentage of children aged 2 to 4 years with one or more functional difficulties
FIGURE 1.13 Percentage of children aged 5 to 17 years with one or more functional difficulties
51
2 2 21 0.6 0.4 0.4 0.3
Chi
ldre
n w
ith o
ne o
r mor
efu
nctio
nal d
ifficu
lties
Chi
ldre
n w
ith m
ore
than
one
func
tiona
l diffi
culty
Con
trol
ling
beha
viou
r
Lear
ning
Com
mun
icat
ing
Wal
king
Play
ing
Fine
mot
or s
kills
Seei
ng
Hea
ring
Domain of functional difficulty
16 6 7 1 3 7 4 4 2 2 2 2 1 10.8 0.8 0.5 0.3
Chi
ldre
n w
ith o
ne o
r mor
e fu
nctio
nal d
ifficu
lties
Chi
ldre
n w
ith m
ore
than
one
func
tiona
l diffi
culty
Chi
ldre
n w
ith a
nxie
ty o
r de
pres
sion
sym
ptom
s on
ly
Chi
ldre
n w
ith o
ne o
r mor
e se
vere
func
tiona
l diffi
culti
es, w
ithou
tan
xiet
y or
dep
ress
ion
sym
ptom
s
Chi
ldre
n w
ith m
ore
than
one
sev
ere
func
tiona
l diffi
culty
Sym
ptom
s of
anx
iety
Sym
ptom
s of
dep
ress
ion
Con
trol
ling
beha
viou
r
Acc
eptin
g ch
ange
Wal
king
Lear
ning
Rem
embe
ring
Mak
ing
frie
nds
Con
cent
ratin
g
Self-
care
Com
mun
icat
ing
Seei
ng
Hea
ring
Domain of functional difficulty

30 Seen, Counted, Included: Using data to shed light on the well-being of children with disabilities
The most frequently occurring functional difficulties vary according to the age of the child; however, psychosocial difficulties predominate across all ages
FIGURE 1.14 Percentage distribution of children aged 2 to 4 years with functional difficulties
FIGURE 1.15 Percentage distribution of children aged 5 to 17 years with functional difficulties
10
5 3 2Accepting change Making friends Learning
7Controlling behaviour Walking
22
5
Symptoms of anxiety15
8
3
Other combinations Symptoms of anxietyand depression and another domain
7
5
Other combinationsSymptoms of anxiety and depression
Controlling behaviourplus 1 domain
2 2
Remembering
1
Concentrating
Co
mm
un
icat
ing
1
1Self-care
Seeing
Symptoms of depression
Hea
rin
g1
Children with functional difficultyin only one domain
Children with functional difficultiesin two domains
Children with functional difficultiesin three or more domains
Controlling behaviour Learning
Seeing Walking Playing
Communicating Various combinations
Hearing
Fine motorskills
Children with functional difficulty in only one domain Children with functional difficulty in two or more domains
37 16
4 3 2
14 21
2
1
31CHAPTER 1 Every child has the right to be counted
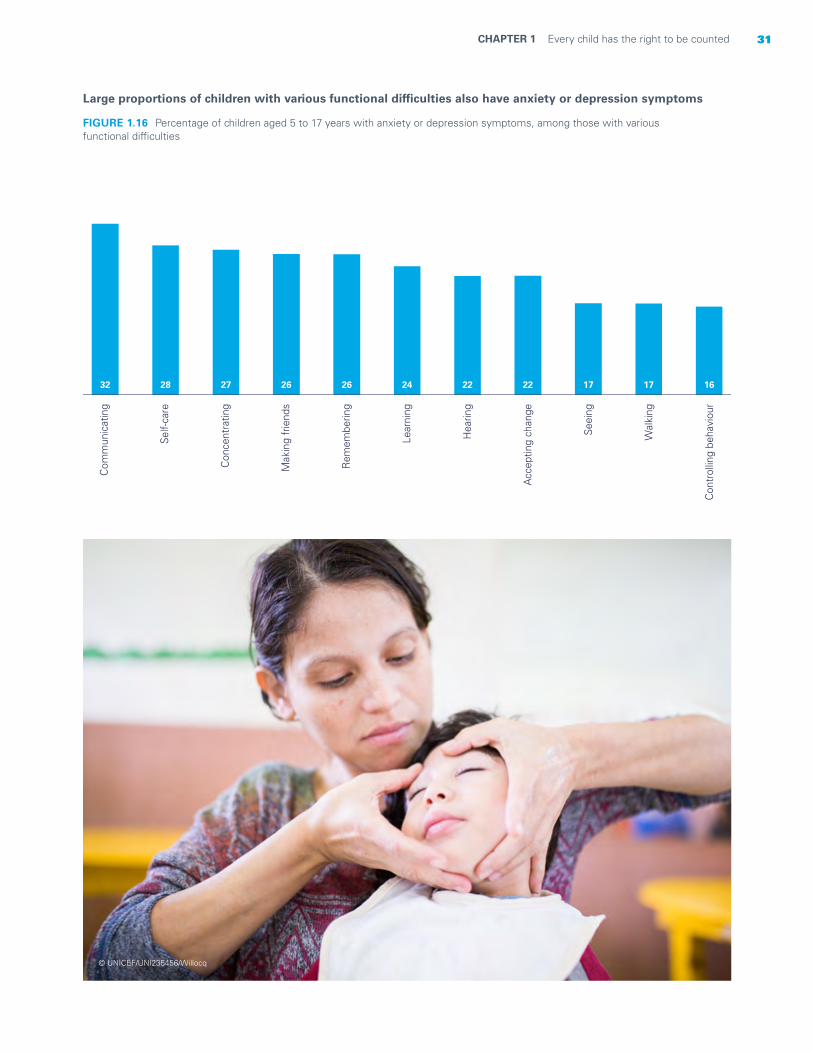
Large proportions of children with various functional difficulties also have anxiety or depression symptoms
FIGURE 1.16 Percentage of children aged 5 to 17 years with anxiety or depression symptoms, among those with various functional difficulties
Con
trol
ling
beha
viou
r
16
Wal
king
17
Seei
ng
17
Acc
eptin
g ch
ange
22
Hea
ring
22
Lear
ning
24
Rem
embe
ring
26
Mak
ing
frie
nds
26
Con
cent
ratin
g
27
Self-
care
28
Com
mun
icat
ing
32
© UNICEF/UNI235456/Willocq
32 Seen, Counted, Included: Using data to shed light on the well-being of children with disabilities
How to read the charts
The statistical charts on the following pages show results for more than 60 indicators organized into seven thematic chapters. The report’s main goal is to illustrate inequities experienced by children with disabilities. Therefore, most of the analyses aim to quantify the differences between children with and without disabilities in relation to key indicators (see Tip 1). Throughout the report, results are presented at the county level as well as for a pooled sample of children from all countries and areas for which data are available (we refer to this in the charts as a ‘weighted average’). The total number of countries and areas with available data may change depending on the indicators.
The thematic chapters present two main types of charts. Chart 1 (see example) focuses on pooled sample analyses from the 31 countries with available data. It describes the overall difference between children with and without disabilities in a particular age group for a specific indicator (see Tip 2); it also provides a closer look at results for children with difficulties in various functional domains (see Tip 3). Chart 2 (see example) includes both pooled sample- and country-level analyses based on 42 countries with available data. This type of chart focuses on differences between children with and without disabilities of different socioeconomic backgrounds (see Tip 4).
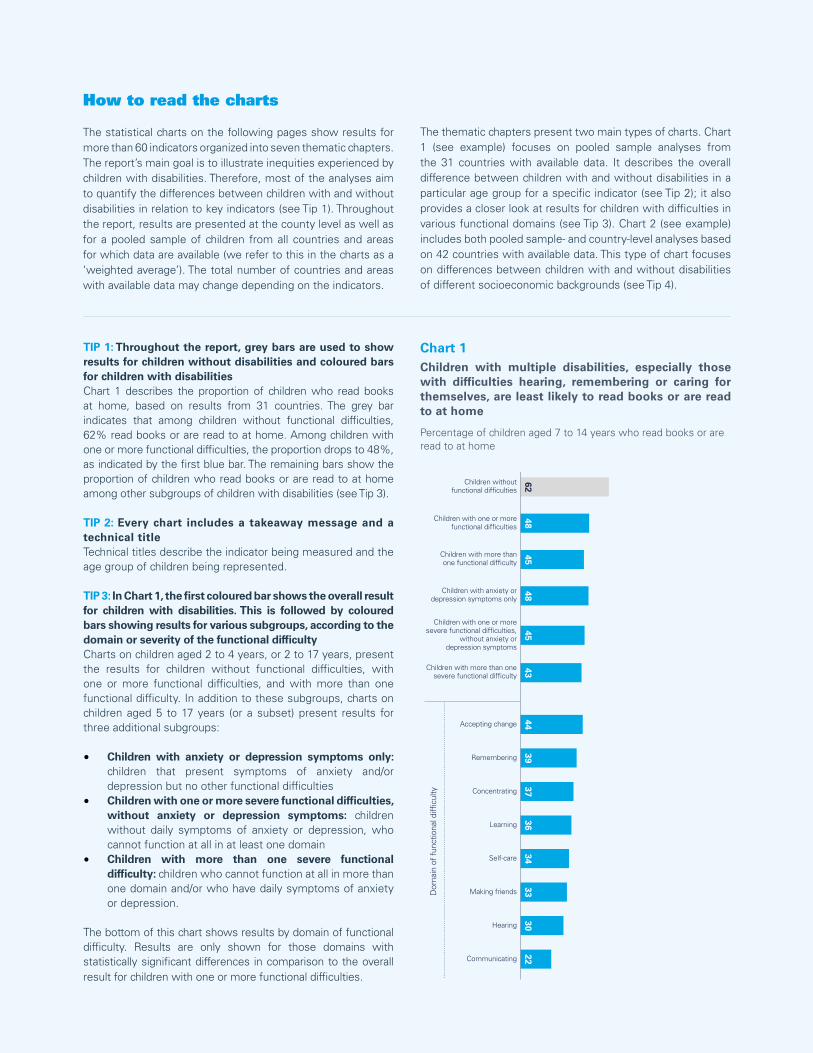
Children with multiple disabilities, especially those with difficulties hearing, remembering or caring for themselves, are least likely to read books or are read to at home
Percentage of children aged 7 to 14 years who read books or are read to at home
Chart 1
6248
4548
4543
Children withoutfunctional difficulties
Children with one or morefunctional difficulties
Children with more thanone functional difficulty
Children with anxiety ordepression symptoms only
Children with one or moresevere functional difficulties,
without anxiety ordepression symptoms
Children with more than onesevere functional difficulty
22Communicating
30Hearing
33Making friends
34Self-care
36Learning
37Concentrating
39Remembering
44Accepting change
Dom
ain
of fu
nctio
nal d
ifficu
lty
TIP 1: Throughout the report, grey bars are used to show results for children without disabilities and coloured bars for children with disabilitiesChart 1 describes the proportion of children who read books at home, based on results from 31 countries. The grey bar indicates that among children without functional difficulties, 62% read books or are read to at home. Among children with one or more functional difficulties, the proportion drops to 48%, as indicated by the first blue bar. The remaining bars show the proportion of children who read books or are read to at home among other subgroups of children with disabilities (see Tip 3).
TIP 2: Every chart includes a takeaway message and a technical titleTechnical titles describe the indicator being measured and the age group of children being represented.
TIP 3: In Chart 1, the first coloured bar shows the overall result for children with disabilities. This is followed by coloured bars showing results for various subgroups, according to the domain or severity of the functional difficultyCharts on children aged 2 to 4 years, or 2 to 17 years, present the results for children without functional difficulties, with one or more functional difficulties, and with more than one functional difficulty. In addition to these subgroups, charts on children aged 5 to 17 years (or a subset) present results for three additional subgroups:
• Children with anxiety or depression symptoms only: children that present symptoms of anxiety and/or depression but no other functional difficulties
• Children with one or more severe functional difficulties, without anxiety or depression symptoms: children without daily symptoms of anxiety or depression, who cannot function at all in at least one domain
• Children with more than one severe functional difficulty: children who cannot function at all in more than one domain and/or who have daily symptoms of anxiety or depression.
The bottom of this chart shows results by domain of functional difficulty. Results are only shown for those domains with statistically significant differences in comparison to the overall result for children with one or more functional difficulties.
33CHAPTER 1 Every child has the right to be counted
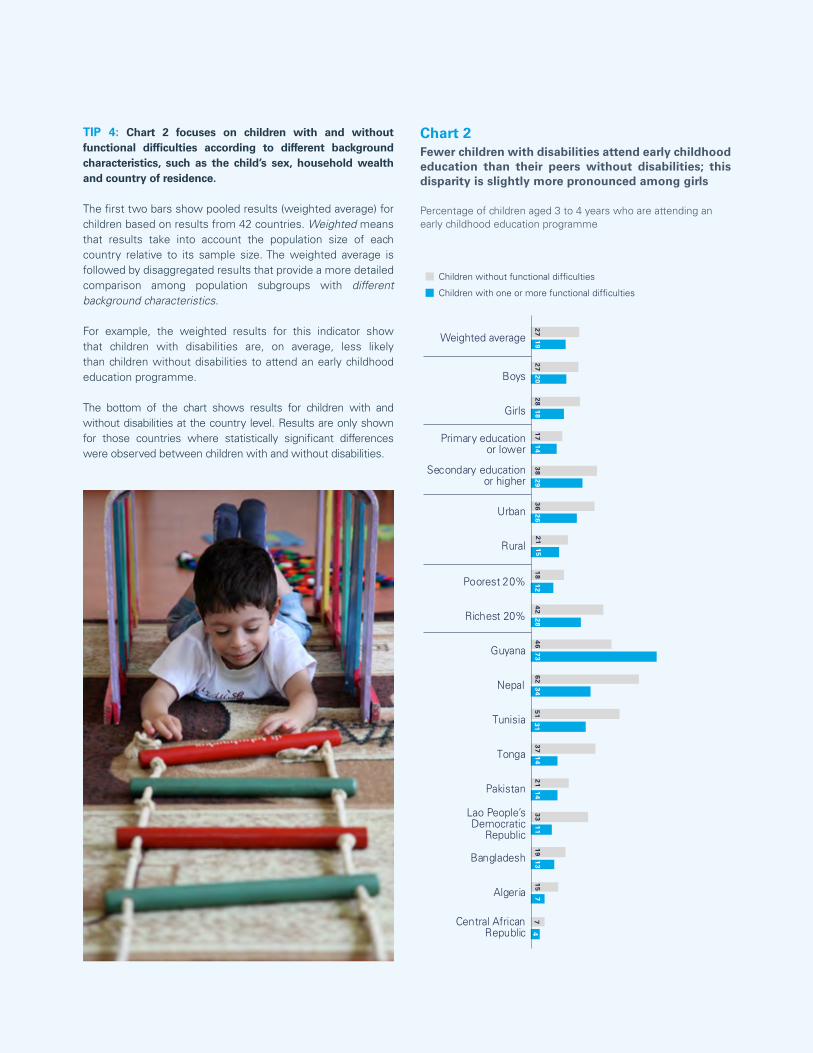
TIP 4: Chart 2 focuses on children with and without functional difficulties according to different background characteristics, such as the child’s sex, household wealth and country of residence.
The first two bars show pooled results (weighted average) for children based on results from 42 countries. Weighted means that results take into account the population size of each country relative to its sample size. The weighted average is followed by disaggregated results that provide a more detailed comparison among population subgroups with different background characteristics.
For example, the weighted results for this indicator show that children with disabilities are, on average, less likely than children without disabilities to attend an early childhood education programme.
The bottom of the chart shows results for children with and without disabilities at the country level. Results are only shown for those countries where statistically significant differences were observed between children with and without disabilities.
Fewer children with disabilities attend early childhood education than their peers without disabilities; this disparity is slightly more pronounced among girls
Percentage of children aged 3 to 4 years who are attending an early childhood education programme
Chart 2
Children without functional difficulties
Children with one or more functional difficulties
27
27
28
17
38
36
21
18
42
46
62
513
72
13
31
91
57
19
20
18
14
29
26
15
12
28
73
34
311
41
41
11
37
4
Weighted average
Boys
Girls
Primary educationor lower
Secondary educationor higher
Urban
Rural
Poorest 20%
Richest 20%
Guyana
Nepal
Tunisia
Tonga
Pakistan
Lao People’sDemocratic
Republic
Bangladesh
Algeria
Central AfricanRepublic

34 Seen, Counted, Included: Using data to shed light on the well-being of children with disabilities
Every child has the right to survive and thrive
CHAPTER 2
All children have the right to survive and develop, and to live a life free from disease, illness or other conditions that affect their well-being and future prospects.1 Access to adequate nutrition and quality health care, including immunization, is paramount in making this right a reality for every child.
The SDGs include specific targets to ensure that children have the best start in life and can achieve their potential. Target 2.2 calls for an end to all forms of malnutrition by 2030, including achieving the internationally agreed targets on stunting and wasting in children under 5 years of age by 2025. Various targets under Goal 3 seek to ensure healthy lives and promote well-being at all ages, including the expansion of health and vaccination coverage and an end to preventable deaths in children under 5. Although progress is being made, the lives of too many children continue to be lost, and children with disabilities remain among those likely to be left behind.
This chapter examines the current state of child health and nutrition and seeks to deepen understanding of specific vulnerabilities faced by children with disabilities. It provides important insights into areas that require the most urgent attention and response by governments, families and other stakeholders.
34 Seen, Counted, Included: Using data to shed light on the well-being of children with disabilities
35CHAPTER 2 Every child has the right to survive and thrive 35CHAPTER 2 Every child has the right to survive and thrive
© UNICEF/UNI136064/Dean
36 Seen, Counted, Included: Using data to shed light on the well-being of children with disabilities
Indicators used in this chapter
Immunization coverage for all basic vaccinations: Percentage of children aged 24 to 35 months who received all basic vaccinations at any time before the survey. Basic immunizations include one dose of BCG (the Bacillus Calmette–Guérin vaccine, primarily used against tuberculosis), three doses of vaccine for polio, three doses of vaccine for DTP (diphtheria, tetanus and pertussis, or whooping cough) and one dose of vaccine for measles.
Prevalence of diarrhoea: Percentage of children aged 24 to 59 months for whom the mother or other caretaker reported an episode of diarrhoea in the last two weeks.
Prevalence of acute respiratory infection (ARI) symptoms: Percentage of children aged 24 to 59 months for whom the mother or other caretaker reported symptoms of ARI in the last two weeks.
Prevalence of fever: Percentage of children aged 24 to 59 months for whom the mother or other caretaker reported an episode of fever in the last two weeks.
Care-seeking for ARI: Percentage of children aged 24 to 59 months who have had ARI symptoms in the last two weeks for whom advice or treatment was sought from a health facility or provider. Care-seeking for diarrhoea: Percentage of children aged 24 to 59 months who have had diarrhoea in the last two weeks for whom advice or treatment was sought from a health facility or provider.
Moderate and severe underweight prevalence: Percentage of children aged 24 to 59 months who fall below minus two standard deviations of the median weight-for-age of the World Health Organization (WHO) Child Growth Standards.
Moderate and severe stunting prevalence: Percentage of children aged 24 to 59 months who fall below minus two standard deviations of the median height-for-age of the WHO Child Growth Standards.
Moderate and severe wasting prevalence: Percentage of children aged 24 to 59 months who fall below minus two standard deviations of the median weight-for-height of the WHO Child Growth Standards.
Overweight: Percentage of children aged 24 to 59 months who fall above two standard deviations of the median weight-for-height of the WHO Child Growth Standards.
Definitions and data interpretation issues
Some of the findings in this chapter present limitations. Since the Child Functioning Module only captures information on children 2 years of age and older, some health and nutrition outcomes that may affect children with disabilities before this age are not reflected in the data. This is significant since it is before age 2 that many immunizations are administered, vulnerability to infection remains high and challenges arise in providing early nutrition (such as difficulties in breastfeeding).
Findings on disease symptoms and reported disease episodes also present limitations. Symptoms of ARI are collected to capture symptoms related to pneumonia, a leading cause of death in children under 5. In the data analysed, a child was considered to have had symptoms of ARI if the mother or caretaker reported that the child had, over the specified period, an illness with a cough and rapid or difficult breathing and whose symptoms were perceived to be due to a problem in the chest, or both a problem in the chest and a blocked or runny nose. While this approach is reasonable in the context of a multi-topic household survey, these simple case definitions must be kept in mind when interpreting the results and the potential for reporting and recall biases. Furthermore, diarrhoea, fever and ARI are seasonal and characterized by the often rapid spread of localized outbreaks from one area to another at different points in time. The timing of the survey and the location of the teams, therefore, might affect the results considerably. Thus, these results must be interpreted with caution and should not be used to assess the epidemiological characteristics of these diseases; rather, they provide an indication of the prevalence of such diseases over a short period of time.
Findings on nutritional status should also be interpreted with caution. Anthropometric measurements in MICS are carried out by trained measurers and under uniform conditions, which include the use of standardized digital scales and measurement boards.2 Nevertheless, collecting data on the growth of children with disabilities presents additional challenges. Children with certain types of impairments may not grow in the same way as children who develop more typically. This may mean that their health and development cannot be properly measured by
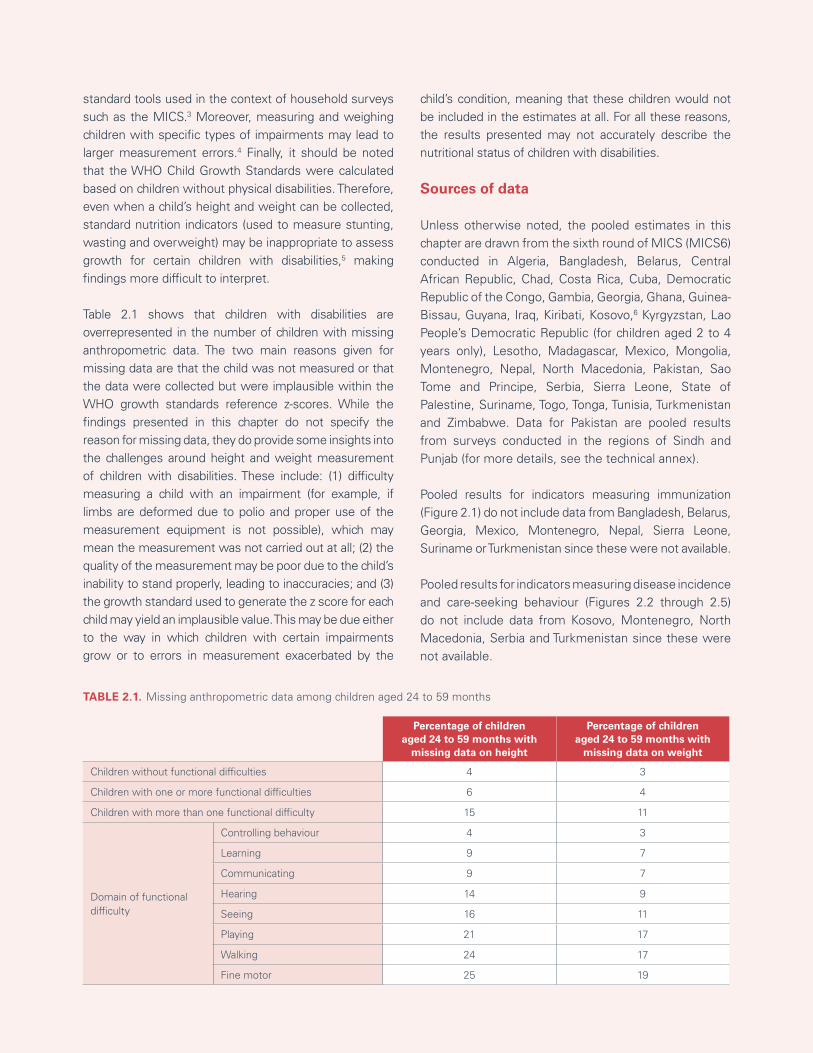
37CHAPTER 2 Every child has the right to survive and thrive
Percentage of childrenaged 24 to 59 months with
missing data on height
Percentage of childrenaged 24 to 59 months with
missing data on weight
Children without functional difficulties 4 3
Children with one or more functional difficulties 6 4
Children with more than one functional difficulty 15 11
Domain of functional difficulty
Controlling behaviour 4 3
Learning 9 7
Communicating 9 7
Hearing 14 9
Seeing 16 11
Playing 21 17
Walking 24 17
Fine motor 25 19
TABLE 2.1. Missing anthropometric data among children aged 24 to 59 months
standard tools used in the context of household surveys such as the MICS.3 Moreover, measuring and weighing children with specific types of impairments may lead to larger measurement errors.4 Finally, it should be noted that the WHO Child Growth Standards were calculated based on children without physical disabilities. Therefore, even when a child’s height and weight can be collected, standard nutrition indicators (used to measure stunting, wasting and overweight) may be inappropriate to assess growth for certain children with disabilities,5 making findings more difficult to interpret.
Table 2.1 shows that children with disabilities are overrepresented in the number of children with missing anthropometric data. The two main reasons given for missing data are that the child was not measured or that the data were collected but were implausible within the WHO growth standards reference z-scores. While the findings presented in this chapter do not specify the reason for missing data, they do provide some insights into the challenges around height and weight measurement of children with disabilities. These include: (1) difficulty measuring a child with an impairment (for example, if limbs are deformed due to polio and proper use of the measurement equipment is not possible), which may mean the measurement was not carried out at all; (2) the quality of the measurement may be poor due to the child’s inability to stand properly, leading to inaccuracies; and (3) the growth standard used to generate the z score for each child may yield an implausible value. This may be due either to the way in which children with certain impairments grow or to errors in measurement exacerbated by the
child’s condition, meaning that these children would not be included in the estimates at all. For all these reasons, the results presented may not accurately describe the nutritional status of children with disabilities.
Sources of data
Unless otherwise noted, the pooled estimates in this chapter are drawn from the sixth round of MICS (MICS6) conducted in Algeria, Bangladesh, Belarus, Central African Republic, Chad, Costa Rica, Cuba, Democratic Republic of the Congo, Gambia, Georgia, Ghana, Guinea-Bissau, Guyana, Iraq, Kiribati, Kosovo,6 Kyrgyzstan, Lao People’s Democratic Republic (for children aged 2 to 4 years only), Lesotho, Madagascar, Mexico, Mongolia, Montenegro, Nepal, North Macedonia, Pakistan, Sao Tome and Principe, Serbia, Sierra Leone, State of Palestine, Suriname, Togo, Tonga, Tunisia, Turkmenistan and Zimbabwe. Data for Pakistan are pooled results from surveys conducted in the regions of Sindh and Punjab (for more details, see the technical annex).
Pooled results for indicators measuring immunization (Figure 2.1) do not include data from Bangladesh, Belarus, Georgia, Mexico, Montenegro, Nepal, Sierra Leone, Suriname or Turkmenistan since these were not available.
Pooled results for indicators measuring disease incidence and care-seeking behaviour (Figures 2.2 through 2.5) do not include data from Kosovo, Montenegro, North Macedonia, Serbia and Turkmenistan since these were not available.
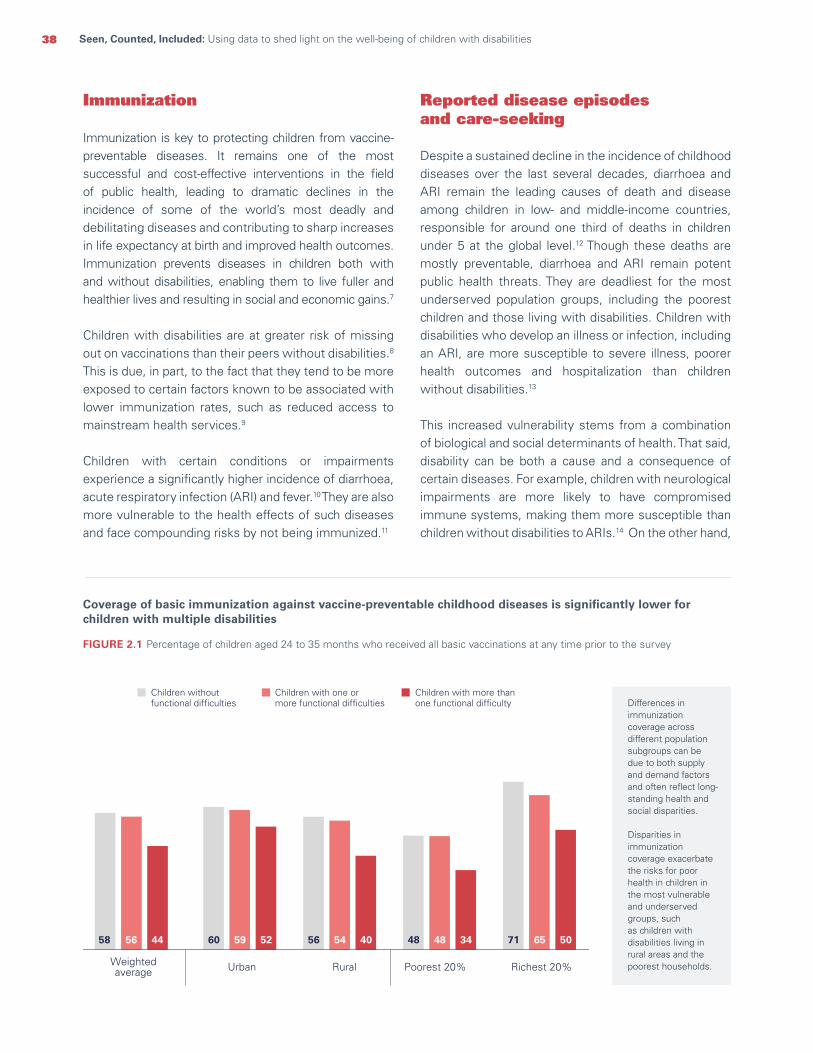
38 Seen, Counted, Included: Using data to shed light on the well-being of children with disabilities
FIGURE 2.1 Percentage of children aged 24 to 35 months who received all basic vaccinations at any time prior to the survey
Differences in immunization coverage across different population subgroups can be due to both supply and demand factors and often reflect long-standing health and social disparities.
Disparities in immunization coverage exacerbate the risks for poor health in children in the most vulnerable and underserved groups, such as children with disabilities living in rural areas and the poorest households.
Coverage of basic immunization against vaccine-preventable childhood diseases is significantly lower for children with multiple disabilities
Immunization
Immunization is key to protecting children from vaccine-preventable diseases. It remains one of the most successful and cost-effective interventions in the field of public health, leading to dramatic declines in the incidence of some of the world’s most deadly and debilitating diseases and contributing to sharp increases in life expectancy at birth and improved health outcomes. Immunization prevents diseases in children both with and without disabilities, enabling them to live fuller and healthier lives and resulting in social and economic gains.7
Children with disabilities are at greater risk of missing out on vaccinations than their peers without disabilities.8 This is due, in part, to the fact that they tend to be more exposed to certain factors known to be associated with lower immunization rates, such as reduced access to mainstream health services.9
Children with certain conditions or impairments experience a significantly higher incidence of diarrhoea, acute respiratory infection (ARI) and fever.10 They are also more vulnerable to the health effects of such diseases and face compounding risks by not being immunized.11
Reported disease episodesand care-seeking Despite a sustained decline in the incidence of childhood diseases over the last several decades, diarrhoea and ARI remain the leading causes of death and disease among children in low- and middle-income countries, responsible for around one third of deaths in children under 5 at the global level.12 Though these deaths are mostly preventable, diarrhoea and ARI remain potent public health threats. They are deadliest for the most underserved population groups, including the poorest children and those living with disabilities. Children with disabilities who develop an illness or infection, including an ARI, are more susceptible to severe illness, poorer health outcomes and hospitalization than children without disabilities.13
This increased vulnerability stems from a combination of biological and social determinants of health. That said, disability can be both a cause and a consequence of certain diseases. For example, children with neurological impairments are more likely to have compromised immune systems, making them more susceptible than children without disabilities to ARIs.14 On the other hand,
58 56 44 60 59 52 56 54 40 48 48 34 71 65 50
Weightedaverage Urban Rural Poorest 20% Richest 20%
Children withoutfunctional difficulties
Children with one ormore functional difficulties
Children with more thanone functional difficulty
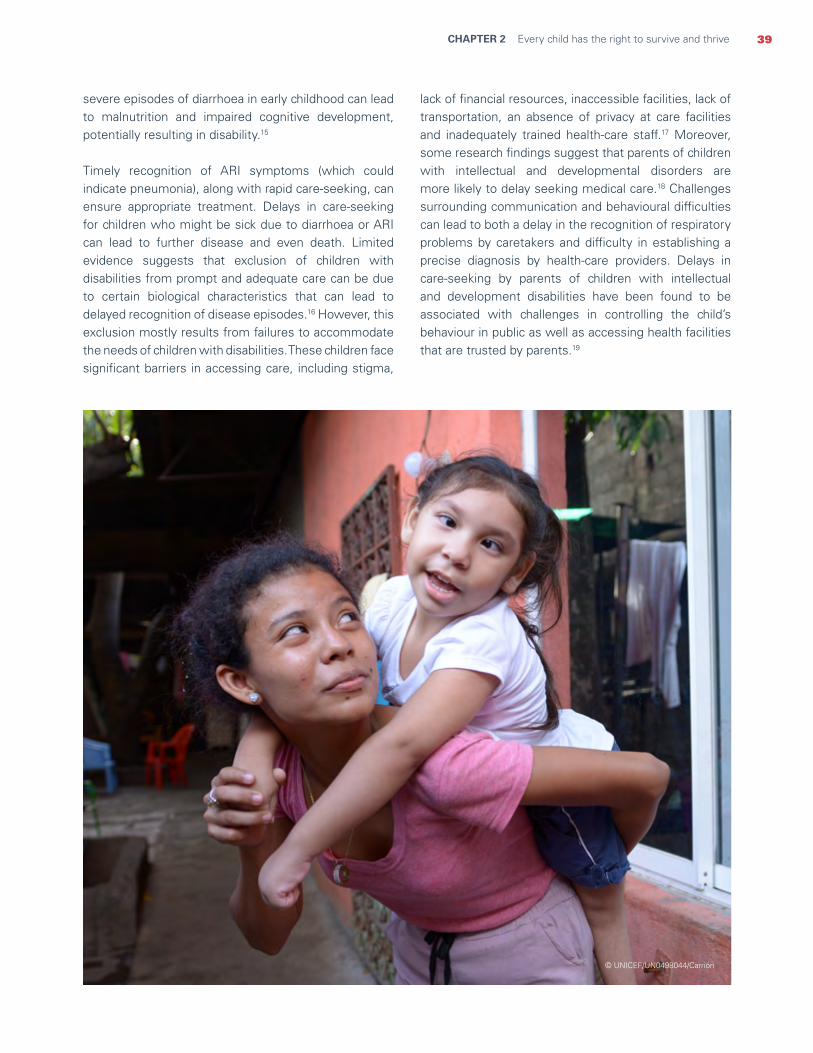
39CHAPTER 2 Every child has the right to survive and thrive
severe episodes of diarrhoea in early childhood can lead to malnutrition and impaired cognitive development, potentially resulting in disability.15
Timely recognition of ARI symptoms (which could indicate pneumonia), along with rapid care-seeking, can ensure appropriate treatment. Delays in care-seeking for children who might be sick due to diarrhoea or ARI can lead to further disease and even death. Limited evidence suggests that exclusion of children with disabilities from prompt and adequate care can be due to certain biological characteristics that can lead to delayed recognition of disease episodes.16 However, this exclusion mostly results from failures to accommodate the needs of children with disabilities. These children face significant barriers in accessing care, including stigma,
lack of financial resources, inaccessible facilities, lack of transportation, an absence of privacy at care facilities and inadequately trained health-care staff.17 Moreover, some research findings suggest that parents of children with intellectual and developmental disorders are more likely to delay seeking medical care.18 Challenges surrounding communication and behavioural difficulties can lead to both a delay in the recognition of respiratory problems by caretakers and difficulty in establishing a precise diagnosis by health-care providers. Delays in care-seeking by parents of children with intellectual and development disabilities have been found to be associated with challenges in controlling the child’s behaviour in public as well as accessing health facilities that are trusted by parents.19
© UNICEF/UN0498044/Carrión
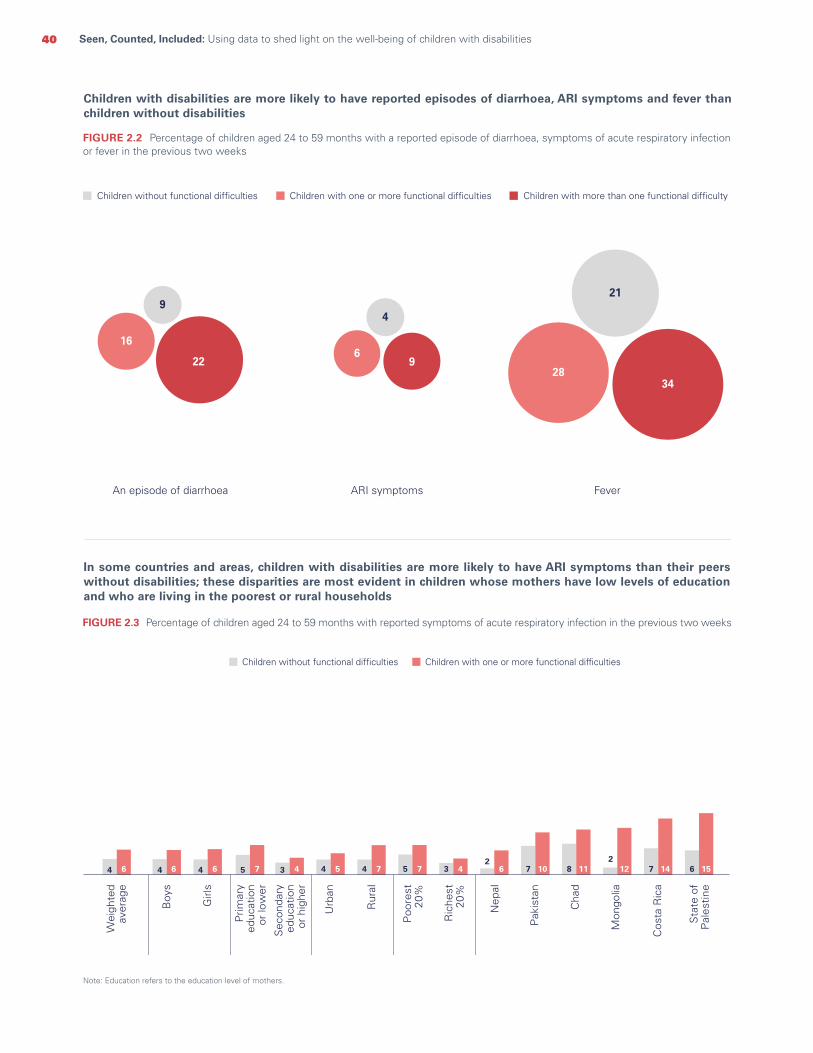
40 Seen, Counted, Included: Using data to shed light on the well-being of children with disabilities
Note: Education refers to the education level of mothers.
Children with disabilities are more likely to have reported episodes of diarrhoea, ARI symptoms and fever than children without disabilities
FIGURE 2.2 Percentage of children aged 24 to 59 months with a reported episode of diarrhoea, symptoms of acute respiratory infection or fever in the previous two weeks
In some countries and areas, children with disabilities are more likely to have ARI symptoms than their peers without disabilities; these disparities are most evident in children whose mothers have low levels of education and who are living in the poorest or rural households
FIGURE 2.3 Percentage of children aged 24 to 59 months with reported symptoms of acute respiratory infection in the previous two weeks
ARI symptomsAn episode of diarrhoea Fever
Children without functional difficulties Children with one or more functional difficulties Children with more than one functional difficulty
16
9
22
4
69
21
2834
4 6 4 6 4 6 5 7 3 4 4 5 4 7 5 7 3 42
6 7 10 8 112
12 7 14 6 15
Wei
ghte
dav
erag
e
Boy
s
Girl
s
Prim
ary
educ
atio
n o
r lo
wer
Sec
onda
ry e
duca
tion
or h
ighe
r
Urb
an
Rur
al
Poo
rest
20%
Ric
hest
20%
Nep
al
Pak
ista
n
Cha
d
Mon
golia
Cos
ta R
ica
Sta
te o
fP
ales
tine
Children without functional difficulties Children with one or more functional difficulties

41CHAPTER 2 Every child has the right to survive and thrive
Note: Education refers to the education level of mothers.
In some countries, children with disabilities are far more likely to have diarrhoea than their peers without disabilities. Disparities are largest among children with disabilities whose mothers have little education or who live in the poorest or rural households
FIGURE 2.4 Percentage of children aged 24 to 59 months with a reported episode of diarrhoea in the previous two weeks
In the poorest households, caregivers of children with disabilities are less likely to seek care for children who have diarrhoea and more likely to seek care when such children have symptoms of ARI
FIGURE 2.5 Percentage of children aged 24 to 59 months who have had diarrhoea or symptoms of acute respiratory infection in the last two weeks, for whom advice or treatment was sought from a health facility or provider
Wei
ghte
dav
erag
e
Boy
s
Girl
s
Urb
an
Rur
al
Poo
rest
20%
Ric
hest
20%
Children without functional difficulties Children with one or more functional difficulties
9 9 8 11 7 8 9 10 7 5 6 10 9 8 8 10 20 2216 16 15 18 12 15 17 19 11 10 13 14 14 16 17 17 26 32
Ban
glad
esh
Mex
ico
Mad
agas
car
Pak
ista
n
Iraq
Nep
al
Dem
ocra
ticR
epub
lic o
fth
e C
ongo
Cen
tral
Afr
ican
Rep
ublic
Cha
d
Prim
ary
educ
atio
n o
r lo
wer
Sec
onda
ry e
duca
tion
or h
ighe
r
Diarrhoea ARI symptoms
Richest 20% Richest 20%Poorest 20% Poorest 20%
Children without functional difficulties Children with one or more functional difficulties
44 44
3639
53
6368
66
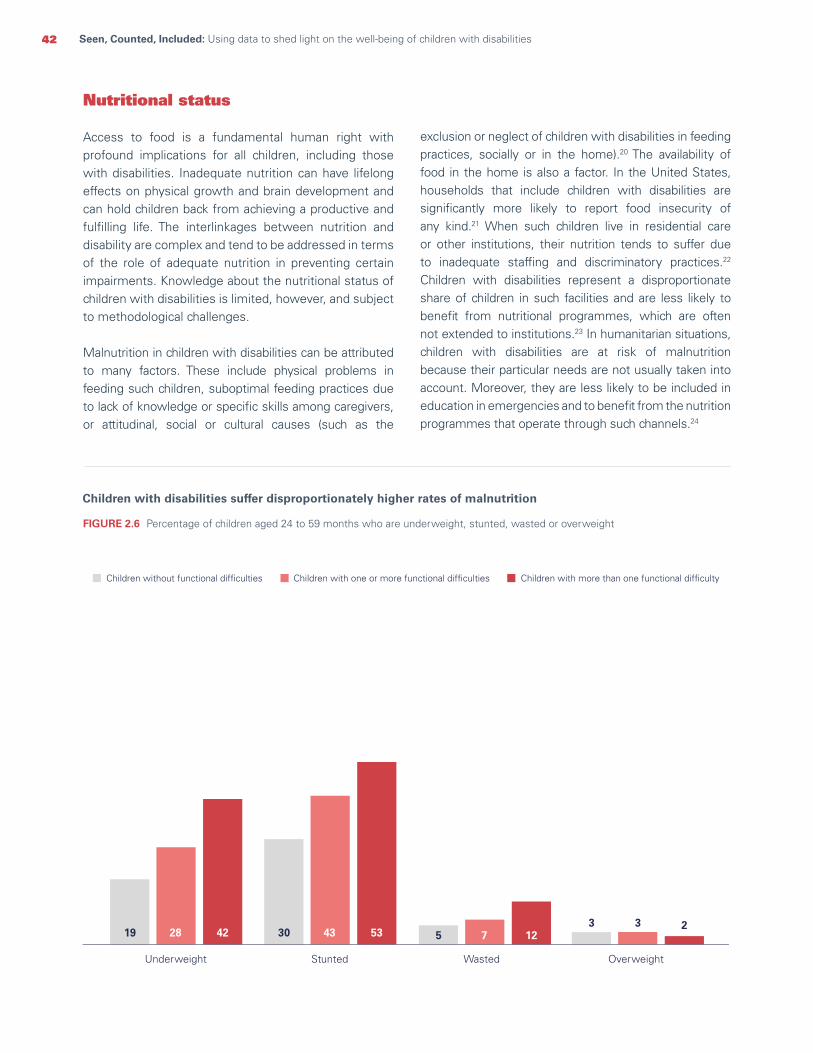
42 Seen, Counted, Included: Using data to shed light on the well-being of children with disabilities
Nutritional status
Access to food is a fundamental human right with profound implications for all children, including those with disabilities. Inadequate nutrition can have lifelong effects on physical growth and brain development and can hold children back from achieving a productive and fulfilling life. The interlinkages between nutrition and disability are complex and tend to be addressed in terms of the role of adequate nutrition in preventing certain impairments. Knowledge about the nutritional status of children with disabilities is limited, however, and subject to methodological challenges.
Malnutrition in children with disabilities can be attributed to many factors. These include physical problems in feeding such children, suboptimal feeding practices due to lack of knowledge or specific skills among caregivers, or attitudinal, social or cultural causes (such as the
exclusion or neglect of children with disabilities in feeding practices, socially or in the home).20 The availability of food in the home is also a factor. In the United States, households that include children with disabilities are significantly more likely to report food insecurity of any kind.21 When such children live in residential care or other institutions, their nutrition tends to suffer due to inadequate staffing and discriminatory practices.22 Children with disabilities represent a disproportionate share of children in such facilities and are less likely to benefit from nutritional programmes, which are often not extended to institutions.23 In humanitarian situations, children with disabilities are at risk of malnutrition because their particular needs are not usually taken into account. Moreover, they are less likely to be included in education in emergencies and to benefit from the nutrition programmes that operate through such channels.24
Children with disabilities suffer disproportionately higher rates of malnutrition
FIGURE 2.6 Percentage of children aged 24 to 59 months who are underweight, stunted, wasted or overweight
StuntedUnderweight
19 28 42 30 43 53
Wasted
5 7 12
Overweight
3 3 2
Children without functional difficulties Children with one or more functional difficulties Children with more than one functional difficulty
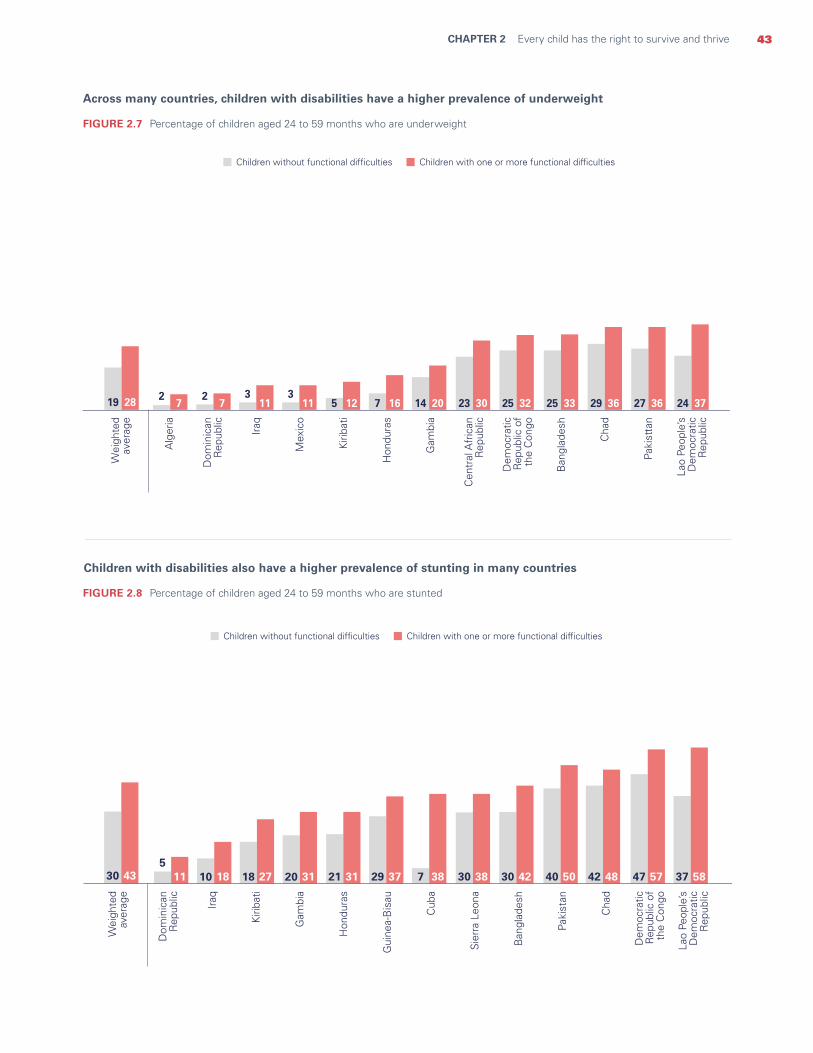
43CHAPTER 2 Every child has the right to survive and thrive
Across many countries, children with disabilities have a higher prevalence of underweight
FIGURE 2.7 Percentage of children aged 24 to 59 months who are underweight
Children with disabilities also have a higher prevalence of stunting in many countries
FIGURE 2.8 Percentage of children aged 24 to 59 months who are stunted
Alg
eria
Dom
inic
anR
epub
lic
Iraq
Mex
ico
Kiri
bati
Hon
dura
s
Gam
bia
Cen
tral
Afr
ican
Rep
ublic
Ban
glad
esh
Cha
d
Paki
stta
n
Lao
Peop
le’s
Dem
ocra
ticR
epub
lic
Dem
ocra
ticR
epub
lic o
fth
e C
ongo
19 28 27
27
311
311 5 12 7 16 14 20 23 30 25 32 25 33 29 36 27 36 24 37
Children without functional difficulties Children with one or more functional difficulties
Wei
ghte
dav
erag
eW
eigh
ted
aver
age
Dom
inic
anR
epub
lic
Iraq
Kiri
bati
Hon
dura
s
Gui
nea-
Bis
au
Gam
bia
Sie
rra
Leon
a
Ban
glad
esh
Paki
stan
Cha
d
Cub
a
Lao
Peop
le’s
Dem
ocra
ticR
epub
lic
30 435
10 18 18 2711 20 31 21 31 29 37 7 38 30 38 30 42 40 50 42 48 47 57 37 58
Dem
ocra
ticR
epub
lic o
fth
e C
ongo
Children without functional difficulties Children with one or more functional difficulties
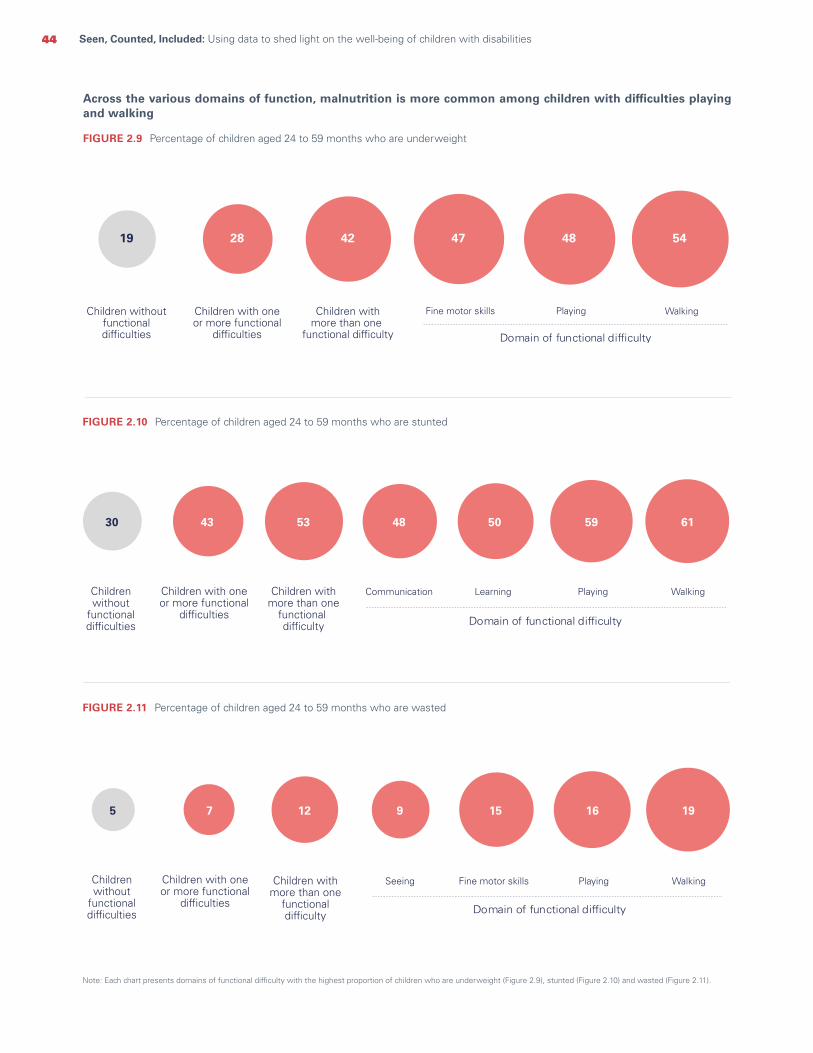
44 Seen, Counted, Included: Using data to shed light on the well-being of children with disabilities
Across the various domains of function, malnutrition is more common among children with difficulties playing and walking
FIGURE 2.9 Percentage of children aged 24 to 59 months who are underweight
FIGURE 2.10 Percentage of children aged 24 to 59 months who are stunted
FIGURE 2.11 Percentage of children aged 24 to 59 months who are wasted
Note: Each chart presents domains of functional difficulty with the highest proportion of children who are underweight (Figure 2.9), stunted (Figure 2.10) and wasted (Figure 2.11).
Children withoutfunctionaldifficulties
Children withmore than one
functional difficulty
Children with oneor more functional
difficulties
Fine motor skills Playing Walking
19 42 47 48 5428
Domain of functional difficulty
Childrenwithout
functionaldifficulties
Children withmore than one
functional difficulty
Children with oneor more functional
difficulties
Communication Learning Playing Walking
53 48 50 59 614330
Domain of functional difficulty
Childrenwithout
functionaldifficulties
Children withmore than one
functionaldifficulty
Children with oneor more functional
difficulties
Seeing Fine motor skills Playing Walking
12 9 15 16 1975
Domain of functional difficulty

45CHAPTER 2 Every child has the right to survive and thrive
UNDERWEIGHT
Children without functional difficulties Children with one or more functional difficulties
Urban Rural Urban Rural
Richest 10 12 15 14
Middle 13 21 25 26
Poorest 17 28 28 37
STUNTING
Children without functional difficulties Children with one or more functional difficulties
Urban Rural Urban Rural
Richest 17 18 25 21
Middle 24 35 38 43
Poorest 31 43 40 54
Stunting and underweight are more prevalent among children with disabilities living in the poorest and rural households
TABLE 2.2 Percentage of children aged 24 to 59 months who are underweight and stunted
© UNICEF/UNI231131/Estey
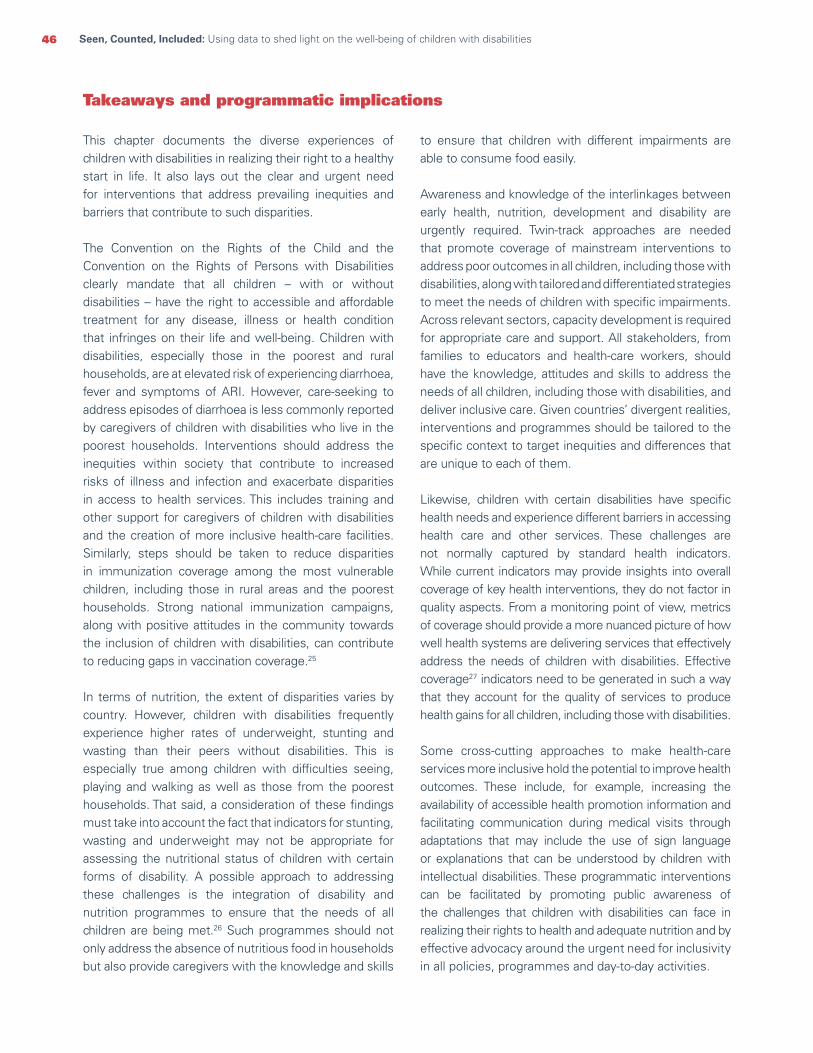
46 Seen, Counted, Included: Using data to shed light on the well-being of children with disabilities
Takeaways and programmatic implications
This chapter documents the diverse experiences of children with disabilities in realizing their right to a healthy start in life. It also lays out the clear and urgent need for interventions that address prevailing inequities and barriers that contribute to such disparities.
The Convention on the Rights of the Child and the Convention on the Rights of Persons with Disabilities clearly mandate that all children – with or without disabilities – have the right to accessible and affordable treatment for any disease, illness or health condition that infringes on their life and well-being. Children with disabilities, especially those in the poorest and rural households, are at elevated risk of experiencing diarrhoea, fever and symptoms of ARI. However, care-seeking to address episodes of diarrhoea is less commonly reported by caregivers of children with disabilities who live in the poorest households. Interventions should address the inequities within society that contribute to increased risks of illness and infection and exacerbate disparities in access to health services. This includes training and other support for caregivers of children with disabilities and the creation of more inclusive health-care facilities. Similarly, steps should be taken to reduce disparities in immunization coverage among the most vulnerable children, including those in rural areas and the poorest households. Strong national immunization campaigns, along with positive attitudes in the community towards the inclusion of children with disabilities, can contribute to reducing gaps in vaccination coverage.25
In terms of nutrition, the extent of disparities varies by country. However, children with disabilities frequently experience higher rates of underweight, stunting and wasting than their peers without disabilities. This is especially true among children with difficulties seeing, playing and walking as well as those from the poorest households. That said, a consideration of these findings must take into account the fact that indicators for stunting, wasting and underweight may not be appropriate for assessing the nutritional status of children with certain forms of disability. A possible approach to addressing these challenges is the integration of disability and nutrition programmes to ensure that the needs of all children are being met.26 Such programmes should not only address the absence of nutritious food in households but also provide caregivers with the knowledge and skills
to ensure that children with different impairments are able to consume food easily.
Awareness and knowledge of the interlinkages between early health, nutrition, development and disability are urgently required. Twin-track approaches are needed that promote coverage of mainstream interventions to address poor outcomes in all children, including those with disabilities, along with tailored and differentiated strategies to meet the needs of children with specific impairments. Across relevant sectors, capacity development is required for appropriate care and support. All stakeholders, from families to educators and health-care workers, should have the knowledge, attitudes and skills to address the needs of all children, including those with disabilities, and deliver inclusive care. Given countries’ divergent realities, interventions and programmes should be tailored to the specific context to target inequities and differences that are unique to each of them.
Likewise, children with certain disabilities have specific health needs and experience different barriers in accessing health care and other services. These challenges are not normally captured by standard health indicators. While current indicators may provide insights into overall coverage of key health interventions, they do not factor in quality aspects. From a monitoring point of view, metrics of coverage should provide a more nuanced picture of how well health systems are delivering services that effectively address the needs of children with disabilities. Effective coverage27 indicators need to be generated in such a way that they account for the quality of services to produce health gains for all children, including those with disabilities.
Some cross-cutting approaches to make health-care services more inclusive hold the potential to improve health outcomes. These include, for example, increasing the availability of accessible health promotion information and facilitating communication during medical visits through adaptations that may include the use of sign language or explanations that can be understood by children with intellectual disabilities. These programmatic interventions can be facilitated by promoting public awareness of the challenges that children with disabilities can face in realizing their rights to health and adequate nutrition and by effective advocacy around the urgent need for inclusivity in all policies, programmes and day-to-day activities.

47CHAPTER 2 Every child has the right to survive and thrive
© UNICEF/UNI102936/Noorani

Every child has the right to a nurturing family environment
CHAPTER 3
All children have the right to grow up in a family environment that provides them with the love, nutrition, protection, opportunities for early learning and responsive care they require to survive, grow and thrive.1 Both the Convention on the Rights of the Child and the Convention on the Rights of Persons with Disabilities mandate children’s right to a good start in life and to adequate care and development. A central aspect of this care is the engagement and stimulation provided by caregivers.2 This right is further cemented as a global priority in the SDGs. Target 4.2 explicitly outlines the importance of quality early childhood development and care, in addition to primary education.
Starting even before they are born, children’s development is heavily influenced by biological and environmental factors. Early childhood provides a window of opportunity to invest in actions that can enhance development and prevent or mitigate vulnerabilities that can seriously compromise long-term outcomes.3 It is well known, for example, that adverse experiences during childhood can affect not only a child’s mental and physical health and educational achievements but also his or her life prospects.
Children with disabilities risk missing out on the care and stimulation they need in the early years due to increased exposure to factors that make them more vulnerable. These include poverty, stigma and discrimination, exclusion from early learning opportunities, institutionalization, violence, abuse and neglect.4 Moreover, children with disabilities may face high barriers in accessing mainstream programmes and services that support early childhood development,5 and even if they do obtain access, their specific needs are often overlooked.
Stimulating home environments and nurturing relationships are key to fostering growth, learning and development in all children, and their lack can have worrisome effects. More frequent exclusion from such environments, for example, means that children with disabilities are at higher risk of struggling to acquire the skills associated with literacy.6
48 Seen, Counted, Included: Using data to shed light on the well-being of children with disabilities
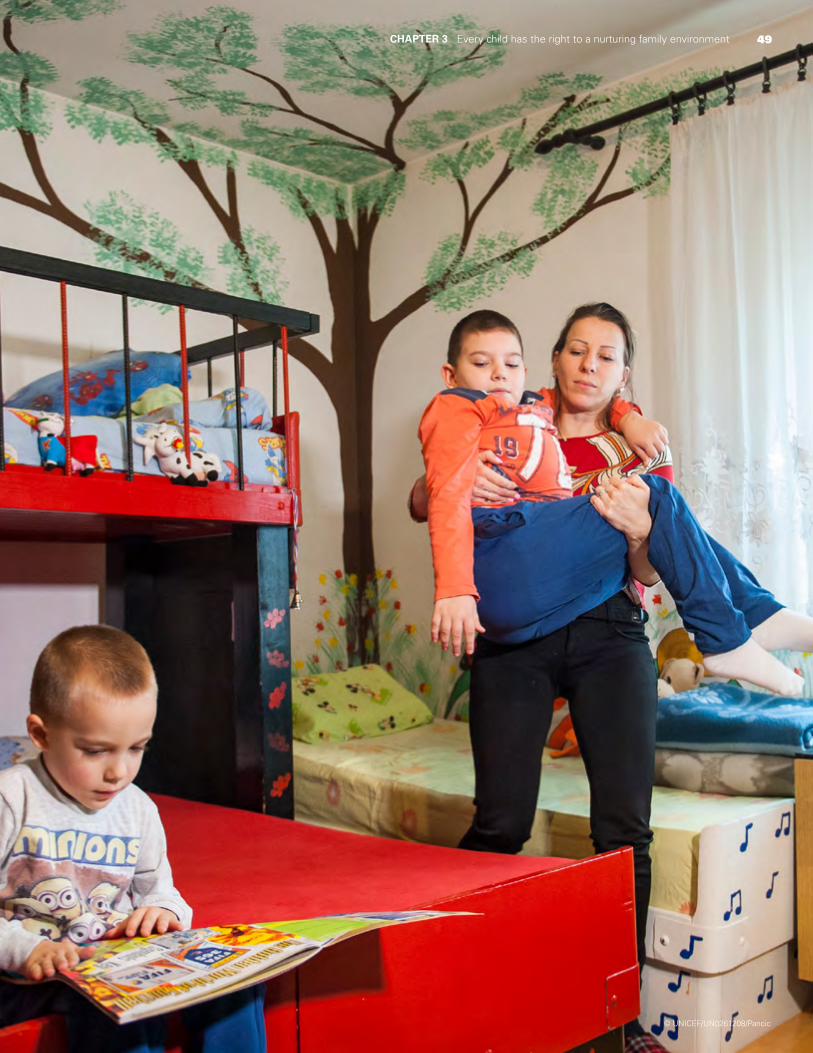
49CHAPTER 3 Every child has the right to a nurturing family environment
© UNICEF/UN0261208/Pancic
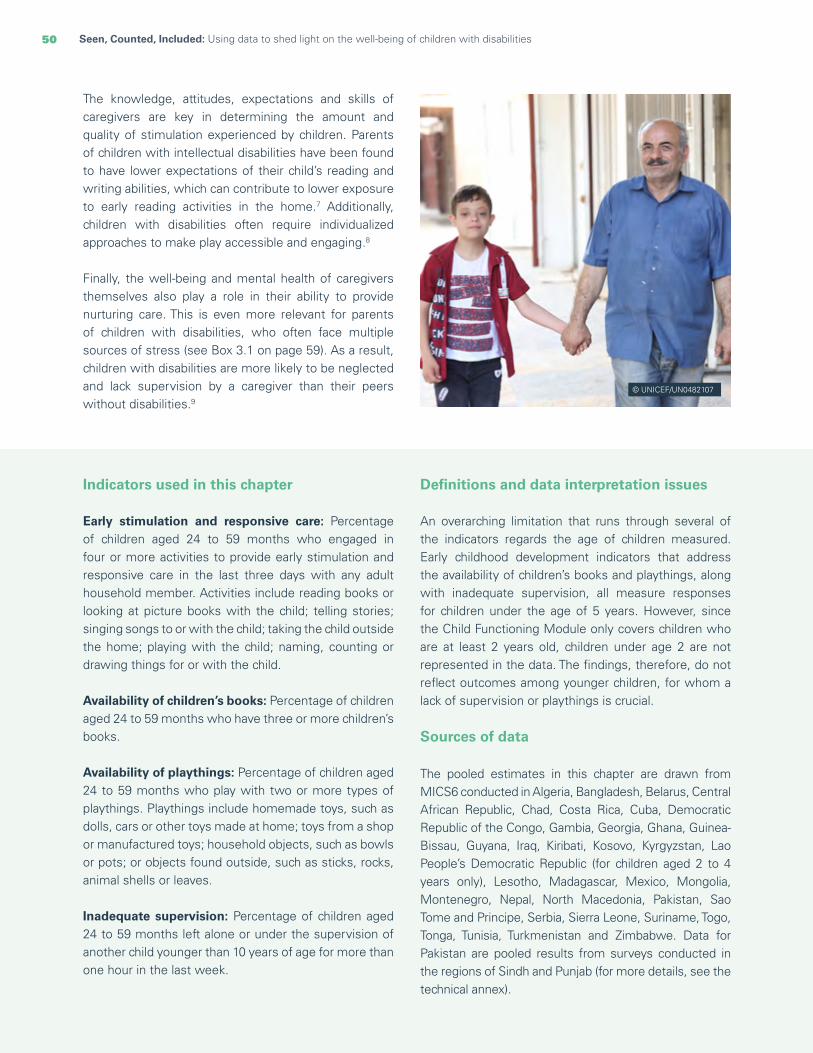
50 Seen, Counted, Included: Using data to shed light on the well-being of children with disabilities
Indicators used in this chapter Early stimulation and responsive care: Percentage of children aged 24 to 59 months who engaged in four or more activities to provide early stimulation and responsive care in the last three days with any adult household member. Activities include reading books or looking at picture books with the child; telling stories; singing songs to or with the child; taking the child outside the home; playing with the child; naming, counting or drawing things for or with the child.
Availability of children’s books: Percentage of children aged 24 to 59 months who have three or more children’s books.
Availability of playthings: Percentage of children aged 24 to 59 months who play with two or more types of playthings. Playthings include homemade toys, such as dolls, cars or other toys made at home; toys from a shop or manufactured toys; household objects, such as bowls or pots; or objects found outside, such as sticks, rocks, animal shells or leaves.
Inadequate supervision: Percentage of children aged 24 to 59 months left alone or under the supervision of another child younger than 10 years of age for more than one hour in the last week.
Definitions and data interpretation issues
An overarching limitation that runs through several of the indicators regards the age of children measured. Early childhood development indicators that address the availability of children’s books and playthings, along with inadequate supervision, all measure responses for children under the age of 5 years. However, since the Child Functioning Module only covers children who are at least 2 years old, children under age 2 are not represented in the data. The findings, therefore, do not reflect outcomes among younger children, for whom a lack of supervision or playthings is crucial.
Sources of data
The pooled estimates in this chapter are drawn from MICS6 conducted in Algeria, Bangladesh, Belarus, Central African Republic, Chad, Costa Rica, Cuba, Democratic Republic of the Congo, Gambia, Georgia, Ghana, Guinea-Bissau, Guyana, Iraq, Kiribati, Kosovo, Kyrgyzstan, Lao People’s Democratic Republic (for children aged 2 to 4 years only), Lesotho, Madagascar, Mexico, Mongolia, Montenegro, Nepal, North Macedonia, Pakistan, Sao Tome and Principe, Serbia, Sierra Leone, Suriname, Togo, Tonga, Tunisia, Turkmenistan and Zimbabwe. Data for Pakistan are pooled results from surveys conducted in the regions of Sindh and Punjab (for more details, see the technical annex).
The knowledge, attitudes, expectations and skills of caregivers are key in determining the amount and quality of stimulation experienced by children. Parents of children with intellectual disabilities have been found to have lower expectations of their child’s reading and writing abilities, which can contribute to lower exposure to early reading activities in the home.7 Additionally, children with disabilities often require individualized approaches to make play accessible and engaging.8
Finally, the well-being and mental health of caregivers themselves also play a role in their ability to provide nurturing care. This is even more relevant for parents of children with disabilities, who often face multiple sources of stress (see Box 3.1 on page 59). As a result, children with disabilities are more likely to be neglected and lack supervision by a caregiver than their peers without disabilities.9
© UNICEF/UN0482107
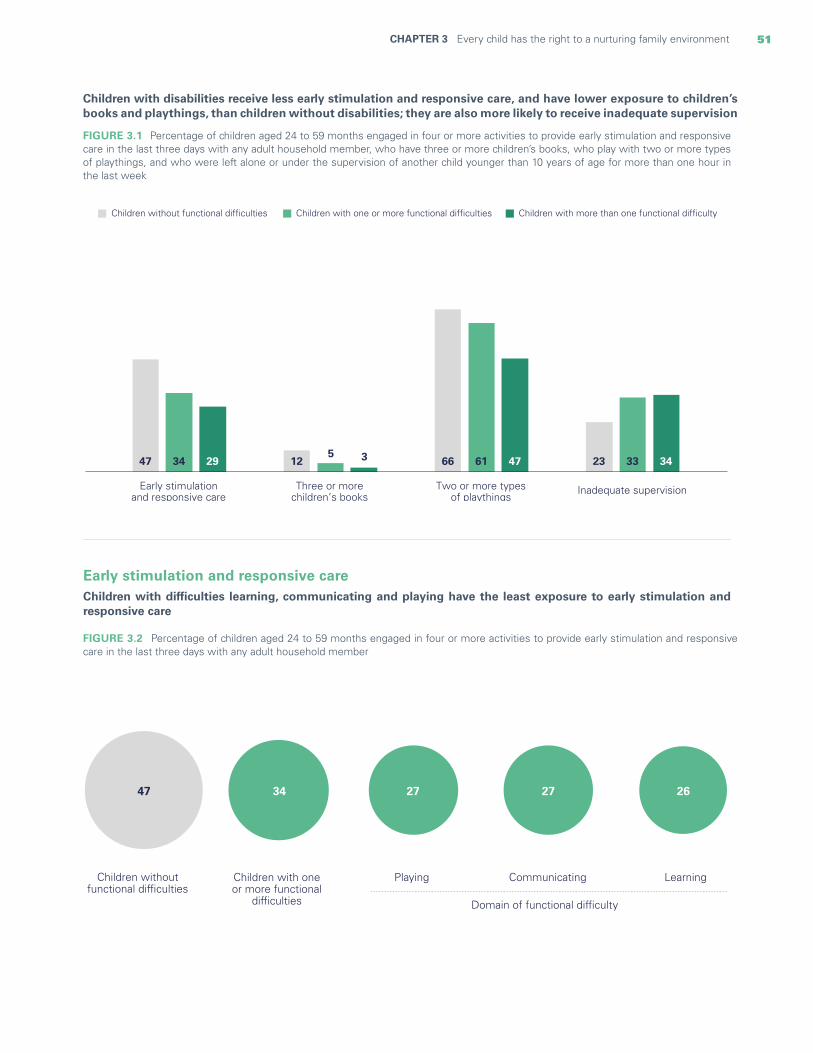
51CHAPTER 3 Every child has the right to a nurturing family environment
Children with disabilities receive less early stimulation and responsive care, and have lower exposure to children’s books and playthings, than children without disabilities; they are also more likely to receive inadequate supervision
FIGURE 3.1 Percentage of children aged 24 to 59 months engaged in four or more activities to provide early stimulation and responsive care in the last three days with any adult household member, who have three or more children’s books, who play with two or more types of playthings, and who were left alone or under the supervision of another child younger than 10 years of age for more than one hour in the last week
Early stimulation and responsive care Children with difficulties learning, communicating and playing have the least exposure to early stimulation and responsive care
FIGURE 3.2 Percentage of children aged 24 to 59 months engaged in four or more activities to provide early stimulation and responsive care in the last three days with any adult household member
47 12 66 23345
61 3329 3 47 34
Early stimulationand responsive care
Children without functional difficulties Children with one or more functional difficulties Children with more than one functional difficulty
Two or more typesof playthings
Inadequate supervisionThree or morechildren’s books
Domain of functional difficulty
Children withoutfunctional difficulties
Children with oneor more functional
difficulties
Playing Communicating Learning
34 27 27 2647
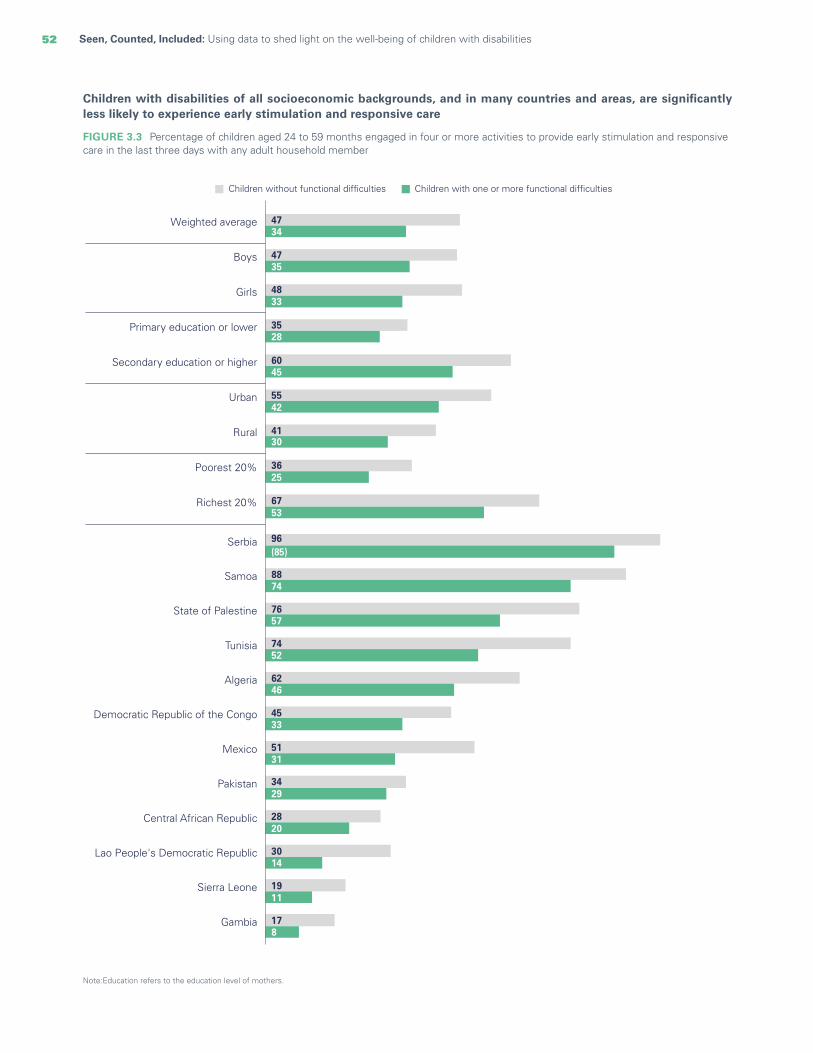
52 Seen, Counted, Included: Using data to shed light on the well-being of children with disabilities
Children with disabilities of all socioeconomic backgrounds, and in many countries and areas, are significantly less likely to experience early stimulation and responsive care
FIGURE 3.3 Percentage of children aged 24 to 59 months engaged in four or more activities to provide early stimulation and responsive care in the last three days with any adult household member
Note:Education refers to the education level of mothers.
Children without functional difficulties Children with one or more functional difficulties
4734
4735
4833
3528
6045
5542
4130
3625
6753
Weighted average
Boys
Girls
Primary education or lower
Secondary education or higher
Urban
Rural
Poorest 20%
Richest 20%
178
Gambia
1911
Sierra Leone
2820
Central African Republic
3014
Lao People's Democratic Republic
3429
Pakistan
5131
Mexico
4533
Democratic Republic of the Congo
6246
Algeria
7452
Tunisia
7657
State of Palestine
8874
Samoa
96(85)
Serbia

53CHAPTER 3 Every child has the right to a nurturing family environment
For all children, being taken outside the home and engaged in play are the most common types of early stimulation activities; the largest disparities between children with and without disabilities are found in the proportion who are read to and engaged in naming or counting objects
FIGURE 3.4 Percentage of children aged 24 to 59 months engaged in specific activities to provide early stimulation and responsive care in the last three days with any adult household member
43 48 54 61 72 7129 34 41 55 65 6726 28 34 52 60 61
Read books Named orcounted objects
Told stories Sang songs Played with Took outside
Children without functional difficulties Children with one or more functional difficulties Children with more than one functional difficulty
Fathers generally engage less in early stimulation activities than mothers, but this disparity is more pronounced among parents of children with disabilities
FIGURE 3.5 Percentage of children aged 24 to 59 months who have engaged in at least four early stimulation activities in the previous three days with mothers (x axis) and fathers (y axis)
Dots in this graph represent countries. Each country has two dots: a grey dot, showing the country-level proportion of children without disabilities who engage in early stimulation activities with mothers versus fathers, and a green dot showing the proportion of children with functional difficulties who engage in early stimulation activities with mothers versus fathers.
Dots falling close to the diagonal line represent countries where engagement with mothers is very similar to that with fathers.
0
10
20
30
40
50
60
70
80
90
100
10 20 30 40 50 60 70 80 90 100
Ear
ly s
timul
atio
n an
d re
spon
sive
car
e by
fat
hers
Early stimulation and responsive care by mothers
Children without functional difficulties Children with one or more functional difficulties
How to read this graph: In this country, around 80 per cent of mothers of children with functional difficulties engage in early stimulation activities with them, compared to only 10 per cent of fathers.

54 Seen, Counted, Included: Using data to shed light on the well-being of children with disabilities
Availability of books and playthings Children with disabilities in the domains of fine motor skills, playing and learning are least likely to have three or more children’s books
FIGURE 3.6 Percentage of children aged 24 to 59 months who have three or more children’s books
Domain of functional difficulty
Children withoutfunctional difficulties
Children with oneor more functional
difficulties
Playing Fine motor skillsLearning
5 12312
Children with disabilities, especially those in rural areas whose mothers have little education and are from the poorest households, have significantly lower access to children’s books
FIGURE 3.7 Percentage of children aged 24 to 59 months who have three or more children’s books
Note: Education refers to the education level of mothers.
Wei
ghte
d av
erag
e
Boy
s
Girl
s
24 t
o 35
mon
ths
36 t
o 47
mon
ths
48 t
o 59
mon
ths
Prim
ary
educ
atio
n o
r lo
wer
Sec
onda
ry e
duca
tion
or
high
er
Urb
an
Rur
al
Children without functional difficulties Children with one or more functional difficulties
12 12 13 9 11 16 2 22 21 64
245 5 53
5 7 1 11 10 22 12
Poo
rest
20%
Ric
hest
20%
11 6
Gha
na
37 20
Tuni
sia
50 29
Cos
ta R
ica
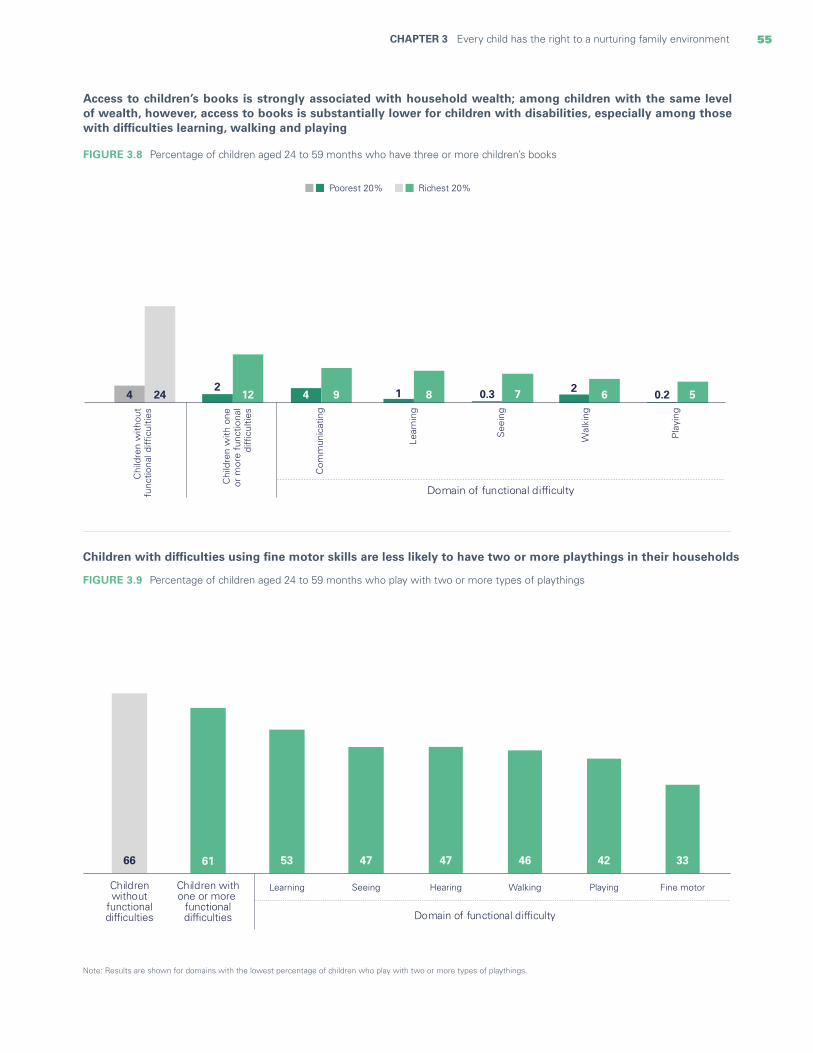
55CHAPTER 3 Every child has the right to a nurturing family environment
Access to children’s books is strongly associated with household wealth; among children with the same level of wealth, however, access to books is substantially lower for children with disabilities, especially among those with difficulties learning, walking and playing
FIGURE 3.8 Percentage of children aged 24 to 59 months who have three or more children’s books
Children with difficulties using fine motor skills are less likely to have two or more playthings in their households
Note: Results are shown for domains with the lowest percentage of children who play with two or more types of playthings.
FIGURE 3.9 Percentage of children aged 24 to 59 months who play with two or more types of playthings
66 61 53 47 47 46 42 33
Childrenwithout
functionaldifficulties
Children withone or more
functionaldifficulties
Learning Hearing WalkingSeeing Playing Fine motor
Domain of functional difficulty
Chi
ldre
n w
ithou
tfu
nctio
nal d
ifficu
lties
See
ing
Chi
ldre
n w
ith o
neor
mor
e fu
nctio
nal
diffi
culti
es
Com
mun
icat
ing
Lear
ning
Wal
king
Pla
ying
Poorest 20% Richest 20%
4 24 0.3 72
12 4 9 1 8 2 6 0.2 5
Domain of functional difficulty
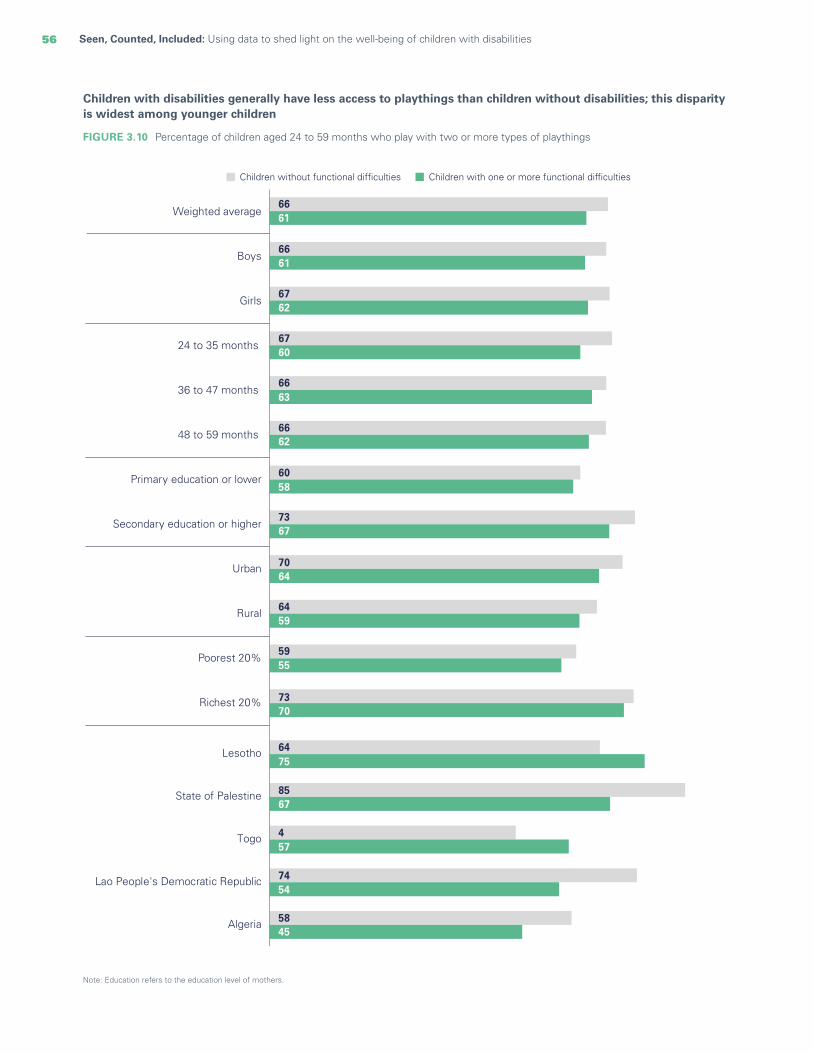
56 Seen, Counted, Included: Using data to shed light on the well-being of children with disabilities
Note: Education refers to the education level of mothers.
Children with disabilities generally have less access to playthings than children without disabilities; this disparity is widest among younger children
FIGURE 3.10 Percentage of children aged 24 to 59 months who play with two or more types of playthings
Children without functional difficulties Children with one or more functional difficulties
66
66
67
67
66
66
60
73
70
64
59
73
61
61
62
60
63
62
58
67
64
59
55
70
Algeria 5845
Lao People's Democratic Republic 7454
4Togo 457
State of Palestine 8567
Lesotho 6475
Weighted average
Boys
Girls
Primary education or lower
24 to 35 months
36 to 47 months
48 to 59 months
Secondary education or higher
Urban
Rural
Poorest 20%
Richest 20%
57CHAPTER 3 Every child has the right to a nurturing family environment
© UNICEF/UN0396341/Khakimova
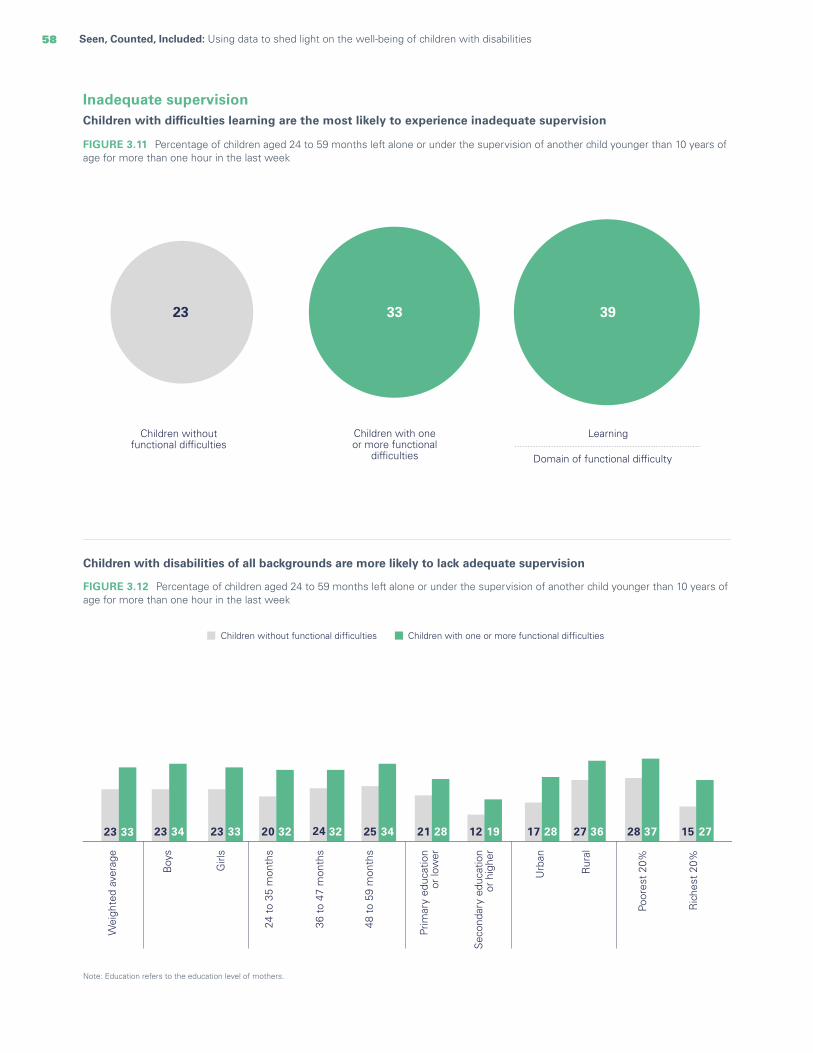
58 Seen, Counted, Included: Using data to shed light on the well-being of children with disabilities
Inadequate supervision Children with difficulties learning are the most likely to experience inadequate supervision
FIGURE 3.11 Percentage of children aged 24 to 59 months left alone or under the supervision of another child younger than 10 years of age for more than one hour in the last week
Children with disabilities of all backgrounds are more likely to lack adequate supervision
FIGURE 3.12 Percentage of children aged 24 to 59 months left alone or under the supervision of another child younger than 10 years of age for more than one hour in the last week
Domain of functional difficulty
Children withoutfunctional difficulties
Children with oneor more functional
difficulties
Learning
33 3923
23 23 23 20 24 25 21 12 17 27 28 1533 34 33 32 32 34 28 19 28 36 37 27
Wei
ghte
d av
erag
e
Boy
s
Girl
s
24 t
o 35
mon
ths
36 t
o 47
mon
ths
48 t
o 59
mon
ths
Prim
ary
educ
atio
n o
r lo
wer
Sec
onda
ry e
duca
tion
or
high
er
Urb
an
Rur
al
Poor
est
20%
Ric
hest
20%
Children without functional difficulties Children with one or more functional difficulties
Note: Education refers to the education level of mothers.
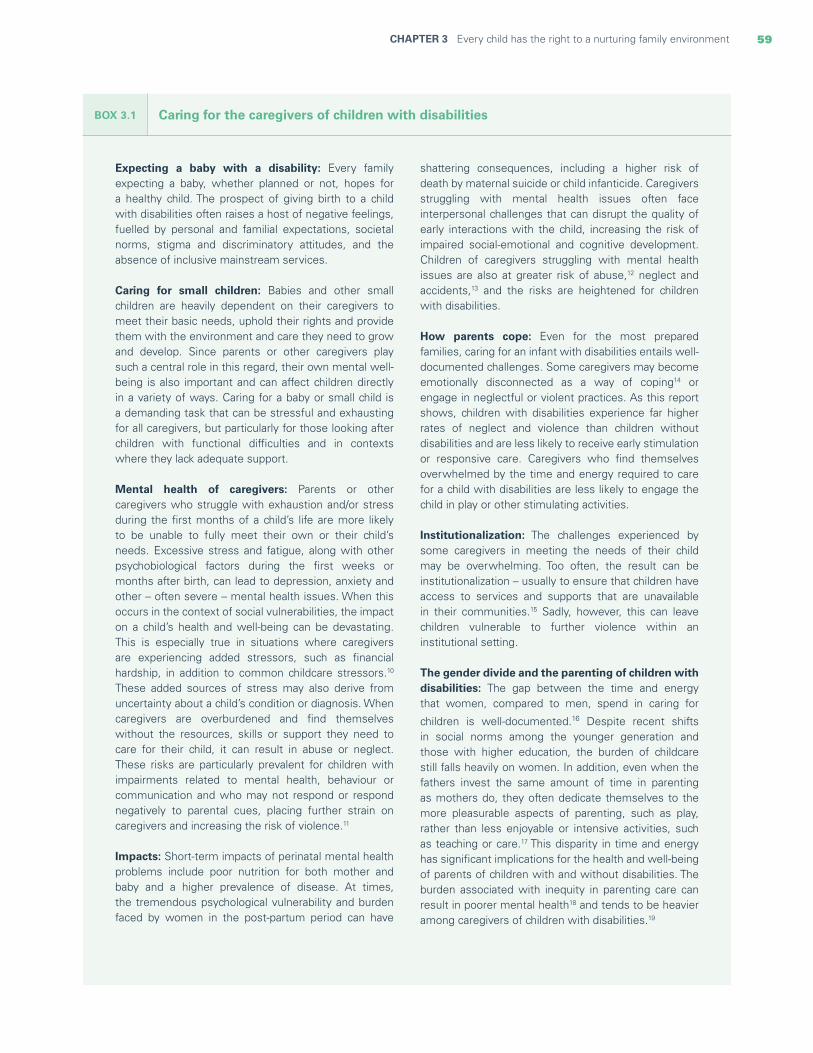
59CHAPTER 3 Every child has the right to a nurturing family environment
BOX 3.1 Caring for the caregivers of children with disabilities
Expecting a baby with a disability: Every family expecting a baby, whether planned or not, hopes for a healthy child. The prospect of giving birth to a child with disabilities often raises a host of negative feelings, fuelled by personal and familial expectations, societal norms, stigma and discriminatory attitudes, and the absence of inclusive mainstream services.
Caring for small children: Babies and other small children are heavily dependent on their caregivers to meet their basic needs, uphold their rights and provide them with the environment and care they need to grow and develop. Since parents or other caregivers play such a central role in this regard, their own mental well-being is also important and can affect children directly in a variety of ways. Caring for a baby or small child is a demanding task that can be stressful and exhausting for all caregivers, but particularly for those looking after children with functional difficulties and in contexts where they lack adequate support.
Mental health of caregivers: Parents or other caregivers who struggle with exhaustion and/or stress during the first months of a child’s life are more likely to be unable to fully meet their own or their child’s needs. Excessive stress and fatigue, along with other psychobiological factors during the first weeks or months after birth, can lead to depression, anxiety and other – often severe – mental health issues. When this occurs in the context of social vulnerabilities, the impact on a child’s health and well-being can be devastating. This is especially true in situations where caregivers are experiencing added stressors, such as financial hardship, in addition to common childcare stressors.10 These added sources of stress may also derive from uncertainty about a child’s condition or diagnosis. When caregivers are overburdened and find themselves without the resources, skills or support they need to care for their child, it can result in abuse or neglect. These risks are particularly prevalent for children with impairments related to mental health, behaviour or communication and who may not respond or respond negatively to parental cues, placing further strain on caregivers and increasing the risk of violence.11
Impacts: Short-term impacts of perinatal mental health problems include poor nutrition for both mother and baby and a higher prevalence of disease. At times, the tremendous psychological vulnerability and burden faced by women in the post-partum period can have
shattering consequences, including a higher risk of death by maternal suicide or child infanticide. Caregivers struggling with mental health issues often face interpersonal challenges that can disrupt the quality of early interactions with the child, increasing the risk of impaired social-emotional and cognitive development. Children of caregivers struggling with mental health issues are also at greater risk of abuse,12 neglect and accidents,13 and the risks are heightened for children with disabilities.
How parents cope: Even for the most prepared families, caring for an infant with disabilities entails well-documented challenges. Some caregivers may become emotionally disconnected as a way of coping14 or engage in neglectful or violent practices. As this report shows, children with disabilities experience far higher rates of neglect and violence than children without disabilities and are less likely to receive early stimulation or responsive care. Caregivers who find themselves overwhelmed by the time and energy required to care for a child with disabilities are less likely to engage the child in play or other stimulating activities.
Institutionalization: The challenges experienced by some caregivers in meeting the needs of their child may be overwhelming. Too often, the result can be institutionalization – usually to ensure that children have access to services and supports that are unavailable in their communities.15 Sadly, however, this can leave children vulnerable to further violence within an institutional setting.
The gender divide and the parenting of children with disabilities: The gap between the time and energy that women, compared to men, spend in caring for
children is well-documented.16 Despite recent shifts in social norms among the younger generation and those with higher education, the burden of childcare still falls heavily on women. In addition, even when the fathers invest the same amount of time in parenting as mothers do, they often dedicate themselves to the more pleasurable aspects of parenting, such as play, rather than less enjoyable or intensive activities, such as teaching or care.17 This disparity in time and energy has significant implications for the health and well-being of parents of children with and without disabilities. The burden associated with inequity in parenting care can result in poorer mental health18 and tends to be heavier among caregivers of children with disabilities.19

60 Seen, Counted, Included: Using data to shed light on the well-being of children with disabilities
Takeaways and programmatic implications
Children with disabilities often face major challenges in realizing their right to optimal development, including early and responsive care. For every indicator and across every background characteristic measured in this chapter, such children experience worse overall outcomes than children without disabilities. However, nuances emerge. The data vary significantly among countries and by the domain of functional difficulty experienced by children. Children with difficulties learning, communicating and playing are much less likely to receive early stimulation and responsive care than children with difficulties in other domains. Similarly, children with difficulties in fine motor skills, playing, walking and learning are far less likely to have access to playthings than children with other challenges.
Children’s backgrounds can also provide insights into the level of risk they are likely to experience. While children with disabilities of all backgrounds show worse outcomes for all indicators, the extent of the difference is closely linked to other characteristics that are risk factors for all children. For example, access to books is closely tied to wealth for all children; however, children with disabilities in the poorest households still face greater deprivation than children without disabilities. A similar result is found among children left with inadequate supervision. All children in rural areas whose mothers are under the age of 18, have a low level of education or are from the poorest households experience a high likelihood of being inadequately supervised. But children with disabilities with these same background characteristics face a disproportionately higher risk. These findings illustrate how existing inequalities can intersect with disability and compound risk.
Governments and organizations can take concrete steps to address the inequality in early care received by children with disabilities. Family-centred support, including family-friendly policies and services for children and parents with disabilities, can make a substantial difference in keeping families together and fostering emotional well-being in both caregivers and children. This can include appropriate policies on parental leave and breastfeeding support, services such as affordable, accessible, high-quality and inclusive childcare, and resources such as child benefits, which can help to create supportive environments for families.20 Additionally, parents or other caregivers of children with disabilities need services that promote their own well-being and mental health.
Programmes that help parents provide the best possible care to their children, while mitigating potential sources of emotional stress, have had demonstrable success.21 For instance, research has shown that training programmes for parents are effective in increasing self-efficacy in those who have children with certain disabilities.22 However, such programmes need to be tailored to the child’s specific impairments. Support for families of young children with disabilities can be facilitated through the promotion of public awareness of the risks faced by these children as well as advocacy at all levels of society to prioritize their needs and those of their families.23 Finally, capacity must be built across different sectors to identify and support parents of young children with disabilities and refer them to specialized services as needed.
61CHAPTER 3 Every child has the right to a nurturing family environment
© UNICEF/UN0503535/Willocq

62 Seen, Counted, Included: Using data to shed light on the well-being of children with disabilities
Every child hasthe right to learn
CHAPTER 4
62
Education provides children with the knowledge and skills they need to grow and prosper, creating well-being, pathways to future opportunities and healthier lives. Ensuring opportunities for all children to succeed in school requires equity and inclusion that guarantees access, participation, progress and achievement of key learning outcomes. This means addressing all aspects of a child’s educational path and eliminating the disparities and barriers that begin early in life, accumulate during childhood and generate further disadvantages for the most marginalized children, including children with disabilities.
Education has long been recognized as a global priority. For years, governments and other national and international stakeholders have focused their attention on making sure that all children can attend school, and they have backed up that commitment with funding. The SDGs have built on this foundation through Goal 4, which calls for inclusive and equitable quality education for all. Targets within the Goal call for universal completion of primary and secondary school (target 4.1), increasing the number of youths with relevant skills for life and employment (target 4.4), and ensuring their literacy and numeracy skills (target 4.6), among others. Target 4.5 calls for eliminating gender disparities and inequities in education, specifically highlighting the need to ensure access to education for persons with disabilities. Target 4.a calls for the upgrading of educational facilities so that they are child- and disability-sensitive and promote inclusive learning environments.
Despite widespread agreement on the importance of education, children with disabilities are still falling behind.1 They are more likely to never attend school or to drop out due to multiple barriers, including stigma, lack of trained teachers, inadequate learning materials and inaccessible facilities.2 A lack of inclusive policies by governments can contribute to these barriers. Only 68 per cent of countries in 2020 had definitions of inclusive education in their policies, leaving many schools and children without a national framework to facilitate this type of education.3
The impact of excluding children with disabilities from education goes far beyond diminished educational outcomes. They are also more likely to miss out on school-based health and nutrition programmes, such as school meals and immunization campaigns,4 and face increased vulnerability to violence and exploitation while not at school.5
Seen, Counted, Included: Using data to shed light on the well-being of children with disabilities
63CHAPTER 2 Every child has the right to survive and thrive 63CHAPTER 4 Every child has the right to learn
© UNICEF/UN0441182/Shing

64 Seen, Counted, Included: Using data to shed light on the well-being of children with disabilities
Indicators used in this chapter
Children that never attended school: Percentage of children aged 10 to 17 years who have never attended school.
Attendance of early childhood education: Percentage of children aged 36 to 59 months who are attending an early childhood education programme.
School readiness: Percentage of children attending the first grade of primary school who attended an early childhood education programme during the previous school year.
Out-of-school rate: Percentage of children of: • Primary-school age who are not attending early
childhood education, primary school or higher• Lower-secondary-school age who are not attending
primary school, lower- or upper-secondary school or higher
• Upper-secondary-school age who are not attending primary school, lower- or upper-secondary school or higher.
Disability education parity index: Adjusted net attendance rate (ANAR) for children with disabilities divided by the ANAR for children without disabilities: • One year before primary or pre-primary school• Primary school• Lower-secondary school• Upper-secondary school.
Overage for grade: Percentage of students attending each grade who are two or more years older than the official age for that grade.
Dropout rate in primary education: Percentage of students who in the previous school year were enrolled in any grade in primary education (excluding the last grade), and who are no longer attending primary school in the current year.
Repetition rate in primary education: Percentage of students who attended any given grade in primary school in the previous year and are attending the same grade in the current year.
Books and reading:• Percentage of children aged 7 to 14 years who have
three or more books to read at home
• Percentage of children aged 7 to 14 years who read books or are read to at home.
Parent involvement with school: • Discussion with teachers regarding progress:
percentage of children aged 7 to 14 years attending school for whom an adult household member discussed progress with the teacher
• Report cards: percentage of children aged 7 to 14 years attending schools that provided student report cards to parents
• Support with homework: percentage of children aged 7 to 14 years attending school who have homework and received help with homework.
Learning outcomes:• Foundational reading skills: Percentage of children aged
7 to 14 years who demonstrate foundational reading skills by successfully completing three foundational reading tasks:
· Word recognition (correctly reading 90 per cent of words in a story)
· Literal questions (correctly answering three literal questions)
· Inferential questions (correctly answering two inferential questions).
Only by correctly reading 90 per cent of words in a story and correctly answering the questions in all three categories of the module is a child considered to have foundational reading skills.
• Foundational numeracy skills: Percentage of children aged 7 to 14 who demonstrate foundational numeracy skills by successfully completing four foundational numeracy tasks:
· Number reading · Number discrimination · Addition · Pattern recognition.
Each category has several questions, and the child must answer every question in every category correctly to be considered to have foundational numeracy skills.
Use of Internet, computers and communication technologies:• Use of a computer: percentage of children aged 15 to
17 years who used a computer in the last three months • Use of mobile phone: percentage of children aged 15
to 17 years who used a mobile phone in the last three months
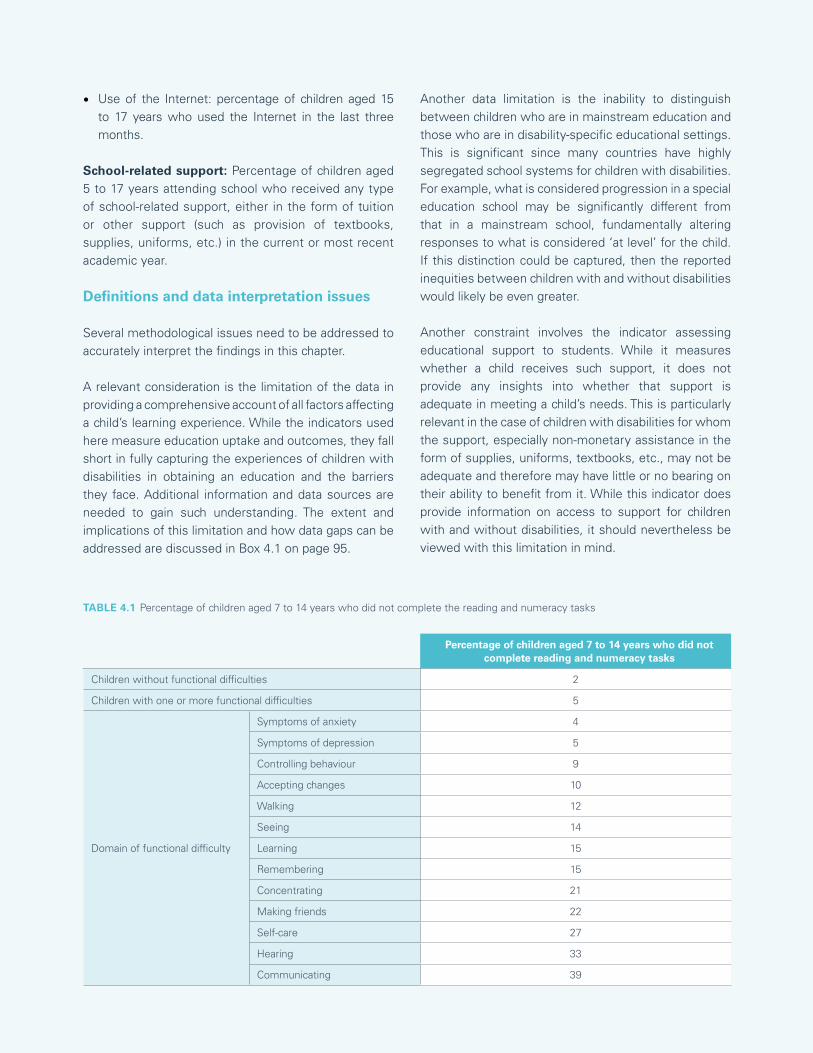
65CHAPTER 4 Every child has the right to learn
• Use of the Internet: percentage of children aged 15 to 17 years who used the Internet in the last three months.
School-related support: Percentage of children aged 5 to 17 years attending school who received any type of school-related support, either in the form of tuition or other support (such as provision of textbooks, supplies, uniforms, etc.) in the current or most recent academic year.
Definitions and data interpretation issues
Several methodological issues need to be addressed to accurately interpret the findings in this chapter.
A relevant consideration is the limitation of the data in providing a comprehensive account of all factors affecting a child’s learning experience. While the indicators used here measure education uptake and outcomes, they fall short in fully capturing the experiences of children with disabilities in obtaining an education and the barriers they face. Additional information and data sources are needed to gain such understanding. The extent and implications of this limitation and how data gaps can be addressed are discussed in Box 4.1 on page 95.
Another data limitation is the inability to distinguish between children who are in mainstream education and those who are in disability-specific educational settings. This is significant since many countries have highly segregated school systems for children with disabilities. For example, what is considered progression in a special education school may be significantly different from that in a mainstream school, fundamentally altering responses to what is considered ‘at level’ for the child. If this distinction could be captured, then the reported inequities between children with and without disabilities would likely be even greater.
Another constraint involves the indicator assessing educational support to students. While it measures whether a child receives such support, it does not provide any insights into whether that support is adequate in meeting a child’s needs. This is particularly relevant in the case of children with disabilities for whom the support, especially non-monetary assistance in the form of supplies, uniforms, textbooks, etc., may not be adequate and therefore may have little or no bearing on their ability to benefit from it. While this indicator does provide information on access to support for children with and without disabilities, it should nevertheless be viewed with this limitation in mind.
Percentage of children aged 7 to 14 years who did not complete reading and numeracy tasks
Children without functional difficulties 2
Children with one or more functional difficulties 5
Domain of functional difficulty
Symptoms of anxiety 4
Symptoms of depression 5
Controlling behaviour 9
Accepting changes 10
Walking 12
Seeing 14
Learning 15
Remembering 15
Concentrating 21
Making friends 22
Self-care 27
Hearing 33
Communicating 39
TABLE 4.1 Percentage of children aged 7 to 14 years who did not complete the reading and numeracy tasks

66 Seen, Counted, Included: Using data to shed light on the well-being of children with disabilities
Results related to upper-secondary-school attendance are based on children who were less than 18 years old at the time of the survey. These results should thus be interpreted carefully given that they do not include persons above the age of 18 who may still have been attending upper-secondary school.
A final consideration is the fact that the denominators used for some indicators do not capture the entire population of children represented by the sample. For example, school progression indicators only represent the situation of children who have ever attended school. It is well known that the most marginalized children in society, including those with disabilities, tend to be overrepresented among those who are out of school, either because they have never attended school or because they have dropped out. Therefore, the results that show disaggregated information on school progression for children with and without disabilities reflect the experiences of a subgroup of children that, in all likelihood, face lower barriers to education than those who have never been able to attend school.
A similar consideration applies to the results on foundational learning. In this case, the indicators for foundational reading and numeracy skills are only generated for children who can complete three reading tasks and four numeracy tasks. Non-completion observations include children who started but were unable to finish the assessment tasks, who refused to take the assessment (or whose mothers did not permit them to take the assessment) or who could not participate in the assessment due to illness or an impairment. Inaccessibility could thus be a barrier to participation for some children (for example, if a child is blind or requires assistive technology or reasonable accommodations to participate and these could not be provided). Therefore, the results that show differences in foundational learning skills for children with and without disabilities should be interpreted with the understanding that children with the highest degrees of difficulty are less likely to have been part of such an assessment, as shown in Table 4.1.
Sources of data
Unless otherwise noted, the pooled estimates in this chapter are drawn from MICS6 conducted in Algeria, Bangladesh, Belarus, Central African Republic, Chad, Costa Rica, Cuba, Democratic Republic of the Congo, Gambia, Georgia, Ghana, Guinea-Bissau, Guyana, Iraq, Kiribati, Kosovo, Kyrgyzstan, Lao People’s Democratic Republic, Lesotho, Madagascar, Mexico, Mongolia, Montenegro, Nepal, North Macedonia, Pakistan, Sao Tome and Principe, Serbia, Sierra Leone, Suriname, Togo, Tonga, Tunisia, Turkmenistan and Zimbabwe. Data for Pakistan are pooled results from surveys conducted in the regions of Sindh and Punjab (for more details, see the technical annex).
Pooled results for all indicators that refer to children aged 5 or above do not include data from the Lao People’s Democratic Republic since that survey only captured information on children aged 2 to 4 years.
Pooled results for indicators measuring the number of books in a child’s home (Figure 4.20) do not include data from Mexico since these were not available. Pooled results for indicators measuring whether a child is reading or being read to at home (Figures 4.21 and 4.22) do not include data from Algeria, Costa Rica, Cuba, Georgia, Iraq, Mexico, Montenegro, Serbia, Sierra Leone or Tonga since these were not available.
Pooled results for indicators measuring foundational reading and numeracy skills (Figures 4.25 through 4.29) do not include data from Algeria, Costa Rica, Cuba, Georgia, Iraq, Kosovo, Mexico, Montenegro, Serbia, Sierra Leone and Tonga since these were not available.
Pooled results for indicators measuring use of information and communication technology (ICT) (Figure 4.30) do not include data from Belarus, Costa Rica, Georgia, Kosovo, Mexico, Montenegro, North Macedonia, Serbia and Tonga since these were not available.
Pooled results for indicators measuring education support (Figures 4.31 and 4.32) do not include data from Cuba, Democratic Republic of the Congo, Gambia, Ghana, Guinea-Bissau, Kosovo, Lesotho, Montenegro, Mexico, Togo and Turkmenistan since these were not available.

67CHAPTER 4 Every child has the right to learn
School participation
All children have the right to inclusive, accessible and high-quality education, which can be denied to children with disabilities. Children with certain impairments may be more likely to experience exclusion because schools may not be able to accommodate their needs. For many children with disabilities, education is only available in segregated settings, denying them the multiple benefits of inclusive education in a general environment.6
Other barriers to education, such as the gender of the household head or poverty, can also increase disparities in school participation.7 The impact of poverty on the educational trajectories of children with disabilities tends to be magnified, as families struggle to meet the additional costs of keeping their children in school.8 This can be compounded by negative beliefs about the capabilities of children with disabilities: Families of such children may refrain from enrolling them in school in the belief that there is limited benefit to doing so.9
Children with difficulties walking, playing or using fine motor skills are less likely to attend early childhood education programmes
FIGURE 4.1 Percentage of children aged 3 and 4 years who are attending an early childhood education programme
27
Ch
ildre
n w
itho
utfu
nctio
nal d
ifficu
lties
19
Ch
ildre
n w
ith o
ne
or m
ore
fun
ctio
nal
diffi
culti
es
9
Ch
ildre
n w
ithm
ore
than
on
efu
nctio
nal
diffi
culty
13
Co
mm
unic
atin
g
13
Lear
ning
8
Hea
ring
7
Fin
e m
oto
r ski
lls
6
Play
ing
5
Wal
k in
g
Domain of functional difficulty
© UNICEF/UNI180622/Brake
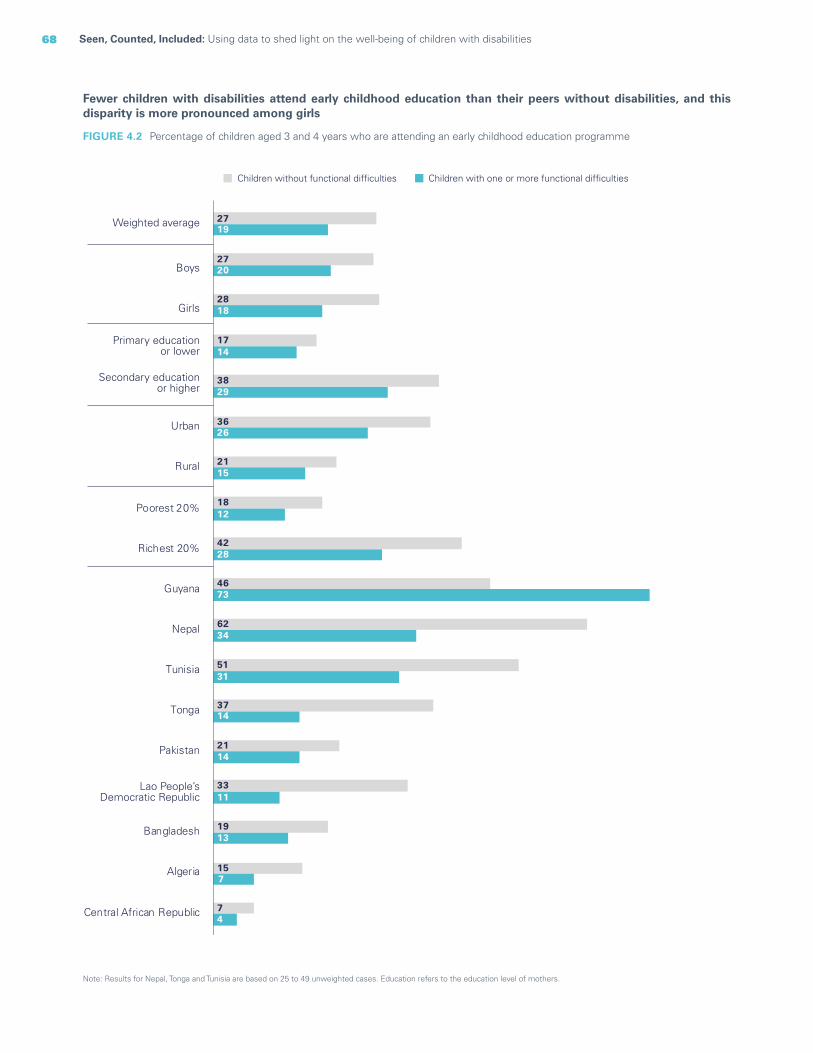
68 Seen, Counted, Included: Using data to shed light on the well-being of children with disabilities
Fewer children with disabilities attend early childhood education than their peers without disabilities, and this disparity is more pronounced among girls
Note: Results for Nepal, Tonga and Tunisia are based on 25 to 49 unweighted cases. Education refers to the education level of mothers.
FIGURE 4.2 Percentage of children aged 3 and 4 years who are attending an early childhood education programme
27
27
28
17
38
36
21
18
42
46
62
51
37
21
33
19
15
7
19
20
18
14
29
26
15
12
28
73
34
31
14
14
11
13
7
4
Weighted average
Boys
Girls
Primary educationor lower
Secondary educationor higher
Urban
Rural
Poorest 20%
Richest 20%
Guyana
Nepal
Tunisia
Tonga
Pakistan
Lao People’sDemocratic Republic
Bangladesh
Algeria
Central African Republic
Children without functional difficulties Children with one or more functional difficulties

69CHAPTER 4 Every child has the right to learn
Among children in the first grade of primary school, those with difficulties hearing are less likely to have attended early childhood education in the previous year, while children with difficulties controlling their behaviour are more likely to have attended
Domain of functional difficulty
Children withoutfunctional difficulties
Children with oneor more functional
difficulties
Children withmore than one
functional difficulty
HearingControlling behaviour
51 48 467162
FIGURE 4.3 Percentage of children attending the first grade of primary school who attended an early childhood education programme during the previous school year
© UNICEF/UNI303920/Younis
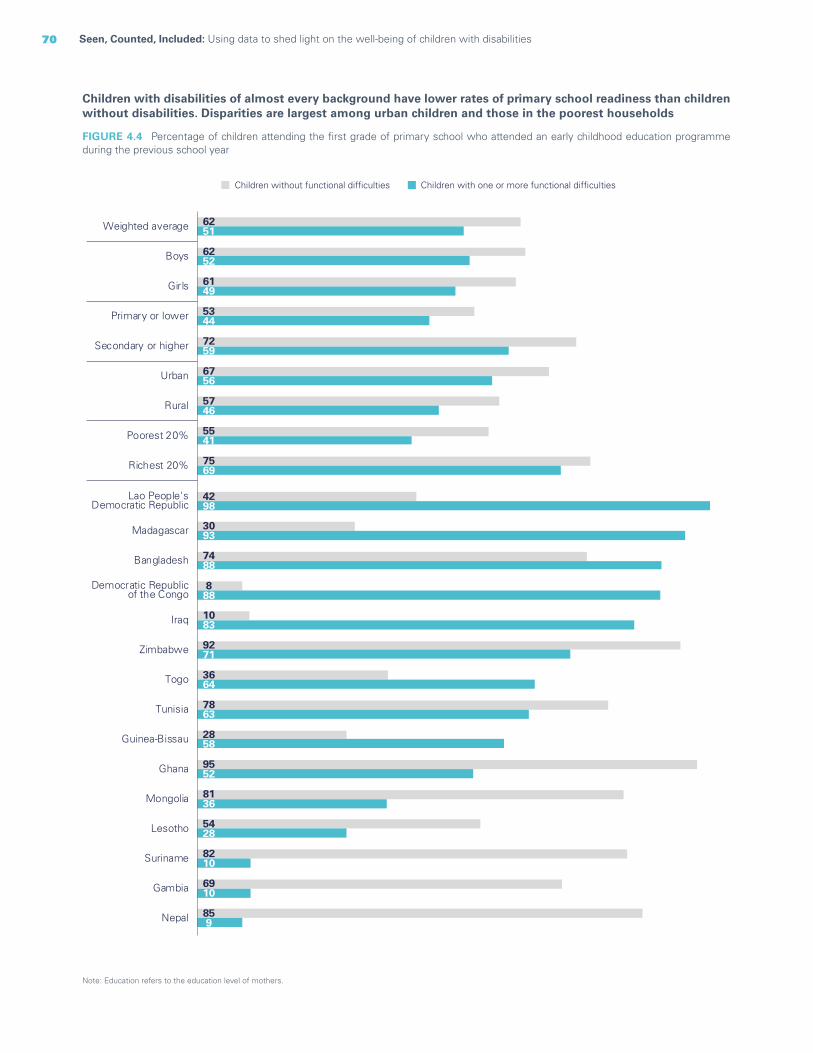
70 Seen, Counted, Included: Using data to shed light on the well-being of children with disabilities
Children with disabilities of almost every background have lower rates of primary school readiness than children without disabilities. Disparities are largest among urban children and those in the poorest households
Note: Education refers to the education level of mothers.
FIGURE 4.4 Percentage of children attending the first grade of primary school who attended an early childhood education programme during the previous school year
62
62
61
53
72
67
57
55
75
51
52
49
44
59
56
46
41
69
Weighted average
Boys
Girls
Primary or lower
Secondary or higher
Urban
Rural
Poorest 20%
Richest 20%
859Nepal
6910Gambia
8210Suriname
5428Lesotho
8136Mongolia
9552Ghana
2858Guinea-Bissau
7863Tunisia
3664Togo
9271Zimbabwe
1083Iraq
888
Democratic Republicof the Congo
7488Bangladesh
3093Madagascar
4298
Lao People'sDemocratic Republic
Children without functional difficulties Children with one or more functional difficulties

71CHAPTER 4 Every child has the right to learn
Children with disabilities in most domains are disproportionately more likely to be out of primary school than children without disabilities
Domain of functional difficulty
Ch
ildre
n w
itho
utfu
nctio
nal d
ifficu
lties
Ch
ildre
n w
ith o
ne
or m
ore
fun
ctio
nal
diffi
culti
es
12 19 23 24 24 30 31 33 34 37 42 43 53
Sym
ptom
s of
de
pres
sion
Acc
eptin
g ch
ange
Seei
ng
Lear
ning
Rem
embe
ring
Con
cent
ratin
g
Wal
king
Mak
ing
frie
nds
Hea
ring
Self-
care
Com
mun
icat
ing
FIGURE 4.6 Percentage of children of primary-school age who are not attending primary school or higher
Regardless of education level, children with disabilities are more likely to be out of school than children without disabilities. Out-of-school rates increase during secondary school and are higher among children with multiple disabilities; rates are highest among children with severe disabilities
FIGURE 4.5 Percentage of primary-, lower-secondary- and upper-secondary-school-aged children who are not attending primary or secondary school or higher
13 16 2819 21 3524 28 4317 21 3136 36 59
Out of primary school Out of lower-secondary school Out of upper-secondary school
Children withoutfunctional difficulties
Children with oneor more functionaldifficulties
Children with more thanone functional difficulty
Children with anxietyor depressionsymptoms only
Children with one or more severefunctional difficulties, without anxietyor depression symptoms
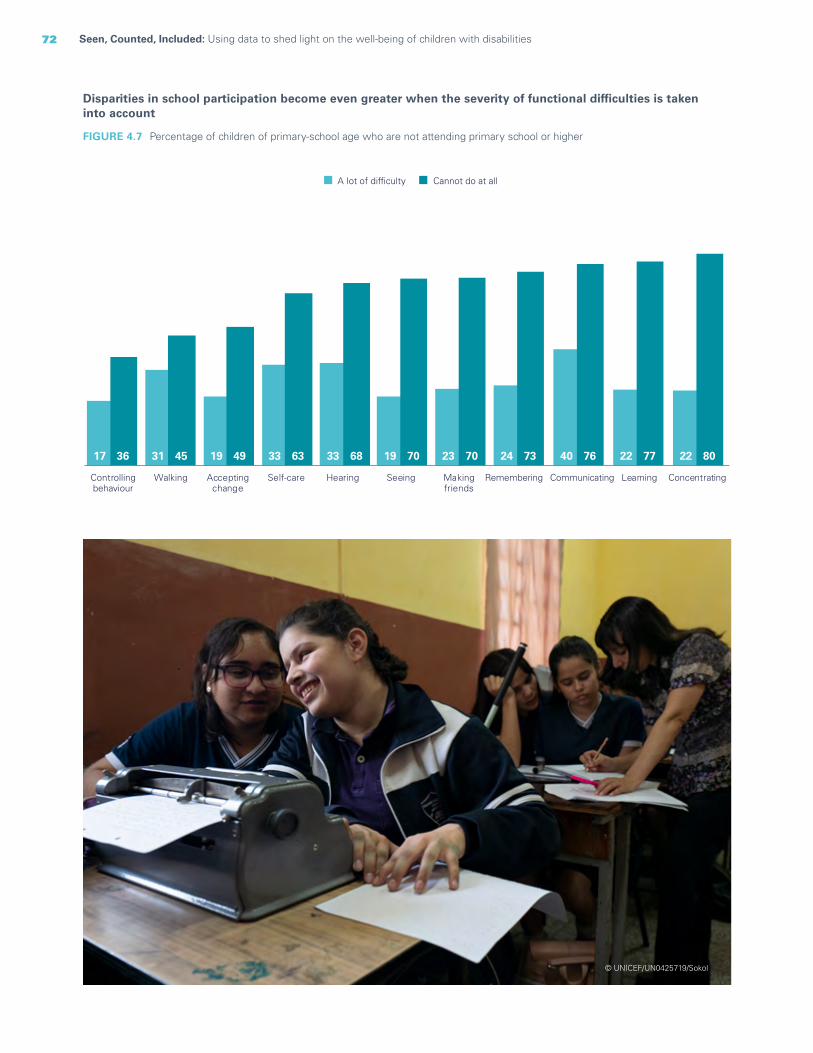
72 Seen, Counted, Included: Using data to shed light on the well-being of children with disabilities
Disparities in school participation become even greater when the severity of functional difficulties is taken into account
FIGURE 4.7 Percentage of children of primary-school age who are not attending primary school or higher
17 31 19 33 33 19 23 24 40 22 2236 45 49 63 68 70 70 73 76 77 80
Controllingbehaviour
Walking Acceptingchange
Self-care RememberingHearing Seeing Makingfriends
Learning Concentrating
A lot of difficulty Cannot do at all
Communicating
© UNICEF/UN0425719/Sokol
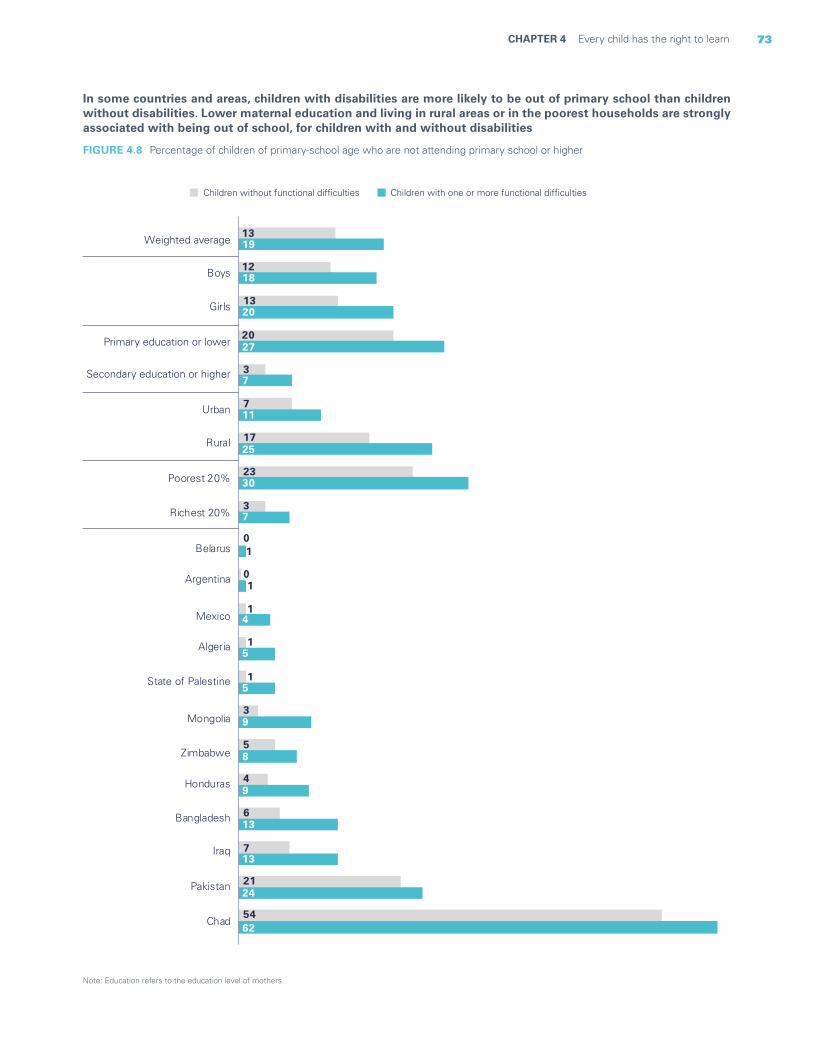
73CHAPTER 4 Every child has the right to learn
Note: Education refers to the education level of mothers.
FIGURE 4.8 Percentage of children of primary-school age who are not attending primary school or higher
In some countries and areas, children with disabilities are more likely to be out of primary school than children without disabilities. Lower maternal education and living in rural areas or in the poorest households are strongly associated with being out of school, for children with and without disabilities
Children without functional difficulties Children with one or more functional difficulties
13
12
13
20
3
7
17
23
3
0
0
1
1
3
5
4
6
7
21
54
19
18
20
27
7
11
25
30
7
1
1
4
5
15
9
8
9
13
13
24
62
Weighted average
Boys
Girls
Primary education or lower
Secondary education or higher
Urban
Rural
Poorest 20%
Richest 20%
Belarus
Argentina
Mexico
Algeria
State of Palestine
Mongolia
Zimbabwe
Honduras
Bangladesh
Iraq
Pakistan
Chad
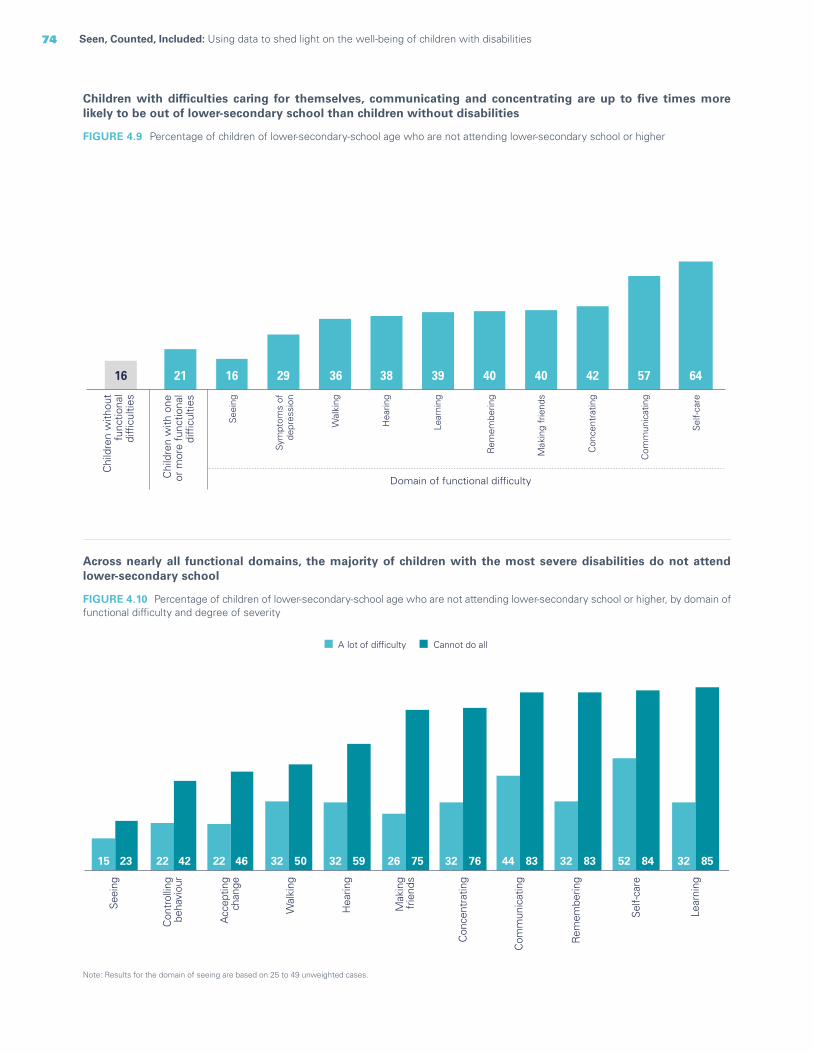
74 Seen, Counted, Included: Using data to shed light on the well-being of children with disabilities
FIGURE 4.9 Percentage of children of lower-secondary-school age who are not attending lower-secondary school or higher
Children with difficulties caring for themselves, communicating and concentrating are up to five times more likely to be out of lower-secondary school than children without disabilities
Chi
ldre
n w
ithou
tfu
nctio
nal
diffi
culti
es
Chi
ldre
n w
ith o
neor
mor
e fu
nctio
nal
diffi
culti
es
Domain of functional difficulty
See
ing
Wal
king
Hea
ring
Lear
ning
Rem
embe
ring
Mak
ing
frie
nds
Con
cent
ratin
g
Com
mun
icat
ing
Sel
f-ca
re
Sym
ptom
s of
depr
essi
on
16 21 16 29 36 38 39 40 40 42 57 64
Note: Results for the domain of seeing are based on 25 to 49 unweighted cases.
FIGURE 4.10 Percentage of children of lower-secondary-school age who are not attending lower-secondary school or higher, by domain of functional difficulty and degree of severity
Across nearly all functional domains, the majority of children with the most severe disabilities do not attend lower-secondary school
15 22 22 32 32 26 32 44 32 52 3223 42 46 50 59 75 76 83 83 84 85
A lot of difficulty Cannot do all
See
ing
Con
trol
ling
beha
viou
r
Acc
eptin
gch
ange
Wal
king
Hea
ring
Con
cent
ratin
g
Com
mun
icat
ing
Rem
embe
ring
Sel
f-car
e
Lear
ning
Mak
ing
frie
nds
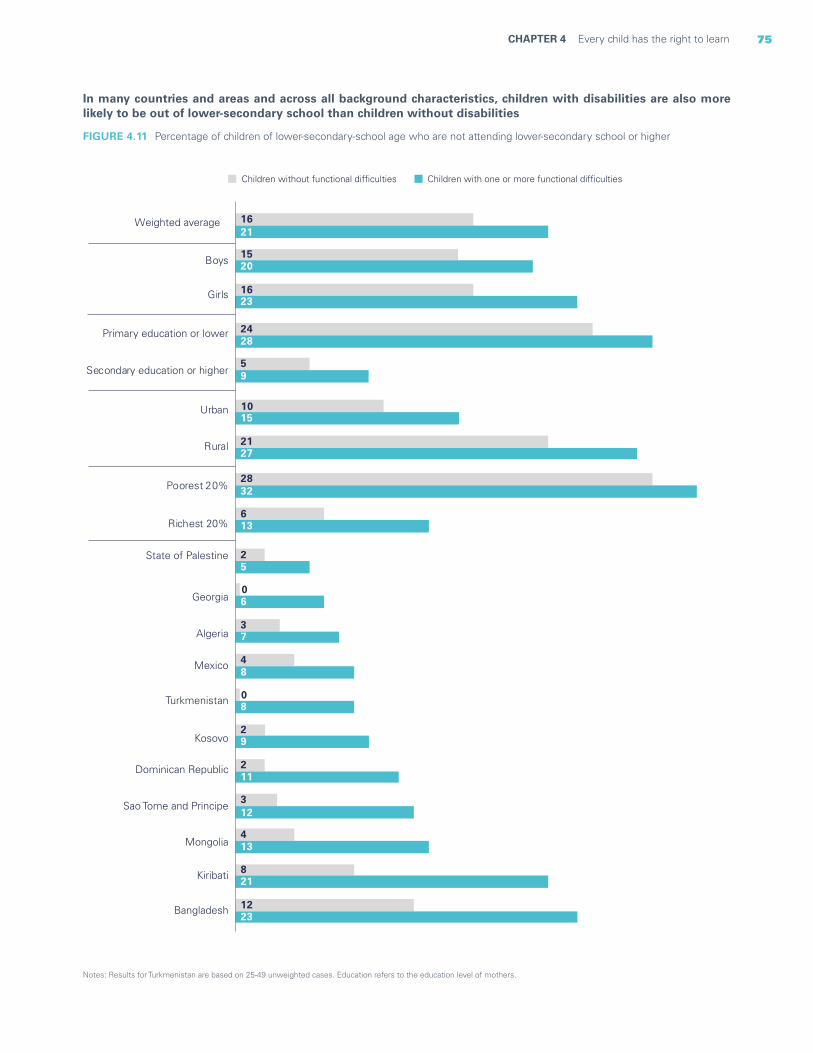
75CHAPTER 4 Every child has the right to learn
In many countries and areas and across all background characteristics, children with disabilities are also more likely to be out of lower-secondary school than children without disabilities
Notes: Results for Turkmenistan are based on 25-49 unweighted cases. Education refers to the education level of mothers.
FIGURE 4.11 Percentage of children of lower-secondary-school age who are not attending lower-secondary school or higher
Children without functional difficulties Children with one or more functional difficulties
16
15
16
24
5
10
21
28
6
2
0
3
4
0
2
2
3
4
8
12
21
20
23
28
9
15
27
32
13
5
6
7
8
8
9
11
12
13
21
23
Weighted average
Boys
Girls
Primary education or lower
Secondary education or higher
Urban
Rural
Poorest 20%
Richest 20%
State of Palestine
Georgia
Algeria
Mexico
Turkmenistan
Kosovo
Dominican Republic
Sao Tome and Principe
Mongolia
Kiribati
Bangladesh
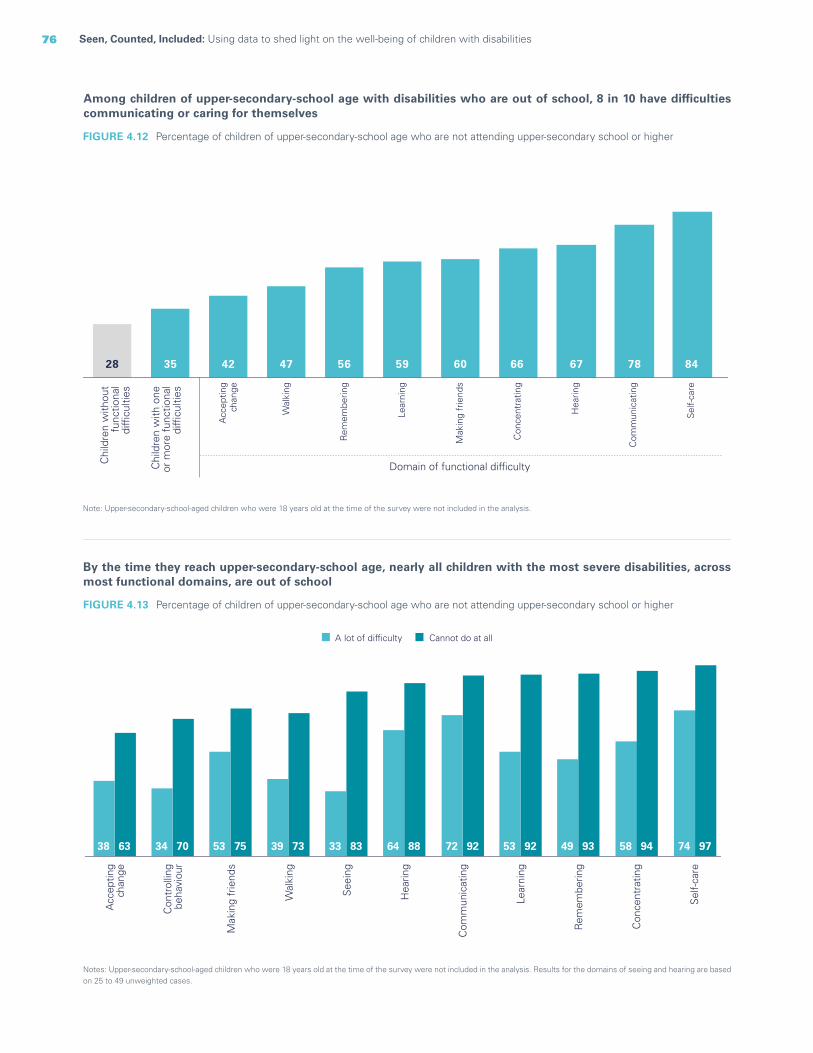
76 Seen, Counted, Included: Using data to shed light on the well-being of children with disabilities
Note: Upper-secondary-school-aged children who were 18 years old at the time of the survey were not included in the analysis.
FIGURE 4.12 Percentage of children of upper-secondary-school age who are not attending upper-secondary school or higher
By the time they reach upper-secondary-school age, nearly all children with the most severe disabilities, across most functional domains, are out of school
Notes: Upper-secondary-school-aged children who were 18 years old at the time of the survey were not included in the analysis. Results for the domains of seeing and hearing are based on 25 to 49 unweighted cases.
FIGURE 4.13 Percentage of children of upper-secondary-school age who are not attending upper-secondary school or higher
Among children of upper-secondary-school age with disabilities who are out of school, 8 in 10 have difficulties communicating or caring for themselves
38 34 53 39 33 64 72 53 49 58 7463 70 75 73 83 88 92 92 93 94 97
Acc
eptin
gch
ange
Con
trol
ling
beha
viou
r
Wal
king
Rem
embe
ring
See
ing
Mak
ing
frie
nds
Con
cent
ratin
g
Hea
ring
Com
mun
icat
ing
Lear
ning
Sel
f-ca
re
A lot of difficulty Cannot do at all
Chi
ldre
n w
ithou
tfu
nctio
nal
diffi
culti
es
Chi
ldre
n w
ith o
neor
mor
e fu
nctio
nal
diffi
culti
es
Domain of functional difficulty
Acc
eptin
gch
ange
Wal
king
Rem
embe
ring
Lear
ning
Mak
ing
frie
nds
Con
cent
ratin
g
Hea
ring
Com
mun
icat
ing
Sel
f-ca
re
28 35 42 47 56 59 60 66 67 78 84

77CHAPTER 4 Every child has the right to learn
Notes: Upper-secondary-school-aged children who were 18 years old at the time of the survey have not been included in the analysis. Results for Kiribati are based on 25 to 49 unweighted cases. Education refers to the education level of mothers.
FIGURE 4.14 Percentage of children of upper-secondary-school age who are not attending upper-secondary school or higher
In many countries and areas and across all background characteristics, children of upper-secondary-school age with disabilities are more likely to be out of school than children without disabilities
28
27
28
36
12
21
33
44
13
7
8
14
19
13
20
13
21
21
29
17
36
35
36
35
42
20
29
41
54
16
18
19
23
27
28
29
31
34
40
40
41
48
Weighted average
Boys
Girls
Primary education or lower
Secondary education or higher
Urban
Rural
Poorest 20%
Richest 20%
Costa Rica
Mongolia
Nepal
Tunisia
State of Palestine
Algeria
Dominican Republic
Mexico
Kiribati
Bangladesh
Cuba
Iraq
Children with one or more functional difficultiesChildren without functional difficulties
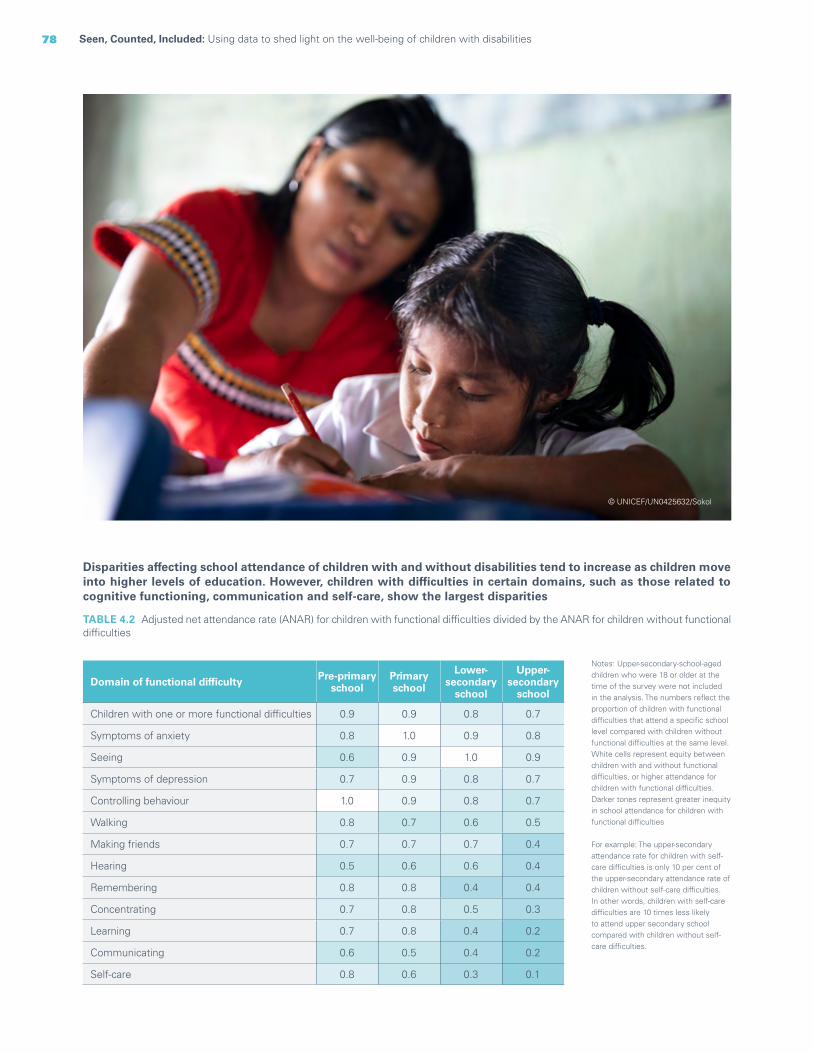
78 Seen, Counted, Included: Using data to shed light on the well-being of children with disabilities
Disparities affecting school attendance of children with and without disabilities tend to increase as children move into higher levels of education. However, children with difficulties in certain domains, such as those related to cognitive functioning, communication and self-care, show the largest disparities
TABLE 4.2 Adjusted net attendance rate (ANAR) for children with functional difficulties divided by the ANAR for children without functional difficulties
Domain of functional difficulty Pre-primary school
Primaryschool
Lower-secondary
school
Upper-secondary
school
Children with one or more functional difficulties 0.9 0.9 0.8 0.7
Symptoms of anxiety 0.8 1.0 0.9 0.8
Seeing 0.6 0.9 1.0 0.9
Symptoms of depression 0.7 0.9 0.8 0.7
Controlling behaviour 1.0 0.9 0.8 0.7
Walking 0.8 0.7 0.6 0.5
Making friends 0.7 0.7 0.7 0.4
Hearing 0.5 0.6 0.6 0.4
Remembering 0.8 0.8 0.4 0.4
Concentrating 0.7 0.8 0.5 0.3
Learning 0.7 0.8 0.4 0.2
Communicating 0.6 0.5 0.4 0.2
Self-care 0.8 0.6 0.3 0.1
Notes: Upper-secondary-school-aged children who were 18 or older at the time of the survey were not included in the analysis. The numbers reflect the proportion of children with functional difficulties that attend a specific school level compared with children without functional difficulties at the same level. White cells represent equity between children with and without functional difficulties, or higher attendance for children with functional difficulties. Darker tones represent greater inequity in school attendance for children with functional difficulties
For example: The upper-secondary attendance rate for children with self-care difficulties is only 10 per cent of the upper-secondary attendance rate of children without self-care difficulties. In other words, children with self-care difficulties are 10 times less likely to attend upper secondary school compared with children without self-care difficulties.
© UNICEF/UN0425632/Sokol
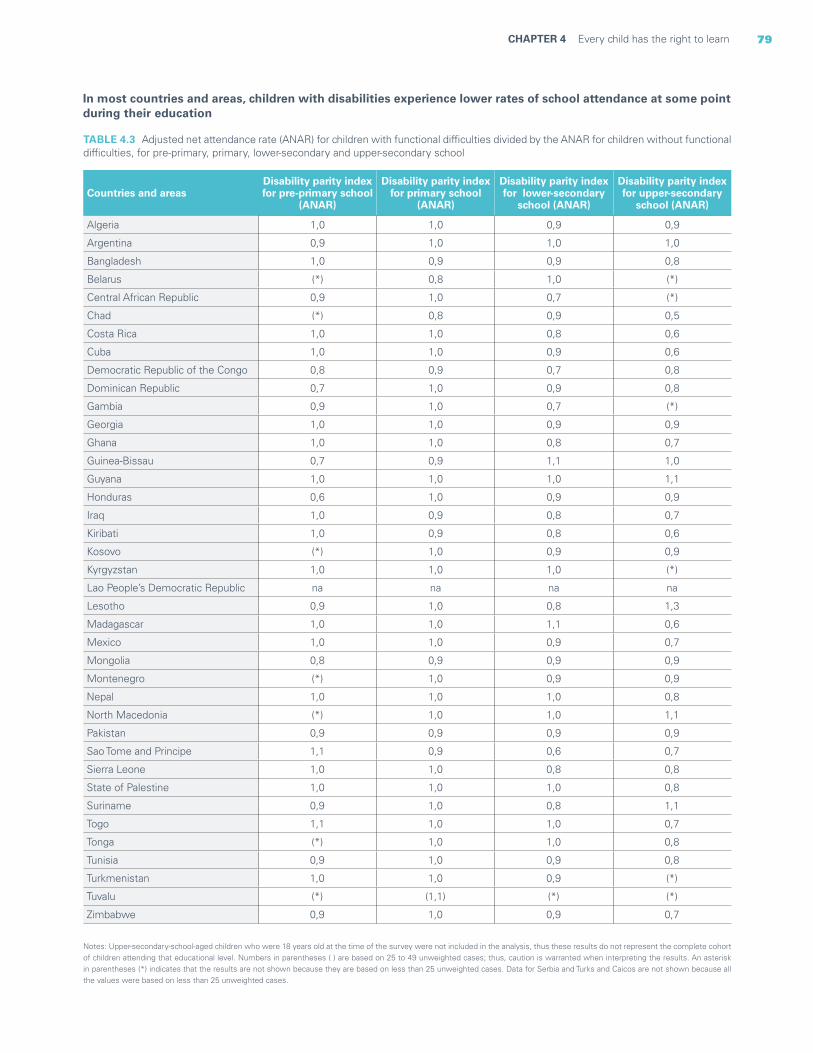
79CHAPTER 4 Every child has the right to learn
In most countries and areas, children with disabilities experience lower rates of school attendance at some point during their education
Notes: Upper-secondary-school-aged children who were 18 years old at the time of the survey were not included in the analysis, thus these results do not represent the complete cohort of children attending that educational level. Numbers in parentheses ( ) are based on 25 to 49 unweighted cases; thus, caution is warranted when interpreting the results. An asterisk in parentheses (*) indicates that the results are not shown because they are based on less than 25 unweighted cases. Data for Serbia and Turks and Caicos are not shown because all the values were based on less than 25 unweighted cases.
TABLE 4.3 Adjusted net attendance rate (ANAR) for children with functional difficulties divided by the ANAR for children without functional difficulties, for pre-primary, primary, lower-secondary and upper-secondary school
Countries and areasDisability parity index for pre-primary school
(ANAR)
Disability parity index for primary school
(ANAR)
Disability parity index for lower-secondary
school (ANAR)
Disability parity index for upper-secondary
school (ANAR)
Algeria 1,0 1,0 0,9 0,9
Argentina 0,9 1,0 1,0 1,0
Bangladesh 1,0 0,9 0,9 0,8
Belarus (*) 0,8 1,0 (*)
Central African Republic 0,9 1,0 0,7 (*)
Chad (*) 0,8 0,9 0,5
Costa Rica 1,0 1,0 0,8 0,6
Cuba 1,0 1,0 0,9 0,6
Democratic Republic of the Congo 0,8 0,9 0,7 0,8
Dominican Republic 0,7 1,0 0,9 0,8
Gambia 0,9 1,0 0,7 (*)
Georgia 1,0 1,0 0,9 0,9
Ghana 1,0 1,0 0,8 0,7
Guinea-Bissau 0,7 0,9 1,1 1,0
Guyana 1,0 1,0 1,0 1,1
Honduras 0,6 1,0 0,9 0,9
Iraq 1,0 0,9 0,8 0,7
Kiribati 1,0 0,9 0,8 0,6
Kosovo (*) 1,0 0,9 0,9
Kyrgyzstan 1,0 1,0 1,0 (*)
Lao People’s Democratic Republic na na na na
Lesotho 0,9 1,0 0,8 1,3
Madagascar 1,0 1,0 1,1 0,6
Mexico 1,0 1,0 0,9 0,7
Mongolia 0,8 0,9 0,9 0,9
Montenegro (*) 1,0 0,9 0,9
Nepal 1,0 1,0 1,0 0,8
North Macedonia (*) 1,0 1,0 1,1
Pakistan 0,9 0,9 0,9 0,9
Sao Tome and Principe 1,1 0,9 0,6 0,7
Sierra Leone 1,0 1,0 0,8 0,8
State of Palestine 1,0 1,0 1,0 0,8
Suriname 0,9 1,0 0,8 1,1
Togo 1,1 1,0 1,0 0,7
Tonga (*) 1,0 1,0 0,8
Tunisia 0,9 1,0 0,9 0,8
Turkmenistan 1,0 1,0 0,9 (*)
Tuvalu (*) (1,1) (*) (*)
Zimbabwe 0,9 1,0 0,9 0,7

80 Seen, Counted, Included: Using data to shed light on the well-being of children with disabilities
Note: The figure covers children at least 10 years old to avoid capturing late entries into primary school.
FIGURE 4.15 Percentage of children aged 10 to 17 years who have never attended school
Children with difficulties caring for themselves, communicating and hearing are most likely to have never attended school
School progression
While children with disabilities have an equal right to education, they frequently face higher barriers in completing their schooling than children without disabilities. Schools and classrooms are often not accessible to children with disabilities, either physically or because they lack specialized teaching, contributing
to lower academic achievement, including dropout and repetition of grades.10 Dropping out of school limits the future educational and employment opportunities of these children, depriving them of the skills and knowledge they need to progress on their chosen career paths.11
Chi
ldre
n w
ithou
tfu
nctio
nal d
ifficu
lties
Chi
ldre
n w
ith o
ne o
r mor
efu
nctio
nal d
ifficu
lties
Chi
ldre
n w
ith m
ore
than
one
func
tiona
l diffi
culty
Chi
ldre
n w
ith a
nxie
ty o
rde
pres
sion
sym
ptom
s on
ly
Chi
ldre
n w
ith m
ore
than
one
seve
re fu
nctio
nal d
ifficu
lty
Chi
ldre
n w
ith o
ne o
r mor
e se
vere
func
tiona
l diffi
culti
es, w
ithou
tan
xiet
y or
dep
ress
ion
sym
ptom
s
711 15 9 26 18 13 14 15 15 23 24 28 28 31 32 47 58
Sym
ptom
s of
dep
ress
ion
Con
trol
ling
beha
viou
r
See
ing
Acc
eptin
g ch
ange
Rem
embe
ring
Lear
ning
Wal
king
Mak
ing
frie
nds
Con
cent
ratin
g
Hea
ring
Com
mun
icat
ing
Sel
f-ca
re
Domain of functional difficulty
© UNICEF/UN0367651/Raab

81CHAPTER 4 Every child has the right to learn
FIGURE 4.16 Percentage of children who are two or more years older than the official school age for their grade in primary school
FIGURE 4.17 Percentage of children who are 2 or more years older than the official school age for their grade in lower-secondary school
Children with difficulties hearing, remembering and learning are most likely to be overage for their grade in primary school
Children with difficulties remembering, controlling their behaviour and learning are most likely to be overage for their grade in lower-secondary school
25 29 31 25 28 30 25 34 36 37 40 45
Sym
ptom
s of
anx
iety
Com
mun
icat
ing
Con
trol
ling
beha
viou
r
Lear
ning
Rem
embe
ring
Hea
ring
Chi
ldre
n w
ithou
tfu
nctio
nal d
ifficu
lties
Chi
ldre
n w
ith o
ne o
r mor
efu
nctio
nal d
ifficu
lties
Chi
ldre
n w
ith m
ore
than
one
func
tiona
l diffi
culty
Chi
ldre
n w
ith a
nxie
ty o
rde
pres
sion
sym
ptom
s on
ly
Chi
ldre
n w
ith m
ore
than
one
seve
re fu
nctio
nal d
ifficu
lty
Chi
ldre
n w
ith o
ne o
r mor
e se
vere
func
tiona
l diffi
culti
es, w
ithou
tan
xiet
y or
dep
ress
ion
sym
ptom
s
Domain of functional difficulty
Chi
ldre
n w
ithou
tfu
nctio
nal d
ifficu
lties
Chi
ldre
n w
ith o
ne o
r mor
efu
nctio
nal d
ifficu
lties
Chi
ldre
n w
ith m
ore
than
one
func
tiona
l diffi
culty
Chi
ldre
n w
ith a
nxie
ty o
rde
pres
sion
sym
ptom
s on
ly
Chi
ldre
n w
ith m
ore
than
one
seve
re fu
nctio
nal d
ifficu
lty
Chi
ldre
n w
ith o
ne o
r mor
e se
vere
func
tiona
l diffi
culti
es, w
ithou
tan
xiet
y or
dep
ress
ion
sym
ptom
s
Domain of functional difficulty
24 28 31 27 31 30 16 18 37 37 38 45
See
ing
Hea
ring
Wal
king
Lear
ning
Con
trol
ling
beha
viou
r
Rem
embe
ring
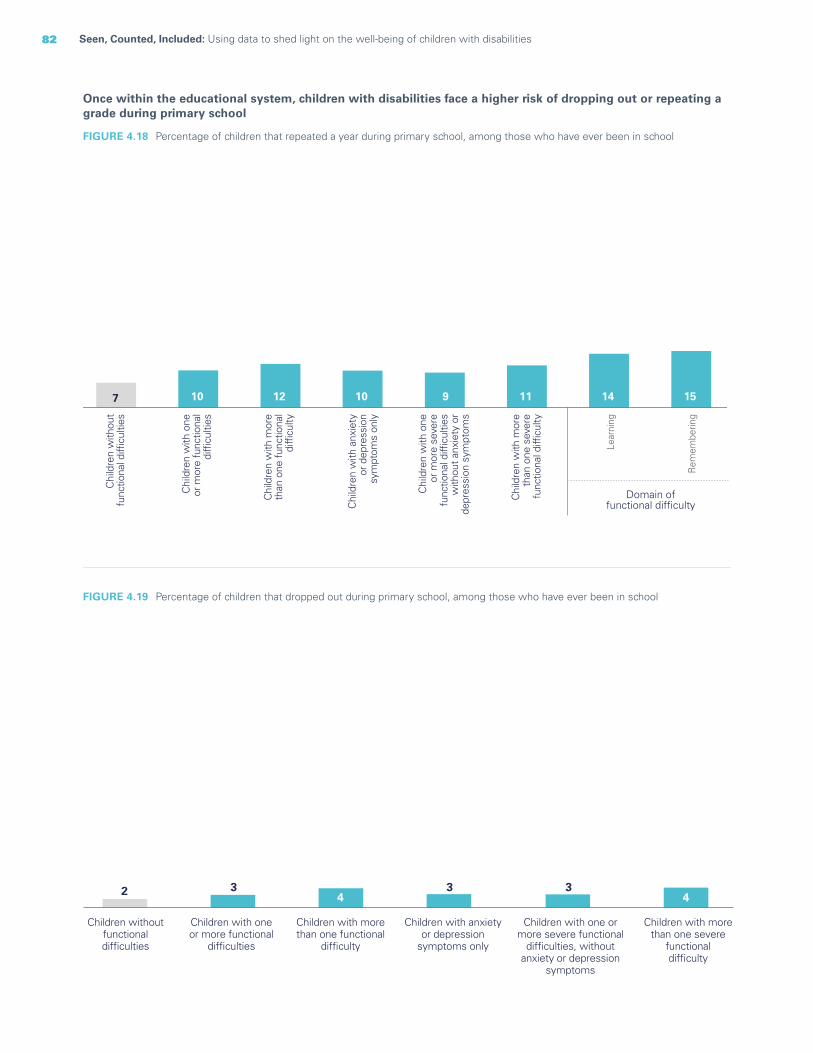
82 Seen, Counted, Included: Using data to shed light on the well-being of children with disabilities
Once within the educational system, children with disabilities face a higher risk of dropping out or repeating a grade during primary school
FIGURE 4.18 Percentage of children that repeated a year during primary school, among those who have ever been in school
FIGURE 4.19 Percentage of children that dropped out during primary school, among those who have ever been in school
7 10 12 10 9 11 14 15
Lear
ning
Rem
embe
ring
Domain offunctional difficulty
Chi
ldre
n w
ithou
tfu
nctio
nal d
ifficu
lties
Chi
ldre
n w
ith o
neor
mor
e fu
nctio
nal
diffi
culti
es
Chi
ldre
n w
ith m
ore
than
one
func
tiona
ldi
fficu
lty
Chi
ldre
n w
ith a
nxie
tyor
dep
ress
ion
sym
ptom
s on
ly
Chi
ldre
n w
ith m
ore
than
one
sev
ere
func
tiona
l diffi
culty
Chi
ldre
n w
ith o
neor
mor
e se
vere
func
tiona
l diffi
culti
esw
ithou
t anx
iety
or
depr
essi
on s
ympt
oms
2 34
3 34
Children withoutfunctionaldifficulties
Children with oneor more functional
difficulties
Children with morethan one functional
difficulty
Children with anxietyor depression
symptoms only
Children with one ormore severe functional
difficulties, withoutanxiety or depression
symptoms
Children with morethan one severe
functionaldifficulty
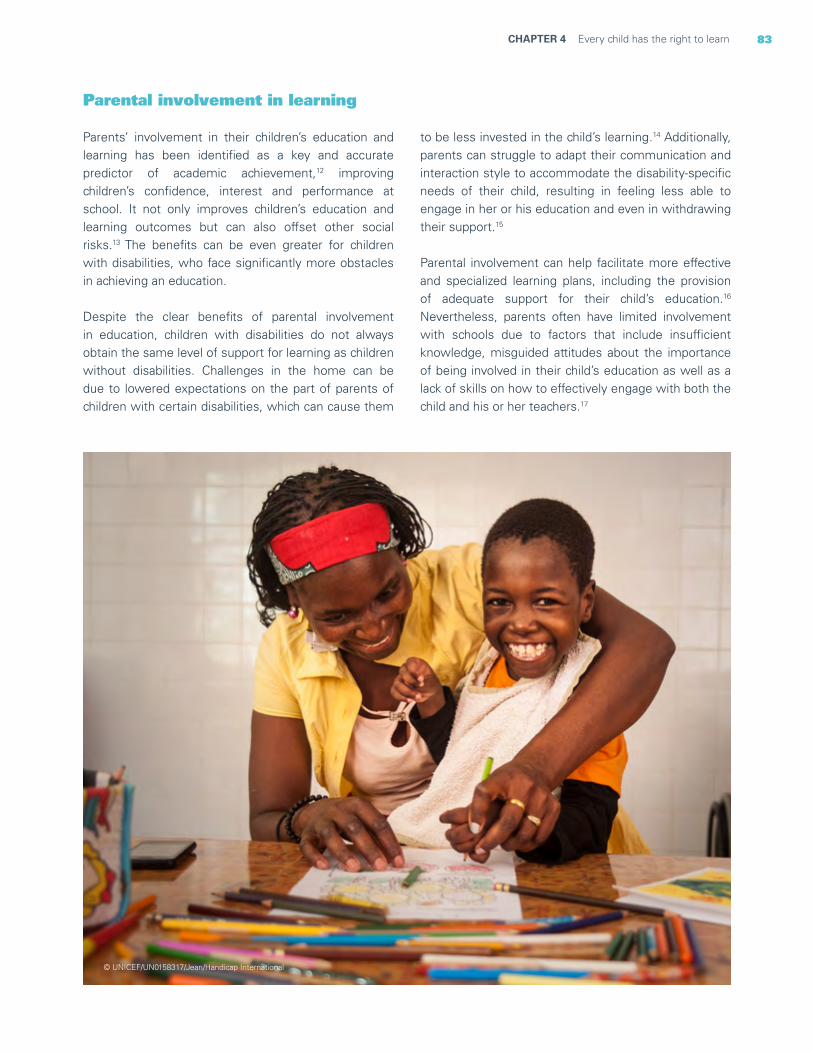
83CHAPTER 4 Every child has the right to learn
Parental involvement in learning
Parents’ involvement in their children’s education and learning has been identified as a key and accurate predictor of academic achievement,12 improving children’s confidence, interest and performance at school. It not only improves children’s education and learning outcomes but can also offset other social risks.13 The benefits can be even greater for children with disabilities, who face significantly more obstacles in achieving an education.
Despite the clear benefits of parental involvement in education, children with disabilities do not always obtain the same level of support for learning as children without disabilities. Challenges in the home can be due to lowered expectations on the part of parents of children with certain disabilities, which can cause them
to be less invested in the child’s learning.14 Additionally, parents can struggle to adapt their communication and interaction style to accommodate the disability-specific needs of their child, resulting in feeling less able to engage in her or his education and even in withdrawing their support.15
Parental involvement can help facilitate more effective and specialized learning plans, including the provision of adequate support for their child’s education.16 Nevertheless, parents often have limited involvement with schools due to factors that include insufficient knowledge, misguided attitudes about the importance of being involved in their child’s education as well as a lack of skills on how to effectively engage with both the child and his or her teachers.17
© UNICEF/UN0158317/Jean/Handicap International
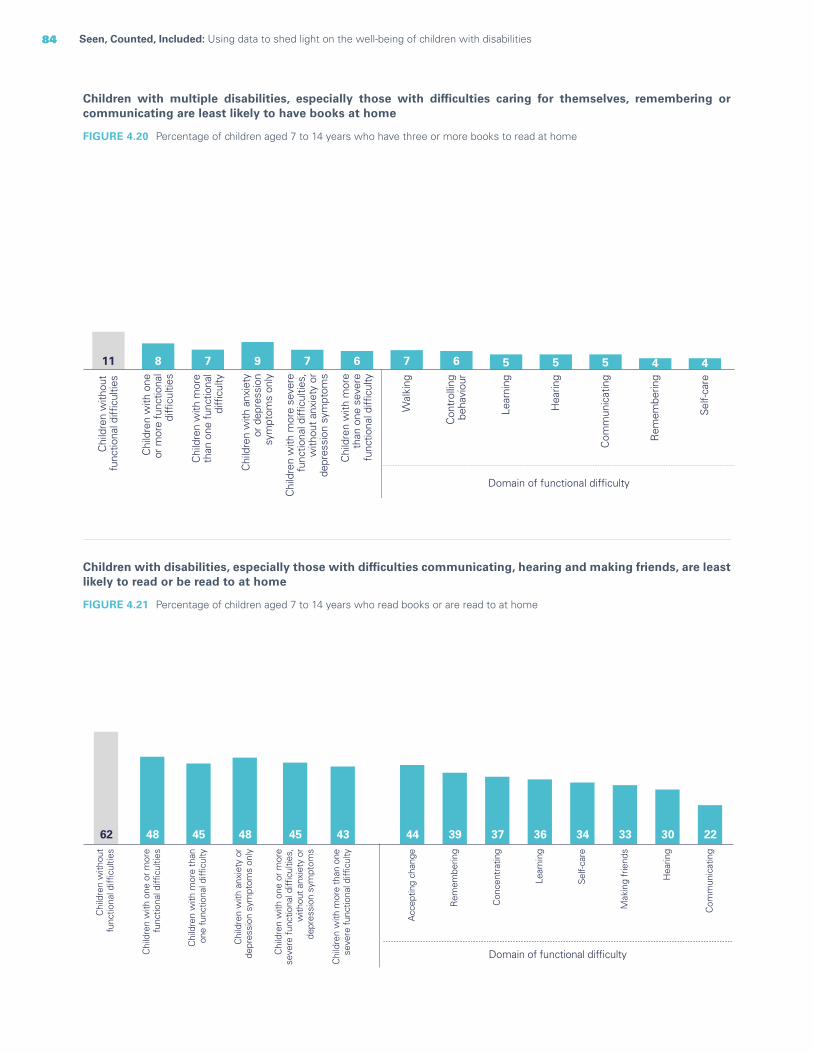
84 Seen, Counted, Included: Using data to shed light on the well-being of children with disabilities
FIGURE 4.20 Percentage of children aged 7 to 14 years who have three or more books to read at home
Children with disabilities, especially those with difficulties communicating, hearing and making friends, are least likely to read or be read to at home
FIGURE 4.21 Percentage of children aged 7 to 14 years who read books or are read to at home
Children with multiple disabilities, especially those with difficulties caring for themselves, remembering or communicating are least likely to have books at home
11
Chi
ldre
n w
ithou
tfu
nctio
nal d
ifficu
lties
8
Chi
ldre
n w
ith o
neor
mor
e fu
nctio
nal
diffi
culti
es
7
Chi
ldre
n w
ith m
ore
than
one
func
tiona
ldi
fficu
lty
9
Chi
ldre
n w
ith a
nxie
tyor
dep
ress
ion
sym
ptom
s on
ly
7
Chi
ldre
n w
ith m
ore
seve
refu
nctio
nal d
ifficu
lties
,w
ithou
t anx
iety
or
depr
essi
on s
ympt
oms
6C
hild
ren
with
mor
eth
an o
ne s
ever
efu
nctio
nal d
ifficu
lty7
Wal
king
6
Con
trol
ling
beh
avio
ur
5
Lear
ning
5
Hea
ring
5
Com
mun
icat
ing
4
Rem
embe
ring
4
Self-
care
Domain of functional difficulty
62 48 45 48 45 43
Chi
ldre
n w
ithou
tfu
nctio
nal d
ifficu
lties
Chi
ldre
n w
ith o
ne o
r mor
efu
nctio
nal d
ifficu
lties
Chi
ldre
n w
ith m
ore
than
one
func
tiona
l diffi
culty
Chi
ldre
n w
ith a
nxie
ty o
rde
pres
sion
sym
ptom
s on
ly
Chi
ldre
n w
ith o
ne o
r mor
ese
vere
func
tiona
l diffi
culti
es,
with
out a
nxie
ty o
rde
pres
sion
sym
ptom
s
Chi
ldre
n w
ith m
ore
than
one
seve
re fu
nctio
nal d
ifficu
lty
22
Com
mun
icat
ing
30
Hea
ring
33
Mak
ing
frie
nds
34
Self-
care
36
Lear
ning
37
Con
cent
ratin
g
39
Rem
embe
ring
44
Acc
eptin
g ch
ange
Domain of functional difficulty

85CHAPTER 4 Every child has the right to learn
Note: Education refers to the education level of mothers.
FIGURE 4.22 Percentage of children aged 7 to 14 years who read books or are read to at home
Children with disabilities, especially those whose mothers have little education and who live in the poorest or rural households, are less likely to read or be read to at home
58
57
59
50
71
64
54
46
73
48
48
49
42
61
57
43
35
62
Weighted average
Boys
Girls
Primary education or lower
Secondary education or higher
Urban
Rural
Poorest 20%
Richest 20%
5238
State of Palestine
5543
Togo
6349
Gambia
5952
Sierra Leone
6855
Zimbabwe
7564
Sao Tome and Principe
8069
Tunisia
9677
Turkmenistan
8777
Kosovo
8781
Bangladesh
9283
Kyrgyzstan
Children without functional difficulties Children with one or more functional difficulties
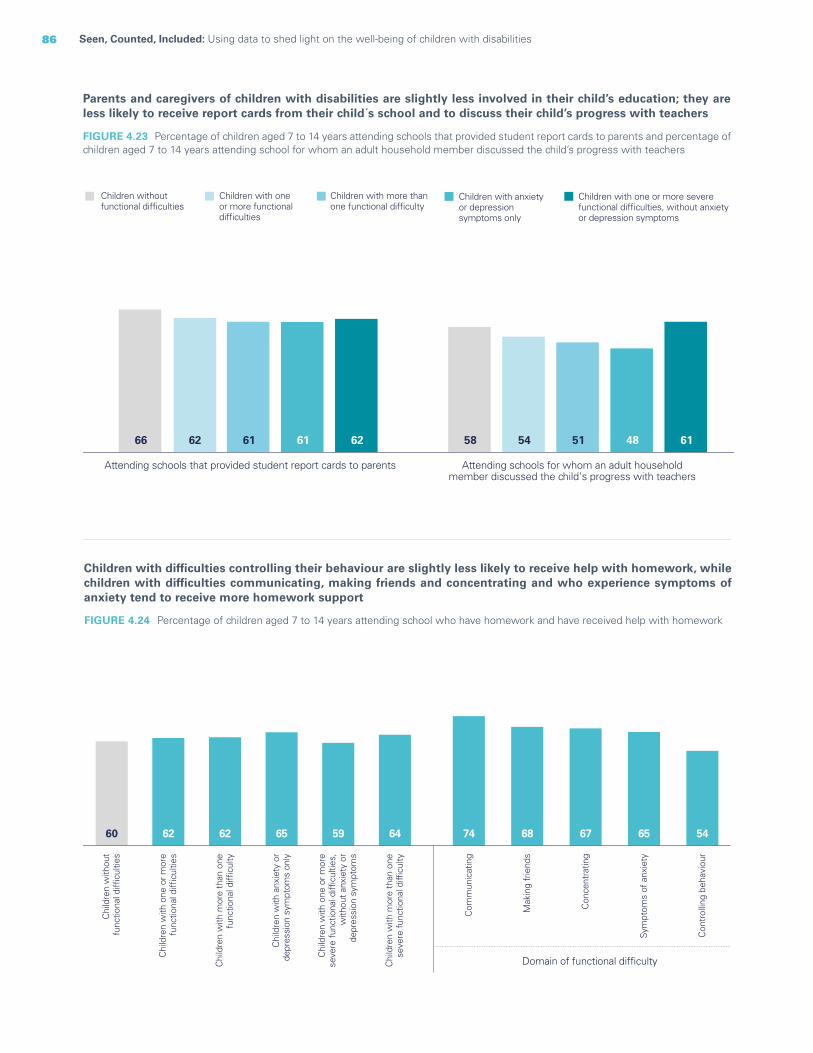
86 Seen, Counted, Included: Using data to shed light on the well-being of children with disabilities
Parents and caregivers of children with disabilities are slightly less involved in their child’s education; they are less likely to receive report cards from their child´s school and to discuss their child’s progress with teachers
FIGURE 4.23 Percentage of children aged 7 to 14 years attending schools that provided student report cards to parents and percentage of children aged 7 to 14 years attending school for whom an adult household member discussed the child’s progress with teachers
66 5862 5461 5161 4862 61
Attending schools that provided student report cards to parents Attending schools for whom an adult householdmember discussed the child's progress with teachers
Children withoutfunctional difficulties
Children with oneor more functionaldifficulties
Children with more thanone functional difficulty
Children with anxietyor depressionsymptoms only
Children with one or more severefunctional difficulties, without anxietyor depression symptoms
FIGURE 4.24 Percentage of children aged 7 to 14 years attending school who have homework and have received help with homework
Children with difficulties controlling their behaviour are slightly less likely to receive help with homework, while children with difficulties communicating, making friends and concentrating and who experience symptoms of anxiety tend to receive more homework support
Domain of functional difficulty
Chi
ldre
n w
ithou
tfu
nctio
nal d
ifficu
lties
60
Chi
ldre
n w
ith o
ne o
r mor
efu
nctio
nal d
ifficu
lties
62
Chi
ldre
n w
ith m
ore
than
one
func
tiona
l diffi
culty
62
Chi
ldre
n w
ith a
nxie
ty o
rde
pres
sion
sym
ptom
s on
ly
65
Chi
ldre
n w
ith o
ne o
r mor
ese
vere
func
tiona
l diffi
culti
es,
with
out a
nxie
ty o
rde
pres
sion
sym
ptom
s
59
Chi
ldre
n w
ith m
ore
than
one
seve
re fu
nctio
nal d
ifficu
lty
64 74
Com
mun
icat
ing
68
Mak
ing
frie
nds
67
Con
cent
ratin
g
65
Sym
ptom
s of
anx
iety
54
Con
trol
ling
beha
viou
r

87CHAPTER 4 Every child has the right to learn
Learning outcomes
The acquisition of basic reading and numeracy skills is fundamental to helping children thrive and prosper. Access to quality education that facilitates these outcomes is a right enshrined in both the Convention on the Rights of the Child and the Convention on the Rights of Persons with Disabilities.
Poor learning outcomes stem from disadvantages that accumulate as children grow and that are common in children with and without disabilities. That said, children with disabilities typically face additional barriers that place them at higher risk of experiencing less than optimal educational trajectories. When families do search for educational opportunities for their children, they often find schools and classrooms that are not accessible, either physically or due to the lack of appropriate learning materials.18 The needs of children with mild, or less visible, disabilities often go unidentified, which can mean that these children miss out on individualized attention and support. In addition, many students with disabilities are taught by teachers who do not have the necessary knowledge or skills to include and support them.19
Just like all other children, children with disabilities are a heterogeneous group with individual needs and challenges. The barriers they face in acquiring literacy and numeracy skills are also varied. Children with physical disabilities may have trouble physically accessing classrooms and learning materials. In contrast, children with learning disabilities can struggle to keep up with the rest of the class if accommodations are not made for their specific impairment.
Poor learning outcomes, specifically in literacy and numeracy skills, can have lifelong implications. A lack of reading skills severely limits future educational and job opportunities, making it exceedingly difficult for impoverished children with disabilities to ever break out of poverty. Literacy has also been associated with more positive health and nutrition rates throughout one’s life, and lack of such skills could lead to poorer health outcomes for children with disabilities.20 Likewise, numeracy skills are essential in daily life. While they have not been linked directly to poverty in the way literacy has, they nevertheless facilitate a broad range of career options that would be closed to children who lack these skills.21
Children with disabilities are substantially less likely to demonstrate foundational reading and numeracy skills than children without disabilities
FIGURE 4.25 Percentage of children aged 7 to 14 years who demonstrate foundational numeracy skills and percentage of children aged 7 to 14 years who demonstrate foundational reading skills
32 1720 1018 920 1221 816 5
Foundational reading skills Foundational numeracy skills
Children without functional difficulties Children with one or more functional difficulties Children with more than one functional difficulty
Children with anxiety or depressionsymptoms only
Children with one or more severe functionaldifficulties, without anxiety or depression symptoms
Children with more than onesevere functional difficulty

88 Seen, Counted, Included: Using data to shed light on the well-being of children with disabilities
FIGURE 4.26 Percentage of children aged 7 to 14 years who demonstrate foundational reading skills
Children with difficulties remembering, learning and caring for themselves are least likely to demonstrate foundational numeracy skills
FIGURE 4.27 Percentage of children aged 7 to 14 years who demonstrate foundational numeracy skills
Children with difficulties communicating, learning and remembering are least likely to have foundational reading skills
Domain of functional difficulty
Chi
ldre
n w
ithou
tfu
nctio
nal d
ifficu
lties
17
Chi
ldre
n w
ith o
ne o
r mor
efu
nctio
nal d
ifficu
lties
10 4
Rem
embe
ring
5
Lear
ning
5
Self-
care
7
Con
cent
ratin
g
32
Chi
ldre
n w
ithou
tfu
nctio
nal d
ifficu
lties
20
Chi
ldre
n w
ith o
ne o
r mor
efu
nctio
nal d
ifficu
lties
8
Com
mun
icat
ing
8
Lear
ning
9
Rem
embe
ring
11
Self-
care
15C
once
ntra
ting
16
Mak
ing
frie
nds
Domain of functional difficulty
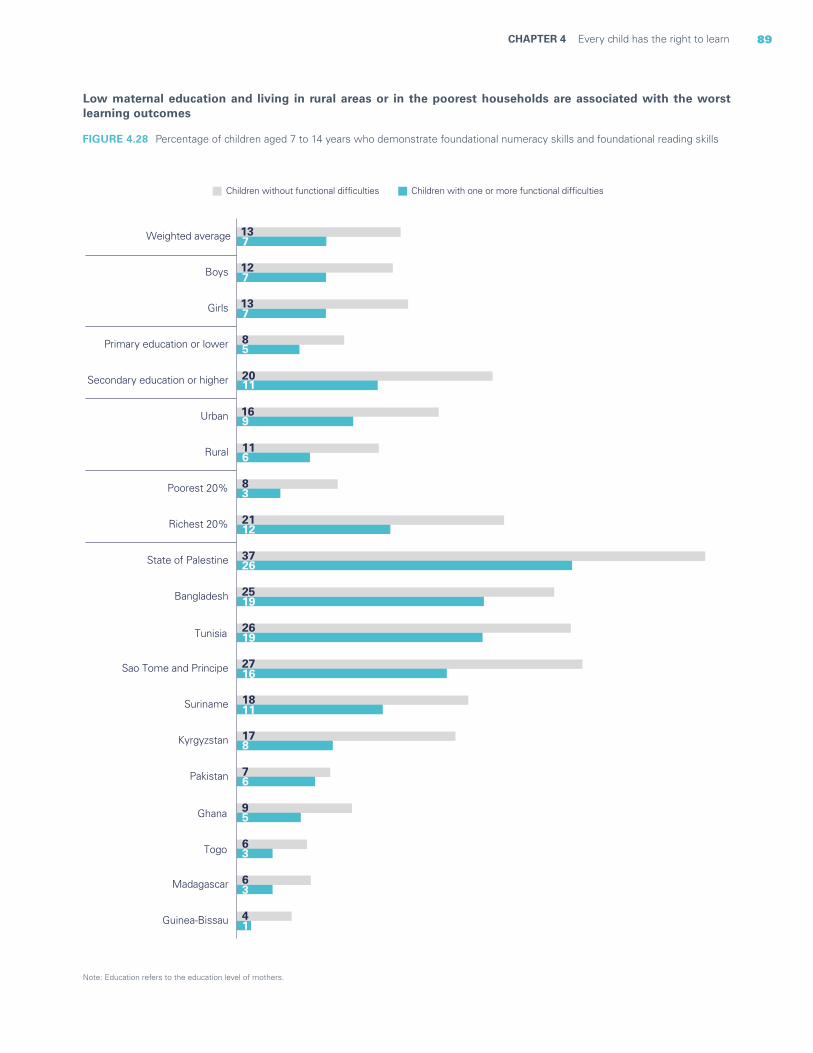
89CHAPTER 4 Every child has the right to learn
Note: Education refers to the education level of mothers.
FIGURE 4.28 Percentage of children aged 7 to 14 years who demonstrate foundational numeracy skills and foundational reading skills
Low maternal education and living in rural areas or in the poorest households are associated with the worst learning outcomes
4
6
6
9
7
17
18
27
26
25
37
21
8
11
16
20
8
13
12
13
1
3
3
5
6
8
11
16
19
19
26
12
3
6
9
11
5
7
7
7
Guinea-Bissau
Madagascar
Togo
Ghana
Pakistan
Kyrgyzstan
Suriname
Sao Tome and Principe
Tunisia
Bangladesh
State of Palestine
Richest 20%
Poorest 20%
Rural
Urban
Secondary education or higher
Primary education or lower
Girls
Boys
Weighted average
Children without functional difficulties Children with one or more functional difficulties

90 Seen, Counted, Included: Using data to shed light on the well-being of children with disabilities
Disparities in the achievement of foundational skills increase as children grow older
0
0.05
0.1
0.15
0.2
0.25
0.3
0.35
0.4
0.45
0.5
7 8 9 10 11 12 13 14
Foundational reading skills
0
0.05
0.1
0.15
0.2
0.25
0.3
0.35
0.4
0.45
0.5
7 8 9 10 11 12 13 14
Foundational numeracy skills
Children without functional difficulties Children with one or more functional difficulties
Child's age in years Child's age in years
Notes: These graphs show the probability of demonstrating foundational reading and numeracy skills according to age, for children with and without disabilities. The results were estimated using generalized linear regression models, with the foundational skills variable as a dependent variable, and the age and disability status of the child as independent variables. Both models were adjusted for child’s sex, area of residence and wealth.
FIGURE 4.29 Predictive probabilities for foundational reading and numeracy skills
© UNICEF/UN0120998/Gilbertson VII Photo
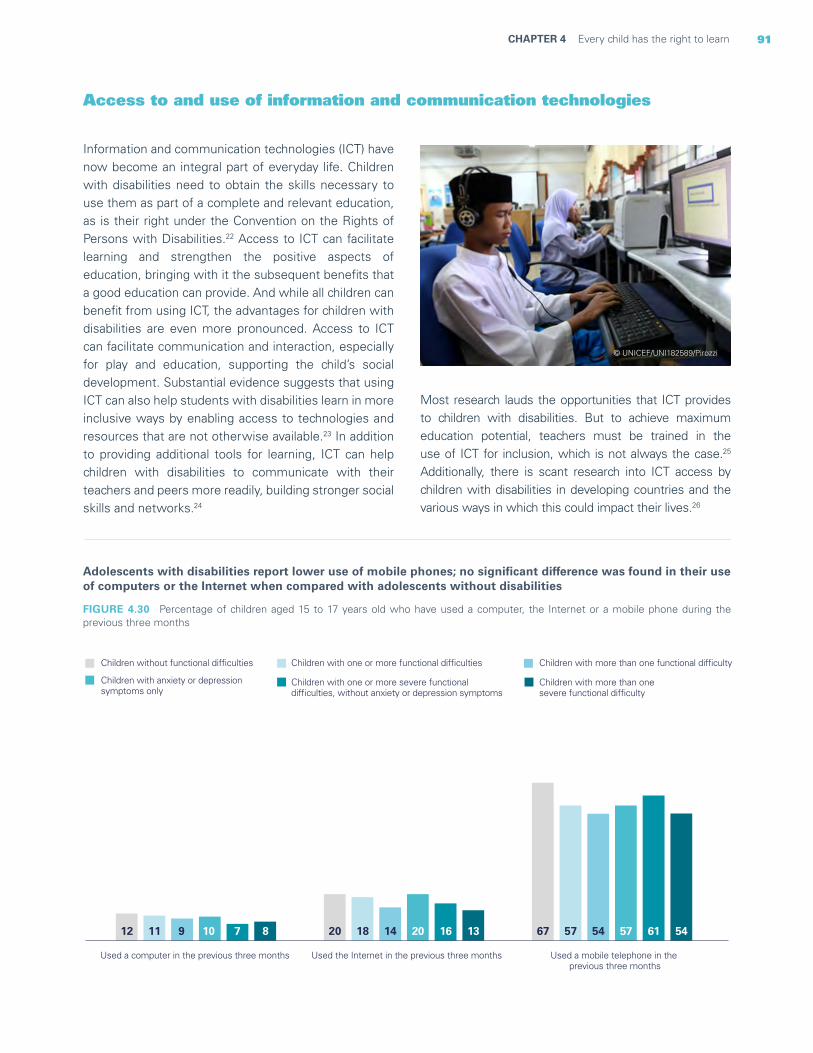
91CHAPTER 4 Every child has the right to learn
Access to and use of information and communication technologies
Information and communication technologies (ICT) have now become an integral part of everyday life. Children with disabilities need to obtain the skills necessary to use them as part of a complete and relevant education, as is their right under the Convention on the Rights of Persons with Disabilities.22 Access to ICT can facilitate learning and strengthen the positive aspects of education, bringing with it the subsequent benefits that a good education can provide. And while all children can benefit from using ICT, the advantages for children with disabilities are even more pronounced. Access to ICT can facilitate communication and interaction, especially for play and education, supporting the child’s social development. Substantial evidence suggests that using ICT can also help students with disabilities learn in more inclusive ways by enabling access to technologies and resources that are not otherwise available.23 In addition to providing additional tools for learning, ICT can help children with disabilities to communicate with their teachers and peers more readily, building stronger social skills and networks.24
Most research lauds the opportunities that ICT provides to children with disabilities. But to achieve maximum education potential, teachers must be trained in the use of ICT for inclusion, which is not always the case.25 Additionally, there is scant research into ICT access by children with disabilities in developing countries and the various ways in which this could impact their lives.26
Adolescents with disabilities report lower use of mobile phones; no significant difference was found in their use of computers or the Internet when compared with adolescents without disabilities
FIGURE 4.30 Percentage of children aged 15 to 17 years old who have used a computer, the Internet or a mobile phone during the previous three months
12 20 6711 18 579 14 5410 20 577 16 618 13 54
Used a computer in the previous three months Used the Internet in the previous three months Used a mobile telephone in the previous three months
Children without functional difficulties Children with one or more functional difficulties Children with more than one functional difficulty
Children with anxiety or depressionsymptoms only
Children with one or more severe functionaldifficulties, without anxiety or depression symptoms
Children with more than onesevere functional difficulty
© UNICEF/UNI182589/Pirozzi
92 Seen, Counted, Included: Using data to shed light on the well-being of children with disabilities
Education support
Support for education is key to promoting the inclusion of vulnerable children – including those with disabilities – in school. This support can take many forms, such as financial assistance (scholarships, cash grants or other tuition aid) or the provision of educational materials (such as textbooks, uniforms and other school supplies). Support for education is often provided by governments, but it can also come from private, charitable, local or international organizations. Many programmes offer funding to a school on identification of a child’s disability to compensate for the additional resources required for their education. Such transfers can also be provided directly to the child and his or her family. These direct transfers are designed to give the family greater
control in meeting a child’s specific educational needs, including assistive technologies.27 Funds that are flexibly transferred enable families to adjust their spending as necessary. This was the case in Australia, for example, at the onset of the 2020 COVID-19 pandemic, when schooling was suddenly made remote. The educational support transfers were typically used to purchase assistive technologies and supplies that would allow for home learning.28
Despite progress in ensuring universally funded education for children, children with disabilities often have needs beyond this. Education support can address this gap and can be crucial for children in lower-income families.29
© UNICEF/UN0429128/Djemidzic
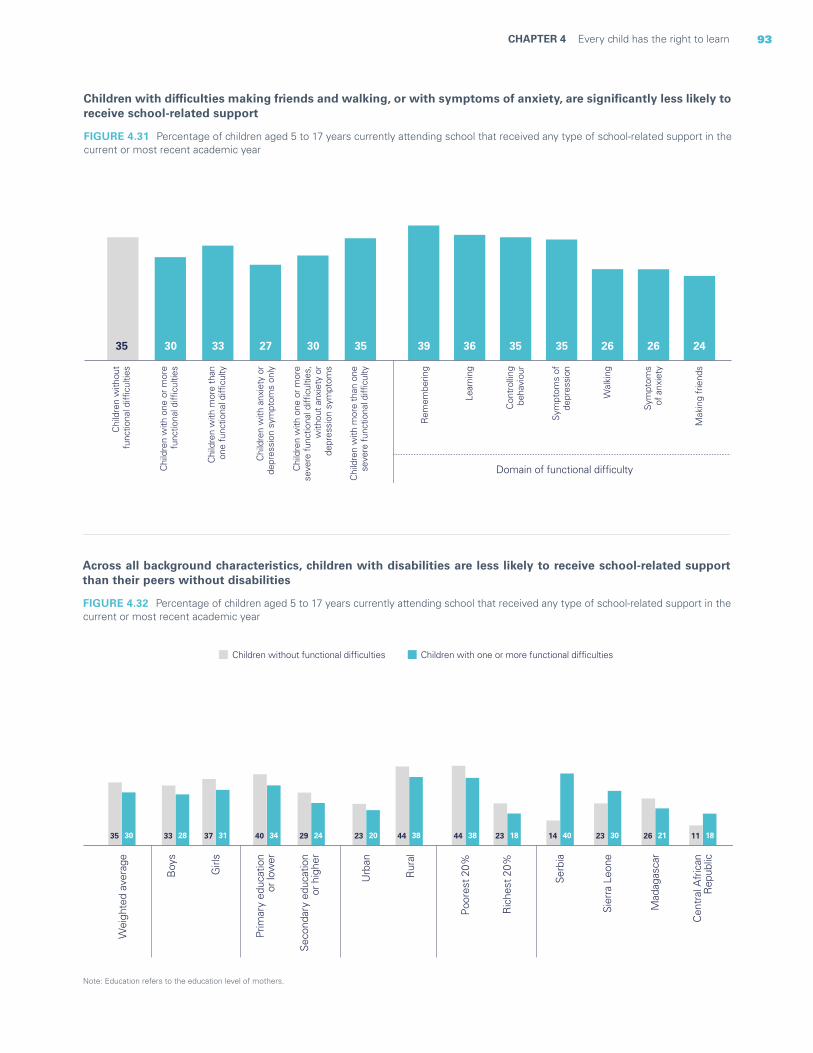
93CHAPTER 4 Every child has the right to learn
Note: Education refers to the education level of mothers.
FIGURE 4.32 Percentage of children aged 5 to 17 years currently attending school that received any type of school-related support in the current or most recent academic year
Across all background characteristics, children with disabilities are less likely to receive school-related support than their peers without disabilities
35 33 37 40 29 23 44 44 2330 28 31 34 24 20 38 38 18
Wei
ghte
d av
erag
e
Boy
s
Girl
s
Prim
ary
educ
atio
n o
r low
er
Seco
ndar
y ed
ucat
ion
or h
ighe
r
Urb
an
Rur
al
Poo
rest
20%
Ric
hest
20%
11 18
Cen
tral
Afr
ican
Rep
ublic
26 21
Mad
agas
car
23 30
Sier
ra L
eone
14 40
Serb
ia
Children without functional difficulties Children with one or more functional difficulties
Children with difficulties making friends and walking, or with symptoms of anxiety, are significantly less likely to receive school-related support
Chi
ldre
n w
ithou
tfu
nctio
nal d
ifficu
lties
Chi
ldre
n w
ith o
ne o
r mor
efu
nctio
nal d
ifficu
lties
Chi
ldre
n w
ith m
ore
than
one
func
tiona
l diffi
culty
Chi
ldre
n w
ith a
nxie
ty o
rde
pres
sion
sym
ptom
s on
ly
Chi
ldre
n w
ith m
ore
than
one
seve
re fu
nctio
nal d
ifficu
lty
Chi
ldre
n w
ith o
ne o
r mor
ese
vere
func
tiona
l diffi
culti
es,
with
out a
nxie
ty o
rde
pres
sion
sym
ptom
s
Domain of functional difficulty
35 30 33 27 30 35 24
Mak
ing
frie
nds
26
Sym
ptom
sof
anx
iety
26
Wal
king
35
Sym
ptom
s of
depr
essi
on
35
Con
trol
ling
beha
viou
r
36
Lear
ning
39
Rem
embe
ring
FIGURE 4.31 Percentage of children aged 5 to 17 years currently attending school that received any type of school-related support in the current or most recent academic year
94 Seen, Counted, Included: Using data to shed light on the well-being of children with disabilities
Takeaways and programmatic implications
The data in this chapter highlight the significant disadvantages and inequities that many children with disabilities face in accessing, progressing in and benefiting from education. However, they also show that these challenges are not uniform: Outcomes and risks vary a great deal depending on a child’s particular disability and background.
Many of the results regarding lower attendance and participation rates among children with disabilities are consistent with findings from the existing literature.30 However, while the overall results show significant disparities between children with and without disabilities, they also indicate that the likelihood of a child never attending school can depend on her or his functional difficulty. These findings are further nuanced by the different participation rates of children based on their economic background. Children with disabilities from the poorest households are substantially more likely to have never attended school than their peers from the richest households. Furthermore, disparities in attendance and participation do not appear to be adequately addressed by education transfers. The provision of transfers in the form of school-related support, such as educational materials or tuition assistance, is less frequently reported for children with disabilities than for children without disabilities, even when controlling for household wealth.
A nuanced perspective can also be gleaned from the data in assessing the progression of children with disabilities through school. Among children in school, those with disabilities were most likely to be overage for their grade in both primary and secondary school. However, as with participation, this risk was not the same for children with difficulties in different domains. While pooled outcomes indicate substantially worse educational participation and progression for children with disabilities compared to those without, this masks the different challenges and risks for children with various types of functional difficulties. These findings add to the existing literature by providing a fuller picture of the impact of various types of disability on educational progression.31
Understanding the level of parental involvement in a child’s education is important in identifying the needs of children with different types of disabilities. It also
helps in advocating for programmes that foster better support for such children and their families. The analysis found that children with disabilities in various domains experienced significantly different home learning environments, shaped by factors such as help with homework, parental engagement with teachers and home reading environments.
As might be expected, educational outcomes overall in foundational reading and numeracy skills are lower for children with disabilities. Among all children, disadvantages such as living in poor households or rural areas or having a mother with little education are strongly associated with lower levels of numeracy and literacy. But these disparities are magnified in the case of children with disabilities. Surprisingly, the disparities noted in other aspects of a child’s education did not appear when looking at ICT skills and access to the Internet. No significant differences were found in this regard between children with and without disabilities with the same background characteristics.
Concrete steps can be taken to immediately address the inequities faced by children with disabilities. Closing the education gap for these children requires committed effort on the part of all parties and capacity development across many sectors.
Within families, parental involvement in a child’s education is important for all children but even more so for those with disabilities. It can help facilitate more effective and inclusive learning plans and provide needed educational support. Empowering parents with the requisite knowledge, attitudes and skills to provide such support is essential. Likewise, programmes to educate parents about the right to education can encourage them to advocate on behalf of their children. Within schools, all staff must be trained, buildings must be refurbished, and accessible learning materials and curricula must be available to meet the needs of all students. At the community level, stigma and discrimination need to be addressed and awareness of the multiple benefits of inclusive education harnessed. At the governmental level, political commitment must be fostered so that laws and policies are aligned with the Convention on the Rights of Persons with Disabilities. Such interventions must also account for the distinct barriers facing children with difficulties
95CHAPTER 4 Every child has the right to learn
in various functional domains and employ targeted approaches to ensure that all children’s educational needs are met. These interventions need to address both specific barriers faced by children with disabilities and broader inequities in society among households of different backgrounds to ensure that every child is reached.
The complex interaction between a health condition or impairment and environmental and personal factors means that each child’s experience of disability is unique. The diversity of results by background characteristics and domains of functional difficulty highlights the challenges in making broad statements about the barriers faced by children with disabilities in accessing education. However, the findings do suggest that, on top of any pre-existing vulnerabilities, many children with disabilities experience multiple barriers that compound one another.
Dismantling barriers to education for children with disabilities also requires the strengthening of data collection systems. Data need to be regularly collected to: (1) identify the number of children with disabilities in and out of school; (2) document the experiences of children with disabilities in the education system; and (3) identify the educational structures and resources required to deliver a school environment that is adequate and inclusive of all children.
Inclusive education, increased data collection and, ultimately, a lowering of barriers to education can be encouraged by greater public awareness of the multiple issues faced by children with disabilities. The evidence in this report can be used to as a tool for advocacy campaigns that call for the increased commitment of governments to address long-standing inequities in education and for the deployment of concrete actions that improve the education outlook for all children.
BOX 4.1 Closing information gaps around the education of children with disabilities
All children have the right to a quality education to realize their full potential. The data in this report can be used to address the inequities that prevent children with disabilities from participating in and benefiting from education. The findings point to the immediate actions required in response. However, other crucial information is also needed to gain a fuller understanding of the experience of such children in accessing inclusive quality education.
Inclusive education is a key strategy to achieve education for all. It involves the strengthening of conditions and capacities to enable the education system to cater to all learners, regardless of sex, ethnicity, language, socioeconomic status, nationality, place of residence and disability status, among other characteristics. It promotes meaningful and successful participation in the education system. It can include any aspect of community and school infrastructure, norms, attitudes and behaviours at the family, community and school level. It also includes the provision of adequate curricula and pedagogic approaches that accommodate the needs of all children, in line with the principles of the Universal Design for Learning.32 Despite growing recognition of the importance of inclusive education, children with disabilities in nearly every corner of the world face
significant issues related to inclusion.33 Often these involve underresourced schools and classrooms34 and inaccessible water, sanitation and hygiene facilities.35 Stigma, discrimination and negative perceptions about disability held by teachers, coupled with a lack of knowledge and skills on how to include children with disabilities, are other common barriers.
Ensuring inclusive education requires closing the information gap around the education of children with disabilities. UNICEF – in collaboration with key partners – has been working to address this gap. One ongoing project seeks to support countries in collecting and managing data on children with disabilities through Education Management Information Systems (EMIS). An EMIS is an important source of information that can meet the urgent need for data to inform policy development and evaluation. Another project involves the validation of the Inclusive Education Module, which is an extended set of questions on children with disabilities that focuses on environmental barriers and participation in school. The module, which is intended for use in household surveys, will generate information that can inform policy, provide a statistical summary of environmental influences on school participation, and identify key bottlenecks that require follow-up action.
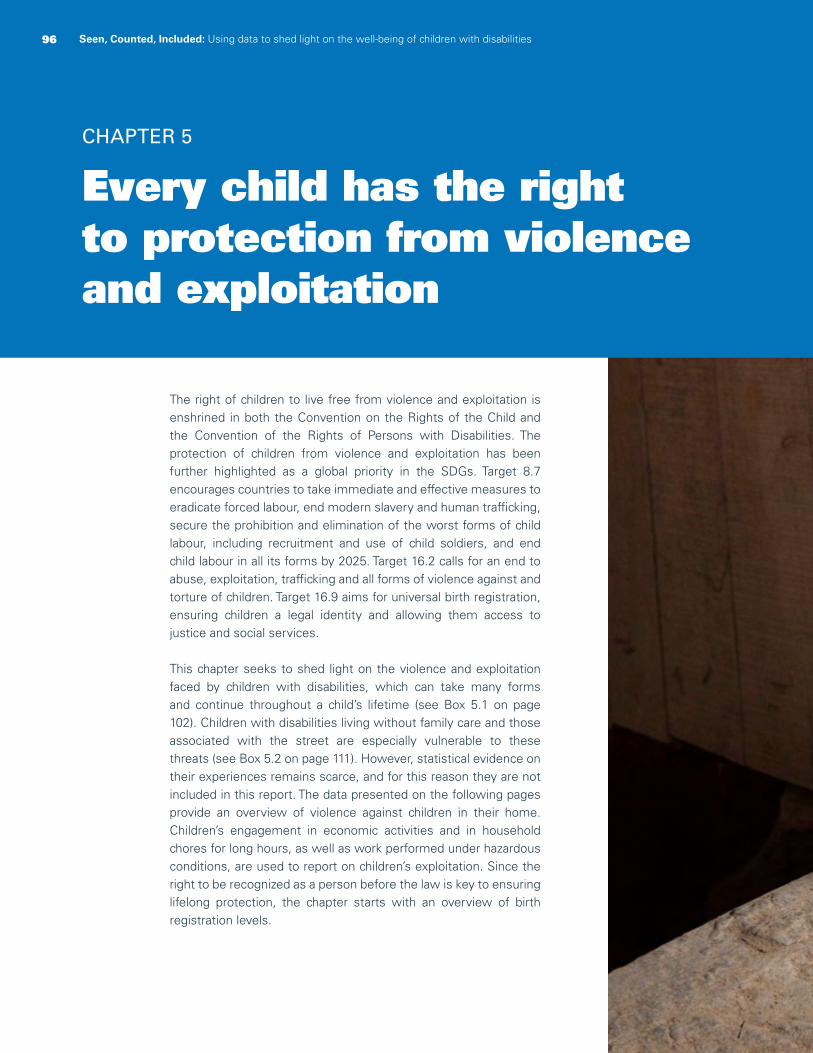
96 Seen, Counted, Included: Using data to shed light on the well-being of children with disabilities
Every child has the rightto protection from violence and exploitation
CHAPTER 5
The right of children to live free from violence and exploitation is enshrined in both the Convention on the Rights of the Child and the Convention of the Rights of Persons with Disabilities. The protection of children from violence and exploitation has been further highlighted as a global priority in the SDGs. Target 8.7 encourages countries to take immediate and effective measures to eradicate forced labour, end modern slavery and human trafficking, secure the prohibition and elimination of the worst forms of child labour, including recruitment and use of child soldiers, and end child labour in all its forms by 2025. Target 16.2 calls for an end to abuse, exploitation, trafficking and all forms of violence against and torture of children. Target 16.9 aims for universal birth registration, ensuring children a legal identity and allowing them access to justice and social services.
This chapter seeks to shed light on the violence and exploitation faced by children with disabilities, which can take many forms and continue throughout a child’s lifetime (see Box 5.1 on page 102). Children with disabilities living without family care and those associated with the street are especially vulnerable to these threats (see Box 5.2 on page 111). However, statistical evidence on their experiences remains scarce, and for this reason they are not included in this report. The data presented on the following pages provide an overview of violence against children in their home. Children’s engagement in economic activities and in household chores for long hours, as well as work performed under hazardous conditions, are used to report on children’s exploitation. Since the right to be recognized as a person before the law is key to ensuring lifelong protection, the chapter starts with an overview of birth registration levels.
96 Seen, Counted, Included: Using data to shed light on the well-being of children with disabilities
97CHAPTER 2 Every child has the right to survive and thrive 97CHAPTER 5 Every child has the right to protection from violence and exploitation
© UNICEF/UNI62271/Ramoneda
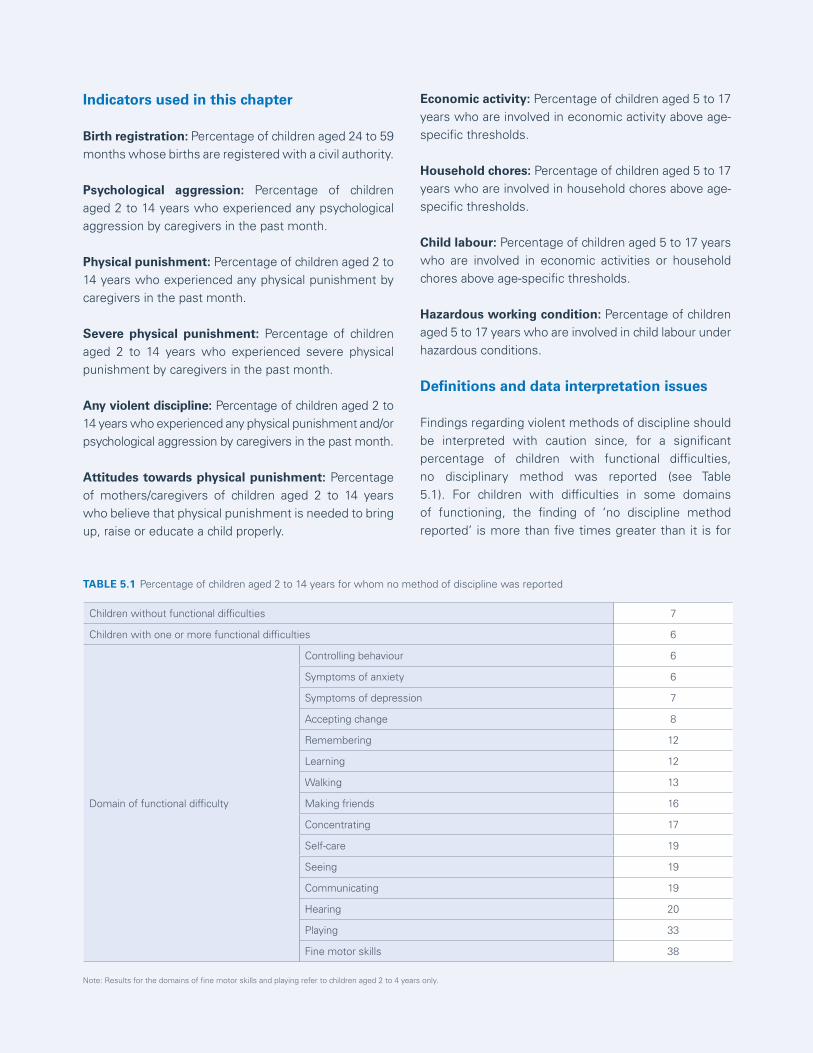
98 Seen, Counted, Included: Using data to shed light on the well-being of children with disabilities
Indicators used in this chapter
Birth registration: Percentage of children aged 24 to 59 months whose births are registered with a civil authority.
Psychological aggression: Percentage of children aged 2 to 14 years who experienced any psychological aggression by caregivers in the past month.
Physical punishment: Percentage of children aged 2 to 14 years who experienced any physical punishment by caregivers in the past month.
Severe physical punishment: Percentage of children aged 2 to 14 years who experienced severe physical punishment by caregivers in the past month.
Any violent discipline: Percentage of children aged 2 to 14 years who experienced any physical punishment and/or psychological aggression by caregivers in the past month.
Attitudes towards physical punishment: Percentage of mothers/caregivers of children aged 2 to 14 years who believe that physical punishment is needed to bring up, raise or educate a child properly.
Economic activity: Percentage of children aged 5 to 17 years who are involved in economic activity above age-specific thresholds.
Household chores: Percentage of children aged 5 to 17 years who are involved in household chores above age-specific thresholds.
Child labour: Percentage of children aged 5 to 17 years who are involved in economic activities or household chores above age-specific thresholds.
Hazardous working condition: Percentage of children aged 5 to 17 years who are involved in child labour under hazardous conditions.
Definitions and data interpretation issues
Findings regarding violent methods of discipline should be interpreted with caution since, for a significant percentage of children with functional difficulties, no disciplinary method was reported (see Table 5.1). For children with difficulties in some domains of functioning, the finding of ‘no discipline method reported’ is more than five times greater than it is for
Children without functional difficulties 7
Children with one or more functional difficulties 6
Domain of functional difficulty
Controlling behaviour 6
Symptoms of anxiety 6
Symptoms of depression 7
Accepting change 8
Remembering 12
Learning 12
Walking 13
Making friends 16
Concentrating 17
Self-care 19
Seeing 19
Communicating 19
Hearing 20
Playing 33
Fine motor skills 38
Note: Results for the domains of fine motor skills and playing refer to children aged 2 to 4 years only.
TABLE 5.1 Percentage of children aged 2 to 14 years for whom no method of discipline was reported
99CHAPTER 5 Every child has the right to protection from violence and exploitation
children without disabilities, suggesting issues within this indicator that may have numerous explanations. Data for this indicator are collected by the interviewer asking whether a child is subjected to different disciplinary methods – both positive and negative. It is therefore possible that the methods used on children with disabilities vary significantly from those used on children without disabilities. However, as these are not mentioned in the survey, they have gone unrecorded. In this situation, the high number of ‘no discipline method reported’ findings could be attributed to a tool that is not accurately capturing the experiences of children with disabilities. Alternatively, it could be indicative of parents not engaging with their disabled children and putting time and energy into disciplining them, either positively or negatively.
A further limitation is that the definition of child labour used for statistical purposes does not include begging, since this activity does not imply an exchange of good or services. Since children with disabilities may be forced to beg,1 the prevalence of child labour among such children may be underestimated in certain contexts.
Sources of data
Unless otherwise noted, the pooled estimates in this chapter are drawn from MICS6 conducted in Algeria, Bangladesh, Belarus, Central African Republic, Chad, Costa Rica, Cuba, Democratic Republic of the Congo,
Gambia, Georgia, Ghana, Guinea-Bissau, Guyana, Iraq, Kiribati, Kosovo, Kyrgyzstan, Lao People’s Democratic Republic (for children aged 2 to 4 years only), Lesotho, Madagascar, Mexico, Mongolia, Montenegro, Nepal, North Macedonia, Pakistan, Sao Tome and Principe, Serbia, Sierra Leone, Suriname, Togo, Tonga, Tunisia, Turkmenistan and Zimbabwe. Data for Pakistan are pooled results from surveys conducted in the regions of Sindh and Punjab (for more details, see the technical annex).
Pooled results for indicators measuring birth registration (Figures 5.1 and 5.2) do not include data from Belarus, Costa Rica, Georgia or Montenegro since these were not available.
Pooled results for some of the indicators on violent discipline (Figure 5.9) do not include data from the Lao People’s Democratic Republic since this figure presents data on children aged 5 to 14 years; that country only collected data on functional difficulties for children aged 2 to 4 years.
Pooled results for indicators measuring child labour (Figures 5.11 through 5.14) do not include data from Cuba, Nepal, Tunisia or Turkmenistan since these were not available. Also, since these figures present data on children aged 5 to 14 years, they do not include data from the Lao People’s Democratic Republic.
© UNICEF/UNI175964/Vassie
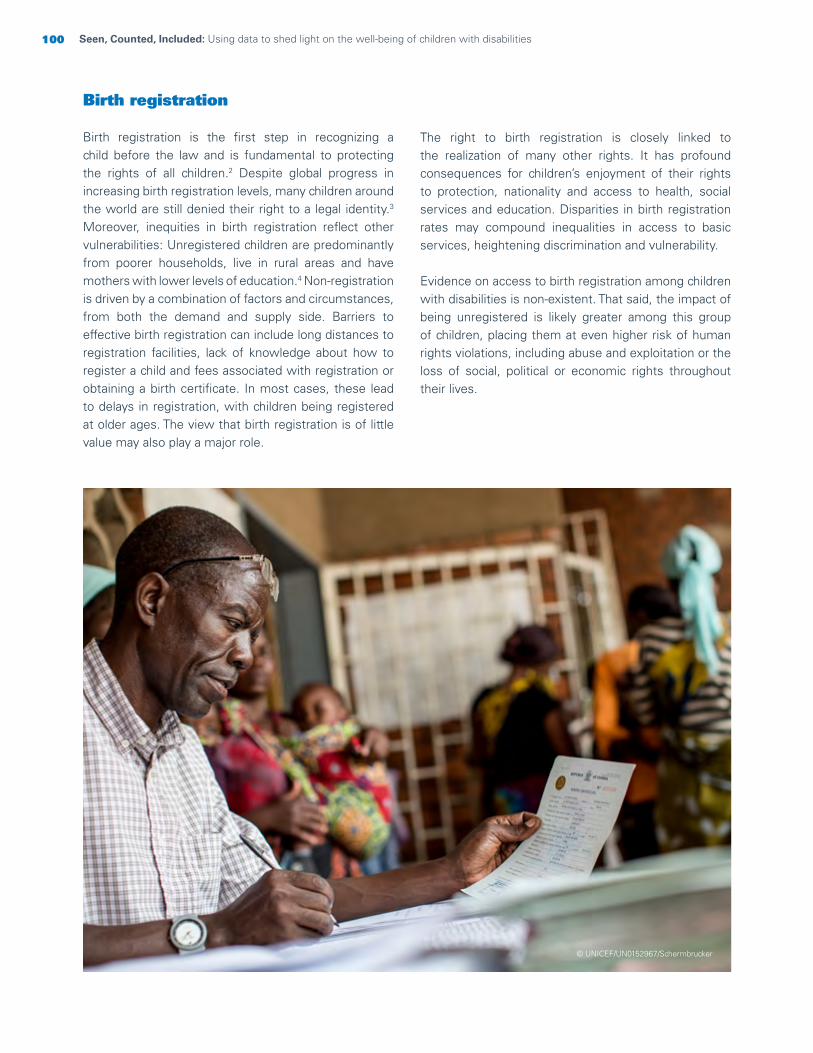
100 Seen, Counted, Included: Using data to shed light on the well-being of children with disabilities
Birth registration
Birth registration is the first step in recognizing a child before the law and is fundamental to protecting the rights of all children.2 Despite global progress in increasing birth registration levels, many children around the world are still denied their right to a legal identity.3 Moreover, inequities in birth registration reflect other vulnerabilities: Unregistered children are predominantly from poorer households, live in rural areas and have mothers with lower levels of education.4 Non-registration is driven by a combination of factors and circumstances, from both the demand and supply side. Barriers to effective birth registration can include long distances to registration facilities, lack of knowledge about how to register a child and fees associated with registration or obtaining a birth certificate. In most cases, these lead to delays in registration, with children being registered at older ages. The view that birth registration is of little value may also play a major role.
The right to birth registration is closely linked to the realization of many other rights. It has profound consequences for children’s enjoyment of their rights to protection, nationality and access to health, social services and education. Disparities in birth registration rates may compound inequalities in access to basic services, heightening discrimination and vulnerability.
Evidence on access to birth registration among children with disabilities is non-existent. That said, the impact of being unregistered is likely greater among this group of children, placing them at even higher risk of human rights violations, including abuse and exploitation or the loss of social, political or economic rights throughout their lives.
© UNICEF/UN0152967/Schermbrucker
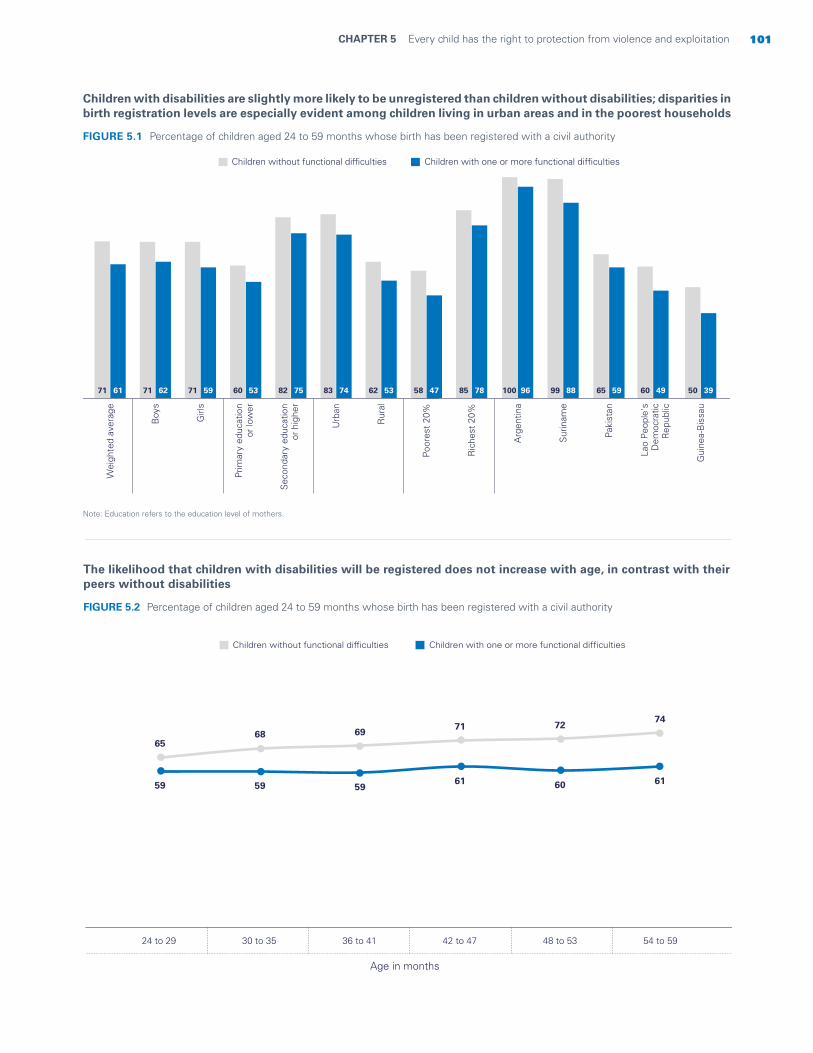
101CHAPTER 5 Every child has the right to protection from violence and exploitation
The likelihood that children with disabilities will be registered does not increase with age, in contrast with their peers without disabilities
FIGURE 5.2 Percentage of children aged 24 to 59 months whose birth has been registered with a civil authority
Children with disabilities are slightly more likely to be unregistered than children without disabilities; disparities in birth registration levels are especially evident among children living in urban areas and in the poorest households
Note: Education refers to the education level of mothers.
FIGURE 5.1 Percentage of children aged 24 to 59 months whose birth has been registered with a civil authority
Wei
ghte
d av
erag
e
Boy
s
Girl
s
Prim
ary
educ
atio
n o
r lo
wer
Sec
onda
ry e
duca
tion
or
high
er
Urb
an
Rur
al
Poor
est
20%
Ric
hest
20%
71 61 71 62 71 59 60 53 82 75 83 74 62 53 58 47 85 78
Gui
nea-
Bis
sau
50 39
Lao
Peo
ple'
sD
emoc
ratic
Rep
ublic
60 49
Paki
stan
65 59
Sur
inam
e
99 88
Arg
entin
a
100 96
Children with one or more functional difficultiesChildren without functional difficulties
Children with one or more functional difficultiesChildren without functional difficulties
6568 69
71 7274
59 59 5961 60 61
24 to 29 30 to 35 36 to 41 42 to 47 48 to 53 54 to 59
Age in months

102 Seen, Counted, Included: Using data to shed light on the well-being of children with disabilities
Violent discipline
Too often, parents resort to violent methods of discipline because they feel they lack other options to effectively teach their children self-control and acceptable behaviour. For parents of children with disabilities, these challenges can be compounded.5 Parenting such children often requires a higher and more constant level of involvement, which can contribute to parental distress and an increased propensity to resort to violent disciplinary methods.6 Violent forms of discipline can also be driven by prevailing attitudes towards the disability itself. Children with disabilities can face stigma along with negative attitudes and beliefs that place them
BOX 5.1 A lifetime of violence
at increased risk of violence and neglect, sometimes resulting in their deaths.7
Factors that exacerbate the risk of exposure to violent disciplinary methods include background characteristics that are associated with children both with and without disabilities, such as poverty and parental education level. 8 Additionally, there is some indication that children with disabilities in certain domains of functioning – such as cognition, communication, seeing and hearing – are at increased risk of violent physical discipline compared with their peers with difficulties in other domains.9
Starting at birth, children with disabilities are exposed to multiple forms of violence that can continue throughout their lifetimes.
An infant born with a disability faces an increased risk of infanticide. This could be linked to the belief that disability makes a person ‘unfit’ or unworthy to live or superstition about the misfortune such a child might bring to the household.10 Some parents have even described killing their child as an act of love, preventing him or her from having to live with what they perceive to be the burden of disability.11 Negative and discriminatory attitudes and beliefs can fuel such notions. The increased stress often placed on parents caring for a child with disabilities can lead to heightened risks of abuse and violence, especially when parents do not have adequate resources and support.
As children grow and expand their lives outside their immediate household, enter school and begin to develop peer relationships, the risk of exposure to interpersonal violence from their peers increases. Research has indicated that children with disabilities experience significantly higher rates of bullying than children without disabilities.12 Bullying of such children is also associated with certain beliefs about the nature of disability: that it is a ‘curse’ from God for the transgressions of the child or his her family, for example, or prejudiced beliefs and misconceptions regarding disability more generally.13 Often, a lack of support within communities and schools to meet the needs of children with disabilities and ensure their
inclusion and participation can inadvertently encourage bullying.14
Such children may also face an increased risk of sexual violence,15 with girls at higher risk than boys.16 Children who have difficulties in the domain of self-care, or who live in institutions, are particularly vulnerable.17 Children with disabilities, or their families, may choose not to report sexual abuse for fear of bringing additional shame to an already stigmatized child and family.18 In addition, children with disabilities who experience sexual violence often face barriers in reporting the crime. They are frequently denied justice since their testimonies are often considered unreliable.19 Exposure to sexual violence can be exacerbated by the lack of disability-sensitive education and protective mechanisms.20
© UNICEF/UN0149688/Dejongh
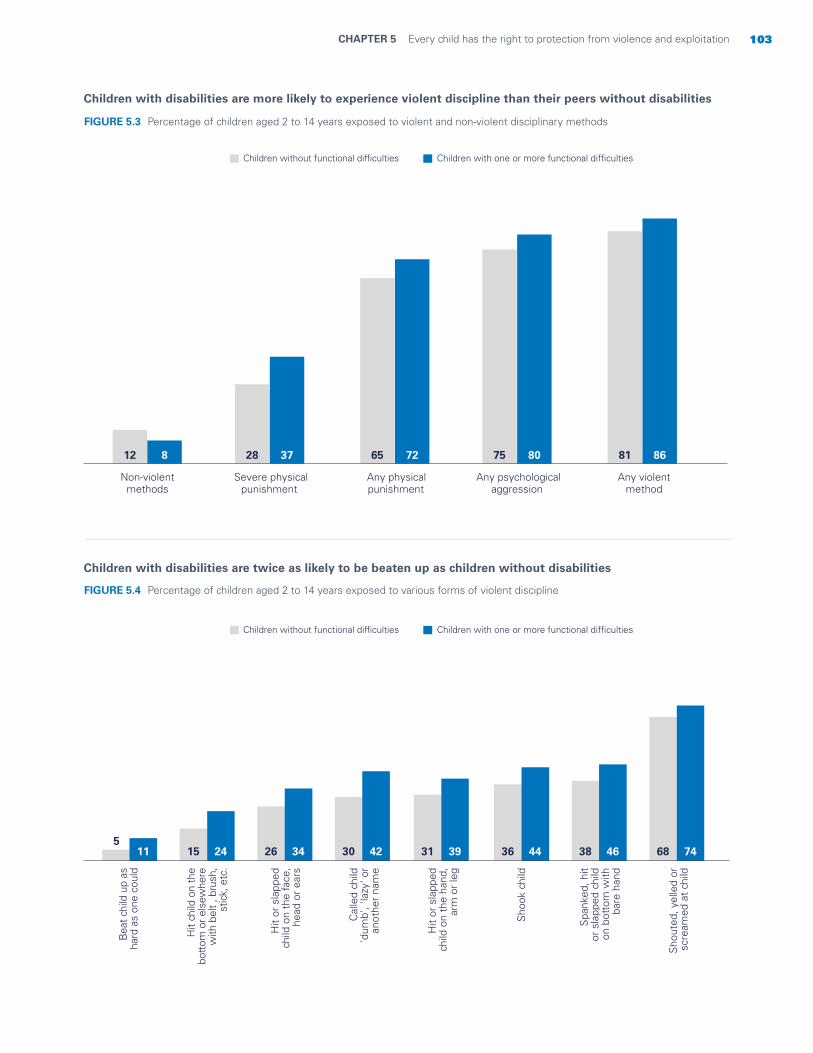
103CHAPTER 5 Every child has the right to protection from violence and exploitation
Children with disabilities are more likely to experience violent discipline than their peers without disabilities
Children with disabilities are twice as likely to be beaten up as children without disabilities
FIGURE 5.3 Percentage of children aged 2 to 14 years exposed to violent and non-violent disciplinary methods
FIGURE 5.4 Percentage of children aged 2 to 14 years exposed to various forms of violent discipline
12 8
Non-violentmethods
28 37
Severe physicalpunishment
65 72
Any physicalpunishment
75 80
Any psychologicalaggression
81 86
Any violentmethod
Children with one or more functional difficultiesChildren without functional difficulties
515 26 30 31 36 38 6811 24 34 42 39 44 46 74
Bea
t chi
ld u
p as
hard
as
one
coul
d
Hit
child
on
the
botto
m o
r els
ewhe
rew
ith b
elt ,
bru
sh,
stic
k, e
tc.
Hit
or s
lapp
edch
ild o
n th
e fa
ce,
head
or
ears
Cal
led
child
'dum
b', '
lazy
' or
anot
her
nam
e
Hit
or s
lapp
edch
ild o
n th
e ha
nd,
arm
or
leg
Sho
ok c
hild
Spa
nked
, hit
or s
lapp
ed c
hild
on b
otto
m w
ithba
re h
and
Sho
uted
, yel
led
orsc
ream
ed a
t ch
ild
Children with one or more functional difficultiesChildren without functional difficulties
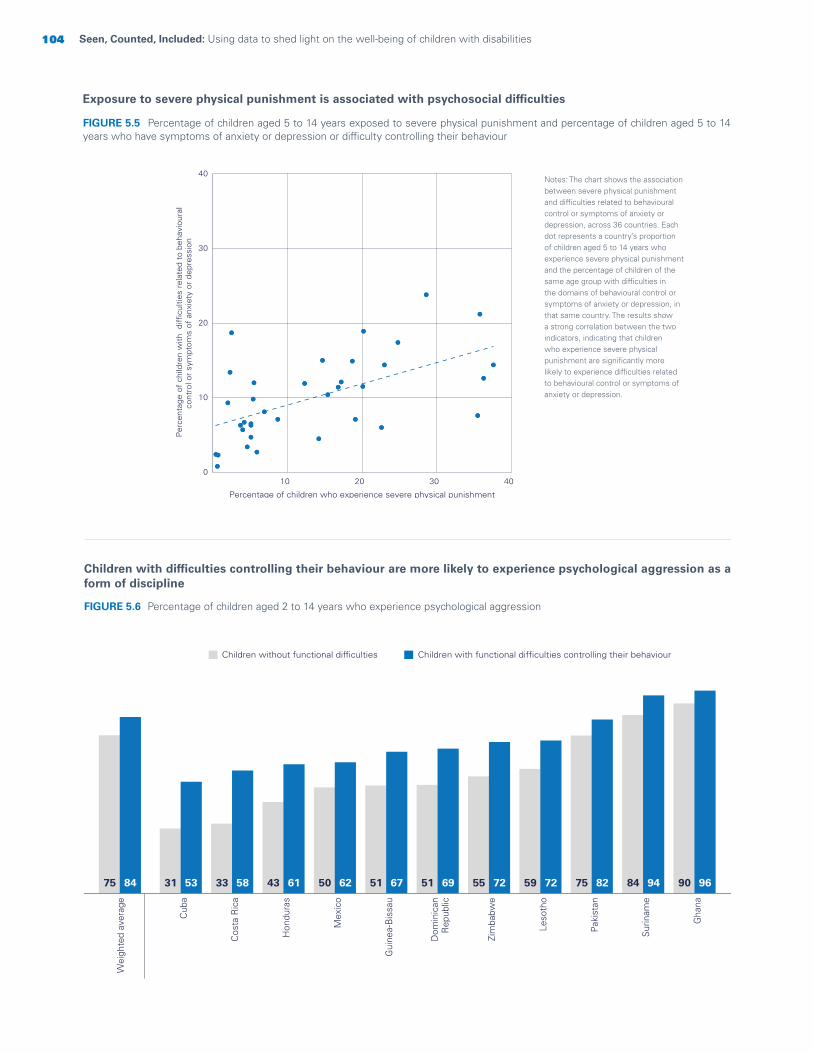
104 Seen, Counted, Included: Using data to shed light on the well-being of children with disabilities
Exposure to severe physical punishment is associated with psychosocial difficulties
Children with difficulties controlling their behaviour are more likely to experience psychological aggression as a form of discipline
FIGURE 5.5 Percentage of children aged 5 to 14 years exposed to severe physical punishment and percentage of children aged 5 to 14 years who have symptoms of anxiety or depression or difficulty controlling their behaviour
FIGURE 5.6 Percentage of children aged 2 to 14 years who experience psychological aggression
Per
cent
age
of c
hild
ren
with
diffi
culti
es r
elat
ed t
o be
havi
oura
lco
ntro
l or
sym
ptom
s of
anx
iety
or
depr
essi
on
Percentage of children who experience severe physical punishment
0
10
20
30
40
10 20 30 40
Notes: The chart shows the association between severe physical punishment and difficulties related to behavioural control or symptoms of anxiety or depression, across 36 countries. Each dot represents a country’s proportion of children aged 5 to 14 years who experience severe physical punishment and the percentage of children of the same age group with difficulties in the domains of behavioural control or symptoms of anxiety or depression, in that same country. The results show a strong correlation between the two indicators, indicating that children who experience severe physical punishment are significantly more likely to experience difficulties related to behavioural control or symptoms of anxiety or depression.
Wei
ghte
d av
erag
e
Children with functional difficulties controlling their behaviourChildren without functional difficulties
75 84
Gha
na
90 96
Sur
inam
e
84 94
Pak
ista
n
75 82
Leso
tho
59 72
Zim
babw
e
55 72
Dom
inic
an R
epub
lic
51 69
Gui
nea-
Bis
sau
51 67
Mex
ico
50 62
Hon
dura
s
43 61
Cos
ta R
ica
33 58
Cub
a
31 53
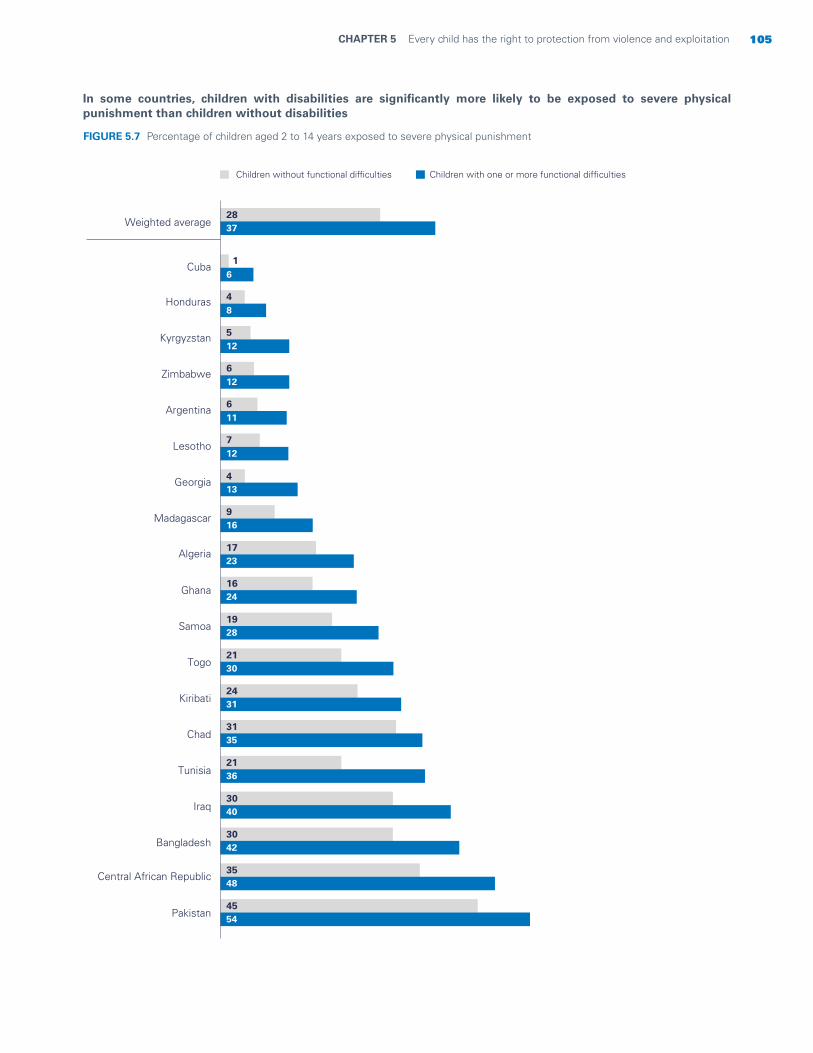
105CHAPTER 5 Every child has the right to protection from violence and exploitation
In some countries, children with disabilities are significantly more likely to be exposed to severe physical punishment than children without disabilities
FIGURE 5.7 Percentage of children aged 2 to 14 years exposed to severe physical punishment
Children with one or more functional difficultiesChildren without functional difficulties
Weighted average2837
Pakistan4554
Central African Republic3548
Bangladesh3042
Iraq3040
Tunisia2136
Chad3135
Kiribati2431
Togo2130
Samoa1928
Ghana1624
Algeria 1723
Madagascar916
Georgia 413
Lesotho712
Argentina 611
Zimbabwe 612
Kyrgyzstan 512
Honduras 48
Cuba1
6
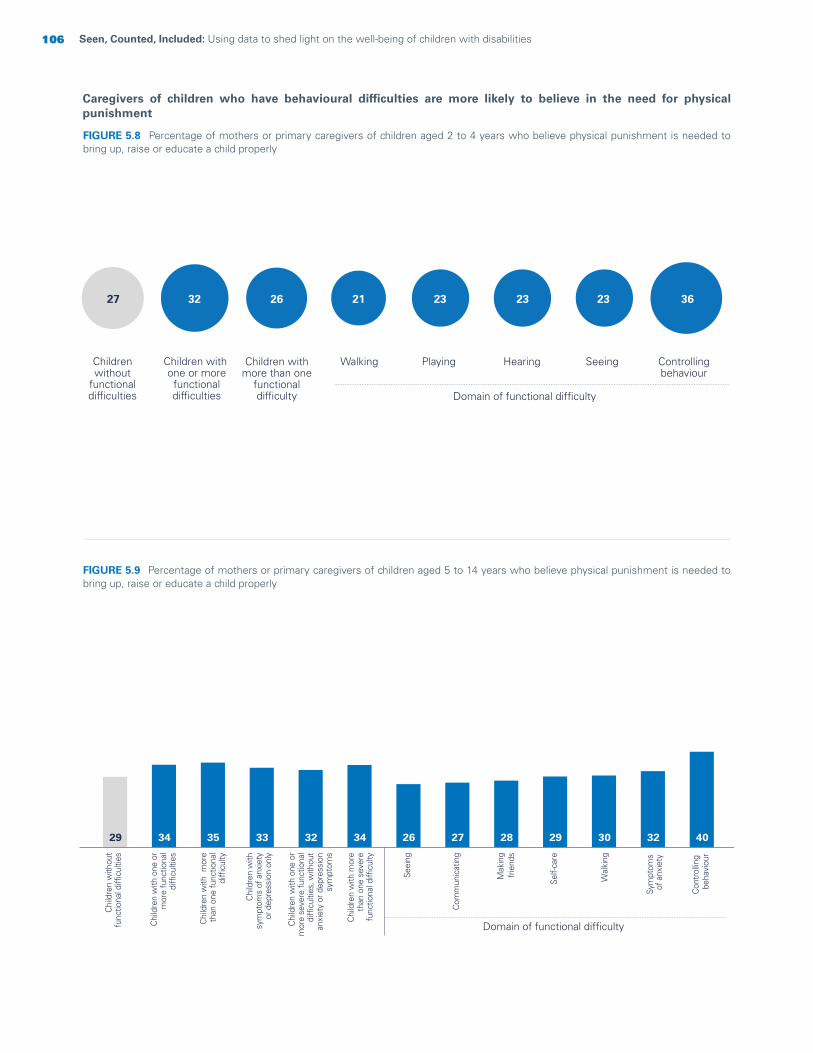
106 Seen, Counted, Included: Using data to shed light on the well-being of children with disabilities
FIGURE 5.9 Percentage of mothers or primary caregivers of children aged 5 to 14 years who believe physical punishment is needed to bring up, raise or educate a child properly
29 34 35 33 32 34 26 27 28 29 30 32 40
Seei
ng
Com
mun
icat
ing
Mak
ing
frie
nds
Self-
care
Wal
king
Sym
ptom
sof
anx
iety
Con
trol
ling
beha
viou
r
Domain of functional difficulty
Chi
ldre
n w
ithou
tfu
nctio
nal d
ifficu
lties
Chi
ldre
n w
ith o
ne o
r m
ore
func
tiona
ldi
fficu
lties
Chi
ldre
n w
ith m
ore
than
one
func
tiona
ldi
fficu
lty
Chi
ldre
n w
ith o
ne o
rm
ore
seve
re fu
nctio
nal
diffi
culti
es, w
ithou
t a
nxie
ty o
r dep
ress
ion
sym
ptom
s
Chi
ldre
n w
ith m
ore
than
one
sev
ere
func
tiona
l diffi
culty
Chi
ldre
n w
ithsy
mpt
oms
of a
nxie
tyor
dep
ress
ion
only
Caregivers of children who have behavioural difficulties are more likely to believe in the need for physical punishment
FIGURE 5.8 Percentage of mothers or primary caregivers of children aged 2 to 4 years who believe physical punishment is needed to bring up, raise or educate a child properly
Childrenwithout
functionaldifficulties
Children with one or more
functionaldifficulties
Walking Playing Hearing Seeing Controllingbehaviour
Children withmore than one
functionaldifficulty
32 26 21 23 23 23 3627
Domain of functional difficulty
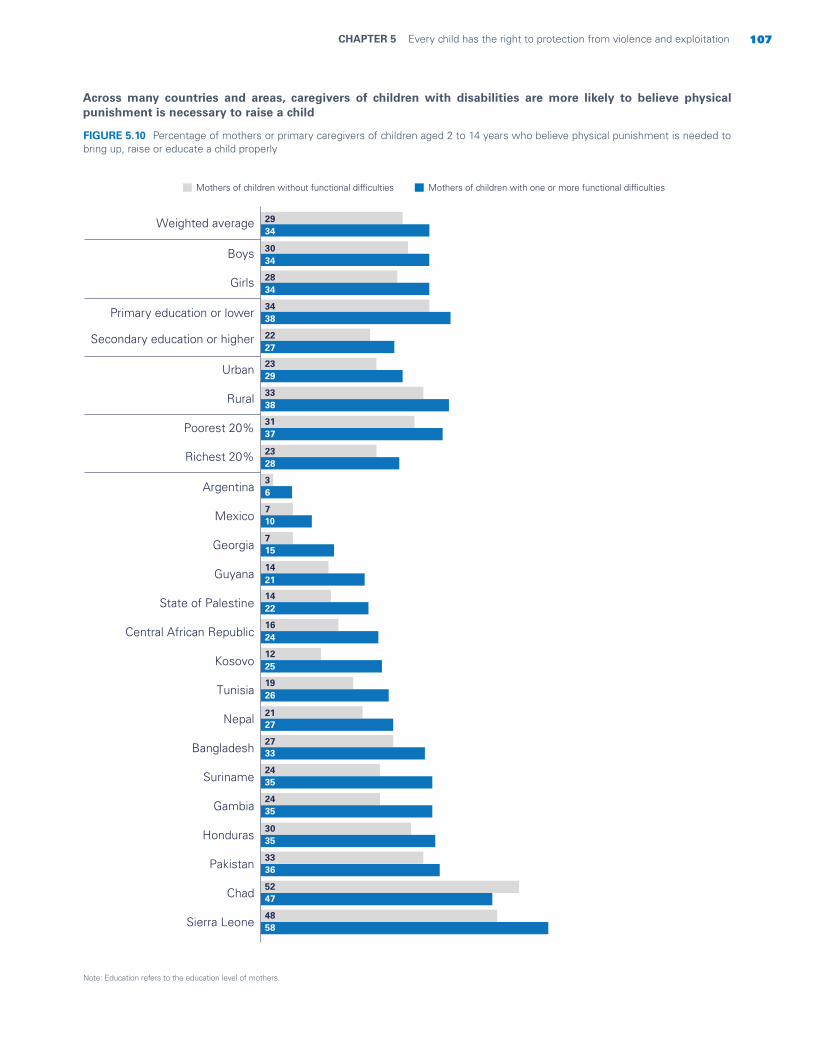
107CHAPTER 5 Every child has the right to protection from violence and exploitation
Across many countries and areas, caregivers of children with disabilities are more likely to believe physical punishment is necessary to raise a child
Note: Education refers to the education level of mothers.
FIGURE 5.10 Percentage of mothers or primary caregivers of children aged 2 to 14 years who believe physical punishment is needed to bring up, raise or educate a child properly
Weighted average
Boys
Girls
Primary education or lower
Secondary education or higher
Urban
Rural
Poorest 20%
Richest 20%
Argentina
Mexico
Georgia
Guyana
State of Palestine
Central African Republic
Kosovo
Tunisia
Nepal
Bangladesh
Suriname
Gambia
Honduras
Pakistan
Chad
Sierra Leone
Mothers of children with one or more functional difficultiesMothers of children without functional difficulties
2934
3034
2834
3438
2227
2329
3338
3137
2328
36
710
715
1421
1422
1624
1225
1926
2127
2733
2435
2435
3035
3336
5247
4858
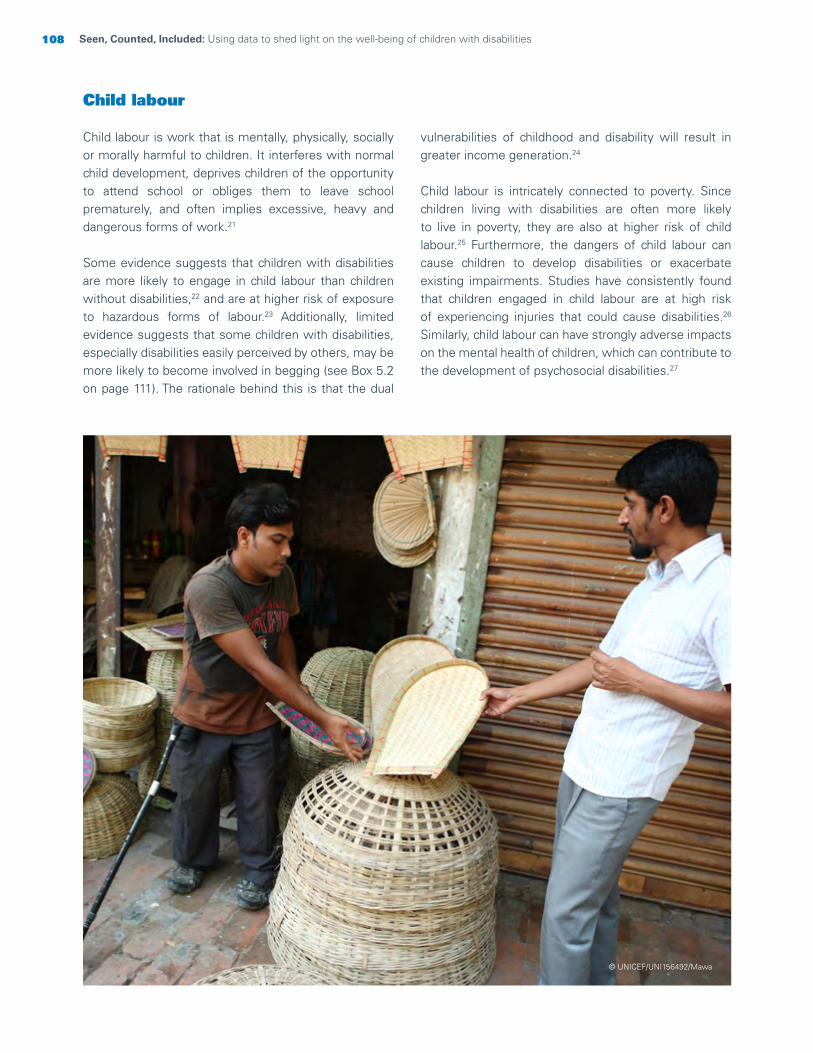
108 Seen, Counted, Included: Using data to shed light on the well-being of children with disabilities
Child labour
Child labour is work that is mentally, physically, socially or morally harmful to children. It interferes with normal child development, deprives children of the opportunity to attend school or obliges them to leave school prematurely, and often implies excessive, heavy and dangerous forms of work.21
Some evidence suggests that children with disabilities are more likely to engage in child labour than children without disabilities,22 and are at higher risk of exposure to hazardous forms of labour.23 Additionally, limited evidence suggests that some children with disabilities, especially disabilities easily perceived by others, may be more likely to become involved in begging (see Box 5.2 on page 111). The rationale behind this is that the dual
vulnerabilities of childhood and disability will result in greater income generation.24
Child labour is intricately connected to poverty. Since children living with disabilities are often more likely to live in poverty, they are also at higher risk of child labour.25 Furthermore, the dangers of child labour can cause children to develop disabilities or exacerbate existing impairments. Studies have consistently found that children engaged in child labour are at high risk of experiencing injuries that could cause disabilities.26 Similarly, child labour can have strongly adverse impacts on the mental health of children, which can contribute to the development of psychosocial disabilities.27
© UNICEF/UNI156492/Mawa

109CHAPTER 5 Every child has the right to protection from violence and exploitation
The prevalence of child labour is higher among children with symptoms of depression and difficulties learning and remembering
Across all background characteristics, children with disabilities are more likely to be engaged in child labour than children without disabilities
FIGURE 5.11 Percentage of children aged 5 to 17 years who are engaged in child labour
Note: Education refers to the education level of mothers.
FIGURE 5.12 Percentage of children aged 5 to 17 years who are engaged in child labour
12 14 14 15 11 13 7 7 7 11 11 12 13 15 16 16
Self-
care
Wal
king
Com
mun
icat
ing
Seei
ng
Con
cent
ratin
g
Con
trollin
g b
ehav
iour
Acc
eptin
g c
hang
e
Sym
ptom
s o
f dep
ress
ion
Rem
embe
ring
Lear
ning
Domain of functional difficulty
Chi
ldre
n w
ithou
tfu
nctio
nal d
ifficu
lties
Chi
ldre
n w
ith o
ne o
r m
ore
func
tiona
ldi
fficu
lties
Chi
ldre
n w
ith m
ore
than
one
func
tiona
ldi
fficu
lty
Chi
ldre
n w
ith o
ne o
rm
ore
seve
re fu
nctio
nal
diffi
culti
es, w
ithou
t an
xiet
yor
dep
ress
ion
sym
ptom
s
Chi
ldre
n w
ith m
ore
than
one
sev
ere
func
tiona
l diffi
culty
Chi
ldre
n w
ithsy
mpt
oms
of a
nxie
tyor
dep
ress
ion
only
Ban
glad
esh
Mex
ico
Gui
nea-
Bis
sau
Zim
babw
e
Cha
d
Wei
ghte
d av
erag
e
Boy
s
Girl
s
Prim
ary
educ
atio
n o
r lo
wer
Sec
onda
ry e
duca
tion
or
high
er
Urb
an
Rur
al
Poo
rest
20%
Ric
hest
20%
Children without functional difficulties Children with one or more functional difficulties
12 13 11 16 7 7 16 19 5 5 5 15 22 4114 14 14 17 9 8 18 20 8 6 13 21 31 36
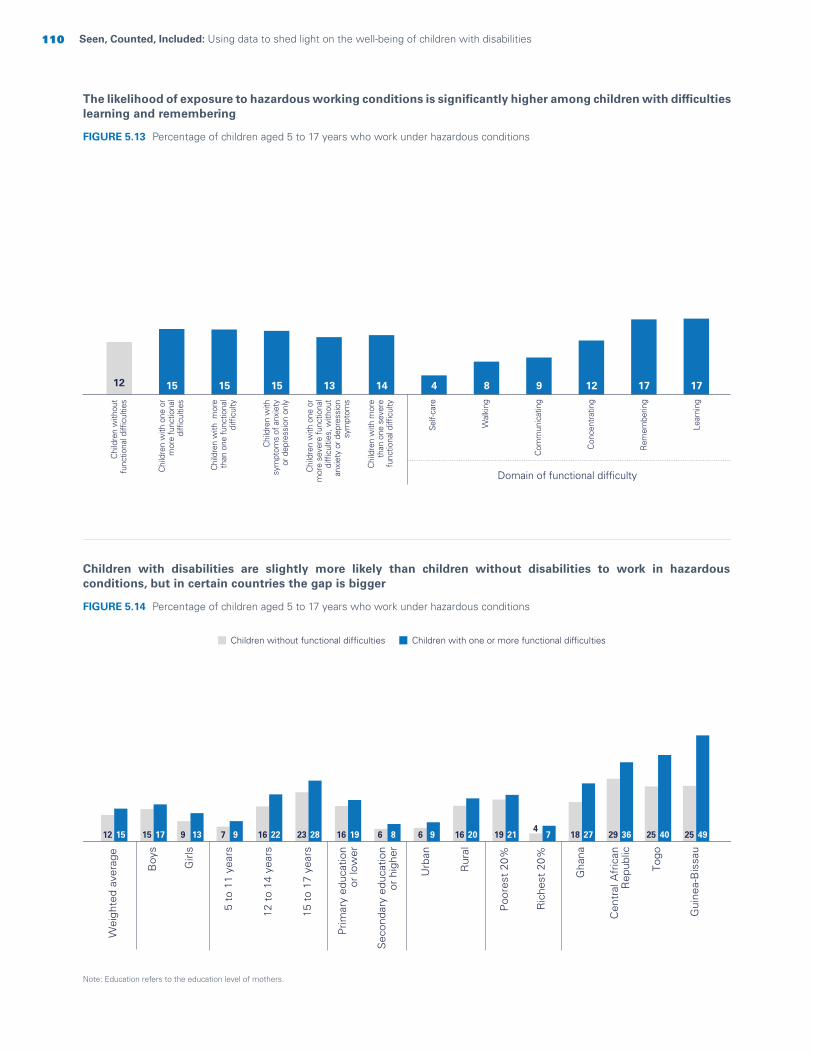
110 Seen, Counted, Included: Using data to shed light on the well-being of children with disabilities
The likelihood of exposure to hazardous working conditions is significantly higher among children with difficulties learning and remembering
Children with disabilities are slightly more likely than children without disabilities to work in hazardous conditions, but in certain countries the gap is bigger
FIGURE 5.13 Percentage of children aged 5 to 17 years who work under hazardous conditions
Note: Education refers to the education level of mothers.
FIGURE 5.14 Percentage of children aged 5 to 17 years who work under hazardous conditions
Self-
care
Wal
king
Com
mun
icat
ing
Con
cent
ratin
g
Rem
embe
ring
Lear
ning
Domain of functional difficulty
Chi
ldre
n w
ithou
tfu
nctio
nal d
ifficu
lties
Chi
ldre
n w
ith o
ne o
r m
ore
func
tiona
ldi
fficu
lties
Chi
ldre
n w
ith m
ore
than
one
func
tiona
ldi
fficu
lty
Chi
ldre
n w
ith o
ne o
rm
ore
seve
re fu
nctio
nal
diffi
culti
es, w
ithou
t a
nxie
ty o
r dep
ress
ion
sym
ptom
s
Chi
ldre
n w
ith m
ore
than
one
sev
ere
func
tiona
l diffi
culty
Chi
ldre
n w
ithsy
mpt
oms
of a
nxie
tyor
dep
ress
ion
only
12 15 15 15 13 14 4 8 9 12 17 17
Gha
na
Cen
tral
Afr
ican
Rep
ublic
Togo
Gui
nea-
Bis
sau
Wei
ghte
d av
erag
e
Boy
s
Girl
s
Prim
ary
educ
atio
n o
r lo
wer
Sec
onda
ry e
duca
tion
or
high
er
Urb
an
Rur
al
Poo
rest
20%
Ric
hest
20%
5 to
11
year
s
15 t
o 17
yea
rs
12 t
o 14
yea
rs
Children without functional difficulties Children with one or more functional difficulties
12 15 9 7 16 23 16 6 6 16 194
18 29 25 2515 17 13 9 22 28 19 8 9 20 21 7 27 36 40 49
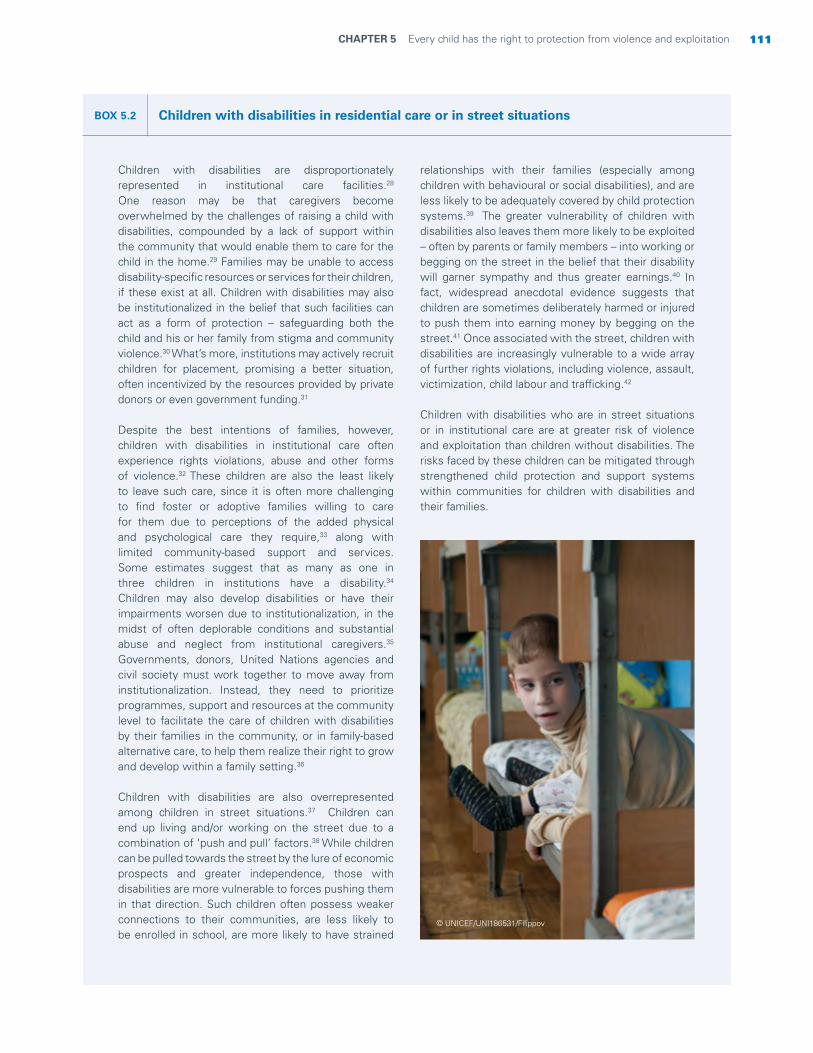
111CHAPTER 5 Every child has the right to protection from violence and exploitation
BOX 5.2 Children with disabilities in residential care or in street situations
Children with disabilities are disproportionately represented in institutional care facilities.28 One reason may be that caregivers become overwhelmed by the challenges of raising a child with disabilities, compounded by a lack of support within the community that would enable them to care for the child in the home.29 Families may be unable to access disability-specific resources or services for their children, if these exist at all. Children with disabilities may also be institutionalized in the belief that such facilities can act as a form of protection – safeguarding both the child and his or her family from stigma and community violence.30 What’s more, institutions may actively recruit children for placement, promising a better situation, often incentivized by the resources provided by private donors or even government funding.31
Despite the best intentions of families, however, children with disabilities in institutional care often experience rights violations, abuse and other forms of violence.32 These children are also the least likely to leave such care, since it is often more challenging to find foster or adoptive families willing to care for them due to perceptions of the added physical and psychological care they require,33 along with limited community-based support and services. Some estimates suggest that as many as one in three children in institutions have a disability.34 Children may also develop disabilities or have their impairments worsen due to institutionalization, in the midst of often deplorable conditions and substantial abuse and neglect from institutional caregivers.35 Governments, donors, United Nations agencies and civil society must work together to move away from institutionalization. Instead, they need to prioritize programmes, support and resources at the community level to facilitate the care of children with disabilities by their families in the community, or in family-based alternative care, to help them realize their right to grow and develop within a family setting.36
Children with disabilities are also overrepresented among children in street situations.37 Children can end up living and/or working on the street due to a combination of ‘push and pull’ factors.38 While children can be pulled towards the street by the lure of economic prospects and greater independence, those with disabilities are more vulnerable to forces pushing them in that direction. Such children often possess weaker connections to their communities, are less likely to be enrolled in school, are more likely to have strained
relationships with their families (especially among children with behavioural or social disabilities), and are less likely to be adequately covered by child protection systems.39 The greater vulnerability of children with disabilities also leaves them more likely to be exploited – often by parents or family members – into working or begging on the street in the belief that their disability will garner sympathy and thus greater earnings.40 In fact, widespread anecdotal evidence suggests that children are sometimes deliberately harmed or injured to push them into earning money by begging on the street.41 Once associated with the street, children with disabilities are increasingly vulnerable to a wide array of further rights violations, including violence, assault, victimization, child labour and trafficking.42
Children with disabilities who are in street situations or in institutional care are at greater risk of violence and exploitation than children without disabilities. The risks faced by these children can be mitigated through strengthened child protection and support systems within communities for children with disabilities and their families.
© UNICEF/UNI186531/Filippov

112 Seen, Counted, Included: Using data to shed light on the well-being of children with disabilities
Takeaways and programmatic implications
The data in this chapter show that many children with disabilities are experiencing disproportionately more violence and exploitation than children without disabilities. However, the type and level of violence experienced by such children vary greatly among countries depending on the domains of functional difficulty experienced by the child.
On the whole, children with disabilities are more likely to experience violent discipline than their peers without disabilities, a finding consistent with existing literature.43 That said, the forms and degrees of violence tend to vary considerably. Children with difficulties controlling their behaviour experience the highest rates of violent discipline of any type. By contrast, children with difficulties walking and playing face less violent discipline than children without disabilities. The specific types of violence suffered by children also vary according to the domain of disability, with children with difficulties in the psychosocial realm experiencing higher levels of physical punishment. Similarly, children with difficulties controlling their behaviour are subjected to the highest levels of psychological aggression. While these patterns were consistently found across many countries, the extent and differences still vary greatly.
Children with disabilities are also vulnerable to exploitation, with those who have difficulties learning or remembering experiencing the highest prevalence of child labour. By contrast, children with disabilities in the domains of self-care, walking or communicating experience a substantially lower risk of being engaged in child labour than children without disabilities; the same patterns are found among children engaged in hazardous child labour. It is important to note that for many of these indicators, but especially child labour, the risk factors for violence and exploitation are the same for children with and without disabilities. Children who are engaged in child labour are usually from the poorest households in rural areas, with mothers who have little education. Since children with disabilities are overrepresented in child labour generally, but especially when they come from these backgrounds, a combination of risk factors and pre-existing inequalities appear to be at work.
The violence and exploitation experienced by children with disabilities is compounded by their lower rates of birth registration. Campaigns to expand birth registration must be inclusive of children with disabilities and actively reach out to their families, including through awareness raising of the importance of registration for every child. Birth registration systems themselves must be flexible and responsive to the circumstances of children with disabilities and their parents and strive to reduce barriers, such as long distances to or the cost of registration. Suggested response strategies to address barriers include extending legally permissible registration periods, waiving associated fees and fines, deploying mobile registration units, and leveraging routine outreach programmes in health and social protection.
While children with disabilities are at increased risk of experiencing violence and exploitation, they are also at greater risk of falling through safety nets,44 especially when protection systems are not accessible to and inclusive of them. These children may face significant challenges and barriers in reporting abuse or violence and in providing forensically relevant details. This is particularly true if they communicate in non-verbal ways (for example, if they use augmentative and alternative communication or sign language), have difficulty accurately conveying their thoughts and ideas or have other problems communicating.45 For children with certain types of disabilities, signs of abuse can sometimes be attributed to their disability (for example, mistaking physical injuries for self-injurious behaviours). For professionals working with children with disabilities, a lack of training that is disability-sensitive, along with social stigma and discriminatory attitudes about disability, can prevent them from providing equitable services to such children and limit their ability to accurately identify, report and respond to their abuse.46 Limited understanding of disability, along with stigma and discriminatory attitudes, also affect the ability of family members, caregivers and other community members to identify and report abuse.

113CHAPTER 5 Every child has the right to protection from violence and exploitation
Professionals working with children, including teachers, social workers and health-care providers, should be trained to recognize and adequately respond to signs of abuse in children with disabilities and have the knowledge and skills necessary to support the child and his or her family. Governments and civil society organizations should be equipped to meet the needs of such children through the provision of inclusive mainstream services, specialized services where required, monetary payments and community-based support to families and caregivers. Such support to families can help lighten the burden of care when services are not tailored to children with disabilities. It can also reduce the ‘push’ factors driving the institutionalization of such children.
Similarly, justice systems must be made more accessible to children with disabilities, ensuring that their testimonies are heard and valued. This could involve training police, investigators and legal and judicial actors on the accessibility and inclusion needs of such children and how to work with them to improve access to justice. The right of every child to live a life free from violence and exploitation can be realized through raising public awareness and increasing the capacity of protection systems to support and protect children with disabilities. Moreover, since the factors that place children with disabilities at greater risk of child labour are the same for children with and without disabilities, steps should be taken to reduce social inequality more broadly and strengthen protective systems for all children.
© UNICEF/UN064133/Paleykov
Every child has the right toa safe and clean environment
CHAPTER 6
The right to a safe and clean environment is a global priority identified in the 2030 Agenda for Sustainable Development. SDG target 6.1 calls for universal and equitable access to safe and affordable drinking water for all, while target 6.2 calls for adequate and equitable sanitation and hygiene for all and an end to open defecation, with a special focus on the needs of women and girls and those in vulnerable situations.
Access to safe drinking water, sanitation and hygiene (WASH) services is essential for preventing respiratory and diarrhoeal diseases, which remain leading causes of child deaths. Despite progress, billions of people around the world still lack basic WASH services.1 Extending access is especially important for children with disabilities, but even a basic level of service may not be sufficient to meet their needs and ensure privacy, dignity and safety. Such children need drinking water, sanitation and handwashing facilities that are specially designed to meet their particular needs and protect their rights. In addition, menstruating girls2 with disabilities need access to personal care products as well as a private place where they can wash themselves and change.
Seen, Counted, Included: Using data to shed light on the well-being of children with disabilities114
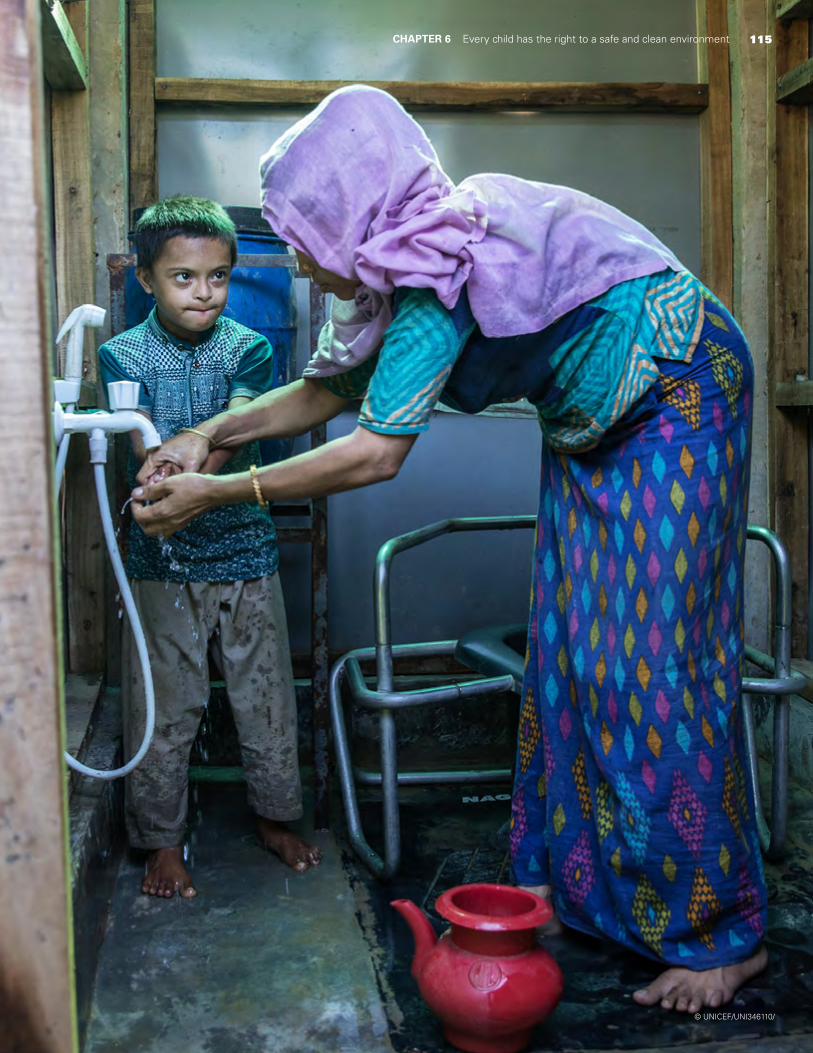
115CHAPTER 6 Every child has the right to a safe and clean environment
© UNICEF/UNI346110/

116 Seen, Counted, Included: Using data to shed light on the well-being of children with disabilities
Indicators used in this chapter
Basic drinking water service: Percentage of children aged 2 to 17 years who live in a household that uses an improved source of drinking water within a 30-minute round-trip collection time, including queuing.
Basic drinking water service accessible on premises: Percentage of children aged 2 to 17 years who live in a household that uses an improved source of drinking water on premises.
Basic sanitation service: Percentage of children aged 2 to 17 years living in a household with improved sanitation facilities not shared with other households.
Basic sanitation service accessible on premises: Percentage of children aged 2 to 17 years living in a household with improved sanitation facilities not shared with other households and located in their own dwelling or in their own yard/plot.
Basic hygiene service: Percentage of children aged 2 to 17 years living in a household with a place for handwashing, where water and soap or detergent are present.
Menstrual hygiene management: Percentage of girls aged 15 to 17 years reporting menstruating in the last 12 months and using menstrual hygiene products with a private place to wash and change while at home.
Participation in activities during menstruation: Percentage of girls aged 15 to 17 years who did not participate in social activities, school or work due to their last menstruation in the previous 12 months.
Definitions and data interpretation
Indicators used in this chapter are based on definitions established by the WHO/UNICEF Joint Monitoring Programme for Water Supply, Sanitation and Hygiene, known as the JMP.3 In assessing and measuring WASH services, it is important to consider not only the types of facilities available to households but also whether they are easily accessible and/or shared with other households. The distinction between availability and access is particularly significant for children with disabilities since they often face unique and disproportionate barriers to access even when services are available.4
The JMP defines improved drinking water sources as those that have the potential to deliver safe water due to the nature of their design and construction. They include piped water, boreholes or tube wells, protected dug wells, protected springs, rainwater and packaged or delivered water. ‘Basic drinking water service’ is defined as an improved drinking water source that involves a round-trip collection time of no more than 30 minutes, including queuing. If water is accessible on premises, however, this represents a higher level of service. A ‘safely managed drinking water service’ is defined as drinking water from an improved source that is located
Basic WASH services are neither available nor accessible
Basic WASH services are available, but not accessible on premises
Basic WASH services are accessible on premises
Basic WASH services are accessible on premises for all, including for children with disabilities
The accessibility of WASH services can be visualized as a continuum towards service meeting the needs of all children
Schools
Other Premises
While existing data on the type and location of household WASH facilities can be used to determine whether basic services are available on premises, such data do not shed light on whether children with disabilities are able to use such services, not only in their homes but also in other contexts, such as schools, health centres, public buildings and recreational spaces in general.
Available data Data not available
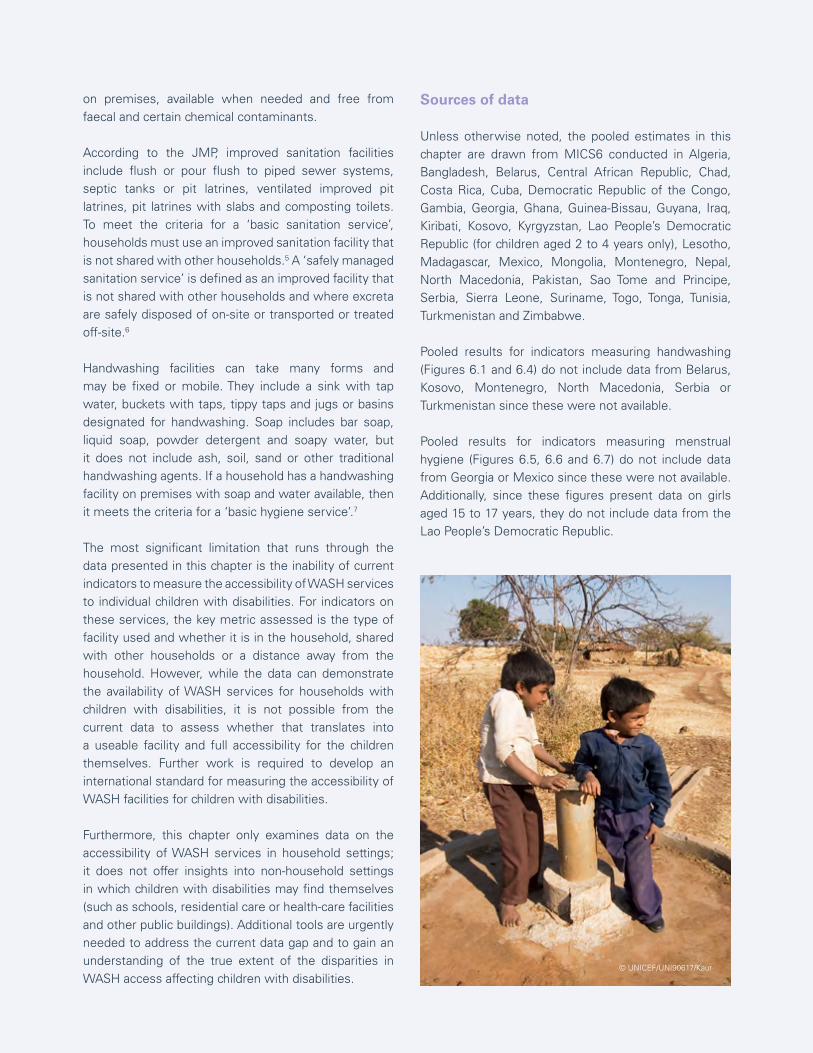
117CHAPTER 6 Every child has the right to a safe and clean environment
on premises, available when needed and free from faecal and certain chemical contaminants.
According to the JMP, improved sanitation facilities include flush or pour flush to piped sewer systems, septic tanks or pit latrines, ventilated improved pit latrines, pit latrines with slabs and composting toilets. To meet the criteria for a ‘basic sanitation service’, households must use an improved sanitation facility that is not shared with other households.5 A ‘safely managed sanitation service’ is defined as an improved facility that is not shared with other households and where excreta are safely disposed of on-site or transported or treated off-site.6
Handwashing facilities can take many forms and may be fixed or mobile. They include a sink with tap water, buckets with taps, tippy taps and jugs or basins designated for handwashing. Soap includes bar soap, liquid soap, powder detergent and soapy water, but it does not include ash, soil, sand or other traditional handwashing agents. If a household has a handwashing facility on premises with soap and water available, then it meets the criteria for a ‘basic hygiene service’.7
The most significant limitation that runs through the data presented in this chapter is the inability of current indicators to measure the accessibility of WASH services to individual children with disabilities. For indicators on these services, the key metric assessed is the type of facility used and whether it is in the household, shared with other households or a distance away from the household. However, while the data can demonstrate the availability of WASH services for households with children with disabilities, it is not possible from the current data to assess whether that translates into a useable facility and full accessibility for the children themselves. Further work is required to develop an international standard for measuring the accessibility of WASH facilities for children with disabilities.
Furthermore, this chapter only examines data on the accessibility of WASH services in household settings; it does not offer insights into non-household settings in which children with disabilities may find themselves (such as schools, residential care or health-care facilities and other public buildings). Additional tools are urgently needed to address the current data gap and to gain an understanding of the true extent of the disparities in WASH access affecting children with disabilities.
Sources of data
Unless otherwise noted, the pooled estimates in this chapter are drawn from MICS6 conducted in Algeria, Bangladesh, Belarus, Central African Republic, Chad, Costa Rica, Cuba, Democratic Republic of the Congo, Gambia, Georgia, Ghana, Guinea-Bissau, Guyana, Iraq, Kiribati, Kosovo, Kyrgyzstan, Lao People’s Democratic Republic (for children aged 2 to 4 years only), Lesotho, Madagascar, Mexico, Mongolia, Montenegro, Nepal, North Macedonia, Pakistan, Sao Tome and Principe, Serbia, Sierra Leone, Suriname, Togo, Tonga, Tunisia, Turkmenistan and Zimbabwe.
Pooled results for indicators measuring handwashing (Figures 6.1 and 6.4) do not include data from Belarus, Kosovo, Montenegro, North Macedonia, Serbia or Turkmenistan since these were not available.
Pooled results for indicators measuring menstrual hygiene (Figures 6.5, 6.6 and 6.7) do not include data from Georgia or Mexico since these were not available. Additionally, since these figures present data on girls aged 15 to 17 years, they do not include data from the Lao People’s Democratic Republic.
© UNICEF/UNI90617/Kaur
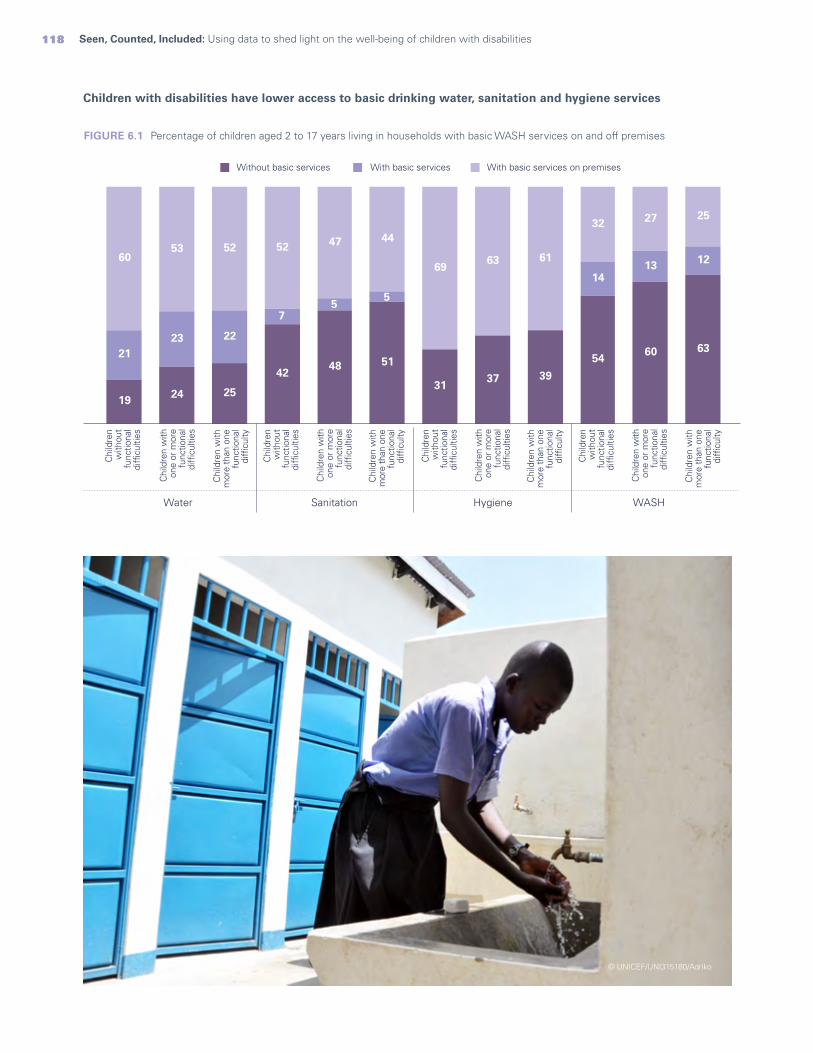
118 Seen, Counted, Included: Using data to shed light on the well-being of children with disabilities
Children with disabilities have lower access to basic drinking water, sanitation and hygiene services
FIGURE 6.1 Percentage of children aged 2 to 17 years living in households with basic WASH services on and off premises
Water
Chi
ldre
n w
ithou
t fu
nctio
nal
diffi
culti
es
Chi
ldre
n w
ithon
e or
mor
efu
nctio
nal
diffi
culti
es
Chi
ldre
n w
ith m
ore
than
one
func
tiona
ldi
fficu
lty
Sanitation
Chi
ldre
n w
ithou
t fu
nctio
nal
diffi
culti
es
Chi
ldre
n w
ithon
e or
mor
efu
nctio
nal
diffi
culti
es
Chi
ldre
n w
ith m
ore
than
one
func
tiona
ldi
fficu
lty
Hygiene
Chi
ldre
n w
ithou
t fu
nctio
nal
diffi
culti
es
Chi
ldre
n w
ithon
e or
mor
efu
nctio
nal
diffi
culti
es
Chi
ldre
n w
ith m
ore
than
one
func
tiona
ldi
fficu
lty
WASH
Chi
ldre
n w
ithou
t fu
nctio
nal
diffi
culti
es
Chi
ldre
n w
ithon
e or
mor
efu
nctio
nal
diffi
culti
es
Chi
ldre
n w
ith m
ore
than
one
func
tiona
ldi
fficu
lty
Without basic services With basic services With basic services on premises
252732
616369
444752525360 1213
14
55
7
222321 6360
54
393731
514842
252419
© UNICEF/UNI315180/Adriko
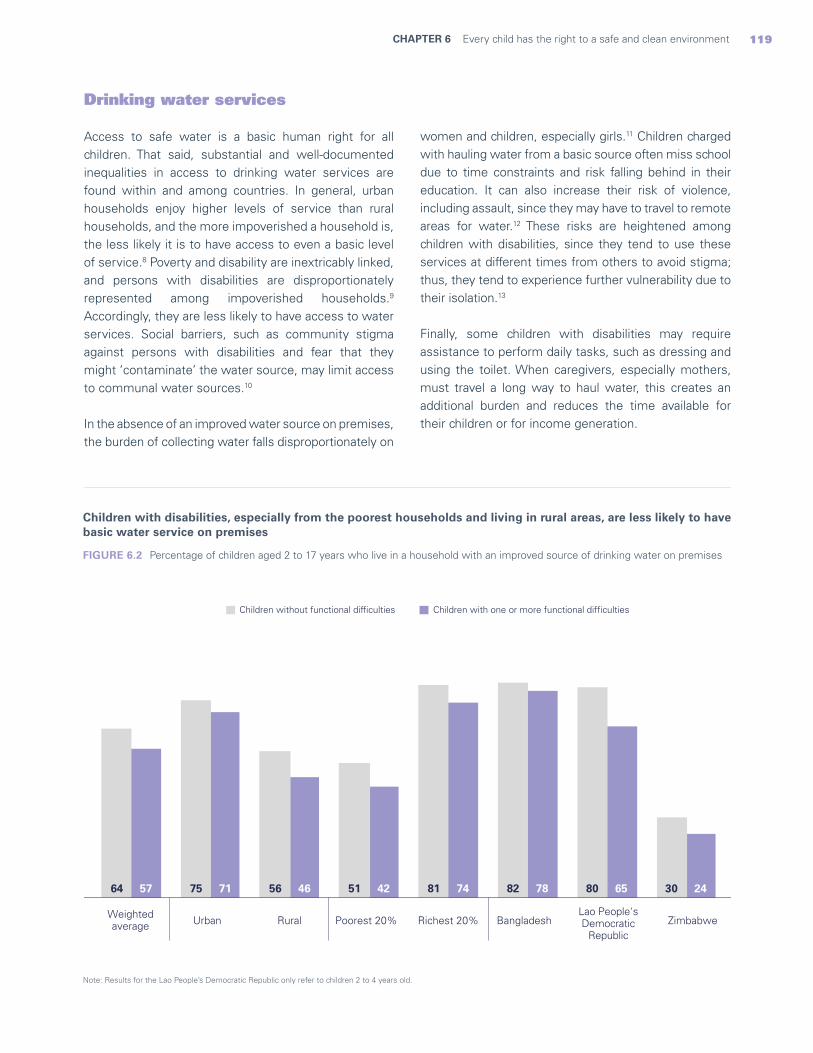
119CHAPTER 6 Every child has the right to a safe and clean environment
Drinking water services
Access to safe water is a basic human right for all children. That said, substantial and well-documented inequalities in access to drinking water services are found within and among countries. In general, urban households enjoy higher levels of service than rural households, and the more impoverished a household is, the less likely it is to have access to even a basic level of service.8 Poverty and disability are inextricably linked, and persons with disabilities are disproportionately represented among impoverished households.9 Accordingly, they are less likely to have access to water services. Social barriers, such as community stigma against persons with disabilities and fear that they might ‘contaminate’ the water source, may limit access to communal water sources.10
In the absence of an improved water source on premises, the burden of collecting water falls disproportionately on
women and children, especially girls.11 Children charged with hauling water from a basic source often miss school due to time constraints and risk falling behind in their education. It can also increase their risk of violence, including assault, since they may have to travel to remote areas for water.12 These risks are heightened among children with disabilities, since they tend to use these services at different times from others to avoid stigma; thus, they tend to experience further vulnerability due to their isolation.13
Finally, some children with disabilities may require assistance to perform daily tasks, such as dressing and using the toilet. When caregivers, especially mothers, must travel a long way to haul water, this creates an additional burden and reduces the time available for their children or for income generation.
Children with disabilities, especially from the poorest households and living in rural areas, are less likely to have basic water service on premises
Note: Results for the Lao People’s Democratic Republic only refer to children 2 to 4 years old.
FIGURE 6.2 Percentage of children aged 2 to 17 years who live in a household with an improved source of drinking water on premises
2465787442467157 3080828151567564
Children with one or more functional difficultiesChildren without functional difficulties
Weightedaverage Urban Rural Poorest 20% Richest 20% Bangladesh
Lao People'sDemocratic
RepublicZimbabwe

120 Seen, Counted, Included: Using data to shed light on the well-being of children with disabilities
Sanitation services
Inadequate sanitation can result in a variety of poor health outcomes, including the spread of diseases that can cause impairment or death, the brunt of which are borne by children under the age of 5.14 And even when households have improved sanitation facilities, these are often not accessible or useable by individuals with disabilities. One substantial barrier facing children with disabilities is the location of toilets or latrines and whether they are on the premises or at a distance and shared with other households. Some barriers, such as structural issues in the design, or social factors, such as the inability to use sanitation facilities with independence and dignity, contribute to inaccessibility regardless of whether the facility is on the premises or not.15 Other factors, such as the distance needed to access the facility, can generate additional challenges.16 When using basic sanitation services that are not on the child’s premises, safety concerns contribute to limited
access due to stigma as well as concerns over privacy and violence. All these factors can cause children with disabilities to limit their visits as much as possible.17 In some situations, children with disabilities may reduce food and water consumption to minimize their need to use the toilet, with potentially harmful consequences.18
A lack of accessible sanitation facilities can result in children with disabilities being dependent on others to use them. This can erode children’s self-esteem and cause them to be perceived as a burden by their family.19 Challenges in accessing sanitation services can also limit a child’s attendance and participation in school, resulting in poor educational outcomes.20 For children with visual and/or physical impairments, moving through areas of open defecation or crawling to use unclean and inaccessible facilities may harm their health, result in injuries, compromise their dignity and increase stigma.21
Children with disabilities are less likely to have basic sanitation services on premises than children without disabilities
Note: Results for the Lao People’s Democratic Republic refer to children 2 to 4 years old only.
FIGURE 6.3 Percentage of children aged 2 to 17 years living in a household with improved sanitation not shared with other households and located on premises
5057787234406852 6563847739477258
Children without functional difficulties Children with one or more functional difficulties
Weightedaverage
Suriname Lao People's Democratic Republic
BangladeshUrban Rural Poorest 20% Richest 20%
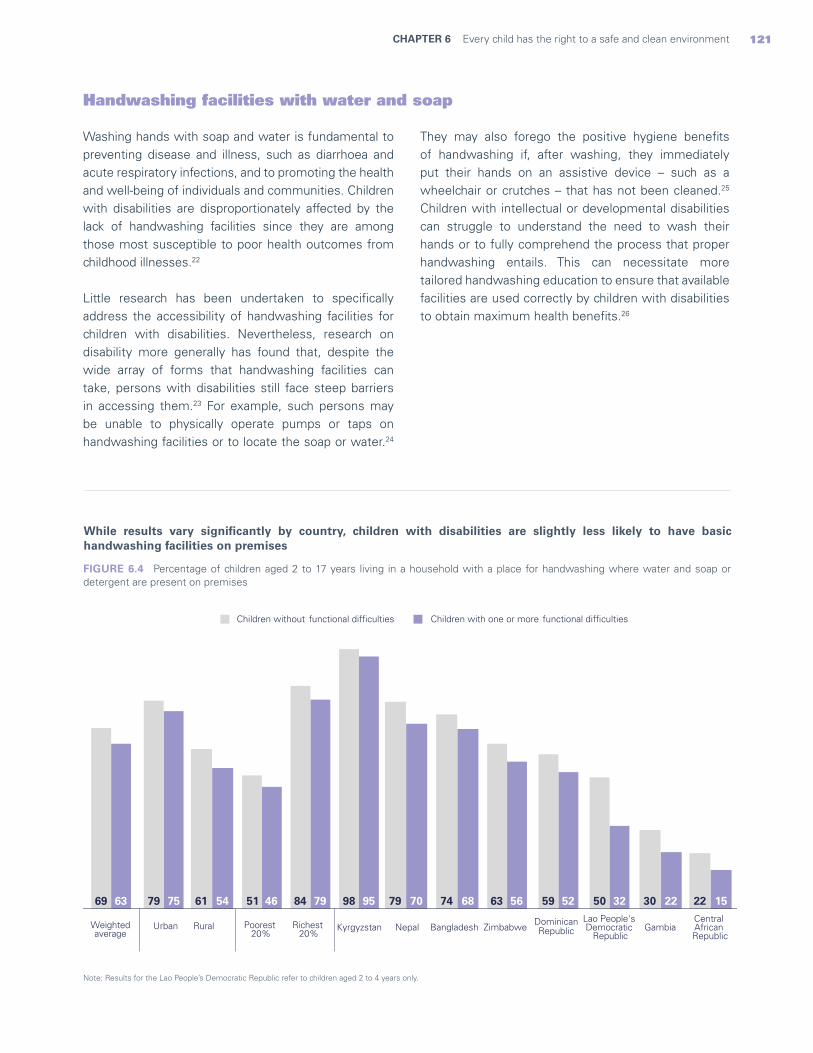
121CHAPTER 6 Every child has the right to a safe and clean environment
Handwashing facilities with water and soap
Washing hands with soap and water is fundamental to preventing disease and illness, such as diarrhoea and acute respiratory infections, and to promoting the health and well-being of individuals and communities. Children with disabilities are disproportionately affected by the lack of handwashing facilities since they are among those most susceptible to poor health outcomes from childhood illnesses.22
Little research has been undertaken to specifically address the accessibility of handwashing facilities for children with disabilities. Nevertheless, research on disability more generally has found that, despite the wide array of forms that handwashing facilities can take, persons with disabilities still face steep barriers in accessing them.23 For example, such persons may be unable to physically operate pumps or taps on handwashing facilities or to locate the soap or water.24
They may also forego the positive hygiene benefits of handwashing if, after washing, they immediately put their hands on an assistive device – such as a wheelchair or crutches – that has not been cleaned.25 Children with intellectual or developmental disabilities can struggle to understand the need to wash their hands or to fully comprehend the process that proper handwashing entails. This can necessitate more tailored handwashing education to ensure that available facilities are used correctly by children with disabilities to obtain maximum health benefits.26
While results vary significantly by country, children with disabilities are slightly less likely to have basic handwashing facilities on premises
Note: Results for the Lao People’s Democratic Republic refer to children aged 2 to 4 years only.
FIGURE 6.4 Percentage of children aged 2 to 17 years living in a household with a place for handwashing where water and soap or detergent are present on premises
15223252566870957946547563 22305059637479988451617969
Children without functional difficulties Children with one or more functional difficulties
Weightedaverage
Urban Rural Kyrgyzstan Nepal Bangladesh Zimbabwe GambiaPoorest 20%
Richest 20%
DominicanRepublic
Lao People's Democratic
Republic
Central African Republic

122 Seen, Counted, Included: Using data to shed light on the well-being of children with disabilities
Menstrual health and hygiene
For many adolescents, the onset of menstruation can be upsetting and disruptive.27 While research on this topic has been problematic due to the level of privacy surrounding menstruation, common themes have emerged in the challenges faced by adolescents with disabilities attempting to practise menstrual hygiene.28 These challenges include not only the lack of a private facility but also physical, cognitive or behavioural limitations.29 Lack of basic and private WASH services that are accessible to adolescent girls with disabilities are a major barrier to adequate management of menstrual hygiene. In contexts of social and economic vulnerability, this barrier is often compounded by the struggle to access menstrual hygiene products. However, even when such products and services are available, girls with disabilities can still have problems using them, either physically or through lack of understanding of how to use them.30
When girls with disabilities are unable to manage menstruation hygiene, they face increased risks of
not participating in everyday activities and of feeling ashamed and socially isolated.31 This can cause girls to miss school when school-based facilities are not accessible or when they are unable to physically manage their own menstrual hygiene and there is not a caregiver at the school who is able or willing to help.32
FIGURE 6.5 Percentage of girls aged 15 to 17 years using menstrual hygiene products with a private place to wash and change
Use of menstrual products and access to a private place to wash and change are similar for girls with and without disabilities
Girls withoutfunctional difficulties
Girls with oneor more functional
difficulties
Girls with anxietyor depression
symptoms only
Girls with one ormore severe functional
difficulties, withoutanxiety or depression
symptoms
Girls with morethan one
functional difficulty
Girls with morethan one severe
functional difficulty
84 86 82 84 8688
© UNICEF/UN0214841/Vishwanathan
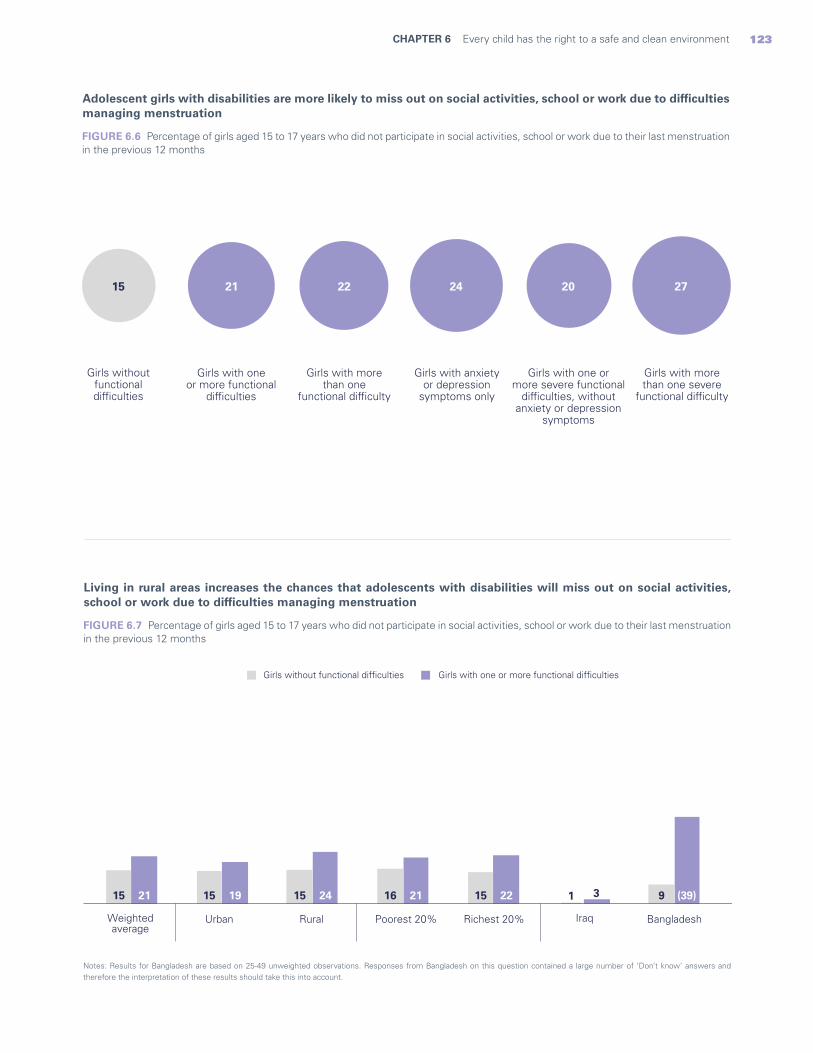
123CHAPTER 6 Every child has the right to a safe and clean environment
FIGURE 6.6 Percentage of girls aged 15 to 17 years who did not participate in social activities, school or work due to their last menstruation in the previous 12 months
Adolescent girls with disabilities are more likely to miss out on social activities, school or work due to difficulties managing menstruation
Notes: Results for Bangladesh are based on 25-49 unweighted observations. Responses from Bangladesh on this question contained a large number of ‘Don’t know’ answers and therefore the interpretation of these results should take this into account.
FIGURE 6.7 Percentage of girls aged 15 to 17 years who did not participate in social activities, school or work due to their last menstruation in the previous 12 months
Living in rural areas increases the chances that adolescents with disabilities will miss out on social activities, school or work due to difficulties managing menstruation
Girls withoutfunctionaldifficulties
Girls with oneor more functional
difficulties
Girls with anxietyor depression
symptoms only
Girls with one ormore severe functional
difficulties, withoutanxiety or depression
symptoms
Girls with morethan one
functional difficulty
Girls with morethan one severe
functional difficulty
21 22 24 20 2715
(39)32221241921 911516151515
Girls without functional difficulties Girls with one or more functional difficulties
Weightedaverage
Urban Rural Poorest 20% Richest 20% Iraq Bangladesh
124 Seen, Counted, Included: Using data to shed light on the well-being of children with disabilities
Takeaways and programmatic implications
Depriving children with disabilities of access to WASH services not only aggravates their risk for poor health and well-being but also has ramifications for their experience of social isolation, loss of dignity and exclusion from basic human rights.
The data in this chapter capture some of the challenges faced by children with disabilities when accessing WASH services. As a group, they are less likely to have drinking water and sanitation facilities on premises than children without disabilities. They are also slightly less likely to have basic handwashing facilities on premises. These differences are significantly more pronounced for adolescent girls who are managing menstruation. While a slight difference was found in the availability of a private place to wash and change (with girls with disabilities at a disadvantage), substantial differences were found in how this impacts their participation in society. Adolescent girls with disabilities are far more likely not to participate in social activities, school or work due to menstruation than girls without disabilities. For all indicators, significant variations were found among countries, both in the overall availability of WASH services as well as in their availability to children with disabilities.
When interpreting these findings, it must be reiterated that the data in this chapter present a far from complete picture of the WASH status of children with disabilities. Even in situations where a household has basic water, sanitation and hygiene facilities, children with disabilities may still encounter obstacles to using them.33 Many of the challenges in accessing and using WASH services are dependent on the types of adaptations they provide to accommodate the needs of children with various impairments. Unfortunately, this information is not yet reflected in available data.
To address the challenges that children with disabilities experience in using WASH services, steps need to be taken at all levels of society. Governments need to invest in the development of national standards as well as programming to ensure that safe WASH facilities are available in all households, schools, health centres and public facilities and are constructed to be used by children with a wide array of impairments. COVID-19 has highlighted the importance of handwashing with
soap, and further investment is needed in accessible handwashing facilities. Moreover, disability-inclusive programmes need to be developed to remove barriers that prevent girls with disabilities from participating in society when they are menstruating. This means making affordable and suitable menstrual hygiene products available as well as ensuring that public buildings, including schools and health centres, have gender-sensitive and disability-accessible sanitation facilities. It is also critical to provide information on menstrual health and hygiene in various formats, including easy-to-read instructions for those with intellectual impairments, so that girls with different types of disabilities can understand them. Additionally, training is needed for parents of girls with disabilities to understand and support their daughters in managing menstruation.
Management of menstruation and of menstrual hygiene has important ethical and human rights implications, with profound impacts on the lives of young girls. In certain situations, adolescents with disabilities may be medicated to suppress or stop their menstruation or even forced to undergo hysterectomies.34 These practices are not carried out in the best interest of the child35 and can lead to irreversible damage. Young women with disabilities and their families need to be supported and empowered with relevant knowledge, attitudes and skills that can help them make informed decisions.
Increasing access to WASH services for children with disabilities can help reduce the barriers they face in realizing many other rights, including education and health. The SDG commitment to leave no one behind and to promote universal access means that targeting children with disabilities should be a priority for governments and all other stakeholders. This includes sustaining advocacy efforts and increasing investments to strengthen WASH sector programming, monitoring and reporting systems so that a disability-inclusive perspective is fully incorporated to address the needs of all children.
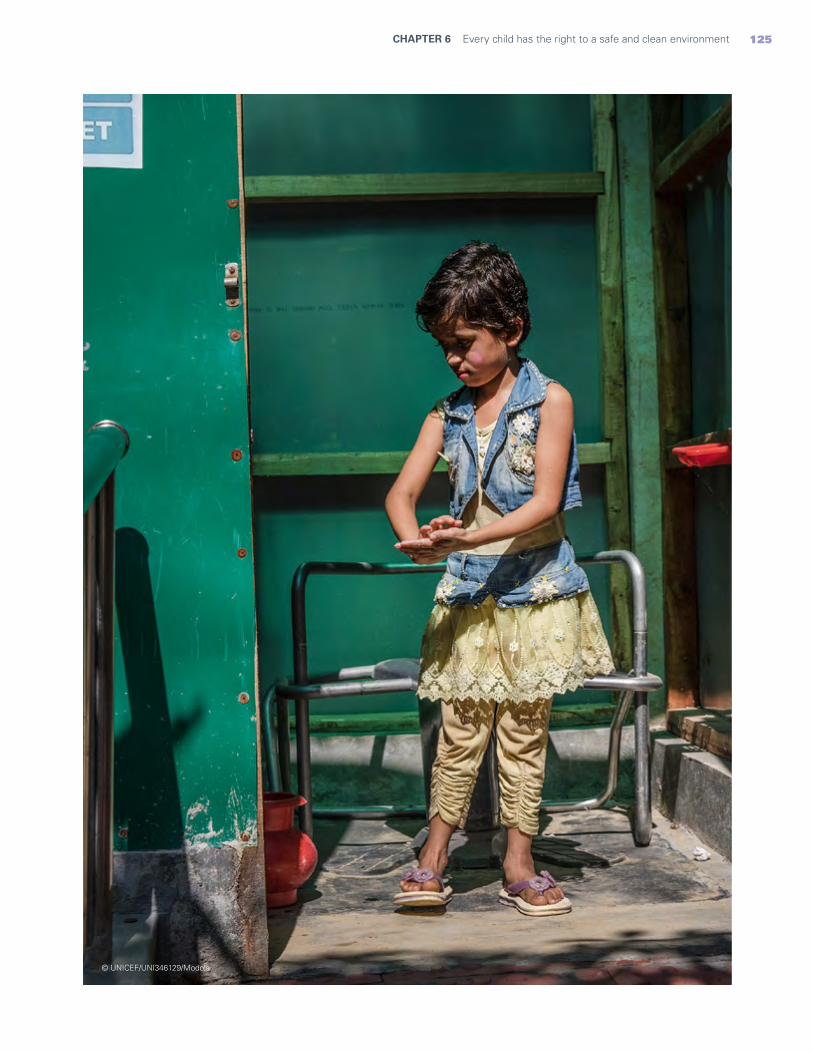
125CHAPTER 6 Every child has the right to a safe and clean environment
© UNICEF/UNI346129/Modola
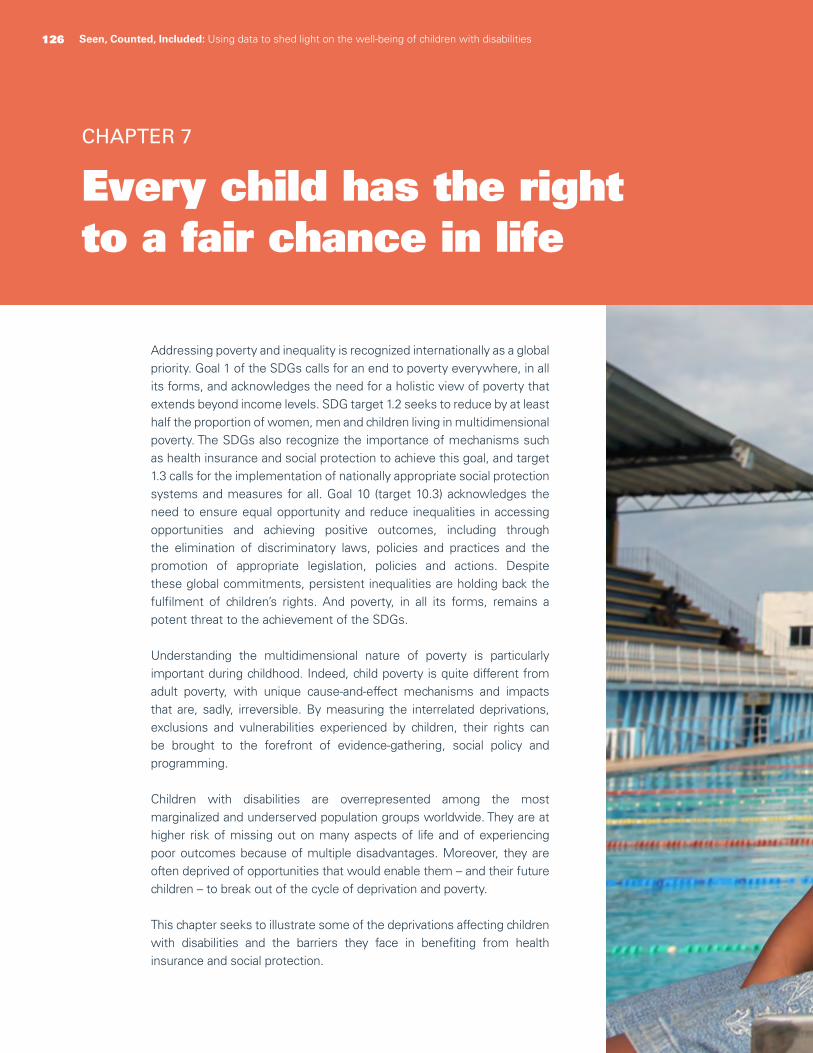
Every child has the right to a fair chance in life
CHAPTER 7
Addressing poverty and inequality is recognized internationally as a global priority. Goal 1 of the SDGs calls for an end to poverty everywhere, in all its forms, and acknowledges the need for a holistic view of poverty that extends beyond income levels. SDG target 1.2 seeks to reduce by at least half the proportion of women, men and children living in multidimensional poverty. The SDGs also recognize the importance of mechanisms such as health insurance and social protection to achieve this goal, and target 1.3 calls for the implementation of nationally appropriate social protection systems and measures for all. Goal 10 (target 10.3) acknowledges the need to ensure equal opportunity and reduce inequalities in accessing opportunities and achieving positive outcomes, including through the elimination of discriminatory laws, policies and practices and the promotion of appropriate legislation, policies and actions. Despite these global commitments, persistent inequalities are holding back the fulfilment of children’s rights. And poverty, in all its forms, remains a potent threat to the achievement of the SDGs.
Understanding the multidimensional nature of poverty is particularly important during childhood. Indeed, child poverty is quite different from adult poverty, with unique cause-and-effect mechanisms and impacts that are, sadly, irreversible. By measuring the interrelated deprivations, exclusions and vulnerabilities experienced by children, their rights can be brought to the forefront of evidence-gathering, social policy and programming.
Children with disabilities are overrepresented among the most marginalized and underserved population groups worldwide. They are at higher risk of missing out on many aspects of life and of experiencing poor outcomes because of multiple disadvantages. Moreover, they are often deprived of opportunities that would enable them – and their future children – to break out of the cycle of deprivation and poverty.
This chapter seeks to illustrate some of the deprivations affecting children with disabilities and the barriers they face in benefiting from health insurance and social protection.
Seen, Counted, Included: Using data to shed light on the well-being of children with disabilities126
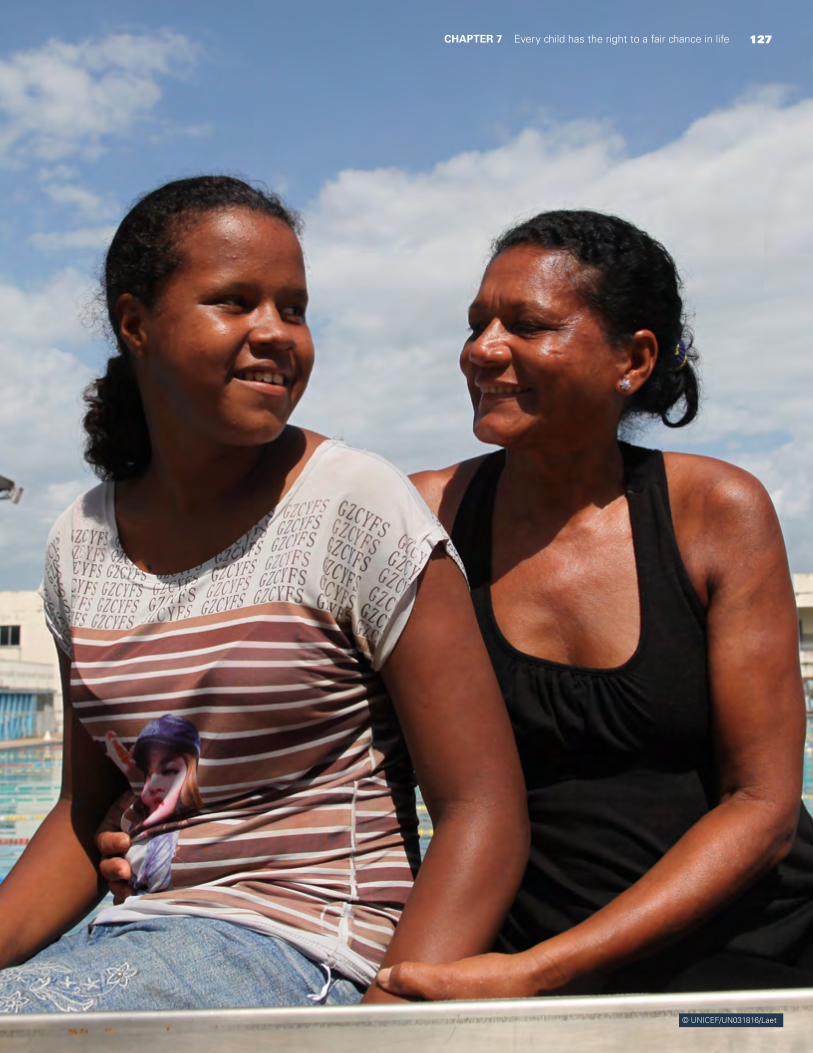
127CHAPTER 7 Every child has the right to a fair chance in life
© UNICEF/UN031816/Laet
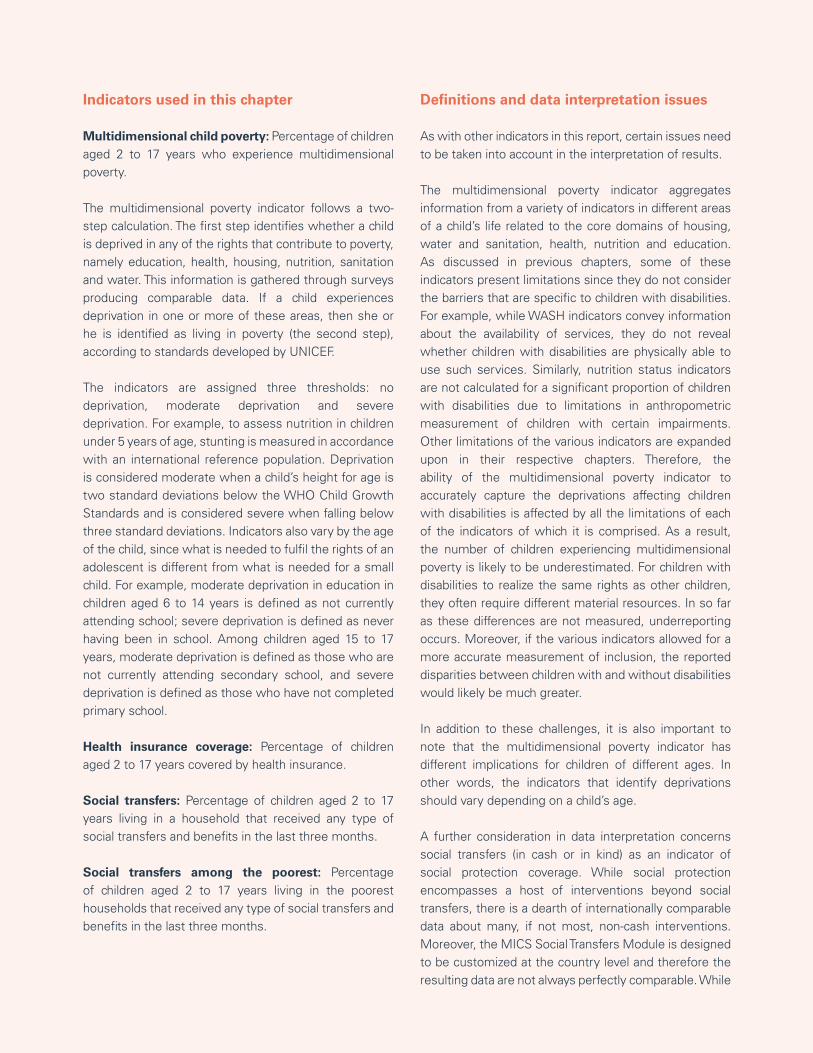
128 Seen, Counted, Included: Using data to shed light on the well-being of children with disabilities
Indicators used in this chapter
Multidimensional child poverty: Percentage of children aged 2 to 17 years who experience multidimensional poverty.
The multidimensional poverty indicator follows a two-step calculation. The first step identifies whether a child is deprived in any of the rights that contribute to poverty, namely education, health, housing, nutrition, sanitation and water. This information is gathered through surveys producing comparable data. If a child experiences deprivation in one or more of these areas, then she or he is identified as living in poverty (the second step), according to standards developed by UNICEF.
The indicators are assigned three thresholds: no deprivation, moderate deprivation and severe deprivation. For example, to assess nutrition in children under 5 years of age, stunting is measured in accordance with an international reference population. Deprivation is considered moderate when a child’s height for age is two standard deviations below the WHO Child Growth Standards and is considered severe when falling below three standard deviations. Indicators also vary by the age of the child, since what is needed to fulfil the rights of an adolescent is different from what is needed for a small child. For example, moderate deprivation in education in children aged 6 to 14 years is defined as not currently attending school; severe deprivation is defined as never having been in school. Among children aged 15 to 17 years, moderate deprivation is defined as those who are not currently attending secondary school, and severe deprivation is defined as those who have not completed primary school.
Health insurance coverage: Percentage of children aged 2 to 17 years covered by health insurance.
Social transfers: Percentage of children aged 2 to 17 years living in a household that received any type of social transfers and benefits in the last three months.
Social transfers among the poorest: Percentage of children aged 2 to 17 years living in the poorest households that received any type of social transfers and benefits in the last three months.
Definitions and data interpretation issues
As with other indicators in this report, certain issues need to be taken into account in the interpretation of results.
The multidimensional poverty indicator aggregates information from a variety of indicators in different areas of a child’s life related to the core domains of housing, water and sanitation, health, nutrition and education. As discussed in previous chapters, some of these indicators present limitations since they do not consider the barriers that are specific to children with disabilities. For example, while WASH indicators convey information about the availability of services, they do not reveal whether children with disabilities are physically able to use such services. Similarly, nutrition status indicators are not calculated for a significant proportion of children with disabilities due to limitations in anthropometric measurement of children with certain impairments. Other limitations of the various indicators are expanded upon in their respective chapters. Therefore, the ability of the multidimensional poverty indicator to accurately capture the deprivations affecting children with disabilities is affected by all the limitations of each of the indicators of which it is comprised. As a result, the number of children experiencing multidimensional poverty is likely to be underestimated. For children with disabilities to realize the same rights as other children, they often require different material resources. In so far as these differences are not measured, underreporting occurs. Moreover, if the various indicators allowed for a more accurate measurement of inclusion, the reported disparities between children with and without disabilities would likely be much greater.
In addition to these challenges, it is also important to note that the multidimensional poverty indicator has different implications for children of different ages. In other words, the indicators that identify deprivations should vary depending on a child’s age.
A further consideration in data interpretation concerns social transfers (in cash or in kind) as an indicator of social protection coverage. While social protection encompasses a host of interventions beyond social transfers, there is a dearth of internationally comparable data about many, if not most, non-cash interventions. Moreover, the MICS Social Transfers Module is designed to be customized at the country level and therefore the resulting data are not always perfectly comparable. While
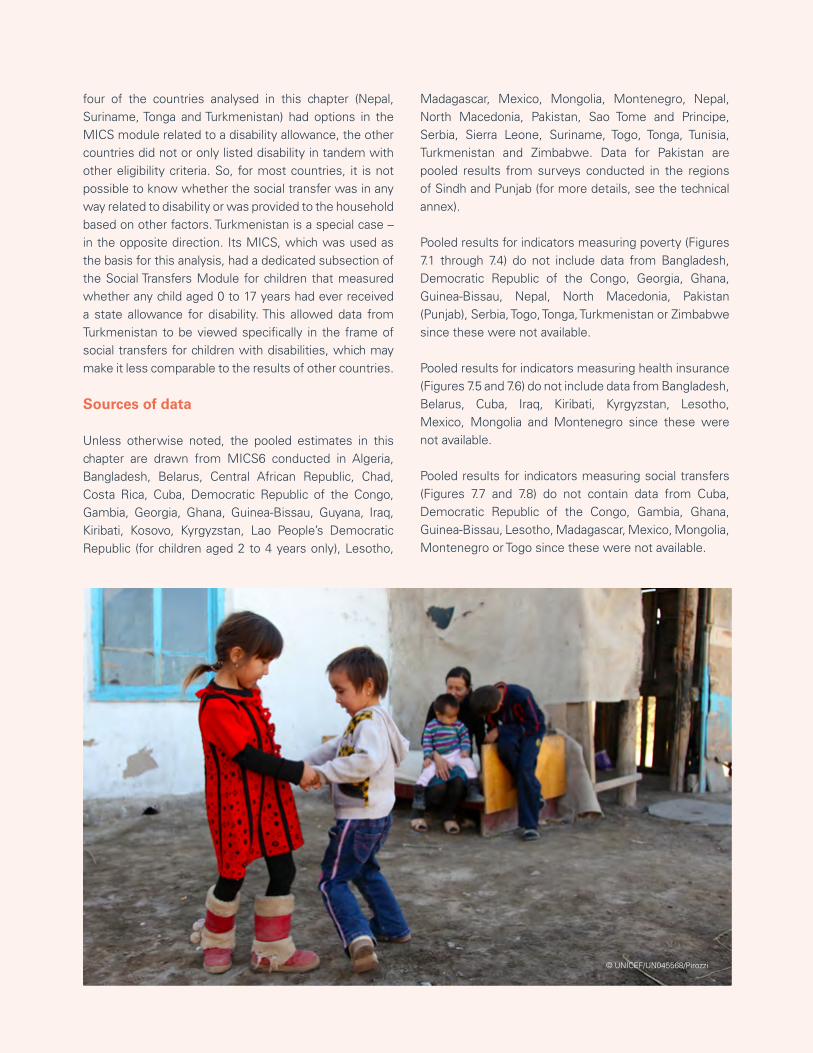
129CHAPTER 7 Every child has the right to a fair chance in life
four of the countries analysed in this chapter (Nepal, Suriname, Tonga and Turkmenistan) had options in the MICS module related to a disability allowance, the other countries did not or only listed disability in tandem with other eligibility criteria. So, for most countries, it is not possible to know whether the social transfer was in any way related to disability or was provided to the household based on other factors. Turkmenistan is a special case – in the opposite direction. Its MICS, which was used as the basis for this analysis, had a dedicated subsection of the Social Transfers Module for children that measured whether any child aged 0 to 17 years had ever received a state allowance for disability. This allowed data from Turkmenistan to be viewed specifically in the frame of social transfers for children with disabilities, which may make it less comparable to the results of other countries.
Sources of data
Unless otherwise noted, the pooled estimates in this chapter are drawn from MICS6 conducted in Algeria, Bangladesh, Belarus, Central African Republic, Chad, Costa Rica, Cuba, Democratic Republic of the Congo, Gambia, Georgia, Ghana, Guinea-Bissau, Guyana, Iraq, Kiribati, Kosovo, Kyrgyzstan, Lao People’s Democratic Republic (for children aged 2 to 4 years only), Lesotho,
Madagascar, Mexico, Mongolia, Montenegro, Nepal, North Macedonia, Pakistan, Sao Tome and Principe, Serbia, Sierra Leone, Suriname, Togo, Tonga, Tunisia, Turkmenistan and Zimbabwe. Data for Pakistan are pooled results from surveys conducted in the regions of Sindh and Punjab (for more details, see the technical annex).
Pooled results for indicators measuring poverty (Figures 7.1 through 7.4) do not include data from Bangladesh, Democratic Republic of the Congo, Georgia, Ghana, Guinea-Bissau, Nepal, North Macedonia, Pakistan (Punjab), Serbia, Togo, Tonga, Turkmenistan or Zimbabwe since these were not available.
Pooled results for indicators measuring health insurance (Figures 7.5 and 7.6) do not include data from Bangladesh, Belarus, Cuba, Iraq, Kiribati, Kyrgyzstan, Lesotho, Mexico, Mongolia and Montenegro since these were not available.
Pooled results for indicators measuring social transfers (Figures 7.7 and 7.8) do not contain data from Cuba, Democratic Republic of the Congo, Gambia, Ghana, Guinea-Bissau, Lesotho, Madagascar, Mexico, Mongolia, Montenegro or Togo since these were not available.
© UNICEF/UN045568/Pirozzi
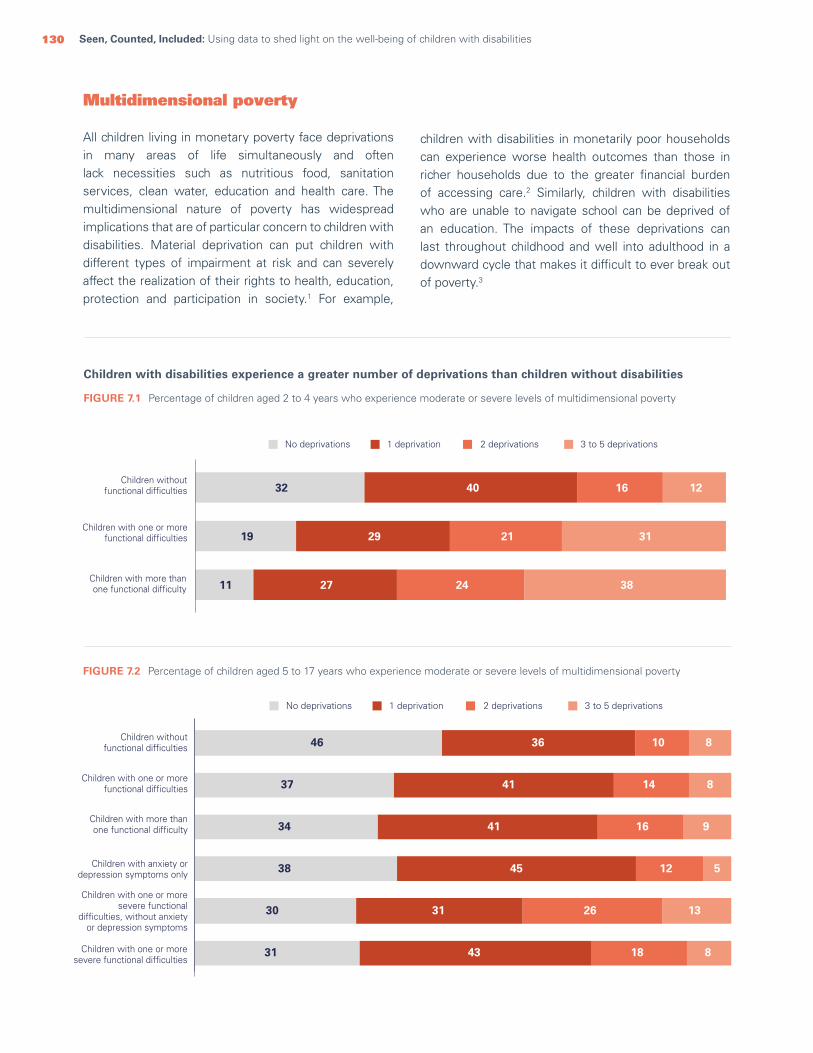
130 Seen, Counted, Included: Using data to shed light on the well-being of children with disabilities
Multidimensional poverty
All children living in monetary poverty face deprivations in many areas of life simultaneously and often lack necessities such as nutritious food, sanitation services, clean water, education and health care. The multidimensional nature of poverty has widespread implications that are of particular concern to children with disabilities. Material deprivation can put children with different types of impairment at risk and can severely affect the realization of their rights to health, education, protection and participation in society.1 For example,
Children with disabilities experience a greater number of deprivations than children without disabilities
FIGURE 7.1 Percentage of children aged 2 to 4 years who experience moderate or severe levels of multidimensional poverty
children with disabilities in monetarily poor households can experience worse health outcomes than those in richer households due to the greater financial burden of accessing care.2 Similarly, children with disabilities who are unable to navigate school can be deprived of an education. The impacts of these deprivations can last throughout childhood and well into adulthood in a downward cycle that makes it difficult to ever break out of poverty.3
FIGURE 7.2 Percentage of children aged 5 to 17 years who experience moderate or severe levels of multidimensional poverty
Children without functional difficulties
Children with one or morefunctional difficulties
Children with one or moresevere functional difficulties
Children with more thanone functional difficulty
Children with anxiety ordepression symptoms only
Children with one or moresevere functional
difficulties, without anxietyor depression symptoms
1 deprivation 2 deprivations 3 to 5 deprivationsNo deprivations
8
8
14
10
41
36
37
46
9164134
5124538
13263130
8184331
Children without functional difficulties
Children with one or morefunctional difficulties
Children with more thanone functional difficulty
1 deprivation 2 deprivations 3 to 5 deprivationsNo deprivations
11
19
32
38
31
12
24
21
16
27
29
40
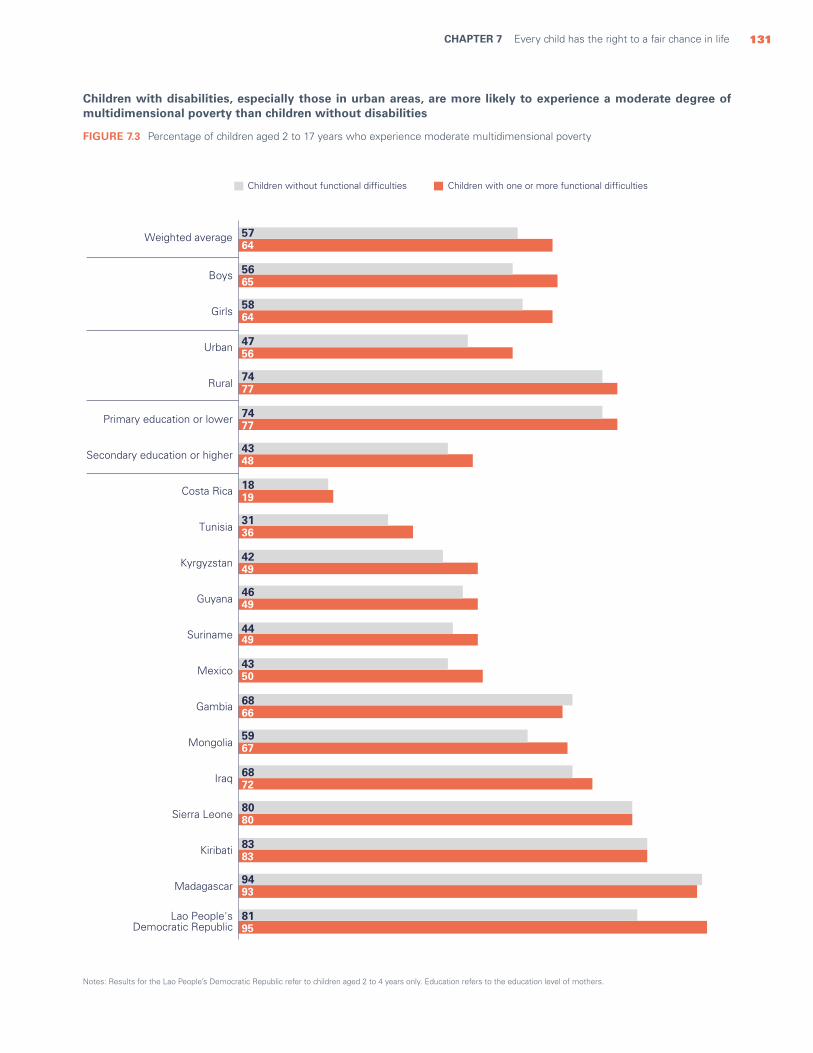
131CHAPTER 7 Every child has the right to a fair chance in life
Children with disabilities, especially those in urban areas, are more likely to experience a moderate degree of multidimensional poverty than children without disabilities
Notes: Results for the Lao People’s Democratic Republic refer to children aged 2 to 4 years only. Education refers to the education level of mothers.
FIGURE 7.3 Percentage of children aged 2 to 17 years who experience moderate multidimensional poverty
Weighted average
Boys
Girls
Urban
Rural
Primary education or lower
Secondary education or higher
Costa Rica
Tunisia
Kyrgyzstan
Guyana
Suriname
Mexico
Gambia
Mongolia
Iraq
Sierra Leone
Kiribati
Madagascar
Lao People's Democratic Republic
5764
5665
5864
4756
7477
7477
4348
1819
3136
4249
4649
4449
4350
6866
5967
6872
8080
8383
9493
8195
Children with one or more functional difficultiesChildren without functional difficulties
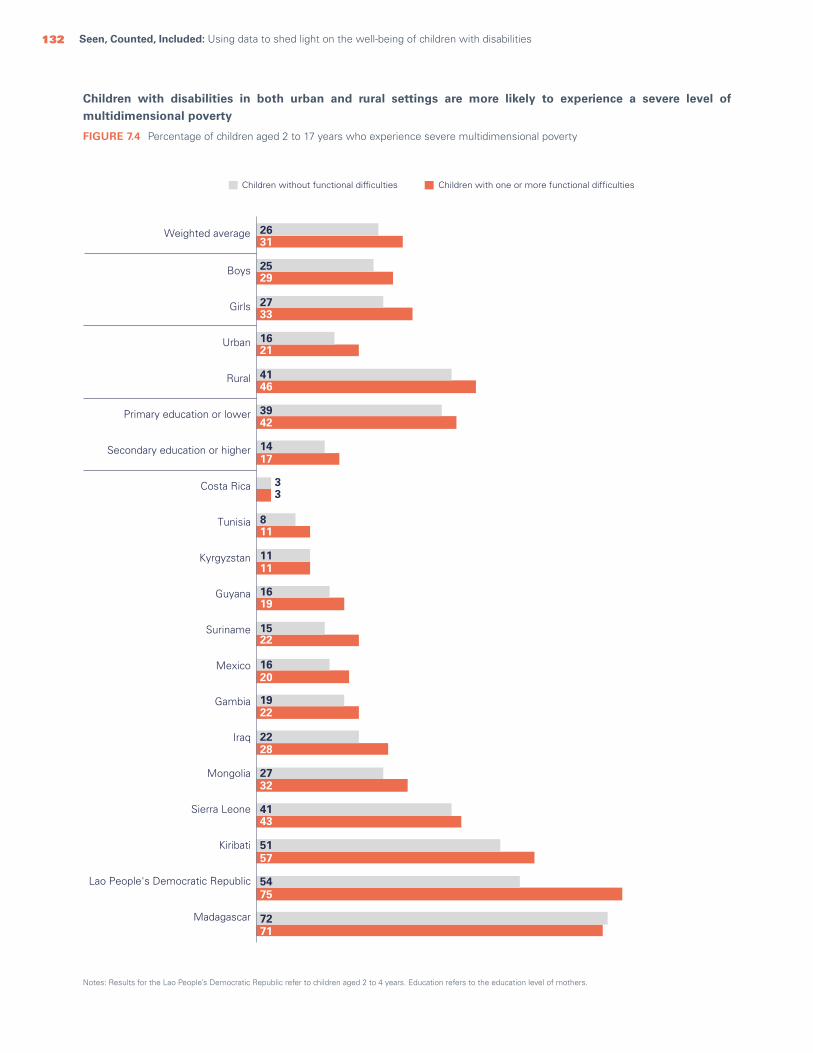
132 Seen, Counted, Included: Using data to shed light on the well-being of children with disabilities
Children with disabilities in both urban and rural settings are more likely to experience a severe level of multidimensional poverty
Notes: Results for the Lao People’s Democratic Republic refer to children aged 2 to 4 years. Education refers to the education level of mothers.
FIGURE 7.4 Percentage of children aged 2 to 17 years who experience severe multidimensional poverty
Weighted average
Boys
Girls
Urban
Rural
Primary education or lower
Secondary education or higher
Costa Rica
Tunisia
Kyrgyzstan
Guyana
Suriname
Mexico
Gambia
Iraq
Mongolia
Sierra Leone
Kiribati
Lao People's Democratic Republic
Madagascar
2631
2529
2733
1621
4146
3942
1417
33
811
1111
1619
1522
1620
1922
2228
2732
4143
5157
5475
7271
Children with one or more functional difficultiesChildren without functional difficulties

133CHAPTER 7 Every child has the right to a fair chance in life
Health insurance and social transfers
The right to health and social security seeks to address and mitigate existing inequalities, including those that affect persons with disabilities. Children with disabilities often face disproportionately higher health-care costs due to their need for extra health care and specialized services, as well as assistive devices and transportation. The burden of these additional expenses often falls entirely on families4 and can be exacerbated by a loss of income if one or both parents have to give up – or make major sacrifices in – their jobs to care for their child.5 As a result, persons with disabilities and their families are among those who can benefit most from social transfers and health insurance policies. All too often, however, these do not reach those most in need.6 Many social transfer programmes are underfunded, resulting in gaps in service. And, in some countries, they fail to explicitly include children.7 Among low- and middle-income countries, only a few provide specific child-disability benefits.8 Similarly, many children with disabilities do not have access to health insurance, or significant gaps in coverage mean that many disability-specific health needs are not adequately covered.9
Realizing the right to social protection, including access to social transfers and health insurance, can be challenging
for families of children with disabilities due to lack of knowledge and understanding of available programmes, as well as stringent requirements and conditions for programme inclusion.10 Long distances to service points can also present barriers.11 In terms of health insurance, the cost for disability-specific coverage can be prohibitive and can vary dramatically depending on the type of disability.12
Significant benefits accrue from giving children with disabilities access to both health insurance and social transfers. Social transfers in the form of money, particularly unconditional cash transfers, for individuals with disabilities can reduce the burden of care on other family members, provide access to additional support services and bolster the independence of the individual with disabilities.13 In addition, social transfers can help alleviate financial stress within families, especially in situations where parents have had to give up or limit their employment in order to care for a child with disabilities.14 Access to health insurance helps remove financial barriers to health care, ensuring that children with disabilities can get the care they need without undue financial stress on their families, helping them live healthier lives.15
Health-insurance coverage is insufficient for all children, but especially those with disabilities. Children who live in rural areas, in the poorest households and whose mothers have low levels of education are least likely to have health insurance
FIGURE 7.5 Percentage of children aged 2 to 17 years covered by health insurance
Weightedaverage
Boys Girls Urban Rural
209247919131313 167207717111111 188227817121212Primary
education or lower
Poorest20%
Richest20%
Secondaryeducationor higher
Children with one or more functional difficultiesChildren without functional difficulties Children with more than one functional difficulty
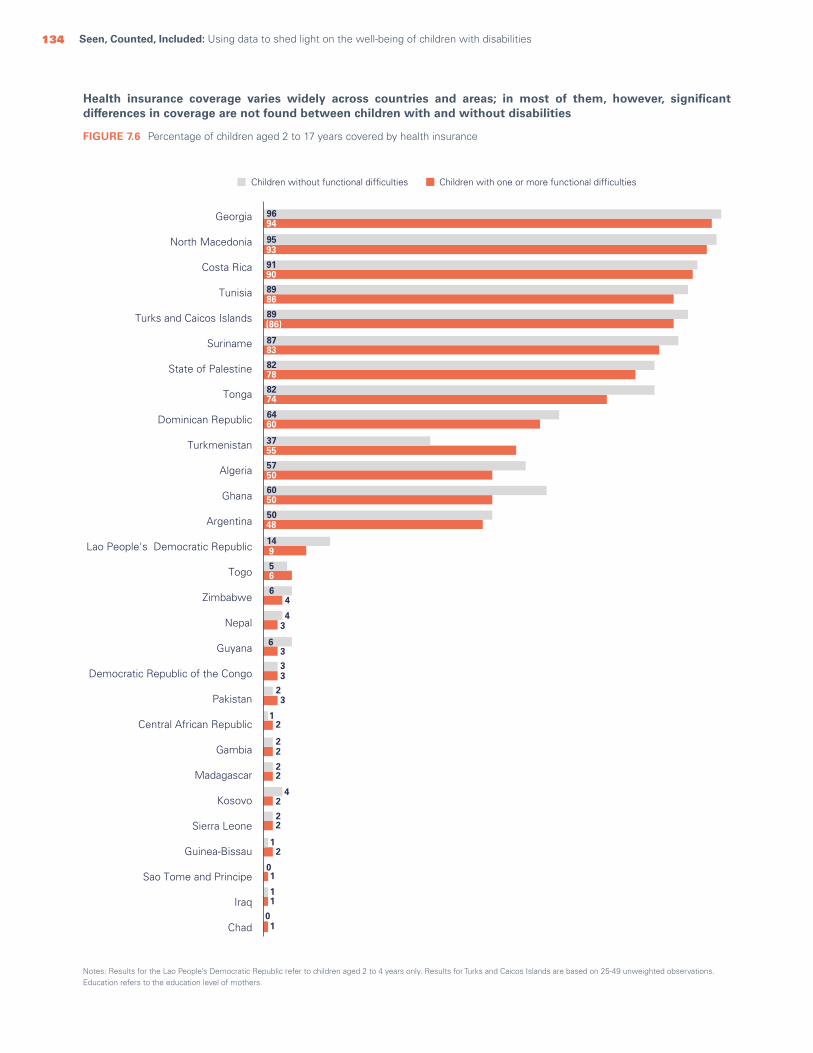
134 Seen, Counted, Included: Using data to shed light on the well-being of children with disabilities
Health insurance coverage varies widely across countries and areas; in most of them, however, significant differences in coverage are not found between children with and without disabilities
Notes: Results for the Lao People’s Democratic Republic refer to children aged 2 to 4 years only. Results for Turks and Caicos Islands are based on 25-49 unweighted observations. Education refers to the education level of mothers.
FIGURE 7.6 Percentage of children aged 2 to 17 years covered by health insurance
Children without functional difficulties Children with one or more functional difficulties
9694
9593
9190
8986
89(86)
8783
8278
8274
6460
3755
5750
6050
5048
149
56
6
6
4
4
33
22
3
3
23
22
22
11
01
01
12
42
12
Georgia
North Macedonia
Costa Rica
Tunisia
Turks and Caicos Islands
Suriname
State of Palestine
Tonga
Dominican Republic
Turkmenistan
Algeria
Ghana
Argentina
Lao People's Democratic Republic
Togo
Zimbabwe
Nepal
Guyana
Democratic Republic of the Congo
Pakistan
Central African Republic
Gambia
Madagascar
Kosovo
Sierra Leone
Guinea-Bissau
Sao Tome and Principe
Iraq
Chad
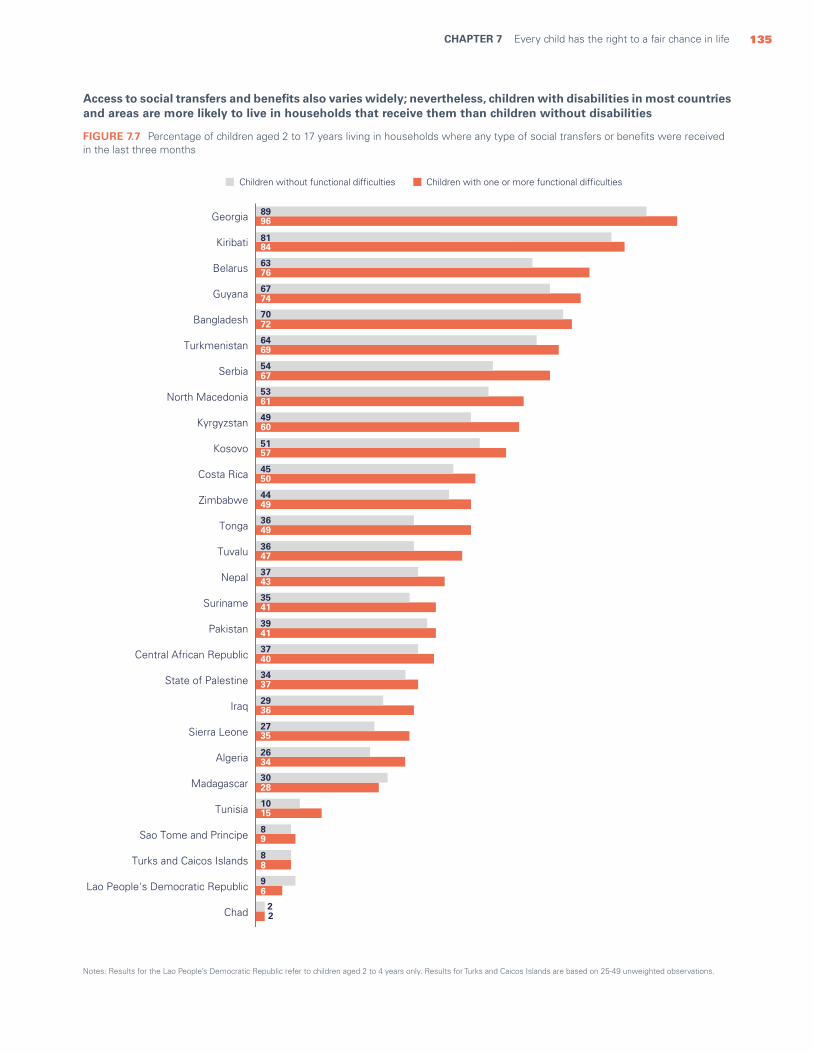
135CHAPTER 7 Every child has the right to a fair chance in life
Access to social transfers and benefits also varies widely; nevertheless, children with disabilities in most countries and areas are more likely to live in households that receive them than children without disabilities
Notes: Results for the Lao People’s Democratic Republic refer to children aged 2 to 4 years only. Results for Turks and Caicos Islands are based on 25-49 unweighted observations.
FIGURE 7.7 Percentage of children aged 2 to 17 years living in households where any type of social transfers or benefits were received in the last three months
2
6
8
9
15
28
34
35
36
37
40
41
41
43
47
49
49
50
57
60
61
67
69
72
74
76
84
96
2
9
8
8
10
30
26
27
29
34
37
39
35
37
36
36
44
45
51
49
53
54
64
70
67
63
81
89Georgia
Kiribati
Belarus
Guyana
Bangladesh
Turkmenistan
Serbia
North Macedonia
Kyrgyzstan
Kosovo
Costa Rica
Zimbabwe
Tonga
Tuvalu
Nepal
Suriname
Pakistan
Central African Republic
State of Palestine
Iraq
Sierra Leone
Algeria
Madagascar
Tunisia
Sao Tome and Principe
Turks and Caicos Islands
Lao People's Democratic Republic
Chad
Children without functional difficulties Children with one or more functional difficulties

136 Seen, Counted, Included: Using data to shed light on the well-being of children with disabilities
In the poorest households, however, children without disabilities are just as likely to live in a household receiving social transfers and benefits as children with disabilities
Note: Results for the Lao People’s Democratic Republic refer to children aged 2 to 4 years only.
FIGURE 7.8 Percentage of children aged 2 to 17 years living in the poorest households where any type of social transfers and benefits were received in the last three months
Georgia
State of Palestine
Kiribati
North Macedonia
Guyana
Belarus
Bangladesh
Costa Rica
Kyrgyzstan
Tonga
Kosovo
Zimbabwe
Nepal
Suriname
Pakistan
Algeria
Iraq
Central African Republic
Madagascar
Sierra Leone
Tunisia
Sao Tome and Principe
Chad
Lao People's Democratic Republic
9893
7978
7779
7764
76
7374
70
7272
6565
6458
6431
6463
5558
5548
4031
4035
3531
2623
2419
77
22
1
4
4943
4444
3743
4
Children without functional difficulties Children with one or more functional difficulties
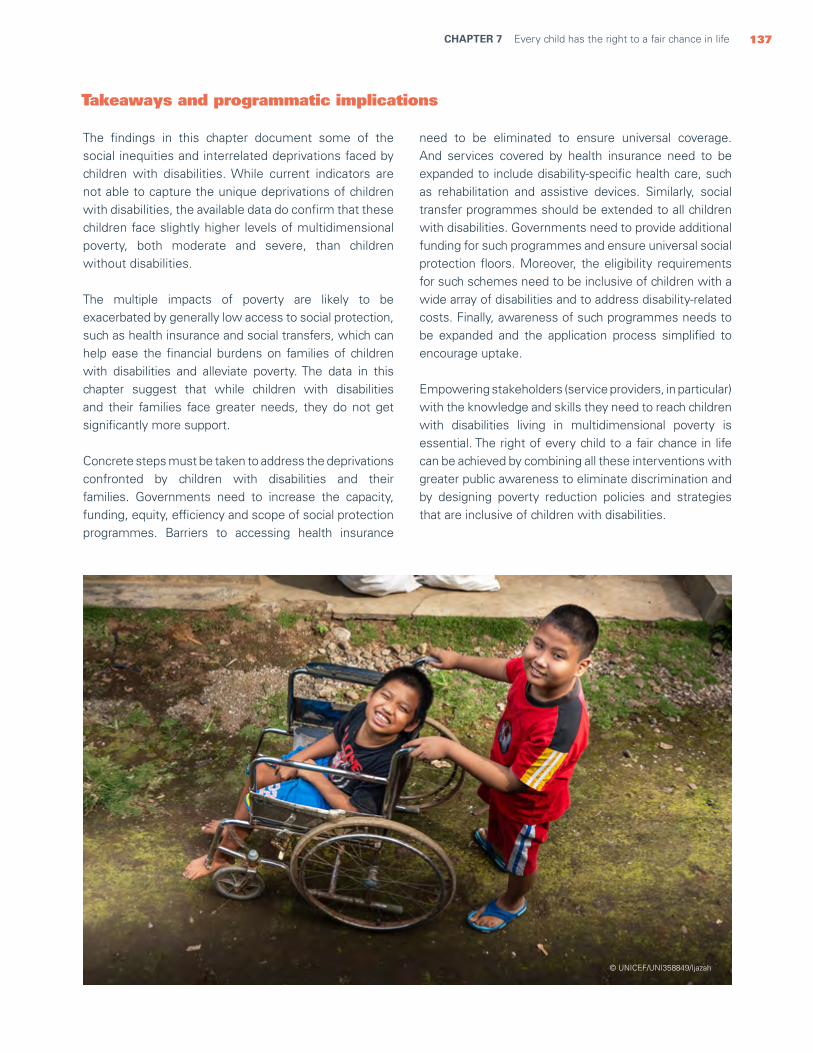
137CHAPTER 7 Every child has the right to a fair chance in life
Takeaways and programmatic implications
need to be eliminated to ensure universal coverage. And services covered by health insurance need to be expanded to include disability-specific health care, such as rehabilitation and assistive devices. Similarly, social transfer programmes should be extended to all children with disabilities. Governments need to provide additional funding for such programmes and ensure universal social protection floors. Moreover, the eligibility requirements for such schemes need to be inclusive of children with a wide array of disabilities and to address disability-related costs. Finally, awareness of such programmes needs to be expanded and the application process simplified to encourage uptake.
Empowering stakeholders (service providers, in particular) with the knowledge and skills they need to reach children with disabilities living in multidimensional poverty is essential. The right of every child to a fair chance in life can be achieved by combining all these interventions with greater public awareness to eliminate discrimination and by designing poverty reduction policies and strategies that are inclusive of children with disabilities.
The findings in this chapter document some of the social inequities and interrelated deprivations faced by children with disabilities. While current indicators are not able to capture the unique deprivations of children with disabilities, the available data do confirm that these children face slightly higher levels of multidimensional poverty, both moderate and severe, than children without disabilities.
The multiple impacts of poverty are likely to be exacerbated by generally low access to social protection, such as health insurance and social transfers, which can help ease the financial burdens on families of children with disabilities and alleviate poverty. The data in this chapter suggest that while children with disabilities and their families face greater needs, they do not get significantly more support.
Concrete steps must be taken to address the deprivations confronted by children with disabilities and their families. Governments need to increase the capacity, funding, equity, efficiency and scope of social protection programmes. Barriers to accessing health insurance
© UNICEF/UNI358849/Ijazah
138 Seen, Counted, Included: Using data to shed light on the well-being of children with disabilities
Every child has the right to a happy life, free from discrimination
CHAPTER 8
Subjective well-being is how individuals assess their situation in life and is influenced by both actual experiences and perceptions. More specifically, it is an individual’s perceived happiness, whether he or she has positive expectations for the future and how satisfied he or she is in daily life. Children with high levels of subjective well-being often experience more positive personal, behavioural and social outcomes than children with lower levels; they also tend to be more resilient in stressful life situations.1
How individuals perceive their own well-being is based on a wide array of factors. Experiences of deprivation can result in lower levels of life satisfaction, whereas experiences of strong parental and familial relationships can result in higher life satisfaction.2 Since children with disabilities frequently experience deprivations and barriers, it is reasonable to assume that these constraints have a negative impact on their subjective well-being compared with children without disabilities.
The specific challenges that children with disabilities face in their daily lives vary significantly based on the dynamic between their impairment(s) and their environment. Children who live in unaccommodating environments can be prevented from participating fully in their communities, and such exclusion is likely to affect both their current happiness and how they perceive their future.
One factor that can influence the subjective well-being of children with disabilities is discrimination. Children have the right to live free from discrimination in any form, including discrimination based on disability, as outlined in article 2 of the Convention on the Rights of the Child and article 5 of the Convention on the Rights of Persons with Disabilities. Nevertheless, many children with disabilities experience discrimination because of their impairments. Since discrimination can raise barriers in accessing services that these children need to realize their rights, it is likely that it negatively affects their subjective well-being.
Seen, Counted, Included: Using data to shed light on the well-being of children with disabilities138
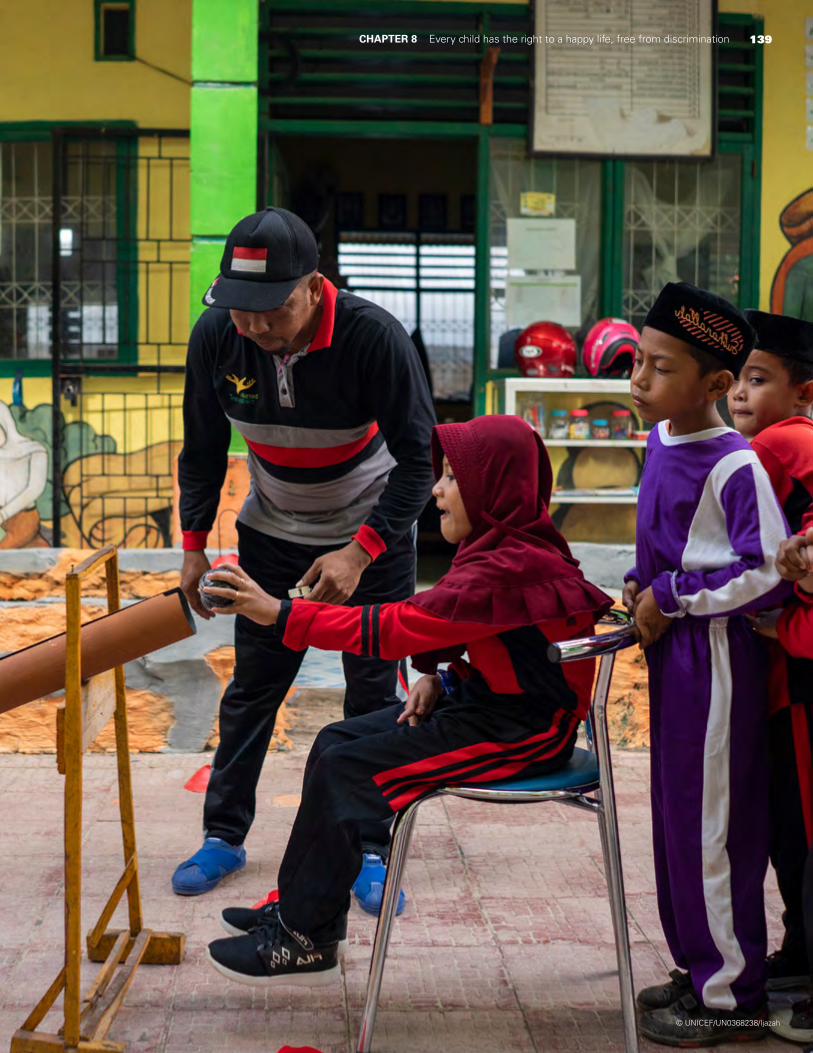
139CHAPTER 8 Every child has the right to a happy life, free from discrimination 139CHAPTER 8 Every child has the right to a happy life, free from discrimination
© UNICEF/UN0368238/Ijazah
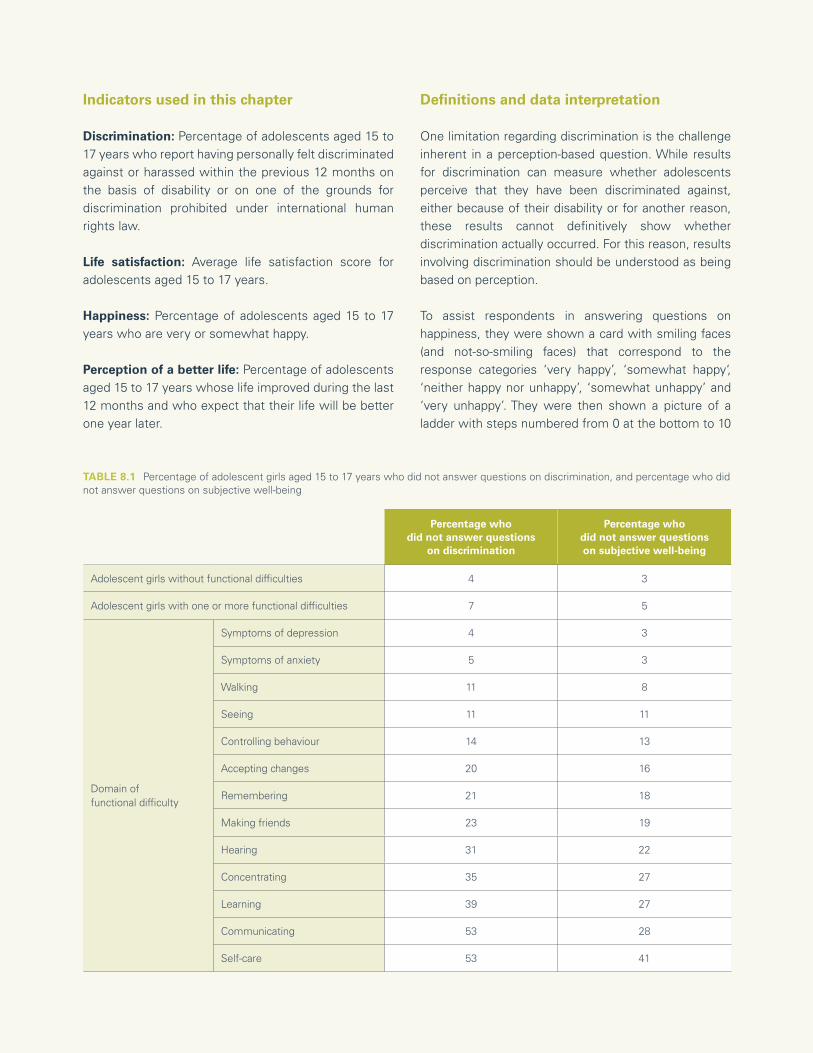
140 Seen, Counted, Included: Using data to shed light on the well-being of children with disabilities
Indicators used in this chapter
Discrimination: Percentage of adolescents aged 15 to 17 years who report having personally felt discriminated against or harassed within the previous 12 months on the basis of disability or on one of the grounds for discrimination prohibited under international human rights law.
Life satisfaction: Average life satisfaction score for adolescents aged 15 to 17 years.
Happiness: Percentage of adolescents aged 15 to 17 years who are very or somewhat happy.
Perception of a better life: Percentage of adolescents aged 15 to 17 years whose life improved during the last 12 months and who expect that their life will be better one year later.
Definitions and data interpretation
One limitation regarding discrimination is the challenge inherent in a perception-based question. While results for discrimination can measure whether adolescents perceive that they have been discriminated against, either because of their disability or for another reason, these results cannot definitively show whether discrimination actually occurred. For this reason, results involving discrimination should be understood as being based on perception.
To assist respondents in answering questions on happiness, they were shown a card with smiling faces (and not-so-smiling faces) that correspond to the response categories ‘very happy’, ‘somewhat happy‘, ‘neither happy nor unhappy’, ‘somewhat unhappy’ and ‘very unhappy’. They were then shown a picture of a ladder with steps numbered from 0 at the bottom to 10
Percentage whodid not answer questions
on discrimination
Percentage whodid not answer questionson subjective well-being
Adolescent girls without functional difficulties 4 3
Adolescent girls with one or more functional difficulties 7 5
Domain of functional difficulty
Symptoms of depression 4 3
Symptoms of anxiety 5 3
Walking 11 8
Seeing 11 11
Controlling behaviour 14 13
Accepting changes 20 16
Remembering 21 18
Making friends 23 19
Hearing 31 22
Concentrating 35 27
Learning 39 27
Communicating 53 28
Self-care 53 41
TABLE 8.1 Percentage of adolescent girls aged 15 to 17 years who did not answer questions on discrimination, and percentage who did not answer questions on subjective well-being
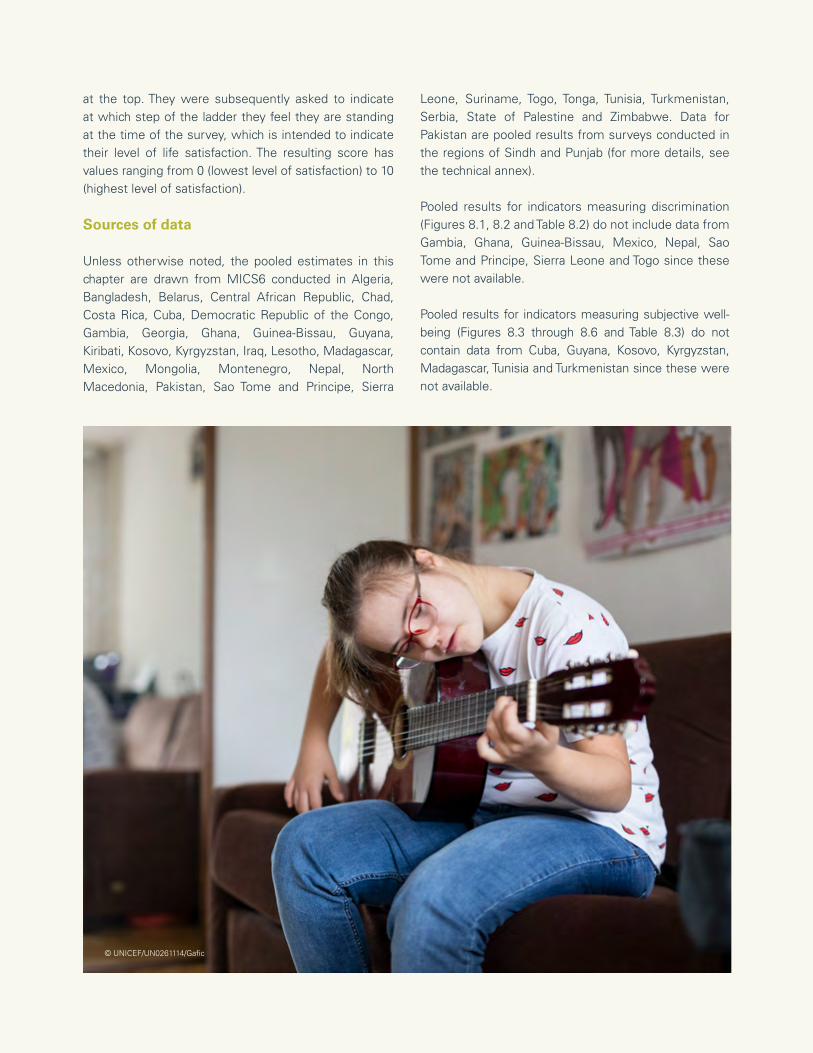
141CHAPTER 8 Every child has the right to a happy life, free from discrimination
at the top. They were subsequently asked to indicate at which step of the ladder they feel they are standing at the time of the survey, which is intended to indicate their level of life satisfaction. The resulting score has values ranging from 0 (lowest level of satisfaction) to 10 (highest level of satisfaction).
Sources of data
Unless otherwise noted, the pooled estimates in this chapter are drawn from MICS6 conducted in Algeria, Bangladesh, Belarus, Central African Republic, Chad, Costa Rica, Cuba, Democratic Republic of the Congo, Gambia, Georgia, Ghana, Guinea-Bissau, Guyana, Kiribati, Kosovo, Kyrgyzstan, Iraq, Lesotho, Madagascar, Mexico, Mongolia, Montenegro, Nepal, North Macedonia, Pakistan, Sao Tome and Principe, Sierra
Leone, Suriname, Togo, Tonga, Tunisia, Turkmenistan, Serbia, State of Palestine and Zimbabwe. Data for Pakistan are pooled results from surveys conducted in the regions of Sindh and Punjab (for more details, see the technical annex).
Pooled results for indicators measuring discrimination (Figures 8.1, 8.2 and Table 8.2) do not include data from Gambia, Ghana, Guinea-Bissau, Mexico, Nepal, Sao Tome and Principe, Sierra Leone and Togo since these were not available.
Pooled results for indicators measuring subjective well-being (Figures 8.3 through 8.6 and Table 8.3) do not contain data from Cuba, Guyana, Kosovo, Kyrgyzstan, Madagascar, Tunisia and Turkmenistan since these were not available.
© UNICEF/UN0261114/Gafic
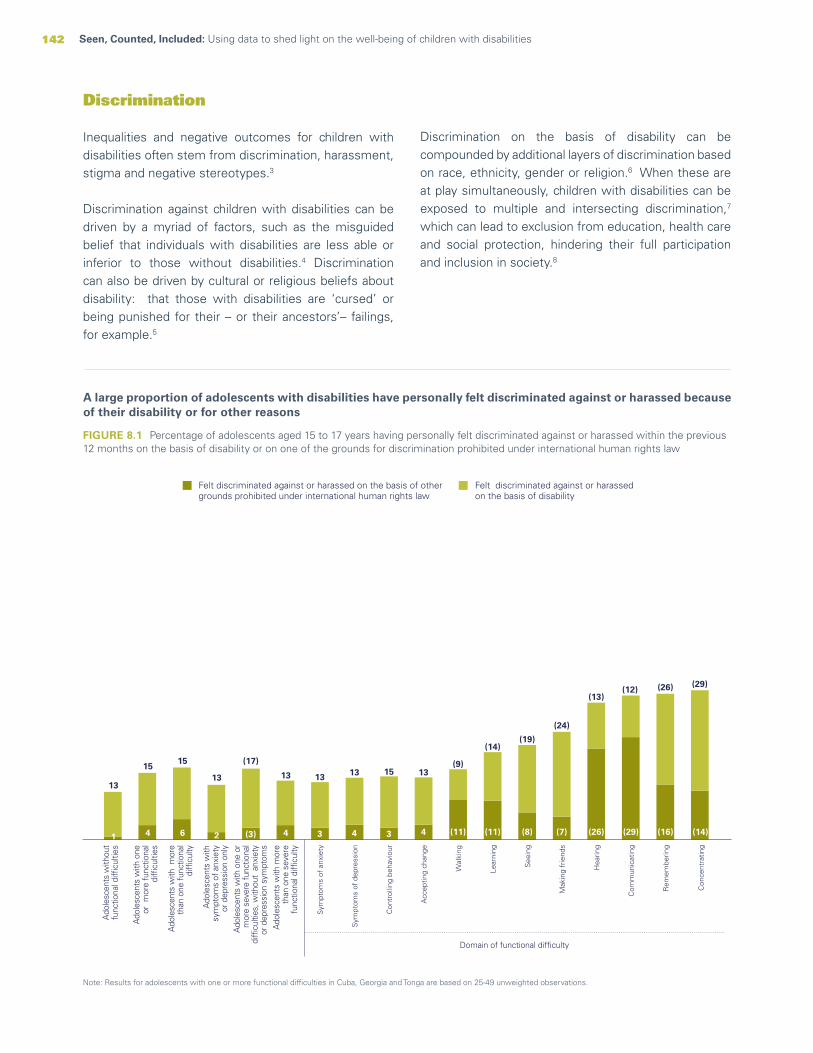
142 Seen, Counted, Included: Using data to shed light on the well-being of children with disabilities
Discrimination
Inequalities and negative outcomes for children with disabilities often stem from discrimination, harassment, stigma and negative stereotypes.3
Discrimination against children with disabilities can be driven by a myriad of factors, such as the misguided belief that individuals with disabilities are less able or inferior to those without disabilities.4 Discrimination can also be driven by cultural or religious beliefs about disability: that those with disabilities are ‘cursed’ or being punished for their – or their ancestors’– failings, for example.5
Note: Results for adolescents with one or more functional difficulties in Cuba, Georgia and Tonga are based on 25-49 unweighted observations.
Discrimination on the basis of disability can be compounded by additional layers of discrimination based on race, ethnicity, gender or religion.6 When these are at play simultaneously, children with disabilities can be exposed to multiple and intersecting discrimination,7 which can lead to exclusion from education, health care and social protection, hindering their full participation and inclusion in society.8
A large proportion of adolescents with disabilities have personally felt discriminated against or harassed because of their disability or for other reasons
FIGURE 8.1 Percentage of adolescents aged 15 to 17 years having personally felt discriminated against or harassed within the previous 12 months on the basis of disability or on one of the grounds for discrimination prohibited under international human rights law
Felt discriminated against or harassedon the basis of disability
Felt discriminated against or harassed on the basis of othergrounds prohibited under international human rights law
41 6 2 (3) 4 3 4 3 4 (11) (11) (8) (7) (26) (29) (16) (14)
13
1515
13
(17)
13 13 13 15 13(9)
(14)(19)
(24)
(13)(12) (26) (29)
Sym
ptom
s of
anx
iety
Sym
ptom
s of
dep
ress
ion
Con
trol
ling
beha
viou
r
Acc
eptin
g ch
ange
Wal
king
Lear
ning
See
ing
Mak
ing
frie
nds
Hea
ring
Com
mun
icat
ing
Rem
embe
ring
Con
cent
ratin
g
Domain of functional difficulty
Ado
lesc
ents
with
out
func
tiona
l diffi
culti
es
Ado
lesc
ents
with
one
or m
ore
func
tiona
ldi
fficu
lties
Ado
lesc
ents
with
mor
eth
an o
ne fu
nctio
nal
diffi
culty
Ado
lesc
ents
with
one
or
mor
e se
vere
func
tiona
ldi
fficu
lties
, with
out
anxi
ety
or d
epre
ssio
n sy
mpt
oms
Ado
lesc
ents
with
mor
e th
an o
ne s
ever
efu
nctio
nal d
ifficu
lty
Ado
lesc
ents
with
sym
ptom
s of
anx
iety
or d
epre
ssio
n on
ly

143CHAPTER 8 Every child has the right to a happy life, free from discrimination
The proportion of adolescents experiencing discrimination varies among countries and areas, but in most of them, those with disabilities experience higher levels
Note: Results for adolescents with one or more functional difficulties in Cuba, Georgia and Tonga are based on 25-49 unweighted observations.
FIGURE 8.2 Percentage of adolescents aged 15 to 17 years having personally felt discriminated against or harassed within the previous 12 months on the basis of disability or on one of the grounds for discrimination prohibited under international human rights law
Adolescents with disabilities are more likely to feel discriminated against, especially if they are girls and live in the poorest households
BOYS GIRLS
Richest 20% Poorest 20% Richest 20% Poorest 20%
Adolescents without functional difficulties 10 11 13 15
Adolescents with one or more functional difficulties 11 15 18 28
Adolescents with more than one functional difficulty 15 21 18 32
TABLE 8.2 Percentage of adolescents aged 15 to 17 years having personally felt discriminated against or harassed within the previous 12 months on the basis of disability or on one of the grounds for discrimination prohibited under international human rights law
Adolescents with one or more functional difficultiesAdolescents without functional difficulties
34
29
25
22
19
12
16
3
14
11
14
13
16
13
12
10
13
11
2
39
36
34
28
(27)
27
27
26
(23)
19
19
18
17
17
16
16
14
12
8
(0)
Kiribati
Central African Republic
Costa Rica
Democratic Republic of the Congo
Tonga
Lesotho
Tunisia
Madagascar
Georgia
Zimbabwe
Iraq
Bangladesh
Guyana
Chad
Kosovo
State of Palestine
Pakistan
Suriname
Mongolia
Cuba
20

144 Seen, Counted, Included: Using data to shed light on the well-being of children with disabilities
Happiness, life satisfaction and expectations about the future
Having a disability – whether physical, cognitive or psychosocial – should not prevent a child from living a fulfilling and happy life.
Some disabilities are accompanied by significant pain and frustration, especially when they involve high levels of dependency on others or on assistive devices that may not always be available or functioning well. In fact, research suggests that, rather than the impairments themselves, the lack of an accommodating environment and social barriers are the major determinants of participation, happiness and well-being in persons with disabilities. In this regard, a few fundamental questions need to be asked:
• Do stigma and negative attitudes prevent children with disabilities from participating on equal terms with children without disabilities?
• Do inaccessible environments make it systematically difficult or even impossible for children with disabilities to enjoy recreational and cultural activities?
• Do access barriers prevent children from going to school?
• Do social welfare and protection systems meet or support the extra costs of having a disability?
• Do children with disabilities and their families have access to justice when their rights are violated?
Too often, the answers to these questions indicate that governments, societies and communities are not doing enough to realize the fundamental human rights of children, perpetuating cycles of exclusion and disadvantage. Discrimination, marginalization and disempowerment take a heavy toll on the overall well-being of children with disabilities. And segregation is still a reality for far too many of these children. In all countries of the world, thousands of children with disabilities are still denied the right to attend mainstream education and too many spend their childhood – and sometimes their lives – in long-term residential care. Stigma and negative attitudes make it difficult for these children to cultivate or maintain peer group relationships and social networks.9 These factors overlap to create situations in which children with disabilities experience significantly lower rates of subjective happiness and well-being than children without disabilities.
Adolescents with difficulties caring for themselves, concentrating and hearing are least likely to describe themselves as very or somewhat happy
Note: Results for adolescents with one or more severe functional difficulties, without anxiety or depression symptoms, and in the domains of self-care, concentrating and hearing are based on 25-49 unweighted cases.
FIGURE 8.3 Percentage of adolescents aged 15 to 17 years who say they are very or somewhat happy
Ado
lesc
ents
with
out
func
tiona
l diffi
culti
es
Ado
lesc
ents
with
one
or
mor
efu
nctio
nal d
ifficu
lties
Ado
lesc
ents
with
mor
e th
anon
e fu
nctio
nal d
ifficu
lty
Ado
lesc
ents
with
anx
iety
or
depr
essi
on s
ympt
oms
only
Ado
lesc
ents
with
one
or
mor
ese
vere
fun
ctio
nal d
ifficu
lties
sw
ithou
t an
xiet
y or
depr
essi
on s
ympt
oms
Ado
lesc
ents
with
mor
e th
an o
nese
vere
func
tiona
l diffi
culty
Domain of functional difficulty
81 72 66 69 (71) 66
Sel
f-ca
re
(49)
Con
cent
ratin
g
(49)
Hea
ring
(49)
Rem
embe
ring
55
Mak
ing
frie
nds
61
Con
trol
ling
beha
viou
r
83

145CHAPTER 8 Every child has the right to a happy life, free from discrimination
Adolescents with disabilities are less likely to describe themselves as happy, with girls and adolescents from the poorest households experiencing the lowest levels of happiness
FIGURE 8.4 Percentage of adolescents aged 15 to 17 years who say they are very or somewhat happy
81 80 82 81 82 82 81 77 8472 73 71 71 74 76 68 57 81
Weightedaverage Boys Girls
Primaryeducationor lower
Secondaryeducationor higher
Urban Rural Poorest 20% Richest 20%
Adolescents with one or more functional difficultiesAdolescents without functional difficulties
Adolescents with difficulties communicating and concentrating report the lowest levels of life satisfaction
Notes: Values can range from 0 (lowest level of satisfaction) to 10 (highest level of satisfaction). Results within parentheses ( ) are based on 25-49 unweighted observations.
Note: Education refers to the education level of mothers.
TABLE 8.3 Average life satisfaction score for adolescents aged 15 to 17 years
Total Poorest 20% Richest 20%
Adolescents without functional difficulties 7 6 7
Adolescents with one or more functional difficulties 6 6 7
Adolescents with more than one functional difficulty 6 5 7
Adolescents with anxiety or depression symptoms only 6 5 6
Adolescents with one or more severe functional difficulties, without anxiety or depression symptoms 6 (6) (8)
Adolescents with more than one severe functional difficulty 6 (5) (6)
Domain of functional difficulty
Controlling behaviour 7 (6) (8)
Walking 7 (6) (7)
Symptoms of depression 6 5 6
Seeing (6) (5) (7)
Making friends 6 (5) (7)
Symptoms of anxiety 6 6 7
Accepting change 6 (5) (7)
Learning 5 (4) (5)
Remembering 5 (3) (6)
Communicating 4 (3) (7)
Concentrating 4 (3) (7)
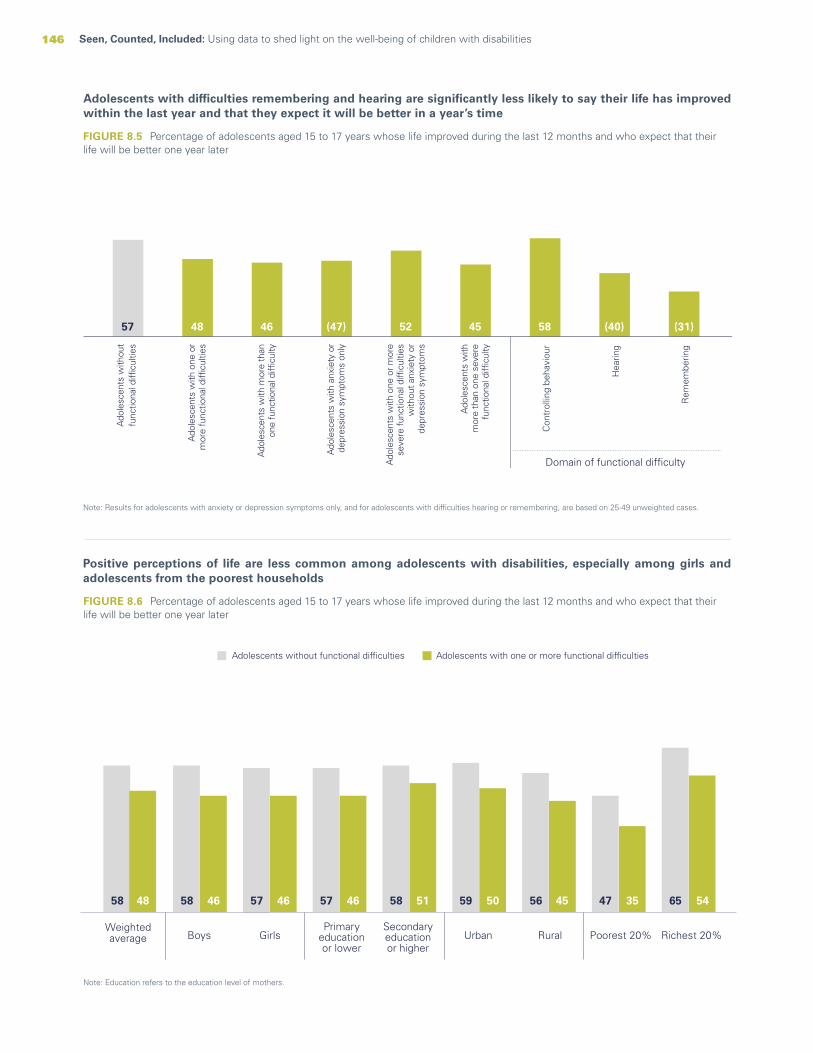
146 Seen, Counted, Included: Using data to shed light on the well-being of children with disabilities
Adolescents with difficulties remembering and hearing are significantly less likely to say their life has improved within the last year and that they expect it will be better in a year’s time
Note: Results for adolescents with anxiety or depression symptoms only, and for adolescents with difficulties hearing or remembering, are based on 25-49 unweighted cases.
FIGURE 8.5 Percentage of adolescents aged 15 to 17 years whose life improved during the last 12 months and who expect that their life will be better one year later
Positive perceptions of life are less common among adolescents with disabilities, especially among girls and adolescents from the poorest households
FIGURE 8.6 Percentage of adolescents aged 15 to 17 years whose life improved during the last 12 months and who expect that their life will be better one year later
58 58 57 57 58 59 56 47 6548 46 46 46 51 50 45 35 54
Weightedaverage Boys Girls Urban Rural Poorest 20% Richest 20%
Adolescents with one or more functional difficultiesAdolescents without functional difficulties
Primaryeducationor lower
Secondaryeducationor higher
57 48 46 (47) 52 45 58 (40) (31)
Con
trol
ling
beha
viou
r
Hea
ring
Rem
embe
ring
Ado
lesc
ents
with
out
func
tiona
l diffi
culti
es
Ado
lesc
ents
with
one
or
mor
e fu
nctio
nal d
ifficu
lties
Ado
lesc
ents
with
mor
e th
anon
e fu
nctio
nal d
ifficu
lty
Ado
lesc
ents
with
anx
iety
or
depr
essi
on s
ympt
oms
only
Ado
lesc
ents
with
one
or m
ore
seve
re fu
nctio
nal d
ifficu
lties
with
out a
nxie
ty o
rde
pres
sion
sym
ptom
s
Ado
lesc
ents
with
mor
e th
an o
ne s
ever
efu
nctio
nal d
ifficu
lty
Domain of functional difficulty
Note: Education refers to the education level of mothers.
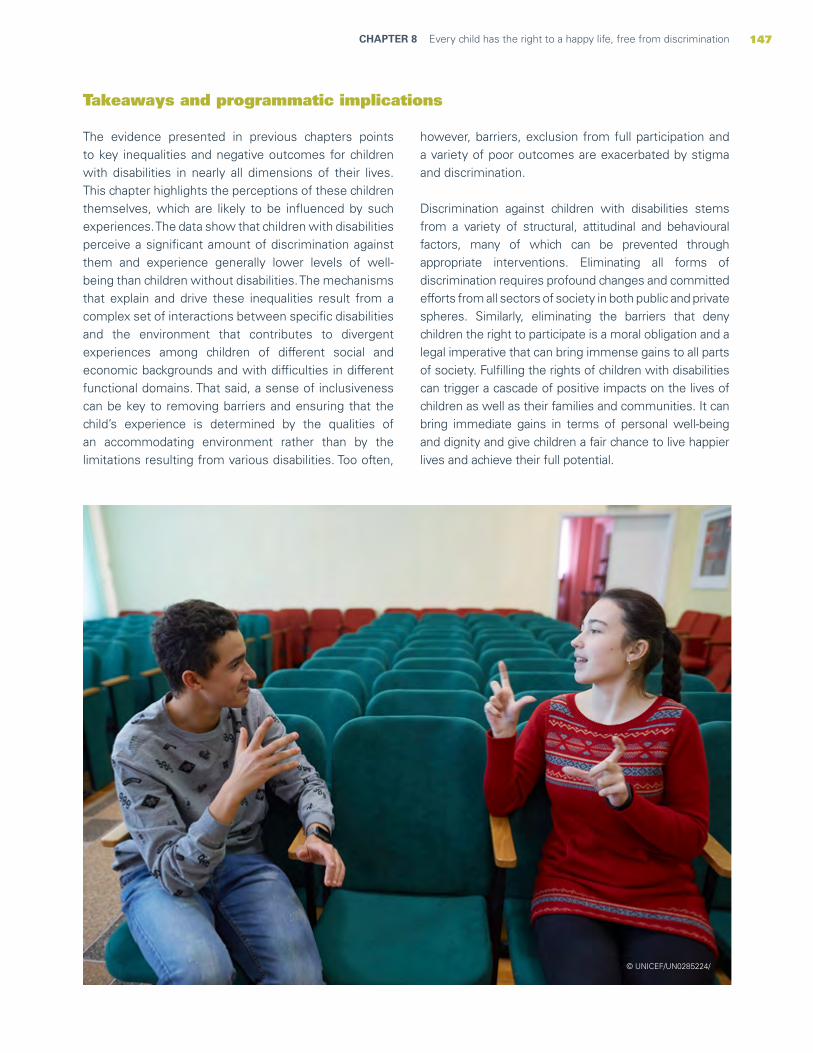
147CHAPTER 8 Every child has the right to a happy life, free from discrimination
Takeaways and programmatic implications
The evidence presented in previous chapters points to key inequalities and negative outcomes for children with disabilities in nearly all dimensions of their lives. This chapter highlights the perceptions of these children themselves, which are likely to be influenced by such experiences. The data show that children with disabilities perceive a significant amount of discrimination against them and experience generally lower levels of well-being than children without disabilities. The mechanisms that explain and drive these inequalities result from a complex set of interactions between specific disabilities and the environment that contributes to divergent experiences among children of different social and economic backgrounds and with difficulties in different functional domains. That said, a sense of inclusiveness can be key to removing barriers and ensuring that the child’s experience is determined by the qualities of an accommodating environment rather than by the limitations resulting from various disabilities. Too often,
however, barriers, exclusion from full participation and a variety of poor outcomes are exacerbated by stigma and discrimination.
Discrimination against children with disabilities stems from a variety of structural, attitudinal and behavioural factors, many of which can be prevented through appropriate interventions. Eliminating all forms of discrimination requires profound changes and committed efforts from all sectors of society in both public and private spheres. Similarly, eliminating the barriers that deny children the right to participate is a moral obligation and a legal imperative that can bring immense gains to all parts of society. Fulfilling the rights of children with disabilities can trigger a cascade of positive impacts on the lives of children as well as their families and communities. It can bring immediate gains in terms of personal well-being and dignity and give children a fair chance to live happier lives and achieve their full potential.
© UNICEF/UN0285224/
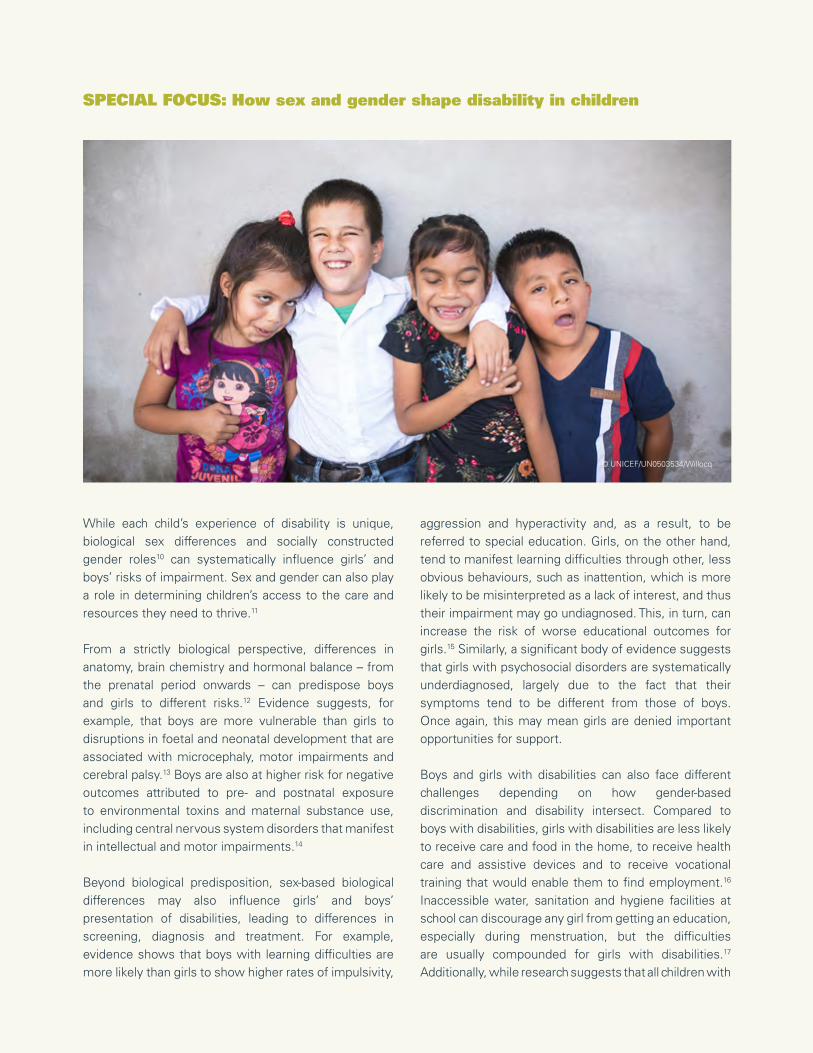
148 Seen, Counted, Included: Using data to shed light on the well-being of children with disabilities
SPECIAL FOCUS: How sex and gender shape disability in children
While each child’s experience of disability is unique, biological sex differences and socially constructed gender roles10 can systematically influence girls’ and boys’ risks of impairment. Sex and gender can also play a role in determining children’s access to the care and resources they need to thrive.11
From a strictly biological perspective, differences in anatomy, brain chemistry and hormonal balance – from the prenatal period onwards – can predispose boys and girls to different risks.12 Evidence suggests, for example, that boys are more vulnerable than girls to disruptions in foetal and neonatal development that are associated with microcephaly, motor impairments and cerebral palsy.13 Boys are also at higher risk for negative outcomes attributed to pre- and postnatal exposure to environmental toxins and maternal substance use, including central nervous system disorders that manifest in intellectual and motor impairments.14
Beyond biological predisposition, sex-based biological differences may also influence girls’ and boys’ presentation of disabilities, leading to differences in screening, diagnosis and treatment. For example, evidence shows that boys with learning difficulties are more likely than girls to show higher rates of impulsivity,
aggression and hyperactivity and, as a result, to be referred to special education. Girls, on the other hand, tend to manifest learning difficulties through other, less obvious behaviours, such as inattention, which is more likely to be misinterpreted as a lack of interest, and thus their impairment may go undiagnosed. This, in turn, can increase the risk of worse educational outcomes for girls.15 Similarly, a significant body of evidence suggests that girls with psychosocial disorders are systematically underdiagnosed, largely due to the fact that their symptoms tend to be different from those of boys. Once again, this may mean girls are denied important opportunities for support.
Boys and girls with disabilities can also face different challenges depending on how gender-based discrimination and disability intersect. Compared to boys with disabilities, girls with disabilities are less likely to receive care and food in the home, to receive health care and assistive devices and to receive vocational training that would enable them to find employment.16 Inaccessible water, sanitation and hygiene facilities at school can discourage any girl from getting an education, especially during menstruation, but the difficulties are usually compounded for girls with disabilities.17 Additionally, while research suggests that all children with
© UNICEF/UN0503534/Willocq
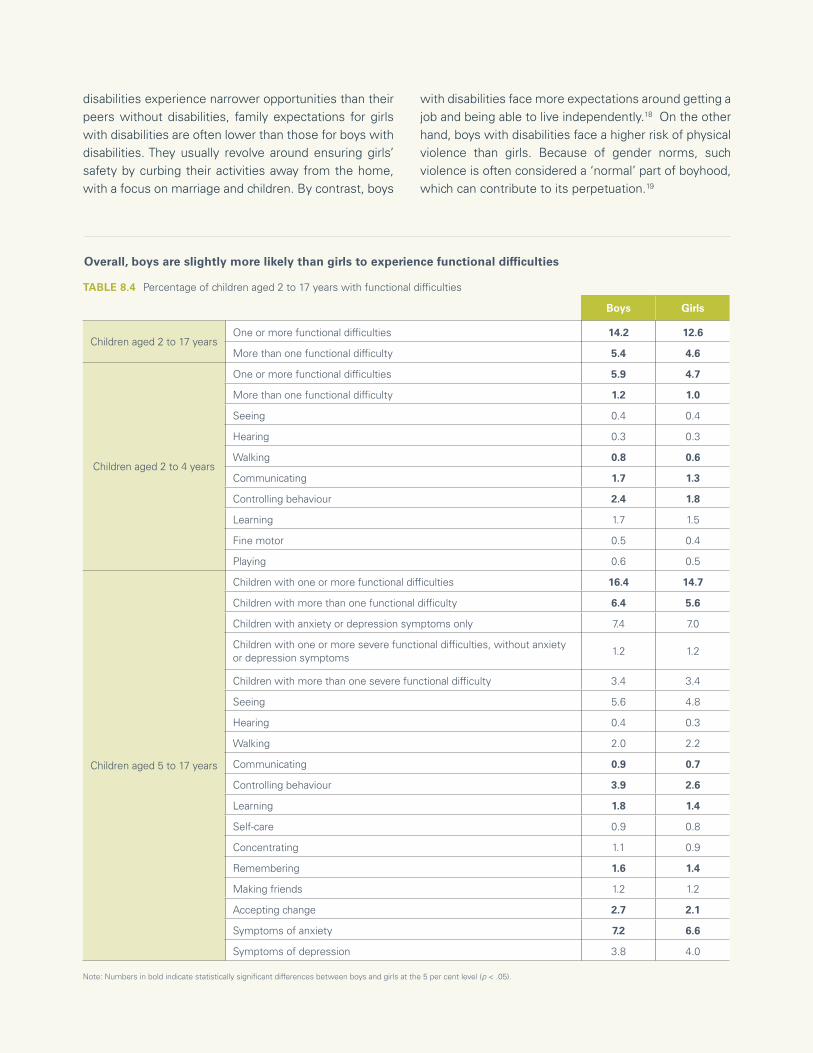
149CHAPTER 8 Every child has the right to a happy life, free from discrimination
Boys Girls
Children aged 2 to 17 yearsOne or more functional difficulties 14.2 12.6
More than one functional difficulty 5.4 4.6
Children aged 2 to 4 years
One or more functional difficulties 5.9 4.7
More than one functional difficulty 1.2 1.0
Seeing 0.4 0.4
Hearing 0.3 0.3
Walking 0.8 0.6
Communicating 1.7 1.3
Controlling behaviour 2.4 1.8
Learning 1.7 1.5
Fine motor 0.5 0.4
Playing 0.6 0.5
Children aged 5 to 17 years
Children with one or more functional difficulties 16.4 14.7
Children with more than one functional difficulty 6.4 5.6
Children with anxiety or depression symptoms only 7.4 7.0
Children with one or more severe functional difficulties, without anxietyor depression symptoms
1.2 1.2
Children with more than one severe functional difficulty 3.4 3.4
Seeing 5.6 4.8
Hearing 0.4 0.3
Walking 2.0 2.2
Communicating 0.9 0.7
Controlling behaviour 3.9 2.6
Learning 1.8 1.4
Self-care 0.9 0.8
Concentrating 1.1 0.9
Remembering 1.6 1.4
Making friends 1.2 1.2
Accepting change 2.7 2.1
Symptoms of anxiety 7.2 6.6
Symptoms of depression 3.8 4.0
Note: Numbers in bold indicate statistically significant differences between boys and girls at the 5 per cent level (p < .05).
TABLE 8.4 Percentage of children aged 2 to 17 years with functional difficulties
Overall, boys are slightly more likely than girls to experience functional difficulties
disabilities experience narrower opportunities than their peers without disabilities, family expectations for girls with disabilities are often lower than those for boys with disabilities. They usually revolve around ensuring girls’ safety by curbing their activities away from the home, with a focus on marriage and children. By contrast, boys
with disabilities face more expectations around getting a job and being able to live independently.18 On the other hand, boys with disabilities face a higher risk of physical violence than girls. Because of gender norms, such violence is often considered a ‘normal’ part of boyhood, which can contribute to its perpetuation.19
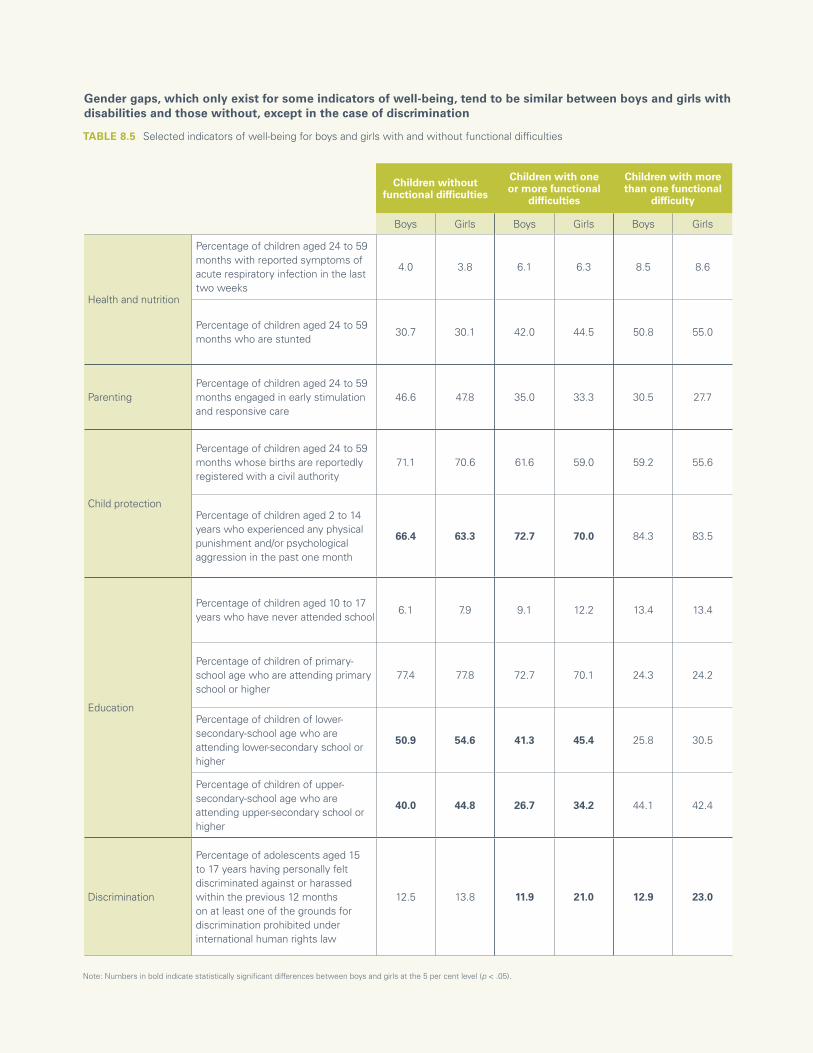
150 Seen, Counted, Included: Using data to shed light on the well-being of children with disabilities
Note: Numbers in bold indicate statistically significant differences between boys and girls at the 5 per cent level (p < .05).
TABLE 8.5 Selected indicators of well-being for boys and girls with and without functional difficulties
Gender gaps, which only exist for some indicators of well-being, tend to be similar between boys and girls with disabilities and those without, except in the case of discrimination
Children without functional difficulties
Children with one or more functional
difficulties
Children with more than one functional
difficulty
Boys Girls Boys Girls Boys Girls
Health and nutrition
Percentage of children aged 24 to 59 months with reported symptoms of acute respiratory infection in the last two weeks
4.0 3.8 6.1 6.3 8.5 8.6
Percentage of children aged 24 to 59 months who are stunted
30.7 30.1 42.0 44.5 50.8 55.0
ParentingPercentage of children aged 24 to 59 months engaged in early stimulation and responsive care
46.6 47.8 35.0 33.3 30.5 27.7
Child protection
Percentage of children aged 24 to 59 months whose births are reportedly registered with a civil authority
71.1 70.6 61.6 59.0 59.2 55.6
Percentage of children aged 2 to 14 years who experienced any physical punishment and/or psychological aggression in the past one month
66.4 63.3 72.7 70.0 84.3 83.5
Education
Percentage of children aged 10 to 17 years who have never attended school
6.1 7.9 9.1 12.2 13.4 13.4
Percentage of children of primary-school age who are attending primary school or higher
77.4 77.8 72.7 70.1 24.3 24.2
Percentage of children of lower-secondary-school age who are attending lower-secondary school or higher
50.9 54.6 41.3 45.4 25.8 30.5
Percentage of children of upper-secondary-school age who are attending upper-secondary school or higher
40.0 44.8 26.7 34.2 44.1 42.4
Discrimination
Percentage of adolescents aged 15 to 17 years having personally felt discriminated against or harassed within the previous 12 months on at least one of the grounds for discrimination prohibited under international human rights law
12.5 13.8 11.9 21.0 12.9 23.0
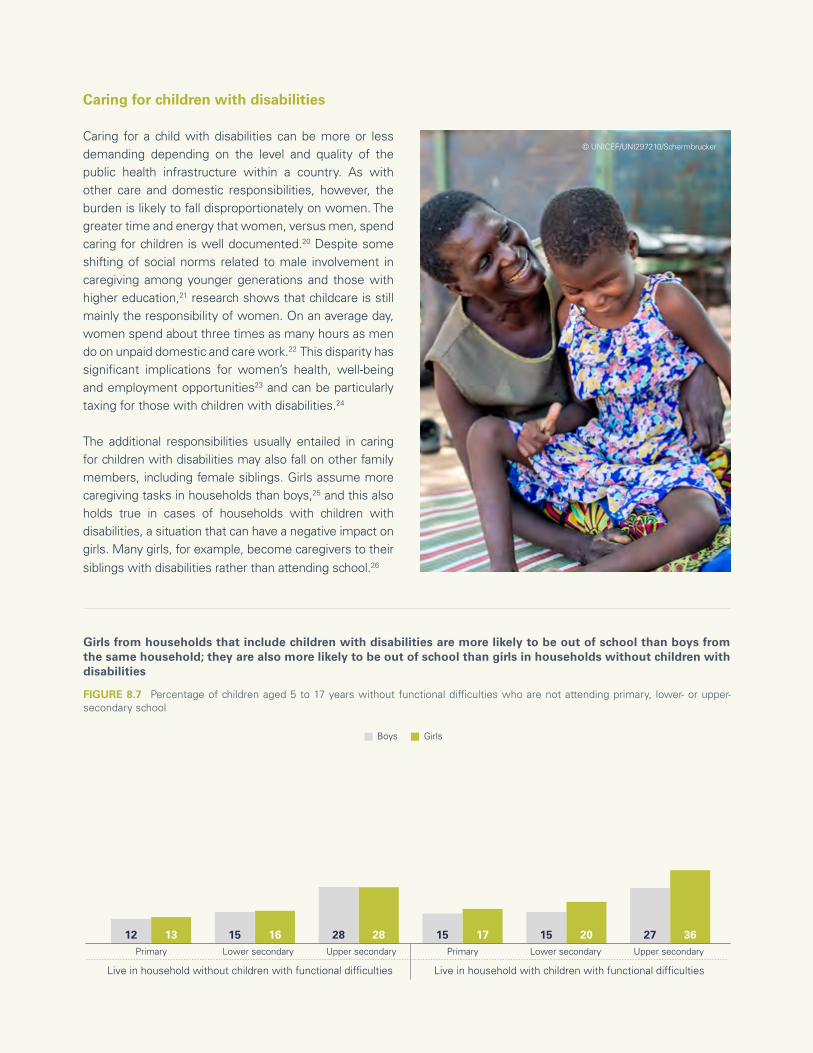
151CHAPTER 8 Every child has the right to a happy life, free from discrimination
Caring for children with disabilities
Caring for a child with disabilities can be more or less demanding depending on the level and quality of the public health infrastructure within a country. As with other care and domestic responsibilities, however, the burden is likely to fall disproportionately on women. The greater time and energy that women, versus men, spend caring for children is well documented.20 Despite some shifting of social norms related to male involvement in caregiving among younger generations and those with higher education,21 research shows that childcare is still mainly the responsibility of women. On an average day, women spend about three times as many hours as men do on unpaid domestic and care work.22 This disparity has significant implications for women’s health, well-being and employment opportunities23 and can be particularly taxing for those with children with disabilities.24
The additional responsibilities usually entailed in caring for children with disabilities may also fall on other family members, including female siblings. Girls assume more caregiving tasks in households than boys,25 and this also holds true in cases of households with children with disabilities, a situation that can have a negative impact on girls. Many girls, for example, become caregivers to their siblings with disabilities rather than attending school.26
Girls from households that include children with disabilities are more likely to be out of school than boys from the same household; they are also more likely to be out of school than girls in households without children with disabilities
FIGURE 8.7 Percentage of children aged 5 to 17 years without functional difficulties who are not attending primary, lower- or upper-secondary school
12 15 28 15 15 2713 16 28 17 20 36Primary Lower secondary Upper secondary Primary Lower secondary Upper secondary
Live in household without children with functional difficulties Live in household with children with functional difficulties
Boys Girls
© UNICEF/UNI297210/Schermbrucker
152 Seen, Counted, Included: Using data to shed light on the well-being of children with disabilities
Fulfilling the rightsof every child
This report marks a pivot point. For the first time, rich, global data on children with disabilities offer a glimpse into their widely diverse experiences. The data provide the foundation for understanding who these children are and the scope and depth of the deprivation they face. When put to use through advocacy and in forging transformative policies and programmes, these data have the power to change lives.
Documenting, measuring, understanding
Nearly 240 million children in the world today have some form of disability. This estimate is higher than previous figures and is based on a more meaningful and inclusive understanding of disability, which considers several domains of functioning, including those related to psychosocial well-being.
Most children with disabilities have difficulties in just one functional domain. Psychosocial issues predominate at every age, in some cases in combination with other functional difficulties.
The lives of many children with disabilities are marked by deep exclusion and deprivation. Compared with their peers without disabilities, children with disabilities are 34 per cent more likely to be stunted, 49 per cent more likely to
have never attended school, 41 per cent more likely to feel discriminated against, 51 per cent more likely to consider themselves unhappy, and 20 per cent less likely to have expectations of a better life.
Children who have difficulties in more than one domain are even more deprived: 53 per cent are stunted; just 29 per cent receive early stimulation and responsive care in the first, most critical, years of life; and 43 per cent are out of school by upper-secondary-school age.
Children with certain types of functional difficulties may experience particularly high levels of exclusion. For instance, children with difficulties communicating or caring for themselves are several times less likely to attend school than children who do not have difficulties in these domains. In contrast, children who experience anxiety or depression attend schools at similar rates as those without functional difficulties but appear to lag behind, especially in the acquisition of numeracy skills.
The severity of these difficulties is another critical factor. By lower-secondary-school age, the majority of children with the most severe disabilities do not attend school. By upper-secondary-school age, virtually none do.
CHAPTER 9

153CHAPTER 1 Every child has the right to be counted 153CHAPTER 9 Fulfilling the rights of every child
© UNICEF/UN0425679/Sokol
154 Seen, Counted, Included: Using data to shed light on the well-being of children with disabilities
Meanwhile, children with disabilities from poor socioeconomic backgrounds experience compounded deprivations. Those whose mothers have, at most, a primary education are significantly more likely to have had recent episodes of diarrhoea. Young children living in the poorest households are generally less likely to receive early stimulation and responsive care, but children with disabilities are at the greatest disadvantage.
From knowledge to action
All children with disabilities deserve the opportunity to thrive. For this to become a reality, governments must consider the full range of needs of these children and their families in providing programmes or services. They need to work together with persons or associations of persons with disabilities to ensure that:
• All social services and environments are inclusive and accessible, so that community-based care and assistance, critical information and opportunities to play and engage are available to every child, in times of stability as well as in humanitarian emergencies.
• Education is inclusive and accessible, so that children with disabilities can go to school in their communities and learn alongside their peers without disabilities.
• Children with disabilities are protected against violence, abuse, neglect and exploitation, are able to benefit from birth registration and family support, and can seek child-friendly, disability-inclusive support and justice when their rights are violated.
• Children with disabilities access psychosocial support, so that they are able to maintain their well-being and receive care for mental health issues such as anxiety and depression.
• Stigma and discrimination against children with disabilities and their families are eradicated, and the voices of children with disabilities are heard.
• Children with disabilities and their families are covered by adequate social protection that supports their individual needs, links them with critical services, and helps break the cycle of poverty, deprivation and exclusion.
• Parents and caregivers of children with disabilities receive support to raise their children in the best way possible while maintaining their own mental health and well-being.
• Robust, relevant and inclusive data are generated at regular intervals. These data are used to raise awareness of rights violations and to design, implement and evaluate interventions aimed at preventing them.
Provide disability-inclusive services in every community
All children and their families, wherever they may live, have the right to easily accessible, high-quality, holistic services that respond to their specific needs as part of routine support across the life cycle. Moreover, they have the right to safe, inclusive and accessible environments for learning, play and civic and cultural engagement.
All services – including health, nutrition, early childhood development, mental health and psychosocial support, child protection, water, sanitation and hygiene, and social protection – should be well integrated. They must also be informed by a nuanced understanding of different types of childhood disability, the social barriers that children with disabilities face, and the impact of both of these factors on their well-being, development and inclusion in society.
Putting this into practice involves twin-track approaches that promote increased coverage of mainstream interventions to improve outcomes for all children, while incorporating tailored and differentiated strategies to meet the needs of children with specific impairments. Children with disabilities and their families should not have to travel long distances or wait for referrals to specialized facilities to obtain basic services and support. All professionals working with children – including health-care workers, teachers, social workers, the police, judges and lawyers – need training to understand the full extent of childhood disability and to combat related stigma and discriminatory attitudes. Parents and caregivers, too, need knowledge and skills to provide responsive care specific to their child’s unique challenges.
Invest in inclusive education for all
Children with disabilities have the right to learn together with their peers without disabilities in accessible schools in their communities. Inclusive education means taking into account the distinct barriers facing children with

155CHAPTER 9 Fulfilling the rights of every child
disabilities and employing targeted approaches to help them learn.
Within schools, all staff and administrators should be able to identify and respond to the needs of learners with a range of disabilities, and to counter stigma and discrimination. Buildings must be refurbished so that classrooms, facilities such as toilets and water taps, and spaces for play and recreation are accessible to all children, and appropriate forms of transportation must be provided to and from school. All new schools must be built to be fully accessible.
Learning materials and curricula need to be tailored to children’s needs, assistive technologies secured for children who require them, and additional assistance provided in the classroom so that every child can learn and progress.
Finally, schools must provide accessible and inclusive structures for engagement, including feedback by students, families and communities, on the extent to which they provide an inclusive environment.
Put mental health care and psychosocial support within easy reach of all children
Mental health is central to children’s right to health. All children, including children with disabilities should have access to comprehensive and friendly primary health care that includes a psychosocial and family-centred approach. Primary health care providers or community health workers often provide the only safe space for many children struggling with mental health issues. When such spaces are available, accessible and effective, they constitute a critical and timely entry point for children requiring specialized care. Such support should also be available through schools, child protection and justice systems or any other social service with which children come into contact – wherever they may be, including in humanitarian crises.
Systematic efforts must also be made to address the social determinants that impact children’s mental health and to tackle misconceptions and stigma. It is critical that families, communities, teachers and all professionals who work with children are equipped with
© UNICEF/UN040577/Sandovici
156 Seen, Counted, Included: Using data to shed light on the well-being of children with disabilities
the knowledge and skills they need to promote mental well-being, recognize mental health issues and connect children to appropriate, community-based forms of support.
Protect children with disabilities from violence, abuse and exploitation
Every child has the right to live free from violence, abuse and exploitation. For children with disabilities, this means increasing the capacity of protection and justice officials, enabling them to understand and respond to the vulnerabilities and challenges faced by these children.
All strategies to prevent and respond to violence, abuse and exploitation must take children with disabilities into account. Professionals working with children, including teachers, social workers and health-care providers, need training to recognize and adequately respond to signs of abuse in children with different types of disabilities. They need specific knowledge and skills to support children and families. Similarly, justice systems should listen to and value the testimonies of children with disabilities. This involves training police, investigators, and legal and judicial actors on the needs of children with disabilities and working with them to improve access to justice.
Register children with disabilities at birth
Birth registration is a portal to a range of human rights, including health care and education. It is critical to preventing discrimination, abuse and other rights violations.
Campaigns to expand birth registration should make efforts to include children with disabilities by actively reaching out to their families and raising awareness about the importance of registration for every child.
Acknowledgement of their existence is the birthright of every child. For that reason, birth registration systems must be flexible and responsive to the circumstances of children with disabilities and their parents and work to reduce barriers, such as the cost of registration and long distances to registration facilities. Strategies to raise levels of birth registration include extending legally permissible registration periods, waiving associated
fees and fines, deploying mobile registration units, and leveraging routine outreach programmes in health and social protection.
Make water, sanitation and hygiene facilities accessible everywhere
Increasing access to WASH services for children with disabilities can help reduce the barriers they face in realizing many other rights, including education and health. This entails the strengthening of WASH systems to ensure that related services, infrastructure, supplies and information are accessible to and usable by children with different types of impairments.
Governments need to invest in the development of national standards as well as programming to ensure that safe and accessible WASH facilities are available in all households, schools, health centres and other public facilities. COVID-19 has highlighted the importance of handwashing with soap. Further investment is needed to improve the accessibility of handwashing facilities. Disability-inclusive programmes should remove barriers that prevent girls with disabilities from participating in society when they are menstruating by ensuring inclusive access to WASH facilities, menstrual hygiene products and sensitive information.
Invest in robust social protection that takes disability into account
Every child has the right to a life free from poverty and exclusion. To alleviate the deprivations confronted by children with disabilities and their families, governments need to increase the capacity, funding, equity, efficiency and scope of social protection programmes. Universal health coverage is essential, with services to include disability-specific health care, such as rehabilitation and assistive devices.
Social transfer programmes should also be extended to all children with disabilities. And governments need to provide additional funding to ensure universal social protection floors. Eligibility requirements should include children with a wide array of disabilities, recognizing the costs related to disability. Awareness of such programmes needs to be expanded and the application process simplified to encourage uptake.
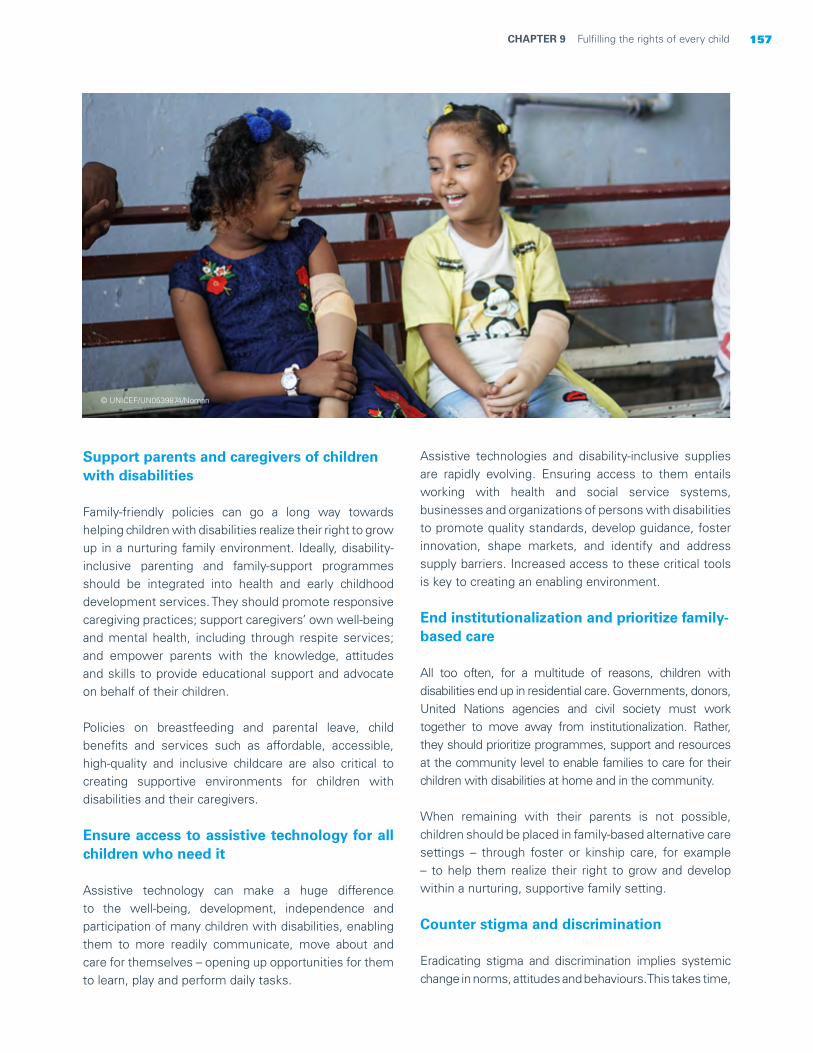
157CHAPTER 9 Fulfilling the rights of every child
Support parents and caregivers of children with disabilities
Family-friendly policies can go a long way towards helping children with disabilities realize their right to grow up in a nurturing family environment. Ideally, disability-inclusive parenting and family-support programmes should be integrated into health and early childhood development services. They should promote responsive caregiving practices; support caregivers’ own well-being and mental health, including through respite services; and empower parents with the knowledge, attitudes and skills to provide educational support and advocate on behalf of their children.
Policies on breastfeeding and parental leave, child benefits and services such as affordable, accessible, high-quality and inclusive childcare are also critical to creating supportive environments for children with disabilities and their caregivers.
Ensure access to assistive technology for all children who need it
Assistive technology can make a huge difference to the well-being, development, independence and participation of many children with disabilities, enabling them to more readily communicate, move about and care for themselves – opening up opportunities for them to learn, play and perform daily tasks.
Assistive technologies and disability-inclusive supplies are rapidly evolving. Ensuring access to them entails working with health and social service systems, businesses and organizations of persons with disabilities to promote quality standards, develop guidance, foster innovation, shape markets, and identify and address supply barriers. Increased access to these critical tools is key to creating an enabling environment.
End institutionalization and prioritize family-based care
All too often, for a multitude of reasons, children with disabilities end up in residential care. Governments, donors, United Nations agencies and civil society must work together to move away from institutionalization. Rather, they should prioritize programmes, support and resources at the community level to enable families to care for their children with disabilities at home and in the community.
When remaining with their parents is not possible, children should be placed in family-based alternative care settings – through foster or kinship care, for example – to help them realize their right to grow and develop within a nurturing, supportive family setting.
Counter stigma and discrimination
Eradicating stigma and discrimination implies systemic change in norms, attitudes and behaviours. This takes time,
© UNICEF/UN0539874/Noman
158 Seen, Counted, Included: Using data to shed light on the well-being of children with disabilities
investment and a range of integrated communications, programming, policy and advocacy interventions at many levels of society.
Promoting shifts of this magnitude will require awareness-raising and capacity building around disability among key stakeholders. It also demands advocating for and implementing policies and legislation that explicitly address stigma and discrimination against children with disabilities and their families and ensuring adequate financing, so that evidence-based strategies can be taken to scale.
Social and behaviour change communication interventions are another critical tool, engaging children, families, communities, service providers and decision-makers in identifying, understanding and addressing the complex, underlying sociocultural practices and norms that influence negative attitudes and discriminatory behaviours.
Include children with disabilities in COVID-19 prevention and response
Governments must make explicit efforts to include children with disabilities and their families in COVID-19 prevention and response efforts, vaccination campaigns and reopening strategies and guidelines (see page 160). Measures must be adapted to the needs of children with a range of disabilities, taking into account the heightened health vulnerabilities of children with certain types of impairments, and formulating targeted strategies to reach children with limitations in mobility, who may require in-home care and vaccination. Forward-looking action is required to prevent children with disabilities from being excluded as societies reopen. And with the resumption of in-person learning, assistance should be given to those children whose disabilities make radical changes in routine especially difficult.
Close data gaps and build knowledge that can make a difference
All countries should produce high-quality data on children with disabilities at regular intervals. An important first step is adopting data collection instruments that measure the breadth and depth of functional difficulties that children with disabilities experience. Data should also capture the extent of the restrictions they face in becoming active members of society. This means
collecting additional data about the context in which they live, the barriers in their environment, the extent of their participation in different spheres, and their access to core services and interventions. The collection of robust data on children and adults with disabilities needs to extend to humanitarian settings and also includes children who are institutionalized or in street situations.
Counting and including all children requires the building of capacity so that quality standards are adopted worldwide for official disability statistics. Countries need support in their efforts to collect, analyse and disseminate disability data. This should include the engagement – and empowerment – of all relevant stakeholders, including persons with disabilities.
For every child, inclusion
Including children with disabilities in all aspects of life must be a priority. Every child, everywhere, has something to offer. His or her energies, talents and ideas can make a positive difference to families, communities and the world.
The extent to which children with disabilities are deprived, feel discriminated against and lack hope for the future makes it clear that societies are not doing enough to realize the most basic human rights of all children. As a result, the vicious cycle of exclusion and disadvantage that leaves children with disabilities behind continues. Knowing that the problem comes down to barriers that society creates – which are a matter of choice, not immutable realities – means that there is potential for change. Part of that change will involve celebrating children with disabilities and embracing diversity in all its forms.
It starts right here. Right now. When children with disabilities are seen and counted, they are no longer invisible, and the promise of inclusion becomes a real possibility.
The steps in between depend upon every stakeholder. They involve shared responsibility, accountability and working together to ensure that all children, including children with disabilities, are able to achieve their inherent potential.

159CHAPTER 9 Fulfilling the rights of every child
© UNICEF/UNI309764// Frank Dejongh
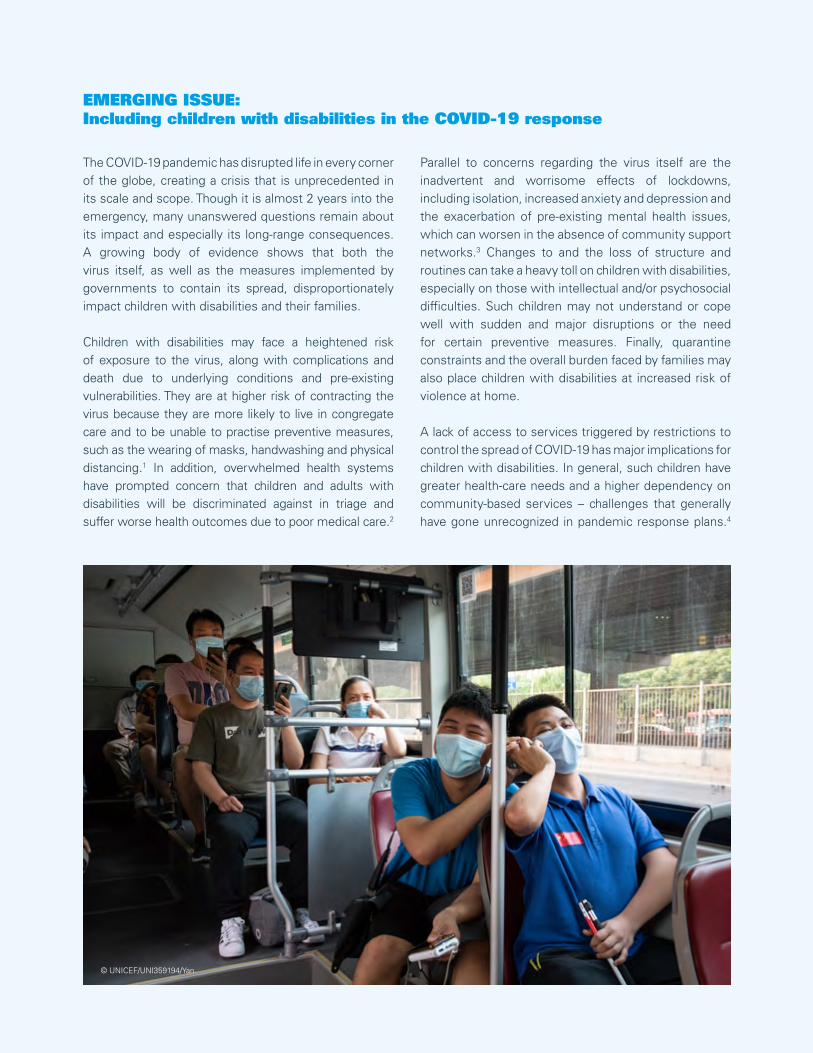
160 Seen, Counted, Included: Using data to shed light on the well-being of children with disabilities
EMERGING ISSUE: Including children with disabilities in the COVID-19 response
The COVID-19 pandemic has disrupted life in every corner of the globe, creating a crisis that is unprecedented in its scale and scope. Though it is almost 2 years into the emergency, many unanswered questions remain about its impact and especially its long-range consequences. A growing body of evidence shows that both the virus itself, as well as the measures implemented by governments to contain its spread, disproportionately impact children with disabilities and their families.
Children with disabilities may face a heightened risk of exposure to the virus, along with complications and death due to underlying conditions and pre-existing vulnerabilities. They are at higher risk of contracting the virus because they are more likely to live in congregate care and to be unable to practise preventive measures, such as the wearing of masks, handwashing and physical distancing.1 In addition, overwhelmed health systems have prompted concern that children and adults with disabilities will be discriminated against in triage and suffer worse health outcomes due to poor medical care.2
Parallel to concerns regarding the virus itself are the inadvertent and worrisome effects of lockdowns, including isolation, increased anxiety and depression and the exacerbation of pre-existing mental health issues, which can worsen in the absence of community support networks.3 Changes to and the loss of structure and routines can take a heavy toll on children with disabilities, especially on those with intellectual and/or psychosocial difficulties. Such children may not understand or cope well with sudden and major disruptions or the need for certain preventive measures. Finally, quarantine constraints and the overall burden faced by families may also place children with disabilities at increased risk of violence at home.
A lack of access to services triggered by restrictions to control the spread of COVID-19 has major implications for children with disabilities. In general, such children have greater health-care needs and a higher dependency on community-based services – challenges that generally have gone unrecognized in pandemic response plans.4
© UNICEF/UNI359194/Yan
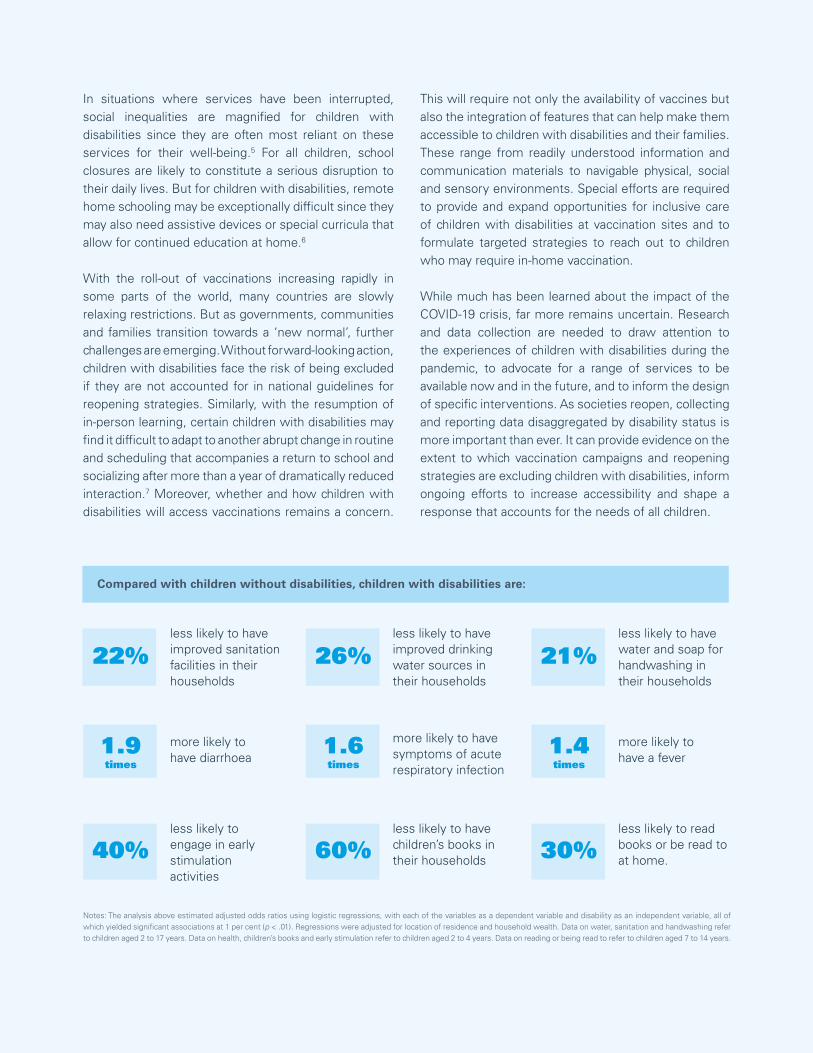
161CHAPTER 9 Fulfilling the rights of every child
Compared with children without disabilities, children with disabilities are:
In situations where services have been interrupted, social inequalities are magnified for children with disabilities since they are often most reliant on these services for their well-being.5 For all children, school closures are likely to constitute a serious disruption to their daily lives. But for children with disabilities, remote home schooling may be exceptionally difficult since they may also need assistive devices or special curricula that allow for continued education at home.6
With the roll-out of vaccinations increasing rapidly in some parts of the world, many countries are slowly relaxing restrictions. But as governments, communities and families transition towards a ‘new normal’, further challenges are emerging. Without forward-looking action, children with disabilities face the risk of being excluded if they are not accounted for in national guidelines for reopening strategies. Similarly, with the resumption of in-person learning, certain children with disabilities may find it difficult to adapt to another abrupt change in routine and scheduling that accompanies a return to school and socializing after more than a year of dramatically reduced interaction.7 Moreover, whether and how children with disabilities will access vaccinations remains a concern.
This will require not only the availability of vaccines but also the integration of features that can help make them accessible to children with disabilities and their families. These range from readily understood information and communication materials to navigable physical, social and sensory environments. Special efforts are required to provide and expand opportunities for inclusive care of children with disabilities at vaccination sites and to formulate targeted strategies to reach out to children who may require in-home vaccination.
While much has been learned about the impact of the COVID-19 crisis, far more remains uncertain. Research and data collection are needed to draw attention to the experiences of children with disabilities during the pandemic, to advocate for a range of services to be available now and in the future, and to inform the design of specific interventions. As societies reopen, collecting and reporting data disaggregated by disability status is more important than ever. It can provide evidence on the extent to which vaccination campaigns and reopening strategies are excluding children with disabilities, inform ongoing efforts to increase accessibility and shape a response that accounts for the needs of all children.
less likely to have improved sanitation facilities in their households
22%less likely to have improved drinking water sources in their households
26%less likely to have water and soap for handwashing in their households
21%
more likely to have diarrhoea
1.9times
more likely to have symptoms of acute respiratory infection
more likely to have a fever
1.6times
1.4times
less likely to engage in early stimulation activities
40%less likely to have children’s books in their households 60%
less likely to read books or be read to at home.30%
Notes: The analysis above estimated adjusted odds ratios using logistic regressions, with each of the variables as a dependent variable and disability as an independent variable, all of which yielded significant associations at 1 per cent (p < .01). Regressions were adjusted for location of residence and household wealth. Data on water, sanitation and handwashing refer to children aged 2 to 17 years. Data on health, children’s books and early stimulation refer to children aged 2 to 4 years. Data on reading or being read to refer to children aged 7 to 14 years.
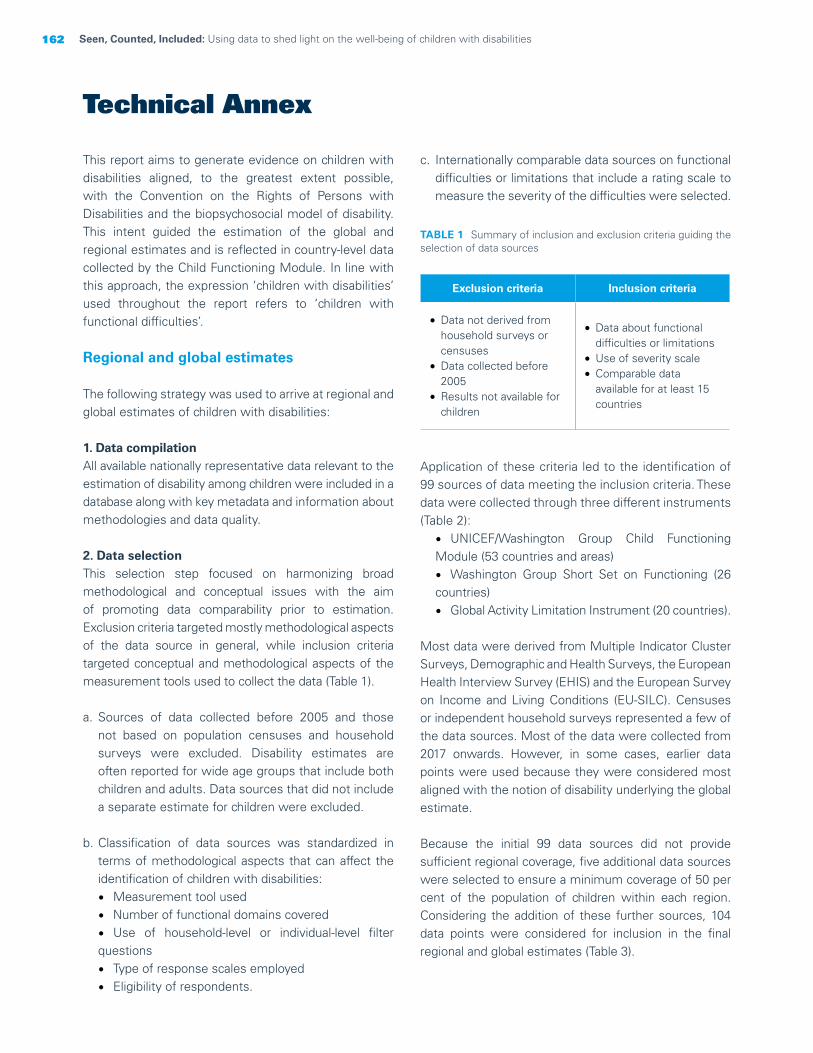
162 Seen, Counted, Included: Using data to shed light on the well-being of children with disabilities
Technical Annex
This report aims to generate evidence on children with disabilities aligned, to the greatest extent possible, with the Convention on the Rights of Persons with Disabilities and the biopsychosocial model of disability. This intent guided the estimation of the global and regional estimates and is reflected in country-level data collected by the Child Functioning Module. In line with this approach, the expression ‘children with disabilities’ used throughout the report refers to ‘children with functional difficulties’.
Regional and global estimates
The following strategy was used to arrive at regional and global estimates of children with disabilities:
1. Data compilationAll available nationally representative data relevant to the estimation of disability among children were included in a database along with key metadata and information about methodologies and data quality.
2. Data selectionThis selection step focused on harmonizing broad methodological and conceptual issues with the aim of promoting data comparability prior to estimation. Exclusion criteria targeted mostly methodological aspects of the data source in general, while inclusion criteria targeted conceptual and methodological aspects of the measurement tools used to collect the data (Table 1).
a. Sources of data collected before 2005 and those not based on population censuses and household surveys were excluded. Disability estimates are often reported for wide age groups that include both children and adults. Data sources that did not include a separate estimate for children were excluded.
b. Classification of data sources was standardized in terms of methodological aspects that can affect the identification of children with disabilities:• Measurement tool used• Number of functional domains covered• Use of household-level or individual-level filter questions• Type of response scales employed• Eligibility of respondents.
c. Internationally comparable data sources on functional difficulties or limitations that include a rating scale to measure the severity of the difficulties were selected.
TABLE 1 Summary of inclusion and exclusion criteria guiding the selection of data sources
Exclusion criteria Inclusion criteria
• Data not derived from household surveys or censuses
• Data collected before 2005
• Results not available for children
• Data about functional difficulties or limitations
• Use of severity scale • Comparable data
available for at least 15 countries
Application of these criteria led to the identification of 99 sources of data meeting the inclusion criteria. These data were collected through three different instruments (Table 2):
• UNICEF/Washington Group Child Functioning Module (53 countries and areas)• Washington Group Short Set on Functioning (26 countries) • Global Activity Limitation Instrument (20 countries).
Most data were derived from Multiple Indicator Cluster Surveys, Demographic and Health Surveys, the European Health Interview Survey (EHIS) and the European Survey on Income and Living Conditions (EU-SILC). Censuses or independent household surveys represented a few of the data sources. Most of the data were collected from 2017 onwards. However, in some cases, earlier data points were used because they were considered most aligned with the notion of disability underlying the global estimate.
Because the initial 99 data sources did not provide sufficient regional coverage, five additional data sources were selected to ensure a minimum coverage of 50 per cent of the population of children within each region. Considering the addition of these further sources, 104 data points were considered for inclusion in the final regional and global estimates (Table 3).
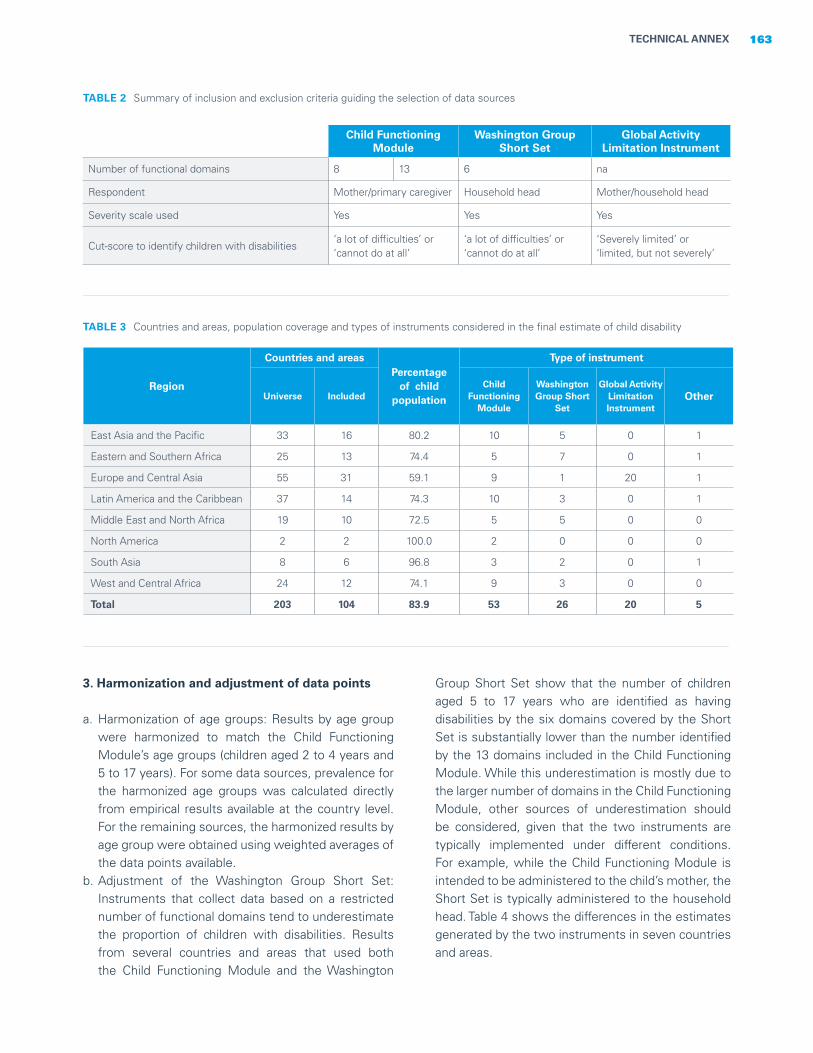
163TECHNICAL ANNEX
TABLE 2 Summary of inclusion and exclusion criteria guiding the selection of data sources
Child Functioning Module
Washington Group Short Set
Global Activity Limitation Instrument
Number of functional domains 8 13 6 na
Respondent Mother/primary caregiver Household head Mother/household head
Severity scale used Yes Yes Yes
Cut-score to identify children with disabilities‘a lot of difficulties’ or ‘cannot do at all’
‘a lot of difficulties’ or ‘cannot do at all’
‘Severely limited’ or ‘limited, but not severely’
Region
Countries and areasPercentage
of child population
Type of instrument
Universe IncludedChild
Functioning Module
Washington Group Short
Set
Global Activity Limitation Instrument
Other
East Asia and the Pacific 33 16 80.2 10 5 0 1
Eastern and Southern Africa 25 13 74.4 5 7 0 1
Europe and Central Asia 55 31 59.1 9 1 20 1
Latin America and the Caribbean 37 14 74.3 10 3 0 1
Middle East and North Africa 19 10 72.5 5 5 0 0
North America 2 2 100.0 2 0 0 0
South Asia 8 6 96.8 3 2 0 1
West and Central Africa 24 12 74.1 9 3 0 0
Total 203 104 83.9 53 26 20 5
TABLE 3 Countries and areas, population coverage and types of instruments considered in the final estimate of child disability
3. Harmonization and adjustment of data points
a. Harmonization of age groups: Results by age group were harmonized to match the Child Functioning Module’s age groups (children aged 2 to 4 years and 5 to 17 years). For some data sources, prevalence for the harmonized age groups was calculated directly from empirical results available at the country level. For the remaining sources, the harmonized results by age group were obtained using weighted averages of the data points available.
b. Adjustment of the Washington Group Short Set: Instruments that collect data based on a restricted number of functional domains tend to underestimate the proportion of children with disabilities. Results from several countries and areas that used both the Child Functioning Module and the Washington
Group Short Set show that the number of children aged 5 to 17 years who are identified as having disabilities by the six domains covered by the Short Set is substantially lower than the number identified by the 13 domains included in the Child Functioning Module. While this underestimation is mostly due to the larger number of domains in the Child Functioning Module, other sources of underestimation should be considered, given that the two instruments are typically implemented under different conditions. For example, while the Child Functioning Module is intended to be administered to the child’s mother, the Short Set is typically administered to the household head. Table 4 shows the differences in the estimates generated by the two instruments in seven countries and areas.

Washington Group Short Set(6 domains)
Child Functioning Module(6 domains only)
Child Functioning Module (13 domains)
Costa Rica 4.0 7.1 21.1
Guyana 2.2 5.6 17.5
Mexico 1.5 4.1 11.2
Pakistan 2.5 5.0 17.9
State of Palestine 1.5 3.0 14.9
Tonga 1.4 2.7 9.8
Zimbabwe 4.7 4.9 10.1
To correct for the underestimation of the proportion of children with disabilities, the data points based on the Short Set were adjusted as follows, : Considering: the conceptual closeness between the Short Set and the Child Functioning Module; that the 13 Child Functioning Module domains include the six Short Set domains; and that these six domains are operationalized in the two instruments using similar questions, it was assumed that the data points based on the Short Set could be used to approximate the results that would be obtained if the Child Functioning Module had been used to measure disability in the same population. Country-level under-five mortality rates were also used to inform the construction of the adjustment factor. To calculate the adjustment factor, we used microdata from 36 countries that used the Child Functioning Module. Using linear regressions, we predicted the prevalence of disability among children yielded by the Child Functioning Module from the prevalence of children with disabilities based on the six domains common to the Short Set and the Child Functioning Module, adjusted by the under-five mortality rate. Three separate models generated the adjustment factors for the three Child Functioning Module age groups. These models produced the following formulas considered to model the adjustment of data points based on the Short Set, for each age group:
i. 2 to 4 years: CFM2-4 =(0.846*SS) + (0.0005*U5MR) - 0.0051
ii. 5 to 17 years: CFM5-17 =(1.79*SS) + (0.0006* U5MR) + 0.0466
iii. 2 to 17 years: CFM2-17 = (1.573*SS) + (0.0006* U5MR) + 0.0337
Where SS is the score in the Short Set instrument and U5MR is the under-five mortality rate per 1,000 live births.
Table 5 summarizes the process of data selection, harmonization and adjustment.
4. Confidence intervals
Because errors in data are inevitable, uncertainty will always exist around data and estimates, both nationally and internationally. To allow for added comparability, estimates of children with disabilities were generated with confidence intervals. Because 66 data sources did not include the standard errors for their data points, their confidence intervals needed to be imputed. In such cases, it was assumed that countries would have produced their data points with the average precision observed in their region. Western Europe was a special case, since we had point estimates but lacked confidence intervals for the whole region, with the exception of one country. Considering the development of the region, we assumed Western European countries would produce estimates with a similar precision to those of North America. Thus, Western Europe confidence intervals were informed by the average semi-amplitude of the North America region.
5. Imputation of the estimate for children under 2 years of age
Data on disabilities among children under the age of 2 are scarce. To date, no questions on functional difficulties have been validated that could be implemented to collect data about very young children in surveys and generate results that are reliable and comparable cross-nationally. While most severe impairments manifest early, sometimes even before children are
TABLE 4 Percentage of children aged 5 to 17 years with functional difficulties measured by the six domains covered by the Short Set, by the same six domains in the Child Functioning Module and by the 13 domains covered in the Child Functioning Module
164 Seen, Counted, Included: Using data to shed light on the well-being of children with disabilities
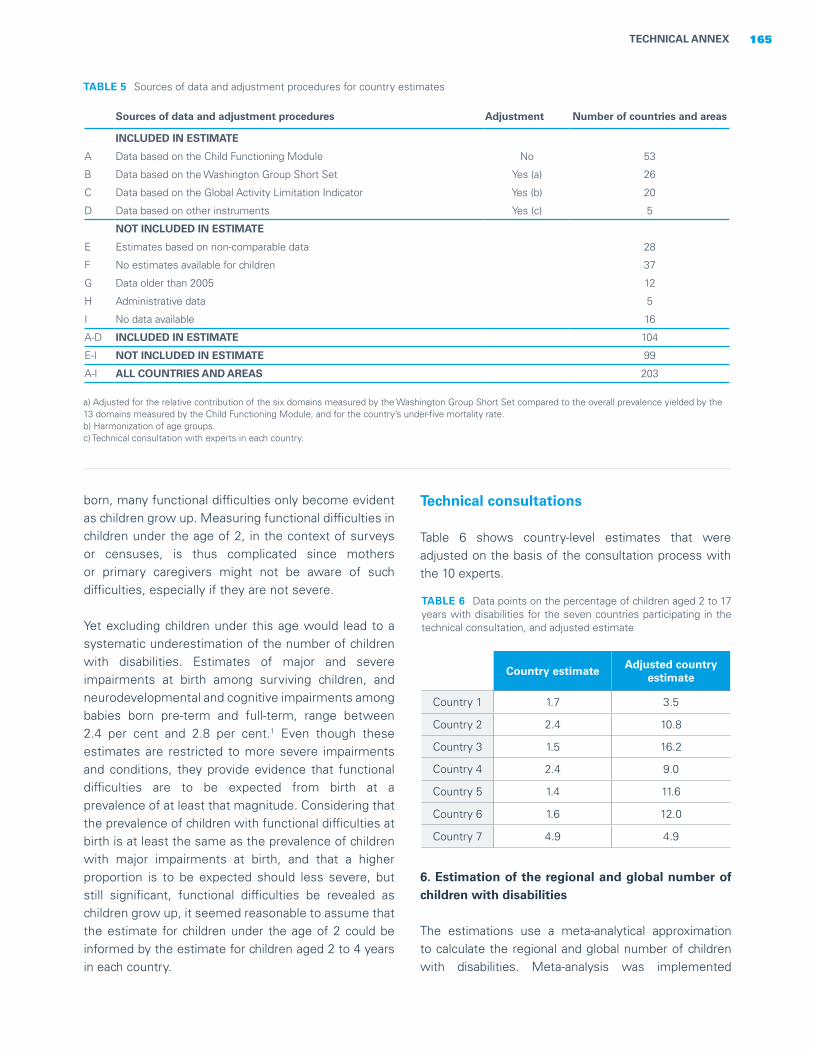
born, many functional difficulties only become evident as children grow up. Measuring functional difficulties in children under the age of 2, in the context of surveys or censuses, is thus complicated since mothers or primary caregivers might not be aware of such difficulties, especially if they are not severe.
Yet excluding children under this age would lead to a systematic underestimation of the number of children with disabilities. Estimates of major and severe impairments at birth among surviving children, and neurodevelopmental and cognitive impairments among babies born pre-term and full-term, range between 2.4 per cent and 2.8 per cent.1 Even though these estimates are restricted to more severe impairments and conditions, they provide evidence that functional difficulties are to be expected from birth at a prevalence of at least that magnitude. Considering that the prevalence of children with functional difficulties at birth is at least the same as the prevalence of children with major impairments at birth, and that a higher proportion is to be expected should less severe, but still significant, functional difficulties be revealed as children grow up, it seemed reasonable to assume that the estimate for children under the age of 2 could be informed by the estimate for children aged 2 to 4 years in each country.
TABLE 5 Sources of data and adjustment procedures for country estimates
Sources of data and adjustment procedures Adjustment Number of countries and areas
INCLUDED IN ESTIMATE
A Data based on the Child Functioning Module No 53
B Data based on the Washington Group Short Set Yes (a) 26
C Data based on the Global Activity Limitation Indicator Yes (b) 20
D Data based on other instruments Yes (c) 5
NOT INCLUDED IN ESTIMATE
E Estimates based on non-comparable data 28
F No estimates available for children 37
G Data older than 2005 12
H Administrative data 5
I No data available 16
A-D INCLUDED IN ESTIMATE 104
E-I NOT INCLUDED IN ESTIMATE 99
A-I ALL COUNTRIES AND AREAS 203
a) Adjusted for the relative contribution of the six domains measured by the Washington Group Short Set compared to the overall prevalence yielded by the 13 domains measured by the Child Functioning Module, and for the country’s under-five mortality rate.b) Harmonization of age groups. c) Technical consultation with experts in each country.
Technical consultations
Table 6 shows country-level estimates that were adjusted on the basis of the consultation process with the 10 experts.
TABLE 6 Data points on the percentage of children aged 2 to 17 years with disabilities for the seven countries participating in the technical consultation, and adjusted estimate
Country estimate Adjusted country estimate
Country 1 1.7 3.5
Country 2 2.4 10.8
Country 3 1.5 16.2
Country 4 2.4 9.0
Country 5 1.4 11.6
Country 6 1.6 12.0
Country 7 4.9 4.9
165TECHNICAL ANNEX
6. Estimation of the regional and global number of children with disabilities
The estimations use a meta-analytical approximation to calculate the regional and global number of children with disabilities. Meta-analysis was implemented

using the prevalence rates of children with disabilities for each country, 95 per cent confidence intervals and the child population for all age groups. Country-level prevalence rates were transformed into the number of cases using the child population and used as input for the metaprop command in Stata, version 16.0 (College Station, TX). To stabilize the variance, proportions were transformed using Freeman and Tukey’s double arcsine transformation. Regional estimates were generated using random effects models considering that, despite harmonization efforts, the methods used to estimate the prevalence of disability were heterogeneous. This approach also assumed that prevalence estimates from countries that could not be included in the analysis were better informed by the random effects model. Random effects meta-analysis incorporates the heterogeneity of prevalence across countries rather than relying on the prevalence of larger countries, as assumed by the fixed effect model. The only exception was the North America region, where the two countries that constitute the region (Canada and the United States of America) used the same instrument and a fixed effect model was used. Therefore, for regional estimates, random effects were assumed a priori, to incorporate the within- and between-country variability. The regional estimates were then used to generate the population-averaged final global estimate (Table 7).
Analyses using country-level microdata
Child Functioning Module The Child Functioning Module captures the perceptions of mothers or primary caretakers about a child’s functional difficulties, including manifestations of behavioural difficulties, among children aged 2 to 4 years and of anxiety and depression among children aged 5 to 17 years. The report of daily signs of anxiety or depression should be interpreted as an indication of those conditions, rather than a clinical diagnosis. Results should not be used to assess the epidemiological characteristics of any disease or impairment; rather, they provide an indication of the prevalence of moderate to severe functional difficulties that, in interaction with various barriers, can place children at increased risk for non-participation and exclusion.
Microdata preparationAll data were obtained from publicly available databases from MICS. MICS survey design follows a probabilistic, cluster, stratified and multi-stage sampling approach to generate population-level indicators that are representative at the national level, urban-rural and other domains (usually regions), according to the country-specific stratification strategy.
TABLE 7 Regional and global estimates
For a complete list of countries and areas in the regions, subregions and country categories, see <data.unicef.org/regionalclassifications>.Demographic data are from: United Nations, Department of Economic and Social Affairs, Population Division, World Population Prospects 2020, Rev. 1, 2020.
166 Seen, Counted, Included: Using data to shed light on the well-being of children with disabilities
Children aged0 to 4 years
Children aged5 to 17 years
Children aged0 to 17 years
% Lower bound
Upper bound
Number of children with disabilities
(in thousands)
% Lower bound
Upper bound
Number of children with disabilities
(in thousands)
%
Number of children with disabilities
(in thousands)
East Asia and the Pacific 3.5 3.2 3.8 5,333 9.5 7.5 11.6 37,788 7.8 43,121
Eastern and Southern Africa 5.2 4.3 6.2 4,509 12.8 11.2 14.4 24,430 10.4 28,938
Europe and Central Asia 2.7 2.3 3.2 1,515 6.5 5.6 7.4 9,299 5.4 10,814
Latin America and the Caribbean
3.8 3.1 4.6 1,978 12.6 11.5 13.7 17,106 10.2 19,084
Middle East and North Africa 4.5 2.9 6.5 2,246 16.9 13.5 20.5 18,694 13.1 20,940
North America 4.4 3.7 5.0 943 12.0 11.3 12.7 7,073 9.9 8,016
South Asia 3.7 2.5 5.0 6,254 13.0 10.2 16.1 58,174 10.5 64,428
West and Central Africa 6.8 5.5 8.3 6,139 18.9 15.3 22.7 34,944 14.9 41,083
World 10.1 236,424
Standard errors for the pooled estimations can then be calculated from the resulting pooled variance.
• Estimations for a given indicator at the pooled level are expected to be more precise than at the country level because the aggregated sample size is greater than the sample size of individual countries.
Analytic approachThe main goal of the report is to identify disparities and inequities affecting children with disabilities. Most of the analyses aim to illustrate differences between children with and without disabilities in relation to key indicators. To achieve this, the report analyses are heavily based on so-called statistical inference for finite populations and follow mostly a ‘design-based’ approach. In survey data, standard errors and confidence intervals can be used to describe the precision of estimates as described in the next section.
Confidence intervalsMost analyses in the report draw on confidence intervals (CI) to make inferences about the different indicators under study. The CI is a central concept in statistical inference for finite populations, being a random interval that states the probability of containing the unknown value of the population parameter that has been estimated.
CIs reflect the precision of an indicator estimate. Several factors, including the sample design and sample size, as well as the expected prevalence and variability of an indicator, can influence the precision of any reported estimate. Indicators with lower prevalence typically require larger sample sizes to allow for precise estimations.
CIs can also be used to identify statistically significant differences between two results – that is, differences that are not due to chance. In the report, CIs were thus used to compare results for children with and without disabilities and other population subgroups of interest, such as boys versus girls or children living in rural versus urban areas.
Because the report draws on a large number of countries, country-level results only show countries with statistically significant differences at the 5 per cent level.
Technical note on estimates on the back coverThe results were estimated using generalized linear regression models, with each of the outcomes as a dependent variable, and disability status of the child as independent variables. All models were adjusted for a child’s sex, age, residence and wealth.
As of November 2021, data were available across 42 countries and areas, including data from two subnational surveys (Pakistan’s Punjab and Sindh regions). Data processing was carried out to generate standard child functioning variables, more than 60 standard indicators, and disaggregation variables harmonized across countries (such as sex, residence and maternal education).
Throughout the report, country-level analyses are used whenever sample sizes allow for it. Pooled analyses are mostly used to show results at the domain level, for which country-level sample sizes tend to be insufficient. We also use pooled analyses to illustrate disaggregated results for key indicators at the pooled-sample level.
Country-level data were merged into a pooled dataset, together with the country’s sample weights and sample design variables (primary sample units and strata). In this pooled dataset, we have kept the country-level sample weights for country-level analyses. First, a single stratum indicator was generated to reflect the complete multi-frame design and ensure that each stratum and PSU assumed a unique value across countries, Next, population scaling was carried out to recalibrate the country-specific weights, adjusting for country population size relative to sample sizes. Because the child population in Punjab and Sindh regions represent around 70 per cent of the total population of children in Pakistan, data from these two surveys were considered to be representative at the country level. Sample weights for both regions were thus recalibrated in a similar way to that of other countries.
There are a few assumptions beyond this approach that should be considered:• The surveys are comparable with respect to aspects
that could influence results, such as standardized survey questions and interviewing protocols.
• Each dataset contains nationally representative probabilistic samples with similar designs.
• In the resulting pooled dataset, the sample selection process for each of the finite populations for each country is assumed to be random.
• Each country dataset includes a calibrated sample weight that reflects the county-specific sample design parameters, including selection probabilities and non-response.
• In the pooled dataset, each country becomes like an additional stratum.
• Since country samples are independent, the variance for pooled estimations for a given indicator is equal to the sum of variance for that indicator in each country.
167TECHNICAL ANNEX

168 Seen, Counted, Included: Using data to shed light on the well-being of children with disabilities
CHAPTER 1. Every child has the right to be counted1 The inclusion of questions regarding children younger than 2 years was one objective of the Child Functioning Module. However, to date, no universal functioning questions have been identified for these very young children that could be implemented in surveys and that would elicit valid, reliable, and cross-nationally comparable results.
2 Rydzewska, Ewelina, ‘Unexpected Changes of Itinerary: Adaptive functioning difficulties in daily transitions for adults with Autism Spectrum Disorder’, European Journal of Special Needs Education, vol. 31, no. 3, 2016, pp. 330-343.
3 Loeb, Mitchell, et al., ‘The Development and Testing of a Module on Child Functioning for Identifying Children with Disabilities on Surveys. I: Background’, Journal of Disability and Health, vol. 11, no. 4, 2018, pp. 495-501.
4 Ibid.
5 Massey, Meredith, ‘The Development and Testing of a Module on Child Functioning for Identifying Children with Disabilities on Surveys. II: Question development and pretesting’, Journal of Disability and Health, vol. 11, no. 4, 2018, pp. 502-509.
6 International Disability Alliance, ‘Joint Statement by the Disability Sector: Disability data disaggregation’, <www. internationaldisabilityalliance.org/data-joint-statement-march2017>, accessed 19 May 2021.
7 Washington Group on Disability Statistics, ‘Washington Group Short Set on Functioning’, <www.washingtongroup-disability.com/question-sets/wg-short-set-on-functioning-wg-ss/> , accessed 7 November 2021.
8 Byass, Peter, ‘The Imperfect World of Global Health Estimates’, PLoS Medicine, vol. 7, no. 11, 30 November 2010.
9 World Health Organization, ‘Disability Prevention and Rehabilitation: Report of the WHO Expert Committee on Disability Prevention and Rehabilitation’, Technical Report Series 668, WHO, Geneva, 1981, <http://whqlibdoc.who.int/trs/WHO_TRS_668.pdf>, accessed 7 November 2021.
10 World Health Organization, World Report on Disability, WHO, Geneva, 2011. 11 Arnesen, Trude, and Erik Nord, ‘The Value of DALY Life: Problems with ethics and validity of disability adjusted life years’, British Medical Journal, vol 319, 1999, pp. 1423-1425. 12 Anand, Sudhir, and Kara Hanson, ‘Disability-Adjusted Life Years: A critical review’, Journal of Health Economics, vol. 16, no. 6, 1997, pp. 685-702. 13 Mont, Daniel, ‘Measuring Health and Disability’, The Lancet, vol. 369, no. 9573, 2007, pp. 1658-1663. 14 Olusanya, Bolajoko O., et al. ‘Global Burden of Childhood Epilepsy, Intellectual Disability, and Sensory Impairments’, Pediatrics, vol. 146, no. 1, July 2020.
CHAPTER 2. Every child has the right to survive and thrive1 United Nations, Universal Declaration of Human Rights, United Nations, Paris, 10 December 1948, Article 3; United Nations, Convention on the Rights of the Child, United Nations, New York, 20 November 1989, article 23; United Nations, Convention on the Rights of Persons with Disabilities, 30 March 2007, United Nations, New York, articles 10 and 25.
2 United Nations Children’s Fund, ‘Manual for Anthropometry’, UNICEF Multiple Indicator Cluster Surveys (MICS), UNICEF, New York, undated.
3 Bell, Kristie L., et al., ‘Use of Segmental Lengths for the Assessment of Growth in Children with Cerebral Palsy’, in Handbook of Anthropometry: Physical measures in human form in health and disease, edited by Victor R. Preedy, Springer-Verlag, New York, 2021, pp. 1279-1297; Samson-Fang, Lisa, and Kristie L. Bell, ‘Assessment of Growth and Nutrition in Children with Cerebral Palsy’, European Journal of Clinical Nutrition, vol. 67, 2013, pp. S5-S8.
4 Hardy, Jane, et al., ‘Reliability of Anthropometric Measurements in Children with Special Needs’, Archives of Disease in Childhood, vol. 103, no. 8, August 2018, pp. 757-762.
5 Samson-Fang and Bell, ‘Assessment of Growth and Nutrition in Children with Cerebral Palsy’.
6 All references to Kosovo in this report should be understood to be in the context of United Nations Security Council resolution 1244 (1999).
7 Cowley, Peter, and Dean T. Jamison, ‘The Cost-Effectiveness of Immunization’, World Health, vol. 46, no. 2, March-April 1993, pp. 20-22.
8 United Nations Children’s Fund and Leonard Cheshire Disability and Inclusive Development Centre, ‘Disability Prevention Efforts and Disability Rights: Finding common ground on immunization efforts’, Working paper, undated, <www.unicef.org/disabilities/files/UNICEF_Immunization_and_Disability_Paper_FINAL.pdf>, accessed 10 February 2020; Mactaggert, Islay, et al., ‘Assessing Health and Rehabilitation Needs of People with Disabilities in Cameroon and India’, Disability and Rehabilitation, vol. 38, no. 18, December 2016, pp. 1757-1764.
9 ‘Disability Prevention Efforts and Disability Rights’.
10 Alabaf, Setareh, et al., ‘Physical Health in Children with Neurodevelopmental Disorders’, Journal of Autism and Developmental Disorders, vol. 48, no. 1, January 2019, pp. 83-95; Seddon, P.C., and Y. Khan, ‘Respiratory Problem in Children with Neurological Impairment’, Archives of Disease in Childhood, vol. 88, no. 1, January 2003, pp. 75-78.
11 ‘Disability Prevention Efforts and Disability Rights’.
12 United Nations Children’s Fund, One Is Too Many: Ending child deaths from pneumonia and diarrhoea, UNICEF, New York, 2016.
13 Kuper, Hannah, et al., ‘The Impact of Disability on the Lives of Children: Cross-sectional data including 8,900 children with disabilities and 898,834 children without disabilities across thirty countries’, PLoS One, vol. 9, no. 9, September 2014.
14 Seddon and Khan, ‘Respiratory Problem in Children with Neurological Impairment’.
15 Lorntz, Breyette, et al., ‘Early Childhood Diarrhea Predicts Impaired School Performance’, Pediatric Infectious Disease Journal, vol. 25, no. 6, June 2006, pp. 513-520; Niehaus, Mark D., et al., ‘Early Childhood Diarrhea Is Associated with Diminished Cognitive Function 4 to 7 Years Later in Children in a Northeast Brazilian Shantytown’, American Journal of Tropical Medicine and Hygiene, vol. 66, no. 5, May 2002, pp. 590-593; Podewils, Laura Jean, ‘Acute, Infectious Diarrhea among Children in Developing Countries’, Seminars in Paediatric Infectious Diseases, vol. 15, no. 3, July 2004, pp. 155-168.
16 Seddon and Khan ‘Respiratory Problem in Children with Neurological Impairment’.
17 Adugna, Molalign, et al., ‘Barriers and Facilitators to Healthcare Access for Children with Disabilities in Low and Middle-Income Sub-Saharan African Countries: A scoping review’, BMC Health Services Research, vol. 20, no. 1, January 2020; Kuper, Hannah, and Phyllis Heydt, ‘The Missing Billion: Access
Endnotes
169ENDNOTES
to health services for 1 billion people with disabilities’, International Centre for Evidence in Disability (ICED), July 2019, <www.lshtm.ac.uk/media/38726>, accessed 10 February 2021.
18 Lamptey, De-Lawrence, ‘Health Beliefs and Behaviours of Families towards the Health Needs of Children with Intellectual and Developmental Disabilities (IDD) in Accra, Ghana’, Journal of Intellectual Disability Research, vol. 63, no. 1, January 2019, pp. 12-20.
19 Ibid.
20 Groce, Nora E., et al., ‘Inclusive Nutrition for Children and Adults with Disabilities’, The Lancet Global Health, vol. 1, no. 4, October 2013, pp. E180-E181; United Nations Children’s Fund, The State of the World’s Children 2019 : Children, food and nutrition – Growing well in a changing world, UNICEF, New York, 2019.
21 Sonik, Rajan, et al., ‘Food Insecurity in U.S. Households that include Children with Disabilities’, Exceptional Children, vol. 83, no. 1, July 2016.
22 Groce, et al., ‘Inclusive Nutrition for Children and Adults with Disabilities’.
23 Groce, Nora E., et al., ‘Malnutrition and Disability: Unexplored opportunities for collaboration’, Paediatrics and International Child Health, vol. 34, no. 4, April 2014, pp. 308-314.
24 CBM Australia, et al., ‘Disability Inclusion in Drought and Food Crisis Emergency Response’, Fact sheet, July 2011, <www.cbm.org/fileadmin/user_upload/Disability_Inclusion_in_Drought_and_Food_Crisis_Emergency_Response.pdf>, accessed 20 August 2021.
25 Groce, Nora Ellen, Paola Ayora and Lawrence C. Kaplan, ‘Immunization Rates among Disabled Children in Ecuador: Unanticipated findings’, The Journal of Pediatrics, vol. 151, no. 2, August 2007, pp. 105-222.
26 Groce et al., ‘Malnutrition and Disability’.
27 Ng, Marie, et al., ‘Effective Coverage: A metric for monitoring universal health coverage’, PLoS Medicine, vol. 11, no. 9, September 2014.
CHAPTER 3. Every child has the right to a nurturing family environment 1 World Health Organization, United Nations Children’s Fund and World Bank Group, Nurturing Care for Early Childhood Development: A framework for helping children survive and thrive to transform health and human potential, WHO, Geneva, 2018. Responsive care refers to interactions that are emotionally supportive and entail engagement of a child with a parent or caregiver; they can include responsive feeding, playing, singing or talking. See United Nation’s Children Fund, Early Moments Matter for Every Child, UNICEF, New York, 2017.
2 United Nations, Convention on the Rights of the Child, United Nations, New York, 1989; United Nations, Convention on the Rights of Persons with Disabilities, United Nations, New York, 2006.
3 Early Moments Matter for Every Child; Walker, Susan P., et al., ‘Inequality in Early Childhood: Risk and protective factors for early child development’, The Lancet, vol. 378, 2011, pp. 1325-1338.
4 Early Moments Matter for Every Child.
5 Wall, Shavaun, et al., ‘Child Care for Low-Income Children with Disabilities: Access, quality, and parental satisfaction’, Journal of Early Intervention, vol. 28, no. 4, 2006, pp. 283-298.
6 Green, Katherine B., Nicole Pattern Terry and Peggy A. Gallagher, ‘Progress in Language and Literacy Skills among Children with Disabilities in Inclusive Early Reading First Classrooms’, Topics in Early Childhood Special Education, vol. 33, no. 4, 2013, pp. 249-259.
7 van der Schuit, M., et al., ‘Home Literacy Environment of Pre-School Children with Intellectual Disability’, Journal of Intellectual Disability Research, vol. 53, no. 12, 2009, pp. 1024-1037.
8 Buchanan, Michelle, and Tricia Giovacco Johnson, ‘A Second Look at the Play of Young Children with Disabilities’, American Journal of Play, vol. 2, no. 1, 2009, pp. 41-59.
9 Llewellyn, Gwynnyth, et al., ‘The Well-Being of Children with Disabilities in the Asia Pacific Region: An analysis of UNICEF MICS 3 survey data from Bangladesh, Lao PDR, Mongolia, and Thailand’, Centre for Disability Research and Policy, University of Sydney, Sidney, 2012; Spiker, Donna, Glenna C. Boyce and Lisa K. Boyce, ‘Parent-Child Interactions When Young Children Have Disabilities’, International Review of Research in Mental Retardation, vol. 25, 2002, pp. 35-70.
10 Leeb, Rebecca T., et al., ‘Does Childhood Disability Increase Risk for Child Abuse and Neglect?’, Journal of Mental Health Research in Intellectual Disabilities, vol. 5, no. 1, 2012, pp. 4-31.
11 Hibbard, Roberta A., et al., ‘Maltreatment of Children with Disabilities’, American Academy of Pediatrics, vol. 199, 2007, p. 1018.
12 Collishaw, Stephan, et al., ‘Longitudinal Study of Parents and Children Study Team. Maternal childhood abuse and offspring adjustment over time’, Development Psychopathology, vol. 19, no. 2, 2007, pp. 367-383.
13 de Castro, Filipa, et al., ‘Poor Early Childhood Outcomes Attributable to Maternal Depression in Mexican Women’, Archives of Women’s Mental Health, vol. 20, no. 4, 2017, pp. 561-568.
14 Bizzego, Andrea, et al., ‘Children with Developmental Disabilities in Low- and Middle-Income Countries: More neglected and physically punished’, International Journal of Environmental Research and Public Health, vol. 17, no. 19, 2020.
15 Njelesani, Janet, ‘”A Child Who Is Hidden Has No Rights”: Responses to violence against children with disabilities’, Child Abuse and Neglect, vol. 89, 2019, pp. 58-69.
16 Schieman, Scot, Leah Ruppanner and Melissa A. Milkie, ‘Who Helps with Homework? Parenting inequality and relationship quality among employed mothers and fathers’, Journal of Family Economic Issues, vol. 39, no. 3, 2018, pp. 46-65.
17 Negraia, Daniela, Jennifer March Augustine and Kate Chambers Prickett, ‘Gender Disparities in Parenting Time across Activities, Child Ages, and Educational Groups’, Journal of Family Issues, vol. 39, no. 11, 2018, pp. 3006-3028.
18 Schieman et al., ‘Who Helps with Homework?’.
19 Dabrowska-Zimakowska, Anna, and Ewa Pisula, ‘Parenting Stress and Coping Styles in Mothers and Fathers of Pre-School Children with Autism and Downs Syndrome’, Journal of Intellectual Disability Research, vol. 54, no. 3, 2010, pp. 266-280.
20 United Nations Children’s Fund, ‘Family-Friendly Policies: Redesigning the workplace of the future – A policy brief’, UNICEF, New York, 2019.
170 Seen, Counted, Included: Using data to shed light on the well-being of children with disabilities
21 Culver, Lucie, et al., ‘Parenting in a Time of COVID-19’, The Lancet, vol. 395, no. 10231, 2020.
22 Hohlfeld, Ameer S. J., Michal Harty and Mark E. Engel, ‘Parents of Children with Disabilities: A systematic review of parenting interventions and self-efficacy’, African Journal of Disability, vol. 7, 2018. p. 437.
23 United Nations Children’s Fund, ‘UNICEF’s Vision for Elevating Parenting: A strategic note’, UNICEF, New York, 2021.
CHAPTER 4. Every child has the right to learn
1 Aron, Laudan, and Pamela Loprest, ‘Disability and the Education System’, The Future of Children, vol. 22, no. 1, Spring 2021, pp. 97-122; Luo, Yifeng, et al., ‘How Various Types of Disabilities Impact Children’s School Attendance and Completion: Lessons learned from censuses in eight developing countries’, International Journal of Educational Development, vol. 77, September 2020; Mizunoya, Suguru, Sophie Mitra and Izumi Yamasaki, ‘Disability and School Attendance in 15 Low- and Middle-Income Countries’, World Development, vol. 104, 2018, pp. 388-403; Kuper, Hannah, et al., ‘The Impact of Disability on the Lives of Children: Cross-sectional data including 8,900 children with disabilities and 898,834 children without disabilities across 30 countries’, PLoS One, vol. 9, no. 9, September 2014.
2 United Nations Educational, Scientific and Cultural Organization, Global Education Monitoring Report: Inclusion and education – All means all, UNESCO, Paris, 2020.
3 Ibid.
4 Groce, Nora, Eleanor Challenger and Marko Kerac, ‘Stronger Together: Nutrition-disability links and synergies’, Briefing Note, Leonard Cheshire Disability and Inclusive Development Centre, University College London, 2013; O’Neill, Jenny, et al., ‘The Uptake of Adolescent Vaccinations through the School Immunisation Program in Specialist Schools in Victoria, Australia’, Vaccine, vol. 37, no. 2, 2019, pp. 272-279.
5 Banks, Lena Morgon, et al., ‘“If He Could Speak, He Would Be Able to Point Out Who Does Those Things to Him”: Experiences of violence and access to child protection among children with disabilities in Uganda and Malawi’, PLoS One, vol. 12, no. 9, September 2017.
6 Global Education Monitoring Report 2020.
7 Kameyama, Yuriko, ‘Who Are Out-of-School Children? Children with disabilities in Mongolia’, Compare: A Journal of Comparative and International Education, vol. 51, no. 5, September 2019, pp. 670-689.
8 World Health Organization and World Bank, World Report on Disability, WHO, Geneva, 2011, <www.who.int/disabilities/world_report/2011/en/index.html>, accessed 23 August 2021.
9 Groce, Nora Ellen, and Parul Bakhshi, ‘Illiteracy Among Adults in the Developing World: A review of the literature and a call for action’, International Journal of Inclusive Education, vol. 15, no. 10, 2011, pp. 1153-1168.
10 Ibid., Mizunoya, Suguru, Sophie Mitra and Izumi Yamasaki, ‘Towards Inclusive Education: The impact of disability on school attendance in developing countries’, Innocenti Working Paper no. 2016-03, UNICEF Innocenti Research Centre, Florence, May 2016.
11 Shandra, Carrie L., and Dennis Hogan, ‘The Educational Attainment Process among Adolescents with Disabilities and Children of Parents with Disabilities’, International Journal of Disabilities, Development and Education, vol. 56, no. 4, November 2006, pp. 363-379.
12 Castro, María, et al., ‘Parental Involvement on Student Academic Achievement: A meta-analysis’, Educational Research Review, vol. 14, February 2015, pp. 33-46.
13 Foster, Martha A., et al., ‘A Model of Home Learning Environment and Social Risk Factors in Relation to Children’s Emergent Literacy and Social Outcomes’, Early Childhood Research Quarterly, vol. 20, no. 1, March 2005, pp. 13-36; Lee, Kyunghee, et al., ‘Individualized Education Programmes and Parental Behaviours for Children with Disabilities: Moderation effects of Head Start on children’s development’, Child and Family Social Work, vol. 22, no. 2, September 2016, pp. 1000-1014.
14 van der Schuit, Marjge, et al., ‘Home Literacy Environment of Pre-School Children with Intellectual Disabilities’, Journal of International Disability Research, vol. 53, no. 12, December 2009, pp. 1024-1037.
15 Ibid.
16 Lee et al., ‘Individualized Education Programmes and Parental Behaviours for Children with Disabilities’.
17 Al-Dababneh, Kholoud Adeeb, ‘Barriers Preventing Parental Involvement in Mainstream Education of Children with Specific Learning Disabilities: Parent perspectives’, European Journal of Special Needs Education, vol. 33, no. 5, 2018, pp. 615-630.
18 Groce and Bakhshi, ‘Illiteracy among Adults in the Developing World’.
19 Karr, Valerie, Anne Hayes and Samuel Hayford, ‘Inclusion of Children with Learning Difficulties in Literacy and Numeracy in Ghana: A literature review’, International Journal of Disability, Development and Education, July 2020.
20 Groce and Bakhshi, ‘Illiteracy Among Adults in the Developing World’.
21 Cheong, Janice M.Y., Zachary M. Walker and Kara Rosenblatt, ‘Numeracy Abilities of Children in Grades 4 to 6 with Mild Intellectual Disability in Singapore’, International Journal of Disability, Development and Education, vol. 64, no. 2, 2017, pp. 150-168.
22 United Nations, Convention on the Rights of Persons with Disabilities, United Nations, New York, 2006, articles 9 (2g) and 21 (c and d).
23 Adam, Tas, and Arthur Tatnall, ‘The Value of Using ICT in the Education of School Students with Learning Difficulties’, Education and Information Technologies, vol. 22, no. 1, May 2017, pp. 2711-2726; Chantry, Jane, and Carolyn Dunford, ‘How Do Computer Assistive Technologies Enhance Participation in Childhood Occupations for Children with Multiple and Complex Difficulties? A review of the current literature’, British Journal of Occupational Therapy, vol. 73, no. 8, August 2010, pp. 351-365; Lidström, Helene, and Helena Hemmingsson, ‘Benefits of the Use of ICT in School Activities by Students with Motor, Speech, Visual, and Hearing Impairment: A literature review’, Scandinavian Journal of Occupational Therapy, vol. 21, no. 4, July 2014, pp. 251-266; Murchland, Sonya, and Helen Parkyn, ‘Promoting Participation in Schoolwork: Assistive technology use by children with physical disabilities’, Assistive Technology: The Official Journal of RESNA, vol. 23, no. 2, May 2011, pp. 93-105; Van den Heuvel, Renée, et al., ‘Robots and ICT to Support Play in Children with Severe Physical Disabilities: A systematic review’, Disability and Rehabilitation: Assistive Technology, vol. 11, no. 2, February 2016, pp. 103-116.
24 Chantry and Dunford, ‘How Do Computer Assistive Technologies Enhance Participation in Childhood Occupations for Children’.
25 Brodin, Jane, ‘Can ICT Give Children with Disabilities Equal Opportunities at School?’, Improving Schools, vol. 13, no. 1, April 2010, pp. 99-112.
26 Lynch, Paul, Nidhi Singal and Gill A. Francis, ‘EdTech for Learners with Disabilities in Primary School Settings in LMICs: A systematic literature review’,
171ENDNOTES
Working Paper, EdTech Hub, 2021, <https://docs.edtechhub.org/lib/XJ42VUQG>, accessed 23 August 2021.
27 Judge, Sharon Lesar, ‘Accessing and Funding Assistive Technology for Young Children with Disabilities’, Early Childhood Education Journal, vol. 28, no. 2, December 2000, pp. 125-131.
28 Yates, Sophie, et al., ‘Flexibility in Individual Funding Schemes: How well did Australia’s National Disability Insurance Scheme support remote learning for students with disability during COVID-19?’, Social Policy Administration, November 2000.
29 Judge, ‘Accessing and Funding Assistive Technology for Young Children with Disabilities’; Yates et al., ‘Flexibility in Individual Funding Schemes’.
30 Kuper, et al., ‘The Impact of Disability on the Lives of Children’; Luo et al., ‘How Various Types of Disabilities Impact Children’s School Attendance and Completion’; Male, Chata, and Quentin Wodon, ‘Disability Gaps in Educational Attainment and Literacy’, The Price of Exclusion: Disability and Education Series, World Bank Group, Washington, DC, 2017, p. 3; Mizunoya et al., ‘Disability and School Attendance in 15 Low- and Middle-Income Countries’; Wapling, Lorraine, ‘Inclusive Education and Children with Disabilities: Quality education for all in low and middle income countries’, CBM Policy Brief, Christian Blind Mission, January 2016.
31 Kuper et al., ‘The Impact of Disability on the Lives of Children’.
32 Barteaux, Susan, ‘Universal Design for Learning’, BU Journal of Graduate Studies in Education, vol. 6, no. 2, 2014, pp. 50-54; Katz, Jennifer, ‘The Three Block Model of Universal Design for Learning (UDL): Engaging students in inclusive education’, Canadian Journal of Education, vol. 36, no. 1, January 2013, pp. 153-194.
33 Mizunoya et al., ‘Towards Inclusive Education’.
34 Luo et al., ‘How Various Types of Disabilities Impact Children’s School Attendance and Completion’; Purdue, Kerry, ‘Barriers to and Facilitators of Inclusion for Children with Disabilities in Early Childhood Education’, Contemporary Issues in Early Childhood, vol. 10, no. 2, June 2009, pp. 133-143; Wapling, ‘Inclusive Education and Children with Disabilities’.
35 Wapling, ‘Inclusive Education and Children with Disabilities’.
CHAPTER 5. Every child has the right to protection from violence and exploitation1 Groce, Nora, Marie Loeb and Barbara Murray, ’The Disabled Beggar – Literature Review: Begging as an overlooked issue of disability and poverty’, ILO Working Papers, International Labour Office, Geneva, 2014.
2 Cappa, Claudia, et al. ‘Birth Registration: A child’s passport to protection’, The Lancet Global Health, vol. 2, no. 2, February 2014, pp. e67-e68; Todres, Jonathan, ‘Birth Registration: An essential first step toward ensuring the rights of all children’, Human Rights Brief, vol. 10, no. 3, 2003, pp. 32-35.
3 United Nations Children’s Fund, Birth Registration for Every Child by 2030: Are we on track?, UNICEF, New York, 2019.
4 Ibid.
5 Hendricks, Charlene, et al., ‘Associations between Child Disabilities and Caregiver Discipline and Violence in Low- and Middle-Income Countries’, Child Development, vol. 85, no. 2, 2014, pp. 513-531.
6 Ibid., Fisher, Marisa A., Robert M. Hodapp and Elizabeth M. Dykens, ‘Child Abuse among Children with Disabilities, What we know and what we need to know’, International Review of Research in Mental Retardation, vol. 35, 2008, pp. 251-289.
7 Groce, Nora, ‘Violence against Disabled Children: UN Secretary-General’s Report on Violence against Children. Thematic Group on Violence against Children with Disabilities’, New York, 2005; Njelesani, Janet, et al., ‘From the Day They Are Born: A qualitative study exploring violence against children with disabilities in West Africa’, BMC Public Health, vol. 18, no. 153, 2018.
8 Bizzego, Andrea, et al., ‘Children with Developmental Disabilities in Low- and Middle-Income Countries: More neglected and physically punished’, International Journal of Environmental Research and Public Health, vol. 17, no. 19, 2020.
9 Jones, L., et al., ‘Prevalence and Risk of Violence against Children with Disabilities: A systematic review and meta-analysis of observational studies’, The Lancet, vol. 380, no. 9845, 2012, pp. 899-907; Njelesani, ‘From the Day They Are Born’.
10 Njelesani et al., ‘From the Day They Are Born’.
11 Sullivan, Patricia M., ‘Violence Exposure among Children with Disabilities’, Clinical Child and Family Psychological Review, vol. 12, no. 2, 2009, pp. 196-216.
12 Ibid.
13 Njelesani et al., ‘From the Day They Are Born’.
14 Banks, Lena Morgan, et al., ‘“If He Could Speak, He Would Be Able to Point Out Who Does Those Things to Him”: Experiences of violence and access to child protection among children with disabilities in Uganda and Malawi’, PLoS One, vol. 12, no. 9, 2017.
15 Braathen, Stine Hellum, Poul Rohleder and Gloria Azalda, ‘Sexual and Reproductive Health and Rights of Girls with Disabilities’: A review of the literature, SINTEF and the University of East London, Trondheim, Norway 2017; Ellery, Frances, Gerison Lansdown and Corinna Csáky, ‘Out from the Shadows: Sexual violence against children with disabilities’. Save the Children UK and Handicap International, London, 2011; Hershkowitz, Irit, Michael E. Lamb and Dvora Horowitz, ‘Victimization of Children with Disabilities’, American Journal of Orthopsychiatry, vol. 77, no. 4, 2007, pp. 629-635.
16 Braathen et al., ‘Sexual and Reproductive Health and Rights’.
17 United Nations Children’s Fund Innocenti Research Centre, ‘Promoting the Rights of Children with Disabilities’, UNICEF IRC, Florence, 2007.
18 ‘Promoting the Rights of Children with Disabilities’.
19 Ellery et al., Lansdown and Csáky, ‘Out from the Shadows’.
20 Miller, Hannah L., et al., ‘An Exploratory Study on the Knowledge of Personal Safety Skills among Children with Developmental Disabilities and their Parents’, Journal of Applied Research in Intellectual Disabilities, vol. 30, no. 2, 2017, pp. 290-300.
21 International Labour Organization, ‘What is Child Labour’, <www.ilo.org/ipec/facts/lang--en/index.htm#:~:text=The%20term%20%E2%80%9Cchild%20labour%E2%80%9D%20is,harmful%20to%20children%3B%20and%2For>, accessed 16 February 2021.
22 Rakshit et al., ‘Educational Attainment and Child Labor Status among Disabled Children in Tamil Nadu, India: An econometric analysis’, The Journal of Developing Areas, vol. 53, no. 3, 2019; Villalobos, Aremis, et al., ‘Child Labor and Severe Functioning Difficulty and Disability in Mexican Children and Adolescents 5-17 Years of Age’, Salud Publica de Mexico, vol. 59, no. 4, 2017.
23 Emerson, Eric, and Gwynnyth Lyewellyn, ‘Youth with Disabilities Are More Likely than their Peers to Engage in Hazardous Child Labour’, Child Care, Health and Development, vol. 47, 2020, pp. 119-121.
172 Seen, Counted, Included: Using data to shed light on the well-being of children with disabilities
24 Sarker, et al., ’Education and Health Status of Child Beggars in Sylhet City, Bangladesh’, American Journal of Social Science, vol. 4, no. 5, 2016, pp. 58-66.
25 Rakshit et al., ‘Educational Attainment and Child Labor Status’.
26 Ibrahim, Abdalla, et al., ‘Child Labor and Health: A systematic literature review of the impacts of child labor on a child’s health in low- and middle-income countries’, Journal of Public Health, 2018, vol. 41, no. 1, pp. 18-26; Kuimi, Brice Lionel Batomen, et al., ‘Child Labor and Health: A systematic review’, International Journal of Public Health, vol. 63, 2018, pp. 663-672; Rahman, Sazedur, ‘Occupational Injuries among Children in Bangladesh’, International Research Journal of Social Sciences, vol. 7, no. 10, 2018, pp. 17-20.
27 Sturrock, Sarah, and Matthew Hodes, ‘Child Labor in Low- and Middle-Income Countries and Its Consequences for Mental Health: A systematic literature review of epidemiologic studies’, European Child and Adolescent Psychiatry, vol. 25, 2016, pp. 1273-1286.
28 Águila-Otero, A., et al., ‘Children and Young People with Intellectual Disability in Residential Childcare: Prevalence of mental health disorders and therapeutic interventions’, International Journal of Social Welfare, vol. 27, 2018, pp. 337-347; United Nations, Global Study on Children Deprived of Liberty – Note by the Secretary-General, A/74/163, United Nations, New York, 2019.
29 Global Study on Children Deprived of Liberty.
30 Njelesani, Janet, ‘”A Child Who is Hidden Has No Rights”: Responses to violence against children with disabilities’, Child Abuse and Neglect, vol. 89, 2019, pp. 58-69.
31 United Nations, Status of the Convention on the Rights of the Child, Report of the Secretary-General, A/74/231, 26 July, 2019, para. 36.
32 Rosenthal, Eric, and Laurie Ahern, ‘Segregation and Abuse in Institutions’, in The State of the World’s Children: Children with disabilities, UNICEF, New York, 2013, p. 46.
33 Burge, Philip, et al., ‘Making Choices: Adoption seekers’ preferences and available children with special needs’, Journal of Public Child Welfare, vol. 10, no. 1, 2016, pp. 1-20.
34 Global Study on Children Deprived of Liberty.
35 United Nations, Interim Report of the Special Rapporteur on Torture and other Cruel, Inhuman or Degrading Treatment or Punishment, A/63/175, 2008, para 55; Status of the Convention on the Rights of the Child, Report of the Secretary-General, A/74/231, 2019, paras 53-61.
36 United Nations, Thematic Study on the Right of Persons with Disabilities to Live Independently and Be Included in the Community, Report of the Office of the United Nations High Commissioner for Human Rights, A/HRC/28/37, 2014, paras 58-66; Status of the Convention on the Rights of the Child, Report of the Secretary-General, A/74/231, 2019, paras. 62-71.
37 Anam, Nirafat, Nazmul Bari and Khandaker Jahurul Alam, ‘Street Children with Disabilities: Situation analysis and need assessment on the street children with disabilities in Dhaka City’, Centre for Services and Information on Disability, Dhaka, 1999; Kerfoot, Michael, et al., ‘The Health and Well-Being of Neglected, Abused and Exploited Children: The Kyiv Street Children Project’, Child Abuse and Neglect, vol. 31, 2007, pp. 27-37; Taylor, Carol, et al., ‘Street-Connected Children with Communication Disabilities and their Caregivers in Western Kenya: Experiences, beliefs, and needs’, Disability and Rehabilitation, vol. 43, no. 1, 2019, pp. 1-11; Zima, Bonnie T., et al., ‘Sheltered Homeless Children: Their eligibility and unmet need for special education evaluations’, American Journal of Public Health, vol. 87, 1997, pp. 236-240.
38 United Nations, Report of the United Nations High Commissioner for Human Rights on the Protection and Promotion of the Rights of Children Working and/or Living on the Street, A/HRC/19/35, 2012.
39 Kerfoot, ‘The Kyiv Street Children Project’; Report of the United Nations High Commissioner for Human Rights on the Protection and Promotion of the Rights of Children Working and/or Living on the Street.
40 Sarker, ‘Education and Health Status of Child Beggars in Sylhet City’.
41 Groce, ‘The Disabled Beggar’.
42 Anam, ‘Street Children with Disabilities’; Sarker, ‘Education and Health Status of Child Beggars in Sylhet City’.
43 Emerson, Eric, and Gwynnyth Llewellyn, ‘The Exposure of Children with and without Disabilities to Violent Parental Discipline’: Cross-Sectional Surveys in 17 Middle- and Low-Income Countries’, Child Abuse and Neglect, vol. 111, January 2021; Jones, L., et al., ‘Prevalence and Risk of Violence’; United Nations Children’s Fund, ‘Focus: Violence against children with disabilities’, in The State of the World’s Children, 2013, pp. 44-45.
44 Fisher et al., ‘Child Abuse among Children with Disabilities’.
45 Hershkowitz et al., ‘Victimization of Children with Disabilities’.
46 Fisher et al., ‘Child Abuse among Children with Disabilities’.
CHAPTER 6. Every child has the right to a safe and clean environment
1 World Health Organization/United Nations Children’s Fund Joint Monitoring Programme (JMP) for Water Supply, Sanitation and Hygiene, Progress on Drinking Water, Sanitation and Hygiene in Households 2000-2020: 5 years into the SDGs, WHO and UNICEF, forthcoming 2021.
2 The term ‘girls’ is used as a stand-in for all those menstruating, regardless of gender identity. As part of UNICEF’s commitment to equality and human rights mandates, programmes should be inclusive of transgender and non-binary persons who have menstrual health and hygiene needs.
3 World Health Organization/United Nations Children’s Fund Joint Monitoring Programme (JMP) for Water Supply, Sanitation and Hygiene, ‘JMP Methodology: 2017 update and SDG baselines’, UNICEF and WHO, March 2018, <https://washdata.org/sites/default/files/documents/reports/2018-04/JMP-2017-update-methodology.pdf>, accessed 4 November 2021; World Health Organization/United Nations Children’s Fund Joint Monitoring Programme (JMP) for Water Supply, Sanitation and Hygiene, Core Questions on Drinking Water, Sanitation and Hygiene for Household Surveys: 2018 update, WHO and UNICEF, Geneva, 2018, <https://washdata.org/sites/default/files/documents/reports/2019-05/JMP-2018-core-questions-for-household-surveys.pdf>, accessed 4 November 2021.
4 A more detailed account of WASH information at global and regional levels, along with measurement challenges, can be found on the JMP web page: <https://washdata.org>.
5 ‘JMP Methodology’.
6 World Health Organization/United Nations Children’s Fund Joint Monitoring Programme (JMP) for Water Supply, Sanitation and Hygiene, ‘Sanitation’, undated, <https://washdata.org/monitoring/sanitation>, accessed 4 November 2021.
7 ‘JMP Methodology’.
8 Hutton, Guy, and Claire Chase, ‘The Knowledge Base for Achieving the Sustainable Development Goal Targets on Water Supply, Sanitation and Hygiene’,
173ENDNOTES
International Journal of Environmental Research and Public Health, vol. 13, no. 6, 2016, p. 526; Prüss, Annette, et al., ‘Estimating the Burden of Disease from Water, Sanitation and Hygiene at a Global Level’, Environmental Health Perspectives, vol. 110, no. 5, 2002, pp. 537-542; Noga, Jacqueline, and Gregor Wolbring, ‘The Economic and Social Benefits and the Barriers of Providing People with Disabilities Accessible Clean Water and Sanitation’, Sustainability, vol. 4, no. 11, 2012, pp. 3023-3041; World Health Organization/United Nations Children’s Fund Joint Monitoring Programme (JMP) for Water Supply, Sanitation and Hygiene, Progress on Household Drinking Water, Sanitation and Hygiene, 2000-2017: Special focus on inequalities, UNICEF and WHO, New York, 2019.
9 World Health Organization and the World Bank, World Report on Disability, WHO, Geneva, 2011, pp. 39-40; Filmer, Deon, ‘Disability, Poverty, and Schooling in Developing Countries: Results from 14 household surveys’, The World Bank Economic Review, vol. 22, no. 1, 2008, pp. 141-163.
10 Groce, Nora, et al., ‘Water and Sanitation Issues for Persons with Disabilities in Low- and Middle-Income Countries: A literature review and discussion of implications for global health and international development’, Journal of Water and Health, vol. 9, no. 4, 2011, pp. 617-627.
11 Progress on Household Drinking Water.
12 Hutton and Chase, ‘The Knowledge Base’
13 United Nations Children’s Fund, The State of the World’s Children 2013: Children with disabilities, UNICEF, New York, 2013.
14 Groce et al., ‘Water and Sanitation Issues’; Prüss-Ustün, Annette, et al., ‘Burden of Disease from Inadequate Water, Sanitation and Hygiene for Selected Adverse Health Outcomes: An updated analysis with a focus on low- and middle-income countries’, International Journal of Hygiene and Environmental Health, vol. 222, no. 5, 2019, pp. 765-777.
15 Banks, Lena Morgon, et al., ‘Are Current Approaches for Measuring Access to Clean Water and Sanitation Inclusive of People with Disabilities? Comparison of individual- and household-level access between people with and without disabilities in the Tanahun District of Nepal’, PLoS One, vol. 14, no. 10, 2019.
16 Groce et al., ‘Water and Sanitation Issues’; White, Sian, et al., ‘A Qualitative Study of Barriers to Accessing Water, Sanitation and Hygiene for Disabled People in Malawi’, PLoS One, vol. 11, no. 5, 2015.
17 Groce et al., ‘Water and Sanitation Issues’; The State of the World’s Children 2013.
18 Ibid.
19 Groce et al., ‘Water and Sanitation Issues’.
20 Erhard, Loida, et al., ‘Policy and Provision of WASH in Schools for Children with Disabilities: A case study in Malawi and Uganda’, Global Public Health, vol. 8, no. 9, 2013, pp. 1000-1013.
21 United Nations Children’s Fund, ‘Guidance: Including children with disabilities in humanitarian action – WASH’, UNICEF, New York, 2017.
22 Hutton and Chase, ‘The Knowledge Base’; Prüss-Ustün et al., ‘Burden of Disease’.
23 White et al., ‘A Qualitative Study’.
24 Banks et al., ‘Are Current Approaches’; White et al., ‘A Qualitative Study’.
25 White et al., ‘A Qualitative Study’.
26 Lee, Regina L.T., et al. ‘Comparative Efficacy of a Simplified Handwashing Program for Improvement in Hand Hygiene and Reduction of School Absenteeism among Children with Intellectual Disability’, American Journal of Infection Control, vol. 43, no. 9, 2015, pp. 907-912. Wilbur, Jane, et al., ‘Systematic Review of Menstrual Hygiene Management Requirements, Its Barriers and Strategies for Disabled People’, PLoS ONE, vol. 14, no. 2, 2019.
27 Jeffrey, Elizabeth, Salma Kayani and Anne Garden, ‘Management of Menstrual Problems in Adolescents with Learning and Physical Disabilities’, The Obstetrician and Gynaecologist, vol. 15, no. 2, 2013, pp. 106-112; Wilbur et al. ‘Systematic Review’.
28 Wilbur et al. ‘Systematic Review’.
29 Jeffrey et al., ‘Management of Menstrual Problems’.
30 Altundağ, Sebahat, and Nazan Çakirer Çalbayram, ‘Teaching Menstrual Care Skills to Intellectually Disabled Female Students’, Journal of Clinical Nursing, vol. 25, no. 13-14, 2016, pp. 1962-1968; Wilbur et al. ‘Systematic Review’.
31 Wilbur et al. ‘Systematic Review’.
32 Quint, Elizabeth H., ‘Menstrual Issues in Adolescents with Physical and Developmental Disabilities’, New York Academy of Sciences, vol. 1135, 2008, pp. 230-236.
33 Groce et al., ‘Water and Sanitation Issues’; Pryor, Wesley, et al., ‘The Case for Investment in Accessible and Inclusive WASH’, WASH Technical Paper, United Nations Children’s Fund, New York, 2018.
34 Albanese, Assunta, and Neil W. Hopper, ‘Suppression of Menstruation in Adolescents with Severe Learning Disabilities’, Archives of Disease in Childhood, vol. 92, no. 7, 2007, pp. 629-632; Márquez-González, Horacio, Edith Valdez-Martinez and Miguel Bedolla, ‘Hysterectomy for the Management of Menstrual Hygiene in Women with Intellectual Disability: A systematic review focusing on standards and ethical considerations for developing countries’, Frontiers in Public Health, vol. 28, no. 6, 2018, p. 338; Quint, Elizabeth H., and Rebecca F. O’Brien, ‘Menstrual Management for Adolescents with Disabilities’, Pediatrics,138, no. 1, July, 2016.
35 Márquez-González et al., ‘Hysterectomy for the Management of Menstrual Health’.
CHAPTER 7. Every child has the right to a fair chance in life 1 Groce, Nora, et al., ‘Poverty and Disability: A critical review of the literature in low- and middle-income countries’, Working Paper Series No. 16, Leonard Cheshire Disability and Inclusive Development Centre, University College London, September 2011.
2 Emerson, E., and C. Hatton, ‘Poverty, Socio-Economic Position, Social Capital and the Health of Children and Adolescents with Intellectual Disabilities in Britain: A replication’, Journal of Intellectual Disability Research, vol. 51, no. 11, November 2007, pp. 866-874.
3 Groce, Nora, et al., ‘Disability and Poverty: The need for a more nuanced understanding of implications for development policy and practice’, Third World Quarterly, vol. 32, no. 8, September 2011, pp. 1493-1513.
4 Hogan, Dennis P., Michelle L. Rogers and Michael E. Msall, ‘Functional Limitations and Key Indicators of Well-Being in Children with Disability’, Archives of Pediatrics and Adolescent Medicine, vol. 154, no. 10, October 2000, pp. 1042-1048; Mitra, Sophie, et al., ‘Extra Costs of Living with a Disability: A review and agenda for research’, Disability and Health Journal, 10, October 2017, pp. 475-484; United Nations General Assembly, Rights of Persons with Disabilities: Report of the Special Rapporteur, A/70/297, 2015, <https://undocs.org/en/A/70/297>, accessed 4 March 2021; Shahat, Ahmed R.S., and Giulia Greco, ‘The Economic Costs of Childhood Disability: A literature review’, International Journal of Environmental Research and Public Health’, vol. 18, no. 7, 2021, p. 3531.

174 Seen, Counted, Included: Using data to shed light on the well-being of children with disabilities
5 South African Department of Social Development, ‘Elements of the Financial and Economic Costs of Disability to Households in South Africa: Results from a pilot study’, DSD and United Nations Children’s Fund, Pretoria, 2016; Mont, Daniel, and Nguyen Viet Cuon, ‘Disability and Poverty in Vietnam’, World Bank Economic Review, vol. 25, no. 2, May 2011, pp. 323–359.
6 Devereux, Stephen, et al., ‘Evaluating the Targeting Effectiveness of Social Transfers: A literature review’, IDS Working Paper, vol. 2015, no. 460, July 2015, Institute for Development Studies, Brighton, UK; Lin, Jin-Ding, et al., ‘Received, Understanding and Satisfaction of National Health Insurance Premium Subsidy Scheme by Families of Children with Disabilities: A census study in Taipei City’, Research in Developmental Disabilities, vol. 30, no. 2, March-April 2008, pp. 275-283; Mont, Daniel, ‘Social Protection and Disability’, in Poverty and Disability, edited by Tanya Barron and Jabulani Manombe Ncube, Leonard Cheshire Disability and Inclusive Development Centre, London, 2010, pp. 317-339; Szilagyi, Peter G., ‘Health Insurance and Children with Disabilities’, The Future of Children, vol. 22, no. 1, Spring 2012, pp. 123-148; United Nations Children’s Fund, The State of the World’s Children 2013: Children with disabilities, UNICEF, New York, 2013.
7 Gooding, Kate, and Anna Marriot, ‘Including Persons with Disabilities in Social Cash Transfer Programmes in Developing Countries’, Journal of International Development, vol. 21, no. 5, June 2009, pp. 685-698.
8 Kidd, Stephen, et al., ‘Leave No One Behind: Building inclusive social protection systems for persons with disabilities’, Working Paper, Development Pathways Limited, Orpington, UK, February 2019.
9 Szilagyi, ‘Health Insurance and Children with Disabilities’; Vanegas, Sandra B., and Randa Abdelrahim, ‘Characterizing Systems of Support for Families of Children with Disabilities: A review of the literature’, Journal of Family Social Work, vol. 19, no. 4, 2016, pp. 286-327.
10 Gooding and Marriot, ‘Including Persons with Disabilities in Social Cash Transfer Programmes in Developing Countries’; Lin et al., ‘Received, Understanding and Satisfaction of National Health Insurance Premium Subsidy Scheme’; Szilagyi, ‘Health Insurance and Children with Disabilities’; Holmes, Rebecca, et al., ‘Nepal’s Cash Allowances for Children with Disabilities’, Overseas Development Institute, London, 2018.
11 Gooding and Marriot, ‘Including Persons with Disabilities in Social Cash Transfer Programmes’.
12 Szilagyi, ‘Health Insurance and Children with Disabilities’; Vanegas and Abdelrahim, ‘Characterizing Systems of Support for Families of Children with Disabilities’.
13 Gooding and Marriot, ‘Including Persons with Disabilities in Social Cash Transfer Programmes’; Kelly, Gabrielle, ‘Disability, Cash Transfers and Family Practices in South Africa’, Critical Social Policy, vol. 39, no. 4, November 2019, pp. 541-559.
14 Mont and Cuon, ‘Disability and Poverty in Vietnam’.
15 Szilagyi, ‘Health Insurance and Children with Disabilities’.
CHAPTER 8. Every child has the right to a happy life, free from discrimination1 United Nations Children’s Fund, Understanding Child Subjective Well-Being: A call for more data, research and policymaking targeting children, UNICEF, New York, 2021.
2 Ibid.
3 Mephan, Sarah, ‘Disabled Children: The right to feel safe’, Child Care in Practice, vol. 16, no. 1, 2019, pp. 19-34; Smythe, Tracey, Jaimie Adelson and Sarah Polack, ‘Systematic Review of Interventions for Reducing Stigma Experienced by Children with Disabilities and their Families in Low- and Middle-Income Countries: State of the evidence’, Tropical Medicine and International Health, vol. 25, no. 5, 2020, pp. 508-524.
4 Etieyibo, Edwin, and Odirin Omiegbe, ‘Religion, Culture, and Discrimination against Persons with Disabilities in Nigeria’, African Journal of Disability, vol. 5, no. 1, 2016, p. 192
5 Ibid.
6 McHatton, Patricia Alvarez, and Vivian Correa, ‘Stigma and Discrimination: Perspectives from Mexican and Puerto Rican mothers of children with special needs’, Topics in Early Childhood Special Education, vol. 25, no. 3, 2005, pp. 131-142.
7 United Nations Committee on the Rights of Persons with Disabilities, General Comment No. 3 (2016), Article 6: Women and girls with disabilities, CRPD/C/GC/3, 2 September 2016.
8 European Disability Forum, European Human Rights Report: Ensuring the rights of persons with disabilities to equality and non-discrimination in the European Union, Issue 3-2019, EDF, Brussels, 2019, p. 28.
9 Lung, For-Wey, et al., ‘Prevalence of Bullying and Perceived Happiness in Adolescents with Learning Disability, Intellectual Disability, ADHD, and Autism Spectrum Disorder in the Taiwan Birth Cohort Pilot Study’, Medicine, vol. 98, no. 6, 2019; Watson, Silvana M. R., and Kenneth D. Keith, ‘Comparing the Quality of Life of School-Aged Children with and without Disabilities’, Mental Retardation, vol. 40, no. 4, 2004, pp. 304-312.
10 “Sex refers to the biological characteristics of being male or female, while gender is defined as the socially constructed roles and relationships, personality traits, attitudes, behaviours, values, relative power and influence that society ascribes to individuals on the basis of their assigned sex. Gender is relational and refers not simply to women, men, or gender diverse people but to the relationships between them. Although the words ‘gender’ and ‘sex’ are often used interchangeably, they have different connotations: sex tends to refer to biological differences, while gender more often refers to cultural and social differences and sometimes encompasses a broader range of identities than the binary of male and female.” United Nations Development Group, Resource Book for Mainstreaming Gender in UN Common Programming at the Country Level, UNDG, New York, 2018.
11 Kuper, Hannah, et al., ‘The Impact of Disability on the Lives of Children; Cross-Sectional Data including 8,900 Children with Disabilities and 898,834 Children without Disabilities across 30 Countries’, PLoS One, vol. 9, no. 9, 2014.
12 Thompson, Travis, Mary Caruso and Kathryn Ellerbeck, ‘Sex Matters in Autism and Other Developmental Disabilities’, Journal of Learning Disabilities, vol. 7, no. 4, 2003, pp. 345-362.
13 Kuban, Karl C. K., et al., ‘Girls and Boys Born before 28 Weeks Gestation: Risks of cognitive, behavioral, and neurologic outcomes at age 10 years’, The Journal of Pediatrics, vol. 173, 2016, pp. 69-75; Tsai, Cheng-Fang, et al., ‘Sex and Geographic Differences in the Prevalence of Reported Childhood Motor Disability and their Trends in Taiwan’, BioMed Research International, 5 April 2018.
14 DiPietro, Janet A., and Kristin M. Voegtline, ‘The Gestational Foundation of Sex Differences in Development and Vulnerability’, Neuroscience, vol. 342, 2017, pp. 4-20.
15 Abdullah, Mohamad Qasim, ‘Gender Difference in Learning Disabled Children’, Neuropsychological Review, vol. 1, no. 3, 2018; Rice, Elizabeth Hess, Esther

175ENDNOTES
Merves and Amy Srsic, ‘Perceptions of Gender Differences in the Expression of Emotional and Behavioral Disabilities’, Education and Treatment of Children, vol. 31, no. 4, 2008, pp. 549-565.
16 Leonard Cheshire Disability and United Nations Girls’ Education Initiative, Still Left Behind: Pathways to inclusive education for girls with disabilities, Leonard Cheshire Disability, London, 2017; Powers, Kristin, et al., ‘Gender Matters in Transition to Adulthood: A survey study of adolescents with disabilities and their families’, Psychology in the Schools, vol. 45, no. 4, 2008, pp. 349-364; Rousso, Harilyn, ‘Education for All: A gender and disability perspective’, background paper prepared for the Education for All Monitoring Report 2003/4, United Nations Educational, Scientific and Cultural Organization, Paris; United Nations Children’s Fund, The State of the World’s Children 2013 Children with disabilities, UNICEF, New York, 2013.
17 Hutton, Guy, and Claire Chase, ‘The Knowledge Base for Achieving the Sustainable Development Goal Targets on Water Supply, Sanitation and Hygiene’, International Journal of Environmental Research and Public Health, vol. 13, 2016; White, Sian, et al. ‘Qualitative Study of Barriers to Accessing Water, Sanitation and Hygiene for Disabled People in Malawi’, PLoS One, vol. 11, no. 5, 2016.
18 Powers, ‘Gender Matters in Transition to Adulthood’.
19 Hui, Neva, et al., ‘Gendered Experiences of Inclusive Education for Children with Disabilities in West and East Africa’, International Journal of Inclusive Education, vol. 22, no. 5, 2017, pp. 457-474.
20 Schieman, Scot, Leah Ruppanner and Melissa A. Milkie, ‘Who Helps with Homework? Parenting inequality and relationship quality among employed mothers and fathers’, Journal of Family Economic Issues, vol. 39, 2018, pp. 46-65.
21 Beghini, Valentina, Umberto Cattaneo and Emanuela Pozzan, A Quantum Leap for Gender Equality: For a better future of work for all, International Labour Office, Geneva, 2019.
22 United Nations Department of Economic and Social Affairs, Statistics Division, ‘Time Spent in Unpaid Work; Total Work Burden; and Work-Life Balance’, World’s Women 2020, <https://worlds-women-2020-data-undesa.hub.arcgis.com/apps/time-spent-in-unpaid-work-total-work-burden-and-work-life-balance/explore>, accessed 1 October 2021.
23 Beghini et al., A Quantum Leap for Gender Equality.
24 Dabrowska, -Zabrowska, Anna, and Ewa Pisula, ‘Parenting Stress and Coping Styles in Mothers and Fathers of Pre-School Children with Autism and Downs Syndrome’, Journal of Intellectual Disability Research, vol. 54, no. 3, 2010, pp. 266-280.
25 United Nations Children’s Fund, Harnessing the Power of Data for Girls: Taking stock and looking ahead to 2030, UNICEF, New York, 2016.
26 United Nations Children’s Fund Innocenti Research Centre, ‘Promoting the Rights of Children with Disabilities’, Innocenti Digest No. 13, UNICEF IRC, Florence, 2007, p. 15, box 5.1; The State of the World’s Children 2013.
CHAPTER 9. Fulfilling the rights of every child1 Boyle, Coleen A., et al., ‘The Public Health Response to the COVID-19 Pandemic for People with Disabilities’, Disability and Health Journal, vol. 13, no. 3, 2020; Courtenay, Ken, and Bhathika Perera, ‘COVID-19 and People with Intellectual Disability: Impacts of a pandemic’, Irish Journal of Psychological Medicine, vol. 37, no. 3, 2020, pp. 231-236; Sabatello, Maya, Scott D. Landes and Katherine E. McDonald, ‘People with Disabilities and COVID-19: Fixing our priorities’, The American Journal of Bioethics, vol. 20, no. 7, 2020, pp. 187-190.
2 Scully, Jackie Leach, ‘Disability, Disablism, and COVID-19 Pandemic Triage’, Bioethical Inquiry, vol. 17, 2020, pp. 601-605.
3 Masi, Anne, et al., ‘Impact of the COVID-19 Pandemic on the Well-Being of Children with Neurodevelopmental Disabilities and Their Parents’, Journal of Paediatrics and Child Health, vol. 57, no. 5, 2021 , pp. 631-636; Patel, Khushboo, ‘Mental Health Implications of COVID-19 on Children with Disabilities’, Asian Journal of Psychiatry, vol. 54, no. 5, 2020.
4 Ramkumar, Aishworiya, and Ying Qi Kang, ‘Including Children with Developmental Disabilities in the Equation during this COVID-19 Pandemic’, Journal of Autism and Developmental Disorders, 2020, vol. 51, no. 5, pp. 1-4.
5 Jan, Sophia, and Nicole Lurie, ‘Perspective: Disaster resilience and people with functional needs’, The New England Journal of Medicine, vol. 367, no. 24, 2012, pp. 2272-2273; Peek, Lori, and Laura M. Stough, ‘Children with Disabilities in the Context of Disaster: A social vulnerability perspective’, Child Development, vol. 81, no. 4, 2010, pp. 1260-1270; Yates, Sophie, and Helen Dickinson, ‘Navigating Complexity in a Global Pandemic: The effects of COVID-19 on children and young people with disability and their families in Australia’, Public Administrative Review, 18 January 2021, pp. 1-5.
6 Jeste, S., et al., ‘Changes in Access to Educational and Healthcare Services for Individuals with Intellectual and Developmental Disabilities during COVID-19 Restrictions’, Journal of Intellectual Disability Research, vol. 64, no. 11, 2020, pp. 825-833; Jones, Benjamin, et al., ‘COVID-19 Pandemic: The impact on vulnerable children and young people in Australia’, Journal of Paediatrics and Child Health, vol. 56, 2021, pp. 1851-1855; Mbazzi, Femke Bannick, et al., ‘The Impact of COVID-19 Measures on Children with Disabilities and their Families in Uganda’, Disability and Society, 2021.
7 Couper-Kenney, Fiona, and Sheila Riddell, ‘The Impact of COVID-19 on Children with Additional Support Needs and Disabilities in Scotland’, European Journal of Special Needs Education, vol 36, no. 1, 2021, pp. 20-34.
Technical Annex1 Bourke, Jenny, et al., ‘Predicting Long-Term Survival without Major Disability for Infants Born Preterm’, The Journal of Pediatrics, vol. 215, 2019, pp. 90-97.
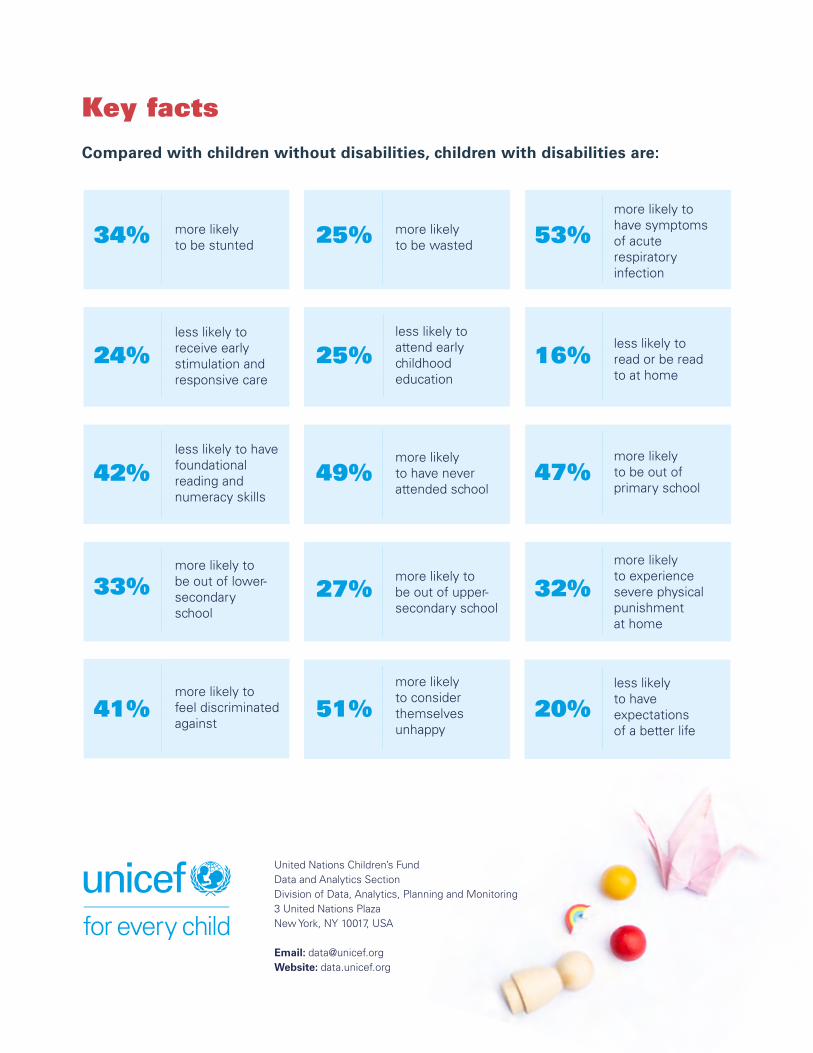
Key facts Compared with children without disabilities, children with disabilities are:
more likely to be stunted34% 25% more likely
to be wasted 53%more likely to have symptoms of acute respiratory infection
24%less likely to receive early stimulation and responsive care
25%less likely to attend early childhood education
less likely to read or be read to at home
16%
42%less likely to have foundational reading andnumeracy skills
49%more likely to have never attended school
47%more likely to be out of primary school
33%more likely to be out of lower-secondary school
more likely to be out of upper-secondary school
27% 32%more likely to experience severe physicalpunishment at home
41%more likely to feel discriminated against
51%more likely to consider themselves unhappy
20%less likely to have expectations of a better life
United Nations Children’s FundData and Analytics SectionDivision of Data, Analytics, Planning and Monitoring3 United Nations PlazaNew York, NY 10017, USA
Email: [email protected]: data.unicef.org