PAKISTAN GEOGRAPHICAL REVIEW - Punjab University
80
PAKISTAN GEOGRAPHICAL REVIEW ED Vol. 20 Number I January 19 6 5 a ~ ..
-
Upload
khangminh22 -
Category
Documents
-
view
0 -
download
0
Transcript of PAKISTAN GEOGRAPHICAL REVIEW - Punjab University

PAKISTANGEOGRAPHICALREVIEW
ED
Vol. 20 Number I
January 1965a~ ..

Associate Editor : Rashid A. Malik
Nafis AhmadChauncy D. HarrisGeorge H. T. KimbleO. H. K. spate
Qudsia AzizMahmuda Hashmi
EDITORIAL BOARD
Editor : Kazi S. Ahmad
Associate Editor: Iqtidar H. Zaidi
Corresponding Editors:
Assistants:
R. O. BuchananPreston E. JamesThomas F. BartonCarl Troll
NazirA, CheemaKhurshid Ahmad

I"U-Latlore
Pakistan Geographical Review,2.. C?7Volume 20 I J I JANUARY, 1965 Number 1
CONTENTS
SOME GEOGRAPHICAL ASPECTS OF THE INDUSWATERS TREATY AND DEVELOPMENT OFIRRIGATION IN WEST PAKISTAN .. Kazi S. Ahmad
Page
CLIMATOLOGY OF ISLAMABAD, THE CAPITAL OFPAKISTAN .. S. N. Naqvi
andM. Rahmatallah 31
~AR FACTORY INDUSTRY OF WEST PAKISTAN Kazi s: Ahmad<;
andMiss M. K. Elahi .. 41
CITIES OF THE UPPER INDO-GANGETIC PLAIN .. Rashid A. Malik .. 61.»NEWS AND NOTES 73
BOOK REVIEWS 75

Pakistan Geographical Review
Volume 21 JANUARY, 1965 Number 1
SOME GEOGRAPHICAL ASPECTS OF THE INDUS WATERS TREATYA D DEVELOPMENT OF IRRIGATION IN WEST PAKISTAN
BY
KAZI S. AHMAD
Professor of Geography, Punjab University Lahore
West .Pakistan is an arid or s~mi arid country wit~ mountains in the nort~ and .the w~st.A little less than half consists of a flat plain drained by the Indus and Its tributaries,
~ combined waters of which fall into the Indus about half way from the mountains to thesea) While the upper part of the Indus basin lies in the Himalayan region, the middle andthe lower parts lying in the plain consist partly of prosperous irrigated land and partly ofdesert. Out of a total area of 198.7 million acres in West Pakistan, ]02.5 million acrescomprise rugged mountainous terrain, the remaining 96.2 million acres consist of desertsand flat aggradational plains. The Indus basin, which spreads over both these regions,has an area of 138.7 million acres. Of the portion which constitutes the plain, only about66.6 million acres are good agricultural land. Due to a general paucity of rainfall, theeconomy of the plain is based on an elaborate system of irrigation which has been builtlargely during a century of the British rule and wh ich is one of the best in the world. About42 million acres are now under cultivation in West Pakistan, of which some 32.8 millionac 'S are under the command of about 38 thousand miles of canals.' The remaining 9.2million acres depend upon rainfall for cultivation. Actually, on the average, 24 millionacres" are irrigated every year in the principal canal systems, slightly more in the Rabi (winter)season than in the Kharif (summer) season. For the purpose of water resources evaluationand their effect on land use, West Pakistan may be divided into two regions, northern andsouthern, roughly along the old boundary of the former provinces of Punjab and Sind inthe plains, and along the divide between the rivers flowing into the Persian Gulf and those
1. The gross area is 36.8 million acres-22.3 million acres in the Upper Indus Plain and 14.5 in theLower Indus Plain.
2. This is about 12 % of the irrigated area of the world. In comparison with it, the total irrigatedarea of the Nile valley is just over 6 million acres and in U.S A. about 7 million acres.

2 PAKISTAN GEOGRAPHICAL REVIEW
flowing into the Indus in the mountain region in the north of Baluchistan. Along the sameboundary the Indus plain may also be divided into two parts, Upper and Lower. Asubterranean ridge underneath the plain near the boundary also separates the two parts,which differ not only climatically but also in the problems of surface water supply and groundwater.
WEST PAKISTA NMEAN MONTHLY RAINFALL
ItfILlS 'O~O--"-"......:;."'--,<":.-,-:;..O ~/OO MILlS
G
\"-- !,J
('~~~I. OueHa
.... --.
•i..-.~," .....!.
iI RAN !
R ••.
,
i, ,
,.--,.
<,
..•.'.I'U.<'«..•..•.. _.-.-._._.,. ~
ME ..••N :.t.; ANNUlt.L
a:
'" z :> OJe, tx~ i5 oJ ~'"oJ oJ
~ :> ~ «:l; oJ
Fig 1Water Resources
Before discussing the Indus Waters Treaty, it will be useful to make a brief appraisalof the water resources of the basin.
Rainfall
Excepting a narrow submontane strip in the north, the rainfall is generally low in the

INDUS WATERS TREATY AND IRRIGATION 3
Indus plain and rapidly decreases from the Himalayas toward the south. The mean annualrainfall ofSialkot at the foot ofthe Himalayas is 31.8", Lahore 19.2", Lyal\pur 12", Multan7", Sukkur 2.7", Hyderabad 7", Karachi 7.7." (Fig. J). It drops to less than 5" in a largearea below the junction of the Panjnad with the Indus. In more than 60 per cent of thecultivable area, the rainfall is less than ] 0" and, therefore, irrigation is necessary foragriculture. The rainfall variations though of little value in the Lower Indus plain arequite important in the Upper Indus plain.
More than half to three quarters of the rainfall is obtained in the late summer fromthe monsoons, July and August being the months of highest rainfall in all the stations men-tioned above. The variations in rainfall therefore become a significant factor in floodirrigation.
Surface Flow or Runoff
The following table gives the hydrological data of the rivers of the Indus Plain asgiven by Burrard and Hayden.!
TABLE 1
HYDROLOGICAL DATA OF THE I DUS PLAIN RIVERS
RiverMean annualrainfall in thecatchments
Percentageof rainfall
run-off
Runoff in acrefeet in thou-
sacds
Total disch-arge of waterin one year:l
avi
17.74 77.98 87,355 9.0
42.33 84.93 23,860 5.5
47.24 81.06 23,277 5.5
39.00 40.89 6,541 1.0
19.71 56.67 13,938 3.5
56.50 77.34 12,546 2.5
Total 167,517
Indus
Jhelum
Chenab
Sutlej
Beas
It is not very different from the average of the decennium 1937-46 immediately beforepartition or for the 40 years 1922-1961 as given below. It is graphically shown in Figure2. (a) and (b)
I. S.G. Burrard and H.H. Hayden, A sketch a/the Geography and Geology a/the Himalaya Mountainsand Tibet, Delhi. Manager of Publications, 1934.
2. Taking the Ravi discharge as unit, based on short abservations and rough estimates.

4
TABLE 21
PAKISTAN GEOGRAPHICAL REVIEW
Group
Eastern
Western
River
Average Annual RainfallMillion Acre Feet
1937-1946 1922-1961Station-
Ravi Madhopur 6Beas Mandi Plain 13Sutlej Rupar 14Indus Attock 89lhelum Mangla 23Chenab Marala 23
Total:
33
7
1334932326 142
'J..,~
135
168 176
It will be seen that the average flow of the Indus is greater than the total of the otherrivers, while that of the three western rivers, Indus, Jhelum and Chenab, is about 80percent of the total flow. In respect of the three western rivers, the flow of the Indus aloneis about two-thirds of the total.
ANNUAL STREAMFLOWOISTRIBUTlON
'" THREE WESTERN RIVERS~400r-----------=-~-----------------,'"::>v'b~~300~------------~~~~----------~~.!::
INDUS RIVER",,-01 Mock '"
The fivers show great fluctuations10 their flow during the Course of theyear. The discharges are generally lowfrom September/October, the end 0
summer monsoon, to March/April whenthe snow begins to melt. The highflow discharges in summer are bout 50to 100 times larger than the minimumwinter discharges. Figure 3 gives themonthly flow of the three westernrivers. While the flow in the Indusand the Chenab show similar trends,
FMAMJJASFig. 3
conspicuously high peaks in July and August, that of the Jhelum is much smoother. Itspeak is much lower and occurs earlier, extending over the three months May to JUly. Thisis obviously due to the fact that it flows through a great lake, the Wular, and therefore
I. Programme for Water and Power Development in West Pakistan Supporting Studies; AReport by Harza Engineering Co. for WAPDA, Lahore, 1963,p. 1-12.

INDUS WATERS TREATY AND IRRIGATION 5
HltviAlAYf\SWATER SOURCES OF
ItliOUS
89
I
DISCHARGEAT KOTRI
l<---- 99---
A.RA9IAN SE A
JHSLUM CH::MaI
RAVI B.EAS SUTLEJ
6 13 14
AVERAGE YEARLYFLOW IN
MILLION ACRE-FEET1'37-46
['NDUS 89WESTERN JHELUM 23RIVERS CHENAB 23 135
EASTERN [RAVI 6RIVERS BEAS 13
SUTLEJ 14 33
TOTAL i68
LOSSES ANDIRRIGATION 69
DISCHARGED AT KOTRI 99
INDUS BASIN RIVER SYSTEMPREPARTITION FLOW OF WATER
From: Indus, Vol. 2, No.4, May, 19(11,
Fig 2. (a)
6 PAKISTAN GEOGRAPHICAL REVIEW
HIMALAYASWATER SOURCES OF
LOSSES
WESTERNRIVERS
B5
11
-
3
-122
-WESTERN ANDEASTERN RIVERSIRRIGATION INPAKISTAN 99
1<-----141
34
-
WESTERN RIVERS: INDUS,JHELUM,CHENAB
EASTERN RIVERS: RAVI, BEAS,SUTLEJ
99DISCHARGE AT KOTRI 1
ARABIAN
Fig. 2 (b)
EASTERNRIVERS
33
28LOSSES
18
1 ,,--_E_A_S_T_E_R_N_R_I_VE_R_S_~_~ IRRIGATION IN IN~
SEA
WATER DISTRIBUTIONFOR AN AVERAGE YEARiN MILLION ACRE- FEET
INDUS BASIN RIVER SYSTEMUNREGULATED FLOWPREPARTITION CONDITIONS
From: Indus, Vol. 2, No.4, May, 1961.

INDUS WATERS TREATY AND IRRIGATION 7
its waters are naturaly regulated. Even after the Mangla Dam is constructed the Wularlake will continue to function as a second reservoir.
The following table shows the maximumJflood discharges for Indus Plain rivers.".
TABLE 3
MAXIMUM FLOOD DISCHARGES
River Location Date Cusecs
-------------~---------- i ---------
Indus · . Attock · . August 1929 820,000
Indus Sukkur Aug. 1958 1,IGO,OOO
Jhelurn · . Mangla · . August 1929 1,043,000
Chenab Marala July 1959 871,000
Ravi · . Shadara · . October 1955 542,000
Sutlej .. Suleimanki October 1955 422,000
Panjnad Punjnad · - September 1950 677,000
It will be seen that a tremendous quantity of water goes waste. The Indus carriesnot only the greatest amount of flow but also the maximum flood discharges.
The flow regime of the Jhelum suggests the possibility of creating natural reservoirsin the for~ of lakes at suitable points in the upper courses of the Indus and the Chenab.With a more regulated flow, the cost of the Tarbela dam on the Indus is likely to be consi-derably reduced, and technically the project may be more feasible. It may also, to someextent, even out the effects of the variations of rainfall from year to year.
Ground Water Reservoir
Investigations have shown that virtually the entire Upper Indus Plain is underlainto depths of 1000 ft. or more by unconsolidated alluvial sediments which are saturated bygroundwater to within a few feet of the land surface. The texture of these sediments is notuniform, but it is estimated that high capacity wells can be developed practically on any site.H is shown that the alluvium beneath 60 percent of the Bari doab (4.4 million acres), 85 per-cent of Rechna doab (4.7 million acres), 80 percent of Chaj doab (2 million acres), and 72percent of Thal doab (5.3 million acres) is saturated with fresh water suitable for irrigation.It is estimated that there are 500 million acre feet of water stored in each hundred feet ofdepth in the Upper Indus plain. The reservoir can yield 1900 MAF of fresh water, whichis equal to 10 times the yearly average discharge of the entire Indus Plain, and probably is
1. Wapda, Programme for Water and Power Development in West Pakistan through 1975 (MasterPlan-Initial Phase) A Report by Harza Engg. Co. lnt. 1964, p. 45.

8 PAKISTAN GEOGRAPHICAL REVIEW
more than the total quantity of water that will be available from both Mangla and Tarbeladarns.!
It is estimated that approximately one-third of the irrigation water diverted from themain rivers percolates into the underground aquifers of the plain. The total amount ofpercolation from various sources-rivers, canal, farms and rainfall-amounts to about36.4 MAF, about 22 MAF in Upper Indus Plain and 14 MAF in the Lower. On accountof the flatness of the country, all this amount cannot drain away as quickly as it is addedwith the result that the ground water reservoir is increasing and the water table is rising.Under the Upper Indus plain there is a concealed extension of the Peninsular blockon which lies the sub-terranean Delhi-Sargodha ridge. It serves as an undergrounddam preventing the flow of water to the southwest. This accounts for the abundance ofground water to the northeast of the ridge and the lower water table to the southwest.
The possibilities for finding appreciable supplies of suitable water from beneath theLower Indus plain are relatively small. There are indications.that most of the ground water,except for land within about 3 to ]5 miles of the Indus, is too saline for irrigation purposes.
Indus Waters TreatyOn the partition of the sub-continent in August, 1947, the unified system of irrigatiorr
under one control was split between Pakistan and India. The boundary was unfortunatelyso drawn that the headworks on the two rivers Sutlej and Ravi went to India while most ofthe area commanded by canals from these rivers came to the share of Pakistan, therebynecessitating Pakistan to depend on water over which she had no control. The headstreams and the upper courses of the other two rivers, Chenab and Jhelum, which flow intoWest Pakistn are in Kashmir which soon after the partition provisionally acceded toIndia.
On the first of April, 1948 one day after the Arbitral Tribunal instituted for settlingdisputes arising out of the partition ceased to exist, India stopped irrigation supplies fromSutlej, Beas, and Ravi to all canals crossing into Pakistan. A serious dispute thus arosefor the distribution of their waters. After long negotiations, the dispute was eventuallyresolved through the mediation of the World Bank by a treaty between the two countriessigned on the 19th of September 1960, commonly known as the Indus Waters Treaty. Itprovides that India will be entitled to the unrestricted use of the waters of the three easternrivers (Sutlej, Beas and Ravi). Pakistan will be entitled to the use of the three westernrivers (Indus, Jehlum and Chenab), except for certain uses specified in the treaty for areaslying in India and Jammu and Kashmir. The Treaty also specifically provides that Indiawill not construct any storage works on the western rivers except for uses mentioned above.The settlement plan for Pakistan includes the construction of two storage dams at Manglaand Tarbela, seven link canals, four barrages, and one gated syphon along with the remodel-
1. Wapda Miscellany, Lahore 1962 p. 10.

~ ,.,.-.-.;:-i',._,. ;:: .\",7 •••••• ,,_~.'.' ..,,.- ,« • "! I ---~-/
I ,-----------.-
!•~.•......, .•....•..•.
ARABIAN
INDUS WATERS TRIOATV AND IRRIGA nON 9
ling of existing link canals and some irrigation systems severed by the new construction(Fig. 4).
WEST PAKISTANIRRIGATION
~.;:..•...•.......,.•.-;~:~:•..-.
.' /la-.-~',./I' K ASH ~.'1.
'.~.. AND
~
CAN.l.l,S HEADWORt<S, BA~RAGES
AND DAMS
IIIL£$ ~o46 3D ao 10 Ct 100 MILES50
JAM M U
.. propDS",
Hotmer.,.!! or Nor/hern .mdSOCl/hern Regions.8otlntl"ry Inlernl/ional
R/ve,.s ---<ClJnal or Ois!ri6ufilry ~He~a'w(l"ks or 8arragf! •••.DAM: comp/de _
uncler CQI'Islrudion 0
SEA.,'
.-._.-. 8o.l/ndar!:l Inlerf?af'-onal~Rfvers
C!J Darn %o"nc:,;udicn
[,,;sI1n9 Barrages or H.W.••. Proposed .•
------Proposed Linkso 25 50 100MIUS
;eD ~8s(//. GHlra6"e/./" QlJcli,,~"(Jd- 8,,110",
o Balloki.S"/.timAnk •€I) ChasmlJ-Jhc/umC5> Trimf7tCJ- Sidhn"iG Sid'Anl/:"M~ilsi·84ha.,.,al
<7.l Taun$.-Panjn#d
Fig. 4

10 PAKISTAN GEOGRAPHICAL REVIEW
Along with the Treaty there has been set up the Indus Basin Fund; and there weremade international agreements to finance the replacement works, including the Indus BasinDevelopment Fund Agreement.
The total expenditure has been estimated to be about 900 crores of rupees. Startingin 1960, the works under the treaty are scheduled to be completed by 1970 and will consti-tute the biggest water development project ever undertaken at anyone time in the historyof the world. An important provision of the treaty is that during the next ten years (I stApril, 1960-31st March, 1970) the diversion of waters to India will be made gradually toenable Pakistan to complete the works to replenish the water allocated to India. Duringthis transition period, Pakistan will have unrestricted use of water of the eastern rivers.
The primary function of the Indus Basin Project is to reestablish the normal riverflows of the Sutlej and the Ravi, replacing the water diverted to India for the irrigation ofareas (in Pakistan) presently dependent upon eastern rivers. It will mean the transfer ofapproximately 24 MAF from the western rivers through the new link canals.
But the project has to be considered as part of the development of water supplies ofthe whole Indus plain to provide for the rapidly increasing population's needs in respect offood and industrial raw materials. During the decade 1951-61 the population has increas-ed by 2.4 percent and it is estimated that the population will be increasing by 2.6 to 3percent, which will mean about another 15 million people to provide for.
Water Supply and the Implementation of the TreatyThe following table gives the average annual conditions of water supply before
partition, after the implementation of the Treaty and after additional water from storagereservoir is and tubewell water is provided.
TABLE 41AVERAGE ANNUAL CON DlTlONS OF EASTERN AND WESTERN RIVERS (MILLION ACRF FEET)
INDIA PakistanEastern Rivers Western Rivers
BeforePartion
After I BeforeImplemen- ! Partition
tation ofTreaty
Afterlmpleme-tat ion of
Treaty
AfterIncreaseStorageCapacity
Storage Capacity None .16.5 None 9.5 88.9Ratio Storage Capacity to Inflow 0% 50% 0% 6.5% 61 %
Inflow from Himalayas 33 33 135 135 135Outside of Himalayas and rains 10 10 10
Subtotal 145
Tubewells 15Total: 33 33 145 145 160
Irrigation 8 28 41 42 122Losses 5 3 25 27 27Discharged into the Arabian Sea via Indus River " 20 None 79 76 11
Drainage Canals 24
l. Karpor and Nebolsin, "West Pakistan and Indus Valley". Indus, Lahore, Vol. 5, No.1, Feb, 1964, p. 27·

INDUS WATERS TREATY AND IRRIGATION 11
It will be seen that while India will utilize all the 28 million acre feet of water avail-able in the Eastern rivers after the implementation of the Treaty;! Pakistan will still be los-ing to the sea 76 MAF till the two dams are constructed. Losing 24 MAF to India it willhave to be content with the unregulated flow that could be diverted from western riverswhich will be considerably reduced during winter. It will seriously impair the productivity
of the irrigated cropped lands in this region. It is estimated that the diversion of watersto India will take about 5 million acres out of irrigation in Pakistan and turn that area to
desert again unless alternative sources of irrigation ~re f~und. "<-Present surface Water Supply and Use of Water
Unlike West European countries and some other parts of the world, the prodominantuse of river waters in Pakistan is tpeir diversion to the irrigated areas. At present the sur-face water supply is estimated to be 164.5 M AF (Fig. 5). Of this amount, 51 percent is beingdiverted into the canal systems, about 12 percent is lost through evaporation and seepagealong the main river channels, and the remaining 37 percent passes into the sea.
Of the total diversions of 83.5 MAF for irrigation purposes, 48.2 MAF takes placein the Upper Indus plain-19.8 MAF in the low flow season from October to April, whichapproximately corresponds with the Rabi season, and 28.4 MAF in the high flow season,from May to September, which approximately corresponds with the Kharif season."
In the Lower Indus Plain the total diversion is about 35.3 MAF, 11.4 from Octoberto April and 23.9 from May to September." The total diversions of the river flows for irriga-tion use thus now average about 52.3 MAF in the high flow season and 31.2 MAF in the lowflow season. These are generally limited in the former by the capacity of the canal systemsand in the latter by the available water supply.
Within the plains the lands are generally under-irrigated. In each of the two cropseasons, about 12 million acres are at present under irrigation. Farm deliveries of surfacewater in the Upper Indus plain are estimated at 2.2 acre feet per cropped acre during themonths May to September and 1.6 acre feet from October to April. For adequate watersupply they should be 2.7 acre feet and 2.4 acre feet respectively. The present water use i 11
the Lower Indus plain is simiarly deficient.
Present Water Balance
The present water balance in the Indus Plain is given in the following table" andis shown graphically in Fig. 5.
1. Before partition four million aeres feet were already being used in the territory now in India.
2. Master Plan, op. cit., p. 39.
3. [bid., p. 40.
4. Ibid.
12 PAKfSTAN GEOGRAPHICAL REVIEW
TABLE 5
PRF.~ENT WATER BALANCE IN THE J-ND-tTS Pr.AINS
River Ba1c.nceMAFPER
YearTotal Surface Water SupplyNet percolation to ground waterOther lossesFlow to Arabian Sea
164'54'0
!6'160'9
Total Surface Water (Diversion
Canal Balance .inclnding Water Courses)Total Surface Water DiversionPumped from ground waterEvaporation lessesPercolation to ground water
83';
Total Farm Delivery
83'52'0
8'023'0
54'S
MAFPer year
54'55'4
8'2
40'9
Farm Irrigation BalanceTotal Farm DeliverySurface lossPercolation to ground water
Net Crop Use
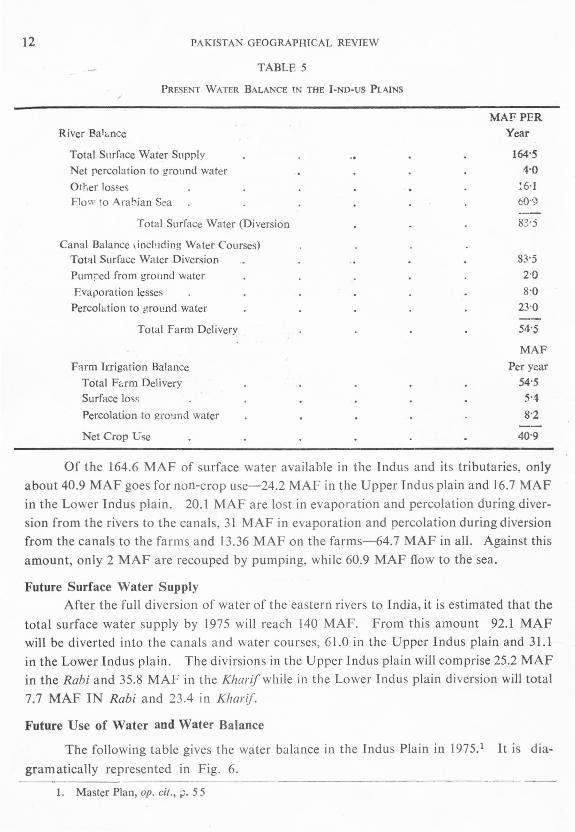
Of the 164.6 MAF of surface water available in the Indus and its tributaries, onlyabout 40.9 MAF goes for non-crop use-24.2 MAF in the Upper Indus plain and 16.7 MAFin the Lower Indus plain. 20.1 MAF are lost in evaporation and percolation during diver-sion from the rivers to the canals, 31 MAF in evaporation and percolation during diversionfrom the canals to the farms and 13.36 MAF on the farms-64.7 MAF in all. Against thisamount, only 2 MAF are recouped by pumping, while 60.9 MAF flow to the sea.
Future Surface Water SupplyAfter the full diversion of water of the eastern rivers to India, it is estimated that the
total surface water supply by 1975 will reach 140 MAF. From this amount 92.1 MAFwill be diverted into the canals and water courses, 61.0 in the Upper Indus plain and 31.1in the Lower Indus plain. The divirsions in the Upper Indus plain will comprise 25.2 MAFin the Rabi and 35.8 MAF in the Kharif while in the Lower Indus plain diversion will total7.7 MAF IN Rabi and 23.4 in Kharif.
Future Use of Water and Water Balance
The following table gives the water balance in the Indus Plain in 1975.1 It is dia-gramatically represented in Fig, 6.
1. Master Plan, op. cit. p. 55

INDUS WATERS TREATY AND IRRIGATION 13
EVAPO~TI~N
ius;
SOUTHERN REGIONEVAPORATJON
CANALS 1L2.1r Q24.7~
EVAPORA~~~ ~~0~~ 8.5.J.a., 1.2 0
EVAPORATION 22.312.2 9.7
NET CROPUSE16.7
10.7
RIVER INPUT164.5 MILLION
ACRE-FEETn EV,\PORATION
V {} 2.9~ CANALS116.3 1~48.2 33.8 •....•....'-v'" <=:, 2. 0
.....-::--=----""L11.5 ~5.el~V~P~RATION
c,l.8 D~WATER 32;1
COURSES
iJ<01.0
SEEPAGE
3.4 d 0.2RAIN"
14 3 PERCOLATI~. RECHARGE
~~~ ~~1~3
GROUND ~APORATIONWATER I OR STORAGE
107.3
D-104.3
D 13.3
NORTHERN REGION
3.0QSEEPAG
UJ<f)
EVAPORATION J
f3.2r----"-v/--..,NET CROP
USE24.2
IXou,
aUJo,~JCl.4.8
RAIN 1.0 .3 0PERCOLATION
~J 22 . I RECHARGE
2.0620.1~flEVAP. OR
STORAGE
"-- ...J
60.9 OUTFLOW
~/
U.69.0
U68.0
ARA BIA N SEA
GROUNDWATER
PRESENT WATEk BALANCE.IN THE INDUS PLAINS
from ; Mast~r plan, P. 4l,

14 PAKISTAN GEOGRAPHICAL REVIEW
TABLE 6
FUTURE WATER BALANCE IN THE INDUS PLAINS IN AN AVERAGE YEAR
Million Acre Feet per year
River Balance
Total surface Water SupplyNe percolat.on to ground waterOther losses Other lossesOther lossesInflow from drainage pumpingFlow to Arabian Sea ..
Total Surface-Water Diversion
1975
140·03·1
Other losses11·95·0
27·9
92·1
Canal Balance (including Link Canals andWater Courses)
Total Surface Water DiverstionPumped from ground water
Evaporation lossesPercolation to ground water
Total Farm De\:very
Farm Irrigation Balance
Total Farm Delivery ..Surface lossesPercolation to eround water
92·126·<)10·228·6
80·2
Net Crop USe"
80·28·0
12·0
1)(>2
While at present irrigation is entirely dependent on the diversions of unregulated riverflows, by 1975 the supply of water from the river flows will be increased by storage releasefrom the Mangla and Tarbela dams and by pumping ground water. The percolation andother losses in the diversion to the canals are expected to be 15 percent which will be com-pensated to the extent of 5 percent by inflow from drainage and pumping. ./
Of the 92./MAF (65.8 %) diverted to canals, evaporation and percolation losses willamount to 38.8 MAF (42.1 % of the diverted water), which will be offset by 26 MAF bypumping from ground water. Of the 80.2 MAF thus delivered to the farms, 20 MAF(about 25 %) will be lost in delivering and 60.2 MAF will go to net crop use-42.4 MAF inthe Upper Indus plain and 17.8 MAF in the Lower Indus plain. This will mean an increaseof about 75 percent over the present supply in the former and of about 6.6 percent in the later.37.9 MAF (27 percent of the total supply) will flow to the sea.
Surface Water DevelopmentThe development of surface waters will in the main consist of the Settlement Plan
works constructed as part of the Indus Basin Project. It is being done as a part of the generalprogramme for water and power development in West Pakistan. At present the surface

INDUS WATERS TREATY AND IRRIGATION
EVAPORATION
3.0
EVAPORATION
SOUTHERN REGION
EVAPORATION
1.9
RIVER INPUT140.0 MILLION
ACRE-FEET
5.2
on•IIIII!:::JD:
00...aUJa.~:::Ja.
za EVAPORATION
24
n ~12V SEEPAGE
3·5
QIO.I1"-;:=~====.L0Q3.2 RAINPERCOLATION
13.6 RECHARGEEVAPORATION
GROUNDWATER
8.1
9.9
TO SEA
NORTHERN REGION
V76 0
EVAPORATION
610 ,3.8 CANALS
40.40 022.4
~ 62.8 EVAPORATIO
v~ 32
565 EV,6,PORATI'<tNN
UJII!:::JOIXoILo
68.9
1.9 NET CROPUSE4 :4SEEPAGE
8.5
EVAPORATION
()73 9
GROUNDWATER
{}42.8 EVAPORATION
3·7
POTENTIAL WATER BALANCEIN THE INDUS PLAINSBY 1975
37.9 OUTFLOW
ARABIAN SEA
Fig. 6From: Master plan. P. 56.
lS
aUJa.~:::Ja.

16 PAKISTAN GEOGRAPHICAL REVIEW
waters are utili sed during their natural flow. They are not controlled by stroage reservoirexcept for minor storage of less than 0.3 MAF. For the maximum utilisation of thesurface waters, reservoirs are to be constructed and the canals are to be remodelJed tocarry a larger volume of water during Kharif and to provide for an increase in irrigationintensities.
The canals are to be lined with suitable material to prevent the loss from percolationand seepage. It is estimated that surface storage requirements for the irrigation of the Indusplains will ultimately be in the range of 20 to 30 MAF.
With ultimate development, the average annual diversions from the rivers are expectedto be 40 MAF in the Rabi and 80 MAF in the Kharif season, or about 87 % of the totalwater supply."
Mangla and Tarbela dams of the Indus Basin Project will finally provide useful stor-age of 7.7. MAF and 9.3 MAF when they are raised further after the com pleti on of initialphases. These dams, in addition to storing water for irrigation, will reduce the flood peakof the Indus and the Jhelum rivers. Besides these two there will be smaller reservoirs on thetributaries of the major rivers which will have a collective storage capacity of 4 MAF. Itwill increase the total storage capacity to 21 MAF. About 390 canals will transfer waterfrom the western rivers to replace the water diverted hy India. Investigations have shownthat exclusive of Mangla and Tarbela dams there are potential reservoirs with a totalquantity of some 60 MAF within West Pakistan.
After the Tarbela and Mangla dams are completed, a large volume of water (about37.8 MAF) will still be flowing to the Arabian sea. Thus, additional \' uter supplies can beobtained by diverting the unused flows into temporary lakes along the course of the Indus inthe adjacent ThaI and Thar deserts. It will help in reclaiming these dry areas by improvingirrigation and fertilizing the soil and inturn, will also reduce soil erosion and encourageafforestation. It so happens that in both these desert areas depressions exist which candrain off large quantities of water from the Indus. In the Thal region, there are oldchannels now abandoned by the Indus and many other suitable depressions between thesand-dunes. In the Lower Indus plain, a long depression has been pointed out byOldham" which runs from Khairpur to Vmar Kot in Tharparkar and is partly occupied byEastern N ara canal.
Ground Water DevelopmentThe great reservoir of ground water is expected to be another very important source
of irrigation water in the irrigated area of the Indus plain. It will be needed not only to sup-plement the water supply in the areas commanded by canals but also to develop other areaslying outside the canal zone. Ground water reserves are also important as a buffer to tide
1. Master Plan op. cit., p. 432. R. D. Oldham, A Mannual of the Geology of India, Calcutta, 1893.

INDUS WATERS TREATY AND IRRIGATION 17over dry periods when a deficiency of surface waters occurs. It is estimated that about36.4 MAF are added to it annually, 22 MAF in the Upper Indus plain and 14 MAF in theLower Indus plain as given below! :-
Percolation from riversfrom canalsfrom farmsfrom rainfall
4.0 MAF23.0 "8.2 "1.2 "
Total: 36.4 MAF
But all the ground water is not usable for irrigation because of high salinity in manyareas. Salinity concentrations vary from a low acceptiable ratio of 500 parts per millionin the Upper Indus plain to an intolerably high ratio of 3000 PPM in some parts of Sind.In general ground water containing 2000 to 3000 PPM can be used in irrigation if supple-mented with fresh water. Some 28 million acres, or 80 percent of the Upper Indus Plain,have ground water salinity concentration of less than 3000 PPM. About 18.6 million acres(or 56 percent of the 33 million acres lying over the ground water reservoir) are included inthe culturable commanded area of the canal system.P Experiments have shown that largecapacity tubewells, yielding 4 cusecs or more, can be developed at practically any locationin the Upper Indus Plain.
Not much detailed information is available for the Lower Indus Plain where theground water over a large area is highly saline. But it is estimated that at least 5 MAF offresh ground water can be developed annually by tubewells for irrigation use in a strip 3to 15miles wide on each side of the Indus between Gudu and Ghulam MuhammadBarrages.
It is planned to construct about 34,000 tubeweJls by 1975, of which about 2:;00 areto be financed as part of the Indus Basin Project. Of the total about 29,000 wells willserve for irrigation, adding some 24 MAF to the water supply in the irrigated farms.
Extension of canal irrigation in future will lead to greater percolation and furtherdevelopment of the ground water reservoir. By 1975 the ground water balance is expectedto be')
Percolation from riverscanalsfarmsrainfall
3.1 MAF28.6 "12.02.1 /I
Total: 46.2
1. Master Plan op. cit., p. 4.2. Supporting Studies, op. cit., p. 11-35.3. Master Plan, op. cit. p. 55.
18 PAKISTAN GEOGRAPHICAL REVIEW
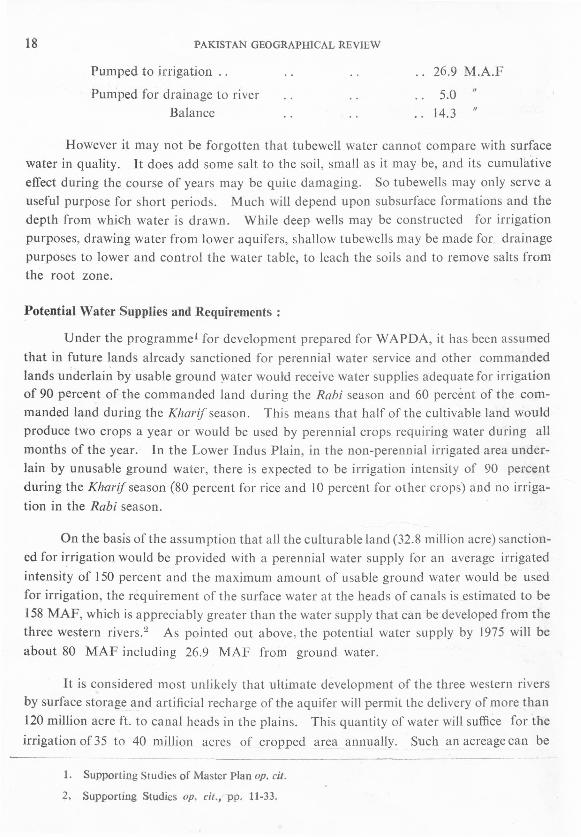
Pumped to irrigation ..
Pumped for drainage to riverBalance
26.9 M.A.F
5.014.3
However it may not be forgotten that tubewell water cannot compare with surfacewater in quality. It does add some salt to the soil, small as it may be, and its cumulativeeffect during the course of years may be quite damaging. So tubewells may only serve auseful purpose for short periods. Much will depend upon subsurface formations and thedepth from which water is drawn. While deep wells may be constructed for irrigationpurposes, drawing water from lower aquifers, shallow tubewells may be made for drainagepurposes to lower and control the water table, to leach the soils and to remove salts fromthe root zone.
Potential Water Supplies and Requirements:
Under the programme! for development prepared for WAPDA, it has been assumedthat in future lands already sanctioned for perennial water service and other commandedlands underlain by usable ground water would receive water supplies adequate for irrigationof 90 percent of the commanded land during the Rabi season and 60 percent of the com-manded land during the Kharif season. This means that half of the cultivable land wouldproduce two crops a year or would be used by perennial crops requiring water during allmonths of the year. In the Lower Indus Plain, in the non-perennial irrigated area under-lain by unusable ground water, there is expected to be irrigation intensity of 90 percentduring the Kharif season (80 percent for rice and 10 percent for other crops) and no irriga-tion in the Rabi season.
On the basis of the assumption that all the culturable land (32.8 million acre) sanction-ed for irrigation would be provided with a perennial water supply for an average irrigatedintensity of 150 percent and the maximum amount of usable ground water would be usedfor irrigation, the requirement of the surface water at the heads of canals is estimated to be158 MAF, which is appreciably greater than the water supply that can be developed from thethree western rivers." As pointed out above, the potential water supply by 1975 will beabout 80 MAF including 26.9 MAF from ground water.
It is considered most unlikely that ultimate development of the three western riversby surface storage and artificial recharge of the aquifer will permit the delivery of more than120 million acre ft. to canal heads in the plains. This quantity of water will suffice for theirrigation of35 to 40 million acres of cropped area annually. Such an acreage can be
1. Supporting Studies of Master Plan op, cit,
2. Supporting Studies op, cit., pp. 11-33.

· .~INDUS WATERS TREATY AND IRRIGATION 19
obtained by the irrigation of 24 to 30 million acres of culturable land at cropping intensitiesthat will produce optimum returns and permit control of soil salinisation.!
In any estimate of potential water requirements, it should be kept in view that Pak-istan is a developing country. More and more water will be required not only for irrigation
but also for its growing industry and municipal and domestic consumption. With the increa-sing pace of urbanisation and a rise in the standard of living, there will be heavier and
heavier demands on water, only a part of which could be met by the construction of tube-
wells.
Agriculture and Irrigation:
The total cultivated area in West Pakistan is at present 42 million acres, about 27million acres in the northern r i and J5 million acres in. the southern r~~n:-(Fig. 7)
Another 25 million ,!:cres ~re cultivable if water
could be brought to them .. At present irriga- LAND USE IN WEST PAKISTANdon facilities are available to only 32.8 millionacres-19.5 million in the northern and J3~3million in the - southern region. Some -z24 ~million acres get perennial water supply, while11.4 million acres are irrigated during the peakflow season only. About 24 million acresare actually irrigated every year.
Apart from climate and soil, the amountand periodicity of irrigation water avail-
able in any culturable area mainly determine
the agricultural use of the land and the crop-ping patterns and intensities. These in theirturn have a great bearing on crop yields.
Present Cropping Patterns and Intensities-
Fig. 7.
The crop patterns and intensities in the present culturable commanded areas bothin the Upper and Lower Indus plains are shown in the following table and are graphicallyrepresented in Figs. 8&9.
1. Supporting Studies, op, cit., pp. 11-33.---------
2. Cropping intensities express the percentage of the culturable commanded area irrigated andcropped in either the Rabi or Kharif season.

20 PAKISTAN GEOGRAPHICAL REVIEW
TABLE 7
CROP PATTERNS AND INTENSITIES (1960-61)1
Season
Kharif
Rabi
Percent of Cultur-able Commanded
AreaCrop
Northern \Sout,hernregion region
--------' ---Sugar caneRiceCottonFood GrainsFodder and OtherSubtotal Kharif
4'6 0'46'0 11'4
11'3 6'13'5 8'5
15"6 3"6
41'0 30'0
22'0 5"52'8 3'84'6 0'4
11'6 17'341'0 27'0
82'0 57'0
WheatOil seedsSugarcaneFodder and OtherSubtotal Rabi
Annual
Under the present conditions, in the Kharif season rice and cotton are the principalcrops, Rice needs plenty of water and is, therefore, quite suitable forthe flood plains of therivers and the area commanded by inundation canals, It has the highest percentage undercultivation in the Lower Indus Plain where a large area is flooded, and it is the most suitablecrop for growing in this area, It is the principal crop of the non-perennial areas, Inthe Upper Indus Plain cotton has the highest percentage of the total acreage under cultiva-tion, Here a large net of the canal system helps the flood waters to be distributed over alarge area, and the cultivation of cotton, a good cash crop and an economic user of watergives the best returns, For the same reason, sugarcane is also important in this part andoccupies land throughout the year. On the other hand, in the Lower Indus Plain sugarcaneis insignificant in the crop pattern on account of competition with rice,
In the Rabi season, the patterns and intensities of cropping are influencedby the limited supply of irrigation water available, In the Upper Indus Plain wheatoccupies the most important position both in crop pattern and acreage under cultivation, asit is the chief food grain of this region and grows well under irrigation, It is estimated thatof the total acreage under wheat in the Upper Indus Plain about two-thirds of the crop isgrown on irrigated land, Another important reason for its high acreage is that excepting
1. Supporting Studies op, cit, P: 11-17 and 18.

INDUS WATERS TREATY AND IRRIGATION 21
PRESENT CROPPING PATTERNS& INTENSITIES
UPPER INDUS PLAIN100
90
« 80u 70u
LL0~ZUJU
0:1&1G-
kHARIF & RABITOTAL INTEN!>ITY 82%
(41+-41 )
LOWER INDUS PLAIN
100
9080
«u 7u
KHARII' & RABITOTAL INTENSITY S7 %
(30 +27')
LLo
M J J
FUTU E CROPPINf'; PATTERNS& INTENSITIES 1975
70
LL 600~ 50zUI 40u
0:UIG-
O ,',5-.'M J
l.OWER INDUS PLAIN
100
9080-c
u 70
U 60LLo 50
TOTALINTENSITY
150%
~ 40Z ~Tn~~'~~~~~~~~~~UI 30 I, , , 'SUGAR-CANE 101.' I I III II' " " " III"U j I I I' II 111111 I I II
so 20 _=:::: :::(QDj>gR: Io"t -=-_=.:- _-:. ~~_UI
Q. '" ""10 " "~'"",10'/., , -, OTHER, CROPS 16'/.' ,0" '"" """",,,
MJJASONDJFMA
PERENNIAL LANDS
NON PERENNIAL JRICE1..?THERS
TOTAl. I<HARIF
80°/.,IC! "Ie90%
Fig. 8 and 91. C. C. A. Culturable Commanded Area.
2. Letters along abscissa denote months.

22 PAKISTAN GEOGRAPHICAL REVIEW
gram it is the most economic water user of all the winter and summer crops. In the LowerIndus Plain, wheat is less important as much less area is available under perennial irrigation.
TABLE 8
CULTIVATED AREA (000 ACRES) COMMANDED BY CANALS-I 960-61 1
Area Commanded Area irrigated---------- ------1-----Region Perennial I Non Pere Total Kharif Rabi Total
nnial ---,----Upper Indus Plain 13,579 5,962 19,541 8,002 7.995 15799,Lower Indus Plain 7'796 5,504 13,300 3,951 3,663 7,614Total Indus Plain 21,375 11,466 32,841 11,953 11,658 23,611
Fodder is grown all the year round both in the Upper and Lower Plains to feed thecattle as there are no good natural grasslands. Patches of poor grass occur where cultiva-tion cannot be carried on for want of water.
Future Cropping Patterns and Intensities :
During the course of the next ten years when more surface water is available forirrigation under the treaty, when more canals are constructed to carry it and their capacitiesare enlarged, and when ground water would be obtainable in large quantities, the croppatterns and intensities will automatically adjust themselves to this increased water supply.
The culturable commanded area is expected to be increased from the present 82percent to 150 percent in the perennial. It is shown in the following table and graphicallyrepresented in Fig. 9.~
TABLE 9
CROP PATTERNS AND INTENSITIES FOR THE YEAR 1975
Session Crop
Percent of Cultur-able Commanded
Area
1
_-----Northern Suothern
region region------------------------1-.10 108 10
17 15.10 5
15 20
Kharif Sugar CaneRice ..Cotton
'fOOd GrainsFader and Other
Subtotal Kharif .. 60 60
1. Abstracted from table II-I, p. TT-2 and 2 (a), Supporting Studies, op. cit,? Master Plan op. cit; p, 31,

INDUS WATERS TREATY AND IRRIGATION
CROP PATTER S ANDINTENSITIESFORTHEYEAR 1975-(Continued from page 22)
Season Crop
Percent of Cultur-able Commanded
Area----------Northern Southern
region region
50 42
7 12
10 10
23 2690 90
150 ISO
Rabi Wheat
Oil Seeds
Sugarcane
Fodder and Other
Subtotal Rabi
Annual Total
Cotton will still remain the most important Kharif crop in .the Upper Indus Plainwith about 50 percent increase in its intensity over that of present. With an increasedregulated water supply and reclamation of saline and waterlogged areas, its intensity willconsiderably increase in the Lower Indus Plain from 6.1 percent to 15 percent (a rise of 50perce.nt), replacing rice as the most important Kharif crop of the perennial lands. In theUpper Indus Plain the rice acreage will also rise by 25 %.
Wheat will remain the most important Rabi crop of the Upper Indus Plain, occupy-ing 50 % of the culturable commanded area, with a rise of 127 percent. In the LowerIndus Plain as well, cotton will become by far the most important crop, occupying 42 per-cent of the culturable commanded area, an increase of 66.3 percent. The increase in theintensity of cotton and wheat cultivation will be gratifying as the former is the principalearner of foreign exchange and the latter will make Pakistan self-sufficient in food grains.Another important change in the crop pattern will be that sugarcane will develop into animportant cash crop in both the parts of the plain. There will be a rise of about 22 percentin its acreage in the Upper Indus Plain and as much as 25 times in the Lower Indus Plain.In the non-perennial area, rice will occupy about 80 percent out of the 90 percent of the
culturable commanded area.
With the development of the irrigated lands, the production of food crops is expectedto rise from the present 9.46 million tons to 19.62 million tons, almost double the present
quantity.
Crop Yields and Irrigation:
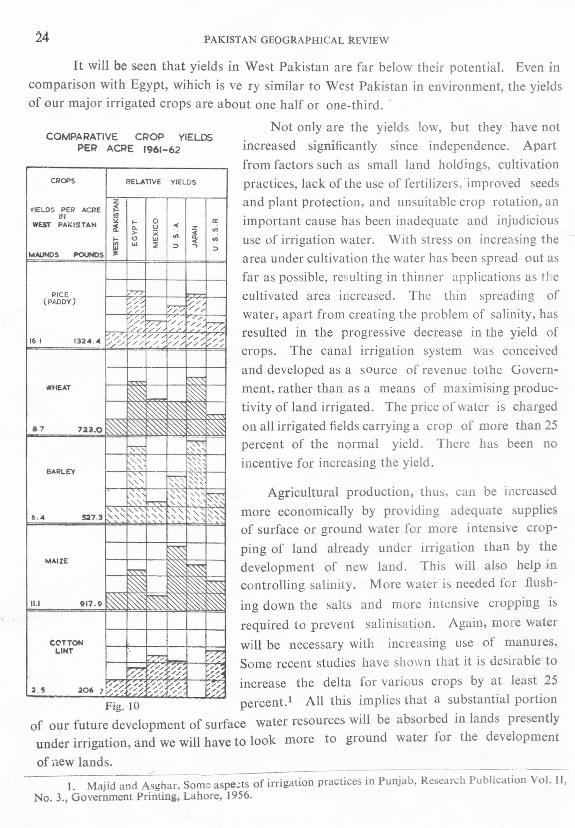
A very conspicuous aspect of agriculture in West Pakistan is that the crop yields areamongst the lowest in the world, as given in the Fig. 10 and tables 10 and 11.
24 PAKISTAN GEOGRAPHICAL REVIEW
It will be seen that yields in West Pakistan are far below their potential. Even incomparison with Egypt, wihich is ve ry similar to West Pakistan in environment, the yieldsof our major irrigated crops are about one half or one-third ..
Not only are the yields low, but they have notincreased significantly since independence. Apartfrom factors such as small land holdings, cultivationpractices, lack of the use of fertilizers, improved seedsand plant protection, and unsuitable crop rotation, animportant cause has been inadequate and injudicioususe of irrigation water. With stress on increasing thearea under cultivation the water has been spread out asfar as possible, resulting in thinner applications as thecultivated area increased. The thin spreading ofwater, apart from creating the problem of salinity, hasresulted in the progressive decrease in the yield ofcrops. The canal irrigation system was conceivedand developed as a source of revenue tothe Govern-ment, rather than as a means of maximising produc-tivity of land irrigated. The price of water is chargedon all irrigated fields carrying a crop of more than 25percent of the normal yield. There has been noincentive for increasing the yield.
COMPARATIVE CROP YIELDSPER ACRE 1961-62
CROPS RELATIVE YIELDS
z1'IELD5 PE~ ACRE s
Itl !!!WEST PAKISTAN " I- 0 a:
~ 0- U • Z '"0>- X '" if.l- I.'> '" • '"i3 '" ~ :> .,
:>MAUNOS POUNDS ~
RICE -T7 ~(PADDY) /
'7'/:/
/ ////,
::/7T ///
77//
161 1324.4 "'//'l / // // /// // /
- // // ,/ / //
J.....-. ~'Nt/EAT
~8.7 7:U.O W~~
""" "'" "'"BARLEY " ",~ '"", '"
" ~~ ,',~'" h-.- "", " -, " ",~~6.4 527.3 ", " " " -,
MAIZE ~M~~
11.1 917.9 ~ ~
CC'TTONLINT ',
777 0/b /// // "
// ~~/ // ~~;-:/ // // / //2.5 <106 7 '// // //
0 , // // //
Agricultural production, thus, can be increasedmore economically by providing adequate suppliesof surface or ground water for more intensive crop-ping of land already under irrigation than by thedevelopment of new land. This will also help incontrolling salinity. More water is needed for flush-ing down the salts and more intensive cropping isrequired to prevent salinisation. Again, more waterwill be necessary with increasing use of manures.Some recent studies have shown that it is desirable toincrease the delta for various crops by at least 25
Fig. 10 percent.l All this implies that a substantial portionof our future development of surface water resources will be absorbed in lands presentlyunder irrigation, and we will have to look more to ground water for the development
of new lands.1. Majid and Asghar, Some aspects of irrigation practices in Punjab, Research Publication Vol. 11,
No.3., Government Printing, Lahore, 1956.

INDUS WATERS TREATY AND IRRIGATION 25
TABLE 10
YIELDSPER ACRE (1961-62) 1
Country Rice Wheat
IBarley
IMaize Cotton
(paddy)I
West Pakistan lbs. 1324-4 723'0 527-3 917-9 206-7
Mds_ 16-1 8-7 6-4 11-1 2-5
Egypt lbs, 4505-4 2197-7 2328-5 2141"1 356-8
Mds_ 58-4 26-6 28'4 26-0 4-3
Mexico lbs. 2285-5 1498-8 686-1 776-1 490-6
Mds_ 27-8 18-2 8-3 9-4 5-9
Japan lbs, 4193-1 2444"4 2551-1 2480-8Mds_ 51-0 29-7 31-0 29-3
U.S_S.R. lbs. 2141-1 945"6 832-2 1650'5 579-9
Mds_ 26-0 11-5 10-7 20-5 7'0
With the provision of adequate water and the employment of improved farm practices,increases in average yields are anticipated for all crops amounting to about 100 percent forthe irrigated areas of the Upper Indus Plain and about 73 and 53 percent respectively for theperennial and non-perennial areas of the Lower Indus Plain, as shown in the table 11below.?
TABLE 11
ANTICIPATEDAVERAGECRoP YIELDSFROMIRRIGATEDLANDS
MAVNDSANDPOUNDSPERHARVESTEDACRE
1949-1959 AVerage Future Yields-1975 .--Crop
Maund, I Northern SouthernPounds region Pounds region
Maunds Maunds Pounds
-Rice (cleaned) 9-2 760 17-2 1420 15'3 1245
Wheat 8'7 720 18'7 1500 12'0 990
Barley 7.3 600 15-3 1260 8'5 700
Maize 10'9 895 21-0 1730 9'0 740
Colton Lint 2'2 185 3-9 320 4'2 345
Cane- sugar 31-3 2580 61'0 5020 69·5 5720
1. Yearbook F_A.O. 1930. Figures for West Pakistan from Statistical Handbook of WestPakistan Figures for paddy have been calcuated from cleared rice in the ratio of 8 to 5_
2. Master Plan of op. cit, p. 29.
26 PAKISTAN GEOGRAPHICAL REVIEW
IReclamation of Lands :A large quantitiy of water will be required for the reclamation of our saline lands.
A comprehensive survey of the Indus Plain completed In 1958,1 showed that about 11.3million acres of irrigated land in the Indus Plain were waterlogged or poorly -drained,another 4.8 million acres were severely saline and inan additional 11.2 million acres salinepatcheswere common. Since that survey, another half a million acres -a~eestimated to havebeen seriously affected. It is estimated that West Pakistan is losing 100,000 acres each yearthrough the spread of waterlogging and salinity. Reclamation of these lands isnecessary for increasing argicultural production. This will require extensive use oftubewells as the flatness of the country prevents drainage over large areas.
The basic principle in the reclamation of saline lands is to wash down the salts bysupplying copious watering. For this more irrigation water is required. To reclaim.....=----....,40,000 acres, which are affected by salt every year in the Punjab region alone, about 7500cusecs are needed while only 4000 cusecs are available. Thus, at present more land isbeing lost through salinity than is being reclaimed.
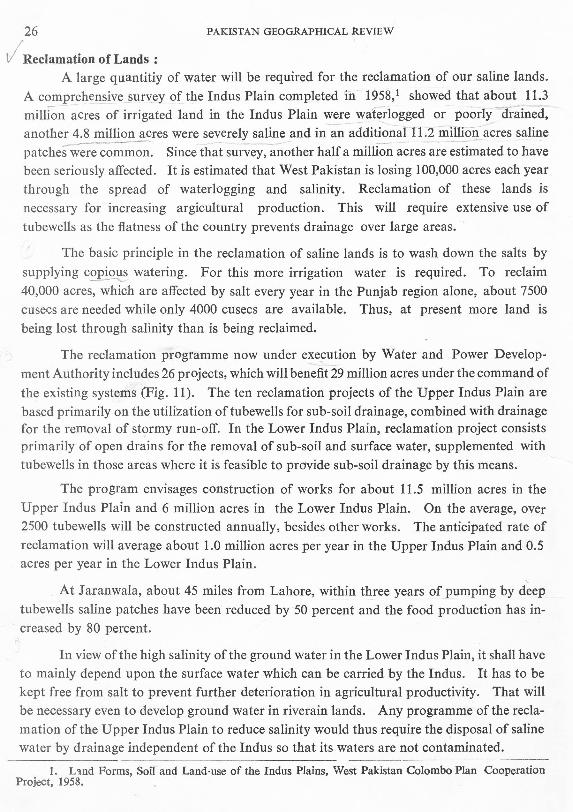
The reclamation programme now under execution by Water and Power Develop-ment Authority includes 26 projects, which will benefit 29 million acres under the command ofthe existing systems (Fig. 11). The ten reclamation projects of the Upper Indus Plain arebased primarily on the utilization oftubewelJs for sub-soil drainage, combined with drainagefor the removal of stormy run-off. In the Lower Indus Plain, reclamation project consistsprimarily of open drains for the removal of sub-soil and surface water, supplemented withtubewells in those areas where it is feasible to provide sub-soil drainage by this means.
The program envisages construction of works for about 11.5 million acres in theUpper Indus Plain and 6 million acres in the Lower Indus Plain. On the average, over2500 tubewells will be constructed annually, besides other works. The anticipated rate ofreclamation will average about 1.0 million acres per year in the Upper Indus Plain and 0.5acres per year in the Lower Indus Plain.
At Jaranwala, about 45 miles from Lahore, within three years of pumping by deeptubewells saline patches have been reduced by 50 percent and the food production has in-creased by 80 percent.
In view ofthe high salinity of the ground water in the Lower Indus Plain, it shall haveto mainly depend upon the surface water which can be carried by the Indus. It has to bekept free from salt to prevent further deterioration in agricultural productivity. That willbe necessary even to develop ground water in riverain lands. Any programme of the recla-mation of the Upper Indus Plain to reduce salinity would thus require the disposal of salinewater by drainage independent of the Indus so that its waters are not contaminated.
---I. Land Forms, Soil and Land-use of the Indus Plains, West Pakistan Colombo Plan Cooperation
Project, 1958.

INDUS WATERS TREATY AND IRRIGATION
WEST PAKISTANSALINITY CONTROL
ANDRECLAMATION PROJECTS
MILES IOP,-_'~5__ S~"_~2_5_.•.,? ~/OO MILES
"
•.....,......•., "!I
I
">.".......•.•t,.,•">.•.
~I
-_.-,.,-
ARABIAN SEA
Fig. 11
~,II
",KASHMIR
ANDJAMMU
"
~ PROJECTS READY FOR CONSTRUCTION~2.Chaj Doa6~ 2a.Khqirpur
2b.Gaja
PROJECTS rOBE I.INDERTAKEN
b--==-13.-LowerThai(Sind Sagar 0006)- - 3a.-Larkana·5hikarpur
3b.-Tando.Bago.( -Upper Rechna Doeb, 4 e-cower Rechna Ooab46/~Shandadkof Manchar. 4b2~ThaHa. 4C1-Pin.'/ari.Gun,'4C2.-Kllshmore -Jacobabad. 4C3.-Guni - FulellS- Southern 8arl Doa6. 5a-Upp~rThal (5indSagar Ooa6,501- Sekro-ds,», 562..- Gnotkt: 503- Jilli- Badin5CI-Ochi'o. 5C2.- Fuleli East. 5d- 8ahawalpur6-Norlhern Bari 00116. 68- Pai, 66-East Nara7- Righf Bank Indus. 7a- Rohri Norlt.. 7b-Rohri South

28 PAKISTAN GEOGRAPHICAL REVIEW
Food and Population :
The primary aim of the expansion of irrigation facilities and reclamation projectsis to increase production not only for the present population but also for the increasingnumbers. The net availability of food in 1961 and the potential for 1975 is given in thefollowing table.
TABLE 121
NET AVAILABLE FOOD (MILLION TONS)
Subtotal
/1961 1975Supply Potential
6-14 2-955'63
0'11046 0'27
0'280'45
6-60 9'69
0-270'33 0'13
0'17
0'69 4'09
0'96 3'360,88 1'91
2·86 9'93
9'46 19'62
Product
Food Grains
Rice JWheat )
Barlev JSorghum ~Millet 'Maize )
OtherGram 'IOther Pulses rOil Seeds )
Cane sugar
Vegetables and miscellaneousFruits
Subtotal
Total Crops
Animal Products
Meat and FishEggsMilkOils and fats
Subtotal
Grand total
0'31 0'450'01 0032'05 4'820'15 0'30
2'52 5,60
11'98 25'22
The present supply of food for a population of 42.9 million is about 12 million tons,including imports of 1 million tons. If the programme of development is executed accord-
1. Master Plan op. cit. p. 32.
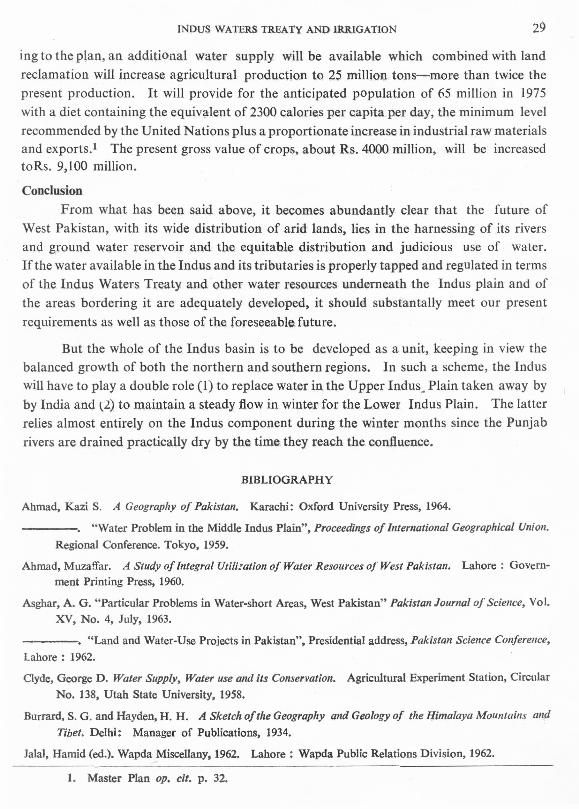
INDUS WATERS TREATY AND IRRIGATION 29ing to the plan, an additional water supply will be available which combined with landreclamation will increase agricultural production to 25 million tons~more than twice thepresent production. It will provide for the anticipated population of 65 million in 1975with a diet containing the equivalent of 2300 calories per capita per day, the minimum levelrecommended by the United Nations plus a proportionate increase in industrial raw materialsand exports.! The present gross value of crops, about Rs. 4000 million, will be increasedtoRs. 9,100 million.
ConclusionFrom what has been said above, it becomes abundantly clear that the future of
West Pakistan, with its wide distribution of arid lands, lies in the harnessing of its riversand ground water reservoir and the equitable distribution and judicious use of water.If the water available in the Indus and its tributaries is properly tapped and regulated in termsof the Indus Waters Treaty and other water resources underneath the Indus plain and ofthe areas bordering it are adequately developed, it should substantally meet our presentrequirements as well as those of the foreseeable: future.
But the whole of the Indus basin is to be developed as a unit, keeping in view thebalanced growth of both the northern and southern regions. In such a scheme, the Induswill have to playa double role (1) to replace water in the Upper Indus, Plain taken away byby India and t2) to maintain a steady flow in winter for the.Lower Indus Plain. The latterrelies almost entirely on the Indus component during the winter months since the Punjabrivers are drained practically dry by the time they reach the confluence.
BIBLIOGRAPHY
Ahmad, Kazi S. A Geography of Pakistan. Karachi: Oxford University Press, 1964.
---.....,. "Water Problem in the Middle Indus Plain", Proceedings of International Geographical Union.Regional Conference. Tokyo, 1959.
Ahmad, Muzaffar. A Study of Integral Utilisation of Water Resources of West Pakistan. Lahore: Govern-ment Printing Press, 1960.
Asghar, A. G. "Particular Problems in Water-short Areas, West Pakistan" Pakistan Journal of Science, Vol.XV, No.4, July, 1963.
----,. "Land and Water-Use Projects in Pakistan", Presidential address, Pakistan Science Conference,Lahore: 1962.
Clyde, George D. Water Supply, Water use and its Conservation. Agricultural Experiment Station, CircularNo. 138, Utah State University, 1958.
Burrard, S. G. and Hayden, H. H. A Sketch of the Geography and Geology of the Himalaya Mountains andTibet. Delhi: Manager of Publications, 1934.
Jalal, Hamid (ed.), Wapda Miscellany, 1962. Lahore: Wapda Public Relations Division, 1962.
1. Master Plan op, cit. p. 32.

30 PAKISTAN GEOGRAPItICAL REVIEW
-----. Wapda Annual Report, 1961-62. Lahore: Wapda Public Relations Division, 1962.
Karpov, A. V. and Ross, Nebolsin, "West Pakistan and the Indus Valley", Indus, Vol. 5. No.1, February,1964.
Lahore "Indus Valley-Key to West Pakistan's Future", Indus, Vol. 2, No.4, May, 1961.
Mahboob, S. I. Land and Water Use in West Pakistan", Presidential address, Section Engineering Irrigation,Pakistan Science Conference, l.ahore, 1960.
Majid and Asghar, A. G. Some Aspects of Irrigation Problems in Punjab (Pakistan). Research Publication,Vol. 11. No.3, Lahore: Government Pringting Press, 1956.
Malik, R. A. Irrigation Development and Land Occupance in the Upper Indus Basin. Doctroral dissertation,Department of Geography, Indiana University, Bloomington, 1963.
Murphy, Patrick. Partition of the Punjab and the Indus Basin Water Dispute. An unpublished Report underthe auspices of Oxford and Cambridge Far Eastern Expedition, 1957.
West Pekistan Water and Power Development Authority. Program for Water and Power Development inWest Pakistan through 1975 (Master Plan-Initial Phase).
West Pakistan Water and Power Development Aughority. Program for Water and Power DevelopmentWest Pakistan, 1963--75, Supporting Studies, an appraisal of Resources and Potential Develcpment,A Report by Harza Engineering Company International. Lahore, Wapda Printing Press, September,1963.
----- Program for Water and Power Development in West Pakistan through 1975 (MasterPlan-Initial Phase). A Report by Harza Engineering Company International. Lahore. WapdaPrinting Press, January. 1964.
Land Form. Soil and Landuse of the Indus Plains, West Pakistan Colombo Plan Cooperation Project,Torinto 1958.

31
BY
CLIMATOLOGY OF ISLAMABAD THE CAPITAL OF PAKISTAN
SIBTE NABI NAQVI AND MUHAMMAD RAHMATULLAH
Pakistan Meteorological Department
Introduction :The site selected for the new Capital of Pakistan lies on a plateau bordered in
the north and east by the hill ranges of Siwalik formation at an elevation of 1,500 ft. to5,000 ft. and ultimately merges into the Galies and the Murree hills. It is drained by theRawal and the Soan rivers and their numerous perennial and seasonal tributaries. Thesudden rise of the land from about 1,500 ft. to 5,000 ft. in the Federal Capital Area itselfgives rise to rapid variation in the various climatic elements due to the variations of heightand topography. The biotic potential of the land is fairly high, but it has been subject toerosion and is badly cut at places by various drainage channels. The climatological featuresof this area are discussed below.
From February to May the mean dailymaximum and minimum temperatures rise
Fig. t. ANNUAL MARCH OF" TEMPERATURE
at the rate of about lOoF during successive AT RAWAL PINOI
months. The highest value is reached in June ••.••,when the hot season is at its climax. In this month the mean daily maximum and mini-mum temperatures are 103.5°F and 75.9°F respectively. The mean ill the highest maxi-
Temperature :The temperature conditions of Rawalpindi
(illustrated in Fig. 1) are fairly representa-tive of the plain strip of land at the foot ofhills in the Potwar Plateau. This area is coldin winter and hot in summer. The coldestmonth is January when the mean daily maxi-mum temperature is 62.3°F., and the mean dailyminimum is 37.9°F, the mean being 50.1°F.In this month the mean of the lowest mini-mum temperatures recorded in different yearssince 1881 is 30.8°F and the lowest minimumtemperature was 25°F recorded on the 14thJanuary 1937.
/ "- ~/ I---<,I / "'-,
1/ <, \> '! /tC'~ \
.- f!- t! S i -, \-.- -1
\<' .'1 1 I./
! 7 \/ /
.~
\I \
/ I \·7~ -_. - j. I . ~
.\1--- --.~ t . -
: 100
: 90
:eo~w~ 70
-c
~,~ 60
; !:IO
: 40
f.o!ON' H S

32 PAKISTAN GEOGRAPHICAL REVIEW
mum temperatures of different years is 113°P with the highest temperature of 11rp recordedin 1929.
Although the highest temperature recorded in July is the same as in June viz., 117°P,the mean daily maximum temperature falls to 98°P on the onset of monsoon. It furtherfalls to 94°P in August and to 93°P in September, but the minimum temperatures do not showany marked fall during July and August.
Rapid coolling of air in the region starts in October when the mean minimum tempera-ture falls by about 12°P, while maximum temperature falls by about Sop only. In November,with its clear nights, the fall in day and night temperature is very considerable. The meandaily maximum temperature falls by 11° to 78°P., while the mean daily minimum tempera-ture falls by 13° to 44°P. In fact November is almost a cold month, and climatologicallyspeaking the change from October to November is sudden and considerable. The nightsin December are practically as cool as in January. The day temperatures are however,higher by about Sop as compared to January.
As we proceed northward up the mountains, the temperatures in winter and summerfall considerably with height but the day temperature falls more rapidly than the night tem-perature, the rate of fall being nearly double during day time. This becomes evident by a
fall being nearly double during day time. Thisbecomes evident by a study of temperaturesat Murree where the daily minimum tempera-ture in January goes down to about 31°P,while the mean daily maximum tempeartureeven in June, the hottest month, does not riseabove 81°P. The annual march of temperatureover Murree, as given in Pig. 2, follows thegeneral pattern of Rawalpindi, except for thefact that the mean daily range of temperature'is less over Murree than at Rawalpindi.
The meteorological observatory at Rawal-pindi is about 1674 feet a.s.l., while theobservatory at Murree is 7100 ft. a.s.l. For adifference of height of over 5000 ft. the tem-perature should normally differ by about 16°Pand this agrees fairly well with the difference
'---------------7Fi;;"';;;;qi,:;;J,.;n" between annual mean temperature of thetwo places, as it is 17.4"F. But the difference in the day and night temperatures at thetwo stations varies considerably from the above value, being 22.8°P for the maximumtemperatures in June and 2.9°P for the minimum value in December.
v -,/ r----- i
/ / .......1"--..'\ I
/1 / <, \JI / V i- r-, \ 1\,II /1 /1
""\j' ;i''''
../ II .r I i 1i\ l~--;II I
V I I \ IV I
i
i
"0 Feb. M;lr. •. I. "1;0 J•.",c '" A S~D'l 0(\ .,,, cec
: eo
~ 60
: 40
: )0
rig. 2. ANNUAL MARCH OF TEMPERATURE
AT MURAEE

CLtMA TOLOGY OF 1lSLAMABAb 33
In order to study the effect of elevation and topography on the fall of temperature,the values of the rate of fall of the mean daily maximum and minimum temperatures per1000 ft. for Khushab and Rawalpindi and Rawalpindi and Murree are plotted on graphs Ito IV in Figure 3. From the Graphs, it is clear that the mean maximum and minimum tem-peratures fall by about 6°F between Khushaband Rawalpindi per 1000 ft. This rate of fallis almost double the value computed on thebasis of normal lapse rate of temperature infree air.
On the other hand, the rate of fall in daytemperature between Rawalpindi and Murreeis about 3of to 4of per 1000 ft. and for nighttemperature it is generally 2-3°F in summer andis as small as 1°F per 1000 ft. in the wintermonths. The marked differences noted in thetemperature variation per 1000 ft. over thePotwar Plateau as compared to the Punjabplains bring out the characteristic features ofthe two regions. It is clear that while supera- "0.' •.••..." MooY",:,,:;y •os s.", 0" H~ 0.,diabatic lapse rates characterise the Punjab Fig. 3. RATE OF FALL OF TEMPERATURE PER
1000 Fb BETWEEN KHUSHAB-RA'llALPINDl
plains the Powtar plateau is greatly influenced AND RAWALPINDI- MURREE
by anabatic effect in dry air during day time '''"''and by katabatic flowduring night. These effects are particularly marked in the summerand winter months. Thus at higher elevations over the Federal Capital Area therewill be considerable relief from high temperatures in summer during day time, but theminimum temperatures are not likely to be much lower than those at Rawalpindi, parti-cularly in the winter months.
w«o ,
1\l \ -,
I---- 1 \ \ / 1\
/ \ /~ \/ 1\ '1 \
II \ 1\1-,u I \
/ -: \ I ~!v- /'------- r-,/'
/<, , -
/ --V \/ \
\, -M
<
ax,
""
.,
Humidity:The hygrometric normals for Rawalpindi and Murree are given in Table 1 for a
comparative study.TABLE 1
M0NTHLY MEAN RELATIVE HUMIDI1 Y AT 0300 AND 1200 GMT.
Months \ Rawalpindi I Murree
January I 83 62II 46 59
February I 81 64JI 50 68
March I 63 55II 39 59
34 PAKISTAN GEOGRAPHICAL REVIEW
MO'lfHLY MEAN RELATIVE HUMIDITY AT 0300 AND 1200 GMT.-(Continued from page 33)
Months I Rawalpindi \ Murre~
April J 51 50n 29 47
May J 35 42]J !7 32
June I 38 53II 29 55
July I 67 78II 48 75
August J 75 88II , 52 79..
September I 62 69II 37 61
Octoher I 58 49II 29 46
November 1 67 43II 29 42
December J 77 50II 41 49
Annual I 63 57Mean II 37 56
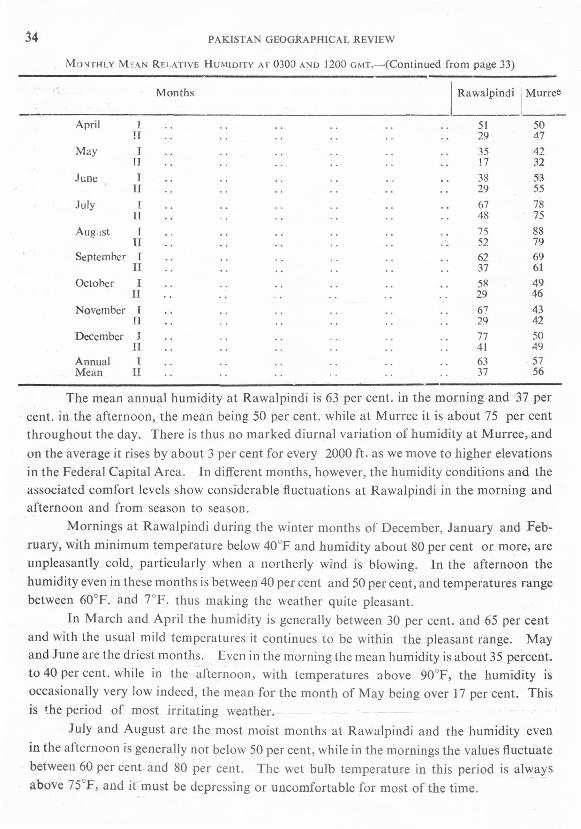
The mean annual humidity at Rawalpindi is 63 per cent. in the morning and 37 percent. in the afternoon, the mean being 50 per cent. while at Murree it is about 75 per centthroughout the day. There is thus no marked diurnal variation of humidity at Murree, andon the average it rises by about 3 per cent for every 2000 ft. as we move to higher elevationsin the Federal Capital Area. In different months, however, the humidity conditions and theassociated comfort levels show considerable fluctuations at Rawalpindi in the morning andafternoon and from season to season.
Mornings at Rawalpindi during the winter months of December, January and Feb-ruary, with minimum temperature below 40°F and humidity about 80 per cent or more, areunpleasantly cold, particularly when a northerly wind is blowing. In the afternoon thehumidity even in these months is between 40 per cent and 50 per cent, and temperatures rangebetween 60°F. and 7°F. thus making the weather quite pleasant.
In March and April the humidity is generally between 30 per cent. and 65 per centand with the usual mild temperatures it continues to be within the pleasant range. Mayand June are the driest months. Even in the morning the mean humidity is about 35 percent.to 40 per cent. while in the afternoon, with temperatures above 90°F, the humidity isoccasionally very low indeed, the mean for the month of May being over] 7 per cent. Thisis the period of most irritating weather.
July and August are the most moist months at Rawalpindi and the humidity evenin the afternoon is generally not below 50 per cent, while in the mornings the values fluctuatebetween 60 per cent and 80 per cent. The wet bulb temperature in this period is alwaysabove 75°F, and it must be depressing or uncomfortable for most of the time.

CLIMATOLOGY OF ISLAMABAD 35
The post-monsoon period (mid-September to November) is like the spring, with highhumidity in the morning and low values of the order of 30 per cent. in the afternoon. Withtemperatures below 90°F. it should not be unpleasant.
At Murree the difference in the morning and afternoon humidities is generally lessthan 4 per cent. except in May, August and September when it is 8 per cent. The actralvalues are also not far beyond the comfortable range and vary between 40 per cent. ar.d70 percent. except during the monsoon period when the humidity varies between 75 per cent.and 90 percent.
This characteristic variation in the humidity and comfort ccr.diticns between Rawal-pindi and Murree is fully explained if one looks up the differences in the normals of drybulb and wet bulb temperature and vapou r pressures of the two places for the morning andthe afternoon, which are given in Table II.
fABLE 2MEAN DRY BULB, WET BULB AND VAPOUR PRESURE AT RAWAI.PINDI AND MURRIlE AND THFIR DIFFERENCE,
AT 0300 AND 1200 GMT
Mean Dry Bulb Mean Wet Bulb Vapour Pressure (mb)
Rawal- Differ- Rawal- Differ- Rawal- Differ-Month pindi Murree ence pindi Murree ence pindi Murree ence
January I .. 40.7 36.5 4.2 38.~ 31.9 6.9 7.2 4.4 2.8II .. 58.0 39.0 19.0 48.2 33.9 14.3 7.4 4.6 2.8
February I .. 45.2 37.2 R8.0 42.9 32.8 10.0 8.3 4.7 3.6II .. 61.7 41.2 20.5 51.8 36.6 15.2 9.0 5.7 3.3March I .. 55.5 44.7 10.8 49.6 38.2 11.4 10.5 5A 5.1H .. 69.9 47.1 22.8 55.9 40.5 15.4 9.2 6.2 3.0April I .. 67.7 54.3 13.4 57.8 45.6 12.2 12.9 7.2 5.9
II .. 82.5 58.3 24.2 62.3 47.7 14.6 10.4 7.4 3.4May I .. 80.5 64.2 16.3 63.6 51.7 11.9 14.2 8.5 5.7II .. 100.0 74.0 26.0 69.1 55.9 13.2 11.1 8.8 2.3June T .. 86.5 68.7 17.r 69.2 58.0 11.2 IS .1 12.3 6.0II .. 99.4 74.1 2''.3 74.1 61.4 12.7 18.1 13.9 4.2July T .. 83.6 66.1 17.5 75.4 61.6 13.8 26.5 17.2 9.3
II .. 95.4 71.9 23.2 78.0 65.8 12.2 26.6 19.4 7.2August I .. 80.6 63.5 17.1 74.8 61.2 13 .6 27.7 17.7 10.0II .. 92.6 69.7 22.9 77.4 65.1 12.3 25.3 19.4 5.9September I 75.8 60.6 15.2 67.2 54.6 12.6 21.7 12.8 8.9II 82.7 68.4 14.3 72.7 59.5 13.2 1'.8 14.0 4.8October I 63.5 54.7 8.8 55.7 45.5 10.2 12.4 6.9 5.5
II 84.9 60.8 24.1 64.1 49.6 14.5 11.5 8.1 3.4November I 48.4 47.1 1.3 43'9 38.3 5.6 8.0 4.3 3.7
If 72.1 50.9 12.2 55'5 33.8 4.1 6.7 3.9 2.9II 60.9 42.3 18.6 49'5 35.5 14.3 7.2 4.3 4.9Annual I 64.0 53.2 10.8 56.1 46.1 \03 14.5 8.7 5.8Mean II 80 8 15.1 32.7 63.3 49.3 14.0 13.5 9.8 3.7
It is also noticed that while the mean annual vapour pressure at Rawalpindi is 14 mbit is only 9.2 mb at Murree. This decrease in the vapour content of the air at Murree is

36 PAKISTAN GEOGRAPHICAL REVIEW
certainly due to different hygrometric table. The rate of fall of wet bulb temperature bet-ween Rawalpindi and Murree is more or less uniform throughout the year with little differe-nce between day and night except in the winter months. The rate of fall of wet bulb tem-perature with height in the region is about 2SFjl000 ft. At Rawalpindi the wet bulb tem-perature enters the range of discomfort and low capacity of work in June, July and Augustwhen its value ranges from 70-7SoF. The parts of the Federal Capital Area sited at a heightof 1000 to 2000 ft. higher than Rawalpindi will remain outside the uncomfortable limits ofhumidity and wet bulb temperature practically throughout the year.
Wind direction is an element which is very sensitive to the conditions of exposureof the recording instrument. The wind frequencies for Rawalpindi given in Table III referto the wind vane which was situated at the Central Telegraph Office on the Mall, while thefrequencies of wind for Murree refer to the top of the church at nearly the highest point inthe neighbourhood of the Mall. This explains for the more regular variation of wind direc-tions in different seasons at the latter.
TABLE III
RAWALPINDI
N
PERCENTAGE No. OF DAYS OF WIND FROM
SNE E SE SW W NW Calm.
January
February
March
April
May
June
July
August
September
Octover
November
December
AnnualMean
III ..I
IIIIII ..
II ..III ..III ..I ..
II ..I ..II ..I ..II ..I ..II ..II ..II ..IIII ..II ..
6o81
1018174726o61
10252613171
588
149
12101586
12111310
910
87
653o3689
2o513o4o5192
11o916o213o1151
23213533
57
131715
421229
41123
11
135
10
21
232o3133638
65631
1o11
1o32
438
5394
337
273
231
352
202
213
282
272
314
313
29
7219
17111512178
14352313355
144
218
226
13
5 6714 156 62
11 139 49
21 107 46
28 89 52
28 144 44
12 132 412 172 555 244 59
21 256 70
18 305 75
20 254. 75
15 215 58
17 18

CLIMATOLOGY OF ISLAMABAD 37MURREE
PERCENTAGENo. OFDAYSOFWINDFROM
N NE B SB S SW W NW Clam
January I 5 3 9 31 16 2 0 1 33II 3 6 24 36 6 2 5 5 12
February I 7 2 9 32 11 1 0 2 35II 0 3 17 35 10 5 11 6 14
March I 11 4 5 28 12 1 0 5 34II 2 6 12 35 10 9 13 8 3
April I 12 3 8 21 10 1 1 4 41II 1 7 9 25 9 13 20 9 6
May I 17 3 5 13 8 2 0 6 46II 5 7 8 7 17 37 17 2
June I 7 2 5 18 9 2 1 33 5II 5 6 4 13 12 17 30 13 0
July I 8 3 13 15 8 2 1 6 55II 3 1 5 17 10 19 32 10 2
August I 10 1 2 15 5 1 1 6 59II 1 1 3 15 12 15 32 14 6
September I 15 5 3 10 3 1 1 8 54II 1 3 3 9 7 14 43 17 2
October I 22 5 3 8 6 2 1 8 46II 2 3 6 17 11 14 34 12 1
November I 15 3 4 11 7 1 1 5 54II 1 5 3 17 5 11 29 17 11
December I 9 6 5 22 9 2 1 1 45II 7 12 13 ::0 5 3 11 14 5
Annual I 11 3 5 19 9 1 1 5 46Mean II 2 5 9 21 9 11 26 12 5
At Rawalpindi the wind in the morning is calm on 58 per cent. occasions, while itis calm on hardly 18 per cent. occasions in the afternoon. When the wind is blowing in themorning, it generally veers from W to NE in the winter season and from NE to SE insummer. In the afternoon the most predominant direction throughout the year is SW,while the other prevalent directions are W to NW in winter and NE to SE in summer. Inspite of the fact that there is a complete reversal of winds from winter to summer due tothe monsoons, the South-westerly continues to be the predominant wind throughout theyear in the afternoon.
At Murree the wind in the morning is calm on 46 per cent. occasions, while it is calmonly on 5 per cent. occasions in the afternoon. In winter when the wind blows it is usuallyfrom East to South-east with a good percentage of southerly component. This is in accor-dance with the general meteorological features of the area. The western disturbances whichinfluence the weather over West Pakistan, are in fact occluded and extra-tropical in nature.They are more pronounced at higher elevations and affect the surface wind of Murree morethan the surface wind at Rawalpindi.
During summer and Monsoon period Southeasterly to Southerly winds are morepredominant in the morning. Southwest to Westerly winds prevail in the evening. On

38 PAKISTAN GEOGRAPHICAL REVIEW
the whole as we go higher up from Rawalpindi the winds will veer with elevation. Themost predominant wind in the evening will be from southwest.
Wind speed at Rawalpindi is usually low, the mean annual wind speed being 1.9 m.p.h.It is lowest in November when it is 1.3 m.p.h. and highest in April when it reaches thevalue of 2.7 m.p.h. In individual weather conditions, however, winds with much higherspeed are met with and may occasionally reach 70 to 80 m.p.h. in a squall or a thunder-storm. On the other hand at Murree the mean wind speed is 5 to 6 m.p.h. from Decem-ber to April and varies from 3.7 m.p.h. to 5.2. m.p.h. during the remaining months of theyear. The annual mean wind speed is 4.9 m.p.h. The mean wind speed thus increases overthe Potwar Plateau with higher elevation at the rate of Lm.p.h. per 2000 ft.
Cloud:
The total cloud amount at Rawalpindi varies from 3-4/10 from December to April.In May and June it is about 2/10, but increases to 4/10 in July and August. It is only 1-2/10during the period from September to November. The cloud amount at Murree follows thepattern of Rawalpindi except that it is about 5 per cent. more clouded at Murree in eachmonth.
Rainfall :The normals of monthly total rainfall at Rawalpindi and Murree are given in Table IV.
TABLE IV
MEAN MONTHLY RAINFALL AT RAWALPINDI AND MURREE (Inches)
Months Rawalpindi Murree
JanuaryFebruaryMatchAprilMayJUDeJulyA ugustSeptemberOctoberNovemberDecember
Annual Total
2.49 3.792.~8 4.312.6' 4.811.92 4.n1.25 2.622.31 3.988.07 12.409.17 !3 .813.89 5.420.60 1.560.28 0.731.24 !.80
36.37 59.36
It may be noticed that the area has two distinct rainfall seasons-the late summerseason from July to September and the winter-spring season from December to April.The bulk of the monsoon precipitation in Rawalpindi occurs in July and August withmonthly average of 8" and 9" respectively. The monsoon precipitation is associated withthe convergence of the Arabian Sea and Bay of Bengal currents in the upper air when atropical depression is situated over central parts of India or when it i actually centred inthe neighbourhood of the region itself.

CLIMATOLOGY OF ISLAMABAD 39
In Septem ber when this convergence zone shifts southwards there is a marked decreasein rainfall of the area. Rainfall decreases further after the withdrawal of the monsoon, andNovember is uually the driest month of the year. With the onset of winter in December,rainfall activity is revived and the area gets appreciable winter rainfall, which is characteristicof the Mediterranean type of climate. The months of January, February and March eachreceive on an average about 2~" of rainfall, which is generally sufficient for dry farming ifuniformaly distributed. The actual rainfall in any month, however, may very considerablyfrom the mean in different years. During winter the highest total rainfall of a month was8.4", which occurred in January 1911. During August the highest rainfall record pertainsto 1916when a total of 23.6" of rain was received in the month.
The winter rainfall is associated with the passage of western disturbances which moveeastwards from Iran and Afghanistan. An active western disturbance can induce fairlyheavy rain. In some of the heaviest falls in winter, amounts as high as 3" to 4" have beenreported in 24 hours. But the intensity of heavy rainfall is far greater in the monsoon seasonthan in winter. The heaviest fall of 9.8" in 24 hours was reported 011 28 August, 1929.The amounts of these heavy falls, though rare, are particularly important for planning of thedrainage system of the area. For this purpose it may be noted that the highest intensity inshort durations up to an hour or so may reach a value as high as 4." to 5" per hour.
The mean annual rainfall for Murree is 59" as compared to 36" of rainfall at Rawal-pindi. The mean monthly rainfall at Murree during July, August and September is 12.4",13.8" and 5.4" respectively. The winter rainfall at Murree is also considerably higher thanat Rawalpindi and is usually of the order of 4" in each month from January to April.
Though there are two well marked rainy seasons at Rawalpindi, some rainfall is re-ceived in all the months, but the number of days with rainfall of 0.1" or more varies from2 in December to 4.7 in June. In July and August the number of such rainy days is 8.8and 9.1 respectively. It falls to 4.6 in September and then 1.4 in October. November hasas an average only 1 rainy day in two years.
The number of rainy days in Murree is larger than Rawalpindi. It is about 6 to 7days in each of the months from January to April. Then the number decreases to 5 and 6in May and June. There is a sudden increase in July and August with the average of l3- J 4rainy days. In September the number of rainy days is 7 and in October 3 only. As inRawalpindi, November is the driest month with only 12 rainy days in 10 years.
Over the Capital Area the number of rainy days will vary in a similar way. Octoberand November will be the driest months. During the monsoon months from July to Septem-ber, the number of rainy days will be 10 to 12. Winter months from December to Marchwill have about 3 to 4 rainy days per month.
Thus, from the climatological point of view, the rainfall pattern at Islamabad resem-bles the middle latitudes climates during winter and the monsoon climates in summer.Thunderstorms :
Thunderstorm activity is most pronounced during July and August when 13-14thunderstorms are recorded in winter months. In March, 3 thunderstorms are reportedbut the number increase to 6 in April and to 8 in June. In September and October, 7and 3 thunderstorms are reported respectively. Hailstorms are rare in Rawalpindi area,and on an average only one hailscorm is likely to occur in March. But the chances ofhailstorms during the monsoon period are only 1 to 2 in a decade.

40 PAKISTAN GEOGRAPHtCAt REVIEW
At Murree the thunderstorm activity is most pronounced in the monsoon season andless in winter. The number of thunderstorms reported in June, July and August are 10,13 and 11respectively. During the premonsoon and the post-monsoon months, the numberof thunderstorms recorded in each month varies from 5 to 9. The highest frequency ofhailstorms is reported from February to April when 2-4 hailstorms occur in each month.During July and August the chances of a hailstorms are only once in two years.
Fog:The surface visibility in the morning is generally good in Rawalpindi throughout
the year. There are, however, about 8 days in a year when the visibility deteriorates to1100 yards and 60 days when it is between 1100 yards to 2.5 miles. During the rest of theyear it is always greater than 2.5 miles. The days of poor visibility occur mostly in wintermonths from December to March. The visibility improves considerably in the afternoon.
At Murree, 011 the other hand, the days of poor visibility in the morning and eveningare evenly distributed. The number of days in a year when visibility is less than 1100 yardsis 27 in the morning and 29 in the evening. The number of days when surface visibility isbetween 1100 yards and 2.5 miles are 16 in the moring an9---22in the evening.
At higher elevations in the Capital Area the days of poor visibility (upto 1100 yards)are expected to be between 15 to 20 and will be more evenly distributed in the morningand evening than at Rawalpindi.Conclusion :
The climate of Islamabad in Potwar Plateau is found to be quite distinct from thatof the Punjab plains and is greatly influenced by anabatic effect in dry air during day timeand by katabatic flow during nights. These effects are particularly will marked in thesummer and the winter months. The climatic conditions of the new Federal Capital general-ly follow the pattern of Rawalpindi, but the day temperatures decrease by about 3°F to 4°Ffor every 1000 ft. in height, while the fall in night tempertatures with height is much less andmay be as small as IOF/I000 ft. in winter months and 2°F to 3°F in summer.
The mean annual humidity is generally about 60 per cent. in the morning and about40 per cent. in the afternoon, with large seasonal variation. The differences in the valueof the morning and the afternoon humidity is, however, less as we go higher up. At Rawal-pindi the wet bulb temperature enters the range of discomfort and low capacity of work inJune, July and August when the values are generally above 75°F. Thus, the weather inthe 'summer months is very dry and irritating. The areas of Islamabad located 1000 ft.to 2000 ft. higher than Rawalpindi are, thus, outside the uncomfortable limits of humidityand wet bulb temperature throughout the year.
Islamabad has two distinct rainfall seasons, the summer season from July to Septemberand the winter-spring season from December to April. The bulk of the monsoonprecipitation occurs in July and August due to the convergence of the Arabian Sea andBay of Bengal currents in upper air in association with tropical depressions lying overcentral parts of India or moving towards the area itself.
The winter rainfall over the region is associated with western disturbances whichmove eastwards from Iran and Afghanistan. Thus the rainfall pattern at Islamabadreflects a combination of sub-tropical conditions with a distinct moonsoonal touch.
The variation of wind with height is found to be considerable and is greatly influe-nced by topography.

41
SUGAR FACTORY INDUSTRY OF WEST PAKISTAN
BY
KAZI S. AHMAD AND MISS M. K. Elahi
Department of Geography University of the Punjab, Lahore
Sugar, an important constituent of the daily diet is obtained from various sources.In West Pakistan 96.7 % of the total white sugar produced in 1961-62 was derived fromsugarcane. A vsxs large section of the population lives in rural areas (81.5 %1 in West and
94.9 % in East Pakistan) and the per capita annual income'' is only Rs. 261. With such ameagre income the consumption of white sugar per capita is very small, only about 7 lbs"(1961-62). Much of the sugar requirements of the rural masses are fulfilled by GUr and Desisugar or Khandsari. West Pakistan, which has a higher ratio of urban population t22:-5-%) ~and abetter standard of living than East Pakistan, has a greater consumption of white sugar;and with greater urbanization the demand should increase.
The sugar factory industry has accordingly been given great attention in all thedevelopment plans as one of the major food industries of the country.
The development of the sugar factory industry can be traced in four phases from thetime of independence to date.
The Industry at the time of Independence-------------------------At the time of independence in 1947 the Sugar industry was in a very poor condi-
tion. There were only eight sugar mills, ?f which only two were in West PakistaIL-one atRahwali (Gujranwalajestablished in 1936 the other at Takhti-Bahi near Mardan establishedin 1938-39. The reasons for this poor heritage were many. Most of the sugar mills in~artition India were located in the central part of the northern sugarcane belt in whatwas then the provinces of Bihar and U.P. India had been a very large producer of sugar-cane, most of which was converted into Gur and Desi sugar, and almost all the white sugarwas imported from the tropical countries. The first sugar mill was established in 1902in Bihar. Later on many more mills were established in the main sugarcane belt of northern
1. Census of Pakistan.
2. Statistical Bulletin No. 12, December 1963, Vol. 11 p. 225.
3. This as compared to the white sugar consumption in other countries is very low. It is 1/20thof U.S.A. and 1/4th to that in Turkey, but in West Pakistan Gur and Desi sugar is also consumed in substantialquantities specially in the rural areas. Therefore the consumption of all types of sugar per capita turns outto be about 38 lbs. including the imported sugar.

42 PAKISTAN GEOGRAPHICAL REVIEW
India, but the overall progress of the industry was slow and the imports of refined sugaroperated to the detriment of the industry within the country. The Indian sub-continent couldnot compete with the tropical countries becasue of inferior varieties of low yielding sugar-cane. The discovery that sugarcane can produce viable seeds in certain parts of southernIndia and the Indian Sugarcane Act of 19201 gave some impetus to the industry. 'The SugarIndustry Projection Act' of 1932 and the development at Coimbatore of new sugarcanevarieties suitable for the climate of northern India were two other landmarks in the develop-ment of this industry in the sub-continent.
By 1946-47, there were 135 sugar factories operating in the country mostly located inBihar and U. P. provinces. The two wings of Pakistan, placed at the two extremities of theSugarcane belt of Northern India, inherited only 8 of these mills, two in West Pakistanand six in East Pakistan. This was mainly due to limited cultivation of the cane anddifficulties of transport for this bulky commodity but partly to the lack of initiative andcapital for industrial development in these Muslim majority areas.
West Pakistan was, therefore, badly deficit in the production of white sugar, only l.8lbs. per capita annually (1·1 lbs. per capita in East Pakistan and l.5 lbs per capita inWest Pakistan). The production of sugar from the two sugar mills was 793 tons only in1947-48 against an installed capacity of 11,000 tons annually.
The Industry during the post-partition period from 1947-48 to 1954-1.955During this period, the industry made some progress. The Premier ,Sugar Mills and
Distillery at M.lu.dan, which was under construction at the time of independence was com-pleted in 1950 with an installed annual capacity of 35.00tons. The existing capacity of theTa~Bahi Sugar Mills was increased by about 4,.0.0.0tons.
In 1954, the P.LD.C.' set up a Sugar Mill at Jauharabad (which was later named asKohinoor Sugar Mills Ltd) in the irrigated areas of Thal, During the same period the ThalDevelopment Authority established one sugar mill at Leiah in Muzaffargarh district. Withthese five sugar mills the total annual installed capacity increased to 70,.0.00tons distributed
\ as follows :
1. The Frontier Sugar Mills,Takhti-Bhai
Extension plant of Frontier Sugar MillsRahwali Cooperative Sugar Mills, GujranwalaThe Premier Sugar Mills, MardanKohinoor Sugar Mills Ltd., JauharabadThe Leiah Sugar Mills Ltd. Leiah.
Total:
Annualcapacity(tons)6000
.. ,;, 40005000
35.0001000010000
I. Report of the Pakistan 'Sugar Commission, 1957, 59.2. Pakistan Industrial Corporation established in January, 1952.
70000

SUGAR FACTORy INDUSTRy OF W. PAKISTAN 43
None of these mills worked to full capacity, with the result that the production during 1954-55 was only 40,211 tons, about 57% of the installed capacity. However, in spite of this theproduction of white sugar in West Pakistan had increased five fold since 1947-48(Fig. 1).
The Industry during 1955-56- 1959-60The sugar industry showed a much more rapid progress during these five years, the
period of the First Five Year Plan. This industry was given great priority in the programmeof industrial development. The plan Thovsand TC7i4L PRODUCTION OF SUGAR oo: ,
Tons
provided for the increase of sugar "production to 2,35,00 tons III
Pakistan to be undertaken byP. I. D. C. and the private sector
'00
partly by providing additionalcapacity to the existing mills andpartly by adding new mills especiallyin the central and southern regions.The special feature of the plan wasto provide large sugarcane farms ofat least 6000 acres for each of thenew mills. About Rs. 12.0 m. weresanctioned for the modernizationand Rs. 226 m. for increasing the capacity of the existing mills.
,
O~·--WEST PAKISTAN
,f-------- --- --
------
f----
ra ~ ~ ~~ ~ - ~ ~ '" ~ 0 -
'5
50
25
r 'r ~ 'f' 'f' 'ri ~ '0; ~ ; ~ ~ ~ ~ ~
The only mill that was established in this period was the Charsaddah Sugar MillsLtd. at Charsadda, in 1956with a total capacity of about 15,000tons. Another 5,000 tonscapacity beet sugar plant was added to this mill in 1958.
During this period the sugar production more than doubled (See fig. 1 and Table 1).The marked rise in sugar production during 1957-58and 1958-59was mainly due to the ex-ceptionally long crushing season of 175 days and milder winters free of heavy frost, whichdoes great damage to the sugarcane crop. The peak production of 123,697tons was record-ed in 1957-58when all the six mills produced much beyond their installed capacity. Theproduction, however, was again lowered in 1959-60due to the lesser quantities of cane crush-ed due to the damage done by frost and pests and a low recovery percentage/of 7.41
against the possible normal recovery of 9.5%.2 On the whole the progress, during this.period was satisfactory but the P.I.D.C. failed to develop the planned production capacity.
The Industry during 1960-61-1963-64 \The Second Five Year Plan laid a target of 300,000 tons of sugar to be produced in
both the wings of the country. So far West Pakistan was producting 66% of all the sugar
1. Annual Bulletin of Food Statistics 1963-Food Deptt. Pakistan Lahore.2. Report of the Indian Sugar Committee=Simla Government of India 1921, p. 251.

44 PAKISTAN GEOGRAPBICAL REVIEW
of the country to maintain the balance it was proposed that both wings should share thetotal production capacity of the country equally.
From 1960 to 1963 four more milling units were established; namely, The CrescentSugar Mills and Distillery at Lyallpur, The Fauji Sugar Mills Ltd. at Tando MohammadKhan (in Hyderabad district), K. B. Industries Ltd. Okara and Ahmer Sugar Mills at MangaMandi in Montgomery and Lahore districts respectively. Despite the installed addedcapacity, the production of white sugar in West Pakistan went so low that the total produc-tion in 1960-61 was only 59,335 tons-lowest since 1955-56 and about half of that in 1958-59.This was due to the small quantities of cane crushed in almost all the mills and a lowrecovery rate of 7.5 % on account of reasons mentioned above. In 1961-62 the productionshowed a marked recovery (see fig. 2)., Figures for 1962-63 show an increase of about85% over the previous year. This was primarily due to the increased production from thenewly established mills at Lyallpur and Tando Mohammad Khan.
Present Position of the IndustryThe overall progress of the industry since independence is evident from the fact that
the production of white sugar per capita in West Pakistan has increased from 1.8 lbs. to 5.7SUGARCANE CRUSHED AND nG , Ibs between 1947-48 and 1961-62
SUGAR PRODl/CED IN.FACTORIES
THOVi;Z: WEST PAKISTAN despite the increase in population by2,Doo r---- -- ---~ _
33.8% between 1951-1961. Adetailed analysis shows that onlp,two areas of Peshawar-D. I. Khan>divisions and Lahore+Rawalpindidivisions produce more than 5' lbs.of sugar per capita per annum,
b. Khairpur, Hyderabad divisions pro-~ SClGtl~ PROO£K£O
'7 ~ ~ ~ ~ ~ ~ duce very small quantities. This~ ~ ~ Iii ~ ~ level of production is far from
satisfactory. The estimated requirements of white sugar at the existing rationed rates 1
were about 3,50,000 tons for. the population in 1961 which has now increased, and theprojected demand is estimated to be 5,00,000 tons of white sugar by 1965. The past trendsof progress show that self- sufficiency in this respect is as yet far off. Due to the largescale production of Gur and Desi Sugars amounting 36.5 lbs. per capita, the shortage ofSugar has become less acute. (Table 2). Given 10% for other sugar consuming industriesabout 36 lbs. of all sugars and gur are available from local sources (excluding importedsugar). This, according to Dr. Kykroyd's? estimates of a minimum of 2.3 ounces of sugarper capita per day or 521bs. per capita annually, is deficit by about 16 lbs. This condition
1. 241bs. per capita per annum for the urban and 6 lbs. per capita per annum for the rural popula-tion.
2. Pakistan Sugar Commission, pp. 4
1,500 ._-------
1,000 __ r- I-- I-- -

SUGAR FACTORY INOUSTRy OF W. PAKISTAN 45
necessitates imports of white sugar. The share of imported sugar in the .consumption ofwhite sugar is much higher in Karachi, Hyderabad and Quetta regions, which produce verylittle sugar of their own (Fig. 3).
Raw materials of the Industry
Sugarcane is the basic raw material covering about 62 % of the cost of sugar produc-tion. In West Pakistan, 96.3 % of the sugar is produced from sugarcane. Like the sugarindustry in other parts of the world, the industry in this country is oriented to this basic rawmaterial. In West Pakistan, about 11,00,000 acres are under sugarcane which covers 4.7 %
WEST PAKISTAN ''' .. _.... . ..•.. -._ ...._ .•.•••••••••• 'C' •••
"<;- •••••• #
;
Per capita productionr1 factoru sugar and des) sugar -gur
Mdes
" - ,"
",
<D peSHAWAR - 0 I K#AN D'''''6
® NAWAI.PINOI - L AHOIU _
@ MULTAN. SA;MWALPUIl
/ WlST PAKIS"A/r
\ ..y \~# ••••
i
Fig. 3
of the total sown area. Fig. 4 reveals that the area under sugarcane has increased morethan 100% since 1947-48. This is due to the growing demand for Gur and Desi sugars atattractive prices and the extension of irrigation by the newly constructed canals 'in the LowerIndus Basin. In spite of this large scale production of sugarcane only about lOA % of thetotal produced is consumedin the manufacture of white sugar .
.-- ""Climatically speaking West Pakistan is not ideally suited for the cultivation of sugar-
cane. Being a tropical crop it grows best in areas with equable high temperature, free offrost, plenty of sunshine, well distributed rainfal between 50"-100", high humidity and adry season at the ripening stage. In West Pakistan, the great seasonal range oftem.,peratureand the occurence of severe winter frost in the northern regions are detrimental to higlt~yields.

46 PAKIstAN GEOGRAPHICAL REVIEW
Moreover, the rainfall is too meagre for the crop to grow without irrigation. This defi-ciency of water is, however, made up by canal irrigation. All the sugarcane grown in WestPakistan is irrigated. The southern regions, which are free from winter frost, are relativelybetter suited to this crop. This is reflected in higher yields, in Hyderabad region as com-pared to the Peshawar regio n.!
Fig. 5 shows the relative impor-"tance of sugarcane in various districts
r ~f West Pakistan. The frontier~.,50' t---j---t------ii---+------t-----t--t----t,'oo districts of Peshawar and Mardan
____.,~~~,V form the main trans-Indus sugarcane-~ooo -f--+----f---i---+--,""/""'"l-----=±-c../--+ 1,000
/~)~~~c:-"""' belt in the north where 24.2. and
~/ dsoot---:::::=I--=:f=y;r:--'-t--+---t----j--+---fs.oo 9.3 %2 of the total sown area is un ersugajcane respectively in spite -,ofheavy-winter frost. It is associatedwith the extension of canal irrigation
l
THOUSAND WEST PAKISTAN ,"O"<ANOTO!fS ACR€S
2,000 ,------'-'r---,,-----,,---,-----,------,---,----,2pOO
Ac.R£4GE AND PRODUCTION OF SVGARCAN£'N
~/G. 4
~ •••• ~ ;:0 ~
'" ~ ~ ~ 10
~ :;: ~ :::: ~ ~~~~~~~
in this area and the influence of the factories.The second sugarcance belt stretches from Sialkot district in the northeast to Rahim-
yar Khan district in the southwest. The greatest concentration is in LyaUpur districtF16. 5
'~.-".
.."
WEST PAKISTANAcreage under sugarcaneas percentage of the total sown
/!>56/57 -60/61MILlS
50 100 200

SUGAR FACTORY INDUSTRy OF W. PAKISTAN 47
where 11.5% of the sown area is under this crop. The third sugarcane belt is in Khairpurdivision, centered round Khairpur and Nawabshah districts . .",r ~.
Sugarcane is a bulky product and its long distance transport proves costly. Thesugar factories, therefore, have to be located in the midst of sugarcane growing areas. Therea sure supply of sugarcane is possible during the crushing season from within a distance of10-15 miles of the factory.
Experiments at Rahwali Sugar Mills have shown that the sugar content in the sugar-cane is adversely affected by the time lag between harvesting and crushing and is inverselyproportionate. Fig. 6 shows the association between these. If the harvested cane is crush-ed within 24 hours the recovery percentage is as high as 10.6 %. It drops to 10.2 % with atime lag of 48 hours and to 9.7 % with a time lag of FIG. ~
RELATIONSHIP 8£TWfEN TIME LAG72 hours. The recovery percentage and consequently AND RECOVERY P£RCETAGE
the sugar production is inversely proportionate to thetime lag between harvesting and crushing. 15r-----------------~.6Z
RECOVERY PERCENTAGC
To overcome the difficulty of regular supply of24
sugarcane within the shortest time, a zoning system was 48
d na opted in 1950 in the Frontier Regions when the Premier TlMC LAG IN HOURS
Sugar Mills went into production. It was later on modified and applied to other millsin the region. According to this system, four zones were demarcated and the percentageof cane to be lifted from each zone was fixed. The Premier Sugar Mills was to lift 75 % of /'the sugarcane crop from within a radius of 1-7 miles, marked as zone A, 50% of the crop ,/from zone B within a radius of 7-10 miles, 40 % of the crop from zone C within a radius of10-15 miles, 30 % from zone, D, beyond a radius of 15 miles. The Frontier Sugar Millsbeing smaller could lift 75 % of the crop from zone A, within a radius of 1-3 miles, 30 %from within zone B within a radius of 3-5 miles, 40 % from zone C within a radius of§-7t miles.
This system created some difficulties and had to be modified. After the impositionof Martial Law, the entire sugarcane area was declared as Assigned Area for various mills.Two zones were demarcated A and B. The mill was to lift 65 % of the cane cropped fromzone A and 36 % from zone B. In the former Panjab area, no zoning was introduced. Thefollowing table shows the actual position regarding sugarcane supply to the various mills in1958-591•
1. Report of Pakistan Sugar Commission, Appendix No. 10.

48 PAKISTANGEOGRAPHICALREVIEW
PROCUREMENTOFSUGARCANE
Within 5-10 10-25 Beyond5 miles miles miles milesradius radius radius radius
Premier Sugar Mills 19% 40% 23% 17
Charsadda Sugar Mills 36 25 39
Fauji Sugar Mills 37 43 20
Rahwali Sugar Mills 49 25 26
Kohi Noor Sugar Mills 17 8 18 57
Lieah Sugar Mills 18 9 30 43
These figures clearly show the more favourable location of certain mills as regardsthe supply of sugarcane. Premier Sugar Mills and Charsadda Sugar Mills draw 60-65 %of the total cane crushed from within short distances. Frontier Sugar Mills and RahwaliSugar Mills draw 70-80 % of the total cane crushed from within 10miles radius. KohinoorSugar Mills at Jauharabad and Leiah Sugar Mills are not so favourably located in this respect.Both these mills draw about half the required sugar cane from a distance beyond 25 miles.Kohinoor Sugar Mills has been drawing sugar cane from Sargodha district from a distancebetween 40-90 miles. Quite often the mill has been using GUY as an alternate raw materialon account of a shortage of sugarcane supply. Recently a farm of 6260 acres has been attach-ed to the mill to ease out the situation. The worst affected in this respect is Leiah Sugar Millswhich had been drawing cane from as far as Mardan (275 miles). It has been reported thatthis shortage of sugarcane supply has not been due to lack of sugarcane round the mill.The mill's own farm was auctioned on account of bad management, and the private growersuse sugar cane more profitably for making Gur and Desi Sugar. Crescent Sugar Millsat Lyallpur has no dearth of sugarcane supply and the Fauji Sugar Mills at. TandoMohammad Khan has a large farm attached to it which had made it almost selfsufficient in sugarcane requirements.
In 1962-63, the Government in its sugar policy considered the zoning system necessaryfor all those mills which did not have their own farms on the pattern discussed earlier. Thezoning system in particular and the establishment of sugar mills in general, has changed thepattern of land use in areas round the mills. In Peshawar regions in the vicnity of Premierand Frontier Sugar Mills the concentration of sugarcane is reflected in the high ratio I ofsown area under this crop.
13. 40% in some villages round the mill. Cans us of Agriculture, 1961.
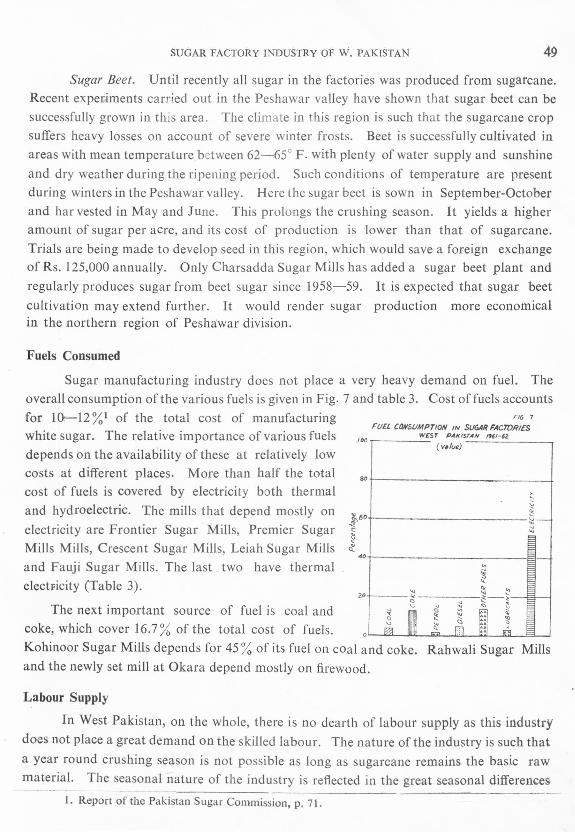
SUGAR FACTORy INDUSTRy OF W. PAKISTAN 49
Sugar Beet. Until recently all sugar in the factories was produced from sugarcane.Recent experiments carried out in the Peshawar valley have shown that sugar beet can besuccessfully grown in this area. The climate in this region is such that the sugarcane cropsuffers heavy losses on account of severe winter frosts. Beet is successfully cultivated inareas with mean temperature between 62-65° F. with plenty of water supply and sunshineand dry weather during the ripening period. Such conditions of temperature are presentduring winters in the Peshawar valley. Here the sugar beet is sown in September-Octoberand har vested in May and June. This prolongs the crushing season. It yields a higheramount of sugar per acre, and its cost of production is lower than that of sugarcane.Trials are being made to develop seed in this region, which would save a foreign exchangeof Rs. 125,000annually. Only Charsadda Sugar Mills has added a sugar beet plant andregularly produces sugar from beet sugar since 1958-59. It is expected that sugar beetcultivation may extend further. It would render sugar production more economicalin the northern region of Peshawar division.
Fuels Consumed
Sugar manufacturing industry does not place a very heavy demand on fuel. Theoverall consumption of the various fuels is given in Fig. 7 and table 3. Cost of fuels accountsfor 1Or-12%1 of the total cost of manufacturing riG 7
FUEL CONSUMPTION IN SUGAR FACTORIESwhite sugar. The relative importance of various fuels /00 WEST PAKIS_T"_H_"..:..:6_'-.:..:6Z __ ---,
(v4Iue)depends on the availability of these at relatively lowcosts at different places. More than half the totalcost of fuels is covered by electricity both thermal t
and hydroelectric. The mills that depend mostly on ~60+- ~~ :::-
electricity are Frontier Sugar Mills, Premier Sugar " ;;:t
Mills Mills, Crescent Sugar Mills, Leiah Sugar Mills <t40t--------- __ ~--4
and Fauji Sugar Mills. The last two have thermalelectricity (Table 3).
'";:i;'
20+-- __ ';:----~-~-S---1The next important source of fuel is coal and ~~. g ~ ~ i
coke, which cover 16.7% of the total cost of fuels. '---"~""___-JllIIII.IIIII~--'.-".U1~_n"".'·L-.JO.IH::"___I_" -"''''--....3---''':Kohinoor Sugar Mills depends for 45 % of its fuel on coal and coke.and the newly set mill at Okara depend mostly on firewood.
Mt------------ ~
Rahwali Sugar Mills
Labour Supply
In West Pakistan, on the whole, there is no dearth of labour supply as this industrydoes not place a great demand on the skilled labour. The nature of the industry is such thata year round crushing season is not possible as long as sugarcane remains the basic rawmaterial. The seasonal nature of the industry is reflected in the great seasonal differences
1. Report of the Pakistan Sugar Commission, p. 71.

50 PAKISTAN GEOGRAPHICAL REVIEW
in the production of labour force (Fig. 8). In September, 1962, the total number of pro-duction workers was only 2103 , but from December to March the number increased to about7000. By June, 1963, when the crushing season was over the number dropped to about6000. The average crushing season is normally calculated to be of] 50 days in West Pak-istan. The commencement and the end of the crushing season varies from factory to factoryand year to year depending on the temperature conditions that affect the crop in general andthe sucrose content of sugarcane in particular. The crushing season begins earlier in thesouthern regions and also finishes earlier on account of early ripening of cane. A compari-son between the sugar seasons at Fauji Sugar Mills, and Frontier Sugar Mills clearly re-veals this fact. At the Fauji Sugar Mills at Tando Mohammad Khan in the southern region,
WEST PAKISTANSeasonal f1uctuationsin 'production workers'
in sugar factories1962-63
ii
--;;ii .•..,
.,'
,~.i';!.ft-r.----.f ~."-,~~--(
~
"WAI •• ::-) ,'\'-'-;
'.'.TAN. MONAMMAO KHAN ', ..
;i..... -.- _ .•.. WEST PAKIST"tN
the mean maximum temperature in October and November is higher than in the north atTakhti- Bhai by about 9° and J 5° F respectively; therefore, the cane ripens earlier and thecrushing season commences by the last week of October and ends by mid April. In theTakhti Bhai Sugar Mills in the north, the crushing season begins by the end of Novemberand lasts till middle of May. The rise of temperature in April and May is more marked inthe south, which reduces the sucrose content of the sugarcane and, therefore, leads to earlyending of the crushing season. Both these trends are shown in Fig. IX. The sugar millsat Leiah and Jauharabad do not show an early begining and ending of the crushing season.This is due to the lack of sufficient supply of sugarcane for the crushing. There has been

SUGAR FACTORy INDUSTRY OF W. PAKISTAN 51
a great competition between these mills and the growers for the consumption of sugarcane.The growers like to manufacture Gur which is more paying. This delays the functioning ofthe mill and hence quite often the crushing season is prolonged due to a late start.
SEASONAL FLUCTUATION IN PRODUCTION LABOUR
OR(lDUCTIONLABOUR
1600
FIe. 9
T£MP£RATUR£ PRODUCTION rEMP£RATUR£
160 F L~'7HF'rR-.--_~_~__ ,--- 160F
140
r--rr-v- ~
j-,t0 - ~ ..-Qo-«~
I
tax.i,' \
I.l 'AKHTB""A\~,',, l', I,II--~!;": 1\~,
'- f,..,\ ,' ••.•I
rl2
0
1400 f---- -- ---1--+-+140'
1200 20 1200T-i--t---+---+--++120'
tf)/OOO
"C)V)
<>:
~~ 800
'"'"..,~::,<: 600
400
200
o o hi JMONTHS
5s
e00 ~/OOO
<n<>:'""-~ 800
lod'
80'
60'
0' 200'+-1---+--+--\----+-+20
1. Recently one more sugar mill has been set up in Nawab Shah.
80
O~S~--DL---ML---~J----S~O
MONTHS
Important Centres of the IndustryThere are ten centres of the industry in the whole West Pakistan. These are very
unevenly placed as far as their distribution is concerned. Three centres of the industry inthe Peshawar Region are within short distances of each other, while the centres in Lahoreregion show a more even distribution. The southern areas of Multan, Bahawalpur, Khair-pur and Hyderabad divisions have only two mills.1 The importance of some of thesecentres in discussed.
Sugar Mills in the Peshawar and D. I. Khan DivisionsThis area has 13.5% of the total cane acreage and utilizes 40.5 % of the total crop
for the manufacture of white sugar. There are three centres of the industry-Takhti Bhai,

52 PAKISTAN GEOGRAPHICAL REVIEW
Mardan and Charsadda with one sugar mill each. These three mills produce 48.0 % of thetotal sugar of West Pakistan. All these sugar mills show great fluctuations in productionfrom year to year. This is mainly due to the area being frequently subject to heavy winterfrosts, which damage the sugar cane crop and reduce the recovery percentage.
The Frontier Sugar Mills Takhti BhaiThe mill was installed in 1938-39. The present capacity is 10,000tons of sugar annual-
ly. Its further extension is contemplated. The production from this mill has undergoneviolent fluctuations between 8,000 tons to 1792 tons in the past few years. The low pro-duction in 1960-61 and 1961-62 (see Map 10) was mostly due to lesser quantities of canecrushed and a low recovery percentage between 5-7%1 on account of heavy winter froststhat damaged the sugarcane crop. The Mill employs about 700 persons during the slackseason from June to September, but the number increases to about 1500 during the crushingseason. The Mil! is favourably located regarding the supply of sugarcane and can pro-cure plenty of sugarcane from within a radius of 10 miles It also has the advantage ofcheap hydroelectric power from Malakand.
WEST PAKISTANProduction of sugar
b]:l factories(1957/58 -/961/62)
-,i.
.••.....•...•.•...•.• -c,
\ •...-.-.-.~
-,.' TANOOM;AI>fMAO KuAN \
\
,) . IPremier Sugar Mills, Mardan
This is the largest sugar milI in Pakistan with a total annual production capacity of35,000 tons. It employs about 1118 persons in the slack season, but the number increases
1. Annual Bulletin of Food Statistics 62, 63, Food Department, West Pakistan, Lahore,

SUGAR FACTORy INDUSTRy OF W. PAKISTAN 53to 2200 in the crushing season. It went into production in 1950-51. During 1957-58 themill produced more 'sugar than its capacity on account of milder winters which prolonged thecrushing season. On the other hand the production in 1960-61and 1961-62shows low trendson account of winter frosts. (Fig. 11).
WEST PAKISTANProduction of
factory sugar, su.garcaneand percentage of sugarcane
consumed by fad cr'ies/96/-62
MILES<I to '"
v-;.~.•.........
\i-.-ro P£SHAWAR. • 0 I /fIlAIoI D/~'" /'\...f... •.•
<6> ItAWAUWfO! - LAHORe ,." .•••••."1<1> MvaAN - 8AHAWALPUR ~./
~ IO/AIRPVR - H'IOERA8AO ~ •.
r.,.. ..••......•....•................
..c: .\.
'.~\....•. -,
"
i..••..••.:
...•..• r .••".,'
,.-
i!"\:\
,_..... , .. , I-.'t_.... \1
.( II
?.•'
{AI FACTORY SUGAR. PNODU(rION
M(JtTAIf' V,.AWA(PVIt o.~nJ".%
I(HAIRP(JP • IirOIIl"UD D'~"",I!
The Charsadda Sugar Mills, CharsaddaThis mill was set up in 1956 by the P. I. D. C. with an annual capacity of 15,000
tons of sugar production and a provision for extension. The production, in keepingwith the general overall conditions in the region, was low during 1960-61 and 1961-62.
About 500 persons work during the slack season and 1200 during the crushing period.The mill has its Own farm of about 4500 acres rwhere higher yields of sugarcane, upto350 maunds (1~ times the average in the country), are obtained.
The mill was the first to produce sugar from sugar beet in 1958-59. A sugar beetplant has been added with a daily crushing capacity of 1000 tons. The experiments in sugarbeet cultivation, as has been referred to earlier, have been quite encouraging. The foreignexperts who visited the mill farm were surprised to see the successful crop of sugar beet.The mill produced about 4,000 tons of beet sugar in 1961-62.
"
""
\\...P£SHAl/iAlf - D lillIAN 0_.
"I
.' --i?AWA(PIN{J' - "O{(JIII (hom,.,
Sugar Mills in Lahore and Rawalpindi DivisionsThere are five centres of the industry in this area-one each at Rahwali, Lyallpur,

54 PAKISTAN GEOGRAPHICAL REVIEW
Jauharabad, Manga Mandi and Okara. In this area 5.5% of the sown acreage is undersugarcane. It produces 46 % of the sugarcane and 31~,-;;of the sugar of West Pakistan whichamounts to 5.2. lbs. of sugar per capita.
There is room for more units to be set up III this area as until now it has onlyutilized 4.6% of the total sugarcane that is produced for the production of white sugar. Withmilder winters in most parts of the region, the sugarcane crop is less subject to frostdamages and the crushing season is relatively longer.
Rahwali Co-operative Sugar Mills, Rahwali (GujranwaJa)
This is the oldest sugar mills in West Pakistan, established in 1936, with an annualcapacity of 5'000 tons of sugar. It was formerly owned and managed by non-Muslimsand was declared evacuee property after independence. The provincial government tookover its management which was not satisfactory. The mill only functioned intermittantlyduring 1945-47. The production remained much below its productive capacity on accountof bad management. On 1st July, 1962, the provincial government transferred the mill tothe West Pakistan Cooperative Development Board. Many sugarcane supply cooperativesoceities were also organized around the mill zone. This has proved very encouraging,and the production increased by 50% in 1962-63 as compared to the previous season.Due to efficient management, a high recovery percentage, a high daily crushing rate and alonger crushing season were possible in 1962-63.
Lying in the midst of the good quality sugarcane growing area, it is very favourablylocated regarding the regular supply of sugarcane during the crushing season. For the quickand regular supply of sugarcane to the mill, the mill zone has been divided into eight sub-zones and almost all the cane is drawn from the zone area in such a way that on a particularday, the supply comes from one or at the most two sub-zones shown in Fig. ]2.
Crescent Sugar Mills, Lyallpur
This mill has been recently installed and has a daily crushing capacity of 1500 tons ofsugarcane. It produced 932 and 16,826 tons of sugar in 1960-61 and 1961-62 respectively.The c, ushing season begins in the third week of November and ends by the last week of Aprilor beginning of May. The recovery percentage is supposed to improve in future with themills efficient working. It employs between 500-11 00 people during the slack andcrushing season respectively.
The mill is ideally located as regards sugar cane supply, fuel and market. Lyallpurdistrict has 1].5 per cent of its sown area under sugarcane. This is the highest ratio, afterPeshawar district, in whole of West Pakistan. Lyallpur district has been a very importantsugarcane producer even during the pre-partition time, but unfortunately no sugar mill wasestablished here. About 2/3 of the fuel cost is covered by electricity. In the near futureit shall enjoy the cheap fuel of natural gas from Sui.

SUGAR FACTORy JNDUSTRY OF W. PAKISTAN 55Kohi Noor Sugar MiUs, Jauharabad
It was set up in 1954 by the P. I. D. C. with a total production capacity of 10,000tons of sugar annually and a provision for further extension. This mill was originally desi-gned to cater for the needs of Sargodha division. The mill, however, was not favourablylocated as regards sugar cane supply. In the first instance there is no great concentrationof sugarcane in the area round the mill and secondly there has been a keen competitionbetween the white sugar and gur making. It has been discussed earlier that the mill had todraw a greater portion of the total cane crushed from beyond 15 miles, which factor alonerendered the functioning uneconomic. Plans have been made to ease out the raw materialsituation, and a farm of about 6200 acres has been attached to the mill of which about 1/3rdremains under sugar cane each year. The area is rapidly becoming waterlogged and nofurther extension of the mill is expected.
Two more mills were establishedin 1962-63 in this area, one in MangaMandi (Lahore)and the other inOkara (Montgomery), but the pro-duction from these two units is atpresent small.
The Sugar Mills in Bahawalpur,MuItan Divisions
CANE SUB ZONESRAHWALI SUGAR MILLS
To W8zirahadtt
rtc. 12
This area produces only 4.3 lbs.of sugar per capita from only onefactory at Leiah, which has anannual capacity of 15,000 tons ofsugar. The region has about 3.4 %of its sown area under sugarcaneand grows about 1/3 of the totalsugarcane of West Pakistan. Thefactory at Leiah (Muzaffargarh dis-trict) in the Trans-Indus zone wasset up by Thal DevelopmentAuthority in 1954. The mill original-ly was attached to a farm of 6000 FI'rJITI SMkhupura Fr~), Lahore
acres which was later on leased to Roil,,"y Un.~; M.lbllecl/?lJad=; Unmefallea'Road:::the growers. It shows great fluctua- (anal or Oislri6uf ••rY-::;::;:::r-. 011agsSile 0.. Pal/, - ---
Zona/ Boundary -------- ~ I~ 3 6tions in the quantity of sugar "",Ies ' •
produced on account of difficulties of sugarcane supply to the mill. The area round themill grows plenty of sugarcane which is more profitably used for making Gur and Knanddesi. The difficulty of procuring sugarcane has been so great that the mill has been usingOur for the manufuacture of sugar which had proved costlier. Due to this factor furtherextension of this mill is not advisable until the regular supply. of sugarcane may beensured from the nearby areas.

56 PAKISTAN GEOGRAPHICAL REVIEW
Sugar Mills in the Khairpur and Hyderabad divisions
There are two sugar mills in this southern region, .one at Tando Mohammad Khannear Hyderabad and the other at Nawabshah (very recently established). The Fauji SugarMills at Tando Mohd Khan was established in 1960-61 in order to supply sugar to thesouthern region, which formerly used all its sugarcane f r making Gur and Desi sugar. Thefactory is located in Hyderabad district, which at present has only 1.1% of its sawn areaunder sugarcane. In order to ensure the sugarcane supply ta the factory, the mill hasdeveloped its awn farm of about 20,000 acres. The factory has a daily crushing capacity of1500 tons. It employs about 650 people in the slack season and about 1600during the crush-ing season; all of these are ex-military men.
ProblemsThe sugar industry is a socio-economic industry. Many handicaps which at present
result in uneconomic functioning of the mills can be removed by efficient management andbetter pLanning.
Procurement of sugarcaneThe foremost problem that has been facing the mills is the regular and quick supply
of sugarcane during the crushing season. The Pakistan Sugar Commission recommendedthat all new mills established should have their own farms. This may partly solve the pro-blem of sugar cane supply and may reduce the time lag between harvesting and crushing.Case studies at Rahwali Sugar Mills have shown that in most of the cases the greatest timelag is due to time wasted when sugarcane is kept waiting at the factory gate afterarrival. (Fig. 13). This is partly due to lack of good management. Lack of efficient means
FIG. 13 of transport also contributes a great deal to this~6 TIME LAG BETWEEN HARVESTING&CRJJSHING time lag. Apart from the approach roads, most of
I"
» the roads serving the sugarcane areas around the mills'" are unmetalled and present great transport difficulties.
72+---+---t--+: -t1-:7.=:-==Iz", The greater concentration of sugarcane cultiva-60 -.--.-+--+--+-!+.~t'f' >-='-=-::=-=--" 3~ tion around factories would also help in more
'" !/1 0
: ,I economic transport by trolly lines. This is done at:/j
+---+---1~,~:/I-'"--ft------J 4'" Premier Sugar Mills from within a distance of 10miles.o 36 L )-
__:::;-',I / : In the Rahwali Sugar Mills most of the cane isl~/ .../ / ; brought to the factory gate by trucks and carts from
12 1/' •.• / ~ within short distances. In a few cases, such as Leiah; -
-J '- and Jauharabad, railways are also used as a means of~ ~ ~ ~'" ~ ! ~ :;: transport for sugarcane. The mills with their own~ ~ , ~ ~~ ." ~ ;: ~ farms can easily overcame this difficulty by mechanized
transport of their own. For other factories, cooperative transport societies can help ta salvethis problem. Another aspect of procurement of sugarcane is the competition offered by
84t---+---t---+t---4
:>48-.
X 2~

SUGAR FACTORY INDUSTRY OF W. PAKISTAN 57
growers for making Gur. Gur and Khandsari making, as has been stated, proves to be moreeconomic than selling sugarcane to the mill. In view of this difficulty, the Government hasfixed the prices of sugarcane between Rs. 1.75 to 2.25 per maund for different varietiesand has banned the manufacture of Khandsari within the mill zone.
Yields of SugarThe other problem is of low yields of sugarcane. The average yield of sugarcane
per acre in Pakistan is about 1/5 of that in Hawaii and about 1/4 of that in Java. This ispartly accounted for by the climatic factors. A short growing season and severe winterfrosts in the northern regions are partly responsible for the low yields. In the southern re-gions where winters are mild, low yilelds are more on account of general lack of Scientificapproach and insufficient use of fertilizer than due to any other factor. Many factorieslike the Premier Sugar Mills at Mardan, Frontier Sugar Mills at Takhti Bhai and the Char-sadda Sugar Mills have been suffering losses due to damages done to sugarcane by frost andpests. No suitable frost variety has been evolved as yet. As regards pests and diseases,chemical sprays have proved helpful for the farmers in keeping them under control.
However, experiments have shown that the per acre yield of sugarcane is much higher,almost one and a half times as large, on the factory farms than on private sugarcanefields. This clearly shows the importance of efficient management and the coordinationbetween the field and the factory. Due to the various problems mentioned above, the priceof sugar manufactured in Pakistan is higher than the price of imported sugar (Report of thePakistan Sugar Commission, p. 73). This can be brought down by various measuressuggested above.
Planning for the future
As shown in table 2, all West Pakistan is deficient in white sugar production, accord-ing to the existing ration rates. This deficiency is made up by imports of white sugar, theshare of imports decreases with increasing distance from Karachi. The only region thathas surplus to offer is the Peshawar and D.1. Khan divisions. This means that the centraland the southern regions should have a greater share in the future share of sugar mills.The extension of the existing mills in the Peshawar region is also contemplated on thebasis of sugar beet cultivation. As has been referred to earlier, a beet sugar plant hasalready been added to Charsadda Sugar Mills. This means an extension of the crushingperiod. It also brightens the future prospects of the industry in the region where sugarcaneis often badly hit by frost.
At present the north-western regions of Peshawar and D. I. Khan divisions utilize40.5 % of the total cane produced in the region for the manufacture of white sugr. The restof the sugarcane is utilised for making Gur and Khandsari. The Lahore- Rawa1pindi divi-sions produce 46 % of the total cane of West Pakistan but' use only 4.6 % of the total for the

58 PAKlSTAN GEOGRAPHlCAL REVlEW
manufacture of sugar, whereas Bahawalpur-Multan divisions with about 1/3 of total sugar-cane crop of West Pakistan only use 3.5% in the factories. The rest is mostly used formaking Gur and Khandsari. The condition in the southern regions formerly Was worse butwith the installation of Fauji Sugar Mills at Tando Mohammad Khan, it now utilizes 13 %of the total sugarcane of the region for milling. These figures suggest that the central andsouthern regions should have many more sugar mills as sugegested by the Pakistan SugarCommission. Each of these units should be medium sized with an annual capacity of 15,000tons of white sugar. All these should have their own farms of 20,000 acres which shouldrender the mill self-sufficient in the requirements of sugarcane. Sialkot and Sheikhupuradistricts with 6.6, and 5.5 % of the sown area under cane, are suitable areas for further installa-ation of sugar mills. Bhawalpur, Multan, Bahawalnagar and Rahim Yar Khan districts,with plenty of sugarcane production, are suitable areas for the location of sugar mills.
There will, however, be no dearth of power for these mills as the southern and centralregions will have the facilities of the cheap power supplied by Sui Gas, whereas the northernregions have plently of water power for running the factries. Moreover, there is no dearthof industrial labour in any of these regions. The case for the installation of new sugarmills is strengthend on the basis of existing small production of sugar and large quantities ofsugarcane available. Climatically also these regions are more suited to sugarcane cultiva-tion. The milder winters eliminate the danger of frost that is a great enemy of the sugar-cane crop in the northern regions. Moreover, the early ripening of cane and an early com-mencement and ending of the crushing season leaves the ratooned crop of sugarcane to sproutagain in April and Mayor leaves the field clear for the next crop to follow. The useful re-search being done at the sugar research centres at LyaJ1pur, Mardan and Murree would alsobe of great help in evolving new, better yielding varieties with greater environmental resis-tance. A comparative study of the statistics for the sugar production and sugar importsof West Pakistan shows that despite the larger production of white sugar, the imports haverisen. This is due to the population increase, greater urbanisation and better standardsof living. The future developments in the sugar industry would go a long way in saving aforeign exchange of about 30-40 million rupees for West Pakistan alone which shares about76 % of the sugar imports of the country.
BIBLIOGRAPHY
1. Report of the Pakistan Sugar Commission, 1957-59, Government of Pakistan, Ministry of Foodand Agriculture, Karachi July, 1959.
2. Indian Sugar Industry-1945-46-Annual Vol. XI.
3. Board of Economic Enquiry-Panjab Pakistan Publication No. 116.
Manufacture of Desi Sugar in the Punjab-1957.
4. Annual Bulletin of Food Statistics-1963, Food Department, West Pakitan, Lahore.
5. First Five Year Plan+-Government of Pakistan, Planning Board, Karachi -1956-60.

SUGAR FACTORy INDUSTRY OF W. PAKISTAN 59
6. Second Five Year Plan-Government of Pakistan, Planning Board, 1961-65.
7. Census of Manufacturing Industries, 1959-60 Government of Pakistan-Economic AffairsCentral Statistical Office, Karachi.
8. Sugar Policy of Government of West Pakistan for 1962-63 Department of Food, Lahore.
9. Census Report Pakistan 1951.
[0. Census Report Bulletin No.2, Ministry of Home and Kashmir Affairs, Karachi, Pakistan [961.
II. Annual Report and accounts-1962 Frontier Sugar Mills and DistilleryLtd. Takht-i-Bhai,Mardan.
12. Charsadda Sugar Mills Ltd., Report and acounts, 1961-62.
13. Premier Sugar Mills and Distillery Co. Ltd. 17th annual report-balance sheet and accounts1961-62. --..
\14. Rahwali Sugar Mills,-A review 1962-63 West Pakistan Cooperative Board.
15. Report of the Food and Agriculture Commission, Government of Pakistan, Ministry of Foodand Agriculture, 19<60.
16. Trade Year Book, F.A.O. 1962.
17. Review of the SugarIndustry ofIndia-1931-37, Government ofIndia.
19. "The India Sugar Industry" by M.P. Gandhi, M.A. Calcuttaa, 1934.
A paper contributed to the 20th International Geographical Congress, London 1964.
LIST OF FIGURES
1. Total production of Sugar in West Pakistan, 1947-48, 1961-62.
2. Sugarcane crushed, sugar produced in factories and recovery percentage-WestPakistan-I 955-56-1 961-62.
3. West Pakistan-Per capita production of Factory sugar and Desi Sugar andGur.
4. Acreage and production of sugarcane in West Pakistan-1947-48-1961-62.
5. West Pakistan-Acreage under sugarcane as percentage to total sown-1956-571960-61.
6. Relationship between time lag and recovery percentage.
7. Fuel consumption in sugar factories, West Pakistan (value) 1961-62.
8. West Pakistan-seasonal fluctuations in production workers sugar factories-1962-63.
9. Seasonal fluctuation in Production labour at Premier, Takhti Bhai and TandoMohd Khan sugar factories.

60 PAKISTAN GEOGRAPHICAL REVIEW
10. West Pakistan-Production of sugar by factories 1957-58-1961-62.
11. West Pakistan-Production of factory sugar, sugarcane and percentage of sugar-cane consumed by factories-1962-63.
12. Cane sub zones+Rahwali Sugar Mills.
13. Time lag between harvesting and crushing-Rahwali.
LIST OF TABLES
1. Production of white sugar-West Pakistan 1947-48-1961-62.
2. Division wise per capita available sugar-all types-1961-62.
3. Fuels consumed in sugar factories-(value in percentages) West Pakistan-1961-6L.
4. Statement of employment in sugar factories, West Pakistan, 1962-63.
5. Division wise production of sugarcane, use of sugarcane by mills and produc-tion of sugar in factories 1961-62.
6. Foreign trade of sugar.

61
CITIES OF T;HE UPPER INDO-GANGETIC PLAIN
BY
RASHID A. MALIK
The history of the Upper Indo-Gangetic plain has left strong impress on the patternand character of cities that lie in this region. Their morphology and structure are reminiscentof the cultures that penetrated into the sub-continent in the past. Lying in the path ofany invader through the passes on the northwestern frontier, the Upper Indo-Gangetic plainexprerienced frequent invasions. This, in fact, was the thoroughfare by means of whichseveral culture groups penetrated into the subcontinent. Each early migration has left astrong impression upon the functional, and geometric pattern of the cities. Thus, thecities of the plain are the result of a long period of evolution in which elements of manycreeds and cultures have been incorporated.
In the Upper Indo-Gangetic plain, urbanism as a mode of life has existed since earlyhistory. The excavations of cities, such as Mohenjodaro, Harappa, and Kot Diji Taxila,indicate a high degree of urbanization in the Indus Valley dating as far back as 4,500 years.Although study of these ancient cities would be of great value, the available space doesnot permit to discuss the subject at such a length. For the purposes of this paper, discus-sion has been confined to cities of relatively recent origin. The objective of this study is toanalyse the basic elements of city structure and to determine the influence of the successiveHindu, Moslem and English cultures on the growth and pattern of cities in the studyarea. It is hoped the paper will indicate historical associations that have come to establishthe existing pattern of cities in the area. To fully understand the mosaic of complex citystructure, basic elements of settlement in the city of Lahore are discussed at some length asa representative case study of the region.
The area chosen for study encloses portions of both India and Pakistan. The landstretching from the Khyber Pass down to Vanarsi (Benaras) on the Jumna River is, in thispaper, termed the Upper Indo-Gangetic plain. This area encloses the former Panjab andN. W. F. P. in Pakistan and the States of Panjab and Uttar Pardeshin India. It is a vastalluvial plain, climatically speaking semi-arid, and is watered by the Indus, Jhelum,Chenab, Ravi, Satluj, Beas, Jumna and Ganga Rivers. To the north, the Himalayan rangesand to the south, the Thar desert constitute natural frontiers. The natural and climatic uni-formity of this region have contributed to the development of a culture more comparableto near-Eastern countries than the rest ofIndia. The cultural uniformity in the area and theareal and functional likeness in the cities have been two of the reasons for selectingthis area.

62 PAI(rSTAr-l GBOGRAP.ftrCAL .REWIEW
Another reason for studying the Upper Indo-Gangetic plain is that this is the mosthighly nrbanized region in the sub-continent. The degree to which this area is urbanizedcan be judged from the fact that, according to 1961 census about 30 percent of theIndian cities of over 200,000 population are located in the Upper Ganges Plain, whichconstitutes only 13percent of the total land in India. In Pakistan, the concentration of urbancommunities in the Upper Indus Plain is of an even more striking nature. It is significantto observe that in 1961 the Upper Indus Plain, which constitutes only 27 per cent of thePakistan territory, contained over 60 per cent of the cities of over 200,000 population (Map 1).
/......... '--
INDIA PAKISTANCities over 2,00,000 population
.,, ,o
.i'''?''ii. .•·-·r-·,
Ii -.,-.•:::..-r:
/> ;"s,/,)-
! MILES 200 100 290 MILES
,!c,
i..-.',; ,
\..... j
\ •....•. _- .. ,----,:.:
• Over 10,00.000 persons
• 5,00,000 10,00,0002,00,000 5,00,000
",•• __ f
.-..••.•_ ••...•., .• t ••.• " .•-~ .••••.~-.-;"
, :: '1••..•.•.,_.••..•.~~..•~};~••.•~~:~~.'_ .••J".- .
.',
•
••
Map. 1
These percentages will increase if we only consider the inland cities, leaving out fourlarge ports in India and two in Pakistan. Primarily, therefore, the purpose of this paper is to

CITIES OF UPPER INDO-GANGETIC PLAIN 63
account for the factors, both cultural and physical, which have contributed to form andfunction of the highly urbainzed settlements in this area.
HISTORICO-GEOGRAPHIC SETTING
The reason for the high degree of urban development in the Upper Indo-Gangeticplain lies in its location and history. On the banks of the holy rivers Ganges and Jumna,various highly developed Hindu kingdoms have emerged. Buddhism flourished in Taxila(West Pakistan) and in the Ganges Valley. The Delhi-Peshawar axis, acting as a highway,brought the Upper Indo-Gangetic Valley into contact with Central Asia, China and Greece.The cultural influence of Buddhism was great, but to-day it can only be traced in ruins andtemples long abandoned. The Hindu influence, although greatly modified, can be detectedin the existing urban landscape.
'i'he strong cultural impact exerted by the Moslems in this area may also be attributedto its location, since the Delhi-Peshawar axis served as a Moslem marchland along whichwaves of invasions from the northwest came during the last 1,2CO years. Since this area waseasily accessible through the Khyber and Bolan Passes and had natural affinities with thesteppes of Central Asia, Moslem invaders were greatly attracted to it and used it as a basefor penetration into India. Even after the Moslems were established in India, this remainedthe way for armies, traders and travellers from Central and Western Asia and from Europe.In time a string of towns, greatly influenced by Islamic culture, grew up at commandingstrategic positions on river crossings or central positions on the doabs (Map 1). In the 16thcentury, Sher Shah Suri, Emperor ofIndia, developed the highway from the Khyber Pass toCalcutta. It then became a great business and commercial thoroughfare, and urbangrowth was accelerated. Admittedly, fairly large urban centres existed in the area beforethe Moslems came into power, but dominance of the Moslem culture and latter the Britishhave obscured the indigenous pattern.
The Old City complex that we find in most cities of the area show somewhat similarmorpohological features. Common historical and cultural associations, combined with thetendency to settle at water sites in this semi-arid plain, gave rise to large agglomerations hav-ing common characteristics.' These cities were the seats of Moslem power and administra-tion and thus became remarkably similar in function and form. In almost all cases, theywere fortified administrative and political centres and quite often Royal capitals.s Later,as commerce and trade developed, the cities grew and emerged as great centres of adminis-tration, culture, commerce and trade.
The British impact on the cities' growth and functions has been most striking. TheEnglish were a naval power; so they entered India during the 18th century from its seafront.
1. N. S. Ginsburing. Pattern of Asia. (Englewood Cliffs: Prentice Hall, 1958), p. 545.2. R. I. Crane, "Urbsanism in India" American Journal of Sociology, Vol. 66 (1954), pp. 469.

64 PAKISTAN GEOGRAPHICAL REVIEW
The ports of Calcutta and Bombay were two early areas of British influence. As a matterof fact, the very existence of metropolitan ports like Calcutta, Bombay, Madras and Karachimay be attributed to British planning and development. However, the British soon realizedthat effective control over India first necessitated control of the Delhi-Peshawar axis, thestronghold of the Moghul Empire. Their capital, which was first Calcutta, was changed toDelhi, the Moghal capital and the heart of the Empire. This political change reflected clearlythe great strategic significance of the Upper Indo-Gangetic plain.
BASIC ELEMENTS OF CITY COMPLEX
Having studied the function, nature and morphology of 19 cities, all over 200,000 inpopulation, of which Delhi and Lahore have over a million, is has been possible to
generalize certain elements of settlement which are largely specific to the cities under study.
The Need for Protection
As pointed out earlier, the Upper Indo-Gangetic plain has been the highway of armiesthat came to rule India. The frequent wars and invasions created a need for protection frommarauding raids. Therefore, the cities were often sited on a river bank or located on ahighway. Since water and roads were the major avenues of transportation, such a site notonly provided better defense and security, but also better opportunities for economic andcultural growth. Out of the J 9 cities of 2,00,000 population in this region, 11 are located onriver banks (Map I).
Walled City
Almost all towns indicated on the map are enclosed by a wall, once again reflectingsecurity considerations. A little distance from the wall was the moat, which in most cases isnow filled in and is occupied by gardens around the city. The wall is usually of brick and isstudded with gates, from four to 17 in number. Through these gates the roads lead to thecore of the city where in the past they met in a square often the site of a mosque or temple.On both sides of the roads are shops and stores which constitute the major bazaars orbusiness centres. The already narrow roads are made narrower by the encroachment ofopen shop fronts and booths on both sides. The bazaars are occupied by special classesof tradesmen and guilds of craftsmen.
Enclosed by the wall, the old city appears to be radio-centric in shape and to haveregularity. However, the internal pattern of the city is irregular with a maze of criscrossingstreets and alleys. Within a walled enclosure, often over-looking a river is the royal fort orpalace. The royal fort at one time included residences of the king and the high governmentofficials. Outside the fort there is generally a mosque where the king would say prayers withthe city dwellers on important occasions. At other times certain festivals were celebrated

CITIES OF UPPER INDO-GANGETIC PLAIN 65
within the palace and elaborate bazaars were held inside or just outside the palace walls.Therefore, the fort and the royal mosque, although most often on the fringes of the city,acted as a focal point.
Old buildings in the walled city are generally of red brick, wheras the newer houses areplastered with cement of pastel colors. The style and shape vary according to the traditionand culture ofthe people. Generally, houses are three to four stories high with shops alwayson the ground floor. The upper stories are often used by the house owner as his dwelling,and, if the family increases, an additional room may be added at the top. The houses aretightly joined, occasionally separated by a very narrow street measuring hardly three to fourfeet.
Lack of Functional Differentiation
Most cities in India and Pakistan, particularly those which are very old cultural centres,do not have separate residential and business centres. The walled cities are char-acterized by business cum residential structures along the streets. Well-to-do merchants andtraders still live over their shops and offices, and a large proportion of day-to-day consumerneeds are still met by artisans living or working in tiny shops at street corners or in the bazaararea.! Except for the Europeanized section in the Civil Lines, the city structures serve thepurposes of both residence and business.
Community Quarters
As against lack of functional differentation, the cities of the Upper Indo-Gangeticplain indicate a strong tendency to differentation and discrimination between differentgroups of people. Although only a modified version of the Hindu caste system, there stillremains a strong tendency for members of each religious community, caste, race or evenoccupational group to live together in one quarter. 2 Thus the city is divided into separatecommunities based on ethnic, religious occupational consideration.
ALIEN TOWN
With the coming ofthe English, the urban landscape of the whole sub"continent under-went a striking morphological change, and in the old cities, where past and present are living
.together, these changes are of great interest and complexity. Juxtaposition of the over-crowded and irregular old city of trades and handicrafts and the more spacious and oftenwell-planned European center of administration, business and industry has been a featureof the city structure for over a century but is still alien to it. In the following, some of the
1. O. H. K. Spate, India and Pakistan (London: Methuen and Co., Ltd., 1954), p. 183.
. 2.. H. F. Hirt. "Aligarh, U. P.: A Geography of Urdban Growth" (Unpublished Ph.D.dissertation submitted to the Dept. of Geography, Syracuse University, 1955), p, 80.

66 PAKISTAN GEOGRAPHICAL REVIEW
European elements are explained to show the contrast in settlement pattern between theindigenous town and the western city that surrounds it.
CantonmentsAmong other elements of English origin, cantonments early formed the most con-
spicuous element added to the Indian scene.1 In the words of Spate, the cantonments were a"monotonously planned open-developed town of European-style bungalows in large gardensalong straight, broad roads, aloof and boring in a high degree, and absolutely dead in theheat of the day."2 Besides the houses, bungalows and offices, the contonment complexincluded barracks for troops, a parade ground and a cluster of shops called the "militarybazaar." This rectangularly-designed settlement constituted an important European strong-hold when the English first arrived and was generally located well outside the limits of theold city.
Civil LinesHowever, as the contact and influence of the English improved, they started to extend
their control towards the central city. In time, a new colony emerged between the can-tonment and the old city, the civil lines. This feature, completely foreign to the indigenousculture, was originally intended to be the new seat of civil administration. Therefore, the"Mall" of the civil lines became the site of public buildings, offices, banks, business firms,European-styled shops and stores. Occasionally, there appeared a cafe or bar, frequentedby the Indian aristocracy and Europeans. Also in the civil lines, around the business center,were the official residences or kothees of the English officials and the local bureacracy andlawyers. Civil lines has broad roads lined on both sides with trees and interspersed withgardens, play-grounds and western-style bungalows adapted to the dry, hot climate of thenorthwestern sub-continent.
Railway ColoniesMost cities in the Upper Indo-Gangetic plain were connected by the railway after the
Great Mutiny of India in 1857. The network of railroads that developed had a strikinginfluence on the urban landscape of the region. Since these cities were not only cultural andadministrative but also military centers, the cantonment was directly connected with thecantonments in other strategic cities in the area." But in time, as traffic and business grew,a larger staff was employed from the cities to run the railways more effectively. Since underthe government plan the railway officials and employees were provided residence in thevicinity of the railway station, there evolved a new community,called the railway colony.Within such a colony one finds railway workshops, railway yards, and residence for railwayemployees.
1. J. E. Spencer, Asia, East by South (New York: John Wiley and Sons, Inc., 1954), p. 141.2. Spate, India and Pakistan, p. 183.3. See the article, O. H. K. Spate and Enayat Ahmad, "Five Cities of the Gangetic Plain'i, Geo-
graphical Review, Vol. XL, No.2 (1950), pp. 260-278.

CITIES OF UPPER INDO-GANGETIC PLAIN 67
THE CITY OF LAHORE AS A CASE STUDY
Lahore, the old provincial administrative capital, owes its importance to its strategicsite. Lying On the highway leading from Central Asia, it has been one of the poles of thevital Peshawar-Delhi axis. On the one hand was the Moslem northwest, with its strongclimatic and cultural ties with the Middle East; on the other, the Ganges plain with Hinduinfluence. Up until 1013 A. D. Lahore, then called Panchalnagar, was in the hands of aBrahman king of Kabul, from whom it was wrested by Mahmud of Ghazni.! Since thenLahore has been a stronghold of Moslem power and a seat of administration and culture.In 1849,Lahore passed to the English, thereby ending a thousand years of Moslem influence.
Under the English, Lahore became an important trading and commercial center.The development of transport, industry and irrigation added to its significance. Lahore'sstrategic value combined with its nodality contributed then, as always, to its economic andurban growth.
Lahore, with a population of over a million, is today the capital of West Pakistan andthe third largest inland city in the Indo-Pakistan sub-continent. Situated on the banks ofthe Ravi it is also at the junction of railway and roads from Karachi, Peshawar andCalcutta. The river flowing west once washed the walls of the city, but has now shifted itscourse and passes about one mile west of the city (Map 2). The strategic site on the riverbank indicates the early need for security against frequent invations from the northwest.
INTERNAL STRUCTURE
Looking at the map of Lahore, one can easily classify the city into two distinct cate-gories, the old city and the new city. The old city is the core area and presents indigenouselements of both Hindu and Islamic culture. The new city is the creation of English and postEnglish periods during which distinct features have been added to the city complex.Although juxtaposed together, these two sections may properly be called two cities,different in their character and functions. The old part offers the glory and culture ofMedeival India, whereas the settlement in the new section reflect the occidental type ofadministration, business and industry.
ELEMENTS OF OLD CITY COMPLEX
Although Lahore was an important administrative center under the Hindus as earlyas the first century A. D., 2 lack of historical evidence prevents a verification of urban condi-tions prevailing at that time. The fragmentary records of Lahore by Hiun Tsang, a Chinesepilgrim traveller who visited India in 646 A.D., gives some idea of the internal structure of thecity." He mentions that it was a large, Brahmanical city and that it was enclosed by a wall
1. Im 'erial Gazetteer of India. Vol. 16 (London: Clarendon Press), p. 107.2. Imperial Gazetteer, V. 16, p. 106.3. Imperial Gazetteer, V. 16, p. 106.

68 PAKISTAN GEOGRAPHICAL REVIEW
CITY OF LAHORE
FEET6,QOO
~ Old City
METALLED ROADS
_ RAILWAYS
---.-.-. CAHA L~<;O-..::.."..
T
Map. ~

ClTiES OF UPPER INDO-GANGET1C PLAIN 69with large inner gates. The streets and lanes were tortuous and winding, and the city wasdivided into quarters based on social and racial stratification in the Hindu caste system. Themenial class workers have their dwellings outside the city walls' 1
The period of Moslem rule was the golden time in the history of Lahore, and it wasduring this period that Lahore took its present shape. Under the Moghals it became a placeof royal residence and grew to be a resort for people of all nations. Akbar, Emperor ofIndia, held his court at Lahore from 1584 to 1598.2 He enlarged and repaired the old fortand surrounded the city with a wall, portions of which still enclose the old city. The corecity covers an area of about one square mile. The brick wall around it is about 30 feet highand once was strengthened by a moat and other defences. Now, however, the moat has beenfilled in and is a garden around the city. A metalled road ran around the city which hadaccess from 13 gates. The citadel or fort rose upon a slight but commanding imminenceat the northeastern angle and abutted northward on the old river bed.
Within the city are narrow and tortuous streets, some of them dead-end, lined on bothsides by four to five-story buildings. The street pattern, though completely irregular andunsystematic, has advantages of security and weather. The winding roads provide an easymeans of defense, and the narrow streets keep the hot summer sun from hitting the ground.In many interior communities a gate fixed at the exit of the dead-end road provides a citadelwithin a citadel. In the fort, the magnificent buildings of the Mughal period are in contrastto the simple dwellings in the city. The city wall has 13 gates, and a road reaches the centerof the city from each of these gates, ending in a fairly open square where the biggest reservoir(talab) in the walled city is located. In the past the reservoir stored water for emergencies.The thirteen streets constitute the business arteries of the old city and are called bazaars.Other feeding lanes, from four to eight feet wide, join them from various directions, depend-ing upon the consideration of distance rather than plan.
The royal mosque outside the fort brings most of the Moslem community togetheron religious festivals, when huge congregations form. The mosques in the walled city oftenconstitute a focal point of a ward or a community. There are also innumerable temples andgurdwaras, which before Partition provided religious services for the Hindu and Sikh com-munities. The mosque or temple is usually located in a central position often at the crossingsof streets. Every quarter or community has its own coffee house, hamam (public bath), sweetshops, religious school and other sources of everyday needs. Thus, within the walled citywe have various religious, racial, and occupational groups, living together but still confinedfor the most part to their own group or clan. There are two markets in the old city, one forvegetables and the other for meat, which meet the local needs and are an avenue of socialintercourse between various groups.
1. Rift, Aligarh, p, 80.2. Handbook for Travellers in India, Pakistan, Burma, and Ceylon (London: John Murray, Publis-
sher, 1953), p. 340.

70 PAKISTAN GEOGRAPHICAL REVIEW
NEW CITY ELEMENTSLooking at the map of Lahore, one finds that areal spread of the city took place pri-
marily during the British rule. The walled city, with its indigenous characteristics, was notsuitable for the English requirements. The cultural differences and industrial technologythat the English had set them apart from the indigenous culture. Thus, their earlier build-ings were raised outside the old city for the purpose of isolation and security from the localpopulation. Later on, as security increased and the city grew, the old and new sectionsmerged to form one compact settlement of both indigenous and foreign elements.Cantonment
The cantonment was the first English element. It was built around the beginning ofthe 19th century and lies five miles to the southeast of the city.! The original purpose of thesettlement was military in nature and thus it mainly included barracks for the troops. Nowit has become a high income residential area for both Pakistanis and the English. However,the bungalows and barracks are still occupied by army officers and military troops.
The cantonment is separated from the civil lines by a railway, obviously for purposesof security and transport. The roads are perfectly rectangular and are quite distinct fromthe irregular and unsystematic pattern in the old city. There is a polo ground and a paradestadium, where important military sports are held. A shopping center, the Military Bazaar,serves the needs of the officers and troops residing in the cantonment area.
Civil LinesUnder the English, Civil Lines served as the seat of district administration. In the
middle of the Civil lines runs the Mall, on both sides of which are the western-style businessdistrict. The road pattern in the civil lines, though systematic, does not follow the gridsystem employed in other Europeanized sections, but the roads are open and lined with trees.The gable-roofed dwellings (kothees) of the cantonment are replaced by houses and buildingsof indigenous styles. In the case of important public buildings such as the High CourtHouse, the Lower Court, Government House, Gymkhana Club, Assembly Hall and theGeneral Post Office, the architecture is a good blend of the Islamic, Hindu and Europeancultures. Despite all this blending, the cafes, banks, European firms, cinemas, race courseand large open gardens still give it a foreign air, if not quite British. The shops on bothsides of the Mall deal in business of various sorts, ranging from cars to needles. The build-ings are generally of brick and are not generally more than three stories high. The upperstories are used as office space or as apartments for middle and upper-class people. Thegeneral skyline of "downtown" is fiat, occasionally broken by a tall public building ora church spire. Schools are generally conducted by missionaries, but local childrenconstitute most of the student body. Away from the Mall, one gets into the upper-classresidential area with the bungalows occupied by foreigners, Pakistani Officers, landlords,and other richmen.
The civil line has been extended in all directions, thereby merging with the walled city,on one side, and the cantonment on the other. Between the Mall and the Circular Road that
1. Handbook for Travellers , p. 358.

CITIES OF UPPER INDO-GANGETIC PLAIN 71
runs around the walled city is the transition between the old and the new. The shops andresidences are of a lower order and prestige than those on the Mall, but certainly higher thanin the walled city. Between civil lines and the cantonment the land is mostly occupied byupper-class residential bungalows. The land along the canal between the cantonment andGulberg is one of the choicest residental areas today.Railway Colony
The coming of the railway to Lahore had great influence on its settlements. SinceLahore was strategically located and acted as a hub of transport between Peshawar, Karachi,Delhi, and Calcutta, it became a railway junction. The government constructed a railwayworkshop and yards to provide the necessary services for the railway department. Lahorestation is today the largest railway junction in Pakistan.
Due to its significance as a railway center, Lahore acquired another element alien toits indigenous characteristics. Along the railway line to the east, there evolved a railwaycolony, which is occupied by railway officials of every rank. Immediately next to therailway line are extended rows of one-story dwe!Iings which provide residential facili-ties to the railway employees. Mayo Gardens in the southeastern part of the city constitutesresidences for the upper-class railway employees These dwellings are laid out inrectangular pattern and are thickly interspersed with trees. The houses are one-story and quite spacious, and are surrounded by extensive lawns with trees and hedgessurrounding the garden. The place was obviously meant for English officers to save themfrom the hot summers of Lahore. The whole section of railway quarters and Mayo Gardensis only 60 years old and is reminiscent of English culture.
Industrial SectorLahore is one of the leading industrial cities of Pakistan. The textile industry goes
back to Moghal days, when Lahore as the Imperial capital had a large market dependent onthe court. The leather industry is also an old industry, which once met the local demandsof the Moghal court. Under the English these industries declined in competition with new'industrial factories in other parts of the country. However, craft production has remainedimportant as gold and silver jewellery, lace, carpets and rugs are important elements ofthe indigenous culture.
Since industrial, commercial and residential functions in Lahore have been intermingl-ed, there is no section or area which may be termed as industrial in nature. A great deal ofmerchandise is still produced by artisans in their own homes. A few modern factories thathave been built are lying on the outskirts of the city, particularly to the north of the RaviRiver, and might be classified as an industrial sector.
POST INDEPENDENCE ELEMENTSThe feature that first strikes an observer in Lahore is the planned growth of the city
since Partition. Government and civic planning has become an important feature of the newsettlements developed during the last eighteen years. The keenness and particularity with

72 PAKISTAN GEOGRAPHICAL REVIEW
which the new sectors of the city are being planned and developed has set a new trend in thegrowth of cities in Indo-Pakistan.
Walled City DevelopmentMorphological change in Lahore after Partition has taken place along two lines. One
is to rehabilitate and rebuild those parts of the walled city which were destroyed during thecommunal riots before Partition. Second is the development of new residential areas orcolonies to reduce the congestion from the already overpopulated city. Planning and re-construction some of the damaged parts of the city have thrust new settlement featuresinto the heart of the old city. Wide roads lined with trees and shops arranged in a regularorder are quite a change from the old pattern in which they now are set. Shah Alam Bazaaris a good illustration of the changing order in the old city structure of Lahore.Suhurbanization
Civic planning has been more active in extending new residential areas into the out-skirts of the city. Cultural borrowing from the west is clearly expressed in the pattern andfunctions of these residential areas. The two new residential sections are laid out along thesouthwestern and southeastern peripheries of the city. Gulberg Colony (Map 2) in thesoutheast, covers about three sqaure miles and is an upper-class residential area with bung-alows of the local elite, firm representatives and diplomatic officers from abroad. Thepattern is rectangular, and the streets are wide and lined with trees. It has schools,playgrounds, a stadium and a shopping center, indicating a marked similarity in designand nature with American suburbs. Samnabad Colony, covering abcut two square miles,is a middle-class residential area. This government project is designed to accommodatemiddle income group people moving out from the walled city.
CONCLUSIONSSummarizing the paper, it may be concluded that urban occupance in the Upper Indo-
Gangetic plain has been strongly influenced by its history. Concentration of large urbancenters in this region may be attributed to the geographic location that helped establishedancient seats of culture, administration and trade. Settlement elements that constitute thetotal city structure are the result of a long period of evolution, to which various cultures andcreeds contributed. The present pattern, size and character of the cities are the product ofthe successive Hindu, Moslem and English cultures that have penetrated into this region.
The study of 19 cities, in terms of their morphological characteristics, indicates thatthe common cultural heritage of the Upper Indo-Gangetic plain has imparted to them aremarkably similar form and function. In all cases, the city structure is made of an old cityand a new city, the former an unsystematically laid out walled city and the latter a well-plann-ed occidental community. The cultural elements, as exemplified by study of the city ofLahore, show the arrangement and setting of a typical city in the Upper Indo-Gangetic plain.The post Partition growth of Lahore indicates the increasing role of government planning inthe newly developed settlements. The rectangular street pattern, boulevards and dividedhighways that are emerging on the scene are adding new elements to the mosaic of the city ofLahore.
NEWS & NOTES
The Twentieth International Geographical Con-gress was held in London under the auspices of theRoyal Society from 20th to 28th July, 1964 at theImperial College of Science. Professor Carl Trollof the University of Bonn Federal Republic ofGermany was the President. It was inaugurated byHer Majesty the Queen. About 1500 delegatesfrom different parts of the world attended the Con-gress. Dr.KaziS. Ahmad, Professorof Geography,University of the Punjab, Lahore, Dr. Nafis Ahmad,Professor of Geography, University of Dacca andDr. Mushtaqur Rahman of the University ofKarachi, Karachi represented Pakistan.
The Congress was divided into nine sectionsand seventeen Commissions to which more than3000 papers were contributed. Dr. Kazi S. Ahmadcontributed a paper on "Some Geographical As-pects of the Indus Waters Treaty and developmentof irrigation in West Pakistan". and Dr. Mushtaq-ur-Rahrnan on "Rural Settlements in Sind".
Local excursions in and around London werearranged. A number of exhibitions of maps includ-ing that of National Atlases were held.
British National Committee for Geographyunder the Chairman-ship of Prof. L. Dudley Stamp,C. B. E made excellent arrangments for the stayof the delegates and every effort was made to makethem comfortable. Delegates were entertained ata number of receptions practically every day.
On the occasion of XXth Geographical Con-gress in recognition "of their distinguished servicesto the International Advancement of Geography theCouncil of the Royal Geographical Society electedthe following persons into Honorary Correspond-ing Membership, which also carries with it theprivileges of Fellowship:
1. Professor Carl Troll, University of Bonn,German Federal Republic, President, In-ternational Geographical Union, 1960-64.
2. Academician I. P. Gerasimov, Academy ofSciences, USSR Moscow, President elect1964-; Vice President, I. G. U. 1960-64.
73
3. Professor Chauncy D. Harris, Universityof Chicago, U.S.A. Vice-President T.G.U.1956-60; 1960-64.
4. Professor Hans H. Boesch, University ofZurich, Switzerland, Vice-President, J.G.U.1956-60; Secretary-Treasurer 19£C- (4
1964-.
5. Professor Hassan Awad, University ofRabat, Morocco (formerly University ofCairo) Vice-President T. G. U. 1956-60;1960-64.
6. Professor George Kuriyan, formerly Uni-versity of Madras, India, Vice-President1. G. U. 1952-56; 1956-60.
7. Professor Kazi S. Ahmad, University ofLahore (Pakistan).
8. Professor Funio Tada, University ofTokyo (Japan), Vice-Presidnt J. G. U.1956-60; 1960-64; Chairman JapanRegional Congress 1. G. U. 1957.
9. Professor H ilgard 0' Reilly SternbergUniversity of California (U. S. A.) Vice-President I. G. U. 1952-56; 1956--60;
Organizing Secretary Rio Congress 1956.
10. Professor Georges Chabot, Director of theInstitute of Geography, Paris.
11. Professor Kenneth B. Cumberland, Uni-versity of Auckland, New Zealand. Vice-President, I. G. U. 1960-64.
The Diplomas of the Membership were awardedby Royal Highness Princess Merina, the Duchessof Kent at an exclusive ceremony during the recep-tion of the Royal Geographical Society to the dele-gates on the 23rdJuly, 1964.
The Congress was preceded and followed bySymposia on various aspects of Geography andfield studies in different parts of the United Kin-gdom. Dr. Kazi S. Ahmad was invited to presideover one of the a sessions of the Symposium on"Urban Geography" held at Edinburgh from 30July to 6th August. He also contributed to it a paper

74 PAKISTAN GEOGRAPHICAL REVIEW
on Urbanization Trends in West Pakistan".Meetings of the International Cartographic Associa-tion which is affiliated to the International Geograp-phical Congress were also held at Edinburghalong with the Symposium.
The Royal Scottish Geographical Society Edin-burgh at a reception held on J st August 1964 con-ferred Medals and Honorary Fellowships on thefollowing persons for their contribution to theknowledge of Geography and work respectivefields:
(A) Medals:
(I) The Scottish Geographical Medal (GoldMedal) to Professor L. Dudley Stamp,London, President of the Royal Geographi-cal Society, and Chairman of the XXth1. G. Congress, London.
(2) The Livingstone Medal (Gold Medal-toProfessor Eduard Imhof, Zuirch, firstPresident of the International Cartogra-phic Association.
(3) The Research Medal to Professor ArthurE. Smailes, Queen Marry College, London,for original work on Urban Geography.
(D) Fellowship:
(I) Professor Kazi S. Ahmad, University of thePunjab, Lahore, Pakistan.
(2) ProfessorA.N. Baranov, Chiefofthe Direc-torate of Geodesy and Cartography of theU. S. S. R.
(3) Professor Hans H. Boesch, University ofZurich, Switzerland.
(4) David P. Bickmore, Oxford, Editor of the"Atlas of Britain and Northern Ireland".
(5) Stephane De Brommer, Institut Geograp-phique National, Paris, France.
(6) Professor Henri Gaussen, Paris, DirectorVegetation Survey of France.
(7) Professor1.P.Gerasimov, USSR Chairman,National Committee of Soviet Geogra-phers.
(8) Professor Erwin Gigas, Institute fuer An-gewandte Geodaesie, Frankfurt am Main.
(9) Charles B. Hitchcock, Director, AmericanGeographical Society.
(10) Professor S. Kiuchi, University of Tokyo.
(11) Professor Aymond E. Murphy, Universityof Hawaii, Honolulu.
(12) Professor Konstantin A. Salischev (Carto-graphy) Moscow.
(13) Professor Carl Troll, University, Bonn,President of the 1. G. U. 1960-64.
The Diplomas were awarded by Lord Cameron,the President of the Society.
At the last meeting of the General Assemblyelections were held to various commissions. Dr.Nafis Ahmad was elected to the Commission onthe Teaching of Geography. It was decided tohold XXI Geographical Congress in December,1968 in India and Dr. S.P. Chatterji of the Univer-sity of Calcutta was elected as the President.

BOOK REVIEWS 75
THE BRITISH ISLES: A SYSTEMATIC GEOGRAPHY: By J. Wreford Waston andJ. B. Sissons- editors, 452 pp. Nelson (London) 1964 45 shillings.
Twenty three British Geographers have contributed to "The Britsih Isles: A Syste-matic Geography" which is an official publication of The International Geographical Union,to mark the 20th Congress, which was held in London in July 1964.
Though the publication of this book has rapidly followed the publication in 1962of "Great Britain: Geographical Essays" - edited by Jean Mitchell, it by no means dupli-cates it. The books need to be used in conjunction with each other if a full picture ofthe geography of Great Britain is to be obtained.
The first chapter deals with "The Individuality of Britain and The British Isles",and though each succeeding chapter is written by a difierent geographer itis this aspect ofBritain which is often ernphasised, giving the book a unity which is often absent from collec-tions of essays.
The physical basis of British geography receives very adequate attention and sets thestage for the development of the economy under the hand of Man. Separate chapters aredevoted to Prehistoric Geography; Historical Geography, (from the coming of the AngloSaxons to the Industrial Revolution); and The Industrial Revolution. Students of theGeography of the British Isles will realise that this is essential if the present day economyis to be understood.
The last ten chapters are chiefly devoted to the economy of the British Isles a-id recenttrends and changes in the patterns of agriculture, industry, transportation and population areemphasised. The final chanter by Prof. W. G. East on "The British Isles in Their WorldContext" is a fitting end to this scholarly though very readable book, as it traces the roleof Britain thrcugh the centuries from the Megalithic Period to the recent negotiations to jointhe European Common Market.
This book is tc be highly recommended to the thcughtful georgapher, since it is notjust concerued with the presentation of facts, but r,veaIs the many pre blems which face theBritish people, to which the geographer together with other specialists is attempting to findthe answers.
MARY P. COOPER.

76 PAKISTAN GEOGRAPHICAL REVIEW
BOOK REVIEWS
A SHORT HISTORY OF GEOGRAPHICAL DISCOVERY. By A. Torayah ShararXV and 417 pp.; Bibliogr., Indexes. M. Zaki el Mahdy, Alexandria. 1963.71- X 51- Inches.
History of exploration and discovery is a subject of great importance to geographersin that it familiarizes them with the development of geographic thoight. 'Although there isevident need for more and more interest in this important field of geography, it is surprisingthat the existing notable works are not only too few but are also fairly out of date. This bookby Sharaf is a step forward in the direction of partially fulfilling these gaps. In general, thebook is organized with an objective to familiarize the reader with the development of geo-graphical discovery both in practice and theory, from the earliest recorded times to the con-temporary period.
Judging in terms of its contents, the book may not seem to present anything new fromwhat has already been discussed in the existing Iiterature on the subject. However, OL closerexamination of the subject matter discussed in this volume it will become evident that it isunique in at least two respects. Firstly, this book is significant in that it lays more emphasison Muslim period with a view to pointing out the advancement made by the Muslims inexploration and geographic thought. Chapters V and VI, which deal in Muslim geography,are a valuable contribution to the field in that the English or other European literature haswoefully inadequate information on the subject.
Secondly, the exploration of Africa discussed in Chapter XVI is another feature ofdistinction in the book. The author in this chapter attempts to point out that the Africancontinent, termed as the dark continent by the Europeans, is now emerging as a focus ofgreat nations. Since Africa is becoming a center of attraction to outside observors, parti-cularly Asians, the emphasis laid on the continent's ancient civilization and its bearing onthe geographic exploration and thought will give a clearer understanding to non-Africanreaders. Considered from these two aspects it may be suggested that the book makes a vau-able and up to date addition to the existing literature on the history of exploration and geo-graphic thought.
R. A. MALIK

PAKISTAN GEOGRAPHICAL REVIEW was instituted in 1949 replacingPunjab Geographical Review which was started in 1942. The object of this publicationis to further dissemination and exchange of scholarly knowlege. Its volumes containresearch articles on various topical and regional themes of Geography with particularreference to Pakistan. The Review is published half-yearly in January and July.
Submit all manuscripts and publications for review to the Editor, Pakistan Geo-graphical Review, Department of Geography University of the Panjab, Lahore.
Address all communications reg-rding subscriptions, purchase of back numbersetc. to the Manager, Pakistan Geographical Review, Department of Geography, Univer-sity of the Panjab, Lahore.
SUBSCRIPTION
" "
$ 2·00 or 15s.$ 1·00 or 8s.
Annual,Single Copy,
Inland: Rs. 8·00Rs.4·00
Foreign:
Published by Kazi S. Ahmad, Editor, Pakistan Geographical Review,Printed at the Panjab University Press, Lahore.