Geographical Reports 5 - DiVA
230
Geographical Reports 5 Published by The Department of Geography, University of Umeå GÖSTA WEISSGLAS Studies on Service Problems in the Sparsely Populated Areas in Northern Sweden UMEÄ 1975
-
Upload
khangminh22 -
Category
Documents
-
view
2 -
download
0
Transcript of Geographical Reports 5 - DiVA

Geographical Reports 5
Published by The Department of Geography, University of Umeå
GÖSTA WEISSGLAS
Studies on Service Problems in the Sparsely Populated Areas
in Northern Sweden
UMEÄ 1975

"en plcuU, òom knappaòt kan l oxd fåJutäljaA, däx vaxgen ylade ock ulven finöA ..."
UW> Haóóelòkog

Studies on Service Problems in the Sparsely Populated Areas
in Northern Sweden
AKADEMISK AVHANDLING
som med vederbörligt tillstånd av Samhällsvetenskapliga fakulteten vid Umeå universitet
för vinnande av filosofie doktorsexamen framlägges för offentlig granskning
vid Geografiska institutionen, föreläsningssal F l, Södra paviljongerna,
Umeå universitet den 29 april 1975, kl. 10.00
av
GÖSTA WEISSGLAS
fil lic
Centraltryckeriet, Umeå 1975


Preface
III
This thesis is based mainly on the research and the studies carried out
with in the framework of the project cal led Glesbygdsforskningen (Project
fo r Studies of Sparsely Populated Areas) at the Department of Geography
at the u nivers ity of Umeå, under the d irec tion of professor Er ik Bylund.
The project was in i t ia te d in 1966 in accordance with the g rea t ly in
creasing in te re s t in regional p o l i t ic a l issues and regional economic
problems, and i t has been financed p a r t ly by grants from S t i f te ls e n Riks
bankens Jubileumsfond ( th e Tri-Centennial Fund of the Bank of Sweden),
p ar t ly by money from the Home O ff ice and the M in is try fo r the Labour Mar
ket. Even from the beginning th is project had a m u l t i -d is c ip l in a ry charac
t e r , and a d irec t re s u lt of the cooperation with the Department of Socio
logy was, above a l l , a study based on a questionnaire, answered by the in
habitants in a number of sparsely populated communes. (See fu r th e r chap
t e r 2 .6 ) .
This thesis would not have been possible to accomplish without the a id ,
the knowledge and the enthusiasm of a great many people. I should l i k e to
express my gratitude to my t u to r , professor Erik Bylund, and also to la te
Mrs Ingrid B urva ll , to Kathrin Haraldsson, Margit Söderberg and S ig fr id
F jä l l ström. I am also grateful to Olof Erson, U l f Wiberg and Berndt öqvist.
I t has been very stimulating to cooperate d i r e c t ly with them. I should a l
so l ik e to thank Einar Holm, whose knowledge of methods and techniques has
been of great help to me, and a l l my collègues at the Department of Geo
graphy who have been extremely generous by contributing t h e i r viewpoints
during the course of th is work. Thanks to many undergraduates who have
w rit ten papers in connection to th is p ro jec t , valuable data have been made
ava ilab le . I am also grateful to Anders Lundström for his e f fo r ts at t rans
la t in g my thesis from Swedish into English.
Financial support has been obtained from the Tri-Centennial Fund of the
Bank of Sweden, Expertgruppen fö r Regional Utredningsverksamhet (ERU),
from the University of Umeå and from the commune of Vilhelmina.
Umeå in January 1975.
Gösta Weissglas

Contents
IV
Preface I I I
Contents IV
L is t of Tables VI
L is t of Figures V I I
1 INTRODUCTION 1
1.1 Terminology and D e lim ita t ion of Areas 1
1.2 The Growth of the Problem of Sparsely Populated Areas 5
1.3 Aims and Arrangement of This Study 11
1.4 Studies With a General Reference to This Thesis 16
2 THE PUBLIC REPORTS 20
2.1 Introduction 20
2.2 The Period 1940-1950 21
2.3 Comments 29
2.4 The Period 1950-1965 30
2.5 Comments 41
2.6 'Glesbygdsutredningen' - The Invest igat ion of theSparsely Populated Areas. 42
3 THE BEHAVIOURAL-SCIENCE FRAME OF REFERENCE 48
4 DEFINITION AND CLASSIFICATION OF PROBLEM AREAS 63
4.1 The Basis of Reference 63
4.2 On C la s s if ic a t io n Pr inc ip les 65
4 .3 On E lectoral Wards 67
4.4 The C lass if ica t io ns 704.4 .1 General Pr inc ip les of Measurement 704 .4 .2 C la s s if ic a t io n With Regards to the Proportion of
Aged People 71

788383878989959697
102105
111
111
120
123
133
133135138140
141144
149
149154160
160
173
174178185189
193
198
210
V
Depopulation and Changes in the Age Structure C la s s if ic a t io n by C e n tra l i ty
The Measure of C e n tra l i ty The Measurement of C e n tra l i ty
C la s s if ica t io n With Regard to Combined Q ua l i t ies The Method of Measurement The Regional D is tr ibu t io n of the Variables A Regional Comment The Result of the C la s s if ic a t io n A Regional CommentThe Population in D i f fe re n t Types of Wards
THE STRATEGIC LOCALITIES
Planning and Central Place Hierarchies
The Discussion of S tra teg ic L o ca l i t ies C r i te r ia of Measurements and Calculation of Population Bases
On the Size of S tra teg ic L o c a l i t ie s The Addition to Purchasing Power by the Popula t io n of the Hinterland
The Local S h ort fa l lThe Addition to Purchasing Power by G-areas The Addition to Purchasing Power by L o c a l i t ie s Summary of the Addition to Purchasing Power by the Population of the Hinterland
Changes in the Threshold Value Through Time
ON PLANNING IN SPARSELY POPULATED AREAS
Theoretical Aspects On Demands and Needs The Concept of A c c e s s ib i l i ty
Planning on a Regional Level
Planning on a Commune Level The Out-Patient Health Services in a G-area. Data From the Commune of Vindeln in the County of Västerbotten.A c c e s s ib i l i ty and Transport Work CommentsConcluding Remarks
SUMMARY
APPENDIX
BIBLIOGRAPHY

VI
List of TablesTable 1:1 The Population in the Six Northernmost Counties 1900-1940.
1:2 The A gricu ltura l Population in the Six Norternmost Counties 1930-1940.
1:3 The Changes in the Total Population in the Six Norternmost Counties 1940-1950.
1:4 The Changes in the Population of the L o c a l i t ie s in the Six Norternmost Counties 1940-1950.
1:5 The A g ricu ltura l Population in the Six Norternmost Counties 1940-1950.
1:6 The Changes in the Population 1950-1965 in Total and in G- areas.
4:1 Basic Data o f the Electoral Wards.
4:2 The Proportion of Aged People, N at ion al ly and in the Research Area. Q uarti le and Median Values.
4:4 Population and Median Age in the Merged Communes of Västerbotten and Norrbotten 1950, 1960 and 1970.
4:5 The Population o f the Electoral Wards Grouped According to C e n tra l i ty .
4:6 The Proportion o f Yes-answers fo r the Variables x-j - Xg Distr ibuted Over Counties.
4:7 The Electoral Wards in Each County, Respectively, Grouped According to A t tr ib u t io n to Levels.
4:8 The Population in the Electoral Wards, Grouped According to S-L Level.
5:1 The Calculations o f Threshold Values.
5:2 Total Population o f the Research Area, D is tr ibu ted Over L o c a l i t ie s and G-areas.
5:3 L o c a l i t ie s C lass if ied by Size.
5:4 % Population by Size of Lo ca l i ty .
5:5 Weighted Values of Completeness.
5:6 D is tr ib u t io n of Purchasing Power Within G-areas.
5:7 Reduction of the Degree of Completeness.
5:8 The Proportion of Purchasing Power in Classes of Locality Size A fte r Reduction for Own Degree of Completeness.
5:9 Reduction fo r a Lower Capacity of Consumption.

VII
6:1 D is tr ibu t io n According to Level Responsible fo r Treatment.
6:2 D is tr ibu t io n According to Level of Treatment F ir s t Consulted.
6:3 Population Consulting Health Service in a Close and a Remote Zone, Broken Down by Age and Level o f Treatment.
6:4 Factor Scores for the Calculation of Transport Work.
6:5 Weight Scores for the Estimation of A cce s s ib i l i ty .
6:6 A c c e s s ib i l i ty and Transport Work. An Analysis of the AmseleArea.
8:1 Tables Showing A c c e s s ib i l i ty and Transport Work According toFigures 6:9 and 6:10.
8:2 L is t of Publications in the Series Glesbygdsforskningen.
List of FiguresFigure 1:1 The Research Area.
1:2 The Population of Sweden 1880-1970.
4:1 Deductive C la s s if ic a t io n .
4:2 Induct i ve Cl a s s i f i ca t i on.
4:3 Population in Electoral Wards in BD-W Counties. CumulativeCurve.
4:4 Diagram of the D is tr ib u t io n o f Those Aged 65+. D is tr ibu t io nOver Counties Composed With the D is tr ib u t io n Over the Total Research Area.
4:5 Proportion o f the Population in the Ages 65+ in the Countyof Västerbotten 1965.
4:6 The Proportion of the Population Aged 0-19 in the County ofVästerbotten 1965.
4:7 Regression Lines and Correlat ion Between X = Change inMedian Age and Y =Change in Total Population 1950-1960.
4:8 Regression Lines and Correlat ion Between X = Change inMedian Age and Y =Change in Total Population 1960-1970.
4:9 Level C r i t e r ia fo r S-L C la s s if ic a t io n .
4:10 Diagram Showing the C lass if ied Electoral Wards in EachCounty, Respectively.
4:11 S-L C la s s if ic a t io n 1965. All leve ls .
4:12 S-L C la s s if ic a t io n 1965. Level S-4.

VIII
4:13 S-L C la s s if ic a t io n 1965. Level S-3.
5:1 The Aid Areas and the Suggested P r io r i t y Places (1969).
5:2 GRUP's C la s s if ic a t io n Scheme.
5:3 The O f f ic ia l Plan fo r Development of the Regional Structure.
5:4 Diagram of the Degree of Completeness by Size of Groups.All Functions Included.
5:5 Diagram of the Degree of Completeness by Size of Groups.Each Service Function Analyzed Separately.
5:6 Central Places and Spatial Demand Cones According toC h r is ta l le r 's Marketing Pr in c ip le .
5:7 Schematic I l lu s t r a t io n of Reluctance to Travel.
5:8 Diagram of S h ort fa l l in Purchasing Power Over time.
6:1 Medical Care in Västerbotten.
6:2 Frequency Adjusted Average Distance to Out PatientMedical Care in Västerbotten.
6:3 D is tr ib u t io n of Wards A f te r C la s s if ic a t io n by a) FrequencyAdjusted Average Distance and b) Transport Volume.
6:4 Diagram Showing the Ratio Between Transformed Scores ofFrequency Adjusted Average Distance and Transport Volume.
6:5 Ratio Between Transformed Scores o f Frequency AdjustedAverage Distance and Transport Volume.
6:6 Frequency Adjusted Average Distance to Out Patient HealthCare.
6:7 Transport Volume Per Head to Out Patient Health Care.
6:8 The Commune of Vindeln.
6:9 Regional Consequences in the Amsele Area.
6:10 Regional Consequences in The Vindeln Area.
.6:11 A c c e s s ib i l i ty Zones, According to Table 6:6.
6:12 A cc e s s ib i l i ty Zones, According to Table 8:2 b).
8:1 C e n tra l i ty Scores.
8:2 Flow Chart fo r S-L C la s s if ic a t io n .
8:3 Places With a Population Over 2200 (1970).

1 Introduction
1.1 Terminology and Delimitation of Areas
The t i t l e of th is thesis is Studies on Service Problems in the Sparsely
Populated Areas in Northern Sweden. I t implies a s ign if ican t de lim ita tion .
Since 1967, a large scale pro ject, called 1 Glesbygdsforskningen1 (Project
for Studies of Sparsely Populated Areas) has been carried out in the De
partment of Geography of the University of Umeå in northern Sweden. The
project has been divided into two parts: one dealing with labour market
problems, one with service problems, thus covering the two central issues
in this f i e ld . As the t i t l e of th is thesis suggests, the author has been
concerned with the service problems.
The Swedish concept 'glesbygd' has no adequate equivalent in English. As
a formal concept, i t is one of the categories used in s ta t is t ic a l compi
la t ion s , e .g . in Folk- och Bostadsräkningen (the Swedish census, FoB). As
a general concept, i t includes scattered habitations and small v il lages
and homesteads, especially in remote areas. Scattered habitations, close
to re la t iv e ly big centres, are not characterized as 'glesbygd' in the pub
l i c mind. Moreover, to many people 'glesbygd' has been closely associated
with the unwanted developments that have occurred in the depopulated areas
in Sweden. The English expressions 'distressed areas ', 'backward areas'
and 'depressed areas' have not been regarded as suitable for use in th is
thesis , as they might evoke the idea of declining industria l areas. Here
the terms 'depopulated areas' and 'sparsely populated areas' w i l l sometimes
be used as translations of the Swedish word 'glesbygd'. I t is essential to
emphasize, however that "glesbygd" is not only a formal concept, but also
a concept with certain negative connotations. In contexts where 'depopu
lated areas' and 'sparsely populated areas' are not f u l l y adequate, I have
made the expression 'G-areas' to denote 'glesbygd'. In compounds, too, (G-
problems, G-communes, G-research), G stands for 'glesbygd'. These expres
sions have been considered to be operationally suitable for this thesis,
especially since the text was o r ig in a l ly written in Swedish and then trans
lated into English.

2
"Tätort" is another concept, which has no adequate equivalent in English.
In the O f f ic ia l S ta t is t ic s of Sweden i t denotes places with a certain den
s ity between the habitations and more than 200 inhabitants, and in the Eng
lish translations in s ta t is t ic a l compilations, l i k e , fo r instance FoB, (the
Swedish census) the English word " lo ca li ty" is used as a synonym. "Locality"
is thus used in this thesis whenever I have considered i t necessary to point
out that i t is the formal concept of " tä to rt" that is referred to. (See a l
so note 2, chapter 1).
In a comparatively short time, Sweden has developed from a predominantly
rural country into a nation which has passed a long way into the so called
post-industria l society. There are s ig n if ican t variations in population den
s i ty and economic structure within the country, however, and the d i f f e
rences have gradually increased since the break-through of industrialism.
At the beginning of the 19th century, the degree of urbanization was very
low and there were only three towns with more than 10 000 inhabitants -
Stockholm, Gothenburg and KarlskronaJ hn 1970, 56,4% of the population
lived in urban areas over 10 000 inhabitants, and the urbanization figure
was 81,4%.^The re-structuring has, of course, implied extensive adaption
problems, both in expanding and declining areas. But nevertheless at the
same time, the country has reached a high level of welfare. When the G-
problems are being discussed in the fo llowing, i t is therefore important
to bear in mind, that the problems are minor ones compared with those in
less prosperous parts of the world. Thus they are somewhat of a 'maladie
de la r ichesse'.
For more than h a lf a century, the so called 'Norrlandsproblemet' (the Norr
land problem) has been consistently debated. In the past, the Norrland pro
blem meant the regulation of the development of the country. I t was also
a matter of how to cope with the demand fo r labour of the Norrlandic indus
t r ie s . Since the second world war, there has been a reduction of s e t t le
ment and a depopulation causing problems for the region involved. The population decreases, and the average age of the population increases. The num
ber of jobs available becomes in s u f f ic ie n t . The long distances make i t d i f
f i c u l t to keep contacts. The supply of services decreases, shops close down,

3
schools are withdrawn, the demand for medical and g e r ia t r ic care is be
coming harder to meet. The costs to the communes for the services go u p .^
In Sweden, a l l these things are referred to as 'glesbygdsproblem', G-
problems. Of course such problems are not peculiar to Norrland. They occur
whereever there is a depopulation process going on. But, seeing these
problems from a quantita tive point of view, in Sweden they are no doubt
strongly associated with Norrland.^
The area dealt with in th is thesis consists of Norrland on one hand, i . e .
the f iv e most northern counties ( lä n ) , and the county of Kopparberg on
the other, since i t has many features in common with the counties of Norr-
land.^Thus, the counties included are Kopparberg (W), Gävleborg (X ),
Jämtland (Z ) , Västernorrland (Y ), Västerbotten (AC) and Norrbotten (BD).
The deta il studies in chapter 6 re fer to areas in the county of Västerbotten.
The delim itation of the area is made ch ie f ly fo r practical reasons. More
over, the "län" units are advantageous, because s ta t is t ic a l data are a l
ready available fo r them, whereas such data are not available on a lower
regional leve l . There would be good reasons fo r extending the research
area in the south to parts of Värmland and Dalsland, but, taken as a whole,
these areas d i f f e r too much from the delimited area.
Within the framework of the pro ject, parts of the material in th is thesis
have been published previously in Swedish, above a l l in the series ' Gl es -
bygdsforskningen', a stencil led series of reports of a working paper characte r . References to such publications w i l l be given in each chapter respec
t iv e ly , and source-crit ica l comments have therefore received l i t t l e emphasis
in th is thesis. Instead the stress has been la id on the discussion of methods
and princip les. In the te x t , these previous studies w i l l be referred to as
report nr x x . A l i s t of the reports that have been published in 'Glesbygds-
forskningen' up to the autumm of 1974, w i l l be given in the Appendix, table
8 :2 .

4
Figure 1:1 The Research Area
Southern L im it o f Research Area
County Boundary Commune Boundary
Norrbotten County (BD)
Västerbotten County (AC)
Jämtland County (Z)
UmeåVaster- ^ norrland \ County
{ * * Gävle- borg CountyKopparberg
kCounty (W
i
100 200 300km
5
1.2 The Growth of the Problem of Sparsely Populated Areas
From an international point of view, Sweden is a sparsely populated coun
t r y , and i t has been so as long as records have been kept. In 1750, when
Swedish population s ta t is t ic s came into being, there were 1.8 m i l l , in -
habitants l iv in g in an area of 449 000 km . Approx. 4/5 of the population
are estimated to have earned th e ir l iv ing in agriculture. In 1800, the
population of Sweden had risen to over 2.3 m ill ion and by 1880, i t stood at 4,5 m ill ion inhabitants.
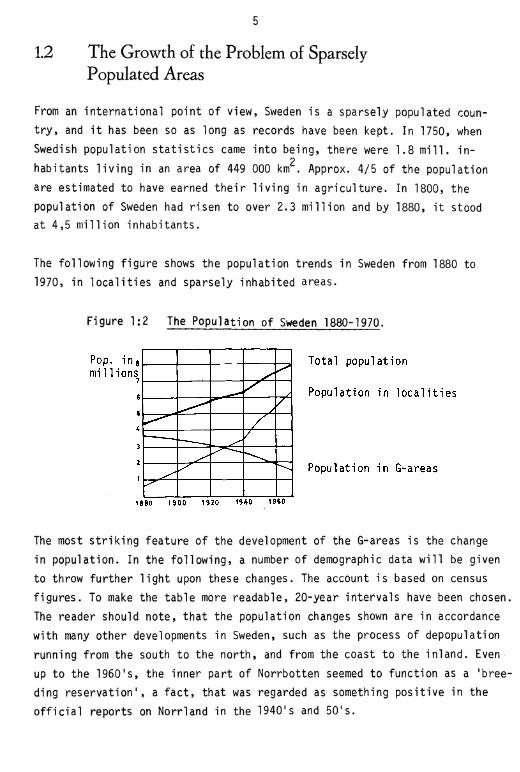
The following figure shows the population trends in Sweden from 1880 to
1970, in lo c a l i t ie s and sparsely inhabited areas.
Figure 1:2 The Population of Sweden 1880-1970.
Pop. in millions
Total population
Population in lo c a l i t ie s
Population in G-areas
I960194019208 BO 1900
The most s tr ik ing feature of the development of the G-areas is the change
in population. In the following, a number of demographic data w i l l be given
to throw further l ig h t upon these changes. The account is based on census
f igures. To make the table more readable, 20-year intervals have been chosen.
The reader should note, that the population changes shown are in accordance
with many other developments in Sweden, such as the process of depopulation
running from the south to the north, and from the coast to the inland. Even
up to the 1960's, the inner part of Norrbotten seemed to function as a 'bree
ding reservation ' , a fa c t , that was regarded as something positive in the
o f f ic ia l reports on Norrland in the 1940's and 5 0 's.

6
During the l a t t e r ha lf of the 19th century, the re la t iv e proportion of
population dependent upon agriculture started to decline and a f te r 1880
the absolute numbers also diminished. By the turn of the century, the popu
lat ion dependent upon agriculture comprised 55% of the t o t a l , in industry
and crafts 28%, in commerce and transport 10%, and in the c iv i l service
and professions 7%. The degree of urbanization was comparatively modest:
36% lived in lo c a l i t ie s and 64% in G-areas.
In 1920, the part of the population occupied in agriculture decreased to
44% of the to ta l population, and 35% earned th e ir l iv in g in industry and
cra f ts . The proportion of the population employed in commerce and transport had increased by 4%, whereas the share of the to ta l population employed in
public service was nearly unchanged. Approximately 45% of the population
now lived in towns or lo c a l i t ie s .
Twenty years la t e r , in 1940, the agricu ltu ra l population comprised only
34% of the total population, whereas those employed in industry and crafts
were 38%, those in commerce and transport 20%, and those in the c iv i l ser
vice e tc . , 8%. The population in lo c a l i t ie s was over 56% and in the G-areas
ju s t under 44%. The to ta l population of Sweden was 6 371 000 in the same
year. In the six northernmost counties, the population figures had developed
as shown in table 1:1.
Table 1:1 The Population in the Six Northernmost Counties 1900-1940 TTOOO's).
County 1900 1910 1920 1930 1940 Change 1900-1930 Change 1930-1940 absolute re la t iv e absolute re la t iv e figures figures figures figures
Kopparberg 218 234 254 250 249 + 32 +14,7 - 1 - 0,4Gävleborg 238 254 268 280 274 + 42 +17,6 - 6 - 2,1Västernorrland 232 251 265 279 275 + 47 +20,2 - 4 - 1,4Jämtland 111 118 134 135 139 + 34 +30,6 + 4 + 3,0Västerbotten 144 161 182 204 220 + 60 +41,7 +16 + 7,8Norrbotten 135 161 183 200 216 + 65 +48,1 +16 + 8,0

7
I t is evident that in the three northernmost counties, there continued
to be an increase in the population between 1930-40, whereas there was
a population decrease in the other three counties. In the county of Koppar
berg (W), the decline started as early as a f te r 1920, and in the two other
counties, a f te r 1930.
The following table shows the changes in the size of the agricu ltura l popu
lation of the six northernmost counties during 1930-40.
Table 1:2 The Agricultural Population in the Six Northernmost Counties1930-1940 (10001 s ).
County 1930 1940 Changeabs.fig :s r e i . f ig : s abs.fig :s re i . f ig :s abs .f ig :s r e i . f ig :s
Kopparberg 101 40,5 88 35,3 -13 - 5,2GävleborgVäster-
99 35,4 95 34,8 - 4 - 0,6
norrl and 106 37,9 108 39,1 + 2 + 1,2JämtlandVäster
77 57,6 77 55,6 0 - 2
botten 119 58,6 126 57,4 + 7 - 0,8Norrbotten 95 47,7 102 47,2 + 7 - 0,5
Even in 1930, the agricu ltura l part of the population was much higher in
the three northernmost counties. The difference between the two groups of
counties is s t i l l more obvious in the census of 1940, when the proportion
of people in agriculture in the county of Kopparberg had considerably declined.
From 1940 to 1950, the population of Sweden increased from 6 371 000 to
7 042 000 inhabitants. The degree of urbanization of the whole country
was 66% i . e . , an apparent change from 56% in 1940. Strong tendencies
towards a clustering of more expansive lo c a l i t ie s into conurbation areas
had already started to predominate.
In 1950, the agricultura l part of the population was 25% of the whole coun
t r y , in industry 42% and in service 33%. The development in the six northern
most counties is reflected in the table below.
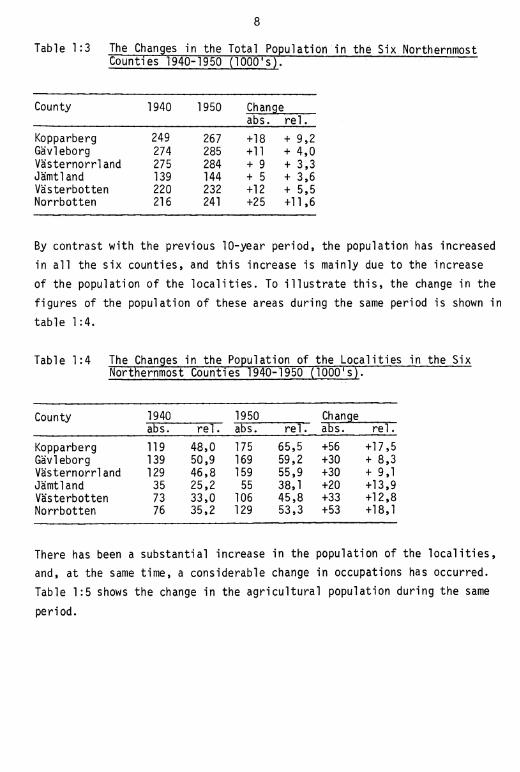
Table 1:3 The Changes in the Total Population in the Six Northernmost Counties T940-1950 (1000*s ) . ~ ”
County 1940 1950 Change abs. r e i .
Kopparberg 249 267 +18 + 9,2Gävleborg 274 285 +11 + 4,0Västernorrland 275 284 + 9 + 3,3Jämtland 139 144 + 5 + 3,6Västerbotten 220 232 +12 + 5,5Norrbotten 216 241 +25 +11,6
By contrast with the previous 10-year period, the population has increased
in a l l the six counties, and this increase is mainly due to the increase
of the population of the lo c a l i t ie s . To i l lu s t r a te th is , the change in the
figures of the population of these areas during the same period is shown in
table 1:4.
Table 1:4 The Changes in the Population of the Localit ies in the Six Northernmost Counties 1940-1950 (10001s) .
County 1940abs. r e i .
1950abs. re1.
Changeabs. r e i .
Kopparberg 119 48,0 175 65,5 +56 +17,5Gävleborg 139 50,9 169 59,2 +30 + 8,3Västernorrland 129 46,8 159 55,9 +30 + 9,1Jämtland 35 25,2 55 38,1 +20 +13,9Västerbotten 73 33,0 106 45,8 +33 +12,8Norrbotten 76 35,2 129 53,3 +53 +18,1
There has been a substantial increase in the population of the lo c a l i t ie s ,
and, at the same time, a considerable change in occupations has occurred.
Table 1:5 shows the change in the agricu ltu ra l population during the same
period.

9
Table 1:5 The Agricultural Population in the Six Northernmost Counties 1940-1950 (lOOO's).
County 1940 1950 Changeabs. r e i .
Kopparberg 88 71 -17 -19,3Gävleborg 95 72 -23 -24,2Västernorrland 108 80 -28 -25,9Jämtland 77 62 -15 -19,4Västerbotten 126 107 -19 -15,0Norrbotten 102 87 -15 -14,7
As is shown in table 1:5, the agricu ltura l population has considerably
diminished, and i t was in the period of 1940-50 that the depopulation of
the G-areas and also of the northernmost counties began. The counties Y-BD
show increases in the agricu ltura l population of up to 7% between 1930-40.
For the next 10-year period, the decrease percentages are a l l over 14,7%.
Norborg (1968)^has shown the regional d is tr ibu tion of the changes in the
agricultura l population of Sweden. At the beginning of the 20th century,
the agricu ltura l population decreased most strongly in the south-western
parts of Sweden. After that period, the area with the maximal regression
has gradually shifted towards the east and north. Not until the 1950's is
the area with maximal regression to be found in Norrland.
Norborg also shows how the structural change in agriculture can ch ie f ly be
regarded as an e ffe c t of the general social changes in Sweden. The changes
have been canalized by the regional hierarchy, following the same pattern
as other innovation processes, and the internal conditions in agriculture
have only affected details in th is pattern.
But, because of the pattern of scattered habitations in Norrland, the de
population process there had more drastic consequences, at an early stage.
At the time of the f i r s t public reports analysed in th is thesis (chapter 2 ) ,
i . e . when the war broke out in 1939, i t was already being claimed that the
cr is is of Swedish agriculture would be an over-production c r is is . During
'normal' years, Sweden is , by and large, self-supporting. In Norrland, i t

10
was stated, ra t io n a l iza t io n was strongly required. At th is early stage,
there was already a discussion of farms in s u ff ic ie n t to provide a l i v e l i
hood, “which sometimes in an undesirable way, might be an obstacle to
the owner looking for other job opportunit i es" .^The agriculture of Norr
land was to be planned and re-structured , by amalgamations or by rec la
mation. But reclamation might only be carried out in connection with pre
viously cultivated land, the main purpose being s o c io -p o l i t ic a l , i . e . the
holdings were often too small. In the report quoted, i t was stated that
i t was in fact the concern fo r forestry that was the only va lid reason for
preserving parts of the scattered holdings on the periphery.
After World War I I , Parliament authorized an agricu ltura l programme aimed
at making Swedish agricu ltu ra l policy self-supporting, in case of iso la t io n ,
a natural goal when one considers the experience of wartime. But even a few
years a fte r th is policy had been authorized, production had increased to
reach a surplus of 6-8% due to the rapid pace of ra t io na lisa t io n .
As fa r as Norrland was concerned, the consequence was that the planned
expansion of arable land was carried out to only a very limited extent. In
stead, the importance of urban trades increased, especially in connection
with the boom in the beginning of the 1950's. The outflow of population a t
tracted to the southern and central parts of Sweden and towards the coastal
areas of Norrland was in operation.
In 1965, Sweden had a population of 7 766 000 inhabitants. The part of the
population l iv in g in G-areas was 22,6%. The changes in the to ta l population
and in the population in G-areas, respectively, during 1950-65, in the re
search area and in the whole country, are shown in table 1:6.

11
Table 1:6 The changes in the Population 1950-1965, in Total and in G-areas.
Total Population (1000's) Population in G-areas (1000's)
County 1950 1965 Change 1950 1965 Changeabs. r e i . abs. r e i .
Kopparberg 267 282 + 15 + 5,6 92 66 - 26 -28,3Gävleborg 285 293 + 8 + 2,8 116 77 - 39 -33,6Västernorrland 284 277 - 7 - 2,5 125 89 - 36 -28 ,8Jämtland 144 131 - 13 - 9,0 89 67 - 22 -24,7Västerbotten 232 234 + 2 + 0,9 125 96 - 29 -23,2Norrbotten 241 259 + 18 + 7,5 113 76 - 37 -32,7Sweden 7042 7772 +730 +10,4 2383 1754 -629 -26,4
As is shown in the tab le , the population in G-areas has d ras t ica l ly de
creased, and in the research area, the average decrease is 28,6%.
The year 1965 is taken as the f in a l year in th is account. Since 1960,
the Swedish censuses have been carried out every f iv e years. At the
i n i t i a l stages of the studies in th is thesis, the figures from 1965
where the most recent ones available.
1.3 Aims and Arrangement of This Study
G-problems are the side effects of urbanization. Whereas problems of over
crowding and economic overheating are commonplace for citizens and c i ty
planners, the population of G-areas are affected by economic stagnation,
decline and depopulation as well as deterioration of service and contacts.
Not so very long ago, a l l these things did not a ffect the planner in G-
areas, simply because such a planner did not ex is t . Today there is a planning organization for G-areas, ch ie f ly attached to the new, bigger com
munes and on a county-regional leve l . On the other hand, decisions with
implications for planning have natura lly been made during previous periods,
above a l l in connection with sectorial considerations on a national leve l .

12
I t would be wrong, however, to accuse the authorities of having neglec
ted the problems. The ‘o f f i c i a l 1 view can be observed in Statens o ffen t
liga utredningar, (SOU). I t is easy to see in them that a regionally
centred standpoint was gradually growing in the 1950's, even i f the in
f lu e n t ia l trades union organization, LO (corresponding to TUC in B r i ta in ) ,
and Arbetsmarknadsstyrelsen (AMS, Labour Market Board) s t i l l at that time
stressed very strongly the necessity of a continuing flow of labour from
north to south and from the inland to the coast. But as always, there was
an associated time-lag and i t was not u n t i l 1965 that Sweden adopted an
active locational policy. As la te as in the 501s and the early 60 's , the
view was that the speed of immigration into c ity areas was "an inevitable
feature of a spontaneous development".^
I t is evident from the tables in the previous section, how rapidly the
migration process has developed in the most typical G-counties. The lo
cational and reg io n a l-p o l i t ic a l measures, adopted at an accelerating speed
from 1965 onwards, give the impression of ad-hoc solutions. The economic
expansion in Sweden since the second world war has concealed the regional
problems that have become the drawbacks of th is expansion. The in tensity
of the migration from the G-areas in Norrland is a somewhat tragi-comic
example of these draw-backs. In trade booms, the in tens ity of migration
increases. In a less favourable economic s itua t io n , the speed of migration
slackens, since fewer people are employed in the expanding industria l areas
in southern and middle Sweden.
I t is interesting to note that the trends towards regionalization have gone
hand in hand with a more ind iv idually centred a tt itu d e by the au thorit ies .
Man tends to be seen in an ecological context. The environmental aspects
are being stressed more and more. The suburban areas, constructed in a hurry, are questioned, and governmental organs, such as Konsumentverket (Con
sumers' Board) and konsumentombudsman (Consumers' ombudsman) have been
established fo r the benefit of the individual. ‘Glesbygdsutredningen‘ , too,
which was set up in 1966, is an expression of the awareness of the neces
s ity of the measures that have to be taken to master the d i f f ic u l t ie s ex
perienced by individuals in a period of contrac tion .^

13
At the international le v e l , s im ilar and associated problems have been
pointed out. Well-known studies of regional development planning and
methods of analysing economic processes via regional units are, e.g.
Isard : Methods of Regional Analysis (1960) and Me Loughlin"s Urban and
Regional planning (1969). Rostow"s generalization of the h is torica l de
velopment as a set of stages of growth, is regarded as being capable of
application at the regional leve l . Myrdal"s model of "the Process of
Cumulative Causation" is obviously applicable, by showing how new in
crements of a c t iv i ty and growth w i l l tend to be concentrated in the a l
ready expanding regions because of th e ir derived advantages rather than
in the remaining areas of the country. 1C% n the other hand, studies of
contraction processes and 'winding-up' planning are in general lacking.
The background of the project in which th is thesis is a part , is , above
a l l , the necessity of quantifying and locating the G-problems. I t is taken
for granted that only a shapshot can be given. The development process cau
sing the G-problems, is extremely complex, and isolated factors , such as
technical development, the needs of communication consumption habits, and
influences from outside, (such as regional po lic ies) are only pieces of
a mosaic, d i f f i c u l t to perceive. Factors, which may seem ir re le v a n t , are
often relevant for deeply rooted h is torica l reasons, and they may have a
strong influence on the att itudes of the population and on the decision
makers, and Swedish regional policy has, as been mentioned above, mainly
aimed at s tab i l iz in g regions and places of some vigour, rather than trying
to turn the direction of the flow.
As has been mentioned above, th is thesis deals mainly with one aspect of
the G-problems, namely with the issues of service. These problems can be
looked upon from a macro- as well as from a micro-point of view, and they
involve both economic and physical aspects. The economic aspect concerns
transport costs, threshold values and substitution e ffec ts . The physical
aspect includes such things as the organization of transports, the size
and position of a node and the mesh-size of the network of available ser
vice amenities.

14
On a macro-level, the s ta b i l i t y of the upper stages of the hierarchy of
places is of great in te res t. The most important function of most major
centres of the G-areas in Norrland is to serve as service centres. The
locating of industries to those centres is a re la t iv e ly new phenomenon.
Their main function has been to provide goods and services for th e ir own
inhabitants and fo r the population of the hinterland. In a structural ana
lysis approach on the macro-level, i t is therefore natural to use th is
main function as a s ta r t in g -p o in t, especially i f the analysis is intended
to give a picture of the importance of the centre for i ts hinterland.
On the m ic ro -leve l, the delim itation of areas and the quantifying of problems are central tasks, as well as discussions and analyses of planning
strategies. No matter i f planning is aiming at s ta b i l iz in g the s itua t io n ,
re liev ing the l iv in g conditions during a period of trans it io n or at d irec
ting migration de liberate ly from the scattered habitations to the major
nodes, there is an obvious need to define and to quantify the G-problems.
I t seems as i f economic considerations on a national le v e l , such as those
which a ffect employment, education and directed migration, have ch ie fly
tended to take a centra l iz ing course. The trend is evident in public govern
mental publications, e .g . , and in reports from Landsorganisationen (TUC).
Within physical planning, however, the target has often been more c e n tr i
fugal: better roads in peripheral areas, restoring habitations remotely
situated, extended network of e le c t r ic i t y and telephones, etc. The physical
structure is often dealt with regionally and lo c a l ly , whereas economic p o l i
cy is debated and dealt with on an aggregated, national leve l . In Sweden,
as well as in most other countries, regional accounting is something which
does not ex ist in p r a c t i c e . ^
In the circumstances referred to above, there is obviously a la tent reason
for c o n f l ic ts , in tens if ied not least by the predominant sectorization of
social planning that has been prevailing in Sweden up to the end of the
1960"s. Thus, decisions within one sector often causes unforeseen conse
quences within other sectors. Further on in th is thesis I have used the
expression 'unconscious regional p o l ic y 1 to describe such phenomena.

15
The problems are in teresting and well worth studying. To penetrate the
public reports, available for nearly a l l major p o l i t ic a l issues in Sweden,
is one way of re f lec t ing th is dualism and, at the same time, of giving
a survey of the ideas behind the contemporary Swedish regional policy.
For th is purpose the regional policy from 1940 onwards has been considered
to be of special in te re s t , and a survey of a number of reports are summa
rized in a separate chapter. The reports have a l l in common that they are
dealing with regional issues. The reason for including such a summary in
th is thesis is mainly to make the reader fam iliar with the regional p o l i
t ic a l debate reflected in the reports, and, thereby, also with the basis
for decisions that was available to the government when the decisions were
made that had a heavy impact on the G-areas. I have chosen to make a chrono
logical survey, above a l l because the reports accounted for were so hetero- genious th a t , in many cases, a thematic account of them would not have made
much sense. The reports have been selected from an extensive collection of
reports as being the most representive ones. They a l l deal with issues with
apparently regional implications, both economic and physical. Moreover, to
my mind, such a survey has a value of i ts own. Only by knowing the previous
views on these problems can one give an account of today's s ituation that
can contribute to the forming of a basis for an estimate of the future.
The aim of th is thesis is to re f le c t the G-problems from d if fe re n t angles,
from a macro as well as from a micro le v e l , in order to try to give a broad
ened basis for a necessary future planning of measures. Point by point, the
sub-aims may be summed up in the following way:
a) to give a survey of some of the most important public reports in order
1) to give a background to contemporary Swedish regional p o l ic ies , 2)
to indicate certain target conflicts that may emerge in connection to
sectorial economic and physical planning.
b) to give a basis for the planning of an improved environment in the de
populated areas, by analysing the location and the extention of the
problems, connected with the supply of services in the six northernmost
counties in Sweden.

16
c) to define the basis of a stable place structure by means of a s tra te
gic lo c a l i ty system, by estimating the minimum size for a place in
which the supply of services can be kept at a re la t iv e ly high le v e l ,
even i f the population in the surrounding area d ras t ica l ly decreases,
using estimates of the consumer base of the area.
d) to discuss methods of planning the supply of services in sparsely populated areas.
The arrangement of th is thesis w i l l in general follow the above-mentioned
points. In the f i r s t part of each chapter there w i l l be a discussion of
the main issues. In chapter 2, the public reports w i l l be dea lt w ith , ac
cording to point a ) , and an account of the princip le viewpoints of Gles-
bygdsutredningen (The Investigation of the Sparsely Populated Areas) w i l l
be given. The above-mentioned points b-d w i l l be dealt with in chapters
4-6. A summary w i l l be given in chapter 7. Chapter 3 is called 'The Be
havioural Science Frame of References. In this chapter there is a survey
of sociological and other behavioural s c ie n t i f ic studies, d ire c t ly or in d i
re c t ly forming the references of the author fo r the discussions in chapters
4-6, concerning c lass if ica t ion princ ip les , standards of service and planning
methods.
1.4 Studies With a General Reference to This Thesis
The survey of the public reports comprises the period 1940-64, with one ex
ception. Since 1964, a great number of public reports, s c ie n t i f ic studies
and many polemical books have dealt with the Norrland question and the G-' problems. As has been mentioned above, the books with a more sociological
and antropological approach w i l l be discussed in chapters 2 and 3. A selec
tion of relevant studies w i l l be mentioned here b r ie f ly : The set of essays
"Norrländska framtidsperspektiv" (Perspectives on the future of Norrland)
deals with population and capital questions, industr ia l enterprises and
transport, consumption habits and cultural problems. A number of experts
have contributed essays to th is volume. Gösta Lindhagen dealt with the

17
transport question in G-areas using a central p lace-theoretical approach,
in his thesis "Kostnader för lokala transporter vid o lika lokalisering
hos näringsliv och befolkning"(1968). Anders Alvarsson outlined a plan
ning system for a typical G-commune (Vilhelmina in the county of Väster
botten) in the report "Glesbygdsplanering, en problemanalys" (1970). This
area was also dealt with by a team from the Department of Communications
in the study "Lokal t ra f ikserv ice : Modellplanering i Vilhelmina" (1968).
The studies carried out in para lle l within the G-research project are,
of course, of special in terest in th is context. Above a l l , the studies by
Qlof Erson and Einar Holm (appendix, p .208), on the labour market s ituation
in G-areas, should be mentioned, as well as Erik Bylund's "Glesbygdsproblemet
- Norrlandsproblemet", "Arbete, Serviceunderlag och tä tortss truk tu r i Norr
ländsk glesbygd" (1972), and other papers concerning Swedish regional pro
blems and location policy (see l i s t of references).
In our neighbouring country, Norway, a number of studies re la t ing to the G-
problems have been published. For this thesis Vi dar Vanberg's "Mål of Midler
i utkantströkenes serviceforsyning" (1972) and the collection of essays
"Rapport f ra nordisk seminar om regionalpolitikkens mål og midier" (1969)
are of d irect in te res t.
As has been mentioned above, a more active regional planning was carried
out in the middle of the 196Cfs. The increased planning resources fo r the
counties, being a resu lt of th is active policy, have brought about the two-
co-ordinated county_j)lann^^ 'Länsplanering 1967' and 'Länsprogram
1970', as well as "Regional- och t r a f ik p o l i t ik " by Backlund and others (1969),
and a study by Ake G Andersson: "Glesbygd och lo ka l ise r in g sp o li t ik . En ana
lys av Dalslands arbetsmarknadsproblem" (1967). Public reports, not dealt
with in chapter 2, are ERU's (Expert Group on Regional Studies) reports
"Balanserad regional utveckling" (1970) and "Orter i regional samverkan"(1974) both with appendices. A study, also emanating from a central govern
mental le v e l , is the publication 'Glesbygd' (1969), published by Kungl.
Maj:ts kansli (H.M. Chancery). ERU has also published a collection of essays
"Regioner a t t leva i . Elva forskare om reg io na lpo li t ik och välstånd" (1972).

18
As has been mentioned above, the following chapter deals with a number of
public reports, in i t ia te d and published during 1940-64. The survey has to
be a summary one, and the stress is as mentioned above, la id on matters
connected with questions dealt with in chapters 4, 5 and 6, i . e . service
supply, central place h ierarchies, systems of s tra teg ic lo c a l i t ie s and
planning principles.

19
Notes to chapter 1
1) Montgomery (1947) p. 17.
2) Centres with more than 2Q0 inhabitants are here regarded as "urban"“a very low figure compared with international standards.
3) Kungl. Maj:ts kansli (1969).
4) Bylund (1966).
5) Norrland consists of Lappland, Norrbotten, Västerbotten, Ångermanland, Medelpad, Hälsingland, Gästrikland, Jämtland and Härjedalen.
6) Norborg (1968).
7) SOU 1943:39 p. 90. Translated quotation.
8) Sandlund (1971) p. 47.
9) See chapter 2.
10) For a detailed discussion, see Keeble: Models of economic development,in Chorley-Haggett (1967).
11) In SOU 1974:1 ERU discusses the p o s s ib i l i t ie s of applying regional accounting as a general planning instrument.

20
2 The Public Reports
2.1 IntroductionFor a long time the public committee system has been one of the most im
portant factors in the p o lit ic a l decision process in Sweden. Great social
reforms have been regu larly prepared by committees, the reports of which
have been published in the series Statens O ffen tlig a Utredningar (SOU).
There is no equally extensive equivalent in other countries where the
preparation of proposals fo r reform are generally the concern of the c iv i l
and governmental departments.
The expansion of the committee apparatus in the 20th century has made i t
many times bigger today than i t was in the 19th century. From a re la tiv e
point o f view the fas tes t growth occurred before the f i r s t world war. At
the beginning of 1972, 293 committees were a c tiv e , ranging from one-man-
committees to large committees composed in a parliamentary way, engaging
up to 100 people, expert groups and o f f ic ia l s ta f f included.^During the
la s t decades the d is tr ib u tio n of p o lit ic a l parties w ithin the committee
system has been close to the d is tr ib u tio n of p o lit ic a l parties in P a rlia
ment, but there is a trend towards a weaker pariiamentary basis. Partly
th is development is a re s u lt of the increasing representation of in te res t
groups. In many aspects of society these organisations have taken over the
ro le of representing the wishes of various groups of people, a ro le pre
viously played by the p o lit ic a l p arties . Among these organisations are,
e .g . , LO, TCO and SAF.2)
The reports th a t w ill be dealt with in th is thesis have a ll a greater or
lesser connection with the regional problems concerning northern Sweden
and its sparsely populated areas. In some cases there is an in d ire c t con
nection only. What might be called 'unconscious' regional policy is some
times relevant in those cases. Sandlund (1971) m aintains, e .g . , that the
Norrland problem is d ire c tly dependent on the speed of the expansion of
Greater Stockholm.

21
The study refers to the period 1940-64. The outbreak of the war in
1939 faced Sweden with immediate and extensive problems of economic
maintenance because of the iso la tio n caused by the war.
2.2 The Period 1940-1950
The economy of Norrland was weakly developed, and in 1940 motions were
tabled in Parliament to establish a committee to take action fo r the
promotion of economic l i f e in Norrland. A committee was set up in the
same year, given the task of carrying out a preparatory survey. I t was
called "1940 års norrlandsutredning", with the geographer W. W illiam -
Olsson as the secretary, and in October 1943 i t delivered its report
"Utredning angående Norrlands näringsliv" (SOU 1943:34). In many re
spects the report is s tr ik in g ly prescient in estimating the character
and the extent of the Norrland problem. I t pointed out that the economy
of Norrland in th is context meant the in teractio n between its population
and th e ir means of support. The prevailing d if f ic u lt ie s emanated from
the lack of balance between these factors . The means of support were
scarce in re la tio n to the size of the population. A survey of the popula
tion changes and the increasing "urbanism" shows that William-Olsson had
observed the spreading mechanisms of depopulation: "Thus i t can be esta
blished th a t the population decrease of the rural areas, o r ig in a lly a
phenomenon in some areas in southern Sweden, has spread fu rth e r north
year by year, so th a t in the la s t years, 1935-38, there are only a few
areas in Norrland where there is a population increase at a l l . In the
rural areas of Norrland there w ill be a population decrease which w ill be
very serious, i f the trend of the decrease in the population spreading
from south to north continues without re s tr ic t io n " . A survey of the s itu a
tion in d iffe re n t sectors of the economy of Norrland showed a weak struc
ture throughout. William-Olsson discussed fo restry and hinted at certa in
demands fo r concentration, above a l l depending on foreign competition.
"The fo rest provides employment and income to the rura l population to a
great extent. I t is the basis of the sawmills and the wood pulp industries ,
the most important industries in Norrland, and, furthermore, the most im
portant export industries in Sweden In th is connection, one problem pre
dominates, one to which the committee must pay a tte n tio n , namely the loca-

22
tion of the wood industry. The main issue w ill be the very d i f f ic u l t
problem of deciding in which p arts , and in which places w ith in these
p arts , the bulk of the re fin in g in d u stria l a c t iv ity should take place".
Furthermore, William-Olsson stressed the importance of reducing the
fre ig h t-co sts and suggested th a t the p o s s ib ilit ie s of decentralizing
the adm inistration should be examined. He pointed a t what is today re
ferred to as the b ra in -d ra in , and he found the risks of "the leading
forces" leaving Norrland to be great; and he warned of the negative
effec ts that might be the re s u lt of closing down the small v illa g e 4)schools. '
This preparatory committee was succeeded by a new committee, which was
called the "1944 års Norrlandskommitte". A report setting out its p rin
c ip le s , Norrländska u tv e c k lin g s lin je r, (SOU 1949:1) was published in
1949.
In the introduction to Norrländska u tveck lin g s lin je r i t was noted that
from a Norrlandic point o f view, i t was not acceptable that Norrland
should have the character of being mainly an object of ex p lo ita tio n ,
and a number of fie ld s were mentioned where Norrland could be said to
be in a less favourable position than other regions. The conditions in
Norrland, however, varied too much reg iona lly to make i t possible to re
gard i t as a homogenous u n it , and the committee pointed out that a mis
leading s im p lifica tio n would be made i f the general question o f Norrland
were to be construed as a c o lle c tiv e expression of the demands w ithin
Norrland. As a s ta rtin g -p o in t fo r tackling the Norrland problems, the
committee gave the following summary: "Due to a certa in lag , in economic
development, the labour of Norrland is not so e ffe c tiv e ly used fo r pro
ductive and p ro fita b le a c t iv it ie s as ought to be possible, especia lly not
i f the rich natural resources are taken into consideration. The develop
ment of the economy has been held back by factors which p artly re la te to
the fa c t th a t the position of Norrland has not always been s u ffic ie n tly
paid regard to in national p o lit ic s . In these circumstances l ie the reasons why the liv in g conditions in some parts of the region, fo r certain
groups of the population in p a rtic u la r , are much more unfavourable than
those regarded as normal in our country. In connection to what has been

23
said, the solution of the Norrland problems w il l be found c h ie fly in
the development of the economy.. . " ^ In th is connection, they also de
bated the question whether Norrland were a net producer or consumer,
and they found that such questions were th eo re tica l constructions, and
that i t was impossible to give any comprehensive answer to the question.
The studies presented do not, however, seem to show Norrland as on ba
lance a net re c ip ie n t. They consider i t to be important to stress th is
fa c t , since measures to promote the economy of Norrland are too often
regarded as subventions, without taking in to consideration what Norrland
has produced in the past and produces at present.
The committee found i t desirable fo r Norrland to get the opportunity to
make up fo r the lag th a t prevails in the Norrlandic economy. I f the popu
la tio n in the d iffe re n t parts of the country could compete on a more
equal basis than had been the case so fa r , i t would be fo r the benefit
of the economy of the country as a whole. I f , in the long run, no eq ua li
zation were brought about, the consequence would be that labour would mi
grate to the south, which would make the s ituation fo r those who stay in
the sparsely populated areas worse, the sparsity being a heavy burden fo r
the economy of Norrland. I t was also regarded as important to point out
that Norrland, and northern Norrland in p a rtic u la r , contributed g reatly
to the increase in the population of the country, which was of great im
portance, "as the maintenance of the population figures is of v ita l in te
rest fo r the country." But the population increase ought not to 'leak out'
to the res t o f the country. The economy of Norrland would need a ll the
labour ava ilab le . Thus, the population of Norrland should not have to mi
grate to be able to earn a liv in g in productive work. There should be an
emigration of Norrlandic youth provided only th a t there were a b ila te ra l
m obility in other parts of the country.
Within the framework of th is general outlook in favour of decentralization
considerable advantages would be gained, however, i f the population of
Norrland could be concentrated in to a few areas according to the views of
the committee. The committee thought that more densely populated areas
would be advantageous from many points of view. The costs o f roads and

24
other f a c i l i t ie s in common could be lim ite d , and a concentration of
the settlements would give greater p o s s ib ilit ie s fo r services, such
as communications, medical care, f i r e prevention, schools and adult
education. A less sparsely populated area should also give b e tte r
chances to meet the needs, m aterial and c u ltu ra l, of liv in g in a com
munity, as well as promoting the well-being in general of the popu
la t io n . With these ideas in mind, the committee regarded i t as being
in the in te res t of both the population and the economy of Norrland to
s tr iv e fo r a greater concentration of the population.
Thus, a depopulation ought to take place from some remote, iso lated
farms, especially in the inland of Norrland, but the committee points
out, th a t they do not "aim at a thinning o f the population, but the
contrary". The development must not imply that fo res try would be de- 6 )prived of its labour. }
The committee summed up the way the government's Norrland policy ought
to be planned, in the following manner: Norrland ought to get the oppor
tu n ity of making up fo r the lag , s t i l l p revailing in the economy in th is
part of the country. The economy, based on the s o il , the forests and the
ore, should be developed, but, simultaneously, other parts of the eco
nomy should be promoted and d iffe re n tia te d . By these means, the present
and the fu ture population could acquire the means of support, equal to
those in southern Sweden, and thus they need not move to other parts of
the country to earn th e ir liv in g . Thereby, and by additional measures,
a population decrease in Norrland might be avoided. When building up the
economy of Norrland, a ttention should be paid to the fa c t , that the con
d itions fo r the development of the economy are not the same in the coas
ta l areas as in the in land, and that the conditions fo r the development
of the economy as a whole vary very much in d iffe re n t parts of Norrland.
Greater concentration of the settlements is d es irab le , but the need of
labour in fo res try should be taken into consideration. The population of
Norrland ought to be given b e tte r chances to have a say in the economic
l i f e of the country, by improvements in access to vocational education.
Conditions ought to be created fo r a r is e in cu ltu ra l standards. Atten-

25
tion ought to be paid to the special social problems occurring in cer
ta in parts of Norrland. An equalization between Norrland and the rest
of the country, m a te ria lly and c u ltu ra lly , should be aimed a t.
The recommendations fo r a more concentrated settlement pattern was s t i l l
more stressed, when dealing with the social and the cu ltu ra l conditions.
The committee thought that a concentration of the population in fo res try
areas should be into small v illag es conveniently situated in those areas.
These v illa g e s , however, should be big enough to provide schools and com
munity amenities to meet d iffe re n t kinds of economic and social needs.
Such nuclei also require goods roads to the nearest lo c a lity with a doc
to r and more specialised shops, fo r instance.
When the report was made, the members of the committee were n a tu ra lly
influenced by the need a fte r the second world war of securing a ll that
could be produced w ith in the country. This view is expressed in s ta te
ments lik e the fo llow ing: although a concentration of the population in
to the major centres might seem to be the most rational th ing , th is would
mean, th a t there w ill not be labour enough fo r fo res try , and the natural
assets, such as b e rries , fish and game, w ill not be u t il iz e d .
The Unions of Enterprisers ought to take an in te res t in the building up
of centres by stim ulating such cra fts or other enterprises th a t would
make the conditions more convenient fo r those who liv e there , and thus
also promote the forming of centres.
The needs fo r medical care should be met by an increase both in the num
ber of public general p ra c titio n e r's practices and in an expansion of the
d is tr ic t nursing service. An increase in the number of small maternity
hospitals was desirab le , and they proposed to set up a regional hospital
in Norrland, with Umeå as the most su itab le place fo r such a hosp ita l.
The question of schooling played an important ro le , when the location of
the population was discussed. During the whole of the 194CTs, the r a t io n a li
zation and cen tra liza tio n of schools in rura l areas were carried out. An

26
elaborate ra tio n a liza tio n plan was introduced by school ra tio n a liza tio n
experts ( Folkskolans rationaliseringssakkunniga, SOU 1940:36). The com
m ittee had been set up mainly because of the increases in the cost o f
the school sector, but "in many schools there are so few pup ils , that
there are also pedagogical reasons fo r closing down the schools". Of
course the members of the committee were aware of the consequences fo r
the small v illag es and the scattered population that the closing down of
the schools might have: "The resistance that sometimes emerges, in connec
tion with the shutting down of schools and cen tra liza tio n measures, cannot
have any decisive impact, o f course, but, on the other hand, is should not
be to ta l ly ignored". Warnings were also given not to over-estim ate the
costs saved by closing schools, since the costs of school transport and
boarding eas ily tend to r i s e .^
The School Committee of 1940 ( 1940 års skolutredning (SOU 1946:11) ob
served in p a rtic u la r the q u a lita tiv e aspects, and, contrary to the Ratio
n a liza tio n Experts, they thought that i f , as a re s u lt of cen tra lis ing
schooling, which might be convenient from various points of view, children
could bç taught in a school providing higher levels of education in su i
tab le premises, such c en tra liza tio n should be carried out "even i f an in
crease of the costs th a t could not be regarded as small w i l l a r is e " .^
In 1948 a parliamentary committee - 1948 års skolkommission - published
its report (SOU 1948:27). A 9-year school was suggested, 'enhetsskolan1
(the comprehensive school). In 1950 Parliament made a compromise decision
implying intensive work to te s t the new school system. Among other th ings,
the school committee noted th a t a population basis of 2500-3000 was needed
fo r the 9-year school. In 1945, the so called 'kommunindelningskommitten'
(Commune Merger Committee) published its report, setting out po lic ies fo r
the reform of the d iv is ion of c iv i l local communes (SOU 1945:38). Sur
veying the d iffe re n t fie ld s of local adm in istration, they drew the con
clusion that 2000-3500 inhabitants was a minimum, and that the figure in
communes with a shrinking population should be s t i l l higher. The reform
was set in operation from the 1st of January, 1952. The number of rural
communes decreased from 2281 to 816. The to ta l number of local communes

27
was 1037. I t may be of in te re s t to observe that while today there is
a widespread concern that the diminished number of appointed repre
sentatives may possibly have negative effects on local democracy,
one of the motives of the committee in creating bigger units was the
shortage of appointed representatives in the communes.^
According to the school committee i t was necessary fo r the construc
tion of a 9-year school to bring about a c en tra liza tio n of the schools
in the countryside, and in the School B il l in the parliament of 1950,
the M inister fo r Education declared that a general c en tra liza tio n of
forms 7-9 was in e v ita b le . A cen tra liza tio n of forms 1-4 should be avoided as fa r as p o s s ib le .^ )
A sub-report from the Norrland Committee (SOU 1949:3) also paid special
attention to the educational problems. I t was shown, e .g . , th a t 25% of
a ll farm ers 'fam ilies in Norrbotten had children boarded out, and the
social problems associated with the existing sparsely populated areas
were fu rth e r emphasized. Not least because of these problems was a con
centration of settlements found desirable
During the la t te r h a lf of the 1940's, there was renewed vigour in the
arguments fo r making society try to stop the emigration from rural areas.
In several motions in the parliaments of 1945 and 1947, i t was stressed
that development had reached a l im it where society ought to step in and
try to a ffe c t the migration by measures aiming a t the location of industr ie s and other enterprises
In 1947 The Committee fo r Industria l Location (Utredningen fö r närings
liv e ts lo k a lis e rin g ) was set up, and i t was authorized to investigate
and make proposals concerning the location of industries. Their report
was published in 1951 (N äringslivets lo k a lis e r in g , SOU 1951:6). The sec
re tary was the present professor of regional planning at KTH, Per Holm.
In the journal Plan nr 1-69 he commented on the report: "The population
decrease in certa in geographic areas and parts of the country should be
counteracted by an active decentra lization p o licy , which in the f i r s t
place should a ffe c t in d u stria l lo ca tio n , but secondly also social a c t iv i-

28
t i e s . . . The ta rge t could not be to preserve the population figures
in sparsely populated areas and rural d i s t r i c t s " . ^
I t is stressed in the report, that in Sweden, contrary to most coun
tr ie s on the Continent and to B r ita in , i t was the problems of the rural
areas that a ttrac ted a tten tio n . I f the expanding part of the economy
were concentrated in a few big c it ie s , the population figures would most
l ik e ly be stagnant or decrease in many parts of the c o u n tr y .^ In the
next few decades the labour occupied in agricu ltu re and fo restry would
probably diminish gradually. The labour put out of work would be trans
ferred to the urban trades. I f , as fa r as the location of the urban t r a
des is concerned, there were development trends s im ila r to those in the
la s t decades, the m ajority of the population unemployed in agricu ltu re
would, according to the rep o rt, most l ik e ly move in to lo c a l it ie s , and
to a great extent to the big c it ie s .
A concentration of urban trades to lim ited areas and to big centres was
regarded as unavoidable in many cases fo r economic reasons. The possi
b i l i t i e s , as had been suggested by the committee, fo r locating crafts
in sparsely populated areas or in minor centres were considered to be
lim ite d . "The most adequate solution w il l therefore probably in most
cases, be to try to locate the in d u stries , or other possible types of
enterprises, in the centres that already e x is t , and which can grow so
large and are situated in such a way th a t th e ir expansion might be bene
f ic ia l fo r the surrounding rural a r e a " . ^
In a discussion of the general views of the need fo r a regional policy
carried out by society , the report stated that "local areas with a sur
plus of labour may, only under special circumstances, influence regional
polic ies with the purpose of increasing the supply of employment. Instead,
from a regional policy point of view, i t would be b e tte r , in many cases,
to try to fa c i l i t a te the migration of labour to a place where there is a
shortage of labour and which is more favourable fo r production from other
points of v ie w .. . “

29
Nor is i t possible by a changed location of industries to provide equal
supplies of such f a c i l i t ie s that require a bigger population base to be
pursued. In th is case, however, regional polic ies can be pursued to pro
mote an equalization by concentrating the population and settlements
both lo c a lly and reg iona lly . Furthermore, by coordinating settlement plan
ning, ag ricu ltu ra l planning and d irec t regional p o lic ie s , i t would be
possible to support the development of the economy in small and medium
sized lo c a l it ie s , situated in such a way th a t they may be important as
commercial and cu ltu ra l centres fo r the population in purely rural areas.
Therefore the crucial point of the location issue would be: Which centres
should in fu ture increase and which possibly d ecrease?"^
Contrary to what happened to the contemporary expansion programme fo r
northern Norway, the reports, mentioned above, were not followed up by
any special regional action programmes. The regional po lic ies suggested
were mainly information and advice. On the other hand, point by point mea
sures were taken, e .g . , the establishing of Norrbottens järnverk -NJA-
(the Norrbotten Ironworks) at Luleå and Statens Skogsindustrier -ASSI-
(the National Forestry Industries) with plants in P iteå , Karlsborg and
elsewere.
2.3 Comments
A cautious in te rp re ta tio n of the o f f ic ia l a ttitudes in the 4CTs towards
the problems of Norrland and the G-areas would be that the o f f ic ia l out
look appears to move towards emphasizing the importance of the local cen
tres and regional systems. In the beginning of that period a careful con
centration of the most peripheral settlements to more productive areas is
recommended, although i t is im p lic it that a l l arable land should be t i l l e d .
The question of services was confined at the s ta r t to mean schools and
basic food supply. In the statement of principles of the Norrland Committee
of 1944 (Norrlands kommi tténs pri nei pbetänkande) i t was noted th a t the eco
nomy was lagging behind compared with the developed areas in middle and
southern Sweden, and the economy, based on the s o il , the forests and the
ore, should be developed, but simultaneously other parts of the economy
should be promoted and d iffe re n tia te d . From an in d u s tria l point of view,

30
e .g . , a certa in concentration o f the settlements should be strived fo r ,
but the need of labour in fo res try should be taken in to consideration.
The to ta l ag ricu ltu ra l production should be maintained to the same ex
te n t, and the required increase in the size of the farms should be brought
about by reclaiming rather than by merging exis ting farms th a t were un
su itab ly s ituated . I t is regarded as unfavourable to concentrate the popu
la tio n in to major centres, and the promotion of embryos of lo c a lit ie s is
ju s t recommended. The ro le of northern Norrland as being a 'breeding re
servation' is emphasized, but, at the same time, they point out that the
natural population increase should not lead to the necessity of emigration.
Nor should the labour put out of work from agricu ltu re and fo res try have
to go to southern Sweden to earn a l iv in g . But in Näringslivets lo k a li
sering , published in 1951, i t was stressed th a t in d u stria l a c t iv it ie s
should be located in centres conveniently situated and of such a size
th a t an expansion might be benefic ia l fo r the surrounding rural area.
Since the committee found i t in ev itab le that the urban trades be concen
tra ted in lim ited areas and major centres fo r economic reasons, an emi
gration o f unemployed people, previously occupied in ag ricu ltu re and
fo res try should be fa c i l i ta te d rather than merely attempting an increase
in local job opportunities. In th is context the report also mentioned
something that is today a currently central planning problem: the authori
tie s have to decide which centres shall in future increase or decrease
th e ir populations.
The school question was to play a ro le of growing importance in the de
bate on the location of the settlem ents. The cost savings, which were
referred to at the beginning of the decade as a reason fo r a modest cen
t r a liz a t io n , were replaced in the argument by q u a lita tiv e reasons and the
thought of a comprehensive school reform was also to have an e ffe c t in
the same d irec tio n .
2.4 The Period 1950-1965
From the end of the 194CTs, the labour market au thorities have gradually
become the dominant fac to r in the f ie ld o f regional policy . In the 1920's
the governmental labour market policy had consisted of in s ig n ific a n t adapta-

31
t iv e devices, c h ie fly labour exchanges, and a very re s tric ted unemploy
ment policy was carried out. The r e l ie f work and the unemployment bene
f i t s could on the whole be regarded as part of social w elfare policy.
In 1934, a B il l fo r unemployment insurance and an expansion of the
labour exchange was approved. This expansion, implying among other things
a certa in amount of vocational guidance and re -tra in in g , was accelerated
during the second world war. When the s itua tio n was back to normal a fte r
the war, the Labour Market Commission, as i t was then, was replaced by
a permanent organisation, Arbetsmarknadsstyrelsen (Labour Market Board,
AMS), and, a t the same tim e, the labour exchanges were nationalized once
and fo r a l l . Immediately a fte r the second world war, the ch ief goal of
economic policy was fu l l employment, and towards the end of the 1940's,
the labour market policy was looked upon in a widened context. Labour
market po lic ies were used to cope with problems in a period of economic
boom, and these po lic ies were much more integrated with economic policy
than they were p r e v io u s ly .^
In 1952 the commune merger reform, mentioned above (storkommunre-
formen) was carried out. The reason was p a rtly , th a t there has been a
substantial decrease in the population in many communes, and, p a rtly
that there were new and expanded tasks to be undertaken by the communes.
The introduction of the comprehensive schools was one of them. The number
of communes was cut down considerably, and a fte r the reform p ra c tic a lly
no commune had a population under 1000 people, a normal figu re being
2000-3000 inhabitants. But i t was not a question of adapting the new mer
ged communes to any form of functional regions, and, as w ill be shown be
low, a new commune reform was required.
As a consequence of The Committee fo r the Location of In d ustries , the
Location Bureau of AMS was established, and in 1955 th is bureau was given
the task of implementing a report, requested by Parliam ent, to design a
basis fo r the modelling of the fu ture economic and population structure
in the country, in the f i r s t place w ith in the Home O ffic e 's f ie ld of ac
tio n . 20h n 1958 the f i r s t parts of the reports were published, Befolkning
och Näringsliv (Population and Economy). The committee estimated that mi
gration would continue, although they did not exclude the p o s s ib ility of

32
people remaining in sparsely populated areas to a greater extent than
had been possible previously, commuting to work in the centres.
I t was pointed out in the report that lo c a lit ie s and sparsely populated
areas should not be looked upon separately , but together, and that i t
is essential to observe the development in areas consisting of both21 )centres and sparsely populated areas. 'Therefore, to make th is possible,
the country was divided up p rovis ionally into regions, each of which con
sisted of one major or medium-sized centre, as a regional centre, and the
surrounding areas. 101 such so called A-regions were delim ited , among
other things by means of Dahl's research on the extent of the commercial
hinterlands. In p rin c ip le , an A-region should have at least 30 000 inhabi
tan ts . A number of studies on the demographic and labour market develop
ment w ith in each of these regions are described in the report.
In 1960 the fin a l part of the rep o rt, Samhällsservice och lo ka lisering s-
verksamhet (Community service and location measures) was published. In
th is part of the report AMS considered that the p o s s ib ilit ie s of contro l
ling the regional development were small: "Taking in to account that the
p o s s ib ility of influencing the location of industries are lim ite d , the
goals must be extensively re lated to the dominant development trend s."22^
The d iv is ion in to regions was pursued in Samhällsservice och lo ka lisering s-
verksamhet by d ividing the A-regions in to B- and C-regions. The minimum
size of a B-region was 15 000 inhab itan ts , whereas the C-regions had a
minimum of approx. 7500 inhabitants. I t was pointed out in the report that " lo c a lit ie s having a population basis of 30-35 000 inhabitants , including
the surrounding h in terland, could be considered as being able to provide
good service, With a population basis of 7-8000 inhabitants i t is possible
to provide a re la t iv e ly d iffe re n tia te d service. In sp ite of the d e fic ien
cies in the service supply of the la t te r centres, they would most 1ikey
be accepted as places to s e tt le down in and to locate a plant in " .2^B u t
i t is also established as a fa c t , that a great number of small places lack
the prerequisites to a ttra c t industries , and that a decrease in the popu
la tio n must be accepted in these v illa g e s . Some of them have lo s t th e ir
importance as service centres, e ith e r to ta l ly or as regards some amenities

33
that have been forced to be concentrated in b e tte r situated centres. The
report states that the demands fo r service have increased substantia lly
and w ill probably continue to do so in the fu tu re .
In the 1950"s 9 the labour market policy was gradually reorientated from
an unemployment policy to an adaption p o licy , i . e . , re -tra in in g , migration
support, vocational guidance and other schemes, with the labour exchange
as the p rerequ is ite . P ara lle l to the above-mentioned AMS-research, i . e .
in the recession period of 1957-58, AMS also started an extensive labour
market policy programme, in which, above a l l , two concepts were stressed:
m obility of labour and s e le c t iv ity in the measures taken to stim ulate em
ployment.
In 1956, Balanserad expansion (SOU 1956:53) (Balanced Expansion) was pub
lished, i . e . , the report of the Långtidsutredningen (The Long Term In v e s ti
gation Committee) of 1955.
The report stated th a t the rapid pace of urbanization had been one of the
dominant features of the development in the la s t decades, and no slowing
down was expected during the next decade. Thus the number of people em
ployed in urban trades was expected to rise by 300 000 w ith in th is period,
i . e . by approx. 15%, even i f the to ta l urban population would not rise to
that exten t. In th is context they warned of overheating in the c ity regions
and h in t at the a d v is ib ili ty of decentralizing central bodies, which was
also followed up in a special public report. The Långtidsutredningen also
found i t important to u t i l iz e the regional labour surplus and recommended
the promotion, in various ways, of the m obility of labour. Thus construc
tion should not be located in places with a labour surplus, following the
law of the least e f fo r t , but, instead, the labour should move to places
where there was a need fo r construction. I t was also emphasized that such
an increase in house-construction th a t might lead to a certa in over-produc
tion would, most l ik e ly , promote the m obility of labour. At the same time
i t was pointed out, that i t was sometimes preferable to have a policy that had an influence on the regional development of the economy. But, as fa r
as agricu ltu re was concerned, a continuous in terna l and external ra t io n a li
zation ought to be achieved. Such ra tio n a liza tio n would make transferring

34
the ag ricu ltu ra l population to other trades possible, and thereby,
in the long run, f a c i l i t a t e a reduction of uneconomic production.
The idea behind making changes in the physical structure is closely re
lated to d ecentra liza tion . One example of th is is th a t the possible re
moval of c iv i l service departments and other in s titu tio n s that was la te r
d ea lt with by a special committee. This committee was constituted in 1957,
and its report Lokalisering av s ta t lig verksamhet (SOU 1963:69) stated
that i t was possible to remove approx. 120 in s titu tio n s , including approx.
30 000 employees. The reasons fo r a removal of c iv i l service departments
from Stockholm, given in the terms of reference to the committee were
that i t seemed to be desirable to avoid a too rapid growth of Greater Stock
holm, on the one hand, and to contribute to the economic structure in d if f e
rent parts of the country, on the other hand, by an active governmental lo
cation po licy . The proposals where not followed up, however, u n til the ques
tion was brought up again at the end of the 1 9 6 C T s .^
At the end of the 195CTs, AMS was also a c tiv e ly working on location re
ports fo r d iffe re n t counties. Such a report is Tornedalsutredningen. In
th is report i t was pointed out that the area of Tornedalen is extremely
l i t t l e in d u s tria lize d , and that more than 50% of the population are s t i l l
occupied in ag ricu ltu re and fo re s try , whereas the national figu re is approx.
20%. At the same time high b irth rates in th is area caused a much bigger in
crease of the productive part of the population than had been the case in
other parts o f the country. The s itua tio n in Tornedalen was therefore charac
terized by high unemployment, especia lly since fo res try had been recently
highly mechanized.
Migration during the next 10-year period was expected, but i t was stressed
that th is migration must be controlled in such a way that the age propor
tions would not become too unbalanced. On the basis of studies carried out
by professor Sven Godlund and Gunnar Rasmusson, an approximate picture of
the urbanization structure was given. The prospects were linked with the
growth of the centres. "The growth of the centres normally means, in addition to an increase in the number of inhab itan ts , an improvement in the
supply of services benefic ia l also to the surrounding rural areas. In the

35
attempt to preserve - or create - a l iv e ly country-side, the strengthen-26 Ìing of the service centres is an important lin k " . ‘'They were also in
favour of a revision of the d iv is ion of communes in Tornedalen. Both
the introduction o f the comprehensive school and the construction of a
well d iffe re n tia te d local vocational education were considered to re
quire a bigger population basis than these communes had.
AMS also in it ia te d a committee to deal with the problems of fo re s try ,
Skogsbrukets arbetsmarknad, (The Labour Market in Forestry, SOU 1956:36.
The thinning of the population in fo restry areas was considered to have
caused a concentration of both the settlements and the school. But the
concentration of schools had been much fas te r than that of the s e t t le
ments, and i t would, most l ik e ly continue to be so. A fte r the c e n tra li
zation o f the higher forms, the number o f children in the lower forms
in many v illag es would not be s u ffic ie n t to ju s t i fy an elementary school
(bygdeskola). Therefore, a necessary p a rtia l cen tra liza tio n enforced a
to ta l c e n tra liza tio n , according to the report. The committee fu l ly agreed
with the view of the Norrland Committee, that a continuous concentration
of the population was desirable. But they warned of the consequences of a
too strong concentration - there should not be too long and inconvenient
distances to important timber cutting areas. Types of school, which in
prin c ip le were to vanish from the school system, - B3 - were recommended
fo r extremely sparsely populated areas, since the consequences fo r the
people liv in g in these areas would otherwise be very s e r io u s .^
In 1960, the Swedish Confederation of Trade Unions (L0) established a team,
given the task of examining questions concerning the structura l problems
of industry. The report o f the group - Samordnad n äringspo litik - (Co-ordi
nated Economic Policy) was published in 1961. In th is report i t was stated
that regional po lic ies cannot be separated from labour market p o lic ies : in
both fie ld s the task was to give selective support to expansion. "Conse
quently, we disapprove of such location p o lic ie s , th a t work fo r an a r t i
f ic ia l spreading of a d iffe re n tia te d economy, that counter-act the natural migration of labour from areas lacking the p o s s ib ilit ie s of development,
and fo r a rb itra ry reasons, that obstruct the migration into c ity regions".
The main task fo r Swedish location policy was considered to be the promotion

36
of a concentration of industries in the expanding parts of the country,
and they opposed the ambitions of the au th orities to obstruct the estab
lishment and expansion of industries in the biggest urban centres in
Sweden, i . e . the Stockholm, Gothenburg and Malmö regions. I t was con
sidered unsuitable fo r an enterprise to take socio-economic calculations
into consideration, and they maintained, that enterprises run by the s ta te ,
the communes as well as by private owners should take account of no other
aspects than business-oriented ones. The development and the planning of
the in s titu tio n s and enterprises owned by the community also have a strong
influence on p rivate enterprises, and they emphasize the importance of d i
recting public enterprises according to a c e n tra lis tic a l pattern. "There
fore i t is of great importance, that the community i t s e l f , when locating
its own establishments, follows the princip les that promote an optim ally
ra tiona l structure in the economy as a whole".
As regards the impact th a t the so called Wage S o lid a rity Policy has on the
region policy process, the committee thought th a t, "in its widest impact
i t might have a conserving influence on the employment strucutre". This
policy meant a d e liberate abstention from using wage d if fe re n tia ls as an
incitement fo r m ob ility . Then, i t is argued, one ignores the fa c t that the
constant wage pressure that the wage s o lid a r ity policy was expected to put
on weak industries , must enforce ra t io n a liz a t io n , and in those cases where
such p o s s ib ilit ie s are exhausted, to the closure of firm s. This was conside
red to be a more e f f ic ie n t way of bringing about the migration of labour
than to try to do so by wage d if fe re n t ia ls . Of course, one prerequisite would
be th a t there should be a high ra te o f employment, and th a t an active labour
market policy were operating.
To sum up, i t could be said th a t the labour market po lic ies and the regional
polic ies have to accept the need fo r adaption and m igration, and that these
polic ies must work in step with the development towards more concentrated
in d u stria l units and a pattern of more concentrated settlem ents. Trade, tax
and c re d it polic ies can be conveniently used as tools to bring about greater29)
compulsion and increased incentives fo r m obility w ith in the economy.

37
As has been mentioned above, (p 31 ) , the commune merger reform, passed in
1952, was soon found to be in s u ff ic ie n t, and seven years la te r , in 1959,
the so called "indelningssakkunniga" (merger experts) were appointed.
They were given the task of examining whether a revision of the existing
division of communes could be regarded as necessary. The report of th is
committee, Principer fö r en ny kommunindelning, (P rincip les fo r a new d i
vision into communes) SOD 1961:9, was published two years la te r . The com
m ittee had been assisted by geographic experts, among others Torsten Häger
strand and Sven Godlund. Two population prognoses, Godlund's and Guldbrand-
sen's, formed a basis fo r the evaluations of the committee. The communes
had been given new re s p o n s ib ilities during the past period. Among other
th ings, the Parliament of 1957 had been in favour of a general tra n s itio n
to a compulsory 9-year comprehensive school, s ta rtin g from the school year
of 1962-63. The committee stated , that i t took a population of 7500-8500 in
habitants to ju s t i fy the organisation of the education fo r a l l subjects and
streams in the 9th form.
Social w elfare and the care of the aged were two other sectors requiring
increased resources. The committee stated, that the size of a home fo r the
aged of approx. 40-50 places would o ffe r the optimal p o s s ib ility of giving
adequate care at a reasonable cost. A population basis of 5000-6000 people
was needed fo r a home fo r aged people of that s ize , according to the com
m ittee, and the same minimum figu re was considered va lid fo r social w elfare .
The care of alcoholics was estimated to require la rger resources, as well as
health care. Further more, Socialstyrelsen (The National Board of Social Wel
fare and Medical Care) had stated that the d iffe re n t tasks of the social sec
to r ju s t i f ie d a commune size of a t least 10 000 inhabitants. Thus, public
general p ra c titio n e r d is tr ic ts generally had 4000-7000 inhab itan ts , and an
expansion of the organization of medical care should be implemented c h ie fly
by an increase in the number o f doctors per d is t r ic t , and not by an increase
in the number of d is tr ic ts . A two-doctor practice was considered to need a
basis of 7500-8000 inhabitants. From a housing policy point of view i t was
also desirable th a t a commune included both a centre and its h in terland,
since in that case there would be greater p o s s ib ilit ie s fo r making an objec
tiv e balance in the housing construction in the centre and the h in terland.

38
As regards the location of in d ustries , the committee referred to the
divis ion by AMS into A-, B- and C-regions. I t was considered d i f f ic u l t
to locate industries and enterprises of any considerable importance in
places smaller than the C-centres, i . e . centres in regions with at least
7500 inhabitants. As regards the police fo rce , the committee argued that
a police d is t r ic t should have a strength th a t was ju s t i f ie d in a few communes o n ly .3<̂
According to the committee, the above-mentioned community resp o n s ib ili
tie s a ll indicated fu rther commune mergers, even though they were, natu
r a l ly , aware o f the disadvantages th a t might arise . The number of c iv i l
servants might increase, and that was regarded as a positive fea tu re , since the u t il iz a t io n of c iv i l servants would give the appointed repre
sentatives more time to devote themselves to matters of p rin c ip le .
I t was considered important fo r the commune to be b u ilt up around a cen
tr a l place, which could function as an autonomous centre fo r services;
thus the new communes should be constructed on principles of the central
place theory. To an increasing exten t, community service a c tiv it ie s should
be located in the main place to which the population of a certa in area
trave l of th e ir own accord. The ta rge t fo r the minimum size of a commune
in 1975 was set a t . 8000 inhabitants. Such a system of merged communes was
considered to have a stable population development, and, on an average,
a re la t iv e ly major part o f the population lived in , or close to , the centre
of the merged commune. The boundaries o f the new communes were recommended
to be drawn according to Godlund's method to define the h interland but nor-31 )mally adjusted to the existing boundaries of the communes. 'Thus, the com
mune reform implied decentra liza tion on a national level inasmuch as the
f ie ld of action of the communes was extended. On the other hand, on a local
le v e l, i t meant c e n tra liza tio n , because the communal functions were concen
trated to the centres of the new communes.
Delegationen fö r ö v e rs ik tlig vägplanering (The Delegation fo r General Road
Planning) noted in th e ir report, Vägplan fö r Sverige, SOU 1958:1, a struc
tu ra l change in the central place system w ithin the regions. Several centres

39
had been set aside by bigger and more v ita l centres, and they had also
p artly lo s t th e ir central function. I t was considered th a t th is develop
ment would continue. Planning ought to aim at creating a system of re la
t iv e ly d iffe re n tia te d and vigorous centres, situated at a reasonable
distance from each other, and located in such a way th a t the population
liv in g in the country-side and in small v illages could share these cen
tr a l services without too great tra v e llin g distances.
The consequence, as fa r as road planning was concerned, was, that i t was
considered as natural that the so called 'parlbandsprincipen1 (the neck
lace p rin c ip le ) would be used when forming the national road net, i . e . to
strengthen, to the greatest possible exten t, the links between the impor
tant nodes, ' p e a rls 1 . ^ F o r the investment period of 1962-67, 50% of the
to ta l costs of the roads in the countryside were recommended to be spent
on the new national road network, thereby improving the more frequently
used roads which are p a rtic u la r ly important fo r the economy. This applied
to both the national and the country road n e tw o rk s .^
In the Parliament of 1959, motions were tabled that led to the setting
up of a committee called Kommittén fö r näringslivets lo ka lisering (The
Committee fo r the Location of In d u stries ). The chairman of the committee
was the Provincial Governor of the country of Norrbotten, Manfred Näslund.
The report of the committee, Aktiv lo k a lis e r in g s p o litik , SOU 1963:58, was
published in 1963.
The view of the committee was that development had led to a s ituation that
was, in some parts of the country, disturbing and required immediate, vigo
rous p o lit ic a l measures. There had been a lack of an overall regional policy
ta rg e t, and the aims of the location polic ies recommended by the committee
were drawn up in the following way:
1) to promote such a location of industry that the country's access to the
factors of production would be u til iz e d and d is trib u ted in d iffe re n t
ways in such a manner that national income would be as large as possible
and the labour force fu lly employed.

40
2) to create a harmonious social environment which can, as fa r as pos
s ib le give people - no matter where they have to liv e to f u l f i l th e ir
tasks - equal standards as regards social and cu ltu ra l service.
3) to locate industry in such a way that the defence of the country w ill be fa c i l i t a t e d .35^
The committee sta ted , th a t they wesie mon.e and mosie convinced th a t the G- pA.oblemô LOQjie pAobtemò o£ locaJUXieA.
Thus they said , e .g . , that "the conditions fo r maintaining a reasonable
standard of services fo r the population in G-areas depends on the continuing
development of urbanization. The crucial point is thus not, whether sm all,
urban agglomerations, in s ig n ific a n t from a service point of view, can keep
th e ir populations, but th a t there w ill be a s u ffic ie n tly fine-meshed net of
centres with service fa c i l i t ie s of d iffe re n t kinds and ex ten ts".35)
They warned that the continuing reduction in employment w ithin agricu ltu re
and fo res try might lead to a s ituation where the comparatively favourable
development o f the service trades in regions with weakly developed industry
might be in terrupted.
The supply of services in the centres of large and sparsely populated, rural
areas are highly dependent on the basis in the h in terland , and a decline in
the population in these areas could cause a decline in important aspects of
the service. Therefore, the location policy fo r these areas should aim at
stim ulating employment in industry and service trades, and a t d irecting the
employment geographically, in such a way that vigorous centres with a d if fe
ren tia ted industry would be developed. Economic support ought to be provided,
in such a way th a t the expansion of certa in service centres would be stimu
la ted , but with the aim of creating by these means an econorny with its own
vigour. The committee considered the decrease in employment in agricu ltu re
and fo res try as an expression of an increase in e ffic ien cy which was desi
rable in i t s e l f and because i t maintained the competitive strength of the
timber industry. In d u s tr ia liza tio n of the sparsely populated areas was not

41
regarded as p laus ib le , not least because firms made such demands fo r
accessible services, that only the urban centres could in general in te rest them at possible lo c a t io n s .^
The committee made a number of proposals fo r a more active regional policy.
In 1964, Parliament decided on the goals of regional p o licy , and in A p r il,
1965, issued a Royal Proclamation on governmental regional a id , which came
into operation on July 1st the same year. The main points of the regional
polic ies from 1965 onwards w ill be described below. (Chapter 5 ).
2.5 Comments
As has been pointed out above, in the course of the 1940“s the o f f ic ia l
view of the G-problems in Norrland gradually changed towards thinking in
terms of central places and regions. During the subsequent period, th is
trend is s t i l l more obvious.
In the 195CTs, the labour market au thorities commenced a more active
labour market po licy . I t was no longer a matter of preserving agricu ltu re
in Norrland in order to strengthen the national ag ricu ltu ra l production.
The maintenance of certa in parts of the agricu ltu re was more an argument
fo r avoiding unnecessary hardship fo r fo res try . The thing that was to pre
serve purchasing power and the s ta b il i ty of the new local communes was to
be the growth of central places, and the minimum population required fo r
public and other services suggested, that in practice i t would be the cen
tres of the communes that would work as poles. The new communes were designed
according to cen tra l-p lace -th eo re tica l p rin c ip le s , the road net was planned
mainly to lin k to major nodes together, and the employment goal of LO was
set in such a way that the 'n a tu ra l' exodus from the G-areas and the small
lo c a lit ie s would not be counteracted. Not u n til the beginning of the 1960's
were the lo ca liz in g princip les in "Näringslivets lo k a lis e rin g ' (SOU 1951:6)
taken up again, and a programme fo r regional policy was presented in 1965.
In chapter 1, section 3, i t was mentioned that the economic considerations
on a national level seem to have had a cen tra liz ing in fluence, whereas the
planning of the physical structure has had the opposite e ffe c t. By and large,

42
the survey of the public reports has confirmed th is dualism. The idea
of a fu n ctio n a l, decentra lized , physical structure has been counteracted
by the s tr iv e fo r economic growth that has been the central theme in
national economic planning. Spontaneous and s e c to r ia lly directed migration
has rap id ly changed the economic and demographical conditions in many of
the new communes, and, thereby, the active location polic ies endorsed by
the Näslund committee have been obstructed.
2.6 ’Glesbygdsutredningen’ - The Investigation of the Sparsely Populated Areas
The studies th a t are of the greatest in te re s t fo r th is thesis are the
above-mentioned sub-reports of the Glesbygdsutredningen and its fin a l re
port, "Glesbygder och glesbygdspolitik" (1972:56). In many ways the report
deals with matters of d ire c t in te re s t to th is thesis. Therefore, in my view,
i t would be of value fo r the reader to have, at th is stage, information on
what has become the o f f ic ia l view of the G-problems, and a b r ie f account of
the main points of the sub-reports w ill therefore be given below.
The G-problems are problems of a c c e s s ib ility , i . e . d if f ic u lt ie s fo r the
population to have access to important public and commercial services. Ac
cording to 'Glesbygdsutredningen', th is makes i t especially urgent to main
ta in public transport f a c i l i t ie s in the G-areas. In many G-areas the G-pro-
blems are on the whole ordinary communication problems, and people's d i f f i
c u ltie s in gaining access to d iffe re n t forms of service can c h ie fly be re
duced by improved transport f a c i l i t ie s . Also in such extremely sparsely in
habited areas in which measures have to be taken to maintain the fixed ser
v ice , there are transportation needs that have to be met by c o llec tive means
of communication, also including taxi-cabs.
In th e ir general consideration of the need fo r service establishments of
d iffe re n t kinds in G-areas, the s ta rtin g -p o in t fo r the committee has been
that the basic needs fo r servi ces,which are of p a rtic u la r in te res t to people
in G-areas, can be grouped schematically by how eas ily they can normally be381met so that the standards of service can be considered s a tis fac to ry . ' The

43
committee considered that a l l the important relevant service functions
could be grouped into two need le v e ls , namely 1) a local le v e l, re fe r
ring to the most basic and frequent needs, which ought to be met w ithin
a distance regarded as reasonable fo r d a ily tra v e l. 2) a regional level
corresponding to a more q u a lifie d service supply, where a lower degree of
a c c e s s ib ility ought to be acceptable. The committee also discussed which
service functions could be considered to be of special importance and under which level they should be c la s s ifie d .
The committee thought that the service supply of the sparsely populated
areas could be considered as s a tis fa c to r ily provided, i f the local and
regional battery of services, containing a ll the important service func
tion s , was also, to some extent, spread into the sparsely populated areas.
As regards the most basic local service functions, one might accept a
tra v e llin g time of 30-40 minutes one way, i . e . what is normally regarded
as an acceptable maximum distance fo r the d a ily journey to work. As re
gards the more q u a lifie d regional services mentioned, the committee f e l t ,
th a t, as fa r as a c c e s s ib ility was concerned, the standard of services could
be regarded as s a tis fa c to ry , i f regional service centres could be reached
w ith in a couple of hours. One condition fo r such a concentration of the
fixed service establishments to be acceptable was that the people in the
area had access to local and regional public means of transporta tion , making
i t possible to reach local and regional service centres.
Furthermore, the committee held the view that a ll households ought to have
access to public transport. Taxi-cabs th a t could be ordered in advance,
where also included. A reasonable frequency of transport service meant con
nections at least twice a week to commune centres or local service centres.
According to the committee, the battery of services, mentioned above, in
cluded grocery shop, hardware shop, chemist's shop, decorating supplies,
men's and women's o u t f i t t e r s ' , pharmacy, ordering stations fo r wines and
s p ir i ts , petrol s ta tio n , motor garages and other domestic repair services
such as plumbing, e le c tr ic a l in s ta lla tio n s and the maintenance of domestic
appliances, such as radio and TV, men's and women's hairdressers, cafés and
banks.

44
By and large th is l i s t covers what elsewhere w ith in the G-reseach has
been considered as an adequate battery of services.
I t is thus p rim arily through transport measures that Glesbygdsutredningen
considered th a t the s ituation of periphera lly s ituated households, lacking
access to means of transportation of th e ir own could be re lieved . The idea
of d ire c t subsidies to neighbourhood services was re jec ted , and instead
d iffe re n t kinds of investment support were recommended. Support ought to
be given to finance the new construction, the rebuilding and the enlarging
of shop premises and other buildings needed by firm s , or to get in ternal
f i t t in g s and equipment.
In previous discussion memoranda, the view was that the planning fo r the
G-areas should aim a t three service leve ls : neighbourhood services, commune
centre services ( lo c a l) , and regional services. In th e ir fin a l report they
considered i t as u n re a lis tic to discuss neighbourhood services (grocery
shops, primary schools, petrol s tations) as a general planning ta rg e t for
G-areas. Neighbourhood services in these areas could only ex is t in the form
of mobile service u n its , according to the committee. In th e ir f in a l report,
a tra v e llin g time up to 30-45 minutes, one way, was regarded as to le rab le
fo r the most frequent service n e e d s .^ However, they regarded the access
to fixed services as important fo r the population in G-areas, but they con
sidered as reasonable that special community support should be directed to
basic service functions in commune centres. Measures to maintain service
functions in a fixed form outside the main commune centres ought to be taken
only in such areas of depopulation, in which an acceptable service standard
would not be achieved by normal transport subsidies. Thus, a primary goal
fo r the policy fo r the G-areas should be to contribute to the maintenance
of public transport f a c i l i t ie s , which make i t possible fo r those who are
dependent on these fa c i l i t ie s to get to major service centres at low cost
and frequently enough, as well as to get goods and services brought to th e ir
homes. According to the committee there is no reason to believe that the popu
la tio n in G-areas in general would benefit from public measures taken to pre
serve a service structure which was established under other economic con
d itio n s , and with lower demand fo r the extent and types of service. The im-

45
portance of fixed nuclei fo r services was however, emphasized, and a
system of various forms of agencies, complementary to the mobile ser
vices, was outlined .
The following chapter is also of a background character. A substantial
part of the reference li te ra tu re used fo r th is thesis orig inates from
the behavioural sciences. With regard to what has already been said
about planning which is more and more centred on the in d iv id u a l, I have
considered i t to be urgent to give a survey of the works th a t the ap
proaches and the methods used in chapter 4-6 are based upon.

46
Notes to chapter 2
123
4
5
6
7
8 9
10
1112
13
14
1516
17
1819
20
21
22
23
24
25
26
27
28
29
30
31
Claesson (1972) pp 7-10 and p 31.
M eijer (1956) pp 83-86.
Sandlund (1971) in ftydberg(ed): Vårt behov av re g io n a lp o litik .
SOU 1943:39, p 13 and pp 191-194. The quotations are more or less d ire c tly translated from Swedish. In the following there w ill only be a note (translated quotation) in such a case.
SOU 1949:1, p 16. Translated quotation.
Ib id . , pp 31-44. Translated quotation.
pp 231-249.
SOU 1940:36, p 18 and 24.
See also SOU 1956:36, p 158 e t seq.
SOU 1961:9, p 13.
See also Marklund (1970) p 38f and Richardson (1968).
SOU 1949:3, p 155 et seq.
Näslund-Persson (1972) p 34.
Holm, Per (1969) p 29.
SOU 1951:6, p 9.Ib id , p 92.
Ib id , p 167 e t seq. Translated quotation.
See also ftydberg (1971) p 19.
Uhman (1968) in SOU 1968:62.
See also Rydberg (1971) p 19.
Kungl. Arbetsmarknadsstyrelsen (1958) Befolkning och N ärings liv , p 5.
Kungl. Arbetsmarknadsstyrelsen (1960) Samhällsservice och loka liserings-verksamhet, p 5.
Ib id , p 63. Translated quotation.
SOU 1956:53, pp 32, 36, 104 and 117.
See also Rydberg (1971) p 20 et seq.
SOU 1960:37, p 146. Translated quotation.
SOU 1956:36, p 182 e t seq.
Landsorganisationen (1961) p 65f. Translated quotation.
Ib id , pp 155, 161, 185 and 206 e t seq. Translated quotation.
SOU 1961:9, p 84-116.
Ib id , pp 137, 176 and 237.

47
32) SOU 1958:1, p 38.
33) See also Kungl. Arbetsmarknadsstyrelsen (1960) p 164.
34) SOU 1958:1, pp 121 and 224.
35) See also Naslund-Persson (1972) p 39.
36) SOU 1963:58, p 119.
37) Ib id , pp 120, 215 e t seq. and 341.
38) "Need" w ill la te r be used in a more lim ited sense, (chapter 6, p 154 e t seq .).
39) I t may be of in te re s t to note that a tra v e llin g time of 45 minutes to work and to a regional service centre has been set as a standard in the proposal fo r a regional plan fo r the Stockholm area. Kommunalförbundet fö r Stockholms stad och läns regionala frågor (1971) p 24.

48
3 The Behavioural-Science Frame of Reference
The behavioural-science research plays an important complementary ro le fo r
the more tr a d it io n a lly social s c ie n t if ic studies, under which th is thesis
and other studies on the general regional planning can be categorized. A
number of sociological and ethnological studies have been intensely pre
occupied with the problems connected with depopulation. At the same tim e,
during the la s t decade, there has been an increased in te re s t in the ap
proaches and methods of the behavioural-sciences among those who deal with
the theory of geography. Among those works the follow ing should be mentioned:
Torsten Hägerstrand's time budget studies and Peter Gould's "Mental Maps",
as well as Julian Wolpert: The Decision Process in Spatial Context, Allan
Pred: Behavior and Location, and R.E. Pah!: Sociological Models in Geography.
Within the research on migration a behavioural-science approach has been used
much e a r l ie r , see e .g . Börje Hanssen's paper "The h o lis t ic approach" in the
co llection of essays Migration in Sweden (1957).
The basis of cooperation with behavioural-scientists and also with other
sc ien tis ts has been broadened, when geographers, to a greater exten t, grew
more and more interested in d iffe re n t types of social planning. The cross-
s c ie n tif ic approach th a t has been required fo r the new tasks, has been f r u i t
fu l , and in many respects th is has meant mutual giving and taking.
As has been mentioned in the previous chapter, parts of the G-research pro
je c t , the Department of Geography at the U niversity of Umeå have been car
ried out with the d ire c t cooperation of the Department of Sociology a t the
same u n ivers ity . Simultaneously, much m aterial has been produced w ith in both
sociology and ethnology, m aterial th a t n a tu ra lly is bound to be the s ta r tin g -
point fo r a study of G-problems, both fo r the analyses and the discussion of
planning.
In th is chapter, I shall give an account in b r ie f of the socio log ical, the ethnological and other studies of a b ehav io u ra l-sc ien tific character that
have formed the most important references fo r th is thesis .

49
One early sociological study was made by Bengt G Rundblad: Problems of
a Depopulated Rural Community (1957). Rundblad used both socio-anthropo-
logical and conventional sociological methods, and he took an active part
in the community in a small place in northern Sweden, 'F o re s tv il le ', fo r
nearly h a lf a year. In 'F o re s tv il le 1 the usual disadvantages of the G-
areas predominated, and the population had continuously declined during
the past 50 years. Rundblad analysed the grounds fo r discontent that he
considered to be the background of the depopulation, and he noted three
p rin c ip ia i points: Poor means of support, a declining sense of community
in ag ricu ltu ra l work, mainly caused by the ra tio n a liza tio n s in th is sec
to r , and the spreading of urban culture and an urban set of values to the
rural areas. He stated that the people of 'F o re s tv il le 1 were insecure,
both economically and psychologically , and th a t they isolated themselves
from the rest of the community, especially from the nearby centre, where,
unlike 'F o r e s tv il le ', the development had been prosperous. Rundblad was
not prepared to give a solution to the problem with the in s u ffic ie n t know
ledge a v a ila b le , and he pointed out the need fo r continued research.
In 1959, Göran Lindahl and Birger Lindskog published a study of small lo
c a lit ie s : De små tä torte rn a - omland och utnyttjande. The study was based
on m aterial from studies in western Värmland. What makes th is study p a r t i
cu la rly in teresting is that the travel and movements of the population have
been recorded, thus, mapping the f ie ld that an ind ividual moves w ith in during
work and le isu re . The basic m aterial consisted of d iaries kept fo r a fo r t
night by every in d iv id ua l; in that respect i t is s im ila r to the time budget
studies which have been carried out at Lund U niversity under the d irection
of Torsten Hägerstrand.
The fa c t th a t, seeing i t from the point of view of the h in terlan d , the d if f e rent lo c a lit ie s seemed to function in d iffe re n t ways, each one having its
special functions, was one o f the most important observations in Lindahl's
and Lindskog's study. The fa c t that one large centre had a d iv e rs ifie d eco
nomy did not necessarily mean th a t those who lived nearby u til iz e d its pos
s ib i l i t ie s ; when surveying a net of small and big places, one could observe
that they were fu nctiona lly d iffe re n tia te d in re la tio n to the h in terland.
I t was apparent th a t trave l to work and to shopping went in d iffe re n t di ree-

50
tions and were very seldom combined. The size of the h interland varied
in a pronounced way with d iffe re n t functions. Private social l i f e was
nearly always conducted w ith in a closer c irc le than the shopping or jobs.
The movements o f the e ld e rly population were thoroughly re s tr ic te d . Their
conduct of l i f e had been lim ited to a minimum of motion, both geographi
c a lly and tem porarily. Another case when the p icture of the motion fie ld s
formed a pronounced pattern was when the research lo c a lity was situated
in the v ic in ity of a major lo c a lity . The m ajority of the movements w ithin
the lo c a lity were then directed towards th is major lo c a lity fo r the pur
pose of shopping, le isu re a c t iv it ie s and v is its to various in s titu tio n s .
Only the journeys to work went mostly in other d irections and were spread
over a great number of places. I t was obvious how the research lo c a lity
was situated in the shade of the major centre. Shopping lo ya lty was small.
The general grovery shop, with a rather poor varie ty of merchandise, had
only a 20% share of the shopping journeys.^0n the other hand, i t was the
view o f the authors that the local shops stood a b e tte r chanse i f situated
at a longer distance from a major centre.
F in a lly , in De små tä to rte rn a , the functional d iffe re n tia t io n of the lo
c a lit ie s was emphasized. The authors regarded a strong s p li t to be natural
and something th a t had to be accepted. The question whether a region should
be mono-nuclear or b i-nuclear was considered to be irre le v a n t from the in d i
v id u a l's point of view: the f ie ld w ith in which an ind ividual moved had a
great number of nodes, and thus i t was poly-nuclear. The authors also war
ned against over-estim ating the p o s s ib ilit ie s of industry in ru ra l areas
ò t a b J J iL z lv iQ the s itua tio n in a G-area: " .. .a n enterprise employing some hund
reds of people has a remarkable a b il i ty to change the s ituation of the popu
la tio n and habitation w ith in wast areas".
The migration pattern of the fo res try workers described in Mårten Bendz'
and Birger Ytterm yr's study Skogsarbetskraftens arbets- och servicefärder
(1966), reminds one in many respects of the study described by Lindahl and
Lindskog. A special feature of the journeys conducted by the fo res try workers
was th a t the journeys to work and to services went in separate d irections . The

51
recent increase in the consumption of central services, shopping, social
contacts e tc . , had caused more hardship and costs fo r the service jo u r
neys. Simultaneously the compensation fo r travel expenses had been gradual
ly improved, which had meant th a t the hardship of journeys to work had been
re la t iv e ly diminished. These changes had meant that the fo res try workers
experienced the marginal hardship in connection with journeys inwards (fo r
service e tc .) to be greater than the marginal hardship connected to jo u r
neys outwards, i . e . , towards the work places. The resu lt of th is was a trend
towards a pattern of more concentrated hab ita tion .
The problems of G-areas in Skåne have been studied by a team at Skånes
re g io n p lan e in s titu t: Kommunikationer och service på glesbygd (1968). The
aim of the study was to gain knowledge of how aged people in such areas ex
perienced th e ir s itu a tio n , and what fie ld s that should be given p r io r ity
when try ing to improve th e ir conditions. The target group was people over
67 years of age. I t was established that the lim ited communication p o s s ib ili
ties had a strong e ffe c t on the u t il iz a t io n of d iffe re n t kinds of service.
As regards medical care, a s lig h t ly smaller consumption could be observed in
predominantly rural areas, whereas no s ig n ific a n t d ifferences in consumption
could be observed by an increasing time distance. A contributive explanation
to th is might be that there is no d is tin c tio n made in the study between medi-2 )cal care performed by medical doctors and by d is tr ic t nurses. '
Harald Swedner's thesis Ecological D iffe re n tia tio n of Habits and Attitudes
(1960) should also be mentioned among the references. He compared habits and
attitudes between the urban and the rural population in the Hässleholm area
in southern Sweden. The h interland was defined by means of studies of the
areas w ith in which people tra v e lle d . The study was based on an extensive
questionnaire. Swedner found c le a rly s ig n ific a n t d iffe rences , and he drew
the conclusion th a t "the urban-rural variab le is s t i l l of some significance
fo r the varia tion in habits and a ttitudes in the area studied". He expected,
however, the d ifferences to diminish as a consequence of improvements in the
means of communication, e .g . an extended ownership of cars and TV-sets.
52
Swedner continued the discussion on sp ec ific rural a ttitudes and habits
in the chapter "Social s truktur på landsbygden" in Svensk samhällsstruktur
i sociologisk belysning (1965). In th is context, Torsten Hägerstrand's
studies on innovation spreading in a Swedish rura l area should be mentio
ned, which shows, among other th ings, how the private information f ie ld
of d iffe re n t individuals affects the d isposition to accept inn o vatio n s .^
A great number o f studies have dealt with the geographical and professio
nal m obility of labour. In 1961, Einar Neymark published his thes is , Selek
t iv rö r lig h e t. He tr ie d to establish how the apparent se lective trends
varied depending on education, in te llig en ce and social o rig in in connec
tion with emigration from communes, counties and rural areas. The study was
based on a sample of a male age group, and Neymark also showed the changes
that occurred, as regarded trades and professions between the age of 21 and
25, the d is tr ib u tio n of trades and professions in th is age class, and how
these variables could be re lated to the above-mentioned background variables.
The study showed c lear differences in the migration structures. The migra
tion was conducted according to the patterns typ ical of a p a rtic u la r back
ground or neighbourhood. The higher the education, the more intensive was
the m igration, especia lly in p a rtic u la r ly ru ra l areas.^A s regarded i n t e l l i
gence, Neymark also found indications of a se lective m igration: there was
a c lear overrepresentation o f those with high in te llig en ce among those mi
grating a long distance and among those who migrated d ire c tly from a rural
d is t r ic t into an urban area.
Bengt G Rundblad's thesis Arbetskraftens rö rlig h e t (1964) d ea lt c h ie fly
with professional m ob ility . The research area was Norrköping. Certain data
about geographical m obility were however given; thus i t was established
that the number of geographical changes of jobs decreased highly with in
creasing age. The oldest group investigated (34-45) made 0,29 changes on an
average, during a 5-year period, whereas the figu re of the younger group
(born 20 years la te r ) was 0,79.
Rundblad was also the leader of the pro ject In fly tta d arbetskrafts anpass
ning i en expanderande arbetsmarknad, (sub-reports published in 1968). Here
geographical m obility was stressed; the research population consisted of

53
Swedish c itizen s who had moved into the A-regi on of Gothenburg in August-
October, 1966, and were employed in firms with more than 100 employees.
The age d is tr ib u tio n of the investigated migrants was s tr ik in g ly skewed,
with 75% under 25 and only 9% over 39 years of age. The educational level
of the migrants was re la t iv e ly high: 42% had an education corresponding
to 'realexamen1 (0 - le v e l) or more, 16% had 'studentexamen' (A -leve l) or
more. 39% of the migrants came from rural areas.
Among the reasons fo r leaving the place of o rig in , those that had to do
with the job predominated. The older people mentioned the job more often
as a reason, whereas the younger ones mentioned education and environment.
Most of them were p os itive ly disposed towards the m igration, but approx.
1/3 of the migrants would have preferred to move to a smaller p lace, and
the same number would have preferred to move to a place closer to th e ir
place of o rig in . 41% regarded i t as a ' t r i a l ' m igration. Only 10% of the
migrants had any economic support from the labour market au th o ritie s . To
many of them the geographical change meant a social change: 15% of those
who were categorized under social group 2 before the m igration, were cate
gorized as members of social group 3 a fte r the m igration, whereas only 7%
had changed from social group 3 to 2 in connection with the m igration.
2/3 of the migrants had a wage increase, while 1/4 had got lower wages a f
te r th e ir m igration. Their housing costs had r isen , and the standard of
housing had generally decreased. On the other hand, sa tis fac tion with the
new job was high throughout, and there were very few who were d is s a tis fie d
with the social service in the place of immigration. Many of them thought
that the migration had meant an improvement in that respect.
General sa tis fac tion a fte r the migration was somewhat higher among those
with a high level of education than among those with a lower one. In the
oldest group, 50-64 years of age, there was a greater proportion of d is sa tis fac tion than in the other groups. Moreover, i t was evident that those
who lived in an urban area before the migration were b e tte r adapted than
those who lived in a rural area. A point of special in te re s t fo r th is the
sis is the fa c t , th a t the migrants from the four northernmost counties (län )

54
were worse o ff than the others as regards both housing and working con
d itio n s . This applied also to the change in wages and social groups.
In 1966, the County Adm inistrative Board in the county of Älvsborg pub
lished an analysis of Dalsland, w ritten by Ake E. Andersson: Glesbygd
och lo k a lis e r in g s p o lit ik . Among other th ings, an a ttitu d e survey in the
form of interviews and ^n extensive manpower investigation (arbetskrafts
(AK)-undersökning) were used as a basis fo r an analysis. Andersson in
vestigated the w illingness to m igrate, and he found that the m ajority pre
ferred to move out, in case of a long period of unemployment. But the group
unw illing to move was considerable. There was no s ig n ific a n t correlation
between the length of time that a not fu lly employed individual had lived
in his home commune and his w illingness to migrate. Furthermore, i t was
evident that a very small frac tio n of the under-employed was w ill in g to
commute at a cost, which allowed more than 30 km of commuting with a ll
costs covered. Andersson, th ere fo re , drew the conclusion that a concen
tra tio n of the population, although i t might be incomplete, must be accep
ted , " i f the population of the county (landskapet) is to remain re la t iv e ly
in ta c t" .
The Royal Commission of Low Income's survey of the Level of Living (1970)
is o f obvious in te res t fo r th is th es is , even i f the material has not been
availab le in a reg ionally divided form. The investigation has been d irec
ted by a soc io lo g is t, Sten Johansson. As w ill been mentioned below, the oc
currence of unacceptable conditions guided the selection of variab les , and
they concentrated on those conditions which could be influenced compara
t iv e ly quickly by p o lit ic a l decisions. The d iv is ion in to components of le
vels of liv in g is thus connected to ex isting in s titu tio n a l frameworks. The
components investigated are: health , food habits , housing, childhood con
ditions and fam ily re la tio n s , education, occupation and work place conditionSj
economic resources, p o lit ic a l resources, spare time and recreation.
In connection with the county planning of 1967, the County Adm inistrative
Board in the county of Norrbotten carried out a questionnaire survey, which
was published in the county plan BD-80 (1968). The questionnaire was directed

55
to students in a ll the la s t classes in a l l schools above the 9th form
level in the county, and people attending central re -tra in in g courses5)in the same area. / Those who were doing th e ir m ilita ry service at various
m ilita ry units were also questioned. One of the results worth mentioning
is th a t the respondent made extensively higher demands on the labour mar
ket in his future home region than could be met in his home place at the
time of the research. Furthermore, the respondent tended to have re la
t iv e ly greater demands the b e tte r equipped his home lo c a lity was. The pos
s ib i l i t ie s of getting and changing employment were highly valued. There
were high demands on the basis of the c r i te r ia of a ttra c tiv e environmental
conditions to which the respondents gave p r io r ity . Depending on the grade
of completeness, the estimated threshold values were 5-25 000 inhabitants.
Glesbygdsutredningen, too, organized an interview investigation in one of
the areas selected fo r intensive studies. The study was carried out in the
commune of Sorsele in the inland of Västerbotten, and i t aimed c h ie fly at
describing the service conditions of the households (Kommersiell service
i glesbygder, SOU 1972:13). In agreement with what has been established in
other stud ies, i t was apparent that a re la t iv e ly small proportion of the
food purchases of the households were conducted in connection with commuting
to work or schools. The grade of selfsupport in the area was re la t iv e ly high:
over 50% of the households met th e ir demand fo r potatoes, meat and fish in
other ways than by buying in a shop. The service demands varied with age,
but also with the existing service le v e l. Thus households with re la t iv e ly
good service p o s s ib ilit ie s tended to have greater demands fo r standards of
service than other households.
In the Department of Geography at Umeå U nivers ity , a number of studies on
service consumption and a ttitudes to the existing supply of services have
been carried out. In most cases these studies have been more or less closely
connected to the G-research p ro ject. Among those are the fo llow ing: Persson-
Skog-Westberg: Servicestudie i Lycksele kommun (1973), Grundberg-Lundholm-
Mårtensson: Service i glesbygd, En studie i Ramsjö försam ling, Ljusdals kom
mun (1971), and Wikström: En landsbygds kontakter med två närliggande tä t
o rte r (1971).

56
The Lycksele study showed th a t the most acute problems were those con
cerning food supply. The closings down of shops had caused d i f f ic u l t
problems fo r aged people. The authors recommended home d e liveries and
b e tte r co-ordination with the school transports as a means of improving
the s itu a tio n .
Also in Ramsjö there was discontent with the service s itu a tio n , but i t
was indicated in the study that the households had adapted th e ir demands
to a low le v e l. The s itua tio n was accepted as long as there was access
to a general store and a mobile shop. The greatest improvement during the
la s t fiv e years was considered by everybody to be the re-organization of
the mail de livery to the current rural postman system. The ra tio n a liza tio n
of fo res try and its consequences fo r the labour market were regarded as
the greatest d e te rio ra tio n .
Wikström"s study comprised the e lec to ra l ward of Sjöbotten between Skel
le fte å and Bureå in Northern Västerbotten. The author stated that the
people accepted a longer distance to work than to shopping, and that the
corre lation between the journeys to work and the place where they bought
everyday goods was p ra c tic a lly n i l . The reluctance to migrate was great.
The most important reasons fo r staying were the access to cheap and good
housing and th a t one ' f e l t at home'.
Three intensive studies of places in a depopulation s ituation are of e v i
dent in te re s t in th is context: Margareta Bäck-Wiklund and Hans L indfors:
Samhälle i förändring. En intensivstudie av e t t samhälle i västra Värmland
(1969), Ake Daun: Upp t i l l kamp i Båtskärsnäs (1969) and Stig Lindholm:
A tt leva i glesbygd. Rapport från Klövsjö och Rätan (1973).
Bäck-Wiklund and Lindfors aimed at establishing the conditions which ap
p lied in the environment th a t many people were forced to leave because of
the re -s tructu ring of the economy. The authors are ethnologists, and they
argued that we know too l i t t l e about social change in Swedish society, how
these e ffe c t the individual and what changes in the local l i f e patterns
they bring about. The place studied was Koppom in western Värmland, a foun

57
dry v il la g e , where there had been a d rastic decline in the number of
jobs availab le in industry in the 196(Ts. The most s tr ik in g consequence
had turned out to be the fee ling of insecurity created by the shutting
down of the dominant firm . In p ractica l terms th is meant, th a t many young
people le f t the community, and many of the e ld e rly people became unem
ployed. When a new plant was established in the v il la g e , i t turned out
to be those who had not previously been in the labour market who were em
ployed. At the same tim e, the extension of the compulsory school system
contributed to accelerating the migration of youth.
Ake Daun: Upp t i l l kamp i Båtskärsnäs^is an ethnological study of a com
munity threatened by the shutting down of a p lan t. Båtskärsnäs is a p r i
m arily sawmilling community on the coast of Norrbotten, and the aim of
Daun's study was to explain the unusually strong opposition that had arisen
from the decision by the state-run fo restry enterprise to close down the
saw-m ill. In the same way as Rundblad, Daun stayed in the community fo r a
long tim e, and he wanted to involve himself as much as possible in the
social l i f e of the community. Båtskärsnäs proved to be a community with a
strong cu ltu ra l in teg ra tio n . The values and the interests of the inhabi
tants were highly homogeneous, and l i f e in the community required a high
degree of conformity. I t is , there fore , not surprising th a t Daun found that
those who were leas t integrated in the social l i f e of the community were the
ones who were positive towards migration.
Rapport från Klövsjö och Rätan is based on a series of informal interviews
in v illag es in the county of Jämtland, threatened by depopulation. Lindholm
summed up the advantages of liv in g in th is environment as follows: nature
(clean water, fresh a i r , mountains and fo res ts , hunting and fish ing e tc .)
freedom (nobody gives orders) t r a n q u i l l i ty , and the good opportunities of
associating with other people. A common view held by the respondents was
that those who had moved out had done so out of necessity and not according
to th e ir own wishes. The overwhelming disadvantages were the problems of de
population and the shortage of work. The poor supply of medical care was a-
nother important factor as well as the lack of shops and the long distances
to schools on various high leve ls . In sp ite of the drawbacks, the m ajority

58
of the respondents were re luctan t to migrate. Lindholm also referred to
a study made on Gotland (1968), where interviews about the reasons fo r
migration had given s im ila r resu lts . Furthermore, the study d ea lt with
the problems of people's involvement in local community issues, and he
showed that local community committees had had a s ig n if ic a n tly positive
e ffe c t as a ‘ compensation1 fo r the decreased influence in the commune
caused by the merger of communes.
Hva skjer i Nordnorge? (1966) by the Norwegian Ottar Brox, and Vad sker
i glesbygden, published by Norrbottens museum, also belong to th is group
of studies.
Brox used the s itua tio n in northern Norway as a s ta rtin g -p o in t, and he
aimed at establishing what the negative effects on the tra d itio n a l
philosophy of development there would be in the l i f e in the northern Nor
wegian coastal and fishery areas. He is a popu lis t, and he considered i t
to be necessary to bring about economic development in the local communi
t ie s , which consequently meant th a t the p o s s ib ilit ie s fo r the individual
fam ilies had to be maximized. The ra tio n a liza tio n in fish ing had been d is
advantageous to most fishermen. The combination of small farms and coastal
fish in g with small boats gave a b e tte r net resu lt than being employed on
a big fish in g -bo at, which implied emigration from the small v illa g e and
immigration to major centres. Brox' book was received with great in te res t
in Sweden and stimulated a number of polemical books, among others Macke
Nilsson: Sveket mot Norrland (1969) and Gunnar Balgård: Angår det Sverige
om Norrland finns? (1970).
In Vad sker i glesbygden there is an account of the re s u lt of the in te r
views in the commune of Jokkmokk in Norrbotten, made with representatives
of the most typ ical trade categories: fo res try workers, power station wor
kers, reindeer keepers, etc . The aim was to c le a r ify the mechanism behind
the emigration from the backwoods of Norrland, and to show how the people
have adapted themselves to the a ltered liv in g conditions. As was the case
in Daun's study on Båtskärsnäs, the background is th a t the area had been
dominated by one single enterprise - in th is case the construction of power
stations.^W hen th is occupation was fin ish ed , the basis fo r live lihood was
demolished.

59
The study that has been the primary reference fo r the G-research pro
je c t is Torsten Åström: En sociologisk studie av fem glesbygdsområden
(1969}.^The study was based on an extensive interview m ateria l, co l
lected in 1967 in f iv e emphatically sparsely populated areas, namely
the communes of P a ja la , Stensele, Hammerdal-Ramse ie , Sveg-Hogdal and
Älvdalen-Transtrand-Lima, and one major centre, S k e lle fte å , as an ur
ban point of reference. The aim of the study was, p a rtly , to "describe
the actual s ituation of the population in G-areas, and p a rtly , to re
cord the evaluation of these conditions made by ind iv iduals".
In the autumm of 1966, a team was established to plan the in vestigation ,
with representatives of the Home O ffice and the Departments of Geography
and Sociology at Umeå U niversity . The section dealing with service is
sues is the part of the investigation which has been of in te res t to th is
thesis . This section has p a rtly aimed at giving a p icture of the service
a c tiv ity of individuals and households, and of distances and means of com
munication to d iffe re n t service locations, and p artly to give a p icture
of a battery of services th a t could be regarded as ‘ very good' by in d ividuals.
The various service establishments that together formed a 'very good' bat
tery of services were according to the study by Åström, as follows: De-xlpartment store , general store , grocery shop, chemist's shop ; hardware
shop, e le c tr ic ity -ra d io -T V -s e rv ic e , motor garage, men's and women's out
f i t t e r s , shoe shop, men's and women's hairdressers, doctor, d e n tis t, bank,
p osto ffice , church, cinema, cafe, commune o ff ic e , labour exchange, medical
insurance o ffic e . To th is l i s t , schools of d iffe re n t kinds should, of course,
be added. Thus the existence of th is battery of services would imply that
a place is situated s u ffic ie n tly high in the hierarchy of central places
to give l i t t l e reason fo r d issatis faction with the service supplied, and
thus, the place could be classed as 'very good' from a service point of• 9)view. '
x) Swedish 'färghandel' which does not se ll drugs.

60
The general stores dominated shopping journeys. Approx. 50% of the respon
dents v is ite d general stores every other day. 3/4 o f the respondents lived
less than 5 km from the nearest general store. The public means of tran
sport did not operate frequently enough fo r shopping journeys, and 60% or
more used th e ir own car fo r shopping. Approx. 75% of the respondents con
sidered the battery of services lis te d above as corresponding to a 'very
good' shopping centre.
A ttitudes in favour of staying were very strong, the average of the f iv e
G-areas being approx. 85%, with a certa in over-representation of old people.
Given the choice between giving support to migration or improving services
to re lieve hardship fo r those who stayed in the area, over 90% of the re
spondents declared that the support should be provided fo r those who stayed.
Two projects th a t have been carried out at Umeå U nivers ity , p a ra lle l with
the G-project should also be mentioned. One refers to the social s truc tu re ,
the liv in g conditions and the s o c ia l-p o lit ic a l a c t iv it ie s in the commune
of Vilhelm ina, and i t is carried out by a research team in the Department
of Sociology a t Umeå. A sub-report, SamhälIsstruktur i Vilhelmina kommun
(1971), is a descrip tive study in d e ta il of a typ ical G-commune. Further re
ports that w il l among other th ings, be analysing the in teraction between
individual conditions and structural change, w ill be published in the course
of 1974.
The other project is a cross-d isc ip linary study with the purpose of analy
sing the reasons fo r , and the consequences of the migration to urban areas.
The part dealing with the economy took the form of a co st-benefit analysis,
analysing the flow of migration fin a n c ia lly supported by the labour market
a u th o r it ie s ,^ a n d in its sociological sectors, there is an analysis of the
social processes and the changes in the levels of liv in g associated with
geographical m obility caused by conditions in the labour market. A summary
w ill be found in Rune Åberg"s th es is , Changes in work conditions as a re
su lt of changes in economic structure (1973).

61
When summing up what has been mentioned above, the following points
should be stressed: there is a great number of studies with re fe
rences to the human problems involved in the depopulation and urbani
zation processes. A certa in polariza tion can be perceived - authors
at one extreme concentrate on showing how ind ividuals are powerlessly
mangled between the wheels of a social machine, which in the authors'
opinion, are running in the wrong d irec tio n . Authors at the other ex
treme accept the s itua tio n and c o lle c t data to indicate the human bene
f i t s and the broader spectra of p o s s ib il it ie s , which larger units make
possible.

Notes to chapter 3
62
1) See also Ericsson's (1969) investigations on purchase lo y a lity in rural areas.
2) See also discussion on consumption of medical care in chapter 6.
3) Hägerstrand (1953).
4) Fransson (1969) has shown how the proportion of an age-group that carries on with more q u a lif ie d types of education is considerably higher in remote parts of the country such as G-communes in the inner parts of Västerbotten.
5) A discussion of the most su itab le age of the respondents in a s im ila r survey is carried out in Andersson (1967).
6) See also an a r t ic le of the same author in Häften fö r k r it is k a s tu d ie r, nr 2 -3 , 1969.
7) The local economic significance of the construction of hydro -e lectric power plants has been studied by Bylund (1962).
8) A more extensive version is found in Äström (1972).
9) See a fu rth e r discussion in chapter 5.
10) See Dahlberg (1972).

4 Definition and Classification of Problem Areas
As has been mentioned above, the lack of adequate regional s ta t is tic s
has made i t d i f f ic u l t to get an overall p icture of the q uan tita tive and
regional extent of the G-problems. In a number of reports in the series
Glesbygdsforskningen, various methods to quantify these phenomena have
been presented. A ll these studies re fe r to the six northernmost countiesJ
In th is chapter various c la s s ific a tio n methods w ill be discussed. In ad
d it io n , a regional d iv is ion that has not previously been used in regional
studies, w ill be introduced, namely the e lectora l wards. Three d iffe re n t
methods fo r the c la s s ific a tio n of G-areas w ill be discussed. The resu lt
of the c la s s ific a tio n is shown in maps and in tab les , giving the number
of inhabitants in each category, respectively .
4.1 The Basis of Reference
Taxonomical problems occur in a ll sciences. To d e lim it areas and to c las
s ify and order them have been regarded as one of the principal tasks of
geographers. Today, the d iv is ion into regions is , per se, not an a p rio ri
problem, but i t should rather be seen as something that can be adapted in
accordance with the problem to be solved. I t has also been argued, that
the d ivis ion in to regions should be regarded as a varia tio n of the c la s s ific a tio n problem in common of a l l sciences and not as peculiar to geo
graphy. 2 ^
The problem that w il l be prim arily discussed is the d e fin itio n of the G-
areas, a functional d e fin itio n devised fo r th is context to make i t possibl
to locate and to quantify G-problems.
As has been mentioned above, in a formal sense 'glesbygd' (G) refers to
such areas that are not lo c a l it ie s . But the concept defined in such a way

64
is to ta l ly in v a lid in a problem-centred context lik e th is . A well estab
lish ed , sparsely populated area, situated w ith in a reasonable distance
from major centres providing employment and a d iffe re n tia te d supply of
services would not have what is referred to as G-problems. So much the
more, these problems are associated with areas where people are moving
to other places and regions, and where there is a declining economy. But
that implies that such depopulation, labour market and service problems
also a ffe c t small and middle-sized lo c a l it ie s , i f they are centres of
such declining areas. When the migration from the h interland is strong,
the population basis fo r d iffe re n t kinds of service establishments in
such centres gradually becomes in s u ff ic ie n t, although the population in
the centre i t s e l f may have decreased, but, on the contrary, i t may even
have increased.
Thus, i t is incorrect to regard a form ally defined 'sparsely populated
area' and 'areas with G-problems' as synonyms. I t is equally incorrect
to regard the 'G-problems' and 'the Norrland problems' as congruent. The
G-problems occur, in p rin c ip le , anywhere where the depopulation process
has s tarted . On the other hand, the G-problems, looked upon from a quan
t i ta t iv e point o f view, are c h ie fly linked to Norrland.
In many other contexts, attempts have been made to avoid the formal con
cept of 'glesbygd'. Early examples are Gerd Enequist's d is tin c tio n bet
ween inhabitated land (ökumen)^and uninhabitated land (anökumen), where?
anökumen is defined as areas with a population density below 1 per km .
Another example is Sten Rudberg's d e fin itio n drawn in such a way that i t
comprises every inhabited homestead with any cu ltiva ted land including the
area that might be used fo r grazing and hay making.^ERlTs d e fin itio n of
'fja rrb yg d ' (remote areas) as areas with a local population basis under
5000 people w ith in a c irc le with a radius o f 30 km, is an example of an
extreme in the opposite d ire c tio n . ERU has also defined "Norra glesbygden"
(the northern sparsely populated area) as communes where the population
figure is less than 27 000 w ith in a radius of 30 km from the centre o f the
merged commune.6 ^

65
ERlTs d e fin itio n s of 'Fjärrbygd' and 'Norra glesbygden' can be re
garded as examples of d iffe re n t types of functional d e fin itio n s , in
so fa r as they form a measure of the in teraction potentia l w ith in the
area, and from th a t point o f view, they could work as a s ta rtin g -p o in t
fo r studies on G-problems. But the figures of the to ta l population alone
give too l i t t l e information fo r my purpose. I am interested in a more
complex p icture of the regional and q uan tita tive extent o f the G-problems.
A contributary reason to the fa c t that 'the Norrland problems' have been
confused with the 'G-problems' is surely the lack of adequate regional
s ta t is t ic s . Communes and, to some exten t, parishes, have been the t r a d i
tiona l basis of reference fo r s ta t is t ic a l compilations. One consequence
of the commune merger reform has already been (though i t was not yet to
t a l ly completed, when th is thesis was w ritten ) that a great amount of
s ta t is tic s and other data are already recorded on a merged commune le v e l,
a fa c t that does not f a c i l i t a te penetrating analyses. Data fixed by coordi
nates have been desired fo r a long tim e, preferably on the basis of pro
perty holdings, but there have been no such data availab le in the research
period.
Thus the s ta rtin g -p o in t fo r the fu rther discussion is th a t the region of
reference must be an area defined on a d im in is tra tive grounds, since they
form the units fo r the s ta t is t ic a l compilations. Moreover, t h e data that
can be compiled must fa c i l i ta te a comparison between, and a c la s s ific a tio n
o f, the reference regions. The regional d iv is ion selected in th is thesis
to make a serviceable description of the G -situation in 1965, is the d i
vision into e lectora l wards, and i t is these units that w ill be referred
to in the fo llow ing.
4.2 On Classification Principles
Harvey^makes a d is tin c tio n between two main types of c la s s ific a tio n :
log ical (or deductive) c la s s ific a tio n and grouping (or inductive c la s s if i
ca tion ). A deductive c la s s ific a tio n implies the p o s s ib ility of a logical
division of q u a lit ie s , illu s tra te d as follows:

66
Figure 4:1 Deductive C la s s if ication. A ll counties
Norrland counties Non Norrland counties
Coastalcounties
Non coastal Coastal Non coastalcounties counties counties
In a deductive c la s s if ic a tio n , the groupings are ju s t i f ie d by a search fo r
re g u la ritie s th a t make is possible to group the objects in a way suitable
fo r a p a rtic u la r purpose, and, in th is respect, th is is a subjective method.
From a deductive c la s s if ic a tio n , classes without any members might be ob
tained. In inductive c la s s if ic a tio n , the grouping method i t s e l f implies that
the classes created contain factors that the c la s s ific a tio n is based upon.
An example of such a procedure might look as follows:
Figure 4:2 Inductive C lass ifica tion*^
x) The counties are arranged along a nominal scale.
I t is evident that the inductive c la s s ific a tio n p rin c ip le is the only
p rin c ip le of in te res t in th is context: in th is study the purpose is to
group areas with s im ila r q u a litie s along a scale in such a way th a t re le
vant comparisons can be made.
A ll counties
Good transport position
Bad transport position
COUNTY COUNTY C O U N T Y ^ T c o y ^ T Y ^ COUNTYm m mm m m mm m

67
As is well known, there are d iffe re n t princip les fo r the construction of
scales. The types of scales usually referred to are: a) Nominal scale,
b) ordinal scale, c) in terva l scale, d) ra tio scale and e) multi-dimensional
scales. Various c la s s ific a tio n systems w ill be used fo r the measurement of
the e lectora l wards and the princip les of the construction of scales w ill
be discussed in connection with each c la s s ific a tio n method, respectively.
Three d iffe re n t systems of c lass ifica tio n s have been selected, two of which
are based on one c r ite r io n only, the th ird of which combines a number of
factors estimated to have a relevance fo r the description of the s ituation
in the G-areas. Whichever scale is used, the purpose of the c la s s ific a tio n
system is to make comparisons between d is tr ic ts on as low a h ierarchical
level as possible.
4.3 On Electoral WardsAs has been mentioned above, the e lectora l wards have been chosen as a
regional basis of reference, and the reasons fo r th is choice w ill be given
below.
As a p rin c ip le , every 'kommun1 (commune) comprises one ward, but, under
special circumstances, the 'kommun' may be divided up in to several wards,
and i f such circumstances p re v a il, a d ivision is normally made. A vast area
or a large population have been regarded as 'special circumstances'. There
is no formal upper lim it fo r the number of inhabitants in a ward, but in
p ractise , i t appears that a ward may be divided i f the number of inhabitants exceeds 3000.^Many e lectora l wards, however, have only a few hundred
p e o p le .^ T h e gradual change in the organization of e lectora l wards has been
caused by amalgamations between two or more wards.
For the private in d iv id u a l, the question of ward membership has in general
been decided by p ractica l considerations, and, in most cases, an e lectora l
ward (N .B ., i f i t is not part of a large urban area) could be regarded to
correspond to the Scandinavian concept 'bygd' which f a i r ly well corresponds
to the French "pays" and the German "Gau", e .g . t in y culture re g io n s .^ T h e
wards are, in most cases, mononuclear: a small place is c en tra lly situated

68
in the ward, and the surrounding, scattered habitations are connected
with the nucleus via connected settlements and road networks. Also where
there is a poly-nuclear s tructure , one place is generally dominant. To
wards the boundaries of the ward, the a llia n c e to a 1bygd1 is more doubt
fu l , but, in p rin c ip le , the inhabitants should not have a longer distance
to the po lling station than those in the adjoining ward. In wards in ty p i
cal G-areas, the population i t often very sm all, as a considerable popu
la tio n drain has occurred since the e lectora l ward was formed. Such wards
have sometimes been amalgamated by the County Adm inistrative Board, and
the resu lt has been e lec to ra l wards with very large areas, in which a no-
d a lity can hardly be found. This is the s ituation in the mountainous wards
along the Norwegian border: from the centre in the eastern part of the wards
they comprise a l l the western mountainous area to the border. These elec
to ra l wards have the largest areas. They are only a few out of a to ta l of
1823 wards in the research area. *
The maximum population of an e lectora l ward is approx. 3000, and that makes
the areas of wards in densely populated areas very small. Taking these c i r
cumstances in to consideration, i t is v ita l to emphasize that the e lectora l
wards are to ta l ly unsuitable fo r any comparisons based on area.
As has been mentioned above, adm inistrative units such as parishes or com
munes, are not su itab le as reference areas fo r comparative regional studies
of th is type. On the other hand e lectora l wards are generally not larger
than would enable meaningful comparisons being made in the m ajority of cases
N atu ra lly , the problem with heterogenous reference areas s t i l l remains, but
i t is su bstantia lly reduced because of the lim ited area of most of the e lec
to ra l wards
At the time of the census in 1965, the e lec to ra l wards of the s ix northern
most counties were d is trib u ted in the following way:

69
Table 4:1 Basic Data of the Electoral Wards.
County Number of electora l wards '
Inhab itan ts /e lectora lward
Average size of e lectora l ward
Inhab itan ts /km
Kopparberg 224 1080 109 9Gävleborg 191 1200 75 16Västernorrland 252 880 77 11Jämtland 205 590 214 2Västerbotten 416 530 125 4Norrbotten 275 790 301 2
x) A fter operationally motivated amalgamations.
As is ev ident, the conditions vary considerably between the counties.
Västerbotten has the most heterogenous pattern , with both densely and
sparsely populated wards. The differences between the counties are even
more apparent when the cumulative d is tr ib u tio n of the population figures
of the wards is il lu s tra te d graphically:
Figure 4:3 Population in E lectoral Wards in BD-W Counties. Cumulative Curve.
100
90
60
pop/ward399 599 799 999 1199 1 399 1599 1799 1999 2199 3199

70
The figure 4:3 c le a r ly shows the frequency of e lec to ra l wards with small
populations. In Västerbotten, e .g . , those with less than 400 people make
up over 80% of the to ta l number, in Jämtland 70%, in Norrbotten nearly 65%
and so on. A steep rise in any part of the curve indicates a greater number
of wards of the size in question compared with adjoining s izes , e .g . , in
the county of Gävleborg, the in te rva l between 2000 and 2399 people per
elec to ra l ward. A completely even d is tr ib u tio n of size groups would have
given a diagonal lin e across the diagram. The curve of the county o f Gävle
borg is the one nearest to such a l in e , but i t is s t i l l fa r from being a
diagonal.
On the whole, in my view, the e lectora l wards can be regarded as acceptable
as units of reference. In most cases, the e lec to ra l wards in G-areas are
good examples of adm inistrative u n its , established to correspond conveniently
with manageably centred regions. Population s ta t is t ic s fo r the e lectora l ward
are a v a ila b le , and since also the wards in densely populated areas can be
id e n tifie d with manipulable units o f area, other kinds of s ta t is t ic s , e .g . ,
data from the Account of Commerce, or data on other provisions, can be re fe r
red to the r ig h t area. The fa c t that the areas can d if fe r so very much, and
th a t wards with a small population are often the largest ones, are the main
disadvantages. I t should also be pointed out that in th is thesis a number of
wards have been amalgamated fo r operational reasons e .g . wards in densely
populated areas, since i t has not been possible to distinguish between them
cartographically . The d iv is ion into e lectora l wards is evident from f ig . 8:2 .
4.4 The Classifications
4.4.1 GENERAL PRINCIPLES OF MEASUREM ENT
With phenomena are therefore appropriate fo r measurement i t one wishes to
give an accurate picture o f the geographical and q uan tita tive extent of G-
problems? The term G-problems implies a search fo r negative fac to rs . I t
should be strongly stressed that th is does not mean that a ll the favourable
liv in g conditions that can be offered in G-areas have been ignored. On the
contrary, in the concluding section on planning, (chapter 6 ) , planning method
are suggested th a t aim a t re lie v in g the s itua tio n fo r those who remain th ere ,

71
ju s t because, in my view, the p o s s ib ility of liv in g and working in G-
areas is of great value. But, lik e 'Låginkomstutredningen1 (the Low
Income Commission), I have considered the use of the term 'unacceptable
conditions' to be the most promising way of d irecting the choice of
v a r ia b le s .^
I t should also be pointed out once more that the labour market sector
w ill not be dealt with in th is thes is , since i t has been covered by other
p a ra lle l s tu d ie s .^ N a tu ra lly , the primary need of the G-areas is employ
ment, but I regard i t as an equally ju s t if ie d demand that the supply of
basic service must not d if fe r too much from the conditions in densely popu
lated areas.
In the fo llow ing, an account is given of three d iffe re n t c la s s ific a tio n
systems which have been applied to the e lectora l wards in the six northern
most counties. Some of the results are given in d irec t connection with the
te x t. Some assorted maps and tabulations w ill be found in Appendix.
4.4.2 CLASSIFIC A TIO N W IT H REGARD TO TH E PR O PO R TIO N 15)OF AGED PEOPLE.
The proportion of people of 64 years of age is the variable of the f i r s t
of the three c la s s ific a tio n s . The reason is , of course th a t the ' seni 1i -
zation ' in rural areas has been a problem fo r a long time. During 1950-60,
fo r example, the proportion of employees in ag ricu ltu re and fo res try in
the age group 50+ increased from 34 to 44%J6 ^and, as w ill be shown below,
the trend to a more skewed age structure is strong in p ra c tic a lly a l l com
munes with l i t t l e urbanization in the northernmost counties. The high pro
portion of aged people in G-areas means an acute planning problem, above
a ll fo r health services and social welfare a u th o ritie s , and is of course
also a heavy burden fo r the communal econony. In 1967, e .g . , an estimate
was made (published in the journal Sociala Meddelanden), that certa in parts
of the in te r io r of Norrland would have, as soon as the beginning of the
1970's, a th ird of its population in the age group over 6 5 ^ Table 4i2 be
low shows the proportion of aged people in the census of 1965.

72
Table 4:2 The Proportion of Aged People, N ationally and in the Northernmost Counties.
In 1965 th is age group comprised the follow ing proportion of the to ta l population in each county:
Norrbotten (BD) 9,05%Västerbotten (AC) 11,07%Jämtland (Z) 15,10%Västernorrland (Y) 13,45%Gävleborg (X) 13,94%Kopparberg (W) 13,87%
The to ta l research area 12,62%Sweden 12,89%
The figures in th is d is tr ib u tio n can be arranged in three natural groups:
the f i r s t being Norrbotten and Västerbotten, where the proportion of aged
people is much lower than the national average and the research area, the
second comprising the two southern coastal counties and Kopparberg, and
the th ird , Jämtland alone, where the aged make up a substantial part of the population.
In p rin c ip le , the proportion of the aged could range from 0 to 100%, and
th is makes i t possible to arrange the figures in a ra t io scale, i . e . the
values may be accumulated - thus, 20% of aged people is twice as much as
10% of aged people.
The proportion of the aged in the e lectora l wards has been c la ss ified in
a 4-po int scale, where the median and quarti le values constitute the boun
daries. The median values fo r the proportion of aged people, calculated
over a ll counties, is 14 ,5 , and the upper and lower q u a rtile values are
17,9 and 11,1, respective ly , Counties, taken separately , have values that
vary considerably from these values; thus, e .g . Jämtland has a median value
of 17,3% and Norrbotten 11,1%.

73
Table 4:3 The Proportion of Aged People in The Research Area. Q uartile and Median Values.
County Md *3
Norrbotten 8,0 11,1 14,0Västerbotten 10,3 12,9 15,9Västernorrland 12,2 15,7 19,3Jämtland 14,6 17,3 20,2Gävleborg 13,0 15,9 19,2Kopparberg 12,9 15,9 19,2
The to ta lresearch area 11,1 14,5 17,9
This does not give a s ig n if ic a n tly d iffe re n t p icture compared with the
previous tab le . The counties of Norrbotten and Västerbotten have the
lowest median values and Jämtland the highest. I t is evident that the
varying size and number of the wards w ithin the counties have only a
very small influence on the overall picture of the d is tr ib u tio n of people
in the oldest age group. A thorough analysis o f how the proportion of
aged people is d istribu ted in the e lectora l wards and in the counties,
throughout the e n tire research area is shown in previously published
maps (Glesbygdsforskningen, report nr 5 ).
There are considerable d ifferences between the counties. Table 4:4 below
shows how the proportion of the aged in the population is d is tribu ted w ith
in each county in re la tio n to the to ta l d is tr ib u tio n of population in wards
in these counties.

74
Figure 4:4 Diagram of the D i s t r i - county Compared withbution of Those Aged 65+. Total Research AreaD is tr ibu t io n over Counties Compared with the D i s t r i bution over the lota I Research Areai ~~
wardsVästerbotten
D eficitSurpl us
wards
Norrbotten
wards wards
15-
- t -e s -e
wards
20-
wards
•/.20 '
15-
10
5
0 — IM M 5» M K>-s -ü i -e -2
ill J> NI NJ N| (jj»
-S I
Source: Erson- Weissglas (1969) in Glesbygds forskningen, nr 5.
% 65+
65+
% 65+

75
Figure 4:4 shows thus positive and negative residuals by comparison with
the values fo r the whole area* In the county of Norrbotten, fo r instance,
there are a great many wards with only 6-10% aged people, and the county
has also considerably fewer (compared to the average of the research area)
such wards having a high proportion of aged people. The diagram fo r Jämt
land shows a contrasting p ic tu re . In th is area there are a great number of
wards with a high proportion o f aged people, and there are only few wards
with a low proportion.
In the following there w ill be regional comments to the maps below of the
county of V ästerbotten.^ T h e two lowest classes have been amalgamated in
order to increase the surveyabi1i t y , and the map thus shows where, in 1965,
there were wards with a proportion of aged people above the median and the
upper q u a rtile values, respective ly , fo r the six northernmost counties.
Figure 4:5 The Proportion of the Population in the Ages 65+ in the County of Västerbotten, 1965.
TÄRNABY •SORSELEBYSKE
JÖRN
«SKELLEFTEÅburea•NORSJÖ
STENSELE
BURTRÄSK LÖVÅNGER
( ÄNÄSET• LYCKSELE
ROBERTSFORSVINDELN
VILHELMINASÄVAR 1
' \ \ - J -’ UMEÅ J HOLMÖ]
ÖRTRÄSK
•ÅSELE J FREDRIKA - R% 65+ DOROTEA-- HOLMS UND
HÖRNEFORSU : U.s 14,5 - t 7,9
i«,o
O 10 20 30 .0 ip fcm

76
I t Is evident from the map that in inland communes and along the Norwegian
border, with one exception, Åsele, the largest proportion of aged people
is on the periphery. This is the case also in some of the 'coastal com
munes': Vindeln, Nordmaling and the former Burträsk communes. In the coas
ta l communes, however the p icture is more complex: the merged communes of
Robertsfors and the former communes of Nysätra, Lövånger and Bjurholm have
th e ir centres in wards with an over-representation of the older age groups.
Part of an explanation of th is could be, th a t the emigration there has been
a more prolonged process and has had a calmer course, and the aged have con
tinued to move into the central places.
Another study, carried out by the Department of Geography in U m eå ,^ a lso
points out an overall trend of a larger decrease in the to ta l population in
areas situated more than 20 km from the centre of the commune during 1960-69.
When these areas have been arranged according to density, i t is evident that the re la tiv e population decrease is the largest in the most sparsely popu
lated areas. S im ila r ly , there is a gradual s h ift towards an older population
struc tu re , the more scattered the pattern of residence.
In th is context i t might also be of in te re s t to observe the d is tr ib u tio n
of the youngest age group, 0-19 years old. In 1960, the proportion of those
aged 0-19 was 29,9% in the whole country. In 1970, th is proportion had de
creased by 2,5% to 27,4%. In Västerbotten the corresponding proportions were
33,8% and 28,9%, resp ective ly , i . e . a decrease of 4,9%. Thus, the change has
been considerably greater there than in the country as a whole.
The following map (4 :6 ) shows the proportion of those aged 0-19 in Västerbotten. Here, as well as on the map of the d is tr ib u tio n of the aged, median
and quarti le values have constituted the boundaries.

77
Figure 4:6 The Proportion of the Population Aged 0-19 in the County o f Västerbotten 1965. “
' TARNABY I
% 0-19
29,6 -33,6
f SORSELE .
ISTENSELE j
\ MALÅ ; ’ JORNv
\ NORSJO !\ SKELLEFTEÅ
Sbureå
. VILHEIKINA :
LYCKSELE '
I ORTRASK̂
burträsk S vänger
ÅNÄSET
! ROBERTSFORS
I VINDELNJ
VÄNNÄS i_ W
FREDRIKA BJURHÎlm
1 \! SÄVAR
I UMEÅ HOLMÖN F y V
i HOIKSUND
HÜRNEFORS
10 20 30 < 0 50km
NORDMALING ^
As was expected, the map of the d is tr ib u tio n of those aged 0-19 shows a
p ra c tic a lly contrary p icture . Throughout, e lectora l wards with an over
representation of youth, have few aged people. In inland communes and com
munes along the Norwegian border (with the exception of A sele), the wards
containing a centre have a high proportion of youth. Thus, the picture is
the complete opposite of the one of the d is tr ib u tio n of aged people. Ana
logously with the map of aged, the reserve s ituation is also found in the
coastal communes, even i f the p icture there is less homogenous.

78
4.4.2.1 Depopulation and Changes in the Age Structure
Of course, the maps and the tables of the regional d is tr ib u tio n of the
aged give only a s ta t ic picture of the s itu a t io n , but, fo r technical
reasons concerned with the source of s ta t is t ic s , i t has not been pos
sib le to give information on the process over a period fo r each elec
toral ward. In order to give an idea of the general tendency, a study
of the change in the population figures in 1950-60 and in 1960-70 and
the change in the median age during the same periods w i l l be described
below (table 4 :4 ) . Here the merged communes in Norrbotten and Väster
botten a t FoB 70, w i l l be used as the relevant regions.

79
Table 4:4 Population and Median Age in the Merged Communes of Vaster- botten and Norrbotten 1950, I960 and 1970.
Coastal Total jDopulation Change in % Median Age Change in Median Agecommunes 1950 1960 1970 1950-60 1960-70 1950 I960' 1970 1950-60 1960-70
Boden 25504 28729 27149 +12,2 - 5,4 29,1 31,5 35,0 + 2,4 + 3,5Haparanda 10615 9819 8888 - 7,4 - 9,5 25,2 29,3 30,3 + 4,1 + 1,0Kal ix 19964 19664 18199 - 1,5 - 7,5 27,7 31,1 35,5 + 3,4 + 4,4Luleå 42643 48528 58946 +13,7 +21,5 29,4 30,8 30,8 + 1,1 - 0,2Nord- maling 10414 9538 8159 - 8,4 -14,0 31,5 36,0 41,0 + 4,5 + 5,0Piteå 28912 30047 32829 - 3,0 + 9,2 29,8 32,9 33,4 + 3,1 + 0,5Roberts-fors 10394 9234 7571 -11,6 -18,0 33,6 37,0 43,0 + 3,4 + 6,0Skellefteå 73618 73667 71539 + 0,1 - 3,0 30,1 33,0 36,0 + 2,9 + 3,0Umeå 46323 54417 69582 +17,5 +28,0 30,4 31,0 29,0 + 0,6 - 2,0Vindeln 10080 9834 7619 - 2,5 -23,0 31,4 34,0 42,0 + 2,6 + 8,0Vännäs 13293 13479 12034 + 1,4 -11,0 29,5 32,0 37,0 + 2,5 + 5,0Ä1 vsbyn 9295 9493 8686 + 2,1 - 8,5 26,8 30,1 35,5 + 3,3 + 5,4
In la ndcommunes
A rv id s ja u r 11117 10317 8400 - 7,1 -1 8 ,5 27,7 32,9 40,1 + 5,2 + 7 ,2Gäl 1 i va re 22414 27670 25417 +23,4 - 8,1 26,0 26,9 31,0 + 0,9 + 4,1Lyckse le 15072 16611 14619 +10,2 -1 2 ,0 29,0 30,0 34,0 + 1,0 + 4 ,0N ors jö 12708 12799 10892 + 0,7 -1 5 ,0 28,1 31,0 36,0 + 2,9 + 5,0P a ja l a 15196 14165 10745 - 6 ,8 -24,1 19,8 24,8 33,7 + 5,0 + 8 ,9Âsele 13640 12662 9378 - 7,2 -2 6 ,0 29,1 33,0 43,0 + 3,9 +10,0öve rka l ix 9215 8598 6023 - 6 ,7 -3 0 ,0 23,1 26,4 37,9 + 3,3 +11,5öve rto rneå 10080 9471 7356 - 6 ,0 -2 2 ,3 20,5 23,8 34,0 + 3,3 +10,2
Bordercommunes
A rje p lo g 5315 5573 4435 - 4 ,8 -2 0 ,4 27,6 30,7 38,4 + 3,2 + 7,7Jokkmokk 10737 11533 7998 + 7,4 -3 0 ,6 28,6 29,5 37,5 + 0,9 + 8 ,0K iruna 20432 28195 30623 +38,0 + 8,6 28,0 27,7 28,2 - 0 ,3 + 0 ,5Sorse le 6129 5719 4316 - 6 ,7 -2 5 ,0 28,2 31,0 40,0 + 2,8 + 9 ,0StorumanV i lh e l
9177 10409 8768 +13,4 -1 6 ,0 27,7 29,0 34,0 + 1,3 + 5,0
mina 10902 11335 8657 + 4,0 -2 4 ,0 28,0 30,0 38,0 + 2,0 + 8,0
Sweden 7041829 7462823 8076903 + 6 ,0 + 8 ,2 34,2 35,6 35,5 + 1,4 - 0,1
Source: FoB, LP-70 f V äs te rb o tte n .

In 1950-60 the decreases in the populations of Norrbotten and Väster
botten were comparatively small. Among the coastal communes the largest
percentage decrease was 11,6% (in Robertsfors, where the decrease in
absolute numbers amounted to 1160 people).
Among the inland communes, Asele had a decrease of 7,2%, which corre
sponds to 978 people, and among the mountainous border communes, Sorsele
by 6,7%, i . e . 410 people.
Nor did the median ages change so very d ra s t ic a l ly : a common increase fo r
a l l types of communes was approx. 3 years, and the highest value measured
refers to Arvidsjaur, where the median age rose from 27,7 to 32,9. A number
of communes p r in c ip ia l ly inland, have s tr ik in g ly low values at the beginning
of the 1950's, övertorneå, e .g . , has 20,5 years as a median age and Pajala
19,8.
The period 1960-70 shows quite a d if fe re n t picture. Among the coastal com
munes, there are population decreases up to 23% (Vindeln), among the inland
communes up to 30% (överkalix ) and equally high values are found among the
mountainous border communes. In the age structure, too, there have been con
siderable changes: In överka lix , e .g . , the median age has increased from
26,4 to 37,9, an increase of 11,5 years, and in the commune of Vindeln,
the median age in 1970 was 42 years. By comparison, the national median age
has changed very l i t t l e between 1950-70, from 34,2 to 35,5 years.
There is an apparent correlation betweeh an increased median age and a de
creasing population, which confirms a general observation that i t is mainly
young people who migrate. The tables 4:7 and 4 :8 , show the regression lines
and corresponding equations. The correlation coeffic ients are high fo r both
periods, about +0,90 for 1950-60, and about +0,95 for the la t te r period. On
the other hand, the b-values d i f f e r between the two periods.
During the former period, the b-value was approx. -0,1 and during the l a t
te r between -0 ,17 and -0 ,38 . This means, that the in tensity of the age s h i f t
has increased s tr ik in g ly . This may be p art ly explained by the fac t that the
birth rates were high in many border and inland communes up to the beginning
of the 1960's, but also by the fac t that during the la t t e r period i t was prin
ci pi a l ly the younger people who l e f t .

Figu
re
4:7
Reg
ress
ion
Line
s an
d C
orr
ela
tion
be
twee
n X
= Ch
ange
in
Med
ian
Age
and
Y =
% Ch
ange
in
T
otal
P
opul
atio
n 19
50-1
960.
81
inCO
mo m inino
in
o
in
oCM
in
in
o
in
o
in+ in oo ino
oCM
f O
cr> oo in
o
in oinoo in
in
in
inc m
CO
inCM
CM
in
o
oCM
O

Figu
re
4:8
Reg
ress
ion
Line
s an
d C
orr
ela
tion
be
twee
n X
= Ch
ange
in
Med
ian
Age
and
Y -
%
Chan
ge
in
Tot
al
Pop
ulat
ion
1960
-197
0.
82
CO
inC Ni
m m m in
in
o
in
o
m
o
in
CO
o
in
o
oCM
ininCM
in
o
o
in
X
O
in
in
in
m
o

83
4.4.3 CLASSIFIC A TIO N BY C E N TR A LITY 21 )
4.4.3.1 The Measure of Centrality
The second method of c lassify ing e lectoral wards introduced in this thesis
is based on the situation in r e ta i l trade. Poor access to re ta i l services
is a problem for most people in G-areas. The principles of a c lass if ica tion
of th is type are b r ie f ly as follows: When measuring the attractiveness of a place, as fa r as the services are concerned, some kind of measure of cen
t r a l i t y is generally used. In p r inc ip le , there is no objection in taking a
considerably larger area than that into account, when measuring c e n t ra l i ty .2^
I f we think of the electoral ward as a large place, sparsely populated on
the periphery, there is , within each such 'p la c e ', one centre or more. An
estimate of the c e n tra l i ty of a complete e lectora l ward does not d i f f e r
from a trad it io n a l estimate: the joined polar strength of the 'place' is
estimated with no regard to where the p art ia l weights are situated within
the 'p lace '. Others have also expressed the view that i t is often p ro f i
table to estimate c e n tra l i ty over an area including both a central place and
its h interland, arguing that the central functions are so dependent on the
population of the hinterland that i t is not meaningful to f i x a sharp border
line between the central place and the h in te r lan d .2^Thus i t ought to be
fu l ly ju s t i f ie d to have some form of measure of cen tra l i ty as a basis for
c la s s i f ic a t io n .
Since the purpose of the c lass if ica t io n is to f a c i l i t a t e a comparison bet
ween areas on a low hierarchical le v e l , i t is evident that a c lass if ica t io n
based on c e n tra l i ty c r i t e r ia alone ought to have a basis of autonomous func
tions. An enumerati ve measure of c e n tra l i ty , l ike Jacobsson's index of cen
t ra l i t y , 2^ u t i 1 izes level characteris tics , including both autonomous and25)
fixed references, and, therefore, i t should not be used in th is context. 1
Even i f an enumerative method were constructed for r e ta i l trade exclusively»
the use of such a method would imply d iv i s i b i l i t y of functions and establish
ments, at a level where d i f fe re n t forms of combined functions are frequent.
Thus, the general grocery store, for instance, sells groceries, to i le t r ie s
and hardware. One must therefore s t i l l choose a method that aggregates the
t o t a l i t y of supply.

84
To tes t the relevance of measuring c e n tra l i ty over a whole electoralpr \
ward, God!und's method 'was used to measure the c e n tra l i ty both, on
one hand of a l l n u c l e i ^ i n the county of Västerbotten, and on the other
hand of a l l e lectoral wards in the county. A comparison between the figures
of c e n tra l i ty obtained showed no s ig n if ican t differences.
God!und's formula of c e n tra l i ty subtracts the 'unsophisticated' part of
the r e ta i l services in G-areas by correcting the formula of c e n tra l i ty by
a factor (K^), expressing the average supply of re ta i l trade service on low levels.
There are therefore many indications that the God!und index should be appli
cable as a measure in this context. I t indicates absolute c e n tra l i ty , i . e . ,
i t gives a measure of the to ta l volume of the amenities offered, and i t de
ducts services at such low levels that has no impact on c e n tra l i ty . But the
question is i f the number of shops is re a l ly a serviceable indicator to use
in a measure which is intended in the f i r s t place to describe the re ta i l trade
situation in G-areas. The average re ta i l turnover in those areas is low, and
there is therefore a r isk that an estimate of c e n tra l i ty based on the number
of shops w i l l give values which are too high in G-areas. I f a shop is shut
down, the turnover w i l l usually be transferred to other shops in the area.
The whole turnover is unlike ly to 'disappear'. I f there are no other shops,
local substitutes of d i f fe re n t kinds w i l l take over part of the turnover.
Thus, while turnover w i l l decrease along a continuous scale, the disappea
rance of shops gives a stepwise decrease, i f the amount of supply is calcu
lated in shop units. Micklander28^has discussed the u t i l i t y of d if fe re n t mea
sures of polar strength, and he grades, by decreasing exactitude the measures
of the importance of re ta i l trade, in the following way: turnover, employ
ment, area of premises, number of shops.
I have come to the same conclusion as Micklander th a t , in this case, a measure
of c e n tra l i ty calculated on measures of turn-over w i l l give the most d i f f e
rentiated results.

85
By a special p r in t-out from the Account of Commerce of 1964, data of the
branches, the adresses and turn-overs of a l l shops in the six northern
most counties could be obtained. As regards the r e l i a b i l i t y of this
m ateria l , C-E Ericsson's study of the development of the re ta i l trade in
the county of Jämtland 1950-60 is f i r s t l y referred t o . ^ T h e material was
mapped, and could thereby form a basis of quantita tive data for each ward.
Thus, the s tarting -poin t fo r the discussion is as follows: A c lass if ica t ion
can be made based on a measure of c e n tra l i ty . This measure should be based
on autonomous functions, i . e . , in this case, the re ta i l trade. Turn-over
is a better indicator than the number of shops. The Account of Commerce of
1964 can form a basis for the calculations.
What kinds of consumption should be taken into account? There are reasons
to believe that the structure of consumption varies by the social environ
ment. To a great extent, the income class determines the d is tr ibu tion of
the means available fo r consumption. As individual income r ises , there is
generally a re la t iv e s h i f t from a consumption of necessities to a consump
tion of less necessary things. Sociological studies also show, that members
of higher social classes tend to have more varied and nutrit ious food than
those in lower classes, which implies higher food expenditures. The consump
tion of certain luxuries and t o i l e t a rt ic les shows a d e f in i te ly higher level
in urban than in rural areas. Furthermore, there were regional differences.
Trad it iona lly the consumption in northern Norrland, and in i ts inland in
p a rt ic u la r , has been characterized by an obvious p u r ita n is m .^ T h e measure
ment of the ‘ unsophisticated1 supply discussed above ought therefore not to
be based on the average national consumption, or on an area where a l l kinds
of lo c a l i t ie s are represented.
In th is thesis , the ‘unsophisticated1 supply, i . e . the supply of every day
commodities, is defined as access to those re ta i l services tha t, in the
ISIC nomenclature include general grocery shop, news agents, tobacconist's
and petrol stat ion. The existence of a grocery shop and access to a car
are given high p r io r i ty in Âstrom's sociological study, and tobacconists'
and news agents'suppli es are often available even in very small agglomeration
A r e ta i l supply other than the above-mentioned w i l l be referred to as "specia
re ta i l goods", in this thesis.

86
Since the number of shops w i l l not be used as a measure, the 'unsophisti
cated' supply has to be calculated as part of the to ta l turn-over, and,
for th is purpose, i t is considered to be a reasonable approximation to
assume that the consumption relevant in th is context takes place at levels31 )below that of an e lectoral ward of 3000 people. 'Within the range 1-3000,
there are groups with a comparatively high degree of s e l f suffic iency,
even though high income groups are sparsely represented.
The annual consumption of every day commodities is calculated fo r each
ward separately, and the to ta l sum is then transformed into a turn-over
per head, by dividing this sunyby the to ta l number of inhabitants.
The figure was 1300 Sw.Cr. Thus, in th is year, 1963, every individual in
the ward units of the research area with a population of less than 3000 in
habitants used 1300 Sw.Cr. fo r every day c o m m o d it ie s .^ I t should be noted,
that these calculations are subject to a systematic e rror , since the popu
lation figures re fer to 1965. Thus, areas that have been rapidly depopu
lated may get too high per head figures. The error may, however, be con
sidered to be of an acceptable s ize.
Taking into account the turn-over of every day commodities noted above,
the principles of a measure of c e n tra l i ty , useable in this context, can be
summed up in the following way: The to ta l turn-over of the r e ta i l trade of
an area consists of three distinguishable parts: a) the turn-over of special
goods, b) the average turn-over of every day commodities, c) the turn-over
of the part of the every day commodities that exceeds the average annual
turn-over of 1300 Sw.Cr. per head. N atu ra lly , th is figure applies to the
research occasion only.
The point a) adds to c e n tra l i ty , when the turnover of every day commodities
is defined in th is modest way. As regards the point c ) , I have considered
a positive residual of the average consumption to indicate a certain degree
of c e n tra l i ty . The reason is that a more extensive turn-over of every day
commodities implies an increased turn-over also in the part of the merchan
dise that is not c lassif ied as 'every day commodities'. Thus, the c e n tra l i ty
measure, used in this thesis , consists of the turn-over of special goods +
87
thp positive residual of the turn-over of every day com m odities .^
Centra lity is measured on a scale which starts from a zero-point. The
scale is constructed in such a way that minus-values might be obtained
and that there is in princip le no upper l im i t . Thus, by d e f in i t io n , i t
is an interval s c a l e . ^
4.4.3.2 The Measurements of Centrality
The above-mentioned pr in t-ou t of the Account of Commerce lis ted the adres
ses of each re ta i l enterprise o u t le t , and some data on the volume of turn
over. The turnover figures fo r each electoral ward or cluster of wards
were calculated on the basis of the mapped e lectoral w a rd s .^ T h e popu
lation f igure of the ward was multip lied by the calculated average turn
over of every day commodities, i . e . , 1300 Sw.Cr. per head. In those cases
where the recorded turn-over figures of every day commodities exceeded the
estimated 'base va lue ', th is was noted as a f i r s t value of c e n tra l i ty . The
turn-over of special goods was added to this f ig u r e .3^The to ta l cen tra l i ty
calculated in this way w i l l be given in 1000's of Sw.Cr.
The scores of c e n tra l i ty are given cartographically in a 10-point scale
with consequently doubled intervals (see figure 8 :1 ) . In the tables below,
the population in each in te rv a l , respectively, is d istr ibuted over the re
search area according to county.

Table 4:5 The Population of the Electoral Wards Grouped According to C e n tra l i ty .
KOPPARBERG GÄVLEBORG
C entrality Population abs. % cum. %
C entra lity Population abs. % cum. %
< -0 78179 27,7 27,7 < -0 75941 25,9 25,91-100 16299 5,8 33,5 1-100 13479 4,6 30,5
101-200 4338 1,5 35,0 101-200 1854 0 ,7 31,2201-400 10019 3 ,6 38,6 201-400 13111 4 ,5 35,7401-800 19470 5,9 45,5 401-800 14718 5 ,0 40,7801-1600 14326 5,1 50,6 801-1600 9533 3,3 44,0
1601-3200 14806 5,2 55,8 1601-3200 15022 5,1 49,13201-6400 6384 2,3 58,1 3200-6400 16061 5,5 54,66401-12800 9316 3,3 61,4 6401-12800 9932 3 ,4 58,0
>12800 108786 38,6 iocr,o >12800 123001 42,0 100,0
Z 281923 100,0 I 292652
ooo
VÄSTERNORRLAND JÄMTLAND
C entra lity Population C entrality Populationabs. % cum. % abs. % cum. %
< -0 73273 26,4 26,4 < -0 20103 15,4 15,41-100 12607 4 ,5 30,9 1-100 14022 0 ,7 26,1
101-200 6376 2,3 33,2 101-200 3877 3,0 29,1201-400 17107 6 ,2 39,4 201-400 7674 5,9 35,0401-800 16435 5,9 45,3 401-800 7219 5,5 40,5801-1600 14905 5,4 50,7 801-1600 13489 10,3 50 ,8
1601-3200 21274 7,7 58,4 1601-3200 25135 19,2 70,03201-6400 23697 8 ,6 67,0 3201-6400 5652 4,3 74 ,36401-12800 11514 4,1 71,1 6401-12800 4908 3 ,7 78,0
>12800 80279 28,9 100,0 >12800 28769 22,0 100,0
z 277467 100,0 z 120848 100,0
VÄSTERBOTTEN
C entrality Populationabs. % cum. %
< -0 72413 31,0 31 ,01-100 11141 4 ,8 35 ,8
101-200 7619 3,3 39,1201-400 11754 5,0 44,1401-800 7320 3,1 47,2801-1600 10012 4 ,3 51,5
1601-3200 6344 2,7 54,23201-6400 12929 5,5 59,76401-12800 13699 5,9 65,6
>12800 80366 34,4 100,0
233597 100,0'
NORRBOTTEN
Centrality Populationabs. % cum. %
< -0 59107 22 ,8 22 ,81-100 14782 5 ,7 28,5
101-200 5493 2,1 30,6201-400 17158 6,6 37,2401-800 9316 3,6 4 0 ,8801-1600 9430 3,6 44 ,4
1601-3200 8823 3 ,4 47 ,83201-6400 7997 3,1 50,96401-12800 24466 9 ,4 60 ,3
>12800 103007 39,4 100,0
z 259579 100,0

89
There are s tr ik ing differences between the counties. Jämtland has a com
paratively low proportion of people l iv in g in wards completely lacking
c e n tra l i ty . On the other hand, no less than 35,4% liv e in areas with a
c e n tra l i ty figure in the interval 1-1600. This county has also the lowest
calculated proportion of people in wards with valuer above 12800, namely
22%.
Both the counties of Kopparberg and of Jämtland form a contrast to this
picture. In these counties, the proportion of inhabitants in wards lacking
ce n tra l i ty is high, 27,9 and 25,9% respectively, whereas the proportion in
classes with low c e n tra l i ty is low. The proportion of the population in
the uppermost classes is 38,6 and 42,0%.
The structures of the two northernmost counties d i f f e r considerably from
each other. Västerbotten has more than 30% of i ts population l iv in g in wards
lacking c e n tra l i ty . Some further 20% of the population l iv e in wards within
the in terval 1-1600. In Norrbotten nearly 40% live in wards with a cen tra l i ty
value above 12 800, while the corresponding proportion in Västerbotten is 5%
lower.
F in a l ly , in Västernorrland over 26% of the population l iv e in wards lacking
c e n tra l i ty , and over 24% in the interval 1-1600. The proportion of inhabi
tants in wards with the highest score of c e n tra l i ty is comparatively low,
28,9%.37)
4.4.4 CLASSIFIC A TIO N W IT H REGARD TO C O M BINED Q U A LITIES
4.4.4.1 The Method of Measurement 3®)
The th ird c lass if ica t ion method d if fe rs from the other two in as fa r as i t
combines a series of variables with a scale with discrete steps. The regional
units of reference are the same, but when a distance factor is included, the
distance has been estimated from an approximation of the median point of the
population of the e lectoral w a r d s . ^

90
The c lass if ica t ion method is based on the existence, or lack of i t , of
the factors discussed above, i . e . , high proportions of aged people and
surpluses in the turn-over of re ta i l trade, and also on the distance to
a number of public service provisions. Thus, while the status of an area
from one single point of view was estimated by the two previous c la s s i f i
cations of the e lectoral wards, th is c lass if ica t io n aims at giving a more
complex picture by combining the two previous estimates with a measure of
access to public services.
I t should be emphasized th a t such a measure must necessarily include a
considerable amount of sub jec tiv ity . Although some support for the variables
selected in th is thesis might be found in the sociological studies mentioned,
there are, most l i k e ly , numerous arguments fo r excluding or substituting the
included variables. In the introduction of this chapter i t was c lear ly poin
ted out that 'unacceptable' conditions have been the c r i te r io n that has d i
rected the choice of variables. Here 'unacceptable conditions' and 'long d i
stances to d if fe re n t supplies of services' are treated as synonymous. An in
d iv idu a l 's well-being natura lly depends on many other factors besides these,
e.g. the wish to stay proves to be strong even in areas with apparent de
fic ienc ies as regard employment opportunities and service supplies.
These problems are closely related to the intensive argument whether the
social sciences are value-free or not, an argument that has been carried on,
above a l l , since the la t te r part of the 1 9 6 0 's .^ T h e r e w i l l be no further
discussion of th is matter in th is context; I need only say, that I have been
f u l l y aware of the problems.
The measure, called Service Location Characteristics (S-L), is constructed
in the form of a 's ie v e ' , where the e lectoral ward to be classed is i n i t i a l
ly assumed to be on the highest level of a hierarchy. This hierarchy con
sists of 1+7 classes, in which the highest class consists of wards which l i e
at such a high hiearchical level that the principles of c lass if ica t io n used
have been considered unsuitable. The aim is to be able to handle the s ituation
at low levels. I f there were an even increase up to wards with highly urban
functions, this would involve placing too great a demand on the range of the
measure, since i t is prim arily devised fo r measurement at low levels.

91
Thus the measure comprises the seven lowest stages in a scale as well
as a superior part that comprises wards and clusters of wards with a41 )population of 2200 people or more. ; Consequently, the areas in the su
perior class w i l l be regarded as inclusive in a higher, not systematized,
hierarchy. Exceptions have been made for wards which cannot f u l f i l a l l
the c r i t e r ia to be included in the highest class, in spite of its high
population figures. Instead they have been systematized in the same way
as wards with a lower population.
The following variables form the basis of c lass if ica t io n :
a) Population structure, as measured by the proportion of aged people.
b) Retail trade amenities, measured by the turn-over of re ta i l trade
of the area.
c) Retail trade amenities, measured by the turn-over of special goods
in the area.
d) Proximity to ward ranged in a superior class (S-ward).
e) Proximity to 15 selected public service provisions.
f ) Proximity to public service provisions considered to be of special
importance.
g) Situation in re la tion to superior ward.
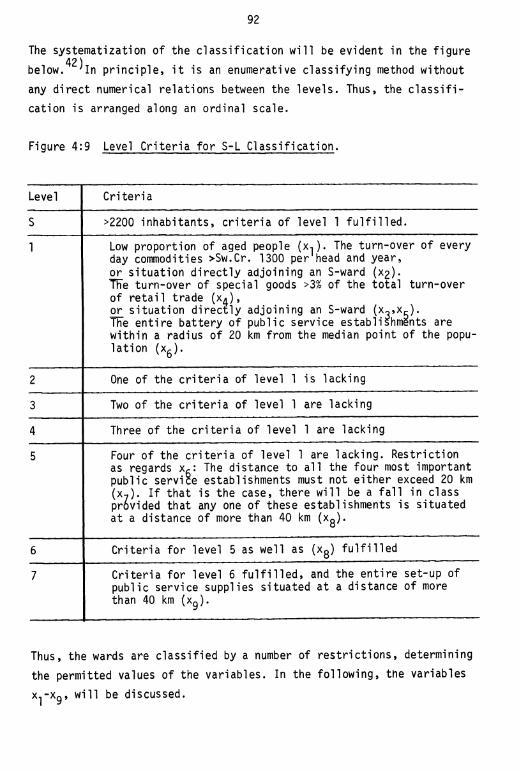
92
The systematization of the c lass if ica t io n w i l l be evident in the figure 421below. ' In p r in c ip le , i t is an enumerative c lassify ing method without
any d irec t numerical re lations between the levels . Thus, the c la s s i f i
cation is arranged along an ordinal scale.
Figure 4:9 Level C r ite r ia fo r S-L C lass if ica t io n .
Level C r ite r ia
S >2200 inhabitants, c r i t e r ia of level 1 f u l f i l l e d .
1 Low proportion of aged people (x-,). The turn-over of every day commodities >Sw.Cr. 1300 per head and year, or s ituation d ire c t ly adjoining an S-ward ( X 2 ) .Tiïe turn-over of special goods >3% of the to ta l turn-over of re ta i l trade (x^),or s ituation d ire c t ly adjoining an S-ward (x3 ,x 5).The en tire battery of public service establishments are within a radius of 20 km from the median point of the populat ion (x6 ).
2 One of the c r i t e r ia of level 1 is lacking
3 Two of the c r i t e r ia of level 1 are lacking
4 Three of the c r i t e r ia of level 1 are lacking
5 Four of the c r i t e r ia of level 1 are lacking. Restriction as regards xß: The distance to a l l the four most important public service establishments must not e ither exceed 20 km (x7 ). I f that is the case, there w i l l be a f a l l in class provided that any one of these establishments is situated at a distance of more than 40 km ( X g ) .
6 C rite r ia fo r level 5 as well as ( X g ) f u l f i l l e d
7 C r ite r ia for level 6 f u l f i l l e d , and the en tire set-up of public service supplies situated at a distance of more than 40 km ( X g ) .
Thus, the wards are c lass if ied by a number of re s tr ic t io n s , determining
the permitted values of the variables. In the fo llowing, the variables
x^-Xg, w i l l be discussed.

93
a) Population s tructure . The proportion of aged people must not be too
high (x-j). An analysis of the proportion of aged people has previously
been given in this chapter. The l im i t of an unacceptable proportion of
aged people has been set at the upper quarti le l im i t fo r the d is tr ibution
of aged people over the wards. Thus, the l i m i t , leading to the f a l l in
class of ward by one le v e l , occurs at a proportion of aged people of 18%.
The reason is predictive: areas with such a high proportion of aged people
can hardly have any other future than one of contraction. This implies that
the possible existence of service establishments motivating the c la s s i f i
cation in a higher level may disappear from the a r e a . ^ A s has been shown
above, the number of wards with the burden of having too many aged people
tends to increase in areas with a heavy population decrease. A high pro
portion of aged people has therefore been regarded as a ju s t i f ia b le reason
for a f a l l by one class.
b) Retail trade amenities. The turn-over of every day commodities (x^)
that was used to measure the c e n tra l i ty of the electoral wards in the
previous section, has been used as a measure of the supply of every day
commodities. Thus, the turn-over of every day commodities refers to gene
ral grocery shops, petrol stations and news agents. As has been shown by44)Eriksson , ' the contraction of re ta i l trade in G-areas started r e la t iv e ly
early. Since, therefore , i t is plausible to suppose that people have adap
ted themselves to a rather limited supply, the demands on neighbourhood
services are low. The annual turn-over of every day commodities (x^) should
be higher than 1300 Sw.Cr. per head, i . e . , the average value that forms a
basis of the estimate of c e n tra l i ty . The second cr i te r ion of r e ta i l trade,
trade in special goods (x^) refers to the part of the to ta l re ta i l trade
that comprises special goods. The demands set for the turn-over of special
goods are low. The l im i t has been fixed at a turn-over of special goods of
3%. In fa c t , th is means that the only thing that is indicated by the c r i
terion is i f any form of trade in special goods is represented in the ward.
As regards wards adjoining wards belonging to a superior class, in su ff ic ien t
turn-over of re ta i l trade has not been considered to be of any importance
(x3 , x5 ). As has been mentioned above, the population is l i k e ly to be ac

94
customed to poor access to neighbourhood services in the re ta i l trade sec
tor of sparsely populated areas. Therefore, low turn-over figures cannot
be said to have such a negative impact that i t ju s t i f ie s a lower class fo r
a ward situated close to a ward with a high c e n tra l i ty score. In th is con
te x t , the consequence has been th a t , i f a ward d ire c t ly adjoins a ward that
has a centre with a population exceeding 2200 people and f u l f i l s the qua li
f ications fo r level 1, insuffic iencies in the local re ta i l trade supply have
not been allowed to a f fec t the c lass if ica t ion into levels in a negative way.
Another reason fo r th is procedure has been the fact that wards of a suburban
character have normally a modest turn-over per head in the r e ta i l trade sec
to r , since the population usually make th e ir purchases in the centre. I t
should also be pointed out that the varying sizes of the ward areas produce
the a ffec t that a varying distance to the central place has been made a c r i
terion fo r the classing into levels. I have considered this e rro r , however,
to be of acceptable size.
I f , however, a ward is so peripherally situated that i t does not adjoin a
highly central ward, I have regarded the lack of re ta i l trade, with the low
c r i te r ia set fo r such trade, to imply such a serious discrepancy from an ac
ceptable level of re ta i l trade that i t is ju s t i f ie d to make i t f a l l by one
class.
Access to public services must f i l l certain requirements set for wards on
level 1 (xg). The calculations are based on the existence of a collection of
services consisting of a series of 15 d if fe re n t kinds of public service
establishments. The choice of establishments has been based on what might be
called 'c r i t e r ia of reasonableness'. I n i t i a l l y , the existence of public ser
vice establishments in the whole research area was investigated. Thus, with
the support of the sociological studies dealt with in chapter 3, f i f te e n such
establishments were selected as relevant, namely a resident medical doctor,
maternity and child welfare c l in ic , d en t is t , home for old people, pharmacy,
primary and secondary schools, other schools (e.g. technical colleges fo r
forestry and domestic science) bank, post o f f ic e , f i r e s ta t io n , police s ta
t io n , reg istry o f f ic e , labour exchange, l ib ra ry . Those units normally make
the most important part of the supply of services available in a lo c a l i ty

95
on level 1, or in the superior hierarchy. The level c r i te r ion is based
on a concept of completeness. I f any one of these establishments is lac
king within a 20 km zone (as the crow f l i e s ) from the median point of
population of the ward, th is ju s t i f ie s a lower class.
Moreover, one group of services have been considered to be of greater451importance than the others. 'Those are resident medical doctor, home
fo r old people, d e n t is t , primary and secondary sch o o ls .^ T h e basis in
th is case has also been a concept of completeness. I f any one of these
four establishments is lacking within a zone with a radius of 20 km,
or within a zone with a radius of 40 km, these deficiencies have been
reasons fo r a f a l l in class.
The f ina l variable refers to an extreme s itua t io n , when a l l the services,
included in the main l i s t , are located at a distance of more than 40 km
from the point of measurement.
4.4.4.2 The Regional Distribution of the Variables
As is evident from note 42 ,p 92 ,and figure 8:2, the c lass if ica t io n is based
on a series of questions with 'yes' or 'no' as possible answers to be given
in each separate ward. The table below shows the regional d is tr ibu tion of
yes-answers in re la t iv e figures.

96
Table 4:6 The Proportion of Yes-answers fo r the Variables x-,-x n Distributed Over Counties. 1 "
W X Y Z AC BD
X1 Is the proportion of aged people too high? 34,4 37,1 42,1 47,3 17,2 5,9
x2 Is the turn-over per head too low? 49,300*3- 51,7 52,1 63 ,8 63,8
x~,
X5 Poor s ituation in re la tion to shopping centre? 79,1 •̂J CO -P»
ununco 96,6 95,3 90,1
X4 Is special goods shop lacking? 61,0 76,8 69,7 76,3 86,0 79,1
X6 Are there provisions on the major l i s t lacking within a 20 km zone? 60,6 44,3 49,5
00 82,1 64,4
X7 Are there provisions on the minor l i s t lacking within a 20 km zone? 16,8 9 ,8 50,3 39,2 36,0 40,0
X8 Are there provisions on the minor l i s t lacking within a 40 km zone? 1,0 2 ,0 0,5 8,3 5,9 15,4
X9 Are a l l public service provisions according on the main l i s t lacking within a 40 km zone? 0 ,4 0,0 1,5 0,0 0 ,0 1,4
4.4.4.3 A Regional Comment
x-j In this case, the two northernmost counties vary a great deal. Norr
botten has only had 6% of i ts wards declassed because of a high pro
portion of aged people, whereas Västerbotten has a much higher f ig u re ,
approx. 17%. Jämtland has over 47% of the wards "sieved" o f f , and Väster
botten 42%. In Kopparberg and Gävleborg 35-37% of the wards are in this
group.
*2 Here the picture is contrary. Norrbotten and Västerbotten have both
approx. 60% of the wards in turn-over classes below 1300 Sw.Cr. per head.
The rest of the counties are grouped round values of 50%.

97
Xg,Xg In practice the variable re f lects the distance to major purchase
centres. In Västerbotten and Jämtland less than 5% of the wards have a
situation in re la t ion to a major purchase centre that may excuse d e f i
ciencies in the variable or x^, in accordance with the discussion above.
Gävleborg has the highest score, 26%, whereas the other counties have scores
varying between 10 and 20%.
x^ Here, Västerbotten and Norrbotten have the poorest scores - over 86
and 79% of the wards, respectively, have a turn-over of special goods that
is less than 3% of the to ta l turn-over of re ta i l trade of the wards. Koppar
berg has the highest score, 61% , whereas the other counties have scores bet
ween 69 and 76 per cent.
Xg Jämtland has the lowest scores - over 87% of the wards do not satis fy
the demands of completeness. Also Västerbotten shows low scores - 82%. Norr
botten and Kopparberg have higher f igures, between 60 and 65%. Gävleborg and
Västernorrland have the best scores, 36-40%.
X j The existence of public services on the minor l i s t within a 20 km zone
gives the following picture: In Kopparberg and Gävleborg only 17% and 10%,
respectively, have fa l len in class for th is reason. Västernorrland has
roughly the same proportion here as in x^ - approx. 50%. The scores of the
other counties are between 36 and 40%.
x0 ,x0 As regards the lowest levels of demands for public services: In o y
Norrbotten approx. 15% of the wards have fa l len in class according to
Xg, in Jämtland approx. 8%, and in Västerbotten approx. 6%. The other
counties have scores under 2%. In Norrbotten, Jämtland and Kopparberg on
ly a few odd wards q ualify for the lowest le v e l , otherwise there are none.
4.4.4.4 The Result of the Classification
The d is tr ibu tio n of wards over the counties is l is ted below, a f te r c la s s i f i
cation, in absolute and re la t iv e terms. The per cent scores are shown in the
form of histograms.

98
Table 4:7 The Electoral Wards in Each County, Respectively, Grouped According to A ttr ibution to Levels.
CountyAbsolute Figures
Level W X Y Z AC BD Total Research Area
s 14 16 16 3 9 11 691 34 26 18 3 11 21 1132 44 36 43 23 40 28 2143 51 39 63 37 89 67 3464 41 42 70 53 151 74 4315 31 30 35 60 80 40 2766 8 2 7 23 36 30 1067 1 0 0 3 0 4 8
z 224 191
CM
LOCM
]1 205 4T6 275 1563
CountyRelative Figures
Level W X Y Z AC BD Total Research Area
S 6,3 8,4 6,3 1,5 2,2 4,0 4,41 15,2 13,6 7,1 1,5 2,6 7,7 7,22 19,6 18,9 17,1 11,2 9,6 10,2 13,73 22,8 20,4 25,0 18,0 21,4 24,4 22,14 18,3 22,0 27,8 25,8 36,3 26,9 27,65 13,8 15,7 13,9 29,3 19,2 14,5 17,76 3,6 1,0 2,8 11,2 8,7 10,9 6,87 0,4 - 1,5 - 1,4 0,5
Z 100,0 100,0 100,0 100,0
ooo ooo
100,0

99
F igure 4:10 Diagram Showing the C la s s if ie d E le c to ra l Wards in Each County, R e sp e c tive ly .
BDo f wards
S-L le v e l'Z
o f wards
S-L le v e l
AC30 % o f wards
20
10
S ’ 1 ' 2 ' 3 4 5 6 7S-L le v e l
o f wards
S-L le v e l
o f wards
S-L le v e l
o f wards
S-L le v e l'
T o ta l Research Area% o f wards!
30
S-L le v e l

100
When looking at the d is tr ibu tion of a l l wards a f te r the grouping into
leve ls , the following picture is seen: The wards are f a i r l y well centred
towards the classes in the middle. In classes 4 -7 , there are 52,6% of
the wards. The lowest classes are s tr ik in g ly weakly represented, while
classes S and 1 together comprise 11,6%. Class 4 is the biggest with 27,6%.
Kopparberg and Gävleborg have a conspicuously higher proportion in the two
highest classes, 21,5% and 22,0% respectively, compared with 11,6% for the
to ta l area. Västernorrland and Norrbotten have scores close to the average
score, whereas Jämtland and Västerbotten have s tr ik in g ly low scores, 3,0%
and 4,8%, respectively.
I f one compares the counties with regard to the two lowest classes, the high
proportion of extreme G-area wards of the three northernmost counties is
evident. The score of Jämtland is 12,7%, of Västerbotten 8,7% and of Norr
botten 12,3%. Västernorrland and Gävleborg have only 2,8% and 1,0%, respect i v e ly , whereas the score of Kopparberg is 4,0%.
I f the percentage scores of the four lowest classes are aggregated, the
picture w i l l be somewhat d i f fe re n t . Kopparberg and Gävleborg have the lowest
scores, 36,1 and 38,7%, respectively, whereas Jämtland and Västerbotten have
a considerably higher proportion, 67,8% and 64,2%, respectively. Norrbotten
with 53,7% is closer to the score of the en tire research area, which is 52,6%
On the map, f igure 4:11, the S-L scores fo r each electoral ward in the whole
research area have been marked with a darker shade by increased S-L value.
T ota lly dark areas denote S-areas, and to ta l ly white areas denote wards on
the levels 6 and 7. As is apparent from the summary tab les , the number of
wards on the lowest level is very lim ited . There is no d irec t reason for
distinguishing between the two lowest levels in a cartographical description,
mainly because they have small population f igures , which implies, as a resu lt
of the construction of the wards, that they have very large areas. A more
fine-meshed net would have distinguished between an additional number of
areas that should have been classed into the lowest leve l .
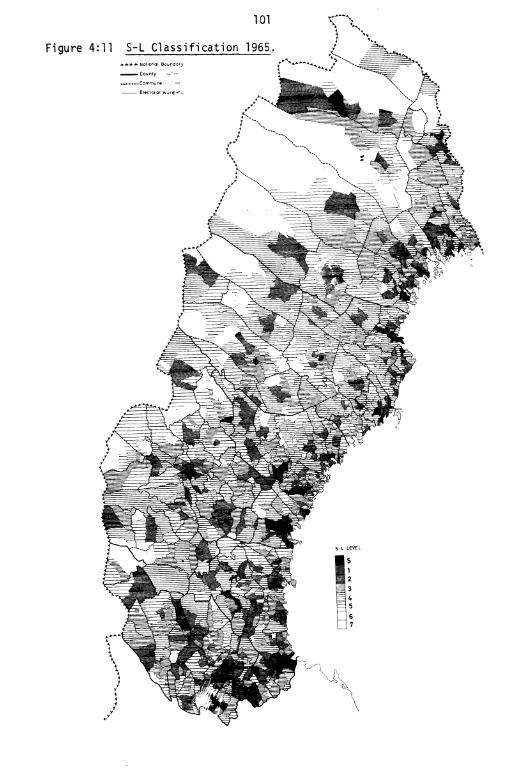
101
Figure 4:11 S-L C lassif ication 1965

102
4.4.4.5 A Regional Comment
The to ta l ly black areas on the map correspond in general, to the s itua
tion of the lo c a l i t ie s which emerge in the discussion of the size of the
"strategic lo c a l i t ie s " in chapter 5. Thus, the coastal area is s tr ik in g ly
dark. A dark b e lt also stretches from east of the mountain chain in the
northern part of Kopparberg to Kiruna. North and east of Kiruna there are
mainly l ig h t areas, as well as west of the b e l t , where the whiteness is
broken only by the passage to Norway. South of Östersund the dark b e lt is
divided and surrounds Orsa Finnmark, which stands out as a l ig h te r area.
The area between the coastal zones in Västernorrland, Västerbotten and
Norrbotten and the dark area, consists ch ie f ly of l ig h t areas, with the
exception of dark areas here and there, abruptly standing out without any
smooth trans it io n as in the coastal zone. There is a conspicuously l ig h t
zone inside the coastal area in Norrbotten. I t is , in general, bounded by
a line Jokkmokk-Gällivare-Pajala-övertorneå-Boden. A corresponding ligh t
zone is found in an area limited by a line Ange-Vilhelmina-Storuman-Malå-
Norsjö-Boliden-Vindeln. The area towards the border of Värmland which is
bounded by a l ine S i l jan-Grängesberg has a rather l ig h t shade with smooth
transitions towards more central wards. There is a s tr ik in g ly dark be lt
from the coast of Gävleborg via Gävle-Sandviken-Hofors-Falun-Ludvika.
The two lowest classes, which have remained unshaded in figure 4:11, com
prised only 114 (7,3%) of a to ta l of 1563 wards. In figure 4:12, s t i l l
another class has been unshaded, i . e . level 5. This gives the result that
another 276 wards (now a to ta l of 24,9% of the wards) have disappeared.
The picture of the G-areas is made s t i l l c learer. Both in Västerbotten and
Norrbotten there is now a continuous chain of unshaded wards starting some
50 km from the coast. Moreover, the domination of the r ive r valleys is be
ginning to be apparent. Commune centres with adjoining wards stand out l ik e
islands. S t i l l , the joined b e lt of more favoured wards along the coast is
prac t ica lly unbroken.
F in a l ly , f igure 4:13, shows the s itua t ion , when the wards within level 4
have also been l e f t unshaded. On that le v e l , there are 471 wards (30,1%).
Now a to ta l of 861 wards have been excluded (55,0%). Wards at higher levels

103
Figure 4:12 S-L C lassif ication 1965

104
Figure 4:13 S-L C lassif ication 1965
bcjr’dcry
Electoral VM
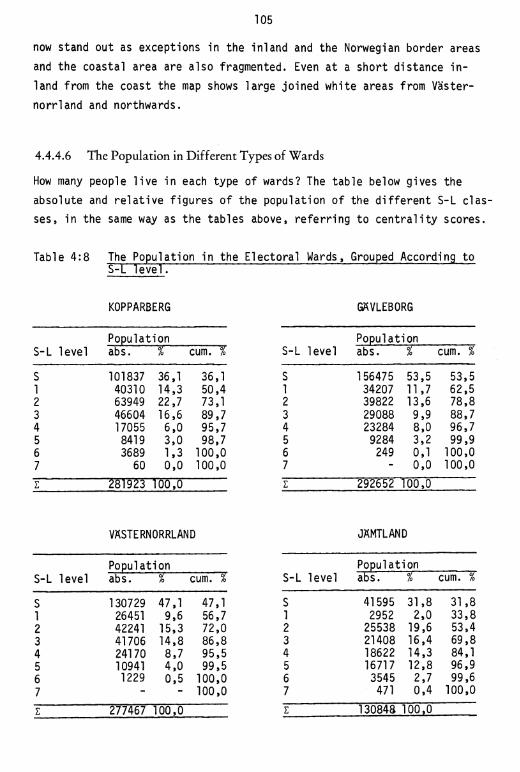
105
now stand out as exceptions in the inland and the Norwegian border areas
and the coastal area are also fragmented. Even at a short distance in
land from the coast the map shows large joined white areas from Väster
norrland and northwards.
4.4.4.6 The Population in Different Types of Wards
How many people l iv e in each type of wards? The table below gives the
absolute and re la t iv e figures of the population of the d i f fe re n t S-L clas
ses, in the same way as the tables above, re ferr ing to c e n tra l i ty scores.
Table 4:8 The Population in the Electoral Wards, Grouped According to S-L le v e l .
KOPPARBERG GÄVLEBORG
S-L levelPopulation abs. % cum. % S-L level
Population abs. % cum. %
S 101837 36,1 36,1 S 156475 53,5 53,51 40310 14,3 50,4 1 34207 11,7 62,52 63949 22,7 73,1 2 39822 13,6 78,83 46604 16,6 89,7 3 29088 9,9 88,74 17055 6,0 95,7 4 23284 8,0 96,75 8419 3,0 98,7 5 9284 3,2 99,96 3689 1,3 100,0 6 249 0,1 100,07 60 0,0 100,0 7 - 0,0 100,0
z 281923 100,0 Z 292652 100,0
VÄSTERNORRLAND JÄMTLAND
S-L levelPopulation abs. % cum. i S-L level
Population abs. i cum. %
S 130729 47,1 47,1 S 41595 31,8 31,81 26451 9,6 56,7 1 2952 2,0 33,82 42241 15,3 72,0 2 25538 19,6 53,43 41706 14,8 86,8 3 21408 16,4 69,84 24170 8,7 95,5 4 18622 14,3 84,15 10941 4,0 99,5 5 16717 12,8 96,96 1229 0,5 100,0 6 3545 2,7 99,67 - - 100,0 7 471 0,4 100,0
z 277467
ooo
z 130848 100,0

106
VÄSTERBOTTEN
S-L levelPopulationabs. % cum. %
S 93043 39,8 39,81 7867 3,4 43,22 39741 17,0 60,23 36850 15,8 76,04 39050 16,7 92,75 12900 5,5 98,26 4155 1,8 100,07 - -Z 233606 100,0
NORRBOTTEN
S-L levelPopulationabs. % cum. %
S 121036 46,6 46,61 22708 8,7 55,32 34463 13,3 68,63 33110 12,8 81,44 29181 11,2 92,65 11971 4,6 97,26 6737 2,6 99,87 400 0,2 100,0z 259606 100,0
Rather few people l iv e in wards categorised in levels 6 and 7. The to ta l
number of people is 20535, in a l l the counties, which corresponds to 1,4%
of a to ta l of 1 476 066 inhabitants. The proportion at the two lowest levels
is highest in Jämtland and Norrbotten with 3,1 and 2,8%, respectively. In
absolute figures Norrbotten dominates with over 7000 people, whereas Jämt
land, Västerbotten and Kopparberg have approx. 4000 people at these levels.
In Gävleborg the proportion is neglig ib le .
I f , as was done with the set of maps on pages 103-104, the lowest classes
are cut o f f so that only the four highest remain, the number of inhabitantsin the excluded electoral wards amounts to over 240 000, i . e . 16,4%. There
are now great variations between the counties. In Jämtland the proportion
is 30,2 and in Västerbotten 24,1. In the counties of Kopparberg and Gävle
borg the proportions are only 10,3 and 11,3%, respectively, and in Väster
norrland and Norrbotten 13,2 and 18,6%, respectively. In absolute figures
the scores of Västerbotten and Norrbotten are the highest with 56 105 and
48 289 inhabitants, respectively , and the lowest in Kopparberg and Gävle
borg with 29 223 and 32 817. In Västernorrland and Jämtland the figures are
36 340 and 39 355.
I f we were to take class 3 as the minimum class for representing a standard
of 'acceptable liv ing conditions', i t would suggest, that in 1965 over 240 000
people in the research area were l iv in g in areas with an unacceptable access

107
to services. Today th is figure would be smaller. The lack of s ta t is t ic a l
data makes i t impossible to give an exact f igu re , but an example from
Västerbotten may i l lu s t r a te the development.^During the period 1965-68,
the number of inhabitants l iv in g in the three lowest S-L classes decreased
from 17 055 to 13 992, i . e . a decrease of 18%. Calculated over the county,
th is means a decrease from 7,3 to 6,0%.
The example thus i l lu s t ra te s what has already been pointed out above, that
the areas on the periphery are rapidly being depopulated, even though an
annual decrease of 6% must be regarded as an extreme one. During the f i r s t
three years of the 1970's, the rate of depopulation has been lower.

108
Notes to chapter 4
1) The studies referred to have been published in Glesbygdsforskningen, reports nr 3, 4, 5 and 8.
2) Helmfrid (1969).
3) Bylund (1966).
4) The concepts ökumen - anbkumen have been discussed by Ahlenius (1903) According to Enequist, his d e f in i t io n corresponds f a i r l y wellto the concept 'kulturlandskap'. The concept ' bygd' has also, according to Enequist, d if fe re n t meanings, varying with the approach of the authors. The de f in i t io n of in te res t in th is context is that 'bygd' should re fer to one integrated economic area. See Enequist (1941).
5) Atlas över Sverige, map 49-50 and Rudberg (1957).
6) Samhällsutvecklingen i glesbygderna. ERU (in SOU 1972:56).
7) Harvey (1969), chapter 17 and 18. See also Abler-Adams-Gould (1971), chapter 4, Johnston (1958) and Helmfrid (1969).
8) Studies on the division into e lectoral wards and the c lass if ica t io n of the wards has been published in Glesbygdsforskningen. In p a rt ic u la r , see report nr 3: Erson-Weissglas (1969), which contains a map over the division into electoral wards in the six northernmost counties. See also SOU 1970:14.
9) A discussion on formalization of th is l im i t is found in SOU 1967:27.
10) See figure 4:3.
11) These concepts have also been discussed by Eriksson (1969) and Rice (1973).
12) Nordbeck-Rystedt have la te r used the maps of electoral wards constructed by Erson-Weissglas, and the s ta t is t ic s compiled by them as a basis for a computer-made map of the population in northern Sweden. See Nordbeck-Rystedt (1973).
13) Johansson (1970).14) The studies referred to are mainly carried out by Erson and Holm, and
published in Glesbygdsforskningen. See appendix, table 8:2.
15) In p a rt icu la r , see Erson-Weissglas (1969) in Glesbygdsforskningen, report nr 5 and SOU 1970:14, bilaga 2.
16) See s ta t is t ic a l compilations in S ta t is t is k årsbok, 1954 and 1964.
17) Aström (1972).18) Glesbygdsforskningen, report nr 5.
19) Ib id.
20) Vesterlund-Norberg (1971).
21) In p a rt ic u la r , see Weissglas-öquist (1969) and SOU 1970:14.

109
22) A discussion on the terminology of the concept of c e n tra l i ty has been carried out in Glesbygdsforskningen, report nr 4. See also Micklander (1964).
23) Neef (1962) and Glesbygdsforskningen, report nr 4.
24) Jacobsson (1959).
25) Naturally there is no objection to enumerative c lass if ica t ion principles being used in other contexts. On p 89, there is an account of a th ird c lass if ica t io n system, where, among other things, the distance to d if fe re n t kinds of public services is one variab le , and where the wards are arranged in an ordinal scale, i . e . , according to enumerative principles.
26) Godlund (1954) chapter XXII.
27) "Nuclei" is here used in the same sense as "orter" in the County Investigation of Västerbotten (1961), e .g. places with any central function.
28) Micklander (1964) p IV:7.
29) Eriksson (1969) in Glesbygdsforskningen, report nr 11. See also Gles- bygdsforskningen, report nr 4 and SOU 1970:14.
30) Bratt-Jonsson (1965) See also the reports of the Low Income Commission, and Samhällsutvecklingen i glesbygderna, ERU (in SOU 1972:56).
31) I t should be noted that the wards of the lo c a l i t ie s have regularly been systematically amalgamated into larger units. Thus, even i f the upper population f igure of a ward should not exceed 3000 people in this thesis , there are units with a considerably larger population. The amalgamations are the same for a l l the three c lass if ica t ions .
32) Figures showing average consumption of every day commodities 1970 are available in Statens Planverk (1972).
33) In p a rt ic u la r , see Glesbygdsforskningen, report nr 4, chapter 2.
34) See the references in note 7, this chapter.
35) See Glesbygdsforskningen, reports 3 and 4.36) I t should be pointed out that the turn-over of special goods is used
as a factor in a c lass if ica t ion system that w i l l be presented la te r .
37) These c e n tra l i ty scores have also been used in County Programme (1970) of Västerbotten.
38) In p a rt icu la r; see SOU 1970:14 and Glesbygdsforskningen, report nr 8. Parts of the c lass if ica tions have also been used in the County Programmes (1970) of Västerbotten and Norrbotten.
39) Precision has depended on the a v a i la b i l i t y of up-to-date maps of the dis tr ibu tion of population or corresponding grid maps for each county respectively. In most cases the solution of the problems has been evident in advance, since the centre of the e lectoral ward has been so dominant.A l is t in g by coordinates of the wards has been published in Glesbygdsforskningen, report nr 8.

110
40) A more thorough discussion on th is subject has been carried out in Glesbygdsforskningen, reports 8 and 14.
41) Cf. the discussion about the size of the s trateg ic lo c a l i t ie s in chapter 5. Among other things, i t is shown in th is chapter, th a t , what has been defined as an acceptable collection of service supplies, does not occur at population levels below 2200 in one place.
42) Techically , the procedure fo r c lass if ica t io n is , that data for x^-Xg are fed into a computer that has been programmed fo r successive logical choices. I f the ward does not f u l f i l the demands on membership in the superior class, i t is directed through the schedule unt i l the c r i t e r ia for the proper level are f u l f i l l e d . The construction is shown in figure 8:2.
43) See the discussion on population bases of threshold values in chapter 5.
44) Eriksson (1969).
45) See Glesbygdsforskningen, report nr 8 and SOU 1970:14, p 45-46.
46) I t should be pointed out, th a t , as argued in chapter 6, the d is t r ic t nurse should be given a high p r io r i ty , when planning public services in G-areas. The reason fo r excluding th is function in the present conte x t is , that the pattern of provision was being re-organised in many places.
47) Länsprogram -70 för Västerbotten, p 188, and SOU 1970:14.

n i
5 The Strategic Localities
5.1 Planning and Central Place HierarchiesIn the previous chapter, d i f fe re n t methods of measuring the extent and
location of G-problems in the six northernmost counties were presented.
The situation described referred to 1965. Previously, in chapter 3, I
have given an account of the o f f i c ia l view of G-problems in the period
1940-65, as i t was expressed in the public reports. To begin with , I
shall give a b r ie f account below of the tackling of the G-problems up to
the beginning of the 1970's. In the f i r s t place, attention w i l l be focused
on the discussion of a desirable central place structure, the background
being that certain places have to service as key stones.
In general, i t can be stated that there has been an intensive discussion
of the structures of central places thoroughout the whole of the 60 's , not
only in Sweden. Within the frame of the a c t iv i ty of the U.N., fo r example,
a series of conferences have been held on the concepts Growth poles and
Growth centers, where "Growth poles are those of a large scale and of a
national scope, while growth centers are of a smaller scale and a regional
scope". ^Behind the discussion a l l economically developed countries need
to meet, by planning, a l l the problems of depopulation and bottle-necks
that are caused by the trans it ion to more and more sophisticated economies.
Many scientists share the view, that a structure of centres situated s tra te
g ic a l ly both economically and geographically ought to be p ro f i ta b le , both
for society and for the individual.
In addition to the above-mentioned conferences, i t is also worth mentioning
the a c t iv i ty of UNRISD, i . e . The United Nations Research In s t i tu te fo r Social
Development, with A. Kuklinski, R. P e tre l la , R. Lasuén and T. Hermansen as
coordinators. Together with K.J. A llen, Hermansen is responsible of the valu
able summary of the discussions within the in s t i tu te in an EFTA publication:
Regional Policy in EFTA. An examination of the Growth Center idea, (1973).
Teams have also been active within the Nordic countries. One resu lt has been
Rapport f ra Nordisk Seminar om regional poi i t i kkens mål og midier, (Report

112
from a Nordic seminar on the aims and means of regional policy , a co llec
tion of papers from a seminar arranged by Nordisk arbeidsgruppe for samar-
beid om forskning vedr0rende loka l iser ingspo lit iske sp0rsmål (1969).
As has been pointed out by Bylund, the discussion in Sweden about the
size of lo c a l i t ie s has mainly dealt with three levels: 1. Minimum c ity
size with a s u f f ic ie n t number of c i ty advantages and a minimum of environ
mental disadvantages. 2. Minimum size of a lo c a l i ty fo r an industria l and
labour market environment, permitting a self-generating economic develop
ment. 3. Minimum size of a lo c a l i ty as a basic guarantee for a minimumlevel of service p ro v is ion .^
The discussion that follows w i l l mainly concern i t s e l f with the lowest of
the levels mentioned above.
As has been mentioned in chapter 3, the Näslund investigation, Aktiv lo k a l i
seringspolit ik (SOU 1963:58), provided a basis for a proposal for a more
active location policy. The B i l l (1964:185), passed by Parliament in the
subsequent year, contained a number of suggestions for provisions in order
to contro l, or at least to a l le v ia te , the effects of the rapid structural
changes.
For a s ta r t , 800 m i l l . Sw.Cr. were set aside over a f ive -year period as eco
nomic support in the form of loans and grants for the establishment and the
expansion of enterprises, in the areas where a strengthening of economy and
employment were considered to be desireable. In the f i r s t place, the location
support was made available within an area called "norra stödområdet" (the
Northern Aid Area), comprising the four northernmost counties and Hälsingland,
the northern part of Kopparberg, north-western Värmland, Dalsland and northern
Bohuslän (see figure 5 :1 ) . In the proposal, however, i t was stressed that on
ly a lim ited number of places could be supplied with industria l a c t iv i t ie s
by social means, and that industria l expansion was not possible anywhere,
simply because there was a surplus of labour. The support provisions were
to be directed to places where from a social point of view the promotion of

113
development was most urgent. A division of support over a great number
of places should be avoided, but no "support places" were named. In
large parts of the G-areas and in several small lo c a l i t ie s one had to
expect continued migration, and, thereby, worsened conditions for main
taining acceptable public services for those who stay. I t was pointed out
in the proposal that an active planning policy was a basic condition for
the rea l iza t io n of the target set fo r the location policy. On the regional
le v e l , research and planning were in the f i r s t place to be co-ordinated
by the County Administration Boards. The planning resources of the County
Administration Boards were reinforced from 1965 onwards, and on a national
le v e l , a body, Lokaliseringsberedningen, was set up, with the task of achiev
ing a co-ordination and survey of such location policy issues that concerned
the f ie ld s of several governmental and c iv i l departments. Among other things,
the body was to in i t ia t e d i f fe re n t kinds of research and surveys to provide
a firmer basis fo r governmental decisions in planning and locating issues,
and to t r y to find solutions to d i f fe re n t problems of adaption.
In connection with the a c t iv i t ie s of Lokaliseringsberedningen, the so cal
led ' Expertgruppen för Regional Utredningsverksamhet1(ERU) (the expert
group for regional investigation a c t iv i ty ) was established. The tasks of
ERU were to be both short-range and long-range. In the short run, investi
gation a c t iv i ty was to be carried out to re l ieve the work of the Lokali -
seringsberedningen, the Home Office and the regional planners. To the great
est possible extent, decisions of a short-range character were to be given
firm grounding. A long-term target for the a c t iv i ty of ERU was be to aim
at the presentation of material which could serve as a background for the
subsequent location p o lic ies , when the f i r s t f ive -year period plan had
been carried out. ERU's f i r s t major publication, Balanserad regional ut
veckling was published in 1970 (SOU 1970:3) together with two supplementary
volumes with contributions from the research projects that had been attached
to the a c t iv i ty . In one of these, Urbaniseringen i Sverige (SOU 1970:14),
there is a collection of the studies of the G-research project that form
the basis of chapters 4 and 5 of th is thesis. Likewise, in a supplementary
volume of the second major ERU report, Orter i Regional samverkan (SOU 1974:1),

114
a summary of some of the studies that form the basis of chapter 6 is
published.
The G-problems were paid special attention to , among others, by a special
project group fo r G-problems being constituted within H. M. Chancery. As
has been mentioned in chapter 1, th e ir publication 'Glesbygd' was published
in 1969, and a committee was established fo r further investigation of the
G-problems. The committee was called 'Glesbygdsutredningen' and published
i ts reports in 1972. (See also chapter 2, p42 ).
As has been mentioned above, the location aid scheme was to be in operation
fo r a test period of f ive years, 1965/66 - 1969/70. At the beginning of
1968, a committee was established with Provincial Governor Mats Lemne as
chairman. I t was given the task of investigating the future aid measures
for location po lic ies . Even at an early stage, i t was evident that i t would
not be possible to make any new radical proposals u nt i l the end of the test
period, on the 1st of July, 1970, so instead they intended to present l im i
ted proposals fo r changes in the system in operation, in the f i r s t place
aiming at increasing support in those parts of the country where such measure;
had proved to be of the greatest urgency.^
Simultaneously, together with a gradually strengthened team of regional eco
nomic experts, the County Administrative Boards were working on a co-ordi
nated preliminary plan fo r each county ( ' lansplanering 1967'). An important
aim of th is round of planning was to recommend to the County Administrative
Boards on which merged communes the location p o l i t ic a l provisions should be
concentrated.^
In 1960, an combined working party fo r co-operation in industria l location
issues between the Government and Sveriges Industriförbund (Federation of
Swedish Industry) delivered a report on the location prerequisites of 29
places within the aid area. The places had been chosen with regard to
the views of the County Administrative Boards and the county-regional plan
ning expert groups on where the location policy measures should be concentrated . 15 of these 29 places were situated within the area fo r which the

115
Lemne Committee had suggested special location policy provisions. The lo
cation of these places are shown in figure 5:1.
The Lemne Committee suggested that the 15 places should be considered as
p r io r i ty places. In p r in c ip le , special location support should be given
to a c t iv i t ie s in only those places. But at the same time, the committee
pointed at a number of merged communes that would, thereby, lack p r io r i ty
places, and they questioned whether additional places should not be in
cluded, However, no concrete suggestion of any more p r io r i ty places was
given. Moreover, i t was considered necessary to get clear statements from
the government to the e ffe c t that the aim would be to give long-term sup
port to the p r io r i ty places, and that satis factory public services would
be guaranteed.

Figure 5:1 The Aid Areas and the Suggested P rio r ity Places (1969).
c The General Aid Area
„ The Inner Aid Area
• « * • • • The Northern Aid Area
BD.NORRBOTTENS LAN
v ä s t e r b o v e n ^ V a n
* JAMTLANDS LAN
• 13 ÏVÂSTERNORRLANDS
N w . y " ‘
15,.»X
N> GÄVLEBORGS«
J ' I \ \ KOP^ARBfRGsL . , •1 \ T > N
1 v r S
* VARM — • .r LANDS . • J LAN *
Suggested P r io r ity Places
1 Kiruna2 G ällivare3 Kalix4 Boden5 Luleå6 Älvsbyn7 Piteå8 Arvidsjaur9 Storuman10 Vilhelmina11 Lycksele12 Strömsund13 Östersund14 So llefteå15 Sveg
300 km

117
No formal minimum lim its fo r the population f igure in the p r io r i ty places
were suggested, but i t was considered that the places ought to be selected
from the centres of the merged communes. The number of possible places
was n a tu ra l ly , s t r ic t l y lim ited . As has been shown above, (chapter 2 ) , a
minimum number of inhabitants of about 8000 had been considered necessary
as a basis fo r the enlarged responsib il it ies of the communes. By and large,
th is is the population reached by the merged communes in inner Norrland.
In the B i l l to Parliament that was based on the report of the Lemne com
mittee (prop. 1970:75), they were not prepared to name any p r io r i ty places
e x p l ic i t ly . The Minister declared, however, th a t e fforts should be made to
avoid a division in the location aid over a great number of places. The
B il l referred to the fact tha t the p r io r i t ie s between places and merged com
munes, should be co-ordinated by the new county planning round,County Pro
gramme 1970. Having made the p r io r i t ie s more e x p l ic i t they could give further
information about the need fo r “support points". Special p o ss ib il i t ies fo r
aiding enterprises in the inland were available already in the f i r s t aid
period, and further p o ss ib i l i t ies for d i f fe re n t ia t io n could now be ava ilab le ,
by the establishment of a special Inner Aid Area. (See figure 5 :1 ) .
Employment support was recommended for those industrial enterprises within
the Inner Aid Area which increased the number of th e ir employees. In ad
d it io n , they suggested transport subsidies, tra in ing support and the possi
b i l i t y of grants and location loans fo r service a c t iv i t i e s , too, within the
entire aid area. This area had now been extended by certain merged communes
in the counties of Värmland and Kopparberg, subsequently called 'Allmänna
stödområdet' (The General Aid Area', see f igure 5 :1 ) . The Minister also determined the principles of a grouping of the central places of the country,
a grouping that would make a basis for the principles that should be used
in the future p r io r i ty decisions. Five categories were distinguished: Metro
politan Areas, A lternatives to Metropolitan Areas, Regional Growth Centres,
Service Centres in G-areas and Other Places (not in need of special support
provisions). Among the 'Service Centres' in G-areas, two categories were
distinguished: 1) centres where i t could be expected that location policy
measures would be taken and that had already been indicated as "support

118
points" fo r the provision of services by Länsplanering 1967, and 2)
centres where the experience of location policies had proved that means
other than location aid had to be used to help the population to have ac
cess to satis factory services.
In the B i l l i t was also emphasized that from a planning point of view i t
would be convenient not do distinguish between centres and merged communes.
The question of the d is tr ibu tion of public resources within each merged com
mune, ought to be the concern of the local commune i t s e l f . A decision made
by Parliament, based on the B i l l of 1970, did not establish any p r io r i ty
places e i th e r , and an e x p l ic i t selection was not achieved until 1973 when
the proposition 1972:111, 'Regionalpolit iskt handlingsprogram' was presen
ted. In general, th is proposition was based on the above mentioned second
major round of co-ordinated county planning, Länsplanering 1970. In the
mean-time, however, a group within the Home Office , GRUP, 'Gruppen för Regio
nal Utvecklingsplanering' (the Group for Regional Development Planning),
had presented the outline of a more d if fe ren t ia ted c lass if ica t ion system.
GRUP's c lass if ica t io n principles d iffered from the system presented in the
B il l of 1970, mainly inasmuch as that additional levels of places were de
fined within the categories 'Regional Growth Centres' and 'Service Centres'.
Thus, no less than nine levels were defined in this c lass if ica t ion system.
From the point of view of th is thesis , the fac t that the group 'Service cen
tres ' as well as the group 'Regional centres' have been s p l i t up into three
levels is of special in terest. Figure 5:2 shows the places that have been
c lass if ied in th is way in the six northernmost counties.

119
Figure 5:2 GRUP1s Classif ication Scheme.
• 3c
4b
v4b
3c
4b
3a.i
4 0 »
13a
3a(s]
3b3c
3c/5
4a4b
Metropolitan Areas Primary Centre >100 000 inh. Including Alternatives to Metropolitan Areas (2 ) .Primary Centre close to Metropolitan Area.Other Primary Centre. County Sub-Divisional Centre.Other Places >30 km from Places in Categories 1,2 or 3.Service Centre.Centre in Merged Communes.
In the B i l l 1972:111, the Government's view of the question of the c lass i
f ica t ion of centres was expressed. The Minister said he based his opinion
on the proposals of the County Administrative Boards on the c lass if ica tion
of centres, which, with certain modifications, he considered to be suitable
as a basis of a plan fo r the development of the regional structure. I t is
of in terest to note that the number of levels was limited to four - Metro
politan Areas, Primary Centres, Regional Centres and Municipal Centres. The
fact that there were only four levels implies in practice an agreement with
the proposal of Glesbygdsutredningen of a c lass if ica t ion in the bottom of
the hierarchy. I t also means that the concept "Alternatives to Metropolitan
Areas" was replaced by the more modest concept ‘ Primary Centres1. After some
small changes had been made, Parliament assented to the B i l l . The d e fin ite
c lass if ica t io n is shown in figure 5:3 below.

120
Figure 5:3 The O f f ic ia l Plan fo r Development of the Regional s tructure«
1 Metropolitan Areas.
2 Primary Centres.
3 Regional Centres.
4 Commune Centres.
5.2 The Discussion of Strategic Localities
As has been mentioned above, (chapter 3 ) , Torsten Astronfs sociological
study showed the att itudes and the preferences of the population in G-areas
to d if fe re n t kinds of service supplies. Among other things his studies
showed how a service set-up should be composed in order to correspond to
the demands for a 'very good' service centre.
This is of course essential information. Migration from an area can be con
sidered to be caused by a series of discontent s ituat ions , some of which
are caused by an in s u ff ic ie n t supply of services. I t is convenient, however,
to s p l i t up the supply into d i f fe re n t levels . The level discussed in th is
context almost corresponds to what is referred to as 'service on a local
leve l ' by Glesbygdsutredningen.^In th is thesis , centres that with any cer-

121
ta in ty can o ffe r services according to Äströms's l i s t , are called “s tra te
gic lo c a l i t i e s 1' .
The area studied is experiencing a painful process of adaption, passing
through an expansion stage into a contraction phase, the end of which can
not be foreseen. By and large, the d if fe ren t service provisions are sub
je c t to trad it io n a l market mechanisms. The existence of each separate ser
vice provision is grounded in more or less e x p l ic i t economic reasons. Thus,
threshold values regulate the provisions, and values below these threshold
values cause (a f te r some delay) the withdrawal of the service, in most cases.
In chapter 6, the importance of neighbourhood service w i l l be discussed. I t
is s t i l l of course essential for a region to have a stable set-up of services
at a higher hierarchical leve l . In the f i r s t place, the purpose of this dis
cussion is to analyse the existing strategic lo c a l i t ie s and to give standards
fo r the threshold values that support them. The consequences fo r planning are
obvious. I f a place, s tra te g ic a l ly s ituated, has not got a su ff ic ie n t number
of inhabitants to reach the threshold values th is is an indication that some
sort of measures w i l l , sooner or la t e r , have to be taken by society to pre
vent a reduction in the provision of services.
The discussion in i t s e l f of the minimum size of a strategic lo c a l i ty was i n i
t ia ted much e a r l ie r than in the middle of the 1960's. In a supplement to the
f in a l report of the Social Housing Commission (Bostadssociala utredningen),
(SOU 1945:63), Uno Ähren discusses the desireable size of place able to pro
vide d i f fe re n t kinds of material and cultural services. Ähren states that
there are no c lear norms fo r what standard level could be regarded as neces
sary, nor, consequently, what threshold values are required. According to
Ähren, a population of 2000-5000 people is a cautious estimate of the number
of inhabitants required for a ‘ decent practical and cultural service1. In
1940, there were only 99 lo c a l i t ie s in that size group, and, i f certain places
of a suburban character were excluded, there would be a remainder of approx.
1000 lo c a l i t ie s that would be too small from this point of view.

122
ÄhrérTs discussion is presented in the AMS report, Samhällsservice och
lokal i seringsverksamhet (1960), referred to previously. In th is report,
the discussion is summed up in the following way: Places with a popu
lat ion basis of 30- 40 000 inhabitants, including both the lo c a l i ty i t
s e l f and i ts h interland, are considered to be able to give good service.
On a basis of 7-8000 people, i t is possible to maintain a re la t iv e ly com
plex service. In spite of the deficiencies in the service provisions in
the la t t e r places, they are l ik e ly to be accepted as residentia l and in
dustria l lo c a t io n s .^
Similar figures are also found in Sven Dahl's Det svenska nätet av handelsorte r (1965). There i t is stated, that a market centre having a population
of 5-8000 people, including the hinterland, can supply most of the re ta i l
trade services that are demanded by the individual.
Other, lower values are discussed in a report by the planning committee of
the County Administrative Board of Kris t ianstad, Tätorterna i Kristianstad
(1968). Without giving a detailed d e f in i t io n of the composition of a set
up of services they point out that the experience in Skåne suggests a mini
mum population of 2000-3000 to enable a central place to maintain a minimum
standard, provided that i t has a hinterland to back i t up.
The estimates of the threshold values for d i f fe re n t service provisions,
made by the trade and professional organizations, w i l l be dealt with further
on in th is chapter.
In an appendix to the Långtidsutredningen 1966 (the report of Long-term Plan
ning Committee) Torsten Hägerstrand stated, that there was probably a mini
mum size for lo c a l i t ie s below which i t would not be possible to f u l f i l es
sential welfare c r i t e r ia . Hägerstrand also pointed out that these central
functions could, in themselves, be carried out by groups of minor lo c a l i t ie s ,
provided that they were situated s u f f ic ie n t ly close to each other and were
prepared to divide the tasks between themselves. No doubt such a division of
functions would also be possible in the six northernmost counties. But, in
the f i r s t place, th is discussion refers to c lear ly mononuclear regions. (See

123
for instance By!und"s discussion on overlapping commuting areas in SOU
1970:14 and Regioner a t t leva i (1972).
The problem we must now solve is how to find a 'guaranteed s iz e 1 for the
strategic lo c a l i t ie s in the research area.
5.2.1 C R ITER IA OF MEASUREMENTS A N D CALCULAT IO N OF PO PU LA TIO N BASES
The way of tackling the problem which follows may seem simple: an inventory
of service provisions should be capable of indicating which central places
have an aggregate of services as defined according to the above-mentioned
norms.
The somewhat predictive aim of an estimate of s trateg ic lo c a l i t ie s , however,
makes i t less su itab le , to my mind, to actually investigate in detail the
existence of each separate service function in the d i f fe re n t lo c a l i t ie s .
This is an area of contraction, where the phenomena of contraction proceed
with varying in tens ity and in various ways, depending on the s ituation and
the point in time. The service supply within the r e ta i l trade sector gene
r a l ly lags behind by comparison with changes in the population, whereas the
corresponding lag in the public sector proceeds in accordance with a d i f f e
rent pattern. Thus the service pattern at a given point of time does not -
in depopulation areas - correspond to the population l iv in g within the range
of the d i f fe re n t supplies, and I have therefore, decided to f i x the base
points by means of a general method, where the population basis is the c r i terion of the leve l .
One of the main themes of the sociological section of the 6-research is the
attitudes and the preferences of the population in G-areas as regards private
and public services. Among other things, one resu lt of these studies has been
the d e fin it io n of a service aggregate, comprising a number of service establishments. The existence of th is set-up in a central place means that th is lo c a l i
ty has been characterized as 'very good' - from a service point of view. The
sociological studies have also shown that the urban reference group shows
sim ilar att itudes towards th is service aggregate.

124
I t follows that the existence of such an aggregate should indicate that
a lo c a l i ty is situated s u f f ic ie n t ly highly in the hierarchy to remove the
primary reasons fo r d issatis faction with the service s ituation .
Thus, a strategic lo c a l i ty , defined in this way, would to some extent en
sure that d issatis faction with the supply of services is not a reason for
emigration. On the other hand, the choice of s trategic lo c a l i t ie s te l ls
nothing about the labour market s ituation within the area.
The l i s t of service establishments constituting the 'very good' service
aggregate, according to the study by Åström, consists of the following:
general store, grocery shop, hardware shop, chemist's, shop, e le c t r ic i ty
radi o-TV-servi ce, department store, men's and women's o u t f i t t e r s , shoe
shop, men's and women's hairdressers, doctor, dent is t , bank, post o f f ic e ,
church, cinema, café, commune o f f ic e , labour exchange, local social in surance o f f i c e . ^
At an i n i t i a l stage, the existence of these service establishments in a l l
the places in the research area was investigated. 'P lace1 was given a wide
d e f in i t io n , which had the e ffe c t that a to ta l of 1973 nuclei were in ves t igated. In fa c t , th is implied that a l l habition clusters with any central
function according to the l i s t above were included in the investigation.
The places were grouped according to the s iz^ of population into the groups
1-199, 200-399, and so on. Over the level of 2200 inhabitants, i t turned out
to be meaningless to have closed classes. The material shows such a scatte
red picture that a specialized place of an extreme industria l character, fo r
example, or a place of a suburban character, whould be too dominant, i f ap
pearing alone in one class. Consequently, a l l places over a population level
of 2200 are grouped into one open cl a s s .^
Public services correspond closely to the re ta i l trade pattern so fa r as certain p ro f i t c r i t e r ia are taken into consideration, in the form of a popu
lat ion basis in both f ie ld s . There is one essential d ifference, however. The
establishment and the withdrawal of a public service provision are due to
p o l i t ic a l decisions, which could imply that changes occur in ways other than
might be indicated by the population basis. For these reasons, I have come to

125
the conclusion that the threshold values fo r a commune o f f ic e , labour
exchange and a local social insurance o ff ice cannot be estimated in the
same way as the other service establishments.
Furthermore, the functions 'church', 'c a fé ' , 'bank', 'post o f f i c e ' , 'de
partment s to re ' , 'general s to re ' , and 'men's and women's hairdressers *
have been d i f f i c u l t to define, p artly because of the inconsistencies in
the c lass if ied telephone d irectory and because of some ambiguities in the
interview investigation. Therefore, in the estimates of the threshold
values reported below, (p i29), these functions have been excluded. Instead,
a general discussion about the existence of these functions follows below.
The labour exchanges have a head o ff ice in each county cap ita l . Under this
head o f f ic e , there is a number of branch-offices in places which may have
greatly varying numbers of inhabitants. Normally, they have been located in
the commune centres. Under the branch-offices there is a network of mobile
exchanges. The la t te r operate in places with populations around 400 inhabi
tants. On the lowest le v e l , there is a system of local employment o f f i c ia ls .
The sizes of the places vary greatly . Some of the places are on a very low
level in the hierarchy of places, while others are on a comparatively high
leve l . The impression given by the spread suggests, that proximity to major
centres has had a pronounced influence, so that re la t iv e ly big places, s itua
ted within a short distance from a major centre that is provided with a branch-
o ff ic e , has only a local employment o f f i c ia l . The following summarises the
picture: th is form of public service exists in some form even on a very low
l e v e l ,9 ^and i t could therefore be stated as a certainty that i t is located in
places having the rest of the aggregate of services.
Local social insurance o f f i c e . The local insurance offices are much more
scattered. The county community is covered by means of a net of local o f f ic e s ,
serving a defined area. These areas consist of one commune or more, and the
branch-offices are located in commune centres. There seems to be no demand
for proximity attached to th is a c t iv i ty . I t appears to be part of the general pattern, even in major centres with one branch-office or more, that communi
cation with applicants is carried out by mail.

126
Commune o f f ic e s . Commune o f f ic ie s and other social functions linked to
those offices are , in most cases, located in the dominant centre of the
commune, and, thereby, they are not appropriate to a discussion of thres-
hold values.10^
Church premises could be considered to be referred to as 'public se rv ic e ' ,
in as fa r as they are public places of meeting. The d i f f ic u l t ie s of d e f i
n it ion (State Church, and Free Church premises, e tc . ) made me omit this
item in the course of the study. No doubt church premises do exist on a
very low level of place hierarchy.
Café, could be looked upon in the same way, from certain points of view.
The sources available show l i t t l e agreement within the region on th e ir
d e f in i t io n . The item 'café' appears in the c lass if ied telephone d irectory ,
but a check showed l i t t l e correspondence with r e a l i ty . Baker's shops, too,
often have certain service a c t iv i t i e s , and the same goes for certain types
of grocery shops. As is considered to be the case regarding church premises,
th is function is l ik e ly to be found on a very low leve l .
Bank - p o s t -o ff ic e . The situation with regard to bank - post-o ff ice is simi
la r . A post-office f i l l s certain bank functions, and, to a limited extent,
banks are able to undertake certain postal functions. The Postal Admini
s tration has a network from general post offices down to rural postal de
l iv e ry c i rc u i ts , whereas the banks locate th e ir offices according to business-
oriented principles. Bank offices ex is t on f a i r l y low levels and post offices
at very low levels .
Department s to re . There is no generally accepted d e f in i t io n of 'varuhus'
(department store) . Handelns Utredningsinstitut (the Research In s t i tu te for
Commerce) points out that the course of the development is towards a broader
and more extensive choice of goods within the department store. I t should
thereby be possible, within a few years, to introduce a much s t r ic te r d e f i
n it ion of 'varuhus'. Tur itz & Co and Âhlén & Holm, (well-known chains of de
partment s tores) , give roughly the same def in i t io n of th e ir 'varuhus'. The
cooperative society (KF)divides theirs into A- and B-'varuhus'. The older

127
'B-varuhus' has a more lim ited choice of goods. In addition to these de
partment stores, KF has small supermarkets, which cannot be defined as
'varuhus1. These three multi-branch companies comprise 317 out of a national
to ta l of 355 'varuhus'. I f one t r ie s to define the concept 'varuhus', using
the information on goods as a basis, only 16% of these could be said to have
the complete, all-round merchandise of a department store. The multi-branch
companies are occupied with re-organization within the research area, new
buildings are planned and the re-building of older 'varuhus' is being aimed
at. Since the analyses of the interviews in G-areas showed that the d i f f i
culties of defining 'varuhus' implied serious risks of e rro r , i t was con
sidered that 'department store' should be omitted from the analysis of the
aggregate of services, presented above.
General store has been omitted from the subsequent analysis, because i t is
not reasonable to regard the existence of such a shop as a c riterion of
level. The existence of general grocery shops also proved to be rather un
interesting in the sociological study of a 'very good' aggregate.
Hairdressers: In th is case, i t was also considered useless to base an e s t i
mate of threshold values on the material available. One reason is that the
function, as defined in the sociological study, had been given a double
meaning, i . e . , hairdresser fo r both men and women, and i t is often the same
people that carry out both functions. This implies, that is has been impos
sible to re ly on the c lass if ied telephone directory in th is respect. Moreover, hairdressing is l ik e ly to be frequently carried out by people other
than professional hairdressers. Material has been collected, however, and
there are indications that places with more than 800 inhabitants (with a
few exceptions) have hairdressing establishments.
Thus, the following service functions remain fo r an estimate of threshold
values: Grocery shop, hardware shop, e le c tr ic i ty -rad io -T V -se rv ice , motor
garage, cinema, men's and women's o u t f i t t e r s , shoe shop, chemist's shop, doctor and dentist.
The threshold values of the en tire aggregate of service supplies have been
calculated on the basis on an operationally defined concept of completeness:

128
The necessary size must be one where each separate service establish
ment exists in at least 2/3 of the places of that s ize. Furthermore,
the mean score of a l l establishments must exceed 90%, calculated ac
cording to the following formula:
inn i the number of places lacking any one of these establishments u the number o f places x the number of service functions surveyed
The table below presents the resu lt of the s t u d y . ^

Popu
latio
n of
the
plac
e 1-
200-
40
0-
600-
80
0-
1000
- 12
00-
1400
- 16
00-
1800
- 20
00-
2200
- Th
e nu
mbe
r S
ervi
ce
199
399
599
799
999
1199
13
99
1599
17
99
1999
21
99__
____
_of
plac
es
fun
ctio
n
129
r- <U S- I o 4-> O O •>- <U "O i— rtJ O)
S- t/i
O r tocoLO
CO « CO
r - OC\J " i— <3-
<u o .c .c +-> to
-t-> ofl3 - r -
r— +->=J asCLt— O =3 CL CL

130
Results: The class of places with a population of 2000-2199 is the level
at which the c r i t e r ia are almost completely f u l f i l l e d . 90% and 2 /3 , res
pective ly , may seem low, but these c r i t e r ia have been selected with the
im p l ic i t idea, that a s t r ic t hierarchy of functions does not ex is t in the
research area. There are also a few major places that lack establishments
found on lower levels . This does not imply that the size of the place is
not 's u f f ic ie n t ly large' for the establishment that is absent, but that
the lack is the resu lt of strong spec ia l iza t ion , other a rb it ra ry circum
stances or the closeness to a separate centre. The a v a i la b i l i ty of services
in places d e f in i te ly above the size normally required fo r a part icu la r ser
vice establishment is a more reasonable ce il ing of completeness than '100%'
would be. Therefore, comparisons should be made with the proportion of the
open class, in which a l l the major places are grouped. The score of complete
ness of the open class is only just over 3% above the level where the c r i te r
are f u l f i l l e d .
As has been mentioned above, i t is pointless to continue classifying places
with over 2200 inhabitants - the number of such places is too small. There
fo re , as an approximation, the upper l im i t of the interval 2000-2199 has
been fixed as the level where the c r i t e r ia of completeness are f u l f i l l e d .
Figures 5:4 and 5:5 shows the degree of completeness in a diagram form.
Completeness•/.
100
90 -
8 0
7 0 -
60 -
50
40 -
30
20
1 0
Figure 5:4 Diagram of the Degree of Completeness by Size of GroupsT All Functions In - cluded.
0 - 2 0 0 - 4 0 0 - 6 0 0 - 8 0 0 - 1 0 0 0 -1 2 0 0 -1 4 0 0 -1 6 0 0 - 1800- 2 0 0 0 -2 2 0 0 - 199 399 599 799 999 1199 1399 1599 1799 1999 2199
//V --------------Size of Places

131
Figure 5:5 Diagram of the Degree of Completeness by Size of Groups. Each Service Function Analysed Separately.
Shoe shop100 7 «
90
80
70
30
^ vl 0
1 0 0 *
90
80
70 60
50
40 30
20
1 0 0
/o r Motor garacje
i i— i— i— i— i— i— i— i— i— i—
1 0 0 °
90
807060
504030
20
10Q
Cinema
“ i i i— j— i— 3 3 — i— i— i— i—~r
l Û l D l û l û i û l f l l û U ) ^ g U3C O C O t O t O t O C O c O l O t O to to
100
90
807060
50
403020
10
0
’/o T Doctor
“I—1----1—I--1--- 1--1—I---1—r-— co cn - j (o —*to co to to to to
O -40 CO cO to tO tO
( j j U1 V l (O -co CO CO io toto co co co to
E le c tr ic ity - radio-
to to co CO too to to CO to
Chemist's shop1007a * TV-service x * 100 7»90 - X 90 -8 0 -i X * *
X 80 -70 ■ X ,
X 70 -60 - X 60 -50 - X 50 - X
40 - 40 - X
30 - 30 - X *
2 0 - 20 -10 - 10 -0 \ I 1 1 1 1 1 1 1 ” ”I 1 f 0 1 1 i
— t O u i - J to — CO m v l CO —to co to to to co to to to to toto to to to to to to to to to to

132
1 00 '
90
807060
50
4030
2010
0
'/•THardware shop
—i—i—i—r~-I—r—■ W Ul s] (fl — u ui vj ID —CD to CO CO CO CD u ) (ß (Û U3
C .̂ CO CO CO CO CD CD CD CD CD CD CD
Grocery shoploov.90
80 70
60
50
40
30
20 10
0 ' I I i i1 1 _ _ _ _ _- W U l s l C D - C O ( / t v l ( D ~ C D c D C D C D C D C D C D l D C D C D C D CD CD CD CD CD CD CD CO CO CD CD
Men's and Women's100V.- r o u t f i t t e r s *
X *100 V i *
90 - X 9 0 -
80 - X 8 0 •70 - y
X 7 0 -60 - 6 0 -50 - X X 50 -4 0 - X 4 0 -3 0 - 3 0 -2 0 - 2 0 -■
10 -
o - — 1— 1— 1— 1— 1— i— 1— i— 1— 1— 1------------- h
i o - 0 ■■
i i i i iCD CD CD CDcDCDCDOCDCDCD
O CD CD CO CD CD CD CO CD CO CO CD
Dentist
, , i i 1 1 J J. A-1* c*j ui vi co ■- w t n - jCD (D I D CD 10 10 CD CDto CD CD CD CD CD CD to to

133
5.3 On the Size of Strategic Localities
5.3.1 T H E A D D IT IO N TO PU R C HA SIN G POWER BY TH E PO PULATIO N OF TH E H IN T E R L A N D
The threshold value of 2200 people that has been the resu lt of the calcu
lations made in the previous section, does not correspond to the real
basis of purchasing power. The contribution from the trade area must be
added to the number of people in the central place. A discussion on the
size of this contribution follows.
One of the issues is in what ways a change in the population in the h in te r
land affects the threshold values of the s trateg ic lo c a l i t ie s . With the
exception of minor lo c a l i t ie s of a surburban character, the characteristic
feature of the population development in the research area is that major
lo c a l i t ie s tend to grow, or a t leas t , do not decrease.^Depopulation is
something that affects scattered settlements and minor lo c a l i t ie s . To a
large extent, th is is also where the supply of services has been withdrawn,
whereas the major central places are often s tr ik in g ly well supplied as fa r
as services are concerned. The lack of closely situated services as an a l
ternative to those of the central place, has influenced the s e n s it iv i ty to
distance to the extent that the in tensity of the decay has been weake
ned by comparison with previous decades. Distance no longer affects the
propensity to consume to the same extent. I t is hardly possible to ana
lyse th is correlation in d e ta i l , since the leve l l in g of the gradient of
decay coincides with a period of heavy increase in car usage. The fact re
mains th a t , especially in the 60 's , the curve of decay has been l e v e l l e d . ^
The number of places within the research area with a population over 2200
inhabitants is very l im ited . In practice, i t is only the main centres of
the communes that reach th is f ig u re , with few exceptions.
From a trad it io n a l central-piace theoretical point of view, each of these
places is a centre of a network of subordinate places, the centre being at
the same time one of the foundations of a superior hierarchy. The places in
the v ic in i ty of a central place are small, and they have a demand cone th a t ,

134
only in regard to certa in , p a rt ic u la r ly local supplies, rises through
the mantle surface of the superior central place. Further away from the
central place, there is a major centre, the demand cone of which rises
conspicuously above the mantle surface of the central place but with a
steeper rate of decay. Somewhere along the radius of the range, the
boundary of the inner range w i l l be reached, i . e . , where the threshold
values of the central services of the central places are reached. I f we
continue along the radius, we shall gradually reach the boundary of the
outer range, i . e . , where consumers abstain from consuming the services
of the central place, and e ither substitute fo r them or consume them in
a centre on a corresponding level that is more closely situated. This can
be i l lu s tra te d by a sketch:
Figure 5:6 Central Places and Spatial Demand Cones According to C h ris ta lle r 's Marketing P rin c ip le .
BA C D E
X C entrality
^ DistanceDemand Curve
Demand Curve estimating demand for special local supplies
A-E Centres
Source: Godlund (1954), SOU 1961:9,Berry (1967) and M o rrill (1970.
The answer to the question where the boundaries of the outer and the
inner ranges are, natura lly depends on, p a r t ly , which service function
is studied, and partly on local conditions. That substitution effects

135
do ar ise , even in highly specialized sectors such as, fo r instance,
medical care, is a matter of fac t . (See, e .g . , chapter 6 ).
I f the threshold population used the central place fo r a l l th e ir shop
ping, i t would imply that the threshold value of the central functions
of the central place would be equal to the number of inhabitants in the
central place plus the population within the inner range of the entire
aggregate of services of the central place.
Now we know that th is is not the case. The propensity to go to the central
place fo r a l l shopping diminishes with increasing distance and intervening
opportunities. A great number of studies concerning the size of the d is
tance exponent have been carried out, but there are not results available
that are generally applicable to a situation such as th is . The picture is
not least biased by regional variations depending on preferences, income
levels and the domination of various means of communication, etc.
5.3.1.1 The Local Shortfall
Below follows a discussion of the size of the proportion of the purchasing
power outside the strategic lo c a l i t ie s that should be included in the thres
hold values of the aggregate of services. The general functions of decay
that are t ra d i t io n a l ly applied, contain, in p r inc ip le , the following compo
nents: 1) 'leakage' to local shopping centres and others, 2) lower income
level in minor places and G-areas, 3) pure reluctance to tra v e l . In addition
to these three points, I think a further point should be added: 4) 'leakage'
to places conspicuously superior to the nearest s trateg ic lo c a l i t ie s .
The population of the research area is d istr ibuted over G-areas and size
classes of lo c a l i t ie s as shown in table 5:2.

136
Table 5:2 Total Population of the Research Area, Distributed Over Localit ies and G-areas. "
County Total popu- Population Population in Population inlat ion in G-areas lo c a l i t ie s <2200 lo c a l i t ie s >2000
abs. % abs °/o abs. %Kopparberg 282093 66607 23,6 53448 18,9 162038 57,5Gävleborg 292581 77190 26,4 48524 16,5 166867 57,1Västernorrland 277294 89260 32,1 53661 19,3 134373 48,6Jämtland 131046 67010 51 ,1 34016 25,9 30020 23,0Västerbotten 233423 96080 41,1 41458 17,8 95885 41,1Norrbotten 259418 76365 29,4 58067 22,3 124986 48,3
1475855 472512 32,0 289174 19,5 714169 48,5
In to ta l there are 544 lo c a l i t ie s within the research area. They <iredistr ibuted over size iclasses as shown in the following table:
Table 5:3 Localit ies Classified by Size.
Locality Size 200-599 600-999 1000-1399 1400-1799 1800-2199 2200 z
Number of Localit ies 311 92 31 29 10 71 544% 57 17 6 5 2 13 100
As is apparent in table 5:2, lo c a l i t ie s with a population exceeding 2200
people comprise 48,5% of the population, and the minor lo c a l i t ie s 19,5%.
I f the population of these places is d istr ibuted over the same size classes
of lo c a l i t ie s as in table 5:3, the following figures w i l l be obtained:
Table 5:4 % Population by Size of L oca lity .
Locality Size % Population
200-599 41600-999 241000-1399 121400-1799 151800-2199 8E ioo%

137
How great a proportion of the purchasing power of the hinterland goes to
the local centres? Table 5:1 showed degrees of completeness fo r each res
pective class of lo c a l i t ie s . Even in G-areas and at a low place leve l ,
the degree of completeness as regards certa in services, was quite high.
This implies that a great deal of purchasing power is used fo r local pur
chases. Furthermore, we should bear in mind that the d if fe re n t service
functions have d i f fe re n t weights, depending on from which point of view
they are graded.
In the following, the values of completeness w i l l be weighted by re fe
rence to the frequency of v is i t in g , i . e . , highly frequent service functions
w i l l have a higher weight than less frequent ones. The weights have been
selected from a study of a G-commune showing great s im ila r i t ie s to an
‘average1 G-commune as regards population, place structure, economy and
rate of depopulation, namely Vindeln in the county of Västerbotten (see14) f ig 6 : 8 ) . ' The to ta l aggregate of services in this commune was examined
with regard to frequency of v is i ts by means of interviews. Two service
functions dominated the v is i t in g pattern strongly, namely grocery shop and
petrol station - garage. The other functions showed low and re la t iv e ly un
d if fe ren tia ted figures of frequency of v is i t in g .
Provided that the figures of v i s i t frequency, obtained at Vindeln, for
grocery shop and petrol station - garage are representative of the research
area, and that the other eight functions may stand for the other services in
the commune centre, the weights w i l l be as follows: 31,5 fo r grocery shop,
17,0 fo r petrol station - garage, and 6,4 fo r each one of the other service
functions, separately. Table 5:5 shows the weighted values of completeness.

138
Table 5:5 Weighted Values o f Compìetenessx^
Size of Locality
Values of Completeness before Standardization to 100
Values of Completeness a fte r Standardization to 100
G-area200-599600-9991000-1399
23,5433,2548,8363,0668,2084,6592,96
253652687991
100
1400-1799 1800-2199 > 2200
5.3.1.2 The Addition of the Purchasing Power by G-areas
As has been shown above, the proportion of the population in G-areas is
32%. Their own completeness is 25% according to table 5:5. Let us use a
hypothetical area of 10 000 inhabitants as a s ta r t ing -po in t. Out of these
people, 3200 l iv e in G-areas. A 25% reduction of 3200 gives 2400. The rest
of the demand in G-areas is s a t is f ie d , partly in local centres, partly in
the s trateg ic lo c a l i ty .
I f we assume, that the population in the research area is distr ibuted
equally over the area, so that the 544 lo c a l i t ie s would also be equally
distr ibu ted , th is would imply that the remaining purchasing power of the
G-areas would be d istr ibuted proportionally to the proportion of lo c a l i t ie s
in each size class.
The resu lt of these calculations is shown in table 5:6 below.
x) The method of calculation is shown in the following example: In the class 0-199 (G-area), 799 out of a possible to ta l of 1315 places had a grocery shop and 274 a petrol station - garage. Only a few places had supplies other than these:
= 23,54

139
Table 5:6 Dis tr ib u tio n of Purchasing Power Within G-areas.
Size of Purchasing Power from G-areas Grouped by Size ofLocality___________ Locality___________________________________________
200-599 311544 . 2400 = 1372
600-999 925W . 2400 = 405
1000-1399 31544 . 2400 = 136
1400-1799 29544 . 2400 = 127
1800-2199 10544 . 2400 = 44
> 2200 71544 . 2400 = 316
The 316 population units in G-areas that according to table 5:6 are closer
to the strateg ic lo c a l i ty than to any other lo c a l i ty w i l l , according to
the conditions, locate the remainder of th e ir consumption there. The other
population units d is tr ib u te the remainder of th e ir consumption between the
local centre and the strateg ic lo c a l i ty .
As has been shown above, 25% of the purchasing power in G-areas has been
accounted for by local consumption, and thus, as regards the consumption
in local centres by the population in G-areas, the weighted degree of com
pleteness must be reduced by that value. These estimates are shown in table
5:7.

140
Table 5:7 Reduction of the Degree o f Completeness.
Size of Locality
Weighted degree of completeness of the lo c a l i ty
Weighted degree of completeness a f te r reduction
Population in G-areas fo r each class of lo c a l i ty
Population in G-areas a f te r reduction
200-599 36 11 1372 1221600-999 52 27 405 2951000-1399 68 43 136 771400-1799 73 48 127 66
1800-2199 91 66 44 15
z 1674
Thus, by th is procedure, the orig inal number of inhabitants in the G-areas
has been reduced from 3200 (32% of the to ta l population), to a purchasing
power corresponding to 316 + 1674 = 1990 (19,9%) inhabitants in G-areas.
5.3.1.3 The Addition to Purchasing Power by Localities
In minor lo c a l i t ie s , there are, according to previous estimates (table 5 :2 ) ,
19,5% of the to ta l population, or 1950 people i f we continue the a r i th
metical example with 10 000 inhabitants as a s tart in g -p oin t.
Table 5:8 shows the proportions of population and the weighted degree of
completeness in each class of lo c a l i ty sizes, and the number of inhabitants
a f te r reduction.

141
Table 5:8 The Proportion of Purchasing Power in Classes of Locality Size A fter Reduction for Own Degree of Completeness.
Size of Locality
Share of population
Weighted degree of completeness
Share of population a f te r reduction
200-599 41% = 799 36 511600-999 24% = 468 52 2241000-1399 12% = 234 6 8 741400-1799 15% = 292 73 491800-2199 8 % = 156 91 14
E =1950 E 872
The table shows, that the orig inal number of inhabitants in the minor
lo c a l i t ie s has been reduced from 1950 (19,5%) to 872 (8,72%).
5.3.1.4 Summary of the Addition to Purchasing Power by the Population of the Hinterland
I f the reduced values of the population of the hinterlands and the popu
lation of the lo c a l i t ie s are aggregated, the result w i l l be 1990+872 = 2862
(28,62%). But th is sum s t i l l has to be reduced because of lower incomelevels as follows from the argument on page 135 point 2.
Data on income variations have been taken from a study of local variations
and changes of the income of the population in a number of G-communes in
Västerbotten J 5^In this study, i t is obvious that the index of the average
income varies between 72 and 108, d istr ibuted over classes of population
density. I f the grouping of the sizes of lo c a l i t ie s used above, are put
proportionally into th is schedule, the aggregated resu lt would be that the
population in G-areas have a 30% lower income (and, thereby, purchasing
power) than the population in s trateg ic lo c a l i t ie s . The income of the popu
lation in minor places would be 15% lower on average. A further reduction
must therefore be made as shown in the table below.

Table 5:9 Reduction For a Lower Capacity to Consume.
Purchasing Power Before Reduction
Reduction Factor Purchasing Power A fter Reduction
In G-areas 1990 0,70 1393InLocalit ies 872 0,85 741
z 2134
In th is way the purchasing power, e .g . , the number of inhabitants in
the h interland, has been reduced to a value which corresponds to a popula t ion of 2134 (21 ,34%).
Point 3, reluctance to travel can be schematized in the following way:
In 1965, the distance between central places with more than 2200 inhabi
tants was 44 km, as measured in a s tra ight l in e using a conventional con
stant fo r lengthening s tra ig h t - l in e distances to road distances, this
would correspond to 60 km.
In studies within the G-research pro ject, carried out simultaneously by
Erson (1969), i t has been shown that a short-distance commuting to work
within the research area does not indicate any part icu la r s e n s it iv ity to
distance up to distances of approx. 20 km. Above th is , the 'w ill ingness'
to commute diminishes substantia lly and above 30 km th is 'w ill ingness' is
very weak. I f we consider commuting frequency to be a measure of re luc
tance to t r a v e l , i t would imply that 2/3 of the population of the h in te r
land, i . e . , those l iv in g within a radius of 20 km, should not, in principi
be reduced by any distance decay, but tha t the remaining th ir d , the popula t ion in the interval 20-30 km, should be reduced by h a lf . What th is
means, is i l lu s tra te d schematically by f igure 5:7.

143
Figure 5:7 Schematic I l lu s t r a t io n of Reluctance to Trave l.
Population in Locality A
Population in Locality B
60 km
Shaded Area Denotes Reduction Due to Travel Reluctance
I t has been shown above how the number of inhabitants o f the hinterland
has been reduced to 2134 (21,34% of the to ta l population). 2/3 of th is
value remain unreduced, whereas the remaining th ird must be reduced by
50%, as follows from the discussion above. The to ta l w i l l therefore be
1422+355 = 1777 (17,7%), i . e . , around 36% of the proportion of the popu
lation of the s trateg ic lo c a l i ty .
The fourth point, as argued on page 135, is the leakage to superior centres.
We lack data to show the extension of th is additional drain on purchasing
power, but i t is obvious that the value of the contribution to purchasing
power by the population of the hinterland must be adjusted downwards even
fu rther . The calculations have been based on the assumption that 100% of
the purchasing power that has been directed towards lo ca l ly available sup
p l ie s , w i l l be directed towards the strategic lo c a l i ty and subcentres within the hinterland. This suggests an obviously u n rea l is t ic description of the
situation in the areas mainly referred to in the discussion of strategic
lo c a l i t ie s , i . e . , the sparsely populated inland. T ra d it io n a l ly , people in

144
these areas often travel long distances to do th e ir shopping in the de
partment stores of the county centres and other major centres. The studies
on the commune of Vindeln reported above, suggest a leakage of 10% calcu
lated over the whole commune, which implies a lower f igure fo r the popu
lat ion of the h interland, when taking into consideration the poorer ava ila
b i l i t y of transportation and lower purchasing p o w e r .^
In previously published studies, a standard value of 30% has been used as
an approximation of the addition to purchasing power from the h i n t e r l a n d . ^
There are thus no detailed data on the leakage to superior centres, but i t
seems reasonable to make a rough estimate that is so low that the previously
used value fo r the proportion of the threshold value of the hinterland popu
lat ion can remain. In th is way, the material presented in th is thesis can
be related to the discussion in the previous studies referred to concerning
the changes in the basis of purchasing power.
5.3.2 CHANGES IN TH E THRESHO LD VALUE T H R O U G H T IM E
One conclusion drawn from th is discussion is that a s trateg ic lo c a l i ty
should have i ts population figure increased by 30% to correspond to the
real threshold value of i ts service establishments. I f we accept 2200 in
habitants as a minimum s ize , th is w i l l imply that the threshold population
w i l l amount to 2860 people.
Many of the lo c a l i t ie s that we are interested in are however centres of
G-areas that have been strongly affected by depopulation. Between 1960
and 1965, for example, the population of lo c a l i t ie s with less than 2200 in
habitants, and in G-areas within the research area, f e l l by 14,5%, i . e . ,
approx. 3% per year.
In an extreme situation th is means that certain s trateg ic lo c a l i t ie s may
have to allow fo r an almost neglig ible addition to purchasing power from
the hinterland. As a re s u lt , a s trategic lo c a l i ty in such areas ought to
have a population that is not lower than the threshold value, i . e . 2860
people. Under present conditions, the calculations above suggest th a t , such

145
a place would have an average marginal contribution of 30%, i . e . 860
people from its hinterland.
The structural changes in the service sector must be added to what has
been mentioned above. In the county report of Norrbotten, BD-80, a table
based on estimates prepared by the trade and professional organizations,
shows the basic essentials fo r a ' ra t io n a l ' unit fo r the years 1965 and
1980.^ T h e figures given referred to the en tire country. The sum of the
to ta l basic requirements at these two points in time shows an increase of
basic requirements of 43% over th is period, which corresponds to an approxi mate annual increase of 3%.
In f igure 5 :8 , the rate of depopulation and the necessary increase in pur
chasing power have been related to the population figures discussed above.
I f the star t ing -poin t is a central place with a population of 2860 people,
i t w i l l have a contribution from the hinterland corresponding to 660 people.
The strateg ic lo c a l i ty w i l l thus have an overcapacity in re la tion to the
assumed collection of service supplies that is i l lu s tra te d in figure 5:8 by
the distance between a and 3 on the population axis.
From the point a there is a curve <a, which represents the population de
crease, i f the population of the strateg ic lo c a l i ty is assumed to be con
stant and the population of the hinterland decreases by 3% per year. The de
cline in the population of the hinterland is represented by the curve c .
Starting at point 3 the curve b̂ represents the requirements of a 3% increase
in purchasing power, with the threshold value of 2860 people as a point of
departure. The over-capacity that a strategic lo c a l i ty with 2860 inhabitants
would have at the beginning of the period w i l l gradually disappear, and a f
te r seven years there w i l l be a basis deficiency.

146
Figure 5:8 Diagram of Shortfa ll in Purchasing Power Over Time.
Pop.
5 000
4 000
3000
2 000
1 000
900 800700
600
5 00
3 00
200
1 00
Time
The example is , n a tu ra lly , highly hypothetical, but i t shows that a
central place with 2200 inhabitants (in extreme cases even 2860 inhabi
tants) may end up in a s ituation when the basis of purchasing power is

147
no longer s u f f ic ie n t for a central place to be able to maintain what in
the sociological study of service preferences was defined as the aggre
gate of service supplies that is available in a central place with a 'very
good' service.
On the basis of the discussion above, one can distinguish two sizes of cen
t r a l places of in terest in theory: on the one hand, those central places
that are in the size interval 2200-3000, and those with more than 3000 in
habitants, on the other. The lower size represents central places, which
had at the time of the survey populations s u ff ic ie n t to ju s t i f y the pro
vision of services, but where various circumstances may take the basis of
purchasing power in s u ff ic ie n t within the reasonably near future. The higher
size represents the central places that would, most l i k e ly , be able to main
tain th e ir supply of services, even i f the hinterland were to become comple
te ly depopulated.
A map showing a l l places with a population over 2200 in the research area
is in the appendix, figure 8:3.

148
Notes to chapter 5
1) Hermansen (1969).
2) Bylund (1972) p 59.
3) SOU 1969:49, p 9.
4) Kungl Maj:ts prop, nr 75:1970.
5) See Glesbygdsutredningen's main report, SOU 1972:56.
6) Arbetsmarknadsstyrelsen (1960) p 55 f .
7) Naturally schools of d if fe re n t kinds also belong to a strategic lo c a l i ty of th is kind, but for various reasons the schools were dealt with elsewhere in the Äström investigation.
8) The material has been taken from FoB-65, the c lass if ied telephonedirectory of 1967 and from accounts from AMS, from the NationalSocial Insurance Service, The Swedish Dental Federation, The NationalSocial Welfare Board, The Research In s t i tu te of Commerce and from accounts from the separate County Councils.
9) Since the study was made (in 1968), however, the labour exchange service has been centra lized , though not to such an extent that the conclusions of the existence on a strategic lo c a l i ty level would no longer be valid .
10) Since the study was carried out changes have also occurred in this f i e ld . The mergers of communes have resulted in several former commune centres no longer being the major centre of the commune. In most cases, important functions, such as social welfare o ff ic e s , etc . have branch offices in the former major centres.
11) See also Glesbygdsforskningen, report nr 2, SOU 1970:14, bilaga 2 and Vanberg (1972).
12) Examples of research closely connected to these problems are Steiglbauer (1967): Central places at the lowest level in Austria, Johnston (1966): Central places and settlement patterns, and Boustedt ( I960 ): Die Centralen Orte und ihren Einflussbereiche.
13) See also Glesbygdsforskningen, report nr 24, section I I I .
14) Ib id.
15) Westerlund and Norberg (1971) p 56.
16) See also Glesbygdsforskningen, report nr 24, concerning the to ta l leakage. A discussion is also carried out in Nordmark and Nordstrom (1972).
17) Glesbygdsforskningen, report nr 2 and SOU 1970:14.
18) Länsstyrelsen i Norrbottens län (1968).

149
6 On Planning in Sparsely Populated Areas
In th is chapter, methods of planning the supply of services in G-areas
w i l l be discussed on the bases of what has previously been demonstrated.
The sector I have chosen is that of health services. I t represents a clas
sical G-problem and i t is concerned not only with distances to medical care
in s t i tu t io n s , but also with the over-representati on of the older age group
in the G-areas. In th is respect the s ituation is rapidly deteriorating in
some G-communes. As has been shown above, there is a d ire c t , l in ear corre
lation between depopulation and increased median age.
The crucial problems in community care (outside formal in s t i tu t io n s ) may
be summarised as follows: The au thor it ies , responsible fo r health services
say, that they are in favour of an increase in the resources devoted to
out-patient care and e x tra - in s t i tu t io n a l forms of care, in co-operation
with adjoining sectors such as the social welfare care and educational
systems.^But, at the same time, the expansion in expenditure on health
services indicates, that the advantages of large scale operation should
be explo ited, to a reasonable extent.
This chapter s tarts with a theoretical discussion of planning norms. I t
then examines out-patient care in a commune in one of the counties of the
research area, the commune of Vindeln in the county of Västerbotten.
6.1 Theoretical AspectsAs has been mentioned above i t is of course labour market issues which are
pre-eminent among the problems of the G-areas. This is a question of purely
economic aspects, but also of access to meaningful jobs. Direct transfer
payments and casual r e l i e f work are in su ff ic ien t to s ta b i l ize the develop
ment of the population in the long run. Against th is background one can
natura lly ask i f there is any point in examining the service aspects in de
t a i l . Would we not get a decent supply of services as a bonus for the people
l iv ing in outlying settlements, i f the labour market problems could be solved?
In my opinion, the answer to the question is no. The trend within the service

150
sector is towards bigger units and greater demands on bases. As is ap
parent from chapters 4 and 5, the broad variety of service establishments
that generally exists in the major centres in G-areas, has had its pur
chasing power base undermined by the thinning out of the population in
the trading areas. In addition, the number of general stores and other
small shops in G-communes has fa l le n substantia lly in the 195(Ts and 6 CTs.
Even i f the problems of transportation to the centre of the commune can
be solved, the problems of neighbourhood services remain.
The argument concerning these and related problems has been, and s t i l l is ,
intensive. In chapter 2 I have given a survey of the most important govern
ment reports since the 1940's which re fe r to regional po lic ies . The survey
showed how the aims of the governmental polic ies fo r G-areas have gradually
become more and more e x p l ic i t ly reg ionally -oriented, and the stress has s h if
ted towards regional support centres, or strateg ic lo c a l i t ie s , as they are
referred to in th is thesis. An examination of the threshold values fo r a
re la t iv e ly modest collection of services gives a s tr ik in g ly coarse-meshed
net of s tra teg ic lo c a l i t ie s as f ig . 8:3 shows.
The regional policy action programme (prop. 1972:111), makes i t clear that
the Government does not want regional policy to create a form of free compet i t io n between the communes about the objects of location policy , and that
i t must be the role of the Government to promote, in various ways, lo c a l i
sation in areas where the needs are greatest. As has been mentioned above,
(chapter 5 ) , four levels of lo c a l i t ie s were f in a l ly defined: Metropolitan
Areas, Primary Centres, Regional Centres and Municipal Centres. One must put into the last category those central places whose functions are mainly
confined to the inhabitants of the commune, i t s e l f . There is thus in general no reason for including other s tra te g ic a l ly situated places within a com
mune (subcentres of the commune which f u l f i l essential functions) in the
national comprehensive plan, since this is based on the new communes as the
lowest level of planning units. The exception is certain communes in the
in te r io r of the Aid Area that are large and sparsely populated. In these
cases, special measures may be taken by co-operation between the County Ad
m inistrat ive Boards and the communes. The small service centres are not in
cluded in the discussion of a supportive place structure.

In a discussion paper from the Ministry fo r Social A f fa i r s ,2Uhe prob
lems of G-areas are defined as problems of service and communication in
those areas where one cannot expect an 'automatic' r e l i e f of deficiencies
as a result of the expansion of the economy or the location of industries.
I t states that there are two principal long-term factors which are deci
sive for the location of the population: the supply of job opportunities,
and the existence of service provisions. I t is not s u ff ic ie n t for a place
to be well provided in only one of these respects - both factors are equal
ly important in securing the s ta b i l i t y of the population in the place con
cerned. I t also states that experience shows that when enterprises con
sider plant location they not only take into consideration the supply of
labour, but they also regard i t as at least equally important that there
is a good supply of various shops, schools and other service establishments
In 1970, the Minister declared that one of the main roles of regional p o l i
cy is to maintain and develop an e ffec tive service structure, and a good
social environment in other respects in those places and areas which have
good p o s s ib i l i t ie s for development and good conditions fo r industria l ac
t i v i t y . I t was also pointed out that the regional policies must include
measures to create acceptable l iv in g conditions even in areas where a long
term estimate suggests that contraction is inevitab le .
This target has not been changed in the regional policy action programme
of 1972.
Another problem discussed in this programme is that places, e.g. commune
centres, at such a high level that the supply of services is satis factory
in essentia ls , also have d i f f ic u l t ie s in a ttracting or holding younger
employees, as the labour market in such places is in s u f f ic ie n t ly d ive rs i
f ied . In the long run, th is is l ik e ly to have the e ffe c t that many of the
service centres referred to , i . e . at the fourth le v e l , w i l l have th e ir
bases undermined as well.
I t is against th is background that one must see the e x p l ic i t governmental
goal of ensuring that the d is tr ibu tion of public resources within each mer
ged commune should be a communal matter. The merged communes are to be regi

152
nal build ing-bricks, and the d is tr ib u tion of resources within the com
munes is a matter to be decided by the communes themselves. In a depopu
lat ion s itu a t io n , th is means extremely d i f f i c u l t planning problems for
the commune au thorit ies .
In th is thesis , I have considered i t reasonable to assume that the regio
nal policy may expect to have the e f fe c t , of solving the problems of em
ployment in communes in G-areas, one way or another, even i f the regional
population goals cannot be completely reached, thereby. (This assumption
has been considered suitable as a s tar t ing -poin t for th is study). I t means
assuming, that many people w i l l continue to l ive in G-areas and small places,
some as commuters working in industria l and service occupations, some con
tinuing to work above a l l in the local economy of agriculture and forestry .
At the same time, i t must be f irm ly accepted that the supply of services is
a subject worth as much attention as labour market issues. I t is a basic
princip le of equa lity , that the gap in service and consumption standards
between d if fe re n t parts of the country must not become unreasonably large.
The service aspect of the problems of G-areas j_s important, not least be
cause i t has a dimension that must not be forgotten: as has been shown above,
the population structure is such that certain groups requiring services are
over-represented in re la t ion to the national average. Consequently, i t must
be r igh t to plan in such a way that the population of G-areas has access
to services and other welfare provisions without being exposed to excessive
costs in money and time.
These principles have been adopted by the Glesbygdsutredningen. I t main
ta ins , that the social services must be adapted to local conditions, so
that they can meet the demands of the people in the area that is to be ser
ved. The s tarting -poin t ought to be the population's need fo r security and
i ts claims for reasonable access to services, instead of the demand by the
social services for "customer support". ^
As is evident from chapter 1, parts of th is thesis deal with issues within
the framework of ERLTs research project on production costs in d if fe re n t

1534)
regions. 'The terms of reference for th is research project state that a
survey of the prerequisites for d i f fe re n t kinds of production is necessary.
The conditions fo r the productivity of an individual in a contracting
area may be assumed to d i f f e r essentia lly from the corresponding conditions
in an expanding, urban area. Given that a good health s ituation of the
population is a reasonable prerequisite fo r productiv ity , there may be
grounds fo r examining i f the regional structure has an injurious e ffec t
on any of the components of health, taken in a wide sense. The concept
'health ' can then also be used as a scarcely controversial goal fo r the
aspirations of society for the individual. According to WHO's d e f in it ion
of ‘ h ea lth1, society strives fo r the welfare of indiv iduals , physically , mentally and soc ia lly .
To people in Sweden, these ambitions have been fa m il ia r fo r a long time,
in the form of normative standards for sectoral planning in the f i r s t place;
standards that have gradually been changed, through p o l i t ic a l decisions of a welfare character.
Corresponding sets of standards can also be traced behind the guiding prin
ciples of overall planning. "Location policies should aim at promoting such
a location of industries that the resources of capital and labour w i l l be
fu l l y u t i l iz e d and d istr ibuted so that rapid economic growth is promoted.
Society, however, should also t ry to d irec t development into such courses
that increasing welfare is d istr ibuted f a i r l y , and that people in d if fe re n t
parts of the country are offered acceptable social and cultural services.
Consequently, location policies should also be directed towards diminishing
the d i f f ic u l t ie s of adaptation that the individual has to face in a stage
of development characterized by extensive structural ra t io na liza t io n with
in the economy and the associated population m igrations" .^
Some consequences of these normative standards w i l l be discussed in the f o l
lowing section.

154
6.1.1 O N DEM ANDS A N D NEEDS
The supply of public services, and other services supported by society
in any way, can be seen as expressions of the view of society about the
needs of the individual in various respects. 'Need' is often used in a
normative sense, i . e . the need in question is defined fo r the individual
and not by the ind iv idual. In the course of time, society's level of
aspirations fo r the qua lity of services has risen. These increased de
mands fo r qua lity have often resulted in a sparser supply, since i t has
been essential to keep costs down.
While 'need' has sometimes been used as a normative concept, the term
"demands" has been used to denote demands, derived from subjective in d i
vidual evaluations. The report of the Consumers' Commission (Konsument
utredningens lägesrapport), emphasizes that in r e a l i ty there are big d i f f e
rences in the levels of demands between d if fe re n t people, and that these
variations are related to an ind iv idua l's previous experiences, which, in
th e ir turn , are related to th e ir s ituation in l i f e , i . e . , in the f i r s t
place, to the economic and social environment.^
As the aspirations of society to meet these demands have changed, the claims
by individuals fo r services have risen, although perhaps not everywhere.
I t can be argued that empirical evidence suggests that the 'well-equipped'
individual gradually raises his level of demands, whereas the opposite is
true of the less 'well-equipped' individual. A soc ia lly and economically
weak individual may end up in a vicious c irc le ; in th is context th is may
mean that the level of demand w i l l gradually decline. A plausible assumption is that th is is not an uncommon situation in a sparsely populated area
experiencing depopulation, where people may experience the withdrawal of
d if fe re n t kinds of services as an indication that they are regarded as un
comfortable burdens by the rest of society. A sub-report within the frame
of the Glesbygdsutredningen p a r t ic a l ly confirms th is assumption. "Households
with re la t iv e ly good service opportunities thus tend to make heavier demands
on the standard of service than other households".^

155
Such situations may have contributed to the fact that the s ituation in G-
areas is , in some places, so obviously precarious. The demands that have
been expressed have often referred to aspects of a c c e s s ib i l i ty , rather than
to q ua l i ta t ive factors , but i t is the q u a l i ta t iv e factors that have been
listened to. The basic requirements of the resu lt ing , q u a l i ta t iv e ly high
le v e l , services has been s a t is f ied by a centralised provision. The problem
has been well expressed by Eva Hamrin: "The thing is , that d i f fe re n t parts
of the administrative system admit the claims, and define the needs. The
co-ordination between demand and supply does not w o rk" .^
91A memorandum from ERU 'points out, th a t , to a greater extent than previously,
future regional policies w i l l be directed towards investment in social capi
tal which allows a better use of time fo r the inhabitants of the region.
The use of time is natura lly a function of a c c e s s ib i l i t y .^ T h e better that
work place and service establishments are placed in re la t ion to residence,
the better are an ind iv idual's opportunities for spending his time in a way
that is advantageous for him. But i t is also true , that access ib i l i ty means
d if fe re n t things to d i f fe re n t age groups and d if fe re n t socio-economic groups.
A ccessib il ity has also an obviously regional aspect. A person who l ives in
a G-area in northern Sweden must get accustomed to certain physical distances
that would seem rather long to a person l iv in g in southern Sweden or in a
c ity . I t would often probably be possible to distinguish what could be re fe r
red to as regionally specific levels of expectation. In th is context, i t
might be of in terest to note that Glesbygdsutredningen maintained in a re
port, that " i t would have quite unacceptable consequences, i f one tr ie d to
f i t the provisions of society in d if fe re n t parts of the country, to the
varying levels of demand of the p o p u la t io n ." ^
When planning public services at d i f fe re n t leve ls , the planning authorities
have generally la id the main stress on the d irec t cost of supply. The pat
tern of public service today does not vary much from that of commercial ser
vices. Standards and threshold values have been created, ch ie fly in a p o l i t i
cal way, and these standards have determined the scale and location of the
services. I t has been a characteristic of these standards and threshold values

156
that they have not been the expressions of a spatial or regional view
of the problems. Instead they have reflected f a i r l y clumsy attempts at
try ing to give a business-oriented touch to administrative a c t iv i t ie s .
I t is not hard to see why, since action could only take place within
s t r ic t l y defined sectors and economically restr ic ted l im its .
Thus, i t is often e ff ic ien cy c r i t e r ia th a t have guided the decisions on
the scale and location of d i f fe re n t provisions. In this way, an essential
aspect is ignored, namely the costs (or other hardship) fo r the individual
of consuming the service o ffered . This is not a question of the standard
of services in the communes in G-areas being q u a l i ta t iv e ly d e f ic ie n t , on
the contrary, as has been shown above, many of the centres in our G-areas
are s tr ik in g ly well-provided with regard to both commercial and public ser
vices.
The administrative concept 'glesbygd' is rather uninteresting nowadays.
One might also ask i f i t is r e a l is t i c to think of the range G-area - urban
area, as a continuum. Within the research area, there are quite d is t in c t
place leve ls , or, such levels are l ik e ly to be established when the results
of the governmental regional policy goals become clearer. In balanced regions,
an even f l ig h t of steps of central place levels can often be distinguished,
while one step or more are lacking in regions that have been too rapidly re
structured.
A formalized comprehensive scheme for these places (p r io r i ty areas, c lass i
f ied places) w i l l probably have centra liz ing e ffects . The demand on the
places chosen turns the d is tr ibu tion of the resources externally provided,
into a disadvantage fo r the remaining places, even though i t is accepted,
that some positive sp in -o ff effects w i l l be obtained by s ta b i l iz in g , for
example a commune centre.
In order to l ink in with the ERU studies referred to previously, (p i52)»
I want to point out that a region in which good productivity conditions pre
v a i l , has, among other things, the following characteristics : a) there are
few discrepancies between individual demands and the need-based services pro

157
vided by the community, b) the damage to the individual's .resource budgets,
i . e . both economic and time budgets is l im ited , c) a minimum of individuals
f ind themselves in a s ituation where, as suggested in the discussion above,
they may risk ending up in a downward spiral of expectations.
Disturbances in these conditions are l ik e ly to emerge in a l l types of regions,
as much in areas with bottle-neck problems, as in areas with problems of de
population and stagnation. As has been emphasized above, I shall focus atten
tion in the following on the cardinal problem of the supply of services in
G-areas, namely, deficiencies in access ib i l i ty and the consequent d is tu r
bances in the system, which, according to the planning standards discussed
above, should bring physical, mental and social welfare to the individual.
A common problem of the supply of public services in G-areas is that th e ir
use often involves extensive inconveniences with transportation. Among the
i r r i t a t io n s in G-areas are the i r re g u la t i t ie s in services caused by s ta f f
vacancies, and sometimes q ua l i ta t iv e differences. This may mean res tr ic t ions
in the freedom of choice, and, somebody might add that obsolete equipment
and the lack of attractiveness of various positions cause a ‘biased1 selec
tion of s ta f f . There are no indications, however, that the la t te r two points
are p a rt ic u la r ly relevant today, and they w i l l doubtlessly become ir re levan t
in the future. What distinguishes the G-area s ituation from that in other
parts of the country, as fa r as services are concerned, is in fe r io r accessi
b i l i t y and limited p o s s ib i l i t ie s of choice among the services available .
These lim ited p o s s ib i l i t ie s of choice are ch ie f ly caused by the basic re
quirements la id down for d i f fe re n t kinds of service, generally defined by
means of threshold values. The ind iv is ib les are not so important in densely
populated areas, but they are a nuisance in G-areas. Among the complications
are also the demands for q u a l i ta t iv e improvements in equipment and so on,
made by the s ta f f of services, e.g. the d is t r ic t medical officers'demands
for better equipment in the branch surgeries. The c o n f l ic t with the grant
giving authorit ies which thus arises makes the reduction in branch a c t iv i t ie s
a matter of time to the advantage of cen tra l iza t ion .

158
The supply of services determined by 'need1 cannot, fo r p o l i t ic a l reasons,
vary to any major extent in d i f fe re n t parts of the country. Planning is
normally done on the basis of threshold values, (xxxx people per d is t r ic t
medical o f f ic e r , xx children per class or school). A sh o rtfa l l in the local
basis is compensated for by more or less satis factory means of communication
and by compensation fo r travel expenses. At the same time, the need standards
generally make substitutes unacceptable. This implies a c o n f l ic t s ituation:
a substitute may very well correspond to a generally accepted demand le v e l ,
but i t w i l l not be permitted, because i t does not su it the normative need
le v e l . In a stable or expanding phase, these problems are not very pronoun
ced. But in a phase of contraction, th is is an extensive problem, which
might be formulated as follows: People want forms of services that are not
so fa r away. People get a high quality service that is very fa r away.
We have s t r ic t qua lity standards in th is country, and nobody is l i k e ly to
want to reduce them, since they are part of the concept of the welfare state .
But the question is whether the points of contact between d if fe re n t service
hierarchies could not be re-structured in such a way, that the population's
demands fo r access ib i l i ty in G-areas can be met in a better way than is the
case today. As has been mentioned above, the opinion that th is w i l l be achie
ved as fa r as health services are concerned has already been expressed. One
can, fo r example, see th is in the targets , set fo r the health service plans
of Västerbotten. In the same way, one can detect s im ilar goals in the a t t i
tudes towards cross-sectoral "chains" of services. (See fo r example the pub
l ica t ion Integrerat Samhälle published by the National Board of Social Wel
fare and Medical care .^ T h o u g hts in that d irection have also been expressed13Ìin the report of Glesbygdsutredningen,"Hälso- och sjukvård i Glesbygder". J
The claims is made in " In tegrerat samhälle", that "the role of regional
planning is to analyse and test the ends and means for the ind iv idual's
in teraction , with others, with nature and with what man has created, and
to transform the chosen ends and means into p rac t ica l ly workable, operative
concepts, that can lead to action. The yardstick fo r measuring results is
man himself, both as an individual and as a social being. The way that
society functions can, for example, be measured in re la t ion to needs during
the d if fe re n t phases of the l i f e cycle".

159
This is also in accordance with one of the assumptions of the following
discussion: The supply of services should be analysed and planned with an
age grouping of consumers as a s ta r t ing -po in t. One basic point to be stres
sed is that people in certain phases of the l i f e cycle are more dependent
on public services than those in other phases. For example, up to the ages
of 15-19, an individual is obviously dependent on the need-standardised
services provided by society. One has to go to child welfare c l in ic s , to
schools and to many other in s ti tu t ion s established for the benefit of
young people. During the next phase, the 'productive' phase of the l i f e
cycle, most people are l ik e ly to be least dependent on in s t i tu t io n a l ser
vices. But with increasing age a new phase s ta r ts , with a gradually in
creasing dependence on health and care in s t i tu t io n s . Poor access to d i f f e
rent kinds of commercial services is a problem to individuals mainly in
the middle phase, since this age group is the one most vulnerable to dis
turbances in the time budget.
As was mentioned at the beginning of this chapter, the survey w i l l be l im i
ted to problems linked to out-patient health services. I t is an important
sector, not least because the use of out-patient medical care involves ex
tensive transport work. In Västerbotten, fo r example, 2,2 annual v is i ts per
head in 1968, means approx. 42 m ill ion person km that year, or 180 km per
head. The regional variations are great. In the commune of Sorsele, the
transport work amounts to 445 km per inhabitant and year, in Vännäs to 110 km
and at Holmsund to only 33 km.14^
Travel also involves heavy costs, which can be i l lu s tra te d by a simple a r i th
metical example. I f the costs per km are set at 0,30 Sw.Cr., the costs of 42 m ill ion person kilometers w i l l be 12,6 m ill ion Sw.Cr. The t ra v e ll in g time
fo r 180 km may be estimated at roughly 3 hours. The value of the time that
the passenger loses by the t r i p , could be set a t 5,10 Sw.Cr. per head as a
rough estimate for 1974. Calculated on these data, the time costs would be
3 X 5,10 X 233 500 = 3,6 m ill ion Sw.Cr. that year. Thus, i f we disregard
the costs of terminal time, waiting time in surgeries and other costs a t
tached to the t r i p , the costs of journey to out-patient medical services
in Västerbotten to ta ls at least 3,6 + 12,6 = 16,2 m il l ion Sw.Cr. a year.

160
6.1.2 THE CONCEPT OF ACCESSIBILITY
In the geographical l i t e r a t u r e , the concept 'a c c e s s ib i l i ty ' has been
given a rather narrow d e f in i t io n . The population potential has been
interpreted as a measure of access ib i l i ty fo r consumers, provided that
the transport costs are l in e a r ly related to distance, and that a l l con
sumers have equal purchasing power.^ Lindberg discussed a d i f fe re n t con
cept of a c c e s s ib i l i ty , where the sum of the consumers- transport work to
a service point defines access ib i l i ty from a welfare point of view.16)
In a less s t r ic t sense, access ib i l i ty to services of d if fe re n t kinds can
be shown by some form of simple zoning: The number of inhabitants within
a given distance zone round a certain service point can be one example of
such zoning. Two examples of other methods are f ix in g an average distance,
e .g . , within a commune to a service point, or f ix ing the number of services
per spatial unit or per unit o f inhabitants. The distance to the service con
cerned can be combined with a measure of capacity. This has been done, for
example, by Öberg, in order to estimate the regional variations in the aver
age supply of certain complex serv ices .1^)
In th is study, access ib i l i ty has been defined f i r s t l y as a measure in which
weighted distances are combined to provide a c lass if ica t io n of the s ituat ion .
I f the services within a sector are situated at d if fe re n t hierarchic leve ls ,
the picture becomes quite complicated. The construction of a measure of 'ac
c e s s ib i l i ty ' w i l l then be a question of combining the distances to several
services, and, simultaneously, taking into consideration the weights of the
services in re la t ion to each other.
6.2 Planning on a Regional LevelTo begin with , the planning of out-patient health services at a regional
level w i l l be discussed.
Report nr 19 of the Glesbygdsforskningen outlined a method for analysing
the regional variations in access ib i l i ty to out-patient health services.
The research area was the county council area of Västerbotten, and the year

161
concerned was 1968. The method was based on the combined distances from
a series of demand points, (the population median point of the electoral
wards), to the nearest service point for out-patient health service, struc
tured at four d i f fe re n t structural leve ls , (see tables 6:1 and 6:2 below).
Furthermore, the distances were given weights calculated on the basis of
studies of the composition of the flows and frequencies of patients in the
Örnsköldsvik a r e a ^ i n the county of Västernorrland, and in the commune of
V i lh e lm in a ^ in the county of Västerbotten.
Some of the results o f ' th e study can be summarised in two % d is tr ib u tio n s ,
as shown below.
I f the patients spontaneously consulted the medical personel at the level
responsible for treatment, the patients would have been d istr ibuted on levels
as shown below:
Table 6:1 D istr ibution According to Level Responsible fo r Treatment.
Care Level D istr ibution of treatment
D is t r ic t nurse 26,7%D is t r ic t medical o f f ic e r 58,2%General hospital 8,7%D is t r ic t General hospital 6,4%
I f , instead, the patients were d istr ibuted according to the level f i r s t
consulted, the picture would be somewhat d i f fe re n t . The proportions going
to General and D is t r ic t General hospitals, respectively, would not change
much, but there would be a substantial difference in the two lower levels.
Table 6:2 shows, that a much higher proportion of patients f i r s t contacts
the d is t r ic t nurse than is the case in the d is tr ibu tio n in table 6:1. I t
does not seem far-fetched to in te rpre t this as meaning that the d is t r ic t
nurse acts as a sort of "collection agency".

162
Table 6:2 D istr ibution According to Level of Treatment F irs t Consulted.
Care Level D istr ibution of Primary Contacts
D is t r ic t nurse 38,7%D is t r ic t medical o f f ic e r 45,3%General hospital 7,6%D is t r ic t General hospital 8,4%

Fig
ure
6:1
Med
ical
Ca
re
in V
äst
erb
ott
en
163
s a ■ « + t>

164
Figure 6:1 shows the a v a i la b i l i t y of services at the time of the research
project. The in s t i tu t io n s for treatment are located above a l l in the main
centres of the communes. In addition, there are branch surgeries, and oc
casionally resident d is t r ic t nurses, in the inland communes.
On the premise that a hypothetical s ituation can form the basis for the
analysis, a s ituation where the patients without exceptions were treated
at the appropriate le v e l , i . e . without fu rther r e f e r r a l , and provided that
there were no s ta f f vacancies, a schematic picture of the access ib i l i ty to
out-patient health services could be constructed by weighting the distances from each demand point to the nearest service point fo r each of the four trea
ment levels defined above. In such a case, the % figures in table 6:1 would
be used. The resu lt would be a weighted measure of distance fo r each point
of measurement, in previous publications called 'frequency weighted average
d is tan ce '.
A map showing the resu lt of these calculations is given on page 165 . I t has
been constructed by drawing isaritms for f ive classes, a r b i t r a r i ly selected,
with class l im its of 10, 25 and 60 km average distance.
The map shows c lear ly how s ig n if ican t ly the coastal zone d if fe rs from the
inner parts of the county. Within this zone, only very limited areas aroundX )major commune centres reach a corresponding standard of access ib i l i ty . '
The score fo r Skellefteå may serve as an example of the measure of weigh
ted distance used. The score there is less than 10 km, according to the
map. According to the table above, only 6 patients out of 100 go to Umeå,
where the d is t r ic t general hospital is situated. This means, that the
average distance to Umeå for these patients is fixed at — , since
the distance between Skellefteå and Umeå is 140 km. The distance to other
levels of treatment situated in Skelle fteå is f ixed , by d e f in i t io n at 1 kr
and the average distance to other levels of treatment is consequently
" l ‘0(T * The frecluenC‘V weighted average distance is accordingly - Ÿqq~" + = 9,3 km. For further information, see Glesbygdsforskningen, repor
nr 19, Sjukvård i glesbygd.

Figu
re
6:2
Freq
uenc
y A
djus
ted
Aver
age
Dis
tanc
e to
Out
Pat
ien
t M
edic
al
Care
in
Väs
terb
ott
en.
165
.< HI

166
What the map therefore shows is the a c c e s s ib ility in a hypothetical s itu a
tion where the premise is that patients know which level of treatment is
appropriate in any s itu a tio n . The s itua tio n is thus something of a planner's
dream of d e ligh t: no d isturbing regional varia tions in the population structu re , and optimal behaviour by the population.
Of course, these values of weighted distances are an improvement compared
with a s itua tio n where planning is based only on raw population data and on
the locations of the service points. But the s ituation is s t i l l obviously
u n re a lis tic . Both the age structure of the population and the actual trave l
pattern must be taken in to account, in order to get more accurate spatia l
re la tio n sh ip . In the county o f Västerbotten, the age group 0-19 comprises
30,1% of the population (in 1968), whereas i t consumed only 26,3% o f the
o ut-patien t health services. On the other hand, the age group 65+ was 12,5%
of the to ta l population, but consumed 26,32% of the to ta l volume of out
patien t health services. On the basis of the d is tr ib u tio n in the tables 6:1
and 6:2 and the so called consumer u n its ,20^the scores of the to ta l transport
work to u t i l is e o ut-patien t health services can be calculated.
A measure denoting trave l volume per time un it can also be used as a measure
of a c c e s s ib ility , and to fa c i l i t a te the construction of a map according to
the same principles as the previous one, the values of the to ta l transport
work fo r journeys to o u t-p a tien t health services care have been transformed
into volume per head and per e lectora l ward. Thus, the score of a c c e s s ib ility
fo r each demand point (ward) is a score of the annual transport work of the
average inhab itan t. Two wards with id en tica l distances to the d iffe re n t tre a t
ment supply points w ill thus have th e ir a c c e s s ib ility classed in d iffe re n t21 )ways, i f the population structure varies between the wards. 1
Following th is procedure, the scores of the frequency weighted average d i
stance described, and the actual transport volume, were converted into a
scale from 1 to 100, thereby fa c i l i ta t in g d ire c t comparisons between the
results of the two methods of measurement.
Figure 6:3 shows the d is tr ib u tio n of the wards a fte r c la s s ific a tio n by the
two methods.

167
Figure 6:3 D is tribution of Wards A fte r C lass ifica tio n by a) Frequency Adjusted Average Distance and b) Transport Volume.
Number o f Number o fwards wards
40
Transform ed a c c e s s ib i l i t y scores
There are c le a r ly large varia tio n s . The average score has risen from 27,2
units according to the frequency weighted average distance, to 29 according
to the estimates of transport work. There are also grounds fo r assuming,
that the variations are regional. A calcu lation of the corre lation between
the two scores gives r= +0,86 w ithin the merged commune ot Robertsfors. In
the merged commune of Asele, where there has been a more rapid rate of de
population in the 1960's, r= +0,44.
The change fo r each ward has been calculated by estimating the ra t io between
the transformed value of frequency weighted average distance and the value
of the transport work per head, s im ila rly transformed. The resu lt of the
calculations is shown in figure 6 :4 . Ratio values below 1,0 imply a de terio
ration by comparison with the frequency weighted average distance, and values
over 1,0 imply an improvement.

168
Figure 6:4 Diagram Showing the Ratio Between Transformed Scores of FrequencyAdjusted Average Distance and Transport Volume.
uofkNumber o f wards
0.6< 0,6 Ratio
The map on the following page shows, the wards which according to calcu
lations above have received higher, unchanged or lower location scores.
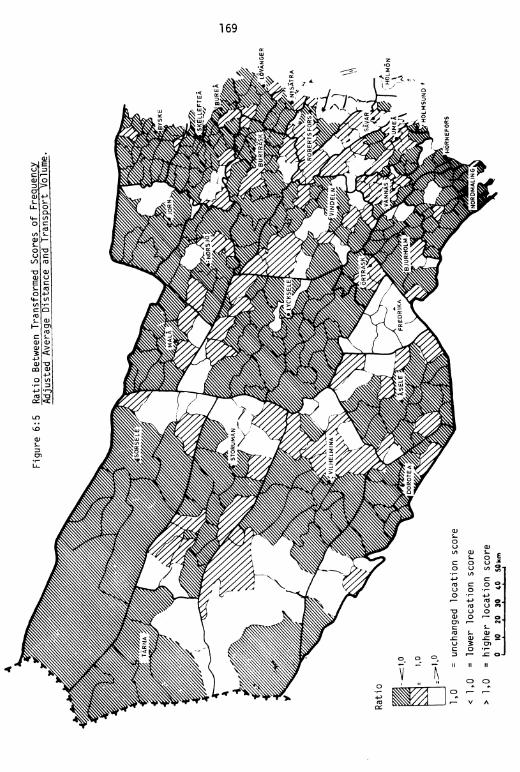
Figu
re
6:5
Rat
io
Bet
wee
n Tr
ansf
orm
ed
Sco
res
of F
requ
ency
A
djus
ted
Ave
rage
D
ista
nce
and
Tra
nspo
rt
Vol
ume.
169

170
The wards with unchanged or improved scores are found p r in c ip ia lly around
Umeå. In addition to Umeå and Vännäs, örträsk is the only commune centre
ward with an unchanged or improved location score. Such connected areas
are also found in land, in the communes of F redrika , V ilhelm ina, Storuman
and Sorsele.
Apart from these, the overall impression is one of reduced location scores
in commune centre wards and adjoining wards. Reduced scores of 4-6 location
units are common. Thus, the
ward of Vilhelmina has a reduction of 3 units
As eie
Norsjö
S ke lle fteå
Dorotea
Tärnaby
4 "
3 "
3 "
5 "
6 11
25% of the population of the wards of Lövliden in the commune of V ilh e l
mina are over 64 years old. The change in location score is here 10 units.
An analysis of the number of inhabitants in each group of those wards which
received changed scores as shown in the histogram (fig u re 6 :4) above, shows
the follow ing:
In wards with the ra tio 0,6 or less: 3 097 inhabitantsh h H h h 0,7 II h 34 731 h
h h h h h 0,8 II h 54 039 hÌ 139 789
h h h h h 0,9 II ii 47 922 h
h h H h h 1,0 II » 74 723 h J1
h h h h h 1,1 II h 11 134h h h h h 1,2 II h 4 542 h ' 18 641 f 93 377h H h H h 1,3 or more 2 948
We have thus compared two s ituations . In the f i r s t one the a c c e s s ib ility
score depends on two conditions, a) th a t the consumers of treatment have
complete knowledge of which level of treatment is responsible in every

171
s itu a tio n , b) th a t, to be f a i r , the age d is tr ib u tio n is homogenous through
out the area.
In the second s itu a tio n , the measure of a c c e s s ib ility is based on more
re a l is t ic conditions. The consumers often c a ll at the 'wrong' level and
have to be referred fu rth e r , and the regional variations in age struc
ture - and thereby in the consumption of treatment - are considerable.
I t must be said that th is is s t i l l a crude measure, since i t does not take
into account that d iffe re n t age groups have d iffe re n t patterns of con
su lta tio n , but i t only allows fo r gross volumes of treatment. For example,
la te r in th is section, i t w i ll be shown that old people in outlying wards
consult th e ir d is t r ic t nurse to a much greater extent than other groups
do. Nevertheless, th is method of measurement is an improvement in comparison
with previous ones. As has been shown, 60% of the population of the county
w ill have th e ir access to o u t-patien t treatment over-estim ated, i f age
specific volumes of treatment and actual travel patterns are not allowed
fo r in the analysis. Thus, when these variables have been added, the p ic
ture changes in several respects.
What has been said above is i l lu s tra te d in the two follow ing maps. They
show a c c e s s ib ility zones, and have been calculated on the basis of the two
measures of location , a fte r the scores have been transformed. They are d i
rec tly comparable, and the isaritm s have been constructed according to the
same c la s s ific a tio n .

Figure 6:6 Frequency Adjusted AverageDi stance to Out Patient Health
Locationscore
Figure 6:7 Transport Volume Per Head to Out Patient Health Care.
Locationscore
: 16-30
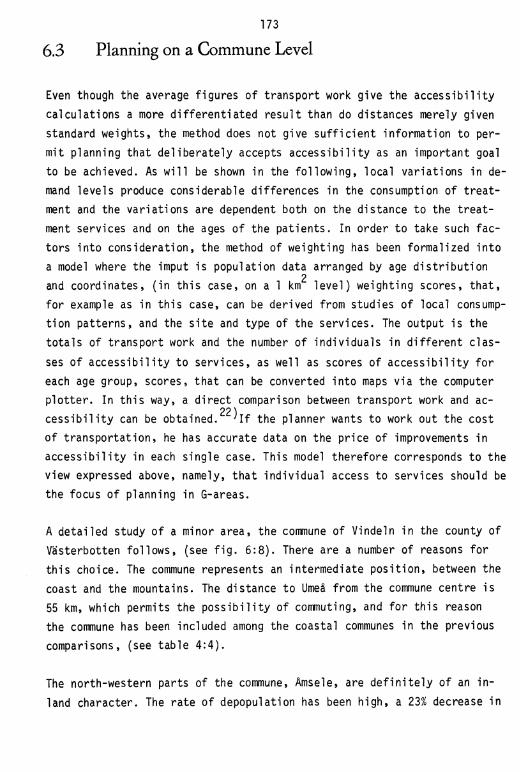
173
6.3 Planning on a Commune Level
Even though the average figures of transport work give the ac c e s s ib ility
calculations a more d iffe re n tia te d resu lt than do distances merely given
standard weights, the method does not give s u ffic ie n t information to per
mit planning that d e lib e ra te ly accepts a c c e s s ib ility as an important goal
to be achieved. As w ill be shown in the fo llow ing , local variations in de
mand levels produce considerable differences in the consumption of tre a t
ment and the variations are dependent both on the distance to the t re a t
ment services and on the ages o f the patien ts . In order to take such fac
tors into consideration, the method of weighting has been formalized in to
a model where the imput is population data arranged by age d is tr ib u tio n2
and coordinates, (in th is case, on a 1 km le v e l) weighting scores, th a t,
fo r example as in th is case, can be derived from studies of local consump
tion patterns, and the s ite and type of the services. The output is the
to ta ls of transport work and the number of individuals in d iffe re n t c las
ses of a c c e s s ib ility to services, as well as scores of a c c e s s ib ility fo r
each age group, scores, th a t can be converted into maps via the computer
p lo tte r . In th is way, a d irec t comparison between transport work and ac-22 )c e s s ib ility can be obtained. ; I f the planner wants to work out the cost
of transportation , he has accurate data on the price of improvements in
a c c e s s ib ility in each single case. This model therefore corresponds to the
view expressed above, namely, th a t individual access to services should be
the focus of planning in G-areas.
A deta iled study of a minor area, the commune of Vindeln in the county of
Västerbotten fo llow s, (see f ig . 6 :8 ) . There are a number of reasons fo r
th is choice. The commune represents an interm ediate position , between the
coast and the mountains. The distance to Umeå from the commune centre is
55 km, which permits the p o s s ib ility of commuting, and fo r th is reason
the commune has been included among the coastal communes in the previous
comparisons, (see table 4 :4 ).
The north-western parts of the commune, Amsele, are d e fin ite ly of an in
land character. The rate of depopulation has been high, a 23% decrease in

174
the to ta l population between 1960 and 70, and a simultaneous increase in
the median age from 34 to 42 years. In 1970, the to ta l population was
approx. 7600, i . e . , a typ ica l figure fo r th is type of commune in spar
sely populated areas. The system of central places is well developed on
d iffe re n t hierachical le v e ls , and the commune centre c le a r ly dominates.
Furthermore, there are a few major service centres and a number of small nodes. The proportion of scattered settlements corresponds well with
an 'average commune' in a G-area in northern Sweden. The major centres
are situated along the r iv e r va lleys , in accordance with the general
pattern in Norrland. The commune centre is s tr ik in g ly well-equipped with
both commercial and in s titu tio n a l services. But i t is feared that the pur
chasing power may not ju s t i fy the level of services, which could lead to
th e ir being withdrawn. The labour market shows a negative picture - high
unemployment and in d u stria l premises that have stood vacant fo r some time.
In the ward containing the commune centre , the older age groups are s t i l l
underrepresented. Wards with a high proportion o f e ld e rly people are s itu a
ted at the periphery and away from the r iv e r va lleys.
6.3.1 TH E O U T -P A TIE N T H E A L T H SERVICES IN A G- AREA. D A TA FROM TH E C O M M U N E OF V IN D E L N IN TH E C O U N T Y OF VÄSTERBOTTEN.
During the week 24th-30th of A p r il, 1972, a study of the o ut-patien t health
services in the commune of Vindeln was carried out w ith in the ambit of the
G-research pro ject. The studie embraced a l l forms of o u t-p a tien t health ser
v ic e .23^At the time of the survey, the follow ing services were provided in
the commune: A Health Centre a t Vindeln, providing a medical surgery (3 doc
to rs ) , d is t r ic t nurse and d is t r ic t nursing and maternity c lin ics (3 nurses);
24 hour casualty services at the cottage hospital at Vindeln (19 beds), and
branch surgeries at the c lin ic fo r chronic treatment at Häl Inas and at Amsele.
A d is tr ic t nurse is resident in Amsele, where the midwife from Vindeln has
also a branch c lin ic . There were no s ta f f vacancies, at the time of the sur
vey and the s ta f f s ituation had been sa tis fac to ry fo r a long time. The state
of the health services in the commune could be considered to be good by com
parison with many other communes in the G-areas.

175
F igu re 6 :8 The Commune o f V in d e ln .
M an jau r
Bran nforsliden[M årdsele
lolm träsktSäysjönIM altträsk
Petisträsk
Lån gträsk►Arvnäs
»Amsel
A rv lu n d
Krok -E korrseìè^U rask
»Broknäs
M årtsb rä n n a[Sjöbotten
. YttersjömS te n trä s k TDegernäs
ImsjÖlideri*►Lil Is eie
y Z v ^ v sele ^ Kamsjön
iranölund »Hällnas
'i dstrands A i näs Strandåker
A n äset([ryckeltjäm
Granö [Löv liden*
iMeselee g s -näset
'indelnO tto n trä s k fr o IL berget
JDverrödåRödålu
itrom sjö -»Ski vsjö
ITvärålun d
R am sele .iRambfi
V y Boundary betweenth e Åmsele and V in d e ln - H ä llnä s a rea .
•Boundary between c lose zone and remote zone.
' Road ; R ive r *R a ilw ay
10i—
2 0 km — t

176
The resu lt of the study can be summarised in the following tab le . The
data has been allocated to a close and a remote zone; the boundary being
set at a distance of 10 km radius from each service point» respective ly .
Table 6:3 Population Consulting Health Services in a Close and a Demote zone» Broken bown by Age and Level of Treatment.
The Vindeln - Häll näs - areaTotal Population: 6366 (Close zone: 3083, Remote zone:: 3283), 315 patients.
Type of Care Age and popula tion
The number tacts in Close zone
of con-
Remote zoneV is its to Doctor 0-19, in the 21 16Children's health care close zone:826 9 4D is tr ic t nurse o ffic e remote zone:970 - _
D is tr ic t nurse. Home v is its . 3 10V is its to Doctor 20-64 69 59Maternity care close zone:1740 6 4D is tr ic t nurse o ffic e remote zone:1740 3 10D is tr ic t nurse. Home v is its . - 4Midwife's o ffice 13 15Midwife. Home v is its . 2 2V is its to Doctor 65+ 17 31D is tr ic t nurse o ffic e close zone:517 2 2D is tr ic t nurse. Home v is its . remote zone:573 5 8
The Âmsele - areaTotal Population: 1166 (Close zone: 524, Remote zone: 642), 54 patients.
Type of Care Age and population
The number tacts in Close zone
of con-
Remote zoneV is its to Doctor 0-19, in the _ 1Children's health care close zone:150 - -
D is tr ic t nurse o ffic e remote zone:229 6 -
D is tr ic t nurse. Home v is its . 1 1V is its to Doctor 20-64 5 1Maternity care close zone:270 - -
D is tr ic t nurse o ffic e remote zone:318 13 -
D is tr ic t nurse. Home v is its . 1 -
Midwife's o ffice 2 1Midwife. Home v is its . - -V is its to Doctor 65+ 6 1D is tr ic t nurse o ffic e cTöse zone:104 3 ■-D is tr ic t nurse. Home v is its . remote zone:95 - 12
Source: Glesbygdsforskningen, report nr 25: Forslin-Persson: Patientströmmar och vårdkonsumtion i Vindelns kommun.

177
In re la tiv e terms, the scores in tab le 6:3 suggest the fo llow ing , among
other things: The proportion of patients is somewhat higher in the Vindeln-
Hällnäs area than in the Âmsele area. The sources of treatment sought are
very d iffe re n t in the two areas. 67% of the consultations in the Vindeln-
Hällnäs area took place with a doctor, and 33% with the d is t r ic t nurse.
At Âmsele, the s itua tio n was the opposite: 26% with a doctor and 74% with
the d is t r ic t nurse.
I f the findings are d is tribu ted by distance zones and age groups, the p ic
ture becomes less of a unity . Treatment by the d is t r ic t nurse is sought
less by the age group 0-19 and 20-64, in the remote zone in the Âmsele area.
On the other hand, the d is t r ic t nurse was consulted to a considerably grea
te r extent by the oldest age group in the remote zone. The proportion of
consultations with a doctor decreased in the remote zone, even among the
oldest age group.
In the Vindeln-Hällnäs area, treatment by the d is t r ic t nurse does not vary
so much according to the zone, although the intermediate age groups had a
somewhat higher rate of consultation. Consultations with a doctor were
somewhat less frequent fo r those aged 0-19 and 20-64 in the remote zone.
On the other hand, in the remote zone the proportion of patients in the
oldest age group is conspicuously higher.
While 7,1% of the population on the close zone of Âmsele consulted a doc
to r or a d is t r ic t nurse, the corresponding score in the remote zone was only
2,6%. In the Vindeln-Hällnäs area, the d ifference between the zones was
n eg lig ib le : 4,9 and 5,0% respective ly .
Thus, in the remote zone in the Âmsele area, there is a lower to ta l usage
of services than there is in the Vindeln-Hällnäs area. The d is t r ic t nurse
plays an important ro le , especially fo r the oldest age group. A higher pro
portion o f e ld e rly people are treated by doctors in the remote zone round
Vindeln-Hällnäs.
The p icture of the usage of health service in the commune of Vindeln corre
sponds well with the general conception of the variations in the usage of

178
services. In more w ell-defined rural areas, the usage is lower, and
patients tend to go to the nearest source of treatm ent, in sp ite of the
fa c t that the journey to the doctor's surgery does not normally involve
any d ire c t expenses. This applies especia lly to the oldest section of the population .24^
6.3.2 ACCESSIBILITY A N D TRANSPORT W ORK
The m aterial in tab le 6:3 has been the basis fo r fu rth e r ca lcu lations. As
was also the case in the survey mentioned above, the commune was divided
into two areas: a) the Amsele area and b) the Vindeln-Hällnäs area. The
transport volume, shown fo r in table 6 :6 , in figures 6:9 and 6:10 and pages
200-205 in appendix, is based on the fac to r values in table 6:4 below, a f
te r correction by the conventional distance lengthening constant, 1,35. In
the f i r s t place, the values form the basis fo r the calculations of the to
ta l annual transport volume of journeys to o ut-p a tien t health services.
Table 6:4 Factor Scores fo r the Calculation of Transport Work.
Age Group Factor scores Doctor
fo rD is tr ic t nurse
The Amsele Area
0-19 0,13 1,0920-64 0,53 1,5065+ 1,82 3,91
The Vindeln-Hällnäs area
0-19 1,07 0,7520-64 1,91 0,8965+ 2,28 0,81
The following example shows, how the fac to r scores have been calculated.I t refers to consultations with doctors by the age group 20-64. During
the period, 65+69 such consultations were made. The number of inhabitants
in th is age group in the close and the remote zones amounted to 3480. For
each in d iv id u a l, th is makes a to ta l of ^ 4 'gQ consultations per week, (see

179
table 6:3 on page 176 ) , and ^ ^ 6 9 + 6 9 ) = 1>gl per year_ This figure de_
notes the amount of single journeys per head. I f th is figure were doubled,
the to ta l annual journeys per head would be obtained. I t should be pointed
out that the calculations re fe r to journeys to sources of treatment w ith in
the commune only.
The measure of a c c e s s ib ility is based on weight scores, and these have
been constructed by transforming the factor values in tab le 6 :4 , in such a
way that the sum fo r each age group is = 100. The weight scores are shown
in the table below.
Table 6:5 Weight Scores fo r the Estimation of A c c e ss ib ility .
Area Age Group Weight Scores fo r Doctor D is tr ic t nurse Total
Amsele 0-19 11 89 10020-64 26 74 10065+ 31 69 100
Vindeln 0-19 58 42 10020-64 68 32 10065+ 73 27 100
For these purposes, the area has been divided into two parts only, the
Amsele area, and the Vindeln-Hällnäs area. Technically, i t is quite pos
s ib le to make fu rth e r divisions and thereby derive weight scores from
smaller sections. I t was considered inappropriate to do so in th is case,
however, since the survey period was only one week, and the empirical data
would the risk becoming too shallow, i f s p li t any fu rth e r.
The assumed or actual sources of treatment selected, were based on the
s ituation prevailing at the end of 1972, i . e . unchanged in re la tio n to the
survey period in A pril of the same year. The health service plan fo r the
county, envisages the establishment of one additional post of d is t r ic t nurse
in the commune, whereas the number of doctors w il l remain unchanged.^The
places of Mårdsele, Granö and Tvärålund have been selected as possible com
plementary service locations. The following a lte rn a tiv e combinations of ser
vices have been studied:

180
1. The same service as at the time of the survey, referred to , i . e . ser-
vises at V indeln, Hällnäs and Âmsele.
2. An additional d is t r ic t nurse stationed in a) Mårdseleb) Granöc) Tvärålund
3. A ll d is t r ik t nurses located in the Health Centre with three doctors
at Vindeln.
4. D is tr ic t nurses a t Vindeln, Granö and Tvärålund.
In a l l the a lte rn a tives the doctors" branch surgeries at Âmsele and Hällnäs
remain unchanged.
The results are shown in the following tables and diagrams. For each combi
nation of services, the a c c e s s ib ility by the three d iffe re n t age groups,
and transport costs, d is tribu ted by d iffe re n t a lternatives of time consump
tio n , are presented. For want o f space, certain tables have been transferred
to the appendix (pages 200-205). The tables and diagrams in the main tex t
re fe r only to the f i r s t combination of services described in points 1-4
above.

181
Table 6:6 A ccess ib ility and Transport Work. An Analysis of the Âmsele Area.
Supply: Doctor's surgery at Vindeln. Doctor's branch-surgery at Häl 1 näs and Âmsele. D is tr ic t nurse at Vindeln and Åsele.
A ccessib ility )Low scores denote a favourable s ituation
Age Group
0-19abs. cum. r e i .
20-64 abs. cum. r e i .
65+abs. cum. r e i .
0-5 122 122 40,1 231 231 36,4 88 88 43,15-10 34 156 11,1 60 291 9,4 16 104 7,810-15 17 173 5,5 40 331 6,3 10 114 4,415-20 47 220 15,4 126 457 19,8 35 149 17,120-25 62 282 20,3 129 586 20,3 32 181 15,625-30 22 304 7,2 46 632 9,2 20 201 9,830-35 0 304 0 2 634 0,3 4 205 1,9Upper and lower quarti le :
The population in the three most favourable classes of access ib ility :
Qn= 0, (4=20,
,69,17
173
Qi= 0,84 (^=20,26
331
Qi= 0,62 (^=20,20
114
Age Group Measurements of Transportation
Person k ilo meter per year /Return/
Person k ilo - Transport Time costc ̂meter per costbjper per year head and year year/Return/ /Return/ /Return/
Transport cost+Time cost per year
0-19 7797 25,64 2573I 1473I I 987I I I 927
I 4046I I 3560I I I 3500
20-64 29279 46,18 9662I 5529I I 3686I I I 2746
I 15191I I 13348I I I 12408
65+ 25488 124,33 8411I 4837I I 3225I I I 2418
I 13248I I 11636I I I 10829
a) A ccessib ility , in th is way based on the weight scores in table 6 :5 , is calculated on the following pattern: Suppose that a person from each age group lives in one spatial u n it. The distance to the nearest d is t r ic t nurse, as well as to a doctor, is 20 km. Then the weighted distance w ill be 20 km. I f a d is t r ic t nurse is stationed at a distance of 3 km from the square, access ib ility fo r the person aged 0-19 w ill be (3 x 89 + 20 x 11 ) „ n ,,m
100 " *
S im ila rly , a ccess ib ility fo r a person aged 20-64 w ill be 7,4 km, and fo r theperson in the oldest age group 8,3 km.
b) Transport costs are calculated on the basis of a cost 0,33 Sw.Cr. per km.c) For reasons of s im p lic ity , the same time costs fo r the d iffe re n t age groups
have been used, which means that the costs fo r the youngest and the oldest groups may be somewhat overestimated. See also Glesbygdsforskningen, report nr 24, p 64 and 161. The Roman numerals re fe r to the a lte rn a tive tra v e llin g speeds 30 km/hour ( I ) , 45 km/hour ( I I ) and 60 km/hour ( I I I ) .

182
In figures 6:9 and 6:10, below, the scores in tab le 6:6 and tables 8 : la - f
in appendix have been transformed in to diagrams, where a c c e s s ib ility
is shown in the form of p ro file s fo r each age group and the cost a lte rn a
tives in the form of bar graphs. The reader should note that the following
comments are based mainly on the m aterial in the tab les.

183
Figure 6:9 Regional Consequences in the Amsele Area.
Profiles of Accessib ility
cum % of pop 90
70
50
Supply: Doctor in Vindeln. Branch Surgery in Häl Inäs and Amsele. D is tr ic t Nurse in Vindeln and Amsele.
f Age group r/ 0-19 I 20-64 { 65+
f/ 100 000̂
i i i " 1------- 1------- 1-------
5 0 0 0 0 - ■
Transport cost per age group and year. Alternatives according to table 6:6.
_ u l_20 4 0 60 20 40 60 20
Accessib ility in weighted kilometer distance.
40 60 0-19 20-64 65+
Supply reinforced with d is tr ic t nurse in Mårdsele.
/ // 100 00 0 -
/ ^ 5 0 0 0 0 -
ni III ill20 40 60
■ i i20 40 60
1 1 - T ----------20 4 0 60 0-19 20-64 65+
D is tr ic t nurse in Vindeln only
9 0 -100 000 -
70-
5 0 -
5 0 0 0 0 -3 0 -
10-
20 4 0 60 0-19 20-64 65+20 40 60 20 60

184
cum % of pop
Figure 6:10 Regional Consequences in the Vindeln Area.
P ro files o f A ccessib ility Transport costSupply: Doctor in Vindeln. Branch Surgery in Häl Inäs.
D is tr ic t nurse in Vindeln.per age group and year.
125000-
90. Age group 0-19 65+ 10 0 000-20-64
70-
50 -5 0 0 0 0 -
30 -
0-19 20-64 65+6060
Supply reinforced with d is t r ic t nurse in Granö.
90-100 0 0 0 -
70-
50 -50 000-
3 0-
0-19 20-64 65+20 40 60 20 40 60 20 4Reinforced supply in Tvärålund instead of Granö.
60
90-100 000 -
70-
50-50 000-
30-
0-19 20-64 65+6020 40 6 0 20 40Supply reinforced with d is tr ic t nurse both in Granö and
X ** / X ^ v ä rå lu n d .
100 00090-
70-
50 -50 000
3 0-
0-19 20-64 65+60 60 60

6.3.3 COM MENTS
185
The method of analysis used, has shown how the s itua tio n of the in
habitants would change i f the structure of services is a lte red . In the
fo llow ing, the results w ill be fu rth e r e la b o ra te d .^
The Åmsele Area
In the orig ina l s itua tio n there is a d is t r ic t nurse at Amsele and doctors
at the branch surgery. 173 aged 0-19, 331 aged 20-64 and 114 aged 65+ be
long to the three most favourable classes of a c c e s s ib ility . Those 25% (Q3)
who belong to the most unfavourable classes of a c c e s s ib ility liv e in areas
with scores above 20,1 km weighted distance. I f the Amsele area were re in
forced by one nurse at Mårdsele, the number of people in the three most
favoured classes would be increased by 36+79+20=135 people.
For the youngest age group, the s ituation would be improved fo r those 25%
who have the most unfavourable s itu a tio n , from 20,1 to 16 ,9 , and fo r the
oldest age group from 20,2 to 17,2. The transport work would be decreased
by 8601 person km per year. In to ta l costs, th is corresponds to a decrease
from 26 737 to 22 884 Sw.Cr., based on a tra v e llin g speed of 60 km/hour.
I f , instead, the post of the d is t r ic t nurse were abolished, the s itua tio n
would be d ra s tic a lly worsened. The class with the most favourable scores of
a c c e s s ib ility would have a lower lim it of 33 km weighted d istance, and those
25% who have the leas t favourable scores would have values above 44,0 . The
corresponding score fo r the youngest age group would be 52,5. A ll the in
habitants of the area would have a worsened s itu a tio n . The annual transport
work would amount to 248 648 per head, which would mean an increase of
186 084 person km annually compared with the orig ina l s itu a tio n . In costs,
th is would imply an increase of 78 000 Sw.Cr. (a t 60 km/hour).
The Vindeln-Hällnäs Area
In the orig ina l s itu a tio n , 3280 people belong to any of the three most
favoured classes of a c c e s s ib ility . Those 25% who have the least favourable

186
Situation have scores above 21 ,8 , 21,0 and 20,4 km, weighted distance
fo r each age group, respective ly . The transport work amounts to 405 134
person km annually, which corresponds to values between 171 986 and
210 282 Sw.Cr., depending on the tra v e llin g speed used fo r the calcula tio n .
I f the service is increased by an additional nurse at Granö, the number
of people in the most favoured classes w ill increase by 261. The s ituation
of the least favoured 25% w ill be considerably improved: from an accessi
b i l i t y score of approx. 21 to approx. 17 km, weighted distance. The tran
sport work w ill be decreased by 38 904 person km per year, (16 000 Sw.Cr.
at a tra v e llin g speed of 60 km/hour).
I f , instead, the additional service were stationed at Tvärålund, the number
of people in the three most favoured classes would increase by 717. On the
other hand, the l im it fo r the least favoured 25% would not be changed very
much, other than fo r the oldest age group: from 20,4 to 19,4. The transport work would amount to 382 620 person km per year, a decrease of 22 514 per
son km per year, compared with the o rig ina l s itua tio n .
I f there is an additional reinforcement in the provision of nurses both at
Tvärålund and Grandi the e ffe c t would be, that the number of people in the
most favoured classes of a c c e s s ib ility would increase by 978 compared with
the o rig inal s itu a tio n . The least favoured group would have a c c e s s ib ility
scores from 15,6 instead of 21 ,8 , weighted distance, previously. The tran
sport work would decrease by 50 910 person km per year, which corresponds
to a cost varying between 23 076 and 30 347 Sw.Cr. depending on the speed
used.
In the maps below the a c c e s s ib ility scores fo r the oldest age group to some
selected a lternatives are shown by is o -lin e s .

187
Figure 6:11 A ccessib ility Zones according to table 6 :6 .
^ ♦ i< &
Accessi b il i ty scores
20 km

188
Figure 6:12 A ccessib ility Zones according to table 8:2 b)
10 - 1515 - 2020 - 25
30 - 3520 km
A c c e s s ib i l i tyscores

189
6.3.4 C O N C LU D IN G REMARKS
In the method presented above, the existing pattern o f usage has been
used to give a rough estimate of the level of demand. The weights determi
ning a c c e s s ib ility have been derived from data that describe the patterns
of tra v e llin g and usage of d iffe re n t sections of the population. At the
same tim e, these data give a basis fo r the estimates of costs, both to
society and the in d iv idua l.
A lternative services in an area, well suited fo r th is kind o f planning,
have been analysed in greater or lesser d e ta il , to give a tangib le perspective to the potentia l fo r demand-oriented planning which can be car
ried out by using th is method. I t must be strongly emphasized that th is
approach must not be used as an excuse fo r using a low level of demand as
an argument fo r withholding any ju s t if ie d parts o f our w elfare , but to
quote an old proverb, the best must not be the enemy of the good.
In any case, i t is only f a i r th a t the tra v e llin g costs and the inconvenien-
cies born by the population must be taken into account, when deciding the
location and the scope of the services. As has been mentioned above, i t is
a well-known fa c t th a t the usage of health services diminishes by the d i
stance to the source of supply. This also applies to more specialised forms
of treatment. A study of treatment frequency in Västerbotten,^show s ob
vious corre lation between the proportion of people treated fo r serious eye
diseases such as ca taract, glaucoma and squint, on the one hand, and the
distance to an ophthalmic c lin ic , on the other. The frequency of eye tr e a tment of diseases caused by diabetes, which involve closer tie s to the source
of treatment and demands fo r specia lis ts examinations in connection with the
driving te s t , fo r example, do not show the same degree of v u ln e ra b ility to
distance. I t should be an urgent goal of research to try to f ix relevant
standards of a c c e s s ib ility fo r other forms and levels of medical care as
well as o ut-p atien t health services on a local le v e l. The disadvantages of
using the data on local usage fo r weighting are of course, p a rtly , th a t i t
presupposes a detailed study of the area th a t the planning is concerned
w ith , and p a rtly , that the patterns of usage are lia b le to change. The level

190
of demand is l ik e ly to depend on the services th a t people have become
accustomed to , and a changed pattern of services w i l l , th ere fo re , gradual
ly a ffe c t the demand fo r other p o s s ib ilit ie s . But a series of studies in
representative areas would give data s u ffic ie n tly applicable in general
to make i t possible to use the method in most cases. I t should of course
also be pointed out that data based on one week's observations alone,
are too u n re liab le , to form the basis fo r a d e fin ite plan. Longer series
of observations are necessary, but, fo r reasons of tim e, i t was not pos
s ib le to make such observations w ithin the course of th is study.
What has been demonstrated here can n a tu ra lly be applied as well to other
social service sectors besides health. In Glesbygdsforskningen, report nr
24, the model has also been applied, with certa in minor m odifications, to
the r e ta il trade and nursery schools. The weights fo r the planning of re
t a i l trade were obtained from studies on shopping habits in the commune
of V indeln ,28^and the problems of a c c e s s ib ility by the preschool children
were s im ila rly demonstrated by le t t in g the ages of the children constitu te
the weights that modified the actual d ifferences in distance from home to
school.

Notes to chapter 6
191
1) Socialstyrelsen (Nat.Board of Social Welfare and Medical Care) (1971). See also Glesbygdsforskningen, report nr 24, fo r a more thorough discussion on the intentions of society with out-patien t care.
2) Socialdepartementet (The M inistry fo r Health & Social A ffa irs ) (1967).
3) Glesbygdsutredningen: Hälso- och sjukvård i glesbygder.
4) SOU 1974:1 and SOU 1974:3.
Kungl. Majt:s prop 1970:75, Translated quotation. See also Kurt Samuelsson's discussion on the problem of values and regional p o licies in Regioner a t t leva i (1972).
67
8
9
10
1112
13
14
15
16
17
18
19
20
21
22
23
2425
Handelsdepartementet (1969).
SOU 1972:13, p 159.
Hamrin (1970).
ERU (1971).
See the discussion on the concept of a c c e s s ib ility , p l6 0 e t seq.
SOU 1972:56, p 37 et seq.
Socialstyrelsen (1971).
See the discussion on health care planning fu rther below in th is
chapter.
Glesbygdsforskningen, report nr 19 (1971).
Yeates (1968) p 148.
Lindberg (1972) p
SOU 1970:14, b ilaga 4.
Spri report 14/69.
Glesbygdsforskningen, report nr 19.
'Consumer u n it' is a standardized measure which was used in SOU 1961:8 as an instrument fo r estimating the fu ture need of medical doctors.See also Glesbygdsforskningen, report nr 19, p 23-25.
See also the discussion on the spatia l d is tr ib u tio n of aged people in chapter 4.
A technical description of the model is given in Glesbygdsforskningen, report nr 24. See also SOU 1974:3 and Gabrielsson-Wiberg (1974).
Glesbygdsforskningen, report nr 25 (1973).
Spri report 14/71 pp 36-47 (paper w ritten by Björn Smedby).
Spri pro ject 3003 (1972).

192
26) See also appendix, tab le 8:1 .
27) Linnér (1973) pp 311-315.
28) See also the discussion on the calculations of completeness in chapter 5.

193
7 Summary
This thesis deals with issues concerning the problems of depopulation in
the six northernmost counties in Sweden. I t is part of a research project
called ' Glesbygdsforskningen1 (The research project fo r Sparsely Popu
lated Areas) at the Department of Geography at the U niversity of Umeå,
in northern Sweden. In th is thesis "G-" stands fo r “Glesbygd", (depopu
lated or sparsely populated area). As the t i t l e of the thesis ind icates,
i t deals with the problems in the planning of services. The aims of the
thesis may be formulated in the following points:
a) to give a survey of some of the most important public reports in order
1) to give a background to contemporary Swedish regional p o lic ie s ,
2) to indicate certain target conflic ts th a t may emerge in connection
to sectoria l economic and physical planning.
b) to give a basis fo r the planning o f an improved environment in the de
populated areas, by analysing the location and the extent of problems
connected with the supply of services in the six northernmost counties.
c) to define the basis of a stable place structure in the form of a s tra te
gic lo c a lity system, by estimating the minimum size fo r a place in which
the supply of services can be kept at a re la t iv e ly high le v e l, even i f the
population in the surrounding area decreases d ra s tic a lly , using estimates
of the consumer base of the area.
d) to discuss methods of planning the supply of services in sparsely popu
lated areas.
As regards point a ) , the survey of the public reports mainly covers the
period 1940-1965. At the beginning of th is period, i t is evident th a t the
reports recommended a careful concentration of the outlying settlements to
more p ro fita b le areas, though always against the background that i t was
desirable to maintain as much local areal production as possible. Towards
the end of the 1940’*s, the importance of central places was stressed. In
d ustria l a c t iv it ie s should be located in s tra te g ic a lly situated places of

194
such a size that expansion might favour the agricu ltura l h interland. The
p o s s ib i l i t ie s of re l iev ing the loss of the labour force through emigration
were discussed more and more, and the question of the location of schools
played an increasingly important part in the debate on the location of the
settlements.
In the 195(Ts, the labour market authorities began an increasingly active
labour market policy. I t was no longer a question of preserving the ag ri
cultural areas in Norrland to strengthen national agricu ltura l production.
The maintenance of some agricu lture in G-areas in Norrland became more an
argument fo r not creating unnecessary d i f f ic u l t ie s fo r forestry . A new com
mune reform was prepared, and the device intended to maintain the purchasing
power of the new bigger communes was the development of centres. The new
communes were created according to central place theoretical princip les,
and the road net system was planned mainly to link major nodes together.
Not until 1965 was a location policy programme presented.
As regards b ) , the location and the estimates of the extent of the problem
areas have been carried out by means of three d i f fe re n t methods. In each
case, e lectoral wards have been used as the unit of spatial reference. The
variable providing the basis for the f i r s t of the three c lass if ica tions car
ried out, is the proportion of aged people over 64 years of age. The high
proportion of aged people in G-areas constitutes an acute planning problem, p rin c ipa l ly for the health and social welfare authorit ies . The trend towards
a more and more skewed age structure is strong in p rac t ica l ly a l l weakly ur
banized communes in the northernmost counties. The analysis of the spatial
d istr ibution of aged people also shows high proportions of aged people in
the outlying parts of the inland communes and along the Norwegian border,
where proportions of aged people of 25% are not unusual. A study of the
rate of depopulation and the changed median age also indicates a strong cor
re la t ion . In inland communes, such as överkalix in the county of Norrbotten,
fo r example, there has been a population decrease of 30% between the years
1960 and 1970. During the same period, the median age has increased by 11,5
years: from 26,4 to 37,9 years.
195
The second c lass if ica t io n of e lectoral wards is based on conditions in
the r e ta i l trades. With the turnover of every day commodities and specia
lised goods as a s ta r t in g -p o in t , a measure of c e n tra l i ty has been con
structed, where a l l the turnover above a minimum level forms an index of
c e n tra l i ty . The minimum level is based on a study of the consumption of
every day commodities in e lectoral wards and in places on a low h ie rar
chical leve l . I t is shown th a t , with one exception, the proportion of the
population l iv ing in wards to ta l ly lacking c e n tra l i ty , exceeds 22% of the
to ta l population of the counties studied. In the county of Västerbotten,
there are no less than 72 400 inhabitants (31%), in such wards.
The th ird c lass if ica t io n method d if fe rs from the two others inasmuch as
i t combines a whole series of variables into a scale with discrete steps.
The method is based on the presence or the absence of high proportions
of aged people and the turn-over in the r e ta i l trade forming the index
of c e n tra l i ty , and, in addition, on the distance to a number of public
service establishments.
This method of measurement may be compared to a "sieve", where the ward
to be c lass if ied is i n i t i a l l y assumed to be situated on the highest level
of a hierarchy of 1+7 classes, where the superior class comprises wards
with populations of 2200 people or more. Areas within this class can be
conceived to be part of a higher, not systematized hierarchy. Technically,
th is c lass if ica t ion is carried out by feeding data about the wards into a
computer programmed for successive logical choices. I f the wards does not
f i l l the qualif ica tions for membership in the highest class, i t is brought
through a flow schedule until the c r i te r ia fo r the appropriate level fo r
a tt r ib u t io n are f i l l e d .
The results of the calculations are presented in maps, showing the a t t r i
buted levels fo r the to ta l of 1563 wards. I f an a rb it ra ry l im i t between
levels 3 and 4 is f ixed , th is means that 240 000 out of the 1 476 000 in
habitants of the research area belonged to classes with too poor accessi
b i l i t y to services during the period of the study.

196
As regards c ) , threshold values fo r a number of service establishments
have been calculated. The s ta r t in g -p o in t has been a sociological study
of att itudes and preferences with regard to private and public services.
These establishments, seen as a t o t a l , constitute an aggregate, the
existence of which in one single place conveys that this place can be
characterized by the population in the sparsely populated hinterland as
'very good1 as regards service.
The study of the completeness of service in a l l places within the research
area shows that a population of 2200 people in a central place generally
gives a reasonable certa in ty that a l l service functions are represented,
and that such a place can work as a s trateg ic lo c a l i ty in a stable hierarchy
of central places. The contribution of purchasing power by the hinterland has been estimated by:
a) calculating the shortfa l l from se lfsuffic iency of the hinterland.
b) recalculating the number of inhabitants with regard to lower purchasing
power,
c) applying a travel reluctance function, and by
d) estimating the 'leakage' to s ig n if ic a n t ly superior centres.
The calculations have shown that the contribution to purchasing power by
the hinterland amounts, on average, to 30% of the number of inhabitants in
a strateg ic lo c a l i ty . The consequences of th is fact are, that a strategic
lo c a l i ty in an area extremely affected by depopulation should not have a
population lower than 3000, i f the depopulation and the increase in costs
continue.
As regards d ) , the concluding chapter is based on the situation of the people
in sparsely populated areas, presented in the study of the supply of services
There is a considerable over-representation of aged people in the outlying
areas, poor service coverage, and risks of reduction in the collection of

197
services in the central place because of reduced population base. The
concept 'a c c e s s ib i l i ty 1 is discussed on the basis of the terms 'demands'
and 'needs', where 'needs' are normative and 'demands' depend upon the
ind iv idua l's subjective demands. Examples of the differences are given
in the study of how out-patient health service in a ty p ic a l ly sparsely
populated commune, Vindeln, in the county of Västerbotten. A planning
system that is based on a g e -s tra t i f ie d weighted distances, where the
weights have been derived from usage patterns, is discussed, and this
system is applied to the health service sector of the studied commune.
The calculations show, among other things, that substantial gains in
access ib i l i ty can be made by comparatively modest measures taken in the
form of treatment at a low hiearchical leve l . Above a l l , the older sec
tion of the population are shown to be p art icu la r ly dependent on supplies
close at hand.

8Figure
Table
Figure
Figure
Table
198
Appendix1:1 C entra li ty Scores.
1:1 Tables Showing A ccessib il ity and Transport Work- f According to Figures 6:9 and 6:10.
1:2 Flow Chart fo r S-L C lass if ica tion .
1:3 Places With a Population Over 2200 (1970).
1:2 L is t of Publications in the Series Glesbygdsforskningen.

Figure 8:1 C en tra lity Scores
Division into E lectoral Wards in the Research A rea 1965

200
Table 8:1 Tables Showing A ccess ib il ity and Transport Work According to Figures 6:9 and 6:10.
a) Supply reinforced with d is t r i c t nurse at Mårdsele.
Consequences in the Âmsele area
A ccessib il ity Low scores denote a favourable s ituation
Age Group
0-19abs. cum. r e i .
20-64abs. cum. r e i .
65+IB?. cum. r e i .
0-5 132 132 43,4 238 238 37,5 88 88 42,95-10 42 174 13,8 88 326 13,8 30 118 14,610-15 35 209 11,5 84 410 13,2 16 134 7,815-20 32 241 10,5 96 506 15,1 31 165 15,120-25 53 294 17,4 107 613 16,8 26 191 12,625-30 10 304 3,2 19 632 2,9 10 201 4,830-35 0 304 2 634 0,3 4 205 1,9
Upper and lower quarti le: Qn= 0,69
Q‘ =16,93Qi= 0 <4=08
,84,31
Qn= 0<4=17
,62,25
The population in the three most favourable classesof access ib i l i ty : 209 410 134
Age Group Measurements of Transportation________________________________Person k i lo - Person k i lo - Transport Time cost Transportmeter per year meter per cost per per year cost+Time/Return/ head and year year /Return/ cost per
____________________________________ /Return/_______/Return/_____________.yearI 1247 I 3432
0-19 6620 21,77 2185 I I 831 I I 3016I I I 623 I I I 2808
I 4842 I 1324820-64 25473 40,17 8406 I I 3216 I I 11622
I I I 2385 I I I 10791
I 4159 I 1137665+ 21870 106,68 7217 I I 2769 I I 9986
I I I 2068 I I I 9285

201
b) D is t r ic t nurse in Vindeln only.
Consequencesin the Ämselearea
Accessib il ity Low scores denote a favourable situation
Age Group
0-19abs. cum. r e i .
20-64abs. cum. r e i .
65+abs. cum. r e i .
0-33 0 0 0 0 0 0 0 0 033-35 0 0 0 14 14 2,2 15 15 9,335-40 19 19 6,2 166 180 26,2 132 147 64,340-45 41 60 13,4 272 452 49,2 18 154 5,345-50 148 208 48,6 59 511 9,9 8 173 3,950-55 29 237 9,5 41 552 6,5 7 180 3,455-60 30 267 9,8 26 578 4,1 15 195 7,360-65 5 272 1,6 29 607 4,5 8 203 3,965-70 32 304 10,5 27 634 4,3 2 205 0,9
Upper and lower quarti le: Q-i =47
<4=52 cn o Q-i =39
<4=45,42,67
Q-i =38 <4=44 o
o CO
No one lives in areas with access ib i l i ty scores under 33 km weighted distance.
Age Group Measurements of Transportation
Person k i lo Person k i lo Transport Time cost Transportmeter per year meter per cost per per year cost+Time/Return/ head and year year /Return/ cost per
/Return/ /Return/ year
0-19 38006 125,02 12540I 7208I I 4816I I I 3604
I 19748I I 17356I I I 16144
20-64 113156 164,48 37340I 19802I I 13226I I I 9900
I 57142I I 50566I I I 47240
65+ 97486 475,46 32170I 18508I I 12338I I I 9254
I 50678I I 44508I I I 41424

202
c) Doctor at Vindeln. Branch surgery at Häl 1 näs - D is t r ic t nurse at Vindeln.
Consequencesin the Vindelnarea
A ccessib il ity Low scores denote a favourable s ituation
Age Group
0-19abs. cum. r e i .
20-64 abs. cum. r e i .
65+abs. cum. r e i .
0-5 598 598 33,3 1195 1195 33,5 462 462 43,25-10 205 803 11,4 504 1699 14,1 36 498 3,310-15 67 870 3,7 149 1848 4,1 64 562 5,915-20 366 1236 20,4 731 2579 20,4 231 793 21,620-25 337 1573 18,8 596 3175 16,7 165 958 15,425-30 116 1689 6,4 199 3374 5,5 50 1008 4,630-35 61 1750 3,4 194 3568 5,4 61 1069 5,735-40 41 1791 2,2 0 0 0 0 0 0
Upper andlower quart i le : Q-,= 0,75 Q.,= 0,76 Q.,= 0,85
Q^=21,85 Q^=21,05 (^=20,44
The population in the three most favourable classesof access ib i l i ty : 870 1848 562
Age Group Measurements of Transportation_________________________________
Person k i lo - Person k i lo - Transport Time cost Transportmeter per year meter per cost per per year cost+Time/Return/ head and year year /Return/ cost per
/Return/_______ /Return/_____________ year
I 15924 I 43740-19 84304 47,06 27820 I I 10616 I I 3843
I I I 7962 I I I 3578
I 45556 I 1250920-64 241020 67,54 79536 I I 30506 I I 11004
I I I 22778 I I I 10239
I 15110 I 414465+ 79810 74,64 26336 I I 10114 I I 3645
I I I 7554 I I I 3389

203
d) Supply reinforced with d is t r ic t nurse at Granö.
Consequencesin the Vindelnarea
Accessib il ity Low scores denote a favourable s ituation
Age Group
0-19 20-64abs. cum. r e i . abs. cum.
65+r e i . abs. cum. re i .
0-5 598 598 33,3 1195 1195 33,4 462 462 43,25-10 205 803 11,4 504 1696 14,1 36 498 3,310-15 277 1080 15,4 189 1888 5,2 75 573 7,015-20 425 1505 23,7 1120 3008 31,3 319 892 29,820-25 140 1645 7,8 235 3243 6,5 80 972 7,425-30 78 1723 4,3 210 3453 5,8 60 1032 5,630-35 27 1750 1,5 115 3568 3,2 37 1069 3,435-40 41 1791 2,2 0 3568 0 0 1069 0
Upper and lower quarti le: Q i = 0,75
Qg=16,79Q i = 0,75 Q^=l6,80
Q,= 0,85 Q^=16,96
The population in the three most favourable classes of access ib i l i ty : 1080 1880 573
Age Group Measurements of Transportation
Person k i lo meter per year /Return/
Person k i lo meter per head and year /Return/
Transport Time cost cost per per year year /Return/ /Return/
Transport cost+Time cost per
0-19 73374 40,96 24213I 13883I I 9289I I I 6941
I 38096I I 33502I I I 31154
20-64 218272 61,17 72029I 41285I I 27659I I I 20540
I 113314I I 99688I I I 92569
65+ 74584 69,76 24612I 14136I I 9444I I I 7068
I 38748I I 34056I I I 31680

204
e) Reinforced supply at Tvärål und instead of Granö.
Consequencesin the Vindelnarea
Accessib il ity Age Grouplow scores denote a favourable s ituation 0-19
abs. cum. r e i .20-64 abs. cum. r e i .
65+abs. cum. re i .
0-5 598 598 33,3 1195 1195 33,4 462 462 43,25-10 354 952 19,7 512 1707 14,3 39 501 3,610-15 124 1076 6,9 541 2248 15,1 172 673 16,015-20 189 1265 10,5 385 2633 10,7 143 816 13,320-25 311 1576 17,3 552 3185 15,4 145 961 13,525-30 124 1700 6,9 227 2412 6,3 58 1019 5,430-35 50 1750 2,7 156 3568 4,3 50 1069 4,635-40 41 1791 2,2 0 3568 0 0 1069 0
Upper andlower q uart i le : Q.= 0,75 Q-,= 0,76 Q,= 0,85
00=21,55 00=20,43 q ' =19,42The population in the three most favourable classesof access ib i l i ty : 1076 2248 673
Age Group Measurements of Transportation_________________________________
Person k i lo - Person k i lo - Transport Time cost Transportmeter per year meter per cost per per year cost+Time/Return/ head and year year /Return/ cost per
/Return/ /Return/_______________year
0-19 78675 43,92 25962I 14904I I 9902I I I 7452
I 40866I I 35864I I I 33414
20-64 227935 63,88 75218I 43115I I 28879I I I 21557
I 118333I I 104097I I I 96775
65+ 76010 71 ,10 25083I 14441I I 9627I I I 7190
I 39524I I 34710I I I 32273

205
f ) Supply reinforced with d is t r ic t nurse both at Granö and Tvärålund.
Consequencesin the Vindelnarea
A ccessib il ity Age GroupL.UW d t U I C d UCMUUC
a favourable s ituation 0-19 ab s. cum. r e i .
20-64 abs. cum. r e i .
65+abs. cum. r e i .
0-5 598 598 33,4 1195 1195 33,4 462 462 43,25-10 354 952 19,8 512 1707 14,3 39 501 3,610-15 334 1268 18,6 581 2288 16,2 183 684 17,115-20 184 1470 10,3 711 2999 19,9 205 889 19,120-25 178 1648 9,9 254 3253 7,1 86 975 8,025-30 75 1723 4,2 200 3453 5,6 57 1032 5,330-35 27 1750 1 »5 115 3568 3,2 37 1069 3,435-40 41 1791 2,3 0 3568 0 0 1069 0
Upper and lower quarti le Qt= 0,75 Q,=
0^=15,67: 0,75 =16,0
Q i = 0 Qj 6
,85,82
The population in the three most favourable classes of access ib i l i ty : 1286 2288 684
Age Group Measurements of Transportation
Person k i lo - Person k i lo - Transport Time cost meter per year meter per cost per per year /Return/ head and year year /Return/
/Return/ /Return/
Transport cost+Time cost per year
0-19 68400 38,19 22572I 12965I I 8677I I I 6431
I 35537I I 31429I I I 29003
20-64 206758 57,94 68230I 39251I I 26032I I I 19524
I 107481I I 94262I I I 87754
65+ 71066 66,47 23451I 13466I I 8957I I I 6702
I 36917I I 32408I I I 30153

Reduction
by one
class
Total reduction
should be
summed up
206
V V
Initia
of
a g
zo f® 2
O
Yes
O —oQ. COa o
3 rnV 'oo 3 m
> 'Oo3
It)
OID
r-t- Qi O O'
ID
•< cft- Oio o-
3C 1
O O'"O rt> "O o-»• Of n*
oo ft)o crO 1®o o -*• at
3rt-
CO l/iID
■O ID3 C
co v» a>
id o 3 -♦>T -o
id
i
t3 C O lf>
f®f® O 33 T3
ID
Of3it)o
O X5 *0 T— o * oO) -s
IDo Of r® 3•nJ O S oT3 3
Of oO' -h
1 ' I '
ID
VN
o Yes
*o
Yes
*2 -< o r®
on
! i<DQ.oo
I®Q.
O
2P °IB O Q- 3 C r-T
*<
3crV:
-*• cO f®
cr o
IDn
o3tx>
V:o ?
" ;
I
Or
l “
o Of
? 1
L1
2-h Ooi re
1
4-*• Z -h O Of ID 3
Of
^ i®CL*< 3
ID O.co
-»• z-*» o
o o3 10 V: -i
ID Q.
V 4 1* i/> —1->• i® 3- r t 1 (( 3- <- • ->• a>3 0 3 I® rf£V _j,
8 3 ?3 r® o1 . 5CL cr r-t- —• T O )
4CO
-o -iro t ro o o < «/> i®3 t/> «-►
-■ O — I® < 1® V) f®
3 cr a> on at
CO
c3n; ° c0 3 - 0 f® O
a. o at on o a f® »b r® < n f® cr
3o<ID
■oC—• cr
c — • a> o
B» *< S-c l n
g at re Ov< 3TIDOfQ
<®CL 1
_J
Figure 8:2
Flow Chart
for S-L
Classificatio
n.

207
Figure 8 :3 Places With a Popula tionOver 22Q0 (1970).(+) denotes places with more than 3000 inh.
O C 3
+1 Avesta +37 Kvissleby+2 Borlänge 38 Låagsele+3 Falun +39 Matfors
4 Grycksbo +40 S o lle fteå+5 Hedemora 41 Sundsbruk
+6 Leksand +42 Sundsvall+7 Ludvika +43 Timrå
8 Långshyttan +44 inge+9 Malung +45 Örnsköldsvik
+10 Mora 46 Brunflo
+11 Orsa +47 Frösön12 Roane +48 Ströasund
+13 Rättvik 49 Sveg
+14 Smedjebacken +50 Östersund
„ +15 Säter 51 BolidenS tV j l6 A lfta +52 Holasund
17 Arbrå 53 Hörnefors+18 Bollnäs 54 Kleaensnäs
+19 Edsbyn +55 Lycksele+20 Gävle +56 Skelleftehamn+21 Hofors +57 S kellefteå+22 Hudiksvall +58 TJneå+23 Iggesund 59 Asele+24 Ljusdal +60 Arvidsjaur+25 Ljusne +61 Bergnäset
26 Ockelbo +62 Boden27 Sandarne +63 Gaanelstad
+28 Sandviken +64 Gällivare29 Storvik +65 Haparanda
+30 Söderhaan 66 Jokkaokk+31 Valbo +67 Kalix32 Alvik +68 Kiruna
+33 Bollstabruk +69 Luleå34 Husun +70 Malmberget
+35 Härnösand +71 Piteå+36 Kramfors +72 Älvsbyn+74 Grängesberg +73 Öjebyn

Table 8:2
Rapport nr
Rapport nr
Rapport nr
Rapport nr
Rapport nr
Rapport nr
Rapport nr
Rapport nr
Rapport nr
Rapport nr
Rapport nr
Rapport nr
Rapport nr
Rapport nr
Rapport nr
Rapport nr
208
L is t of Publications in the Series Glesbygdsforskningen.
1 Gösta Weissglas: Karta över vägtätheten i W9 X, Y, Z9 AC och BD län.
2 Gösta Weissglas: Baspunkter fö r serviceutbudet i W9 X,Y, Z } AC och BD län.
3 Olof Erson-Gösta Weissglas: Karta över v a ld is t r ik ts in - delningen i W, X, Y, Z9 AC och BD län.
4 Gösta Weissglas-Berndt öquist: Vald istriktens c e n tra l i - t e t ; en undersökning baserad på detaljhandelsomsättningen i glesbygdsforskningens undersökningsområde.
5 Olof Erson-Gösta Weissglas: Befolkningens fördelning på ålder och v a ld is t r ik t i W9 X9 Y9 Z9 AC och BD län.
6 Einar Holm: Glesbygd och rumsliga kontraktionsprocesser.
7 Roger Axelsson: K apita lför lust t i l l fö l jd av snabb be- folkningsminskning.
8 Gösta Weissglas: Services-läges karakter is tika för va ld is tr ik ten i W, X9 Y9 Z9 AC och BD län.
9 Olof Erson: Arbetsresor och sysselsättning. En studie av pendling med material från AC län.
10 Torsten Åström: En sociologisk undersökning av fem glesbygdsområden. Del I .
11 Carl-Er ic Ericsson: Livsmedelshandelns utveckling i Jämtlands lä n 9 1950-1963.
12 Bengt Berggren-Ove Hessmo: Skogsbruket och serviceorterna. En övers ik t l ig studie av dagspendling9 serviceunderlag och skogsbrukssysselsättning samt skogsuttag i norra Sverige.
13 Olof Erson: Sysselsättning i industri i de sex nordliga länen.
14 Gösta Weissglas: Glesbygd och samhällsplanering.
15 Torsten Lundberg-Per Sjöstedt: Glesbygdsstudie i Umeå- regionen.
16 Fred Hedquist: Lokaliseringsstödets sysselsättningseffekt inom stödområdet.

209
Rapport
Rapport
Rapport
Rapport
Rapport
Rapport
Rapport
Rapport
Rapport
Rapport
Rapport
nr 17 Dan Jonsson-Ulf Wiberg: Serviceförsörjning i glesbygd i Gävleborgs län.
nr 18 Olof Erson-Einar Holm: Bo-pendla-arbeta. En studie avlokala variationer i befolkningens t i l lg å n g på ind ustr iarbete baserad på situationen i de sex nordliga länen 1965/66.
nr 19 Gottne Lindgren-Jan Palmquist-Gösta Weissglas: Sjukvårdi glesbygd. En undersökning av den öppna sjukvårdens organisation och regionala variation .
nr 20 Ulf K jä l1-Lars-Eric Westin: Flyttning från Umeå A-regionmed särskild hänsyn t i l l "AMS-flyttarna".
nr 21 Rolf Johnsson-Eric Lindahl: Tätorterna och servicens täckningsgrad i Norrland och Dalarna.
nr 22 Sven-Olof Edström: Samhällsekonomiska fö r lu s te r inom handeln t i l l fö l jd av arbetskraftens f ly t tn in g a r - en intensi vstudie avseende Vilhelmina kommun.
nr 23 Jan Johansson-Leif Lundberg: Kust och inland. En studie av kommunikationerna t i l l och från Arvidsjaur.
nr 24 Gösta Weissglas-Ulf Wiberg: T il lgänglighet t i l l service.
nr 25 Barbro Forslin-Gudrun Persson: Patientströmmar och vårdkonsumtion i Vindelns kommun.
nr 26 Christer Lundin-Nils Sundberg: Utbudet av öppen vård iSverige. En t i l lg ä n g ! i ghets stud i e .
nr 27 U lf Wiberg: Service- och tra f ikp lanering i glesbygd.

210
9 BibliographyAbler, R - Adams, I -Gould, P(1971)
Ahlenius, K (1903)
Allen, K J - Hermansen, T (1973)
Alvarsson, A(1970)
Andersson, A(1967)
Backlund et al(1970)
Bal gård, G(1970)
Bendz, M - Yttermyr, B(1966)
Bergroth, A et al(1971)
Berry, B(1967)
Boalt, C - Jonsson, E(1965)
Boustedt, 0 (1962)
Brox, 0 (1969)
Bylund, E (1962)
Spatial organisation. Englewood C l i f f s . N J.
Ängermanälfvens flodområde. En genommorfologi sk-antropogeografi sk undersökning. Uppsal a.
Regional Policy in EFTA. An Examination of the Growth Centre Idea. Geneve.
Glesbygdsplanering - en problemanalys. Stockholm.
Glesbygd och lo ka l ise r in g sp o li t ik . Vänersborg.
Regional- och t r a f i k p o l i t i k . Luleå.
Angår det Sverige om Norrland finns? Stockholm.
Skogsarbetskraftens arbets- och servicefärder. Institutionen för skogs- teknik , Skogshögskolan. Rapporter och Uppsatser nr 30. Stockholm.
Samhällsstruktur i Vilhelmina kommun. Sociologiska insti tu t ionen ,Umeå un ivers ite t . Umeå.
Geography of market centers and ret a i l d is tr ib u tio n .
Konsumtionen ur sociologisk belysning. Stockholm.
Die Centralen Orte und ihre Einflussbereiche. In Proceedings of the IGU symposium in urban geography,Lund 1960. Lund.
Central byråkraterna och glesbygden. Halmstad.
Vattenkraftsutbyggnadernas inverkan på de ekonomisk-geografiska förhå llandena i Norrbottens län. Uppsala.

211
Bylund, E (1966)
(1969)
(1972)
(1972)
(1972)
(1972)
(1972)
Bäck-Wiklund, M (1969)
Carlsson, B et (1968)
Claesson, G (1972)
Glesbygdsproblemet - Norrlands- problemet. -Ymer, Stockholm.
Industrial location policy and the problem of sparsely populated areas in Sweden. In Robinson, E.A.G. (ed) Backward areas in advanced count r ie s . London.
Promemoria concerning growth centre problems within the framework of the Swedish policy. Kuklinski, A - P e tre l la , R (ed) Growth Poles and Regional polic ies. Haag.
Growth centre and administrative area problems within the framework of the Swedish location policy. In Kuklinski (ed) ^Growth Poles and Growth centres in Regional planning. Haag.
Areas of population decrease and the provision of services in northern Sweden. International Federation, for Housing and Planning. 31st World Congress. Liverpool.
The central place structure and access i b i l i t y to services in northern and western Sweden. In Plan 1972, In te r national issue, Stockholm.
Regional Development and Urban Structure. A Summary of some observations mainly from Swedish material. In European Coordination Centre for Research and Documentation in Social Sciences: Backward Areas in Industria lized Countr ie s , Bonn 1970. Haag.
- Lindfors, H Samhälle i förändring. Länsstyrelseni Värmlands län. Karlstad.
al Kommunikationer och service på glesbygd. Skånes Regionplaneinstitut.Lund.
Statens Ostyriga Utredande. Karlstad.
Dahlberg, Â (1972)
Arbetsmarknadsutbildning - verkningar fö r den enskilde och samhället. Umeå.

212
Dahl, S (1950)
Register t i l l Sveriges tä to r te r .
(1965)
Daun, A (1969)
Enequist, 6 (1941)
Eriksson, C-E (1969)
Erson, 0 - Weissglas, G (1969)
(1969)
Expertgruppen fö r regional utredningsverksamhet (ERU)(1971)
(1972)
Fors lin , B - Persson, G(1973)
Fransson, R(1969)
Det svenska nätet av handel sorter. Göteborg.
Upp t i l l kamp i Båtskärsnäs.Oskarshamn.
Bygd som geografisk term. Svensk geografisk årsbok 1941. Lund.
Livsmedelshandelns utveckling i Jämtlands län 1950-1963. Geografiska inst i tu t io nen , Umeå u nivers ite t . Umeå.
Karta över vald istriktsindeln ingen i W, X, Y, Z, AC och BD län. Geografiska ins t i tu t ionen , Umeå univers ite t . Umeå.
Befolkningens fördelning på ålder och v a ld is t r ik t i W, X, Y, Z, AC och BD län vid FoB 1965. Geografiska insti tu tionen , Umeå univers ite t. Umeå.
Arbetsgruppen för studier av hushållens levnadsvillkor. PM 14/12 1971. Stockholm.
Regioner a t t leva i . Elva forskare om reg io na lpo li t ik och välstånd. Stockholm.
Patientströmmar och vårdkonsumtion i Vindelns kommun. Geografiska in s t i tu tionen, Umeå univers ite t . Umeå.
Gymnasieomland och gymnasiefrekvens. Geografiska in s ti tu t ion en , Umeå unive rs i te t . Umeå.
Förslag t i l l Regionplan 1970 fö r Stockholmstrakten. Kommunalförbundet fö rStockholms stads och läns regionala frågor, 1970. Stockholm.
Gabriel sson, R - Wiberg, U(1974)
Manual t i l l datamodell fö r beräkning av t i l lg ä n g l ig h e t och transportarbete. Geografiska insti tu t ionen , Umeå univ e rs i te t . Umeå.
Glesbygdsforskni ngen Se l i s t p

213
Glesbygdsutredningen(1972)
Godlund, S (1954)
Gould, P(1972)
Häl so- och sjukvård i glesbygder.Ds In 1972:6. Inrikesdepartementet. Stockholm.
Busstrafikens framväxt och funktion i de urbana in fluensfä lten . Lund.
On mental maps. In Ward, P - Mayfield, R (ed). Man, Space and Environment.New York.
Grundberg, I - Lundholm, B-MMårtensson, L(1971)
Hamrin, E(1970)
Handel sdepartementet (1969)
Hanssen, B(1957)
Harvey, D (1969)
Hel mfrid , S(1969)
Hermansen, T(1969)
Holm, P(1969)
Service i glesbygd. Geografiska in s t i tu t ionen , Umeå u nivers ite t. Umeå.
Stadsplanering. Teknik kontra v e rk l ig het. Stockholm.
Lägesrapport från konsumentutredningen H 1969:5. Stockholm.
The H o lis t ic Approach. In Migration in Sweden. Lund. Studies in Geography, ser B, no 13. Lund.
Explanation in Geography. London.
Bruk och missbruk av regionbegreppet.In Ymer 1969. Stockholm.
Growth Poles and Service Centres in Regional Planning - Some Geographical Aspects. Discussion paper. Geneve.
Skall näringslivet koncentreras t i l l storstadsregionerna - några synpunkter. In Plan 1:1969.
Hägerstrand, T (1953)
Innovationsförloppet ur korologisk synpunkt. Medd från Lunds universitets geografiska in s t i tu t io n . Avhandlingar XXV. Lund.
(1966)
h _
(1970)
In f ly t ta d arbetskrafts anpassning
Regionala utvecklingstendenser och problem. Urbanisering. In SOU 1966:1.
Tidsanvändning och omgivningsstruktur. In SOU 1970:14. Stockholm.
i en expanderande arbetsmarknad (1968).5 subreports (ed): Bengt, G Rundblad. Sociologiska in s ti tu t ion en , Göteborgs univers ite t .

214
In r i kesdepartementet(1971)
Isard, W(1960)
Jacobsson, B (1958)
Johansson, S(1970)
Johnston, R J(1966)
II _
(1968)
Keeble, D E(1967)
Kungl. Arbetsmarknadsstyrelsen(1958)
h _
(1964)
Kungl. Maj:ts kansli(1969)
Kungl. Maj:t(1970)
Kungl. Maj:t(1972)
Landsorgani sati onen(1961)
Lindahl, G - Lindskog, B(1959)
O rtsklassif icering i e t t regionalpol i t i s k t handlingsprogram. Skiss t i l l klassificeringssystem. Ds In 1971:7. Stockholm.
Methods of Regional Analysis. An Introduction to Regional Science Cambridge. Massachusetts.
Metod fö r bestämning av tä tor te rs centra lite tsgrad. Svensk Geografisk Årsbok. Lund.
Om levnadsnivåundersökningen. Utkast t i l l kapitel 1 och 2 i betänkande a t t avgivas av Låginkomstutredningen. Stockholm.
Central places and the settlement patterns. In Annals of the Association of American Geographers, 56.
Chice in c lass if ica t io n : The subject i v i t y of Objective Methods. In Annals of the Association of American Geographers, 5-8.
Models of Economic Development In: Chorley, R J & Haggett, R (ed): Models in Geography. London.
Befolkning och Näringsliv. Stockholm.
Kungl. Maj:ts proposition nr 185, år 1964. Stockholm.
Glesbygd. Stockholm.
Kungl. Maj:ts proposition nr 75, år 1970. Stockholm.
Regional poii t i s k t handlingsprogram m m. Bilaga 1 t i l l Kungl. Maj:ts propos it ion 1972:111. Stockholm.
Samordnad Näringspolitik . Stockholm.
De små tätorterna - omland och u tny ttjande. In Landskommunernas T id s k r i f t , nr 12/1959 and 2/1960. Stockholm.

215
Lindberg, 0(1972)
Lindgren, G - Palmqvist, J -Weissglas, G(1971)
Lindhagen, G(1968)
Lindholm, S(1973)
Linnér, E(1973)
Lundqvist, M - Enequist, G -Holdar, C G(1960)
Låginkomstutredningen(1970)
Länsstyrelsen i Kristianstads län(1968)
Länsstyrelsen i Norrbottens län(1968)
(1971)
Länsstyrelsen i Västerbottens län(1961)
(1971)
Marklund, S (1970)
Mc Loughlin, J (1969)
Urban settlement and income d i s t r i bution. Geographical reports 3.Dep:t of Geography, Umeå University. Umeå.
Sjukvård i glesbygd. Geografisk in s titu t ion en , Umeå univers ite t . Umeå.
Kostnader fö r lokala transporter vid olika lokalisering hos näringsliv och befolkning. Stockholm.
Att leva i glesbygd. Rapport från Klövsjö och Rätan. Pedagogiska in s t i tu tionen, Stockholms univers ite t . Stockholm.
Geographical aspects on eye diseases in a sparsely populated area of Northern Sweden. Acta Ophthalmologica, voi 51.
Atlas över Sverige 49-50. Landsbygdens fo lk tä the t 1950. Stockholm.
Utkast t i l l kapitlen 1-9 i betänkande om svenska fo lkets levnadsförhållanden. Stockholm.
Tätorterna i Kristianstad. K r is t ian stad.
BD 80. Länsutredning fö r Norrbottens län. Luleå.
Länsprogram 1970. Luleå.
Västerbottensutredningen (1961).
Länsprogram 1970. Umeå.
Vår nya skola. Stockholm.
Urban and Regional Planning. A systems Approach. London.

216
M eijer, H(1956)
Micklander, Å (1964)
Montgomery, A (1947)
M o r r i l l , R (1969)
Neymark, E (1961 )
Nilsson, M (1969)
Nordbeck, S - Rystedt, B(1973)
Norborg, K(1968)
Nordmark, A - Nordstrom, R(1972)
Kommittépolitik och Kommittéarbete. Lund.
Handel sorternas h ie ra rk i. Geografiska ins ti tu t ionen , Uppsala un ivers ite t . Uppsala.
Industrialismens genombrott i Sverige. Stockholm.
The Spatial Organisation of Society.
Selektiv Rörlighet. Stockholm.
Sveket mot Norrland. Stockholm.
Computer cartography. Lund.
Jordbruksbefolkningen i Sverige. Lund.
Serviceefterfrågan och serviceutbud - en planeringsstudie avseende Vindelns kommun. Geografiska institu t ionen , Umeå univers ite t . Umeå.
Norrländska Framtidsperspektiv (1964) Sundsvall.
Näslund, M - Persson, S(1972)
Persson, L - Skog, T - Westberg, A-L(1973)
Regionalpolitik. Igår , Idag, Imorgon. Stockholm.
Servicestudie i Lycksele kommun. Geografiska insti tu t ion en , Umeå universite t . Umeå.
Regionalpolitikkens mål og midier. (1969) Nordisk arbeidsgruppe for samar-beid om forskning vedrtfrende lokal i - seringspoli t i ske sptfrsmål. Oslo.
Rice, J (1973)
Richardson, G (1968)
Patterns of E thnicity in a Minnesota County, 1880-1905. Geographical Reports 4. Dep:t of Geography, University of Umeå. Umeå.
Det svenska skolväsendets h is to r ia . Lund.

217
Rudberg,(1957)
Rundblad, B (1956)
(1964)
Rydberg, H(1971)
Samuelsson, K(1972)
Sandlund, M-B(1971)
Soci aldepartementet (1967)
Socialstyrelsen(1971)
ödemarkerna och den perifera bebyggelsen i inre nordsverige. Uppsala.
Problems of a Depopulated Rural Community. In Migration in Sweden, Lund. Studies in Geography, ser B, nr 13.Lund.
Arbetskraftens rö r l ig h e t . Uppsala.
Den medvetna regionalpolitiken in Rydberg (ed) 1971: Vårt behov av regionalp o l i t ik . Halmstad.
Reflexioner kring värderingsproblematik och reg io n a lp o li t ik . In Regioner a t t leva i . Stockholm.
Den omedvetna regionalpo lit iken . In Rydberg (ed) 1971: Vårt behov av regionalp o l i t ik . Halmstad.
Sociala problem i bygder som avfolkats. Stockholm.
Socialstyrelsen redovisar, nr 21. Stockholm.
Statens Offentliga Utredningar, SOU:
SOU 1940:36
SOU 1943:39
SOU 1943:34
SOU 1945:38
SOU 1945:63
SOU 1946:11
SOU 1948:27
Folkskolans rationaliseringssakkunniga.
Utredning angående Norrlands näringsliv .
Utredning angående Norrlands näringsliv .
R ik t l in je r fö r en revision av r ike ts indelning i borgerliga primärkommuner.
Slutbetänkande avgivet av bostadssociala utredningen.
1940 års skolutredning.
1946 års skol kommissions betänkande med förslag t i l l r i k t l i n j e r för det svenska skolväsendets utveckling.
SOU 1949:1 Norrländska utveck lings lin jer .

SOU 1949:3
SOU 1951:6
SOU 1956:53
SOU 1956:36
SOU 1958:22 and 1960:37
SOU 1958:1
SOU 1961:4
SOU 1961:8
SOU 1961:9
SOU 1963:69
SOU 1963:58
SOU 1967:27
SOU 1968:33
SOU 1969:49
SOU 1970:3
SOU 1970:14
SOU 1972:56
SOU 1972:13
SOU 1974:1
SOU 1974:3
Spri(1969)
ii _
(1971)
218
Norrlandskommitténs principbetänkande. Tredje delen.
Näringslivets loka lisering .
Balanserad expansion.
Skogsbrukets arbetsmarknad.
Tornedalsutredni ngen.
Vägplan fö r Sverige.
Principer fö r en ny kommunindelning.
Om läkarbehov och 1ä k a r t i11 gång.
Principer för en ny kommun indel ning.
Lokalisering av s ta t l ig verksamhet.
Aktiv loka l ise r ing sp o li t ik .
Förtidsröstning och gemensamma tvådagars- v a l .
Lokal t ra f ikserv ice . Model 1 planering i Vilhelmina.
Lokaliserings- och reg io na lpo li t ik .
Balanserad regional utveckling.
Urbaniseringen i Sverige.
Glesbygder och Glesbygdspoli t i k.
Kommersiell service i glesbygder.
Orter i regional samverkan.
Produktionskostnader och regionala produktionssystem.
örnsköldsviksstudien, del 2. Rapport 14/69. Stockholm.
R ik t l in je r för hälso- och sjukvårdsplanering. Rapport 14/71. Stockholm.

219
Spri(1972)
Statens Planverk(1972)
S ta t is t iska Centralbyrån (1954, 1964)
Steiglbauer, K(1967)
Swedner, H(1960)
(1965)
Sveriges Industriförbund (1969)
Sveriges o f f i c i e l l a s ta t is t ik (1954, 1964, 1973)
Vanberg, V(1972)
Vesterlund, V - Norberg, L-G(1971)
Weissglas, G - Wiberg, U(1973)
Weissglas, G - öquist, B(1969)
Weissglas, G(1969)
(1969)
Genomgång av sjukvårdsplan för e t t glesbygdsområde. Spri report 3003.Umeå.
Bostadens grannskap. Rapport 24. Stockholm.
S ta t is t is k årsbok 1950 and 1960. Stockholm.
Some problems of Central Places at the lowest level in Austria. Regional Science Association; Papers, vol X V I I I .
Ecological D if fe ren t ia t io n of Habits and Attitudes. Lund. Studies in Sociology. Lund.
Social struktur på landsbygden. In Dahlström, (ed): Svensk samhällsstruktu r i sociologisk belysning. Stockholm.
Lokaliseringsförutsättningar inom stödområdet. Stockholm.
Folk- och Bostadsräkningen 1950, 1960, 1970. Stockholm.
Mål og Midler i Utkantstråkenes ser- viceforsyning. Oslo.
Inkomst i Glesbygd. Geografiska in s t i tu t ion en , Umeå univers ite t . Umeå.
T il lgänglighet t i l l service. Geografiska institutionen vid Umeå univers ite t . Umeå.
Valdistriktens central i t e t : En undersökning baserad på detaljhandelsomsättningen i Glesbygdsforskningens undersökningsområde. Geografiska ins ti tu t ion en , Umeå u nivers ite t.
Service-Läges Karakteristika fö r va ld is tr ik ten i W, X, Y, Z, AC och BD län. Geografiska in s ti tu t ionen , Umeå universite t . Umeå.
Baspunkter för serviceutbudet i W, X, Y, Z, AC och BD län. Geografiska in s t i tu tionen, Umeå univers ite t . Umeå.

220
Wikström, S En landsbygds kontakter med två(1971) närliggande tä to r te r . Geografiska
in s ti tu t io n en , Umeå u nivers ite t. Umeå.
Wolpert, J The Decision Process in Spatial Con-(1964) te x t . Annals of the Association of
American Geographers, 54.
Yeates, M An introduction to quantitative ana-(1968) lys is in Economic Geography. New York.
Aberg, R Changes in Work conditions as a result(1973) of Changes in economic structure. Umeå.
Åström, T En sociologisk studie av fem glesbygds-(1969) områden. Glesbygdsforskningen, rapport
nr 10. Geografiska insti tu t ion en , Umeå un ivers ite t . Umeå.
Fem glesbygdsområden ur sociologisk(1972) synvinkel. Sociologiska insti tu tionen ,
Umeå univers ite t. Umeå.
öhman, B (1969)
Från arbetslöshetshjälp t i l l samhälls - idê. In SOU 1968:62. Stockholm.